
February 2025 / © 2025 Remitly Inc. 1 Investor Presentation Fourth Quarter 2024 Earnings February 19, 2025

February 2025 / © 2025 Remitly Inc. 2 Disclosures Forward-Looking Statements This presentation contains forward-looking statements within the meaning of the Private Securities Litigation Reform Act of 1995. All statements other than statements of historical fact are forward-looking statements. These statements include, but are not limited to, statements regarding our future results of operations and financial position, including our fiscal year and first quarter 2025 financial outlook, including forecasted fiscal year and first quarter 2025 revenue, net income (loss), and Adjusted EBITDA, anticipated future expenses and investments, expectations relating to certain of our key financial and operating metrics, our business strategy and plans, our growth, our position and potential opportunities, and our objectives for future operations. The words such as “anticipate,” “believe,” “continue,” “could,” “estimate,” “expect,” “intend,” “may,” “might,” “likely,” “plan,” “potential,” “predict,” “project,” “seek,” “should,” “target,” “will,” “would,” or similar expressions and the negatives of those terms are intended to identify forward-looking statements. Forward-looking statements are based on management’s expectations, assumptions, and projections based on information available at the time the statements were made. These forward-looking statements are subject to a number of risks, uncertainties, and assumptions, including risks and uncertainties related to: our expectations regarding our revenue, expenses, and other operating results; our ability to acquire new customers and successfully retain existing customers; our ability to develop new products and services in a timely manner; our ability to achieve or sustain our profitability; our ability to maintain and expand our strategic relationships with third parties; our business plan and our ability to effectively manage our growth; anticipated trends, growth rates, and challenges in our business and in the market segments in which we operate; our ability to attract and retain qualified employees; uncertainties regarding the impact of geopolitical and macroeconomic conditions, including currency fluctuations, inflation, regulatory changes (including as may be related to immigration, fiscal policy, foreign trade, or foreign investment), or regional and global conflicts or related government sanctions; our ability to maintain the security and availability of our solutions; our ability to maintain our money transmission licenses and other regulatory clearances; our ability to maintain and expand international operations; and our expectations regarding anticipated technology needs and developments and our ability to address those needs and developments with our solutions. It is not possible for our management to predict all risks, nor can we assess the impact of all factors on our business or the extent to which any factor, or combination of factors, may cause actual results to differ materially from those contained in any forward-looking statements we may make. In light of these risks, uncertainties, and assumptions, our actual results could differ materially and adversely from those anticipated or implied in the forward-looking statements. Further information on risks that could cause actual results to differ materially from forecasted results is included in our annual report on Form 10-K for the year ended December 31, 2024 to be filed with the SEC, and within our annual report on Form 10-K for the year ended December 31, 2023 filed with the SEC, which are or will be available on our website at https://ir.remitly.com and on the SEC’s website at www.sec.gov. The forward-looking statements in this presentation speak only as of the date of this presentation and except as required by law, we assume no obligation to update these forward-looking statements, or to update the reasons if actual results differ materially from those anticipated in the forward-looking statements. The guidance in this presentation is only effective as of the date given, February 19, 2025, and will not be updated or affirmed unless and until we publicly announce updated or affirmed guidance. Distribution of or reference to this deck following February 19, 2025 does not constitute re-affirming guidance by Remitly. Non-GAAP Financial Measures A reconciliation of GAAP to non-GAAP financial measures has been provided in the Appendix included in this presentation. An explanation of these measures is also included in the Appendix within this presentation under the heading “Non-GAAP Financial Measures.” We have not provided a quantitative reconciliation of forecasted Adjusted EBITDA to forecasted GAAP net income (loss) or to forecasted GAAP income (loss) before income taxes within this presentation because we cannot, without unreasonable effort, calculate certain reconciling items with confidence due to the variability, complexity, and limited visibility of the adjusting items that would be excluded from forecasted Adjusted EBITDA. These items include but are not limited to income taxes and stock-based compensation expense, which are directly impacted by unpredictable fluctuations in the market price of our common stock. The variability of these items could have a significant impact on our future GAAP financial results.

February 2025 / © 2025 Remitly Inc. 4Q Strategic Overview 3 Matt Oppenheimer Co-Founder & CEO
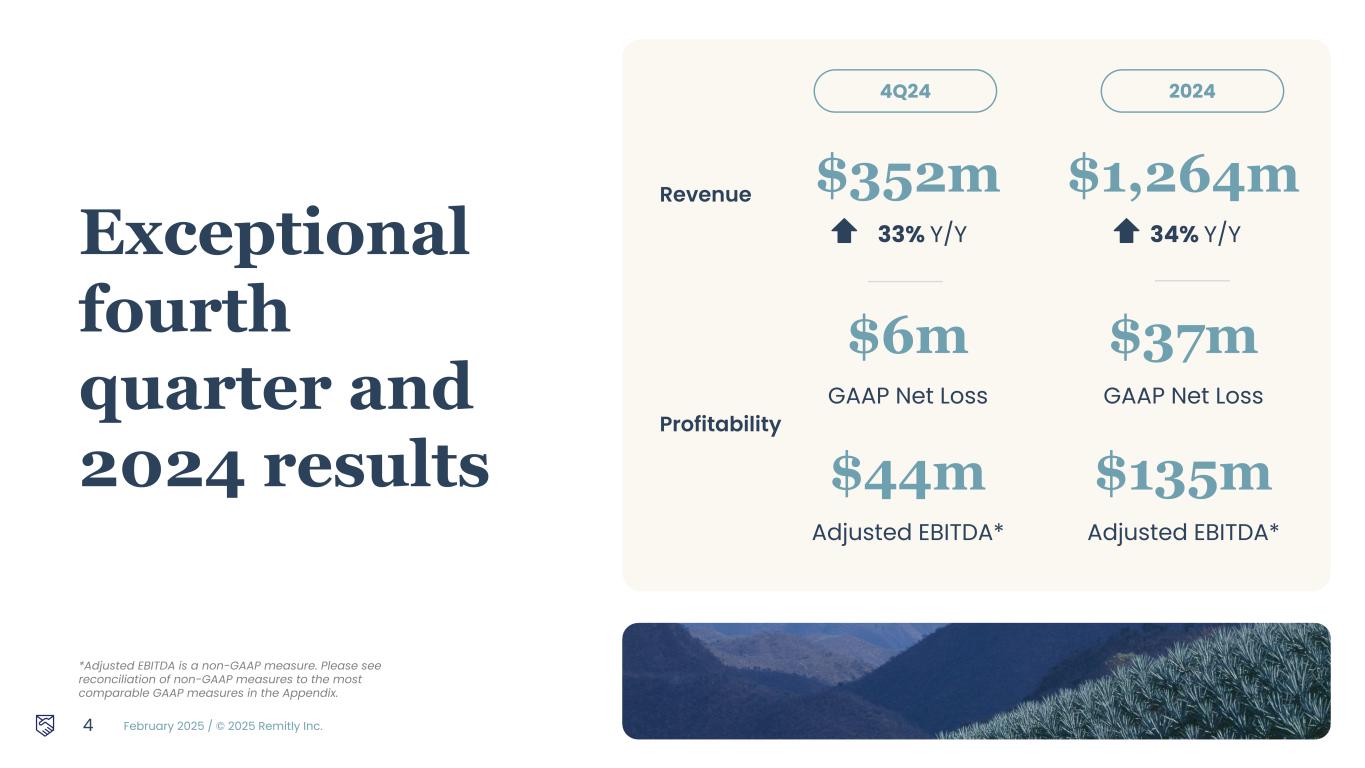
February 2025 / © 2025 Remitly Inc. Revenue $352m 33% Y/Y $1,264m 34% Y/Y Profitability $6m GAAP Net Loss $44m Adjusted EBITDA* $37m GAAP Net Loss $135m Adjusted EBITDA* 4 *Adjusted EBITDA is a non-GAAP measure. Please see reconciliation of non-GAAP measures to the most comparable GAAP measures in the Appendix. Exceptional fourth quarter and 2024 results 4Q24 2024

February 2025 / © 2025 Remitly Inc. 5 Vision Transform lives with trusted financial services that transcend borders

February 2025 / © 2025 Remitly Inc. 4.9 iOS App Store rating3 (~3.2m reviewers) 6 1. Remitly internal data for 4Q 2024. 2. Disbursement speed reflects the time between when Remitly has the customer funds and when the funds are successfully disbursed (e.g., completed or available for pickup). 3. App rating is based on all countries or regions and the rating may vary based on user location and device type. Customer experience continues to improve >92% Record customer transactions disbursed in less than an hour1,2 >95% Record transactions without customer support contact1 99.80% Uptime1 Focus areas across transaction lifecycle ● New customer use cases ● AI-powered virtual assistant ● Additional lower cost and convenient pay-in options ● More high quality direct integrations Key Outcomes 4.8 Android Google Play rating3 (>950k reviewers)
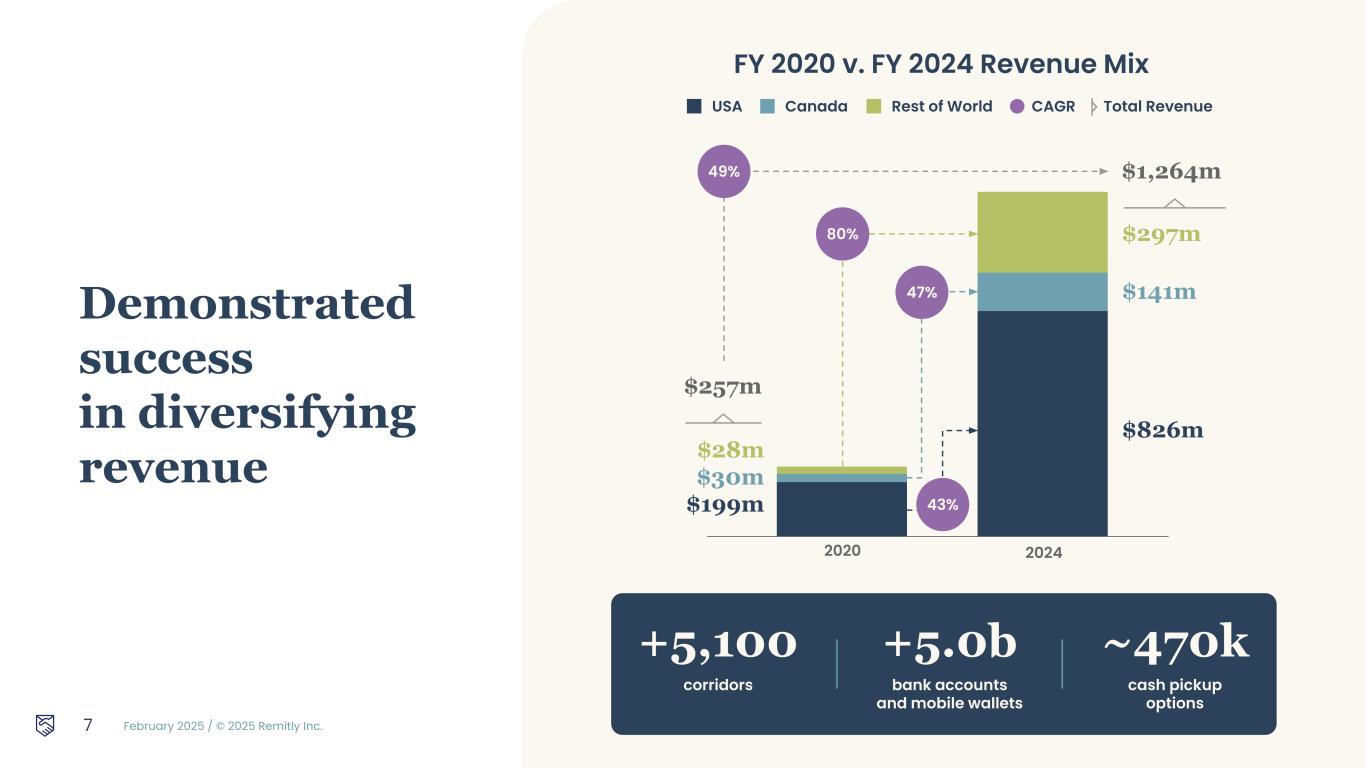
February 2025 / © 2025 Remitly Inc. 7 Demonstrated success in diversifying revenue FY 2020 v. FY 2024 Revenue Mix +5,100 corridors +5.0b bank accounts and mobile wallets ~470k cash pickup options 2020 2024 $199m $30m $28m $826m $141m $297m 43% 47% 80% $257m $1,264m49% USA Canada Rest of World CAGR Total Revenue

February 2025 / © 2025 Remitly Inc. 8 4Q Financial Results Vikas Mehta CFO
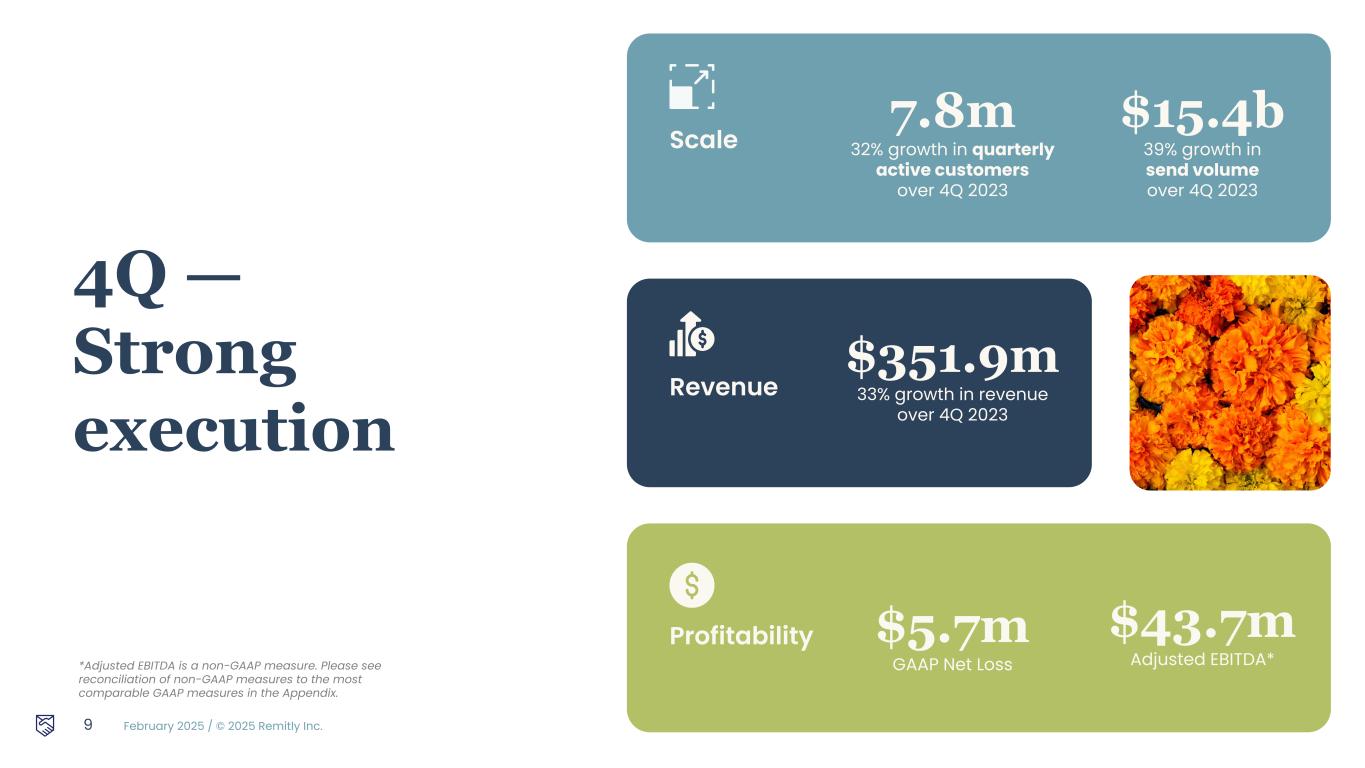
February 2025 / © 2025 Remitly Inc. 4Q — Strong execution Scale 7.8m 32% growth in quarterly active customers over 4Q 2023 $15.4b 39% growth in send volume over 4Q 2023 Revenue $351.9m 33% growth in revenue over 4Q 2023 9 Profitability $5.7m GAAP Net Loss $43.7m Adjusted EBITDA* *Adjusted EBITDA is a non-GAAP measure. Please see reconciliation of non-GAAP measures to the most comparable GAAP measures in the Appendix.
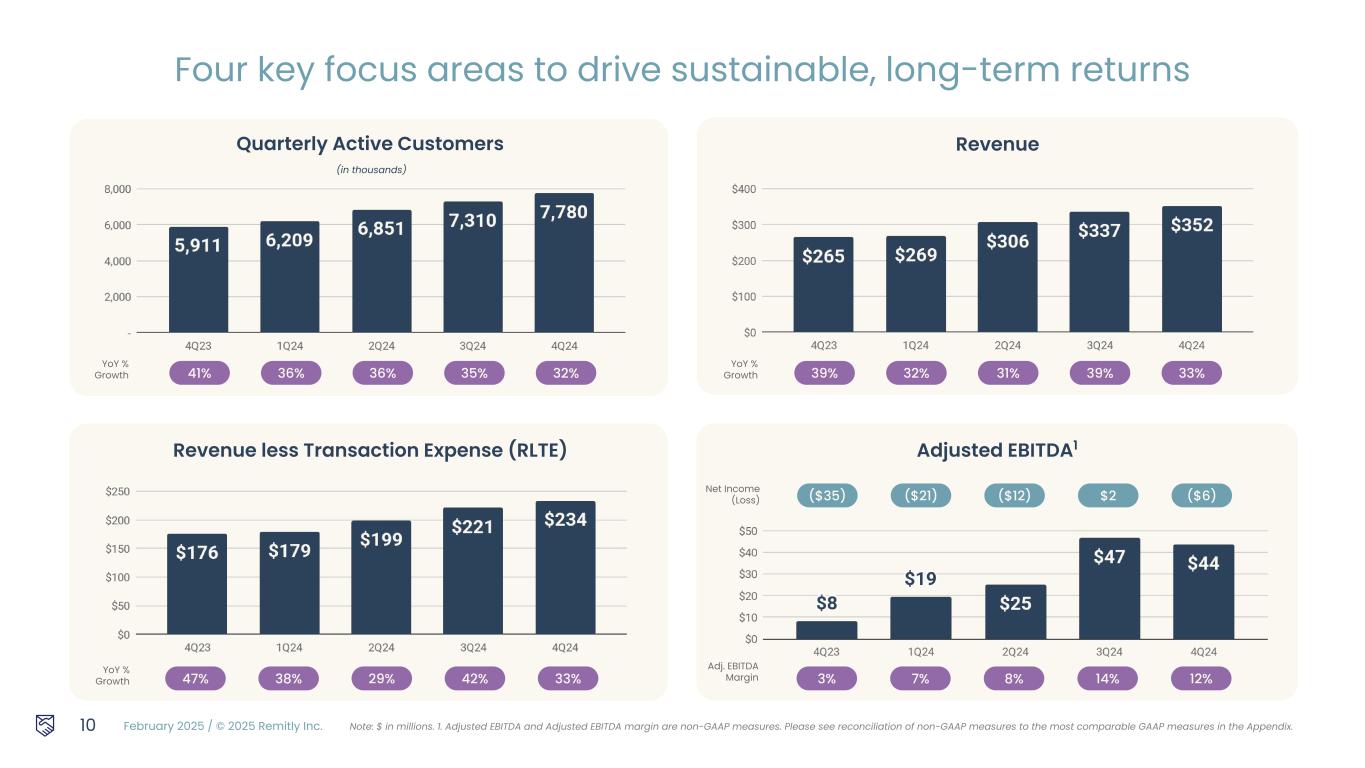
February 2025 / © 2025 Remitly Inc. Quarterly Active Customers (in thousands) 10 Revenue YoY % Growth 39% 32% 31% 39% 33% Revenue less Transaction Expense (RLTE) YoY % Growth Adj. EBITDA Margin 3% 7% 8% 14% 12%47% 38% 29% 42% 33% Adjusted EBITDA1 Four key focus areas to drive sustainable, long-term returns YoY % Growth 41% 36% 36% 35% 32% Net Income (Loss) ($35) ($21) ($12) $2 ($6) Note: $ in millions. 1. Adjusted EBITDA and Adjusted EBITDA margin are non-GAAP measures. Please see reconciliation of non-GAAP measures to the most comparable GAAP measures in the Appendix.
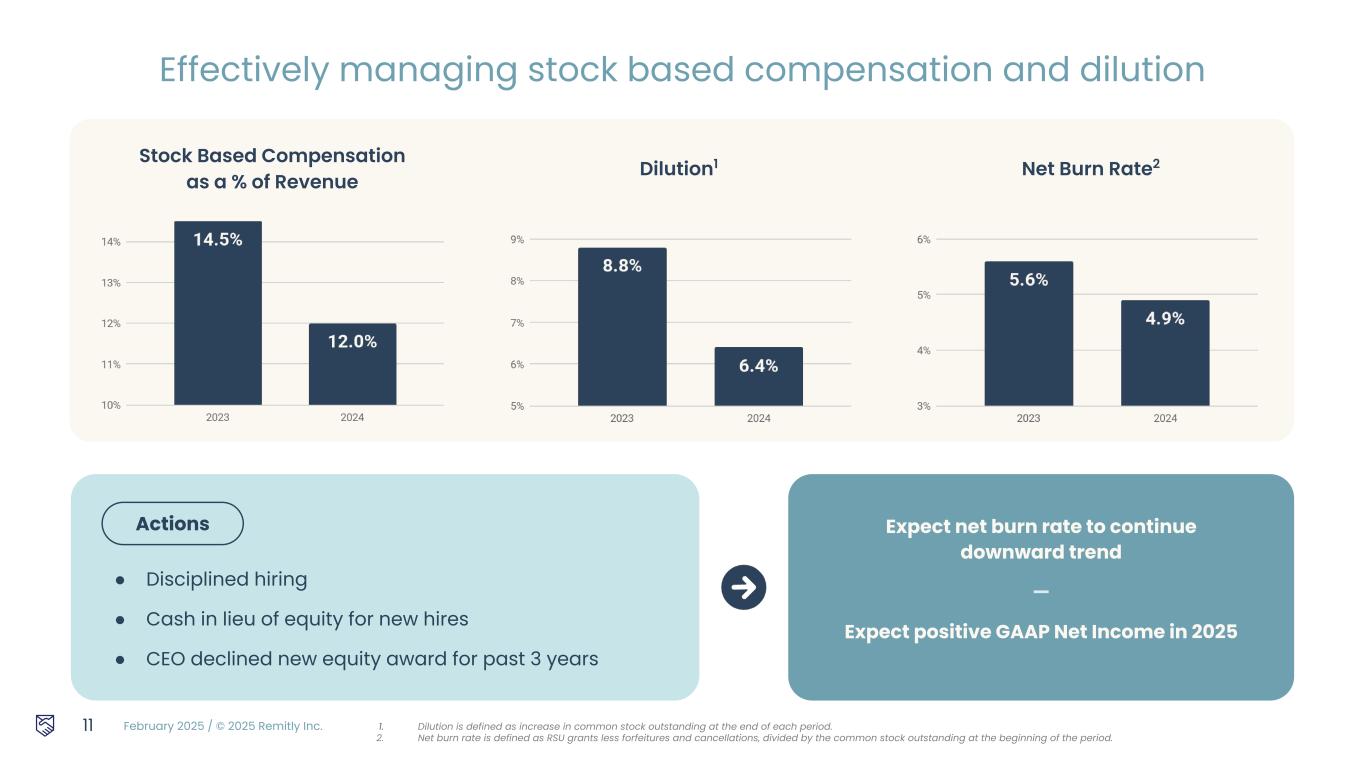
February 2025 / © 2025 Remitly Inc. Stock Based Compensation as a % of Revenue 11 ● Disciplined hiring ● Cash in lieu of equity for new hires ● CEO declined new equity award for past 3 years Effectively managing stock based compensation and dilution 1. Dilution is defined as increase in common stock outstanding at the end of each period. 2. Net burn rate is defined as RSU grants less forfeitures and cancellations, divided by the common stock outstanding at the beginning of the period. Expect net burn rate to continue downward trend — Expect positive GAAP Net Income in 2025 Dilution1 Net Burn Rate2 Actions

February 2025 / © 2025 Remitly Inc. $345m-$348m Q1 2025 Revenue 28% to 29% YoY growth — $36m-$40m Q1 2025 Adjusted EBITDA $1.565b-$1.580b 2025 Revenue 24% to 25% YoY growth — $180m-$200m 2025 Adjusted EBITDA 2025 and Q1 2025 Outlook 12 Note: We expect to remain in a GAAP net-loss position in Q1 2025 and expect positive GAAP net income for the full year 2025. This guidance is only effective as of the date given, February 19, 2025, and will not be updated or affirmed unless and until we publicly announce updated or affirmed guidance. Distribution or reference of this deck following February 19, 2025 does not constitute re-affirming guidance. We cannot, without unreasonable effort, provide a quantitative reconciliation of forecasted adjusted EBITDA to forecasted GAAP net loss due to the variability, complexity, and limited visibility of the adjusting items that would be excluded from forecasted adjusted EBITDA. 2025 Q1 2025
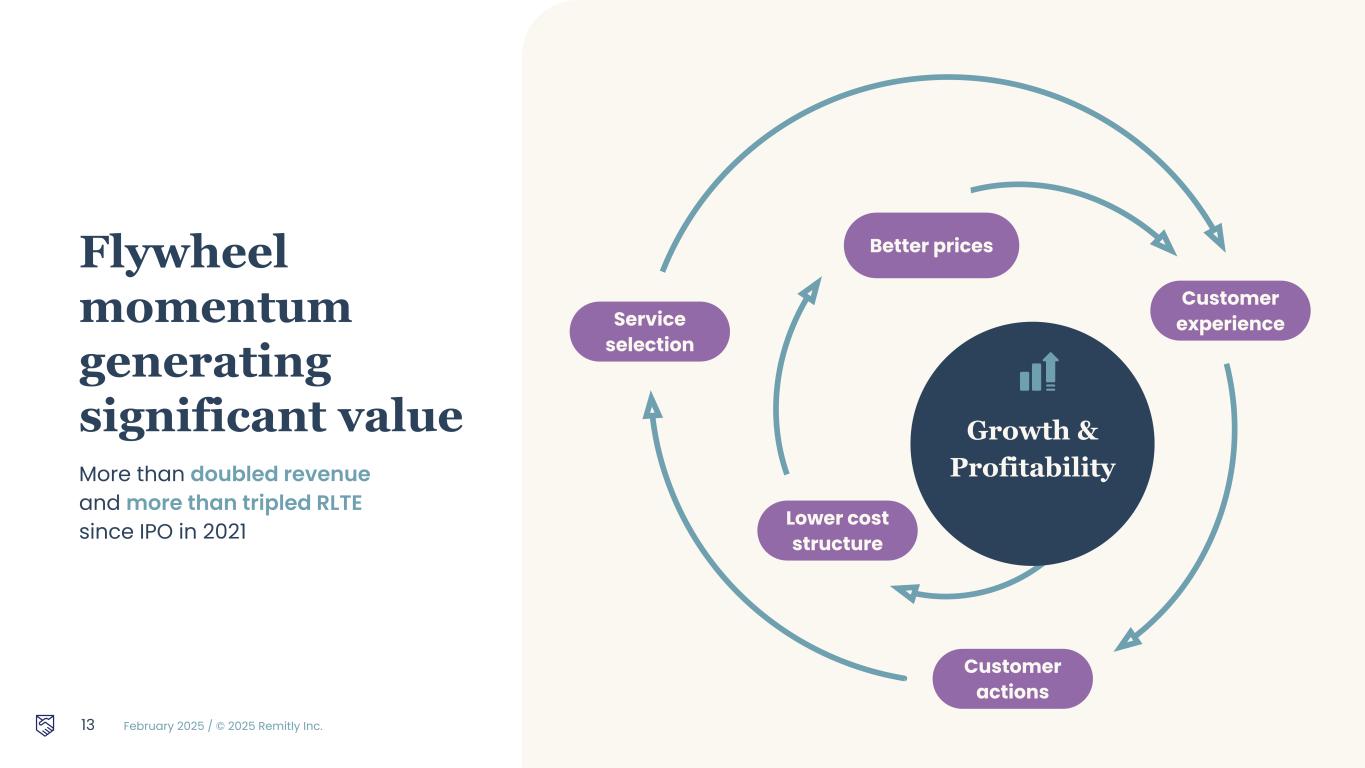
February 2025 / © 2025 Remitly Inc. 13 Lower cost structure Better prices Customer experience Customer actions Service selection Growth & Profitability Flywheel momentum generating significant value More than doubled revenue and more than tripled RLTE since IPO in 2021

February 2025 / © 2025 Remitly Inc. Q & A 14

February 2025 / © 2025 Remitly Inc. “ Jigyasa Remitly customer since 2018 Sends money from United States to India 15 I haven’t used anything apart from Remitly…. It is very intuitive, no fluff.

February 2025 / © 2025 Remitly Inc. Appendix 16
February 2025 / © 2025 Remitly Inc. Some of the financial information and data contained in this presentation, such as Adjusted EBITDA and non-GAAP operating expenses, have not been prepared in accordance with United States generally accepted accounting principles ("GAAP"). We regularly review our key business metrics and non-GAAP financial measures to evaluate our performance, identify trends affecting our business, prepare financial projections, and make strategic decisions. We believe that these key business metrics and non-GAAP financial measures provide meaningful supplemental information for management and investors in assessing our historical and future operating performance. Adjusted EBITDA and non-GAAP operating expenses are key output measures used by our management to evaluate our operating performance, inform future operating plans, and make strategic long-term decisions, including those relating to operating expenses and the allocation of internal resources. Remitly believes that the use of Adjusted EBITDA and non-GAAP operating expenses provides additional tools to assess operational performance and trends in, and in comparing Remitly’s financial measures with, other similar companies, many of which present similar non-GAAP financial measures to investors. Remitly’s non-GAAP financial measures may be different from non-GAAP financial measures used by other companies. The presentation of non-GAAP financial measures is not intended to be considered in isolation or as a substitute for, or superior to, financial measures determined in accordance with GAAP. Because of the limitations of non-GAAP financial measures, you should consider the non-GAAP financial measures presented herein in conjunction with Remitly’s financial statements and the related notes thereto. Please refer to the non-GAAP reconciliations in this presentation for a reconciliation of these non-GAAP financial measures to the most comparable financial measure prepared in accordance with GAAP. We calculate Adjusted EBITDA as net loss adjusted by (i) interest (income) expense, net, (ii) provision for income taxes, (iii) noncash charges of depreciation and amortization, (iv) gains and losses from the remeasurement of foreign currency assets and liabilities into their functional currency, (v) noncash charges associated with our donation of common stock in connection with our Pledge 1% commitment, (vi) noncash stock-based compensation expense, net, and (vii) certain acquisition, integration, restructuring, and other costs. We calculate non-GAAP operating expenses as our GAAP operating expenses adjusted by (i) noncash stock-based compensation expense, net, (ii) noncash charges associated with our donation of common stock in connection with our Pledge 1% commitment, as well as (iii) certain acquisition, integration, restructuring, and other costs. We calculate revenue growth on a constant currency basis by translating current period GAAP revenue from foreign currency denominated subsidiary revenue at an exchange rate consistent with the prior period's average monthly rates, and then comparing it to the prior period reported GAAP revenue. Fluctuations in the United States Dollar compared to foreign currency resulted in an increase to revenue of approximately $0.5 million for the three months ended December 31, 2024, when compared to foreign currency rates in the prior period. On a constant currency basis, revenue would have been up 33% as compared to the same quarter in the prior year. Beginning in the first quarter of 2025, we will also be excluding from Adjusted EBITDA the payroll taxes related to stock based compensation. During the year ended December 31, 2024, payroll taxes related to stock based compensation were $6.4 million. This included $3.5 million in the first quarter, $1.1 million in the second quarter, $0.7 million in the third quarter, and $1.1 million in the fourth quarter. 17 Non-GAAP Financial Measures

February 2025 / © 2025 Remitly Inc. Reconciliation of operating expenses to non-GAAP operating expenses (in thousands) 2024 4Q 2024 3Q 2024 2Q 2024 1Q 2024 4Q 2023 Customer support and operations $83,918 $22,008 $21,792 $19,999 $20,119 $19,917 Excluding: Stock-based compensation expense, net 1,158 268 278 259 353 394 Excluding: Acquisition, integration, restructuring, and other costs 758 - - - 758 - Non-GAAP customer support and operations $82,002 $21,740 $21,514 $19,740 $19,008 $19,523 Marketing $303,799 $83,937 $74,792 $77,056 $68,014 $75,343 Excluding: Stock-based compensation expense, net 17,609 4,595 4,514 4,521 3,979 3,930 Non-GAAP marketing $286,190 $79,342 $70,278 $72,535 $64,035 $71,413 Technology and development $269,817 $70,611 $68,446 $67,554 $63,206 $59,240 Excluding: Stock-based compensation expense, net 84,381 22,527 21,873 20,354 19,627 19,920 Excluding: Acquisition, integration, restructuring, and other costs - - - - - 700 Non-GAAP technology and development $185,436 $48,084 $46,573 $47,200 $43,579 $38,620 General and administrative $195,857 $54,875 $50,920 $45,889 $44,173 $48,657 Excluding: Stock-based compensation expense, net 48,989 14,224 12,613 12,023 10,129 11,716 Excluding: Donation of common stock 2,587 - 2,587 - - - Excluding: Acquisition, integration, restructuring, and other costs 710 - - - 710 (893) Non-GAAP general and administrative $143,571 $40,651 $35,720 $33,866 $33,334 $37,834 18 Non-GAAP Reconciliation
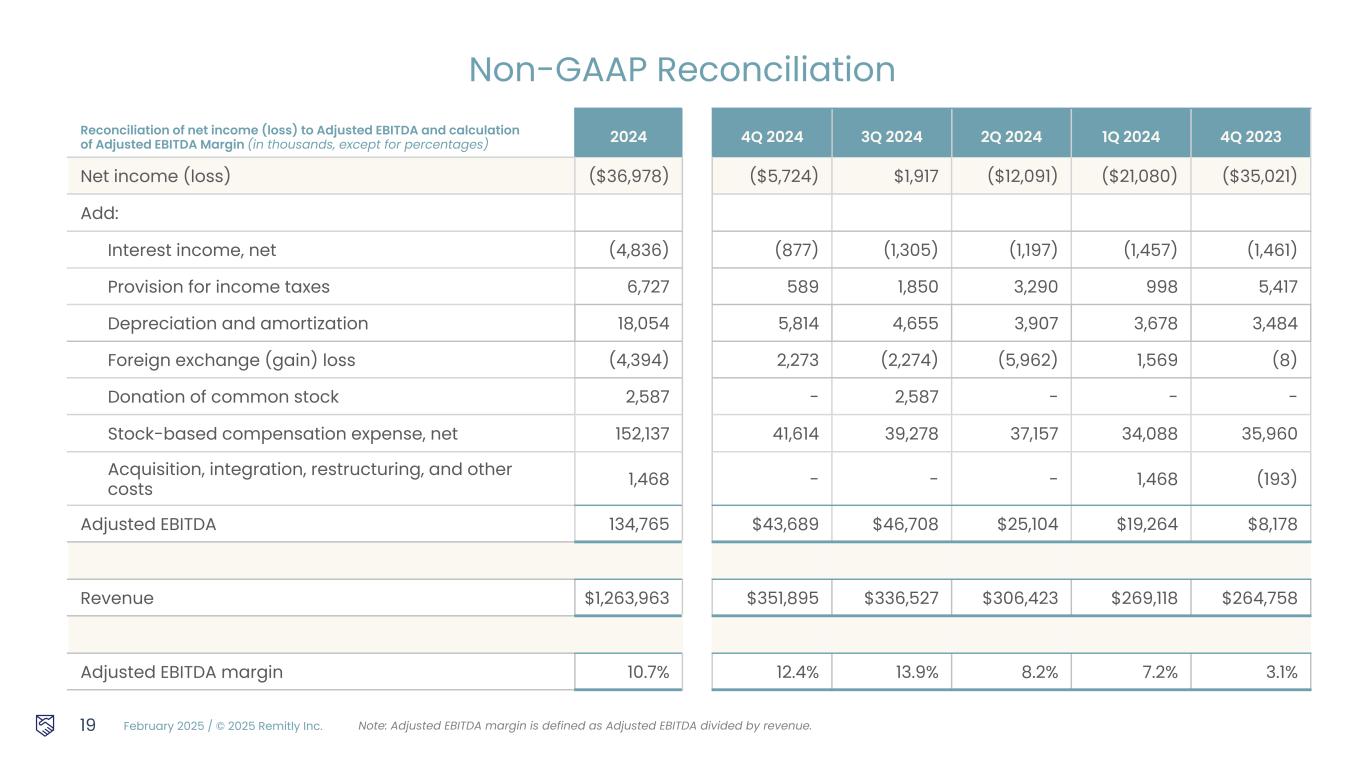
February 2025 / © 2025 Remitly Inc. Reconciliation of net income (loss) to Adjusted EBITDA and calculation of Adjusted EBITDA Margin (in thousands, except for percentages) 2024 4Q 2024 3Q 2024 2Q 2024 1Q 2024 4Q 2023 19 Non-GAAP Reconciliation Net income (loss) ($36,978) ($5,724) $1,917 ($12,091) ($21,080) ($35,021) Add: Interest income, net (4,836) (877) (1,305) (1,197) (1,457) (1,461) Provision for income taxes 6,727 589 1,850 3,290 998 5,417 Depreciation and amortization 18,054 5,814 4,655 3,907 3,678 3,484 Foreign exchange (gain) loss (4,394) 2,273 (2,274) (5,962) 1,569 (8) Donation of common stock 2,587 - 2,587 - - - Stock-based compensation expense, net 152,137 41,614 39,278 37,157 34,088 35,960 Acquisition, integration, restructuring, and other costs 1,468 - - - 1,468 (193) Adjusted EBITDA 134,765 $43,689 $46,708 $25,104 $19,264 $8,178 Revenue $1,263,963 $351,895 $336,527 $306,423 $269,118 $264,758 Adjusted EBITDA margin 10.7% 12.4% 13.9% 8.2% 7.2% 3.1% Note: Adjusted EBITDA margin is defined as Adjusted EBITDA divided by revenue.

February 2025 / © 2025 Remitly Inc. Thank you.


