UNITED STATES
SECURITIES AND EXCHANGE COMMISSION
WASHINGTON, D.C. 20549
________________________________________________
FORM 10-K
________________________________________________
| | | | | |
| ☒ | ANNUAL REPORT PURSUANT TO SECTION 13 OR 15(d) OF THE SECURITIES EXCHANGE ACT OF 1934 |
For the fiscal year ended December 31, 2024
OR | | | | | |
| ☐ | TRANSITION REPORT PURSUANT TO SECTION 13 OR 15(d) OF THE SECURITIES EXCHANGE ACT OF 1934 |
Commission file number 001-39220
________________________________________________
CARRIER GLOBAL CORPORATION
(Exact name of registrant as specified in its charter)
________________________________________________
| | | | | | | | |
| Delaware | | 83-4051582 |
| (State or Other Jurisdiction of Incorporation or Organization) | | (I.R.S. Employer Identification No.) |
13995 Pasteur Boulevard, Palm Beach Gardens, Florida 33418
(Address of principal executive offices, including zip code)
(561) 365-2000
(Registrant's telephone number, including area code)
Securities registered pursuant to Section 12(b) of the Act: | | | | | | | | | | | | | | |
| Title of each class | | Trading Symbol(s) | | Name of each exchange on which registered |
| Common Stock ($0.01 par value) | | CARR | | New York Stock Exchange |
| 4.125% Notes due 2028 | | CARR28 | | New York Stock Exchange |
| 4.500% Notes due 2032 | | CARR32 | | New York Stock Exchange |
| | | | |
Indicate by check mark if the registrant is a well-known seasoned issuer, as defined in Rule 405 of the Securities Act. Yes ☒ No ☐
Indicate by check mark if the registrant is not required to file reports pursuant to Section 13 or Section 15(d) of the Act. Yes ☐ No ☒
Indicate by check mark whether the registrant (1) has filed all reports required to be filed by Section 13 or 15(d) of the Securities Exchange Act of 1934 during the preceding 12 months (or for such shorter period that the registrant was required to file such reports), and (2) has been subject to such filing requirements for the past 90 days. Yes ☒ No ☐
Indicate by check mark whether the registrant has submitted electronically every Interactive Data File required to be submitted pursuant to Rule 405 of Regulation S-T during the preceding 12 months (or for such shorter period that the registrant was required to submit such files). Yes ☒. No ☐.
Indicate by check mark whether the registrant is a large accelerated filer, an accelerated filer, a non-accelerated filer, a smaller reporting company, or an emerging growth company. See the definitions of "large accelerated filer," "accelerated filer," "smaller reporting company," and "emerging growth company" in Rule 12b-2 of the Exchange Act.
| | | | | | | | | | | | | | | | | |
| Large accelerated filer | ☒ | Accelerated filer | ☐ | Emerging growth company | ☐ |
| Non-accelerated filer | ☐ | Smaller reporting company | ☐ | | |
If an emerging growth company, indicate by check mark if the registrant has elected not to use the extended transition period for complying with any new or revised financial accounting standards provided pursuant to Section 13(a) of the Exchange Act. ☐
Indicate by check mark whether the registrant has filed a report on and attestation to its management's assessment of the effectiveness of its internal control over financial reporting under Section 404(b) of the Sarbanes-Oxley Act (15 U.S.C. 7262(b)) by the registered public accounting firm that prepared or issued its audit report. ☒
If securities are registered pursuant to Section 12(b) of the Act, indicate by check mark whether the financial statements of the registrant included in the filing reflect the correction of an error to previously issued financial statements. ☐.
Indicate by check mark whether any of those error corrections are restatements that required a recovery analysis of incentive-based compensation received by any of the registrant’s executive officers during the relevant recovery period pursuant to §240.10D-1(b). ☐.
Indicate by check mark whether the registrant is a shell company (as defined in Rule 12b-2 of the Exchange Act). Yes ☐ No ☒
The aggregate market value of the voting Common Stock held by non-affiliates of the Registrant as of June 30, 2024, the last business day of the Registrant's most recently completed second fiscal quarter, was approximately $53.2 billion, based on the New York Stock Exchange closing price for such shares on that date. Solely for purposes of this disclosure, shares of Common Stock held by executive officers and directors of the Registrant as of such date have been excluded because such persons may be deemed to be affiliates. This determination of executive officers and directors as affiliates is not necessarily a conclusive determination for any other purpose.
As of January 31, 2025, there were 868,339,902 shares of Common Stock outstanding.
DOCUMENTS INCORPORATED BY REFERENCE
Part III hereof incorporates by reference portions of the Registrant's definitive proxy statement related to its 2025 annual meeting of shareowners.
Index
Carrier Global Corporation and its subsidiaries' names, abbreviations thereof, logos and product and service designators are all either the registered or unregistered trademarks or trade names of Carrier Global Corporation and its subsidiaries. Names, abbreviations of names, logos and products and service designators of other companies are either the registered or unregistered trademarks or trade names of their respective owners. As used herein, the terms "we," "us," "our," "the Company" or "Carrier," unless the context otherwise requires, mean Carrier Global Corporation and its subsidiaries. References to internet websites in this Annual Report on Form 10-K (the "Annual Report") are provided for convenience only. Information available through these websites is not incorporated by reference into this Annual Report.
CAUTIONARY NOTE CONCERNING FACTORS THAT MAY AFFECT FUTURE RESULTS
This Annual Report contains statements which, to the extent they are not statements of historical or present fact, constitute "forward-looking statements" under the securities laws. From time to time, oral or written forward-looking statements may also be included in other information released to the public. These forward-looking statements are intended to provide management’s current expectations or plans for our future operating and financial performance, based on assumptions currently believed to be valid. Forward-looking statements can be identified by the use of words such as "believe," "expect," "expectations," "plans," "strategy," "prospects," "estimate," "project," "target," "anticipate," "will," "should," "see," "guidance," "outlook," "confident," "scenario" and other words of similar meaning in connection with a discussion of future operating or financial performance. Forward-looking statements may include, among other things, statements relating to future sales, earnings, cash flow, results of operations, uses of cash, share repurchases, tax rates and other measures of financial performance or potential future plans, strategies or transactions of Carrier, Carrier's plans with respect to our indebtedness and other statements that are not historical facts. All forward-looking statements involve risks, uncertainties and other factors that may cause actual results to differ materially from those expressed or implied in the forward-looking statements. For those statements, we claim the protection of the safe harbor for forward-looking statements contained in the U.S. Private Securities Litigation Reform Act of 1995. Such risks, uncertainties and other factors include, without limitation:
•the effect of economic conditions in the industries and markets in which Carrier and our businesses operate in the U.S. and globally and any changes therein, including financial market conditions, inflationary cost pressures, fluctuations in commodity prices, interest rates and foreign currency exchange rates, levels of end market demand in construction, the impact of weather conditions, pandemic health issues, natural disasters and the financial condition of our customers and suppliers;
•challenges in the development, production, delivery, support, performance and realization of the anticipated benefits of advanced technologies and new products and services;
•future levels of capital spending and research and development spending;
•future availability of credit and factors that may affect such availability, including credit market conditions and Carrier's capital structure and credit ratings;
•the timing and scope of future repurchases of Carrier's common stock, including market conditions and the level of other investing activities and uses of cash;
•delays and disruption in the delivery of materials and services from suppliers;
•cost reduction efforts and restructuring costs and savings and other consequences thereof;
•new business and investment opportunities;
•the outcome of legal proceedings, investigations and other contingencies;
•the impact of pension plan assumptions on future cash contributions and earnings;
•the impact of the negotiation of collective bargaining agreements and labor disputes;
•the effect of changes in political conditions in the U.S. and other countries in which Carrier and our businesses operate, including the effect of changes in U.S. trade policies, on general market conditions, global trade policies, the imposition of tariffs, and currency exchange rates in the near term and beyond;
•the effect of changes in tax, environmental, regulatory (including among other things import/export) and other laws and regulations in the U.S. and other countries in which we and our businesses operate;
•the ability of Carrier to retain and hire key personnel;
•the scope, nature, impact or timing of acquisition and divestiture activity, such as our acquisition of the VCS Business (as defined below) and our portfolio transformation transactions, including among other things integration of acquired businesses into existing businesses and realization of synergies and opportunities for growth and innovation and incurrence of related costs;
•a determination by the U.S. Internal Revenue Service ("IRS") and other tax authorities that the Distribution (as defined below) or certain related transactions should be treated as taxable transactions; and
•risks associated with current and future indebtedness, as well as our ability to reduce indebtedness and the timing thereof.
This Annual Report includes important information as to risks, uncertainties and other factors that may cause actual results to differ materially from those expressed or implied in the forward-looking statements. See the Notes to the Consolidated Financial Statements in this Annual Report under the heading "Note 23 – Commitments and Contingent Liabilities," the sections entitled "Management's Discussion and Analysis of Financial Condition and Results of Operations" under the headings "Business Overview," "Results of Operations," "Liquidity and Financial Condition," and "Critical Accounting Estimates," and the section entitled "Risk Factors." This Annual Report also includes important information as to these factors in the "Business" section under the headings "General," "Other Matters Relating to Our Business as a Whole," and in the "Legal Proceedings" section. The forward-looking statements speak only as of the date of this report or, in the case of any document incorporated by reference, the date of that document. We undertake no obligation to publicly update or revise any forward-looking statements, whether as a result of new information, future events or otherwise, except as required by applicable law. Additional information as to factors that may cause actual results to differ materially from those expressed or implied in the forward-looking statements is disclosed from time to time in our other filings with the United States Securities and Exchange Commission ("SEC").
This Annual Report and our Quarterly Reports on Form 10-Q, Current Reports on Form 8-K and amendments to those reports are available free of charge through the Investors section of our Internet website (http://www.corporate.carrier.com) under the heading "SEC Filings" as soon as reasonably practicable after these reports are electronically filed with, or furnished to, the SEC. In addition, the SEC maintains an Internet website (http://www.sec.gov) containing reports, proxy and information statements, and other information regarding issuers that file electronically with the SEC.
PART I
ITEM 1. BUSINESS
General
Carrier Global Corporation ("we" or "our" or the "Company") is a global leader in intelligent climate and energy solutions with a focus on providing differentiated, digitally-enabled lifecycle solutions to our customers. Our portfolio includes industry-leading brands such as Carrier, Viessmann, Toshiba, Automated Logic and Carrier Transicold that offer innovative heating, ventilating and air conditioning ("HVAC"), refrigeration and cold chain transportation solutions to help make the world safer and more comfortable. We also provide a broad array of related building services, including audit, design, installation, system integration, repair, maintenance and monitoring.
Through our performance-driven culture, we anticipate creating long-term shareowner value by investing strategically to strengthen our product position in homes, buildings and across the cold chain in order to drive profitable growth. We believe our business segments are well positioned to benefit from favorable secular trends, including the mega-trends of urbanization, population growth and demographic shifts, food security and safety, digitalization, global connectivity and energy efficiency. Coupled with our industry-leading brands and track record of innovation, we continue to provide market-leading solutions for our customers.
In addition, we continue to invest in product and technology innovation within our offerings as well as invest in new business models including Carrier Energy, our solution to reduce demands on power grids and energy infrastructure by better managing energy consumption and reducing end-customer energy costs. This new business model is also expected to provide a digital connection between the end-customers and Carrier, providing us with opportunities to offer services and aftermarket parts and components over the life of a product.
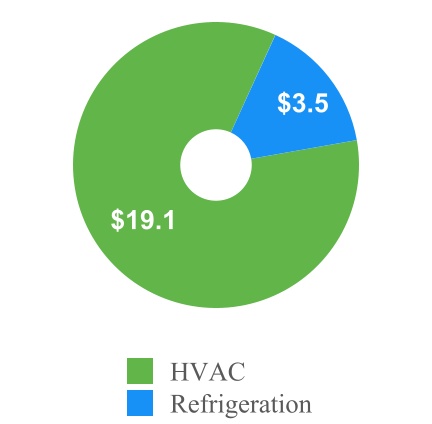
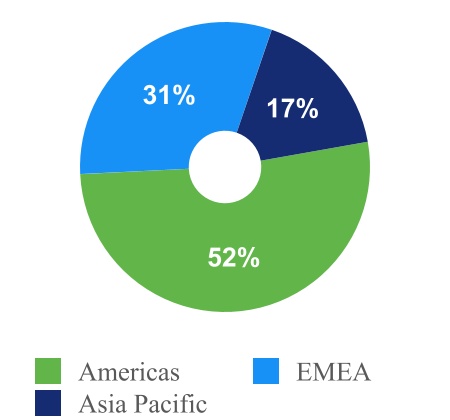
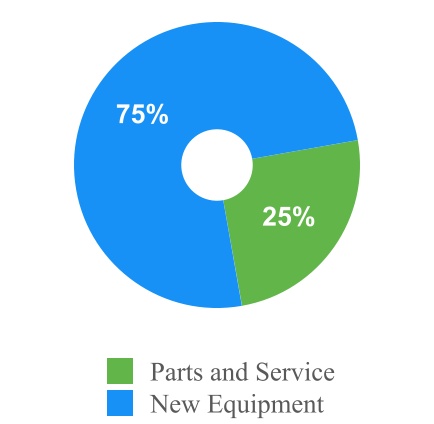
For the year ended December 31, 2024, our net sales were $22.5 billion and our operating profit was $2.6 billion. Our net sales for 2024 were derived from the Americas (52%), Europe, Middle East and Africa ("EMEA") (31%) and Asia-Pacific (17%). Our international operations, including U.S. export sales, represented approximately 50% of our net sales for 2024. During the same period, new equipment comprised 75% and parts and service comprised 25% of our net sales.
| | | | | | | | | | | | | | |
| Sales by Segment * | | Net Sales by Region | | Sales by Type |
* Segment sales include inter-company sales.
Separation from United Technologies Corporation
On April 3, 2020 (the "Distribution Date"), United Technologies Corporation, ("UTC"), since renamed RTX Corporation ("Raytheon Technologies Corporation" or "RTX") completed the spin-off of Carrier into an independent publicly traded company (the "Separation") through a pro rata distribution (the "Distribution") on a one-for-one basis of all of the outstanding shares of common stock of Carrier to UTC shareowners who held shares of UTC common stock as of the close of business on March 19, 2020, the record date of the Distribution. In addition, we entered into several agreements with UTC and Otis Worldwide Corporation ("Otis") that govern various aspects of the relationship among us, UTC and Otis following the Separation and Distribution. As of December 31, 2024, only certain portions of the Tax Matters Agreement ("TMA") remain in effect.
Business Segments
We globally manage our business operations through two segments: HVAC and Refrigeration. Each respective segment's major products, services and distribution methods are as follows:
The HVAC segment provides products, controls, services and solutions to meet the heating, cooling and ventilation needs of our customers while enhancing building performance, health and energy efficiency. Products and services include air conditioners, heating systems, heat pumps, building automation systems, aftermarket components, repair and maintenance services and rentals as well as modernization and upgrades through the product lifecycle. Our products and services cover a wide range of customers, including in the residential, commercial, education, healthcare, technology, retail, hospitality, data center, and infrastructure markets, among others. Products and solutions are sold directly to building contractors and owners and indirectly through joint ventures, independent sales representatives, distributors, wholesalers, dealers and retail outlets. Our established brands include Carrier, Viessmann, Toshiba, Automated Logic, Bryant, CIAT, Day & Night, Heil, NORESCO and Riello which offer an innovative and complete portfolio of products that provide numerous solutions for our customers. These products, in addition to the markets they serve, provide future service opportunities including replacement components, preventative and on-demand contractual maintenance and repair, digital monitoring and modifications/upgrades.
The Refrigeration segment provides products, services and monitoring for reliable transport and preservation of food, medicine and other perishable cargo. Products include trucks, trailers, shipping containers and intermodal applications to meet customer needs for both ground transport and ocean freight, while services include maintenance, repair, and monitoring. Products and services are sold directly to transportation companies and indirectly through joint ventures, independent sales representatives, distributors, wholesalers and dealers. Products and services are sold under established brand names, including Carrier Transicold and Sensitech. We provide customers the flexibility to select solutions from a very broad range of technologies including fossil fuel applications and electric solutions to best adhere to their objectives and preferences as well as regulatory requirements. In addition, our focus on digitalization and innovation is expanding our offering of service and aftermarket solutions, including on-demand and subscription-based monitoring of customer cargo. Through the lifecycle of the product, we also offer modifications and upgrades to the current installed base, improving energy efficiency, noise or other customer requirements.
Portfolio Transformation
In 2023, we began the journey to further simplify our company and accelerate our business strategy. Our actions transformed our business portfolio in an effort to establish us as a pure-play, global leader in intelligent climate and energy solutions. We believe that our greater focus on breakthrough innovation, electrification, energy-efficient solutions, the use of environmentally friendly refrigerants and connected ecosystems will further strengthen our global leadership position in our end-markets and provide responsible solutions for our customers.
On April 25, 2023, we announced that we entered into a Share Purchase Agreement (the “Agreement”) to acquire the climate solutions business (the "VCS Business") of Viessmann Group GmbH & Co. KG (“Viessmann”), a privately-held company. The VCS Business develops intelligent, integrated and sustainable technologies, including heat pumps, boilers, photovoltaic systems, home battery storage and digital solutions, primarily for residential customers in Europe. The acquisition was completed on January 2, 2024 and reported within our HVAC segment.
On June 2, 2024, we completed the sale of our Access Solutions business ("Access Solutions") to Honeywell International Inc. ("Honeywell") for cash proceeds of $5.0 billion. Access Solutions, historically reported in our Fire & Security segment, is a global supplier of physical security and digital access solutions supporting the hospitality, commercial, education and military markets. We recognized a net gain on the sale of $1.8 billion.
On July 1, 2024, we completed the sale of our Industrial Fire business ("Industrial Fire") for cash proceeds of $1.4 billion. Industrial Fire, historically reported in our Fire & Security segment, is a leading manufacturer of a full spectrum of fire detection and suppression solutions and services in critical high-hazard environments, including oil and gas, power generation, marine and offshore facilities, automotive, data centers and aircraft hangars. We recognized a net gain on the sale of $319 million.
On October 1, 2024, we completed the sale of our Commercial Refrigeration business ("CCR") for cash proceeds of $679 million. CCR, historically reported in our Refrigeration segment, is a global supplier of turnkey solutions for commercial refrigeration systems and services, with a primary focus on serving food retail customers, cold storage facilities and warehouses. We recognized a net gain on the sale of $292 million. The net proceeds received are subject to working capital and other adjustments provided in the stock purchase agreement.
On December 2, 2024, we completed the sale of our Commercial and Residential Fire business ("CRF Business") for cash proceeds of $2.9 billion. The CRF Business, historically reported in our Fire & Security segment, is a leading manufacturer of fire detection and alarm solutions for both commercial and residential applications. We recognized a net gain on the sale of $1.4 billion. The net proceeds received are subject to working capital and other adjustments provided in the stock purchase agreement.
Business Strategy
Our vision is to be a global leader in intelligent climate and energy solutions with a focus on providing differentiated, digitally-enabled lifecycle solutions to our customers. To achieve our vision, our core business strategy is to create innovative, differentiated products and solutions to provide a fully-integrated customer experience in order to be our customer’s preferred provider. We believe our strategy is supported by significant favorable secular trends, our industry-leading brands and track record of innovation. Our business strategy is built around the following pillars to drive long-term growth and deliver shareholder value:
Differentiated Products, Channels and Brands
Our strategy involves driving organic growth by further enhancing our proven track record of innovation, which is focused on designing smarter, more connected and more efficient sustainable systems and solutions. Our strategy also relies on our iconic, industry-leading brands and on strengthening our long-term relationships with channel partners and customers by offering solutions that anticipate customer needs with a focus on technologies related to energy efficiency, emissions, air quality, electrification, refrigerants with lower global warming potential and noise reduction.
Digitally-Enabled Lifecycle Solutions
We are focused on offering a comprehensive and differentiated suite of sustainable technologies and services. We expect that these solutions increase our total available market opportunity, enhance our predictive service and maintenance capabilities, strengthen our customer intimacy and increase aftermarket growth. Beginning with product design, our product offerings are moving towards digitally-enabled solutions that connect us to our customers throughout the product’s full lifecycle and help us grow our aftermarket sales. We plan to meet our customer’s needs by offering a wider-range of aftermarket products and services including replacement components, preventative and on-demand maintenance and repair, digital monitoring and modifications/upgrades. Our digitally-enabled lifecycle solutions include Abound, a cloud-based building platform that unlocks and unites building data to create healthy, sustainable and intelligent solutions for indoor spaces. It gathers data from disparate systems, sensors and sources; identifies opportunities to optimize performance; and works with healthy building solutions to improve occupant experiences. In addition, our Lynx digital platform, developed in collaboration with Amazon Web Services (“AWS”), allows customers to leverage data to enhance visibility, resiliency, agility and efficiency in the cold chain to reduce loss of cargo, lower operations costs and support real-time decisions.
Expand Portfolio with Energy Management Solutions
As power grids and transportation infrastructure shift from fossil fuels to renewables, we will continue to position ourselves as a leader in innovative solutions that reduce emissions and energy consumption and promote power grid stability. Our solutions range from residential home energy management to sustainable solutions for commercial and industrial buildings to optimized low noise and low gas emission transport solutions. With the addition of the VCS Business on January 2, 2024, we are well positioned to provide complete energy solutions globally. Our portfolio includes environmentally friendly refrigerants, high temperature heat pumps for use in industrial and commercial applications, natural refrigerant heat pumps for residential buildings and a connected ecosystem for homes including solar PV, batteries and a differentiated digital platform, all supported by extensive service and aftermarket offerings.
Strategic Capital Allocation
Our priorities for capital deployment include funding organic growth, acquisitions and capital returns to shareowners through a growing and sustainable dividend and share repurchases. We pursue potential acquisitions to complement existing products and services and to expand the range of technologies and solutions available to our customers. We leverage our global operations, the strength of our iconic, industry-leading brands and our success in creating valuable partnerships to focus on targeted expansion into new locations and channels where we believe that we can drive profitable growth. These drivers are supported by research and development activities with a focus on new product development and new technology innovation. In addition, Carrier Ventures, our global venture capital wholly-owned subsidiary, focuses on investments to accelerate the development of sustainable innovations and disruptive technologies to transform future building and cold chain management. It engages in strategic partnerships with high growth organizations as they invest in the development of technologies to innovate and commercialize the next generation of integrated offerings.
Other Matters Relating to Our Business as a Whole
Competitive Conditions
Each of our businesses is subject to significant competition from a number of companies throughout the world. Due to the nature of our products and services and the markets we serve, our competition can vary from regional or specialized companies to larger public or private companies.
The most significant competitive factors we face are technology differentiation, product performance, service, delivery schedule and price. Brand reputation, service to customers and quality are also important competitive factors for our products and services. While our competitive position varies among our products and services, we are a significant competitor with respect to each of our major product and service offerings. We believe that the loss of any individual contract or customer would not have a material adverse effect on our results.
Raw Materials and Supplies
We rely on suppliers and commodity markets to secure components and raw materials such as copper, aluminum and steel. In addition, we also use semi-conductors and other electronic components in the manufacture of our products. To maximize our buying effectiveness and leverage our scale, we have a central strategic sourcing group that consolidates purchases of certain materials and components across our business segments. We work closely with our suppliers to ensure availability of products and implement other cost savings initiatives. In addition, we continue to invest in our supply chain to improve its resilience with a focus on automation, dual sourcing of critical components and localized manufacturing when feasible.
Intellectual Property
We maintain a broad portfolio of patents, trademarks, copyrights, trade secrets, licenses and franchises related to our business to protect our research and development investments and to maintain our competitive advantages. We hold approximately 12,000 active patents and pending patent applications worldwide. From time to time, we take actions to protect our business by asserting our intellectual property rights against third-party infringement. We believe that we have taken reasonable measures to build and protect this portfolio of intellectual property rights, but we cannot be assured that these rights will not be challenged, found invalid or unenforceable.
Operating System
We plan to continue to foster operational, financial and commercial excellence to drive sales and earnings growth. With roots in our legacy manufacturing and business processes, the Carrier operating system — Carrier Excellence — is our continuous improvement framework that is expected to drive operational excellence across our businesses. Our Supplier Excellence program is intended to apply these same operating principles to our supply base and we continue to focus on strategic cost reductions through operational efficiency, digitalization, automation and supply chain productivity.
Joint Ventures and Strategic Relationships
Our joint ventures and strategic relationships are an important part of our business. We hold direct ownership interests in approximately 55 joint ventures, the financial results of which are accounted for by the equity method of accounting or the cost basis of accounting, of which 97% of such investments are in our HVAC segment. These relationships engage in distribution, manufacturing and product development activities and are integral to our business operations and growth strategy.
Seasonality
Demand for certain of our products and services is seasonal and can be impacted by weather conditions. For instance, sales and services of our HVAC products to residential customers have historically been higher in the second and third quarters of the calendar year, which represent the peak seasons for air conditioning-related sales in North America markets. A change in building and remodeling activity also can affect our financial performance. In addition, our financial performance may be influenced by the production and utilization of transport equipment, including truck production cycles in North America and Europe.
Compliance with the Regulation of our Business and Operations
We operate our businesses and sell our products all over the world. As a result, rapid changes in legislation, regulations and government policies affect our operations and business in the countries, regions and localities in which we operate and sell our products. International accords such as the Paris Agreement and the subsequent U.S. climate policies to meet its nationally determined contributions as well as local regulations in the U.S. reducing the use of fossil fuels in buildings all have the potential to impact our products and service offerings. Such changes, which can render our products and technologies non-compliant, involve refrigerants, noise levels, product and fire safety, hydrofluorocarbon emissions, fluorinated gases, hazardous substances and electric and electronic equipment waste. Increased fragmentation of regulatory requirements changes the manner in which we conduct our business and increases our costs because it necessitates the development of country or regional specific variants, monitoring of and compliance with those regulations and additional testing and certifications. In addition, our operations are subject to and affected by environmental regulations promulgated by federal, state and local authorities in the U.S. and by authorities with jurisdiction over our foreign operations. We have made, and will be required to continue to make, capital expenditures to design and upgrade our products to comply with or exceed environmental and other regulations and energy efficiency standards. However, we believe that the costs related to compliance requirements for environmental or other government regulations will not have a material adverse effect on our capital expenditures, financial results or competitive position.
Environmental Goals
As a global leader in intelligent climate and energy solutions, we are committed to making the world safer, sustainable and more comfortable. We have set ambitious sustainability goals to be reached by 2030, which include the following:
•Invest over $4 billion to develop intelligent climate and energy solutions that reduce environmental impacts,
•Avoid more than 1 gigaton of customer greenhouse gas emissions,
•Achieve carbon neutral operations,
•Reduce energy intensity by 10% across our operations,
•Develop water stewardship programs across our global operations, prioritizing water-scarce locations, and
•Promote sustainability and positively impact communities and our workforce through education, partnerships, programs and volunteering our time and talent.
Human Capital Management
At Carrier, we strive to connect our people to our purpose, our vision, our strategic priorities, our culture and each other, with the ultimate goal to engage our teams, drive success and create value for our customers and shareowners.
Culture and People
Our operating fundamentals - The Carrier Way, Leading People The Carrier Way, and Carrier Excellence – serve as a basis for how we operate our company and drive success, as One Team. The Carrier Way outlines our vision, values, and cultural behaviors. Leading People The Carrier Way sets expectations for people leaders and how we build the best teams. Carrier Excellence is our continuous improvement operating system, a mindset that focuses the organization on enhancing efficiency, and delivering high-quality outcomes across all facets of our business.
Our employees collaborate as one team across more than 50 countries. We develop and deploy best-in-class programs and practices, provide enriching career opportunities, listen to employee feedback and always challenge ourselves to do better. As of December 31, 2024, we had approximately 48,000 employees worldwide, of which 35% are located in the Americas, 36% are located in EMEA and 29% are located in Asia Pacific.
We are an employer of choice and we focus on our Build Best Teams cultural behavior priority through the deployment of our talent ecosystem that connects strategy, embeds talent in our culture and activates it through people programs, processes and leadership. One of our core values in The Carrier Way, inclusion, is fundamental to who we are and what we do. We aspire to have an inclusive culture where each and every employee can come to work, every day, feeling like they _belong, and can contribute to their fullest and greatest potential. We continuously evaluate, modify and enhance our recruitment and retention strategies as part of the overall management of our business.
Aligned to our fundamentals and talent ecosystem, we promote learning and development through technical and leadership programs, as well as tuition assistance to enhance our employees’ skills and abilities. Our offerings include an online platform, strategic partnerships and on-site technical training centers. We conduct annual leadership development reviews to identify future leaders and foster succession planning. We also renew our talent pipeline with internships and early career rotational programs. Through a strategic approach to human capital, we are creating an environment where employees thrive, belong, and contribute to a more sustainable and resilient world.
Employee Well-being, Health and Safety
Creating an environment where employees thrive includes prioritizing health, safety, and overall well-being. We are committed to maintaining world-class standards.
Our Environmental, Health and Safety program is focused on eliminating the risk of serious injuries, illness and fatalities to employees, contractors and customers during manufacturing, installation, servicing and other business activities. We apply rigorous standards to ensure that our operations and premises comply with national and local regulations and our incident reporting requirements. For 2024, our total recordable incident rate ("TRIR"), based upon the number of employee injuries per 200,000 hours worked, was 0.32 and our lost time incident rate ("LTIR") was 0.15.
Our global well-being programs support employees’ physical, mental and financial health, offering flexible benefits, mental health resources, hybrid-work and financial planning tools. Our total rewards philosophy is designed to align the compensation of our employees with individual and company performance and to provide the appropriate market-competitive incentives to attract, retain and motivate employees to achieve superior results.
We measure the Pulse of our workforce three times per year through company-wide employee surveys to help us understand how employees feel about working at Carrier and what we can do to improve their experience.
As of December 31, 2024, in the U.S., 90% of our approximately 4,000 production and maintenance employees were covered under six collective bargaining agreements with expiration dates ranging from 2025 to 2027. In Europe, approximately 16,200 employees are represented by a European Works Council and, at national and local levels, we inform and consult with 49 local works councils and with unions representing employees at approximately 40 sites. Relations with our labor unions and works councils are generally positive.
Corporate Information
Carrier was incorporated in Delaware in connection with the Separation on March 15, 2019. Our principal executive offices are located at 13995 Pasteur Boulevard, Palm Beach Gardens, Florida 33418, and our telephone number is (561) 365-2000. We maintain an Internet website at www.corporate.carrier.com.
ITEM 1A. RISK FACTORS
RISK FACTOR SUMMARY
Risks Related to Our Business
•Risks associated with our international operations could adversely affect our competitive position, results of operations, cash flows or financial condition.
•We are party to joint ventures and other strategic relationships, which may not be successful and may expose us to unique risks and restrictions.
•Risks associated with climate events, government regulations and incentives associated with climate events and mitigation efforts could adversely affect our business.
•Demand for our HVAC products and services is influenced by weather conditions and seasonality.
•Our business and financial performance depend on continued and substantial investments in our information and operational technology infrastructure, which may not yield anticipated benefits and which may be vulnerable to cyber-attacks.
•Cybersecurity incidents could disrupt business operations, result in the loss of critical and confidential information, and adversely impact our reputation and results of operations.
•We engage in acquisitions and divestitures and may encounter difficulties integrating acquired businesses with, or disposing of businesses from, our current operations; therefore, we may not realize the anticipated benefits of these acquisitions and divestitures.
•We incurred debt obligations, and we may incur additional debt in the future, which could adversely affect our business and profitability and our ability to meet other obligations.
•We depend on our intellectual property and have access to certain intellectual property and information of our customers and suppliers. Infringement of or the failure to protect that intellectual property could adversely affect our future growth and success.
•We use a variety of raw materials, supplier-provided parts, and third-party service providers in our business. The ability of suppliers to deliver materials, parts, components and manufacturing equipment to our manufacturing facilities, and our ability to manufacture without disruption, could affect our business performance. Significant shortages, supplier capacity constraints or production disruptions, price increases, duties, tariffs or other government actions could increase our operating costs, disrupt our operations and adversely impact the competitive positions of our products.
•We design, manufacture and service products that incorporate advanced technologies. The introduction of new products and technologies involves risks, and we may not realize the degree or timing of benefits initially anticipated.
•We operate in a competitive environment and our profitability and competitive position depend on our ability to accurately estimate the costs and timing of providing our products and services.
•Customers and others may take disruptive actions.
•Labor matters may impact our business.
•Our defined benefit pension plans are subject to financial market risks that could adversely affect our results.
•We may not realize expected benefits from our cost reduction and restructuring efforts, and our profitability or our business otherwise might be adversely affected.
•Failure to achieve and maintain a high level of product and service quality could damage our reputation with customers and negatively impact our results.
•We are subject to litigation, environmental and other legal and compliance risks.
•We are subject to risks arising from doing business with the U.S. government.
•We may recognize impairment charges for our goodwill and intangible assets.
•Failure to maintain a satisfactory credit rating could adversely affect our liquidity, capital position, borrowing costs and access to the capital markets.
Risks Related to the Separation from UTC
•After the Separation and the Distribution, certain members of management, directors and shareowners own stock in UTC, Carrier and Otis and as a result may face actual or potential conflicts of interest.
•In connection with the Separation into three independent public companies, each of UTC, Carrier and Otis has agreed to indemnify the other parties for certain liabilities. If we are required to pay UTC and/or Otis under these indemnities, our financial results could be negatively impacted. Also, the UTC or Otis indemnities may not be sufficient to hold us harmless from the full amount of liabilities for which UTC and Otis have been allocated responsibility, and UTC and/or Otis may not be able to satisfy their respective indemnification obligations in the future.
•In certain circumstances, we could be required to indemnify UTC for material taxes and other related amounts pursuant to indemnification obligations under the TMA.
•Potential liabilities may arise due to fraudulent transfer considerations, which would adversely affect our financial condition and results of operations.
Risks Related to Our Common Stock
•The market price and trading volume of our common stock may fluctuate significantly.
•Shareowner's percentage of ownership in our common stock may be diluted in the future.
•Quarterly cash dividends may be discontinued or modified, are subject to a number of uncertainties and may affect the price of our common stock.
•Our amended and restated bylaws designate the courts within the State of Delaware as the sole and exclusive forum for certain types of actions and proceedings that may be initiated by our shareowners, which could discourage lawsuits against Carrier and our directors and officers.
•Anti-takeover provisions could enable our Board of Directors to resist a takeover attempt by a third party and limit the power of our shareowners.
General Risks
•Natural disasters, epidemics or other unexpected events may disrupt our operations, adversely affect our results of operations, cash flows or financial condition, and may not be fully covered by insurance.
•We may be affected by global economic, capital market and political conditions, and conditions in the energy, construction, transportation and infrastructure industries in particular. Uncertainty in U.S. trade policy, including uncertainty surrounding changes in tariffs, trade agreements or other trade restrictions imposed by the U.S. or other governments, as well as political conditions in and between the United States and foreign countries in which we operate, could significantly and adversely affect our business and financial results.
•Our business success depends on attracting and retaining key personnel and other talent throughout the Company.
•Additional tax expense or additional tax exposures could affect our future profitability.
•Failure to maintain effective internal controls over financial reporting in accordance with Section 404 of the Sarbanes-Oxley Act could materially and adversely affect us.
RISK FACTORS
Our business, financial condition, operating results and cash flows can be impacted by the factors set forth subsequently, any one of which could cause our actual results to vary materially from recent results or from our anticipated future results.
Risks Related to Our Business
Risks associated with our international operations could adversely affect our competitive position, results of operations, cash flows or financial condition.
Approximately 50% of our net sales for the year ended December 31, 2024, are derived from international operations, including U.S. export sales. As a result, changes in local and regional economic conditions, including fluctuating exchange rates, may adversely affect demand for our products and the profits generated by our non-U.S. operations because a significant portion of our sales and expenses are denominated in currencies other than U.S. dollars. While we attempt to manage our exchange rate risks, we are not completely insulated from that exposure. Exchange rates can be volatile and a substantial weakening of foreign currencies against the U.S. dollar could reduce our operating margins in various locations outside of the U.S., which would adversely impact the comparability of our results from period to period.
Our international sales and operations are also subject to the risks associated with changes in local government regulations and policies regarding investments, employment, taxation, incentives, foreign exchange and capital controls and the repatriation of earnings. Moreover, government regulations and policies regarding international trade, such as import quotas, punitive taxes or tariffs or similar trade barriers, whether imposed by individual governments or regional trade blocs, can affect demand for our products and services, impact the competitive position of our products or services or encumber our ability to manufacture or sell or procure products in certain countries. The implementation of more restrictive trade policies, including tariffs, by the U.S. or by other countries, such as China and Mexico, where we sell or produce our products and services or procure materials, including as a result of trade conflict between the U.S. and other countries, could negatively impact our business, results of operations and financial condition. Our international sales and operations are also sensitive to political and economic instability, changes in foreign national priorities and government budgets, and the risks associated with differing legal systems and customs in foreign countries.
We expect that sales to emerging markets will continue to account for a significant portion of our sales as developing nations around the world increase their demand for our products. In addition, as part of our globalization strategy, we have invested in certain countries, including Mexico, Brazil, China, India, Saudi Arabia and other countries in the Middle East. Emerging markets can present many risks, including cultural differences (such as employment and business practices), compliance risks, economic and government instability, exchange rate fluctuations and the imposition of foreign exchange and capital controls. While these factors and their impact are difficult to predict, any one or more of them could have a material adverse effect on our competitive position, results of operations, cash flows or financial condition.
We are party to joint ventures and other strategic relationships, which may not be successful and may expose us to unique risks and restrictions.
Our business operations, particularly in our HVAC segment, depend on various strategic relationships, namely, joint ventures and non-wholly owned subsidiaries. We sell our products and services through certain key distributor, joint venture and similar relationships, including the Carrier Enterprise joint ventures with Watsco, Inc., AHI-Carrier FZC, a United Arab Emirates-based joint venture and various joint ventures with members of the Midea Group.
Some of our strategic relationships engage in manufacturing and/or product development. Loss of a key channel partner, or a significant downturn or deterioration in the business or financial condition of a key channel partner, joint venture or similar relationship, whether related to, among other things, a labor strike, diminished liquidity or credit unavailability, weak demand for products or delays in the launch of new products, could adversely affect our results of operations in a particular period or the value of our equity investment. If we are not successful in maintaining our strategic distribution relationships, our financial condition, results of operations and cash flows may be adversely affected.
In addition, our ability to apply our internal controls and governance and compliance policies to our minority-held joint ventures is limited and can expose us to additional financial and reputational risks. We seek to take proactive steps to mitigate these concerns, including through audits and similar reviews.
Joint ventures and strategic relationships inherently involve certain other risks. Whether or not we hold a majority interest or maintain operational control in such arrangements, our partners and similar business associates may, for example: (1) have economic or business interests or objectives that are inconsistent with or contrary to our own; (2) exercise veto or other rights, to the extent available, to block actions that we believe are in our or the joint venture’s best interests; (3) act contrary to our policies or objectives; or (4) be unable or unwilling to fulfill their obligations.
In addition, there can be no assurance that any particular joint venture or strategic relationship will continue to be beneficial to us in the long term. For example, some of our joint ventures or other strategic agreements prohibit us from competing in certain geographic markets or product and services channels, and these restrictions may apply to other products and services we develop or businesses we acquire in the future.
Risks associated with climate events, government regulations and incentives associated with climate events and mitigation efforts could adversely affect our business.
The effects of climate events, including increased frequency and intensity of extreme weather conditions and water scarcity, create financial risks to our business. The potential impacts of climate events on our operations are highly uncertain and depend upon the unique geographic and environmental factors present; for example rising sea levels at certain of our facilities, changing storm patterns and intensities and changing temperature levels. The effects of climate events could disrupt our operations by impacting the availability and cost of materials and by increasing insurance and other operating costs. The effects of climate events also may impact our decisions to construct new facilities or maintain existing facilities in the areas most prone to physical risks, which could similarly increase our operating and material costs. We could also face indirect financial risks passed through the supply chain that could result in higher prices for our products and the resources needed to produce them. Potential adverse impacts from climate events may create health and safety issues for employees operating at our facilities and may lead to an inability to maintain standard operating hours.
There is a general consensus that greenhouse gas emissions are linked to climate events, and that these emissions must be reduced dramatically to avert its worst effects. Increased public awareness and concern about climate events may continue to: (1) generate more international, regional and/or national requirements to curtail the use of high global warming potential refrigerants (e.g., the Kigali Amendment to the Montreal Protocol and the American Innovation and Manufacturing ("AIM") Act of 2020, which are essential to many of our products); (2) increase building energy and cold chain efficiency; (3) cause a shift away from the use of fossil fuels as an energy source, including natural gas prohibitions; and (4) lead to the adoption of additional rules and regulations surrounding public disclosures relating to greenhouse gas emissions, including those adopted in California and the European Union. In some instances, these requirements may render our existing technology, particularly some of our HVAC and refrigeration products, non-compliant or obsolete and we may be required to make increased capital expenditures to meet new regulations and standards, changing interpretations and stricter enforcement of current laws and regulations. Furthermore, our customers and the markets we serve may impose emissions or other environmental standards through regulation, market-based emissions policies or consumer preferences that we may not be able to timely meet due to our required level of capital investment and technology advancement. While we are committed to pursuing sustainable solutions for our products, there can be no assurance that our development efforts will be successful, that our products will be accepted by the market, that proposed regulations or deregulation will not have an adverse effect on our competitive position, or that economic returns will justify our investments in new product development.
At the same time, U.S. energy and climate policy may not align with the above trends. Inconsistent international, regional and/or national requirements associated with climate regulations, such as U.S. participation in the Paris Climate Agreement, also create economic and regulatory uncertainty. There is also regulatory and budgetary uncertainty associated with government incentives, which, if discontinued or materially reduced, could adversely impact the demand for energy-efficient buildings and homes and could increase costs of compliance. Further, the retraction of existing and implementation of new U.S. energy and/or climate policy and incentives could significantly and adversely impact our business, strategic direction and growth plans.
We have set sustainability goals to be achieved by 2030, which include investing over $4 billion to develop intelligent climate and energy solutions that reduce environmental impacts, avoiding more than 1 gigaton of customer greenhouse gas emissions, achieving carbon neutral operations and reducing energy intensity by 10% across our operations. Although we intend to meet these goals, we may be required to expend significant resources to do so, which could increase our operational costs. Further, there can be no assurance of the extent to which any of our goals will be achieved, or that any future expenditures or investments we make in furtherance of achieving such goals will be available, effective, meet investor expectations or any binding or non-binding legal standards regarding sustainability performance. For example, to make substantial progress toward or to meet some of these goals, we may need to purchase or deploy a combination of renewable energy utility contracts, carbon credits or offsets, energy-efficient or low-emission products or operations, or carbon sequestration technologies, and there can be no assurance of the extent to which such contracts, credits, offsets, products, operations or technologies will be available or effective in reducing emissions or energy intensity. As global regulatory reporting obligations continue to emerge and evolve, we strive to align our sustainability disclosures to global reporting requirements, standards, and best practices. To the extent that reporting gaps exist as reporting standards change over time, this could result in increased compliance costs and risks.
Moreover, we may determine that it is in the best interest of our company and our shareowners to prioritize other business, social, governance or sustainability investments over the achievement of our current goals based on economic, regulatory and social factors, business strategy or pressure from investors, activist groups or other stakeholders. If we are unable to make substantial progress toward or meet these goals, then we could incur adverse publicity and reaction from investors, activist groups or other stakeholders, which could adversely impact the perception of us and our products and services by current and potential customers, as well as investors, which could in turn adversely impact our results of operations. Differing views of environmental, social and governance issues may also increase the risk that our goals or actions taken to meet our goals would be viewed unfavorably by investors, activist groups, current and potential customers, employees and other stakeholders.
Demand for our HVAC products and services is influenced by weather conditions and seasonality.
Demand for our HVAC products and services, representing our largest segment by sales, is seasonal and affected by the weather. Cooler than normal summers depress sales of our replacement air conditioning products and services and warmer than normal winters have the same effect on our heating products. Historically, sales to residential HVAC customers tend to be higher in the second and third quarters of the year because, in the U.S. and other northern hemisphere regions, spring and summer are the peak seasons for sales of air conditioning systems and services. In these circumstances, the results of any quarterly period may not be indicative of expected results for a full year, and unusual weather patterns or events could positively or negatively affect our business and impact overall results of operations.
Our business and financial performance depend on continued and substantial investments in our information and operational technology infrastructure, which may not yield anticipated benefits and which may be vulnerable to cyber-attacks.
The efficient operation of our business requires continued and substantial investments in information technology ("IT") and operational technology (“OT”, together, “Technology”) infrastructure systems. The failure to design, develop, maintain and implement Technology infrastructure systems in an effective and timely manner or to maintain these systems could divert management’s attention and resources. Our information systems may also become obsolete because of inadequate investments, requiring an unplanned transition to a new platform that could be time consuming, costly, and damaging to our competitive position and could require additional management attention. Repeated or prolonged interruptions of service because of poor execution, inadequate investments or obsolescence could have a significant adverse impact on our reputation and our ability to sell products and services.
Cybersecurity incidents could disrupt business operations, result in the loss of critical and confidential information, and adversely impact our reputation and results of operations.
Our business has been and may again in the future be impacted by disruptions to our or third-party providers’ Technology infrastructure, which have resulted and could in the future result from (among other causes) cyber-attacks, infrastructure failures or compromises to our physical security. Cyber-based risks are evolving and include attacks: (i) on our Technology infrastructure; (ii) targeting the security, integrity and/or availability of hardware and software; (iii) exploiting weaknesses or vulnerabilities in our products, or capturing information installed, stored or transmitted in our products (including after the purchase of those products and when they are installed into, or into environments using, third-party products); and (iv) on facilities or similar infrastructure. Such attacks could disrupt our systems (or those of third parties) and business operations, impact the ability of our products to work as intended or result in the unauthorized access, use, disclosure, modification or destruction of information in violation of applicable law and/or contractual obligations. We continue to make investments and adopt measures to enhance our protection, detection, response and recovery capabilities, and to mitigate potential risks to our technology, products, services, operations and confidential data. However, depending on the nature, sophistication and scope of cyber-attacks, it is possible that potential vulnerabilities could go undetected for an extended period. As a result, we could potentially experience: (i) production downtimes; (ii) operational delays or other detrimental impacts on our operations; (iii) destruction or corruption of our data (or data at or third-party providers); (iv) security breaches; (v) manipulation or improper use of our or third-party systems, networks or products; and (vi) financial losses from remedial actions, loss of business, liability, penalties, fines and/or damage to our reputation, any of which could have a material adverse effect on our competitive position, results of operations, cash flows or financial condition. Due to the evolving nature of such risks, the impact of any potential incident cannot be predicted.
In addition, because of the global nature of our business, our internal systems and products must comply with applicable laws, regulations and standards in a number of jurisdictions, and government enforcement actions and violations of data privacy and cybersecurity laws could be costly or interrupt our business operations. Any disruption to our business arising from such issues, or an increase in our costs to cover these issues that is greater than what we have anticipated, could have an adverse effect on our reputation, competitive position, results of operations, cash flows or financial condition.
These risks are heightened by the increasingly connected nature of our products and services as we continue to focus on providing digitally-enabled lifecycle solutions to our customers, including due to the use of third-party products to connect these products and services to the internet, which may be subject to additional vulnerabilities beyond our control.
We engage in acquisitions and divestitures and may encounter difficulties integrating acquired businesses with, or disposing of businesses from, our current operations; therefore, we may not realize the anticipated benefits of these acquisitions and divestitures.
We seek to grow through strategic acquisitions in addition to organic growth. In the past several years, we have acquired consolidated and minority-owned businesses in an effort to complement and expand our business, including the acquisition of the VCS Business, which we completed on January 2, 2024. We expect to continue such pursuits in the future. Our due diligence reviews may not identify all of the issues necessary to accurately estimate the cost and potential loss contingencies of a particular transaction, including potential exposure to regulatory sanctions resulting from an acquisition target’s historical activities.
In connection with these acquisitions, we have in the past incurred, and expect to incur in the future, significant costs, including in connection with the integration of such businesses. For example, in connection with the integration of the VCS Business, we incurred transaction fees and costs related to formulating integration plans and achieving cost synergies, and the execution of our integration plans may lead to additional unanticipated costs, including costs related to employee retention, redeployment, relocation or severance fees, as well as costs necessary to maintain employee morale and to attract, motivate or retain management personnel and other key employees. Furthermore, integrating a business, including the VCS Business, may result in material challenges, including the diversion of management’s attention from ongoing business concerns; retaining key management and other employees; retaining or attracting business and operational relationships; managing the expenses and operational challenges of the integration process; consolidating corporate and administrative infrastructures; coordinating geographically separate organizations; loss of customers, distributors, suppliers, and other business partners of the acquired business; unanticipated issues in integrating information technology, communications, internal controls and other systems; as well as potential unknown liabilities and unforeseen expenses related to integration. We ultimately may not realize, and have sometimes not realized, the degree or timing of benefits or cost synergies we anticipate when we first enter into a transaction.
We also may incur - and have incurred - unanticipated costs or expenses, including asset impairment and other charges and expenses associated with litigation and other liabilities. In addition, in connection with certain acquisitions including the acquisition of the VCS Business, we have disclosed and may from time to time disclose, unaudited pro forma financial information. This pro forma financial information is presented for illustrative purposes only and is not necessarily indicative of what our actual financial position or results of operations would have been had the acquisition been completed on the dates indicated therein. Further, our actual results and financial position may differ materially and adversely from the unaudited pro forma financial information, including due to certain adjustments made by our management, and due to changes between preliminary estimates of the fair value of assets to be acquired and liabilities to be assumed, and the final acquisition accounting. Additionally, accounting requirements relating to business combinations, including the requirement to expense certain acquisition costs as incurred, may cause us to incur greater earnings volatility and generally lower earnings subsequent to periods in which we acquire new businesses. Any of the foregoing could adversely affect our business and results of operations.
We also make strategic divestitures from time to time, including the dispositions during 2024 of Access Solutions, Industrial Fire, CCR and the CRF Business. These and other divestitures may result in continued financial exposure to the divested businesses, such as through guarantees, other financial arrangements, continued supply and services arrangements or through the retention of liabilities, such as for environmental and product liability claims. Under these arrangements, nonperformance by those divested businesses or claims against retained liabilities could result in the imposition of obligations that could have a material adverse effect on our results of operations, cash flows or financial condition.
The success of future acquisitions, divestitures and joint ventures will depend on the satisfaction of conditions precedent to such transactions, which will depend in part on the ability of the parties to secure any required regulatory approvals in a timely manner, among other things.
We incurred debt obligations, and we may incur additional debt in the future, which could adversely affect our business and profitability and our ability to meet other obligations.
As of December 31, 2024, we had approximately $12.3 billion in aggregate principal amount of outstanding indebtedness, including debt incurred to close the acquisition of the VCS Business on January 2, 2024. See Note 7 – Borrowings and Lines of Credit in the accompanying Notes to the Consolidated Financial Statements and the section entitled "Liquidity and Financial Condition" in this Annual Report for additional information. We may also incur additional indebtedness in the future, including via issuance of commercial paper, under our Revolving Credit Facility.
Our debt obligations could potentially have important consequences to us and our debt and equity investors, including: (1) requiring a substantial portion of our cash flows from operations to make debt service payments or to refinance our indebtedness as it becomes due, making it more difficult for us to satisfy our other priorities and obligations; (2) increasing the risk of a future credit ratings downgrade of our debt, which could increase future debt costs and limit the future availability of debt financing; (3) increasing our vulnerability to general adverse economic and industry conditions; (4) reducing the cash flows available to fund capital expenditures and other corporate purposes and to grow our business; (5) limiting our flexibility in pursuing strategic opportunities or planning for, or reacting to, changes in our business and the industry; (6) placing us at a competitive disadvantage relative to our competitors that may not be as highly leveraged; and (7) limiting our ability to borrow additional funds as needed or take advantage of business opportunities as they arise, pay cash dividends or repurchase shares.
Our ability to make scheduled payments of the principal of, to pay interest on or to refinance our indebtedness depends on our future performance, which is subject to economic, financial, competitive, regulatory factors, and other factors beyond our control. Our cash flow from operations in the future may be insufficient to service our indebtedness because of factors beyond our control, including if our actual cash requirements in the future are greater than expected. If we are unable to generate the necessary cash flow, we may be required to adopt one or more alternatives, such as selling assets, restructuring debt or obtaining additional equity capital on terms that may be onerous or highly dilutive. Our ability to refinance our indebtedness will depend on the capital markets and our financial condition at such time. We may not be able to engage in any of these activities or engage in these activities on desirable terms, which could result in a default on our debt obligations.
As described in Note 7 – Borrowings and Lines of Credit in the accompanying Notes to the Consolidated Financial Statements and "Liquidity and Financial Condition," the agreements governing our indebtedness contain covenants restricting our financial flexibility in a number of ways, including, among other things, restrictions on our ability and the ability of certain of our subsidiaries to incur liens, to make certain fundamental changes and to enter into sale and leaseback transactions. In addition, some of the agreements governing our indebtedness require that we not exceed a maximum consolidated total leverage ratio and contain certain customary events of default, including related to changes of control. As of the date of this report, we were in compliance with the covenants under the agreements governing our outstanding indebtedness. Our ability to comply with such restrictions and covenants, some of which have already been amended as described above, may be affected by events beyond our control. If we breach any of these restrictions or covenants and do not obtain a waiver from the lenders or holders, as applicable, then, subject to the applicable cure periods and conditions, any outstanding indebtedness could be declared immediately due and payable.
Apart from these covenants, neither we nor any of our subsidiaries are restricted from incurring additional unsecured debt or liabilities, and to the extent that we incur additional indebtedness, the foregoing risks could increase.
We depend on our intellectual property and have access to certain intellectual property and information of our customers and suppliers. Infringement of or the failure to protect that intellectual property could adversely affect our future growth and success.
Our intellectual property rights are important to our business and include numerous patents, trademarks, copyrights, trade secrets, proprietary technology, technical data, business processes and other confidential information. Although we consider our intellectual property rights in the aggregate to be valuable, we do not believe that our business is materially dependent on a single intellectual property right or any group of them. We nonetheless rely on a combination of patents, trademarks, copyrights, trade secrets, nondisclosure agreements, customer and supplier agreements, license agreements, Technology security systems, internal controls and compliance systems and other measures to protect our intellectual property. We also rely on nondisclosure agreements, Technology security systems and other measures to protect certain customer and supplier information and intellectual property that we have in our possession or to which we have access. Our efforts to protect such intellectual property and proprietary information may not be sufficient, however.
We cannot be sure that our pending patent applications will result in the issuance of patents, that patents issued to or licensed by us in the past or in the future will not be challenged or circumvented by competitors, or that these patents will be found to be valid or sufficiently broad to preclude our competitors from introducing technologies similar to those covered by our patents and patent applications.
In addition, we may be the target of competitor or other third-party patent enforcement actions seeking substantial monetary damages or seeking to prevent the sale and marketing of certain of our products. Our competitive position also may be adversely impacted by limitations on our ability to obtain possession, ownership or necessary licenses concerning data important to the development or sale of our products or service offerings, or by limitations on our ability to restrict the use by others of data related to our products or services. Any of these events or factors could subject us to judgments, penalties and significant litigation costs or temporarily or permanently disrupt our sales and marketing of the affected products or services and could have a material adverse effect on our competitive position, results of operations, cash flows or financial condition.
We use a variety of raw materials, supplier-provided parts, and third-party service providers in our business. The ability of suppliers to deliver materials, parts, components and manufacturing equipment to our manufacturing facilities, and our ability to manufacture without disruption, could affect our business performance. Significant shortages, supplier capacity constraints or production disruptions, price increases, duties, tariffs or other government actions could increase our operating costs, disrupt our operations and adversely impact the competitive positions of our products.
Our reliance on suppliers and commodity markets to secure components (such as motors and valves) and raw materials (such as copper, aluminum and steel), and on service providers to deliver our products, exposes us to volatility in the prices and availability of these materials and services. We use a wide range of materials and components in the global production of our products, which come from numerous suppliers around the world. Because some key parts may be available only from a single supplier or a limited group of suppliers, we are subject to supply and pricing risk. In addition, certain proprietary component parts used in some of our products are provided by single-source unaffiliated third-party suppliers. We would be unable to obtain these proprietary components for an indeterminate period of time if these single-source suppliers were to cease or interrupt production or otherwise fail to supply these components to us, which could adversely affect our product sales and operating results. Our supply chain could be impacted by climate events through extreme weather, resulting in delivery or production disruptions and increased material costs. In addition, other issues with suppliers (such as capacity constraints, quality issues, consolidations, closings or bankruptcies), price increases, raw material/component shortages, regulatory limitations, or the decreased availability of trucks and other delivery services could also have a material adverse effect on our ability to meet our commitments to customers or increase our operating costs. Periodic disruptions in our supply chains have resulted, and may continue to result, in sufficient inventory not being available in a timely manner or during the appropriate season as well as higher freight and other logistic costs, including increased carrier rates, which could have a material adverse effect on our business.
We use various tactical and strategic actions to mitigate our raw material and supply chain risks and challenges, including consolidating commodity purchases, locking in prices of expected purchases of certain raw materials, dual sourcing, increasing regionalization, proactive engagement with suppliers and our workforce and dynamic management of freight costs and availability. However, these efforts may be unsuccessful or could cause us to pay higher prices for a commodity when compared with the market price at the time the commodity is actually purchased or delivered. For example, the availability and prices of raw materials and supplies may be impacted as a result of, among other things, the imposition of tariffs, duties and other potential changes in trade policies. Our suppliers could also be subject to regulations including climate related regulations, compliance with which would increase our costs and the impacts of which are difficult to predict. We believe that our supply management and production practices appropriately balance the foreseeable risks and the costs of alternative practices or other mitigation. Nonetheless, these risks may have a material adverse effect on our competitive position, results of operations, cash flows or financial condition.
Our operations and those of our suppliers are subject to disruption for a variety of reasons, including epidemics, pandemics, supplier plant shutdowns or slowdowns, transportation delays, work stoppages, labor relations, changes in laws or regulations, governmental regulatory and enforcement actions, intellectual property claims against suppliers, financial issues such as a supplier bankruptcy, Technology failures and hazards such as fire, earthquakes, flooding or other natural disasters. Insurance for certain disruptions may not be available, affordable or adequate. The effects of climate-related matters, including extreme weather events, long-term changes in temperature levels and water availability may exacerbate these risks. Such disruption has in the past and could in the future interrupt our ability to manufacture certain products. Any significant disruption could have a material adverse impact on our competitive position.
We design, manufacture and service products that incorporate advanced technologies. The introduction of new products and technologies involves risks, and we may not realize the degree or timing of benefits initially anticipated.
Our future success depends on designing, developing, producing, selling and supporting innovative products that incorporate advanced technologies. The regulations and policies applicable to our products, as well as our customers’ product and service needs, change from time to time. Moreover, regulatory and policy changes, inclusive of those aimed at addressing energy infrastructure and incentives and climate events and its impacts, may render our products and technologies non-compliant or noncompetitive and may subject us to operational, compliance, business and reputational risks. Our ability to realize the anticipated benefits of our technological advancements or product improvements – including those associated with regulatory or policy changes – depends on a variety of factors, including: meeting development, production and regulatory approval schedules; meeting performance plans and expectations; the availability of raw materials and parts; our suppliers’ performance; the hiring, training and deployment of qualified personnel; achieving efficiencies; identifying emerging regulatory, policy and technological trends; validating innovative technologies; the level of customer interest in new technologies and products; and the costs and customer acceptance of our new or improved products.
Our products and services also may incorporate technologies developed or manufactured by third parties, which, when combined with our technology or products, creates additional risks and uncertainties. As a result, the performance and market acceptance of these third-party products and services could affect the level of customer interest and acceptance of our own products in the marketplace.
Our research and development efforts, including those that advance environmental sustainability, may not culminate in new technologies or timely products, or may not meet the needs of our customers as effectively as competitive offerings. Our competitors may develop competing technologies that gain market acceptance before or instead of our products. In addition, we may not be successful in anticipating or reacting to changes in the regulatory or policy environments in which our products are sold, and the markets for our products may not develop or grow as we anticipate.
We operate in a competitive environment and our profitability and competitive position depend on our ability to accurately estimate the costs and timing of providing our products and services.
In certain of our businesses, our contracts are typically awarded on a competitive basis. Our bids are based upon, among other factors, the cost to timely provide the products and services. To generate an acceptable return, we must accurately estimate our costs and schedule. If we fail to do so, the profitability of contracts may be adversely affected – including because some of our contracts provide for liquidated damages if we do not perform on time – which could have a material adverse effect on our competitive position, results of operations, cash flows or financial condition.
Customers and others may take disruptive actions.
From time to time customers and others may seek to become suppliers of products and services that compete with our own or pursue other strategies to disrupt our business model. For example, an affiliate of a customer in our transport refrigeration business produces refrigeration units for shipping containers that compete with our products, and another one of our transport refrigeration customers produces refrigeration units for truck trailers that compete with our refrigeration units. In addition, our customers or existing or future competitors may seek to introduce non-traditional business models or disruptive technologies and products in the industries in which we participate, resulting in increased competition and new dynamics in these industries.
Labor matters may impact our business.
A significant portion of our employees are represented by labor unions or works councils in a number of countries under various collective bargaining agreements with varying durations and expiration dates. See the section entitled "Other Matters Relating to Our Business as a Whole - Human Capital Management." We may not be able to successfully renegotiate each of these agreements before they expire. In addition, existing agreements may not prevent a strike or work stoppage, union and works council campaigns and other labor disputes. We may also be subject to general national or sector-level strikes or work stoppages unrelated to our specific business or collective bargaining agreements, for example, those resulting from geopolitical instability or social unrest. Additionally, a shortage in certain work forces, such as technicians, manufacturing workers or truck drivers, due to external forces such as geopolitical strife or pandemics, may impact our business by affecting the ability to produce, install, sell and deliver our products. Any such work stoppages (or potential work stoppages) or labor shortages could have a material adverse effect on our reputation, productivity, financial condition, cash flows and results of operations.
Our defined benefit pension plans are subject to financial market risks that could adversely affect our results.
The performance of the financial markets and interest rates can impact our defined benefit pension plan expenses and funding obligations. Significant decreases in the discount rate or investment losses on plan assets may increase our funding obligations and adversely impact our financial results. See Note 10 – Employee Benefit Plans to the accompanying Notes to the Consolidated Financial Statements in this Annual Report for additional discussion on pension plans and related obligations and contingencies.
We may not realize expected benefits from our cost reduction and restructuring efforts, and our profitability or our business otherwise might be adversely affected.
In order to operate more efficiently and cost effectively, we have, and we may from time to time, adjust employment levels, optimize our footprint and/or implement other restructuring activities. These activities are complex and may involve or require significant changes to our operations. If we do not successfully manage these activities, expected efficiencies and benefits might be delayed or not realized. Risks associated with these actions and other workforce management issues include: unfavorable political responses and reputational harm; unforeseen delays in the implementation of the restructuring activities; additional costs; adverse effects on employee morale; the failure to meet operational targets due to the loss of employees or work stoppages; and difficulty managing our operations during or after facility consolidations, any of which may impair our ability to achieve anticipated cost reductions, harm our business or reputation, or have a material adverse effect on our competitive position, results of operations, cash flows or financial condition.
Failure to achieve and maintain a high level of product and service quality could damage our reputation with customers and negatively impact our results.
Product and service quality issues could harm customer confidence in our company and our brands. If certain of our product and service offerings do not meet applicable safety standards – which has been the case – or our customers’ expectations regarding safety or quality, we can experience, and have experienced previously, lost sales and increased costs and we can be exposed, and have previously been exposed, to legal, financial and reputational risks. Actual, potential or perceived product safety concerns could expose us to litigation as well as government enforcement actions, which has also occurred in certain instances. In addition, when our products fail to perform as expected, we have been, and may in the future be, exposed to warranty, product liability, personal injury and other claims.
We maintain strict quality controls and procedures. However, we cannot be certain that these controls and procedures will reveal defects in our products or their raw materials, which may not become apparent until after the products have been placed in use in the market. Accordingly, there is a risk that products will have defects, which could require a product recall or field corrective action. Product recalls and field corrective actions can be expensive to implement and may damage our reputation, customer relationships and market share. We have conducted product recalls and field corrective actions in the past and may do so again in the future.
In many jurisdictions, product liability claims are not limited to any specified amount of recovery. If any such claims or contribution requests or requirements exceed our available insurance or if there is a product recall, there could be an adverse impact on our results of operations. In addition, a recall or claim could require us to review our entire product portfolio to assess whether similar issues are present in other products, which could result in a significant disruption to our business and which could have a further adverse impact on our business, financial condition, results of operations and cash flows. There can be no assurance that we will not experience any material warranty or product liability claims in the future, that we will not incur significant costs to defend such claims or that we will have adequate reserves to cover any recall, repair and replacement costs.
We are subject to litigation, environmental and other legal and compliance risks.
We are subject to a variety of litigation, legal and compliance risks including, without limitation, claims, lawsuits and/or regulatory enforcement actions relating to breach of contract, cybersecurity and data privacy, employment and labor, environmental and employee health and safety matters, global chemical compliance, intellectual property rights, personal injury, product safety and taxes as well as anti-corruption, competition and securities laws and other laws governing improper business practices. If found responsible in connection with such matters, we could be subject to significant fines, penalties, repayments and other damages (in certain cases, treble damages) and experience reputational harm.
As a global business, we are subject to complex laws and regulations in the U.S. and other countries in which we operate. Those laws and regulations may be interpreted in different ways. They may also change from time to time, as may related interpretations and other guidance. Changes in laws or regulations could result in higher expenses. Uncertainty relating to laws or regulations may also affect how we operate, structure our investments and enforce our rights.
Global chemical use restrictions related to protection of human health and the environment as well as climate event directives may require additional investments in product designs, resulting in increased manufacturing, production and sourcing costs as well as updates to product safety assessments. These restrictions may also increase our legal obligations regarding remediation of our current and legacy operational sites.
At times, we are involved in disputes with private parties over environmental issues, including litigation over the allocation of cleanup costs, alleged personal injuries and property damage. Existing and future asbestos-related claims could adversely affect our financial condition, results of operations and cash flows. Personal injury lawsuits may involve individual and putative class actions alleging that contaminants originating from our current or former products or operating facilities caused or contributed to medical conditions. Property damage lawsuits may involve claims relating to environmental damage or diminution of real estate values. Even in litigation where we believe our liability is remote, there is a risk that a negative finding or decision could have a material adverse effect on our competitive position, results of operations, cash flows or financial condition, in particular with respect to environmental claims in regions where we have, or previously had, significant operations or where certain of our products have been manufactured and used.
We must comply with U.S. Foreign Corrupt Practices Act (“FCPA”), antitrust, anti-money laundering, and other anti-corruption and anti-collusion laws. Despite meaningful measures to ensure lawful conduct, which include training, audits and internal control policies and procedures, violations or allegations of violations of such laws may occur, and could disrupt our operations, cause reputational harm, involve significant management distraction, subject us to criminal and civil penalties, as well as disgorgement, and result in a material adverse effect on our competitive position, results of operations, cash flows or financial condition. We could be required to make changes or enhancements to our compliance measures that could increase our costs, and we could be subject to other remedial actions.
We also must comply with various laws and regulations relating to the import and export of products, services and technology into and from the U.S. and other countries having jurisdiction over our operations. In the U.S., these laws include, amongst others, the Export Administration Regulations administered by the U.S. Department of Commerce and embargoes and sanctions regulations administered by the U.S. Department of the Treasury. Restrictions on the export of our products, services or technologies could have a material adverse effect on our competitive position, results of operations, cash flows or financial condition.
For a description of material legal proceedings and regulatory matters, see the section entitled "Legal Proceedings" and Note 23 – Commitments and Contingent Liabilities in the accompanying Notes to the Consolidated Financial Statements in this Annual Report.
We are subject to risks arising from doing business with the U.S. government.
As a supplier and service provider to the U.S. government, including as a subcontractor under prime contracts with the U.S. government, we are subject to certain heightened risks, such as those associated with the government’s rights to audit and conduct investigations and with its rights to terminate contracts for convenience or default. In light of the current U.S. government contracting environment, we are and will continue to be the subject of U.S. government investigations relating to our U.S. government contracts or subcontracts. Such investigations often take years to complete and could result in administrative, civil or criminal liabilities, including repayments, fines, treble and other damages, forfeitures, restitution or penalties, or could lead to suspension or debarment of U.S. government contracting or of export privileges. For instance, if a business unit were charged with wrongdoing in connection with a U.S. government investigation (including fraud or violation of certain environmental or export laws), the U.S. government could suspend us from bidding on or receiving awards of new U.S. government contracts or subcontracts. If convicted or found liable, the U.S. government could fine and debar us from receiving new awards for a period generally not to exceed three years and could void any contracts found to be tainted by fraud. We also could suffer reputational harm if allegations of impropriety were made against us, even if such allegations are later determined to be unsubstantiated. There is also uncertainty in the current U.S. government contracting environment as to the extent of funding that may be available for future projects.
We may recognize impairment charges for our goodwill and intangible assets.
As of December 31, 2024, the net carrying value of our goodwill and intangible assets totaled $14.6 billion and $6.4 billion, respectively. Our intangible assets primarily consist of customer relationships, patents, service portfolios and trademarks. We periodically assess these assets to determine if they are impaired. Significant negative industry or economic trends, disruptions to our business, planned or unexpected significant changes in the use of the assets, and sustained market capitalization declines may result in the impairment of goodwill or intangible assets. Any charges relating to such impairments could have a material adverse impact on our results of operations in the period in which the impairment is recognized.
Failure to maintain a satisfactory credit rating could adversely affect our liquidity, capital position, borrowing costs and access to the capital markets.
We have been issued an investment grade credit rating by each of Moody’s Investors Services, Inc. ("Moody's"), Standard & Poor’s ("S&P") and Fitch Ratings Inc. ("Fitch Ratings"). Nonetheless, any future downgrades could increase our borrowing costs, reduce market capacity for our commercial paper or require the posting of collateral under our derivative contracts. There can be no assurance that we will be able to maintain our credit ratings, and any additional actual or anticipated changes or downgrades, including any announcement that our ratings are under review for a downgrade, may have a negative impact on our liquidity, capital position and access to the capital markets. Additionally, our credit agreements generally provide for an increase in interest rates if the ratings for our debt are downgraded.
Risks Related to the Separation from UTC
After the Separation and the Distribution, certain members of management, directors and shareowners own stock in UTC, Carrier and Otis, and as a result may face actual or potential conflicts of interest.
Following the Separation and the Distribution, certain members of management and the Board of Directors of each of UTC, Carrier and Otis own common stock in all three companies. This ownership overlap could create, or appear to create, potential conflicts of interest when the management and directors of one company face decisions that could have different implications for themselves and the other two companies. These agreements include a separation and distribution agreement, the TMA, the employee matters agreement, the intellectual property agreement and any commercial agreements between the parties or their affiliates. Potential conflicts of interest may also arise out of any commercial arrangements that we or UTC may enter into in the future. See Note 1 – Description of the Business in the accompanying Notes to the Consolidated Financial Statements in this Annual Report for additional information on these agreements.
In connection with the Separation into three independent public companies, each of UTC, Carrier and Otis has agreed to indemnify the other parties for certain liabilities. If we are required to pay UTC and/or Otis under these indemnities, our financial results could be negatively impacted. Also, the UTC or Otis indemnities may not be sufficient to hold us harmless from the full amount of liabilities for which UTC and Otis have been allocated responsibility, and UTC and/or Otis may not be able to satisfy their respective indemnification obligations in the future.
Pursuant to the separation and distribution agreement and certain other agreements among UTC, us and Otis, each party has agreed to indemnify the other parties for certain liabilities as discussed further in Note 1 – Description of the Business in the accompanying Notes to the Consolidated Financial Statements in this Annual Report. Indemnities that we may be required to provide UTC and/or Otis are not subject to any cap, may be significant and could negatively impact our business. Third parties could also seek to hold us responsible for any of the liabilities that UTC and/or Otis has agreed to retain. The indemnities from UTC and Otis for our benefit may not be sufficient to protect us against the full amount of such liabilities, and UTC and/or Otis may not be able to fully satisfy their respective indemnification obligations. Any amounts we are required to pay pursuant to such indemnification obligations and other liabilities could require us to divert cash that would otherwise have been used in furtherance of our operating business.
Moreover, even if we ultimately succeed in recovering from UTC or Otis, as applicable, we may be temporarily required to bear these losses. Each of these risks could negatively affect our business, results of operations, cash flows and financial condition.
In certain circumstances, we could be required to indemnify UTC for material taxes and other related amounts pursuant to indemnification obligations under the TMA.
Under the TMA, we are generally required to indemnify UTC and Otis for any taxes resulting from the Separation (and any related costs and other damages) to the extent such amounts resulted from: (1) an acquisition of all or a portion of the equity securities or assets of Carrier, whether by merger or otherwise (and regardless of whether we participated in or otherwise facilitated the acquisition), (2) other actions or failures to act by Carrier or (3) certain of Carrier’s representations, covenants or undertakings contained in any of the Separation-related agreements and documents or in any documents relating to the IRS ruling and/or the opinion of counsel being incorrect or violated. Further, under the TMA, we are generally required to indemnify UTC and Otis for a specified portion of any taxes (and any related costs and other damages) (a) arising as a result of the failure of the Distribution and certain related transactions to qualify as a transaction that is generally tax-free (including if the transactions were determined not to qualify for non-recognition of gain or loss under Section 355 and related provisions of the Internal Revenue Code of 1986) or a failure of any internal separation transaction that is intended to qualify as a transaction that is generally tax-free to so qualify, in each case, to the extent such amounts did not result from a disqualifying action by, or acquisition of equity securities of, Carrier, Otis or UTC or (b) arising from an adjustment, pursuant to an audit or other tax proceeding, with respect to any separation transaction that is not intended to qualify as a transaction that is generally tax-free. Any such indemnity obligations could be material. See Note 1 – Description of the Business in the accompanying Notes to the Consolidated Financial Statements in this Annual Report for additional information.
Potential liabilities may arise due to fraudulent transfer considerations, which would adversely affect our financial condition and results of operations.
In connection with the Separation (including the internal reorganization described previously), UTC completed several corporate reorganization transactions involving its subsidiaries which, along with the Distribution, may be subject to various fraudulent conveyance and transfer laws. If, under these laws, a court were to determine that, at the time of the Separation, any entity involved in these reorganization transactions or the Separation: (1) was insolvent, was rendered insolvent by reason of the Separation, or had remaining assets constituting unreasonably small capital, and (2) received less than fair consideration in exchange for the Distribution; or intended to incur, or believed it would incur, debts beyond its ability to pay these debts as they matured, then the court could void the Separation and the Distribution, in whole or in part, as a fraudulent conveyance or transfer. The court could then require our shareowners to return to UTC some or all of the shares of Carrier common stock issued in the Distribution, or require UTC or us, as the case may be, to fund liabilities of the other company for the benefit of creditors. The measure of insolvency will vary depending upon the jurisdiction and the applicable law. Generally, however, an entity would be considered insolvent if the fair value of its assets was less than the amount of its liabilities (including the probable amount of contingent liabilities), or if it incurred debt beyond its ability to repay the debt as it matures. No assurance can be given as to what standard a court would apply to determine insolvency or that a court would determine that we or any of our subsidiaries were solvent at the time of or after giving effect to the Distribution.
Risks Related to Our Common Stock
The market price and trading volume of our common stock may fluctuate significantly.
The trading price of our common stock has been and may continue to be volatile and the trading volume in our common stock may fluctuate.
The factors that could affect our common stock price include among others: (1) industry or general market conditions, including inflation and increasing cost of goods; (2) domestic and international economic factors unrelated to our performance; (3) our ability to execute our planned strategies; (4) lawsuits, enforcement actions and other claims by third parties or governmental authorities; (5) changes in our customers’ preferences; (6) new regulatory pronouncements and changes in regulatory guidelines; (7) actual or anticipated fluctuations in our quarterly operating results; (8) changes in securities analysts’ estimates of our financial performance or lack of research coverage and reports by industry analysts; (9) action by institutional shareowners or other large shareowners; (10) failure to meet any financial guidance given by us or any change in any financial guidance given by us, or changes by us in our financial guidance practices; (11) announcements by us of significant impairment charges; (12) speculation in the press or investment community; (13) investor perception of us and our industry; (14) changes in market valuations or earnings of similar companies; (15) announcements by us or our competitors of significant contracts, acquisitions, dispositions or strategic partnerships; (16) war or terrorist acts; (17) any future sales of our common stock or other securities; (18) additions or departures of key personnel; (19) failure to achieve any of our sustainability goals; and (20) other risk factors discussed in this "Risk Factors" section or in our other filings from time to time with the SEC.
Stock markets experience volatility that can be unrelated to the operating performance of particular companies. These broad market fluctuations may adversely affect the market price of our common stock. In the past, following periods of volatility in the market price of a company’s securities, class action litigation has often been instituted against the affected company. Any litigation of this type brought against us could result in substantial costs and a diversion of our management’s attention and resources, which could harm our business, operating results and financial condition.
Shareowner's percentage of ownership in our common stock may be diluted in the future.
The percentage ownership of shareowners in our common stock may be diluted because of equity issuances for acquisitions, capital market transactions or otherwise, including any equity awards that we grant to our directors, officers and employees. Our employees have, and will receive from us, stock-based awards that correspond to shares of our common stock. Such awards have had and will have a dilutive effect on our earnings per share, which could adversely affect the market price of our common stock. Additionally, in connection with our acquisition of the VCS Business, we issued 58,608,959 shares of our common stock to Viessmann, with which we entered into an Investor Rights Agreement that provides for, among other things, customary resale, demand and piggyback registration rights. While the Investor Rights Agreement also provides that, for the time periods specified therein, Viessmann and its affiliates are subject to customary standstill, lockup and transfer restrictions, registration of the shares of common stock held by Viessmann will permit those shares to be sold into the public market, once eligible to be disposed of pursuant to the Investor Rights Agreement. See Note 14 – Stock-Based Compensation and Note 18 – Earnings Per Share in the accompanying Notes to the Consolidated Financial Statements in this Annual Report for additional information.
Quarterly cash dividends may be discontinued or modified, are subject to a number of uncertainties and may affect the price of our common stock.
Quarterly cash dividends are a component of our capital allocation strategy, which we fund with operating cash flows, borrowings and divestitures. However, we are not required to declare dividends. Dividends may be discontinued, accelerated, suspended or delayed at any time without prior notice. Even if not discontinued, the amount of such dividends may be changed, and the amount, timing and frequency of such dividends may vary from past practice or from our stated expectations. Decisions with respect to dividends are subject to the discretion of our Board of Directors and will be based on a variety of factors. Important factors that could cause us to discontinue, limit, suspend, increase or delay our quarterly cash dividends include market conditions, the price of our common stock, the nature and timing of other investment opportunities, changes in our business strategy, the terms of our financing arrangements, our outlook as to the ability to obtain financing at attractive rates, the impact on our credit ratings and the availability of domestic cash. The reduction or elimination of our cash dividend could adversely affect the market price of our common stock.
Our amended and restated bylaws designate the courts within the State of Delaware as the sole and exclusive forum for certain types of actions and proceedings that may be initiated by our shareowners, which could discourage lawsuits against Carrier and our directors and officers.
Our amended and restated bylaws provide that unless our Board of Directors otherwise determines, the state courts within the State of Delaware (or, if no state court located within the State of Delaware has jurisdiction, the federal district court for the District of Delaware) will be the sole and exclusive forum for any derivative action or proceeding brought on behalf of Carrier, any action asserting a claim for or based on a breach of a fiduciary duty owed by any current or former director or officer or other employee of Carrier to Carrier or to Carrier shareowners, including a claim alleging the aiding and abetting of such a breach of fiduciary duty, any action asserting a claim against Carrier or any current or former director or officer or other employee of Carrier arising pursuant to any provision of the Delaware General Corporation Law (“DGCL”) or our amended and restated certificate of incorporation or amended and restated bylaws, any action asserting a claim relating to or involving Carrier governed by the internal affairs doctrine, or any action asserting an “internal corporate claim” as that term is defined in Section 115 of the DGCL.
To the fullest extent permitted by law, this exclusive forum provision applies to state and federal law claims, including claims under the federal securities laws, including the Securities Act of 1933, as amended ("Securities Act"), and the Securities Exchange Act of 1934, as amended (the "Exchange Act"), although Carrier shareowners will not be deemed to have waived our compliance with the federal securities laws and the rules and regulations thereunder. The enforceability of similar choice of forum provisions in other companies’ organizational documents has been challenged in legal proceedings, and it is possible that, in connection with claims arising under federal securities laws or otherwise, a court could find the exclusive forum provision contained in the amended and restated bylaws to be inapplicable or unenforceable.
This exclusive forum provision may limit the ability of our shareowners to bring a claim in a judicial forum that such shareowners find favorable for disputes with Carrier or our directors or officers, which may discourage such lawsuits against Carrier and our directors and officers. Alternatively, if a court were to find this exclusive forum provision inapplicable to, or unenforceable in respect of, one or more of the specified types of actions or proceedings described previously, we may incur additional costs associated with resolving such matters in other jurisdictions, which could negatively affect our business, results of operations and financial condition.
Anti-takeover provisions could enable our Board of Directors to resist a takeover attempt by a third party and limit the power of our shareowners.
Our amended and restated certificate of incorporation and amended and restated bylaws contain, and Delaware law contains, provisions that are intended to deter coercive takeover practices and inadequate takeover bids by making such practices or bids unacceptably expensive to the bidder and to encourage prospective acquirers to negotiate with our Board of Directors rather than to attempt a hostile takeover. These provisions include, among others: (1) the ability of our remaining directors to fill vacancies on our Board of Directors (except in an instance where a director is removed by shareowners and the resulting vacancy is filled by shareowners); (2) limitations on shareowners’ ability to call a special shareowner meeting; (3) rules regarding how shareowners may present proposals or nominate directors for election at shareowner meetings; and (4) the right of our Board of Directors to issue preferred stock without shareowner approval.
In addition, we are subject to Section 203 of the DGCL, which could have the effect of delaying or preventing a change of control that shareowners may favor. Section 203 provides that, subject to limited exceptions, persons that acquire, or are affiliated with persons that acquire, more than 15% of the outstanding voting stock of a Delaware corporation may not engage in a business combination with that corporation, including by merger, consolidation or acquisitions of additional shares, for a three-year period following the date on which that person or any of its affiliates becomes the holder of more than 15% of the corporation’s outstanding voting stock.
We believe these provisions will protect our shareowners from coercive or otherwise unfair takeover tactics by requiring potential acquirers to negotiate with our Board of Directors and by providing our Board of Directors with more time to assess any acquisition proposal. These provisions are not intended to make us immune from takeovers; however, these provisions will apply even if the offer may be considered beneficial by some shareowners and could delay or prevent an acquisition that our Board of Directors determines is not in the best interests of Carrier and our shareowners. These provisions may also prevent or discourage attempts to remove and replace incumbent directors.
General Risks
Natural disasters, epidemics or other unexpected events may disrupt our operations, adversely affect our results of operations, cash flows or financial condition and may not be fully covered by insurance.
The occurrence of one or more natural disasters, power outages or other unexpected events, including hurricanes, fires, earthquakes, volcanic eruptions, tsunamis, floods and other forms of severe weather, health epidemics, pandemics or other contagious outbreaks, conflicts, wars or terrorist acts, in the U.S. or in other countries in which we or our suppliers or customers operate have in the past and could in the future adversely affect our operations and financial performance. Natural disasters, power outages or other unexpected events could damage or close one or more of our facilities or disrupt our operations temporarily or long-term, such as by causing business interruptions or by affecting the availability and/or cost of materials needed for manufacturing. In some cases, we have one factory that can manufacture a specific product or product line. As a result, damage to or the closure of a certain factory or factories may disrupt or prevent us from manufacturing certain products. Existing insurance arrangements may not cover all of the costs or lost cash flows that may arise from such events. The occurrence of any of these events could also increase our insurance and other operating costs or harm our sales.
We may be affected by global economic, capital market and political conditions, and conditions in the energy, construction, transportation and infrastructure industries in particular. Uncertainty in U.S. trade policy, including uncertainty surrounding changes in tariffs, trade agreements or other trade restrictions imposed by the U.S. or other governments, as well as political conditions in and between the U.S. and foreign countries in which we operate, could significantly and adversely affect our business and financial results.
Our business, operating results, cash flows and financial condition have in the past been and in the future may be adversely affected by changes in global economic conditions and geopolitical risks and conditions, including climate and energy policies, regulatory changes, credit market conditions, levels of consumer and business confidence, fluctuations in residential, commercial and industrial construction activity, pandemic health issues, natural disasters, commodity prices, energy costs, interest rate fluctuations, inflation, recession, foreign exchange rates, levels of government spending and deficits, trade policies (including tariffs, boycotts and sanctions), military conflicts, acts of terrorism, government instability, actual or anticipated defaults on sovereign debt and other challenges that could affect the global economy. These economic and political conditions affect our business in a number of ways. For example, because we have a number of factories and suppliers in foreign countries, the imposition of tariffs or additional sanctions or unusually restrictive border crossing rules could adversely affect our supply chain, operations and overall business.
There are ongoing threats of war, terrorism or governmental instability in various countries and regions, including those where we do business. In March 2022, we suspended business operations in Russia by ceasing to pursue new business opportunities while continuing to fulfill existing contracts for equipment, service and parts, where possible, in a manner that fully complies with applicable sanctions and trade controls. Our sales, operations and supply chain in Russia and Ukraine are not material to Carrier. However, the military conflict between the two countries and attendant geopolitical environment may continue to negatively impact the global economy and major financial markets, and may result in additional increases in commodity prices and supply-chain disruptions, including shortages of materials, higher costs for fuel and freight and increased transportation delays. Uncertainty related to these global economic, capital market and political conditions and events, and the perception that such conditions and events may occur, could have a material adverse effect on our business, results of operations, cash flows and financial condition. Furthermore, the tightening of credit in the capital markets could adversely affect the ability of our customers, including individual end-customers and businesses, to obtain financing for significant purchases and operations, which could result in a decrease in or cancellation of orders for our products and services. Similarly, tightening credit may adversely affect our supply base and increase the potential for one or more of our suppliers to experience financial distress or bankruptcy.
Our business and financial performance is also adversely affected by decreases in the general level of economic activity, such as decreases in business and consumer spending and construction (both residential and commercial as well as remodeling). In addition, our financial performance may be influenced by the production and utilization of transport equipment, including truck production cycles in North America and Europe.
Our business success depends on attracting and retaining key personnel and other talent throughout the Company.
Our future success and ability to execute our strategic plan depends on our ability to hire, retain and develop a high performance, customer-centric executive management team and its ability to provide consistent leadership and direction. The failure to retain our executive officers and other key personnel could result in significant disruption and have a material adverse effect on our business operations and ability to deliver our growth objectives.
Our future success also depends on our ability to attract, retain and develop qualified personnel with the requisite technical expertise and understanding of our customers’ needs at all levels of the organization, including skilled labor. The availability of skilled labor needed for the design and production of our products and delivery of services is limited in a number of the locations in which we operate, and the competition for talent is robust. Difficulties attracting and retaining a qualified workforce could adversely impact our operations and overall business.
This risk may also be exacerbated as a result of acquisitions undertaken as part of our transformation, which are dependent on the continuity, experience and industry knowledge of management personnel and other key employees to execute our business plans for the acquired businesses. Our success after completion of any acquisition may depend in part upon our ability to attract, motivate and retain key management personnel and other key employees within the acquired business, and current and prospective employees of the acquired business may experience uncertainty about their roles, which may have an adverse effect on the acquired business's ability to attract, motivate or retain management personnel and other key personnel.
Additional tax expense or additional tax exposures could affect our future profitability.
We are subject to income taxes in the U.S. and various international jurisdictions. Changes to tax laws and regulations as well as changes and conflicts in related interpretations or other tax guidance could materially impact our tax receivables and liabilities and our deferred tax assets and deferred tax liabilities. Additionally, in the ordinary course of business, we are subject to examinations by various tax authorities. Tax authorities in various jurisdictions could also launch new examinations and expand existing examinations. The global and diverse nature of our operations means that these risks will continue, and additional examinations, proceedings and contingencies will arise from time to time. Our competitive position, results of operations, cash flows or financial condition may be affected by the outcome of examinations, proceedings and contingencies that cannot be predicted with certainty.
See "Business Overview" and "Results of Operations—Income Taxes" under "Management's Discussion and Analysis of Financial Condition and Results of Operations" and Note 3 – Summary of Significant Accounting Policies and Note 17 – Income Taxes in the accompanying Notes to the Consolidated Financial Statements in this Annual Report for further discussion on income taxes and related contingencies.
Failure to maintain effective internal controls over financial reporting in accordance with Section 404 of the Sarbanes-Oxley Act could materially and adversely affect us.
As a public company, we are subject to the reporting requirements of the Exchange Act, Sarbanes-Oxley Act of 2002 (the "Sarbanes-Oxley Act") and the Dodd-Frank Wall Street Reform and Consumer Protection Act and are required to prepare our financial statements according to the rules and regulations required by the SEC. In addition, the Exchange Act requires that we file annual, quarterly and current reports. Our failure to prepare and disclose this information in a timely manner or to otherwise comply with applicable law could subject us to penalties under federal securities laws, expose us to lawsuits and restrict our ability to access financing. In addition, the Sarbanes-Oxley Act requires that, among other things, we establish and maintain effective internal controls and procedures for financial reporting and disclosure purposes. Internal control over financial reporting is complex and may change over time due to changes in our business or in applicable accounting rules. We cannot provide assurance that our internal controls over financial reporting will be effective in the future or that a material weakness will not be discovered with respect to a prior period for which we had previously believed that internal controls were effective. If we are not able to maintain or document effective internal controls over financial reporting, our independent registered public accounting firm will not be able to certify as to the effectiveness of our internal controls over financial reporting.
Matters affecting our internal controls may cause us to be unable to report our financial information on a timely basis, or may cause us to restate previously issued financial information, and thereby subject us to adverse regulatory consequences, including sanctions or investigations by the SEC, or violations of applicable stock exchange listing rules. There could also be a negative reaction in the financial markets due to a loss of investor confidence in our company and the reliability of our financial statements. Confidence in the reliability of our financial statements is also likely to suffer if we or our independent registered public accounting firm report a material weakness in our internal controls over financial reporting. This could have a material and adverse effect on us by, for example, leading to a decline in the share price of our common stock and impairing our ability to raise additional capital.
ITEM 1B. UNRESOLVED STAFF COMMENTS
None.
ITEM 1C. CYBERSECURITY
Impact of cybersecurity risks on business strategy, results of operations or financial condition.
As discussed under the “Risk Factors” heading in this Annual Report, our business has been and may again in the future be impacted by disruptions to our Technology infrastructure or our third-party providers’ Technology infrastructures from (among other causes) cybersecurity-based risks, including attacks (i) on our Technology infrastructure (ii) targeting the security, integrity and/or availability of hardware and software; (iii) exploiting weaknesses or vulnerabilities in products, or capturing information installed, stored or transmitted in our products (including after the purchase of those products and when they are installed into third-party products); and (iv) on facilities or similar infrastructure.
Risk Management and strategy
We mitigate cybersecurity risks (and other material risks) through our enterprise risk management (“ERM”) program, which is a company-wide effort, managed by senior executives and overseen by our Audit Committee and Board of Directors to identify, assess, manage, report and monitor material risks that may affect our ability to achieve our business objectives.
In connection with the ERM process, cybersecurity risks, including those relating to risks posed by our use of third-party service providers, are assigned to cross-functional management committees responsible for identifying and classifying the cybersecurity risks in accordance with our ERM risk rating methodology, and developing and administering risk mitigation and incident response plans. These cross-functional management committees regularly meet to review current and emerging cybersecurity risks and maintain policies and procedures governing the evaluation and classification of such risks.
Cybersecurity risks deemed to be critical are reviewed by a Critical Threat Committee, which is comprised of members of our senior leadership team including our Chief Financial Officer, Chief Legal Officer, Chief Digital Officer, Senior Vice President of Operations, Chief Technology Officer, Chief Product Officer and Controller/Chief Accounting Officer. The Critical Threat Committee reviews the risk and mitigation plan with the applicable cross-functional management team and facilitates notification to the Audit Committee of emerging critical cybersecurity risks. The Audit Committee and the Board of Directors receive regular briefings on cybersecurity risks. See “Governance” below for further discussion of governance of our cybersecurity program.
In the event of a cybersecurity incident, we maintain incident response plans to investigate, classify, respond to, and manage cybersecurity incidents that may compromise the availability or integrity of our information systems, network resources, or data. In accordance with the incident response plans, cross-functional management teams assess and assign a threat level to each cybersecurity incident. A cybersecurity incident (or incidents, if aggregated together) assigned a critical threat level is escalated to the Critical Threat Committee for review.
To ensure that our employees are equipped to identify and mitigate material cybersecurity incidents and to empower them to help us maintain a secure environment for our operations and data assets, we utilize a multifaceted training approach aimed at fostering a culture of security awareness and responsibility among all employees. These tailored programs are designed and updated to address evolving threats and industry best practices. In addition to annual cybersecurity training for employees and contractors and simulated phishing email campaigns, our cybersecurity teams conduct tabletop exercises with our senior management team. Our cybersecurity teams also oversee a security assessment process that is used to screen our third-party service providers for cybersecurity vulnerabilities based on the level of inherent risk they pose to the company or our customers, based on factors including but not limited to the products or services they provide and their ability to access our information systems, network resources, or data.
We engage and retain outside consultants and legal advisors and we are members of several cybersecurity industry groups to keep us apprised of emerging cybersecurity risks, defense and mitigation strategies and governance best practices. Many of our processes and procedures are independently audited and assessed on a periodic basis against leading international cybersecurity standards and programs.
Cybersecurity threats are constantly evolving, are becoming more frequent and more sophisticated and are made by groups of individuals with a wide range of expertise and motives which increases the difficulty of detecting and successfully defending against them. However, to date, cybersecurity threats have not materially affected us, including our business, strategy, results of operations or financial condition.
Governance
Our cybersecurity programs, including the cross-functional management committees described above are the responsibility of our Chief Information Security Officer. Day-to-day administration of the cybersecurity programs are led by our Chief Information Security Officer and Chief Product Security Officer who collectively possess significant experience related to cybersecurity issues in both the private and government sectors, and possess certifications including but not limited to Certified Information Systems Security Professional ("CISSP") and Certified Information Security Manager ("CISM").
Cybersecurity risk oversight continues to remain a top priority for the Board of Directors. Although the Audit Committee maintains primary responsibility for oversight of cybersecurity risks through the ERM program, responsibility related to oversight of cybersecurity risks is also delegated to other committees in alignment with their focus charter responsibilities. For example, the Technology and Innovation and Governance Committees assist with the cybersecurity programs through their oversight of our technology, digital, and innovation strategies and product integrity program, respectively.
The Critical Threat Committee is also responsible for evaluating the materiality of a cybersecurity incident based on criteria that has been reviewed with the Board of Directors, and for determining whether there are disclosure obligations under applicable securities laws. In the event that the Critical Threat Committee determines that a critical cybersecurity incident (or incidents, if aggregated together) is deemed to be material, the Critical Threat Committee will brief the Board of Directors and oversee the disclosure process. For all critical cybersecurity incidents that are not deemed to be material, the Critical Threat Committee will notify the Chairman of the Board to determine whether the Board of Directors will be notified of the critical incident during the next regularly-scheduled cybersecurity update to the Audit Committee, or sooner as circumstances warrant.
ITEM 2. PROPERTIES
We operate approximately 900 sites, which comprise approximately 36 million square feet of productive space. Of these, our facilities and key manufacturing sites greater than 100,000 square feet comprise approximately 27 million square feet of productive space. Approximately 80% and 9% of these significant properties are associated with our HVAC and Refrigeration segments, respectively, with approximately 11% not associated with a particular segment. Approximately 35% of these significant properties are leased and the remainder are owned. Approximately 30% of these significant properties are located in the U.S.
Our fixed assets as of December 31, 2024, include manufacturing facilities and non-manufacturing facilities, such as warehouses and machinery and equipment, most of which is general purpose machinery and equipment that use special jigs, tools and fixtures and that, in many instances, have automatic control features and special adaptations. The facilities, warehouses, machinery and equipment in use as of December 31, 2024, are in good operating condition, are well-maintained and substantially all are in regular use.
ITEM 3. LEGAL PROCEEDINGS
Asbestos Matters
The Company has been named as a defendant in lawsuits alleging personal injury as a result of exposure to asbestos allegedly integrated into certain Carrier products or business premises. While the Company has never manufactured asbestos and no longer incorporates it into any currently-manufactured products, certain products that the Company no longer manufactures contained components incorporating asbestos. A substantial majority of these asbestos-related claims have been dismissed without payment or have been covered in full or in part by insurance or other forms of indemnity. Additional cases were litigated and settled without any insurance reimbursement. The amounts involved in asbestos-related claims were not material individually or in the aggregate in any period. The amounts recorded for asbestos-related liabilities are based on currently available information and assumptions that the Company believes are reasonable and are made with input from outside actuarial experts. These amounts are undiscounted and exclude the Company’s legal fees to defend the asbestos claims, which are expensed as incurred. In addition, the Company has recorded insurance recovery receivables for probable asbestos-related recoveries.
Aqueous Film Forming Foam Litigation
As of December 31, 2024, the Company, Kidde-Fenwal, Inc. ("KFI") and others have been named as defendants in more than 9,000 lawsuits filed in United States state or federal courts and a single case in Canada alleging that the historic use of Aqueous Film Forming Foam ("AFFF") caused personal injuries and damage to property and water supplies. In December 2018, the U.S. Judicial Panel on Multidistrict Litigation transferred and consolidated all AFFF cases pending in the U.S. federal courts against the Company, KFI and others to the U.S. District Court for the District of South Carolina (the "MDL Proceedings"). Individual plaintiffs in the MDL Proceedings generally seek damages for alleged personal injuries, medical monitoring, diminution in property value and injunctive relief to remediate alleged contamination of water supplies. U.S. state, municipal and water utility plaintiffs in the MDL Proceedings generally seek damages and costs related to the remediation of public property and water supplies.
AFFF is a firefighting foam, developed beginning in the late 1960s pursuant to U.S. military specification, used to extinguish certain types of hydrocarbon-fueled fires. The lawsuits identified above relate to Kidde Fire Fighting, Inc., which owned the "National Foam" business that manufactured AFFF for sale to government (including the U.S. federal government) and non-government customers in the U.S. at a single facility located in West Chester, Pennsylvania (the "Pennsylvania Site"). Kidde Fire Fighting, Inc. was acquired by a UTC subsidiary in 2005 and merged into KFI in 2007. In 2013, KFI divested the AFFF businesses to an unrelated third party. The Company acquired KFI as part of the Separation in April 2020.
The key components that contribute to AFFF's fire-extinguishing capabilities are known as fluorosurfactants. Neither the Company, nor KFI, nor any of the Company's subsidiaries involved in the AFFF litigation manufactured fluorosurfactants. Instead, the National Foam business purchased these substances from unrelated third parties for use in manufacturing AFFF. Plaintiffs in the MDL Proceedings allege that the fluorosurfactants used by various manufacturers in producing AFFF contained, or over time degraded into, compounds known as per- and polyfluoroalkyl substances (referred to collectively as "PFAS"), including perflourooctanesulfonic acid ("PFOS") and perflourooctanoic acid ("PFOA"). Plaintiffs further allege that, as a result of the use of AFFF, PFOS and PFOA were released into the environment and, in some instances, ultimately reached drinking water supplies.
Plaintiffs in the MDL Proceedings have named multiple defendants, including suppliers of chemicals and raw materials used to manufacture fluorosurfactants, fluorosurfactant manufacturers and AFFF manufacturers. The defendants in the MDL Proceedings moved for summary judgment on the government contractor defense, which potentially applies to AFFF sold to or used by the U.S. government. After full briefing and oral argument, on September 16, 2022, the MDL court declined to enter summary judgment for the defendants. The defense, however, remains available at any trial in which it would apply.
On May 14, 2023, KFI filed a voluntary petition with the United States Bankruptcy Court for the District of Delaware (the “Bankruptcy Court”) seeking relief under chapter 11 of the Bankruptcy Code, after the Company determined that it would not provide financial support to KFI going forward other than ensuring KFI has access to services necessary for the effective operation of its business. As a result, all litigation against KFI was automatically stayed. By agreement, all AFFF-related litigation against the Company, its other subsidiaries and RTX also was stayed. On November 21, 2023, the Bankruptcy Court ordered certain parties, including the Company, to participate in mediation sessions with respect to claims that might be asserted by and against it in the bankruptcy proceedings.
Following the conclusion of these mediation sessions in October 2024, the Company entered into a Settlement and Plan Support Agreement which contemplates that the Company will subsequently enter into three distinct settlement agreements (collectively, the “Proposed Settlement Agreements”) with KFI, the Official Committee of Unsecured Creditors appointed in KFI’s bankruptcy case (the “Committee”) and the Plaintiffs’ Executive Committee (the “MDL PEC”) appointed in the MDL Proceedings.
The first of the Proposed Settlement Agreements relates to claims that the Company is responsible for liabilities arising from KFI’s manufacture or sale of AFFF (“Estate Claims Settlement”). Upon Bankruptcy Court approval, the Estate Claims Settlement will permanently resolve all present and future claims that the Company is responsible for any liabilities of KFI, including all liabilities arising from KFI’s manufacture and sale of AFFF. The second and third of the Proposed Settlement Agreements release a very substantial amount of current and future direct claims against the Company (the “Direct Claims Settlements”). Direct claims allege that UTC, which indirectly owned KFI’s AFFF business for eight years, engaged in conduct independent of KFI that caused harm to AFFF claimants. The Company agreed to indemnify UTC for these direct claims when it was spun-off from UTC. Upon approval by the MDL Court, the Direct Claims Settlements resolve and enjoin all current and future AFFF-related direct claims against the Company by participating public water providers and airports. Non-settling parties may still assert direct AFFF-related claims, although we expect a vast majority of public water providers and airports will participate in the Direct Claims Settlements.
As part of the Proposed Settlement Agreements, the Company will pay $615 million in cash over five years, 100% of the net sale proceeds from its sale of KFI’s assets to Pacific Avenue Capital Partners, which are estimated to be $115 million, and contribute the right to recover proceeds under certain of its insurance policies. The Company will be entitled to receive up to $2.4 billion of proceeds from those insurance policies and will contribute the first $125 million of such proceeds as additional consideration in the Direct Claims Settlements. The Company also will be entitled to any earnouts payable to KFI under the KFI sale agreement. The Company expects insurance proceeds it receives in the future, in the aggregate, to cover the amount paid under the Proposed Settlement Agreements. As a result of the Proposed Settlement Agreements, the Company recorded a liability in the amount of $565 million during the year ended December 31, 2024. The amount recognized is in addition to liabilities of $50 million that the Company recorded upon the deconsolidation of KFI on May 14, 2023. As of December 31, 2024, the Company has not recorded any amounts associated with expected insurance proceeds.
The Company and KFI believe that they have meritorious defenses to the remaining AFFF claims. Given the numerous factual, scientific and legal issues to be resolved relating to these claims, the Company is unable to assess the probability of liability or to reasonably estimate a range of possible loss at this time. There can be no assurance that any such future exposure will not be material in any period.
On November 14, 2024, KFI filed the chapter 11 plan of liquidation (as may be further amended, restated, supplemented, waived, or otherwise modified from time to time, the "Chapter 11 Plan"), which incorporates the Estate Claims Settlement, provides for the treatment of the various creditor classes, and establishes wind-down provisions, among other things, and the disclosure statement for the Chapter 11 Plan (as may be further amended, restated, supplemented, waived, or otherwise modified from time to time, the "Disclosure Statement"). A hearing to approve the Disclosure Statement, its ancillary documents and establish a Chapter 11 Plan confirmation timeline in the Bankruptcy Court is expected to be held in March 2025.
Other
We have commitments and contingent liabilities related to legal proceedings, self-insurance programs and matters arising out of the ordinary course of business. Additionally, we are routinely a defendant in, party to or otherwise subject to many pending and threatened legal actions, claims, disputes and proceedings. These matters are often based on alleged violations of contract, product liability, warranty, regulatory, environmental, health and safety, employment, intellectual property, tax and other laws. In some of these proceedings, claims for substantial monetary damages are asserted against us and could result in fines, penalties, compensatory or treble damages or non-monetary relief. We do not believe that these matters will have a material adverse effect upon our competitive position, results of operations, cash flows or financial condition.
A further discussion of our potential regulatory liabilities can be found under the headings "Business" and "Risk Factors" in this Annual Report.
ITEM 4. MINE SAFETY DISCLOSURE
Not Applicable.
PART II
ITEM 5. MARKET FOR REGISTRANT'S COMMON EQUITY, RELATED SHAREOWNER MATTERS AND ISSUER PURCHASES OF EQUITY SECURITIES
The Company's common stock is listed on the NYSE under the ticker symbol "CARR." As of December 31, 2024, the approximate number of common stock shareowners of record was 19,648.
The declaration and payment of dividends is at the discretion of our Board of Directors, and will depend upon our financial results, cash requirements and other factors deemed relevant by our Board of Directors.
PERFORMANCE GRAPH
The following information is not deemed to be “soliciting material” or to be “filed” with the SEC or subject to Regulation 14A or 14C under the Exchange Act or to the liabilities of Section 18 of the Exchange Act, and will not be deemed to be incorporated by reference into any filing of the Company under the Securities Act or the Exchange Act, except to the extent the Company specifically incorporates it by reference into such a filing.
On April 3, 2020, UTC completed the Separation of Carrier into a stand-alone company. As a result of the Separation and the Distribution, Carrier became an independent public company. The following graph presents the cumulative total shareowner return from the Distribution Date through December 31, 2024, for our common stock, as compared with the S&P 500 Index and the Dow Jones Industrial Index.
Our common stock is a component of the S&P 500 Index. These figures assume that all dividends paid over the period were reinvested and that the starting value of each index and the investment in our common stock was $100 on April 3, 2020.
Comparison of Cumulative Total Return
The cumulative total returns on our common stock and each index as of each April 3, 2020 through December 31, 2024, plotted in the above graph are as follows:
| | | | | | | | | | | | | | | | | | | | | | | | | | | | | | | | | | | | |
| Company / Index | April 3, 2020 | | December 31, 2020 | | December 31, 2021 | | December 31, 2022 | | December 31, 2023 | | December 31, 2024 | |
| Carrier Global Corporation | $ | 100.00 | | | $ | 225.02 | | | $ | 326.97 | | | $ | 252.80 | | | $ | 357.66 | | | $ | 430.12 | | |
| S&P 500 Index | $ | 100.00 | | | $ | 152.88 | | | $ | 196.73 | | | $ | 161.07 | | | $ | 203.37 | | | $ | 254.20 | | |
| Dow Jones Industrial Index | $ | 100.00 | | | $ | 147.76 | | | $ | 178.71 | | | $ | 166.45 | | | $ | 193.38 | | | $ | 222.37 | | |
Issuer Purchases of Equity Securities
The following table provides information about our purchases during the three months ended December 31, 2024, of equity securities that are registered by us pursuant to Section 12 of the Exchange Act.
| | | | | | | | | | | | | | | | | | | | | | | | | | |
| | Total Number of Shares Purchased
(in 000's) | | Average Price Paid per Share (1) | | Total Number of Shares Purchased as Part of a Publicly Announced Program
(in 000's) | | Approximate Dollar Value of Shares that May Yet Be Purchased Under the Program
(in millions) |
| 2024 | | | | | | | | |
| October 1 - October 31 | | 2,636 | | $77.14 | | 2,636 | | $ | 4,494 | |
| November 1 - November 30 | | 11,446 | | $75.65 | | 11,446 | | $ | 3,628 | |
| December 1 - December 31 | | 6,352 | | $69.68 | | 6,352 | | $ | 3,186 | |
| Total | | 20,434 | | $73.96 | | 20,434 | | |
| | | | | | | | |
(1) Excludes broker commissions.
We may purchase our outstanding common stock from time to time subject to market conditions and at our discretion. Repurchases occur in the open market or through one or more other public or private transactions pursuant to plans complying with Rules 10b5-1 and 10b-18 under the Exchange Act. Since the initial authorization in February 2021, the Company's Board of Directors authorized the repurchase of up to $7.1 billion of the Company's outstanding common stock.
Equity Compensation Plan Information
See Item 12, Security Ownership of Certain Beneficial Owners and Management and Related Shareowner Matters, of this Annual Report.
ITEM 7. MANAGEMENT'S DISCUSSION AND ANALYSIS OF FINANCIAL CONDITION AND RESULTS OF OPERATIONS
BUSINESS OVERVIEW
Business Summary
Carrier Global Corporation ("we" or "our") is a global leader in intelligent climate and energy solutions with a focus on providing differentiated, digitally-enabled lifecycle solutions to our customers. Our portfolio includes industry-leading brands such as Carrier, Viessmann, Toshiba, Automated Logic and Carrier Transicold that offer innovative heating, ventilating and air conditioning ("HVAC"), refrigeration and cold chain transportation solutions to help make the world safer and more comfortable. We also provide a broad array of related building services, including audit, design, installation, system integration, repair, maintenance and monitoring. Our operations are classified into two segments: HVAC and Refrigeration.
Through our performance-driven culture, we anticipate creating long-term shareowner value by investing strategically to strengthen our product position in homes, buildings and across the cold chain in order to drive profitable growth. We believe our business segments are well positioned to benefit from favorable secular trends, including the mega-trends of urbanization, population growth and demographic shifts, food security and safety, digitalization, global connectivity and energy efficiency. Coupled with our industry-leading brands and track record of innovation, we continue to provide market-leading solutions for our customers.
Our worldwide operations are affected by global and regional industrial, economic and political factors, trade policies and trends. They are also affected by changes in the general level of economic activity, such as changes in business and consumer spending, construction and shipping activity as well as short-term economic factors such as currency fluctuations, commodity price volatility and supply disruptions. We continue to invest in our business, take pricing actions to mitigate supply chain and inflationary pressures, develop new products and services in order to remain competitive in our markets and use risk management strategies to mitigate various exposures.
We are actively monitoring recent trade policy and tariff announcements including the three executive orders issued by the President in February 2025 directing the United States to impose new tariffs on imports from Canada, Mexico and China and the subsequent announcement that the Administration intended to pause tariffs on Canada and Mexico for a month. We are currently evaluating the potential impact of the announced tariffs on our business and financial condition and actions we may take to mitigate the impact. In addition, we are currently monitoring the potential impact, if any, of actions taken by these countries in response to the announced tariffs. There can be no assurance that the future imposition of any tariffs, changes thereto or potential actions taken by countries in response to the tariffs will not have a material adverse effect upon our results of operations, financial condition or liquidity in any period or that any actions we take to mitigate the impact of the tariffs will be effective.
Significant Events
Acquisition of Viessmann Climate Solutions
On April 25, 2023, we announced that we entered into a Share Purchase Agreement (the “Agreement”) to acquire the climate solutions business (the "VCS Business") of Viessmann Group GmbH & Co. KG (“Viessmann”), a privately-held company. The VCS Business develops intelligent, integrated and sustainable technologies, including heat pumps, boilers, photovoltaic systems, home battery storage and digital solutions, primarily for residential customers in Europe. The acquisition was completed on January 2, 2024. As a result, the assets, liabilities and results of operations of the VCS Business are consolidated in the accompanying Consolidated Financial Statements as of the date of acquisition and reported within our HVAC segment.
Portfolio Transformation
On June 2, 2024, we completed the sale of our Access Solutions business ("Access Solutions") for cash proceeds of $5.0 billion. Access Solutions, historically reported in our Fire & Security segment, is a global supplier of physical security and digital access solutions supporting the hospitality, commercial, education and military markets. We recognized a net gain on the sale of $1.8 billion, which is included in Discontinued operations, net of tax on the accompanying Consolidated Statement of Operations during the year ended December 31, 2024.
On July 1, 2024, we completed the sale of our Industrial Fire business ("Industrial Fire") for cash proceeds of $1.4 billion. Industrial Fire, historically reported in our Fire & Security segment, is a leading manufacturer of a full spectrum of fire detection and suppression solutions and services in critical high-hazard environments, including oil and gas, power generation, marine and offshore facilities, automotive, data centers and aircraft hangars. We recognized a net gain on the sale of $319 million, which is included in Discontinued operations, net of tax on the accompanying Consolidated Statement of Operations during the year ended December 31, 2024.
On October 1, 2024, we completed the sale of our Commercial Refrigeration business ("CCR") for cash proceeds of $679 million. CCR, historically reported in our Refrigeration segment, is a global supplier of turnkey solutions for commercial refrigeration systems and services, with a primary focus on serving food retail customers, cold storage facilities and warehouses. We recognized a gross gain on the sale of $318 million, which is included in Other income (expense), net on the accompanying Consolidated Statement of Operations during the year ended December 31, 2024. The net proceeds received are subject to working capital and other adjustments provided in the stock purchase agreement.
On December 2, 2024, we completed the sale of our Commercial and Residential Fire business ("CRF Business") for cash proceeds of $2.9 billion. The CRF Business, historically reported in our Fire & Security segment, is a leading manufacturer of fire detection and alarm solutions for both commercial and residential applications. We recognized a net gain on the sale of $1.4 billion, which is included in Discontinued operations, net of tax on the accompanying Consolidated Statement of Operations during the year ended December 31, 2024. The net proceeds received are subject to working capital and other adjustments provided in the stock purchase agreement.
Deconsolidation of Kidde-Fenwal, Inc.
On May 14, 2023, Kidde-Fenwal, Inc. ("KFI"), an indirect wholly-owned subsidiary of ours, filed a petition for voluntary reorganization under Chapter 11 of the United States Bankruptcy Code ("Chapter 11") in the United States Bankruptcy Court for the District of Delaware. KFI, an industrial fire detection and suppression business historically reported in our Fire & Security segment, filed a voluntary petition with the United States Bankruptcy Court for the District of Delaware (the “Bankruptcy Court”) seeking relief under chapter 11 of the Bankruptcy Code. As of the petition date, KFI was deconsolidated and its respective assets and liabilities were derecognized from our Consolidated Financial Statements.
RESULTS OF OPERATIONS
This discussion summarizes the significant factors affecting our consolidated results of operations, financial condition and liquidity for the year ended December 31, 2024, compared with December 31, 2023. This discussion should be read in conjunction with Item 8, the Consolidated Financial Statements and the accompanying Notes to the Consolidated Financial Statements in this Annual Report. A detailed discussion of the year ended December 31, 2023, compared with December 31, 2022, is not included herein and can be found in the Management's Discussion and Analysis of Financial Condition and Results of Operations section in the Company's 2023 Annual Report, filed with the SEC on February 6, 2024, under the heading "Results of Operations," which is incorporated herein by reference.
Year Ended December 31, 2024 Compared with Year Ended December 31, 2023
The following represents our consolidated net sales and operating results:
| | | | | | | | | | | | | | | | | | | | | | | | |
| (In millions) | 2024 | | 2023 | | Period Change | | % Change | |
| Net sales | $ | 22,486 | | | $ | 18,951 | | | $ | 3,535 | | | 19 | % | |
| Cost of products and services sold | (16,505) | | | (13,789) | | | (2,716) | | | 20 | % | |
| Gross margin | 5,981 | | | 5,162 | | | 819 | | | 16 | % | |
| | | | | | | | |
| | | | | | | | |
| | | | | | | | |
| | | | | | | | |
| Operating expenses | (3,335) | | | (3,002) | | | (333) | | | 11 | % | |
| Operating profit | 2,646 | | | 2,160 | | | 486 | | | 23 | % | |
| | | | | | | | |
| | | | | | | | |
| Non-operating income (expense), net | (372) | | | (161) | | | (211) | | | 131 | % | |
| Earnings (loss) before income taxes | 2,274 | | | 1,999 | | | 275 | | | 14 | % | |
| Income tax expense | (1,062) | | | (521) | | | (541) | | | 104 | % | |
| Earnings (loss) from continuing operations | 1,212 | | | 1,478 | | | (266) | | | (18) | % | |
| Discontinued operations, net of income taxes | 4,496 | | | (38) | | | 4,534 | | | (11932) | % | |
| Net earnings (loss) | 5,708 | | | 1,440 | | | 4,268 | | | 296 | % | |
| Less: Non-controlling interest in subsidiaries' earnings from operations | 104 | | | 91 | | | 13 | | | 14 | % | |
| Net earnings (loss) attributable to common shareowners | $ | 5,604 | | | $ | 1,349 | | | $ | 4,255 | | | 315 | % | |
Net Sales
For the year ended December 31, 2024, Net sales was $22.5 billion, an 19% increase compared with the same period of 2023. The components of the year-over-year change were as follows:
| | | | | | | | |
| 2024 | |
| Organic / Operational | 3 | % | |
| | |
| Acquisitions and divestitures, net | 16 | % | |
| | |
| Total % change | 19 | % | |
Organic sales for the year ended December 31, 2024, increased by 3% compared with the same period of 2023. The organic increase was primarily driven by our HVAC segment due to improved end-markets in the Americas, which more than offset reduced end-markets in EMEA and Asia. Results in our Refrigeration segment were down compared to the prior year as each of the segment's businesses experienced challenges in certain end-markets. Refer to "Segment Review" below for a discussion of Net sales by segment.
Gross Margin
For the year ended December 31, 2024, gross margin was $6.0 billion, a 16% increase compared with the same period of 2023. The components were as follows:
| | | | | | | | | | | |
| (In millions) | 2024 | | 2023 |
| Net sales | $ | 22,486 | | | $ | 18,951 | |
| Cost of products and services sold | (16,505) | | | (13,789) | |
| Gross margin | $ | 5,981 | | | $ | 5,162 | |
| Percentage of net sales | 26.6 | % | | 27.2 | % |
Gross margin increased by $819 million compared with the year ended December 31, 2023. The main driver of the increase related to ongoing customer demand, pricing improvements and our continued focus on productivity initiatives. Operating results associated with the VCS Business since the date of acquisition further benefited gross margin during the period. However, the results of the VCS Business included inventory step-up, backlog amortization and intangible asset amortization resulting from the recognition of acquired assets at fair value. These costs had a 260 basis point unfavorable impact on gross margin as a percentage of Net sales. As a result, gross margin as a percentage of Net sales decreased by 60 basis points compared with the same period of 2023.
Operating Expenses
For the year ended December 31, 2024, operating expenses, including Equity method investment net earnings, was $3.3 billion, a 11% increase compared with the same period of 2023. The components were as follows:
| | | | | | | | | | | | | |
| For the Year Ended December 31, | | |
| (In millions) | 2024 | | 2023 | | |
| Selling, general and administrative | $ | (3,197) | | | $ | (2,607) | | | |
| Research and development | (686) | | | (493) | | | |
| Equity method investment net earnings | 231 | | | 211 | | | |
| Other income (expense), net | 317 | | | (113) | | | |
| Operating expenses | $ | (3,335) | | | $ | (3,002) | | | |
| Percentage of net sales | 14.8 | % | | 15.8 | % | | |
| | | | | |
For the year ended December 31, 2024, Selling, general and administrative expenses were $3.2 billion, a 23% increase compared with the same period of 2023. The increase is primarily due to incremental expenses associated with the VCS Business since the date of acquisition. In addition, higher compensation and other employee-related costs further contributed to the increase. The current year also included $95 million of acquisition and divestiture-related costs compared with $123 million during the year ended December 31, 2023.
Research and development costs relate to new product development and new technology innovation. Due to the variable nature of program development schedules, year-over-year spending levels can fluctuate. In addition, we continue to invest to prepare for future energy efficiency and refrigerant regulation changes and in digital controls technologies.
Investments over which we do not exercise control, but have significant influence, are accounted for using the equity method of accounting. For the year ended December 31, 2024, Equity method investment net earnings were $231 million, a 9% increase compared with the same period of 2023. The increase was primarily driven by higher earnings in HVAC joint ventures across all regions. The increase was partially offset by a $23 million charge associated with the devaluation of U.S. Dollar denominated balances at an HVAC equity investment in Egypt. In addition, prior year results include a $16 million benefit recognized in connection with a favorable tax ruling at a minority owned joint venture.
Other income (expense), net primarily includes the impact of gains and losses related to the sale of businesses or interests in our equity method investments, foreign currency gains and losses on transactions that are denominated in a currency other than an entity's functional currency and hedging-related activities. During the year ended December 31, 2024, we completed the sale of CCR and recognized a gain on the sale of $318 million. In addition, we recognized a $46 million gain associated with our share of United Technologies Corporation's conclusion of certain income tax matters from their 2017 and 2018 tax audit with the Internal Revenue Service ("IRS"). In connection with the acquisition of the VCS Business, we recognized an $86 million loss on the mark-to-market valuation of our window forward contracts associated with the expected cash outflows of the Euro-denominated purchase price.
During the year ended December 31, 2023, we recognized a $96 million loss on the mark-to-market valuation of our window forward contracts associated with the expected cash outflows of the Euro-denominated purchase price of the VCS Business. In addition, the carrying value of our previously held equity investments in Toshiba Carrier Corporation ("TCC") were recognized at fair value at the date of acquisition. As a result, we recognized an $8 million non-cash loss associated with the increase in our ownership interest.
Non-Operating Income (Expense), net
For the year ended December 31, 2024, Non-operating income (expense), net was $372 million, a 131% increase compared with the same period of 2023. The components were as follows:
| | | | | | | | | | | | |
| For the Year Ended December 31, | |
| (In millions) | 2024 | | 2023 | |
| Non-service pension benefit (expense) | $ | (1) | | | $ | (1) | | |
| | | | |
| Interest expense | (580) | | | (306) | | |
| Interest income | 209 | | | 146 | | |
| Interest (expense) income, net | (371) | | | (160) | | |
| | | | |
| Non-operating income (expense), net | $ | (372) | | | $ | (161) | | |
| | | | |
Non-operating income (expense), net includes the results from activities other than normal business operations such as interest expense, interest income and the non-service components of pension and post-retirement obligations. Interest expense is affected by the amount of debt outstanding and the interest rates on that debt. For the year ended December 31, 2024, interest expense was $580 million, a 90% increase compared with the same period of 2023. During 2024, we redeemed $1.0 billion aggregate principal amount of USD-denominated 5.80% notes due in 2025 and redeemed €750 million aggregate principal amount of 4.375% Euro-denominated notes due 2025 with the proceeds from the issuance of €750 million aggregate principal amount of 3.625% Euro-denominated notes due 2037. In addition, we completed tender offers to repurchase approximately $1.1 billion aggregate principal which included $125 million of notes due 2034, $350 million of notes due 2054, and approximately $600 million of notes due 2050. Combined, we incurred make-whole premiums of $14 million in Interest expense, wrote off $17 million of unamortized deferred financing costs in Interest expense and recognized a net gain of $97 million in Interest income. During 2023, we entered into several financing arrangements in connection with the acquisition of the VCS Business and capitalized $105 million of deferred financing costs. As a result, we amortized $55 million of deferred financing costs in Interest expense, of which $47 million related to our senior unsecured bridge term loan facility (the "Bridge Loan").
Income Taxes
| | | | | | | | | | | | | | | | |
| | | 2024 | | 2023 | | |
| Effective tax rate | | 46.7 | % | | 26.1 | % | | |
The effective tax rate for the year ended December 31, 2024, was higher than the statutory U.S. federal income tax rate. The increase was primarily driven by a net tax charge of $650 million related to a re-organization of the VCS Business and a non-deductible loss of $86 million on the mark-to-market valuation of our window forward contracts associated with the expected cash outflows of the Euro-denominated purchase price of the VCS Business, partially offset by the lower effective tax rate on the $318 million gain on the sale of CCR and $44 million of foreign tax credits generated and utilized in the current year.
The effective tax rate for the year ended December 31, 2023, was higher than the statutory U.S. federal income tax rate. The increase was primarily driven by a net tax charge of $27 million relating to the re-organization and disentanglement of the CCR businesses in advance of the planned divestiture. In addition, the effective tax rate was impacted by the recognition of a deferred tax liability for withholding tax of $19 million on repatriated foreign earnings, non-deductible divestiture-related costs and a non-deductible loss of $96 million on the mark-to-market valuation of our window forward contracts associated with the expected cash outflows of the Euro-denominated purchase price of the VCS Business.
Segment Review
We conduct our operations through two reportable segments:
•The HVAC segment provides products, controls, services and solutions to meet the heating, cooling and ventilation needs of residential and commercial customers while enhancing building performance, health, energy efficiency and sustainability.
•The Refrigeration segment includes transport refrigeration and monitoring products, services and digital solutions for trucks, trailers, shipping containers, intermodal and rail.
We determine our segments based on how our Chief Executive Officer, who is the Chief Operating Decision Maker (the "CODM"), allocates resources, assesses performance and makes operational decisions. The CODM allocates resources and evaluates the financial performance of each of our segments based on Net sales and Operating profit. Adjustments to reconcile segment reporting to the consolidated results are included in Note 21 - Segment Financial Data.
Due to the completion of our portfolio transformation activities in 2024, we anticipate changes to our management reporting structure and to the information provided to our CODM beginning in 2025. As a result, we are reassessing our reportable segment structure to align with any changes.
Summary performance for each of our segments is as follows:
| | | | | | | | | | | | | | | | | | | | | | | | | | | | | | | | | | | | | | | | | |
| Net Sales | | Operating Profit | | Operating Margin |
| (In millions) | 2024 | | 2023 | | | | 2024 | | 2023 | | | | 2024 | | 2023 | | |
| HVAC | $ | 19,078 | | | $ | 15,139 | | | | | $ | 2,308 | | | $ | 2,275 | | | | | 12.1 | % | | 15.0 | % | | |
| Refrigeration | 3,475 | | | 3,818 | | | | | 715 | | | 428 | | | | | 20.6 | % | | 11.2 | % | | |
| Total segment | $ | 22,553 | | | $ | 18,957 | | | | | $ | 3,023 | | | $ | 2,703 | | | | | 13.4 | % | | 14.3 | % | | |
| | | | | | | | | | | | | | | | | |
| | | | | | | | | | | | | | | | | |
| | | | | | | | | | | | | | | | | |
HVAC Segment
For the year ended December 31, 2024, Net sales in our HVAC segment was $19.1 billion, a 26% increase compared with the same period of 2023. The components of the year-over-year change were as follows:
| | | | | |
| Net sales |
| Organic / Operational | 5 | % |
| |
| Acquisitions and divestitures, net | 21 | % |
| |
| |
| Total % change | 26 | % |
The organic increase in Net sales of 5% was driven by continued strong results in the segment. Growth in the Americas (up 9%) was primarily driven by our Commercial and Residential businesses which benefited from ongoing customer demand and pricing improvements. Moderate growth in our Light Commercial business was due to improved pricing compared with the prior year. EMEA (down 1%) continues to be impacted by reduced volumes in residential markets. The reduction was partially offset by ongoing customer demand and pricing improvements in our Commercial business. Results in Asia (down 2%) were impacted by lower demand in the region, primarily in China.
On January 2, 2024, we acquired the VCS Business, a leading manufacturer of high efficiency heating and renewable energy systems in Europe. The results of the VCS Business have been included in our Consolidated Financial Statements since the date of acquisition. The transaction added 21% to Net sales for the year ended December 31, 2024, and is included in Acquisitions and divestitures, net.
For the year ended December 31, 2024, Operating profit in our HVAC segment was $2.3 billion, a 1% increase compared with the same period of 2023. The components of the year-over-year change were as follows:
| | | | | |
| Operating profit |
| Organic / Operational | 23 | % |
| |
| Acquisitions and divestitures, net | 3 | % |
| Amortization of acquired intangibles | (24) | % |
| Restructuring | (2) | % |
| Other | 1 | % |
| Total % change | 1 | % |
The operational profit increase of 23% was primarily attributable to ongoing customer demand and pricing improvements in certain end-markets compared with the prior year. In addition, favorable productivity initiatives further benefited the segment. These benefits more than offset volume reductions in certain end-markets. Higher earnings from equity method investments further benefited operational profit in the segment. The increase was partially offset by a $23 million charge associated with the devaluation of U.S. Dollar denominated balances at an HVAC equity investment in Egypt.
Refrigeration Segment
For the year ended December 31, 2024, Net sales in our Refrigeration segment was $3.5 billion, a 9% decrease compared with the same period of 2023. The components of the year-over-year change were as follows:
| | | | | |
| Net sales |
| Organic / Operational | (1) | % |
| |
| Acquisitions and divestitures, net | (8) | % |
| |
| |
| Total % change | (9) | % |
The organic decrease in Net sales of 1% was primarily driven by volume reductions within certain end-markets compared with the prior year. Transport results decreased (down 8%) compared to the prior year primarily due to lower end-market demand in North America. The reduction was partially offset by higher volumes in Asia and Europe. Results in the Container business (up 24%) was primarily driven by strong end-market demand and improved pricing.
On October 1, 2024, we divested CCR, a global supplier of turnkey solutions for commercial refrigeration systems and services. The results of CCR are excluded from our Consolidated Financial Statements subsequent to the divestiture date. The transaction reduced Net Sales by 8% for the year ended December 31, 2024, and is included in Acquisitions and divestitures, net.
For the year ended December 31, 2024, Operating profit in our Refrigeration segment was $715 million, a 67% increase compared with the same period of 2023. The components of the year-over-year change were as follows:
| | | | | |
| Operating profit |
| Organic / Operational | 2 | % |
| Foreign currency translation | (1) | % |
| Acquisitions and divestitures, net | (4) | % |
| Restructuring | 3 | % |
| CCR gain on sale | 74 | % |
| Other | (7) | % |
| Total % change | 67 | % |
The increase in operational profit of 2% was primarily driven by favorable productivity initiatives and price improvements compared with the prior year. In addition, volume growth in certain end-markets further benefited the segment. These amounts were partially offset by volume reductions in certain other end-markets. Amounts reported in Other represent $10 million of divestiture-related costs associated with the sale of CCR. In addition, the prior year includes a $24 million gain on the sale of a business within the Transport business.
LIQUIDITY AND FINANCIAL CONDITION
We assess liquidity in terms of our ability to generate adequate amounts of cash necessary to fund our current and future cash requirements to support our business and strategic initiatives. In doing so, we review and analyze our cash on hand, working capital, debt service requirements and capital expenditures. We rely on operating cash flows as our primary source of liquidity. In addition, we have access to other sources of capital to finance our strategic initiatives and fund growth.
As of December 31, 2024, we had Cash and cash equivalents of $4.0 billion, of which approximately 44% was held by our foreign subsidiaries. We manage our worldwide cash requirements by reviewing available funds and the cost effectiveness with which we can access funds held by foreign subsidiaries. On occasion, we are required to maintain cash deposits in connection with contractual obligations related to acquisitions or divestitures or other legal obligations. As of December 31, 2024 and 2023, the amount of such restricted cash was $3 million and $1 million, respectively.
We continue to actively manage and strengthen our business portfolio to meet the current and future needs of our customers. This is accomplished through research and development activities with a focus on new product development and new technology innovation as well as sustaining activities with a focus on improving existing products and reducing production costs. We also pursue potential acquisitions to complement existing products and services to enhance our product portfolio. In addition, we routinely conduct discussions, evaluate targets and enter into agreements regarding possible acquisitions, divestitures, joint ventures and equity investments to manage our business portfolio.
We believe that our available cash and operating cash flows will be sufficient to meet our future operating cash needs. Our committed credit facilities and access to the debt and equity markets provide additional sources of short-term and long-term capital to fund current operations, debt maturities and future investment opportunities. Although we believe that the arrangements currently in place permit us to finance our operations on acceptable terms and conditions, our access to and the availability of financing on acceptable terms and conditions in the future will be impacted by many factors, including: (1) our credit ratings or absence of credit ratings; (2) the level of our existing indebtedness; (3) the restrictions under our debt agreements; (4) the liquidity of the overall capital markets and (5) the state of the economy. There can be no assurance that we will be able to obtain additional financing on terms favorable to us, if at all.
The following table contains several key measures of our financial condition and liquidity:
| | | | | | | | | | | | | | |
| | As of December 31, |
| (In millions) | | 2024 | | 2023 |
| Cash and cash equivalents | | $ | 3,969 | | | $ | 9,852 | |
| Total debt | | $ | 12,278 | | | $ | 14,293 | |
| Total equity | | $ | 14,395 | | | $ | 9,005 | |
| | | | |
| Net debt (total debt less cash and cash equivalents) | | $ | 8,309 | | | $ | 4,441 | |
| Total capitalization (total debt plus total equity) | | $ | 26,673 | | | $ | 23,298 | |
| Net capitalization (total debt plus total equity less cash and cash equivalents) | | $ | 22,704 | | | $ | 13,446 | |
| Total debt to total capitalization | | 46 | % | | 61 | % |
| Net debt to net capitalization | | 37 | % | | 33 | % |
Acquisition of VCS Business
On April 25, 2023, we announced that we entered into an Agreement to acquire the VCS Business. Under the terms of the Agreement, 20% of the purchase price was to be paid in Carrier common stock, issued directly to Viessmann and subject to certain lock-up provisions and 80% was to be paid in cash. Simultaneously, we entered into commitment letters with JPMorgan Chase Bank, N.A., BofA Securities, Inc. and Bank of America, N.A. to provide a €8.2 billion senior unsecured bridge term loan facility (the "Bridge Loan") to fund a portion of the Euro-denominated purchase price.
On May 19, 2023, we entered into a 364-day, $500 million, senior unsecured revolving credit agreement with JPMorgan Chase Bank, N.A., as administrative agent and certain other lenders (the "Revolver"). In addition, we entered into a senior unsecured delayed draw term loan credit agreement with JPMorgan Chase Bank, N.A., as administrative agent and certain other lenders that permits aggregate borrowings of up to €2.3 billion (the "Delayed Draw Facility"). Upon entering into the Delayed Draw Facility, the aggregate principal amount of the Bridge Loan was reduced by €2.3 billion. In November 2023, we issued $3.0 billion principal amount of USD-denominated notes ("USD Notes") and €2.35 billion principal amount of Euro-denominated notes ("Euro Notes"). Upon issuance, the aggregate principal amount of the Bridge Loan was reduced by €5.4 billion. On January 2, 2024, we entered into a 60-day senior unsecured term loan agreement consisting of a Euro-denominated tranche in an aggregate amount of €113 million and a USD-denominated tranche in an aggregate amount of $349 million (the “60-day Loan”). Upon entering into the 60-day Loan, we reduced the final portion of the Bridge Loan by €500 million and subsequently terminated the agreement.
On January 2, 2024, we completed the acquisition of the VCS Business for $14.2 billion. The cash portion of the purchase price was funded through cash on hand, proceeds from the USD Notes and the Euro Notes and borrowings under the Delayed Draw Facility and the 60-day Loan. Proceeds from the Revolver became available upon closing.
In March 2024, borrowings under the 60-day loan were repaid. In May 2024, the Revolver was terminated and refinanced in order to extend its maturity to May 2025 (the "364-day Revolver"). In June 2024, we redeemed our $1.0 billion aggregate principal amount of 5.80% notes due in 2025 and repaid borrowings under the Delayed Draw Facility, which was subsequently terminated. In addition, we completed tender offers on certain tranches of our notes in August 2024 which included $125 million of notes due 2034, $350 million of notes due 2054 and approximately $600 million of notes due 2050. In November 2024, we issued €750 million aggregate principal amount of 3.625% notes due 2037 and used the proceeds to redeem €750 million aggregate principal amount of 4.375% notes due in 2025. In December 2024, we terminated the 364-day Revolver as part of a transaction to refinance and replace prior credit agreements.
Borrowings and Lines of Credit
We maintain a $2.0 billion unsecured, unsubordinated commercial paper program which we can use for general corporate purposes, including the funding of working capital and potential acquisitions. In addition, we maintain a $2.5 billion revolving credit agreement with various banks (the "Revolving Credit Facility") that matures in December 2029 which supports our commercial paper borrowing program and can be used for general corporate purposes. A ratings-based commitment fee is charged on unused commitments. As of December 31, 2024, we had no borrowings outstanding under our commercial paper program or our Revolving Credit Facility.
Our short-term obligations primarily consist of current maturities of long-term debt. Our long-term obligations primarily consist of long-term notes with maturity dates ranging between 2025 and 2054. Interest payments related to long-term notes are expected to approximate $420 million per year, reflecting an approximate weighted-average interest rate of 3.5%. Any borrowings from the Revolving Credit Facility are subject to variable interest rates. See Note 7 - Borrowings and Lines of Credit in the accompanying Notes to the Consolidated Financial Statements for additional information regarding the terms of our long-term debt obligations.
Scheduled maturities of long-term debt, excluding amortization of discount, are as follows:
| | | | | | | | | |
| (In millions) | | | |
| 2025 | | $ | 1,252 | | |
| 2026 | | $ | 70 | | |
| 2027 | | $ | 1,284 | | |
| 2028 | | $ | 803 | | |
| 2029 | | $ | 19 | | |
| Thereafter | | $ | 8,938 | | |
The following table presents our credit ratings and outlook as of December 31, 2024:
| | | | | | | | | | | | | | |
| Rating Agency | Long-term Rating (1) | Short-term Rating (2) | | Outlook (2) (3) |
| S&P | BBB | A2 | | Positive |
| Moody's | Baa2 | P2 | | Positive |
| Fitch Ratings | BBB+ | F1 | | Stable |
| | | | |
(1) The long-term rating was upgraded by Moody's to Baa2 on May 13, 2024. Fitch's was updated to BBB+ on October 18, 2024.
(2) Fitch upgraded its short-term rating to F1 from F2 and revised its outlook to stable from positive on October 18, 2024.
(3) S&P revised its outlook to positive from stable in December 2023.
Portfolio Transformation
On June 2, 2024, we completed the divestiture of Access Solutions for cash proceeds of $5.0 billion. On July 1, 2024, we completed the divestiture of Industrial Fire for cash proceeds of $1.4 billion. On October 1, 2024, we completed the divestiture of CCR for cash proceeds of $679 million, subject to customary working capital and other adjustments. On December 2, 2024, we completed the divestiture of the CRF Business for cash proceeds of $2.9 billion, subject to customary working capital and other adjustments. Consistent with our capital allocation strategy, the net proceeds will be used to fund repayment of debt, investments in organic and inorganic growth initiatives and capital returns to shareowners as well as for general corporate purposes.
Share Repurchase Program
We may purchase our outstanding common stock from time to time subject to market conditions and at our discretion. Repurchases occur in the open market or through one or more other public or private transactions pursuant to plans complying with Rules 10b5-1 and 10b-18 under the Exchange Act. Since the initial authorization in February 2021, the Company's Board of Directors authorized the repurchase of up to $7.1 billion of our outstanding common stock which includes a $3 billion increase approved in October 2024. As of December 31, 2024, the Company repurchased 70.1 million shares of common stock for an aggregate purchase price of $3.9 billion. As a result, the Company has approximately $3.2 billion remaining under the current authorization at December 31, 2024.
Dividends
We paid dividends on our common stock of $0.76 per share during the year ended December 31, 2024, totaling $670 million. On December 6, 2024, the Board of Directors declared a dividend of $0.225 per share payable on February 7, 2025, to shareowners of record at the close of business on December 20, 2024.
Discussion of Cash Flows
The following table reflects the major categories of cash flows for the following periods:
| | | | | | | | | | | | | | | | |
| | For the Years Ended December 31, |
| (In millions) | | 2024 | | 2023 | | |
| Net cash provided by (used in): | | | | | | |
| Continuing operating activities | | $ | 1,571 | | | $ | 2,252 | | | |
| Continuing investing activities | | (11,025) | | | (504) | | | |
| Continuing financing activities | | (4,611) | | | 4,632 | | | |
| | | | | | |
| | | | | | |
Cash flows from continuing operating activities primarily represent inflows and outflows associated with our continuing operations. Primary activities include net earnings from continuing operations adjusted for non-cash transactions, working capital changes and changes in other assets and liabilities. The year-over-year decrease in net cash provided by continuing operating activities was primarily driven by an increase in working capital balances compared with the prior period. Improved inventory levels and lower customer receivable balances were more than offset by lower accounts payable balances.
Cash flows from continuing investing activities primarily represent inflows and outflows associated with long-term assets. Primary activities include capital expenditures, acquisitions, divestitures and proceeds from the sale of fixed assets. During the year ended December 31, 2024, net cash used in continuing investing activities was $11.0 billion. The primary driver of the outflow related to the acquisition of the VCS Business, which totaled $10.8 billion, net of cash acquired. Additional investing outflows include $264 million related to settlement of derivatives and $519 million of capital expenditures. These outflows were partially offset by net proceeds of $634 million related to divestitures. During the year ended December 31, 2023, net cash used in continuing investing activities was $504 million. The primary driver of the outflow related to $439 million of capital expenditures. In addition, we settled working capital and other transaction-related items associated with the acquisition of Toshiba Carrier Corporation and invested in several businesses. These amounts totaled $84 million, net of cash acquired and were partially offset by the proceeds from the sale of a business during the period.
Cash flows from continuing financing activities primarily represent inflows and outflows associated with equity or borrowings. Primary activities include debt transactions, paying dividends to shareowners and the repurchase of our common stock. During the year ended December 31, 2024, net cash used in continuing financing activities was $4.6 billion. The primary driver of the outflow is due to repayments of long-term debt of $5.3 billion which includes prepayments of the Delayed Draw Facility, redemption of our 5.80% notes due in 2025 and 4.375% notes due in 2025 and tender offers of approximately $1.1 billion. In addition, we made payments totaling $1.9 billion to repurchase shares of our common stock and dividend payments of $670 million to our common shareowners. These outflows were partially offset by the proceeds of borrowings used to fund the cash portion of the acquisition of the VCS Business and the November 2024 issuance of our 3.625% notes due 2037. During the year ended December 31, 2023, net cash provided by continuing financing activities was $4.6 billion. The primary driver of the inflow related to the issuance of the USD Notes and the Euro Notes related to the acquisition of the VCS Business. The inflow was partially offset by the payment of $620 million in dividends to our common shareowners. In addition, we paid $62 million to repurchase shares of our common stock.
Summary of Other Sources and Uses of Cash
Rapid changes in legislation, regulations and government policies, including with respect to regulations intended to combat climate events, affect our operations and business in the countries, regions and localities in which we operate and sell our products. We are committed to comply with these regulations and to environmental stewardship. As a result, we have set goals to invest over $4 billion by 2030 to develop intelligent climate and energy solutions that reduce environmental impacts. In addition, to reach our goal to achieve carbon neutrality in our operations by 2030, we expect to incur capital expenditures for climate-related projects including upgrading our facilities, equipment and controls to optimize energy efficiency, transition our energy consumption from a dependency on fossil fuels to renewable energy and expanding the electrification of our fleet vehicles. See section entitled Environmental Goals under the headings "Other Matters Relating to Our Business as a Whole" for additional information.
We also have obligations related to environmental and asbestos matters, pension and post-retirement benefits and taxes. See Note 10 - Employee Benefit Plans, Note 17 - Income Taxes, and Note 23 - Commitments and Contingent Liabilities in the accompanying Notes to the Consolidated Financial Statements in this Annual Report for additional information.
CRITICAL ACCOUNTING ESTIMATES
Our financial statements are prepared in accordance with accounting principles generally accepted in the United States. The preparation of financial statements in conformity with those accounting principles requires management to use judgement in making estimates and assumptions based on the relevant information available at the end of each period. These estimates and assumptions have a significant effect on reported amounts of assets, liabilities, sales and expenses as well as the disclosure of contingent assets and liabilities because they result primarily from the need to make estimates and assumptions on matters that are inherently uncertain. Actual results could differ from management's estimates.
Business Combinations
In accordance with ASC 805, Business Combinations ("ASC 805"), acquisitions that meet the definition of a business are recorded using the acquisition method of accounting. We recognize and measure the identifiable assets acquired, liabilities assumed and any non-controlling interest as of the acquisition date at fair value. The valuation of intangible assets is determined by an income approach methodology, using assumptions such as projected future revenues, customer attrition rates, royalty rates, tax rates and discount rates. The excess, if any, of total consideration transferred in a business combination over the fair value of identifiable assets acquired, liabilities assumed and any non-controlling interest is recognized as goodwill. Costs incurred as a result of a business combination other than costs related to the issuance of debt or equity securities are recorded in the period the costs are incurred.
Goodwill and Indefinite-Lived Intangible Assets
In accordance with the Financial Accounting Standards Board ("FASB") Accounting Standards Codification ("ASC") 350, Intangibles - Goodwill and Other ("ASC 350"), goodwill and other indefinite-lived intangible assets are tested and reviewed annually for impairment or whenever there is a material change in events or circumstances that indicate that the fair value of the asset is more likely than not less than the carrying amount of the asset. We test our reporting units and indefinite-lived intangible assets for impairment annually as of the first day of our third quarter, or more frequently if events or circumstances occur.
ASC 350 provides entities with an option to perform a qualitative assessment (commonly referred to as “step zero”) to determine whether a quantitative analysis for impairment is necessary. In performing step zero for our impairment test, we are required to make assumptions and judgments, including but not limited to the following: the evaluation of macroeconomic conditions as related to our business, industry and market trends, and the overall future financial performance of our reporting units and future opportunities in the markets in which they operate. If impairment indicators are present after performing step zero, we would perform a quantitative impairment analysis to estimate fair value.
For our 2024 goodwill and indefinite-lived intangible assets impairment tests, we elected to perform qualitative step zero assessments for all tests (except one) to determine if it was more likely than not that the fair values of our reporting units and indefinite-lived intangible assets were below carrying value. We considered macroeconomic factors including global economic growth, general macroeconomic trends for the markets in which our reporting units operate and where the intangible assets are utilized and the forecasted growth of the global industrial products industry. In addition to these macroeconomic factors, among other things, we considered the reporting units’ current results and forecasts, changes in the nature of each business, any significant legal, regulatory, contractual, political or other business climate factors, changes in the industry and competitive environment, changes in the composition or carrying amount of net assets and any intention to sell or dispose of a reporting unit or cease the use of any indefinite-lived intangible assets. Based upon our qualitative analysis, we determined that our goodwill and indefinite-lived intangible assets were not impaired.
For the remaining goodwill test, we elected to perform a quantitative test to determine if it was more likely than not that the fair value of our Refrigeration reporting unit was below carrying value. We utilized a discounted cash flow method under the income approach to estimate the fair value of the reporting unit. The approach relies on our estimates of future cash flows, long-term growth rates, discount rates and income tax rates and explicitly addressed factors such as timing, growth and margins with due consideration given to forecasting, market and geographic risk. The results did not indicate any goodwill impairment. A significant increase in the discount rate, decrease in the long-term growth rate or substantial reductions in our end markets and volume assumptions could have a negative impact on the estimated fair value of this reporting unit.
Revenue Recognition from Contracts with Customers
Revenue is recognized when control of a good or service promised in a contract (i.e., performance obligation) is transferred to a customer. Control is obtained when a customer has the ability to direct the use of and obtain substantially all of the remaining benefits from that good or service. A significant portion of our performance obligations are recognized at a point-in-time when control of the product transfers to the customer, which is generally the time of shipment. The remaining portion of our performance obligations are recognized over time as the customer simultaneously obtains control as we perform work under a contract, or if the product being produced for the customer has no alternative use and we have a contractual right to payment.
A performance obligation is a distinct good, service or a bundle of goods and services promised in a contract. Some of our contracts with customers contain a single performance obligation, while others contain multiple performance obligations most commonly when a contract spans multiple phases of a product life-cycle such as production, installation, maintenance and support. We identify performance obligations at the inception of a contract and allocate the transaction price to each distinct performance obligation. Revenue is recognized when or as the performance obligation is satisfied. When there are multiple performance obligations within a contract, we allocate the transaction price to each performance obligation based on its relative stand-alone selling price.
We primarily generate revenue from the sale of products to customers and recognize revenue at a point in time when control transfers to the customer. Transfer of control is generally based on the shipping terms of the contract. In addition, we recognize revenue on an over-time basis on installation and service contracts. For over-time performance obligations requiring the installation of equipment, revenue is recognized using costs incurred to date relative to total estimated costs at completion to measure progress. Incurred costs represent work performed, which correspond with and best depict transfer of control to the customer. Contract costs include direct costs such as labor, materials and subcontractors’ costs and, where applicable, indirect costs.
The transaction price allocated to performance obligations reflects our expectations about the consideration we will be entitled to receive from a customer. We include variable consideration in the estimated transaction price when there is a basis to reasonably estimate the amount and when it is probable that a significant reversal of revenue recognized would not occur when the uncertainty associated with variable consideration is subsequently resolved. In addition, we customarily offer our customers incentives to purchase products to ensure an adequate supply of our products in distribution channels. The principal incentive programs provide reimbursements to distributors for offering promotional pricing for products. We account for estimated incentive payments as a reduction in sales at the time a sale is recognized.
Income Taxes
We account for income taxes in accordance with ASC 740, Income Taxes ("ASC 740"). Deferred tax assets and liabilities are determined based on temporary differences between financial reporting and tax bases of assets and liabilities, applying enacted tax rates expected to be in effect for the year in which the differences are expected to reverse. We recognize future tax benefits to the extent that realizing these benefits is considered in our judgment to be more likely than not. For those jurisdictions where the expiration date of tax carryforwards or the projected operating results indicate that realization is not likely, a valuation allowance is provided. We review the realizability of our deferred tax asset valuation allowances on a quarterly basis, or whenever events or changes in circumstances indicate that a review is required and will adjust our estimate if significant events so dictate. To the extent that the ultimate results differ from our original or adjusted estimates, the effect will be recorded in the provision for income taxes in the period that the matter is finally resolved.
In the ordinary course of business, there is inherent uncertainty in quantifying our income tax positions. We assess our income tax positions and record tax benefits for all years subject to examination based upon management’s evaluation of the facts, circumstances and information available at the reporting date. For those tax positions where it is more likely than not that a tax benefit will be sustained, we have recorded the largest amount of tax benefit with a greater than 50% likelihood of being realized upon ultimate settlement with a taxing authority that has full knowledge of all relevant information. For those income tax positions where it is not more likely than not that a tax benefit will be sustained, no tax benefit has been recognized in the Consolidated Financial Statements.
Contingent Liabilities
We are involved in various litigation, claims and administrative proceedings, including those related to environmental (including asbestos) and legal matters. In accordance with ASC 450, Contingencies ("ASC 450"), we record accruals for loss contingencies when it is probable that a liability will be incurred and the amount of the loss can be reasonably estimated. These accruals are generally based upon a range of possible outcomes. If no amount within the range is a better estimate than any other, we accrue the minimum amount. In addition, these estimates are reviewed periodically and adjusted to reflect additional information when it becomes available. We are unable to predict the final outcome of these matters based on the information currently available. However, we do not believe that the resolution of any of these matters will have a material adverse effect upon our competitive position, results of operations, cash flows or financial condition.
As described in Note 23 – Commitments and Contingent Liabilities in the accompanying Notes to the Consolidated Financial Statements in this Annual Report, contractual, regulatory and other matters, including asbestos claims, may arise in the ordinary course of business that subject us to claims or litigation. We have recorded reserves in the consolidated financial statements related to these matters, which are developed using input derived from actuarial estimates and historical and anticipated experience depending on the nature of the reserve, and in certain instances in consultation with legal counsel, internal and external consultants and engineers. Subject to the uncertainties inherent in estimating future costs for these types of liabilities, we believe our estimated reserves are reasonable and do not believe the final determination of the liabilities with respect to these matters would have a material adverse effect upon our competitive position, results of operations, cash flows or financial condition. See the "Risk Factors" section in this Annual Report for additional information.
Recent Accounting Pronouncements
See Note 3 – Summary of Significant Accounting Policies in the accompanying Notes to the Consolidated Financial Statements in this Annual Report for a discussion of recent accounting pronouncements and their effect on our financial statements.
ITEM 7A. QUANTITATIVE AND QUALITATIVE DISCLOSURES ABOUT MARKET RISK
Market Risk and Risk Management
We are exposed to fluctuations in foreign currency exchange rates, interest rates and commodity prices which could impact our results of operations and financial condition. There has been no significant change in our exposure to market risk for the year ended December 31, 2024.
Foreign Currency Exposures. We have operations throughout the world that manufacture and sell products in various international markets. As a result, we are exposed to exchange rate movements in relation to our reporting currency, the U.S. dollar. Many of our non-U.S. operations have a functional currency other than the U.S. dollar. Therefore, our reported results will be higher or lower depending on the weakening or strengthening of the U.S. dollar against the respective foreign currency. We actively manage material currency exposures that are associated with purchases and sales and other assets and liabilities at the legal entity level.
During 2024, we entered into cross currency swaps in order to manage foreign currency translation risk on Euro-denominated assets. We designated the cross currency swaps as a partial hedge of our investment in certain subsidiaries whose functional currency is the Euro. As a result, changes in the fair value of the cross currency swaps are recorded in Equity in the Consolidated Balance Sheet. To the extent that any hedge is not fully effective at offsetting changes in the underlying hedged item, the ineffective portion of the hedge would impact net earnings.
In connection with the TCC acquisition, we entered into cross currency swaps and the Japanese Term Loan Facility to fund the Yen-denominated purchase price. We designated the cross currency swaps and the Japanese Term Loan Facility as a hedge of our investment in certain subsidiaries whose functional currency is the Japanese Yen in order to manage foreign currency translation risk. As a result, changes in the fair value of the cross currency swaps and the carrying value of the Japanese Term Loan Facility associated with foreign exchange rate movements are recorded in Equity in the Consolidated Balance Sheet. To the extent that any hedge is not fully effective at offsetting changes in the underlying hedged item, the ineffective portion of the hedge would impact net earnings.
Commodity Price Exposures. We are exposed to volatility in the prices of commodities used in some of our products and when appropriate, we use fixed price contracts with suppliers to manage this exposure. In addition, we are exposed to fuel costs to ship our products and materials. We do not have commodity hedge contracts in place at December 31, 2024.
Interest Rate Exposures. Substantially all of our long-term debt has fixed interest rates. As a result, any fluctuation in market interest rates is not expected to have a material effect on our results of operations.
ITEM 8. FINANCIAL STATEMENTS AND SUPPLEMENTARY DATA
Report of Independent Registered Public Accounting Firm
To the Board of Directors and Shareowners of Carrier Global Corporation
Opinions on the Financial Statements and Internal Control over Financial Reporting
We have audited the accompanying consolidated balance sheets of Carrier Global Corporation and its subsidiaries (the “Company”) as of December 31, 2024 and 2023, and the related consolidated statements of operations, of comprehensive income (loss), of changes in equity and of cash flows for each of the three years in the period ended December 31, 2024, including the related notes (collectively referred to as the “consolidated financial statements”). We also have audited the Company's internal control over financial reporting as of December 31, 2024, based on criteria established in Internal Control - Integrated Framework (2013) issued by the Committee of Sponsoring Organizations of the Treadway Commission (COSO).
In our opinion, the consolidated financial statements referred to above present fairly, in all material respects, the financial position of the Company as of December 31, 2024 and 2023, and the results of its operations and its cash flows for each of the three years in the period ended December 31, 2024 in conformity with accounting principles generally accepted in the United States of America. Also in our opinion, the Company maintained, in all material respects, effective internal control over financial reporting as of December 31, 2024, based on criteria established in Internal Control - Integrated Framework (2013) issued by the COSO.
Basis for Opinions
The Company's management is responsible for these consolidated financial statements, for maintaining effective internal control over financial reporting, and for its assessment of the effectiveness of internal control over financial reporting, included in Management’s Report on Internal Control Over Financial Reporting appearing under Item 9A. Our responsibility is to express opinions on the Company’s consolidated financial statements and on the Company's internal control over financial reporting based on our audits. We are a public accounting firm registered with the Public Company Accounting Oversight Board (United States) (PCAOB) and are required to be independent with respect to the Company in accordance with the U.S. federal securities laws and the applicable rules and regulations of the Securities and Exchange Commission and the PCAOB.
We conducted our audits in accordance with the standards of the PCAOB. Those standards require that we plan and perform the audits to obtain reasonable assurance about whether the consolidated financial statements are free of material misstatement, whether due to error or fraud, and whether effective internal control over financial reporting was maintained in all material respects.
Our audits of the consolidated financial statements included performing procedures to assess the risks of material misstatement of the consolidated financial statements, whether due to error or fraud, and performing procedures that respond to those risks. Such procedures included examining, on a test basis, evidence regarding the amounts and disclosures in the consolidated financial statements. Our audits also included evaluating the accounting principles used and significant estimates made by management, as well as evaluating the overall presentation of the consolidated financial statements. Our audit of internal control over financial reporting included obtaining an understanding of internal control over financial reporting, assessing the risk that a material weakness exists, and testing and evaluating the design and operating effectiveness of internal control based on the assessed risk. Our audits also included performing such other procedures as we considered necessary in the circumstances. We believe that our audits provide a reasonable basis for our opinions.
As described in Management’s Report on Internal Control Over Financial Reporting, management has excluded the climate solutions business (the "VCS Business") of Viessmann Group GmbH & Co. KG from its assessment of internal control over financial reporting as of December 31, 2024 because it was acquired by the Company in a purchase business combination during 2024. We have also excluded the VCS Business from our audit of internal control over financial reporting. The VCS Business is a wholly-owned subsidiary whose total assets excluding intangible assets and goodwill arising from the acquisition and total net sales excluded from management’s assessment and our audit of internal control over financial reporting represent approximately 14% and 15%, respectively, of the related consolidated financial statement amounts as of and for the year ended December 31, 2024.
Definition and Limitations of Internal Control over Financial Reporting
A company’s internal control over financial reporting is a process designed to provide reasonable assurance regarding the reliability of financial reporting and the preparation of financial statements for external purposes in accordance with generally accepted accounting principles. A company’s internal control over financial reporting includes those policies and procedures that (i) pertain to the maintenance of records that, in reasonable detail, accurately and fairly reflect the transactions and dispositions of the assets of the company; (ii) provide reasonable assurance that transactions are recorded as necessary to permit preparation of financial statements in accordance with generally accepted accounting principles, and that receipts and expenditures of the company are being made only in accordance with authorizations of management and directors of the company; and (iii) provide reasonable assurance regarding prevention or timely detection of unauthorized acquisition, use, or disposition of the company’s assets that could have a material effect on the financial statements.
Because of its inherent limitations, internal control over financial reporting may not prevent or detect misstatements. Also, projections of any evaluation of effectiveness to future periods are subject to the risk that controls may become inadequate because of changes in conditions, or that the degree of compliance with the policies or procedures may deteriorate.
Critical Audit Matters
The critical audit matter communicated below is a matter arising from the current period audit of the consolidated financial statements that was communicated or required to be communicated to the audit committee and that (i) relates to accounts or disclosures that are material to the consolidated financial statements and (ii) involved our especially challenging, subjective, or complex judgments. The communication of critical audit matters does not alter in any way our opinion on the consolidated financial statements, taken as a whole, and we are not, by communicating the critical audit matter below, providing a separate opinion on the critical audit matter or on the accounts or disclosures to which it relates.
Acquisition of the VCS Business - Valuation of Intangible Assets Acquired
As described in Note 19 to the consolidated financial statements, on January 2, 2024, the Company completed the acquisition of the VCS Business for total consideration of $14.2 billion. Of the acquired intangible assets, $4,787 million of customer relationships, $679 million of a trademark, and $1,051 million of technology intangible assets (collectively, the “intangible assets acquired”) were recorded. The valuation of the intangible assets acquired was determined using an income approach methodology including the multi-period excess earnings method and the relief from royalty method. Key assumptions used in estimating future cash flows included short-term revenue growth rates, research and development expenses, earnings before interest, taxes, depreciation and amortization (EBITDA) margins, income tax rates, discount rates, customer attrition rate, royalty rates, contributory asset charge, and obsolescence rates, among others.
The principal considerations for our determination that performing procedures relating to the valuation of intangible assets acquired in the acquisition of the VCS Business is a critical audit matter are (i) the significant judgment by management when developing the fair value estimate of the intangible assets acquired; (ii) a high degree of auditor judgment, subjectivity, and effort in performing procedures and evaluating management's significant assumptions related to (a) short-term revenue growth rates, research and development expenses, EBITDA margins, income tax rates, discount rate, customer attrition rate, royalty rates, and contributory asset charge for the customer relationships, (b) short-term revenue growth rates, discount rate, and royalty rate for the trademark, and (c) short-term revenue growth rates, discount rate, royalty rates, and obsolescence rates for certain technologies; and (iii) the audit effort involved the use of professionals with specialized skill and knowledge.
Addressing the matter involved performing procedures and evaluating audit evidence in connection with forming our overall opinion on the consolidated financial statements. These procedures included testing the effectiveness of controls relating to the acquisition accounting, including controls over management’s valuation of the intangible assets acquired. These procedures also included, among others (i) reading the purchase agreement; (ii) testing management’s process for developing the fair value estimate of the intangible assets acquired; (iii) evaluating the appropriateness of the multi-period excess earnings and relief from royalty methods used by management; (iv) testing the completeness and accuracy of the underlying data used in the multi-period excess earnings and relief from royalty methods; and (v) evaluating the reasonableness of the significant assumptions used by management related to (a) short-term revenue growth rates, research and development expenses, EBITDA margins, income tax rates, discount rate, customer attrition rate, royalty rates, and contributory asset charge for the customer relationships, (b) short-term revenue growth rates, discount rate, and royalty rate for the trademark, and (c) short-term revenue growth rates, discount rate, royalty rates, and obsolescence rates for certain technologies. Evaluating management’s assumptions related to (a) short-term revenue growth rates, research and development expenses, EBITDA margins, and income tax rates for the customer relationships, (b) short-term revenue growth rates for the trademark, and (c) short-term revenue growth rates for certain technologies involved considering (i) the current and past performance of the VCS Business; (ii) the consistency with external market and industry data; and (iii) whether the assumptions were consistent with evidence obtained in other areas of the audit. Professionals with specialized skill and knowledge were used to assist in evaluating (i) the appropriateness of the multi-period excess earnings and relief from royalty methods and (ii) the reasonableness of the (a) discount rate, customer attrition rate, royalty rates, and contributory asset charge assumptions for the customer relationships, (b) discount rate and royalty rate assumptions for the trademark, and (c) discount rate, royalty rates, and obsolescence rates assumptions for certain technologies.
/s/ PricewaterhouseCoopers LLP
Miami, Florida
February 11, 2025
We have served as the Company's auditor since 2019.
CARRIER GLOBAL CORPORATION AND SUBSIDIARIES
CONSOLIDATED STATEMENT OF OPERATIONS
| | | | | | | | | | | | | | | | | | |
| For the Year Ended December 31, | |
| (In millions, except per share amounts) | 2024 | | 2023 | | 2022 | |
| Net sales | | | | | | |
| Product sales | $ | 19,990 | | | $ | 16,665 | | | $ | 15,315 | | |
| Service sales | 2,496 | | | 2,286 | | | 1,973 | | |
| Total Net sales | 22,486 | | | 18,951 | | | 17,288 | | |
| Costs and expenses | | | | | | |
| Cost of products sold | (14,580) | | | (12,002) | | | (11,459) | | |
| Cost of services sold | (1,925) | | | (1,787) | | | (1,532) | | |
| Research and development | (686) | | | (493) | | | (416) | | |
| Selling, general and administrative | (3,197) | | | (2,607) | | | (1,977) | | |
| Total Costs and expenses | (20,388) | | | (16,889) | | | (15,384) | | |
| Equity method investment net earnings | 231 | | | 211 | | | 262 | | |
| Other income (expense), net | 317 | | | (113) | | | 1,818 | | |
| Operating profit | 2,646 | | | 2,160 | | | 3,984 | | |
| Non-service pension benefit (expense) | (1) | | | (1) | | | (4) | | |
| Interest (expense) income, net | (371) | | | (160) | | | (157) | | |
| Earnings before income taxes | 2,274 | | | 1,999 | | | 3,823 | | |
| Income tax (expense) benefit | (1,062) | | | (521) | | | (616) | | |
| Earnings from continuing operations | 1,212 | | | 1,478 | | | 3,207 | | |
| Discontinued operations, net of tax | 4,496 | | | (38) | | | 377 | | |
| Net earnings (loss) | 5,708 | | | 1,440 | | | 3,584 | | |
| Less: Non-controlling interest in subsidiaries' | 104 | | | 91 | | | 50 | | |
| Net earnings (loss) attributable to common shareowners | $ | 5,604 | | | $ | 1,349 | | | $ | 3,534 | | |
| Amounts attributable to common shareowners: | | | | | | |
| Continuing operations | $ | 1,108 | | | $ | 1,387 | | | $ | 3,157 | | |
| Discontinued operations | 4,496 | | | (38) | | | 377 | | |
| Net earnings (loss) attributable to common shareowners | $ | 5,604 | | | $ | 1,349 | | | $ | 3,534 | | |
| Earnings per share | | | | | | |
| Basic: | | | | | | |
| Continuing operations | $ | 1.23 | | | $ | 1.66 | | | $ | 3.74 | | |
| Discontinued operations | 5.01 | | | (0.05) | | | 0.45 | | |
| Net earnings (loss) | $ | 6.24 | | | $ | 1.61 | | | $ | 4.19 | | |
| Diluted: | | | | | | |
| Continuing operations | $ | 1.22 | | | $ | 1.63 | | | $ | 3.67 | | |
| Discontinued operations | 4.93 | | | (0.05) | | | 0.43 | | |
| Net earnings (loss) | $ | 6.15 | | | $ | 1.58 | | | $ | 4.10 | | |
| Weighted-average number of shares outstanding | | | | | | |
| Basic | 898.2 | | | 837.3 | | | 843.4 | | |
| Diluted | 911.7 | | | 853.0 | | | 861.2 | | |
| | | | | | |
The accompanying notes are an integral part of the Consolidated Financial Statements.
CARRIER GLOBAL CORPORATION AND SUBSIDIARIES
CONSOLIDATED STATEMENT OF COMPREHENSIVE INCOME (LOSS)
| | | | | | | | | | | | | | | | | | |
| For the Year Ended December 31, | |
| (In millions) | 2024 | | 2023 | | 2022 | |
| | | | | | |
| | | | | | |
| Net earnings (loss) | $ | 5,708 | | | $ | 1,440 | | | $ | 3,584 | | |
| Other comprehensive income (loss), net of tax: | | | | | | |
| | | | | | |
| Foreign currency translation: | | | | | | |
| Foreign currency translation adjustments arising during period | (1,173) | | | 157 | | | (551) | | |
| | | | | | |
| Divestitures | 564 | | | — | | | (574) | | |
| | | | | | |
| | | | | | |
| Foreign currency translation adjustments arising during period | (609) | | | 157 | | | (1,125) | | |
| | | | | | |
| Pension and post-retirement benefit plans: | | | | | | |
| Net actuarial gain (loss) arising during period | (15) | | | (17) | | | 63 | | |
| | | | | | |
| Amortization of actuarial (gain) loss and prior service credit | 2 | | | 1 | | | 11 | | |
| Divestitures | 7 | | | — | | | 329 | | |
| | | | | | |
| (6) | | | (16) | | | 403 | | |
| Tax (expense) benefit | (1) | | | — | | | (3) | | |
| Pension and post-retirement benefit plans adjustments arising during period | (7) | | | (16) | | | 400 | | |
| | | | | | |
| | | | | | |
| | | | | | |
| | | | | | |
| | | | | | |
| | | | | | |
| | | | | | |
| | | | | | |
| Change in unrealized cash flow hedging: | | | | | | |
| Unrealized cash flow hedging gain (loss) arising during period | — | | | 58 | | | — | | |
| Amortization of unrealized cash flow hedging gain (loss) | (6) | | | — | | | — | | |
| (6) | | | 58 | | | — | | |
| Tax (expense) benefit | 2 | | | — | | | — | | |
| Change in unrealized cash flow hedging adjustments arising during period | (4) | | | 58 | | | — | | |
| | | | | | |
| Other comprehensive income (loss), net of tax | (620) | | | 199 | | | (725) | | |
| Comprehensive income (loss) | 5,088 | | | 1,639 | | | 2,859 | | |
| Less: Comprehensive income (loss) attributable to non-controlling interest | (104) | | | (88) | | | (24) | | |
| Comprehensive income (loss) attributable to common shareowners | $ | 4,984 | | | $ | 1,551 | | | $ | 2,835 | | |
The accompanying notes are an integral part of the Consolidated Financial Statements.
CARRIER GLOBAL CORPORATION AND SUBSIDIARIES
CONSOLIDATED BALANCE SHEET
| | | | | | | | | | | |
| As of December 31, |
| (In millions, except share amounts) | 2024 | | 2023 |
| Assets | | | |
| Cash and cash equivalents | $ | 3,969 | | | $ | 9,852 | |
| Accounts receivable, net | 2,651 | | | 2,080 | |
| Inventories, net | 2,299 | | | 1,823 | |
| Assets held for sale | — | | | 5,093 | |
| Other assets, current | 972 | | | 728 | |
| Total current assets | 9,891 | | | 19,576 | |
| Future income tax benefits | 1,131 | | | 718 | |
| Fixed assets, net | 2,999 | | | 2,160 | |
| Operating lease right-of-use assets | 554 | | | 421 | |
| Intangible assets, net | 6,432 | | | 945 | |
| Goodwill | 14,601 | | | 7,520 | |
| Pension and post-retirement assets | 43 | | | 32 | |
| Equity method investments | 1,194 | | | 1,140 | |
| Other assets | 558 | | | 310 | |
| Total Assets | $ | 37,403 | | | $ | 32,822 | |
| | | |
| Liabilities and Equity | | | |
| Accounts payable | $ | 2,458 | | | $ | 2,483 | |
| Accrued liabilities | 4,182 | | | 2,997 | |
| Liabilities held for sale | — | | | 1,450 | |
| Current portion of long-term debt | 1,252 | | | 51 | |
| Total current liabilities | 7,892 | | | 6,981 | |
| Long-term debt | 11,026 | | | 14,242 | |
| Future pension and post-retirement obligations | 214 | | | 149 | |
| Future income tax obligations | 2,015 | | | 523 | |
| Operating lease liabilities | 432 | | | 333 | |
| Other long-term liabilities | 1,429 | | | 1,589 | |
| Total Liabilities | 23,008 | | | 23,817 | |
| Commitments and contingent liabilities (Note 23) | | | |
| Equity | | | |
| | | |
| Common stock, par value $0.01; 4,000,000,000 shares authorized; 948,068,772 and 883,068,393 shares issued; 878,337,677 and 839,910,275 outstanding as of December 31, 2024 and 2023, respectively | 9 | | | 9 | |
| Treasury stock - 70,093,639 and 43,490,981 common shares, respectively | (3,915) | | | (1,972) | |
| Additional paid-in capital | 8,610 | | | 5,535 | |
| Retained earnings | 11,483 | | | 6,591 | |
| Accumulated other comprehensive income (loss) | (2,106) | | | (1,486) | |
| Non-controlling interest | 314 | | | 328 | |
| Total Equity | 14,395 | | | 9,005 | |
| Total Liabilities and Equity | $ | 37,403 | | | $ | 32,822 | |
The accompanying notes are an integral part of the Consolidated Financial Statements.
CARRIER GLOBAL CORPORATION AND SUBSIDIARIES
CONSOLIDATED STATEMENT OF CHANGES IN EQUITY
| | | | | | | | | | | | | | | | | | | | | | | | | | | | | | | | | | | | | | | | | | | | | | | | |
| (In millions) | | | | Accumulated Other Comprehensive Income (Loss) | | Common Stock | | Treasury Stock | | Additional Paid-In Capital | | Retained Earnings | | Non-Controlling Interest | | Total Equity | | |
| | | | | | | | | | | | | | | | | | |
| Balance, December 31, 2021 | | | | $ | (989) | | | $ | 9 | | | $ | (529) | | | $ | 5,411 | | | $ | 2,865 | | | $ | 327 | | | $ | 7,094 | | | |
| | | | | | | | | | | | | | | | | | |
| Net earnings (loss) | | | | — | | | — | | | — | | | — | | | 3,534 | | | 50 | | | 3,584 | | | |
| Other comprehensive income (loss), net of tax | | | | (699) | | | — | | | — | | | — | | | — | | | (26) | | | (725) | | | |
| Dividends declared on common stock ($0.635 per share) | | | | — | | | — | | | — | | | — | | | (533) | | | — | | | (533) | | | |
| Shares issued under incentive plans, net | | | | — | | | — | | | — | | | (12) | | | — | | | — | | | (12) | | | |
| Stock-based compensation | | | | — | | | — | | | — | | | 77 | | | — | | | — | | | 77 | | | |
| Acquisition (sale) of non-controlling interest, net | | | | — | | | — | | | — | | | 5 | | | — | | | 17 | | | 22 | | | |
| Dividends attributable to non-controlling interest | | | | — | | | — | | | — | | | — | | | — | | | (50) | | | (50) | | | |
| Treasury stock repurchases | | | | — | | | — | | | (1,381) | | | — | | | — | | | — | | | (1,381) | | | |
| | | | | | | | | | | | | | | | | | |
| | | | | | | | | | | | | | | | | | |
| | | | | | | | | | | | | | | | | | |
| Balance at December 31, 2022 | | | | $ | (1,688) | | | $ | 9 | | | $ | (1,910) | | | $ | 5,481 | | | $ | 5,866 | | | $ | 318 | | | $ | 8,076 | | | |
| | | | | | | | | | | | | | | | | | |
| Net earnings (loss) | | | | — | | | — | | | — | | | — | | | 1,349 | | | 91 | | | 1,440 | | | |
| Other comprehensive income (loss), net of tax | | | | 202 | | | — | | | — | | | — | | | — | | | (3) | | | 199 | | | |
| Dividends declared on common stock ($0.745 per share) | | | | — | | | — | | | — | | | — | | | (624) | | | — | | | (624) | | | |
| Shares issued under incentive plans, net | | | | — | | | — | | | — | | | (27) | | | — | | | — | | | (27) | | | |
| Stock-based compensation | | | | — | | | — | | | — | | | 81 | | | — | | | — | | | 81 | | | |
| Acquisition (sale) of non-controlling interest, net | | | | — | | | — | | | — | | | — | | | — | | | (22) | | | (22) | | | |
| Dividends attributable to non-controlling interest | | | | — | | | — | | | — | | | — | | | — | | | (56) | | | (56) | | | |
| Treasury stock repurchases | | | | — | | | — | | | (62) | | | — | | | — | | | — | | | (62) | | | |
| | | | | | | | | | | | | | | | | | |
| | | | | | | | | | | | | | | | | | |
| | | | | | | | | | | | | | | | | | |
| | | | | | | | | | | | | | | | | | |
| | | | | | | | | | | | | | | | | | |
| Balance at December 31, 2023 | | | | $ | (1,486) | | | $ | 9 | | | $ | (1,972) | | | $ | 5,535 | | | $ | 6,591 | | | $ | 328 | | | $ | 9,005 | | | |
| | | | | | | | | | | | | | | | | | |
| Net earnings (loss) | | | | — | | | — | | | — | | | — | | | 5,604 | | | 104 | | | 5,708 | | | |
| Other comprehensive income (loss), net of tax | | | | (620) | | | — | | | — | | | — | | | — | | | — | | | (620) | | | |
| Dividends declared on common stock ($0.795 per share) | | | | — | | | — | | | — | | | — | | | (712) | | | — | | | (712) | | | |
| Shares issued under incentive plans, net | | | | — | | | — | | | — | | | (25) | | | — | | | — | | | (25) | | | |
| Stock-based compensation | | | | — | | | — | | | — | | | 100 | | | — | | | — | | | 100 | | | |
| Acquisition of VCS Business | | | | — | | | — | | | — | | | 3,000 | | | — | | | — | | | 3,000 | | | |
| Acquisition (sale) of non-controlling interest, net | | | | — | | | — | | | — | | | — | | | — | | | (36) | | | (36) | | | |
| Dividends attributable to non-controlling interest | | | | — | | | — | | | — | | | — | | | — | | | (82) | | | (82) | | | |
| Treasury stock repurchase | | | | — | | | — | | | (1,943) | | | — | | | — | | | — | | | (1,943) | | | |
| | | | | | | | | | | | | | | | | | |
| | | | | | | | | | | | | | | | | | |
| | | | | | | | | | | | | | | | | | |
| | | | | | | | | | | | | | | | | | |
| | | | | | | | | | | | | | | | | | |
| Balance as of December 31, 2024 | | | | $ | (2,106) | | | $ | 9 | | | $ | (3,915) | | | $ | 8,610 | | | $ | 11,483 | | | $ | 314 | | | $ | 14,395 | | | |
| | | | | | | | | | | | | | | | | | |
The accompanying notes are an integral part of the Consolidated Financial Statements.
CARRIER GLOBAL CORPORATION AND SUBSIDIARIES
CONSOLIDATED STATEMENT OF CASH FLOWS
| | | | | | | | | | | | | | | | | |
| | For the Year Ended December 31, |
| (In millions) | 2024 | | 2023 | | 2022 |
| Operating Activities | | | | | |
| Net earnings (loss) | $ | 5,708 | | | $ | 1,440 | | | $ | 3,584 | |
| Discontinued operations, net of tax | (4,496) | | | 38 | | | (377) | |
| Adjustments for non-cash items, net: | | | | | |
| Depreciation and amortization | 1,232 | | | 491 | | | 328 | |
| Deferred income tax provision | (352) | | | (243) | | | (106) | |
| Stock-based compensation cost | 86 | | | 71 | | | 65 | |
| Equity method investment net earnings | (231) | | | (211) | | | (262) | |
| | | | | |
| (Gain) loss on extinguishment of debt | (82) | | | — | | | (36) | |
| (Gain) loss on sale of investments / deconsolidation | (322) | | | (19) | | | (1,815) | |
| | | | | |
| Changes in operating assets and liabilities | | | | | |
| Accounts receivable, net | (40) | | | (161) | | | (51) | |
| Inventories, net | 292 | | | 123 | | | (173) | |
| Accounts payable and accrued liabilities | 87 | | | 541 | | | (17) | |
| Distributions from equity method investments | 46 | | | 129 | | | 148 | |
| Other operating activities, net | (357) | | | 53 | | | 217 | |
| Net cash flows provided by (used in) continuing operating activities | 1,571 | | | 2,252 | | | 1,505 | |
| Net cash flows provided by (used in) discontinued operating activities | (1,008) | | | 355 | | | 238 | |
| Net cash flows provided by (used in) operating activities | 563 | | | 2,607 | | | 1,743 | |
| | | | | |
| Investing Activities | | | | | |
| Capital expenditures | (519) | | | (439) | | | (317) | |
| | | | | |
| Investment in businesses, net of cash acquired | (10,890) | | | (84) | | | (506) | |
| Dispositions of businesses | 634 | | | 54 | | | 2,902 | |
| Settlement of derivative contracts, net | (264) | | | (50) | | | (194) | |
| Payment to former shareholders of TCC | — | | | — | | | (104) | |
| Other investing activities, net | 14 | | | 15 | | | 20 | |
| Net cash flows provided by (used in) continuing investing activities | (11,025) | | | (504) | | | 1,801 | |
| Net cash flows provided by (used in) discontinued investing activities | 9,000 | | | (156) | | | (56) | |
| Net cash flows provided by (used in) investing activities | (2,025) | | | (660) | | | 1,745 | |
| | | | | |
| Financing Activities | | | | | |
| (Decrease) increase in short-term borrowings, net | 50 | | | (5) | | | (149) | |
| Issuance of long-term debt | 3,412 | | | 5,609 | | | 432 | |
| Repayment of long-term debt | (5,345) | | | (111) | | | (1,275) | |
| Repurchases of common stock | (1,944) | | | (62) | | | (1,380) | |
| Dividends paid on common stock | (670) | | | (620) | | | (509) | |
| Dividends paid to non-controlling interest | (84) | | | (58) | | | (46) | |
| Other financing activities, net | (30) | | | (121) | | | (1) | |
| Net cash flows provided by (used in) continuing financing activities | (4,611) | | | 4,632 | | | (2,928) | |
| Net cash flows provided by (used in) discontinued financing activities | (25) | | | (20) | | | (3) | |
| Net cash flows provided by (used in) financing activities | (4,636) | | | 4,612 | | | (2,931) | |
| Effect of foreign exchange rate changes on cash and cash equivalents | (103) | | | 88 | | | (56) | |
| Net increase (decrease) in cash and cash equivalents and restricted cash, including cash classified in current assets held for sale | (6,201) | | | 6,647 | | | 501 | |
| Less: Change in cash balances classified as assets held for sale | (320) | | | 97 | | | (33) | |
| Net increase (decrease) in cash and cash equivalents and restricted cash | (5,881) | | | 6,550 | | | 534 | |
| Cash, cash equivalents and restricted cash, beginning of period | 9,853 | | | 3,303 | | | 2,769 | |
| Cash, cash equivalents and restricted cash, end of period | 3,972 | | | 9,853 | | | 3,303 | |
| Less: restricted cash | 3 | | | 1 | | | 5 | |
| Cash and cash equivalents, end of period | $ | 3,969 | | | $ | 9,852 | | | $ | 3,298 | |
The accompanying notes are an integral part of the Consolidated Financial Statements.
CARRIER GLOBAL CORPORATION AND SUBSIDIARIES
NOTES TO THE CONSOLIDATED FINANCIAL STATEMENTS
NOTE 1: DESCRIPTION OF THE BUSINESS
Carrier Global Corporation (the "Company") is a global leader in intelligent climate and energy solutions with a focus on providing differentiated, digitally-enabled lifecycle solutions to its customers. The Company's portfolio includes industry-leading brands such as Carrier, Viessmann, Toshiba, Automated Logic and Carrier Transicold that offer innovative heating, ventilating and air conditioning ("HVAC"), refrigeration and cold chain transportation solutions to help make the world safer and more comfortable. The Company also provides a broad array of related building services, including audit, design, installation, system integration, repair, maintenance and monitoring. The Company's operations are classified into two segments: HVAC and Refrigeration.
NOTE 2: BASIS OF PRESENTATION
The accompanying Consolidated Financial Statements reflect the consolidated operations of the Company and have been prepared in accordance with U.S. Generally Accepted Accounting Principles ("GAAP") as defined by the Financial Accounting Standards Board ("FASB") within the FASB Accounting Standards Codification ("ASC"). Inter-company accounts and transactions have been eliminated. Related party transactions between the Company and its equity method investees have not been eliminated.
The accompanying Consolidated Financial Statements include all majority-owned subsidiaries of the Company. A non-controlling interest in a subsidiary is considered an ownership interest in a majority-owned subsidiary that is not attributable to the parent. The Company includes Non-controlling interest as a component of Total equity in the accompanying Consolidated Balance Sheet and the Non-controlling interest in subsidiaries' earnings from operations are presented as an adjustment to Earnings before income taxes used to arrive at Net earnings (loss) attributable to common shareowners in the accompanying Consolidated Statement of Operations. Partially-owned equity affiliates represent 20 to 50% ownership interests in investments where the Company demonstrates significant influence, but does not have a controlling financial interest. Partially-owned equity affiliates are accounted for under the equity method.
Acquisition of Viessmann Climate Solutions
On April 25, 2023, the Company announced that it entered into a Share Purchase Agreement (the “Agreement”) to acquire the climate solutions business (the "VCS Business") of Viessmann Group GmbH & Co. KG (“Viessmann”), a privately-held company. The acquisition was completed on January 2, 2024. As a result, the assets, liabilities and results of operations of the VCS Business are consolidated in the accompanying Consolidated Financial Statements as of the date of acquisition and reported within the Company’s HVAC segment. See Note 19 - Acquisitions for additional information.
Portfolio Transformation
On December 7, 2023, the Company entered into a stock purchase agreement to sell its Access Solutions business ("Access Solutions") to Honeywell International Inc. As a result, the assets and liabilities of Access Solutions are presented as held for sale on the accompanying Consolidated Balance Sheet as of December 31, 2023, and recorded at the lower of their carrying value or fair value less estimated cost to sell. The sale of Access Solutions was completed on June 2, 2024. See Note 20 - Divestitures for additional information.
During the fourth quarter of 2023, the net assets of the Company's Industrial Fire business ("Industrial Fire") met the criteria to be classified as held for sale. As a result, the assets and liabilities of Industrial Fire are presented as held for sale on the accompanying Consolidated Balance Sheet as of December 31, 2023, and recorded at the lower of their carrying value or fair value less estimated cost to sell. On March 5, 2024, the Company entered into a stock purchase agreement to sell Industrial Fire to Sentinel Capital Partners. The sale of Industrial Fire was completed on July 1, 2024. See Note 20 - Divestitures for additional information.
On December 12, 2023, the Company entered into a stock purchase agreement to sell its Commercial Refrigeration business ("CCR") to Haier Group Corporation. As a result, the assets and liabilities of CCR are presented as held for sale on the accompanying Consolidated Balance Sheet as of December 31, 2023, and recorded at the lower of their carrying value or fair value less estimated cost to sell. The sale of CCR was completed on October 1, 2024. See Note 20 - Divestitures for additional information.
On August 15, 2024, the Company entered into a stock purchase agreement to sell its Commercial and Residential Fire business (“CRF Business”) to an affiliate of Lone Star Funds. As a result, the assets and liabilities of the CRF Business are presented as held for sale on the accompanying Consolidated Balance Sheet as of December 31, 2023, and recorded at the lower of their carrying value or fair value less estimated cost to sell. The sale of CRF was completed on December 2, 2024. See Note 20 - Divestitures for additional information.
Discontinued Operations
In 2023, the Company announced plans to exit its Fire & Security and Commercial Refrigeration businesses over the course of 2024. The announced plan to exit the Fire & Security segment represents a single disposal plan to separately divest multiple businesses over different reporting periods. Upon the CRF Business qualifying as held for sale during the year ended December 31, 2024, the components of the Fire & Security segment in aggregate met the criteria to be presented as discontinued operations in the accompanying Consolidated Statement of Operations and Consolidated Statement of Cash Flows. In addition, the assets and liabilities of the CRF Business have been reclassified to held for sale at December 31, 2023. The results of the CCR business did not meet the criteria to be presented as discontinued operations. See Note 20 - Divestitures for additional information.
Deconsolidation of Kidde-Fenwal, Inc.
On May 14, 2023, Kidde-Fenwal, Inc. ("KFI"), an indirect wholly-owned subsidiary of the Company, filed a petition for voluntary reorganization under Chapter 11 of the United States Bankruptcy Code ("Chapter 11") in the United States Bankruptcy Court for the District of Delaware. KFI, an industrial fire detection and suppression business historically reported in the Company's Fire & Security segment, filed a voluntary petition with the United States Bankruptcy Court for the District of Delaware (the “Bankruptcy Court”) seeking relief under chapter 11 of the Bankruptcy Code. As of the petition date, KFI was deconsolidated and its respective assets and liabilities were derecognized from the Company's Consolidated Financial Statements.
Acquisition of Toshiba Carrier Corporation
On February 6, 2022, the Company entered into a binding agreement to acquire a majority ownership interest in Toshiba Carrier Corporation (“TCC”), a variable refrigerant flow ("VRF") and light commercial HVAC joint venture between Carrier and Toshiba Corporation. The acquisition was completed on August 1, 2022. As a result, the assets, liabilities and results of operations of TCC are consolidated in the accompanying Consolidated Financial Statements as of the date of acquisition and reported within the Company’s HVAC segment. Upon closing, Toshiba Corporation retained a 5% ownership interest in TCC.
Sale of Chubb Fire & Security Business
On July 26, 2021, the Company entered into a stock purchase agreement to sell its Chubb Fire and Security business ("Chubb") to APi Group Corporation ("APi"). Chubb, which was reported within the Company's Fire & Security segment, delivered essential fire safety and security solutions from design and installation to monitoring, service and maintenance across more than 17 countries around the globe. On January 3, 2022, the Company completed the sale of Chubb (the "Chubb Sale") for net proceeds of $2.9 billion and recognized a gain on the sale of $1.1 billion, which is included in Other income (expense), net during the year ended December 31, 2022.
Separation from United Technologies
On April 3, 2020 (the "Distribution Date"), United Technologies Corporation ("UTC"), since renamed RTX Corporation ("Raytheon Technologies Corporation" or "RTX"), completed the spin-off of Carrier into an independent, publicly traded company (the "Separation") through a pro rata distribution (the "Distribution") on a one-for-one basis of all of the outstanding shares of common stock of Carrier to UTC shareowners who held shares of UTC common stock as of the close of business on March 19, 2020, the record date for the Distribution. In addition, the Company entered into several agreements with UTC and Otis Worldwide Corporation ("Otis") that govern various aspects of the relationship among the Company, UTC and Otis. As of December 31, 2024, only certain portions of the Tax Matters Agreement ("TMA") remain in effect.
NOTE 3: SUMMARY OF SIGNIFICANT ACCOUNTING POLICIES
A summary of significant accounting policies used in the preparation of the accompanying Consolidated Financial Statements is as follows:
Use of Estimates. The preparation of the Consolidated Financial Statements in conformity with GAAP requires management to make estimates and assumptions that affect the reported amounts of assets and liabilities and the disclosure of contingent assets and liabilities at the date of the financial statements as well as the reported amounts of revenues and expenses during the reporting period. Estimates are based on several factors including the facts and circumstances available at the time the estimates are made, historical experience and various other assumptions that are believed to be reasonable under the circumstances. Actual results could differ from those estimates.
Currency Translation. Assets and liabilities of non-U.S. subsidiaries, where the functional currency is not the U.S. dollar, have been translated at year-end exchange rates, and income and expense accounts have been translated using average exchange rates throughout the year. Adjustments resulting from the process of translating an entity’s financial statements into the U.S. dollar have been recorded in the equity section of the Consolidated Balance Sheet within Accumulated other comprehensive income (loss). Transactions that are denominated in a currency other than an entity’s functional currency are subject to changes in exchange rates with the resulting gains and losses recorded in Net earnings (loss).
Cash and Cash Equivalents. Cash and cash equivalents include cash on hand, demand deposits and short-term cash investments that are highly liquid in nature and have original maturities of three months or less. On occasion, the Company is required to maintain restricted cash deposits with certain banks due to contractual or other legal obligations. Restricted cash of $3 million and $1 million is included in Other assets, current as of December 31, 2024 and 2023, respectively.
Accounts Receivable. Accounts receivable consist of billed amounts owed for products shipped to or services performed for customers. Amounts are recorded net of an allowance for expected credit losses which represents the best estimate of probable loss inherent in the Company's accounts receivable portfolio. The allowance is determined using a combination of factors including a reserve based on the aging of the outstanding accounts receivable portfolio and the Company's historical credit loss experience with its end markets, customer base and products. In addition, the Company considers knowledge of specific customers, current market conditions as well as reasonable and supportable forecasts of future events and economic conditions. As of December 31, 2024 and 2023, the allowance for expected credit losses was $97 million and $91 million, respectively. These estimates and assumptions are reviewed periodically with the effects of changes, if any, reflected in the Consolidated Statement of Operations in the period that they are determined.
Fixed Assets. Property, plant and equipment are stated at cost less accumulated depreciation. Assets placed in service are recorded at cost and depreciated using the straight-line method over the estimated useful life of the asset. Assets acquired in a business combination are recorded at fair value at the date of acquisition. Major expenditures for replacements and significant improvements that increase asset values and extend useful lives are capitalized. Repairs and maintenance expenditures that do not extend the useful life of an asset are charged to expense as incurred.
Per ASC 360, Property, Plant and Equipment ("ASC 360"), the Company assesses the recoverability of the carrying value of its property, plant and equipment whenever events or changes in circumstances indicate that the carrying amount of an asset group may not be recoverable. Recoverability is measured by a comparison of the carrying amount of an asset group to the future net undiscounted cash flows expected to be generated by the asset group. If the undiscounted cash flows are less than the carrying amount of the asset group, an impairment loss is recognized for the amount by which the carrying amount of the asset group exceeds the fair value of the asset group.
Equity Method Investments. Investments in which the Company has the ability to exercise significant influence, but does not control, are accounted for under the equity method of accounting and are presented on the Consolidated Balance Sheet. Under this method of accounting, the Company’s share of the net earnings or losses of the investee is presented within Operating profit on the Consolidated Statement of Operations since the activities of the investee are closely aligned with the operations of the Company. The Company evaluates its equity method investments whenever events or changes in circumstance indicate that the carrying amounts of such investments may be impaired. If a decline in the value of an equity method investment is determined to be other than temporary, a loss is recorded in earnings in the current period. Distributions received from equity method investees are presented in the Consolidated Statement of Cash Flows based on the cumulative earnings approach.
Goodwill and Intangible Assets. The Company records goodwill as the excess of the purchase price over the fair value of the net assets acquired in a business combination. In accordance with ASC 350, Intangibles - Goodwill and Other ("ASC 350"), goodwill and other indefinite-lived intangibles are tested and reviewed annually for impairment on July 1 or whenever there is a material change in events or circumstances that indicate that the fair value of the asset is more likely than not less than the carrying amount of the asset.
Impairment of goodwill is assessed at the reporting unit level and begins with a qualitative assessment to determine if it is more likely than not that the fair value of each reporting unit is less than its carrying amount as a basis for determining whether it is necessary to perform the goodwill impairment test under ASC 350. For those reporting units that bypass or fail the qualitative assessment, the test compares the carrying amount of the reporting unit to its estimated fair value. If the estimated fair value of a reporting unit exceeds its carrying amount, goodwill of the reporting unit is not impaired. To the extent that the carrying amount of the reporting unit exceeds its estimated fair value, an impairment loss will be recognized for the amount by which the reporting unit's carrying amount exceeds its fair value, not to exceed the carrying amount of goodwill in that reporting unit.
Intangible assets such as patents, service contracts, monitoring lines and customer relationships with finite useful lives are amortized based on the pattern in which the economic benefits of the intangible assets are consumed. If a pattern of economic benefit cannot be reliably determined or if straight-line amortization approximates the pattern of economic benefit, a straight-line amortization may be used.
The range of useful lives approximate the following (in years):
| | | | | |
| Customer relationships | 1 to 30 |
| Patents and trademarks | 5 to 40 |
| Monitoring lines | 7 to 10 |
| Service portfolio and other | 1 to 50 |
The Company assesses the recoverability of the carrying amount of its intangible assets with finite useful lives whenever events or changes in circumstances indicate that the carrying amount of the asset group may not be recoverable. Recoverability is measured by a comparison of the carrying amount of an asset group to the future net undiscounted cash flows expected to be generated by the asset group. If the undiscounted cash flows are less than the carrying amount of the asset group, an impairment loss is recognized for the amount by which the carrying value of the asset group exceeds the fair value of the asset group.
Leases. The Company accounts for leases in accordance with ASC 842, Leases ("ASC 842"), which requires a lessee to record a right-of-use ("ROU") asset and a lease liability on the Consolidated Balance Sheet for all leases with terms longer than 12 months. ROU assets and liabilities are recognized at the commencement date based on the present value of lease payments over the lease term. The Company generally uses its incremental borrowing rate, which is based on information available at the lease commencement date, to determine the present value of lease payments except when an implicit interest rate is readily determinable. The lease term may include options to extend or terminate the lease when it is reasonably certain that the Company will exercise that option. The Company has elected not to recognize ROU assets and lease obligations for its short-term leases, which are defined as leases with an initial term of 12 months or less.
Income Taxes. The Company accounts for income taxes in accordance with ASC 740, Income Taxes ("ASC 740"). Deferred tax assets and liabilities are determined based on temporary differences between financial reporting and tax bases of assets and liabilities, applying enacted tax rates expected to be in effect for the year in which the differences are expected to reverse. The Company recognizes future tax benefits to the extent that realizing these benefits is considered in its judgment to be more likely than not. For those jurisdictions where the expiration date of tax carryforwards or the projected operating results indicate that realization is not likely, a valuation allowance is provided. The Company reviews the realizability of its deferred tax asset valuation allowances on a quarterly basis, or whenever events or changes in circumstances indicate that a review is required and will adjust its estimate if significant events so dictate. To the extent that the ultimate results differ from the Company's original or adjusted estimates, the effect will be recorded in the provision for income taxes in the period that the matter is finally resolved.
In the ordinary course of business, there is inherent uncertainty in quantifying the Company's income tax positions. The Company assesses its income tax positions and records tax benefits for all years subject to examination based upon management’s evaluation of the facts, circumstances and information available at the reporting date. For those tax positions where it is more likely than not that a tax benefit will be sustained, the Company has recorded the largest amount of tax benefit with a greater than 50% likelihood of being realized upon ultimate settlement with a taxing authority that has full knowledge of all relevant information. For those income tax positions where it is not more likely than not that a tax benefit will be sustained, no tax benefit has been recognized in the Consolidated Financial Statements.
Pension and Post-retirement Obligations. The Company provides a range of benefit plans to eligible current and former employees. The Company accounts for its benefit plans in accordance with ASC 715, Compensation - Retirement Benefits ("ASC 715") which requires balance sheet recognition of the overfunded or underfunded status of pension and post-retirement benefit plans. Determining the amounts associated with these benefits are performed by actuaries and dependent on various actuarial assumptions including discount rates, expected return on plan assets, compensation increases, mortality and health care cost trends. Actual results may differ from the actuarial assumptions and are generally recorded in Accumulated other comprehensive income (loss) and amortized into Net earnings (loss) over future periods. The Company reviews its actuarial assumptions at each measurement date and makes modifications to the assumptions based on current rates and trends, if appropriate. See Note 10 – Employee Benefit Plans for additional information.
Business Combinations. In accordance with ASC 805, Business Combinations ("ASC 805"), acquisitions that meet the definition of a business are recorded using the acquisition method of accounting. The Company recognizes and measures identifiable assets acquired, liabilities assumed and any non-controlling interest as of the acquisition date at fair value. The valuation of intangible assets is determined by an income approach methodology, using assumptions such as projected future revenues, customer attrition rates, royalty rates, tax rates and discount rates. The excess, if any, of total consideration transferred in a business combination over the fair value of identifiable assets acquired, liabilities assumed and any non-controlling interest is recognized as goodwill. Costs incurred as a result of a business combination other than costs related to the issuance of debt or equity securities are recorded in the period the costs are incurred.
Asset Retirement Obligations. The Company records the fair value of legal obligations associated with the retirement of tangible long-lived assets in the period in which a liability is determined to exist, if a reasonable estimate of fair value can be made. Upon initial recognition of a liability, the Company capitalizes the cost of the asset retirement obligation by increasing the carrying amount of the related long-lived asset. Over time, the liability is increased for changes in its present value and the capitalized cost is depreciated over the useful life of the related asset.
Research and Development. The Company conducts research and development activities with a focus on new product development and technology innovation. These costs are charged to expense as incurred. For the years ended December 31, 2024, 2023 and 2022, these costs amounted to $686 million, $493 million and $416 million, respectively.
Recent Pronouncements
The FASB ASC is the sole source of authoritative GAAP other than United States Securities and Exchange Commission ("SEC') issued rules and regulations that apply only to SEC registrants. The FASB issues Accounting Standards Updates ("ASU") to communicate changes to the codification. The Company considers the applicability and impact of all ASUs. ASUs not referenced below were assessed and determined to be either not applicable or are not expected to have a material impact on the Consolidated Financial Statements.
Recently Issued and Adopted Accounting Pronouncements
In November 2023, the FASB issued ASU 2023-07, Segment Reporting (Topic 280): Improvements to Reportable Segment Disclosures (“ASU 2023-07”), which requires public entities to disclose information about their reportable segments’ significant expenses on an interim and annual basis. In addition, the amendments clarify circumstances in which an entity can disclose multiple segment measures of profit or loss, provides new segment disclosure requirements for entities with a single reportable segment and contains other disclosure requirements. The Company adopted ASU 2023-07 on January 1, 2024, with no material impact on its financial statements.
In December 2023, the FASB issued ASU 2023-09, Income Taxes (Topic 740): Improvements to Income Tax Disclosures ("ASU 2023-09"), which requires public entities to disclose disaggregated information about their effective tax rate reconciliation as well as information on income taxes paid. ASU 2023-09 is effective for fiscal years beginning after December 15, 2024, with early adoption permitted. The Company is currently assessing the impact of this ASU on its financial statements.
On March 6, 2024, the SEC adopted new rules designed to enhance public company disclosures related to the risks and impacts of climate-related matters. The rules amend the provisions of both Regulation S-K and Regulation S-X to require disclosure of climate-related risks, transition plans, targets and goals, risk management and governance as well as require disclosure of the financial effects of severe weather events and other natural conditions as well as the use of carbon offsets or renewable energy credits. Disclosure requirements will begin phasing in for fiscal years beginning on or after January 1, 2025, subject to legal challenges and the SEC's voluntary stay of the disclosure requirements. The Company will continue to assess the impact of these new rules on its financial statements while the stay is in place.
In November 2024, the FASB issued ASU 2024-03, Disaggregation of Income Statement Expenses (DISE) ("ASU 2024-03"), which requires public entities to disclose disaggregated information about expenses by nature on an interim and annual basis. ASU 2024-03 is effective for fiscal years beginning after December 15, 2026 and interim periods within fiscal years beginning after December 15, 2027, with early adoption permitted. The Company is currently assessing the impact of this ASU on its financial statements.
NOTE 4: INVENTORIES, NET
Inventories are stated at the lower of cost or estimated net realizable value. Cost is primarily determined based on the first-in, first-out inventory method ("FIFO") or average cost methods, which approximates current replacement cost. However, certain Carrier entities use the last-in, first-out inventory method ("LIFO").
Inventories, net consisted of the following:
| | | | | | | | | | | |
| (In millions) | 2024 | | 2023 |
| Raw materials | $ | 625 | | | $ | 534 | |
| Work-in-process | 213 | | | 245 | |
| Finished goods | 1,461 | | | 1,044 | |
| | | |
| Inventories, net | $ | 2,299 | | | $ | 1,823 | |
The Company performs periodic assessments utilizing customer demand, production requirements and historical usage rates to determine the existence of excess and obsolete inventory and records necessary provisions to reduce such inventories to the lower of cost or estimated net realizable value. Raw materials, work-in-process and finished goods are net of valuation reserves of $215 million and $173 million as of December 31, 2024 and 2023, respectively.
Certain entities use LIFO to determine the cost of inventory. If inventories that were valued using the LIFO method had been valued under the FIFO method, the net book value of the inventories would have been higher by $238 million and $226 million as of December 31, 2024 and 2023, respectively. As of December 31, 2024 and 2023, approximately 39% and 42%, respectively, of all inventory utilized the LIFO method.
NOTE 5: FIXED ASSETS, NET
Fixed assets, net consisted of the following:
| | | | | | | | | | | | | | | | | |
| (In millions) | Estimated Useful Lives (Years) | | 2024 | | 2023 |
| Land | | | $ | 169 | | | $ | 109 | |
| Buildings and improvements | 20 to 40 | | 1,325 | | | 1,083 | |
| Machinery, tools and equipment | 3 to 25 | | 2,947 | | | 2,520 | |
| Rental assets | 3 to 12 | | 355 | | | 346 | |
| Other, including assets under construction | | | 715 | | | 415 | |
| Fixed assets, gross | | | 5,511 | | | 4,473 | |
| Accumulated depreciation | | | (2,512) | | | (2,313) | |
| Fixed assets, net | | | $ | 2,999 | | | $ | 2,160 | |
Depreciation expense was $385 million, $270 million and $224 million for the years ended December 31, 2024, 2023 and 2022, respectively.
NOTE 6: GOODWILL AND INTANGIBLE ASSETS
The Company records goodwill as the excess of the purchase price over the fair value of the net assets acquired in a business combination. Goodwill is tested and reviewed annually for impairment on July 1 or whenever there is a material change in events or circumstances that indicates that the fair value of the reporting unit may be less than its carrying value.
The changes in the carrying amount of goodwill were as follows:
| | | | | | | | | | | | | | | | | | | | | | | |
| (In millions) | HVAC | | Refrigeration | | Corporate and other | | Total |
| Balance at December 31, 2022 | $ | 6,392 | | | $ | 1,158 | | | $ | 76 | | | $ | 7,626 | |
Goodwill resulting from business combinations (1) | 1 | | | (4) | | | — | | | (3) | |
Reclassified to held for sale (2) | — | | | (72) | | | — | | | (72) | |
| Foreign currency translation | 14 | | | (45) | | | — | | | (31) | |
| Balance at December 31, 2023 | $ | 6,407 | | | $ | 1,037 | | | $ | 76 | | | $ | 7,520 | |
Goodwill resulting from business combinations (1) | 7,622 | | | 33 | | | — | | | 7,655 | |
| | | | | | | |
| Foreign currency translation | (631) | | | 57 | | | — | | | (574) | |
| Balance as of December 31, 2024 | $ | 13,398 | | | $ | 1,127 | | | $ | 76 | | | $ | 14,601 | |
(1) See Note 19 - Acquisitions for additional information.
(2) See Note 20 - Divestitures for additional information.
Indefinite-lived intangible assets are tested and reviewed annually for impairment on July 1 or whenever there is a material change in events or circumstances that indicates that the fair value of the asset may be less than the carrying amount of the asset. Intangible assets with finite useful lives are amortized over their estimated useful lives.
Identifiable intangible assets consisted of the following:
| | | | | | | | | | | | | | | | | | | | | | | | | | | | | | | | | | | | | | | |
| | | 2024 | | 2023 |
| (In millions) | | | Gross Amount | | Accumulated Amortization | | Net Amount | | Gross Amount | | Accumulated Amortization | | Net Amount |
| | | | | | | | | | | | | |
| Customer relationships | | | $ | 5,607 | | | $ | (939) | | | $ | 4,668 | | | $ | 1,056 | | | $ | (445) | | | $ | 611 | |
| Patents and trademarks | | | 885 | | | (147) | | | 738 | | | 255 | | | (96) | | | 159 | |
| | | | | | | | | | | | | |
| Service portfolios and other | | | 1,530 | | | (504) | | | 1,026 | | | 431 | | | (256) | | | 175 | |
| | | | | | | | | | | | | |
| | | | | | | | | | | | | |
| | | | | | | | | | | | | |
Total intangible assets (1) | | | $ | 8,022 | | | $ | (1,590) | | | $ | 6,432 | | | $ | 1,742 | | | $ | (797) | | | $ | 945 | |
(1) Indefinite-lived intangible assets were sold as part of the CRF Business divestiture.
Amortization of intangible assets was $843 million, $221 million and $104 million for the years ended December 31, 2024, 2023 and 2022, respectively.
The estimated future amortization of intangible assets is as follows:
| | | | | | | | | | | | | | | | | | | | | | | | | | | | | | | | | | | |
| (In millions) | 2025 | | 2026 | | 2027 | | 2028 | | 2029 | | Thereafter |
| Future amortization | $ | 819 | | | $ | 779 | | | $ | 731 | | | $ | 660 | | | $ | 581 | | | $ | 2,862 | |
Annual Impairment Assessment
The Company tested its goodwill and indefinite-lived intangible assets for impairment on July 1 as part of its annual assessment. For each test except one, the Company qualitatively assessed all relevant events or circumstances that could impact the estimate of fair value and determined it was more likely than not that the fair value of each reporting unit and indefinite-lived intangible assets exceeded their carrying amount. For the remaining test, the Company performed a quantitative goodwill impairment test to determine if any impairment existed. The test did not indicate any goodwill impairment.
In connection with the presentation of the CRF Business as held for sale at December 31, 2024, the Company reassigned goodwill to the remaining business activities previously reported within the Fire & Security segment. For the test, the Company qualitatively assessed all relevant events or circumstances that could impact the estimate of fair value and determined it was more likely than not that the fair value of the remaining business activities exceeded their carrying amount. Due to these business activities no longer meeting the criteria of a reportable segment, they have been included in Corporate and other.
NOTE 7: BORROWINGS AND LINES OF CREDIT
Long-term debt consisted of the following:
| | | | | | | | | | | | | | |
| | | | |
| (In millions) | | 2024 | | 2023 |
2.242% Notes due 2025 (1) | | 1,200 | | | 1,200 | |
| 4.375% Notes due 2025 | | — | | | 830 | |
| 5.800% Notes due 2025 | | — | | | 1,000 | |
| 2.493% Notes due 2027 | | 900 | | | 900 | |
| 4.125% Notes due 2028 | | 783 | | | 830 | |
| 2.722% Notes due 2030 | | 2,000 | | | 2,000 | |
| 2.700% Notes due 2031 | | 750 | | | 750 | |
| 4.500% Notes due 2032 | | 887 | | | 941 | |
| 5.900% Notes due 2034 | | 875 | | | 1,000 | |
| 3.625% Notes due 2037 | | 783 | | | — | |
| 3.377% Notes due 2040 | | 1,500 | | | 1,500 | |
| 3.577% Notes due 2050 | | 1,400 | | | 2,000 | |
| 6.200% Notes due 2054 | | 650 | | | 1,000 | |
| Total long-term notes | | 11,728 | | | 13,951 | |
| Japanese Term Loan Facility | | 342 | | | 379 | |
| Other debt (including project financing obligations and finance leases) | | 296 | | | 74 | |
| Discounts and debt issuance costs | | (88) | | | (111) | |
| Total debt | | 12,278 | | | 14,293 | |
| Less: current portion of long-term debt | | 1,252 | | | 51 | |
| Long-term debt, net of current portion | | $ | 11,026 | | | $ | 14,242 | |
(1) 2.242% Notes due February 15, 2025; reclassified to Current portion of long-term debt.
Acquisition Funding
On January 2, 2024, the Company completed the acquisition of the VCS Business for total consideration of $14.2 billion. Under the terms of the Agreement, 20% of the purchase price was paid in Carrier common stock, issued directly to Viessmann and subject to certain lock up provisions and 80% was paid in cash, subject to working capital and other adjustments. In order to fund the Euro-denominated cash portion of the purchase price, the Company used cash on hand, debt financing and various term loan facilities.
Debt Issuance
In November 2023, the Company issued $3.0 billion principal amount of USD-denominated notes in three tranches. The tranches consisted of $1.0 billion aggregate principal amount of 5.80% notes due 2025, $1.0 billion aggregate principal amount of 5.90% notes due 2034 and $1.0 billion aggregate principal amount of 6.20% notes due 2054 (collectively, the “USD Notes”). In addition, the Company issued €2.35 billion principal amount of Euro-denominated notes in three tranches. The tranches consisted of €750 million aggregate principal amount of 4.375% notes due 2025, €750 million aggregate principal amount of 4.125% notes due 2028 and €850 million aggregate principal amount of 4.50% notes due 2032 (collectively, the “Euro Notes”). The notes are subject to certain customary covenants and the Company has the option to redeem the notes in whole or in part at any time prior to their stated maturity date at the redemption price set forth in the indenture agreements. The Company capitalized $51 million of deferred financing costs which are being amortized over the term of their related notes. In June 2024, the Company redeemed the $1.0 billion aggregate principal amount of 5.80% notes due in 2025 and incurred a $8 million make-whole premium upon prepayment and wrote off $4 million of related unamortized debt financing costs.
In November 2024, the Company issued €750 million aggregate principal amount of 3.625% Euro-denominated notes due 2037. The notes are subject to certain customary covenants and the Company has the option to redeem the notes in whole or in part at any time, prior to their stated maturity date at the redemption price set forth in the indenture agreement. The Company capitalized $11 million of deferred financing costs which are being amortized over the term of the notes. The Company used the net proceeds, together with cash on hand, to redeem its €750 million aggregate principal amount of outstanding 4.375% Euro-denominated notes due 2025 and to pay fees and expenses in connection with the new offering. The Company incurred a $6 million make-whole premium upon prepayment and wrote off $2 million of related unamortized debt financing costs.
Bridge Loan
On April 25, 2023, the Company entered into commitment letters with JPMorgan Chase Bank, N.A., BofA Securities, Inc. and Bank of America, N.A. to provide a €8.2 billion aggregate principal, senior unsecured bridge term loan facility (the “Bridge Loan”). Euro-denominated borrowings bore interest at the EURIBOR Rate plus a ratings-based margin, USD-denominated borrowings bore interest at either a Term SOFR Rate plus 0.10% and a ratings-based margin or, alternatively, at a base rate plus a ratings-based margin. The Company capitalized $48 million of deferred financing costs associated with the Bridge Loan which were amortized over the commitment period. Upon entering into a senior unsecured delayed draw term loan facility and issuing the USD Notes and the Euro Notes, the Company reduced the Bridge Loan by €7.7 billion and accelerated the amortization on $25 million of deferred financing costs in Interest expense during 2023. On January 2, 2024, the Company entered into a 60-day senior unsecured term loan agreement consisting of a Euro-denominated tranche in an aggregate amount of €113 million and a USD-denominated tranche in an aggregate amount of $349 million (the “60-day Loan”). Upon entering into the 60-day Loan, the Company reduced the final portion of the Bridge Loan by €500 million and subsequently terminated the agreement. Borrowings under the 60-day Loan were repaid in March 2024.
Delayed Draw Facility
On May 19, 2023, the Company entered into a senior unsecured delayed draw term loan credit agreement with JPMorgan Chase Bank, N.A., as administrative agent and certain other lenders that permitted aggregate borrowings of up to €2.3 billion (the "Delayed Draw Facility"). The facility consisted of an 18-month, Euro-denominated tranche in an aggregate amount of €1.15 billion and a 3-year, Euro-denominated tranche in an aggregate amount of €1.15 billion. Euro-denominated borrowings bear interest at the EURIBOR Rate plus a ratings-based margin, USD-denominated borrowings bear interest at either a Term SOFR Rate plus 0.10% and a ratings-based margin or, alternatively, at a base rate plus a ratings-based margin. The Company capitalized $4 million of deferred financing costs which will be amortized over the respective term of the tranches. On January 2, 2024, the Company borrowed the full amount available under the Delayed Draw Facility in U.S. Dollars. Borrowings under the Delayed Draw Facility were repaid in June 2024 and the facility was subsequently terminated.
364-Day Revolver
On May 17, 2024, the Company entered into a 364-day, $500 million, senior unsecured revolving credit agreement with JPMorgan Chase Bank, N.A., as administrative agent and certain other lenders (the “364-day Revolver”). Borrowings are available in U.S. Dollars and Euros. USD-denominated borrowings bear interest at either a Term SOFR Rate plus 0.10% and a ratings-based margin or, alternatively, at a base rate plus a ratings-based margin, Euro-denominated borrowings bear interest at the Adjusted EURIBOR Rate plus a ratings-based margin. Upon entering into the 364-day Revolver, the Company terminated its existing $500 million senior unsecured revolving credit agreement that was set to mature in May 2024. In December 2024, the Company terminated the 364-day Revolver as part of a transaction to refinance and replace prior credit agreements.
Japanese Term Loan Facility
On July 15, 2022, the Company entered into a five-year, JPY 54 billion (approximately $400 million) senior unsecured term loan facility with MUFG Bank Ltd., as administrative agent and lender, and certain other lenders (the "Japanese Term Loan Facility"). Borrowings under the Japanese Term Loan Facility bear interest at a rate equal to the Tokyo Term Risk Free Rate plus 0.75%. In addition, the Japanese Term Loan Facility is subject to customary covenants including a covenant to maintain a maximum consolidated leverage ratio. The Company capitalized $2 million of deferred financing costs which are being amortized over the term of the facility. On July 25, 2022, the Company borrowed JPY 54 billion under the Japanese Term Loan Facility and used the proceeds to fund a portion of the TCC acquisition and to pay related fees and expenses.
Revolving Credit Facility
On December 20, 2024, the Company entered into a revolving credit agreement with JPMorgan Chase Bank, N.A., as administrative agent, and certain other lenders, permitting aggregate borrowings of up to $2.5 billion pursuant to an unsecured, unsubordinated revolving credit facility that matures in December 2029 (the "Revolving Credit Facility"). The Revolving Credit Facility supports the Company's commercial paper program and can be used for other general corporate purposes. Borrowings are available in U.S. Dollars and Euros. U.S. Dollar borrowings can bear interest at either a Term SOFR Rate plus 0.10% and a ratings-based margin or, alternatively, at an alternate base rate plus a ratings-based margin. Euro borrowings bear interest at an adjusted EURIBOR rate plus a ratings-based margin. A ratings-based commitment fee is charged on unused commitments. Upon entering into the agreement, the Company terminated its existing $2.0 billion revolving credit facility that was set to mature in May 2028 as part of a transaction to refinance and replace prior credit agreements. In addition, the Company capitalized $11 million of deferred financing costs which are being amortized over the term of the facility. As of December 31, 2024, there were no borrowings outstanding under the Revolving Credit Facility.
Commercial Paper Program
The Company has a $2.0 billion unsecured, unsubordinated commercial paper program, which can be used for general corporate purposes, including the funding of working capital and potential acquisitions. As of December 31, 2024, there were no borrowings outstanding under the commercial paper program.
Project Financing Arrangements
The Company is involved in long-term construction contracts in which it arranges project financing with certain customers. As a result, the Company issued $53 million and $39 million of debt during the year ended December 31, 2024 and 2023, respectively. Long-term debt repayments associated with these financing arrangements for the years ended December 31, 2024 and 2023, were $14 million and $111 million, respectively.
Debt Covenants
The Revolving Credit Facility, the indenture for the long-term notes and the Japanese Term Loan Facility contain affirmative and negative covenants customary for financings of these types, which, among other things, limit the Company's ability to incur additional liens, to make certain fundamental changes and to enter into sale and leaseback transactions. As of December 31, 2024, the Company was in compliance with the covenants under the agreements governing its outstanding indebtedness.
Tender Offers
In July 2024, the Company commenced tender offers to purchase up to $800 million ("Aggregate Tender Cap") aggregate purchase price of certain tranches of the Company's notes. The tender offers included payment of applicable accrued and unpaid interest up to the settlement date, along with a fixed spread for early repayment. Based on several factors, the Company elected to increase the Aggregate Tender Cap and settle the tender offers early. The aggregate principal amount tendered and accepted was approximately $1.1 billion, which included $125 million of notes due 2034, $350 million of notes due 2054 and approximately $600 million of notes due 2050. Upon settlement, the Company recognized a net gain of $97 million and wrote off $11 million of unamortized deferred financing costs within Interest (expense) income, net on the accompanying Consolidated Statement of Operations.
Schedule of Long-term Debt Maturities
Scheduled maturities of long-term debt, excluding amortization of discount, are as follows:
| | | | | | | | |
| (In millions) | | |
| 2025 | | $ | 1,252 | |
| 2026 | | $ | 70 | |
| 2027 | | $ | 1,284 | |
| 2028 | | $ | 803 | |
| 2029 | | $ | 19 | |
| Thereafter | | $ | 8,938 | |
As of December 31, 2024, the average maturity of the Company's long-term notes is approximately 10 years and the weighted-average interest rate on its total borrowings is approximately 3.5%. Interest expense associated with long-term debt for the years ended December 31, 2024, 2023 and 2022 was $580 million, $306 million and $238 million, respectively.
NOTE 8: FAIR VALUE MEASUREMENTS
ASC 820, Fair Value Measurement ("ASC 820"), defines fair value as the price that would be received if an asset is sold or the price paid to transfer a liability in an orderly transaction between market participants at the measurement date. ASC 820 also establishes a three-level fair value hierarchy that prioritizes information used in developing assumptions when pricing an asset or liability as follows:
•Level 1: Observable inputs such as quoted prices in active markets;
•Level 2: Inputs, other than quoted prices in active markets, that are observable either directly or indirectly; and
•Level 3: Unobservable inputs where there is little or no market data, which requires the reporting entity to develop its own assumptions.
ASC 820 requires the use of observable market data, when available, in making fair value measurements. When inputs used to measure fair value fall within different levels of the hierarchy, the level within which the fair value measurement is categorized is based on the lowest level input that is significant to the fair value measurement.
In the normal course of business, the Company is exposed to certain risks arising from business operations and economic factors, including foreign currency and commodity price risk. These exposures are managed through operational strategies and the use of undesignated hedging contracts. The Company's derivative assets and liabilities are measured at fair value on a recurring basis using internal models based on observable market inputs, such as forward, interest, contract and discount rates with changes in fair value reported in Other income (expense), net in the accompanying Consolidated Statement of Operations.
In connection with the TCC acquisition, the Company funded a portion of the Yen-denominated purchase price with cash on hand by entering into cross currency swaps with various financial institutions. The cross currency swaps are measured at fair value on a recurring basis using observable market inputs, such as forward, discount and interest rates as well as credit default swap spreads. The Company designated the cross currency swaps as a partial hedge of its investment in certain subsidiaries whose functional currency is the Japanese Yen in order to manage foreign currency translation risk. As a result, changes in the fair value of the swaps are recorded in Equity in the accompanying Consolidated Balance Sheet.
The remaining portion of the Yen-denominated purchase price was funded by the Japanese Term Loan Facility. The carrying value of the facility is translated on a recurring basis using the exchange rate at the end of the applicable period and approximates its fair value. The Company designated the Japanese Term Loan Facility as a partial hedge of its investment in certain subsidiaries whose functional currency is the Japanese Yen in order to manage foreign currency translation risk. As a result, changes in the carrying value of the Japanese Term Loan Facility associated with foreign exchange rate movements are recorded in Equity in the Consolidated Balance Sheet.
In connection with the acquisition of the VCS Business, the Company entered into window forward contracts with Bank of America N.A. and JPMorgan Chase Bank N.A. to mitigate the foreign currency risk of the expected cash outflows associated with the Euro-denominated purchase price. The instruments have an aggregate notional amount of €7 billion and are measured at fair value on a recurring basis using observable market inputs, such as forward, discount and interest rates with changes in fair value reported in Other income (expense), net in the accompanying Consolidated Statement of Operations. During the year ended December 31, 2023, the Company recognized a $96 million loss on the mark-to-market valuation of its window forward contracts. The Company settled the window forward contracts on January 2, 2024, upon the acquisition of the VCS Business and recognized an additional $86 million loss.
During 2023, the Company entered into several interest rate swap contracts to mitigate interest rate exposure on the forecasted issuance of long-term debt. The contracts had an aggregate notional amount of $1.5 billion and were designated as cash flow hedges with changes in fair value reported in Equity in the accompanying Consolidated Balance Sheet. Fair value was measured on a recurring basis using observable market inputs, such as forward, discount and interest rates. In November 2023, the contracts were settled upon the issuance of the underlying debt. As a result, the Company deferred a net unrecognized gain of $58 million in Equity which will be subsequently recognized in Interest expense over the term of the related notes which range from 2034 to 2044. The amount expected to be amortized during 2025 is a net gain of $4 million.
During 2024, the Company entered into cross currency swaps with Barclays Bank PLC as syndication swap arranger in order to manage foreign currency translation risk on Euro-denominated assets. The swaps have an aggregate notional amount of $2.0 billion and are measured at fair value on a recurring basis using observable market inputs, such as forward, discount and interest rates. The Company designated the cross currency swaps as a partial hedge of its investment in certain subsidiaries whose functional currency is the Euro. As a result, changes in the fair value of the swaps are recorded in Equity in the accompanying Consolidated Balance Sheet.
The following tables provide the valuation hierarchy classification of assets and liabilities that are recorded at fair value and measured on a recurring basis in the accompanying Consolidated Balance Sheet:
| | | | | | | | | | | | | | | | | | | | | | | | | | |
| (In millions) | | Total | | Level 1 | | Level 2 | | Level 3 |
| December 31, 2024 | | | | | | | | |
| Fair value measurement: | | | | | | | | |
| | | | | | | | |
Derivative assets (1)(3) | | $ | 82 | | | $ | — | | | $ | 82 | | | $ | — | |
Derivative liabilities (2)(3) | | $ | (41) | | | $ | — | | | $ | (41) | | | $ | — | |
| | | | | | | | |
| December 31, 2023 | | | | | | | | |
| Fair value measurement: | | | | | | | | |
Derivative assets (1) (3) | | $ | 32 | | | $ | — | | | $ | 32 | | | $ | — | |
Derivative liabilities (2)(3) | | $ | (126) | | | $ | — | | | $ | (126) | | | $ | — | |
(1) Included in Other assets, current and Other assets on the accompanying Consolidated Balance Sheet.
(2) Included in Accrued liabilities and Other long-tern liabilities on the accompanying Consolidated Balance Sheet.
(3) Includes cross currency swaps and window forward contracts (which were settled on January 2, 2024).
The following table provides the carrying amounts and fair values of the Company's long-term notes that are not recorded at fair value in the accompanying Consolidated Balance Sheet:
| | | | | | | | | | | | | | | | | | | | | | | | | | |
| | 2024 | | 2023 |
| (In millions) | | Carrying
Amount | | Fair
Value | | Carrying
Amount | | Fair
Value |
Total long-term notes (1) | | $ | 11,728 | | | $ | 10,798 | | | $ | 13,951 | | | $ | 13,194 | |
| | | | | | | | |
(1) Excludes debt discount and issuance costs.
The fair value of the Company's long-term debt is measured based on observable market inputs which are considered Level 1 within the fair value hierarchy. The carrying value of cash and cash equivalents, accounts receivable, accounts payable and short-term borrowings approximate fair value due to the short-term nature of these accounts and would be classified as Level 1 in the fair value hierarchy. The Company's financing leases and project financing obligations, included in Long-term debt and Current portion of long-term debt on the accompanying Consolidated Balance Sheet, approximate fair value and are classified as Level 3 in the fair value hierarchy.
NOTE 9: LEASES
The Company enters into operating and finance leases for the use of real estate, vehicles, information technology equipment and certain other equipment. At contract inception, the Company determines a lease exists if the arrangement conveys the right to control an identified asset for a period of time in exchange for consideration. Control is considered to exist when the lessee has the right to obtain substantially all of the economic benefits from the use of an identified asset as well as the right to direct the use of that asset. If a contract is considered to be a lease, the Company recognizes a lease liability based on the present value of the future lease payments with an offsetting entry to recognize a right-of-use asset.
Operating lease right-of-use assets and liabilities are reflected on the Consolidated Balance Sheet as follows:
| | | | | | | | | | | | | | |
| (In millions) | | 2024 | | 2023 |
| Operating lease right-of-use assets | | $ | 554 | | | $ | 421 | |
| | | | |
| Accrued liabilities | | $ | (135) | | | $ | (93) | |
| Operating lease liabilities | | (432) | | | (333) | |
| Total operating lease liabilities | | $ | (567) | | | $ | (426) | |
| | | | |
| Weighted-Average Remaining Lease Term (in years) | | 6.8 | | 7.0 |
| Weighted-Average Discount Rate | | 4.5 | % | | 3.9 | % |
Where applicable, the Company accounts for each separate lease component of a contract and its associated non-lease component as a single lease component.
Supplemental cash flow and lease expense information related to operating leases were as follows:
| | | | | | | | | | | | | | | | | | | | |
| (In millions) | | 2024 | | 2023 | | 2022 |
| | | | | | |
| Operating cash flows for measurement of operating lease liabilities | | $ | 173 | | | $ | 135 | | | $ | 119 | |
| Operating lease ROU assets obtained in exchange for operating lease obligations | | $ | 112 | | | $ | 50 | | | $ | 91 | |
| | | | | | |
| Operating lease expense | | $ | 175 | | | $ | 127 | | | $ | 121 | |
| | | | | | |
| | | | | | |
| | | | | | |
| | | | | | |
| | | | | | |
| | | | | | |
Operating lease expense is recognized on a straight-line basis over the lease term. In addition, the Company has certain leases that contain variable lease payments which are based on an index, a rate referenced in the lease or on the actual usage of the leased asset. These payments are not included in the right-of-use asset or lease liability and are expensed as incurred as variable lease expense.
Undiscounted maturities of operating lease liabilities as of December 31, 2024, are as follows:
| | | | | | | | |
| (In millions) | | |
| 2025 | | $ | 154 | |
| 2026 | | 128 | |
| 2027 | | 93 | |
| 2028 | | 68 | |
| 2029 | | 48 | |
| Thereafter | | 169 | |
| Total undiscounted lease payments | | 660 | |
| Less: imputed interest | | (93) | |
| Total discounted lease payments | | $ | 567 | |
| | |
NOTE 10: EMPLOYEE BENEFIT PLANS
The Company sponsors U.S. and international defined benefit pension and defined contribution plans. In addition, the Company contributes to various U.S. and international multi-employer defined benefit pension plans.
Pension Plans
Qualified U.S. pension plan benefits covering collectively bargained employees comprise approximately 35% of the projected benefit obligation. This noncontributory defined benefit plan provides benefits on a flat dollar formula based on an employee's location and is closed to new entrants. The non-U.S. plans comprise approximately 65% of the projected benefit obligation; certain of these plans provide participants with one-time payments upon separation of employment rather than a retirement annuity. The plans' benefits are based on plan specific parameters. Non-qualified U.S. pension plans provide supplementary retirement benefits to certain employees and are not a material component of the projected benefit obligation.
The following table details information regarding the Company's pension plans:
| | | | | | | | | | | |
| (In millions) | 2024 | | 2023 |
| Change in Benefit Obligation | | | |
| Benefit obligation at beginning of year | $ | 575 | | | $ | 760 | |
| Service cost | 14 | | | 15 | |
| Interest cost | 26 | | | 31 | |
| | | |
| | | |
| Actuarial (gain) loss | (9) | | | 27 | |
| Benefits paid | (24) | | | (25) | |
| | | |
| Curtailment, settlements and special termination benefits | (13) | | | (24) | |
| | | |
| Other, including expenses paid | (25) | | | 3 | |
Reclassified to held for sale (1) | — | | | (212) | |
Acquisitions (2) | 113 | | | — | |
| Benefit obligation at end of year | $ | 657 | | | $ | 575 | |
| | | |
| | | |
| Change in Plan Assets | | | |
| Fair value at beginning of year | $ | 468 | | | $ | 451 | |
| Actual return on plan assets | 1 | | | 39 | |
| Company contributions | 34 | | | 33 | |
| | | |
| Benefits paid | (24) | | | (25) | |
| | | |
| Settlements | (13) | | | (24) | |
| | | |
| Other, including expenses paid | (15) | | | 2 | |
Reclassified to held for sale (1) | — | | | (8) | |
Acquisitions (2) | 56 | | | — | |
| Fair value of assets end of year | $ | 507 | | | $ | 468 | |
| | | |
| | | |
| | | |
| | | |
| Funded status of plans | $ | (150) | | | $ | (107) | |
| | | |
| Amounts included in the balance sheet: | | | |
| Other non-current assets | $ | 43 | | | $ | 32 | |
| Accrued compensation and benefits | (13) | | | (12) | |
| Post-employment and other benefit liabilities | (180) | | | (127) | |
| Net amount recognized | $ | (150) | | | $ | (107) | |
(1) See Note 20 - Divestitures for additional information.
(2) See Note 19 - Acquisitions for additional information.
The decrease in funded status was primarily driven by the acquisition of the VCS Business on January 2, 2024. However, the decrease was partially offset by the increase in discount rates over the measurement period which resulted in lower benefit obligations.
The pretax amounts recognized in Accumulated other comprehensive (income) loss are:
| | | | | | | | | | | | | | | | | | | | |
| (In millions) | | Prior Service Cost (Benefit) | | Net Actuarial (Gain) Loss | | Total |
| As of December 31, 2023 | | $ | 6 | | | $ | 120 | | | $ | 126 | |
| Current year changes recorded in AOCI | | — | | | 27 | | | 27 | |
| Amortization reclassified to earnings | | (1) | | | (1) | | | (2) | |
| Prior Service Cost or (Credit) Occurring During Fiscal Year | | (1) | | | — | | | (1) | |
| Settlement/curtailment reclassified to earnings | | — | | | (3) | | | (3) | |
| Currency translation and other | | — | | | (3) | | | (3) | |
| Divestitures | | — | | | (10) | | | (10) | |
| As of December 31, 2024 | | $ | 4 | | | $ | 130 | | | $ | 134 | |
Information for pension plans with accumulated benefit obligations in excess of plan assets:
| | | | | | | | | | | |
| (In millions) | 2024 | | 2023 |
| Projected benefit obligation | $ | 481 | | | $ | 378 | |
| Accumulated benefit obligation | $ | 456 | | | $ | 362 | |
| Fair value of plan assets | $ | 288 | | | $ | 239 | |
Information for pension plans with projected benefit obligations in excess of plan assets:
| | | | | | | | | | | |
| (In millions) | 2024 | | 2023 |
| Projected benefit obligation | $ | 481 | | | $ | 378 | |
| Accumulated benefit obligation | $ | 456 | | | $ | 362 | |
| Fair value of plan assets | $ | 288 | | | $ | 239 | |
The accumulated benefit obligation for all defined benefit plans was $0.6 billion and $0.6 billion as of December 31, 2024 and 2023, respectively.
Pension benefit payments, including amounts to be paid from corporate assets, and reflecting expected future service, as appropriate, are expected to be paid as follows:
| | | | | |
| (In millions) | |
| 2025 | $ | 37 | |
| 2026 | $ | 38 | |
| 2027 | $ | 47 | |
| 2028 | $ | 45 | |
| 2029 | $ | 46 | |
| 2030 through 2034 | $ | 242 | |
For the years ended December 31, 2024, 2023 and 2022, the Company made $34 million, $33 million and $16 million, respectively, of cash contributions to its defined benefit pension plans. The Company expects to make total contributions of approximately $6 million to its defined benefit pension plans in 2025.
The components of net periodic pension expense (benefit) for the defined benefit pension plans are as follows:
| | | | | | | | | | | | | | | | | | | | | |
| (In millions) | 2024 | | 2023 | | 2022 | | | | |
| Service cost | $ | 14 | | | $ | 15 | | | $ | 20 | | | | | |
| Interest cost | 26 | | | 31 | | | 18 | | | | | |
| Expected return on plan assets | (36) | | | (32) | | | (27) | | | | | |
| Amortization of prior service cost | 1 | | | 3 | | | 2 | | | | | |
| Recognized actuarial net loss | 1 | | | (2) | | | 9 | | | | | |
| Net settlement, curtailment and special termination benefit loss | 4 | | | 1 | | | 2 | | | | | |
| Net periodic pension expense (benefit) | $ | 10 | | | $ | 16 | | | $ | 24 | | | | | |
| | | | | | | | | |
| Amounts recorded in continuing operations | $ | 10 | | | $ | 16 | | | $ | 24 | | | | | |
| Amounts recorded in discontinued operations | — | | | — | | | — | | | | | |
| Net periodic pension expense (benefit) | $ | 10 | | | $ | 16 | | | $ | 24 | | | | | |
Major assumptions used in determining the benefit obligation and net cost for pension plans are presented in the following table as weighted-averages:
| | | | | | | | | | | | | | | | | | | | | | | | | | | | | | | | | | | |
| | Benefit Obligation | | Net Costs |
| | 2024 | | 2023 | | 2024 | | 2023 | | 2022 | |
| Discount rate | | | | | | | | | | | |
| Projected benefit obligation | 4.3% | | 4.3 | % | | 4.3% | | 4.2 | % | | 2.1 | % | |
Interest cost (1) | | —% | | — | % | | 4.2% | | 4.1 | % | | 1.9 | % | |
Service cost (1) | | —% | | — | % | | 4.5% | | 4.5 | % | | 2.8 | % | |
| Salary scale | | 2.6% | | 2.2 | % | | 2.2% | | 2.4 | % | | 3.1 | % | |
| Expected return on plan assets | —% | | — | % | | 6.3% | | 5.7 | % | | 5.0 | % | |
| | | | | | | | | | | |
(1) The 2024 and 2023 discount rates used to measure the service cost and interest cost applies to the significant plans of the Company. The projected benefit obligation discount rate is used for the service cost and interest cost measurements for non-significant plans.
The expected long-term rate of return on plan assets is determined by considering the relative weighting of plan assets, the historical performance of total plan assets, individual asset classes, economic and other indicators of future performance. Return projections are assessed for reasonableness using a simulation model that incorporates yield curves, credit spreads and risk premiums to project long-term prospective returns.
The Company's investment objective is to provide liquidity and asset levels needed to meet current and future benefit payments, while maintaining a prudent degree of portfolio diversification considering interest rate risk and market volatility. Globally, investment strategies target a mix of approximately 20% of growth seeking assets and 80% of income generating and hedging assets using a wide diversification of asset types, fund strategies and investment managers.
The growth seeking allocation consists of global public equities in developed and emerging countries and alternative asset class strategies. The income generating assets primarily consist of government and broadly diversified high quality corporate bonds. In addition, the Company's investment strategies seek to reduce interest rate risk and have incorporated liability hedging programs as part of the long-term investment strategy. Under this objective, the income generating and hedging assets typically increase as the plans' funded status improves. The Company monitors plan funded status and asset allocation regularly in addition to investment manager performance.
The fair values of pension plan assets by asset category are as follows:
| | | | | | | | | | | | | | | | | | | | | | | | | | | | | | | | |
| (In millions) | | Quoted Prices in Active Markets for Identical Assets | | Significant Observable Inputs | | Significant Unobservable Inputs | | Not Subject
to Leveling | | Total |
| Asset Category | | (Level 1) | | (Level 2) | | (Level 3) | | | | |
| Public Equities: | | | | | | | | | | |
| Global Equities | | $ | — | | | $ | 23 | | | $ | — | | | $ | — | | | $ | 23 | |
| | | | | | | | | | |
| | | | | | | | | | |
Global Equity Funds at net asset value (1) (2) | | — | | | — | | | — | | | 125 | | | 125 | |
| | | | | | | | | | |
| Fixed Income Securities: | | | | | | | | | | |
| Governments | | — | | | 23 | | | — | | | 25 | | | 48 | |
| Corporate Bonds | | — | | | 93 | | | — | | | — | | | 93 | |
Fixed Income Securities (2) | | — | | | — | | | — | | | 156 | | | 156 | |
Real Estate (3) | | — | | | 1 | | | — | | | — | | | 1 | |
Other (4) (5) | | — | | | 15 | | | — | | | 8 | | | 23 | |
Cash & Cash Equivalents (2)(6) | | — | | | 28 | | | — | | | 9 | | | 37 | |
| Subtotal | | $ | — | | | $ | 183 | | | $ | — | | | $ | 323 | | | $ | 506 | |
Other assets and liabilities (7) | | | | | | | | | | 1 | |
| Total as of December 31, 2024 | | | | | | | | | | $ | 507 | |
| | | | | | | | | | |
| | | | | | | | | | |
| (In millions) | | Quoted Prices in Active Markets for Identical Assets | | Significant Observable Inputs | | Significant Unobservable Inputs | | Not Subject
to Leveling | | Total |
| Asset Category | | (Level 1) | | (Level 2) | | (Level 3) | | | | |
| Public Equities: | | | | | | | | | | |
| Global Equities | | $ | — | | | $ | 26 | | | $ | — | | | $ | — | | | $ | 26 | |
| | | | | | | | | | |
| | | | | | | | | | |
Global Equity Funds at net asset value (1) (2) | | — | | | — | | | — | | | 125 | | | 125 | |
| | | | | | | | | | |
| Fixed Income Securities: | | | | | | | | | | |
| Governments | | — | | | 40 | | | — | | | 23 | | | 63 | |
| Corporate Bonds | | — | | | 44 | | | — | | | — | | | 44 | |
Fixed Income Securities (2) | | — | | | 9 | | | — | | | 172 | | | 181 | |
Real Estate (3) | | — | | | 1 | | | — | | | — | | | 1 | |
Other (4)(5) | | — | | | 10 | | | — | | | — | | | 10 | |
Cash & Cash Equivalents (2)(6) | | — | | | 13 | | | — | | | 3 | | | 16 | |
| Subtotal | | $ | — | | | $ | 143 | | | $ | — | | | $ | 323 | | | $ | 466 | |
Other assets and liabilities (7) | | | | | | | | | | 2 | |
| Total as of December 31, 2023 | | | | | | | | | | $ | 468 | |
| | | | | | | | | | |
| | | | | | | | | | |
| | | | | | | | | | |
| | | | | | | | | | |
(1) Represents commingled funds that invest primarily in common stocks.
(2) In accordance with ASU 2015-07, Fair Value Measurement (Topic 820), certain investments that are measured at fair value using the net asset value per share (or its equivalent) practical expedient have not been classified in the fair value hierarchy. The fair value amounts presented in this table are intended to permit reconciliation of the fair value hierarchy to the amounts presented for the total pension plan assets.
(3) Represents investments in real estate, including commingled funds and directly held properties.
(4) Represents insurance contracts and global balanced risk commingled funds consisting mainly of equity, bonds and some commodities.
(5) Includes fixed income repurchase agreements entered into for purposes of pension asset and liability matching.
(6) Represents short-term commercial paper, bonds and other cash or cash-like instruments.
(7) Represents trust receivables and payables that are not leveled.
Derivatives in the plan are primarily used to manage risk and gain asset class exposure while still maintaining liquidity. Derivative instruments mainly consist of fixed income repurchase agreements, interest rate swaps, total return swaps and currency forward contracts.
Quoted market prices are used to value investments when available. Investments in securities traded on exchanges, including listed futures and options, are valued at the last reported sale prices on the last business day of the year or, if not available, the last reported bid prices. Fixed income securities are primarily measured using a market approach pricing methodology, whereby observable prices are obtained by market transactions involving identical or comparable securities of issuers with similar credit ratings. Over-the-counter securities and government obligations are valued at the bid prices or the average of the bid and ask prices on the last business day of the year from published sources or, if not available, from other sources considered reliable, including broker quotes. Temporary cash investments are stated at cost, which approximates fair value.
Multiemployer Benefit Plans
The Company contributes to various domestic and foreign multiemployer defined benefit pension plans. The risks of participating in these multiemployer plans are different from those of single-employer plans in that assets contributed are pooled and may be used to provide benefits to employees of other participating employers. If a participating employer stops contributing to the plan, the unfunded obligations of the plan may be borne by the remaining participating employers. The Company's contributions to these plans for the years ended December 31, 2024 and 2023, was $15 million and $15 million, respectively.
Employee Savings Plans
The Company sponsors various employee savings plans. Employer contributions are determined based on criteria specific to each plan and were $138 million, $125 million and $123 million for the years ended December 31, 2024, 2023 and 2022, respectively.
NOTE 11: PRODUCT WARRANTIES
In the ordinary course of business, the Company provides standard warranty coverage on its products. Provisions for these amounts are established at the time of sale and estimated primarily based on product warranty terms and historical claims experience. In addition, the Company incurs discretionary costs to service its products in connection with specific product performance issues. Provisions for these amounts are established when they are known and estimable. The Company assesses the adequacy of its initial provisions and will make adjustments as necessary based on known or anticipated claims or as new information becomes available that suggests it is probable that future costs will be different than estimated amounts. Amounts associated with these provisions are classified on the accompanying Consolidated Balance Sheet as Accrued liabilities or Other long-term liabilities based on their anticipated settlement date.
The changes in the carrying amount of warranty related provisions are as follows:
| | | | | | | | | | | |
| (In millions) | 2024 | | 2023 |
| Balance as of January 1, | $ | 568 | | | $ | 544 | |
| Warranties, performance guarantees issued and changes in estimated liability | 327 | | | 239 | |
| Settlements made | (346) | | | (194) | |
| Other | 5 | | | (11) | |
Acquisitions (1) | 232 | | | — | |
Reclassified to held for sale (2) | — | | | (10) | |
| Balance as of December 31, | $ | 786 | | | $ | 568 | |
(1) See Note 19 - Acquisitions for additional information.
(2) See Note 20 - Divestitures for additional information.
NOTE 12: EQUITY
The authorized number of shares of common stock of Carrier is 4,000,000,000 shares of $0.01 par value. As of December 31, 2024 and December 31, 2023, 948,068,772 and 883,068,393 shares of common stock were issued, respectively, which includes 70,093,639 and 43,490,981 shares of treasury stock, respectively.
Share Repurchase Program
The Company may purchase its outstanding common stock from time to time subject to market conditions and at the Company's discretion. Repurchases occur in the open market or through one or more other public or private transactions pursuant to plans complying with Rules 10b5-1 and 10b-18 under the Exchange Act. Shares acquired are recognized at cost and presented separately on the balance sheet as a reduction to Equity. Since the initial authorization in February 2021, the Company's Board of Directors authorized the repurchase of up to $7.1 billion of the Company's outstanding common stock which includes a $3 billion increase approved in October 2024. As of December 31, 2024, the Company repurchased 70.1 million shares of common stock for an aggregate purchase price of $3.9 billion. As a result, the Company has approximately $3.2 billion remaining under the current authorization at December 31, 2024.
Accumulated Other Comprehensive Income (Loss)
A summary of changes in the components of Accumulated other comprehensive income (loss) is as follows:
| | | | | | | | | | | | | | | | | | | | | | | | | | | |
| (In millions) | Foreign Currency Translation | | Defined Benefit Pension and Post-retirement Plans | | | | | | Unrealized Hedging Gains (Losses) | | Accumulated Other Comprehensive Income (Loss) |
| Balance as of January 1, 2022 | $ | (505) | | | $ | (484) | | | | | | | $ | — | | | $ | (989) | |
| Other comprehensive income (loss) before reclassifications, net | (525) | | | 63 | | | | | | | — | | | (462) | |
| Amounts reclassified, pre-tax | — | | | 11 | | | | | | | — | | | 11 | |
| Tax benefit reclassified | — | | | (3) | | | | | | | — | | | (3) | |
| Chubb divestiture | (574) | | | 329 | | | | | | | — | | | (245) | |
| Balance as of December 31, 2022 | $ | (1,604) | | | $ | (84) | | | | | | | $ | — | | | $ | (1,688) | |
| Other comprehensive income (loss) before reclassifications, net | 160 | | | (17) | | | | | | | 58 | | | 201 | |
| Amounts reclassified, pre-tax | — | | | 1 | | | | | | | — | | | 1 | |
| | | | | | | | | | | |
| | | | | | | | | | | |
| Balance as of December 31, 2023 | $ | (1,444) | | | $ | (100) | | | | | | | $ | 58 | | | $ | (1,486) | |
| Other comprehensive income (loss) before reclassifications, net | (1,173) | | | (15) | | | | | | | — | | | (1,188) | |
| Amounts reclassified, pre-tax | — | | | 2 | | | | | | | (6) | | | (4) | |
| Tax benefit reclassified | — | | | (1) | | | | | | | 2 | | | 1 | |
| Divestitures, net | 564 | | | 7 | | | | | | | — | | | 571 | |
| Balance as of December 31, 2024 | $ | (2,053) | | | $ | (107) | | | | | | | $ | 54 | | | $ | (2,106) | |
NOTE 13: REVENUE RECOGNITION
The Company accounts for revenue in accordance with ASC 606: Revenue from Contracts with Customers. Revenue is recognized when control of a good or service promised in a contract (i.e., performance obligation) is transferred to a customer. Control is obtained when a customer has the ability to direct the use of and obtain substantially all of the remaining benefits from that good or service. A significant portion of the Company's performance obligations are recognized at a point-in-time when control of the product transfers to the customer, which is generally the time of shipment. The remaining portion of the Company’s performance obligations are recognized over time as the customer simultaneously obtains control as the Company performs work under a contract, or if the product being produced for the customer has no alternative use and the Company has a contractual right to payment.
Performance Obligations
A performance obligation is a distinct good, service or a bundle of goods and services promised in a contract. Some of the Company's contracts with customers contain a single performance obligation, while others contain multiple performance obligations most commonly when a contract spans multiple phases of a product life-cycle such as production, installation, maintenance and support. The Company identifies performance obligations at the inception of a contract and allocates the transaction price to each distinct performance obligation. Revenue is recognized when or as the performance obligation is satisfied. When there are multiple performance obligations within a contract, the Company allocates the transaction price to each performance obligation based on its relative stand-alone selling price.
The Company primarily generates revenue from the sale of products to customers and recognizes revenue at a point in time when control transfers to the customer. Transfer of control is generally based on the shipping terms of the contract. In addition, the Company recognizes revenue on an over-time basis on installation and service contracts. For over-time performance obligations requiring the installation of equipment, revenue is recognized using costs incurred to date relative to total estimated costs at completion to measure progress. Incurred costs represent work performed, which correspond with and best depict transfer of control to the customer. Contract costs include direct costs such as labor, materials and subcontractors’ costs and where applicable, indirect costs.
Segment sales disaggregated by product and service are as follows:
| | | | | | | | | | | | | | | | | | | | |
| | | |
| (In millions) | | 2024 | | 2023 | | 2022 |
| Sales Type | | | | | | |
| Product | | $ | 16,986 | | | $ | 13,313 | | | $ | 11,882 | |
| Service | | 2,092 | | | 1,826 | | | 1,526 | |
| HVAC sales | | 19,078 | | | 15,139 | | | 13,408 | |
| | | | | | |
| Product | | 3,061 | | | 3,352 | | | 3,432 | |
| Service | | 414 | | | 466 | | | 451 | |
| Refrigeration sales | | 3,475 | | | 3,818 | | | 3,883 | |
| | | | | | |
| Total segment sales | | 22,553 | | | 18,957 | | | 17,291 | |
| | | | | | |
Eliminations and other (1) | | (67) | | | (6) | | | (3) | |
| Consolidated | | $ | 22,486 | | | $ | 18,951 | | | $ | 17,288 | |
(1) Includes certain business activities previously reported in the Fire & Security segment.
The transaction price allocated to performance obligations reflects the Company’s expectations about the consideration it will be entitled to receive from a customer. The Company includes variable consideration in the estimated transaction price when there is a basis to reasonably estimate the amount and when it is probable that a significant reversal of revenue recognized would not occur when the uncertainty associated with variable consideration is subsequently resolved. In addition, the Company customarily offers its customers incentives to purchase products to ensure an adequate supply of its products in distribution channels. The principal incentive programs provide reimbursements to distributors for offering promotional pricing for products. The Company accounts for estimated incentive payments as a reduction in sales at the time a sale is recognized.
Contract Balances
Total contract assets and liabilities consisted of the following:
| | | | | | | | | | | |
| (In millions) | 2024 | | 2023 |
Contract assets, current (included within Other current assets) | $ | 366 | | | $ | 306 | |
Contract assets, non-current (included within Other assets) | 65 | | | 26 | |
| Total contract assets | 431 | | | 332 | |
| | | |
Contract liabilities, current (included within Accrued liabilities) | (553) | | | (419) | |
Contract liabilities, non-current (included within Other long-term liabilities) | (164) | | | (160) | |
| Total contract liabilities | (717) | | | (579) | |
| Net contract assets (liabilities) | $ | (286) | | | $ | (247) | |
The timing of revenue recognition, billings and cash collections results in contract assets and contract liabilities. Contract assets relate to the conditional right to consideration for any completed performance under a contract when costs are incurred in excess of billings under the percentage-of-completion methodology. Contract liabilities relate to payments received in advance of performance under a contract or when the Company has a right to consideration that is conditioned upon transfer of a good or service to the customer. Contract liabilities are recognized as revenue as (or when) the Company performs under the contract.
The Company recognized revenue of $469 million for the year ended December 31, 2024, that was related to contract liabilities as of January 1, 2024. The Company expects a majority of its contract liabilities at the end of the period to be recognized as revenue over the next 12 months. There were no individually significant customers with sales exceeding 10% of total sales for the years ended December 31, 2024, 2023 and 2022.
NOTE 14: STOCK-BASED COMPENSATION
The Company accounts for stock-based compensation plans in accordance with ASC 718, Compensation - Stock Compensation, which requires a fair-value based method for measuring the value of stock-based compensation. Fair value is measured at the date of grant and is generally not adjusted for subsequent changes. The Company's stock-based compensation plans include programs for stock appreciation rights, restricted stock and performance share units.
Stock Options and Appreciation Rights
Eligible participants may receive stock options or stock appreciation rights as part of the Company's long-term incentive program. The fair value of each instrument is determined as of the date of grant using a binomial lattice model and expensed on a straight-line basis over the required service period, which is generally a three-year vesting period. However, in the event of retirement, awards held for at least one year may vest and become exercisable (if applicable), subject to certain terms and conditions.
The following table summarizes fair value information for stock options and stock appreciation rights:
| | | | | | | | | | | | | | | | | | | | |
| | 2024 (1) | | 2023 (1) | | 2022 (1) |
| Stock options and stock appreciation rights weighted-average fair value per award | | $ | 14.84 | | | $ | 11.64 | | | $ | 10.68 | |
| Assumptions: | | | | | | |
| Volatility | | 30.6% to 31.7% | | 30.9% | | 30.8% to 31.3% |
| | | | | | |
| Expected term (in years) | | 5.6 to 7.8 | | 5.8 | | 6.1 |
| Expected dividend yield | | 1.8% | | 1.8% | | 1.5% |
| Range of risk-free rates | | 4.0% to 4.3% | | 3.6% | | 1.7% to 3.0% |
(1) Carrier has limited historical trading data and used peer group data to estimate expected volatility for the 2024, 2023 and 2022 awards.
The Company used historical employee data, including data prior to the Separation and the Distribution, to estimate expected term. The expected dividend yield is consistent with management's expectations. The risk-free rate is based on the term structure of interest rates at the time the awards were granted.
Changes in stock options and stock appreciation rights outstanding were as follows:
| | | | | | | | | | | | | | | | | | | | | | | |
| Shares Subject to Option
(in thousands) | | Weighted-Average Exercise Price | | Aggregate Intrinsic Value
(in millions) | | Weighted- Average Remaining Life
(in years) |
| As of December 31, 2021 | 32,441 | | | $ | 22.02 | | | | | |
| Granted | 2,715 | | | $ | 47.72 | | | | | |
| Exercised | (3,495) | | | $ | 17.76 | | | | | |
| Cancelled | (883) | | | $ | 30.33 | | | | | |
| As of December 31, 2022 | 30,778 | | | $ | 24.53 | | | | | |
| Granted | 3,494 | | | $ | 46.13 | | | | | |
| Exercised | (8,432) | | | $ | 20.48 | | | | | |
| Cancelled | (769) | | | $ | 42.94 | | | | | |
| As of December 31, 2023 | 25,071 | | | $ | 28.34 | | | | | |
| Granted | 4,187 | | | $ | 56.46 | | | | | |
| Exercised | (8,041) | | | $ | 23.21 | | | | | |
| Cancelled | (430) | | | $ | 50.77 | | | | | |
| Outstanding as of December 31, 2024 | 20,787 | | | $ | 35.52 | | | $ | 681 | | | 5.8 |
| | | | | | | |
| Exercisable as of December 31, 2024 | 12,746 | | | $ | 25.48 | | | $ | 545 | | | 4.1 |
Restricted Stock Units
Eligible participants may receive restricted stock units ("RSU") as part of the Company's long-term incentive program. The fair value of restricted stock units are based on the closing market price of the Company's common stock on the date of grant and expensed on a straight-line basis over the required service period (which is generally a three-year vesting period). However, in the event of retirement, awards held for at least one year may vest and become exercisable (if applicable), subject to certain terms and conditions. Dividends accrue during the vesting period and are paid in shares of the Company's common stock.
Changes in restricted stock units were as follows:
| | | | | | | | | | | |
| RSUs (in thousands) | | Weighted-Average Grant Date Fair Value |
| Outstanding and unvested as of December 31, 2021 | 3,570 | | | $ | 23.33 | |
| Granted | 555 | | | $ | 41.88 | |
| Vested | (1,915) | | | $ | 20.85 | |
| Cancelled | (143) | | | $ | 32.92 | |
| Outstanding and unvested as of December 31, 2022 | 2,067 | | | $ | 29.87 | |
| Granted | 577 | | | $ | 45.71 | |
| Vested | (1,140) | | | $ | 26.09 | |
| Cancelled | (161) | | | $ | 35.09 | |
| Outstanding and unvested as of December 31, 2023 | 1,343 | | | $ | 39.22 | |
| Granted | 264 | | | $ | 59.88 | |
| Vested | (448) | | | $ | 38.17 | |
| Cancelled | (68) | | | $ | 49.14 | |
| Outstanding and unvested as of December 31, 2024 | 1,091 | | | $ | 43.94 | |
Performance Share Units
The Company has a performance share program for key employees whereby awards are provided in the form of performance share units ("PSU") based on performance against pre-established objectives. The annual target level is expressed as shares of the Company's common stock based on the fair value of its stock on the date of grant. Awards are generally earned over a three-year performance period based equally on a performance condition, measured by the compound annual growth rate of the Company's earnings per share and on a market condition, measured by the Company's relative total shareowner return compared to the total shareowner return of a subset of industrial companies in the S&P 500 Index. The fair value of the market condition is estimated using a Monte Carlo simulation approach. The fair value of the PSU awards are expensed over the required service period, which is generally a three-year vesting period. In the event of retirement, performance share units held for at least one year remain eligible to vest based on actual performance relative to pre-established metrics. Dividends do not accrue on the performance share units during the performance period.
Changes in PSUs were as follows:
| | | | | | | | | | | |
| PSUs (in thousands) | | Weighted-Average Grant Date Fair Value |
| Outstanding and unvested as of December 31, 2021 | 1,421 | | | $ | 30.75 | |
| Granted | 653 | | | $ | 46.93 | |
| Vested | (5) | | | $ | 41.81 | |
| Forfeited | (139) | | | $ | 35.45 | |
| Outstanding and unvested as of December 31, 2022 | 1,930 | | | $ | 35.86 | |
| Granted | 902 | | | $ | 47.93 | |
| Vested | (607) | | | $ | 18.23 | |
| Forfeited | (183) | | | $ | 46.52 | |
| Outstanding and unvested as of December 31, 2023 | 2,042 | | | $ | 45.47 | |
| Granted | 1,741 | | | $ | 50.75 | |
| Vested | (1,339) | | | $ | 41.49 | |
| Forfeited | (121) | | | $ | 52.56 | |
| Outstanding and unvested as of December 31, 2024 | 2,323 | | | $ | 51.35 | |
Compensation Expense
Stock-based compensation expense, net of estimated forfeitures, is included in Cost of products sold, Selling, general and administrative and Research and development, in the accompanying Consolidated Statement of Operations.
Stock-based compensation cost by award type are as follows:
| | | | | | | | | | | | | | | | | |
| (In millions) | 2024 | | 2023 | | 2022 |
| Equity compensation costs - equity settled | $ | 98 | | | $ | 81 | | | $ | 77 | |
Equity compensation costs - cash settled (1) | 2 | | | 3 | | | (15) | |
| Total stock-based compensation cost | $ | 100 | | | $ | 84 | | | $ | 62 | |
| | | | | |
| Amounts recorded in continuing operations | $ | 87 | | | $ | 74 | | | $ | 53 | |
| Amounts recorded in discontinued operations | 13 | | | 10 | | | 9 | |
| Total stock-based compensation cost | $ | 100 | | | $ | 84 | | | $ | 62 | |
| | | | | |
| Income tax benefit | $ | 13 | | | $ | 11 | | | $ | 9 | |
(1) The cash settled awards are classified as liability awards and are measured at fair value at each balance sheet date.
As of December 31, 2024 and 2023, there were $112 million and $63 million of unrecognized stock-based compensation costs related to non-vested awards granted under the plan, respectively, which will be recognized ratably over the awards weighted-average remaining vesting period of 3 years.
NOTE 15: RESTRUCTURING COSTS
The Company incurs costs associated with restructuring initiatives intended to improve operating performance, profitability and working capital levels. Actions associated with these initiatives may include improving productivity, workforce reductions and the consolidation of facilities. Due to the size, nature and frequency of these discrete plans, they are fundamentally different from the Company’s ongoing productivity initiatives.
The Company recorded net pre-tax restructuring costs for new and ongoing restructuring actions as follows:
| | | | | | | | | | | | | | | | | |
| (In millions) | 2024 | | 2023 | | 2022 |
| HVAC | $ | 87 | | | $ | 44 | | | $ | 8 | |
| Refrigeration | 8 | | | 21 | | | 10 | |
| Total Segment | 95 | | | 65 | | | 18 | |
| General corporate expenses | 13 | | | 10 | | | 2 | |
Total restructuring costs (1) | $ | 108 | | | $ | 75 | | | $ | 20 | |
| | | | | |
| Cost of sales | $ | 42 | | | $ | 13 | | | $ | 6 | |
| Selling, general and administrative | 66 | | | 62 | | | 14 | |
| | | | | |
Total restructuring costs (1) | $ | 108 | | | $ | 75 | | | $ | 20 | |
(1) 2024 restructuring costs include period-related charges.
The following table summarizes changes in the restructuring reserve, included in Accrued liabilities on the accompanying Consolidated Balance Sheet:
| | | | | | | | | | | | | | |
| (In millions) | | 2024 | | 2023 |
| Balance as of January 1, | | $ | 41 | | | $ | 21 | |
| Net pre-tax restructuring costs | | 98 | | | 75 | |
Acquisitions (1) | | 8 | | | — | |
| Utilization, foreign exchange and other | | (78) | | | (48) | |
Reclassified to held for sale (2) | | — | | | (7) | |
| Balance as of December 31, | | $ | 69 | | | $ | 41 | |
(1) See Note 19 - Acquisitions for additional information.
(2) See Note 20 - Divestitures for additional information.
As of December 31, 2024, the Company had $69 million accrued for costs associated with its announced restructuring initiatives. The balance relates to cost reduction efforts, primarily severance, across each of the Company's segments. In addition, reserves associated with the Company's planned portfolio transformation were established during the year, all of which are expected to be paid within 12 months.
NOTE 16: OTHER INCOME (EXPENSE), NET
Other income (expense), net consisted of the following:
| | | | | | | | | | | | | | | | | |
| (In millions) | 2024 | | 2023 | | 2022 |
| | | | | |
| | | | | |
| Viessmann-related hedges | (86) | | | (96) | | | — | |
| CCR gain | 318 | | | — | | | — | |
| TMA-related gain | 46 | | | — | | | — | |
| TCC acquisition-related gain | — | | | (8) | | | 705 | |
| Chubb gain | — | | | — | | | 1,105 | |
| Other | 39 | | | (9) | | | 8 | |
| Other income (expense), net | $ | 317 | | | $ | (113) | | | $ | 1,818 | |
Other income (expense), net primarily includes the impact of gains and losses related to the sale of businesses or interests in equity method investments, foreign currency gains and losses on transactions that are denominated in a currency other than the entity's functional currency and hedging-related activities. During the year ended December 31, 2024, the Company completed the sale of CCR and recognized a gain on the sale of $318 million. In addition, the Company recognized a $46 million gain associated with its share of UTC's conclusion of certain income tax matters from their 2017 and 2018 tax audit with the IRS. In connection with the acquisition of the VCS Business, the Company recognized a $86 million loss on the mark-to-market valuation of its window forward contracts associated with the cash outflows of the Euro-denominated purchase price.
During the year ended December 31, 2023, the Company recognized a $96 million loss on the mark-to-market valuation of its window forward contracts associated with the cash outflows of the Euro-denominated purchase price of the VCS Business. During the year ended December 31, 2022, the carrying value of the Company's previously held equity investments in TCC were recognized at fair value at the date of acquisition. As a result, the Company recognized a $697 million non-cash gain associated with the increase in its ownership interest. In addition, the Company completed the Chubb Sale and recognized a gain on the sale of $1.1 billion.
NOTE 17: INCOME TAXES
Income Before Income Taxes
The sources of Income from operations before income taxes are as follows:
| | | | | | | | | | | | | | | | | |
| (In millions) | 2024 | | 2023 | | 2022 |
| United States | $ | 1,948 | | | $ | 1,398 | | | $ | 1,528 | |
| Foreign | 326 | | | 601 | | | 2,295 | |
| Total | $ | 2,274 | | | $ | 1,999 | | | $ | 3,823 | |
Provision for Income Taxes
The income tax expense (benefit) consisted of the following components:
| | | | | | | | | | | | | | | | | |
| (In millions) | 2024 | | 2023 | | 2022 |
| Current: | | | | | |
| United States: | | | | | |
| Federal | $ | 920 | | | $ | 361 | | | $ | 405 | |
| State | 120 | | | 110 | | | 106 | |
| Foreign | 374 | | | 293 | | | 211 | |
| 1,414 | | | 764 | | | 722 | |
| Future: | | | | | |
| United States: | | | | | |
| Federal | (90) | | | (135) | | | (10) | |
| State | (13) | | | (28) | | | (26) | |
| Foreign | (249) | | | (80) | | | (70) | |
| (352) | | | (243) | | | (106) | |
| Income tax expense | $ | 1,062 | | | $ | 521 | | | $ | 616 | |
| | | | | |
| | | | | |
| | | | | |
Reconciliation of Effective Income Tax Rate
The differences between the effective income tax rate and the statutory U.S. federal income tax rate are as follows:
| | | | | | | | | | | | | | | | | | | | |
| 2024 | | 2023 | | 2022 | |
| Statutory U.S. federal income tax rate | 21.0 | % | | 21.0 | % | | 21.0 | % | |
| State income tax | 2.4 | | | 2.4 | | | 1.4 | | |
| Taxes on international activities | (0.2) | | | 4.9 | | | (0.9) | | |
| CCR divestiture impact | (2.0) | | | — | | | — | | |
| VCS reorganization impact | 28.6 | | | — | | | — | | |
| TCC acquisition impact | — | | | — | | | (4.7) | | |
| | | | | | |
| Other | (3.1) | | | (2.2) | | | (0.7) | | |
| Effective income tax rate | 46.7 | % | | 26.1 | % | | 16.1 | % | |
The effective tax rate for the year ended December 31, 2024 was higher than the Company's statutory U.S. federal income tax rate. The increase was primarily driven by a net tax charge of $650 million related to a re-organization of the VCS Business and a non-deductible loss of $86 million on the mark-to-market valuation of the Company's window forward contracts associated with the expected cash outflows of the Euro-denominated purchase price of the VCS Business, partially offset by the lower effective tax rate on the $318 million gain on the sale of CCR and $44 million of foreign tax credits generated and utilized in the current year.
The effective tax rate for the year ended December 31, 2023 was higher than the Company's statutory U.S. federal income tax rate. The increase was primarily driven by a net tax charge of $27 million relating to the re-organization and disentanglement of the CCR businesses in advance of the planned divestiture. In addition, the effective tax rate was impacted by the recognition of a deferred tax liability for withholding tax of $19 million on repatriated foreign earnings, non-deductible divestiture-related costs and a non-deductible loss of $96 million on the mark-to-market valuation of the Company's window forward contracts associated with the expected cash outflows of the Euro-denominated purchase price of the VCS Business.
The effective tax rate for the year ended December 31, 2022 was lower than the Company's statutory U.S. federal income tax rate. The decrease was driven by a lower effective tax rate on the $705 million non-cash gain resulting from the recognition of the Company's previously held TCC equity investments at fair value upon acquisition of TCC, a lower effective tax rate on the $1.1 billion Chubb gain and $45 million of foreign tax credits generated and utilized in the current year.
Deferred Tax Assets and Liabilities
Future income taxes represent the tax effects of transactions, which are reported in different periods for tax and GAAP purposes. These amounts consist of the tax effects of differences between tax and GAAP that are expected to be reversed in the future and tax carryforwards. Future income tax benefits and obligations within the same tax paying component of a particular jurisdiction are offset for presentation in the Consolidated Balance Sheet.
The tax effects of temporary differences and tax carryforwards which give rise to future income tax benefits and obligations as of December 31, 2024 and 2023, are as follows:
| | | | | | | | | | | |
| (In millions) | 2024 | | 2023 |
| Future income tax benefits: | | | |
| Insurance and employee benefits | $ | 142 | | | $ | 155 | |
| Other assets basis differences | 576 | | | 413 | |
| Other liabilities basis differences | 674 | | | 531 | |
| Tax loss carryforwards | 178 | | | 159 | |
| Tax credit carryforwards | 1,404 | | | 1,332 | |
| Valuation allowances | (1,442) | | | (1,372) | |
| Future income tax benefits | $ | 1,532 | | | $ | 1,218 | |
| | | |
| Future income tax obligations: | | | |
| Goodwill and intangible assets | $ | (1,769) | | | $ | (401) | |
| Other asset basis differences | (381) | | | (389) | |
| Future income tax obligations | $ | (2,150) | | | $ | (790) | |
Valuation allowances have been established primarily for tax credit carryforwards, tax loss carryforwards and certain foreign temporary differences to reduce future income tax benefits to expected realizable amounts.
Changes to valuation allowances consisted of the following:
| | | | | | | | |
| (In millions) | | |
| | |
| Balance as of January 1, 2022 | | $ | 90 | |
| Additions charged to income tax expense | | 18 | |
| Reduction credited to income tax expense | | (22) | |
| Other adjustments | | 14 | |
| Reclassified to held for sale | | (17) | |
| Balance at December 31, 2022 | | $ | 83 | |
| Additions charged to income tax expense | | 27 | |
| Reduction credited to income tax expense | | (22) | |
Other adjustments (1) | | 1,303 | |
| Reclassified to held for sale | | (19) | |
| Balance at December 31, 2023 | | $ | 1,372 | |
| Additions charged to income tax expense | | 46 | |
| Reduction credited to income tax expense | | (41) | |
| Other adjustments | | 65 | |
| | |
| Balance as of December 31, 2024 | | $ | 1,442 | |
| | |
(1) See discussion below regarding the Swiss tax credit.
Tax Credit and Loss Carryforwards
As of December 31, 2024, tax credit carryforwards and tax loss carryforwards were as follows:
| | | | | | | | | | | |
| (In millions) | Tax Loss Carryforwards | | Tax Credit Carryforwards |
| Expiration period: | | | |
| 2025-2029 | $ | 525 | | | $ | 15 | |
| 2030-2034 | 21 | | | 1,375 | |
| 2035-2044 | 77 | | | — | |
| Indefinite | 457 | | | 14 | |
| Total | $ | 1,080 | | | $ | 1,404 | |
The Company assesses the realizability of its deferred tax assets on a quarterly basis through an analysis of potential sources of future taxable income, including prior year taxable income available to absorb a carryback of tax losses, reversals of existing taxable temporary differences, tax planning strategies and forecasts of taxable income. The Company considers all negative and positive evidence, including the weight of the evidence, to determine if valuation allowances against deferred tax assets are required. The Company maintains valuation allowances against certain deferred tax assets.
In conjunction with the announced portfolio transformation, the Company is implementing changes to its corporate structure, including intra-entity transfers of certain intellectual property to a subsidiary in Switzerland. During 2025, the Company will begin transferring certain intellectual property from wholly-owned legal entities to the Swiss subsidiary. During 2023, the Company’s Swiss subsidiary was granted a tax credit of approximately $1.3 billion that is available to offset cantonal income tax liability over a ten-year period. As the Company is in the preliminary stages of the reorganization, a full valuation allowance was recorded against this tax credit. As operations in the Swiss subsidiary expand in future years it will be necessary to reassess the estimated realizable tax benefit associated with the tax credit.
Unrecognized Tax Benefits
As of December 31, 2024, the Company had unrecognized tax benefits of $365 million, all of which, if recognized, would impact its effective tax rate. A reconciliation of the beginning and ending amounts of unrecognized tax benefits and related interest expense is as follows:
| | | | | | | | | | | | | | | | | |
| (In millions) | 2024 | | 2023 | | 2022 |
| Balance at beginning of period | $ | 382 | | | $ | 291 | | | $ | 251 | |
| Additions for tax positions related to the current year | 34 | | | 37 | | | 34 | |
Additions for tax positions of prior years (1) | 30 | | | 81 | | | 32 | |
| Reductions for tax positions of prior years | (7) | | | — | | | (13) | |
| Settlements | (68) | | | (27) | | | (13) | |
| Reclassified to other accounts | (6) | | | — | | | — | |
| Balance at end of period | $ | 365 | | | $ | 382 | | | $ | 291 | |
| Gross interest expense related to unrecognized tax benefits | $ | 19 | | | $ | 18 | | | $ | 16 | |
| Total accrued interest balance at end of period | $ | 57 | | | $ | 64 | | | $ | 48 | |
(1) Includes $73 million during the year ended December 31, 2023, related to acquisitions.
The Company conducts business globally and, as a result, the Company and its subsidiaries file income tax returns in the U.S. federal, various state and foreign jurisdictions. In certain jurisdictions, the Company's operations were included in UTC's combined tax returns for the periods through the date of the Separation and Distribution. The IRS finalized the examination of UTC's tax years 2017 and 2018 resulting in the recognition of a tax benefit of $21 million in the first quarter of 2024. The IRS examination of UTC's tax year 2020, which Carrier was included in through the date of Separation and Distribution, is expected to conclude in 2025. The U.S. Federal statute of limitations for Carrier's tax year ending on December 31, 2020 expired during the three months ended December 31, 2024 resulting in a recognized tax benefit of $8 million. The IRS has begun an examination of Carrier's tax year 2022 with the examination in an early stage. In the normal course of business, the Company is subject to examination by taxing authorities throughout the world, including the U.S., Australia, Belgium, Canada, China, France, Germany, India, Italy, Malaysia, Poland, Singapore, Spain, and the United Kingdom. The Company is no longer subject to U.S. federal income tax examination for years prior to 2020 and, with few exceptions, is no longer subject to U.S. state and local and foreign income tax examinations for tax years before 2013.
In the ordinary course of business, there is inherent uncertainty in quantifying the Company's income tax positions. The Company assesses its income tax positions and records tax benefits for all years subject to examination based upon management’s evaluation of the facts, circumstances and information available at the reporting date. The Company believes that it is reasonably possible that a net decrease in unrecognized tax benefits of $10 million to $40 million may occur within 12 months as a result of additional uncertain tax positions, the revaluation of uncertain tax positions arising from examinations, appeals, court decisions or the closure of tax statutes.
In October 2021, the Organization for Economic Co-operation and Development ("OECD")/G20 finalized the significant components of a two-pillar global tax reform plan, which has now been agreed to by the majority of OECD members. Pillar One allows countries to reallocate amongst other taxing jurisdictions a portion of residual profits earned by multinational enterprises ("MNE"), with annual global revenue exceeding €20 billion and a profit margin over 10%. The adoption of Pillar One and its potential effective date remain uncertain. Pillar Two requires MNEs with annual global revenue exceeding €750 million to pay a global minimum tax of 15%. On January 13, 2025, the OECD published additional administrative guidance on Pillar Two regarding deferred tax accounting for loss carryforwards and tax credits. The Company is evaluating the impact this additional guidance may have on the utilization of the income tax credit generated by the Company's Swiss subsidiary as discussed above.
As a result of the Tax Cuts and Jobs Act ("TCJA"), the Company no longer intends to reinvest certain undistributed earnings of its international subsidiaries including some earnings which have been previously taxed in the U.S. As such, the Company has recorded tax liabilities associated with the future remittance of these earnings. For the remainder of the Company's undistributed international earnings, unless it becomes tax effective to repatriate, the Company intends to continue to permanently reinvest these earnings. As of December 31, 2024, such undistributed earnings were approximately $11.5 billion, excluding other comprehensive income amounts. It is not practicable to estimate the amount of tax that might be payable on the remaining amounts. In addition, the TCJA subjects the Company to a tax on global intangible low-taxed income ("GILTI"). GILTI is a tax on foreign income in excess of a deemed return on tangible assets of foreign corporations which the Company has elected to account for as a period cost.
NOTE 18: EARNINGS PER SHARE
Earnings per share is computed by dividing Net earnings (loss) attributable to common shareowners by the weighted-average number of shares of common stock outstanding during the period (excluding treasury stock). Diluted earnings per share is computed by giving effect to all potentially dilutive stock awards that are outstanding. The computation of diluted earnings per share excludes the effect of the potential exercise of stock-based awards, including stock appreciation rights and stock options, when the effect of the potential exercise would be anti-dilutive.
The following table summarizes the weighted-average number of shares of common stock outstanding for basic and diluted earnings per share calculations:
| | | | | | | | | | | | | | | | | | | | | | |
| (In millions, except per share amounts) | | 2024 | | 2023 | | 2022 | | |
| Net earnings (loss) attributable to common shareowners | | $ | 5,604 | | | $ | 1,349 | | | $ | 3,534 | | | |
| | | | | | | | |
| Basic weighted-average number of shares outstanding | | 898.2 | | | 837.3 | | | 843.4 | | | |
| Stock awards and equity units (share equivalent) | | 13.5 | | | 15.7 | | | 17.8 | | | |
| Diluted weighted-average number of shares outstanding | | 911.7 | | | 853.0 | | | 861.2 | | | |
| | | | | | | | |
| Antidilutive shares excluded from computation of diluted earnings per share | | 0.1 | | | 2.0 | | | 2.9 | | | |
| | | | | | | | |
| | | | | | | | |
| | | | | | | | |
| | | | | | | | |
NOTE 19: ACQUISITIONS
During the year ended December 31, 2024, the Company acquired consolidated and minority-owned businesses. The aggregate cash paid, net of cash acquired, totaled $10.9 billion. Acquisitions are recorded using the acquisition method of accounting in accordance with ASC 805. As a result, the aggregate purchase price has been allocated to assets acquired and liabilities assumed based on the estimate of fair market value of such assets and liabilities at the date of acquisition. The excess purchase price over the estimated fair value of net assets acquired is recognized as goodwill.
Viessmann Climate Solutions
On January 2, 2024, the Company completed the acquisition of the VCS Business from Viessmann for total consideration of $14.2 billion. The purchase price consisted of (i) $11.2 billion in cash and (ii) 58,608,959 shares of the Company's common stock, subject to certain lock-up provisions and anti-dilution protection. The Company funded the cash portion of the purchase price with a combination of cash on hand, net proceeds from the USD Notes and Euro Notes and borrowings under the Delayed Draw Facility and the 60-day Loan.
The VCS Business develops intelligent, integrated and sustainable technologies, including heat pumps, boilers, photovoltaic systems, home battery storage and digital solutions, primarily for residential customers in Europe. The Company believes that secular trends in these areas will drive significant, sustained future growth. In addition, the Company anticipates realizing significant operational synergies including savings through supplier rationalization and leverage, reduced manufacturing costs and lower general and administrative costs. Longer term, the Company expects to benefit from synergies related to service revenue expansion, leverage of distribution channels and cross-selling opportunities.
The components of the purchase price are as follows:
| | | | | | | | |
| (In millions) | | January 2, 2024 |
| Cash | | $ | 11,156 | |
| Common shares (58,608,959 shares at $51.20 per share) | | 3,001 | |
| Total consideration | | $ | 14,157 | |
The preliminary allocation of the purchase price is as follows:
| | | | | | | | | | | | | | | | | | | | |
| (In millions) | | Preliminary January 2, 2024 | | Measurement Period Adjustments | | As Adjusted January 2, 2024 |
| Cash and cash equivalents | | $ | 394 | | | $ | (1) | | | $ | 393 | |
| Accounts receivable | | 408 | | | 5 | | | 413 | |
| Inventories | | 948 | | | (28) | | | 920 | |
| Other current assets | | 17 | | | — | | | 17 | |
| Fixed assets | | 913 | | | 6 | | | 919 | |
| Intangible assets | | 6,640 | | | 5 | | | 6,645 | |
| Other assets | | 284 | | | 15 | | | 299 | |
| Accounts payable | | (288) | | | (2) | | | (290) | |
| Other liabilities, current | | (626) | | | (37) | | | (663) | |
| Future income tax obligations | | (1,825) | | | 15 | | | (1,810) | |
| Other liabilities | | (284) | | | (17) | | | (301) | |
| Total identifiable net assets | | 6,581 | | | (39) | | | 6,542 | |
| Goodwill | | 7,576 | | | 31 | | | 7,607 | |
| Total consideration | | $ | 14,157 | | | $ | (8) | | | $ | 14,149 | |
The excess purchase price over the estimated fair value of the net identifiable assets acquired was recognized as goodwill and totaled $7.6 billion, which is not deductible for tax purposes. Accounts receivable and current liabilities were stated at their historical carrying value, which approximates fair value given the short-term nature of these assets and liabilities. The estimate of fair value for inventory and fixed assets was based on an assessment of the acquired assets' condition as well as an evaluation of the current market value of such assets.
The Company recorded intangible assets based on its estimate of fair value which consisted of the following:
| | | | | | | | | | | | | | |
| (In millions) | | Estimated Useful Life (in years) | | Intangible Assets Acquired |
| Customer relationships | | 17 | | $ | 4,787 | |
| Technology | | 10 - 20 | | 1,051 | |
| Trademark | | 40 | | 679 | |
| Backlog | | 1 | | 123 | |
| Other | | 50 | | 5 | |
| Total intangible assets acquired | | | | $ | 6,645 | |
The valuation of intangible assets was determined using an income approach methodology including the multi-period excess earnings method and the relief from royalty method. Key assumptions used in estimating future cash flows included projected short-term revenue growth rates, research and development expenses, EBITDA margins, income tax rates, discount rates, customer attrition rates, royalty rates, contributory asset charge and obsolescence rates among others. The projected future cash flows are discounted to present value using an appropriate discount rate. The Company finalized the process of allocating the purchase price and valuing the acquired assets and liabilities during the year ended December 31, 2024.
The Company incurred $40 million of acquisition-related costs during 2024. During 2023, $80 million of acquisition-related costs were incurred. These acquisition costs are reflected within Selling, general and administrative in the Consolidated Statement of Operations.
The assets, liabilities and results of operations of the VCS Business are consolidated in the accompanying Consolidated Financial Statements as of the date of acquisition and reported within the Company's HVAC segment.
The following table summarizes the results of the VCS Business since the date of acquisition:
| | | | | |
| (In millions) | 2024 |
| Net sales | $ | 3,266 | |
| Net earnings (loss) | (400) | |
| |
| |
The financial results of the VCS Business includes amortization of the step-up to fair value of inventory and backlog as well as intangible amortization totaling $834 million for the year ended December 31, 2024.
Unaudited Pro Forma Financial Information
The following unaudited pro forma financial information is presented to illustrate the estimated effects of the acquisition of the VCS Business as if the business combination had occurred on January 1, 2023:
| | | | | | | | | | | |
| (In millions) | 2024 | | 2023 |
| Net sales | $ | 22,486 | | | $ | 23,342 | |
| Net earnings (loss) | 1,272 | | | 1,163 | |
The pro forma amounts include the historical operating results of the Company and the VCS Business prior to the acquisition, with adjustments directly attributable to the acquisition including amortization of the step-up to fair value of inventory and amortization expense of acquired intangible assets. The unaudited pro forma financial information is not necessarily indicative of the results of operations that actually would have been achieved had the acquisition of the VCS Business been consummated as of the dates indicated, nor is it indicative of any future results. In addition, the unaudited pro forma financial information does not reflect the expected realization of any synergies or cost savings associated with the acquisition.
Toshiba Carrier Corporation
On February 6, 2022, the Company entered into a binding agreement to acquire a majority ownership interest in TCC for $920 million. TCC, a VRF and light commercial HVAC joint venture between Carrier and Toshiba Corporation, designs and manufactures flexible, energy-efficient and high-performance VRF and light commercial HVAC systems as well as commercial products, compressors and heat pumps. The acquisition included all of TCC’s advanced research and development centers and global manufacturing operations, product pipeline and the long-term use of Toshiba’s iconic brand. The acquisition was completed on August 1, 2022 and funded through the Japanese Term Loan Facility and cash on hand. Upon closing, Toshiba Corporation retained a 5% ownership interest in TCC.
The excess purchase price over the estimated fair value of the net assets acquired was recognized as goodwill and totaled $876 million, which is not deductible for tax purposes. Accounts receivable and current liabilities were stated at their historical carrying value, which approximates fair value given the short-term nature of these assets and liabilities. The estimate of fair value for inventory and fixed assets was based on an assessment of the acquired assets' condition as well as an evaluation of the current market value of such assets. The sale agreement included several customary provisions to settle working capital and other transaction-related items as of the date of sale. During 2022, the parties finalized these amounts in accordance with the terms of the sale agreement and the Company paid an additional $41 million to Toshiba Corporation in 2023. In addition, the parties finalized amounts related to pension funding levels during 2023 which resulted in the Company receiving $12 million from Toshiba Corporation.
The Company previously accounted for its minority ownership in TCC under the equity method of accounting. In connection with the transaction, the carrying value of the Company's previously held TCC equity investments were recognized at fair value at the date of acquisition using an income approach methodology. As a result, the Company recognized a $697 million non-cash gain within Other income (expense), net on the accompanying Consolidated Statement of Operations. In addition, the assets, liabilities and results of operations of TCC are consolidated in the accompanying Consolidated Financial Statements as of the date of acquisition and reported within the Company's HVAC segment. The Company incurred $29 million of acquisition-related costs during 2022 which are included within Selling, general and administrative on the accompanying Consolidated Statement of Operations. The Company has not included pro forma financial information required under ASC 805 as the pro forma impact was not deemed significant.
NOTE 20: DIVESTITURES
Discontinued Operations
In 2023, the Company announced plans to exit its Fire & Security and Commercial Refrigeration businesses over the course of 2024. The announced plan to exit the Fire & Security segment represents a single disposal plan to separately divest multiple businesses over different reporting periods. Upon the CRF Business qualifying as held for sale during the year ended December 31, 2024, the components of the Fire & Security segment in aggregate met the criteria to be presented as discontinued operations in the accompanying Consolidated Statement of Operations and Consolidated Statement of Cash Flows. In addition, the assets and liabilities of the CRF Business have been reclassified to held for sale at December 31, 2023. The results of the CCR business did not meet the criteria to be presented in discontinued operations.
The components of Discontinued operations, net of tax are as follows:
| | | | | | | | | | | | | | | | | |
| (In millions) | 2024 | | 2023 | | 2022 |
| Net sales | $ | 2,323 | | | $ | 3,147 | | | $ | 3,133 | |
| Costs of sales | (1,390) | | | (1,926) | | | (1,966) | |
| Research and development | (86) | | | (124) | | | (123) | |
| Selling, general and administrative | (564) | | | (690) | | | (535) | |
| Other income (expense), net | (584) | | | 26 | | | 22 | |
| Gain (loss) on divestitures and deconsolidation | 5,176 | | | (297) | | | — | |
| Interest (expense) income, net | (41) | | | (51) | | | (62) | |
| Earnings before income taxes | 4,834 | | | 85 | | | 469 | |
| Income tax (expense) benefit | 1,391 | | | (128) | | | (92) | |
| Tax on divestitures and deconsolidation | (1,729) | | | 5 | | | — | |
| Discontinued operations, net of tax | $ | 4,496 | | | $ | (38) | | | $ | 377 | |
Portfolio Transformation
The following table summarizes assets and liabilities classified as held for sale:
| | | | | | | | | | | | | | | | | | | | | | | | | | | | | |
| December 31, 2023 |
| (In millions) | Commercial
Refrigeration | | Access
Solutions | | Industrial
Fire | | Commercial & Residential Fire | | Total |
| Cash and cash equivalents | $ | 131 | | | $ | 6 | | | $ | 20 | | | $ | 163 | | | $ | 320 | |
| Accounts receivable, net | 274 | | | 104 | | | 101 | | | 401 | | | 880 | |
| Inventories, net | 84 | | | 31 | | | 65 | | | 394 | | | 574 | |
| Other assets, current | 113 | | | 5 | | | 46 | | | 25 | | | 189 | |
| Fixed assets, net | 78 | | | 13 | | | 22 | | | 133 | | | 246 | |
| Intangible assets, net | — | | | 53 | | | 2 | | | 83 | | | 138 | |
| Goodwill | 72 | | | 1,498 | | | 439 | | | 469 | | | 2,478 | |
| Operating lease right-of-use assets | 49 | | | 13 | | | 28 | | | 70 | | | 160 | |
| Other assets | 44 | | | 10 | | | 13 | | | 41 | | | 108 | |
| Total assets held for sale | $ | 845 | | | $ | 1,733 | | | $ | 736 | | | $ | 1,779 | | | $ | 5,093 | |
| | | | | | | | | |
| Accounts payable | $ | 129 | | | $ | 20 | | | $ | 39 | | | $ | 259 | | | $ | 447 | |
| Accrued liabilities | 204 | | | 74 | | | 77 | | | 239 | | | 594 | |
| Long-term debt, including current portion | 8 | | | — | | | — | | | — | | | 8 | |
| Future pension and post-retirement obligations | 203 | | | — | | | 1 | | | 6 | | | 210 | |
| Future income tax obligations | 4 | | | 2 | | | 3 | | | 12 | | | 21 | |
| Operating lease liabilities | 40 | | | 11 | | | 23 | | | 58 | | | 132 | |
| Other long-term liabilities | 3 | | | 12 | | | 9 | | | 14 | | | 38 | |
| Total liabilities held for sale | $ | 591 | | | $ | 119 | | | $ | 152 | | | $ | 588 | | | $ | 1,450 | |
On June 2, 2024, the Company completed the sale of Access Solutions for cash proceeds of $5.0 billion. Access Solutions, historically reported in the Company's Fire & Security segment, is a global supplier of physical security and digital access solutions supporting the hospitality, commercial, education and military markets. The Company recognized a net gain on the sale of $1.8 billion, which is included in Discontinued operations, net of tax on the accompanying Consolidated Statement of Operations.
On July 1, 2024, the Company completed the sale of Industrial Fire for cash proceeds of $1.4 billion. Industrial Fire, historically reported in the Company's Fire & Security segment, is a leading manufacturer of a full spectrum of fire detection and suppression solutions and services in critical high-hazard environments, including oil and gas, power generation, marine and offshore facilities, automotive, data centers and aircraft hangars. The Company recognized a net gain on the sale of $319 million, which is included in Discontinued operations, net of tax on the accompanying Consolidated Statement of Operations.
On October 1, 2024, the Company completed the sale of CCR for cash proceeds of $679 million. CCR, historically reported in the Company's Refrigeration segment, is a global supplier of turnkey solutions for commercial refrigeration systems and services, with a primary focus on serving food retail customers, cold storage facilities and warehouses. The Company recognized a gross gain on the sale of $318 million, which is included in Other income (expense), net on the accompanying Consolidated Statement of Operations. The net proceeds received are subject to working capital and other adjustments provided in the stock purchase agreement governing the sale of CCR.
On December 2, 2024, the Company completed the sale of the CRF Business for cash proceeds of $2.9 billion. The CRF Business, historically reported in the Company's Fire & Security segment, is a leading manufacturer of fire detection and alarm solutions for both commercial and residential applications. The Company recognized a net gain on the sale of $1.4 billion, which is included in Discontinued operations, net of tax on the accompanying Consolidated Statement of Operations. The net proceeds received are subject to working capital and other adjustments provided in the stock purchase agreement governing the sale of the CRF Business.
The following table summarizes the assets and liabilities divested as of their respective dates of sale:
| | | | | | | | | | | | | | | | | | | | | | | |
| | | | | | | |
| (In millions) | Access
Solutions | | Industrial
Fire | | Commercial Refrigeration | | Commercial & Residential Fire |
| Cash and cash equivalents | $ | 82 | | | $ | 40 | | | $ | 121 | | | $ | 64 | |
| Accounts receivable, net | 90 | | | 93 | | | 217 | | | 422 | |
| Inventories, net | 43 | | | 73 | | | 99 | | | 408 | |
| Other current assets | 6 | | | 55 | | | 155 | | | 26 | |
| Fixed assets, net | 18 | | | 24 | | | 84 | | | 127 | |
| Intangible assets, net | 53 | | | 2 | | | 10 | | | 81 | |
| Goodwill | 1,467 | | | 452 | | | 72 | | | 449 | |
| Operating lease right-of-use assets | 16 | | | 24 | | | 48 | | | 66 | |
| Other assets | 8 | | | 2 | | | 46 | | | 29 | |
| Total assets held for sale | $ | 1,783 | | | $ | 765 | | | $ | 852 | | | $ | 1,672 | |
| | | | | | | |
| Accounts payable | $ | 54 | | | $ | 43 | | | $ | 124 | | | $ | 195 | |
| Accrued liabilities | 80 | | | 65 | | | 154 | | | 153 | |
| Operating lease liabilities | 17 | | | 24 | | | 49 | | | 66 | |
| Other long-term liabilities | 10 | | | 6 | | | 213 | | | 24 | |
| Total liabilities held for sale | $ | 161 | | | $ | 138 | | | $ | 540 | | | $ | 438 | |
NOTE 21: SEGMENT FINANCIAL DATA
The Company conducts its operations through two reportable operating segments: HVAC and Refrigeration. In accordance with ASC 280 - Segment Reporting, the Company’s segments maintain separate financial information for which results of operations are evaluated on a regular basis by the Company’s Chief Operating Decision Maker ("CODM") in deciding how to allocate resources and in assessing performance.
•The HVAC segment provides products, controls, services and solutions to meet the heating, cooling and ventilation needs of residential and commercial customers while enhancing building performance, health, energy efficiency and sustainability.
•The Refrigeration segment includes transport refrigeration and monitoring products, services and digital solutions for trucks, trailers, shipping containers, intermodal and rail.
The Corporate and Other category primarily includes corporate administrative functions such as tax, treasury, internal audit, legal and human resources. A portion of these costs and costs associated with shared service centers that provide transaction processing, accounting and other business support functions are allocated to the reportable segments. In addition, the Corporate and Other category reflects certain business activities previously reported with the Fire & Security segment that no longer met the criteria of a reportable segment. The category also includes elimination of activity between segments.
Segment Operating profit is the measure of profit and loss that the Company’s CODM, the Chief Executive Officer (“CEO”), uses to evaluate the financial performance of the business and as the basis for resource allocation, performance reviews and compensation. In addition, it represents the measure most consistent with amounts included in the Company’s consolidated financial statements. Segment Operating profit targets are established on an annual basis and used by the CODM throughout the year to compare with actual results. Quarterly forecasts supplement annual targets and provide incremental information utilized to assess the performance of a segment. Segment Operating profit variance analysis further provides insight into segment end-markets and operational cost optimization. These results also support the CODM to manage the Company’s business portfolio and benchmarking with competitors.
Consistent with the management approach for segment reporting, the tables below present reported Net sales and significant expense categories for each of the Company’s segments that are regularly provided to the CODM and included in is reported measure of segment profit or loss. The Company manages research and development costs on a global basis. As a result, amounts presented by segment reflect where costs are incurred rather than where the benefit is received. Due to the completion of the Company's portfolio transformation activities in 2024, the Company anticipates changes to its management reporting structure and to the information provided to its CODM beginning in 2025. As a result, the Company is reassessing its reportable segment structure to align with any changes.
| | | | | | | | | | | | | | | | | | | | | | | | | | | | | |
| For the Year Ended December 31, 2024 |
| (In millions) | HVAC | | REF | | Segment Total | | Corporate & Other | | Total |
| Net sales | $ | 19,078 | | | $ | 3,475 | | | $ | 22,553 | | | $ | (67) | | | $ | 22,486 | |
| | | | | | | | | |
| | | | | | | | | |
| | | | | | | | | |
| Cost of goods sold | (14,041) | | | (2,580) | | | (16,621) | | | 116 | | | (16,505) | |
| Research and development | (531) | | | (88) | | | (619) | | | (67) | | | (686) | |
| Selling, general and administrative | (2,475) | | | (409) | | | (2,884) | | | (313) | | | (3,197) | |
| | | | | | | | | |
| Equity method investment net earnings | 225 | | | 6 | | | 231 | | | — | | | 231 | |
| Other income (expense), net | 52 | | | 311 | | | 363 | | | (46) | | | 317 | |
| Operating profit | $ | 2,308 | | | $ | 715 | | | $ | 3,023 | | | $ | (377) | | | $ | 2,646 | |
| | | | | | | | | | | | | | | | | | | | | | | | | | | | | |
| For the Year Ended December 31, 2023 |
| (In millions) | HVAC | | REF | | Segment Total | | Corporate & Other | | Total |
| Net sales | $ | 15,139 | | | $ | 3,818 | | | $ | 18,957 | | | $ | (6) | | | $ | 18,951 | |
| | | | | | | | | |
| | | | | | | | | |
| | | | | | | | | |
| Cost of goods sold | (10,992) | | | (2,889) | | | (13,881) | | | 92 | | | (13,789) | |
| Research and development | (322) | | | (85) | | | (407) | | | (86) | | | (493) | |
| Selling, general and administrative | (1,782) | | | (450) | | | (2,232) | | | (375) | | | (2,607) | |
| | | | | | | | | |
| Equity method investment net earnings | 206 | | | 6 | | | 212 | | | (1) | | | 211 | |
| Other income (expense), net | 26 | | | 28 | | | 54 | | | (167) | | | (113) | |
| Operating profit | $ | 2,275 | | | $ | 428 | | | $ | 2,703 | | | $ | (543) | | | $ | 2,160 | |
| | | | | | | | | | | | | | | | | | | | | | | | | | | | | |
| For the Year Ended December 31, 2022 |
| (In millions) | HVAC | | REF | | Segment Total | | Corporate & Other | | Total |
| Net sales | $ | 13,408 | | | $ | 3,883 | | | $ | 17,291 | | | $ | (3) | | | $ | 17,288 | |
| | | | | | | | | |
| | | | | | | | | |
| | | | | | | | | |
| Cost of goods sold | (10,151) | | | (2,926) | | | (13,077) | | | 86 | | | (12,991) | |
| Research and development | (265) | | | (82) | | | (347) | | | (69) | | | (416) | |
| Selling, general and administrative | (1,341) | | | (421) | | | (1,762) | | | (215) | | | (1,977) | |
| | | | | | | | | |
| Equity method investment net earnings | 256 | | | 6 | | | 262 | | | — | | | 262 | |
| Other income (expense), net | 703 | | | 22 | | | 725 | | | 1,093 | | | 1,818 | |
| Operating profit | $ | 2,610 | | | $ | 482 | | | $ | 3,092 | | | $ | 892 | | | $ | 3,984 | |
Total assets are not presented for each segment as they are not presented to or reviewed by the CODM. Segment assets in the following table represent Accounts receivable, net and Inventories, net. These assets are regularly reviewed by management and are therefore reported in the following table as segment assets. All other remaining assets and liabilities for all periods presented are managed on a company-wide basis.
| | | | | | | | | | | | | | | | | | | | | | | | | | | | | | | | | | | | | | | | | | | | | | | | | |
| Segment Assets | | Capital Expenditures | | Depreciation & Amortization |
| (In millions) | 2024 | | 2023 | | | | 2024 | | 2023 | | 2022 | | 2024 | | 2023 | | 2022 |
| HVAC | $ | 3,851 | | | $ | 2,899 | | | | | $ | 438 | | | $ | 313 | | | $ | 232 | | | $ | 1,153 | | | $ | 413 | | | $ | 256 | |
| Refrigeration | 818 | | | 833 | | | | | 32 | | | 30 | | | 32 | | | 35 | | | 34 | | | 31 | |
| Total Segment | 4,669 | | | 3,732 | | | | | 470 | | | 343 | | | 264 | | | 1,188 | | | 447 | | | 287 | |
| Eliminations and other | 281 | | | 171 | | | | | 49 | | | 96 | | | 53 | | | 44 | | | 44 | | | 41 | |
| Consolidated | $ | 4,950 | | | $ | 3,903 | | | | | $ | 519 | | | $ | 439 | | | $ | 317 | | | $ | 1,232 | | | $ | 491 | | | $ | 328 | |
| Cash and cash equivalents | 3,969 | | | 9,852 | | | | | | | | | | | | | | | |
| Other assets, current | 972 | | | 728 | | | | | | | | | | | | | | | |
| Assets held for sale | — | | | 5,093 | | | | | | | | | | | | | | | |
| Total current assets | $ | 9,891 | | | $ | 19,576 | | | | | | | | | | | | | | | |
Geographic External Sales
Geographic external sales and operating profits are attributed to the geographic regions based on their location of origin. With the exception of the U.S. as presented in the following table, there were no individually significant countries with sales exceeding 10% of total sales for the years ended December 31, 2024, 2023 and 2022.
| | | | | | | | | | | | | | | | | | | | | | | | | | | | | | | | | | | |
| | | | | | | | |
| | External Sales | | Long-Lived Assets | | | |
| (In millions) | | 2024 | | 2023 | | 2022 | | 2024 | | 2023 | | | |
| United States Operations | | $ | 11,294 | | | $ | 10,457 | | | $ | 9,997 | | | $ | 807 | | | $ | 795 | | | | |
| International Operations | | | | | | | | | | | | | |
| Europe | | 6,687 | | | 3,910 | | | 3,591 | | | 1,253 | | | 450 | | | | |
| Asia Pacific | | 3,817 | | | 3,949 | | | 3,090 | | | 486 | | | 499 | | | | |
| Other | | 688 | | | 635 | | | 610 | | | 453 | | | 416 | | | | |
| Consolidated | | $ | 22,486 | | | $ | 18,951 | | | $ | 17,288 | | | $ | 2,999 | | | $ | 2,160 | | | | |
NOTE 22: RELATED PARTIES
Equity Method Investments
The Company sells products to and purchases products from unconsolidated entities accounted for under the equity method and, therefore, these entities are considered to be related parties. The Company has 29 directly owned unconsolidated domestic and foreign affiliates as of December 31, 2024, of which 97% of such investments are in its HVAC segment. The Company periodically reviews the carrying value of its equity method investments to determine if there has been an other-than-temporary decline in fair value.
Amounts attributable to equity method investees are as follows:
| | | | | | | | | | | | | | | | | |
| (In millions) | 2024 | | 2023 | | 2022 |
Sales to equity method investees included in Product sales | $ | 2,956 | | | $ | 2,920 | | | $ | 2,845 | |
Purchases from equity method investees included in Cost of products sold | $ | 237 | | | $ | 214 | | | $ | 331 | |
The Company had receivables from and payables to equity method investees as follows:
| | | | | | | | | | | |
| (In millions) | 2024 | | 2023 |
Receivables from equity method investees included in Accounts receivable, net | $ | 363 | | | $ | 231 | |
Payables to equity method investees included in Accounts payable | $ | 32 | | | $ | 44 | |
The financial results of TCC are included in the Company's consolidated results since the acquisition date of August 1, 2022. Prior to the acquisition, the Company previously accounted for its minority ownership in TCC under the equity method of accounting. As a result, prior period results may not be comparable to the current period.
Summarized Financial Information. Pursuant to Rule 3-10 and Rule 4-08(g) of Regulation S-X under the Securities Act, the Company presents summarized financial information of the combined accounts of its non-consolidated joint ventures accounted for by the equity method.
Summarized unaudited financial information for equity method investments is as follows:
| | | | | | | | | | | |
| |
| (In millions) | 2024 | | 2023 |
| Current assets | $ | 12,823 | | | $ | 11,432 | |
| Non-current assets | 2,396 | | | 1,834 | |
| Total assets | 15,219 | | | 13,266 | |
| | | |
| Current liabilities | (11,053) | | | (9,296) | |
| Non-current liabilities | (210) | | | (190) | |
| Total liabilities | (11,263) | | | (9,486) | |
| Total net equity of investees | $ | 3,956 | | | $ | 3,780 | |
| | | | | | | | | | | | | | | | | |
| |
| (In millions) | 2024 | | 2023 | | 2022 |
| Net sales | $ | 17,567 | | | $ | 16,180 | | | $ | 11,524 | |
| Gross profit | $ | 3,063 | | | $ | 2,862 | | | $ | 2,274 | |
| Income from continuing operations | $ | 700 | | | $ | 655 | | | $ | 757 | |
| Net earnings (loss) | $ | 700 | | | $ | 655 | | | $ | 757 | |
NOTE 23: COMMITMENTS AND CONTINGENT LIABILITIES
The Company is involved in various litigation, claims and administrative proceedings, including those related to environmental (including asbestos) and legal matters. In accordance with ASC 450, Contingencies, the Company records accruals for loss contingencies when it is probable that a liability has been incurred and the amount of the loss can be reasonably estimated. These accruals are generally based upon a range of possible outcomes. If no amount within the range is a better estimate than any other, the Company accrues the minimum amount. In addition, these estimates are reviewed periodically and adjusted to reflect additional information when it becomes available. The Company is unable to predict the final outcome of the following matters based on the information currently available, except as otherwise noted. However, the Company does not believe that the resolution of any of these matters will have a material adverse effect upon its results of operations or financial condition.
Environmental Matters
The Company’s operations are subject to environmental regulation by various authorities. The Company has accrued for the costs of environmental remediation activities, including but not limited to, investigatory, remediation, operating and maintenance costs and performance guarantees. The most likely cost to be incurred is accrued based on an evaluation of currently available facts with respect to individual sites, including the technology required to remediate, current laws and regulations and prior remediation experience.
As of December 31, 2024 and 2023, the outstanding liability for environmental obligations are as follows:
| | | | | | | | | | | | | | |
| (In millions) | | 2024 | | 2023 |
Environmental reserves included in Accrued liabilities | | $ | 25 | | | $ | 19 | |
Environmental reserves included in Other long-term liabilities | | 185 | | | 199 |
| Total environmental reserves | | $ | 210 | | | $ | 218 | |
For sites with multiple responsible parties, the Company considers its likely proportionate share of the anticipated remediation costs and the ability of other parties to fulfill their obligations in establishing a provision for these costs. Accrued environmental liabilities are not reduced by potential insurance reimbursements and are undiscounted.
Asbestos Matters
The Company has been named as a defendant in lawsuits alleging personal injury as a result of exposure to asbestos allegedly integrated into certain Carrier products or business premises. While the Company has never manufactured asbestos and no longer incorporates it into any currently-manufactured products, certain products that the Company no longer manufactures contained components incorporating asbestos. A substantial majority of these asbestos-related claims have been dismissed without payment or have been covered in full or in part by insurance or other forms of indemnity. Additional cases were litigated and settled without any insurance reimbursement. The amounts involved in asbestos-related claims were not material individually or in the aggregate in any period.
The Company's asbestos liabilities and related insurance recoveries are as follows:
| | | | | | | | | | | | | | |
| (In millions) | | 2024 | | 2023 |
Asbestos liabilities included in Accrued liabilities | | $ | 17 | | | $ | 15 | |
Asbestos liabilities included in Other long-term liabilities | | 208 | | | 206 | |
| Total asbestos liabilities | | $ | 225 | | | $ | 221 | |
| | | | |
Asbestos-related recoveries included in Accounts receivable, net | | $ | 7 | | | $ | 5 | |
Asbestos-related recoveries included in Other assets | | 88 | | | 88 | |
| Total asbestos-related recoveries | | $ | 95 | | | $ | 93 | |
The amounts recorded for asbestos-related liabilities are based on currently available information and assumptions that the Company believes are reasonable and are made with input from outside actuarial experts. These amounts are undiscounted and exclude the Company's legal fees to defend the asbestos claims, which are expensed as incurred. In addition, the Company has recorded insurance recovery receivables for probable asbestos-related recoveries.
Aqueous Film Forming Foam Litigation
As of December 31, 2024, the Company, Kidde-Fenwal, Inc. ("KFI") and others have been named as defendants in more than 9,000 lawsuits filed in United States state or federal courts and a single case in Canada alleging that the historic use of Aqueous Film Forming Foam ("AFFF") caused personal injuries and damage to property and water supplies. In December 2018, the U.S. Judicial Panel on Multidistrict Litigation transferred and consolidated all AFFF cases pending in the U.S. federal courts against the Company, KFI and others to the U.S. District Court for the District of South Carolina (the "MDL Proceedings"). Individual plaintiffs in the MDL Proceedings generally seek damages for alleged personal injuries, medical monitoring, diminution in property value and injunctive relief to remediate alleged contamination of water supplies. U.S. state, municipal and water utility plaintiffs in the MDL Proceedings generally seek damages and costs related to the remediation of public property and water supplies.
AFFF is a firefighting foam, developed beginning in the late 1960s pursuant to U.S. military specification, used to extinguish certain types of hydrocarbon-fueled fires. The lawsuits identified above relate to Kidde Fire Fighting, Inc., which owned the “National Foam” business that manufactured AFFF for sale to government (including the U.S. federal government) and non-government customers in the U.S. at a single facility located in West Chester, Pennsylvania (the "Pennsylvania Site"). Kidde Fire Fighting, Inc. was acquired by a UTC subsidiary in 2005 and merged into KFI in 2007. In 2013, KFI divested the AFFF businesses to an unrelated third party. The Company acquired KFI as part of the Separation in April 2020.
The key components that contribute to AFFF's fire-extinguishing capabilities are known as fluorosurfactants. Neither the Company, nor KFI, nor any of the Company's subsidiaries involved in the AFFF litigation manufactured fluorosurfactants. Instead, the National Foam business purchased these substances from unrelated third parties for use in manufacturing AFFF. Plaintiffs in the MDL Proceedings allege that the fluorosurfactants used by various manufacturers in producing AFFF contained, or over time degraded into, compounds known as per- and polyfluoroalkyl substances (referred to collectively as "PFAS"), including perflourooctanesulfonic acid ("PFOS") and perflourooctanoic acid ("PFOA"). Plaintiffs further allege that, as a result of the use of AFFF, PFOS and PFOA were released into the environment and, in some instances, ultimately reached drinking water supplies.
Plaintiffs in the MDL Proceedings have named multiple defendants, including suppliers of chemicals and raw materials used to manufacture fluorosurfactants, fluorosurfactant manufacturers and AFFF manufacturers. The defendants in the MDL Proceedings moved for summary judgment on the government contractor defense, which potentially applies to AFFF sold to or used by the U.S. government. After full briefing and oral argument, on September 16, 2022, the MDL court declined to enter summary judgment for the defendants. The defense, however, remains available at any trial in which it would apply.
On May 14, 2023, KFI filed a voluntary petition with the United States Bankruptcy Court for the District of Delaware (the “Bankruptcy Court”) seeking relief under chapter 11 of the Bankruptcy Code, after the Company determined that it would not provide financial support to KFI going forward other than ensuring KFI has access to services necessary for the effective operation of its business. As a result, all litigation against KFI was automatically stayed. By agreement, all AFFF-related litigation against the Company, its other subsidiaries and RTX also was stayed. On November 21, 2023, the Bankruptcy Court ordered certain parties, including the Company, to participate in mediation sessions with respect to claims that might be asserted by and against it in the bankruptcy proceedings.
Following the conclusion of these mediation sessions in October 2024, the Company entered into a Settlement and Plan Support Agreement which contemplates that the Company will subsequently enter into three distinct settlement agreements (collectively, the “Proposed Settlement Agreements”) with KFI, the Official Committee of Unsecured Creditors appointed in KFI’s bankruptcy case (the “Committee”) and the Plaintiffs’ Executive Committee (the “MDL PEC”) appointed in the MDL Proceedings.
The first of the Proposed Settlement Agreements relates to claims that the Company is responsible for liabilities arising from KFI’s manufacture or sale of AFFF (“Estate Claims Settlement”). Upon Bankruptcy Court approval, the Estate Claims Settlement will permanently resolve all present and future claims that the Company is responsible for any liabilities of KFI, including all liabilities arising from KFI’s manufacture and sale of AFFF. The second and third of the Proposed Settlement Agreements release a very substantial amount of current and future direct claims against the Company (the “Direct Claims Settlements”). Direct claims allege that UTC, which indirectly owned KFI’s AFFF business for eight years, engaged in conduct independent of KFI that caused harm to AFFF claimants. The Company agreed to indemnify UTC for these direct claims when it was spun-off from UTC. Upon approval by the MDL Court, the Direct Claims Settlements resolve and enjoin all current and future AFFF-related direct claims against the Company by participating public water providers and airports. Non-settling parties may still assert direct AFFF-related claims, although we expect a vast majority of public water providers and airports will participate in the Direct Claims Settlements.
As part of the Proposed Settlement Agreements, the Company will pay $615 million in cash over five years, 100% of the net sale proceeds from its sale of KFI’s assets to Pacific Avenue Capital Partners, which are estimated to be $115 million, and contribute the right to recover proceeds under certain of its insurance policies. The Company will be entitled to receive up to $2.4 billion of proceeds from those insurance policies and will contribute the first $125 million of such proceeds as additional consideration in the Direct Claims Settlements. The Company also will be entitled to any earnouts payable to KFI under the KFI sale agreement. The Company expects insurance proceeds it receives in the future, in the aggregate, to cover the amount paid under the Proposed Settlement Agreements. As a result of the Proposed Settlement Agreements, the Company recorded a liability in the amount of $565 million during the year December 31, 2024. The amount recognized is in addition to liabilities of $50 million that the Company recorded upon the deconsolidation of KFI on May 14, 2023, as further discussed below. As of December 31, 2024, the Company has not recorded any amounts associated with expected insurance proceeds.
The Company and KFI believe that they have meritorious defenses to the remaining AFFF claims. Given the numerous factual, scientific and legal issues to be resolved relating to these claims, the Company is unable to assess the probability of liability or to reasonably estimate a range of possible loss at this time. There can be no assurance that any such future exposure will not be material in any period.
On November 14, 2024, KFI filed the chapter 11 plan of liquidation (as may be further amended, restated, supplemented, waived, or otherwise modified from time to time, the "Chapter 11 Plan"), which incorporates the Estate Claims Settlement, provides for the treatment of the various creditor classes, and establishes wind-down provisions, among other things, and the disclosure statement for the Chapter 11 Plan (as may be further amended, restated, supplemented, waived, or otherwise modified from time to time, the "Disclosure Statement"). A hearing to approve the Disclosure Statement, its ancillary documents and establish a Chapter 11 Plan confirmation timeline in the Bankruptcy Court is expected to be held in March 2025.
Deconsolidation Due to Bankruptcy
As of May 14, 2023, the Company no longer controlled KFI as its activities are subject to review and oversight by the Bankruptcy Court. Therefore, KFI was deconsolidated and its respective assets and liabilities were derecognized from the Company’s Consolidated Financial Statements. Upon deconsolidation, the Company determined the fair value of its retained interest in KFI to be zero and accounted for it prospectively using the cost method. As a result of these actions, the Company recognized a net loss of $292 million in its Consolidated Statement of Operations within Discontinued operations, net of tax. In addition, the deconsolidation resulted in an investing cash outflow of $134 million in the Company's Consolidated Statement of Cash Flows within Net cash flows provided by (used in) discontinued investing activities.
In connection with the bankruptcy filing, KFI entered into several agreements with subsidiaries of the Company to ensure they have access to services necessary for the effective operation of their business. All post-deconsolidation activity between the Company and KFI are reported as third-party transactions recorded within the Company's Consolidated Statement of Operations. Since the petition date, there were no material transactions between the Company and KFI other than a $15 million payment by the Company to KFI under the terms of a tax sharing arrangement.
Income Taxes
Under the TMA relating to the Separation, the Company is responsible to UTC for its share of the TCJA transition tax associated with foreign undistributed earnings as of December 31, 2017. During 2024, the Company recognized a $46 million gain associated with the TMA and UTC's conclusion of certain income tax matters from their 2017 and 2018 tax audit with the IRS. In addition, the Company recognized a $23 million tax benefit associated with a favorable court ruling and paid its April 2025 installment in 2024. As a result, a liability of $78 million is included within the accompanying Consolidated Balance Sheet within Other Long-Term Liabilities as of December 31, 2024. This obligation is expected to be settled in April 2026. The Company believes that the likelihood of incurring losses materially in excess of this amount is remote.
Self-Insurance
The Company maintains self-insurance for a number of risks, including but not limited to, workers’ compensation, general liability, automobile liability, property and employee-related healthcare benefits. It has obtained insurance coverage for amounts exceeding individual and aggregate loss limits. The Company accrues for known future claims and incurred but not reported losses.
The Company's self-insurance liabilities were as follows:
| | | | | | | | | | | |
| (In millions) | 2024 | | 2023 |
Self-insurance liabilities included in Accrued liabilities | $ | 173 | | | $ | 160 | |
Self-insurance liabilities included in Other long-term liabilities | 43 | | | 55 |
| Total self-insurance liabilities | $ | 216 | | | $ | 215 | |
The Company incurred expenses related to self-insured risks of $135 million, $139 million and $124 million for the years ended December 31, 2024, 2023 and 2022, respectively.
Other Matters
The Company has other commitments and contingent liabilities related to legal proceedings, self-insurance programs and matters arising in the ordinary course of business. The Company accrues for contingencies generally based upon a range of possible outcomes. If no amount within the range is a better estimate than any other, the Company accrues the minimum amount.
In the ordinary course of business, the Company is also routinely a defendant in, party to or otherwise subject to many pending and threatened legal actions, claims, disputes and proceedings. These matters are often based on alleged violations of contract, product liability, warranty, regulatory, environmental, health and safety, employment, intellectual property, tax and other laws. In some of these proceedings, claims for substantial monetary damages are asserted against the Company and could result in fines, penalties, compensatory or treble damages or non-monetary relief. The Company does not believe that these matters will have a material adverse effect upon its competitive position, results of operations, cash flows or financial condition.
NOTE 24: SUPPLEMENTAL CASH FLOW INFORMATION
Supplemental cash flow information was as follows:
| | | | | | | | | | | | | | | | | |
| (In millions) | 2024 | | 2023 | | 2022 |
| Interest paid, net of amounts capitalized | $ | 610 | | | $ | 320 | | | $ | 297 | |
| | | | | |
| | | | | |
| Income taxes paid, net of refunds | $ | 2,126 | | | $ | 942 | | | $ | 833 | |
| | | | | |
| Non-cash financing activity: | | | | | |
| Common stock dividends payable | $ | 199 | | | $ | 161 | | | $ | 158 | |
NOTE 25: SELECTED QUARTERLY FINANCIAL INFORMATION (UNAUDITED)
During the year ended December, 31, 2024, the components of the Fire & Security segment in aggregate met the criteria to be presented as discontinued operations. The following table presents select quarterly financial information for continuing operations:
| | | | | | | | | | | | | | | | | | | | | | | |
| 2024 Quarters |
| (In millions) | Q1 | | Q2 | | Q3 | | Q4 |
| Net sales | $ | 5,420 | | | $ | 5,934 | | | $ | 5,984 | | | $ | 5,148 | |
| Operating profit | $ | 385 | | | $ | 724 | | | $ | 763 | | | $ | 774 | |
| Earnings from continuing operations attributable to common shareowners | $ | 177 | | | $ | 415 | | | $ | 564 | | | $ | (48) | |
| Basic earnings per share - continuing operations | $ | 0.20 | | | $ | 0.46 | | | $ | 0.63 | | | $ | (0.05) | |
| Diluted earnings per share - continuing operations | $ | 0.19 | | | $ | 0.45 | | | $ | 0.62 | | | $ | (0.05) | |
| | | | | | | |
| 2023 Quarters |
| (In millions) | Q1 | | Q2 | | Q3 | | Q4 |
| Net sales | $ | 4,518 | | | $ | 5,182 | | | $ | 4,935 | | | $ | 4,316 | |
| Operating profit | $ | 460 | | | $ | 651 | | | $ | 510 | | | $ | 539 | |
| Earnings from continuing operations attributable to common shareowners | $ | 306 | | | $ | 394 | | | $ | 270 | | | $ | 417 | |
| Basic earnings per share - continuing operations | $ | 0.37 | | | $ | 0.47 | | | $ | 0.32 | | | $ | 0.50 | |
| Diluted earnings per share - continuing operations | $ | 0.36 | | | $ | 0.46 | | | $ | 0.32 | | | $ | 0.49 | |
ITEM 9. CHANGES IN AND DISAGREEMENTS WITH ACCOUNTANTS ON ACCOUNTING AND FINANCIAL DISCLOSURE
None.
ITEM 9A. CONTROLS AND PROCEDURES
Evaluation of Disclosure Controls and Procedures — Our management, with the participation of our CEO and Senior Vice President and Chief Financial Officer ("CFO"), has evaluated the effectiveness of the Company's disclosure controls and procedures (as such term is defined in Rules 13a-15(e) and 15d-15(e) under the Exchange Act) as of December 31, 2024. Based on that evaluation, the Company's CEO and CFO have concluded that, as of December 31, 2024, the Company's disclosure controls and procedures were effective in recording, processing, summarizing and reporting, within the time periods specified in the SEC's rules and forms, information required to be disclosed by the Company in the reports that it files or submits under the Exchange Act, and that information is accumulated and communicated to the Company's management, including our CEO and CFO, as appropriate, to allow timely decisions regarding required disclosures.
Management’s Report on Internal Control Over Financial Reporting — The Company’s management is responsible for establishing and maintaining adequate internal control over financial reporting, as such term is defined in Exchange Act Rules 13a-15(f) and 15d-15(f). The Company’s management, with the participation of the Company’s CEO and CFO, has evaluated the effectiveness of the Company’s internal control over financial reporting based on the criteria described in Internal Control-Integrated Framework (2013) issued by the Committee of Sponsoring Organizations of the Treadway Commission. Based on this evaluation, the Company’s management has concluded that, as of December 31, 2024, the Company’s internal control over financial reporting was effective.
In accordance with guidance issued by the staff of the SEC, companies are permitted to exclude acquisitions from their assessment of internal control over financial reporting for the first fiscal year in which the acquisition occurred. As discussed in Note 19 "Acquisitions" of the Company's Notes to the Consolidated Financial Statements, the Company acquired the climate solutions business (the "VCS Business") of Viessmann Group GmbH & Co. KG on January 2, 2024 in a purchase business combination. The VCS Business has total assets excluding intangible assets and goodwill arising from the acquisition and total net sales, of approximately 14% and 15%, respectively, of the related consolidated financial statement amounts as of and for the year ended December 31, 2024. Management's assessment of the effectiveness of our internal control over financial reporting as of December 31, 2024 excluded the VCS Business, as the Company is in the process of aligning and integrating various processes, systems and internal controls related to the business and operations of this subsidiary, excluding intangible assets and goodwill, which are included within the scope of management’s assessment.
Because of its inherent limitations, internal control over financial reporting may not prevent or detect misstatements. Also, projections of any evaluation of effectiveness to future periods are subject to risk that controls may become inadequate because of changes in conditions, or that the degree of compliance with the policies or procedures may deteriorate.
PricewaterhouseCoopers LLP, an independent registered public accounting firm, has audited the effectiveness of the Company's internal control over financial reporting as of December 31, 2024, as stated in their report which appears herein.
Changes in Internal Control Over Financial Reporting — There were no changes in our internal control over financial reporting during the three months ended December 31, 2024, that have materially affected, or are reasonably likely to materially affect, our internal control over financial reporting.
ITEM 9B. OTHER INFORMATION
During the three months ended December 31, 2024, no director or Section 16 officer of the Company adopted or terminated a "Rule 10b5-1 trading arrangement" or "non-Rule 10b5-1 trading arrangement," as each term is defined in Item 408(a) of Regulation S-K.
ITEM 9C. DISCLOSURE REGARDING FOREIGN JURISDICTIONS THAT PREVENT INSPECTIONS
Not applicable.
PART III.
ITEM 10. DIRECTORS, EXECUTIVE OFFICERS AND CORPORATE GOVERNANCE
The information required by Item 10 with respect to directors, the Audit Committee of the Board of Directors, audit committee financial experts and insider trading arrangements and policies is incorporated herein by reference to the sections of our Proxy Statement for the 2025 Annual Meeting of Shareowners entitled "Proposal 1: Election of Directors" (under the subheadings "Criteria for Board Membership", "Nominees for the 2025 Annual Meeting" and "Corporate Governance").
Information about our Executive Officers
The following persons are executive officers of Carrier Global Corporation:
| | | | | | | | | | | | | | |
| Name | | Position | | Age as of February 11, 2025 |
| | | | |
| David Gitlin | | Chairman and Chief Executive Officer | | 55 |
| Ajay Agrawal | | Senior Vice President, Global Services and Healthy Buildings | | 61 |
| Francesca Campbell | | Senior Vice President, Chief Legal Officer | | 41 |
| Kyle Crockett | | Vice President, Controller and Chief Accounting Officer | | 51 |
| Patrick Goris | | Senior Vice President and Chief Financial Officer | | 53 |
| Gaurang Pandya | | President, HVAC Americas and Commercial HVAC EMEA | | 48 |
| Nadia Villeneuve | | Senior Vice President, Chief Human Resources Officer | | 52 |
David Gitlin. Mr. Gitlin was elected Chairman of the Board in April 2021 and was appointed President and Chief Executive Officer of Carrier in June 2019. Mr. Gitlin also held the position of President, HVAC from December 2019 to March 2020. He most recently served as President and Chief Operating Officer of Collins Aerospace Systems from 2018 to 2019 and President of UTC Aerospace Systems from 2015 to 2018.
Ajay Agrawal. Mr. Agrawal was appointed Chief Strategy Officer and Senior Vice President, Global Services & Healthy Buildings in March 2021 and served as Senior Vice President, Strategy & Services for Carrier from October 2019 to March 2021. Previously he served as President, Aftermarket Services, and Vice President responsible for Rockwell Collins integration for Collins Aerospace, a UTC company, from August 2015 to September 2019.
Francesca Campbell. Ms. Campbell was appointed Senior Vice President & Chief Legal Officer in 2024. She joined Carrier in 2021, where prior to her current role, she served as Vice President, Legal Affairs. Prior to joining Carrier, Ms. Campbell served as an attorney at Davis, Polk & Wardell within their mergers & acquisitions group.
Kyle Crockett. Mr. Crockett was appointed Vice President, Controller and Chief Accounting Officer of Carrier in January 2020. He joined Carrier from General Motors where he held several positions, including Director, Global Business Solutions – Finance from 2017 to 2020.
Patrick Goris. Mr. Goris was appointed Senior Vice President and Chief Financial Officer of Carrier in November 2020. Prior to joining Carrier, Mr. Goris served as Senior Vice President and Chief Financial Officer of Rockwell Automation, Inc., from 2017 to 2020.
Gaurang Pandya. Mr. Pandya was appointed President, HVAC Americas and Commercial HVAC EMEA in 2024. He has 25 years of experience with Carrier and has held various positions of increasing responsibility in finance and general management, with roles leading both regional and global businesses. Prior to his current role, he served as President, Commercial HVAC and President, Global Equipment, HVAC.
Nadia Villeneuve. Ms. Villeneuve was appointed Senior Vice President, Chief Human Resources Officer of Carrier in 2015. Prior to that, she served as Vice President and Chief Human Resources Officer for the Pratt & Whitney division of UTC from 2012 to 2015.
Information concerning Section 16(a) compliance is incorporated herein by reference to the section of our Proxy Statement for the 2025 Annual Meeting of Shareowners entitled "Other Important Information" under the heading "Delinquent Section 16(a) Reports." We have adopted a code of ethics that applies to all of our directors, officers, employees and representatives. This code is publicly available on our website at https://www.corporate.carrier.com/corporate-responsibility/governance. Amendments to the code of ethics and any grant of a waiver from a provision of the code requiring disclosure under applicable SEC rules will be disclosed on our website. Our Corporate Governance Guidelines and the charters of our Board of Directors’ Audit Committee, Compensation Committee, and Governance Committee are available on our website at https://www.corporate.carrier.com. These materials may also be requested in print free of charge by writing to our Investor Relations Department at Carrier Global Corporation, 13995 Pasteur Boulevard, Palm Beach Gardens, Florida 33418.
ITEM 11. EXECUTIVE COMPENSATION
The information required by Item 11 is incorporated herein by reference to the sections of our Proxy Statement for the 2025 Annual Meeting of Shareowners entitled "Proposal 2: Advisory Vote to Approve Named Executive Officer Compensation."
ITEM 12. SECURITY OWNERSHIP OF CERTAIN BENEFICIAL OWNERS AND MANAGEMENT AND RELATED SHAREOWNER MATTERS
The information relating to security ownership of certain beneficial owners and management is incorporated herein by reference to the section of our Proxy Statement for the 2025 Annual Meeting of Shareowners titled "Share Ownership."
Equity Compensation Plan Information
The following table provides information as of December 31, 2024, concerning Common Stock issuable under Carrier’s equity compensation plans.
| | | | | | | | | | | | | | | | | | | | | | | | | | |
| Plan Category | | Number of securities to be issued upon exercise of outstanding options, warrants and rights (a) | | | Weighted-average exercise price of outstanding options, warrants and rights (b) | | Number of securities remaining available for future issuance under equity compensation plans (excluding securities reflected in column (a)) (c) | |
| Equity compensation plans approved by shareowners | | 13,696,000 | | (1) | | $ | 35.52 | | | 11,100,000 | | (2) |
| | | | | | | | |
(1) Consists of the following issuable shares of Common Stock awarded under the Carrier Global Corporation 2020 Long-Term Incentive Plan (the “2020 LTIP”): (i) shares of Common Stock issuable upon the exercise of outstanding non-qualified stock options; (ii) shares of Common Stock issuable upon the exercise of outstanding Stock Appreciation Rights (SARs); (iii) shares of Common Stock issuable pursuant to outstanding restricted stock unit and performance share unit awards, assuming performance at the target level (up to an additional 2,706,000 shares of Common Stock could be issued if performance goals are achieved above target) ; and (iv) shares of Common Stock issuable upon the settlement of outstanding deferred stock units awarded under the 2020 LTIP. Under the 2020 LTIP, each SAR referred to in clause (ii) is exercisable for a number of shares of Common Stock having a value equal to the increase in the market price of a share of such stock from the date the SAR was granted. For purposes of determining the total number of shares to be issued in respect of outstanding SARs as reflected in column (a) above, we have used the NYSE closing price for a share of Common Stock on December 31, 2024 of $68.26. The weighted-average exercise price of outstanding options, warrants and rights shown in column (b) takes into account only the shares identified in clauses (i) and (ii).
(2) Represents the maximum number of shares of Common Stock available to be awarded under the 2020 LTIP as of December 31, 2024. Performance share units and restricted stock units (Full Share Awards) will result in a reduction in the number of shares of Common Stock available for delivery under the 2020 LTIP in an amount equal to 2 times the number of shares to which the award corresponds. Stock options and stock appreciation rights do not constitute Full Share Awards and will result in a reduction in the number of shares of Common Stock available for delivery under the 2020 LTIP on a one-for-one basis.
ITEM 13. CERTAIN RELATIONSHIPS AND RELATED TRANSACTIONS, AND DIRECTOR INDEPENDENCE
The information required by Item 13 is incorporated herein by reference to the sections of our Proxy Statement for the 2025 Annual Meeting of Shareowners entitled "Nominees for the 2025 Annual Meeting" (under the subheading "Director Independence") and "Other Important Information" (under the subheading "Transactions with Related Persons").
ITEM 14. PRINCIPAL ACCOUNTANT FEES AND SERVICES
The information required by Item 14 is incorporated by reference to the sections of our Proxy Statement for the 2025 Annual Meeting of Shareowners entitled "Proposal 3: Ratify Appointment of Independent Auditor for 2025," including the information provided in that section with regard to "Audit Fees," "Audit-Related Fees," "Tax Fees" and "All Other Fees."
PART IV
ITEM 15. EXHIBIT AND FINANCIAL STATEMENT SCHEDULES
(a) Financial Statements, Financial Statement Schedules and Exhibits
1.Financial Statements
2.Financial Statement Schedules
Schedules not filed herewith called for under Regulation S‑X are omitted because of the absence of conditions under which they are required, they are included in the Consolidated Financial Statements, Notes to the Consolidated Financial Statements, elsewhere in this Annual Report on Form 10‑K or are not material.
3.Exhibits
The exhibits listed on the accompanying Exhibit Index are filed or incorporated by reference as part of this report.
Exhibit Index | | | | | | | | |
Exhibit
Number | | Exhibit Description |
| | |
| 2.1 | | |
| | |
| 2.2 | | |
| | |
| 3.1 | | |
| | |
| 3.2 | | |
| | |
| 4.1 | | |
| | |
| 4.2 | | |
| | |
| 4.3 | | |
| | |
| 4.4 | | |
| | |
| 4.5 | | |
| | |
| 4.6 | | |
| | |
| 4.7 | | |
| | |
| 4.8 | | |
| | |
| | | | | | | | |
| 4.9 | | Registration Rights Agreement, dated November 29, 2023, by and among Carrier Global Corporation, J.P. Morgan Securities plc, Merrill Lynch International, Citigroup Global Markets Limited, HSBC Bank plc, Barclays Bank PLC, Goldman Sachs & Co. LLC, Morgan Stanley & Co. International plc, BNP Paribas, Deutsche Bank AG, London Branch, Intesa Sanpaolo S.p.A., Mizuho International plc, MUFG Securities EMEA plc, SMBC Nikko Capital Markets Limited, UniCredit Bank AG, Wells Fargo Securities International Limited, Bank of Montreal, London Branch, Commerzbank Aktiengesellschaft, ICBC Standard Bank Plc, Loop Capital Markets LLC, Société Générale, and Siebert Williams Shank & Co., LLC. (incorporated by reference to Exhibit 4.4 of Carrier Global Corporation’s Current Report on Form 8-K filed with the SEC on November 30, 2023, File No. 001-39220) |
| | |
| 4.10 | | |
| | |
| 10.1 | | Amendment No. 2 dated as of November 15, 2021 to the Revolving Credit Agreement, dated as of February 10, 2020, among Carrier Global Corporation, the subsidiary borrowers party thereto, the lenders party thereto and JPMorgan Chase Bank, N.A., as administrative agent (incorporated by reference to Exhibit 10.1 of Carrier Global Corporation's Annual Report on Form 10-K filed with the SEC on February 8, 2022, File No. 001-39220) |
| | |
| 10.2 | | |
| | |
| 10.3 | | |
| | |
| 10.4 | | |
| | |
| 10.5 | | |
| | |
| 10.6 | | |
| | |
| 10.7 | | |
| | |
| 10.8 | | |
| | |
| 10.9 | | |
| | |
| 10.10 | | |
| | |
| 10.11 | | |
| | |
| 10.12 | | |
| | |
| 10.13 | | |
| | |
| 10.14 | | |
| | |
| 10.15 | | |
| | |
| 10.16 | | |
| | |
| | | | | | | | |
| 10.17 | | |
| | |
| 10.18 | | |
| | |
| 10.19 | | |
| | |
| 10.20 | | |
| | |
| 10.21 | | |
| | |
| 10.22 | | |
| | |
| 10.23 | | |
| | |
| 10.24 | | |
| | |
| 10.25 | | |
| | |
| 10.26 | | |
| | |
| 10.27 | | |
| | |
| 10.28 | | |
| | |
| 10.29 | | |
| | |
| 10.30 | | |
| | |
| 10.31 | | |
| | |
| 10.32 | | |
| | |
| 10.33 | | |
| | |
| 10.34 | | |
| | |
| 10.35 | | |
| 10.36 | | |
| | |
| | | | | | | | |
| 10.37 | | |
| | |
| 10.38 | | |
| | |
| 10.39 | | |
| | |
| 10.40 | | Revolving Credit Agreement, dated as of May 19, 2023, among Carrier Global Corporation, Carrier Intercompany Lending Designated Activity Company, the Subsidiary Borrowers party hereto, the Lenders party hereto and JPMorgan Chase Bank, N.A., as administrative agent (incorporated by reference to Exhibit 10.1 to Carrier Global Corporation’s Current Report on Form 8-K filed with the SEC on May 25, 2023, File No. 001-39220) |
| | |
| 10.41 | | |
| | |
| 10.42 | | |
| | |
| 10.43 | | |
| | |
| 10.44 | | |
| | |
| 10.45 | | |
| | |
| 10.46 | | |
| | |
| 10.47 | | |
| | |
| 10.48 | | |
| | |
| 10.49 | | |
| | |
| 10.50 | | |
| | |
| 10.51 | | |
| | |
| 10.52 | | |
| | |
| 10.53 | | |
| | |
| 10.54 | | |
| | |
| | | | | | | | |
| 10.55 | | |
| | |
| 10.56 | | |
| | |
| 10.57 | | |
| | |
| 10.58 | | |
| | |
| 10.59 | | Registration Rights Agreement, dated November 8, 2024, by and among Carrier, J.P. Morgan Securities plc, HSBC Continental Europe, Morgan Stanley & Co. International plc, Merrill Lynch International, Citigroup Global Markets Limited, Goldman Sachs & Co. LLC, UniCredit Bank GmbH, Barclays Bank PLC, BNP Paribas, Deutsche Bank AG, London Branch, Mizuho International plc, MUFG Securities EMEA plc, SMBC Bank International plc, Wells Fargo Securities International Limited, Bank of Montreal, London Branch, Commerzbank Aktiengesellschaft, ICBC Standard Bank plc, Intesa Sanpaolo S.p.A., Loop Capital Markets LLC, Siebert Williams Shank & Co., LLC, Société Générale and Standard Chartered Bank (incorporated by reference to Exhibit 4.2 to Carrier Global Corporation’s Current Report on Form 8-K filed with the SEC on November 8, 2024, File No. 001-39220) |
| | |
| 10.60 | | Revolving Credit Agreement, dated as of December 20, 2024, among Carrier Global Corporation, Carrier Intercompany Lending Designated Activity Company and Carrier Treasury Services Ireland Limited as borrowers, the lenders party thereto, and JPMorgan Chase Bank, N.A., as administrative agent (incorporated by reference to Exhibit 10.1 to Carrier Global Corporation’s Current Report on Form 8-K filed with the SEC on December 20, 2024, File No. 001-39220)† |
| | |
| 14 | | Code of Ethics. The Carrier Global Corporation Code of Ethics may be accessed via Carrier Global Corporation's website at https://www.corporate.carrier.com/corporate-responsibility/governance/ethics-compliance/ |
| | |
| 19 | | Carrier Global Corporation Prohibited Securities Trading Policy at https://www.corporate.carrier.com/Images/CPSW-Section-13B-Preventing-Insider-Other-Prohibited-Securities-Trade-Practices-0124_tcm558-136603.pdf |
| | |
| 21 | | |
| | |
| 23 | | |
| | |
| 31.1 | | |
| | |
| 31.2 | | |
| | |
| 31.3 | | |
| | |
| 32 | | |
| | |
| 97 | | |
| | |
| 101.INS | | XBRL Instance Document - the instance document does not appear in the Interactive Data File because its XBRL tags are embedded within the Inline XBRL document.*
(File name: carr-20211231.xml) |
| | |
| 101.SCH | | XBRL Taxonomy Extension Schema Document.*
(File name: carr-20211231.xsd) |
| | |
| 101.CAL | | XBRL Taxonomy Extension Calculation Linkbase Document.*
(File name: carr-20211231_cal.xml) |
| | |
| 101.DEF | | XBRL Taxonomy Extension Definition Linkbase Document.*
(File name: carr-20211231_def.xml) |
| | |
| 101.LAB | | XBRL Taxonomy Extension Label Linkbase Document.*
(File name: carr-20211231_lab.xml) |
| | |
| 101.PRE | | XBRL Taxonomy Extension Presentation Linkbase Document.*
(File name: carr-20211231_pre.xml) |
| | |
| 104 | | The cover page from the Company's Annual Report on Form 10-K for the year ended December 31, 2024, formatted in Inline XBRL and contained in Exhibit 101. |
Notes to Exhibits List:
* Filed herewith.
‡ Furnished herewith.
+ Exhibit is a management contract or compensatory plan or arrangement.
† Certain exhibits and schedules to this Exhibit have been omitted in accordance with Item 601(a)(5) of Regulation S-K. The registrant agrees to furnish supplementally a copy of all omitted exhibits and schedules to the Securities and Exchange Commission upon its request.
Attached as Exhibit 101 to this report are the following formatted in extensible Business Reporting Language ("XBRL"): (i) Consolidated Statement of Operations for the years ended December 31, 2024, 2023 and 2022, (ii) Consolidated Statement of Comprehensive Income (Loss) for the years ended December 31, 2024, 2023 and 2022, (iii) Consolidated Balance Sheet as of December 31, 2024 and 2023, (iv) Consolidated Statement of Cash Flows for the years ended December 31, 2024, 2023 and 2022, (v) Consolidated Statement of Changes in Equity for the years ended December 31, 2024, 2023 and 2022 and (vi) Notes to the Consolidated Financial Statements.
ITEM 16. FORM 10-K SUMMARY
Not applicable.
SIGNATURES
Pursuant to the requirements of Section 13 or 15(d) of the Securities Exchange Act of 1934, the Registrant has duly caused this report to be signed on its behalf by the undersigned, thereunto duly authorized.
| | | | | | | | | | | |
| | CARRIER GLOBAL CORPORATION
(Registrant) |
| | | |
| Dated: | February 11, 2025 | by: | /s/PATRICK GORIS |
| | | Patrick Goris |
| | | Senior Vice President and Chief Financial Officer |
| | | |
| | | (on behalf of the Registrant and as the Registrant's Principal Financial Officer) |
| | | |
| Dated: | February 11, 2025 | by: | /s/KYLE CROCKETT |
| | | Kyle Crockett |
| | | Vice President, Controller and Chief Accounting Officer |
| | | |
| | | (on behalf of the Registrant and as the Registrant's Principal Accounting Officer) |
Pursuant to the requirements of the Securities Exchange Act of 1934, this report has been signed below by the following persons on behalf of the Registrant and in the capacities and on the dates indicated.
| | | | | | | | | | | | | | |
| Signature | | Title | | Date |
| /s/David Gitlin | | Director, Chairman and Chief Executive Officer | | February 11, 2025 |
| David Gitlin | | (Principal Executive Officer) | | |
| /s/Patrick Goris | | Senior Vice President and Chief Financial Officer | | February 11, 2025 |
| Patrick Goris | | (Principal Financial Officer) | | |
| /s/Kyle Crockett | | Vice President, Controller and Chief Accounting Officer | | February 11, 2025 |
| Kyle Crockett | | (Principal Accounting Officer) | | |
| /s/Jean-Pierre Garnier | | Director | | February 11, 2025 |
| Jean-Pierre Garnier | | | | |
| /s/John J. Greisch | | Director | | February 11, 2025 |
| John J. Greisch | | | | |
| /s/Charles M. Holley, Jr. | | Director | | February 11, 2025 |
| Charles M. Holley, Jr. | | | | |
| /s/Michael M. McNamara | | Director | | February 11, 2025 |
| Michael M. McNamara | | | | |
| /s/Amy E. Miles | | Director | | February 11, 2025 |
| Amy E. Miles | | | | |
| /s/Susan N. Story | | Director | | February 11, 2025 |
| Susan N. Story | | | | |
| /s/Michael A. Todman | | Director | | February 11, 2025 |
| Michael A. Todman | | | | |
| /s/Maximilian Viessmann | | Director | | February 11, 2025 |
| Maximilian Viessmann | | | | |
| /s/Virginia M. Wilson | | Director | | February 11, 2025 |
| Virginia M. Wilson | | | | |