As filed with the Securities and Exchange Commission on September 7, 2021
Registration No. 333- ��
UNITED STATES
SECURITIES AND EXCHANGE COMMISSION
Washington, D.C. 20549
FORM
S-1
REGISTRATION STATEMENT
UNDER
THE SECURITIES ACT OF 1933
McAfee Corp.
(Exact name of registrant as specified in its charter)
Delaware | 7372 | 84-2467341 | ||
(State or other jurisdiction of incorporation or organization) | (Primary Standard Industrial Classification Code Number) | (I.R.S. Employer Identification Number) |
6220 America Center Drive
San Jose, CA 95002
(866)
622-3911
(Address, including zip code, and telephone number, including area code, of registrant’s principal executive offices)
Peter Leav
Chief Executive Officer
McAfee Corp.
6220 America Center Drive
San Jose, CA 95002
(866)
622-3911
(Name, address, including zip code, and telephone number, including area code, of agent for service)
Copies to:
Thomas Holden Benjamin Kozik Ropes & Gray LLP 3 Embarcadero Center San Francisco, CA 94111-4006 (415) 315-6300 | Sayed Darwish Chief Legal Officer McAfee Corp. 6220 America Center Drive San Jose, CA 95002 (866) 622-3911 | Katharine Martin Andrew Hill Andrew Gillman Wilson Sonsini Goodrich & Rosati, P.C. 650 Page Mill Road Palo Alto, CA 94304-1050 (650) 493-9300 |
Approximate date of commencement of proposed sale to public:
If any of the securities being registered on this Form are to be offered on a delayed or continuous basis pursuant to Rule 415 under the Securities Act of 1933, check the following box. ☐
If this Form is filed to register additional securities for an offering pursuant to Rule 462(b) under the Securities Act, check the following box and list the Securities Act registration statement number of the earlier effective registration statement for the same offering. ☐
If this Form is a post-effective amendment filed pursuant to Rule 462(c) under the Securities Act, check the following box and list the Securities Act registration statement number of the earlier effective registration statement for the same offering. ☐
If this Form is a post-effective amendment filed pursuant to Rule 462(d) under the Securities Act, check the following box and list the Securities Act registration statement number of the earlier effective registration statement for the same offering. ☐
Indicate by check mark whether the registrant is a large accelerated filer, an accelerated filer, a
non-accelerated
filer, smaller reporting company, or an emerging growth company. See the definitions of “large accelerated filer,” “accelerated filer,” “smaller reporting company,” and “emerging growth company” in Rule12b-2
of the Exchange Act. (Check one):| Large accelerated filer | ☐ | Accelerated filer | ☐ | |||
| Non-accelerated filer | ☒ | Smaller reporting company | ☐ | |||
| Emerging growth company | ☐ | |||||
If an emerging growth company, indicate by check mark if the registrant has elected not to use the extended transition period for complying with any new or revised financial accounting standards provided pursuant to Section 7(a)(2)(B) of the Securities Act. ☐
CALCULATION OF REGISTRATION FEE
Title of Each Class of Securities to be Registered | Shares to Be Registered(1) | Proposed Maximum Aggregate Offering Price per Share(2) | Proposed Maximum Aggregate Offering Price (1)(2) | Amount of Registration Fee | ||||
Class A common stock, $0.001 par value per share | 23,000,000 | $26.54 | $610,420,000 | $66,596.83 | ||||
| (1) | Includes 3,000,000 shares of Class A common stock that may be sold if the underwriters’ option to purchase additional shares is exercised. |
| (2) | Estimated solely for the purpose of calculating the registration fee pursuant to Rule 457(a) under the Securities Act of 1933, as amended. In accordance with Rule 457(c) under the Securities Act of 1933, as amended, the price shown is the average of the high and low prices on August 31, 2021 as reported on the Nasdaq Stock Market LLC. |
The Registrant hereby amends this Registration Statement on such date or dates as may be necessary to delay its effective date until the Registrant shall file a further amendment which specifically states that this Registration Statement shall thereafter become effective in accordance with Section 8(a) of the Securities Act of 1933 or until the Registration Statement shall become effective on such date as the Securities and Exchange Commission, acting pursuant to said Section 8(a), may determine.
Confidential Treatment Requested by McAfee Corp.
Pursuant to 17 C.F.R. Section 200.83
The information in this prospectus is not complete and may be changed. The selling stockholders may not sell these securities until the registration statement filed with the Securities and Exchange Commission is effective. This prospectus is not an offer to sell these securities and it is not soliciting an offer to buy these securities in any jurisdiction where the offer or sale is not permitted.
PRELIMINARY PROSPECTUS (Subject to Completion)
Issued September 7, 2021
20,000,000 SHARES

McAfee Corp.
CLASS A COMMON STOCK
$ per share
The selling stockholders identified in this prospectus are offering 20,000,000 shares of our Class A common stock. We are not selling any shares of Class A common stock under this prospectus, and we will not receive any of the proceeds from the sale of the shares being sold by the selling stockholders.
Our Class A common stock is listed on the Nasdaq Stock Market LLC (“Nasdaq”) under the symbol “MCFE.” On September 3, 2021, the last sale price of our Class A common stock as reported on the Nasdaq was $27.72 per share.
Investing in shares of our Class A common stock involves risk. See “Risk Factors” beginning on page 24.
Per share | Total | |||||||
Public offering price | $ | $ | ||||||
Underwriting discounts and commissions (1) | $ | $ | ||||||
Proceeds to the selling stockholders, before expenses | $ | $ | ||||||
| (1) | We have agreed to reimburse the underwriters for certain expenses in connection with this offering. See “Underwriters (Conflicts of Interest)” for additional information regarding underwriting compensation. |
To the extent that the underwriters sell more than 20,000,000 shares of our Class A common stock, the selling stockholders have granted the underwriters the option to purchase up to additional 3,000,000 shares of our Class A common stock at the public offering price less the underwriting discount within 30 days from the date of this prospectus.
Neither the Securities and Exchange Commission nor any state securities commission has approved or disapproved of these securities or passed on the adequacy or accuracy of this prospectus. Any representation to the contrary is a criminal offense.
The underwriters expect to deliver the shares of our Class A common stock to our investors on or about , 2021.
Morgan Stanley | Goldman Sachs & Co. LLC | TPG Capital BD, LLC |
BofA Securities | Citigroup |
Confidential Treatment Requested by McAfee Corp.
Pursuant to 17 C.F.R. Section 200.83
TABLE OF CONTENTS
Page | ||||
| 2 | ||||
| 24 | ||||
| 66 | ||||
| 68 | ||||
| 68 | ||||
| 69 | ||||
| 70 | ||||
| 71 | ||||
| 72 | ||||
| 117 | ||||
| 129 | ||||
| 133 | ||||
| 169 | ||||
| 173 | ||||
| 178 | ||||
| 182 | ||||
| 187 | ||||
| 189 | ||||
| 193 | ||||
| 207 | ||||
| 207 | ||||
| 208 | ||||
| F-1 | ||||
We are responsible for the information contained in this prospectus and in any free writing prospectus we prepare or authorize. Neither we nor the selling stockholders nor the underwriters have authorized anyone to provide you with different information, and neither we nor the selling stockholders nor the underwriters take responsibility for any other information others may give you. Neither we nor the selling stockholders nor the underwriters are making an offer to sell these securities in any jurisdiction where the offer or sale is not permitted. You should not assume that the information contained in this prospectus is accurate as of any date other than its date.
For investors outside of the United States: neither we nor the selling stockholders nor any of the underwriters have done anything that would permit this offering or possession or distribution of this prospectus or any free writing prospectus we may provide to you in connection with this offering in any jurisdiction where action for that purpose is required, other than in the United States. You are required to inform yourselves about, and observe any restrictions relating to, this offering of the shares of our Class A common stock and the distribution of this prospectus and any such free writing prospectus outside of the United States.
i
Confidential Treatment Requested by McAfee Corp.
Pursuant to 17 C.F.R. Section 200.83
BASIS OF PRESENTATION
Unless the context requires otherwise, references in this prospectus to the “Company,” “we,” “us,” “our,” and “McAfee” refer to McAfee Corp. and its consolidated subsidiaries after giving effect to the reorganization transactions described in this prospectus that were completed in connection with our initial public offering and excluding the Enterprise Business (as defined herein), which was sold to STG (as defined herein) on July 27, 2021.
As used in this prospectus:
| • | “Enterprise Business” refers to certain of our Enterprise assets together with certain of our Enterprise liabilities, which were sold to STG pursuant to a definitive agreement dated March 6, 2021; |
| • | “fiscal 2018” refers to the fiscal year of Foundation Technology Worldwide LLC and its subsidiaries ended December 29, 2018; |
| • | “fiscal 2019” refers to our fiscal year ended December 28, 2019; |
| • | “fiscal 2020” refers to our fiscal year ended December 26, 2020; |
| • | “fiscal 2021” refers to our fiscal year ending December 25, 2021; |
| • | “Intel” refers to Intel Corporation; |
| • | “IPO” refers to the initial public offering of shares of Class A common stock of McAfee Corp.; |
| • | “Reorganization Transactions” refers to the reorganization transactions that are described under “Prospectus Summary—Summary of the Reorganization Transactions and Our Structure”; |
| • | “Sponsor Acquisition” refers to: (i) the conversion of McAfee, Inc., which was then a part of a business unit of Intel, into a limited liability company, McAfee, LLC, (ii) the contribution of McAfee, LLC to Foundation Technology Worldwide LLC, a wholly-owned subsidiary of Intel, (iii) the transfer beginning on April 3, 2017, by Intel and its subsidiaries of assets and liabilities of the Predecessor Business not already held through Foundation Technology Worldwide LLC to Foundation Technology Worldwide LLC, and (iv) the acquisition immediately thereafter on April 3, 2017, by our Sponsors and certain co-investors of a majority stake in Foundation Technology Worldwide LLC, following which our Sponsors and certain of theirco-investors owned 51.0% of the common equity interests in Foundation Technology Worldwide LLC, with certain affiliates of Intel retaining the remaining 49.0% of the common equity interests; |
| • | “Sponsors” refers to investment funds affiliated with or advised by TPG Global, LLC (“TPG”) and Thoma Bravo, L.P. (“Thoma Bravo”), respectively; and |
| • | “STG” refers to Symphony Technology Group. |
1
Confidential Treatment Requested by McAfee Corp.
Pursuant to 17 C.F.R. Section 200.83
PROSPECTUS SUMMARY
This summary highlights information contained in other parts of this prospectus. Because it is only a summary, it does not contain all of the information that you should consider before investing in shares of our Class A common stock, and it is qualified in its entirety by, and should be read in conjunction with, the more detailed information appearing elsewhere in this prospectus. You should read the entire prospectus carefully, especially “Risk Factors,” “Cautionary Note Regarding Forward-Looking Statements,” and our financial statements and the related notes, before deciding to purchase shares of our Class A common stock.
OVERVIEW
Our Company
McAfee has been a pioneer and leader in protecting consumers from cyberattacks for more than 30 years with integrated security, privacy, and trust solutions. We built our platform through a deep, rich history of innovation and have established a leading global brand. When securing the digital experience of a consumer who is increasingly living life online, McAfee is singularly committed to one mission: to protect all things that matter through leading-edge cybersecurity.
We live in a digital world. Consumers are increasingly mobile, interacting through multiple devices, networks and platforms, while leveraging technology as they work, socialize, consume and transact. Remote work and increasing work from home arrangements are driving a pronounced convergence of work and personal life. This lifestyle shift has been accompanied by a more challenging threat landscape and an increase in points of vulnerability, risking individuals’ privacy, identity, data and other vital resources. This challenge, coupled with an increase in cyberthreats, has heightened the importance of the consumer in making security decisions for their converged digital lives.
We have a differentiated ability to secure the digital experience against cyberthreats, using threat intelligence capabilities developed through the scale and diversity of our sensor network. Our sensor network includes our subscribers’ endpoints, personal networks, and cloud-based environments that generate massive amounts of data that we translate into actionable, real-time insights. As of 2020, the platform is continuously enriched by artificial intelligence, machine learning and the telemetry gathered from over one billion sensors. As of 2020, our vast and dynamic data set and advanced analytics capabilities enable us to provide defense for advanced
zero-day
threats by training machine learning models on the over 60 billion threat queries. McAfee simplifies the complexity of threat detection and response by correlating events, detecting new threats, reducing false positives, and guiding consumers through remediation. Protecting our subscribers has been the foundation of our success, enabling us to maintain an industry-leading reputation among our subscribers and partners.For over 30 years, consumers have turned to McAfee as a leader in cybersecurity services. Our Personal Protection Service provides holistic digital protection for an individual or family at home, on the go, and on the web. Our platform includes device security, privacy and safewhether on a computer, smartphone or tablet, and across multiple operating systems.
Wi-Fi,
online protection, and identity protection, creating a seamless and integrated digital moat. With a single interface, simple set up and ease of use, consumers obtain immediatetime-to-value
Ourstrategy has reached the consumer at crucial moments in their purchase lifecycle resulting in the protection of over 600 million devices as of June 26, 2021. We have longstanding exclusive partnerships with many of the leading PC original equipment manufacturers (“OEMs”)
digitally-led
omni channelgo-to-market
2
Confidential Treatment Requested by McAfee Corp.
Pursuant to 17 C.F.R. Section 200.83
and increasingly with mobile and internet service providers (“ISPs”) as the demand for mobile security protection increases. Through many of these relationships, our consumer security software ischannel also includes some of the largest electronics retailers globally. We operate a global business, with 37% of our fiscal 2020 net revenue earned outside of the United States and Canada.
pre-installed
on devices on a trial basis until conversion to a paid subscription. Ourgo-to-market
In 2017, investment funds affiliated with or advised by TPG Global, LLC (“TPG”) and Thoma Bravo, L.P. (“Thoma Bravo”) (collectively “Sponsors”) acquired a controlling interest in McAfee, accelerating our transformational journey to optimize and reinforce our cybersecurity platform. Over the years, we have invested in new routes to market and partnerships for the business. We have also made multiple operational changes designed to increase efficiency in our product delivery andstrategies. These efforts included the transformation of our performance marketing through a digital first approach focused on new customer acquisition, channel led conversion and overall customer retention, through our PC led product experience and consumer application development programs. Our investments in our platform and strategy have reinforced our market leadership, and we intend to continue innovating to protect our subscribers.
go-to-market
Sale of our Enterprise Business
On July 27, 2021, we completed the sale of our Enterprise Business to STG, pursuant to a Contribution and Equity Purchase Agreement (the “Purchase Agreement”) entered in on March 6, 2021 between McAfee, LLC (“US Seller”) and McAfee Security UK LTD (“UK Seller” and together with US Seller, the “Seller Entities”) and Magenta Buyer LLC, organized by a consortium led by STG, entered into the Purchase Agreement, in exchange for (i) $4,000,000,000 in cash consideration and (ii) the assumption of certain liabilities of the Enterprise Business as specified in the Purchase Agreement. We believe this transaction will allow McAfee to singularly focus on our Consumer business and to accelerate our strategy to be a leader in personal security for consumers.
In connection with the closing of the sale, the Seller Entities and Buyer entered into a Transition Services Agreement, Transitional Trademark License Agreement, Intellectual Property Matters Agreement and Commercial Services Agreement, under which each party granted certain licenses to the other party with respect to certain intellectual property rights and technology transferred by us in the Enterprise Sale and retained by us after the consummation of the sale of our Enterprise Business. We also agreed not to compete with the Enterprise Business for four years following the closing of the transaction. In addition, we and Buyer agreed to indemnify each other for losses arising from certain covenant breaches under the Purchase Agreement and certain liabilities expressly assumed or retained by the relevant indemnifying party.
In August 2021, we used a portion of the proceeds received in the transaction to repay $332 million of our First Lien USD Term Loan and €563 million of our First Lien EUR Term Loan. We expect to use a portion of such proceeds to pay approximately $175 million in customary transaction expenses and
other one-time charges.
The remaining proceeds were distributed by Foundation Technology Worldwide LLC, our controlled subsidiary, on a pro rata basis to all holders, including McAfee Corp. McAfee Corp. expects its pro rata portion of such proceeds to pay approximately $300 million in required corporate taxes and related payments in connection with the transaction. McAfee Corp. declareda one-time special
dividend of $4.50 per share to holders of record of our Class A Common Stock as of August 13, 2021, paid on August 27, 2021. Purchases of shares in this offering will not receive this special dividend. We also expect to pay approximately $300 million in totaladditional one-time separation
costs and stranded cost optimization, a portion of which will be expenses paid using proceeds from the sale of our Enterprise Business.3
Confidential Treatment Requested by McAfee Corp.
Pursuant to 17 C.F.R. Section 200.83
Industry Background
We live in an increasingly digitally interconnected and mobile world that is driving profound changes for consumers, causing them to react to the following trends:
Online adoption use is global and continues to grow.
The global consumer is completing more of their everyday routine online, expanding their digital footprint.
Increased attack surface results in high risk of being hacked and critical data used for profit.
There is a need for integratedcybersecurity solutions that secure consumers in a connected world by offering the following:
device-to-cloud
| • | Comprehensive and convenient security solutions to protect consumers across their digital footprint. |
| • | Consumer protection powered by seamless digital experience across device platforms. |
| • | Consumer products to address privacy needs. |
| • | Comprehensive threat intelligence leveraging a unique global sensor network. |
KEY BENEFITS OF OUR SOLUTIONS
We protect consumers with our differentiated ability to detect, analyze, and manage responses to adversarial threats. Our subscribers trust us to protect and defend their families, data, network and online experience whether it is on a device or in the cloud, at home or on the go.
Our products are multi-faceted privacy protection solutions that provide consumers security in their everyday lives.
4
Confidential Treatment Requested by McAfee Corp.
Pursuant to 17 C.F.R. Section 200.83
encrypt sensitive files on public networks, and erases digital footprints that could be used to compromise their data, identity and privacy.
| • | Our solutions provide a seamless and user friendly experience. time-to-value |
| • | Our solutions have comprehensive features that provide consumers peace of mind that their online experience is protected. |
| • | Our solutions are supported by our global threat intelligence network, which is bolstered by artificial intelligence, machine learning, and deep learning to increase efficacy and efficiency. |
Market Opportunity
According to Frost & Sullivan, the global consumer endpoint security market (comprised of endpoint protection and prevention and consumer privacy and identity protection) addressed by our solutions is expected to reach nearly $13.1 billion in 2020, growing to $18.7 billion in 2024. The consumer endpoint security market has remained strong throughout the
COVID-19
pandemic and has not shown signs of waning during the first half of 2021. While theCOVID-19
pandemic may have accelerated the market for consumer endpoint security solutions, we believe there continues to be a robust market for consumer personal protection, including mobile solution and broader Consumer protection offerings.Competitive Strengths
Our competitive strengths include:
| • | Brand recognition |
| • | Holistic cybersecurity solutions seamlessly integrated across the consumers’ entire digital ecosystem. |
5
Confidential Treatment Requested by McAfee Corp.
Pursuant to 17 C.F.R. Section 200.83
| • | Unique footprint across devices. |
| • | Scale and diversity of threat intelligence network |
| • | Differentiated omnichannel go-to-market |
| • | Experienced management team with deep cybersecurity expertise. go-to-market |
Our Growth Strategy
Our strategy is to maintain and extend our technology leadership in cybersecurity solutions by driving frictionless and secure digital experiences. We believe that consummation of the Enterprise Sale will enable us to focus on and devote all of our resources to delivering leading solutions to protect consumers across their digital lives. The following are key elements of our growth strategy:
| • | Continue to leverage our strength as a trusted cybersecurity brand to increase sales from new and existing subscribers. |
| • | Invest in new and existing routes to market for subscribers. direct-to-consumer |
| • | Enhance and tailor the subscriber conversion and renewal process. |
| • | Continue to innovate and enhance our consumer security platform and user experience. |
| • | Continue to pursue targeted acquisitions. |
6
Confidential Treatment Requested by McAfee Corp.
Pursuant to 17 C.F.R. Section 200.83
and believe we are well positioned to successfully execute on our acquisition strategy by leveraging our scale, global reach and routes to market, and data assets. |
Our Products
We have one of the industry’s most comprehensive cybersecurity portfolios protecting consumers’ digital life.
Our Personal Protection Service provides holistic digital protection of the individual and family wherever they go, whatever they do and whatever they own. It encompasses device security, privacy, and
safe Wi-Fi, online
protection, and identity protection through a trusted brand with an experience that is equally easy to use whether on a computer, a mobile smartphone or a tablet and across multiple operating system platforms. Our Personal Protection Service delivers a multi-experience user interface with no performance trade-offs, and with a focus on simple and seamless protection during a consumers’ digital experience. Our platform frees consumers to work on sensitive files, videoconference their friends, and have their kids go on social media platforms while having peace of mind that our Personal Protection Service is keeping their data and files encrypted, alerting them when they are at risk, and helping them to resolve security threats. We achieve this by integrating the following solutions and capabilities within our Personal Protection Service:| • | Device Security. Anti-Malware Software Total Protection / LiveSafe Secure Home Platform (“SHP”) . |
| • | Online Privacy and Comprehensive Internet Security. Safe Connect VPN TunnelBear any Wi-Fi connection safe and private. With bank-gradeAES 256-bit encryption, our solution keeps personal data, such as banking account credentials and credit card information protected while keeping IP addresses and physical locations private. This capability helps consumers prevent password and data theftand IP-based tracking and allows customers to access global content, by bypassing local censorship. Consumers can add an additional layer of protection with FileLock Shredder WebAdvisor Safe Family blocks age-inappropriate websites, provides device usage monitoring and device restriction services and gives parents the ability to track children’s devices. |
| • | Identity Protection. IdentityProtection |
7
Confidential Treatment Requested by McAfee Corp.
Pursuant to 17 C.F.R. Section 200.83
credit monitoring and SSN trace, helping consumers take action to prevent from fraud. Our solution also helps consumers recover from fraud through our 24/7/365 support and range of additional services, such as our full-service ID restoration, stolen funds reimbursement, lost wallet recovery, and identify theft insurance, covering expenses up to $1 million. Our Password Manager or re-used passwords. |
We also provide these services to consumers who want to complement their existing protection in the form of individual products, such as,,,, and, as well as to consumers who want to protect their complete digital life through our Total Protection and LiveSafe portfolio brands.
Mobile Security
Safe Connect
Safe Family
WebAdvisor
Identity Theft Protection
In addition, we extended our protection services to small business owners and the gamer community. Our Small Business Security package helps small businesses keep their businesses and customer data safe by leveraging our award-winning multi-device protection and privacy capabilities, enhanced with our 24/7 technical support and virus removal service. Our Gamer Security package delivers anti-malware functionality while enhancing gaming performance. By offloading threat detection to the cloud, keeping necessary virus definitions locally, and optimizing system resources like CPU, GPU, and RAM by pausing background services, we deliver a smoother and safer gaming experience.
Our Technology
We deploy the latest technologies to maintain our competitive advantage in our product offerings as well as to design a digital experience for consumers that drive customer engagement, satisfaction, and retention.
Quality of Our Protection and AI
Our solutions defend against a wide range of threats by using technology that leverages a combination of threat intelligence and artificial intelligence. Unlike other alternatives that rely only on artificial intelligence, our approach minimizes false positives while detecting a wide range of threats, including
new zero-day threats
that have never been seen before.Our solutions are enhanced by our from detected events across the product portfolio in addition to structural and behavioral feature vectors from telemetry collected through our artificial intelligence sensors. This telemetry enables McAfee to understand the blueprint of threats for which we do not necessarily possess the sample but can identify based on behavioral and structural vectors which improves our efficacy in
Global Threat Intelligence Telemetry
detecting zero-day threats.
Our provides two options for performing automated analysis—on the device or in the cloud. The former uses machine learning on customer systems to determine whether existing and incoming files match known malware. Our cloud-based machine learning scanner collects and sends file attributes and behavioral information to the machine-learning system in the cloud for malware analysis, without transmitting personally identifiable information.
Machine Learning Scanner
Anti-Malware Engine
Our anti-malware engine is the core component of our award-winning products. Using patented technology, the engine analyzes potentially malicious code to detect and block Trojans, viruses, worms, adware, spyware, and other threats. The engine scans files at particular points, processes, and pattern-matches malware definitions with data it finds within scanned files, decrypts, and runs malware code in an emulated environment, applies heuristic techniques to recognize new malware, and removes infectious code from legitimate files.
8
Confidential Treatment Requested by McAfee Corp.
Pursuant to 17 C.F.R. Section 200.83
Consumer Experience Innovation
We continuously improve the digital experience for consumers through the following technologies:
| • | Platform Innovation. |
| • | Ability to Integrate with Our Partners. |
Sales and Marketing
Ourengine consists of a
go-to-market
digitally-led
omnichannel approach to reach the consumer at crucial moments in their purchase lifecycle including direct to consumer online sales, acquisition through trialpre-loads
on PC OEM devices, and other indirect modes via additional partners such as mobile providers, ISPs, electronics retailers, ecommerce sites, and search providers.| • | Direct to consumer marketing. |
| • | PC OEMs. we pre-install a 30-day free a one-year or longer subscription and the OEM pays McAfee a royalty. During the subscription lifecycle, McAfee engages the consumer with our digital marketing engine to convert the consumer to a McAfee customer at the end of the subscription period. |
| • | Retail and eCommerce. |
| • | Communications Service Providers, ISPs and Mobile Providers. Verizon, T-Mobile, Lumen, Telefonica, NTT Docomo, Softbank, British Telecom, and Sky, to offer our mobile security and secure home platform products through the service providers. In some cases, we also partner with the service providers to integrate and bundle one or more of our security products into their mobile product value added service offerings. In addition to our partnerships with service providers, we partner with Samsungto pre-install one or more of our security products on their smartphones. |
9
Confidential Treatment Requested by McAfee Corp.
Pursuant to 17 C.F.R. Section 200.83
| • | Search Providers |
Our omnichannel approach and strong partnerships work together to increase our presence at key moments of purchase and security engagement for consumers, allowing us to drive customer engagement and acquisition of new subscribers.
SUMMARY RISK FACTORS
An investment in our Class A common stock involves a high degree of risk. Any of the factors set forth under “Risk Factors” may limit our ability to successfully execute our business strategy. You should carefully consider all of the information set forth in this prospectus, and, in particular, you should evaluate the specific factors set forth under “Risk Factors” in deciding whether to invest in our Class A common stock. Among these important risks are the following:
| • | The COVID-19 pandemic has affected how we are operating our business, and the duration and extent to which this will impact our future results of operations and overall financial performance remains uncertain. |
| • | If we are unsuccessful at executing our business plan and necessary transition activities as a standalone consumer cybersecurity company following the recent sale of our Enterprise Business, our business and results of operations may be adversely affected and our ability to invest in and grow our business could be limited. |
| • | The cybersecurity market is rapidly evolving and becoming increasingly competitive in response to continually evolving cybersecurity threats from a variety of increasingly sophisticated cyberattackers. If we fail to anticipate changing customer requirements or industry and market developments, or we fail to adapt our business model to keep pace with evolving market trends, our financial performance will suffer. |
| • | We operate in a highly competitive environment, and we expect competitive pressures to increase in the future, which could cause us to lose market share. |
| • | Our results of operations can be difficult to predict and may fluctuate significantly, which could result in a failure to meet investor expectations. |
| • | Forecasting our estimated annual effective tax rate is complex and subject to uncertainty, and there may be material differences between our forecasted and actual tax rates. |
| • | We face risks associated with past and future investments, acquisitions, and other strategic transactions. |
| • | Over the last several years, we have pursued a variety of strategic initiatives designed to optimize and reinforce our cybersecurity platform. If the benefits of these initiatives are less than we anticipate, or if the realization of such benefits is delayed, our business and results of operations may be harmed. |
| • | If our solutions have or are perceived to have defects, errors, or vulnerabilities, or if our solutions fail or are perceived to fail to detect, prevent, or block cyberattacks, including in circumstances where customers may fail to take action on attacks identified by our solutions, our reputation and our brand could suffer, which would adversely impact our business, financial condition, results of operations, and cash flows. |
| • | Failure to adapt our product and service offerings to changing customer demands, or lack of customer acceptance of new or enhanced solutions, could harm our business and financial results. |
10
Confidential Treatment Requested by McAfee Corp.
Pursuant to 17 C.F.R. Section 200.83
| • | If the protection of our proprietary technology is inadequate, we may not be able to adequately protect our innovations and brand. |
| • | If we fail to maintain relationships with our channel partners, or if we must agree to significant adverse changes in the terms of our agreements with these partners, it may have an adverse effect on our ability to successfully and profitably market and sell our products and solutions. |
| • | If our security measures are breached or unauthorized access to our data is otherwise obtained, our brand, reputation, and business could be harmed, and we may incur significant liabilities. |
| • | We operate globally and are subject to significant business, economic, regulatory, social, political, and other risks in many jurisdictions. |
| • | We may become involved in litigation, investigations, and regulatory inquiries and proceedings that could negatively affect us and our reputation. |
| • | Our substantial leverage could adversely affect our ability to raise additional capital to fund our operations, limit our ability to react to changes in the economy or our market, expose us to interest rate risk, and prevent us from timely satisfying our obligations. |
| • | Restrictions imposed by our outstanding indebtedness and any future indebtedness may limit our ability to operate our business and to finance our future operations or capital needs or to engage in acquisitions or other business activities necessary to achieve growth. |
| • | Our principal asset is our interest in Foundation Technology Worldwide LLC, and we are dependent upon Foundation Technology Worldwide LLC and its consolidated subsidiaries for our results of operations, cash flows, and distributions. |
| • | We will be required to pay certain Continuing Owners and certain Management Owners for certain tax benefits we may realize or are deemed to realize in accordance with the tax receivable agreement between us and such Continuing Owners and Management Owners, and we expect that the payments we will be required to make will be substantial. |
| • | In certain circumstances, under its limited liability company agreement, Foundation Technology Worldwide LLC will be required to make tax distributions to us, the Continuing Owners and certain Management Owners and the distributions that Foundation Technology Worldwide LLC will be required to make may be substantial. |
SPONSOR ACQUISITION
Through April 3, 2017, the Predecessor Business was operated as a part of a business unit of Intel. Also prior to April 3, 2017, McAfee, Inc., a Delaware corporation, then a wholly-owned subsidiary of Intel, was converted into a Delaware limited liability company, McAfee, LLC. Following such conversion, Intel contributed McAfee, LLC to Foundation Technology Worldwide LLC, a wholly-owned subsidiary of Intel. On April 3, 2017, Intel and its subsidiaries transferred assets and liabilities of the Predecessor Business not already held through Foundation Technology Worldwide LLC to Foundation Technology Worldwide LLC. Immediately thereafter on April 3, 2017, our Sponsors and certain of their
co-investors
acquired a majority stake in Foundation Technology Worldwide LLC, which we refer to, collectively, as the Sponsor Acquisition. Following the Sponsor Acquisition, our Sponsors and certain of theirco-investors
owned 51.0% of the common equity interests in Foundation Technology Worldwide LLC, with certain affiliates of Intel retaining the remaining 49.0% of the common equity interests. We have operated as a standalone company at all times following the Sponsor Acquisition.11
Confidential Treatment Requested by McAfee Corp.
Pursuant to 17 C.F.R. Section 200.83
SUMMARY OF THE REORGANIZATION TRANSACTIONS AND OUR STRUCTURE
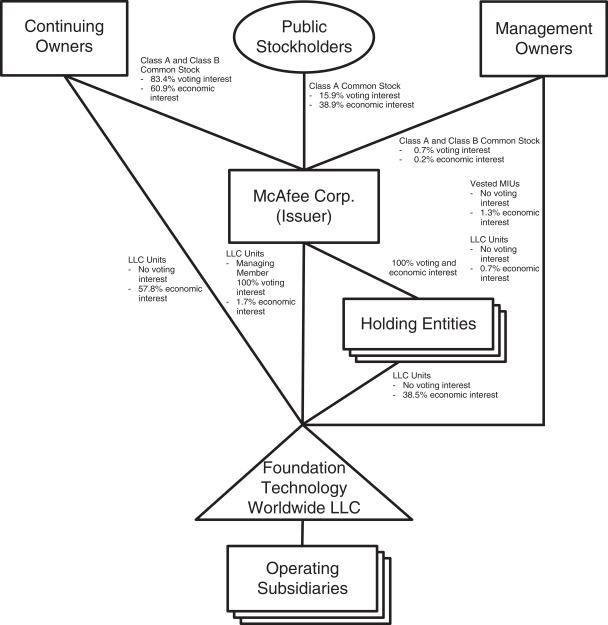
McAfee Corp. (the “Corporation”) was incorporated in Delaware on July 19, 2019. The Corporation was formed for the purpose of completing an initial public offering (the “IPO”) and related transactions in order to carry on the business of Foundation Technology Worldwide LLC (“FTW”) and its subsidiaries (the Corporation, FTW and its subsidiaries are collectively the “Company”). On October 21, 2020, the Corporation became the sole managing member and holder of 100% of the voting power of FTW due to the reorganization transactions described below. With respect to the Corporation and FTW, each entity owns only the respective entities below it in the corporate structure and each entity has no other material operations, assets, or liabilities.
In October, 2020, the Corporation completed the IPO pursuant to which the Corporation and selling stockholders sold an aggregate of 37 million shares of Class A common stock par value $0.001 per share (“Class A common stock”) at a public offering price of $20.00 per share. The Corporation issued 31 million shares and received $586 million in proceeds, net of underwriting discounts and commissions, of which $553 million was used to purchase newly-issued limited liability company units (“LLC Units”) and $33 million was used to purchase LLC Units from existing holders (“Continuing LLC Owners”) of interests in FTW, at a purchase price per unit equal to the public offering price per share of Class A common stock, less underwriting discounts and commissions.
We refer to the holders of management incentive units of FTW (“MIUs”) as well as members of management who hold LLC Units following the closing of the offering or are to receive Class A common stock in satisfaction of existing incentive awards as “Management Owners.” We refer to those of our
pre-IPO
investors and certain of their affiliates who received shares of Class A common stock in connection with the Reorganization Transactions (as defined below) and who do not hold LLC Units as “Continuing Corporate Owners,” and together with the Continuing LLC Owners, as “Continuing Owners.”In connection with the closing of the IPO, the following Reorganization Transactions were consummated:
| • | a new limited liability company operating agreement (“New LLC Agreement”) was adopted for FTW making the Corporation the sole managing member of FTW; |
| • | the Corporation’s certificate of incorporation was amended and restated to, among other things, (i) provide for Class A common stock and Class B common stock and (ii) issue shares of Class B common stock to the Continuing Owners and Management Owners, on a one-to-one |
| • | the Corporation (i) issued 126.3 million shares of its Class A common stock to certain of the Continuing Owners in exchange for their contribution of LLC units or the equity of certain other entities, which pursuant to the Reorganization Transactions, became its direct or indirect subsidiaries and (ii) settled 5.7 million restricted stock units (“RSUs”) with shares of its Class A common stock, net of tax withholding, held by certain employees, which were satisfied in connection with the Reorganization Transactions. |
The diagram below depicts our organizational structure immediately following this offering, assuming no exercise by the underwriters of their option to purchase additional shares of Class A common stock.
12
Confidential Treatment Requested by McAfee Corp.
Pursuant to 17 C.F.R. Section 200.83
DIVESTITURE OF THE ENTERPRISE BUSINESS
On July 27, 2021, McAfee, LLC and McAfee Security UK LTD (“UK Seller” and together with US Seller, the “Seller Entities”) and Magenta Buyer LLC, organized by a consortium led by STG, entered into the Second Amendment to Contribution and Equity Purchase Agreement (the “Purchase Agreement Amendment”) governing the sale by the Company of certain assets of its Enterprise Business to STG in exchange for (i) $4,000,000,000 in cash consideration and (ii) the assumption of certain liabilities of the Enterprise business as specified in the Contribution and Equity Purchase Agreement (as amended, the “Purchase Agreement”) (such transaction, the “Enterprise Business Sale”). The Purchase Agreement Amendment clarifies the treatment of
13
Confidential Treatment Requested by McAfee Corp.
Pursuant to 17 C.F.R. Section 200.83
certain transferred employees of the Enterprise Business and the treatment of certain residual cash balances and certain transferred assets and liabilities upon the consummation of the Enterprise Business Sale, among other matters.
OUR SPONSORS
TPG
Thoma Bravo
CORPORATE INFORMATION
McAfee Corp. was formed in Delaware on July 19, 2019. Our principal executive offices are located at 6220 America Center Drive, San Jose, California 95002, and our telephone number is (866)
622-3911.
Our Internet website is www.mcafee.com. The information on, or that can be accessed through, our website and the other websites that we present in this prospectus is not part of this prospectus, and you should not rely on any such information in making the decision whether to purchase shares of our Class A common stock.14
Confidential Treatment Requested by McAfee Corp.
Pursuant to 17 C.F.R. Section 200.83
THE OFFERING
Issuer in this offering | McAfee Corp. |
Class A common stock offered by the selling stockholders | 20,000,000 shares (or 23,000,000 shares if the underwriters exercise in full their option to purchase additional shares of Class A common stock). |
Underwriters’ option to purchase additional shares of Class A common stock from the selling stockholders | 3,000,000 shares. |
Class A common stock to be outstanding after this offering | 175,849,441 shares (or 178,003,855 shares if the underwriters exercise in full their option to purchase additional shares of Class A common stock). |
Class B common stock to be outstanding after this offering | 255,532,090 shares (or 253,377,676 shares if the underwriters exercise in full their option to purchase additional shares of Class A common stock). |
Voting power held by holders of Class A common stock after giving effect to this offering by the selling stockholders | 40.8% |
Voting power held by holders of Class B common stock after giving effect to this offering by the selling stockholders | 59.2% |
Voting rights | Holders of our Class A common stock and Class B common stock vote together as a single class on all matters presented to stockholders for their vote or approval, except as otherwise required by law or as otherwise provided by our certificate of incorporation. Each share of Class A common stock and Class B common stock entitles its holder to one vote per share on all such matters. See “Description of Capital Stock.” |
Use of proceeds | The selling stockholders will receive all of the net proceeds from this offering. We will not receive any of the proceeds from the sale of shares of Class A common stock offered by the selling stockholders. We will, however, bear the costs associated with the sale of shares by the selling stockholders, other than underwriting discounts and commissions. See “Use of Proceeds.” |
Conflicts of Interest | Affiliates of TPG beneficially own in excess of 10% of our issued and outstanding common stock. Because TPG Capital BD, LLC, an |
15
Confidential Treatment Requested by McAfee Corp.
Pursuant to 17 C.F.R. Section 200.83
affiliate of TPG, is an underwriter in this offering and its affiliates own in excess of 10% of our issued and outstanding common stock, TPG Capital BD, LLC is deemed to have a “conflict of interest” under Rule 5121 (“Rule 5121”) of the Financial Industry Regulatory Authority, Inc. (“FINRA”). Accordingly, this offering is being made in compliance with the requirements of Rule 5121. Pursuant to that rule, the appointment of a “qualified independent underwriter” is not required in connection with this offering as the member primarily responsible for managing the public offering does not have a conflict of interest, is not an affiliate of any member that has a conflict of interest and meets the requirements of paragraph (f)(12)(E) of Rule 5121. See “Underwriters (Conflicts of Interest).” |
Dividend Policy | Foundation Technology Worldwide LLC expects to pay a cash distribution to its members on a quarterly basis at an aggregate annual rate of approximately $200 million. McAfee Corp. is expected to receive a portion of any such distribution through the LLC Units it holds directly or indirectly through its wholly-owned subsidiaries on the record date for any such distribution declared by Foundation Technology Worldwide LLC, which is expected to equal the number of shares of Class A common stock outstanding on such date. McAfee Corp. expects to use the proceeds it receives from such quarterly distribution to declare a cash dividend on its shares of Class A common stock. We intend to fund any future dividends from distributions made by Foundation Technology Worldwide LLC from its available cash generated from operations. |
| In addition, in connection with the consummation of the sale of our Enterprise Business to STG, we declared a one-time special dividend of $4.50 to holders of record of our Class A common stock as of August 13, 2021, paid on August 27, 2021. Purchasers of shares in this offering will not be entitled to receive such special dividend with the respect to the shares of Class A common stock that they purchase in this offering. |
| The timing, declaration, amount of, and payment of any such dividends will be made at the discretion of McAfee Corp.’s board of directors, subject to applicable laws, and will depend upon many factors, including the amount of the distribution received by McAfee Corp. from Foundation Technology Worldwide LLC, our financial condition, results of operations, capital requirements, contractual restrictions, general business conditions, and other factors that McAfee Corp.’s board of directors may deem relevant. Moreover, if, as expected, McAfee Corp. determines to initially pay a dividend following any quarterly distributions from Foundation Technology Worldwide LLC, there can be no assurance that McAfee Corp. will continue to pay dividends in the same amounts or at all thereafter. See “Dividend Policy.” |
Controlled Company | Following this offering, our Sponsors and Intel and certain of its affiliates will control approximately 77.7% of the combined voting |
16
Confidential Treatment Requested by McAfee Corp.
Pursuant to 17 C.F.R. Section 200.83
power of our outstanding common stock. As a result, we will continue to be a “controlled company” under the Exchange’s corporate governance standards. Under these standards, a company of which more than 50% of the voting power is held by an individual, group, or another company is a “controlled company” and may elect not to comply with certain corporate governance standards. |
Risk factors | You should read the “Risk Factors” section of this prospectus for a discussion of factors to consider carefully before deciding to invest in shares of our Class A common stock. |
Exchange symbol | “MCFE” |
Unless otherwise indicated, the number of shares of Class A common stock to be outstanding after this offering is based on 166,004,840 shares of Class A common stock outstanding as of June 26, 2021 and excludes:
| • | 265,376,691 shares of Class A common stock issuable upon exchange or redemption of LLC Units, together with corresponding shares of Class B common stock; |
| • | 5,854,008 shares of Class A common stock that would be outstanding if all vested MIUs were exchanged for shares of Class A common stock, and 6,814,340 shares of Class A common stock that would be outstanding if all unvested MIUs were exchanged for shares of Class A common stock; |
| • | 23,847,140 shares of Class A common stock issuable upon vesting of outstanding RSUs; |
| • | 1,834,063 shares of Class A common stock issuable upon vesting of outstanding PSUs; |
| • | 482,231 shares of Class A common stock issuable upon exercise of vested option awards having a weighted average exercise price of $19.88 and 1,350,954 shares of Class A common stock issuable upon exercise of unvested option awards having a weighted average exercise price of $19.38; |
| • | 43,130,213 shares of Class A common stock reserved for future issuance under our 2020 equity incentive plan, without taking into account the “evergreen” provision of our 2020 equity incentive plan; and |
| • | 9,389,809 shares of Class A common stock authorized for sale under the Employee Stock Purchase Plan (“ESPP”) without taking into account the “evergreen” provision of our ESPP; |
Unless otherwise indicated, this prospectus reflects and assumes no exercise by the underwriters of their option to purchase up to 3,000,000 additional shares of our Class A common stock in this offering.
17
Confidential Treatment Requested by McAfee Corp.
Pursuant to 17 C.F.R. Section 200.83
SUMMARY OF CONSOLIDATED FINANCIAL AND OTHER DATA
The following table sets forth the summary consolidated financial and other data of McAfee Corp. for the periods presented and at the dates indicated below.
The summary of consolidated statements of operations and cash flows data presented below for fiscal 2018, fiscal 2019, and fiscal 2020 are derived from the audited consolidated financial statements that are included elsewhere in this prospectus. The consolidated balance sheet data as of June 26, 2021 is derived from unaudited condensed consolidated financial statements that are included elsewhere in this prospectus. The summary of unaudited condensed consolidated statements of operations and cash flows data for the six months ended June 27, 2020 and June 26, 2021 are derived from unaudited condensed consolidated financial statements that are included elsewhere in this prospectus.
On March 6, 2021, we entered into a definitive agreement (the “Purchase Agreement”) with a consortium led by Symphony Technology Group (“STG”) under which STG agreed to purchase certain of our Enterprise assets together with certain of our Enterprise liabilities (“Enterprise Business”), representing substantially all of our Enterprise segment, for an
all-cash
purchase price of $4.0 billion. The divestiture transaction closed on July 27, 2021. The divestiture of our Enterprise Business represents a strategic shift in our operations that will allow us to focus on our Consumer Business. As a result of the divestiture, the results of our Enterprise Business were reclassified as discontinued operations in our consolidated statements of operations and excluded from both continuing operations and segment results for all periods presented. Starting in the first quarter of fiscal 2021, we began to operate in one reportable segment as the Enterprise Business comprised substantially all of our Enterprise segment. Results of discontinued operations includes all revenues and expenses directly derived from our Enterprise Business, with the exception of general corporate overhead costs that were previously allocated to our Enterprise segment but have not been allocated to discontinued operations. The Enterprise Business, as specified in the Purchase Agreement, was reclassified as discontinued operations in our consolidated balance sheets, subject to changes set forth in the Purchase Agreement, which included amendments to the agreement in July 2021. See Note 3 to our audited consolidated financial statements that are included elsewhere in this prospectus for additional information about the divestiture of our Enterprise Business.We maintain a
52-
or53-week
fiscal year that ends on the last Saturday in December. The year ended December 29, 2018 is a52-week
year starting on December 31, 2017 and ending on December 29, 2018. The year ended December 28, 2019 is a52-week
year starting on December 30, 2018 and ending on December 28, 2019. The year ended December 26, 2020 is a52-week
year starting on December 29, 2019 and ending on December 26, 2020. Six months ended June 27, 2020 is a26-week
period starting on December 29, 2019 and ending on June 27, 2020. Six months ended June 26, 2021 is a26-week
period starting on December 27, 2020 and ending on June 26, 2021.The unaudited condensed consolidated financial statements were prepared on a basis consistent with our audited consolidated financial statements and include all adjustments, consisting of normal and recurring adjustments that we consider necessary for a fair statement of the financial condition and results of operations as of and for such periods. Operating results for the periods presented are not necessarily indicative of the results that may be expected in future periods, and operating results for the six months ended June 26, 2021 are not necessarily indicative of results for the full year. The following information should be read in conjunction with “Capitalization,” “Management’s Discussion and Analysis of Financial Condition and Results of Operations,” our audited consolidated financial statements, and our unaudited condensed consolidated financial statements and the related notes included elsewhere in this prospectus.
18
Confidential Treatment Requested by McAfee Corp.
Pursuant to 17 C.F.R. Section 200.83
Results of Operations Data
Fiscal Year Ended | Six Months Ended | |||||||||||||||||||
(in millions expect per share data) | December 29, 2018 | December 28, 2019 | December 26, 2020 | June 27, 2020 | June 26, 2021 | |||||||||||||||
Net revenue | $ | 1,161 | $ | 1,303 | $ | 1,558 | $ | 737 | $ | 909 | ||||||||||
Cost of sales (2) | 386 | 391 | 444 | 209 | 232 | |||||||||||||||
Gross profit | 775 | 912 | 1,114 | 528 | 677 | |||||||||||||||
Operating expenses: | ||||||||||||||||||||
Sales and marketing (2) | 348 | 299 | 348 | 140 | 174 | |||||||||||||||
Research and development (2) | 186 | 161 | 188 | 75 | 92 | |||||||||||||||
General and administrative (2) | 170 | 182 | 235 | 100 | 93 | |||||||||||||||
Amortization of intangibles | 153 | 146 | 143 | 72 | 49 | |||||||||||||||
Restructuring charges | 19 | 6 | 2 | 1 | 8 | |||||||||||||||
Total operating expenses | 876 | 794 | 916 | 388 | 416 | |||||||||||||||
Operating income (loss) | (101 | ) | 118 | 198 | 140 | 261 | ||||||||||||||
Interest (expense) and other, net | (308 | ) | (296 | ) | (307 | ) | (149 | ) | (118 | ) | ||||||||||
Foreign exchange gain (loss), net | 30 | 21 | (104 | ) | (6 | ) | 15 | |||||||||||||
Income (loss) from continuing operations before income taxes | (379 | ) | (157 | ) | (213 | ) | (15 | ) | 158 | |||||||||||
Provision for income tax expense (benefit) | 29 | 38 | 5 | (5 | ) | 7 | ||||||||||||||
Income (loss) from continuing operations | (408 | ) | (195 | ) | (218 | ) | (10 | ) | 151 | |||||||||||
Income (loss) from discontinued operations, net of taxes | (104 | ) | (41 | ) | (71 | ) | 41 | 51 | ||||||||||||
Net income (loss) | $ | (512 | ) | $ | (236 | ) | $ | (289 | ) | $ | 31 | $ | 202 | |||||||
Less: Net income (loss) attributable to redeemable noncontrolling interests | N/A | N/A | (171 | ) | N/A | 136 | ||||||||||||||
Net income (loss) attributable to McAfee Corp. | N/A | N/A | $ | (118 | ) | N/A | $ | 66 | ||||||||||||
Net income (loss) attributable to McAfee Corp.: | ||||||||||||||||||||
Income (loss) from continuing operations attributable to McAfee Corp. | N/A | N/A | $ | (55 | ) | N/A | $ | 50 | ||||||||||||
Income (loss) from discontinued operations attributable to McAfee Corp. | N/A | N/A | (63 | ) | N/A | 16 | ||||||||||||||
Net income (loss) attributable to McAfee Corp. | N/A | N/A | $ | (118 | ) | N/A | $ | 66 | ||||||||||||
Earnings (loss) per share attributable to McAfee Corp., basic: | ||||||||||||||||||||
Continuing operations | N/A | N/A | $ | (0.34 | ) | N/A | $ | 0.31 | ||||||||||||
Discontinued operations | N/A | N/A | (0.39 | ) | N/A | 0.10 | ||||||||||||||
Earnings (loss) per share, basic (1) | N/A | N/A | $ | (0.73 | ) | N/A | $ | 0.40 | ||||||||||||
Earnings (loss) per share attributable to McAfee Corp., diluted: | ||||||||||||||||||||
Continuing operations | N/A | N/A | $ | (0.34 | ) | N/A | $ | 0.30 | ||||||||||||
Discontinued operations | N/A | N/A | (0.39 | ) | N/A | 0.09 | ||||||||||||||
Earnings (loss) per share, diluted (1) | N/A | N/A | $ | (0.73 | ) | N/A | $ | 0.39 | ||||||||||||
Weighted-average shares outstanding, basic | N/A | N/A | 162.3 | N/A | 163.7 | |||||||||||||||
Weighted-average shares outstanding, diluted | N/A | N/A | 162.3 | N/A | 179.5 | |||||||||||||||
Statements of Cash Flows Data | ||||||||||||||||||||
Net cash provided by (used in): | ||||||||||||||||||||
Operating activities | $ | 319 | $ | 496 | $ | 760 | $ | 288 | $ | 448 | ||||||||||
Investing activities | (677 | ) | (63 | ) | (51 | ) | (33 | ) | (18 | ) | ||||||||||
Financing activities | 459 | (734 | ) | (651 | ) | (162 | ) | (239 | ) | |||||||||||
| (1) | Basic and diluted earnings (loss) per share of Class A common stock are applicable only for periods after October 22, 2020, which is the period following our IPO and related Reorganization Transactions. Refer to Note 17 in our audited consolidated financial statements included elsewhere in this prospectus |
19
Confidential Treatment Requested by McAfee Corp.
Pursuant to 17 C.F.R. Section 200.83
| for information about the Net Loss Per Share during fiscal 2020. Refer to Note 15 Earnings Per Share in the notes to the unaudited condensed consolidated financial statements included elsewhere in this prospectus for information about the Earnings Per Share during the six months ended June 26, 2021. |
| (2) | Includes equity-based compensation expense as follows: |
Fiscal Year Ended | Six Months Ended | |||||||||||||||||||
(in millions) | December 29, 2018 | December 28, 2019 | December 26, 2020 | June 27, 2020 | June 26, 2021 | |||||||||||||||
Cost of sales | $ | 1 | $ | — | $ | 5 | $ | — | $ | 2 | ||||||||||
Sales and marketing | 1 | 1 | 23 | 1 | 7 | |||||||||||||||
Research and development | 1 | 1 | 40 | — | 10 | |||||||||||||||
General and administrative | 3 | 3 | 45 | 15 | 14 | |||||||||||||||
Total equity-based compensation expense from continuing operations | 6 | 5 | 113 | 16 | 33 | |||||||||||||||
Discontinued operations | 22 | 20 | 200 | 3 | 45 | |||||||||||||||
Total equity-based compensation expense | $ | 28 | $ | 25 | $ | 313 | $ | 19 | $ | 78 | ||||||||||
Consolidated Balance Sheet Data
(in millions) | As of June 26, 2021 | |||
Cash and cash equivalents | $ | 420 | ||
Working capital (1) | (1,351 | ) | ||
Total assets | 5,437 | |||
Current and long-term deferred revenue | 1,019 | |||
Current and long-term debt, net of borrowing costs (2) | 3,948 | |||
Redeemable noncontrolling interests | 7,687 | |||
Accumulated deficit | (52 | ) | ||
| (1) | Working capital is comprised of current assets less current liabilities. |
| (2) | In connection with the consummation of the sale of our Enterprise Business to STG, we repaid $332 million of our First Lien USD Term Loan and €563 million of our First Lien EUR Term Loan in August 2021. See “Capitalization”. |
Non-GAAP
Financial MeasuresWe believe that in addition to our results determined in accordance with GAAP, adjusted operating income, adjusted operating income margin, adjusted EBITDA, adjusted EBITDA margin, adjusted net income, adjusted net income margin, and free cash flow are useful in evaluating our business, results of operations and financial condition. We believe that this
non-GAAP
financial information may be helpful to investors because it provides consistency and comparability with past financial performance and facilitates period to period comparisons of operations, as these eliminate the effects of certain variables from period to period for reasons that we do not believe reflect our underlying business performance. However,non-GAAP
financial information is presented for supplemental informational purposes only and should not be considered in isolation or as a substitute for financial information presented in accordance with GAAP. Our presentation of these measures should not be construed as an inference that our future results will be unaffected by the types of items excluded from the calculation. Other companies in our industry may calculate these measures differently, which may limit their usefulness as a comparative measure.20
Confidential Treatment Requested by McAfee Corp.
Pursuant to 17 C.F.R. Section 200.83
See “Management’s Discussion and Analysis of Financial Condition and Results of
Operations—Non-GAAP
Financial Measures” for explanations of how we calculate these measures and for reconciliation to the most directly comparable financial measure stated in accordance with GAAP.Fiscal Year Ended | Six Months Ended | |||||||||||||||||||
(in millions except percentages) | December 29, 2018 | December 28, 2019 | December 26, 2020 | June 27, 2020 | June 26, 2021 | |||||||||||||||
Net revenue | $ | 1,161 | $ | 1,303 | $ | 1,558 | $ | 737 | $ | 909 | ||||||||||
Operating income (loss) | $ | (101 | ) | $ | 118 | $ | 198 | $ | 140 | $ | 261 | |||||||||
Operating income (loss) margin | (8.7 | )% | 9.1 | % | 12.7 | % | 19.0 | % | 28.7 | % | ||||||||||
Net income (loss) | $ | (512 | ) | $ | (236 | ) | $ | (289 | ) | $ | 31 | $ | 202 | |||||||
Net income (loss) margin | (44.1 | )% | (18.1 | )% | (18.5 | )% | 4.2 | % | 22.2 | % | ||||||||||
Adjusted operating income | $ | 220 | $ | 427 | $ | 624 | $ | 303 | $ | 403 | ||||||||||
Adjusted operating income margin | 18.9 | % | 32.8 | % | 40.1 | % | 41.1 | % | 44.3 | % | ||||||||||
Adjusted EBITDA | $ | 247 | $ | 455 | $ | 651 | $ | 317 | $ | 417 | ||||||||||
Adjusted EBITDA margin | 21.3 | % | 34.9 | % | 41.8 | % | 43.0 | % | 45.9 | % | ||||||||||
Adjusted net income (loss) | $ | (57 | ) | $ | 116 | $ | 278 | $ | 127 | $ | 235 | |||||||||
Adjusted net income (loss) margin | (4.9 | )% | 8.9 | % | 17.8 | % | 17.2 | % | 25.9 | % | ||||||||||
Net cash provided by operating activities | 319 | 496 | 760 | 288 | 448 | |||||||||||||||
Net cash used in investing activities | (677 | ) | (63 | ) | (51 | ) | (33 | ) | (18 | ) | ||||||||||
Net cash provided by (used in) financing activities | 459 | (734 | ) | (651 | ) | (162 | ) | (239 | ) | |||||||||||
Free cash flow | 257 | 435 | 714 | 260 | 430 | |||||||||||||||
Adjusted Operating Income, Adjusted Operating Income Margin, Adjusted EBITDA and Adjusted EBITDA Margin
We regularly monitor adjusted operating income, adjusted operating income margin, adjusted EBITDA, and adjusted EBITDA margin to assess our operating performance. We define adjusted operating income as net income (loss), excluding the impact of amortization of intangible assets, equity-based compensation expense, interest expense and other, net, provision for income tax expense, foreign exchange loss (gain), net, income (loss) from discontinued operations, net of taxes, and other costs that we do not believe are reflective of our ongoing operations. Adjusted operating income margin is calculated as adjusted operating income divided by net revenue. We define adjusted EBITDA as adjusted operating income, excluding the impact of depreciation expense plus certain other
non-operating
costs. Adjusted EBITDA margin is calculated as adjusted EBITDA divided by net revenue. We believe presenting adjusted operating income, adjusted operating income margin, adjusted EBITDA, and adjusted EBITDA margin provides management and investors consistency and comparability with our past financial performance and facilitates period to period comparisons of operations, as it eliminates the effects of certain variations unrelated to our overall performance. Adjusted operating income, adjusted operating income margin, adjusted EBITDA, and adjusted EBITDA margin have limitations as analytical tools, and you should not consider it in isolation or as a substitute for analysis of our results as reported under GAAP. Some of these limitations are:| • | although depreciation and amortization are non-cash charges, the assets being depreciated and amortized may have to be replaced in the future, and adjusted EBITDA does not reflect cash capital expenditure requirements for such replacements or for new capital expenditure requirements; |
| • | adjusted operating income and adjusted EBITDA do not reflect changes in, or cash requirements for, our working capital needs; |
| • | adjusted operating income and adjusted EBITDA do not reflect the significant interest expense, or the cash requirements necessary to service interest or principal payments, on our debt; |
21
Confidential Treatment Requested by McAfee Corp.
Pursuant to 17 C.F.R. Section 200.83
| • | adjusted operating income and adjusted EBITDA do not reflect income tax payments that may represent a reduction in cash available to us; and |
| • | other companies, including companies in our industry, may calculate adjusted operating income and adjusted EBITDA differently, which reduce their usefulness as comparative measures. |
Because of these limitations, you should consider adjusted operating income and adjusted EBITDA alongside other financial performance measures, including operating income (loss), net income (loss) and our other GAAP results. In evaluating adjusted operating income, adjusted operating income margin, adjusted EBITDA, and adjusted EBITDA margin, you should be aware that in the future we may incur expenses that are the same as or similar to some of the adjustments in this presentation. Our presentation of adjusted operating income, adjusted operating income margin, adjusted EBITDA, and adjusted EBITDA margin should not be construed as an inference that our future results will be unaffected by the types of items excluded from the calculation of adjusted operating income, adjusted operating income margin, adjusted EBITDA, and adjusted EBITDA margin. Adjusted operating income, adjusted operating income margin, adjusted EBITDA, and adjusted EBITDA margin are not presentations made in accordance with GAAP and the use of these terms varies from other companies in our industry.
Adjusted Net Income and Adjusted Net Income Margin
We regularly monitor adjusted net income and adjusted net income margin to assess our operating performance. Adjusted net income assumes all net income (loss) is attributable to McAfee Corp., which assumes the full exchange of all outstanding LLC Units for shares of Class A common stock of McAfee Corp., and is adjusted for the impact of amortization of debt issuance costs, amortization of intangible assets, equity-based compensation expense, foreign exchange loss (gain), net, income (loss) from discontinued operations, net of taxes, and other costs that we do not believe are reflective of our ongoing operations. The adjusted provision for income taxes represents the tax effect on net income, adjusted for all of the listed adjustments, assuming that all consolidated net income was subject to corporate taxation for all periods presented. We have assumed rate of 22% which represents our long term expected corporate tax rate excluding discrete and
non-recurring
tax items. This amount has been recast for periods reported previously.Adjusted net income margin is calculated as adjusted net income divided by net revenue. Adjusted net income and adjusted net income margin have limitations as analytical tools, and you should not consider it in isolation or as a substitute for analysis of our results as reported under GAAP. Some of these limitations are:
| • | although amortization is non-cash charge, the assets being amortized may have to be replaced in the future, and adjusted net income does not reflect cash capital expenditure requirements for such replacements or for new capital expenditure requirements; |
| • | adjusted net income does not reflect changes in, or cash requirements for, our working capital needs; |
| • | other companies, including companies in our industry, may calculate adjusted net income differently, which reduce its usefulness as comparative measures. |
Because of these limitations, you should consider adjusted net income alongside other financial performance measures, including net income (loss) and our other GAAP results. In evaluating adjusted net income and adjusted net income margin, you should be aware that in the future we may incur expenses that are the same as or similar to some of the adjustments in this presentation. Our presentation of adjusted net income and adjusted net income margin should not be construed as an inference that our future results will be unaffected by the types of items excluded from the calculation of adjusted net income and adjusted net income margin. Adjusted net income and adjusted net income margin are not presentations made in accordance with GAAP and the use of these terms vary from other companies in our industry.
22
Confidential Treatment Requested by McAfee Corp.
Pursuant to 17 C.F.R. Section 200.83
Free Cash Flow
We define free cash flow as net cash provided by operating activities less capital expenditures. We consider free cash flow to be a liquidity measure that provides useful information to management and investors about the amount of cash generated by the business that can be used for strategic opportunities, including investing in our business, making strategic acquisitions, and strengthening the balance sheet.
23
Confidential Treatment Requested by McAfee Corp.
Pursuant to 17 C.F.R. Section 200.83
RISK FACTORS
This offering and investing in shares of our Class A common stock involves a high degree of risk. You should carefully consider the risks and uncertainties described below together with all of the other information contained in this prospectus, including our consolidated financial statements and the related notes appearing at the end of this prospectus, before deciding to invest in shares of our Class A common stock. If any of the following risks actually occurs, our business, prospects, results of operations, and financial condition could suffer materially, the trading price of our Class A common stock could decline, and you could lose all or part of your investment. Please also see “Cautionary Note Regarding Forward-Looking Statements.” In addition, the impacts of the
COVID-19
pandemic and any worsening of the economic environment may exacerbate the risks described below, any of which could have a material impact on us. This situation is changing rapidly and additional impacts may arise that we are not currently aware of.Risks Related to the
COVID-19
PandemicThe
COVID-19
pandemic has affected how we are operating our business, and the duration and extent to which this will impact our future results of operations and overall financial performance remains uncertain.The
COVID-19
pandemic is having widespread, rapidly evolving, and unpredictable impacts on global society, economies, financial markets, and business practices. Federal, state and foreign governments have implemented measures to contain the virus, including social distancing, travel restrictions, border closures, limitations on public gatherings, work from home, and closure ofnon-essential
businesses. At the onset of theCOVID-19
pandemic, we implemented work-from-home requirements, made substantial modifications to employee travel policies, and cancelled or shifted marketing and other corporate events to virtual-only formats. While we have begun to adjust our current policies and procedures in accordance with public health guidance that is available, we cannot be certain that similar precautionary measures will not be necessary in the future, and any such precautionary measures could negatively affect our customer success efforts, sales and marketing efforts, delay and lengthen our sales cycles, or create operational or other challenges, any of which could harm our business and results of operations. In addition, theCOVID-19
pandemic has disrupted the operations of many of our channel partners, and may continue to disrupt their operations, for an indefinite period of time, including as a result of any future public health precautionary measures, uncertainty in the financial markets, or other harm to their businesses and financial results, resulting in delayed purchasing decisions, extended payment terms, and postponed or cancelled projects, all of which could negatively impact our business and results of operations, including our revenue and cash flows. Further, if theCOVID-19
pandemic has a substantial impact on our employees’, partners’, or third-party service providers’ health, attendance, or productivity in the future, our results of operations and overall financial performance may be adversely impacted.The ultimate duration and extent of the impact from the
COVID-19
pandemic depends on future developments that cannot be accurately forecasted at this time, such as the efficacy of new vaccines, the efficiency and scope of global inoculation efforts, the severity and transmission rate of the disease and new variants, the actions of governments, businesses and individuals in response to the pandemic, the extent and effectiveness of containment actions, the impact on economic activity, and the impact of these and other factors on our employees, partners, and third-party service providers. This uncertainty also affects management’s accounting estimates and assumptions, which could result in greater variability in a variety of areas that depend on these estimates and assumptions, including those related to investments, receivables, retention rates, renewal and pricing. For example, we have experienced growth and increased demand for our solutions in recent quarters, which may be due in part to greater demand for devices or our solutions in response to theCOVID-19
pandemic. We cannot determine what, if any, portion of our growth in net revenue, the number of our Direct to Consumer subscribers, or any other measures of our performance during 2020 and the first half of 2021 was the result of such responses to theCOVID-19
pandemic. However, if we are unable to successfully drive renewals of new subscriptions and retention of new customers in future periods, including any such new subscriptions or new24
Confidential Treatment Requested by McAfee Corp.
Pursuant to 17 C.F.R. Section 200.83
customers that may be related to the response to the
COVID-19
pandemic, or if global conditions and macroeconomic forces, including those related to theCOVID-19
pandemic, reduce demand for solutions in the future, we may be unsuccessful in sustaining our recent growth rates. In addition, the extent to which theCOVID-19
pandemic will continue to drive demand for devices is uncertain, and if demand for devices decreases, we may experience slower growth in future periods. These uncertainties may increase variability in our future results of operations and adversely impact our ability to accurately forecast changes in our business performance and financial condition in future periods. If we are not able to respond to and manage the impact of such events effectively or if global economic conditions do not improve, or deteriorate further, our business, financial condition, results of operations, and cash flows could be adversely affected.Risks Related to the Recent Sale of our Enterprise Business
If we are unsuccessful at executing our business plan and necessary transition activities as a standalone consumer cybersecurity company following the recent sale of our Enterprise Business, our business and results of operations may be adversely affected and our ability to invest in and grow our business could be limited.
On July 27, 2021, we completed the sale of our Enterprise Business to STG, which divestiture comprised a substantially whole operating segment. This and other operational transitions have involved turnover in management and other key personnel and changes in our strategic direction. Transitions of this type can be disruptive, result in the loss of focus and employee morale and make the execution of business strategies more difficult. We also expect to pay approximately $300 million in
additional one-time separation
costs and stranded cost optimization, a portion of which will be expenses paid by proceeds from the transaction. We have also entered into a transition service agreement under which we will provide assistance to STG including, but not limited to, business support services and information technology services as well as a commercial services agreement, under which we will provide certain product services and licensed technology, including certain threat intelligence data, that has historically been provided to the enterprise business. We may experience delays in the anticipated timing of activities related to such transitions and higher than expected or unanticipated execution costs. If we do not succeed in executing on these transition activities while achieving our cost optimization goals, or if these efforts are more costly or time-consuming than expected, our business and results of operations may be adversely affected, which could limit our ability to invest in and grow our business.We may not achieve the intended benefits of the sale of our Enterprise Business.
We may not realize some or all of the anticipated benefits from the sale of our Enterprise Business. The resource constraints as a result of our focus on completing the transaction, which include the loss of employees, could have a continuing impact on the execution of our business strategy and our overall operating results. Further, our remaining employees may become concerned about the future of our remaining operations and lose focus or seek other employment. There can be no guarantee that the divestiture will result in stronger long term financial and operational results for our remaining consumer business.
Additionally, in connection with the divestiture, our Board of Directors returned a portion of the proceeds of the sale of our Enterprise Business in the form of distributions paid to holders of LLC Units of FTW, including McAfee Corp., and to holders of our Class A common stock in the form of a special dividend of $4.50 per share to holders of record of our Class A common stock as of August 13, 2021. The use of proceeds in this manner could impair our future financial growth.
Our future results of operations are dependent solely on the operations of our pure play consumer cyber security business and will differ materially from our previous results.
The Enterprise Business generated approximately 46% of total combined company revenue for fiscal 2020, and approximately 51% of total combined company revenue for fiscal 2019. Accordingly, our future financial
25
Confidential Treatment Requested by McAfee Corp.
Pursuant to 17 C.F.R. Section 200.83
results will differ materially from our previous results since our future financial results are dependent solely on our consumer operations. Any downturn in our consumer business could have a material adverse effect on our future operating results and financial condition and could materially and adversely affect the trading price of our outstanding securities.
Risks Related to Competition and Industry Trends
The cybersecurity market is rapidly evolving and becoming increasingly competitive in response to continually evolving cybersecurity threats from a variety of increasingly sophisticated cyberattackers. If we fail to anticipate changing customer requirements or industry and market developments, or we fail to adapt our business model to keep pace with evolving market trends, our financial performance will suffer.
The cybersecurity market is characterized by continual changes in customer preferences and requirements, frequent and rapid technological developments and continually evolving market trends. We must continually address the challenges of dynamic, and accelerating market trends, such as the emergence of new cybersecurity threats, the continued decline in the sale of new personal computers, and the rise of mobility and cloud-based solutions, all of which make satisfying our subscribers’ diverse and evolving needs more challenging.
The technology underlying our solutions is particularly complex because it must effectively and efficiently identify and respond to new and increasingly sophisticated threats while meeting other stringent technical requirements in areas of performance, usability, and availability. Although our subscribers expect new solutions and enhancements to be rapidly introduced to respond to new cybersecurity threats, product development requires significant investment, the efficacy of new technologies is inherently uncertain, and the timing for commercial release and availability of new solutions and enhancements is uncertain. We may be unable to develop new technologies to keep pace with evolving threats or experience unanticipated delays in the availability of new solutions, and therefore fail to meet customer expectations. If we fail to anticipate or address the evolving and rigorous needs of our subscribers, or we do not respond quickly to shifting customer expectations or demands by developing and releasing new solutions or enhancements that can respond effectively and efficiently to new cybersecurity threats on an ongoing and timely basis, our competitive position, business, and financial results will be harmed.
The introduction of new products or services by competitors, market acceptance of products or services based on emerging or alternative technologies, and the evolution of new standards, whether formalized or otherwise, could each render our existing solutions obsolete or make it easier for other products or services to compete with our solutions. In addition, modern cyberattackers are skilled at adapting to new technologies and developing new methods of breaching customers. We must continuously work to ensure our solutions protect against the increased volume and complexity of the cybersecurity threat landscape. Changes in the nature of advanced cybersecurity threats could result in a shift in cybersecurity spending and preferences away from solutions such as ours. If our solutions are not viewed by our subscribers as necessary or effective in addressing their cybersecurity needs, then our revenues may not grow as quickly as expected, or may decline, and our business could suffer.
We cannot be sure that we will accurately predict how the cybersecurity markets in which we compete or intend to compete will evolve. Failure on our part to anticipate changes in our markets and to develop solutions and enhancements that meet the demands of those markets will significantly impair our business, financial condition, results of operations, and cash flows.
We operate in a highly competitive environment, and we expect competitive pressures to increase in the future, which could cause us to lose market share.
The markets for our solutions are highly competitive, and we expect both the requirements and pricing competition to increase, particularly given the increasingly sophisticated attacks, changing customer preferences
26
Confidential Treatment Requested by McAfee Corp.
Pursuant to 17 C.F.R. Section 200.83
and requirements, current economic pressures, and market consolidation. Competitive pressures in these markets may result in price reductions, reduced margins, loss of market share and inability to gain market share, and a decline in sales, any one of which could seriously impact our business, financial condition, results of operations, and cash flows.
We face competition from players, such as NortonLifelock, Avast/AVG, Kaspersky, Trend Micro, ESET, and Microsoft, which expanded from desktop anti-malware into mobile, security, VPN, and identity protection among others. At the same time we compete with point-tool providers, such as Cujo and Dojo in the home IoT space or AnchorFree, ExpressVPN, and ProtonVPN in the network security space, across our full consumer offering.
In addition to competing with these and other vendors directly for sales to
end-users
of our products, we compete with several of them for the opportunity to have our products bundled with the product offerings of our strategic partners, including computer hardware OEMs, ISPs, mobile carriers, and other distribution partners. Our competitors could gain market segment share from us if any of these strategic partners replace our solutions with those of our competitors or if these partners more actively promote our competitors’ offerings than ours. In addition, vendors who have bundled our products with theirs may choose to bundle their products with their own or other vendors’ software or may limit our access to standard product interfaces and inhibit our ability to develop products for their platform. We also face competition from many smaller companies that specialize in particular segments of the markets in which we compete, including Crowdstrike, VMware, Netskope, and Zscaler. In the future, further product development by these providers could cause our products and services to become redundant or lose market segment share, which could significantly impact our sales and financial results.We face growing competition from network equipment, computer hardware manufacturers, large operating system providers, telecommunication companies, and other large or diversified technology companies. Examples of large, diversified competitors include Microsoft, International Business Machines Corporation, and Dell Technologies. Large vendors of hardware or operating system software increasingly incorporate cybersecurity functionality into their products and services, and enhance that functionality either through internal development or through strategic alliances or acquisitions. Similarly, telecommunications providers are increasingly investing in the enhancement of the cybersecurity functionality in the devices and services they offer. Certain of our current and potential competitors may have competitive advantages such as longer operating histories, more extensive international operations, larger product development and strategic acquisition budgets, and greater financial, technical, sales, and marketing resources than we do. Such competitors also may have well-established relationships with our current and potential subscribers and extensive knowledge of our industry and the markets in which we compete and intend to compete. As a result, such competitors may be able to respond more quickly to new or emerging technologies and changes in customer requirements, or to devote greater resources to the development, marketing, sale, and support of their products. These competitors have made strategic acquisitions or established cooperative relationships among themselves or with other providers, thereby increasing their ability to provide a broader suite of products, and potentially causing customers to decrease purchases of, or defer purchasing decisions with respect to, our products and services. Additionally, some or all of our solutions may rely upon access to certain hardware or software interfaces. These competitors may limit our access to such interfaces or may provide greater or earlier access available to others. These actions could adversely affect the operations of our products relative to competitors or render our solutions inoperative.
Cybersecurity protection is also offered by certain of our competitors at prices lower than our prices or, in some cases, free of charge. Other companies bundle their own or our competitors’ lower-priced or free cybersecurity products with their own computer hardware or software product offerings in a manner that discourages users from purchasing our products and subscriptions. Our competitive position could be adversely affected to the extent that our current or potential subscribers perceive these cybersecurity products as replacing the need for our products or if they render our solutions unmarketable—even if these competitive products are inferior to or more limited than our products and services. The expansion of these competitive trends could have a significant negative impact on our sales and financial results by causing, among other things, price reductions of our products, reduced profitability, and loss of market share.
27
Confidential Treatment Requested by McAfee Corp.
Pursuant to 17 C.F.R. Section 200.83
To compete successfully, we must continue to develop new solutions and enhance existing solutions, effectively adapt to changes in the technology or rights held by our competitors, respond to competitive strategies, and effectively adapt to technological changes within the consumer cybersecurity market. If we are unsuccessful in responding to our competitors, our competitive position and our financial results could be adversely affected.
Our business depends substantially on our ability to retain subscribers and to expand sales of our solutions to them. If we are unable to retain our subscribers or to expand our product offerings, our future results of operations will be harmed.
For us to maintain or improve our results of operations in a market that is rapidly evolving and places a premium on market-leading solutions, it is important that we retain existing subscribers and that our subscribers expand their use of our solutions. Our subscribers have no obligation to renew their subscription with us upon their expiration. Retention rates may decline or fluctuate as a result of a number of factors, including but not limited to the level of our subscribers’ satisfaction or dissatisfaction with our solutions, our prices and the prices of competing products or services, industry consolidation, the effects of global economic conditions, new technologies, changes in our subscribers’ spending levels, and changes in how our subscribers perceive the cybersecurity threats. In addition, a significant portion of our renewals come from autorenewal arrangements incorporated within our solutions. Any changes in the laws regarding autorenewal arrangements could adversely affect our ability to retain consumer subscribers and harm our financial condition and operating performance.
In addition, our ability to generate revenue and maintain or improve our results of operations partly depends on our ability to cross-sell our solutions to our existing subscribers. We expect our ability to successfully cross-sell our solutions will be one of the most significant factors influencing our growth. We may not be successful in cross-selling our solutions because our subscribers may find our additional solutions unnecessary or unattractive. Our failure to sell additional solutions to our existing and new subscribers could adversely affect our ability to grow our business.
We may need to change our pricing models to compete successfully.
The intense competition we face in the cybersecurity market, in addition to general economic and business conditions (including the economic downturn resulting from the
COVID-19
pandemic), can result in downward pressure on the prices of our solutions. If our competitors offer significant discounts on competing products or services, or develop products or services that our subscribers believe are more valuable or cost-effective, we may be required to decrease our prices or offer other incentives in order to compete successfully. Additionally, if we increase prices for our solutions, demand for our solutions could decline as subscribers adopt less expensive competing products and our market share could suffer. If we do not adapt our pricing models to reflect changes in customer use of our products or changes in customer demand, our revenues could decrease.Any broad-based change to our pricing strategy could cause our revenues to decline or could delay future sales as our sales force implements and our subscribers adjust to the new pricing terms. We or our competitors may bundle products for promotional purposes or as a long-termor pricing strategy or provide price guarantees to certain subscribers as part of our overall sales strategy. These practices could, over time, significantly limit our flexibility to change prices for existing solutions and to establish prices for new or enhanced products and services. Any such changes could reduce our margins and adversely affect our results of operations.
go-to-market
If cybersecurity industry analysts publish unfavorable or inaccurate research reports about our business, our financial performance could be harmed.
An increasing number of independent industry analysts and researchers regularly evaluate, compare, and publish reviews regarding the performance, efficiency, and functionality of cybersecurity products and services,
28
Confidential Treatment Requested by McAfee Corp.
Pursuant to 17 C.F.R. Section 200.83
including our own solutions. The market’s perception of our solutions may be significantly influenced by these reviews. We do not have any control over the content of these independent industry analysts and research reports, or the methodology they use to evaluate our solutions, which may be flawed or incomplete. Demand for our solutions could be harmed if these industry analysts publish negative reviews of our solutions or do not view us as a market leader. If we are unable to maintain a strong reputation, sales to new and existing subscribers and renewals could be adversely affected, and our financial performance could be harmed.
Risks Related to Our Financial and Operating Performance
Our results of operations can be difficult to predict and may fluctuate significantly, which could result in a failure to meet investor expectations.
Our results of operations have in the past varied, and may in the future vary, significantly from period to period due to a number of factors, many of which are outside of our control, including the macroeconomic environment. These factors limit our ability to accurately predict our results of operations and include factors discussed throughout this “Risk Factors” section, including the following:
| • | the level of competition in our markets, including the effect of new entrants, consolidation, and technological innovation; |
| • | macroeconomic conditions in our markets, both domestic and international, as well as the level of discretionary technology spending; |
| • | fluctuations in demand for our solutions; |
| • | disruptions in our business operations or target markets caused by, among other things, terrorism or other intentional acts, pandemics, such as the COVID-19 pandemic, riots, protests or political unrest, or earthquakes, floods, or other natural disasters; |
| • | variability and unpredictability in the rate of growth in the markets in which we compete; |
| • | technological changes in our markets; |
| • | our ability to renew existing subscribers, acquire new subscribers, and sell additional solutions; |
| • | execution of our business strategy and operating plan, and the effectiveness of our sales and marketing programs; |
| • | product announcements, introductions, transitions, and enhancements by us or our competitors, which could result in deferrals of customer orders; |
| • | the impact of our recent divesture of our enterprise business, and any stranded or other costs incurred in connection with the transaction and the efficacy of our cost optimization efforts following the transaction; |
| • | the impact of future acquisitions or divestitures; |
| • | changes in accounting rules and policies that impact our future results of operations compared to prior periods; and |
| • | the need to recognize certain revenue ratably over a defined period or to defer recognition of revenue to a later period, which may impact the comparability of our results of operations across those periods. |
Furthermore, a high percentage of our expenses, including those related to overhead, research and development, sales and marketing, and general and administrative functions are generally fixed in nature in the short term. As a result, if our net revenue is less than forecasted, we may not be able to effectively reduce such expenses to compensate for the revenue shortfall and our results of operations will be adversely affected. We also expect the recent sale of our enterprise business to lead to increased costs that were previously allocated to both segments to now be part of continuing operations which will have a dilutive impact on operating margins. We
29
Confidential Treatment Requested by McAfee Corp.
Pursuant to 17 C.F.R. Section 200.83
also expect to pay approximately $300 million in additional
one-time
separation costs and stranded cost optimization, a portion of which will be expenses paid by proceeds from the transaction. In addition, our ability to maintain or expand our operating margins may be limited given economic and competitive conditions, and we therefore could be reliant upon our ability to continually identify and implement operational improvements in order to maintain or reduce expense levels. There can be no assurance that we will be able to maintain or expand our current operating margins in the future.We derive revenue from the sale of security products and subscriptions or a combination of these items, which may decline.
Our sales may decline and fluctuate as a result of a number of factors, including our subscribers’ level of satisfaction with our products and services, the prices of our products and services, the prices of products and services offered by our competitors, reductions in our subscribers’ spending levels, and other factors beyond our control. We also derive part of our revenue through indirect agreements with third parties including mobile providers, ISPs, electronics retailers, ecommerce sites, and search providers. Any change in these agreements, in indirect party’s demand with end consumers in mobile, ISP, and retail, in user search behavior, advertising market for search or ecosystem changes could adversely affect our revenue. If our sales decline, our revenue and revenue growth may decline, and our business will suffer. We recognize a majority of revenue as control of the goods and services is transferred to our customer. As a result, a majority of revenue we report each quarter is the recognition of deferred revenue from subscriptions entered into during previous quarters. Consequently, a decline in sales in any single quarter will not be fully or immediately reflected in revenue in that quarter but will continue to negatively affect our revenue in future quarters. Accordingly, the effect of significant downturns in sales is not reflected in full in our results of operations until future periods. Furthermore, it is difficult for us to rapidly increase our revenue through additional sales in any period, as revenue from subscriptions must be recognized over the applicable future time period. Finally, any increase in the average term of a subscription would result in revenue for such subscriptions being recognized over longer periods of time.
The sudden and significant economic downturn or volatility in the economy in the United States and our other major markets could have a material adverse impact on our business, financial condition, results of operations, or cash flows.
We operate globally and as a result our business and revenues are impacted by global macroeconomic conditions. In recent periods, investor and customer concerns about the global economic outlook, which significantly increased in 2020 and early 2021 due to the
COVID-19
pandemic, have adversely affected market and business conditions in general. In addition, a weakening of economic conditions could lead to reductions in demand for our solutions. Weakened economic conditions or a recession could reduce the amounts that subscribers are willing or able to spend on our products and solutions, and could make it more difficult for us to compete against less expensive and free products for new subscribers. Furthermore, a high percentage of our expenses, including those related to overhead, research and development, sales and marketing, and general and administrative functions are generally fixed in nature in the short term. If we are not able to timely and appropriately adapt to changes resulting from a weak economic environment, it could have an adverse impact on our business, financial condition, results of operations, and cash flows.We have experienced net losses in recent periods and may not maintain profitability in the future.
We experienced net losses of $236 million and $289 million for fiscal 2019 and 2020, respectively. While we have experienced revenue growth over these same periods, we may not be able to sustain or increase our growth or maintain profitability in the future or on a consistent basis. In recent years, we have changed our portfolio of products and invested in research and development to develop new products and enhance current solutions.
We also expect to continue to invest for future growth. We expect that to achieve profitability we will be required to increase revenues, manage our cost structure, and avoid significant liabilities. Revenue growth may
30
Confidential Treatment Requested by McAfee Corp.
Pursuant to 17 C.F.R. Section 200.83
slow, revenue may decline, or we may incur significant losses in the future for a number of possible reasons, increasing competition, a decrease in the growth of the markets in which we operate, or if we fail for any reason to continue to capitalize on growth opportunities. We also expect the recent sale of our enterprise business to lead to increased costs that were previously allocated to both segments to now be part of continuing operations which will have a dilutive impact on operating margins. Additionally, we may encounter unforeseen operating expenses, difficulties, complications, delays, and other unknown factors that may result in losses in future periods. If these losses exceed our expectations or our revenue growth expectations are not met in future periods, our financial performance may be harmed.
Changes in tax laws or in their implementation may adversely affect our business and financial condition.
Changes in tax law may adversely affect our business or financial condition. As part of Congress’s response to thelimitation on the use of NOLs, which was enacted as part of the TCJA. It also provided that NOLs arising in any taxable year beginning after December 31, 2017 and before January 1, 2021 are generally eligible to be carried back up to five years. The CARES Act also temporarily (for taxable years beginning in 2019 or 2020) relaxed the limitation of the tax deductibility for net interest expense by increasing the limitation from 30% to 50% of adjusted taxable income.
COVID-19
pandemic, the Families First Coronavirus Response Act, commonly referred to as the FFCR Act, was enacted on March 18, 2020, the Coronavirus Aid, Relief, and Economic Security Act, commonly referred to as the CARES Act, was enacted on March 27, 2020, the act commonly known as the Consolidated Appropriations Act, 2021 was enacted on December 27, 2020, and the act commonly known as the American Rescue Plan Act was enacted on March 11, 2021. Each contains numerous tax provisions. In particular, the CARES Act retroactively and temporarily (for taxable years beginning before January 1, 2021) suspended application of the80%-of-taxable-income
Regulatory guidance under the Tax Cuts and Job Act (“TCJA”), the FFCR Act, the CARES Act, the Consolidated Appropriations Act, 2021, and the American Rescue Plan Act is and continues to be forthcoming, and such guidance could ultimately increase or lessen impact of these laws on our business and financial condition. It is also likely that Congress will enact additional legislation in connection with the
COVID-19
pandemic, some of which could have an impact on our Company. In addition, it is uncertain if and to what extent various states will conform to the TCJA, the FFCR Act, the CARES Act, the Consolidated Appropriations Act, 2021, or the American Rescue Plan Act. The Biden Administration has also proposed a significant number of changes to U.S. tax laws, including an increase in the maximum tax rate applicable to U.S. corporations and certain individuals, which could potentially have retroactive effect and may significantly affect McAfee Corp. or FTW. Any such rate increases or future changes to U.S. tax laws could also require McAfee Corp. to increase its payments to the Continuing Owners and Management Owners pursuant to its tax receivable agreement.As a multinational corporation, forecasting our estimated annual effective tax rate is complex and subject to uncertainty, and there may be material differences between our forecasted and actual tax rates.
Forecasts of our income tax position and effective tax rate are complex and subject to uncertainty because our income tax position for each year combines the effects of a mix of profits and losses earned by us and our subsidiaries in various tax jurisdictions with a broad range of income tax rates, as well as changes in the valuation of deferred tax assets and liabilities, the impact of various accounting rules and changes to these rules and tax laws, such as the U.S. federal income tax laws, including impacts of the TCJA, FFCR Act, CARES Act, Consolidated Appropriations Act, 2021, and American Rescue Plan Act arising from future interpretations of such legislation, the results of examinations by various tax authorities and the impact of any acquisition, business combination, or other reorganization or financing transaction. To forecast our global tax rate, we estimate our
pre-tax
profits and losses by jurisdiction and forecast our tax expense by jurisdiction. If our mix of profits and losses, our ability to use tax credits, or effective tax rates by jurisdiction is different than those estimated, our actual tax rate could be different than forecasted, which could have a material impact on our financial condition and results of operations.31
Confidential Treatment Requested by McAfee Corp.
Pursuant to 17 C.F.R. Section 200.83
As a multinational corporation, we conduct our business in many countries and are subject to taxation in many jurisdictions. The taxation of our business is subject to the application of multiple and conflicting tax laws and regulations as well as multinational tax conventions. Our effective tax rate is highly dependent upon the geographic distribution of our worldwide earnings or losses, the tax regulations in each geographic region, the availability of tax credits and carryforwards, changes in accounting principles (including accounting for uncertain tax positions), and changes in the valuation of our deferred tax assets, and the effectiveness of our tax planning strategies. The application of tax laws and regulations is subject to legal and factual interpretation, judgment, and uncertainty, and significant judgment is required to determine the recognition and measurement attributes prescribed in certain accounting guidance. Tax laws themselves are subject to change as a result of changes in fiscal policy, changes in legislation, and the evolution of regulations and court rulings. Consequently, taxing authorities may impose tax assessments or judgments against us that could materially impact our tax liability and/or our effective income tax rate.
Our provision for income taxes is subject to volatility and can be adversely affected by a variety of factors, including but not limited to: unanticipated decreases in the amount of revenue or earnings in countries with low statutory tax rates, changes in tax laws and the related regulations and interpretations (including various proposals currently under consideration), changes in accounting principles (including accounting for uncertain tax positions), and changes in the valuation of our deferred tax assets. Significant judgment is required to determine the recognition and measurement attributes prescribed in certain accounting guidance. This guidance applies to all income tax positions, including the potential recovery of previously paid taxes, which if settled unfavorably could adversely impact our provision for income taxes.
In addition, we are subject to examination of our income tax returns by the Internal Revenue Service (“IRS”) and other tax authorities. If tax authorities challenge the relative mix of our U.S. and international income, our future effective income tax rates could be adversely affected, including for future periods and retroactively. While we regularly assess the likelihood of adverse outcomes from such examinations and the adequacy of our provision for income taxes, there can be no assurance that such provision is sufficient and that a determination by a tax authority will not have an adverse effect on our business, financial condition, results of operations, and cash flows.
Our ability to use certain net operating loss carryforwards and certain other tax attributes may be limited.
Under Sections 382 and 383 of the Code, if a corporation undergoes an “ownership change,” the corporation’s ability to use its
pre-change
net operating loss carryforwards and otherpre-change
tax attributes to offset its post-change income and taxes may be limited. In general, an “ownership change” occurs if there is a cumulative change in ownership of the relevant corporation by “5% shareholders” (as defined under U.S. income tax laws) that exceeds 50 percentage points over a rolling three-year period. Similar rules apply under state tax laws. If our corporate subsidiaries experience one or more ownership changes in connection with transactions in our stock, then we may be limited in our ability to use our corporate subsidiaries’ net operating loss carryforwards and other tax assets to reduce taxes owed on the net taxable income that such subsidiaries earn. Any such limitations on the ability to use net operating loss carryforwards and other tax assets could adversely impact our business, financial condition, results of operations, and cash flows.We face risks associated with past and future investments, acquisitions, and other strategic transactions.
We may buy or make investments in complementary or competitive companies, products, and technologies, sell strategic businesses or other assets, or engage in other strategic transactions. For example, in fiscal 2018 we bolstered our consumer VPN offering through our acquisition of TunnelBear. The consideration exchanged for an acquisition may be greater than the value we realize from the transaction. In addition, we and our Sponsors periodically evaluate our capital structure and strategic alternatives with advisors and other third parties in an effort to maximize value for our stockholders. We cannot be certain when or if any of the discussions we have will lead to a proposal that we may find attractive, including with respect to the refinancing or repricing of some
32
Confidential Treatment Requested by McAfee Corp.
Pursuant to 17 C.F.R. Section 200.83
or all of our indebtedness, the sale of some or a significant portion of our assets, or other similar significant transactions. Whether in connection with such events or otherwise, we may also take other actions that impact our balance sheet and capital structure, including the payment of special dividends, the increase or decrease of regular dividends, repayment of debt, repurchases of our equity through privately negotiated transactions, as part of a tender offer, in the open market and/or through a share repurchase plan, including an accelerated share repurchase plan, or any other means permitted by law. In some cases these transactions could be with, or disproportionately benefit, one or more of our significant stockholders.
Future transactions could result in significant transactions-related charges, acceleration of some or all payments under our tax receivable agreement, disparate tax treatment for our stockholders, distraction for our management team, and potential dilution to our equity holders. In addition, we face a number of risks relating to such transactions, including the following, any of which could harm our ability to achieve the anticipated benefits of our past or future strategic transactions.
Technology and market risk.
Integration or separation.
The geographic distance between sites, the complexity of the technologies and operations being integrated or separated, and disparate corporate cultures, may increase the difficulties of such integration or separation. Management’s focus on such operations may distract attention from ourbusiness and may disrupt key research and development, marketing, or sales efforts. In addition, it is common in the technology industry for aggressive competitors to attract customers and recruit key employees away from companies during the integration phase of an acquisition.
day-to-day
Internal controls, policies, and procedures.
non-U.S.
companies are particularly challenging because their prior practices in these areas may not meet the requirements of GAAP and U.S. export regulations. Furthermore, we may assume liabilities associated with past practices and the Company’s compliance with legal and regulatory requirements in the jurisdictions in which they or we operate. Any acquisitions may require that we spend significant management time and attention establishing these standards, controls, contracts, procedures, and policies.Key employees may be difficult to retain and assimilate.
33
Confidential Treatment Requested by McAfee Corp.
Pursuant to 17 C.F.R. Section 200.83
Risks Related to Our Solutions and Sales to Our Subscribers
Over the last several years, we have pursued a variety of strategic initiatives designed to optimize and reinforce our cybersecurity platform. If the benefits of these initiatives are less than we anticipate, or if the realization of such benefits is delayed, our business and results of operations may be harmed.
Over the last several years, we have pursued a variety of strategic initiatives designed to optimize and reinforce our cybersecurity platform, including investing in new routes to market and partnerships, refining ourstrategies, adding new capabilities and products through strategic acquisitions, and divesting our enterprise business to focus on a standalone consumer-focused strategy. The anticipated benefits of these initiatives may not be fully realized, if at all, until future periods. However, if we do not achieve the anticipated benefits from these and our other strategic initiatives, or if the achievement of such anticipated benefits is delayed, our financial condition, results of operations, and cash flows may be adversely affected.
go-to-market
Our investments in new or enhanced solutions may not yield the benefits we anticipate.
The success of our business depends on our ability to develop new technologies and solutions, to anticipate future customer requirements and applicable industry standards, and to respond to the changing needs of our subscribers, competitive technological developments, and industry changes. Within our consumer business, we are presently investing in cybersecurity solutions to protect consumers’ PC and mobile devices, identity, privacy, family safety, web browsing, IoT, and smart home devices. We intend to continue to invest in these cybersecurity solutions by adding personnel and other resources to our business. We will likely recognize costs associated with these investments earlier than the anticipated benefits. If we do not achieve the anticipated benefits from these investments, or if the achievement of these benefits is delayed, our business, financial condition, results of operations, and cash flows may be adversely affected.
The process of developing new technologies is time consuming, complex, and uncertain, and requires the commitment of significant resources well in advance of being able to fully determine market requirements and industry standards. Furthermore, we may not be able to timely execute new technical product or solution initiatives for a variety of reasons such as errors in planning or timing, technical difficulties that we cannot timely resolve, or a lack of appropriate resources. Complex solutions like ours may contain undetected errors or compatibility problems, particularly when first released, which could delay or adversely impact market acceptance. We may also experience delays or unforeseen costs related to integrating products we acquire with products we develop, because we may be unfamiliar with errors or compatibility issues of products we did not develop ourselves. Any of these development challenges, or the failure to appropriately adjust ourstrategy to accommodate new offerings, may result in delays in the commercial release of new solutions or may cause us to terminate development of new solutions prior to commercial release. Any such challenges could result in competitors bringing products or services to market before we do and a related decrease in our market segment share and net revenue. Our inability to introduce new solutions and enhancements in a timely and cost-effective manner, or the failure of these new solutions or enhancements to achieve market acceptance and comply with industry standards and governmental regulation, could seriously harm our business, financial condition, results of operations, and cash flows.
go-to-market
If our solutions have or are perceived to have defects, errors, or vulnerabilities, or if our solutions fail or are perceived to fail to detect, prevent, or block cyberattacks, including in circumstances where subscribers may fail to take action on attacks identified by our solutions, our reputation and our brand could suffer, which would adversely impact our business, financial condition, results of operations, and cash flows.
Many of our solutions are complex and may contain design defects, vulnerabilities, or errors that are not detected before their commercial release. Our solutions also provide our subscribers with the ability to customize a multitude of settings, and it is possible that a customer could misconfigure our solutions or otherwise fail to configure our solutions in an optimal manner. Such defects, errors, and misconfigurations of our solutions could cause our solutions to be vulnerable to cybersecurity attacks, cause them to fail to perform the intended
34
Confidential Treatment Requested by McAfee Corp.
Pursuant to 17 C.F.R. Section 200.83
operation, or temporarily interrupt the operations of our subscribers. In addition, since the techniques used by adversaries change frequently and generally are not recognized until widely applied, there is a risk that our solutions would not be able to address certain attacks. Moreover, our solutions could be targeted by bad actors and attacks specifically designed to disrupt our business and undermine the perception that our solutions are capable of providing their intended benefits, which, in turn, could have a serious impact on our reputation. The risk of a cybersecurity attack increased during the recent
COVID-19
pandemic as more individuals are working from home and utilizing home networks for the transmission of sensitive information. Any cybersecurity vulnerability or perceived cybersecurity vulnerability of our solutions or systems could adversely affect our business, financial condition, results of operations, and cash flows.Changing, updating, enhancing, and creating new versions of our solutions may cause errors or performance problems in our products and solutions, despite testing and quality control. We cannot be certain that defects, errors, or vulnerabilities will not be found in any such changes, updates, enhancements, or new versions, especially when first introduced. In addition, changes in our technology may not provide the additional functionality or other benefits that were expected. Implementation of changes in our technology also may cost more or take longer than originally expected and may require more testing than initially anticipated. While new solutions are generally tested before they are used in production, we cannot be sure that the testing will uncover all problems that may occur in actual use.
If any of our subscribers are affected by a cybersecurity attack (such as suffering a ransomware attack or otherwise becoming infected with malware) while using our solutions, such subscribers could be disappointed with our solutions or perceive that our solutions failed to perform their intended purpose, regardless of whether our solutions operated correctly, blocked, or detected the attack or would have blocked or detected the attack if configured properly. If our subscribers experience security breaches or incidents, such subscribers and the general public may believe that our solutions failed. Real or perceived security breaches or incidents impacting our subscribers could cause disruption or damage or other negative consequences and could result in negative publicity about us, reduced sales, damage to our reputation and competitive position, increased expenses, and customer retention challenges.
Furthermore, our solutions may fail to detect or prevent malware, viruses, worms, or similar threats for any number of reasons, including our failure to enhance and expand our solutions to reflect market trends and new attack methods, new technologies and new operating environments, the complexity of our subscribers’ environment and the sophistication and coordination of threat actors launching malware, ransomware, viruses, intrusion devices, and other threats. Failure to keep pace with technological changes in the cybersecurity industry and changes in the threat landscape could also adversely affect our ability to protect against security breaches and incidents and could cause us to lose subscribers.
If we are unable to increase sales of our solutions to new subscribers, our future results of operations may be harmed.
An important part of our growth strategy involves continued investment in direct marketing efforts, channel partner relationships, our sales force, and infrastructure to add new subscribers. The number and rate at which new subscribers may purchase our products and services depends on a number of factors, including those outside of our control, such as subscribers’ perceived need for our solutions, competition, general economic conditions, market transitions, product obsolescence, technological change, public awareness of security threats to IT systems, macroeconomic conditions, and other factors. These new subscribers, if any, may renew their subscriptions at lower rates than we have experienced in the past, which could affect our financial results.
We rely on large amounts of data from a variety of sources to support our solutions and the loss of access to or the rights to use such data could reduce the efficacy of our solutions and harm our business.
Like many of our industry peers, we leverage large amounts of data related to threats, vulnerabilities, cyberattacks, and other cybersecurity intelligence to develop and maintain a number of our products and services.
35
Confidential Treatment Requested by McAfee Corp.
Pursuant to 17 C.F.R. Section 200.83
We collect, develop, store, and otherwise process portions of this data using third parties and our own technology. We cannot be assured that such third parties or our technology that support the collection, development, storage or other processing of such data, and the sources of such data itself, will continue to be effective or available and the loss or reduction in quality of such data may adversely impact the efficacy of our solutions. Changes in laws or regulations in the United States or foreign jurisdictions, or their interpretation or application, or the actions of governmental or quasi-governmental entities may increase the costs to collect, develop, store, or otherwise process such data, partially or completely prohibit use of such, impose burdensome obligations in connection with such, or could result in disclosure of such data to the public or other third parties, which may reduce its value to us or as part of our solutions and thereby harm our business.
Risks Related to Our Brand and Intellectual Property
If the protection of our proprietary technology is inadequate, we may not be able to adequately protect our innovations and brand.
Our success is dependent on our ability to create proprietary technology and to protect and enforce our intellectual property rights in that technology, as well as our ability to defend against adverse claims of third parties with respect to our technology and intellectual property rights. To protect our proprietary technology, we rely primarily on a combination of patent, copyright, trademark, and trade secret laws, as well as contractual provisions and operational and procedural confidentiality protections. The agreements that we enter into with our employees, contractors, partners, vendors, and
end-users
may not prevent unauthorized use or disclosure of our proprietary technology or infringement of our intellectual property rights and may not provide an adequate remedy in the event of unauthorized use or disclosure of our proprietary technology or infringement of our intellectual property rights, which may substantially harm our business. Furthermore, we cannot be assured that such agreements will be fully enforceable, or that they will not be breached by the counterparties, or that we will be able to detect, deter, or adequately address any such breach or threatened breach. As a provider of cybersecurity solutions, we may be an attractive target for computer hackers or other bad actors and may have a greater risk of unauthorized access to, and misappropriation of, our systems, technology, and proprietary information. Despite our efforts to protect our proprietary rights, unauthorized parties may attempt to copy aspects of our products or obtain and use information that we regard as proprietary. Policing unauthorized use of our products and infringement of our rights is difficult. In addition, the laws of some foreign countries, including countries where we sell solutions or have operations, do not protect proprietary rights to as great an extent as do the laws of the United States. Our means of protecting our proprietary rights may not be adequate and third parties, including current and future competitors, may independently develop similar or superior technology, duplicate or reverse engineer aspects of our products, or design around our patented technology or otherwise infringe or circumvent our intellectual property rights.As of June 26, 2021, we had approximately 1,375 issued U.S. patents, in addition to approximately 835 issued foreign patents. There can be no assurance that any of our pending patent applications will issue or that the patent examination process will not result in our narrowing the claims applied for in our patent applications or that any current or future issued patents will not be later challenged, limited, or invalidated. Furthermore, there can be no assurance that we will be able to detect any infringement of our existing or future intellectual property rights or, if infringement is detected, that we will be successful in asserting claims or counterclaims, that our intellectual property rights will be enforceable, that any damages awarded to us will be sufficient to adequately compensate us for the infringement, that we will be able to obtain injunctive relief to prevent ongoing infringement, or that the costs of seeking enforcement will not outweigh any benefits.
There can be no assurance or guarantee that any products, services, or technologies that we are presently developing, or will develop in the future, will result in intellectual property that is subject to legal protection under the laws of the United States or a foreign jurisdiction or that produces a competitive advantage for us.
36
Confidential Treatment Requested by McAfee Corp.
Pursuant to 17 C.F.R. Section 200.83
We may be sued by third parties for alleged infringement, misappropriation, or other violation of their proprietary rights, and it may be necessary for us to sue third parties to enforce and protect our proprietary rights, resulting in potential lengthy and expensive litigation.
From time to time, third parties may claim that we have infringed, misappropriated, or otherwise violated their intellectual property rights, including claims regarding patents, copyrights, trademarks, and trade secrets. Because of constant technological change in the segments in which we compete, the extensive patent coverage of existing technologies, and the rapid rate of issuance of new patents, we expect the trend of third-party claims to continue and that we will be required to defend against actual or threatened litigation of this type. The litigation process is subject to inherent uncertainties, so we may not prevail in litigation matters regardless of the merits of our position. Our participation in any litigation could cause us to incur substantial costs and could distract our management from theoperations of our business. In addition to the expense and distraction associated with litigation, adverse determinations could cause us to lose our proprietary rights, prevent us from manufacturing or selling our products, require us to obtain licenses to patents or other intellectual property rights that our products are alleged to infringe, misappropriate, or otherwise violate (which licenses may not be available on commercially reasonable terms or at all), or
day-to-day
re-design
orre-engineer
our products to address actual or claimed infringement, misappropriation, or other violation and subject us to significant liabilities.If we acquire technology to include in our products from third parties, our exposure to actions alleging infringement, misappropriation, or other violation may increase because we must rely upon these third parties to verify the origin and ownership of such technology. Our agreements with such third parties may not provide adequate protections or remedies, and we may not be able to compel such third parties to provide any available remedies in the case of such actions. Similarly, we face exposure to actions alleging infringement, misappropriation, or other violation if we hire or engage software engineers or other personnel who were previously engaged by competitors or other third parties and those personnel inadvertently or deliberately incorporate proprietary technology of third parties into our products despite efforts to prevent such infringement, misappropriation, or other violation.
From time to time, the U.S. Supreme Court, other U.S. federal courts and the U.S. Patent and Trademark Appeals Board, and their foreign counterparts, have made and may continue to make changes to the interpretation of patent, copyright, trademark, or other intellectual property laws in their respective jurisdictions. We cannot predict future changes to the interpretation of such existing laws or whether U.S. or foreign legislative bodies will amend such laws in the future. Any such changes may lead to uncertainties or increased costs and risks surrounding the prosecution, validity, ownership, enforcement, and defense of our issued patents and patent applications and other intellectual property, the outcome of third-party claims of infringement, misappropriation, or other violation of intellectual property brought against us and the actual or enhanced damages (including treble damages) that may be awarded in connection with any such current or future claims, and could have a material adverse effect on our business, financial condition, results of operations, and cash flows.
We rely on certain technology that we license from third parties, including software that is integrated with internally developed software and used with our products. Any loss of those licenses or any quality issues with third-party technology integrated with our products could have an adverse impact on our reputation and business.
We rely on certain technology that we license from third parties, including third-party commercial software and open source software, which is integrated into or used with many of our solutions. This third-party technology may currently or could, in the future, infringe the intellectual property rights of third parties or the licensors may not have sufficient rights to the technology they license us in all jurisdictions in which we may sell our solutions. The licensors of the third-party technology we use may discontinue their offerings or change the prices for and other terms under which their technology is licensed. If we are unable to continue to license any of this technology on terms we find acceptable, or if there are quality, security, or other substantive issues with any of this technology, we may face delays in releases of our solutions or we may be required to find alternative
37
Confidential Treatment Requested by McAfee Corp.
Pursuant to 17 C.F.R. Section 200.83
vendors or remove functionality from our solutions. In addition, our inability to obtain certain licenses or other rights might require us to engage in potentially costly and time-consuming dispute resolution or litigation regarding these matters. Any of the foregoing could have a material adverse effect on our business, financial condition, results of operations, and cash flows.
Our use of open source software could negatively affect our ability to sell our solutions and subject us to possible litigation.
We use open source software in our solutions and our development and operating environments and expect to continue to use open source software in the future. Open source software is typically provided without assurances of any kind and could contain errors, bugs, or vulnerabilities or infringe the intellectual property rights of third parties. Because the source code of open source software components included in our solutions is publicly available, in instances where our usage is publicly disclosed or known, it may be easier to identify exploits or vulnerabilities in such open source software components, making our solutions using such open source software components more vulnerable to third parties seeking to compromise, undermine, or circumvent our solutions. If open source software programmers do not continue to develop and enhance open source technologies, our development expenses could increase and our schedules could be delayed. In addition, we may face claims from others seeking to enforce the terms of open source licenses, including by demanding release of derivative works or our proprietary source code that was developed using or otherwise used in connection with such open source software. The terms of many open source licenses have not been interpreted by U.S. or foreign courts, and these licenses could be construed in a way that could impose other unanticipated costs, conditions, or restrictions on our ability to commercialize our products. These claims could also result in litigation, require us to purchase a costly license, require us to devote additional research and development resources to change our solutions, or stop or delay shipment of such solutions, any of which could have a negative effect on our business, financial condition, results of operations, and cash flows. In addition, if the license terms for the open source software that we utilize change, we may be forced to reengineer our solutions or incur additional costs. Although we have policies designed to manage the use, incorporation, and updating of open source software into our products, we cannot be certain that we have in all cases incorporated open source software in our products in a manner that is consistent with the applicable open source license terms and inclusive of all available updates or security patches, and as a result we may be subject to claims for breach of contract or infringement by the applicable licensor, claims for breach of contract or indemnity by our partners or subscribers, or other third parties, or we or our partners or subscribers could be required to release our proprietary source code, pay damages, royalties, or license fees or other amounts, seek licenses, or experience quality control or security risks, any of which could require us to
re-engineer
our solutions, discontinue sales in the eventre-engineering
cannot be accomplished on a timely basis, or take other remedial action that may divert resources away from our development efforts, any of which could adversely affect our business.If we fail to successfully promote or protect our brand, our business, and competitive position may be harmed.
Due to the intensely competitive nature of our markets, we believe that building and maintaining our brand and reputation is critical to our success, and that the importance of positive brand recognition will increase as competition in our market further intensifies. Over our
30-year
history, we have invested and expect to continue to invest substantial resources to promote and maintain our brand as a trusted cybersecurity provider, but there is no guarantee that our brand development strategies will enhance the recognition of our brand or lead to increased sales of our solutions.In recent years, there has been a marked increase in the use of social media platforms, including blogs, chat platforms, social media websites, and other forms of internet-based communications that allow individuals access to a broad audience of consumers and other persons. The rising popularity of social media and other consumer-oriented technologies has increased the speed and accessibility of information dissemination and given users the ability to more effectively organize collective actions such as boycotts. Negative publicity, whether or not
38
Confidential Treatment Requested by McAfee Corp.
Pursuant to 17 C.F.R. Section 200.83
justified, can spread rapidly through social media. The dissemination of information via social media could harm our brand or our business, regardless of the information’s accuracy. To the extent that we are unable to respond timely and appropriately to negative publicity, our reputation and brand could be harmed. This could include negative publicity related to our products or services or negative publicity related to actions by our executives, team members or other unaffiliated individuals or entities that may be perceived as being associated with us. Moreover, even if we are able to respond in a timely and appropriate manner, we cannot predict how negative publicity may affect our reputation and business. In addition, we and our employees use social media and other internet-based communications methods to communicate with our
end-users,
subscribers, partners, and the public in general. There is risk that the social media communications of us or our employees could be received negatively. Failure to use social media or other internet-based communication methods effectively could lead to a decline in our reputation. Further, laws and regulations, including associated enforcement priorities, rapidly evolve to govern social media platforms and other internet-based communications, any failure by us or third parties acting at our direction to abide by applicable laws and regulations in the use of social media or internet-based communications could adversely impact our reputation, financial performance or subject us to fines or other penalties. Other risks associated with the use of social media and internet based-communication include improper disclosure of proprietary information, negative comments about our brand, products, or services, exposure of personally identifiable information, fraud, hoaxes, or malicious dissemination of false information.Risks Related to Third Party Relationships
We rely significantly on third-party channel partners to facilitate the sale of our products and solutions. If we fail to manage our sales and distribution channels effectively, or if our partners choose not to market and sell our solutions to their customers, our operating results could be adversely affected.
We sell a significant portion of our solutions through third-party intermediaries such as affiliates, retailers, ecommerce, PC OEMs, and other distribution channel partners (we refer to them collectively as “channel partners”). In fiscal 2018, fiscal 2019, and fiscal 2020, our largest customer accounted for 13%, 13%, and 13%, respectively, of our net revenue with its parent company contributing an additional 1%, 2%, and 5%, respectively. Our reliance on these channel partners is subject to a number of risks, including:
| • | our channel partners are generally not subject to minimum sales requirements or any obligation to market our solutions to their customers; |
| • | many channel partner agreements are nonexclusive and may be terminated at any time without cause and or renegotiated with us on new terms that may be less favorable due to competitive conditions in our markets and other factors; |
| • | our channel partners may encounter issues or have violations of applicable law or regulatory requirements or otherwise cause damage to our reputation through their actions; |
| • | certain of our channel partners market and distribute competing solutions and may, from time to time, may place greater emphasis on the sale of these competing solutions due to pricing, promotions, and other terms offered by our competitors; |
| • | any consolidation of electronics retailers can increase their negotiating power with respect to software providers such as us and any decline in the number of physical retailers could decrease the channels of distribution for us; |
| • | the continued consolidation of online sales through a small number of larger channels has been increasing, which could reduce the channels available for online distribution of our solutions; and |
| • | sales through our partners are subject to changes in general economic conditions, strategic direction, competitive risks, and other issues that could result in a reduction of sales, or cause our partners to suffer financial difficulty which could delay payments to us, affecting our operating results. |
From an anti-bribery and anti-corruption perspective, our business activities are subject to the FCPA and similar anti-bribery or anti-corruption laws, regulations, and rules of the countries that we operate in. These laws
39
Confidential Treatment Requested by McAfee Corp.
Pursuant to 17 C.F.R. Section 200.83
generally prohibit companies and their employees and third party business partners, representatives, and agents from engaging in corruption and bribery, including offering, promising, giving, or authorizing the provision of anything of value, either directly or indirectly, to a government official or commercial party to influence any official action, direct business to any person, gain any improper advantage, or obtain or retain business. Anti-corruption and anti-bribery laws have been enforced aggressively in recent years and are interpreted broadly. We and our third-party partners may have direct or indirect interactions with officials and employees of government agencies or state-owned or affiliated entities and may be held liable for inaccurate or incomplete accounting records, internal accounting controls deemed inadequate by applicable regulatory authorities, and corrupt or other illegal activities of our employees, affiliates, third parties, representatives, and agents even if we did not explicitly authorize those activities. This risk is even greater in the countries where we operate that are known to present a heightened risk for corruption.
A significant portion of our revenue is derived from sales through our PC OEM partners that bundle our products with their products. Our reliance on this sales channel is significantly affected by our partners’ sales of new products into which our products or services are bundled. Our revenue from sales through our PC OEM partners is affected primarily by the number of personal computers on which our products are bundled, the geographic mix of their sales, and the rate at which consumers purchase or subscribe to the bundled products. Our PC OEM partners are also in a position to exert competitive pricing pressure. The rate at which consumers purchase or subscribe to the bundled products is affected by other factors, including other terms with the OEM. The continued decline in the PC market as the market shifts towards mobility has increased competition for PC OEMs’ business and gives PC OEMs leverage to demand financial concessions from us in order to secure their business. These agreements require a significant commitment of resources and capital. There is no guarantee we will have sufficient resources to maintain these agreements or secure new PC OEM partners. Even if we negotiate what we believe are favorable terms when we first establish a relationship with a PC OEM, at the time of the renewal of the agreement, we may be required to renegotiate our agreement with them on less favorable terms. Lower net prices for our products or other financial concessions would adversely impact our financial results. Further, acquiring high numbers of subscribers through our PC OEM partner channel may adversely impact our profitability, as we may see lower average prices from higher mix of new subscribers and under the PC OEM agreements we may see higher partner related spending during the period of high PC demand and high customer acquisition, until such subscribers renew with us upon subscription expiration. Any adverse changes in our relationship with our channel partners could have an adverse effect on our business and financial results.
We rely on third-parties to replicate and package certain of our software products, which subjects us to risks of product delivery delays and other supply risks.
We rely on a limited number of third parties to replicate and package our boxed software products.
Our reliance on these third-parties reduces our control over our supply chain and exposes us to risks, including reduced control over quality assurance, product costs, product supply, timing, and transportation risk. From time to time, we may be required to add new partners to accommodate growth in orders or the addition of new products. It is time consuming and costly to qualify and implement new supply chain partner relationships, and such additions increase the complexity of our supply chain management. If we lose, terminate, or fail to effectively manage our supply chain partner relationships, or if any of our partners experience production interruptions or shut-downs, including those caused by a natural disaster, epidemic, pandemic (such as the
COVID-19
pandemic), capacity shortage, or quality-control problem, it would negatively affect sales and adversely affect our business and results of operations.We rely on third parties to support our information technology infrastructure and any service interruptions or other failures of our third-party providers or of our information technology infrastructure could result in disruption to our operations or adversely impact our business.
We engage third parties to provide variety of information technology products and services to support our information technology infrastructure. Any failure on the part of our third-party providers or of our information
40
Confidential Treatment Requested by McAfee Corp.
Pursuant to 17 C.F.R. Section 200.83
technology infrastructure to operate effectively, stemming from maintenance problems, upgrading or transitioning to new platforms, a breach in security or other unanticipated problems could result in interruptions to or delays in our operations or our products or services. Our third-party providers may also discontinue providing the information technology products or services we use and we may be required to replace such products or services, which could result in unanticipated expenses and disruptions to our information technology infrastructure.
In addition, we make significant investments in new information technology infrastructure, but the implementation of such investments could exceed estimated budgets and we may experience challenges that prevent new strategies or technologies from being realized according to anticipated schedules. If we are unable to effectively maintain our current information technology and processes or encounter delays, or fail to exploit new technologies, then the execution of our business plans may be disrupted. Our employees and other personnel require effective tools and techniques supported by our information technology infrastructure to perform functions integral to our business. Any failure to successfully provide such tools and systems, or ensure that our personnel have properly adopted them, could materially and adversely impact our ability to achieve positive business outcomes.
Some of our systems or data that we may maintain or process may not be adequately backed up, and our disaster recovery planning cannot account for all eventualities. The occurrence of a natural disaster, intentional sabotage, or other unanticipated problems could result in significant interruptions to our operations or the permanent loss of valuable data, which could harm our reputation and reduce the efficacy and value of products and services. In addition, the implementation of changes and upgrades to our information technology infrastructure and any errors, vulnerabilities, damage, or failure of our information technology infrastructure, could result in interruptions to our operations or products or services and
non-compliance
with certain laws or regulations, which may lead us to face fines or penalties, give rise to indemnification or other contractual claims against us by our subscribers or other third parties, and otherwise adversely impact our business.Our third-party strategic alliances expose us to a range of business risks and uncertainties that are outside of our control and that could have a material adverse impact on our business and financial results.
We have entered, and intend to continue to enter, into strategic alliances with third parties to support our future growth plans. These relationships involve technology licensing, product integration, and
co-marketing
andco-promotion
activities. For example, we have arrangements with operating system vendors that provide us with sufficient technological access to new and updated versions of their operating systems to enable us to develop and deploy interoperable products that are deeply integrated with their operating systems on our subscribers’ networks and devices. We also partner with certain Internet search providers to promote their offerings to our subscribers. We invest significant time, money, and resources to establish and maintain these strategic relationships, but we have no assurance that any particular relationship will continue for any specific period of time.Furthermore, certain of these strategic partners currently offer, and may in the future offer, products, and services that compete with our own solutions in certain markets, and in the future these partners may impose limitations on, or terminate, our partnerships in order to improve their own competitive position. Generally, our agreements with these partners are terminable without cause with no or minimal notice or penalties. Any adverse change in our relationships with a significant strategic partner could limit or delay our ability to offer certain new or competitive solutions, increase our development costs, and reduce our revenue, any of which could have an adverse impact on our competitive position and our financial performance. In addition, we could be required to incur significant expenses to develop a new strategic partnership or to develop and implement an alternative plan to pursue the opportunity that we targeted with the former partner, which could adversely affect our business, financial condition, results of operations, and cash flows.
41
Confidential Treatment Requested by McAfee Corp.
Pursuant to 17 C.F.R. Section 200.83
Risks Related to our Technology Systems and Privacy
If our security measures are breached or unauthorized access to our data is otherwise obtained, or if we suffer other cybersecurity incidents, our brand, reputation, and business could be harmed, and we may incur significant liabilities.
As a cybersecurity leader, we are a high-profile target for data breaches, cyberattacks, and other intentional disruptions of our systems and our solutions. Our networks and solutions may have bugs, defects, or vulnerabilities that may be targeted by hackers and could be targeted by attacks specifically designed to disrupt our business, access our network, source code or other data (including by causing data to be lost, corrupted or unavailable), and harm our reputation. Similarly, experienced computer programmers or other sophisticated individuals or entities, including malicious hackers, state-sponsored organizations, criminal networks, and insider threats including actions by employees and third-party service providers, may attempt to penetrate our network security or the security of our systems and websites, and misappropriate proprietary information or cause interruptions of our solutions, including the operation of the global civilian cyber intelligence threat network. This risk has increased during the current
COVID-19
pandemic as more individuals are working from home and utilizing home networks for the transmission of sensitive information. The techniques used to obtain unauthorized access, disable or degrade service, or sabotage systems change frequently, often are not recognized until launched against a target, and may originate from less regulated or remote areas around the world. As a result, we may be unable to proactively prevent these techniques, implement adequate preventative or reactionary measures, react to or address any attack or incident in a timely manner or enforce the laws and regulations that govern such activities. Such attacks may go undetected for a period of time complicating our ability to respond effectively. In addition, it is possible that hardware failures, human errors (including being subject to phishing attacks, social engineering techniques, or similar methods) or errors in our systems could result in data loss, unavailability, or corruption, or cause the information that we collect to be incomplete or contain inaccuracies. We may not be able to correct any security flaws or vulnerabilities promptly, or at all. A breach of our network security and systems or other cybersecurity incidents or events, including attacks involving ransomware or other malware, that cause the loss or public disclosure of, or access by third parties to, our systems or any unauthorized access to, or loss, corruption, unavailability, or unauthorized use of data that we maintain or process, or the perception that any of these have occurred, could have serious negative consequences for our business, including possible fines, penalties and damages, reduced demand for our solutions, an unwillingness of our subscribers to use our solutions, harm to our brand and reputation, and time consuming and expensive litigation. In addition, such a security breach or incident could impair our ability to operate our business, including our ability to provide subscription and support services to our subscribers. Additionally, our service providers may suffer or be perceived to suffer, data security breaches or other incidents, or may have exploitable defects or bugs in their systems, software, or networks, that may compromise data stored or processed for us that may give rise to any of the foregoing. Additionally, supply chain attacks have increased in frequency and severity, and we cannot guarantee that third parties and infrastructure in our supply chain have not been compromised or that they do not contain exploitable defects or bugs that could result in a breach of or disruption to our solutions, systems, or networks or the systems and networks of third parties that support us and our services. Any of these negative outcomes could adversely impact our business and results of operations.We incur significant costs in an effort to detect and prevent security breaches and other security-related incidents and we expect our costs will increase as we make improvements to our systems and processes to prevent further breaches and incidents. In the event of a future breach or incident, we could be required to expend additional significant capital and other resources in an effort to prevent further breaches or incidents, which may require us to divert substantial resources. Moreover, we could be required or otherwise find it appropriate to expend significant capital and other resources to respond to, notify third parties of, and otherwise address the incident or breach and its root cause. Each of these could require us to divert substantial resources.
Furthermore, while our errors and omissions insurance policies include liability coverage for certain of these matters, if we experience a widespread security breach or other incident, we could be subject to indemnity claims or other damages that exceed our insurance coverage. We also cannot be certain that our insurance coverage will
42
Confidential Treatment Requested by McAfee Corp.
Pursuant to 17 C.F.R. Section 200.83
be adequate for data handling or data security liabilities actually incurred, that insurance will continue to be available to us on economically reasonable terms, or at all, or that any insurer will not deny coverage as to any future claim. The successful assertion of one or more large claims against us that exceed available insurance coverage, or the occurrence of changes in our insurance policies, including premium increases or the imposition of large deductible or
co-insurance
requirements, could have a material adverse effect on our business, including our financial condition, results of operations, and reputation.We rely on payment cards to receive payments and are subject to payment-related risks.
We accept a variety of payment methods, including credit cards and debit cards, as payment for certain of our consumer solutions. Accordingly, we are, and will continue to be, subject to significant and evolving regulations and compliance requirements relating to payment card processing. This includes laws governing the collection, processing and storage of sensitive consumer information, as well as industry requirements such as the Payment Card Industry Data Security Standard
(“PCI-DSS”).
These laws and obligations may require us to implement enhanced authentication and payment processes that could result in increased costs and liability, and reduce the ease of use of certain payment methods. For certain payment methods, including credit and debit cards, we pay interchange and other fees, which may increase over time. We are also subject to payment card association operating rules and agreements, includingPCI-DSS,
certification requirements, and rules governing electronic funds transfers, which could change or be reinterpreted to make it difficult or impossible for us to comply. If we fail to comply with these rules or requirements, or if our data security systems are breached or compromised, we may be liable for losses incurred by card issuing banks or consumers, subject to fines and higher transaction fees, lose our ability to accept credit or debit card payments from our consumers, or process electronic fund transfers or facilitate other types of payments. Any failure to comply with these requirements could significantly harm our brand, reputation, business, and results of operations.Our failure to adequately maintain and protect personal information of our subscribers or our employees in compliance with evolving legal requirements could have a material adverse effect on our business.
We collect, use, store, disclose, or transfer (collectively, “process”) personal information, including from employees and subscribers, in connection with the operation of our business. A wide variety of local and international laws and regulations apply to the processing of personal information. Data protection and privacy laws and regulations are evolving and being tested in courts and may result in increasing regulatory and public scrutiny and escalating levels of enforcement and sanctions. For example, the E.U. has adopted the General Data Protection Regulation (“GDPR”), which took effect on May 25, 2018. The GDPR imposes requirements that may limit how we are permitted to process data on behalf of ourselves and our clients, and we may be required to incur significant additional costs to comply with these requirements. Applicable laws, regulations and court decisions in the E.U. relating to privacy and data protection could also impact our ability to transfer personal data internationally. The GDPR specifies substantial maximum fines for failure to comply of up to 20 million Euros or 4% of a company’s worldwide turnover, whichever is higher. Continued compliance with the GDPR and national laws in the E.U. may require significant changes to our products and practices to ensure compliance with applicable law.
A variety of data protection legislation also apply in the United States at both the federal and state level, including new laws that may impact our operations. For example, in June 2018, the State of California enacted the California Consumer Privacy Act of 2018 (“CCPA”), which went into effect on January 1, 2020, with enforcement by the state attorney general beginning July 1, 2020. The CCPA defines “personal information” in a broad manner and generally requires companies that process personal information of California residents to make new disclosures about their data collection, use, and sharing practices, allows consumers to
opt-out
of certain data sharing with third parties or sale of personal information, and provides a new cause of action for data breaches. Moreover, California voters approved the California Privacy Rights Act (“CPRA”), in November 2020. The CPRA significantly modifies the CCPA, creating obligations relating to consumer data beginning on43
Confidential Treatment Requested by McAfee Corp.
Pursuant to 17 C.F.R. Section 200.83
January 1, 2022, with implementing regulations expected on or before July 1, 2022, and enforcement beginning July 1, 2023. On March 2, 2021, Virginia enacted the Virginia Consumer Data Protection Act, or CDPA, which becomes effective on January 1, 2023, and on June 8, 2021, Colorado enacted the Colorado Privacy Act, or CPA, which takes effect on July 1, 2023. The CPA and CDPA share similarities with the CCPA, CPRA, and legislation proposed in other states. Aspects of these state privacy statutes remain unclear resulting in uncertainty and potentially requiring us to modify our data practices and policies and to incur substantial additional costs and expenses in an effort to comply. Additionally, the Federal Trade Commission, and many state attorneys general are interpreting federal and state consumer protection laws to impose standards for the online collection, use, dissemination, and security of data. The burdens imposed by the CCPA and other similar laws that have been or may be enacted at the federal and state level may require us to modify our data processing practices and policies and to incur substantial expenditures in order to comply.
Global privacy and data protection legislation, enforcement, and policy activity are rapidly expanding and evolving, and may be inconsistent from jurisdiction to jurisdiction. On July 16, 2020, the Court of Justice of the European Union (“CJEW”), Europe’s highest court, held in thecase that thecase, regulatory guidance, and other developments relating to cross-border data transfers, and we and our subscribers face the potential for regulators in the European Economic Area (“EEA”) to apply different standards to the transfer of personal data from the EEA to the U.S., and to block, or require ad hoc verification of measures taken with respect to, certain data flows from the EEA to the U.S. We may experience reluctance or refusal by current or prospective European subscribers to use our products, and we may find it necessary or desirable to make further changes to our handling of personal data of EEA residents. The regulatory environment applicable to the handling of EEA residents’ personal data, and our actions taken in response, may cause us to assume additional liabilities or incur additional costs and could result in our business, operating results and financial condition being harmed. We and our subscribers may face a risk of enforcement actions by data protection authorities in the EEA relating to personal data transfers to us and by us from the EEA. Any such enforcement actions could result in substantial costs and diversion of resources, distract management and technical personnel and negatively affect our business, operating results and financial condition. Additionally, we may be or become subject to data localization laws mandating that data collected in a foreign country be processed only within that country. If any country in which we have subscribers were to adopt a data localization law, we could be required to expand our data storage facilities there or build new ones in order to comply. The expenditure this would require, as well as costs of compliance generally, could harm our financial condition.
Schrems II
E.U.-U.S.
Privacy Shield, a mechanism for the transfer of personal data from the E.U. to the U.S., was invalid, and imposed additional obligations in connection with the use of standard contractual clauses approved by the European Commission. The impact of this decision on the ability to lawfully transfer personal data from the E.U. to the U.S. remains uncertain. The European Commission released a draft of revised standard contractual clauses addressing the CJEU concerns in November 2020, and on June 4, 2021, published new standard contractual clauses. We may, in addition to other impacts, experience additional costs associated with increased compliance burdens relating to theSchrems II
In addition to the GDPR, the European Commission has another draft regulation in the approval process that focuses on a person’s right to conduct a private life. The proposed legislation, known as the Regulation of Privacy and Electronic Communications, or ePrivacy Regulation, would replace the current ePrivacy Directive. Originally planned to be adopted and implemented at the same time as the GDPR, the ePrivacy Regulation is still being negotiated. Most recently, on February 10, 2021, the Council of the E.U. agreed on its version of the draft ePrivacy Regulation. If adopted, the earliest date for entry into force is in 2023, with broad potential impacts on the use of internet-based services and tracking technologies, such as cookies. Aspects of the ePrivacy Regulation remain for negotiation between the European Commission and the Council.
Further, in June 2016, the U.K. voted to leave the E.U., which resulted in the U.K. exiting the E.U. on January 31, 2020, subject to a transition period that ended on December 31, 2020. Brexit could lead to further legislative and regulatory changes. The U.K. has implemented legislation similar to the GDPR, including the U.K. Data Protection Act and legislation similar to the GDPR referred to as the U.K. GDPR, and which provides
44
Confidential Treatment Requested by McAfee Corp.
Pursuant to 17 C.F.R. Section 200.83
for substantial penalties of up to the greater of 17.5 million British Pounds or 4% of a company’s worldwide turnover, whichever is higher. Further, it remains to be seen whether the U.K.’s withdrawal from the E.U. pursuant to Brexit will substantially impact the manner in which U.K. data protection laws or regulations will develop in the medium to longer term and how data transfers to and from the U.K. will be regulated. On June 28, 2021, the European Commission announced a decision of “adequacy” concluding that the UK ensures an equivalent level of data protection to the GDPR, which provides some relief regarding the legality of continued personal data flows from the EEA to the U.K. Some uncertainty remains, however, as this adequacy determination must be renewed after four years and may be modified or revoked in the interim.
Our actual or alleged failure to comply with any applicable laws and regulations or contractual obligations relating to privacy, data protection, or information security, or to protect such data that we process, could result in litigation, regulatory investigations, and enforcement actions against us, including fines, orders, public censure, claims for damages by employees, subscribers, and other affected individuals, public statements against us by consumer advocacy groups, damage to our reputation and competitive position, and loss of goodwill (both in relation to existing subscribers and prospective subscribers), any of which could have a material adverse effect on our business, financial condition, results of operations, and cash flows. Evolving and changing definitions of personal information, personal data, and similar concepts within the E.U., the United States, and elsewhere, especially relating to classification of IP addresses, device identifiers, location data, household data, and other information we may collect, may limit or inhibit our ability to operate or expand our business, including limiting strategic partnerships that may involve the sharing of data. Additionally, if third parties that we work with, such as vendors or developers, violate applicable laws or our policies, such violations may also place personal information at risk and have an adverse effect on our business. Even the perception of privacy concerns, whether or not valid, may harm our reputation, subject us to regulatory scrutiny and investigations, and inhibit adoption of our products by existing and potential subscribers.
Risks Related to Our International Operations
We operate globally and are subject to significant business, economic, regulatory, social, political, and other risks in many jurisdictions.
Global or regional conditions may harm our financial results
| • | global and local economic conditions; |
| • | differing employment practices and labor issues; |
| • | formal or informal imposition of new or revised export and/or import and doing-business regulations, including trade sanctions, taxes, and tariffs, which could be changed without notice; |
| • | regulations or restrictions on the use, import, or export of encryption technologies that could delay or prevent the acceptance and use of encryption products and public networks for secure communications; |
| • | compliance with evolving foreign laws, regulations, and other government controls addressing privacy, data protection, data localization, and data security; |
| • | ineffective legal protection of our intellectual property rights in certain countries; |
| • | increased uncertainties regarding social, political, immigration, and trade policies in the United States and abroad, such as those caused by recent U.S. legislation and the withdrawal of the United Kingdom (the “U.K.”) from the European Union (the “E.U.”), which is commonly referred to as “Brexit;” |
45
Confidential Treatment Requested by McAfee Corp.
Pursuant to 17 C.F.R. Section 200.83
| • | geopolitical and security issues, such as armed conflict and civil or military unrest, crime, political instability, human rights concerns, and terrorist activity; |
| • | natural disasters, public health issues, pandemics (such as the COVID-19 pandemic), and other catastrophic events; |
| • | inefficient infrastructure and other disruptions, such as supply chain interruptions and large-scale outages or unreliable provision of services from utilities, transportation, data hosting, or telecommunications providers; |
| • | other government restrictions on, or nationalization of, our operations in any country, or restrictions on our ability to repatriate earnings from a particular country; |
| • | seasonal reductions in business activity in the summer months in Europe and in other periods in other countries; |
| • | costs and delays associated with developing software and providing support in multiple languages; |
| • | greater difficulty in identifying, attracting, and retaining local qualified personnel, and the costs and expenses associated with such activities; |
| • | longer payment cycles and greater difficulties in collecting accounts receivable; and |
| • | local business and cultural factors that differ from our normal standards and practices, including business practices that we are prohibited from engaging in by U.S. Foreign Corrupt Practices Act of 1977 (“FCPA”) and other anti-corruption laws and regulations. |
Research and development risks.
Other operating risks.
Risks Related to Regulation
We are subject to governmental export and import controls that could subject us to liability or impair our ability to compete in international markets.
Our solutions are subject to U.S. export and import controls, specifically the Export Administration Regulations and economic sanctions enforced by the Office of Foreign Assets Control. We incorporate standard encryption algorithms into certain of our solutions, which, along with the underlying technology, may be exported outside of the United States only with the required export authorizations, including by license, license exception, or other appropriate government authorizations, which may require the filing of a classification request or report. Furthermore, U.S. export control laws and economic sanctions prohibit the shipment of certain
46
Confidential Treatment Requested by McAfee Corp.
Pursuant to 17 C.F.R. Section 200.83
products and services to countries, governments, and persons targeted by U.S. sanctions. Even though we take precautions to ensure that we and our channel partners comply with all relevant regulations, any failure by us or our channel partners to comply with U.S. export requirements, U.S. customs regulations, U.S. economic sanctions, or other laws could have negative consequences, including reputational harm, government investigations, and substantial civil and criminal penalties (, fines, incarceration for responsible employees and managers, and the possible loss of export or import privileges).
e.g.
In addition, changes in our solutions or changes in export and import regulations may create delays in the introduction of our solutions into international markets, including as a consequence of new licensing requirements, prevent certain personnel from developing or maintaining our products, prevent our
end-subscribers
with international operations from deploying our products globally or, in some cases, prevent or delay the export or import of our solutions to certain countries, governments, or persons altogether. Any change in export or import regulations, economic sanctions or related legislation, shift in the enforcement or scope of existing regulations, or change in the countries, governments, entities, persons, or technologies targeted by such regulations, could result in decreased use of our solutions by, or in our decreased ability to develop, export to, import into, or sell our solutions to, existing or potentialend-subscribers
with international operations. Any decreased use of our solutions or limitation on our ability to develop, export to, import into, or sell our solutions in international markets would likely adversely affect our business, financial condition, results of operations, and cash flows.There is also significant uncertainty about the future relationship between the United States and various other countries, most significantly China, with respect to trade policies, treaties, government regulations, and tariffs. The current United States presidential administration is continuing to pursue substantial changes to United States foreign trade policy imposed by the previous administration with respect to China, Mexico, and other countries, including the possibility of imposing greater restrictions on international trade, restrictions on sales and technology transfers to certain Chinese corporations, and continued increased tariffs on goods imported into the United States. Given the relatively fluid regulatory environment in China and the United States and uncertainty regarding how the United States or foreign governments will act with respect to tariffs, international trade agreements and policies, a trade war, further governmental action related to tariffs or international trade policies, or additional tax or other regulatory changes in the future could occur and could directly and adversely impact our financial results and results of operations.
Failure to comply with the U.S. Foreign Corrupt Practices Act, other applicable anti-corruption and anti-bribery laws, and applicable anti-money-laundering laws could subject us to penalties and other adverse consequences.
We currently conduct a substantial portion of our operations and sell our products and services in numerous countries outside of the United States, including in the APAC, EMEA, and LAR regions. Our global operations are subject to the FCPA, the U.K. Bribery Act 2010, and other anti-corruption, anti-bribery, anti-money laundering, and similar laws in the United States and other countries in which we conduct activities. In addition, other applicable anti-corruption laws prohibit bribery of domestic government officials as well as commercial bribery, which involves the giving or receiving improper payments to or from
non-government
parties.While we have implemented policies, internal controls, and other measures reasonably designed to promote compliance with applicable anti-corruption, anti-bribery, and anti-money-laundering laws and regulations, our employees, agents, and strategic partners may engage in improper conduct for which we might be held responsible. Any violations of these anti-corruption, anti-bribery laws and anti-money laundering laws and regulations, or even allegations of such violations, can lead to an investigation and/or enforcement action, which could disrupt our operations, involve significant management distraction, and lead to significant costs and expenses, including legal fees. If we, or our employees, agents, or strategic partners acting on our behalf, are found to have engaged in practices that violate these laws and regulations, we could suffer severe fines and penalties, profit disgorgement, injunctions on future conduct, securities litigation, bans on transacting government business, and other consequences that may have a material adverse effect on our business, financial condition, results of operations, and cash flows.
47
Confidential Treatment Requested by McAfee Corp.
Pursuant to 17 C.F.R. Section 200.83
In addition, our brand and reputation, our sales activities, or the value of our business could be adversely affected if we become the subject of any negative publicity related to actual or potential violations of anti-corruption, anti-bribery, or anti-money-laundering laws and regulations.
If we fail to comply with environmental requirements, our business, financial condition, results of operations, cash flows, and reputation could be adversely affected.
Our operations and the sale of our solutions are subject to various federal, state, local, and foreign environmental and safety regulations, including laws adopted by the E.U., such as the Waste Electrical and Electronic Equipment Directive (“WEEE Directive”), and the Restriction of the Use of Certain Hazardous Substances in Electrical and Electronic Equipment Directive (“E.U. RoHS Directive”), of certain metals from global hot spots. The WEEE Directive requires electronic goods producers to be responsible for marking, collection, recycling, and treatment of such products. Changes in the WEEE Directive of the interpretation thereof may cause us to incur additional costs or meet additional regulatory requirements, which could be material. Similar laws and regulations have been passed or are pending in China, South Korea, Norway, and Japan and may be enacted in other regions, including in the United States, and we are, or may in the future be, subject to these laws and regulations.
The E.U. RoHS Directive and similar laws of other jurisdictions limit the content of certain hazardous materials such as lead, mercury, and cadmium in the manufacture of electrical equipment, including our products. Currently, our products comply with the E.U. RoHS Directive requirements. However, if there are changes to this or other laws, or to their interpretation, or if new similar laws are passed in other jurisdictions, we may be required to reengineer our products or to use different components to comply with these regulations. This reengineering or component substitution could result in substantial costs to us or disrupt our operations or logistics.
We are also subject to environmental laws and regulations governing the management of hazardous materials, which we use in small quantities in our engineering labs. Our failure to comply with past, present, and future environmental and safety laws could result in increased costs, reduced sales of our products, substantial product inventory write-offs, reputational damage, penalties, third-party property damage, remediation costs, and other sanctions, any of which could harm our business, financial condition, results of operations, and cash flows. To date, our expenditures for environmental compliance have not had a material impact on our results of operations or cash flows, and although we cannot predict the future impact of such laws or regulations, they will likely result in additional costs and may increase penalties associated with violations or require us to change the content of our products or how they are manufactured, which could have a material adverse effect on our business, financial condition, results of operations, and cash flows. We also expect that our business will be affected by new environmental laws and regulations on an ongoing basis, which may be more stringent, imposing greater compliance costs and increasing risks and penalties associated with violations which could harm our business.
General Business Risks
If we are unable to attract, train, motivate, and retain senior management and other qualified personnel, our business could suffer.
Our success depends in large part on our ability to attract and retain senior management personnel, as well as technically qualified and highly skilled sales, consulting, technical, finance, and marketing personnel. It could be difficult, time consuming, and expensive to identify, recruit, and onboard any key management member or other critical personnel. Competition for highly skilled personnel is often intense, particularly in the markets in which we operate including Silicon Valley. If we are unable to attract and retain qualified individuals, our ability to compete in the markets for our products could be adversely affected, which would have a negative impact on our business and financial results. Our competitors may be successful in recruiting and hiring members of our management team or other key employees, including key employees obtained through our acquisitions, and it may be difficult for us to find suitable replacements on a timely basis, on competitive terms or at all.
48
Confidential Treatment Requested by McAfee Corp.
Pursuant to 17 C.F.R. Section 200.83
Changes in management or other critical personnel may be disruptive to our business and might also result in our loss of unique skills, loss of knowledge about our business, and may result in the departure of other existing employees, subscribers or partners. We have experienced recent turnover in our senior management team, and further turnover in the future could adversely affect our business.
We operate in an industry with an overall shortage of skilled and experienced talent that generally experiences high employee attrition. We have experienced significant turnover over the last few years and expect that may continue. The loss of one or more of our key employees could seriously harm our business. If we are unable to attract, integrate, or retain the qualified and highly skilled personnel required to fulfill our current or future needs, our business, financial condition, results of operations, and cash flows could be harmed.
Effective succession planning is also important to the long-term success of our business. If we fail to ensure effective transfer of knowledge and smooth transitions involving key employees could hinder our strategic planning and execution. The loss of senior management or any ineffective transitions in management, especially in our sales organization, could significantly delay or prevent the achievement of our development and strategic objectives, which could adversely affect our business, financial condition, results of operations, and cash flows.
We may become involved in litigation, investigations, and regulatory inquiries and proceedings that could negatively affect us and our reputation.
From time to time, we are involved in various legal, administrative, and regulatory proceedings, claims, demands, and investigations relating to our business, which may include claims with respect to commercial, product liability, intellectual property, data privacy, consumer protection, breach of contract, employment, class action, whistleblower, and other matters. In the ordinary course of business, we also receive inquiries from and have discussions with government entities regarding the compliance of our contracting and sales practices with laws and regulations. Such matters can be costly and time consuming and divert the attention of our management and key personnel from our business operations. We have been and are currently, and expect to continue to be, subject to third-party intellectual property infringement claims by entities that do not have operating businesses of their own and therefore limit our ability to seek counterclaims for damages and injunctive relief. Plaintiffs may seek, and we may become subject to, preliminary or provisional rulings in the course of any such litigation, including potential preliminary injunctions requiring us to cease some or all of our operations. Similarly, if any litigation to which we are a party is resolved adversely, we may be subject to an unfavorable judgment that may not be reversed upon appeal. Any claims or litigation could cause us to incur significant expenses and, if successfully asserted against us, could require that we pay substantial damages (including, for example, treble damages if we are found to have willfully infringed patents and increased statutory damages if we are found to have willfully infringed copyrights), pay ongoing royalty payments, delay or prevent us from offering our products or services, or require that we comply with other unfavorable terms. In addition, we might be required to seek a license for the use of such intellectual property, which may not be available on commercially reasonable terms or at all. We may also decide to settle such matters on terms that are unfavorable to us.
Our business is subject to the risks of product defects, warranty claims, product returns, and product liability.
Our solutions are highly complex and may contain design defects or errors that are not detected before their commercial release, particularly when first introduced or as new versions or upgrades are released. Despite testing by us and by current and potential subscribers, design defects or errors may not be found until after commencement of commercial shipments, resulting in customer dissatisfaction and loss of or delay in market acceptance and sales opportunities. These errors and quality problems could also cause us to incur significant repair or replacement costs, divert the attention of our engineering personnel from our product development efforts, and cause significant customer relations problems. We may also incur significant costs in connection with a product recall and any related indemnification obligations. We have experienced errors or quality problems in the past in connection with solutions and enhancements and expect that errors or quality problems
49
Confidential Treatment Requested by McAfee Corp.
Pursuant to 17 C.F.R. Section 200.83
will be found from time to time in the future. Any of these errors or other quality problems could adversely affect our results of operations.
Historically, the amount of warranty claims we have received has not been significant, but there is no guarantee that claims will not be significant in the future. Any errors, defects, or other problems with our products could negatively impact our subscribers and result in financial or other losses. While we typically seek by contract to limit our exposure to damages, liability limitation provisions in our standard terms and conditions of sale, and those of our channel partners, may not be enforceable under some circumstances or may not fully or effectively protect us from customer claims and related liabilities and costs, including indemnification obligations under our agreements with channel partners or subscribers. The sale and support of our solutions also entail the risk of product liability claims. In addition, even claims that ultimately are unsuccessful could require us to incur costs in connection with litigation and divert management’s time and other resources, and could seriously harm the reputation of our business and solutions.
We may be unable to raise additional capital on acceptable terms, or at all.
We believe that our available cash and cash equivalents generated from our operating activities and unused availability under our Revolving Credit Facility, will be sufficient to meet our near term working and other capital requirements. However, if cash is required for unanticipated needs, including in connection with a proposed acquisition of a company or technology, we may need additional capital. The development and marketing of new solutions and our investment in sales and marketing efforts require a significant commitment of resources. If the markets for our solutions develop at a slower pace than anticipated, we could be required to raise additional capital. We cannot guarantee that, should it be required, sufficient debt or equity capital will be available to us under acceptable terms, if at all. If we were unable to raise additional capital when required, our business, financial condition, results of operations, and cash flows could be seriously harmed.
Our business, financial condition, results of operations, or cash flows could be significantly hindered by the occurrence of a natural disaster, terrorist attack, pandemic, or other catastrophic event.
Our business operations are susceptible to outages due to fire, floods, unusual weather conditions, power loss, telecommunications failures, terrorist attacks, pandemics, such as the
COVID-19
pandemic, and other events beyond our control, and our sales opportunities may also be affected by such events. Natural disasters including tornados, hurricanes, floods and earthquakes may damage the facilities of our subscribers or those of their suppliers or retailers or their other operations, which could lead to reduced revenue for our subscribers and thus reduced sales. In addition, a substantial portion of our facilities, including our headquarters, are located in Northern California, an area susceptible to earthquakes. We do not carry earthquake insurance for earthquake-related losses. Despite our implementation of network security measures, our servers are vulnerable to computer viruses,break-ins,
and similar disruptions from unauthorized tampering with our computer systems. We may not carry sufficient business interruption insurance to compensate us for losses that may occur as a result of any of these events.Additionally, our subscribers may face a number of potential business interruption risks that are beyond our respective control. For example, our subscribers depend on the continuous availability of our cloud-based offerings. Our cloud-based offerings are vulnerable to damage or interruption from a variety of sources, including damage or interruption caused by telecommunications or computer systems failure, fire, earthquake, power loss, cyberattack, human error, terrorist acts, and war. We use a variety of third-party data centers and do not control their operation. These facilities and networks may experience technical failures and downtime, may fail to distribute appropriate updates, or may fail to meet the increased requirements of a growing customer base, any of which could temporarily or permanently expose our subscribers’ networks, leaving their networks unprotected against the latest security threats, or, in the case of technical failures and downtime of a customer’s security operation center, all security threats. Depending upon how subscribers have configured their use of our products and services, network downtime within our data centers may also prevent certain subscribers from being able to access the Internet during the period of such network downtime.
50
Confidential Treatment Requested by McAfee Corp.
Pursuant to 17 C.F.R. Section 200.83
To the extent that such events disrupt our business or the business of our current or prospective subscribers, or adversely impact our reputation, such events could adversely affect our business, financial condition, results of operations, and cash flows.
Risks Related to Our Indebtedness
Our substantial leverage could adversely affect our financial condition.
As of June 26, 2021, our total debt outstanding under our Senior Secured Credit Facilities was approximately $3,993 million and additional unused borrowing capacity under our Revolving Credit Facility was approximately $660 million. In connection with the closing of the sale of our enterprise business, we repaid approximately $1 billion of our outstanding indebtedness.
Our high degree of leverage could have important consequences, including:
| • | making it more difficult for us to make payments on the Senior Secured Credit Facilities and our other obligations; |
| • | increasing our vulnerability to general economic and market conditions and to changes in the industries in which we compete; |
| • | requiring a substantial portion of cash flow from operations to be dedicated to the payment of principal and interest on our indebtedness, thereby reducing our ability to use our cash flow to fund our operations, future working capital, capital expenditures, investments or acquisitions, future strategic business opportunities, or other general corporate requirements; |
| • | restricting us from making acquisitions or causing us to make divestitures or similar transactions; |
| • | limiting our ability to obtain additional financing for working capital, capital expenditures, debt service requirements, investments, acquisitions, and general corporate or other purposes; |
| • | limiting our ability to adjust to changing market conditions and placing us at a competitive disadvantage compared to our competitors who are less highly leveraged; and |
| • | increasing our cost of borrowing. |
Borrowings under our Senior Secured Credit Facilities are at variable rates of interest and expose us to interest rate risk. If interest rates increase, our debt service obligations may increase even though the amount borrowed remains the same, and our net income and cash flows, including cash available for servicing our indebtedness, will correspondingly decrease.
Restrictions imposed by our outstanding indebtedness and any future indebtedness may limit our ability to operate our business and to take certain actions.
The terms of our outstanding indebtedness restrict us from engaging in specified types of transactions. These covenants restrict our ability to:
| • | incur additional indebtedness; |
| • | create or incur liens; |
| • | engage in consolidations, amalgamations, mergers, liquidations, dissolutions, or dispositions; |
| • | pay dividends and distributions on, or purchase, redeem, defease, or otherwise acquire or retire for value, our capital stock; |
| • | make acquisitions, investments, loans (including guarantees), advances, or capital contributions; |
| • | create negative pledges or restrictions on the payment of dividends or payment of other amounts owed from subsidiaries; |
51
Confidential Treatment Requested by McAfee Corp.
Pursuant to 17 C.F.R. Section 200.83
| • | sell, transfer, or otherwise dispose of assets, including capital stock of subsidiaries; |
| • | make prepayments or repurchases of debt that is contractually subordinated with respect to right of payment or security; |
| • | engage in certain transactions with affiliates; |
| • | modify certain documents governing debt that is subordinated with respect to right of payment; |
| • | change our fiscal year; and |
| • | change our material lines of business. |
In addition, our First Lien Credit Agreement includes a financial covenant which requires that, at the end of each fiscal quarter, for so long as the aggregate principal amount of borrowings under the Revolving Credit Facility exceeds 35% of the aggregate commitments under the Revolving Credit Facility, our first lien net leverage ratio cannot exceed 6.30 to 1.00. Our ability to comply with this financial covenant can be affected by events beyond our control, and we may not be able to satisfy it. See “Description of Certain Indebtedness.” As a result of these restrictions, we may be:
| • | limited in how we conduct our business; |
| • | unable to raise additional debt or equity financing to operate during general economic or business downturns; |
| • | unable to compete effectively or to take advantage of new business opportunities; and/or |
| • | limited in our ability to grow in accordance with, or otherwise pursue, our business strategy. |
Our Senior Secured Credit Facilities also contain numerous affirmative covenants that will remain in effect as long as our Senior Secured Credit Facilities remain outstanding. We are also required to make mandatory prepayments of the obligations under our Senior Secured Credit Facilities in certain circumstances, including upon certain asset sales or receipt of certain insurance proceeds or condemnation awards, upon certain issuances of debt, and, annually, with a portion of our excess cash flow.
We cannot guarantee that we will be able to maintain compliance with these covenants or, if we fail to do so, that we will be able to obtain waivers from the lenders or investors and/or amend the covenants.
A breach of any of the covenants in the credit agreements governing our Senior Secured Credit Facilities could result in an event of default, which, if not cured or waived, could trigger acceleration of our indebtedness and an increase in the interest rates applicable to such indebtedness, and may result in the acceleration of or default under any other debt we may incur in the future to which a cross-acceleration or cross-default provision applies. The acceleration of the indebtedness under our Senior Secured Credit Facilities or under any other indebtedness could have a material adverse effect on our business, results of operations, and financial condition. In the event of any default under our existing or future credit facilities, the applicable lenders could elect to terminate borrowing commitments and declare all borrowings and loans outstanding, together with accrued and unpaid interest and any fees and other obligations, to be due and payable. In addition, we have granted a security interest in a significant portion of our assets to secure our obligations under our Senior Secured Credit Facilities. During the existence of an event of default under our Senior Secured Credit Facilities, the applicable lenders could exercise their rights and remedies thereunder, including by way of initiating foreclosure proceedings against any assets constituting collateral for our obligations under the Senior Secured Credit Facilities.
Despite our level of indebtedness, we and our subsidiaries may still be able to incur substantially more debt, including
off-balance
sheet financing, contractual obligations, and general and commercial liabilities. This could further exacerbate the risks to our financial condition described above.We and our subsidiaries may be able to incur significant additional indebtedness in the future, including additional tranches of term loans and/or term loan increases, increases to our revolving commitments and/or
52
Confidential Treatment Requested by McAfee Corp.
Pursuant to 17 C.F.R. Section 200.83
additional revolving credit facilities as well as
off-balance
sheet financings, contractual obligations, and general and commercial liabilities. Although the terms of Senior Secured Credit Facilities contain restrictions on the incurrence of additional indebtedness, such restrictions are subject to a number of significant exceptions and qualifications and any additional indebtedness incurred in compliance with such restrictions could be substantial. These restrictions also will not prevent us from incurring obligations that do not constitute indebtedness. If we and our subsidiaries incur significant additional indebtedness or other obligations, the related risks that we face could increase.We may be adversely affected by the
phase-out
of, or changes in the method of determining, the London Interbank Offered Rate (“LIBOR”) or the Euro Interbank Offered Rate (“EURIBOR”), or the replacement of LIBOR and/or EURIBOR with different reference rates.LIBOR is the basic rate of interest used in lending between banks on the London interbank market and is widely used as a reference for setting the interest rate on U.S. dollar-denominated loans globally. EURIBOR is a basic rate of interest used in lending between Eurozone banks and is widely used as a reference for setting the interest rate on Euro-denominated loans globally. Our Senior Secured Credit Facilities use LIBOR and EURIBOR as reference rates such that the interest due to our creditors under those facilities is calculated using LIBOR or EURIBOR, as applicable.
On July 27, 2017, the U.K.’s Financial Conduct Authority (the authority that administers LIBOR) announced that it intends to phase out LIBOR by the end of 2021, and subsequently extended the
phase-out
period until June 2023. It is unclear whether new methods of calculating LIBOR will be established such that it continues to exist after 2023, or if alternative rates or benchmarks will be adopted. Changes in the method of calculating LIBOR, or the replacement of LIBOR with an alternative rate or benchmark, may adversely affect interest rates and result in higher borrowing costs. This could materially and adversely affect our results of operations, cash flows, and liquidity. We cannot predict the effect of the potential changes to LIBOR or the establishment and use of alternative rates or benchmarks. We may need to renegotiate our Senior Secured Credit Facilities or incur other indebtedness, and changes in the method of calculating LIBOR, or the use of an alternative rate or benchmark, may negatively impact the terms of such renegotiated Senior Secured Credit Facilities or such other indebtedness. If changes are made to the method of calculating LIBOR or LIBOR ceases to exist, we may need to amend certain contracts and cannot predict what alternative rate or benchmark would be negotiated. This may result in an increase to our interest expense.The European Money Markets Institute (the authority that administers EURIBOR) has undertaken a number of reforms in response to the EU Benchmark Regulation, which was first published in June 2016 and requires only benchmarks published by “authorized administrators” to be used in new financial contracts beginning on January 1, 2022. It is unclear whether new methods of calculating EURIBOR will be established such that it continues to exist after 2021, or if alternative rates or benchmarks will be adopted. Changes in the method of calculating EURIBOR, or the replacement of EURIBOR with an alternative rate or benchmark, may adversely affect interest rates and result in higher borrowing costs. This could materially and adversely affect our results of operations, cash flows, and liquidity. We cannot predict the effect of the potential changes to EURIBOR or the establishment and use of alternative rates or benchmarks. We may need to renegotiate our First Lien Credit Agreement or incur other indebtedness, and changes in the method of calculating EURIBOR, or the use of an alternative rate or benchmark, may negatively impact the terms of such renegotiated First Lien Credit Agreement or such other indebtedness. If changes are made to the method of calculating EURIBOR or EURIBOR ceases to exist, we may need to amend certain contracts and cannot predict what alternative rate or benchmark would be negotiated. This may result in an increase to our interest expense.
53
Confidential Treatment Requested by McAfee Corp.
Pursuant to 17 C.F.R. Section 200.83
We utilize derivative financial instruments to reduce our exposure to market risks from changes in interest rates on our variable rate indebtedness, including our Senior Secured Credit Facilities, and we will be exposed to risks related to counterparty credit worthiness or
non-performance
of these instruments.We have entered into interest rate swap instruments to limit our exposure to changes in variable interest rates. While our hedging strategy is designed to minimize the impact of increases in interest rates applicable to our variable rate debt, including our Senior Secured Credit Facilities, there can be no guarantee that our hedging strategy will be effective, and we may experience credit-related losses in some circumstances. See Note 15 to our audited consolidated financial statements included elsewhere in this document.
Risks Related to Our Organizational Structure
Our principal asset is our interest in Foundation Technology Worldwide LLC, and we are dependent upon Foundation Technology Worldwide LLC and its consolidated subsidiaries for our results of operations, cash flows, and distributions.
We are a holding company and have no material assets other than our direct and indirect ownership of the LLC Units. As such, we have no independent means of generating revenue or cash flow, and our ability to pay our taxes and operating expenses, including to satisfy our obligations under the tax receivable agreement, or declare and pay dividends in the future, if any, depend upon the results of operations and cash flows of Foundation Technology Worldwide LLC and its consolidated subsidiaries and distributions we receive from Foundation Technology Worldwide LLC. There can be no assurance that our subsidiaries will generate sufficient cash flow to distribute funds to us or that applicable state law and contractual restrictions will permit such distributions.
We anticipate that Foundation Technology Worldwide LLC will continue to be treated as a partnership (and not as a “publicly traded partnership,” within the meaning of Section 7704(b) of the Code, subject to tax as a corporation) for U.S. federal income tax purposes and, as such, generally will not be subject to any entity-level U.S. federal income tax. Instead, taxable income will be allocated to holders of Foundation Technology Worldwide LLC Units. Accordingly, we and our subsidiaries will be required to pay income taxes on our allocable share of any net taxable income of Foundation Technology Worldwide LLC. Further, Foundation Technology Worldwide LLC and its subsidiaries may, absent an election to the contrary, be subject to material liabilities pursuant to partnership audit rules enacted pursuant to the Bipartisan Budget Act of 2015 and related guidance if, for example, its calculations of taxable income are incorrect. Further, we are responsible for the unpaid tax liabilities of the corporate entities we acquired as part of the Reorganization Transactions (as defined herein), including for the taxable year (or portion thereof) of such entities ending on the date of our initial public offering (the “IPO”). To the extent that we need funds and Foundation Technology Worldwide LLC and its subsidiaries are restricted from making such distributions, under applicable law or regulation, or as a result of covenants in the credit agreements of Foundation Technology Worldwide LLC and its subsidiaries, we may not be able to obtain such funds on terms acceptable to us or at all and as a result could suffer an adverse effect on our liquidity and financial condition.
We are required to pay certain Continuing Owners and certain Management Owners for certain tax benefits we may realize or are deemed to realize in accordance with the tax receivable agreement between us and such Continuing Owners and Management Owners, and we expect that the payments we will be required to make will be substantial.
The contribution by certain Continuing Owners and certain Management Owners to McAfee Corp. of certain corporate entities in connection with the Reorganization Transactions and future exchanges of LLC Units for cash or, at our option, for shares of our Class A common stock have produced and are expected to produce or otherwise deliver to us favorable tax attributes that can reduce our taxable income. We are a party to a tax receivable agreement, under which generally we are required to pay to certain of our Continuing Owners and
54
Confidential Treatment Requested by McAfee Corp.
Pursuant to 17 C.F.R. Section 200.83
certain Management Owners (collectively, the “TRA Beneficiaries”) 85% of the applicable cash savings, if any, in U.S. federal, state, and local income tax that we actually realize or, in certain circumstances, are deemed to realize as a result of (i) all or a portion of McAfee Corp.’s allocable share of existing tax basis in the assets of Foundation Technology Worldwide LLC (and its subsidiaries) acquired in connection with the Reorganization Transactions, (ii) increases in McAfee Corp.’s allocable share of existing tax basis in the assets of Foundation Technology Worldwide LLC (and its subsidiaries) and tax basis adjustments in the assets of Foundation Technology Worldwide LLC (and its subsidiaries) as a result of sales or exchanges of LLC Units, (iii) certain tax attributes of the corporations McAfee Corp. acquired in connection with the Reorganization Transactions (including their allocable share of existing tax basis in the assets of Foundation Technology Worldwide LLC (and its subsidiaries)), and (iv) certain other tax benefits related to entering into the tax receivable agreement, including tax benefits attributable to payments under the tax receivable agreement. We generally will retain the benefit of the remaining 15% of the applicable tax savings.
The payment obligations under the tax receivable agreement are obligations of McAfee Corp., and we expect that the payments we will be required to make under the tax receivable agreement will be substantial. Assuming no material changes in the relevant tax law and that we earn sufficient taxable income to realize all tax benefits that are subject to the tax receivable agreement, we expect that the reduction in tax payments for us associated with the tax attributes described above would aggregate to approximately $3,294.8 million over 20 years from the date of this offering based on an assumed offering price of $28.34 per share of our Class A common stock (the closing price on June 25, 2021) and assuming all future sales of LLC Units in exchange for our Class A common stock would occur on the
one-year
anniversary of this offering at such price. In this scenario, we estimate that we would be required to pay the TRA Beneficiaries 85% of such amount, or $2,800.6 million, over the20-year
period from the date of this offering. The actual amounts may materially differ from these hypothetical amounts, as potential future reductions in tax payments for us and tax receivable agreement payments by us will be determined in part by reference to the market value of our Class A common stock at the time of the sale and the prevailing tax rates applicable to us over the life of the tax receivable agreement and will be dependent on us generating sufficient future taxable income to realize the benefit. See “Certain Relationships and Related Party Transactions—Recapitalization Transactions in Connection with our IPO—Tax Receivable Agreement.” Payments under the tax receivable agreement are not conditioned on the TRA Beneficiaries’ ownership of our shares.The actual increase in tax basis, as well as the amount and timing of any payments under the tax receivable agreement, will vary depending upon a number of factors, including the timing of sales by the Continuing Owners and participating Management Owners, the price of our Class A common stock at the time of the sales, whether such sales are taxable, the amount and timing of the taxable income we generate in the future, the tax rates then applicable to us, and the portions of our payments under the tax receivable agreement constituting imputed interest. Payments under the tax receivable agreement are expected to give rise to certain additional tax benefits attributable to either further increases in basis or in the form of deductions for imputed interest. Any such benefits that we are deemed to realize under the terms of the tax receivable agreement are covered by the tax receivable agreement and will increase the amounts due thereunder. The tax receivable agreement provides that interest, at a rate equal to
one-year
LIBOR (or if LIBOR ceases to be published, a replacement rate with similar characteristics) plus 1%, will accrue from the due date (without extensions) of the tax return to which the applicable tax benefits relate to the date of payment specified by the tax receivable agreement. In addition, where we fail to make payment by the date so specified, the tax receivable agreement generally provides for interest to accrue on the unpaid amount from the date so specified until the date of actual payment, at a rate equal toone-year
LIBOR (or if LIBOR ceases to be published, a replacement rate with similar characteristics) plus 5%, except under certain circumstances specified in the tax receivable agreement where we are unable to make payment by such date, in which case interest will accrue at a rate equal toone-year
LIBOR (or if LIBOR ceases to be published, a replacement rate with similar characteristics) plus 1%.Payments under the tax receivable agreement will be based in part on our tax reporting positions. We will not be reimbursed for any payments previously made under the tax receivable agreement if such basis increases
55
Confidential Treatment Requested by McAfee Corp.
Pursuant to 17 C.F.R. Section 200.83
or other attributes or benefits are subsequently disallowed by a taxing authority. As a result, in certain circumstances, the payments we are required to make under the tax receivable agreement could exceed the benefits that we actually realize in respect of the attributes in respect of which the tax receivable agreement required us to make payment.
In addition, the tax receivable agreement provides that in the case of a change of control of McAfee Corp. (as defined therein) or a material breach of our obligations (that is not timely cured) under the tax receivable agreement, or if, at any time, we elect an early termination of the tax receivable agreement, our payment obligations under the tax receivable agreement will accelerate and may significantly exceed the actual benefits we realize in respect of the tax attributes subject to the tax receivable agreement. We will be required to make a payment to the TRA Beneficiaries covered by such termination in an amount equal to the present value of future payments (calculated using a discount rate equal to the lesser of (i) 6.5% per annum and
(ii) one-year
LIBOR (or if LIBOR ceases to be published, a replacement rate with similar characteristics) plus 1%, which may differ from our, or a potential acquirer’s, then-current cost of capital) under the tax receivable agreement, which payment would be based on certain assumptions, including those relating to our future taxable income. In certain cases, a sale or other disposition of a substantial portion of assets of Foundation Technology Worldwide LLC will be treated as a change of control transaction. In these situations, our obligations under the tax receivable agreement could have a substantial negative impact on our, or a potential acquirer’s, liquidity and could have the effect of delaying, deferring, modifying, or preventing certain mergers, asset sales, other forms of business combinations, or other changes of control. These provisions of the tax receivable agreement may result in situations where the TRA Beneficiaries have interests that differ from or are in addition to those of our other stockholders. In addition, we could be required to make payments under the tax receivable agreement that are substantial, significantly in advance of any potential actual realization of such further tax benefits, and in excess of our, or a potential acquirer’s, actual cash savings in income tax.If we were to elect to terminate the tax receivable agreement immediately after this offering, based on the offering price of $28.34 per share of our Class A common stock (the closing price on June 25, 2021), we estimate that we would be required to pay approximately $2,901.0 million in the aggregate under the tax receivable agreement.
Finally, because we are a holding company with no operations of our own, our ability to make payments under the tax receivable agreement is dependent on the ability of our subsidiaries to make distributions to us. The First Lien Credit Agreement restricts the ability of our subsidiaries to make distributions to us, which could affect our ability to make payments under the tax receivable agreement. To the extent that we are unable to make payments under the tax receivable agreement as a result of restrictions in the First Lien Credit Agreement, such payments will be deferred and will accrue interest until paid, which could negatively impact our results of operations and could also affect our liquidity in periods in which such payments are made.
In certain circumstances, under its limited liability company agreement, Foundation Technology Worldwide LLC will be required to make tax distributions to us, the Continuing Owners and certain Management Owners and the distributions that Foundation Technology Worldwide LLC will be required to make may be substantial.
Funds used by Foundation Technology Worldwide LLC to satisfy its tax distribution obligations to the Continuing Owners and certain Management Owners will not be available for reinvestment in our business. Moreover, the tax distributions that Foundation Technology Worldwide LLC will be required to make may be substantial, and will likely exceed (as a percentage of Foundation Technology Worldwide LLC’s net income) the overall effective tax rate applicable to a similarly situated corporate taxpayer.
As a result of potential differences in the amount of net taxable income allocable to us and to the Continuing Owners and certain Management Owners, as well as the use of an assumed tax rate in calculating Foundation Technology Worldwide LLC’s tax distribution obligations to the Continuing Owners and the Management
56
Confidential Treatment Requested by McAfee Corp.
Pursuant to 17 C.F.R. Section 200.83
Owners, we may receive distributions significantly in excess of our tax liabilities and obligations to make payments under the tax receivable agreement. To the extent, as currently expected, we do not distribute such cash balances as dividends on shares of our Class A common stock and instead, for example, hold such cash balances or lend them to Foundation Technology Worldwide LLC, the Continuing Owners would benefit from any value attributable to such accumulated cash balances as a result of their ownership of Class A common stock following an exchange of their LLC Units for such Class A common stock. Our board of directors, in its sole discretion, will make any determination from time to time with respect to the use of any such excess cash so accumulated, which may include, among other uses, to acquire additional newly issued LLC Units from Foundation Technology Worldwide LLC at a per unit price determined by reference to the market value of the Class A common stock; to pay dividends, which may include special dividends, on its Class A common stock; to fund repurchases of its Class A common stock; to make payments under the tax receivable agreement; or any combination of the foregoing. We will have no obligation to distribute such cash (or other available cash other than any declared dividend) to our stockholders.
Our organizational structure, including the tax receivable agreement, confers certain benefits upon certain Continuing Owners and certain Management Owners, which benefits are not conferred on Class A common stockholders generally.
Our organizational structure, including the tax receivable agreement, confers certain benefits upon certain Continuing Owners and certain Management Owners, which benefits are not conferred on the holders of shares of our Class A common stock generally. In particular, we entered into the tax receivable agreement with Foundation Technology Worldwide LLC and the TRA Beneficiaries, which provides for the payment by us to the TRA Beneficiaries of 85% of the amount of tax benefits, if any, that we actually realize, or in some circumstances are deemed to realize, as a result of (i) all or a portion of McAfee Corp.’s allocable share of existing tax basis in the assets of Foundation Technology Worldwide LLC (and its subsidiaries) acquired in connection with the Reorganization Transactions, (ii) increases in McAfee Corp.’s allocable share of existing tax basis in the assets of Foundation Technology Worldwide LLC (and its subsidiaries) and tax basis adjustments in the assets of Foundation Technology Worldwide LLC (and its subsidiaries) as a result of sales or exchanges of LLC Units, (iii) certain tax attributes of the corporations McAfee Corp. acquired in connection with the Reorganization Transactions (including their allocable share of existing tax basis in the assets of Foundation Technology Worldwide LLC (and its subsidiaries)), and (iv) certain other tax benefits related to entering into the tax receivable agreement, including tax benefits attributable to payments under the tax receivable agreement. Although we will generally retain 15% of the amount of such tax benefits, this and other aspects of our organizational structure may adversely impact the future trading market for the Class A common stock.
We will not be reimbursed for any payments made to the TRA Beneficiaries under the tax receivable agreement in the event that any purported tax benefits are subsequently disallowed by the IRS.
If the IRS or a state or local taxing authority challenges the tax basis adjustments and/or deductions that give rise to payments under the tax receivable agreement and the tax basis adjustments and/or deductions are subsequently disallowed, the recipients of payments under the agreements will not reimburse us for any payments we previously made to them. Any such disallowance would be taken into account in determining future payments under the tax receivable agreement and may, therefore, reduce the amount of any such future payments. Nevertheless, if the claimed tax benefits from the tax basis adjustments and/or deductions are disallowed, our payments under the tax receivable agreement could exceed our actual tax savings, and we may not be able to recoup payments under the tax receivable agreement that were calculated on the assumption that the disallowed tax savings were available.
57
Confidential Treatment Requested by McAfee Corp.
Pursuant to 17 C.F.R. Section 200.83
Unanticipated changes in effective tax rates or adverse outcomes resulting from examination of our income or other tax returns could adversely affect our financial condition and results of operations.
We will be subject to income taxes in the United States, and our domestic and foreign tax liabilities will be subject to the allocation of expenses in differing jurisdictions. Our future effective tax rates could be subject to volatility or adversely affected by a number of factors, including:
| • | changes in the valuation of our deferred tax assets and liabilities; |
| • | expected timing and amount of the release of any tax valuation allowances; |
| • | tax effects of equity-based compensation; |
| • | costs related to intercompany restructurings; |
| • | changes in tax laws, regulations, or interpretations thereof; or |
| • | lower than anticipated future earnings in jurisdictions where we have lower statutory tax rates and higher than anticipated future earnings in jurisdictions where we have higher statutory tax rates. |
In addition, we may be subject to audits of our income, sales and other transaction taxes by U.S. federal, state, and local and foreign authorities. Outcomes from these audits could have an adverse effect on our financial condition and results of operations.
Risks Related to Our Class A Common Stock and this Offering
Our Sponsors and Intel will continue to have significant influence over us, including control over decisions that require the approval of stockholders, which could limit your ability to influence the outcome of matters submitted to stockholders for a vote.
We are currently controlled, and after this offering is completed will continue to be controlled, by our Sponsors and Intel. Upon completion of this offering, investment funds affiliated with our Sponsors will beneficially own 36.8% of the voting power of our outstanding Class A common stock and Class B common stock, on a combined basis (or 36.5% if the underwriters exercise in full their option to purchase additional shares), and Intel will beneficially own 40.9% of the voting power of our outstanding Class A common stock and Class B common stock, on a combined basis (or 40.5% if the underwriters exercise in full their option to purchase additional shares). As long as our Sponsors and Intel collectively own or control at least a majority of our outstanding voting power, they will have the ability to exercise substantial control and significant influence over our management and affairs and all corporate actions requiring stockholder approval, irrespective of how our other stockholders may vote, including the election and removal of directors and the size of our board of directors, any amendment of our certificate of incorporation or bylaws, or the approval of any merger or other significant corporate transaction, including a sale of substantially all of our assets. The concentration of voting power limits your ability to influence corporate matters and, as a result, we may take actions that you do not view as beneficial. As a result, the market price of our Class A common stock could be adversely affected. Even if their collective ownership falls below 50%, our Sponsors and Intel will continue to be able to strongly influence or effectively control our decisions.
Additionally, the interests of our Sponsors and Intel may not align with the interests of our other stockholders. Our Sponsors and Intel may, in the ordinary course of their respective businesses, acquire and hold interests in businesses that compete directly or indirectly with us. Our Sponsors and Intel each may also pursue acquisition opportunities that may be complementary to our business, and, as a result, those acquisition opportunities may not be available to us.
Certain of our directors have relationships with our Sponsors and Intel, which may cause conflicts of interest with respect to our business.
Three of our seven directors are affiliated with our Sponsors and Intel. Our directors who are affiliated with our Sponsors or Intel have fiduciary duties to us and, in addition, have duties to our Sponsors and Intel. As a
58
Confidential Treatment Requested by McAfee Corp.
Pursuant to 17 C.F.R. Section 200.83
result, these directors may face real or apparent conflicts of interest with respect to matters affecting both us and our Sponsors, whose interests may be adverse to ours in some circumstances.
We previously identified a material weakness in our internal control over financial reporting in recent periods, which we concluded as of the end of the first quarter of fiscal 2020 had been fully remediated, and if we fail to maintain proper and effective internal control over financial reporting in accordance with Section 404 of the Sarbanes-Oxley Act in the future, our ability to produce accurate and timely consolidated financial statements could be impaired, which could harm our results of operations, our ability to operate our business, and investor confidence.
In connection with the audit of our consolidated financial statements for fiscal 2018 and fiscal 2019, we and our independent registered public accounting firm identified a number of errors in our revenue recognition process that were immaterial to our consolidated financial statements, which led us to conclude we had a material weakness in our internal control over financial reporting. A material weakness is a deficiency, or a combination of deficiencies, in internal control over financial reporting, such that there is a reasonable possibility that a material misstatement of our consolidated financial statements will not be prevented or detected on a timely basis. We did not maintain effective controls specifically over the accuracy of our revenue accounting and reporting, due to the lack of effective review necessary to ensure accurate reporting of revenue and deferred revenue. Additionally, this material weakness could have resulted in a misstatement of the aforementioned account balances or disclosures for the periods during which the material weakness was ongoing that would have resulted in a material misstatement to the annual or interim consolidated financial statements for such periods that would not have been prevented or detected.
We have taken numerous steps designed to address the underlying causes of the material weakness, primarily through the hiring of additional accounting and finance personnel with responsibility for revenue accounting and reporting with relevant accounting and financial reporting experience, reorganizing reporting and supervisory roles among our finance and accounting personnel, enhancing our training programs within our accounting and finance department, and enhancing our internal review procedures. As of the end of the first quarter of fiscal 2020, we concluded that the aforementioned material weakness had been fully remediated. However, our current efforts to maintain an effective control environment may not be sufficient to prevent future material weaknesses or significant deficiencies from occurring or to promptly remediate any such future material weaknesses or significant deficiencies.
As a public company, we are required to comply with the SEC’s rules implementing Sections 302 and 404 of the Sarbanes-Oxley Act of 2002 (“Sarbanes-Oxley Act”), which requires management to certify financial and other information in our quarterly and annual reports and provide an annual management report on the effectiveness of our controls over financial reporting. Although we are required to disclose material changes made in our internal controls and procedures on at least a quarterly basis, we are not required to make our first annual assessment of our internal controls over financial reporting pursuant to Section 404 of the Sarbanes-Oxley Act (including an auditor attestation on management’s internal controls report) until our annual report on Form
10-K
for the fiscal year ending December 25, 2021.To comply with the internal controls requirements of being a public company, we may need to undertake various actions as our business or applicable rules and regulations evolve, such as implementing new internal controls and procedures and hiring additional accounting or internal audit staff that have the requisite knowledge of U.S. GAAP. Testing and maintaining internal controls can be costly, challenging, and potentially divert our management’s attention from other matters that are important to the operation of our business.
If we identify future material weaknesses in our internal control over financial reporting, or if we are unable to comply with the demands that will be placed upon us as a public company, including the requirements of Section 404 of the Sarbanes-Oxley Act, in a timely manner, we may be unable to accurately report our consolidated financial results, or report them within the timeframes required by the SEC. We also could become
59
Confidential Treatment Requested by McAfee Corp.
Pursuant to 17 C.F.R. Section 200.83
subject to sanctions or investigations by the SEC or other regulatory authorities. In addition, if we are unable to assert that our internal control over financial reporting is effective, or if our independent registered public accounting firm is unable to express an opinion as to the effectiveness of our internal control over financial reporting, when required, investors may lose confidence in the accuracy and completeness of our financial reports, we may face restricted access to the capital markets, and our stock price may be adversely affected.
Moreover, no matter how well designed, internal control over financial reporting has inherent limitations. Therefore, internal control over financial reporting determined to be effective can provide only reasonable assurance with respect to financial statement preparation and may not prevent or detect all misstatements. Due to the inherent limitations in all control systems, no evaluation of controls can provide absolute assurance that all control issues and instances of fraud, if any, have been detected. These inherent limitations include the realities that judgments in decision-making can be incorrect, and that breakdowns can occur because of error or mistake. Further, controls can be circumvented by the individual acts of some persons, by collusion of two or more people or by management override of the internal controls. Additionally, projections of any evaluation of effectiveness to future periods are subject to the risk that controls may become inadequate due to changes in conditions, or that the degree of compliance with the policies or procedures may deteriorate. As such, we could lose investor confidence in the accuracy and completeness of our financial reports, which may have a material adverse effect on our reputation and stock price.
We are a “controlled company” under the Exchange’s rules and, as a result, qualify for certain exemptions from certain corporate governance requirements; you will therefore not have the same protections afforded to stockholders of companies that are subject to these governance requirements.
Because our Sponsors and Intel collectively control a majority of the voting power of our outstanding Class A common stock and Class B common stock on a combined basis, we are a “controlled company” within the meaning of the Exchange’s corporate governance standards. Under these rules, a company of which more than 50% of the voting power for the election of directors is held by an individual, group, or another company is a “controlled company” and may elect not to comply with certain corporate governance requirements, including the requirements that, within one year of the date of the listing of our Class A common stock, we have:
| • | a board of directors that is composed of a majority of “independent directors,” as defined under rules; |
| • | a compensation committee that is composed entirely of independent directors; and |
| • | a nominating and corporate governance committee that is composed entirely of independent directors. |
Our board of directors is composed of a majority of independent directors. However, we may utilize some or all of the other exemptions applicable to “controlled companies.” Accordingly, for so long as we are a “controlled company,” you will not have the same protections afforded to stockholders of companies that are subject to all of the Exchange’s corporate governance requirements. Our status as a controlled company could make our Class A common stock less attractive to some investors or otherwise harm our stock price.
Your percentage ownership in us may be diluted by future issuances of capital stock, which could reduce your influence over matters on which stockholders vote.
Pursuant to our amended and restated certificate of incorporation and amended and restated bylaws, our board of directors has the authority, without action or vote of our stockholders, to issue all or any part of our authorized but unissued shares of Class A common stock, including shares issuable upon the exercise of options, or shares of our authorized but unissued preferred stock. Issuances of Class A common stock or voting preferred stock would reduce your influence over matters on which our stockholders vote and, in the case of issuances of preferred stock, would likely result in your interest in us being subject to the prior rights of holders of that preferred stock.
60
Confidential Treatment Requested by McAfee Corp.
Pursuant to 17 C.F.R. Section 200.83
Our results of operations and the market price of our Class A Common Stock may be volatile.
Our quarterly results of operations are likely to fluctuate in the future. In addition, securities markets worldwide have experienced, and are likely to continue to experience, significant price and volume fluctuations. This market volatility, as well as general economic, market, or political conditions, could subject the market price of our shares to wide price fluctuations regardless of our operating performance. Our results of operations and the trading price of our shares may fluctuate in response to various factors, including:
| • | actual or anticipated changes or fluctuations in our results of operations and whether our results of operations meet the expectations of securities analysts or investors; |
| • | actual or anticipated changes in securities analysts’ estimates and expectations of our financial performance; |
| • | announcements of new solutions, commercial relationships, acquisitions, or other events by us or our competitors; |
| • | general market conditions, including volatility in the market price and trading volume of technology companies in general and of companies in the IT security industry in particular; |
| • | changes in how current and potential customers perceive the effectiveness of our platform in protecting against advanced cyberattacks or other reputational harm; |
| • | network outages or disruptions of our solutions or their availability, or actual or perceived privacy, data protection, or network information breaches; |
| • | investors’ perceptions of our prospects and the prospects of the businesses in which we participate; |
| • | sales of large blocks of our Class A common stock, including sales by our executive officers, directors, and significant stockholders; |
| • | announced departures of any of our key personnel; |
| • | lawsuits threatened or filed against us or involving our industry, or both; |
| • | changing legal or regulatory developments in the United States and other countries; |
| • | any default or anticipated default under agreements governing our indebtedness; |
| • | adverse publicity about us, our products and solutions, or our industry; |
| • | effects of public health crises, such as the COVID-19 pandemic; |
| • | general economic conditions and trends; and |
| • | other events or factors, including those resulting from major catastrophic events, war, acts of terrorism, or responses to these events. |
These and other factors, many of which are beyond our control, may cause our results of operations and the market price and demand for our shares to fluctuate substantially. While we believe that results of operations for any particular quarter are not necessarily a meaningful indication of future results, fluctuations in our quarterly results of operations could limit or prevent investors from readily selling their shares and may otherwise negatively affect the market price and liquidity of our shares. In addition, in the past, when the market price of a stock has been volatile, holders of that stock have sometimes instituted securities class action litigation against the company that issued the stock. If any of our stockholders brought a lawsuit against us, we could incur substantial costs defending the lawsuit. Such a lawsuit could also divert the time and attention of our management from our business, which could significantly harm our profitability and reputation.
61
Confidential Treatment Requested by McAfee Corp.
Pursuant to 17 C.F.R. Section 200.83
The Continuing Owners have the right to have their LLC Units exchanged for cash or (at our option) shares of Class A common stock and any disclosure of such exchange or the subsequent sale (or any disclosure of an intent to enter into such an exchange or subsequent sale) of such shares of Class A common stock may cause volatility in our stock price.
As of June 26, 2021, 271,230,699 shares of Class A common stock are issuable upon exchange of LLC Units and MIUs that are held by the Continuing Owners. Under the amended and restated limited liability company agreement of Foundation Technology Worldwide LLC (the “LLC Agreement”), subject to certain restrictions set forth therein, the Continuing Owners are entitled to have their LLC Units exchanged for cash or (at our option) shares of our Class A common stock. The holders of MIUs also have the right, from time to time and subject to certain restrictions, to exchange their MIUs for LLC Units, which will then be immediately redeemed for cash or shares of Class A Common Stock, at the option of the Company, based on the value of such MIUs relative to their applicable distribution threshold.
We cannot predict the timing, size, or disclosure of any future issuances of our Class A common stock resulting from the exchange of LLC Units or the effect, if any, that future issuances, disclosure, if any, or sales of shares of our Class A common stock may have on the market price of our Class A common stock. Sales or distributions of substantial amounts of our Class A common stock, or the perception that such sales or distributions could occur, may cause the market price of our Class A common stock to decline.
A significant portion of our total outstanding shares are restricted from immediate resale but may be sold into the market in the near future. This could cause the market price of our Class A common stock to drop significantly, even if our business is doing well.
Sales of a substantial number of shares of our Class A common stock in the public market could occur at any time. These sales, or the perception in the market that the holders of a large number of shares intend to sell shares, could reduce the market price of our Class A common stock. In connection with this offering, our officers, directors, the selling stockholders, and holders of 88% of our outstanding capital stock and securities convertible into our capital stock will enter into
75-day
lock-up
agreements with the underwriters. These shares will, however, be able to be resold after the expiration of thelock-up
agreement as described in the “Shares eligible for future sale” section of this prospectus. We have also filed a FormS-8
under the Securities Act to register all shares of Class A common stock that we may issue under our equity compensation plans. In addition, our Sponsors and Intel have certain demand registration rights that could require us in the future to file registration statements in connection with sales of our stock they currently hold. See “Certain Relationships and Related Party Transactions—Recapitalization Transactions in Connection with our IPO—Registration Rights Agreement.” Such sales could be significant. Once we register these shares, they can be freely sold in the public market upon issuance, subject to thelock-up
agreements described in the “Underwriting” section of this prospectus. As restrictions on resale end, the market price of our stock could decline if the holders of currently restricted shares sell them or are perceived by the market as intending to sell them.If securities or industry analysts do not publish research or reports about our business, if they adversely change their recommendations regarding our shares or if our results of operations do not meet their expectations, our share price and trading volume could decline.
The trading market for our shares is influenced by the research and reports that industry or securities analysts publish about us or our business. We do not have any control over these analysts. In the event one or more securities analysts cease coverage of our Company or fail to publish reports on us regularly, we could lose visibility in the financial markets, which in turn could cause our share price or trading volume to decline. Moreover, if one or more of the analysts who cover us downgrade our stock, or if our results of operations do not meet their expectations, our share price could decline.
62
Confidential Treatment Requested by McAfee Corp.
Pursuant to 17 C.F.R. Section 200.83
We cannot guarantee the timing, amount, or payment of dividends on our Class A common stock.
We intend to fund any future dividends from distributions made by Foundation Technology Worldwide LLC from its available cash generated from operations. If McAfee Corp. decides to pay any other dividend on shares of our Class A common stock in the future, it would likely need to cause Foundation Technology Worldwide LLC to make distributions to McAfee Corp. and its wholly-owned subsidiaries in an amount sufficient to cover such dividend. If Foundation Technology Worldwide LLC makes such distributions to McAfee Corp. and its wholly-owned subsidiaries, the other holders of LLC Units will be entitled to receive pro rata distributions, as well as, in certain cases, the holders of MIUs. The timing, declaration, amount of, and payment of any such dividends will be made at the discretion of McAfee Corp.’s board of directors, subject to applicable laws, and will depend upon many factors, including the amount of the distribution received by McAfee Corp. from Foundation Technology Worldwide LLC, our financial condition, results of operations, capital requirements, contractual restrictions, general business conditions, and other factors that McAfee Corp.’s board of directors may deem relevant. Currently, the provisions of our Senior Secured Credit Facilities place certain limitations on the amount of cash dividends we can pay. Moreover, if as expected McAfee Corp. determines to initially pay a dividend following any quarterly distributions from Foundation Technology Worldwide LLC, there can be no assurance that McAfee Corp. will continue to pay dividends in the same amounts or at all thereafter. As a result, we cannot guarantee the timing, amount or payment of dividends on our Class A common stock.
A credit ratings downgrade or other negative action by a credit rating organization could adversely affect the trading price of the shares of our Class A common stock.
Credit rating agencies continually revise their ratings for companies they follow. The condition of the financial and credit markets and prevailing interest rates have fluctuated in the past and are likely to fluctuate in the future. In addition, developments in our business and operations could lead to a ratings downgrade for us or our subsidiaries. Any such fluctuation in the rating of us or our subsidiaries may impact our ability to access debt markets in the future or increase our cost of future debt which could have a material adverse effect on our operations, and financial condition, which in return may adversely affect the trading price of shares of our Class A common stock.
Provisions of our corporate governance documents could make an acquisition of our Company more difficult and may prevent attempts by our stockholders to replace or remove our current management, even if beneficial to our stockholders.
In addition to our Sponsors’ and Intel’s beneficial ownership of a controlling percentage of our common stock, our certificate of incorporation and bylaws, and the Delaware General Corporation Law (the “DGCL”) contain provisions that could make it more difficult for a third party to acquire us, even if doing so might be beneficial to our stockholders. These provisions include a classified board of directors and the ability of our board of directors to issue preferred stock without stockholder approval that could be used to dilute a potential acquiror. In addition, these provisions may frustrate or prevent any attempts by our stockholders to replace or remove our current management by making it more difficult for stockholders to replace members of our board of directors. Because our board of directors is responsible for appointing the members of our management team, these provisions could in turn affect any attempt to replace current members of our management team. As a result, you may lose your ability to sell your stock for a price in excess of the prevailing market price due to these protective measures, and efforts by stockholders to change the direction or management of the Company may be unsuccessful.
63
Confidential Treatment Requested by McAfee Corp.
Pursuant to 17 C.F.R. Section 200.83
Our certificate of incorporation designates courts in the State of Delaware as the sole and exclusive forum for certain types of actions and proceedings that may be initiated by our stockholders, and also provides that the federal district courts will be the exclusive forum for resolving any complaint asserting a cause of action arising under the Securities Act, each of which could limit our stockholders’ ability to choose the judicial forum for disputes with us or our directors, officers, stockholders, or employees.
Our certificate of incorporation provides that, subject to limited exceptions, the Court of Chancery of the State of Delaware will be the sole and exclusive forum for:
| • | any derivative action or proceeding brought on our behalf; |
| • | any action asserting a claim of breach of a fiduciary duty owed by any of our directors, officers or other employees to us or our stockholders; |
| • | any action asserting a claim against us arising pursuant to any provision of the General Corporation Law of the State of Delaware, our certificate of incorporation or our bylaws; |
| • | any action to interpret, apply, enforce or determine the validity of our certificate of incorporation or bylaws; and |
| • | any other action asserting a claim against us that is governed by the internal affairs doctrine (each, a “Covered Proceeding”). |
Our certificate of incorporation also provides that the federal district courts of the United States of America will be the exclusive forum for the resolution of any complaint asserting a cause of action against us or any of our directors, officers, employees or agents and arising under the Securities Act. However, Section 22 of the Securities Act provides that federal and state courts have concurrent jurisdiction over lawsuits brought the Securities Act or the rules and regulations thereunder. To the extent the exclusive forum provision restricts the courts in which claims arising under the Securities Act may be brought, there is uncertainty as to whether a court would enforce such a provision. We note that investors cannot waive compliance with the federal securities laws and the rules and regulations thereunder. This provision does not apply to claims brought under the Exchange Act.
Any person or entity purchasing or otherwise acquiring any interest in shares of our capital stock shall be deemed to have notice of and to have consented to these provisions. These provisions may limit a stockholder’s ability to bring a claim in a judicial forum that it finds favorable for disputes with us or our directors, officers or other employees, which may discourage such lawsuits against us and our directors, officers and employees. Alternatively, if a court were to find these provisions of our certificate of incorporation inapplicable to, or unenforceable in respect of, one or more of the specified types of actions or proceedings, we may incur additional costs associated with resolving such matters in other jurisdictions, which could adversely affect our business and financial condition.
Our certificate of incorporation contains a provision renouncing our interest and expectancy in certain corporate opportunities, which could adversely impact our business.
Each of TPG, Intel Americas, Inc. and its affiliates, and Thoma Bravo, and the members of our board of directors who are affiliated with them, by the terms of our certificate of incorporation, will not be required to offer us any corporate opportunity of which they become aware and can take any such corporate opportunity for themselves or offer it to other companies in which they have an investment. We, by the terms of our certificate of incorporation, have expressly renounced any interest or expectancy in any such corporate opportunity to the extent permitted under applicable law, even if the opportunity is one that we or our subsidiaries might reasonably have pursued or had the ability or desire to pursue if granted the opportunity to do so. Our certificate of incorporation is not able to be amended to eliminate our renunciation of any such corporate opportunity arising prior to the date of any such amendment.
64
Confidential Treatment Requested by McAfee Corp.
Pursuant to 17 C.F.R. Section 200.83
TPG and Thoma Bravo are in the business of making investments in companies and any of TPG, Intel and Thoma Bravo may from time to time acquire and hold interests in businesses that compete directly or indirectly with us. These potential conflicts of interest could have a material adverse effect on our business, financial condition, results of operations or prospects if TPG, Intel Americas, Inc. and its affiliates, or Thoma Bravo allocate attractive corporate opportunities to themselves or their affiliates instead of to us.
65
Confidential Treatment Requested by McAfee Corp.
Pursuant to 17 C.F.R. Section 200.83
CAUTIONARY NOTE REGARDING FORWARD-LOOKING STATEMENTS
This prospectus contains forward-looking statements. Forward-looking statements are neither historical facts nor assurances of future performance. Instead, they are based on our current beliefs, expectations, and assumptions regarding the future of our business, future plans and strategies, and other future conditions. Forward-looking statements can be identified by words such as “anticipate,” “believe,” “estimate,” “expect,” “intend,” “may,” “plan,” “predict,” “project,” “target,” “potential,” “will,” “would,” “could,” “should,” “continue,” “contemplate,” and other similar expressions, although not all forward-looking statements contain these identifying words.
We may not actually achieve the plans, intentions, or expectations disclosed in our forward-looking statements, and you should not rely on our forward-looking statements in making your investment decision. Actual results or events could differ materially from the plans, intentions, and expectations disclosed in the forward-looking statements we make. Important factors that could cause actual results and events to differ materially from those indicated in the forward-looking statements include, among others, the following:
| • | the efficiency and success of our transition to a pure-play Consumer cybersecurity company following the sale of our Enterprise Business; |
| • | plans to develop and offer new products and services and enter new markets; |
| • | our expectations with respect to the continued stability and growth of our customer base; |
| • | anticipated trends, growth rates, and challenges in our business and in domestic and international markets; |
| • | our financial performance, including changes in and expectations with respect to revenues, and our ability to maintain profitability in the future; |
| • | investments or potential investments in new or enhanced technologies; |
| • | market acceptance of our solutions; |
| • | the success of our business strategy, including the growth in the market for cloud-based security solutions, acceptance of our own cloud-based solutions, and changes in our business model and operations; |
| • | our ability to cross-sell and up-sell to our existing subscribers; |
| • | our ability to maintain and expand our relationships with partners and on commercially acceptable terms, including our channel and strategic partners; |
| • | the effectiveness of our sales force, distribution channel, and marketing activities; |
| • | the growth and development of our direct and indirect channels of distribution; |
| • | our response to emerging and future cybersecurity risks; |
| • | our ability to continue to innovate and enhance our solutions; |
| • | our ability to develop new solutions and bring them to market in a timely manner; |
| • | our ability to prevent serious errors, defects, or vulnerabilities in our solutions; |
| • | our ability to develop solutions that interoperate with our subscribers’ existing systems and devices; |
| • | our ability to maintain, protect, and enhance our brand and intellectual property; |
| • | our continued use of open source software; |
| • | our ability to compete against established and emerging cybersecurity companies; |
66
Confidential Treatment Requested by McAfee Corp.
Pursuant to 17 C.F.R. Section 200.83
| • | risks associated with fluctuations in exchange rates of the foreign currencies in which we conduct business; |
| • | past and future acquisitions, investments, and other strategic investments; |
| • | our ability to remain in compliance with laws and regulations that currently apply or become applicable to our business both domestically and internationally; |
| • | the attraction, transition, and retention of management and other qualified personnel; |
| • | economic and industry trend analysis; |
| • | litigation, investigations, regulatory inquiries, and proceedings; |
| • | the increased expenses associated with being a public company; |
| • | our estimated total addressable market; |
| • | the future trading prices of our Class A common stock; |
| • | the impact of macroeconomic conditions on our business, including the impact of the COVID-19 on economic activity and financial markets; |
| • | our expectation regarding the impact of the COVID-19 pandemic, including its geographic spread and severity, and the related responses by governments and private industry on our business and financial condition, as well as the businesses and financial condition of our subscribers and partners; |
| • | the adequacy of our capital resources to fund operations and growth; |
| • | our Sponsors’ and Intel’s significant influence over us and our status as a “controlled company” under the rules of the Exchange; |
| • | risks relating to our corporate structure, tax rates, and tax receivable agreement; and |
| • | the other factors identified under the heading “Risk Factors” appearing elsewhere in this prospectus. |
The forward-looking statements in this prospectus represent our views as of the date of this prospectus. We undertake no obligation to update any forward-looking statements whether as a result of new information, future developments or otherwise.
67
Confidential Treatment Requested by McAfee Corp.
Pursuant to 17 C.F.R. Section 200.83
INDUSTRY AND MARKET DATA
This prospectus includes market data with respect to the computer software industry. In some cases we rely on and refer to market data and certain industry forecasts that were obtained from third-party surveys, market research, consultant surveys, publicly available information and industry publications and surveys, and in some cases, the information has been developed by us for purposes of this offering based on our existing data or data available from known sources or other proprietary research and analysis and is believed by us to have been prepared in a reasonable manner.
These sources of certain statistical data, estimates, and forecasts contained in this prospectus are the following independent industry publications or reports:
| • | eMarketer, Global Commerce 2020, Ecommerce Decelerates amid Global Retail Contraction but Remains a Bright Spot, June 2020; |
| • | eMarketer, US Mobile Time Spent 2020, Lockdowns augment Gains in Time Spent with Mobile Devices, June 2020; |
| • | eMarketer, US Time Spent with Media 2020, Gains in Consumer Usage During the Year of COVID-19 and Beyond, April 2020; |
| • | Frost & Sullivan, Total Addressable Market (TAM) for the Global Consumer Cyber Security and Privacy Market, August 31, 2020; |
| • | ForgeRock, 2021 ForgeRock Consumer Identity Breach Report, The Year of the Great Digital Migration: How Usernames and Passwords Found Their Way Into the Crosshairs of Attackers, June 7, 2021; |
| • | Identity Theft Resource Center, Identity Theft Resource Center Reports 33 Percent Decrease in Data Breaches in the First Half of 2020, July 14, 2019 (https://www.idtheftcenter.org/identity-theft-resource-center-reports-33-percent-decrease-in-data-breaches-in-the-first-half-of-2020/); |
| • | IDC, New Media Market Model 1Q20 Deliverable, 12 June 2020; |
| • | IDC, Public Cloud Services Spending Guide Forecast Pivot, June 2020; |
| • | IDC, The State of U.S. Enterprise Mobile Workers: Information, Frontline, and Work from Home Trends in 2020, 28 July 2020; |
| • | IDC, Total Addressable Market (TAM) Calculator, 2020; |
| • | IDC, Worldwide Mobile Phone Forecast Update, 2020-2024, June 2020; |
| • | McAfee ATR Threats Report, April 2021; |
| • | RiskBased Security, 2020 Year End Data Breach QuickView Report, 2021; and |
| • | Statista, Global Consumer Survey - Average for 5 Countries (US, Japan, Germany, Australia, United Kingdom), 2018 & 2019. |
TRADEMARKS, TRADE NAMES, AND SERVICE MARKS
We own or have rights to trademarks, trade names, and service marks that we use in connection with the operation of our business, including “McAfee,” the McAfee logo, “TunnelBear,” and various other marks. Solely for convenience, the trademarks, trade names and service marks referred to in this prospectus are listed without the
®
, SM, and TM symbols, but we will assert our rights to our trademarks, trade names, and service marks to the fullest extent under applicable law.68
Confidential Treatment Requested by McAfee Corp.
Pursuant to 17 C.F.R. Section 200.83
USE OF PROCEEDS
The selling stockholders will receive all of the net proceeds from this offering. We will not receive any of the proceeds from the sale of shares of Class A common stock offered by the selling stockholders. We will, however, bear the costs associated with the sale of shares by the selling stockholders, other than underwriting discounts and commissions. For more information, see “Certain Relationships and Related Party Transactions—Registration Rights Agreement,” “Principal and Selling Stockholders” and “Underwriters (Conflicts of Interest).”
69
Confidential Treatment Requested by McAfee Corp.
Pursuant to 17 C.F.R. Section 200.83
DIVIDEND POLICY
Foundation Technology Worldwide LLC expects to pay a cash distribution to its members on a quarterly basis at an aggregate annual rate of approximately $200 million. McAfee Corp. is expected to receive a portion of any such distribution through the LLC Units it holds directly or indirectly through its wholly-owned subsidiaries on the record date for any such distribution declared by Foundation Technology Worldwide LLC, which is expected to equal the number of shares of Class A common stock outstanding on such date. McAfee Corp. expects to use the proceeds it receives from such quarterly distribution to declare a cash dividend on its shares of Class A common stock. We intend to fund any future dividends from distributions made by Foundation Technology Worldwide LLC from its available cash generated from operations.
In addition, in connection with the consummation of the sale of our Enterprise Business to STG, we declared a
one-time
special dividend of $4.50 to holders of record of our Class A common stock as of August 13, 2021, paid on August 27, 2021. Purchasers of shares in this offering will not be entitled to receive such special dividend.The timing, declaration, amount of, and payment of any such dividends will be made at the discretion of McAfee Corp.’s board of directors, subject to applicable laws, and will depend upon many factors, including the amount of the distribution received by McAfee Corp. from Foundation Technology Worldwide LLC, our financial condition, results of operations, capital requirements, contractual restrictions, general business conditions, and other factors that McAfee Corp.’s board of directors may deem relevant. Moreover, if, as expected, McAfee Corp. determines to initially pay a dividend following any quarterly distributions from Foundation Technology Worldwide LLC, there can be no assurance that McAfee Corp. will continue to pay dividends in the same amounts or at all thereafter.
70
Confidential Treatment Requested by McAfee Corp.
Pursuant to 17 C.F.R. Section 200.83
CAPITALIZATION
The following table sets forth our cash and cash equivalents and capitalization as of June 26, 2021 on an actual basis, as well as on a pro forma basis to reflect :
| • | the consummation of the sale of our Enterprise Business to STG on July 27, 2021; and |
| • | the application of the proceeds from the sale of our Enterprise Business to STG, including (i) the declaration and payment of a one time special dividend of $4.50 per share to holders of record of Class A common stock as of August 13, 2021 and a one-time special cash distribution to FTW members and (ii) the repayment of $332 million of our First Lien USD Term Loan and €563 million of our First Lien EUR Term Loan in August 2021. |
The pro forma information set forth in the table below is illustrative only. You should read this information together with our audited and unaudited consolidated and combined financial statements and related notes appearing elsewhere in this prospectus and the information set forth under “Management’s Discussion and Analysis of Financial Condition and Results of Operations.”
As of June 26, 2021 | ||||||||||||
(in millions) | Actual | Pro Forma Adjustments | Pro Forma | |||||||||
Cash and cash equivalents | $ | 420 | $ | 63 | (6) | $ | 483 | |||||
Long-term debt: | ||||||||||||
First Lien USD Term Loan | 2,717 | (1) | (332 | ) (3) | 2,385 | |||||||
First Lien EUR Term Loan | 1,276 | (2) | (673 | ) (3) | 603 | |||||||
Second Lien USD Term Loan | — | — | — | |||||||||
Revolving Credit Facility | — | — | — | |||||||||
Redeemable noncontrolling interests | 7,687 | (1,710 | ) (4) | 5,977 | ||||||||
Equity (deficit): | ||||||||||||
Class A common stock, $0.001 par value - 1,500,000,000 shares authorized, 166,004,840 shares issued and outstanding as of June 26, 2021 | — | — | — | |||||||||
Class B common stock, $0.001 par value - 300,000,000 shares authorized, 265,376,691 shares issued and outstanding as of June 26, 2021 | — | — | — | |||||||||
Additional paid-in capital | (9,306 | ) | (747 | ) (4) | (10,053 | ) | ||||||
Accumulated other comprehensive income (loss) | (33 | ) | — | (33 | ) | |||||||
Accumulated deficit | (52 | ) | (475 | ) (5) | (527 | ) | ||||||
Total deficit | (9,391 | ) | (1,222 | ) | (10,613 | ) | ||||||
Total capitalization | $ | 2,289 | $ | (3,937 | ) | $ | (1,648 | ) | ||||
| (1) | First Lien USD Term Loan of $2,717 million excludes discount and issuance costs of $33 million. |
| (2) | First Lien EUR Term Loan of $1,276 million excludes discount and issuance costs of $11 million. |
| (3) | Represents prepayment of $332 million of First Lien USD Term Loan and €563 million of First Lien EUR Term Loan ($673 million using our June 26, 2021 exchange rate of 1.1951), representing a total of $1,005 million on our condensed consolidated balance sheet as of June 26, 2021, excluding related discount and issuance costs. |
| (4) | Represents approximate paid distributions to LLC Unit holders ($1,710 million) along with dividend of $4.50 per share of Class A common stock based on Class A shares outstanding at June 26, 2021. |
| (5) | Includes estimated $300 million in required corporate taxes and related payments and $175 million in customary transaction and one-time charges. This amount excludes gain on sale of Enterprise Business expected to be in excess of $2 billion, net of taxes. |
| (6) | Includes the proceeds of $4.0 billion from sale of the Enterprise Business less the amounts described in footnotes (3), (4), and (5) above. |
71
Confidential Treatment Requested by McAfee Corp.
Pursuant to 17 C.F.R. Section 200.83
MANAGEMENT’S DISCUSSION AND ANALYSIS OF FINANCIAL CONDITION AND RESULTS OF OPERATIONS
You should read the following discussion and analysis of our financial condition and consolidated results of operations in conjunction with our condensed consolidated financial statements and the related notes appearing elsewhere in this prospectus. In addition to historical information, this discussion and analysis contains forward-looking statements that involve risks, uncertainties, and assumptions. See “Cautionary Note Regarding Forward Looking Statements.” Our actual results may differ materially from those anticipated in these forward-looking statements as a result of certain factors, including, but not limited to, those set forth in the “Risk Factors” section and elsewhere in this prospectus.
Organization
McAfee Corp. (the “Corporation”) was incorporated in Delaware on July 19, 2019. The Corporation was formed for the purpose of completing an initial public offering (the “IPO”) and related transactions in order to carry on the business of Foundation Technology Worldwide LLC (“FTW”) and its subsidiaries. On October 21, 2020, the Corporation became the sole managing member and holder of 100% of the voting power of FTW due to the reorganization transactions. With respect to the Corporation and the Company, each entity owns nothing other than the respective entities below it in the corporate structure and each entity has no other material operations, assets, or liabilities. The Reorganization Transactions were accounted for as a reorganization of entities under common control. Refer to Note 1 in our audited consolidated financial statements included elsewhere in this prospectus for information about the reorganization transactions noted above.
Overview
As a global leader and trusted brand in cybersecurity for over 30 years, McAfee protects millions of consumers with one of the industry’s most comprehensive cybersecurity portfolios. Our award-winning products offer individuals and families protection for their digital lives. We meet the cyber security needs of consumers wherever they are, with solutions for device security, privacy and safe
Wi-Fi,
online protection, and identity protection, among others. Our mission is to protect all things that matter through leading-edge cybersecurity.Our consumer-focused products protect consumers across the digital spectrum. Our Personal Protection Service provides holistic digital protection of the individual and family wherever they go under our Total Protection and LiveSafe brands. We achieve this by integrating the following solutions and capabilities within our Personal Protection Service:
| • | Device Security, home-use, protected from viruses, ransomware, malware, spyware, and phishing. |
| • | Online Privacy and Comprehensive Internet Security, Wi-Fi connections safe with our bank-grade AES256-bit encryption, keeping personal data protected while keeping IP addresses and physical locations private. |
| • | Identity Protection, |
Our
go-to-market
digitally-led
omnichannel approach reaches the consumer at crucial moments in their purchase lifecycle including direct to consumer online sales, acquisition through trialpre-loads
on PC OEM devices, and other indirect modes via additional partners such as mobile providers, ISPs, electronics retailers, ecommerce sites, and search providers. We have longstanding exclusive partnerships with many of the leading72
Confidential Treatment Requested by McAfee Corp.
Pursuant to 17 C.F.R. Section 200.83
PC OEMs and continue to expand our presence with mobile service providers and ISPs as the demand for mobile security protection increases. Through these relationships, our consumer security software ischannel also consists of partners including some of the largest electronics retailers and ISPs globally.
pre-installed
on devices on either a trial basis until conversion to a paid subscription, which is enabled by a tailored renewal process that fits the customer’s journey, or through a live version that can be purchased directly through the OEMs’ website. Our consumergo-to-market
Divestiture of Enterprise Business
On March 6, 2021, we entered into a definitive agreement (the “Purchase Agreement”) with a consortium led by Symphony Technology Group (“STG”) under which STG agreed to purchase certain of our Enterprise assets together with certain of our Enterprise liabilities (“Enterprise Business”), representing substantially all of our Enterprise segment, for an
all-cash
purchase price of $4.0 billion. The divestiture transaction closed on July 27, 2021. The divestiture of our Enterprise Business represents a strategic shift in our operations that will allow us to focus on our Consumer business. As a result of the divestiture, the results of our Enterprise Business were reclassified as discontinued operations in our consolidated statements of operations and thus excluded from both continuing operations and segment results for all periods presented. Starting in the first quarter of fiscal 2021, we began to operate as one reportable segment as the Enterprise Business comprised substantially all of our Enterprise segment. Results of discontinued operations include all revenues and expenses directly derived from our Enterprise Business, with the exception of general corporate overhead costs that were previously allocated to our Enterprise segment but have not been allocated to discontinued operations. The Enterprise Business, as specified in the Purchase Agreement, was reclassified as discontinued operations in our consolidated balance sheets, subject to changes set forth in the Purchase Agreement, which included amendments to the agreement in July 2021.On July 27, 2021, we completed the sale of our Enterprise Business to STG for an
all-cash
purchase price of $4.0 billion. In connection with the transaction, we expect to recognize a gain in excess of $2 billion, net of taxes. As a direct result of the taxable gain on the Enterprise Business divestiture, we expect to realize certain tax benefits subject to our TRA and thus expect to record a TRA liability of between $170 million to $260 million.Subsequent to the completion of the sale of the Enterprise Business, we notified our lenders of our intent to prepay approximately $1 billion of our indebtedness in August 2021. In connection with this prepayment, we expect to incur a loss on extinguishment of debt in Q3 2021 of approximately $10 million related to recognition of unamortized discount and deferred financing costs. We also terminated $150 million of our $250 million notional interest rate swap that had an expiration date of January 29, 2022. We expect to use a portion of the proceeds from the transaction to pay approximately $175 million in customary transaction expenses and other
one-time
charges.Additionally, on August 3, 2021, the Board of Directors of McAfee Corp. declared a special
one-time
cash dividend of $4.50 per share of Class A common stock paid on August 27, 2021 to shareholders of record on August 13, 2021 (the “Special Dividend”). In connection with the declaration of the Special Dividend, the Board of Directors of McAfee Corp., as sole managing member of FTW, authorized FTW to declare a specialone-time
cash distribution to its members in the aggregate of approximately $2.8 billion (the “Special Distribution”). The Special Distribution resulted in the payment of approximately $1.7 billion to Continuing LLC Owners and approximately $1.1 billion to McAfee Corp. McAfee Corp. used a portion of its share of the Special Distribution to pay the Special Dividend to participating shareholders on August 27, 2021. Under the provisions of our equity plans, the Special Dividend is anticipated to constitute an equity restructuring under applicable accounting rules, which will require us to make certain adjustments to our outstanding equity awards. McAfee Corp. used approximately $0.8 billion of its share of the Special Distribution to pay the Special Dividend, and expects to use the remainder of the proceeds to pay up to $0.3 billion in required corporate taxes and related payments in connection with the transaction.73
Confidential Treatment Requested by McAfee Corp.
Pursuant to 17 C.F.R. Section 200.83
We also expect to pay approximately $300 million in additional
one-time
separation costs and stranded cost optimization, a portion of which will be expenses paid by proceeds from the transaction. In connection with the divestiture of the Enterprise Business, we entered into a transition service agreement under which we will provide assistance to STG including, but not limited to, business support services and information technology services as well as a commercial services agreement under which we will provide certain product services and licensed technology.Financial Highlights
For fiscal 2020 compared to fiscal 2019 we delivered the following:
| • | Net revenue increased by 20% to $1.6 billion |
| • | Net loss increased 22% to $289 million |
| • | Loss from continuing operations increased 12% to a loss of $218 million |
| • | Adjusted EBITDA increased 43% to $651 million |
| • | Cash provided by operating activities increased by 53% to $760 million |
| • | Free cash flow increased by 64% to $714 million |
For the six months ended June 26, 2021 compared to the six months ended June 27, 2020 we delivered the following:
| • | Net revenue increased by 23% to $909 million |
| • | Net income increased by 552% to $202 million |
| • | Income from continuing operations increased by 1,610% to $151 million |
| • | Adjusted EBITDA increased by 32% to $417 million |
| • | Net cash provided by operating activities increased by 56% to $448 million |
| • | Free cash flow increased by 65% to $430 million |
See
“Non-GAAP
Financial Measures” section for a description of adjusted EBITDA and free cash flow, and a reconciliation of these measures to the nearest financial measure calculated in accordance with GAAP.COVID-19
PandemicThe
COVID-19
pandemic is having widespread, rapidly evolving, and unpredictable impacts on global society, economies, financial markets, and business practices. Federal, state and foreign governments have implemented measures to contain the virus, including social distancing, travel restrictions, border closures, limitations on public gatherings, work from home, and closure ofnon-essential
businesses. To protect the health and well-being of our employees, partners, and third-party service providers, we have implemented work-from-home requirements, made substantial modifications to employee travel policies, and cancelled or shifted marketing and other corporate events to virtual-only formats for the foreseeable future.The ultimate duration and extent of the impact from the
COVID-19
pandemic depends on future developments that cannot be accurately forecasted at this time. These developments include the severity and transmission rate of the disease, the actions of governments, businesses and individuals in response to the pandemic, the extent and effectiveness of containment actions and vaccines, the impact on economic activity and the impact of these and other factors. We have experienced growth and increased demand for our solutions in recent quarters, which may be due in part to greater demand for devices or our solutions in response to the74
Confidential Treatment Requested by McAfee Corp.
Pursuant to 17 C.F.R. Section 200.83
COVID-19
pandemic. We cannot determine what, if any, portion of our growth in net revenue, the number of our Direct to Consumer Customers, or any other measures of our performance during the fiscal 2021 compared to the fiscal 2020 was the result of such responses to theCOVID-19
pandemic. See Risk Factors for further discussion of the possible impact of theCOVID-19
pandemic on our business.Fiscal Calendar
We maintain a
52-
or53-week
fiscal year that ends on the last Saturday in December. The year ended December 29, 2018 is a52-week
year starting on December 31, 2017 and ending on December 29, 2018. The year ended December 28, 2019 is a52-week
year starting on December 30, 2018 and ending on December 28, 2019. The year ended December 26, 2020 is a52-week
year starting on December 29, 2019 and ending on December 26, 2020. Six months ended June 27, 2020 is a26-week
period starting on December 29, 2019 and ending on June 27, 2020. Six months ended June 26, 2021 is a26-week
period starting on December 27, 2020 and ending on June 26, 2021.Key Operating Metrics
We monitor the following key metrics to help us evaluate our business, identify trends affecting our business, measure our performance, formulate business plans, and make strategic decisions. We believe the following metrics are useful in evaluating our business, but should not be considered in isolation or as a substitute for GAAP. Certain judgments and estimates are inherent in our processes to calculate these metrics.
We define Core Direct to Consumer Customers as active subscribers whose transaction for a subscription is directly with McAfee. These customers include those who (i) transact with us directly through McAfee web properties, (ii) are converted during or after the trial period of the McAfee product preinstalled on their new PC purchase, or (iii) are channel led subscribers who are converted to Core Direct to Consumer Customers after expiration of their subscription of our product initially purchased through our retail, ecommerce or PC OEM partners.
We define Trailing Twelve Months (“TTM”) Dollar Based Retention – Core Direct to Consumer Customers as the annual contract value of Core Direct to Consumer Customer subscriptions that were renewed in the trailing twelve months divided by the annual contract value for Core Direct to Consumer Customers subscriptions that were up for renewal in the same period. We monitor TTM Dollar Based Retention as an important measure of the value we retain of our existing Core Direct to Consumer Customer base and as a measure of the effectiveness of the strategies we deploy to improve those rates over time.
We define Monthly Average Revenue Per Customer (“ARPC”) as monthly subscription net revenue from transactions directly between McAfee and Core Direct to Consumer Customers, divided by average Core to Direct Consumer Customers from the same period. ARPC can be impacted by price, mix of products, and change between periods in Core Direct to Consumer Customer count. We believe that ARPC allows us to understand the value of our solutions to the portion of our customer base transacting directly with us.
December 29, 2018 | December 28, 2019 | December 26, 2020 | June 27, 2020 | June 26, 2021 | ||||||||||||||||
Core Direct to Consumer Customers (in millions) | 14.1 | 15.2 | 18.0 | 16.6 | 19.4 | |||||||||||||||
TTM Dollar Based Retention—Core Direct to Consumer Customers | 93 | % | 97 | % | 100 | % | 98 | % | 100 | % | ||||||||||
Fiscal Year Ended | Three Months Ended | |||||||||||||||||||
December 29, 2018 | December 28, 2019 | December 26, 2020 | June 27, 2020 | June 26, 2021 | ||||||||||||||||
Monthly ARPC | $ | 5.79 | $ | 5.96 | $ | 6.01 | $ | 6.06 | $ | 5.99 | ||||||||||
75
Confidential Treatment Requested by McAfee Corp.
Pursuant to 17 C.F.R. Section 200.83
Non-GAAP
Financial MeasuresWe have included both financial measures compiled in accordance with GAAP and certain
non-GAAP
financial measures for our continuing operations, including adjusted operating income, adjusted operating income margin, adjusted EBITDA, adjusted EBITDA margin, adjusted net income, adjusted net income margin, and free cash flow and ratios based on these financial measures.Adjusted Operating Income, Adjusted Operating Income Margin, Adjusted EBITDA and Adjusted EBITDA Margin
We regularly monitor adjusted operating income, adjusted operating income margin, adjusted EBITDA, and adjusted EBITDA margin to assess our operating performance. We define adjusted operating income as net income (loss), excluding the impact of amortization of intangible assets, equity-based compensation expense, interest expense and other, net, provision for income tax expense, foreign exchange (gain) loss, net, income (loss) from discontinued operations, net of taxes, and other costs that we do not believe are reflective of our ongoing operations. Adjusted operating income margin is calculated as adjusted operating income divided by net revenue. We define adjusted EBITDA as adjusted operating income, excluding the impact of depreciation expense plus certain other
non-operating
costs. Adjusted EBITDA margin is calculated as adjusted EBITDA divided by net revenue. We believe presenting adjusted operating income, adjusted operating income margin, adjusted EBITDA, and adjusted EBITDA margin provides management and investors consistency and comparability with our past financial performance and facilitates period to period comparisons of operations, as it eliminates the effects of certain variations unrelated to our overall performance. Adjusted operating income, adjusted operating income margin, adjusted EBITDA, and adjusted EBITDA margin have limitations as analytical tools, and you should not consider it in isolation or as a substitute for analysis of our results as reported under GAAP. Some of these limitations are:| • | although depreciation and amortization are non-cash charges, the assets being depreciated and amortized may have to be replaced in the future, and adjusted EBITDA does not reflect cash capital expenditure requirements for such replacements or for new capital expenditure requirements; |
| • | adjusted operating income and adjusted EBITDA do not reflect changes in, or cash requirements for, our working capital needs; |
| • | adjusted operating income and adjusted EBITDA do not reflect the significant interest expense, or the cash requirements necessary to service interest or principal payments, on our debt; |
| • | adjusted operating income and adjusted EBITDA do not reflect income tax payments that may represent a reduction in cash available to us; and |
| • | other companies, including companies in our industry, may calculate adjusted operating income and adjusted EBITDA differently, which reduce their usefulness as comparative measures. |
Because of these limitations, you should consider adjusted operating income and adjusted EBITDA alongside other financial performance measures, including operating income (loss), net income (loss) and our other GAAP results. In evaluating adjusted operating income, adjusted operating income margin, adjusted EBITDA, and adjusted EBITDA margin, you should be aware that in the future we may incur expenses that are the same as or similar to some of the adjustments in this presentation. Our presentation of adjusted operating income, adjusted operating income margin, adjusted EBITDA, and adjusted EBITDA margin should not be construed as an inference that our future results will be unaffected by the types of items excluded from the calculation of adjusted operating income, adjusted operating income margin, adjusted EBITDA, and adjusted EBITDA margin. Adjusted operating income, adjusted operating income margin, adjusted EBITDA, and adjusted EBITDA margin are not presentations made in accordance with GAAP and the use of these terms vary from other companies in our industry.
76
Confidential Treatment Requested by McAfee Corp.
Pursuant to 17 C.F.R. Section 200.83
The following table presents a reconciliation of our adjusted operating income and adjusted EBITDA to our net income (loss) for the periods presented:
Fiscal Year Ended | Six Months Ended | |||||||||||||||||||
(in millions except percentages) | December 29, 2018 | December 28, 2019 | December 26, 2020 | June 27, 2020 | June 26, 2021 | |||||||||||||||
Net income (loss) | $ | (512 | ) | $ | (236 | ) | $ | (289 | ) | $ | 31 | $ | 202 | |||||||
Add: Amortization | 260 | 253 | 251 | 126 | 98 | |||||||||||||||
Add: Equity-based compensation | 6 | 5 | 113 | 16 | 33 | |||||||||||||||
Add: Cash in lieu of equity awards (1) | 5 | 3 | 1 | 1 | — | |||||||||||||||
Add: Acquisition and integration costs (2) | 7 | 8 | 8 | 3 | 2 | |||||||||||||||
Add: Restructuring charges (3) | 19 | 6 | 2 | 1 | 8 | |||||||||||||||
Add: Management fees (4) | 7 | 11 | 28 | 4 | — | |||||||||||||||
Add: Transformation (5) | 17 | 23 | 20 | 9 | 1 | |||||||||||||||
Add: Executive severance (6) | — | — | 3 | 3 | — | |||||||||||||||
Add: Interest expense and other, net | 308 | 296 | 307 | 149 | 118 | |||||||||||||||
Add: Provision for income tax expense (benefit) | 29 | 38 | 5 | (5 | ) | 7 | ||||||||||||||
Add: Foreign exchange loss (gain), net | (30 | ) | (21 | ) | 104 | 6 | (15 | ) | ||||||||||||
Less: (Income) loss from discontinued operations, net of taxes | 104 | 41 | 71 | (41 | ) | (51 | ) | |||||||||||||
Adjusted operating income | 220 | 427 | 624 | 303 | 403 | |||||||||||||||
Add: Depreciation | 28 | 29 | 28 | 14 | 14 | |||||||||||||||
Less: Other expense | (1 | ) | (1 | ) | (1 | ) | — | — | ||||||||||||
Adjusted EBITDA | $ | 247 | $ | 455 | $ | 651 | $ | 317 | $ | 417 | ||||||||||
Net revenue | $ | 1,161 | $ | 1,303 | $ | 1,558 | $ | 737 | $ | 909 | ||||||||||
Net income (loss) margin | (44.1 | )% | (18.1 | )% | (18.5 | )% | 4.2 | % | 22.2 | % | ||||||||||
Adjusted operating income margin | 18.9 | % | 32.8 | % | 40.1 | % | 41.1 | % | 44.3 | % | ||||||||||
Adjusted EBITDA margin | 21.3 | % | 34.9 | % | 41.8 | % | 43.0 | % | 45.9 | % | ||||||||||
See “” section for an explanation of adjustments to
Description of
Non-GAAP
Adjustmentsnon-GAAP
measures and other items.Adjusted Net Income and Adjusted Net Income Margin
We regularly monitor adjusted net income and adjusted net income margin to assess our operating performance. Adjusted net income assumes all net income (loss) is attributable to McAfee Corp., which assumes the full exchange of all outstanding LLC Units for shares of Class A common stock of McAfee Corp., and is adjusted for the impact of amortization of intangible assets, amortization of debt issuance costs, equity-based compensation expense, foreign exchange loss (gain), net, income (loss) from discontinued operations, net of taxes, and other costs that we do not believe are reflective of our ongoing operations. The adjusted provision for income taxes represents the tax effect on net income, adjusted for all of the listed adjustments, assuming that all consolidated net income was subject to corporate taxation for all periods presented. We have assumed an annual effective tax rate of 22%, which represents our long term expected corporate tax rate excluding discrete and
non-recurring
tax items. This amount has been recast for periods reported previously.Adjusted net income margin is calculated as adjusted net income divided by net revenue. Adjusted net income and adjusted net income margin have limitations as analytical tools, and you should not consider it in isolation or as a substitute for analysis of our results as reported under GAAP. Some of these limitations are:
| • | although amortization is a non-cash charge, the assets being amortized may have to be replaced in the future, and adjusted net income does not reflect cash capital expenditure requirements for such replacements or for new capital expenditure requirements; |
77
Confidential Treatment Requested by McAfee Corp.
Pursuant to 17 C.F.R. Section 200.83
| • | adjusted net income does not reflect changes in, or cash requirements for, our working capital needs; |
| • | other companies, including companies in our industry, may calculate adjusted net income differently, which reduce its usefulness as comparative measures. |
Because of these limitations, you should consider adjusted net income alongside other financial performance measures, including net income (loss) and our other GAAP results. In evaluating adjusted net income and adjusted net income margin, you should be aware that in the future we may incur expenses that are the same as or similar to some of the adjustments in this presentation. Our presentation of adjusted net income and adjusted net income margin should not be construed as an inference that our future results will be unaffected by the types of items excluded from the calculation of adjusted net income and adjusted net income margin. Adjusted net income and adjusted net income margin are not presentations made in accordance with GAAP and the use of these terms vary from other companies in our industry.
The following table presents a reconciliation of our adjusted net income (loss) to our net income for the periods presented:
Fiscal Year Ended | Six Months Ended | |||||||||||||||||||
(in millions except percentages) | December 29, 2018 | December 28, 2019 | December 26, 2020 | June 27, 2020 | June 26, 2021 | |||||||||||||||
Net income (loss) | $ | (512 | ) | $ | (236 | ) | $ | (289 | ) | $ | 31 | $ | 202 | |||||||
Add: Amortization of debt discount and issuance costs | 15 | 17 | 36 | 9 | 8 | |||||||||||||||
Add: Amortization | 260 | 253 | 251 | 126 | 98 | |||||||||||||||
Add: Equity-based compensation | 6 | 5 | 113 | 16 | 33 | |||||||||||||||
Add: Cash in lieu of equity awards (1) | 5 | 3 | 1 | 1 | — | |||||||||||||||
Add: Acquisition and integration costs (2) | 7 | 8 | 8 | 3 | 2 | |||||||||||||||
Add: Restructuring charges (3) | 19 | 6 | 2 | 1 | 8 | |||||||||||||||
Add: Management fees (4) | 7 | 11 | 28 | 4 | — | |||||||||||||||
Add: Transformation (5) | 17 | 23 | 20 | 9 | 1 | |||||||||||||||
Add: Executive severance (6) | — | — | 3 | 3 | — | |||||||||||||||
Add: TRA adjustment (7) | — | — | 2 | — | 8 | |||||||||||||||
Add: Other | — | — | 2 | — | — | |||||||||||||||
Add: Provision for income taxes (benefit) | 29 | 38 | 5 | (5 | ) | 7 | ||||||||||||||
Add: Foreign exchange loss (gain), net (8) | (30 | ) | (21 | ) | 104 | 6 | (15 | ) | ||||||||||||
Less: (Income) loss from discontinued operations, net of taxes | 104 | 41 | 71 | (41 | ) | (51 | ) | |||||||||||||
Adjusted income (loss) before taxes | (73 | ) | 148 | 357 | 163 | 301 | ||||||||||||||
Adjusted provision for income taxes (9) | (16 | ) | 32 | 79 | 36 | 66 | ||||||||||||||
Adjusted net income (loss) | $ | (57 | ) | $ | 116 | $ | 278 | $ | 127 | $ | 235 | |||||||||
Net revenue | $ | 1,161 | $ | 1,303 | $ | 1,558 | $ | 737 | $ | 909 | ||||||||||
Net income (loss) margin | (44.1 | )% | (18.1 | )% | (18.5 | )% | 4.2 | % | 22.2 | % | ||||||||||
Adjusted net income (loss) margin | (4.9 | )% | 8.9 | % | 17.8 | % | 17.2 | % | 25.9 | % | ||||||||||
See “” section for an explanation of adjustments to
Description of
Non-GAAP
Adjustmentsnon-GAAP
measures and other items.78
Confidential Treatment Requested by McAfee Corp.
Pursuant to 17 C.F.R. Section 200.83
Description of
Non-GAAP
AdjustmentsBelow are additional information to the adjustments for adjusted operating income, adjusted EBITDA, and adjusted net income:
| (1) | As a result of the Sponsor Acquisition, cash awards were provided to certain employees who held Intel equity awards in lieu of equity in FTW. |
| (2) | Represents both direct and incremental costs in connection with business acquisitions, including acquisition consideration structured as cash retention, third party professional fees, and other integration costs. |
| (3) | Represents both direct and incremental costs associated with our separation from Intel as well as subsequent costs incurred to realign toward our core business and realign staffing. It includes implementing our stand alone back office and costs to execute strategic restructuring events, including third-party professional fees and services, transition services provided by Intel, severance, and facility restructuring costs. |
| (4) | Represents management fees paid to certain affiliates of our Sponsors and Intel pursuant to the Management Services Agreement. The Management Services Agreement has been terminated subsequent to the IPO and we paid a one-time fee of $22 million to such parties in October 2020. |
| (5) | Represents costs incurred in connection with transformation of the business post-Intel separation. Also includes the cost of workforce restructurings involving both eliminations of positions and relocations to lower cost locations in connection with our transformational initiatives, strategic initiatives to improve customer retention, activation to pay and cost synergies, inclusive of duplicative run rate costs related to facilities and data center rationalization, and other one-time costs. |
| (6) | Represents severance for executive terminations not associated with a strategic restructuring event. |
| (7) | Represents the impact on net income of adjustments to liabilities under our tax receivable agreement. |
| (8) | Represents foreign exchange gain (loss), net as shown on in our audited consolidated statement of operations and condensed consolidated statements of operations. This amount is attributable to gains or losses on non-U.S. Dollar denominated balances and is primarily due to unrealized gains or losses associated with our 1st Lien Euro Term Loan. |
| (9) | Prior to our IPO, our structure was that of a pass-through entity for U.S. federal income tax purposes with certain U.S. and foreign subsidiaries subject to income tax in their respective jurisdictions. Subsequent to the IPO, McAfee Corp. is taxed as a corporation and pays corporate federal, state, and local taxes on income allocated to it from FTW. This amount has been recast for periods reported previously. The adjusted provision for income taxes and adjusted provision for income taxes now represent the tax effect on net income, adjusted for all of the listed adjustments, assuming that all consolidated net income was subject to corporate taxation for all periods presented. We have assumed an annual effective tax rate of 22%, which represents our long term expected corporate tax rate excluding discrete and non-recurring tax items. |
Free Cash Flow
We define free cash flow as net cash provided by operating activities less capital expenditures. We consider free cash flow to be a liquidity measure that provides useful information to management and investors about the amount of cash generated by the business that can be used for strategic opportunities, including investing in our business, making strategic acquisitions, and strengthening the balance sheet.
79
Confidential Treatment Requested by McAfee Corp.
Pursuant to 17 C.F.R. Section 200.83
The following table presents a reconciliation of our free cash flow to our net cash provided by operating activities for the periods presented:
Fiscal Year Ended | Six Months Ended | |||||||||||||||||||
(in millions) | December 29, 2018 | December 28, 2019 | December 26, 2020 | June 27, 2020 | June 26, 2021 | |||||||||||||||
Net cash provided by operating activities | $ | 319 | $ | 496 | $ | 760 | $ | 288 | $ | 448 | ||||||||||
Less: Capital expenditures (1) | (62 | ) | (61 | ) | (46 | ) | (28 | ) | (18 | ) | ||||||||||
Free cash flow (2) | $ | 257 | $ | 435 | $ | 714 | $ | 260 | $ | 430 | ||||||||||
| (1) | Capital expenditures includes payments for property and equipment and capitalized labor costs incurred in connection with certain software development activities. |
| (2) | Free cash flow includes $290 million, $281 million, and $268 million in cash interest payments for fiscal 2018, fiscal 2019, fiscal 2020, respectively, and $141 million and $101 million in cash interest payments for the six months ended June 27, 2020 and June 26, 2021, respectively. |
Factors Affecting the Comparability of Our Results of Operations
As a result of a number of factors, our historical results of operations are not comparable from period to period and may not be comparable to our financial results of operations in future periods. Set forth below is a brief discussion of the key factors impacting the comparability of our results of operations.
Payments to Channel Partners
We make various payments to our channel partners, which may include revenue share, product placement fees and marketing development funds. Costs that are incremental to revenue, such as revenue share, are capitalized and amortized over time as cost of sales. This classification is an accounting policy election, which may make comparisons to other companies difficult. Product placement fees and marketing development funds are expensed in sales and marketing expense as the related benefit is received. Many of our channel partner agreements contain a clause whereby we pay the greater of revenue share calculated for the period or product placement fees. This may impact the comparability of our financial results between periods.
Under certain of our channel partner agreements, the partners pay us a royalty on our technology sold to their customers, which we recognize as revenue in accordance with our revenue recognition policy. In certain situations, the payments made to our channel partners are recognized as consideration paid to a customer, and thus are recorded as reductions to revenue up to the amount of cumulative revenue recognized from contracts with the channel partner during the period of measurement. Any payments to channel partners in excess of such cumulative revenue during the period of measurement are recognized as cost of sales or marketing expense as described above. As royalty revenue from individual partners varies, the amount of costs recognized as a reduction of revenue rather than as cost of sales or sales and marketing expense fluctuates and may impact the comparability of our financial statements between periods.
Impact of the Reorganization Transactions
McAfee Corp. is a corporation for U.S. federal and state income tax purposes. Following the Reorganization Transactions, FTW is the predecessor of McAfee Corp. for accounting purposes. FTW is and remains a partnership for U.S. federal income tax purposes and will therefore generally not be subject to any U.S. federal income taxes at the entity level in respect of income it recognizes directly or through its U.S. and foreign subsidiaries that are also pass- through or disregarded entities for U.S. federal income tax purposes. Instead, taxable income and loss of these entities flow through to the members of FTW (including McAfee Corp. and certain of its subsidiaries) for U.S. federal income tax purposes. Certain of FTW’s
non-U.S.
subsidiaries that are treated as pass-through or disregarded entities for U.S. federal income tax purposes are nonetheless treated as80
Confidential Treatment Requested by McAfee Corp.
Pursuant to 17 C.F.R. Section 200.83
taxable entities in their respective jurisdictions and are thus subject to
non-U.S.
taxes at the entity level. FTW also has certain U.S. and foreign subsidiaries that are treated as corporations for U.S. federal income tax purposes and that therefore are or may be subject to income tax at the entity level. McAfee Corp. pays U.S. federal, state and local income taxes as a corporation on its share of the taxable income of FTW (taking into account the direct and indirect ownership of FTW by McAfee Corp.).In addition, in connection with the Reorganization Transactions and the IPO, McAfee Corp. entered into the tax receivable agreement. Refer to “—Tax Receivable Agreement” below.
Impact of Purchase Accounting Related to Mergers and Acquisitions
Through April 3, 2017, the McAfee cybersecurity business, which we refer to as the Predecessor Business, was operated as a part of a business unit of Intel. Also prior to April 3, 2017, McAfee, Inc., which was then a wholly-owned subsidiary of Intel, was converted into a limited liability company, McAfee, LLC. Following such conversion, Intel contributed McAfee, LLC to FTW, a wholly-owned subsidiary of Intel. On April 3, 2017, Intel and its subsidiaries transferred assets and liabilities of the Predecessor Business not already held through FTW to FTW. Immediately thereafter on April 3, 2017, our Sponsors and certain of their
co-investors
acquired a majority stake in FTW, pursuant to the Sponsor Acquisition. Following the Sponsor Acquisition, our Sponsors and certain of theirco-investors
owned 51.0% of the common equity interests in FTW, with certain affiliates of Intel retaining the remaining 49.0% of the common equity interests. We have operated as a stand alone company at all times following the Sponsor Acquisition. As a result of the Sponsor Acquisition, we recorded all assets and liabilities at their fair value, including our deferred revenue and deferred costs balances, as of the effective date of the Sponsor Acquisition, which in some cases was different than the historical book values. Adjusting our deferred revenue and deferred costs balances to fair value on the date of the Sponsor Acquisition had the effect of reducing revenue and expenses from that which would have otherwise been recognized in subsequent periods. We also recorded identifiable intangible assets that are amortized over their useful lives, increasing expenses from that which would otherwise have been recognized.In addition, we have made acquisitions and recorded the acquired assets and liabilities at fair value on the date of acquisition, which similarly impacted deferred revenue and deferred costs balances and reduced revenue and expenses from that which would have otherwise been recognized in subsequent periods. We also recorded identifiable intangible assets that are amortized over their useful lives, increasing expenses from that which would otherwise have been recognized.
81
Confidential Treatment Requested by McAfee Corp.
Pursuant to 17 C.F.R. Section 200.83
The accounting impact resulting from these acquisitions limits the comparability of our financial statements between periods. The table below shows the impact of purchase accounting on our financial statements.
Fiscal Year Ended | Six Months Ended | |||||||||||||||||||
(in millions) | December 29, 2018 | December 28, 2019 | December 26, 2020 | June 27, 2020 | June 26, 2021 | |||||||||||||||
Impact of purchase accounting on net revenue | $ | (32 | ) | $ | (1 | ) | $ | — | $ | — | $ | — | ||||||||
Purchase accounting adjustments to cost of sales | (14 | ) | (1 | ) | 1 | 1 | — | |||||||||||||
Amortization of acquired and developed technologies | 107 | 107 | 108 | 54 | 49 | |||||||||||||||
Impact of purchase accounting on cost of sales | 93 | 106 | 109 | 55 | 49 | |||||||||||||||
Purchase accounting adjustments to operating expenses | (1 | ) | (1 | ) | — | — | — | |||||||||||||
Amortization of customer relationships | 153 | 146 | 143 | 72 | 49 | |||||||||||||||
Impact of purchase accounting on operating expenses | 152 | 145 | 143 | 72 | 49 | |||||||||||||||
Impact of purchase accounting on operating loss related to continuing operations | (277 | ) | (252 | ) | (252 | ) | (127 | ) | (98 | ) | ||||||||||
Impact of purchase accounting on operating loss related to discontinued operations | (322 | ) | (252 | ) | (187 | ) | (99 | ) | (36 | ) | ||||||||||
Total impact of purchase accounting | $ | (599 | ) | $ | (504 | ) | $ | (439 | ) | $ | (226 | ) | $ | (134 | ) | |||||
Equity-Based Compensation
Upon consummation of the IPO in October 2020, we modified the terms of our unvested FTW RSUs, outstanding cash-settled restricted equity units (“CRSU”s), and outstanding management equity participation units (“MEPU”s) to permit settlement in the Company’s Class A common stock, par value $0.001 per share (“Class A common stock”) (collectively, “Replacement RSUs”) in lieu of cash settlement, at our election. No service or performance vesting terms were changed at the time of modification. All of our outstanding equity awards were probable of vesting and the change was accounted for as a Type I modification. In addition, we granted stock options with a strike price equal to the IPO price to certain holders of MEPUs with distribution thresholds not fully satisfied at the time of modification and, at the time of the grant, recognized expense for these options immediately. Refer to Note 12 to our audited consolidated financial statements included elsewhere in this prospectus for a detailed discussion of equity-based compensation.
During February 2020, we modified the terms of certain management incentive unit grants to provide for vesting subject to the satisfaction of certain conditions, which resulted in the recognition of $12 million incremental compensation expense for the modified awards at their modification date.
82
Confidential Treatment Requested by McAfee Corp.
Pursuant to 17 C.F.R. Section 200.83
The accounting impact resulting from the recognition of this equity-based compensation limits the comparability of our financial statements between periods. The table below shows the impact of all equity-based compensation on our financial statements:
Fiscal Year Ended | Six Months Ended | |||||||||||||||||||
(in millions) | December 29, 2018 | December 28, 2019 | December 26, 2020 | June 27, 2020 | June 26, 2021 | |||||||||||||||
Cost of sales | $ | 1 | $ | — | $ | 5 | $ | — | $ | 2 | ||||||||||
Sales and marketing | 1 | 1 | 23 | 1 | 7 | |||||||||||||||
Research and development | 1 | 1 | 40 | — | 10 | |||||||||||||||
General and administrative | 3 | 3 | 45 | 15 | 14 | |||||||||||||||
Total equity-based compensation expense from continuing operations | 6 | 5 | 113 | 16 | 33 | |||||||||||||||
Discontinued operations | 22 | 20 | 200 | 3 | 45 | |||||||||||||||
Total equity-based compensation expense | $ | 28 | $ | 25 | $ | 313 | $ | 19 | $ | 78 | ||||||||||
Composition of Revenues, Expenses, and Cash Flows
Net Revenue
We derive our revenue primarily from the sale of software subscriptions or royalty agreements, primarily through our indirect relationships with our partners or direct relationships with end customers through our website. We have various marketing programs with certain business partners who we consider customers and reduce revenue by the cash consideration given to these partners. Revenue is recognized as control of the promised goods or services are transferred to our customers, in an amount that reflects the consideration we expect to be entitled to in exchange for the promised goods or services.
Cost of Sales
Our total cost of sales include fees paid under revenue share arrangements, amortization of certain intangibles, transaction processing fees, the costs of providing delivery (i.e., hosting), support, which include salaries and benefits for employees and fees related to third parties, and technology licensing fees. We anticipate our total cost of sales to increase in absolute dollars as we grow our net revenue. Cost of sales as a percentage of net revenue may vary from period to period based on our investments in the business, the efficiencies we are able to realize going forward as well as due to the accounting for payments to channel partners discussed in Factors Affecting the Comparability of Our Results of Operations.
We expect the divestiture to lead to costs that were previously allocated to both segments to now be part of continuing operations which will have a dilutive impact on gross margins.
Operating Expenses
Our operating expenses consist of sales and marketing, research and development, general and administrative, amortization of intangibles, and restructuring charges.
We expect the divestiture to lead to costs that were previously allocated to both segments will be part of continuing operations which will have a dilutive impact on operating margins. We also expect to pay approximately $300 million in additional
one-time
separation costs and stranded cost optimization, a portion of which will be expenses paid using proceeds from the transaction. There was $43 million of stranded costs within income from continuing operations for the six months ended June 26, 2021.83
Confidential Treatment Requested by McAfee Corp.
Pursuant to 17 C.F.R. Section 200.83
Sales and Marketing.
Research and Development.
General and Administrative
Amortization of Intangibles
Restructuring Charges
Interest Expense and Other, Net
Interest expense and other, net primarily relates to interest expense on our outstanding indebtedness. In connection with the divestiture of the Enterprise Business, we entered into a transition service agreement under which we will provide assistance to STG including, but not limited to, business support services and information technology services.
Foreign Exchange Gain (Loss), Net
Foreign exchange gain (loss), net is primarily attributable to realized and unrealized gains or losses
on non-U.S. Dollar
denominated balances and is primarily due to unrealized gains or losses associated with our 1st Lien Euro Term Loan.Provision for Income Tax Expense
McAfee Corp. is taxed as a corporation and pays corporate federal, state and local taxes on income allocated to it from FTW based upon McAfee Corp.’s economic interest in FTW. FTW is a pass through entity for U.S. federal income tax purposes and will not incur any federal income taxes either for itself or its U.S. subsidiaries that are also pass through or disregarded subsidiaries. Taxable income or loss for these entities will flow through to its respective members for U.S. tax purposes. FTW does have certain U.S. and foreign subsidiaries that are corporations and are subject to income tax in their respective jurisdiction.
We believe it is reasonably possible that subsequent to the closing of the sale of the Enterprise Business we will no longer have a cumulative loss incurred over the trailing three-year period. As a result, we could then consider subjective evidence, such as our projections for future growth, and may conclude that the valuation allowance against the net deferred tax assets of our domestic entities will no longer be required. A release of the valuation allowance would have the following impact in the period in which such release is recorded:
| • | Recognition of certain deferred tax assets and corresponding discrete income tax benefit up to $125 million. |
84
Confidential Treatment Requested by McAfee Corp.
Pursuant to 17 C.F.R. Section 200.83
| • | Recognition of a long-term TRA liability and corresponding TRA expense of $170 million to $260 million, including the TRA liability recorded directly as a result of tax attributes utilized from the Enterprise Business divestiture. This TRA liability relates to net deferred tax assets that did not meet the probable recognition criteria as of December 26, 2020 and thus was not recorded in our consolidated balance sheet as of that date. |
Income from Discontinued Operations, Net of Taxes
Following the agreement with STG, the results of our Enterprise Business were classified as discontinued operations in our audited consolidated financial statements and condensed statements of operations and excluded from continuing operations for all periods presented.
Results of Operations
The following tables set forth the consolidated statements of operations in dollar amounts and as a percentage of our total revenue for the periods indicated. Thecomparison of results is not necessarily indicative of results for future periods.
period-to-period
Fiscal Year Ended | Six Months Ended | |||||||||||||||||||
(in millions) | December 29, 2018 | December 28, 2019 | December 26, 2020 | June 27, 2020 | June 26, 2021 | |||||||||||||||
Net revenue | $ | 1,161 | $ | 1,303 | $ | 1,558 | $ | 737 | $ | 909 | ||||||||||
Cost of sales | 386 | 391 | 444 | 209 | 232 | |||||||||||||||
Gross profit | 775 | 912 | 1,114 | 528 | 677 | |||||||||||||||
Operating expenses: | ||||||||||||||||||||
Sales and marketing | 348 | 299 | 348 | 140 | 174 | |||||||||||||||
Research and development | 186 | 161 | 188 | 75 | 92 | |||||||||||||||
General and administrative | 170 | 182 | 235 | 100 | 93 | |||||||||||||||
Amortization of intangibles | 153 | 146 | 143 | 72 | 49 | |||||||||||||||
Restructuring charges | 19 | 6 | 2 | 1 | 8 | |||||||||||||||
Total operating expenses | 876 | 794 | 916 | 388 | 416 | |||||||||||||||
Operating income (loss) | (101 | ) | 118 | 198 | 140 | 261 | ||||||||||||||
Interest (expense) and other, net | (308 | ) | (296 | ) | (307 | ) | (149 | ) | (118 | ) | ||||||||||
Foreign exchange gain (loss), net | 30 | 21 | (104 | ) | (6 | ) | 15 | |||||||||||||
Income (loss) from continuing operations before income taxes | (379 | ) | (157 | ) | (213 | ) | (15 | ) | 158 | |||||||||||
Provision for income tax expense (benefit) | 29 | 38 | 5 | (5 | ) | 7 | ||||||||||||||
Income (loss) from continuing operations | (408 | ) | (195 | ) | (218 | ) | (10 | ) | 151 | |||||||||||
Income (loss) from discontinued operations, net of taxes | (104 | ) | (41 | ) | (71 | ) | 41 | 51 | ||||||||||||
Net income (loss) | $ | (512 | ) | $ | (236 | ) | $ | (289 | ) | $ | 31 | $ | 202 | |||||||
Less: Net income (loss) attributable to redeemable noncontrolling interests | N/A | N/A | (171 | ) | N/A | 136 | ||||||||||||||
Net income (loss) attributable to McAfee Corp. | N/A | N/A | $ | (118 | ) | N/A | $ | 66 | ||||||||||||
85
Confidential Treatment Requested by McAfee Corp.
Pursuant to 17 C.F.R. Section 200.83
Fiscal Year Ended | Six Months Ended | |||||||||||||||||||
December 29, 2018 | December 28, 2019 | December 26, 2020 | June 27, 2020 | June 26, 2021 | ||||||||||||||||
Net revenue | 100.0 | % | 100.0 | % | 100.0 | % | 100.0 | % | 100.0 | % | ||||||||||
Cost of sales | 33.2 | % | 30.0 | % | 28.5 | % | 28.4 | % | 25.5 | % | ||||||||||
Gross profit | 66.8 | % | 70.0 | % | 71.5 | % | 71.6 | % | 74.5 | % | ||||||||||
Operating expenses: | ||||||||||||||||||||
Sales and marketing | 30.0 | % | 22.9 | % | 22.3 | % | 19.0 | % | 19.1 | % | ||||||||||
Research and development | 16.0 | % | 12.4 | % | 12.1 | % | 10.2 | % | 10.1 | % | ||||||||||
General and administrative | 14.6 | % | 14.0 | % | 15.1 | % | 13.6 | % | 10.2 | % | ||||||||||
Amortization of intangibles | 13.2 | % | 11.2 | % | 9.2 | % | 9.8 | % | 5.4 | % | ||||||||||
Restructuring charges | 1.6 | % | 0.5 | % | 0.1 | % | 0.1 | % | 0.9 | % | ||||||||||
Total operating expenses | 75.5 | % | 60.9 | % | 58.8 | % | 52.6 | % | 45.8 | % | ||||||||||
Operating income (loss) | (8.7 | )% | 9.1 | % | 12.7 | % | 19.0 | % | 28.7 | % | ||||||||||
Interest (expense) and other, net | (26.5 | )% | (22.7 | )% | (19.7 | )% | (20.2 | )% | (13.0 | )% | ||||||||||
Foreign exchange gain (loss), net | 2.6 | % | 1.6 | % | (6.7 | )% | (0.8 | )% | 1.7 | % | ||||||||||
Income (loss) from continuing operations before income taxes | (32.6 | )% | (12.0 | )% | (13.7 | )% | (2.0 | )% | 17.4 | % | ||||||||||
Provision for income tax expense (benefit) | 2.5 | % | 2.9 | % | 0.3 | % | (0.7 | )% | 0.8 | % | ||||||||||
Income (loss) from continuing operations | (35.1 | )% | (15.0 | )% | (14.0 | )% | (1.4 | )% | 16.6 | % | ||||||||||
Income (loss) from discontinued operations, net of taxes | (9.0 | )% | (3.1 | )% | (4.6 | )% | 5.6 | % | 5.6 | % | ||||||||||
Net income (loss) | (44.1 | )% | (18.1 | )% | (18.5 | )% | 4.2 | % | 22.2 | % | ||||||||||
Less: Net income (loss) attributable to redeemable noncontrolling interests | N/A | N/A | (11.0 | )% | N/A | 15.0 | % | |||||||||||||
Net income (loss) attributable to McAfee Corp. | N/A | N/A | (7.6 | )% | N/A | 7.3 | % | |||||||||||||
Comparison of Fiscal 2018 and Fiscal 2019
Net Revenue
Fiscal Year Ended | Variance in | |||||||||||||||
(in millions except percentages) | December 29, 2018 | December 28, 2019 | Dollars | Percent | ||||||||||||
Net revenue | $ | 1,161 | $ | 1,303 | $ | 142 | 12.2 | % | ||||||||
Net revenue increased $142 million, or 12.2 % from $1,161 million during fiscal 2018 to $1,303 million during fiscal 2019. The increase in net revenue was primarily attributable to (i) a $127 million increase in revenue consistent with growth in the Core Direct to Customer subscriber base, increases in TTM Dollar Based Retention—Core Direct to Consumer Customers, increases in ARPC, and growth in Mobile & Internet Service Provider channel which is inclusive of the sales of TunnelBear and (ii) a $30 million increase due to a reduced impact of purchase accounting adjustments primarily relating to the Sponsor Acquisition compared to prior period. These increases were partially offset by a $15 million decrease related release of revenue under reserve for a single customer in connection with such customer’s right under certain circumstances to claw-back revenue from us within twelve months of payment.
Cost of Sales
Fiscal Year Ended | Variance in | |||||||||||||||
(in millions except percentages) | December 29, 2018 | December 28, 2019 | Dollars | Percent | ||||||||||||
Cost of sales | $ | 386 | $ | 391 | $ | 5 | 1.3 | % | ||||||||
Gross profit margin | 66.8 | % | 70.0 | % | ||||||||||||
86
Confidential Treatment Requested by McAfee Corp.
Pursuant to 17 C.F.R. Section 200.83
Cost of sales increased $5 million, or 1.3%, from $386 million during fiscal 2018 to $391 million during fiscal 2019. The increase in cost of sales is primarily driven by $12 million in fair value adjustments to deferred revenue share in connection with purchase accounting primarily relating to the Sponsor Acquisition. This increase was partially offset by a reduction in various cost of sales expenses.
Operating Expenses
Fiscal Year Ended | Variance in | |||||||||||||||
(in millions except percentages) | December 29, 2018 | December 28, 2019 | Dollars | Percent | ||||||||||||
Sales and marketing | $ | 348 | $ | 299 | $ | (49 | ) | (14.1 | )% | |||||||
Research and development | 186 | 161 | (25 | ) | (13.4 | )% | ||||||||||
General and administrative | 170 | 182 | 12 | 7.1 | % | |||||||||||
Amortization of intangibles | 153 | 146 | (7 | ) | (4.6 | )% | ||||||||||
Restructuring charges | 19 | 6 | (13 | ) | (68.4 | )% | ||||||||||
Total | $ | 876 | $ | 794 | $ | (82 | ) | (9.4 | )% | |||||||
Sales and Marketing
Sales and marketing expense decreased $49 million, or 14.1%, from $348 million during fiscal 2018 to $299 million during fiscal 2019. The decrease in sales and marketing expense was primarily attributable to (i) a $28 million decrease in OEM partner expense, (ii) a $10 million decrease in employee expenses due to strategic initiatives in 2019, which resulted in a reduced headcount, and (iii) a $6 million decrease in external consulting primarily related to 2018 projects and a decrease in marketing and sales promotion expenses due to lower spend in 2019.
Research and Development
Research and development expense decreased $25 million, or 13.4%, from $186 million during fiscal 2018 to $161 million during fiscal 2019. The decrease in research and development expense was primarily attributable to (i) an $18 million decrease in employee expenses due to strategic initiatives in 2019, which resulted in a reduced headcount, and (ii) a decrease in other research and development expenses.
General and Administrative
General and administrative expense increased $12 million, or 7.1%, from $170 million during fiscal 2018 to $182 million during fiscal 2019. The increase in general and administrative expense was primarily attributable to a $12 million increase in legal counsel and external consulting expenses primarily for public offering preparation.
Amortization of Intangibles
Amortization of intangibles decreased $7 million, or 4.6%, from $153 million during fiscal 2018 to $146 million during fiscal 2019. The decrease is due to certain intangible assets becoming fully amortized in 2019.
Restructuring Charges
Restructuring charges decreased $13 million, or 68.4%, from $19 million during fiscal 2018 to $6 million during fiscal 2019. The decrease in restructuring charges was primarily attributable to (i) a $7 million decrease related to nonrecurring separation costs incurred in fiscal 2018 following the separation from Intel and (ii) a decrease in employee severance and benefits as a result of winding down of McAfee Acceleration Program (MAP) related headcount reduction initiatives in 2019 compared to 2018.
87
Confidential Treatment Requested by McAfee Corp.
Pursuant to 17 C.F.R. Section 200.83
Operating Income (Loss)
Fiscal Year Ended | Variance in | |||||||||||||||
(in millions except percentages) | December 29, 2018 | December 28, 2019 | Dollars | Percent | ||||||||||||
Operating income (loss) | $ | (101 | ) | $ | 118 | $ | 219 | (216.8 | )% | |||||||
Operating income (loss) margin | (8.7 | )% | 9.1 | % | ||||||||||||
Operating income (loss) increased $219 million, or 216.8%, from an operating loss of $101 million during fiscal 2018 to operating income $118 million during fiscal 2019. The overall net increase to operating income was primarily driven by (i) the $142 million increase in net revenue discussed above, (ii) a $28 million decrease in OEM partner expense due to lower shipments, and (iii) a $34 million decrease in employee expenses due to strategic initiatives in 2019, which resulted in a reduced headcount. These increases to operating income were partially offset by a $12 million increase in legal counsel and external consulting expenses primarily for public offering preparation.
Interest Expense and Other, Net
Fiscal Year Ended | Variance in | |||||||||||||||
(in millions except percentages) | December 29, 2018 | December 28, 2019 | Dollars | Percent | ||||||||||||
Interest (expense) and other, net | $ | (308 | ) | $ | (296 | ) | $ | 12 | (3.9 | )% | ||||||
Interest expense and other, net decreased $12 million, or 3.9%, from a $308 million expense during fiscal 2018 to $296 million expense during fiscal 2019. The decrease in interest expense and other, net was primarily attributable to the refinancing of certain of our indebtedness in fiscal 2018.
Provision for Income Tax Expense
Fiscal Year Ended | Variance in | |||||||||||||||
(in millions except percentages) | December 29, 2018 | December 28, 2019 | Dollars | Percent | ||||||||||||
Provision for income tax expense | $ | 29 | $ | 38 | $ | 9 | 31.0 | % | ||||||||
Provision for income tax expense increased $9 million, or 31%, from $29 million expense during fiscal 2018 to $38 million expense during fiscal 2019. The increase in provision for income tax expense was primarily attributable to a $9 million increase in reserve for uncertain tax positions.
Discontinued Operations
Fiscal Year Ended | Variance in | |||||||||||||||
(in millions except percentages) | December 29, 2018 | December 28, 2019 | Dollars | Percent | ||||||||||||
Net revenue | $ | 1,248 | $ | 1,332 | $ | 84 | 6.7 | % | ||||||||
Operating income (loss) | (72 | ) | 8 | 80 | (111.1 | )% | ||||||||||
Income (loss) from discontinued operations before income taxes | (71 | ) | 8 | 79 | (111.3 | )% | ||||||||||
Income tax expense | 33 | 49 | 16 | 48.5 | % | |||||||||||
Loss from discontinued operations, net of tax | (104 | ) | (41 | ) | 63 | (60.6 | )% | |||||||||
Net revenue—Discontinued Operations increased $84 million, or 6.7%, from $1,248 million during fiscal 2018 to $1,332 million during fiscal 2019. The increase was primarily attributable to (i) a $79 million increase
88
Confidential Treatment Requested by McAfee Corp.
Pursuant to 17 C.F.R. Section 200.83
due to a reduced impact of purchase accounting adjustments primarily relating to the Sponsor Acquisition compared to prior period, and (ii) a $15 million increase in enterprise revenue driven by growth in our cloud security products due to our sales force integration efforts following our Skyhigh acquisition in the first quarter of fiscal 2018. These increases were partially offset by a $10 million decrease in revenue from certain legacy enterprise offerings.
Operating income (loss)—Discontinued Operations improved $80 million, or 111.1%, from an operating loss of $72 million during fiscal 2018 to an operating income of $8 million during fiscal 2019. The improvement in operating income was primarily attributable to (i) the increase in Enterprise revenue as discussed above, and (ii) $25 million decrease in employee expenses from lower headcount and a reduction in equity-based compensation and cash in lieu related to awards issued in connection with the Intel separation. These were partially offset by a $26 million increase in commissions expense due to increases in amortization of deferred commissions expense as deferred commissions balances continue to build subsequent to purchase accounting adjustments at the time of separation from Intel and subsequent to adoption of Accounting Standards Codification (“ASC”) 606.
Income tax expense—Discontinued Operations increased $16 million, or 48.5%, from $33 million during fiscal 2018 to a $49 million during fiscal 2019. The increase was primarily attributable to (i) a $4 million increase in reserve for uncertain tax positions and (ii) a $9 million increase in federal tax expense due to the impact of distributions through corporate subsidiaries.
Comparison of Fiscal 2019 and Fiscal 2020
Net Revenue
Fiscal Year Ended | Variance in | |||||||||||||||
(in millions except percentages) | December 28, 2019 | December 26, 2020 | Dollars | Percent | ||||||||||||
Net revenue | $ | 1,303 | $ | 1,558 | $ | 255 | 19.6 | % | ||||||||
Net revenue increased $255 million, or 19.6%, from $1,303 million during fiscal 2019 to $1,558 million during fiscal 2020. The increase was primarily attributable to a combination of (i) increases in ARPC, (ii) higher Core Direct to Consumer Customer subscriber base from prior year, (iii) increase in TTM Dollar Based Retention—Core Direct to Consumer Customers, (iv) increased new subscribers from improvements in customer acquisition across channels combined with higher demand due to the accelerated shift to working from home as a result of the
COVID-19
pandemic, (v) growth in our Mobile & Internet Service Provider channel, and (vi) increase in secure search revenue.Cost of Sales
Fiscal Year Ended | Variance in | |||||||||||||||
(in millions except percentages) | December 28, 2019 | December 26, 2020 | Dollars | Percent | ||||||||||||
Cost of sales | $ | 391 | $ | 444 | $ | 53 | 13.6 | % | ||||||||
Gross profit margin | 70.0 | % | 71.5 | % | ||||||||||||
Cost of sales increased $53 million, or 13.6%, from $391 million during fiscal 2019 to $444 million during fiscal 2020. The increase in cost of sales was primarily attributable to (i) a $46 million increase in revenue share expense and online transaction processing fees resulting from increases in Core Direct to Consumer Customer subscriber base, and (ii) a $5 million increase in equity-based compensation primarily due to expense relating to our Replacement RSUs recognized as a cumulative
catch-up
upon consummation of the IPO.89
Confidential Treatment Requested by McAfee Corp.
Pursuant to 17 C.F.R. Section 200.83
Operating Expenses
Fiscal Year Ended | Variance in | |||||||||||||||
(in millions except percentages) | December 28, 2019 | December 26, 2020 | Dollars | Percent | ||||||||||||
Sales and marketing | $ | 299 | $ | 348 | $ | 49 | 16.4 | % | ||||||||
Research and development | 161 | 188 | 27 | 16.8 | % | |||||||||||
General and administrative | 182 | 235 | 53 | 29.1 | % | |||||||||||
Amortization of intangibles | 146 | 143 | (3 | ) | (2.1 | )% | ||||||||||
Restructuring charges | 6 | 2 | (4 | ) | (66.7 | )% | ||||||||||
Total | $ | 794 | $ | 916 | $ | 122 | 15.4 | % | ||||||||
Sales and Marketing
Sales and marketing expense increased $49 million, or 16.4%, from $299 million during fiscal 2019 to $348 million during fiscal 2020. The increase in sales and marketing expense was primarily attributable to (i) a $45 million increase in product placement fees and marketing development funds under agreements with certain OEM partners, primarily driven by increased PC shipments, (ii) a $22 million increase in equity-based compensation primarily due to expense relating to our Replacement RSUs recognized as a cumulative
catch-up
upon consummation of the IPO, and (iii) a $19 million increase in advertising expenses primarily due to online campaigns in 2020. These increases were partially offset by (i) a $16 million decrease in external consulting costs primarily related to strategic initiatives in 2019, (ii) a $6 million decrease in employee expenses primarily driven by a decrease in headcount, (iii) a $4 million decrease in travel expenses due to theCOVID-19
pandemic and reduction in headcount, and (iv) a decrease in other sales and marketing expenses.Research and Development
Research and development expense increased $27 million, or 16.8%, from $161 million during fiscal 2019 to $188 million during fiscal 2020. The increase in research and development expense was primarily attributable to a $39 million increase in equity-based compensation primarily due to expense relating to our Replacement RSUs recognized as a cumulative
catch-up
upon consummation of the IPO. These increases were partially offset by a $10 million decrease in employee expenses primarily driven by a decrease in headcount and a decrease in travel expenses due to theCOVID-19
pandemic.General and Administrative
General and administrative expense increased $53 million, or 29.1%, from $182 million during fiscal 2019 to $235 million during fiscal 2020. The increase in expense was primarily attributable to (i) a $42 million increase in equity-based compensation primarily due to expense relating to our Replacement RSUs recognized as a cumulative
catch-up
upon consummation of the IPO, and (ii) a $17 million increase in management fees due to the fee incurred upon termination of the management agreement at the time of IPO partially offset by management fee savings subsequent to the IPO. These increases were partially offset by a $9 million decrease in external consulting costs primarily related to strategic initiatives in 2019.Amortization of Intangibles
Amortization of intangibles decreased $3 million, or 2.1%, from $146 million during fiscal 2019 to $143 million during fiscal 2020. The decrease was the result of certain assets recorded at the Sponsor Acquisition that have since fully amortized.
90
Confidential Treatment Requested by McAfee Corp.
Pursuant to 17 C.F.R. Section 200.83
Restructuring Charges
Restructuring charges decreased $4 million, or 66.7%, from $6 million during fiscal 2019 to $2 million during fiscal 2020. The decrease was a result of restructuring expenses recognized in 2019 related to staffing realignment.
Operating Income
Fiscal Year Ended | Variance in | |||||||||||||||
(in millions except percentages) | December 28, 2019 | December 26, 2020 | Dollars | Percent | ||||||||||||
Operating income | $ | 118 | $ | 198 | $ | 80 | 67.8 | % | ||||||||
Operating income margin | 9.1 | % | 12.7 | % | ||||||||||||
Operating income increased $80 million, or 67.8%, from $118 million during fiscal 2019 to $198 million during fiscal 2020. The overall net increase to operating income was primarily driven by (i) the $255 million increase in net revenue discussed above, and (ii) a $25 million decrease in external consulting costs primarily related to strategic initiatives in 2019. These increases to operating income were partially offset by (i) a $108 million increase in equity-based compensation primarily due to expense relating to our Replacement RSUs recognized as a cumulative
catch-up
upon consummation of the IPO, (ii) a $46 million increase in revenue share expense and online transaction processing fees resulting from increases in Core Direct to Consumer Customer subscriber base, (iii) a $45 million increase in product placement fees and marketing development funds under agreements with certain OEM partners, primarily driven by increased PC shipments, and (iv) increases in other operating expenses discussed above.Interest Expense and Other, Net
Fiscal Year Ended | Variance in | |||||||||||||||
(in millions except percentages) | December 28, 2019 | December 26, 2020 | Dollars | Percent | ||||||||||||
Interest (expense) and other, net | $ | (296 | ) | $ | (307 | ) | $ | (11 | ) | 3.7 | % | |||||
Interest expense and other, net increased $11 million, or 3.7%, from $296 million expense during fiscal 2019 to $307 million expense during fiscal 2020. The increase was primarily attributable to an increase in interest expense primarily due to the write off of deferred costs on the 2nd Lien Term Loan upon repayment and a portion of deferred costs on the 1st Lien USD Term Loan partially offset by a decrease in interest expense incurred after the repayment of the 2nd Lien Term Loan.
Provision for Income Tax Expense
Fiscal Year Ended | Variance in | |||||||||||||||
(in millions except percentages) | December 28, 2019 | December 26, 2020 | Dollars | Percent | ||||||||||||
Provision for income tax expense | $ | 38 | $ | 5 | $ | (33 | ) | (86.8 | )% | |||||||
Provision for income tax expense decreased $33 million, or 86.8%, from $38 million expense for the year ended December 28, 2019 to $5 million expense for the year ended December 26, 2020. The decrease was primarily attributable to (i) a $22 million decrease due to change in reserve for uncertain tax positions due to an election to treat one of our subsidiary entities as a corporation for U.S. federal income tax purposes and (ii) a $7 million decrease in foreign provisions.
91
Confidential Treatment Requested by McAfee Corp.
Pursuant to 17 C.F.R. Section 200.83
Discontinued Operations
Fiscal Year Ended | Variance in | |||||||||||||||
(in millions except percentages) | December 28, 2019 | December 26, 2020 | Dollars | Percent | ||||||||||||
Net revenue | $ | 1,332 | $ | 1,348 | $ | 16 | 1.2 | % | ||||||||
Operating income (loss) | 8 | (46 | ) | (54 | ) | (675.0 | )% | |||||||||
Income (loss) from discontinued operations before income taxes | 8 | (46 | ) | (54 | ) | (675.0 | )% | |||||||||
Income tax expense | 49 | 25 | (24 | ) | (49.0 | )% | ||||||||||
Loss from discontinued operations, net of tax | (41 | ) | (71 | ) | (30 | ) | 73.2 | % | ||||||||
Net revenue—Discontinued Operations increased $16 million, or 1.2% from $1,332 million during fiscal 2019 to $1,348 million during fiscal 2020. The increase was primarily attributable to a $37 million increase due to a reduced impact of purchase accounting adjustments primarily relating to the Sponsor Acquisition, partially offset by a $21 million decrease in Enterprise revenue largely due to lower year on year billings over the prior 12 months due to the continued reorientation of our Enterprise business.
Operating income (loss)—Discontinued Operations decreased $54 million, or 675.0% from operating income of $8 million during fiscal 2019 to an operating loss of $46 million during fiscal 2020. The change in operating loss was primarily attributable to a $172 million increase in equity-based and cash in lieu of equity compensation primarily due to expense relating to our Replacement RSUs recognized as a cumulative
catch-up
upon consummation of the IPO. These increases in expenses were partially offset by (i) a $40 million decrease in depreciation and amortization largely as a result of certain assets recorded at the Sponsor Acquisition that have since fully amortized, (ii) a $38 million decrease employee expenses principally due to lower headcount as a result of strategic and transformational initiatives, in addition to decreased travel and event expenses partially related to theCOVID-19
pandemic, (iii) a $23 million decrease in external consulting and marketing expenses primarily due to the completion of 2019 campaigns and strategic initiatives, (iv) the $16 million increase in revenue discussed above, and (v) a $16 million decrease in acquisition and integrations costs due to compensation relating to one of our acquisitions becoming fully earned in January 2020.Income tax expense—Discontinued Operations decreased $24 million, or 49.0%, from $49 million for the year ended December 28, 2019 to $25 million for the year ended December 26, 2020. The decrease was primarily attributable to (i) a $4 million decrease due to change in reserve for uncertain tax positions due to an election to treat one of our subsidiary entities as a corporation for U.S. federal income tax purposes, (ii) a $10 million decrease in foreign provisions and (iii) a $10 million decrease due to outside basis differences in a consolidated subsidiary partnership.
Comparison of the Six Months Ended June 27, 2020 and June 26, 2021
Net Revenue
Six Months Ended | Variance in | |||||||||||||||
(in millions except percentages) | June 27, 2020 | June 26, 2021 | Dollars | Percent | ||||||||||||
Net revenue | $ | 737 | $ | 909 | $ | 172 | 23.3 | % | ||||||||
The net revenue increase was primarily driven by (i) growth in Core Direct to Consumer Customers, (ii) increases in TTM Dollar Based Retention—Core Direct to Consumer Customers, (iii) increases in secure search revenue, and (iv) growth in Mobile and Internet Service Provider business.
92
Confidential Treatment Requested by McAfee Corp.
Pursuant to 17 C.F.R. Section 200.83
Net Revenue by Geographical Region
Net revenue by geographic region based on the
sell-to
address of theend-users
is as follows:Six Months Ended | ||||||||||||||||
(in millions except percentages) | June 27, 2020 | % of Total | June 26, 2021 | % of Total | ||||||||||||
Americas | $ | 482 | 65.4 | % | $ | 601 | 66.1 | % | ||||||||
EMEA | 175 | 23.7 | % | 213 | 23.4 | % | ||||||||||
APJ | 80 | 10.9 | % | 95 | 10.5 | % | ||||||||||
Total net revenue | $ | 737 | 100.0 | % | $ | 909 | 100.0 | % | ||||||||
The Americas include the U.S., Canada and Latin America; EMEA includes Europe, the Middle East and Africa; APJ includes Asia Pacific and Japan.
Net revenue by geographic region in the first six months of fiscal 2021 showed growth in all geographies when compared to the corresponding periods in the prior year and we expect such percentages to remain relatively consistent in the near term.
Net Revenue by Channel
Direct to Consumer revenue is from customers who transact with us directly through McAfee web properties, including those converted after the trial period of the McAfee product preinstalled on their new PC purchase or converted subsequent to their subscription period purchased from another channel. Indirect revenue is driven by users who purchase directly through a partner inclusive of mobile providers, ISPs, electronics retailers, ecommerce sites, and search providers.
Net revenue by channel of the
end-users
is as follows:Six Months Ended | ||||||||||||||||
(in millions except percentages) | June 27, 2020 | % of Total | June 26, 2021 | % of Total | ||||||||||||
Direct to Consumer | $ | 575 | 78.0 | % | $ | 673 | 74.0 | % | ||||||||
Indirect | 162 | 22.0 | % | 236 | 26.0 | % | ||||||||||
Total net revenue | $ | 737 | 100.0 | % | $ | 909 | 100.0 | % | ||||||||
Percentage of net revenue by channel in the first six months of fiscal 2021 was similar to the corresponding periods in the prior year and we expect such percentages to remain relatively consistent in the near term.
Cost of Sales
Six Months Ended | Variance in | |||||||||||||||
(in millions except percentages) | June 27, 2020 | June 26, 2021 | Dollars | Percent | ||||||||||||
Cost of sales | $ | 209 | $ | 232 | $ | 23 | 11.0 | % | ||||||||
Gross profit margin | 71.6 | % | 74.5 | % | ||||||||||||
The increase in cost of sales was primarily attributable to a $19 million increase in revenue share expense and a $4 million increase in transaction processing fees driven by increases in Core Direct to Consumer Customer subscriber base.
93
Confidential Treatment Requested by McAfee Corp.
Pursuant to 17 C.F.R. Section 200.83
Operating Expenses
Six Months Ended | Variance in | |||||||||||||||
(in millions except percentages) | June 27, 2020 | June 26, 2021 | Dollars | Percent | ||||||||||||
Sales and marketing | $ | 140 | $ | 174 | $ | 34 | 24.3 | % | ||||||||
Research and development | 75 | 92 | 17 | 22.7 | % | |||||||||||
General and administrative | 100 | 93 | (7 | ) | (7.0 | )% | ||||||||||
Amortization of intangibles | 72 | 49 | (23 | ) | (31.9 | )% | ||||||||||
Restructuring charges | 1 | 8 | 7 | 700.0 | % | |||||||||||
Total | $ | 388 | $ | 416 | $ | 28 | 7.2 | % | ||||||||
The increase in sales and marketing expense was primarily attributable to (i) a $13 million increase in marketing spend, (ii) a $10 million increase due to fluctuations in the amount of product placement fees and marketing development funds recorded as reductions of net revenue rather than sales and marketing expenses, and (iii) the increase in equity-based compensation expense discussed above.
The increase in research and development expense was primarily attributable to the increase in equity-based compensation expense discussed above and an increase in employee expenses.
The decrease in general and administrative expense was primarily attributable to a decrease in consulting costs and a decrease in rent expense due to expiring leases.
The decrease in amortization of intangibles was primarily attributable to assets that became fully amortized in March 2021.
The increase in restructuring charges is primarily the result of
one-time
termination benefits to the impacted employees, including severance payments and healthcare and other accrued benefits related to the workforce reduction that was initiated in December 2020.Operating Income
Six Months Ended | Variance in | |||||||||||||||
(in millions except percentages) | June 27, 2020 | June 26, 2021 | Dollars | Percent | ||||||||||||
Operating income | $ | 140 | $ | 261 | $ | 121 | 86.4 | % | ||||||||
Operating income margin | 19.0 | % | 28.7 | % | ||||||||||||
The operating income increase was primarily driven by (i) the $172 million increase in net revenue and (ii) the $23 million decrease in amortization expense discussed above, partially offset by (i) a $19 million increase in revenue share expense resulting from increases in Core Direct to Consumer Customer subscriber base, (ii) a $10 million increase in product placement fees and marketing development funds under agreements with certain OEM partners, primarily driven by changes in amounts recorded as reductions in revenue as discussed above in the factors affecting comparability, (iii) the increase in equity-based compensation discussed above, (iv) a $13 million increase in marketing campaigns, (v) the $7 million increase in restructuring expenses, and (vi) a $4 million increase in transaction processing fees.
Interest Expense and Other, Net
Six Months Ended | Variance in | |||||||||||||||
(in millions except percentages) | June 27, 2020 | June 26, 2021 | Dollars | Percent | ||||||||||||
Interest (expense) and other, net | $ | (149 | ) | $ | (118 | ) | $ | 31 | (20.8 | )% | ||||||
94
Confidential Treatment Requested by McAfee Corp.
Pursuant to 17 C.F.R. Section 200.83
The decrease in interest expense and other, net was primarily attributable to the payoff of our 2nd Lien Term Loan and the $300 million prepayment on our 1st Lien USD Term Note in the fourth quarter of 2020 in addition to a lower LIBOR rate, partially offset by $8 million in expense related to an adjustment in our liabilities under our tax receivable agreement.
Provision for Income Tax Expense
Six Months Ended | Variance in | |||||||||||||||
(in millions except percentages) | June 27, 2020 | June 26, 2021 | Dollars | Percent | ||||||||||||
Provision for income tax (benefit) | $ | (5 | ) | $ | 7 | $ | 12 | (240.0 | )% | |||||||
The change in the provision for income tax benefit was primarily attributable to (i) a $13 million decrease in reserve for uncertain tax positions due to an election to treat one of our subsidiary entities as a corporation for U.S. federal income tax purposes in 2020 (ii) a $6 million increase in foreign tax expense related to our equity awards, partially offset by an $8 million decrease in reserve for uncertain tax positions due to a ruling in a foreign jurisdiction in 2021.
Discontinued Operations
Six Months Ended | Variance in | |||||||||||||||
(in millions except percentages) | June 27, 2020 | June 26, 2021 | Dollars | Percent | ||||||||||||
Net revenue | $ | 664 | $ | 677 | $ | 13 | 2.0 | % | ||||||||
Operating income | 58 | 73 | 15 | 25.9 | % | |||||||||||
Income from discontinued operations before income taxes | 58 | 69 | 11 | 19.0 | % | |||||||||||
Income tax expense | 17 | 18 | 1 | 5.9 | % | |||||||||||
Income from discontinued operations, net of tax | 41 | 51 | 10 | 24.4 | % | |||||||||||
Net revenue—The increase in net revenue related to discontinued operations was consistent with increased billings when compared to the prior period.
Operating income—The improvement in operating income from discontinued operations was primarily driven by (i) the $13 million increase in net revenue, (ii) a $63 million decrease in amortization expense due to assets that were fully amortized in 2020 in addition to discontinuing amortization in March 2021 for Enterprise Business assets held for sale, (iii) a $26 million decrease in operating expenses primarily due to reduced headcount related to the reduction in force that was initiated in December 2020, (iv) an $11 million decrease in depreciation partially due to discontinuing depreciation in March 2021 for Enterprise Business assets held for sale, (v) an $11 million decrease in other sales and marketing expenses, and (vi) a $6 million decrease in limited travel caused by the
COVID-19
pandemic. These increases were partially offset by (i) a $60 million increase in transformation and transition expenses comprised of consulting fees, legal fees, and other costs to facilitate the sale transaction and the separation of the Enterprise Business, including incremental costs associated with data disentanglement and acceleration of data migration to the clouds, (ii) the $42 million increase in equity-based compensation expense discussed above, and (iii) a $17 million increase in restructuring expenses related to the workforce reduction that was initiated in December 2020.Income tax expense—Discontinued Operations was consistent for the two periods.
Quarterly Results of Operations and Other Financial and Operations Data
The following tables set forth selected unaudited quarterly results of operations and other financial and operations data for each of the eight three month periods presented below, as well as the percentage that each line item represents of net revenue. The information for each of these quarters has been prepared on the same basis as
95
Confidential Treatment Requested by McAfee Corp.
Pursuant to 17 C.F.R. Section 200.83
the audited annual consolidated financial statements included elsewhere in this prospectus and in the opinion of management, includes all adjustments, which include only normal recurring adjustments, necessary for the fair statement of our consolidated results of operations for these periods. This data should be read in conjunction with our consolidated financial statements and related notes included elsewhere in this prospectus. Our quarterly results of operations will vary in the future. These quarterly operating results are not necessarily indicative of our operating results for any future period. See “—Factors Affecting the Comparability of Our Results of Operations” for the key factors that impacting the comparability of our results of operations from period to period and future periods.
Three Months Ended | ||||||||||||||||||||||||||||||||
(in millions except per share data) | September 28, 2019 | December 28, 2019 | March 28, 2020 | June 27, 2020 | September 26, 2020 | December 26, 2020 | March 27, 2021 | June 26, 2021 | ||||||||||||||||||||||||
Net revenue | $ | 322 | $ | 347 | $ | 354 | $ | 383 | $ | 395 | $ | 426 | $ | 442 | $ | 467 | ||||||||||||||||
Cost of sales | 95 | 99 | 99 | 110 | 112 | 123 | 116 | 116 | ||||||||||||||||||||||||
Gross profit | 227 | 248 | 255 | 273 | 283 | 303 | 326 | 351 | ||||||||||||||||||||||||
Operating expenses: | ||||||||||||||||||||||||||||||||
Sales and marketing | 73 | 84 | 60 | 80 | 88 | 120 | 85 | 89 | ||||||||||||||||||||||||
Research and development | 40 | 37 | 38 | 37 | 35 | 78 | 44 | 48 | ||||||||||||||||||||||||
General and administrative | 50 | 53 | 58 | 42 | 43 | 92 | 48 | 45 | ||||||||||||||||||||||||
Amortization of intangibles | 36 | 36 | 36 | 36 | 36 | 35 | 36 | 13 | ||||||||||||||||||||||||
Restructuring charges | — | 1 | 1 | — | — | 1 | 8 | — | ||||||||||||||||||||||||
Total operating expenses | 199 | 211 | 193 | 195 | 202 | 326 | 221 | 195 | ||||||||||||||||||||||||
Operating income (loss) | 28 | 37 | 62 | 78 | 81 | (23 | ) | 105 | 156 | |||||||||||||||||||||||
Interest (expense) and other, net | (76 | ) | (77 | ) | (75 | ) | (74 | ) | (73 | ) | (85 | ) | (60 | ) | (58 | ) | ||||||||||||||||
Foreign exchange gain (loss), net | 44 | (24 | ) | 11 | (17 | ) | (43 | ) | (55 | ) | 35 | (20 | ) | |||||||||||||||||||
Income (loss) from continuing operations before income taxes | (4 | ) | (64 | ) | (2 | ) | (13 | ) | (35 | ) | (163 | ) | 80 | 78 | ||||||||||||||||||
Provision for income tax expense (benefit) | 17 | 9 | (10 | ) | 5 | 5 | 5 | (3 | ) | 10 | ||||||||||||||||||||||
Income (loss) from continuing operations | (21 | ) | (73 | ) | 8 | (18 | ) | (40 | ) | (168 | ) | 83 | 68 | |||||||||||||||||||
Income (loss) from discontinued operations, net of taxes | 12 | (8 | ) | 1 | 40 | 40 | (152 | ) | 11 | 40 | ||||||||||||||||||||||
Net income (loss) | $ | (9 | ) | $ | (81 | ) | $ | 9 | $ | 22 | $ | — | $ | (320 | ) | $ | 94 | $ | 108 | |||||||||||||
Less: Net income (loss) attributable to redeemable noncontrolling interests | N/A | N/A | N/A | N/A | N/A | (202 | ) | 64 | 72 | |||||||||||||||||||||||
Net income (loss) attributable to McAfee Corp. | N/A | N/A | N/A | N/A | N/A | $ | (118 | ) | $ | 30 | $ | 36 | ||||||||||||||||||||
Net income (loss) attributable to McAfee Corp.: | ||||||||||||||||||||||||||||||||
Income (loss) from continuing operations attributable to McAfee Corp. | N/A | N/A | N/A | N/A | N/A | $ | (55 | ) | $ | 27 | $ | 23 | ||||||||||||||||||||
Income (loss) from discontinued operations attributable to McAfee Corp. | N/A | N/A | N/A | N/A | N/A | (63 | ) | 3 | 13 | |||||||||||||||||||||||
Net income (loss) attributable to McAfee Corp. | N/A | N/A | N/A | N/A | N/A | $ | (118 | ) | $ | 30 | $ | 36 | ||||||||||||||||||||
96
Confidential Treatment Requested by McAfee Corp.
Pursuant to 17 C.F.R. Section 200.83
Three Months Ended | ||||||||||||||||||||||||||||||||
(in millions except per share data) | September 28, 2019 | December 28, 2019 | March 28, 2020 | June 27, 2020 | September 26, 2020 | December 26, 2020 | March 27, 2021 | June 26, 2021 | ||||||||||||||||||||||||
Earnings (loss) per share attributable to McAfee Corp., basic: | ||||||||||||||||||||||||||||||||
Continuing operations | N/A | N/A | N/A | N/A | N/A | $ | (0.34 | ) | $ | 0.17 | $ | 0.14 | ||||||||||||||||||||
Discontinued operations | N/A | N/A | N/A | N/A | N/A | (0.39 | ) | 0.02 | 0.08 | |||||||||||||||||||||||
Earnings (loss) per share, basic | N/A | N/A | N/A | N/A | N/A | $ | (0.73 | ) | $ | 0.18 | $ | 0.22 | ||||||||||||||||||||
Earnings (loss) per share attributable to McAfee Corp., diluted: | ||||||||||||||||||||||||||||||||
Continuing operations | N/A | N/A | N/A | N/A | N/A | $ | (0.34 | ) | $ | 0.16 | $ | 0.14 | ||||||||||||||||||||
Discontinued operations | N/A | N/A | N/A | N/A | N/A | (0.39 | ) | 0.02 | 0.07 | |||||||||||||||||||||||
Earnings (loss) per share, diluted | N/A | N/A | N/A | N/A | N/A | $ | (0.73 | ) | $ | 0.18 | $ | 0.21 | ||||||||||||||||||||
Weighted-average shares outstanding, basic | N/A | N/A | N/A | N/A | N/A | 162.3 | 162.4 | 165.0 | ||||||||||||||||||||||||
Weighted-average shares outstanding, diluted | N/A | N/A | N/A | N/A | N/A | 162.3 | 176.3 | 182.8 | ||||||||||||||||||||||||
Three Months Ended | ||||||||||||||||||||||||||||||||
September 28, 2019 | December 28, 2019 | March 28, 2020 | June 27, 2020 | September 26, 2020 | December 26, 2020 | March 27, 2021 | June 26, 2021 | |||||||||||||||||||||||||
Net revenue | 100.0 | % | 100.0 | % | 100.0 | % | 100.0 | % | 100.0 | % | 100.0 | % | 100.0 | % | 100.0 | % | ||||||||||||||||
Cost of sales | 29.5 | % | 28.5 | % | 28.0 | % | 28.7 | % | 28.4 | % | 28.9 | % | 26.2 | % | 24.8 | % | ||||||||||||||||
Gross profit | 70.5 | % | 71.5 | % | 72.0 | % | 71.3 | % | 71.6 | % | 71.1 | % | 73.8 | % | 75.2 | % | ||||||||||||||||
Operating expenses: | ||||||||||||||||||||||||||||||||
Sales and marketing | 22.7 | % | 24.2 | % | 16.9 | % | 20.9 | % | 22.3 | % | 28.2 | % | 19.2 | % | 19.1 | % | ||||||||||||||||
Research and development | 12.4 | % | 10.7 | % | 10.7 | % | 9.7 | % | 8.9 | % | 18.3 | % | 10.0 | % | 10.3 | % | ||||||||||||||||
General and administrative | 15.5 | % | 15.3 | % | 16.4 | % | 11.0 | % | 10.9 | % | 21.6 | % | 10.9 | % | 9.6 | % | ||||||||||||||||
Amortization of intangibles | 11.2 | % | 10.4 | % | 10.2 | % | 9.4 | % | 9.1 | % | 8.2 | % | 8.1 | % | 2.8 | % | ||||||||||||||||
Restructuring charges | — | 0.3 | % | 0.3 | % | — | — | 0.2 | % | 1.8 | % | — | ||||||||||||||||||||
Total operating expenses | 61.8 | % | 60.8 | % | 54.5 | % | 50.9 | % | 51.1 | % | 76.5 | % | 50.0 | % | 41.8 | % | ||||||||||||||||
Operating income (loss) | 8.7 | % | 10.7 | % | 17.5 | % | 20.4 | % | 20.5 | % | (5.4 | )% | 23.8 | % | 33.4 | % | ||||||||||||||||
Interest (expense) income and other, net | (23.6 | )% | (22.2 | )% | (21.2 | )% | (19.3 | )% | (18.5 | )% | (20.0 | )% | (13.6 | )% | (12.4 | )% | ||||||||||||||||
Foreign exchange gain (loss), net | 13.7 | % | (6.9 | )% | 3.1 | % | (4.4 | )% | (10.9 | )% | (12.9 | )% | 7.9 | % | (4.3 | )% | ||||||||||||||||
Income (loss) from continuing operations before income taxes | (1.2 | )% | (18.4 | )% | (0.6 | )% | (3.4 | )% | (8.9 | )% | (38.3 | )% | 18.1 | % | 16.7 | % | ||||||||||||||||
Provision for income tax expense (benefit) | 5.3 | % | 2.6 | % | (2.8 | )% | 1.3 | % | 1.3 | % | 1.2 | % | (0.7 | )% | 2.1 | % | ||||||||||||||||
Income (loss) from continuing operations | (6.5 | )% | (21.0 | )% | 2.3 | % | (4.7 | )% | (10.1 | )% | (39.4 | )% | 18.8 | % | 14.6 | % | ||||||||||||||||
Income (loss) from discontinued operations, net of taxes | 3.7 | % | (2.3 | )% | 0.3 | % | 10.4 | % | 10.1 | % | (35.7 | )% | 2.5 | % | 8.6 | % | ||||||||||||||||
Net income (loss) | (2.8 | )% | (23.3 | )% | 2.5 | % | 5.7 | % | — | (75.1 | )% | 21.3 | % | 23.1 | % | |||||||||||||||||
Less: Net income (loss) attributable to redeemable noncontrolling interests | N/A | N/A | N/A | N/A | N/A | (47.4 | )% | 14.5 | % | 15.4 | % | |||||||||||||||||||||
Net income (loss) attributable to McAfee Corp. | N/A | N/A | N/A | N/A | N/A | (27.7 | )% | 6.8 | % | 7.7 | % | |||||||||||||||||||||
97
Confidential Treatment Requested by McAfee Corp.
Pursuant to 17 C.F.R. Section 200.83
The following tables present” section for a description of the
non-GAAP
financial measures for each of the eight three month periods presented below. In addition to our results determined in accordance with GAAP, we believe the followingnon-GAAP
measures are useful in evaluating our operating performance. See “Description of
Non-GAAP
Adjustmentsnon-GAAP
measures and the adjustments to reconcile to GAAP.Three Months Ended | ||||||||||||||||||||||||||||||||
(in millions except percentages) | September 28, 2019 | December 28, 2019 | March 28, 2020 | June 27, 2020 | September 26, 2020 | December 26, 2020 | March 27, 2021 | June 26, 2021 | ||||||||||||||||||||||||
Net revenue | $ | 322 | $ | 347 | $ | 354 | $ | 383 | $ | 395 | $ | 426 | $ | 442 | $ | 467 | ||||||||||||||||
Net income (loss) | $ | (9 | ) | $ | (81 | ) | $ | 9 | $ | 22 | $ | — | $ | (320 | ) | $ | 94 | $ | 108 | |||||||||||||
Net income (loss) margin | (2.8 | )% | (23.3 | )% | 2.5 | % | 5.7 | % | — | (75.1 | )% | 21.3 | % | 23.1 | % | |||||||||||||||||
Adjusted operating income | $ | 104 | $ | 119 | $ | 152 | $ | 151 | $ | 158 | $ | 163 | $ | 192 | $ | 211 | ||||||||||||||||
Adjusted operating income margin | 32.3 | % | 34.3 | % | 42.9 | % | 39.4 | % | 40.0 | % | 38.3 | % | 43.4 | % | 45.2 | % | ||||||||||||||||
Adjusted EBITDA | $ | 112 | $ | 126 | $ | 159 | $ | 158 | $ | 164 | $ | 170 | $ | 199 | $ | 218 | ||||||||||||||||
Adjusted EBITDA margin | 34.8 | % | 36.3 | % | 44.9 | % | 41.3 | % | 41.5 | % | 39.9 | % | 45.0 | % | 46.7 | % | ||||||||||||||||
Adjusted net income | $ | 26 | $ | 36 | $ | 64 | $ | 63 | $ | 70 | $ | 81 | $ | 110 | $ | 125 | ||||||||||||||||
Adjusted net income margin | 8.1 | % | 10.4 | % | 18.1 | % | 16.4 | % | 17.7 | % | 19.0 | % | 24.9 | % | 26.8 | % | ||||||||||||||||
98
Confidential Treatment Requested by McAfee Corp.
Pursuant to 17 C.F.R. Section 200.83
The following tables present cash flow data for each of the eight three month periods presented below:
Three Months Ended | ||||||||||||||||||||||||||||||||
(in millions) | September 28, 2019 | December 28, 2019 | March 28, 2020 | June 27, 2020 | September 26, 2020 | December 26, 2020 | March 27, 2021 | June 26, 2021 | ||||||||||||||||||||||||
Net cash provided by operating activities | 189 | 211 | 171 | 117 | 176 | 296 | 259 | 189 | ||||||||||||||||||||||||
Net cash used in investing activities | (18 | ) | (21 | ) | (21 | ) | (12 | ) | (7 | ) | (11 | ) | (11 | ) | (7 | ) | ||||||||||||||||
Net cash provided by (used in) financing activities | (62 | ) | (265 | ) | 239 | (401 | ) | (83 | ) | (406 | ) | (130 | ) | (109 | ) | |||||||||||||||||
Free cash flow | 171 | 190 | 150 | 110 | 169 | 285 | 248 | 182 | ||||||||||||||||||||||||
Three Months Ended | ||||||||||||||||||||||||||||||||
(in millions except percentages) | September 28, 2019 | December 28, 2019 | March 28, 2020 | June 27, 2020 | September 26, 2020 | December 26, 2020 | March 27, 2021 | June 26, 2021 | ||||||||||||||||||||||||
Net income (loss) | $ | (9 | ) | $ | (81 | ) | $ | 9 | $ | 22 | $ | — | $ | (320 | ) | $ | 94 | $ | 108 | |||||||||||||
Add: Amortization | 63 | 62 | 63 | 63 | 62 | 63 | 63 | 35 | ||||||||||||||||||||||||
Add: Equity-based compensation | 1 | 1 | 14 | 2 | 5 | 92 | 14 | 19 | ||||||||||||||||||||||||
Add: Cash in lieu of equity awards (1) | — | 1 | — | 1 | — | — | — | — | ||||||||||||||||||||||||
Add: Acquisition and integration costs (2) | 2 | 2 | 1 | 2 | 2 | 3 | 1 | 1 | ||||||||||||||||||||||||
Add: Restructuring charges (3) | — | 1 | 1 | — | — | 1 | 8 | — | ||||||||||||||||||||||||
Add: Management fees (4) | 3 | 3 | 2 | 2 | 2 | 22 | — | — | ||||||||||||||||||||||||
Add: Transformation (5) | 7 | 12 | 7 | 2 | 6 | 5 | 1 | — | ||||||||||||||||||||||||
Add: Executive severance (6) | — | — | 2 | 1 | — | — | — | — | ||||||||||||||||||||||||
Add: Interest expense and other, net | 76 | 77 | 75 | 74 | 73 | 85 | 60 | 58 | ||||||||||||||||||||||||
Add: Provision for income tax expense (benefit) | 17 | 9 | (10 | ) | 5 | 5 | 5 | (3 | ) | 10 | ||||||||||||||||||||||
Add: Foreign exchange loss (gain), net (8) | (44 | ) | 24 | (11 | ) | 17 | 43 | 55 | (35 | ) | 20 | |||||||||||||||||||||
Less: (Income) loss from discontinued operations, net of taxes | (12 | ) | 8 | (1 | ) | (40 | ) | (40 | ) | 152 | (11 | ) | (40 | ) | ||||||||||||||||||
Adjusted operating income | 104 | 119 | 152 | 151 | 158 | 163 | 192 | 211 | ||||||||||||||||||||||||
Add: Depreciation | 6 | 8 | 7 | 7 | 7 | 7 | 7 | 7 | ||||||||||||||||||||||||
Less: Other expense | 2 | (1 | ) | — | — | (1 | ) | — | — | — | ||||||||||||||||||||||
Adjusted EBITDA | $ | 112 | $ | 126 | $ | 159 | $ | 158 | $ | 164 | $ | 170 | $ | 199 | $ | 218 | ||||||||||||||||
Net revenue | $ | 322 | $ | 347 | $ | 354 | $ | 383 | $ | 395 | $ | 426 | $ | 442 | $ | 467 | ||||||||||||||||
Net income (loss) margin | (2.8 | )% | (23.3 | )% | 2.5 | % | 5.7 | % | — | (75.1 | )% | 21.3 | % | 23.1 | % | |||||||||||||||||
Adjusted operating income margin | 32.3 | % | 34.3 | % | 43.2 | % | 39.4 | % | 40.0 | % | 38.3 | % | 43.4 | % | 45.2 | % | ||||||||||||||||
Adjusted EBITDA margin | 34.8 | % | 36.3 | % | 45.2 | % | 41.3 | % | 41.5 | % | 39.9 | % | 45.0 | % | 46.7 | % | ||||||||||||||||
99
Confidential Treatment Requested by McAfee Corp.
Pursuant to 17 C.F.R. Section 200.83
See “” section for an explanation of adjustments to
Description of
Non-GAAP
Adjustmentsnon-GAAP
measures and other items.Three Months Ended | ||||||||||||||||||||||||||||||||
(in millions except percentages) | September 28, 2019 | December 28, 2019 | March 28, 2020 | June 27, 2020 | September 26, 2020 | December 26, 2020 | March 27, 2021 | June 26, 2021 | ||||||||||||||||||||||||
Net income (loss) | $ | (9 | ) | $ | (81 | ) | $ | 9 | $ | 22 | $ | — | $ | (320 | ) | $ | 94 | $ | 108 | |||||||||||||
Add: Amortization of debt discount and issuance costs | 5 | 4 | 5 | 4 | 5 | 22 | 4 | 4 | ||||||||||||||||||||||||
Add: Amortization | 63 | 62 | 63 | 63 | 62 | 63 | 63 | 35 | ||||||||||||||||||||||||
Add: Equity-based compensation | 1 | 1 | 14 | 2 | 5 | 92 | 14 | 19 | ||||||||||||||||||||||||
Add: Cash in lieu of equity awards (1) | — | 1 | — | 1 | — | — | — | — | ||||||||||||||||||||||||
Add: Acquisition and integration costs (2) | 2 | 2 | 1 | 2 | 2 | 3 | 1 | 1 | ||||||||||||||||||||||||
Add: Restructuring charges (3) | — | 1 | 1 | — | — | 1 | 8 | — | ||||||||||||||||||||||||
Add: Management fees (4) | 3 | 3 | 2 | 2 | 2 | 22 | — | — | ||||||||||||||||||||||||
Add: Transformation (5) | 7 | 12 | 7 | 2 | 6 | 5 | 1 | — | ||||||||||||||||||||||||
Add: Executive severance (6) | — | — | 2 | 1 | — | — | — | — | ||||||||||||||||||||||||
Add: TRA adjustment (7) | — | — | — | — | — | 2 | 5 | 3 | ||||||||||||||||||||||||
Add: Other | — | — | — | — | — | 2 | — | — | ||||||||||||||||||||||||
Add: Provision for income taxes (benefit) | 17 | 9 | (10 | ) | 5 | 5 | 5 | (3 | ) | 10 | ||||||||||||||||||||||
Add: Foreign exchange loss (gain), net (8) | (44 | ) | 24 | (11 | ) | 17 | 43 | 55 | (35 | ) | 20 | |||||||||||||||||||||
Less: (Income) loss from discontinued operations, net of taxes | (12 | ) | 8 | (1 | ) | (40 | ) | (40 | ) | 152 | (11 | ) | (40 | ) | ||||||||||||||||||
Adjusted income before taxes | 33 | 46 | 82 | 81 | 90 | 104 | 141 | 160 | ||||||||||||||||||||||||
Adjusted provision for income taxes (9) | 7 | 10 | 18 | 18 | 20 | 23 | 31 | 35 | ||||||||||||||||||||||||
Adjusted net income | $ | 26 | $ | 36 | $ | 64 | $ | 63 | $ | 70 | $ | 81 | $ | 110 | $ | 125 | ||||||||||||||||
Net revenue | $ | 322 | $ | 347 | $ | 354 | $ | 383 | $ | 395 | $ | 426 | $ | 442 | $ | 467 | ||||||||||||||||
Net income (loss) margin | (2.8 | )% | (23.3 | )% | 2.5 | % | 5.7 | % | — | (75.1 | )% | 21.3 | % | 23.1 | % | |||||||||||||||||
Adjusted net income margin | 8.1 | % | 10.4 | % | 18.1 | % | 16.4 | % | 17.7 | % | 19.0 | % | 24.9 | % | 26.8 | % | ||||||||||||||||
See “” section for an explanation of adjustments to
Description of
Non-GAAP
Adjustmentsnon-GAAP
measures and other items.Description of
Non-GAAP
AdjustmentsBelow are additional information to the adjustments for adjusted operating income, adjusted EBITDA, and adjusted net income:
| (1) | As a result of the Sponsor Acquisition, cash awards were provided to certain employees who held Intel equity awards in lieu of equity in FTW. |
100
Confidential Treatment Requested by McAfee Corp.
Pursuant to 17 C.F.R. Section 200.83
| (2) | Represents both direct and incremental costs in connection with business acquisitions, including acquisition consideration structured as cash retention, third party professional fees, and other integration costs. |
| (3) | Represents both direct and incremental costs associated with our separation from Intel as well as subsequent costs incurred to realign toward our core business. It includes implementing our stand alone back office and costs to execute strategic restructuring events, including third-party professional fees and services, transition services provided by Intel, severance, and facility restructuring costs. |
| (4) | Represents management fees paid to certain affiliates of our Sponsors and Intel pursuant to the Management Services Agreement. The Management Services Agreement has been terminated subsequent to the IPO and we paid a one-time fee of $22 million to such parties in October 2020. |
| (5) | Represents costs incurred in connection with transformation of the business post-Intel separation. Also includes the cost of workforce restructurings involving both eliminations of positions and relocations to lower cost locations in connection with our transformational initiatives, strategic initiatives to improve customer retention, activation to pay and cost synergies, inclusive of duplicative run rate costs related to facilities and data center rationalization, and other one-time costs. |
| (6) | Represents severance for executive terminations not associated with a strategic restructuring event. |
| (7) | Represents the impact of net income of adjustments of liabilities under our tax receivable agreement. |
| (8) | Represents Foreign exchange gain (loss), net as shown on the condensed consolidated statements of operations. This amount is attributable to gains or losses on non-U.S. Dollar denominated balances and is primarily due to unrealized gains or losses associated with our 1st Lien Euro Term Loan. |
| (9) | Prior to our IPO, our structure was that of a pass-through entity for U.S. federal income tax purposes with certain U.S. and foreign subsidiaries subject to income tax in their respective jurisdictions. Subsequent to the IPO, McAfee Corp. is taxed as a corporation and pays corporate federal, state, and local taxes on income allocated to it from Foundation Technology Worldwide LLC. This amount has been recast for periods reported previously. The adjusted provision for income taxes now represents the tax effect on net income, adjusted for all of the listed adjustments, assuming that all consolidated net income was subject to corporate taxation for all periods presented. We have assumed an annual effective tax rate of 22% which represents our long term expected corporate tax rate excluding discrete and non-recurring tax items. |
Three Months Ended | ||||||||||||||||||||||||||||||||
(in millions) | September 28, 2019 | December 28, 2019 | March 28, 2020 | June 27, 2020 | September 26, 2020 | December 26, 2020 | March 27, 2021 | June 26, 2021 | ||||||||||||||||||||||||
Net cash provided by operating activities | $ | 189 | $ | 211 | $ | 171 | $ | 117 | $ | 176 | $ | 296 | $ | 259 | $ | 189 | ||||||||||||||||
Less: Capital expenditures (1) | (18 | ) | (21 | ) | (21 | ) | (7 | ) | (7 | ) | (11 | ) | (11 | ) | (7 | ) | ||||||||||||||||
Free cash flow | $ | 171 | $ | 190 | $ | 150 | $ | 110 | $ | 169 | $ | 285 | $ | 248 | $ | 182 | ||||||||||||||||
| (1) | Capital expenditures includes payments for property and equipment and capitalized labor costs incurred in connection with certain software development activities. |
Seasonality
While portions of our business are impacted by seasonality, the net impact of seasonality on our business is limited. Orders are generally higher in the first and fourth quarters and lower in the second and third quarters. A significant number of orders in the fourth quarter is reflective of historically higher holiday sales of PC computers leading to higher subscriptions in the fourth quarter as well as in the first quarter due to lag from computer purchase to paid subscription of our products. This seasonal effect is present both in new subscriptions as well as in the renewal of prior year subscriptions due in those quarters.
101
Confidential Treatment Requested by McAfee Corp.
Pursuant to 17 C.F.R. Section 200.83
Liquidity and Capital Resources
McAfee Corp. is a holding company with no operations and, as such, will depend on its subsidiaries for cash to fund all of its operations and expenses through the payment of distributions by its current and future subsidiaries, including FTW. The terms of the agreements governing our senior secured credit facilities contain certain negative covenants prohibiting certain of our subsidiaries from making cash dividends or distributions to McAfee Corp. or to FTW unless certain financial tests are met. For a discussion of those restrictions, see “—Senior Secured Credit Facilities” below and “Risk Factors—Risks Related to Our Indebtedness—Restrictions imposed by our outstanding indebtedness and any future indebtedness may limit our ability to operate our business and to finance our future operations or capital needs or to engage in acquisitions or other business activities necessary to achieve growth”. We currently anticipate that such restrictions will not impact our ability to meet our cash obligations.
Sources of Liquidity
As of June 26, 2021, we had cash and cash equivalents of $420 million. Our primary source of cash for funding operations and growth has been through cash flows generated from operating activities. In addition, we have funded certain acquisitions, distributions to members, and to a lesser extent, capital expenditures and our operations, through borrowings under the Senior Secured Credit Facilities, primarily in the form of long-term debt obligations. As of June 26, 2021, we had $660 million of additional unused borrowing capacity under our Revolving Credit Facility.
We believe that our existing cash on hand, expected future cash flows from operating activities, and additional borrowings available under our credit facilities will provide sufficient resources to fund our operating requirements as well as future capital expenditures, debt service requirements, and investments in future growth for at least the next twelve months. Our future capital requirements will depend on many factors, including our growth rate, the timing and extent of spending to support development efforts, the expansion of sales and marketing activities, the introduction of new and enhanced product and service offerings, and the continuing market acceptance of our products. In the event that additional financing is required from outside sources, we may not be able to raise such financing on terms acceptable to us or at all. If we are unable to raise additional capital when desired, our business, operating results, and financial condition may be adversely affected.
On July 27, 2021, we completed the sale of our Enterprise Business to STG for an
all-cash
purchase price of $4.0 billion. In connection with the transaction, we expect to recognize a gain in excess of $2 billion, net of taxes. Refer to “—Divestiture of Enterprise Business” above.Senior Secured Credit Facilities
As of June 26, 2021, our Senior Secured Credit Facilities consisted of a U.S. dollar-denominated term loan tranche of $2,717 million (the “First Lien USD Term Loan”), a Euro-denominated term loan tranche of €1,067 million (the “First Lien EUR Term Loan”, and together with the First Lien USD Term Loan, the “First Lien Term Loans”), and a $664 million Revolving Credit Facility, of which we had $4 million outstanding as letters of credit. The Revolving Credit Facility includes a $50 million sublimit for the issuance of letters of credit.
The commitments under the First Lien Term Loans will mature on September 29, 2024. As of June 26, 2021, our total outstanding indebtedness under the Senior Secured Credit Facilities was $3,993 million. The First Lien Term Loans require equal quarterly repayments equal to 0.25% of the total amount borrowed.
As of June 26, 2021, the material terms of our outstanding debt remain unchanged from those described in our consolidated financial statements as of December 26, 2020.
Our 1
st
Lien Net Leverage Ratio as defined in the credit facility agreement was 2.6 as of June 26, 2021. For the six months ended June 26, 2021, the weighted average interest rate was 3.9% under the First Lien USD Term102
Confidential Treatment Requested by McAfee Corp.
Pursuant to 17 C.F.R. Section 200.83
Loan and 3.5% under the First Lien EUR Term Loan. We currently pay a commitment fee of 0.25% on the unused portion of the Revolving Credit Facility.
Subsequent to the completion of the sale of the Enterprise Business, we notified our lenders of our intent to prepay approximately $1 billion of our indebtedness completed in August 2021. We repaid $332 million of First Lien USD Term Loan and €563 million of First Lien EUR Term Loan. In connection with this prepayment, we expect to incur a loss on extinguishment of debt in the third quarter of our 2021 fiscal year of approximately $10 million related to recognition of unamortized discount and deferred financing costs. We also terminated $150 million of our $250 million notional interest rate swap that had an expiration date of January 29, 2022. Refer to “—Divestiture of Enterprise Business” above.
Tax Receivable Agreement
The contribution by the Continuing Owners to the Corporation of certain corporate entities in connection with the IPO (including the Reorganization Transactions) and future exchanges of LLC Units for shares of the Corporation’s Class A common stock are expected to produce or otherwise deliver to the Corporation favorable tax attributes that can reduce its taxable income. Prior to the completion of the IPO, the Corporation entered into a Tax Receivable Agreement (“TRA”), which generally will require it to pay the TRA Beneficiaries, as defined in Note 1 to the condensed consolidated financial statements, 85% of the applicable cash savings, if any, in U.S. federal, state, and local income tax that the Corporation actually realizes or, in certain circumstances, is deemed to realize as a result of (i) all or a portion of the Corporation’s allocable share of existing tax basis in the assets of FTW (and its subsidiaries) acquired in connection with the Reorganization Transactions, (ii) increases in the Corporation’s allocable share of existing tax basis in the assets of FTW (and its subsidiaries) and tax basis adjustments in the assets of FTW (and its subsidiaries) as a result of sales or exchanges of LLC Units after the IPO, (iii) certain tax attributes of the corporations acquired by McAfee Corp. in connection with the Reorganization Transactions (including their allocable share of existing tax basis in the assets of FTW (and its subsidiaries)), and (iv) certain other tax benefits related to entering into the tax receivable agreement, including tax benefits attributable to payments under the tax receivable agreement. The Corporation generally will retain the benefit of the remaining 15% of the applicable tax savings. The payment obligations under the tax receivable agreement are obligations of McAfee Corp., and we expect that the payments that will be required to make under the tax receivable agreement will be substantial. As of June 26, 2021, we have recorded $2 million current portion and $12 million long-term portion of the TRA liability recorded within Accounts payable and other accrued liabilities and Other long-term liabilities, respectively, in the condensed consolidated balance sheet.
On July 27, 2021, we completed the sale of our Enterprise Business to STG for an
all-cash
purchase price of $4.0 billion. In connection with the transaction, we expect to recognize a gain in excess of $2 billion, net of taxes. As a direct result of the taxable gain on the Enterprise Business divestiture, we expect to realize certain tax benefits subject to our TRA and thus expect to record a TRA liability of between $170 million to $260 million.Dividend Policy
FTW is expected to pay a cash distribution to its members on a quarterly basis at an aggregate annual rate of approximately $200 million for fiscal 2021. The Corporation is expected to receive a portion of any such distribution through the LLC Units it holds directly or indirectly through its wholly-owned subsidiaries on the record date for any such distribution declared by FTW. The Corporation expects to use the proceeds it receives from such quarterly distribution to declare a cash dividend on its shares of Class A common stock. The Corporation declared or paid the following dividends during the six months ended June 26, 2021:
Declaration Date | Record Date | Payment Date | Dividend per Share | Amount (in millions) | ||||||||
December 9, 2020 | December 24, 2020 | January 7, 2021 | $ | 0.087 | $ | 14 | ||||||
March 11, 2021 | March 26, 2021 | April 9, 2021 | $ | 0.115 | $ | 19 | ||||||
June 10, 2021 | June 25, 2021 | July 9, 2021 | $ | 0.115 | $ | 19 | ||||||
103
Confidential Treatment Requested by McAfee Corp.
Pursuant to 17 C.F.R. Section 200.83
In August 2021, we declared a
one-time
Special Dividend of $4.50 per share of Class A common stock outstanding in connection with the consummation of the sale of our Enterprise Business. See Note 3 to the condensed consolidated financial statements for additional dividend information on the Special Dividend.Consolidated Statements of Cash Flows
Our cash flows for the fiscal 2018, fiscal 2019 and fiscal 2020 and the six months ended June 27, 2020 and June 26, 2021 were:
Fiscal Year Ended | Six Months Ended | |||||||||||||||||||
(in millions) | December 29, 2018 | December 28, 2019 | December 26, 2020 | June 27, 2020 | June 26, 2021 | |||||||||||||||
Net cash provided by operating activities | $ | 319 | $ | 496 | $ | 760 | $ | 288 | $ | 448 | ||||||||||
Net cash used in investing activities | (677 | ) | (63 | ) | (51 | ) | (33 | ) | (18 | ) | ||||||||||
Net cash provided by (used in) financing activities | 459 | (734 | ) | (651 | ) | (162 | ) | (239 | ) | |||||||||||
Effect of exchange rate fluctuations on cash and cash equivalents | (4 | ) | — | 6 | (3 | ) | (2 | ) | ||||||||||||
Change in cash and cash equivalents | $ | 97 | $ | (301 | ) | $ | 64 | $ | 90 | $ | 189 | |||||||||
See Note 3 to the audited consolidated financial statements and Note 3 to the condensed consolidated financial statements for additional cash flow information associated with our discontinued operations.
Operating Activities
For fiscal 2018, net cash provided by operating activities was $319 million, as a result of a net loss of $512 million, adjusted for
non-cash
charges of $568 million and net cash inflow of $263 million from changes in operating assets and liabilities.Non-cash
charges primarily consisted of $543 million in depreciation and amortization and $28 million in equity-based compensation. The net cash inflow from changes in operating assets and liabilities was primarily due to (i) a $309 million increase in deferred revenue due to an increase in billings as well as increasing balances subsequent to purchase accounting at the time of the Sponsor Acquisition, and (ii) a $29 million decrease in accounts receivable resulting from collections exceeding billings for the period, partially offset by a $54 million increase in other assets and a $26 million increase in current deferred costs, both primarily resulting from adoption of ASC Topic 606 and increasing balances subsequent to purchase accounting at the time of the Sponsor Acquisition.For fiscal 2019, net cash provided by operating activities was $496 million, as a result of a net loss of $236 million, adjusted for
non-cash
charges of $612 million and net cash inflow of $120 million from changes in operating assets and liabilities.Non-cash
charges consisted primarily of $536 million in depreciation and amortization, $25 million in equity-based compensation, $18 million in deferred income taxes, and $53 million in other operating activities principally consisting of lease asset amortization, and amortization of debt discount and issuance costs, partially offset by $20 million in foreign exchange gains. The net cash inflow from changes in operating assets and liabilities was primarily due to (i) a $186 million increase in deferred revenue driven by increasing balances for deferred revenue and increasing balances subsequent to purchase accounting at the time of the Sponsor Acquisition, (ii) a $59 million increase in other liabilities driven by increases in lease liabilities primarily due to a new lease for our headquarters, an increase in reserve for uncertain tax positions, increase in annual bonus accrual due to the company performing above its annual performance target in 2019, and increase in compensation liabilities related to acquisitions due to timing of payment, and (iii) a $28 million increase in other current liabilities primarily driven by timing of vendor payments. These changes were partially offset by (i) a $71 million increase in prepaid expenses and other assets largely driven by increases in the right of use assets recorded primarily due to a new lease for our headquarters, along with an increase in long-term deferred104
Confidential Treatment Requested by McAfee Corp.
Pursuant to 17 C.F.R. Section 200.83
costs driven by continued increasing balances subsequent to purchase accounting at the time of the Sponsor Acquisition, (ii) a $60 million increase in accounts receivable, net which is primarily caused by timing of Enterprise billings and collections, and (iii) a $22 million increase in deferred costs primarily due to increased deferred revenue share resulting from an increased subscriber base.
For fiscal 2020, net cash provided by operating activities was $760 million, as a result of a net loss of $289 million, adjusted for
non-cash
charges of $968 million and net cash inflow of $81 million from changes in operating assets and liabilities.Non-cash
charges primarily consisted of $491 million in depreciation and amortization, $313 million in equity-based compensation, $104 million for foreign exchange loss, and $70 million in other operating activities primarily consisting of lease asset amortization, and amortization of debt discount and issuance costs, partially offset by $10 million in deferred income taxes. The net cash inflow from changes in operating assets and liabilities was primarily due to (i) a $106 million increase in deferred revenue balances resulting from increases in deferred revenue consistent with the increases in subscriber base and dollar retention rates, partially offset by decrease in deferred revenue primarily due to recognition of Enterprise deferred revenue outpacing billings, (ii) a $41 million increase other current liabilities due largely to increased amounts for revenue share and shipments fees related to our increased subscriber base and increased PC shipments for our OEM partners as well as timing of vendor payments, and (iii) a $15 million decrease in accounts receivable, net which is primarily caused by the decrease in Enterprise billings. These changes were partially offset by (i) a $46 million increase in deferred costs primarily due to increased deferred revenue share resulting from an increased subscriber base and new affiliate programs, (ii) a $26 million decrease in other liabilities primarily due to lower bonus attainment in 2020 due to slightly lower performance against target, and a slightly lower ending headcount in 2020, and (iii) a $9 million increase in other assets primarily due to new leases signed during the period.For the six months ended June 27, 2020, net cash provided by operating activities was $288 million, as a result of net loss of $31 million, adjusted for
non-cash
charges of $309 million and net cash outflow of $52 million from changes in operating assets and liabilities.Non-cash
charges primarily consisted of $252 million in depreciation and amortization, $19 million in equity-based compensation, $5 million for deferred taxes, and $33 million in other operating activities primarily consisting of lease asset amortization, amortization of debt discount and issuance costs, and changes in foreign exchange rates. The net cash outflow from changes in operating assets and liabilities was primarily due to (i) an $86 million decrease in other liabilities, (ii) a $29 million decrease in accounts payable and accrued liabilities, (iii) a $27 million decrease in deferred revenue primarily due to recognition of prior period deferred revenue, (iv) a $22 million increase in deferred costs primarily due to increased deferred revenue share resulting from an increased consumer subscriber base and a new consumer affiliate program, and (v) a $14 million increase in prepaids and other assets primarily due to new leases signed during the period. These changes were partially offset by a $126 million decrease in accounts receivable, net due to collections exceeding billings for the period.For the six months ended June 26, 2021, net cash provided by operating activities was $448 million, as a result of net income of $202 million, adjusted for
non-cash
charges of $245 million and net cash inflow of $1 million from changes in operating assets and liabilities.Non-cash
charges primarily consisted of $153 million in depreciation and amortization, $78 million in equity-based compensation, and $29 million in other operating activities, partially offset by $15 million in foreign exchange gains. The net cash inflow from changes in operating assets and liabilities was primarily due to (i) a $100 million decrease in accounts receivable, net which is primarily caused by seasonality of billings and collections related to discontinued operations, (ii) a $10 million increase in deferred revenue primarily due to increases in deferred revenue balances resulting from increases in Consumer billings, partially offset by decreases resulting from seasonality of billings related to discontinued operations, and (iii) a $6 million increase in accounts payable and accrued liabilities primarily due to timing. These changes were partially offset primarily by (i) a $45 million increase in other assets primarily driven by increases in long-term deferred revenue share with more long-term subscribers and in right of use assets recorded primarily due to new leases, (ii) a $38 million decrease in other liabilities primarily due to payment of annual105
Confidential Treatment Requested by McAfee Corp.
Pursuant to 17 C.F.R. Section 200.83
bonuses and larger
year-end
commissions in the first half of fiscal 2021, and (iii) a $32 million increase in deferred costs primarily due to increased deferred revenue share resulting from an increased subscriber base.Investing Activities
For fiscal 2018, net cash used in investing activities was $677 million, which was primarily the result of acquisitions of $615 million, net of cash acquired, and additions to property and equipment of $61 million.
For fiscal 2019, net cash used in investing activities was $63 million, which was primarily the result of the additions to property and equipment and other investing activities totaling $61 million and $2 million on businesses acquisitions, net of cash.
For fiscal 2020, net cash used in investing activities was $51 million, which was primarily the result of additions to property and equipment and other investing activities totaling $46 million and a $5 million business acquisition, net of cash.
For the six months ended June 27, 2020, net cash used in investing activities was $33 million, which was primarily the result of the additions to property and equipment of $25 million and $5 million on acquisition of businesses, net of cash.
For the six months ended June 26, 2021, net cash used in investing activities was $18 million, which was primarily the result of additions to property and equipment.
Financing Activities
For fiscal 2018, net cash provided by financing activities was $459 million, which was primarily the result of net proceeds of debt of $494 million, used for our business acquisitions, net proceeds of $52 million from the modification of our debt, and $20 million in proceeds from a note issued to a member partially offset by $87 million in payment of long-term debt, and $20 million in other financing activities primarily relating to equity repurchase and equity-based compensation tax withholdings.
For fiscal 2019, net cash used in financing activities was $734 million, which was primarily the result of (i) distributions to members of FTW of $1,334 million, (ii) payment of long-term debt of $67 million, (iii) $8 million payment of tax withholding on equity awards, and (iv) $5 million in other financing activities primarily relating to units repurchased. These uses were partially offset by net proceeds of long-term debt of $679 million.
For fiscal 2020, net cash used in financing activities was $651 million, which was primarily the result of (i) payment of long-term debt of $869 million, (ii) distributions to members of FTW of $277 million before our IPO, (iii) $24 million in payment of tax withholding on equity awards, (iv) $8 million in payment of IPO related costs, and (v) $23 million in other financing activities primarily relating to equity repurchases. The uses were partially offset by proceeds from IPO of $586 million, net of underwriters’ discount, commissions offset by $33 million to purchase FTW LLC Units.
For the six months ended June 27, 2020, net cash used in financing activities was $162 million, which was primarily the result of (i) distributions to members of $130 million, (ii) payment of long-term debt of $21 million, and (iii) $10 million in other financing activities primarily relating to equity repurchases. As of June 27, 2020, there were distribution amounts of $5 million that had not yet been disbursed.
For the six months ended June 26, 2021, net cash used in financing activities was $239 million, which was primarily the result of (i) distributions to members of FTW of $148 million, (ii) payment of tax withholding for shares withheld of $38 million, (iii) payment of dividends of $33 million to holders of Class A common stock, and (iv) payment of long-term debt of $22 million.
106
Confidential Treatment Requested by McAfee Corp.
Pursuant to 17 C.F.R. Section 200.83
Contractual Obligations and Commitments
The following is a summary of our contractual obligations as of December 26, 2020:
Payments Due by Period (1) | ||||||||||||||||||||
(in millions) | Total | Less than 1 Year | 1-3 Years | 3-5 Years | Over 5 Years | |||||||||||||||
Long-term debt (2) | $ | 4,038 | $ | 44 | $ | 89 | $ | 3,905 | $ | — | ||||||||||
Cash interest (3) | 686 | 197 | 365 | 124 | — | |||||||||||||||
Purchase obligations (4) | 149 | 49 | 84 | 16 | — | |||||||||||||||
Operating lease obligations, including imputed interests | 123 | 25 | 33 | 22 | 43 | |||||||||||||||
Total | $ | 4,996 | $ | 315 | $ | 571 | $ | 4,067 | $ | 43 | ||||||||||
| (1) | Includes both continuing and discontinued operations and excludes any obligations under the tax receivable agreement. Although the actual timing and amount of any payments that we make to the TRA Beneficiaries under the tax receivable agreement will vary, we expect that those payments will be significant. Refer to “—Tax Receivable Agreement” above. |
| (2) | See Note 13 to our audited consolidated financial statements included elsewhere in this prospectus for further information on our long-term debt. |
| (3) | Interest payments were calculated based on the interest rate in effect on December 26, 2020 and based upon expected debt balances after mandatory repayments related to the First Lien USD Term Loan, and First Lien Euro Term Loan, and include the impact of our interest rate swaps. See Note 13 to our audited consolidated financial statements for further information on the First Lien USD Term Loan and First Lien Euro Term Loan and Note 15 to our audited consolidated financial statements included elsewhere in this prospectus for further information on our interest rate swaps. |
| (4) | Subsequent to December 26, 2020, we have executed contracts with additional unconditional purchase commitments. As of June 26, 2021, including amounts associated with our discontinued operations, we have unconditional purchase obligations of $431 million that expire at various dates through 2026 and guarantees of $11 million that expire at various dates through 2028. See Note 19 to our audited consolidated financial statements and Note 17 to our condensed consolidated financial statements included elsewhere in this prospectus. |
Off-Balance
Sheet ArrangementsAs of December 26, 2020 and June 26, 2021, we did not have any relationships with unconsolidated entities or financial partnerships, such as structured finance or special purpose entities, that were established for the purpose of
facilitating off-balance
sheet arrangements or other purposes.Critical Accounting Policies and Use of Estimates
Our discussion and analysis of operating results and financial condition are based upon our consolidated financial statements included elsewhere in this document. The preparation of our financial statements in accordance with GAAP requires us to make estimates and assumptions that affect the reported amounts of assets, liabilities, revenue, expenses and related disclosures of contingent assets and liabilities. We base our estimates on past experience and other assumptions that we believe are reasonable under the circumstances, and we evaluate these estimates on an ongoing basis. Actual results may differ from those estimates.
Our critical accounting policies are those that materially affect our consolidated financial statements including those that involve difficult, subjective or complex judgments by management. A thorough understanding of these critical accounting policies is essential when reviewing our consolidated financial statements. We believe that the critical accounting policies listed below are those that are most important to the portrayal of our results of operations or involve the most difficult management decisions related to the use of significant estimates and assumptions as described above.
107
Confidential Treatment Requested by McAfee Corp.
Pursuant to 17 C.F.R. Section 200.83
Revenue Recognition
We derive revenue from the sale of security products, subscriptions, software as a service (“SaaS”) offerings, support and maintenance, professional services, or a combination of these items, primarily through our indirect relationships with our partners or direct relationships with end customers through our internal sales force. On December 31, 2017, we adopted ASC Topic 606 under the modified retrospective approach with the cumulative effect of initially applying the new standard as an adjustment to the opening balance of retained earnings. Results for the reporting period beginning December 31, 2017 are presented under ASC Topic 606, while prior period amounts were not adjusted.
We recognize revenue pursuant to the five-step framework within ASC Topic 606:
1. | Identify the contract(s) with a customer non-cancelable purchase order or agreement that creates enforceable rights and obligations. |
2. | Identify the performance obligations in the contract |
3. | Determine the transaction price |
4. | Allocate the transaction price to the performance obligations in the contract |
5. | Recognize revenue when (or as) we satisfy a performance obligation |
We generally consider our customer to be the entity with which we have a contractual agreement. This could be the end user, or when we sell products and services through the channel, our customer could be either the distributor or the reseller. As part of determining whether a contract exists, probability of collection is assessed on abasis at the outset of the contract. Customers are subjected to a credit review process that evaluates the customers’ financial position and the ability and intention to pay.
customer-by-customer
At contract inception, we assess the goods and services promised in our contracts with customers and identify a performance obligation for each promise to transfer to the customer a good or service (or bundle of goods or services) that is distinct — i.e., if a good or service is separately identifiable from other items in the bundled package and if a customer can benefit from it on its own or together with other resources that are readily available to the customer. To identify our performance obligations, we consider all of the goods or services promised in the contract regardless of whether they are explicitly stated or are implied by customary business practices. Determining whether products and services are considered distinct performance obligations or should be combined to create a single performance obligation may require significant judgment. We recognize revenue when (or as) we satisfy a performance obligation by transferring control of a good or service to a customer.
The transaction price is determined based on the consideration to which we will be entitled in exchange for transferring goods or services to the customer, adjusted for estimated variable consideration, if any. We typically estimate the transaction price impact of sales returns and discounts offered to the customers, including discounts for early payments on receivables, rebates or certain distribution partner incentives, including marketing programs. Constraints are applied when estimating variable considerations based on historical experience where applicable.
Once we have determined the transaction price, we allocate it to each performance obligation in a manner depicting the amount of consideration to which we expect to be entitled in exchange for transferring the goods or
108
Confidential Treatment Requested by McAfee Corp.
Pursuant to 17 C.F.R. Section 200.83
services to the customer (the “allocation objective”). If the allocation objective is met at contractual prices, no allocations are made. Otherwise, we allocate the transaction price to each performance obligation identified in the contract on a relative SSP basis, except when the criteria are met for allocating variable consideration or a discount to one or more, but not all, performance obligations in the contract.
To determine the SSP of our goods or services, we conduct a regular analysis to determine whether various goods or services have an observable SSP. If we do not have an observable SSP for a particular good or service, then SSP for that particular good or service is estimated using an approach that maximizes the use of observable inputs. We generally determine SSPs using various methodologies such as historical prices, expected cost plus margin, adjusted market assessment or
non-standalone
selling prices.We recognize revenue as control of the promised goods or services is transferred to our customers, in an amount that reflects the consideration we expect to be entitled to in exchange for the promised goods or services. Revenue is recognized net of any taxes collected from customers and subsequently remitted to governmental authorities. Control of the promised goods or services is transferred to our customers at either a point in time or over time, depending on the performance obligation.
The nature of our promise to the customer to provide our time-based software licenses and related support and maintenance is to stand ready to provide protection for a specified or indefinite period of time. Maintenance and support in these cases are typically not distinct performance obligations as the licenses are dependent upon regular threat updates to the customer. Instead the maintenance and support is combined with a software license to create a single performance obligation. We typically satisfy these performance obligations over time, as control is transferred to the customer as the services are provided.
Additional Revenue Recognition Considerations
Royalties and Managed Service Provider Revenues
Our original equipment manufacturer (“OEM”) and managed service provider (“MSP”) sales channels have revenues derived from sales- or usage-based royalties. Such revenue is excluded from any variable consideration and transaction price calculations and is recognized at the later of when the sale or usage occurs, or the performance obligation is satisfied or partially satisfied.
Consideration Payable to a Customer
We make various payments to our channel partners, which may include revenue share, product placement fees and marketing development funds. Costs that are incremental to revenue, such as revenue share, are capitalized and amortized over time as cost of sales. Product placement fees and marketing development funds are expensed in sales and marketing expense as the related benefit is received and were $187 million, $142 million and $170 million for the years ended December 26, 2020, December 28, 2019, and December 29, 2018, respectively.
Under certain of our channel partner agreements, the partners pay us royalties on our technology sold to their customers, which we recognize as revenue in accordance with our revenue recognition policy. In these situations, the payments made to our channel partners are recognized as consideration paid to a customer, and thus are recorded as reductions to revenue up to the amount of cumulative revenue recognized from the contract with the channel partner during the period of measurement.
Contract Costs
Contract acquisition costs consist mainly of sales commissions and associated fringe benefits, as well as revenue share under programs with certain of our distribution partners. For revenue share, the partner receives a
109
Confidential Treatment Requested by McAfee Corp.
Pursuant to 17 C.F.R. Section 200.83
percentage of the revenue we receive from an end user upon conversion to a paid customer or renewal. These costs would not have been incurred if the contract was not obtained and are considered incremental and recoverable costs of obtaining a contract with a customer. These costs are capitalized and amortized over time in accordance with ASC
340-40.
Contract fulfillment costs consist software and related costs. These costs are incremental and recoverable and are capitalized and amortized on a systematic basis that is consistent with the pattern of transfer of the goods and services to which the asset relates.
Discontinued Operations
Certain of our perpetual software licenses or hardware with integrated software are not distinct from their accompanying maintenance and support, as they are dependent upon regular threat updates. These contracts typically contain a renewal option that we have concluded creates a material right for our customer. The license, hardware and maintenance and support revenue is recognized over time, as control is transferred to the customer over the term of the initial contract period while the corresponding material right is recognized over time beginning at the end of the initial contractual period over the remainder of the technology constrained customer life.
Alternatively, certain of our perpetual software licenses, hardware appliances, or hardware with integrated software provide a benefit to the customer that is separable from the related support as they are not dependent upon regular threat updates. Revenue for these products is recognized at a point in time when control is transferred to our customers, generally at shipment. The related maintenance and support represent a separate performance obligation and the associated transaction price allocated to it is recognized over time as control is transferred to the customer.
The nature of our promise to the customer to provide our SaaS offerings and related support and maintenance is to stand ready to provide protection for a specified or indefinite period of time. Maintenance and support in these cases are typically not distinct performance obligations as the licenses are dependent upon regular threat updates to the customer. Instead the maintenance and support is combined with a software license to create a single performance obligation. We typically satisfy these performance obligations over time, as control is transferred to the customer as the services are provided.
Revenue for professional services that are a separate and distinct performance obligation is recognized as services are provided to the customer.
Payment Terms and Warranties
Our payment terms vary by the type and location of our customer and the products or services offered. The term between invoicing and when payment is due is not significant. For certain products or services and customer types, we require payment before the products or services are delivered to the customer.
We provide assurance warranties on our products and services. The warranty timeframe varies depending on the product or service sold, and the resolution of any issues is at our discretion to either repair, replace, reperform or refund the fee.
Contract Costs
Contract acquisition costs consist mainly of sales commissions and associated fringe benefits. We typically recognize the initial commissions that are not commensurate with renewal commissions over the longer of the customer relationship (generally estimated to be four to five years) or over the same period as the initial revenue arrangement to which these costs relate. Renewal commissions paid are generally amortized over the renewal period.
110
Confidential Treatment Requested by McAfee Corp.
Pursuant to 17 C.F.R. Section 200.83
Contract fulfillment costs consist primarily of hardware and related costs. These costs are incremental and recoverable and are capitalized and amortized on a systematic basis that is consistent with the pattern of transfer of the goods and services to which the asset relates.
Goodwill
Goodwill is recorded as the excess of consideration transferred over the acquisition-date fair values of assets acquired and liabilities assumed in a business combination. Historically, we have assigned goodwill to our reporting units based on the relative fair value expected at the time of the acquisition. Goodwill and intangible assets to be disposed of as a result of our agreement with STG to sell certain assets of Enterprise Business were included in assets of discontinued operations in our consolidated balance sheets. We now have one reporting unit for goodwill.
We perform an annual impairment assessment on the first day of the third month in the fourth quarter or more frequently if indicators of potential impairment exist, which includes evaluating qualitative and quantitative factors to assess the likelihood of an impairment of our reporting unit’s goodwill. If the conclusion of an impairment assessment is that it is more likely than not that the fair value is more than its carrying value, goodwill is not considered impaired and we are not required to perform the quantitative goodwill impairment test.
If the conclusion of an impairment assessment is that it is more likely than not that the fair value is less than its carrying value, we perform the quantitative goodwill impairment test, which compares the fair value of the reporting unit to its carrying value. Impairments, if any, are based on the excess of the carrying amount over the fair value. Our goodwill impairment test considers the income method and/or market method to estimate a reporting unit’s fair value.
Identified Intangible Assets
We amortize all finite-lived intangible assets that are subject to amortization over their estimated useful life of economic benefit on a straight-line basis.
For significant intangible assets subject to amortization, we perform a quarterly assessment to determine whether facts and circumstances indicate that the useful life is shorter than we had originally estimated or that the carrying amount of assets may not be recoverable. If such facts and circumstances exist, we assess recoverability by comparing the projected undiscounted net cash flows associated with the related asset or group of assets over their remaining useful lives against their respective carrying amounts. Impairments, if any, are based on the excess of the carrying amount over the fair value of those assets. If an asset’s useful life is shorter than originally estimated, we accelerate the rate of amortization and amortize the remaining carrying value over the updated, shorter useful life.
For our intangible assets not subject to amortization, we perform an annual impairment assessment on the first day of the third month in the fourth quarter, or more frequently if indicators of potential impairment exist, to determine whether it is more likely than not that the carrying value of the asset may not be recoverable. If necessary, a quantitative impairment test is performed to compare the fair value of the indefinite-lived intangible asset with its carrying value. Impairments, if any, are based on the excess of the carrying amount over the fair value of the asset.
Research and Development
Costs incurred in the research and development of new software products are expensed as incurred until technological feasibility is established. Research and development costs include salaries and benefits of researchers, supplies, and other expenses incurred during research and development efforts. Development costs
111
Confidential Treatment Requested by McAfee Corp.
Pursuant to 17 C.F.R. Section 200.83
are capitalized beginning when a product’s technological feasibility has been established and ending when the product is available for general release to customers. Technological feasibility is reached when the product reaches the working-model stage. To date, new products and enhancements generally have reached technological feasibility and have been released for sale at substantially the same time. All research and development costs to date have been expensed as incurred except for software subject to a hosting arrangement.
Software development costs of both
internal-use
applications and software sold subject to hosting arrangements are capitalized when we have determined certain factors are present, including factors that indicate technology exists to achieve the performance requirements, the decision has been made to develop internally versus buy and our management has authorized the funding for the project. Capitalization of software costs ceases when the software is substantially complete and is ready for its intended use and capitalized costs are amortized over their estimated useful life of three to five years using the straight-line method. When events or circumstances indicate the carrying value of internal use software might not be recoverable, we assess the recoverability of these assets by determining whether the amortization of the asset balance over its remaining life can be recovered through undiscounted future operating cash flows.Equity-Based Awards
We currently provide various equity-based compensation to those whom, in the opinion of the Board or its designee, are in a position to make a significant contribution to our success.
Equity-based compensation cost is measured at the grant date based on the fair value of the award and recognized as expense over the appropriate service period. Determining the fair value of equity-based awards requires considerable judgment, including assumptions and estimates of the following:
| (1) | fair value of the unit; |
| (2) | life of the award; |
| (3) | volatility of the unit price; and |
| (4) | dividend yield |
Before our IPO, the fair value of the unit was determined by the Board reasonably and in good faith. Generally, this involved a review of an independent valuation of our business, which requires judgmental inputs and assumptions such as our cash flow projections, peer company comparisons, market data, growth rates and discount rate. The Board reviewed its prior determination of fair value of a unit on a quarterly basis to decide whether any change was appropriate (including whether to obtain a new independent valuation), considering such factors as any significant financial, operational, or market changes affecting the business since the last valuation date. Due to us not having sufficient historical volatility, we used the historical volatilities of publicly traded companies which are similar to us in size, stage of life cycle and financial leverage. We will continue to use this peer group of companies unless a situation arises within the group that would require evaluation of which publicly traded companies are included or once sufficient data is available to use our own historical volatility. In addition, for awards where vesting is dependent upon achieving certain operating performance goals, we estimate the likelihood of achieving the performance goals. For goals dependent upon a qualifying liquidity event, (i.e., a change of control or public offering registered on a Form
S-1
(or successor form), in either case, occurring on or before April 3, 2024) (a “Qualifying Liquidity Event”), we will not recognize any expense until the event occurs. Upon consummation of our IPO, we recognized a cumulativecatch-up
of expense based on the vesting dates for our time-based awards and expected vesting dates for our performance-based awards. We recognize forfeitures as they occur. For awards with only time-vesting requirement, we recognize the expense over a straight-line basis during the vesting period.After the close of our IPO, our outstanding Management Equity Participation Units (“MEPUs”) and Cash RSU (“CRSUs”) were converted into RSUs (“Replacement RSUs”), which are to be settled in Class A common
112
Confidential Treatment Requested by McAfee Corp.
Pursuant to 17 C.F.R. Section 200.83
stock. The fair value of these Replacement RSUs was our IPO price less the present value of the expected dividends not received during the vesting period. For all other RSU grants after our IPO, we utilize the closing price of our common stock on the day of the grant date, less the present value of expected dividends not received during the vesting period to determine grant date fair value.
In addition, certain MEPU holders were also granted stock options with a strike price equal to our IPO price. For all other stock option grants after our IPO, we utilize the closing price of our common stock on the day of grant date to determine the strike price. All of our granted stock options are
non-qualified
and expire 10 years after grant. We utilize a Black-Scholes model to determine grant date fair value of our stock options.Our time-based awards generally vest evenly over the 16 quarters following grant date. For time-based awards granted to our new hires, the vesting period is generally 25% vest one year after grant date and quarterly thereafter for 12 quarters. Time-based awards granted to our
non-employee
directors vest one year from grant date. Generally, unvested awards are forfeited upon termination of employment with us, however, our executive officers may have provisions permitting acceleration or pro rata acceleration upon termination without cause (as defined in the respective award agreements).Our performance-based RSU awards (“PSUs”) are granted to executive officers and certain employees annually. These awards vest after approximately three years, with the number vesting based upon internal profitability targets that are communicated to employees in the year to which the targets relate. The number of shares of common stock issued will range from zero to stretch, with stretch typically defined as 130% of target. At the time our Board or its designee approves such grants, the targets for performance years other than the current year are not known or knowable by us nor our employees. Upon determination and communication of such targets in future years, grant date fair value is determined based upon the closing price, less the present value of expected dividends not received during the vesting period.
A portion of our RSU awards and all of our performance-based stock option and performance-based MIU awards vest upon achievement of certain return of cash metrics. In January 2021, these awards were modified to vest annually in equal tranches over the three year anniversaries of our IPO. If the original return of cash performance is achieved prior to such anniversaries, the awards vest in full. In both cases, the unvested portion of the awards is forfeited upon termination.
Upon the settlement of RSUs, we withhold a portion of the earned units to cover no more than the maximum statutory income and employment taxes and remit the net shares to an individual brokerage account. Authorized shares of our common stock are used to settle RSUs and stock options.
Awards granted prior to our IPO and/or converted at the time of our IPO are covered under our 2017 Management Incentive Plan (“2017 Plan”). Stock options granted at our IPO and/or awards granted at our IPO or after are covered under our 2020 Equity Omnibus Plan (“2020 Plan”). No new awards may be authorized under our 2017 Plan.
After the close of the separation from Intel, our employees were no longer eligible for Intel Awards (as defined below). Prior to the transaction, Intel’s stockholders approved the adoption of the Intel Corporation 2006 Equity Incentive Plan. The plan provides for the grant of stock options, stock appreciation rights, restricted stock, and restricted stock units (collectively “Intel Awards”) to eligible full-time and part-time employees and
non-employee
directors. These awards generally vested over three or four years. Stock options generally expire ten years from the date of grant. Awards were generally granted with only a time-vesting requirement, but may have had certain performance and/or market conditions required for vesting.All outstanding Intel Awards were replaced with fixed cash payouts (“retention awards”) or unvested Class A Unit awards. After the close of the Skyhigh Networks, Inc. (“Skyhigh”) acquisition (Note 6), Skyhigh employees were no longer eligible for Skyhigh’s equity incentive plan and all outstanding awards were replaced with retention awards or unvested Class A unit awards.
113
Confidential Treatment Requested by McAfee Corp.
Pursuant to 17 C.F.R. Section 200.83
Derivative and Hedging Instruments
The fair values of each of our derivative instruments are recorded as an asset or liability on a net basis at the balance sheet date within other current or long-term assets or liabilities. The change in fair value of our derivative instruments is recorded through earnings in the line item on the Consolidated Statements of Operations to which the derivatives most closely relate, primarily in Interest expense and other, net. Changes in the fair value of the underlying assets and liabilities associated with the hedged risk are generally offset by the changes in the fair value of the related derivatives. We do not use derivative financial instruments for speculative trading purposes.
To reduce the interest rate risk inherent in variable rate debt, we entered into certain interest rate swap agreements to convert a portion of our variable rate borrowing into a fixed rate obligation. These interest rate swap agreements fix the London Interbank Offered Rate (“LIBOR”) portion of the U.S. dollar denominated variable rate borrowings. Accordingly, to the extent the cash flow hedge is effective, changes in the fair value of interest rate swaps will be included within Accumulated other comprehensive income in the consolidated balance sheets. Hedge accounting will be discontinued when the interest rate swap is no longer effective in offsetting cash flows attributable to the hedged risk, the interest rate swap expires or the cash flow hedge is designated because it is no longer probable that the forecasted transaction will occur according to the original strategy. When hedge accounting is discontinued, any related amounts previously included in Accumulated other comprehensive income (loss) would be reclassified to Interest expenses and other, net, within the consolidated statements of operations.
Leases
We adopted ASC Topic 842 which primarily requires leases to be recognized on the balance sheet. We adopted the standard using the modified retrospective approach with an effective date as of the beginning of our fiscal year, December 30, 2018. Prior year financial statements were not recast under the new standard.
We determine if an arrangement contains a lease and classification of that lease, if applicable, at inception based on:
| • | Whether the contract involves the use of a distinct identified asset; |
| • | Whether we obtain the right to obtain substantially all the economic benefits from the use of the asset throughout the period; and |
| • | Whether we have a right to direct the use of the asset. |
Right-of-use
non-lease
components, and thenon-lease
components are generally accounted for separately and not included in our leased assets and corresponding liabilities.The depreciable life of assets and leasehold improvements are limited by the expected lease term unless there is a transfer of title or purchase option reasonably certain of exercise. Payments related to short-term leases are expensed on a straight-line basis over the lease term and reflected as a component of lease cost within our consolidated statements of operations. Lease payments generally consist of fixed amounts, as well as variable amounts based on a market rate or an index which are not material to our consolidated lease cost. Our leases do not contain significant terms and conditions for variable lease payments.
114
Confidential Treatment Requested by McAfee Corp.
Pursuant to 17 C.F.R. Section 200.83
When available, we use the rate implicit in the lease to discount lease payments to present value; however, most of our leases do not provide a readily determinable implicit rate. Therefore, we estimate our incremental borrowing rate to discount the lease payments based on information available at lease commencement. For leases which commenced prior to our adoption of ASU
No. 2016-02,
Leases, and all related updates (collectively, “ASC Topic 842”), we estimated our incremental borrowing rate as of adoption date based on our credit rating, current economic conditions, and collateralized borrowing.Discontinued Operations
We review the presentation of planned business dispositions in our audited consolidated financial statements and condensed consolidated financial statements based on the available information and events that have occurred. The review consists of evaluating whether the business meets the definition of a component for which the operations and cash flows are clearly distinguishable from the other components of the business, and if so, whether it is anticipated that after the disposal the cash flows of the component would be eliminated from continuing operations and whether the disposition represents a strategic shift that has a major effect on operations and financial results. In addition, we evaluate whether the business has met the criteria as a business held for sale. In order for a planned disposition to be classified as a business held for sale, the established criteria must be met as of the reporting date, including an active program to market the business and the expected disposition of the business within one year.
Planned business dispositions are presented as discontinued operations when all the criteria described above are met. For those divestitures that qualify as discontinued operations, all comparative periods presented are reclassified in our audited consolidated balance sheet and condensed consolidated balance sheets. Additionally, the results of operations of a discontinued operation are reclassified to income from discontinued operations, net of tax, for all periods presented in our audited consolidated statements of operations and condensed consolidated statements of operations. Results of discontinued operations include all revenues and expenses directly derived from such businesses; general corporate overhead is not allocated to discontinued operations.
Recent Accounting Pronouncements
For further information, see Note 2 to our audited consolidated financial statements included elsewhere in this prospectus.
Quantitative and Qualitative Disclosures About Market Risk
We are exposed to certain risk arising from both our business operations and economic conditions. We principally manage our exposure to a wide variety of business and operational risks through management of our core business activities. We manage economic risks, including interest rate, liquidity, and credit risk primarily by managing the amount, sources, and duration of our debt funding and through the use of derivative financial instruments.
Foreign Currency Exchange Risk
Our sales contracts are primarily denominated in U.S. dollars. A portion of our operating expenses are incurred outside of the United States and are denominated in foreign currencies and are subject to fluctuations due to changes in foreign currency exchange rates, particularly changes in the Euro, Argentine Peso, Indian Rupee, British Pound Sterling, Australian Dollar, and Japanese Yen. Additionally, fluctuations in foreign currency exchange rates may cause us to recognize transaction gains and losses in our consolidated statement of operations. The effect of an immediate 10% adverse change in foreign exchange rates on monetary assets and liabilities at June 26, 2021 would not be material to our financial condition or results of operations. To date, foreign currency transaction gains and losses and exchange rate fluctuations have not been material to our consolidated financial statements, and we have not engaged in any foreign currency hedging transactions.
115
Confidential Treatment Requested by McAfee Corp.
Pursuant to 17 C.F.R. Section 200.83
As our international operations continue to grow, our risks associated with fluctuation in currency rates will become greater, and we will continue to reassess our approach to managing this risk, such as using foreign currency forward and option contracts to hedge certain exposures to fluctuations in foreign currency exchange rates. In addition, currency fluctuations or a weakening U.S. dollar can increase the costs of our international expansion, and the currently strengthening U.S. dollar could slow international demand as products and services priced in the U.S. dollar become more expensive.
Interest Rate Risk
We utilize long-term debt to, among other things, finance our acquisitions and, to a lesser extent, our operations. We are exposed to interest rate risk on our outstanding floating rate debt instruments which bear interest at rates that fluctuate with changes in certain short-term prevailing interest rates. Borrowings under the Senior Secured Credit Facilities bear interest at a Euro currency rate determined by reference to LIBOR, plus an applicable margin, subject to established floors of 0.00%. During the fiscal year ended December 29, 2018, the 2017 Predecessor and 2017 Successor periods and the fiscal year ended December 31, 2016, applicable interest rates have been lower than the designated floors under our Senior Secured Credit Facilities; therefore, interest rates under the Senior Secured Credit Facilities have not been subject to change. Assuming that the rates remain below the applicable floors under the Senior Secured Credit Facilities, a 25 basis point increase or decrease in the applicable interest rates on our variable rate debt, excluding debt outstanding under the Senior Secured Credit Facilities, would result in a minor change in interest expense on an annual basis.
In 2018 and through 2020, we entered into multiple interest rate swaps in order to fix a substantial amount of the LIBOR portion of our USD denominated variable rate borrowings. Our derivative financial instruments are used to manage differences in the amount, timing, and duration of the our known or expected cash payments principally related to our variable-rate borrowings.
A hypothetical 10% increase or decrease in interest rates during any of the periods presented would not have had a material impact on our interest expense.
Inflation Rate Risk
We do not believe that inflation has had a material effect on our business, financial condition or results of operations. Nonetheless, if our costs were to become subject to significant inflationary pressures, we may not be able to fully offset such higher costs through price increases. Our inability or failure to do so could harm our business, financial condition, and results of operations.
116
Confidential Treatment Requested by McAfee Corp.
Pursuant to 17 C.F.R. Section 200.83
BUSINESS
Our Company
McAfee has been a pioneer and leader in protecting consumers from cyberattacks with integrated security, privacy, and trust solutions. For over 30 years, consumers have turned to McAfee as a leader in cybersecurity services. We built our platform through a deep, rich history of innovation and have established a leading global brand. When securing the digital experience of a consumer who is increasingly living life online, McAfee is singularly committed to one mission: to protect our subscribers’ digital presence through leading-edge cybersecurity.
We live in a digital world. Consumers are increasingly mobile, interacting through multiple devices, networks and platforms, while leveraging technology as they work, socialize, consume and transact. Remote and increasing work and study from home arrangements are driving a pronounced convergence of professional and personal life. This lifestyle shift has been accompanied by a more advanced cyberthreat landscape and a proliferation of points of vulnerability, risking individuals’ privacy, identity, data and other vital resources. This challenge, has heightened the importance of securing the consumers’ converged digital lives.
We have a differentiated ability to secure the consumers’ digital experience against cyberthreats, using
our proprietary advanced artificial intelligence and machine learning capabilities combined with our real time threat intelligence that leverages the scale and diversity of our threat sensor network. As of 2020, our network of over one billion threat sensors includes our subscribers’ endpoints, personal networks, and cloud-based environments that generates massive amounts of telemetry that we translate into actionable, real-time insights. As of 2020, our vast and dynamic data set and advanced analytics capabilities enable us to provide defense for advanced
zero-day
threats by training machine learning models on the over 60 billion threat queries. McAfee simplifies the complexity of threat detection and response by correlating events, detecting new threats, reducing false positives, and guiding consumers through remediation. Protecting our subscribers has been the foundation of our success, enabling us to maintain an industry-leading reputation among our subscribers and partners.Our Personal Protection Service provides holistic digital protection for an individual or family at home, on the go, and on the web. Our platform includes device security, privacy and safewhether on a computer, smartphone or tablet, and across multiple operating systems.
Wi-Fi,
online protection, and identity protection, creating a seamless and integrated digital moat. With a single interface, simple set up and ease of use, consumers obtain immediatetime-to-value
Our broad andstrategy has reached the consumer at crucial moments in their cybersecurity purchase lifecycle resulting in the protection of over 600 million devices as of June 26, 2021. We have longstanding exclusive partnerships with many of the leading PC original equipment manufacturers (“OEMs”) and increasingly with mobile and internet service providers (“ISPs”) as the demand for mobile security protection increases. Through many of these relationships, our consumer security software ischannel also includes some of the largest retailers globally. We operate a global business, with 37% of our fiscal 2020 net revenue earned outside of the United States and Canada.
digitally-led
omni channelgo-to-market
pre-installed
on devices on a trial basis until conversion to a paid subscription. Ourgo-to-market
In 2017, investment funds affiliated with or advised by TPG Global, LLC (“TPG”) and Thoma Bravo, L.P. (“Thoma Bravo”) (collectively “Sponsors”) acquired a controlling interest in McAfee, accelerating our transformational journey to optimize and reinforce our cybersecurity platform. Over the years, we have invested in new routes to market and partnerships for the business. We have also made multiple operational changes designed to increase efficiency in our product delivery andstrategies. These efforts included the transformation of our performance marketing through a digital first approach focused on new customer acquisition, channel led conversion and overall customer retention, through our simple and intuitive user experience and consumer application development programs. Our investments in our platform and strategy have reinforced our market leadership, and we intend to continue innovating to protect our subscribers.
go-to-market
117
Confidential Treatment Requested by McAfee Corp.
Pursuant to 17 C.F.R. Section 200.83
Sale of our Enterprise Business
On July 27, 2021, we completed the sale of our Enterprise Business to STG, pursuant to a Contribution and Equity Purchase Agreement (the “Purchase Agreement”) entered in on March 6, 2021 between McAfee, LLC (“US Seller”) and McAfee Security UK LTD (“UK Seller” and together with US Seller, the “Seller Entities”) and Magenta Buyer LLC, organized by a consortium led by STG, entered into a Contribution and Equity Purchase Agreement (the “Purchase Agreement”), in exchange for (i) $4,000,000,000 in cash consideration and (ii) the assumption of certain liabilities of the Enterprise Business as specified in the Purchase Agreement. We believe this transaction will allow McAfee to singularly focus on our Consumer business and to accelerate our strategy to be a leader in online protection for consumers.
In connection with the closing of the sale, the Seller Entities and Buyer to enter into a Transition Services Agreement, Transitional Trademark License Agreement, Intellectual Property Matters Agreement and Commercial Services Agreement, under which each party granted certain licenses to the other party with respect to certain intellectual property rights and technology transferred by us in the Enterprise Sale and retained by us after the consummation of the sale of our Enterprise Business. We also agreed not to compete with the Enterprise Business for four years following the closing of the transaction. In addition, we and Buyer agreed to indemnify each other for losses arising from certain covenant breaches under the Purchase Agreement and certain liabilities expressly assumed or retained by the relevant indemnifying party.
In August 2021, we used a portion of the proceeds received in the transaction to repay $332 million of our First Lien USD Term Loan and €563 million of our First Lien EUR Term Loan. We expect to use a portion of such proceeds to pay approximately $175 million in customary transaction expenses and
other one-time charges.
The remaining proceeds were distributed by Foundation Technology Worldwide LLC, our controlled subsidiary, on a pro rata basis to all holders, including McAfee Corp. McAfee Corp. expects its pro rata portion of such proceeds to pay approximately $300 million in required corporate taxes and related payments in connection with the transaction. McAfee Corp. declareda one-time special
dividend of $4.50 per share to holders of record of our Class A Common Stock as of August 13, 2021, paid on August 27, 2021. Purchases of shares in this offering will not receive this special dividend. We also expect to pay approximately $300 million in totaladditional one-time separation
costs and stranded cost optimization, a portion of which will be expenses paid using proceeds from the sale of our Enterprise Business.Industry Background
We live in an increasingly digitally interconnected and mobile world that is driving profound changes for consumers, causing them to react to the following trends:
Adoption of online lifestyle is global and continues to grow.
Consumers everywhere are living more of their everyday lives online, thereby expanding their digital footprint.
118
Confidential Treatment Requested by McAfee Corp.
Pursuant to 17 C.F.R. Section 200.83
Increased attack surface combined with more organized cybercriminals heightens risk of being hacked and personal data used for profit.
There is a need for integrated online protection solutions that secure consumers in a connected world by offering the following:
| • | Comprehensive and convenient security solutions to protect consumers across their digital footprint. |
| • | Online protection powered by seamless digital experience across devices and platforms. |
| • | Consumer products to address privacy needs. Wi-Fi connection, requiring virtual private network (“VPN”) solutions to secure personally identifiable information over unsecured networks. |
| • | Comprehensive real time threat intelligence leveraging a unique global sensor network. |
KEY BENEFITS OF OUR SOLUTIONS
We protect consumers with our differentiated ability to detect, analyze, and manage responses to adversarial threats. Our subscribers trust us to protect and defend their families, data, network and online experience whether it is on a device or in the cloud, at home or on the go.
Our products are multi-faceted privacy protection solutions that provide consumers security in their everyday lives.
119
Confidential Treatment Requested by McAfee Corp.
Pursuant to 17 C.F.R. Section 200.83
protect consumers and their families across their digital lives. Our products provide cross-device identity protection, online privacy, and device security against the latest virus, malware, spyware and ransomware attacks that are pervasive across all digital devices. Personal Protection Service allows consumers to have mobile and PC antivirus protection across all of their devices, spam filtering capabilities, the ability to securely encrypt sensitive files on public networks, and erases digital footprints that could be used to compromise their data, identity and privacy.
Our solutions provide a seamless and user friendly experience.
Our solutions have comprehensive features that provide consumers peace of mind that their online experience is protected.
Our solutions are supported by our global real time threat intelligence network, which is bolstered by artificial intelligence, machine learning, and deep learning to increase efficacy and efficiency.
Market Opportunity
According to Frost & Sullivan, the global consumer endpoint security market (comprised of endpoint protection and prevention and consumer privacy and identity protection) addressed by our solutions is expected to reach nearly $13.1 billion in 2020, growing to $18.7 billion in 2024. The consumer endpoint security market has remained strong throughout the
COVID-19
pandemic and has not shown signs of waning during the first half of 2021. While theCOVID-19
pandemic may have accelerated the market for consumer endpoint security solutions, we believe there continues to be a robust market for consumer personal protection, including mobile solution and broader Consumer protection offerings as consumers continue to increase their digital footprint.Competitive Strengths
Our competitive strengths include:
| • | Brand recognition |
| • | Holistic cybersecurity solutions seamlessly integrated across the consumers’ entire digital ecosystem. |
120
Confidential Treatment Requested by McAfee Corp.
Pursuant to 17 C.F.R. Section 200.83
of our consumers and their loved ones, across multitude of devices and platforms. With a single interface, simple set up and intuitive user experience, we provide a seamless and integrated digital moat. |
| • | Unique footprint across devices . |
| • | Scale and diversity of threat intelligence network . |
| • | Deep and innovative threat research expertise. |
| • | Differentiated omnichannel go-to-market |
| • | Experienced management team with deep cybersecurity expertise. go-to-market |
Our Growth Strategy
Our strategy is to maintain and extend our technology leadership in cybersecurity solutions by driving frictionless and secure digital experiences. We believe that consummation of the Enterprise Sale will enable us to focus on and devote all of our resources to delivering leading solutions to protect consumers across their digital lives. The following are key elements of our growth strategy:
| • | Continue to leverage our strength as a trusted cybersecurity brand to increase sales from new and existing subscribers. |
| • | Invest in new and existing routes to market for subscribers. direct-to-consumer |
| • | Enhance and tailor the subscriber conversion and renewal process. |
| • | Continue to innovate and enhance our consumer security platform and user experience. |
121
Confidential Treatment Requested by McAfee Corp.
Pursuant to 17 C.F.R. Section 200.83
invest in new product and platform innovation to help protect data wherever it resides or travels and defend against threats across multiple domains. At the product level, we have created a platform of integrated solutions that aligns with consumer needs for a holistic, easy to use cybersecurity solution. We will continue to utilize our “test and learn” design methodology to improve the customer experience while ensuring our products deliver value and an engaging experience on PC, mobile, tablet, and online. As the digital world gets more complex, our approach is to continue to offer unified solutions that meet customer needs. |
| • | Continue to pursue targeted acquisitions. |
Our Products
We have one of the industry’s most comprehensive cybersecurity portfolios protecting consumers’ digital life.
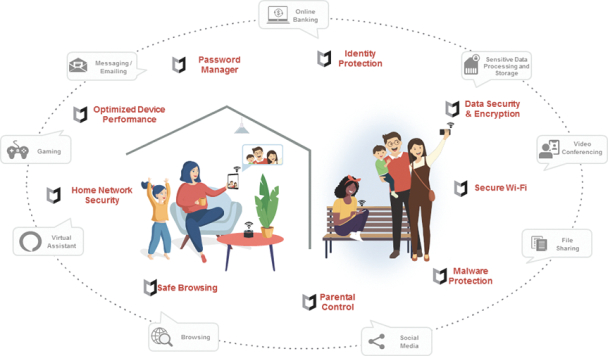
Our Personal Protection Service provides holistic online protection of the individual and family across their entire digital life. It encompasses device security, privacy, and
safe Wi-Fi, and
identity protection through a trusted brand with an intuitive experience that is equally easy to use whether on a PC, a mobile smartphone or a tablet and across multiple operating system platforms. Our Personal Protection Service delivers a simple user interface with no performance trade-offs, and with a focus on proactive, intelligent, and seamless protection during a consumers’ digital experience. Our platform frees consumers to work on sensitive documents, videoconference their friends and coworkers, and have their kids go on social media platforms while having peace of mind that our Personal Protection Service is keeping their data and files encrypted, proactively alerting them when they are at risk, and helping them to resolve security threats. We achieve this by integrating the following solutions and capabilities within our Personal Protection Service:| • | Device Security. Anti-Malware Software |
122
Confidential Treatment Requested by McAfee Corp.
Pursuant to 17 C.F.R. Section 200.83
Windows protected from viruses, ransomware, malware, spyware and phishing as of June 26, 2021. Our net promoter score grew from 36 in 2019 to 45 as of June 26, 2021. Additionally, these 600 million devices help power our threat intelligence engine. As consumers expand their digital footprint with an increasing number of devices and share personal data among them by hopping from one device to another, our threat intelligence engine becomes more robust. We built our Total Protection / LiveSafe Secure Home Platform (“SHP”) . |
| • | Online Privacy and Comprehensive Internet Security. Safe Connect VPN TunnelBear any Wi-Fi connection safe and private. With bank-gradeAES 256-bit encryption, our solution keeps personal data, such as banking account credentials and credit card information protected while keeping IP addresses and physical locations private. This capability helps consumers prevent password and data theftand IP-based tracking and allows customers to access global content, by bypassing local censorship. Consumers can add an additional layer of protection with FileLock Shredder WebAdvisor Safe Family blocks age-inappropriate websites, provides device usage monitoring and device restriction services and gives parents the ability to track children’s devices. |
| • | Identity Protection. Identity Protection Service Password Manager or re-used passwords. |
We also provide these services to consumers who want to complement their existing protection in the form of individual products, such as,,,, and, as well as to consumers who want to protect their complete digital life through our Total Protection and LiveSafe portfolio brands.
Mobile Security
Safe Connect
Safe Family
WebAdvisor
Identity Protection
In addition, we extended our protection services to small business owners and the gamer community. Our Small Business Security package helps small businesses keep their businesses and customer data safe by leveraging our award-winning multi-device protection and privacy capabilities, enhanced with our 24/7 technical support and virus removal service. Our Gamer Security package delivers anti-malware functionality while enhancing gaming performance. By offloading threat detection to the cloud, keeping necessary virus definitions locally, and optimizing system resources like CPU, GPU, and RAM by pausing background services, we deliver a smoother and safer gaming experience.
Our Technology
We deploy the latest technologies to maintain our competitive advantage in our product offerings as well as to design a personalized digital experience for consumers that drive customer engagement, satisfaction, and retention.
123
Confidential Treatment Requested by McAfee Corp.
Pursuant to 17 C.F.R. Section 200.83
Quality of Our Protection and AI/ML
Our solutions defend against a wide range of threats by using technology that leverages a combination of threat intelligence, artificial intelligence and machine learning. Unlike other alternatives that rely only on artificial intelligence, our approach minimizes false positives while detecting a wide range of threats, including
new zero-day threats
that have never been seen before.Our solutions are enhanced by our from detected events across the product portfolio in addition to structural and behavioral feature vectors from telemetry collected through our network of threat sensors. This telemetry enables McAfee to understand the blueprint of threats for which we do not necessarily possess the sample but can identify based on behavioral and structural vectors which improves our efficacy in
Global Threat Intelligence Telemetry
detecting zero-day threats.
Our provides two options for performing automated analysis—on the device or in the cloud. The former uses machine learning on customer systems to determine whether existing and incoming files match known malware. Our cloud-based machine learning scanner collects and sends file attributes and behavioral information to the machine-learning system in the cloud for malware analysis, without transmitting personally identifiable information.
Machine Learning Scanner
Anti-Malware Engine
Our anti-malware engine is the core component of our award-winning products. Using patented technology, the engine analyzes potentially malicious code to detect and block Trojans, viruses, worms, adware, spyware, ransomware and other threats. The engine scans files at particular points, processes, and pattern-matches malware definitions with data it finds within scanned files, decrypts, and runs malware code in an emulated environment, applies heuristic techniques to recognize new malware, and removes infectious code from legitimate files.
Consumer Experience Innovation
We continuously improve the digital experience for consumers through the following technologies:
| • | Platform Innovation. |
| • | Ability to Integrate with Our Partners. |
124
Confidential Treatment Requested by McAfee Corp.
Pursuant to 17 C.F.R. Section 200.83
Sales and Marketing
Ourengine consists of a
go-to-market
digitally-led
omnichannel approach to reach the consumer at crucial moments in their purchase lifecycle including direct to consumer online sales, acquisition through trialpre-loads
on PC OEM devices, and other indirect modes via additional partners such as mobile providers, ISPs, electronics retailers, ecommerce sites, and search providers.| • | Direct to consumer marketing . |
| • | PC OEMs . we pre-install a 30-day free a one-year or longer subscription and the OEM pays McAfee a royalty. During the subscription lifecycle, McAfee engages the consumer with our digital marketing engine to convert the consumer to a McAfee Direct to Consumer subscriber at the end of the initial subscription period. |
| • | Retail and eCommerce . We partner with major retailers worldwide including Office Depot, Staples, Walmart, Sam’s Club, MediaMarkt, Best Buy, and Amazon, to offer consumers a McAfee subscription for purchase through the retailer stores and ecommerce websites. During the subscription lifecycle McAfee engages the consumer with our digital marketing engine to convert the consumer to a McAfee Direct to Consumer subscriber at the end of the initial subscription period. |
| • | Communications Service Providers, ISPs and Mobile Providers Verizon, T-Mobile, Lumen, Telefonica, NTT Docomo, Softbank, British Telecom, and Sky, to offer our mobile security and secure home platform products through the service providers. In some cases, we also partner with the service providers to integrate and bundle one or more of our security products into their mobile product value added service offerings. In addition to our partnerships with service providers, we partner with Samsungto pre-install one or more of our security products on their smartphones. |
| • | Search Providers. |
Our omnichannel approach and strong partnerships work together to increase our presence at key moments of purchase and security engagement for consumers, allowing us to drive customer engagement and acquisition of new subscribers.
Competition
The market for cybersecurity solutions for is intensely competitive and constantly evolving. Conditions in our market are prone to frequent and rapid changes in technology, customer requirements and preferences, and industry standards resulting in frequent new product and service offerings and improvements and the entrance of new market participants. As a result, we face a broad set of competitors, representative of the diverse security domains in which we operate. In the consumer cybersecurity market, we face competition from players, such as NortonLifelock, Avast/AVG, Kaspersky, Trend Micro, ESET, and Microsoft, which expanded from desktop anti-malware into mobile, security, VPN, and identity protection among others. At the same time, we compete with point-tool providers, such as Cujo and Dojo in the home IoT space or AnchorFree, ExpressVPN, and ProtonVPN in the network security space, across our full consumer offering.
In addition, we expect additional competition from other established and emerging companies as the marketto develop and expand and as industry consolidation occurs.
for security-as-a-service continues
125
Confidential Treatment Requested by McAfee Corp.
Pursuant to 17 C.F.R. Section 200.83
The principal competitive factors in the markets for our solutions include:
| • | brand recognition and reputation; |
| • | scale and diversity of threat intelligence network; |
| • | tenure and strength of customer and partner relationships; |
| • | breadth and integration of product offerings; |
| • | unique footprint across devices; |
| • | product features, reliability, performance, and effectiveness; |
| • | price and total cost of ownership; |
| • | strength and productivity of sales and marketing efforts; |
| • | quality of customer service; and |
| • | financial resources and stability. |
We believe we compete favorably across these factors. However, certain of our current and potential competitors may have competitive advantages, such as more extensive international operations, larger product development and strategic acquisition budgets, or greater financial, technical, sales, or marketing resources than we do. For additional information about the risks to our business related to competition, see “Risk Factors—Risks Related to Our Business and Industry—We operate in a highly competitive environment and we expect competitive pressures to increase in the future, which could cause us to lose market share.”
COVID-19
PandemicThe
COVID-19
pandemic is having widespread, rapidly evolving, and unpredictable impacts on global society, economies, financial markets, and business practices. Federal, state and foreign governments have implemented measures to contain the virus, including social distancing, travel restrictions, border closures, limitations on public gatherings, work from home, and closure ofnon-essential
businesses. To protect the health and well-being of our employees, partners, and third-party service providers, we have implemented work-from-home requirements, made substantial modifications to employee travel policies, and cancelled or shifted marketing and other corporate events to virtual-only formats for the foreseeable future.The ultimate duration and extent of the impact from the
COVID-19
pandemic depends on future developments cannot be accurately forecasted at this time. These developments include the severity and transmission rate of the disease, the actions of governments, businesses and individuals in response to the pandemic, the extent and effectiveness of containment actions and vaccines, the impact on economic activity and the impact of these and other factors. We have experienced growth and increased demand for our solutions in recent quarters, particularly with respect to our Consumer business, which may be due in part to greater demand for devices or our solutions in response to theCOVID-19
pandemic. We cannot determine what, if any, portion of our growth in net revenue, the number of our Direct to Consumer subscribers, or any other measures of our performance during the fiscal 2020 compared to the fiscal 2019 was the result of such responses to theCOVID-19
pandemic. See “Risk Factors” for further discussion of the possible impact of theCOVID-19
pandemic on our business.Intellectual Property
Our intellectual property is an important and vital asset of the company that enables us to develop, market, and sell our products and services and enhance our competitive position. We rely on trademarks, patents, copyrights, trade secrets, license agreements, intellectual property assignment agreements, confidentiality procedures,
non-disclosure
agreements, and employeenon-disclosure
and invention assignment agreements to establish and protect our proprietary rights.126
Confidential Treatment Requested by McAfee Corp.
Pursuant to 17 C.F.R. Section 200.83
We maintain an internal patent program to identify inventions that provide the basis for new patent applications in areas of importance to our business. As of June 26, 2021, we had approximately 1,375 issued U.S. patents, in addition to approximately 835 issued foreign patents, which generally relate to inventive aspects of our products and technology. The duration of our issued patents is determined by the laws of the issuing country. Although we have patent applications pending, there can be no assurance that patents will issue from pending applications or that claims allowed on any future issued patents will be sufficiently broad to protect our technology. Also, these protections may not preclude competitors from independently developing products with functionality or features similar to our products.
In certain cases, we license intellectual property from third parties for use in our products and generally must rely on those third parties to protect the licensed rights. This can include open source software, which is subject to limited proprietary rights. While the ability to maintain and protect our intellectual property rights is important to our success, we believe our business is not materially dependent on any individual patent, copyright, trademark, trade secret, license, or other intellectual property right. For information on the risks associated with our intellectual property, please see “Risk Factors”.
Third-Party Service Providers
We are heavily reliant on our technology and infrastructure to provide our products and services to our subscribers. For example, we host many of our products using third-party data center facilities, and we do not control the operation of these facilities. In addition, we rely on certain technology that we license from third parties, including third-party commercial software and open source software, which is used with certain of our solutions. For information on the risks associated with our dependence on such third-party service providers, please see “Risk Factors” in Item 1A.
Governmental Regulation
We collect, use, store or disclose an increasingly high volume, variety, and velocity of personal information, including from employees and customers, in connection with the operation of our business, particularly, in relation to our identity and information protection offerings, which rely on large data repositories of personal information and consumer transactions. The personal information we process is subject to an increasing number of federal, state, local, and foreign laws regarding privacy and data security. For information on the risks associated with complying with privacy and data security laws, please see “Risk Factors”.
Employee & Human Capital
Protecting our subscribers’ online life demands constant innovation. Doing our job well requires building a workplace that embraces individuality, encourages different perspectives, and welcomes a range of experiences to boost real innovation, creativity, and strategic problem-solving. But it’s not just the right thing to do for
business-it’s
about every person’s innate right to be their true self and belong.Building a more inclusive, sustainable world starts within our walls. We believe that when we mirror the varying perspectives of the outside world, we are stronger, more innovative, and better positioned to solve tomorrow’s toughest cybersecurity challenges. Our approach starts with our hiring and interview practices, but representation isn’t enough. Once people walk through our open door, we ensure all life experiences are not just valued, but accepted and encouraged. Only when people feel a deep sense of belonging can they thrive.
To solve tomorrow’s cybersecurity challenges, we know that our industry needs a more diverse, innovative workforce. To fulfill our mission to protect all that matters, we stand firm in our commitment to drive this change. But first, we must understand who we are today to define our journey ahead. As of June 26, 2021, McAfee employed 6,248 employees in 42 countries worldwide. Of these employees, up to 4,370 are expected to transition to the new, standalone Enterprise Business upon consummation of the Enterprise Sale.
127
Confidential Treatment Requested by McAfee Corp.
Pursuant to 17 C.F.R. Section 200.83
To contribute a more diverse workforce to the cybersecurity industry, we know that we will need to exercise genuine, authentic, and transparent recruiting and hiring practices aligned with our values. That’s why we support techniques and programs designed specifically to connect us with people of all backgrounds:
| • | We write clear, searchable, and applicable job descriptions for candidates of all backgrounds. By leveraging the only augmented writing platform that addresses language as well as content, all candidates can find and understand our open roles. |
| • | We assemble a diverse hiring panel for every role, so each candidate is considered from varying perspectives. |
| • | To plant a firm cultural foundation and minimize any unconscious bias, we train all recruiters and hiring managers to use our values-based behavioral interview approach. |
| • | We provide a Return to Workplace program to tap into the experiences of women and men who may have paused their career to raise children, care for loved ones, or serve their country. |
| • | Our internship program serves as the training ground for top talent around the world, welcoming qualified, interested students of all backgrounds |
Real collaboration, innovation, and impact happens in workplaces where you can express yourself authentically. That’s why we work hard to ensure life at McAfee is one where our employees can be authentic, engage with others, and reach the best versions of themselves, both at the office and away from it:
| • | Because each person plays a role, McAfee employees included an inclusion goal as part of their individual goals. |
| • | We sponsor 6 McAfee Communities to support members and allies within each of our African Heritage, Veterans, Latino, Women, LGBTQ, and Differently Abled communities. |
| • | We provide mentors for members of our WISE (Women in Security) community. |
| • | We ensure fair and equal compensation based on contributions and impact to the company through our annual pay parity analysis. |
| • | We provide a Diversity Impact analysis to ensure that at a minimum, any promotion or rewards are representative of each diverse group’s population within the organization. |
| • | We focus our global benefits strategy on providing inclusive and family friendly benefits. |
Facilities
Our corporate headquarters is located in San Jose, California pursuant to the terms of
an 11-year lease
that was entered into on April 10, 2019 for approximately 84,000 square feet of space. We also conduct finance, accounting, sales and marketing, and administration activities in Plano, Texas where we own an office building with approximately 170,000 square feet of space. In addition, we lease space for personnel in locations throughout the United States and various international locations, including significant research and development activities in India and Argentina, significant sales and operational offices in Ireland, the U.K., Canada, and Japan and smaller sales and marketing offices located in major markets around the globe. We believe that our current facilities are adequate to meet our current needs.Legal Proceedings
From time to time, we are subject to various legal proceedings and claims, either asserted or unasserted, which arise in the ordinary course of business. While the outcome of these matters cannot be predicted with certainty, we do not believe that the outcome of any of these matters, individually or in the aggregate, will have a material adverse effect on our consolidated financial condition, results of operations, or cash flows.
128
Confidential Treatment Requested by McAfee Corp.
Pursuant to 17 C.F.R. Section 200.83
MANAGEMENT
Executive Officers and Directors
Below is a list of the names, ages, positions and a brief account of the business experience of the individuals who serve as our executive officers and directors as of the date of this prospectus.
Name | Age | Position | ||
Peter Leav | 50 | President, Chief Executive Officer and Director | ||
Venkat Bhamidipati | 53 | Executive Vice President and Chief Financial Officer | ||
Terry Hicks | 57 | Executive Vice President and General Manager, Consumer Business | ||
Sohaib Abbasi | 64 | Director | ||
Mary Cranston | 73 | Director | ||
Tim Millikin | 38 | Director | ||
Jon Winkelried | 61 | Director | ||
Kathy Willard | 54 | Director | ||
Jeff Woolard | 52 | Director |
Peter Leav
Venkat Bhamidipati
Terry Hicks
129
Confidential Treatment Requested by McAfee Corp.
Pursuant to 17 C.F.R. Section 200.83
Sohaib Abbasi
Mary Cranston
non-profits,
including Visa, Inc. (since 2007), where Mary is a member of the finance committee and Nominating and Corporate Governance Committee, The Chemours Company (since 2015), Boardspan (since March 2016), and CSAA Insurance Group (since 2008), and previously served on the board of MyoKardia (May 2016 to November 2020). Mary holds a bachelor’s degree in political science from Stanford University, a J.D. degree from Stanford Law School, and M.A. degree in education from the University of California, Los Angeles. We believe that Mary’s legal and board experience qualifies Mary to serve on the Board.Tim Millikin
Tim co-leads TPG’s
investment activities in software & enterprise technology. Tim has served on the boards of ThycoticCentrify since March 2021, Government Brands since August 2021, and Ellucian since September 2015. Tim previously served on the boards of Renaissance Learning from July 2018 to January 2019, INFINIDAT from December 2017 to February 2019, and Isola Group from July 2012 to January 2018. Tim holds an M.B.A. degree from the Stanford Graduate School of Business, where Tim was an Arjay Miller Scholar, and a bachelor’s degree from Dartmouth College. We believe that Tim’s board and industry experience qualifies Tim to serve on the Board.Jon Winkelried
and Co-Chief Operating
Officer. Jon has served on the board of directors for Evolution Media since May 2016, Anastasia Beverly Hills since August 2018, Bounty Minerals LLC since December 2012, ATTN: from May 2019 to May 2021, and MX Technologies since December 2020. Jon was elected to the Board of Trust of Vanderbilt University in 2012, and was elected Chair for the Investment Committee in 2017. Jon served as a trustee at the University of Chicago from 2006 to 2012. Jon received a bachelor’s degree in business from the University of Chicago and an M.B.A. degree from the University of Chicago. We believe that Jon’s board and industry experience qualifies Jon to serve on the Board.
Kathy Willard
Jeff Woolard
130
Confidential Treatment Requested by McAfee Corp.
Pursuant to 17 C.F.R. Section 200.83
Technology Group since June 2020. Prior to this role, Jeff served as a Vice President and Chief Financial Officer for Intel Capital and the New Technology Group from March 2013 until June 2020, focusing on Intel’s corporate venture investments and acquisition activities. Jeff received a bachelor’s degree in finance from Arizona State University and an M.B.A. from the University of Washington. We believe that Jeff’s board and industry experience qualifies Jeff to serve on the Board.
Controlled Company
Our Sponsors and Intel control a majority of the voting power of our outstanding common stock. As a result, we are a “controlled company” under the Exchange’s corporate governance standards. As a controlled company, exemptions under the Exchange’s standards exempt us from certain of the Exchange’s corporate governance requirements, including the requirements:
| • | that our board that is composed of a majority of “independent directors,” as defined under rules; |
| • | that the compensation committee that is composed entirely of independent directors; and |
| • | that the nominating and corporate governance committee that is composed entirely of independent directors. |
Accordingly, for so long as we are a “controlled company,” you will not have the same protections afforded to stockholders of companies that are subject to all of the Exchange’s corporate governance requirements. In the event that we cease to be a controlled company, we will be required to comply with these provisions within the transition periods specified in the rules of the Exchange.
These exemptions do not modify the independence requirements for our audit committee, and we expect to satisfy the member independence requirement for the audit committee prior to the end of the transition period provided under the Exchange’s listing standards and SEC rules and regulations for companies completing their initial public offering.
Board Composition and Director Independence
Our business and affairs are managed under the direction of our board of directors. Our amended and restated certificate of incorporation provide that our board of directors shall consist of at least three but not more than 12 directors and that the number of directors may be fixed from time to time by resolution of our board of directors. Our board of directors consists of seven members. Our amended and restated certificate of incorporation will provide that our board of directors will be divided into three classes of directors, as nearly equal in number as possible. The division of the three classes is as follows:
| • | Class I, which consists of Jon Winkelried, Jeff Woolard, and Kathy Willard, whose terms will expire at our annual meeting of stockholders to be held in 2024; |
| • | Class II, which consists of Tim Millikin and Sohaib Abbasi, whose terms will expire at our annual meeting of stockholders to be held in 2022; and |
| • | Class III, which consists of Peter Leav and Mary Cranston, whose terms will expire at our annual meeting of stockholders to be held in 2023. |
Upon the expiration of the initial term of office for each class of directors, each director in such class shall be elected for a term of three years and serve until a successor is duly elected and qualified and until his or her earlier death, resignation or removal. Subject to the terms of the stockholders agreement, any additional directorships resulting from an increase in the number of directors or a vacancy may be filled by the directors then in office, even if less than a quorum, or by a sole remaining director.
In connection with the Reorganization Transactions, we entered into a stockholders agreement with investment funds affiliated with our Sponsors, Intel Americas, Inc., and certain other stockholders governing
131
Confidential Treatment Requested by McAfee Corp.
Pursuant to 17 C.F.R. Section 200.83
certain nomination rights with respect to our board of directors. Under the agreement, we are required to take all necessary action to cause the board of directors to include individuals designated by TPG and Intel Americas, Inc. in the slate of nominees recommended by the board of directors for election by our stockholders, as follows:
| • | for so long as TPG owns at least 25% of the shares of our Class A and Class B common stock held by TPG upon completion of our IPO (and the expected use of proceeds therefrom), including any exercise of the underwriters’ option to purchase additional shares, and the Reorganization Transactions, TPG will be entitled to designate six individuals for nomination, including three unaffiliated directors who meet the independence criteria set forth in Rule 10A-3 under the Exchange Act; |
| • | for so long as TPG owns less than 25% but at least 10% of the shares of our Class A and Class B common stock held by TPG upon completion of our IPO (and the expected use of proceeds therefrom), including any exercise of the underwriters’ option to purchase additional shares, and the Reorganization Transactions, TPG will be entitled to designate two individuals for nomination, including one unaffiliated director who meets the independence criteria set forth in Rule 10A-3 under the Exchange Act; |
| • | for so long as Intel Americas, Inc. and its affiliates owns at least 25% of the shares of our Class A and Class B common stock held by Intel Americas, Inc. and its affiliates upon completion of our IPO (and the expected use of proceeds therefrom), including any exercise of the underwriters’ option to purchase additional shares, and the Reorganization Transactions, Intel Americas, Inc. will be entitled to designate two individuals for nomination; and |
| • | for so long as Intel Americas, Inc. and its affiliates owns less than 25% but at least 10% of the shares of our Class A and Class B common stock held by Intel Americas, Inc. and its affiliates upon completion of our IPO (and the expected use of proceeds therefrom), including any exercise of the underwriters’ option to purchase additional shares, and the Reorganization Transactions, Intel Americas, Inc. will be entitled to designate one individual for nomination. |
TPG and Intel have also have the exclusive right to remove their respective designees and to fill vacancies created by the removal or resignation of their designees, and we are required to take all necessary action to cause such removals and fill such vacancies at the request of TPG or Intel, as applicable.
Our board of directors has undertaken a review of the independence of each director. Based on the information provided by each director concerning his or her background, employment, and affiliations, our board of directors has determined that each of Sohaib Abbasi, Mary Cranston, Tim Millikin, Jon Winkelried, Kathy Willard, and Jeff Woolard are independent directors under the rules of the Exchange. In making this determination, the board of directors considered the relationships that such directors have with our Company and all other facts and circumstances that the board of directors deemed relevant in determining such directors’ independence, including beneficial ownership of our capital stock by each
non-employee
director and their affiliates, and the transactions involving them described in “Certain Relationships and Related Party Transactions.”132
Confidential Treatment Requested by McAfee Corp.
Pursuant to 17 C.F.R. Section 200.83
EXECUTIVE COMPENSATION
Compensation Discussion and Analysis
This Compensation Discussion and Analysis focuses on the compensation we provide to our executive officers listed in the “Summary Compensation Table for Fiscal 2020” (our “named executive officers”) and should be read in conjunction with the accompanying tables and text below. In accordance with SEC executive compensation disclosure rules, this Compensation Discussion and Analysis focuses on our compensation decisions with respect to our named executive officers for fiscal 2020, certain of which were made while we have been privately owned. As part of the process of becoming a public company, with the assistance of our independent compensation consultant, we have reviewed and plan to continue to review all elements of our executive compensation program. We expect that our executive compensation program and compensation governance practices will continue to evolve to reflect our status as a new publicly-traded company, while still supporting our overall business and compensation objectives. In this Compensation Discussion and Analysis and the accompanying tables and narratives, references to “the Board” and “the Committee” refer to the board of managers of Foundation Technology Worldwide LLC (“FTW”) and its compensation committee for all periods prior to the restructuring undertaken in connection with our IPO and to the Board of Directors of the Company and its Leadership Development and Compensation Committee (the “Committee”) for all periods following the restructuring.
Our named executive officers for fiscal 2020 are:
Name | Title | |
Peter Leav (1) | President and Chief Executive Officer | |
Venkat Bhamidipati (2) | Executive Vice President and Chief Financial Officer | |
Lynne Doherty McDonald (3) | Former Executive Vice President, Global Sales and Marketing, Enterprise Business Group | |
Terry Hicks | Executive Vice President, Consumer Business Group | |
Ashutosh Kulkarni (4) | Former Executive Vice President and Chief Product Officer, Enterprise Business Group | |
Ashish Agarwal (5) | Senior Vice President, Strategy and Corporate Development | |
Christopher Young (6) | Former Chief Executive Officer | |
Michael Berry (7) | Former Executive Vice President, Chief Financial Officer | |
John Giamatteo (8) | Former President and Chief Revenue Officer, Enterprise Business Group |
| (1) | Peter Leav’s employment with us commenced on February 3, 2020. |
| (2) | Venkat Bhamidipati’s employment with us commenced on September 2, 2020. |
| (3) | Lynne Doherty McDonald’s employment with us commenced on May 4, 2020, and terminated on July 27, 2021 in connection with the consummation of the sale of our Enterprise Business. |
| (4) | Ashutosh Kulkarni’s employment with us terminated on January 1, 2021. |
| (5) | Ashish Agarwal served as our interim Chief Financial Officer from March 13, 2020 until September 2, 2020. |
| (6) | Christopher Young’s employment with us terminated on February 3, 2020. |
| (7) | Michael Berry’s employment with us terminated on March 13, 2020. |
| (8) | John Giamatteo’s employment with us terminated on January 10, 2020. |
Industry Background and Overarching Compensation Considerations
Industry Background
McAfee has been a pioneer and leader in protecting consumers, enterprises, and governments from cyberattacks for more than 30 years with integrated security, privacy and trust solutions. We built our platform through a deep, rich history of innovation and have established a leading global brand. Whether we are securing
133
Confidential Treatment Requested by McAfee Corp.
Pursuant to 17 C.F.R. Section 200.83
the digital experience of a consumer who is increasingly living life online, or defending many of the world’s largest enterprises and governments from sophisticated attacks and nation-state threats, McAfee is singularly committed to one mission: to protect all things digital that matter through leading-edge cybersecurity. We live in a digital world. Consumers are increasingly moving their daily lives online, interacting through multiple devices, networks and platforms, and leveraging technology in nearly every aspect of their lives. This shift is most noticeable in the way individuals are working, banking, socializing, consuming, and paying, leading to a proliferation of digital touchpoints and applications. Remote work and increasing work from home arrangements are driving a pronounced convergence of work and personal life. While people expect effective and frictionless security at work and in their personal lives, this lifestyle shift has been accompanied by a more challenging threat landscape and an increase in points of vulnerability, risking individuals’ privacy, identity, data and other vital resources. Similarly, enterprises embracing employee mobility, work from home strategies, bring your own device, and greater cloud adoption have seen the attack surface broaden and network perimeter dissolve. These drivers have led to a rapid increase in the number of workloads across endpoints and industries, making it challenging for enterprises to monitor and protect all of their workloads and applications and increasing the importance of the consumer in making security decisions for their converged digital lives.
Competitive Hiring Environment and Fiscal 2020 Senior Executive Hiring
Cybersecurity is a fast-paced and competitive industry experiencing a widely-reported shortage of skilled talent and leadership in the face of high and increasing demand. We compete for executive talent with many other cybersecurity companies, large and small. Prior to our IPO, we faced competitive pressure due to the fact that some of our competitors are publicly-traded and therefore were able to offer equity compensation to their executives that is more liquid than the equity compensation we then offered to our executives. Additionally, we compete for executive talent in geographic areas, such as Silicon Valley, and in related industries, such as software development, in which talented executives are in high demand, resulting in an increasingly competitive environment for attracting and retaining executive talent. Given the unique skillset required of our executive team as well as competition from industries beyond cybersecurity for our executives, during fiscal 2020 we offered competitive compensation that accounted not only for these external factors but also, prior to our IPO, for our status as a privately-held company.
In recruiting Peter Leav, Venkat Bhamidipati and Lynne Doherty McDonald, who each joined us in fiscal 2020, McAfee and the Committee were guided by the same executive compensation philosophy as described below for fiscal 2020 and negotiated the level of their compensation and the terms of their executive compensation arrangements, which included an employment agreement (in the cases of Peter Leav and Venkat Bhamidipati) and an offer letter (in the case of Lynne Doherty McDonald), as well as management incentive unit (“MIU”) and restricted equity unit (“RSU”) grants. These arrangements were finalized, in each case, taking into account market compensation level determined by the Committee based on prior input from our independent compensation consultants and the experience of members of the Committee, internal pay equity considerations and the circumstances of our executives’ hires, including their prior roles and compensation in those roles.
Key Strategic Transactions
In fiscal 2020 and fiscal 2021, we undertook two transformative strategic transactions that will shape our company going forward. First, during fiscal 2020 we completed our IPO. Among other potential benefits, our IPO enabled us to more readily raise capital to invest in our business, increases our public profile and gives us a new currency (our publicly-traded stock) for future acquisitions and equity incentive programs. On March 8, 2021, we announced that we had entered a definitive agreement to sell certain assets of our Enterprise business (the “Enterprise Division Sale”) for $4.0 billion in cash before tax, which allowed us to pay a special dividend of $4.50 per Class A common share upon the closing of the transaction and to reduce our debt by approximately $1 billion. The Enterprise Division Sale closed on July 27, 2021. Following the closing of the Enterprise Division Sale, McAfee became a pure play consumer cybersecurity company (other than certain
non-U.S.
subsidiaries related to the Enterprise Business, which will be transferred in subsequent months pursuant to the terms of the134
Confidential Treatment Requested by McAfee Corp.
Pursuant to 17 C.F.R. Section 200.83
Enterprise Division Sale). The Committee viewed the efforts and dedication of our currently employed named executive officers as vital to the success of those key strategic transactions.
Philosophy and Objectives of our Executive Compensation Program
Our global compensation philosophy is to compensate employees competitively, fairly and based on performance to incentivize actions that support achievement of our business objectives and equityholder value appreciation. To that end, we frequently monitor the integrity and functionality of our executive compensation program and refine it as we deem appropriate. Equitable pay practices are critical to our culture. During fiscal 2020, we continued our cybersecurity industry-leading efforts to review and bring about global pay parity, which we define as fair and equal pay for employees in the same job, level, and location, controlling for pay differentiators such as performance, tenure and experience. As part of our ongoing review of pay practices, we have engaged in extensive internal audits because we believe that every employee should be compensated fairly and equally for the employee’s individual contribution to the Company.
Consistent with our global compensation philosophy, our goal has been to implement an executive compensation program that drives results and that is built upon our long-standing executive compensation philosophy and objectives, as outlined below:
| • | Attract and retain talent |
| • | Pay-for-performance |
| • | Align executive goals and compensation with equityholder interests |
Key Features of Our Executive Compensation Program
Our executive compensation program includes the following practices, each of which the Committee believes reinforces our executive compensation philosophy and objectives:
We have followed good governance practices in our executive compensation practices by:
| • | Providing a significant percentage of target annual cash compensation delivered in the form of variable compensation tied to performance |
| • | Using simple and common performance measures that we believe are core drivers of the Company’s operational performance and equityholder value |
| • | Emphasizing future pay opportunity through equity awards, which represent a significant component of compensation |
| • | Using multi-year vesting for equity compensation, which requires our executive officers to hold sufficient unvested equity value to provide a meaningful retention incentive |
| • | Adopting equity ownership requirements for executives (including significant transfer restrictions on pre-IPO equity issued to our named executive officers that continue to apply afterour post-IPO lock-up expired |
| • | Adopting a clawback policy that applies to our executive officers |
| • | Using comparable market data to assess the competitive market position of our executive compensation program |
135
Confidential Treatment Requested by McAfee Corp.
Pursuant to 17 C.F.R. Section 200.83
| • | Engaging independent outside consulting firms to validate market practices and trends for our industry |
| • | Not providing tax gross-ups on change in control benefits |
| • | Not providing excessive executive perquisites |
| • | Not offering a defined benefit pension plan for our executives |
| • | Not repricing stock options, profits interests or other “appreciation” awards |
Decision-making Responsibility
During fiscal 2020, after our IPO, the Committee generally oversaw our executive compensation program. Prior to that time, the compensation committee of the board of managers of FTW oversaw our executive compensation program. In connection with our IPO in fiscal 2020, the Board also approved certain matters related to our executive compensation program.
The Committee considers the views and recommendations of management, in particular those of our President and Chief Executive Officer and our Chief People Officer, in making decisions regarding executive compensation. Among other things, our Chief Executive Officer makes recommendations about executive performance, annual base salary levels, annual incentive targets, and payout levels and long-term incentive grants for our named executive officers (other than for the Chief Executive Officer).
During fiscal 2020, the Committee convened two meetings in which executive compensation matters were discussed and acted by written consent on three other occasions. In addition, the Board held one special meeting and acted by written consent on three occasions on matters that included certain items related to our executive compensation program.
Compensation Setting Process
Independent Compensation Consultants
In fiscal 2020, we continued to engage Compensia, a nationally known compensation consulting firm, to serve as an independent advisor to the Committee on executive compensation matters. In late fiscal 2019, Compensia assisted the Committee with an evaluation of the competitiveness of the Company’s existing executive compensation program and assisted in developing recommendations regarding executive compensation adjustments for fiscal 2020.
In fiscal 2018, we separately engaged Radford, a division of Aon plc, which is a nationally known professional services firm that specializes in collecting and analyzing compensation information, to provide input to the Committee on the design of the Company’s long-term incentive program, which continued to inform decisions made during fiscal 2020.
Market Comparison
For fiscal 2020, the Committee considered market pay practices when setting compensation for executive officers. The Committee uses market data to assess the overall competitiveness and reasonableness of the compensation elements and the Company’s overall executive compensation program. As a starting point, we assess overall competitiveness and reasonableness of compensation at a target total direction compensation basis, while appropriately balancing the individual base salary and target annual cash incentive components. Assessment of each of the base salary, target annual cash incentive and equity holding elements is reviewed against market percentiles, competitive retentive value, and annual target compensation. Following our IPO and after receiving input from our independent compensation consultant, the Committee approved a new long-term incentive program that, for our named executive officers, targets a total unvested equity retention value of
136
Confidential Treatment Requested by McAfee Corp.
Pursuant to 17 C.F.R. Section 200.83
our post-IPO equity
at approximately five times’ annual grant values of our peer group at the 60th
percentile. In assessing the competitive market, we use survey data from the peer group noted below as the primary market data source, with proxy peer group data providing a supplemental viewpoint.The Committee believes that compensation decisions are complex and require a deliberate review of Company performance, market compensation levels, and other factors it deems relevant in a given situation. Accordingly, the factors that may influence the amount of compensation awarded include, but are not limited to:
| • | Market competition for a particular position; |
| • | Internal pay equity considerations; |
| • | Experience and past performance inside or outside the Company; |
| • | Role and responsibilities within the Company; |
| • | Long-term potential with the Company; |
| • | Personal performance and contributions; and |
| • | Business conditions. |
The Committee believes that the Company’s executive compensation peer group should reflect the markets in which the Company competes for business and executive talent. Accordingly, the Company’s peer group consists of peer companies that we believe are our most direct cybersecurity and business competitors, and software companies that are generally comparable to the Company in terms of revenue and number of employees, taking into account the availability of relevant comparison data. No one factor determines whether a company is included within our peer group. We believe these comparisons provide us with a valuable window into the executive pay practices of companies similar to us, and we seek to use information about their compensation levels whenever available to us. As a result of these similarities, we view the companies in the custom peer group below as those that are mostly likely to compete with us for executive talent. We do
not pre-screen members
of our peer group for their compensation levels or practices. The Committee, together with Compensia and our management team, expectsto periodically re-evaluate and
revise our selection criteria and list of peer companies, as it deems appropriate.After soliciting input from Compensia, the Committee determined our peer companies for purposes of assessing the competitiveness of our executive compensation were as follows:
| Cadence Design Systems | Carbon Black | Citrix Systems | ||
| F5 Networks | FireEye | ForeScout Technologies | ||
| Fortinet | Juniper Networks | Symantec | ||
| Nuance Communications | Open Text | Palo Alto Networks | ||
| Proofpoint | Splunk | Synopsys | ||
| Teradata | ||||
For purposes of assessing the competitiveness of our executive compensation for fiscal 2020, we removed CA Technologies and Red Hat, which had been part of our peer group for fiscal 2019, because each company had been acquired. We also removed ServiceNow prior to fiscal 2020 to better align our market capitalization going into fiscal 2020 with those of our peer companies. During fiscal 2020, Symantec was replaced with NortonLifeLock, and used as part of our peer group in late fiscal 2020 to assess the competitiveness of our executive compensation for fiscal 2021.
137
Confidential Treatment Requested by McAfee Corp.
Pursuant to 17 C.F.R. Section 200.83
Elements of Compensation
Consistent withand executive compensation program objectives described above, in determining the fiscal 2020 adjustments to executive compensation levels discussed below, the Committee considered each named executive officer’s role and responsibilities, personal performance and contributions, business performance and conditions, overall job market conditions, internal pay equity, and competitive market data.
our pay-for-performance philosophy
The following is a discussion of the primary elements of the compensation for each of our named executive officers.
Annual Base Salary
Annual base salary is one element of the cash compensation that we provide to our named executive officers and is determined based on the core contributions the executive is expected to make and the specific requirements for the named executive officer’s role. As noted above, we generally consider how a named executive officer’s base salary contributes to named executive officer’s total target direct compensation, and its resulting positioning as compared to our peer group. Under this construct, we place more emphasis on performance-linked elements of total direct compensation as we believe annual incentive pay provides a stronger connection between pay and performance.
In connection with our annual compensation review for fiscal 2020, we reviewed the annual base salaries of the named executive officers who were then employed by us. As part of that review, in late fiscal 2019, our former Chief Executive Officer, in collaboration with our Chief People Officer, made recommendations to the Committee regarding annual base salary levels of our named executive officers (other than related to our former Chief Executive Officer) who were then employed and any adjustments to their base salary levels. Recommendations were based on market considerations (including base salary levels relative to our peers described above) and a holistic assessment of the named executive officer’s performance over the prior year.
As a result of this review, the Committee approved an increase in Ashutosh Kulkarni’s annual base salary in fiscal 2020 from $600,000 to $625,000, and in Ashish Agarwal’s annual base salary in fiscal 2020 from $365,000 to $375,000, in each case, effective January 1, 2020, to further align their compensation with the competitive market. As discussed further below, Ashish Agarwal’s annual base salary was further increased later in fiscal 2020.
In connection with our annual review, no changes were made to the annual base salary of Terry Hicks, Christopher Young, Michael Berry or John Giamatteo. Terry Hicks was determined to have an annual base salary that was consistent with our peer group, as well as individual performance and contributions. Christopher Young, Michael Berry and John Giamatteo ceased to be employed by us during the first quarter of fiscal 2020 and it was determined that no adjustment was appropriate prior to their departures.
Peter Leav, Venkat Bhamidipati and Lynne Doherty McDonald were hired after the beginning of fiscal 2020 and their annual base salaries were determined in a similar manner and with special consideration given to the need to secure their hires in light of their preexisting compensation arrangements, alternative employment opportunities, the competitive market, and internal pay equity. Their annual base salaries remained the same throughout fiscal 2020 after their respective dates of hire.
The Committee may also adjust annual base salaries of our named executive officers at other times during the year in connection with promotions, increased responsibilities or to maintain market competitive compensation levels. The Committee exercised this discretion with respect to Ashish Agarwal, who served as our interim Chief Financial Officer during the period between Michael Berry’s departure and Venkat Bhamidipati’s first day of employment. In recognition of Ashish Agarwal’s increased responsibilities and key contributions as
138
Confidential Treatment Requested by McAfee Corp.
Pursuant to 17 C.F.R. Section 200.83
our interim Chief Financial Officer (including as part of our initial phase of IPO planning) in fiscal 2020, the Committee adjusted the annual base salary of Ashish Agarwal during the course of the year from $375,000 to $425,000.
The table below sets forth the 2020 annualized base salary level for each of our named executive officers as of the end of fiscal 2020 (for those named executive officers who remained employed with us as of that time):
Named Executive Officer | 2020 Base Salary at Year-End | |||
Peter Leav | $ | 900,000 | ||
Venkat Bhamidipati | $ | 650,000 | ||
Lynne Doherty McDonald | $ | 850,000 | ||
Terry Hicks | $ | 650,000 | ||
Ashutosh Kulkarni | $ | 625,000 | ||
Ashish Agarwal | $ | 425,000 | ||
Annual Incentives
Our executive compensation program ties a substantial portion of the cash compensation that our executives are eligible to receive directly to the Company’s performance. We believe our annual incentive plan (“AIP”) is an integral component of our overall executive compensation program because, due to being a private company prior to our IPO and
the lock-up period
that applied to our awards following our IPO, our equity awards were illiquid during fiscal 2020. We also believe that a competitive incentive program is essential to attracting, retaining, and motivating talented leaders. Our AIP is linked to the achievement of certain individual and company goals that we believe are important for our short-term and long-term success and are key to driving increases in the value of the Company. Payouts under our AIP are based on the Company’s performance and our executives’ performance against Company and executive goals, respectively, with the AIP funding only if the Company’s performance exceeds threshold goals relating to “Annual Net Revenue”, “Annual Billings”, “Annual Adjusted Unlevered Free Cash Flow” and “Annual Cash EBITDA”, each as described below. During fiscal 2020, each of our named executive officers was either aligned with our Consumer business unit, our Enterprise business unit or our overall Company performance (which we refer to as “Corporate” as which encompassed both the Consumer and Enterprise business units), which in turn affects how performance is measured with respect to that named executive officer and how named executive officer’s AIP payout is determined.Setting the Annual Incentive Target Opportunity
In general, each of our named executive officers participates in our AIP and is eligible to receive a cash-based annual incentive at a target level that is based on a percentage of the officer’s annual base salary. These annual incentive targets are prorated for any changes in annual base salary during the fiscal year and for any partial years of service. Christopher Young, John Giamatteo, and Mike Berry did not participate in our AIP in fiscal 2020. After reviewing our named executive officers’
total on-target earning
opportunities as part of our annual compensation review process, Ashish Agarwal’s annual incentive target for fiscal 2020 was initially increased from $175,018 to $200,025 and on August 16, 2020 was then increased from $200,025 to $225,000 (in each case, in light of Ashish Agarwal’s increased responsibilities and key contributions as our interim Chief Financial Officer). As noted above, Peter Leav, Venkat Bhamidipati and Lynne Doherty McDonald joined us after the beginning of fiscal 2020 and their annual incentive opportunities were determined in connection with their hires in a manner that is consistent with our general philosophy but with particular attention on the need to secure their hires in light of their preexisting compensation arrangements, alternative employment opportunities, the competitive market, and provide for internal pay equity. No adjustment was made to the AIP target awards for Terry Hicks in fiscal 2020.139
Confidential Treatment Requested by McAfee Corp.
Pursuant to 17 C.F.R. Section 200.83
The table below sets forth the fiscal 2020 annual incentive target opportunities for each of our named executive officers who remained employed with us as of the end of fiscal 2020:
Named Executive Officer | Target Annual Incentive for Fiscal 2020 (1) | |||
Peter Leav | $ | 1,228,279 | ||
Venkat Bhamidipati | $ | 214,891 | ||
Lynne Doherty McDonald (2) | $ | 148,767 | ||
Terry Hicks | $ | 750,035 | ||
Ashutosh Kulkarni | $ | 625,000 | ||
Ashish Agarwal | $ | 209,440 | ||
| (1) | Amounts in this column reflect the annual incentive targets for fiscal 2020. The annual incentive target for Peter Leav, Venkat Bhamidipati and Lynne Doherty McDonald reflects a pro-rated target based on the number of days during fiscal 2020 that the named executive officer was employed. The amount for Ashish Agarwal reflectsa pro-rated target based on the named executive officer’s annual incentive target as in effect for different periods during fiscal 2020. |
| (2) | As described below, in addition to the AIP, Lynne Doherty McDonald was also eligible in fiscal 2020 for a commission arrangement. |
AIP Pool Funding and Attainment
For fiscal 2020, the Committee established an AIP pool for all participants in our AIP, including our participating named executive officers, and the performance metrics and goals for our fiscal 2020 AIP. The initial target funding for this pool was equal to the aggregate amount that would be payable to all AIP participants if each participant received the participant’s full annual incentive target, subject to achievement of financial metrics, adjustment for new hires, changes in status, and changes in participant compensation as provided in the AIP.
We modified our AIP in fiscal 2020 to better align the incentives of our senior executives with those that apply to our other annual bonus-eligible employees within their business units and rebalance the financial metrics that drive the funding of our AIP between revenue measures (Annual Net Revenue and Annual Billings), profitability measures (Annual Cash EBITDA) and cash flow measures (Annual Adjusted Unlevered Free Cash Flow). We used Annual Billings in fiscal 2020 (rather than annual bookings, which was used in fiscal 2019) because the Committee viewed it as a better indicator of future revenue growth. Each of those metrics is described further below.
As noted above, for fiscal 2020, each AIP participant, including our named executive officers, was aligned with our overall Corporate performance, our Consumer business unit or our Enterprise business unit. The named executive officers who remained employed with us as of the end of fiscal 2020 were aligned as follows:
Named Executive Officer | AIP Alignment | |
Peter Leav | Corporate | |
Venkat Bhamidipati | Corporate | |
Lynne Doherty McDonald | Enterprise | |
Terry Hicks | Consumer | |
Ashutosh Kulkarni | Enterprise | |
Ashish Agarwal | Corporate |
140
Confidential Treatment Requested by McAfee Corp.
Pursuant to 17 C.F.R. Section 200.83
For fiscal 2020, the funding of the AIP pool with respect to those AIP participants aligned with Corporate, Consumer and Enterprise (other than Lynne Doherty McDonald) was based on measurement relative targets for the metrics set forth below.
Corporate | Consumer | Enterprise | ||
| Annual Cash EBITDA for the Company (25% weighting) | Corporate Attainment (1) (25% weighting) | Corporate Attainment (1) (25% weighting) | ||
| Annual Billings for the Company (25% weighting) | Adjusted Cash EBITDA for the Consumer business unit (25% weighting) | Adjusted Cash EBITDA for the Enterprise business unit (25% weighting) | ||
| Annual Net Revenue for the Company (25% weighting) | Annual Billings for the Consumer business unit (25% weighting) | Annual Billings for the Enterprise business unit (25% weighting) | ||
| Annual Adjusted Unlevered Free Cash Flow for the Company (25% weighting) | Annual Net Revenue for the Consumer business unit (25% weighting) | Annual Net Revenue for the Enterprise business unit (25% weighting) | ||
| (1) | Performance as measured against the “Corporate” goals reflected in the leftmost column is collectively referred to as “Corporate Attainment”. |
The funding of the AIP bonus for Lynne Doherty McDonald for fiscal 2020 was based on Adjusted Cash EBITDA for our Enterprise business unit only. Lynne’s special commission arrangement is linked to annual bookings for the Enterprise business unit (a “top line” financial metric), so Lynne’s AIP bonus is meant to provide a counterbalance that keeps Lynne accountable for the “bottom line” financial performance associated with the Enterprise business unit, as well.
Performance against each metric is calculated on a constant currency basis (, calculated assuming no changes in the currency exchange rates from budgeted currency exchange rates). A minimum threshold of achievement for each applicable metric within the Corporate-, Consumer- or Enterprise-related calculations (as applicable) had to be achieved for any portion of the AIP pool related to participants with that alignment to be funded. Each of the fiscal 2020 AIP metrics is described below.
i.e.
Financial Metric | Description | |
Annual Cash EBITDA | Annual Cash EBITDA is a non-GAAP financial measure, which is defined as net income (loss), excluding the impact of amortization of intangible assets, equity-based compensation expense, interest expense and other, net, provision for income tax expense, foreign exchange (gain) loss, net, and other costs that we do not believe are reflective of our ongoing operations, and excluding the impact of depreciation expense andother non-operating costs (as described in “Management’s Discussion and Analysis of Financial Condition and Results of Operations”), and further adjusted to eliminate the impact of purchase accounting, capital expenditures, capitalized software expenses and other revenue that we not believe is reflective our ongoing operations, plus the change in year-over-year deferred revenue. | |
Annual Billings | Annual Billings is a non-GAAP financial measure, which is defined as net revenue plus the change in deferred revenue from the beginning to the end of the period, excluding the impact of deferred revenue assumed through acquisitions during the period. Annual Billings includes changes in our deferred revenue during the period. | |
Annual Net Revenue | Annual net revenue is as determined under GAAP. | |
Annual Adjusted Unlevered Free Cash Flow | Annual Adjusted Unlevered Free Cash Flow is a non-GAAP financial measure that represents net cash from operating activities less capital expenditures, and then adding back interest payments and items related to projects with a limited time frame that are outside normal operating activities and are generally transformational in nature. | |
141
Confidential Treatment Requested by McAfee Corp.
Pursuant to 17 C.F.R. Section 200.83
The funding of the AIP pool increased or decreased for achievement above or below the target achievement level, subject to minimum achievement levels of 90% of the Annual Cash EBITDA target, 90% of the Annual Adjusted Unlevered Free Cash Flow target, 95% of the Annual Billings target, and 95% of the Annual Net Revenue target. After all financial metrics were compared to relevant targets (and subject to these minimums), they were weighted as described above and the weighted metrics are added together. The funding of the AIP pool was then determined by applying a slope of 2.5x to the resulting percentage (, subject to the thresholds described above, for each percentage above or below 100%, the AIP pool funding increases or decreases by 2.5%), subject to a maximum achievement level of 140% (which results in funding of the AIP pool at 200% of its target level). After using a slope of 3x in fiscal 2019, we adjusted the slope to 2.5x in fiscal 2020 to better align with market practices while still maintaining a
i.e.
strong pay-for-performance incentive.
Before determining the final AIP pool funding level, the Committee and the Board, with input from our President and Chief Executive Officer, could then adjust the aggregate pool funding level based upon a combination of Company performance as well as the Board’s evaluation of a variety of subjective and objective Company performance metrics. For fiscal 2020, the Committee and the Board did not adjust the aggregate pool funding. Our fiscal 2020 Company performance goals, and our levels of achievement of those goals, were as follows (dollars in millions):
Performance Metric | Goal | Fiscal 2020 Actual | Percentage Achieved | |||||||||
Annual Cash EBITDA – Corporate | $ | 1,034 | $ | 1,182 | 113 | % | ||||||
Annual Cash EBITDA – Consumer | $ | 780 | $ | 854 | 109 | % | ||||||
Annual Cash EBITDA – Enterprise (1) | $ | 259 | $ | 329 | 127 | % | ||||||
Annual Billings – Corporate | $ | 2,902 | $ | 3,013 | 104 | % | ||||||
Annual Billings – Consumer | $ | 1,526 | $ | 1,683 | 110 | % | ||||||
Annual Billings – Enterprise | $ | 1,380 | $ | 1,330 | 96 | % | ||||||
Annual Net Revenue – Corporate | $ | 2,743 | $ | 2,906 | 106 | % | ||||||
Annual Net Revenue – Consumer | $ | 1,435 | $ | 1,558 | 109 | % | ||||||
Annual Net Revenue – Enterprise | $ | 1,308 | $ | 1,348 | 103 | % | ||||||
Annual Adjusted Unlevered Free Cash Flow | $ | 911 | $ | 1,085 | 119 | % | ||||||
| (1) | The Annual Cash EBITDA goal with respect to Lynne Doherty McDonald’s AIP opportunity was pro-rated to reflect performance in the second through fourth quarters of fiscal 2020 only, resulting in a percentage achieved of 126%. |
After the AIP pool has been funded, our President and Chief Executive Officer (with input from our Chief People Officer) could exercise discretion to adjust the funded percentages for the Corporate, Consumer and Enterprise segments. In fiscal 2020, this discretion was applied to increase the Corporate-aligned AIP pool funding from 126% to 129%, to increase the Consumer-aligned AIP pool funding from 123% to 133%, and to decrease the Enterprise-aligned AIP pool funding from 120% to 115% (other than with respect to Lynne Doherty McDonald whose bonus was determined using the alternate formula noted above).
After the funding of each AIP segment (Corporate, Consumer and Enterprise), as well as the AIP opportunity for Lynne Doherty McDonald, was determined by the Committee, individual incentives for each of our named executive officers were then determined by the Committee by applying the relevant AIP pool funding percentage for the named executive officer to the named executive officer’s individual incentive target. The actual amount paid to the named executive officer is then determined by multiplying that amount by a discretionary multiplier determined by the Committee, based on its assessment of the named executive officer’s individual performance relative to predetermined operational and strategic goals. Based on individual performance, a named executive officer was eligible to earn 0% to 200% of the total funded AIP amount.
For our named executive officers who were eligible to participant in our AIP, individual goals related to our financial and operational performance, as well as adding new portfolio offerings, strategic transactions, building
142
Confidential Treatment Requested by McAfee Corp.
Pursuant to 17 C.F.R. Section 200.83
out existing offerings, consumer and enterprise customer initiatives, business optimization and driving a diverse and inclusive culture. These operational and strategic goals were designed to be challenging but achievable with strong management performance.
Following the end of the year, each of our named executive officers assessed the named executive officer’s individual performance against that named executive officer’s individual performance goals for the fiscal year. For fiscal 2020, our President and Chief Executive Officer reviewed these self-assessments (other than with respect to our President and Chief Executive Officer) and the achievement of each named executive officer who was then employed by us and recommended an attainment level for each named executive officer’s annual incentive based on individual performance. After reviewing our President and Chief Executive Officer’s recommendations and these self-assessments, the Committee recommended, and the Board approved the following AIP payouts:
Named Executive Officer | Actual Payout ($) | |||
Peter Leav (1) | 2,000,008 | |||
Venkat Bhamidipati (1) | 291,069 | |||
Lynne Doherty McDonald (1)(2) | 257,739 | |||
Terry Hicks | 1,197,056 | |||
Ashutosh Kulkarni (3) | — | |||
Ashish Agarwal | 324,213 | |||
| (1) | AIP targets (and, as a result, AIP payouts) for Peter Leav, Venkat Bhamidipati and Lynne Doherty McDonald were prorated due to their hire dates after the beginning of fiscal 2020. |
| (2) | As described below, in addition to the AIP, Lynne Doherty McDonald was also eligible in fiscal 2020 for a cash-based commission arrangement. |
| (3) | Ashutosh Kulkarni was no longer employed by us at the time the AIP was paid and therefore was not entitled to, and did not receive, any payout under the AIP for fiscal 2020. |
Commission Arrangement for Lynne Doherty McDonald
In addition to participating in the AIP, Lynne Doherty McDonald is eligible to earn cash commission payments based on Annual Bookings related to our Enterprise business unit, which are paid within 30 days of being earned. Annual Bookings are
a non-GAAP financial
measure, which are defined as contractual commitments for McAfee to provide product, support, subscription and/or professional services to a customer over a contractual term. Under this arrangement, Lynne would have been eligible to earn up to $675,000 on a full-year basis if the Annual Bookings – Enterprise target was achieved, whichwas pro-rated in
fiscal 2020 to reflect Lynne DohertyMcDonald’s mid-year hire
date for a target of $446,311. Lynne’s commission payment rates for fiscal 2020 are summarized below:Attainment (% of Goal) | Commission Rate | |||
0-100% | 0.036 | % | ||
>100-101% | 0.125 | % | ||
>101-102.5% | 0.214 | % | ||
>102.5% | 0.285 | % | ||
The Annual Bookings – Enterprise goal for fiscal 2020 was $1,251,960,416 but
was pro-rated based
on Lynne’s date of hire. To the extent attainment exceeded the relevant tier shown above, commissions were earned at the higher commission rate reflected above. Under Lynne’s commission arrangement, we agreed that Lynne would earn at leastthe pro-rated target
amount of the relevant commission for the quarter in which Lynne was hired. Based on actual achievement equal to $1,153,122,148 (92.1% of the target level), Lynne received an actual payout for fiscal 2020 equal to $411,077.143
Confidential Treatment Requested by McAfee Corp.
Pursuant to 17 C.F.R. Section 200.83
Long-Term Incentives
The Board believes that members of senior management should hold a personally significant interest in the equity of the Company. In furtherance of this philosophy, the Company issued incentive equity awards to our senior management team in fiscal 2020, which (in combination with personal investments in the Company’s equity made, and incentive equity awards from prior fiscal years held, by certain members of our senior management team) serve to align their interests and the interests of our equityholders.
Long-term incentives continued to be the most heavily weighted component of our executive compensation program for named executive officers in fiscal 2020. This reflects our focus on aligning executive interests with those of our equityholders, supportingand encouraging executives to take actions that we believe will grow the value of the Company over time. We also believe that long-term equity awards serve an important retentive function and are essential to attract and retain talented leaders in the competitive market in which we operate.
a pay-for-performance philosophy,
Pre-IPO Long-Term
Incentive ProgramBefore our IPO, FTW (our ultimate parent company prior to our IPO) maintained an incentive equity plan (the “2017 Plan”) under which we issued profits interests (called Management Incentive Units or “MIUs”) and RSUs to our senior management team and other employees and service providers. Consistent with practices among similarly situated private equity financed companies, executive officers were generally provided with one or more initial long-term incentive grants upon hire. Generally, these initial awards were more heavily weighted toward MIUs, though we also granted RSUs to new hires. These initial grants were generally expected to cover a multi-year period; however, executives were in some cases provided an additional long-term incentive grant or grants upon promotion, to maintain market competitiveness, to reward outstanding performance, or to provide for internal parity among similarly situated executives at the Company. All awards granted to our named executive officers in fiscal 2020 prior to our IPO are eligible to vest based on continued employment over four years.
Pre-IPO Purchased
Equity ProgramPrior to our IPO, we also offered each of our named executive officers the opportunity to purchase Class A Units of FTW at fair market value. While we were a private company, we viewed it as particularly important to offer this opportunity to our senior management to further align their interests with the interests of our equityholders (including the interest in creating a liquidity event, such as our IPO), lead them to act as “employee owners” of our Company and allow them to benefit from increases in value that they helped create. Because the Class A Units purchased by our named executive officers represent an investment of personal funds by the executives, these units were not subject to a vesting requirement and are not reflected in the executive compensation tables below. Of our named executive officers who remained employed by us at the end of fiscal 2020, each of Peter Leav, Lynne Doherty McDonald and Ashish Agarwal made a personal cash investment in Class A Units of FTW.
IPO-Related Changes
to Pre-IPO Equity
Holdings and Post-Lockup Transfer Restrictionson Pre-IPO Equity
Prior to our IPO, our business was conducted through FTW and its subsidiaries. FTW is treated as a partnership for U.S. federal income tax purposes. Our IPO was conducted through what is commonly referred to as
an “Up-C” structure.
The Up-C structure
can allow existing owners of a partnership (or limited liability company that is treated as a partnership for U.S. federal income tax purposes) to continue to realize the tax benefits associated with their ownership of an entity that is treated as a partnership for income tax purposes following an initial public offering, and provides potential tax benefits and associated cash flow to both the issuer corporation and the existing owners of the partnership (including FTW as a limited liability company that is treated as a partnership for U.S. federal income tax purposes). Ourcontinuing pre-IPO equityholders
(which included our named executive officers) have the right, from time to time and subject to certain restrictions, to144
Confidential Treatment Requested by McAfee Corp.
Pursuant to 17 C.F.R. Section 200.83
exchange one or more of their FTW units for (1) either (i) cash based upon the market price of the shares of our Class A common stock (in the case of MIUs, after those MIUs are exchanged for FTW Class A Units of equal value), or (ii) at our option, shares of our Class A common stockthe case of MIUs, after those MIUs are exchanged for FTW Class A Units of equal value) and we will cancel a corresponding number of shares of Class B common stock by the exchanging member in connection therewith, to the extent the exchanging member has shares of Class B common stock, subject to customary conversion rate adjustments for stock splits, stock dividends, reclassifications, and other similar transactions and (2) payments of additional amounts pursuant to a tax receivable agreement (referred to above as the “TRA”, which is described below under the subheading “Tax Receivable Agreement” under the heading “Certain Relationships and Related Party Transactions”). Because the payments under the TRA do not represent compensation to our named executive officers, no amount is shown in the compensation tables below related to those payments.
on a one-for-one basis (in
In connection with our IPO, each of our named executive officers entered into an equity adjustment agreement that provided for certain adjustments to their equity and equity-based awards issued by FTW prior to our IPO. Under each of these equity adjustment agreements (i) FTW Class A Units issued to the named executive officer before the completion of our IPO (whether purchased directly or issued in connection with the vesting of awards) may, at the election of the applicable named executive officer, be exchanged for Class A common stock, (ii) vested MIUs, including MIUs that become vested following our IPO, may, at the election of the participant, be exchanged for Class A common stock, (iii) MIUs that were not vested at the time of our IPO remained outstanding and continued to vest on and be subject to the same terms and conditions that applied prior to our IPO, except for the adjustments described in the following paragraph, (iv) outstanding phantom profits interests (referred to as Management Equity Participation Units or “MEPUs”) and RSUs that by their terms became payable in connection with our IPO were generally settled in shares of Class A common stock following our IPO, and (v) outstanding MEPUs and RSUs that were not vested as of immediately before the completion of our IPO were converted into RSUs in respect of Class A common stock (“Converted RSUs”), and such Converted RSUs continued to vest on and be subject to the same terms and conditions that applied to the corresponding RSU prior to our IPO, except that upon vesting the Converted RSU would be settled in Class A common stock.
The portion of any award subject to vesting based on TPG and
certain co-investors receiving
specified returns (which were held only by Terry Hicks and Ashutosh Kulkarni among our named executive officers who remained employed as of our IPO) were adjusted in fiscal 2020 so that the vesting after our IPO was based on the returns received by TPG (and not other co-investors).Additionally, after the expiration of the post-IPO lock-up period, our named executive officers who were then employed by us were subject to additional transfer restrictions on all MIUs, as well as all FTW Class A Units and Class A common stock that they acquired prior to our IPO (or under awards originally granted prior to our IPO). Specifically, afteron April 19, 2021, the named executive officers are limited to selling the sum of the following on a quarterly basis: (i) 5.0% of vested Class A common stock received in respect of vested equity awards (or upon exchange of vested MIUs or Class A Units as described above), (ii) 5.0% of the shares of Class A common stock the applicable executive is eligible to receive in respect of the named executive officer’s exchange of vested Class A Units, and (iii) the shares of Class A common stock the applicable named executive officer is eligible to receive in respect of the exchange of 5.0% of the number of vested MIUs subject to each of the applicable MIU grants to each such executive. Furthermore, on each date on which TPG sells any portion of its shares of Class A common stock, to the extent it would result in the ability to sell more shares of Class A common stock than the remaining amounts available for sale as described in the immediately preceding sentence, the applicable named executive officer will be permitted to sell a pro rata portion of such Class A common stock or Class A common stock the named executive officer could receive upon exchange of the named executive officer’s Class A Units or MIUs, in each case, based on the percentage of Class A common stock and Class A Units sold by TPG. These additional transfer restrictions will cease to apply as of the earliest of (i) six months after the named executive officer’s employment and all other service relationships with us ceases, (ii) the date on which TPG ceases to hold at least 10% of the combined FTW Class A Units, McAfee shares or other equity securities into which such securities are converted or for which
our post-IPO lock-up expired
145
Confidential Treatment Requested by McAfee Corp.
Pursuant to 17 C.F.R. Section 200.83
they are exchanged that it held as of immediately prior to the IPO and (iii) the date that is 42 months following our IPO.
Post-IPO Long-Term
Incentive Program While
our pre-IPO awards
to our named executive officers remain an important tool to motivate our senior management team to focus on long-term growth and equityholder value, in the period following our IPO the Committee also adopted changes to our long-term incentive program that are meant to also align with the interests of our new equityholder base (which now includes public shareholders who acquired their equity through the public markets at different times thanour pre-IPO equityholders),
incentivize our named executive officers to achieve financial performance targets that we believe will ultimately drive higher equity values and keep our program competitive with those of our peers. Going forward, we anticipate evaluating the long-term incentive holdings of our named executive officers on an annual basis and may make annual long-term incentive awards to our named executive officers.Under
our post-IPO long-term
incentive program, awards are provided in the form of time-based RSUs (which we generally refer to simply as “RSUs”) and performance-based RSUs (which we refer to as “PSUs”). For our President and Chief Executive Officer, long-term incentive awards are anticipated to be weighted 50% toward RSUs and 50% toward PSUs. For our Executive Vice Presidents (which describes all of the other named executive officers who are currently employed by us), long-term incentive awards are anticipated to be weighted 60% toward RSUs and 40% toward PSUs. Under the new program, RSUs generally vest on a quarterly basis (witha one-year vesting
cliff for any new hires) over a four-year period (generally starting with the beginning of the quarter in which the grant is made). PSUs will generally be eligible to vest based on performance over a three-year period. With respect to each grant of PSUs, it is anticipated that there will bethree one-year performance
measurement periods within that three-year performance period and that the Committee will determine, on an annual basis, the performance targets that apply with respect to thePSUs. One-third of
the PSUs granted in fiscal 2020 will be eligible to vest based on achievement of performance targets related to Annual Cash EBITDA, Annual Adjusted Unlevered Free Cash Flow and Annual Billings (with those metrics determined consistent with the same metrics under our AIP, as described above), in each case, related to fiscal 2021. As with their use under the AIP, the Committee believes success against those metrics supports the Company’s growth imperatives and long-term equity appreciation, while balancing financial metrics to captureboth top-line and
bottom-line growth. Unlike under the AIP, where performance for certain named executive officers was aligned with only one of our primary business lines, performance underour post-IPO long-term
incentive program is expected to be measured based on the performance of McAfee as a whole.146
Confidential Treatment Requested by McAfee Corp.
Pursuant to 17 C.F.R. Section 200.83
Fiscal 2020 Long-Term Incentive Awards
The equity awards granted to our named executive officers during fiscal 2020 are summarized below:
Named Executive Officer | RSUs | PSUs | MIUs | |||||||||
Peter Leav (Initial Hiring Grants) (1) | 1,874,456 | — | 1,249,636 | |||||||||
Peter Leav (Annual Review Grant) (2) | 484,496 | 484,496 | — | |||||||||
Peter Leav (Distribution Adjustment Grants) (3) | 189,928 | — | — | |||||||||
Venkat Bhamidipati (Initial Hiring Grants) (1) | 800,000 | — | 800,000 | |||||||||
Venkat Bhamidipati (Distribution Adjustment Grants) (3) | 93,528 | — | — | |||||||||
Lynne Doherty McDonald (Initial Hiring Grants) (1) | 500,000 | — | 2,435,504 | |||||||||
Lynne Doherty McDonald (Distribution Adjustment Grant) (3) | 23,024 | — | — | |||||||||
Terry Hicks (Annual Review Grant) (2) | 116,279 | 77,519 | — | |||||||||
Terry Hicks (Distribution Adjustment Grants) (3) | 17,816 | — | — | |||||||||
Ashutosh Kulkarni (Distribution Adjustment Grants) (3) | 18,228 | — | — | |||||||||
Ashish Agarwal (Special Leadership Grants) (4) | 222,224 | — | — | |||||||||
Ashish Agarwal (Annual Review Grant) (2) | 90,843 | 64,599 | — | |||||||||
Ashish Agarwal (Distribution Adjustment Grant) (3) | 14,356 | — | — | |||||||||
| (1) | Granted to each of Peter Leav, Venkat Bhamidipati and Lynne Doherty McDonald under our pre-IPO incentive equity program described above in connection with their respective hires. |
| (2) | Granted in fiscal 2020 in connection with the fiscal 2021 annual compensation review under our post-IPO incentive equity program described above. |
| (3) | Reflects “make whole” RSU grants to each named executive officer in connection with distributions made to our equityholders during fiscal 2020. These “make whole” grants vest on the same basis as the awards to which they relate. |
| (4) | In connection with assuming the interim Chief Financial Officer position, Ashish Agarwal was awarded two special RSU grants – one on May 18, 2020 and the other on August 13, 2020. The grants were meant to recognize Ashish’s increased role and extraordinary and critical contributions during our IPO process. |
Sign-On, Retention
and Special Incentive BonusesThe Committee may elect to award special bonuses as it deems appropriate for recruitment, retention, or incentive purposes. The Committee determines the level of the bonuses as well as the specific terms based on its review of the competitive market, including compensation offered by competing employers, as well as compensation to be forfeited by the executive upon joining the Company.
During fiscal 2020, Lynne Doherty McDonald received a hiring bonus package totaling $1,500,000, payable in three $500,000 increments on June 30, 2020, September 30, 2020 and December 31, 2020, subject to remaining employed with us through the applicable payment date, and subject to repayment if Lynne resigned or was terminated for cause within one year following each applicable anniversary of payment. In fiscal 2020, Lynne was paid $1,000,000 under this arrangement (and the third installment was paid on December 31, 2020, during our 2021 fiscal year).
Ashish Agarwal also received special incentive bonuses for serving as our interim Chief Financial Officer during fiscal 2020. Specifically, Ashish received $25,000 per month between March 2020 and August 2020 (for a total of $150,000). Ashish also received $175,000 asequal to $250,000, subject to remaining employed as of the date of a change in control of the Company.
a sign-on bonus
on the first anniversary of Ashish’s date of hire, which was paid to Ashish in July 2020. Ashish receiveda one-time bonus
equal to $300,000, subject to remaining employed as of May 1, 2021, and will receivea change-in-control bonus
147
Confidential Treatment Requested by McAfee Corp.
Pursuant to 17 C.F.R. Section 200.83
Employee Benefits
Employee health and wellbeing are of great importance to us, therefore ensuring our benefits remain highly competitive is a key focus for McAfee. We continuously review our benefit offerings with the goal of providing competitive benefits that have our employees and their unique family needs in mind. In addition to standard medical and retirement offerings, we offer on a global basis benefits like tuition reimbursement programs, domestic partner coverage and other family-friendly initiatives. We strive to maintain market competitive employee benefits to attract and retain top talent. Our named executive officers are eligible to participate in our broad-based employee benefit plans on the same terms as our other salaried U.S.-based employees, including our 401(k) plan and our health and welfare benefit plans.
We also provide a nonqualified deferred compensation plan, the McAfee Nonqualified Deferred Compensation Plan (the “NQDC Plan”). The NQDC Plan provides a vehicle for additional deferred compensation with discretionary matching contributions from the Company. No match under the NQDC Plan was provided in fiscal 2020. We believe that this type of plan is consistent with competitive pay practices and is an important element in attracting and retaining talent in a competitive market. Please see “—Nonqualified Deferred Compensation for Fiscal 2020” and accompanying narrative disclosure for further information regarding the NQDC Plan.
Perquisites and Executive Benefits
We offer limited perquisites and executive benefits to our named executive officers, including financial planning services and enhanced business travel benefits. While we generally weight executive compensation heavily toward total direct compensation (and particularly performance-based compensation), we believe the modest costs associated with these perquisites and benefits enhance executive retention.
Employment Arrangements
The Company generally executes an offer of employment before an executive joins the Company and, if applicable, will generally provide an updated offer of employment at the time of promotion. Those offers typically provide, among other things, the basic terms of the executive’s employment, including the executive’s start date, starting salary and bonus target. In more limited cases, we may enter into employment agreements with our most senior executives. The terms of the employment agreements, offer and promotion letters are based on competitive market data, including in some cases compensation that may be paid by a competing employer or forfeited upon separation from the executive’s prior employer.
Employment agreements, offer letters and other letter agreements with our named executive officers that were entered into in or prior to fiscal 2020 remained in effect during fiscal 2020, and are described further below.
Severance and Change in Control Arrangements
As described in further detail under “—Potential Payments Upon Termination or Change in Control for Fiscal 2020” below, we have entered into employment or letter agreements with certain of our named executive officers that provide for severance benefits in the event their employment is terminated in certain circumstances and provide certain change in control benefits. We believe that reasonable severance and change in control benefits are appropriate in certain circumstances to attract and retain top talent.
Equity Ownership Requirements
Each of our executive officers has a significant interest in our equity, whether held directly or as the result of outstanding equity-based awards. The Committee believes that equity ownership by senior management
and non-employee directors
aligns executive officer and shareholder interests and that, even after their equity is148
Confidential Treatment Requested by McAfee Corp.
Pursuant to 17 C.F.R. Section 200.83
vested, members of senior management
and non-employee directors
should maintain a meaningful baseline equity stake in our business. In connection with our IPO, we adopted equity ownership requirements that apply to our named executive officersand non-employee directors
(other than those associated with TPG and Intel).Our minimum equity ownership requirements for our executive officers
and non-employee directors
require holdings of vested equity and equity-based awards with the following values:Position | Applicable Target | |
Chief Executive Officer | 2.5x of target annual cash compensation | |
Executive Vice Presidents | 1.5x of target annual cash compensation | |
Employees at the level of Senior Vice President or above who have been designated by the Board | 1.0x of target annual cash compensation | |
Non-employee director | $500,000 |
The value of a share of our Class A common stock is determined based on the average calendar
month-end
closing price over the 12 calendar months of the calendar year immediately preceding the relevant measurement date. The value of an FTW unit is based on its implied value determined by applying the foregoing methodology to value a share of Class A common stock (where applicable to MIUs, less any unsatisfied return threshold). A stock option is valued at the value of the underlying shares of Class A common stock under the foregoing methodology less the applicable exercise price. Any shares that would be withheld or sold to pay any applicable withholding tax upon exercise of an option or delivery of shares will nonetheless be considered owned for purposes determining an executive officer’s ownership level.Any executive officer
or non-employee director
who does not meet or exceed the foregoing requirements following our IPO is subject to a 50% retention requirement that restricts the sale by such executive officeror non-employee directors’
equity. The retention requirements do not apply to equity that was vested prior to our IPO, or shares withheld or sold to satisfy tax or exercise price payment obligations. Each named executive officer is required to achieve the applicable level of ownership by the 5th
anniversary of the date on which the named executive officer was first employed. A named executive officer who, due to a promotion, becomes subject to a higher level of ownership is required to achieve such higher level of ownership within 18 months after the date of such promotion. Eachcovered non-employee director
is required to achieve the applicable level of ownership by the 4th
anniversary of the date on whichcovered non-employee director
was first appointed to the Board.Once the requisite level has been achieved, ownership of the required amount must be maintained for as long as the individual remains subject to the minimum equity ownership requirements, except that an executive officer
or non-employee director
will not be considered out of compliance if the value of the individual’s equity declines between one measurement date and the next so long as the individual comes into compliance by the subsequent measuring date.As noted above, in connection with our IPO, each of the named executive officers also agreed to certain extended transfer restrictions that apply to equity originally issued to them prior to our IPO.
Clawback Policy
We have adopted a clawback policy that permits us, subject to certain conditions, to recoup, cancel, and/or reduce performance-based awards in the event of a restatement of the Company’s financial results due to material noncompliance with financial reporting requirements, restatement of results, or other errors/omissions. Our clawback policy applies to our named executive officers who are currently employed by us.
Tax Considerations
Section 162(m) of the Internal Revenue Code of 1986, as amended (the “Code”) limits the deductibility of compensation paid to certain individuals to $1.0 million per year and may fully or partially limit deductions
149
Confidential Treatment Requested by McAfee Corp.
Pursuant to 17 C.F.R. Section 200.83
associated with compensation paid to our named executive officers. In certain cases, the Committee may consider the potential impact of Section 162(m) of the Code when structuring our executive compensation arrangements with our named executive officers. However, the Committee retains flexibility to approve compensation arrangements that promote the objectives of our compensation program, but which may not qualify for full or partial tax deductibility.
Summary Compensation Table for Fiscal 2020
The following table provides information regarding the compensation earned by our named executive officers for fiscal 2020, 2019 and 2018.
Name and principal position | Year | Salary ($) (1) | Bonus ($) (2) | Stock Awards ($) (3) | Non-equity Incentive Plan Compensation ($) (4) | Change in Pension Value and Nonqualified Deferred Compensation Earnings (5) | All Other Compensation ($) (6) | Total ($) | ||||||||||||||||||||||||
Peter Leav President and Chief Executive Officer | 2020 | 825,000 | — | 26,484,443 | 2,000,088 | — | 6,000 | 29,315,531 | ||||||||||||||||||||||||
Venkat Bhamidipati Executive Vice President and Chief Financial Officer | 2020 | 214,205 | — | 16,820,194 | 291,069 | — | 11,671 | 17,377,139 | ||||||||||||||||||||||||
Lynne Doherty McDonald | 2020 | 563,447 | 1,133,236 | 9,910,749 | 535,570 | — | 6,000 | 12,149,002 | ||||||||||||||||||||||||
Former Executive Vice President, Global Sales and Marketing, Enterprise Business Group | ||||||||||||||||||||||||||||||||
Terry Hicks | 2020 | 650,000 | — | 1,714,635 | 1,197,056 | — | 6,000 | 3,567,691 | ||||||||||||||||||||||||
Executive Vice | 2019 | 650,000 | — | 768,215 | 1,265,684 | — | 3,885 | 2,687,784 | ||||||||||||||||||||||||
President, Consumer Business Group | 2018 | 103,409 | 160,000 | 4,560,708 | 139,377 | — | 2,167 | 4,965,661 | ||||||||||||||||||||||||
Ashutosh Kulkarni | 2020 | 627,368 | — | — | — | — | 24,000 | 651,368 | ||||||||||||||||||||||||
Former Executive Vice | 2019 | 600,000 | 1,800,000 | 1,536,429 | 1,012,500 | — | 50,596 | 4,999,525 | ||||||||||||||||||||||||
President, Enterprise Business Group | 2018 | 122,917 | 1,000,000 | 3,572,551 | 148,669 | — | 2,986 | 4,847,123 | ||||||||||||||||||||||||
Ashish Agarwal Senior Vice President, Strategy and Corporate Development and former interim Chief Financial Officer | 2020 | 393,750 | 325,000 | 3,980,269 | 324,213 | — | 11,590 | 5,034,822 | ||||||||||||||||||||||||
Christopher Young Former Chief Executive Officer | 2020 | 70,000 | — | — | — | — | 3,649,468 | 3,719,468 | ||||||||||||||||||||||||
| 2019 | 800,000 | — | — | 1,800,000 | — | 56,000 | 2,656,000 | |||||||||||||||||||||||||
| 2018 | 725,000 | — | — | 1,047,206 | — | 25,815 | 1,798,021 | |||||||||||||||||||||||||
Michael Berry | 2020 | 125,000 | — | — | — | — | 6,139 | 131,139 | ||||||||||||||||||||||||
Former Executive Vice | 2019 | 537,500 | — | 2,500,033 | 939,478 | — | 5,500 | 3,982,511 | ||||||||||||||||||||||||
President and Chief Financial Officer | 2018 | 475,000 | — | 542,851 | 607,644 | — | 8,505 | 1,634,000 | ||||||||||||||||||||||||
150
Confidential Treatment Requested by McAfee Corp.
Pursuant to 17 C.F.R. Section 200.83
Name and principal position | Year | Salary ($) (1) | Bonus ($) (2) | Stock Awards ($) (3) | Non-equity Incentive Plan Compensation ($) (4) | Change in Pension Value and Nonqualified Deferred Compensation Earnings (5) | All Other Compensation ($) (6) | Total ($) | ||||||||||||||||||||||||
John Giamatteo | 2020 | 19,697 | — | — | — | — | 3,972,137 | 3,991,833 | ||||||||||||||||||||||||
Former President and | 2019 | 650,000 | 500,000 | 291,494 | 637,504 | — | 29,642 | 2,108,640 | ||||||||||||||||||||||||
Chief Revenue Officer, Enterprise Business Group | 2018 | 575,625 | 500,000 | 4,806,293 | 858,424 | — | 10,010 | 6,750,352 | ||||||||||||||||||||||||
| (1) | Amounts reported in this column reflect the base salaries earned for fiscal 2020, 2019 and 2018, as applicable. The base salaries for Peter Leav, Venkat Bhamidipati and Lynne Doherty McDonald in fiscal 2020, and Ashutosh Kulkarni and Terry Hicks in fiscal 2018, were pro-rated to reflect their respective hire dates with the Company after the beginning of fiscal 2020. The base salaries for Ashish Agarwal in fiscal 2020, and Michael Berry in fiscal 2019, were prorated to reflectthe mid-year changes in the named executive officer’s base salary rate and/or our payroll periods. The base salaries for Christopher Young, Michael Berry and John Giamatteo relate to the periods in fiscal 2020 prior to the time of their termination. |
| (2) | The amount reported in this column for Lynne Doherty McDonald in fiscal 2020 represents two installments of a sign-on bonus paid in connection with Lynne’s hire in May 2020 as well as the minimum amount to which Lynne was entitled under Lynne’s special commission arrangement for the fiscal quarter in which Lynne joined the Company. The amount shown for Ashish Agarwal represents six installments of the special monthly leadership bonus ($25,000 per month) payable to Ashish during the time Ashish served as our interim Chief Financial Officer and an additional $175,000, which was paid to Ashish as a signing bonus on the first anniversary of Ashish’s date of hire. The amounts reported in this column for John Giamatteo in fiscal 2018 and 2019 represent two installments ofa one-time recognition bonus paid in connection with John’s promotion in June 2018. The amounts reported in this column for Ashutosh Kulkarni and Terry Hicks in fiscal 2018represent sign-on bonuses paid in the applicable year in connection with the commencement of their employment with the Company. The amount reported in this column for Ashutosh Kulkarni in fiscal 2019 represents two installments ofa one-time retention bonus. Please see “Compensation Discussion and Analysis” above for further information regarding the bonuses that were paid in fiscal 2020. |
| (3) | Amounts reported in this column reflect the aggregate grant date fair value of RSUs (issued by FTW prior to our IPO and by the Company after our IPO), PSUs and MIUs awarded in fiscal 2020, 2019 and 2018, as applicable, computed in accordance with FASB ASC Topic 718, Compensation—Stock Compensation and, in the case of the performance-based awards, calculated based on the probable level of achievement of the underlying performance conditions. Because the performance conditions applicable to certain performance-based awards included market-based vesting conditions outside of the control of the Company, the grant date fair value of the awards based on the probable level of achievement of the performance conditions was zero under applicable accounting rules. Assuming satisfaction of the underlying performance conditions, the grant date fair value of the fiscal 2018 performance-based awards would be as follows for each of the recipient named executive officers: Michael Berry, $247,489; John Giamatteo, $804,006; Terry Hicks, $2,964,571; and Ashutosh Kulkarni, $2,322,247. Because the performance metrics applicable to the PSUs issued to Peter Leav and Terry Hicks were not determined in fiscal 2020, under the applicable accounting rules, the PSUs were not treated as granted and therefore no value is shown above related to those awards. Excluded from this table are the cash payments of $1,709,001 and $657,506 received by Christopher Young and John Giamatteo, respectively, in fiscal 2018 with respect to certain forfeited Intel awards (which were payable in connection with substitute awards issued when the Company was divested by Intel in fiscal 2017) as such amounts were accounted for under FASB ASC Topic 718 and would be considered fiscal 2017 compensation under SEC executive compensation disclosure rules. Also excluded from this table are (i) 58,808 RSUs granted to Terry Hicks and 46,064 RSUs granted to Ashutosh Kulkarni, in each case, in connection with our June 2019 distribution, and (ii) 189,928 RSUs granted to Peter Leav, 93,528 RSUs granted to Venkat Bhamidipati, 23,024 RSUs granted to Lynne Doherty McDonald, 17,816 RSUs granted to Terry Hicks, 18,228 RSUs granted to Ashutosh Kulkarni and 14,356 RSUs granted to Ashish Agarwal, in each case, in connection with the October 2020 distributions by FTW of cash and securities of a corporate subsidiary, which, in each case, were treated as adjustments to previously granted awards and did not result in any incremental charge under FASB ASC Topic 718 for the fiscal year of the distribution or any prior fiscal year. John Giamatteo also received 43,368 RSUs in connection with our June 2019 distribution as an adjustment to John’s June 2018 RSU grant but due to a provision of John’s June 2018 promotion letter allowing John certain equity sale opportunities, the issuance of those RSUs resulted in a recognition of the grant date fair value reflected above. See Note 12 to our audited financial statements that appear in our Annual |
151
Confidential Treatment Requested by McAfee Corp.
Pursuant to 17 C.F.R. Section 200.83
| Report on Form 10-K for the year ended December 26, 2020 |
| (4) | Amounts reported in this column represent cash payments made to the named executive officers under the AIP and, in the case of Lynne Doherty McDonald, a fiscal 2020 commission payout (less the guaranteed minimum amount for the fiscal quarter in which Lynne joined the Company). In the case of Peter Leav, Venkat Bhamidipati and Lynne, their respective fiscal 2020 AIP payouts (and Lynne’s fiscal 2020 commission payout) were prorated to reflect their respective hire dates after the beginning of 2020. In the case of Ashish Agarwal, the fiscal 2020 AIP payout was pro-rated to reflect changes in Ashish’s AIP target over the course of fiscal 2020. In the case of Ashutosh Kulkarni and Terry Hicks, their respective fiscal 2018 AIP payouts were prorated to reflecttheir mid-year hire dates. In connection with Christopher Young’s termination of employment with McAfee, we agreed to pay Christopher’s 2019 AIP payout by assuming 100% achievement of the applicable individual performance goals. Please see “Compensation Discussion and Analysis” for further information regarding the AIP. |
| (5) | While Christopher Young participated in our nonqualified deferred compensation plan (as described below), the fiscal 2019 and fiscal 2020 earnings on Christopher’s balance were not “above-market” as determined under applicable SEC rules and no amount is required to be disclosed here. |
| (6) | The amount reported in this column for fiscal 2020 consists of (i) 401(k) matching contributions for each of the named executive officers, (ii) financial planning services provided to Venkat Bhamidipati ($5,671), Ashutosh Kulkarni ($18,000) and Ashish Agarwal ($5,474) during fiscal 2020, (iii) severance amounts paid to Christopher Young and John Giamatteo during fiscal 2020 in the amounts of $3,647,468 and $3,972,137, respectively, (iv) a nominal points-based recognition program award provided to Ashish Agarwal and Michael Berry and (v) tax reimbursements for Ashish and Michael of $36 and $34, respectively, associated with the points-based recognition program in the case of Ashish and Michael. |
Grants of Plan-Based Awards Table for Fiscal 2020
The following table provides information regarding the possible payouts to our named executive officers in fiscal 2020 under the AIP and Lynne Doherty McDonald’s special commission arrangement, as well as equity awards granted in fiscal 2020 to our named executive officers.
Estimated Possible Payouts Under Non-equity Incentive Plan Awards (1) | Estimated Future Payouts Under Equity Incentive Plan Awards | All Other Stock Awards: Number of Shares of Stock or Units (#) | Grant Date Fair Value of Stock Awards ($) | |||||||||||||||||||||||||||||||||
Name | Grant date | Threshold ($) | Target ($) | Maximum ($) | Threshold (#) | Target (#) | Maximum (#) | |||||||||||||||||||||||||||||
Peter Leav | — | — | 1,228,279 | 4,913,116 | — | — | — | — | — | |||||||||||||||||||||||||||
| 2/3/2020 | — | — | — | — | — | — | 1,249,636 | (2) | 2,784,459 | (2) | ||||||||||||||||||||||||||
| 2/24/2020 | — | — | — | — | — | — | 1,874,456 | (3) | 16,199,986 | (3) | ||||||||||||||||||||||||||
| 10/20/2020 | — | — | — | — | — | — | 189,928 | (4) | — | (4) | ||||||||||||||||||||||||||
| 12/15/2020 | — | — | — | — | — | — | 484,496 | (3) | 7,499,998 | (3) | ||||||||||||||||||||||||||
| — | — | — | — | 339,471 | 484,496 | (5) | 629,845 | — | — | (5) | ||||||||||||||||||||||||||
Venkat Bhamidipati | — | — | 214,891 | 859,564 | — | — | — | — | — | |||||||||||||||||||||||||||
| 8/13/2020 | — | — | — | — | — | — | 800,000 | (2) | 5,364,194 | (2) | ||||||||||||||||||||||||||
| 8/13/2020 | — | — | — | — | — | — | 800,000 | (3) | 11,456,000 | (3) | ||||||||||||||||||||||||||
| 10/20/2020 | — | — | — | — | — | — | 93,528 | (4) | — | (4) | ||||||||||||||||||||||||||
Lynne Doherty McDonald | — | — | 148,767 | 595,068 | — | — | — | — | — | |||||||||||||||||||||||||||
| — | — | 446,311 | (6) | — | — | — | — | — | — | |||||||||||||||||||||||||||
| 5/19/2020 | — | — | — | — | — | — | 2,435,504 | (2) | 5,589,499 | (2) | ||||||||||||||||||||||||||
| 5/19/2020 | — | — | — | — | — | — | 500,000 | (3) | 4,321,250 | (3) | ||||||||||||||||||||||||||
| 10/20/2020 | — | — | — | — | — | — | 23,024 | (4) | — | (4) | ||||||||||||||||||||||||||
Terry Hicks | — | — | 750,035 | 3,000,140 | — | — | — | — | — | |||||||||||||||||||||||||||
| 10/20/2020 | — | — | — | — | — | — | 17,816 | (4) | — | (4) | ||||||||||||||||||||||||||
| 12/15/2020 | — | — | — | — | — | — | 116,279 | (3) | 1,714,635 | (3) | ||||||||||||||||||||||||||
| — | — | — | — | 54,263 | 77,519 | (5) | 100,775 | — | — | (5) | ||||||||||||||||||||||||||
Ashutosh Kulkarni | — | — | 625,000 | 2,500,000 | — | — | — | — | — | |||||||||||||||||||||||||||
| 10/20/2020 | — | — | — | — | — | — | 18,228 | (4) | — | (4) | ||||||||||||||||||||||||||
152
Confidential Treatment Requested by McAfee Corp.
Pursuant to 17 C.F.R. Section 200.83
Estimated Possible Payouts Under Non-equity Incentive Plan Awards (1) | Estimated Future Payouts Under Equity Incentive Plan Awards | All Other Stock Awards: Number of Shares of Stock or Units (#) | Grant Date Fair Value of Stock Awards ($) | |||||||||||||||||||||||||||||||||
Name | Grant date | Threshold ($) | Target ($) | Maximum ($) | Threshold (#) | Target (#) | Maximum (#) | |||||||||||||||||||||||||||||
Ashish Agarwal | — | — | 209,440 | 837,760 | — | — | — | — | — | |||||||||||||||||||||||||||
| 5/19/2020 | — | — | — | — | — | — | 111,112 | (3) | 960,285 | (3) | ||||||||||||||||||||||||||
| 8/13/2020 | — | — | — | — | — | — | 111,112 | (3) | 1,591,124 | (3) | ||||||||||||||||||||||||||
| 10/20/2020 | — | — | — | — | — | — | 14,356 | (4) | — | (4) | ||||||||||||||||||||||||||
| 12/15/2020 | — | — | — | — | — | — | 96,899 | (3) | 1,428,860 | (3) | ||||||||||||||||||||||||||
| — | — | — | — | 45,219 | 64,599 | (5) | 83,979 | — | — | (5) | ||||||||||||||||||||||||||
Christopher Young | — | — | — | — | — | — | — | — | — | |||||||||||||||||||||||||||
Michael Berry | — | — | — | — | — | — | — | — | — | |||||||||||||||||||||||||||
John Giamatteo | — | — | — | — | — | — | — | — | — | |||||||||||||||||||||||||||
| (1) | Except as described in footnote 6 below, these amounts represent target and maximum cash award levels set in fiscal 2020 under the AIP. Under our AIP design for fiscal 2020, no threshold applied to AIP bonuses. Maximum payouts assume that the AIP was funded at maximum levels based on applicable Company and/or business unit performance and individual performance was also achieved at maximum levels. For Ashish Agarwal, the AIP threshold, target and maximum cash award levels for fiscal 2020 are based on Ashish’s blended annual base salary for the year. In the case of Peter Leav, Venkat Bhamidipati and Lynne Doherty McDonald, their respective fiscal 2020 AIP threshold, target and maximum levels were prorated to reflect their hire dates after the beginning of fiscal 2020. The amount actually paid to each named executive officer under the AIP is reported as Non-Equity Incentive Plan Compensation in the “Summary Compensation Table for Fiscal 2020.” Because Christopher Young, Michael Berry, and John Giamatteo terminated early in fiscal 2020, they were not eligible for a bonus under our AIP in fiscal 2020. |
| (2) | These amounts represent time-based MIUs, which were scheduled to vest 6.25% per quarter beginning on the last day of the quarter in which the vesting commencement date fell, provided that the named executive officer remained continuously employed by the Company through each vesting date, unless certain requirements for accelerated vesting were met (see “—Potential Payments Upon Termination or Change in Control for Fiscal 2020” narrative for a description of these requirements). |
| (3) | These amounts represent time-based RSUs, which were scheduled to vest 6.25% per quarter beginning on the last day of the quarter in which the vesting commencement date fell, provided that the named executive officer remained continuously employed by the Company through each vesting date, unless certain requirements for accelerated vesting were met (see “—Potential Payments Upon Termination or Change in Control for Fiscal 2020” narrative for a description of these requirements). |
| (4) | These amounts represent additional time- and/or performance-based RSUs granted in connection with the October 2020 distributions by FTW of cash and securities of a corporate subsidiary. The time-based RSUs vest on a quarterly basis beginning on the last day of the quarter in which the grant date fell provided that the named executive officer has remained continuously employed by the Company through each vesting date, unless the named executive officer meets certain requirements for accelerated vesting (see “—Potential Payments Upon Termination or Change in Control for Fiscal 2020” narrative for a description of these requirements). During fiscal 2020, the performance-based RSUs were eligible to vest 100% upon TPG |
| (5) | On December 15, 2020, grants of PSUs were approved for Peter Leav, Terry Hicks and Ashish Agarwal in the amounts reflected above, respectively. Because the performance metrics applicable to these PSUs were not determined in fiscal 2020, there is no grant date under applicable accounting rules and no amount is reflected above related to these grants. |
| (6) | This amount represents the target cash award levels set in fiscal 2020 under Lynne Doherty McDonald’s special commission arrangement, which was prorated to reflect Lynne’s mid-year hire date. The amount actually paid to Lynne under this commission arrangement is reportedas Non-Equity Incentive Plan Compensation in the “Summary Compensation Table for Fiscal 2020” and Bonus (to the extent guaranteed). |
153
Confidential Treatment Requested by McAfee Corp.
Pursuant to 17 C.F.R. Section 200.83
Narrative Disclosure to Summary Compensation Table and Grants of Plan-Based Awards Table
Employment Agreement with Peter Leav
In connection with Peter Leav’s commencement of employment as our President and Chief Executive Officer, Peter entered into an employment agreement that became effective on February 3, 2020. Peter’s employment agreement provides for an annual base salary of $900,000, a target bonus equal to 150% of annual base salary and an entitlement to participate in our employee benefit plans and programs made available to executive level employees. Pursuant to Peter’s employment agreement, Peter was also granted 1,874,456 RSUs and 1,249,636 MIUs with an original return threshold of $8.64 per unit, and Peter purchased 57,856 Class A Units.
In addition, any compensation paid to Peter is subject to recoupment to the extent required by law, the limited liability company agreement of FTW, our equity plans, the award agreements governing the awards granted under our equity plans, Peter’s subscription agreement, our clawback policy, or the requirements of the exchange on which the shares of an affiliate of ours are listed.
See “—Potential Payments Upon Termination or Change in Control for Fiscal 2020” for a description of the termination-related provisions under Peter’s employment agreement.
Employment Agreement with Venkat Bhamidipati
In connection with Venkat Bhamidipati’s commencement of employment, Venkat entered into an employment agreement, effective September 2, 2020, that provides for an annual base salary of $650,000, a target annual bonus equal to 100% of annual base salary and an entitlement to participate in our employee benefit plans and programs made available to executive level employees. Pursuant to Venkat’s employment agreement, Venkat was also granted 800,000 RSUs and 800,000 MIUs with an original return threshold of $8.64 per unit.
In addition, any compensation paid to Venkat is subject to recoupment to the extent required by law, the limited liability company agreement of FTW, the 2017 Plan, the award agreements governing the awards granted under the 2017 Plan, Venkat’s subscription agreement, our clawback policy, or the requirements of the exchange on which the shares of an affiliate of ours are listed.
See “—Potential Payments Upon Termination or Change in Control for Fiscal 2020” for a description of the termination-related provisions under Venkat’s employment agreement.
Offer Letter with Lynne Doherty McDonald
Prior to the Enterprise Division Sale, Lynne Doherty McDonald was a party to an offer letter with the Company providing for an annual base salary of $850,000 and an annual incentive bonus target equal to 105.9% of annual base salary. Pursuant to Lynne’s offer letter, Lynne also (i) was granted 500,000 RSUs and 2,435,504 MIUs with an original return threshold of $8.64 per unit in fiscal 2020, and (ii) received the hiring bonus described above
under “Sign-On, Retention
and Special Incentive Bonuses” in the “Compensation Discussion and Analysis”.Letter Agreement with Terry Hicks
Terry Hicks is party to a letter agreement with the Company providing for an annual base salary of $650,000 and an annual incentive bonus target equal to 115.39% of annual base salary.
Letter Agreement with Ashutosh Kulkarni
As of the end of fiscal 2020, Ashutosh Kulkarni was party to a letter agreement with the Company providing for an annual base salary of $625,000 and an annual incentive bonus target equal to 100% of annual base salary.
154
Confidential Treatment Requested by McAfee Corp.
Pursuant to 17 C.F.R. Section 200.83
Letter Agreement with Ashish Agarwal
Ashish Agarwal is party to a letter agreement with the Company providing for an annual base salary of $425,000 and an annual incentive bonus target equal to 52.94% of annual base salary. Pursuant to Ashish’s letter agreement, Ashish also remains eligible for the performance award described above
under “Sign-On, Retention
and Special Incentive Bonuses” in the “Compensation Discussion and Analysis”. See “—Potential Payments Upon Termination or Change in Control for Fiscal 2020” for a description of the change in control-related provisions under Ashish’s letter agreement.Outstanding Equity Awards at
Fiscal Year-End for
Fiscal 2020The following table summarizes unvested stock awards held by each named executive officer on December 26, 2020.
Stock Awards | ||||||||||||||||||||
Name | Grant Date (1) | Number of Shares or Units That Have Not Vested (#) | Market Value of Shares or Units That Have Not Vested ($) (2) | Equity Incentive Plan Awards: Number of Unearned Shares or Units that Have Not Vested (#) | Equity Incentive Plan Awards: Market or Payout Value of Unearned Shares or Units that Have Not Vested ($) (2) | |||||||||||||||
Peter Leav | 2/3/2020 | 1,015,332 | (3) | 11,651,239 | — | — | ||||||||||||||
| 2/24/2020 | 1,522,996 | (5) | 27,048,409 | — | — | |||||||||||||||
| 10/20/2020 | 189,928 | (5) | 3,373,121 | — | — | |||||||||||||||
| 12/15/2020 | 484,496 | (5) | 8,604,649 | 339,147 | (7) | 6,023,251 | (7) | |||||||||||||
Venkat Bhamidipati | 8/13/2020 | 750,000 | (3) | 8,754,600 | — | — | ||||||||||||||
| 8/13/2020 | 750,000 | (5) | 13,320,000 | — | — | |||||||||||||||
| 10/20/2020 | 93,528 | (5) | 1,661,057 | — | — | |||||||||||||||
Lynne Doherty McDonald | 5/19/2020 | 2,131,068 | (3) | 24,078,511 | — | — | ||||||||||||||
| 5/19/2020 | 437,500 | (5) | 7,770,000 | — | — | |||||||||||||||
| 10/20/2020 | 23,024 | (5) | 408,906 | — | — | |||||||||||||||
Terry Hicks | 11/14/2018 | 397,456 | (3) | 4,631,157 | 794,916 | (4) | 9,262,361 | |||||||||||||
| 11/14/2018 | 75,000 | (5) | 1,332,000 | 150,000 | (6) | 2,664,000 | ||||||||||||||
| 6/22/2019 | 15,672 | (5) | 278,335 | 31,364 | (6) | 557,025 | ||||||||||||||
| 10/20/2020 | 8,276 | (5) | 146,982 | 9,540 | (6) | 169,430 | ||||||||||||||
| 11/22/2019 | 66,668 | (5) | 1,184,024 | — | — | |||||||||||||||
| 12/15/2020 | 116,279 | (5) | 2,065,115 | 54,263 | (7) | 963,711 | (7) | |||||||||||||
Ashutosh Kulkarni | 11/14/2018 | 311,340 | (3) | 3,629,477 | 622,684 | (4) | 7,259,001 | |||||||||||||
| 11/14/2018 | 58,752 | (5) | 1,043,436 | 117,500 | (6) | 2,086,800 | ||||||||||||||
| 6/22/2019 | 12,256 | (5) | 217,667 | 24,568 | (6) | 436,328 | ||||||||||||||
| 11/22/2019 | 133,332 | (5) | 2,367,976 | — | — | |||||||||||||||
| 10/20/2020 | 10,752 | (5) | 190,956 | 7,476 | (6) | 132,774 | ||||||||||||||
Ashish Agarwal | 9/19/2019 | 186,048 | (3) | 1,991,142 | — | — | ||||||||||||||
| 9/19/2019 | 38,196 | (5) | 678,361 | — | — | |||||||||||||||
| 11/22/2019 | 33,336 | (5) | 592,047 | — | — | |||||||||||||||
| 5/19/2020 | 97,224 | (5) | 1,726,698 | — | — | |||||||||||||||
| 8/13/2020 | 104,168 | 1,850,024 | — | — | ||||||||||||||||
| 10/20/2020 | 14,356 | 254,963 | — | — | ||||||||||||||||
| 12/15/2020 | 96,899 | (5) | 1,720,926 | 45,219 | (7) | 803,089 | (7) | |||||||||||||
155
Confidential Treatment Requested by McAfee Corp.
Pursuant to 17 C.F.R. Section 200.83
Stock Awards | ||||||||||||||||||||
Name | Grant Date (1) | Number of Shares or Units That Have Not Vested (#) | Market Value of Shares or Units That Have Not Vested ($) (2) | Equity Incentive Plan Awards: Number of Unearned Shares or Units that Have Not Vested (#) | Equity Incentive Plan Awards: Market or Payout Value of Unearned Shares or Units that Have Not Vested ($) (2) | |||||||||||||||
Christopher Young | — | — | — | — | — | |||||||||||||||
Michael Berry | — | — | — | — | — | |||||||||||||||
John Giamatteo | — | — | — | — | — | |||||||||||||||
| (1) | Reflects RSUs, PSUs and MIUs granted under our long-term incentive plans. |
| (2) | The value is determined based on the closing price of a share of our Class A common stock as of the end of fiscal 2020 ($17.76). Where applicable, the fair market value of an MIU reflects the value of a Class A Unit of FTW less any unsatisfied return threshold. |
| (3) | Represents time-based MIUs, which were scheduled to vest 6.25% per calendar quarter beginning on the last day of the quarter in which the vesting commencement date fell, provided that the named executive officer has remained continuously employed by the Company through each vesting date, unless certain requirements for accelerated vesting were met (see “—Potential Payments Upon Termination or Change in Control for Fiscal 2020” narrative for a description of these requirements). |
| (4) | Represents performance-based MIUs, which, at the end of fiscal 2020, were eligible to vest based upon TPG’s investment funds receiving specified investment returns, provided that the named executive officer remained continuously employed by the Company through the applicable vesting date (see “—Potential Payments Upon Termination or Change in Control for Fiscal 2020” narrative for a description of these requirements). |
| (5) | Represents time-based RSUs, which are (or, in the case of Ashutosh Kulkarni, were) eligible to vest on a quarterly basis (beginning with the last day of the quarter in which the vesting commencement date fell) over four years, provided that the named executive officer remained continuously employed by the Company through each vesting date, unless certain requirements for accelerated vesting were met (see “—Potential Payments Upon Termination or Change in Control for Fiscal 2020” narrative for a description of these requirements). |
| (6) | Represents performance-based RSUs, which at the end of fiscal 2020, were eligible to vest 100% upon TPG’s investment funds receiving a specified investment return, provided that the named executive officer has remained continuously employed by the Company through the vesting date. |
| (7) | On December 15, 2020, grants of PSUs were approved for Peter Leav, Terry Hicks and Ashish Agarwal, which are reflected above assuming threshold performance levels. These PSUs are eligible to vest based on performance over a three-year period. PSUs granted in fiscal 2020 will be eligible to vest based on achievement of performance targets related to Annual Cash EBITDA, Annual Adjusted Unlevered Free Cash Flow and Annual Billings based on the performance of McAfee as a whole. However, because the targets applicable to these PSUs were not determined as of the end of fiscal 2020, no grant date for accounting purposes had occurred as of that time. |
156
Confidential Treatment Requested by McAfee Corp.
Pursuant to 17 C.F.R. Section 200.83
Stock and Units Vested in Fiscal 2020
The following table summarizes the number and market value of equity awards held by each named executive officer that vested during fiscal 2020. No named executive officers held or exercised stock options during fiscal 2020.
Stock and Unit Awards | ||||||||
Name | Number of Shares or Units Acquired on Vesting (1) (#) | Value Realized on Vesting (2) ($) | ||||||
Peter Leav | 585,764 | 3,037,493 | ||||||
Venkat Bhamidipati | 100,000 | 432,125 | ||||||
Lynne Doherty McDonald | 366,936 | 540,156 | ||||||
Terry Hicks | 266,300 | 693,291 | ||||||
Ashutosh Kulkarni | 235,664 | 776,950 | ||||||
Ashish Agarwal | 113,480 | 396,068 | ||||||
Christopher Young | 1,478,748 | 12,780,080 | ||||||
Michael Berry | 58,648 | 432,479 | ||||||
John Giamatteo | 76,360 | 418,235 | ||||||
| (1) | Amounts reported in this column represent the number of the named executive officer’s RSUs and/or MIUs that vested during fiscal 2020. In certain cases, these Class A Units and MIUs remain subject to transfer restrictions as described above in “IPO-Related Changes to Pre-IPO Equity Holdings and Post-Lockup Transfer Restrictionson Pre-IPO Equity” in the “Compensation Discussion and Analysis”. |
| (2) | Because the Company’s equity was not publicly traded prior to October 22, 2020, there was no ascertainable public market value for units of FTW that became vested prior to that date. For Class A Units and/or MIUs that vested prior to October 22, 2020, the market value reported in this table is based upon the Board’s last determination of the fair market value of the Company’s equity prior to the relevant vesting date (in each case, $8.64 per Class A Unit of FTW). For shares of Class A common stock that vested on or after October 22, 2020, the value is determined based on the closing price of our Class A common stock on the relevant vesting date. Where applicable, the fair market value of an MIU of FTW reflects the value of a Class A Unit of FTW less any unsatisfied return threshold. |
Pension Benefits for Fiscal 2020
None of our named executive officers participated in or was entitled to receive benefits under a defined benefit pension plan in fiscal 2020.
157
Confidential Treatment Requested by McAfee Corp.
Pursuant to 17 C.F.R. Section 200.83
Nonqualified Deferred Compensation for Fiscal 2020
The following table provides information regarding compensation that was deferred by our named executive officers pursuant to the terms of the NQDC Plan during fiscal 2020.
Name | Executive Contributions in Fiscal 2020($) | Registrant Contributions in Fiscal 2020($) | Aggregate Earnings in Fiscal 2020($) | Aggregate Withdrawals/ Distributions($) | Aggregate Balance at 2020 FYE($) | |||||||||||||||
Peter Leav | — | — | — | — | — | |||||||||||||||
Venkat Bhamidipati | — | — | — | — | — | |||||||||||||||
Lynne Doherty McDonald | — | — | — | — | — | |||||||||||||||
Terry Hicks | — | — | — | — | — | |||||||||||||||
Ashutosh Kulkarni | — | — | — | — | — | |||||||||||||||
Ashish Agarwal | — | — | — | — | — | |||||||||||||||
Christopher Young | — | — | 1,542 | 534,363 | — | |||||||||||||||
Michael Berry | — | — | — | — | — | |||||||||||||||
John Giamatteo | — | — | — | — | — | |||||||||||||||
During fiscal 2020, we maintained the NQDC Plan, for certain of our employees, and our named executive officers were eligible to participate. Under the NQDC Plan, participants may defer up to 50% of their compensation, as defined in the Company’s 401(k) plan, and incentive bonuses other than retention, relocation
and sign-on bonuses.
The NQDC also provides the Company with discretion to make matching and discretionary contributions into the NQDC Plan. Participants may specify the timing of the payment of their accounts by choosing either a specified payment date or electing payment upon separation from service, and in either case, may elect to receive their accounts in a lump sum or in annual installments over a period of up to ten years, with accelerated payouts in the event of death or disability of the participant. Participants are generally permitted to choose from among the mutual funds available for investment under the 401(k) plan for purposes of determining the imputed earnings, gains, and losses applicable to their NQDC Plan accounts.Potential Payments Upon Termination or Change in Control for Fiscal 2020
During fiscal 2020, certain of our named executive officers were entitled to receive certain benefits upon a qualifying termination of employment and upon certain change in control transactions, as described below.
Agreements with Executives
Employment Agreement with Peter Leav
Under the terms of Peter Leav’s employment agreement, if we terminate Peter’s employment without cause (as defined in the employment agreement) or if Peter resigns for good reason (as defined in the employment agreement), in either case, other than within two years following a change in control, Peter would be entitled to: (i) one
and one-half times
the sum of then current annual base salary plus target bonus, payable overan 18-month period;
(ii) any earned but unpaid annual bonus related to the completed fiscal year preceding the fiscal year in which termination of employment occurs, payable in accordance with regular payroll practices; (iii) an annual bonus for the year in which the termination date occurs, with payment based on actual performance during the year oftermination, pro-rated to
reflect the number of days during the bonus year in which Peter was employed by us, payable in accordance with regular payroll practices; and (iv) provided that Peter timely elects under the Consolidated Omnibus Budget Reconciliation Act (“COBRA”), a COBRA subsidy that, onan after-tax basis,
is equal to the employer-paid portion of the premium equivalent for active employees who elect the same type of medical, dental and vision coverageduring the 18-month period that
follows Peter’s termination of employment (or, if earlier, the time at which Peter becomes eligible for group health coverage from another employer), payable on a monthly basis during such period. In the event such a termination of158
Confidential Treatment Requested by McAfee Corp.
Pursuant to 17 C.F.R. Section 200.83
employment occurs during
the two-year period
following a change in control, Peter would be entitled to the same payments (subject to the same requirements), except that the severance multiplier would be two (rather than oneand one-half) and
would be paid overa 24-month period
(instead ofan 18-month period),
and the COBRA subsidy would be paid for up to 24 months (instead of 18 months). In addition, in each case, Peter would also be entitled to: (i) any earned but unpaid base salary accrued through the date of termination; (ii) unreimbursed business expenses; and (iii) employee benefits, if any, to which Peter or Peter’s dependents may be entitled under the employee benefit plans or programs of the Company (“Peter Leav’s Accrued Rights”).Upon a termination of employment due to Peter’s death or disability, Peter would be entitled to: (i) Peter Leav’s Accrued Rights; (ii) any earned but unpaid annual bonus related to the completed fiscal year preceding the fiscal year in which termination of employment occurs, payable in accordance with regular payroll practices; and (iii) an annual bonus for the year in which the termination date occurs, with payment based on actual performance during the year of
termination, pro-rated to
reflect the number of days during the bonus year in which Peter Leav was employed by the us, payable in accordance with regular payroll practices.Upon a resignation without good reason or a termination for cause, Peter would be entitled only to Peter Leav’s Accrued Rights.
Peter’s receipt of the severance payments described above (other than Peter Leav’s Accrued Rights) are subject to Peter’s signing (and not revoking) a release of all claims against us and Peter Leav’s continuing to comply with the limited liability company agreement of FTW, the 2017 Plan, the award agreements governing the awards granted under the 2017 Plan, Peter’s subscription agreement, and Peter’s employment agreement, the latter of which includes a covenant not to compete with us or to solicit our subscribers or employees during and, subject to certain limitations, for 18 months following Peter’s employment with us, as well as a perpetual confidentiality covenant.
Peter Leav’s Long-Term Incentive Awards
Peter Leav’s MIU, RSU and PSU award agreements each provide that in the event of a change in control, Peter’s awards will accelerate in full (and, in the case of Peter’s PSUs, will be deemed earned based on target performance or, if higher and if determinable, based on the actual performance of the Company and/or FTW, as applicable, through the date of the change in control (or an earlier date selected for administrative convenience)) as of immediately prior to the change in control, provided that Peter remains employed through the date of the change in control.
Peter Leav’s MIU, RSU and PSU award agreements each also provide that if Peter’s employment or other service is terminated without cause (but not due to death or disability) or Peter resigns for good reason, in either case, other than under circumstances where cause exists and within 24 months following a sale of the Company’s Consumer business unit or Enterprise business unit (either, as applicable, the “Divested Business”) that does not constitute a change in control, then, subject to Peter’s continued material compliance with Peter’s employment agreement, the award agreement, the applicable long-term incentive plan and the second amended and restated limited liability company agreement of FTW, and Peter’s execution, delivery, cash and marketable securities) resulting from the sale of the Divested Business, plus any excess cash retained by the Company after appropriate debt pay down, and “B” is the aggregate fair market of the equity of FTW immediately following the sale of the Enterprise Business (without any duplication of any amount included in “A”).
and non-revocation of
a general release of claims within a specified period, a portion of the then unvested and outstanding award will vest as of immediately prior to such termination, with the portion determined by multiplying the number of then unvested and outstanding MIUs, RSUs or PSUs (or, in each case, any securities or rights for which such MIUs, RSUs or PSUs were previously exchanged) by a ratio of A /(A+B), where “A” is the actual distributed proceeds (i.e.
159
Confidential Treatment Requested by McAfee Corp.
Pursuant to 17 C.F.R. Section 200.83
Employment Agreement with Venkat Bhamidipati
Under the terms of Venkat Bhamidipati’s employment agreement, if we terminate Venkat’s employment without cause (as defined in Venkat’s employment agreement) or if Venkat resigns for good reason (as defined in Venkat’s employment agreement), Venkat would be entitled to: (i) a sum equal to then current annual base salary plus target annual bonus, payable over
a 12-month period
and (ii) provided that Venkat timely elects COBRA, monthly COBRA enrollment premiums that are equal to the employer-paid portion for active employees who elect the same type of medical, dental and vision coverage during the12-month
period that follows Venkat’s termination of employment (or, if earlier, the time at which Venkat becomes eligible for group health coverage from another employer), payable directly to our COBRA provider. In addition, if we terminate Venkat’s employment without cause, Venkat would be entitled to any earned but unpaid annual bonus related to (i) the fiscal year in which the termination date occurs if Venkat was employed through the end of the third quarter of such fiscal year, or (ii) the completed fiscal year preceding the fiscal year in which termination of employment occurs, in each case based on actual performance for the applicable fiscal year and payable in accordance with regular payroll practices. In each case, Venkat would also be entitled to: (i) any earned but unpaid base salary accrued through the date of termination; (ii) unreimbursed business expenses; (iii) any earned and unused vacation; and (iv) employee benefits, if any, to which Venkat, Venkat’s estate, or Venkat’s dependents may be entitled under the employee benefit plans or programs of the Company (“Venkat Bhamidipati’s Accrued Rights”).Upon a termination of employment due to Venkat’s death or disability, a resignation without good reason, or a termination for cause, Venkat would be entitled only to Venkat Bhamidipati’s Accrued Rights.
Venkat’s receipt of the severance payments described above (other than Venkat Bhamidipati’s Accrued Rights) are subject to Venkat’s signing (and not revoking) a release of all claims against us and that Venkat continue to comply with the limited liability company agreement of FTW, the 2017 Plan, the award agreements governing the awards granted under the 2017 Plan, and the employment agreement, the latter of which includes a covenant not to compete with us or to solicit our subscribers or employees during and, subject to certain limitations, for 12 months following Venkat’s employment with us, as well as a perpetual confidentiality covenant.
Venkat Bhamidipati’s Long Term Incentive Awards
Venkat Bhamidipati’s MIU and RSU award agreements each provide that in the event of a change in control, Venkat’s awards will accelerate in full as of immediately prior to the change in control, provided that Venkat remains employed through the date of the change in control.
If Venkat’s employment or other service is terminated without cause (but not due to death or disability) or Venkat resigns for good reason, in either case, other than under circumstances where cause exists, then, subject to Venkat’s continued material compliance with Venkat’s employment agreement, Venkat’s MIU and RSU award agreement, the 2017 Plan and the second amended and restated limited liability company agreement of FTW and Venkat’s execution, delivery and
non-revocation
of a general release of claims within a specified period, if such termination occurs prior to September 2, 2021, the portion of the applicable award that was otherwise scheduled to vest during the one year period following such termination would immediately vest.Offer Letter with Lynne Doherty McDonald
Under the terms of Lynne Doherty McDonald’s offer letter as in effect prior to the Enterprise Division Sale, if Lynne’s employment with us had been terminated without cause (as defined in Lynne’s offer letter) or Lynne resigns for good reason cause (as defined in Lynne’s offer letter), Lynne would have been eligible to receive a severance amount equal to (i) one year of annual base salary as in effect prior to Lynne’s termination, plus (ii) a
160
Confidential Treatment Requested by McAfee Corp.
Pursuant to 17 C.F.R. Section 200.83
payment equal to the employer contribution rate in effect for similarly situated active employees for Lynne’s and Lynne’s eligible dependents to continue healthcare coverage under COBRA for one year. In order to receive those severance benefits, Lynne would have been obligated to sign a general release of claims that became fully effective. Lynne’s severance amount is payable as salary continuation.
Recognition Award for Lynne Doherty McDonald Related to Enterprise Business Sale
In connection with the closing of the Enterprise Business Sale and Lynne Doherty McDonald’s termination of employment with us, we agreed in a letter agreement to provide Lynne with the following benefits: (i) 140,000 RSUs held by Lynne were accelerated as of the July 27, 2021 and (ii) we paid Lynne a
pro-rated
bonus under the AIP for fiscal 2021 equal to $255,199.81.Executive Severance Arrangements
In connection with our IPO, we entered into severance agreements (the “Severance Agreements”) with our current executive officers (other than Peter Leav). Under the terms of the Severance Agreements, each eligible senior management team member (each a “Covered Executive”) is eligible to receive severance in the event the Covered Executive’s employment is terminated by the Company without cause (as defined in the Severance Agreement) or terminates the Covered Executive’s employment with the Company for good reason (as defined in the Severance Agreement), in either case, at a time other than during the period beginning three months prior to, and ending 18 months following, the consummation of a change in control, in an amount equal to the sum of (i) an amount equal to 1.0x the Covered Executive’s base salary and target annual bonus as in effect on the date of the Covered Executive’s termination (or, if higher, the base salary and target annual bonus in effect immediately before any reduction in such amounts which resulted in good reason), payable in substantially equal installments over a period of 12 months after the Covered Executive’s termination of employment in accordance with the Company’s regular payroll practices, and (ii) if the Covered Executive elects continuation coverage under our health plan, a monthly amount equal to the employer portion of the monthly premiums paid under our group health plans (as of the date of the Covered Executive’s termination of employment) for up to 12 months.
Under the Severance Agreements, in the event a Covered Executive’s employment is terminated without cause (as defined in the Severance Agreement), or the Covered Executive terminates the Covered Executive’s employment with the Company for good reason (as defined in the Severance Agreement), in either case, during the period beginning three months prior to, and ending 18 months following, the consummation of a change in control (“Qualifying Change in Control Termination”), the Covered Executive will be eligible to receive severance in an amount equal to the sum of (i) 1.5x the sum of the Covered Executive’s base salary and target annual bonus (in each case at the highest level in effect during
the 12-month period
leading up to the date of the Covered Executive’s termination of employment), payable in a lump sum, (ii) the pro rata portion of the Covered Executive’s annual bonus, based on actual performance for the year in which termination occurs, payable at the time at the time annual bonuses are payable to senior executives of the Company and its affiliates generally, and (iii) if the Covered Executive elects continuation coverage under our health plan, a monthly amount equal to the employer portion of the monthly premiums paid under our group health plans (as of the date of the Covered Executive’s termination of employment) for up to 18 months. Furthermore, in the event of a Qualifying Change in Control Termination, all the Covered Executive’s unvested time-based equity will accelerate and vest in full as of the date of the Covered Executive’s termination of employment and all performance-based equity granted following our IPO would vest as of the separation date based on target performance or, if higher and if determinable, based on our actual performance through the date of termination of employment, as applicable, in accordance with the documents governing such performance-based equity award.The payments provided under the Severance Agreement are in lieu of and will supersede any severance or similar payments or benefits that the Covered Executive may otherwise be entitled to upon termination of the
161
Confidential Treatment Requested by McAfee Corp.
Pursuant to 17 C.F.R. Section 200.83
Covered Executive’s employment, but if payments or benefits become payable under the Severance Agreement and if the severance payments and benefits provided under the Covered Executive’s employment agreement, offer letter, or prior severance agreement (the “Prior Agreement”) remained payable, to the extent such payments and benefits would be greater than the payments and benefits payable under the Severance Agreement (the “Excess Payments”), the Excess Payments will, subject to terms and conditions of the Severance Agreement, be payable under the Severance Agreement but in accordance with the payment schedule that would have applied to them under the Prior Agreement.
All severance payable under the Severance Agreement is contingent upon the Covered Executive’s compliance with the restrictive covenants relatedmaterial compliance with other restrictive covenants that apply to the Covered Executive, and the Covered Executive’s execution and non-revocation of a general release of claims. Severance that would otherwise be payable under other employment agreements and offer letters is generally reduced by amounts payable under an applicable Severance Agreement to avoid duplication of payments.
to non-competition, non-solicitation and no-hire and
In addition, each Covered Executive’s Severance Agreement provides that in the event the Covered Executive’s then unvested time-based equity awards are not continued, assumed or substituted for in connection with a change in control with awards or rights having the same intrinsic value (determined as of the change in control), such time-based equity awards will vest in full effective as of the change in control.
Long-Term Incentive Award Agreements for Lynne Doherty McDonald, Terry Hicks, Ashutosh Kulkarni and Ashish Agarwal
As of the end of fiscal 2020, Lynne Doherty McDonald, Terry Hicks, Ashutosh Kulkarni and Ashish Agarwal each held unvested MIUs and unvested RSUs that were subject to time-based vesting conditions that were issued under the 2017 Plan. The award agreements evidencing these time-based MIU and RSU awards provide that if the named executive officer’s employment with us is terminated without cause or for good reason (each, as defined in the underlying award agreement) within
the two-year period
following a change in control (as such term is defined in our 2017 Plan), all outstanding MIUs and RSUs subject to time-based vesting will automatically become vested in full as of immediately prior to such termination of employment.Terry Hicks also holds time-based RSUs and PSUs, which were granted in December 2020, which do not provide for automatic acceleration in connection with a termination or change in control but would be subject to the terms of Terry’s Severance Agreement as described above.
Change in Control Bonus for Ashish Agarwal
Under Ashish Agarwal’s letter agreement with us, Ashish is entitled toequal to $250,000 if Ashish remains employed as of the date of a change in control (as defined in the 2017 Plan) of the Company.
a change-in-control bonus
Separation Agreement with Christopher Young
We entered into a separation agreement with Christopher Young in fiscal 2020. Christopher’s separation agreement, which was effective February 3, 2020, provided that, in exchange for a release of claims (that was not revoked) and Christopher’s agreement to adhere to certain restrictive covenants, Christopher would receive (i) a payment equal to Christopher’s final annual base salary plus target annual bonus, payable over
the 12-month period
following Christopher termination of employment, (ii) an amount equal to Christopher’s 2019 annual bonus, calculated and determined by our actual performance relative to Company performance objectives during fiscal 2019 and assuming individual performance goals are met at 100% of target, paid in a lump sum that was paid when fiscal 2019 bonuses were paid to senior executives generally,(iii) a pro-rata bonus
162
Confidential Treatment Requested by McAfee Corp.
Pursuant to 17 C.F.R. Section 200.83
for fiscal 2020 based on Christopher’s target 2020 annual bonus, payable when fiscal 2020 bonuses are paid to senior executives generally, and (iv) a COBRA subsidy equal, on
an after-tax basis,
to the employer-paid portion of comparable medical, dental and vision coverage for active employees that corresponds to Christopher’s coverage election, payable on a monthly basis for 12 months (or, if shorter, until Christopher receives coverage under a group health plan of another employer), all of which has been paid. In addition, FTW agreed to accelerate the vesting of 455,000 time-based MIUs scheduled to vest on or before December 31, 2020 as of the separation date and agreed to accelerate 910,000 unvested MIUs that were eligible to vest based on funds affiliated with TPG receiving a certain investment return level as August 3, 2020.Separation Agreement with John Giamatteo
John Giamatteo’s separation agreement, which was effective January 10, 2020, provided that in exchange for a release of claims (that was not revoked) and John’s agreement to adhere to certain restrictive covenants, John was entitled to receive (i) severance pay in the amount of $3,972,137, payable over
the 12-month period
following John’s termination of employment, and (ii) an annual incentive bonus for fiscal 2019 determined in the sole and absolute discretion of the Committee in accordance with the terms of our AIP and the Committee’s charter, all of which has been paid.Offer Letter with Michael Berry
Under the terms of Michael Berry’s offer letter, as in effect prior to Michael’s termination of employment in fiscal 2020, if we terminated Michael’s employment without cause (as defined in the offer letter) or if Michael resigned for good reason (as defined in the offer letter), Michael would be entitled to (i) an amount equal to the sum of one year of Michael’s base salary and annual incentive target, (ii) a payment equal to the employer contribution rate in effect for Michael and Michael’s eligible dependents to continue healthcare coverage under COBRA for one year, and (iii) if we terminated Michael’s employment without cause prior to the payment of any annual incentive relating to any prior fiscal year or during the fourth quarter of any fiscal year, an annual incentive based on actual performance and prorated based on the number of days employed that fiscal year, with such severance payable as salary continuation following the termination of Michael’s employment.
It was a condition to Michael’s receipt of the severance payment described above that Michael timely execute a release of claims against us and that Michael comply with certain restrictive covenants set forth in Michael’s restrictive covenant agreement attached as an addendum to the offer letter, including a covenant not to compete with us or to solicit our clients or employees during and, subject to certain limitations, for 12 months following Michael’s employment with us and covenants relating to
confidentiality and non-disparagement.
Michael did not enter into a separation agreement or receive any separation pay in connection with Michael’s termination of employment in fiscal 2020, other than pay and benefits accrued through Michael’s date of termination.
163
Confidential Treatment Requested by McAfee Corp.
Pursuant to 17 C.F.R. Section 200.83
The amounts that would have been payable by us to each of the named executive officers under their agreements with us that were then in effect, assuming that each individual’s employment had terminated on December 24, 2020, the last business day of fiscal 2020, are set forth below:
Potential Payments Upon a Qualifying Termination of Employment
(1)
Name | Severance Payment ($) (2) | Prorated Annual Incentive Award ($) (3) | Prior Year’s Incentive Award ($) (4) | Value of Accelerated Equity Awards ($) (5) | Welfare Benefits ($) (6) | Aggregate Payments ($) | ||||||||||||||||||
Peter Leav | 3,375,000 | 2,000,088 | — | — | 47,529 | 5,422,617 | ||||||||||||||||||
Venkat Bhamidipati | 1,300,000 | 291,069 | — | — | 15,824 | 1,606,893 | ||||||||||||||||||
Lynne Doherty McDonald (7) | ___ | — | — | ___ | 15,711 | 1,915,711 | ||||||||||||||||||
Terry Hicks | 1,400,035 | — | — | — | 18,706 | 1,418,741 | ||||||||||||||||||
Ashutosh Kulkarni (7) | — | — | — | — | — | — | ||||||||||||||||||
Ashish Agarwal | 650,000 | — | — | — | 26,242 | 676,242 | ||||||||||||||||||
Christopher Young (8) | 2,000,000 | 101,639 | 1,800,000 | 11,797,013 | 18,088 | 15,716,740 | ||||||||||||||||||
Michael Berry (7) | — | — | — | — | — | — | ||||||||||||||||||
John Giamatteo (9) | 3,972,137 | — | — | — | — | 3,972,137 | ||||||||||||||||||
| (1) | A qualifying termination means termination of the named executive officer’s employment (or, in certain cases, employment or other service) by the Company without cause or resignation for good reason, in either case, other than in connection with a change in control (as determined under the applicable arrangement). |
| (2) | Except in the case of John Giamatteo, amounts reported in this column represent the sum of the named executive officer’s base salary and the named executive officer’s annual incentive target, in each case, as in effect on the last business day of fiscal 2020. In the case of John Giamatteo, the amount shown above reflects the full amount of John’s severance payment under John’s separation agreement. |
| (3) | Under the terms of their employment agreements, Peter Leav and Venkat Bhamidipati would be entitled to a prorated incentive payout for the year of termination based on actual performance if a qualifying termination of employment occurred on the last day of fiscal 2020. The amounts reported in this column represent the fiscal 2020 annual incentive award, which is also reported in the “Summary Compensation Table for Fiscal 2020” as 2020 compensation. Peter was also entitled to this amount upon a termination of employment due to death or disability. Under Christopher Young’s separation agreement, Christopher received a pro-rated target bonus for fiscal 2020 based on the number of days Christopher was employed by the Company during fiscal 2020. |
| (4) | Under the terms of Christopher Young’s separation agreement, Christopher received an amount equal to Christopher’s fiscal 2019 annual bonus, calculated and determined based on actual Company performance and assuming individual performance goals were met at 100% of target. |
| (5) | With respect to Christopher Young, amounts reported in this column represent the value of the accelerated vesting of Christopher’s MIUs as of the date they vested pursuant to the terms of Christopher’s separation agreement (which, in each case, was $8.64). As described above, Peter Leav’s MIU, RSU and PSU award agreements provide that if Peter experiences a qualifying termination within 24 months following the sale of a Divested Business that is not part of a change in control, then, subject to certain conditions, a portion of the then unvested and outstanding award will vest as of immediately prior to such termination. While Peter would not be entitled to any accelerated vesting of Peter long-term incentive awards in connection with a qualifying termination alone, assuming (i) the sale of a Divested Business (which would include the Enterprise Division Sale, as discussed above) and qualifying termination occurred on December 26, 2020, (ii) the actual distributed proceeds ( i.e. |
164
Confidential Treatment Requested by McAfee Corp.
Pursuant to 17 C.F.R. Section 200.83
| (6) | Amounts reported in this column represent the estimated value of continued welfare benefits that the indicated named executive officers would have been entitled to receive upon a qualifying termination of employment. |
| (7) | Neither Michael Berry nor Ashutosh Kulkarni was paid any severance when the applicable named executive officer terminated employment with us. When Lynne Doherty McDonald’s employment with us terminated in connection with the Enterprise Division Sale, Lynne received the amounts shown in the table above entitled “Potential Payments Upon a Qualifying Termination of Employment”. The value of Lynne’s accelerated vesting of RSUs is based on the closing price of a share of a share of our Class A common stock on July 27, 2021. |
| (8) | Reflects the amount paid to Christopher Young under the terms of Christopher’s separation agreement. |
| (9) | Reflects the amount paid to John Giamatteo under the terms of John’s separation agreement. |
Potential Payments Upon a Change in Control or a Qualifying Termination of Employment in Connection with a Change in Control
(1)
The amounts that would have been payable by us to each of the named executive officers, assuming that each individual’s employment had terminated and/or a change in control of the Company had occurred on the last business day of our 2020 fiscal year, are as set forth below. Except where noted below that the payment would have been made regardless of a termination of employment, these amounts are payable in connection with a qualifying termination of employment and would be in addition to the amounts in the table directly above.
Name | Severance Payment ($) (2) | Prorated Annual Incentive Award ($) (3) | Value of Accelerated Equity Awards ($) (4) | Welfare Benefits ($) (5) | Aggregate Payments ($) | |||||||||||||||
Peter Leav | 4,500,000 | 2,000,088 | 59,282,067 | 63,372 | 65,845,527 | |||||||||||||||
Venkat Bhamidipati | 1,950,000 | 291,069 | 23,735,657 | 23,736 | 26,000,462 | |||||||||||||||
Lynne Doherty McDonald (6) | — | — | — | — | — | |||||||||||||||
Terry Hicks | 2,100,053 | 1,197,056 | 23,667,166 | 28,059 | 26,992,334 | |||||||||||||||
Ashutosh Kulkarni (6) | — | — | — | — | — | |||||||||||||||
Ashish Agarwal | 975,000 | 324,213 | 9,977,625 | 39,362 | 11,316,200 | |||||||||||||||
Christopher Young (6) | — | — | — | — | — | |||||||||||||||
Michael Berry (6) | — | — | — | — | — | |||||||||||||||
John Giamatteo (6) | — | — | — | — | — | |||||||||||||||
| (1) | A qualifying termination means a termination of the named executive officer’s employment by the Company without cause or by the named executive officer for good reason, in either case, within the applicable protection period related to a change in control (as described above). Ashutosh Kulkarni, Christopher Young, Michael Berry, and John Giamatteo did not receive any payments related to a change in control in connection with their termination of employment with us. |
| (2) | Amounts reported in this column represent the value of the accelerated vesting of the named executive officer’s RSUs, MIUs and/or PSUs that were outstanding and unvested as of our last business day of fiscal 2020 (December 24, 2020), determined based on the closing price of a share of our Class A common stock on that day ($17.76). Where applicable, the fair market value of an MIU reflects the value of a Class A Unit less any unsatisfied return threshold. |
| (3) | Under the terms of their employment agreements, Peter Leav and Venkat Bhamidipati are entitled to a prorated incentive payout for the year of termination based on actual performance. Under the Severance Agreements, in connection with a Qualifying Change in Control Termination, an applicable Covered Executive would be eligible to receive the pro rata portion of the Covered Executive’s annual bonus, based on actual performance for the year in which termination occurs, payable at the time at the time annual bonuses are payable to senior executives of the Company and its affiliates generally. The amounts reported in this column represent the fiscal 2020 annual incentive award, which is also reported in the “Summary Compensation Table for Fiscal 2020” as 2020 compensation, except that for Ashutosh Kulkarni (who |
165
Confidential Treatment Requested by McAfee Corp.
Pursuant to 17 C.F.R. Section 200.83
| terminated employment with the Company as of January 1, 2021 and did not receive any payment under the AIP in respect of fiscal 2020), it reflects the target amount of the named executive officer’s annual bonus. |
| (4) | All long-term incentive awards held by Peter Leav and Venkat Bhamidipati would automatically vest in full as of immediately prior to the consummation of the change in control (with Peter Leav’s PSUs, deemed earned based on target performance (which is assumed for purposes of the table above) or, if higher and if determinable, based on the actual performance of the Company and/or FTW, as applicable, through the date of the change in control (or an earlier date selected for administrative convenience)). In addition, as described further above, other named executive officers are entitled to acceleration of their equity awards under the Severance Agreements and/or the terms of applicable long-term incentive awards upon a qualifying termination in connection with a change in control. The table above assumes that, with respect to long-term incentive awards granted prior to our IPO that vest based on TPG achieving certain investment returns, those investment returns are achieved in connection with the change in control. |
| (5) | Amounts reported in this column represent the estimated value of continued welfare benefits that the indicated named executive officers would have been entitled to receive upon a qualifying termination of employment. |
| (6) | The employment of Christopher Young, Michael Berry and John Giamatteo with the Company terminated during fiscal 2020. The actual amount of severance paid to Christopher and John is reflected above under the heading “Potential Payments Upon a Qualifying Termination of Employment”. Neither Michael nor Ashutosh Kulkarni was paid any severance when the applicable named executive officer terminated employment with us. When Lynne Doherty McDonald’s employment with us terminated in connection with the Enterprise Division Sale, Lynne received the amounts shown above. |
Director Compensation for Fiscal 2020
The following table shows information regarding the compensation earned by
our non-employee directors
during our fiscal 2020.Name | Fees Earned or Paid in Cash ($) (1)(2) | Stock Awards ($) (3) | Total ($) | |||||||||
Sohaib Abbasi | 76,331 | 109,986 | 186,317 | |||||||||
Mary Cranston | 80,320 | 109,986 | 190,306 | |||||||||
Tim Millikin | — | — | — | |||||||||
Kathy Willard | 76,773 | 109,986 | 186,759 | |||||||||
Jon Winkelried | — | — | — | |||||||||
Jeff Woolard | — | — | — | |||||||||
| (1) | Non-employee directors employed by TPG or Intel do not receive compensation for their services on the Board. |
| (2) | Under our non-employee director compensation program in effect during2020, non-employee directors earned an annual cash fee and, following our IPO, certain cash fees for committee membership or chair service, in each case, payable quarterly in arrears. These fees are described further below. The amounts reported in this column reflect the director fees earned during fiscal 2020. Sohaib Abbasi elected to receive Sohaib’s annual cash retainer in the form of RSUs. The number of shares delivered under to Sohaib’squarterly shares-in-lieu-of-cash award |
| (3) | In fiscal 2020, each covered director (as described below) received a pro-rated equity-award, as described below, as part of the transition ournew post-IPO non-employee director Form 10-K for the year ended December 26, 2020 |
166
Confidential Treatment Requested by McAfee Corp.
Pursuant to 17 C.F.R. Section 200.83
Program Prior to our IPO
Under our compensation program
for non-employee members
of the board of managers of FTW in effect prior to our IPO,each non-employee member
who was not employed by TPG, Intel or Thoma Bravo was eligible to receive an annual cash retainer of $75,000 or, at the election ofsuch non-employee director,
a number of RSUs that have a reasonably equivalent value and are paid out at a reasonably equivalent time as the annual retainer in lieu of the cash payment (determined based upon the fair market value of Class A Units of FTW at each quarterly vesting date). Individuals that were covered under the program are referred to below as “covered directors” and directors that are excluded are referred to as “excluded directors.”Each covered director also was generally received an annual grant of RSUs with a value of $225,000, with the actual number of RSUs granted determined by the fair market value of Class A Units of FTW at the time of grant. These RSUs vest were eligible to vest in full on the first anniversary of the grant date, subject to continued service on such vesting date. The RSUs become fully vested upon a change in control event. Covered directors were also provided with the opportunity to purchase Class A Units based upon the fair market value at the time of purchase, up to a mutually agreed upon amount.
Program After our IPO
In connection with our IPO, the Board adopted
a non-employee director
compensation policy for covered directors. Excluded directors are not eligible to receive any compensation in respect of their service on the Board.Under this program, each covered director receives an annual cash retainer for service to the Board and an additional annual cash retainer for service on any committee of the Board or for serving as the chair of the Board or any of its committees, in each
case, pro-rated for
partial years of service, as follows:Board or Committee Member | Board or Committee Chair | |||||||
Annual cash retainer | $ | 75,000 | $ | — | ||||
Additional annual cash retainer for Leadership Development and Compensation Committee | $ | 7,500 | $ | 20,000 | ||||
Additional annual cash retainer for Nominating and Corporate Governance Committee | $ | 5,000 | $ | 15,000 | ||||
Additional annual cash retainer for Audit Committee | $ | 10,000 | $ | 25,000 | ||||
All cash fees are payable in arrears on a quarterly basis (or, if earlier, within 30 days following the earlier resignation or removal of the covered director). Each covered director may elect to receive vested shares of Class A common stock in lieu of all or a portion of the covered director’s annual cash fees payable under
our non-employee director
compensation policy.Commencing in calendar year 2021, on the date of the first meeting of the Board following each annual meeting of our stockholders, each covered director will be granted RSUs having a fair market value of $225,000. The RSUs will vest on the earliest of the following to occur: (i) the first anniversary of the date the RSUs were granted, (ii) the covered director’s death or permanent disability, or (iii) a change in control (as defined in the McAfee 2020 Omnibus Incentive Plan (the “2020 Plan”)), subject, in each case, to
the non-employee director’s
continued service as a member of the Board through the applicable vesting date. However, if our next annual meeting of stockholders that follows the grant date is less than one year after the prior annual meeting of our stockholders, and the covered director continues to serve on the Board through immediately prior to such meeting, but does not standfor re-election, is
not elected or is not nominatedfor re-election at
such meeting, any then unvested RSUs granted in the immediately preceding 12 months will accelerate and vest in full as of the immediately prior to such meeting.167
Confidential Treatment Requested by McAfee Corp.
Pursuant to 17 C.F.R. Section 200.83
All cash fees are prorated for any fiscal quarter of partial service, based on the number of calendar days the covered director was a member of the Board or the applicable committee, in a manner determined by the Board or the Committee. Covered directors may also receive prorated equity awards if they are appointed or elected to the Board other than at the Company’s annual meeting of stockholders. In addition, in December 2020, Sohaib Abbasi, Mary Cranston and Kathy Willard each received
a pro-rated grant
of RSUs (50% of the typical grant) to approximately cover the period from the date the covered director’s last grant of RSUs vests until the Company’s next annual meeting of stockholders.The aggregate value of cash compensation and the grant date fair value of shares of capital stock of the Company that may be paid or granted during any fiscal year of the Company will not exceed the amount prescribed in the 2020 Plan (or any successor plan).
Equity Ownership Requirements
As described further above under “Equity Ownership Requirements” in the “Compensation Discussion and Analysis”, in connection with our IPO we adopted equity ownership requirements that apply to covered directors.
168
Confidential Treatment Requested by McAfee Corp.
Pursuant to 17 C.F.R. Section 200.83
CERTAIN RELATIONSHIPS AND RELATED PARTY TRANSACTIONS
In addition to the compensation arrangements discussed in the sections titled “Management” and “Executive compensation,” the following is a description of each transaction since December 31, 2017 and each currently proposed transaction in which:
| • | we have been or are to be a participant; |
| • | the amount involved exceeds or will exceed $120,000; and |
| • | any of our directors, executive officers, or holders of more than 5% of our capital stock, or any immediate family member of, or person sharing the household with any of these individuals had or will have a direct or indirect material interest. |
Related Party Agreements in Effect Prior to our IPO
Management Services Agreement
On April 3, 2017, Foundation Technology Worldwide LLC and certain of its subsidiaries entered into a management services agreement with our Sponsors and Intel, pursuant to which our Sponsors and Intel (the “Managers”) provide certain management, advisory, consulting, strategic planning, and/or specialized (operational or otherwise) services to the Company. In exchange for these services, the Company is required to pay to the Managers (or their respective designees) an aggregate annual retainer fee equal to $7.5 million, until December 31, 2027. Such annual fee is paid on a quarterly basis in arrears on the 90incurred by the Managers or their designees in connection to the services provided by the Managers or their respective designees under the Management Services Agreement, all reasonable andexpenses incurred by the Managers or their respective designees in connection with the enforcement of rights or taking of actions under the Management Services Agreement, the Subscription Agreement, and related documents or instruments, and all reasonable and documentedexpenses incurred by the Managers, their respective affiliates or their respective designees on behalf of the Company. For fiscal 2018 and fiscal 2019, we paid a total of $11.9 million and $12.6 million, respectively, to the Managers under the Manager Services Agreement. In addition, we agreed to indemnify the Managers and certain persons affiliated with the Managers from and against any and all actions, causes of action, suits, claims, liabilities, losses, damages and costs, andin connection therewith (including, without limitation, attorneys’ fees and expenses) incurred by the Managers and such affiliated persons before or after the date of the Management Services Agreement arising out of any action, cause of action, suit, arbitration, investigation, or claim (whether involving the Company or a third party), or in any way arising out of or relating to operations of, or services provided by any of the Managers or their respective designees to, the Company or its affiliates.
th
day following the end of the applicable quarter. Payments will be made to the Managers on a pro rata basis in accordance with the Managers’ direct or indirect equity ownership of Foundation Technology Worldwide LLC. Under the Management Services Agreement, the Company must also reimburse the Managers for all reasonable anddocumented out-of-pocket expenses
documented out-of-pocket legal
out-of-pocket
reasonable out-of-pocket expenses
In connection with the completion of our IPO, the Management Services Agreement was terminated, and we paid
a one-time termination
fee of $22 million to the Managers in accordance with the terms of the agreement.Repurchase of LLC Units
In April 2020, we repurchased 1,091,172 LLC Units and 111,500 MIUs held by our former Chief Executive Officer following termination of employment at a per unit purchase price of $8.64, for an aggregate repurchase price of $10,394,093.
In December 2018, we repurchased 250,728 LLC Units and 125,000 MIUs held by our former Executive Vice President and Chief Legal Officer upon termination of employment at a per unit purchase price of $10.85 and $8.95, respectively, for an aggregate repurchase price of $3,837,897.
169
Confidential Treatment Requested by McAfee Corp.
Pursuant to 17 C.F.R. Section 200.83
Recapitalization Transactions in Connection with our IPO
Tax Receivable Agreement
The contribution by the certain of
our pre-IPO equityholders
to McAfee Corp. of the equity of certain corporate entities in connection with our IPO and future exchanges of LLC Units for cash or, at our option, shares of our Class A common stock are expected to produce or otherwise deliver to us favorable tax attributes that can reduce our taxable income. Upon the completion of our IPO, we are a party to a tax receivable agreement, under which we generally are required to pay certain ofour pre-IPO equityholders
85% of the applicable cash savings, if any, in U.S. federal, state, and local income tax that we actually realize or, in certain circumstances, are deemed to realize as a result of (i) all or a portion of McAfee Corp.’s allocable share of existing tax basis in the assets of Foundation Technology Worldwide LLC (and its subsidiaries) acquired in connection with the Reorganization Transactions, (ii) increases in McAfee Corp.’s allocable share of existing tax basis in the assets of Foundation Technology Worldwide LLC (and its subsidiaries) and tax basis adjustments in the assets of Foundation Technology Worldwide LLC (and its subsidiaries) as a result of sales or exchanges of LLC Units after our IPO, (iii) certain tax attributes of the corporations McAfee Corp. acquired in connection with the reorganization transactions effected in connection with our IPO (including their allocable share of existing tax basis in the assets of Foundation Technology Worldwide LLC (and its subsidiaries)), and (iv) certain other tax benefits related to entering into the tax receivable agreement, including tax benefits attributable to payments under the tax receivable agreement. We generally will retain the benefit of the remaining 15% of the applicable tax savings.Pursuant to the exchange mechanics, from time to time we may be required to acquire LLC Units of Foundation Technology Worldwide LLC from the holders thereof in exchange for cash or, at our option, shares of our Class A common stock. An exchange of LLC Units is intended to be treated as a purchase of such LLC Units for U.S. federal income tax purposes. Each of Foundation Technology Worldwide LLC and McAfee Finance 2, LLC, a subsidiary of Foundation Technology Worldwide LLC intended to be treated as a partnership for U.S. federal income tax purposes and through which Foundation Technology Worldwide LLC owns its interests in the assets of the McAfee business, intends to have an election under Section 754 of the Internal Revenue Code of 1986, as amended, in effect for taxable years in which such sales or exchanges of LLC Units occur. Pursuant to the Section 754 election, sales of LLC Units are expected to result in an increase in the tax basis of tangible and intangible assets of Foundation Technology Worldwide LLC and certain of its subsidiaries, including McAfee Finance 2, LLC. When we acquire LLC Units from the holders thereof, we expect that both the existing basis for certain assets and the anticipated basis adjustments will increase depreciation and amortization deductions allocable to us for tax purposes from Foundation Technology Worldwide LLC, and therefore reduce the amount of income tax we would otherwise be required to pay in the future to various tax authorities. This increase in tax basis may also decrease gain (or increase loss) on future dispositions of certain assets of Foundation Technology Worldwide LLC and its subsidiaries to the extent increased tax basis is allocated to those assets.
Stockholders Agreement
In connection with our IPO, we entered into a stockholders agreement with the Sponsors, Intel, and certain other stockholders. Pursuant to the stockholders agreement, we are required to take all necessary action to cause the Board and its committees to include director candidates designated by TPG and Intel in the slate of director nominees recommended by the Board for election by our stockholders. The stockholders agreement also provides that we will obtain customary director indemnity insurance. Pursuant to the stockholders agreement, each of our Sponsors and Intel also agreed to certain standstill provisions pursuant to which it is restricted from, among other things, acquiring our securities if that would result in it owning more than 49% of our outstanding voting power without our consent.
170
Confidential Treatment Requested by McAfee Corp.
Pursuant to 17 C.F.R. Section 200.83
Registration Rights Agreement
We entered into a registration rights agreement with our Sponsors, Intel, certain other stockholders, and our Chief Executive Officer in connection with our IPO. The registration rights agreement provides the stockholders party thereto certain registration rights as described below.
Demand Registration Rights
Each of our Sponsors and Intel has the right to demand that we file registration statements. These registration rights are subject to specified conditions and limitations, including the right of the underwriters, if any, to limit the number of shares included in any such registration under specified circumstances. Upon such a request, we are required to use reasonable best efforts to promptly effect the registration.
Piggyback Registration Rights
If we propose to register any shares of our equity securities under the Securities Act of 1933, as amended (the “Securities Act”), either for our own account or for the account of any other person, the parties to the registration rights agreement will be entitled to notice of the registration and will be entitled to include their shares of Class A common stock in the registration statement. These piggyback registration rights are subject to specified conditions and limitations, including the right of the underwriters, if any, to limit the number of shares included in any such registration under specified circumstances.
Shelf Registration Rights
At any time after we become eligible to file a registration statement on
Form S-3, our
Sponsors and Intel will be entitled to have their shares of Class A common stock registered by us on aForm S-3 registration
statement at our expense. These shelf registration rights are subject to specified conditions and limitations.Expenses and Indemnification
We will pay all expenses relating to any demand, piggyback or shelf registration, other than underwriting discounts and commissions and any transfer taxes, subject to specified conditions and limitations. The registration rights agreement will include customary indemnification provisions, including indemnification of the participating holders of shares of Class A common stock and their directors, officers and employees by us for any losses, claims, damages or liabilities in respect thereof and expenses to which such holders may become subject under the Securities Act, state law or otherwise.
Indemnification Agreements
Prior to the completion of our IPO, we entered into indemnification agreements with each of our directors. These agreements require us to indemnify these individuals and, in certain cases, affiliates of such individuals, to the fullest extent permissible under Delaware law against liabilities that may arise by reason of their service to us or at our direction, and to advance expenses incurred as a result of any proceeding against them as to which they could be indemnified. Insofar as indemnification for liabilities arising under the Securities Act may be permitted to directors, we have been informed that in the opinion of the SEC such indemnification is against public policy and is therefore unenforceable.
Certain Relationships
From time to time, Intel, our Sponsors and/or their affiliates have entered into, and may continue to enter into, arrangements with us to use our products and services. We believe that all such arrangements (other than transactions pursuant to a commercial services agreement) have been entered into in the ordinary course of business and have been negotiated on commercially reasonable terms.
171
Confidential Treatment Requested by McAfee Corp.
Pursuant to 17 C.F.R. Section 200.83
Related Party Transactions Policy
In connection with our IPO, we adopted a policy with respect to the review, approval, and ratification of related person transactions. Under the policy, the Audit Committee is responsible for reviewing and approving related person transactions. In the course of its review and approval of related person transactions, the Audit Committee will consider the relevant facts and circumstances to decide whether to approve such transactions. Related person transactions must be approved or ratified by the Audit Committee based on full information about the proposed transaction and the related person’s interest.
172
Confidential Treatment Requested by McAfee Corp.
Pursuant to 17 C.F.R. Section 200.83
PRINCIPAL AND SELLING STOCKHOLDERS
The following table sets forth information with respect to the beneficial ownership of our Class A common stock and Class B common stock for (a) each person, or group of affiliated persons, known by us to own beneficially more than 5% of our outstanding shares of Class A common stock and Class B common stock, (b) each member of our board of directors, (c) each of our named executive officers, (d) all of our directors and executive officers as a group, and (e) each of the selling stockholders.
Beneficial ownership is determined in accordance with SEC rules. The information is not necessarily indicative of beneficial ownership for any other purpose. In general, under these rules a beneficial owner of a security includes any person who, directly or indirectly, through any contract, arrangement, understanding, relationship, or otherwise has or shares voting power or investment power with respect to such security. A person is also deemed to be a beneficial owner of a security if that person has the right to acquire beneficial ownership of such security within 60 days. To our knowledge, except as otherwise indicated, and subject to applicable community property laws, the persons named in the table have sole voting and investment power with respect to all shares of Class A common stock and Class B common stock beneficially owned by that person.
In connection with our IPO and the Reorganization Transactions, we issued to the Continuing Owners one share of our Class B common stock for each LLC Unit that they hold. Each Continuing LLC Owner has the right to exchange their LLC Units for cash (based upon the market price of the shares of our Class A common stock) or, at our option, for shares of our Class A common stock on abasis (and McAfee Corp. will cancel an equal number of shares of Class B common stock to the exchanging member). See “Certain Relationships and Related Party Transactions.”
one-for-one
The percentage of shares beneficially owned is computed on the basis of 166,004,840 shares of our Class A common stock outstanding as of June 26, 2021, and 265,376,691 LLC Units and shares of our Class B common stock outstanding as of June 26, 2021. Shares of our Class A common stock that a person has the right to acquire within 60 days of the date of this prospectus are deemed outstanding for purposes of computing the percentage ownership of such person’s holdings, but are not deemed outstanding for purposes of computing the percentage ownership of any other person, except with respect to the percentage ownership of all directors and executive officers as a group. The amount of shares of Class A and Class B common stock beneficially owned after this offering set forth below are based on the number of shares to be issued and outstanding immediately after the consummation of this offering. Unless otherwise indicated below, the address for each beneficial owner listed is c/o McAfee Corp., 6220 America Center Drive, San Jose, California 95002.
173
Confidential Treatment Requested by McAfee Corp.
Pursuant to 17 C.F.R. Section 200.83
Pursuant to the terms of the Stockholders Agreement, the TPG Funds have the right to appoint a majority of the directors serving on our board. As a result, TPG may be deemed to control the Company’s exercise of its option to settle exchanges of shares of Class B common stock into shares of Class A common stock or cash with respect to any such exchange by the TPG Funds. As a result of this control, the TPG Funds will be deemed to beneficially own all shares of Class A common stock underlying its shares of Class B common stock. The beneficial ownership percentages reflected in the table below accordingly aggregate such shares of Class A common stock underlying the shares of Class B common stock held by the TPG Funds.
Class A common stock beneficially owned (1) | ||||||||||||||||||||||||||||||||
Shares of Class A common stock beneficially owned before this offering | Class A Shares being offered (with no option) | Class A Shares being offered (with option) | Shares of Class A common stock beneficially owned after this offering (with no option) | Shares of Class A common stock beneficially owned after this offering (with option) | ||||||||||||||||||||||||||||
Number | Percentage | Number | Percentage | Number | Percentage | |||||||||||||||||||||||||||
Name of beneficial owner | ||||||||||||||||||||||||||||||||
5% Stockholders and Selling Stockholders | ||||||||||||||||||||||||||||||||
Parties to the Stockholders Agreement (3) | 174,939,679 | 78.1 | % | 19,725,166 | 22,725,166 | 164,957,461 | 70.6 | % | 163,629,186 | 69.5 | % | |||||||||||||||||||||
TPG Funds (4) | 124,520,762 | 55.6 | % | 6,473,440 | 7,457,986 | 118,047,322 | 50.5 | % | 117,062,776 | 49.7 | % | |||||||||||||||||||||
Intel Americas, Inc. (5) | 5,696,831 | 3.4 | % | 9,665,332 | 11,135,332 | 5,696,831 | 3.0 | % | 5,696,831 | 3.0 | % | |||||||||||||||||||||
Thoma Bravo Funds (6) | 18,852,120 | 11.4 | % | 2,241,496 | 2,582,405 | 16,688,240 | 9.5 | % | 16,549,056 | 9.3 | % | |||||||||||||||||||||
Snowlake Investment Pte Ltd (7) | 25,869,966 | 15.6 | % | 1,344,898 | 1,549,443 | 24,525,068 | 13.9 | % | 24,320,523 | 13.7 | % | |||||||||||||||||||||
Sayed Darwish (8) | 247,653 | * | 28,660 | 28,660 | 218,993 | * | 218,993 | * | ||||||||||||||||||||||||
Ashish Agarwal (9) | 224,370 | * | 31,769 | 31,769 | 192,601 | * | 192,601 | * | ||||||||||||||||||||||||
Directors and Named Executive Officers | ||||||||||||||||||||||||||||||||
Peter Leav (10) | 966,261 | * | 129,591 | 129,591 | 836,670 | * | 836,760 | * | ||||||||||||||||||||||||
Venkat Bhamidipati (11) | 420,042 | * | 29,630 | 29,630 | 390,412 | * | 390,412 | * | ||||||||||||||||||||||||
Terry Hicks (12) | 662,498 | * | 55,184 | 55,184 | 607,314 | * | 607,314 | * | ||||||||||||||||||||||||
Jon Winkelried (13) | — | * | — | — | — | * | — | * | ||||||||||||||||||||||||
Tim Millikin (13) | — | * | — | — | — | * | — | * | ||||||||||||||||||||||||
Mary Cranston | 50,868 | * | — | — | 50,868 | * | 50,868 | * | ||||||||||||||||||||||||
Sohaib Abbasi | 68,875 | * | — | — | 68,875 | * | 68,875 | * | ||||||||||||||||||||||||
Kathy Willard | 27,404 | * | — | — | 27,404 | * | 27,404 | * | ||||||||||||||||||||||||
Jeff Woolard | — | * | — | — | — | * | — | * | ||||||||||||||||||||||||
All directors and executive officers as a group (10 people) (14) | 2,266,534 | 1.4% | 214,405 | 214,405 | 2,052,129 | 1.2% | 2,052,129 | 1.2% | ||||||||||||||||||||||||
174
Confidential Treatment Requested by McAfee Corp.
Pursuant to 17 C.F.R. Section 200.83
Class B common stock beneficially owned (2) | ||||||||||||||||||||||||||||||||
Shares of Class B common stock beneficially owned before this offering | Class B Shares being redeemed (with no option) | Class B Shares being redeemed (with option) | Shares of Class B common stock beneficially owned after this offering (with no option) | Shares of Class B common stock beneficially owned after this offering (with option) | ||||||||||||||||||||||||||||
Number | Percentage | Number | Percentage | Number | Percentage | |||||||||||||||||||||||||||
Name of beneficial owner | ||||||||||||||||||||||||||||||||
5% Stockholders and Selling Stockholders | ||||||||||||||||||||||||||||||||
Parties to the Stockholders Agreement (3) | 262,420,115 | 98.9 | % | 9,802,045 | 11,956,459 | 252,618,070 | 98.9 | % | 250,463,656 | 98.8 | % | |||||||||||||||||||||
TPG Funds (4) | 57,933,633 | 21.8 | % | 59,097 | 541,786 | 57,874,536 | 22.6 | % | 57,391,847 | 22.7 | % | |||||||||||||||||||||
Intel Americas, Inc. (5) | 180,222,000 | 67.9 | % | 9,665,332 | 11,135,332 | 170,556,668 | 66.7 | % | 169,086,668 | 66.7 | % | |||||||||||||||||||||
Thoma Bravo Funds (6) | 24,264,482 | 9.1 | % | 77,616 | 279,341 | 24,186,866 | 9.5 | % | 23,985,141 | 9.5 | % | |||||||||||||||||||||
Snowlake Investment Pte Ltd (7) | — | — | — | — | — | — | — | — | ||||||||||||||||||||||||
Sayed Darwish (8) | 51,692 | * | — | — | 51,692 | * | 51,692 | * | ||||||||||||||||||||||||
Ashish Agarwal (9) | 66,192 | * | — | — | 66,192 | * | 66,192 | * | ||||||||||||||||||||||||
Directors and Named Executive Officers | ||||||||||||||||||||||||||||||||
Peter Leav (10) | 252,464 | * | — | — | 252,464 | * | 252,464 | * | ||||||||||||||||||||||||
Venkat Bhamidipati (11) | 37,444 | * | — | — | 37,444 | * | 37,444 | * | ||||||||||||||||||||||||
Terry Hicks (12) | 62,664 | * | 42,556 | 42,556 | 20,108 | * | 20,108 | * | ||||||||||||||||||||||||
Jon Winkelried (13) | — | * | — | — | — | * | — | * | ||||||||||||||||||||||||
Tim Millikin (13) | — | * | — | — | — | * | — | * | ||||||||||||||||||||||||
Mary Cranston | — | * | — | — | * | * | ||||||||||||||||||||||||||
Sohaib Abbasi | — | * | — | — | * | * | ||||||||||||||||||||||||||
Kathy Willard | — | * | — | — | * | * | ||||||||||||||||||||||||||
Jeff Woolard | — | * | — | — | — | * | — | * | ||||||||||||||||||||||||
All directors and executive officers as a group (10 people) (14) | 352,572 | * | 42,556 | 42,556 | 310,016 | * | 310,016 | * | ||||||||||||||||||||||||
| * | Represents beneficial ownership of less than 1%. |
| (1) | The LLC Units held by Continuing Owners are exchangeable for cash or, at our option, shares of our Class A common stock on a one-for-one |
| (2) | The holders of shares of Class B common stock reflected in this table also reflect an equal number of LLC Units beneficially owned by or redeemed by such holder in connection with this offering, as applicable. |
| (3) | Pursuant to the stockholders agreement entered into in connection with our IPO, TPG and Intel have the right to nominate directors and the stockholders party thereto, which include the TPG Funds (as defined below), Intel Americas, Inc., the Thoma Bravo Funds (as defined below) and the GIC Investor (as defined below), will agree to vote for such nominees. See “Certain Relationships and Related Transactions—Recapitalization Transactions in Connection with our IPO—Stockholders Agreement.” |
| (4) | Shares of Class A common stock shown as beneficially owned by the TPG Funds (as defined below) before this offering include: (a) 27,652,384 shares of Class A common stock held by TPG VII Manta Blocker Co-Invest I, L.P., a Delaware limited partnership (“TPG Co-Invest I”); (b) 30,487,224 shares of Class A common stock held by TPG VII Manta AIV I, L.P., a Delaware limited partnership (“TPG AIV I”); (c) 5,332,913 shares of Class A common stock held by TPG VII Side-bySide Separate Account I, L.P. (“TPG Side-by-Side”); (d) 213,376 shares of Class A common stock and 3,968,935 shares of Class A common stock underlying an identical number of LLC Units and shares of Class B common stock held by TPG VII Manta AIV Co-Invest, L.P., a Delaware limited partnership (“TPG Manta AIV Co-Invest”); and (e) 2,901,232 shares of Class A common stock and 53,964,698 shares of Class A common stock underlying an identical number of LLC Units and shares of Class B common stock held by TPG VII Manta Holdings II, L.P., a Delaware limited partnership (“TPG Manta Holdings II”, and, together with TPG Co- |
175
Confidential Treatment Requested by McAfee Corp.
Pursuant to 17 C.F.R. Section 200.83
| Invest I, TPG AIV I, TPG Side-by-Side, and TPG Manta AIV Co-Invest, the “TPG Funds”). Shares of Class B common stock shown as beneficially owned by the TPG Funds before this offering include: (a) 3,968,935 shares of Class B common stock held by TPG Manta AIV Co-Invest; and (b) 53,964,698 shares of Class B common stock by TPG Manta Holdings II. In this offering: (a) TPG Co-Invest I will sell 1,437,560 shares of Class A common stock (or 1,656,198 shares of Class A common stock if the underwriters exercise in full their option to purchase additional shares); (b) TPG AIV I will sell 1,584,934 shares of Class A common stock (or 1,825,987 shares of Class A common stock if the underwriters exercise in full their option to purchase additional shares); (c) TPG Side-by-Side will sell 277,241 shares of Class A common stock (or 319,407 shares of Class A common stock if the underwriters exercise in full their option to purchase additional shares); (d) TPG Manta AIV Co-Invest will sell 213,376 shares of Class A common stock and 4,049 shares of Class A common stock issuable upon the exchange of an equal number of LLC Units, together with corresponding shares of Class B common stock (or 37,117 shares of Class A common stock issuable upon the exchange of an equal number of LLC Units, together with corresponding shares of Class B common stock, if the underwriters exercise in full their option to purchase additional shares); and (e) TPG Manta Holdings II will sell 2,901,232 shares of Class A common stock and 55,048 shares of Class A common stock issuable upon the exchange of an equal number of LLC Units, together with corresponding shares of Class B common stock (or 504,669 shares of Class A common stock issuable upon the exchange of an equal number of LLC Units, together with corresponding shares of Class B common stock, if the underwriters exercise in full their option to purchase additional shares). The general partner of each of (i) TPG Co-Invest I, (ii) TPG AIV I, (iii) TPG VII Manta AIVCo-Invest, and (iv) TPG Manta Holdings II is TPG VII Manta GenPar, L.P., a Delaware limited partnership, whose general partner is TPG VII Manta GenPar Advisors, LLC, a Delaware limited liability company, whose sole member is TPG Holdings II, L.P., a Delaware limited partnership, whose general partner is TPG HoldingsII-A, LLC, a Delaware limited liability company, whose sole member is TPG Group Holdings (SBS), L.P., a Delaware limited partnership (“TPG Group Holdings”), whose general partner is TPG Group Holdings (SBS) Advisors, LLC, a Delaware limited liability company, whose sole member is TPG Group Holdings (SBS) Advisors, Inc., a Delaware corporation. The general partner of TPG VIISide-by-Side III-A, L.P., a Cayman Islands limited partnership, whose general partner is TPG HoldingsIII-A, Inc., a Cayman Islands exempted company, whose sole shareholder is TPG Group Holdings. David Bonderman and James G. Coulter are the sole shareholders of TPG Group Holdings (SBS) Advisors, Inc. and may therefore be deemed to beneficially own the securities held by the TPG Funds. Messrs. Bonderman and Coulter disclaim beneficial ownership of the securities held by the TPG Funds except to the extent of their pecuniary interest therein. The address of each of the TPG Funds and Messrs. Bonderman and Coulter is c/o TPG Global, LLC, 301 Commerce Street, Suite 3300, Fort Worth, TX 76102. |
| (5) | In this offering Intel Americas, Inc. will sell 9,665,332 shares of Class A common stock issuable upon the exchange of an equal number of LLC Units, together with corresponding shares of Class B common stock (or 11,135,332 shares of Class A common stock issuable upon the exchange of an equal number of LLC Units, together with corresponding shares of Class B common stock, if the underwriters exercise in full their option to purchase additional shares). Intel Corporation may also be deemed to beneficially own these shares due to its ownership of Intel Americas Inc. Intel Corporation’s and Intel Americas, Inc. has an address c/o Intel Corporation, 2200 Mission College Boulevard, Santa Clara, California 95054. |
| (6) | Shares of Class A common stock shown as beneficially owned by the Thoma Bravo Funds before this offering include: (a) 71,344 shares of Class A common stock held by Thoma Bravo Partners XII AIV, L.P. (“TB Partners XII”); (b) 17,603,384 shares of Class A common stock held by Thoma Bravo Fund XII-A, L.P. (“TB XII-A”); (c) 1,156,028 shares of Class A common stock held by Thoma Bravo Fund XII AIV, L.P. (“TB XII”); (d) 11,312 shares of Class A common stock held by Thoma Bravo Executive Fund XII AIV, L.P. (“TB Executive XII”); and (e) 10,052 shares of Class A common stock held by Thoma Bravo Executive Fund XII-a AIV, L.P. (“TB Executive XII-a” and, together with TB Partners XII, TB XII-A, TB XII, and TB Executive XII, the “Thoma Bravo Funds”). Shares of Class B common stock shown as beneficially owned by the Thoma Bravo Funds before this offering include: (a) 2,364,188 shares of Class B common stock held by TB Partners XII; (b) 21,502,869 shares of Class B common stock held by TB XII; (c) 210,435 shares of Class B common stock held by TB Executive XII; and (d) 186,990 shares of Class B common stock held by TB Executive XII-a. In this offering: (a) TB Partners XII will sell 71,344 shares of Class A common stock and 55,272 shares of Class A common stock issuable upon the exchange of an equal number of LLC Units, together with corresponding shares of Class B common stock (or 74,529 shares of Class A common stock issuable upon the exchange of an equal number of LLC Units, together with corresponding shares of Class B common stock, if |
176
Confidential Treatment Requested by McAfee Corp.
Pursuant to 17 C.F.R. Section 200.83
| the underwriters exercise in full their option to purchase additional shares); (b) TB XII-A will sell 915,144 shares of Class A common stock (or 1,054,328 shares of Class A common stock if the underwriters exercise in full their option to purchase additional shares); (c) TB XII will sell 1,156,028 shares of Class A common stock and 21,936 shares of Class A common stock issuable upon the exchange of an equal number of LLC Units, together with corresponding shares of Class B common stock (or 201,093 shares of Class A common stock issuable upon the exchange of an equal number of LLC Units, together with corresponding shares of Class B common stock, if the underwriters exercise in full their option to purchase additional shares); (d) TB Executive XII will sell 11,312 shares of Class A common stock and 216 shares of Class A common stock issuable upon the exchange of an equal number of LLC Units, together with corresponding shares of Class B common stock (or 1,969 shares of Class A common stock issuable upon the exchange of an equal number of LLC Units, together with corresponding shares of Class B common stock, if the underwriters exercise in full their option to purchase additional shares); and (e) TB Executive XII-a will sell 10,052 shares of Class A common stock and 192 shares of Class A common stock issuable upon the exchange of an equal number of LLC Units, together with corresponding shares of Class B common stock (or 1,750 shares of Class A common stock issuable upon the exchange of an equal number of LLC Units, together with corresponding shares of Class B common stock, if the underwriters exercise in full their option to purchase additional shares). The general partner of each of the Thoma Bravo Funds (other than TB Partners XII) is TB Partners XII. Thoma Bravo UGP, LLC (“TB UGP”) is the ultimate general partner of TB Partners XII. TB UGP’s voting and investment decisions are made by an investment committee comprised of Seth Boro, Orlando Bravo, S. Scott Crabill, Lee Mitchell, Holden Spaht and Carl Thoma. By virtue of the relationships described in this footnote, TB UGP may be deemed to exercise shared voting and dispositive power with respect to the shares held directly by the Thoma Bravo Funds. Messrs. Boro, Bravo, Crabill, Mitchell, Spaht and Thoma disclaim beneficial ownership of the shares held directly by the Thoma Bravo Funds. The address of each of the Thoma Bravo Funds and TB UGP is c/o Thoma Bravo, L.P., 150 North Riverside Plaza, Suite 2800, Chicago, Illinois 60606. |
| (7) | Snowlake Investment Pte Ltd. (the “GIC Investor”) shares the power to vote and the power to dispose of these shares with GIC Special Investments Pte. Ltd. (“GIC SI”), and GIC Pte. Ltd. (“GIC”), both of which are private limited companies incorporated in Singapore. GIC SI is wholly owned by GIC and is the private equity investment arm of GIC. GIC is wholly owned by the Government of Singapore and was set up with the sole purpose of managing Singapore’s foreign reserves. The Government of Singapore disclaims beneficial ownership of these shares. The business address for the GIC Investor is 168 Robinson Road, #37-01 Capital Tower, Singapore 068912.” |
| (8) | Includes 16,037 shares of Class A common stock underlying RSUs and 40,592 shares of Class A common stock underlying MIUs held by Mr. Darwish that have vested or will vest within 60 days. |
| (9) | Includes 27,252 shares of Class A common stock underlying RSUs and 16,912 shares of Class A common stock underlying MIUs held by Mr. Agarwal that have vested or will vest within 60 days. |
| (10) | Includes 164,312 shares of Class A common stock underlying RSUs and 78,100 shares of Class A common stock underlying MIUs held by Mr. Leav that have vested or will vest within 60 days. |
| (11) | Includes 57,022 shares of Class A common stock underlying RSUs and 50,000 shares of Class A common stock underlying MIUs held by Mr. Bhamidipati that have vested or will vest within 60 days. |
| (12) | Includes 25,047 shares of Class A common stock underlying RSUs and 49,684 shares of Class A common stock underlying MIUs held by Mr. Hicks that have vested or will vest within 60 days. In this offering Mr. Hicks will sell 12,628 shares of Class A common stock and 42,556 shares of Class A common stock issuable upon the exchange of an equal number of LLC Units, together with corresponding shares of Class B common stock. |
| (13) | Does not include shares of Class A common stock beneficially owned by the TPG Funds. Mr. Winkelried is Co-Chief Executive Officer and Partner of TPG. Mr. Millikin is a Partner of TPG. The address of each of Messrs. Winkelried and Millikin is c/o TPG Global, LLC, 301 Commerce Street, Suite 3300, Fort Worth, TX 76102. |
| (14) | Includes 602,220 shares of Class A common stock, 1,392,896 shares of Class A common stock underlying MIUs that have vested or will vest within 60 days, 16,503 options to purchase shares of Class A common stock exercisable within 60 days, 254,915 shares of Class A common stock underlying RSUs that have vested or will vest within 60 days and 352,572 shares of Class B common stock, in each case held by our current directors, our current executive officers, and our named executive officers as a group. |
177
Confidential Treatment Requested by McAfee Corp.
Pursuant to 17 C.F.R. Section 200.83
DESCRIPTION OF CERTAIN INDEBTEDNESS
The following is a summary of certain of our indebtedness that is currently outstanding. This summary does not purport to be complete and is qualified by reference to the agreements and related documents referred to herein, copies of which have been filed as exhibits to the registration statement of which this prospectus is a part, and may be obtained under “Where You Can Find More Information” in this prospectus.
Senior Secured Credit Facilities
General
On September 29, 2017, McAfee, LLC (the “Borrower”) entered into a First Lien Credit Agreement among the Borrower, the other credit parties party thereto, Morgan Stanley Senior Funding, Inc., as administrative agent and collateral agent (the “First Lien Agent”) and the lenders from time to time party thereto. Prior to amendments in January 2018, November 2018, and June 2019, the First Lien Credit Agreement provided for a U.S. dollar-denominated First Lien USD Term Loan tranche of $2,555 million, a Euro-denominated First Lien EUR Term Loan tranche of €507 million, and a $500 million Revolving Credit Facility (the “Senior Secured Credit Facilities”). The First Lien Credit Agreement was amended: (w) on January 3, 2018 to increase the amount of the First Lien USD Term Loan by $324 million and the First Lien EUR Term Loan by €150 million; (x) on November 1, 2018 to make changes to the pricing terms and to increase the amount of the First Lien EUR Term Loan by €46 million to prepay $50 million of the Second Lien Term Loan (as defined below); (y) on June 13, 2019 to increase the amount of the First Lien USD Term Loan by $300 million and the First Lien EUR Term Loan by €355 million; and (z) on October 12, 2020 to extend the maturity date of, and increase the amount by $164 million of, a portion of the commitments under the Revolving Credit Facility. The Revolving Credit Facility includes a $50 million sublimit for the issuance of letters of credit. As of June 26, 2021, the aggregate outstanding principal amount of the First Lien USD Term Loan and the First Lien EUR Term Loan were $2,717 million and €1,067 million, respectively. As of June 26, 2021, we had $660 million of unused borrowing capacity under our revolving credit facility. In connection with the consummation of the sale of our Enterprise Business to STG, we repaid $332 million of our First Lien USD Term Loan and €563 million of our First Lien EUR Term Loan in August 2021. See “Capitalization”.
The First Lien Credit Agreement provides us the right to request additional commitments for new incremental term loans and revolving loans, in an aggregate principal amount not to exceed (w) $500 million (the “First Lien Fixed Basket”) less the amount of any other incremental borrowings incurred in reliance on that amount or the Second Lien Fixed Basket (as defined below),(x) in the case of any incremental facilities that serve to effectively extend the maturity of, or refinance or replace any term loans or revolving commitments, an amount equal to the reductions in the term loans or commitments to be replaced thereby or terminated,(y) the amount of certain voluntary prepayments, redemptions, or repurchases of any term loans and/or previously incurred incremental equivalent debt and any permanent reduction of the commitments under any revolving facility or incremental equivalent debt consisting of a revolving credit facility,(z) an unlimited amount (the “First Lien Ratio Basket”) so long as (1) if such incremental indebtedness is secured by a lien on the collateral on abasis with the Senior Secured Credit Facilities, (i) we are in compliance on a pro forma basis with a first lien net leverage ratio of no greater than 4.75:1.00 or (ii) if such incremental indebtedness is incurred in connection with an acquisition or other similar investment permitted under the First Lien Credit Agreement, the first lien net leverage ratio would not be greater on a pro forma basis after giving effect to such acquisition or similar investment than the first lien net leverage ratio immediately prior to the incurrence of such incremental indebtedness, (2) if such incremental indebtedness is secured by a lien on the collateral by a lien that is junior to the lien securing the Senior Secured Credit Facilities, (i) we are in compliance on a pro forma basis with a secured net leverage ratio of no greater than 5.75:1.00 (ii) if such incremental indebtedness is incurred in connection with an acquisition or other similar investment permitted under the First Lien Credit Agreement, the secured net leverage ratio would not be greater on a pro forma basis after giving effect to such acquisition or similar investment than the secured net leverage ratio immediately prior to the incurrence of such incremental indebtedness, or (3) if such incremental indebtedness is unsecured, (i) we are in compliance on a pro forma basis with a total net leverage ratio of no greater than 6.00:1.00 or (ii) if such incremental indebtedness is incurred in
plus
plus
plus
pari passu
178
Confidential Treatment Requested by McAfee Corp.
Pursuant to 17 C.F.R. Section 200.83
connection with an acquisition or other similar investment permitted under the First Lien Credit Agreement, the total net leverage ratio would not be greater on a pro forma basis after giving effect to such acquisition or similar investment than the total net leverage ratio immediately prior to the incurrence of such incremental indebtedness; provided that amounts borrowed under the First Lien Fixed Basket may later be reclassified as having been borrowed under the First Lien Ratio Basket. In addition, the First Lien Credit Agreement provides that we have the right to replace and extend existing loans or commitments with new commitments from existing or new lenders under the First Lien Credit Agreement. The lenders under the Senior Secured Credit Facilities are not under any obligation to provide any such additional commitments, and any increase in, or replacement or extension of, commitments is subject to customary conditions precedent and limitations.
$500 million of the commitments under the Revolving Credit Facility will mature on September 29, 2024 and $164 million of the commitments under the Revolving Credit Facility will mature on September 29, 2022. The First Lien Term Loans will mature on September 29, 2024.
Amortization, Interest Rates and Fees
The First Lien Term Loans require equal quarterly repayments of, (1) with respect to the First Lien USD Term Loan, $7,756,303.62 and, (2) with respect to the First Lien EUR Term Loan, €2,743,965.25.
The borrowings under the Revolving Credit Facility bear interest at a floating rate which can be, at our option, either (1) a Eurodollar rate for a specified interest period plus an applicable margin of 3.75% or (2) a base rate plus an applicable margin of 2.75%. The applicable margins for Eurodollar rate and base rate borrowings are subject to reductions to 3.50% and 3.25% and 2.50% and 2.25%, respectively, based on our first lien net leverage ratio. The Eurodollar rate applicable to the Revolving Credit Facility is subject to a “floor” of 0.00%.
The borrowings under the First Lien USD Term Loan bear interest at a floating rate which can be, at our option, either (1) a Eurodollar rate for a specified interest period plus an applicable margin of 3.75% or (2) a base rate plus an applicable margin of 2.75%. The borrowings under the First Lien EUR Term Loan bear interest at a floating rate which is a EURIBOR rate for a specified interest period plus an applicable margin of 3.50%. The Eurodollar rate and EURIBOR rate applicable to the First Lien Term Loans are subject to a “floor” of 0.00%.
The base rate for any day is a fluctuating rate per annum equal to the highest of (a) the federal funds effective rate in effect on such day, plus 0.50%, (b) the rate of interest in effect for such day as publicly announced by the First Lien Agent as its “prime rate,” and (c) the Eurodollar rate with a
one-month
interest period plus 1.00%. The base rate applicable to the First Lien USD Term Loan is subject to a “floor” of 1.00%.In addition to paying interest on loans outstanding under the Revolving Credit Facility and the First Lien Term Loans, we are required to pay a commitment fee of 0.50% per annum of unused commitments under the Revolving Credit Facility. The commitment fee is subject to reductions to 0.375% per annum and 0.25% per annum based on our first lien net leverage ratio. We are also required to pay letter of credit fees on the maximum amount available to be drawn under all outstanding letters of credit in an amount equal to the applicable margin for Eurodollar loans under the Revolving Credit Facility on a per annum basis. We are also required to pay customary fronting fees and other customary documentary fees in connection with the issuance of letters of credit.
Voluntary Prepayments
We are permitted to voluntarily prepay or repay outstanding loans under the Revolving Credit Facility or First Lien Term Loans at any time, in whole or in part, subject to prior written notice, minimum amount requirements, and customary “breakage” costs with respect to Eurodollar loans. Amounts prepaid under the Revolving Credit Facility may subsequently be reborrowed.
179
Confidential Treatment Requested by McAfee Corp.
Pursuant to 17 C.F.R. Section 200.83
We are permitted to reduce commitments under the Revolving Credit Facility at any time, in whole or in part, subject to minimum amounts.
Mandatory Prepayments
The First Lien Credit Agreement requires us to prepay, subject to certain exceptions, the First Lien Term Loans with:
| • | 100% of net cash proceeds above a threshold amount of certain asset sales and casualty events, subject to (i) step-downs to (x) 50% if our first lien net leverage ratio is less than or equal to 3.25 to 1.00, but greater than 2.50 to 1.00 and (y) 0% if our first lien net leverage ratio is less than or equal to 2.50 to 1.00 and (ii) reinvestment rights and certain other exceptions; |
| • | 100% of net cash proceeds of the incurrence of certain debt, other than certain debt permitted under the First Lien Credit Agreement; and |
| • | 50% of annual excess cash flow, subject to (i) a step-down to 25% if our first lien net leverage ratio is less than or equal to 3.25 to 1.00, but greater than 2.50 to 1.00, and (ii) a step-down to 0% if our first lien net leverage ratio is less than or equal to 2.50 to 1.00; provided that such a prepayment is required only in the amount (if any) by which such prepayment exceeds $35 million in such fiscal year. |
Guarantees
Subject to certain exceptions, all obligations under the First Lien Credit Agreement, including certain hedging and cash management arrangements, are jointly and severally, fully and unconditionally, guaranteed on a senior secured basis by each of McAfee Finance 2, LLC and certain of the Borrower’s existing and future direct and indirect domestic subsidiaries (other than unrestricted subsidiaries, our joint ventures, subsidiaries prohibited by applicable law from becoming guarantors, immaterial subsidiaries, and certain other exempted subsidiaries).
Security
Our obligations and the obligations of the guarantors of our obligations under the Senior Secured Credit Facilities are secured by perfected first priority pledges of and security interests in (i) substantially all of the existing and future equity interests of our and each guarantor’s material wholly-owned restricted domestic subsidiaries and 65% of the equity interests in the material restricted first-tier foreign subsidiaries held by the Borrower or the guarantors of our obligations under the Senior Secured Credit Facilities and (ii) substantially all of the Borrower’s and each guarantor’s tangible and intangible assets, in each case, subject to certain exceptions.
Certain Covenants
The First Lien Credit Agreement contains a number of covenants that, among other things, restrict, subject to certain exceptions, our ability to:
| • | incur additional indebtedness; |
| • | create or incur liens; |
| • | engage in consolidations, amalgamations, mergers, liquidations, dissolutions, or dispositions; |
| • | pay dividends and distributions on, or purchase, redeem, defease, or otherwise acquire or retire for value, our capital stock; |
| • | make acquisitions, investments, loans (including guarantees), advances, or capital contributions; |
| • | create negative pledges or restrictions on the payment of dividends or payment of other amounts owed from subsidiaries; |
180
Confidential Treatment Requested by McAfee Corp.
Pursuant to 17 C.F.R. Section 200.83
| • | sell, transfer or otherwise dispose of assets, including capital stock of subsidiaries; |
| • | make prepayments or repurchases of debt that is contractually subordinated with respect to right of payment or security; |
| • | engage in certain transactions with affiliates; |
| • | modify certain documents governing debt that is subordinated with respect to right of payment; |
| • | change our fiscal year; and |
| • | change our material lines of business. |
In addition, the First Lien Credit Agreement includes a financial covenant which requires that, at the end of each fiscal quarter, for so long as the aggregate principal amount of borrowings under the Revolving Credit Facility exceeds 35% of the aggregate commitments under the Revolving Credit Facility, our first lien net leverage ratio cannot exceed 6.30 to 1.00. A breach of this financial covenant will not result in a default or event of default under the First Lien Term Loans unless and until the lenders under the Revolving Credit Facility have terminated the commitments under the Revolving Credit Facility and declared the borrowings under the Revolving Credit Facility due and payable.
Events of Defaults
The First Lien Credit Agreement includes certain customary events of default, including, among others, failure to pay principal, interest or other amounts; material inaccuracy of representations and warranties; violation of covenants; specified cross-default and cross-acceleration to other material indebtedness; certain bankruptcy and insolvency events; certain Employee Retirement Income Security Act of 1974 (“ERISA”) events; certain undischarged judgments; material invalidity of guarantees or grant of security interest; and change of control.
181
Confidential Treatment Requested by McAfee Corp.
Pursuant to 17 C.F.R. Section 200.83
DESCRIPTION OF CAPITAL STOCK
General
The following description of our capital stock is intended as a summary only and is qualified in its entirety by reference to our amended and restated certificate of incorporation and bylaws, which are filed as exhibits to the registration statement of which this prospectus forms a part, and to the applicable provisions of Delaware law.
Our authorized capital stock consists of 1,500,000,000 shares of Class A common stock, par value $0.001 per share, 300,000,000 shares of Class B common stock, par value $0.001 per share, and 200,000,000 shares of preferred stock, par value $0.001 per share. Upon the completion of this offering, there will be 175,849,441 shares of our Class A common stock issued and outstanding and 255,532,090 shares of our Class B common stock issued and outstanding.
Common Stock
Voting Rights
.
one-for-one
Generally, all matters to be voted on by stockholders must be approved by a majority of the votes entitled to be cast on a matter by stockholders (or, in the case of election of directors, by a plurality), voting together as a single class. Delaware law would require our Class A stockholders and Class B stockholders to vote separately as a single class in the following circumstances:
| • | if we amend our amended and restated certificate of incorporation to increase the authorized shares of a class of stock, or to increase or decrease the par value of a class of stock, then such class would be required to vote separately to approve the proposed amendment; or |
| • | if we amend our amended and restated certificate of incorporation in a manner that alters or changes the powers, preferences or special rights of a class of stock in a manner that affects holders of such class of stock adversely, then such class would be required to vote separately to approve such proposed amendment. |
Except as otherwise provided by law, amendments to the certificate of incorporation must be approved by a majority or, in some cases, a super-majority of the combined voting power of all shares entitled to vote, voting together as a single class.
Dividend Rights
.
182
Confidential Treatment Requested by McAfee Corp.
Pursuant to 17 C.F.R. Section 200.83
the payment of dividends imposed by the terms of any outstanding preferred stock. The holders of shares of our Class B common stock do not have any right to receive dividends other than dividends consisting of shares of our Class B common stock paid proportionally with respect to each outstanding share of our Class B common stock.
Liquidation Rights
.
On our liquidation, dissolution, or winding up and after payment in full of all amounts required to be paid to creditors and to the holders of preferred stock having liquidation preferences, if any, each holder of Class A common stock are entitled to a pro rata distribution of any assets available for distribution to common stockholders. Other than their par value, the holders of shares of our Class B common stock do not have any right to receive a distribution upon a liquidation or dissolution of our Company.
Other Matters
non-assessable.
Transfers of Class
B Common Stock
| • | the holder will not transfer any shares of Class B common stock to any person unless the holder transfers an equal number of LLC Units to the same person; and |
| • | in the event the holder transfers any LLC Units to any person, the holder will transfer an equal number of shares of Class B common stock to the same person. |
Preferred Stock
Our board of directors may, without further action by our stockholders, from time to time, direct the issuance of shares of preferred stock in series and may, at the time of issuance, determine the designations, powers, preferences, privileges and relative participating, optional or special rights, as well as the qualifications, limitations or restrictions thereof, including dividend rights, conversion rights, voting rights, terms of redemption and liquidation preferences, any or all of which may be greater than the rights of the Class A common stock. Satisfaction of any dividend preferences of outstanding shares of preferred stock would reduce the amount of funds available for the payment of dividends on shares of our Class A common stock. Holders of shares of preferred stock may be entitled to receive a preference payment in the event of our liquidation before any payment is made to the holders of shares of our Class A common stock. Under certain circumstances, the issuance of shares of preferred stock may render more difficult or tend to discourage a merger, tender offer or proxy contest, the assumption of control by a holder of a large block of our securities or the removal of incumbent management. Upon the affirmative vote of a majority of the total number of directors then in office, our board of directors, without stockholder approval, may issue shares of preferred stock with voting and conversion rights which could adversely affect the holders of shares of our Class A common stock and the market value of our Class A common stock. There are no shares of preferred stock outstanding, and we have no present intention to issue any shares of preferred stock.
Stockholders Agreement
In connection with our IPO, we entered into a stockholders agreement with Intel Americas, Inc., investment funds affiliated with our Sponsors, and certain other stockholders pursuant to which such parties have specified board representation rights, governance rights and other rights. See “Certain Relationships and Related Party Transactions—Recapitalization Transactions in Connection with our IPO—Stockholders Agreement.”
183
Confidential Treatment Requested by McAfee Corp.
Pursuant to 17 C.F.R. Section 200.83
Registration Rights
Intel, certain investment funds affiliated with our Sponsors, certain other stockholders, and our Chief Executive Officer will be entitled to rights with respect to the registration of shares of Class A common stock, including shares received in exchange for a corresponding number of LLC Units and shares of Class B common stock under the Securities Act. These registration rights are contained in our registration rights agreement.
Anti-Takeover Effects of Our Certificate of Incorporation and Our Bylaws
Our certificate of incorporation and our bylaws contain provisions that may delay, defer, or discourage another party from acquiring control of us. We expect that these provisions will discourage coercive takeover practices or inadequate takeover bids. These provisions are also designed to encourage persons seeking to acquire control of us to first negotiate with the board of directors, which we believe may result in an improvement of the terms of any such acquisition in favor of our stockholders. However, they may also discourage acquisitions that some stockholders may favor.
These provisions include:
| • | Classified board. one-third of our board of directors is elected each year. The classification of directors has the effect of making it more difficult for stockholders to change the composition of our board. Our board of directors is currently composed of seven members. |
| • | No cumulative voting. |
| • | Requirements for removal of directors |
| • | Advance notice procedures |
| • | Actions by written consent; special meetings of stockholders |
184
Confidential Treatment Requested by McAfee Corp.
Pursuant to 17 C.F.R. Section 200.83
| • | Supermajority approval requirements |
| • | Authorized but unissued shares |
Exclusive Forum
Our amended and restated certificate of incorporation requires, to the fullest extent permitted by law, that (i) derivative actions or proceedings brought on behalf of the Company, (ii) actions against directors, officers and employees asserting a claim of breach of a fiduciary duty owed to the Company or the Company’s stockholders, (iii) actions asserting a claim against the Company arising pursuant to the DGCL or the Company’s amended and restated certificate of incorporation or bylaws, (iv) actions to interpret, apply, enforce or determine the validity of the Company’s amended and restated certificate of incorporation or bylaws or (v) actions asserting a claim against the Company governed by the internal affairs doctrine, may be brought only in specified courts in the State of Delaware. Our amended and restated certificate of incorporation also provides that the federal district courts of the United States of America will be the exclusive forum for the resolution of any complaint asserting a cause of action against us or any of our directors, officers, employees or agents and arising under the Securities Act. However, Section 22 of the Securities Act provides that federal and state courts have concurrent jurisdiction over lawsuits brought the Securities Act or the rules and regulations thereunder. To the extent the exclusive forum provision restricts the courts in which claims arising under the Securities Act may be brought, there is uncertainty as to whether a court would enforce such a provision. We note that investors cannot waive compliance with the federal securities laws and the rules and regulations thereunder. This provision does not apply to claims brought under the Exchange Act. See “Risk Factors—Our certificate of incorporation designates courts in the State of Delaware as the sole and exclusive forum for certain types of actions and proceedings that may be initiated by our stockholders, and also provide that the federal district courts will be the exclusive forum for resolving any complaint asserting a cause of action arising under the Securities Act, each of which could limit our stockholders’ ability to choose the judicial forum for disputes with us or our directors, officers, stockholders, or employees.”
Section 203 of the DGCL
We are subject to the provisions of Section 203 of the DGCL. In general, Section 203 prohibits a publicly-held Delaware corporation from engaging in a “business combination” with an “interested stockholder” for a three-year period following the time that such stockholder becomes an interested stockholder, unless the business combination is approved in a prescribed manner. A “business combination” includes, among other things, a merger, asset or stock sale or other transaction resulting in a financial benefit to the interested stockholder. An “interested stockholder” is a person who, together with affiliates and associates, owns, or did own within three years prior to the determination of interested stockholder status, 15% or more of the corporation’s voting stock.
Under Section 203, a business combination between a corporation and an interested stockholder is prohibited unless it satisfies one of the following conditions: before the stockholder became interested, the board of directors approved either the business combination or the transaction that resulted in the stockholder becoming an interested stockholder; upon consummation of the transaction that resulted in the stockholder becoming an interested stockholder, the interested stockholder owned at least 85% of the voting stock of the corporation outstanding at the time the transaction commenced, excluding for purposes of determining the voting stock outstanding, shares owned by persons who are directors and also officers, and employee stock plans, in some instances; or at or after the time the stockholder became interested, the business combination was approved by board of directors of the corporation and authorized at an annual or special meeting of the stockholders by the
185
Confidential Treatment Requested by McAfee Corp.
Pursuant to 17 C.F.R. Section 200.83
affirmative vote of at least
two-thirds
of the outstanding voting stock which is not owned by the interested stockholder.A Delaware corporation may “opt out” of these provisions with an express provision in its original certificate of incorporation or an express provision in its certificate of incorporation or
by-laws
resulting from a stockholders’ amendment approved by at least a majority of the outstanding voting shares. We have not opted out of these provisions. As a result, mergers or other takeover or change in control attempts of us may be discouraged or prevented.Corporate Opportunities
Our amended and restated certificate of incorporation provides that we renounce any interest or expectancy in the business opportunities of our Sponsors and Intel Americas, Inc. and its affiliates and each of their respective partners, principals, directors, officers, members, managers and/or employees, including any of the foregoing who serve as officers or directors of the Company, and each such party shall not have any obligation to offer us those opportunities unless presented to one of our directors or officers in his or her capacity as a director or officer.
Limitations on Liability and Indemnification of Directors and Officers
Our certificate of incorporation limits the liability of our directors and officers to the fullest extent permitted by Delaware law and requires that we will provide them with customary indemnification. We also entered into customary indemnification agreements with each of our directors that provide them, in general, with customary indemnification in connection with their service to us or on our behalf. Insofar as indemnification for liabilities arising under the Securities Act may be permitted to directors, we have been informed that in the opinion of the SEC such indemnification is against public policy and is therefore unenforceable. We also maintain officers’ and directors’ liability insurance that insures against liabilities that our officers and directors may incur in such capacities.
Transfer Agent and Registrar
The transfer agent and registrar for our Class A common stock is American Stock Transfer & Trust Company, LLC.
Listing
Our Class A common stock is listed on the Exchange under the symbol “MCFE”.
186
Confidential Treatment Requested by McAfee Corp.
Pursuant to 17 C.F.R. Section 200.83
SHARES ELIGIBLE FOR FUTURE SALE
Future sales of substantial amounts of our Class A common stock, including shares issued upon the exercise of outstanding options, in the public market after this offering, or the perception that those sales may occur, could cause the prevailing market price for our Class A common stock to fall or impair our ability to raise capital through sales of our equity securities.
After giving effect to this offering, we will have outstanding 175,849,441 shares of our Class A common stock, assuming no exercise by the underwriters of their option to purchase additional shares and 255,532,090 shares of our Class B common stock outstanding.
All shares sold in this offering will be freely tradable without restriction under the Securities Act, except for any shares purchased by our “affiliates,” as that term is defined in Rule 144 under the Securities Act (“Rule 144”). Shares purchased by our affiliates may not be resold except pursuant to an effective registration statement or an exemption from registration, including the safe harbor under Rule 144 described below.
The 82,557,857 shares of our Class A common stock held by our Sponsors and Intel that will be outstanding after this offering will be “restricted securities,” as that term is defined in Rule 144, and we expect that substantially all of these restricted securities will be subject to the
lock-up
agreements and market standoff provisions of the New LLC Agreement described below. These restricted securities may be sold in the public market only if the sale is registered or pursuant to an exemption from registration, such as the safe harbor provided by Rule 144.Lock-up
Agreements and Market Standoff RestrictionsWe and each of our directors, executive officers, the selling stockholders, and holders of 88% of our capital stock, who collectively own approximately 379,426,161 shares of our Class A common stock, or securities exercisable for or exchangeable into shares of our Class A common stock, including LLC Units, following this offering, have agreed that, without the prior written consent of certain of the underwriters, we and they will not, subject to limited exceptions, directly or indirectly sell or dispose of any shares of Class A common stock or any securities convertible into or exchangeable or exercisable for shares of Class A common stock for a period of 75 days after the date of this prospectus. The
lock-up
restrictions and specified exceptions are described in more detail under “Underwriters (Conflicts of Interest).”Rule 144
In general, under Rule 144, any person who is not our affiliate and has held their shares of Class A common stock for at least six months, including the holding period of any prior owner other than one of our affiliates, may sell shares without restriction, subject to the availability of current public information about us and upon the expiration of the market standoff restrictions and
lock-up
agreements described above. In addition, under Rule 144, any person who is not our affiliate and has not been our affiliate at any time during the preceding three months and has held their shares of Class A common stock for at least one year, including the holding period of any prior owner other than one of our affiliates, would be entitled to sell an unlimited number of shares of Class A common stock immediately upon the completion of this offering without regard to whether current public information about us is available.A person who is our affiliate or who was our affiliate at any time during the preceding three months and who has beneficially owned restricted securities for at least six months, including the holding period of any prior owner other than one of our affiliates, is entitled to sell a number of shares of Class A common stock within any three-month period that does not exceed the greater of: (i) 1% of the number of shares of our Class A common stock outstanding, which will equal approximately 1,758,494 shares immediately after this offering; and (ii) the average weekly trading volume of our Class A common stock on the Exchange during the four calendar weeks preceding the filing of a notice on Form 144 with respect to the sale.
187
Confidential Treatment Requested by McAfee Corp.
Pursuant to 17 C.F.R. Section 200.83
Sales under Rule 144 by our affiliates are also subject to certain manner of sale provisions, notice requirements and the availability of current public information about us.
Rule 701
In general, under Rule 701 under the Securities Act (“Rule 701”), any of our employees, directors, officers, consultants, or advisors who acquired shares of Class A common stock from us in connection with a written compensatory stock or option plan or other written agreement in compliance with Rule 701 is entitled to sell such shares in reliance on Rule 144 but without compliance with certain of the requirements contained in Rule 144. Accordingly, subject to any applicable
lock-up
agreements and market standoff restrictions, under Rule 701 persons who are not our affiliates may resell those shares without complying with the minimum holding period or public information requirements of Rule 144, and persons who are our affiliates may resell those shares without compliance with Rule 144’s minimum holding period requirements.Equity Incentive Plans
We have filed with the SEC a registration statement on Form
S-8
under the Securities Act covering the shares of Class A common stock that are subject to options and other awards issuable pursuant to our equity incentive plans. Shares covered by such registration statement are available for sale in the open market following the effective date, subject to certain Rule 144 limitations applicable to affiliates and the terms oflock-up
restrictions and market standoff agreements applicable to those shares.Registration Rights
Subject to the
lock-up
agreements and market standoff restrictions described above, certain holders of our Class A common stock, or securities exercisable for or exchangeable into shares of Class A common stock, including shares of Class B common stock and LLC Units, may demand that we register the sale of their shares under the Securities Act or, if we file another registration statement under the Securities Act other than a FormS-8
covering securities issuable under our equity plans or on FormS-4,
may elect to include their shares of Class A common stock in such registration. Following such registered sales, the shares will be freely tradable without restriction under the Securities Act, unless held by our affiliates.188
Confidential Treatment Requested by McAfee Corp.
Pursuant to 17 C.F.R. Section 200.83
MATERIAL U.S. FEDERAL INCOME TAX CONSIDERATIONS FOR
NON-U.S.
HOLDERSThe following is a summary of certain United States federal income and estate tax consequences of the purchase, ownership and disposition of shares of our common stock as of the date hereof. Except where noted, this summary deals only with common stock that is held as a capital asset by a
non-U.S.
holder (as defined below).A
“non-U.S.
holder” means a beneficial owner of shares of our common stock (other than an entity treated as a partnership for United States federal income tax purposes) that is not, for United States federal income tax purposes, any of the following:| • | an individual citizen or resident of the United States; |
| • | a corporation (or any other entity treated as a corporation for United States federal income tax purposes) created or organized in or under the laws of the United States, any state thereof or the District of Columbia; |
| • | an estate the income of which is subject to United States federal income taxation regardless of its source; or |
| • | a trust if it (1) is subject to the primary supervision of a court within the United States and one or more United States persons have the authority to control all substantial decisions of the trust or (2) has a valid election in effect under applicable United States Treasury regulations to be treated as a United States person. |
This summary is based upon provisions of the Code, the existing and proposed U.S. Treasury regulations promulgated thereunder, administrative pronouncements, and rulings and judicial decisions interpreting the foregoing, in each case as of the date hereof. Those authorities may be changed, perhaps retroactively, so as to result in United States federal income and estate tax consequences different from those summarized below. This summary does not address all aspects of United States federal income and estate taxes and does not deal with the alternative minimum tax, the Medicare contribution tax, United States federal tax laws other than United States federal income or estate tax laws, or any foreign, state, local or other tax considerations that may be relevant to
non-U.S.
holders in light of their particular circumstances or status. In addition, it does not represent a detailed description of the United States federal income and estate tax consequences applicable to you if you are subject to special treatment under the United States federal income tax laws (including if you are a United States expatriate, foreign pension fund, “controlled foreign corporation,” “passive foreign investment company,” financial institution, broker-dealer, insurance company,tax-exempt
entity, a corporation that accumulates earnings to avoid United States federal income tax, a person subject to special tax accounting as a result of any item of gross income taken into account in an applicable financial statement under Section 451(b) of the Code, a person in a special situation such as those who have elected to mark securities to market or those who hold shares of common stock as part of a straddle, hedge, conversion transaction, or synthetic security or a partnership or other pass-through entity (or beneficial owner thereof) for United States federal income tax purposes). We cannot assure you that a change in law will not alter significantly the tax considerations that we describe in this summary.A modified definition of
“non-U.S.
holder” applies for U.S. federal estate tax purposes (as discussed below).If a partnership (or other entity treated as a partnership for United States federal income tax purposes) holds shares of our common stock, the tax treatment of a partner will generally depend upon the status of the partner and the activities of the partnership. If you are a partner of a partnership holding our common stock, you should consult your tax advisors.
If you are considering the purchase of our common stock, you should consult your own tax advisors concerning the particular United States federal income and estate tax consequences to you of the purchase,
189
Confidential Treatment Requested by McAfee Corp.
Pursuant to 17 C.F.R. Section 200.83
ownership and disposition of our common stock, as well as the consequences to you arising under other United States federal tax laws and the laws of any other taxing jurisdiction, and the application of any tax treaties.
Distributions on Common Stock
In the event that we make a distribution of cash or other property (other than certain pro rata distributions of our stock) in respect of shares of our common stock, the distribution generally will be treated as a dividend for United States federal income tax purposes to the extent it is paid from our current or accumulated earnings and profits, as determined under United States federal income tax principles. Any portion of a distribution that exceeds our current and accumulated earnings and profits generally will be treated first as a
tax-free
return of capital, causing a reduction in the adjusted tax basis of anon-U.S.
holder’s shares of our common stock, and to the extent the amount of the distribution exceeds anon-U.S.
holder’s adjusted tax basis in shares of our common stock, the excess will be treated as gain from the disposition of shares of our common stock (the tax treatment of which is discussed below under “—Gain on Disposition of Common Stock”).Subject to the discussion below regarding effectively connected income, dividends paid to a
non-U.S.
holder generally will be subject to withholding of United States federal income tax at a 30% rate or such lower rate as may be specified by an applicable income tax treaty, as discussed further below. Even if our current or accumulated earnings and profits are less than the amount of the distribution, the applicable withholding agent may elect to treat the entire distribution as a dividend for U.S. federal withholding tax purposes. Dividends that are effectively connected with the conduct of a trade or business by thenon-U.S.
holder within the United States (and, if required by an applicable income tax treaty, are attributable to a United States permanent establishment, or, in certain cases involving individual holders, a fixed base) are not subject to the withholding tax, provided certain certification and disclosure requirements are satisfied. Instead, such dividends are subject to United States federal income tax on a net income basis in the same manner as if thenon-U.S.
holder were a United States person as defined under the Code. To obtain this exemption, anon-U.S.
holder must provide us with a valid IRS FormW-8ECI
properly certifying such exemption. Any such effectively connected dividends received by a foreign corporation may be subject to an additional “branch profits tax” at a 30% rate or such lower rate as may be specified by an applicable income tax treaty.A(or other applicable form) certifying under penalty of perjury that such holder is not a United States person as defined under the Code and is eligible for treaty benefits or (b) if our common stock is held through certain foreign intermediaries, to satisfy the relevant certification requirements of applicable United States Treasury regulations. Special certification and other requirements apply to certain
non-U.S.
holder who wishes to claim the benefit of an applicable treaty rate and avoid backup withholding, as discussed below, for dividends will be required (a) to provide the applicable withholding agent with a properly executed, valid IRS FormW-8BEN
or FormW-8BEN-E
non-U.S.
holders that are pass-through entities rather than corporations or individuals. You are urged to consult your own tax advisors regarding your entitlement to benefits under a relevant income tax treaty.A
non-U.S.
holder eligible for a reduced rate of United States federal withholding tax pursuant to an income tax treaty may be entitled to a refund of any excess amounts withheld if thenon-U.S.
holder timely files an appropriate claim for refund with the IRS.The foregoing discussion is subject to the discussion below under “—Information Reporting and Backup Withholding” and “—Additional Withholding Requirements.”
190
Confidential Treatment Requested by McAfee Corp.
Pursuant to 17 C.F.R. Section 200.83
Gain on Disposition of Common Stock
Subject to the discussion of backup withholding and FATCA below, any gain realized by a
non-U.S.
holder on the sale or other disposition of shares of our common stock generally will not be subject to United States federal income tax unless:| • | the gain is effectively connected with a trade or business of the non-U.S. holder in the United States (and, if required by an applicable income tax treaty, is attributable to a United States permanent establishment of thenon-U.S. holder or, in certain cases involving individual holders, a fixed base of thenon-U.S. holder); |
| • | the non-U.S. holder is an individual who is present in the United States for 183 days or more in the taxable year of that disposition, and certain other conditions are met; or |
| • | we are or have been a “United States real property holding corporation” for United States federal income tax purposes during the applicable period specified in the Code, and certain other conditions are met. |
A
non-U.S.
holder described in the first bullet point immediately above will be subject to tax on the gain derived from the sale or other disposition in the same manner as if thenon-U.S.
holder were a United States person as defined under the Code. In addition, if anynon-U.S.
holder described in the first bullet point immediately above is a foreign corporation, the gain realized by suchnon-U.S.
holder may be subject to an additional “branch profits tax” at a 30% rate or such lower rate as may be specified by an applicable income tax treaty. An individualnon-U.S.
holder described in the second bullet point immediately above will be subject to a 30% (or such lower rate as may be specified by an applicable income tax treaty) tax on the gain derived from the sale or other disposition, which gain may be offset by United States source capital losses even though the individual is not considered a resident of the United States.Generally, a corporation is a “United States real property holding corporation” if the fair market value of its United States real property interests equals or exceeds 50% of the sum of the fair market value of its worldwide real property interests and its other assets used or held for use in a trade or business (all as determined for United States federal income tax purposes). We believe we are not and do not anticipate becoming a “United States real property holding corporation” for United States federal income tax purposes.
Federal Estate Tax
Common stock owned or treated as owned by an individual who is not a U.S. citizen or resident (as specifically determined for United States federal estate tax purposes) at the time of the individual’s death will be included in the individual’s gross estate for United States federal estate tax purposes, unless an applicable estate tax treaty provides otherwise.
Information Reporting and Backup Withholding
Distributions paid to a
non-U.S.
holder and the amount of any tax withheld with respect to such distributions generally will be reported to the IRS. Copies of the information returns reporting such distributions and any withholding may also be made available to the tax authorities in the country in which thenon-U.S.
holder resides under the provisions of an applicable income tax treaty or agreement for the exchange of information.A
non-U.S.
holder will not be subject to backup withholding on dividends received if such holder certifies under penalty of perjury that it is anon-U.S.
holder (and the payor does not have actual knowledge or reason to know that such holder is a United States person as defined under the Code), or such holder otherwise establishes an exemption.Information reporting and, depending on the circumstances, backup withholding will apply to the proceeds of a sale or other disposition of shares of our common stock made within the United States or conducted through
191
Confidential Treatment Requested by McAfee Corp.
Pursuant to 17 C.F.R. Section 200.83
certain United States-related financial intermediaries, unless the beneficial owner certifies under penalty of perjury that it is a
non-U.S.
holder (and the payor does not have actual knowledge or reason to know that the beneficial owner is a United States person as defined under the Code), or such owner otherwise establishes an exemption.Provision of an IRS Form
W-8
appropriate to thenon-U.S.
holder’s circumstances will generally satisfy the certification requirements necessary to avoid the additional information reporting and backup withholding.Backup withholding is not an additional tax and any amounts withheld under the backup withholding rules will be allowed as a refund or a credit against a
non-U.S.
holder’s United States federal income tax liability, provided the required information is timely furnished to the IRS.Additional Withholding Requirements
Under Sections 1471 through 1474 of the Code (such Sections commonly referred to as “FATCA”), a 30% United States federal withholding tax may apply to any dividends paid on and (subject to the proposed Treasury Regulations discussed below) gross proceeds from the sale or other disposition of shares of our common stock paid to (i) a “foreign financial institution” (as specifically defined in the Code) which does not provide sufficient documentation, typically on IRS Formevidencing either (x) an exemption from FATCA or (y) its compliance (or deemed compliance) with FATCA (which may alternatively be in the form of compliance with an intergovernmental agreement with the United States) in a manner which avoids withholding, or (ii) aevidencing either (x) an exemption from FATCA or (y) adequate information regarding certain substantial United States beneficial owners of such entity (if any). An intergovernmental agreement between the United States and the entity’s jurisdiction may modify these requirements. If a dividend payment is both subject to withholding under FATCA and subject to the withholding tax discussed above under “—Distributions on Common Stock,” the withholding under FATCA may be credited against, and therefore reduce, such other withholding tax upon filing a United States federal income tax return containing the required information (which may entail significant administrative burden). Under the applicable Treasury Regulations and administrative guidance, withholding under FATCA generally applies to payments of dividends on our common stock. While withholding under FATCA would have applied also to payments of gross proceeds from the sale or other disposition of our securities, proposed Treasury Regulations eliminate FATCA withholding on payments of gross proceeds from a sale or other disposition that can produce U.S. source income. Taxpayers generally may rely on these proposed Treasury Regulations until final Treasury Regulations are issued. You should consult your own tax advisors regarding these requirements and whether they may be relevant to your ownership and disposition of shares of our common stock.
W-8BEN-E,
“non-financial
foreign entity” (as specifically defined in the Code) which does not provide sufficient documentation, typically on IRS FormW-8BEN-E,
192
Confidential Treatment Requested by McAfee Corp.
Pursuant to 17 C.F.R. Section 200.83
UNDERWRITERS (CONFLICTS OF INTEREST)
Under the terms and subject to the conditions in an underwriting agreement dated the date of this prospectus, the underwriters named below, for whom Morgan Stanley and Goldman Sachs are acting as representatives, have severally agreed to purchase, and the selling stockholders have agreed to sell to them, severally, the number of shares indicated below:
Name | Number of Shares | |||
Morgan Stanley & Co. LLC | ||||
Goldman Sachs & Co. LLC | ||||
TPG Capital BD, LLC | ||||
BofA Securities, Inc. | ||||
Citigroup Global Markets Inc. | ||||
Total: | ||||
The underwriters and the representative are collectively referred to as the “underwriters” and the “representative,” respectively. The underwriters are offering the shares of Class A common stock subject to their acceptance of the shares from the selling stockholders and subject to prior sale. The underwriting agreement provides that the obligations of the several underwriters to pay for and accept delivery of the shares of common stock offered by this prospectus are subject to the approval of certain legal matters by their counsel and to certain other conditions. The underwriters are obligated to take and pay for all of the shares of Class A common stock offered by this prospectus if any such shares are taken. However, the underwriters are not required to take or pay for the shares covered by the underwriters’ option to purchase additional shares described below.
The underwriters initially propose to offer part of the shares of Class A common stock directly to the public at the offering price listed on the cover page of this prospectus and part to certain dealers at a price that represents a concession not in excess of $ per share under the public offering price. After the initial offering of the shares of Class A common stock, the offering price and other selling terms may from time to time be varied by the representatives. Sale of Class A common stock made outside of the United States may be made by affiliates of the underwriters. The offering of the shares by the underwriters is subject to receipt and acceptance and subject to the underwriters’ right to reject any order in whole or in part.
The selling stockholders have granted to the underwriters an option, exercisable for 30 days from the date of this prospectus, to purchase up to 2,250,000 additional shares of Class A common stock at the public offering price listed on the cover page of this prospectus, less underwriting discounts and commissions. To the extent the option is exercised, each underwriter will become obligated, subject to certain conditions, to purchase about the same percentage of the additional shares of Class A common stock as the number listed next to the underwriter’s name in the preceding table bears to the total number of shares of common stock listed next to the names of all underwriters in the preceding table.
The following table shows the per share and total public offering price, underwriting discounts and commissions, and proceeds before expenses to the selling stockholders. These amounts are shown assuming both no exercise and full exercise of the underwriters’ option to purchase up to an additional shares of Class A common stock.
Total | ||||||||||||
Per Share | No Exercise | Full Exercise | ||||||||||
Public offering price | $ | $ | $ | |||||||||
Underwriting discounts and commissions to be paid by the selling stockholders | $ | $ | $ | |||||||||
Proceeds, before expenses, to selling stockholders | $ | $ | $ | |||||||||
193
Confidential Treatment Requested by McAfee Corp.
Pursuant to 17 C.F.R. Section 200.83
The estimated offering expenses payable by us, exclusive of the underwriting discounts and commissions, are approximately $ million. We have agreed to reimburse the underwriters for expense relating to clearance of this offering with the Financial Industry Regulatory Authority up to $ .
The underwriters have informed us and the selling stockholders that they do not intend sales to discretionary accounts to exceed % of the total number of shares of common stock offered by the selling stockholders.
Our Class A common stock is listed on the Exchange under the trading symbol “MCFE”.
We, Foundation Technology Worldwide LLC, the selling stockholders, and all directors and officers and holders of 88% of our outstanding capital stock and securities convertible into our capital stock have agreed that, without the prior written consent of Morgan Stanley & Co. LLC and Goldman Sachs & Co. LLC on behalf of the underwriters, we and they will not, during the period ending 75 days after the date of this prospectus (the “restricted period”):
| • | offer, pledge, sell, contract to sell, sell any option or contract to purchase, purchase any option or contract to sell, grant any option, right or warrant to purchase, lend or otherwise transfer or dispose of, directly or indirectly, any shares of common stock or units of Foundation Technology Worldwide LLC beneficially owned by the locked-up party or any securities convertible into or exercisable or exchangeable for shares of common stock or units of Foundation Technology Worldwide LLC; |
| • | file any registration statement with the SEC relating to the offering of any shares of Class A common stock or any securities convertible into or exercisable or exchangeable for Class A common stock; or |
| • | enter into any swap or other arrangement that transfers to another, in whole or in part, any of the economic consequences of ownership of the common stock or units of Foundation Technology Worldwide LLC, |
whether any such transaction described above is to be settled by delivery of common stock, units of Foundation Technology Worldwide LLC, or such other securities, in cash or otherwise. In addition, we and each such person agrees that, without the prior written consent of Morgan Stanley & Co. LLC and Goldman Sachs & Co. LLC on behalf of the underwriters, we or such other person will not, during the restricted period, make any demand for, or exercise any right with respect to, the registration of any shares of Class A common stock or any security convertible into or exercisable or exchangeable for Class A common stock.
The restrictions described in the immediately preceding paragraph to do not apply to:
| (a) | transactions relating to shares of Class A common stock acquired in open market transactions or in this offering, in each case, upon the completion of this offering; |
| (b) | the transfer of securities by bona fide gift; |
| (c) | transfers of shares of securities (i) as a result of the operation of law through estate, other testamentary document or intestate succession, (ii) to any immediate family member of the lock-up party or any trust for the direct or indirect benefit of thelock-up party or any immediate family member of thelock-up party, (iii) pursuant to a qualified domestic order or in connection with a divorce settlement,provided lock-up agreement, and, in the case of clause (c)(iii) only, if thelocked-up party is required to file a report under Section 16(a) of the Exchange Act reporting a reduction in beneficial ownership of shares of Common Stock during the restricted period, thelocked-up party shall include a statement in such report to the effect that such transfer occurred by operation of law or by court order, including pursuant to a domestic order or in connection with a divorce settlement;provided further |
| (d) | transfers of the lock-up party’s securities pursuant to an order of a court or pursuant to an order of a court or regulatory agency or to comply with any regulations related to the locked- up party’s |
194
Confidential Treatment Requested by McAfee Corp.
Pursuant to 17 C.F.R. Section 200.83
| ownership of securities; provided |
| (e) | distributions of the locked-up parties securities to partners, members, nominees, stockholders or holders of similar equity interests in thelock-up party not involving a disposition of value; |
| (f) | transfers of the locked-up parties securities to a corporation, partnership, limited liability company, investment fund or other entity that directly, or indirectly through one or more intermediaries, controls or is controlled by, or is under common control with, thelocked-up party, or is wholly-owned by thelocked-up party and/or by members of the immediate family of thelocked-up party, or, in the case of an investment fund, that is managed by, or is under common management with, thelocked-up party (including, for the avoidance of doubt, a fund managed by the same manager or managing member or general partner or management company or by an entity controlling, controlled by, or under common control with such manager or managing member or general partner or management company as thelocked-up party or who shares a common investment advisor with thelocked-up party);provided that locked-up party is required to file a report under Section 16(a) of the Exchange Act during the restricted period, thelocked-up party shall include a statement in any such report regarding the circumstances of the transfer. |
| (g) | exercise or settlement of stock options, restricted stock units or other equity awards pursuant to any plan or agreement granting such an award to an employee or other service provider of us or our affiliates, which plan or agreement is described in the registration statement related to the Public Offering or the Prospectus (and any related transfer to us of securities necessary to generate such amount of cash needed for the payment of taxes, including estimated taxes, due as a result of such settlement or exercise whether by means of a “net settlement” or “cashless basis”); provided that provided further locked-up party is required to file a report under Section 16(a) of the Exchange Act during the Restricted Period, thelocked-up party shall include a statement in any such report to the effect that (i) such transfer is in connection with the vesting or settlement of restricted stock units or incentive units, or the “net” or “cashless” exercise of options or other rights to purchase shares of Common Stock, as applicable and (ii) the transaction was only with us; |
| (h) | dispositions to us upon exercise of our right to repurchase or reacquire the locked-up party’s securities in the event thelocked-up party ceases to provide services to us pursuant to agreements in effect on the date hereof, including without limitation our equity incentive plans, which plan or agreement is described in the registration statement related to this offering or the Prospectus that permit us to repurchase or reacquire, at cost, such securities upon termination of thelocked-up party’s services to us;provided |
| (i) | transfers of Securities pursuant to a bona fide third party tender offer, merger, consolidation or other similar transaction made to all holders of Common Stock involving a “change of control” of us, made to all holders of Common Stock involving a change of control (as defined below) of us which occurs after the consummation of the Public Offering, is open to all holders of our capital stock and has been approved by our board of directors; provided |
195
Confidential Treatment Requested by McAfee Corp.
Pursuant to 17 C.F.R. Section 200.83
| the beneficial owner (as defined in Rules 13d-3 and13d-5 of the Exchange Act) of 50% of total voting power of the voting stock of us) (or the surviving entity); |
| (j) | if permitted by us, the establishment of a trading plan on behalf of a shareholder, officer or director of us pursuant to Rule 10b5-1 under the Exchange Act for the transfer of shares of Common Stock,provided locked-up party or us regarding the establishment of such plan, such announcement or filing shall include a statement to the effect that no transfer of shares of Common Stock may be made under such plan during the restricted period; |
| (k) | the sale or transfer of Common Stock pursuant to a 10b5-1 Plan in effect as of the date hereof (an “Existing Plan”), provided that to the extent a public filing under the Exchange Act, if any, is required in connection with such sale or transfer, such filing shall include a statement to the effect that the sale or transfer was made pursuant to such Existing Plan; |
| (l) | the exchange of any units of Foundation Technology Worldwide LLC (or securities convertible into or exercisable or exchangeable for units of Foundation Technology Worldwide LLC) and a corresponding number of shares of Class B common stock into or for shares of Class A common stock (or securities convertible into or exercisable or exchangeable for Class A common stock pursuant to the New LLC Agreement, as defined and described in the Prospectus); provided locked-up party or us regarding the exchange, such announcement or filing shall include a statement to the effect that such exchange occurred pursuant to the New LLC Agreement among us and certain owners of Foundation Technology Worldwide LLC and no transfer of the shares of Class A common stock or other securities received upon exchange may be made during the restricted period; |
| (m) | the transfer, conversion, reclassification, redemption or exchange of any securities pursuant to the reorganization transactions described in the Prospectus; provided provided further locked-up party or us regarding the transfer, conversion, reclassification, redemption or exchange, as applicable, such announcement or filing shall include a statement to the effect that such transfer, conversion, reclassification, redemption or exchange, occurred pursuant to the Amended and Restated Foundation Technology Worldwide LLC Operating Agreement and no transfer of the shares of Class A common stock or other securities received upon exchange may be made during the restricted period; |
| (n) | for certain shareholders, pledges to any third-party pledgee in a bona fide locked-up party and/or its affiliates or any similar arrangement relating to a financing agreement for the benefit of thelocked-up party and/or its affiliates,provided |
| (o) | the transfer of the locked-up party’s securities pursuant to the terms of the underwriting agreement and to the underwriters in connection with this offering contemplated by the underwriting agreement; and |
| (p) | the transfer of the locked-up party’s securities to us or any of our subsidiaries in the manner described in “Use of Proceeds” in the Prospectus. |
provided
lock-up
letter substantially in the form of this letter; andprovided, further,
196
Confidential Treatment Requested by McAfee Corp.
Pursuant to 17 C.F.R. Section 200.83
(m), no filing under Section 16(a) of the Exchange Act, reporting a reduction in beneficial ownership of shares of Common Stock or other Securities, shall be required or shall be voluntarily made during the restricted period, other than a filing on Form 5 made after the expiration of the restricted period.
The lockup restrictions described above to not apply to us with respect to certain transactions including (A) the sale of our Class A common stock to the underwriters pursuant to the underwriting agreement, (B) the issuance of Common Stock or other securities to effect the Reorganization Transactions, (C) the issuance by us of shares of common stock upon the exercise of an option or warrant or the conversion of a security outstanding on the date hereof as described in this prospectus, (D) facilitating the establishment of a trading plan on be half of our shareholders, officers or directors pursuant to Rulethat (i) such plan does not provide for the transfer of common stock during the restricted period and (ii) to the extent a public announcement or filing under the Exchange Act, if any, is required of or voluntarily made by us regarding the establishment of such plan, such announcement or filing shall include a statement to the effect that no transfer of common stock may be made under such plan during the restricted period, (E) the grant by us of awards under equity incentive plans (including employee stock purchase plans) or other similar arrangements, so long as each plan or arrangement is disclosed in this prospectus, (F) the filing of a registration statement on Formthat the aggregate amounts of securities (on an as converted, as exercised or as exchanged basis) that we may sell or issue or agree to sell or issue pursuant to clause (H) shall not exceed 10% of our total number of common stock issued and outstanding immediately following the completion of the transactions contemplated by the underwriting agreement determined on a fully diluted basis, andthat in the case of clauses (F) and (H), any recipients of such shares of common stock shall deliver a
10b5-1
under the Exchange Act for the transfer of shares of Common Stock,provided
S-8
(or equivalent form) with the Commission in connection with our employee stock compensation plan or agreement, which plan or agreement is disclosed in this prospectus, (G) the issuance of securities by us in exchange for securities of Foundation Technology Worldwide LLC pursuant to the terms of the limited liability company agreement of Foundation Technology Worldwide LLC (as amended from time to time), and (H) the issuance of shares of common stock or other securities (including securities convertible into shares of common stock) in connection with the acquisition by us or any of its subsidiaries of the securities, businesses, joint ventures, products or technologies, properties or other assets of another person or entity or pursuant to any equity incentive plan or arrangement, or any employee benefit plan, assumed by us in connection with any such transaction (or any equity incentive plan or arrangement, or any employee benefit plan, to the extent used to issue awards substitute awards or securities related to any such transaction);provided
provided further
“lock-up”
agreement to .Morgan Stanley & Co. LLC and Goldman Sachs & Co. LLC, in their sole discretion, may release the common stock and other securities subject to the
lock-up
agreements described above in whole or in part at any time.In the case of certain shareholders, if, prior to the expiration of the restricted period, the consent of Morgan Stanley & Co. LLC and Goldman Sachs & Co. LLC on behalf of the underwriters to release any securities held by any directors, officers, shareholders of 1% or more of our securities or units (or securities convertible into or exercisable or exchangeable for units of Foundation Technology Worldwide LLC), or any combination thereof from the restrictions of anybasis, such number of securities being the total number of securities held by the
lock-up
arrangement similar to that set forth in thelock-up
agreement (any such release being a “Triggering Release” and such party receiving such release a “Triggering Release Party”), then a number of thelocked-up
party’s securities subject to this agreement shall also be released from the restrictions set forth herein on apro rata
locked-up
party on the date of the Triggering Release with respect to us that are subject to this agreement multiplied by a fraction, the numerator of which shall be the number of securities of us, as applicable, released pursuant to the Triggering Release and the denominator of which shall be the total number of our securities, held by the Triggering Release Party on such date. Notwithstanding the foregoing, such Triggering Release shall not be applied (a) if the aggregate number of shares of Common Stock affected by such discretionary release, waiver, or termination, in whole or in part, is less than or equal to 1.0% of the fully-diluted capitalization of the Company as measured immediately prior to the consummation of this offering; (b) with respect to any release granted to one of our director’s or officer’ due to financial hardship, as determined by Morgan Stanley & Co. LLC and Goldman Sachs & Co. LLC in their sole discretion; or (c) in the event of any primary or secondary public197
Confidential Treatment Requested by McAfee Corp.
Pursuant to 17 C.F.R. Section 200.83
offering or sale that is underwritten, or the Underwritten Saleof Common Stock during the restricted period; provided that if the
,
locked-up
party has a contractual right to demand or require the registration oflocked-up
party’s Common Stock or otherwise “piggyback” on a registration statement filed by us for the offer and sale of its Common Stock, thelocked-up
party is offered the opportunity to participate on a pro rata basis in the Underwritten Sale consistent with such contractual rights and thelocked-up
party is released from its lockup restrictions set forth herein to the extent of thelocked-up
party’s participation in such Underwritten Sale or such contractual rights are waived pursuant to the terms thereof. In the event of a Triggering Release, the Company shall use commercially reasonable efforts to notify the locked- up party within five (5) business days of the occurrence of such Triggering Release, which notification obligation may be satisfied by the issuance of a press release through a major news service, or on a Form8-K,
announcing such Triggering Release; provided that the failure by the Company to give such notice shall not give rise to any claim or liability against us or , except, in respect of us, in the case of bad faith on the part of us.In order to facilitate the offering of the Class A common stock, the underwriters may engage in transactions that stabilize, maintain, or otherwise affect the price of the Class A common stock. Specifically, the underwriters may sell more shares than they are obligated to purchase under the underwriting agreement, creating a short position. A short sale is covered if the short position is no greater than the number of shares available for purchase by the underwriters under the option. The underwriters can close out a covered short sale by exercising the option or purchasing shares in the open market. In determining the source of shares to close out a covered short sale, the underwriters will consider, among other things, the open market price of shares compared to the price available under the option. The underwriters may also sell shares in excess of the option, creating a naked short position. The underwriters must close out any naked short position by purchasing shares in the open market. A naked short position is more likely to be created if the underwriters are concerned that there may be downward pressure on the price of the Class A common stock in the open market after pricing that could adversely affect investors who purchase in this offering. As an additional means of facilitating this offering, the underwriters may bid for, and purchase, shares of Class a common stock in the open market to stabilize the price of the Class A common stock. These activities may raise or maintain the market price of the Class A common stock above independent market levels or prevent or retard a decline in the market price of the Class A common stock. The underwriters are not required to engage in these activities and may end any of these activities at any time.
We, the selling stockholders, and the underwriters have agreed to indemnify each other against certain liabilities, including liabilities under the Securities Act.
A prospectus in electronic format may be made available on websites maintained by one or more underwriters, or selling group members, if any, participating in this offering. The representative may agree to allocate a number of shares of Class A common stock to underwriters for sale to their online brokerage account holders. Internet distributions will be allocated by the representative to underwriters that may make Internet distributions on the same basis as other allocations.
The underwriters and their respective affiliates are full service financial institutions engaged in various activities, which may include securities trading, commercial and investment banking, financial advisory, investment management, investment research, principal investment, hedging, financing, and brokerage activities. Certain of the underwriters and their respective affiliates have, from time to time, performed, and may in the future perform, various financial advisory and investment banking services for us, for which they received or will receive customary fees and expenses.
In addition, in the ordinary course of their various business activities, the underwriters and their respective affiliates may make or hold a broad array of investments and actively trade debt and equity securities (or related derivative securities) and financial instruments (including bank loans) for their own account and for the accounts of their customers and may at any time hold long and short positions in such securities and instruments. Such investment and securities activities may involve our securities and instruments. The underwriters and their respective affiliates may also make investment recommendations or publish or express independent research views in respect of such securities or instruments and may at any time hold, or recommend to clients that they acquire, long or short positions in such securities and instruments.
198
Confidential Treatment Requested by McAfee Corp.
Pursuant to 17 C.F.R. Section 200.83
Conflicts of Interest
Affiliates of TPG beneficially own in excess of 10% of our issued and outstanding common stock. Because TPG Capital BD, LLC, an affiliate of TPG, is an underwriter in this offering and its affiliates own in excess of 10% of our issued and outstanding common stock, TPG Capital BD, LLC is deemed to have a “conflict of interest” under Rule 5121. Accordingly, this offering is being made in compliance with the requirements of Rule 5121. Pursuant to that rule, the appointment of a “qualified independent underwriter” is not required in connection with this offering as the member primarily responsible for managing the public offering does not have a conflict of interest, is not an affiliate of any member that has a conflict of interest and meets the requirements of paragraph (f)(12)(E) of Rule 5121. TPG Capital BD, LLC will not confirm sales of the securities to any account over which it exercises discretionary authority without the specific written approval of the account holder.
Selling Restrictions
European Economic Area and United Kingdom
In relation to each Member State of the European Economic Area and the United Kingdom (each a “Relevant State”), no shares of our Class A common stock have been offered or will be offered pursuant to this offering to the public in that Relevant State prior to the publication of a prospectus in relation to shares of our Class A common stock which has been approved by the competent authority in that Relevant State or, where appropriate, approved in another Relevant State and notified to the competent authority in that Relevant State, all in accordance with the Prospectus Regulation, except that offers of shares of our Class A common stock may be made to the public in that Relevant State at any time under the following exemptions under the Prospectus Regulation:
| • | to any legal entity which is a qualified investor as defined in the Prospectus Regulation; |
| • | to fewer than 150 natural or legal persons (other than qualified investors as defined in the Prospectus Regulation), subject to obtaining the prior consent of the representative for any such offer; or |
| • | In any other circumstances falling within Article 1(4) of the Prospectus Regulation; |
provided that no such offer of shares of our Class A common stock shall require us or any underwriter to publish a prospectus pursuant to Article 3 of the Prospectus Regulation or supplement a prospectus pursuant to Article 23 of the Prospectus Regulation.
For the purposes of this provision, the expression an “offer to the public” in relation to any shares of our Class A common stock in any Relevant State means the communication in any form and by any means of sufficient information on the terms of the offer and any shares of our Class A common stock to be offered so as to enable an investor to decide to purchase or subscribe for any shares of our Class A common stock, and the expression “Prospectus Regulation” means Regulation (EU) 2017/1129.
This European Economic Area selling restriction is in addition to any other selling restrictions set out below.
United Kingdom
Each underwriter has represented and agreed that:
| (a) | it has only communicated or caused to be communicated and will only communicate or cause to be communicated an invitation or inducement to engage in investment activity (within the meaning of Section 21 of the Financial Services and Markets Act 2000 (“FSMA”)) received by it in connection with the issue or sale of the shares of Class A common stock in circumstances in which Section 21(1) of the FSMA does not apply to the company or the selling stockholders; and |
199
Confidential Treatment Requested by McAfee Corp.
Pursuant to 17 C.F.R. Section 200.83
| (b) | it has complied and will comply with all applicable provisions of the FSMA with respect to anything done by it in relation to the shares of Class A common stock in, from or otherwise involving the United Kingdom. |
In the United Kingdom, this prospectus is only addressed to and directed at qualified investors who are (i) investment professionals falling within Article 19(5) of the Financial Services and Markets Act 2000 (Financial Promotion) Order 2005 (the Order); or (ii) high net worth entities and other persons to whom it may lawfully be communicated, falling within Article 49(2)(a) to (d) of the Order (all such persons together being referred to as “relevant persons”). Any investment or investment activity to which this prospectus relates is available only to relevant persons and will only be engaged with relevant persons. Any person who is not a relevant person should not act or rely on this prospectus or any of its contents.
Canada
The shares of our Class A common stock may be sold in Canada only to purchasers purchasing, or deemed to be purchasing, as principal that are accredited investors, as defined in National Instrument
45-106
Prospectus Exemptions or subsection 73.3(1) of the Securities Act (Ontario), and are permitted clients, as defined in National Instrument31-103
Registration Requirements, Exemptions, and Ongoing Registrant Obligations. Any resale of the Class A common stock must be made in accordance with an exemption from, or in a transaction not subject to, the prospectus requirements of applicable securities laws.Securities legislation in certain provinces or territories of Canada may provide a purchaser with remedies for rescission or damages if this prospectus (including any amendment thereto) contains a misrepresentation, provided that the remedies for rescission or damages are exercised by the purchaser within the time limit prescribed by the securities legislation of the purchaser’s province or territory. The purchaser should refer to any applicable provisions of the securities legislation of the purchaser’s province or territory of these rights or consult with a legal advisor.
Pursuant to section 3A.3 of National Instrument
33-105
Underwriting Conflicts (NI33-105),
the underwriters are not required to comply with the disclosure requirements of NI33-105
regarding underwriter conflicts of interest in connection with this offering.Hong Kong
The shares of our Class A common stock may not be offered or sold in Hong Kong by means of any document other than (i) in circumstances which do not constitute an offer to the public within the meaning of the Companies (Winding Up and Miscellaneous Provisions) Ordinance (Cap. 32 of the Laws of Hong Kong) (“Companies (Winding Up and Miscellaneous Provisions) Ordinance”) or which do not constitute an invitation to the public within the meaning of the Securities and Futures Ordinance (Cap. 571 of the Laws of Hong Kong) (“Securities and Futures Ordinance”), (ii) to “professional investors” as defined in the Securities and Futures Ordinance and any rules made thereunder, or (iii) in other circumstances which do not result in the document being a “prospectus” as defined in the Companies (Winding Up and Miscellaneous Provisions) Ordinance, and no advertisement, invitation or document relating to the Class A common stock may be issued or may be in the possession of any person for the purpose of issue (in each case whether in Hong Kong or elsewhere), which is directed at, or the contents of which are likely to be accessed or read by, the public in Hong Kong (except if permitted to do so under the securities laws of Hong Kong) other than with respect to shares of Class A common stock which are or are intended to be disposed of only to persons outside Hong Kong or only to “professional investors” in Hong Kong as defined in the Securities and Futures Ordinance and any rules made thereunder.
Singapore
This prospectus has not been registered as a prospectus with the Monetary Authority of Singapore. Accordingly, this prospectus and any other document or material in connection with the offer or sale, or
200
Confidential Treatment Requested by McAfee Corp.
Pursuant to 17 C.F.R. Section 200.83
invitation for subscription or purchase, of the Class A common stock may not be circulated or distributed, nor may the Class A common stock be offered or sold, or be made the subject of an invitation for subscription or purchase, whether directly or indirectly, to persons in Singapore other than (i) to an institutional investor (as defined under Section 4A of the Securities and Futures Act, Chapter 289 of Singapore (the “SFA”)) under Section 274 of the SFA, (ii) to a relevant person (as defined in Section 275(2) of the SFA) pursuant to Section 275(1) of the SFA, or any person pursuant to Section 275(1A) of the SFA, and in accordance with the conditions specified in Section 275 of the SFA or (iii) otherwise pursuant to, and in accordance with the conditions of, any other applicable provision of the SFA, in each case subject to conditions set forth in the SFA.
Where the shares of Class A common stock are subscribed or purchased under Section 275 of the SFA by a relevant person which is a corporation (which is not an accredited investor (as defined in Section 4A of the SFA)) the sole business of which is to hold investments and the entire share capital of which is owned by one or more individuals, each of whom is an accredited investor, the securities (as defined in Section 239(1) of the SFA) of that corporation shall not be transferable for 6 months after that corporation has acquired the shares under Section 275 of the SFA except: (1) to an institutional investor under Section 274 of the SFA or to a relevant person (as defined in Section 275(2) of the SFA), (2) where such transfer arises from an offer in that corporation’s securities pursuant to Section 275(1A) of the SFA, (3) where no consideration is or will be given for the transfer, (4) where the transfer is by operation of law, (5) as specified in Section 276(7) of the SFA, or (6) as specified in Regulation 32 of the Securities and Futures (Offers of Investments) (Shares and Debentures) Regulations 2005 of Singapore (“Regulation 32”).
Where the shares of Class A common stock are subscribed or purchased under Section 275 of the SFA by a relevant person which is a trust (where the trustee is not an accredited investor (as defined in Section 4A of the SFA)) whose sole purpose is to hold investments and each beneficiary of the trust is an accredited investor, the beneficiaries’ rights and interest (howsoever described) in that trust shall not be transferable for 6 months after that trust has acquired the shares under Section 275 of the SFA except: (1) to an institutional investor under Section 274 of the SFA or to a relevant person (as defined in Section 275(2) of the SFA), (2) where such transfer arises from an offer that is made on terms that such rights or interest are acquired at a consideration of not less than S$200,000 (or its equivalent in a foreign currency) for each transaction (whether such amount is to be paid for in cash or by exchange of securities or other assets), (3) where no consideration is or will be given for the transfer, (4) where the transfer is by operation of law, (5) as specified in Section 276(7) of the SFA, or (6) as specified in Regulation 32.
Solely for the purposes of our obligations pursuant to Section 309B of the SFA, we have determined, and hereby notify all relevant persons (as defined in the Securities and Futures (Capital Markets Products) Regulations 2018 (“CMP Regulations”)) that the shares of Class common stock are “prescribed capital markets products” (as defined in the CMP Regulations) and Excluded Investment Products (as defined in MAS Notice SFA
04-N12:
Notice on the Sale of Investment Products and MAS NoticeFAA-N16:
Notice on Recommendations on Investment Products).Japan
The shares of Class A common stock have not been and will not be registered under the Financial Instruments and Exchange Act of Japan (Act No. 25 of 1948, as amended), or the FIEA. The shares of Class A common stock may not be offered or sold, directly or indirectly, in Japan or to or for the benefit of any resident of Japan (including any person resident in Japan or any corporation or other entity organized under the laws of Japan) or to others for reoffering or resale, directly or indirectly, in Japan or to or for the benefit of any resident of Japan, except pursuant to an exemption from the registration requirements of the FIEA and otherwise in compliance with any relevant laws and regulations of Japan.
201
Confidential Treatment Requested by McAfee Corp.
Pursuant to 17 C.F.R. Section 200.83
Australia
This prospectus:
| • | does not constitute a disclosure document or a prospectus under Chapter 6D.2 of the Corporations Act 2001 (Cth) (the “Corporations Act”); |
| • | has not been, and will not be, lodged with the Australian Securities and Investments Commission (“ASIC”), as a disclosure document for the purposes of the Corporations Act and does not purport to include the information required of a disclosure document for the purposes of the Corporations Act; and |
| • | may only be provided in Australia to select investors who are able to demonstrate that they fall within one or more of the categories of investors, available under section 708 of the Corporations Act (“Exempt Investors”). |
The Class A common stock may not be directly or indirectly offered for subscription or purchased or sold, and no invitations to subscribe for or buy the Class A common stock may be issued, and no draft or definitive offering memorandum, advertisement or other offering material relating to any Class A common stock may be distributed in Australia, except where disclosure to investors is not required under Chapter 6D of the Corporations Act or is otherwise in compliance with all applicable Australian laws and regulations. By submitting an application for the Class A common stock, you represent and warrant to us that you are an Exempt Investor.
As any offer of Class A common stock under this document will be made without disclosure in Australia under Chapter 6D.2 of the Corporations Act, the offer of those securities for resale in Australia within 12 months may, under section 707 of the Corporations Act, require disclosure to investors under Chapter 6D.2 if none of the exemptions in section 708 applies to that resale. By applying for the Class A common stock you undertake to us that you will not, for a period of 12 months from the date of sale of the Class A common stock, offer, transfer, assign or otherwise alienate those Class A common stock to investors in Australia except in circumstances where disclosure to investors is not required under Chapter 6D.2 of the Corporations Act or where a compliant disclosure document is prepared and lodged with ASIC.
Brazil
The offer and sale of our Class A common stock has not been, and will not be, registered (or exempted from registration) with the Brazilian Securities Commission (Comissão de Valores Mobiliários – CVM) and, therefore, will not be carried out by any means that would constitute a public offering in Brazil under Law No. 6,385, of December 7, 1976, as amended, under CVM Rule No. 400, of December 29, 2003, as amended, or under CVM Rule No. 476, of January 16, 2009, as amended. Any representation to the contrary is untruthful and unlawful. As a consequence, our Class A common stock cannot be offered and sold in Brazil or to any investor resident or domiciled in Brazil. Documents relating to the offering of our Class A common stock, as well as information contained therein, may not be supplied to the public in Brazil, nor used in connection with any public offer for subscription or sale of Class A common stock to the public in Brazil.
China
This prospectus will not be circulated or distributed in the People’s Republic of China (“PRC”) and the Class A common stock will not be offered or sold and will not be offered or sold to any person for
re-offering
or resale directly or indirectly to any residents of the PRC except pursuant to any applicable laws and regulations of the PRC. Neither this prospectus nor any advertisement or other offering material may be distributed or published in the PRC, except under circumstances that will result in compliance with applicable laws and regulations.202
Confidential Treatment Requested by McAfee Corp.
Pursuant to 17 C.F.R. Section 200.83
France
Neither this prospectus nor any other offering material relating to the Class A common stock offered by this prospectus has been and will not be submitted to the clearance procedures of the Autorité des Marchés Financiers or of the competent authority of another member state of the European Economic Area and notified to the Autorité des Marchés Financiers. The Class A common stock has not been offered or sold and will not be offered or sold, directly or indirectly, to the public in France. Neither this prospectus nor any other offering material relating to the Class A common stock has been or will be:
| a) | released, issued, distributed or caused to be released, issued or distributed to the public in France; |
| b) | used in connection with any offer for subscription or sale of the notes to the public in France. |
Such offers, sales and distributions will be made in France only:
| c) | to qualified investors (investisseurs qualifiés) and/or to a restricted circle of investors (cercle restreint d’investisseurs), in each case acting for their own account, or otherwise in circumstances in which no offer to the public occurs, all as defined in and in accordance with Articles L.411-2, D.411-1, D.411-2, D.734-1, D.744-1, D.754-1 andD.764-1 of the French Code monétaire et financier; |
| d) | to investment services providers authorized to engage in portfolio management on behalf of third parties; or |
| e) | in a transaction that, in accordance with Article L.411-2-I-1°-or-2° -or 3° of the French Code monétaire et financier and Article211-2 of the General Regulations (Règlement Général) of the Autorité des Marchés Financiers, does not constitute a public offer (offre au public). |
The Class A common stock may not be distributed directly or indirectly to the public except in accordance with Articlesof the French Code monétaire et financier and applicable regulations thereunder.
L.411-1,
L.411-2,
L.412-1
andL.621-8
throughL.621-8-3
Kuwait
The shares of our Class A common stock has not been authorized or licensed for offering, marketing or sale in the State of Kuwait. The distribution of this prospectus and the offering and sale of the Class A common stock in the State of Kuwait is restricted by law unless a license is obtained from the Kuwait Ministry of Commerce and Industry in accordance with Law 31 of 1990. Persons into whose possession this prospectus comes are required by us and the international underwriters to inform themselves about and to observe such restrictions. Investors in the State of Kuwait who approach us or any of the international underwriters to obtain copies of this prospectus are required by us and the international underwriters to keep such prospectus confidential and not to make copies thereof or distribute the same to any other person and are also required to observe the restrictions provided for in all jurisdictions with respect to offering, marketing and the sale of the Class A common stock.
Qatar
The shares of our Class A common stock described in this prospectus have not been, and will not be, offered, sold or delivered, at any time, directly or indirectly in the State of Qatar in a manner that would constitute a public offering. This prospectus has not been, and will not be, registered with or approved by the Qatar Financial Markets Authority or Qatar Central Bank and may not be publicly distributed. This prospectus is intended for the original recipient only and must not be provided to any other person. It is not for general circulation in the State of Qatar and may not be reproduced or used for any other purpose.
Saudi Arabia
This document may not be distributed in the Kingdom of Saudi Arabia except to such persons as are permitted under the Offers of Securities Regulations as issued by the board of the Saudi Arabian Capital Market
203
Confidential Treatment Requested by McAfee Corp.
Pursuant to 17 C.F.R. Section 200.83
Authority (“CMA”) pursuant to resolution numberdated 4 October 2004 as amended by resolution numberas amended (the “CMA Regulations”). The CMA does not make any representation as to the accuracy or completeness of this document and expressly disclaims any liability whatsoever for any loss arising from, or incurred in reliance upon, any part of this document. Prospective purchasers of the securities offered hereby should conduct their own due diligence on the accuracy of the information relating to the securities. If you do not understand the contents of this document, you should consult an authorized financial adviser.
2-11-2004
1-28-2008,
Switzerland
This prospectus is not intended to constitute an offer or solicitation to purchase or invest in the Class A common stock. The Class A common stock may not be publicly offered, directly or indirectly, in Switzerland within the meaning of the Swiss Financial Services Act (“FinSA”) and will not be listed on the SIX Swiss Exchange (“SIX”) or on any other stock exchange or regulated trading venue (exchange or multilateral trading facility) in Switzerland. This document does not constitute a prospectus within the meaning of, and has been prepared without regard to, the disclosure standards for issuance prospectuses under art. 652a or art. 1156 of the Swiss Code of Obligations or the disclosure standards for listing prospectuses under art. 27 ff. of the SIX Listing Rules or the listing rules of any other stock exchange or regulated trading venue (exchange or multilateral trading facility) in Switzerland. Neither this document nor any other offering or marketing material relating to the Class A common stock constitutes a prospectus pursuant to the FinSA, and neither this document nor any other offering or marketing material relating to the Class A common stock or the offering may be publicly distributed or otherwise made publicly available in Switzerland.
Neither this document nor any other offering or marketing material relating to the offering, the Company, or the Class A common stock have been or will be filed with or approved by any Swiss regulatory authority. In particular, this document will not be filed with, and the offer of Class A common stock will not be supervised by, the Swiss Financial Market Supervisory Authority FINMA (FINMA), and the offer of Class A common stock has not been and will not be authorized under the Swiss Federal Act on Collective Investment Schemes (“CISA”). The investor protection afforded to acquirers of interests in collective investment schemes under the CISA does not extend to acquirers of Class A common stock.
United Arab Emirates
The shares of our Class A common stock have not been, and are not being, publicly offered, sold, promoted or advertised in the United Arab Emirates (including the Dubai International Financial Centre) other than in compliance with the laws of the United Arab Emirates (and the Dubai International Financial Centre) governing the issue, offering and sale of securities. Further, this prospectus does not constitute a public offer of securities in the United Arab Emirates (including the Dubai International Financial Centre) and is not intended to be a public offer. This prospectus has not been approved by or filed with the Central Bank of the United Arab Emirates, the Securities and Commodities Authority or the Dubai Financial Services Authority.
Chile
The shares of our Class A common stock are not registered in the Securities Registry (Registro de Valores) or subject to the control of the Chilean Securities and Exchange Commission (Superintendencia de Valores y Seguros de Chile). This prospectus supplement and other offering materials relating to the offer of the shares do not constitute a public offer of, or an invitation to subscribe for or purchase, the shares in the Republic of Chile, other than to individually identified purchasers pursuant to a private offering within the meaning of Article 4 of the Chilean Securities Market Act (Ley de Mercado de Valores) (an offer that is not “addressed to the public at large or to a certain sector or specific group of the public”).
Bermuda
The shares of our Class A common stock may be offered or sold in Bermuda only in compliance with the provisions of the Investment Business Act of 2003 of Bermuda which regulates the sale of securities in Bermuda.
204
Confidential Treatment Requested by McAfee Corp.
Pursuant to 17 C.F.R. Section 200.83
Additionally,
non-Bermudian
persons (including companies) may not carry on or engage in any trade or business in Bermuda unless such persons are permitted to do so under applicable Bermuda legislation.British Virgin Islands
The shares of our Class A common stock are not being and may not be offered to the public or to any person in the British Virgin Islands for purchase or subscription by or on our behalf. The Class A common stock may be offered to companies incorporated under the BVI Business Companies Act, 2004 (British Virgin Islands) (each a “BVI Company”), but only where the offer will be made to, and received by, the relevant BVI Company entirely outside of the British Virgin Islands.
This prospectus has not been, and will not be, registered with the Financial Services Commission of the British Virgin Islands. No registered prospectus has been or will be prepared in respect of the Class A common stock for the purposes of the Securities and Investment Business Act, 2010 or the Public Issuers Code of the British Virgin Islands.
Korea
The shares of our Class A common stock have not been and will not be registered under the Financial Investments Services and Capital Markets Act of Korea and the decrees and regulations thereunder (the “FSCMA”), and the shares have been and will be offered in Korea as a private placement under the FSCMA. None of the Class A common stock may be offered, sold or delivered directly or indirectly, or offered or sold to any person for
re-offering
or resale, directly or indirectly, in Korea or to any resident of Korea except pursuant to the applicable laws and regulations of Korea, including the FSCMA and the Foreign Exchange Transaction Law of Korea and the decrees and regulations thereunder (the “FETL”). Furthermore, the purchaser of the shares shall comply with all applicable regulatory requirements (including but not limited to requirements under the FETL) in connection with the purchase of the shares. By the purchase of the shares, the relevant holder thereof will be deemed to represent and warrant that if it is in Korea or is a resident of Korea, it purchased the shares pursuant to the applicable laws and regulations of Korea.Malaysia
No prospectus or other offering material or document in connection with the offer and sale of the shares of our Class A common stock has been or will be registered with the Securities Commission of Malaysia (“Commission”) for the Commission’s approval pursuant to the Capital Markets and Services Act 2007. Accordingly, this prospectus and any other document or material in connection with the offer or sale, or invitation for subscription or purchase, of the shares of our Class A common stock may not be circulated or distributed, nor may the shares be offered or sold, or be made the subject of an invitation for subscription or purchase, whether directly or indirectly, to persons in Malaysia other than (i) a closed end fund approved by the Commission; (ii) a holder of a Capital Markets Services License; (iii) a person who acquires the shares, as principal, if the offer is on terms that the shares may only be acquired at a consideration of not less than RM250,000 (or its equivalent in foreign currencies) for each transaction; (iv) an individual whose total net personal assets or total net joint assets with his or her spouse exceeds RM3 million (or its equivalent in foreign currencies), excluding the value of the primary residence of the individual; (v) an individual who has a gross annual income exceeding RM300,000 (or its equivalent in foreign currencies) per annum in the preceding 12 months; (vi) an individual who, jointly with his or her spouse, has a gross annual income of RM400,000 (or its equivalent in foreign currencies), per annum in the preceding 12 months; (vii) a corporation with total net assets exceeding RM10 million (or its equivalent in a foreign currencies) based on the last audited accounts; (viii) a partnership with total net assets exceeding RM10 million (or its equivalent in foreign currencies); (ix) a bank licensee or insurance licensee as defined in the Labuan Financial Services and Securities Act 2010; (x) an Islamic bank licensee or takaful licensee as defined in the Labuan Financial Services and Securities Act 2010; and (xi) any other person as may be specified by the Commission; provided that, in the each of the preceding
205
Confidential Treatment Requested by McAfee Corp.
Pursuant to 17 C.F.R. Section 200.83
categories (i) to (xi), the distribution of the shares is made by a holder of a Capital Markets Services License who carries on the business of dealing in securities. The distribution in Malaysia of this prospectus is subject to Malaysian laws. This prospectus does not constitute and may not be used for the purpose of public offering or an issue, offer for subscription or purchase, invitation to subscribe for or purchase any securities requiring the registration of a prospectus with the Commission under the Capital Markets and Services Act 2007.
Taiwan
The shares of our Class A common stock have not been and will not be registered with the Financial Supervisory Commission of Taiwan pursuant to relevant securities laws and regulations and may not be sold, issued or offered within Taiwan through a public offering or in circumstances which constitutes an offer within the meaning of the Securities and Exchange Act of Taiwan that requires a registration or approval of the Financial Supervisory Commission of Taiwan. No person or entity in Taiwan has been authorized to offer, sell, give advice regarding or otherwise intermediate the offering and sale of the shares our Class A common stock in Taiwan.
South Africa
Due to restrictions under the securities laws of South Africa, the shares of our Class A common stock are not offered, and the offer shall not be transferred, sold, renounced or delivered, in South Africa or to a person with an address in South Africa, unless one or other of the following exemptions applies:
| (a) | the offer, transfer, sale, renunciation or delivery is to: |
| (i) | persons whose ordinary business is to deal in securities, as principal or agent; |
| (ii) | the South African Public Investment Corporation; |
| (iii) | persons or entities regulated by the Reverse Bank of South Africa; |
| (iv) | authorized financial service providers under South African law; |
| (v) | financial institutions recognized as such under South African law; |
| (vi) | a wholly-owned subsidiary of any person or entity contemplated in (iii), (iv) or (v), acting as agent in the capacity of an authorized portfolio manager for a pension fund or collective investment scheme (in each case duly registered as such under South African law); or |
| (vii) | any combination of the person in (i) to (vi); or |
| (b) | the total contemplated acquisition cost of the securities, for any single addressee acting as principal is equal to or greater than ZAR1,000,000. |
No “offer to the public” (as such term is defined in the South African Companies Act, No. 71 of 2008 (as amended or
re-enacted)
(the “South African Companies Act”)) in South Africa is being made in connection with the issue of the Class A common stock. Accordingly, this document does not, nor is it intended to, constitute a “registered prospectus” (as that term is defined in the South African Companies Act) prepared and registered under the South African Companies Act and has not been approved by, and/or filed with, the South African Companies and Intellectual Property Commission or any other regulatory authority in South Africa. Any issue or offering of the Class A common stock in South Africa constitutes an offer of the Class A common stock in South Africa for subscription or sale in South Africa only to persons who fall within the exemption from “offers to the public” set out in Section 96(1)(a) of the South African Companies Act. Accordingly, this document must not be acted on or relied on by persons in South Africa who do not fall within Section 96(1)(a) of the South African Companies Act (such persons being referred to as “SA Relevant Persons”). Any investment or investment activity to which this document relates is available in South Africa only to SA Relevant Persons and will be engaged in South Africa only with SA Relevant Persons.206
Confidential Treatment Requested by McAfee Corp.
Pursuant to 17 C.F.R. Section 200.83
LEGAL MATTERS
The validity of the issuance of our Class A common stock offered in this prospectus will be passed upon for us by Ropes & Gray LLP, San Francisco, California. Certain legal matters in connection with this offering will be passed upon for the underwriters by Wilson Sonsini Goodrich & Rosati, Professional Corporation, Palo Alto, California. Ropes & Gray LLP and some of its attorneys are limited partners of RGIP, LP, which is an investor in certain investment funds advised by certain of our Sponsors and often a
co-investor
with such funds. RGIP, LP owns, directly or indirectly, less than 1% of our outstanding Class A common stock and Class B common stock in the aggregate.EXPERTS
The consolidated financial statements of McAfee Corp. as of December 26, 2020 and December 28, 2019 and for the years ended December 26, 2020, December 28, 2019 and December 29, 2018 included in this Prospectus have been so included in reliance on the report of PricewaterhouseCoopers LLP, an independent registered public accounting firm, given on the authority of said firm as experts in auditing and accounting.
PricewaterhouseCoopers LLP (“PwC”) completed an independence assessment to evaluate the services and relationships with McAfee Corp. (“McAfee” or the “Company”) and its affiliates that may bear on PwC’s independence under the SEC and the PCAOB (United States) independence rules. The existence of business relationships, including the performance of a management function, at controlled portfolio companies, and their controlled subsidiaries, of our indirect parent, TPG, were identified that are inconsistent with SEC and PCAOB auditor independence rules provided in Rule 2-01 of Regulation S-X and are described below. Additionally, the performance of employee activities, deemed to be management functions, and a contingent fee arrangement benefitting an upstream affiliate of the Company, were identified that are inconsistent with SEC and PCAOB auditor independence rules provided in 2-01 of Regulation S-X and are described below.
| • | From June 2017 through January 2018, a business relationship between PwC China and a controlled subsidiary, located in China, of a sister entity under common control with McAfee existed, which allowed for the joint pursuit of business opportunities. |
| • | From June 2018 through February 2019, a software reselling arrangement, deemed an impermissible business relationship, including the performance of a management function, between PwC India and a controlled subsidiary, located in India, of a sister entity under common control with McAfee existed. |
| • | From April 2017 through July 2019, PwC US provided services pursuant to a contingent fee benefitting an upstream affiliate of the Company. In July 2019, PwC US agreed to waive the fee and terminate the remaining services. |
| • | From April 2017 through December 2018 and from July 2018 through June 2019, PwC US provided non-audit services which included certain employee activities benefiting an upstream affiliate of the Company. |
| • | From October 2020 through January 15, 2021, a business relationship between PwC Australia and a sister entity under common control with McAfee existed, which allowed for the joint delivery of services to a third party client. |
PwC communicated the facts and circumstances surrounding the services and relationships, including the scope and duration of the services and business relationships, including the fees earned and the steps taken to terminate the prohibited aspect of the services and relationships to the Audit Committee of McAfee. PwC also noted that none of the matters noted have any accounting impact on the financial results of McAfee or any of its subsidiaries and, therefore, presents no self review threat. The Audit Committee and management of the Company and PwC have separately considered the impact that the business relationships and non-audit services
207
Confidential Treatment Requested by McAfee Corp.
Pursuant to 17 C.F.R. Section 200.83
may have had on PwC’s independence with respect to McAfee. Based on the totality of the information provided with respect to the impact of the contingent fee, performance of management functions and the business relationships, both PwC and the Audit Committee of McAfee individually concluded that PwC is capable of exercising objective and impartial judgment in connection with the audits of the Company’s consolidated financial statements as of December 26, 2020 and December 28, 2019 and for the years ended December 26, 2020, December 28, 2019, and December 29, 2018.
WHERE YOU CAN FIND MORE INFORMATION
We have filed with the SEC a registration statement on Form
S-1
under the Securities Act with respect to the shares of Class A common stock offered hereby. This prospectus, which constitutes a part of the registration statement, does not contain all of the information set forth in the registration statement or the exhibits filed therewith. For further information with respect to us and the Class A common stock offered hereby, please refer to the registration statement and the exhibits filed therewith. Statements contained in this prospectus regarding the contents of any contract or any other document that is filed as an exhibit to the registration statement are not necessarily complete, and each such statement is qualified in all respects by reference to the full text of such contract or other document filed as an exhibit to the registration statement. The SEC maintains a website that contains reports, proxy and information statements, and other information regarding registrants that file electronically with the SEC. The SEC’s website address is www.sec.gov.We file periodic reports, proxy statements and other information with the SEC. Such periodic reports, proxy statements and other information are available for inspection at the website of the SEC referred to above.
We also maintain a website at www.mcafee.com. You may access these materials free of charge as soon as reasonably practicable after they are electronically filed with, or furnished to, the SEC. Information contained on, or that can be accessed through, our website does not constitute a part of this prospectus or the registration statement of which this prospectus forms a part, and is not incorporated by reference herein. We have included our website address in this prospectus solely for informational purposes and you should not consider any information contained on, or that can be accessed through, our website as part of this prospectus or in deciding whether to purchase shares of our common stock.
208
Confidential Treatment Requested by McAfee Corp.
Pursuant to 17 C.F.R. Section 200.83
MCAFEE CORP.
INDEX TO FINANCIAL STATEMENTS
Page | ||||
AUDITED CONSOLIDATED FINANCIAL STATEMENTS | ||||
| F-2 | ||||
| F-4 | ||||
| F-5 | ||||
| F-6 | ||||
| F-7 | ||||
| F-8 | ||||
| F-10 | ||||
UNAUDITED CONDENSED CONSOLIDATED FINANCIAL STATEMENTS | ||||
| F-50 | ||||
| F-51 | ||||
| F-52 | ||||
| F-53 | ||||
| F-54 | ||||
| F-56 | ||||
F-1
Confidential Treatment Requested by McAfee Corp.
Pursuant to 17 C.F.R. Section 200.83
Report of Independent Registered Public Accounting Firm
To the Board of Directors and Stockholders of McAfee Corp.
Opinion on the Financial Statements
We have audited the accompanying consolidated balance sheets of McAfee Corp. and its subsidiaries (the “Company”) as of December 26, 2020 and December 28, 2019, and the related consolidated statements of operations, of comprehensive loss, of equity (deficit) and redeemable noncontrolling interests, and of cash flows for each of the three years in the period ended December 26, 2020, including the related notes (collectively referred to as the “consolidated financial statements”). In our opinion, the consolidated financial statements present fairly, in all material respects, the financial position of the Company as of December 26, 2020 and December 28, 2019, and the results of its operations and its cash flows for each of the three years in the period ended December 26, 2020 in conformity with accounting principles generally accepted in the United States of America.
Changes in Accounting Principles
As discussed in Note 1 to the consolidated financial statements, the Company changed the manner in which it accounts for leases in fiscal 2019 and the manner in which it accounts for revenues from contracts with customers in fiscal 2018.
Basis for Opinion
These consolidated financial statements are the responsibility of the Company’s management. Our responsibility is to express an opinion on the Company’s consolidated financial statements based on our audits. We are a public accounting firm registered with the Public Company Accounting Oversight Board (United States) (PCAOB) and are required to be independent with respect to the Company in accordance with the U.S. federal securities laws and the applicable rules and regulations of the Securities and Exchange Commission and the PCAOB.
We conducted our audits of these consolidated financial statements in accordance with the standards of the PCAOB. Those standards require that we plan and perform the audit to obtain reasonable assurance about whether the consolidated financial statements are free of material misstatement, whether due to error or fraud.
Our audits included performing procedures to assess the risks of material misstatement of the consolidated financial statements, whether due to error or fraud, and performing procedures that respond to those risks. Such procedures included examining, on a test basis, evidence regarding the amounts and disclosures in the consolidated financial statements. Our audits also included evaluating the accounting principles used and significant estimates made by management, as well as evaluating the overall presentation of the consolidated financial statements. We believe that our audits provide a reasonable basis for our opinion.
Critical Audit Matters
The critical audit matter communicated below is a matter arising from the current period audit of the consolidated financial statements that was communicated or required to be communicated to the audit committee and that (i) relates to accounts or disclosures that are material to the consolidated financial statements and (ii) involved our especially challenging, subjective, or complex judgments. The communication of critical audit matters does not alter in any way our opinion on the consolidated financial statements, taken as a whole, and we are not, by communicating the critical audit matter below, providing a separate opinion on the critical audit matter or on the accounts or disclosures to which it relates.
F-2
Confidential Treatment Requested by McAfee Corp.
Pursuant to 17 C.F.R. Section 200.83
Revenue Recognition - Identification and Satisfaction of Performance Obligations
As described in Note 1 to the consolidated financial statements, the Company derives revenue from the sale of security products, subscriptions, software as a service (“SaaS”) offerings, support and maintenance, professional services, or a combination of these items. The Company’s revenue was $2,906 million for the year ended December 26, 2020. At contract inception, management assesses the goods and services promised in contracts with customers and identifies a performance obligation that is distinct and separately identifiable from other items in a bundled package and if a customer can benefit from it on its own or together with other resources. Determining whether products and services are considered distinct performance obligations or should be combined to create a single performance obligation may require significant judgment by management. Determining the nature and timing of satisfaction of performance obligations often involves significant judgment. On March 6, 2021, subsequent to the initial issuance of the December 26, 2020 financial statements, the Company entered into a definitive agreement to sell certain Enterprise Business assets and liabilities. As a result, the results of the Enterprise Business were reclassified as discontinued operations in the consolidated statements of operations and excluded from continuing operations for all periods presented. Therefore, the Company’s revenue of $2,906 million for the year ended December 26, 2020 is comprised of $1,558 million from continuing operations and $1,348 million from discontinued operations.
The principal considerations for our determination that performing procedures relating to revenue recognition - identification and satisfaction of performance obligations, is a critical audit matter are the significant judgment by management in identifying performance obligations and determining the nature and timing of satisfaction of performance obligations in contracts with customers, which in turn led to significant auditor judgment, subjectivity and effort in performing procedures and evaluating audit evidence related to whether performance obligations were appropriately identified and accounted for by management.
Addressing the matter involved performing procedures and evaluating audit evidence in connection with forming our overall opinion on the consolidated financial statements. These procedures included, among others, examining revenue contracts on a test basis and evaluating management’s identification of performance obligations and determination of the nature and timing of the satisfaction of performance obligations.
/s/ PricewaterhouseCoopers LLP
Dallas, Texas
March 1, 2021, except for the effects of discontinued operations discussed in Note 1 to the consolidated financial statements, as to which the date is August 2, 2021
We have served as the Company’s or its predecessor’s auditor since 2017.
F-3
Confidential Treatment Requested by McAfee Corp.
Pursuant to 17 C.F.R. Section 200.83
MCAFEE CORP.
CONSOLIDATED BALANCE SHEETS
(in millions, except share and per share amounts)
December 28, 2019 | December 26, 2020 | |||||||
Assets | ||||||||
Current assets: | ||||||||
Cash and cash equivalents | $ | 167 | $ | 231 | ||||
Accounts receivable, net | 70 | 102 | ||||||
Deferred costs | 111 | 137 | ||||||
Other current assets | 49 | 42 | ||||||
Current assets of discontinued operations | 434 | 402 | ||||||
Total current assets | 831 | 914 | ||||||
Property and equipment, net | 115 | 115 | ||||||
Goodwill | 1,018 | 1,018 | ||||||
Identified intangible assets, net | 980 | 729 | ||||||
Deferred tax assets | 21 | 24 | ||||||
Other long-term assets | 58 | 68 | ||||||
Long-term assets of discontinued operations | 2,765 | 2,560 | ||||||
Total assets | $ | 5,788 | $ | 5,428 | ||||
Liabilities, redeemable noncontrolling interests and deficit | ||||||||
Current liabilities: | ||||||||
Accounts payable and other current liabilities | $ | 145 | $ | 227 | ||||
Accrued compensation and benefits | 188 | 179 | ||||||
Accrued marketing | 87 | 118 | ||||||
Income taxes payable | 15 | 14 | ||||||
Long-term debt, current portion | 43 | 44 | ||||||
Lease liabilities, current portion | 13 | 10 | ||||||
Deferred revenue | 710 | 823 | ||||||
Current liabilities of discontinued operations | 959 | 970 | ||||||
Total current liabilities | 2,160 | 2,385 | ||||||
Long-term debt, net | 4,669 | 3,943 | ||||||
Deferred tax liabilities | 156 | 5 | ||||||
Other long-term liabilities | 119 | 153 | ||||||
Deferred revenue, less current portion | 67 | 80 | ||||||
Long-term liabilities of discontinued operations | 711 | 662 | ||||||
Total liabilities | 7,882 | 7,228 | ||||||
Commitments and contingencies (Note 19) | 0 | 0 | ||||||
Redeemable noncontrolling interests | — | 4,840 | ||||||
Equity (deficit): | ||||||||
Members’ deficit | (647 | ) | — | |||||
Class A common stock, $0.001 par value—1,500,000,000 shares authorized, 161,267,412 shares issued and outstanding as of December 26, 2020 | 0 | 0 | ||||||
Class B common stock, $0.001 par value—300,000,000 shares authorized, 267,065,127 shares issued and outstanding as of December 26, 2020 | 0 | 0 | ||||||
Additional paid-in capital | — | (6,477 | ) | |||||
Accumulated deficit | (1,385 | ) | (118 | ) | ||||
Accumulated other comprehensive loss | (62 | ) | (45 | ) | ||||
Total deficit | (2,094 | ) | (6,640 | ) | ||||
Total liabilities, redeemable noncontrolling interests and deficit | $ | 5,788 | $ | 5,428 | ||||
See the accompanying notes to the consolidated financial statements
F-4
Confidential Treatment Requested by McAfee Corp.
Pursuant to 17 C.F.R. Section 200.83
MCAFEE CORP.
CONSOLIDATED STATEMENTS OF OPERATIONS
(in millions except per share amounts)
Fiscal Year Ended | ||||||||||||
(in millions) except per unit and per share data | December 29, 2018 | December 28, 2019 | December 26, 2020 | |||||||||
Net revenue | $ | 1,161 | $ | 1,303 | $ | 1,558 | ||||||
Cost of sales | 386 | 391 | 444 | |||||||||
Gross profit | 775 | 912 | 1,114 | |||||||||
Operating expenses: | ||||||||||||
Sales and marketing | 348 | 299 | 348 | |||||||||
Research and development | 186 | 161 | 188 | |||||||||
General and administrative | 170 | 182 | 235 | |||||||||
Amortization of intangibles | 153 | 146 | 143 | |||||||||
Restructuring charges (Note 9) | 19 | 6 | 2 | |||||||||
Total operating expenses | 876 | 794 | 916 | |||||||||
Operating income (loss) | (101 | ) | 118 | 198 | ||||||||
Interest (expense) and other, net | (308 | ) | (296 | ) | (307 | ) | ||||||
Foreign exchange gain (loss), net | 30 | 21 | (104 | ) | ||||||||
Loss from continuing operations before income taxes | (379 | ) | (157 | ) | (213 | ) | ||||||
Provision for income tax expense | 29 | 38 | 5 | |||||||||
Loss from continuing operations | (408 | ) | (195 | ) | (218 | ) | ||||||
Loss from discontinued operations, net of taxes | (104 | ) | (41 | ) | (71 | ) | ||||||
Net loss | $ | (512 | ) | $ | (236 | ) | $ | (289 | ) | |||
Less: Net loss attributable to redeemable noncontrolling interests | N/A | N/A | (171 | ) | ||||||||
Net loss attributable to McAfee Corp. | N/A | N/A | $ | (118 | ) | |||||||
Net loss attributable to McAfee Corp.: | ||||||||||||
Loss from continuing operations attributable to McAfee Corp. | N/A | N/A | $ | (55 | ) | |||||||
Loss from discontinued operations attributable to McAfee Corp. | N/A | N/A | (63 | ) | ||||||||
Net loss attributable to McAfee Corp. | N/A | N/A | $ | (118 | ) | |||||||
Loss per share attributable to McAfee Corp., basic: | ||||||||||||
Continuing operations | N/A | N/A | $ | (0.34 | ) | |||||||
Discontinued operations | N/A | N/A | (0.39 | ) | ||||||||
Loss per share, basic (1) | N/A | N/A | $ | (0.73 | ) | |||||||
Loss per share attributable to McAfee Corp., diluted: | ||||||||||||
Continuing operations | N/A | N/A | $ | (0.34 | ) | |||||||
Discontinued operations | N/A | N/A | (0.39 | ) | ||||||||
Loss per share, diluted (1) | N/A | N/A | $ | (0.73 | ) | |||||||
Weighted-average shares outstanding, basic | N/A | N/A | 162.3 | |||||||||
Weighted-average shares outstanding, diluted | N/A | N/A | 162.3 | |||||||||
| (1) | Basic and diluted earnings per share of Class A common stock are applicable only for the period from October 22, 2020 through December 26, 2020, which is the period following the initial public offering (“IPO”) and related Reorganization Transactions (as defined in Note 1 to the Consolidated Financial Statements). See Note 17 Net Loss per Share, to the Notes to Consolidated Financial Statements for the number of shares used in the computation of net loss per share of Class A common stock and the basis for the computation of net loss per share. |
See the accompanying notes to the consolidated financial statements
F-5
Confidential Treatment Requested by McAfee Corp.
Pursuant to 17 C.F.R. Section 200.83
MCAFEE CORP.
CONSOLIDATED STATEMENTS OF COMPREHENSIVE LOSS
(in millions)
Year Ended | ||||||||||||
December 29, 2018 | December 28, 2019 | December 26, 2020 | ||||||||||
Net loss | $ | (512 | ) | $ | (236 | ) | $ | (289 | ) | |||
Other comprehensive loss: | ||||||||||||
Interest rate cash flow hedges: | ||||||||||||
Loss on interest rate cash flow hedges, net of tax | (6 | ) | (67 | ) | (98 | ) | ||||||
Reclassification adjustments for loss on interest rate cash flow hedges | 8 | 4 | 40 | |||||||||
Pension and postretirement benefits loss, net of tax | — | (1 | ) | (1 | ) | |||||||
Total comprehensive loss | $ | (510 | ) | $ | (300 | ) | $ | (348 | ) | |||
Less: Comprehensive loss attributable to redeemable noncontrolling interests | N/A | N/A | (234 | ) | ||||||||
Total comprehensive loss attributable to McAfee Corp. | N/A | N/A | $ | (114 | ) | |||||||
See the accompanying notes to the consolidated financial statements
F-6
Confidential Treatment Requested by McAfee Corp.
Pursuant to 17 C.F.R. Section 200.83
MCAFEE CORP.
CONSOLIDATED STATEMENTS OF CASH FLOWS
(in millions)
Year Ended | ||||||||||||
December 29, 2018 | December 28, 2019 | December 26, 2020 | ||||||||||
Cash flows from operating activities: | ||||||||||||
Net loss | $ | (512 | ) | $ | (236 | ) | $ | (289 | ) | |||
Adjustments to reconcile net loss to net cash provided by operating activities: | ||||||||||||
Depreciation and amortization | 543 | 536 | 491 | |||||||||
Equity-based compensation | 28 | 25 | 313 | |||||||||
Deferred taxes | 9 | 18 | (10 | ) | ||||||||
Foreign exchange (gain) loss, net | (30 | ) | (20 | ) | 104 | |||||||
Other operating activities | 18 | 53 | 70 | |||||||||
Change in assets and liabilities: | ||||||||||||
Accounts receivable, net | 29 | (60 | ) | 15 | ||||||||
Deferred costs | (26 | ) | (22 | ) | (46 | ) | ||||||
Other assets | (54 | ) | (71 | ) | (9 | ) | ||||||
Other current liabilities | 1 | 28 | 41 | |||||||||
Deferred revenue | 309 | 186 | 106 | |||||||||
Other liabilities | 4 | 59 | (26 | ) | ||||||||
Net cash provided by operating activities | 319 | 496 | 760 | |||||||||
Cash flows from investing activities: | ||||||||||||
Acquisitions, net of cash acquired | (615 | ) | (2 | ) | (5 | ) | ||||||
Additions to property and equipment | (61 | ) | (56 | ) | (42 | ) | ||||||
Other investing activities | (1 | ) | (5 | ) | (4 | ) | ||||||
Net cash used in investing activities | (677 | ) | (63 | ) | (51 | ) | ||||||
Cash flows from financing activities: | ||||||||||||
Proceeds from IPO, net of underwriters discount and commissions | — | — | 586 | |||||||||
Use of proceeds from issuance of Class A common stock to purchase Foundation Technology Worldwide LLC (“FTW”) units | — | — | (33 | ) | ||||||||
Proceeds from the issuance of Member units | — | 1 | 2 | |||||||||
Proceeds from Excess Separation Note from Member of FTW | 20 | — | — | |||||||||
Payment for the long-term debt due to third party | (87 | ) | (67 | ) | (869 | ) | ||||||
Proceeds from long-term debt | 504 | 685 | — | |||||||||
Payment for debt issuance costs | (10 | ) | (6 | ) | (5 | ) | ||||||
Net change in principal due to debt modification | 52 | — | — | |||||||||
Distributions to members of FTW | — | (1,334 | ) | (277 | ) | |||||||
Payment of tax withholding for shares and units withheld | (10 | ) | (8 | ) | (24 | ) | ||||||
Payment of IPO related expenses | — | — | (8 | ) | ||||||||
Other financing activities | (10 | ) | (5 | ) | (23 | ) | ||||||
Net cash provided by (used in) financing activities | 459 | (734 | ) | (651 | ) | |||||||
Effect of exchange rate fluctuations on cash and cash equivalents | (4 | ) | — | 6 | ||||||||
Change in cash and cash equivalents | 97 | (301 | ) | 64 | ||||||||
Cash and cash equivalents, beginning of period | 371 | 468 | 167 | |||||||||
Cash and cash equivalents, end of period | $ | 468 | $ | 167 | $ | 231 | ||||||
Supplemental disclosures of noncash investing and financing activities and cash flow information: | ||||||||||||
Acquisition of property and equipment included in current liabilities | $ | (5 | ) | $ | (8 | ) | $ | (2 | ) | |||
Distributions to members of FTW included in liabilities | — | (4 | ) | (27 | ) | |||||||
Dividends payable included in liabilities | — | — | $ | (14 | ) | |||||||
Tax withholding for shares and units withheld included in liabilities | — | — | (4 | ) | ||||||||
Other | — | (2 | ) | (3 | ) | |||||||
Cash paid during the period for: | ||||||||||||
Interest, net of cash flow hedges | (290 | ) | (281 | ) | (268 | ) | ||||||
Income taxes, net of refunds | (49 | ) | (47 | ) | (49 | ) | ||||||
See the accompanying notes to the consolidated financial statements
F-7
Confidential Treatment Requested by McAfee Corp.
Pursuant to 17 C.F.R. Section 200.83
MCAFEE CORP.
CONSOLIDATED STATEMENTS OF EQUITY (DEFICIT) AND REDEEMABLE NONCONTROLLING INTERESTS
(in millions, except share amounts)
Foundation Technology Worldwide, LLC (prior to Reorganization Transactions) | McAfee Corp. Stockholders’ Equity | |||||||||||||||||||||||||||||||||||||||||||||||||||||||||||||||||||
Class A Common Stock | Class B Common Stock | |||||||||||||||||||||||||||||||||||||||||||||||||||||||||||||||||||
Accumulated Other Comprehensive Income (Loss) | Members’ Equity (Deficit) | Accumulated Deficit | Shares | Amount | Shares | Amount | Additional Paid-in Capital | Accumulated Deficit | Accumulated Other Comprehensive Income (Loss) | Total Deficit | Redeemable Noncontrolling Interests | Total | ||||||||||||||||||||||||||||||||||||||||||||||||||||||||
Balance at December 30, 2017 | $ | — | $ | 663 | $ | (607 | ) | — | $ | — | — | $ | — | $ | — | $ | — | $ | — | $ | — | $ | — | $ | 56 | |||||||||||||||||||||||||||||||||||||||||||
Cumulative effect adjustment from adoption of ASC Topic 606 | — | — | (29 | ) | — | — | — | — | — | — | — | — | — | (29 | ) | |||||||||||||||||||||||||||||||||||||||||||||||||||||
Other comprehensive income, net of tax | 2 | — | — | — | — | — | — | — | — | — | — | — | 2 | |||||||||||||||||||||||||||||||||||||||||||||||||||||||
Equity-based awards expense, net of equity withheld to cover taxes | — | 19 | — | — | — | — | — | — | — | — | — | — | 19 | |||||||||||||||||||||||||||||||||||||||||||||||||||||||
Unit repurchases | — | (7 | ) | — | — | — | — | — | — | — | — | — | — | (7 | ) | |||||||||||||||||||||||||||||||||||||||||||||||||||||
Net loss | — | — | (512 | ) | — | — | — | — | — | — | — | — | — | (512 | ) | |||||||||||||||||||||||||||||||||||||||||||||||||||||
Balance at December 29, 2018 | 2 | 675 | (1,148 | ) | — | — | — | — | — | — | — | — | — | (471 | ) | |||||||||||||||||||||||||||||||||||||||||||||||||||||
Cumulative effect adjustments from adoption of ASC Topic 842 | — | — | (1 | ) | — | — | — | — | — | — | — | — | — | (1 | ) | |||||||||||||||||||||||||||||||||||||||||||||||||||||
Distributions to Members | — | (1,338 | ) | — | — | — | — | — | — | — | — | — | — | (1,338 | ) | |||||||||||||||||||||||||||||||||||||||||||||||||||||
Other comprehensive loss, net of tax | (64 | ) | — | — | — | — | — | — | — | — | — | — | — | (64 | ) | |||||||||||||||||||||||||||||||||||||||||||||||||||||
Equity-based awards expense, net of equity withheld to cover taxes | — | 17 | — | — | — | — | — | — | — | — | — | — | 17 | |||||||||||||||||||||||||||||||||||||||||||||||||||||||
Unit issuances | — | 1 | — | — | — | — | — | — | — | — | — | — | 1 | |||||||||||||||||||||||||||||||||||||||||||||||||||||||
Unit repurchases | — | (2 | ) | — | — | — | — | — | — | — | — | — | — | (2 | ) | |||||||||||||||||||||||||||||||||||||||||||||||||||||
Net loss | — | — | (236 | ) | — | — | — | — | — | — | — | — | — | (236 | ) | |||||||||||||||||||||||||||||||||||||||||||||||||||||
Balance at December 28, 2019 | $ | (62 | ) | $ | (647 | ) | $ | (1,385 | ) | — | $ | — | — | $ | — | $ | — | $ | — | $ | — | $ | — | $ | — | $ | (2,094 | ) | ||||||||||||||||||||||||||||||||||||||||
Activity prior to Reorganization Transactions and IPO | ||||||||||||||||||||||||||||||||||||||||||||||||||||||||||||||||||||
Distributions to Members | — | (276 | ) | — | — | — | — | — | — | — | — | — | — | (276 | ) | |||||||||||||||||||||||||||||||||||||||||||||||||||||
Other comprehensive loss, net of tax (Note 16) | (71 | ) | — | — | — | — | — | — | — | — | — | — | — | (71 | ) | |||||||||||||||||||||||||||||||||||||||||||||||||||||
Equity-based awards expense, net of equity withheld to cover taxes | — | 24 | — | — | — | — | — | — | — | — | — | — | 24 | |||||||||||||||||||||||||||||||||||||||||||||||||||||||
Unit issuances | — | 2 | — | — | — | — | — | — | — | — | — | — | 2 | |||||||||||||||||||||||||||||||||||||||||||||||||||||||
Unit repurchases (Note 7) | — | (10 | ) | — | — | — | — | — | — | — | — | — | — | (10 | ) | |||||||||||||||||||||||||||||||||||||||||||||||||||||
Reclassification of redeemable units (Note 7) | — | (41 | ) | — | — | — | — | — | — | — | — | — | — | (41 | ) | |||||||||||||||||||||||||||||||||||||||||||||||||||||
Reclassification of redeemable units (Note 7) | — | 41 | — | — | — | — | — | — | — | — | — | — | 41 | |||||||||||||||||||||||||||||||||||||||||||||||||||||||
Net income | — | — | 26 | — | — | — | — | — | — | — | — | — | 26 | |||||||||||||||||||||||||||||||||||||||||||||||||||||||
Other | — | 2 | — | — | — | — | — | — | — | — | — | — | 2 | |||||||||||||||||||||||||||||||||||||||||||||||||||||||
Activity in connection with Reorganization Transactions and IPO | ||||||||||||||||||||||||||||||||||||||||||||||||||||||||||||||||||||
Impact of reorganization transactions | 133 | 905 | 1,359 | — | — | — | — | (2,264 | ) | — | (133 | ) | (2,397 | ) | — | — | ||||||||||||||||||||||||||||||||||||||||||||||||||||
Issuance of Class A common stock, net of costs | — | — | — | 126,314,024 | — | — | — | — | — | — | — | — | — | |||||||||||||||||||||||||||||||||||||||||||||||||||||||
Issuance of Class B common stock | — | — | — | — | — | 268,779,392 | — | — | — | — | — | — | — | |||||||||||||||||||||||||||||||||||||||||||||||||||||||
Initial effect of the Reorganization Transactions and IPO on redeemable noncontrolling interests | — | — | — | — | — | — | — | 968 | — | 84 | 1,052 | (1,052 | ) | — | ||||||||||||||||||||||||||||||||||||||||||||||||||||||
Proceeds from IPO on sale of Class A shares | — | — | — | 30,982,558 | — | — | — | 586 | — | — | 586 | — | 586 | |||||||||||||||||||||||||||||||||||||||||||||||||||||||
Purchase of FTW LLC units | — | — | — | — | — | (1,714,265 | ) | — | (33 | ) | — | — | (33 | ) | — | (33 | ) | |||||||||||||||||||||||||||||||||||||||||||||||||||
IPO costs capitalized | — | — | — | — | — | — | — | (11 | ) | — | — | (11 | ) | — | (11 | ) | ||||||||||||||||||||||||||||||||||||||||||||||||||||
F-8
Confidential Treatment Requested by McAfee Corp.
Pursuant to 17 C.F.R. Section 200.83
Foundation Technology Worldwide, LLC (prior to Reorganization Transactions) | McAfee Corp. Stockholders’ Equity | |||||||||||||||||||||||||||||||||||||||||||||||||||||||||||||||||||
Class A Common Stock | Class B Common Stock | |||||||||||||||||||||||||||||||||||||||||||||||||||||||||||||||||||
Accumulated Other Comprehensive Income (Loss) | Members’ Equity (Deficit) | Accumulated Deficit | Shares | Amount | Shares | Amount | Additional Paid-in Capital | Accumulated Deficit | Accumulated Other Comprehensive Income (Loss) | Total Deficit | Redeemable Noncontrolling Interests | Total | ||||||||||||||||||||||||||||||||||||||||||||||||||||||||
Deferred tax adjustment | — | — | — | — | — | — | — | 148 | — | — | 148 | — | 148 | |||||||||||||||||||||||||||||||||||||||||||||||||||||||
Balance subsequent to Reorganization Transactions and IPO | — | — | — | 157,296,582 | — | 267,065,127 | — | (606 | ) | — | (49 | ) | (655 | ) | (1,052 | ) | (1,707 | ) | ||||||||||||||||||||||||||||||||||||||||||||||||||
Activity subsequent to Reorganization Transactions and IPO | ||||||||||||||||||||||||||||||||||||||||||||||||||||||||||||||||||||
Distributions to RNCI | — | — | — | — | — | — | — | — | — | — | — | (24 | ) | (24 | ) | |||||||||||||||||||||||||||||||||||||||||||||||||||||
Dividend declared | — | — | — | — | — | — | — | (14 | ) | — | — | (14 | ) | — | (14 | ) | ||||||||||||||||||||||||||||||||||||||||||||||||||||
Other comprehensive loss, net of tax (Note 16) | — | — | — | — | — | — | — | — | — | 4 | 4 | 8 | 12 | |||||||||||||||||||||||||||||||||||||||||||||||||||||||
Stock compensation expense, net of withholding to cover taxes | — | — | — | 3,970,830 | — | — | — | 261 | — | — | 261 | — | 261 | |||||||||||||||||||||||||||||||||||||||||||||||||||||||
Dividend declared | — | — | — | — | — | — | — | — | — | — | — | — | — | |||||||||||||||||||||||||||||||||||||||||||||||||||||||
Net loss | — | — | — | — | — | — | — | — | (118 | ) | — | (118 | ) | (197 | ) | (315 | ) | |||||||||||||||||||||||||||||||||||||||||||||||||||
Other | — | — | — | — | — | — | — | (13 | ) | — | — | (13 | ) | — | (13 | ) | ||||||||||||||||||||||||||||||||||||||||||||||||||||
Impact of change in ownership in RNCI | — | — | — | — | — | — | — | (174 | ) | — | — | (174 | ) | 174 | — | |||||||||||||||||||||||||||||||||||||||||||||||||||||
Fair value adjustment for RNCI | — | — | — | — | — | — | — | (5,931 | ) | — | — | (5,931 | ) | 5,931 | — | |||||||||||||||||||||||||||||||||||||||||||||||||||||
Balance at December 26, 2020 | $ | — | $ | — | $ | — | 161,267,412 | $ | — | 267,065,127 | $ | — | $ | (6,477 | ) | $ | (118 | ) | $ | (45 | ) | $ | (6,640 | ) | $ | 4,840 | $ | (1,800 | ) | |||||||||||||||||||||||||||||||||||||||
See the accompanying notes to the consolidated financial statements
F-9
Confidential Treatment Requested by McAfee Corp.
Pursuant to 17 C.F.R. Section 200.83
MCAFEE CORP.
NOTES TO THE CONSOLIDATED FINANCIAL STATEMENTS
NOTE 1: BASIS OF PRESENTATION AND SIGNIFICANT ACCOUNTING POLICIES
Background
McAfee is a leading-edge cybersecurity company that provides advanced security solutions to consumers. Security technologies from McAfee use a unique, predictive capability that is powered by McAfee Global Threat Intelligence, which enables home users to stay one step ahead of the next wave of fileless attacks, viruses, malware, and other online threats.
McAfee Corp. (the “Corporation”) was formed as a Delaware corporation on July 19, 2019 for the purpose of facilitating an initial public offering (“IPO”) and related transactions in order to carry on the business of Foundation Technology Worldwide LLC (“FTW”) and its subsidiaries (the Corporation, FTW and its subsidiaries are collectively the “Company,” “we,” “us” or “our”). On October 21, 2020, the Corporation became the sole managing member and holder of 100% of the voting power of FTW due to the reorganization transactions described below. With respect to the Corporation and FTW, each entity owns only the respective entities below it in the corporate structure and each entity has no other material operations, assets, or liabilities.
In October 2020, the Corporation completed an IPO pursuant to which the Corporation and selling stockholders sold an aggregate of 37.0 million shares of Class A common stock par value $0.001 per share (“Class A common stock”) at a public offering price of $20.00 per share. The Corporation issued 31 million shares and received $586 million in proceeds, net of underwriting discounts and commissions, of which $553 million was used to purchase newly-issued limited liability company units (“LLC Units”) and $33 million was used to purchase LLC Units from existing holders (“Continuing LLC Owners”) of interests in FTW, at a purchase price per unit equal to the public offering price per share of Class A common stock, less underwriting discounts and commissions.
We refer to the holders of management incentive units of FTW (“MIUs”) as well as members of management who hold LLC Units following the closing of the offering or are to receive Class A common stock in satisfaction of existing incentive awards as “Management Owners.” We refer to those of our
pre-IPO
investors and certain of their affiliates who received shares of Class A common stock in connection with the Reorganization Transactions (as defined below) and who do not hold LLC Units as “Continuing Corporate Owners,” and together with the Continuing LLC Owners, as “Continuing Owners.”The Reorganization Transactions
Reorganization
In connection with the closing of the IPO, the following Reorganization Transactions were consummated:
| • | a new limited liability company operating agreement (“New LLC Agreement”) was adopted for FTW making the Corporation the sole managing member of FTW; |
| • | the Corporation’s certificate of incorporation was amended and restated to, among other things, (i) provide for Class A common stock and Class B common stock and (ii) issue shares of Class B common stock to the Continuing Owners and Management Owners, on a 1-to-1 |
| • | the Corporation (i) issued 126.3 million shares of its Class A common stock to certain of the Continuing Owners in exchange for their contribution of LLC units or the equity of certain other entities, which pursuant to the Reorganization Transactions, became its direct or indirect subsidiaries |
F-10
Confidential Treatment Requested by McAfee Corp.
Pursuant to 17 C.F.R. Section 200.83
and (ii) settled 5.7 million restricted stock units (“RSUs”) with shares of its Class A common stock, net of tax withholding, held by certain employees, which were satisfied in connection with the Reorganization Transactions; and |
| • | the Corporation entered into (i) a tax receivable agreement (“TRA”) with certain of our Continuing Owners and certain Management Owners (collectively “TRA Beneficiaries”) and (ii) a stockholders agreement and a registration rights agreement with investment funds affiliated with or advised by TPG Global, LLC (“TPG”) and Thoma Bravo, L.P. (“Thoma Bravo”), respectively, and Intel Americas, Inc. (“Intel”). |
Divestiture of Enterprise Business
On March 6, 2021, we entered into a definitive agreement (the “Purchase Agreement”) with a consortium led by Symphony Technology Group (“STG”) under which STG agreed to purchase certain of our Enterprise assets together with certain of our Enterprise liabilities (“Enterprise Business”), representing substantially all of our Enterprise segment, for an all-cash purchase price of $4.0 billion. The divestiture transaction closed on July 27, 2021. The divestiture of our Enterprise Business represents a strategic shift in our operations that will allow us to focus on our Consumer Business. As a result of the divestiture, the results of our Enterprise Business were reclassified as discontinued operations in our consolidated statements of operations and excluded from both continuing operations and segment results for all periods presented. Starting in the first quarter of fiscal 2021, we began to operate in 1 reportable segment as the Enterprise Business comprised substantially all of our Enterprise segment. Results of discontinued operations includes all revenues and expenses directly derived from our Enterprise Business, with the exception of general corporate overhead costs that were previously allocated to our Enterprise segment but have not been allocated to discontinued operations. The Enterprise Business, as specified in the Purchase Agreement, was reclassified as discontinued operations in our consolidated balance sheets, subject to changes set forth in the Purchase Agreement, which included amendments to the agreement in July 2021. See Note 3 for additional information about the divestiture of our Enterprise Business.
Principles of Consolidation
Subsequent to the Reorganization Transactions and IPO, the Corporation is a holding company, and its sole material asset held directly or through wholly-owned subsidiaries is its equity interest in FTW. The Corporation, as the sole managing member of FTW, exclusively operates and controls the business and affairs of FTW. The Corporation consolidates the financial results of FTW and reports a redeemable noncontrolling interest (“RNCI”) related to the LLC Units held by the Continuing LLC Owners and vested MIUs held by Management Owners (Note 16).
As the Continuing LLC Owners control both the Corporation and FTW, before and after the Reorganization Transactions, the Reorganization Transactions were accounted for as a reorganization of entities under common control. As a result, the financial statements for periods prior to the IPO and the Reorganization Transactions are the financial statements of FTW as the predecessor to the Corporation for accounting and reporting purposes.
Financial information includes the accounts of McAfee and was prepared in accordance with U.S. GAAP. All intercompany balances and transactions within McAfee have been eliminated in consolidation. We have reclassified certain prior period amounts to conform to our current period presentation.
We consolidate entities in which we have a controlling financial interest, the usual condition of which is ownership of a majority voting interest. We also consider for consolidation certain interests where the controlling financial interest may be achieved through arrangements that do not involve voting interests. Such an entity, known as a variable interest entity (“VIE”), is required to be consolidated by its primary beneficiary. The primary beneficiary of a VIE is considered to possess the power to direct the activities of the VIE that most
F-11
Confidential Treatment Requested by McAfee Corp.
Pursuant to 17 C.F.R. Section 200.83
significantly impact its economic performance and has the obligation to absorb losses or the rights to receive benefits from the VIE that are significant to it (Note 18).
Our functional currency for all of our subsidiaries is USD.
Use of Estimates
The preparation of the consolidated financial statements required us to make certain estimates and judgments that affect the amounts reported. Actual results may differ materially from our estimates. The accounting estimates that required our most significant and subjective judgments include:
| • | projections of future cash flows related to revenue share and related agreements with our personal computer original equipment manufacturer partners; |
| • | amounts classified as discontinued operations; |
| • | fair value estimates for assets and liabilities acquired in business combinations; |
| • | the valuation and recoverability of identified intangible assets and goodwill; |
| • | recognition and measurement of current and deferred income taxes as well as our uncertain tax positions; |
| • | fair value of our equity awards; |
| • | fair value of long-term debt and related swaps; |
| • | amount of liability related to the tax receivable agreement; |
| • | determining the nature and timing of satisfaction of performance obligations, assessing any associated material rights and determining the standalone selling price (“SSP”) of performance obligations; and |
| • | determining our technology constrained customer life. |
The effect of the novel coronavirus
(“COVID-19”)
pandemic on our business, operations, and financial results is dependent upon future developments, including the duration of the pandemic and the related length of its impact on the global economy, which are unknown at this time. As a result, some of our estimates and assumptions required increased judgment and carry a higher degree of variability and volatility. As events continue to evolve and additional information becomes available, several of our estimates and assumptions may change materially in future periods due to the impact of theCOVID-19
pandemic.Fiscal Calendar
We maintain a
52-
or53-week
fiscal year that ends on the last Saturday in December. The year ended December 29, 2018 is a52-week
year starting on December 31, 2017 and ending on December 29, 2018. The year ended December 28, 2019 is a52-week
year starting on December 30, 2018 and ending on December 28, 2019. The year ended December 26, 2020 is a52-week
year starting on December 29, 2019 and ending on December 26, 2020.Revenue Recognition
We derive revenue from the sale of security products, subscriptions, software as a service (“SaaS”) offerings, support and maintenance, professional services, or a combination of these items, primarily through our indirect relationships with our partners or direct relationships with end customers through our internal sales force. On December 31, 2017, we adopted ASC Topic 606 under the modified retrospective approach with the cumulative effect of initially applying the new standard as an adjustment to the opening balance of retained earnings. Results for the reporting period beginning December 31, 2017 are presented under ASC Topic 606, while prior period amounts were not adjusted.
F-12
Confidential Treatment Requested by McAfee Corp.
Pursuant to 17 C.F.R. Section 200.83
We recognize revenue pursuant to the five-step framework within ASC Topic 606:
1. | Identify the contract(s) with a customer non-cancelable purchase order or agreement that creates enforceable rights and obligations. |
2. | Identify the performance obligations in the contract |
3. | Determine the transaction price |
4. | Allocate the transaction price to the performance obligations in the contract |
5. | Recognize revenue when (or as) we satisfy a performance obligation |
We generally consider our customer to be the entity with which we have a contractual agreement. This could be the end user, or when we sell products and services through the channel, our customer could be either the distributor or the reseller. As part of determining whether a contract exists, probability of collection is assessed on abasis at the outset of the contract. Customers are subjected to a credit review process that evaluates the customers’ financial position and the ability and intention to pay.
customer-by-customer
At contract inception, we assess the goods and services promised in our contracts with customers and identify a performance obligation for each promise to transfer to the customer a good or service (or bundle of goods or services) that is distinct — i.e., if a good or service is separately identifiable from other items in the bundled package and if a customer can benefit from it on its own or together with other resources that are readily available to the customer. To identify our performance obligations, we consider all of the goods or services promised in the contract regardless of whether they are explicitly stated or are implied by customary business practices. Determining whether products and services are considered distinct performance obligations or should be combined to create a single performance obligation may require significant judgment. We recognize revenue when (or as) we satisfy a performance obligation by transferring control of a good or service to a customer.
The transaction price is determined based on the consideration to which we will be entitled in exchange for transferring goods or services to the customer, adjusted for estimated variable consideration, if any. We typically estimate the transaction price impact of sales returns and discounts offered to the customers, including discounts for early payments on receivables, rebates or certain distribution partner incentives, including marketing programs. Constraints are applied when estimating variable considerations based on historical experience where applicable.
Once we have determined the transaction price, we allocate it to each performance obligation in a manner depicting the amount of consideration to which we expect to be entitled in exchange for transferring the goods or services to the customer (the “allocation objective”). If the allocation objective is met at contractual prices, no allocations are made. Otherwise, we allocate the transaction price to each performance obligation identified in the contract on a relative SSP basis, except when the criteria are met for allocating variable consideration or a discount to one or more, but not all, performance obligations in the contract.
To determine the SSP of our goods or services, we conduct a regular analysis to determine whether various goods or services have an observable SSP. If we do not have an observable SSP for a particular good or service, then SSP for that particular good or service is estimated using an approach that maximizes the use of observable
F-13
Confidential Treatment Requested by McAfee Corp.
Pursuant to 17 C.F.R. Section 200.83
inputs. We generally determine SSPs using various methodologies such as historical prices, expected cost plus margin, adjusted market assessment or
non-standalone
selling prices.We recognize revenue as control of the promised goods or services is transferred to our customers, in an amount that reflects the consideration we expect to be entitled to in exchange for the promised goods or services. Revenue is recognized net of any taxes collected from customers and subsequently remitted to governmental authorities. Control of the promised goods or services is transferred to our customers at either a point in time or over time, depending on the performance obligation.
The nature of our promise to the customer to provide our time-based software licenses and related support and maintenance is to stand ready to provide protection for a specified or indefinite period of time. Maintenance and support in these cases are typically not distinct performance obligations as the licenses are dependent upon regular threat updates to the customer. Instead the maintenance and support is combined with a software license to create a single performance obligation. We typically satisfy these performance obligations over time, as control is transferred to the customer as the services are provided.
Additional Revenue Recognition Considerations
Royalties and Managed Service Provider Revenues
Our original equipment manufacturer (“OEM”) and managed service provider (“MSP”) sales channels have revenues derived from sales- or usage-based royalties. Such revenue is excluded from any variable consideration and transaction price calculations and is recognized at the later of when the sale or usage occurs, or the performance obligation is satisfied or partially satisfied.
Consideration Payable to a Customer
We make various payments to our channel partners, which may include revenue share, product placement fees and marketing development funds. Costs that are incremental to revenue, such as revenue share, are capitalized and amortized over time as cost of sales (
Note 4
). Product placement fees and marketing development funds are expensed in sales and marketing expense as the related benefit is received and were $187 million, $142 million and $170 million for the years ended December 26, 2020, December 28, 2019, and December 29, 2018, respectively.Under certain of our channel partner agreements, the partners pay us royalties on our technology sold to their customers, which we recognize as revenue in accordance with our revenue recognition policy. In these situations, the payments made to our channel partners are recognized as consideration paid to a customer, and thus are recorded as reductions to revenue up to the amount of cumulative revenue recognized from the contract with the channel partner during the period of measurement.
Contract Costs
Contract acquisition costs consist mainly of sales commissions and associated fringe benefits, as well as revenue share under programs with certain of our distribution partners. For revenue share, the partner receives a percentage of the revenue we receive from an end user upon conversion to a paid customer or renewal. These costs would not have been incurred if the contract was not obtained and are considered incremental and recoverable costs of obtaining a contract with a customer. These costs are capitalized and amortized over time in accordance with Accounting Standards Codification (“ASC”)
340-40.
Contract fulfillment costs consist software and related costs. These costs are incremental and recoverable and are capitalized and amortized on a systematic basis that is consistent with the pattern of transfer of the goods and services to which the asset relates.
F-14
Confidential Treatment Requested by McAfee Corp.
Pursuant to 17 C.F.R. Section 200.83
Discontinued Operations
Certain of our perpetual software licenses or hardware with integrated software are not distinct from their accompanying maintenance and support, as they are dependent upon regular threat updates. These contracts typically contain a renewal option that we have concluded creates a material right for our customer. The license, hardware and maintenance and support revenue is recognized over time, as control is transferred to the customer over the term of the initial contract period while the corresponding material right is recognized over time beginning at the end of the initial contractual period over the remainder of the technology constrained customer life.
Alternatively, certain of our perpetual software licenses, hardware appliances, or hardware with integrated software provide a benefit to the customer that is separable from the related support as they are not dependent upon regular threat updates. Revenue for these products is recognized at a point in time when control is transferred to our customers, generally at shipment. The related maintenance and support represent a separate performance obligation and the associated transaction price allocated to it is recognized over time as control is transferred to the customer.
The nature of our promise to the customer to provide our SaaS offerings and related support and maintenance is to stand ready to provide protection for a specified or indefinite period of time. Maintenance and support in these cases are typically not distinct performance obligations as the licenses are dependent upon regular threat updates to the customer. Instead the maintenance and support is combined with a software license to create a single performance obligation. We typically satisfy these performance obligations over time, as control is transferred to the customer as the services are provided.
Revenue for professional services that are a separate and distinct performance obligation is recognized as services are provided to the customer.
Payment Terms and Warranties
Our payment terms vary by the type and location of our customer and the products or services offered. The term between invoicing and when payment is due is not significant. For certain products or services and customer types, we require payment before the products or services are delivered to the customer.
We provide assurance warranties on our products and services. The warranty timeframe varies depending on the product or service sold, and the resolution of any issues is at our discretion to either repair, replace, reperform or refund the fee.
Contract Costs
Contract acquisition costs consist mainly of sales commissions and associated fringe benefits. We typically recognize the initial commissions that are not commensurate with renewal commissions over the longer of the customer relationship (generally estimated to be four to five years) or over the same period as the initial revenue arrangement to which these costs relate. Renewal commissions paid are generally amortized over the renewal period.
Contract fulfillment costs consist primarily of hardware and related costs. These costs are incremental and recoverable and are capitalized and amortized on a systematic basis that is consistent with the pattern of transfer of the goods and services to which the asset relates.
Advertising Expenses
Marketing programs that are facilitated through third parties not considered customers are expensed as incurred. Total advertising expenses for our continuing operations were $39 million, $19 million, and $25 million for the
F-15
Confidential Treatment Requested by McAfee Corp.
Pursuant to 17 C.F.R. Section 200.83
years ended December 26, 2020, December 28, 2019, and December 29, 2018, respectively, excluding amounts included in sales and marketing as discussed in the revenue recognition section above
.
Accounts Receivable
We record accounts receivable at the invoiced amount and maintain an allowance for doubtful accounts to reserve for potentially uncollectible receivables. We review accounts receivable to identify specific customers with known disputes or collectability issues and maintain an allowance for expected credit losses for all other receivables not included in the specific reserve by applying a set percentage for projected uncollectible amounts to the accounts receivable balance. In determining this percentage, judgment based on historical collection experience and current economic trends is applied. We recorded an allowance for credit losses of $4 million and less than $1 million as of December 26, 2020 and December 28, 2019, respectively.
Cash and Cash Equivalents
All highly liquid investments with original maturities of 95 days or less are considered cash equivalents.
Goodwill
Goodwill is recorded as the excess of consideration transferred over the acquisition-date fair values of assets acquired and liabilities assumed in a business combination. Historically, we have assigned goodwill to our reporting units based on the relative fair value expected at the time of the acquisition. Goodwill and intangible assets to be disposed of as a result of our agreement with STG to sell certain assets of Enterprise Business were included in assets of discontinued operations in our consolidated balance sheets. We now have 1 reporting unit for goodwill (Note 10).
We perform an annual impairment assessment on the first day of the third month in the fourth quarter or more frequently if indicators of potential impairment exist, which includes evaluating qualitative and quantitative factors to assess the likelihood of an impairment of our reporting unit’s goodwill. If the conclusion of an impairment assessment is that it is more likely than not that the fair value is more than its carrying value, goodwill is not considered impaired and we are not required to perform the quantitative goodwill impairment test.
If the conclusion of an impairment assessment is that it is more likely than not that the fair value is less than its carrying value, we perform the quantitative goodwill impairment test, which compares the fair value of the reporting unit to its carrying value. Impairments, if any, are based on the excess of the carrying amount over the fair value. Our goodwill impairment test considers the income method and/or market method to estimate a reporting unit’s fair value.
Identified Intangible Assets
We amortize all finite-lived intangible assets that are subject to amortization over their estimated useful life of economic benefit on a straight-line basis (Note 10).
For significant intangible assets subject to amortization, we perform a quarterly assessment to determine whether facts and circumstances indicate that the useful life is shorter than we had originally estimated or that the carrying amount of assets may not be recoverable. If such facts and circumstances exist, we assess recoverability by comparing the projected undiscounted net cash flows associated with the related asset or group of assets over their remaining useful lives against their respective carrying amounts. Impairments, if any, are based on the excess of the carrying amount over the fair value of those assets. If an asset’s useful life is shorter than originally estimated, we accelerate the rate of amortization and amortize the remaining carrying value over the updated, shorter useful life.
F-16
Confidential Treatment Requested by McAfee Corp.
Pursuant to 17 C.F.R. Section 200.83
For our intangible assets not subject to amortization, we perform an annual impairment assessment on the first day of the third month in the fourth quarter, or more frequently if indicators of potential impairment exist, to determine whether it is more likely than not that the carrying value of the asset may not be recoverable. If necessary, a quantitative impairment test is performed to compare the fair value of the indefinite-lived intangible asset with its carrying value. Impairments, if any, are based on the excess of the carrying amount over the fair value of the asset
.
Research and Development
Costs incurred in the research and development of new software products are expensed as incurred until technological feasibility is established. Research and development costs include salaries and benefits of researchers, supplies, and other expenses incurred during research and development efforts. Development costs are capitalized beginning when a product’s technological feasibility has been established and ending when the product is available for general release to customers. Technological feasibility is reached when the product reaches the working-model stage. To date, new products and enhancements generally have reached technological feasibility and have been released for sale at substantially the same time. All research and development costs to date have been expensed as incurred except for software subject to a hosting arrangement.
Software development costs of both
internal-use
applications and software sold subject to hosting arrangements are capitalized when we have determined certain factors are present, including factors that indicate technology exists to achieve the performance requirements, the decision has been made to develop internally versus buy and our management has authorized the funding for the project. Capitalization of software costs ceases when the software is substantially complete and is ready for its intended use and capitalized costs are amortized over their estimated useful life of three to five years using the straight-line method. When events or circumstances indicate the carrying value of internal use software might not be recoverable, we assess the recoverability of these assets by determining whether the amortization of the asset balance over its remaining life can be recovered through undiscounted future operating cash flows.Equity-Based Awards
We currently provide various equity-based compensation to those whom, in the opinion of the Board or its designee, are in a position to make a significant contribution to our success.
Equity-based compensation cost is measured at the grant date based on the fair value of the award and recognized as expense over the appropriate service period. Determining the fair value of equity-based awards requires considerable judgment, including assumptions and estimates of the following:
| • | fair value of the unit; |
| • | life of the award; |
| • | volatility of the unit price; and |
| • | dividend yield |
Before our IPO, the fair value of the unit was determined by the Board reasonably and in good faith. Generally, this involved a review of an independent valuation of our business, which requires judgmental inputs and assumptions such as our cash flow projections, peer company comparisons, market data, growth rates and discount rate. The Board reviewed its prior determination of fair value of a unit on a quarterly basis to decide whether any change was appropriate (including whether to obtain a new independent valuation), considering such factors as any significant financial, operational, or market changes affecting the business since the last valuation date. Due to us not having sufficient historical volatility, we used the historical volatilities of publicly traded companies which are similar to us in size, stage of life cycle and financial leverage. We will continue to use this
F-17
Confidential Treatment Requested by McAfee Corp.
Pursuant to 17 C.F.R. Section 200.83
peer group of companies unless a situation arises within the group that would require evaluation of which publicly traded companies are included or once sufficient data is available to use our own historical volatility. In addition, for awards where vesting is dependent upon achieving certain operating performance goals, we estimate the likelihood of achieving the performance goals. For goals dependent upon a qualifying liquidity event, (i.e., a change of control or public offering registered on a Form
S-1
(or successor form), in either case, occurring on or before April 3, 2024) (a “Qualifying Liquidity Event”), we will not recognize any expense until the event occurs. Upon consummation of our IPO, we recognized a cumulativecatch-up
of expense based on the vesting dates for our time-based awards and expected vesting dates for our performance-based awards. We recognize forfeitures as they occur. For awards with only time-vesting requirement, we recognize the expense over a straight-line basis during the vesting period.After the close of our IPO, our outstanding Management Equity Participation Units (“MEPUs”) and Cash RSU (“CRSUs”) were converted into RSUs (“Replacement RSUs”), which are to be settled in Class A common stock. The fair value of these Replacement RSUs was our IPO price less the present value of the expected dividends not received during the vesting period. For all other RSU grants after our IPO, we utilize the closing price of our common stock on the day of the grant date, less the present value of expected dividends not received during the vesting period to determine grant date fair value.
In addition, certain MEPU holders were also granted stock options with a strike price equal to our IPO price. For all other stock option grants after our IPO, we utilize the closing price of our common stock on the day of grant date to determine the strike price. All of our granted stock options are
non-qualified
and expire 10 years after grant. We utilize a Black-Scholes model to determine grant date fair value of our stock options.Our time-based awards generally vest evenly over the 16 quarters following grant date. For time-based awards granted to our new hires, the vesting period is generally 25% vest one year after grant date and quarterly thereafter for 12 quarters. Time-based awards granted to our
non-employee
directors vest one year from grant date. Generally, unvested awards are forfeited upon termination of employment with us, however, our executive officers may have provisions permitting acceleration or pro rata acceleration upon termination without cause (as defined in the respective award agreements).Our performance-based RSU awards (“PSU”s) are granted to executive officers and certain employees annually. These awards vest after approximately three years, with the number vesting based upon internal profitability targets that are communicated to employees in the year to which the targets relate. The number of shares of common stock issued will range from zero to stretch, with stretch typically defined as 130% of target. At the time our Board approves such grants, the targets for performance years other than the current year are not known or knowable by us nor our employees. Upon determination and communication of such targets in future years, grant date fair value is determined based upon the closing price, less the present value of expected dividends not received during the vesting period.
A portion of our RSU awards and all of our performance-based stock option and performance-based MIU awards vest upon achievement of certain return of cash metrics. In January 2021, these awards were modified to vest annually in equal tranches over the three year anniversaries of our IPO. If the original return of cash performance is achieved prior to such anniversaries, the awards vest in full. In both cases, the unvested portion of the awards are forfeited upon termination.
Upon the settlement of RSUs, we withhold a portion of the earned units to cover no more than the maximum statutory income and employment taxes and remit the net shares to an individual brokerage account. Authorized shares of our common stock are used to settle RSUs and stock options.
Awards granted prior to our IPO and/or converted at the time of our IPO are covered under our 2017 Management Incentive Plan (“2017 Plan”). Stock options granted at our IPO and/or awards granted at our IPO or after are covered under our 2020 Equity Omnibus Plan (“2020 Plan”). No new awards may be authorized under our 2017 Plan.
F-18
Confidential Treatment Requested by McAfee Corp.
Pursuant to 17 C.F.R. Section 200.83
After the close of the separation from Intel, our employees were no longer eligible for Intel Awards (as defined below). Prior to the transaction, Intel’s stockholders approved the adoption of the Intel Corporation 2006 Equity Incentive Plan. The plan provides for the grant of stock options, stock appreciation rights, restricted stock, and restricted stock units (collectively “Intel Awards”) to eligible full-time and part-time employees and
non-employee
directors. These awards generally vested over three or four years. Stock options generally expire ten years from the date of grant. Awards were generally granted with only a time-vesting requirement, but may have had certain performance and/or market conditions required for vesting.All outstanding Intel Awards were replaced with fixed cash payouts (“retention awards”) or unvested Class A Unit awards (Note 12). After the close of the Skyhigh Networks, Inc. (“Skyhigh”) acquisition (Note 6), Skyhigh employees were no longer eligible for Skyhigh’s equity incentive plan and all outstanding awards were replaced with retention awards or unvested Class A unit awards.
Derivative and Hedging Instruments
The fair values of each of our derivative instruments are recorded as an asset or liability on a net basis at the balance sheet date within other current or long-term assets or liabilities. The change in fair value of our derivative instruments is recorded through earnings in the line item on the Consolidated Statements of Operations to which the derivatives most closely relate, primarily in Interest expense and other, net. Changes in the fair value of the underlying assets and liabilities associated with the hedged risk are generally offset by the changes in the fair value of the related derivatives. We do not use derivative financial instruments for speculative trading purposes.
To reduce the interest rate risk inherent in variable rate debt, we entered into certain interest rate swap agreements to convert a portion of our variable rate borrowing into a fixed rate obligation (Note 15). These interest rate swap agreements fix the London Interbank Offered Rate (“LIBOR”) portion of the US dollar denominated variable rate borrowings. Accordingly, to the extent the cash flow hedge is effective, changes in the fair value of interest rate swaps will be included within Accumulated other comprehensive income in the consolidated balance sheets. Hedge accounting will be discontinued when the interest rate swap is no longer effective in offsetting cash flows attributable to the hedged risk, the interest rate swap expires or the cash flow hedge is dedesignated because it is no longer probable that the forecasted transaction will occur according to the original strategy. When hedge accounting is discontinued, any related amounts previously included in Accumulated other comprehensive income (loss) would be reclassified to Interest expenses and other, net, within the consolidated statements of operations.
Leases
We adopted ASC Topic 842 which primarily requires leases to be recognized on the balance sheet. We adopted the standard using the modified retrospective approach with an effective date as of the beginning of our fiscal year, December 30, 2018. Prior year financial statements were not recast under the new standard.
We determine if an arrangement contains a lease and classification of that lease, if applicable, at inception based on:
| • | Whether the contract involves the use of a distinct identified asset; |
| • | Whether we obtain the right to obtain substantially all the economic benefits from the use of the asset throughout the period; and |
| • | Whether we have a right to direct the use of the asset. |
Right-of-use
F-19
Confidential Treatment Requested by McAfee Corp.
Pursuant to 17 C.F.R. Section 200.83
measured at an amount which represents the lease liability, plus any initial direct costs incurred and less any lease incentives received. The lease liability is initially measured at lease commencement date based on the present value of minimum lease payments over the lease term. The lease term may include options to extend or terminate when it is reasonably certain that we will exercise the option. We have lease agreements with lease and
non-lease
components, and thenon-lease
components are generally accounted for separately and not included in our leased assets and corresponding liabilities.The depreciable life of assets and leasehold improvements are limited by the expected lease term unless there is a transfer of title or purchase option reasonably certain of exercise. Payments related to short-term leases are expensed on a straight-line basis over the lease term and reflected as a component of lease cost within our consolidated statements of operations. Lease payments generally consist of fixed amounts, as well as variable amounts based on a market rate or an index which are not material to our consolidated lease cost. Our leases do not contain significant terms and conditions for variable lease payments.
When available, we use the rate implicit in the lease to discount lease payments to present value; however, most of our leases do not provide a readily determinable implicit rate. Therefore, we estimate our incremental borrowing rate to discount the lease payments based on information available at lease commencement. For leases which commenced prior to our adoption of ASU
No. 2016-02,
Leases, and all related updates (collectively, “ASC Topic 842”), we estimated our incremental borrowing rate as of adoption date based on our credit rating, current economic conditions, and collateralized borrowing.Discontinued Operations
We review the presentation of planned business dispositions in the consolidated financial statements based on the available information and events that have occurred. The review consists of evaluating whether the business meets the definition of a component for which the operations and cash flows are clearly distinguishable from the other components of the business, and if so, whether it is anticipated that after the disposal the cash flows of the component would be eliminated from continuing operations and whether the disposition represents a strategic shift that has a major effect on operations and financial results. In addition, we evaluate whether the business has met the criteria as a business held for sale. In order for a planned disposition to be classified as a business held for sale, the established criteria must be met as of the reporting date, including an active program to market the business and the expected disposition of the business within one year.
Planned business dispositions are presented as discontinued operations when all the criteria described above are met. For those divestitures that qualify as discontinued operations, all comparative periods presented are reclassified in the consolidated balance sheets. Additionally, the results of operations of a discontinued operation are reclassified to income from discontinued operations, net of tax, for all periods presented in the consolidated statements of operations. Results of discontinued operations include all revenues and expenses directly derived from such businesses; general corporate overhead is not allocated to discontinued operations.
NOTE 2: RECENT ACCOUNTING STANDARDS
Recently Adopted Accounting Standards
In June 2016, the Financial Accounting Standards Board (“FASB”) issued ASU
December 29, 2019 which had an immaterial impact on our consolidated financial statements and related disclosures.
2016-13,
Financial Instruments — Credit Losses (Topic 326): Measurement of Credit Losses on Financial instruments (ASU2016-13)
and also issued subsequent amendments to the initial guidance (collectively, “Topic 326”). Topic 326 requires measurement and recognition of expected credit losses for financial assets held. We adopted Topic 326 onDecember 29, 2019 which had an immaterial impact on our consolidated financial statements and related disclosures.
In August 2018, the FASB issued ASU
2018-15,
Intangibles—Goodwill andOther—Internal-Use
Software (Subtopic350-40):
Customer’s Accounting for Implementation Costs Incurred in a Cloud ComputingF-20
Confidential Treatment Requested by McAfee Corp.
Pursuant to 17 C.F.R. Section 200.83
Arrangement That Is a Service Contract (“ASU
2018-15”),
which clarifies the accounting for implementation costs in cloud computing arrangements. We adopted ASU2018-15
on December 29, 2019 prospectively, which had an immaterial impact on our consolidated financial statements and related disclosures.In March 2020, the FASB issued ASU
2020-04,
Reference Rate Reform (Topic 848): Facilitation of the Effects of Reference Rate Reform on Financial Reporting (“ASU2020-04”).
The standard provides optional expedients and exceptions for applying GAAP to contracts, hedging relationships, and other transactions, subject to meeting certain criteria, that reference LIBOR or another rate that is expected to be discontinued. We adopted ASU2020-04
on June 27, 2020 and it had no impact on our consolidated financial statements and related disclosures. The guidance is potentially applicable when we modify the current reference rate of LIBOR to another reference rate on our 1st
Lien USD Term Loan (Note 13) and related interest rate swaps (Note 15).Recent Accounting Standards Not Yet Adopted
In December 2019, the FASB issued ASU
2019-12,
Income Taxes (Topic 740): Simplifying the Accounting for Income Taxes (“ASU2019-12”),
which simplifies the accounting for income taxes by removing certain exceptions for recognizing deferred taxes for investments, performing intra-period allocation and calculating income taxes in interim periods. ASU2019-12
also adds guidance to reduce complexity in certain areas, including recognizing deferred taxes for tax goodwill and allocating taxes to members of a consolidated group. ASU2019-12
is effective for us in the first quarter of fiscal year 2021. We have evaluated the impact of this standard on our accounting policies, processes and systems and do not believe it has a material impact on our consolidated financial statements.In August 2020, the FASB issued ASU
2020-06,
Debt—Debt with Conversion and Other Options (Subtopic470-20)
and Derivatives and Hedging—Contracts in Entity’s Own Equity (Subtopic815-40)
(“ASU2020-06”),
which simplifies current guidance for convertible financial instruments. ASU2020-06
also amends derivatives guidance for certain contracts in an entity’s own equity. Finally, ASU2020-06
amends earnings per share guidance related to convertible instruments. ASU2020-06
is effective for us in the first quarter of fiscal year 2022. We do not expect the adoption of ASU2020-06
to have a material effect on our consolidated financial statements.NOTE 3: DISCONTINUED OPERATIONS
On March 6, 2021, we entered into a definitive agreement with a consortium led by STG, pursuant to which STG agreed to purchase our Enterprise Business for an all-cash purchase price of $4.0 billion. The divestiture transaction closed on July 27, 2021. In connection with the divestiture of the Enterprise Business, we entered into a transition service agreement under which we will provide assistance to STG including, but not limited to, business support services and information technology services as well as a commercial services agreement under which we will provide certain product services and licensed technology.
F-21
Confidential Treatment Requested by McAfee Corp.
Pursuant to 17 C.F.R. Section 200.83
The following table presents the aggregate amounts of the classes of assets and liabilities that were sold under the definitive agreement with STG.
(in millions) | December 28, 2019 | December 26, 2020 | ||||||
Assets: | ||||||||
Accounts receivable, net | $ | 339 | $ | 290 | ||||
Deferred costs | 76 | 96 | ||||||
Other current assets | 19 | 16 | ||||||
Total current assets of discontinued operations | 434 | 402 | ||||||
Property and equipment, net | 56 | 34 | ||||||
Intangible assets, net | 1,091 | 915 | ||||||
Goodwill | 1,410 | 1,413 | ||||||
Deferred tax assets | 34 | 43 | ||||||
Other long-term assets | 174 | 155 | ||||||
Total assets of discontinued operations | $ | 3,199 | $ | 2,962 | ||||
Liabilities: | ||||||||
Accounts payable and other current liabilities | $ | 51 | $ | 39 | ||||
Accrued compensation and benefits | 21 | 18 | ||||||
Accrued marketing | 7 | 6 | ||||||
Lease liabilities, current portion | 16 | 15 | ||||||
Deferred revenue | 864 | 892 | ||||||
Total current liabilities of discontinued operations | 959 | 970 | ||||||
Deferred tax liabilities | 4 | 7 | ||||||
Other long-term liabilities | 56 | 51 | ||||||
Deferred revenue, less current portion | 651 | 604 | ||||||
Total liabilities of discontinued operations | $ | 1,670 | $ | 1,632 | ||||
The following table presents information regarding certain components of income from discontinued operations, net of taxes:
Fiscal Year Ended | ||||||||||||
(in millions) | December 29, 2018 | December 28, 2019 | December 26, 2020 | |||||||||
Net revenue | $ | 1,248 | $ | 1,332 | $ | 1,348 | ||||||
Operating income (loss) | (72 | ) | 8 | (46 | ) | |||||||
Income (loss) from discontinued operations before income taxes | (71 | ) | 8 | (46 | ) | |||||||
Income tax expense | 33 | 49 | 25 | |||||||||
Loss from discontinued operations, net of tax | (104 | ) | (41 | ) | (71 | ) | ||||||
The following table presents significant
non-cash
items and capital expenditures of discontinued operations:Year Ended | ||||||||||||
(in millions) | December 29, 2018 | December 28, 2019 | December 26, 2020 | |||||||||
Amortization and depreciation | $ | 254 | $ | 253 | $ | 212 | ||||||
Stock-based compensation expense | 22 | 20 | 200 | |||||||||
Purchases of property and equipment | 27 | 15 | 7 | |||||||||
F-22
Confidential Treatment Requested by McAfee Corp.
Pursuant to 17 C.F.R. Section 200.83
NOTE 4: REVENUE FROM CONTRACTS WITH CUSTOMERS
Deferred Revenue
During the year ended December 26, 2020, we recognized $712 million in revenue from our beginning deferred revenue balance.
During the year ended December 28, 2019, we recognized $628 million in revenue from our beginning deferred revenue balance.
During the year ended December 29, 2018, we recognized $536 million in revenue from our beginning deferred revenue balance. We added $4 million to deferred revenue due to effect of business combinations. An additional $15 million was recognized from deferred revenue due to changes in estimates resulting from a release of revenue under reserve for a single customer in connection with such customer’s right under certain circumstances to claw-back revenue from us within twelve months of payment.
Transaction Price Allocated to the Remaining Performance Obligations
As of December 26, 2020, we have $903 million in estimated revenue expected to be recognized in the future related to performance obligations that are unsatisfied (or partially unsatisfied), which includes deferred revenue and amounts that will be billed and recognized as revenue in future periods. We expect to recognize revenue on approximately 91% over the next 12 months, 9% in the next 13 to 36 months, with the remaining balance recognized thereafter.
Contract Costs
The following tables summarize the various contract costs capitalized on our consolidated financial statements:
(in millions) | December 28, 2019 | December 26, 2020 | ||||||
Capitalized acquisition costs within: | ||||||||
Deferred costs | $ | 109 | $ | 135 | ||||
Other long-term assets | 9 | 18 | ||||||
Total capitalized acquisition costs | $ | 118 | $ | 153 | ||||
Capitalized fulfillment costs within: | ||||||||
Deferred costs | $ | 2 | $ | 2 | ||||
Total capitalized fulfillment costs | $ | 2 | $ | 2 | ||||
F-23
Confidential Treatment Requested by McAfee Corp.
Pursuant to 17 C.F.R. Section 200.83
The following tables summarize the amortization of contract acquisitions and fulfillment costs on our consolidated financial statements:
Year Ended | ||||||||||||
(in millions) | December 29, 2018 | December 28, 2019 | December 26, 2020 | |||||||||
Amortization of capitalized acquisition costs: | ||||||||||||
Net revenue | $ | 25 | $ | 23 | $ | 17 | ||||||
Cost of sales | 141 | 154 | 193 | |||||||||
Sales and marketing | 8 | 7 | 7 | |||||||||
Total amortization of capitalized acquisition costs from continuing operations | 174 | 184 | 217 | |||||||||
Discontinued operations | 50 | 74 | 82 | |||||||||
Total amortization of capitalized acquisition costs | $ | 224 | $ | 258 | $ | 299 | ||||||
Amortization of capitalized fulfillment costs: | ||||||||||||
Cost of sales | $ | 6 | $ | 5 | $ | 3 | ||||||
Discontinued operations | 5 | 7 | 10 | |||||||||
Total amortization of capitalized acquisition costs | $ | 11 | $ | 12 | $ | 13 | ||||||
There were 0 impairment losses in relation to capitalized acquisition or fulfillments costs for the years ended December 26, 2020, December 28, 2019 and December 29, 2018.
NOTE 5: LEASES
As of December 26, 2020, we have operating leases for corporate offices and data centers and no significant finance leases. Information related to operating leases, including leases associated with our discontinued operations, was as follows:
Year Ended | ||||||||
(in millions) | December 28, 2019 | December 26, 2020 | ||||||
Cash paid for amounts included in the measurement of lease liabilities | $ | 38 | $ | 38 | ||||
Right-of-use | 48 | 24 | ||||||
Lease expense from continuing operations | 21 | 16 | ||||||
Lease expense from discontinued operations | 25 | 21 | ||||||
Total lease expense | $ | 46 | $ | 37 | ||||
F-24
Confidential Treatment Requested by McAfee Corp.
Pursuant to 17 C.F.R. Section 200.83
Balance sheet information related to leases, excluding leases associated with our discontinued operations, was as follows:
(in millions) | December 28, 2019 | December 26, 2020 | ||||||
Other long-term assets | $ | 37 | $ | 33 | ||||
Lease liabilities, current portion | $ | 13 | $ | 10 | ||||
Other long-term liabilities | 38 | 37 | ||||||
Total lease liabilities | $ | 51 | $ | 47 | ||||
Weighted Average Remaining Lease Term (in years) | 8 | 8 | ||||||
Weighted Average Discount Rate (percentage) | 6.3 | % | 6.3 | % | ||||
Maturities of lease liabilities, excluding lease liabilities associated with our discontinued operations, were as follows:
(in millions) | December 26, 2020 | |||
2021 | $ | 11 | ||
2022 | 7 | |||
2023 | 6 | |||
2024 | 5 | |||
2025 | 5 | |||
Thereafter | 26 | |||
Total lease payments | 60 | |||
Less imputed interest | (13 | ) | ||
Total lease liabilities | $ | 47 | ||
Disclosures Related to Periods Prior to Adoption of ASC Topic 842
Rental expense related to our facilities was $8 million and $24 million for continuing operations and discontinued operations, respectively, during the year ended December 29, 2018.
NOTE 6: ACQUISITIONS / BUSINESS COMBINATIONS
Acquisition Overview
Under the acquisition method of accounting, the total purchase consideration is allocated to the tangible and identifiable intangible assets acquired and liabilities assumed based on their estimated fair values. Accordingly, the assets acquired and liabilities assumed are recorded at their respective fair values as of the date of the acquisition, with the residual consideration transferred recorded as goodwill. The determination of the fair values of the acquired assets and assumed liabilities requires significant judgment, including estimates impacting the determination of estimated lives of tangible and intangible assets, and the calculation of the fair value of inventory, property and equipment, deferred revenue and identified intangible assets. The fair values were determined primarily using the income method utilizing Level 3 inputs (Note 15).
Skyhigh Networks, Inc. Overview
On January 3, 2018, we acquired 100% of the equity of Skyhigh Networks, Inc. (“Skyhigh”), enabling us to integrate their leading cloud access security broker technology within our product offerings. We acquired
F-25
Confidential Treatment Requested by McAfee Corp.
Pursuant to 17 C.F.R. Section 200.83
Skyhigh at a purchase price of $590 million, primarily funded through new debt issuance (Note 13), net of cash received. An additional amount will be recognized as deferred cash and equity in the period in which certain key employees provide required continuing service. The Skyhigh acquisition is accounted for as a business combination and is included in discontinued operations.
TunnelBear Inc. Overview
On February 26, 2018, we acquired certain assets and liabilities of TunnelBear, Inc. (“TunnelBear”), enabling us to integrate their leading consumer VPN technology within our own product platform. The TunnelBear acquisition is accounted for as a business combination. We acquired those assets and liabilities for a purchase price of $25 million with an additional amount recognized as deferred cash in the period in which certain key employees provide required continuing service.
Deferred Cash and Equity
In connection with the purchase of Skyhigh, we issued approximately 2.2 million Class A FTW LLC units with a fair value of $10.67 per unit to certain employees with a holdback provision (“Restricted Class A Units”). Since this holdback provision is akin to a service condition, we recognize expense for these units over the time period in which the restrictive holdback provision expires over 2 years past the acquisition date (“Restricted Class A Unit Vesting”). Additionally, in connection with our acquisitions during the year ended December 29, 2018, we are required to make deferred cash payments of $59 million over the service period required to be completed by certain employees. Deferred cash and equity are recognized as compensation cost.
As of December 26, 2020, our outstanding deferred cash and equity, as it relates to all acquisitions, including acquisitions related to our discontinued operations, are as follows:
Year Ended | ||||||||||||
(in millions) | December 29, 2018 | December 28, 2019 | December 26, 2020 | |||||||||
Beginning outstanding deferred cash and equity balance | $ | — | $ | 13 | $ | 20 | ||||||
Accruals | 39 | 35 | 12 | |||||||||
Restricted Class A Unit Vesting | (9 | ) | (12 | ) | (3 | ) | ||||||
Cash payment | (17 | ) | (16 | ) | (16 | ) | ||||||
Ending outstanding deferred cash and equity balance | $ | 13 | $ | 20 | $ | 13 | ||||||
As of December 26, 2020, we have unrecognized expense relating to deferred cash of $7 million to be recognized over a weighted average period of less than one year. Deferred cash is recorded within Accrued compensation and benefits and Other long-term liabilities on the consolidated balance sheets for amounts due in the next 12 months and amounts due after 12 months, respectively. Deferred equity is recorded within Members’ equity (deficit) on the consolidated balance sheets.
NOTE 7: TRANSACTIONS WITH MEMBERS, SHAREHOLDERS AND RELATED PARTIES
FTW declared tax and excess cash distributions to its members during the years ended December 26, 2020 and December 28, 2019 in aggregate of $314 million and $1,338 million, respectively. The distributions declared by FTW during the year ended December 26, 2020, included $38 million of which $24 million goes to Continuing LLC Owners and $14 million goes to McAfee Corp. McAfee Corp. used its share to declare a dividend of $0.087 per share of Class A common stock in December 2020. The $38 million in distributions and dividends was recorded within Accounts payable and other current liabilities on the consolidated balance sheet as of
F-26
Confidential Treatment Requested by McAfee Corp.
Pursuant to 17 C.F.R. Section 200.83
December 26, 2020 and was paid in January 2021. The 2019 distributions to FTW members were partially funded through debt issued on June 13, 2019 (Note 13).
McAfee Corp. made a
one-time
payment of $13 million to members that exchanged their FTW LLC Units for Class A common shares in McAfee Corp. at the time of the IPO. The payment was reflected as a reduction to Additionalpaid-in
capital on the consolidated balance sheet as of December 26, 2020.In February 2020, we entered into an agreement with our former President and Chief Executive Officer to repurchase equity units for an aggregate repurchase price of $10 million. We also agreed to repurchase his remaining outstanding equity units in April 2021 at fair market value, contingent on the satisfaction of certain terms and conditions. Upon a sale of the company or an IPO prior to the repurchase date, the units were not required to be repurchased. The units were classified as temporary equity within Redeemable units from the time of the agreement until the IPO when they were reclassified to permanent equity.
In October 2020, the Board of FTW approved and effected aunit split of its member units. All unit and per unit data included in these consolidated financial statements give effect to the unit split and have been retroactively adjusted for all periods.
four-for-one
We had these additional transactions, inclusive of discontinued operations, with TPG, Intel or other Continuing LLC Owners and companies owned or partially owned by those parties that therefore qualify as related parties. The transactions within the table below include sales of our products and purchases of various goods or services and also include a payment of $22 million to certain affiliates of TPG, Thoma Bravo and Intel upon the termination of the Management Services Agreement subsequent to the IPO.
Year Ended | ||||||||||||
(in millions) | December 29, 2018 | December 28, 2019 | December 26, 2020 | |||||||||
Sales with related parties: | ||||||||||||
Intel | $ | 3 | $ | 10 | $ | 1 | ||||||
TPG | — | — | 1 | |||||||||
TPG affiliates | 5 | 4 | 2 | |||||||||
Other | 1 | 2 | 2 | |||||||||
Total | $ | 9 | $ | 16 | $ | 6 | ||||||
Payments to related parties: | ||||||||||||
Intel | $ | 7 | $ | 6 | $ | 15 | ||||||
TPG | 5 | 6 | 17 | |||||||||
TPG affiliates | 35 | 29 | 30 | |||||||||
Other | 6 | 21 | 16 | |||||||||
Total | $ | 53 | $ | 62 | $ | 78 | ||||||
Revenue from the sales transactions are recognized in accordance with our revenue recognition policy.
F-27
Confidential Treatment Requested by McAfee Corp.
Pursuant to 17 C.F.R. Section 200.83
Our receivable from Intel, net consisted of the following:
(in millions) | December 28, 2019 | December 26, 2020 | ||||||
Intel receivable (1) | ||||||||
Tax indemnity | $ | 10 | $ | 8 | ||||
Total | 10 | 8 | ||||||
Intel payable (1) | ||||||||
Tax indemnity | (4 | ) | (2 | ) | ||||
Total | (4 | ) | (2 | ) | ||||
Total, net (2) | $ | 6 | $ | 6 | ||||
| (1) | We have the contractual right of offset of our receivables and payables with Intel. |
| (2) | As of December 26, 2020, $3 million and $3 million are recorded in Other current assets and Other long-term assets on the consolidated balance sheet, respectively. As of December 28, 2019, $2 million and $4 million are recorded in Other current assets and Other long-term assets on the consolidated balance sheet, respectively. |
NOTE 8: OPERATING SEGMENTS
Historically, we had 2 operating segments, which also represented our reportable segments and reporting units. The Consumer segment focused on providing security solutions for consumers. The Enterprise segment focused on providing security solutions for large enterprise, governments, small and
medium-sized
businesses. On March 6, 2021, we entered into a definitive agreement to sell certain assets together with certain liabilities of our Enterprise Business to STG, representing substantially all of our Enterprise segment. The divestiture of the Enterprise Business, which was completed on July 27, 2021, allowed us to shift our operational focus to our Consumer business and represented a strategic shift in our operations. Therefore, the results of our Enterprise Business were classified as discontinued operations in our consolidated statements of operations and thus excluded from both continuing operations and segment results for all periods presented. Accordingly, we now have 1 reportable segment with the change reflected in all periods presented.Revenue by country based on the
sell-to
address of theend-users
is as follows:Year Ended | ||||||||||||
(in millions) | December 29, 2018 | December 28, 2019 | December 26, 2020 | |||||||||
United States | $ | 630 | $ | 739 | $ | 943 | ||||||
United Kingdom | 136 | 132 | 141 | |||||||||
Other (1) | 395 | 432 | 474 | |||||||||
Total net revenue | $ | 1,161 | $ | 1,303 | $ | 1,558 | ||||||
| (1) | No other individual country accounted for more than 10% of net revenue. |
Customer Information
In the years ended December 29, 2018, December 28, 2019, and December 26, 2020, our largest customer accounted for 13%, 13%, and 13%, respectively, of our net revenue with its parent company contributing an additional 1%, 2%, and 5%, respectively. As of December 28, 2019 and December 26, 2020 our largest customer accounted for 23% and 47%, respectively, of our Accounts receivable, net with its parent company accounting for an additional 10% and 2%, respectively.
F-28
Confidential Treatment Requested by McAfee Corp.
Pursuant to 17 C.F.R. Section 200.83
NOTE 9: RESTRUCTURING CHARGES
Restructuring charges generally include significant actions impacting the way we manage our business. Employee severance and benefit charges are largely based upon substantive severance plans, while some charges result from mandated requirements in certain foreign jurisdictions. These charges include items such as employee severance, ongoing benefits, and excess payroll costs directly attributable to the restructuring plan.
Restructuring charges attributable to continuing operations are as follows:
Year Ended | ||||||||||||
(in millions) | December 29, 2018 | December 28, 2019 | December 26, 2020 | |||||||||
Employee severance and benefits | $ | 11 | $ | 5 | $ | 2 | ||||||
Facility Restructuring | 1 | 1 | — | |||||||||
Transition Charges | 7 | — | — | |||||||||
Total | $ | 19 | $ | 6 | $ | 2 | ||||||
In connection with the agreement to sell certain assets of our Enterprise Business, a portion of our Restructuring charges were classified to discontinued operations for all periods presented. Our Restructuring charges attributable to discontinued operations are as follows:
Year Ended | ||||||||||||
(in millions) | December 29, 2018 | December 28, 2019 | December 26, 2020 | |||||||||
Employee severance and benefits | $ | 16 | $ | 15 | $ | 23 | ||||||
Facility Restructuring | 1 | 1 | — | |||||||||
Total | $ | 17 | $ | 16 | $ | 23 | ||||||
In January 2018, we announced the second phase of the McAfee Acceleration Program to further our alignment toward core business. During the fiscal year ended December 29, 2018, we incurred additional employee severance and benefits and facility restructuring costs of $27 million and $2 million, respectively.
In January 2019, we announced the “Transformation 2019” initiative, in which we realigned our staffing across various departments. As part of the initiative, we incurred employee severance and benefits costs and facility restructuring of $20 million and $2 million, respectively.
In January 2020, we commenced the 2020 transformation initiative, in which we are realigning our staffing across various departments. As part of the initiative, we have incurred employee severance and benefits costs of $9 million recorded in restructuring charges in the consolidated statement of operations.
In December 2020, we initiated a workforce reduction and other restructuring activities designed to continue to improve operating margins in connection with the reorientation of our Enterprise business and realignment of staffing in other departments, which was announced in February 2021 following the notification of affected employees. We expect to complete these activities in the first half of fiscal year 2021. As part of the initiative, in December 2020 we recognized $16 million in connection with the workforce reduction and other restructuring activities, consisting primarily of
one-time
termination benefits to the impacted employees, including severance payments and healthcare and other accrued benefits recorded in Restructuring and transition charges in the consolidated statement of operations. We expect to recognize additional severance and other restructuring expense ranging between $30 million and $35 million in the first half of fiscal year 2021 in connection with this action. We expect substantially all of the costs associated with these activities to result in cash expenditures. We may also incur other charges or cash expenditures not currently contemplated due to events that may a occur as a result of, or associated with, the workforce reduction.F-29
Confidential Treatment Requested by McAfee Corp.
Pursuant to 17 C.F.R. Section 200.83
The balance of our restructuring activities are as follows:
(in millions) | Total | |||
Employee severance and benefits | ||||
As of December 30, 2017 | $ | 4 | ||
Additional accruals | 27 | |||
Cash payments | (30 | ) | ||
As of December 29, 2018 | 1 | |||
Additional accruals | 20 | |||
Cash payments | (19 | ) | ||
As of December 28, 2019 | 2 | |||
Additional accruals | 25 | |||
Cash payments | (11 | ) | ||
As of December 26, 2020 | $ | 16 | ||
Facility Restructuring | ||||
As of December 30, 2017 | $ | 7 | ||
Additional accruals | 2 | |||
Cash payments | (5 | ) | ||
As of December 29, 2018 | 4 | |||
Adjustment (1) | (4 | ) | ||
As of December 28, 2019 | — | |||
Additional accruals | — | |||
Cash payments | — | |||
As of December 26, 2020 | $ | — | ||
| (1) | Represents a reclassification to reduce ROU assets as part of the transition to ASC Topic 842. |
NOTE 10: GOODWILL AND INTANGIBLE ASSETS, NET
Goodwill and intangible assets disposed of as a result of our agreement with STG to sell certain assets of Enterprise Business were included in assets of discontinued operations in our consolidated balance sheets as of December 26, 2020 and as of December 28, 2019, and accordingly, are excluded from the tables below.
Goodwill
Goodwill activity was as follows:
(in millions) | Total | |||
Balance as of December 29, 2018 | $ | 1,018 | ||
Additions | 0 | |||
Balance as of December 28, 2019 | $ | 1,018 | ||
Additions | 0 | |||
Balance as of December 26, 2020 | $ | 1,018 | ||
During the fourth quarter of each year, we performed our annual impairment assessment. NaN impairment loss for goodwill or intangibles was recorded during the years ended December 26, 2020 or December 28, 2019.
F-30
Confidential Treatment Requested by McAfee Corp.
Pursuant to 17 C.F.R. Section 200.83
Intangible Assets, Net
Amortization expense for purchased and developed intangible assets is as follows:
December 28, 2019 | December 26, 2020 | |||||||||||||||||||||||
(in millions) | Gross Assets | Accumulated Amortization | Net | Gross Assets | Accumulated Amortization | Net | ||||||||||||||||||
Intangible assets subject to amortization: | ||||||||||||||||||||||||
Customer relationships and other | $ | 758 | $ | (413 | ) | $ | 345 | $ | 758 | $ | (556 | ) | $ | 202 | ||||||||||
Acquired and developed technology | 517 | (293 | ) | 224 | 517 | (401 | ) | 116 | ||||||||||||||||
Total intangible assets subject to amortization | 1,275 | (706 | ) | 569 | 1,275 | (957 | ) | 318 | ||||||||||||||||
Intangible assets not subject to amortization: | ||||||||||||||||||||||||
Brand | 411 | 0 | 411 | 411 | 0 | 411 | ||||||||||||||||||
Total intangible assets not subject to amortization | 411 | 0 | 411 | 411 | 0 | 411 | ||||||||||||||||||
Total intangible assets | $ | 1,686 | $ | (706 | ) | $ | 980 | $ | 1,686 | $ | (957 | ) | $ | 729 | ||||||||||
Year Ended | ||||||||||||||||
(in millions) | December 29, 2018 | December 28, 2019 | December 26, 2020 | Statements of Operations Classification | ||||||||||||
Customer relationships and other | $ | 153 | $ | 146 | $ | 143 | Amortization of intangibles | |||||||||
Acquired and developed technology | 107 | 107 | 108 | Cost of sales | ||||||||||||
Total | $ | 260 | $ | 253 | $ | 251 | ||||||||||
Based on identified intangible assets that are subject to amortization as of December 26, 2020, we expect future amortization expense to be as follows:
(in millions) | Total | |||
2021 | $ | 170 | ||
2022 | 76 | |||
2023 | 28 | |||
2024 | 20 | |||
2025 | 19 | |||
Thereafter | 5 | |||
Total | $ | 318 | ||
F-31
Confidential Treatment Requested by McAfee Corp.
Pursuant to 17 C.F.R. Section 200.83
NOTE 11: PROPERTY AND EQUIPMENT
Property and equipment assets disposed of as a result of our agreement with STG to sell certain assets of Enterprise Business were included in assets of discontinued operations in our consolidated balance sheets as of December 26, 2020 and as of December 28, 2019, and accordingly, are excluded from the tables below.
Property and equipment, net was as follows:
(in millions) | December 28, 2019 | December 26, 2020 | ||||||
Land, buildings and leasehold improvements | $ | 44 | $ | 63 | ||||
Computer equipment, software and other | 126 | 132 | ||||||
Construction in progress | 24 | 23 | ||||||
Total property and equipment | 194 | 218 | ||||||
Less: accumulated depreciation | (79 | ) | (103 | ) | ||||
Total property and equipment, net | $ | 115 | $ | 115 | ||||
We computed depreciation using the straight-line method over the estimated useful life of
10-
25
years for buildings and2-
5
years for computer equipment, software and other. For the years ended December 26, 2020, December 28, 2019 and December 29, 2018, our depreciation expense was $28 million, $29 million and $28 million, respectively.NOTE 12: EMPLOYEE INCENTIVE / BENEFIT PLANS
Equity-Based Compensation
Equity-based compensation costs recognized in our consolidated statements of operations were:
Fiscal Year Ended | ||||||||||||
(in millions) | December 29, 2018 | December 28, 2019 | December 26, 2020 | |||||||||
Cost of sales | $ | 1 | $ | 0 | $ | 5 | ||||||
Sales and marketing | 1 | 1 | 23 | |||||||||
Research and development | 1 | 1 | 40 | |||||||||
General and administrative | 3 | 3 | 45 | |||||||||
Total equity-based compensation expense from continuing operations | 6 | 5 | 113 | |||||||||
Discontinued operations | 22 | 20 | 200 | |||||||||
Total equity-based compensation expense | $ | 28 | $ | 25 | $ | 313 | ||||||
During 2020, the tax benefit that we realized for the tax deduction from share-based awards totaled $1 million for our continuing operations and $4 million for our discontinued operations.
F-32
Confidential Treatment Requested by McAfee Corp.
Pursuant to 17 C.F.R. Section 200.83
The following information related to our share-based awards includes awards associated with our discontinued operations.
Class A Share Awards
RSU activity was as follows:
Number of Units (in millions) | Weighted Average Grant-Date Fair Value | |||||||
Balance as of October 21, 2020 | — | $ | — | |||||
Grants | 2.0 | $ | 15.97 | |||||
Grants replacing pre-IPO Awards | 27.6 | $ | 17.39 | |||||
Vested at IPO | (5.7 | ) | $ | 20.00 | ||||
Vested | (0.1 | ) | $ | 8.38 | ||||
Forfeited | (0.3 | ) | $ | 19.35 | ||||
Balance as of December 26, 2020 | 23.5 | $ | 16.65 | |||||
Upon consummation of the IPO in October 2020, we modified the terms of our unvested FTW RSUs, outstanding CRSUs, and outstanding MEPUs to permit settlement in the Corporation’s Class A common stock, par value $0.001 per share (“Class A common stock”) (collectively, “Replacement RSUs”) in lieu of cash settlement, at the Corporation’s election. No service or performance vesting terms were changed at the time of modification. Upon completion of the modification, all Replacement RSUs are equity classified due to the Corporation’s intent and ability to settle the awards in Class A common stock. MEPUs and CRSUs which had previously met the time-vesting requirement were vested at IPO. We withheld 1.8 million shares to settle our vested RSUs during the quarter ending December 26, 2020.
As of December 26, 2020, our unrecognized compensation costs related to the Class A Unit grants was $235 million with a remaining weighted-average service period of 2.1 years.
PSU
PSU activity was as follows:
Number of Units (in millions) | Weighted Average Grant-Date Fair Value | |||||||
Balance as of October 21, 2020 | — | $ | — | |||||
Grants replacing pre-IPO CRSUs | 0.2 | $ | 19.28 | |||||
Grants replacing pre-IPO RSUs | 0.1 | $ | 8.25 | |||||
Balance as of December 26, 2020 | 0.3 | $ | 14.30 | |||||
As of December 26, 2020, our remaining unrecognized compensation costs related to the PSU grants was $3 million with a remaining weighted-average service period of 2.1 years.
F-33
Confidential Treatment Requested by McAfee Corp.
Pursuant to 17 C.F.R. Section 200.83
Stock Options
Stock options activity was as follows:
Time-based | Performance-based | |||||||||||||||
Number of Units (in millions) | Weighted Average Grant-Date Fair Value | Number of Units (in millions) | Weighted Average Grant-Date Fair Value | |||||||||||||
Balance as of October 21, 2020 | — | $ | — | — | $ | — | ||||||||||
Grants | 0.5 | $ | 6.35 | — | ||||||||||||
Grants in connection with IPO | 1.3 | $ | 7.70 | 0.6 | $ | 7.84 | ||||||||||
Vested | (0.5 | ) | $ | 7.84 | — | |||||||||||
Balance as of December 26, 2020 | 1.3 | $ | 7.29 | 0.6 | $ | 7.84 | ||||||||||
Exercisable as of December 26, 2020 | 0.5 | — | ||||||||||||||
Weighted average strike price | $ | 20.00 | $ | — | ||||||||||||
The Company granted stock options with a strike price equal to the IPO price to certain holders of MEPUs with distribution thresholds not fully satisfied at the time of modification. The stock options have service and/or performance conditions identical to the original MEPU conditions.
As of December 26, 2020, our remaining unrecognized compensation costs related to the stock options grants was $12 million with a remaining weighted-average service period of 2.0 years.
The weighted average estimated value of the stock options granted during the year ended December 26, 2020 was valued using the Black-Scholes model with the following inputs:
Year Ended | ||||
December 26, 2020 | ||||
Estimated values | $ | 15.48 - $20.00 | ||
Expected life (in years) | 5.02 | |||
Risk-free interest rate | 0.37% - 0.83% | |||
Dividend yield | 1.50% - 2.25% | |||
Volatility | 40.00% | |||
Management Incentive and Equity Participation Unit Awards
We granted MIUs and MEPUs to certain employees. The time-based awards’ fair value was calculated using the Black-Scholes model. The performance-based awards’ fair value was calculated using Monte Carlo simulations. The performance-based portion of both awards and the time-based portion of the MEPUs required a Qualifying Liquidity Event to be eligible to vest.
F-34
Confidential Treatment Requested by McAfee Corp.
Pursuant to 17 C.F.R. Section 200.83
Management Incentive Units
MIU activity was as follows:
Time-based | Performance-based | |||||||||||||||
Number of Units (in millions) | Weighted Average Grant-Date Fair Value | Number of Units (in millions) | Weighted Average Grant-Date Fair Value | |||||||||||||
Balance as of December 28, 2019 | 4.9 | $ | 2.98 | 6.0 | $ | 1.14 | ||||||||||
Grants | 5.6 | $ | 3.42 | — | — | |||||||||||
Vested | (2.2 | ) | $ | 4.15 | (0.9 | ) | $ | 8.64 | ||||||||
Forfeited | (1.6 | ) | $ | 2.64 | (2.4 | ) | $ | 0.92 | ||||||||
Balance as of December 26, 2020 | 6.7 | $ | 3.47 | 2.7 | $ | 1.41 | ||||||||||
As of December 26, 2020, unrecognized compensation costs of the time-based awards were $22 million with a remaining weighted average service period of 3.0 years. The unrecognized compensation costs of the performance-based awards were $2 million. Under the terms of our 2017 Plan, we will no longer grant further MIUs.
The weighted average estimated value of the time-based portion of MIUs granted during the years ended December 26, 2020, December 28, 2019 and December 29, 2018 was valued using the Black-Scholes model with the following inputs:
Year Ended | ||||||||||||
December 29, 2018 | December 28, 2019 | December 26, 2020 | ||||||||||
Estimated values | $ | 10.67 - $10.85 | $ | 8.64 | $ | 8.64 - $14.32 | ||||||
Expected life (in years) | 3.69 | 3.17 | 2.82 | |||||||||
Risk-free interest rate | 2.2% - 2.91% | 1.43% - 1.67% | 0.18% - 1.34% | |||||||||
Dividend yield | 0.0% | 0.0% | 0.0% | |||||||||
Volatility | 40.35% - 43.31% | 35.91% - 36.37% | 35.00% - 40.97% | |||||||||
During February 2020, we modified the terms of certain MIU grants to provide for vesting subject to the satisfaction of certain conditions, which resulted in the recognition of $12 million in incremental compensation expense for the modified awards at their modification date.
Class A Unit Awards
As of December 26, 2020, all outstanding FTW RSUs were converted into Class A Share awards. FTW RSU activity during the year ended December 26, 2020 was as follows:
Number of Units (in millions) | Weighted Average Grant-Date Fair Value | |||||||
Balance as of December 28, 2019 | 2.9 | $ | 8.08 | |||||
Grants | 4.3 | $ | 9.46 | |||||
Vested | (1.4 | ) | $ | 8.80 | ||||
Forfeited | (0.7 | ) | $ | 9.14 | ||||
Converted into Class A Share RSUs | (5.1 | ) | $ | 8.13 | ||||
Balance as of December 26, 2020 | — | $ | — | |||||
F-35
Confidential Treatment Requested by McAfee Corp.
Pursuant to 17 C.F.R. Section 200.83
Management Equity Participation Units
As of December 26, 2020, all outstanding MEPUs were converted into Class A Share awards. MEPU activity during the year ended December 26, 2020 was as follows:
(in millions) | Number of Time-based Units | Number of Performance- based Units | ||||||
Balance as of December 28, 2019 | 4.1 | 4.3 | ||||||
Grants | 1.4 | — | ||||||
Time-vested | (1.5 | ) | — | |||||
Forfeited | (0.8 | ) | (0.8 | ) | ||||
Converted into Class A Share RSUs | (3.2 | ) | (3.5 | ) | ||||
Balance as of December 26, 2020 | — | — | ||||||
Cash RSU (“CRSU”)
As of December 26, 2020, all outstanding CRSUs were converted into Class A Share awards. CRSU activity during the year ended December 26, 2020 was as follows:
(in millions) | Number of Units | |||
Balance as of December 28, 2019 | 5.2 | |||
Grants | 9.7 | |||
Time-vested | (2.5 | ) | ||
Forfeited | (1.0 | ) | ||
Converted into Class A Share RSUs | (11.4 | ) | ||
Balance as of December 26, 2020 | — | |||
Cash-Based Retention Awards
The activities related to cash-based retention awards within Accrued compensation and benefits on our consolidated balance sheets were as follows:
Year Ended | ||||||||||||
(in millions) | December 29, 2018 | December 28, 2019 | December 26, 2020 | |||||||||
Beginning retention awards balance | $ | 29 | $ | 11 | $ | 7 | ||||||
Accruals, net of forfeitures | 36 | 19 | 8 | |||||||||
Cash payments | (51 | ) | (23 | ) | (15 | ) | ||||||
Reclass to Intel Receivable | (3 | ) | — | — | ||||||||
Ending retention awards balance | $ | 11 | $ | 7 | $ | — | ||||||
As of December 26, 2020, our remaining unrecognized compensation costs related to the cash-based retention awards were $3 million with a remaining weighted-average period of 1.1 years.
Defined Contribution Plans
We provide
tax-qualified
retirement contribution plans in the United States for the benefit of all full-time employees. The plans are designed to provide employees with an accumulation of funds for retirement on atax-deferred
basis. Additionally, our operations in certain countries require we make payments to definedF-36
Confidential Treatment Requested by McAfee Corp.
Pursuant to 17 C.F.R. Section 200.83
contribution plans for the benefit of our employees. Under the United States’ 401(k) and the foreign countries’ various defined contribution plans, including contributions to employees of our discontinued operations, we expensed $35 million, $36 million and $32 million during the years ended December 26, 2020, December 28, 2019 and December 29, 2018, respectively.
Defined Benefit Plans
In certain jurisdictions outside the United States, we are required to provide a defined benefit obligation and certain post-retirement benefits. As of December 26, 2020 and December 28, 2019, including benefits provided to employees of our discontinued operations, our net benefit obligation of $11 million and $8 million, respectively, is included within Accrued compensation and benefits and Other long-term liabilities on the consolidated balance sheets.
NOTE 13: DEBT
Our long-term debt balance consisted of the following:
(in millions) | December 28, 2019 | December 26, 2020 | ||||||
Long-term debt, net: | ||||||||
1 st Lien USD Term Loan(1) | $ | 3,020 | $ | 2,701 | ||||
1 st Lien Euro Term Loan(2) | 1,200 | 1,298 | ||||||
2 nd Lien USD Term Loan(3) | 509 | — | ||||||
Long-term debt, net of unamortized discounts | 4,729 | 3,999 | ||||||
Unamortized deferred financing costs | (17 | ) | (12 | ) | ||||
Current installments of long-term debt | (43 | ) | (44 | ) | ||||
Total | $ | 4,669 | $ | 3,943 | ||||
| (1) | During the year ended December 26, 2020, the weighted average interest rate was 4.4% |
| (2) | During the year ended December 26, 2020, the weighted average interest rate was 3.5% |
| (3) | During the year ended December 26, 2020, the weighted average interest rate was 9.7% |
As of December 26, 2020, the material terms of our outstanding debt was as follows:
Debt | Issue Date | Issue Principal | Interest Rate (1) | Interest Payment Frequency | Maturity Date | |||||||
1 st Lien | June 2019 | $ | 3,087 | 375 pts above LIBOR | Monthly | September 2024 | ||||||
1 st Lien | June 2019 | € | 1,092 | 350 pts above EURIBOR | Quarterly | September 2024 | ||||||
Additions to and Modifications of Debt
In January 2018, in order to finance the acquisition of Skyhigh (
Note 6
), McAfee, LLC entered into an increase of our term loans under the 1st
Lien Credit Facility. We increased our 1st
Lien USD Term Loan by $324 million and our 1st
Lien Euro Term Loan by €150 million, issued at a discount to par at a price of 99.60% and 99.98%, respectively and recognized issuance costs of $10 million. The discount and issuance costs are being amortized over the life of the respective term loans into Interest expense and other, net, in the consolidated statements of operations. This increase does not change the material terms of our financing arrangements. Substantially all of the U.S. assets acquired by us have been added to the security pledge.In November 2018, we modified the material terms of our 1
st
Lien USD and Euro Term Loans, as well as reduced the outstanding principal by $50 million and increased outstanding principal by €90 million, respectively. As aF-37
Confidential Treatment Requested by McAfee Corp.
Pursuant to 17 C.F.R. Section 200.83
result, we recorded refinancing fees of $3 million within Interest expense and other, net on the consolidated statements of operations. Additionally, on November 1, 2018, we made a prepayment on our 2
nd
Lien Term Loan of $50 million. In connection with the prepayment, we recorded refinancing fees of $2 million within Interest expense and other, net on the consolidated statements of operations.In June, 2019, McAfee, LLC entered into an agreement to increase our term loans under the 1
st
Lien credit facility. We increased our 1st
Lien USD Term Loan by $300 million and our 1st
Lien Euro Term Loan by €355 million, issued at a discount to par at a price of 99.24% and 99.50%, respectively and recognized issuance costs of $6 million. The discount and issuance costs are being amortized over the life of the respective term loans into Interest expense and other, net in the consolidated statements of operations. Additionally, on June 13, 2019, we modified certain material terms of our 1st
Lien and 2nd
Lien credit facilities, including, but not limited to, refreshing certain baskets and permitting a distribution to our owners with the proceeds of the increase of our term loans under the 1st
Lien credit facility (Note 7
). As a result, we capitalized consent fees of $12 million within Long-term debt, net on the consolidated balance sheets.Subsequent to the IPO of McAfee Corp. in October 2020, we repaid all outstanding principal obligations with respect to our 2
nd
Lien Term loan of $525 million and paid $4 million of related accrued interest. We also recognized a loss on extinguishment for the remaining unamortized discount and unamortized deferred financing costs related to our 2nd
Lien Term loan totaling $14 million in October 2020.On December 24, 2020, we prepaid $300 million of the outstanding 1
st
Lien USD Term Loan under the 1st
Lien Credit Facilities and recognized a loss on extinguishment of $4 million for unamortized discount and unamortized deferred financing costs.As of December 26, 2020, our debt repayment obligations for the five succeeding fiscal years and thereafter are as follows:
(in millions) | ||||
2021 | $ | 44 | ||
2022 | 45 | |||
2023 | 44 | |||
2024 | 3,905 | |||
2025 | — | |||
Thereafter | — | |||
Total debt repayment obligations | $ | 4,038 | ||
Revolving Credit Facility
In March 2020, we borrowed $300 million under our Revolving Credit Facility. The funds were borrowed for general corporate purposes due to seasonality in cash flow generation and as a precautionary measure in response to general market conditions. In June 2020, we repaid the Revolving Credit Facility in full and have 0 outstanding balance on the Revolving Credit Facility as of December 26, 2020. During the fiscal year ended December 26, 2020, the weighted average interest rate was 4.3% for borrowings outstanding.
In October 2020, McAfee, LLC entered into an agreement to extend the maturity date of, and increased the amount available to us under, a portion of the commitments under the Revolving Credit Facility. As a result of this agreement, the Revolving Credit Facility consists of a $164 million tranche that will mature on September 29, 2022 and a $500 million tranche that will mature on September 29, 2024.
As of December 26, 2020, we had a letter of credit of $4 million issued against the Revolving Credit Facility and $660 million of undrawn capacity under the Revolving Credit Facility. As of December 28, 2019, we had a letter
F-38
Confidential Treatment Requested by McAfee Corp.
Pursuant to 17 C.F.R. Section 200.83
of credit of $4 million issued against the Revolving Credit Facility and $496 million of undrawn capacity under the Revolving Credit Facility. The commitment fee for the unused portion of the revolving credit facility varies from 0.375% up to 0.50%, and the LIBOR margin of the outstanding borrowings and letters of credit varies from 3.25% to 3.75%, respectively, based upon our 1
st
Lien Net Leverage Ratio as defined in the credit facility agreement (“1st
Lien Net Leverage Ratio”). As of December 26, 2020, our commitment fee was 0.375%.Debt Covenants and Restrictions
Our credit facilities contain customary covenants, including a customary springing financial maintenance covenant under our revolving credit facility, events of default and change of control provisions. In the event we have outstanding loans and letters of credit under the revolving credit facility of more than $175 million at our reporting date (other than cash collateralized letters of credit and up to $30 million of undrawn letters of credit), we are required to maintain a 1
st
Lien Net Leverage Ratio less than or equal to 6.30 or be placed in default of our revolving credit facility.We may be required to make a mandatory prepayment in excess of the 0.25% per quarter amortization of the 1
st
Lien Term Loans. The 1st Lien Credit Facility requires us to make a mandatory prepayment, subject to certain exceptions, with:| • | 100% of net cash proceeds above a threshold amount of certain asset sales and casualty events, subject to (i) step-downs to (x) 50 % if our first lien net leverage ratio is less than or equal to 3.25 to 1.00, but greater than 2.50 to 1.00 and (y)0 % if our first lien net leverage ratio is less than or equal to 2.50 to 1.00 and (ii) reinvestment rights and certain other exceptions; |
| • | 100% of net cash proceeds of the incurrence of certain debt, other than certain debt permitted under the 1st Lien Credit Facility; and |
| • | 50% of annual excess cash flow, subject to (i) a step-down to 25 % if our first lien net leverage ratio is less than or equal to 3.25 to 1.00, but greater than 2.50 to 1.00, and (ii) a step-down to 0% if our first lien net leverage ratio is less than or equal to 2.50 to 1.00; provided that such a prepayment is required only in the amount (if any) by which such prepayment exceeds $35 million in such fiscal year. |
Failure to comply with these covenants, or the occurrence of any other event of default, could result in acceleration of the borrowings and other financial obligations. We are not in default of any of our debt obligations as of December 26, 2020 and have not been required to make any additional payments above the 0.25% per quarter amortization.
NOTE 14: INCOME TAX
McAfee Corp. is taxed as a corporation and pays corporate federal, state and local taxes on income allocated to it from FTW based upon McAfee Corp.’s economic interest in FTW. FTW is a pass through entity for U.S. federal income tax purposes and will not incur any federal income taxes either for itself or its U.S. subsidiaries that are also pass through or disregarded subsidiaries. Taxable income or loss for these entities will flow through to its respective members for U.S. tax purposes. FTW does have certain U.S. and foreign subsidiaries that are corporations and are subject to income tax in their respective jurisdiction.
We account for income taxes under the asset and liability method, which requires the recognition of deferred tax assets and liabilities (“DTAs” and “DTLs”) for the expected future tax consequences of events that have been included in the financial statements. Under this method, we determine DTAs and DTLs on the basis of the differences between the financial statement and tax bases of assets and liabilities by using enacted tax rates in effect for the year in which the differences are expected to reverse. The effect of a change in tax rates on DTAs and DTLs is recognized in income in the period that includes the enactment date. We recognize DTAs to the extent that we believe that these assets are more likely than not to be realized. In making such a determination,
F-39
Confidential Treatment Requested by McAfee Corp.
Pursuant to 17 C.F.R. Section 200.83
we consider all available positive and negative evidence, including future reversals of existing taxable temporary differences, projected future taxable income,
tax-planning
strategies, carryback potential if permitted under the tax law, and results of recent operations. If we determine that we would be able to realize our DTAs in the future in excess of their net recorded amount, we would make an adjustment to the DTA valuation allowance, which would reduce the provision for income taxes. We record uncertain tax positions in accordance with ASC 740 on the basis of atwo-step
process in which (1) we determine whether it is more likely than not that the tax positions will be sustained on the basis of the technical merits of the position and (2) for those tax positions that meet themore-likely-than-not
recognition threshold, we recognize the largest amount of tax benefit that is more than 50 percent likely to be realized upon ultimate settlement with the related tax authority.The loss from continuing operations before income taxes expense includes the following components:
Year Ended | ||||||||||||
(in millions) | December 29, 2018 | December 28, 2019 | December 26, 2020 | |||||||||
U.S. | $ | (405 | ) | $ | (199 | ) | $ | (238 | ) | |||
Non-U.S. | 26 | 42 | 25 | |||||||||
Loss from continuing operations before income taxes | $ | (379 | ) | $ | (157 | ) | $ | (213 | ) | |||
The provision for income tax expense from continuing operations consists of the following:
Year Ended | ||||||||||||
(in millions) | December 29, 2018 | December 28, 2019 | December 26, 2020 | |||||||||
Current: | ||||||||||||
State | $ | 3 | $ | — | $ | 2 | ||||||
Non-U.S. | 23 | 31 | 7 | |||||||||
Total current | 26 | 31 | 9 | |||||||||
Deferred: | ||||||||||||
Federal | 6 | 1 | 1 | |||||||||
State | 1 | 2 | — | |||||||||
Non-U.S. | (4 | ) | 4 | (5 | ) | |||||||
Total deferred | 3 | 7 | (4 | ) | ||||||||
Provision for income tax expense | $ | 29 | $ | 38 | $ | 5 | ||||||
F-40
Confidential Treatment Requested by McAfee Corp.
Pursuant to 17 C.F.R. Section 200.83
The difference between the tax provision and the tax provision computed at the U.S. federal statutory income tax rate for each period was as follows:
Year Ended | ||||||||||||
(in millions) | December 29, 2018 | December 28, 2019 | December 26, 2020 | |||||||||
Income taxes computed at the U.S. federal statutory rate | $ | (81 | ) | $ | (33 | ) | $ | (45 | ) | |||
Non-U.S. income taxed at different rates | 3 | 8 | 4 | |||||||||
Withholding taxes | 9 | 6 | 6 | |||||||||
State tax expense | 4 | 2 | 2 | |||||||||
Partnership earnings flow through to partners | 93 | 45 | 22 | |||||||||
Redeemable noncontrolling interest | — | — | 17 | |||||||||
Valuation allowances | — | — | 24 | |||||||||
Foreign tax credits | — | — | (2 | ) | ||||||||
Uncertain tax positions | 1 | 9 | (11 | ) | ||||||||
Investment in partnerships | — | — | (11 | ) | ||||||||
Other | — | 1 | (1 | ) | ||||||||
Provision for income tax expense | $ | 29 | $ | 38 | $ | 5 | ||||||
A portion of net income taxes has been indemnified by Intel (Note 7).
The components of the deferred tax assets and liabilities are as follows:
(in millions) | December 28, 2019 | December 26, 2020 | ||||||
Deferred tax assets: | ||||||||
Accrued compensation and other benefits | $ | 2 | $ | 2 | ||||
Deferred revenue | 20 | 24 | ||||||
Share-based compensation | — | 3 | ||||||
Net operating losses | 31 | 74 | ||||||
Credits | 10 | 51 | ||||||
Intangibles | — | 151 | ||||||
Interest expense carryforward | 2 | 5 | ||||||
Other | — | 0 | ||||||
Total deferred tax assets | 65 | 310 | ||||||
Deferred tax liabilities: | ||||||||
Licenses and intangibles | (6 | ) | — | |||||
Unremitted earnings of non-US subsidiaries | (2 | ) | (1 | ) | ||||
Investment in partnership | (188 | ) | (78 | ) | ||||
Other | — | 0 | ||||||
Total deferred tax liabilities | (196 | ) | (79 | ) | ||||
Valuation allowance | (4 | ) | (212 | ) | ||||
Net deferred tax assets (liabilities) | $ | (135 | ) | $ | 19 | |||
Reported as: | ||||||||
Deferred tax assets | $ | 21 | $ | 24 | ||||
Deferred tax liabilities | (156 | ) | (5 | ) | ||||
Net deferred tax assets (liabilities) | $ | (135 | ) | $ | 19 | |||
F-41
Confidential Treatment Requested by McAfee Corp.
Pursuant to 17 C.F.R. Section 200.83
As of December 26, 2020, our deferred tax assets include net operating losses, credits and intangibles acquired in connection with the reorganization transactions and amounts related to deferred revenue. As of December 28, 2019, our deferred tax assets were primarily comprised of deferred revenue in certain foreign jurisdictions and are expected to be fully realized as the related entities are expected to have future income. Our deferred tax liabilities were primarily comprised of outside basis differences due to the Reorganization Transactions and prior acquisitions (Note 6) for the years ended December 26, 2020 and December 28, 2019, respectively.
As of December 26, 2020, we had federal, state, and
non-U.S.
net operating loss carryforwards of $319 million, $148 million, and $0, respectively, available to reduce future taxable income. The federal and state net operating loss carryforwards include $319 million and $148 million, respectively, that is not likely to be recovered and have been reduced by valuation allowance. Thenon-U.S.
net operating loss carryforwards have no expiration date. The federal and U.S. state net operating loss carryforwards expire at various dates through 2037. The net operating loss carryforwards and credits in the U.S. relate to the Reorganization Transactions and, as a result, are limited in the amount that can be recognized inany one year.
As of December 26, 2020, we are not permanently reinvested; therefore, we have recognized deferred taxes for all of our undistributed earnings of certain foreign subsidiaries.
Management assesses the available positive and negative evidence to estimate whether sufficient future taxable income will be generated to permit use of the existing deferred tax assets. A significant piece of objective negative evidence evaluated was the cumulative loss incurred over the three-year period ended December 26, 2020. Such objective evidence limits the ability to consider other subjective evidence, such as our projections for future growth. On the basis of this evaluation, as of December 26, 2020, a valuation allowance of $212 million has been recorded to recognize only the portion of the deferred tax asset that is more likely than not to be realized. The amount of the deferred tax asset considered realizable, however, could be adjusted if estimates of future taxable income during the carryforward period are reduced or increased or if objective negative evidence in the form of cumulative losses is no longer present and additional weight is given to subjective evidence such as our projections for growth.
A reconciliation of the aggregate changes in the balance of gross unrecognized tax benefits was as follows:
Year Ended | ||||||||||||
(in millions) | December 29, 2018 | December 28, 2019 | December 26, 2020 | |||||||||
Beginning gross unrecognized tax benefits | $ | 10 | $ | 12 | $ | 27 | ||||||
Settlements with taxing authorities | (1 | ) | — | — | ||||||||
Increases in tax positions for prior years | 1 | — | — | |||||||||
Decreases in tax positions for prior years | (1 | ) | — | (14 | ) | |||||||
Increases in tax positions for current year | 3 | 15 | 4 | |||||||||
Ending gross unrecognized tax benefits | $ | 12 | $ | 27 | $ | 17 | ||||||
We recognize interest and penalties related to unrecognized tax benefits within the Provision for income tax expense on the consolidated statements of operations.
We consider many factors when evaluating and estimating our tax positions, which may require periodic adjustments and may not accurately anticipate actual outcomes. Tax position recognition is a matter of judgment based on the individual facts and circumstances of our position evaluated in light of all available evidence. As of December 26, 2020 and December 28, 2019, we had uncertain tax positions of $16 million and $27 million, including interest and penalties, respectively, recorded within Other long-term liabilities on the consolidated balance sheets. In the next 12 months, it is reasonably possible to have an audit closure or statue expirations in
F-42
Confidential Treatment Requested by McAfee Corp.
Pursuant to 17 C.F.R. Section 200.83
one of our foreign jurisdictions. We do not believe the amount to have a significant impact to our consolidated financial statements. A portion of uncertain taxes positions has been indemnified by Intel (
Note 7
).In the ordinary course of our business, we are subject to examination by taxing authorities for both direct and indirect taxes in many of the domestic and foreign jurisdictions in which we operate. As of December 26, 2020, we are no longer subject to review by the state and local taxing authorities prior to 2015 and foreign taxing authorities prior to 2004. We are unable to make a reasonably reliable estimate as to when or if settlements with taxing authorities may occur. However, we do not anticipate that the resolution of these tax matters or any events related thereto will have a material adverse effect on our business, results of operations, financial condition or cash flows.
Tax Receivable Agreement
Pursuant to our election under Section 754 of the Internal Revenue Code (the “Code”), we expect to obtain an increase in our share of the tax basis in the net assets of FTW when FTW LLC Units are redeemed or exchanged by the Continuing LLC Owners and MIUS are redeemed or exchanged by Management Owners. We intend to treat any redemptions and exchanges of LLC Units as direct purchases of LLC Units for United States federal income tax purposes. These increases in tax basis may reduce the amounts that we would otherwise pay in the future to various tax authorities. They may also decrease gains (or increase losses) on future dispositions of certain capital assets to the extent tax basis is allocated to those capital assets.
In October 2020, we entered into a TRA that provides for the payment by us of 85% of the amount of any tax benefits that we actually realize, or in some cases are deemed to realize, as a result of: (i) all or a portion of the Corporation’s allocable share of existing tax basis in the assets of FTW (and its subsidiaries) acquired in connection with the Reorganization Transactions, (ii) increases in the Corporation’s allocable share of existing tax basis in the assets of FTW (and its subsidiaries) and tax basis adjustments in the assets of FTW (and its subsidiaries) as a result of sales or exchanges of LLC Units after the IPO, (iii) certain tax attributes of the corporations acquired by McAfee Corp. in connection with the Reorganization Transactions (including their allocable share of existing tax basis in the assets of FTW (and its subsidiaries)), and (iv) certain other tax benefits related to entering into the tax receivable agreement, including tax benefits attributable to payments under the tax receivable agreement. We expect to benefit from the remaining 15% of any tax benefits that we may actually realize. The Corporation generally will retain the benefit of the remaining 15% of the applicable tax savings. The payment obligations under the tax receivable agreement are obligations of the Corporation. The timing and amount of aggregate payments due under the TRA may vary based on a number of factors, including the timing and amount of taxable income generated by the Corporation each year, as well as the tax rate then applicable.
As realizability of the net deferred tax assets has not met the more likely than not recognition criteria, the liability under the Tax Receivable Agreement has not met the probable recognition criteria in the accompanying consolidated balance sheet as of December 26, 2020, except for the $2 million current portion of the Tax Receivable Agreement liability recorded within Accounts payable and other accrued liabilities in the consolidated balance sheet. If the net deferred tax assets had not been reduced by a valuation allowance, we would have also recorded a long-term Tax Receivable Agreement liability of $274 million in the consolidated balance sheet.
NOTE 15: FAIR VALUE OF FINANCIAL INSTRUMENTS AND INTEREST RATE SWAPS
Fair Value of Financial Instruments
For assets and liabilities that are measured using quoted prices in active markets (Level 1), total fair value is the published market price per unit multiplied by the number of units held without consideration of transaction costs, discounts or blockage factors. Assets and liabilities that are measured using significant other observable inputs are valued by reference to similar assets or liabilities (Level 2), adjusted for contract restrictions and other terms
F-43
Confidential Treatment Requested by McAfee Corp.
Pursuant to 17 C.F.R. Section 200.83
specific to that asset or liability. For these items, a significant portion of fair value is derived by reference to quoted prices of similar assets or liabilities in active markets. For all remaining assets and liabilities, fair value is derived using other valuation methodologies, including option pricing models, discounted cash flow models and similar techniques (Level 3) and not based on market exchange, dealer or broker traded transactions. These valuations incorporate certain assumptions and projections in determining the fair value assigned to such assets or liabilities.
The fair value of our financial instruments are as follows:
(in millions) | Level 1 | Level 2 | Level 3 | |||||||||
As of December 28, 2019 | ||||||||||||
Financial instruments not carried at fair value: | ||||||||||||
Long-term debt, gross of discounts and deferred issuance costs (Note 13) | $ | — | $ | (4,817 | ) | $ | — | |||||
Financial instruments carried at fair value: | ||||||||||||
Interest rate swaps | $ | — | $ | (61 | ) | $ | — | |||||
As of December 26, 2020 | ||||||||||||
Financial instruments not carried at fair value: | ||||||||||||
Long-term debt, gross of discounts and deferred issuance costs (Note 13) | $ | — | $ | (4,033 | ) | $ | — | |||||
Financial instruments carried at fair value: | ||||||||||||
Interest rate swaps | $ | — | $ | (119 | ) | $ | — | |||||
The fair value of the debt is based on third party quotations and is therefore classified as Level 2. The fair value of our derivative financial instruments, including interest rate swaps, are valued in the market using discounted cash flow techniques. These techniques incorporate Level 1 and Level 2 fair value measurement inputs such as spot rates, foreign currency exchange rates, and the instrument’s term, notional amount and discount rate.
The fair values of our financial instruments included in Cash and cash equivalents, Accounts receivable, net, Other current assets and Accounts payable and accrued liabilities on the consolidated balance sheets approximate their carrying amounts due to their short maturities. We measure the fair value of money market accounts, included in Cash and cash equivalents on the consolidated balance sheets, on a recurring basis and have classified as Level 1 because the fair value is measured with quoted prices in active markets. These amounts have been excluded from the table.
There were no transfers of assets or liabilities between fair value measurement. Transfers between fair value measurement levels are recognized at the end of the reporting period.
Interest Rate Swaps
As of December 26, 2020, the outstanding effective hedging arrangements were as follows:
Notional Value (in millions) | Effective Date | Expiration Date | Fixed Rate | |||
| $225 | January 29, 2018 | January 29, 2021 | 2.33% | |||
| $250 | January 29, 2018 | January 29, 2022 | 2.41% | |||
| $275 | January 29, 2018 | January 29, 2023 | 2.48% | |||
| $275 | January 29, 2018 | January 29, 2023 | 2.49% | |||
| $475 | March 29, 2019 | March 29, 2024 | 2.40% | |||
| $750 | March 4, 2020 | September 29, 2024 | 2.07% | |||
| $250 | March 29, 2020 | March 29, 2024 | 0.93% | |||
| $225 | January 29, 2021 | January 29, 2024 | 0.42% |
F-44
Confidential Treatment Requested by McAfee Corp.
Pursuant to 17 C.F.R. Section 200.83
On March 2, 2020, we cancelled an existing interest rate swap with a notional value of $750 million and accepted an
off-market
fixed rate on a new interest rate swap to offset the cost of the fair value of the original swap. At the time of the cancellation, the original interest rate swap had a negative fair value of $37 million and was recorded in Accounts payable and other current liabilities and Other long-term liabilities on the consolidated balance sheet. The liability associated with the original interest rate swap was incorporated into the fair value of the new interest rate swap.The gross amounts of our interest rate swaps, which are subject to master netting arrangements, were as follows:
(in millions) | Gross amounts recognized | Gross amount offset in Balance Sheets | Net amounts presented in Balance Sheets | |||||||||
As of December 28, 2019 | ||||||||||||
Accounts payable and other current liabilities | $ | (19 | ) | $ | — | $ | (19 | ) | ||||
Other long-term liabilities | (42 | ) | — | (42 | ) | |||||||
As of December 26, 2020 | ||||||||||||
Accounts payable and other current liabilities | $ | (43 | ) | $ | — | $ | (43 | ) | ||||
Other long-term liabilities | (76 | ) | — | (76 | ) | |||||||
NOTE 16: REDEEMABLE NONCONTROLLING INTERESTS
We report a RNCI based on the LLC Units of FTW held by Continuing LLC Owners and vested MIUs held by Management Owners. In connection with the IPO, the New LLC Agreement was adopted, allowing the Continuing LLC Owners (or certain permitted transferees), subject to certain restrictions, to exchange their LLC Units for shares of Class A common stock on abasis (simultaneously cancelling an equal number of shares of Class B common stock of the exchanging member), subject to customary conversion rate adjustments for stock splits, stock dividends, reclassifications and other similar transactions, or, at the option of the Company, for cash (based on the market price of the shares of our Class A common stock). The holders of MIUs also have the right, from time to time and subject to certain restrictions, to exchange their MIUs for LLC Units, which will then be immediately redeemed for cash or shares of Class A common stock, at the option of the Company, based on the value of such MIUs relative to their applicable distribution threshold.
1-for-one
The Company’s decision of whether to exchange LLC Units for Class A common stock or cash is currently made solely at the discretion of the Continuing LLC Owners through their control of our Board of Directors. Accordingly, the LLC Units owned by the Continuing LLC Owners are treated as RNCI as the holders have the option to exchange their LLC Units for cash or for shares of the Corporation’s Class A common stock. The RNCI is reported at the greater of the redemption value of the units or the carrying value as of the balance sheet date, with a corresponding adjustment to Additional
paid-in
capital. The redemption value of our redeemable noncontrolling interests was derived from the closing stock price of the Company’s Class A common stock on the last day of the period.Future redemptions or direct exchanges of LLC Units by the Continuing LLC Owners will result in a change in ownership and reduce or increase the carrying value of the RNCI and increase or decrease Additional
paid-in
capital when FTW has positive or negative net assets, respectively.In connection with the Reorganization Transactions and IPO, McAfee Corp. issued a net 267.1 million shares of Class B common stock to the Continuing LLC Owners. As of December 26, 2020, McAfee Corp. had 161.3 million shares of Class A common stock outstanding, which are represented by an equivalent ownership of LLC Units and an economic interest in FTW of 37.2%. As of December 26, 2020, the Continuing LLC Owners and Management Owners held 272.5 million LLC Units and vested MIUs, which represented a 62.8% noncontrolling economic interest in FTW.
F-45
Confidential Treatment Requested by McAfee Corp.
Pursuant to 17 C.F.R. Section 200.83
NOTE 17: NET LOSS PER SHARE
Basic net loss per share is computed by dividing net loss attributable to McAfee Corp. for the period subsequent to the Reorganization Transactions by the weighted average number of shares of Class A common stock outstanding for the same period. Shares issued during the period and shares reacquired during the period are weighted for the portion of the period in which the shares were outstanding. Diluted net loss per share has been computed in a manner consistent with that of basic net loss per share while giving effect to shares of potentially dilutive common stock that were outstanding during the period.
Prior to the Reorganization Transactions, the FTW capital structure primarily included FTW LLC Units. Certain holders of these units exchanged their FTW LLC units for Class A common stock of the Corporation in the Reorganization Transactions with the remaining FTW LLC Units reflecting RNCI in the Corporation. The completion of the Reorganization Transactions created the Corporation’s current capital structure, which is not reflective of the capital structure of FTW’s business prior to the Reorganization Transactions. Therefore, net loss per unit information has not been presented for the portion of the fiscal year ended prior to the completion of the Reorganization Transactions, or for the fiscal years ended December 28, 2019 and December 29, 2018.
Shares of Class B common stock do not share in the earnings or losses attributable to McAfee Corp. and are therefore not participating securities. As such, separate presentation of basic and diluted net loss per share of Class B common stock under thebasis.
two-class
method has not been presented. Shares of Class B common stock are, however, considered potentially dilutive shares of Class A common stock because shares of Class B common stock, together with the related FTW LLC Units, are exchangeable into shares of Class A common stock on a1-for-one
The following table sets forth reconciliations of the numerators and denominators used to compute basic and diluted net loss per share of Class A common stock for the fiscal year ended December 26, 2020. The basic and diluted net loss per share for the year ended December 26, 2020 represents only the period from October 22, 2020 to December 26, 2020, the period wherein the Corporation had outstanding Class A common stock.
(in millions except per share data) | Year Ended | |||||||||||
December 26, 2020 | ||||||||||||
Continuing Operations | Discontinued Operations | Total | ||||||||||
Numerator: | ||||||||||||
Net loss | $ | (218 | ) | $ | (71 | ) | $ | (289 | ) | |||
Less: Net (income) loss attributable to FTW prior to the Reorganization Transactions | 74 | (100 | ) | (26 | ) | |||||||
Less: Net loss attributable to redeemable noncontrolling interests after the Reorganization Transactions | 89 | 108 | 197 | |||||||||
Net loss attributable to McAfee Corp., basic and diluted | $ | (55 | ) | $ | (63 | ) | $ | (118 | ) | |||
Denominator: | ||||||||||||
Weighted average shares of Class A common stock outstanding, basic and diluted | 162.3 | 162.3 | 162.3 | |||||||||
Earnings (loss) per share attributable to McAfee Corp., basic | ||||||||||||
Earnings (loss) per share, basic | $ | (0.34 | ) | $ | (0.39 | ) | $ | (0.73 | ) | |||
Earnings (loss) per share attributable to McAfee Corp., diluted | ||||||||||||
Earnings (loss) per share, diluted (1) | $ | (0.34 | ) | $ | (0.39 | ) | $ | (0.73 | ) | |||
| (1) | Excluded from dilution includes a one for one conversion of our RNCI’s 267.1 million LLC units and an exchange of 5.4 million MIUs for their common equivalent of Class A common stock, based on the value of such MIUs relative to their applicable distribution threshold. 25.2 million weighted average units were also excluded from dilution. The excluded shares consist of RSUs, PSUs and stock options that were excluded |
F-46
Confidential Treatment Requested by McAfee Corp.
Pursuant to 17 C.F.R. Section 200.83
| from dilution because their effects would have been anti-dilutive for the year ended December 26, 2020 and unvested 9.3 million MIUs outstanding with a weighted average unsatisfied distribution threshold of $5.91. |
NOTE 18: VARIABLE INTEREST ENTITIES
Upon completion of our IPO, McAfee Corp. became the managing member of FTW with 100% of the management and voting power in FTW. In its capacity as managing member, McAfee Corp. has the sole authority to make decisions on behalf of FTW and bind FTW to signed agreements. Further, FTW maintains separate capital accounts for its investors as a mechanism for tracking earnings and subsequent distribution rights. Accordingly, management concluded that FTW is a limited partnership or similar legal entity as contemplated in ASC 810, Consolidation.
Further, management concluded that McAfee Corp. is FTW’s primary beneficiary based on two conditions. First, McAfee Corp., in its capacity as managing member with sole voting rights, has the power to direct the activities of FTW that most significantly impact its economic performance, including selecting, terminating and setting the compensation of management responsible for FTW’s policies and procedures, as well as establishing the strategic, operating and capital decisions of FTW in the ordinary course of business. Second, McAfee Corp. has an obligation to absorb potential losses of FTW or the right to receive potential benefits from FTW in proportion to its equity interest, which was 37.2% as of December 26, 2020. Management considers this exposure to be significant to FTW. As the primary beneficiary, McAfee Corp. consolidates the results of FTW for financial reporting purposes under the variable interest consolidation model guidance in ASC 810.
McAfee Corp.’s relationship with FTW results in no recourse to the general credit of McAfee Corp. FTW and its consolidated subsidiaries represent McAfee Corp.’s sole investment. McAfee Corp. shares in the income and losses of FTW in direct proportion to McAfee Corp.’s economic ownership percentage. Further, McAfee Corp. has no contractual requirement to provide financial support to FTW.
The following table reflects the balance sheet of FTW that is consolidated within the consolidated balance sheets, including Receivable from Parent, net and McAfee Corp.’s interest in the variable interest entity (“VIE”) that are eliminated upon consolidation.
F-47
Confidential Treatment Requested by McAfee Corp.
Pursuant to 17 C.F.R. Section 200.83
The consolidated balance sheet as of December 28, 2019 and for periods prior to the IPO and the Reorganization Transactions is the balance sheet of FTW as the predecessor to the Company for accounting and reporting purposes and, therefore, 2019 is not presented below.
(in millions) | December 26, 2020 | |||
Assets | ||||
Current assets: | ||||
Cash and cash equivalents | $ | 231 | ||
Accounts receivable, net | 102 | |||
Deferred costs | 137 | |||
Other current assets | 42 | |||
Current assets of discontinued operations | 402 | |||
Total current assets | 914 | |||
Property and equipment, net | 115 | |||
Goodwill | 1,018 | |||
Identified intangible assets, net | 729 | |||
Deferred tax assets | 25 | |||
Receivable from Parent, net | 46 | |||
Other long-term assets | 67 | |||
Long-term assets of discontinued operations | 2,560 | |||
Total assets | $ | 5,474 | ||
Liabilities and deficit | ||||
Current liabilities: | ||||
Accounts payable and other current liabilities | $ | 211 | ||
Accrued compensation and benefits | 179 | |||
Accrued marketing | 118 | |||
Income taxes payable | 14 | |||
Long-term debt, current portion | 44 | |||
Lease liabilities, current portion | 10 | |||
Liability to parent | — | |||
Deferred revenue | 823 | |||
Current liabilities of discontinued operations | 970 | |||
Total current liabilities | 2,369 | |||
Long-term debt, net | 3,943 | |||
Deferred tax liabilities | 5 | |||
Other long-term liabilities | 153 | |||
Deferred revenue, less current portion | 80 | |||
Long-term liabilities of discontinued operations | 662 | |||
Total liabilities | 7,212 | |||
Members’ deficit: | ||||
Deficit attributable to Continuing LLC Owners | (1,092 | ) | ||
Deficit attributable to McAfee Corp. | (646 | ) | ||
Total deficit | (1,738 | ) | ||
Total liabilities and deficit | $ | 5,474 | ||
F-48
Confidential Treatment Requested by McAfee Corp.
Pursuant to 17 C.F.R. Section 200.83
NOTE 19: COMMITMENTS AND CONTINGENCIES
As of December 26, 2020, including amounts associated with our discontinued operations, we have unconditional purchase obligations of $149 million that expire at various dates through 2025 and guarantees of $12 million that expire at various dates through 2028.
As of December 26, 2020, excluding the amounts related to lease obligations which are disclosed in
Note 5
, the future minimum payments under all unconditional purchase obligations with a remaining term in excess of one year were as follows:(in millions) | ||||
2021 | $ | 49 | ||
2022 | 45 | |||
2023 | 39 | |||
2024 | 12 | |||
2025 | 4 | |||
Thereafter | — | |||
Total | $ | 149 | ||
Subsequent to December 26, 2020, we have executed contracts with additional unconditional purchase commitments in the amount of $315 million that we expect to incur in the years 2021 through 2026.
We are a party to various legal proceedings that have arisen in the ordinary course of our business. At present, we do not expect that any ordinary course legal proceedings, individually or in the aggregate, will have a material adverse effect on our business, results of operations, financial condition or cash flows.
NOTE 20: SUBSEQUENT EVENTS (UNAUDITED)
In July 2021, two amendments to the definitive agreement with a consortium led by STG for the purchase of the Enterprise Business were executed. The amendments modified certain provisions for assets and liabilities to be transferred as well as the timing and procedures for transfer of certain assets and employees in foreign jurisdictions in connection with the sale, and clarifying requirements for maintenance of such assets prior to transfer. The amendments also include certain other modifications or clarifications of the purchase agreement.
On July 27, 2021, we completed the sale of our Enterprise Business to STG for an all-cash purchase price of $4.0 billion. In connection with the transaction, we expect to recognize a gain in excess of $2 billion, net of taxes.
Subsequent to December 26, 2020, FTW declared and paid tax and excess cash distributions to its members in aggregate of $190 million. The distributions declared by FTW included $152 million to Continuing LLC Owners and $38 million to McAfee Corp. McAfee Corp. used its share to declare a dividend of $0.115 per share of Class A common stock in March 2021 and to declare a dividend of $0.115 per share of Class A common stock in June 2021. Both dividends were paid by McAfee Corp. subsequent to December 2020.
Subsequent to December 26, 2020, we have executed contracts with additional unconditional purchase commitments. As of June 26, 2021, including amounts associated with our discontinued operations, we have unconditional purchase obligations of $431 million that expire at various dates through 2026 and guarantees of $11 million that expire at various dates through 2028.
Subsequent to December 26, 2020, we recognized restructuring charges related to the reorientation of the Enterprise business that was initiated in December 2020. During the three and six months ended June 26, 2021, we recognized $2 million and $33 million in restructuring charges, respectively.
F-49
Confidential Treatment Requested by McAfee Corp.
Pursuant to 17 C.F.R. Section 200.83
MCAFEE CORP.
UNAUDITED CONDENSED CONSOLIDATED BALANCE SHEETS
(in millions, except share and per share amounts)
December 26, 2020 | June 26, 2021 | |||||||
Assets | ||||||||
Current assets: | ||||||||
Cash and cash equivalents | $ | 231 | $ | 420 | ||||
Accounts receivable, net | 102 | 95 | ||||||
Deferred costs | 137 | 163 | ||||||
Other current assets | 42 | 44 | ||||||
Current assets of discontinued operations | 402 | 317 | ||||||
Total current assets | 914 | 1,039 | ||||||
Property and equipment, net | 115 | 103 | ||||||
Goodwill | 1,018 | 1,018 | ||||||
Identified intangible assets, net | 729 | 631 | ||||||
Deferred tax assets | 24 | 25 | ||||||
Other long-term assets | 68 | 93 | ||||||
Long-term assets of discontinued operations | 2,560 | 2,528 | ||||||
Total assets | $ | 5,428 | $ | 5,437 | ||||
Liabilities, redeemable noncontrolling interests and deficit | ||||||||
Current liabilities: | ||||||||
Accounts payable and other current liabilities | $ | 227 | $ | 257 | ||||
Accrued compensation and benefits | 179 | 117 | ||||||
Accrued marketing | 118 | 94 | ||||||
Income taxes payable | 14 | 18 | ||||||
Long-term debt, current portion | 44 | 44 | ||||||
Lease liabilities, current portion | 10 | 9 | ||||||
Deferred revenue | 823 | 926 | ||||||
Current liabilities of discontinued operations | 970 | 925 | ||||||
Total current liabilities | 2,385 | 2,390 | ||||||
Long-term debt, net | 3,943 | 3,904 | ||||||
Deferred tax liabilities | 5 | 7 | ||||||
Other long-term liabilities | 153 | 138 | ||||||
Deferred revenue, less current portion | 80 | 93 | ||||||
Long-term liabilities of discontinued operations | 662 | 609 | ||||||
Total liabilities | 7,228 | 7,141 | ||||||
Commitments and contingencies (Note 17) | ||||||||
Redeemable noncontrolling interests | 4,840 | 7,687 | ||||||
Equity (deficit): | ||||||||
Class A common stock, $0.001 par value—1,500,000,000 shares authorized, 166,004,840 shares issued and outstanding as of June 26, 2021 and 161,267,412 shares issued and outstanding as of December 26, 2020 | 0 | 0 | ||||||
Class B common stock, $0.001 par value—300,000,000 shares authorized, 265,376,691 shares issued and outstanding as of June 26, 2021 and 267,065,127 shares issued and outstanding as of December 26, 2020 | 0 | 0 | ||||||
Additional paid-in capital | (6,477 | ) | (9,306 | ) | ||||
Accumulated deficit | (118 | ) | (52 | ) | ||||
Accumulated other comprehensive income (loss) | (45 | ) | (33 | ) | ||||
Total deficit | (6,640 | ) | (9,391 | ) | ||||
Total liabilities, redeemable noncontrolling interests and deficit | $ | 5,428 | $ | 5,437 | ||||
See the accompanying notes to the condensed consolidated financial statements.
F-50
Confidential Treatment Requested by McAfee Corp.
Pursuant to 17 C.F.R. Section 200.83
MCAFEE CORP.
UNAUDITED CONDENSED CONSOLIDATED STATEMENTS OF OPERATIONS
(in millions, except per share amounts)
Three Months Ended | Six Months Ended | |||||||||||||||
June 27, 2020 | June 26, 2021 | June 27, 2020 | June 26, 2021 | |||||||||||||
Net revenue | $ | 383 | $ | 467 | $ | 737 | $ | 909 | ||||||||
Cost of sales | 110 | 116 | 209 | 232 | ||||||||||||
Gross profit | 273 | 351 | 528 | 677 | ||||||||||||
Operating expenses: | ||||||||||||||||
Sales and marketing | 80 | 89 | 140 | 174 | ||||||||||||
Research and development | 37 | 48 | 75 | 92 | ||||||||||||
General and administrative | 42 | 45 | 100 | 93 | ||||||||||||
Amortization of intangibles | 36 | 13 | 72 | 49 | ||||||||||||
Restructuring charges (Note 9) | — | — | 1 | 8 | ||||||||||||
Total operating expenses | 195 | 195 | 388 | 416 | ||||||||||||
Operating income | 78 | 156 | 140 | 261 | ||||||||||||
Interest expense and other, net | (74 | ) | (58 | ) | (149 | ) | (118 | ) | ||||||||
Foreign exchange gain (loss), net | (17 | ) | (20 | ) | (6 | ) | 15 | |||||||||
Income (loss) from continuing operations before income taxes | (13 | ) | 78 | (15 | ) | 158 | ||||||||||
Provision for income tax expense (benefit) | 5 | 10 | (5 | ) | 7 | |||||||||||
Income (loss) from continuing operations | (18 | ) | 68 | (10 | ) | 151 | ||||||||||
Income from discontinued operations, net of taxes | 40 | 40 | 41 | 51 | ||||||||||||
Net income | $ | 22 | $ | 108 | $ | 31 | $ | 202 | ||||||||
Less: Net income attributable to redeemable noncontrolling interests | N/A | 72 | N/A | 136 | ||||||||||||
Net income attributable to McAfee Corp. | N/A | $ | 36 | N/A | $ | 66 | ||||||||||
Net income attributable to McAfee Corp.: | ||||||||||||||||
Income from continuing operations attributable to McAfee Corp. | N/A | $ | 23 | N/A | $ | 50 | ||||||||||
Income from discontinued operations attributable to McAfee Corp. | N/A | 13 | N/A | 16 | ||||||||||||
Net income attributable to McAfee Corp. | N/A | $ | 36 | N/A | $ | 66 | ||||||||||
Earnings per share attributable to McAfee Corp., basic: | ||||||||||||||||
Continuing operations | N/A | $ | 0.14 | N/A | $ | 0.31 | ||||||||||
Discontinued operations | N/A | 0.08 | N/A | 0.10 | ||||||||||||
Earnings per share, basic (1) | N/A | $ | 0.22 | N/A | $ | 0.40 | ||||||||||
Earnings per share attributable to McAfee Corp., diluted: | ||||||||||||||||
Continuing operations | N/A | $ | 0.14 | N/A | $ | 0.30 | ||||||||||
Discontinued operations | N/A | 0.07 | N/A | 0.09 | ||||||||||||
Earnings per share, diluted (1) | N/A | $ | 0.21 | N/A | $ | 0.39 | ||||||||||
Weighted-average shares outstanding, basic | N/A | 165.0 | N/A | 163.7 | ||||||||||||
Weighted-average shares outstanding, diluted | N/A | 182.8 | N/A | 179.5 | ||||||||||||
| (1) | Basic and diluted earnings per share of Class A common stock are not applicable prior to the initial public offering (“IPO”) and related Reorganization Transactions (as defined in Note 1 to the condensed consolidated financial statements). See Note 15 Earnings Per Share in the notes to the condensed consolidated financial statements for the number of shares used in the computation of earnings per share of Class A common stock and the basis for the computation of earnings per share. May not foot due to rounding. |
See the accompanying notes to the condensed consolidated financial statements.
F-51
Confidential Treatment Requested by McAfee Corp.
Pursuant to 17 C.F.R. Section 200.83
MCAFEE CORP.
UNAUDITED CONDENSED CONSOLIDATED STATEMENTS OF COMPREHENSIVE INCOME (LOSS)
(in millions)
Three Months Ended | Six Months Ended | |||||||||||||||
June 27, 2020 | June 26, 2021 | June 27, 2020 | June 26, 2021 | |||||||||||||
Net income | $ | 22 | $ | 108 | $ | 31 | $ | 202 | ||||||||
Other comprehensive income (loss): | ||||||||||||||||
Interest rate cash flow hedges: | ||||||||||||||||
Gain (loss) on interest rate cash flow hedges, net of tax | (17 | ) | — | (96 | ) | 9 | ||||||||||
Reclassification adjustments for income on interest rate cash flow hedges | 11 | 12 | 15 | 24 | ||||||||||||
Pension and postretirement benefits income, net of tax | — | — | — | 1 | ||||||||||||
Total comprehensive income (loss) | $ | 16 | $ | 120 | $ | (50 | ) | $ | 236 | |||||||
Less: Comprehensive income attributable to redeemable noncontrolling interests | N/A | 80 | N/A | 158 | ||||||||||||
Total comprehensive income attributable to McAfee Corp. | N/A | $ | 40 | N/A | $ | 78 | ||||||||||
See the accompanying notes to the condensed consolidated financial statements.
F-52
Confidential Treatment Requested by McAfee Corp.
Pursuant to 17 C.F.R. Section 200.83
MCAFEE CORP.
UNAUDITED CONDENSED CONSOLIDATED STATEMENTS OF CASH FLOWS
(in millions)
Six Months Ended | ||||||||
June 27, 2020 | June 26, 2021 | |||||||
Cash flows from operating activities: | ||||||||
Net income | $ | 31 | $ | 202 | ||||
Adjustments to reconcile net income to net cash provided by operating activities: | ||||||||
Depreciation and amortization | 252 | 153 | ||||||
Equity-based compensation | 19 | 78 | ||||||
Deferred taxes | 5 | — | ||||||
Foreign exchange (gain) loss, net | 6 | (15 | ) | |||||
Other operating activities | 27 | 29 | ||||||
Change in assets and liabilities: | ||||||||
Accounts receivable, net | 126 | 100 | ||||||
Deferred costs | (22 | ) | (32 | ) | ||||
Other assets | (14 | ) | (45 | ) | ||||
Other current liabilities | (29 | ) | 6 | |||||
Deferred revenue | (27 | ) | 10 | |||||
Other liabilities | (86 | ) | (38 | ) | ||||
Net cash provided by operating activities | 288 | 448 | ||||||
Cash flows from investing activities: | ||||||||
Acquisitions, net of cash acquired | (5 | ) | — | |||||
Additions to property and equipment | (25 | ) | (14 | ) | ||||
Other investing activities | (3 | ) | (4 | ) | ||||
Net cash used in investing activities | (33 | ) | (18 | ) | ||||
Cash flows from financing activities: | ||||||||
Proceeds from the issuance of Member units | 1 | — | ||||||
Payment for the long-term debt | (21 | ) | (22 | ) | ||||
Distributions to members of FTW | (130 | ) | (148 | ) | ||||
Payment of dividends | — | (33 | ) | |||||
Payment of tax withholding for shares and units withheld | (2 | ) | (38 | ) | ||||
Payment of IPO related expenses | — | (3 | ) | |||||
Other financing activities | (10 | ) | 5 | |||||
Net cash used in financing activities | (162 | ) | (239 | ) | ||||
Effect of exchange rate fluctuations on cash and cash equivalents | (3 | ) | (2 | ) | ||||
Change in cash and cash equivalents | 90 | 189 | ||||||
Cash and cash equivalents, beginning of period | 167 | 231 | ||||||
Cash and cash equivalents, end of period | $ | 257 | $ | 420 | ||||
Supplemental disclosures of noncash investing and financing activities and cash flow information: | ||||||||
Acquisition of property and equipment included in current liabilities | $ | (5 | ) | $ | (6 | ) | ||
Distributions to members of FTW included in liabilities | (1 | ) | (31 | ) | ||||
Dividends payable included in liabilities | — | (19 | ) | |||||
Other | 3 | — | ||||||
Cash paid during the period for: | ||||||||
Interest, net of cash flow hedges | (141 | ) | (101 | ) | ||||
Income taxes, net of refunds | (22 | ) | (29 | ) | ||||
See the accompanying notes to the condensed consolidated financial statements.
F-53
Confidential Treatment Requested by McAfee Corp.
Pursuant to 17 C.F.R. Section 200.83
MCAFEE CORP.
UNAUDITED CONDENSED CONSOLIDATED STATEMENTS OF EQUITY (DEFICIT)
AND REDEEMABLE NONCONTROLLING INTERESTS
(in millions, except share amounts)
Foundation Technology Worldwide, LLC (prior to Reorganization Transactions) | McAfee Corp. Stockholders’ Equity | |||||||||||||||||||||||||||||||||||||||||||||||||||||||||||||||||||
Class A Common Stock | Class B Common Stock | |||||||||||||||||||||||||||||||||||||||||||||||||||||||||||||||||||
Accumulated Other Comprehensive Income (Loss) | Members’ Equity (Deficit) | Accumulated Deficit | Shares | Amount | Shares | Amount | Additional Paid-in Capital | Accumulated Deficit | Accumulated Other Comprehensive Income (Loss) | Total Deficit | Redeemable Noncontrolling Interests | Total | ||||||||||||||||||||||||||||||||||||||||||||||||||||||||
Balance at December 28, 2019 | $ | (62 | ) | $ | (647 | ) | $ | (1,385 | ) | — | $ | — | — | $ | — | $ | — | $ | — | $ | — | $ | — | $ | — | $ | (2,094 | ) | ||||||||||||||||||||||||||||||||||||||||
Distributions to Members | — | (131 | ) | — | — | — | — | — | — | — | — | — | — | (131 | ) | |||||||||||||||||||||||||||||||||||||||||||||||||||||
Other comprehensive loss, net of tax | (81 | ) | — | — | — | — | — | — | — | — | — | — | — | (81 | ) | |||||||||||||||||||||||||||||||||||||||||||||||||||||
Equity-based awards expense, net of equity withheld to cover taxes | — | 17 | — | — | — | — | — | — | — | — | — | — | 17 | |||||||||||||||||||||||||||||||||||||||||||||||||||||||
Unit issuances | — | 1 | — | — | — | — | — | — | — | — | — | — | 1 | |||||||||||||||||||||||||||||||||||||||||||||||||||||||
Unit repurchases (Note 6) | — | (10 | ) | — | — | — | — | — | — | — | — | — | — | (10 | ) | |||||||||||||||||||||||||||||||||||||||||||||||||||||
Reclassification of redeemable units (Note 6) | — | (17 | ) | — | — | — | — | — | — | — | — | — | — | (17 | ) | |||||||||||||||||||||||||||||||||||||||||||||||||||||
Net income | — | — | 31 | — | — | — | — | — | — | — | — | — | 31 | |||||||||||||||||||||||||||||||||||||||||||||||||||||||
Other | — | 2 | — | — | — | — | — | — | — | — | — | — | 2 | |||||||||||||||||||||||||||||||||||||||||||||||||||||||
Balance at June 27, 2020 | $ | (143 | ) | $ | (785 | ) | $ | (1,354 | ) | — | $ | — | �� | — | $ | — | $ | — | $ | — | $ | — | $ | — | $ | — | $ | (2,282 | ) | |||||||||||||||||||||||||||||||||||||||
Balance at December 26, 2020 | $ | — | $ | — | $ | — | 161,267,412 | $ | — | 267,065,127 | $ | — | $ | (6,477 | ) | $ | (118 | ) | $ | (45 | ) | $ | (6,640 | ) | $ | 4,840 | $ | (1,800 | ) | |||||||||||||||||||||||||||||||||||||||
Distributions to RNCI | — | — | — | — | — | — | — | — | — | — | — | (152 | ) | (152 | ) | |||||||||||||||||||||||||||||||||||||||||||||||||||||
Dividend declared | — | — | — | — | — | — | — | (38 | ) | — | — | (38 | ) | — | (38 | ) | ||||||||||||||||||||||||||||||||||||||||||||||||||||
Other comprehensive loss, net of tax | — | — | — | — | — | — | — | — | — | 12 | 12 | 22 | 34 | |||||||||||||||||||||||||||||||||||||||||||||||||||||||
Equity-based awards expense, net of equity withheld to cover taxes | — | — | — | 2,237,271 | — | — | — | 45 | — | — | 45 | — | 45 | |||||||||||||||||||||||||||||||||||||||||||||||||||||||
Stock issuances | — | — | — | 222,153 | — | — | — | 5 | — | — | 5 | — | 5 | |||||||||||||||||||||||||||||||||||||||||||||||||||||||
RNCI units conversion into Class A shares | — | — | — | 2,278,004 | — | (1,688,436 | ) | — | — | — | — | — | — | — | ||||||||||||||||||||||||||||||||||||||||||||||||||||||
Net income | — | — | — | — | — | — | — | — | 66 | — | 66 | 136 | 202 | |||||||||||||||||||||||||||||||||||||||||||||||||||||||
Impact of change in ownership in RNCI | — | — | — | — | — | — | — | (42 | ) | — | — | (42 | ) | 42 | — | |||||||||||||||||||||||||||||||||||||||||||||||||||||
Fair value adjustment for RNCI | — | — | — | — | — | — | — | (2,799 | ) | — | — | (2,799 | ) | 2,799 | — | |||||||||||||||||||||||||||||||||||||||||||||||||||||
Balance at June 26, | $ | — | $ | — | $ | — | 166,004,840 | $ | — | 265,376,691 | $ | — | $ | (9,306 | ) | $ | (52 | ) | $ | (33 | ) | $ | (9,391 | ) | $ | 7,687 | $ | (1,704 | ) | |||||||||||||||||||||||||||||||||||||||
F-54
Confidential Treatment Requested by McAfee Corp.
Pursuant to 17 C.F.R. Section 200.83
Foundation Technology Worldwide, LLC (prior to Reorganization Transactions) | McAfee Corp. Stockholders’ Equity | |||||||||||||||||||||||||||||||||||||||||||||||||||||||||||||||||||
Class A Common Stock | Class B Common Stock | |||||||||||||||||||||||||||||||||||||||||||||||||||||||||||||||||||
Accumulated Other Comprehensive Income (Loss) | Members’ Equity (Deficit) | Accumulated Deficit | Shares | Amount | Shares | Amount | Additional Paid-in Capital | Retained Earnings / Accumulated Deficit | Accumulated Other Comprehensive Income (Loss) | Total Deficit | Redeemable Noncontrolling Interests | Total | ||||||||||||||||||||||||||||||||||||||||||||||||||||||||
Balance at March 28, 2020 | $ | (137 | ) | $ | (707 | ) | $ | (1,376 | ) | — | $ | — | — | $ | — | $ | — | $ | — | $ | — | $ | — | $ | — | $ | (2,220 | ) | ||||||||||||||||||||||||||||||||||||||||
Distributions to Members | — | (81 | ) | — | — | — | — | — | — | — | — | — | — | (81 | ) | |||||||||||||||||||||||||||||||||||||||||||||||||||||
Other comprehensive loss, net of tax | (6 | ) | — | — | — | — | — | — | — | — | — | — | — | (6 | ) | |||||||||||||||||||||||||||||||||||||||||||||||||||||
Equity-based awards expense, net of equity withheld to cover taxes | — | 2 | — | — | — | — | — | — | — | — | — | — | 2 | |||||||||||||||||||||||||||||||||||||||||||||||||||||||
Unit issuances | — | 1 | — | — | — | — | — | — | — | — | — | — | 1 | |||||||||||||||||||||||||||||||||||||||||||||||||||||||
Net income | — | — | 22 | — | — | — | — | — | — | — | — | — | 22 | |||||||||||||||||||||||||||||||||||||||||||||||||||||||
Balance at June 27, 2020 | $ | (143 | ) | $ | (785 | ) | $ | (1,354 | ) | — | $ | — | — | $ | — | $ | — | $ | — | $ | — | $ | — | $ | — | $ | (2,282 | ) | ||||||||||||||||||||||||||||||||||||||||
Balance at March 27, 2021 | $ | — | $ | — | $ | — | 162,372,554 | $ | — | 267,065,127 | $ | — | $ | (7,835 | ) | $ | (88 | ) | $ | (37 | ) | $ | (7,960 | ) | $ | 6,177 | $ | (1,783 | ) | |||||||||||||||||||||||||||||||||||||||
Distributions to RNCI | — | — | — | — | — | — | — | — | — | — | — | (65 | ) | (65 | ) | |||||||||||||||||||||||||||||||||||||||||||||||||||||
Dividend declared | — | — | — | — | — | — | — | (19 | ) | — | — | (19 | ) | — | (19 | ) | ||||||||||||||||||||||||||||||||||||||||||||||||||||
Other comprehensive loss, net of tax | — | — | — | — | — | — | — | — | — | 4 | 4 | 8 | 12 | |||||||||||||||||||||||||||||||||||||||||||||||||||||||
Equity-based awards expense, net of equity withheld to cover taxes | — | — | — | 1,132,129 | — | — | — | 38 | — | — | 38 | — | 38 | |||||||||||||||||||||||||||||||||||||||||||||||||||||||
Stock issuances | — | — | — | 222,153 | — | — | — | 5 | — | — | 5 | — | 5 | |||||||||||||||||||||||||||||||||||||||||||||||||||||||
RNCI units conversion into Class A shares | — | — | — | 2,278,004 | — | (1,688,436 | ) | — | — | — | — | — | — | — | ||||||||||||||||||||||||||||||||||||||||||||||||||||||
Net income | — | — | — | — | — | — | — | — | 36 | — | 36 | 72 | 108 | |||||||||||||||||||||||||||||||||||||||||||||||||||||||
Impact of change in ownership in RNCI | — | — | — | — | — | — | — | (38 | ) | — | — | (38 | ) | 38 | — | |||||||||||||||||||||||||||||||||||||||||||||||||||||
Fair value adjustment for RNCI | — | — | — | — | — | — | — | (1,457 | ) | — | — | (1,457 | ) | 1,457 | — | |||||||||||||||||||||||||||||||||||||||||||||||||||||
Balance at June 26, 2021 | $ | — | $ | — | $ | — | 166,004,840 | $ | — | 265,376,691 | $ | — | $ | (9,306 | ) | $ | (52 | ) | $ | (33 | ) | $ | (9,391 | ) | $ | 7,687 | $ | (1,704 | ) | |||||||||||||||||||||||||||||||||||||||
See the accompanying notes to the condensed consolidated financial statements.
F-55
Confidential Treatment Requested by McAfee Corp.
Pursuant to 17 C.F.R. Section 200.83
MCAFEE CORP.
NOTES TO THE UNAUDITED CONDENSED CONSOLIDATED FINANCIAL STATEMENTS
NOTE 1: BASIS OF PRESENTATION
Background
McAfee is a leading-edge cybersecurity company that provides advanced security solutions to consumers. Security technologies from McAfee use a unique, predictive capability that is powered by McAfee Global Threat Intelligence, which enables home users to stay one step ahead of the next wave of fileless attacks, viruses, malware, and other online threats.
McAfee Corp. (the “Corporation”) was formed as a Delaware corporation on July 19, 2019 for the purpose of facilitating an initial public offering (“IPO”) and related transactions in order to carry on the business of Foundation Technology Worldwide LLC (“FTW”) and its subsidiaries (the Corporation, FTW and its subsidiaries are collectively the “Company,” “we,” “us” or “our”). On October 21, 2020, the Corporation became the sole managing member and holder of 100% of the voting power of FTW due to the reorganization transactions described below. With respect to the Corporation and FTW, each entity owns only the respective entities below it in the corporate structure and each entity has no other material operations, assets, or liabilities.
In October 2020, the Corporation completed an IPO pursuant to which the Corporation and selling stockholders sold an aggregate of 37 million shares of Class A common stock par value $0.001 per share (“Class A common stock”) at a public offering price of $20.00 per share. The Corporation issued 31 million shares and received $586 million in proceeds, net of underwriting discounts and commissions, of which $553 million was used to purchase newly-issued limited liability company units (“LLC Units”) and $33 million was used to purchase LLC Units from existing holders (“Continuing LLC Owners”) of interests in FTW, at a purchase price per unit equal to the public offering price per share of Class A common stock, less underwriting discounts and commissions.
We refer to the holders of management incentive units of FTW (“MIUs”) as well as members of management who hold LLC Units following the closing of the offering or are to receive Class A common stock in satisfaction of existing incentive awards as “Management Owners.” We refer to those of our
pre-IPO
investors and certain of their affiliates who received shares of Class A common stock in connection with the Reorganization Transactions (as defined below) and who do not hold LLC Units as “Continuing Corporate Owners,” and together with the Continuing LLC Owners, as “Continuing Owners.”The Reorganization Transactions
Reorganization
In connection with the closing of the IPO, the following Reorganization Transactions were consummated:
| • | a new limited liability company operating agreement (“New LLC Agreement”) was adopted for FTW making the Corporation the sole managing member of FTW; |
| • | the Corporation’s certificate of incorporation was amended and restated to, among other things, (i) provide for Class A common stock and Class B common stock and (ii) issue shares of Class B common stock to the Continuing Owners and Management Owners, on a one-to-one |
| • | the Corporation (i) issued 126.3 million shares of its Class A common stock to certain of the Continuing Owners in exchange for their contribution of LLC units or the equity of certain other |
F-56
Confidential Treatment Requested by McAfee Corp.
Pursuant to 17 C.F.R. Section 200.83
entities, which pursuant to the Reorganization Transactions, became its direct or indirect subsidiaries and (ii) settled 5.7 million restricted stock units (“RSUs”) with shares of its Class A common stock, net of tax withholding, held by certain employees, which were satisfied in connection with the Reorganization Transactions; and |
| • | the Corporation entered into (i) a tax receivable agreement (“TRA”) with certain of our Continuing Owners and certain Management Owners (collectively “TRA Beneficiaries”) and (ii) a stockholders agreement and a registration rights agreement with investment funds affiliated with or advised by TPG Global, LLC (“TPG”) and Thoma Bravo, L.P. (“Thoma Bravo”), respectively, and Intel Americas, Inc. (“Intel”). |
Divestiture of Enterprise Business
On March 6, 2021, we entered into a definitive agreement (the “Purchase Agreement”) with a consortium led by Symphony Technology Group (“STG”) under which STG agreed to purchase certain of our Enterprise assets together with certain of our Enterprise liabilities (“Enterprise Business”), representing substantially all of our Enterprise segment, for an
all-cash
purchase price of $4.0 billion. The divestiture transaction closed on July 27, 2021. The divestiture of our Enterprise Business represents a strategic shift in our operations that allows us to focus on our Consumer business. As a result of the divestiture, the results of our Enterprise Business were reclassified as discontinued operations in our condensed consolidated statements of operations and excluded from both continuing operations and segment results for all periods presented. Starting in the first quarter of fiscal 2021, we began to operate in 1 reportable segment as the Enterprise Business comprised substantially all of our Enterprise segment. Results of discontinued operations includes all revenues and expenses directly derived from our Enterprise Business, with the exception of general corporate overhead costs that were previously allocated to our Enterprise segment but have not been allocated to discontinued operations. The Enterprise Business, as specified in the Purchase Agreement, was reclassified as discontinued operations in our condensed consolidated balance sheets, subject to changes set forth in the Purchase Agreement, which included amendments to the agreement in July, 2021. See Note 3 for additional information about the divestiture of our Enterprise Business.Principles of Consolidation
Subsequent to the Reorganization Transactions and IPO, the Corporation is a holding company, and its sole material asset held directly or through wholly-owned subsidiaries is its equity interest in FTW. The Corporation, as the sole managing member of FTW, exclusively operates and controls the business and affairs of FTW. The Corporation consolidates the financial results of FTW and reports a redeemable noncontrolling interest (“RNCI”) related to the LLC Units held by the Continuing LLC Owners and vested MIUs held by Management Owners (Note 14 and 16).
As the Continuing LLC Owners control both the Corporation and FTW, before and after the Reorganization Transactions, the Reorganization Transactions were accounted for as a reorganization of entities under common control. As a result, the financial statements for periods prior to the IPO and the Reorganization Transactions are the financial statements of FTW as the predecessor to the Corporation for accounting and reporting purposes.
Financial information includes the accounts of the Company and was prepared in accordance with U.S. generally accepted accounting principles (“GAAP”). All intercompany balances and transactions within the Company have been eliminated in consolidation. These condensed consolidated financial statements, in the opinion of management, reflect all adjustments, consisting only of normal recurring adjustments, that are necessary for a fair statement of our financial information. The condensed consolidated balance sheet as of December 26, 2020, has been derived from the audited financial statements as of that date, but it does not include all of the information and footnotes required by GAAP for complete financial statements. These condensed consolidated financial statements should be read in conjunction with the audited consolidated financial statements and accompanying
F-57
Confidential Treatment Requested by McAfee Corp.
Pursuant to 17 C.F.R. Section 200.83
Notes thereto included in our Annual Report on Form
10-K
for the year ended December 26, 2020, which were recast to reflect discontinued operations and filed with our Current Report on Form8-K
on August 2, 2021. The results of operations for the three and six months ended June 26, 2021 are not necessarily indicative of the results expected for the entire fiscal year. We have reclassified certain prior period amounts to conform to our current period presentation.We consolidate entities in which we have a controlling financial interest, the usual condition of which is ownership of a majority voting interest. We also consider for consolidation certain interests where the controlling financial interest may be achieved through arrangements that do not involve voting interests. Such an entity, known as a variable interest entity (“VIE”), is required to be consolidated by its primary beneficiary. The primary beneficiary of a VIE is considered to possess the power to direct the activities of the VIE that most significantly impact its economic performance and has the obligation to absorb losses or the rights to receive benefits from the VIE that are significant to it (Note 16).
Our functional currency for all of our subsidiaries is the U.S. dollar (“USD”).
Use of Estimates
The preparation of the condensed consolidated financial statements required us to make certain estimates and judgments that affect the amounts reported. Actual results may differ materially from our estimates. The accounting estimates that required our most significant and subjective judgments include:
| • | projections of future cash flows related to revenue share and related agreements with our personal computer original equipment manufacturer partners; |
| • | amounts classified as discontinued operations; |
| • | the valuation and recoverability of identified intangible assets and goodwill; |
| • | recognition and measurement of current and deferred income taxes as well as our uncertain tax positions; |
| • | fair value of our equity awards; |
| • | fair value of long-term debt and related swaps; |
| • | amount of liability related to the tax receivable agreement; |
| • | determining the nature and timing of satisfaction of performance obligations, assessing any associated material rights and determining the standalone selling price (“SSP”) of performance obligations; and |
| • | determining our technology constrained customer life. |
The effect of the novel coronavirus
(“COVID-19”)
pandemic on our business, operations, and financial results is dependent upon future developments, including the duration of the pandemic and the related length of its impact on the global economy and vaccines, which are unknown at this time. As a result, some of our estimates and assumptions required increased judgment and carry a higher degree of variability and volatility. As events continue to evolve and additional information becomes available, several of our estimates and assumptions may change materially in future periods due to the impact of theCOVID-19
pandemic.Fiscal Calendar
We maintain a
52-
or53-week
fiscal year that ends on the last Saturday in December. The year ending December 25, 2021 is a52-week
year starting on December 27, 2020. These condensed consolidated financial statements are presented as of June 26, 2021 and December 26, 2020, and for the three and six months ended June 26, 2021 and the three and six months ended June 27, 2020. The three and six months ended June 26, 2021 consisted of 13 and 26 weeks, respectively, and the three and six months ended June 27, 2020 consisted of 13 and 26 weeks, respectively.F-58
Confidential Treatment Requested by McAfee Corp.
Pursuant to 17 C.F.R. Section 200.83
Significant Accounting Policies
There have been no material changes to our significant accounting policies as of and for the six months ended June 26, 2021, except for those related to discontinued operations and those noted in Note 2, as compared to the significant accounting policies described in our Annual Report on Form
10-K
for the year ended December 26, 2020, which were recast to reflect discontinued operations and filed with our Current Report on Form8-K
on August 2, 2021.Discontinued Operations
We review the presentation of planned business dispositions in the condensed consolidated financial statements based on the available information and events that have occurred. The review consists of evaluating whether the business meets the definition of a component for which the operations and cash flows are clearly distinguishable from the other components of the business, and if so, whether it is anticipated that after the disposal the cash flows of the component would be eliminated from continuing operations and whether the disposition represents a strategic shift that has a major effect on operations and financial results. In addition, we evaluate whether the business has met the criteria as a business held for sale. In order for a planned disposition to be classified as a business held for sale, the established criteria must be met as of the reporting date, including an active program to market the business and the expected disposition of the business within one year.
Planned business dispositions are presented as discontinued operations when all the criteria described above are met. For those divestitures that qualify as discontinued operations, all comparative periods presented are reclassified in the condensed consolidated balance sheets. Additionally, the results of operations of a discontinued operation are reclassified to income from discontinued operations, net of tax, for all periods presented in the condensed consolidated statements of operations. Results of discontinued operations include all revenues and expenses directly derived from such businesses; general corporate overhead is not allocated to discontinued operations.
NOTE 2: RECENT ACCOUNTING STANDARDS
Recently Adopted Accounting Standards
In December 2019, the FASB issued ASU
2019-12,
Income Taxes (Topic 740): Simplifying the Accounting for Income Taxes (“ASU2019-12”),
which simplifies the accounting for income taxes by removing certain exceptions for recognizing deferred taxes for investments, performing intra-period allocation and calculating income taxes in interim periods. ASU2019-12
also adds guidance to reduce complexity in certain areas, including recognizing deferred taxes for tax goodwill and allocating taxes to members of a consolidated group. We adopted ASU2019-12
on December 27, 2020 and it had no material impact on our consolidated financial statements and related disclosures.Recent Accounting Standards Not Yet Adopted
In August 2020, the FASB issued ASU
2020-06,
Debt—Debt with Conversion and Other Options (Subtopic470-20)
and Derivatives and Hedging—Contracts in Entity’s Own Equity (Subtopic815-40)
(“ASU2020-06”),
which simplifies current guidance for convertible financial instruments. ASU2020-06
also amends derivatives guidance for certain contracts in an entity’s own equity. Finally, ASU2020-06
amends earnings per share guidance related to convertible instruments. ASU2020-06
is effective for us in the first quarter of fiscal year 2022. We do not expect adoption of ASU2020-06
to have a material effect on our consolidated financial statements.NOTE 3: DISCONTINUED OPERATIONS AND TRANSITION COSTS
On March 6, 2021, we entered into a definitive agreement with a consortium led by STG, pursuant to which STG agreed to purchase our Enterprise Business for an
all-cash
purchase price of $4.0 billion, which closed onF-59
Confidential Treatment Requested by McAfee Corp.
Pursuant to 17 C.F.R. Section 200.83
July 27, 2021. In connection with the divestiture of the Enterprise Business, we entered into a transition service agreement under which we will provide assistance to STG including, but not limited to, business support services and information technology services as well as a commercial services agreement under which we will provide certain product services and licensed technology.
The following table presents the aggregate amounts of the classes of assets and liabilities sold under the definitive agreement with STG:
(in millions) | December 26, 2020 | June 26, 2021 | ||||||
Assets: | ||||||||
Accounts receivable, net | $ | 290 | $ | 194 | ||||
Deferred costs | 96 | 102 | ||||||
Other current assets | 16 | 21 | ||||||
Total current assets of discontinued operations | 402 | 317 | ||||||
Property and equipment, net | 34 | 37 | ||||||
Intangible assets, net | 915 | 881 | ||||||
Goodwill | 1,413 | 1,413 | ||||||
Deferred tax assets | 43 | 40 | ||||||
Other long-term assets | 155 | 157 | ||||||
Total assets of discontinued operations | $ | 2,962 | $ | 2,845 | ||||
Liabilities: | ||||||||
Accounts payable and other current liabilities | $ | 39 | $ | 37 | ||||
Accrued compensation and benefits | 18 | 18 | ||||||
Accrued marketing | 6 | 8 | ||||||
Lease liabilities, current portion | 15 | 17 | ||||||
Deferred revenue | 892 | 845 | ||||||
Total current liabilities of discontinued operations | 970 | 925 | ||||||
Deferred tax liabilities | 7 | 6 | ||||||
Other long-term liabilities | 51 | 58 | ||||||
Deferred revenue, less current portion | 604 | 545 | ||||||
Total liabilities of discontinued operations | $ | 1,632 | $ | 1,534 | ||||
The following table presents information regarding certain components of income from discontinued operations, net of taxes:
Three Months Ended | Six Months Ended | |||||||||||||||
(in millions) | June 27, 2020 | June 26, 2021 | June 27, 2020 | June 26, 2021 | ||||||||||||
Net revenue | $ | 333 | $ | 346 | $ | 664 | $ | 677 | ||||||||
Operating income | $ | 49 | $ | 54 | $ | 58 | $ | 73 | ||||||||
Income before income taxes | $ | 49 | $ | 51 | $ | 58 | $ | 69 | ||||||||
Income tax expense | $ | 9 | $ | 11 | $ | 17 | $ | 18 | ||||||||
Income from discontinued operations, net of taxes | $ | 40 | $ | 40 | $ | 41 | $ | 51 | ||||||||
F-60
Confidential Treatment Requested by McAfee Corp.
Pursuant to 17 C.F.R. Section 200.83
The following table presents significant
non-cash
items and capital expenditures of discontinued operations:Six Months Ended | ||||||||
(in millions) | June 27, 2020 | June 26, 2021 | ||||||
Depreciation and amortization | $ | 112 | $ | 41 | ||||
Equity-based compensation expense | $ | 3 | $ | 45 | ||||
Additions to property and equipment | $ | 4 | $ | 3 | ||||
In July 2021, two amendments to the definitive agreement with a consortium led by STG for the purchase of the Enterprise Business were executed. The amendments modified certain provisions for assets and liabilities to be transferred as well as the timing and procedures for transfer of certain assets and employees in foreign jurisdictions in connection with the sale, and clarifying requirements for maintenance of such assets prior to transfer. The amendments also include certain other modifications or clarifications of the purchase agreement.
On July 27, 2021, we completed the sale of certain assets and the assumption of certain liabilities of our Enterprise Business to STG for an
all-cash
purchase price of $4.0 billion. In connection with the transaction, we expect to recognize a gain in excess of $2 billion, net of taxes. As a direct result of the taxable gain on the Enterprise Business divestiture, we expect to realize certain tax benefits subject to our TRA and thus we expect to record a TRA liability of between $170 million and $260 million.Subsequent to the completion of the sale of the Enterprise Business, we notified our lenders of our intent to prepay approximately $1 billion of our indebtedness, which will be completed in August 2021. In connection with this prepayment, we expect to incur a loss on extinguishment of debt in Q3 2021 of approximately $10 million related to recognition of unamortized discount and deferred financing costs (Note 11). We also terminated $150 million of our $250 million notional interest rate swap that had an expiration date of January 29, 2022 (Note 13).
Additionally, on August 3, 2021, the Board of Directors of McAfee Corp. declared a special(the “Special Dividend”). In connection with the declaration of the Special Dividend, the Board of Directors of McAfee Corp., as sole managing member of FTW, authorized FTW to declare a special
one-time
cash dividend of $4.50 per share of Class A common stock payable to shareholders of record at 5:00 PM Eastern Time on August 13, 2021, payable on or about August 27, 2021
one-time
cash distribution to its members in the aggregate of approximately $2.8 billion (the “Special Distribution”). The Special Distribution is expected to result in the payment of approximately $1.7 billion to Continuing LLC Owners and approximately $1.1 billion to McAfee Corp. McAfee Corp. will use approximately $0.8 billion of its share of the Special Distribution to pay the Special Dividend to participating shareholders on or about August 27, 2021. Under the provisions of our equity plans, the Special Dividend is anticipated to constitute an equity restructuring under applicable accounting rules, which will require us to make certain adjustments to our outstanding equity awards.In connection with the sale of the Enterprise Business we have incurred costs consisting primarily of consulting fees, legal fees, and other costs to facilitate the sale transaction and the separation of the Enterprise Business, including incremental costs associated with data disentanglement and acceleration of data migration to the cloud. During the three and six months ended June 26, 2021, we recorded $39 million and $61 million, respectively, for these transition costs. These costs are recorded within Income from discontinued operations, net of taxes, on the condensed consolidated statements of operations.
NOTE 4: REVENUE FROM CONTRACTS WITH CUSTOMERS
Deferred Revenue
During the six months ended June 26, 2021, we recognized $553 million from our deferred revenue balance as of December 26, 2020. During the six months ended June 27, 2020, we recognized $483 million in revenue from our deferred revenue balance as of December 28, 2019.
F-61
Confidential Treatment Requested by McAfee Corp.
Pursuant to 17 C.F.R. Section 200.83
Transaction Price Allocated to the Remaining Performance Obligations
As of June 26, 2021, we have $1,019 million in estimated revenue expected to be recognized in the future related to performance obligations that are unsatisfied (or partially unsatisfied), which includes deferred revenue and amounts that will be billed and recognized as revenue in future periods. We expect to recognize approximately 91% as revenue over the next 12 months, 9% in next 13 to 36 months.
Net Revenue by Geographic Region
Net revenue by geographic region based on the
sell-to
address of theend-users
is as follows:Three Months Ended | Six Months Ended | |||||||||||||||||||||||||||||||
(in millions except percentages) | June 27, 2020 | % of Total | June 26, 2021 | % of Total | June 27, 2020 | % of Total | June 26, 2021 | % of Total | ||||||||||||||||||||||||
Americas | $ | 251 | 65.5 | % | $ | 309 | 66.2 | % | $ | 482 | 65.4 | % | $ | 601 | 66.1 | % | ||||||||||||||||
EMEA | 90 | 23.5 | % | 109 | 23.3 | % | 175 | 23.7 | % | 213 | 23.4 | % | ||||||||||||||||||||
APJ | 42 | 11.0 | % | 49 | 10.5 | % | 80 | 10.9 | % | 95 | 10.5 | % | ||||||||||||||||||||
Total net revenue | $ | 383 | 100.0 | % | $ | 467 | 100.0 | % | $ | 737 | 100.0 | % | $ | 909 | 100.0 | % | ||||||||||||||||
Note: The Americas include U.S., Canada and Latin America; EMEA includes Europe, Middle East and Africa; APJ includes Asia Pacific and Japan. See Note 8 for individual countries that accounted for more than 10% of net revenue.
Net Revenue by Channel
Direct to Consumer revenue is from customers who transact with us directly through McAfee web properties, including those converted after the trial period of the McAfee product preinstalled on their new PC purchase or converted subsequent to their subscription period purchased from another channel. Indirect revenue is driven by users who purchase directly through a partner inclusive of mobile providers, ISPs, electronics retailers, ecommerce sites, and search providers.
Net revenue by channel of the
end-users
is as follows:Three Months Ended | Six Months Ended | |||||||||||||||||||||||||||||||
(in millions except percentages) | June 27, 2020 | % of Total | June 26, 2021 | % of Total | June 27, 2020 | % of Total | June 26, 2021 | % of Total | ||||||||||||||||||||||||
Direct to Consumer | $ | 294 | 76.8 | % | $ | 344 | 73.7 | % | $ | 575 | 78.0 | % | $ | 673 | 74.0 | % | ||||||||||||||||
Indirect | 89 | 23.2 | % | 123 | 26.3 | % | 162 | 22.0 | % | 236 | 26.0 | % | ||||||||||||||||||||
Total net revenue | $ | 383 | 100.0 | % | $ | 467 | 100.0 | % | $ | 737 | 100.0 | % | $ | 909 | 100.0 | % | ||||||||||||||||
F-62
Confidential Treatment Requested by McAfee Corp.
Pursuant to 17 C.F.R. Section 200.83
NOTE 5: LEASES
As of June 26, 2021, we have operating leases primarily for corporate offices and data centers and no significant finance leases. Information related to operating leases, including leases associated with our discontinued operations, was as follows:
Six Months Ended | ||||||||
(in millions) | June 27, 2020 | June 26, 2021 | ||||||
Cash paid for amounts included in the measurement of lease liabilities | $ | 20 | $ | 19 | ||||
Right-of-use | 14 | 20 | ||||||
Lease expense from continuing operations | $ | 9 | $ | 7 | ||||
Lease expense from discontinued operations | 10 | 11 | ||||||
Total lease expense | $ | 19 | $ | 18 | ||||
Balance sheet information related to leases, excluding leases associated with our discontinued operations, was as follows:
(in millions) | December 26, 2020 | June 26, 2021 | ||||||
Other long-term assets | $ | 33 | $ | 31 | ||||
Lease liabilities, current portion | $ | 10 | $ | 9 | ||||
Other long-term liabilities | 37 | 34 | ||||||
Total lease liabilities | $ | 47 | $ | 43 | ||||
Weighted Average Remaining Lease Term (in years) | 8 | 8 | ||||||
Weighted Average Discount Rate (percentage) | 6.3 | % | 6.1 | % | ||||
Maturities of lease liabilities, excluding lease liabilities associated with our discontinued operations, were as follows:
(in millions) | June 26, 2021 | |||
Remainder of 2021 | $ | 5 | ||
2022 | 8 | |||
2023 | 6 | |||
2024 | 5 | |||
2025 | 5 | |||
Thereafter | 26 | |||
Total lease payments | 55 | |||
Less imputed interest | (12 | ) | ||
Total lease liabilities | $ | 43 | ||
F-63
Confidential Treatment Requested by McAfee Corp.
Pursuant to 17 C.F.R. Section 200.83
NOTE 6: TRANSACTIONS WITH MEMBERS, SHAREHOLDERS AND RELATED PARTIES
Total tax and excess cash distributions to its members declared by FTW were as follows:
Three Months Ended | Six Months Ended | |||||||||||||||
(in millions) | June 27, 2020 | June 26, 2021 | June 27, 2020 | June 26, 2021 | ||||||||||||
FTW members excluding McAfee Corp. | $ | 81 | $ | 65 | $ | 131 | $ | 152 | ||||||||
McAfee Corp. | — | 39 | — | 90 | ||||||||||||
Total tax and excess cash distributions declared | $ | 81 | $ | 104 | $ | 131 | $ | 242 | ||||||||
McAfee Corp. used a portion of its share of the cash distributions declared by FTW to declare or pay the dividends noted in the table below during the six months ended June 26, 2021. Remaining distributions received by McAfee Corp. were used for corporate taxes and general corporate purposes.
Declaration Date | Record Date | Payment Date | Dividend per Share | Amount (in millions) | ||||
December 9, 2020 | December 24, 2020 | January 2021 | $0.087 | $14 | ||||
March 11, 2021 | March 26, 2021 | April 9, 2021 | $0.115 | $19 | ||||
June 10, 2021 | June 25, 2021 | July 9, 2021 | $0.115 | $19 |
Distributions and dividends of $50 million were recorded primarily within Accounts payable and other current liabilities on the condensed consolidated balance sheet as of June 26, 2021, and $50 million was paid in July 2021.
In February 2020, we entered into an agreement with our former President and Chief Executive Officer to repurchase equity units for an aggregate repurchase price of $10 million. We also agreed to repurchase his remaining outstanding equity units in April 2021 at fair market value, contingent on the satisfaction of certain terms and conditions. Upon a sale of the company or an IPO prior to the repurchase date, the units were not required to be repurchased. The units were classified as temporary equity within Redeemable units from the time of the agreement until the IPO when they were reclassified to permanent equity. As of June 27, 2020, the estimated value of the April 2021 repurchase was $17 million.
We had these additional transactions, inclusive of discontinued operations, with TPG, Intel or other Continuing LLC Owners and companies owned or partially owned by those parties that therefore qualify as related parties. These transactions include sales of our products and purchases of various goods or services.
Three Months Ended | Six Months Ended | |||||||||||||||
(in millions) | June 27, 2020 | June 26, 2021 | June 27, 2020 | June 26, 2021 | ||||||||||||
Sales with related parties: | ||||||||||||||||
TPG affiliates | $ | 0 | $ | 0 | $ | 1 | $ | 1 | ||||||||
Other | 2 | 0 | 2 | — | ||||||||||||
Total | $ | 2 | $ | 0 | $ | 3 | $ | 1 | ||||||||
Payments to related parties: | ||||||||||||||||
Intel | $ | 2 | $ | 0 | $ | 2 | $ | 1 | ||||||||
TPG | 4 | — | 5 | — | ||||||||||||
TPG affiliates | 7 | 8 | 15 | 18 | ||||||||||||
Other | 2 | 2 | 9 | 2 | ||||||||||||
Total | $ | 15 | $ | 10 | $ | 31 | $ | 21 | ||||||||
F-64
Confidential Treatment Requested by McAfee Corp.
Pursuant to 17 C.F.R. Section 200.83
Revenue from the sales transactions are recognized in accordance with our revenue recognition policy.
Our Intel receivable, net consisted of the following:
(in millions) | December 26, 2020 | June 26, 2021 | ||||||
Intel receivable (1) | ||||||||
Tax indemnity | $ | 8 | $ | 9 | ||||
Total | 8 | 9 | ||||||
Intel payable (1) | ||||||||
Tax indemnity | (2 | ) | (3 | ) | ||||
Total | (2 | ) | (3 | ) | ||||
Total, net (2) | $ | 6 | $ | 6 | ||||
| (1) | We have the contractual right of offset of our receivables and payables with Intel. |
| (2) | As of June 26, 2021, $5 million and $1 million are recorded in Other current assets and Other long-term assets, respectively, on the condensed consolidated balance sheet. As of December 26, 2020, $3 million and $3 million are recorded in Other current assets and Other long-term assets, respectively, on the condensed consolidated balance sheet. |
NOTE 7: GOODWILL AND INTANGIBLE ASSETS
Goodwill and intangible assets to be disposed of as a result of our agreement with STG to sell certain assets of Enterprise Business were included in assets of discontinued operations in our condensed consolidated balance sheets as of June 26, 2021 and December 26, 2020, and accordingly, are excluded from the tables below.
Goodwill
Goodwill was $1,018 million as of June 26, 2021 and December 26, 2020.
Intangible Assets, Net
December 26, 2020 | June 26, 2021 | |||||||||||||||||||||||
(in millions) | Gross Assets | Accumulated Amortization | Net | Gross Assets | Accumulated Amortization | Net | ||||||||||||||||||
Intangible assets subject to amortization: | ||||||||||||||||||||||||
Customer relationships and other | $ | 758 | $ | (556 | ) | $ | 202 | $ | 758 | $ | (605 | ) | $ | 153 | ||||||||||
Acquired and developed technology | 517 | (401 | ) | 116 | 517 | (450 | ) | 67 | ||||||||||||||||
Total intangible assets subject to amortization | 1,275 | (957 | ) | 318 | 1,275 | (1,055 | ) | 220 | ||||||||||||||||
Intangible assets not subject to amortization: | ||||||||||||||||||||||||
Brand | 411 | 0 | 411 | 411 | 0 | 411 | ||||||||||||||||||
Total intangible assets not subject to amortization | 411 | 0 | 411 | 411 | 0 | 411 | ||||||||||||||||||
Total intangible assets | $ | 1,686 | $ | (957 | ) | $ | 729 | $ | 1,686 | $ | (1,055 | ) | $ | 631 | ||||||||||
F-65
Confidential Treatment Requested by McAfee Corp.
Pursuant to 17 C.F.R. Section 200.83
Amortization expense for purchased and developed intangible assets is as follows:
Three Months Ended | Six Months Ended | |||||||||||||||||
| (in millions) | June 27, 2020 | June 26, 2021 | June 27, 2020 | June 26, 2021 | Statements of Operations Classification | |||||||||||||
Customer relationships and other | $ | 36 | $ | 13 | $ | 49 | $ | 72 | Amortization of intangibles | |||||||||
Acquired and developed technology | 27 | 22 | 49 | 54 | Cost of sales | |||||||||||||
Total | $ | 63 | $ | 35 | $ | 98 | $ | 126 | ||||||||||
Based on identified intangible assets that are subject to amortization as of June 26, 2021, we expect future amortization expense to be as follows:
(in millions) | Total | |||
Remainder of 2021 | $ | 72 | ||
2022 | 76 | |||
2023 | 28 | |||
2024 | 20 | |||
2025 | 19 | |||
Thereafter | 5 | |||
Total | $ | 220 | ||
NOTE 8: SEGMENT AND GEOGRAPHIC INFORMATION
Historically, we had 2 operating segments, which also represented our reportable segments and reporting units. The Consumer segment focused on providing security solutions for consumers, while the Enterprise segment focused on providing security solutions for large enterprise, governments, small and
medium-sized
businesses. On March 6, 2021, we entered into a definitive agreement to sell certain assets together with certain liabilities of our Enterprise Business to STG, representing substantially all of our Enterprise segment. The divestiture of the Enterprise Business, which was completed on July 27, 2021, allows us to shift our operational focus to our Consumer business and represents a strategic shift in our operations. Therefore, the results of our Enterprise Business were classified as discontinued operations in our condensed consolidated statements of operations and thus excluded from both continuing operations and segment results for all periods presented. Accordingly, we now have 1 reportable segment with the change reflected in all periods presented.Net revenue by country based on the
sell-to
address of theend-users
is as follows:Three Months Ended | Six Months Ended | |||||||||||||||
(in millions) | June 27, 2020 | June 26, 2021 | June 27, 2020 | June 26, 2021 | ||||||||||||
U.S. | $ | 231 | $ | 284 | $ | 442 | $ | 552 | ||||||||
Other (1) | 152 | 183 | 295 | 357 | ||||||||||||
Total net revenue | $ | 383 | $ | 467 | $ | 737 | $ | 909 | ||||||||
| (1) | NaN other individual country accounted for more than 10% of net revenue. |
NOTE 9: RESTRUCTURING CHARGES
Restructuring charges generally include significant actions impacting the way we manage our business. Employee severance and benefit charges are largely based upon substantive severance plans, while some charges result from mandated requirements in certain foreign jurisdictions. These charges include items such as employee severance, ongoing benefits, and excess payroll costs directly attributable to the restructuring plan.
F-66
Confidential Treatment Requested by McAfee Corp.
Pursuant to 17 C.F.R. Section 200.83
In connection with the agreement to sell certain assets of our Enterprise Business, a portion of our Restructuring charges were classified to discontinued operations for all periods presented. Restructuring charges are as follows:
Three Months Ended | Six Months Ended | |||||||||||||||
(in millions) | June 27, 2020 | June 26, 2021 | June 27, 2020 | June 26, 2021 | ||||||||||||
Employee severance and benefits | $ | — | $ | — | $ | 1 | $ | 8 | ||||||||
Restructuring charges attributable to continuing operations | — | — | 1 | 8 | ||||||||||||
Employee severance and benefits | — | 2 | 8 | 24 | ||||||||||||
Facility restructuring | — | — | — | 1 | ||||||||||||
Restructuring charges attributable to discontinued operations | �� | — | 2 | 8 | 25 | |||||||||||
Total restructuring charges | $ | — | $ | 2 | $ | 9 | $ | 33 | ||||||||
In January 2020, we commenced the 2020 transformation initiative, in which we realigned our staffing across various departments. As part of the initiative, we incurred employee severance and benefits costs of $1 million recorded in restructuring charges in the condensed consolidated statement of operations for the six months ended June 27, 2020, respectively.
In December 2020, we initiated a workforce reduction and other restructuring activities designed to continue to improve operating margins in connection with the reorientation of our Enterprise Business and realignment of staffing in other departments, which was announced in February 2021 following the notification of affected employees. These activities were substantially completed in the second quarter of fiscal year 2021. As part of the initiative, in December 2020 we recognized $16 million in connection with the workforce reduction and other restructuring activities. During the three and six months ended June 26, 2021, we recognized $2 million and $33 million in restructuring charges, respectively. These charges consist primarily of
one-time
termination benefits to the impacted employees, including severance payments and healthcare and other accrued benefits. We may also incur other charges or cash expenditures not currently contemplated due to events that may occur as a result of, or associated with, the workforce reduction.The balance of our restructuring activities are as follows:
(in millions) | Total | |||
Employee severance and benefits | ||||
As of December 26, 2020 | $ | 16 | ||
Additional accruals | 32 | |||
Cash payments | (41 | ) | ||
As of June 26, 2021 | $ | 7 | ||
F-67
Confidential Treatment Requested by McAfee Corp.
Pursuant to 17 C.F.R. Section 200.83
NOTE 10: EMPLOYEE INCENTIVES
Equity-Based Compensation
Equity-based compensation costs recognized in our condensed consolidated statements of operations were:
Three Months Ended | Six Months Ended | |||||||||||||||
(in millions) | June 27, 2020 | June 26, 2021 | June 27, 2020 | June 26, 2021 | ||||||||||||
Cost of sales | $ | — | $ | 1 | $ | — | $ | 2 | ||||||||
Sales and marketing | — | 4 | 1 | 7 | ||||||||||||
Research and development | — | 7 | — | 10 | ||||||||||||
General and administrative | 2 | 7 | 15 | 14 | ||||||||||||
Total equity-based compensation expense from continuing operations | 2 | 19 | 16 | 33 | ||||||||||||
Discontinued operations | 2 | 33 | 3 | 45 | ||||||||||||
Total equity-based compensation expense | $ | 4 | $ | 52 | $ | 19 | $ | 78 | ||||||||
As of June 26, 2021, there was $303 million of unrecognized equity-based compensation cost, which is expected to be recognized over a weighted average vesting period of 2.5 years.
During the six months ended June 26, 2021, we granted 1.8 million Restricted Stock Units (“RSU”s) with a grant date fair value of $42 million as part of the divestiture of the Enterprise Business (“Enterprise RSU grant”). The Enterprise RSU grants are expected to vest over a weighted average service period of less than one year.
During the six months ended June 26, 2021, we granted an additional 4.8 million RSU’s with a grant date fair value of $107 million. These RSUs are generally expected to vest over a four-year period. We also granted 0.6 million Performance Stock Units (“PSU”s) with a fair value of $13 million. PSUs are generally expected to vest over a weighted average three-year period.
Deferred Cash and Equity
As of June 26, 2021, our outstanding deferred cash and equity related to our acquisitions is as follows:
(in millions) | ||||
Outstanding deferred cash and equity balance at December 26, 2020 | $ | 13 | ||
Accruals | 3 | |||
Cash payment | (15 | ) | ||
Outstanding deferred cash and equity balance at June 26, 2021 | $ | 1 | ||
As of June 26, 2021, we have unrecognized expense relating to deferred cash of $3 million with a remaining weighted average service period of less than one year. Deferred cash is recorded within Accrued compensation and benefits on the condensed consolidated balance sheet.
F-68
Confidential Treatment Requested by McAfee Corp.
Pursuant to 17 C.F.R. Section 200.83
NOTE 11: DEBT
Our long-term debt balance consisted of the following:
(in millions) | December 26, 2020 | June 26, 2021 | ||||||
Long-term debt, net: | ||||||||
1 st Lien USD Term Loan(1) | $ | 2,701 | $ | 2,690 | ||||
1 st Lien Euro Term Loan(2) | 1,298 | 1,269 | ||||||
Long-term debt, net of unamortized discounts | 3,999 | 3,959 | ||||||
Unamortized deferred financing costs | (12 | ) | (11 | ) | ||||
Current installments of long-term debt | (44 | ) | (44 | ) | ||||
Total | $ | 3,943 | $ | 3,904 | ||||
| (1) | During the six months ended June 26, 2021, the weighted average interest rate was 3.9% |
| (2) | During the six months ended June 26, 2021, the weighted average interest rate was 3.5% |
Long-Term Debt
As of June 26, 2021, the material terms of our outstanding debt remain unchanged from those described in our consolidated financial statements as of December 26, 2020.
Subsequent to the completion of the sale of the Enterprise Business, we notified our lenders of our intent to prepay approximately $1 billion of our indebtedness, which will be completed in August 2021. In connection with this prepayment, we expect to incur a loss on extinguishment of debt in Q3 2021 of approximately $10 million related to recognition of unamortized discount and deferred financing costs (Note 3).
Revolving Credit Facility
As of June 26, 2021 and December 26, 2020, we had a letter of credit of $4 million issued against the Revolving Credit Facility and $660 million of undrawn capacity under the Revolving Credit Facility, for which our commitment fee on the unused portion was 0.25%.
Debt Covenants and Restrictions
No event of default had occurred under any of our debt obligations as of June 26, 2021. We were not required to make any additional prepayments above the 0.25% per quarter amortization of the 1
st
Lien Term Loans during the six months ended June 26, 2021.NOTE 12: INCOME TAX
McAfee Corp. is taxed as a corporation and pays corporate federal, state and local taxes on income allocated to it from FTW based upon McAfee Corp.’s economic interest in FTW. FTW is a pass through entity for U.S. federal income tax purposes and will not incur any federal income taxes either for itself or its U.S. subsidiaries that are also pass through or disregarded subsidiaries. Taxable income or loss for these entities will flow through to its respective members for U.S. tax purposes. FTW does have certain U.S. and foreign subsidiaries that are corporations and are subject to income tax in their respective jurisdiction.
We consider many factors when evaluating and estimating our tax positions, which may require periodic adjustments and may not accurately anticipate actual outcomes. Tax position recognition is a matter of judgment
F-69
Confidential Treatment Requested by McAfee Corp.
Pursuant to 17 C.F.R. Section 200.83
based on the individual facts and circumstances of our position evaluated in light of all available evidence. As of June 26, 2021 and December 26, 2020, we had uncertain tax positions, including interest and penalties, of $7 million and $16 million, respectively, primarily recorded within Other long-term liabilities and Other long-term assets on the condensed consolidated balance sheets. In the next 12 months, it is reasonably possible to have an audit closure or statute expirations in one of our foreign jurisdictions. We do not believe the amount to have a significant impact to our consolidated financial statements. A portion of income taxes and uncertain tax positions has been indemnified by Intel (Note 6).
Tax Receivable Agreement
As realizability of the net deferred tax assets has not met the more likely than not recognition criteria, the liability under the TRA has not met the probable recognition criteria in the accompanying condensed consolidated balance sheet as of June 26, 2021, except for the $2 million current portion and $12 million long-term portion of the TRA liability recorded within Accounts payable and other accrued liabilities and Other long-term liabilities, respectively, in the condensed consolidated balance sheet.
We believe it is reasonably possible subsequent to the closing of the sale of the Enterprise Business we will no longer have a cumulative loss incurred over the trailing three-year period. As a result, we could then consider subjective evidence, such as our projections for future growth, and may conclude that the valuation allowance against the net deferred tax assets of our domestic entities will no longer be required. A release of the valuation allowance would have the following impact in the period in which such release is recorded:
| • | Recognition of certain deferred tax assets and corresponding discrete income tax benefit up to $125 million. |
| • | Recognition of a long-term TRA liability and corresponding TRA expense of $170 million to $260 million, including the TRA liability recorded directly as a result of tax attributes utilized from the Enterprise Business divestiture (Note 3). This TRA liability relates to net deferred tax assets that did not meet the probable recognition criteria as of December 26, 2020 and thus was not recorded in our consolidated balance sheet as of that date. |
NOTE 13: FAIR VALUE OF FINANCIAL INSTRUMENTS AND INTEREST RATE SWAPS
Fair Value of Financial Instruments
For assets and liabilities that are measured using quoted prices in active markets (Level 1), total fair value is the published market price per unit multiplied by the number of units held without consideration of transaction costs, discounts or blockage factors. Assets and liabilities that are measured using significant other observable inputs are valued by reference to similar assets or liabilities (Level 2), adjusted for contract restrictions and other terms specific to that asset or liability. For these items, a significant portion of fair value is derived by reference to quoted prices of similar assets or liabilities in active markets. For all remaining assets and liabilities, fair value is derived using other valuation methodologies, including option pricing models, discounted cash flow models and similar techniques (Level 3) and not based on market exchange, dealer or broker traded transactions. These valuations incorporate certain assumptions and projections in determining the fair value assigned to such assets or liabilities.
F-70
Confidential Treatment Requested by McAfee Corp.
Pursuant to 17 C.F.R. Section 200.83
The fair value of our financial instruments are as follows:
(in millions) | Level 1 | Level 2 | Level 3 | |||||||||
As of December 26, 2020 | ||||||||||||
Financial instruments not carried at fair value: | ||||||||||||
Long-term debt, gross of discounts and deferred issuance costs (Note 11) | $ | — | $ | (4,033 | ) | $ | — | |||||
Financial instruments carried at fair value: | ||||||||||||
Interest rate swaps | $ | — | $ | (119 | ) | $ | — | |||||
As of June 26, 2021 | ||||||||||||
Financial instruments not carried at fair value: | ||||||||||||
Long-term debt, gross of discounts and deferred issuance costs (Note 11) | $ | — | $ | (3,991 | ) | $ | — | |||||
Financial instruments carried at fair value: | ||||||||||||
Interest rate swaps | $ | — | $ | (86 | ) | $ | — | |||||
The fair value of the debt is based on third party quotations and is therefore classified as Level 2. The fair value of our derivative financial instruments, including interest rate swaps, are valued in the market using discounted cash flow techniques. These techniques incorporate Level 1 and Level 2 fair value measurement inputs such as spot rates, foreign currency exchange rates, and the instrument’s term, notional amount and discount rate.
The fair values of our financial instruments included in Cash and cash equivalents, Accounts receivable, net, Other current assets, Accounts payable and other current liabilities on the condensed consolidated balance sheets approximate their carrying amounts due to their short maturities. We measure the fair value of money market accounts, included in Cash and cash equivalents on the condensed consolidated balance sheets, on a recurring basis and have classified them as Level 1 because the fair value is measured with quoted prices in active markets. These amounts have been excluded from the table.
There were no transfers of assets or liabilities between fair value measurement levels. Transfers between fair value measurement levels are recognized at the end of the reporting period.
Interest Rate Swaps
We have multiple interest rate swaps in order to fix the LIBOR portion of our USD denominated variable rate borrowings (Note 11). As of June 26, 2021, the outstanding effective arrangements were as follows:
Notional Value (in millions) | Effective Date | Expiration Date | Fixed Rate | |||
$250 | January 29, 2018 | January 29, 2022 | 2.41% | |||
$275 | January 29, 2018 | January 29, 2023 | 2.48% | |||
$275 | January 29, 2018 | January 29, 2023 | 2.49% | |||
$475 | March 29, 2019 | March 29, 2024 | 2.40% | |||
$750 | March 4, 2020 | September 29, 2024 | 2.07% | |||
$250 | March 29, 2020 | March 29, 2024 | 0.93% | |||
$225 | January 29, 2021 | January 29, 2024 | 0.42% |
Subsequent to the completion of the sale of the Enterprise Business, we notified our lenders of our intent to prepay approximately $1 billion of our indebtedness, which will be completed in August 2021. We also terminated $150 million of our $250 million notional interest rate swap that had an expiration date of January 29, 2022 (Note 3).
F-71
Confidential Treatment Requested by McAfee Corp.
Pursuant to 17 C.F.R. Section 200.83
The gross amounts of our interest rate swaps, which are subject to master netting arrangements, were as follows:
(in millions) | Gross amounts recognized | Gross amount offset in Balance Sheets | Net amounts presented in Balance Sheets | |||||||||
As of December 26, 2020 | ||||||||||||
Accounts payable and other current liabilities | $ | (43 | ) | $ | — | $ | (43 | ) | ||||
Other long-term liabilities | (76 | ) | — | (76 | ) | |||||||
As of June 26, 2021 | ||||||||||||
Accounts payable and other current liabilities | $ | (41 | ) | $ | — | $ | (41 | ) | ||||
Other long-term liabilities | (45 | ) | — | (45 | ) | |||||||
NOTE 14: REDEEMABLE NONCONTROLLING INTERESTS
We report a RNCI based on the LLC Units of FTW held by Continuing LLC Owners and vested MIUs held by Management Owners. The Continuing LLC Owners (or certain permitted transferees), subject to certain restrictions, can exchange their LLC Units for shares of Class A common stock on abasis (simultaneously cancelling an equal number of shares of Class B common stock of the exchanging member), subject to customary conversion rate adjustments for stock splits, stock dividends, reclassifications and other similar transactions, or, at the option of the Company, for cash (based on the market price of the shares of our Class A common stock). The holders of MIUs also have the right, from time to time and subject to certain restrictions, to exchange their MIUs for LLC Units, which will then be immediately redeemed for cash or shares of Class A common stock, at the option of the Company, based on the value of such MIUs relative to their applicable distribution threshold.
1-for-one
The Company’s decision of whether to exchange LLC Units for Class A common stock or cash is currently made solely at the discretion of the Continuing LLC Owners through their control of our Board of Directors. Accordingly, the LLC Units owned by the Continuing LLC Owners are treated as RNCI as the holders have the option to exchange their LLC Units for cash or for shares of the Corporation’s Class A common stock. The RNCI is reported at the greater of the redemption value of the units or the carrying value as of the balance sheet date, with a corresponding adjustment to Additional
paid-in
capital. The redemption value of our redeemable noncontrolling interests was derived from the closing stock price of the Company’s Class A common stock on the last day of the period.Future redemptions or direct exchanges of LLC Units by the Continuing LLC Owners will result in a change in ownership and reduce or increase the carrying value of the RNCI and increase or decrease Additional
paid-in
capital when FTW has positive or negative net assets, respectively.The following table summarizes the ownership and economic interest in FTW LLC:
December 26, 2020 | June 26, 2021 | |||||||||||||||
(in millions except percentages) | Units Outstanding | Ownership % | Units Outstanding | Ownership % | ||||||||||||
Number of LLC Units held by McAfee Corp. | 161.3 | 37.2 | % | 166.0 | 38.0 | % | ||||||||||
Number of LLC Units and vested MIUs held by RNCI | 272.5 | 62.8 | % | 271.3 | 62.0 | % | ||||||||||
Total LLC Units and vested MIUs outstanding | 433.8 | 100.0 | % | 437.3 | 100.0 | % | ||||||||||
F-72
Confidential Treatment Requested by McAfee Corp.
Pursuant to 17 C.F.R. Section 200.83
NOTE 15: EARNINGS PER SHARE
Basic earnings per share is computed by dividing net income attributable to McAfee Corp. for the periods subsequent to the Reorganization Transactions by the weighted average number of shares of Class A common stock outstanding for the same period. Shares issued during the period and shares reacquired during the period are weighted for the portion of the period in which the shares were outstanding. Diluted earnings per share has been computed in a manner consistent with that of basic net income per share while giving effect to shares of potentially dilutive common stock that were outstanding during the period.
Prior to the Reorganization Transactions, the FTW capital structure primarily included FTW LLC Units. Certain holders of these units exchanged their FTW LLC units for Class A common stock of the Corporation in the Reorganization Transactions with the remaining FTW LLC Units reflecting RNCI in the Corporation. The completion of the Reorganization Transactions created the Corporation’s current capital structure, which is not reflective of the capital structure of FTW’s business prior to the Reorganization Transactions. Therefore, earnings per share information has not been presented for the three and six months ended June 27, 2020.
Shares of Class B common stock do not share in the earnings or losses attributable to McAfee Corp. and are therefore not participating securities. As such, separate presentation of basic and diluted earnings per share of Class B common stock under thebasis.
two-class
method has not been presented. Shares of Class B common stock are, however, considered potentially dilutive shares of Class A common stock because shares of Class B common stock, together with the related FTW LLC Units, are exchangeable into shares of Class A common stock on a1-for-one
F-73
Confidential Treatment Requested by McAfee Corp.
Pursuant to 17 C.F.R. Section 200.83
The following table sets forth reconciliations of the numerators and denominators used to compute basic and diluted earnings per share of Class A common stock for the three and six months ended June 26, 2021, the periods wherein the Corporation had outstanding Class A common stock.
Three Months Ended | Six Months Ended | |||||||||||||||||||||||
(in millions except per share data) | June 26, 2021 | June 26, 2021 | ||||||||||||||||||||||
Continuing Operations | Discontinued Operations | Total | Continuing Operations | Discontinued Operations | Total | |||||||||||||||||||
Numerator: | ||||||||||||||||||||||||
Net income attributable to McAfee Corp., basic | $ | 23 | $ | 13 | $ | 36 | $ | 50 | $ | 16 | $ | 66 | ||||||||||||
Net income attributable to change in ownership percentage due to dilutive equity awards | 2 | — | 2 | 4 | — | 4 | ||||||||||||||||||
Less: Provision for income tax expense (1) | 0 | 0 | 0 | 0 | 0 | 0 | ||||||||||||||||||
Net income attributable to McAfee Corp., diluted | $ | 25 | $ | 13 | $ | 38 | $ | 54 | $ | 16 | $ | 70 | ||||||||||||
Denominator: | ||||||||||||||||||||||||
Weighted average shares of Class A common stock outstanding, basic | 165.0 | 165.0 | 165.0 | 163.7 | 163.7 | 163.7 | ||||||||||||||||||
Dilutive impact of equity awards (2) | 17.8 | 17.8 | 17.8 | 15.8 | 15.8 | 15.8 | ||||||||||||||||||
Weighted average shares of Class A common stock outstanding, diluted | 182.8 | 182.8 | 182.8 | 179.5 | 179.5 | 179.5 | ||||||||||||||||||
Earnings per share attributable to McAfee Corp., basic | ||||||||||||||||||||||||
Earnings per share, basic (3) | $ | 0.14 | $ | 0.08 | $ | 0.22 | $ | 0.31 | $ | 0.10 | $ | 0.40 | ||||||||||||
Earnings per share attributable to McAfee Corp., diluted | ||||||||||||||||||||||||
Earnings per share, diluted (4) | $ | 0.14 | $ | 0.07 | $ | 0.21 | $ | 0.30 | $ | 0.09 | $ | 0.39 | ||||||||||||
| (1) | Represents incremental income tax provision we would have recognized due to change in ownership. |
| (2) | Represents the dilutive impact of equity awards. |
| (3) | Amounts may not add due to rounding. |
| (4) | For the three and six months ended June 26, 2021, 271.5 million and 272.7 million weighted average units were excluded from dilution, respectively. The excluded units consist primarily of RNCI that is excluded from dilution because its effects would have been anti-dilutive. |
NOTE 16: VARIABLE INTEREST ENTITIES
Upon completion of our IPO, McAfee Corp. became the sole managing member of FTW with 100% of the management and voting power in FTW. In its capacity as managing member, McAfee Corp. has the sole authority to make decisions on behalf of FTW and bind FTW to signed agreements. Further, FTW maintains separate capital accounts for its investors as a mechanism for tracking earnings and subsequent distribution rights. Accordingly, management concluded that FTW is a limited partnership or similar legal entity as contemplated in ASC 810, Consolidation.
F-74
Confidential Treatment Requested by McAfee Corp.
Pursuant to 17 C.F.R. Section 200.83
Further, management concluded that McAfee Corp. is FTW’s primary beneficiary based on two conditions. First, McAfee Corp., in its capacity as managing member with sole voting rights, has the power to direct the activities of FTW that most significantly impact its economic performance, including selecting, terminating and setting the compensation of management responsible for FTW’s policies and procedures, as well as establishing the strategic, operating and capital decisions of FTW in the ordinary course of business. Second, McAfee Corp. has an obligation to absorb potential losses of FTW or the right to receive potential benefits from FTW in proportion to its equity interest. As the primary beneficiary, McAfee Corp. consolidates the results of FTW for financial reporting purposes under the variable interest consolidation model guidance in ASC 810.
The following table reflects the balance sheet of FTW that is consolidated within the condensed consolidated balance sheets, including Receivable from Parent, net and McAfee Corp.’s interest in the variable interest entity (“VIE”) that are eliminated upon consolidation.
(in millions) | December 26, 2020 | June 26, 2021 | ||||||
Assets | ||||||||
Current assets: | ||||||||
Cash and cash equivalents | $ | 231 | $ | 416 | ||||
Accounts receivable, net | 102 | 95 | ||||||
Deferred costs | 137 | 163 | ||||||
Other current assets | 42 | 44 | ||||||
Current assets of discontinued operations | 402 | 317 | ||||||
Total current assets | 914 | 1,035 | ||||||
Property and equipment, net | 115 | 103 | ||||||
Goodwill | 1,018 | 1,018 | ||||||
Identified intangible assets, net | 729 | 631 | ||||||
Deferred tax assets | 25 | 25 | ||||||
Receivable from Parent, net | 46 | 0 | ||||||
Other long-term assets | 67 | 93 | ||||||
Long-term assets of discontinued operations | 2,560 | 2,528 | ||||||
Total assets | $ | 5,474 | $ | 5,433 | ||||
Liabilities and deficit | ||||||||
Current liabilities: | ||||||||
Accounts payable and other current liabilities | $ | 211 | $ | 236 | ||||
Accrued compensation and benefits | 179 | 117 | ||||||
Accrued marketing | 118 | 94 | ||||||
Income taxes payable | 14 | 18 | ||||||
Long-term debt, current portion | 44 | 44 | ||||||
Lease liabilities, current portion | 10 | 9 | ||||||
Liability to Parent, net | — | 3 | ||||||
Deferred revenue | 823 | 926 | ||||||
Current liabilities of discontinued operations | 970 | 925 | ||||||
Total current liabilities | 2,369 | 2,372 | ||||||
Long-term debt, net | 3,943 | 3,904 | ||||||
Deferred tax liabilities | 5 | 7 | ||||||
Other long-term liabilities | 153 | 126 | ||||||
Deferred revenue, less current portion | 80 | 93 | ||||||
Long-term liabilities of discontinued operations | 662 | 609 | ||||||
Total liabilities | 7,212 | 7,111 | ||||||
Members’ deficit: | ||||||||
Deficit attributable to Continuing LLC Owners | (1,092 | ) | (1,041 | ) | ||||
Deficit attributable to McAfee Corp. | (646 | ) | (637 | ) | ||||
Total deficit | (1,738 | ) | (1,678 | ) | ||||
Total liabilities and deficit | $ | 5,474 | $ | 5,433 | ||||
F-75
Confidential Treatment Requested by McAfee Corp.
Pursuant to 17 C.F.R. Section 200.83
NOTE 17: COMMITMENTS AND CONTINGENCIES
As of June 26, 2021, including amounts associated with our discontinued operations, we have unconditional purchase obligations of $431 million that expire at various dates through 2026 and guarantees of $11 million that expire at various dates through 2028.
We are a party to various legal proceedings that have arisen in the ordinary course of our business. At present, we do not expect that any ordinary course legal proceedings, individually or in the aggregate, will have a material adverse effect on our business, results of operations, financial condition or cash flows.
In the ordinary course of our business, we are subject to examination by taxing authorities for both direct and indirect taxes in many of the domestic and foreign jurisdictions in which we operate. We are unable to make a reasonably reliable estimate as to when or if settlements with taxing authorities may occur. However, we do not anticipate that the resolution of these tax matters or any events related thereto will have a material adverse effect on our business, results of operations, financial condition or cash flows.
F-76
Confidential Treatment Requested by McAfee Corp.
Pursuant to 17 C.F.R. Section 200.83
PART II
Information Not Required In Prospectus
ITEM 13. OTHER EXPENSES OF ISSUANCE AND DISTRIBUTION
The following table sets forth the costs and expenses, other than the underwriting discounts and commissions, payable by the registrant in connection with the sale of common stock being registered. All amounts are estimates except for the SEC registration fee and the FINRA filing fee.
Item | Amount to be paid | |||
SEC registration fee | $ | 66,597 | ||
FINRA filing fee | $ | 69,402 | ||
Printing and engraving expenses | $ | 250,000 | ||
Legal fees and expenses | $ | 750,000 | ||
Accounting fees and expenses | $ | 1,000,000 | ||
Transfer agent and registrar fees and expenses | $ | 11,800 | ||
Miscellaneous expenses | $ | 25,000 | ||
Total | $ | 2,172,799 | ||
ITEM 14. INDEMNIFICATION OF DIRECTORS AND OFFICERS
Section 145(a) of the DGCL grants each corporation organized thereunder the power to indemnify any person who was or is a party or is threatened to be made a party to any threatened, pending or completed action, suit or proceeding, whether civil, criminal, administrative or investigative (other than an action by or in the right of the corporation), by reason of the fact that such person is or was a director, officer, employee or agent of the corporation, or is or was serving at the request of the corporation as a director, officer, employee or agent of another corporation, partnership, joint venture, trust or other enterprise, against expenses (including attorneys’ fees), judgments, fines, and amounts paid in settlement actually and reasonably incurred by such person in connection with such action, suit or proceeding if such person acted in good faith and in a manner such person reasonably believed to be in or not opposed to the best interests of the corporation, and, with respect to any criminal action or proceeding, had no reasonable cause to believe such person’s conduct was unlawful. The termination of any action, suit or proceeding by judgment, order, settlement, conviction or upon a plea of nolo contendere or its equivalent shall not, of itself, create a presumption that such person did not act in good faith and in a manner which such person reasonably believed to be in or not opposed to the best interests of the corporation, and, with respect to any criminal action or proceeding, had reasonable cause to believe that such person’s conduct was unlawful.
Section 145(b) of the DGCL grants each corporation organized thereunder the power to indemnify any person who was or is a party or is threatened to be made a party to any threatened, pending or completed action or suit by or in the right of the corporation to procure a judgment in its favor by reason of the fact that the person is or was a director, officer, employee or agent of the corporation, or is or was serving at the request of the corporation as a director, officer, employee or agent of another corporation, partnership, joint venture, trust or other enterprise, against expenses (including attorneys’ fees) actually and reasonably incurred by such person in connection with the defense or settlement of such action or suit if the person acted in good faith and in a manner the person reasonably believed to be in or not opposed to the best interests of the corporation and except that no indemnification shall be made in respect of any claim, issue or matter as to which such person shall have been adjudged to be liable to the corporation unless and only to the extent that the Delaware Court of Chancery or the court in which such action or suit was brought shall determine upon application that, despite the adjudication of liability but in view of all the circumstances of the case, such person is fairly and reasonably entitled to indemnity for such expenses which the Court of Chancery or such other court shall deem proper.
Section 102(b)(7) of the DGCL enables a corporation in its certificate of incorporation or an amendment thereto to eliminate or limit the personal liability of a director to the corporation or its stockholders of monetary
II-1
Confidential Treatment Requested by McAfee Corp.
Pursuant to 17 C.F.R. Section 200.83
damages for violations of the director’s fiduciary duty, except (i) for any breach of the director’s duty of loyalty to the corporation or its stockholders, (ii) for acts or omissions not in good faith or that involve intentional misconduct or a knowing violation of law, (iii) pursuant to Section 174 of the DGCL (providing for liability of directors for unlawful payment of dividends or unlawful stock purchases or redemptions), or (iv) for any transaction from which a director derived an improper personal benefit. Our certificate of incorporation includes a provision that eliminates the personal liability of directors for monetary damages for actions taken as a director to the fullest extent authorized by the DGCL.
We have also entered into indemnification agreements with our directors. Such agreements generally provide for indemnification by reason of being our director, as the case may be. These agreements are in addition to the indemnification provided by our certificate of incorporation and bylaws. Insofar as indemnification for liabilities arising under the Securities Act may be permitted to directors, we have been informed that in the opinion of the SEC such indemnification is against public policy and is therefore unenforceable.
The underwriting agreement provides that the underwriters are obligated, under certain circumstances, to indemnify our directors, officers, and controlling persons against certain liabilities, including liabilities under the Securities Act. Please see the form of underwriting agreement filed as Exhibit 1.1 hereto.
Our amended and restated bylaws indemnify the directors and officers to the full extent of the DGCL and also allow the board of directors to indemnify all other employees. Such right of indemnification is not exclusive of any right to which such officer or director may be entitled as a matter of law and shall extend and apply to the estates of deceased officers and directors. Section 145(f) of the DGCL further provides that a right to indemnification or to advancement of expenses arising under a provision of the bylaws shall not be eliminated or impaired by an amendment to such provision after the occurrence of the act or omission which is the subject of the civil, criminal, administrative or investigative action, suit or proceeding for which indemnification or advancement of expenses is sought.
We also maintain a directors’ and officers’ insurance policy. The policy insures directors and officers against unindemnified losses arising from certain wrongful acts in their capacities as directors and officers and reimburses us for those losses for which we have lawfully indemnified the directors and officers. The policy contains various exclusions that are normal and customary for policies of this type. Section 145(g) of the DGCL provides that a corporation shall have power to purchase and maintain insurance on behalf of any person who is or was a director or officer of the corporation, or is or was serving at the request of the corporation as a director or officer of another corporation, partnership, joint venture, trust, or other enterprise, against any liability asserted against such person and incurred by such person in any such capacity, or arising out of such person’s status as such, whether or not the corporation would have the power to indemnify such person against such liability under that section.
ITEM 15. RECENT SALES OF UNREGISTERED SECURITIES
In connection with the Sponsor Acquisition, on April 3, 2017, Foundation Technology Worldwide LLC issued and sold in the aggregate 11,600,000,000 Class A Units to our Sponsors and Intel for aggregate consideration of $2,900,000,000 without registration in reliance on the exemption afforded by Section 4(a)(2) of the Securities Act and Rule 506 promulgated thereunder. On April 3, 2017, 2,800,000,000 Class A Units held by our Sponsors were redeemed in exchange for $700,000,000 of redemption units of Foundation Technology Worldwide LLC. The remaining 8,800,000,000 Class A Units were subsequently reduced to 367,800,000 pursuant to a reverse split of Class A Units. On September 29, 2017, the $700,000,000 of redemption units were redeemed in full and retired for $700,000,000.
Between April 3, 2017 and our IPO, Foundation Technology Worldwide LLC has issued 7,243,692 Class A Units to our employees at an average purchase price of $9.55. These securities were issued without registration in reliance on the exemptions afforded by Section 4(a)(2) of the Securities Act and Rule 701 promulgated thereunder.
II-2
Confidential Treatment Requested by McAfee Corp.
Pursuant to 17 C.F.R. Section 200.83
On September 27, 2020, McAfee Corp. issued 100 shares of common stock to Foundation Technology Worldwide LLC at par value pursuant to Section 4(a)(2) of the Securities Act. The issuance was exempt from registration as a transaction by an issuer not involving any public offering. These shares were redeemed in connection with the Reorganization Transactions.
ITEM 16. EXHIBITS AND FINANCIAL STATEMENT SCHEDULES
(a) Exhibit Index
See the Exhibit Index immediately preceding the signature page hereto for a list of exhibits filed as part of this registration statement on Form
S-1,
which Exhibit Index is incorporated herein by reference.(b) Financial statement schedules
Schedules not listed above have been omitted because the information required to be set forth therein is not applicable or is shown in the financial statements or notes thereto.
ITEM 17. UNDERTAKINGS
The undersigned Registrant hereby undertakes:
(1) That for purposes of determining any liability under the Securities Act of 1933, the information omitted from the form of prospectus filed as part of this registration statement in reliance upon Rule 430A and contained in a form of prospectus filed by the Registrant pursuant to Rule 424(b)(1) or (4) or 497(h) under the Securities Act of 1933 shall be deemed to be part of this registration statement as of the time it was declared effective.
(2) That for the purpose of determining any liability under the Securities Act of 1933, each post-effective amendment that contains a form of prospectus shall be deemed to be a new registration statement relating to the securities offered therein, and the offering of such securities at that time shall be deemed to be the initial bona fide offering thereof.
II-3
Confidential Treatment Requested by McAfee Corp.
Pursuant to 17 C.F.R. Section 200.83
Exhibit Index
II-4
Confidential Treatment Requested by McAfee Corp.
Pursuant to 17 C.F.R. Section 200.83
II-5
Confidential Treatment Requested by McAfee Corp.
Pursuant to 17 C.F.R. Section 200.83
II-6
Confidential Treatment Requested by McAfee Corp.
Pursuant to 17 C.F.R. Section 200.83
Exhibit Number | Exhibit Description | Incorporated by Reference | ||||||||||||||||
Form | File No. | Exhibit | Filing Date | |||||||||||||||
| 10.37+ | Form of Subscription Agreement | S-1/A | 333-249101 | 10.35 | 10/8/2020 | |||||||||||||
| 10.38+ | Form of Indemnification Agreement | S-1/A | 333-249101 | 10.36 | 10/13/2020 | |||||||||||||
| 10.39+ | McAfee Non-Employee Director Compensation Policy | S-1/A | 333-249101 | 10.37 | 10/8/2020 | |||||||||||||
| 10.40+ | Form of Equity Adjustment Agreement for Senior Management | S-1/A | 333-249101 | 10.38 | 10/8/2020 | |||||||||||||
| 21.1 | List of Subsidiaries of McAfee Corp. | 10-K | 001-39651 | 21.1 | 03/01/2021 | |||||||||||||
| 23.1* | Consent of Independent Registered Public Accounting Firm, PricewaterhouseCoopers LLP | |||||||||||||||||
| 23.2* | Consent of Ropes & Gray LLP (included in Exhibit 5.1) | |||||||||||||||||
| 24.1* | Power of Attorney (included in the signature pages to this Registration Statement) | |||||||||||||||||
| 101.INS* | XBRL Instance Document |
| 101.SCH* | XBRL Taxonomy Extension Schema Document |
| 101.CAL* | XBRL Taxonomy Extension Calculation Linkbase Document |
| 101.DEF* | XBRL Taxonomy Extension Definition Linkbase Document |
| 101.LAB* | XBRL Taxonomy Extension Label Linkbase Document |
| 101.PRE* | XBRL Taxonomy Extension Presentation Linkbase Document |
| + | Indicates management contract or compensatory plan or arrangement. |
| * | Filed herewith. |
II-7
Confidential Treatment Requested by McAfee Corp.
Pursuant to 17 C.F.R. Section 200.83
SIGNATURES
Pursuant to the requirements of the Securities Act of 1933, the registrant has duly caused this registration statement to be signed on its behalf by the undersigned, thereunto duly authorized, in the city of San Jose, State of California, on September 7, 2021.
MCAFEE CORP. | ||
| By: | /s/ Peter Leav | |
Name: Title: | Peter Leav President and Chief Executive Officer | |
* * *
KNOW ALL PERSONS BY THESE PRESENTS, that each person whose signature appears below constitutes and appoints each of Peter Leav, Venkat Bhamidipati and Sayed Darwish as his or her true andagent, with full power of substitution and resubstitution, for him or her and in his or her name, place and stead, in any and all capacities, to sign this registration statement. and any or all amendments (including post-effective amendments) or supplements thereto and any new registration statement with respect to the offering contemplated thereby filed pursuant to Rule 462(b) of the Securities Act of 1933, as amended, and to file the same, with all exhibits thereto, and other documents in connection therewith, with the Securities and Exchange Commission, granting untoagents full power and authority to do and perform each and every act and thing requisite or necessary to be done in and about the premises hereby ratifying and confirming all theagent, or his or her substitute or substitutes, may lawfully do or cause to be done by virtue hereof.
lawful attorney-in-fact and
said attorneys-in-fact and
said attorney-in-fact and
Pursuant to the requirements of the Securities Act of 1933, as amended, this registration statement has been signed by the following persons in the capacities and on the dates indicated.
Signature | Title | Date | ||
/s/ Peter Leav Peter Leav | President, Chief Executive Officer, and Director (Principal Executive Officer) | September 7, 2021 | ||
/s/ Venkat Bhamidipati Venkat Bhamidipati | Executive Vice President and Chief Financial Officer (Principal Financial Officer) | September 7, 2021 | ||
/s/ Christine Kornegay Christine Kornegay | Vice President and Chief Accounting Officer (Principal Accounting Officer) | September 7, 2021 | ||
/s/ Sohaib Abbasi Sohaib Abbasi | Director | September 7, 2021 | ||
/s/ Mary Cranston Mary Cranston | Director | September 7, 2021 | ||
/s/ Tim Millikin Tim Millikin | Director | September 7, 2021 | ||
/s/ Jon Winkelried Jon Winkelried | Director | September 7, 2021 | ||
II-8
Confidential Treatment Requested by McAfee Corp.
Pursuant to 17 C.F.R. Section 200.83
Signature | Title | Date | ||
/s/ Kathy Willard Kathy Willard | Director | September 7, 2021 | ||
/s/ Jeff Woolard Jeff Woolard | Director | September 7, 2021 | ||
II-9