Exhibit 99.1

1 November 2019 Investor Presentation
2 Safe Harbor During the course of this presentation the Company will be making forward - looking statements (as such term is defined in the Private Securities Litigation Reform Act of 1995 ) that are based on our current expectations, beliefs and assumptions about the industry and markets in which US Ecology, Inc . and its subsidiaries operate . Statements in this communication that are not historical facts are forward - looking statements that reflect US Ecology’s and NRCG’s respective management’s current expectations, assumptions and estimates of future performance and economic conditions . These forward - looking statements are made in reliance on the safe harbor provisions of Section 27 A of the Securities Act of 1933 and Section 21 E of the Securities Exchange Act of 1934 . These forward - looking statements relate to, among other things, the anticipated closing of the proposed transaction, the satisfaction of closing conditions to the transaction, the expected benefits of the proposed merger, including estimated synergies, estimates and projections concerning the business and operations, strategic initiatives and value creation plans of the combined companies, the ownership structure of the combined company and the refinancing of NRCG’s existing indebtedness . All statements other than historical facts may be forward - looking statements ; words such as “anticipate,” “believe,” “could,” “design,” “estimate,” “expect,” “forecast,” “goal,” “guidance,” “imply,” “intend,” “may”, “objective,” “opportunity,” “outlook,” “plan,” “position,” “potential,” “predict,” “project,” “prospective,” “pursue,” “seek,” “should,” “strategy,” “target,” “would,” “will” or other similar expressions that convey the uncertainty of future events or outcomes are used to identify forward - looking statements . Such forward - looking statements are not guarantees of future performance and are subject to risks, uncertainties and other factors, some of which are beyond the control of US Ecology or NRCG . Factors that could cause US Ecology’s or NRCG’s actual results to differ materially from those implied in the forward - looking statements include : ( 1 ) the risk that the conditions to the closing of the transaction are not satisfied ( 2 ) the occurrence of any event, change or other circumstances that either could give rise to the right of one or both of NRCG or US Ecology to terminate the Merger Agreement ; ( 3 ) litigation relating to the transaction ; ( 4 ) uncertainties as to the timing of the consummation of the transaction and the ability of each party to consummate the transaction ; ( 5 ) risks related to disruption of management time from ongoing business operations due to the proposed transaction ; ( 6 ) unexpected costs, charges or expenses resulting from the transaction ; ( 7 ) the ability of NRCG and US Ecology to retain and hire key personnel ; ( 8 ) competitive responses to the proposed transaction and the impact of competitive services ; ( 9 ) certain restrictions during the pendency of the mergers that may impact NRCG’s or US Ecology’s ability to pursue certain business opportunities or strategic transaction ; ( 10 ) the terms and availability of the indebtedness planned to be incurred in connection with the transaction to refinance NRCG’s existing indebtedness ; ( 11 ) potential adverse changes to business relationships resulting from the announcement or completion of the transaction ; ( 12 ) the combined companies’ ability to achieve the growth prospects and synergies expected from the transaction, as well as delays, challenges and expenses associated with integrating the combined companies’ existing businesses ; and ( 13 ) legislative, regulatory and economic developments, including changing business conditions in the industries in which NRCG and US Ecology operate . These risks, as well as other risks associated with the proposed transaction, are more fully described in the joint proxy statement/prospectus that was filed with the Securities and Exchange Commission (“SEC”) by US Ecology Parent on September 19 , 2019 , in connection with the proposed transaction . Investors and potential investors are urged not to place undue reliance on forward - looking statements in this communication, which speak only as of the date made . Neither US Ecology nor NRCG undertakes any obligation to revise or update publicly any forward - looking statement to reflect future events or circumstances . Nothing contained herein constitutes or will be deemed to constitute a forecast, projection or estimate of the future financial performance of US Ecology, NRCG or the combined company, whether following the implementation of the proposed transaction or otherwise . In addition, actual results are subject to other risks and uncertainties that relate more broadly to US Ecology’s and NRCG’s overall business, including those more fully described in US Ecology’s and NRCG’s filings with the SEC .
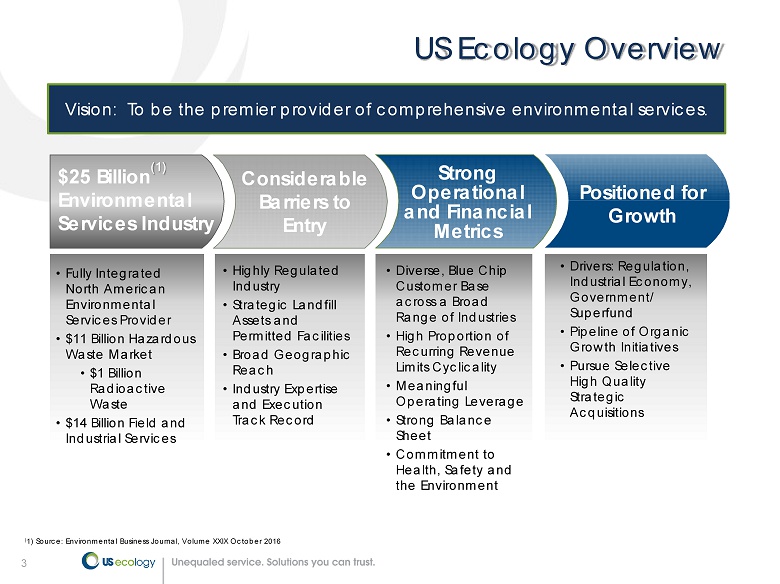
3 US Ecology Overview Vision: To be the premier provider of comprehensive environmental services. • Fully Integrated North American Environmental Services Provider • $11 Billion Hazardous Waste Market • $1 Billion Radioactive Waste • $14 Billion Field and Industrial Services • Highly Regulated Industry • Strategic Landfill Assets and Permitted Facilities • Broad Geographic Reach • Industry Expertise and Execution Track Record • Diverse, Blue Chip Customer Base across a Broad Range of Industries • High Proportion of Recurring Revenue Limits Cyclicality • Meaningful Operating Leverage • Strong Balance Sheet • Commitment to Health, Safety and the Environment • Drivers: Regulation, Industrial Economy, Government/ Superfund • Pipeline of Organic Growth Initiatives • Pursue Selective High Quality Strategic Acquisitions $25 Billion (1) Environmental Services Industry Considerable Barriers to Entry Positioned for Growth Strong Operational and Financial Metrics ( 1) Source: Environmental Business Journal, Volume XXIX October 2016

4 1952 US Ecology has six decades of experience, adding new sites and expanding its unique and comprehensive mix of environmental services 4 2019 History and Growth Stablex facility acquired Grand View, ID facility acquired 2001 2008 Thermal recycling services opened 1984 1965 Founded as Nuclear Engineering Company America’s second LLRW disposal facility ( Richland, WA) opened 1968 First hazardous waste services facility opened (Sheffield, IL) 1962 America’s first licensed LLRW disposal facility (Beatty, NV) 1973 Opened Robstown, TX hazardous waste disposal cells 2007 2005 Changed name to US Ecology, Inc. 2010 American Ecology Corp. IPO 1970 Opened Beatty, NV hazardous waste disposal cells 1975 1976 The Resource Conservation & Recovery Act (RCRA) and Toxic Substances Control Act (TSCA) was passed Upgraded infrastructure at Texas, Nevada and Idaho; Added rail fleet 2012 Dynecol Acquired 2014 EQ Acquired; US Ecology is nationwide; Field & Industrial Services added 2018 Acquired facilities: Tilbury, ON Vernon, CA Divested Allstate PowerVac 2015 ES&H Dallas and Midland Acquired; Emergency & Spill Response Services added 2016 Ecoserv Industrial Disposal LLC Acquired Merger with NRCG
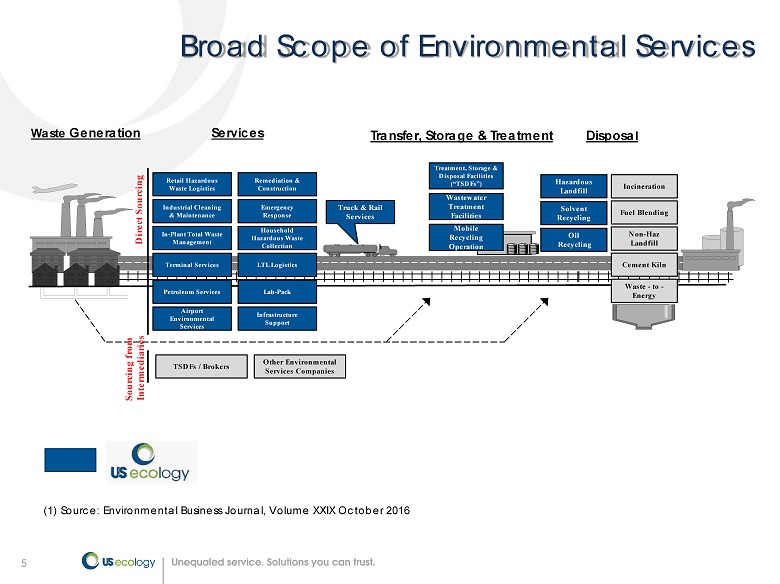
5 Broad Scope of Environmental Services Retail Hazardous Waste Logistics Industrial Cleaning & Maintenance In - Plant Total Waste Management Terminal Services Petroleum Services Airport Environmental Services Remediation & Construction Emergency Response Household Hazardous Waste Collection Lab - Pack TSDFs / Brokers Other Environmental Services Companies Truck & Rail Services Treatment, Storage & Disposal Facilities (“TSDFs”) Wastewater Treatment Facilities Mobile Recycling Operation Hazardous Landfill Solvent Recycling Oil Recycling Incineration Fuel Blending Non - Haz Landfill Cement Kiln Waste - to - Energy Sourcing from Intermediaries Direct Sourcing Waste Generation Services Transfer, Storage & Treatment Disposa l Infrastructure Support LTL Logistics (1) Source: Environmental Business Journal, Volume XXIX October 2016
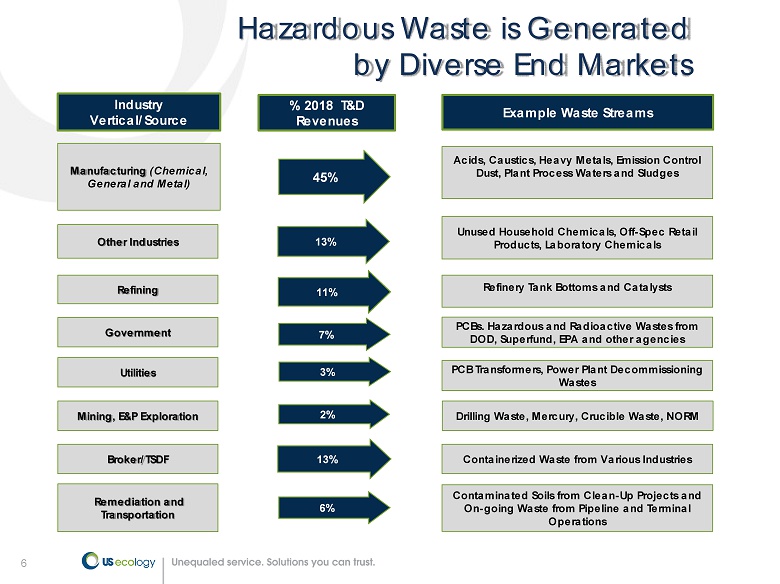
6 Hazardous Waste is Generated by Diverse End Markets Acids, Caustics, Heavy Metals, Emission Control Dust, Plant Process Waters and Sludges Industry Vertical/Source Example Waste Streams Drilling Waste, Mercury, Crucible Waste, NORM Refinery Tank Bottoms and Catalysts Unused Household Chemicals, Off - Spec Retail Products, Laboratory Chemicals PCB Transformers, Power Plant Decommissioning Wastes PCBs. Hazardous and Radioactive Wastes from DOD, Superfund, EPA and other agencies Manufacturing (Chemical, General and Metal) % 2018 T&D Revenues 45% 7% 3% 11% Other Industries 13% 2% Containerized Waste from Various Industries 13% Contaminated Soils from Clean - Up Projects and On - going Waste from Pipeline and Terminal Operations Remediation and Transportation 6% Refining Government Utilities Mining, E&P Exploration Broker/TSDF

7 US Ecology Focuses on the Most Complex Waste Streams Waste Stream Pricing Continuum Price per Ton MSW LLRW Refinery Sludges / Catalysts Hazardous Containerized Fission Products / SNM Hazardous Debris NORM PCB / Hazardous Solids High Low Volume Low High Non Haz / State Regulated TENORM Heavy Metals High Level Radium 7
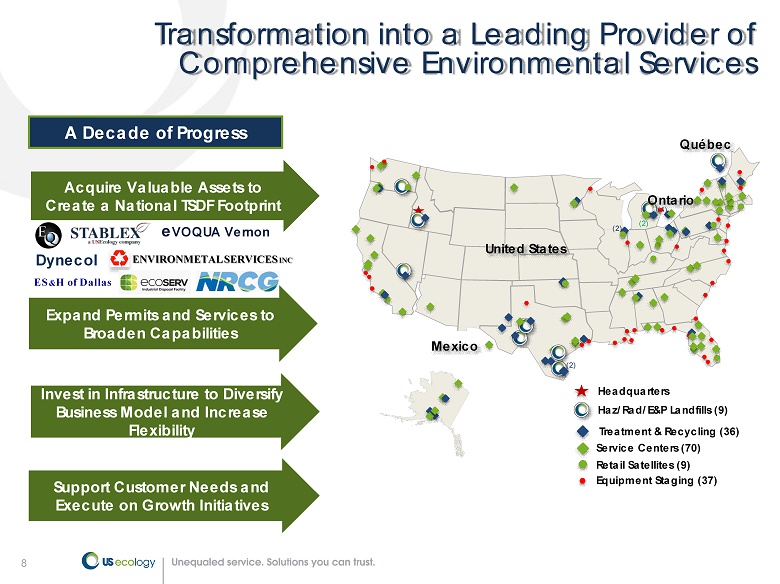
8 Acquire Valuable Assets to Create a National TSDF Footprint Expand Permits and Services to Broaden Capabilities Invest in Infrastructure to Diversify Business Model and Increase Flexibility Support Customer Needs and Execute on Growth Initiatives Transformation into a Leading Provider of Comprehensive Environmental Services Dynecol ENVIRONMETAL SERVICES INC e VOQUA Vernon A Decade of Progress ES & H of Dallas (4) Mexico Québec (2) (2) United States (2) Ontario Equipment Staging (37) Haz/Rad/E&P Landfills (9) Treatment & Recycling (36) Service Centers (70) Headquarters Retail Satellites (9)
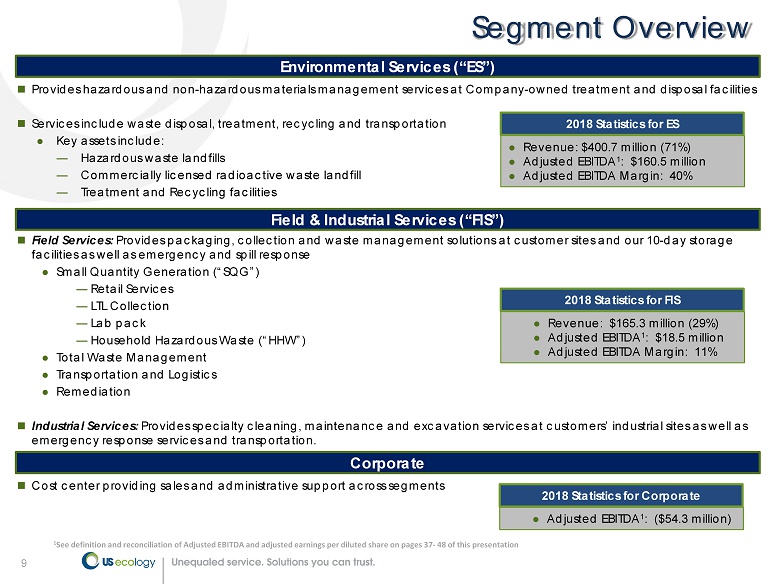
9 Provides hazardous and non - hazardous materials management services at Company - owned treatment and disposal facilities Services include waste disposal, treatment, recycling and transportation Key assets include: ― Hazardous waste landfills ― Commercially licensed radioactive waste landfill ― Treatment and Recycling facilities 9 Field Services: Provides packaging, collection and waste management solutions at customer sites and our 10 - day storage facilities as well as emergency and spill response Small Quantity Generation (“SQG”) ― Retail Services ― LTL Collection ― Lab pack ― Household Hazardous Waste (“HHW”) Total Waste Management Transportation and Logistics Remediation Industrial Services: Provides specialty cleaning, maintenance and excavation services at customers’ industrial sites as well as emergency response services and transportation. Cost center providing sales and administrative support across segments Segment Overview 1 See definition and reconciliation of Adjusted EBITDA and adjusted earnings per diluted share on pages 37 - 48 of this presentation Revenue: $400.7 million (71%) Adjusted EBITDA 1 : $160.5 million Adjusted EBITDA Margin: 40% Environmental Services (“ES”) Field & Industrial Services (“FIS”) Corporate 2018 Statistics for ES Revenue: $165.3 million (29%) Adjusted EBITDA 1 : $18.5 million Adjusted EBITDA Margin: 11% 2018 Statistics for FIS Adjusted EBITDA 1 : ($54.3 million) 2018 Statistics for Corporate
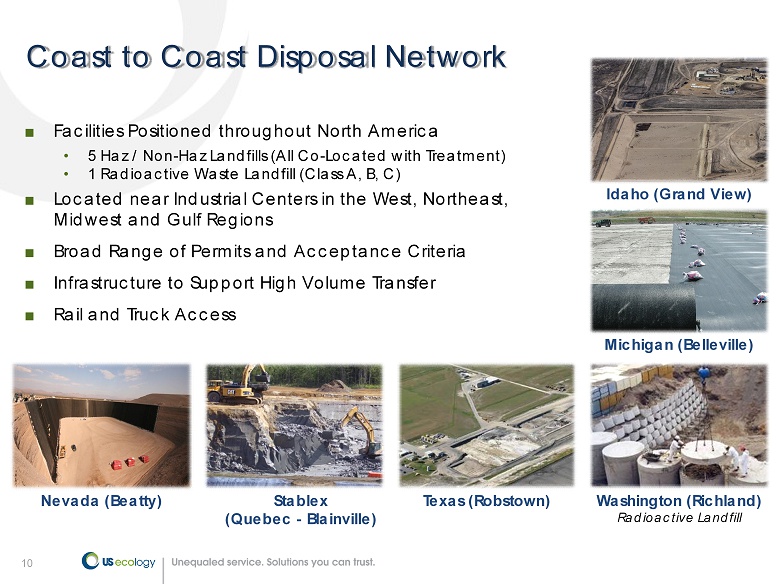
10 Coast to Coast Disposal Network ■ Facilities Positioned throughout North America • 5 Haz / Non - Haz Landfills (All Co - Located with Treatment) • 1 Radioactive Waste Landfill (Class A, B, C) ■ Located near Industrial Centers in the West, Northeast, Midwest and Gulf Regions ■ Broad Range of Permits and Acceptance Criteria ■ Infrastructure to Support High Volume Transfer ■ Rail and Truck Access Idaho (Grand View) Washington (Richland) Radioactive Landfill Michigan (Belleville) Nevada (Beatty) Texas (Robstown) Stablex (Quebec - Blainville)
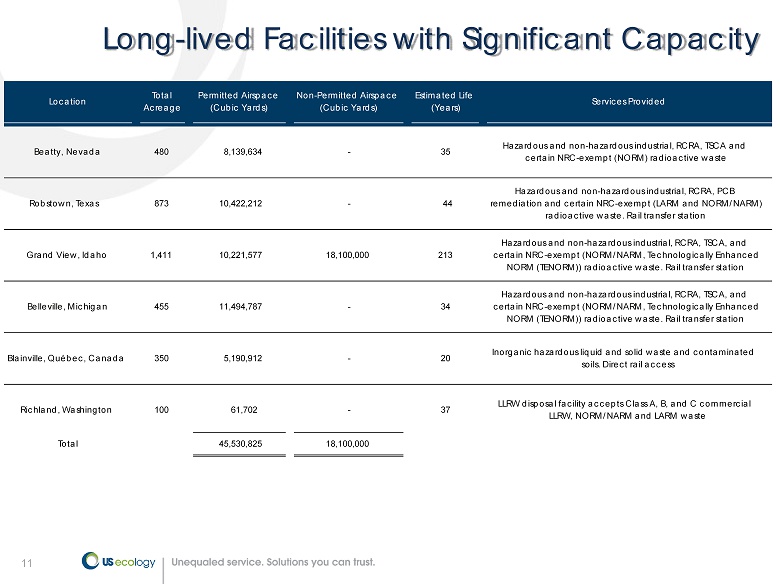
11 Long - lived Facilities with Significant Capacity Location Total Acreage Permitted Airspace (Cubic Yards) Non - Permitted Airspace (Cubic Yards) Estimated Life (Years) Services Provided Beatty, Nevada 480 8,139,634 - 35 Hazardous and non - hazardous industrial, RCRA, TSCA and certain NRC - exempt (NORM) radioactive waste Robstown, Texas 873 10,422,212 - 44 Hazardous and non - hazardous industrial, RCRA, PCB remediation and certain NRC - exempt (LARM and NORM/NARM) radioactive waste. Rail transfer station Grand View, Idaho 1,411 10,221,577 18,100,000 213 Hazardous and non - hazardous industrial, RCRA, TSCA, and certain NRC - exempt (NORM/NARM, Technologically Enhanced NORM (TENORM)) radioactive waste. Rail transfer station Belleville, Michigan 455 11,494,787 - 34 Hazardous and non - hazardous industrial, RCRA, TSCA, and certain NRC - exempt (NORM/NARM, Technologically Enhanced NORM (TENORM)) radioactive waste. Rail transfer station Blainville, Québec, Canada 350 5 ,190,912 - 20 Inorganic hazardous liquid and solid waste and contaminated soils. Direct rail access Richland, Washington 100 61,702 - 37 LLRW disposal facility accepts Class A, B, and C commercial LLRW, NORM/NARM and LARM waste Total 45,530,825 18,100,000
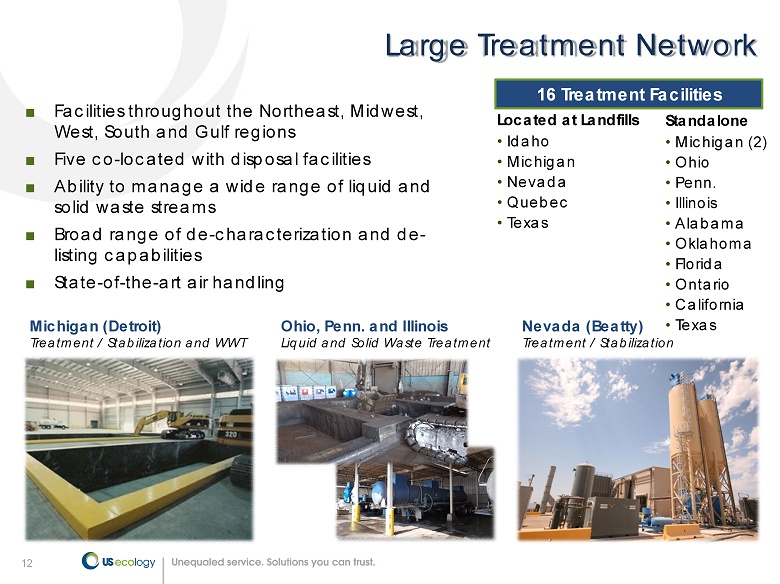
12 Large Treatment Network ■ Facilities throughout the Northeast, Midwest, West, South and Gulf regions ■ Five co - located with disposal facilities ■ Ability to manage a wide range of liquid and solid waste streams ■ Broad range of de - characterization and de - listing capabilities ■ State - of - the - art air handling 16 Treatment Facilities Located at Landfills • Idaho • Michigan • Nevada • Quebec • Texas Standalone • Michigan (2) • Ohio • Penn. • Illinois • Alabama • Oklahoma • Florida • Ontario • California • Texas Michigan (Detroit) Treatment / Stabilization and WWT Ohio, Penn. and Illinois Liquid and Solid Waste Treatment Nevada (Beatty) Treatment / Stabilization
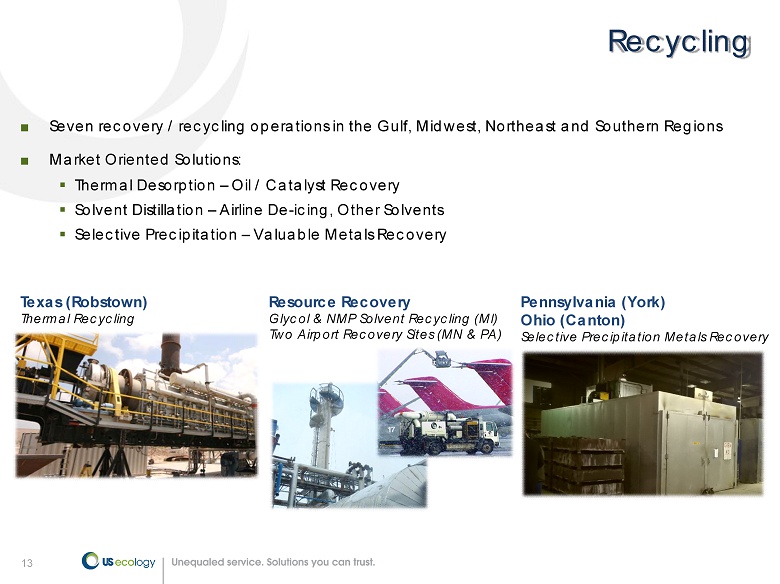
13 Recycling ■ Seven recovery / recycling operations in the Gulf, Midwest, Northeast and Southern Regions ■ Market Oriented Solutions: ▪ Thermal Desorption – Oil / Catalyst Recovery ▪ Solvent Distillation – Airline De - icing, Other Solvents ▪ Selective Precipitation – Valuable Metals Recovery Resource Recovery Glycol & NMP Solvent Recycling (MI) Two Airport Recovery Sites (MN & PA) Texas (Robstown) Thermal Recycling Pennsylvania (York) Ohio (Canton) Selective Precipitation Metals Recovery
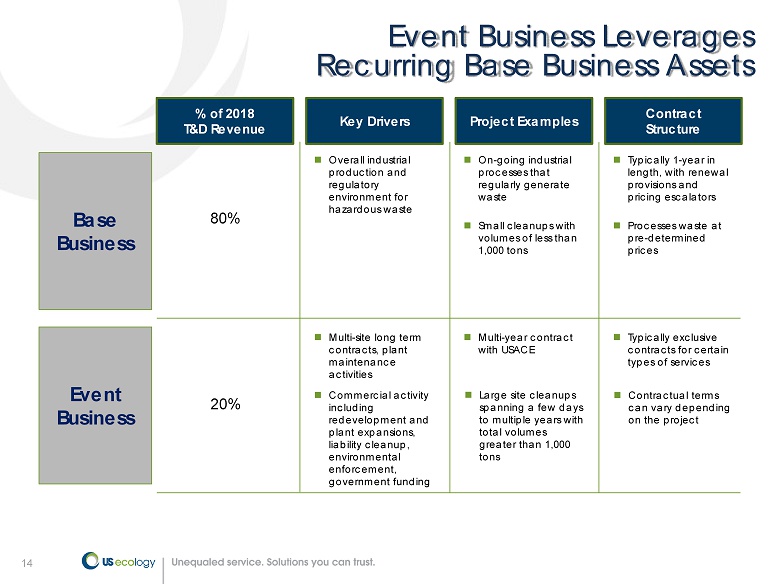
14 Event Business Leverages Recurring Base Business Assets Base Business % of 2018 T&D Revenue Key Drivers Project Examples Overall industrial production and regulatory environment for hazardous waste Multi - site long term contracts, plant maintenance activities Commercial activity including redevelopment and plant expansions, liability cleanup, environmental enforcement, government funding On - going industrial processes that regularly generate waste Multi - year contract with USACE Large site cleanups spanning a few days to multiple years with total volumes greater than 1,000 tons 80% 20% Contract Structure Typically 1 - year in length, with renewal provisions and pricing escalators Typically exclusive contracts for certain types of services Contractual terms can vary depending on the project Event Business Processes waste at pre - determined prices Small cleanups with volumes of less than 1,000 tons
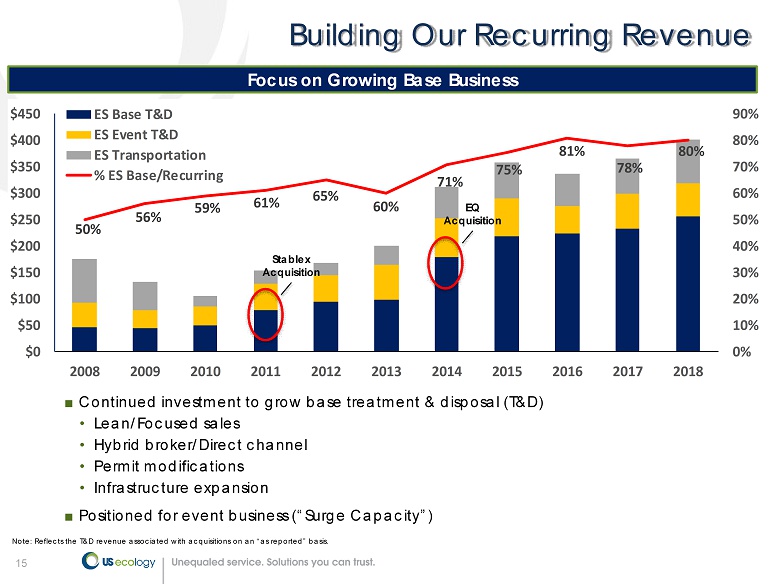
15 50% 56% 59% 61% 65% 60% 71% 75% 81% 78% 80% 0% 10% 20% 30% 40% 50% 60% 70% 80% 90% $0 $50 $100 $150 $200 $250 $300 $350 $400 $450 2008 2009 2010 2011 2012 2013 2014 2015 2016 2017 2018 ES Base T&D ES Event T&D ES Transportation % ES Base/Recurring Building Our Recurring Revenue Focus on Growing Base Business ■ Continued investment to grow base treatment & disposal (T&D) • Lean/Focused sales • Hybrid broker/Direct channel • Permit modifications • Infrastructure expansion ■ Positioned for event business (“Surge Capacity”) Note: Reflects the T&D revenue associated with acquisitions on an “as reported” basis. EQ Acquisition Stablex Acquisition

16 Comprehensive Offering of Field & Industrial Services Remediation Management of remedial construction projects from start to finish Retail End - to - end management of retail hazardous waste programs Transportation & Logistics Transport of waste from point of generation to ultimate disposal Lab Pack Small quantity chemical management services Total Waste Management Outsourced management, tracking and reporting all waste streams for generators LTL / HHW HHW collection and LTL container management Small Quantity Generator Services Other Field Services Emergency Response Services to respond to any spill, natural disaster or accident Field Services Industrial Services Marine & Terminal Services Industrial cleaning & maintenance for large petroleum & chemical distribution terminals Industrial Maintenance & Cleaning Wet & dry vacuuming, water blasting, paint system cleaning, pollution control, etc.
17 NRCG Acquisition
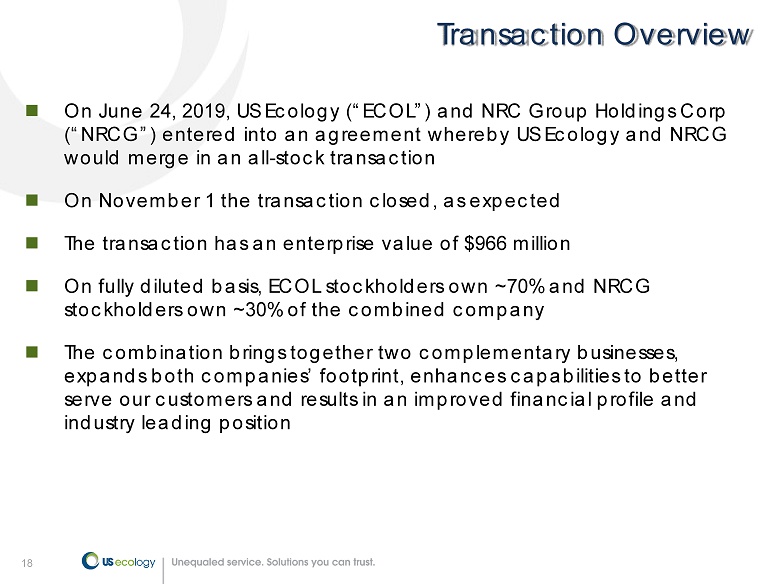
18 On June 24, 2019, US Ecology (“ECOL”) and NRC Group Holdings Corp (“NRCG”) entered into an agreement whereby US Ecology and NRCG would merge in an all - stock transaction On November 1 the transaction closed, as expected The transaction has an enterprise value of $966 million On fully diluted basis, ECOL stockholders own ~70% and NRCG stockholders own ~30% of the combined company The combination brings together two complementary businesses, expands both companies’ footprint, enhances capabilities to better serve our customers and results in an improved financial profile and industry leading position Transaction Overview
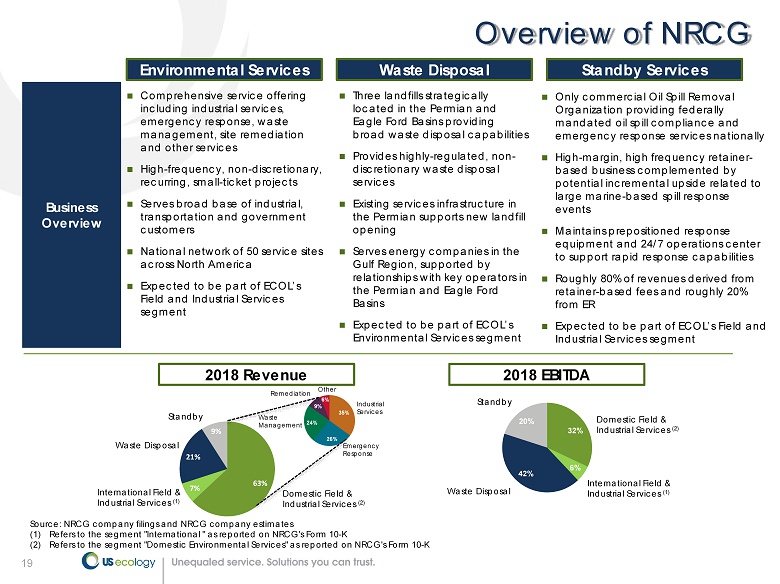
19 Source: NRCG company filings and NRCG company estimates (1) Refers to the segment "International " as reported on NRCG's Form 10 - K (2) Refers to the segment "Domestic Environmental Services" as reported on NRCG's Form 10 - K 35% 26% 24% 9% 6% Business Overview Comprehensive service offering including industrial services, emergency response, waste management, site remediation and other services High - frequency, non - discretionary, recurring, small - ticket projects Serves broad base of industrial, transportation and government customers National network of 50 service sites across North America Expected to be part of ECOL’s Field and Industrial Services segment Three landfills strategically located in the Permian and Eagle Ford Basins providing broad waste disposal capabilities Provides highly - regulated, non - discretionary waste disposal services Existing services infrastructure in the Permian supports new landfill opening Serves energy companies in the Gulf Region, supported by relationships with key operators in the Permian and Eagle Ford Basins Expected to be part of ECOL’s Environmental Services segment Only commercial Oil Spill Removal Organization providing federally mandated oil spill compliance and emergency response services nationally High - margin, high frequency retainer - based business complemented by potential incremental upside related to large marine - based spill response events Maintains prepositioned response equipment and 24/7 operations center to support rapid response capabilities Roughly 80% of revenues derived from retainer - based fees and roughly 20% from ER Expected to be part of ECOL’s Field and Industrial Services segment 32% 6% 42% 20% Standby Waste Disposal Domestic Field & Industrial Services (2) 63% 7% 21% 9% Waste Management Industrial Services Remediation Emergency Response Other International Field & Industrial Services (1) Waste Disposal Standby Domestic Field & Industrial Services (2) International Field & Industrial Services (1) Overview of NRCG Environmental Services Waste Disposal Standby Services 2018 Revenue 2018 EBITDA
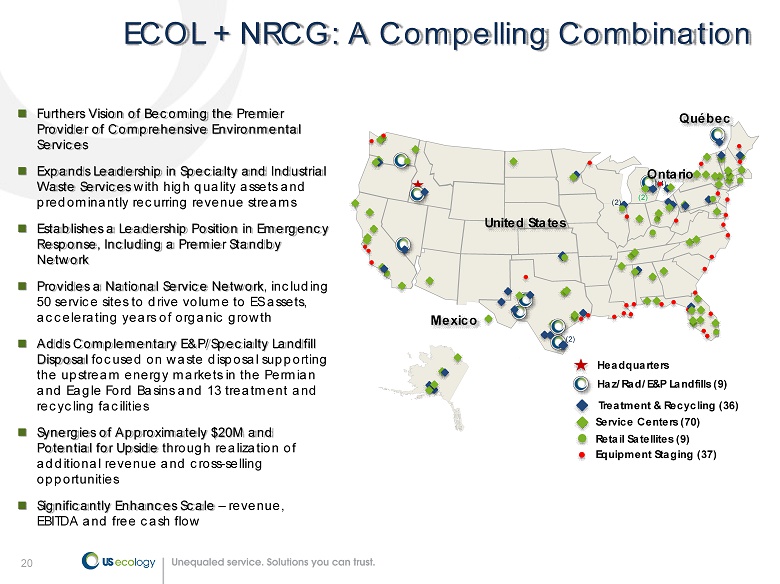
20 ECOL + NRCG: A Compelling Combination Furthers Vision of Becoming the Premier Provider of Comprehensive Environmental Services Expands Leadership in Specialty and Industrial Waste Services with high quality assets and predominantly recurring revenue streams Establishes a Leadership Position in Emergency Response, Including a Premier Standby Network Provides a National Service Network , including 50 service sites to drive volume to ES assets, accelerating years of organic growth Adds Complementary E&P/Specialty L andfill Disposal focused on waste disposal supporting the upstream energy markets in the Permian and Eagle Ford Basins and 13 treatment and recycling facilities Synergies of Approximately $20M and Potential for Upside through realization of additional revenue and cross - selling opportunities Significantly Enhances Scale – revenue, EBITDA and free cash flow (4) Mexico Québec (2) (2) United States (2) Ontario Equipment Staging (37) Haz/Rad/E&P Landfills (9) Treatment & Recycling (36) Service Centers (70) Headquarters Retail Satellites (9)
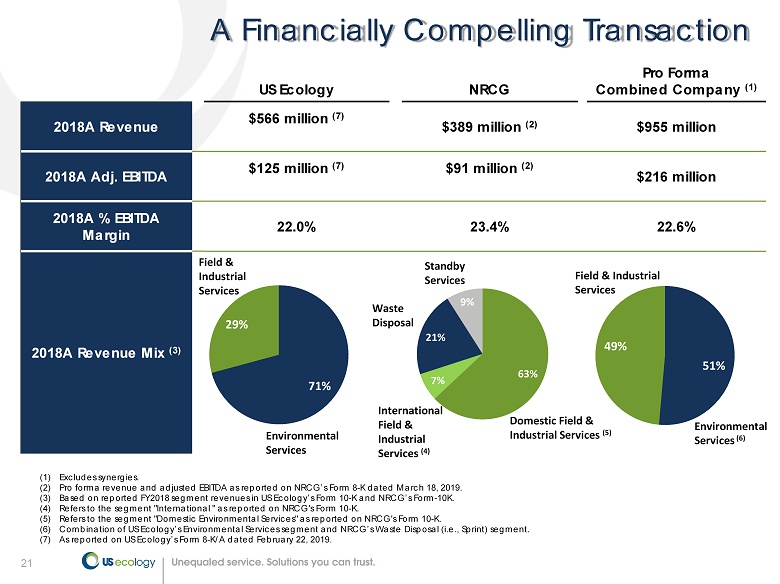
21 US Ecology NRCG Pro Forma Combined Company (1) 2018A Revenue $566 million (7) $389 million (2) $955 million 2018A Adj. EBITDA $125 million (7) $91 million (2) $216 million 2018A % EBITDA Margin 22.0% 23.4% 22.6% 2018A Revenue Mix (3) (1) Excludes synergies. (2) Pro forma revenue and adjusted EBITDA as reported on NRCG’s Form 8 - K dated March 18, 2019. (3) Based on reported FY2018 segment revenues in US Ecology’s Form 10 - K and NRCG’s Form - 10K. (4) Refers to the segment "International " as reported on NRCG's Form 10 - K. (5) Refers to the segment "Domestic Environmental Services" as reported on NRCG's Form 10 - K. (6) Combination of US Ecology’s Environmental Services segment and NRCG’s Waste Disposal (i.e., Sprint) segment. (7) As reported on US Ecology’s Form 8 - K/A dated February 22, 2019. 71% 29% 51% 49% Environmental Services Field & Industrial Services Field & Industrial Services Environmental Services (6) Waste Disposal Standby Services A Financially Compelling Transaction Domestic Field & Industrial Services (5) 63% 7% 21% 9% International Field & Industrial Services (4)
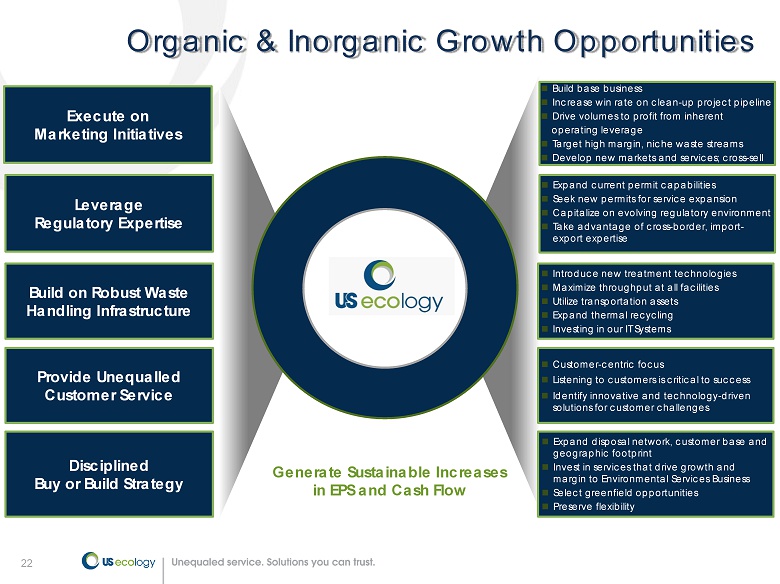
22 Organic & Inorganic Growth Opportunities Build on Robust Waste Handling Infrastructure Leverage Regulatory Expertise Provide Unequalled Customer Service Generate Sustainable Increases in EPS and Cash Flow Focus on High Value Waste Streams Build base business Increase win rate on clean - up project pipeline Drive volumes to profit from inherent operating leverage Target high margin, niche waste streams Develop new markets and services; cross - sell Expand current permit capabilities Seek new permits for service expansion Capitalize on evolving regulatory environment Take advantage of cross - border, import - export expertise Introduce new treatment technologies Maximize throughput at all facilities Utilize transportation assets Expand thermal recycling Investing in our IT Systems Customer - centric focus Listening to customers is critical to success Identify innovative and technology - driven solutions for customer challenges Disciplined Buy or Build Strategy Expand disposal network, customer base and geographic footprint Invest in services that drive growth and margin to Environmental Services Business Select greenfield opportunities Preserve flexibility Execute on Marketing Initiatives

23 Financial Overview
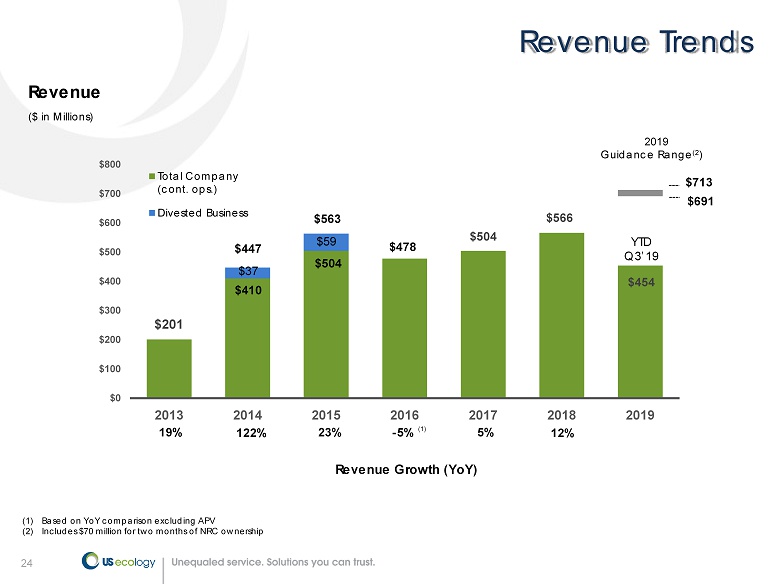
24 ($ in Millions) Revenue Growth (YoY) $201 $504 $566 $454 $0 $100 $200 $300 $400 $500 $600 $700 $800 2013 2014 2015 2016 2017 2018 2019 Total Company (cont. ops.) Divested Business Revenue 19% 122% 23% - 5% (1) Based on YoY comparison excluding APV (2) Includes $70 million for two months of NRC ownership Revenue Trends $410 $37 $504 $59 $478 $447 $563 2019 Guidance Range (2 ) $691 $713 5% (1) 12% YTD Q3’19
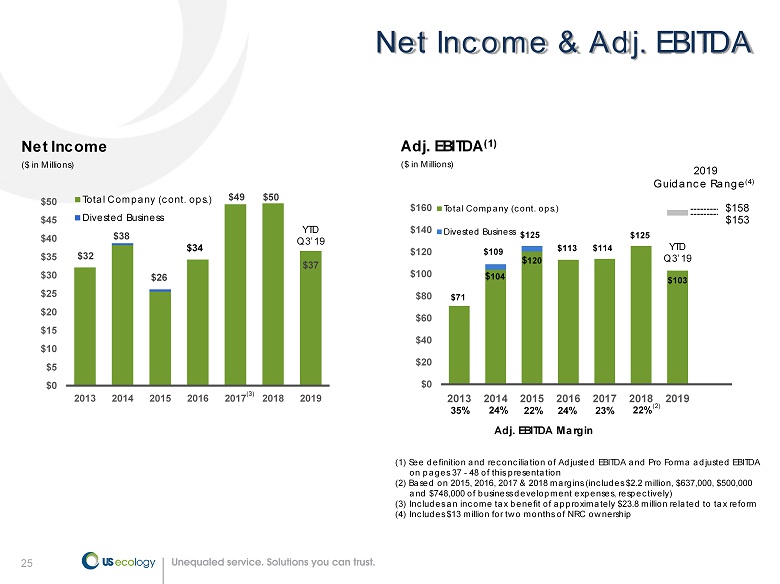
25 ($ in Millions) $32 $38 $26 $49 $50 $37 $0 $5 $10 $15 $20 $25 $30 $35 $40 $45 $50 2013 2014 2015 2016 2017 2018 2019 Total Company (cont. ops.) Divested Business Net Income Net Income & Adj. EBITDA (1) See definition and reconciliation of Adjusted EBITDA and Pro Forma adjusted EBITDA on pages 37 - 48 of this presentation (2) Based on 2015, 2016, 2017 & 2018 margins (includes $2.2 million, $637,000, $500,000 and $748,000 of business development expenses, respectively) (3) Includes an income tax benefit of approximately $23.8 million related to tax reform (4) Includes $13 million for two months of NRC ownership $71 $114 $125 $103 $0 $20 $40 $60 $80 $100 $120 $140 $160 2013 2014 2015 2016 2017 2018 2019 Total Company (cont. ops.) Divested Business $ 104 $ 120 ($ in Millions) Adj. EBITDA (1) 24% 22% 24% Adj. EBITDA Margin (2) 35% 2019 Guidance Range (4) $153 $34 $109 $125 (3) 23% $113 22% $158 YTD Q3’19 YTD Q3’19

26 Strong Free Cash Flow Cash on hand: $21.1 million Net Borrowing’s outstanding: $334.5 million Free Cash Flow (1) ($ in Millions) $28 $43 $32 $39 $45 $41 $36 $0 $5 $10 $15 $20 $25 $30 $35 $40 $45 $50 $55 $60 2013 2014 2015 2016 2017 2018 2019 $40 $45 2019 Guidance Range (2) Future growth and stable operations Attractive Dividend $0.72 - Yield ~ 1.1% Cash and Debt (as of 9/30/19 ) (1) Free cash flow is calculated as net cash provided by operating activities less purchases of property and equipment net of ins ura nce proceeds from damaged property and equipment. See reconciliation on page 42 and 49. (2) 2019 Guidance range of $40 million to $45 million excludes NRCG acquisition, Idaho facility rebuild capital expenditures, pro per ty insurance recoveries and business development expenses. YTD Q3’19
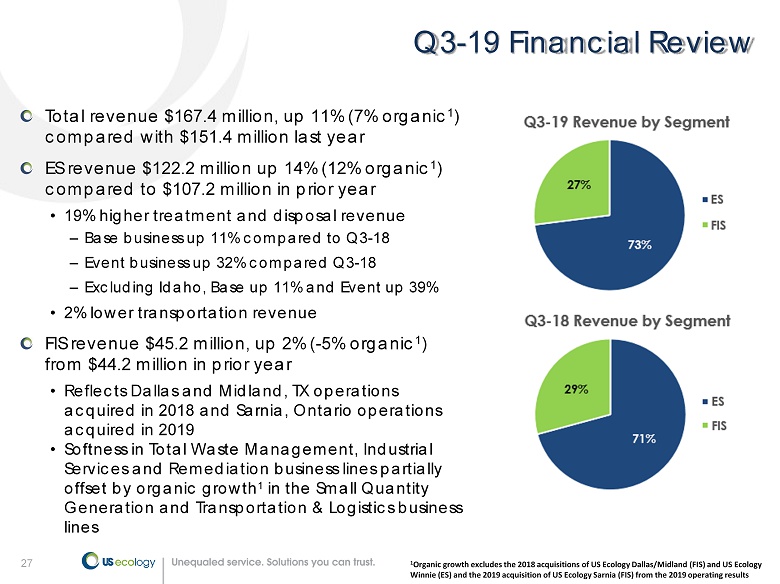
27 Q3 - 19 Financial Review Total revenue $167.4 million, up 11% (7% organic 1 ) compared with $151.4 million last year ES revenue $122.2 million up 14% (12% organic 1 ) compared to $107.2 million in prior year • 19% higher treatment and disposal revenue – Base business up 11% compared to Q3 - 18 – Event business up 32% compared Q3 - 18 – Excluding Idaho, Base up 11% and Event up 39% • 2 % lower transportation revenue FIS revenue $45.2 million , up 2 % ( - 5% organic 1 ) from $44.2 million in prior year • Reflects Dallas and Midland, TX operations acquired in 2018 and Sarnia, Ontario operations acquired in 2019 • Softness in Total Waste Management, Industrial Services and Remediation business lines partially offset by organic growth 1 in the Small Quantity Generation and Transportation & Logistics business lines 1 Organic growth excludes the 2018 acquisitions of US Ecology Dallas/Midland (FIS) and US Ecology Winnie (ES) and the 2019 acquisition of US Ecology Sarnia (FIS) from the 2019 operating results

28 Gross profit of $56.5 million , up 20% from $47.3 million in Q3 - 18 • ES gross profit of $49.4 million , up from $39.9 million in Q3 - 18 (includes $2.6 million in business interruption insurance proceeds) – T&D margin of 47% compared with 43% in Q3 - 18 • FIS gross profit of $7.2 million , compared to $7.4 million in Q3 - 18 – FIS margin of 16% compared with 17% in Q3 - 18 SG&A of $33.3 million compared with $23.6 million in Q3 - 18 • $4.0 million of business development expenses primarily associated with NRCG • Excluding business development, SG&A would have been up 24% as a result of higher labor and incentive compensation, increased property taxes and higher intangible asset amortization Operating income of $23.2 million , up 16% from $20.0 million in Q3 - 18 which includes $3.7 million goodwill and intangible asset impairment charge on the mobile solvent recycling business Net interest expense of $3.7 million , up from $3.0 million in Q3 - 18 • Higher borrowings in Q3 - 19 due to acquisitions in 2018 and 2019 Net income of $13.1 million , or $0.59 per diluted share, compared with $13.4 million , or $0.61 per diluted share, in Q3 - 18 Adjusted EPS 1 of $0.75 per diluted share compared with $0.71 per diluted share in Q3 - 18 Adjusted EBITDA 1 of $37.4 million , up 5% from $35.6 million in Q3 - 18; Pro Forma adjusted EBITDA 1 of $41.5 million, up 16% from $35.8 million in Q3 - 18 28 Q3 - 19 Financial Review 1 See definition and reconciliation of adjusted earnings per diluted share, adjusted EBITDA and Pro Forma adjusted EBITDA on pages 37 - 48 of this presentation or attached as Exhibit A to our earnings release filed with the SEC on Form 8 - K
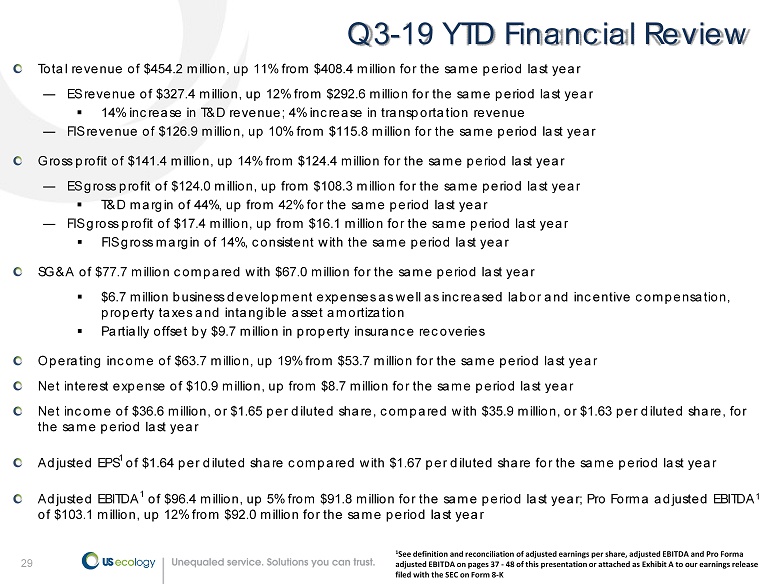
29 Total revenue of $454.2 million , up 11% from $408.4 million for the same period last year ― ES revenue of $327.4 million , up 12% from $292.6 million for the same period last year ▪ 14% increase in T&D revenue; 4% increase in transportation revenue ― FIS revenue of $126.9 million , up 10% from $115.8 million for the same period last year Gross profit of $141.4 million, up 14% from $124.4 million for the same period last year ― ES gross profit of $124.0 million, up from $108.3 million for the same period last year ▪ T&D margin of 44%, up from 42% for the same period last year ― FIS gross profit of $17.4 million, up from $16.1 million for the same period last year ▪ FIS gross margin of 14%, consistent with the same period last year SG&A of $77.7 million compared with $67.0 million for the same period last year ▪ $6.7 million business development expenses as well as increased labor and incentive compensation, property taxes and intangible asset amortization ▪ Partially offset by $9.7 million in property insurance recoveries Operating income of $63.7 million , up 19% from $53.7 million for the same period last year Net interest expense of $10.9 million , up from $8.7 million for the same period last year Net income of $36.6 million , or $1.65 per diluted share, compared with $35.9 million , or $1.63 per diluted share, for the same period last year Adjusted EPS 1 of $1.64 per diluted share compared with $1.67 per diluted share for the same period last year Adjusted EBITDA 1 of $96.4 million , up 5% from $91.8 million for the same period last year; Pro Forma adjusted EBITDA 1 of $103.1 million , up 12% from $92.0 million for the same period last year 29 Q3 - 19 YTD Financial Review 1 See definition and reconciliation of adjusted earnings per share, adjusted EBITDA and Pro Forma adjusted EBITDA on pages 37 - 48 of this presentation or attached as Exhibit A to our earnings release filed with the SEC on Form 8 - K
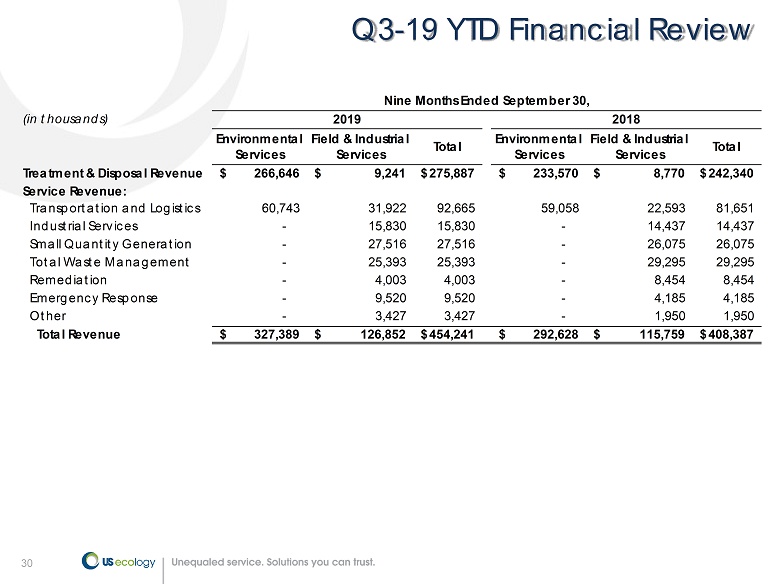
30 Q3 - 19 YTD Financial Review (in thousands) Environmental Services Field & Industrial Services Total Environmental Services Field & Industrial Services Total Treatment & Disposal Revenue 266,646$ 9,241$ 275,887$ 233,570$ 8,770$ 242,340$ Service Revenue: Transportation and Logistics 60,743 31,922 92,665 59,058 22,593 81,651 Industrial Services - 15,830 15,830 - 14,437 14,437 Small Quantity Generation - 27,516 27,516 - 26,075 26,075 Total Waste Management - 25,393 25,393 - 29,295 29,295 Remediation - 4,003 4,003 - 8,454 8,454 Emergency Response - 9,520 9,520 - 4,185 4,185 Other - 3,427 3,427 - 1,950 1,950 Total Revenue 327,389$ 126,852$ 454,241$ 292,628$ 115,759$ 408,387$ Nine Months Ended September 30, 2019 2018
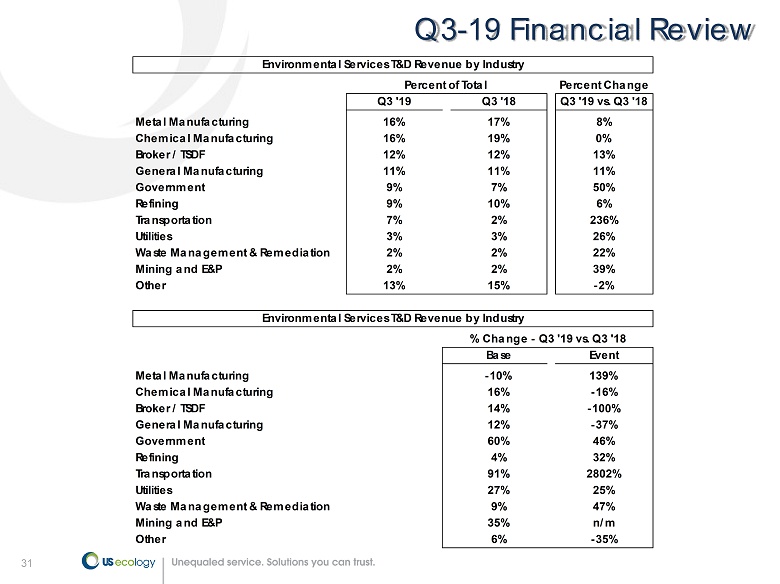
31 Q3 - 19 Financial Review Percent Change Q3 '19 Q3 '18 Q3 '19 vs. Q3 '18 Metal Manufacturing 16% 17% 8% Chemical Manufacturing 16% 19% 0% Broker / TSDF 12% 12% 13% General Manufacturing 11% 11% 11% Government 9% 7% 50% Refining 9% 10% 6% Transportation 7% 2% 236% Utilities 3% 3% 26% Waste Management & Remediation 2% 2% 22% Mining and E&P 2% 2% 39% Other 13% 15% -2% Base Event Metal Manufacturing -10% 139% Chemical Manufacturing 16% -16% Broker / TSDF 14% -100% General Manufacturing 12% -37% Government 60% 46% Refining 4% 32% Transportation 91% 2802% Utilities 27% 25% Waste Management & Remediation 9% 47% Mining and E&P 35% n/m Other 6% -35% Environmental Services T&D Revenue by Industry Percent of Total Environmental Services T&D Revenue by Industry % Change - Q3 '19 vs. Q3 '18
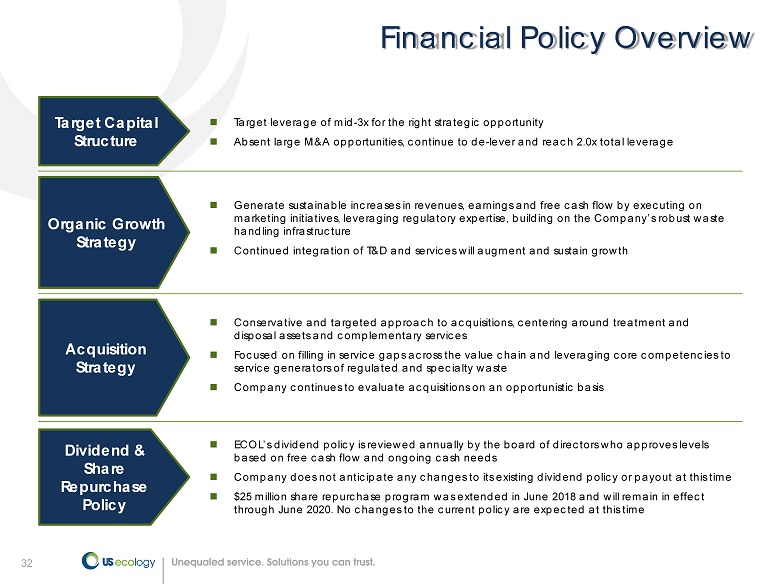
32 Financial Policy Overview Acquisition Strategy Conservative and targeted approach to acquisitions, centering around treatment and disposal assets and complementary services Focused on filling in service gaps across the value chain and leveraging core competencies to service generators of regulated and specialty waste Company continues to evaluate acquisitions on an opportunistic basis Organic Growth Strategy Generate sustainable increases in revenues, earnings and free cash flow by executing on marketing initiatives, leveraging regulatory expertise, building on the Company’s robust waste handling infrastructure Continued integration of T&D and services will augment and sustain growth Target Capital Structure Target leverage of mid - 3x for the right strategic opportunity Absent large M&A opportunities, continue to de - lever and reach 2.0x total leverage Dividend & Share Repurchase Policy ECOL’s dividend policy is reviewed annually by the board of directors who approves levels based on free cash flow and ongoing cash needs Company does not anticipate any changes to its existing dividend policy or payout at this time $25 million share repurchase program was extended in June 2018 and will remain in effect through June 2020. No changes to the current policy are expected at this time
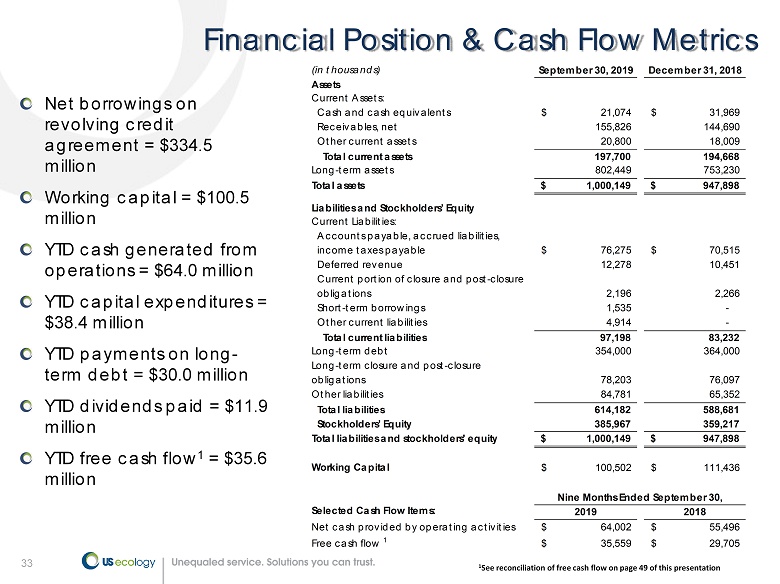
33 33 Financial Position & Cash Flow Metrics Net borrowings on revolving credit agreement = $334.5 million Working capital = $100.5 million YTD cash generated from operations = $64.0 million YTD capital expenditures = $38.4 million YTD payments on long - term debt = $30.0 million YTD dividends paid = $11.9 million YTD free cash flow 1 = $35.6 million 1 See reconciliation of free cash flow on page 49 of this presentation (in thousands) September 30, 2019 December 31, 2018 Assets Current Assets: Cash and cash equivalents 21,074$ 31,969$ Receivables, net 155,826 144,690 Other current assets 20,800 18,009 Total current assets 197,700 194,668 Long-term assets 802,449 753,230 Total assets 1,000,149$ 947,898$ Liabilities and Stockholders’ Equity Current Liabilities: Accounts payable, accrued liabilities, income taxes payable 76,275$ 70,515$ Deferred revenue 12,278 10,451 Current portion of closure and post-closure obligations 2,196 2,266 Short-term borrowings 1,535 - Other current liabilities 4,914 - Total current liabilities 97,198 83,232 Long-term debt 354,000 364,000 Long-term closure and post-closure obligations 78,203 76,097 Other liabilities 84,781 65,352 Total liabilities 614,182 588,681 Stockholders’ Equity 385,967 359,217 Total liabilities and stockholders' equity 1,000,149$ 947,898$ Working Capital 100,502$ 111,436$ Selected Cash Flow Items: 2019 2018 Net cash provided by operating activities 64,002$ 55,496$ Free cash flow 1 35,559$ 29,705$ Nine Months Ended September 30,
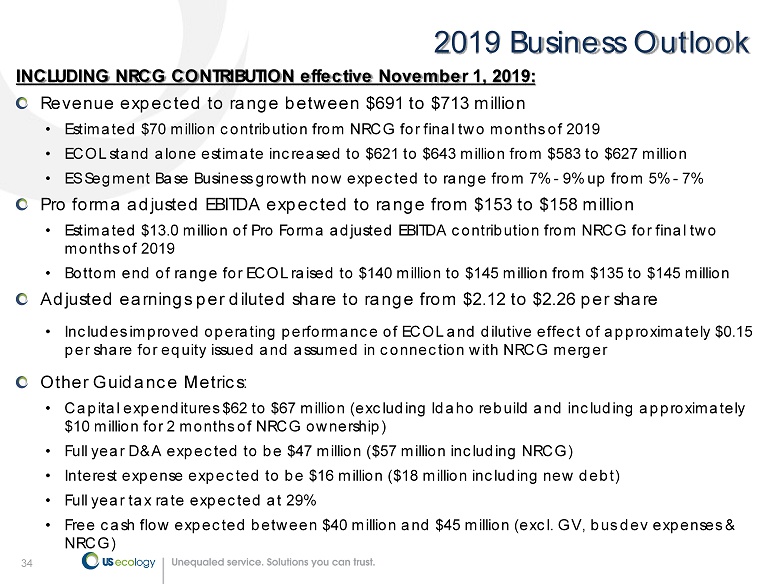
34 34 2019 Business Outlook INCLUDING NRCG CONTRIBUTION effective November 1, 2019: Revenue expected to range between $691 to $713 million • Estimated $70 million contribution from NRCG for final two months of 2019 • ECOL stand alone estimate increased to $621 to $643 million from $583 to $627 million • ES Segment Base Business growth now expected to range from 7% - 9% up from 5% - 7% Pro forma adjusted EBITDA expected to range from $153 to $158 million • Estimated $13.0 million of Pro Forma adjusted EBITDA contribution from NRCG for final two months of 2019 • Bottom end of range for ECOL raised to $140 million to $145 million from $135 to $145 million Adjusted earnings per diluted share to range from $2.12 to $2.26 per share • Includes improved operating performance of ECOL and dilutive effect of approximately $0.15 per share for equity issued and assumed in connection with NRCG merger Other Guidance Metrics: • Capital expenditures $62 to $67 million (excluding Idaho rebuild and including approximately $10 million for 2 months of NRCG ownership) • Full year D&A expected to be $47 million ($57 million including NRCG) • Interest expense expected to be $16 million ($18 million including new debt ) • Full year tax rate expected at 29% • Free cash flow expected between $40 million and $ 45 million (excl. GV, bus dev expenses & NRCG)
35 Experienced Management Team with Proven Ability to Execute Valuable Landfill Position within the Industry Broad Set of Blue Chip Customers from a Wide Range of Industries Strong Cash Flow Highly Strategic Assets and Broad Geographic Reach US Ecology Investment Highlights High Proportion of Recurring Revenue Limiting Cyclicality Highly Regulated Industry that Requires Expertise
36 Appendix
37 US Ecology reports adjusted EBITDA, Pro Forma adjusted EBITDA, adjusted earnings per diluted share and free cash flow results, which are non - GAAP financial measures, as a complement to results provided in accordance with generally accepted accounting principles in the United States (GAAP) and believes that such information provides analysts, stockholders, and other users information to better understand the Company’s operating performance . Because adjusted EBITDA, Pro Forma adjusted EBITDA, adjusted earnings per diluted share and free cash flow are not measurements determined in accordance with GAAP and are thus susceptible to varying calculations they may not be comparable to similar measures used by other companies . Items excluded from adjusted EBITDA, Pro Forma adjusted EBITDA, adjusted earnings per diluted share and free cash flow are significant components in understanding and assessing financial performance . Adjusted EBITDA, Pro Forma adjusted EBITDA, adjusted earnings per diluted share and free cash flow should not be considered in isolation or as an alternative to, or substitute for, net income, cash flows generated by operations, investing or financing activities, or other financial statement data presented in the consolidated financial statements as indicators of financial performance or liquidity . Adjusted EBITDA, Pro Forma adjusted EBITDA, adjusted earnings per diluted share and free cash flow have limitations as analytical tools and should not be considered in isolation or a substitute for analyzing our results as reported under GAAP . 37 Non - GAAP Financial Measures
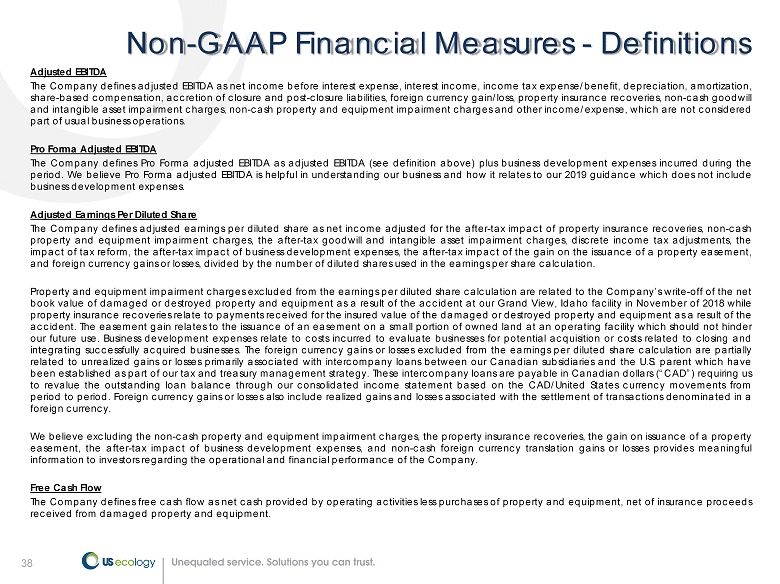
38 Adjusted EBITDA The Company defines adjusted EBITDA as net income before interest expense, interest income, income tax expense/benefit, depreciation, amortization, share - based compensation, accretion of closure and post - closure liabilities, foreign currency gain/loss, property insurance recoveries, non - cash goodwill and intangible asset impairment charges, non - cash property and equipment impairment charges and other income/expense, which are not considered part of usual business operations . Pro Forma Adjusted EBITDA The Company defines Pro Forma adjusted EBITDA as adjusted EBITDA (see definition above) plus business development expenses incurred during the period . We believe Pro Forma adjusted EBITDA is helpful in understanding our business and how it relates to our 2019 guidance which does not include business development expenses . Adjusted Earnings Per Diluted Share The Company defines adjusted earnings per diluted share as net income adjusted for the after - tax impact of property insurance recoveries, non - cash property and equipment impairment charges, the after - tax goodwill and intangible asset impairment charges, discrete income tax adjustments, the impact of tax reform, the after - tax impact of business development expenses, the after - tax impact of the gain on the issuance of a property easement, and foreign currency gains or losses, divided by the number of diluted shares used in the earnings per share calculation . Property and equipment impairment charges excluded from the earnings per diluted share calculation are related to the Company’s write - off of the net book value of damaged or destroyed property and equipment as a result of the accident at our Grand View, Idaho facility in November of 2018 while property insurance recoveries relate to payments received for the insured value of the damaged or destroyed property and equipment as a result of the accident . The easement gain relates to the issuance of an easement on a small portion of owned land at an operating facility which should not hinder our future use . Business development expenses relate to costs incurred to evaluate businesses for potential acquisition or costs related to closing and integrating successfully acquired businesses . The foreign currency gains or losses excluded from the earnings per diluted share calculation are partially related to unrealized gains or losses primarily associated with intercompany loans between our Canadian subsidiaries and the U . S . parent which have been established as part of our tax and treasury management strategy . These intercompany loans are payable in Canadian dollars (“CAD”) requiring us to revalue the outstanding loan balance through our consolidated income statement based on the CAD/United States currency movements from period to period . Foreign currency gains or losses also include realized gains and losses associated with the settlement of transactions denominated in a foreign currency . We believe excluding the non - cash property and equipment impairment charges, the property insurance recoveries, the gain on issuance of a property easement, the after - tax impact of business development expenses, and non - cash foreign currency translation gains or losses provides meaningful information to investors regarding the operational and financial performance of the Company . Free Cash Flow The Company defines free cash flow as net cash provided by operating activities less purchases of property and equipment, net of insurance proceeds received from damaged property and equipment . 38 Non - GAAP Financial Measures - Definitions
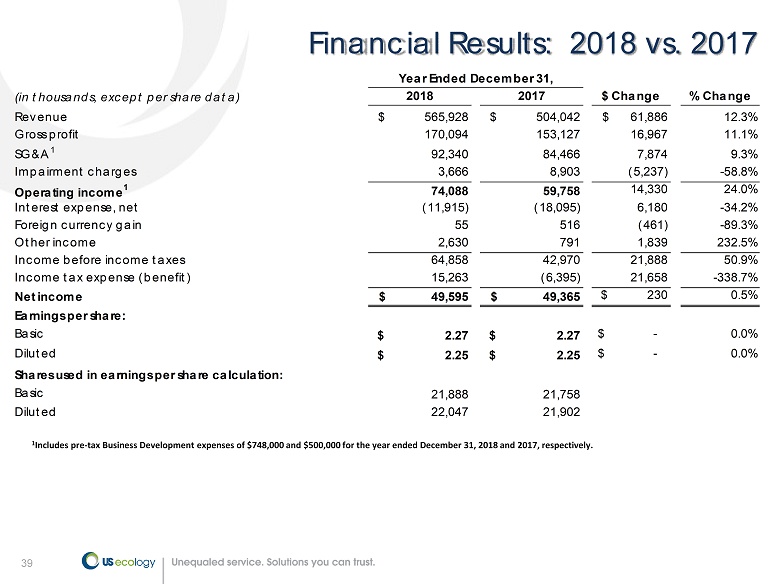
39 39 Financial Results: 2018 vs. 2017 1 Includes pre - tax Business Development expenses of $748,000 and $500,000 for the year ended December 31, 2018 and 2017, respectiv ely. (in thousands, except per share data) 2018 2017 $ Change % Change Revenue $ 565,928 $ 504,042 $ 61,886 12.3% Gross profit 170,094 153,127 16,967 11.1% SG&A 1 92,340 84,466 7,874 9.3% Impairment charges 3,666 8,903 (5,237) -58.8% Operating income 1 74,088 59,758 14,330 24.0% Interest expense, net (11,915) (18,095) 6,180 -34.2% Foreign currency gain 55 516 (461) -89.3% Other income 2,630 791 1,839 232.5% Income before income taxes 64,858 42,970 21,888 50.9% Income tax expense (benefit) 15,263 (6,395) 21,658 -338.7% Net income $ 49,595 $ 49,365 $ 230 0.5% Earnings per share: Basic $ 2.27 $ 2.27 $ - 0.0% Diluted $ 2.25 $ 2.25 $ - 0.0% Shares used in earnings per share calculation: Basic 21,888 21,758 Diluted 22,047 21,902 Year Ended December 31,
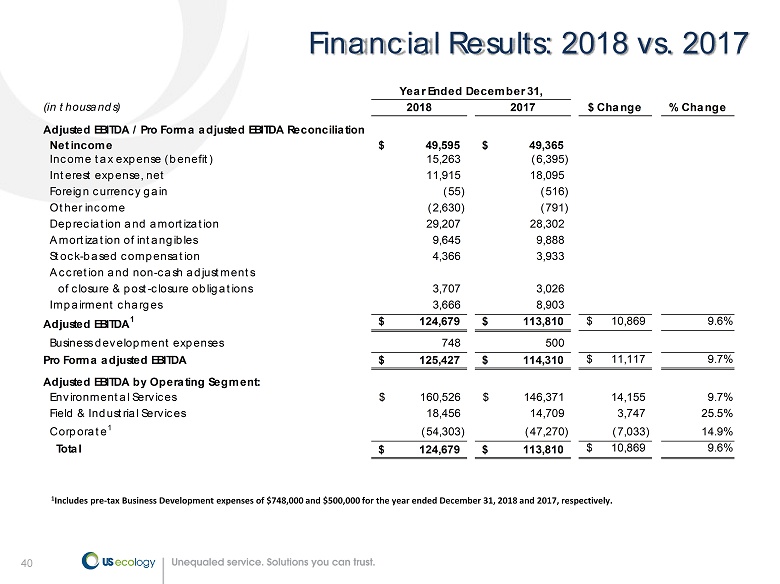
40 40 Financial Results: 2018 vs. 2017 1 Includes pre - tax Business Development expenses of $748,000 and $500,000 for the year ended December 31, 2018 and 2017, respectiv ely. (in thousands) 2018 2017 $ Change % Change Adjusted EBITDA / Pro Forma adjusted EBITDA Reconciliation Net income 49,595$ 49,365$ Income tax expense (benefit) 15,263 (6,395) Interest expense, net 11,915 18,095 Foreign currency gain (55) (516) Other income (2,630) (791) Depreciation and amortization 29,207 28,302 Amortization of intangibles 9,645 9,888 Stock-based compensation 4,366 3,933 Accretion and non-cash adjustments of closure & post-closure obligations 3,707 3,026 Impairment charges 3,666 8,903 Adjusted EBITDA 1 124,679$ 113,810$ 10,869$ 9.6% Business development expenses 748 500 Pro Forma adjusted EBITDA 125,427$ 114,310$ 11,117$ 9.7% Adjusted EBITDA by Operating Segment: Environmental Services 160,526$ 146,371$ 14,155 9.7% Field & Industrial Services 18,456 14,709 3,747 25.5% Corporate 1 (54,303) (47,270) (7,033) 14.9% Total 124,679$ 113,810$ 10,869$ 9.6% Year Ended December 31,

41 41 Financial Results: 2018 vs. 2017 (1) In the first quarter of 2019, the Company conformed the amount of the foreign currency gains or losses included in the ca lcu lation of adjusted earnings per diluted share with the amount of the foreign currency gains or losses included in the calculation of adjusted EBITDA and Pro forma adjusted EBIT DA. In previous quarters only non - cash translation gains or losses were included in the calculation of adjusted earnings per diluted share while total foreign currency gains or lo sses were included in the calculation of adjusted EBITDA and Pro forma adjusted EBITDA. The calculation of adjusted earnings per diluted share for 2018 and 2017 has been upda ted to include total foreign currency gains resulting in a $0.04 reduction to 2018 adjusted earnings per diluted share and a $0.02 increase to 2017 adjusted earnings per di luted share from what was previously reported in our earnings releases for the years ended December 31, 2018 and December 31, 2017. (in thousands, except per share data) Adjusted Earnings Per Share Reconciliation Income before income taxes Income tax Net income per share Income before income taxes Income tax Net income per share As reported 64,858$ (15,263)$ 49,595$ 2.25$ 42,970$ 6,395$ 49,365$ 2.25$ Adjustments: Plus: Impairment charges 3,666 - 3,666 0.17 8,903 - 8,903 0.41 Less: TX land easement gain (1,990) 512 (1,478) (0.07) - - - - Less: Discrete income tax adjustments - (2,146) (2,146) (0.10) - - - - Less: Impact of tax reform - - - - - (23,778) (23,778) (1.08) Plus: Non-cash write-off of deferred financing fees related to former credit agreement - - - - 5,461 (1,972) 3,489 0.16 Plus: Business development expenses 748 (202) 546 0.03 500 (181) 319 0.01 Foreign currency gain (1) (55) 15 (40) - (516) 186 (330) (0.01) As adjusted 67,227$ (17,084)$ 50,143$ $ 2.28 57,318$ (19,350)$ 37,968$ $ 1.74 Shares used in earnings per diluted share calculation 22,047 21,902 Year Ended December 31, 2018 2017
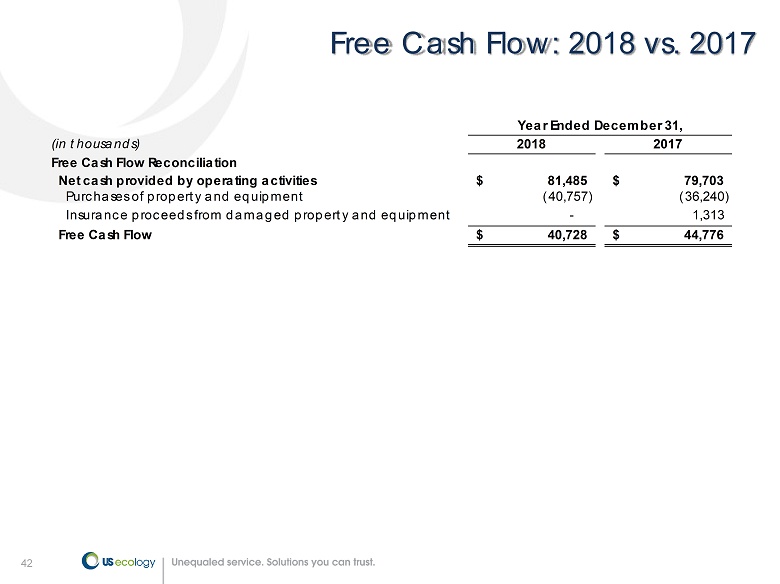
42 42 Free Cash Flow: 2018 vs. 2017 (in thousands) 2018 2017 Free Cash Flow Reconciliation Net cash provided by operating activities 81,485$ 79,703$ Purchases of property and equipment (40,757) (36,240) Insurance proceeds from damaged property and equipment - 1,313 Free Cash Flow 40,728$ 44,776$ Year Ended December 31,
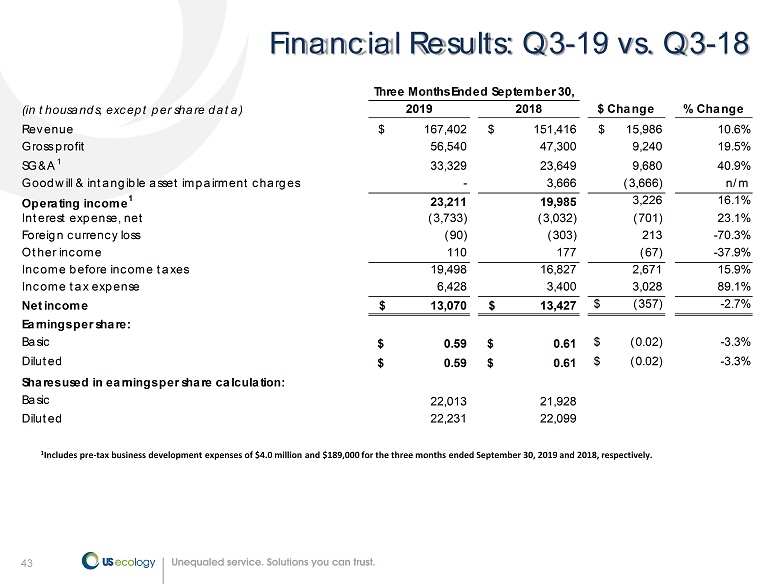
43 43 Financial Results: Q3 - 19 vs. Q3 - 18 1 Includes pre - tax business development expenses of $4.0 million and $189,000 for the three months ended September 30, 2019 and 2018, respectively. (in thousands, except per share data) 2019 2018 $ Change % Change Revenue $ 167,402 $ 151,416 $ 15,986 10.6% Gross profit 56,540 47,300 9,240 19.5% SG&A 1 33,329 23,649 9,680 40.9% Goodwill & intangible asset impairment charges - 3,666 (3,666) n/m Operating income 1 23,211 19,985 3,226 16.1% Interest expense, net (3,733) (3,032) (701) 23.1% Foreign currency loss (90) (303) 213 -70.3% Other income 110 177 (67) -37.9% Income before income taxes 19,498 16,827 2,671 15.9% Income tax expense 6,428 3,400 3,028 89.1% Net income $ 13,070 $ 13,427 $ (357) -2.7% Earnings per share: Basic $ 0.59 $ 0.61 $ (0.02) -3.3% Diluted $ 0.59 $ 0.61 $ (0.02) -3.3% Shares used in earnings per share calculation: Basic 22,013 21,928 Diluted 22,231 22,099 Three Months Ended September 30,
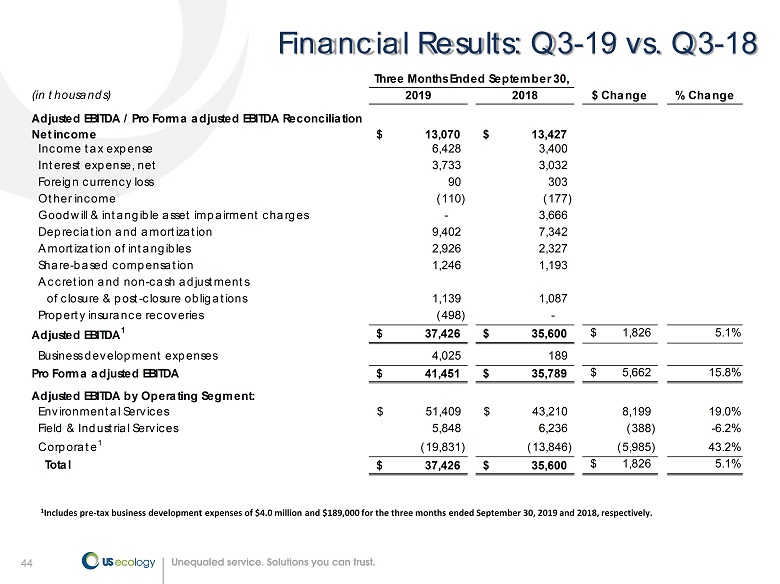
44 44 Financial Results: Q3 - 19 vs. Q3 - 18 1 Includes pre - tax business development expenses of $4.0 million and $189,000 for the three months ended September 30, 2019 and 2018, respectively. (in thousands) 2019 2018 $ Change % Change Adjusted EBITDA / Pro Forma adjusted EBITDA Reconciliation Net income 13,070$ 13,427$ Income tax expense 6,428 3,400 Interest expense, net 3,733 3,032 Foreign currency loss 90 303 Other income (110) (177) Goodwill & intangible asset impairment charges - 3,666 Depreciation and amortization 9,402 7,342 Amortization of intangibles 2,926 2,327 Share-based compensation 1,246 1,193 Accretion and non-cash adjustments of closure & post-closure obligations 1,139 1,087 Property insurance recoveries (498) - Adjusted EBITDA 1 37,426$ 35,600$ 1,826$ 5.1% Business development expenses 4,025 189 Pro Forma adjusted EBITDA 41,451$ 35,789$ 5,662$ 15.8% Adjusted EBITDA by Operating Segment: Environmental Services 51,409$ 43,210$ 8,199 19.0% Field & Industrial Services 5,848 6,236 (388) -6.2% Corporate 1 (19,831) (13,846) (5,985) 43.2% Total 37,426$ 35,600$ 1,826$ 5.1% Three Months Ended September 30,
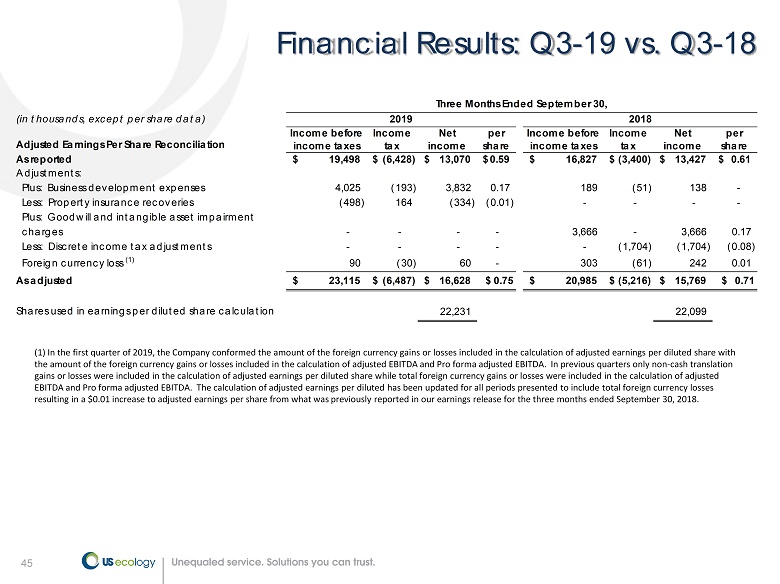
45 45 Financial Results: Q3 - 19 vs. Q3 - 18 (1) In the first quarter of 2019, the Company conformed the amount of the foreign currency gains or losses included in the ca lcu lation of adjusted earnings per diluted share with the amount of the foreign currency gains or losses included in the calculation of adjusted EBITDA and Pro forma adjusted EBIT DA. In previous quarters only non - cash translation gains or losses were included in the calculation of adjusted earnings per diluted share while total foreign currency gains or lo sses were included in the calculation of adjusted EBITDA and Pro forma adjusted EBITDA. The calculation of adjusted earnings per diluted has been updated for all periods presented to include total foreign currency losses resulting in a $0.01 increase to adjusted earnings per share from what was previously reported in our earnings release for the three months ended September 30 , 2018 . (in thousands, except per share data) Adjusted Earnings Per Share Reconciliation Income before income taxes Income tax Net income per share Income before income taxes Income tax Net income per share As reported 19,498$ (6,428)$ 13,070$ 0.59$ 16,827$ (3,400)$ 13,427$ 0.61$ Adjustments: Plus: Business development expenses 4,025 (193) 3,832 0.17 189 (51) 138 - Less: Property insurance recoveries (498) 164 (334) (0.01) - - - - Plus: Goodwill and intangible asset impairment charges - - - - 3,666 - 3,666 0.17 Less: Discrete income tax adjustments - - - - - (1,704) (1,704) (0.08) Foreign currency loss (1) 90 (30) 60 - 303 (61) 242 0.01 As adjusted 23,115$ (6,487)$ 16,628$ $ 0.75 20,985$ (5,216)$ 15,769$ $ 0.71 Shares used in earnings per diluted share calculation 22,231 22,099 Three Months Ended September 30, 2019 2018
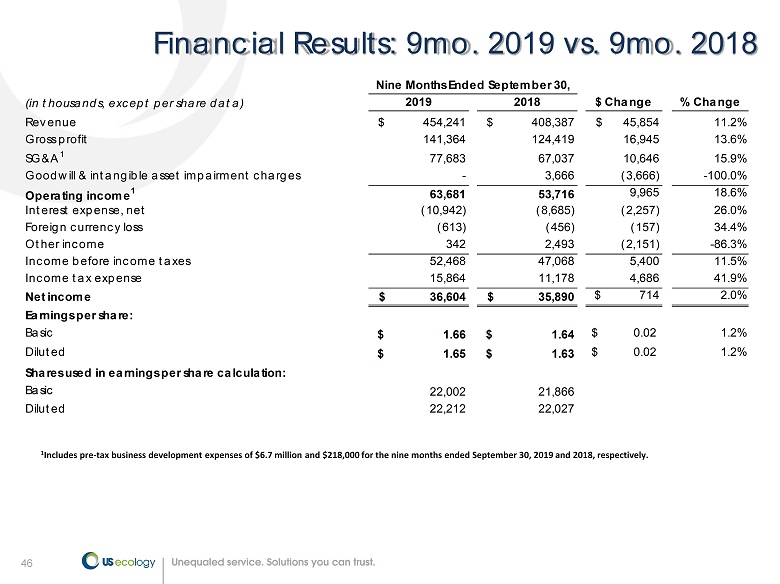
46 46 Financial Results: 9mo . 2019 vs. 9mo . 2018 1 Includes pre - tax business development expenses of $6.7 million and $218,000 for the nine months ended September 30, 2019 and 2018, respectively. (in thousands, except per share data) 2019 2018 $ Change % Change Revenue $ 454,241 $ 408,387 $ 45,854 11.2% Gross profit 141,364 124,419 16,945 13.6% SG&A 1 77,683 67,037 10,646 15.9% Goodwill & intangible asset impairment charges - 3,666 (3,666) -100.0% Operating income 1 63,681 53,716 9,965 18.6% Interest expense, net (10,942) (8,685) (2,257) 26.0% Foreign currency loss (613) (456) (157) 34.4% Other income 342 2,493 (2,151) -86.3% Income before income taxes 52,468 47,068 5,400 11.5% Income tax expense 15,864 11,178 4,686 41.9% Net income $ 36,604 $ 35,890 $ 714 2.0% Earnings per share: Basic $ 1.66 $ 1.64 $ 0.02 1.2% Diluted $ 1.65 $ 1.63 $ 0.02 1.2% Shares used in earnings per share calculation: Basic 22,002 21,866 Diluted 22,212 22,027 Nine Months Ended September 30,
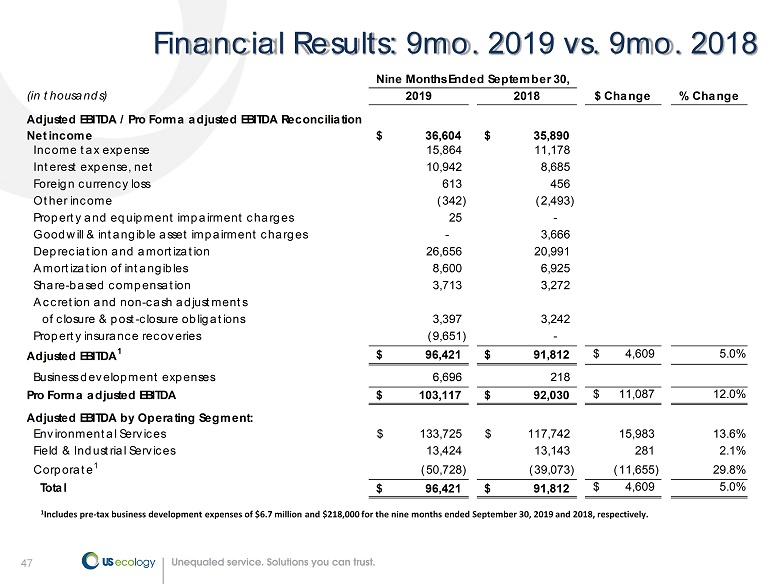
47 47 Financial Results: 9mo . 2019 vs. 9mo . 2018 1 Includes pre - tax business development expenses of $6.7 million and $218,000 for the nine months ended September 30, 2019 and 2018, respectively. (in thousands) 2019 2018 $ Change % Change Adjusted EBITDA / Pro Forma adjusted EBITDA Reconciliation Net income 36,604$ 35,890$ Income tax expense 15,864 11,178 Interest expense, net 10,942 8,685 Foreign currency loss 613 456 Other income (342) (2,493) Property and equipment impairment charges 25 - Goodwill & intangible asset impairment charges - 3,666 Depreciation and amortization 26,656 20,991 Amortization of intangibles 8,600 6,925 Share-based compensation 3,713 3,272 Accretion and non-cash adjustments of closure & post-closure obligations 3,397 3,242 Property insurance recoveries (9,651) - Adjusted EBITDA 1 96,421$ 91,812$ 4,609$ 5.0% Business development expenses 6,696 218 Pro Forma adjusted EBITDA 103,117$ 92,030$ 11,087$ 12.0% Adjusted EBITDA by Operating Segment: Environmental Services 133,725$ 117,742$ 15,983 13.6% Field & Industrial Services 13,424 13,143 281 2.1% Corporate 1 (50,728) (39,073) (11,655) 29.8% Total 96,421$ 91,812$ 4,609$ 5.0% Nine Months Ended September 30,
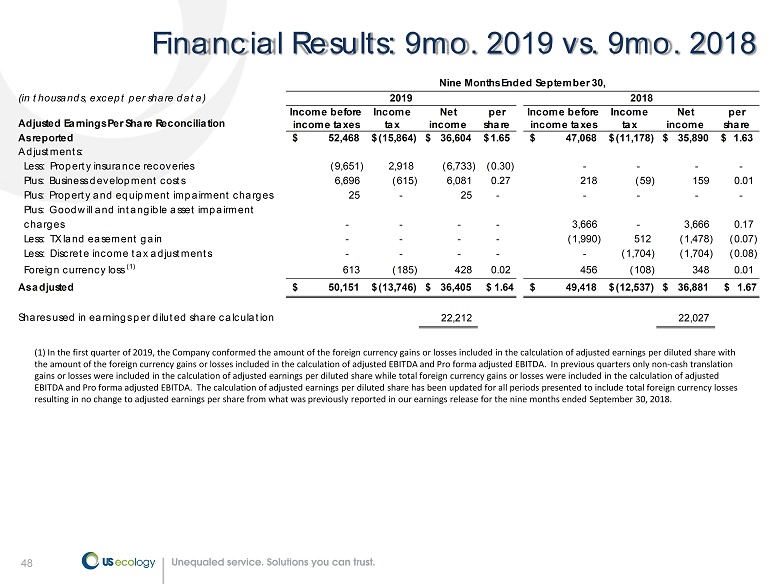
48 48 Financial Results: 9mo . 2019 vs. 9mo . 2018 (1 ) In the first quarter of 2019, the Company conformed the amount of the foreign currency gains or losses included in the calc ula tion of adjusted earnings per diluted share with the amount of the foreign currency gains or losses included in the calculation of adjusted EBITDA and Pro forma adjusted EBIT DA. In previous quarters only non - cash translation gains or losses were included in the calculation of adjusted earnings per diluted share while total foreign currency gains or lo sses were included in the calculation of adjusted EBITDA and Pro forma adjusted EBITDA. The calculation of adjusted earnings per diluted share has been updated for all period s p resented to include total foreign currency losses resulting in no change to adjusted earnings per share from what was previously reported in our earnings release for the nine mon ths ended September 30, 2018. (in thousands, except per share data) Adjusted Earnings Per Share Reconciliation Income before income taxes Income tax Net income per share Income before income taxes Income tax Net income per share As reported 52,468$ (15,864)$ 36,604$ 1.65$ 47,068$ (11,178)$ 35,890$ 1.63$ Adjustments: Less: Property insurance recoveries (9,651) 2,918 (6,733) (0.30) - - - - Plus: Business development costs 6,696 (615) 6,081 0.27 218 (59) 159 0.01 Plus: Property and equipment impairment charges 25 - 25 - - - - - Plus: Goodwill and intangible asset impairment charges - - - - 3,666 - 3,666 0.17 Less: TX land easement gain - - - - (1,990) 512 (1,478) (0.07) Less: Discrete income tax adjustments - - - - - (1,704) (1,704) (0.08) Foreign currency loss (1) 613 (185) 428 0.02 456 (108) 348 0.01 As adjusted 50,151$ (13,746)$ 36,405$ $ 1.64 49,418$ (12,537)$ 36,881$ $ 1.67 Shares used in earnings per diluted share calculation 22,212 22,027 Nine Months Ended September 30, 2019 2018
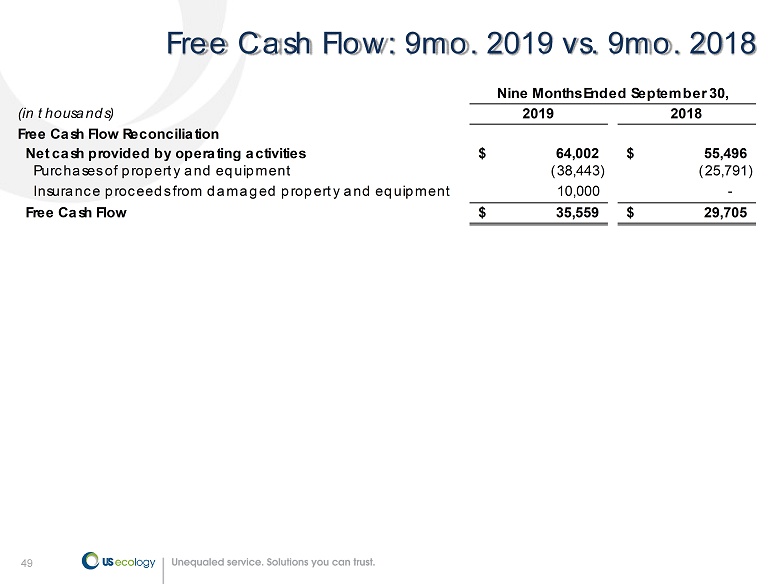
49 49 Free Cash Flow: 9 mo. 2019 vs. 9 mo. 2018 (in thousands) 2019 2018 Free Cash Flow Reconciliation Net cash provided by operating activities 64,002$ 55,496$ Purchases of property and equipment (38,443) (25,791) Insurance proceeds from damaged property and equipment 10,000 - Free Cash Flow 35,559$ 29,705$ Nine Months Ended September 30,