Exhibit 99.1

1 March 2020 Investor Presentation
2 Safe Harbor During the course of this presentation US Ecology, Inc . (“US Ecology,” the “Company” or “we”) will be making forward - looking statements (as such term is defined in the Private Securities Litigation Reform Act of 1995 ) that are based on our current expectations, beliefs and assumptions about the industry and markets in which US Ecology, Inc . and its subsidiaries operate . Statements in this presentation that are not historical facts are forward - looking statements that reflect our current expectations, assumptions and estimates of future performance and economic conditions . These forward - looking statements are made in reliance on the safe harbor provisions of Section 27 A of the Securities Act of 1933 and Section 21 E of the Securities Exchange Act of 1934 . Forward looking statements are only predictions and are not guarantees of performance . These statements are based on management’s beliefs and assumptions, which in turn are based on currently available information . Important assumptions include, among others, those regarding demand for the Company’s services, expansion of service offerings geographically or through new or expanded service lines, the timing and cost of planned capital expenditures, competitive conditions and general economic conditions . These assumptions could prove inaccurate . Forward looking statements also involve known and unknown risks and uncertainties, which could cause actual results to differ materially from those contained in any forward looking statement . Many of these factors are beyond our ability to control or predict . Such factors include the integration of NRC’s operations, the loss or failure to renew significant contracts, competition in our markets, adverse economic conditions, our compliance with applicable laws and regulations, potential liability in connection with providing oil spill response services and waste disposal services, the effect of existing or future laws and regulations related to greenhouse gases and climate change, the effect of our failure to comply with U . S . or foreign anti - bribery laws, the effect of compliance with laws and regulations, an accident at one of our facilities, incidents arising out of the handling of dangerous substances, our failure to maintain an acceptable safety record, our ability to perform under required contracts, limitations on our available cash flow as a result of our indebtedness, liabilities arising from our participation in multi - employer pension plans, the effect of changes in the method of determining the London Interbank Offered Rate (“LIBOR”) or the replacement thereto, risks associated with our international operations, the impact of changes to U . S . tariff and import and export regulations, fluctuations in commodity markets related to our business, a change in NRC’s classification as an Oil Spill Removal Organization, cyber security threats, unanticipated changes in tax rules and regulations, loss of key personnel, a deterioration in our labor relations or labor disputes, our reliance on third - party contractors to provide emergency response services, our access to insurance, surety bonds and other financial assurances, our litigation risk not covered by insurance, the replacement of non - recurring event projects, our ability to permit and contract for timely construction of new or expanded disposal space, renewals of our operating permits or lease agreements with regulatory bodies, our access to cost - effective transportation services, lawsuits, our implementation of new technologies, fluctuations in foreign currency markets and foreign affairs, our integration of acquired businesses, our ability to pay dividends or repurchase stock, anti - takeover regulations, stock market volatility, the failure of the warrants to be in the money or their expiration worthless and risks related to our compliance with maritime regulations (including the Jones Act) . Except as required by applicable law, including the securities laws of the United States and the rules and regulations of the Securities and Exchange Commission (the “SEC”), we are under no obligation to publicly update or revise any forward - looking statements, whether as a result of new information, future events or otherwise . You should not place undue reliance on our forward - looking statements . Although we believe that the expectations reflected in forward - looking statements are reasonable, we cannot guarantee future results or performance . Before you invest in our common stock, you should be aware that the occurrence of the events described in the "Risk Factors" sections of our annual and quarterly reports could harm our business, prospects, operating results, and financial condition .
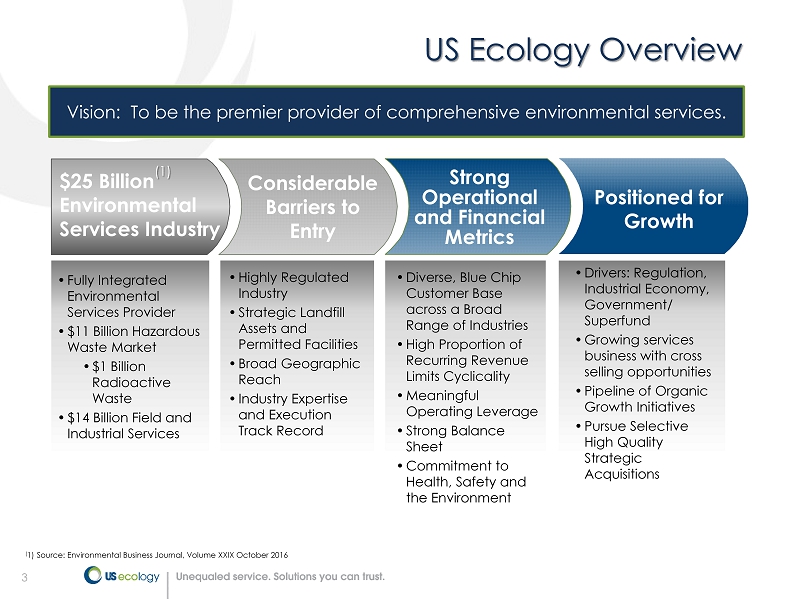
3 US Ecology Overview Vision: To be the premier provider of comprehensive environmental services. • Fully Integrated Environmental Services Provider • $11 Billion Hazardous Waste Market • $1 Billion Radioactive Waste • $14 Billion Field and Industrial Services • Highly Regulated Industry • Strategic Landfill Assets and Permitted Facilities • Broad Geographic Reach • Industry Expertise and Execution Track Record • Diverse, Blue Chip Customer Base across a Broad Range of Industries • High Proportion of Recurring Revenue Limits Cyclicality • Meaningful Operating Leverage • Strong Balance Sheet • Commitment to Health, Safety and the Environment • Drivers: Regulation, Industrial Economy, Government/ Superfund • Growing services business with cross selling opportunities • Pipeline of Organic Growth Initiatives • Pursue Selective High Quality Strategic Acquisitions $25 Billion (1) Environmental Services Industry Considerable Barriers to Entry Positioned for Growth Strong Operational and Financial Metrics ( 1) Source: Environmental Business Journal, Volume XXIX October 2016
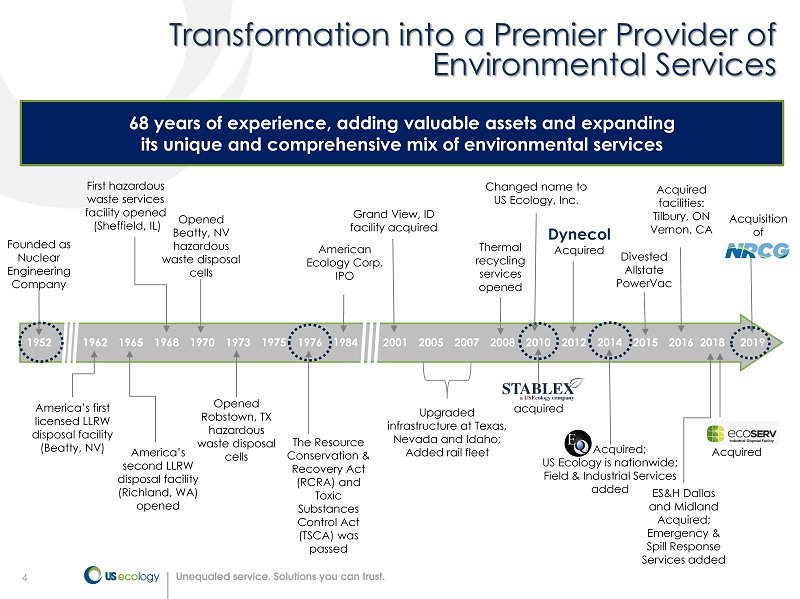
4 68 years of experience, adding valuable assets and expanding its unique and comprehensive mix of environmental services 4 acquired Grand View, ID facility acquired 2001 2008 Thermal recycling services opened 1984 1952 1965 Founded as Nuclear Engineering Company America’s second LLRW disposal facility ( Richland, WA) opened 1968 First hazardous waste services facility opened (Sheffield, IL) 1962 America’s first licensed LLRW disposal facility (Beatty, NV) 1973 Opened Robstown, TX hazardous waste disposal cells 2007 2005 Changed name to US Ecology, Inc. 2010 American Ecology Corp. IPO 1970 Opened Beatty, NV hazardous waste disposal cells 1975 1976 The Resource Conservation & Recovery Act (RCRA) and Toxic Substances Control Act (TSCA) was passed Upgraded infrastructure at Texas, Nevada and Idaho; Added rail fleet 2012 Acquired 2014 EQ Acquired; US Ecology is nationwide; Field & Industrial Services added 2018 Acquired facilities: Tilbury, ON Vernon, CA Divested Allstate PowerVac 2015 ES&H Dallas and Midland Acquired; Emergency & Spill Response Services added 2016 Acquired 2019 Acquisition of Transformation into a Premier Provider of Environmental Services Dynecol
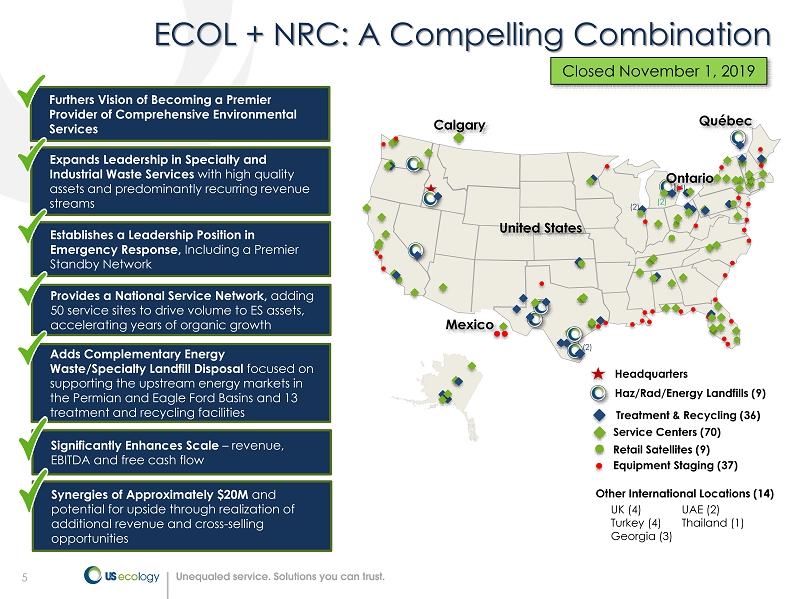
5 ECOL + NRC: A Compelling Combination (4) Mexico Québec (2) (2) United States (2) Ontario Equipment Staging (37) Haz/Rad/Energy Landfills (9) Treatment & Recycling (36) Service Centers (70) Headquarters Retail Satellites (9) Furthers Vision of Becoming a Premier Provider of Comprehensive Environmental Services Expands Leadership in Specialty and Industrial Waste Services with high quality assets and predominantly recurring revenue streams Establishes a Leadership Position in Emergency Response, Including a Premier Standby Network Significantly Enhances Scale – revenue, EBITDA and free cash flow Provides a National Service Network, adding 50 service sites to drive volume to ES assets, accelerating years of organic growth Adds Complementary Energy Waste/Specialty Landfill Disposal focused on supporting the upstream energy markets in the Permian and Eagle Ford Basins and 13 treatment and recycling facilities Synergies of Approximately $20M and potential for upside through realization of additional revenue and cross - selling opportunities Calgary Other International Locations (14) UK (4) UAE (2) Turkey (4) Thailand (1) Georgia (3) Closed November 1, 2019
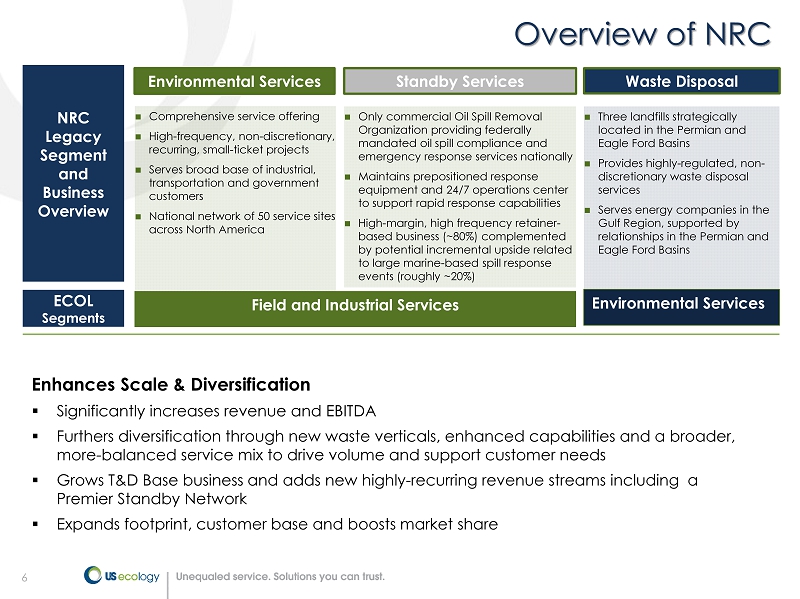
6 NRC Legacy Segment and Business Overview ☐ Comprehensive service offering ☐ High - frequency, non - discretionary, recurring, small - ticket projects ☐ Serves broad base of industrial, transportation and government customers ☐ National network of 50 service sites across North America ☐ Three landfills strategically located in the Permian and Eagle Ford Basins ☐ Provides highly - regulated, non - discretionary waste disposal services ☐ Serves energy companies in the Gulf Region, supported by relationships in the Permian and Eagle Ford Basins ☐ Only commercial Oil Spill Removal Organization providing federally mandated oil spill compliance and emergency response services nationally ☐ Maintains prepositioned response equipment and 24/7 operations center to support rapid response capabilities ☐ High - margin, high frequency retainer - based business (~80%) complemented by potential incremental upside related to large marine - based spill response events (roughly ~20%) Overview of NRC Environmental Services Waste Disposal Standby Services ECOL Segments Field and Industrial Services Environmental Services Enhances Scale & Diversification ▪ Significantly increases revenue and EBITDA ▪ Furthers diversification through new waste verticals, enhanced capabilities and a broader, more - balanced service mix to drive volume and support customer needs ▪ Grows T&D Base business and adds new highly - recurring revenue streams including a Premier Standby Network ▪ Expands footprint, customer base and boosts market share
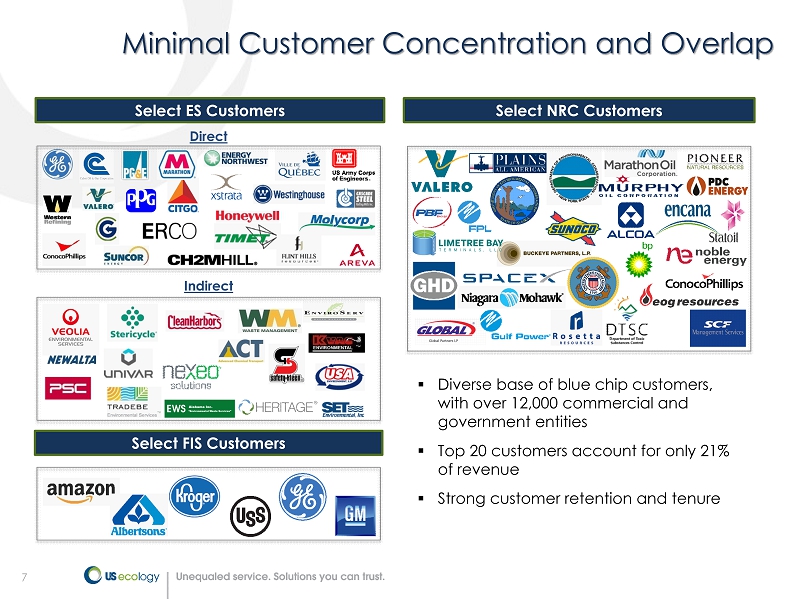
7 ▪ Diverse base of blue chip customers, with over 12,000 commercial and government entities ▪ Top 20 customers account for only 21% of revenue ▪ Strong customer retention and tenure Select ES Customers Select NRC Customers Direct Indirect Minimal Customer Concentration and Overlap Select FIS Customers
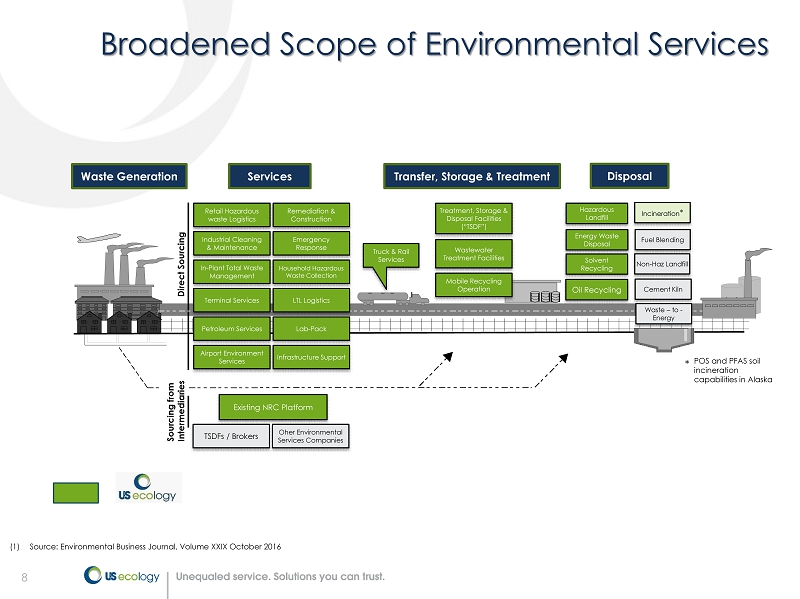
8 Broadened Scope of Environmental Services Waste Generation Services Transfer, Storage & Treatment Disposal Retail Hazardous waste Logistics Industrial Cleaning & Maintenance In - Plant Total Waste Management Terminal Services Petroleum Services Airport Environment Services Remediation & Construction Emergency Response Household Hazardous Waste Collection LTL Logistics Lab - Pack Infrastructure Support TSDFs / Brokers Oher Environmental Services Companies Truck & Rail Services Treatment, Storage & Disposal Facilities (“TSDF”) Wastewater Treatment Facilities Mobile Recycling Operation Hazardous Landfill Solvent Recycling Oil Recycling Waste – to - Energy Incineration * Fuel Blending Non - Haz Landfill Cement Kiln Direct Sourcing Sourcing from Intermediaries (1) Source: Environmental Business Journal, Volume XXIX October 2016 Energy Waste Disposal Existing NRC Platform POS and PFAS soil incineration capabilities in Alaska *
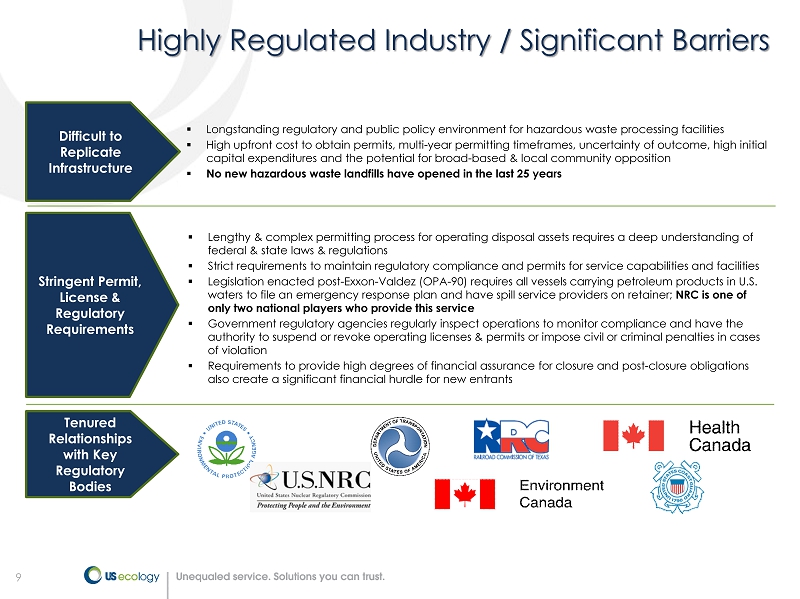
9 Highly Regulated Industry / Significant Barriers Stringent Permit, License & Regulatory Requirements ▪ Lengthy & complex permitting process for operating disposal assets requires a deep understanding of federal & state laws & regulations ▪ Strict requirements to maintain regulatory compliance and permits for service capabilities and facilities ▪ Legislation enacted post - Exxon - Valdez (OPA - 90) requires all vessels carrying petroleum products in U.S. waters to file an emergency response plan and have spill service providers on retainer; NRC is one of only two national players who provide this service ▪ Government regulatory agencies regularly inspect operations to monitor compliance and have the authority to suspend or revoke operating licenses & permits or impose civil or criminal penalties in cases of violation ▪ Requirements to provide high degrees of financial assurance for closure and post - closure obligations also create a significant financial hurdle for new entrants Difficult to Replicate Infrastructure ▪ Longstanding regulatory and public policy environment for hazardous waste processing facilities ▪ High upfront cost to obtain permits, multi - year permitting timeframes, uncertainty of outcome, high initial capital expenditures and the potential for broad - based & local community opposition ▪ No new hazardous waste landfills have opened in the last 25 years Tenured Relationships with Key Regulatory Bodies

10 ☐ Provides hazardous and non - hazardous materials management services at Company - owned/operated treatment and disposal facilities ☐ Services include waste disposal, treatment, recycling and transportation ☐ Key assets include: ― Hazardous waste landfills ― Commercially licensed radioactive waste landfill ― Treatment and Recycling facilities ― Energy waste landfills and related services 10 ☐ Field Services: Provides packaging, collection and waste management solutions at customer sites and our 10 - day storage facilities as well as emergency and spill response ☐ Small Quantity Generation (“SQG”) ― Retail Services ― LTL Collection ― Lab pack ― Household Hazardous Waste (“HHW”) ☐ Emergency Response ☐ Standby Services ☐ Total Waste Management ☐ Transportation and Logistics ☐ Remediation ☐ Industrial Services: Provides specialty cleaning, maintenance and excavation services at customers’ industrial sites as well as emergency response services and transportation. ☐ Cost center providing sales and administrative support across segments Segment Overview 1 See definition and reconciliation of Adjusted EBITDA and adjusted earnings per diluted share on pages 42 – 53 of this presentati on 2 Includes NRC acquisition for the 2 months of ownership in 2019 ☐ Revenue: $453.1 million (66%) ☐ Adjusted EBITDA 1 : $187.8 million ☐ Adjusted EBITDA Margin: 41% Environmental Services (“ES”) Field & Industrial Services (“FIS”) Corporate 2019 Statistics for ES (2) ☐ Revenue: $232.4 million (34%) ☐ Adjusted EBITDA 1 : $26.7 million ☐ Adjusted EBITDA Margin: 11% 2019 Statistics for FIS (2) ☐ Adjusted EBITDA 1 : ($65.1 million) 2019 Statistics for Corporate (2)
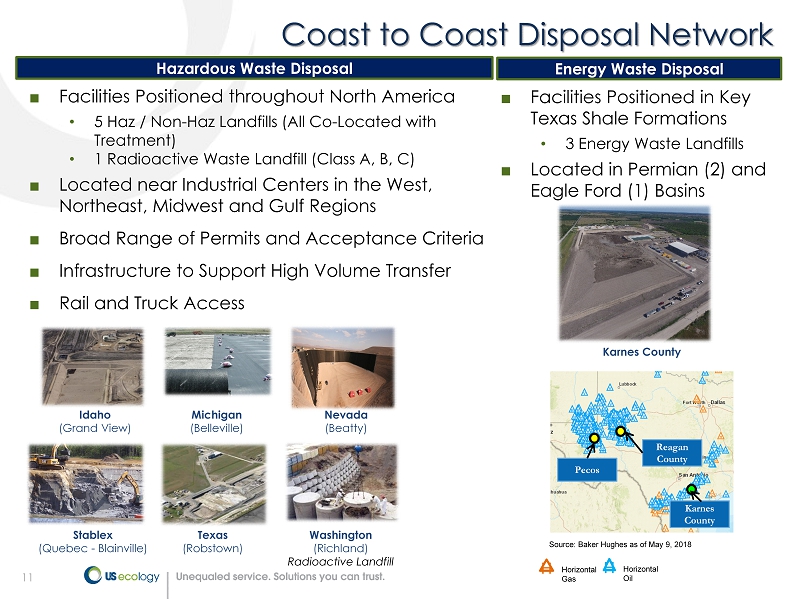
11 Coast to Coast Disposal Network ■ Facilities Positioned throughout North America • 5 Haz / Non - Haz Landfills (All Co - Located with Treatment) • 1 Radioactive Waste Landfill (Class A, B, C) ■ Located near Industrial Centers in the West, Northeast, Midwest and Gulf Regions ■ Broad Range of Permits and Acceptance Criteria ■ Infrastructure to Support High Volume Transfer ■ Rail and Truck Access Idaho (Grand View) Washington (Richland) Radioactive Landfill Michigan (Belleville) Nevada (Beatty) Texas (Robstown) Stablex (Quebec - Blainville) H Horizontal Gas H Horizontal Oil Reagan County Pecos Source: Baker Hughes as of May 9, 2018 Karnes County Hazardous Waste Disposal Energy Waste Disposal Karnes County ■ Facilities Positioned in Key Texas Shale Formations • 3 Energy Waste Landfills ■ Located in Permian (2) and Eagle Ford (1) Basins
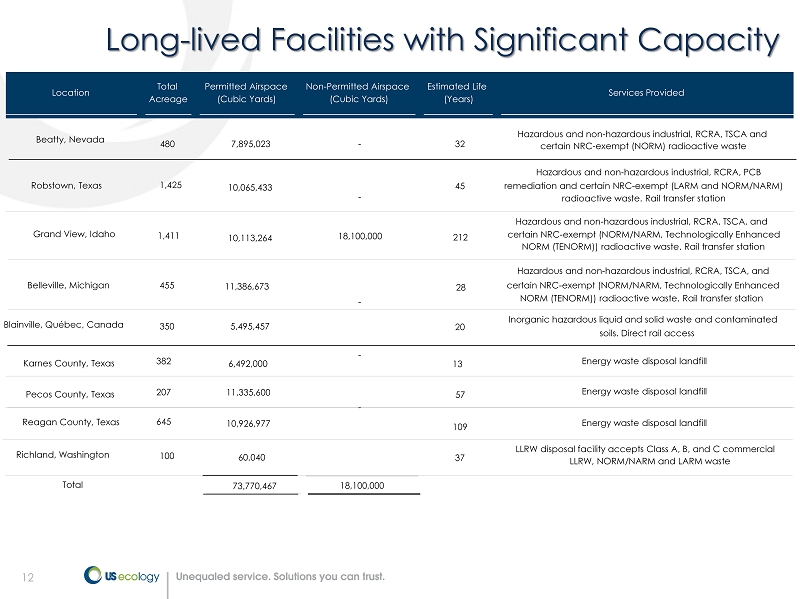
12 Long - lived Facilities with Significant Capacity Location Total Acreage Permitted Airspace (Cubic Yards) Non - Permitted Airspace (Cubic Yards) Estimated Life (Years) Services Provided Beatty, Nevada 480 7,895,023 - 32 Hazardous and non - hazardous industrial, RCRA, TSCA and certain NRC - exempt (NORM) radioactive waste Robstown, Texas 1,425 10,065,433 - 45 Hazardous and non - hazardous industrial, RCRA, PCB remediation and certain NRC - exempt (LARM and NORM/NARM) radioactive waste. Rail transfer station Grand View, Idaho 1,411 10,113,264 18,100,000 212 Hazardous and non - hazardous industrial, RCRA, TSCA, and certain NRC - exempt (NORM/NARM, Technologically Enhanced NORM (TENORM)) radioactive waste. Rail transfer station Belleville, Michigan 455 11,386,673 - 28 Hazardous and non - hazardous industrial, RCRA, TSCA, and certain NRC - exempt (NORM/NARM, Technologically Enhanced NORM (TENORM)) radioactive waste. Rail transfer station Blainville, Québec, Canada 350 5 ,495,457 - 20 Inorganic hazardous liquid and solid waste and contaminated soils. Direct rail access Richland, Washington 100 60,040 - 37 LLRW disposal facility accepts Class A, B, and C commercial LLRW, NORM/NARM and LARM waste Total 73,770,467 18,100,000 Karnes County, Texas Pecos County, Texas 207 382 6,492,000 13 11,335,600 5 7 Reagan County, Texas 645 10,926,977 109 Energy waste disposal landfill Energy waste disposal landfill Energy waste disposal landfill
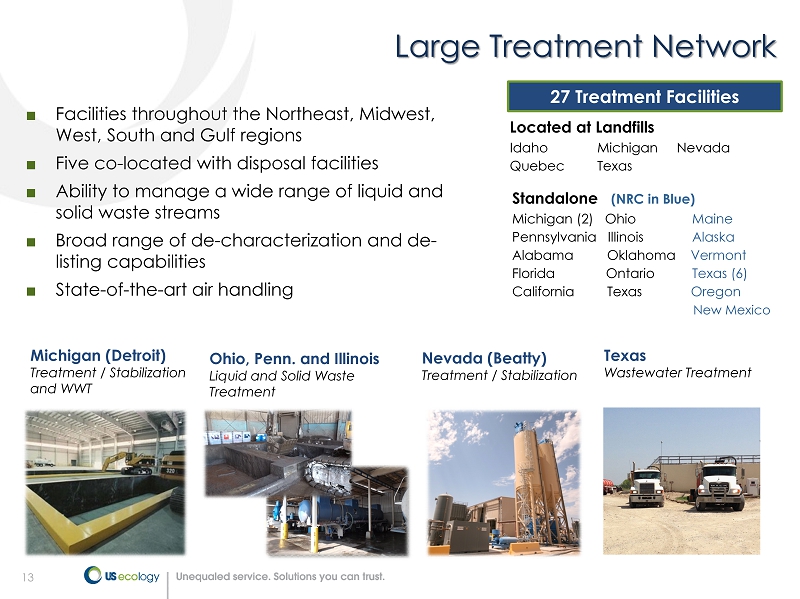
13 Large Treatment Network ■ Facilities throughout the Northeast, Midwest, West, South and Gulf regions ■ Five co - located with disposal facilities ■ Ability to manage a wide range of liquid and solid waste streams ■ Broad range of de - characterization and de - listing capabilities ■ State - of - the - art air handling 27 Treatment Facilities Located at Landfills Idaho Michigan Nevada Quebec Texas Standalone (NRC in Blue) Michigan (2) Ohio Maine Pennsylvania Illinois Alaska Alabama Oklahoma Vermont Florida Ontario Texas (6) California Texas Oregon New Mexico Michigan (Detroit) Treatment / Stabilization and WWT Ohio, Penn. and Illinois Liquid and Solid Waste Treatment Nevada (Beatty) Treatment / Stabilization Texas Wastewater Treatment
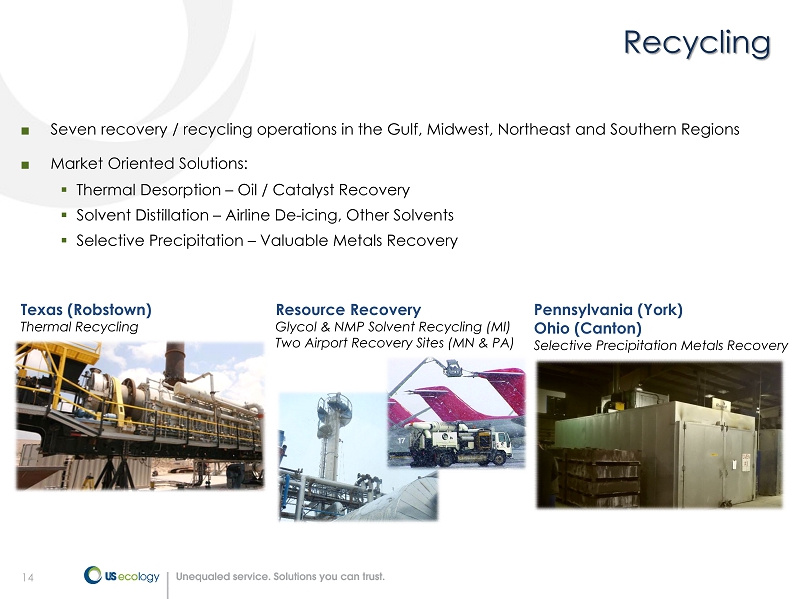
14 Recycling ■ Seven recovery / recycling operations in the Gulf, Midwest, Northeast and Southern Regions ■ Market Oriented Solutions: ▪ Thermal Desorption – Oil / Catalyst Recovery ▪ Solvent Distillation – Airline De - icing, Other Solvents ▪ Selective Precipitation – Valuable Metals Recovery Resource Recovery Glycol & NMP Solvent Recycling (MI) Two Airport Recovery Sites (MN & PA) Texas (Robstown) Thermal Recycling Pennsylvania (York) Ohio (Canton) Selective Precipitation Metals Recovery
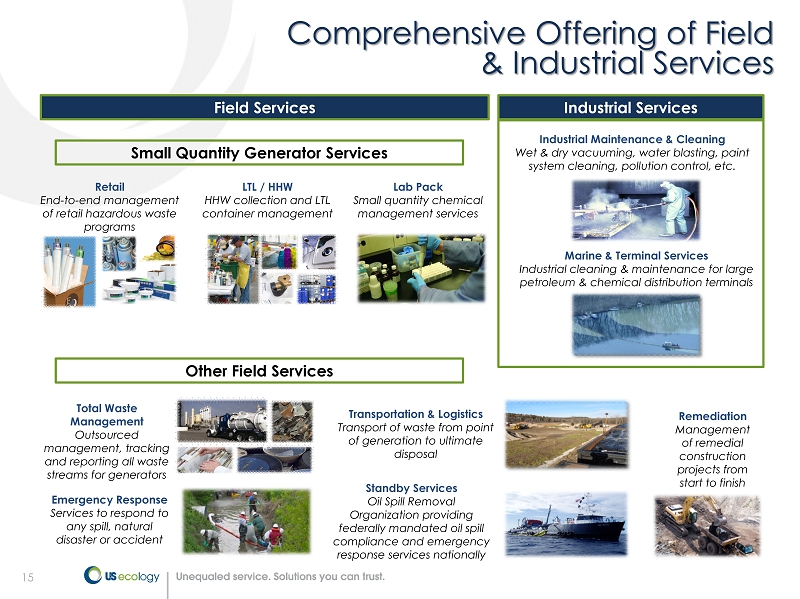
15 Comprehensive Offering of Field & Industrial Services Remediation Management of remedial construction projects from start to finish Retail End - to - end management of retail hazardous waste programs Transportation & Logistics Transport of waste from point of generation to ultimate disposal Lab Pack Small quantity chemical management services Total Waste Management Outsourced management, tracking and reporting all waste streams for generators LTL / HHW HHW collection and LTL container management Small Quantity Generator Services Other Field Services Emergency Response Services to respond to any spill, natural disaster or accident Field Services Industrial Services Marine & Terminal Services Industrial cleaning & maintenance for large petroleum & chemical distribution terminals Industrial Maintenance & Cleaning Wet & dry vacuuming, water blasting, paint system cleaning, pollution control, etc. Standby Services Oil Spill Removal Organization providing federally mandated oil spill compliance and emergency response services nationally
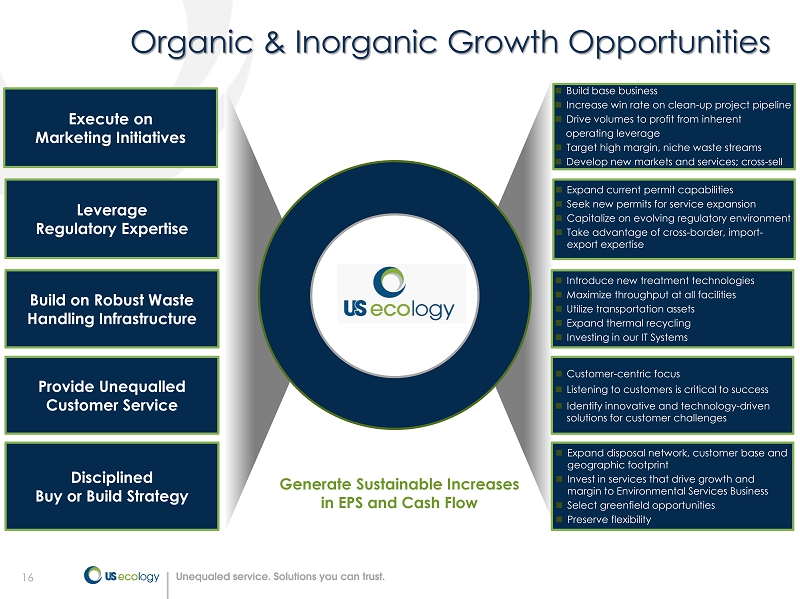
16 Organic & Inorganic Growth Opportunities Build on Robust Waste Handling Infrastructure Leverage Regulatory Expertise Provide Unequalled Customer Service Generate Sustainable Increases in EPS and Cash Flow Focus on High Value Waste Streams ☐ Build base business ☐ Increase win rate on clean - up project pipeline ☐ Drive volumes to profit from inherent operating leverage ☐ Target high margin, niche waste streams ☐ Develop new markets and services; cross - sell ☐ Expand current permit capabilities ☐ Seek new permits for service expansion ☐ Capitalize on evolving regulatory environment ☐ Take advantage of cross - border, import - export expertise ☐ Introduce new treatment technologies ☐ Maximize throughput at all facilities ☐ Utilize transportation assets ☐ Expand thermal recycling ☐ Investing in our IT Systems ☐ Customer - centric focus ☐ Listening to customers is critical to success ☐ Identify innovative and technology - driven solutions for customer challenges Disciplined Buy or Build Strategy ☐ Expand disposal network, customer base and geographic footprint ☐ Invest in services that drive growth and margin to Environmental Services Business ☐ Select greenfield opportunities ☐ Preserve flexibility Execute on Marketing Initiatives

17 Financial Overview
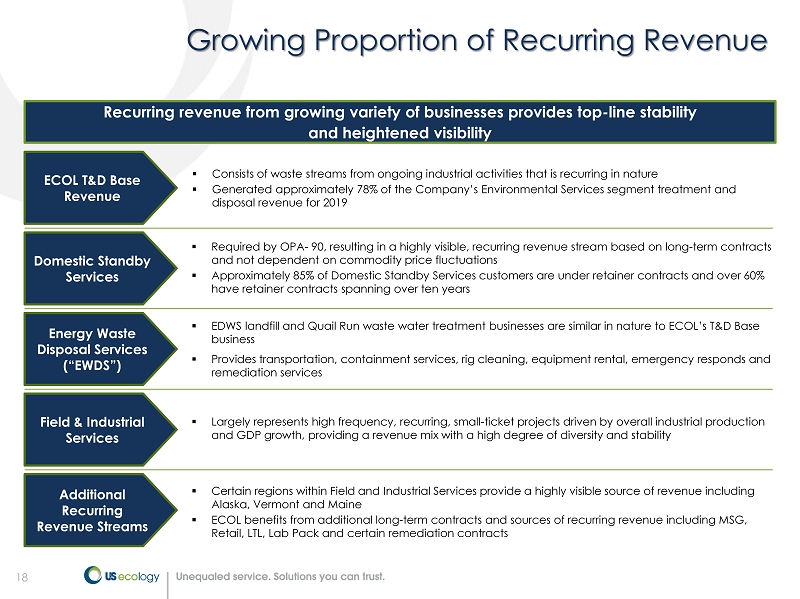
18 Growing Proportion of Recurring Revenue Recurring revenue from growing variety of businesses provides top - line stability and heightened visibility ECOL T&D Base Revenue ▪ Consists of waste streams from ongoing industrial activities that is recurring in nature ▪ Generated approximately 78% of the Company’s Environmental Services segment treatment and disposal revenue for 2019 Energy Waste Disposal Services (“EWDS”) Domestic Standby Services Additional Recurring Revenue Streams ▪ Required by OPA - 90, resulting in a highly visible, recurring revenue stream based on long - term contracts and not dependent on commodity price fluctuations ▪ Approximately 85% of Domestic Standby Services customers are under retainer contracts and over 60% have retainer contracts spanning over ten years ▪ EDWS landfill and Quail Run waste water treatment businesses are similar in nature to ECOL’s T&D Base business ▪ Provides transportation, containment services, rig cleaning, equipment rental, emergency responds and remediation services ▪ Certain regions within Field and Industrial Services provide a highly visible source of revenue including Alaska, Vermont and Maine ▪ ECOL benefits from additional long - term contracts and sources of recurring revenue including MSG, Retail, LTL, Lab Pack and certain remediation contracts Field & Industrial Services ▪ Largely represents high frequency, recurring, small - ticket projects driven by overall industrial production and GDP growth, providing a revenue mix with a high degree of diversity and stability
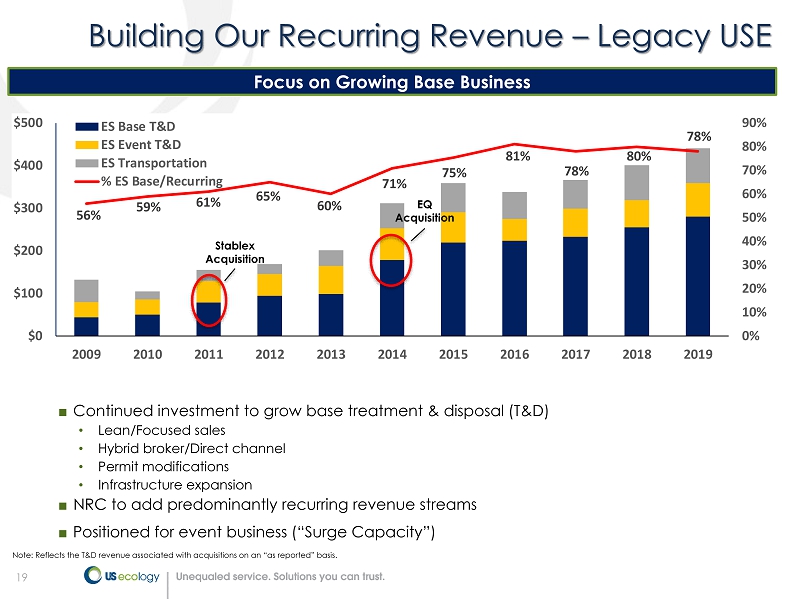
19 56% 59% 61% 65% 60% 71% 75% 81% 78% 80% 78% 0% 10% 20% 30% 40% 50% 60% 70% 80% 90% $0 $100 $200 $300 $400 $500 2009 2010 2011 2012 2013 2014 2015 2016 2017 2018 2019 ES Base T&D ES Event T&D ES Transportation % ES Base/Recurring Building Our Recurring Revenue – Legacy USE Focus on Growing Base Business ■ Continued investment to grow base treatment & disposal (T&D) • Lean/Focused sales • Hybrid broker/Direct channel • Permit modifications • Infrastructure expansion ■ NRC to add predominantly recurring revenue streams ■ Positioned for event business (“Surge Capacity”) Note: Reflects the T&D revenue associated with acquisitions on an “as reported” basis. Stablex Acquisition EQ Acquisition
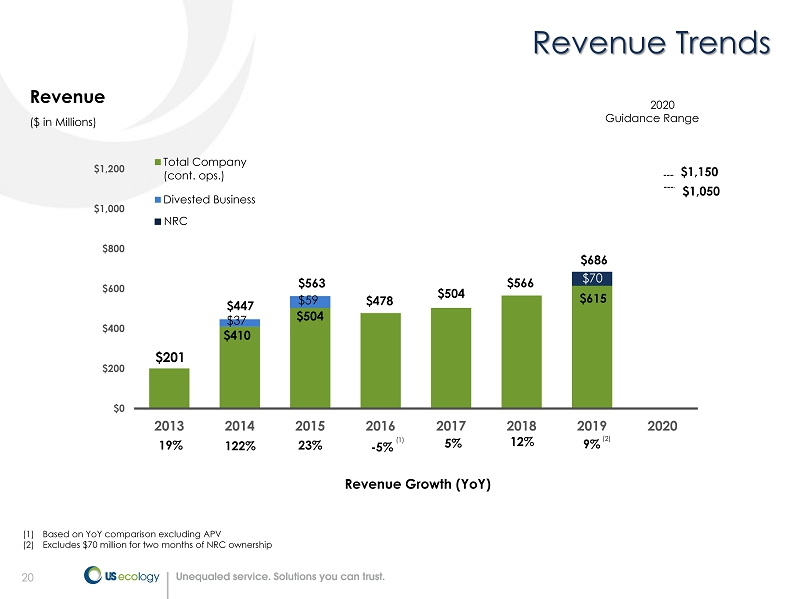
20 ($ in Millions) Revenue Growth (YoY) $201 $504 $566 $615 $0 $200 $400 $600 $800 $1,000 $1,200 2013 2014 2015 2016 2017 2018 2019 2020 Total Company (cont. ops.) Divested Business Revenue 19% 122% 23% - 5% (1) Based on YoY comparison excluding APV (2) Excludes $70 million for two months of NRC ownership Revenue Trends $410 $37 $504 $59 $478 $447 $563 5% (1) 12% $70 ■ NRC 9% (2) $686 2020 Guidance Range $1,150 $1,050
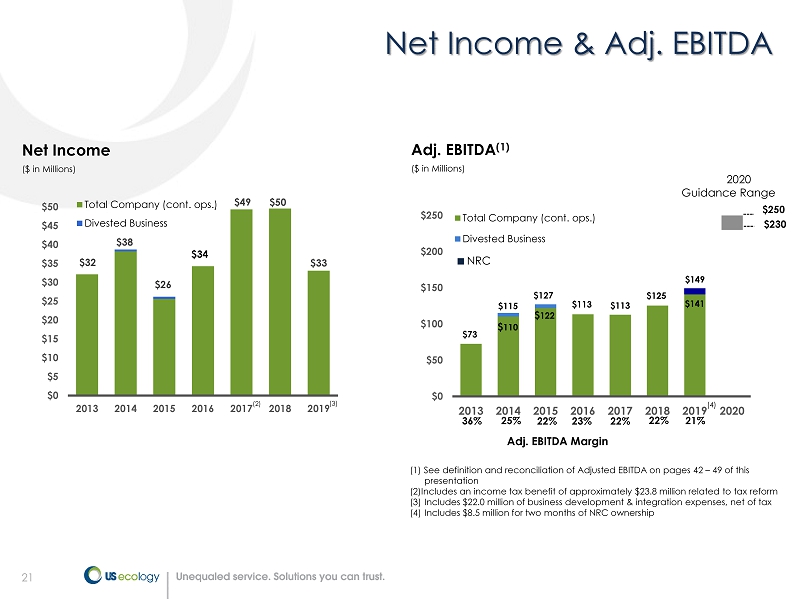
21 ($ in Millions) $32 $38 $26 $49 $50 $33 $0 $5 $10 $15 $20 $25 $30 $35 $40 $45 $50 2013 2014 2015 2016 2017 2018 2019 Total Company (cont. ops.) Divested Business Net Income Net Income & Adj. EBITDA (1) See definition and reconciliation of Adjusted EBITDA on pages 42 – 49 of this presentation (2)Includes an income tax benefit of approximately $23.8 million related to tax reform (3) Includes $22.0 million of business development & integration expenses, net of tax (4) Includes $8.5 million for two months of NRC ownership $73 $113 $125 $141 $0 $50 $100 $150 $200 $250 2013 2014 2015 2016 2017 2018 2019 2020 Total Company (cont. ops.) Divested Business $ 110 $ 122 $149 ($ in Millions) Adj. EBITDA (1) 25% 22% 23% Adj. EBITDA Margin 36% (4) $34 $115 $ 127 (2) 22% $113 22% 2020 Guidance Range $230 $250 ■ NRC 21% (3)
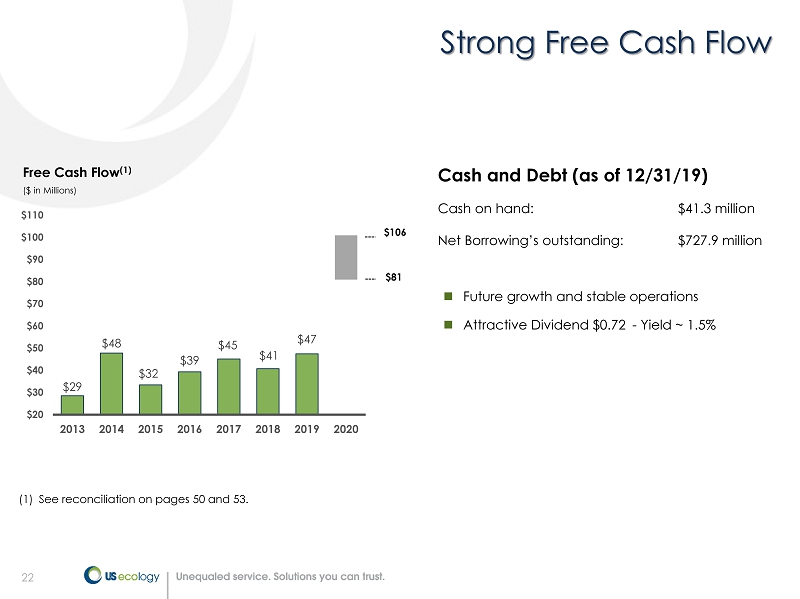
22 Strong Free Cash Flow Cash on hand: $41.3 million Net Borrowing’s outstanding: $727.9 million Free Cash Flow (1) ($ in Millions) $29 $48 $32 $39 $45 $41 $47 $20 $30 $40 $50 $60 $70 $80 $90 $100 $110 2013 2014 2015 2016 2017 2018 2019 2020 ☐ Future growth and stable operations ☐ Attractive Dividend $0.72 - Yield ~ 1.5% Cash and Debt (as of 12/31/19) (1) See reconciliation on pages 50 and 53. $81 $106

23 Q4 - 19 Financial Review Consolidated 1 See definition and reconciliation of adjusted EBITDA and adjusted earnings per diluted share on pages 42 - 53 of this presentation Total revenue $231.3 million, up 47% from $157.5 million last year • Includes $70.2 million for two months of NRC ownership, ES revenue $125.7 million, up 16% from $108.1 million in prior year • Includes $12.5 million from NRC FIS revenue $105.5 million, up 113% from $49.5 million in prior year • Includes $57.7 million from NRC Adjusted diluted EPS 1 was $0.38 per share in Q4 - 19; reflecting approximately $0.15 per share impact on new share issuance Adjusted EBITDA 1 of $46.2 million, up 40% from same period last year
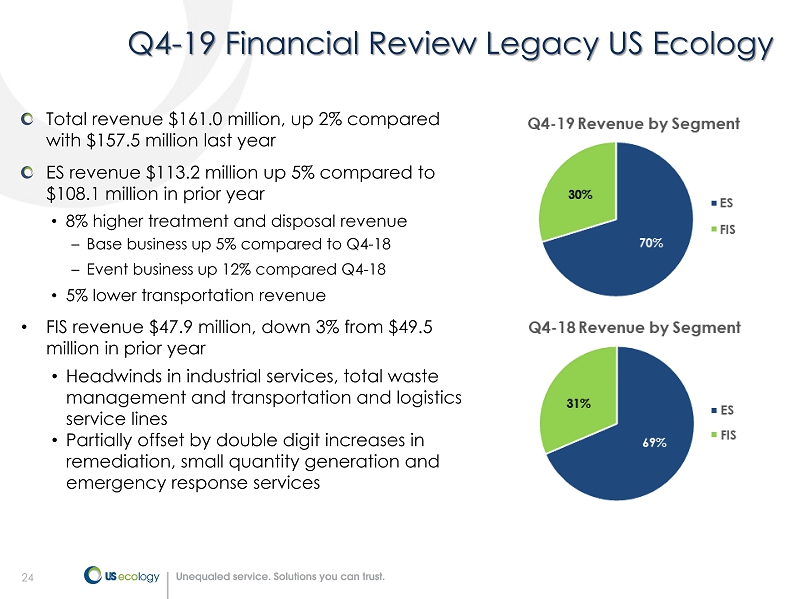
24 Q4 - 19 Financial Review Legacy US Ecology Total revenue $161.0 million, up 2% compared with $157.5 million last year ES revenue $113.2 million up 5% compared to $108.1 million in prior year • 8% higher treatment and disposal revenue – Base business up 5% compared to Q4 - 18 – Event business up 12% compared Q4 - 18 • 5% lower transportation revenue • FIS revenue $47.9 million, down 3% from $49.5 million in prior year • Headwinds in industrial services, total waste management and transportation and logistics service lines • Partially offset by double digit increases in remediation, small quantity generation and emergency response services
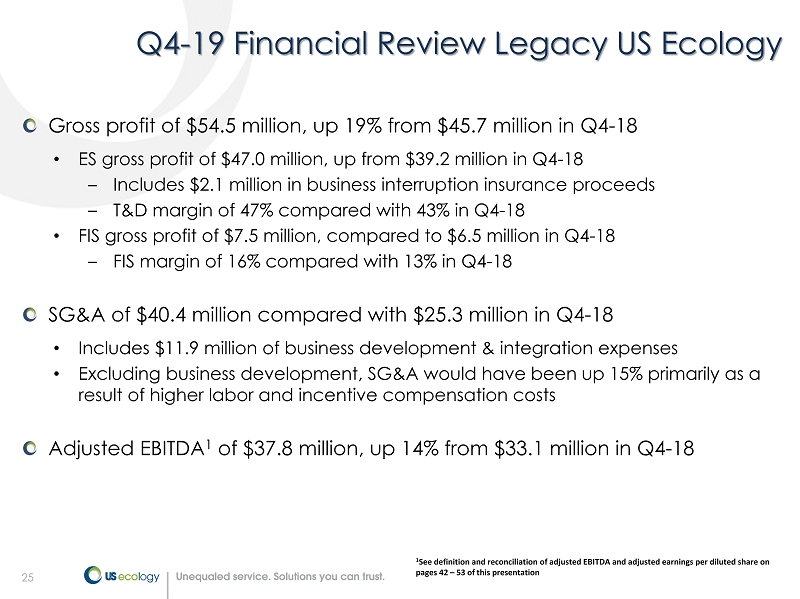
25 25 Q4 - 19 Financial Review Legacy US Ecology 1 See definition and reconciliation of adjusted EBITDA and adjusted earnings per diluted share on pages 42 – 53 of this presentation Gross profit of $54.5 million, up 19% from $45.7 million in Q4 - 18 • ES gross profit of $47.0 million, up from $39.2 million in Q4 - 18 – Includes $2.1 million in business interruption insurance proceeds – T&D margin of 47% compared with 43% in Q4 - 18 • FIS gross profit of $7.5 million, compared to $6.5 million in Q4 - 18 – FIS margin of 16% compared with 13% in Q4 - 18 SG&A of $40.4 million compared with $25.3 million in Q4 - 18 • Includes $11.9 million of business development & integration expenses • Excluding business development, SG&A would have been up 15% primarily as a result of higher labor and incentive compensation costs Adjusted EBITDA 1 of $37.8 million, up 14% from $33.1 million in Q4 - 18
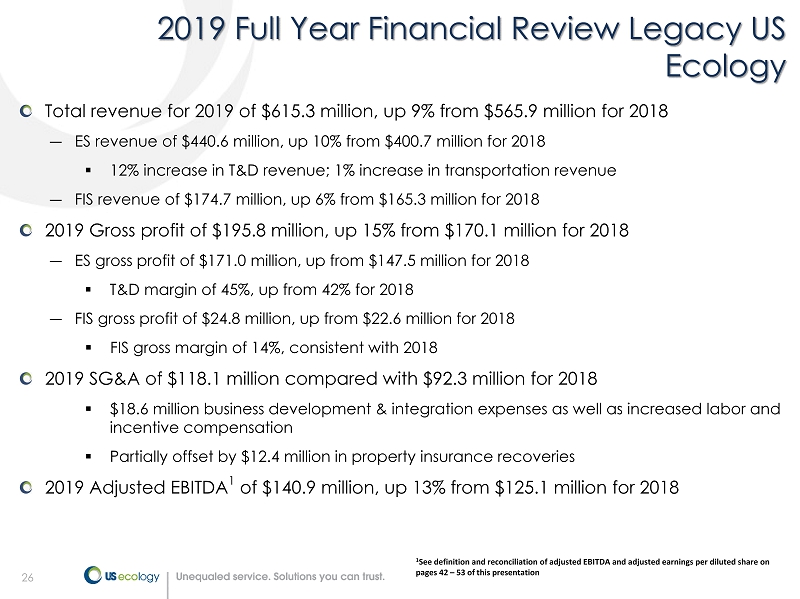
26 26 2019 Full Year Financial Review Legacy US Ecology 1 See definition and reconciliation of adjusted EBITDA and adjusted earnings per diluted share on pages 42 – 53 of this presentation Total revenue for 2019 of $615.3 million, up 9% from $565.9 million for 2018 ― ES revenue of $440.6 million, up 10% from $400.7 million for 2018 ▪ 12% increase in T&D revenue; 1% increase in transportation revenue ― FIS revenue of $174.7 million, up 6% from $165.3 million for 2018 2019 Gross profit of $195.8 million, up 15% from $170.1 million for 2018 ― ES gross profit of $171.0 million, up from $147.5 million for 2018 ▪ T&D margin of 45%, up from 42% for 2018 ― FIS gross profit of $24.8 million, up from $22.6 million for 2018 ▪ FIS gross margin of 14%, consistent with 2018 2019 SG&A of $118.1 million compared with $92.3 million for 2018 ▪ $18.6 million business development & integration expenses as well as increased labor and incentive compensation ▪ Partially offset by $12.4 million in property insurance recoveries 2019 Adjusted EBITDA 1 of $140.9 million, up 13% from $125.1 million for 2018
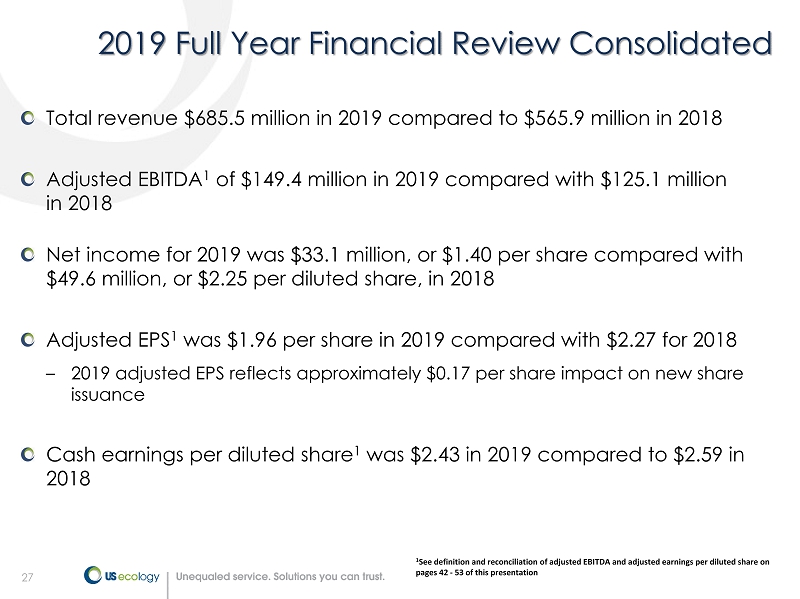
27 2019 Full Year Financial Review Consolidated 1 See definition and reconciliation of adjusted EBITDA and adjusted earnings per diluted share on pages 42 - 53 of this presentation Total revenue $685.5 million in 2019 compared to $565.9 million in 2018 Adjusted EBITDA 1 of $149.4 million in 2019 compared with $125.1 million in 2018 Net income for 2019 was $33.1 million, or $1.40 per share compared with $49.6 million, or $2.25 per diluted share, in 2018 Adjusted EPS 1 was $1.96 per share in 2019 compared with $2.27 for 2018 – 2019 adjusted EPS reflects approximately $0.17 per share impact on new share issuance Cash earnings per diluted share 1 was $2.43 in 2019 compared to $2.59 in 2018
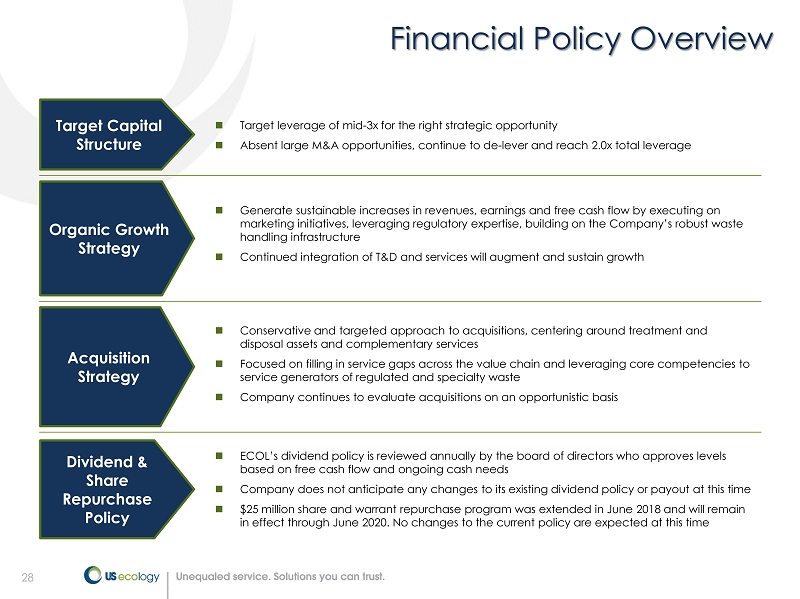
28 Financial Policy Overview Acquisition Strategy ☐ Conservative and targeted approach to acquisitions, centering around treatment and disposal assets and complementary services ☐ Focused on filling in service gaps across the value chain and leveraging core competencies to service generators of regulated and specialty waste ☐ Company continues to evaluate acquisitions on an opportunistic basis Organic Growth Strategy ☐ Generate sustainable increases in revenues, earnings and free cash flow by executing on marketing initiatives, leveraging regulatory expertise, building on the Company’s robust waste handling infrastructure ☐ Continued integration of T&D and services will augment and sustain growth Target Capital Structure ☐ Target leverage of mid - 3x for the right strategic opportunity ☐ Absent large M&A opportunities, continue to de - lever and reach 2.0x total leverage Dividend & Share Repurchase Policy ☐ ECOL’s dividend policy is reviewed annually by the board of directors who approves levels based on free cash flow and ongoing cash needs ☐ Company does not anticipate any changes to its existing dividend policy or payout at this time ☐ $25 million share and warrant repurchase program was extended in June 2018 and will remain in effect through June 2020. No changes to the current policy are expected at this time
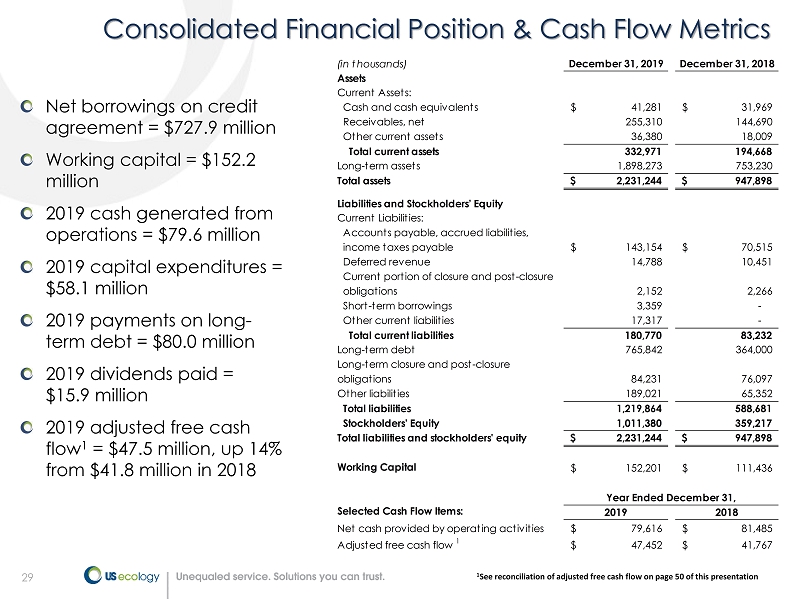
29 29 Consolidated Financial Position & Cash Flow Metrics Net borrowings on credit agreement = $727.9 million Working capital = $152.2 million 2019 cash generated from operations = $79.6 million 2019 capital expenditures = $58.1 million 2019 payments on long - term debt = $80.0 million 2019 dividends paid = $15.9 million 2019 adjusted free cash flow 1 = $47.5 million, up 14% from $41.8 million in 2018 1 See reconciliation of adjusted free cash flow on page 50 of this presentation (in thousands) December 31, 2019 December 31, 2018 Assets Current Assets: Cash and cash equivalents 41,281$ 31,969$ Receivables, net 255,310 144,690 Other current assets 36,380 18,009 Total current assets 332,971 194,668 Long-term assets 1,898,273 753,230 Total assets 2,231,244$ 947,898$ Liabilities and Stockholders’ Equity Current Liabilities: Accounts payable, accrued liabilities, income taxes payable 143,154$ 70,515$ Deferred revenue 14,788 10,451 Current portion of closure and post-closure obligations 2,152 2,266 Short-term borrowings 3,359 - Other current liabilities 17,317 - Total current liabilities 180,770 83,232 Long-term debt 765,842 364,000 Long-term closure and post-closure obligations 84,231 76,097 Other liabilities 189,021 65,352 Total liabilities 1,219,864 588,681 Stockholders’ Equity 1,011,380 359,217 Total liabilities and stockholders' equity 2,231,244$ 947,898$ Working Capital 152,201$ 111,436$ Selected Cash Flow Items: 2019 2018 Net cash provided by operating activities 79,616$ 81,485$ Adjusted free cash flow 1 47,452$ 41,767$ Year Ended December 31,
30 2020 Business Outlook –
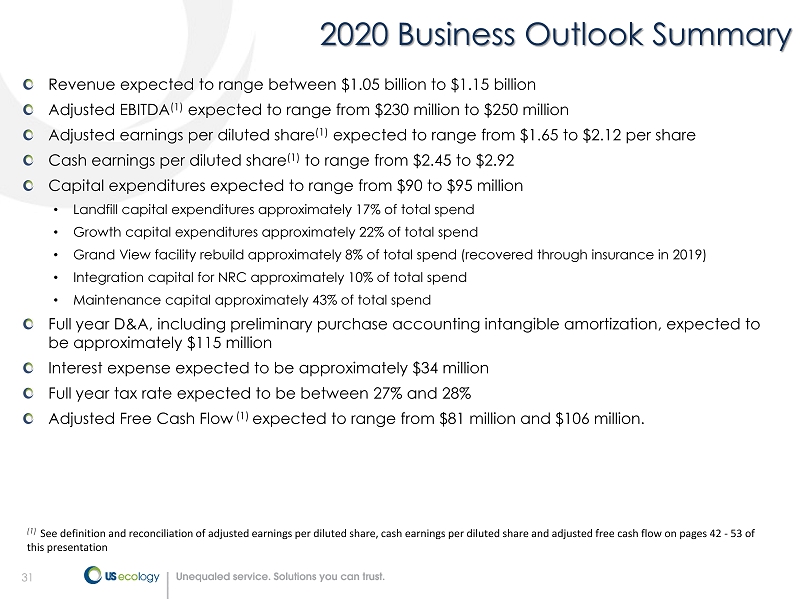
31 31 2020 Business Outlook Summary (1) See definition and reconciliation of adjusted earnings per diluted share, cash earnings per diluted share and adjusted free c ash flow on pages 42 - 53 of this presentation Revenue expected to range between $1.05 billion to $1.15 billion Adjusted EBITDA (1) expected to range from $230 million to $250 million Adjusted earnings per diluted share (1) expected to range from $1.65 to $2.12 per share Cash earnings per diluted share (1) to range from $2.45 to $2.92 Capital expenditures expected to range from $90 to $95 million • Landfill capital expenditures approximately 17% of total spend • Growth capital expenditures approximately 22% of total spend • Grand View facility rebuild approximately 8% of total spend (recovered through insurance in 2019) • Integration capital for NRC approximately 10% of total spend • Maintenance capital approximately 43% of total spend Full year D&A, including preliminary purchase accounting intangible amortization, expected to be approximately $115 million Interest expense expected to be approximately $34 million Full year tax rate expected to be between 27% and 28% Adjusted Free Cash Flow (1) expected to range from $81 million and $106 million.
32 32 Breaking Down Our 2020 Guidance The following slides have been added to provided clarity into our 2020 guidance Provides additional transparency on our business health and growth opportunities Provides more detail on the NRC opportunity and business Guidance on following slides uses the midpoint of our adjusted EBITDA range of $230 million to $250 million Legacy US Ecology and Legacy NRC business broken down for increased transparency
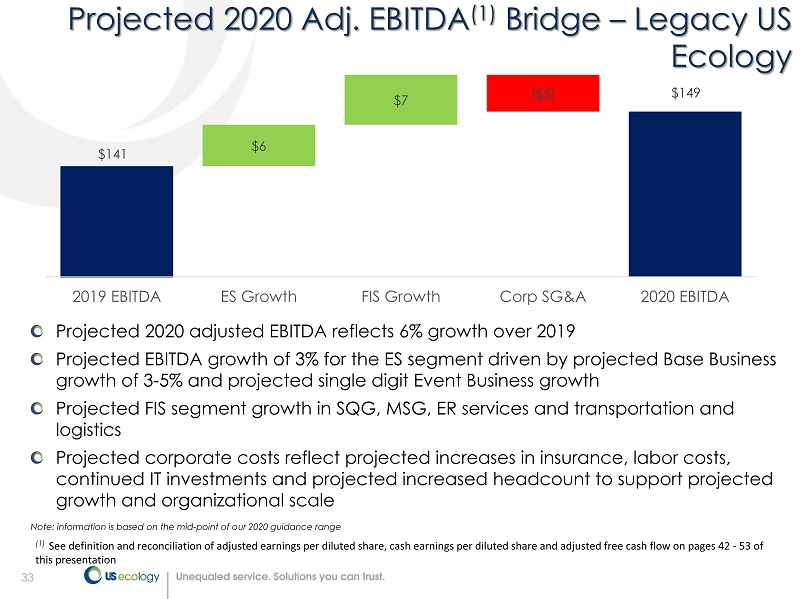
33 33 Projected 2020 Adj. EBITDA (1) Bridge – Legacy US Ecology Projected 2020 adjusted EBITDA reflects 6% growth over 2019 Projected EBITDA growth of 3% for the ES segment driven by projected Base Business growth of 3 - 5% and projected single digit Event Business growth Projected FIS segment growth in SQG, MSG, ER services and transportation and logistics Projected corporate costs reflect projected increases in insurance, labor costs, continued IT investments and projected increased headcount to support projected growth and organizational scale Note: information is based on the mid - point of our 2020 guidance range $149 ($5) $141 $6 $7 2019 EBITDA ES Growth FIS Growth Corp SG&A 2020 EBITDA (1) See definition and reconciliation of adjusted earnings per diluted share, cash earnings per diluted share and adjusted free c ash flow on pages 42 - 53 of this presentation
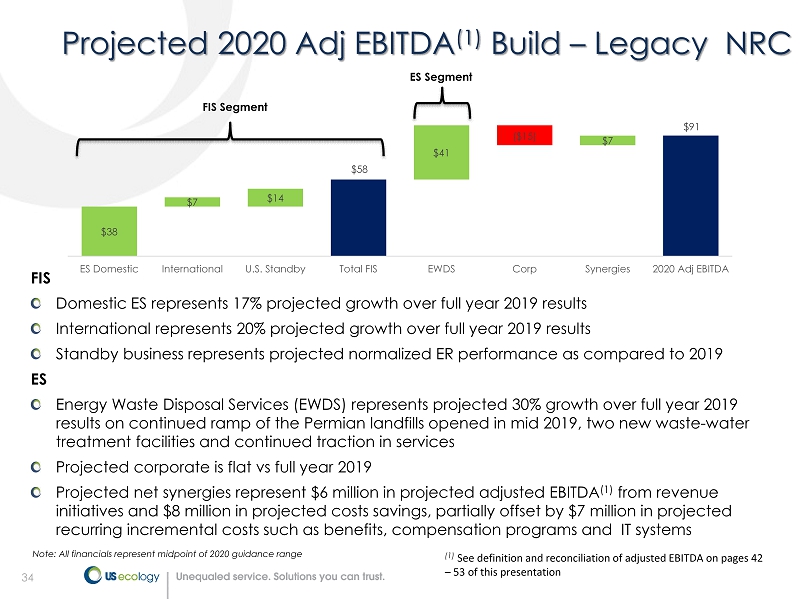
34 34 Projected 2020 Adj EBITDA (1) Build – Legacy NRC FIS Domestic ES represents 17% projected growth over full year 2019 results International represents 20% projected growth over full year 2019 results Standby business represents projected normalized ER performance as compared to 2019 ES Energy Waste Disposal Services (EWDS) represents projected 30% growth over full year 2019 results on continued ramp of the Permian landfills opened in mid 2019, two new waste - water treatment facilities and continued traction in services Projected corporate is flat vs full year 2019 Projected net synergies represent $6 million in projected adjusted EBITDA (1) from revenue initiatives and $8 million in projected costs savings, partially offset by $7 million in projected recurring incremental costs such as benefits, compensation programs and IT systems Note: All financials represent midpoint of 2020 guidance range $38 $7 $14 $58 $41 ($15) $7 $91 ES Domestic International U.S. Standby Total FIS EWDS Corp Synergies 2020 Adj EBITDA FIS Segment ES Segment (1) See definition and reconciliation of adjusted EBITDA on pages 42 – 53 of this presentation
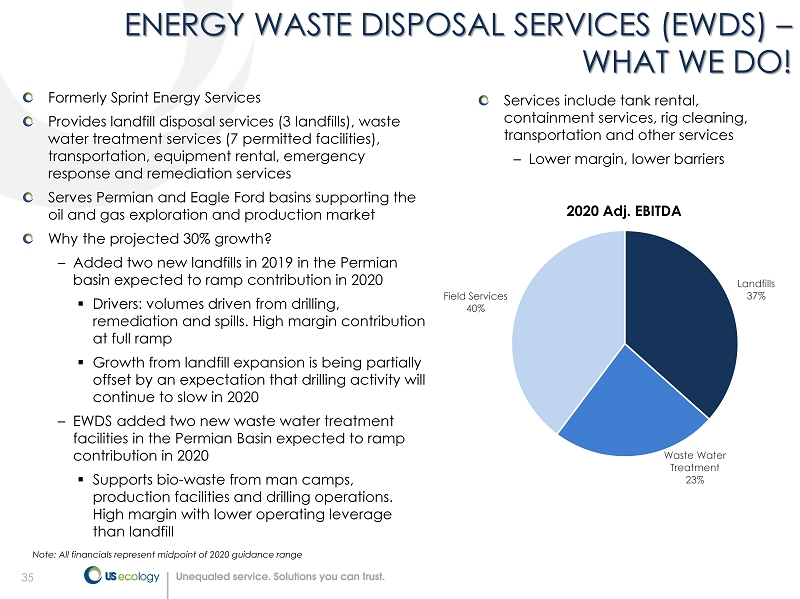
35 35 ENERGY WASTE DISPOSAL SERVICES (EWDS) – WHAT WE DO! Services include tank rental, containment services, rig cleaning, transportation and other services – Lower margin, lower barriers Formerly Sprint Energy Services Provides landfill disposal services (3 landfills), waste water treatment services (7 permitted facilities), transportation, equipment rental, emergency response and remediation services Serves Permian and Eagle Ford basins supporting the oil and gas exploration and production market Why the projected 30% growth? – Added two new landfills in 2019 in the Permian basin expected to ramp contribution in 2020 ▪ Drivers: volumes driven from drilling, remediation and spills. High margin contribution at full ramp ▪ Growth from landfill expansion is being partially offset by an expectation that drilling activity will continue to slow in 2020 – EWDS added two new waste water treatment facilities in the Permian Basin expected to ramp contribution in 2020 ▪ Supports bio - waste from man camps, production facilities and drilling operations. High margin with lower operating leverage than landfill Landfills 37% Waste Water Treatment 23% Field Services 40% 2020 Adj. EBITDA Note: All financials represent midpoint of 2020 guidance range
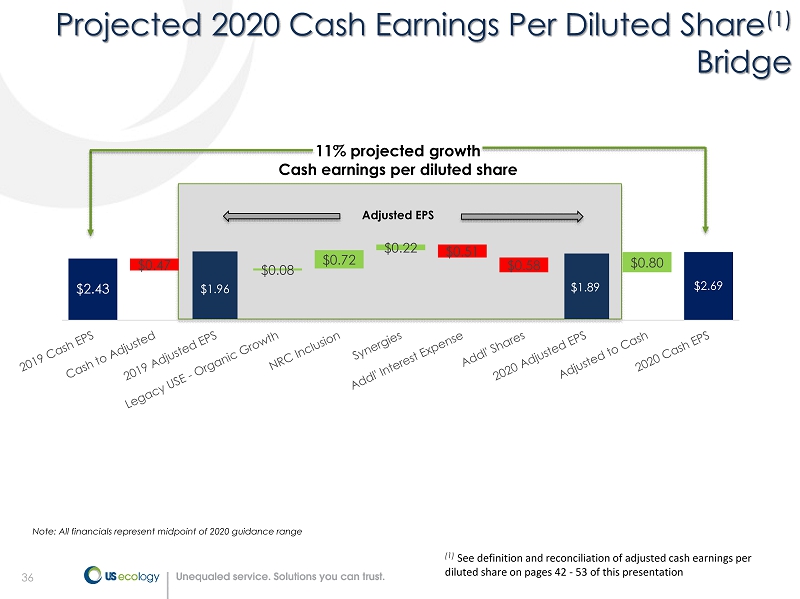
36 36 Projected 2020 Cash Earnings Per Diluted Share (1) Bridge 11% projected growth Cash earnings per diluted share $1.96 $1.89 $2.69 $0.47 $0.51 $0.58 $2.43 $0.08 $0.72 $0.22 $0.80 Adjusted EPS Note: All financials represent midpoint of 2020 guidance range (1) See definition and reconciliation of adjusted cash earnings per diluted share on pages 42 - 53 of this presentation
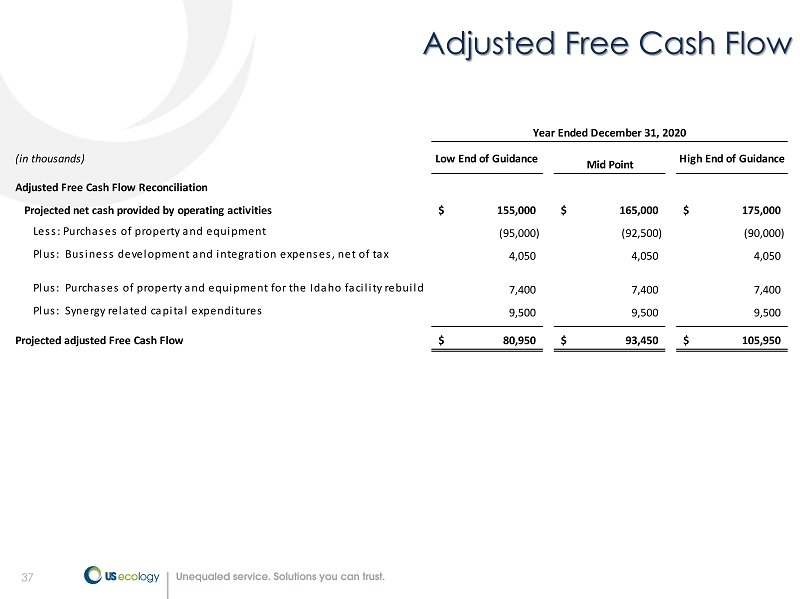
37 37 Adjusted Free Cash Flow (in thousands) Low End of Guidance Mid Point High End of Guidance Adjusted Free Cash Flow Reconciliation Projected net cash provided by operating activities 155,000$ 165,000$ 175,000$ Less: Purchases of property and equipment (95,000) (92,500) (90,000) Plus: Business development and integration expenses, net of tax 4,050 4,050 4,050 Plus: Purchases of property and equipment for the Idaho facility rebuild 7,400 7,400 7,400 Plus: Synergy related capital expenditures 9,500 9,500 9,500 Projected adjusted Free Cash Flow 80,950$ 93,450$ 105,950$ Year Ended December 31, 2020
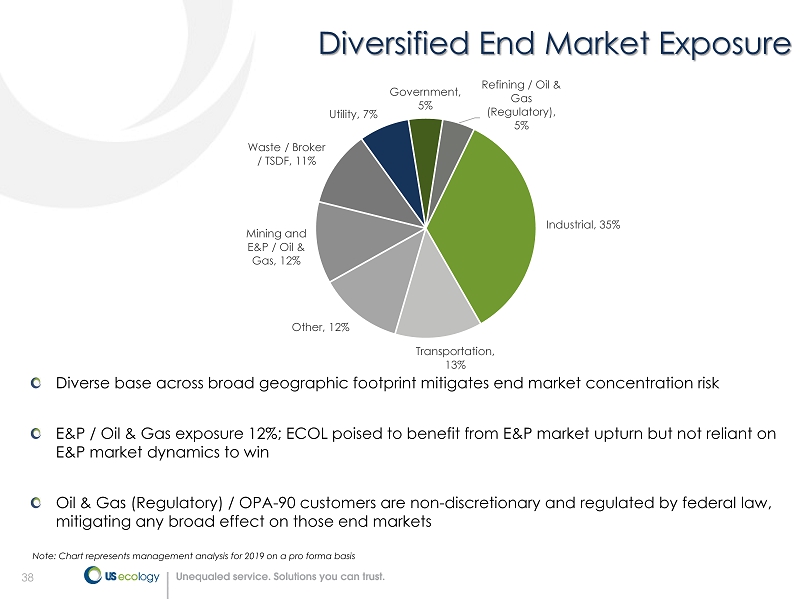
38 38 Diversified End Market Exposure Diverse base across broad geographic footprint mitigates end market concentration risk E&P / Oil & Gas exposure 12%; ECOL poised to benefit from E&P market upturn but not reliant on E&P market dynamics to win Oil & Gas (Regulatory) / OPA - 90 customers are non - discretionary and regulated by federal law, mitigating any broad effect on those end markets Note: Chart represents management analysis for 2019 on a pro forma basis Industrial , 35% Transportation , 13% Other , 12% Mining and E&P / Oil & Gas , 12% Waste / Broker / TSDF , 11% Utility , 7% Government , 5% Refining / Oil & Gas (Regulatory) , 5%
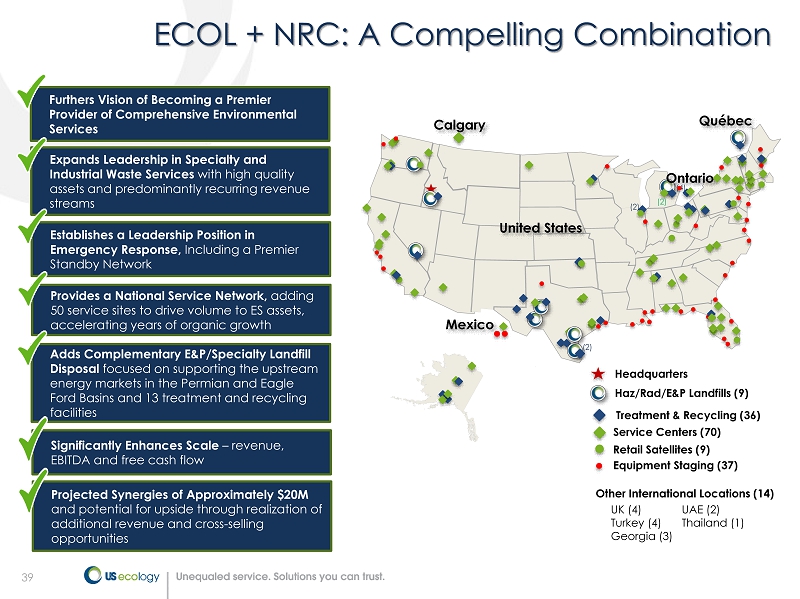
39 ECOL + NRC: A Compelling Combination (4) Mexico Québec (2) (2) United States (2) Ontario Equipment Staging (37) Haz/Rad/E&P Landfills (9) Treatment & Recycling (36) Service Centers (70) Headquarters Retail Satellites (9) Furthers Vision of Becoming a Premier Provider of Comprehensive Environmental Services Expands Leadership in Specialty and Industrial Waste Services with high quality assets and predominantly recurring revenue streams Establishes a Leadership Position in Emergency Response, Including a Premier Standby Network Significantly Enhances Scale – revenue, EBITDA and free cash flow Provides a National Service Network, adding 50 service sites to drive volume to ES assets, accelerating years of organic growth Adds Complementary E&P/Specialty Landfill Disposal focused on supporting the upstream energy markets in the Permian and Eagle Ford Basins and 13 treatment and recycling facilities Projected Synergies of Approximately $20M and potential for upside through realization of additional revenue and cross - selling opportunities Calgary Other International Locations (14) UK (4) UAE (2) Turkey (4) Thailand (1) Georgia (3)
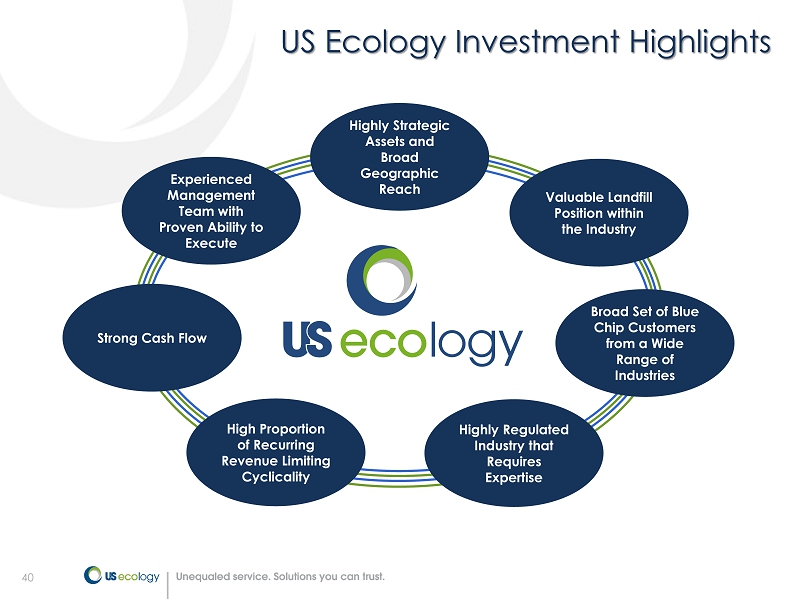
40 Experienced Management Team with Proven Ability to Execute Valuable Landfill Position within the Industry Broad Set of Blue Chip Customers from a Wide Range of Industries Strong Cash Flow Highly Strategic Assets and Broad Geographic Reach US Ecology Investment Highlights High Proportion of Recurring Revenue Limiting Cyclicality Highly Regulated Industry that Requires Expertise

41 Appendix
42 US Ecology reports adjusted EBITDA, adjusted earnings per diluted share, cash earnings per diluted share and adjusted free cash flow, which are non - GAAP financial measures, as a complement to results provided in accordance with generally accepted accounting principles in the United States (“GAAP”) and believes that such information provides analysts, stockholders, and other users information to better understand the Company’s operating performance. Because adjusted EBITDA, adjusted earnings per diluted share, cash earnings per diluted share and adjusted free cash flow are not measurements determined in accordance with GAAP and are thus susceptible to varying calculations they may not be comparable to similar measures used by other companies. Items excluded from adjusted EBITDA, adjusted earnings per diluted share, cash earnings per diluted share and adjusted free cash flow are significant components in understanding and assessing financial performance. Adjusted EBITDA, adjusted earnings per diluted share, cash earnings per diluted share and adjusted free cash flow should not be considered in isolation or as an alternative to, or substitute for, net income, cash flows generated by operations, investing or financing activities, or other financial statement data presented in the consolidated financial statements as indicators of financial performance or liquidity. Adjusted EBITDA, adjusted earnings per diluted share, cash earnings per diluted share and adjusted free cash flow have limitations as analytical tools and should not be considered in isolation or a substitute for analyzing our results as reported under GAAP. 42 Non - GAAP Financial Measures
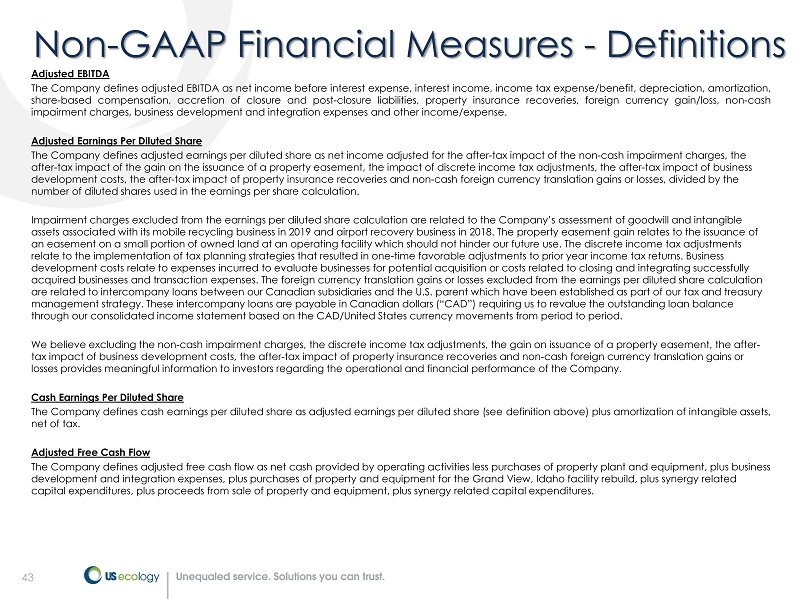
43 Adjusted EBITDA The Company defines adjusted EBITDA as net income before interest expense, interest income, income tax expense/benefit, depreciation, amortization, share - based compensation, accretion of closure and post - closure liabilities, property insurance recoveries, foreign currency gain/loss, non - cash impairment charges, business development and integration expenses and other income/expense . Adjusted Earnings Per Diluted Share The Company defines adjusted earnings per diluted share as net income adjusted for the after - tax impact of the non - cash impairme nt charges, the after - tax impact of the gain on the issuance of a property easement, the impact of discrete income tax adjustments, the after - ta x impact of business development costs, the after - tax impact of property insurance recoveries and non - cash foreign currency translation gains or loss es, divided by the number of diluted shares used in the earnings per share calculation. Impairment charges excluded from the earnings per diluted share calculation are related to the Company’s assessment of goodwi ll and intangible assets associated with its mobile recycling business in 2019 and airport recovery business in 2018. The property easement gai n r elates to the issuance of an easement on a small portion of owned land at an operating facility which should not hinder our future use. The discrete in com e tax adjustments relate to the implementation of tax planning strategies that resulted in one - time favorable adjustments to prior year income tax returns. Business development costs relate to expenses incurred to evaluate businesses for potential acquisition or costs related to closing an d i ntegrating successfully acquired businesses and transaction expenses. The foreign currency translation gains or losses excluded from the earnings per di luted share calculation are related to intercompany loans between our Canadian subsidiaries and the U.S. parent which have been established as part o f o ur tax and treasury management strategy. These intercompany loans are payable in Canadian dollars (“CAD”) requiring us to revalue the outstanding lo an balance through our consolidated income statement based on the CAD/United States currency movements from period to period. We believe excluding the non - cash impairment charges, the discrete income tax adjustments, the gain on issuance of a property ea sement, the after - tax impact of business development costs, the after - tax impact of property insurance recoveries and non - cash foreign currency tr anslation gains or losses provides meaningful information to investors regarding the operational and financial performance of the Company. Cash Earnings Per Diluted Share The Company defines cash earnings per diluted share as adjusted earnings per diluted share (see definition above) plus amorti zat ion of intangible assets, net of tax. Adjusted Free Cash Flow The Company defines adjusted free cash flow as net cash provided by operating activities less purchases of property plant and eq uipment, plus business development and integration expenses, plus purchases of property and equipment for the Grand View, Idaho facility rebuild, pl us synergy related capital expenditures, plus proceeds from sale of property and equipment, plus synergy related capital expenditures. 43 Non - GAAP Financial Measures - Definitions

44 44 Consolidated Financial Results: Q4 - 19 vs. Q4 - 18 1 Includes pre - tax business development expenses of $19.5 million and $530,000 for the three months ended December 31, 2019 and 20 18, respectively. (in thousands, except per share data) 2019 2018 $ Change % Change Revenue $ 231,268 $ 157,541 $ 73,727 46.8% Gross profit 68,470 45,675 22,795 49.9% SG&A 1 63,440 25,303 38,137 150.7% Goodwill & intangible asset impairment charges - - - n/m Operating income 1 5,030 20,372 (15,342) -75.3% Interest expense, net (7,692) (3,230) (4,462) 138.1% Foreign currency (loss) gain (120) 511 (631) -123.5% Other income 113 137 (24) -17.5% Income before income taxes (2,669) 17,790 (20,459) -115.0% Income tax expense 795 4,085 (3,290) -80.5% Net income $ (3,464) $ 13,705 $ (17,169) -125.3% Earnings per share: Basic $ (0.12) $ 0.64 $ (0.76) -118.8% Diluted $ (0.12) $ 0.62 $ (0.74) -119.4% Shares used in earnings per share calculation: Basic 27,916 21,957 Diluted 27,916 22,109 Three months Ended December 31,
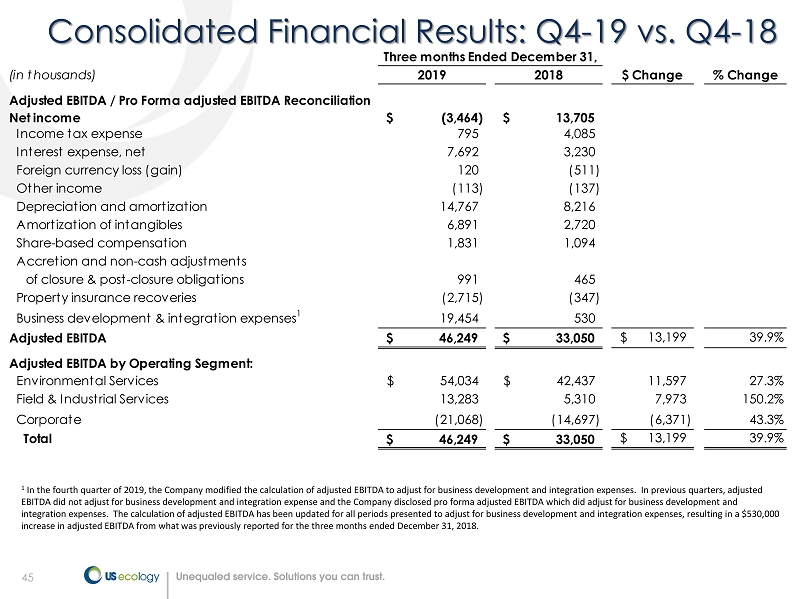
45 45 Consolidated Financial Results: Q4 - 19 vs. Q4 - 18 (in thousands) 2019 2018 $ Change % Change Adjusted EBITDA / Pro Forma adjusted EBITDA Reconciliation Net income (3,464)$ 13,705$ Income tax expense 795 4,085 Interest expense, net 7,692 3,230 Foreign currency loss (gain) 120 (511) Other income (113) (137) Depreciation and amortization 14,767 8,216 Amortization of intangibles 6,891 2,720 Share-based compensation 1,831 1,094 Accretion and non-cash adjustments of closure & post-closure obligations 991 465 Property insurance recoveries (2,715) (347) Business development & integration expenses 1 19,454 530 Adjusted EBITDA 46,249$ 33,050$ 13,199$ 39.9% Adjusted EBITDA by Operating Segment: Environmental Services 54,034$ 42,437$ 11,597 27.3% Field & Industrial Services 13,283 5,310 7,973 150.2% Corporate (21,068) (14,697) (6,371) 43.3% Total 46,249$ 33,050$ 13,199$ 39.9% Three months Ended December 31, 1 In the fourth quarter of 2019, the Company modified the calculation of adjusted EBITDA to adjust for business development and in tegration expenses. In previous quarters, adjusted EBITDA did not adjust for business development and integration expense and the Company disclosed pro forma adjusted EBITDA wh ich did adjust for business development and integration expenses. The calculation of adjusted EBITDA has been updated for all periods presented to adjust for business d eve lopment and integration expenses, resulting in a $530,000 increase in adjusted EBITDA from what was previously reported for the three months ended December 31, 2018.
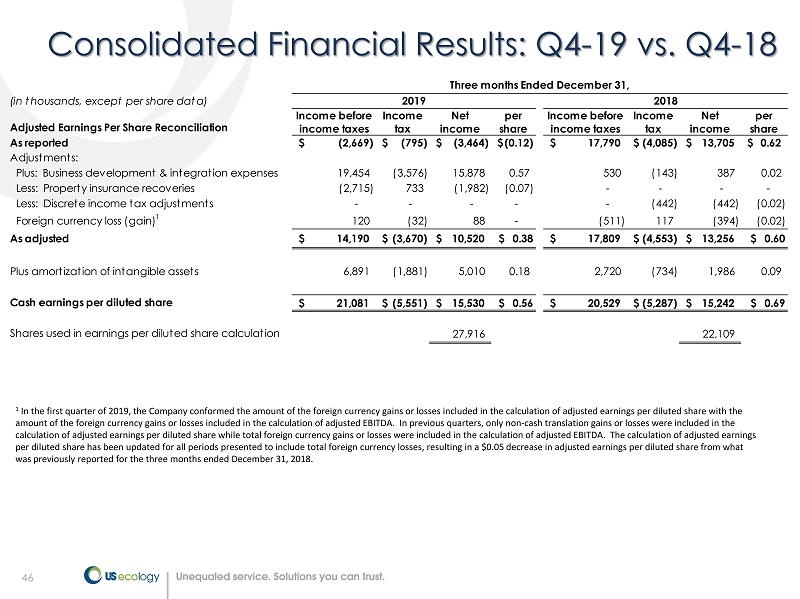
46 46 1 In the first quarter of 2019, the Company conformed the amount of the foreign currency gains or losses included in the calcul ati on of adjusted earnings per diluted share with the amount of the foreign currency gains or losses included in the calculation of adjusted EBITDA. In previous quarters, only no n - c ash translation gains or losses were included in the calculation of adjusted earnings per diluted share while total foreign currency gains or losses were included in the calculat ion of adjusted EBITDA. The calculation of adjusted earnings per diluted share has been updated for all periods presented to include total foreign currency losses, resulting in a $0.05 d ecr ease in adjusted earnings per diluted share from what was previously reported for the three months ended December 31, 2018. Consolidated Financial Results: Q4 - 19 vs. Q4 - 18 (in thousands, except per share data) Adjusted Earnings Per Share Reconciliation Income before income taxes Income tax Net income per share Income before income taxes Income tax Net income per share As reported (2,669)$ (795)$ (3,464)$ (0.12)$ 17,790$ (4,085)$ 13,705$ 0.62$ Adjustments: Plus: Business development & integration expenses 19,454 (3,576) 15,878 0.57 530 (143) 387 0.02 Less: Property insurance recoveries (2,715) 733 (1,982) (0.07) - - - - Less: Discrete income tax adjustments - - - - - (442) (442) (0.02) Foreign currency loss (gain) 1 120 (32) 88 - (511) 117 (394) (0.02) As adjusted 14,190$ (3,670)$ 10,520$ $ 0.38 17,809$ (4,553)$ 13,256$ $ 0.60 Plus amortization of intangible assets 6,891 (1,881) 5,010 0.18 2,720 (734) 1,986 0.09 Cash earnings per diluted share 21,081$ (5,551)$ 15,530$ $ 0.56 20,529$ (5,287)$ 15,242$ $ 0.69 Shares used in earnings per diluted share calculation 27,916 22,109 Three months Ended December 31, 2019 2018

47 47 Consolidated Financial Results: 2019 vs. 2018 (in thousands, except per share data) 2019 2018 $ Change % Change Revenue $ 685,509 $ 565,928 $ 119,581 21.1% Gross profit 209,834 170,094 39,740 23.4% SG&A 1 141,123 92,340 48,783 52.8% Goodwill & intangible asset impairment charges - 3,666 (3,666) -100.0% Operating income 1 68,711 74,088 (5,377) -7.3% Interest expense, net (18,634) (11,915) (6,719) 56.4% Foreign currency (loss) gain (733) 55 (788) -1432.7% Other income 455 2,630 (2,175) -82.7% Income before income taxes 49,799 64,858 (15,059) -23.2% Income tax expense 16,659 15,263 1,396 9.1% Net income $ 33,140 $ 49,595 $ (16,455) -33.2% Earnings per share: Basic $ 1.41 $ 2.27 $ (0.86) -37.9% Diluted $ 1.40 $ 2.25 $ (0.85) -37.8% Shares used in earnings per share calculation: Basic 23,521 21,888 Diluted 23,749 22,047 Year Ended December 31, 1 Includes pre - tax business development expenses of $26.2 million and $748,000 for the year ended December 31, 2019 and 2018, resp ectively.
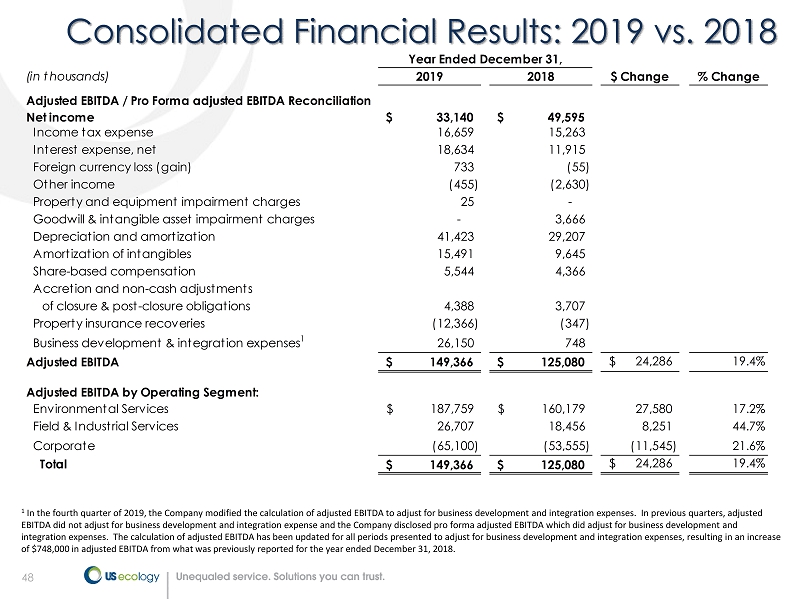
48 48 Consolidated Financial Results: 2019 vs. 2018 (in thousands) 2019 2018 $ Change % Change Adjusted EBITDA / Pro Forma adjusted EBITDA Reconciliation Net income 33,140$ 49,595$ Income tax expense 16,659 15,263 Interest expense, net 18,634 11,915 Foreign currency loss (gain) 733 (55) Other income (455) (2,630) Property and equipment impairment charges 25 - Goodwill & intangible asset impairment charges - 3,666 Depreciation and amortization 41,423 29,207 Amortization of intangibles 15,491 9,645 Share-based compensation 5,544 4,366 Accretion and non-cash adjustments of closure & post-closure obligations 4,388 3,707 Property insurance recoveries (12,366) (347) Business development & integration expenses 1 26,150 748 Adjusted EBITDA 149,366$ 125,080$ 24,286$ 19.4% Adjusted EBITDA by Operating Segment: Environmental Services 187,759$ 160,179$ 27,580 17.2% Field & Industrial Services 26,707 18,456 8,251 44.7% Corporate (65,100) (53,555) (11,545) 21.6% Total 149,366$ 125,080$ 24,286$ 19.4% Year Ended December 31, 1 In the fourth quarter of 2019, the Company modified the calculation of adjusted EBITDA to adjust for business development and in tegration expenses. In previous quarters, adjusted EBITDA did not adjust for business development and integration expense and the Company disclosed pro forma adjusted EBITDA wh ich did adjust for business development and integration expenses. The calculation of adjusted EBITDA has been updated for all periods presented to adjust for business d eve lopment and integration expenses, resulting in an increase of $748,000 in adjusted EBITDA from what was previously reported for the year ended December 31, 2018.
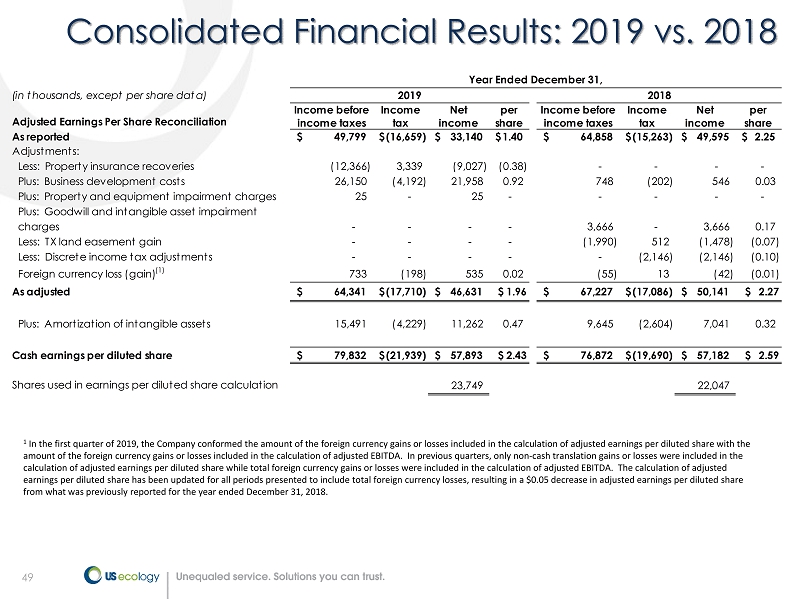
49 49 Consolidated Financial Results: 2019 vs. 2018 (in thousands, except per share data) Adjusted Earnings Per Share Reconciliation Income before income taxes Income tax Net income per share Income before income taxes Income tax Net income per share As reported 49,799$ (16,659)$ 33,140$ 1.40$ 64,858$ (15,263)$ 49,595$ 2.25$ Adjustments: Less: Property insurance recoveries (12,366) 3,339 (9,027) (0.38) - - - - Plus: Business development costs 26,150 (4,192) 21,958 0.92 748 (202) 546 0.03 Plus: Property and equipment impairment charges 25 - 25 - - - - - Plus: Goodwill and intangible asset impairment charges - - - - 3,666 - 3,666 0.17 Less: TX land easement gain - - - - (1,990) 512 (1,478) (0.07) Less: Discrete income tax adjustments - - - - - (2,146) (2,146) (0.10) Foreign currency loss (gain) (1) 733 (198) 535 0.02 (55) 13 (42) (0.01) As adjusted 64,341$ (17,710)$ 46,631$ $ 1.96 67,227$ (17,086)$ 50,141$ $ 2.27 Plus: Amortization of intangible assets 15,491 (4,229) 11,262 0.47 9,645 (2,604) 7,041 0.32 Cash earnings per diluted share 79,832$ (21,939)$ 57,893$ $ 2.43 76,872$ (19,690)$ 57,182$ $ 2.59 Shares used in earnings per diluted share calculation 23,749 22,047 Year Ended December 31, 2019 2018 1 In the first quarter of 2019, the Company conformed the amount of the foreign currency gains or losses included in the calcul ati on of adjusted earnings per diluted share with the amount of the foreign currency gains or losses included in the calculation of adjusted EBITDA. In previous quarters, only no n - c ash translation gains or losses were included in the calculation of adjusted earnings per diluted share while total foreign currency gains or losses were included in the calculat ion of adjusted EBITDA. The calculation of adjusted earnings per diluted share has been updated for all periods presented to include total foreign currency losses, resulting in a $ 0.05 decrease in adjusted earnings per diluted share from what was previously reported for the year ended December 31, 2018.
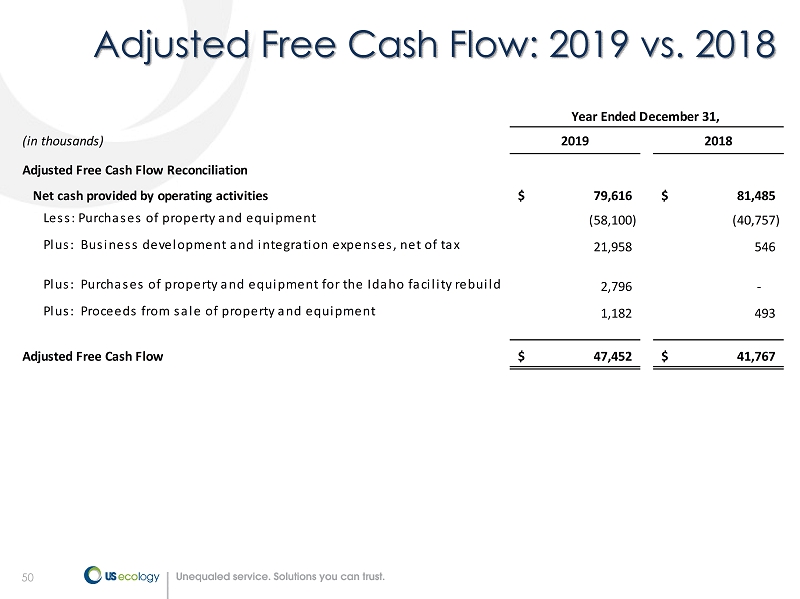
50 50 Adjusted Free Cash Flow: 2019 vs. 2018 (in thousands) 2019 2018 Adjusted Free Cash Flow Reconciliation Net cash provided by operating activities 79,616$ 81,485$ Less: Purchases of property and equipment (58,100) (40,757) Plus: Business development and integration expenses, net of tax 21,958 546 Plus: Purchases of property and equipment for the Idaho facility rebuild 2,796 - Plus: Proceeds from sale of property and equipment 1,182 493 Adjusted Free Cash Flow 47,452$ 41,767$ Year Ended December 31,
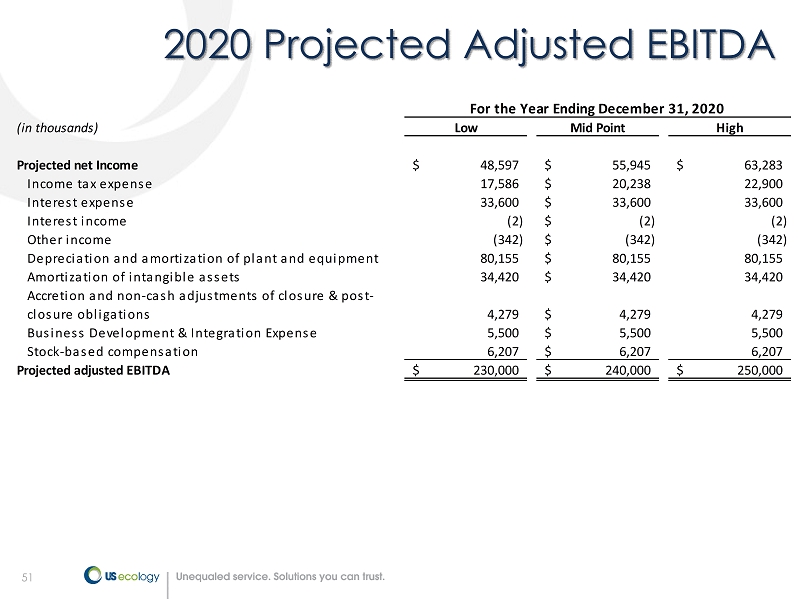
51 51 2020 Projected Adjusted EBITDA (in thousands) Low Mid Point High Projected net Income 48,597$ 55,945$ 63,283$ Income tax expense 17,586 20,238$ 22,900 Interest expense 33,600 33,600$ 33,600 Interest income (2) (2)$ (2) Other income (342) (342)$ (342) Depreciation and amortization of plant and equipment 80,155 80,155$ 80,155 Amortization of intangible assets 34,420 34,420$ 34,420 Accretion and non-cash adjustments of closure & post- closure obligations 4,279 4,279$ 4,279 Business Development & Integration Expense 5,500 5,500$ 5,500 Stock-based compensation 6,207 6,207$ 6,207 Projected adjusted EBITDA 230,000$ 240,000$ 250,000$ For the Year Ending December 31, 2020

52 52 2020 Projected Adjusted EPS and Cash EPS Low Mid Point High Projected earnings per diluted share 1.53$ 1.77$ 2.00$ Adjustments: Plus: projected business development & integration expenses 0.12 0.12 0.12 As Adjusted 1.65$ 1.89$ 2.12$ Plus: projected amortization of Intangible assets 0.80 0.80 0.80 Projected cash EPS 2.45$ 2.69$ 2.92$ Shares used in earnings per diluted share calculation 31,700 31,700 31,700 For the Year Ending December 31, 2019
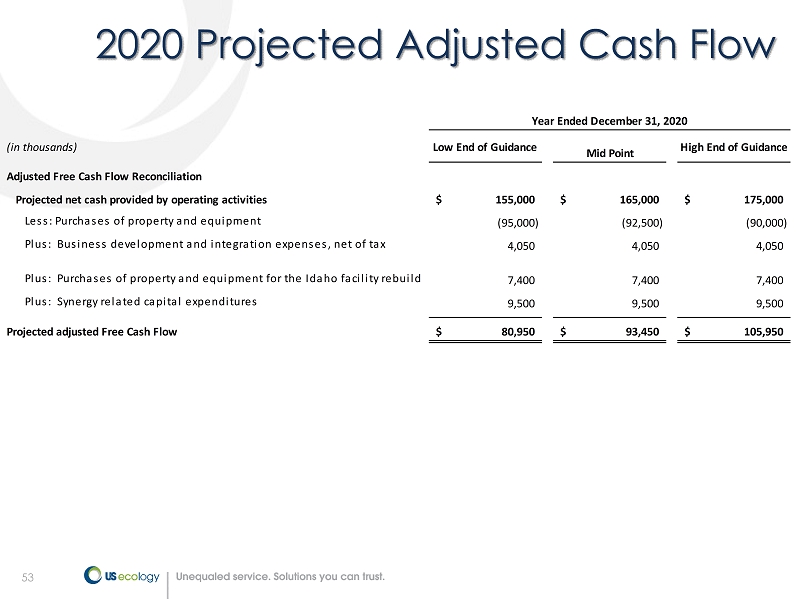
53 53 2020 Projected Adjusted Cash Flow (in thousands) Low End of Guidance Mid Point High End of Guidance Adjusted Free Cash Flow Reconciliation Projected net cash provided by operating activities 155,000$ 165,000$ 175,000$ Less: Purchases of property and equipment (95,000) (92,500) (90,000) Plus: Business development and integration expenses, net of tax 4,050 4,050 4,050 Plus: Purchases of property and equipment for the Idaho facility rebuild 7,400 7,400 7,400 Plus: Synergy related capital expenditures 9,500 9,500 9,500 Projected adjusted Free Cash Flow 80,950$ 93,450$ 105,950$ Year Ended December 31, 2020