Exhibit 99.1

1 November 2020 Investor Presentation
2 Safe Harbor These slides contain (and the accompanying oral discussion will contain) forward - looking statements” within the meaning of the Private Securities Litigation Reform Act of 1995 . Forward looking statements are only predictions and are not guarantees of performance . These statements are based on management’s beliefs and assumptions, which in turn are based on currently available information . Important assumptions include, among others, those regarding demand for the Company’s services, expansion of service offerings geographically or through new or expanded service lines, the timing and cost of planned capital expenditures, competitive conditions and general economic conditions . These assumptions could prove inaccurate . Forward looking statements also involve known and unknown risks and uncertainties, which could cause actual results to differ materially from those contained in any forward - looking statement . Many of these factors are beyond our ability to control or predict . Such factors include developments related to the COVID - 19 pandemic, fluctuations in commodity markets related to our business, the integration of NRC’s operations, the loss or failure to renew significant contracts, competition in our markets, adverse economic conditions, our compliance with applicable laws and regulations, potential liability in connection with providing oil spill response services and waste disposal services, the effect of existing or future laws and regulations related to greenhouse gases and climate change, the effect of our failure to comply with U . S . or foreign anti - bribery laws, the effect of compliance with laws and regulations, an accident at one of our facilities, incidents arising out of the handling of dangerous substances, our failure to maintain an acceptable safety record, our ability to perform under required contracts, limitations on our available cash flow as a result of our indebtedness, liabilities arising from our participation in multi - employer pension plans, the effect of changes in the method of determining the London Interbank Offered Rate (LIBOR”) or the replacement thereto, risks associated with our international operations, the impact of changes to U . S . tariff and import and export regulations, a change in NRC’s classification as an Oil Spill Removal Organization, cyber security threats, unanticipated changes in tax rules and regulations, loss of key personnel, a deterioration in our labor relations or labor disputes, our reliance on third - party contractors to provide emergency response services, our access to insurance, surety bonds and other financial assurances, our litigation risk not covered by insurance, the replacement of non - recurring event projects, our ability to permit and contract for timely construction of new or expanded disposal space, renewals of our operating permits or lease agreements with regulatory bodies, our access to cost - effective transportation services, lawsuits, our implementation of new technologies, fluctuations in foreign currency markets and foreign affairs, our integration of acquired businesses, our ability to pay dividends or repurchase stock, anti - takeover regulations, stock market volatility, the failure of the warrants to be in the money or their expiration worthless and risks related to our compliance with maritime regulations (including the Jones Act) . Except as required by applicable law, including the securities laws of the United States and the rules and regulations of the Securities and Exchange Commission (the SEC”), we are under no obligation to publicly update or revise any forward looking statements, whether as a result of new information, future events or otherwise . You should not place undue reliance on our forward - looking statements . Although we believe that the expectations reflected in forward looking statements are reasonable, we cannot guarantee future results or performance . Such statements involve known and unknown risks, uncertainties and other factors that could cause the actual results of the Company to differ materially from the results implied by such statements, including general economic and business conditions, conditions affecting the industries served by the Company and its subsidiaries, conditions affecting the Company’s customers, competitor responses to the Company’s products and services, the overall market acceptance of such products and services, the integration of acquisitions, and other factors disclosed in the Company’s periodic reports filed with the Securities and Exchange Commission (SEC”) . We refer investors to review such factors in our 2019 Form 10 - K filed with the SEC on March 2 , 2020 . Such statements may include, but are not limited to, statements about the Company’s business outlook and financial guidance and other statements that are not historical facts including any statements, expectations or impacts of the COVID - 19 pandemic . Consequently such forward looking statements should be regarded as the Company’s current plans, estimates and beliefs . The Company does not undertake and specifically declines any obligation to publicly release the results of any revisions to these forward - looking statements that may be made to reflect any future events or circumstances after the date of such statements or to reflect the occurrence of anticipated or unanticipated events .
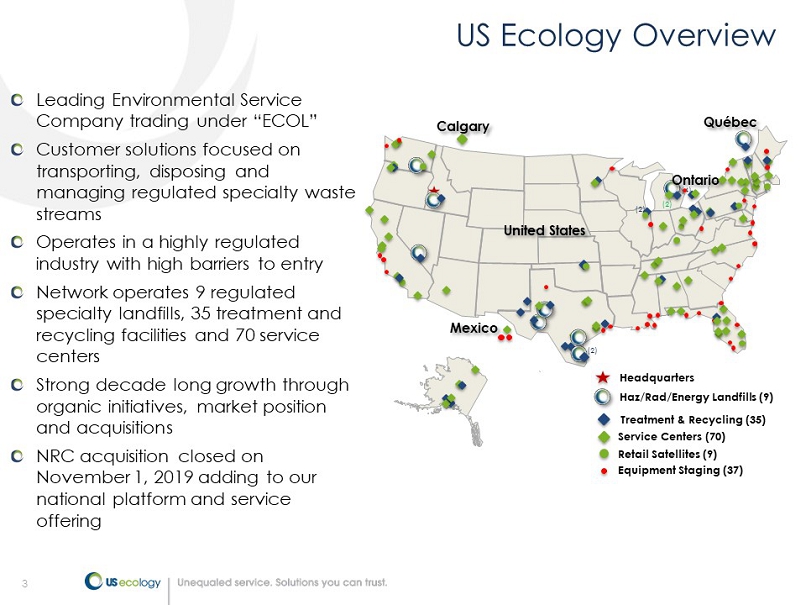
3 US Ecology Overview (4) Mexico Québec (2) (2) United States (2) Ontario Equipment Staging (37) Haz/Rad/Energy Landfills (9) Treatment & Recycling (35) Service Centers (70) Headquarters Retail Satellites (9) Calgary Leading Environmental Service Company trading under ECOL” Customer solutions focused on transporting, disposing and managing regulated specialty waste streams Operates in a highly regulated industry with high barriers to entry Network operates 9 regulated specialty landfills, 35 treatment and recycling facilities and 70 service centers Strong decade long growth through organic initiatives, market position and acquisitions NRC acquisition closed on November 1, 2019 adding to our national platform and service offering
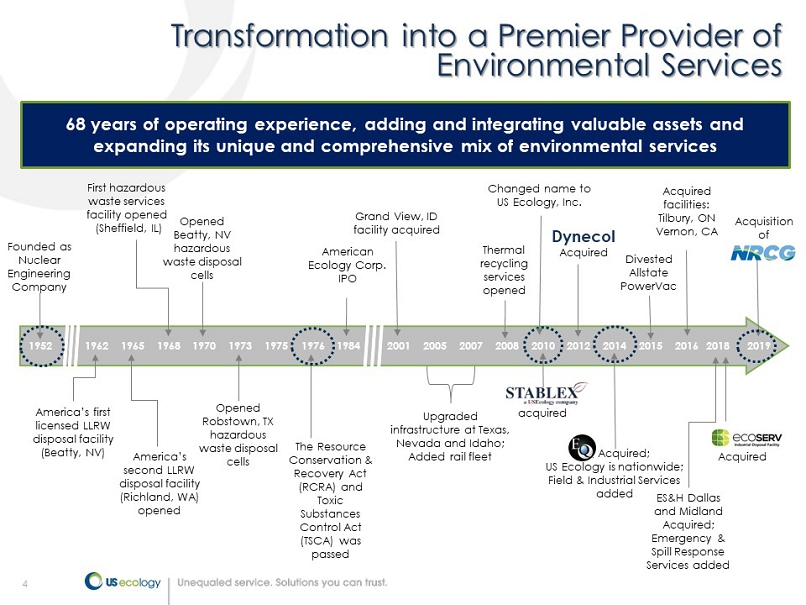
4 68 years of operating experience, adding and integrating valuable assets and expanding its unique and comprehensive mix of environmental services 4 acquired Grand View, ID facility acquired 2001 2008 Thermal recycling services opened 1984 1952 1965 Founded as Nuclear Engineering Company America’s second LLRW disposal facility ( Richland, WA) opened 1968 First hazardous waste services facility opened (Sheffield, IL) 1962 America’s first licensed LLRW disposal facility (Beatty, NV) 1973 Opened Robstown, TX hazardous waste disposal cells 2007 2005 Changed name to US Ecology, Inc. 2010 American Ecology Corp. IPO 1970 Opened Beatty, NV hazardous waste disposal cells 1975 1976 The Resource Conservation & Recovery Act (RCRA) and Toxic Substances Control Act (TSCA) was passed Upgraded infrastructure at Texas, Nevada and Idaho; Added rail fleet 2012 Acquired 2014 EQ Acquired; US Ecology is nationwide; Field & Industrial Services added 2018 Acquired facilities: Tilbury, ON Vernon, CA Divested Allstate PowerVac 2015 ES&H Dallas and Midland Acquired; Emergency & Spill Response Services added 2016 Acquired 2019 Acquisition of Transformation into a Premier Provider of Environmental Services Dynecol

5 ECOL + NRC: A Compelling Combination (4) Mexico Québec (2) (2) United States (2) Ontario Equipment Staging (37) Haz/Rad/Energy Landfills (9) Treatment & Recycling (35) Service Centers (70) Headquarters Retail Satellites (9) Furthers Vision of Becoming a Premier Provider of Comprehensive Environmental Services Expands Leadership in Specialty and Industrial Waste Services Establishes a Leadership Position in Emergency Response Significantly Enhances Scale and Free Cash Flow Provides a National Service Network Adds Complementary Energy Waste/Specialty Landfill Disposal Synergies of Approximately $20M Calgary Other International Locations (14) UK (4) UAE (2) Turkey (4) Thailand (1) Georgia (3) Closed November 1, 2019
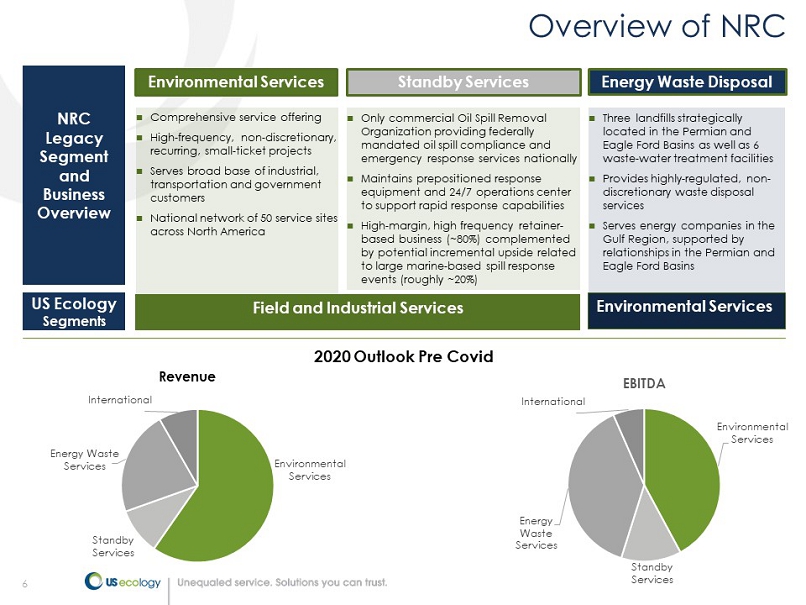
6 Environmental Services Standby Services Energy Waste Services International EBITDA NRC Legacy Segment and Business Overview Comprehensive service offering High - frequency, non - discretionary, recurring, small - ticket projects Serves broad base of industrial, transportation and government customers National network of 50 service sites across North America Three landfills strategically located in the Permian and Eagle Ford Basins as well as 6 waste - water treatment facilities Provides highly - regulated, non - discretionary waste disposal services Serves energy companies in the Gulf Region, supported by relationships in the Permian and Eagle Ford Basins Only commercial Oil Spill Removal Organization providing federally mandated oil spill compliance and emergency response services nationally Maintains prepositioned response equipment and 24/7 operations center to support rapid response capabilities High - margin, high frequency retainer - based business (~80%) complemented by potential incremental upside related to large marine - based spill response events (roughly ~20%) Overview of NRC Environmental Services Energy Waste Disposal Standby Services US Ecology Segments Field and Industrial Services Environmental Services Environmental Services Standby Services Energy Waste Services International Revenue 2020 Outlook Pre Covid
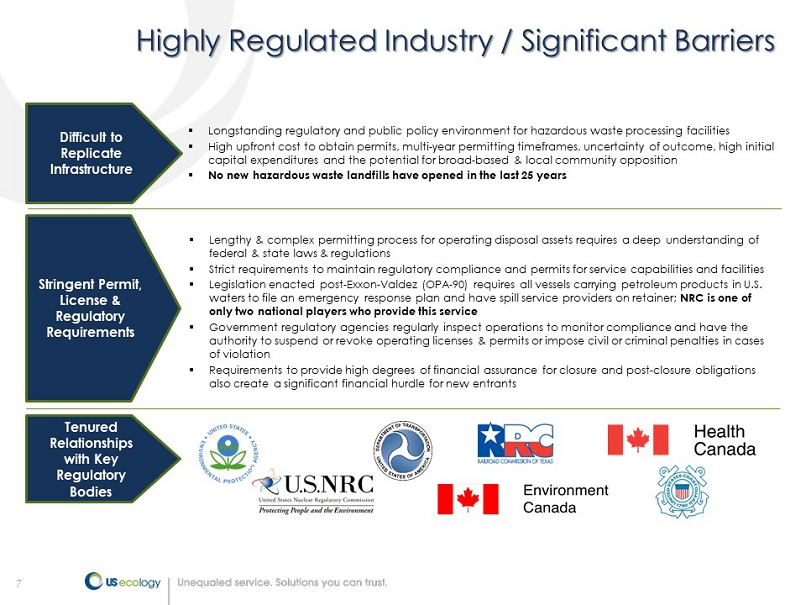
7 Highly Regulated Industry / Significant Barriers Stringent Permit, License & Regulatory Requirements ▪ Lengthy & complex permitting process for operating disposal assets requires a deep understanding of federal & state laws & regulations ▪ Strict requirements to maintain regulatory compliance and permits for service capabilities and facilities ▪ Legislation enacted post - Exxon - Valdez (OPA - 90) requires all vessels carrying petroleum products in U.S. waters to file an emergency response plan and have spill service providers on retainer; NRC is one of only two national players who provide this service ▪ Government regulatory agencies regularly inspect operations to monitor compliance and have the authority to suspend or revoke operating licenses & permits or impose civil or criminal penalties in cases of violation ▪ Requirements to provide high degrees of financial assurance for closure and post - closure obligations also create a significant financial hurdle for new entrants Difficult to Replicate Infrastructure ▪ Longstanding regulatory and public policy environment for hazardous waste processing facilities ▪ High upfront cost to obtain permits, multi - year permitting timeframes, uncertainty of outcome, high initial capital expenditures and the potential for broad - based & local community opposition ▪ No new hazardous waste landfills have opened in the last 25 years Tenured Relationships with Key Regulatory Bodies
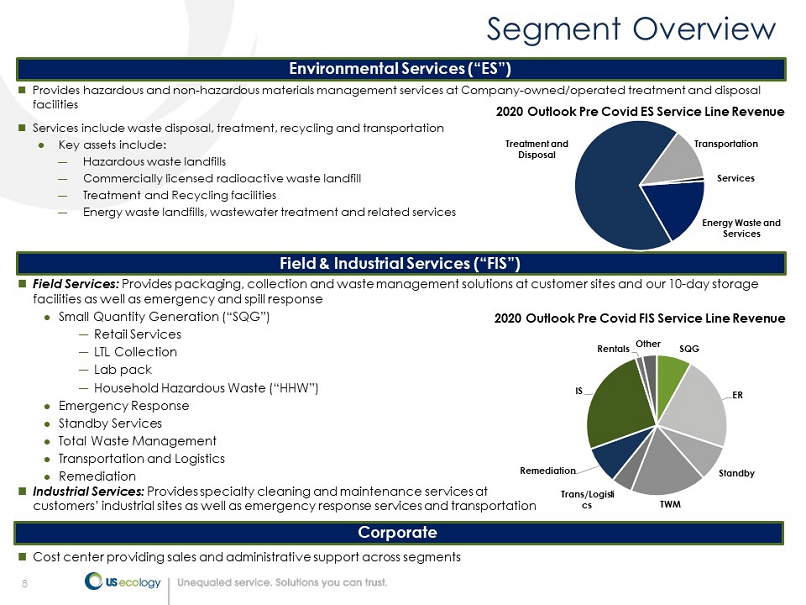
8 Provides hazardous and non - hazardous materials management services at Company - owned/operated treatment and disposal facilities Services include waste disposal, treatment, recycling and transportation Key assets include: ― Hazardous waste landfills ― Commercially licensed radioactive waste landfill ― Treatment and Recycling facilities ― Energy waste landfills, wastewater treatment and related services 8 Field Services: Provides packaging, collection and waste management solutions at customer sites and our 10 - day storage facilities as well as emergency and spill response Small Quantity Generation (SQG”) ― Retail Services ― LTL Collection ― Lab pack ― Household Hazardous Waste (HHW”) Emergency Response Standby Services Total Waste Management Transportation and Logistics Remediation Industrial Services: Provides specialty cleaning and maintenance services at customers’ industrial sites as well as emergency response services and transportation Cost center providing sales and administrative support across segments Segment Overview Environmental Services (ES”) Field & Industrial Services (FIS”) Corporate Energy Waste and Services Treatment and Disposal Transportation Services 2020 Outlook Pre Covid ES Service Line Revenue SQG ER Standby TWM Trans/Logisti cs Remediation IS Rentals Other 2020 Outlook Pre Covid FIS Service Line Revenue
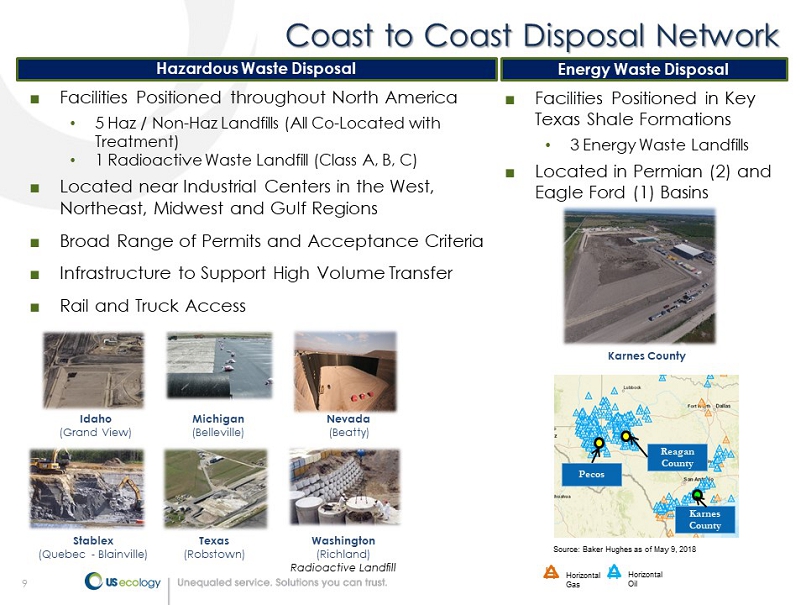
9 Coast to Coast Disposal Network ■ Facilities Positioned throughout North America • 5 Haz / Non - Haz Landfills (All Co - Located with Treatment) • 1 Radioactive Waste Landfill (Class A, B, C) ■ Located near Industrial Centers in the West, Northeast, Midwest and Gulf Regions ■ Broad Range of Permits and Acceptance Criteria ■ Infrastructure to Support High Volume Transfer ■ Rail and Truck Access Idaho (Grand View) Washington (Richland) Radioactive Landfill Michigan (Belleville) Nevada (Beatty) Texas (Robstown) Stablex (Quebec - Blainville) H Horizontal Gas H Horizontal Oil Reagan County Pecos Source: Baker Hughes as of May 9, 2018 Karnes County Hazardous Waste Disposal Energy Waste Disposal Karnes County ■ Facilities Positioned in Key Texas Shale Formations • 3 Energy Waste Landfills ■ Located in Permian (2) and Eagle Ford (1) Basins
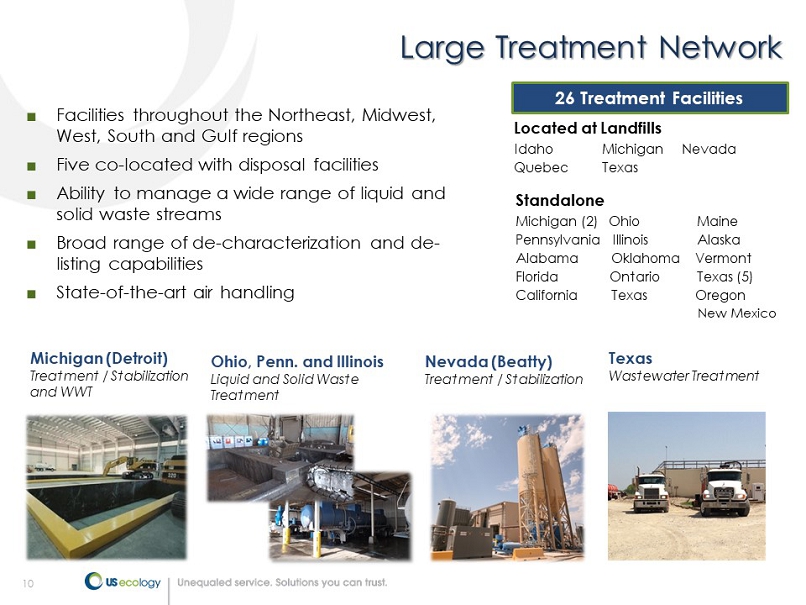
10 Large Treatment Network ■ Facilities throughout the Northeast, Midwest, West, South and Gulf regions ■ Five co - located with disposal facilities ■ Ability to manage a wide range of liquid and solid waste streams ■ Broad range of de - characterization and de - listing capabilities ■ State - of - the - art air handling 26 Treatment Facilities Located at Landfills Idaho Michigan Nevada Quebec Texas Standalone Michigan (2) Ohio Maine Pennsylvania Illinois Alaska Alabama Oklahoma Vermont Florida Ontario Texas (5) California Texas Oregon New Mexico Michigan (Detroit) Treatment / Stabilization and WWT Ohio, Penn. and Illinois Liquid and Solid Waste Treatment Nevada (Beatty) Treatment / Stabilization Texas Wastewater Treatment

11 Comprehensive Offering of Field & Industrial Services Remediation Management of remedial construction projects from start to finish Retail End - to - end management of retail hazardous waste programs Transportation & Logistics Transport of waste from point of generation to ultimate disposal Lab Pack Small quantity chemical management services Total Waste Management Outsourced management, tracking and reporting all waste streams for generators LTL / HHW HHW collection and LTL container management Small Quantity Generator Services Other Field Services Emergency Response Services to respond to any spill, natural disaster or accident Field Services Industrial Services Industrial Maintenance & Cleaning Wet & dry vacuuming, water blasting, paint system cleaning, pollution control, etc. Standby Services Oil Spill Removal Organization providing federally mandated oil spill compliance and emergency response services nationally
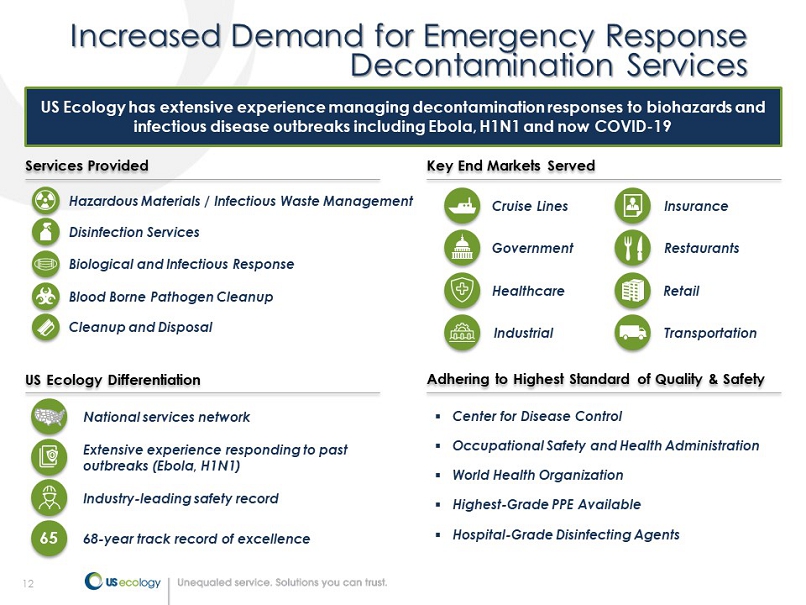
12 Increased Demand for Emergency Response Decontamination Services US Ecology has extensive experience managing decontamination responses to biohazards and infectious disease outbreaks including Ebola, H1N1 and now COVID - 19 Biological and Infectious Response Hazardous Materials / Infectious Waste Management Disinfection Services Blood Borne Pathogen Cleanup Cleanup and Disposal Services Provided Key End Markets Served Insurance Government Retail Restaurants Cruise Lines Transportation US Ecology Differentiation Adhering to Highest Standard of Quality & Safety 68 - year track record of excellence 65 National services network Extensive experience responding to past outbreaks (Ebola, H1N1) ▪ Center for Disease Control ▪ Occupational Safety and Health Administration ▪ World Health Organization ▪ Highest - Grade PPE Available ▪ Hospital - Grade Disinfecting Agents Healthcare Industry - leading safety record Industrial
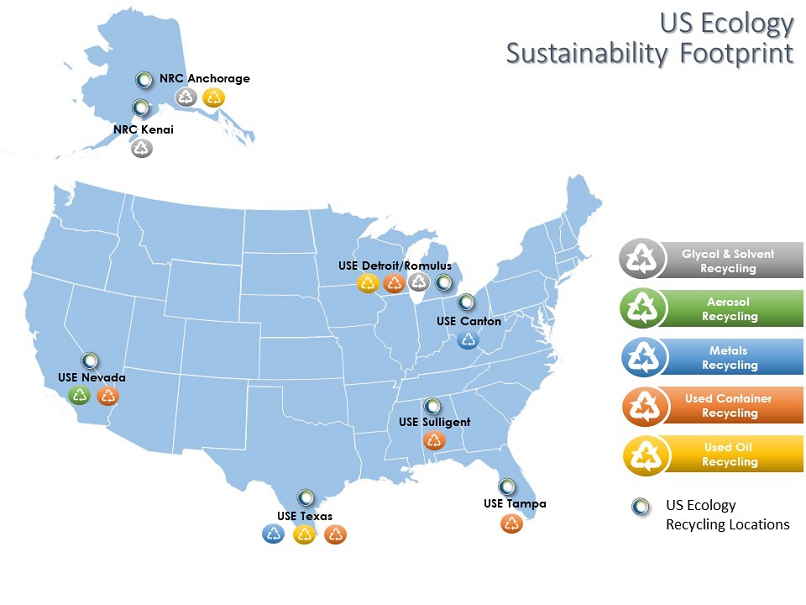
US Ecology Sustainability Footprint Glycol & Solvent Recycling Aerosol Recycling Metals Recycling Used Container Recycling Used Oil Recycling NRC Anchorage NRC Kenai USE Nevada USE Texas USE Tampa USE Detroit/Romulus USE Canton USE Sulligent US Ecology Recycling Locations
14 ESG & Sustainability Reporting – Sustainability is part of our DNA and has been for over 68 years – Sustainability report issued in 2019, being refreshed with 2021 target issuance – Corporate Responsibility and Risk Committee formed in March 2020 – Active focus on data gathering, goal setting Environmental: – We operate inorganic facilities with limited air emissions vs solid waste peers – Growth capital includes normal upgrades to energy efficient equipment – Investments in sustainable recycling solutions – Actively focused on carbon footprint of vehicle fleet Social: – Health and safety is top priority; continued investment, focus and a strive for zero incidents – Continuous investments in our team members including total rewards, incentive plans, medical programs, development opportunities – Our people and our culture is the foundation of our success and built on our shared values resulting in high engagement levels and low voluntary turnover Governance: shareholder centric with top tier rating by ISS Sustainability @ US Ecology
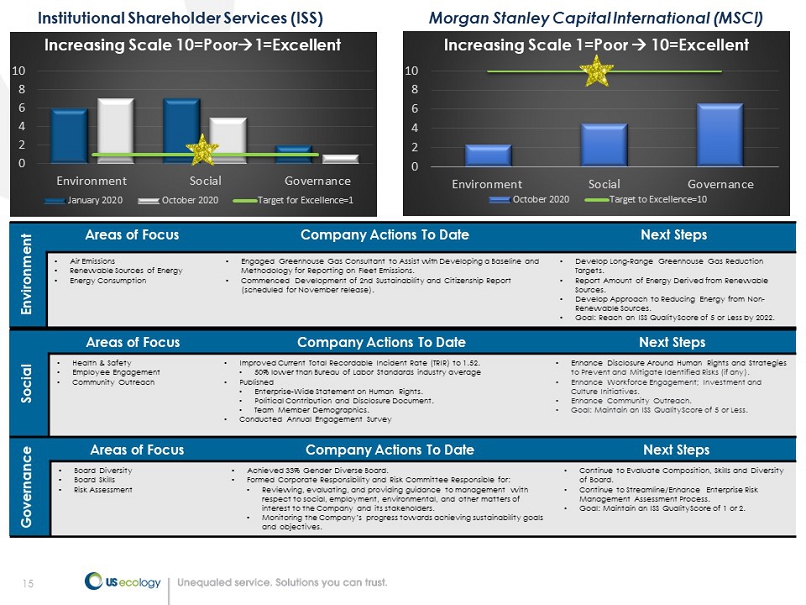
15 Institutional Shareholder Services (ISS) Morgan Stanley Capital International (MSCI) Environment Areas of Focus Company Actions To Date Next Steps • Air Emissions • Renewable Sources of Energy • Energy Consumption • Engaged Greenhouse Gas Consultant to Assist with Developing a Baseline and Methodology for Reporting on Fleet Emissions. • Commenced Development of 2nd Sustainability and Citizenship Report (scheduled for November release). • Develop Long - Range Greenhouse Gas Reduction Targets. • Report Amount of Energy Derived from Renewable Sources. • Develop Approach to Reducing Energy from Non - Renewable Sources. • Goal: Reach an ISS QualityScore of 5 or Less by 2022. Social Areas of Focus Company Actions To Date Next Steps • Health & Safety • Employee Engagement • Community Outreach • Improved Current Total Recordable Incident Rate (TRIR) to 1.52. • 50% lower than Bureau of Labor Standards industry average • Published • Enterprise - Wide Statement on Human Rights. • Political Contribution and Disclosure Document. • Team Member Demographics. • Conducted Annual Engagement Survey • Enhance Disclosure Around Human Rights and Strategies to Prevent and Mitigate Identified Risks (if any). • Enhance Workforce Engagement; Investment and Culture Initiatives. • Enhance Community Outreach. • Goal : Maintain an ISS QualityScore of 5 or Less. Governance Areas of Focus Company Actions To Date Next Steps • Board Diversity • Board Skills • Risk Assessment • Achieved 33% Gender Diverse Board. • Formed Corporate Responsibility and Risk Committee Responsible for: • Reviewing, evaluating, and providing guidance to management with respect to social, employment, environmental, and other matters of interest to the Company and its stakeholders . • Monitoring the Company’s progress towards achieving sustainability goals and objectives . • Continue to Evaluate Composition, Skills and Diversity of Board. • Continue to Streamline/Enhance Enterprise Risk Management Assessment Process. • Goal: Maintain an ISS QualityScore of 1 or 2. 0 2 4 6 8 10 Environment Social Governance January 2020 October 2020 Target for Excellence=1 Increasing Scale 10=Poor 1=Excellent 0 2 4 6 8 10 Environment Social Governance October 2020 Target to Excellence=10 Increasing Scale 1=Poor 10=Excellent
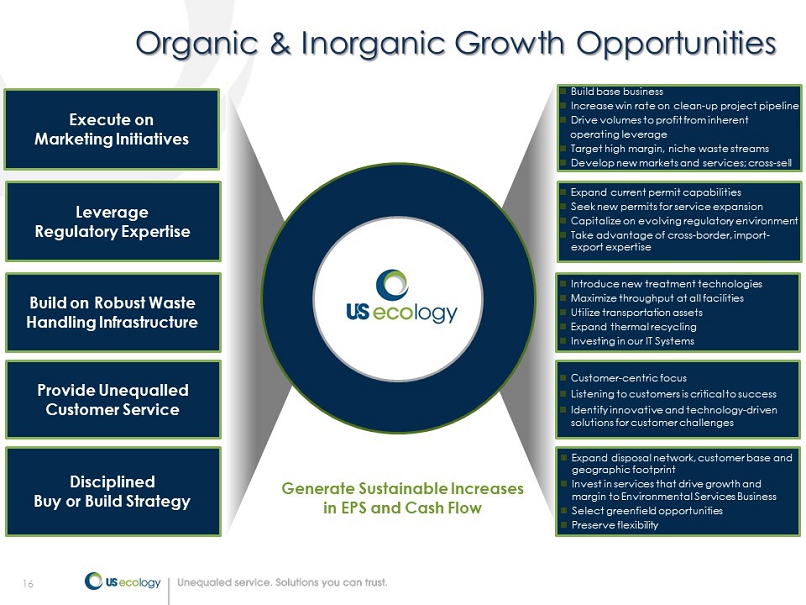
16 Organic & Inorganic Growth Opportunities Build on Robust Waste Handling Infrastructure Leverage Regulatory Expertise Provide Unequalled Customer Service Generate Sustainable Increases in EPS and Cash Flow Focus on High Value Waste Streams Build base business Increase win rate on clean - up project pipeline Drive volumes to profit from inherent operating leverage Target high margin, niche waste streams Develop new markets and services; cross - sell Expand current permit capabilities Seek new permits for service expansion Capitalize on evolving regulatory environment Take advantage of cross - border, import - export expertise Introduce new treatment technologies Maximize throughput at all facilities Utilize transportation assets Expand thermal recycling Investing in our IT Systems Customer - centric focus Listening to customers is critical to success Identify innovative and technology - driven solutions for customer challenges Disciplined Buy or Build Strategy Expand disposal network, customer base and geographic footprint Invest in services that drive growth and margin to Environmental Services Business Select greenfield opportunities Preserve flexibility Execute on Marketing Initiatives

17 Financial Overview
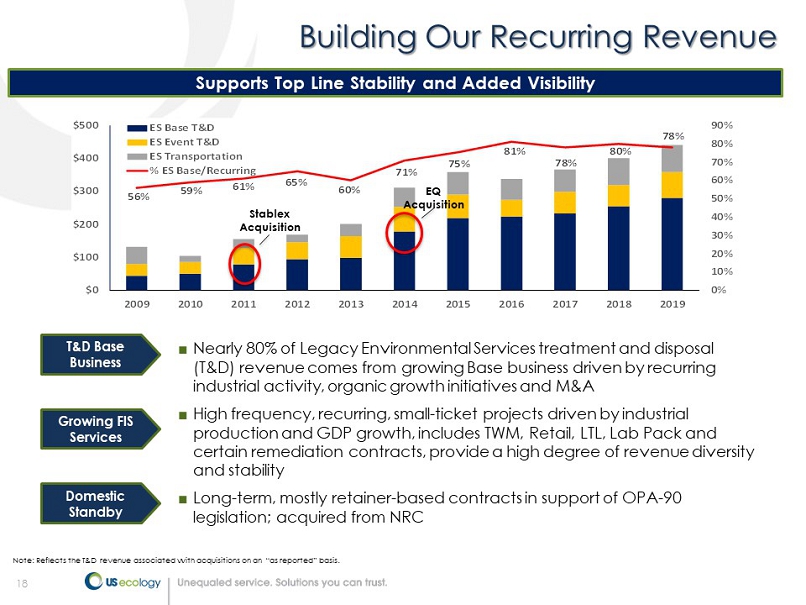
18 Building Our Recurring Revenue Supports Top Line Stability and Added Visibility ■ Nearly 80% of Legacy Environmental Services treatment and disposal (T&D) revenue comes from growing Base business driven by recurring industrial activity, organic growth initiatives and M&A ■ High frequency, recurring, small - ticket projects driven by industrial production and GDP growth, includes TWM, Retail, LTL, Lab Pack and certain remediation contracts, provide a high degree of revenue diversity and stability ■ Long - term, mostly retainer - based contracts in support of OPA - 90 legislation; acquired from NRC Note: Reflects the T&D revenue associated with acquisitions on an as reported” basis. 56% 59% 61% 65% 60% 71% 75% 81% 78% 80% 78% 0% 10% 20% 30% 40% 50% 60% 70% 80% 90% $0 $100 $200 $300 $400 $500 2009 2010 2011 2012 2013 2014 2015 2016 2017 2018 2019 ES Base T&D ES Event T&D ES Transportation % ES Base/Recurring Stablex Acquisition EQ Acquisition T&D Base Business Growing FIS Services Domestic Standby
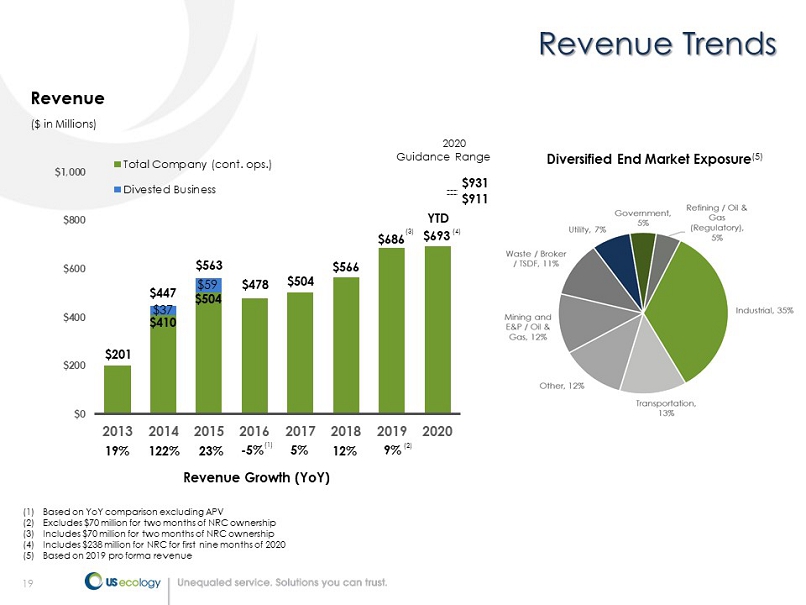
19 ($ in Millions) Revenue Growth (YoY) $201 $504 $566 $693 $0 $200 $400 $600 $800 $1,000 2013 2014 2015 2016 2017 2018 2019 2020 Total Company (cont. ops.) Divested Business YTD Revenue 19% 122% 23% - 5% (1) Based on YoY comparison excluding APV (2) Excludes $70 million for two months of NRC ownership (3) Includes $70 million for two months of NRC ownership (4) Includes $238 million for NRC for first nine months of 2020 (5) Based on 2019 pro forma revenue Revenue Trends $410 $37 $504 $59 $478 $447 $563 5% (1) 12% 9% (2) $686 Diversified End Market Exposure (5) (4) $931 $911 2020 Guidance Range (3)
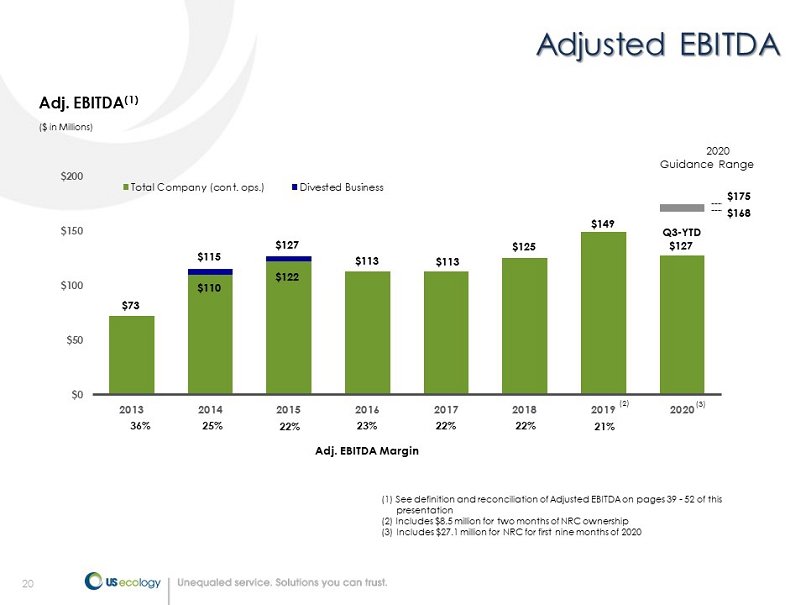
20 Adjusted EBITDA (1) See definition and reconciliation of Adjusted EBITDA on pages 39 - 52 of this presentation (2) Includes $8.5 million for two months of NRC ownership (3) Includes $27.1 million for NRC for first nine months of 2020 $73 $113 $125 $0 $50 $100 $150 $200 2013 2014 2015 2016 2017 2018 2019 2020 Total Company (cont. ops.) Divested Business $110 $122 $149 ($ in Millions) Adj. EBITDA (1) 25% 22% 23% Adj. EBITDA Margin 36% (3) $115 $127 22% $113 22% 21% Q3 - YTD $127 (2) $175 $168 2020 Guidance Range
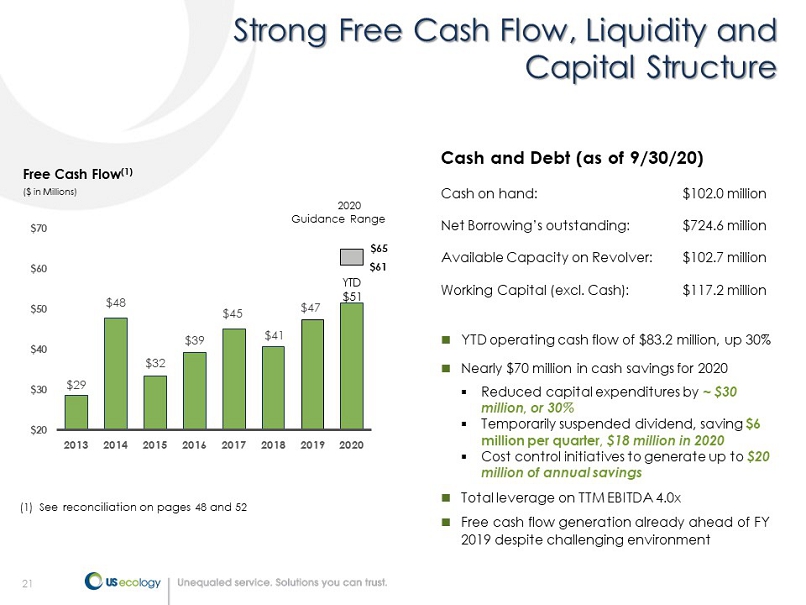
21 Strong Free Cash Flow, Liquidity and Capital Structure Cash on hand: $102.0 million Net Borrowing’s outstanding: $724.6 million Available Capacity on Revolver: $102.7 million Working Capital (excl. Cash): $117.2 million Free Cash Flow (1) ($ in Millions) $29 $48 $32 $39 $45 $41 $47 $20 $30 $40 $50 $60 $70 2013 2014 2015 2016 2017 2018 2019 2020 YTD operating cash flow of $83.2 million, up 30% Nearly $70 million in cash savings for 2020 ▪ Reduced capital expenditures by ~ $30 million, or 30% ▪ Temporarily suspended dividend, saving $6 million per quarter, $18 million in 2020 ▪ Cost control initiatives to generate up to $20 million of annual savings Total leverage on TTM EBITDA 4.0x Free cash flow generation already ahead of FY 2019 despite challenging environment Cash and Debt (as of 9/30/20) (1) See reconciliation on pages 48 and 52 YTD $51 $65 $61 2020 Guidance Range
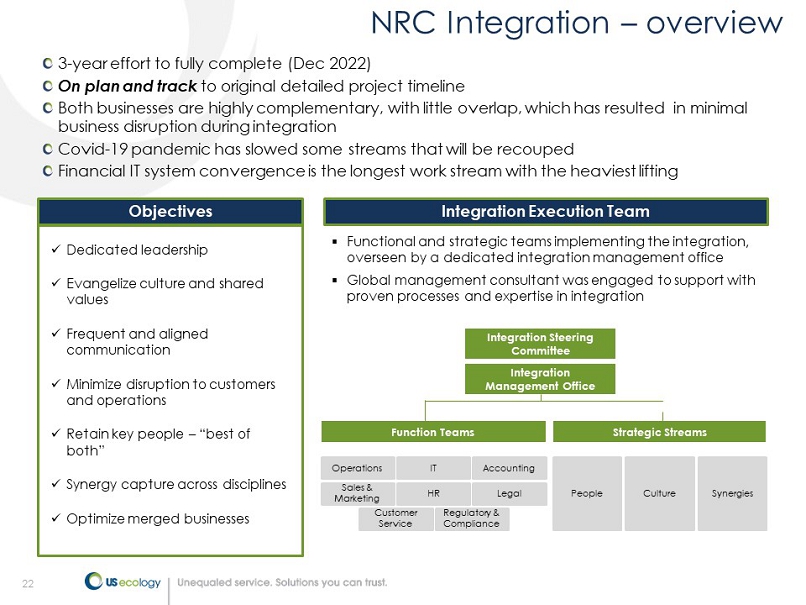
22 3 - year effort to fully complete (Dec 2022) On plan and track to original detailed project timeline Both businesses are highly complementary, with little overlap, which has resulted in minimal business disruption during integration Covid - 19 pandemic has slowed some streams that will be recouped Financial IT system convergence is the longest work stream with the heaviest lifting Objectives x Dedicated leadership x Evangelize culture and shared values x Frequent and aligned communication x Minimize disruption to customers and operations x Retain key people – best of both” x Synergy capture across disciplines x Optimize merged businesses Integration Execution Team ▪ Functional and strategic teams implementing the integration, overseen by a dedicated integration management office ▪ Global management consultant was engaged to support with proven processes and expertise in integration Integration Steering Committee Integration Management Office Function Teams Operations IT Accounting Sales & Marketing HR Legal Customer Service Regulatory & Compliance Strategic Streams People Culture Synergies NRC Integration – overview
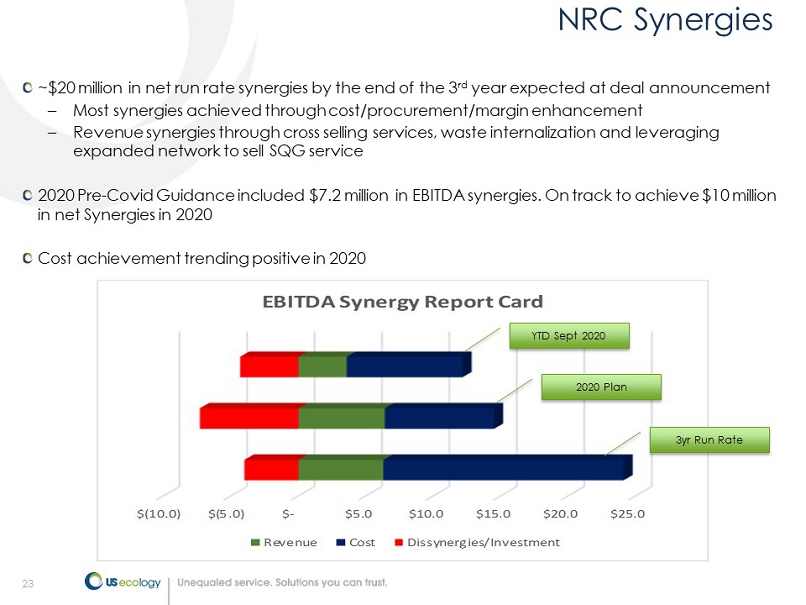
23 ~$20 million in net run rate synergies by the end of the 3 rd year expected at deal announcement – Most synergies achieved through cost/procurement/margin enhancement – Revenue synergies through cross selling services, waste internalization and leveraging expanded network to sell SQG service 2020 Pre - Covid Guidance included $7.2 million in EBITDA synergies. On track to achieve $10 million in net Synergies in 2020 Cost achievement trending positive in 2020 NRC Synergies $(10.0) $(5.0) $- $5.0 $10.0 $15.0 $20.0 $25.0 EBITDA Synergy Report Card Revenue Cost Dissynergies/Investment YTD Sept 2020 2020 Plan 3yr Run Rate
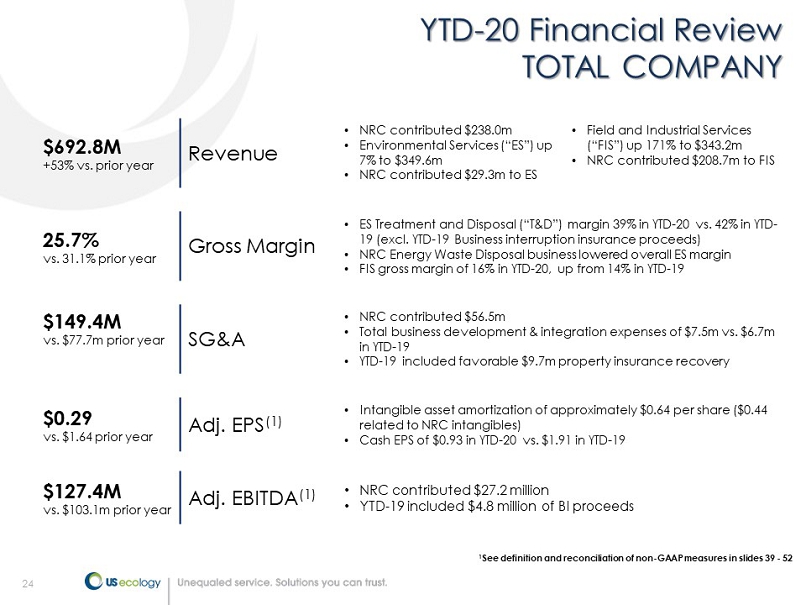
24 1 See definition and reconciliation of non - GAAP measures in slides 39 - 52 YTD - 20 Financial Review TOTAL COMPANY $692.8M +53% vs. prior year Revenue • NRC contributed $238.0m • Environmental Services (ES”) up 7% to $349.6m • NRC contributed $29.3m to ES • Field and Industrial Services (FIS”) up 171% to $343.2m • NRC contributed $208.7m to FIS 25.7% vs. 31.1% prior year Gross Margin • ES Treatment and Disposal (T&D”) margin 39% in YTD - 20 vs. 42% in YTD - 19 (excl. YTD - 19 Business interruption insurance proceeds) • NRC Energy Waste Disposal business lowered overall ES margin • FIS gross margin of 16% in YTD - 20, up from 14% in YTD - 19 $149.4M vs. $77.7m prior year SG&A • NRC contributed $56.5m • Total business development & integration expenses of $7.5m vs. $6.7m in YTD - 19 • YTD - 19 included favorable $9.7m property insurance recovery $0.29 vs. $1.64 prior year Adj. EPS (1) • Intangible asset amortization of approximately $0.64 per share ($0.44 related to NRC intangibles) • Cash EPS of $0.93 in YTD - 20 vs. $1.91 in YTD - 19 $127.4M vs. $103.1m prior year Adj. EBITDA (1) • NRC contributed $27.2 million • YTD - 19 included $4.8 million of BI proceeds
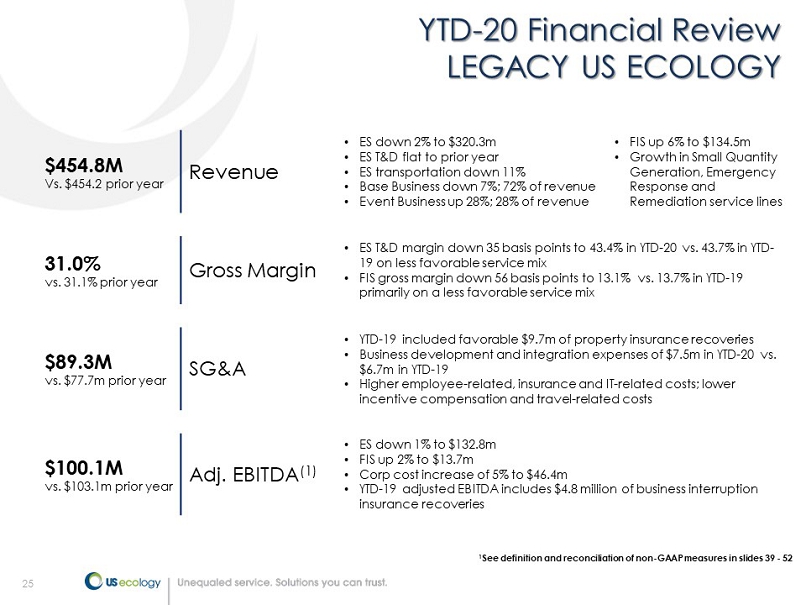
25 YTD - 20 Financial Review LEGACY US ECOLOGY $454.8M Vs. $454.2 prior year Revenue • ES down 2% to $320.3m • ES T&D flat to prior year • ES transportation down 11% • Base Business down 7%; 72% of revenue • Event Business up 28%; 28% of revenue • FIS up 6% to $134.5m • Growth in Small Quantity Generation, Emergency Response and Remediation service lines 31.0% vs. 31.1% prior year Gross Margin • ES T&D margin down 35 basis points to 43.4% in YTD - 20 vs. 43.7% in YTD - 19 on less favorable service mix • FIS gross margin down 56 basis points to 13.1% vs. 13.7% in YTD - 19 primarily on a less favorable service mix $89.3M vs. $77.7m prior year SG&A • YTD - 19 included favorable $9.7m of property insurance recoveries • Business development and integration expenses of $7.5m in YTD - 20 vs. $6.7m in YTD - 19 • Higher employee - related, insurance and IT - related costs; lower incentive compensation and travel - related costs $100.1M vs. $103.1m prior year Adj. EBITDA (1) • ES down 1% to $132.8m • FIS up 2% to $13.7m • Corp cost increase of 5% to $46.4m • YTD - 19 adjusted EBITDA includes $4.8 million of business interruption insurance recoveries 1 See definition and reconciliation of non - GAAP measures in slides 39 - 52
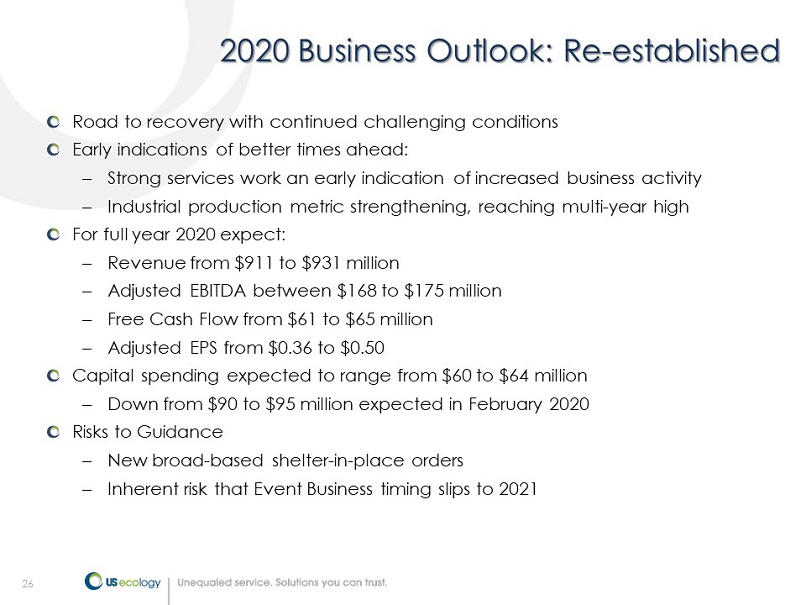
26 2020 Business Outlook: Re - established Road to recovery with continued challenging conditions Early indications of better times ahead: – Strong services work an early indication of increased business activity – Industrial production metric strengthening, reaching multi - year high For full year 2020 expect : – Revenue from $911 to $931 million – Adjusted EBITDA between $168 to $175 million – Free Cash Flow from $61 to $65 million – Adjusted EPS from $0.36 to $0.50 Capital spending expected to range from $ 60 to $ 64 million – Down from $90 to $95 million expected in February 2020 Risks to Guidance – New broad - based shelter - in - place orders – Inherent risk that Event Business timing slips to 2021
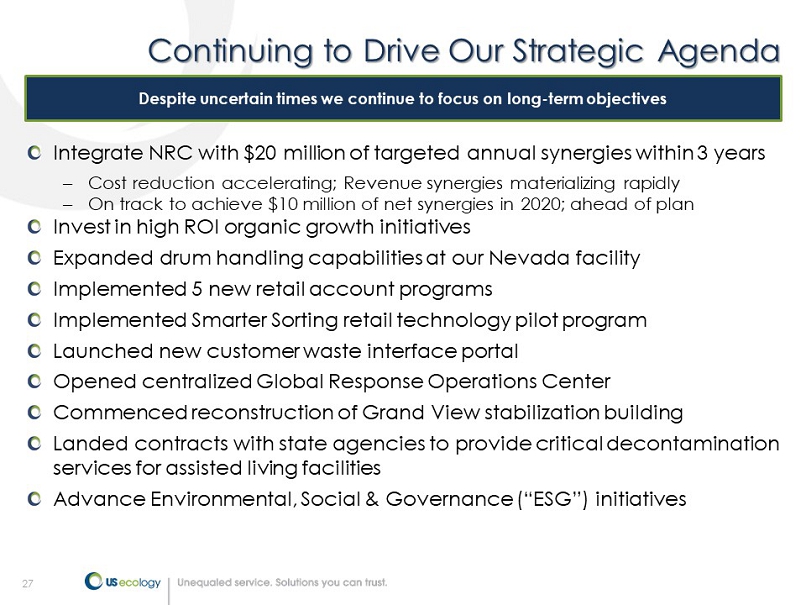
27 Integrate NRC with $20 million of targeted annual synergies within 3 years – Cost reduction accelerating; Revenue synergies materializing rapidly – On track to achieve $10 million of net synergies in 2020; ahead of plan Invest in high ROI organic growth initiatives Expanded drum handling capabilities at our Nevada facility Implemented 5 new retail account programs Implemented Smarter Sorting retail technology pilot program Launched new customer waste interface portal Opened centralized Global Response Operations Center Commenced reconstruction of Grand View stabilization building Landed contracts with state agencies to provide critical decontamination services for assisted living facilities Advance Environmental, Social & Governance (ESG”) initiatives Continuing to Drive Our Strategic Agenda Despite uncertain times we continue to focus on long - term objectives

28 Financial Policy Overview Acquisition Strategy Conservative and targeted approach to acquisitions, centering around treatment and disposal assets and complementary services Focused on filling in service gaps across the value chain and leveraging core competencies to service generators of regulated and specialty waste Company continues to evaluate acquisitions on an opportunistic basis Organic Growth Strategy Generate sustainable increases in revenues, earnings and free cash flow by executing on marketing initiatives, leveraging regulatory expertise, building on the Company’s robust waste handling infrastructure Continued integration of T&D and services will augment and sustain growth Target Capital Structure Target leverage of mid - 3x for the right strategic opportunity Continue to de - lever and reach 2.0x total leverage positioning for future acquisitions Capital Preservation Policy driven by Pandemic Suspended quarterly dividend. Policy is reviewed annually by the board of directors who approves levels based on free cash flow and ongoing cash needs Reducing capital spending by approximately $30 million in 2020 Cost controls to generate $20 million in savings in 2020
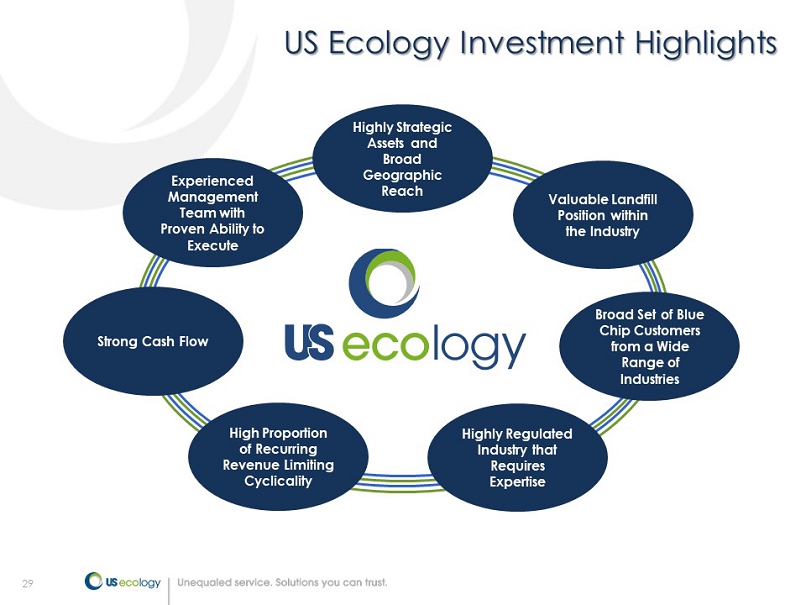
29 Experienced Management Team with Proven Ability to Execute Valuable Landfill Position within the Industry Broad Set of Blue Chip Customers from a Wide Range of Industries Strong Cash Flow Highly Strategic Assets and Broad Geographic Reach US Ecology Investment Highlights High Proportion of Recurring Revenue Limiting Cyclicality Highly Regulated Industry that Requires Expertise
30 Appendix
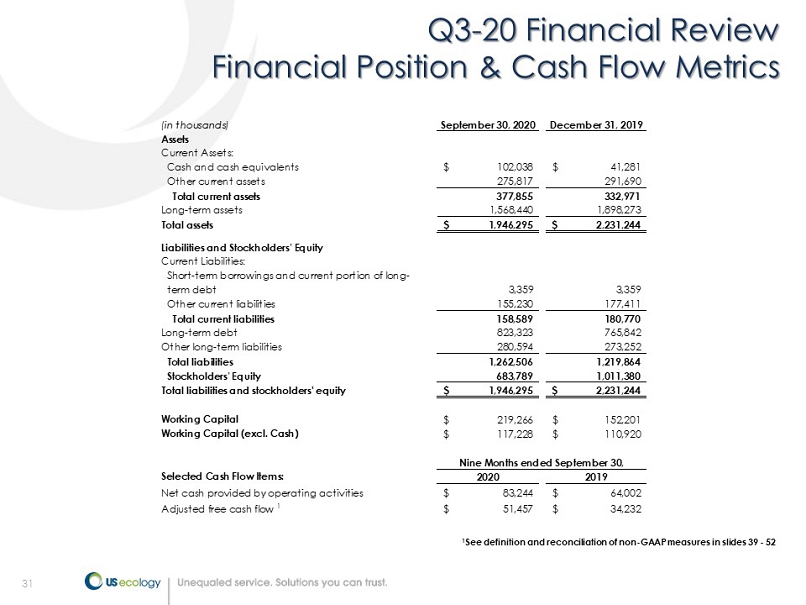
31 Q3 - 20 Financial Review Financial Position & Cash Flow Metrics 1 See definition and reconciliation of non - GAAP measures in slides 39 - 52 (in thousands) September 30, 2020 December 31, 2019 Assets Current Assets: Cash and cash equivalents 102,038$ 41,281$ Other current assets 275,817 291,690 Total current assets 377,855 332,971 Long-term assets 1,568,440 1,898,273 Total assets 1,946,295$ 2,231,244$ Liabilities and Stockholders’ Equity Current Liabilities: Short-term borrowings and current portion of long- term debt 3,359 3,359 Other current liabilities 155,230 177,411 Total current liabilities 158,589 180,770 Long-term debt 823,323 765,842 Other long-term liabilities 280,594 273,252 Total liabilities 1,262,506 1,219,864 Stockholders’ Equity 683,789 1,011,380 Total liabilities and stockholders' equity 1,946,295$ 2,231,244$ Working Capital 219,266$ 152,201$ Working Capital (excl. Cash) 117,228$ 110,920$ Selected Cash Flow Items: 2020 2019 Net cash provided by operating activities 83,244$ 64,002$ Adjusted free cash flow 1 51,457$ 34,232$ Nine Months ended September 30,
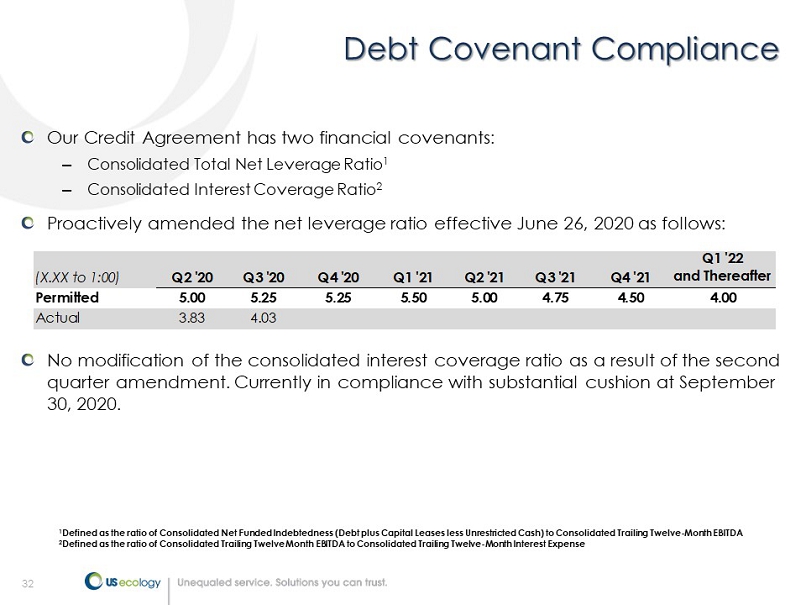
32 Debt Covenant Compliance Our Credit Agreement has two financial covenants: – Consolidated Total Net Leverage Ratio 1 – Consolidated Interest Coverage Ratio 2 Proactively amended the net leverage ratio effective June 26, 2020 as follows: No modification of the consolidated interest coverage r atio as a result of the second quarter amendment. Currently in compliance with substantial cushion at September 30, 2020. (X.XX to 1:00) Q2 '20 Q3 '20 Q4 '20 Q1 '21 Q2 '21 Q3 '21 Q4 '21 Q1 '22and Thereafter Permitted 5.00 5.25 5.25 5.50 5.00 4.75 4.50 4.00 Actual 3.83 4.03 1 Defined as the ratio of Consolidated Net Funded Indebtedness (Debt plus Capital Leases less Unrestricted Cash) to Consolidate d T railing Twelve - Month EBITDA 2 Defined as the ratio of Consolidated Trailing Twelve Month EBITDA to Consolidated Trailing Twelve - Month Interest Expense
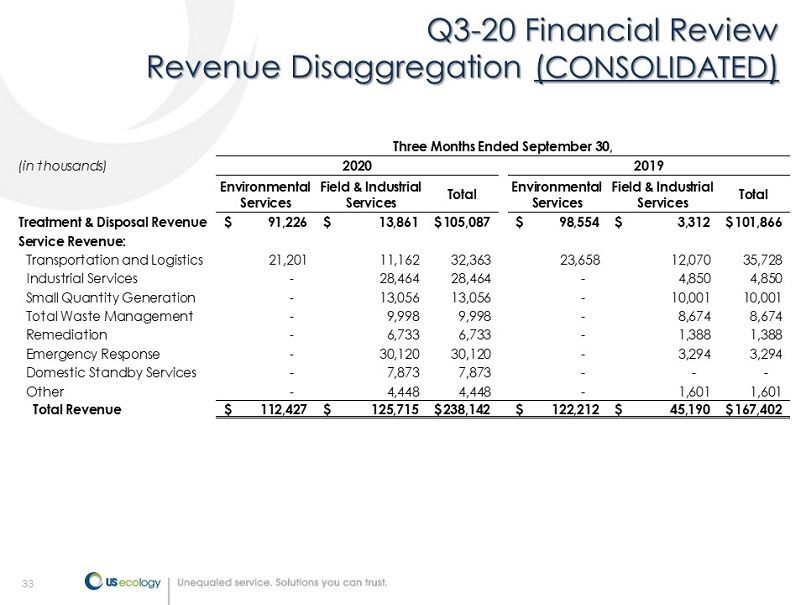
33 Q3 - 20 Financial Review Revenue Disaggregation ( CONSOLIDATED ) (in thousands) Environmental Services Field & Industrial Services Total Environmental Services Field & Industrial Services Total Treatment & Disposal Revenue 91,226$ 13,861$ 105,087$ 98,554$ 3,312$ 101,866$ Service Revenue: Transportation and Logistics 21,201 11,162 32,363 23,658 12,070 35,728 Industrial Services - 28,464 28,464 - 4,850 4,850 Small Quantity Generation - 13,056 13,056 - 10,001 10,001 Total Waste Management - 9,998 9,998 - 8,674 8,674 Remediation - 6,733 6,733 - 1,388 1,388 Emergency Response - 30,120 30,120 - 3,294 3,294 Domestic Standby Services - 7,873 7,873 - - - Other - 4,448 4,448 - 1,601 1,601 Total Revenue 112,427$ 125,715$ 238,142$ 122,212$ 45,190$ 167,402$ Three Months Ended September 30, 2020 2019
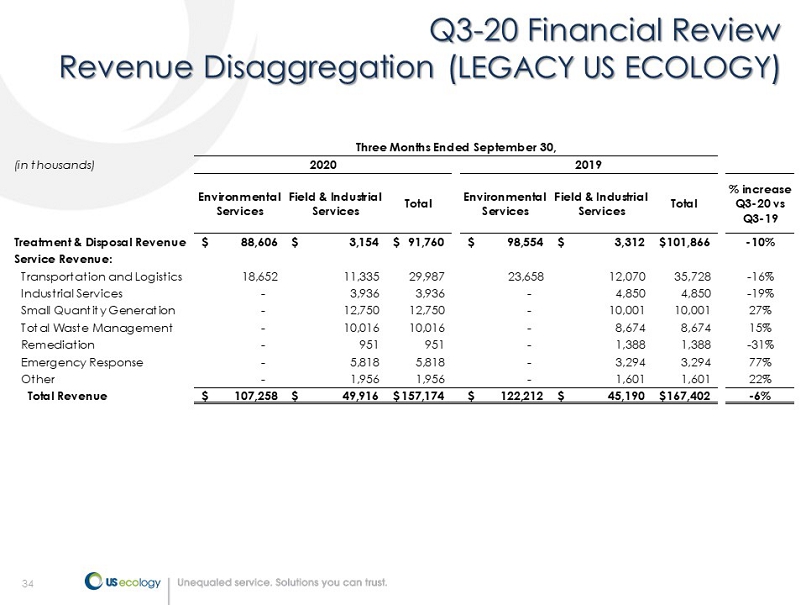
34 Q3 - 20 Financial Review Revenue Disaggregation ( LEGACY US ECOLOGY ) (in thousands) Environmental Services Field & Industrial Services Total Environmental Services Field & Industrial Services Total % increase Q3-20 vs Q3-19 Treatment & Disposal Revenue 88,606$ 3,154$ 91,760$ 98,554$ 3,312$ 101,866$ -10% Service Revenue: Transportation and Logistics 18,652 11,335 29,987 23,658 12,070 35,728 -16% Industrial Services - 3,936 3,936 - 4,850 4,850 -19% Small Quantity Generation - 12,750 12,750 - 10,001 10,001 27% Total Waste Management - 10,016 10,016 - 8,674 8,674 15% Remediation - 951 951 - 1,388 1,388 -31% Emergency Response - 5,818 5,818 - 3,294 3,294 77% Other - 1,956 1,956 - 1,601 1,601 22% Total Revenue 107,258$ 49,916$ 157,174$ 122,212$ 45,190$ 167,402$ -6% Three Months Ended September 30, 2020 2019
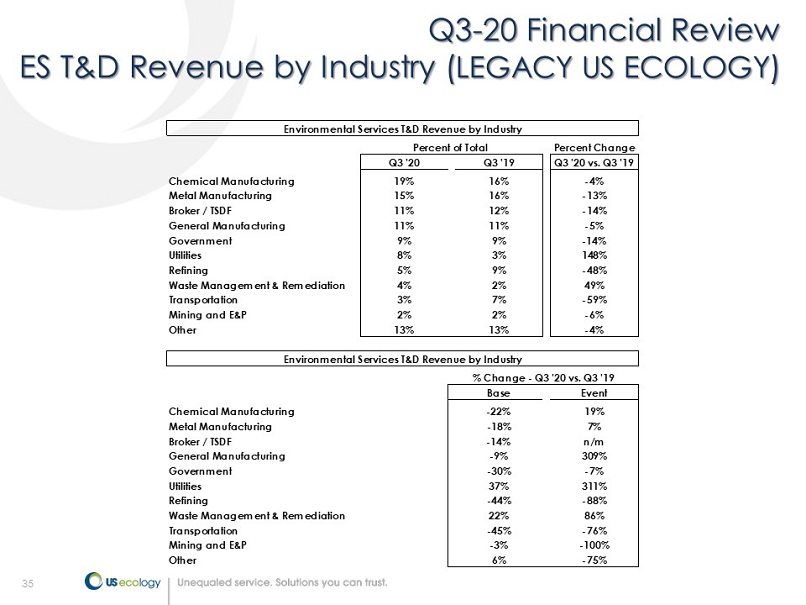
35 Q3 - 20 Financial Review ES T&D Revenue by Industry ( LEGACY US ECOLOGY ) Percent Change Q3 '20 Q3 '19 Q3 '20 vs. Q3 '19 Chemical Manufacturing 19% 16% -4% Metal Manufacturing 15% 16% -13% Broker / TSDF 11% 12% -14% General Manufacturing 11% 11% -5% Government 9% 9% -14% Utilities 8% 3% 148% Refining 5% 9% -48% Waste Management & Remediation 4% 2% 49% Transportation 3% 7% -59% Mining and E&P 2% 2% -6% Other 13% 13% -4% Base Event Chemical Manufacturing -22% 19% Metal Manufacturing -18% 7% Broker / TSDF -14% n/m General Manufacturing -9% 309% Government -30% -7% Utilities 37% 311% Refining -44% -88% Waste Management & Remediation 22% 86% Transportation -45% -76% Mining and E&P -3% -100% Other 6% -75% Environmental Services T&D Revenue by Industry Percent of Total Environmental Services T&D Revenue by Industry % Change - Q3 '20 vs. Q3 '19
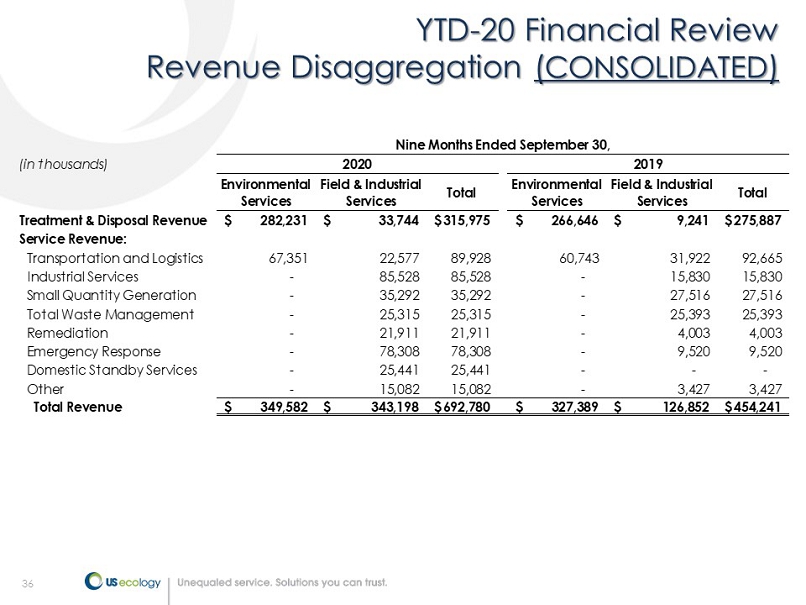
36 YTD - 20 Financial Review Revenue Disaggregation ( CONSOLIDATED ) (in thousands) Environmental Services Field & Industrial Services Total Environmental Services Field & Industrial Services Total Treatment & Disposal Revenue 282,231$ 33,744$ 315,975$ 266,646$ 9,241$ 275,887$ Service Revenue: Transportation and Logistics 67,351 22,577 89,928 60,743 31,922 92,665 Industrial Services - 85,528 85,528 - 15,830 15,830 Small Quantity Generation - 35,292 35,292 - 27,516 27,516 Total Waste Management - 25,315 25,315 - 25,393 25,393 Remediation - 21,911 21,911 - 4,003 4,003 Emergency Response - 78,308 78,308 - 9,520 9,520 Domestic Standby Services - 25,441 25,441 - - - Other - 15,082 15,082 - 3,427 3,427 Total Revenue 349,582$ 343,198$ 692,780$ 327,389$ 126,852$ 454,241$ Nine Months Ended September 30, 2020 2019
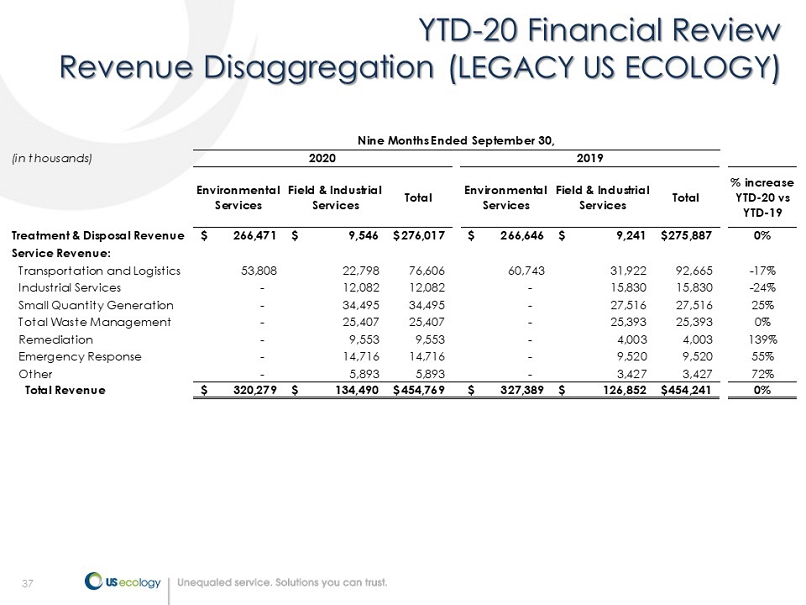
37 YTD - 20 Financial Review Revenue Disaggregation ( LEGACY US ECOLOGY ) (in thousands) Environmental Services Field & Industrial Services Total Environmental Services Field & Industrial Services Total % increase YTD-20 vs YTD-19 Treatment & Disposal Revenue 266,471$ 9,546$ 276,017$ 266,646$ 9,241$ 275,887$ 0% Service Revenue: Transportation and Logistics 53,808 22,798 76,606 60,743 31,922 92,665 -17% Industrial Services - 12,082 12,082 - 15,830 15,830 -24% Small Quantity Generation - 34,495 34,495 - 27,516 27,516 25% Total Waste Management - 25,407 25,407 - 25,393 25,393 0% Remediation - 9,553 9,553 - 4,003 4,003 139% Emergency Response - 14,716 14,716 - 9,520 9,520 55% Other - 5,893 5,893 - 3,427 3,427 72% Total Revenue 320,279$ 134,490$ 454,769$ 327,389$ 126,852$ 454,241$ 0% Nine Months Ended September 30, 2020 2019
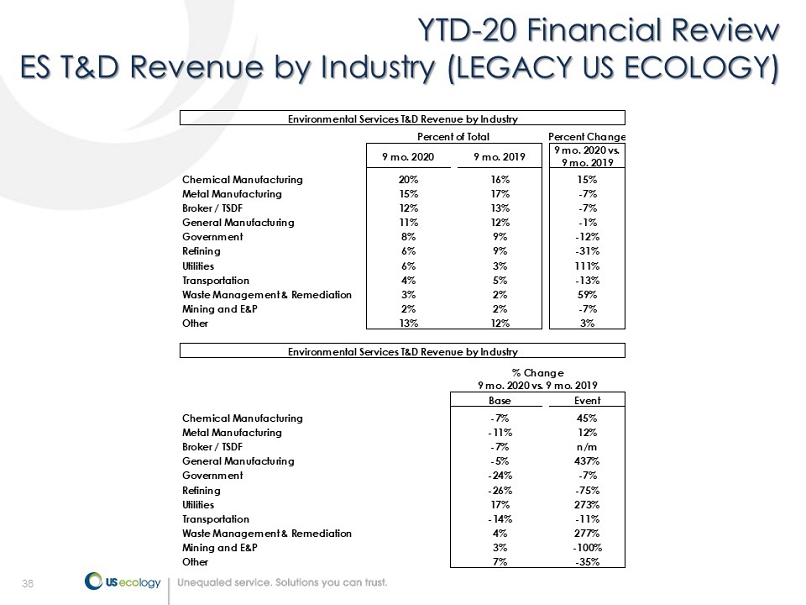
38 YTD - 20 Financial Review ES T&D Revenue by Industry ( LEGACY US ECOLOGY ) Percent Change 9 mo. 2020 9 mo. 2019 9 mo. 2020 vs. 9 mo. 2019 Chemical Manufacturing 20% 16% 15% Metal Manufacturing 15% 17% -7% Broker / TSDF 12% 13% -7% General Manufacturing 11% 12% -1% Government 8% 9% -12% Refining 6% 9% -31% Utilities 6% 3% 111% Transportation 4% 5% -13% Waste Management & Remediation 3% 2% 59% Mining and E&P 2% 2% -7% Other 13% 12% 3% Base Event Chemical Manufacturing -7% 45% Metal Manufacturing -11% 12% Broker / TSDF -7% n/m General Manufacturing -5% 437% Government -24% -7% Refining -26% -75% Utilities 17% 273% Transportation -14% -11% Waste Management & Remediation 4% 277% Mining and E&P 3% -100% Other 7% -35% Environmental Services T&D Revenue by Industry Percent of Total Environmental Services T&D Revenue by Industry % Change 9 mo. 2020 vs. 9 mo. 2019
39 39 Non - GAAP Financial Measures US Ecology reports adjusted EBITDA, adjusted earnings per diluted share, cash earnings per diluted share and adjusted free cash flow results, which are non - GAAP financial measures, as a complement to results provided in accordance with generally accepted accounting principles in the United States (GAAP”) and believes that such information provides analysts, stockholders, and other users information to better understand the Company’s operating performance . Because adjusted EBITDA, adjusted earnings per diluted share, cash earnings per diluted share and adjusted free cash flow are not measurements determined in accordance with GAAP and are thus susceptible to varying calculations they may not be comparable to similar measures used by other companies . Items excluded from adjusted EBITDA, adjusted earnings per diluted share, cash earnings per diluted share and adjusted free cash flow are significant components in understanding and assessing financial performance . Adjusted EBITDA, adjusted earnings per diluted share, cash earnings per diluted share and adjusted free cash flow should not be considered in isolation or as an alternative to, or substitute for, net income, cash flows generated by operations, investing or financing activities, or other financial statement data presented in the consolidated financial statements as indicators of financial performance or liquidity . Adjusted EBITDA, adjusted earnings per diluted share, cash earnings per diluted share and adjusted free cash flow have limitations as analytical tools and should not be considered in isolation or a substitute for analyzing our results as reported under GAAP .
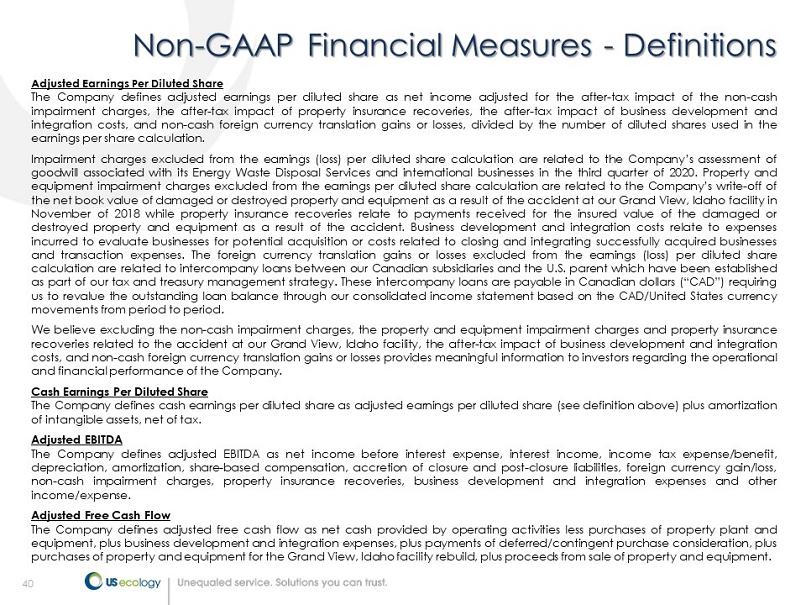
40 40 Non - GAAP Financial Measures - Definitions Adjusted Earnings Per Diluted Share The Company defines adjusted earnings per diluted share as net income adjusted for the after - tax impact of the non - cash impairment charges, the after - tax impact of property insurance recoveries, the after - tax impact of business development and integration costs, and non - cash foreign currency translation gains or losses, divided by the number of diluted shares used in the earnings per share calculation . Impairment charges excluded from the earnings (loss) per diluted share calculation are related to the Company’s assessment of goodwill associated with its Energy Waste Disposal Services and international businesses in the third quarter of 2020 . Property and equipment impairment charges excluded from the earnings per diluted share calculation are related to the Company’s write - off of the net book value of damaged or destroyed property and equipment as a result of the accident at our Grand View, Idaho facility in November of 2018 while property insurance recoveries relate to payments received for the insured value of the damaged or destroyed property and equipment as a result of the accident . Business development and integration costs relate to expenses incurred to evaluate businesses for potential acquisition or costs related to closing and integrating successfully acquired businesses and transaction expenses . The foreign currency translation gains or losses excluded from the earnings (loss) per diluted share calculation are related to intercompany loans between our Canadian subsidiaries and the U . S . parent which have been established as part of our tax and treasury management strategy . These intercompany loans are payable in Canadian dollars (CAD”) requiring us to revalue the outstanding loan balance through our consolidated income statement based on the CAD/United States currency movements from period to period . We believe excluding the non - cash impairment charges, the property and equipment impairment charges and property insurance recoveries related to the accident at our Grand View, Idaho facility, the after - tax impact of business development and integration costs, and non - cash foreign currency translation gains or losses provides meaningful information to investors regarding the operational and financial performance of the Company . Cash Earnings Per Diluted Share The Company defines cash earnings per diluted share as adjusted earnings per diluted share (see definition above) plus amortization of intangible assets, net of tax . Adjusted EBITDA The Company defines adjusted EBITDA as net income before interest expense, interest income, income tax expense/benefit, depreciation, amortization, share - based compensation, accretion of closure and post - closure liabilities, foreign currency gain/loss, non - cash impairment charges, property insurance recoveries, business development and integration expenses and other income/expense . Adjusted Free Cash Flow The Company defines adjusted free cash flow as net cash provided by operating activities less purchases of property plant and equipment, plus business development and integration expenses, plus payments of deferred/contingent purchase consideration, plus purchases of property and equipment for the Grand View, Idaho facility rebuild, plus proceeds from sale of property and equipment .

41 41 Consolidated Financial Results: 2019 vs. 2018 (in thousands, except per share data) 2019 2018 $ Change % Change Revenue $ 685,509 $ 565,928 $ 119,581 21.1% Gross profit 209,834 170,094 39,740 23.4% SG&A 1 141,123 92,340 48,783 52.8% Goodwill & intangible asset impairment charges - 3,666 (3,666) -100.0% Operating income 1 68,711 74,088 (5,377) -7.3% Interest expense, net (18,634) (11,915) (6,719) 56.4% Foreign currency (loss) gain (733) 55 (788) -1432.7% Other income 455 2,630 (2,175) -82.7% Income before income taxes 49,799 64,858 (15,059) -23.2% Income tax expense 16,659 15,263 1,396 9.1% Net income $ 33,140 $ 49,595 $ (16,455) -33.2% Earnings per share: Basic $ 1.41 $ 2.27 $ (0.86) -37.9% Diluted $ 1.40 $ 2.25 $ (0.85) -37.8% Shares used in earnings per share calculation: Basic 23,521 21,888 Diluted 23,749 22,047 Year Ended December 31, 1 Includes pre - tax business development expenses of $26.2 million and $748,000 for the year ended December 31, 2019 and 2018, resp ectively.
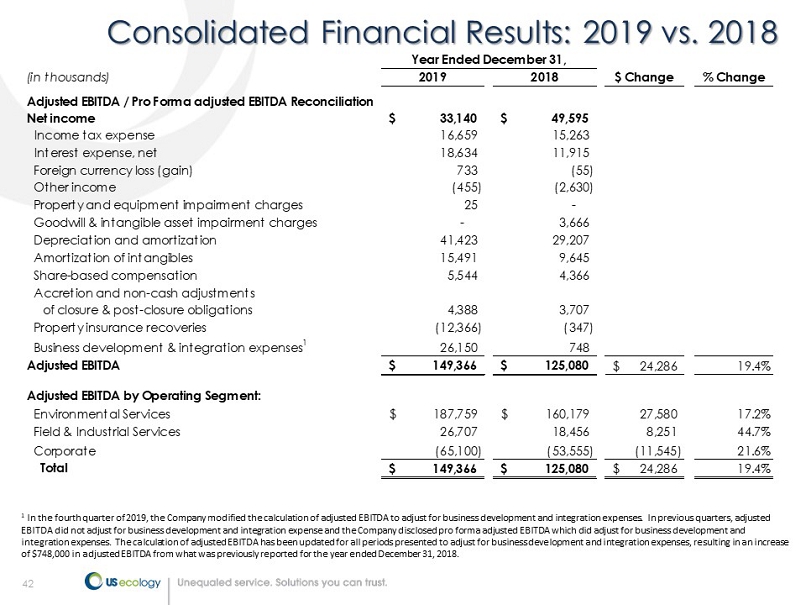
42 42 Consolidated Financial Results: 2019 vs. 2018 (in thousands) 2019 2018 $ Change % Change Adjusted EBITDA / Pro Forma adjusted EBITDA Reconciliation Net income 33,140$ 49,595$ Income tax expense 16,659 15,263 Interest expense, net 18,634 11,915 Foreign currency loss (gain) 733 (55) Other income (455) (2,630) Property and equipment impairment charges 25 - Goodwill & intangible asset impairment charges - 3,666 Depreciation and amortization 41,423 29,207 Amortization of intangibles 15,491 9,645 Share-based compensation 5,544 4,366 Accretion and non-cash adjustments of closure & post-closure obligations 4,388 3,707 Property insurance recoveries (12,366) (347) Business development & integration expenses 1 26,150 748 Adjusted EBITDA 149,366$ 125,080$ 24,286$ 19.4% Adjusted EBITDA by Operating Segment: Environmental Services 187,759$ 160,179$ 27,580 17.2% Field & Industrial Services 26,707 18,456 8,251 44.7% Corporate (65,100) (53,555) (11,545) 21.6% Total 149,366$ 125,080$ 24,286$ 19.4% Year Ended December 31, 1 In the fourth quarter of 2019, the Company modified the calculation of adjusted EBITDA to adjust for business development and in tegration expenses. In previous quarters, adjusted EBITDA did not adjust for business development and integration expense and the Company disclosed pro forma adjusted EBITDA wh ich did adjust for business development and integration expenses. The calculation of adjusted EBITDA has been updated for all periods presented to adjust for business d eve lopment and integration expenses, resulting in an increase of $748,000 in adjusted EBITDA from what was previously reported for the year ended December 31, 2018.
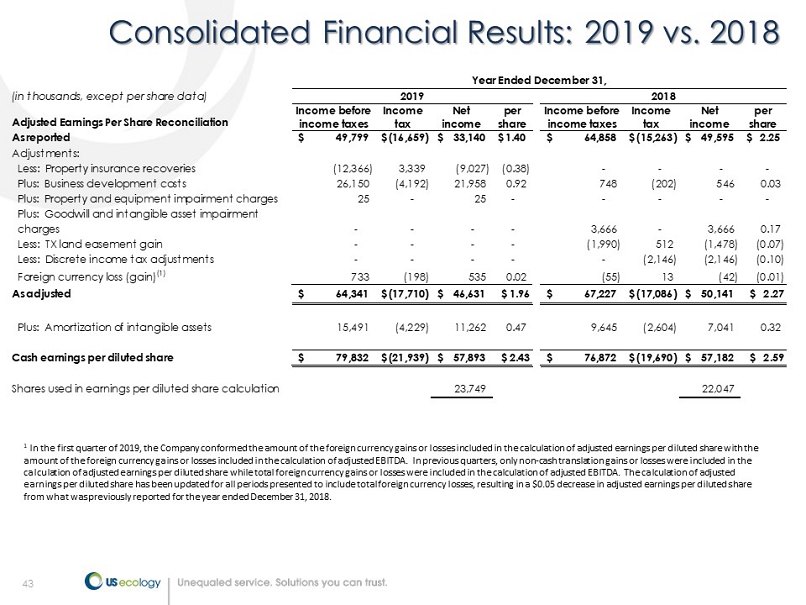
43 43 Consolidated Financial Results: 2019 vs. 2018 (in thousands, except per share data) Adjusted Earnings Per Share Reconciliation Income before income taxes Income tax Net income per share Income before income taxes Income tax Net income per share As reported 49,799$ (16,659)$ 33,140$ 1.40$ 64,858$ (15,263)$ 49,595$ 2.25$ Adjustments: Less: Property insurance recoveries (12,366) 3,339 (9,027) (0.38) - - - - Plus: Business development costs 26,150 (4,192) 21,958 0.92 748 (202) 546 0.03 Plus: Property and equipment impairment charges 25 - 25 - - - - - Plus: Goodwill and intangible asset impairment charges - - - - 3,666 - 3,666 0.17 Less: TX land easement gain - - - - (1,990) 512 (1,478) (0.07) Less: Discrete income tax adjustments - - - - - (2,146) (2,146) (0.10) Foreign currency loss (gain) (1) 733 (198) 535 0.02 (55) 13 (42) (0.01) As adjusted 64,341$ (17,710)$ 46,631$ $ 1.96 67,227$ (17,086)$ 50,141$ $ 2.27 Plus: Amortization of intangible assets 15,491 (4,229) 11,262 0.47 9,645 (2,604) 7,041 0.32 Cash earnings per diluted share 79,832$ (21,939)$ 57,893$ $ 2.43 76,872$ (19,690)$ 57,182$ $ 2.59 Shares used in earnings per diluted share calculation 23,749 22,047 Year Ended December 31, 2019 2018 1 In the first quarter of 2019, the Company conformed the amount of the foreign currency gains or losses included in the calcul ati on of adjusted earnings per diluted share with the amount of the foreign currency gains or losses included in the calculation of adjusted EBITDA. In previous quarters, only no n - c ash translation gains or losses were included in the calculation of adjusted earnings per diluted share while total foreign currency gains or losses were included in the calculat ion of adjusted EBITDA. The calculation of adjusted earnings per diluted share has been updated for all periods presented to include total foreign currency losses, resulting in a $ 0.05 decrease in adjusted earnings per diluted share from what was previously reported for the year ended December 31, 2018.
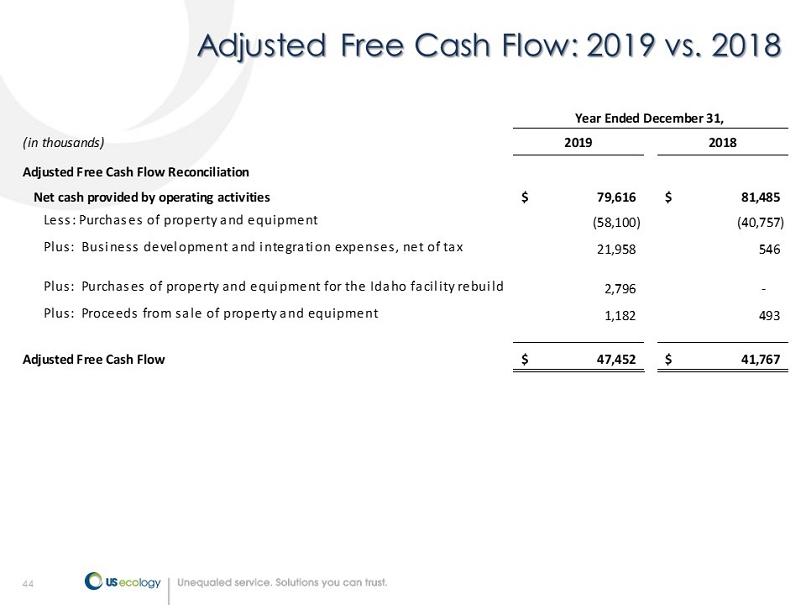
44 44 Adjusted Free Cash Flow: 2019 vs. 2018 (in thousands) 2019 2018 Adjusted Free Cash Flow Reconciliation Net cash provided by operating activities 79,616$ 81,485$ Less: Purchases of property and equipment (58,100) (40,757) Plus: Business development and integration expenses, net of tax 21,958 546 Plus: Purchases of property and equipment for the Idaho facility rebuild 2,796 - Plus: Proceeds from sale of property and equipment 1,182 493 Adjusted Free Cash Flow 47,452$ 41,767$ Year Ended December 31,
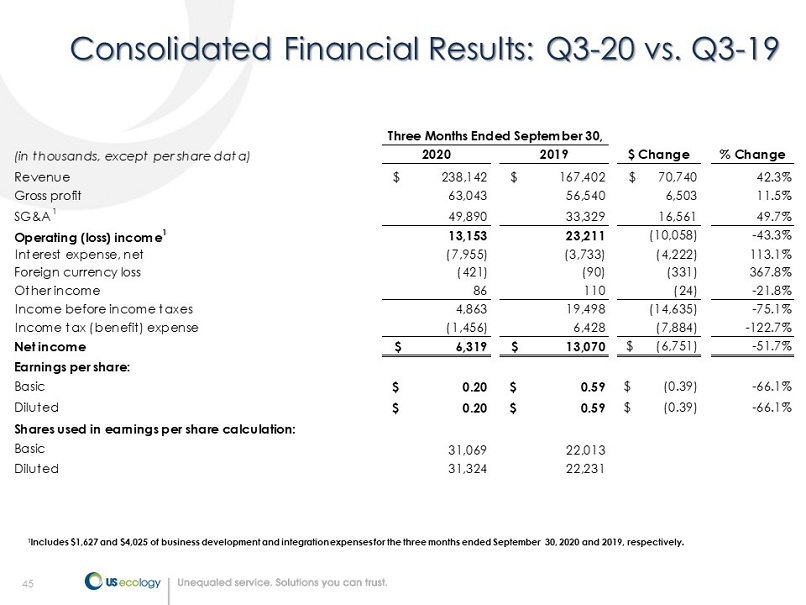
45 Consolidated Financial Results: Q3 - 20 vs. Q3 - 19 (in thousands, except per share data) 2020 2019 $ Change % Change Revenue $ 238,142 $ 167,402 $ 70,740 42.3% Gross profit 63,043 56,540 6,503 11.5% SG&A 1 49,890 33,329 16,561 49.7% Operating (loss) income 1 13,153 23,211 (10,058) -43.3% Interest expense, net (7,955) (3,733) (4,222) 113.1% Foreign currency loss (421) (90) (331) 367.8% Other income 86 110 (24) -21.8% Income before income taxes 4,863 19,498 (14,635) -75.1% Income tax (benefit) expense (1,456) 6,428 (7,884) -122.7% Net income $ 6,319 $ 13,070 $ (6,751) -51.7% Earnings per share: Basic $ 0.20 $ 0.59 $ (0.39) -66.1% Diluted $ 0.20 $ 0.59 $ (0.39) -66.1% Shares used in earnings per share calculation: Basic 31,069 22,013 Diluted 31,324 22,231 Three Months Ended September 30, 1 Includes $1,627 and $4,025 of business development and integration expenses for the three months ended September 30, 2020 an d 2 019, respectively.
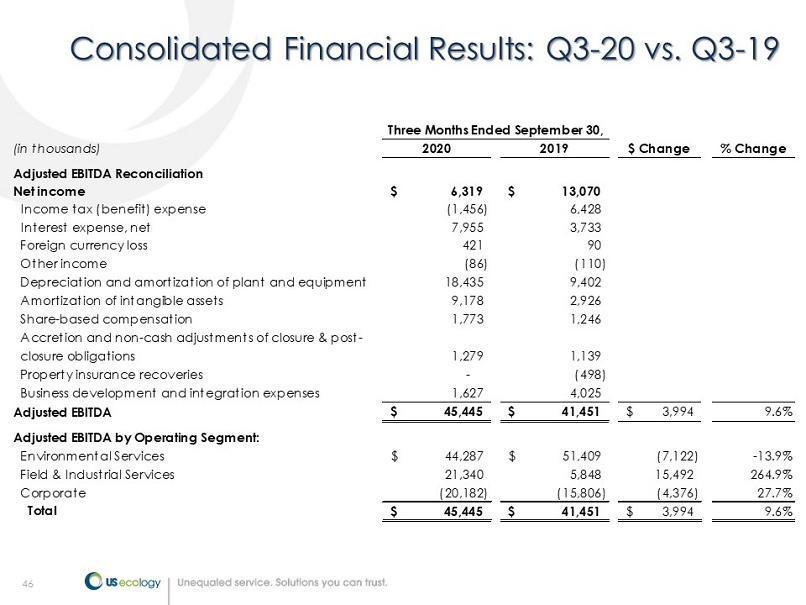
46 Consolidated Financial Results: Q3 - 20 vs. Q3 - 19 (in thousands) 2020 2019 $ Change % Change Adjusted EBITDA Reconciliation Net income 6,319$ 13,070$ Income tax (benefit) expense (1,456) 6,428 Interest expense, net 7,955 3,733 Foreign currency loss 421 90 Other income (86) (110) Depreciation and amortization of plant and equipment 18,435 9,402 Amortization of intangible assets 9,178 2,926 Share-based compensation 1,773 1,246 Accretion and non-cash adjustments of closure & post- closure obligations 1,279 1,139 Property insurance recoveries - (498) Business development and integration expenses 1,627 4,025 Adjusted EBITDA 45,445$ 41,451$ 3,994$ 9.6% Adjusted EBITDA by Operating Segment: Environmental Services 44,287$ 51,409$ (7,122) -13.9% Field & Industrial Services 21,340 5,848 15,492 264.9% Corporate (20,182) (15,806) (4,376) 27.7% Total 45,445$ 41,451$ 3,994$ 9.6% Three Months Ended September 30,
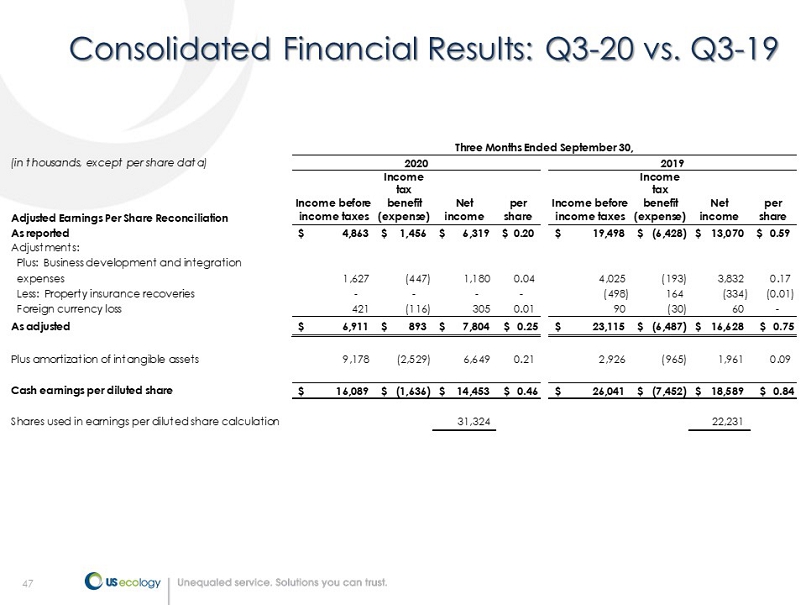
47 Consolidated Financial Results: Q3 - 20 vs. Q3 - 19 (in thousands, except per share data) Adjusted Earnings Per Share Reconciliation Income before income taxes Income tax benefit (expense) Net income per share Income before income taxes Income tax benefit (expense) Net income per share As reported 4,863$ 1,456$ 6,319$ 0.20$ 19,498$ (6,428)$ 13,070$ 0.59$ Adjustments: Plus: Business development and integration expenses 1,627 (447) 1,180 0.04 4,025 (193) 3,832 0.17 Less: Property insurance recoveries - - - - (498) 164 (334) (0.01) Foreign currency loss 421 (116) 305 0.01 90 (30) 60 - As adjusted 6,911$ 893$ 7,804$ $ 0.25 23,115$ (6,487)$ 16,628$ $ 0.75 Plus amortization of intangible assets 9,178 (2,529) 6,649 0.21 2,926 (965) 1,961 0.09 Cash earnings per diluted share 16,089$ (1,636)$ 14,453$ $ 0.46 26,041$ (7,452)$ 18,589$ $ 0.84 Shares used in earnings per diluted share calculation 31,324 22,231 Three Months Ended September 30, 2020 2019
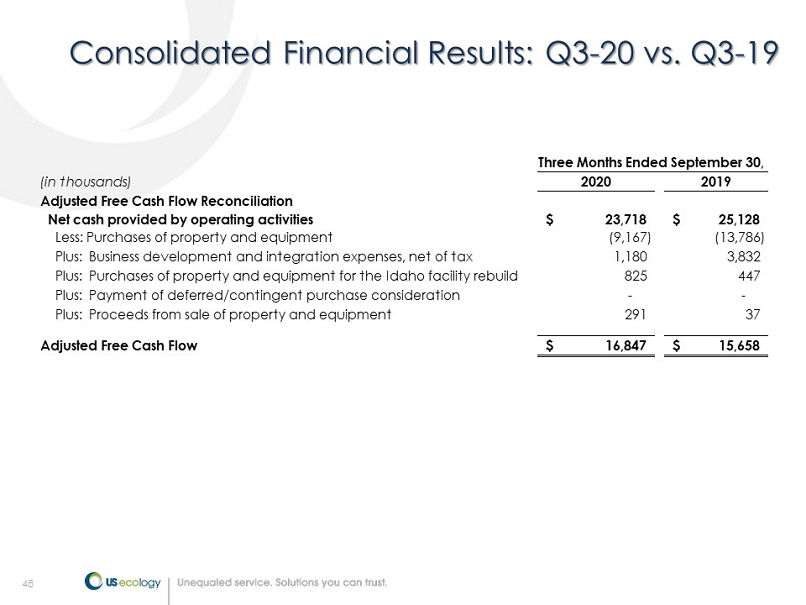
48 Consolidated Financial Results: Q3 - 20 vs. Q3 - 19 (in thousands) 2020 2019 Adjusted Free Cash Flow Reconciliation Net cash provided by operating activities 23,718$ 25,128$ Less: Purchases of property and equipment (9,167) (13,786) Plus: Business development and integration expenses, net of tax 1,180 3,832 Plus: Purchases of property and equipment for the Idaho facility rebuild 825 447 Plus: Payment of deferred/contingent purchase consideration - - Plus: Proceeds from sale of property and equipment 291 37 Adjusted Free Cash Flow 16,847$ 15,658$ Three Months Ended September 30,
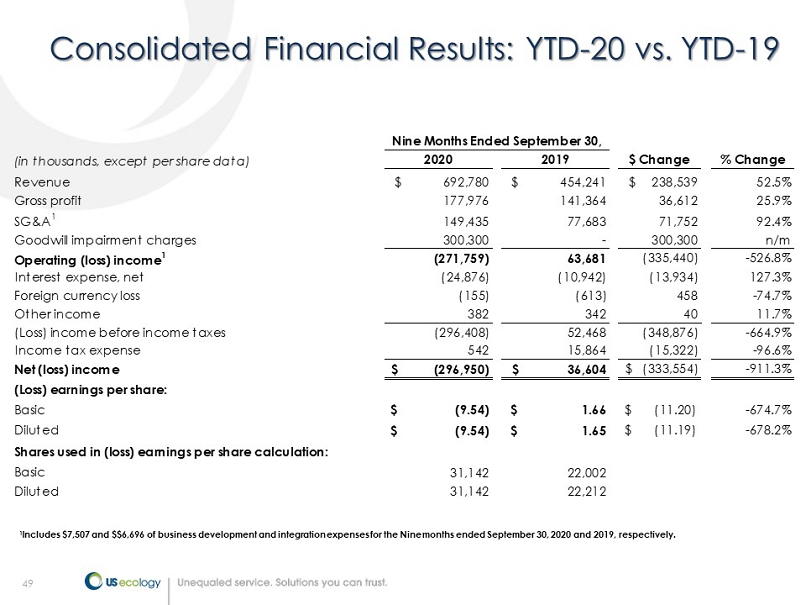
49 Consolidated Financial Results: YTD - 20 vs. YTD - 19 (in thousands, except per share data) 2020 2019 $ Change % Change Revenue $ 692,780 $ 454,241 $ 238,539 52.5% Gross profit 177,976 141,364 36,612 25.9% SG&A 1 149,435 77,683 71,752 92.4% Goodwill impairment charges 300,300 - 300,300 n/m Operating (loss) income 1 (271,759) 63,681 (335,440) -526.8% Interest expense, net (24,876) (10,942) (13,934) 127.3% Foreign currency loss (155) (613) 458 -74.7% Other income 382 342 40 11.7% (Loss) income before income taxes (296,408) 52,468 (348,876) -664.9% Income tax expense 542 15,864 (15,322) -96.6% Net (loss) income $ (296,950) $ 36,604 $ (333,554) -911.3% (Loss) earnings per share: Basic $ (9.54) $ 1.66 $ (11.20) -674.7% Diluted $ (9.54) $ 1.65 $ (11.19) -678.2% Shares used in (loss) earnings per share calculation: Basic 31,142 22,002 Diluted 31,142 22,212 Nine Months Ended September 30, 1 Includes $7,507 and $$6,696 of business development and integration expenses for the Nine months ended September 30, 2020 and 20 19, respectively.
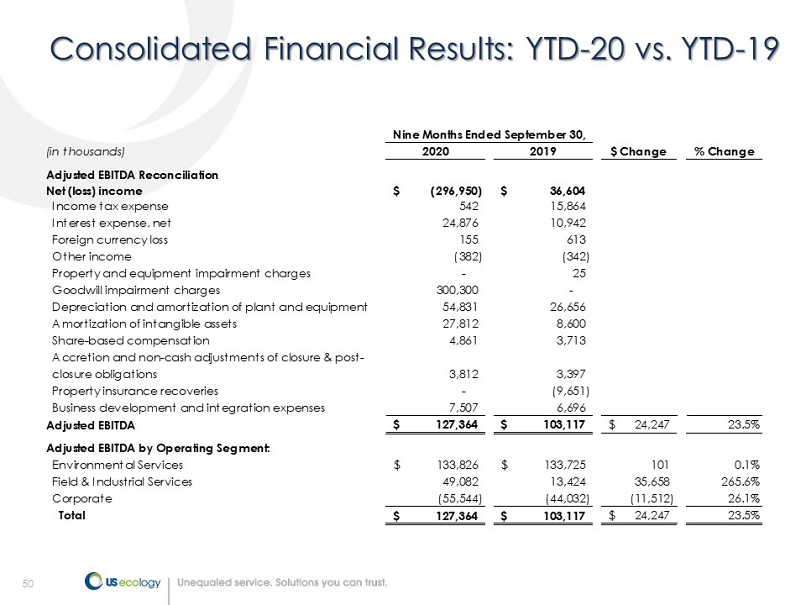
50 Consolidated Financial Results: YTD - 20 vs. YTD - 19 (in thousands) 2020 2019 $ Change % Change Adjusted EBITDA Reconciliation Net (loss) income (296,950)$ 36,604$ Income tax expense 542 15,864 Interest expense, net 24,876 10,942 Foreign currency loss 155 613 Other income (382) (342) Property and equipment impairment charges - 25 Goodwill impairment charges 300,300 - Depreciation and amortization of plant and equipment 54,831 26,656 Amortization of intangible assets 27,812 8,600 Share-based compensation 4,861 3,713 Accretion and non-cash adjustments of closure & post- closure obligations 3,812 3,397 Property insurance recoveries - (9,651) Business development and integration expenses 7,507 6,696 Adjusted EBITDA 127,364$ 103,117$ 24,247$ 23.5% Adjusted EBITDA by Operating Segment: Environmental Services 133,826$ 133,725$ 101 0.1% Field & Industrial Services 49,082 13,424 35,658 265.6% Corporate (55,544) (44,032) (11,512) 26.1% Total 127,364$ 103,117$ 24,247$ 23.5% Nine Months Ended September 30,
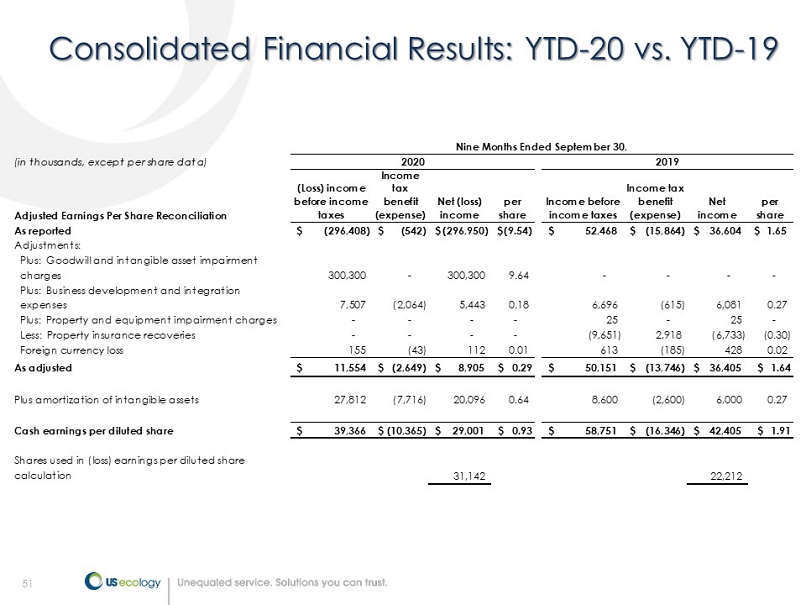
51 Consolidated Financial Results: YTD - 20 vs. YTD - 19 (in thousands, except per share data) Adjusted Earnings Per Share Reconciliation (Loss) income before income taxes Income tax benefit (expense) Net (loss) income per share Income before income taxes Income tax benefit (expense) Net income per share As reported (296,408)$ (542)$ (296,950)$ (9.54)$ 52,468$ (15,864)$ 36,604$ 1.65$ Adjustments: Plus: Goodwill and intangible asset impairment charges 300,300 - 300,300 9.64 - - - - Plus: Business development and integration expenses 7,507 (2,064) 5,443 0.18 6,696 (615) 6,081 0.27 Plus: Property and equipment impairment charges - - - - 25 - 25 - Less: Property insurance recoveries - - - - (9,651) 2,918 (6,733) (0.30) Foreign currency loss 155 (43) 112 0.01 613 (185) 428 0.02 As adjusted 11,554$ (2,649)$ 8,905$ $ 0.29 50,151$ (13,746)$ 36,405$ $ 1.64 Plus amortization of intangible assets 27,812 (7,716) 20,096 0.64 8,600 (2,600) 6,000 0.27 Cash earnings per diluted share 39,366$ (10,365)$ 29,001$ $ 0.93 58,751$ (16,346)$ 42,405$ $ 1.91 Shares used in (loss) earnings per diluted share calculation 31,142 22,212 Nine Months Ended September 30, 2020 2019
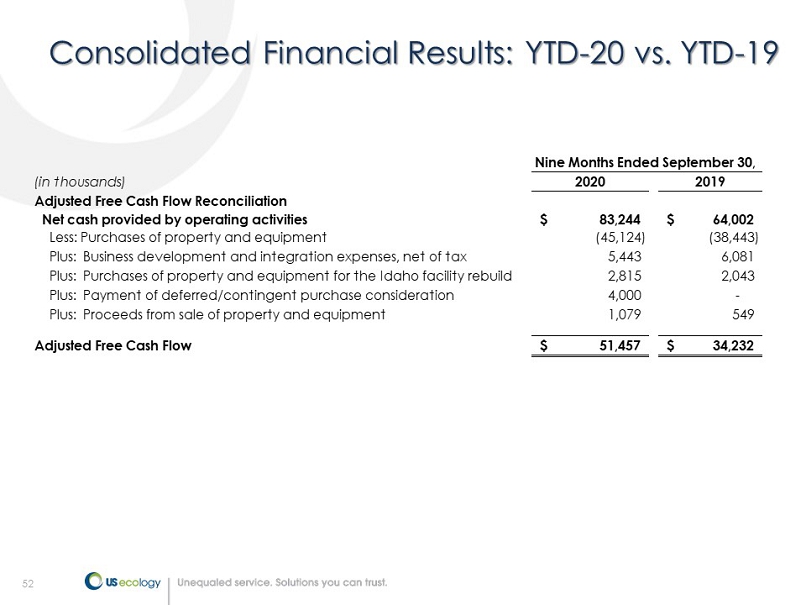
52 Consolidated Financial Results: YTD - 20 vs. YTD - 19 (in thousands) 2020 2019 Adjusted Free Cash Flow Reconciliation Net cash provided by operating activities 83,244$ 64,002$ Less: Purchases of property and equipment (45,124) (38,443) Plus: Business development and integration expenses, net of tax 5,443 6,081 Plus: Purchases of property and equipment for the Idaho facility rebuild 2,815 2,043 Plus: Payment of deferred/contingent purchase consideration 4,000 - Plus: Proceeds from sale of property and equipment 1,079 549 Adjusted Free Cash Flow 51,457$ 34,232$ Nine Months Ended September 30,