EXHIBIT 99.1
Investor Presentation August 2021
2 Safe Harbor Forward looking statements These slides (and the accompanying oral discussion ) contain “forward - looking statements” within the meaning of the federal securities laws . Statements that are not historical facts, including statements about the beliefs and expectations of US Ecology, Inc . (the “Company,” “US Ecology,” “we” or “us), are forward looking statements . Forward looking statements include statements preceded by, followed by or that include the words “may,” “could,” “would,” “should,” “believe,” “expect,” “anticipate,” “plan,” “estimate,” “target,” “project,” “intend” and similar expressions . These statements include, among others, statements regarding our financial and operating results, strategic objectives and means to achieve those objectives, the amount and timing of capital expenditures, repurchases of its stock under approved stock repurchase plans, the amount and timing of interest expense, the likelihood of our success in expanding our business, financing plans, budgets, working capital needs and sources of liquidity . Forward looking statements are only predictions and are not guarantees of performance . These statements are based on management’s beliefs and assumptions, which in turn are based on currently available information . Important assumptions include, among others, those regarding demand for the Company’s services, expansion of service offerings geographically or through new or expanded service lines, the timing and cost of planned capital expenditures, competitive conditions and general economic conditions . These assumptions could prove inaccurate . Forward looking statements also involve known and unknown risks and uncertainties, which could cause actual results to differ materially from those contained in any forward - looking statement . Many of these factors are beyond our ability to control or predict . Such factors may include developments related to the COVID - 19 pandemic, including, but not limited to, the duration and severity of additional measures taken by government authorities and the private sector to limit the spread of COVID - 19 , the integration of the operations of NRC Group Holdings Corp . (“NRC”), the loss or failure to renew significant contracts, competition in our markets, adverse economic conditions, our compliance with applicable laws and regulations, potential liability in connection with providing oil spill response services and waste disposal services, the effect of existing or future laws and regulations related to greenhouse gases and climate change, the effect of our failure to comply with U . S . or foreign anti - bribery laws, the effect of compliance with laws and regulations, an accident at one of our facilities, incidents arising out of the handling of dangerous substances, our failure to maintain an acceptable safety record, our ability to perform under required contracts, limitations on our available cash flow as a result of our indebtedness, liabilities arising from our participation in multi - employer pension plans, the effect of changes in the method of determining the London Interbank Offered Rate (“LIBOR”) or the replacement thereto, risks associated with our international operations, the impact of changes to U . S . tariff and import and export regulations, fluctuations in commodity markets related to our business, a change in NRC’s classification as an Oil Spill Removal Organization, cyber security threats, unanticipated changes in tax rules and regulations, the loss of key personnel, a deterioration in our labor relations or labor disputes, our reliance on third - party contractors to provide emergency response services, our access to insurance, surety bonds and other financial assurances, our litigation risk not covered by insurance, the replacement of non - recurring event projects, our ability to permit and contract for timely construction of new or expanded disposal space, renewals of our operating permits or lease agreements with regulatory bodies, our access to cost - effective transportation services, lawsuits, our implementation of new technologies, fluctuations in foreign currency markets and foreign affairs, our integration of acquired businesses, our ability to pay dividends or repurchase stock, anti - takeover regulations, stock market volatility, the failure of the warrants to be in the money or their expiration worthless and risks related to our compliance with maritime regulations (including the Jones Act) . Except as required by applicable law, including the securities laws of the United States and the rules and regulations of the Securities and Exchange Commission (the “SEC”), we are under no obligation to publicly update or revise any forward - looking statements, whether as a result of new information, future events or otherwise . You should not place undue reliance on our forward - looking statements . Although we believe that the expectations reflected in forward looking statements are reasonable, we cannot guarantee future results or performance . .

3 Introduction
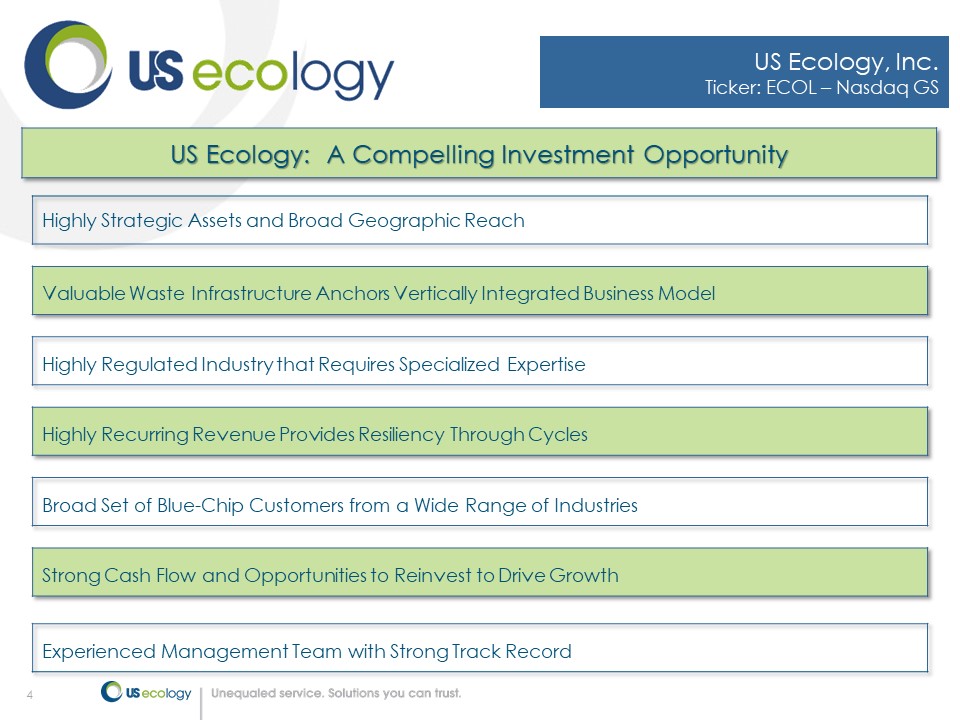
4 US Ecology, Inc. Ticker: ECOL – Nasdaq GS Highly Strategic Assets and Broad Geographic Reach Valuable Waste Infrastructure Anchors Vertically Integrated Business Model Highly Regulated Industry that Requires Specialized Expertise Highly Recurring Revenue Provides Resiliency Through Cycles Broad Set of Blue - Chip Customers from a Wide Range of Industries Strong Cash Flow and Opportunities to Reinvest to Drive Growth Experienced Management Team with Strong Track Record US Ecology: A Compelling Investment Opportunity
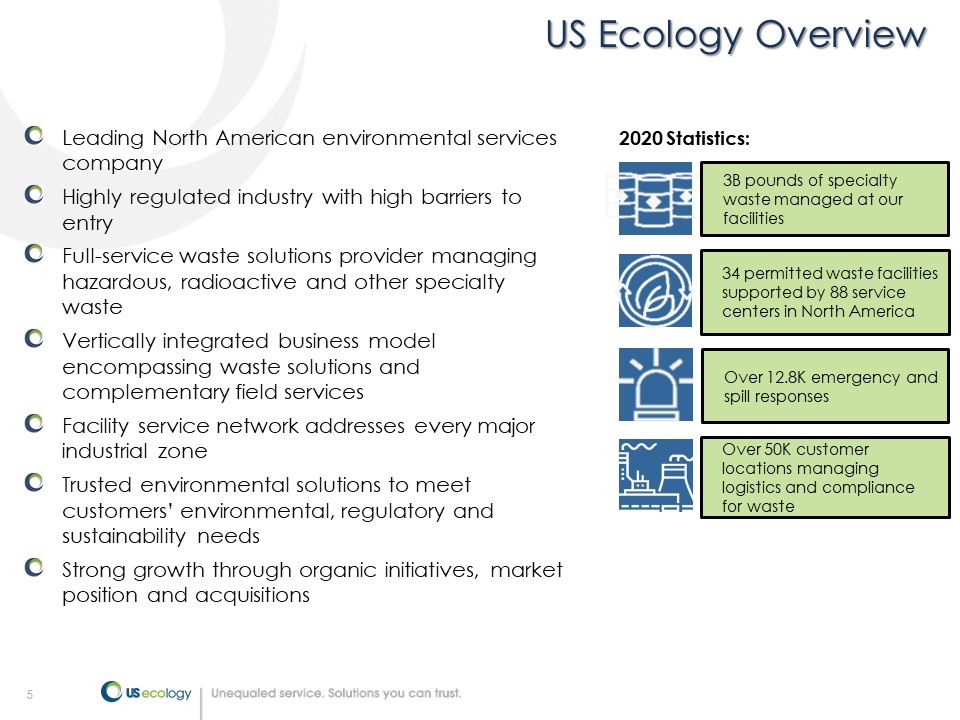
5 US Ecology Overview Leading North American environmental services company Highly regulated industry with high barriers to entry Full - service waste solutions provider managing hazardous, radioactive and other specialty waste Vertically integrated business model encompassing waste solutions and complementary field services Facility service network addresses every major industrial zone Trusted environmental solutions to meet customers’ environmental, regulatory and sustainability needs Strong growth through organic initiatives, market position and acquisitions 3B pounds of specialty waste managed at our facilities 34 permitted waste facilities supported by 88 service centers in North America Over 12.8K emergency and spill responses Over 50K customer locations managing logistics and compliance for waste 2020 Statistics:
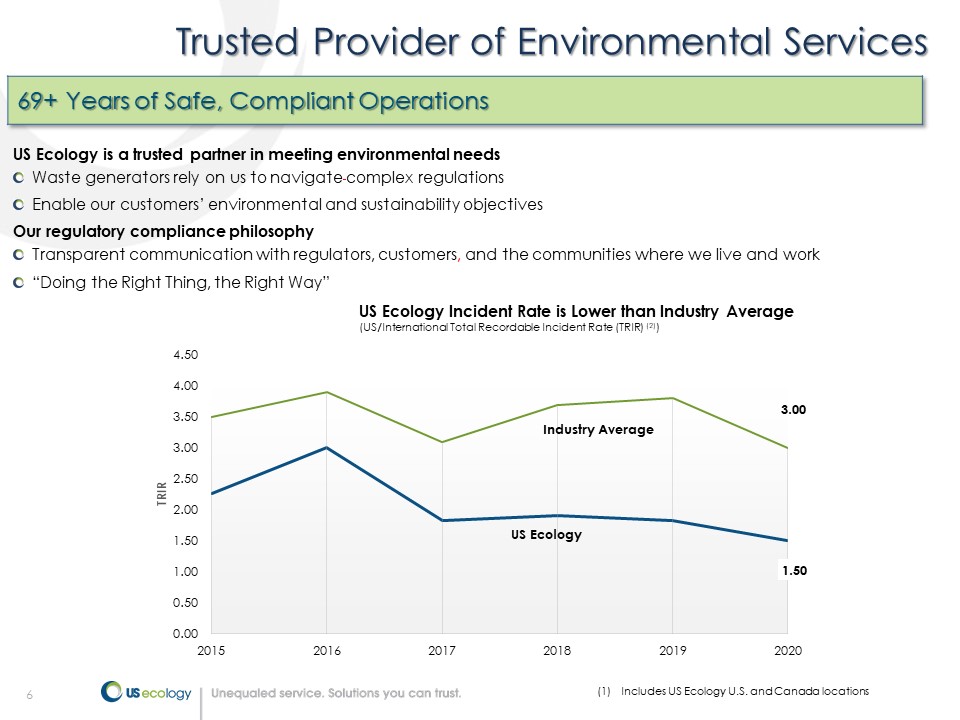
6 Trusted Provider of Environmental Services US Ecology is a trusted partner in meeting environmental needs Waste generators rely on us to navigate complex regulations Enable our customers’ environmental and sustainability objectives Our regulatory compliance philosophy Transparent communication with regulators, customers , and the communities where we live and work “Doing the Right Thing, the Right Way” US Ecology Incident Rate is Lower than Industry Average (US/International Total Recordable Incident Rate (TRIR) (2) ) (1) Includes US Ecology U.S. and Canada locations 1.50 3.00 0.00 0.50 1.00 1.50 2.00 2.50 3.00 3.50 4.00 4.50 2015 2016 2017 2018 2019 2020 TRIR Industry Average US Ecology 69+ Years of Safe, Compliant Operations
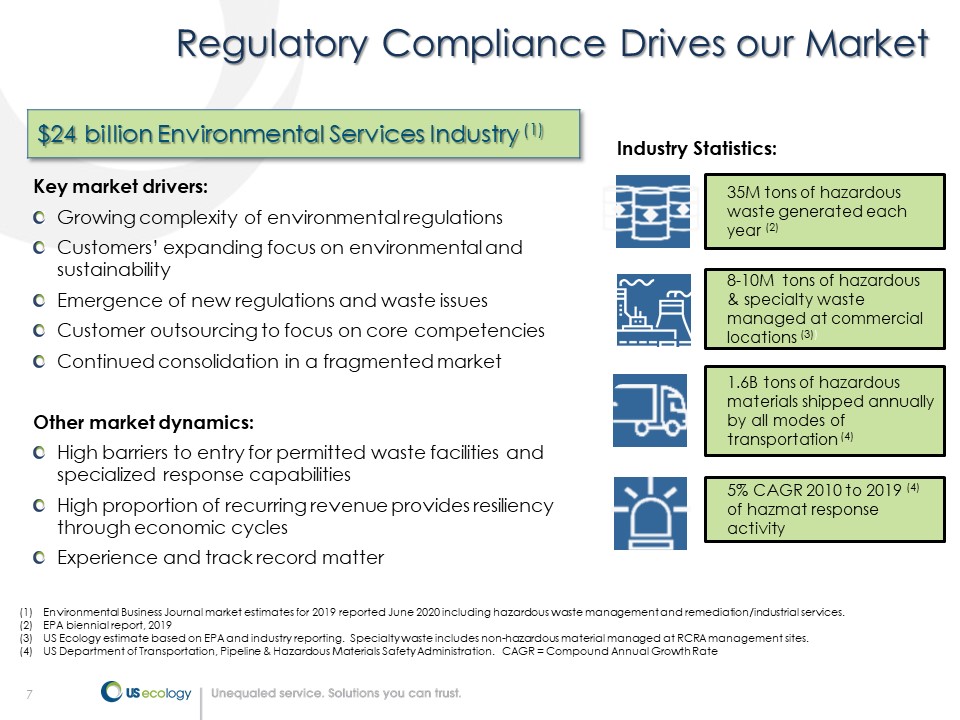
7 Regulatory Compliance Drives our Market 35M tons of hazardous waste generated each year (2) 8 - 10M tons of hazardous & specialty waste managed at commercial locations (3) ) 1.6B tons of hazardous materials shipped annually by all modes of transportation (4) 5% CAGR 2010 to 2019 (4) of hazmat response activity Key market drivers: Growing complexity of environmental regulations Customers’ expanding focus on environmental and sustainability Emergence of new regulations and waste issues Customer outsourcing to focus on core competencies Continued consolidation in a fragmented market Other market dynamics: High barriers to entry for permitted waste facilities and specialized response capabilities High proportion of recurring revenue provides resiliency through economic cycles Experience and track record matter (1) Environmental Business Journal market estimates for 2019 reported June 2020 including hazardous waste management and remediat ion /industrial services. (2) EPA biennial report, 2019 (3) US Ecology estimate based on EPA and industry reporting. Specialty waste includes non - hazardous material managed at RCRA manage ment sites. (4) US Department of Transportation, Pipeline & Hazardous Materials Safety Administration. CAGR = Compound Annual Growth Rate Industry Statistics: $24 billion Environmental Services Industry (1)
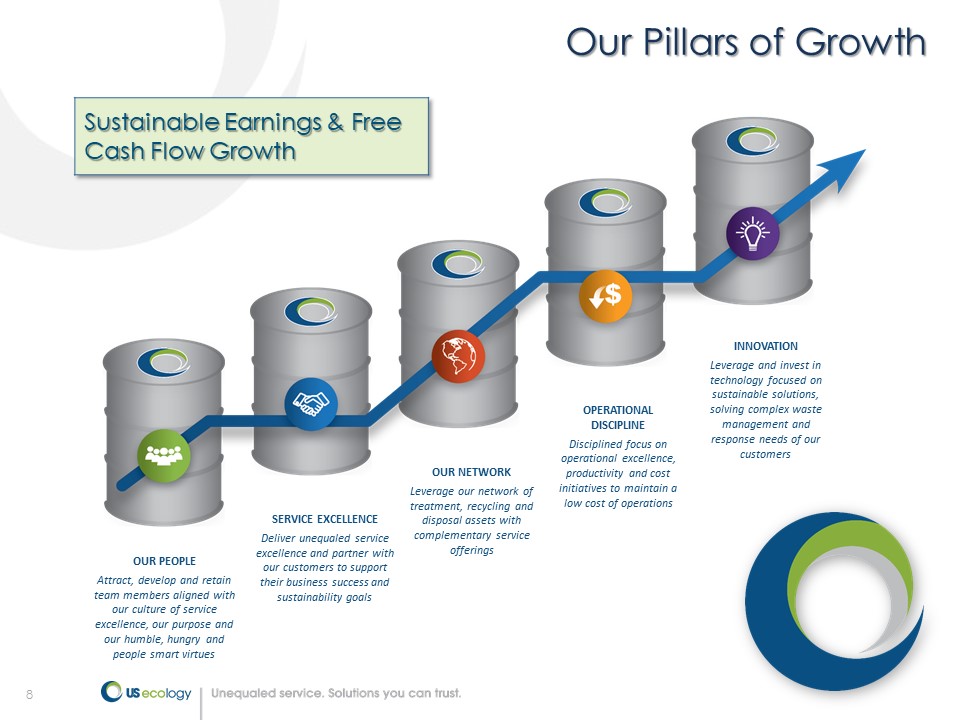
8 Our Pillars of Growth OUR PEOPLE Attract, develop and retain team members aligned with our culture of service excellence, our purpose and our humble, hungry and people smart virtues SERVICE EXCELLENCE Deliver unequaled service excellence and partner with our customers to support their business success and sustainability goals OUR NETWORK Leverage our network of treatment, recycling and disposal assets with complementary service offerings OPERATIONAL DISCIPLINE Disciplined focus on operational excellence, productivity and cost initiatives to maintain a low cost of operations INNOVATION Leverage and invest in technology focused on sustainable solutions, solving complex waste management and response needs of our customers Sustainable Earnings & Free Cash Flow Growth
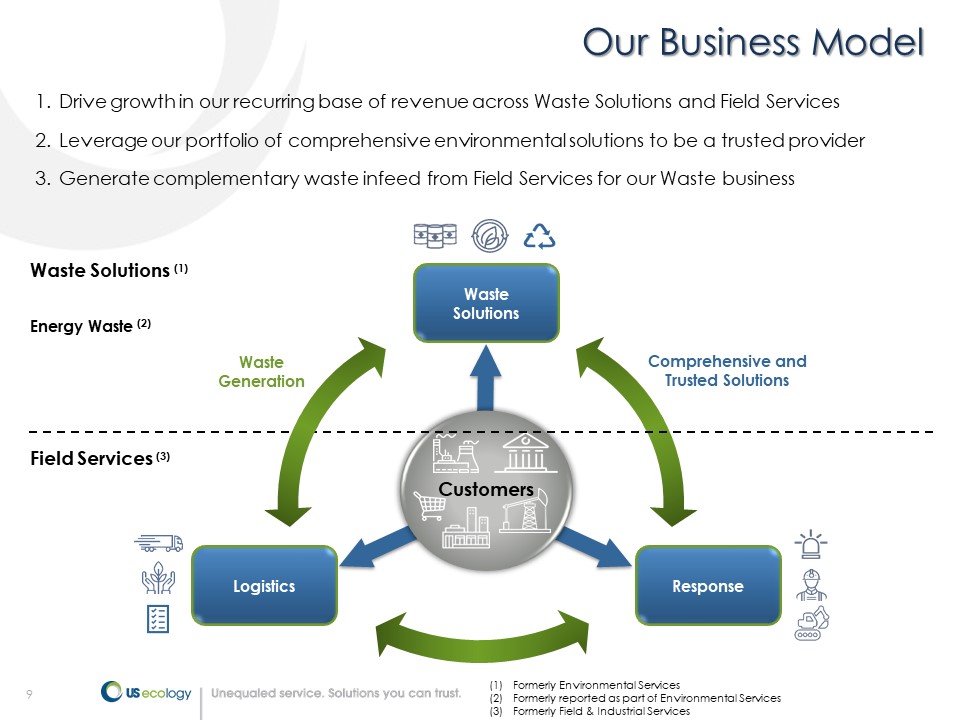
9 Our Business Model 1. Drive growth in our recurring base of revenue across Waste Solutions and Field Services 2. Leverage our portfolio of comprehensive environmental solutions to be a trusted provider 3. Generate complementary waste infeed from Field Services for our Waste business (1) Formerly Environmental Services (2) Formerly reported as part of Environmental Services (3) Formerly Field & Industrial Services Waste Solutions (1) Energy Waste (2) Field Services (3) Customers Logistics Waste Generation Comprehensive and Trusted Solutions Response Waste Solutions
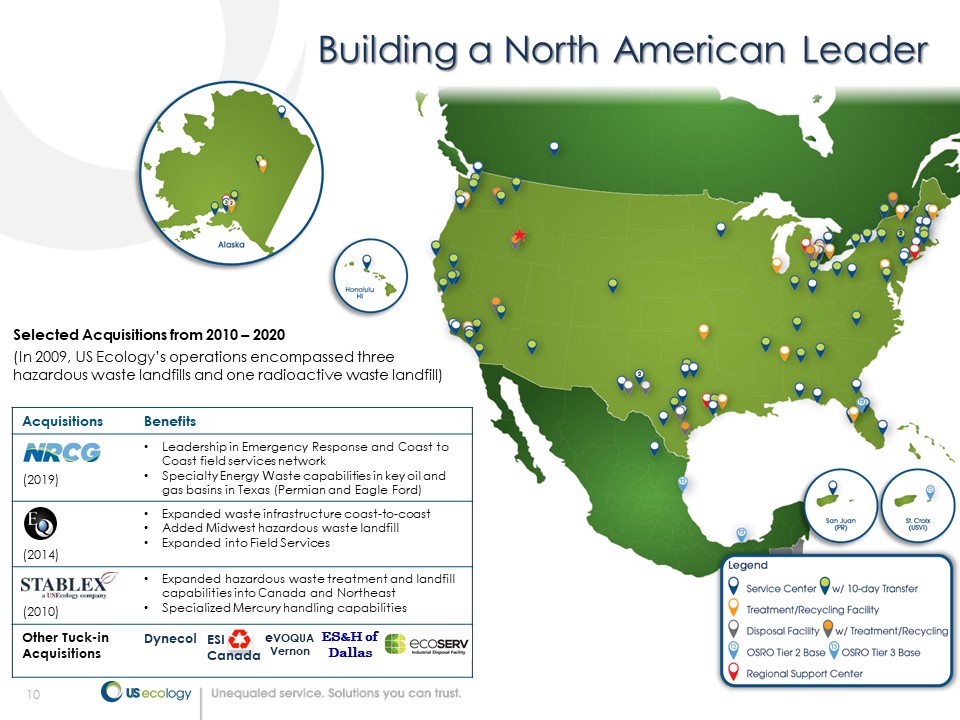
10 Building a North American Leader Acquisitions Benefits (2019) • Leadership in Emergency Response and Coast to Coast field services network • Specialty Energy Waste capabilities in key oil and gas basins in Texas (Permian and Eagle Ford) (2014) • Expanded waste infrastructure coast - to - coast • Added Midwest hazardous waste landfill • Expanded into Field Services (2010) • Expanded hazardous waste treatment and landfill capabilities into Canada and Northeast • Specialized Mercury handling capabilities Other Tuck - in Acquisitions Dynecol e VOQUA Vernon ES & H of Dallas ESI Canada Selected Acquisitions from 2010 – 2020 (In 2009, US Ecology’s operations encompassed three hazardous waste landfills and one radioactive waste landfill)
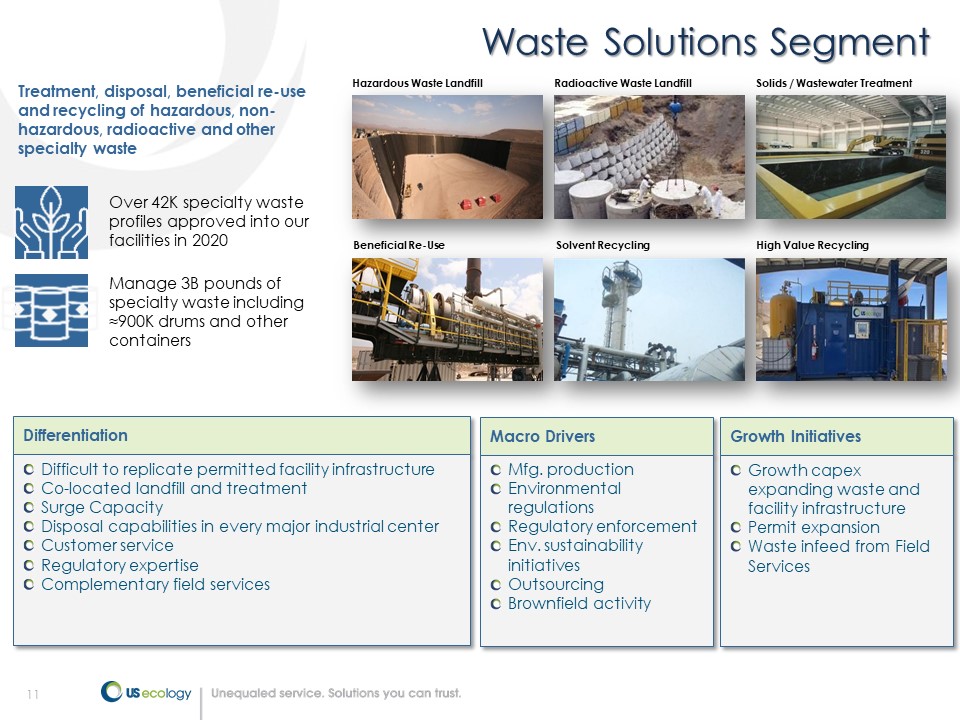
11 Waste Solutions Segment Hazardous Waste Landfill Radioactive Waste Landfill Solids / Wastewater Treatment Beneficial Re - Use Solvent Recycling High Value Recycling Treatment, disposal, beneficial re - use and recycling of hazardous, non - hazardous, radioactive and other specialty waste Over 42K specialty waste profiles approved into our facilities in 2020 Manage 3B pounds of specialty waste including ≈900K drums and other containers Differentiation Difficult to replicate permitted facility infrastructure Co - located landfill and treatment Surge Capacity Disposal capabilities in every major industrial center Customer service Regulatory expertise Complementary field services Macro Drivers Mfg. production Environmental regulations Regulatory enforcement Env. sustainability initiatives Outsourcing Brownfield activity Growth Initiatives Growth capex expanding waste and facility infrastructure Permit expansion Waste infeed from Field Services

12 Field Services Segment Logistics and response solutions focusing on in - field service offerings Logistics Solutions - Characterization, packaging, collection and compliance solutions for specialty waste at customer sites and through our 10 - day transfer facilities Retail LTL Logistics Lab Pack Total Waste Management (“TWM”) Transportation Compliance Retail technicians covered 873K miles, with 52K stops in 2020 at approx. 25K customer locations TWM manages waste & recycling needs at over 1,800 customer locations Differentiation Coast - to - coast Field Services network of 88 service centers (39 Permitted 10 - days) Leverage Waste Solutions for internalization Manage waste into third party disposal partners Among the top providers of Retail and TWM Technology investments in A.I. retail waste identification Next generation lab pack technology platform Macro Drivers Industrial production Consumer spending Environmental regulations Env. sustainability initiatives Outsourcing Regulatory enforcement Growth Initiatives Cross - selling services across larger network Growth capex expanding capabilities across network Smarter Sorting Partnership in Retail New lab pack platform Small Quantity Generation (“SQG”) Solutions
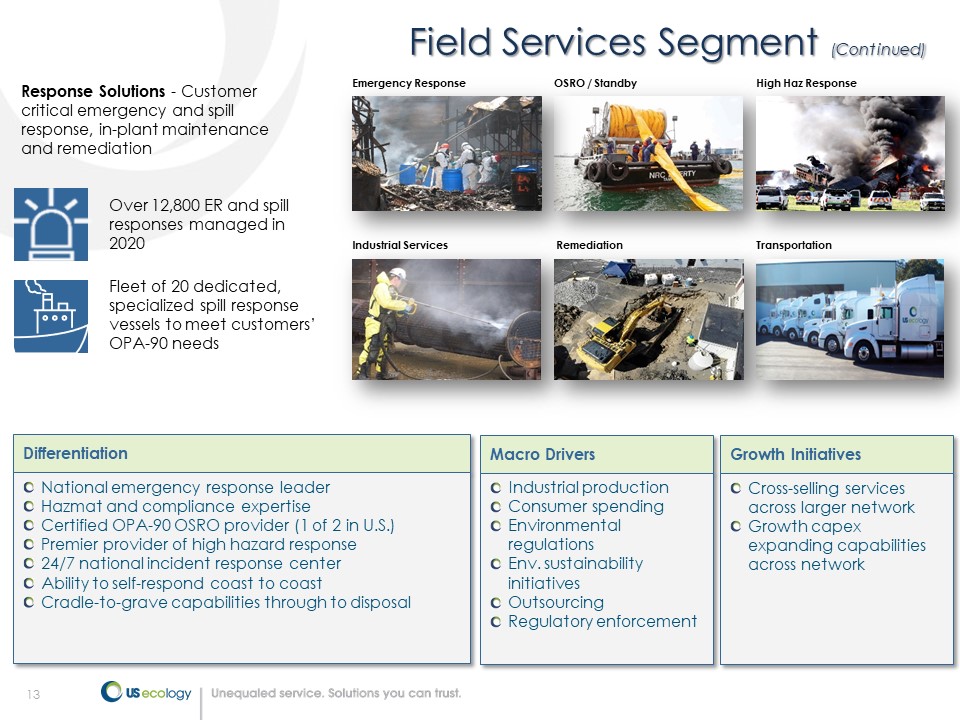
13 Differentiation National emergency response leader Hazmat and compliance expertise Certified OPA - 90 OSRO provider (1 of 2 in U.S.) Premier provider of high hazard response 24/7 national incident response center Ability to self - respond coast to coast Cradle - to - grave capabilities through to disposal Field Services Segment (Continued) Response Solutions - Customer critical emergency and spill response, in - plant maintenance and remediation Over 12,800 ER and spill responses managed in 2020 Fleet of 20 dedicated, specialized spill response vessels to meet customers’ OPA - 90 needs Emergency Response OSRO / Standby High Haz Response Industrial Services Remediation Transportation Macro Drivers Industrial production Consumer spending Environmental regulations Env. sustainability initiatives Outsourcing Regulatory enforcement Growth Initiatives Cross - selling services across larger network Growth capex expanding capabilities across network
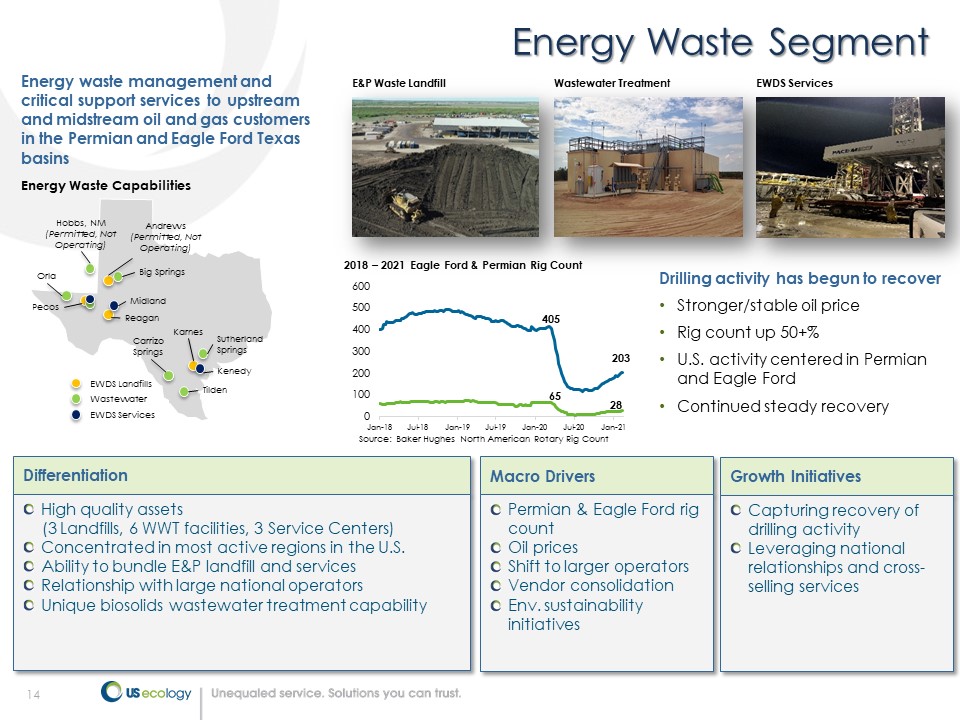
14 Energy Waste Segment Energy waste management and critical support services to upstream and midstream oil and gas customers in the Permian and Eagle Ford Texas basins EWDS Landfills Wastewater EWDS Services Hobbs, NM (Permitted, Not Operating) Orla Andrews (Permitted, Not Operating) Big Springs Tilden Carrizo Springs Kenedy Karnes Sutherland Springs Midland Reagan Pecos Energy Waste Capabilities E&P Waste Landfill Wastewater Treatment EWDS Services Differentiation High quality assets (3 Landfills, 6 WWT facilities, 3 Service Centers) Concentrated in most active regions in the U.S. Ability to bundle E&P landfill and services Relationship with large national operators Unique biosolids wastewater treatment capability Macro Drivers Permian & Eagle Ford rig count Oil prices Shift to larger operators Vendor consolidation Env. sustainability initiatives Growth Initiatives Capturing recovery of drilling activity Leveraging national relationships and cross - selling services 65 28 405 203 0 100 200 300 400 500 600 Jan-18 Jul-18 Jan-19 Jul-19 Jan-20 Jul-20 Jan-21 Source: Baker Hughes North American Rotary Rig Count 2018 – 2021 Eagle Ford & Permian Rig Count Drilling activity has begun to recover • Stronger/stable oil price • Rig count up 50+% • U.S. activity centered in Permian and Eagle Ford • Continued steady recovery

Visit our New ESG Website!
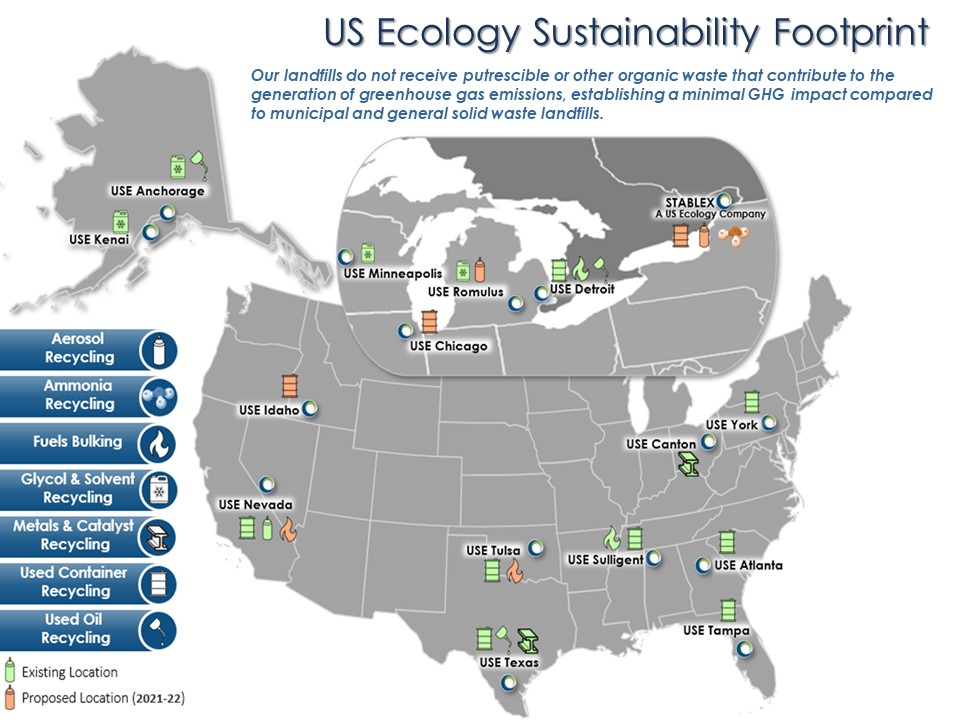
US Ecology Sustainability Footprint Our landfills do not receive putrescible or other organic waste that contribute to the generation of greenhouse gas emissions, establishing a minimal GHG impact compared to municipal and general solid waste landfills.
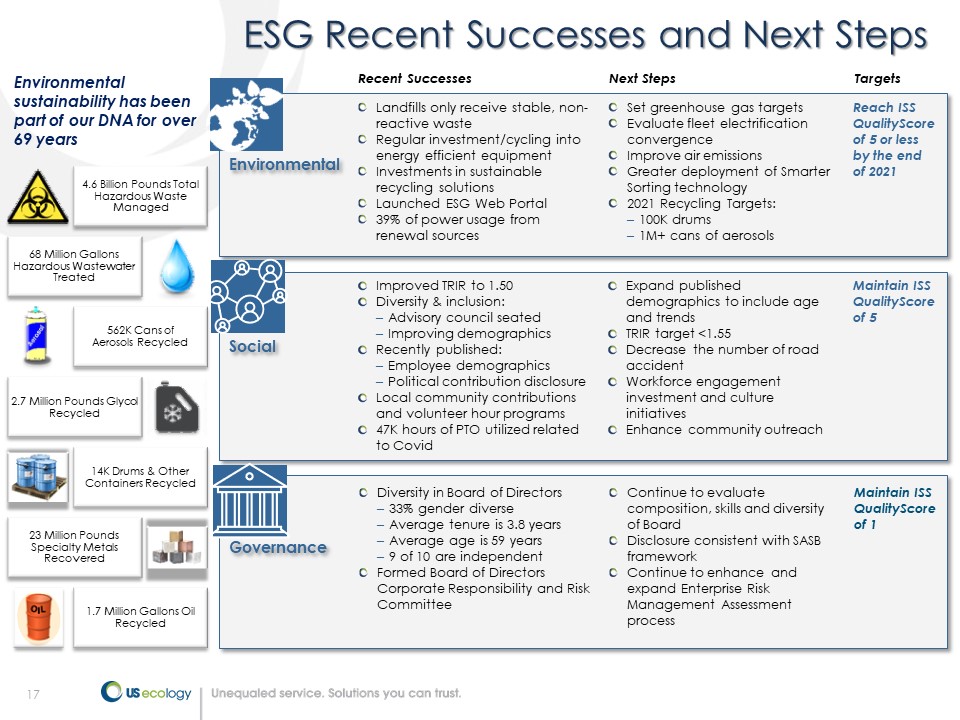
17 ESG Recent Successes and Next Steps 4.6 Billion Pounds Total Hazardous Waste Managed 68 Million Gallons Hazardous Wastewater Treated 562K Cans of Aerosols Recycled 2.7 Million Pounds Glycol Recycled 14K Drums & Other Containers Recycled 23 Million Pounds Specialty Metals Recovered 1.7 Million Gallons Oil Recycled Set greenhouse gas targets Evaluate fleet electrification convergence Improve air emissions Greater deployment of Smarter Sorting technology 2021 Recycling Targets: – 100K drums – 1M+ cans of aerosols Recent Successes Next Steps Landfills only receive stable, non - reactive waste Regular investment/cycling into energy efficient equipment Investments in sustainable recycling solutions Launched ESG Web Portal 39% of power usage from renewal sources Environmental Social Governance Reach ISS QualityScore of 5 or less by the end of 2021 Expand published demographics to include age and trends TRIR target <1.55 Decrease the number of road accident Workforce engagement investment and culture initiatives Enhance community outreach Improved TRIR to 1.50 Diversity & inclusion: – Advisory council seated – Improving demographics Recently published: – Employee demographics – Political contribution disclosure Local community contributions and volunteer hour programs 47K hours of PTO utilized related to Covid Maintain ISS QualityScore of 5 Continue to evaluate composition, skills and diversity of Board Disclosure consistent with SASB framework Continue to enhance and expand Enterprise Risk Management Assessment process Diversity in Board of Directors – 33% gender diverse – Average tenure is 3.8 years – Average age is 59 years – 9 of 10 are independent Formed Board of Directors Corporate Responsibility and Risk Committee Maintain ISS QualityScore of 1 Targets Environmental sustainability has been part of our DNA for over 69 years

18 Financial Overview
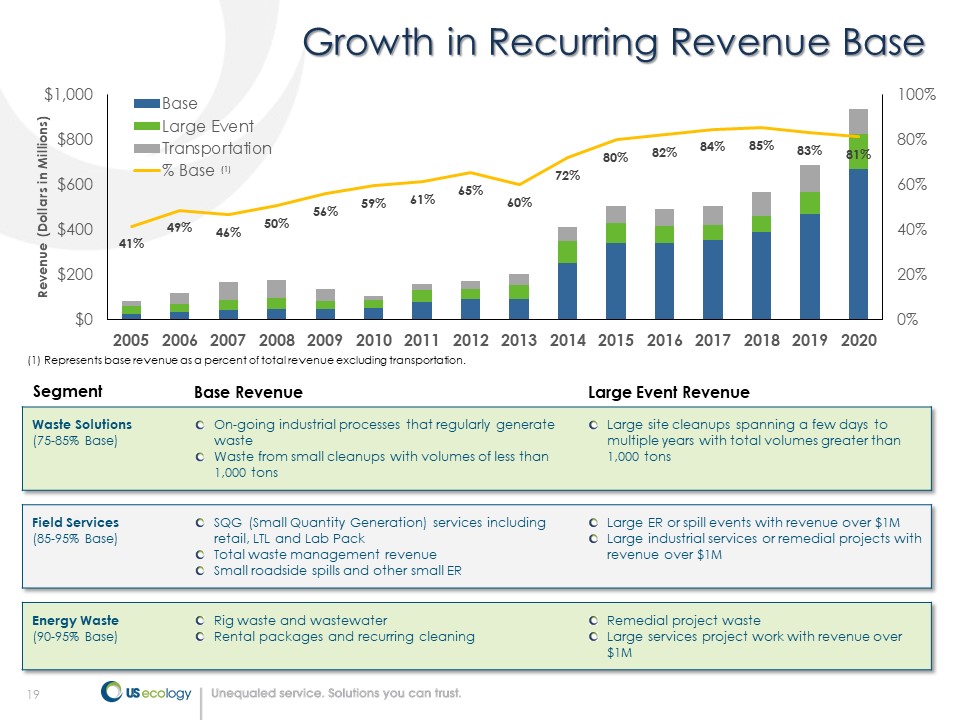
19 41% 49% 46% 50% 56% 59% 61% 65% 60% 72% 80% 82% 84% 85% 83% 81% 0% 20% 40% 60% 80% 100% $0 $200 $400 $600 $800 $1,000 2005 2006 2007 2008 2009 2010 2011 2012 2013 2014 2015 2016 2017 2018 2019 2020 Revenue (Dollars in Millions) Base Large Event Transportation % Base Growth in Recurring Revenue Base (1) (1) Represents base revenue as a percent of total revenue excluding transportation. Segment Base Revenue Large Event Revenue Waste Solutions (75 - 85% Base) On - going industrial processes that regularly generate waste Waste from small cleanups with volumes of less than 1,000 tons Large site cleanups spanning a few days to multiple years with total volumes greater than 1,000 tons Field Services (85 - 95% Base) SQG (Small Quantity Generation) services including retail, LTL and Lab Pack Total waste management revenue Small roadside spills and other small ER Large ER or spill events with revenue over $1M Large industrial services or remedial projects with revenue over $1M Energy Waste (90 - 95% Base) Rig waste and wastewater Rental packages and recurring cleaning Remedial project waste Large services project work with revenue over $1M

20 Revenue and Adj. EBITDA Trends ($ in Millions) $201 $504 $566 $934 $469 $0 $200 $400 $600 $800 $1,000 2013 2014 2015 2016 2017 2018 2019 2020 2021 Revenue 19% 122 % 23 % (5)% (1) Excludes revenue from divested businesses of $37M and $59M for 2014 and 2015, respectively (2) See definition and reconciliation of non - GAAP measures in slides 42 - 59 of this presentation (3) Excludes EBITDA from divested businesses of $5M and $5M for 2014 and 2015, respectively $410 $504 $478 5% 12% 21% $686 $990 $940 2021 Guidance Range $73 $113 $125 $170 $67 $0 $50 $100 $150 $200 2013 2014 2015 2016 2017 2018 2019 2020 2021 $149 $115 $127 0% $113 11% 19% $175 $165 2021 Guidance Range 14% Adj. EBITDA (2) ($ in Millions) Revenue Growth (YoY) Adj. EBITDA Growth (YoY) (7)% 11% 52% 25% (1) (1) (3) (3) Q2 - YTD Q2 - YTD
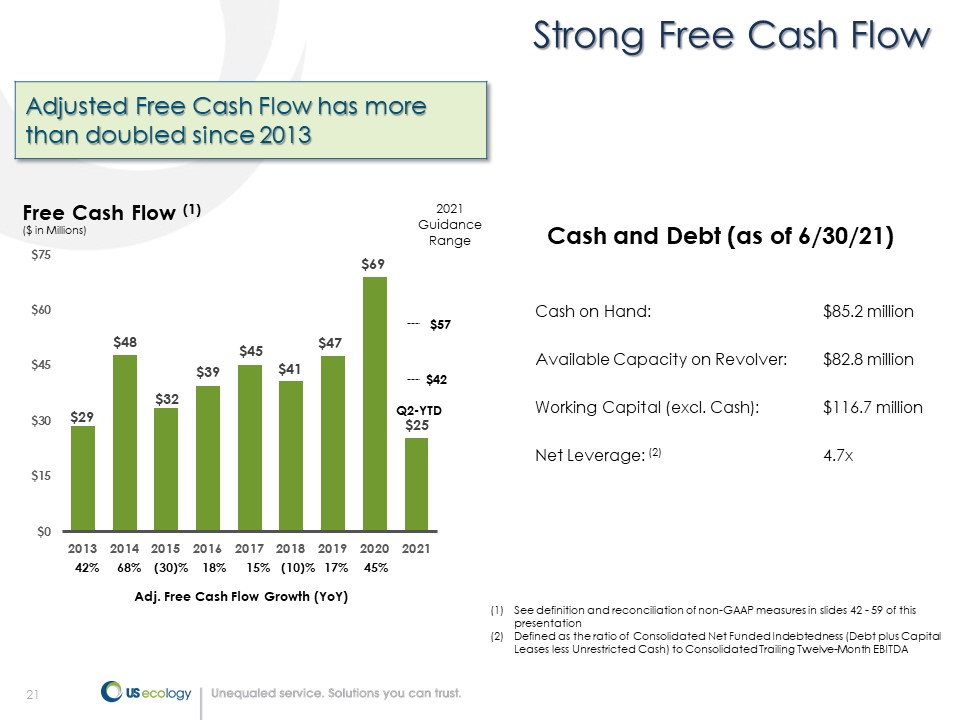
21 Strong Free Cash Flow Cash on Hand: $85.2 million Available Capacity on Revolver: $82.8 million Working Capital (excl. Cash): $116.7 million Net Leverage: (2) 4.7x (1) See definition and reconciliation of non - GAAP measures in slides 42 - 59 of this presentation (2) Defined as the ratio of Consolidated Net Funded Indebtedness (Debt plus Capital Leases less Unrestricted Cash) to Consolidated Trailing Twelve - Month EBITDA Free Cash Flow (1) ($ in Millions) $29 $48 $32 $39 $45 $41 $47 $69 $25 $0 $15 $30 $45 $60 $75 2013 2014 2015 2016 2017 2018 2019 2020 2021 2021 Guidance Range $57 $42 Adjusted Free Cash Flow has more than doubled since 2013 15% (10)% 17% 45% Adj. Free Cash Flow Growth (YoY) 18% (30)% 68% 42% Cash and Debt (as of 6/30/21) Q2 - YTD
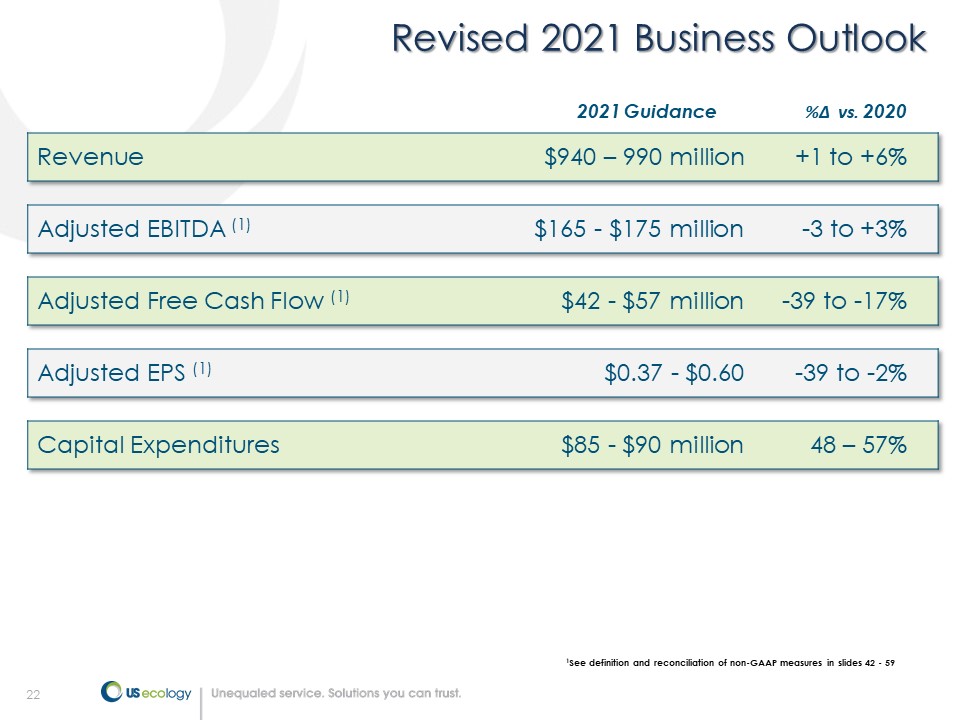
22 Revised 2021 Business Outlook Revenue $940 – 990 million +1 to +6% Adjusted EBITDA (1) $165 - $175 million - 3 to +3% Adjusted Free Cash Flow (1) $42 - $57 million - 39 to - 17% Adjusted EPS (1) $0.37 - $0.60 - 39 to - 2% Capital Expenditures $85 - $90 million 48 – 57% 2021 Guidance % Δ vs. 2020 1 See definition and reconciliation of non - GAAP measures in slides 42 - 59

23 Financial Objectives Organic Revenue Growth $934M 5 – 7% Adjusted EBITDA Margin 18% 20%+ Free Cash Flow $69M $100M+ Free Cash Flow Conversion 40% 40%+ ROIC 4.4% 10% Net Debt to EBITDA Leverage 4.3x 2.0 – 2.5x Long Term Targets (5 Years) (1) (1) These long - term targets represent our goals and are not projections of future performance. These targets are forward - looking , are subject to significant business, economic, regulatory and competitive uncertainties and contingencies, many of which are beyond the control of the Company and its management and a re based upon assumptions with respect to future decisions, which are subject to change. Actual results will vary, and those variations may be material. For discussion of som e o f the important factors that could cause these variations, please see “Risk Factors” in our Annual Report on Form 10 - K for the fiscal year ended December 31, 2020 as filed with the SEC on March 1, 2021, and in other periodic reports we file with the SEC. Nothing in this presentation should be regarded as a representation by any person that these targets will be achieve d, and the Company undertakes no obligation to update this information. See “Forward - Looking Statements Safe Harbor” on page 2 of this presentation. 2020 Reference
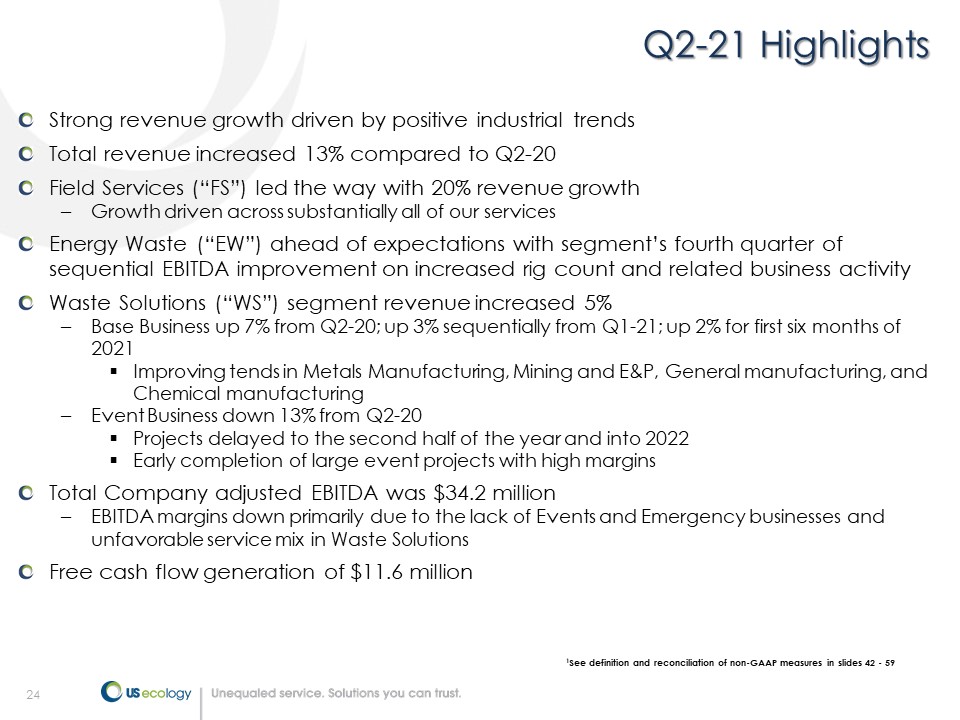
24 Q2 - 21 Highlights 1 See definition and reconciliation of non - GAAP measures in slides 42 - 59 Strong revenue growth driven by positive industrial trends Total revenue increased 13% compared to Q2 - 20 Field Services (“FS”) led the way with 20% revenue growth – Growth driven across substantially all of our services Energy Waste (“EW”) ahead of expectations with segment’s fourth quarter of sequential EBITDA improvement on increased rig count and related business activity Waste Solutions (“WS”) segment revenue increased 5% – Base Business up 7% from Q2 - 20; up 3% sequentially from Q1 - 21; up 2% for first six months of 2021 ▪ Improving tends in Metals Manufacturing, Mining and E&P, General manufacturing, and Chemical manufacturing – Event Business down 13% from Q2 - 20 ▪ Projects delayed to the second half of the year and into 2022 ▪ Early completion of large event projects with high margins Total Company adjusted EBITDA was $34.2 million – EBITDA margins down primarily due to the lack of Events and Emergency businesses and unfavorable service mix in Waste Solutions Free cash flow generation of $11.6 million

25 Q2 - 21 Financial Review 1 See definition and reconciliation of non - GAAP measures in slides 42 - 59 $240.8M +13% vs. prior year Revenue • Waste Solutions (“WS”) up 5% to $108.4m • Field Services (“FS”) up 20% to $124.7m • Energy Waste (“EW”) up 5% to $7.7m 22.7% vs. 25.7% prior year Gross Margin • WS Treatment and Disposal (“T&D”) margin 38% in Q2 - 21 compared with 45% in Q2 - 20 due to less favorable service mix • FS gross margin of 15% in Q2 - 21 compared with 14% in Q2 - 20 • EW gross margin of 10% in Q2 - 21 compared to - 27% in Q2 - 20 $51.2M vs. $49.7m prior year SG&A • The increase in SG&A due to higher incentive compensation and benefits • Total business development & integration expenses of $0.8m in Q2 - 21 compared with $3.0m in Q2 - 20 • Total SG&A as a percent of revenue was 21% in Q2 - 21 compared with 23% in Q2 - 20 (excluding $2.2 million gain on earn out contract which lowered Q2 - 20 SG&A) $(0.11) vs. $(0.08) prior year Adj. EPS (1) • Intangible asset amortization of approximately $0.21 per share in Q2 - 21 and Q2 - 20 • Cash EPS of $0.10 in Q2 - 21 compared with $0.13 in Q2 - 20 $34.2M vs. $38.7m prior year Adj. EBITDA (1) • WS segment contributed $40.0m in Q2 - 21 vs. $46.1m in Q2 - 20 • FS segment contributed $17.2m in Q2 - 21 vs. $16.0m in Q2 - 20 • EW segment contributed $2.3m in Q2 - 21 vs. $(1.1)m in Q2 - 20
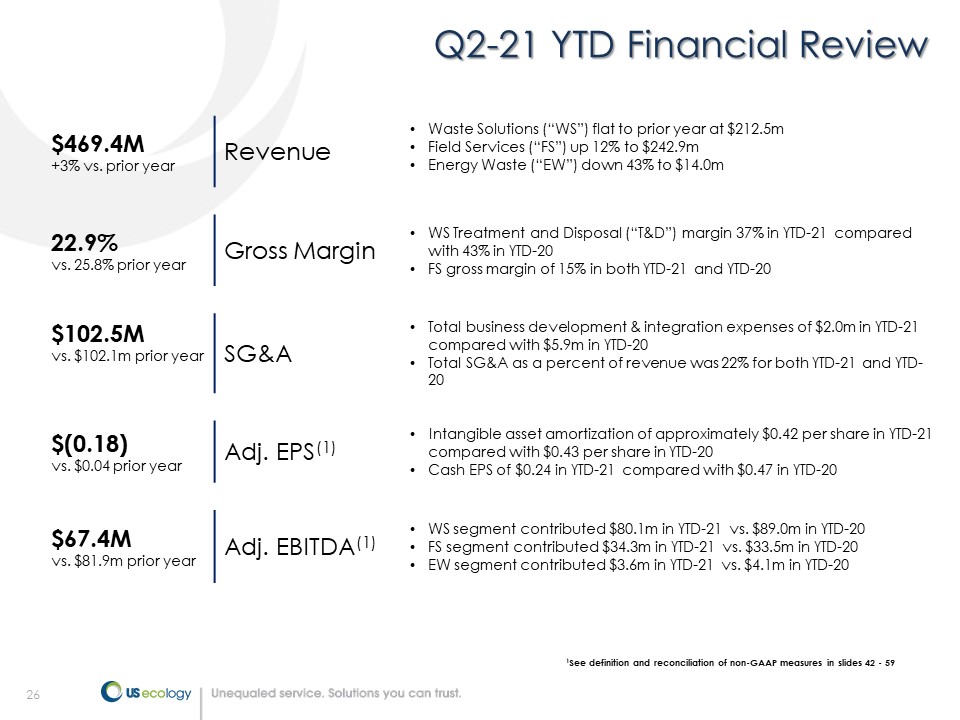
26 Q2 - 21 YTD Financial Review 1 See definition and reconciliation of non - GAAP measures in slides 42 - 59 $469.4M +3% vs. prior year Revenue • Waste Solutions (“WS”) flat to prior year at $212.5m • Field Services (“FS”) up 12% to $242.9m • Energy Waste (“EW”) down 43% to $14.0m 22.9% vs. 25.8% prior year Gross Margin • WS Treatment and Disposal (“T&D”) margin 37% in YTD - 21 compared with 43% in YTD - 20 • FS gross margin of 15% in both YTD - 21 and YTD - 20 $102.5M vs. $102.1m prior year SG&A • Total business development & integration expenses of $2.0m in YTD - 21 compared with $5.9m in YTD - 20 • Total SG&A as a percent of revenue was 22% for both YTD - 21 and YTD - 20 $(0.18) vs. $0.04 prior year Adj. EPS (1) • Intangible asset amortization of approximately $0.42 per share in YTD - 21 compared with $0.43 per share in YTD - 20 • Cash EPS of $0.24 in YTD - 21 compared with $0.47 in YTD - 20 $67.4M vs. $81.9m prior year Adj. EBITDA (1) • WS segment contributed $80.1m in YTD - 21 vs. $89.0m in YTD - 20 • FS segment contributed $34.3m in YTD - 21 vs. $33.5m in YTD - 20 • EW segment contributed $3.6m in YTD - 21 vs. $4.1m in YTD - 20
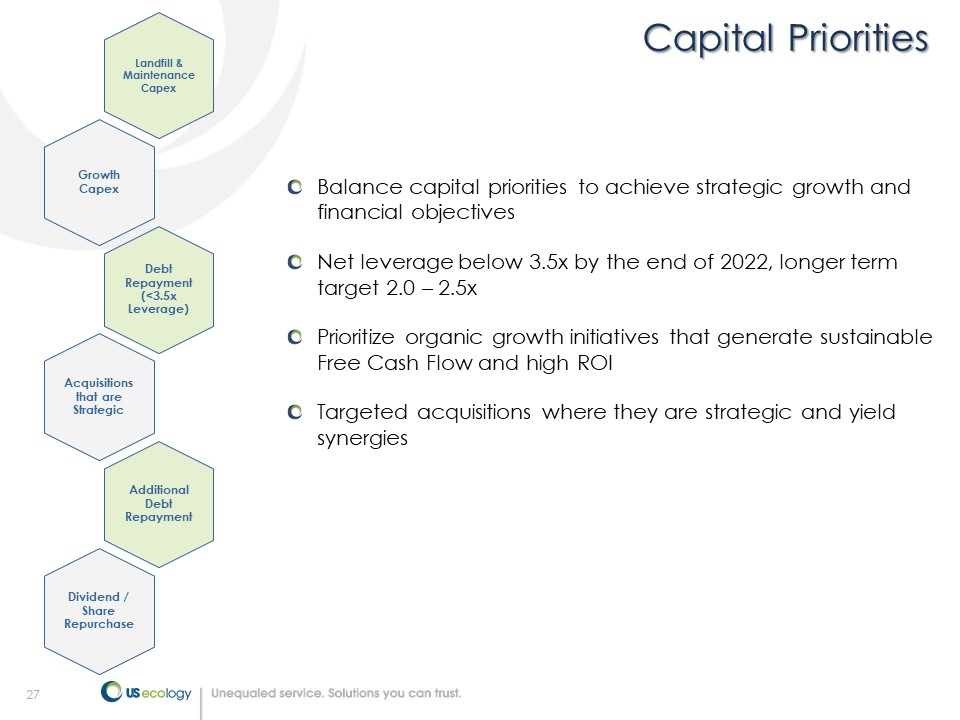
27 Capital Priorities Balance capital priorities to achieve strategic growth and financial objectives Net leverage below 3.5x by the end of 2022, longer term target 2.0 – 2.5x Prioritize organic growth initiatives that generate sustainable Free Cash Flow and high ROI Targeted acquisitions where they are strategic and yield synergies Landfill & Maintenance Capex Growth Capex Debt Repayment (<3.5x Leverage) Acquisitions that are Strategic Additional Debt Repayment Dividend / Share Repurchase

28 Appendix
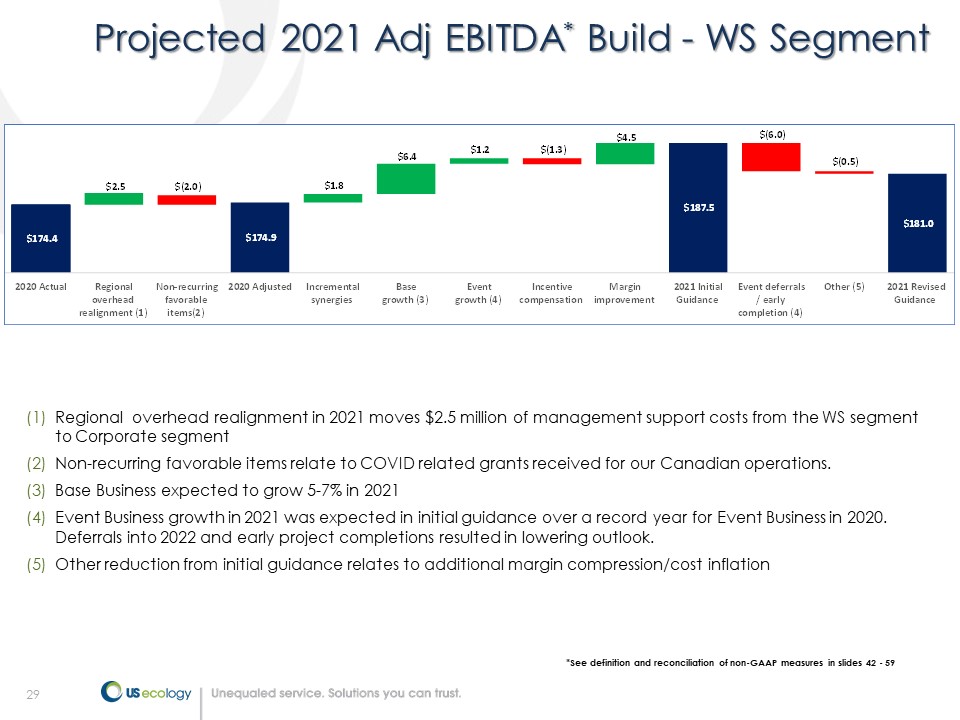
29 Projected 2021 Adj EBITDA * Build - WS Segment (1) Regional overhead realignment in 2021 moves $2.5 million of management support costs from the WS segment to Corporate segment (2) Non - recurring favorable items relate to COVID related grants received for our Canadian operations. (3) Base Business expected to grow 5 - 7% in 2021 (4) Event Business growth in 2021 was expected in initial guidance over a record year for Event Business in 2020. Deferrals into 2022 and early project completions resulted in lowering outlook. (5) Other reduction from initial guidance relates to additional margin compression/cost inflation * See definition and reconciliation of non - GAAP measures in slides 42 - 59 $(2.0) $(1.3) $(6.0) $(0.5) $174.4 $2.5 $174.9 $1.8 $6.4 $1.2 $4.5 $187.5 $181.0 2020 Actual Regional overhead realignment (1) Non-recurring favorable items(2) 2020 Adjusted Incremental synergies Base growth (3) Event growth (4) Incentive compensation Margin improvement 2021 Initial Guidance Event deferrals / early completion (4) Other (5) 2021 Revised Guidance
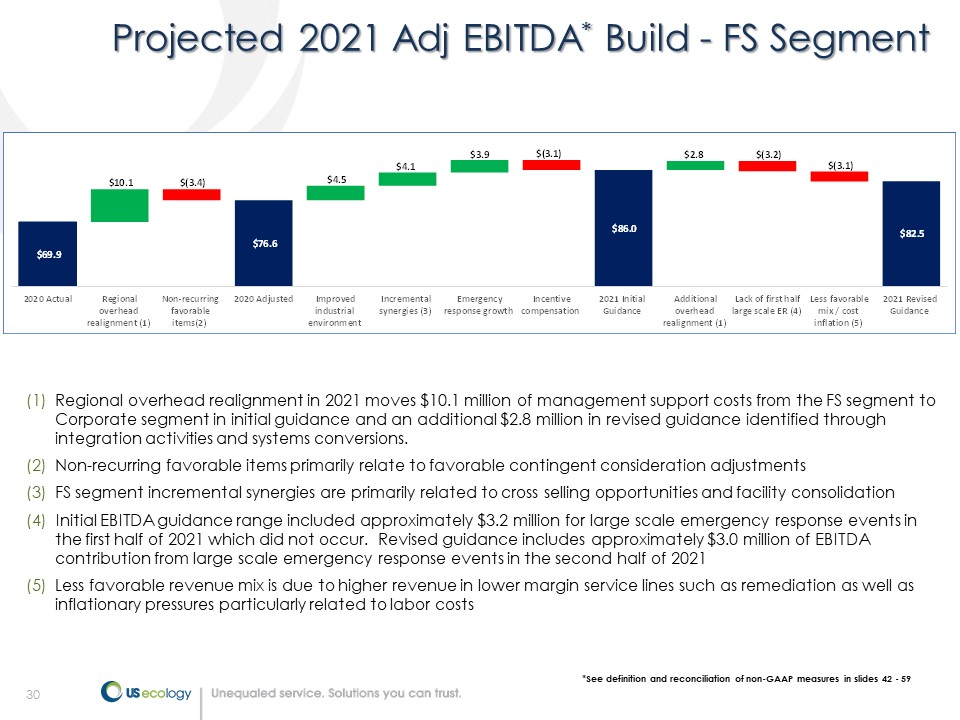
30 Projected 2021 Adj EBITDA * Build - FS Segment (1) Regional overhead realignment in 2021 moves $10.1 million of management support costs from the FS segment to Corporate segment in initial guidance and an additional $2.8 million in revised guidance identified through integration activities and systems conversions. (2) Non - recurring favorable items primarily relate to favorable contingent consideration adjustments (3) FS segment incremental synergies are primarily related to cross selling opportunities and facility consolidation (4) Initial EBITDA guidance range included approximately $3.2 million for large scale emergency response events in the first half of 2021 which did not occur. Revised guidance includes approximately $3.0 million of EBITDA contribution from large scale emergency response events in the second half of 2021 (5) Less favorable revenue mix is due to higher revenue in lower margin service lines such as remediation as well as inflationary pressures particularly related to labor costs $ - $(3.4) $ - $ - $ - $(3.1) $ - $(3.2) $(3.1) $69.9 $10.1 $ - $76.6 $4.5 $4.1 $3.9 $ - $86.0 $2.8 $ - $ - $82.5 2020 Actual Regional overhead realignment (1) Non-recurring favorable items(2) 2020 Adjusted Improved industrial environment Incremental synergies (3) Emergency response growth Incentive compensation 2021 Initial Guidance Additional overhead realignment (1) Lack of first half large scale ER (4) Less favorable mix / cost inflation (5) 2021 Revised Guidance * See definition and reconciliation of non - GAAP measures in slides 42 - 59
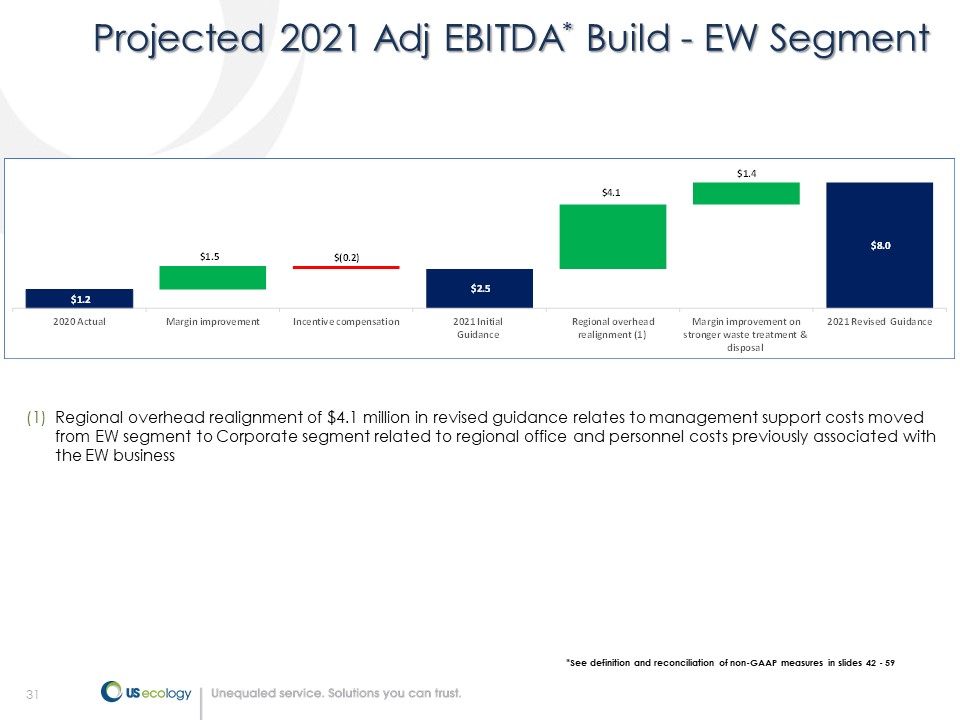
31 Projected 2021 Adj EBITDA * Build - EW Segment $ - $0.2 $ - $ - $1.2 $1.5 $(0.2) $2.5 $4.1 $1.4 $8.0 2020 Actual Margin improvement Incentive compensation 2021 Initial Guidance Regional overhead realignment (1) Margin improvement on stronger waste treatment & disposal 2021 Revised Guidance $1.5 (1) Regional overhead realignment of $4.1 million in revised guidance relates to management support costs moved from EW segment to Corporate segment related to regional office and personnel costs previously associated with the EW business * See definition and reconciliation of non - GAAP measures in slides 42 - 59
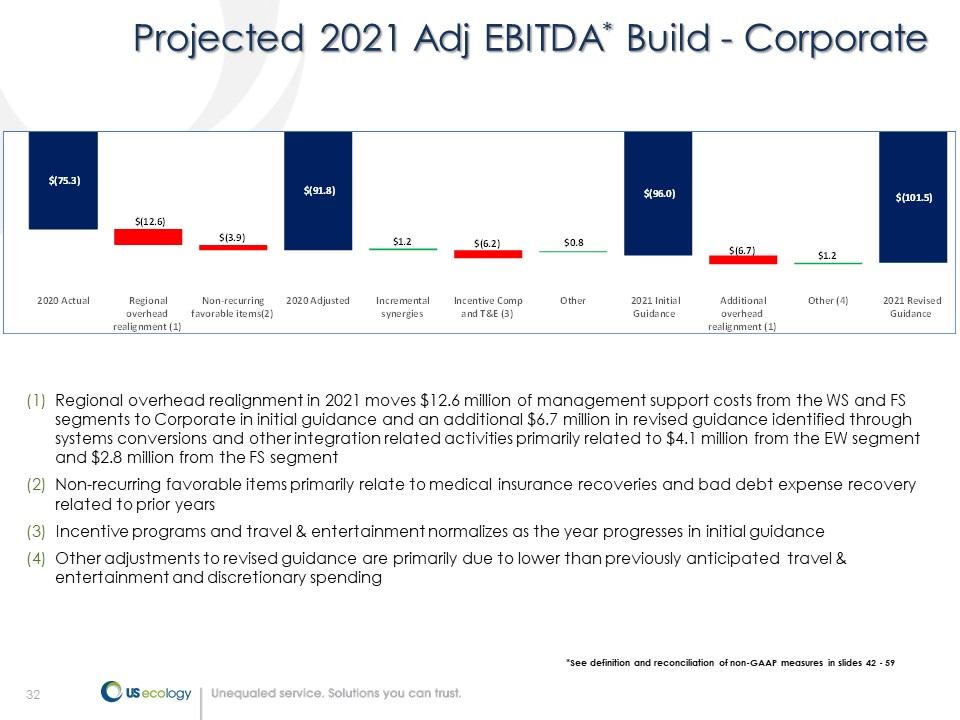
32 Projected 2021 Adj EBITDA * Build - Corporate (1) Regional overhead realignment in 2021 moves $12.6 million of management support costs from the WS and FS segments to Corporate in initial guidance and an additional $6.7 million in revised guidance identified through systems conversions and other integration related activities primarily related to $4.1 million from the EW segment and $2.8 million from the FS segment (2) Non - recurring favorable items primarily relate to medical insurance recoveries and bad debt expense recovery related to prior years (3) Incentive programs and travel & entertainment normalizes as the year progresses in initial guidance (4) Other adjustments to revised guidance are primarily due to lower than previously anticipated travel & entertainment and discretionary spending $(12.6) $(3.9) $ - $(6.2) $ - $(6.7) $ - $(75.3) $ - $ - $(91.8) $1.2 $ - $0.8 $(96.0) $ - $1.2 $(101.5) 2020 Actual Regional overhead realignment (1) Non-recurring favorable items(2) 2020 Adjusted Incremental synergies Incentive Comp and T&E (3) Other 2021 Initial Guidance Additional overhead realignment (1) Other (4) 2021 Revised Guidance * See definition and reconciliation of non - GAAP measures in slides 42 - 59
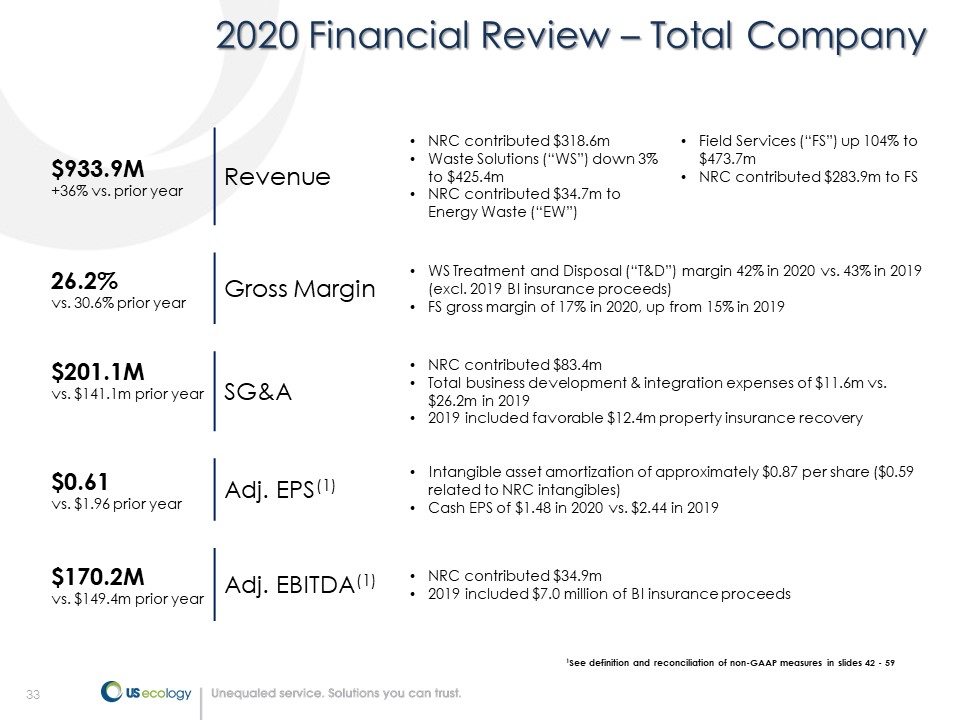
33 2020 Financial Review – Total Company $933.9M +36% vs. prior year Revenue • NRC contributed $318.6m • Waste Solutions (“WS”) down 3% to $425.4m • NRC contributed $34.7m to Energy Waste (“EW”) • Field Services (“FS”) up 104% to $473.7m • NRC contributed $283.9m to FS 26.2% vs. 30.6% prior year Gross Margin • WS Treatment and Disposal (“T&D”) margin 42% in 2020 vs. 43% in 2019 (excl. 2019 BI insurance proceeds) • FS gross margin of 17% in 2020, up from 15% in 2019 $201.1M vs. $141.1m prior year SG&A • NRC contributed $83.4m • Total business development & integration expenses of $11.6m vs. $26.2m in 2019 • 2019 included favorable $12.4m property insurance recovery $0.61 vs. $1.96 prior year Adj. EPS (1) • Intangible asset amortization of approximately $0.87 per share ($0.59 related to NRC intangibles) • Cash EPS of $1.48 in 2020 vs. $2.44 in 2019 $170.2M vs. $149.4m prior year Adj. EBITDA (1) • NRC contributed $34.9m • 2019 included $7.0 million of BI insurance proceeds 1 See definition and reconciliation of non - GAAP measures in slides 42 - 59
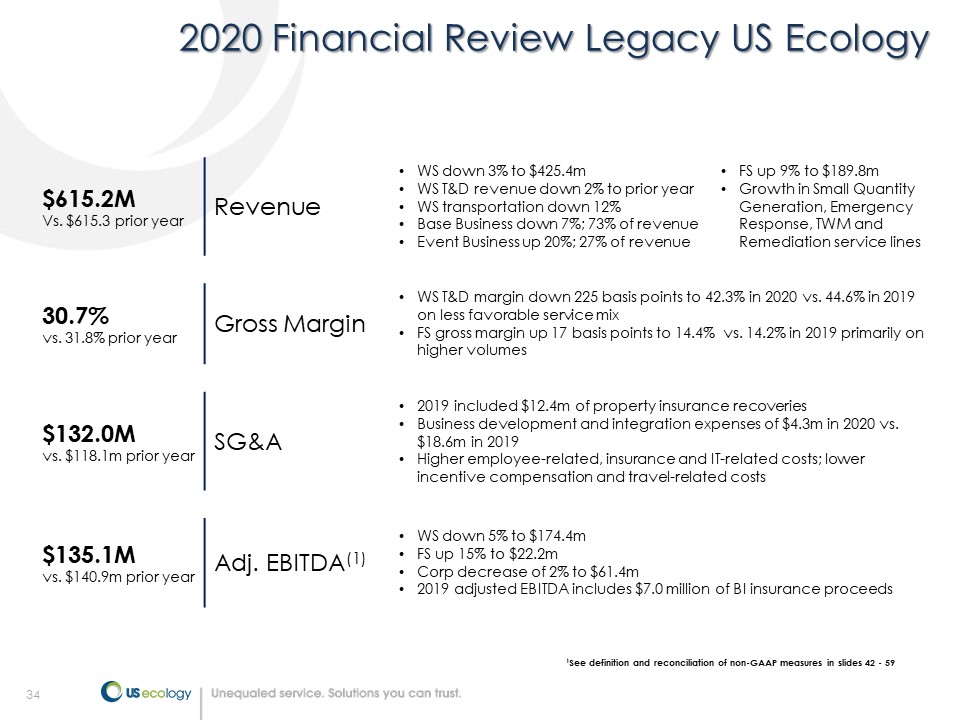
34 2020 Financial Review Legacy US Ecology $615.2M Vs. $615.3 prior year Revenue • WS down 3% to $425.4m • WS T&D revenue down 2% to prior year • WS transportation down 12% • Base Business down 7%; 73% of revenue • Event Business up 20%; 27% of revenue • FS up 9% to $189.8m • Growth in Small Quantity Generation, Emergency Response, TWM and Remediation service lines 30.7% vs. 31.8% prior year Gross Margin • WS T&D margin down 225 basis points to 42.3% in 2020 vs. 44.6% in 2019 on less favorable service mix • FS gross margin up 17 basis points to 14.4% vs. 14.2% in 2019 primarily on higher volumes $132.0M vs. $118.1m prior year SG&A • 2019 included $12.4m of property insurance recoveries • Business development and integration expenses of $4.3m in 2020 vs. $18.6m in 2019 • Higher employee - related, insurance and IT - related costs; lower incentive compensation and travel - related costs $135.1M vs. $140.9m prior year Adj. EBITDA (1) • WS down 5% to $174.4m • FS up 15% to $22.2m • Corp decrease of 2% to $61.4m • 2019 adjusted EBITDA includes $7.0 million of BI insurance proceeds 1 See definition and reconciliation of non - GAAP measures in slides 42 - 59
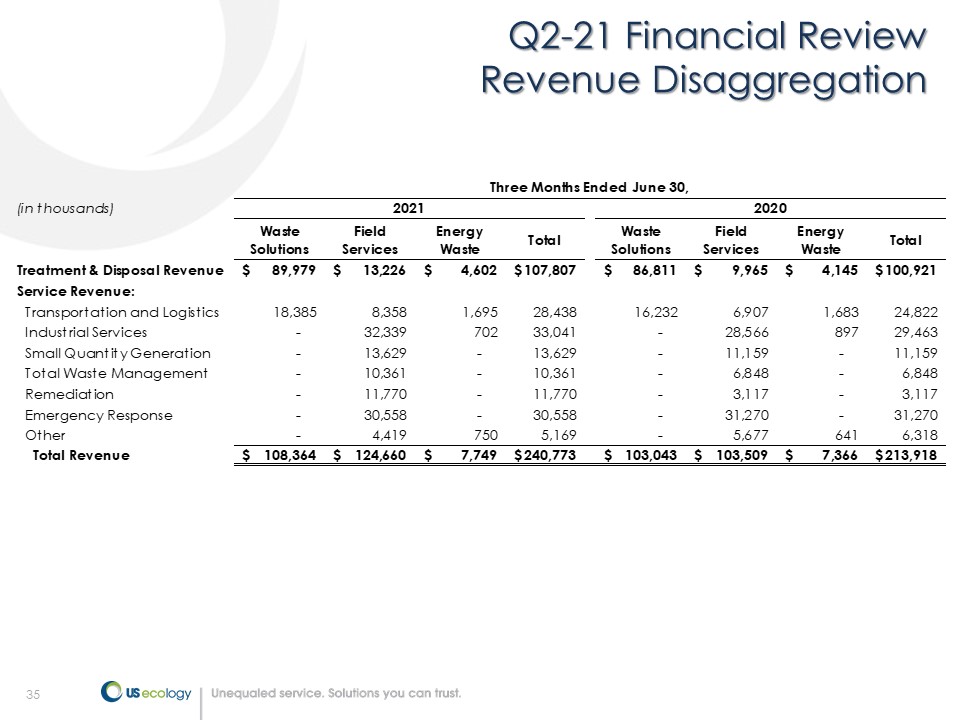
35 Q2 - 21 Financial Review Revenue Disaggregation (in thousands) Waste Solutions Field Services Energy Waste Total Waste Solutions Field Services Energy Waste Total Treatment & Disposal Revenue 89,979$ 13,226$ 4,602$ 107,807$ 86,811$ 9,965$ 4,145$ 100,921$ Service Revenue: Transportation and Logistics 18,385 8,358 1,695 28,438 16,232 6,907 1,683 24,822 Industrial Services - 32,339 702 33,041 - 28,566 897 29,463 Small Quantity Generation - 13,629 - 13,629 - 11,159 - 11,159 Total Waste Management - 10,361 - 10,361 - 6,848 - 6,848 Remediation - 11,770 - 11,770 - 3,117 - 3,117 Emergency Response - 30,558 - 30,558 - 31,270 - 31,270 Other - 4,419 750 5,169 - 5,677 641 6,318 Total Revenue 108,364$ 124,660$ 7,749$ 240,773$ 103,043$ 103,509$ 7,366$ 213,918$ Three Months Ended June 30, 2021 2020
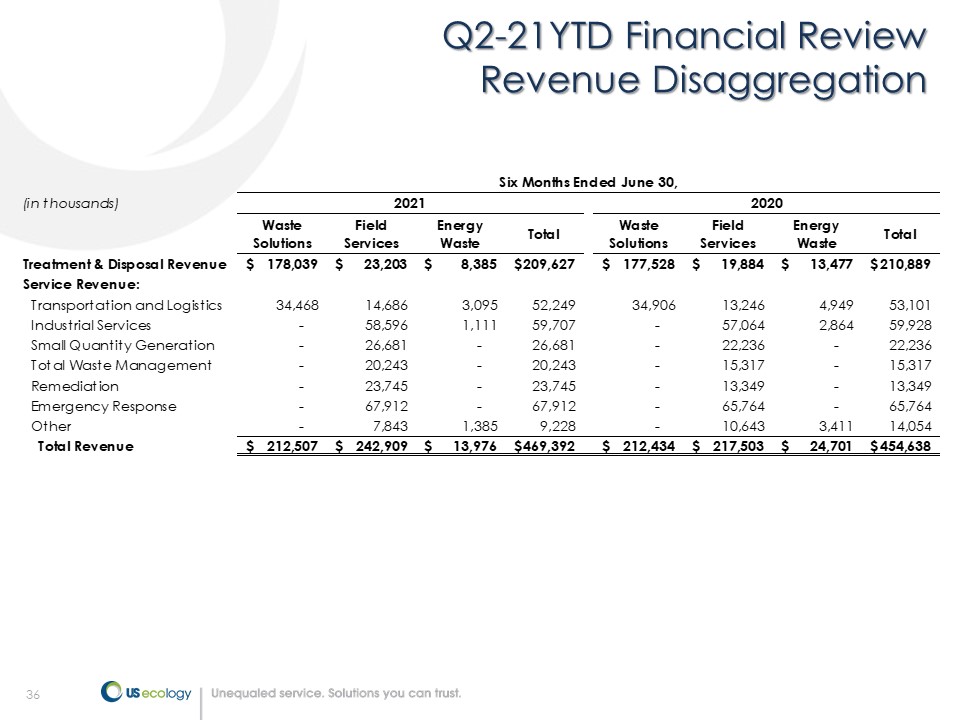
36 Q2 - 21YTD Financial Review Revenue Disaggregation (in thousands) Waste Solutions Field Services Energy Waste Total Waste Solutions Field Services Energy Waste Total Treatment & Disposal Revenue 178,039$ 23,203$ 8,385$ 209,627$ 177,528$ 19,884$ 13,477$ 210,889$ Service Revenue: Transportation and Logistics 34,468 14,686 3,095 52,249 34,906 13,246 4,949 53,101 Industrial Services - 58,596 1,111 59,707 - 57,064 2,864 59,928 Small Quantity Generation - 26,681 - 26,681 - 22,236 - 22,236 Total Waste Management - 20,243 - 20,243 - 15,317 - 15,317 Remediation - 23,745 - 23,745 - 13,349 - 13,349 Emergency Response - 67,912 - 67,912 - 65,764 - 65,764 Other - 7,843 1,385 9,228 - 10,643 3,411 14,054 Total Revenue 212,507$ 242,909$ 13,976$ 469,392$ 212,434$ 217,503$ 24,701$ 454,638$ Six Months Ended June 30, 2021 2020
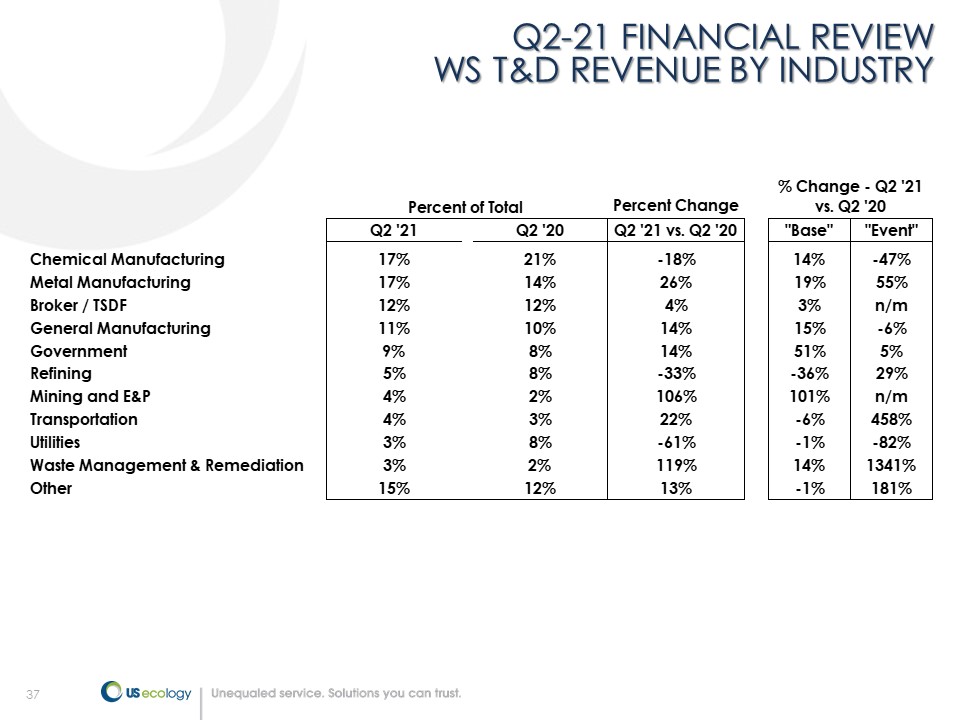
37 Q2 - 21 FINANCIAL REVIEW WS T&D REVENUE BY INDUSTRY Percent Change Q2 '21 Q2 '20 Q2 '21 vs. Q2 '20 "Base" "Event" Chemical Manufacturing 17% 21% -18% 14% -47% Metal Manufacturing 17% 14% 26% 19% 55% Broker / TSDF 12% 12% 4% 3% n/m General Manufacturing 11% 10% 14% 15% -6% Government 9% 8% 14% 51% 5% Refining 5% 8% -33% -36% 29% Mining and E&P 4% 2% 106% 101% n/m Transportation 4% 3% 22% -6% 458% Utilities 3% 8% -61% -1% -82% Waste Management & Remediation 3% 2% 119% 14% 1341% Other 15% 12% 13% -1% 181% Percent of Total % Change - Q2 '21 vs. Q2 '20
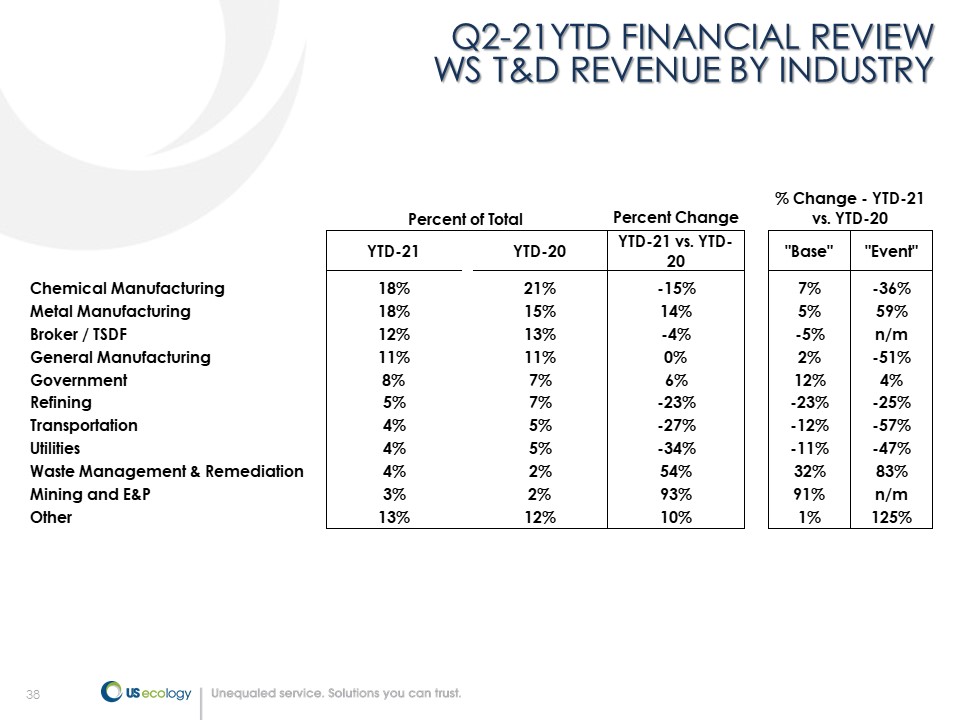
38 Q2 - 21YTD FINANCIAL REVIEW WS T&D REVENUE BY INDUSTRY Percent Change YTD-21 YTD-20 YTD-21 vs. YTD- 20 "Base" "Event" Chemical Manufacturing 18% 21% -15% 7% -36% Metal Manufacturing 18% 15% 14% 5% 59% Broker / TSDF 12% 13% -4% -5% n/m General Manufacturing 11% 11% 0% 2% -51% Government 8% 7% 6% 12% 4% Refining 5% 7% -23% -23% -25% Transportation 4% 5% -27% -12% -57% Utilities 4% 5% -34% -11% -47% Waste Management & Remediation 4% 2% 54% 32% 83% Mining and E&P 3% 2% 93% 91% n/m Other 13% 12% 10% 1% 125% Percent of Total % Change - YTD-21 vs. YTD-20
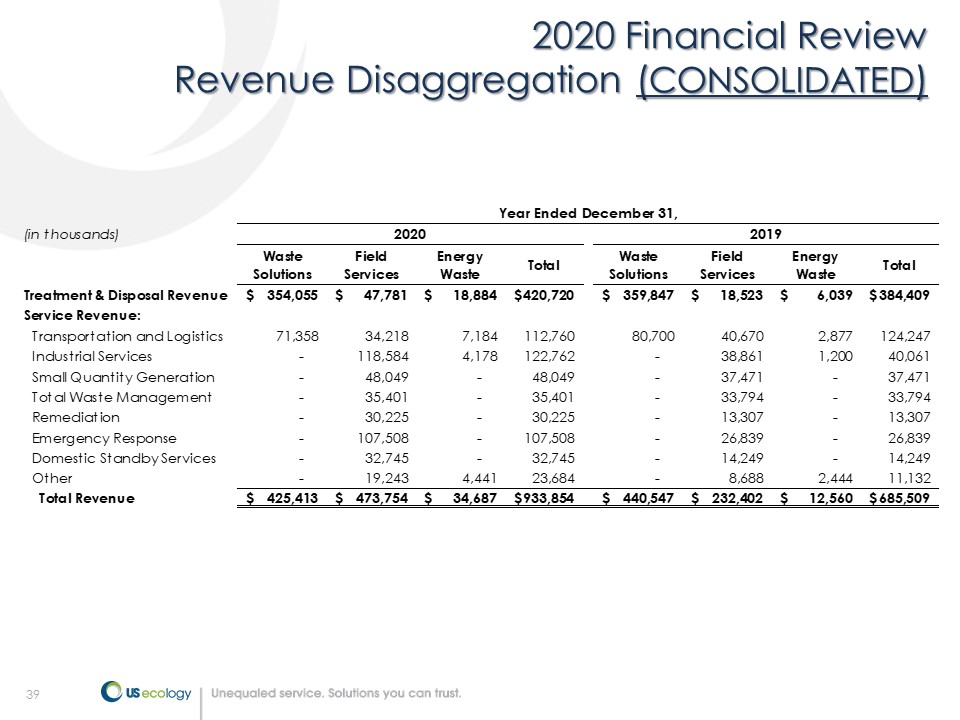
39 2020 Financial Review Revenue Disaggregation ( CONSOLIDATED ) (in thousands) Waste Solutions Field Services Energy Waste Total Waste Solutions Field Services Energy Waste Total Treatment & Disposal Revenue 354,055$ 47,781$ 18,884$ 420,720$ 359,847$ 18,523$ 6,039$ 384,409$ Service Revenue: Transportation and Logistics 71,358 34,218 7,184 112,760 80,700 40,670 2,877 124,247 Industrial Services - 118,584 4,178 122,762 - 38,861 1,200 40,061 Small Quantity Generation - 48,049 - 48,049 - 37,471 - 37,471 Total Waste Management - 35,401 - 35,401 - 33,794 - 33,794 Remediation - 30,225 - 30,225 - 13,307 - 13,307 Emergency Response - 107,508 - 107,508 - 26,839 - 26,839 Domestic Standby Services - 32,745 - 32,745 - 14,249 - 14,249 Other - 19,243 4,441 23,684 - 8,688 2,444 11,132 Total Revenue 425,413$ 473,754$ 34,687$ 933,854$ 440,547$ 232,402$ 12,560$ 685,509$ Year Ended December 31, 2020 2019
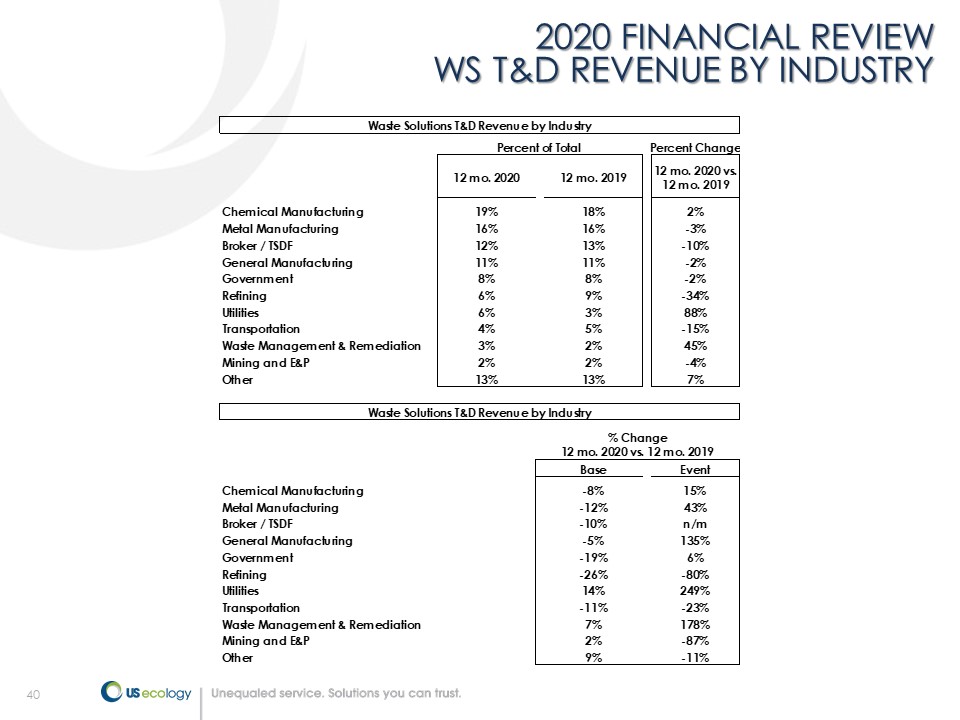
40 2020 FINANCIAL REVIEW WS T&D REVENUE BY INDUSTRY Percent Change 12 mo. 2020 12 mo. 2019 12 mo. 2020 vs. 12 mo. 2019 Chemical Manufacturing 19% 18% 2% Metal Manufacturing 16% 16% -3% Broker / TSDF 12% 13% -10% General Manufacturing 11% 11% -2% Government 8% 8% -2% Refining 6% 9% -34% Utilities 6% 3% 88% Transportation 4% 5% -15% Waste Management & Remediation 3% 2% 45% Mining and E&P 2% 2% -4% Other 13% 13% 7% Base Event Chemical Manufacturing -8% 15% Metal Manufacturing -12% 43% Broker / TSDF -10% n/m General Manufacturing -5% 135% Government -19% 6% Refining -26% -80% Utilities 14% 249% Transportation -11% -23% Waste Management & Remediation 7% 178% Mining and E&P 2% -87% Other 9% -11% Waste Solutions T&D Revenue by Industry Percent of Total Waste Solutions T&D Revenue by Industry % Change 12 mo. 2020 vs. 12 mo. 2019
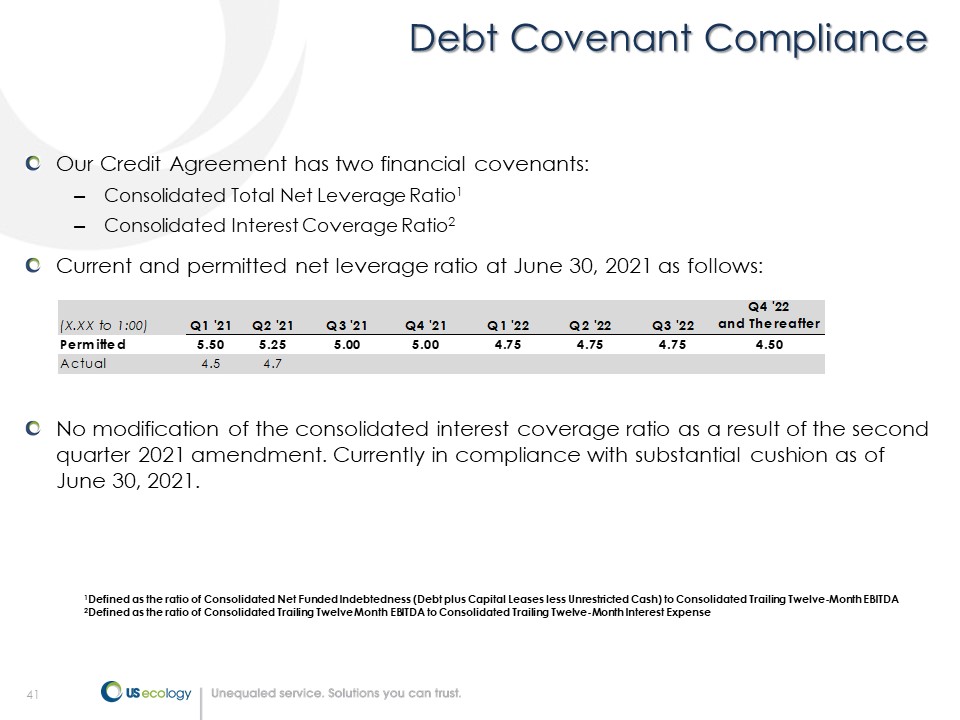
41 Debt Covenant Compliance 1 Defined as the ratio of Consolidated Net Funded Indebtedness (Debt plus Capital Leases less Unrestricted Cash) to Consolidate d T railing Twelve - Month EBITDA 2 Defined as the ratio of Consolidated Trailing Twelve Month EBITDA to Consolidated Trailing Twelve - Month Interest Expense Our Credit Agreement has two financial covenants: – Consolidated Total Net Leverage Ratio 1 – Consolidated Interest Coverage Ratio 2 Current and permitted net leverage ratio at June 30 , 2021 as follows: No modification of the consolidated interest coverage r atio as a result of the second quarter 2021 amendment. Currently in compliance with substantial cushion as of June 30, 2021. (X.XX to 1:00) Q1 '21 Q2 '21 Q3 '21 Q4 '21 Q1 '22 Q2 '22 Q3 '22 Q4 '22and Thereafter Permitted 5.50 5.25 5.00 5.00 4.75 4.75 4.75 4.50 Actual 4.5 4.7
42 NON - GAAP FINANCIAL MEASURES US Ecology reports adjusted EBITDA, adjusted (loss) earnings per diluted share, cash earnings per diluted share and adjusted free cash flow results, which are non - GAAP financial measures, as a complement to results provided in accordance with generally accepted accounting principles in the United States (“GAAP”) and believes that such information provides analysts, stockholders, and other users information to better understand the Company’s operating performance . Because adjusted EBITDA, adjusted earnings per diluted share, cash earnings per diluted share and adjusted free cash flow are not measurements determined in accordance with GAAP and are thus susceptible to varying calculations they may not be comparable to similar measures used by other companies . Items excluded from adjusted EBITDA, adjusted earnings per diluted share, cash earnings per diluted share and adjusted free cash flow are significant components in understanding and assessing financial performance . Adjusted EBITDA, adjusted (loss) earnings per diluted share, cash earnings per diluted share and adjusted free cash flow should not be considered in isolation or as an alternative to, or substitute for, net loss, cash flows generated by operations, investing or financing activities, or other financial statement data presented in the consolidated financial statements as indicators of financial performance or liquidity . Adjusted EBITDA, adjusted (loss) earnings per diluted share, cash earnings per diluted share and adjusted free cash flow have limitations as analytical tools and should not be considered in isolation or a substitute for analyzing our results as reported under GAAP .
43 NON - GAAP FINANCIAL MEASURES – DEFINITIONS (CONT.) Adjusted (Loss) Earnings Per Diluted Share The Company defines adjusted (loss) earnings per diluted share as net loss adjusted for the after - tax impact of the gain on a minority interest investment, the after - tax impact of business development and integration costs, the after - tax impact of non - cash goodwill impairment charges, and non - cash foreign currency translation gains or losses, divided by the number of diluted shares used in the loss per diluted share calculation . The gain on a minority interest investment excluded from the loss per diluted share calculation represents an increase in the fair value of our investment based on a recent observable transaction in the equity of the entity . Impairment charges excluded from the loss per diluted share calculation are related to the Company’s assessment of goodwill associated with its Energy Waste and international businesses in the first quarter of 2020 . Business development and integration costs excluded from the loss per diluted share calculation relate to expenses incurred to evaluate businesses for potential acquisition or costs related to closing and integrating successfully acquired businesses and transaction expenses . The foreign currency translation gains or losses excluded from the loss per diluted share calculation are related to intercompany loans between our Canadian subsidiaries and the U . S . parent which have been established as part of our tax and treasury management strategy . These intercompany loans are payable in Canadian dollars (“CAD”) requiring us to revalue the outstanding loan balance through our consolidated income statement based on the CAD/United States currency movements from period to period . We believe excluding the gain on minority interest investment, business development and integration costs, non - cash impairment charges, and non - cash foreign currency translation gains or losses provides meaningful information to investors regarding the operational and financial performance of the Company .
44 NON - GAAP FINANCIAL MEASURES – DEFINITIONS (CONT.) Cash Earnings Per Diluted Share The Company defines cash earnings per diluted share as adjusted earnings per diluted share (see definition above) plus amortization of intangible assets, net of tax . Adjusted EBITDA The Company defines adjusted EBITDA as net income before interest expense, interest income, income tax expense/benefit, depreciation, amortization, share - based compensation, accretion of closure and post - closure liabilities, foreign currency gain/loss, non - cash impairment charges, business development and integration expenses and other income/expense . Adjusted Free Cash Flow The Company defines adjusted free cash flow as net cash provided by operating activities less purchases of property plant and equipment, plus business development and integration expenses, plus payments of deferred/contingent purchase consideration, plus purchases of property and equipment for the Grand View, Idaho facility rebuild, plus proceeds from sale of property and equipment .
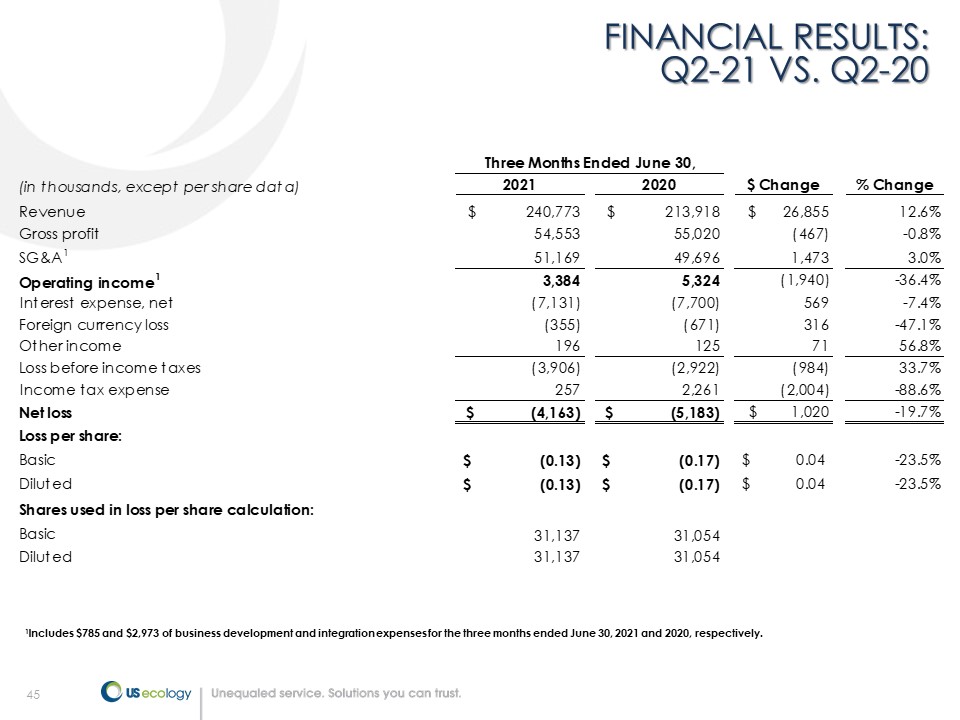
45 FINANCIAL RESULTS: Q2 - 21 VS. Q2 - 20 1 Includes $785 and $2,973 of business development and integration expenses for the three months ended June 30, 2021 and 2020, res pectively. (in thousands, except per share data) 2021 2020 $ Change % Change Revenue $ 240,773 $ 213,918 $ 26,855 12.6% Gross profit 54,553 55,020 (467) -0.8% SG&A 1 51,169 49,696 1,473 3.0% Operating income 1 3,384 5,324 (1,940) -36.4% Interest expense, net (7,131) (7,700) 569 -7.4% Foreign currency loss (355) (671) 316 -47.1% Other income 196 125 71 56.8% Loss before income taxes (3,906) (2,922) (984) 33.7% Income tax expense 257 2,261 (2,004) -88.6% Net loss $ (4,163) $ (5,183) $ 1,020 -19.7% Loss per share: Basic $ (0.13) $ (0.17) $ 0.04 -23.5% Diluted $ (0.13) $ (0.17) $ 0.04 -23.5% Shares used in loss per share calculation: Basic 31,137 31,054 Diluted 31,137 31,054 Three Months Ended June 30,
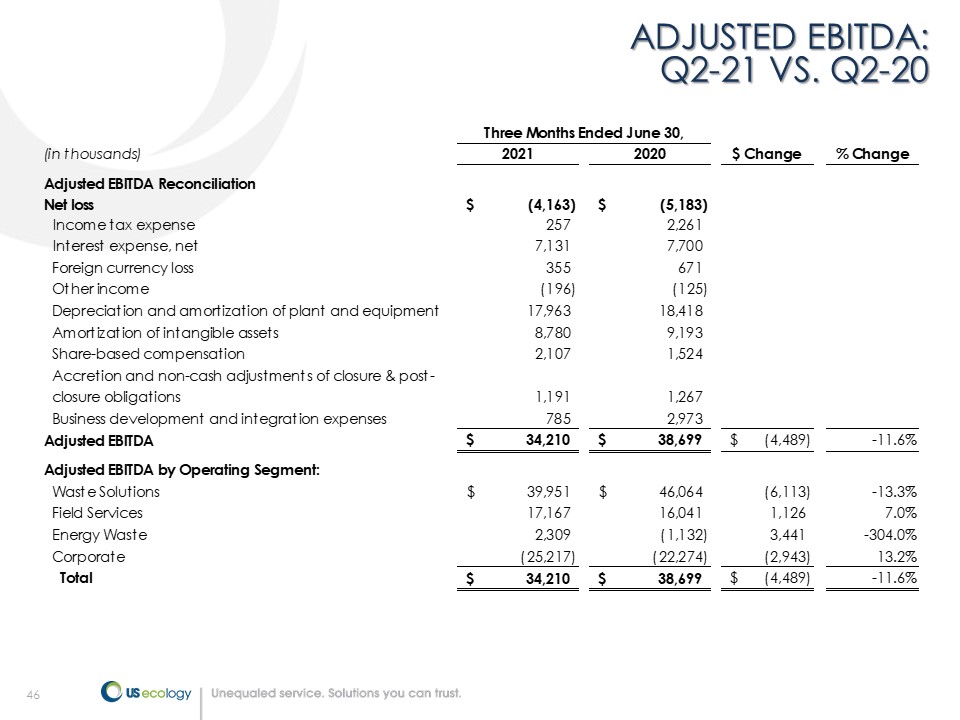
46 ADJUSTED EBITDA: Q2 - 21 VS. Q2 - 20 (in thousands) 2021 2020 $ Change % Change Adjusted EBITDA Reconciliation Net loss (4,163)$ (5,183)$ Income tax expense 257 2,261 Interest expense, net 7,131 7,700 Foreign currency loss 355 671 Other income (196) (125) Depreciation and amortization of plant and equipment 17,963 18,418 Amortization of intangible assets 8,780 9,193 Share-based compensation 2,107 1,524 Accretion and non-cash adjustments of closure & post- closure obligations 1,191 1,267 Business development and integration expenses 785 2,973 Adjusted EBITDA 34,210$ 38,699$ (4,489)$ -11.6% Adjusted EBITDA by Operating Segment: Waste Solutions 39,951$ 46,064$ (6,113) -13.3% Field Services 17,167 16,041 1,126 7.0% Energy Waste 2,309 (1,132) 3,441 -304.0% Corporate (25,217) (22,274) (2,943) 13.2% Total 34,210$ 38,699$ (4,489)$ -11.6% Three Months Ended June 30,
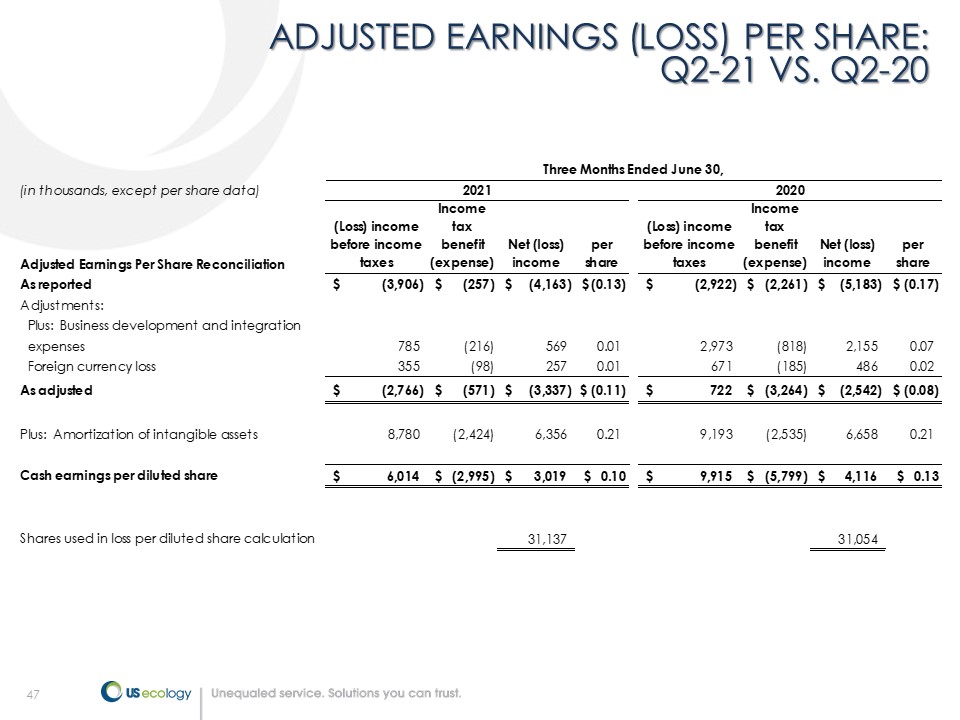
47 ADJUSTED EARNINGS (LOSS) PER SHARE: Q2 - 21 VS. Q2 - 20 (in thousands, except per share data) Adjusted Earnings Per Share Reconciliation (Loss) income before income taxes Income tax benefit (expense) Net (loss) income per share (Loss) income before income taxes Income tax benefit (expense) Net (loss) income per share As reported (3,906)$ (257)$ (4,163)$ (0.13)$ (2,922)$ (2,261)$ (5,183)$ (0.17)$ Adjustments: Plus: Business development and integration expenses 785 (216) 569 0.01 2,973 (818) 2,155 0.07 Foreign currency loss 355 (98) 257 0.01 671 (185) 486 0.02 As adjusted (2,766)$ (571)$ (3,337)$ $ (0.11) 722$ (3,264)$ (2,542)$ $ (0.08) Plus: Amortization of intangible assets 8,780 (2,424) 6,356 0.21 9,193 (2,535) 6,658 0.21 Cash earnings per diluted share 6,014$ (2,995)$ 3,019$ $ 0.10 9,915$ (5,799)$ 4,116$ $ 0.13 Shares used in loss per diluted share calculation 31,137 31,054 Three Months Ended June 30, 2021 2020
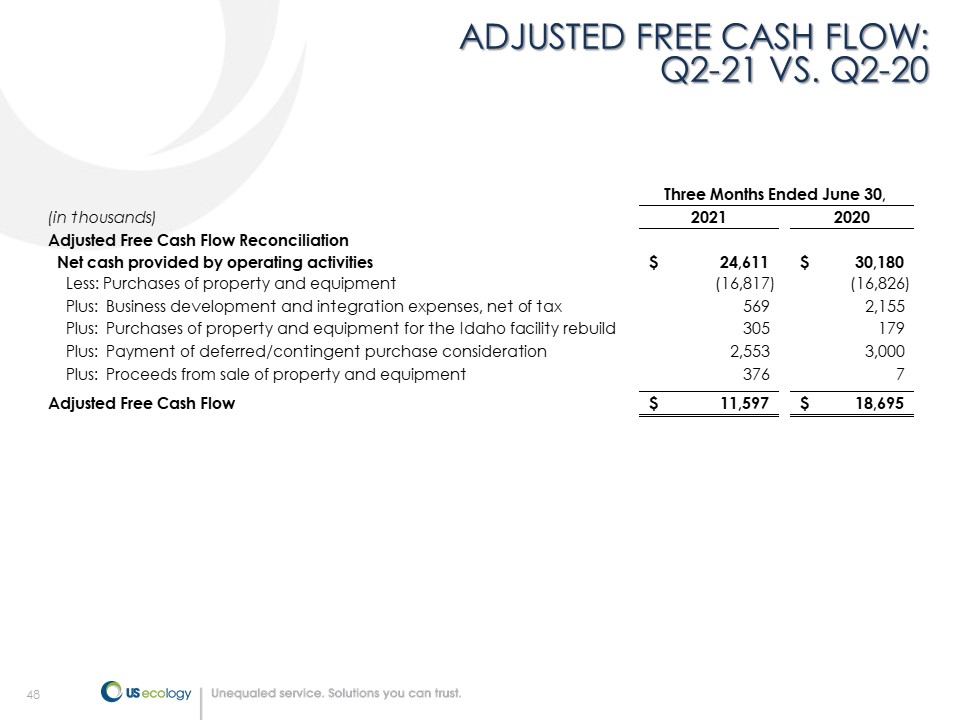
48 ADJUSTED FREE CASH FLOW: Q2 - 21 VS. Q2 - 20 (in thousands) 2021 2020 Adjusted Free Cash Flow Reconciliation Net cash provided by operating activities 24,611$ 30,180$ Less: Purchases of property and equipment (16,817) (16,826) Plus: Business development and integration expenses, net of tax 569 2,155 Plus: Purchases of property and equipment for the Idaho facility rebuild 305 179 Plus: Payment of deferred/contingent purchase consideration 2,553 3,000 Plus: Proceeds from sale of property and equipment 376 7 Adjusted Free Cash Flow 11,597$ 18,695$ Three Months Ended June 30,
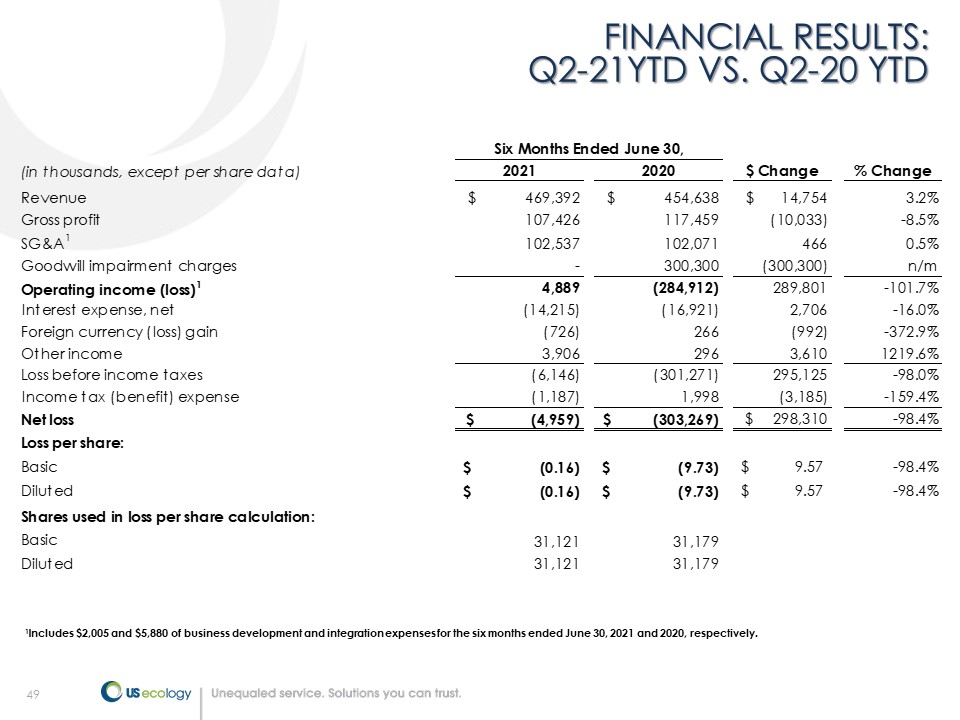
49 FINANCIAL RESULTS: Q2 - 21YTD VS. Q2 - 20 YTD 1 Includes $2,005 and $5,880 of business development and integration expenses for the six months ended June 30, 2021 and 2020, res pectively. (in thousands, except per share data) 2021 2020 $ Change % Change Revenue $ 469,392 $ 454,638 $ 14,754 3.2% Gross profit 107,426 117,459 (10,033) -8.5% SG&A 1 102,537 102,071 466 0.5% Goodwill impairment charges - 300,300 (300,300) n/m Operating income (loss) 1 4,889 (284,912) 289,801 -101.7% Interest expense, net (14,215) (16,921) 2,706 -16.0% Foreign currency (loss) gain (726) 266 (992) -372.9% Other income 3,906 296 3,610 1219.6% Loss before income taxes (6,146) (301,271) 295,125 -98.0% Income tax (benefit) expense (1,187) 1,998 (3,185) -159.4% Net loss $ (4,959) $ (303,269) $ 298,310 -98.4% Loss per share: Basic $ (0.16) $ (9.73) $ 9.57 -98.4% Diluted $ (0.16) $ (9.73) $ 9.57 -98.4% Shares used in loss per share calculation: Basic 31,121 31,179 Diluted 31,121 31,179 Six Months Ended June 30,
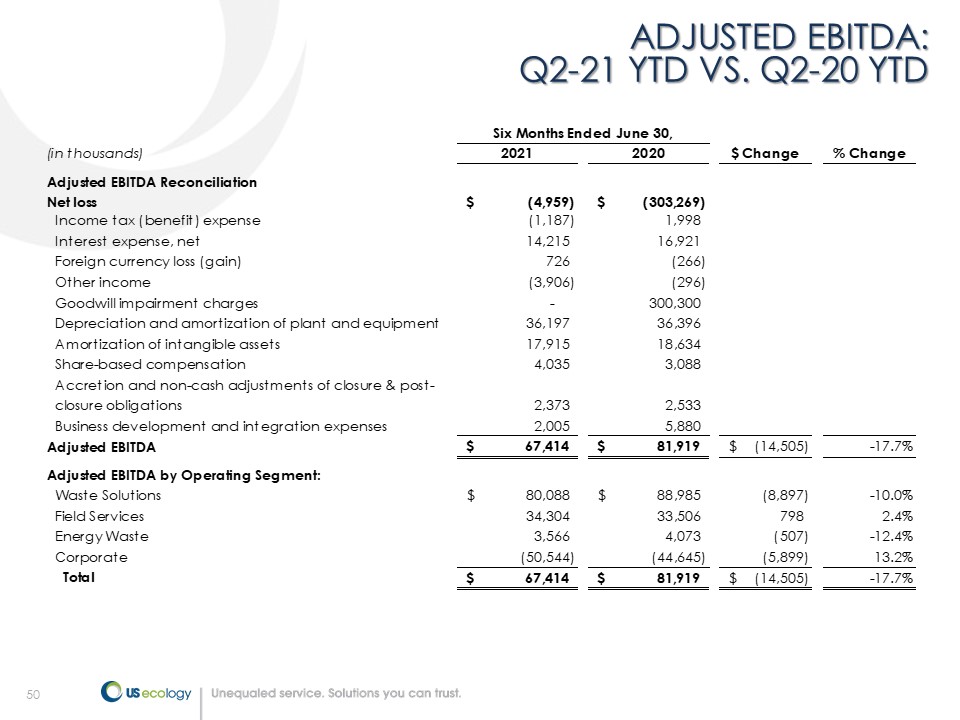
50 ADJUSTED EBITDA: Q2 - 21 YTD VS. Q2 - 20 YTD (in thousands) 2021 2020 $ Change % Change Adjusted EBITDA Reconciliation Net loss (4,959)$ (303,269)$ Income tax (benefit) expense (1,187) 1,998 Interest expense, net 14,215 16,921 Foreign currency loss (gain) 726 (266) Other income (3,906) (296) Goodwill impairment charges - 300,300 Depreciation and amortization of plant and equipment 36,197 36,396 Amortization of intangible assets 17,915 18,634 Share-based compensation 4,035 3,088 Accretion and non-cash adjustments of closure & post- closure obligations 2,373 2,533 Business development and integration expenses 2,005 5,880 Adjusted EBITDA 67,414$ 81,919$ (14,505)$ -17.7% Adjusted EBITDA by Operating Segment: Waste Solutions 80,088$ 88,985$ (8,897) -10.0% Field Services 34,304 33,506 798 2.4% Energy Waste 3,566 4,073 (507) -12.4% Corporate (50,544) (44,645) (5,899) 13.2% Total 67,414$ 81,919$ (14,505)$ -17.7% Six Months Ended June 30,

51 ADJUSTED EARNINGS (LOSS) PER SHARE: Q2 - 21 YTD VS. Q2 - 20 YTD (in thousands, except per share data) Adjusted Earnings Per Share Reconciliation (Loss) income before income taxes Income tax benefit (expense) Net (loss) income per share (Loss) income before income taxes Income tax benefit (expense) Net (loss) income per share As reported (6,146)$ 1,187$ (4,959)$ (0.16)$ (301,271)$ (1,998)$ (303,269)$ (9.73)$ Adjustments: Less: Gain on minority interest investment (3,509) 965 (2,544) (0.08) - - - - Plus: Business development and integration expenses 2,005 (551) 1,454 0.05 5,880 (1,617) 4,263 0.14 Plus: Goodwill impairment charges - - - - 300,300 - 300,300 9.63 Foreign currency loss (gain) 726 (200) 526 0.01 (266) 73 (193) - As adjusted (6,924)$ 1,401$ (5,523)$ $ (0.18) 4,643$ (3,542)$ 1,101$ $ 0.04 Plus: Amortization of intangible assets 17,915 (4,935) 12,980 0.42 18,634 (5,114) 13,520 0.43 Cash earnings per diluted share 10,991$ (3,534)$ 7,457$ $ 0.24 23,277$ (8,656)$ 14,621$ $ 0.47 Shares used in (loss) earnings per diluted share calculation 31,121 31,179 Six Months Ended June 30, 2021 2020
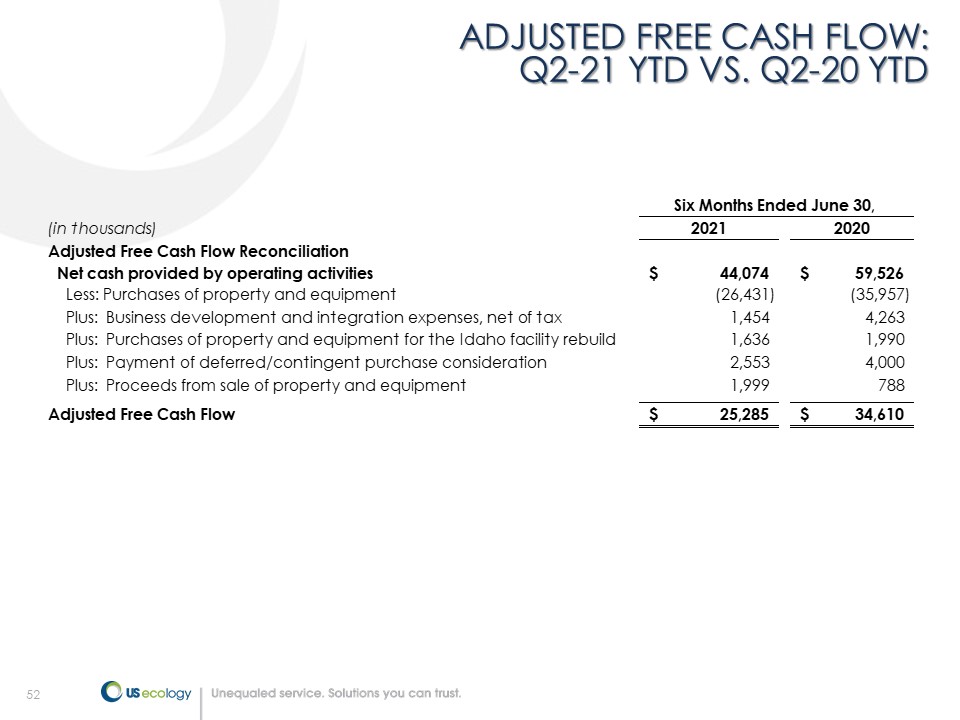
52 ADJUSTED FREE CASH FLOW: Q2 - 21 YTD VS. Q2 - 20 YTD (in thousands) 2021 2020 Adjusted Free Cash Flow Reconciliation Net cash provided by operating activities 44,074$ 59,526$ Less: Purchases of property and equipment (26,431) (35,957) Plus: Business development and integration expenses, net of tax 1,454 4,263 Plus: Purchases of property and equipment for the Idaho facility rebuild 1,636 1,990 Plus: Payment of deferred/contingent purchase consideration 2,553 4,000 Plus: Proceeds from sale of property and equipment 1,999 788 Adjusted Free Cash Flow 25,285$ 34,610$ Six Months Ended June 30,
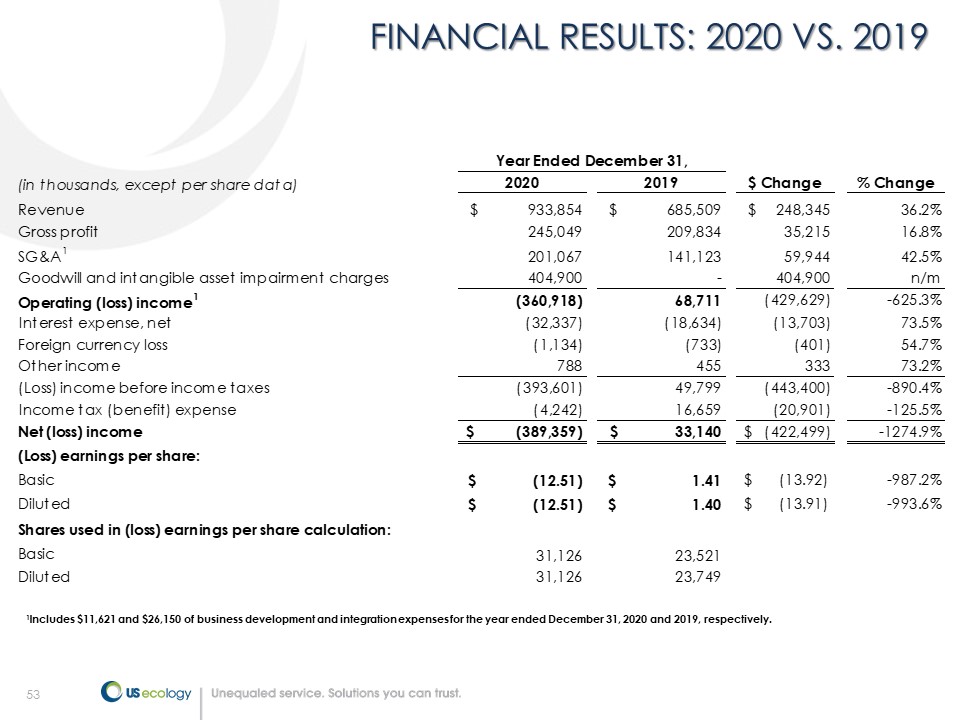
53 FINANCIAL RESULTS: 2020 VS. 2019 1 Includes $11,621 and $26,150 of business development and integration expenses for the year ended December 31, 2020 and 2019, res pectively. (in thousands, except per share data) 2020 2019 $ Change % Change Revenue $ 933,854 $ 685,509 $ 248,345 36.2% Gross profit 245,049 209,834 35,215 16.8% SG&A 1 201,067 141,123 59,944 42.5% Goodwill and intangible asset impairment charges 404,900 - 404,900 n/m Operating (loss) income 1 (360,918) 68,711 (429,629) -625.3% Interest expense, net (32,337) (18,634) (13,703) 73.5% Foreign currency loss (1,134) (733) (401) 54.7% Other income 788 455 333 73.2% (Loss) income before income taxes (393,601) 49,799 (443,400) -890.4% Income tax (benefit) expense (4,242) 16,659 (20,901) -125.5% Net (loss) income $ (389,359) $ 33,140 $ (422,499) -1274.9% (Loss) earnings per share: Basic $ (12.51) $ 1.41 $ (13.92) -987.2% Diluted $ (12.51) $ 1.40 $ (13.91) -993.6% Shares used in (loss) earnings per share calculation: Basic 31,126 23,521 Diluted 31,126 23,749 Year Ended December 31,

54 ADJUSTED EBITDA: 2020 VS. 2019 (in thousands) 2020 2019 $ Change % Change Adjusted EBITDA Reconciliation Net (loss) income (389,359)$ 33,140$ Income tax (benefit) expense (4,242) 16,659 Interest expense, net 32,337 18,634 Foreign currency loss 1,134 733 Other income (788) (455) Property and equipment impairment charges - 25 Goodwill and intangible asset impairment charges 404,900 - Depreciation and amortization of plant and equipment 66,561 41,423 Amortization of intangible assets 37,344 15,491 Share-based compensation 6,651 5,544 Accretion and non-cash adjustments of closure & post- closure obligations 4,000 4,388 Property insurance recoveries - (12,366) Business development and integration expenses 11,621 26,150 Adjusted EBITDA 170,159$ 149,366$ 20,793$ 13.9% Adjusted EBITDA by Operating Segment: Waste Solutions 174,385$ 184,133$ (9,748) -5.3% Field Services 69,869 26,707 43,162 161.6% Energy Waste 1,157 3,626 (2,469) -68.1% Corporate (75,252) (65,100) (10,152) 15.6% Total 170,159$ 149,366$ 20,793$ 13.9% Year Ended December 31,
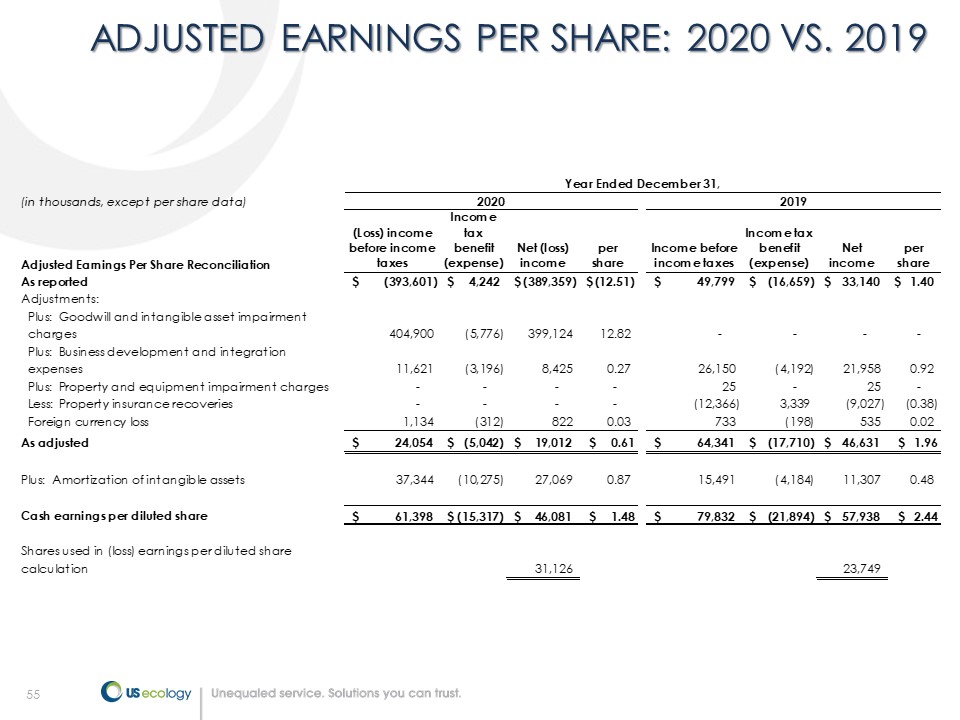
55 ADJUSTED EARNINGS PER SHARE: 2020 VS. 2019 (in thousands, except per share data) Adjusted Earnings Per Share Reconciliation (Loss) income before income taxes Income tax benefit (expense) Net (loss) income per share Income before income taxes Income tax benefit (expense) Net income per share As reported (393,601)$ 4,242$ (389,359)$ (12.51)$ 49,799$ (16,659)$ 33,140$ 1.40$ Adjustments: Plus: Goodwill and intangible asset impairment charges 404,900 (5,776) 399,124 12.82 - - - - Plus: Business development and integration expenses 11,621 (3,196) 8,425 0.27 26,150 (4,192) 21,958 0.92 Plus: Property and equipment impairment charges - - - - 25 - 25 - Less: Property insurance recoveries - - - - (12,366) 3,339 (9,027) (0.38) Foreign currency loss 1,134 (312) 822 0.03 733 (198) 535 0.02 As adjusted 24,054$ (5,042)$ 19,012$ $ 0.61 64,341$ (17,710)$ 46,631$ $ 1.96 Plus: Amortization of intangible assets 37,344 (10,275) 27,069 0.87 15,491 (4,184) 11,307 0.48 Cash earnings per diluted share 61,398$ (15,317)$ 46,081$ $ 1.48 79,832$ (21,894)$ 57,938$ $ 2.44 Shares used in (loss) earnings per diluted share calculation 31,126 23,749 Year Ended December 31, 2020 2019
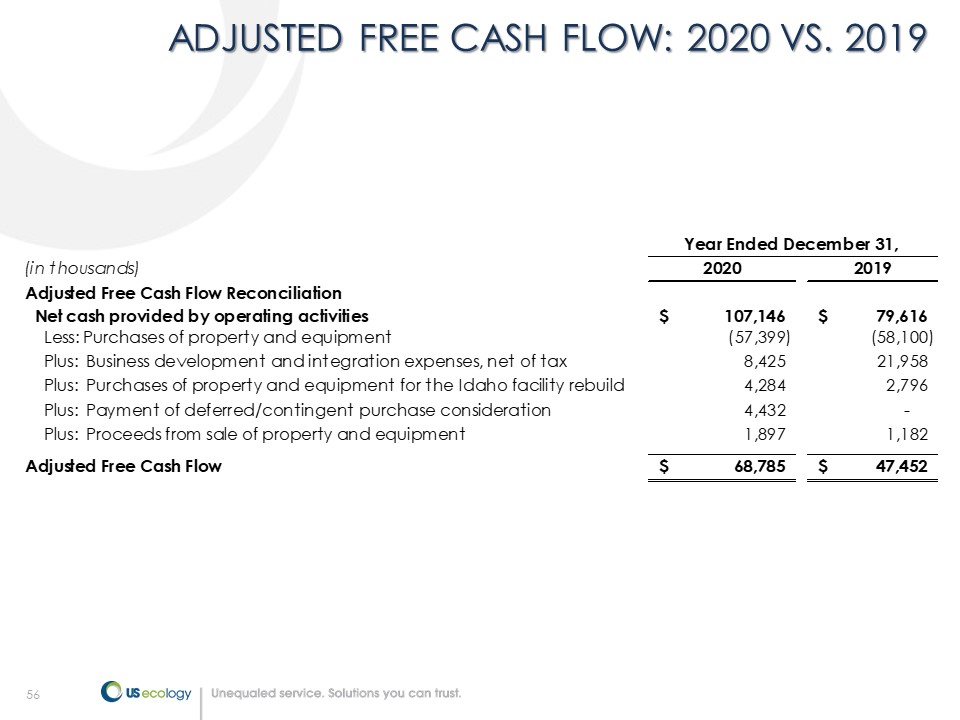
56 ADJUSTED FREE CASH FLOW: 2020 VS. 2019 (in thousands) 2020 2019 Adjusted Free Cash Flow Reconciliation Net cash provided by operating activities 107,146$ 79,616$ Less: Purchases of property and equipment (57,399) (58,100) Plus: Business development and integration expenses, net of tax 8,425 21,958 Plus: Purchases of property and equipment for the Idaho facility rebuild 4,284 2,796 Plus: Payment of deferred/contingent purchase consideration 4,432 - Plus: Proceeds from sale of property and equipment 1,897 1,182 Adjusted Free Cash Flow 68,785$ 47,452$ Year Ended December 31,
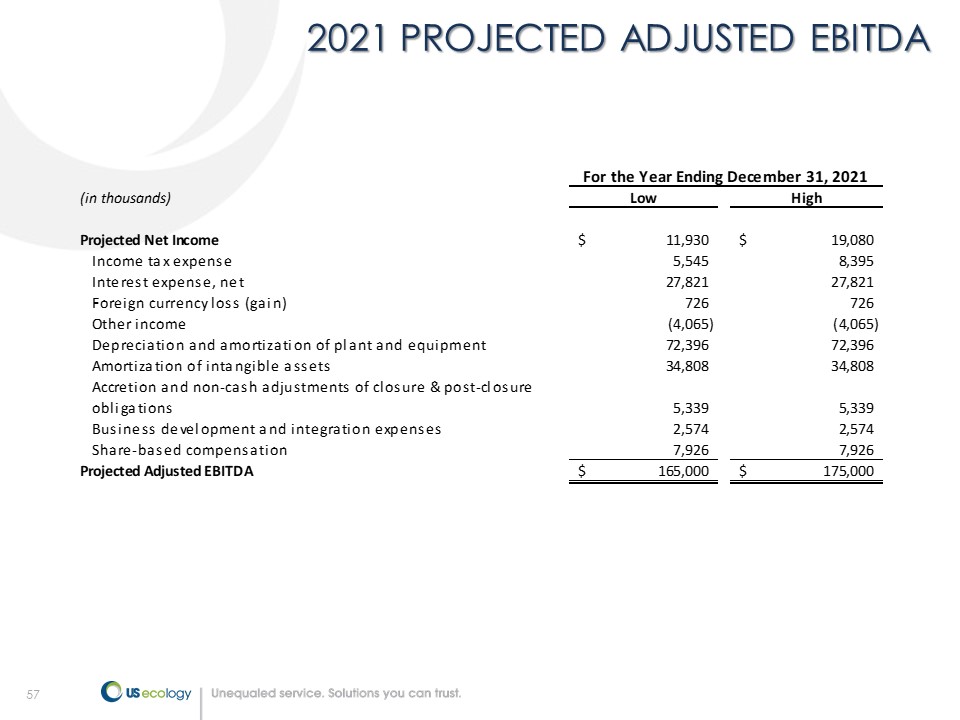
57 2021 PROJECTED ADJUSTED EBITDA (in thousands) Low High Projected Net Income 11,930$ 19,080$ Income tax expense 5,545 8,395 Interest expense, net 27,821 27,821 Foreign currency loss (gain) 726 726 Other income (4,065) (4,065) Depreciation and amortization of plant and equipment 72,396 72,396 Amortization of intangible assets 34,808 34,808 Accretion and non-cash adjustments of closure & post-closure obligations 5,339 5,339 Business development and integration expenses 2,574 2,574 Share-based compensation 7,926 7,926 Projected Adjusted EBITDA 165,000$ 175,000$ For the Year Ending December 31, 2021
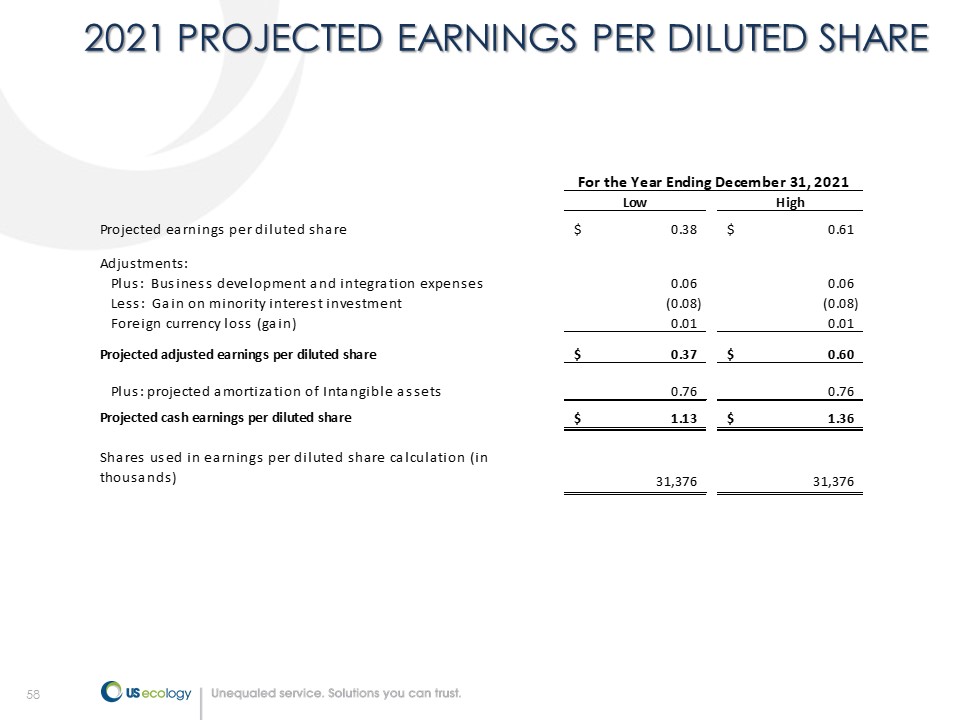
58 2021 PROJECTED EARNINGS PER DILUTED SHARE Low High Projected earnings per diluted share 0.38$ 0.61$ Adjustments: Plus: Business development and integration expenses 0.06 0.06 Less: Gain on minority interest investment (0.08) (0.08) Foreign currency loss (gain) 0.01 0.01 Projected adjusted earnings per diluted share 0.37$ 0.60$ Plus: projected amortization of Intangible assets 0.76 0.76 Projected cash earnings per diluted share 1.13$ 1.36$ Shares used in earnings per diluted share calculation (in thousands) 31,376 31,376 For the Year Ending December 31, 2021
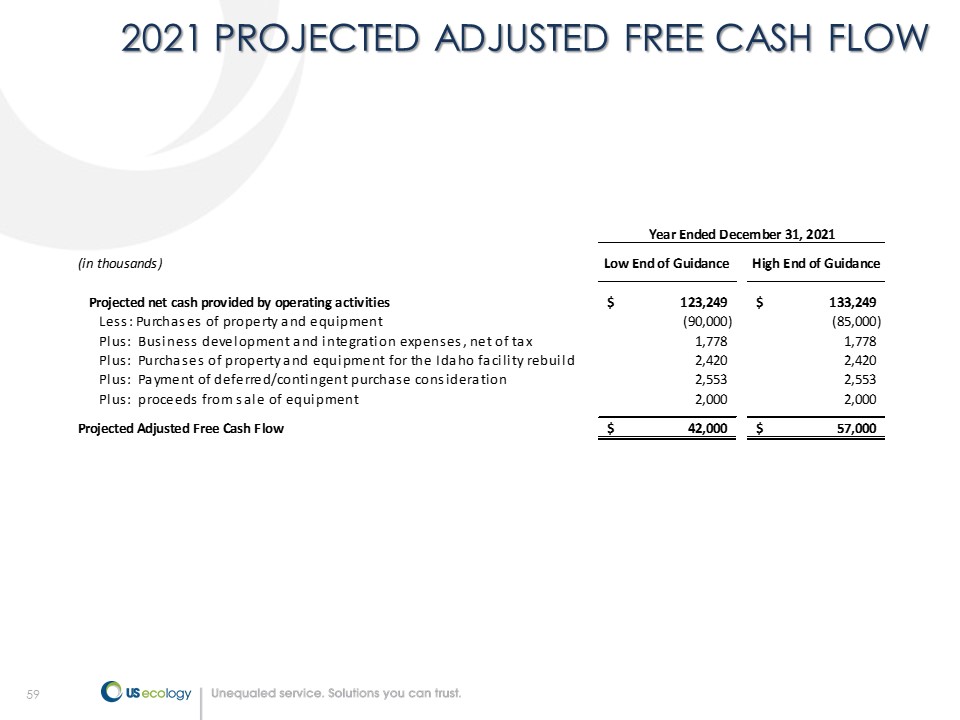
59 2021 PROJECTED ADJUSTED FREE CASH FLOW (in thousands) Low End of Guidance High End of Guidance Projected net cash provided by operating activities 123,249$ 133,249$ Less: Purchases of property and equipment (90,000) (85,000) Plus: Business development and integration expenses, net of tax 1,778 1,778 Plus: Purchases of property and equipment for the Idaho facility rebuild 2,420 2,420 Plus: Payment of deferred/contingent purchase consideration 2,553 2,553 Plus: proceeds from sale of equipment 2,000 2,000 Projected Adjusted Free Cash Flow 42,000$ 57,000$ Year Ended December 31, 2021