Exhibit 99.2
Investor Presentation November 2020 Investor Presentation December 2020
Disclaimer 1 Important Disclosures This investor presentation (the “presentation”) is for information purposes only to assist interested parties in making their own evaluation with respect to the possible transaction (the “Transaction”) between Forum Merger III Corporation (“Forum”) and Electric Last Mile, Inc . (“ELMS”) . The information contained herein does not purport to be all - inclusive and none of Forum, ELMS or their respective directors, officers, stockholders, affiliates or advisers or any other person makes any representation or warranty, express or implied, as to the accuracy, completeness or reliability of the information contained in this presentation or any other written or oral communication to the recipient in the course of the recipient's evaluation of Forum or ELMS . The information contained herein is preliminary and is subject to change and such changes may be material . The information in this presentation assumes that the Transaction is consummated on the terms contemplated by the Agreement and Plan of Merger (“Merger Agreement”) entered into by Forum and ELMS . This presentation does not constitute (i) a solicitation of a proxy, consent or authorization with respect to any securities or in respect of the Transaction or (ii) an offer to sell, a solicitation of an offer to buy, or a recommendation to purchase any security of Forum, ELMS, or any of their respective affiliates (and there shall not be any sale of securities in any jurisdiction in which the offer, solicitation or sale would be unlawful prior to the registration or qualification under the securities laws of any such jurisdiction) . You should not construe the contents of this presentation as legal, tax, accounting or investment advice or a recommendation . You should consult your own counsel and tax and financial advisors as to legal and related matters concerning the matters described, and by accepting this presentation, you confirm that you are not relying upon the information contained herein to make any decision . No securities commission or securities regulatory authority in the United States or any other jurisdiction has in any way passed upon the merits of the Transaction or the accuracy or adequacy of this presentation . Forward - Looking Statements This presentation includes “forward - looking statements” within the meaning of the “safe harbor” provisions of the Private Securities Litigation Reform Act of 1995 . Forum and ELMS’s actual results may differ from their expectations, estimates and projections and consequently, you should not rely on these forward - looking statements as predictions of future events . Words such as “expect,” “estimate,” “project,” “budget,” “forecast,” “anticipate,” “intend,” “plan,” “may,” “will,” “could,” “should,” “believes,” “predicts,” “potential,” “continue,” and similar expressions are intended to identify such forward - looking statements . These forward - looking statements include, without limitation, Forum’s and ELMS’s expectations with respect to future performance and anticipated financial impacts of the Transaction, the satisfaction of the closing conditions to the Transaction, the size, demands and growth potential of the markets for ELMS’s products and ELMS’s ability to serve those markets, ELMS’s ability to develop innovative products and compete with other companies engaged in the commercial delivery vehicle industry and/or the electric vehicle industry, ELMS’s ability to attract and retain customers, the estimated go to market timing and cost for ELMS’s products, the implied valuation of ELMS and the timing of the completion of the Transaction . These forward - looking statements involve significant risks and uncertainties that could cause the actual results to differ materially from the expected results . Most of these factors are outside Forum’s and ELMS’s control and are difficult to predict . Factors that may cause such differences include, but are not limited to : ( 1 ) the occurrence of any event, change or other circumstances that could give rise to the termination of the Merger Agreement or could otherwise cause the Transaction to fail to close ; ( 2 ) the inability of ELMS to (x) execute transaction agreements with SF Motors, Inc . (d/b/a SERES) that are in form and substance acceptable to Forum (at Forum’s sole discretion), (y) acquire a leasehold interest or fee simple title to the Indiana manufacturing facility or (z) secure key intellectual property rights related to its proposed business ; ( 3 ) the outcome of any legal proceedings that may be instituted against Forum or ELMS following the announcement of the Transaction ; ( 4 ) the inability to complete the Transaction, including due to failure to obtain approval of the stockholders of Forum or other conditions to closing in the Merger Agreement ; ( 5 ) the receipt of an unsolicited offer from another party for an alternative business transaction that could interfere with the Transaction ; ( 6 ) the inability to obtain the listing of the common stock of the post - acquisition company on the Nasdaq Stock Market or any alternative national securities exchange following the Transaction ; ( 7 ) the risk that the announcement and consummation of the Transaction disrupts current plans and operations ; ( 8 ) the inability to recognize the anticipated benefits of the Transaction, which may be affected by, among other things, competition and the ability of the combined company to grow and manage growth profitably and retain its key employees ; ( 9 ) costs related to the Transaction ; ( 10 ) changes in applicable laws or regulations ; ( 11 ) the possibility that ELMS may be adversely affected by other economic, business, and/or competitive factors ; ( 12 ) the impact of COVID - 19 on the combined company’s business ; and ( 13 ) other risks and uncertainties indicated from time to time in the proxy statement to be filed relating to the Transaction, including those under the “Risk Factors” section therein, and in Forum’s other filings with the Securities and Exchange Commission . Some of these risks and uncertainties may in the future be amplified by the COVID - 19 outbreak and there may be additional risks that Forum considers immaterial or which are unknown . Forum cautions that the foregoing list of factors is not exclusive . Forum cautions readers not to place undue reliance upon any forward - looking statements, which speak only as of the date made . ELMS is currently engaged in limited operations only and its ability to carry out its business plans and strategies in the future (in each case, as described in this presentation) are contingent upon the closing of the proposed Transaction . The consummation of the Transaction is subject to, among other conditions, (i) the execution and effectiveness of transaction agreements by ELMS with SF Motors, Inc . (d/b/a SERES) that are each in form and substance acceptable to Forum (at Forum’s sole discretion), (ii) the acquisition by ELMS of a leasehold interest or fee simple title to the Indiana manufacturing facility prior to the Transaction, and (iii) the securing by ELMS of key intellectual property rights related to its proposed business (collectively, the “Carveout Transaction”) . All statements in this presentation regarding the anticipated business of ELMS assumes the completion of the Carveout Transaction . Forum does not undertake or accept any obligation or undertaking to release publicly any updates or revisions to any forward - looking statements to reflect any change in its expectations or any change in events, conditions or circumstances on which any such statement is based . Industry and Market Data In this presentation, we rely on and refer to information and statistics regarding market participants in the sectors in which ELMS expects to compete and other industry data . We obtained this information and these statistics from a variety of publicly available sources, including reports by market research firms and other public company filings . No representation is made as to the reasonableness of the assumptions made within or the accuracy or completeness of any projections or modeling or any other information contained herein . Any data on past performance or modeling contained herein is not an indication as to future performance . Trademarks This presentation may contain trademarks, service marks, trade names and copyrights of other companies, which are the property of their respective owners. Solely for convenience, some of the trademarks, service marks, trade names and copyrights referred to in this presentation may be listed without the TM, SM, © or ® symbols, but Forum and ELMS will assert, to the fullest extent under applicable law, the rights of the applicable owners, if any, to these trademarks, service marks, trade names and copyrights. No Offer or Solicitation This presentation shall not constitute a solicitation of a proxy, consent or authorization with respect to any securities or in respect of the Transaction. This presentation shall also not constitute an offer to sell or the solicitation of an offer to buy any securities, nor shall there be any sale of securities in any states or jurisdictions in which such offer, solicitation or sale would be unlawful prior to registration or qualification under the securities laws of any such state or jurisdiction. Use of Projections This presentation also contains certain financial forecasts of ELMS . Neither Forum’s nor ELMS’s independent auditors have studied, reviewed, compiled or performed any procedures with respect to the projections for the purpose of their inclusion in this presentation, and accordingly, neither of them has expressed an opinion or provided any other form of assurance with respect thereto for the purpose of this presentation . These projections are for illustrative purposes only and should not be relied upon as being necessarily indicative of future results . In this presentation, certain of the above - mentioned projected information has been provided for purposes of providing comparisons with historical data . The assumptions and estimates underlying the prospective financial information are inherently uncertain and are subject to a wide variety of significant business, economic and competitive risks and uncertainties that could cause actual results to differ materially from those contained in the prospective financial information . Projections are inherently uncertain due to a number of factors outside of Forum’s and ELMS’s control . Accordingly, there can be no assurance that the prospective results are indicative of future performance of the combined company after the Transaction or that actual results will not differ materially from those presented in the prospective financial information . Inclusion of the prospective financial information in this presentation should not be regarded as a representation by any person that the results contained in the prospective financial information will be achieved . Further, the inclusion of valuation multiples and enterprise value of other companies is solely for illustrative purposes, and no assurance can be given that ELMS will be valued at comparable multiples and ELMS's valuations and projected results may differ materially from comparable companies . Use of Non - GAAP Financial Measures This presentation includes non - GAAP financial measures, including EBITDA . Forum and ELMS believe that these non - GAAP measures are useful to investors for two principal reasons : 1 ) these measures may assist investors in comparing performance over various reporting periods on a consistent basis by removing from operating results the impact of items that do not reflect core operating performance ; and 2 ) these measures will be used by ELMS’s management and board of directors to assess its performance and may (subject to the limitations described below) enable investors to compare the expected performance of ELMS and the combined company to its competition . Forum and ELMS believe that the use of these non - GAAP financial measures provides an additional tool for investors to use in evaluating ongoing operating results and trends . These non - GAAP measures should not be considered in isolation from, or as an alternative to, financial measures determined in accordance with GAAP . Other companies may calculate these non - GAAP measures differently, and therefore such measures may not be directly comparable to similarly titled measures of other companies . This presentation includes financial forecasts, including, but not limited to, with respect to ELMS’s future EBITDA . A reconciliation of these forward - looking non - GAAP financial measures to the most directly comparable GAAP financial measures is not provided in this presentation because neither Forum nor ELMS is able to provide such reconciliation without unreasonable effort .

Transaction Summary Overview Forum Merger III Corp (NASDAQ : FIII) is a publicly listed special acquisition company with ~ $ 250 M in trust that has entered into a letter of intent that contemplates a merger with Electric Last Mile, Inc . (“ELMS”), an EV customer solutions company ; carveout to occur simultaneously with the merger ~$155M PIPE in connection with the merger (1) Valuation $1,196M enterprise value at closing (2) Represents attractive entry multiples relative to peer group metrics Capital Structure ELMS Team expected to have ~$379M of cash (3) to fund operations and growth No additional capital requirements expected after close to achieve positive cash flow Pro Forma Ownersh i p (1) ~66.7% existing shareholders, ~17.6% public shareholders of Forum Merger III Corp, ~4.8% Forum Merger III Corp sponsors, ~10.9% PIPE investors (1) Forum Views ELMS As A Unique Opportunity To Invest In an Innovative Vehicle Solutions Platform With A Proven Management Team Marshall Kiev Co - CEO, President & Director David Boris Co - CEO, CFO & Director ELMS Founders Transaction Highlights Forum Merger III Team Jason Luo Founder, Executive Chairman Former President and CEO of Key Safety Systems (now Joyson Safety Systems) . Following Key Safety Systems, Jason served as Chairman and CEO of Ford China . Jason serves on the boards of Accuride (additionally served as CEO), Sybridge Technology, Elo Touch Solutions, ATC Powertrain, and BMTS . He is currently a Senior Advisor and Operating Executive at Crestview Partners . James Taylor Founder, CEO More than 30 years at General Motors, serving as the President of Cadillac and CEO of Hummer . Former Chairman and CEO of Workhorse . Prior to his role as CEO of SERES, he was at Karma Automotive as Chief Revenue Officer . 2 (1) Includes ELMS convertible notes that will convert to Forum III shares. (2) Assumes no redemptions. Enterprise value estimate based on $10.00 per share. (3) After estimated transaction fees and expenses.

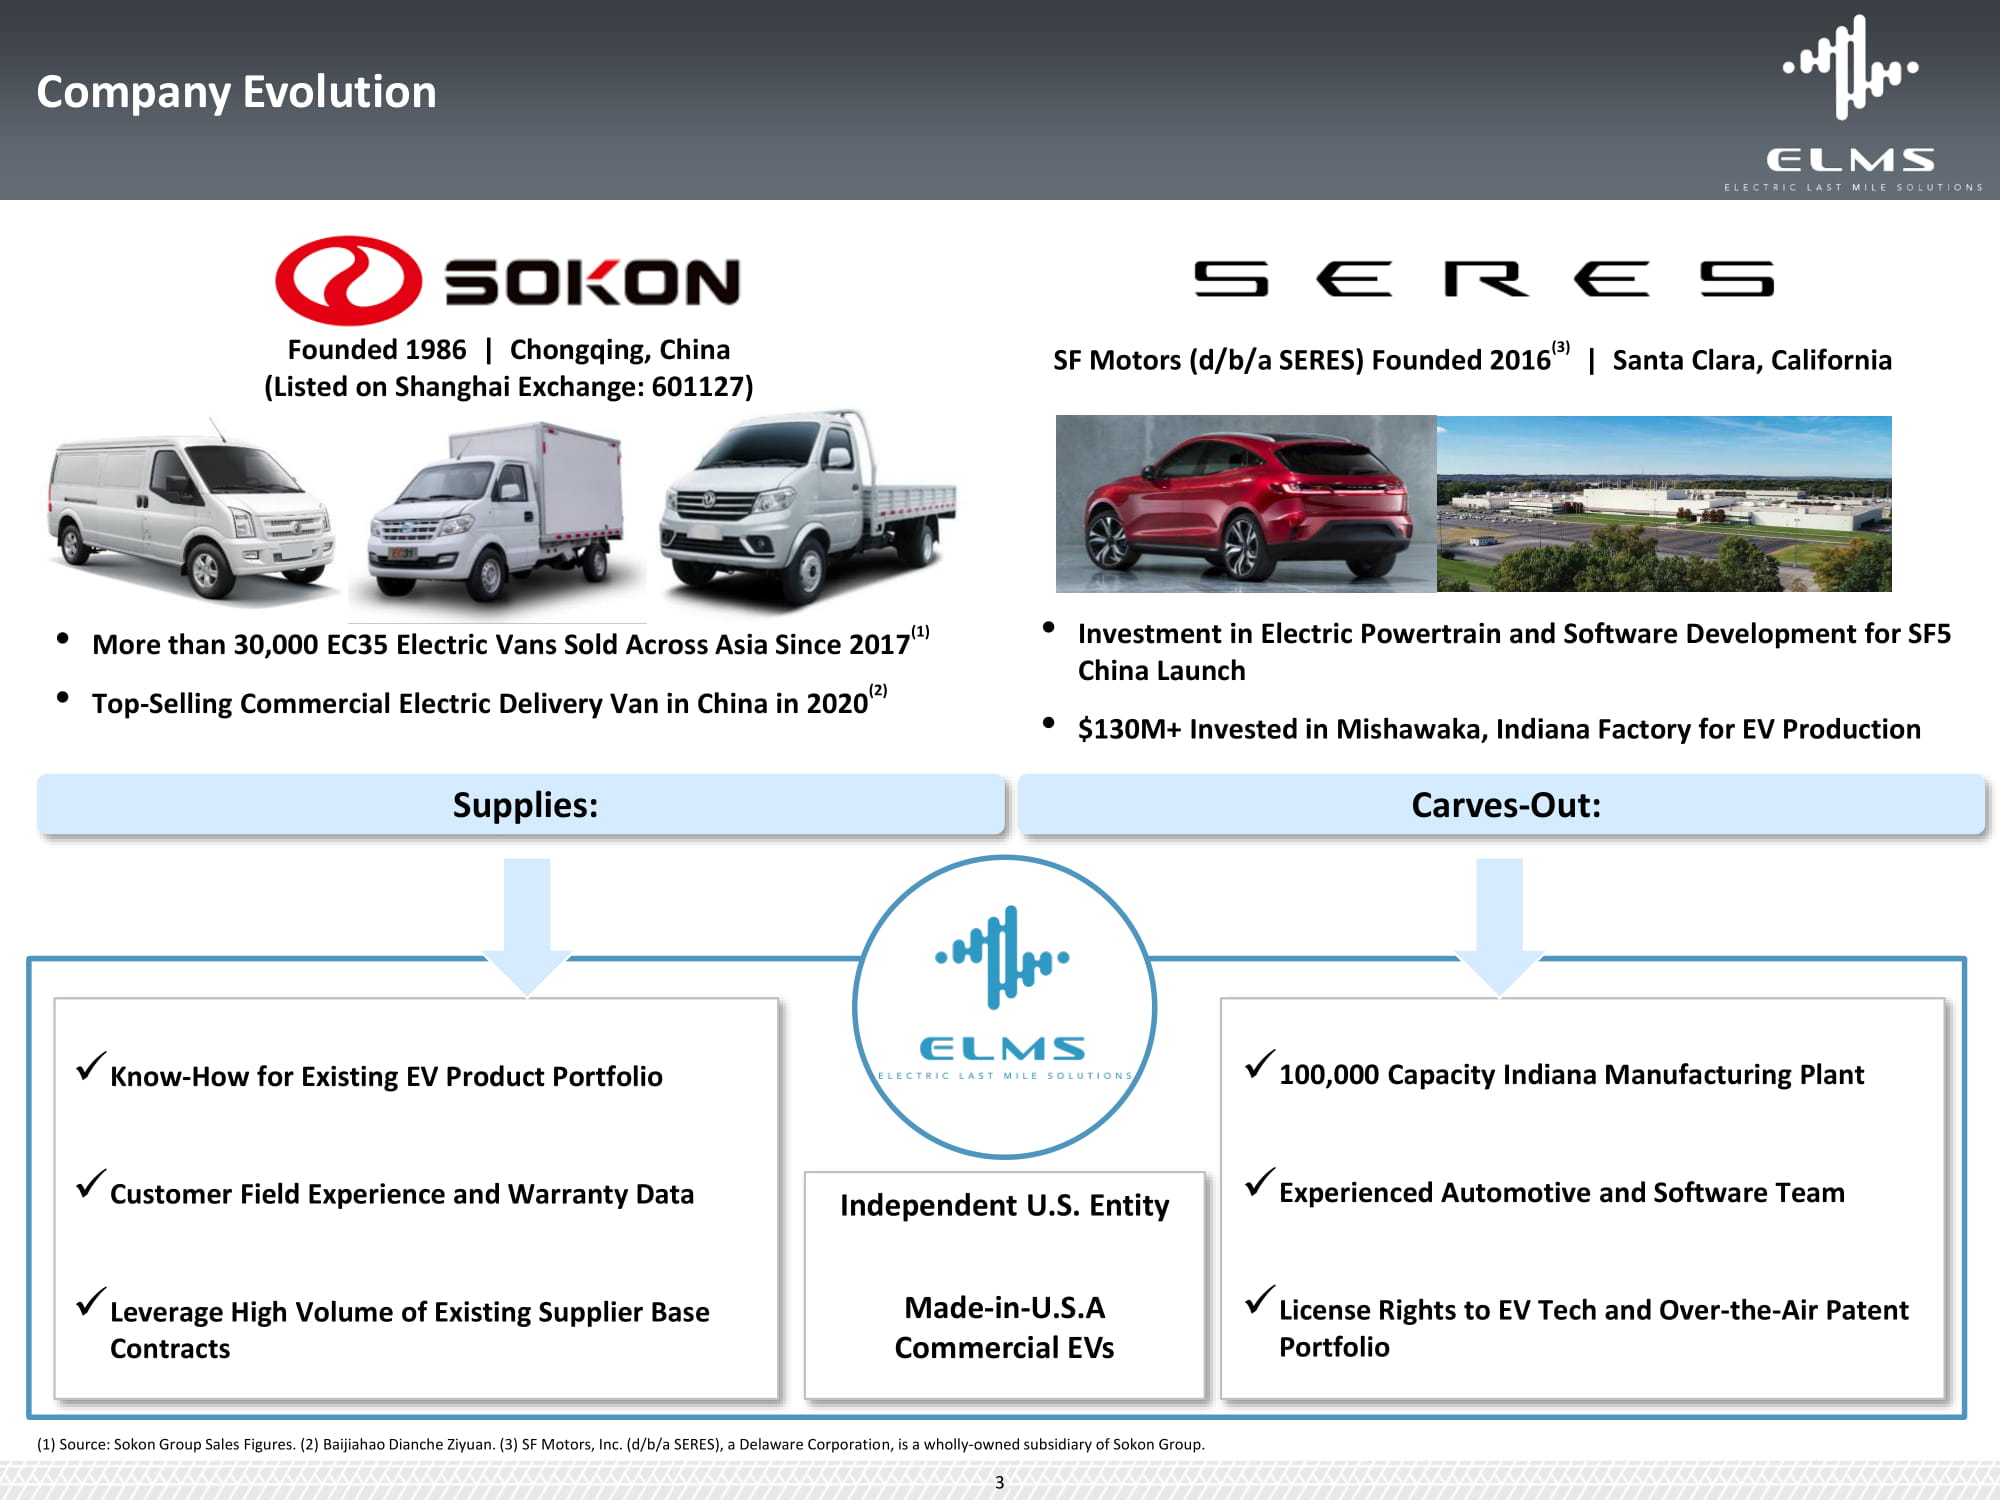
Carves - Out: Supplies: Company Evolution x Know - How for Existing EV Product Portfolio x Customer Field Experience and Warranty Data x Leverage High Volume of Existing Supplier Base Contracts x 100,000 Capacity Indiana Manufacturing Plant x Experienced Automotive and Software Team x License Rights to EV Tech and Over - the - Air Patent Portfolio • More than 30,000 EC35 Electric Vans Sold Across Asia Since 2017 (1) • Top - Selling Commercial Electric Delivery Van in China in 2020 (2) • Investment in Electric Powertrain and Software Development for SF5 China Launch • $130M+ Invested in Mishawaka, Indiana Factory for EV Production (3) SF Motors (d/b/a SERES) Founded 2016 | Santa Clara, California Founded 1986 | Chongqing, China (Listed on Shanghai Exchange: 601127) Independent U.S. Entity Made - in - U.S.A Commercial EVs (1) Source: Sokon Group Sales Figures. (2) Baijiahao Dianche Ziyuan. (3) SF Motors, Inc. (d/b/a SERES), a Delaware Corporation, is a wholly - owned subsidiary of Sokon Group. 3
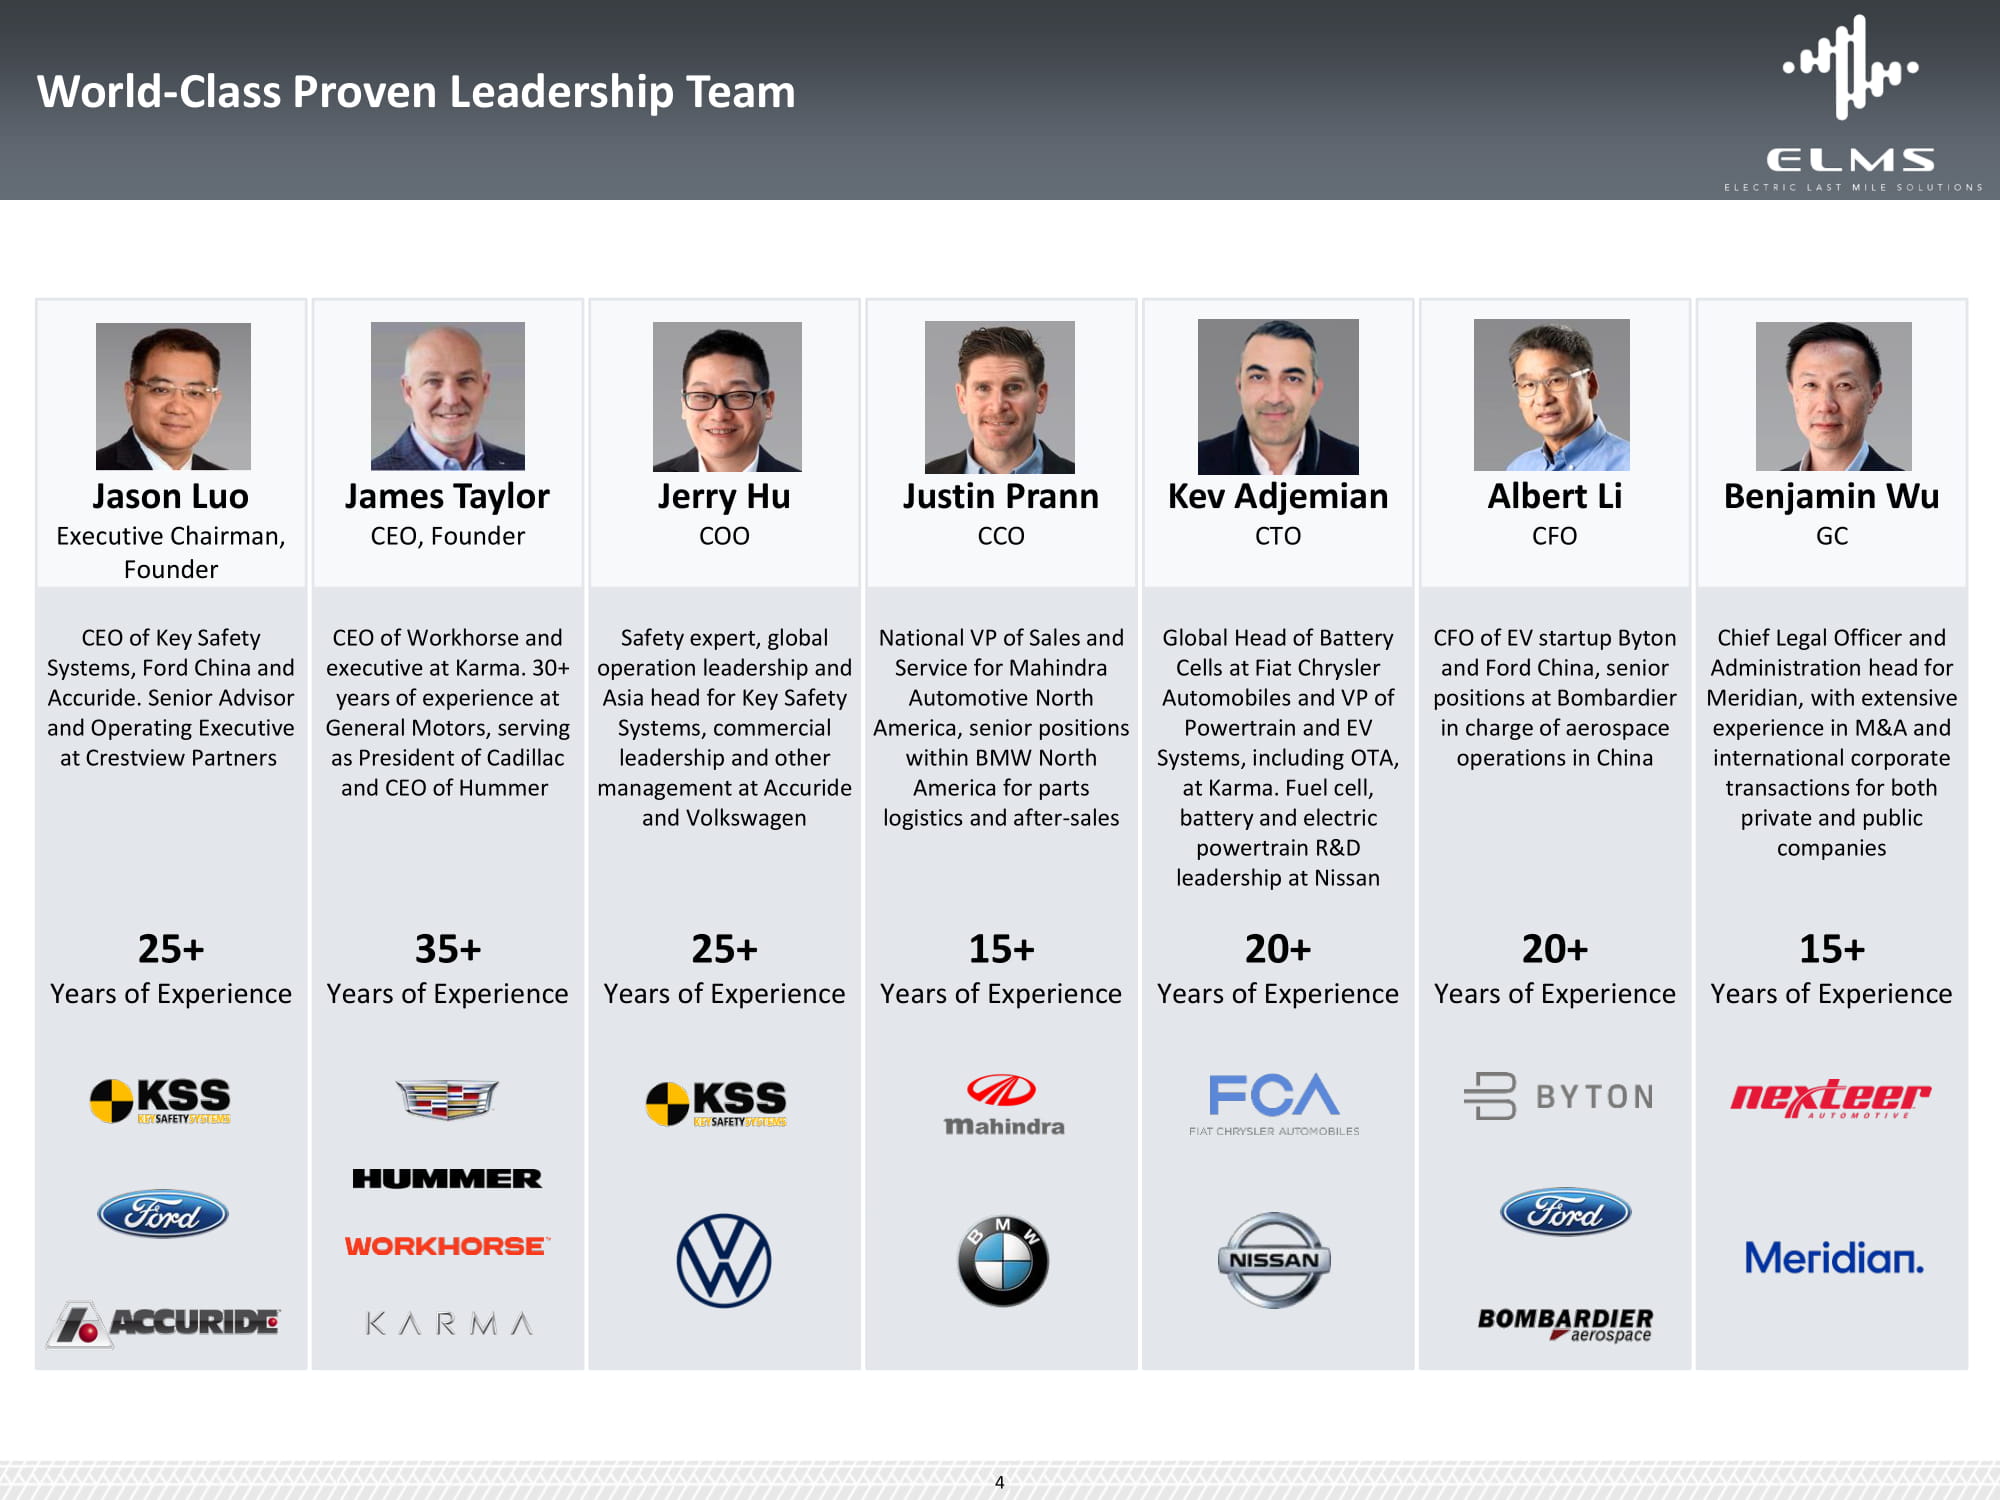
World - Class Proven Leadership Team Jason Luo Executive Chairman, Founder James Taylor CEO, Founder Jerry Hu COO Justin Prann CCO Kev Adjemian CTO Albert Li CFO Benjamin Wu GC CEO of Key Safety Systems, Ford China and Accuride. Senior Advisor and Operating Executive at Crestview Partners CEO of Workhorse and executive at Karma. 30+ years of experience at General Motors, serving as President of Cadillac and CEO of Hummer Safety expert, global operation leadership and Asia head for Key Safety Systems, commercial leadership and other management at Accuride and Volkswagen National VP of Sales and Service for Mahindra Automotive North America, senior positions within BMW North America for parts logistics and after - sales Global Head of Battery Cells at Fiat Chrysler Automobiles and VP of Powertrain and EV Systems, including OTA, at Karma. Fuel cell, battery and electric powertrain R&D leadership at Nissan CFO of EV startup Byton and Ford China, senior positions at Bombardier in charge of aerospace operations in China Chief Legal Officer and Administration head for Meridian, with extensive experience in M&A and international corporate transactions for both private and public companies 25+ Years of Experience 35+ Years of Experience 25+ Years of Experience 15+ Years of Experience 20+ Years of Experience 20+ Years of Experience 15+ Years of Experience 4

Business Overview

Investment Highlights – Transforming Last Mile Commercial Delivery x Significant Last Mile Market Opportunity Driving Explosive Demand for Delivery Vehicles ▪ ~$1 trillion North American eCommerce Market has Driven the Need for Lower Cost Delivery and Fleet Efficiency ▪ Favorable Environment for Green / Sustainability Initiatives x Proven Product - Market Fit to Meet Last Mile Demands ▪ Based On Top Selling EV Model in China for 1H’2020 with Orders from Large National EV Fleet Customers. 30,000 on the Road ▪ Anticipated First Mover in Commercial Class 1 Electric Vehicle Segment in the U.S., with Lowest Total Cost of Ownership, State - of - the - Art Connected Data Platform, and Disruptive Customization Model x Established and Agile Manufacturing Footprint Offering Fast Time to Market ▪ Former Indiana Hummer Plant Already Retrofitted for EV production, Low Investment to be Ready for Production ▪ Over 100k Production Capacity and Agile Vehicle Assembly with Flexibility to Build Several Models ▪ Experienced Workforce Available for Volume Ramp Up ▪ Supply Chain Identified x Go - to - Market Strategy and Partnerships Driving Large Customer Pipeline ▪ Verified Customer Demand with 30,000+ Pre - Orders Representing $1B+ of Anticipated Revenue (1) ▪ Innovative Partnerships for Connected Data, Upfitting and Service x World - Class Leadership and Execution Team with Track - Record of Success ▪ Deep Experience Across Global OEM, EV Start - Ups and Technology Providers ▪ Proven Ability to Design, Develop and Commercially Produce At - Scale EVs x Capital - Efficient Business Model ▪ Conservative Model Assumes ~5% Penetration of Delivery Vehicle Market Would Lead to a $3 Billion Revenue Business by 2025 ▪ Proceeds from Capital Raise Expected to Enable Profitability Starting 2022 Without Additional Future Capital Raises (1) As of November 25, 2020. Final purchase order contingent upon satisfaction of customer requirements. $1 billion projection based on existing signed pre - orders and assumed pre - Federal Tax Credit MSRP of $32,100. 6

Key Critical Enablers To Be First Mover to the Market Short Lead Time to Launch Q3 2021 Proven, Reliable Electric Vehicles Launch Readiness x Engineering Program in Place to Meet U . S . Regulatory Compliance x Sokon to Provide Body Production Parts x Domestic Supply of EV Powertrain From Global Suppliers, With Long - Term Battery Supply From CATL x Transition to Locally Sourced Materials for Key Systems x Business Partner and Customer Test Drives Ongoing x Existing and Reliable Commercial EV Product 30,000+ in Asia Today (1) (1) Vehicles produced and sold by Sokon Group . (2) Projected as of date of presentation. (3) As of November 25, 2020, companies on this page are either a) customers with whom ELMS or its distributing partners are currently in discussions, and/or b) signed pre - order customers. 30,000+ pre - orders figure refers to signed pre - orders. Final purchase order contingent upon satisfaction of customer requirements. Trademarks on this page are the property of the respective companies. x Plant in Indiana Retrofitted for EV Production x Vehicle and Plant 90% Ready for U.S. Production x Access to Trained Workforce of Over 400 (3) Strong Customer Demand And 30,000+ Pre - Orders x First OEM To U.S. Market with an EV Urban Delivery Vehicle (2) 7

$200 $0 $400 $600 $800 $1,2 0 0 $1,0 0 0 $1,4 0 0 ($ in millions) $1,600 ELMS’ Anticipated Launch Cost Is A Fraction Of Competition Source: Public sources and/or management estimates. Pla nt Plant Tooling Product E ngineering Supplier Tooling Typical New Entrant In N.A. Market Sokon Investment to Date ELMS Launch Cost Estimated Vehicle Project Investment Needs OpEx and G&A ~$45M Capital Expenditures ~$25M Tooling ~$20M Plant + Equipment Purchase ~$70M Engineering ~$45M Operating and G&A Expenses Engineering and Software Development Personnel and G&A Costs Go to Market funds At Least $1.6 Billion 8 $570 Million $160 Million Capital - Efficient Business Model To Deliver Two Vehicle Models
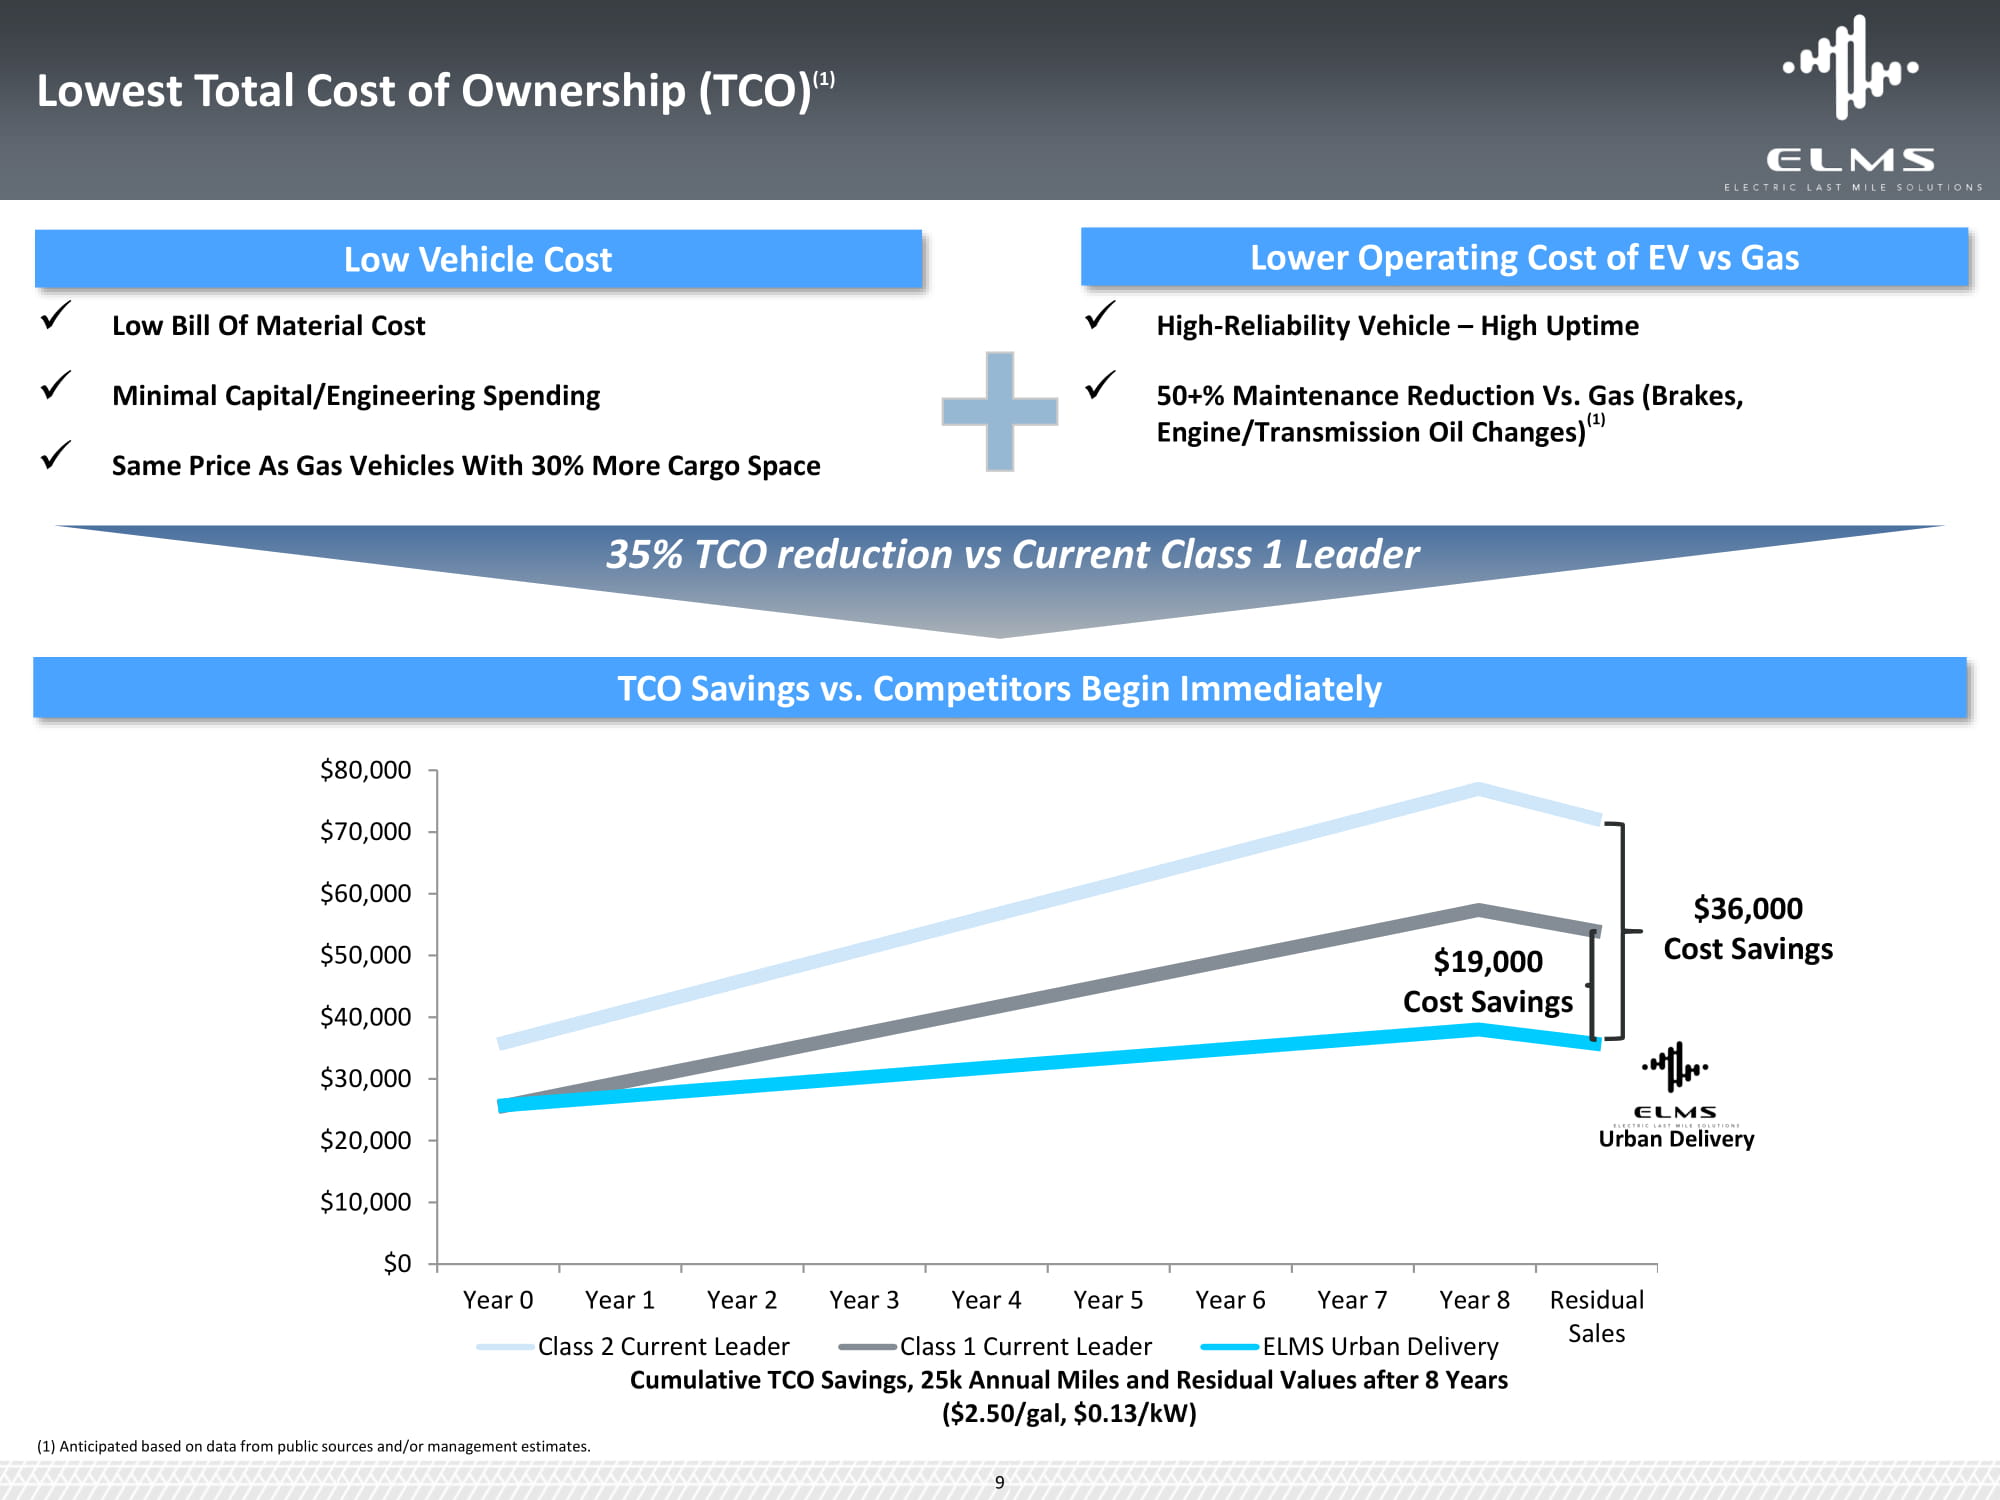
$0 $10 , 000 $20 , 000 $30 , 000 $40 , 000 $50 , 000 $60 , 000 $80 , 000 $70 , 000 Year 0 Year 1 Year 2 Year 3 Class 2 Current Leader R e si d ual Sales Year 4 Year 5 Class 1 Current Leader Year 6 Year 7 Year 8 ELMS Urban Delivery $19,000 Cost Savings $36,000 Cost Savings Cumulative TCO Savings, 25k Annual Miles and Residual Values after 8 Years ($2.50/gal, $0.13/kW) Low Vehicle Cost Lower Operating Cost of EV vs Gas x Low Bill Of Material Cost x Minimal Capital/Engineering Spending x Same Price As Gas Vehicles With 30% More Cargo Space x High - Reliability Vehicle – High Uptime x 50+% Maintenance Reduction Vs. Gas (Brakes, Engine/Transmission Oil Changes) (1) TCO Savings vs. Competitors Begin Immediately Urban Delivery (1) Anticipated based on data from public sources and/or management estimates. 35% TCO reduction vs Current Class 1 Leader 9 L ow e s t T o t al Co s t of Owne r s h ip ( T C O) (1)
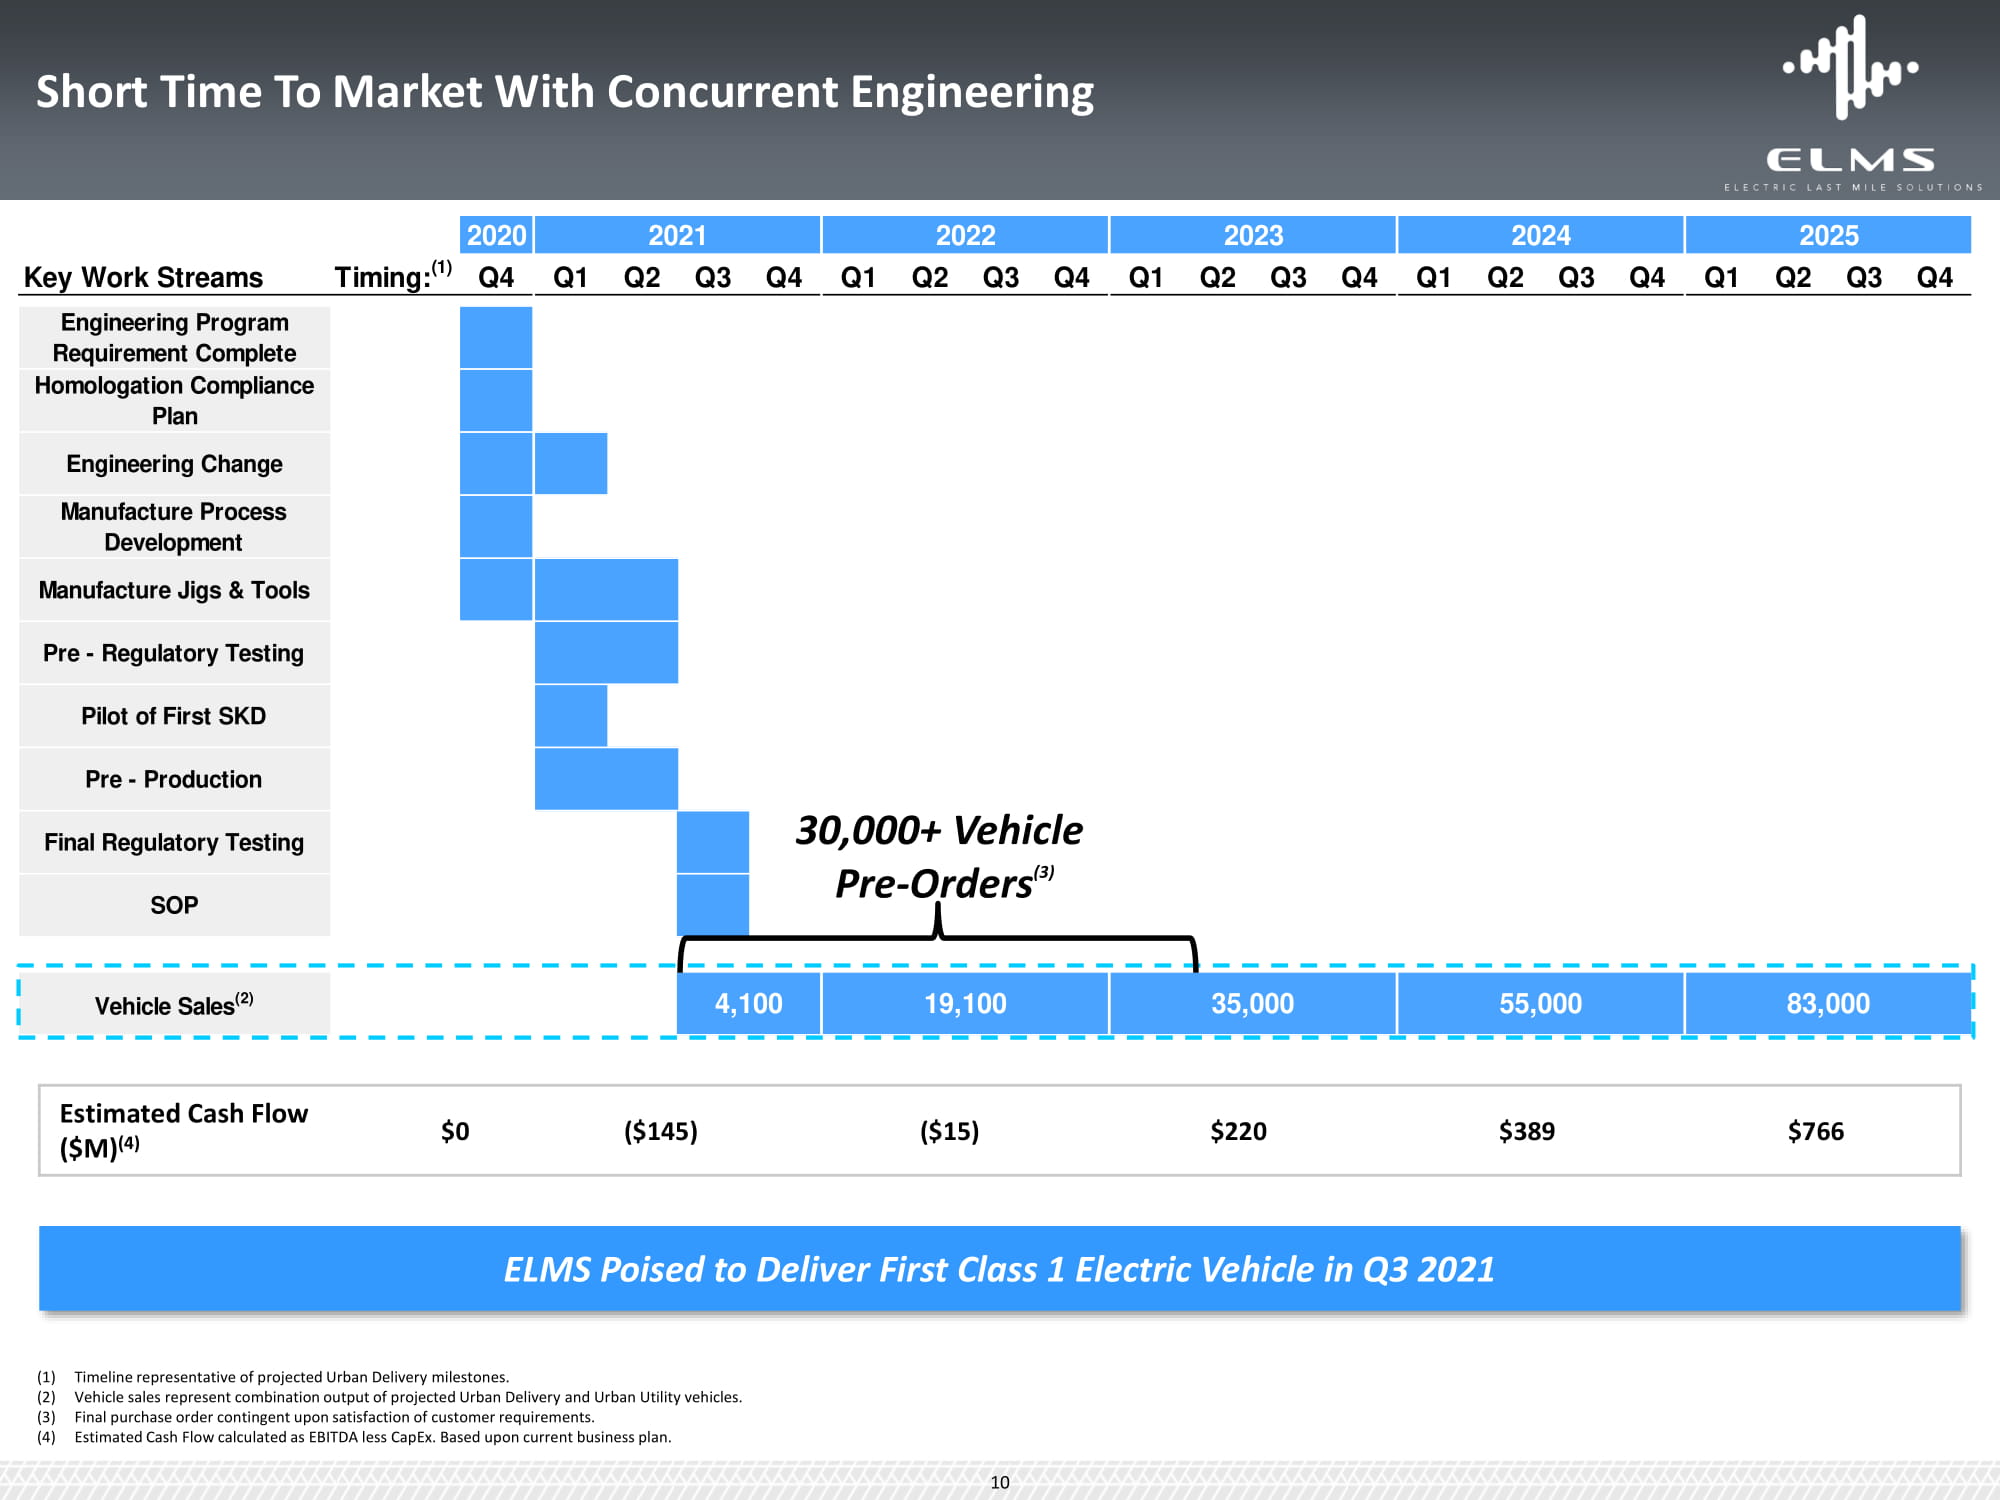
Short Time To Market With Concurrent Engineering 2020 2021 2022 2023 2024 2025 Key Work Streams Timing: (1) Q4 Q1 Q2 Q3 Q4 Q1 Q2 Q3 Q4 Q1 Q2 Q3 Q4 Q1 Q2 Q3 Q4 Q1 Q2 Q3 Q4 Engineering Program Requirement Complete Homologation Compliance Plan Engineering Change Manufacture Process Development Manufacture Jigs & Tools Pre - Regulatory Testing Pilot of First SKD Pre - Production Final Regulatory Testing 30,000+ Vehicle Pre - Orders (3) SOP Vehicle Sales (2) 4,100 19,100 35,000 55,000 83,000 Estimated Cash Flow ($M) (4) $0 ($145) ($15) $220 $389 $766 ELMS Poised to Deliver First Class 1 Electric Vehicle in Q3 2021 10 (1) Timeline representative of projected Urban Delivery milestones. (2) Vehicle sales represent combination output of projected Urban Delivery and Urban Utility vehicles. (3) Final purchase order contingent upon satisfaction of customer requirements. (4) Estimated Cash Flow calculated as EBITDA less CapEx. Based upon current business plan.

Favorable Market Environment
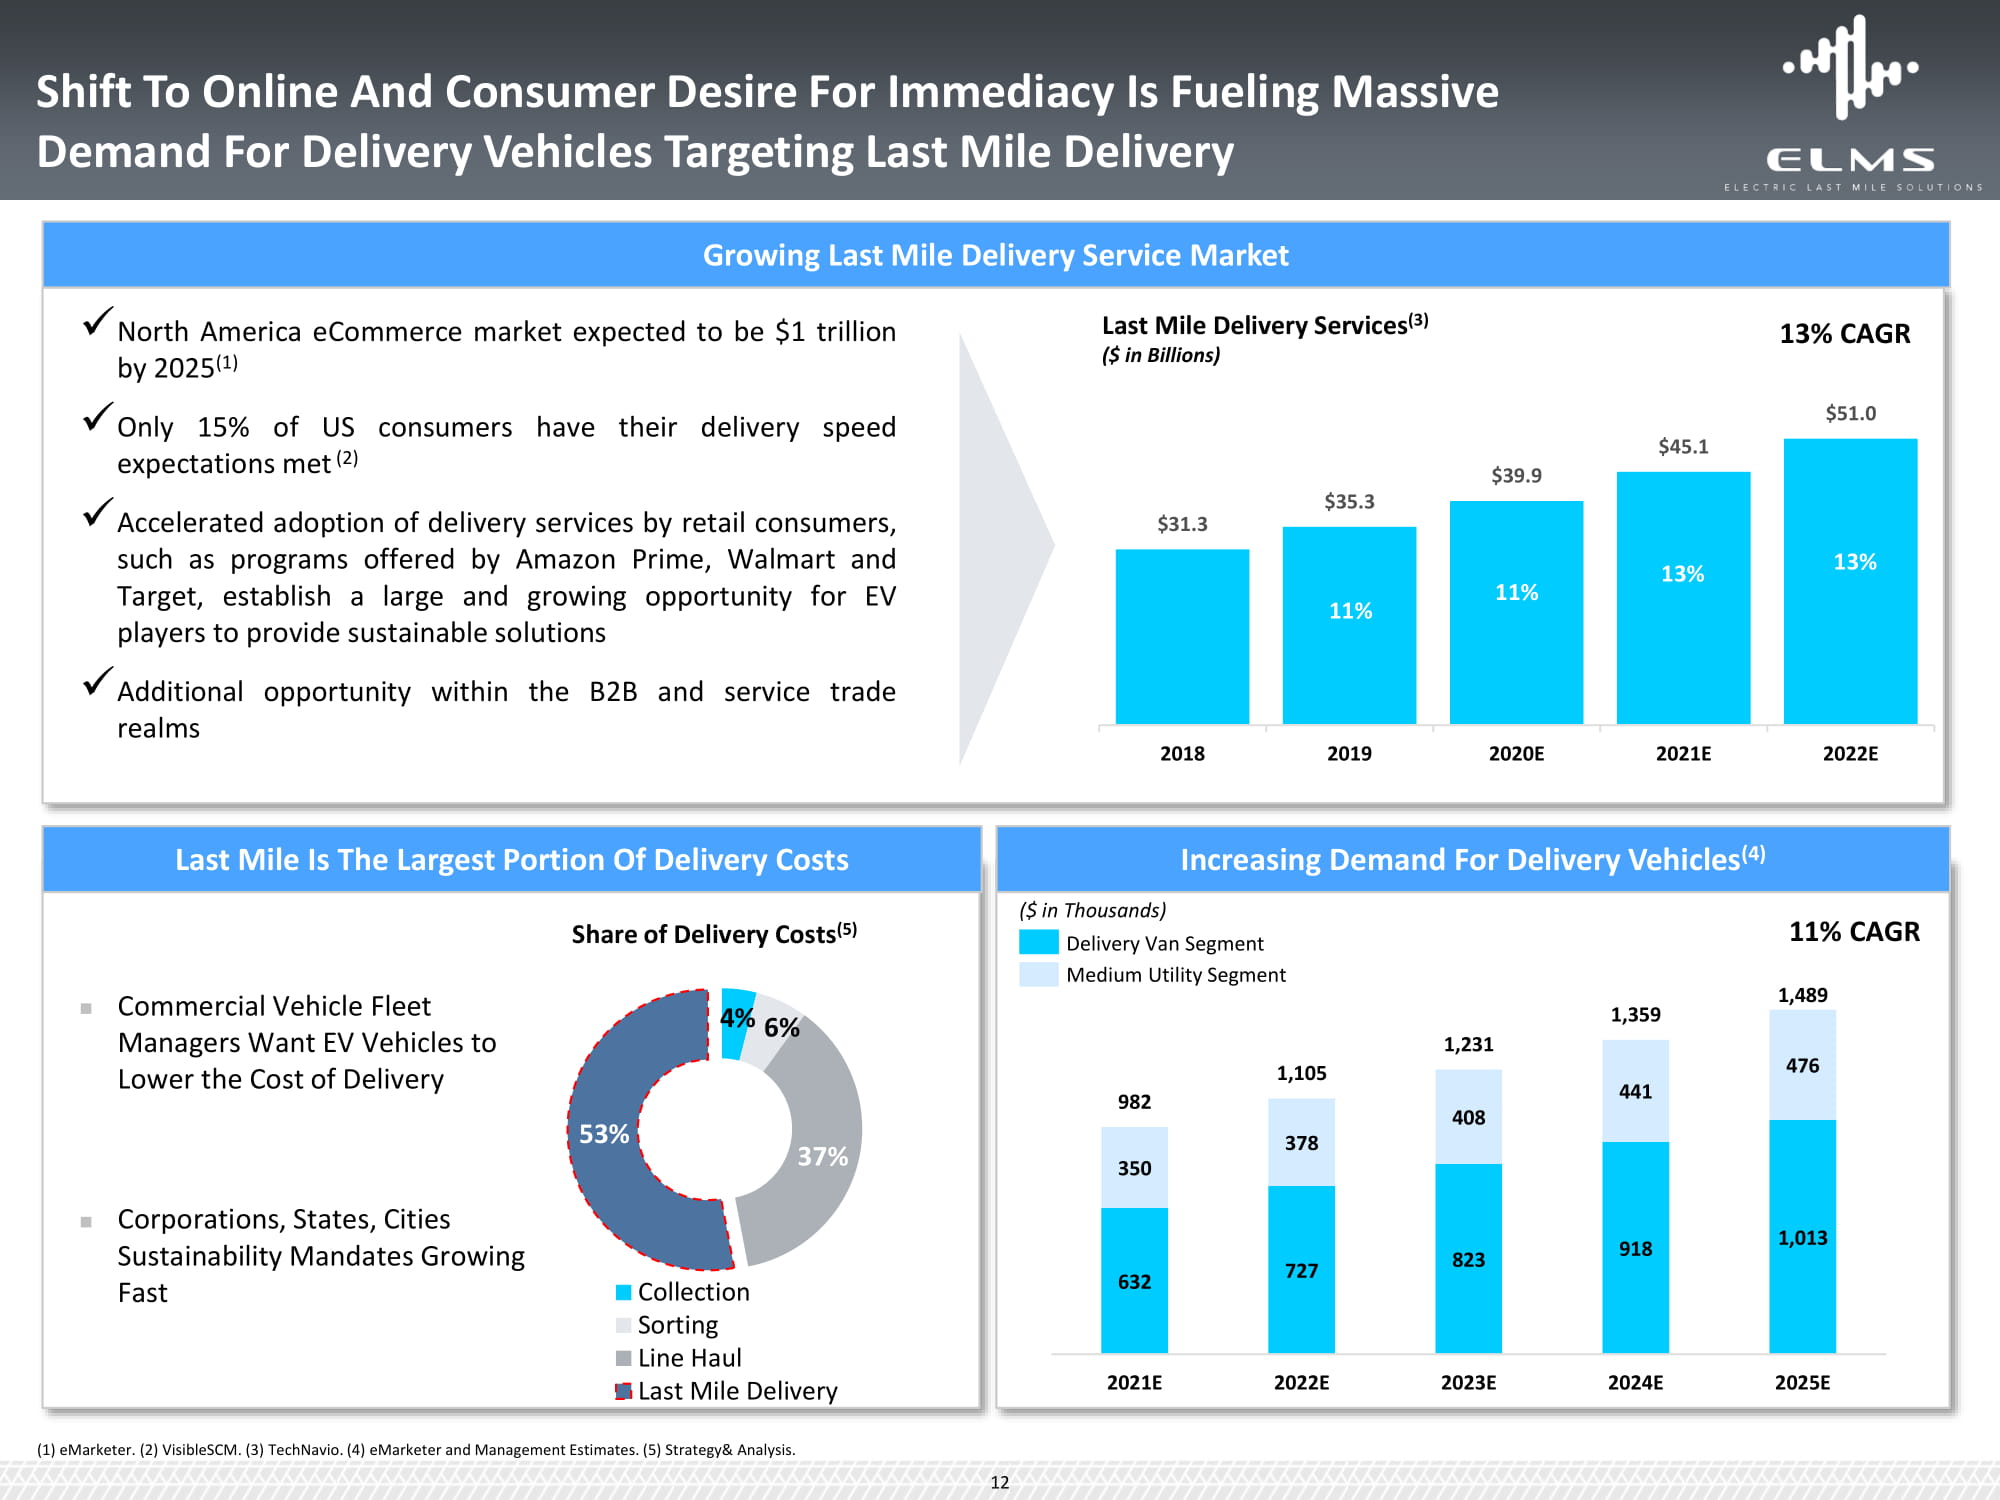
Growing Last Mile Delivery Service Market x North America eCommerce market expected to be $1 trillion Last Mile Delivery Services (3) ($ in Billions) $35.3 $31.3 11% 2 0 18 2 0 19 13% CAGR by 2025 (1) x Only 15% of US consumers have their delivery speed expectations met (2) $39.9 $45.1 $51.0 x Accelerated adoption of delivery services by retail consumers, such as programs offered by Amazon Prime, Walmart and Target, establish a large and growing opportunity for EV 11% 13% 13% players to provide sustainable solutions x Additional opportunity within the B2B and service trade realms 2020E 2021E 2022E Shift To Online And Consumer Desire For Immediacy Is Fueling Massive Demand For Delivery Vehicles Targeting Last Mile Delivery Last Mile Is The Largest Portion Of Delivery Costs 4% 6% 37% 53% Col l ection Sorting Line Haul Last Mile Delivery Share of Delivery Costs (5) Commercial Vehicle Fleet Managers Want EV Vehicles to Lower the Cost of Delivery Corporations, States, Cities Sustainability Mandates Growing Fast (1) eMarketer. (2) VisibleSCM. (3) TechNavio. (4) eMarketer and Management Estimates. (5) Strategy& Analysis. 12 Increasing Demand For Delivery Vehicles (4) ($ in Thousands) Delivery Van Segment Medium Utility Segment 1,105 982 378 350 632 727 2021E 2022E 11% CAGR 1,359 1,489 1,231 476 441 408 823 918 1,013 2 0 2 3 E 2024E 2025E
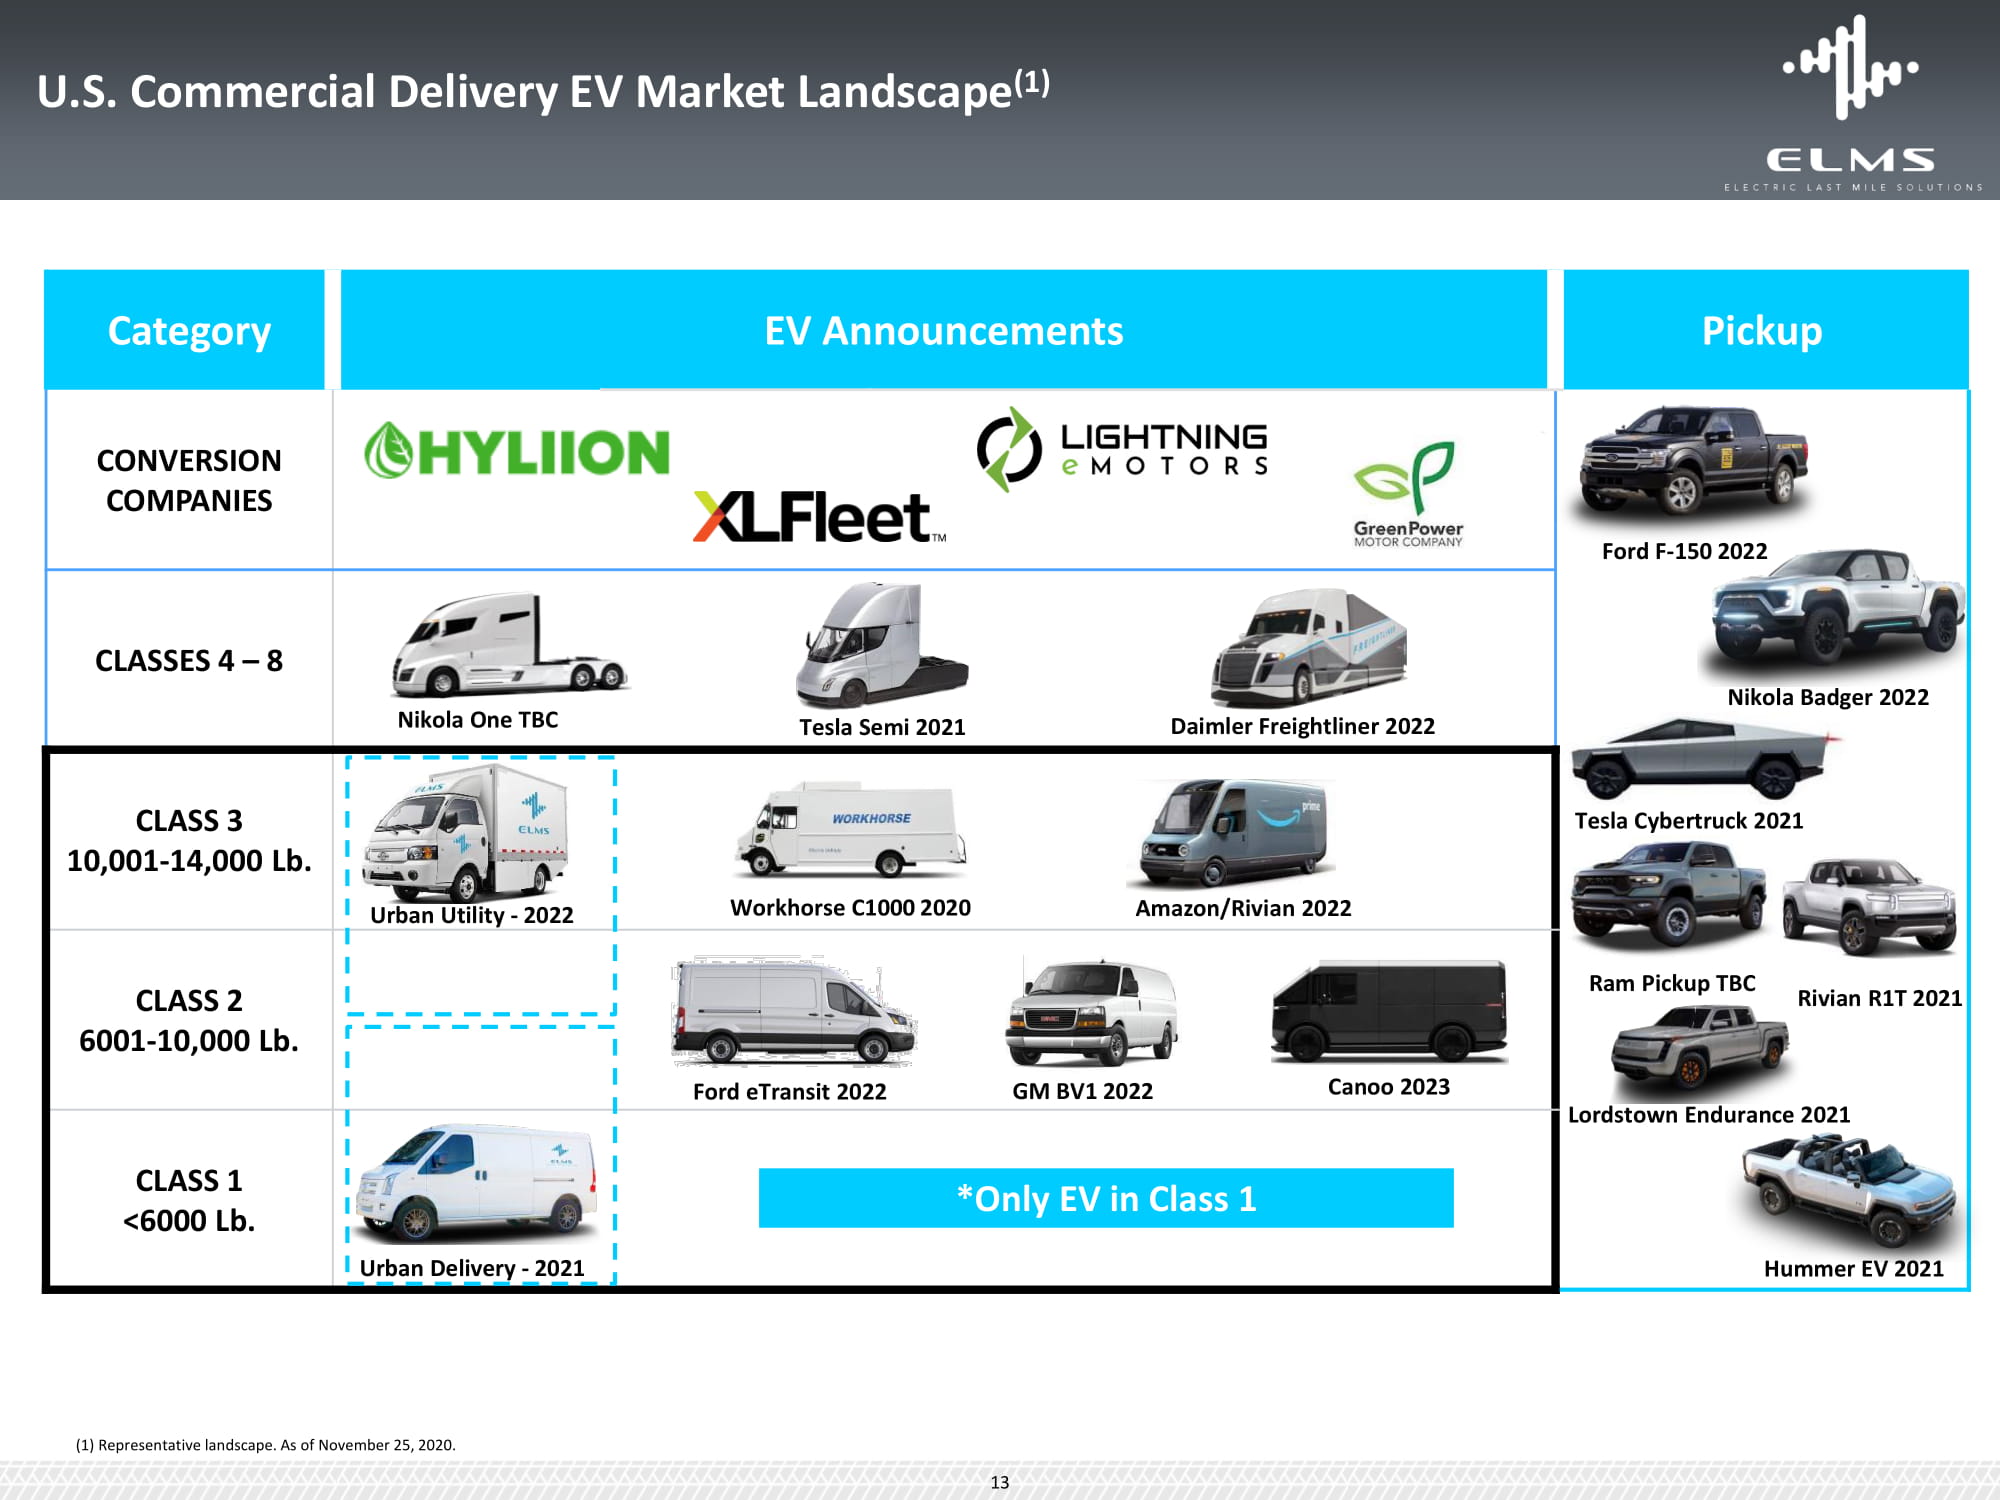
Category EV Announcements Pickup C ONVE R SION COMPANIES Ford F - 150 2022 Nikola Badger 2022 Tesla Cybertruck 2021 Ram Pickup TBC Rivian R1T 2021 Lordstown Endurance 2021 Hummer EV 2021 CLASSES 4 – 8 Nikola One TBC Tesla Se mi 2021 Daimler Freightliner 2022 CLASS 3 10,001 - 14,000 Lb. Urban Utility - 2022 Workhorse C 000 2020 Amazon/Rivian 2022 CLASS 2 6001 - 10,000 Lb. Ford eTransit 2022 GM BV1 2022 Canoo 2023 CLASS 1 <6000 Lb. Urban Delivery - 2021 *Only EV in Class 1 (1) Representative landscape. As of November 25, 2020. U.S. Commercial Delivery EV Market Landscape (1) 13
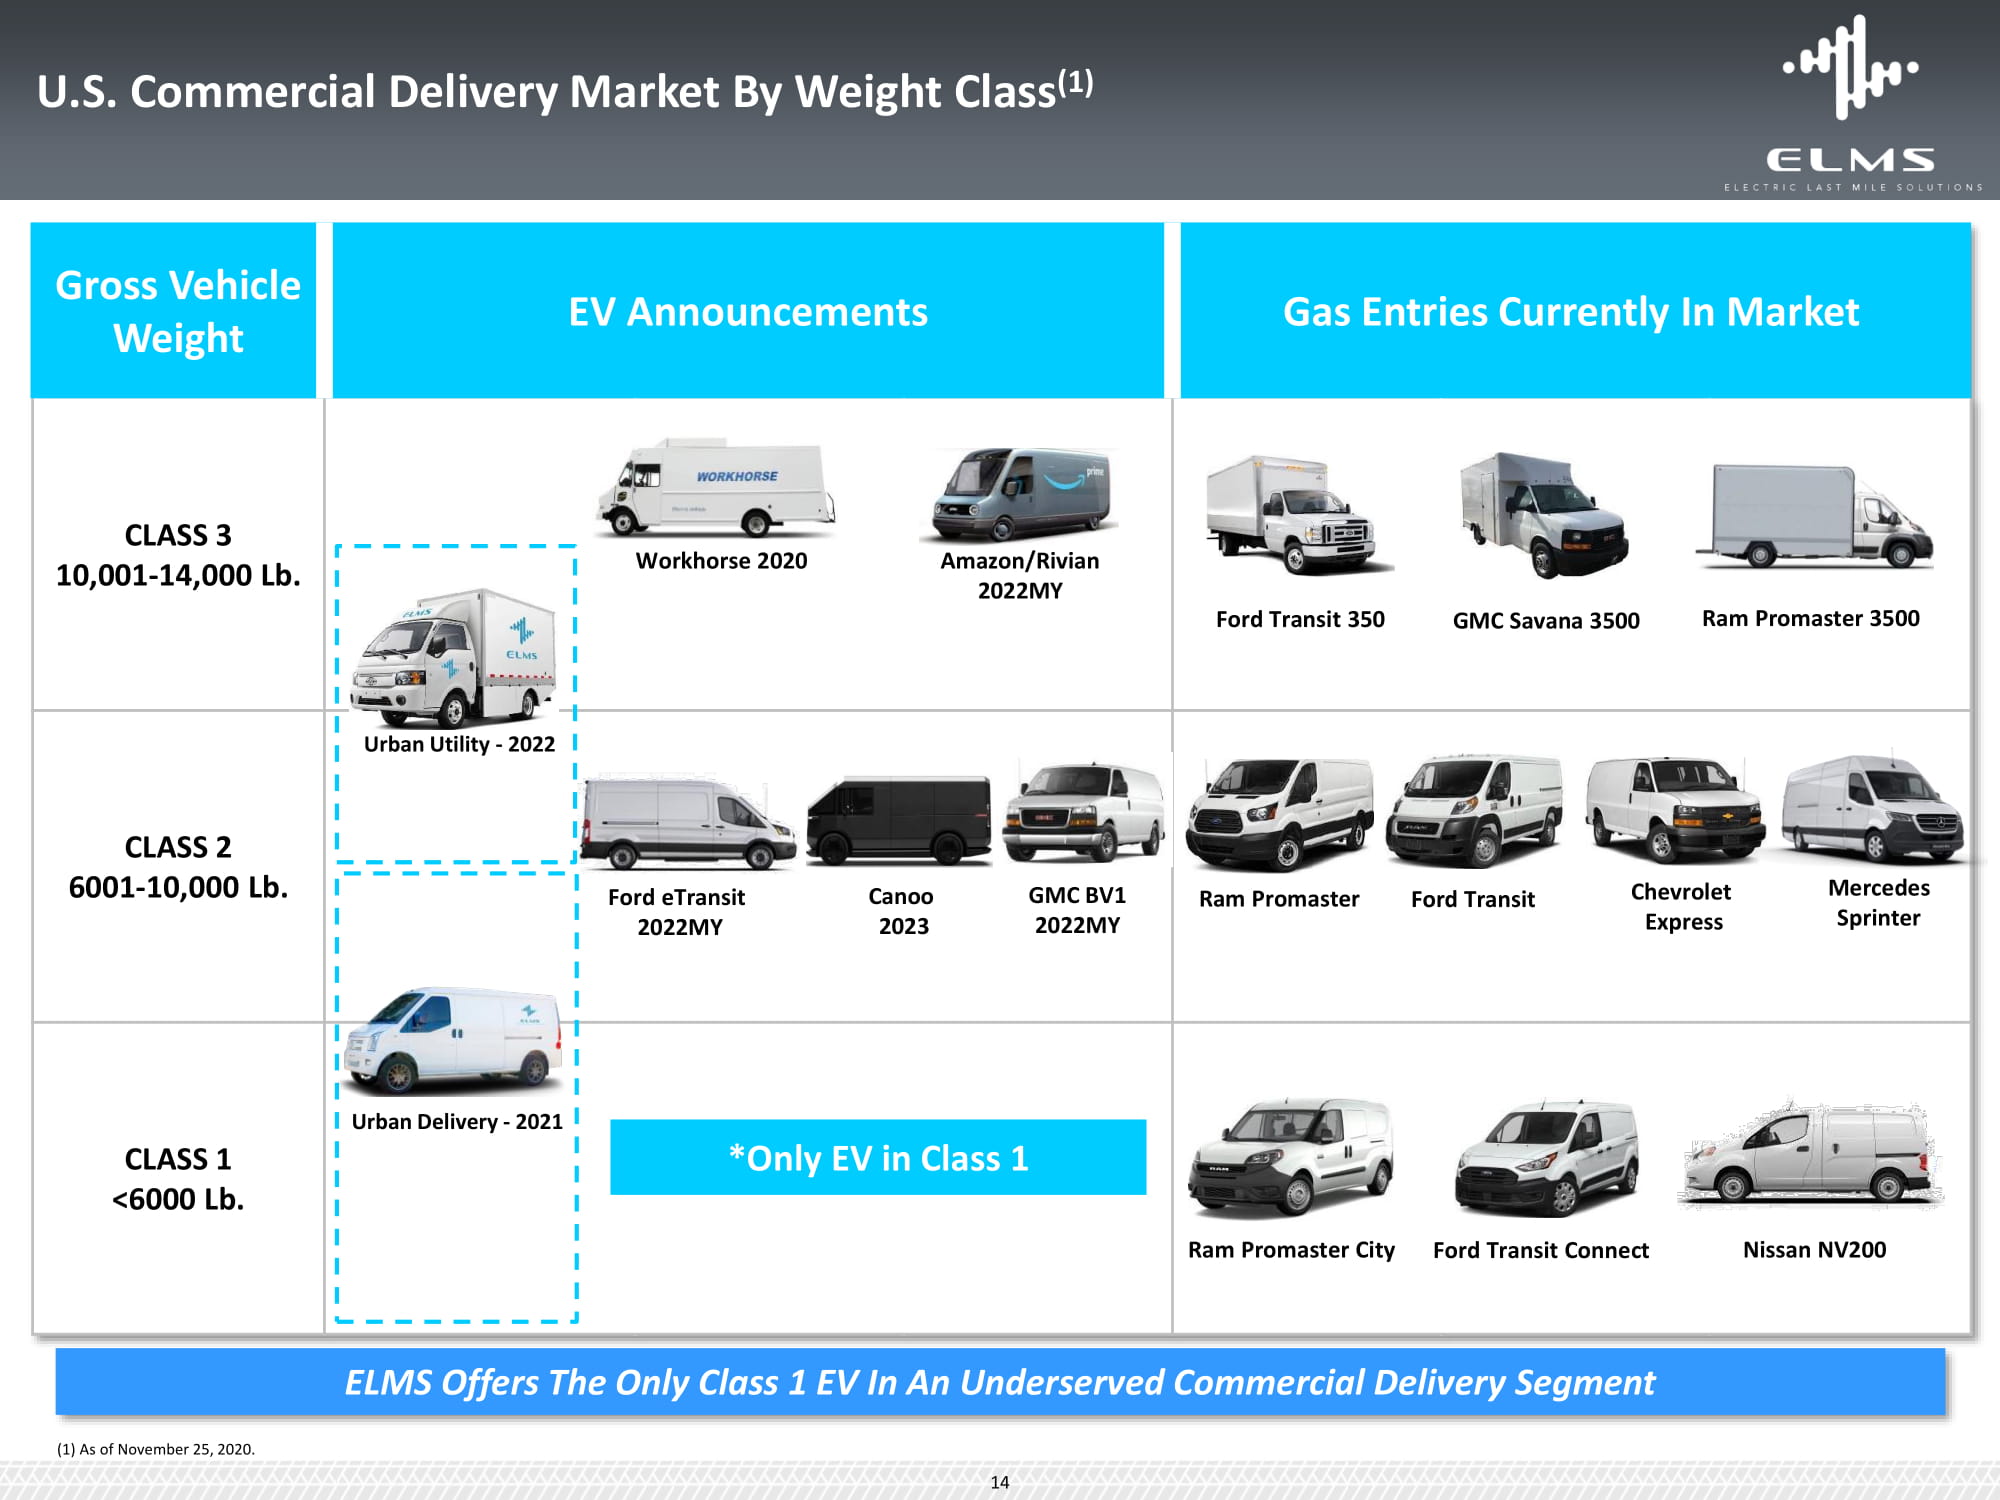
ELMS Offers The Only Class 1 EV In An Underserved Commercial Delivery Segment Gross Vehicle Weight EV Announcements Gas Entries Currently In Market CLASS 3 10,001 - 14,000 Lb. Ford Transit 350 GMC Savana 3500 Ram Promaster 3500 Workhorse 2020 Amazon/ R iv i an 2022MY CLASS 2 6001 - 10,000 Lb. Urban Utility - 2022 Ford eTransit 2022MY Ca noo 2023 GMC BV1 2022MY Ram Promaster Fo r d Tr ansit Ch e vrol et Express Mercedes Sprinter CLASS 1 <6000 Lb. Urban Delivery - 2021 Ram Promaster City Ford Transit Connect Nissan NV200 *Only EV in Class 1 (1) As of November 25, 2020. 14 U.S. Commercial Delivery Market By Weight Class (1)
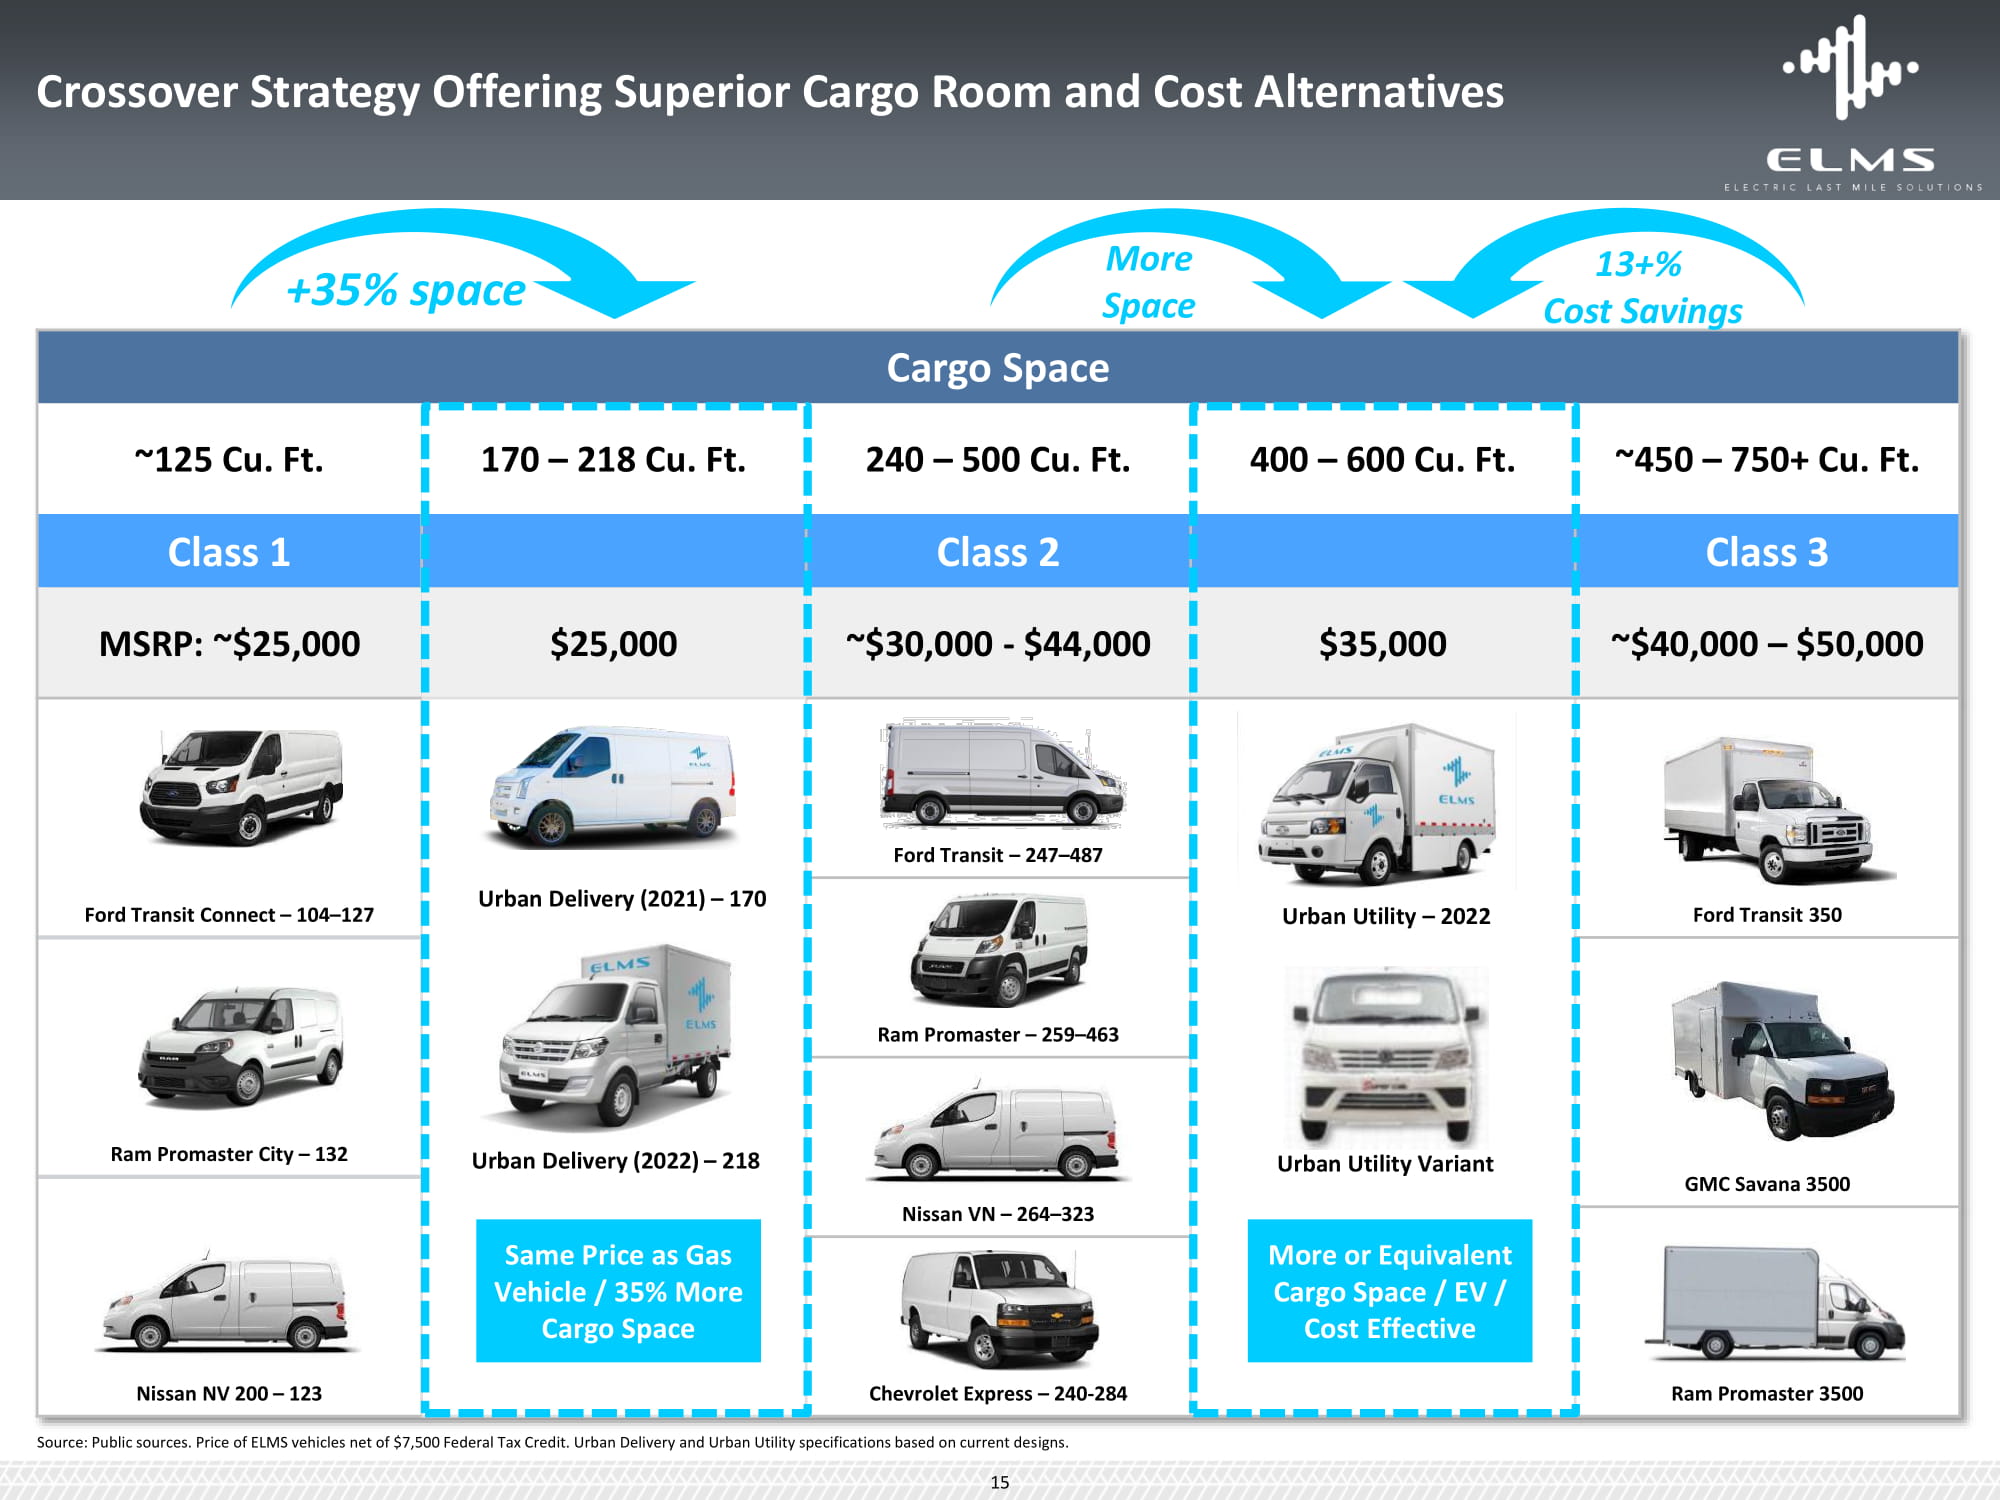
+35% space 13+% Cost Savings More Spa c e Cargo Space ~125 Cu. Ft. 170 – 218 Cu. Ft. 240 – 500 Cu. Ft. 400 – 600 Cu. Ft. ~450 – 750+ Cu. Ft. Class 1 Class 2 Class 3 MSRP: ~$25,000 $25,000 ~$30,000 - $44,000 $35,000 ~$40,000 – $50,000 Ford Transit Connect – 104 – 127 Urban Delivery (2021) – 170 Urban Delivery (2022) – 218 Same Price as Gas Vehicle / 35% More Cargo Space Ford Transit – 247 – 487 Urban Utility – 2022 Urban Utility Variant More or Equivalent Cargo Space / EV / Cost Effective Ford Transit 350 Ram Promaster – 259 – 463 Ram Promaster City – 132 GMC Savana 3500 Nissan VN – 264 – 323 Nissan NV 200 – 123 Ram Promaster 3500 Chevrolet Express – 240 - 284 Crossover Strategy Offering Superior Cargo Room and Cost Alternatives Source: Public sources. Price of ELMS vehicles net of $7,500 Federal Tax Credit. Urban Delivery and Urban Utility specifications based on current designs. 15

Designed in U.S Manufactured in China/Indonesia Target China and EU market Not included in the current financial model Urban Utility SPECIFICATIONS Wheelbase 134 inches L*W*H 215* 74 * 1 2 0 GVWR 10,050 LBS. Curb W eight 4950 lb. Max Payload 5100 lb. Cargo Ca pacity 450 - 600 cu . ft. Battery Size 60 - 90 kW Range 175 – 225 mi l es Long Lasting Safer Cost - Effective SPECIFICATIONS Wheelbase 120 inches L*W*H 177* 66 * 7 8 GVWR 5,732 lbs. Curb Weight 3,329 lbs. Max Payload 2,403 lbs. Cargo Capacity 170 cu.ft. Battery Size 42 kW Range 150 miles Urban Delivery Urban Utility SOP Q4 2023 SOP Q4 2024 SOP Q4 2025 New Vehicle: Upside For China and EU Facelift {UD,UU} Tech. Enhancements Urban Delivery Urban Delivery Variant SPECIFICATIONS Wheelbase 124 inches L*W*H 182* 71 * 9 4 GVWR 5,853 lbs. Curb W eight 2,769 lbs. Max Payload 3,084 lbs. Cargo Ca pacity 218 cu.ft. Battery Size 60 kW Range 200 miles SOP Q4 2022 Class 2/3 SOP Q3 2021 SOP Q3 2022 Class 1/2 Solid State Autonomo u s Mobility - as - a - Service Product Portfolio Roadmap Note: Specifications based on current designs and subject to change based on homologation needs. 16

Solutions to Customer Requirements
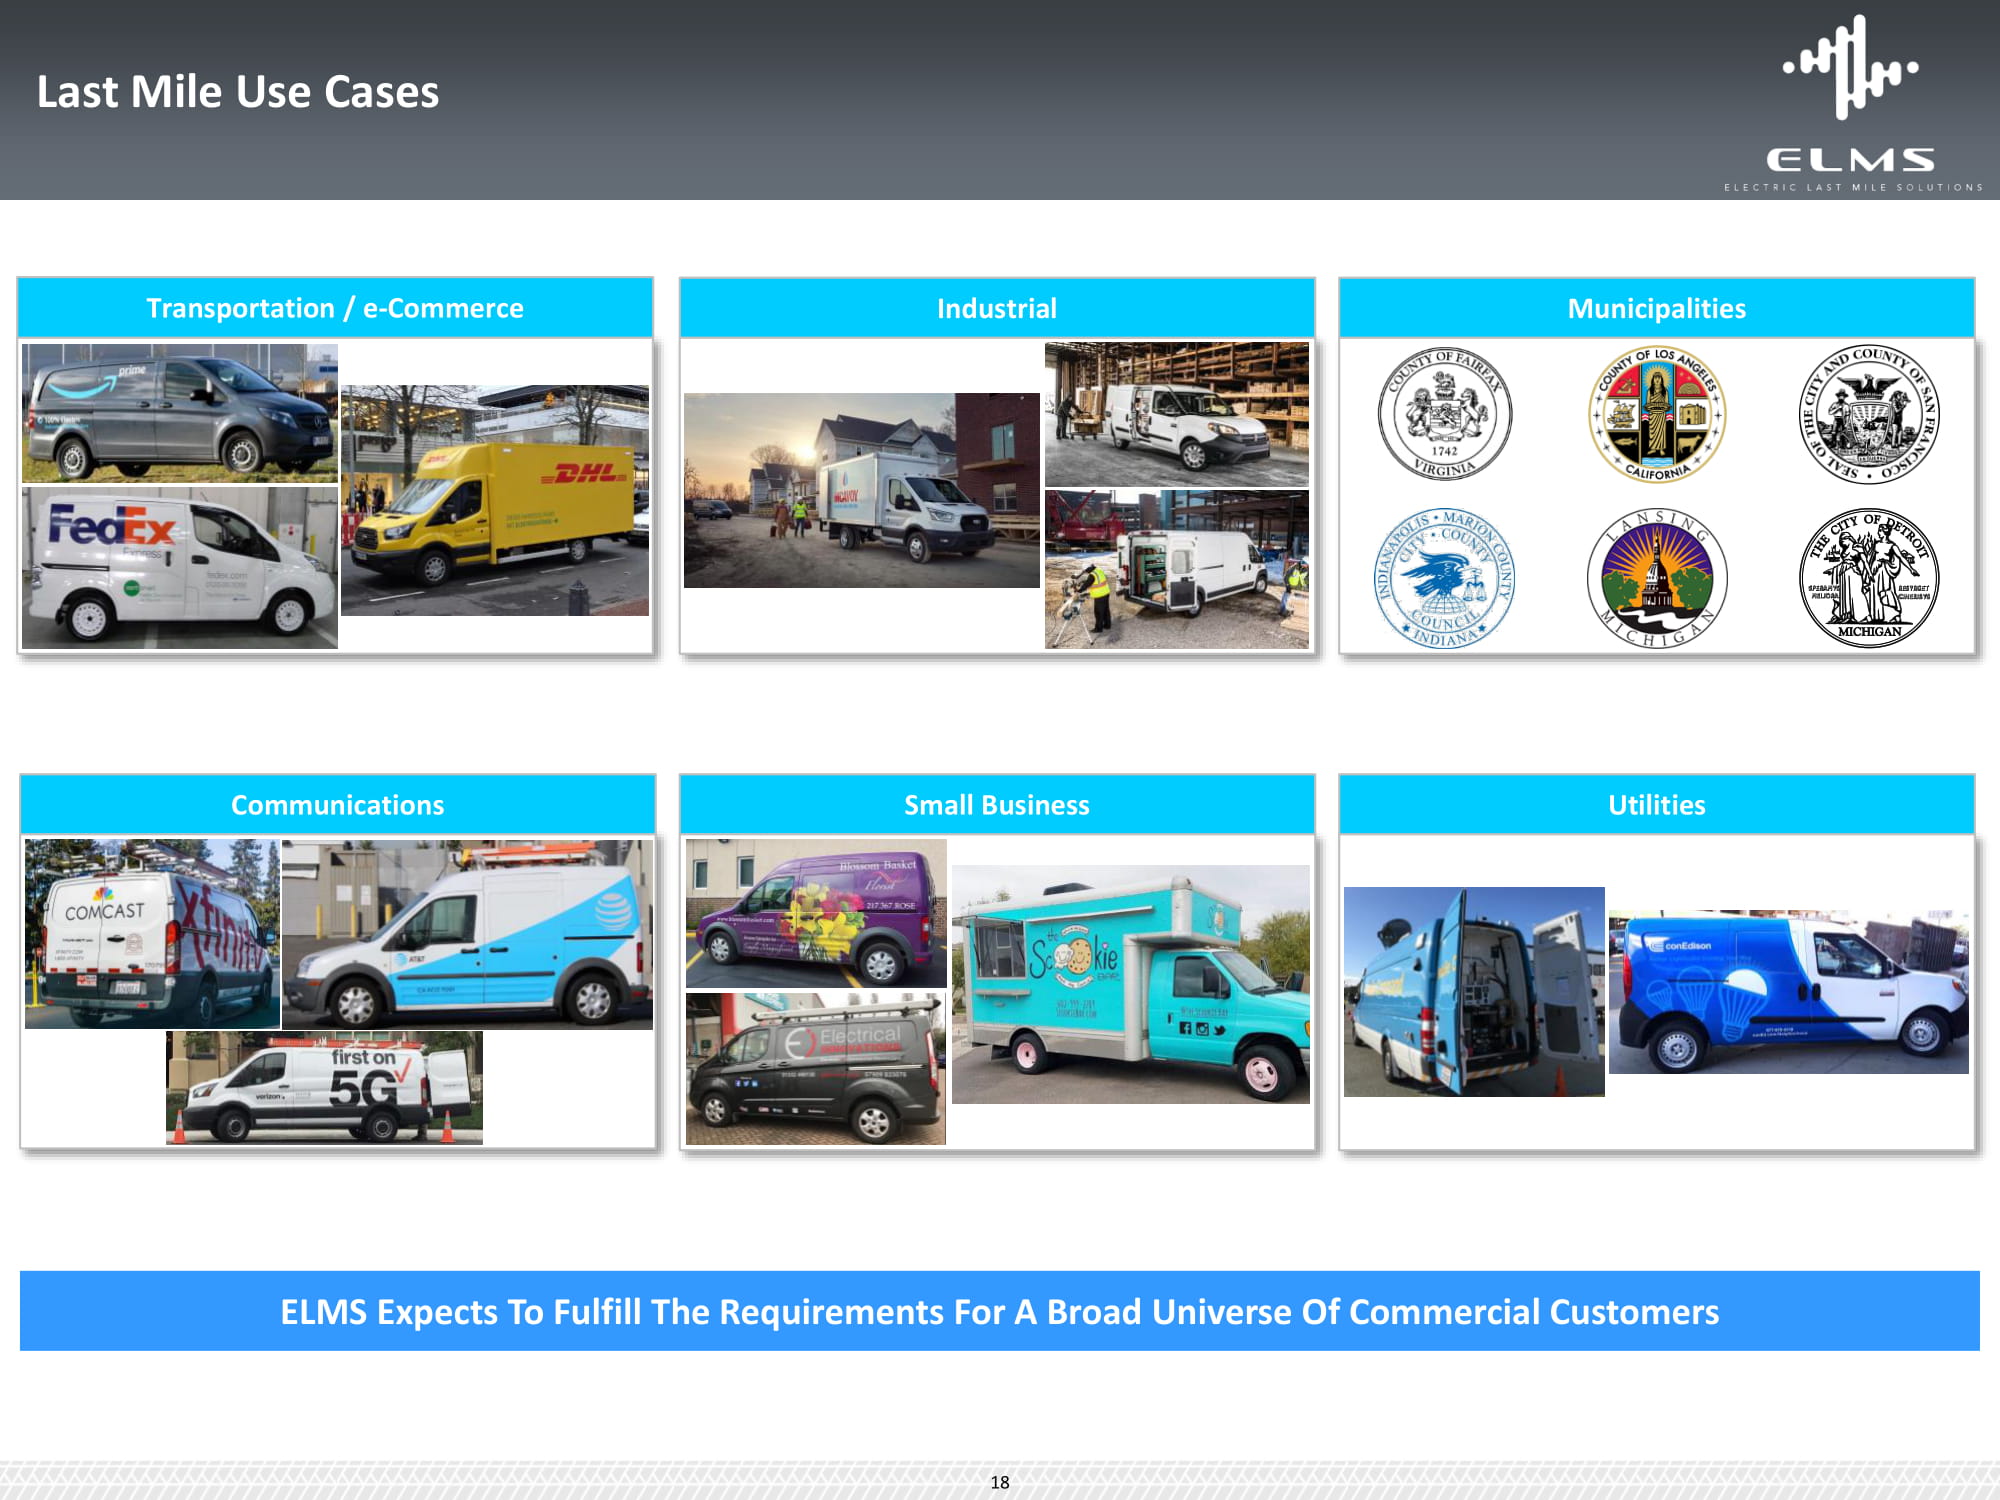
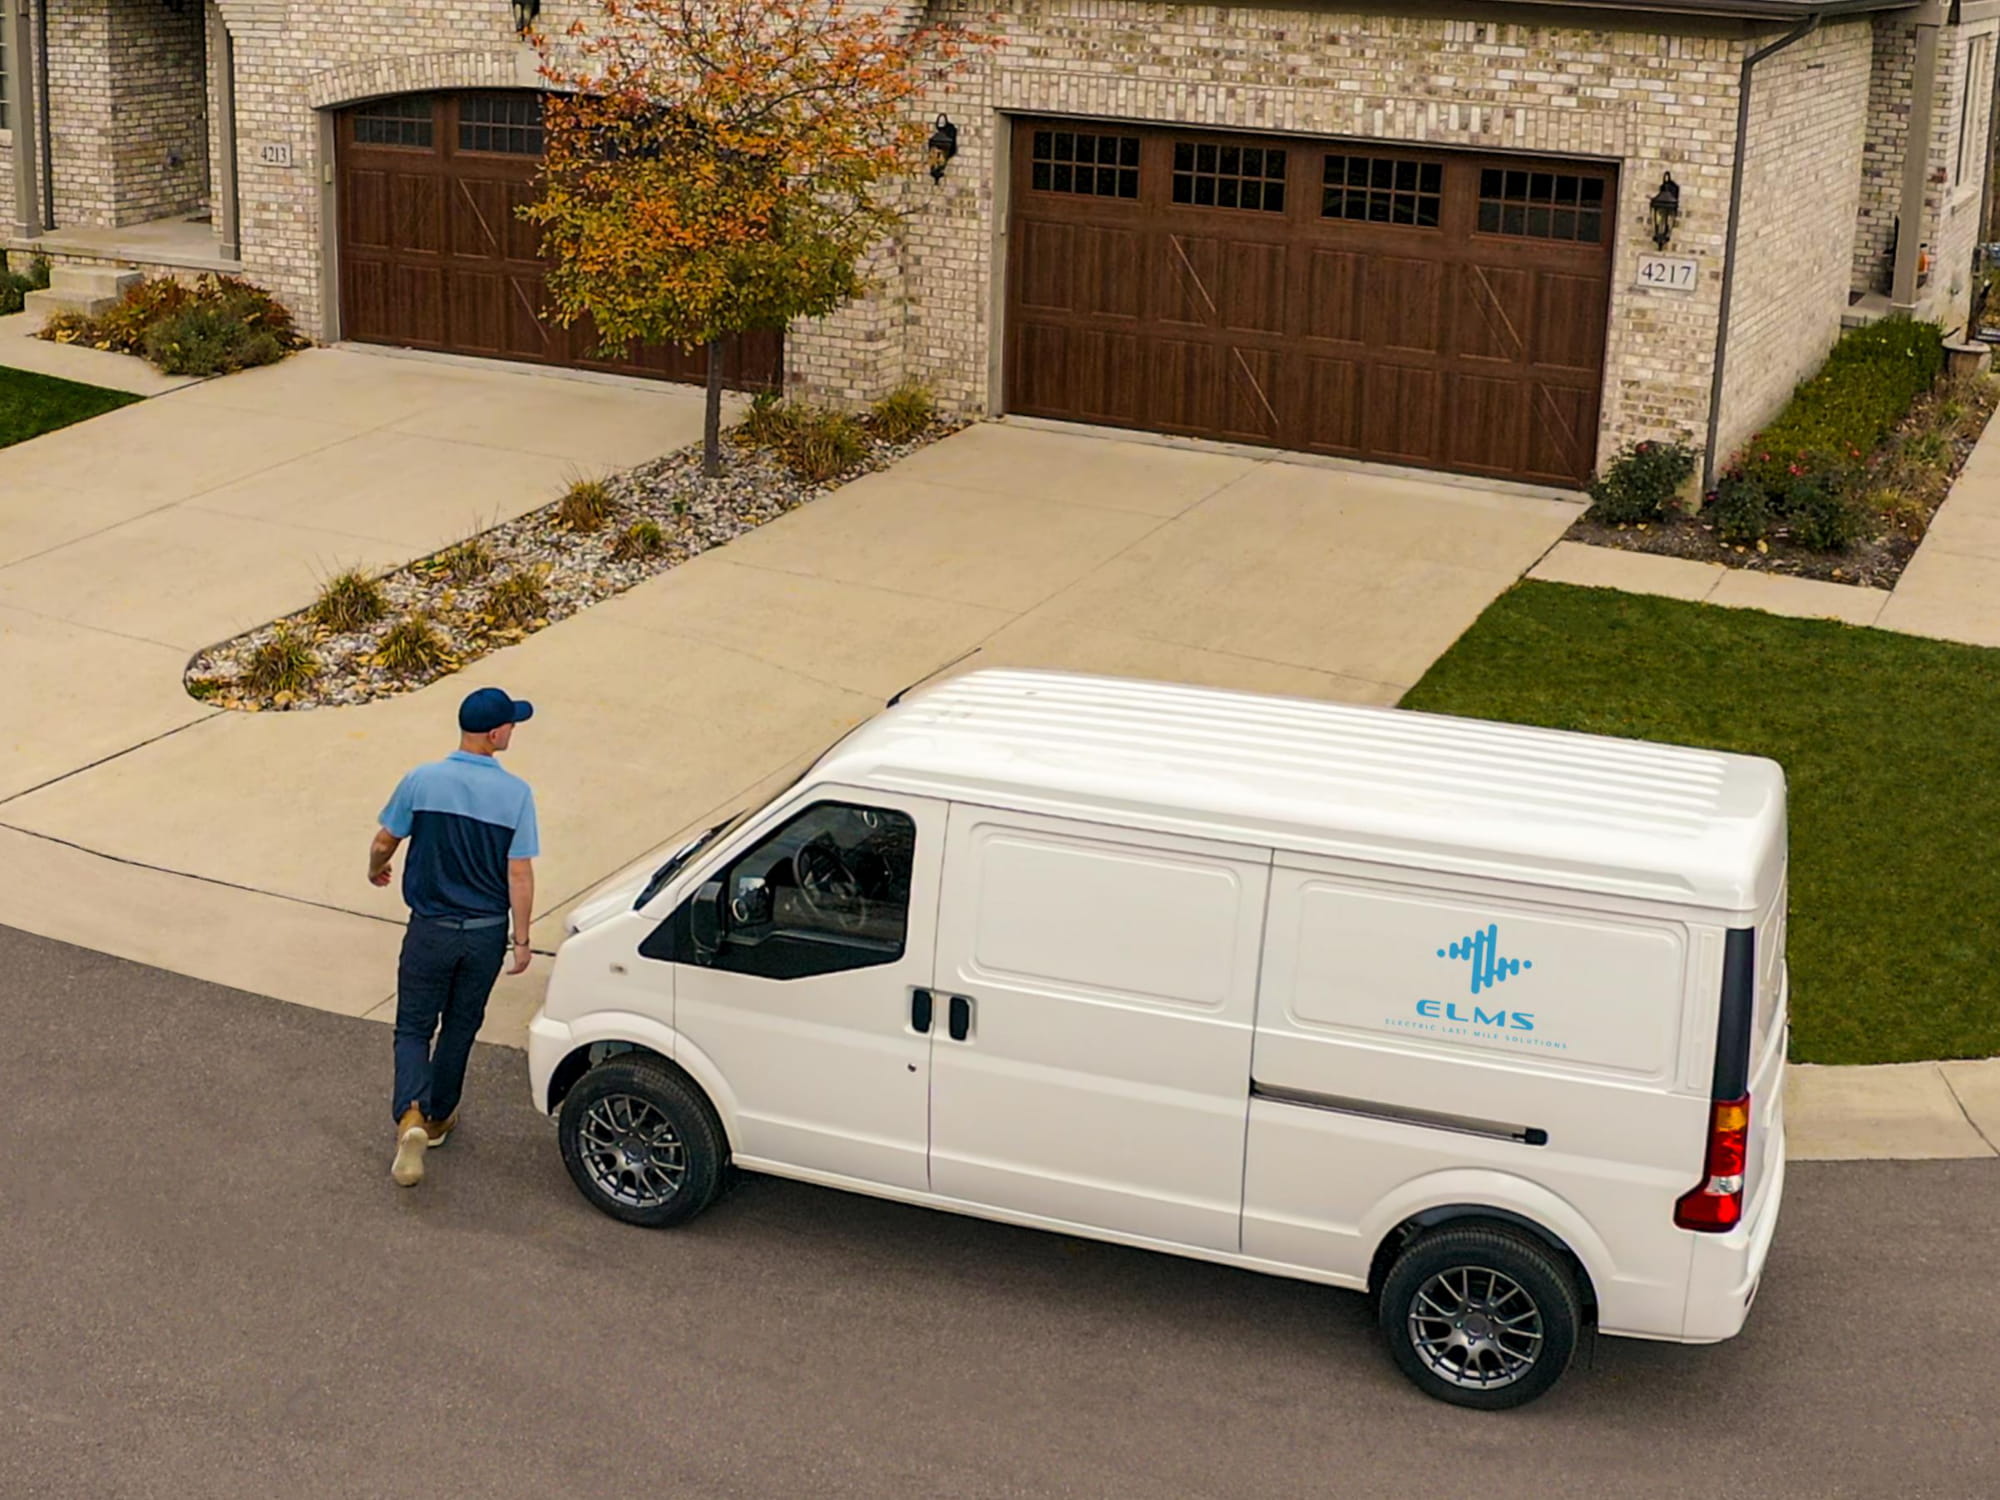
Last Mile Use Cases ELMS Expects To Fulfill The Requirements For A Broad Universe Of Commercial Customers Communications Small Business Utilities Transportation / e - Commerce Industrial Municipalities 18
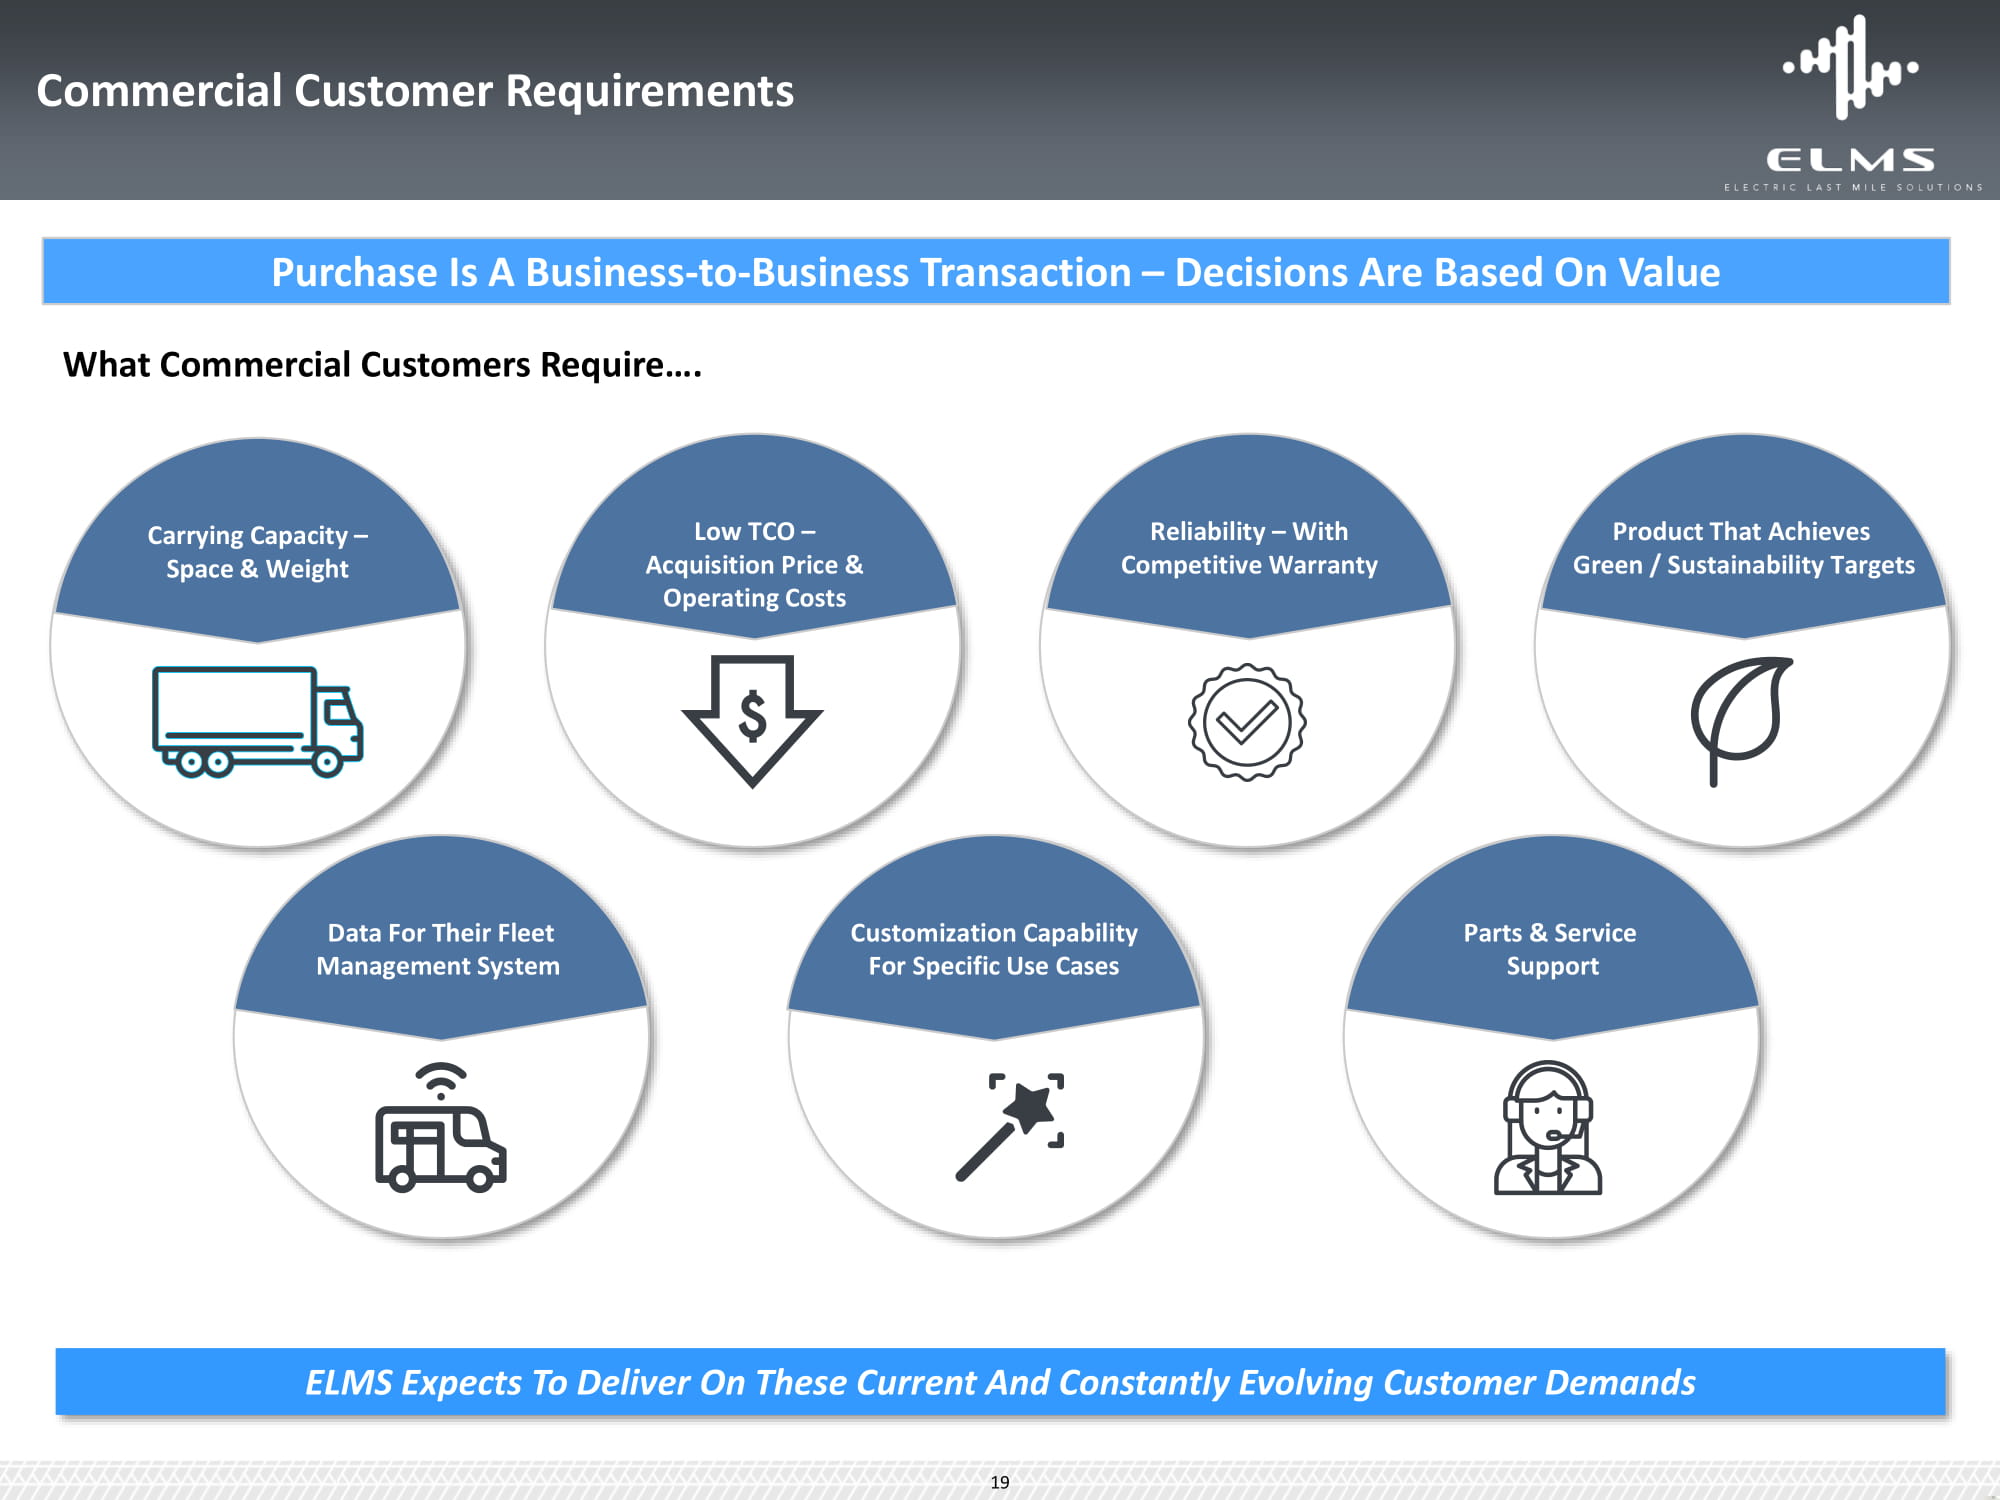
Purchase Is A Business - to - Business Transaction – Decisions Are Based On Value L L o o w w T T C C O O – – A Ac c q q u u i i s s i i t t i i o o n n P P r r ic ic e e & & O O p p e er r a a t t i i n n g g C C o o s s t t s s What Commercial Customers Require…. Commercial Customer Requirements ELMS Expects To Deliver On These Current And Constantly Evolving Customer Demands Carrying Capacity – Space & Weight R R e e l l i i a a b bi i l l i i t t y y – – W W i i t t h h C C o o m m p p e e t ti i t t i i v v e e W W a a r r r r a a n n t t y y P P r r o o d d u u c ct t T T h h a a t t A A c c h h i i e e v v e e s s G G r r e e e e n n / / S S u u s st t a a i i n n a a b b i i l l i i t t y y T T a a r r g g e e ts ts Co D n a n t e a c F t o iv r it T y h t e o ir Su F p le p e o t rt T M he a ir n F a l g e e e m t M en a t n S a y g s e t m em ent System C C u u s s t t o o m m i i z z a at t i i o o n n C C a a p p a a b b i i li l t it y y Fo S r p S e p c e if c i i c fi U c s U e s C e a C se a s ses With a Simple Acquisition Process Part P s a & rt S s e & rv S ic e e rv S i u c p e port Support 19

35% TCO and 60% Maintenance Reduction VS. Class 1 Gas Vehicle TCO – Most Important Fleet Metric Gas Vehicles Electric Vehicles Class 1 Leader Class 2 Leader ELMS Urban Delivery Purchase Price $25,000 $34,510 $25,000* Fuel Gallons Used 1,000 1,471 - Miles per gallon 25 17 - Kilowatts of Energy Used - - 8,065 Miles per Kilowatt - - 3.10 Annual Energy Costs $2,500 $3,676 $1,050 Mainten ance $1,500 $1,500 $500 TCO per Mile $ 0.26 $ 0.35 $0.17 Cargo Volume (cu .ft.) 127 247 170 Cu.ft.: $ per 100 miles $ 0.21 $ 0.14 $0.10 *Price net of $7,500 Federal Tax Credit 25,000 miles per year $2.50 / gal. $0.13 / kWatt Differential Maintenance Costs of Brake Service, Engine and Transmission Oil Changes Our Urban Delivery EV Matches Class 1 Leader (Gas) Purchase Price After Federal Credit — 35% Less TCO than Class 1 leader, 50% of Class 2 Leader TCO Cost Advantage Increases When Factoring Cargo Volume Operating Cost Per cu.ft. Op. Costs per year: $1,550 Op. Costs per Year: $4,000 Urban Delivery EV Class 1 Gas Vehicles TCO $0.26 per mile TCO $0.17 per mile (1) vs. Class 1 and 2 gas vehicles in market. Management statements and assumptions on this page based on data and vehicle specifications from public sources and/or management estimates. Figures subject to change based on final design. ELMS Urban Delivery Poised to Have The Lowest Total Cost Of Ownership ( “ T C O ” ) (1) 20
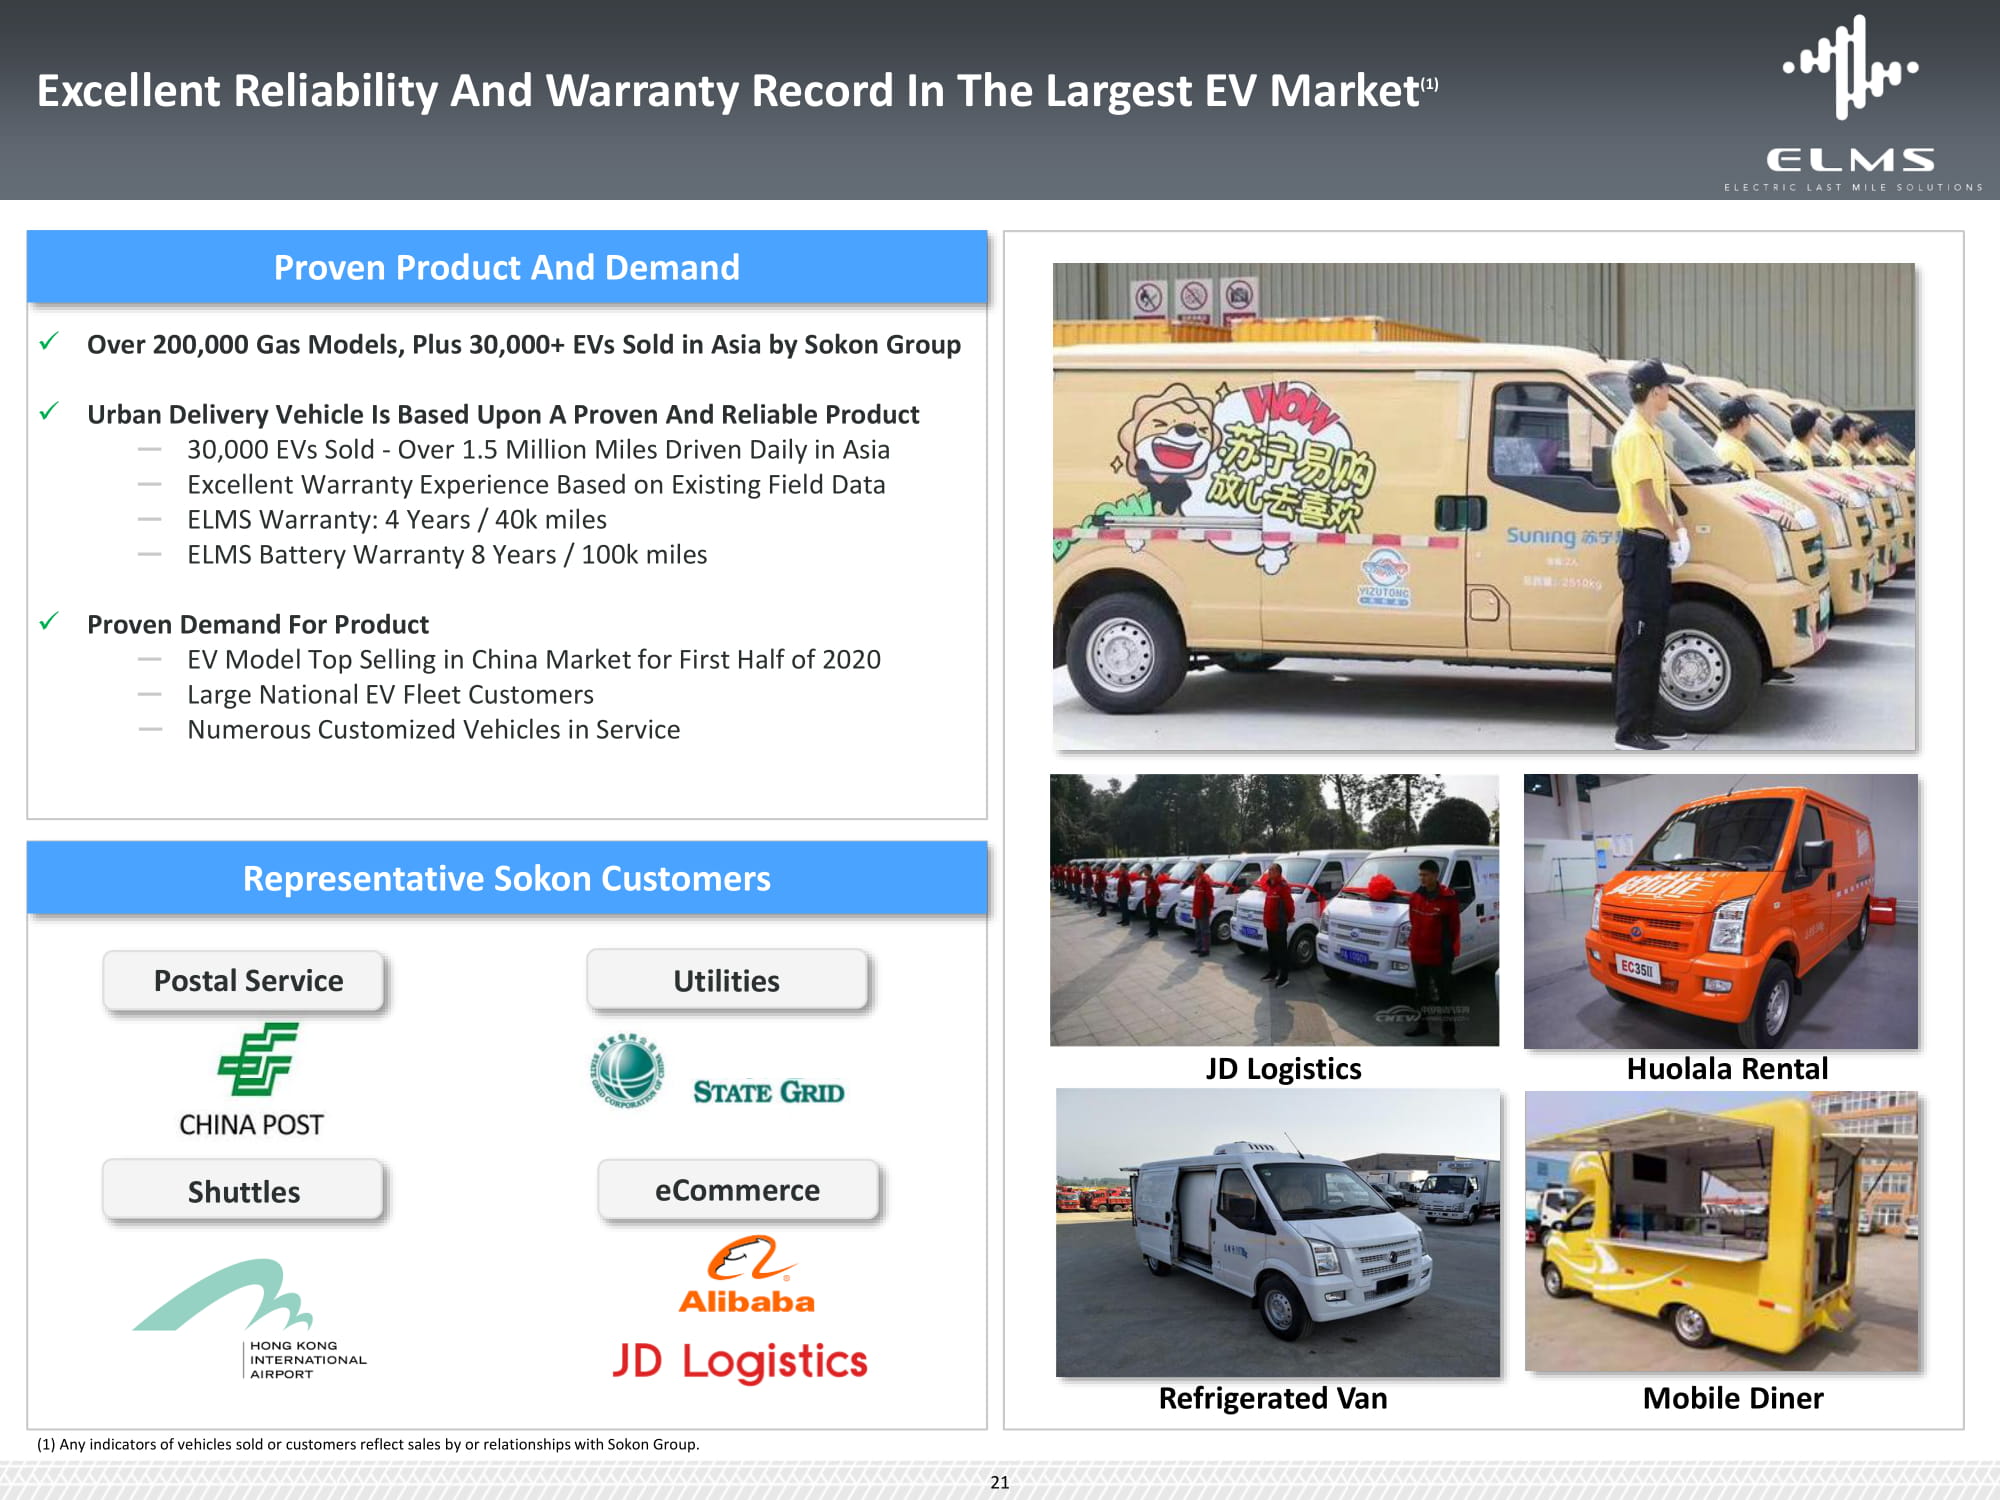
Proven Product And Demand x Over 200,000 Gas Models, Plus 30,000+ EVs Sold in Asia by Sokon Group x Urban Delivery Vehicle Is Based Upon A Proven And Reliable Product — 30,000 EVs Sold - Over 1.5 Million Miles Driven Daily in Asia — Excellent Warranty Experience Based on Existing Field Data — ELMS Warranty: 4 Years / 40k miles — ELMS Battery Warranty 8 Years / 100k miles x Proven Demand For Product — EV Model Top Selling in China Market for First Half of 2020 — Large National EV Fleet Customers — Numerous Customized Vehicles in Service Refrigerated Van Mobile Diner (1) Any indicators of vehicles sold or customers reflect sales by or relationships with Sokon Group. JD Logistics Huolala Rental Representative Sokon Customers P o s t al Se r vic e Util i t ies 21 Shuttles eCommerce E x cel le n t R elia b i l ity And W ar r a n ty R e c o r d In Th e La r g e s t EV Mar k e t (1)
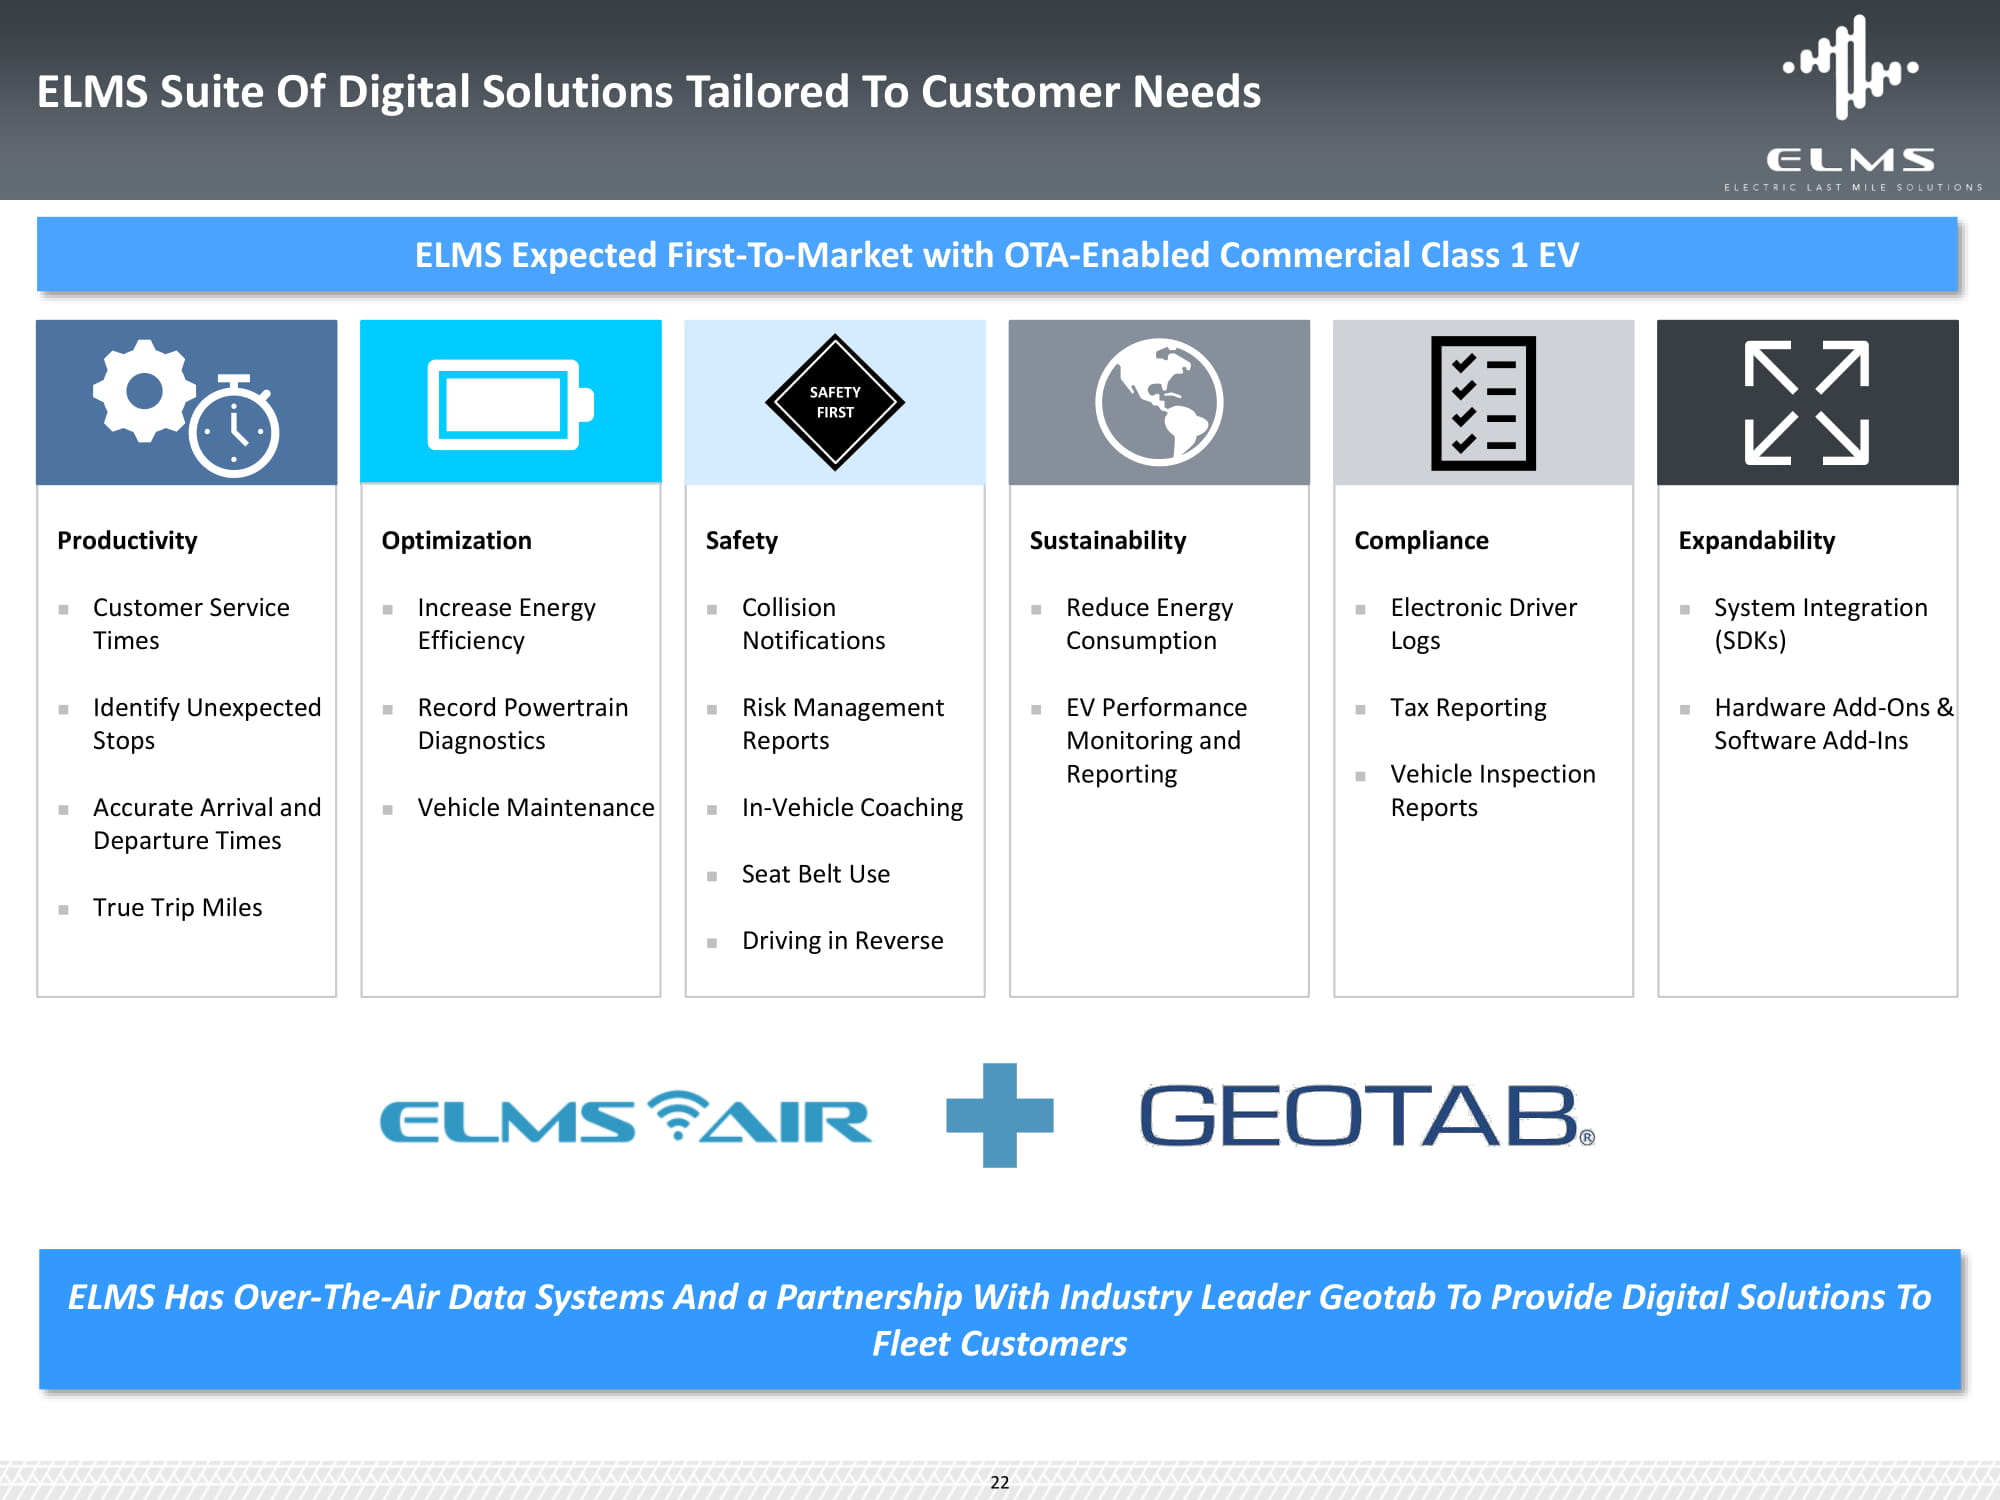
Safety Collision Notif i cati o ns Risk Management Reports In - Vehicle Coaching Seat Belt Use Driving in Reverse ELMS Suite Of Digital Solutions Tailored To Customer Needs Productivity Customer Service Times Identify Unexpected Stops Accurate Arrival and Departure Times True Trip Miles Optimization Increase Energy Efficiency Record Powertrain Diagnostics Vehicle Maintenance Sustainability Reduce Energy Consumption EV Performance Monitoring and Reporting Expandability System Integration (SDKs) Hardware Add - Ons & Software Add - Ins Compliance Electronic Driver Logs Tax Reporting Vehicle Inspection Reports SAFETY FIRST ELMS Has Over - The - Air Data Systems And a Partnership With Industry Leader Geotab To Provide Digital Solutions To Fleet Customers ELMS Expected First - To - Market with OTA - Enabled Commercial Class 1 EV 22

Many Locations Each Have Product Specialties Aligned with FMCs/ OEMs/ Dealers OEM Prioritizes Orders and Builds Vehicle OEM UPFITTER(S) Vehicles Typically Built In At Least 2 Stages And Require Use Of Franchised Dealers For Ordering And Delivery CU S T OMER FMC Time – Dealer Order to Delivery ( 2 ) Ram Promaster City : 137 Days Transit Connect : 130 Days Chevrolet Express : 128 Days Processes Customer Order to OEM DEALER DEALER x Dealer Completes Transaction / Delivery CUSTOMER (1) Source: Public sources and/or management estimates. (2) Source: AutomotiveFleet – 2019 Data. Existing Process – Customer Order To Delivery Is Inefficient And Costly(1) 23
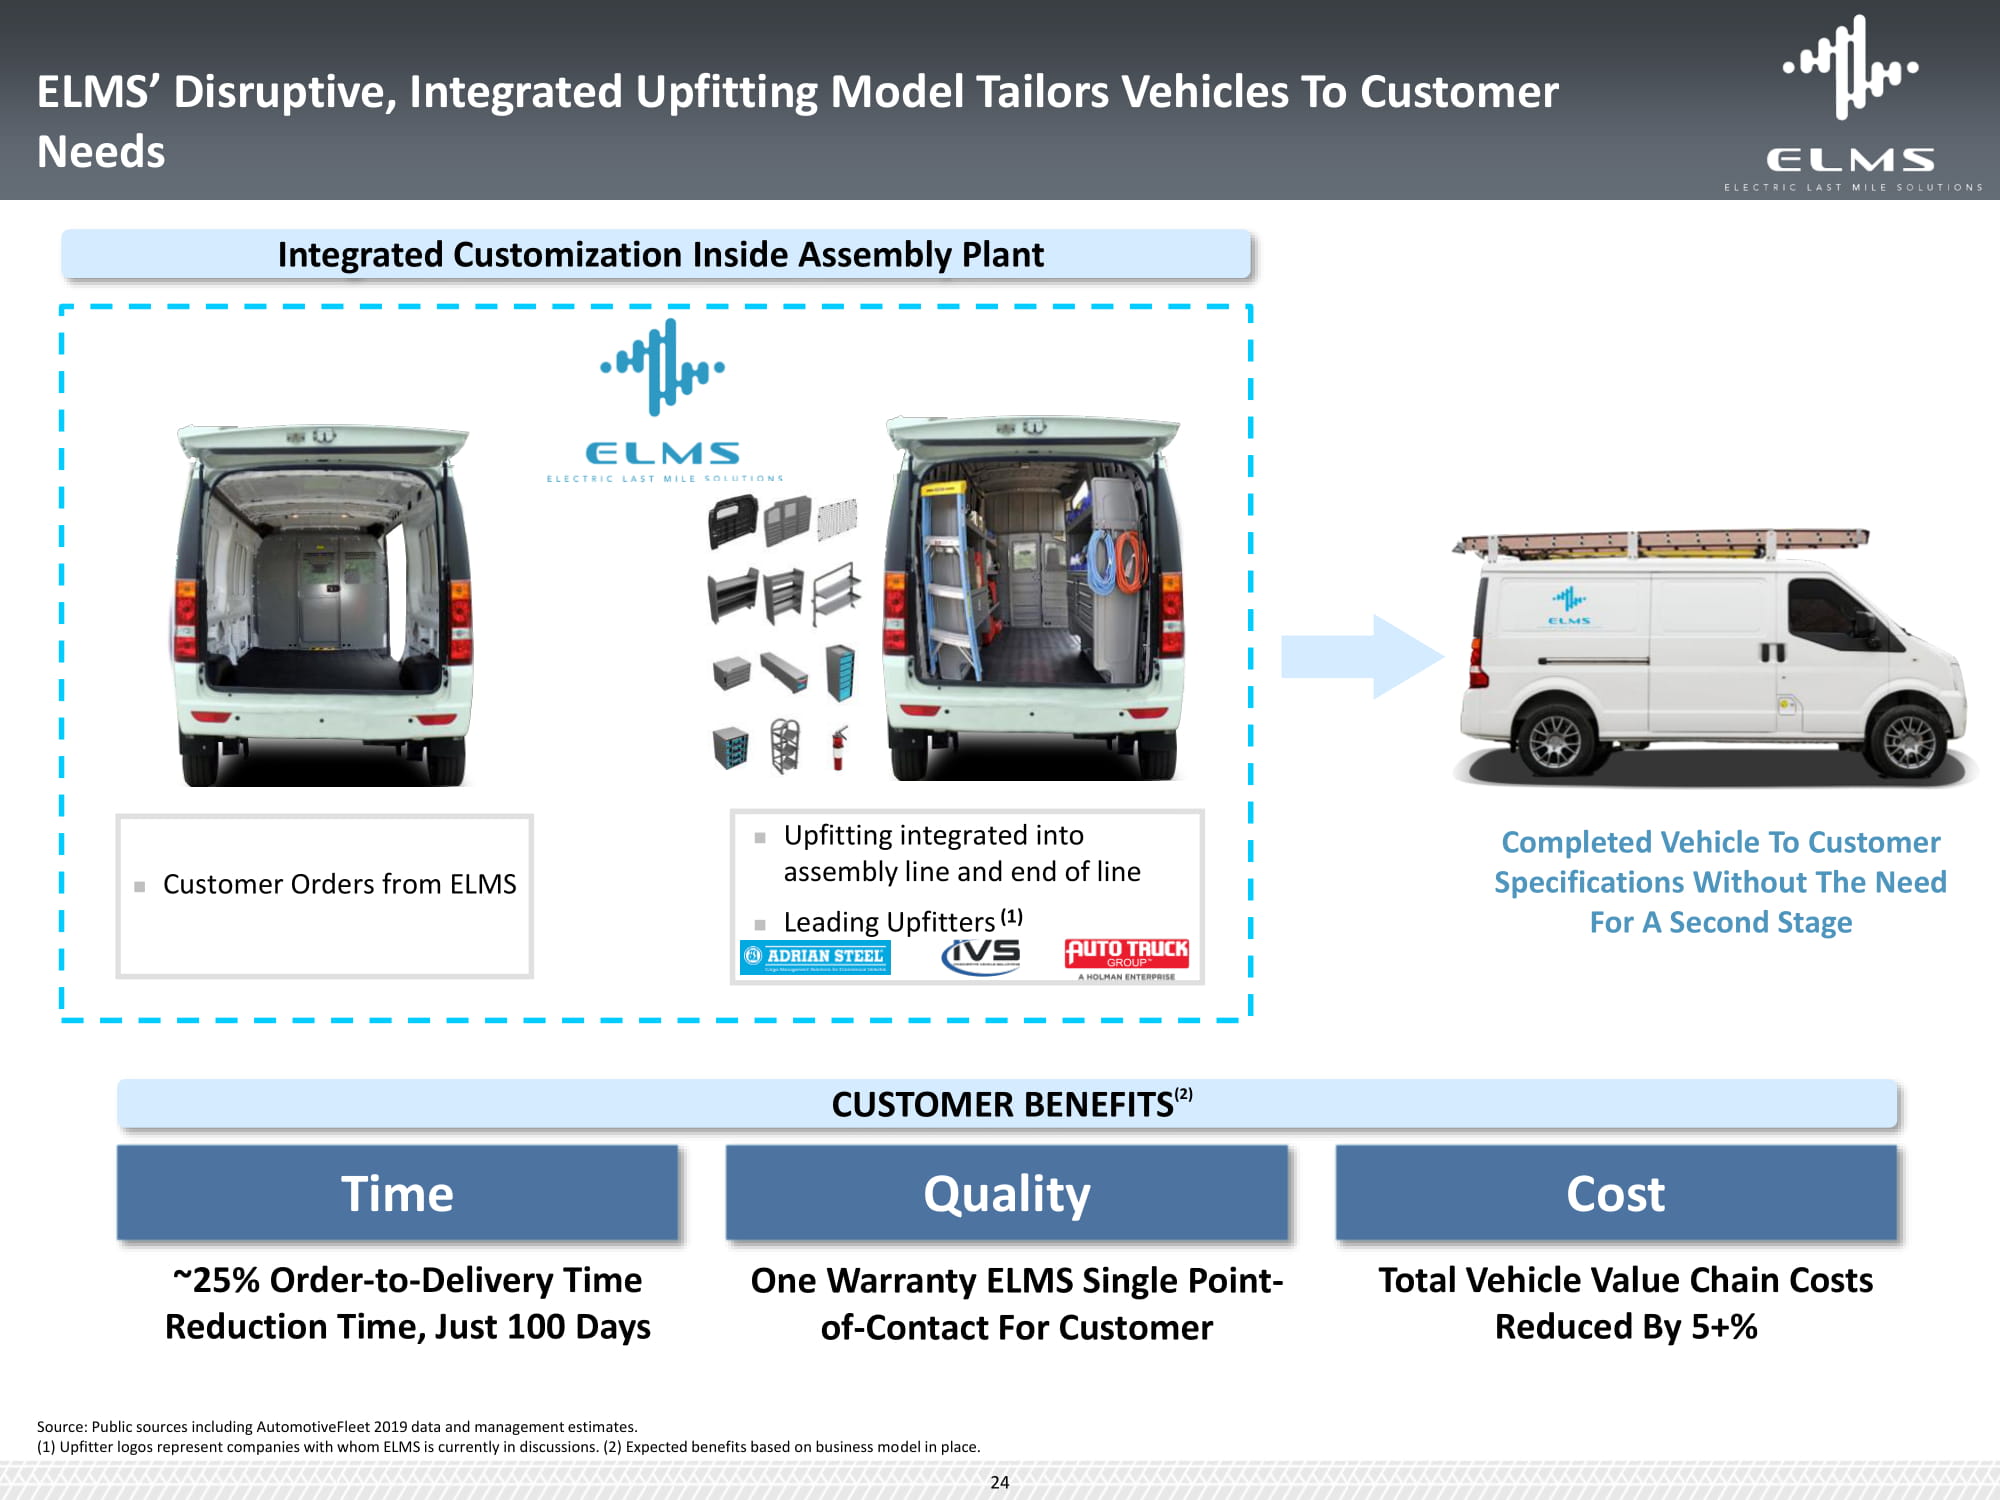
Upfitting integrated into assembly line and end of line Leading Upfitters (1) Customer Orders from ELMS Source: Public sources including AutomotiveFleet 2019 data and management estimates. Integrated Customization Inside Assembly Plant Completed Vehicle To Customer Specifications Without The Need For A Second Stage Time ~25% Order - to - Delivery Time Reduction Time, Just 100 Days Quality One Warranty ELMS Single Point - of - Contact For Customer Cost Total Vehicle Value Chain Costs Reduced By 5+% CU S T O MER BENEFI T S (2) ELMS’ Disruptive, Integrated Upfitting Model Tailors Vehicles To Customer Needs (1) Upfitter logos represent companies with whom ELMS is currently in discussions. (2) Expected benefits based on business model in place. 24
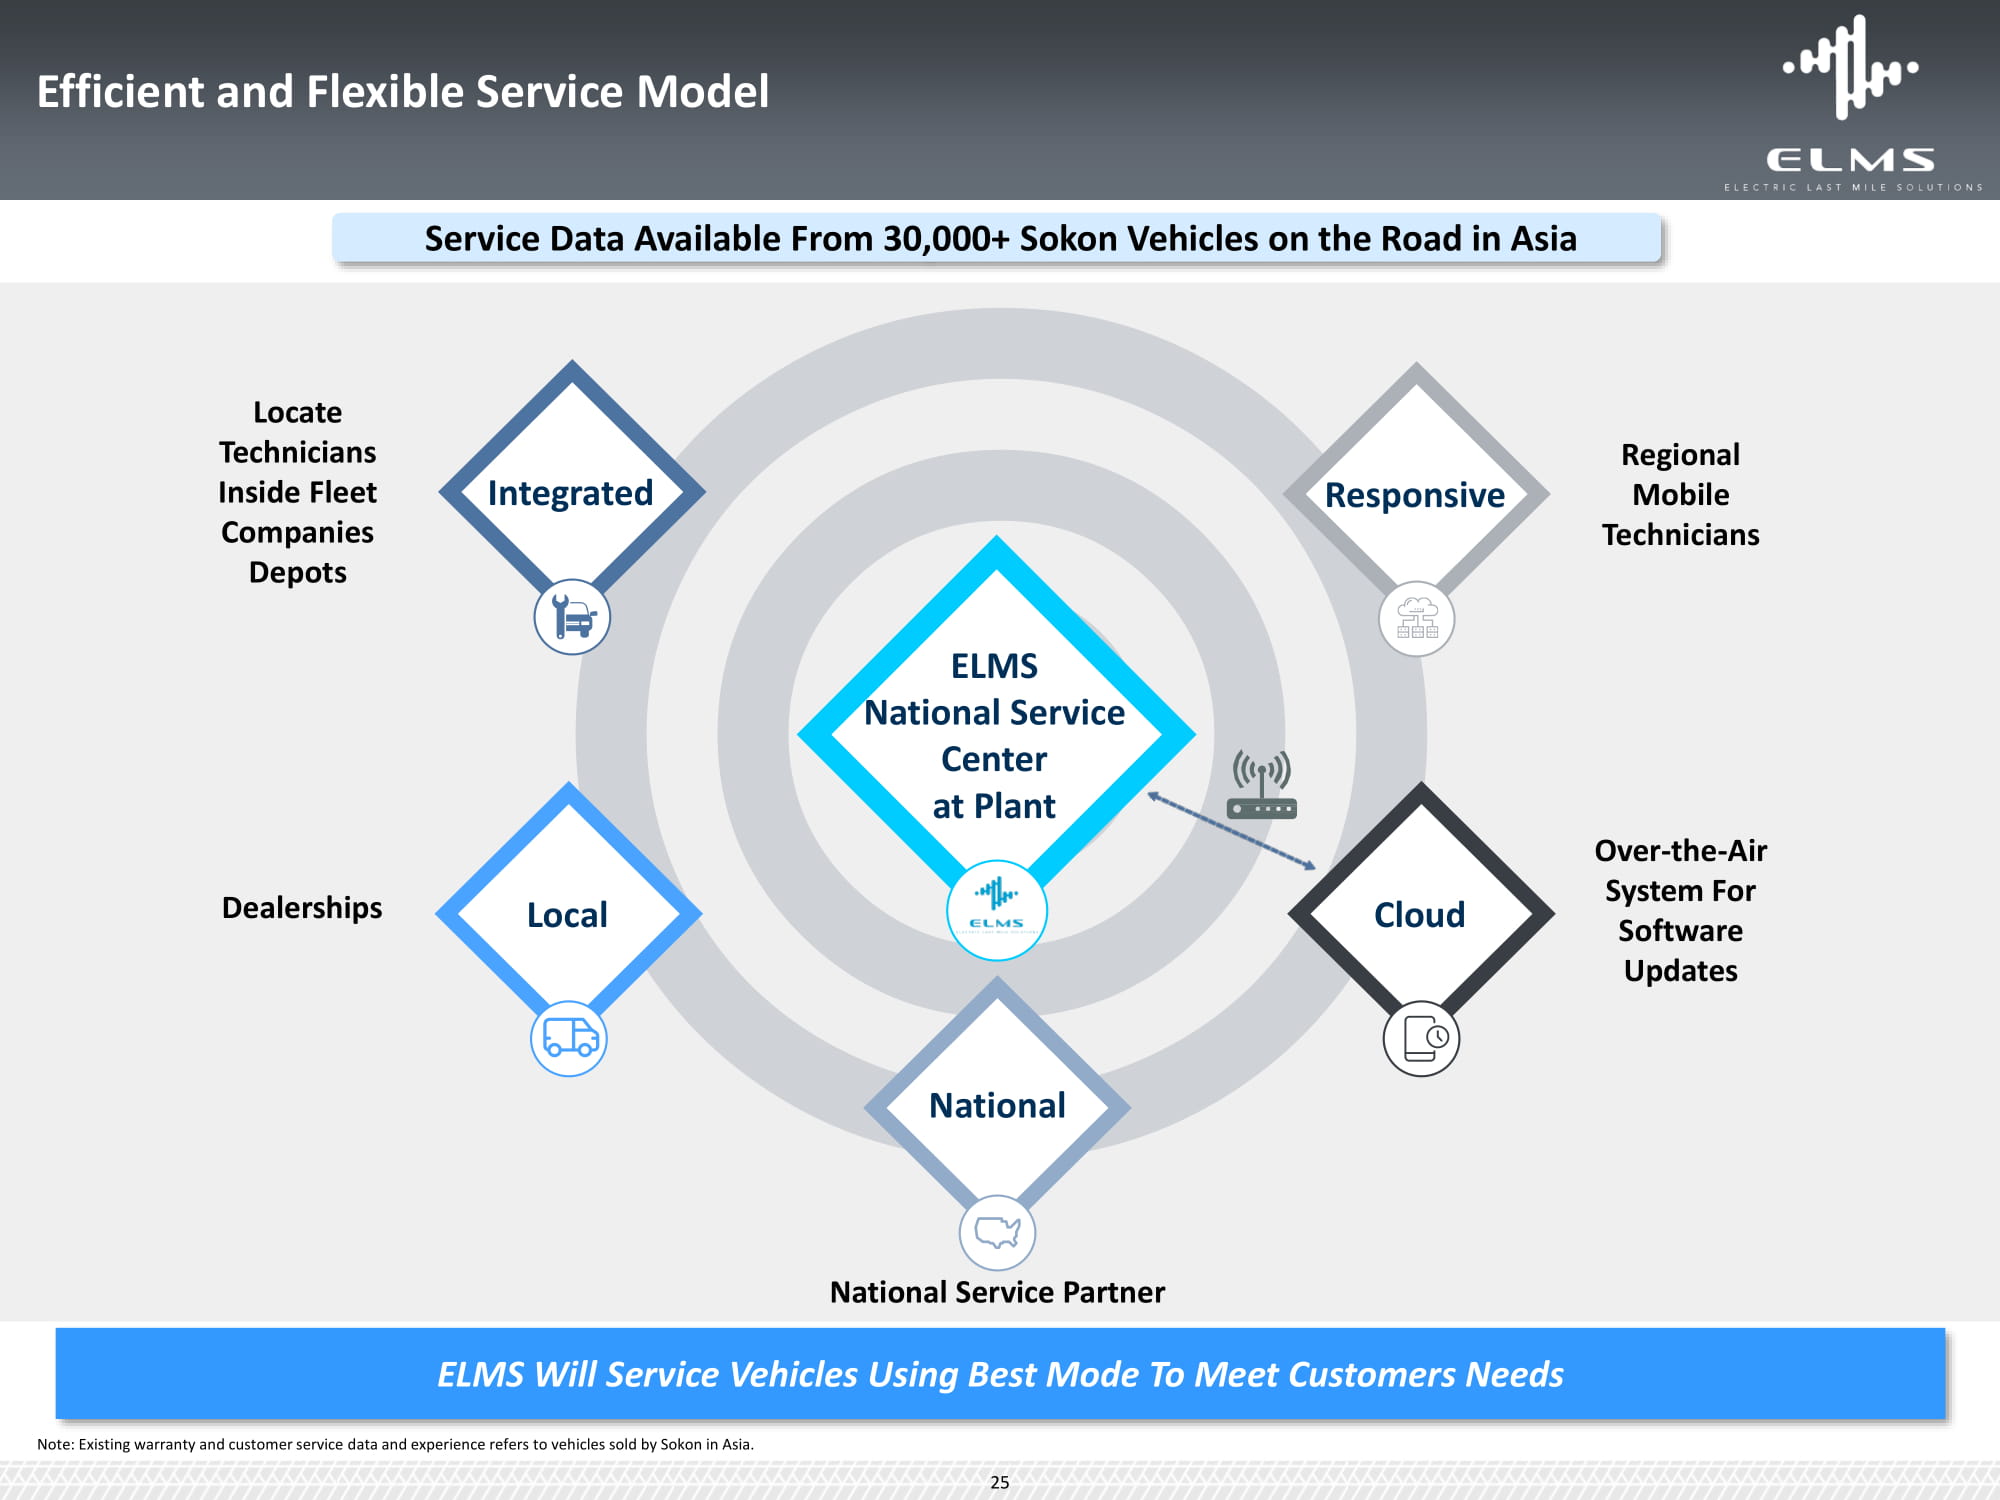
ELMS National Service Center at Plant O v e r - th e - Air System For Software Updates Deale r sh i p s Cloud Regional Mobile T e ch n icians Responsive Local Locate T e ch n icians Inside Fleet Companies Depots Integrated National Service Partner ELMS Will Service Vehicles Using Best Mode To Meet Customers Needs N a tion a l Note: Existing warranty and customer service data and experience refers to vehicles sold by Sokon in Asia. 25 Service Data Available From 30,000+ Sokon Vehicles on the Road in Asia Efficient and Flexible Service Model

Customers
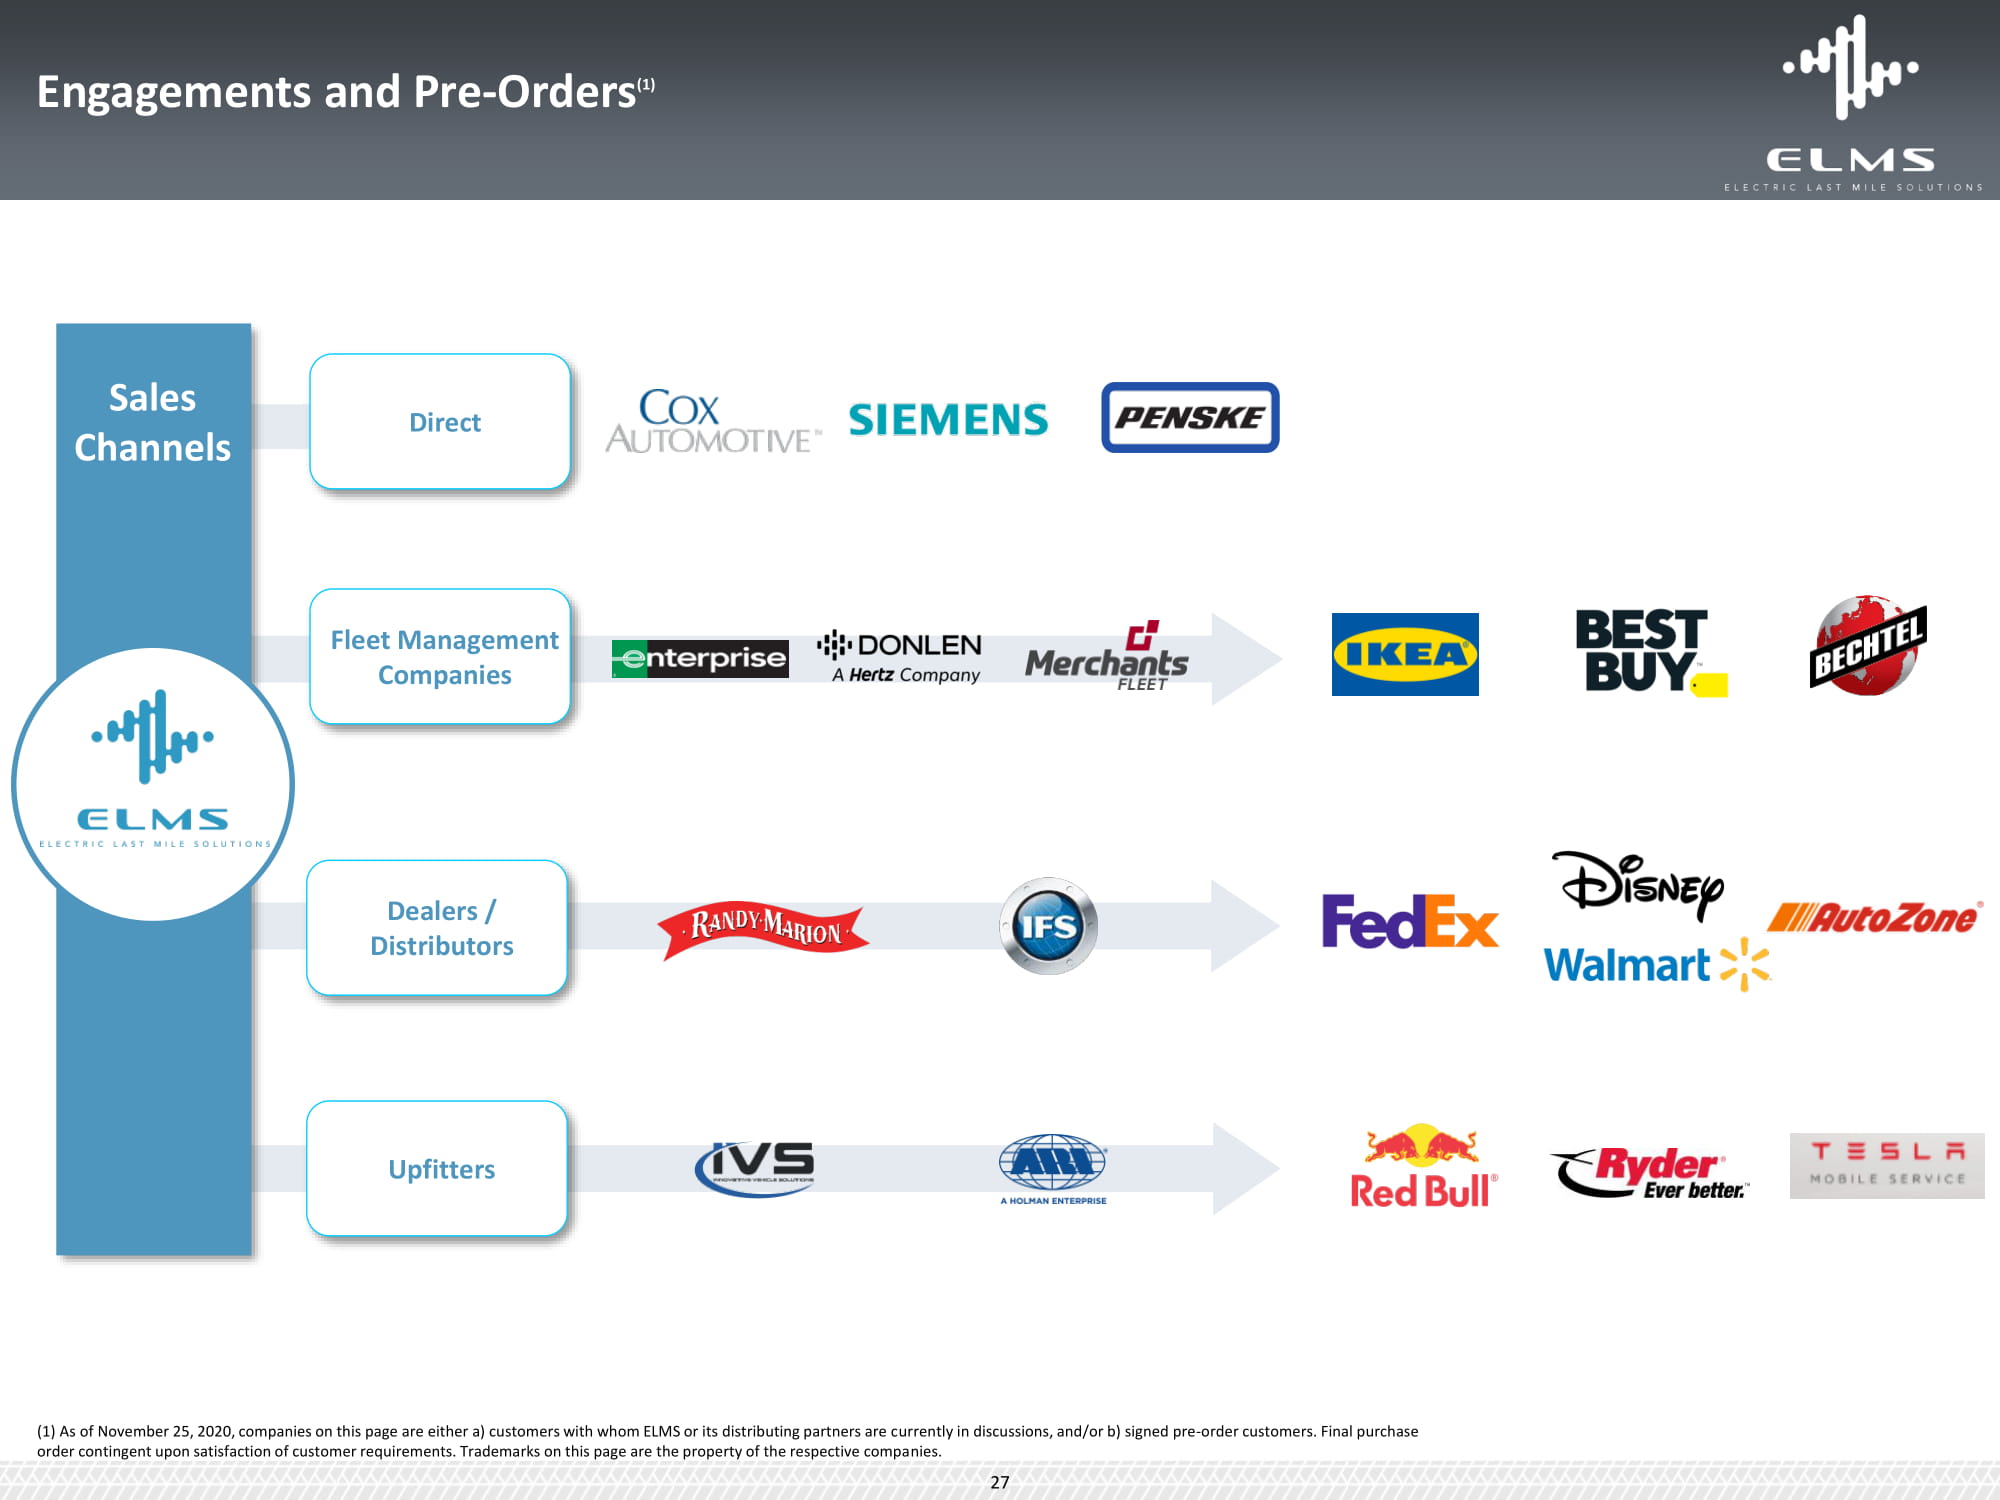
En g a g eme n t s and P r e - O r d e r s ( 1 ) (1) As of November 25, 2020, companies on this page are either a) customers with whom ELMS or its distributing partners are currently in discussions, and/or b) signed pre - order customers. Final purchase order contingent upon satisfaction of customer requirements. Trademarks on this page are the property of the respective companies. 27 Fleet Management Companies Direc t Dealers / Distributors Upfitters Sales Ch a n ne l s

Manu f actur i ng
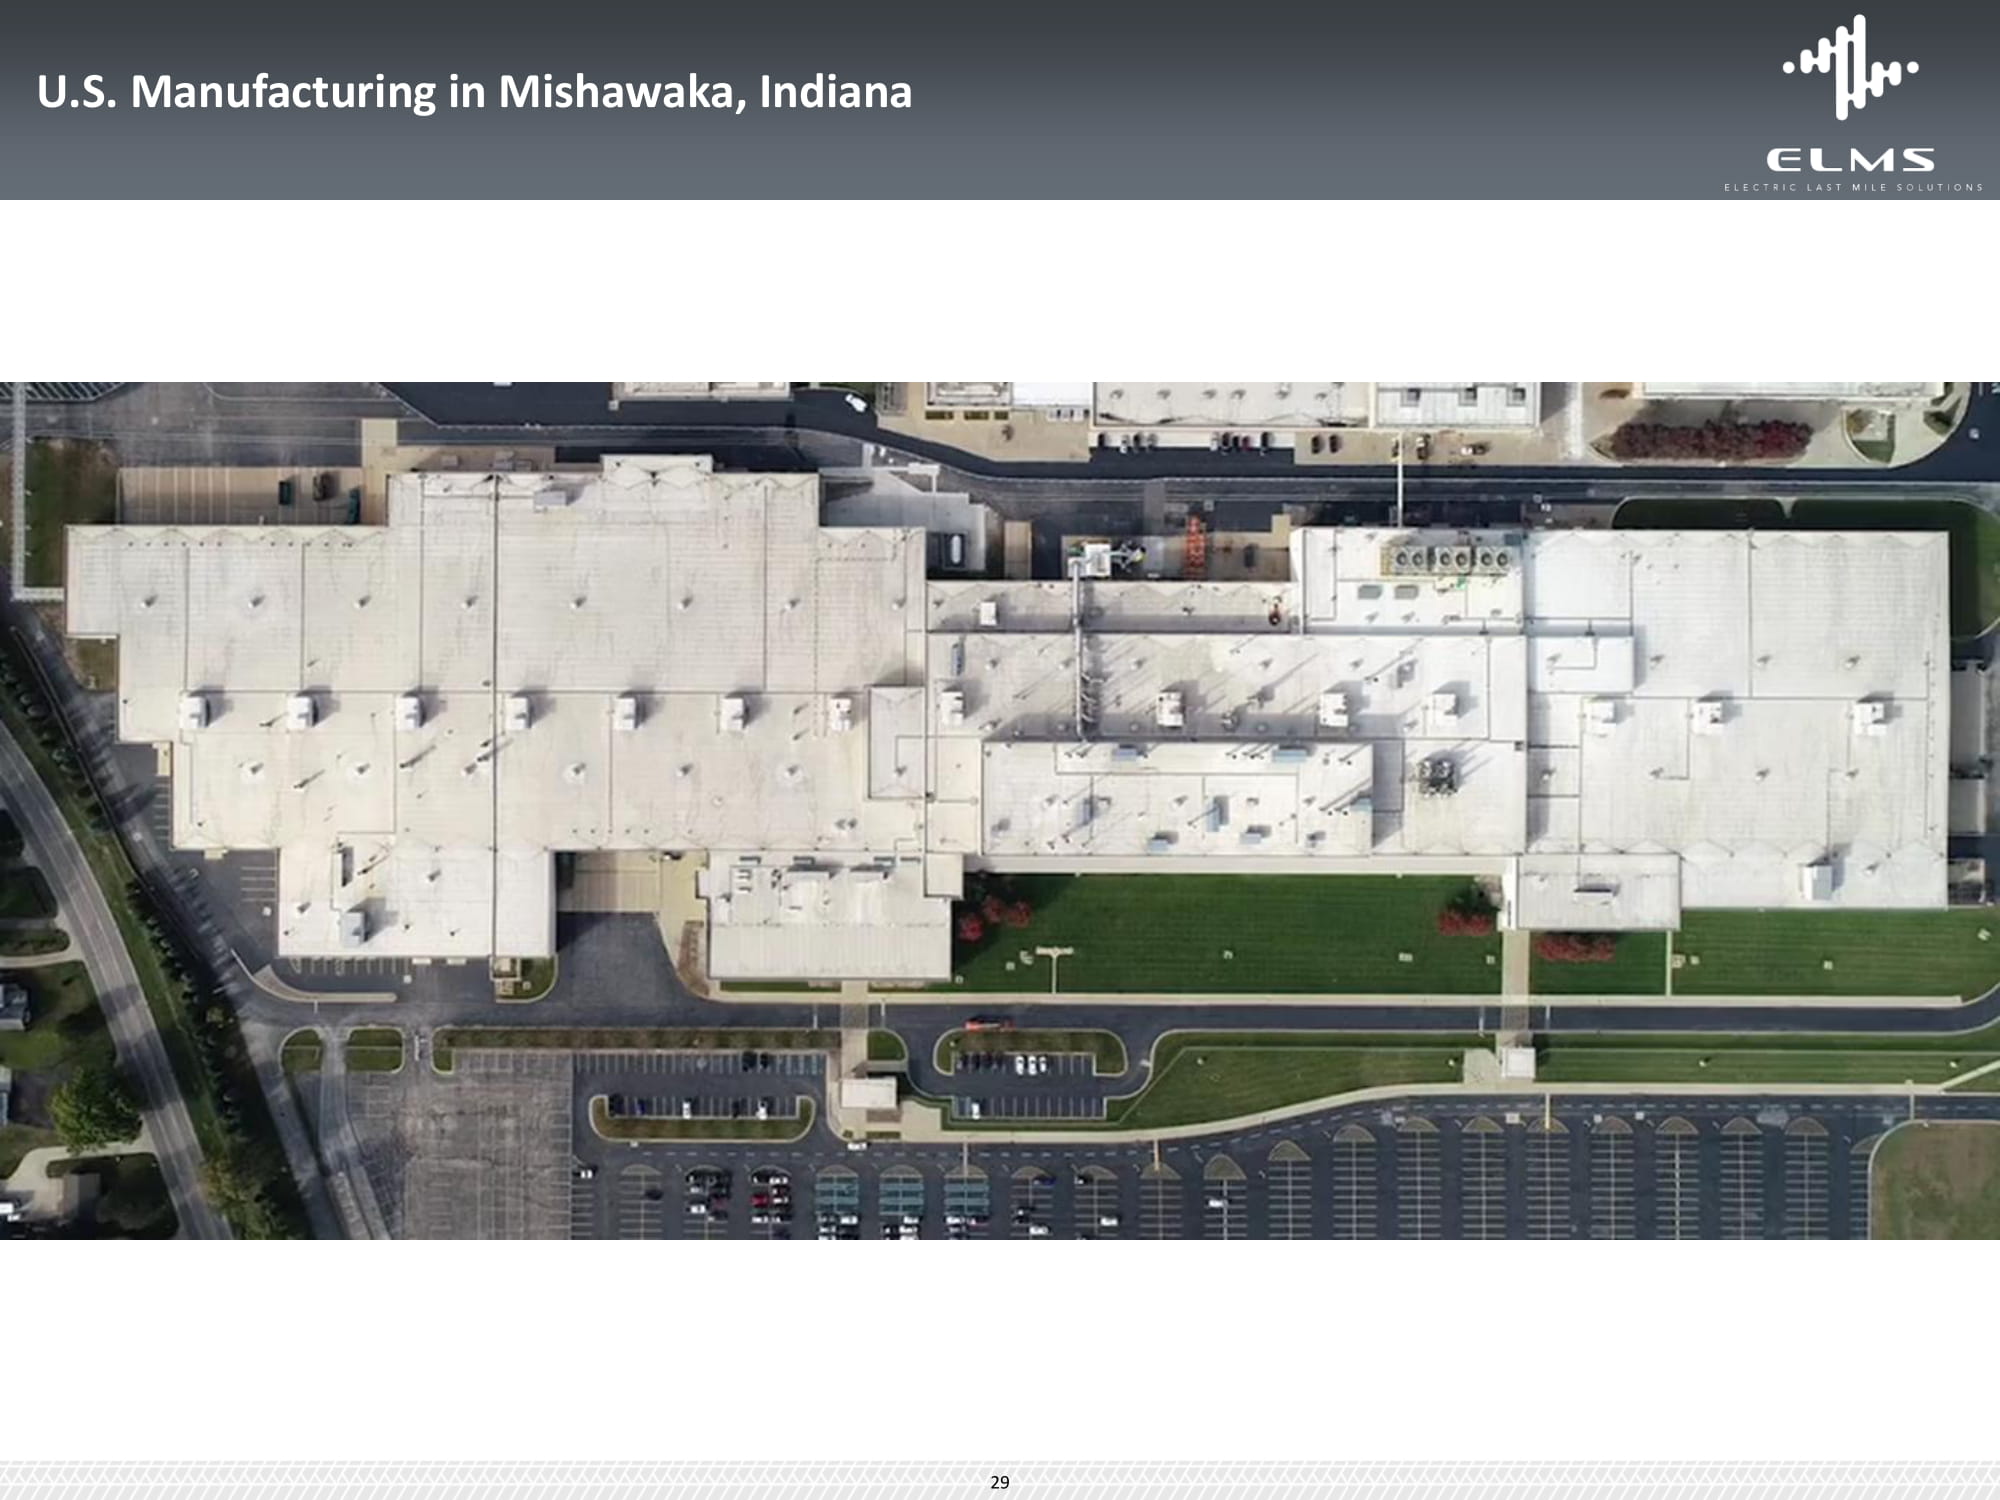
U.S. Manufacturing in Mishawaka, Indiana 29
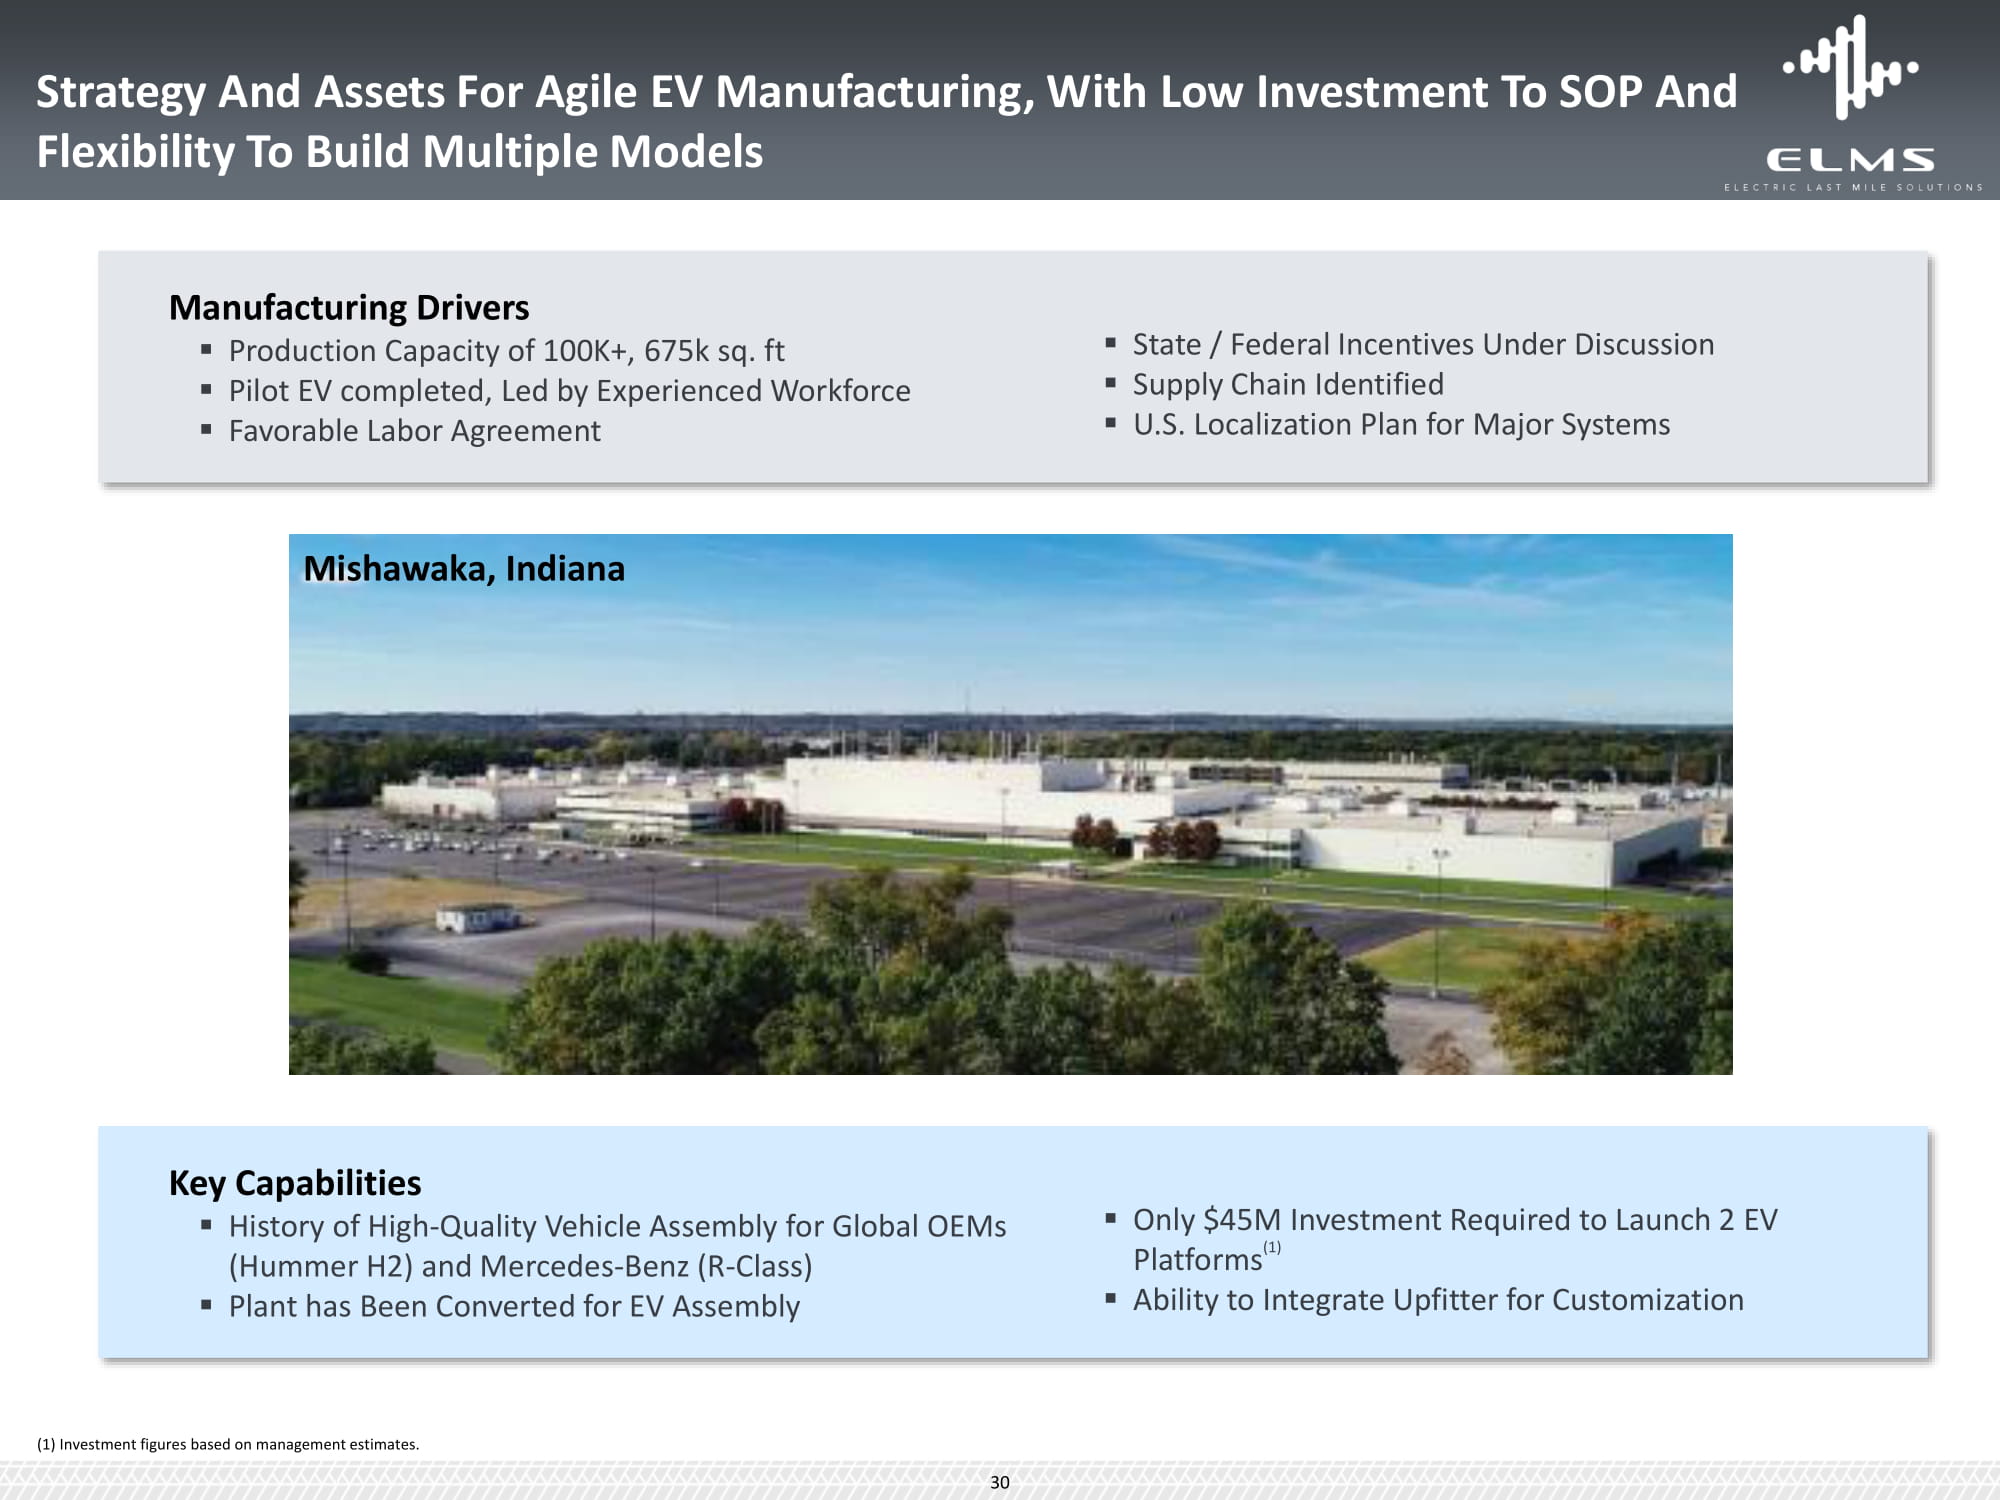
Strategy And Assets For Agile EV Manufacturing, With Low Investment To SOP And Flexibility To Build Multiple Models ▪ State / Federal Incentives Under Discussion ▪ Supply Chain Identified ▪ U.S. Localization Plan for Major Systems Manufacturing Drivers ▪ Production Capacity of 100K+, 675k sq. ft ▪ Pilot EV completed, Led by Experienced Workforce ▪ Favorable Labor Agreement Mishawaka, Indiana Key Capabilities ▪ History of High - Quality Vehicle Assembly for Global OEMs (Hummer H2) and Mercedes - Benz (R - Class) ▪ Plant has Been Converted for EV Assembly 30 (1) ▪ Only $45M Investment Required to Launch 2 EV Platforms ▪ Ability to Integrate Upfitter for Customization (1) Investment figures based on management estimates.

Financials
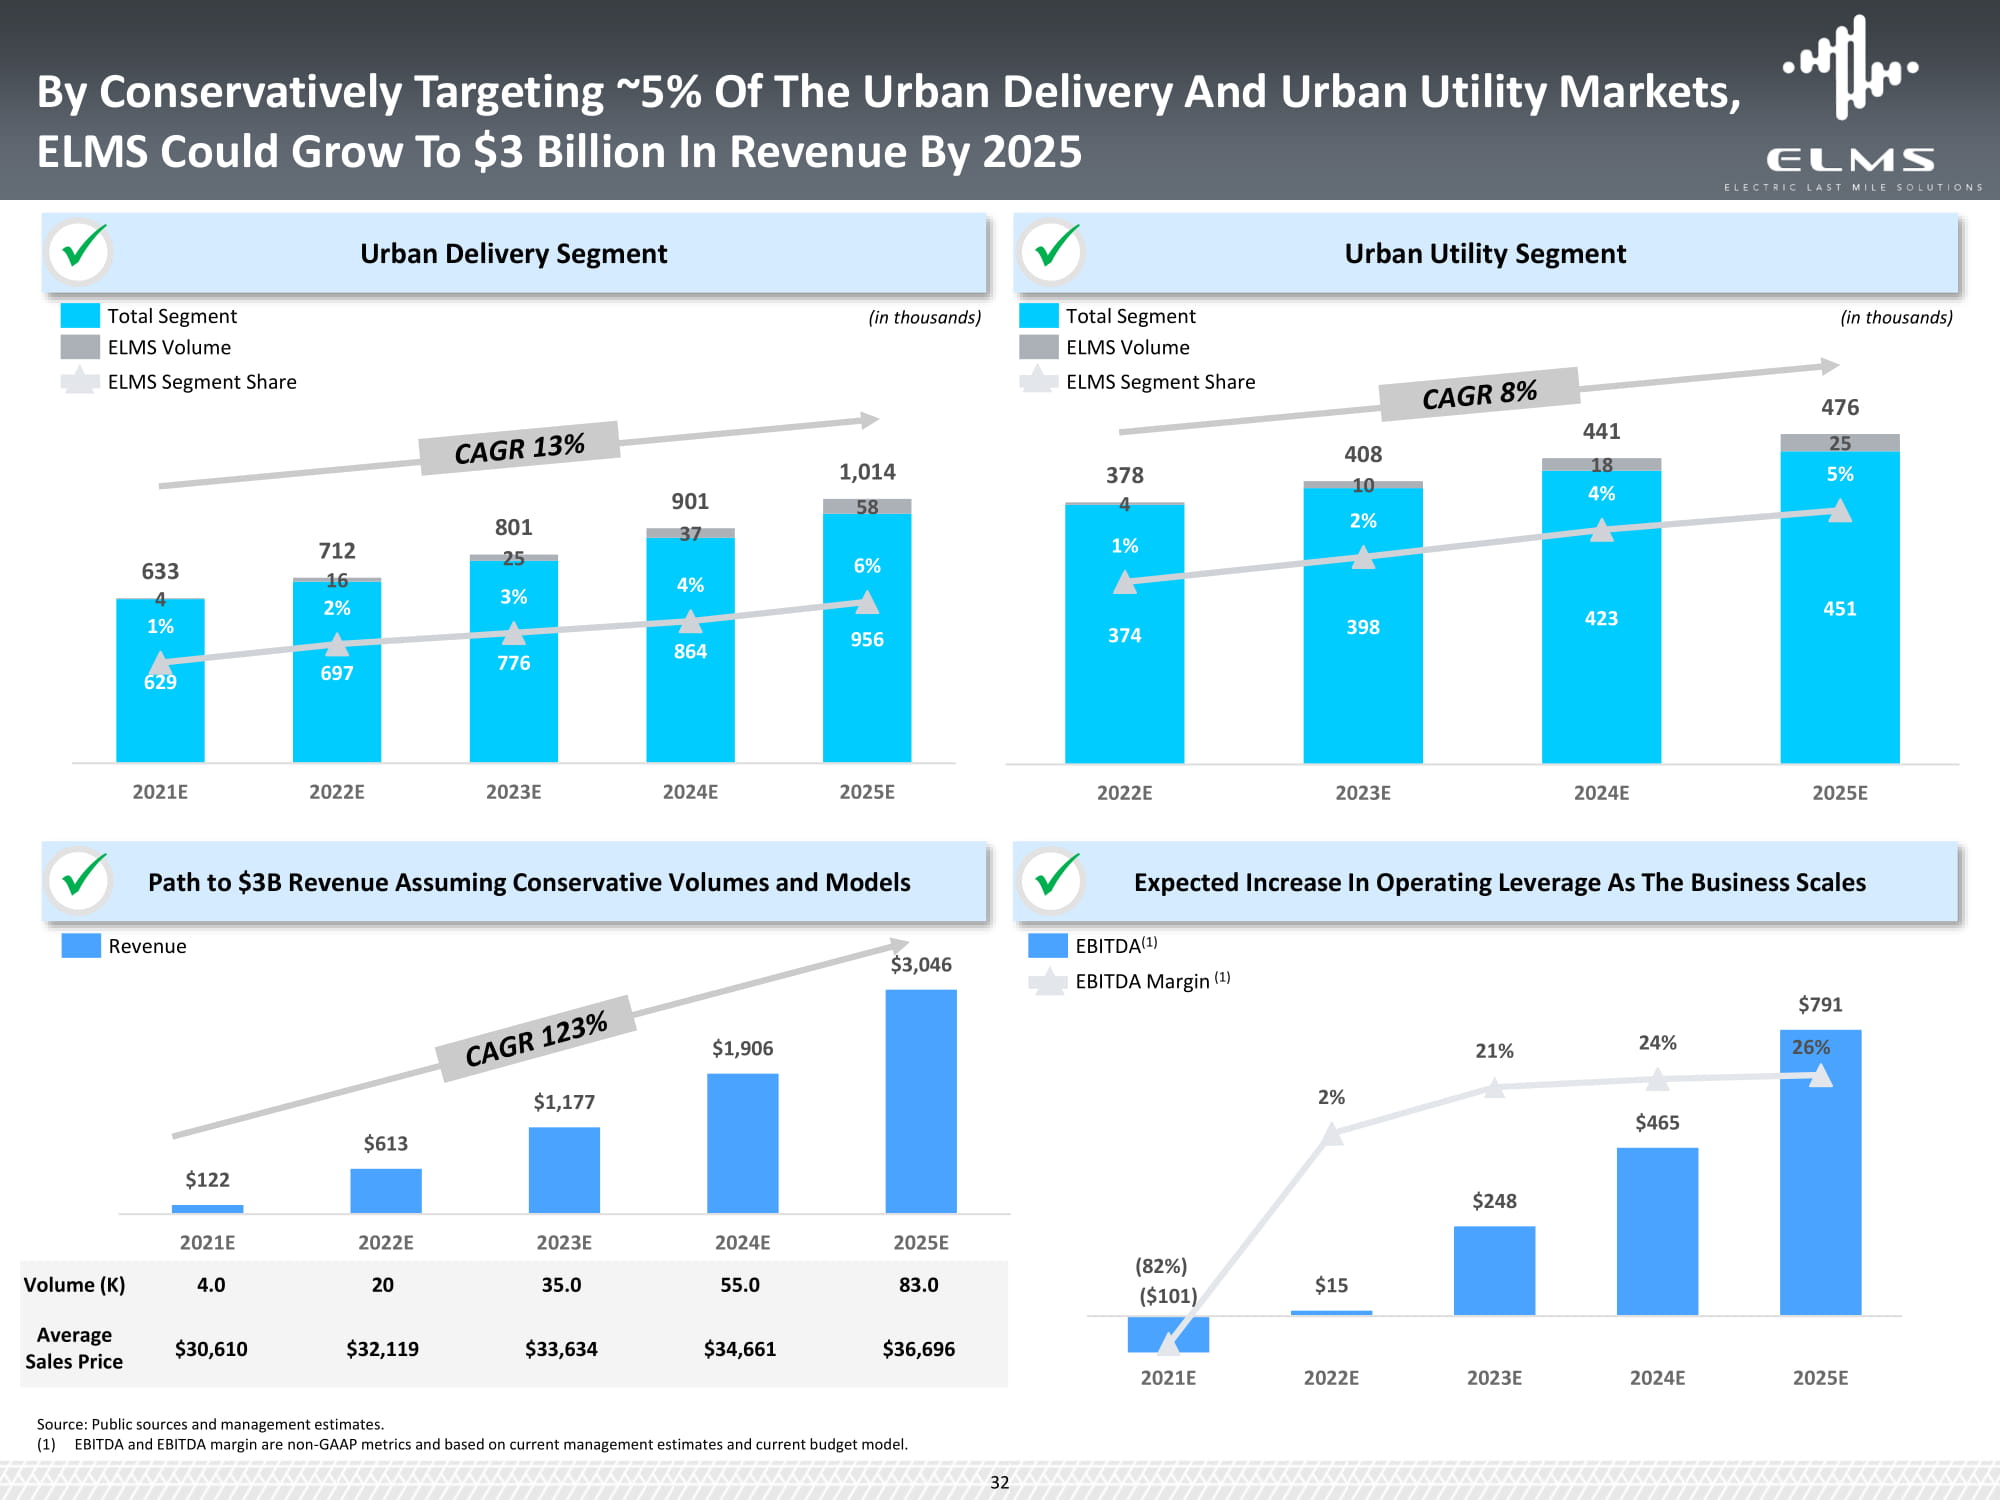
374 398 423 451 25 378 408 441 18 476 4 1% 10 2% 4% 5% 2 0 2 2 E 2 0 2 3 E 2 0 2 4 E 2 0 2 5 E By Conservatively Targeting ~5% Of The Urban Delivery And Urban Utility Markets, ELMS Could Grow To $3 Billion In Revenue By 2025 Urban Delivery Segment Urban Utility Segment Expected Increase In Operating Leverage As The Business Scales Path to $3B Revenue Assuming Conservative Volumes and Models x x x x 633 712 801 901 1,014 4 1% 629 16 2% 697 25 3% 776 37 4% 864 58 6% 956 2 0 2 1 E 2 0 2 2 E 2 0 2 3 E 2 0 2 4 E 2 0 2 5 E $15 $248 $465 (82%) ($101) $791 2% 21% 24% 26% 2 0 2 1 E 2 0 2 2 E 2 0 2 3 E 2 0 2 4 E 2 0 2 5 E $122 $613 $1,177 $1,906 $3,046 2 0 2 1 E 2 0 2 2 E 2 0 2 3 E 2 0 2 4 E 2 0 2 5 E Volume (K) 4.0 20 35.0 55.0 83.0 Average Sales Price $30,610 $32,119 $33,634 $34,661 $36,696 Total Segment ELMS Volume ELMS Segment Share Total Segment ELMS Volume ELMS Segment Share EBITDA (1) EBITDA Margin (1) R e venue (in thousands) (in thousands) Source: Public sources and management estimates. (1) EBITDA and EBITDA margin are non - GAAP metrics and based on current management estimates and current budget model. 32
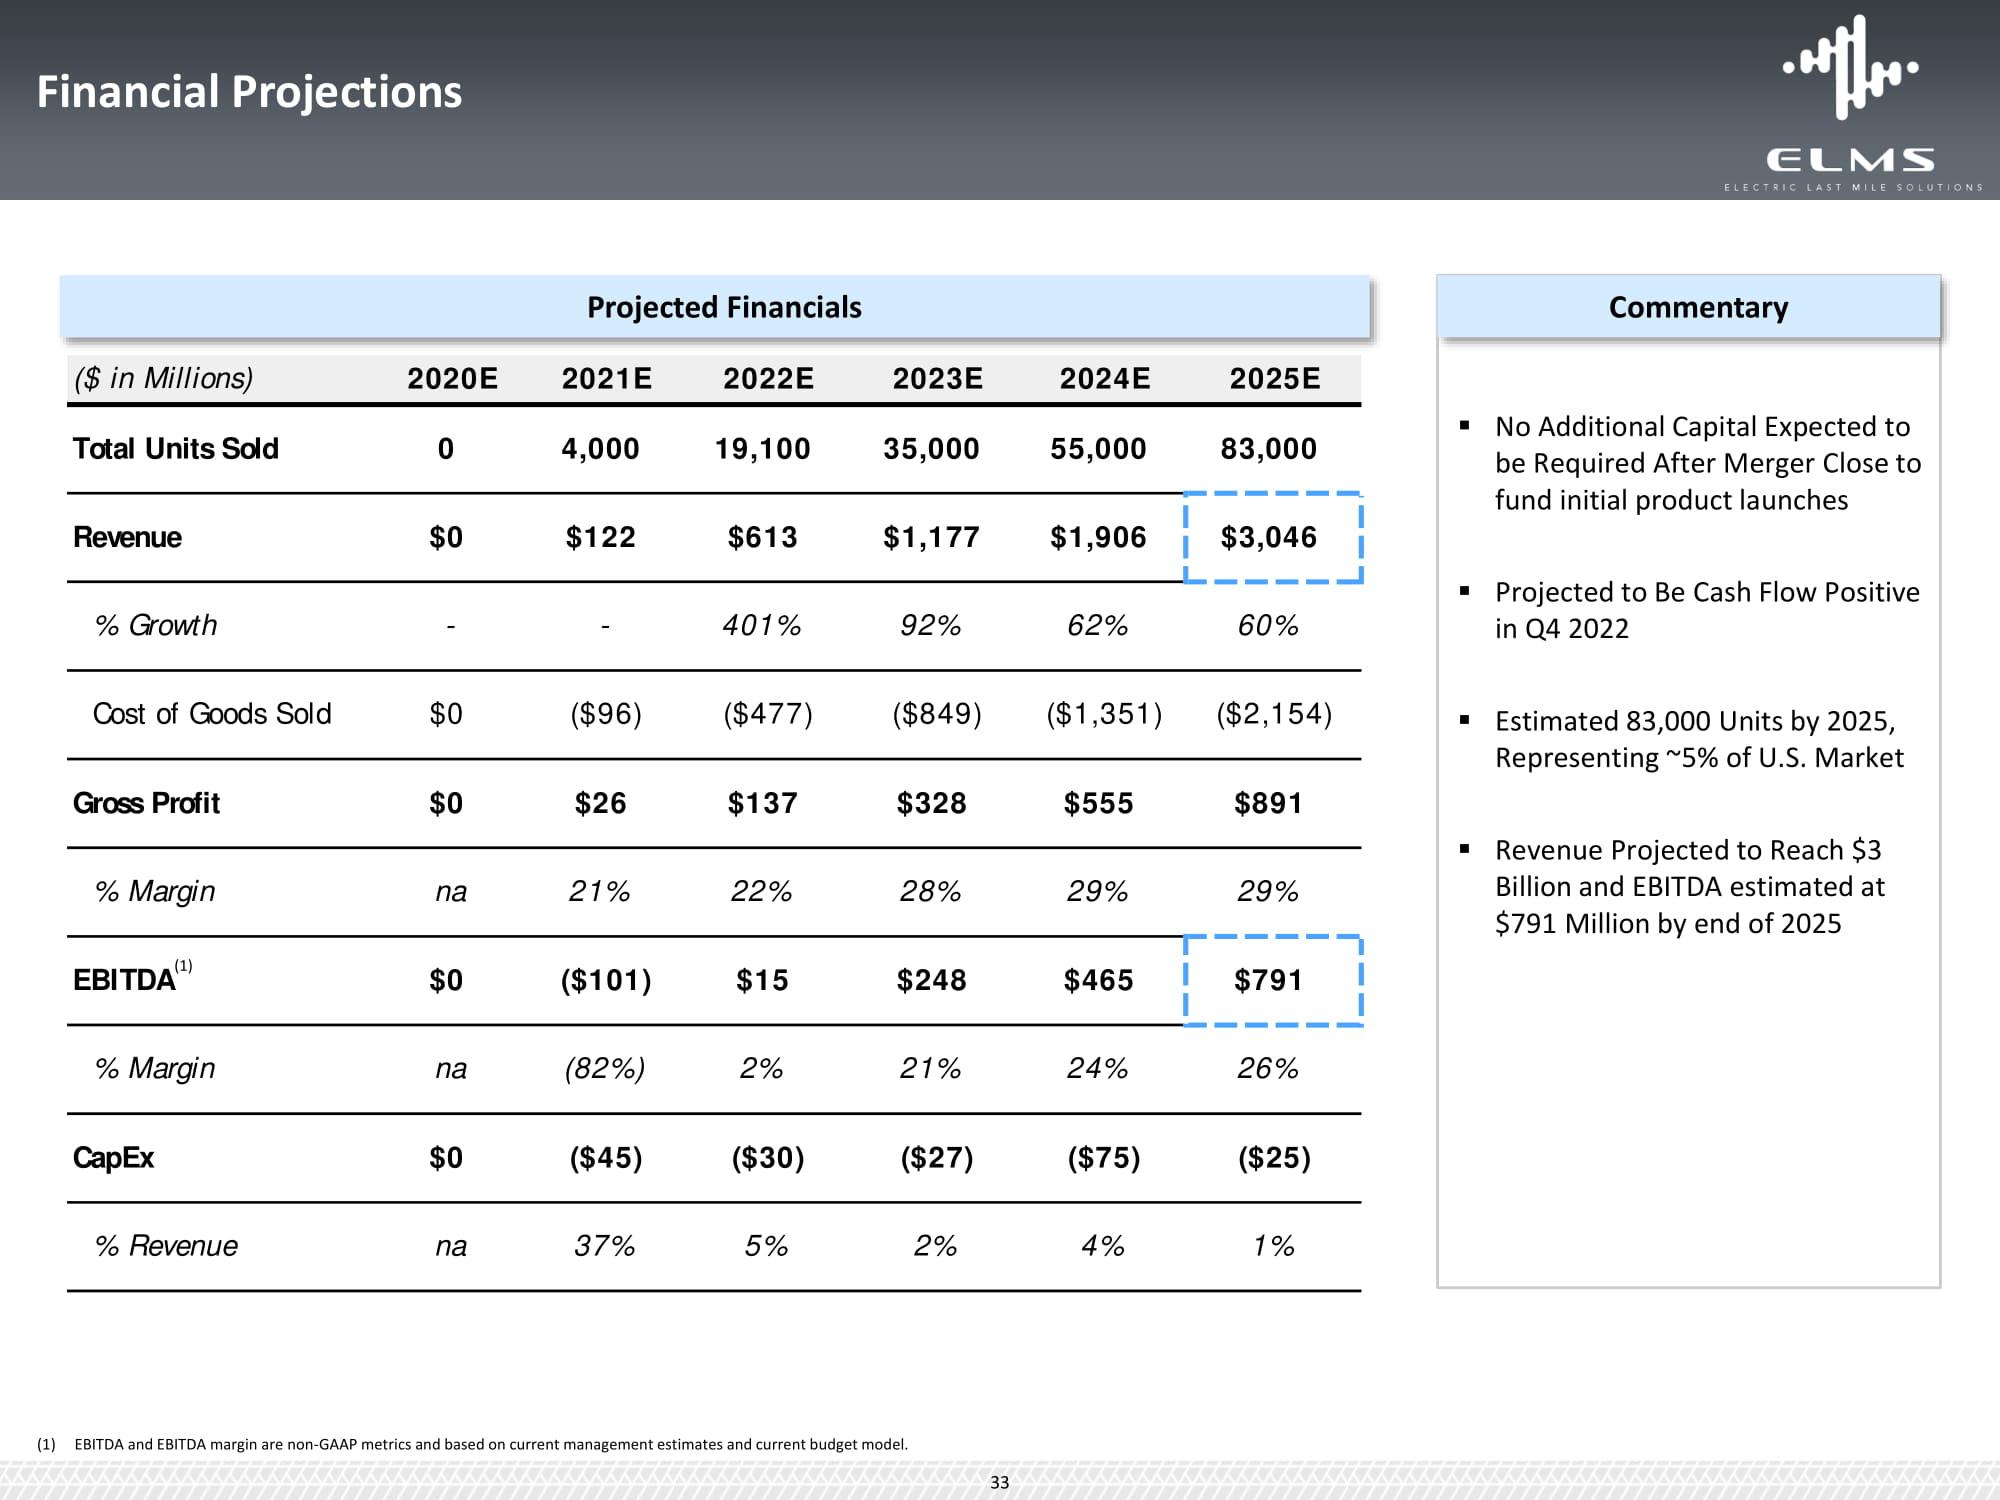
▪ No Additional Capital Expected to be Required After Merger Close to fund initial product launches ▪ Projected to Be Cash Flow Positive in Q4 2022 Financial Projections Commentary Projected Financials % Revenue na 37% 5% 2% 4% 1% ($ in Millions) 2020E 2021E 2022E 2023E 2024E 2025E Total Units Sold 0 4,000 19 , 10 0 35,000 55,000 83 , 00 0 Revenue $0 $122 $613 $1,177 $1,906 $3 , 04 6 % Growth - - 401% 92% 62% 60% Cost of Goods Sold $0 ($96) ($477) ($849) ($1,351) ($2,154) ▪ Estimated 83,000 Units by 2025, Representing ~5% of U.S. Market Gross Profit $0 $26 $137 $328 $555 $891 ▪ Revenue Projected to Reach $3 % Margin na 21% 22% 28% 29% 29% Billion and EBITDA estimated at $791 Million by end of 2025 EBITDA (1) $0 ($101) $15 $248 $465 $791 % Margin na (82%) 2% 21% 24% 26% CapEx $0 ($45) ($30) ($27) ($75) ($25) (1) EBITDA and EBITDA margin are non - GAAP metrics and based on current management estimates and current budget model. 33
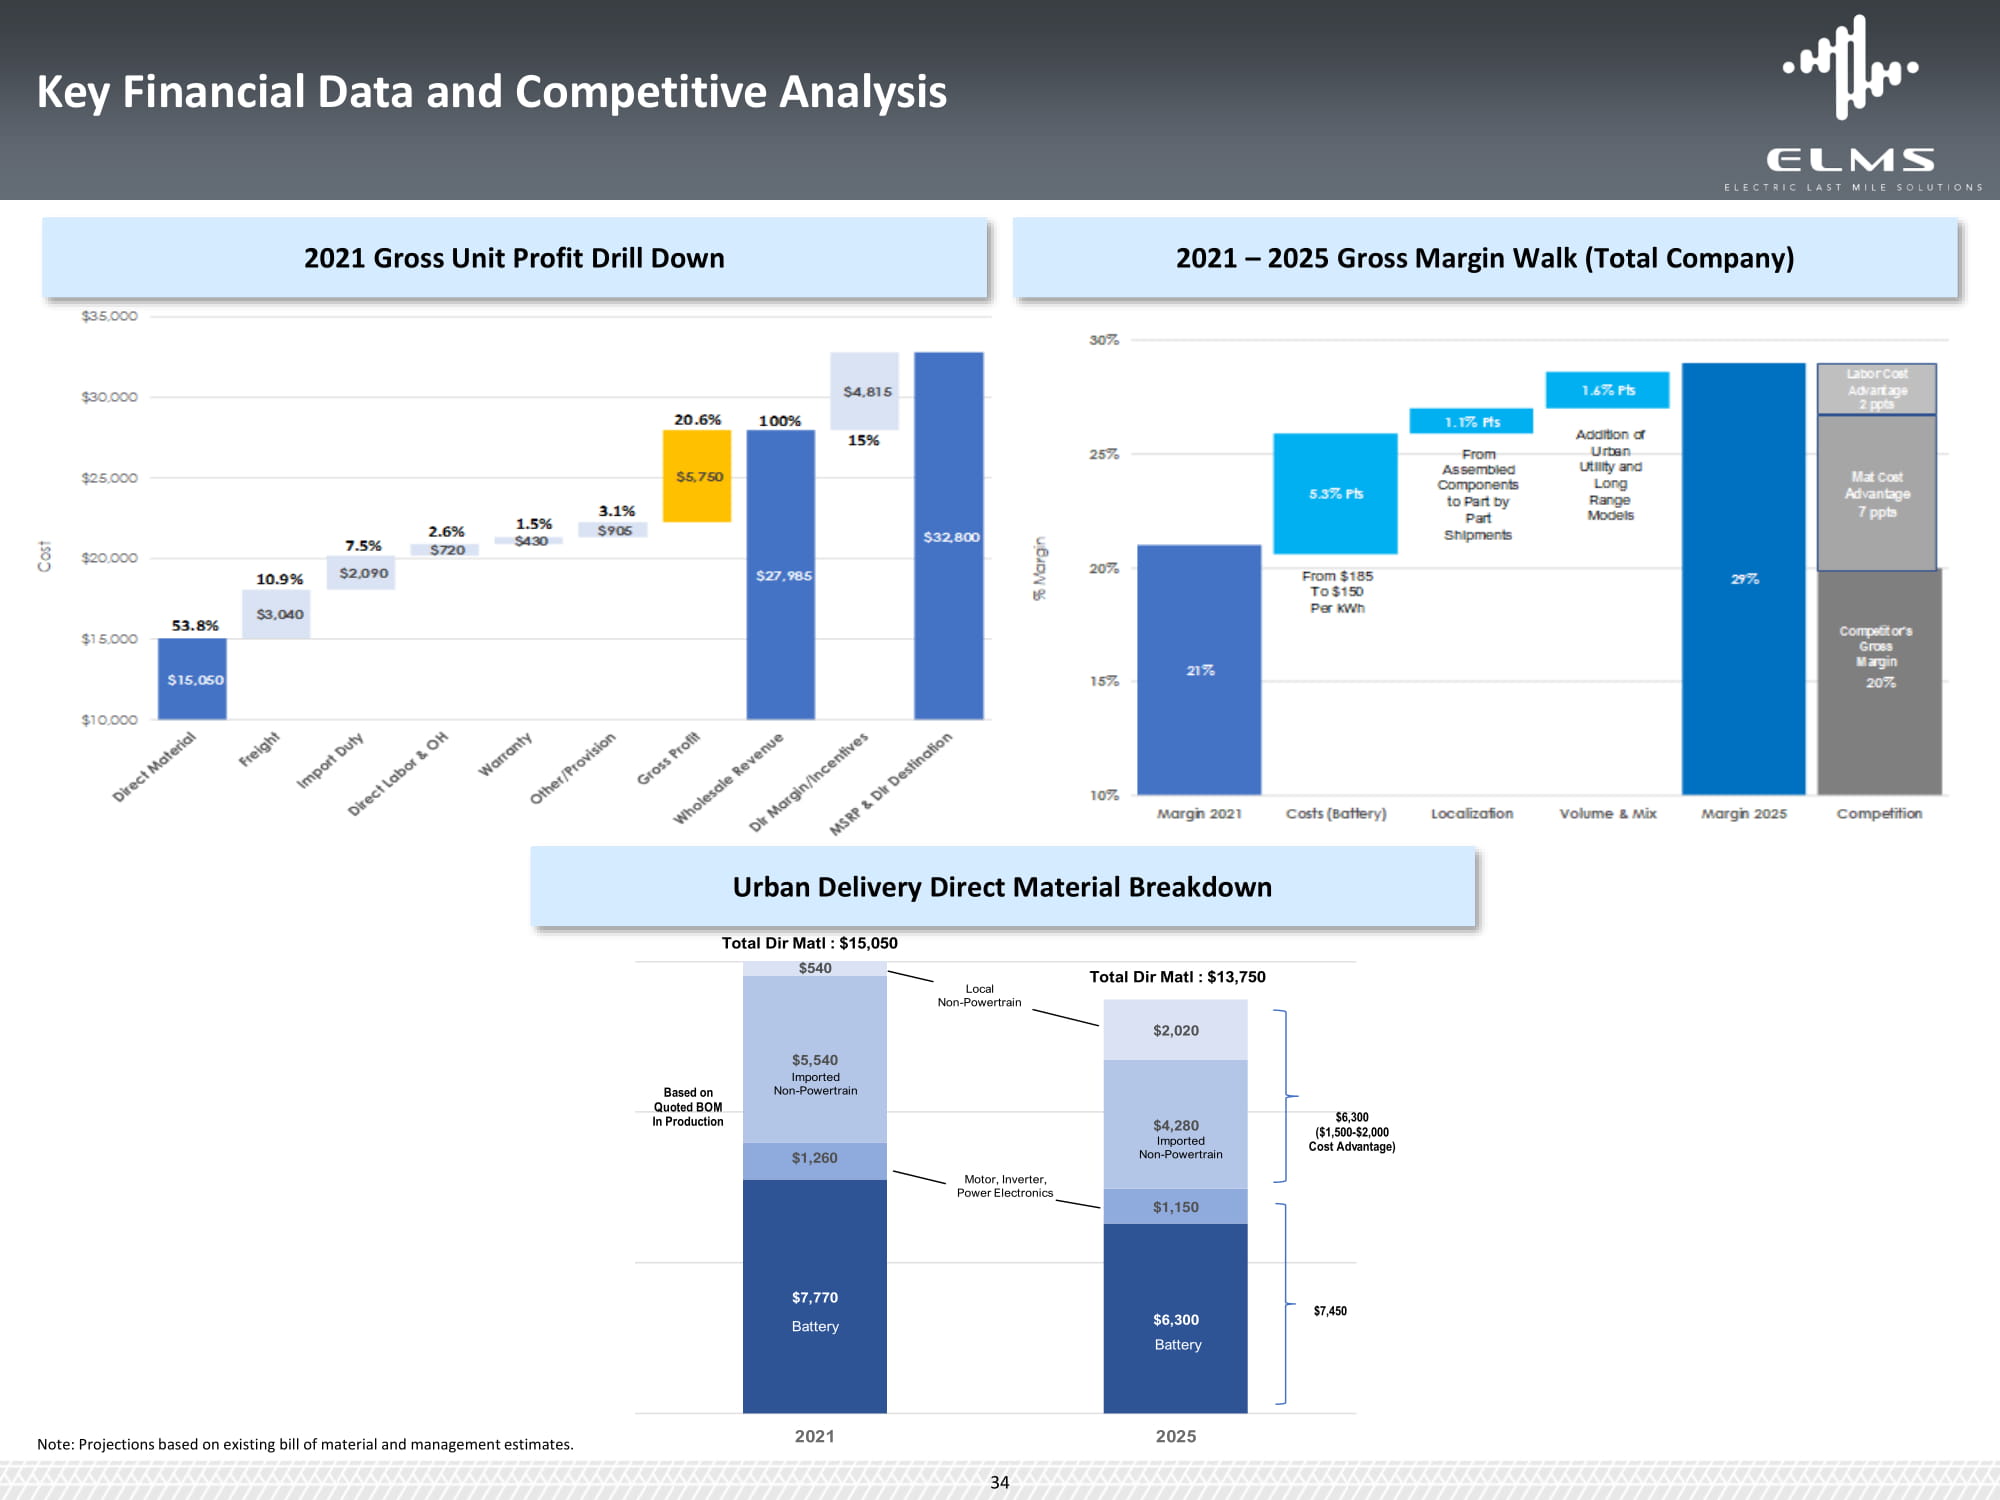
$1,260 $1,150 $540 $2,020 Total Dir Matl : $15,050 Total Dir Matl : $13,750 $6,300 Battery $7,770 Battery $5,540 Imported Non - Powertrain $4,280 Imported Non - Powertrain Local Non - Powertrain Motor, Inverter, Power Electronics Based on Quoted BOM In Production $6,300 ($1,500 - $2,000 Cost Advantage) $7 , 45 0 Key Financial Data and Competitive Analysis 2021 – 2025 Gross Margin Walk (Total Company) Urban Delivery Direct Material Breakdown 2021 Gross Unit Profit Drill Down 2 0 2 1 2 0 2 5 Note: Projections based on existing bill of material and management estimates. 34
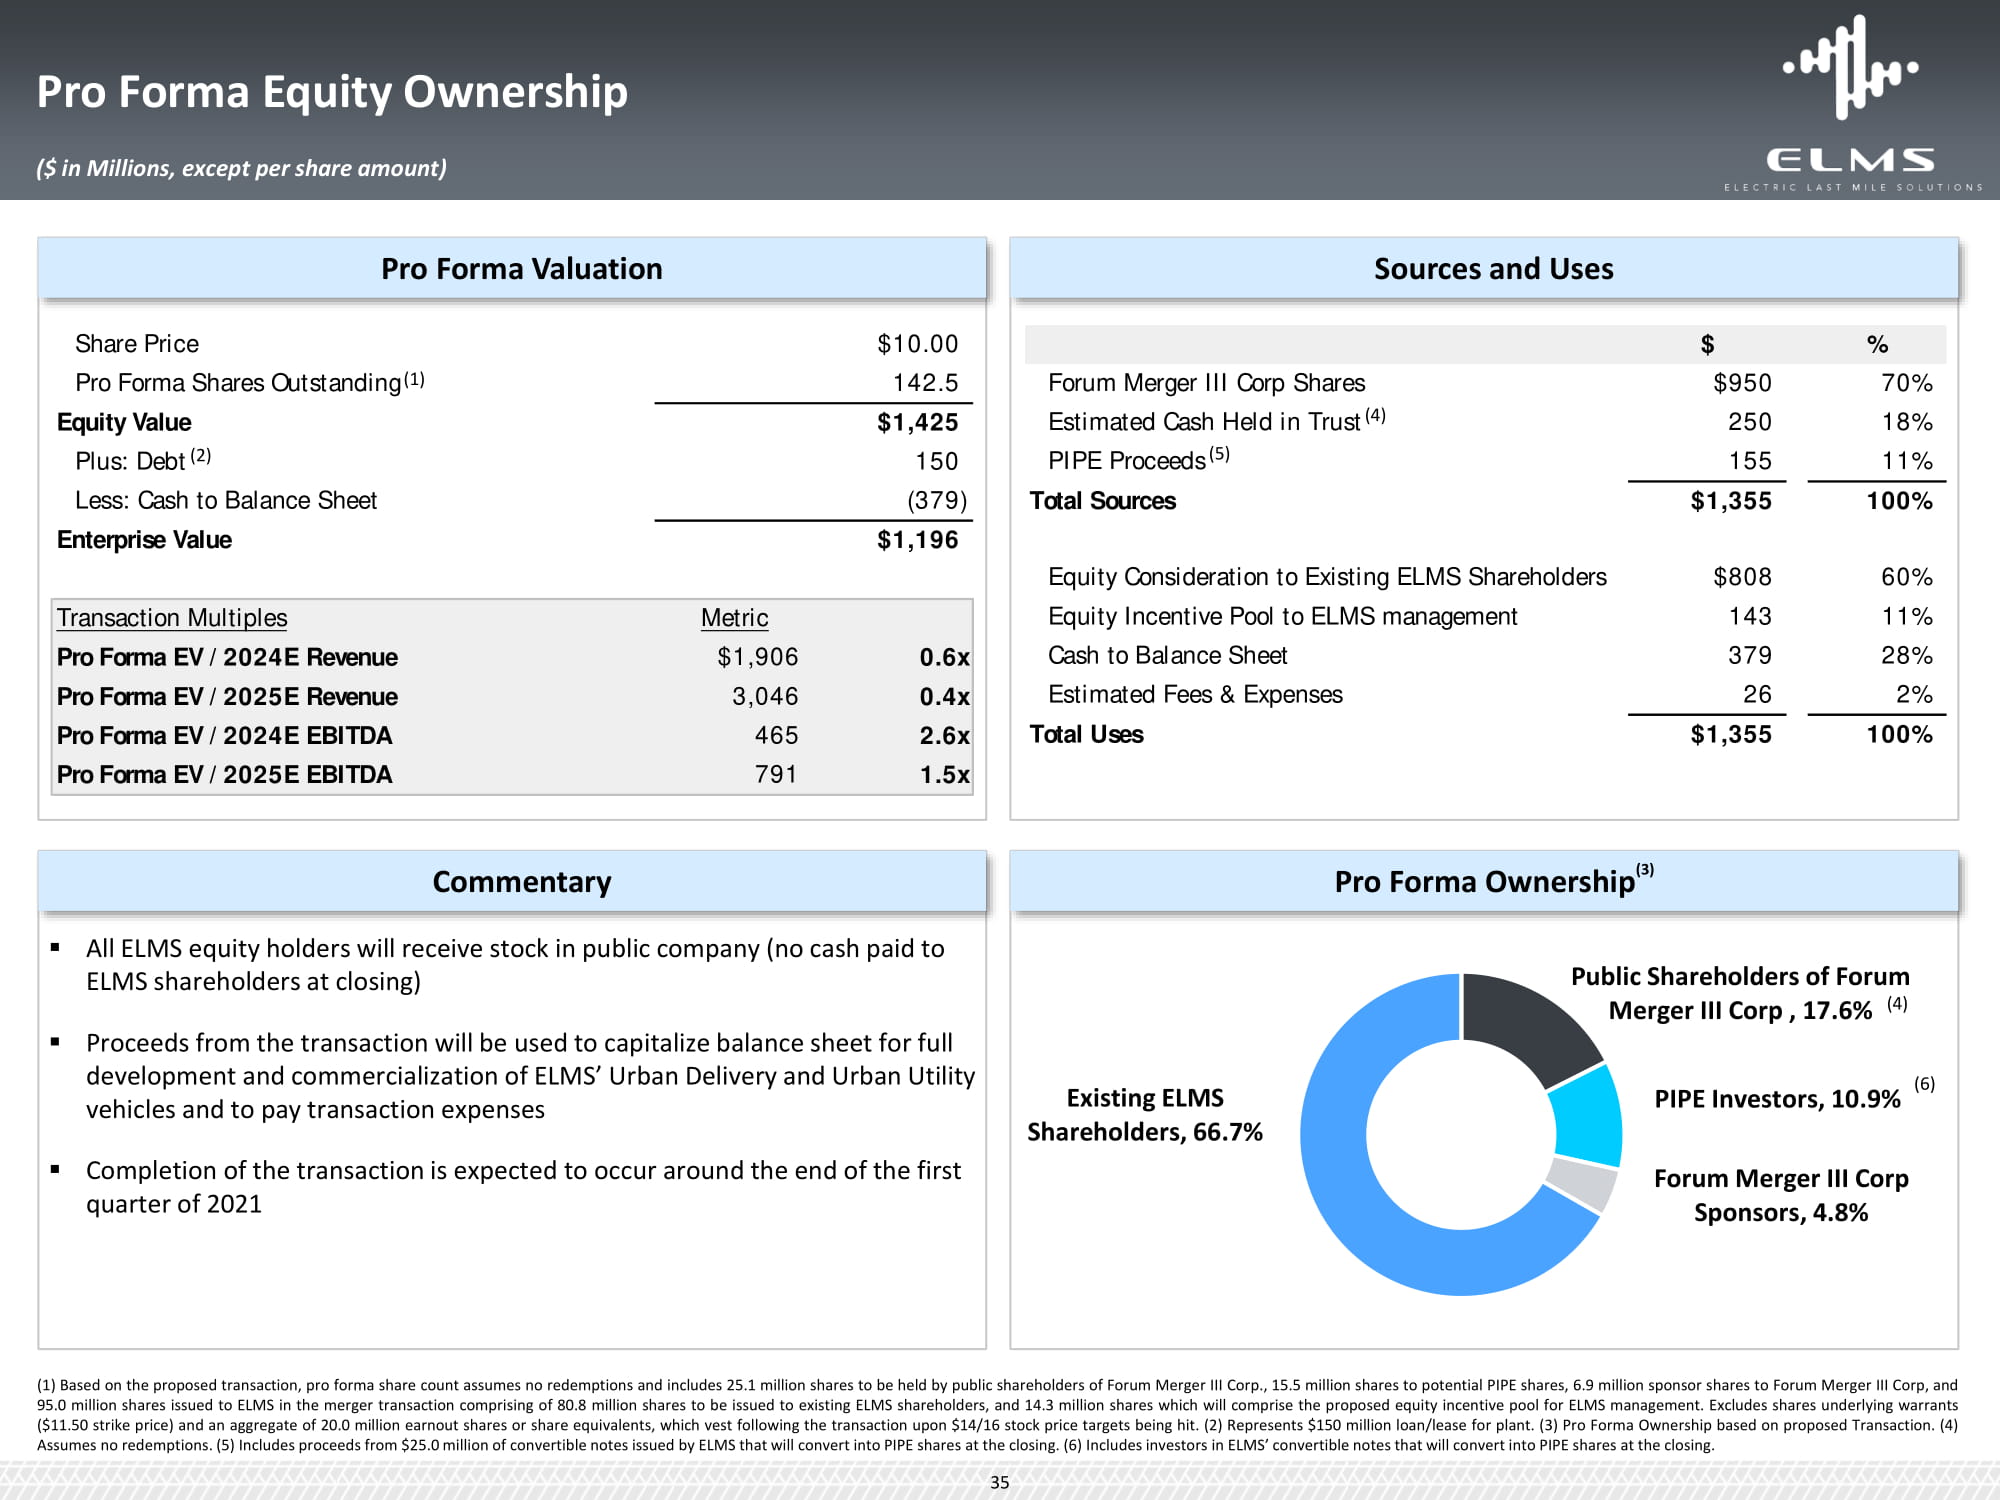
▪ All ELMS equity holders will receive stock in public company (no cash paid to ELMS shareholders at closing) ▪ Proceeds from the transaction will be used to capitalize balance sheet for full development and commercialization of ELMS’ Urban Delivery and Urban Utility vehicles and to pay transaction expenses ▪ Completion of the transaction is expected to occur around the end of the first quarter of 2021 Pro Forma Equity Ownership ($ in Millions, except per share amount) Sources and Uses $ % Forum Merger III Corp Shares $95 0 70% Estimated Cash Held in Trust (4) 25 0 18% PIPE Proceeds (5) 15 5 11% Total Sources $1 , 35 5 100% Equity Consideration to Existing ELMS Shareholders $80 8 60% Equity Incentive Pool to ELMS management 14 3 11% Cash to Balance Sheet 37 9 28% Estimated Fees & Expenses 2 6 2% Total Uses $1 , 35 5 100% Commentary Pro Forma Ownership (3) ( 1 ) Based on the proposed transaction, pro forma share count assumes no redemptions and includes 25 . 1 million shares to be held by public shareholders of Forum Merger III Corp . , 15 . 5 million shares to potential PIPE shares, 6 . 9 million sponsor shares to Forum Merger III Corp, and 95 . 0 million shares issued to ELMS in the merger transaction comprising of 80 . 8 million shares to be issued to existing ELMS shareholders, and 14 . 3 million shares which will comprise the proposed equity incentive pool for ELMS management . Excludes shares underlying warrants ( $ 11 . 50 strike price) and an aggregate of 20 . 0 million earnout shares or share equivalents, which vest following the transaction upon $ 14 / 16 stock price targets being hit . ( 2 ) Represents $ 150 million loan/lease for plant . ( 3 ) Pro Forma Ownership based on proposed Transaction . ( 4 ) Assumes no redemptions . ( 5 ) Includes proceeds from $ 25 . 0 million of convertible notes issued by ELMS that will convert into PIPE shares at the closing . ( 6 ) Includes investors in ELMS’ convertible notes that will convert into PIPE shares at the closing . Public Shareholders of Forum Merger III Corp , 17.6% (4) PIPE Investors, 10.9% Forum Merger III Corp Sponsors, 4.8% Existing ELMS Shareholders, 66.7% (6) Pro Forma Valuation Share Price $10.00 Pro Forma Shares Outstanding (1) 142.5 Equity Value $1,425 Plus: Debt (2) 150 Less: Cash to Balance Sheet ( 379 ) Enterprise Value $1,196 Transaction Multiples Metric Pro Forma EV / 2024E Revenue $1 , 90 6 0 . 6 x Pro Forma EV / 2025E Revenue 3 , 04 6 0 . 4 x Pro Forma EV / 2024E EBITDA 465 2 . 6 x Pro Forma EV / 2025E EBITDA 791 1 . 5 x 3 5
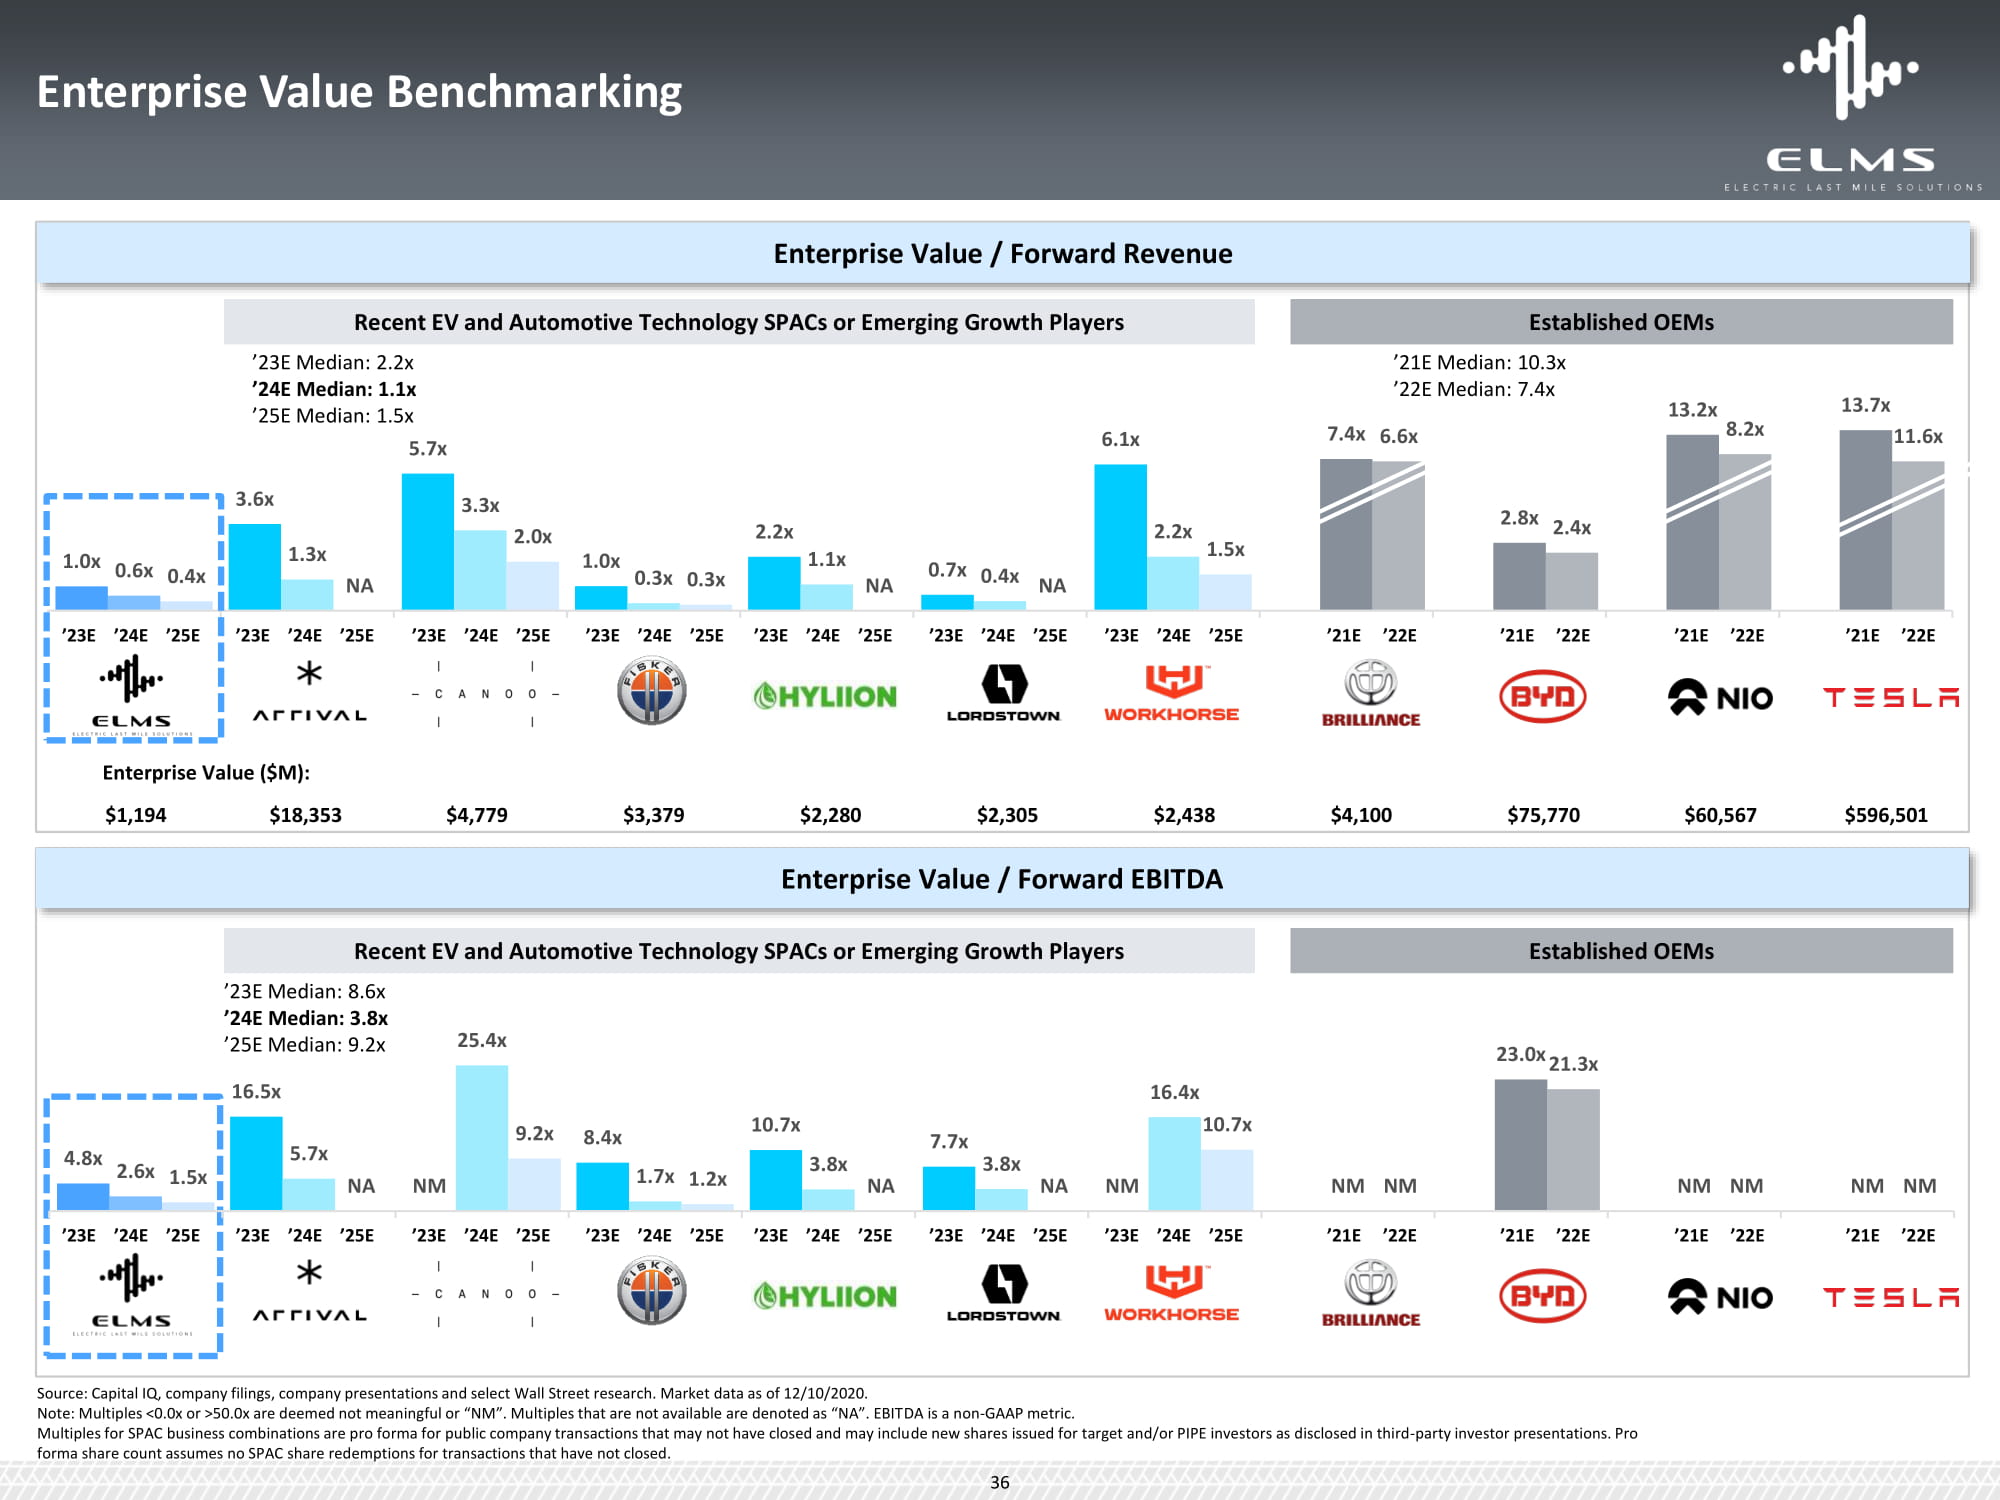
Enterprise Value Benchmarking Source: Capital IQ, company filings, company presentations and select Wall Street research. Market data as of 12/10/2020. Note: Multiples <0.0x or >50.0x are deemed not meaningful or “NM”. Multiples that are not available are denoted as “NA”. EBITDA is a non - GAAP metric. Multiples for SPAC business combinations are pro forma for public company transactions that may not have closed and may include new shares issued for target and/or PIPE investors as disclosed in third - party investor presentations. Pro forma share count assumes no SPAC share redemptions for transactions that have not closed. Enterprise Value / Forward Revenue Recent EV and Automotive Technology SPACs or Emerging Growth Players Established OEMs ’ 23 E Median : 2 . 2 x ’ 24 E Median : 1 . 1 x ’ 25 E Median : 1 . 5 x 5 . 7 x 3.6x 3.3x 2 . 0 x 1.0x 0.6x 0.4x 1.3x NA ’23E ’24E ’25E ’23E ’24E ’25E ’23E ’24E ’25E Enterprise Value ($M): $1,194 $18,353 $4,779 ’21E Median: 10.3x ’22E Median: 7.4x 13.2x 13.7x 6.1x 7.4x 6.6x 8 . 2 x 11 . 6 x 1.0x 0.3x 0.3x 2.2x 1.1x NA 0.7x 0.4x NA 2.2x 1.5x 2.8x 2.4x ’23E ’24E ’25E ’23E ’24E ’25E ’23E ’24E ’25E ’23E ’24E ’25E ’21E ’22E ’21E ’22E ’21E ’22E ’21E ’22E $3,379 $2,280 $2,305 $2,438 $4,100 $75,770 $60,567 $596,501 Enterprise Value / Forward EBITDA Recent EV and Automotive Technology SPACs or Emerging Growth Players Established OEMs ’23E Median: 8.6x ’24E Median: 3.8x ’25E Median: 9.2x 25.4x 23.0x 21.3x 16.5x 16.4x 9.2x 8.4x 10.7x 7.7x 10.7x 4.8x 2.6x 1.5x 5.7x 3.8x 3.8x NA NM 1.7x 1.2x NA NA NM NM NM NM NM NM NM ’23E ’24E ’25E ’23E ’24E ’25E ’23E ’24E ’25E ’23E ’24E ’25E ’23E ’24E ’25E ’23E ’24E ’25E ’23E ’24E ’25E ’21E ’22E ’21E ’22E ’21E ’22E ’21E ’22E 36
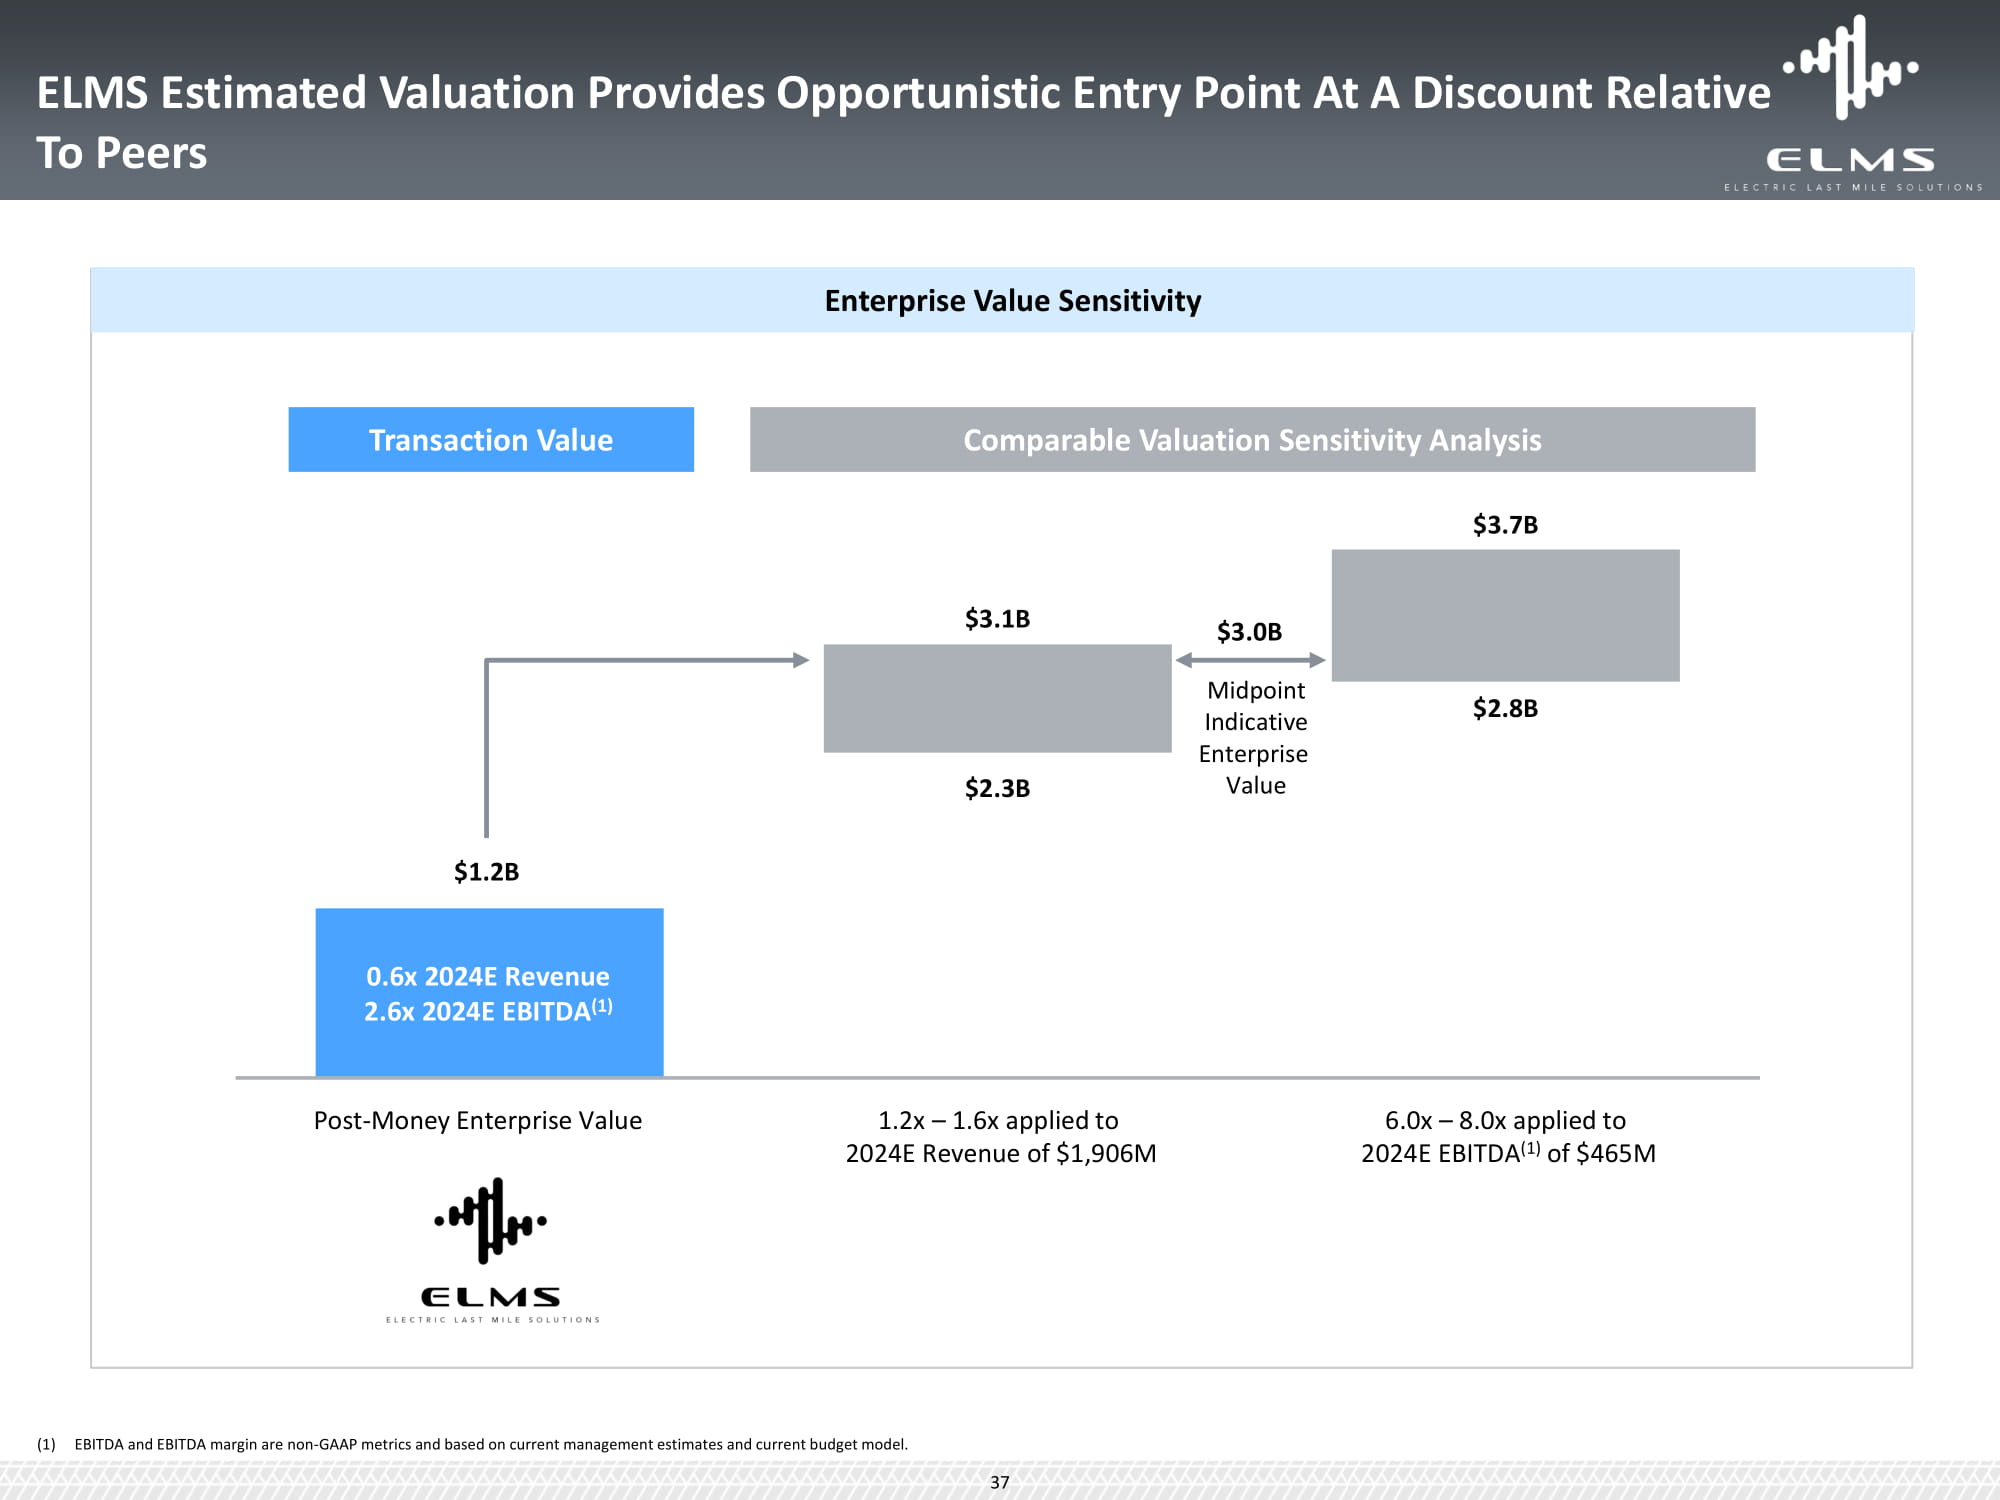
Enterprise Value Sensitivity $2.3B $2.8B $1.2B $3.1B $3.7B Post - Money Enterprise Value 1.2x – 1.6x applied to 2024E Revenue of $1,906M Transaction Value Comparable Valuation Sensitivity Analysis 6.0x – 8.0x applied to 2024E EBITDA (1) of $465M Midpoint Indicative Enterpr i se Value $3.0B 0.6x 2024E Revenue 2.6x 2024E EBITDA (1) (1) EBITDA and EBITDA margin are non - GAAP metrics and based on current management estimates and current budget model. 37 ELMS Estimated Valuation Provides Opportunistic Entry Point At A Discount Relative To Peers

Mine and Monetize Digital Data and Services Data to Reduce Fleet Insurance Costs Rental or S u bscription Models Sale of Zero Emission Vehicle Credits Accelerate Plan to Enter Markets in Mexico and Canada Plan to Manufacture and Distribute ELMS Branded Vehicles in China Plan to Launch Vehicle for European Market Increase Volume Add Variances for Specific Applications Add Passenger Van Models Digital and Data Services Financing Mexico and Canada China Europe Volume Products 38 Potential Upside: $300M (1) Estimated Cost: $100M Potential Upside: $50M - $100M (1) Estimated Cost: $50M (1) Source: Management estimates. ELMS has Multiple Potential Growth Vectors To Drive Long - Term Value Creation For Shareholders
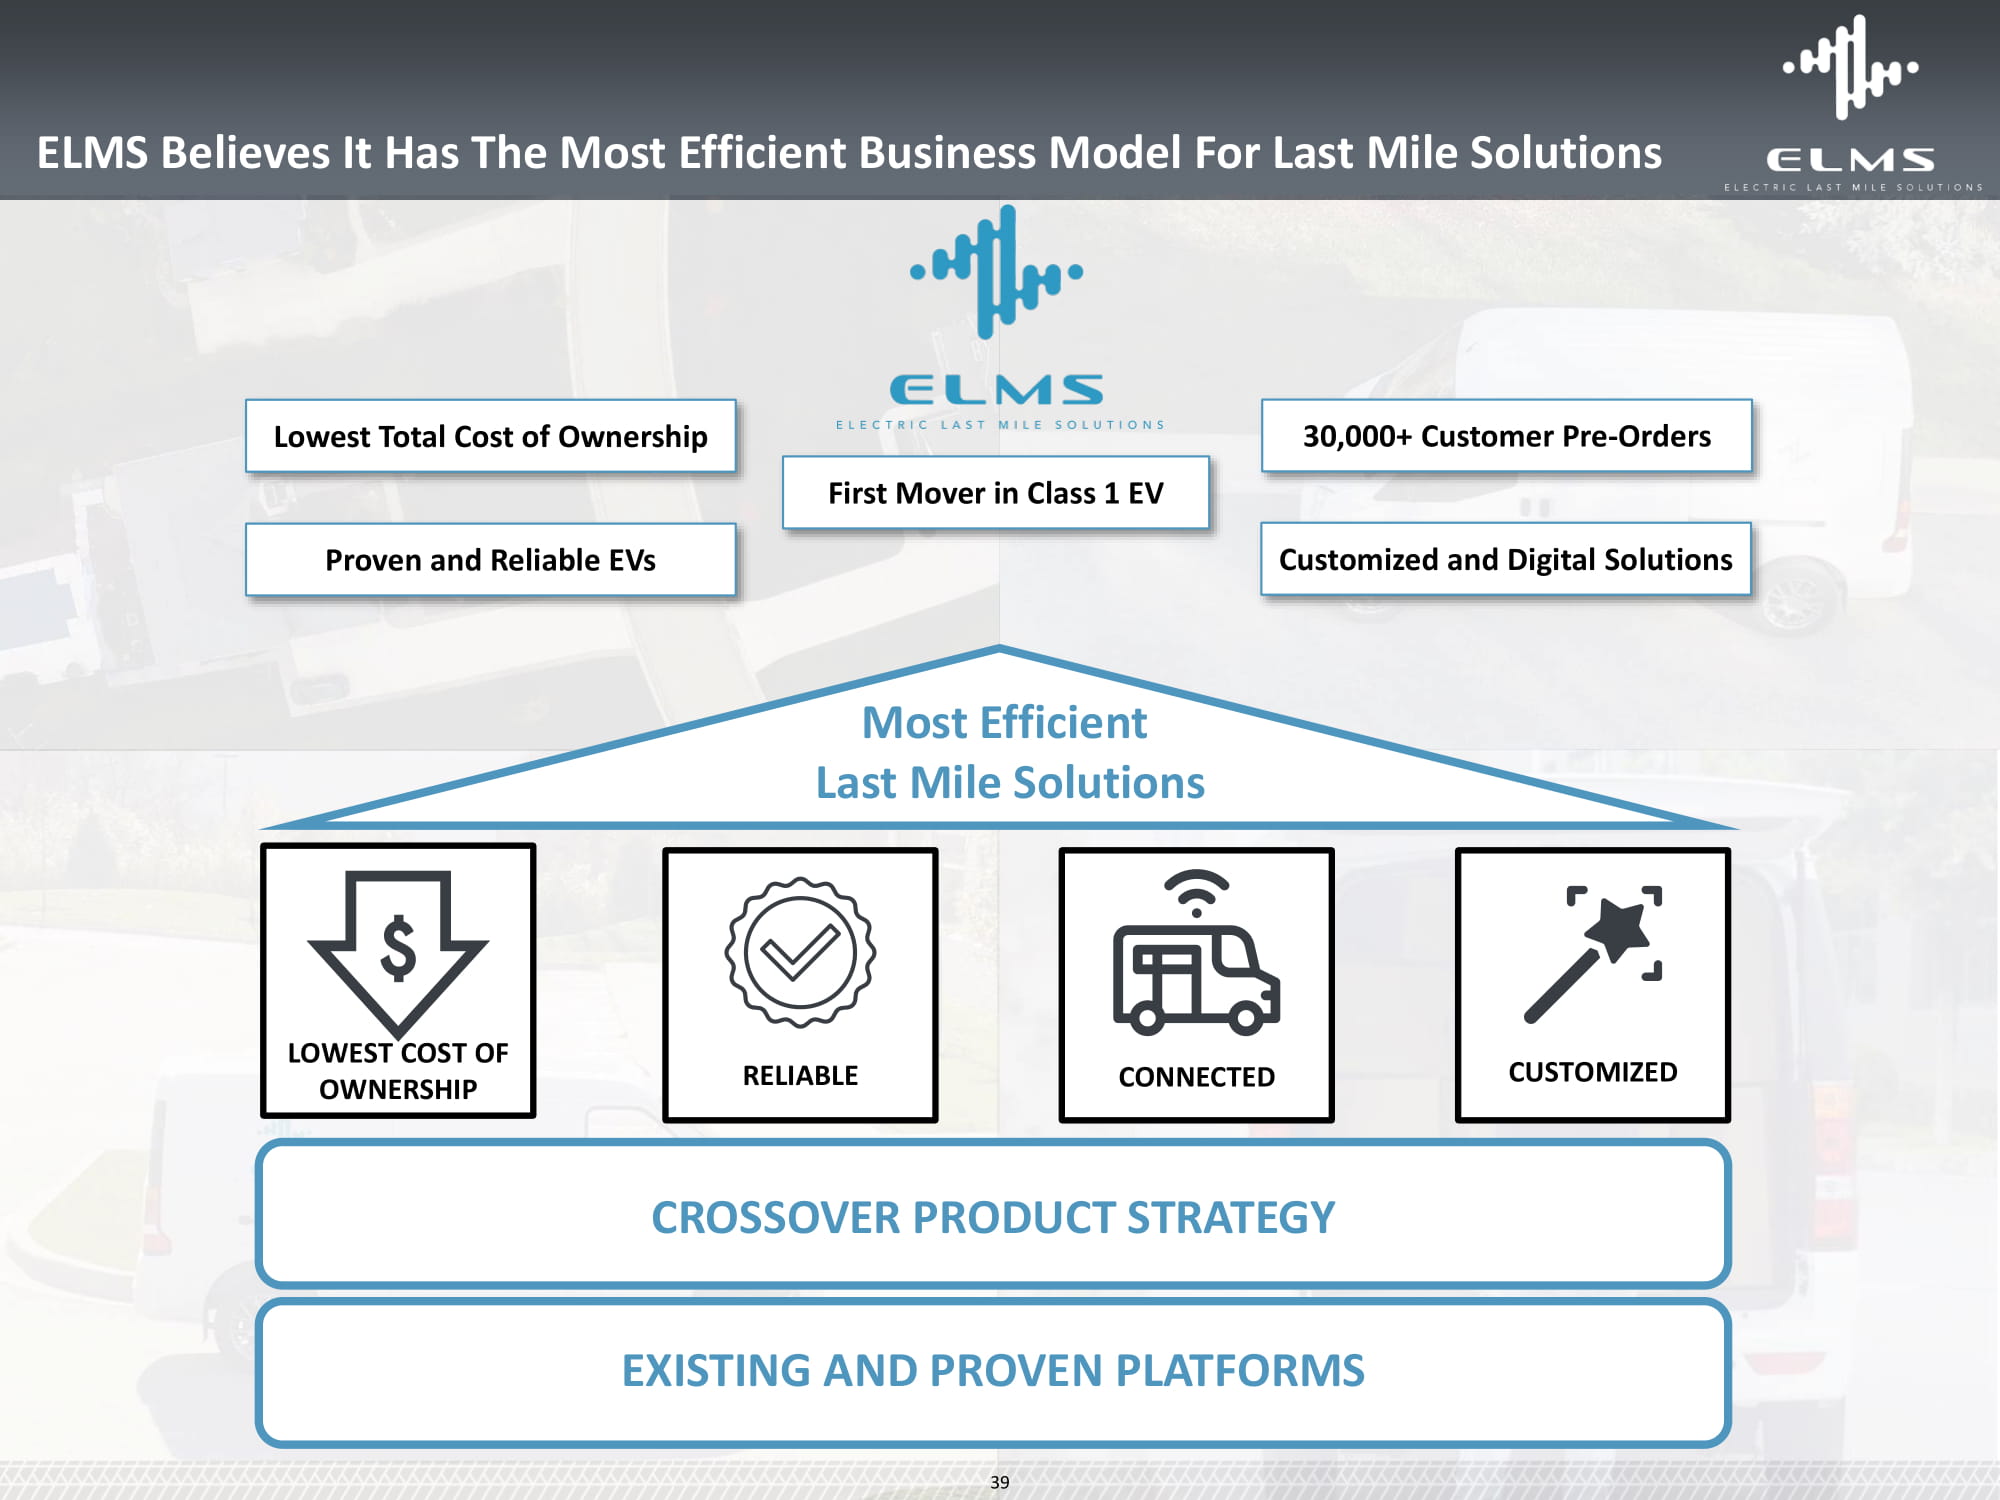
Most Efficient Last Mile Solutions LOWEST COST OF OWNERSHIP RELIABLE CONNECTED CUSTOMIZED CROSSOVER PRODUCT STRATEGY EXISTING AND PROVEN PLATFORMS Lowest Total Cost of Ownership Proven and Reliable EVs First Mover in Class 1 EV 30,000+ Customer Pre - Orders Customized and Digital Solutions 39 ELMS Believes It Has The Most Efficient Business Model For Last Mile Solutions
Appendix: Forum Track Record
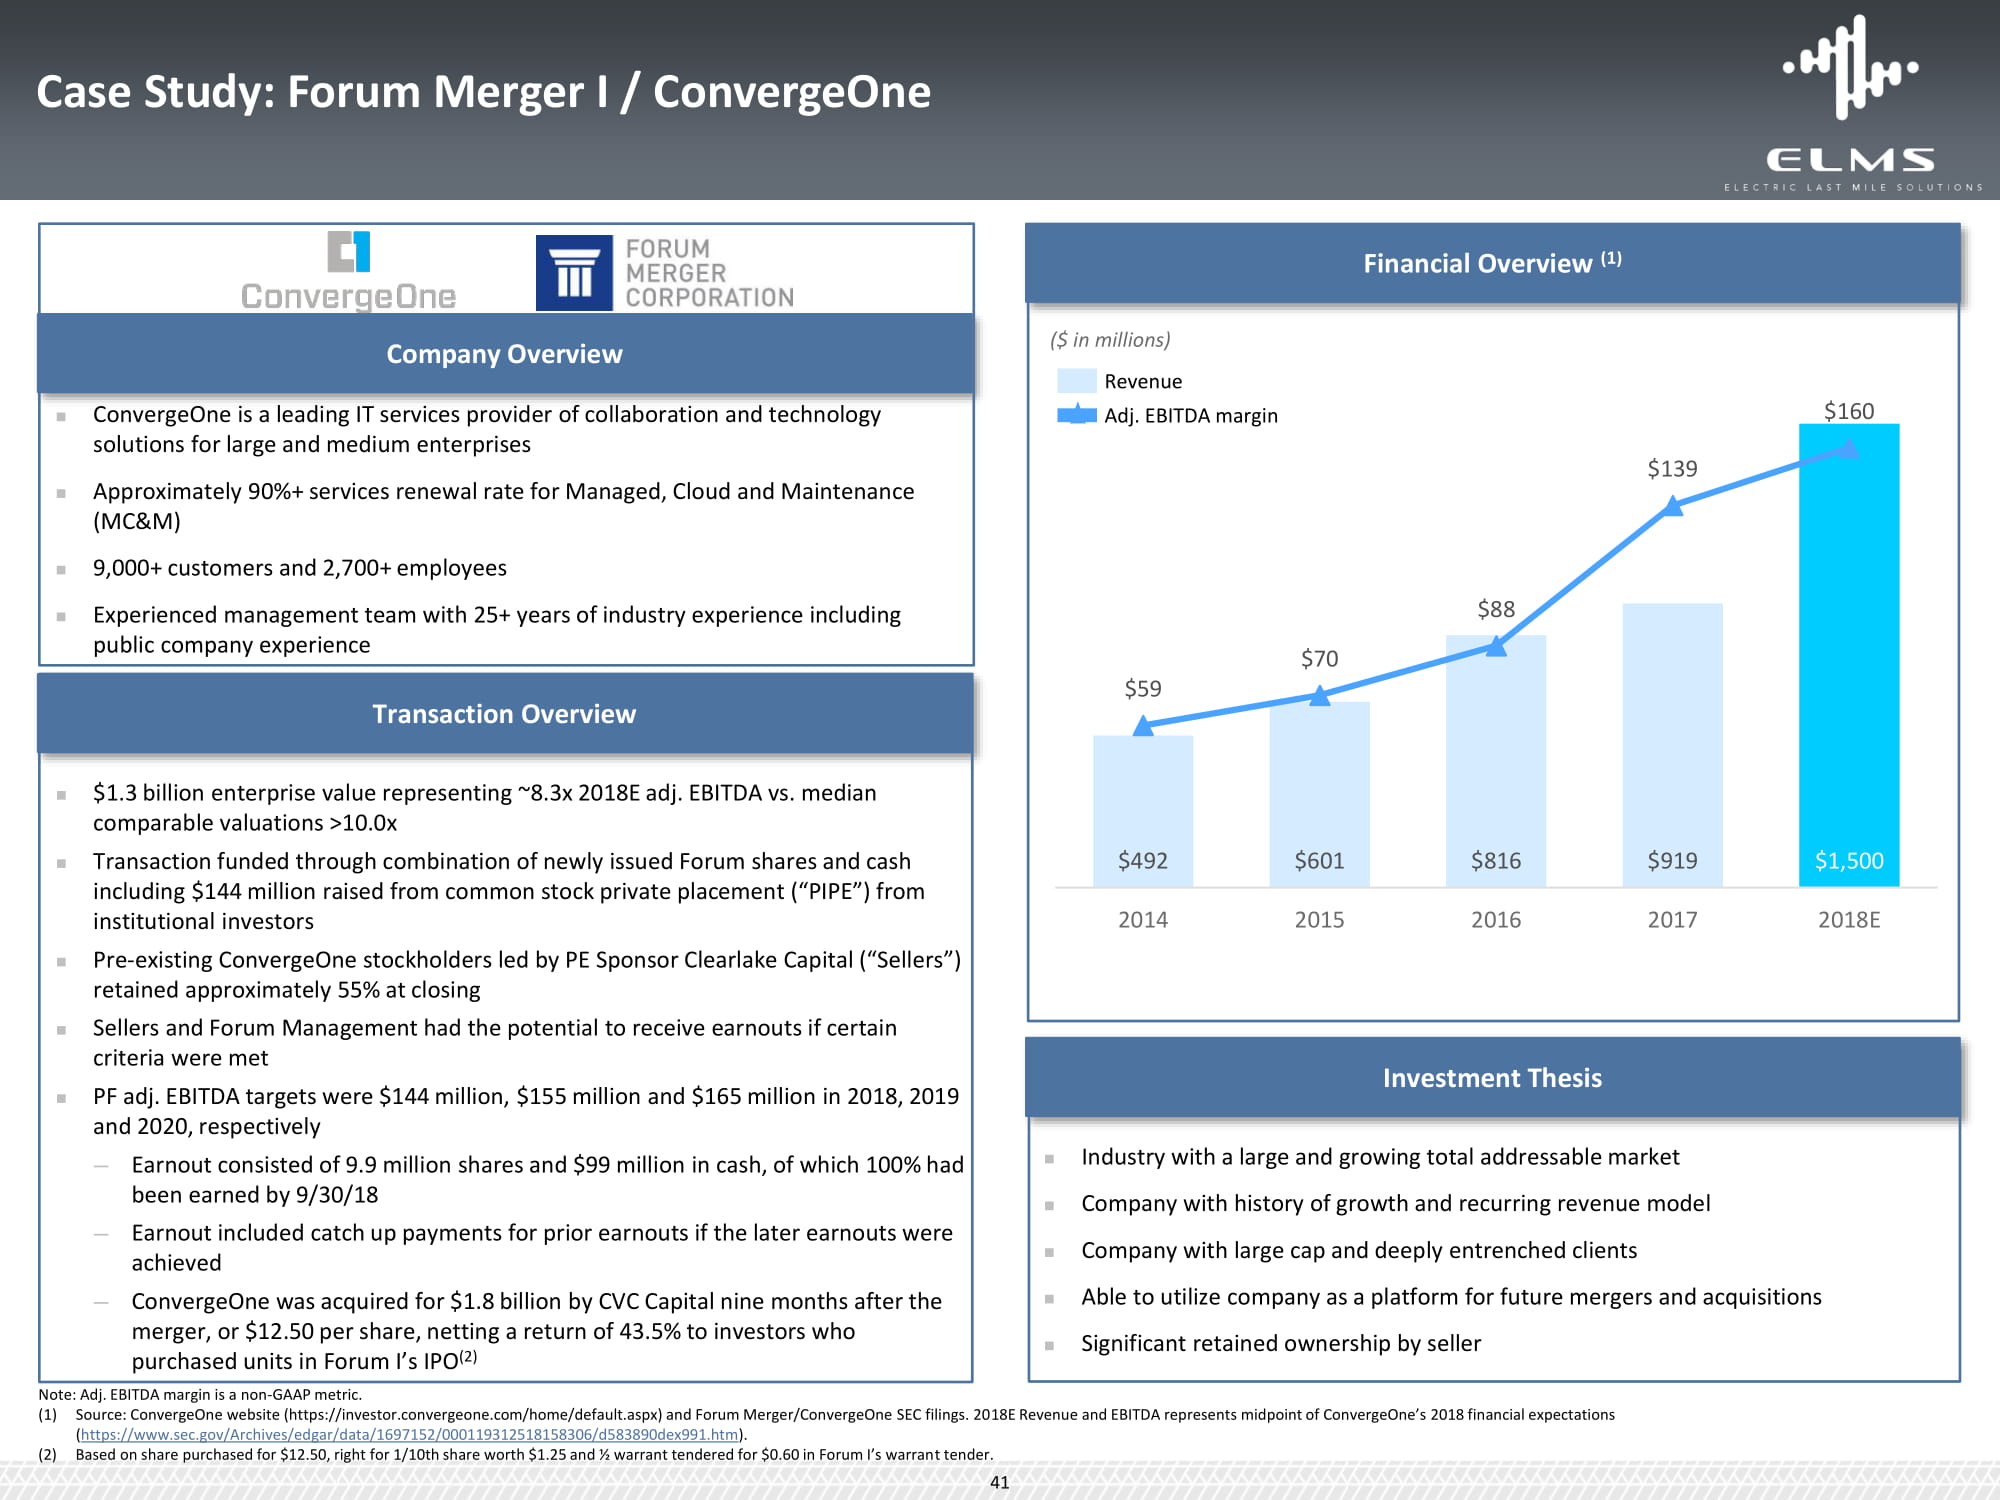
Case Study: Forum Merger I / ConvergeOne Financial Overview (1) $88 $70 $59 $139 $160 $492 $601 $816 $919 $1 , 500 2014 2015 2016 2017 2018E ($ in millions) R e venue Adj. EBITDA margin Company Overview ConvergeOne is a leading IT services provider of collaboration and technology solutions for large and medium enterprises Approximately 90%+ services renewal rate for Managed, Cloud and Maintenance (MC&M) 9,000+ customers and 2,700+ employees Experienced management team with 25+ years of industry experience including public company experience Transaction Overview $1.3 billion enterprise value representing ~8.3x 2018E adj. EBITDA vs. median comparable valuations >10.0x Transaction funded through combination of newly issued Forum shares and cash including $144 million raised from common stock private placement (“PIPE”) from institutional investors Pre - existing ConvergeOne stockholders led by PE Sponsor Clearlake Capital (“Sellers”) retained approximately 55% at closing Sellers and Forum Management had the potential to receive earnouts if certain criteria were met PF adj. EBITDA targets were $144 million, $155 million and $165 million in 2018, 2019 and 2020, respectively — Earnout consisted of 9.9 million shares and $99 million in cash, of which 100% had been earned by 9/30/18 — Earnout included catch up payments for prior earnouts if the later earnouts were achieved — ConvergeOne was acquired for $1.8 billion by CVC Capital nine months after the merger, or $12.50 per share, netting a return of 43.5% to investors who purchased units in Forum I’s IPO (2) Investment Thesis Industry with a large and growing total addressable market Company with history of growth and recurring revenue model Company with large cap and deeply entrenched clients Able to utilize company as a platform for future mergers and acquisitions Significant retained ownership by seller Note: Adj. EBITDA margin is a non - GAAP metric. (1) Source: ConvergeOne website (https://investor.convergeone.com/home/default.aspx) and Forum Merger/ConvergeOne SEC filings. 2018E Revenue and EBITDA represents midpoint of ConvergeOne’s 2018 financial expectations ( https://www.sec.gov/Archives/edgar/data/1697152/000119312518158306/d583890dex991.htm ). (2) Based on share purchased for $12.50, right for 1/10th share worth $1.25 and ½ warrant tendered for $0.60 in Forum I’s warrant tender. 41
Case Study: Forum Merger II / Tattooed Chef
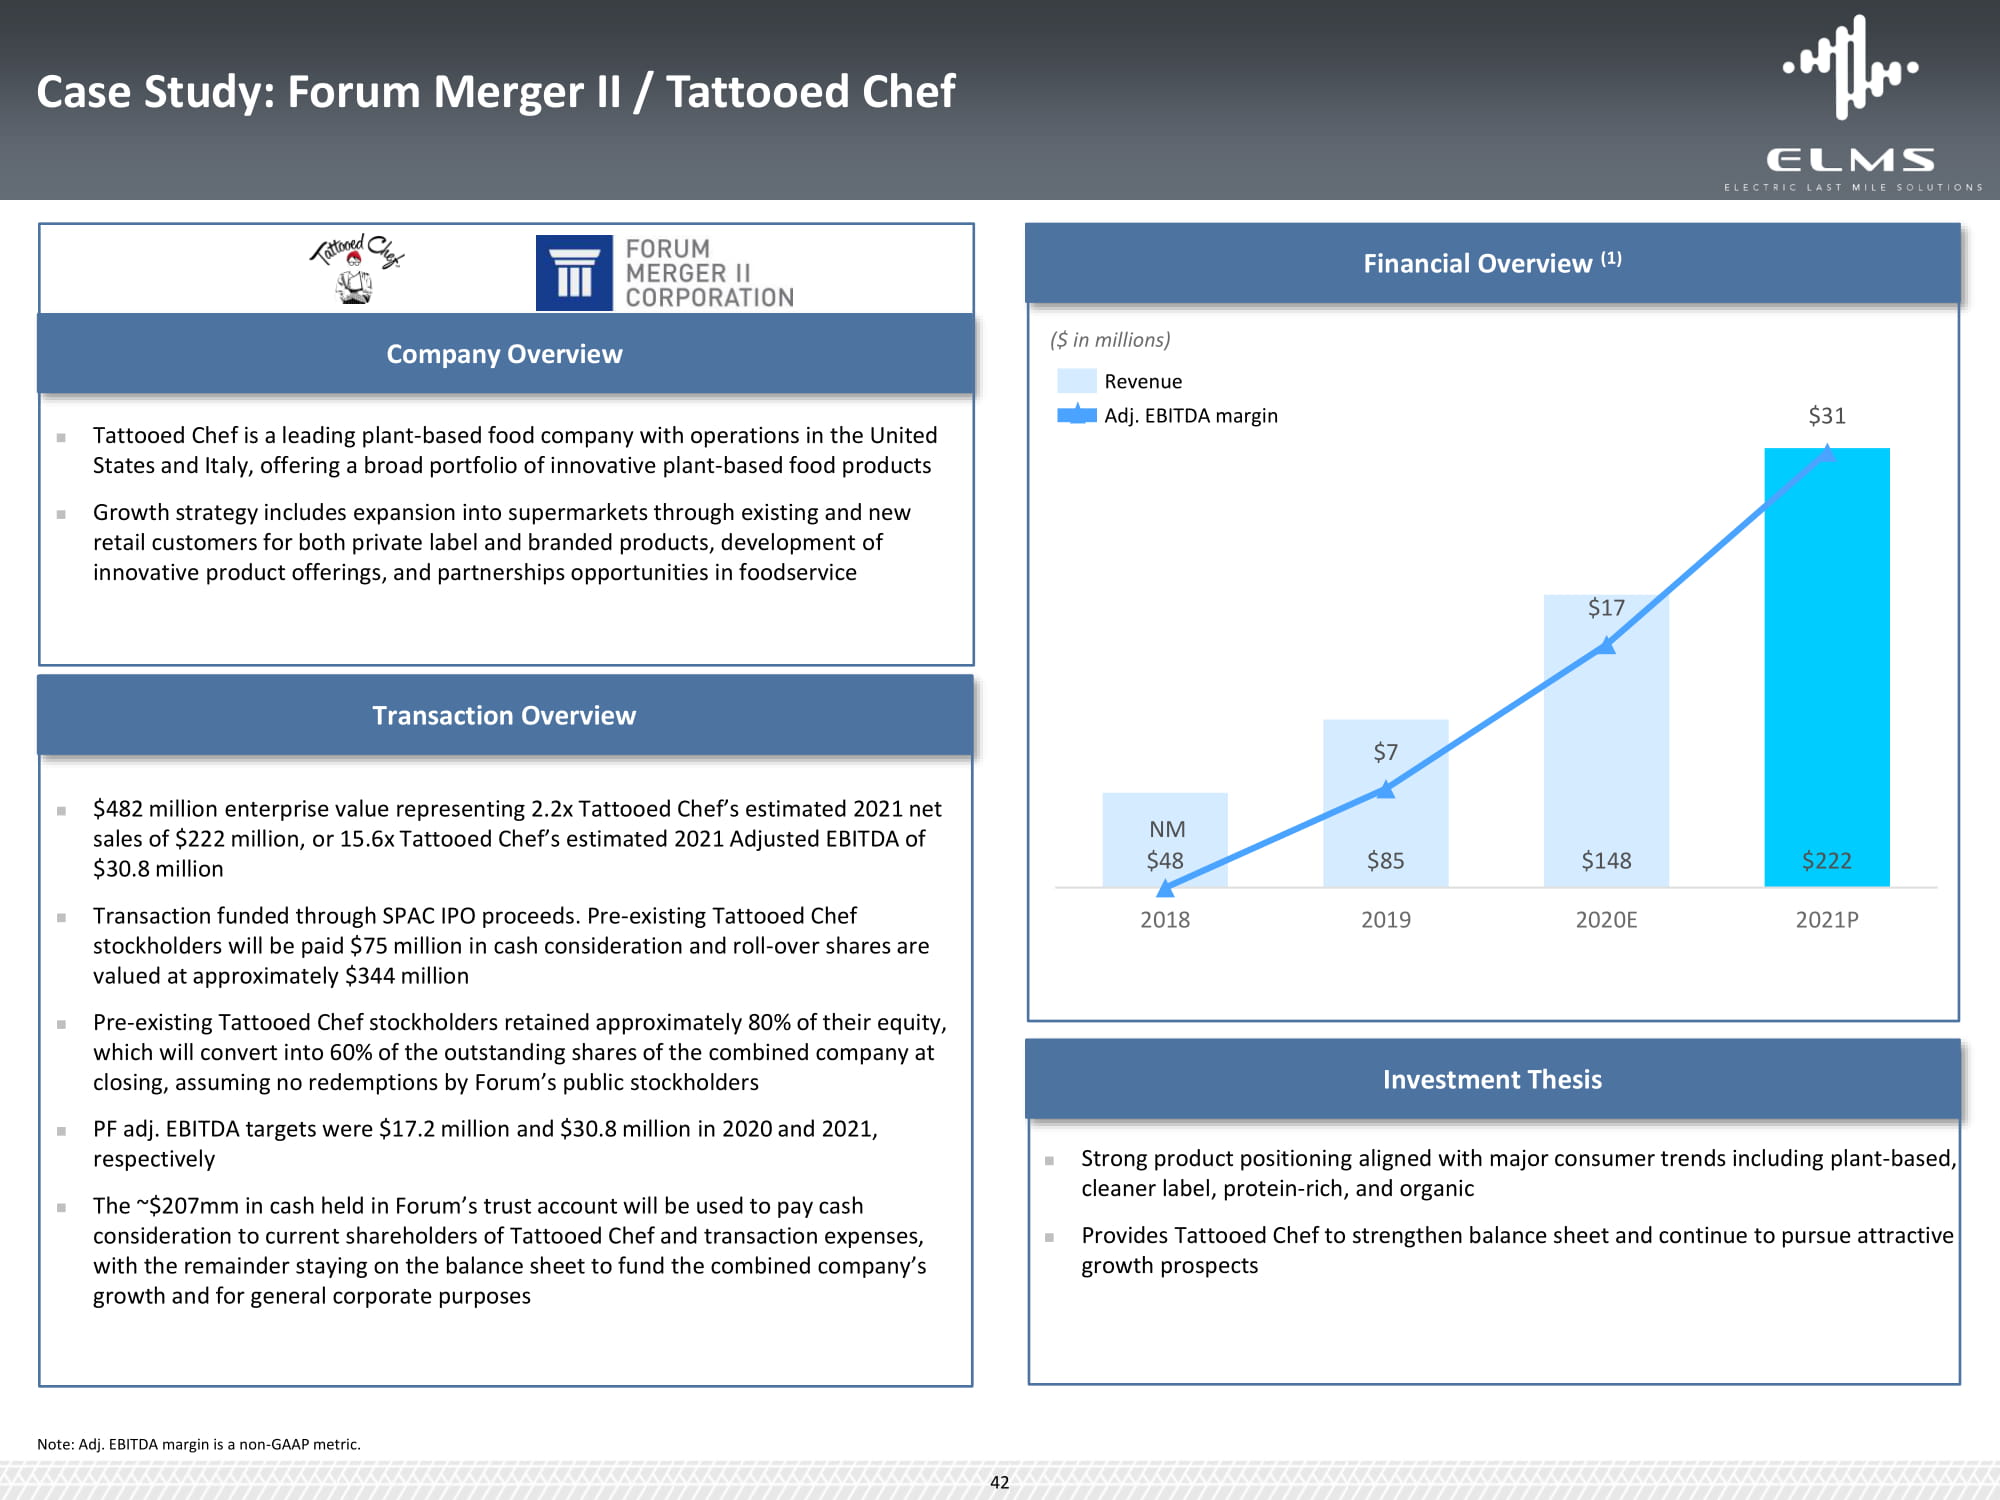
Strong product positioning aligned with major consumer trends including plant - based, cleaner label, protein - rich, and organic Provides Tattooed Chef to strengthen balance sheet and continue to pursue attractive growth prospects $17 $31 $7 NM $48 $85 $148 $222 2018 2019 2020E 2021P Financial Overview (1) Company Overview Tattooed Chef is a leading plant - based food company with operations in the United States and Italy, offering a broad portfolio of innovative plant - based food products Growth strategy includes expansion into supermarkets through existing and new retail customers for both private label and branded products, development
of innovative product offerings, and partnerships opportunities in foodservice Transaction Overview $482 million enterprise value representing 2.2x Tattooed Chef’s estimated 2021 net sales of $222 million, or 15.6x Tattooed Chef’s estimated 2021 Adjusted EBITDA of $30.8 million Transaction funded through SPAC IPO proceeds. Pre - existing Tattooed Chef stockholders will be paid $75 million in cash consideration and roll - over shares are valued at approximately $344 million Pre - existing Tattooed Chef stockholders retained approximately 80% of their equity, which will convert into 60% of the outstanding shares of the combined company at closing, assuming no redemptions by Forum’s public stockholders PF adj. EBITDA targets were $17.2 million and $30.8 million in 2020 and 2021, respectively The ~$207mm in cash held in Forum’s trust account will be used to pay cash consideration to current shareholders of Tattooed Chef and transaction expenses, with the remainder staying on the balance sheet to fund the combined company’s growth and for general corporate purposes Investment Thesis ($ in millions) R e venue Adj. EBITDA margin 42 Note: Adj. EBITDA margin is a non - GAAP metric.