
OFFUTT SECURITIES, INC.
September 2, 2004
Slide 1
Forward - Looking Statements
Some of Carpenter’s statements will be forward-looking statements, which are based on current expectations. Risk factors that could cause actual results to differ materially from these forward-looking statements can be found in Carpenter’s recent SEC filings, including the company’s June 30, 2003, 10-K, third quarter form 10-Q and S-4 Registration Statement and the exhibits attached to those filings.
© 2004 Carpenter Technology Corporation
Slide 2
AGENDA
Bob Torcolini Carpenter Overview
Chairman, President & CEO Market Overview Operating Highlights
Terry Geremski Financial Highlights
Sr. VP - Finance & CFO
Bob Torcolini Corporate Initiatives
© 2004 Carpenter Technology Corporation
Slide 3
Key Characteristics of Carpenter Technology
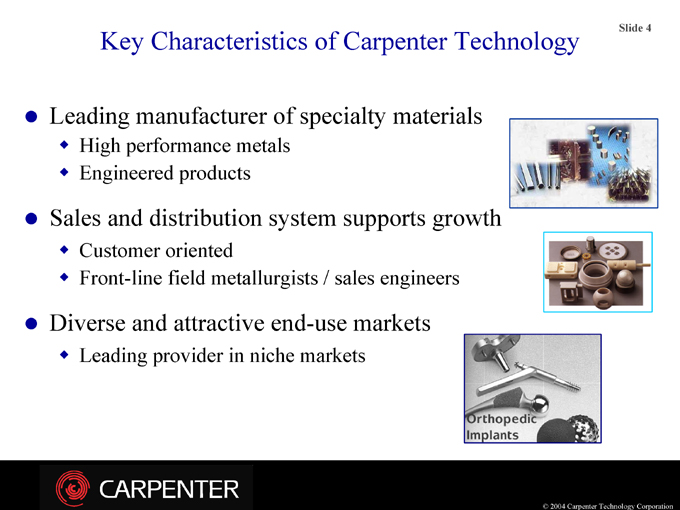
Leading manufacturer of specialty materials
High performance metals Engineered products
Sales and distribution system supports growth
Customer oriented
Front-line field metallurgists / sales engineers
Diverse and attractive end-use markets
Leading provider in niche markets
© 2004 Carpenter Technology Corporation
Slide 4
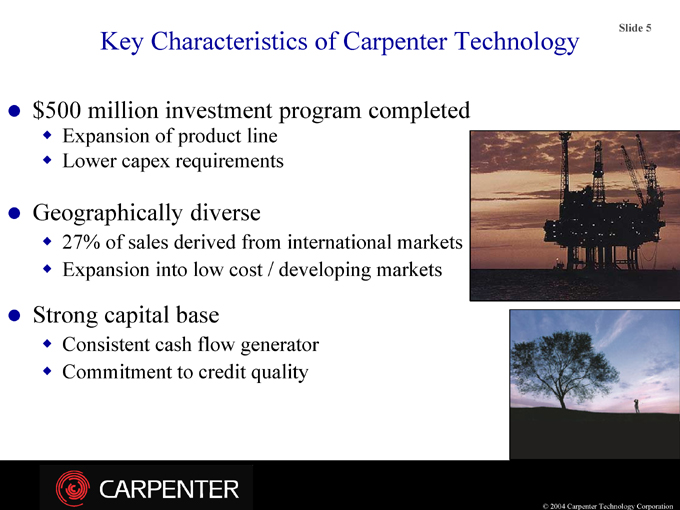
Key Characteristics of Carpenter Technology $500 million investment program completed
Expansion of product line Lower capex requirements
Geographically diverse
27% of sales derived from international markets Expansion into low cost / developing markets
Strong capital base
Consistent cash flow generator Commitment to credit quality
© 2004 Carpenter Technology Corporation
Slide 5
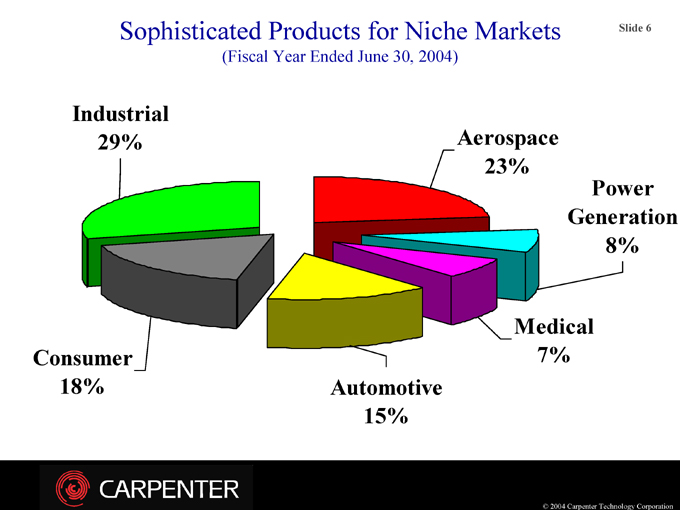
Sophisticated Products for Niche Markets
(Fiscal Year Ended June 30, 2004)
Industrial 29%
Consumer 18%
Aerospace 23%
Power Generation 8%
Medical 7%
Automotive 15%
© 2004 Carpenter Technology Corporation
Slide 6
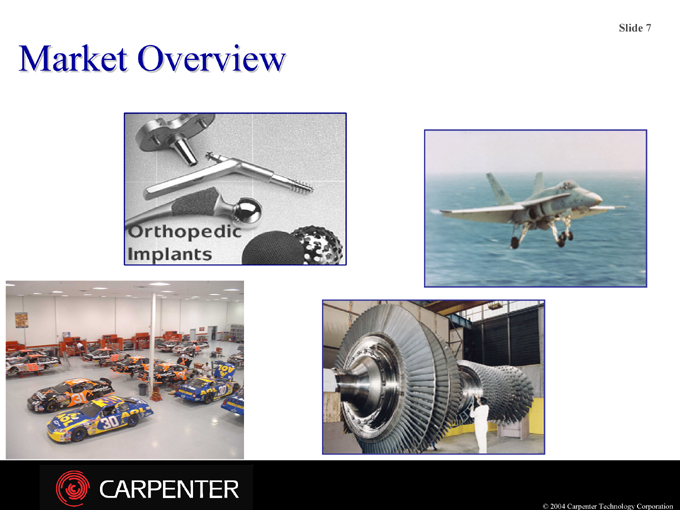
Market Overview
© 2004 Carpenter Technology Corporation
Slide 7
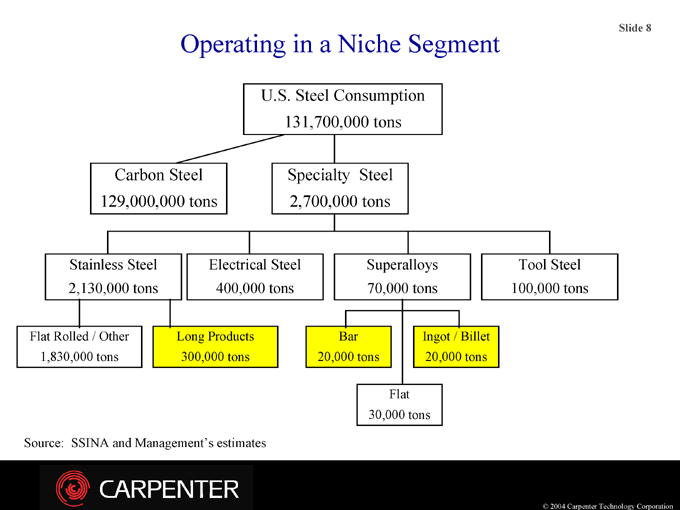
Operating in a Niche Segment
U.S. Steel Consumption 131,700,000 tons
Carbon Steel 129,000,000 tons
Specialty Steel 2,700,000 tons
Stainless Steel 2,130,000 tons
Electrical Steel 400,000 tons
Superalloys 70,000 tons
Tool Steel 100,000 tons
Flat Rolled / Other 1,830,000 tons
Long Products 300,000 tons
Bar 20,000 tons
Ingot / Billet 20,000 tons
Flat 30,000 tons
Source: SSINA and Management’s estimates
© 2004 Carpenter Technology Corporation
Slide 8
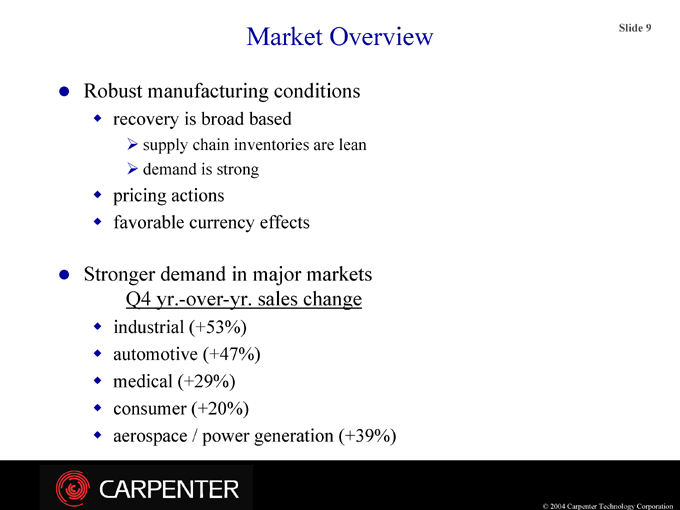
Market Overview
Robust manufacturing conditions
recovery is broad based
supply chain inventories are lean demand is strong
pricing actions
favorable currency effects
Stronger demand in major markets Q4 yr.-over-yr. sales change
industrial (+53%) automotive (+47%) medical (+29%) consumer (+20%)
aerospace / power generation (+39%)
© 2004 Carpenter Technology Corporation
Slide 9
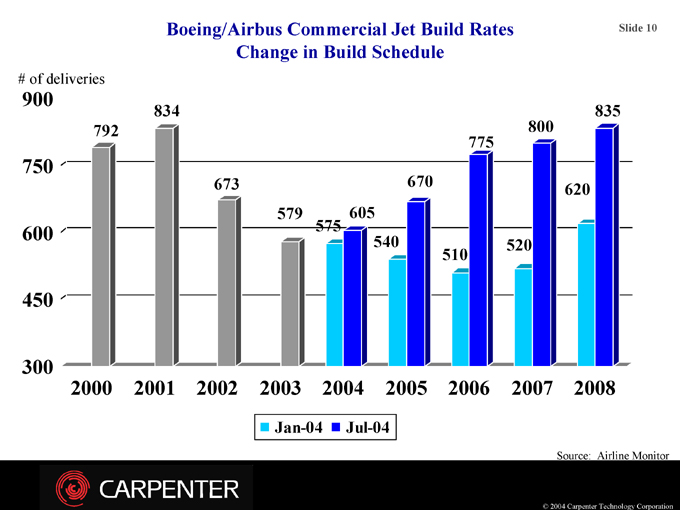
Boeing/Airbus Commercial Jet Build Rates Change in Build Schedule
# of deliveries
900 750 600 450 300
2000 2001 2002 2003 2004 2005 2006 2007 2008
792
834
673
579
575
605
540
670
510
775
520
800
620
835
Jan-04 Jul-04
Source: Airline Monitor
© 2004 Carpenter Technology Corporation
Slide 10
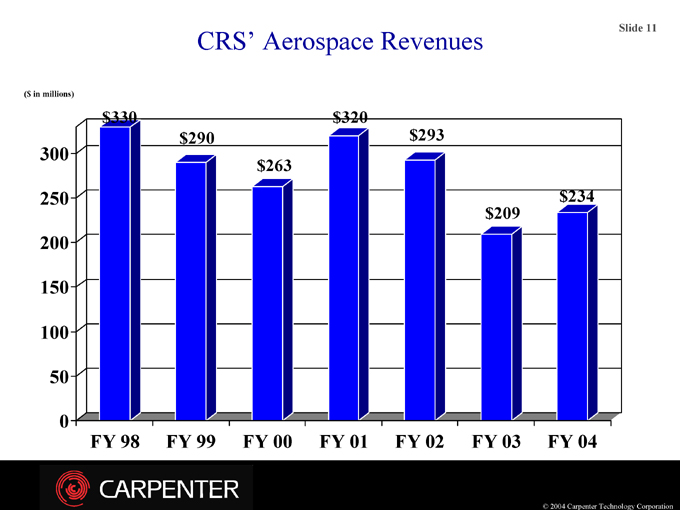
CRS’ Aerospace Revenues
($ in millions)
300 250 200 150 100 50 0
FY 98 FY 99 FY 00 FY 01 FY 02 FY 03 FY 04 $330 $290 $263 $320 $293 $209 $234
© 2004 Carpenter Technology Corporation
Slide 11
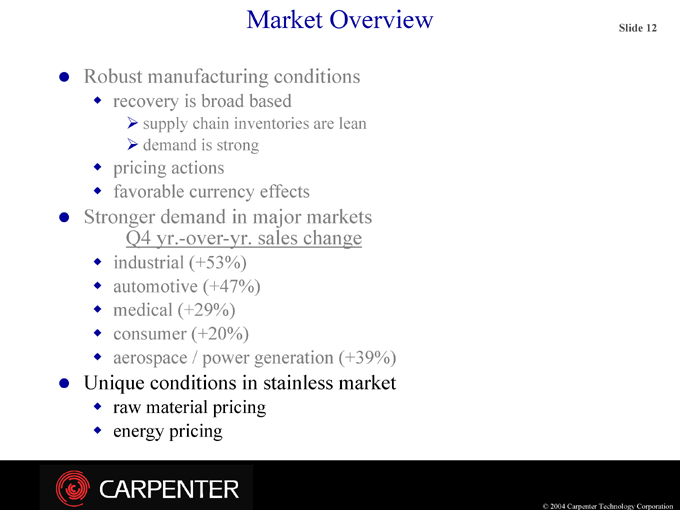
Market Overview
Robust manufacturing conditions
recovery is broad based
supply chain inventories are lean demand is strong
pricing actions
favorable currency effects
Stronger demand in major markets Q4 yr.-over-yr. sales change
industrial (+53%) automotive (+47%) medical (+29%) consumer (+20%)
aerospace / power generation (+39%)
Unique conditions in stainless market
raw material pricing energy pricing
© 2004 Carpenter Technology Corporation
Slide 12
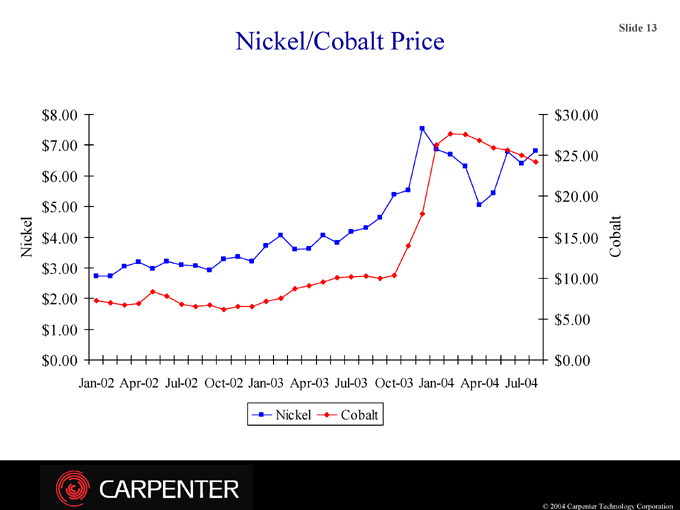
Nickel/Cobalt Price
Nickel $8.00 $7.00 $6.00 $5.00 $4.00 $3.00 $2.00 $1.00 $0.00
Jan-02 Apr-02 Jul-02 Oct-02 Jan-03 Apr-03 Jul-03 Oct-03 Jan-04 Apr-04 Jul-04 $30.00 $25.00 $20.00 $15.00 $10.00 $5.00 $0.00
Cobalt
Nickel Cobalt
© 2004 Carpenter Technology Corporation
Slide 13
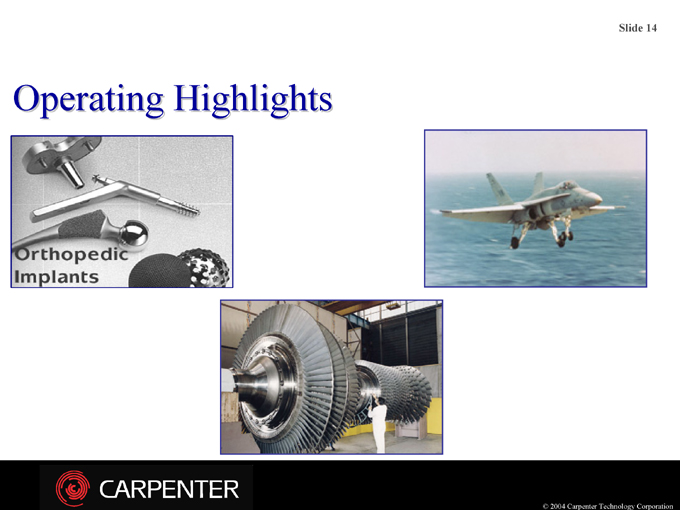
Operating Highlights
© 2004 Carpenter Technology Corporation
Slide 14
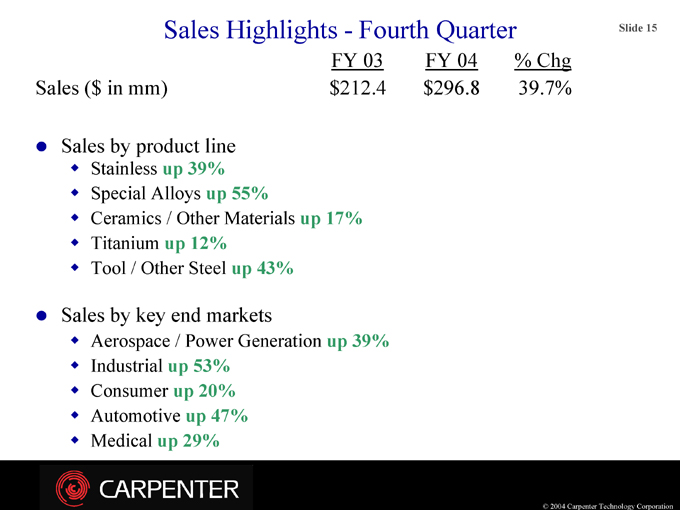
Sales Highlights - Fourth Quarter
FY 03 FY 04 % Chg
Sales ($ in mm) $212.4 $296.8 39.7%
Sales by product line
Stainless up 39% Special Alloys up 55%
Ceramics / Other Materials up 17% Titanium up 12% Tool / Other Steel up 43%
Sales by key end markets
Aerospace / Power Generation up 39% Industrial up 53% Consumer up 20% Automotive up 47% Medical up 29%
© 2004 Carpenter Technology Corporation
Slide 15
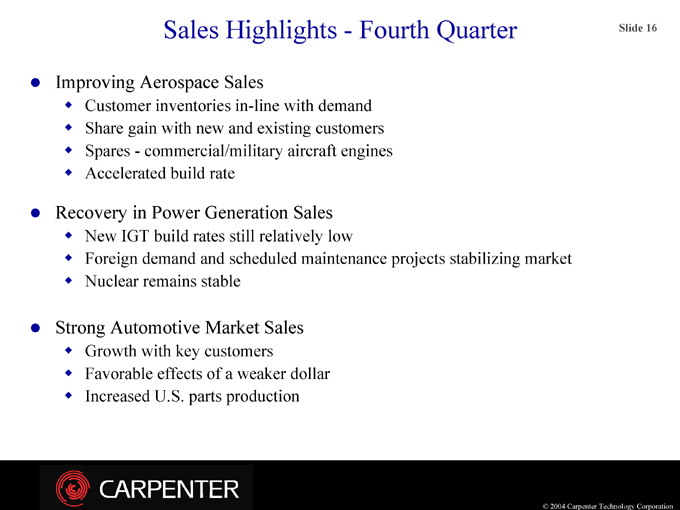
Sales Highlights - Fourth Quarter
Improving Aerospace Sales
Customer inventories in-line with demand Share gain with new and existing customers Spares - commercial/military aircraft engines Accelerated build rate
Recovery in Power Generation Sales
New IGT build rates still relatively low
Foreign demand and scheduled maintenance projects stabilizing market Nuclear remains stable
Strong Automotive Market Sales
Growth with key customers Favorable effects of a weaker dollar Increased U.S. parts production
© 2004 Carpenter Technology Corporation
Slide 16
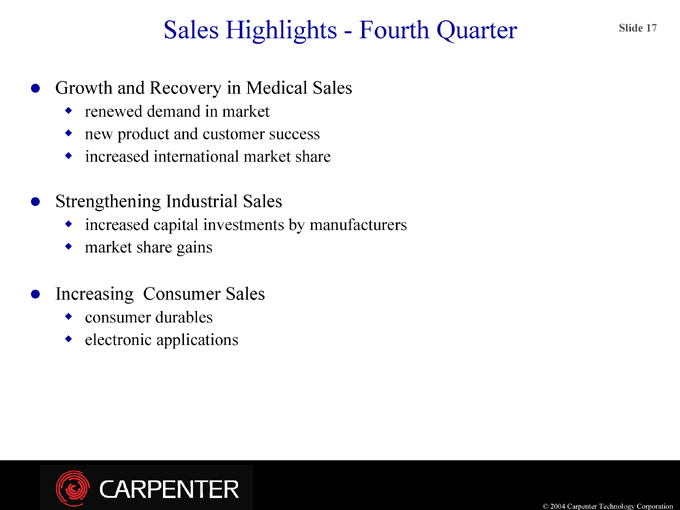
Sales Highlights - Fourth Quarter
Growth and Recovery in Medical Sales renewed demand in market new product and customer success increased international market share
Strengthening Industrial Sales increased capital investments by manufacturers market share gains
Increasing Consumer Sales consumer durables electronic applications
© 2004 Carpenter Technology Corporation
Slide 17
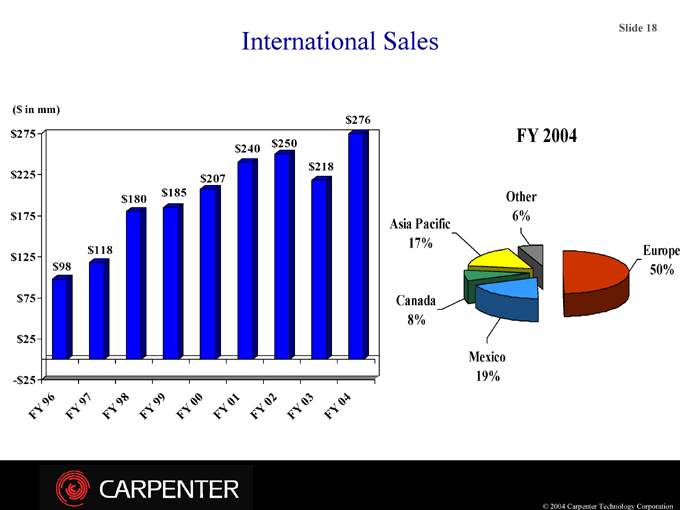
International Sales
($ in mm) $275 $225 $175 $125 $75 $25
-$25
FY 04
FY 96
FY 97
FY 98
FY 99
FY 00
FY 01
FY 02
FY 03
$98 $118 $180 $185 $207 $240 $250
$218 $276
Asia Pacific 17%
Other 6%
Europe 50%
Canada 8%
Mexico 19%
FY 2004
© 2004 Carpenter Technology Corporation
Slide 18
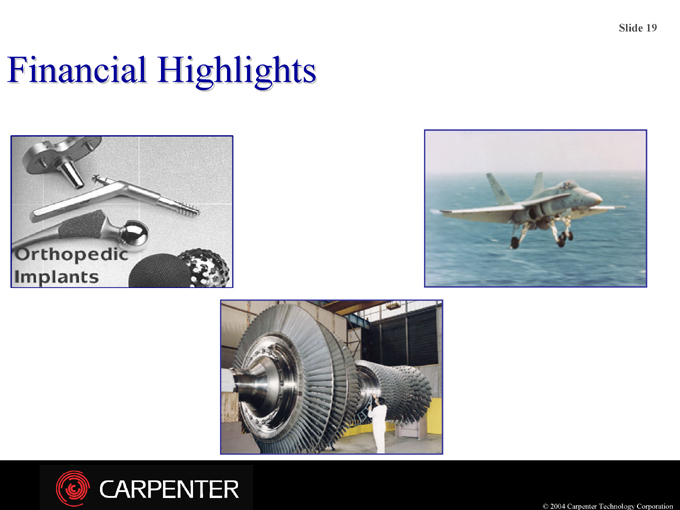
Financial Highlights
© 2004 Carpenter Technology Corporation
Slide 19
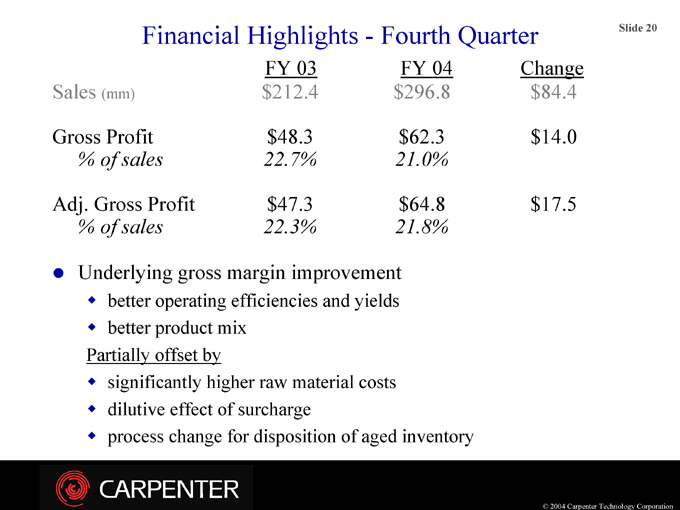
Financial Highlights - - Fourth Quarter
FY 03 FY 04 Change Sales (mm) $212.4 $296.8 $84.4
Gross Profit $48.3 $62.3 $14.0
% of sales 22.7% 21.0%
Adj. Gross Profit $47.3 $64.8 $17.5
% of sales 22.3% 21.8%
Underlying gross margin improvement better operating efficiencies and yields better product mix
Partially offset by significantly higher raw material costs dilutive effect of surcharge process change for disposition of aged inventory
© 2004 Carpenter Technology Corporation
Slide 20
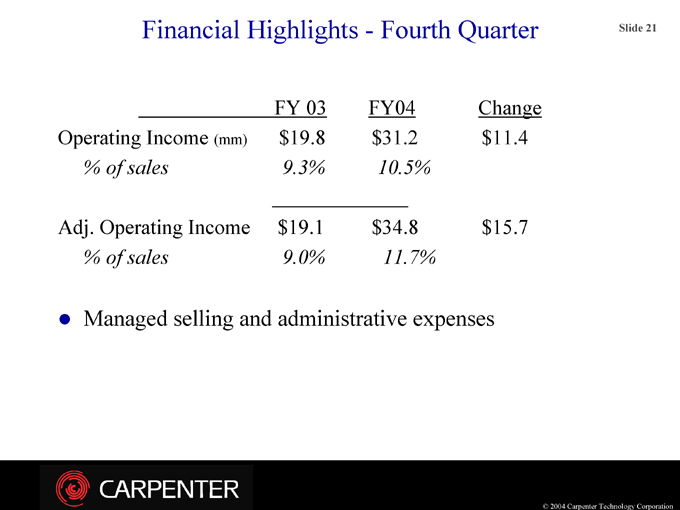
Financial Highlights - - Fourth Quarter
FY 03 FY04
Change Operating Income (mm) $19.8 $31.2 $11.4
% of sales 9.3% 10.5%
Adj. Operating Income $19.1 $34.8 $15.7
% of sales 9.0% 11.7%
Managed selling and administrative expenses
© 2004 Carpenter Technology Corporation
Slide 21
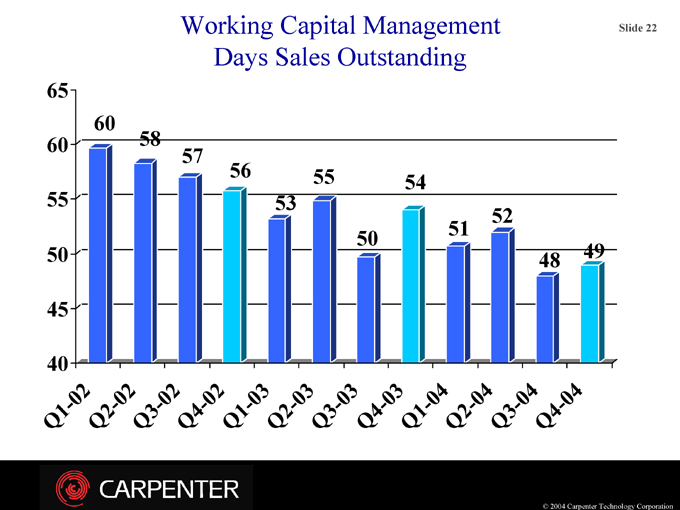
Working Capital Management Days Sales Outstanding
65 60 55 50 45 40
Q1-02 Q2-02 Q3-02 Q4-02 Q1-03 Q2-03 Q3-03 Q4-03 Q1-04 Q2-04 Q3-04 Q4-04
60
58
57
56
53
55
50
54
51
52
48
49
© 2004 Carpenter Technology Corporation
Slide 22
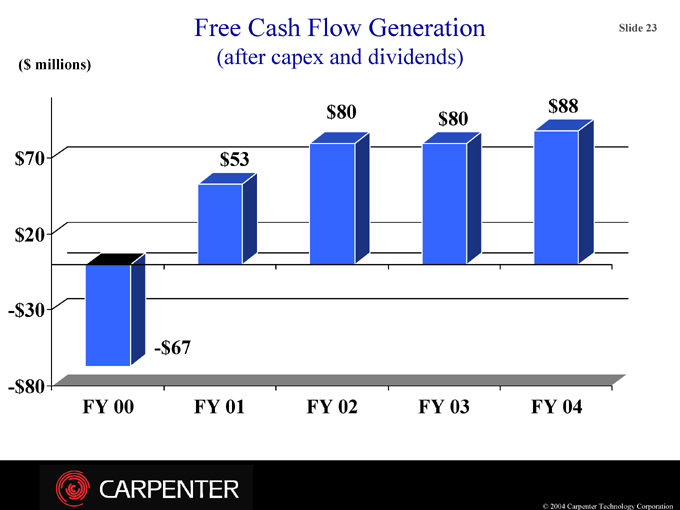
Free Cash Flow Generation
(after capex and dividends)
($ millions) $70
$20
-$30
-$80
FY 00 FY 01 FY 02 FY 03 FY 04
-$67 $53 $80 $80 $88
© 2004 Carpenter Technology Corporation
Slide 23
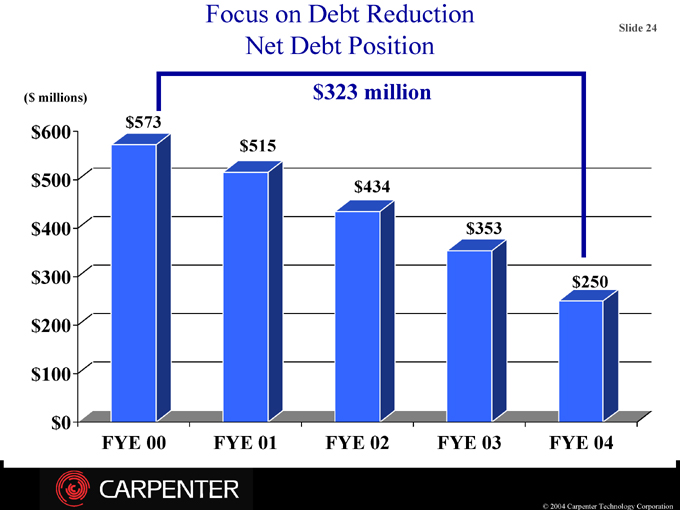
Focus on Debt Reduction Net Debt Position $323 million
($ millions)
$600 $500 $400 $300 $200 $100 $0
FYE 00 FYE 01 FYE 02 FYE 03 FYE 04 $573 $515 $434 $353 $250
© 2004 Carpenter Technology Corporation
Slide 24
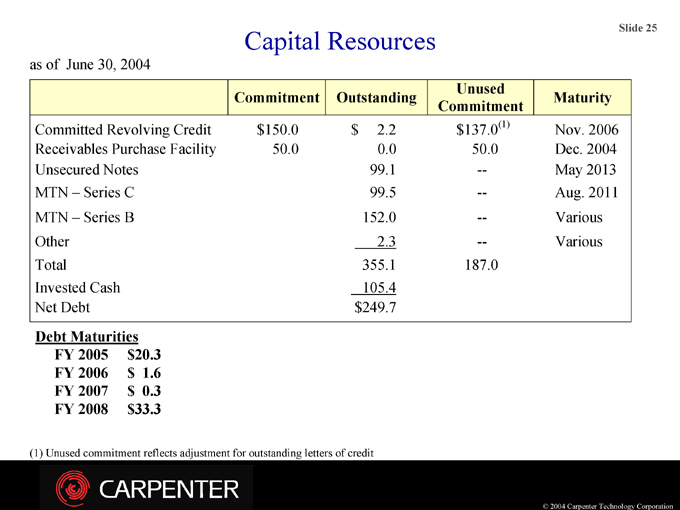
Capital Resources as of June 30, 2004
Commitment Outstanding Unused Commitment Maturity
Committed Revolving Credit $150.0 $2.2 $137.0(1) Nov. 2006 Receivables Purchase Facility 50.0 0.0 50.0 Dec. 2004 Unsecured Notes 99.1 — May 2013 MTN – Series C 99.5 — Aug. 2011 MTN – Series B 152.0 — Various Other 2.3 — Various Total 355.1 187.0 Invested Cash 105.4 Net Debt $249.7
Debt Maturities FY 2005 $20.3 FY 2006 $ 1.6 FY 2007 $ 0.3 FY 2008 $33.3
(1) Unused commitment reflects adjustment for outstanding letters of credit
© 2004 Carpenter Technology Corporation
Slide 25
Corporate Initiatives
© 2004 Carpenter Technology Corporation
Slide 26
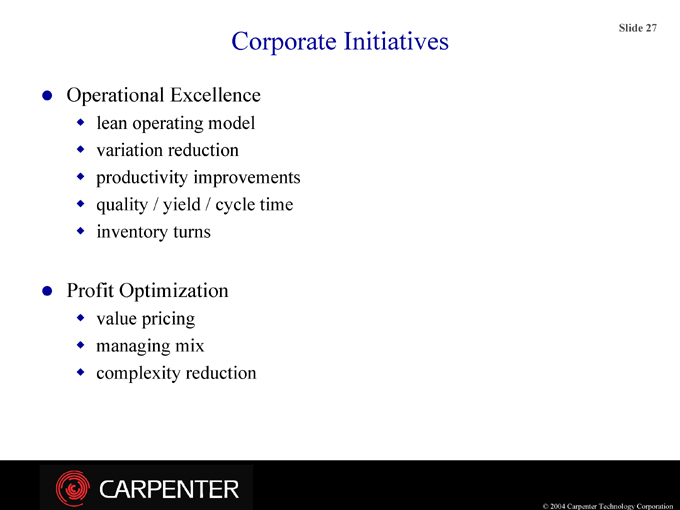
Corporate Initiatives
Operational Excellence
lean operating model variation reduction productivity improvements quality / yield / cycle time inventory turns
Profit Optimization
value pricing managing mix complexity reduction
© 2004 Carpenter Technology Corporation
Slide 27
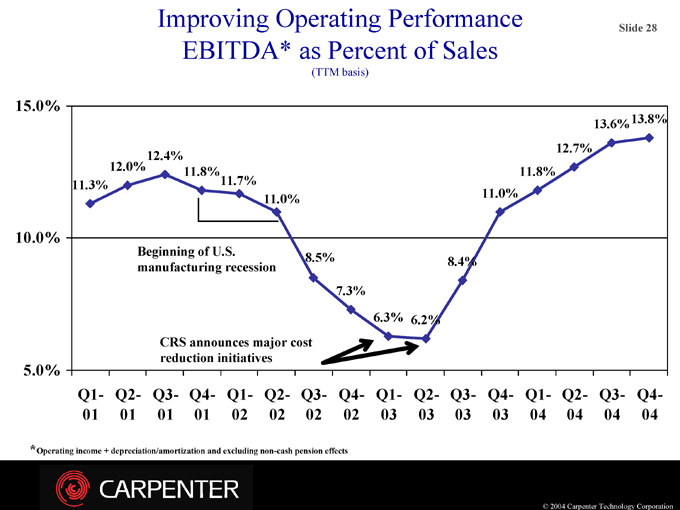
Improving Operating Performance EBITDA* as Percent of Sales
(TTM basis)
15.0% 10.0% 5.0%
Q1-01 Q2-01 Q3-01 Q4-01 Q1-02 Q2-02 Q3-02 Q4-02 Q1-03 Q2-03 Q3-03 Q4-03 Q1-04 Q2-04 Q3-04 Q4-04
11.3%
12.0%
12.4%
11.8%
11.7%
11.0%
8.5%
7.3%
6.3%
6.2%
8.4%
11.0%
11.8%
12.7%
13.6%
13.8%
* Operating income + depreciation/amortization and excluding non-cash pension effects
Beginning of U.S. manufacturing recession
CRS announces major cost reduction initiatives
© 2004 Carpenter Technology Corporation
Slide 28
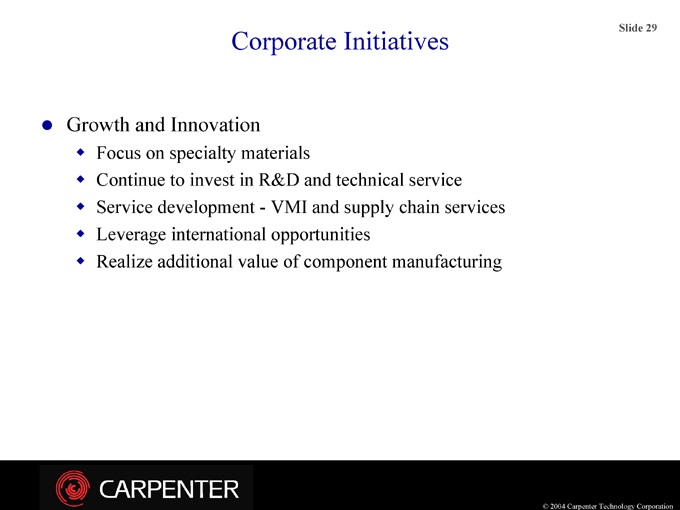
Corporate Initiatives
Growth and Innovation
Focus on specialty materials
Continue to invest in R&D and technical service Service development - VMI and supply chain services Leverage international opportunities Realize additional value of component manufacturing
© 2004 Carpenter Technology Corporation
Slide 29
Summary
Favorable economic conditions Aerospace market improving
Further cost reduction is necessary and possible Profit optimization Improve working capital turns Achieve financial goals. At a minimum,
12% operating margin 9% RONA
© 2004 Carpenter Technology Corporation
Slide 30