
Exhibit 99.1 O C T O B E R 2 2 , 2 0 2 0 CARPENTER TECHNOLOGY CORPORATION 1st Quarter Fiscal Year 2021 Earnings CallExhibit 99.1 O C T O B E R 2 2 , 2 0 2 0 CARPENTER TECHNOLOGY CORPORATION 1st Quarter Fiscal Year 2021 Earnings Call
Cautionary Statement Forward-looking statements This presentation contains forward-looking statements within the meaning of the Private Securities Litigation Act of 1995. These forward-looking statements are subject to risks and uncertainties that could cause actual results to differ from those projected, anticipated or implied. The most significant of these uncertainties are described in Carpenter Technology’s filings with the Securities and Exchange Commission, including its report on Form 10-K for the year ended June 30, 2020 and the exhibits attached to that filing. They include but are not limited to: (1) the cyclical nature of the specialty materials business and certain end-use markets, including aerospace, defense, medical, transportation, energy, industrial and consumer, or other influences on Carpenter Technology’s business such as new competitors, the consolidation of competitors, customers, and suppliers or the transfer of manufacturing capacity from the United States to foreign countries; (2) the ability of Carpenter Technology to achieve cash generation, growth, earnings, profitability, operating income, cost savings and reductions, qualifications, productivity improvements or process changes; (3) the ability to recoup increases in the cost of energy, raw materials, freight or other factors; (4) domestic and foreign excess manufacturing capacity for certain metals; (5) fluctuations in currency exchange rates; (6) the effect of government trade actions; (7) the valuation of the assets and liabilities in Carpenter Technology’s pension trusts and the accounting for pension plans; (8) possible labor disputes or work stoppages; (9) the potential that our customers may substitute alternate materials or adopt different manufacturing practices that replace or limit the suitability of our products; (10) the ability to successfully acquire and integrate acquisitions; (11) the availability of credit facilities to Carpenter Technology, its customers or other members of the supply chain; (12) the ability to obtain energy or raw materials, especially from suppliers located in countries that may be subject to unstable political or economic conditions; (13) Carpenter Technology’s manufacturing processes are dependent upon highly specialized equipment located primarily in facilities in Reading and Latrobe, Pennsylvania and Athens, Alabama for which there may be limited alternatives if there are significant equipment failures or a catastrophic event; (14) the ability to hire and retain key personnel, including members of the executive management team, management, metallurgists and other skilled personnel; (15) fluctuations in oil and gas prices and production; (16) uncertainty regarding the return to service of the Boeing 737 MAX aircraft and the related supply chain disruption; (17) potential impacts of the COVID-19 pandemic on our operations, financial results and financial position; (18) our efforts and efforts by governmental authorities to mitigate the COVID-19 pandemic, such as travel bans, shelter in place orders and business closures, and the related impact on resource allocations and manufacturing and supply chains; (19) our status as a “critical”, “essential” or “life-sustaining” business in light of COVID-19 business closure laws, orders and guidance being challenged by a governmental body or other applicable authority; (20) our ability to execute our business continuity, operational, budget and fiscal plans in light of the COVID-19 pandemic; and (21) our ability to successfully carry out restructuring and business exit activities on the expected terms and timelines. Any of these factors could have an adverse and/or fluctuating effect on Carpenter Technology’s results of operations. The forward-looking statements in this document are intended to be subject to the safe harbor protection provided by Section 27A of the Securities Act of 1933, as amended (the “Securities Act”), and Section 21E of the Securities Exchange Act of 1934, as amended. Carpenter Technology undertakes no obligation to update or revise any forward-looking statements. Non-GAAP financial measures Some of the information included in this presentation is derived from Carpenter Technology's consolidated financial information but is not presented in Carpenter Technology's financial statements prepared in accordance with U.S. Generally Accepted Accounting Principles (GAAP). Certain of these data are considered “non-GAAP financial measures” under SEC rules. These non-GAAP financial measures supplement our GAAP disclosures and should not be considered an alternative to the GAAP measure. Reconciliations to the most directly comparable GAAP financial measures and management’s rationale for the use of the non-GAAP financial measures can be found in the Appendix to this presentation. © 2020 CRS Holdings Inc. All rights reserved. 2Cautionary Statement Forward-looking statements This presentation contains forward-looking statements within the meaning of the Private Securities Litigation Act of 1995. These forward-looking statements are subject to risks and uncertainties that could cause actual results to differ from those projected, anticipated or implied. The most significant of these uncertainties are described in Carpenter Technology’s filings with the Securities and Exchange Commission, including its report on Form 10-K for the year ended June 30, 2020 and the exhibits attached to that filing. They include but are not limited to: (1) the cyclical nature of the specialty materials business and certain end-use markets, including aerospace, defense, medical, transportation, energy, industrial and consumer, or other influences on Carpenter Technology’s business such as new competitors, the consolidation of competitors, customers, and suppliers or the transfer of manufacturing capacity from the United States to foreign countries; (2) the ability of Carpenter Technology to achieve cash generation, growth, earnings, profitability, operating income, cost savings and reductions, qualifications, productivity improvements or process changes; (3) the ability to recoup increases in the cost of energy, raw materials, freight or other factors; (4) domestic and foreign excess manufacturing capacity for certain metals; (5) fluctuations in currency exchange rates; (6) the effect of government trade actions; (7) the valuation of the assets and liabilities in Carpenter Technology’s pension trusts and the accounting for pension plans; (8) possible labor disputes or work stoppages; (9) the potential that our customers may substitute alternate materials or adopt different manufacturing practices that replace or limit the suitability of our products; (10) the ability to successfully acquire and integrate acquisitions; (11) the availability of credit facilities to Carpenter Technology, its customers or other members of the supply chain; (12) the ability to obtain energy or raw materials, especially from suppliers located in countries that may be subject to unstable political or economic conditions; (13) Carpenter Technology’s manufacturing processes are dependent upon highly specialized equipment located primarily in facilities in Reading and Latrobe, Pennsylvania and Athens, Alabama for which there may be limited alternatives if there are significant equipment failures or a catastrophic event; (14) the ability to hire and retain key personnel, including members of the executive management team, management, metallurgists and other skilled personnel; (15) fluctuations in oil and gas prices and production; (16) uncertainty regarding the return to service of the Boeing 737 MAX aircraft and the related supply chain disruption; (17) potential impacts of the COVID-19 pandemic on our operations, financial results and financial position; (18) our efforts and efforts by governmental authorities to mitigate the COVID-19 pandemic, such as travel bans, shelter in place orders and business closures, and the related impact on resource allocations and manufacturing and supply chains; (19) our status as a “critical”, “essential” or “life-sustaining” business in light of COVID-19 business closure laws, orders and guidance being challenged by a governmental body or other applicable authority; (20) our ability to execute our business continuity, operational, budget and fiscal plans in light of the COVID-19 pandemic; and (21) our ability to successfully carry out restructuring and business exit activities on the expected terms and timelines. Any of these factors could have an adverse and/or fluctuating effect on Carpenter Technology’s results of operations. The forward-looking statements in this document are intended to be subject to the safe harbor protection provided by Section 27A of the Securities Act of 1933, as amended (the “Securities Act”), and Section 21E of the Securities Exchange Act of 1934, as amended. Carpenter Technology undertakes no obligation to update or revise any forward-looking statements. Non-GAAP financial measures Some of the information included in this presentation is derived from Carpenter Technology's consolidated financial information but is not presented in Carpenter Technology's financial statements prepared in accordance with U.S. Generally Accepted Accounting Principles (GAAP). Certain of these data are considered “non-GAAP financial measures” under SEC rules. These non-GAAP financial measures supplement our GAAP disclosures and should not be considered an alternative to the GAAP measure. Reconciliations to the most directly comparable GAAP financial measures and management’s rationale for the use of the non-GAAP financial measures can be found in the Appendix to this presentation. © 2020 CRS Holdings Inc. All rights reserved. 2

1ST QUARTER FISCAL YEAR 2021 Tony Thene | President and Chief Executive Officer 31ST QUARTER FISCAL YEAR 2021 Tony Thene | President and Chief Executive Officer 3

Safety is Our Highest Value Total Case Incident Rate (TCIR) 3.9 3.7 3.3 2.2 2.1 2.0 1.3 1.2 1.1 0.4 FY12 FY13 FY14 FY15 FY16 FY17 FY18 FY19 FY20 FY21 YTD © 2020 CRS Holdings Inc. All rights reserved. 4Safety is Our Highest Value Total Case Incident Rate (TCIR) 3.9 3.7 3.3 2.2 2.1 2.0 1.3 1.2 1.1 0.4 FY12 FY13 FY14 FY15 FY16 FY17 FY18 FY19 FY20 FY21 YTD © 2020 CRS Holdings Inc. All rights reserved. 4

1st Quarter Summary • As anticipated, performance impacted by volume headwinds, continued targeted inventory reduction and COVID-19 related costs • Generated $63 million of free cash flow; completed bond offering to Near-term Revenue and Cost extend maturities profile and increase liquidity; total liquidity Headwinds Related to COVID- position of $613 million including $219 million of cash 19; Continuing to Strengthen Liquidity Position and Ensuring • Completed divestiture of Amega West oil & gas business; executing Commitment to Delivering additional restructuring activities to streamline operations and Long-Term Sustainable Growth reduce cost • Continued progress with qualification process at Athens facility • Launched Carpenter Electrification brand to capitalize on solutions portfolio and disruptive potential of electrification across end-use markets © 2020 CRS Holdings Inc. All rights reserved. 51st Quarter Summary • As anticipated, performance impacted by volume headwinds, continued targeted inventory reduction and COVID-19 related costs • Generated $63 million of free cash flow; completed bond offering to Near-term Revenue and Cost extend maturities profile and increase liquidity; total liquidity Headwinds Related to COVID- position of $613 million including $219 million of cash 19; Continuing to Strengthen Liquidity Position and Ensuring • Completed divestiture of Amega West oil & gas business; executing Commitment to Delivering additional restructuring activities to streamline operations and Long-Term Sustainable Growth reduce cost • Continued progress with qualification process at Athens facility • Launched Carpenter Electrification brand to capitalize on solutions portfolio and disruptive potential of electrification across end-use markets © 2020 CRS Holdings Inc. All rights reserved. 5
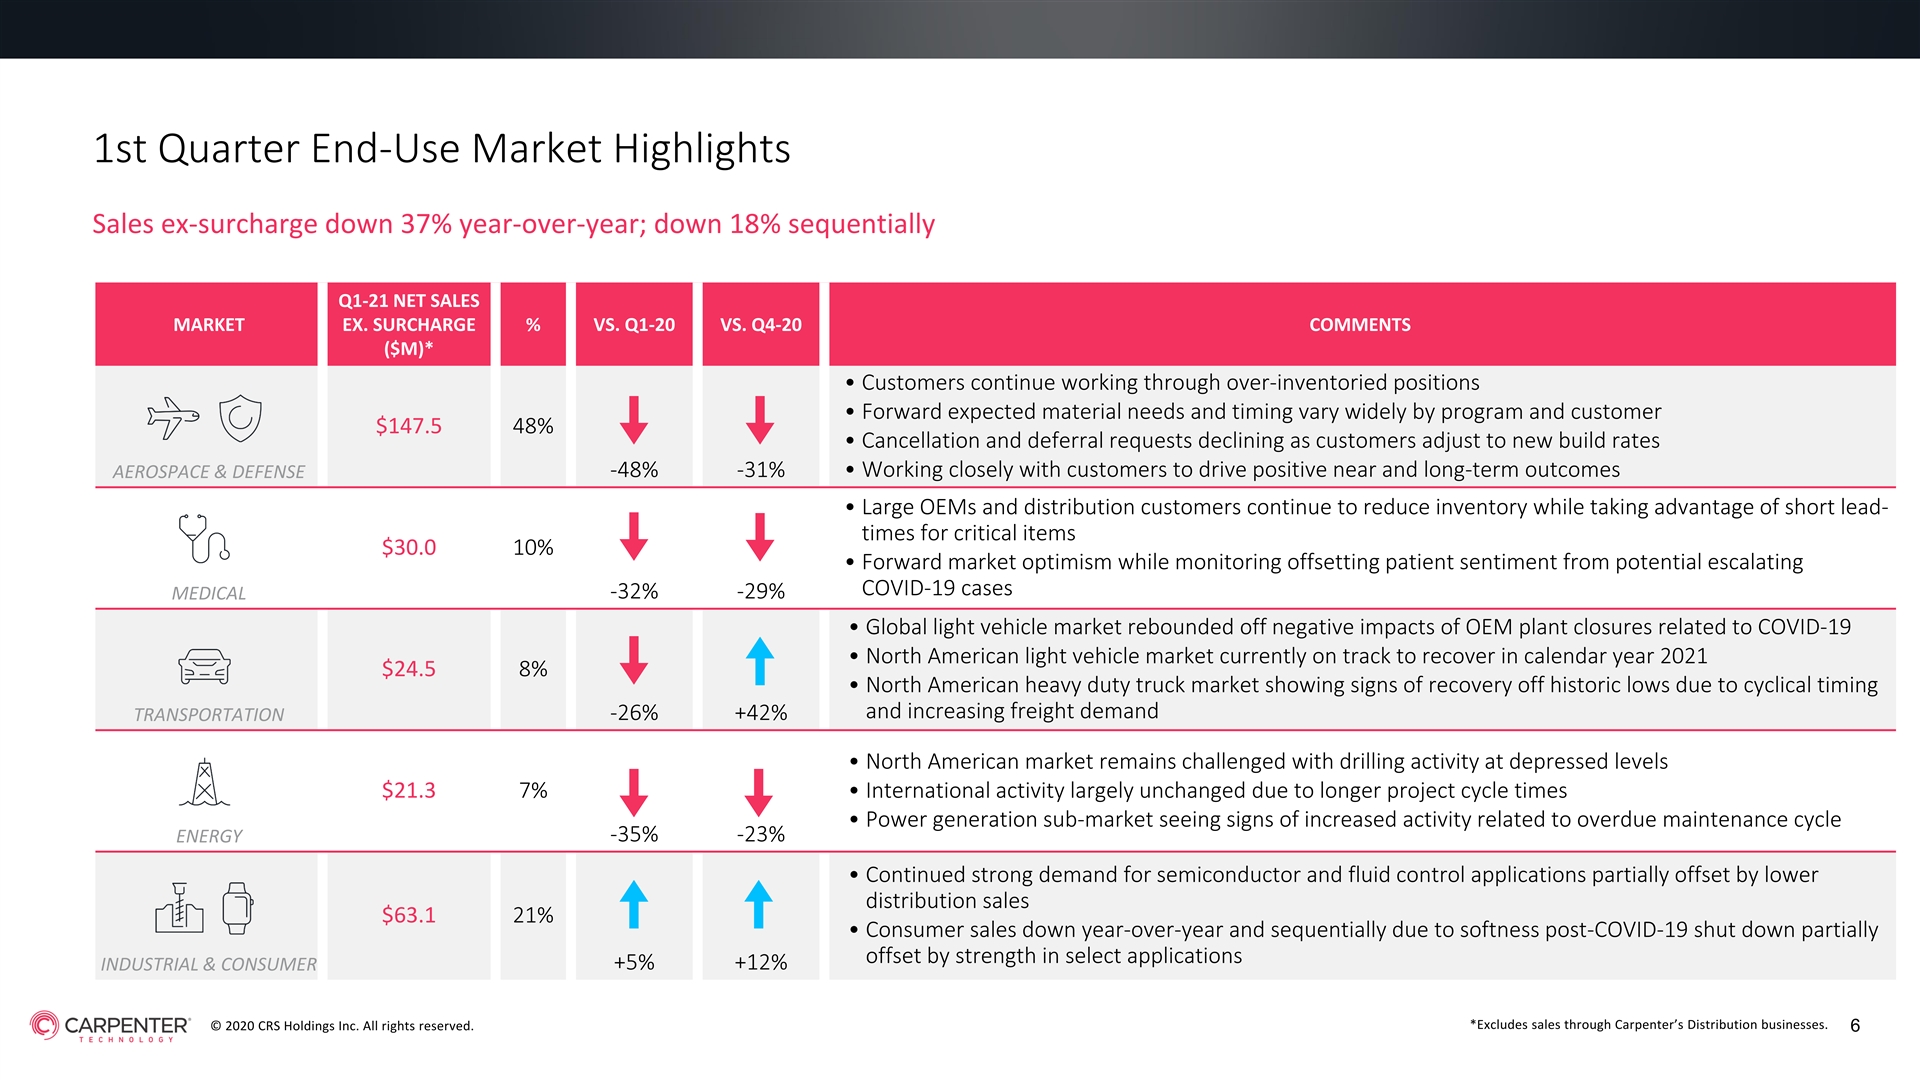
1st Quarter End-Use Market Highlights Sales ex-surcharge down 37% year-over-year; down 18% sequentially Q1-21 NET SALES MARKET EX. SURCHARGE % VS. Q1-20 VS. Q4-20 COMMENTS ($M)* • Customers continue working through over-inventoried positions • Forward expected material needs and timing vary widely by program and customer $147.5 48% • Cancellation and deferral requests declining as customers adjust to new build rates -48% -31%• Working closely with customers to drive positive near and long-term outcomes AEROSPACE & DEFENSE • Large OEMs and distribution customers continue to reduce inventory while taking advantage of short lead- times for critical items $30.0 10% • Forward market optimism while monitoring offsetting patient sentiment from potential escalating COVID-19 cases -32% -29% MEDICAL • Global light vehicle market rebounded off negative impacts of OEM plant closures related to COVID-19 • North American light vehicle market currently on track to recover in calendar year 2021 $24.5 8% • North American heavy duty truck market showing signs of recovery off historic lows due to cyclical timing and increasing freight demand -26% +42% TRANSPORTATION • North American market remains challenged with drilling activity at depressed levels $21.3 7%• International activity largely unchanged due to longer project cycle times • Power generation sub-market seeing signs of increased activity related to overdue maintenance cycle -35% -23% ENERGY • Continued strong demand for semiconductor and fluid control applications partially offset by lower distribution sales $63.1 21% • Consumer sales down year-over-year and sequentially due to softness post-COVID-19 shut down partially offset by strength in select applications +5% +12% INDUSTRIAL & CONSUMER *Excludes sales through Carpenter’s Distribution businesses. © 2020 CRS Holdings Inc. All rights reserved. 61st Quarter End-Use Market Highlights Sales ex-surcharge down 37% year-over-year; down 18% sequentially Q1-21 NET SALES MARKET EX. SURCHARGE % VS. Q1-20 VS. Q4-20 COMMENTS ($M)* • Customers continue working through over-inventoried positions • Forward expected material needs and timing vary widely by program and customer $147.5 48% • Cancellation and deferral requests declining as customers adjust to new build rates -48% -31%• Working closely with customers to drive positive near and long-term outcomes AEROSPACE & DEFENSE • Large OEMs and distribution customers continue to reduce inventory while taking advantage of short lead- times for critical items $30.0 10% • Forward market optimism while monitoring offsetting patient sentiment from potential escalating COVID-19 cases -32% -29% MEDICAL • Global light vehicle market rebounded off negative impacts of OEM plant closures related to COVID-19 • North American light vehicle market currently on track to recover in calendar year 2021 $24.5 8% • North American heavy duty truck market showing signs of recovery off historic lows due to cyclical timing and increasing freight demand -26% +42% TRANSPORTATION • North American market remains challenged with drilling activity at depressed levels $21.3 7%• International activity largely unchanged due to longer project cycle times • Power generation sub-market seeing signs of increased activity related to overdue maintenance cycle -35% -23% ENERGY • Continued strong demand for semiconductor and fluid control applications partially offset by lower distribution sales $63.1 21% • Consumer sales down year-over-year and sequentially due to softness post-COVID-19 shut down partially offset by strength in select applications +5% +12% INDUSTRIAL & CONSUMER *Excludes sales through Carpenter’s Distribution businesses. © 2020 CRS Holdings Inc. All rights reserved. 6

1ST QUARTER FISCAL YEAR 2021 FINANCIAL OVERVIEW AND BUSINESS UPDATE Tim Lain | Senior Vice President and Chief Financial Officer 71ST QUARTER FISCAL YEAR 2021 FINANCIAL OVERVIEW AND BUSINESS UPDATE Tim Lain | Senior Vice President and Chief Financial Officer 7

Income Statement Summary As anticipated, profitability impacted by lower volume and focused efforts to reduce inventory to further strengthen liquidity SEQUENTIAL YEAR-OVER- $ in Millions, except pounds and per-share amounts Q1-20 Q4-20 Q1-21 CHANGE YEAR CHANGE Pounds ('000) 62,298 48,002 44,348 (3,654) (17,950) Net Sales 585.4 437.3 353.3 (84.0) (232.1) Net Sales ex. Surcharge Revenue* 486.6 375.9 307.2 (68.7) (179.4) Gross Profit 112.6 23.9 3.5 (20.4) (109.1) Selling, General and Administrative Expenses 52.8 42.0 42.3 0.3 (10.5) Restructuring and asset impairment charges 0.0 130.1 10.0 (120.1) 10.0 Operating Income (Loss) 59.8 (148.2) (48.8) 99.4 (108.6) Operating Income (Loss) ex. Special Items* 59.8 (10.7) (30.9) (20.2) (90.7) % of Net Sales ex. Surcharge Revenue* 12.3% -2.8% -10.1% -7.3 pts -22.4 pts Effective Tax Rate 23.8% 20.2% 28.6% +8.4 pts +4.8 pts Net Income (Loss) 41.2 (118.4) (47.1) 71.3 (88.3) Diluted Earnings (Loss) per Share $0.85 ($2.46) ($0.98) $1.48 ($1.83) Adjusted Diluted Earnings (Loss) per Share* $0.85 ($0.19) ($0.58) ($0.39) ($1.43) © 2020 CRS Holdings Inc. All rights reserved. *Detailed schedule included in Non-GAAP Schedules in Appendix. 8Income Statement Summary As anticipated, profitability impacted by lower volume and focused efforts to reduce inventory to further strengthen liquidity SEQUENTIAL YEAR-OVER- $ in Millions, except pounds and per-share amounts Q1-20 Q4-20 Q1-21 CHANGE YEAR CHANGE Pounds ('000) 62,298 48,002 44,348 (3,654) (17,950) Net Sales 585.4 437.3 353.3 (84.0) (232.1) Net Sales ex. Surcharge Revenue* 486.6 375.9 307.2 (68.7) (179.4) Gross Profit 112.6 23.9 3.5 (20.4) (109.1) Selling, General and Administrative Expenses 52.8 42.0 42.3 0.3 (10.5) Restructuring and asset impairment charges 0.0 130.1 10.0 (120.1) 10.0 Operating Income (Loss) 59.8 (148.2) (48.8) 99.4 (108.6) Operating Income (Loss) ex. Special Items* 59.8 (10.7) (30.9) (20.2) (90.7) % of Net Sales ex. Surcharge Revenue* 12.3% -2.8% -10.1% -7.3 pts -22.4 pts Effective Tax Rate 23.8% 20.2% 28.6% +8.4 pts +4.8 pts Net Income (Loss) 41.2 (118.4) (47.1) 71.3 (88.3) Diluted Earnings (Loss) per Share $0.85 ($2.46) ($0.98) $1.48 ($1.83) Adjusted Diluted Earnings (Loss) per Share* $0.85 ($0.19) ($0.58) ($0.39) ($1.43) © 2020 CRS Holdings Inc. All rights reserved. *Detailed schedule included in Non-GAAP Schedules in Appendix. 8
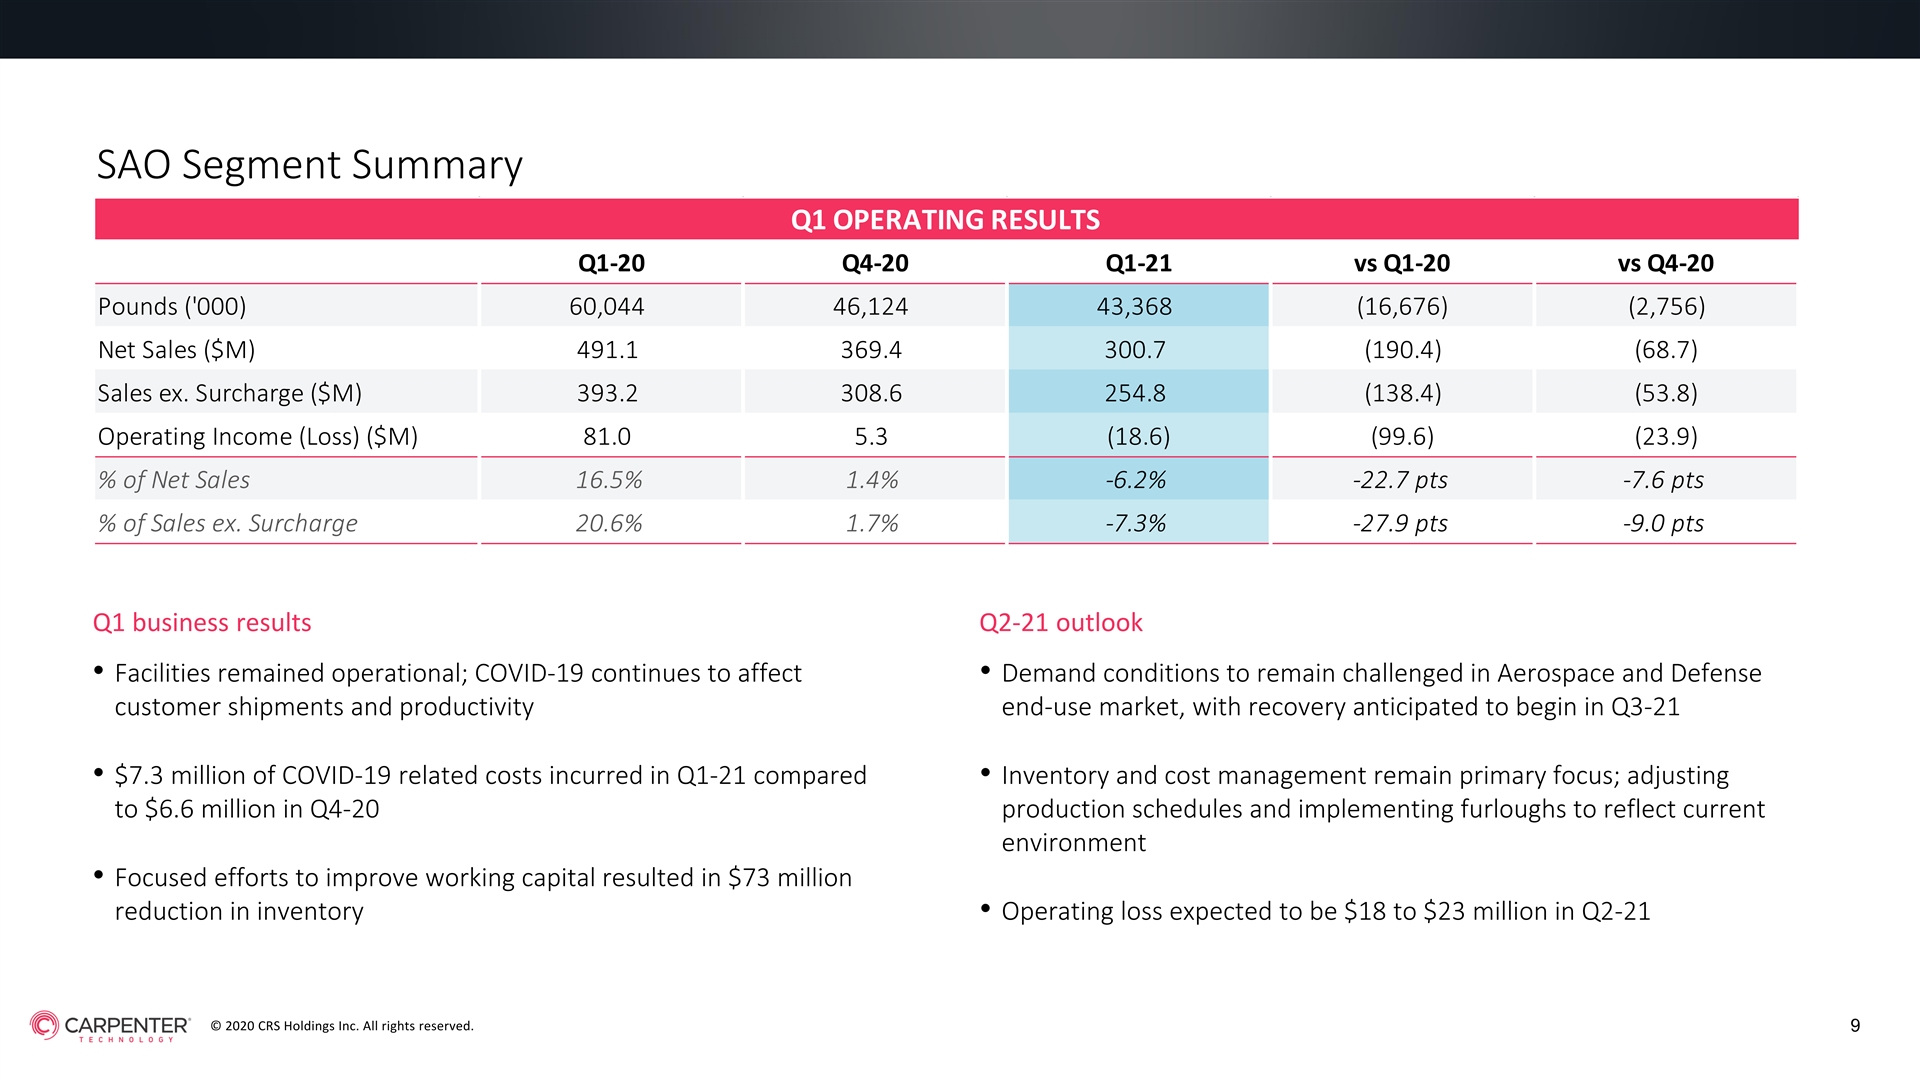
SAO Segment Summary Q1 OPERATING RESULTS Q1-20 Q4-20 Q1-21 vs Q1-20 vs Q4-20 Pounds ('000) 60,044 46,124 43,368 (16,676) (2,756) Net Sales ($M) 491.1 369.4 300.7 (190.4) (68.7) Sales ex. Surcharge ($M) 393.2 308.6 254.8 (138.4) (53.8) Operating Income (Loss) ($M) 81.0 5.3 (18.6) (99.6) (23.9) % of Net Sales 16.5% 1.4% -6.2% -22.7 pts -7.6 pts % of Sales ex. Surcharge 20.6% 1.7% -7.3% -27.9 pts -9.0 pts Q1 business results Q2-21 outlook • Facilities remained operational; COVID-19 continues to affect • Demand conditions to remain challenged in Aerospace and Defense customer shipments and productivity end-use market, with recovery anticipated to begin in Q3-21 • $7.3 million of COVID-19 related costs incurred in Q1-21 compared • Inventory and cost management remain primary focus; adjusting to $6.6 million in Q4-20 production schedules and implementing furloughs to reflect current environment • Focused efforts to improve working capital resulted in $73 million reduction in inventory• Operating loss expected to be $18 to $23 million in Q2-21 © 2020 CRS Holdings Inc. All rights reserved. 9SAO Segment Summary Q1 OPERATING RESULTS Q1-20 Q4-20 Q1-21 vs Q1-20 vs Q4-20 Pounds ('000) 60,044 46,124 43,368 (16,676) (2,756) Net Sales ($M) 491.1 369.4 300.7 (190.4) (68.7) Sales ex. Surcharge ($M) 393.2 308.6 254.8 (138.4) (53.8) Operating Income (Loss) ($M) 81.0 5.3 (18.6) (99.6) (23.9) % of Net Sales 16.5% 1.4% -6.2% -22.7 pts -7.6 pts % of Sales ex. Surcharge 20.6% 1.7% -7.3% -27.9 pts -9.0 pts Q1 business results Q2-21 outlook • Facilities remained operational; COVID-19 continues to affect • Demand conditions to remain challenged in Aerospace and Defense customer shipments and productivity end-use market, with recovery anticipated to begin in Q3-21 • $7.3 million of COVID-19 related costs incurred in Q1-21 compared • Inventory and cost management remain primary focus; adjusting to $6.6 million in Q4-20 production schedules and implementing furloughs to reflect current environment • Focused efforts to improve working capital resulted in $73 million reduction in inventory• Operating loss expected to be $18 to $23 million in Q2-21 © 2020 CRS Holdings Inc. All rights reserved. 9

PEP Segment Summary Q1 OPERATING RESULTS Q1-20 Q4-20 Q1-21 vs Q1-20 vs Q4-20 Pounds* ('000) 3,250 2,384 1,466 (1,784) (918) Net Sales ($M) 109.4 77.1 61.8 (47.6) (15.3) Sales ex. Surcharge ($M) 107.9 76.0 61.2 (46.7) (14.8) Operating Loss ($M) (2.0) (8.4) (3.6) (1.6) 4.8 % of Net Sales -1.8% -10.9% -5.8% -4.0 pts +5.1 pts % of Sales ex. Surcharge -1.9% -11.1% -5.9% -4.0pts +5.2 pts Q1 business results Q2-21 outlook • Headwinds across all end-use markets related to COVID-19 • Focus remains on cost control and working capital management as continuing to impact volume market headwinds persist in Q2-21 with recovery anticipated to begin in the second half of fiscal year 2021 • Amega West oil & gas business divestiture completed • Executing actions to reduce costs while maintaining approach to providing innovative solutions to customers • Realized benefits of cost and portfolio actions taken in fiscal year 2020 particularly in Additive business; additional actions taken to further streamline operations and reduce cost• Operating loss expected to be $3 to $5 million in Q2-21 © 2020 CRS Holdings Inc. All rights reserved. 10 * Pounds includes only Dynamet and Additive businessesPEP Segment Summary Q1 OPERATING RESULTS Q1-20 Q4-20 Q1-21 vs Q1-20 vs Q4-20 Pounds* ('000) 3,250 2,384 1,466 (1,784) (918) Net Sales ($M) 109.4 77.1 61.8 (47.6) (15.3) Sales ex. Surcharge ($M) 107.9 76.0 61.2 (46.7) (14.8) Operating Loss ($M) (2.0) (8.4) (3.6) (1.6) 4.8 % of Net Sales -1.8% -10.9% -5.8% -4.0 pts +5.1 pts % of Sales ex. Surcharge -1.9% -11.1% -5.9% -4.0pts +5.2 pts Q1 business results Q2-21 outlook • Headwinds across all end-use markets related to COVID-19 • Focus remains on cost control and working capital management as continuing to impact volume market headwinds persist in Q2-21 with recovery anticipated to begin in the second half of fiscal year 2021 • Amega West oil & gas business divestiture completed • Executing actions to reduce costs while maintaining approach to providing innovative solutions to customers • Realized benefits of cost and portfolio actions taken in fiscal year 2020 particularly in Additive business; additional actions taken to further streamline operations and reduce cost• Operating loss expected to be $3 to $5 million in Q2-21 © 2020 CRS Holdings Inc. All rights reserved. 10 * Pounds includes only Dynamet and Additive businesses
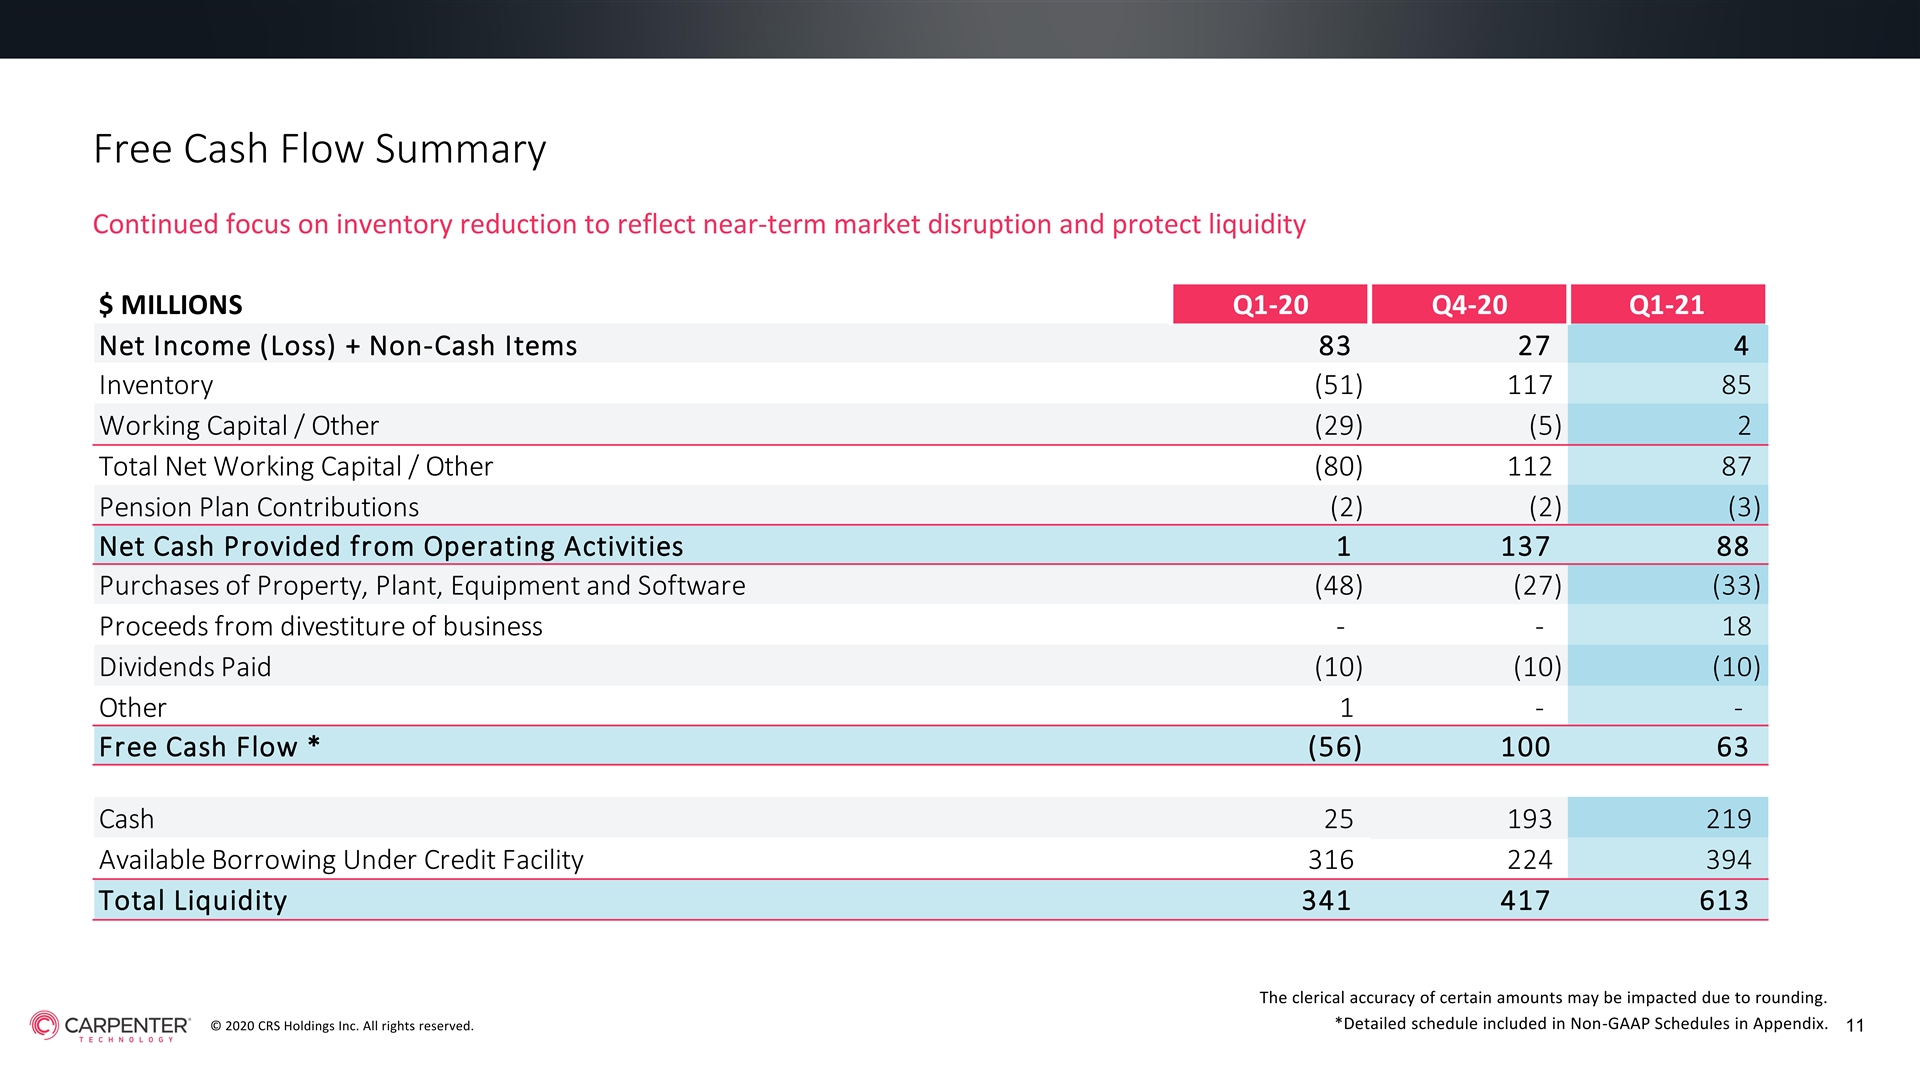
Free Cash Flow Summary Continued focus on inventory reduction to reflect near-term market disruption and protect liquidity $ MILLIONS Q1-20 Q4-20 Q1-21 Net Income (Loss) + Non-Cash Items 83 27 4 Inventory (51) 117 85 Working Capital / Other (29) (5) 2 Total Net Working Capital / Other (80) 112 87 Pension Plan Contributions ( 2) ( 2) (3) Net Cash Provided from Operating Activities 1 137 88 Purchases of Property, Plant, Equipment and Software (48) (27) (33) Proceeds from divestiture of business - - 18 Dividends Paid (10) (10) (10) Other 1 - - Free Cash Flow * (56) 100 63 Cash 25 193 219 Available Borrowing Under Credit Facility 316 224 394 Total Liquidity 341 417 613 The clerical accuracy of certain amounts may be impacted due to rounding. *Detailed schedule included in Non-GAAP Schedules in Appendix. © 2020 CRS Holdings Inc. All rights reserved. 11Free Cash Flow Summary Continued focus on inventory reduction to reflect near-term market disruption and protect liquidity $ MILLIONS Q1-20 Q4-20 Q1-21 Net Income (Loss) + Non-Cash Items 83 27 4 Inventory (51) 117 85 Working Capital / Other (29) (5) 2 Total Net Working Capital / Other (80) 112 87 Pension Plan Contributions ( 2) ( 2) (3) Net Cash Provided from Operating Activities 1 137 88 Purchases of Property, Plant, Equipment and Software (48) (27) (33) Proceeds from divestiture of business - - 18 Dividends Paid (10) (10) (10) Other 1 - - Free Cash Flow * (56) 100 63 Cash 25 193 219 Available Borrowing Under Credit Facility 316 224 394 Total Liquidity 341 417 613 The clerical accuracy of certain amounts may be impacted due to rounding. *Detailed schedule included in Non-GAAP Schedules in Appendix. © 2020 CRS Holdings Inc. All rights reserved. 11

1ST QUARTER FISCAL YEAR 2021 CLOSING COMMENTS Tony Thene | President and Chief Executive Officer 121ST QUARTER FISCAL YEAR 2021 CLOSING COMMENTS Tony Thene | President and Chief Executive Officer 12
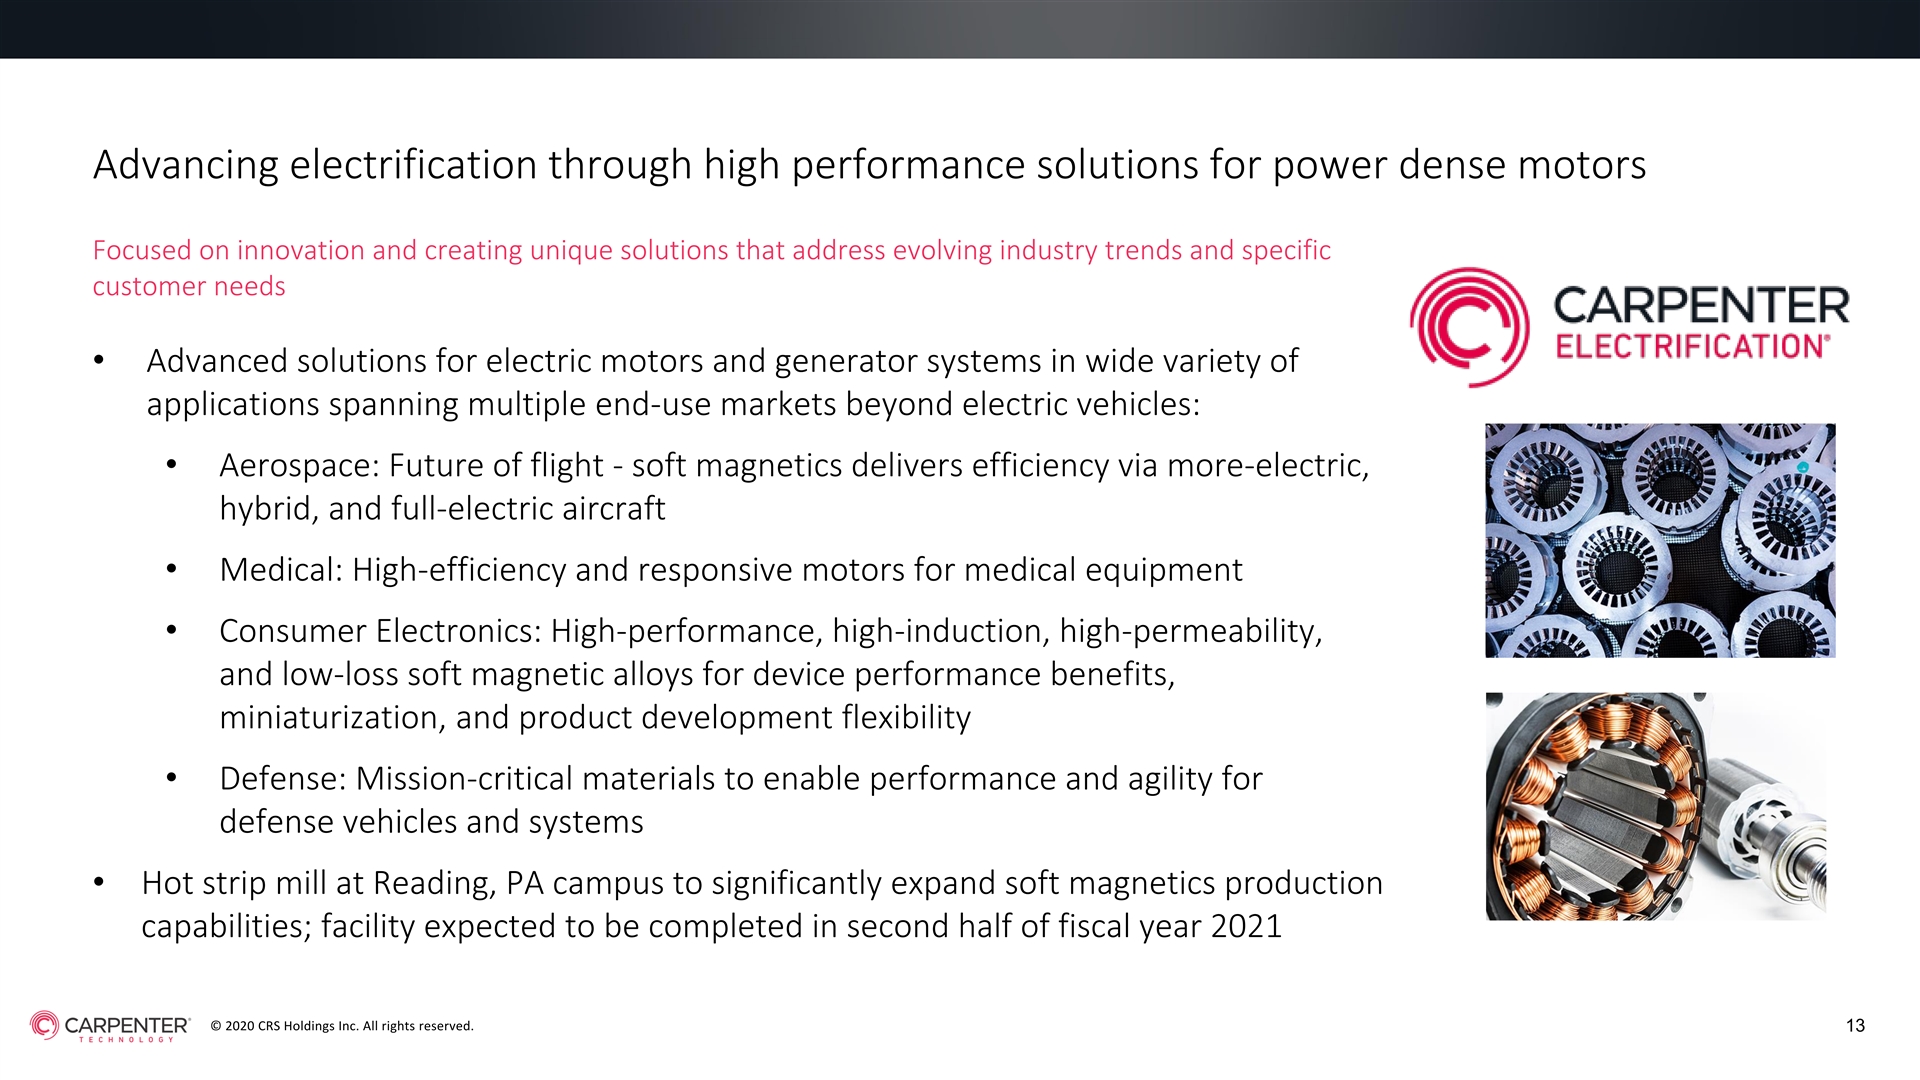
Advancing electrification through high performance solutions for power dense motors Focused on innovation and creating unique solutions that address evolving industry trends and specific customer needs • Advanced solutions for electric motors and generator systems in wide variety of applications spanning multiple end-use markets beyond electric vehicles: • Aerospace: Future of flight - soft magnetics delivers efficiency via more-electric, hybrid, and full-electric aircraft • Medical: High-efficiency and responsive motors for medical equipment • Consumer Electronics: High-performance, high-induction, high-permeability, and low-loss soft magnetic alloys for device performance benefits, miniaturization, and product development flexibility • Defense: Mission-critical materials to enable performance and agility for defense vehicles and systems • Hot strip mill at Reading, PA campus to significantly expand soft magnetics production capabilities; facility expected to be completed in second half of fiscal year 2021 © 2020 CRS Holdings Inc. All rights reserved. 13Advancing electrification through high performance solutions for power dense motors Focused on innovation and creating unique solutions that address evolving industry trends and specific customer needs • Advanced solutions for electric motors and generator systems in wide variety of applications spanning multiple end-use markets beyond electric vehicles: • Aerospace: Future of flight - soft magnetics delivers efficiency via more-electric, hybrid, and full-electric aircraft • Medical: High-efficiency and responsive motors for medical equipment • Consumer Electronics: High-performance, high-induction, high-permeability, and low-loss soft magnetic alloys for device performance benefits, miniaturization, and product development flexibility • Defense: Mission-critical materials to enable performance and agility for defense vehicles and systems • Hot strip mill at Reading, PA campus to significantly expand soft magnetics production capabilities; facility expected to be completed in second half of fiscal year 2021 © 2020 CRS Holdings Inc. All rights reserved. 13
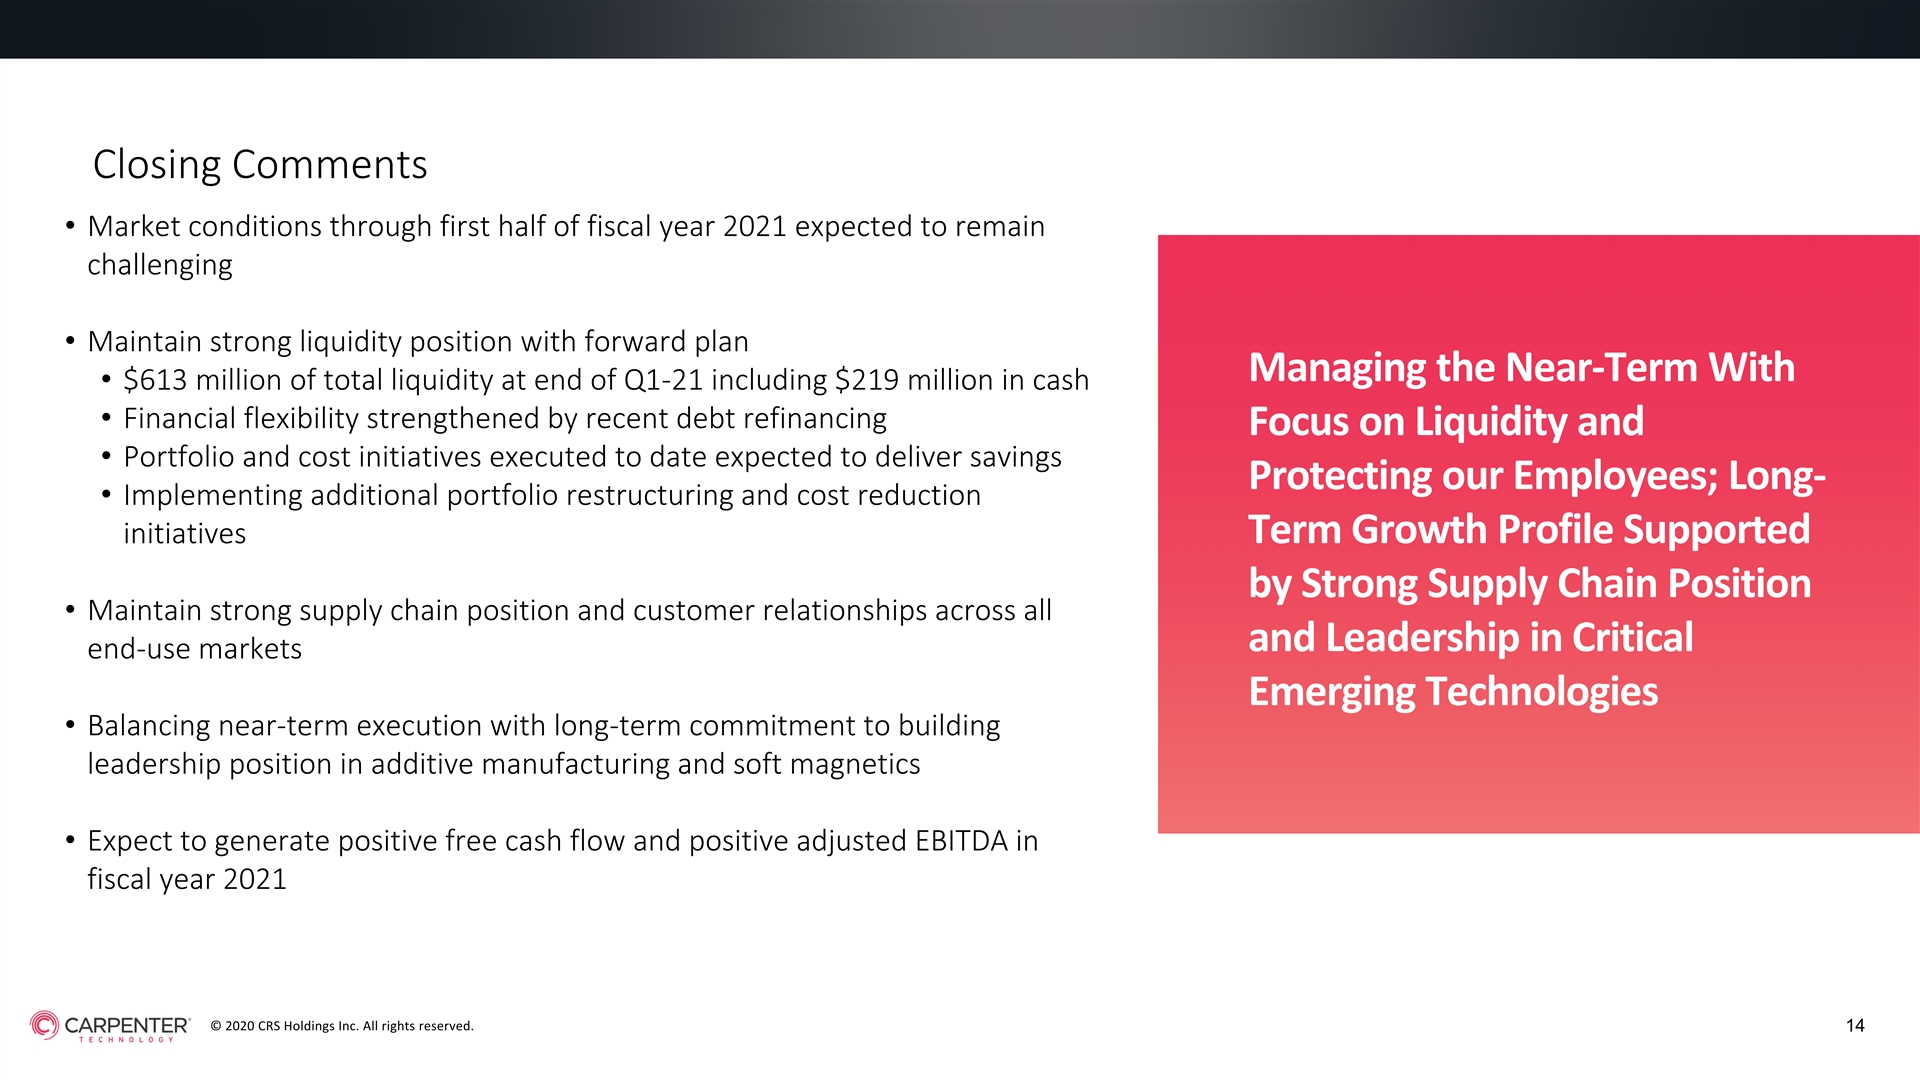
Closing Comments • Market conditions through first half of fiscal year 2021 expected to remain challenging • Maintain strong liquidity position with forward plan Managing the Near-Term With • $613 million of total liquidity at end of Q1-21 including $219 million in cash • Financial flexibility strengthened by recent debt refinancing Focus on Liquidity and • Portfolio and cost initiatives executed to date expected to deliver savings Protecting our Employees; Long- • Implementing additional portfolio restructuring and cost reduction initiatives Term Growth Profile Supported by Strong Supply Chain Position • Maintain strong supply chain position and customer relationships across all and Leadership in Critical end-use markets Emerging Technologies • Balancing near-term execution with long-term commitment to building leadership position in additive manufacturing and soft magnetics • Expect to generate positive free cash flow and positive adjusted EBITDA in fiscal year 2021 © 2020 CRS Holdings Inc. All rights reserved. 14Closing Comments • Market conditions through first half of fiscal year 2021 expected to remain challenging • Maintain strong liquidity position with forward plan Managing the Near-Term With • $613 million of total liquidity at end of Q1-21 including $219 million in cash • Financial flexibility strengthened by recent debt refinancing Focus on Liquidity and • Portfolio and cost initiatives executed to date expected to deliver savings Protecting our Employees; Long- • Implementing additional portfolio restructuring and cost reduction initiatives Term Growth Profile Supported by Strong Supply Chain Position • Maintain strong supply chain position and customer relationships across all and Leadership in Critical end-use markets Emerging Technologies • Balancing near-term execution with long-term commitment to building leadership position in additive manufacturing and soft magnetics • Expect to generate positive free cash flow and positive adjusted EBITDA in fiscal year 2021 © 2020 CRS Holdings Inc. All rights reserved. 14

APPENDIX OF NON-GAAP SCHEDULES 15APPENDIX OF NON-GAAP SCHEDULES 15

Non-GAAP Schedules (Unaudited) Adjusted diluted earnings (loss) per share $ MILLIONS, EXCEPT PER-SHARE AMOUNTS Q1-20 Q4-20 Q1-21 Diluted Earnings (Loss) per Share $0.85 ($2.46) ($0.98) Net Income (Loss) 41.2 (118.4) (47.1) Special Items, net of tax: - - 6.2 Debt prepayment costs, net - 76.0 7.6 Restructuring and asset impairment charges COVID-19 costs - 5.7 5.3 Goodwill impairment - 27.5 - Special Items, net of tax: - 109.2 19.1 Net Income (Loss) Excluding Special Items 41.2 (9.2) (28.0) Adjusted Diluted Earnings (Loss) per Share $0.85 ($0.19) ($0.58) Management believes that earnings (loss) per share adjusted to exclude the impact of special items is helpful in analyzing the operating performance of the Company, as these items are not indicative of ongoing operating performance. Management uses its results excluding these amounts to evaluate its operating performance and to discuss its business with investment institutions, the Company's board of directors and others. © 2020 CRS Holdings Inc. All rights reserved. 16Non-GAAP Schedules (Unaudited) Adjusted diluted earnings (loss) per share $ MILLIONS, EXCEPT PER-SHARE AMOUNTS Q1-20 Q4-20 Q1-21 Diluted Earnings (Loss) per Share $0.85 ($2.46) ($0.98) Net Income (Loss) 41.2 (118.4) (47.1) Special Items, net of tax: - - 6.2 Debt prepayment costs, net - 76.0 7.6 Restructuring and asset impairment charges COVID-19 costs - 5.7 5.3 Goodwill impairment - 27.5 - Special Items, net of tax: - 109.2 19.1 Net Income (Loss) Excluding Special Items 41.2 (9.2) (28.0) Adjusted Diluted Earnings (Loss) per Share $0.85 ($0.19) ($0.58) Management believes that earnings (loss) per share adjusted to exclude the impact of special items is helpful in analyzing the operating performance of the Company, as these items are not indicative of ongoing operating performance. Management uses its results excluding these amounts to evaluate its operating performance and to discuss its business with investment institutions, the Company's board of directors and others. © 2020 CRS Holdings Inc. All rights reserved. 16

Non-GAAP Schedules (Unaudited) Adjusted operating margin, excluding surcharge revenue and special items $ MILLIONS Q1-20 Q4-20 Q1-21 Net Sales 585.4 437.3 353.3 Less: Surcharge Revenue 98.8 61.4 46.1 Net Sales Excluding Surcharge Revenue 486.6 375.9 307.2 Operating Income (Loss) 59.8 ( 148.2) (48.8) Special Items: Restructuring and asset impairment charges - 95.5 10.0 COVID-19 costs - 7.4 7.9 Goodwill impairment - 34.6 - Special Items - 137.5 17.9 Operating Income (Loss) Excluding Special Items 59.8 ( 10.7) (30.9) Operating Margin 10.2% -33.9% -13.8% Adjusted Operating Margin Excluding Surcharge Revenue and Special Items 12.3% -2.8% -10.1% Management believes that removing the impacts of raw material surcharge from operating margin provides a more consistent basis for comparing results of operations from period to period, thereby permitting management to evaluate performance and investors to make decisions based on the ongoing operations of the Company. In addition, management believes that excluding the impact of special items from operating margin is helpful in analyzing the operating performance of the Company, as these items are not indicative of ongoing operating performance. Management uses its results excluding these amounts to evaluate its operating performance and to discuss its business with investment institutions, the Company's board of directors and others. © 2020 CRS Holdings Inc. All rights reserved. 17Non-GAAP Schedules (Unaudited) Adjusted operating margin, excluding surcharge revenue and special items $ MILLIONS Q1-20 Q4-20 Q1-21 Net Sales 585.4 437.3 353.3 Less: Surcharge Revenue 98.8 61.4 46.1 Net Sales Excluding Surcharge Revenue 486.6 375.9 307.2 Operating Income (Loss) 59.8 ( 148.2) (48.8) Special Items: Restructuring and asset impairment charges - 95.5 10.0 COVID-19 costs - 7.4 7.9 Goodwill impairment - 34.6 - Special Items - 137.5 17.9 Operating Income (Loss) Excluding Special Items 59.8 ( 10.7) (30.9) Operating Margin 10.2% -33.9% -13.8% Adjusted Operating Margin Excluding Surcharge Revenue and Special Items 12.3% -2.8% -10.1% Management believes that removing the impacts of raw material surcharge from operating margin provides a more consistent basis for comparing results of operations from period to period, thereby permitting management to evaluate performance and investors to make decisions based on the ongoing operations of the Company. In addition, management believes that excluding the impact of special items from operating margin is helpful in analyzing the operating performance of the Company, as these items are not indicative of ongoing operating performance. Management uses its results excluding these amounts to evaluate its operating performance and to discuss its business with investment institutions, the Company's board of directors and others. © 2020 CRS Holdings Inc. All rights reserved. 17
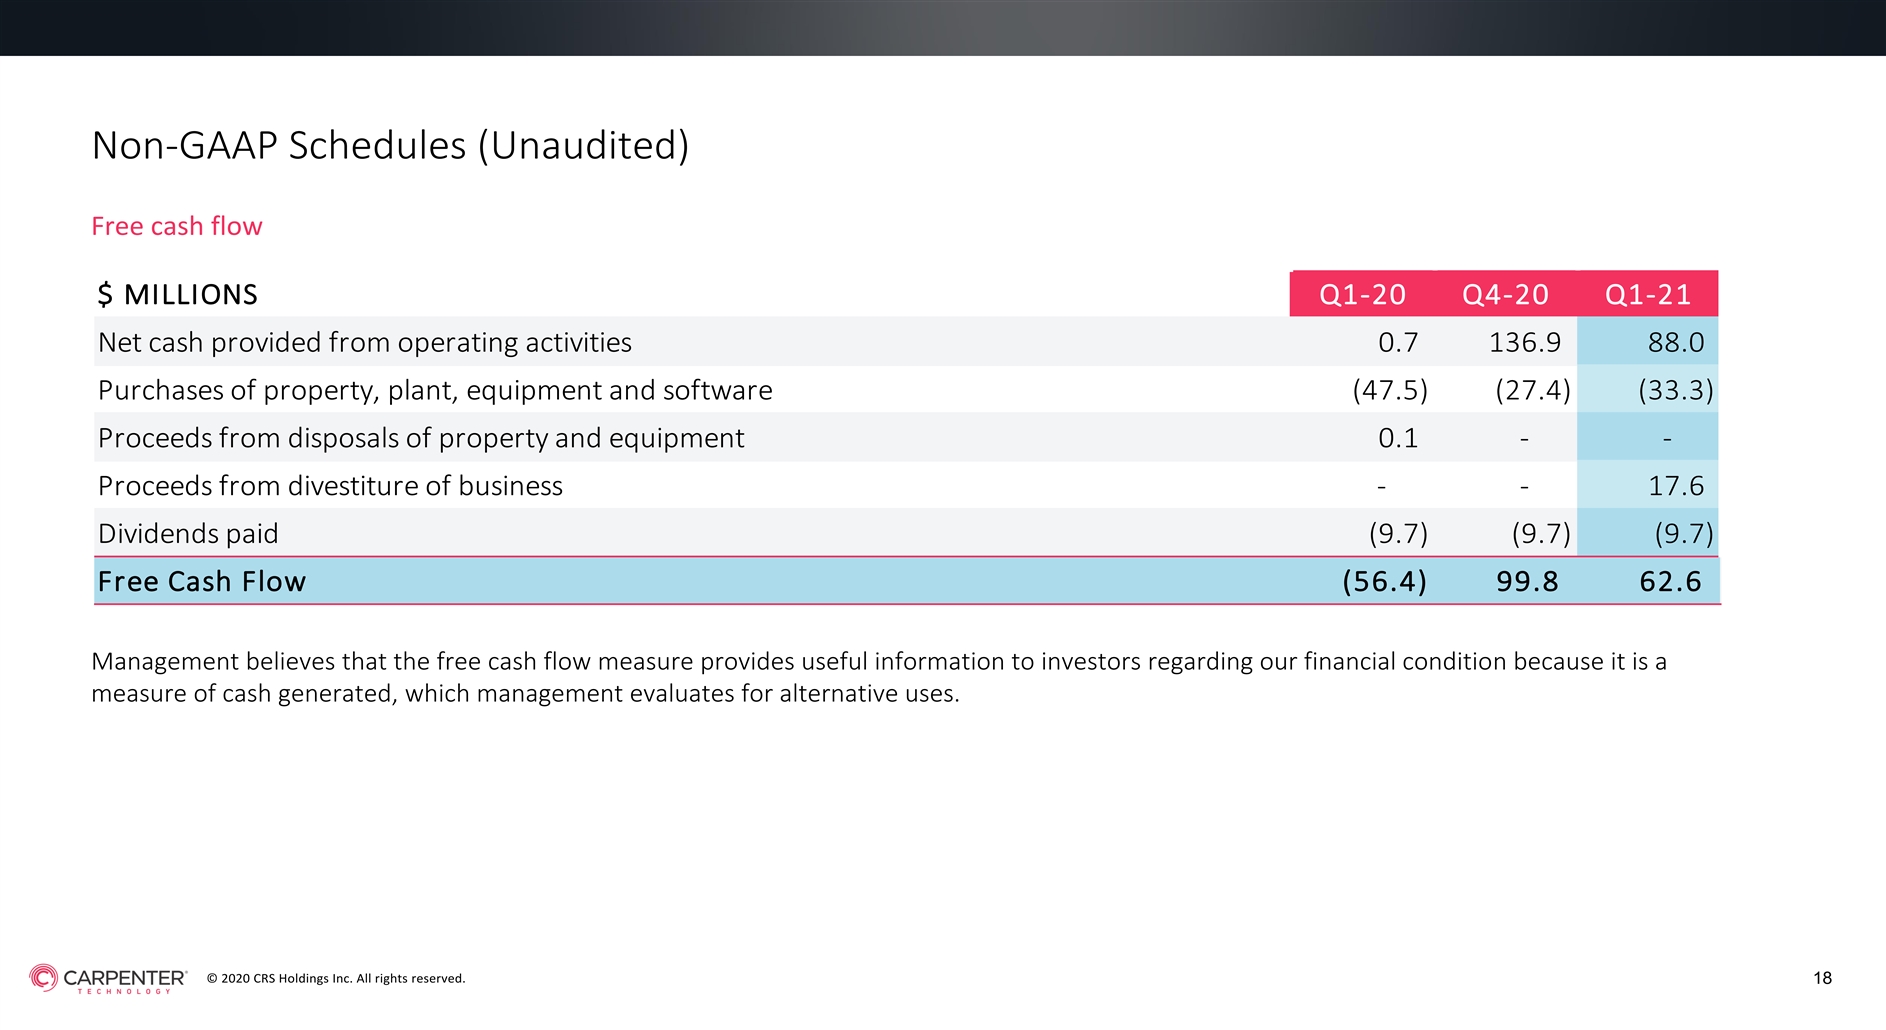
Non-GAAP Schedules (Unaudited) Free cash flow $ MILLIONS Q1-20 Q4-20 Q1-21 Net cash provided from operating activities 0.7 136.9 88.0 Purchases of property, plant, equipment and software (47.5) ( 27.4) (33.3) Proceeds from disposals of property and equipment 0.1 - - Proceeds from divestiture of business - - 17.6 Dividends paid (9.7) (9.7) (9.7) Free Cash Flow ( 56.4) 99.8 62.6 Management believes that the free cash flow measure provides useful information to investors regarding our financial condition because it is a measure of cash generated, which management evaluates for alternative uses. © 2020 CRS Holdings Inc. All rights reserved. 18Non-GAAP Schedules (Unaudited) Free cash flow $ MILLIONS Q1-20 Q4-20 Q1-21 Net cash provided from operating activities 0.7 136.9 88.0 Purchases of property, plant, equipment and software (47.5) ( 27.4) (33.3) Proceeds from disposals of property and equipment 0.1 - - Proceeds from divestiture of business - - 17.6 Dividends paid (9.7) (9.7) (9.7) Free Cash Flow ( 56.4) 99.8 62.6 Management believes that the free cash flow measure provides useful information to investors regarding our financial condition because it is a measure of cash generated, which management evaluates for alternative uses. © 2020 CRS Holdings Inc. All rights reserved. 18

Your trusted partner in innovation. Carpenter Technology Corporation (NYSE: CRS) is a global leader in high-performance specialty alloy-based materials and process solutions for critical applications in the aerospace, defense, transportation, energy, industrial, medical, and consumer electronics markets. For additional information, please contact your nearest sales office: info@cartech.com | 610 208 2000 19 carpentertechnology.comYour trusted partner in innovation. Carpenter Technology Corporation (NYSE: CRS) is a global leader in high-performance specialty alloy-based materials and process solutions for critical applications in the aerospace, defense, transportation, energy, industrial, medical, and consumer electronics markets. For additional information, please contact your nearest sales office: info@cartech.com | 610 208 2000 19 carpentertechnology.com