Exhibit 99.1 A p r i l 2 8 , 202 2 CARPENTER TECHNOLOGY CORPORATION rd 3 Quarter Fiscal Year 2022 Earnings Call
Cautionary Statement Forward-looking statements This presentation contains forward-looking statements within the meaning of the Private Securities Litigation Act of 1995. These forward-looking statements are subject to risks and uncertainties that could cause actual results to differ from those projected, anticipated or implied. The most significant of these uncertainties are described in Carpenter Technology’s filings with the Securities and Exchange Commission, including its report on Form 10-K for the year ended June 30, 2021, Form 10-Q for the quarters ended September 30, 2021 and December 31, 2021 and the exhibits attached to those filings. They include but are not limited to: (1) the cyclical nature of the specialty materials business and certain end-use markets, including aerospace, defense, medical, transportation, energy, industrial and consumer, or other influences on Carpenter Technology’s business such as new competitors, the consolidation of competitors, customers, and suppliers or the transfer of manufacturing capacity from the United States to foreign countries; (2) the ability of Carpenter Technology to achieve cash generation, growth, earnings, profitability, operating income, cost savings and reductions, qualifications, productivity improvements or process changes; (3) the ability to recoup increases in the cost of energy, raw materials, freight or other factors; (4) domestic and foreign excess manufacturing capacity for certain metals; (5) fluctuations in currency exchange rates; (6) the effect of government trade actions; (7) the valuation of the assets and liabilities in Carpenter Technology’s pension trusts and the accounting for pension plans; (8) possible labor disputes or work stoppages; (9) the potential that our customers may substitute alternate materials or adopt different manufacturing practices that replace or limit the suitability of our products; (10) the ability to successfully acquire and integrate acquisitions; (11) the availability of credit facilities to Carpenter Technology, its customers or other members of the supply chain; (12) the ability to obtain energy or raw materials, especially from suppliers located in countries that may be subject to unstable political or economic conditions; (13) Carpenter Technology’s manufacturing processes are dependent upon highly specialized equipment located primarily in facilities in Reading and Latrobe, Pennsylvania and Athens, Alabama for which there may be limited alternatives if there are significant equipment failures or a catastrophic event; (14) the ability to hire and retain key personnel, including members of the executive management team, management, metallurgists and other skilled personnel; (15) fluctuations in oil and gas prices and production; (16) uncertainty regarding the return to service of the Boeing 737 MAX aircraft and the related supply chain disruption; (17) potential impacts of the COVID-19 pandemic on our operations, financial results and financial position; (18) our efforts and efforts by governmental authorities to mitigate the COVID-19 pandemic, such as travel bans, shelter in place orders and business closures, and the related impact on resource allocations and manufacturing and supply chains; (19) our status as a “critical”, “essential” or “life-sustaining” business in light of COVID-19 business closure laws, orders and guidance being challenged by a governmental body or other applicable authority; (20) our ability to execute our business continuity, operational, budget and fiscal plans in light of the COVID-19 pandemic; and (21) our ability to successfully carry out restructuring and business exit activities on the expected terms and timelines. Any of these factors could have an adverse and/or fluctuating effect on Carpenter Technology’s results of operations. The forward-looking statements in this document are intended to be subject to the safe harbor protection provided by Section 27A of the Securities Act of 1933, as amended (the “Securities Act”), and Section 21E of the Securities Exchange Act of 1934, as amended. Carpenter Technology undertakes no obligation to update or revise any forward-looking statements. Non-GAAP and other financial measures Financial information included in this presentation is unaudited. Some of the information included in this presentation is derived from Carpenter Technology's consolidated financial information but is not presented in Carpenter Technology's financial statements prepared in accordance with U.S. Generally Accepted Accounting Principles (GAAP). Certain of these data are considered “non-GAAP financial measures” under SEC rules. These non-GAAP financial measures supplement our GAAP disclosures and should not be considered an alternative to the GAAP measure. Reconciliations to the most directly comparable GAAP financial measures and management’s rationale for the use of the non-GAAP financial measures can be found in the Appendix to this presentation. © 2022 CRS Holdings Inc. All rights reserved. 2

rd 3 QUARTER FISCAL YEAR 2022 Tony Thene | President and Chief Executive Officer 3
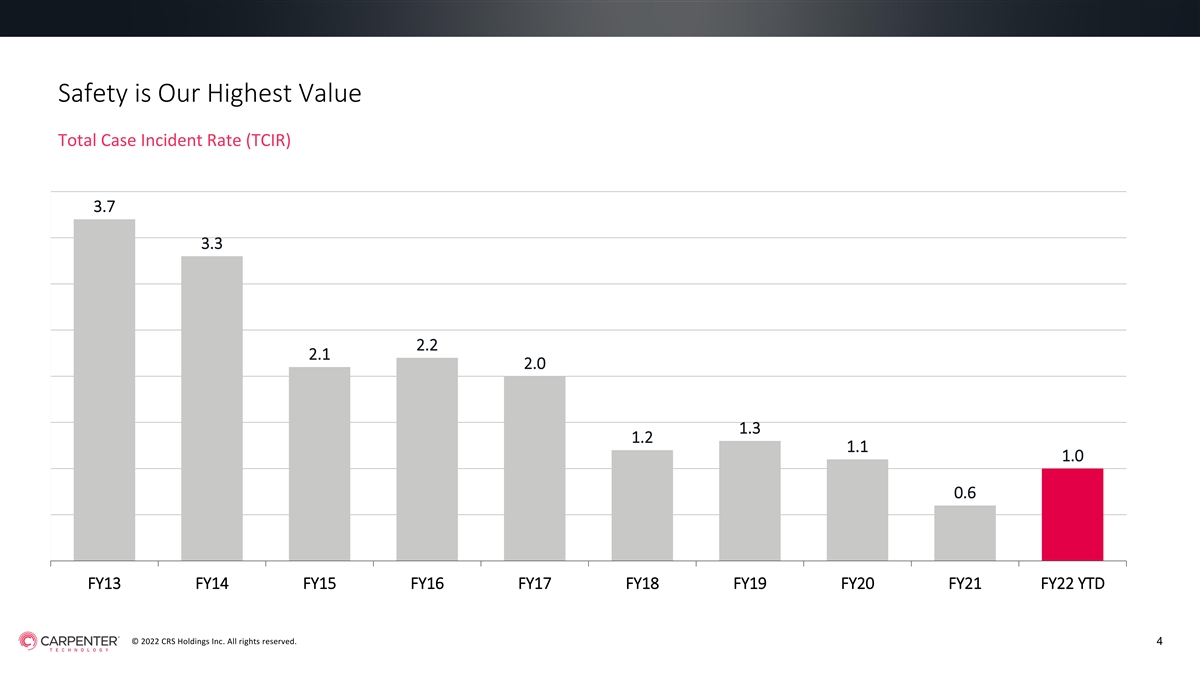
Safety is Our Highest Value Total Case Incident Rate (TCIR) 4 3.7 3.5 3.3 3 2.5 2.2 2.1 2.0 2 1.5 1.3 1.2 1.1 1.0 1 0.6 0.5 0 FY13 FY14 FY15 FY16 FY17 FY18 FY19 FY20 FY21 FY22 YTD © 2022 CRS Holdings Inc. All rights reserved. 4
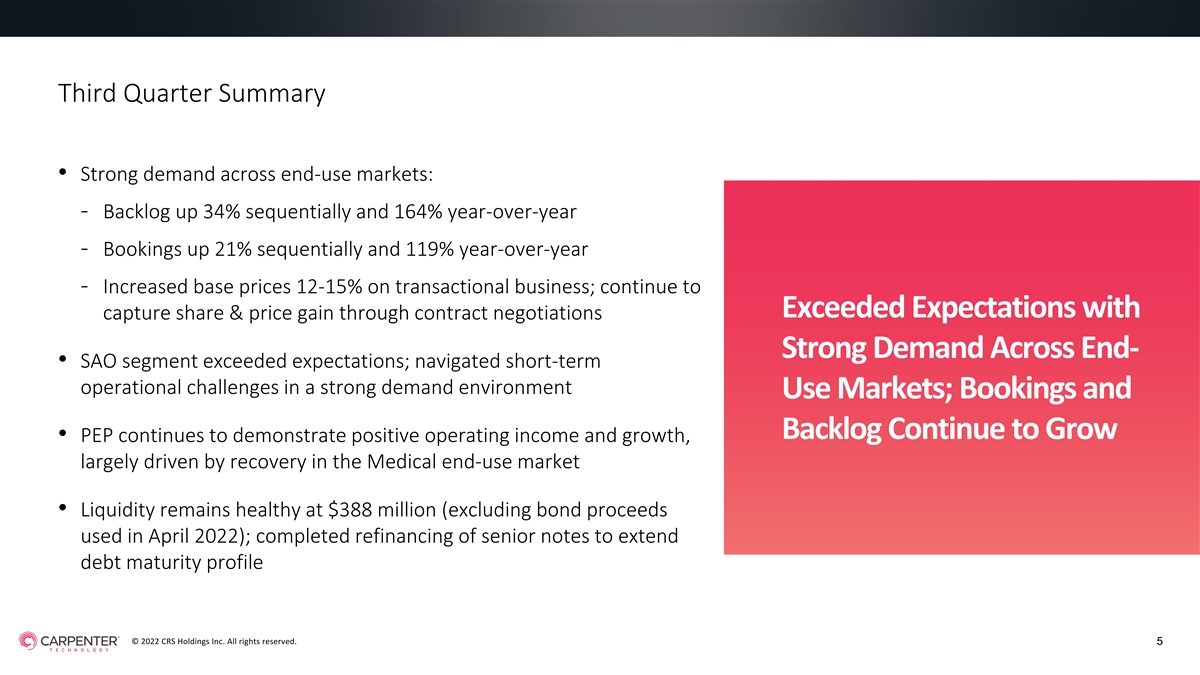
Third Quarter Summary • Strong demand across end-use markets: - Backlog up 34% sequentially and 164% year-over-year - Bookings up 21% sequentially and 119% year-over-year - Increased base prices 12-15% on transactional business; continue to Exceeded Expectations with capture share & price gain through contract negotiations Strong Demand Across End- • SAO segment exceeded expectations; navigated short-term operational challenges in a strong demand environment Use Markets; Bookings and Backlog Continue to Grow • PEP continues to demonstrate positive operating income and growth, largely driven by recovery in the Medical end-use market • Liquidity remains healthy at $388 million (excluding bond proceeds used in April 2022); completed refinancing of senior notes to extend debt maturity profile © 2022 CRS Holdings Inc. All rights reserved. 5
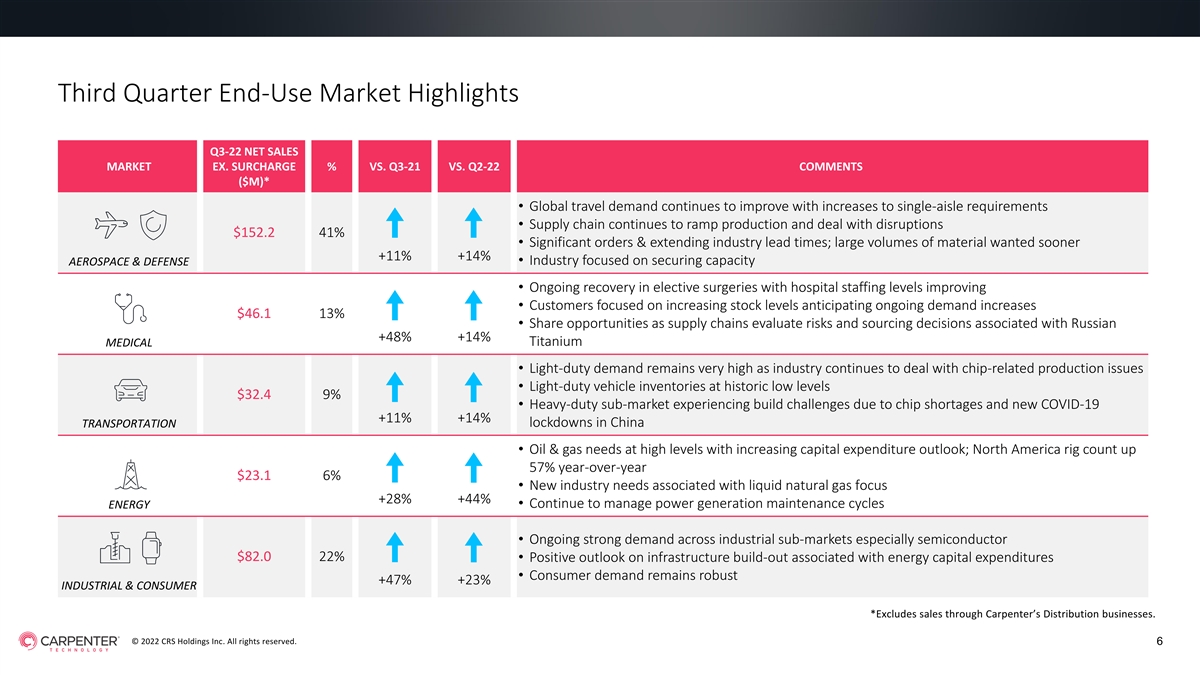
Third Quarter End-Use Market Highlights Q3-22 NET SALES MARKET EX. SURCHARGE % VS. Q3-21 VS. Q2-22 COMMENTS ($M)* • Global travel demand continues to improve with increases to single-aisle requirements • Supply chain continues to ramp production and deal with disruptions $152.2 41% • Significant orders & extending industry lead times; large volumes of material wanted sooner +11% +14% • Industry focused on securing capacity AEROSPACE & DEFENSE • Ongoing recovery in elective surgeries with hospital staffing levels improving • Customers focused on increasing stock levels anticipating ongoing demand increases $46.1 13% • Share opportunities as supply chains evaluate risks and sourcing decisions associated with Russian +48% +14% Titanium MEDICAL • Light-duty demand remains very high as industry continues to deal with chip-related production issues • Light-duty vehicle inventories at historic low levels $32.4 9% • Heavy-duty sub-market experiencing build challenges due to chip shortages and new COVID-19 +11% +14% lockdowns in China TRANSPORTATION • Oil & gas needs at high levels with increasing capital expenditure outlook; North America rig count up 57% year-over-year $23.1 6% • New industry needs associated with liquid natural gas focus +28% +44% • Continue to manage power generation maintenance cycles ENERGY • Ongoing strong demand across industrial sub-markets especially semiconductor $82.0 22% • Positive outlook on infrastructure build-out associated with energy capital expenditures • Consumer demand remains robust +47% +23% INDUSTRIAL & CONSUMER *Excludes sales through Carpenter’s Distribution businesses. © 2022 CRS Holdings Inc. All rights reserved. 6

rd 3 QUARTER FISCAL YEAR 2022 FINANCIAL OVERVIEW AND BUSINESS UPDATE Tim Lain | Senior Vice President and Chief Financial Officer 7
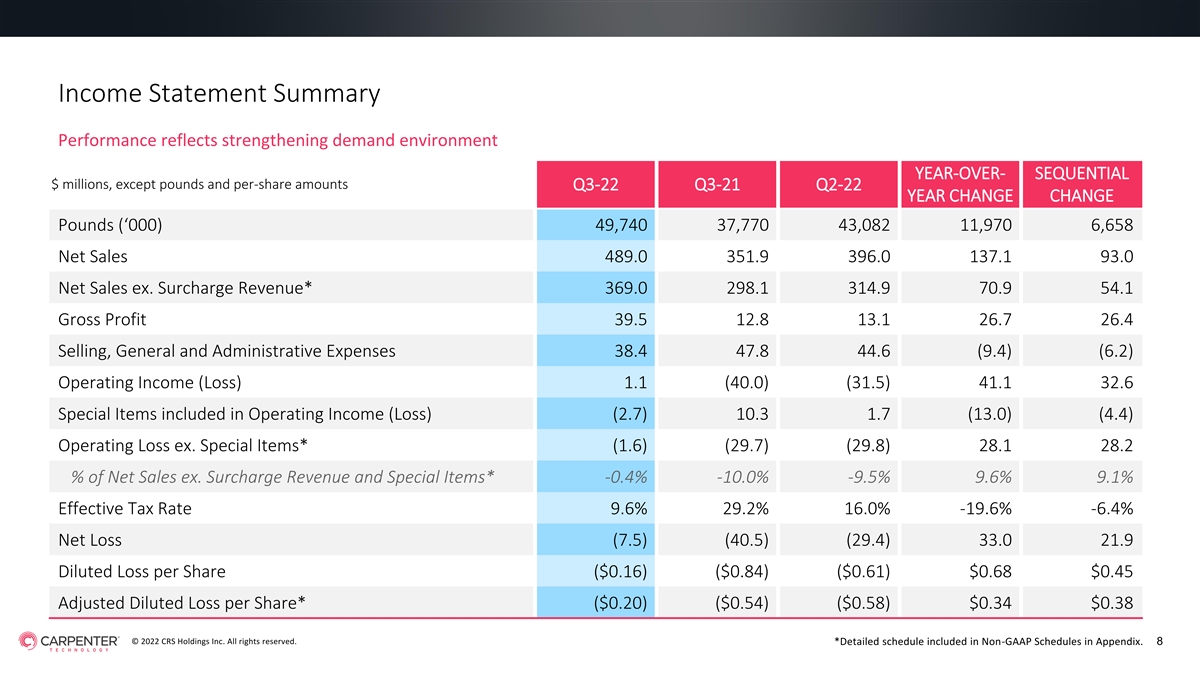
Income Statement Summary Performance reflects strengthening demand environment YEAR-OVER- SEQUENTIAL $ millions, except pounds and per-share amounts Q3-22 Q3-21 Q2-22 YEAR CHANGE CHANGE Pounds (‘000) 49,740 37,770 43,082 11,970 6,658 Net Sales 489.0 351.9 396.0 137.1 93.0 Net Sales ex. Surcharge Revenue* 369.0 298.1 314.9 70.9 54.1 Gross Profit 39.5 12.8 13.1 26.7 26.4 Selling, General and Administrative Expenses 38.4 47.8 44.6 (9.4) (6.2) Operating Income (Loss) 1.1 (40.0) (31.5) 41.1 32.6 Special Items included in Operating Income (Loss) (2.7) 10.3 1.7 (13.0) (4.4) Operating Loss ex. Special Items* (1.6) (29.7) (29.8) 28.1 28.2 % of Net Sales ex. Surcharge Revenue and Special Items* -0.4% -10.0% -9.5% 9.6% 9.1% Effective Tax Rate 9.6% 29.2% 16.0% -19.6% -6.4% Net Loss (7.5) (40.5) (29.4) 33.0 21.9 Diluted Loss per Share ($0.16) ($0.84) ($0.61) $0.68 $0.45 Adjusted Diluted Loss per Share* ($0.20) ($0.54) ($0.58) $0.34 $0.38 © 2022 CRS Holdings Inc. All rights reserved. *Detailed schedule included in Non-GAAP Schedules in Appendix. 8
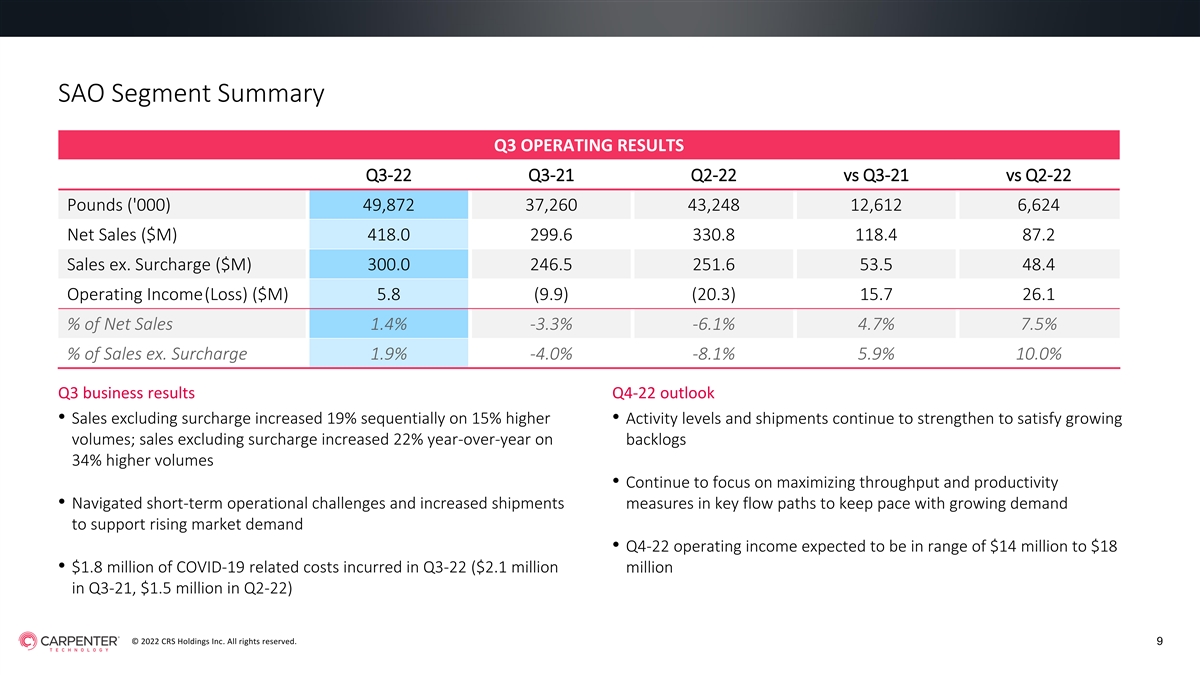
SAO Segment Summary Q3 OPERATING RESULTS Q3-22 Q3-21 Q2-22 vs Q3-21 vs Q2-22 Pounds ('000) 49,872 37,260 43,248 12,612 6,624 Net Sales ($M) 418.0 299.6 330.8 118.4 87.2 Sales ex. Surcharge ($M) 300.0 246.5 251.6 53.5 48.4 Operating Income(Loss) ($M) 5.8 (9.9) (20.3) 15.7 26.1 % of Net Sales 1.4% -3.3% -6.1% 4.7% 7.5% % of Sales ex. Surcharge 1.9% -4.0% -8.1% 5.9% 10.0% Q3 business results Q4-22 outlook • Sales excluding surcharge increased 19% sequentially on 15% higher • Activity levels and shipments continue to strengthen to satisfy growing volumes; sales excluding surcharge increased 22% year-over-year on backlogs 34% higher volumes • Continue to focus on maximizing throughput and productivity • Navigated short-term operational challenges and increased shipments measures in key flow paths to keep pace with growing demand to support rising market demand • Q4-22 operating income expected to be in range of $14 million to $18 • $1.8 million of COVID-19 related costs incurred in Q3-22 ($2.1 million million in Q3-21, $1.5 million in Q2-22) © 2022 CRS Holdings Inc. All rights reserved. 9
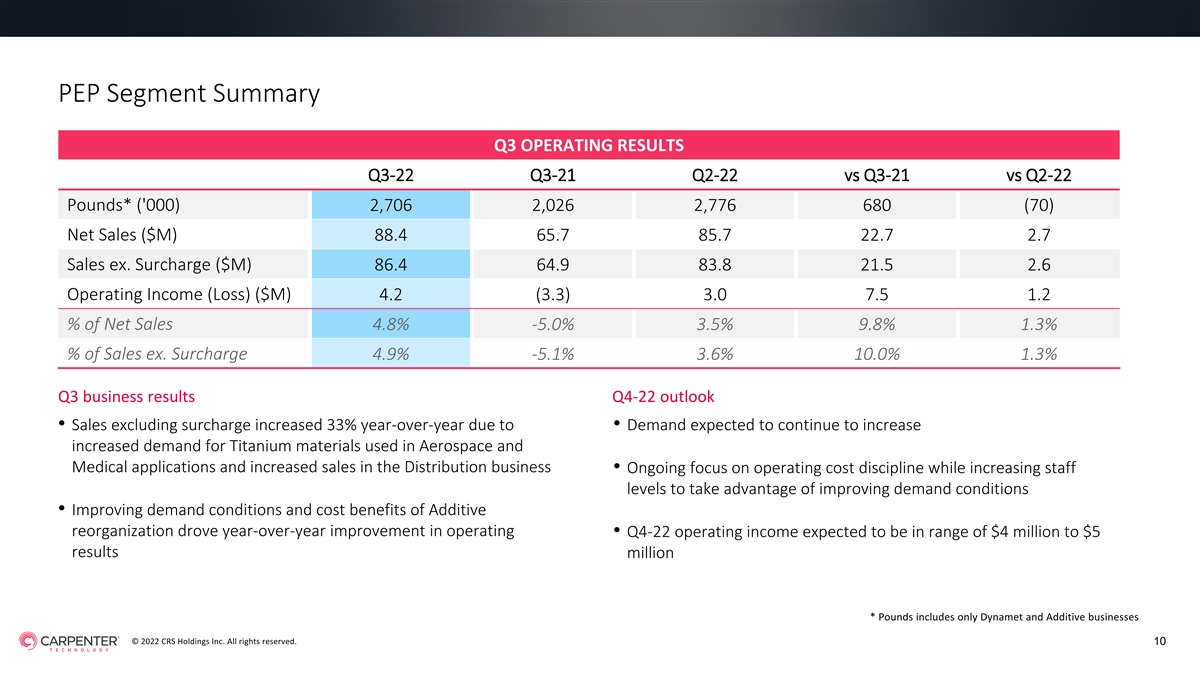
PEP Segment Summary Q3 OPERATING RESULTS Q3-22 Q3-21 Q2-22 vs Q3-21 vs Q2-22 Pounds* ('000) 2,706 2,026 2,776 680 (70) Net Sales ($M) 88.4 65.7 85.7 22.7 2.7 Sales ex. Surcharge ($M) 86.4 64.9 83.8 21.5 2.6 Operating Income (Loss) ($M) 4.2 (3.3) 3.0 7.5 1.2 % of Net Sales 4.8% -5.0% 3.5% 9.8% 1.3% % of Sales ex. Surcharge 4.9% -5.1% 3.6% 10.0% 1.3% Q3 business results Q4-22 outlook • Sales excluding surcharge increased 33% year-over-year due to • Demand expected to continue to increase increased demand for Titanium materials used in Aerospace and Medical applications and increased sales in the Distribution business • Ongoing focus on operating cost discipline while increasing staff levels to take advantage of improving demand conditions • Improving demand conditions and cost benefits of Additive reorganization drove year-over-year improvement in operating • Q4-22 operating income expected to be in range of $4 million to $5 results million * Pounds includes only Dynamet and Additive businesses © 2022 CRS Holdings Inc. All rights reserved. 10

Free Cash Flow Summary Total liquidity remains healthy 9 MOS 9 MOS Q1-22 Q2-22 Q3-22 FY22 FY21 $ millions Net Income (Loss) + Non-Cash Items 11 (5) 21 27 5 Inventory (67) (43) 8 (101) 182 Working Capital / Other 9 (41) 6 (27) (1) Total Net Working Capital / Other (58) (84) 14 (128) 181 Pension Plan Contributions - - - - (11) Net Cash (Used for) Provided from Operating Activities (47) (89) 35 (101) 175 Purchases of Property, Plant, Equipment and Software (14) (19) (25) (59) (79) - 2 - 2 2 Proceeds from Disposals of Property, Plant & Equipment and Assets Held for Sale Proceeds from Divestiture of Business - - - - 20 Dividends Paid (10) (10) (10) (29) (29) Free Cash Flow * (71) (116) 0 (187) 89 Cash (Q3-22 excludes proceeds used in Q4-22) 213 97 94 Available Borrowing Under Credit Facility 295 295 294 Total Liquidity 508 392 388 The clerical accuracy of certain amounts may be impacted due to rounding. © 2022 CRS Holdings Inc. All rights reserved. 11 *Detailed schedule included in Non-GAAP Schedules in Appendix.

rd 3 QUARTER FISCAL YEAR 2022 CLOSING COMMENTS Tony Thene | President and Chief Executive Officer 12
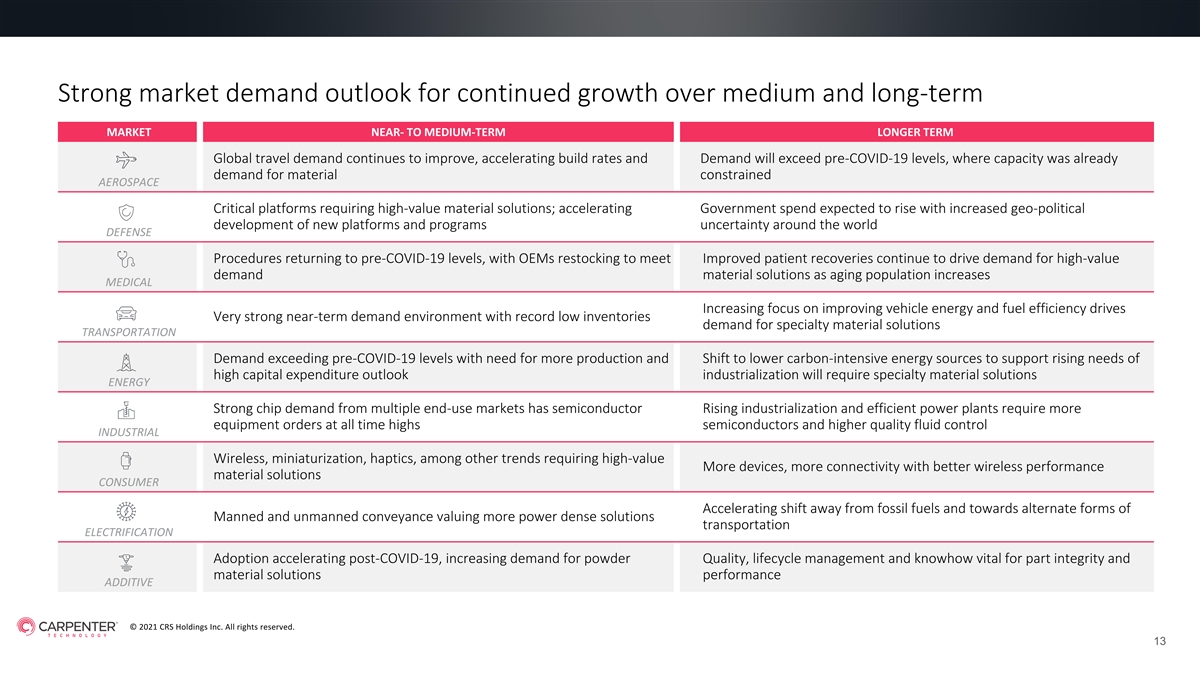
Strong market demand outlook for continued growth over medium and long-term MARKET NEAR- TO MEDIUM-TERM LONGER TERM Global travel demand continues to improve, accelerating build rates and Demand will exceed pre-COVID-19 levels, where capacity was already demand for material constrained AEROSPACE Critical platforms requiring high-value material solutions; accelerating Government spend expected to rise with increased geo-political development of new platforms and programs uncertainty around the world DEFENSE Procedures returning to pre-COVID-19 levels, with OEMs restocking to meet Improved patient recoveries continue to drive demand for high-value demand material solutions as aging population increases MEDICAL Increasing focus on improving vehicle energy and fuel efficiency drives Very strong near-term demand environment with record low inventories demand for specialty material solutions TRANSPORTATION Demand exceeding pre-COVID-19 levels with need for more production and Shift to lower carbon-intensive energy sources to support rising needs of high capital expenditure outlook industrialization will require specialty material solutions ENERGY Strong chip demand from multiple end-use markets has semiconductor Rising industrialization and efficient power plants require more equipment orders at all time highs semiconductors and higher quality fluid control INDUSTRIAL Wireless, miniaturization, haptics, among other trends requiring high-value More devices, more connectivity with better wireless performance material solutions CONSUMER Accelerating shift away from fossil fuels and towards alternate forms of Manned and unmanned conveyance valuing more power dense solutions transportation ELECTRIFICATION Adoption accelerating post-COVID-19, increasing demand for powder Quality, lifecycle management and knowhow vital for part integrity and material solutions performance ADDITIVE © 2021 CRS Holdings Inc. All rights reserved. 13
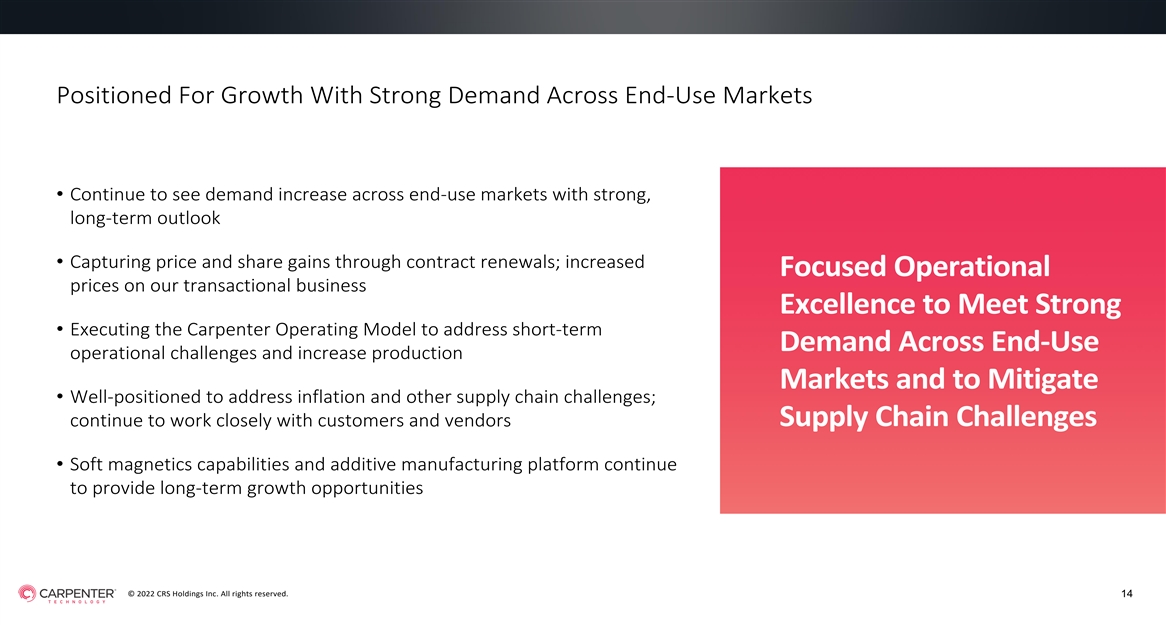
Positioned For Growth With Strong Demand Across End-Use Markets • Continue to see demand increase across end-use markets with strong, long-term outlook • Capturing price and share gains through contract renewals; increased Focused Operational prices on our transactional business Excellence to Meet Strong • Executing the Carpenter Operating Model to address short-term Demand Across End-Use operational challenges and increase production Markets and to Mitigate • Well-positioned to address inflation and other supply chain challenges; Supply Chain Challenges continue to work closely with customers and vendors • Soft magnetics capabilities and additive manufacturing platform continue to provide long-term growth opportunities © 2022 CRS Holdings Inc. All rights reserved. 14
APPENDIX OF NON-GAAP SCHEDULES 15
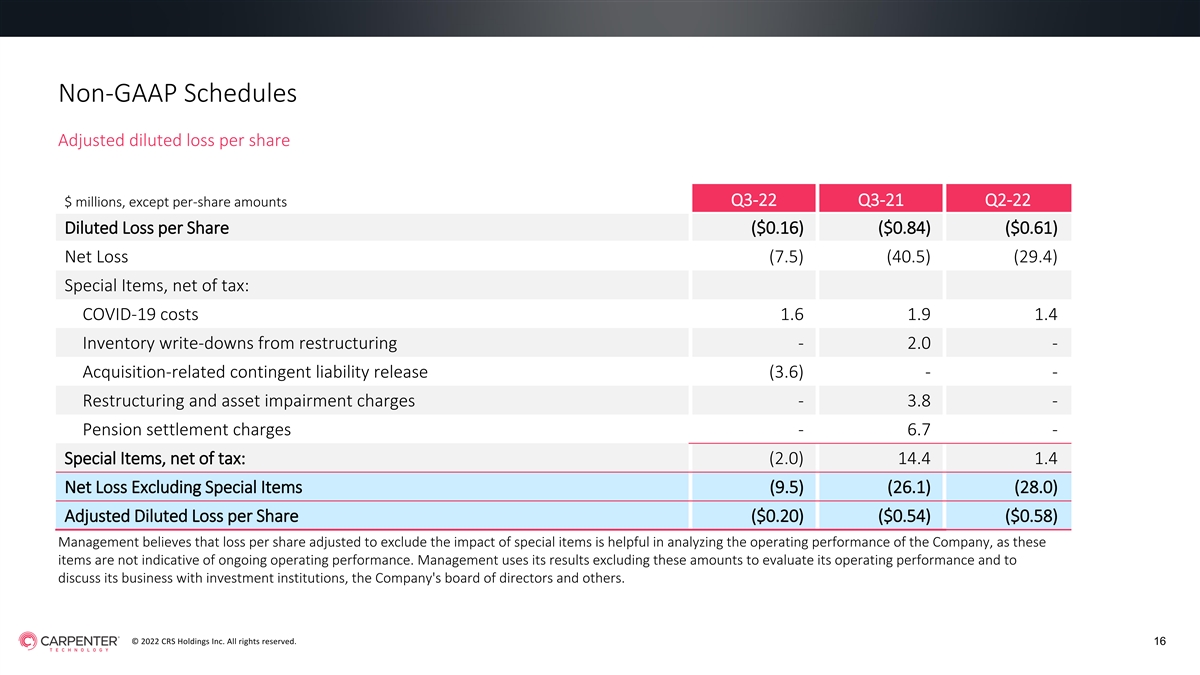
Non-GAAP Schedules Adjusted diluted loss per share Q3-22 Q3-21 Q2-22 $ millions, except per-share amounts Diluted Loss per Share ($0.16) ($0.84) ($0.61) Net Loss (7.5) (40.5) (29.4) Special Items, net of tax: COVID-19 costs 1.6 1.9 1.4 Inventory write-downs from restructuring - 2.0 - Acquisition-related contingent liability release (3.6) - - Restructuring and asset impairment charges - 3.8 - Pension settlement charges - 6.7 - Special Items, net of tax: (2.0) 14.4 1.4 Net Loss Excluding Special Items (9.5) (26.1) (28.0) Adjusted Diluted Loss per Share ($0.20) ($0.54) ($0.58) Management believes that loss per share adjusted to exclude the impact of special items is helpful in analyzing the operating performance of the Company, as these items are not indicative of ongoing operating performance. Management uses its results excluding these amounts to evaluate its operating performance and to discuss its business with investment institutions, the Company's board of directors and others. © 2022 CRS Holdings Inc. All rights reserved. 16
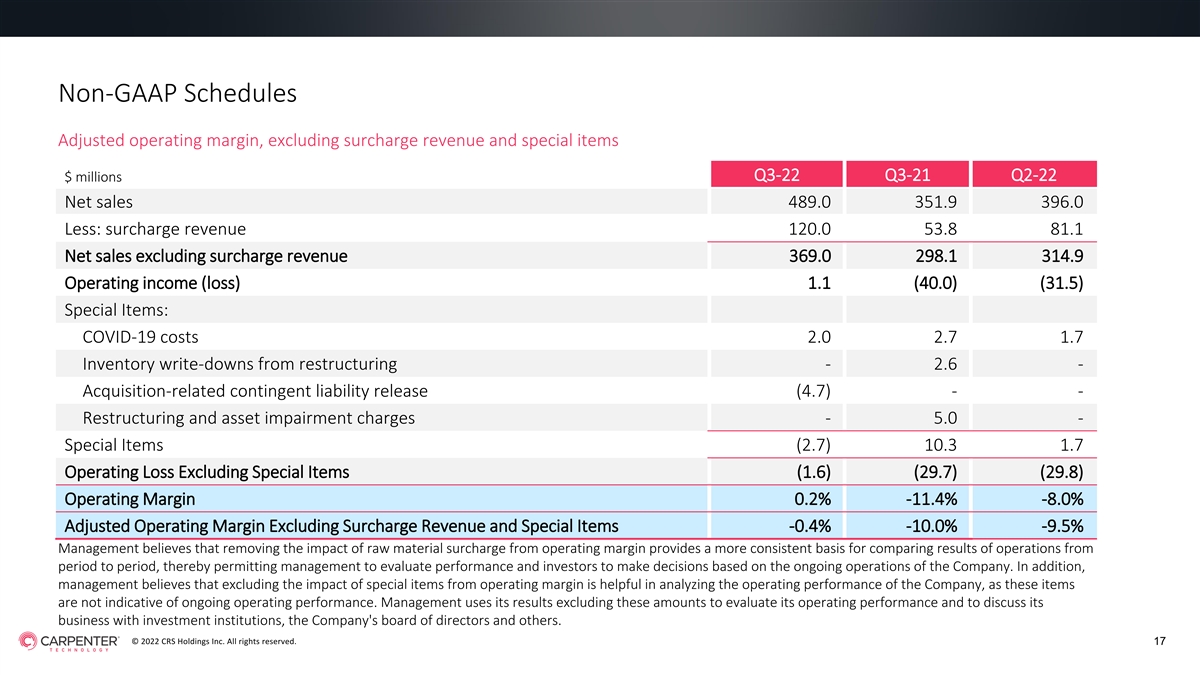
Non-GAAP Schedules Adjusted operating margin, excluding surcharge revenue and special items Q3-22 Q3-21 Q2-22 $ millions Net sales 489.0 351.9 396.0 Less: surcharge revenue 120.0 53.8 81.1 Net sales excluding surcharge revenue 369.0 298.1 314.9 Operating income (loss) 1.1 (40.0) (31.5) Special Items: COVID-19 costs 2.0 2.7 1.7 Inventory write-downs from restructuring - 2.6 - Acquisition-related contingent liability release (4.7) - - Restructuring and asset impairment charges - 5.0 - Special Items (2.7) 10.3 1.7 Operating Loss Excluding Special Items (1.6) (29.7) (29.8) Operating Margin 0.2% -11.4% -8.0% Adjusted Operating Margin Excluding Surcharge Revenue and Special Items -0.4% -10.0% -9.5% Management believes that removing the impact of raw material surcharge from operating margin provides a more consistent basis for comparing results of operations from period to period, thereby permitting management to evaluate performance and investors to make decisions based on the ongoing operations of the Company. In addition, management believes that excluding the impact of special items from operating margin is helpful in analyzing the operating performance of the Company, as these items are not indicative of ongoing operating performance. Management uses its results excluding these amounts to evaluate its operating performance and to discuss its business with investment institutions, the Company's board of directors and others. © 2022 CRS Holdings Inc. All rights reserved. 17
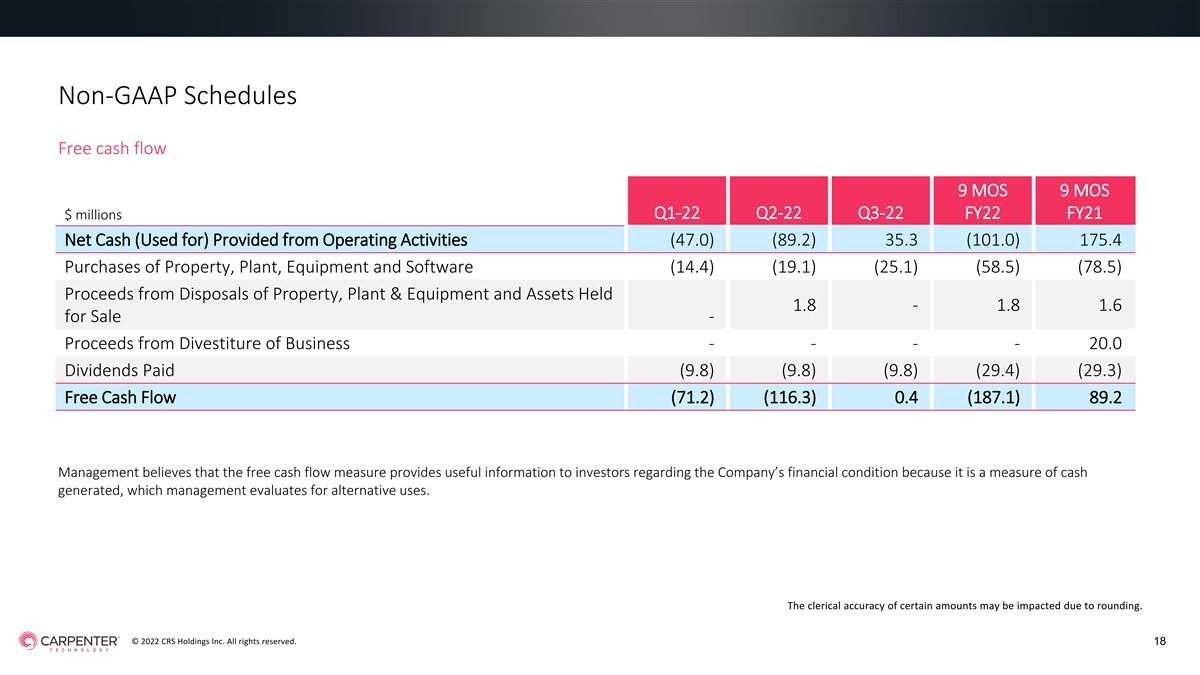
Non-GAAP Schedules Free cash flow 9 MOS 9 MOS Q1-22 Q2-22 Q3-22 FY22 FY21 $ millions Net Cash (Used for) Provided from Operating Activities (47.0) (89.2) 35.3 (101.0) 175.4 Purchases of Property, Plant, Equipment and Software (14.4) (19.1) (25.1) (58.5) (78.5) Proceeds from Disposals of Property, Plant & Equipment and Assets Held 1.8 - 1.8 1.6 for Sale - Proceeds from Divestiture of Business - - - - 20.0 Dividends Paid (9.8) (9.8) (9.8) (29.4) (29.3) Free Cash Flow (71.2) (116.3) 0.4 (187.1) 89.2 Management believes that the free cash flow measure provides useful information to investors regarding the Company’s financial condition because it is a measure of cash generated, which management evaluates for alternative uses. The clerical accuracy of certain amounts may be impacted due to rounding. © 2022 CRS Holdings Inc. All rights reserved. 18
Your trusted partner in innovation. Carpenter Technology Corporation (NYSE: CRS) is a global leader in high-performance specialty alloy-based materials and process solutions for critical applications in the aerospace, defense, medical, transportation, energy, industrial and consumer electronics markets. For additional information, please contact your nearest sales office: info@cartech.com | 610 208 2000 19 carpentertechnology.com