UNITED STATES
SECURITIES AND EXCHANGE COMMISSION
Washington, D.C. 20549
FORM N-CSR
Certified Shareholder Report of
Registered Management Investment Companies
Investment Company Act File Number: 811-23468
American Funds Global Insight Fund
(Exact Name of Registrant as Specified in Charter)
6455 Irvine Center Drive
Irvine, California 92618
(Address of Principal Executive Offices)
Registrant's telephone number, including area code: (949) 975-5000
Date of fiscal year end: October 31
Date of reporting period: October 31, 2022
Gregory F. Niland
American Funds Global Insight Fund
5300 Robin Hood Road
Norfolk, Virginia 23513
(Name and Address of Agent for Service)
ITEM 1 – Reports to Stockholders
American Funds
Annual report |

Pursue a prudent
growth approach
on a global stage
American Funds Global Insight Fund seeks to provide prudent growth of capital and conservation of principal.
This fund is one of more than 40 offered by Capital Group, home of American Funds, one of the nation’s largest mutual fund families. For over 90 years, Capital Group has invested with a long-term focus based on thorough research and attention to risk.
Fund results shown in this report, unless otherwise indicated, are for Class F-3 shares. Class A share results are shown at net asset value unless otherwise indicated. If a sales charge (maximum 5.75%) had been deducted from Class A shares, the results would have been lower. Results are for past periods and are not predictive of results for future periods. Current and future results may be lower or higher than those shown. Prices and returns will vary, so investors may lose money. Investing for short periods makes losses more likely. For current information and month-end results, visit capitalgroup.com.
Here are the average annual total returns on a $1,000 investment for periods ended September 30, 2022 (the most recent calendar quarter-end):
| 1 year | 5 years | 10 years | ||||||||||
| Class F-3 shares* | –20.43 | % | 4.79 | % | 7.87 | % | ||||||
| Class A shares (reflecting 5.75% maximum sales charge) | –25.35 | 3.18 | 6.85 | |||||||||
| * | The fund was organized for the purpose of effecting the reorganization of Capital Group Global Equity Fund (the “predecessor fund”) into a new Delaware statutory trust on November 8, 2019. In connection with the reorganization, former shareholders of the predecessor fund received Class F-3 shares of the fund. The performance of Class F-3 shares of the fund includes the performance of the predecessor fund prior to the reorganization. The inception date shown in the table for Class F-3 shares is that of the predecessor fund. |
For other share class results, visit capitalgroup.com and americanfundsretirement.com.
The total annual fund operating expense ratios are 0.46% for Class F-3 shares and 0.88% for Class A shares as of the prospectus dated January 1, 2023 (unaudited). The expense ratios are restated to reflect current fees.
Investment results assume all distributions are reinvested and reflect applicable fees and expenses. When applicable, investment results reflect fee waivers and/or expense reimbursements, without which results would have been lower. Visit capitalgroup.com for more information.
The expense ratios are as of each fund’s prospectus available at the time of publication.
Investing outside the United States may be subject to risks, such as currency fluctuations, periods of illiquidity and price volatility. These risks may be heightened in connection with investments in developing countries. Refer to the fund prospectus and the Risk Factors section of this report for more information on these and other risks associated with investing in the fund.
Investments are not FDIC-insured, nor are they deposits of or guaranteed by a bank or any other entity, so they may lose value.
Contents
| 1 | Letter to investors | |
| 3 | The value of a $10,000 investment | |
| 4 | Investment portfolio | |
| 9 | Financial statements | |
| 30 | Board of trustees and other officers |
This year, ending October 31, 2022, saw steep declines in markets around the world amid soaring inflation, a war in Ukraine, rising interest rates in the U.S., as well as the ongoing pandemic and its associated impacts on global economies. The American Funds Global Insight Fund shares fell 18.83% during the 12-month period. This result is slightly below the fund’s primary benchmark, the unmanaged MSCI World Index, which fell 18.48%.
We believe it’s important to acknowledge the fund’s performance is largely in line with its stated objective, particularly over longer periods, having participated in the rise in global equity markets while demonstrating lower volatility relative to the primary benchmark. As reflected in the table below, over five- and 10-year periods, the fund has returned 5.67% and 8.64%, respectively.
Market review
The reporting period started strong, with global markets ending the 2021 calendar year up before beginning a steep dive in the first quarter of 2022 on the heels of Russia’s invasion of Ukraine. The war’s grave implications on human life has been reflected in markets, as commodity prices have soared, in particular oil, gas and wheat, which have caused further inflation increases and created additional supply chain disruptions.
In the U.S., equity markets began to decline in the first quarter, with brief rallies in March and July, before ultimately falling nearly 16% during the reporting period. While some economic indicators remained robust, such as unemployment which fell and remained below 4%, others began to show signs of weakness towards the end of the first half of the calendar year. Soaring inflation in the U.S. led the Federal Open Markets Committee (FOMC) to continue interest rate hikes, bringing the target range for the federal funds rate between 3.00% and 3.25% in September with expectations of another raise in November.
Abroad, the effects of the war in Ukraine were more pronounced. Continued disruption to gas supplies helped push inflation to record numbers in the euro area, rising from 9.9% in September to 10.7% in October. Energy alone is expected to finish the month with the highest annual inflation
Results at a glance
(for periods ended October 31, 2022, with all distributions reinvested)
| Cumulative | Average annual | |||||||||||||||
| total returns | total returns | |||||||||||||||
| Lifetime | ||||||||||||||||
| 1 year | 5 years | 10 years | (since 4/1/11) | |||||||||||||
| American Funds Global Insight Fund1 (Class F-3 shares) | -18.83 | % | 5.67 | % | 8.64 | % | 7.43 | % | ||||||||
| American Funds Global Insight Fund (Class A shares)2 | -19.16 | 5.29 | 8.25 | 7.06 | ||||||||||||
| MSCI World Index3 | -18.48 | 6.37 | 8.94 | 7.73 | ||||||||||||
| 1 | The fund was organized for the purpose of effecting the reorganization of Capital Group Global Equity Fund (the “predecessor fund”) into a new Delaware statutory trust on November 8, 2019. In connection with the reorganization, former shareholders of the predecessor fund received Class F-3 shares of the fund. The performance of Class F-3 shares of the fund includes the performance of the predecessor fund prior to the reorganization. The inception date shown in the table for Class F-3 shares is that of the predecessor fund. |
| 2 | Class A shares were first offered on November 8, 2019. Class A share results prior to the date of first sale are hypothetical based on the results of the original share class of the fund, adjusted for typical estimated expenses. Visit capitalgroup.com for more information on specific expense adjustments and the actual dates of first sale. |
| 3 | MSCI World Index is a free float-adjusted market capitalization-weighted index that is designed to measure equity market results of developed markets. The index consists of more than 20 developed market country indexes, including the United States. Results reflect dividends net of withholding taxes. This index is unmanaged, and its results include reinvested dividends and/or distributions but do not reflect the effect of sales charges, commissions, account fees, expenses or U.S. federal income taxes. Investors cannot invest directly in an index. Source: MSCI. |
| American Funds Global Insight Fund | 1 |
rate at nearly 42%. In conjunction, the European Central Bank (ECB) began raising interest rates in July and again in September, bringing rates to the positive side for the first time since 2013.
Inside the portfolio
In a period of significant downturns and volatility, the fund’s cash allocation was the top relative contributor for the period. Industrials followed, aided primarily by stock selection within the sector. Among other positive relative contributions, sector selection within communication services followed by stock selection in information technology helped buoy the portfolio. During the period, real estate was the other positive contributor on a relative basis.
The fund is heavily weighted in the information technology sector, particularly among semiconductor companies; however, the fund is consistently underweight in this sector and its various industries versus the index. Within the sector, the fund benefited from not holding certain companies such as NVIDIA, a top contributor for the 12-month period, but at the same time, others such as Apple and Taiwan Semiconductor Manufacturing Company (TSMC) were some of the largest relative detractors.
While the sector detracted from the fund’s overall results, a few select energy companies were top contributors due to the financial impact of higher realized gas prices and increased production.
Looking ahead
The fund seeks to provide prudent growth of capital and conservation of principal. A global strategy, the fund invests in companies that are predominantly based in developed markets. It seeks to provide a smoother return profile over a full market cycle, targeting less volatility and lower downside capture than the market by focusing on companies with characteristics associated with long-term growth and resilience to market declines, including strong balance sheets and dividend payments.
The International Monetary Fund’s (IMF) October World Economic Outlook report indicates that the final global growth expectations for 2022 will be 3.2%, almost half the 6.0% growth seen in 2021. Looking to 2023, the IMF is currently predicting an additional slowdown to 2.7%, altogether creating one of the weakest growth profiles since 2001, excluding the global financial crisis and the early phases of the COVID-19 pandemic.
The IMF points to significantly higher inflation as one of the primary sources for the broad-based and sharper-than-expected slowdown, with global inflation predicted to rise to 8.8% by the end of the current calendar year. The IMF’s Outlook currently forecasts a slight decline in 2023 to 6.5% but gave guidance that monetary policy should remain consistent to restore price stability, while fiscal policy should target alleviating cost-of-living pressures but maintain a tight enough stance aligned with monetary policy.
As always, we thank you for the trust you have placed in us and for your continued investment in the fund, and we look forward to reporting to you again in six months.
Cordially,

William L. Robbins
President
December 9, 2022
For current information about the fund, visit capitalgroup.com.
| 2 | American Funds Global Insight Fund |
The value of a $10,000 investment
How a hypothetical $10,000 investment has grown
(for the period April 1, 2011, to October 31, 2022, with all distributions reinvested)
Fund results shown are for Class F-3 and Class A shares. Class A share results reflect deduction of the maximum sales charge of 5.75% on the $10,000 investment¹; thus, the net amount invested was $9,425. Results are for past periods and are not predictive of results for future periods. Prices and returns will vary, so investors may lose money. For current information and month-end results, visit capitalgroup.com.
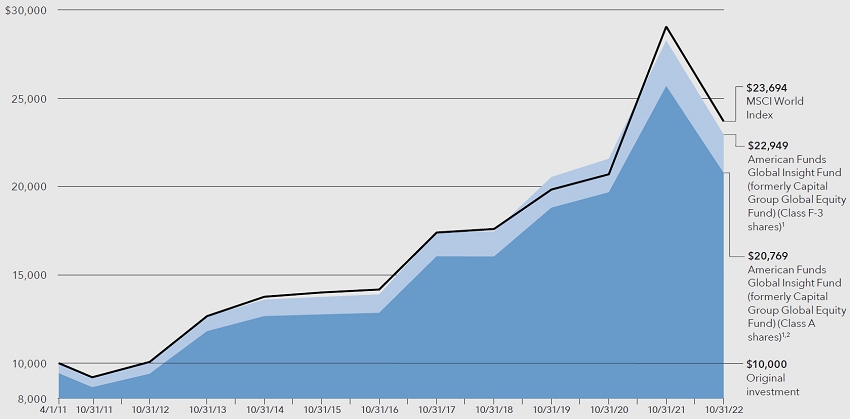
| 1 | Includes reinvested dividends and capital gain distributions. |
| 2 | Class A share results reflect deduction of the maximum sales charge of 5.75% on the $10,000 investment; thus, the net amount invested was $9,425. Class A shares were first offered on November 8, 2019. Class A share results prior to the date of first sale are hypothetical based on the results of the original share class of the fund, adjusted for typical estimated expenses. Visit capitalgroup.com for more information on specific expense adjustments and the actual dates of first sale. |
The results shown are before taxes on fund distributions and sale of fund shares.
Average annual total returns based on a $1,000 investment (for periods ended October 31, 2022)
| 1 year | 5 years | 10 years | Lifetime | |||||||||||||
| Class F-3 shares | -18.83 | % | 5.67 | % | 8.64 | % | 7.43 | % | ||||||||
| Class A shares* | -23.81 | 4.05 | 7.62 | 6.51 | ||||||||||||
| * | Assumes payment of the maximum 5.75% sales charge. |
Investment results assume all distributions are reinvested and reflect applicable fees and expenses. When applicable, investment results reflect fee waivers and/or expense reimbursements, without which results would have been lower. Visit capitalgroup.com for more information.
| American Funds Global Insight Fund | 3 |
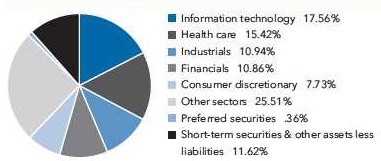
Investment portfolio October 31, 2022
| Sector diversification | Percent of net assets |
 | |
| Country diversification by domicile | Percent of net assets | |||
| United States | 48.59 | % | ||
| Eurozone* | 15.36 | |||
| United Kingdom | 5.40 | |||
| Japan | 3.80 | |||
| Denmark | 3.57 | |||
| Switzerland | 2.57 | |||
| Hong Kong | 1.59 | |||
| Canada | 1.52 | |||
| Taiwan | 1.09 | |||
| Other countries | 4.89 | |||
| Short-term securities & other assets less liabilities | 11.62 | |||
| * | Countries using the euro as a common currency; those represented in the fund’s portfolio are Belgium, Finland, France, Germany, Ireland, Italy, the Netherlands and Spain. |
| Common stocks 88.02% | Shares | Value (000) | ||||||
| Information technology 17.56% | ||||||||
| Microsoft Corp. | 772,197 | $ | 179,250 | |||||
| Apple, Inc. | 981,636 | 150,524 | ||||||
| Broadcom, Inc. | 318,174 | 149,580 | ||||||
| ASML Holding NV | 266,201 | 125,749 | ||||||
| Visa, Inc., Class A | 545,316 | 112,968 | ||||||
| Taiwan Semiconductor Manufacturing Company, Ltd. (ADR) | 1,447,821 | 89,113 | ||||||
| SAP SE | 886,829 | 85,599 | ||||||
| GoDaddy, Inc., Class A1 | 821,207 | 66,025 | ||||||
| Keyence Corp. | 148,460 | 56,231 | ||||||
| Fujitsu, Ltd. | 401,700 | 46,263 | ||||||
| KLA Corp. | 125,990 | 39,869 | ||||||
| EVERTEC, Inc. | 1,053,019 | 37,709 | ||||||
| Amadeus IT Group SA, Class A, non-registered shares1 | 655,948 | 34,188 | ||||||
| Hamamatsu Photonics KK | 707,400 | 32,065 | ||||||
| Trimble, Inc.1 | 419,279 | 25,224 | ||||||
| Jack Henry & Associates, Inc. | 109,639 | 21,825 | ||||||
| ServiceNow, Inc.1 | 50,690 | 21,327 | ||||||
| Fidelity National Information Services, Inc. | 255,706 | 21,221 | ||||||
| Nokia Corp. | 4,254,267 | 18,949 | ||||||
| Texas Instruments, Inc. | 117,039 | 18,800 | ||||||
| Mastercard, Inc., Class A | 54,149 | 17,771 | ||||||
| Analog Devices, Inc. | 106,059 | 15,126 | ||||||
| OBIC Co., Ltd. | 83,700 | 12,592 | ||||||
| Wolfspeed, Inc.1 | 133,018 | 10,475 | ||||||
| Adobe, Inc.1 | 27,367 | 8,716 | ||||||
| Dye & Durham, Ltd. | 680,000 | 7,522 | ||||||
| STMicroelectronics NV (EUR denominated) | 236,904 | 7,398 | ||||||
| MKS Instruments, Inc. | 84,003 | 6,901 | ||||||
| Intel Corp. | 214,536 | 6,099 | ||||||
| VeriSign, Inc.1 | 13,080 | 2,622 | ||||||
| Lam Research Corp. | 4,745 | 1,921 | ||||||
| 1,429,622 | ||||||||
| Health care 15.42% | ||||||||
| UnitedHealth Group, Inc. | 314,409 | 174,544 | ||||||
| Novo Nordisk A/S, Class B | 1,352,330 | 147,020 | ||||||
| AstraZeneca PLC | 1,154,000 | 135,702 | ||||||
| Bristol-Myers Squibb Company | 1,460,007 | 113,107 | ||||||
| Seagen, Inc.1 | 619,633 | 78,793 | ||||||
| Abbott Laboratories | 787,101 | 77,876 | ||||||
| EssilorLuxottica | 427,427 | 67,733 | ||||||
| Genmab A/S1 | 150,443 | 57,986 | ||||||
| BeiGene, Ltd. (ADR)1 | 317,507 | 53,624 | ||||||
| Danaher Corp. | 201,623 | 50,742 | ||||||
| 4 | American Funds Global Insight Fund |
| Common stocks (continued) | Shares | Value (000) | ||||||
| Health care (continued) | ||||||||
| Zoetis, Inc., Class A | 326,483 | $ | 49,227 | |||||
| Edwards Lifesciences Corp.1 | 521,781 | 37,793 | ||||||
| AbbVie, Inc. | 242,093 | 35,442 | ||||||
| Elevance Health, Inc. | 57,513 | 31,446 | ||||||
| Zimmer Biomet Holdings, Inc. | 260,427 | 29,519 | ||||||
| Pfizer, Inc. | 580,615 | 27,028 | ||||||
| Humana, Inc. | 42,500 | 23,718 | ||||||
| Merck & Co., Inc. | 201,291 | 20,371 | ||||||
| Eli Lilly and Company | 35,700 | 12,927 | ||||||
| Regeneron Pharmaceuticals, Inc.1 | 14,495 | 10,853 | ||||||
| Shionogi & Co., Ltd. | 233,900 | 10,838 | ||||||
| Koninklijke Philips NV | 410,579 | 5,194 | ||||||
| Straumann Holding AG | 47,300 | 4,505 | ||||||
| 1,255,988 | ||||||||
| Industrials 10.94% | ||||||||
| Safran SA | 1,070,264 | 119,223 | ||||||
| Northrop Grumman Corp. | 155,971 | 85,630 | ||||||
| Honeywell International, Inc. | 356,906 | 72,816 | ||||||
| Airbus SE, non-registered shares | 651,933 | 70,599 | ||||||
| AMETEK, Inc. | 499,793 | 64,803 | ||||||
| ITT, Inc. | 617,157 | 47,145 | ||||||
| ABB, Ltd. | 1,581,915 | 43,981 | ||||||
| TFI International, Inc. (CAD denominated) | 457,103 | 41,609 | ||||||
| Norfolk Southern Corp. | 173,921 | 39,666 | ||||||
| SMC Corp. | 88,000 | 35,580 | ||||||
| Carrier Global Corp. | 832,478 | 33,099 | ||||||
| HEICO Corp., Class A | 142,523 | 18,143 | ||||||
| HEICO Corp. | 82,698 | 13,450 | ||||||
| Ryanair Holdings PLC (ADR)1 | 434,285 | 29,918 | ||||||
| CSX Corp. | 945,355 | 27,472 | ||||||
| MTU Aero Engines AG | 135,827 | 24,329 | ||||||
| TransDigm Group, Inc. | 28,745 | 16,550 | ||||||
| Armstrong World Industries, Inc. | 200,935 | 15,185 | ||||||
| Epiroc AB, Class A | 987,300 | 15,116 | ||||||
| Jardine Matheson Holdings, Ltd. | 293,500 | 13,507 | ||||||
| DSV A/S | 92,391 | 12,508 | ||||||
| DKSH Holding AG | 151,538 | 10,919 | ||||||
| Delta Air Lines, Inc.1 | 307,953 | 10,449 | ||||||
| Axon Enterprise, Inc.1 | 71,600 | 10,414 | ||||||
| Dun & Bradstreet Holdings, Inc. | 807,641 | 10,378 | ||||||
| Daikin Industries, Ltd. | 57,700 | 8,686 | ||||||
| 891,175 | ||||||||
| Financials 10.86% | ||||||||
| AIA Group, Ltd. | 11,888,400 | 90,038 | ||||||
| JPMorgan Chase & Co. | 714,227 | 89,907 | ||||||
| Aon PLC, Class A | 308,245 | 86,768 | ||||||
| DBS Group Holdings, Ltd. | 2,522,996 | 60,954 | ||||||
| London Stock Exchange Group PLC | 633,247 | 54,945 | ||||||
| HDFC Bank, Ltd. (ADR) | 874,603 | 54,497 | ||||||
| Marsh & McLennan Companies, Inc. | 332,417 | 53,682 | ||||||
| DNB Bank ASA | 2,847,999 | 50,406 | ||||||
| CME Group, Inc., Class A | 286,725 | 49,689 | ||||||
| Intercontinental Exchange, Inc. | 400,306 | 38,257 | ||||||
| Citizens Financial Group, Inc. | 728,747 | 29,806 | ||||||
| MSCI, Inc. | 62,203 | 29,164 | ||||||
| S&P Global, Inc. | 85,194 | 27,369 | ||||||
| State Street Corp. | 362,903 | 26,855 | ||||||
| First Republic Bank | 218,315 | 26,220 | ||||||
| Banco Bilbao Vizcaya Argentaria, SA | 4,200,938 | 21,626 | ||||||
| Wells Fargo & Company | 398,133 | 18,310 | ||||||
| Nasdaq, Inc. | 275,265 | 17,132 | ||||||
| Moody’s Corp. | 63,921 | 16,931 | ||||||
| Western Alliance Bancorporation | 242,307 | 16,276 | ||||||
| American Funds Global Insight Fund | 5 |
| Common stocks (continued) | Shares | Value (000) | ||||||
| Financials (continued) | ||||||||
| UBS Group AG | 766,804 | $ | 12,168 | |||||
| UniCredit SpA | 814,836 | 10,104 | ||||||
| Chubb, Ltd. | 16,270 | 3,496 | ||||||
| 884,600 | ||||||||
| Consumer discretionary 7.73% | ||||||||
| Amazon.com, Inc.1 | 778,516 | 79,751 | ||||||
| Hilton Worldwide Holdings, Inc. | 551,041 | 74,534 | ||||||
| Kering SA | 154,371 | 70,741 | ||||||
| Industria de Diseño Textil, SA | 3,029,883 | 68,689 | ||||||
| Royal Caribbean Cruises, Ltd.1 | 906,992 | 48,415 | ||||||
| YUM! Brands, Inc. | 329,280 | 38,937 | ||||||
| Dollar General Corp. | 136,552 | 34,828 | ||||||
| Hermès International | 25,644 | 33,211 | ||||||
| Cie. Financière Richemont SA, Class A | 332,751 | 32,546 | ||||||
| LVMH Moët Hennessy-Louis Vuitton SE | 43,093 | 27,213 | ||||||
| MercadoLibre, Inc.1 | 28,838 | 26,001 | ||||||
| B&M European Value Retail SA | 6,782,731 | 25,093 | ||||||
| NIKE, Inc., Class B | 255,166 | 23,649 | ||||||
| Lear Corp. | 124,247 | 17,234 | ||||||
| adidas AG | 166,543 | 16,291 | ||||||
| TJX Companies, Inc. | 167,890 | 12,105 | ||||||
| 629,238 | ||||||||
| Consumer staples 7.54% | ||||||||
| Philip Morris International, Inc. | 985,206 | 90,491 | ||||||
| Danone SA | 1,374,048 | 68,357 | ||||||
| Nestlé SA | 616,559 | 67,139 | ||||||
| British American Tobacco PLC | 1,541,547 | 60,699 | ||||||
| Carlsberg A/S, Class B | 448,341 | 52,842 | ||||||
| Reckitt Benckiser Group PLC | 778,630 | 51,611 | ||||||
| L’Oréal SA, non-registered shares | 155,070 | 48,748 | ||||||
| Costco Wholesale Corp. | 96,765 | 48,528 | ||||||
| Anheuser-Busch InBev SA/NV | 945,311 | 47,271 | ||||||
| Imperial Brands PLC | 1,018,348 | 24,805 | ||||||
| Diageo PLC | 564,041 | 23,273 | ||||||
| General Mills, Inc. | 277,457 | 22,635 | ||||||
| Unilever PLC (GBP denominated) | 175,302 | 7,990 | ||||||
| 614,389 | ||||||||
| Energy 6.36% | ||||||||
| Chevron Corp. | 870,716 | 157,512 | ||||||
| TotalEnergies SE | 1,504,097 | 81,902 | ||||||
| EOG Resources, Inc. | 530,214 | 72,385 | ||||||
| BP PLC | 10,104,639 | 55,599 | ||||||
| ConocoPhillips | 436,844 | 55,082 | ||||||
| TC Energy Corp. (CAD denominated)2 | 878,068 | 38,568 | ||||||
| Pioneer Natural Resources Company | 99,376 | 25,481 | ||||||
| Suncor Energy, Inc. | 569,147 | 19,577 | ||||||
| INPEX Corp. | 1,152,100 | 11,762 | ||||||
| 517,868 | ||||||||
| Communication services 5.03% | ||||||||
| Alphabet, Inc., Class A1 | 605,060 | 57,184 | ||||||
| Alphabet, Inc., Class C1 | 526,467 | 49,835 | ||||||
| Koninklijke KPN NV | 20,458,532 | 57,237 | ||||||
| América Móvil, SAB de CV, Series L (ADR) | 2,820,585 | 53,055 | ||||||
| Comcast Corp., Class A | 1,607,743 | 51,030 | ||||||
| Electronic Arts, Inc. | 238,583 | 30,052 | ||||||
| Netflix, Inc.1 | 100,929 | 29,459 | ||||||
| Tencent Holdings, Ltd. | 959,200 | 25,124 | ||||||
| Meta Platforms, Inc., Class A1 | 268,749 | 25,037 | ||||||
| Nippon Telegraph and Telephone Corp. | 829,400 | 22,836 | ||||||
| Cable One, Inc. | 9,873 | 8,485 | ||||||
| 409,334 | ||||||||
| 6 | American Funds Global Insight Fund |
| Common stocks (continued) | Shares | Value (000) | ||||||
| Materials 2.94% | ||||||||
| Air Liquide SA, non-registered shares | 354,817 | $ | 46,391 | |||||
| Vale SA (ADR), ordinary nominative shares | 3,524,155 | 45,602 | ||||||
| Shin-Etsu Chemical Co., Ltd. | 399,200 | 41,720 | ||||||
| Asahi Kasei Corp. | 4,769,900 | 30,619 | ||||||
| Sika AG | 114,138 | 25,738 | ||||||
| Sociedad Química y Minera de Chile SA, Class B (ADR) | 234,595 | 21,977 | ||||||
| Givaudan SA | 3,997 | 11,935 | ||||||
| Linde PLC | 39,772 | 11,826 | ||||||
| Barrick Gold Corp. | 212,553 | 3,195 | ||||||
| 239,003 | ||||||||
| Utilities 2.63% | ||||||||
| Engie SA | 3,305,126 | 42,965 | ||||||
| AES Corp. | 1,516,111 | 39,661 | ||||||
| Edison International | 501,431 | 30,106 | ||||||
| CenterPoint Energy, Inc. | 762,000 | 21,801 | ||||||
| Ørsted AS | 245,394 | 20,239 | ||||||
| Sempra Energy | 127,700 | 19,275 | ||||||
| Exelon Corp. | 438,280 | 16,913 | ||||||
| Evergy, Inc. | 222,211 | 13,584 | ||||||
| Iberdrola, SA, non-registered shares | 851,805 | 8,649 | ||||||
| Enel SpA | 230,340 | 1,029 | ||||||
| 214,222 | ||||||||
| Real estate 1.01% | ||||||||
| Link REIT | 4,459,421 | 26,360 | ||||||
| Equinix, Inc. REIT | 41,031 | 23,242 | ||||||
| Crown Castle, Inc. REIT | 148,155 | 19,743 | ||||||
| Altus Group, Ltd. | 370,000 | 13,148 | ||||||
| 82,493 | ||||||||
| Total common stocks (cost: $7,705,319,000) | 7,167,932 | |||||||
| Preferred securities 0.36% | ||||||||
| Information technology 0.22% | ||||||||
| Samsung Electronics Co., Ltd., preferred shares (GDR) | 19,539 | 18,288 | ||||||
| Health care 0.14% | ||||||||
| Sartorius AG, nonvoting non-registered preferred shares | 31,982 | 11,287 | ||||||
| Total preferred securities (cost: $45,016,000) | 29,575 | |||||||
| Rights & warrants 0.00% | ||||||||
| Consumer discretionary 0.00% | ||||||||
| Compagnie Financière Richemont SA, Class A, warrants, expire 11/22/20231 | 139,690 | 68 | ||||||
| Total rights & warrants (cost: $0) | 68 | |||||||
| Short-term securities 11.53% | ||||||||
| Money market investments 8.46% | ||||||||
| Capital Group Central Cash Fund 3.18%3,4 | 6,891,831 | 689,045 | ||||||
| American Funds Global Insight Fund | 7 |
| Short-term securities (continued) | Weighted average yield at acquisition | Principal amount (000) | Value (000) | |||||||||
| Commercial paper 3.07% | ||||||||||||
| DBS Bank, Ltd. 11/2/20225 | 2.849 | % | USD | 50,000 | $ | 49,991 | ||||||
| DBS Bank, Ltd. 11/3/20225 | 2.873 | 50,000 | 49,987 | |||||||||
| Hydro-Québec 11/17/20225 | 3.308 | 50,000 | 49,917 | |||||||||
| Toronto-Dominion Bank 11/21/20225 | 3.152 | 100,000 | 99,789 | |||||||||
| 249,684 | ||||||||||||
| Total short-term securities (cost: $938,739,000) | 938,729 | |||||||||||
| Total investment securities 99.91% (cost: $8,689,074,000) | 8,136,304 | |||||||||||
| Other assets less liabilities 0.09% | 7,378 | |||||||||||
| Net assets 100.00% | $ | 8,143,682 | ||||||||||
Investments in affiliates4
| Value of | Net | Net | Value of | ||||||||||||||||||||||||||
| affiliates at | realized | unrealized | affiliates at | Dividend | |||||||||||||||||||||||||
| 11/1/2021 | Additions | Reductions | loss | appreciation | 10/31/2022 | income | |||||||||||||||||||||||
| (000) | (000) | (000) | (000) | (000) | (000) | (000) | |||||||||||||||||||||||
| Short-term securities 8.46% | |||||||||||||||||||||||||||||
| Money market investments 8.46% | |||||||||||||||||||||||||||||
| Capital Group Central Cash Fund 3.18%3 | $ | 154,525 | $ | 1,956,095 | $ | 1,421,440 | $ | (153 | ) | $ | 18 | $ | 689,045 | $ | 6,185 | ||||||||||||||
| Money market investments purchased with collateral from securities on loan 0.00% | |||||||||||||||||||||||||||||
| Capital Group Central Cash Fund 3.18%3,6 | 17,077 | 17,077 | 7 | — | — | 8 | |||||||||||||||||||||||
| Total 8.46% | $ | (153 | ) | $ | 18 | $ | 689,045 | $ | 6,185 | ||||||||||||||||||||
| 1 | Security did not produce income during the last 12 months. |
| 2 | All or a portion of this security was on loan. The total value of all such securities was $21,864,000, which represented .27% of the net assets of the fund. Refer to Note 5 for more information on securities lending. |
| 3 | Rate represents the seven-day yield at 10/31/2022. |
| 4 | Part of the same “group of investment companies” as the fund as defined under the Investment Company Act of 1940, as amended. |
| 5 | Acquired in a transaction exempt from registration under Rule 144A or Section 4(2) of the Securities Act of 1933. May be resold in the U.S. in transactions exempt from registration, normally to qualified institutional buyers. The total value of all such securities was $249,684,000, which represented 3.07% of the net assets of the fund. |
| 6 | Affiliated issuer during the reporting period but no longer held at 10/31/2022. |
| 7 | Represents net activity. Refer to Note 5 for more information on securities lending. |
| 8 | Dividend income is included with securities lending income in the fund’s statement of operations and is not shown in this table. |
Key to abbreviations
ADR = American Depositary Receipts
CAD = Canadian dollars
EUR = Euros
GBP = British pounds
GDR = Global Depositary Receipts
REIT = Real Estate Investment Trust
USD = U.S. dollars
Refer to the notes to financial statements.
| 8 | American Funds Global Insight Fund |
| Financial statements | |
| Statement of assets and liabilities at October 31, 2022 | (dollars in thousands) |
| Assets: | ||||||||
| Investment securities, at value (includes $21,864 of investment securities on loan): | ||||||||
| Unaffiliated issuers (cost: $8,000,052) | $ | 7,447,259 | ||||||
| Affiliated issuers (cost: $689,022) | 689,045 | $ | 8,136,304 | |||||
| Cash | 259 | |||||||
| Cash denominated in currencies other than U.S. dollars (cost: $502) | 502 | |||||||
| Receivables for: | ||||||||
| Sales of investments | 210 | |||||||
| Sales of fund’s shares | 9,008 | |||||||
| Dividends | 14,776 | |||||||
| Securities lending income | — | * | ||||||
| Other | — | * | 23,994 | |||||
| 8,161,059 | ||||||||
| Liabilities: | ||||||||
| Payables for: | ||||||||
| Purchases of investments | 10,373 | |||||||
| Repurchases of fund’s shares | 2,362 | |||||||
| Investment advisory services | 2,740 | |||||||
| Services provided by related parties | 399 | |||||||
| Trustees’ deferred compensation | 56 | |||||||
| Non-U.S. taxes | 707 | |||||||
| Other | 740 | 17,377 | ||||||
| Net assets at October 31, 2022 | $ | 8,143,682 | ||||||
| Net assets consist of: | ||||||||
| Capital paid in on shares of beneficial interest | $ | 9,068,075 | ||||||
| Total accumulated loss | (924,393 | ) | ||||||
| Net assets at October 31, 2022 | $ | 8,143,682 |
| * | Amount less than one thousand. |
Refer to the notes to financial statements.
| American Funds Global Insight Fund | 9 |
| Financial statements (continued) | |
| Statement of assets and liabilities at October 31, 2022 (continued) |
(dollars and shares in thousands, except per-share amounts)
Shares of beneficial interest issued and outstanding (no stated par value) —
unlimited shares authorized (463,390 total shares outstanding)
| Net assets | Shares outstanding | Net asset value per share | ||||||||||
| Class A | $ | 105,977 | 6,066 | $ | 17.47 | |||||||
| Class C | 5,906 | 342 | 17.27 | |||||||||
| Class T | 10 | 1 | 17.56 | |||||||||
| Class F-1 | 4,063 | 232 | 17.47 | |||||||||
| Class F-2 | 120,201 | 6,847 | 17.56 | |||||||||
| Class F-3 | 1,116,219 | 63,480 | 17.58 | |||||||||
| Class 529-A | 8,527 | 488 | 17.48 | |||||||||
| Class 529-C | 812 | 47 | 17.27 | |||||||||
| Class 529-E | 146 | 8 | 17.43 | |||||||||
| Class 529-T | 11 | 1 | 17.55 | |||||||||
| Class 529-F-1 | 11 | 1 | 17.55 | |||||||||
| Class 529-F-2 | 2,810 | 160 | 17.50 | |||||||||
| Class 529-F-3 | 11 | 1 | 17.51 | |||||||||
| Class R-1 | 57 | 3 | 17.52 | |||||||||
| Class R-2 | 346 | 20 | 17.31 | |||||||||
| Class R-2E | 86 | 5 | 17.49 | |||||||||
| Class R-3 | 1,125 | 64 | 17.47 | |||||||||
| Class R-4 | 486 | 28 | 17.48 | |||||||||
| Class R-5E | 416 | 24 | 17.54 | |||||||||
| Class R-5 | 91 | 5 | 17.57 | |||||||||
| Class R-6 | 6,776,371 | 385,567 | 17.58 | |||||||||
Refer to the notes to financial statements.
| 10 | American Funds Global Insight Fund |
| Financial statements (continued) | |
| Statement of operations for the year ended October 31, 2022 | (dollars in thousands) |
| Investment income: | ||||||||
| Income: | ||||||||
| Dividends (net of non-U.S. taxes of $7,489; also includes $6,185 from affiliates) | $ | 158,449 | ||||||
| Interest from unaffiliated issuers | 852 | |||||||
| Securities lending income (net of fees) | 316 | $ | 159,617 | |||||
| Fees and expenses*: | ||||||||
| Investment advisory services | 35,152 | |||||||
| Distribution services | 423 | |||||||
| Transfer agent services | 262 | |||||||
| Administrative services | 2,523 | |||||||
| 529 plan services | 6 | |||||||
| Reports to shareholders | 20 | |||||||
| Registration statement and prospectus | 916 | |||||||
| Trustees’ compensation | 100 | |||||||
| Auditing and legal | 100 | |||||||
| Custodian | 364 | |||||||
| Other | 101 | |||||||
| Total fees and expenses before reimbursement | 39,967 | |||||||
| Less reimbursement of fees and expenses: | ||||||||
| Transfer agent services reimbursement | — | † | ||||||
| Total fees and expenses after reimbursement | 39,967 | |||||||
| Net investment income | 119,650 | |||||||
| Net realized loss and unrealized depreciation: | ||||||||
| Net realized loss on: | ||||||||
| Investments: | ||||||||
| Unaffiliated issuers | (463,256 | ) | ||||||
| Affiliated issuers | (153 | ) | ||||||
| Currency transactions | (57 | ) | (463,466 | ) | ||||
| Net unrealized (depreciation) appreciation on: | ||||||||
| Investments: | ||||||||
| Unaffiliated issuers | (1,414,308 | ) | ||||||
| Affiliated issuers | 18 | |||||||
| Currency translations | (295 | ) | (1,414,585 | ) | ||||
| Net realized loss and unrealized depreciation | (1,878,051 | ) | ||||||
| Net decrease in net assets resulting from operations | $ | (1,758,401 | ) |
| * | Additional information related to class-specific fees and expenses is included in the notes to financial statements. |
| † | Amount less than one thousand. |
Refer to the notes to financial statements.
| American Funds Global Insight Fund | 11 |
| Financial statements (continued) | |
| Statements of changes in net assets | (dollars in thousands) |
| Year ended October 31, | ||||||||
| 2022 | 2021 | |||||||
| Operations: | ||||||||
| Net investment income | $ | 119,650 | $ | 64,206 | ||||
| Net realized loss | (463,466 | ) | (7,086 | ) | ||||
| Net unrealized (depreciation) appreciation | (1,414,585 | ) | 612,606 | |||||
| Net (decrease) increase in net assets resulting from operations | (1,758,401 | ) | 669,726 | |||||
| Distributions paid to shareholders | (77,595 | ) | (8,133 | ) | ||||
| Net capital share transactions | 1,126,866 | 7,309,104 | ||||||
| Total (decrease) increase in net assets | (709,130 | ) | 7,970,697 | |||||
| Net assets: | ||||||||
| Beginning of year | 8,852,812 | 882,115 | ||||||
| End of year | $ | 8,143,682 | $ | 8,852,812 | ||||
Refer to the notes to financial statements.
| 12 | American Funds Global Insight Fund |
Notes to financial statements
1. Organization
American Funds Global Insight Fund (the “fund”) is registered under the Investment Company Act of 1940, as amended (the “1940 Act”), as an open-end, diversified management investment company. The fund seeks to provide prudent growth of capital and conservation of principal.
The fund has 21 share classes consisting of six retail share classes (Classes A, C, T, F-1, F-2 and F-3), seven 529 college savings plan share classes (Classes 529-A, 529-C, 529-E, 529-T, 529-F-1, 529-F-2 and 529-F-3) and eight retirement plan share classes (Classes R-1, R-2, R-2E, R-3, R-4, R-5E, R-5 and R-6). The 529 college savings plan share classes can be used to save for college education. The retirement plan share classes are generally offered only through eligible employer-sponsored retirement plans. The fund’s share classes are described further in the following table:
| Share class | Initial sales charge | Contingent deferred sales charge upon redemption | Conversion feature | |||
| Classes A and 529-A | Up to 5.75% for Class A; up to 3.50% for Class 529-A | None (except 1.00% for certain redemptions within 18 months of purchase without an initial sales charge) | None | |||
| Classes C and 529-C | None | 1.00% for redemptions within one year of purchase | Class C converts to Class A after eight years and Class 529-C converts to Class 529-A after five years | |||
| Class 529-E | None | None | None | |||
| Classes T and 529-T* | Up to 2.50% | None | None | |||
| Classes F-1, F-2, F-3, 529-F-1, 529-F-2 and 529-F-3 | None | None | None | |||
| Classes R-1, R-2, R-2E, R-3, R-4, R-5E, R-5 and R-6 | None | None | None |
| * | Class T and 529-T shares are not available for purchase. |
Holders of all share classes have equal pro rata rights to the assets, dividends and liquidation proceeds of the fund. Each share class has identical voting rights, except for the exclusive right to vote on matters affecting only its class. Share classes have different fees and expenses (“class-specific fees and expenses”), primarily due to different arrangements for distribution, transfer agent and administrative services. Differences in class-specific fees and expenses will result in differences in net investment income and, therefore, the payment of different per-share dividends by each share class.
2. Significant accounting policies
The fund is an investment company that applies the accounting and reporting guidance issued in Topic 946 by the U.S. Financial Accounting Standards Board. The fund’s financial statements have been prepared to comply with U.S. generally accepted accounting principles (“U.S. GAAP”). These principles require the fund’s investment adviser to make estimates and assumptions that affect reported amounts and disclosures. Actual results could differ from those estimates. Subsequent events, if any, have been evaluated through the date of issuance in the preparation of the financial statements. The fund follows the significant accounting policies described in this section, as well as the valuation policies described in the next section on valuation.
Security transactions and related investment income — Security transactions are recorded by the fund as of the date the trades are executed with brokers. Realized gains and losses from security transactions are determined based on the specific identified cost of the securities. In the event a security is purchased with a delayed payment date, the fund will segregate liquid assets sufficient to meet its payment obligations. Market discounts, premiums and original issue discounts on fixed-income securities are amortized daily over the expected life of the security.
Class allocations — Income, fees and expenses (other than class-specific fees and expenses), realized gains and losses and unrealized appreciation and depreciation are allocated daily among the various share classes based on their relative net assets. Class-specific fees and expenses, such as distribution, transfer agent and administrative services, are charged directly to the respective share class.
Distributions paid to shareholders — Income dividends and capital gain distributions are recorded on the ex-dividend date.
| American Funds Global Insight Fund | 13 |
Currency translation — Assets and liabilities, including investment securities, denominated in currencies other than U.S. dollars are translated into U.S. dollars at the exchange rates supplied by one or more pricing vendors on the valuation date. Purchases and sales of investment securities and income and expenses are translated into U.S. dollars at the exchange rates on the dates of such transactions. The effects of changes in exchange rates on investment securities are included with the net realized gain or loss and net unrealized appreciation or depreciation on investments in the fund’s statement of operations. The realized gain or loss and unrealized appreciation or depreciation resulting from all other transactions denominated in currencies other than U.S. dollars are disclosed separately.
3. Valuation
Capital Research and Management Company (“CRMC”), the fund’s investment adviser, values the fund’s investments at fair value as defined by U.S. GAAP. The net asset value per share is calculated once daily as of the close of regular trading on the New York Stock Exchange, normally 4 p.m. New York time, each day the New York Stock Exchange is open.
Methods and inputs — The fund’s investment adviser uses the following methods and inputs to establish the fair value of the fund’s assets and liabilities. Use of particular methods and inputs may vary over time based on availability and relevance as market and economic conditions evolve.
Equity securities, including depositary receipts, are generally valued at the official closing price of, or the last reported sale price on, the exchange or market on which such securities are traded, as of the close of business on the day the securities are being valued or, lacking any sales, at the last available bid price. Prices for each security are taken from the principal exchange or market on which the security trades.
Fixed-income securities, including short-term securities, are generally valued at evaluated prices obtained from third-party pricing vendors. Vendors value such securities based on one or more of the inputs described in the following table. The table provides examples of inputs that are commonly relevant for valuing particular classes of fixed-income securities in which the fund is authorized to invest. However, these classifications are not exclusive, and any of the inputs may be used to value any other class of fixed-income security.
| Fixed-income class | Examples of standard inputs | |
| All | Benchmark yields, transactions, bids, offers, quotations from dealers and trading systems, new issues, spreads and other relationships observed in the markets among comparable securities; and proprietary pricing models such as yield measures calculated using factors such as cash flows, financial or collateral performance and other reference data (collectively referred to as “standard inputs”) | |
| Corporate bonds, notes & loans; convertible securities | Standard inputs and underlying equity of the issuer | |
| Bonds & notes of governments & government agencies | Standard inputs and interest rate volatilities | |
| Mortgage-backed; asset-backed obligations | Standard inputs and cash flows, prepayment information, default rates, delinquency and loss assumptions, collateral characteristics, credit enhancements and specific deal information |
Securities with both fixed-income and equity characteristics, or equity securities traded principally among fixed-income dealers, are generally valued in the manner described for either equity or fixed-income securities, depending on which method is deemed most appropriate by the fund’s investment adviser. The Capital Group Central Cash Fund (“CCF”), a fund within the Capital Group Central Fund Series (“Central Funds”), is valued based upon a floating net asset value, which fluctuates with changes in the value of CCF’s portfolio securities. The underlying securities are valued based on the policies and procedures in CCF’s statement of additional information.
| 14 | American Funds Global Insight Fund |
Securities and other assets for which representative market quotations are not readily available or are considered unreliable by the fund’s investment adviser are fair valued as determined in good faith under fair valuation guidelines adopted by the fund’s investment adviser and approved by the board of trustees as further described. The investment adviser follows fair valuation guidelines, consistent with U.S. Securities and Exchange Commission rules and guidance, to consider relevant principles and factors when making fair value determinations. The investment adviser considers relevant indications of value that are reasonably and timely available to it in determining the fair value to be assigned to a particular security, such as the type and cost of the security, contractual or legal restrictions on resale of the security, relevant financial or business developments of the issuer, actively traded similar or related securities, dealer or broker quotes, conversion or exchange rights on the security, related corporate actions, significant events occurring after the close of trading in the security, and changes in overall market conditions. In addition, the closing prices of equity securities that trade in markets outside U.S. time zones may be adjusted to reflect significant events that occur after the close of local trading but before the net asset value of each share class of the fund is determined. Fair valuations of investments that are not actively trading involve judgment and may differ materially from valuations that would have been used had greater market activity occurred.
Processes and structure — The fund’s board of trustees has designated the fund’s investment adviser to make fair value determinations, subject to board oversight. The investment adviser has established a Joint Fair Valuation Committee (the “Fair Valuation Committee”) to administer, implement and oversee the fair valuation process, and to make fair value decisions. The Fair Valuation Committee regularly reviews its own fair value decisions, as well as decisions made under its standing instructions to the investment adviser’s valuation team. The Fair Valuation Committee reviews changes in fair value measurements from period to period and may, as deemed appropriate, update the fair valuation guidelines to better reflect the results of back testing and address new or evolving issues. The Fair Valuation Committee reports any changes to the fair valuation guidelines to the board of trustees. The fund’s board and audit committee also regularly review reports that describe fair value determinations and methods.
The fund’s investment adviser has also established a Fixed-Income Pricing Review Group to administer and oversee the fixed-income valuation process, including the use of fixed-income pricing vendors. This group regularly reviews pricing vendor information and market data. Pricing decisions, processes and controls over security valuation are also subject to additional internal reviews facilitated by the investment adviser’s global risk management group.
Classifications — The fund’s investment adviser classifies the fund’s assets and liabilities into three levels based on the inputs used to value the assets or liabilities. Level 1 values are based on quoted prices in active markets for identical securities. Level 2 values are based on significant observable market inputs, such as quoted prices for similar securities and quoted prices in inactive markets. Certain securities trading outside the U.S. may transfer between Level 1 and Level 2 due to valuation adjustments resulting from significant market movements following the close of local trading. Level 3 values are based on significant unobservable inputs that reflect the investment adviser’s determination of assumptions that market participants might reasonably use in valuing the securities. The valuation levels are not necessarily an indication of the risk or liquidity associated with the underlying investment. For example, U.S. government securities are reflected as Level 2 because the inputs used to determine fair value may not always be quoted prices in an active market. The following table presents the fund’s valuation levels as of October 31, 2022 (dollars in thousands):
| Investment securities | ||||||||||||||||
| Level 1 | Level 2 | Level 3 | Total | |||||||||||||
| Assets: | ||||||||||||||||
| Common stocks: | ||||||||||||||||
| Information technology | $ | 1,429,622 | $ | — | $ | — | $ | 1,429,622 | ||||||||
| Health care | 1,255,988 | — | — | 1,255,988 | ||||||||||||
| Industrials | 891,175 | — | — | 891,175 | ||||||||||||
| Financials | 884,600 | — | — | 884,600 | ||||||||||||
| Consumer discretionary | 629,238 | — | — | 629,238 | ||||||||||||
| Consumer staples | 614,389 | — | — | 614,389 | ||||||||||||
| Energy | 517,868 | — | — | 517,868 | ||||||||||||
| Communication services | 409,334 | — | — | 409,334 | ||||||||||||
| Materials | 239,003 | — | — | 239,003 | ||||||||||||
| Utilities | 214,222 | — | — | 214,222 | ||||||||||||
| Real estate | 82,493 | — | — | 82,493 | ||||||||||||
| Preferred securities | 29,575 | — | — | 29,575 | ||||||||||||
| Rights & warrants | 68 | — | — | 68 | ||||||||||||
| Short-term securities | 689,045 | 249,684 | — | 938,729 | ||||||||||||
| Total | $ | 7,886,620 | $ | 249,684 | $ | — | $ | 8,136,304 | ||||||||
| American Funds Global Insight Fund | 15 |
4. Risk factors
Investing in the fund may involve certain risks including, but not limited to, those described below.
Market conditions — The prices of, and the income generated by, the securities held by the fund may decline — sometimes rapidly or unpredictably — due to various factors, including events or conditions affecting the general economy or particular industries or companies; overall market changes; local, regional or global political, social or economic instability; governmental, governmental agency or central bank responses to economic conditions; and currency exchange rate, interest rate and commodity price fluctuations.
Economies and financial markets throughout the world are highly interconnected. Economic, financial or political events, trading and tariff arrangements, wars, terrorism, cybersecurity events, natural disasters, public health emergencies (such as the spread of infectious disease) and other circumstances in one country or region, including actions taken by governmental or quasi-governmental authorities in response to any of the foregoing, could have impacts on global economies or markets. As a result, whether or not the fund invests in securities of issuers located in or with significant exposure to the countries affected, the value and liquidity of the fund’s investments may be negatively affected by developments in other countries and regions.
Issuer risks — The prices of, and the income generated by, securities held by the fund may decline in response to various factors directly related to the issuers of such securities, including reduced demand for an issuer’s goods or services, poor management performance, major litigation, investigations or other controversies related to the issuer, changes in financial condition or credit rating, changes in government regulations affecting the issuer or its competitive environment and strategic initiatives such as mergers, acquisitions or dispositions and the market response to any such initiatives.
Investing in growth-oriented stocks — Growth-oriented common stocks and other equity-type securities (such as preferred stocks, convertible preferred stocks and convertible bonds) may involve larger price swings and greater potential for loss than other types of investments.
Investing outside the U.S. — Securities of issuers domiciled outside the U.S., or with significant operations or revenues outside the U.S., may lose value because of adverse political, social, economic or market developments (including social instability, regional conflicts, terrorism and war) in the countries or regions in which the issuers operate or generate revenue. These securities may also lose value due to changes in foreign currency exchange rates against the U.S. dollar and/or currencies of other countries. Issuers of these securities may be more susceptible to actions of foreign governments, such as nationalization, currency blockage or the imposition of price controls, sanctions, or punitive taxes, each of which could adversely impact the value of these securities. Securities markets in certain countries may be more volatile and/or less liquid than those in the U.S. Investments outside the U.S. may also be subject to different regulatory, legal, accounting, auditing, financial reporting and recordkeeping requirements, and may be more difficult to value, than those in the U.S. In addition, the value of investments outside the U.S. may be reduced by foreign taxes, including foreign withholding taxes on interest and dividends. Further, there may be increased risks of delayed settlement of securities purchased or sold by the fund, which could impact the liquidity of the fund’s portfolio. The risks of investing outside the U.S. may be heightened in connection with investments in emerging markets.
Management — The investment adviser to the fund actively manages the fund’s investments. Consequently, the fund is subject to the risk that the methods and analyses, including models, tools and data, employed by the investment adviser in this process may be flawed or incorrect and may not produce the desired results. This could cause the fund to lose value or its investment results to lag relevant benchmarks or other funds with similar objectives.
5. Certain investment techniques
Securities lending — The fund has entered into securities lending transactions in which the fund earns income by lending investment securities to brokers, dealers or other institutions. Each transaction involves three parties: the fund, acting as the lender of the securities, a borrower, and a lending agent that acts as an intermediary.
Securities lending transactions are entered into by the fund under a securities lending agent agreement with the lending agent. The lending agent facilitates the exchange of securities between the fund and approved borrowers, ensures that securities loans are properly coordinated and documented, marks-to-market the value of collateral daily, secures additional collateral from a borrower if it falls below preset terms, and may reinvest cash collateral on behalf of the fund according to agreed parameters. The lending agent provides indemnification to the fund against losses resulting from a borrower default. Although risk is mitigated by the collateral and indemnification, the fund could experience a delay in recovering its securities and a potential loss of income or value if a borrower fails to return securities, collateral investments decline in value or the lending agent fails to perform.
| 16 | American Funds Global Insight Fund |
The borrower is required to post highly liquid assets, such as cash or U.S. government securities, as collateral for the loan in an amount at least equal to the value of the securities loaned. Investments made with cash collateral are recognized as assets in the fund’s investment portfolio. The same amount is recorded as a liability in the fund’s statement of assets and liabilities. While securities are on loan, the fund will continue to receive the equivalent of the interest, dividends or other distributions paid by the issuer, as well as a portion of the interest on the investment of the collateral. Additionally, although the fund does not have the right to vote on securities while they are on loan, the fund has a right to consent on corporate actions and a right to recall loaned securities to vote. A borrower is obligated to return loaned securities at the conclusion of a loan or, during the pendency of a loan, on demand from the fund.
As of October 31, 2022, the total value of securities on loan was $21,864,000, and the total value of collateral received was $22,957,000, which consisted entirely of U.S. government securities. Investment securities purchased from cash collateral are disclosed in the fund’s investment portfolio as short-term securities. Securities received as collateral are not recognized as fund assets. The contractual maturity of cash collateral received under the securities lending agreement is classified as overnight and continuous.
6. Taxation and distributions
Federal income taxation — The fund complies with the requirements under Subchapter M of the Internal Revenue Code applicable to regulated investment companies and intends to distribute substantially all of its net taxable income and net capital gains each year. The fund is not subject to income taxes to the extent such distributions are made. Therefore, no federal income tax provision is required.
As of and during the year ended October 31, 2022, the fund did not have a liability for any unrecognized tax benefits. The fund recognizes interest and penalties, if any, related to unrecognized tax benefits as income tax expense in the statement of operations. During the year, the fund did not incur any significant interest or penalties.
The fund’s tax returns are generally not subject to examination by federal, state and, if applicable, non-U.S. tax authorities after the expiration of each jurisdiction’s statute of limitations, which is typically three years after the date of filing but can be extended in certain jurisdictions.
Non-U.S. taxation — Dividend and interest income are recorded net of non-U.S. taxes paid. The fund may file withholding tax reclaims in certain jurisdictions to recover a portion of amounts previously withheld. As a result of rulings from European courts, the fund filed for additional reclaims related to prior years. These reclaims are recorded when the amount is known and there are no significant uncertainties on collectability. During the year ended October 31, 2022, the fund recognized $120,000 in reclaims (net of $276,000 in fees and the effect of realized gain or loss from currency translations) and $36,000 in interest related to European court rulings, which is included in dividend income and interest income, respectively, in the fund’s statement of operations. Gains realized by the fund on the sale of securities in certain countries, if any, may be subject to non-U.S. taxes. If applicable, the fund records an estimated deferred tax liability based on unrealized gains to provide for potential non-U.S. taxes payable upon the sale of these securities.
Distributions — Distributions determined on a tax basis may differ from net investment income and net realized gains for financial reporting purposes. These differences are due primarily to different treatment for items such as currency gains and losses; short-term capital gains and losses and net capital losses. The fiscal year in which amounts are distributed may differ from the year in which the net investment income and net realized gains are recorded by the fund for financial reporting purposes. The fund may also designate a portion of the amount paid to redeeming shareholders as a distribution for tax purposes.
During the year ended October 31, 2022, the fund reclassified $1,330,000 from total accumulated loss to capital paid in on shares of beneficial interest to align financial reporting with tax reporting.
As of October 31, 2022, the tax basis components of distributable earnings, unrealized appreciation (depreciation) and cost of investments were as follows (dollars in thousands):
| Undistributed ordinary income | $ | 103,504 | ||
| Capital loss carryforward* | (474,660 | ) | ||
| Gross unrealized appreciation on investments | 558,956 | |||
| Gross unrealized depreciation on investments | (1,111,960 | ) | ||
| Net unrealized depreciation on investments | (553,004 | ) | ||
| Cost of investments | 8,689,308 |
| * | The capital loss carryforward will be used to offset any capital gains realized by the fund in future years. The fund will not make distributions from capital gains while a capital loss carryforward remains. |
| American Funds Global Insight Fund | 17 |
Tax-basis distributions paid to shareholders from ordinary income were as follows (dollars in thousands):
| Year ended October 31 | ||||||||
| Share class | 2022 | 2021 | ||||||
| Class A | $ | 624 | $ | 279 | ||||
| Class C | 1 | 11 | ||||||
| Class T | — | † | — | † | ||||
| Class F-1 | 28 | 8 | ||||||
| Class F-2 | 814 | 369 | ||||||
| Class F-3 | 10,795 | 7,442 | ||||||
| Class 529-A | 49 | 12 | ||||||
| Class 529-C | — | 1 | ||||||
| Class 529-E | 1 | — | † | |||||
| Class 529-T | — | † | — | † | ||||
| Class 529-F-1 | — | † | — | † | ||||
| Class 529-F-2 | 19 | 5 | ||||||
| Class 529-F-3 | — | † | — | † | ||||
| Class R-1 | — | † | — | † | ||||
| Class R-2 | 1 | — | † | |||||
| Class R-2E | — | † | — | † | ||||
| Class R-3 | — | † | 1 | |||||
| Class R-4 | 7 | — | † | |||||
| Class R-5E | 2 | — | † | |||||
| Class R-5 | 1 | 1 | ||||||
| Class R-6 | 65,253 | 4 | ||||||
| Total | $ | 77,595 | $ | 8,133 | ||||
| † | Amount less than one thousand. |
7. Fees and transactions with related parties
CRMC, the fund’s investment adviser, is the parent company of American Funds Distributors®, Inc. (“AFD”), the principal underwriter of the fund’s shares, and American Funds Service Company® (“AFS”), the fund’s transfer agent. CRMC, AFD and AFS are considered related parties to the fund.
Investment advisory services — The fund has an investment advisory and service agreement with CRMC that provides for monthly fees accrued daily. At the beginning of the year, these fees were based on a series of decreasing annual rates beginning with 0.520% on the first $1.5 billion of daily net assets and decreasing to 0.395% on such assets in excess of $6.5 billion. On March 11, 2022, the fund’s board of trustees approved an amended investment advisory and service agreement effective May 1, 2022, replacing the prior series of rates and breakpoints with a new series of decreasing annual rates beginning with 0.411% on the first $15 billion of daily net assets and decreasing to 0.390% on such assets in excess of $15 billion. For the year ended October 31, 2022, the investment advisory services fees were $35,152,000, which were equivalent to an annualized rate of 0.418% of average daily net assets.
Class-specific fees and expenses — Expenses that are specific to individual share classes are accrued directly to the respective share class. The principal class-specific fees and expenses are further described below:
Distribution services — The fund has plans of distribution for all share classes, except Class F-2, F-3, 529-F-2, 529-F-3, R-5E, R-5 and R-6 shares. Under the plans, the board of trustees approves certain categories of expenses that are used to finance activities primarily intended to sell fund shares and service existing accounts. The plans provide for payments, based on an annualized percentage of average daily net assets, ranging from 0.25% to 1.00% as noted in this section. In some cases, the board of trustees has limited the amounts that may be paid to less than the maximum allowed by the plans. All share classes with a plan may use up to 0.25% of average daily net assets to pay service fees, or to compensate AFD for paying service fees, to firms that have entered into
| 18 | American Funds Global Insight Fund |
agreements with AFD to provide certain shareholder services. The remaining amounts available to be paid under each plan are paid to dealers to compensate them for their sales activities.
| Share class | Currently approved limits | Plan limits | ||||||
| Class A | 0.25 | % | 0.30 | % | ||||
| Class 529-A | 0.25 | 0.50 | ||||||
| Classes C, 529-C and R-1 | 1.00 | 1.00 | ||||||
| Class R-2 | 0.75 | 1.00 | ||||||
| Class R-2E | 0.60 | 0.85 | ||||||
| Classes 529-E and R-3 | 0.50 | 0.75 | ||||||
| Classes T, F-1, 529-T, 529-F-1 and R-4 | 0.25 | 0.50 | ||||||
For Class A and 529-A shares, distribution-related expenses include the reimbursement of dealer and wholesaler commissions paid by AFD for certain shares sold without a sales charge. These share classes reimburse AFD for amounts billed within the prior 15 months but only to the extent that the overall annual expense limits are not exceeded. As of October 31, 2022, unreimbursed expenses subject to reimbursement totaled $111,000 for Class A shares. There were no unreimbursed expenses subject to reimbursement for Class 529-A shares.
Transfer agent services — The fund has a shareholder services agreement with AFS under which the fund compensates AFS for providing transfer agent services to each of the fund’s share classes. These services include recordkeeping, shareholder communications and transaction processing. In addition, the fund reimburses AFS for amounts paid to third parties for performing transfer agent services on behalf of fund shareholders. For the year ended October 31, 2022, CRMC reimbursed transfer agent services fees of less than $1,000 for Class R-1 shares. CRMC does not intend to recoup this reimbursement.
Administrative services — The fund has an administrative services agreement with CRMC under which the fund compensates CRMC for providing administrative services to all share classes. Administrative services are provided by CRMC and its affiliates to help assist third parties providing non-distribution services to fund shareholders. These services include providing in-depth information on the fund and market developments that impact fund investments. Administrative services also include, but are not limited to, coordinating, monitoring and overseeing third parties that provide services to fund shareholders. The agreement provides the fund the ability to charge an administrative services fee at the annual rate of 0.05% of the average daily net assets attributable to each share class of the fund. Currently the fund pays CRMC an administrative services fee at the annual rate of 0.03% of the average daily net assets attributable to each share class of the fund for CRMC’s provision of administrative services.
529 plan services — Each 529 share class is subject to service fees to compensate the Virginia College Savings Plan (“Virginia529”) for its oversight and administration of the CollegeAmerica 529 college savings plan. The fees are based on the combined net assets invested in Class 529 and ABLE shares of the American Funds. Class ABLE shares are offered on other American Funds by Virginia529 through ABLEAmerica®, a tax-advantaged savings program for individuals with disabilities. Virginia529 is not considered a related party to the fund.
Prior to January 1, 2022, the quarterly fees were based on a series of decreasing annual rates beginning with 0.09% on the first $20 billion of the combined net assets invested in the American Funds and decreasing to 0.03% on such assets in excess of $100 billion. Effective January 1, 2022, the quarterly fees were amended to a series of decreasing annual rates beginning with 0.09% on the first $20 billion of the combined net assets invested in the American Funds and decreasing to 0.03% on such assets in excess of $75 billion. The fees for any given calendar quarter are accrued and calculated on the basis of the average net assets of Class 529 and ABLE shares of the American Funds for the last month of the prior calendar quarter. For the year ended October 31, 2022, the 529 plan services fees were $6,000, which were equivalent to 0.058% of the average daily net assets of each 529 share class.
| American Funds Global Insight Fund | 19 |
For the year ended October 31, 2022, class-specific expenses under the agreements were as follows (dollars in thousands):
| Share class | Distribution services | Transfer agent services | Administrative services | 529 plan services | ||||||||||||
| Class A | $313 | $113 | $31 | Not applicable | ||||||||||||
| Class C | 65 | 7 | 2 | Not applicable | ||||||||||||
| Class T | — | — | * | — | * | Not applicable | ||||||||||
| Class F-1 | 11 | 5 | 1 | Not applicable | ||||||||||||
| Class F-2 | Not applicable | 105 | 32 | Not applicable | ||||||||||||
| Class F-3 | Not applicable | — | * | 356 | Not applicable | |||||||||||
| Class 529-A | 18 | 8 | 2 | $4 | ||||||||||||
| Class 529-C | 9 | 1 | — | * | 1 | |||||||||||
| Class 529-E | 1 | — | * | — | * | — | * | |||||||||
| Class 529-T | — | — | * | — | * | — | * | |||||||||
| Class 529-F-1 | — | — | * | — | * | — | * | |||||||||
| Class 529-F-2 | Not applicable | 2 | 1 | 1 | ||||||||||||
| Class 529-F-3 | Not applicable | — | — | * | — | * | ||||||||||
| Class R-1 | — | * | — | * | — | * | Not applicable | |||||||||
| Class R-2 | 2 | 1 | — | * | Not applicable | |||||||||||
| Class R-2E | — | * | — | * | — | * | Not applicable | |||||||||
| Class R-3 | 3 | 1 | — | * | Not applicable | |||||||||||
| Class R-4 | 1 | 1 | — | * | Not applicable | |||||||||||
| Class R-5E | Not applicable | 1 | — | * | Not applicable | |||||||||||
| Class R-5 | Not applicable | — | * | — | * | Not applicable | ||||||||||
| Class R-6 | Not applicable | 17 | 2,098 | Not applicable | ||||||||||||
| Total class-specific expenses | $423 | $262 | $2,523 | $6 | ||||||||||||
| * | Amount less than one thousand. |
Trustees’ deferred compensation — Trustees who are unaffiliated with CRMC may elect to defer the cash payment of part or all of their compensation. These deferred amounts, which remain as liabilities of the fund, are treated as if invested in shares of the fund or other American Funds. These amounts represent general, unsecured liabilities of the fund and vary according to the total returns of the selected funds. Trustees’ compensation of $100,000 in the fund’s statement of operations reflects $112,000 in current fees (either paid in cash or deferred) and a net decrease of $12,000 in the value of the deferred amounts.
Affiliated officers and trustees — Officers and certain trustees of the fund are or may be considered to be affiliated with CRMC, AFD and AFS. No affiliated officers or trustees received any compensation directly from the fund.
Investment in CCF — The fund holds shares of CCF, an institutional prime money market fund managed by CRMC. CCF invests in high-quality, short-term money market instruments. CCF is used as the primary investment vehicle for the fund’s short-term instruments. CCF shares are only available for purchase by CRMC, its affiliates, and other funds managed by CRMC or its affiliates, and are not available to the public. CRMC does not receive an investment advisory services fee from CCF.
Security transactions with related funds — The fund purchased investment securities from, and sold investment securities to, other funds managed by CRMC (or funds managed by certain affiliates of CRMC) under procedures adopted by the fund’s board of trustees. The funds involved in such transactions are considered related by virtue of having a common investment adviser (or affiliated investment advisers), common trustees and/or common officers. Each transaction was executed at the current market price of the security and no brokerage commissions or fees were paid in accordance with Rule 17a-7 of the 1940 Act. During the year ended October 31, 2022, the fund engaged in such purchase and sale transactions with related funds in the amounts of $80,372,000 and $53,315,000, respectively, which generated $22,941,000 of net realized losses from such sales.
Interfund lending — Pursuant to an exemptive order issued by the SEC, the fund, along with other CRMC-managed funds (or funds managed by certain affiliates of CRMC), may participate in an interfund lending program. The program provides an alternate credit facility that permits the funds to lend or borrow cash for temporary purposes directly to or from one another, subject to the conditions of the exemptive order. The fund did not lend or borrow cash through the interfund lending program at any time during the year ended October 31, 2022.
| 20 | American Funds Global Insight Fund |
8. Indemnifications
The fund’s organizational documents provide board members and officers with indemnification against certain liabilities or expenses in connection with the performance of their duties to the fund. In the normal course of business, the fund may also enter into contracts that provide general indemnifications. The fund’s maximum exposure under these arrangements is unknown since it is dependent on future claims that may be made against the fund. The risk of material loss from such claims is considered remote. Insurance policies are also available to the fund’s board members and officers.
9. Capital share transactions
Capital share transactions in the fund were as follows (dollars and shares in thousands):
| Sales* | Reinvestments of distributions | Repurchases* | Net increase (decrease) | |||||||||||||||||||||||||||||
| Share class | Amount | Shares | Amount | Shares | Amount | Shares | Amount | Shares | ||||||||||||||||||||||||
| Year ended October 31, 2022 | ||||||||||||||||||||||||||||||||
| Class A | $ | 58,964 | 3,031 | $ | 612 | 29 | $ | (29,857 | ) | (1,568 | ) | $ | 29,719 | 1,492 | ||||||||||||||||||
| Class C | 2,730 | 143 | 1 | — | † | (1,815 | ) | (100 | ) | 916 | 43 | |||||||||||||||||||||
| Class T | — | — | — | — | — | — | — | — | ||||||||||||||||||||||||
| Class F-1 | 2,694 | 137 | 27 | 1 | (1,633 | ) | (84 | ) | 1,088 | 54 | ||||||||||||||||||||||
| Class F-2 | 97,473 | 5,092 | 784 | 37 | (52,746 | ) | (2,758 | ) | 45,511 | 2,371 | ||||||||||||||||||||||
| Class F-3 | 246,425 | 12,588 | 10,767 | 504 | (130,731 | ) | (6,759 | ) | 126,461 | 6,333 | ||||||||||||||||||||||
| Class 529-A | 4,491 | 239 | 49 | 2 | (1,412 | ) | (74 | ) | 3,128 | 167 | ||||||||||||||||||||||
| Class 529-C | 412 | 20 | — | — | (302 | ) | (16 | ) | 110 | 4 | ||||||||||||||||||||||
| Class 529-E | 76 | 3 | 1 | — | † | (27 | ) | (1 | ) | 50 | 2 | |||||||||||||||||||||
| Class 529-T | — | — | — | † | — | † | — | — | — | † | — | † | ||||||||||||||||||||
| Class 529-F-1 | — | — | — | † | — | † | — | — | — | † | — | † | ||||||||||||||||||||
| Class 529-F-2 | 1,225 | 65 | 19 | 1 | (231 | ) | (13 | ) | 1,013 | 53 | ||||||||||||||||||||||
| Class 529-F-3 | — | — | — | † | — | † | — | — | — | † | — | † | ||||||||||||||||||||
| Class R-1 | 51 | 2 | — | † | — | † | (2 | ) | — | † | 49 | 2 | ||||||||||||||||||||
| Class R-2 | 272 | 15 | 1 | — | † | (127 | ) | (7 | ) | 146 | 8 | |||||||||||||||||||||
| Class R-2E | 21 | 1 | — | † | — | † | (7 | ) | — | † | 14 | 1 | ||||||||||||||||||||
| Class R-3 | 1,030 | 53 | — | † | — | † | (242 | ) | (11 | ) | 788 | 42 | ||||||||||||||||||||
| Class R-4 | 103 | 5 | 7 | — | † | (327 | ) | (15 | ) | (217 | ) | (10 | ) | |||||||||||||||||||
| Class R-5E | 324 | 17 | 2 | — | † | (96 | ) | (5 | ) | 230 | 12 | |||||||||||||||||||||
| Class R-5 | 35 | 2 | — | † | — | † | — | — | 35 | 2 | ||||||||||||||||||||||
| Class R-6 | 963,773 | 50,316 | 65,255 | 3,061 | (111,203 | ) | (5,785 | ) | 917,825 | 47,592 | ||||||||||||||||||||||
| Total net increase (decrease) | $ | 1,380,099 | 71,729 | $ | 77,525 | 3,635 | $ | (330,758 | ) | (17,196 | ) | $ | 1,126,866 | 58,168 | ||||||||||||||||||
Refer to the end of the table for footnotes.
| American Funds Global Insight Fund | 21 |
| Sales* | Reinvestments of distributions | Repurchases* | Net increase (decrease) | |||||||||||||||||||||||||||||
| Share class | Amount | Shares | Amount | Shares | Amount | Shares | Amount | Shares | ||||||||||||||||||||||||
| Year ended October 31, 2021 | ||||||||||||||||||||||||||||||||
| Class A | $ | 57,124 | 2,795 | $ | 271 | 14 | $ | (9,055 | ) | (441 | ) | $ | 48,340 | 2,368 | ||||||||||||||||||
| Class C | 4,294 | 214 | 11 | 1 | (866 | ) | (42 | ) | 3,439 | 173 | ||||||||||||||||||||||
| Class T | — | — | — | — | — | — | — | — | ||||||||||||||||||||||||
| Class F-1 | 2,744 | 133 | 8 | — | † | (274 | ) | (14 | ) | 2,478 | 119 | |||||||||||||||||||||
| Class F-2 | 73,063 | 3,550 | 357 | 19 | (29,476 | ) | (1,402 | ) | 43,944 | 2,167 | ||||||||||||||||||||||
| Class F-3 | 253,376 | 12,380 | 7,443 | 393 | (65,275 | ) | (3,191 | ) | 195,544 | 9,582 | ||||||||||||||||||||||
| Class 529-A | 5,542 | 269 | 12 | 1 | (1,348 | ) | (65 | ) | 4,206 | 205 | ||||||||||||||||||||||
| Class 529-C | 542 | 27 | 1 | — | † | (49 | ) | (2 | ) | 494 | 25 | |||||||||||||||||||||
| Class 529-E | 109 | 5 | — | † | — | † | (31 | ) | (1 | ) | 78 | 4 | ||||||||||||||||||||
| Class 529-T | — | — | — | † | — | † | — | — | — | † | — | † | ||||||||||||||||||||
| Class 529-F-1 | — | — | — | † | — | † | — | — | — | † | — | † | ||||||||||||||||||||
| Class 529-F-2 | 1,645 | 80 | 5 | — | † | (171 | ) | (9 | ) | 1,479 | 71 | |||||||||||||||||||||
| Class 529-F-3 | — | — | — | † | — | † | — | — | — | † | — | † | ||||||||||||||||||||
| Class R-1 | 14 | 1 | — | † | — | † | (30 | ) | (1 | ) | (16) | — | † | |||||||||||||||||||
| Class R-2 | 222 | 11 | — | † | — | † | (10 | ) | (1 | ) | 212 | 10 | ||||||||||||||||||||
| Class R-2E | 97 | 5 | — | — | (29 | ) | (2 | ) | 68 | 3 | ||||||||||||||||||||||
| Class R-3 | 412 | 20 | — | † | — | † | (40 | ) | (2 | ) | 372 | 18 | ||||||||||||||||||||
| Class R-4 | 865 | 41 | — | † | — | † | (83 | ) | (4 | ) | 782 | 37 | ||||||||||||||||||||
| Class R-5E | 237 | 11 | — | † | — | † | (3 | ) | — | † | 234 | 11 | ||||||||||||||||||||
| Class R-5 | — | † | — | † | — | † | — | † | — | — | — | † | — | † | ||||||||||||||||||
| Class R-6 | 7,062,543 | 340,524 | 4 | — | † | (55,097 | ) | (2,576 | ) | 7,007,450 | 337,948 | |||||||||||||||||||||
| Total net increase (decrease) | $ | 7,462,829 | 360,066 | $ | 8,112 | 428 | $ | (161,837 | ) | (7,753 | ) | $ | 7,309,104 | 352,741 | ||||||||||||||||||
| * | Includes exchanges between share classes of the fund. |
| † | Amount less than one thousand. |
10. Investment transactions
The fund engaged in purchases and sales of investment securities, excluding short-term securities and U.S. government obligations, if any, of $2,282,490,000 and $1,546,616,000, respectively, during the year ended October 31, 2022.
11. Ownership concentration
At October 31, 2022, four shareholders held more than 10% of the fund’s outstanding shares. The four shareholders were American Funds 2025 Target Date Retirement Fund, American Funds 2030 Target Date Retirement Fund, American Funds 2035 Target Date Retirement Fund and American Funds 2040 Target Date Retirement Fund, with aggregate ownership of the fund’s outstanding shares of 11%, 15%, 15% and 13%, respectively. CRMC is the investment adviser to the four target date retirement funds.
| 22 | American Funds Global Insight Fund |
Financial highlights
| (Loss) income from investment operations1 | Dividends and distributions | |||||||||||||||||||||||||||||||||||||||||||||||||||
| Year ended | Net asset value, beginning of year | Net investment income (loss) | Net (losses) gains on securities (both realized and unrealized) | Total from investment operations | Dividends (from net investment income) | Distributions (from capital gains) | Total dividends and distributions | Net asset value, end of year | Total return2,3 | Net assets, end of year (in millions) | Ratio of expenses to average net assets before reimburse- ments4 | Ratio of expenses to average net assets after reimburse- ments3,4 | Ratio of net income (loss) to average net assets3 | |||||||||||||||||||||||||||||||||||||||
| Class A: | ||||||||||||||||||||||||||||||||||||||||||||||||||||
| 10/31/2022 | $ | 21.74 | $ | .20 | $ | (4.34 | ) | $ | (4.14 | ) | $ | (.13 | ) | $ | — | $ | (.13 | ) | $ | 17.47 | (19.16 | )% | $ | 106 | .88 | % | .88 | % | 1.03 | % | ||||||||||||||||||||||
| 10/31/2021 | 16.75 | .18 | 4.92 | 5.10 | (.11 | ) | — | (.11 | ) | 21.74 | 30.57 | 100 | .93 | .90 | .87 | |||||||||||||||||||||||||||||||||||||
| 10/31/20205,6 | 16.72 | .10 | .41 | .51 | (.26 | ) | (.22 | ) | (.48 | ) | 16.75 | 3.08 | 7 | 37 | .99 | 8 | .99 | 8 | .63 | 8 | ||||||||||||||||||||||||||||||||
| Class C: | ||||||||||||||||||||||||||||||||||||||||||||||||||||
| 10/31/2022 | 21.52 | .06 | (4.31 | ) | (4.25 | ) | — | 9 | — | — | 9 | 17.27 | (19.74 | ) | 6 | 1.58 | 1.58 | .33 | ||||||||||||||||||||||||||||||||||
| 10/31/2021 | 16.66 | .03 | 4.90 | 4.93 | (.07 | ) | — | (.07 | ) | 21.52 | 29.71 | 6 | 1.63 | 1.60 | .17 | |||||||||||||||||||||||||||||||||||||
| 10/31/20205,6 | 16.72 | (.02 | ) | .44 | .42 | (.26 | ) | (.22 | ) | (.48 | ) | 16.66 | 2.47 | 7 | 2 | 1.68 | 8 | 1.68 | 8 | (.11 | )8 | |||||||||||||||||||||||||||||||
| Class T: | ||||||||||||||||||||||||||||||||||||||||||||||||||||
| 10/31/2022 | 21.83 | .26 | (4.36 | ) | (4.10 | ) | (.17 | ) | — | (.17 | ) | 17.56 | (18.92 | )10 | — | 11 | .56 | 10 | .56 | 10 | 1.33 | 10 | ||||||||||||||||||||||||||||||
| 10/31/2021 | 16.77 | .23 | 4.94 | 5.17 | (.11 | ) | — | (.11 | ) | 21.83 | 30.94 | 10 | — | 11 | .67 | 10 | .64 | 10 | 1.12 | 10 | ||||||||||||||||||||||||||||||||
| 10/31/20205,6 | 16.72 | .14 | .39 | .53 | (.26 | ) | (.22 | ) | (.48 | ) | 16.77 | 3.21 | 7,10 | — | 11 | .94 | 8,10 | .87 | 8,10 | .86 | 8,10 | |||||||||||||||||||||||||||||||
| Class F-1: | ||||||||||||||||||||||||||||||||||||||||||||||||||||
| 10/31/2022 | 21.75 | .20 | (4.34 | ) | (4.14 | ) | (.14 | ) | — | (.14 | ) | 17.47 | (19.14 | ) | 4 | .84 | .84 | 1.06 | ||||||||||||||||||||||||||||||||||
| 10/31/2021 | 16.76 | .19 | 4.92 | 5.11 | (.12 | ) | — | (.12 | ) | 21.75 | 30.61 | 4 | .90 | .87 | .91 | |||||||||||||||||||||||||||||||||||||
| 10/31/20205,6 | 16.72 | .11 | .41 | .52 | (.26 | ) | (.22 | ) | (.48 | ) | 16.76 | 3.14 | 7 | 1 | .95 | 8 | .94 | 8 | .68 | 8 | ||||||||||||||||||||||||||||||||
| Class F-2: | ||||||||||||||||||||||||||||||||||||||||||||||||||||
| 10/31/2022 | 21.83 | .26 | (4.36 | ) | (4.10 | ) | (.17 | ) | — | (.17 | ) | 17.56 | (18.90 | ) | 120 | .57 | .57 | 1.35 | ||||||||||||||||||||||||||||||||||
| 10/31/2021 | 16.80 | .24 | 4.94 | 5.18 | (.15 | ) | — | (.15 | ) | 21.83 | 30.96 | 98 | .64 | .61 | 1.16 | |||||||||||||||||||||||||||||||||||||
| 10/31/20205,6 | 16.72 | .15 | .41 | .56 | (.26 | ) | (.22 | ) | (.48 | ) | 16.80 | 3.39 | 7 | 39 | .66 | 8 | .66 | 8 | .90 | 8 | ||||||||||||||||||||||||||||||||
| Class F-3: | ||||||||||||||||||||||||||||||||||||||||||||||||||||
| 10/31/2022 | 21.85 | .28 | (4.36 | ) | (4.08 | ) | (.19 | ) | — | (.19 | ) | 17.58 | (18.83 | ) | 1,116 | .47 | .47 | 1.43 | ||||||||||||||||||||||||||||||||||
| 10/31/2021 | 16.81 | .25 | 4.94 | 5.19 | (.15 | ) | — | (.15 | ) | 21.85 | 31.03 | 1,249 | .56 | .53 | 1.23 | |||||||||||||||||||||||||||||||||||||
| 10/31/202012 | 16.47 | .18 | .65 | .83 | (.27 | ) | (.22 | ) | (.49 | ) | 16.81 | 5.04 | 800 | .62 | .62 | 1.10 | ||||||||||||||||||||||||||||||||||||
| 10/31/201912 | 14.92 | .22 | 2.21 | 2.43 | (.18 | ) | (.70 | ) | (.88 | ) | 16.47 | 17.65 | 702 | .64 | .64 | 1.45 | ||||||||||||||||||||||||||||||||||||
| 10/31/201812 | 15.62 | .22 | (.16 | ) | .06 | (.21 | ) | (.55 | ) | (.76 | ) | 14.92 | .25 | 567 | .66 | .65 | 1.38 | |||||||||||||||||||||||||||||||||||
| Class 529-A: | ||||||||||||||||||||||||||||||||||||||||||||||||||||
| 10/31/2022 | 21.76 | .20 | (4.34 | ) | (4.14 | ) | (.14 | ) | — | (.14 | ) | 17.48 | (19.13 | ) | 9 | .86 | .86 | 1.06 | ||||||||||||||||||||||||||||||||||
| 10/31/2021 | 16.75 | .21 | 4.90 | 5.11 | (.10 | ) | — | (.10 | ) | 21.76 | 30.69 | 7 | .83 | .80 | .99 | |||||||||||||||||||||||||||||||||||||
| 10/31/20205,6 | 16.72 | .10 | .41 | .51 | (.26 | ) | (.22 | ) | (.48 | ) | 16.75 | 3.01 | 7 | 2 | 1.05 | 8 | 1.05 | 8 | .62 | 8 | ||||||||||||||||||||||||||||||||
Refer to the end of the table for footnotes.
| American Funds Global Insight Fund | 23 |
Financial highlights (continued)
| (Loss) income from investment operations1 | Dividends and distributions | |||||||||||||||||||||||||||||||||||||||||||||||||||
| Year ended | Net asset value, beginning of year | Net investment income (loss) | Net (losses) gains on securities (both realized and unrealized) | Total from investment operations | Dividends (from net investment income) | Distributions (from capital gains) | Total dividends and distributions | Net asset value, end of year | Total return2,3 | Net assets, end of year (in millions) | Ratio of expenses to average net assets before reimburse- ments4 | Ratio of expenses to average net assets after reimburse- ments3,4 | Ratio of net income (loss) to average net assets3 | |||||||||||||||||||||||||||||||||||||||
| Class 529-C: | ||||||||||||||||||||||||||||||||||||||||||||||||||||
| 10/31/2022 | $ | 21.53 | $ | .05 | $ | (4.31 | ) | $ | (4.26 | ) | $ | — | $ | — | $ | — | $ | 17.27 | (19.79 | )% | $ | 1 | 1.62 | % | 1.62 | % | .27 | % | ||||||||||||||||||||||||
| 10/31/2021 | 16.66 | .03 | 4.90 | 4.93 | (.06 | ) | — | (.06 | ) | 21.53 | 29.62 | 1 | 1.66 | 1.63 | .16 | |||||||||||||||||||||||||||||||||||||
| 10/31/20205,6 | 16.72 | — | 9 | .42 | .42 | (.26 | ) | (.22 | ) | (.48 | ) | 16.66 | 2.52 | 7 | — | 11 | 1.69 | 8 | 1.68 | 8 | .01 | 8 | ||||||||||||||||||||||||||||||
| Class 529-E: | ||||||||||||||||||||||||||||||||||||||||||||||||||||
| 10/31/2022 | 21.70 | .17 | (4.34 | ) | (4.17 | ) | (.10 | ) | — | (.10 | ) | 17.43 | (19.30 | ) | — | 11 | 1.04 | 1.04 | .89 | |||||||||||||||||||||||||||||||||
| 10/31/2021 | 16.73 | .14 | 4.93 | 5.07 | (.10 | ) | — | (.10 | ) | 21.70 | 30.42 | 10 | — | 11 | 1.07 | 10 | 1.04 | 10 | .69 | 10 | ||||||||||||||||||||||||||||||||
| 10/31/20205,6 | 16.72 | .10 | .39 | .49 | (.26 | ) | (.22 | ) | (.48 | ) | 16.73 | 2.96 | 7,10 | — | 11 | 1.10 | 8,10 | 1.10 | 8,10 | .60 | 8,10 | |||||||||||||||||||||||||||||||
| Class 529-T: | ||||||||||||||||||||||||||||||||||||||||||||||||||||
| 10/31/2022 | 21.82 | .25 | (4.36 | ) | (4.11 | ) | (.16 | ) | — | (.16 | ) | 17.55 | (18.97 | )10 | — | 11 | .62 | 10 | .62 | 10 | 1.27 | 10 | ||||||||||||||||||||||||||||||
| 10/31/2021 | 16.77 | .22 | 4.93 | 5.15 | (.10 | ) | — | (.10 | ) | 21.82 | 30.91 | 10 | — | 11 | .71 | 10 | .69 | 10 | 1.08 | 10 | ||||||||||||||||||||||||||||||||
| 10/31/20205,6 | 16.72 | .13 | .40 | .53 | (.26 | ) | (.22 | ) | (.48 | ) | 16.77 | 3.14 | 7,10 | — | 11 | .99 | 8,10 | .91 | 8,10 | .82 | 8,10 | |||||||||||||||||||||||||||||||
| Class 529-F-1: | ||||||||||||||||||||||||||||||||||||||||||||||||||||
| 10/31/2022 | 21.82 | .24 | (4.35 | ) | (4.11 | ) | (.16 | ) | — | (.16 | ) | 17.55 | (18.98 | )10 | — | 11 | .66 | 10 | .66 | 10 | 1.23 | 10 | ||||||||||||||||||||||||||||||
| 10/31/2021 | 16.79 | .22 | 4.94 | 5.16 | (.13 | ) | — | (.13 | ) | 21.82 | 30.82 | 10 | — | 11 | .72 | 10 | .69 | 10 | 1.07 | 10 | ||||||||||||||||||||||||||||||||
| 10/31/20205,6 | 16.72 | .15 | .40 | .55 | (.26 | ) | (.22 | ) | (.48 | ) | 16.79 | 3.32 | 7,10 | — | 11 | .76 | 8,10 | .75 | 8,10 | .95 | 8,10 | |||||||||||||||||||||||||||||||
| Class 529-F-2: | ||||||||||||||||||||||||||||||||||||||||||||||||||||
| 10/31/2022 | 21.77 | .26 | (4.36 | ) | (4.10 | ) | (.17 | ) | — | (.17 | ) | 17.50 | (18.97 | ) | 3 | .60 | .60 | 1.33 | ||||||||||||||||||||||||||||||||||
| 10/31/2021 | 16.75 | .23 | 4.93 | 5.16 | (.14 | ) | — | (.14 | ) | 21.77 | 30.91 | 2 | .68 | .65 | 1.13 | |||||||||||||||||||||||||||||||||||||
| 10/31/20205,13 | 16.75 | — | — | — | — | — | — | 16.75 | — | 1 | — | — | — | |||||||||||||||||||||||||||||||||||||||
| Class 529-F-3: | ||||||||||||||||||||||||||||||||||||||||||||||||||||
| 10/31/2022 | 21.76 | .26 | (4.33 | ) | (4.07 | ) | (.18 | ) | — | (.18 | ) | 17.51 | (18.86 | ) | — | 11 | .53 | .53 | 1.36 | |||||||||||||||||||||||||||||||||
| 10/31/2021 | 16.75 | .24 | 4.93 | 5.17 | (.16 | ) | — | (.16 | ) | 21.76 | 30.99 | — | 11 | .66 | .58 | 1.18 | ||||||||||||||||||||||||||||||||||||
| 10/31/20205,13 | 16.75 | — | — | — | — | — | — | 16.75 | — | — | 11 | — | — | — | ||||||||||||||||||||||||||||||||||||||
| Class R-1: | ||||||||||||||||||||||||||||||||||||||||||||||||||||
| 10/31/2022 | 21.77 | .13 | (4.36 | ) | (4.23 | ) | (.02 | ) | — | (.02 | ) | 17.52 | (19.41 | )10 | — | 11 | 1.27 | 10 | 1.26 | 10 | .68 | 10 | ||||||||||||||||||||||||||||||
| 10/31/2021 | 16.80 | .16 | 4.93 | 5.09 | (.12 | ) | — | (.12 | ) | 21.77 | 30.45 | 10 | — | 11 | 1.23 | 10 | 1.10 | 10 | .79 | 10 | ||||||||||||||||||||||||||||||||
| 10/31/20205,6 | 16.72 | .14 | .42 | .56 | (.26 | ) | (.22 | ) | (.48 | ) | 16.80 | 3.33 | 7,10 | — | 11 | 1.02 | 8,10 | .81 | 8,10 | .85 | 8,10 | |||||||||||||||||||||||||||||||
Refer to the end of the table for footnotes.
| 24 | American Funds Global Insight Fund |
Financial highlights (continued)
| (Loss) income from investment operations1 | Dividends and distributions | ||||||||||||||||||||||||||||||||||||||||||||||||||||
| Year ended | Net asset value, beginning of year | Net investment income (loss) | Net (losses) gains on securities (both realized and unrealized) | Total from investment operations | Dividends (from net investment income) | Distributions (from capital gains) | Total dividends and distributions | Net asset value, end of year | Total return2,3 | Net assets, end of year (in millions) | Ratio of expenses to average net assets before reimburse- ments4 | Ratio of expenses to average net assets after reimburse- ments3,4 | Ratio of net income (loss) to average net assets3 | ||||||||||||||||||||||||||||||||||||||||
| Class R-2: | |||||||||||||||||||||||||||||||||||||||||||||||||||||
| 10/31/2022 | $ | 21.64 | $ | .08 | $ | (4.31 | ) | $ | (4.23 | ) | $ | (.10 | ) | $ | — | $ | (.10 | ) | $ | 17.31 | (19.64 | )% | $ | — | 11 | 1.49 | % | 1.49 | % | .44 | % | ||||||||||||||||||||||
| 10/31/2021 | 16.75 | .07 | 4.92 | 4.99 | (.10 | ) | — | (.10 | ) | 21.64 | 29.90 | — | 11 | 1.45 | 1.43 | .36 | |||||||||||||||||||||||||||||||||||||
| 10/31/20205,6 | 16.72 | .06 | .45 | .51 | (.26 | ) | (.22 | ) | (.48 | ) | 16.75 | 3.05 | 7,10 | — | 11 | 1.19 | 8,10 | 1.19 | 8,10 | .37 | 8,10 | ||||||||||||||||||||||||||||||||
| Class R-2E: | |||||||||||||||||||||||||||||||||||||||||||||||||||||
| 10/31/2022 | 21.74 | .14 | (4.35 | ) | (4.21 | ) | (.04 | ) | — | (.04 | ) | 17.49 | (19.39 | )10 | — | 11 | 1.16 | 10 | 1.16 | 10 | .74 | 10 | |||||||||||||||||||||||||||||||
| 10/31/2021 | 16.81 | .14 | 4.95 | 5.09 | (.16 | ) | — | (.16 | ) | 21.74 | 30.39 | 10 | — | 11 | 1.22 | 10 | 1.17 | 10 | .69 | 10 | |||||||||||||||||||||||||||||||||
| 10/31/20205,6 | 16.72 | .18 | .39 | .57 | (.26 | ) | (.22 | ) | (.48 | ) | 16.81 | 3.44 | 7,10 | — | 11 | .85 | 8,10 | .64 | 8,10 | 1.09 | 8,10 | ||||||||||||||||||||||||||||||||
| Class R-3: | |||||||||||||||||||||||||||||||||||||||||||||||||||||
| 10/31/2022 | 21.71 | .15 | (4.35 | ) | (4.20 | ) | (.04 | ) | — | (.04 | ) | 17.47 | (19.39 | ) | 1 | 1.14 | 1.14 | .78 | |||||||||||||||||||||||||||||||||||
| 10/31/2021 | 16.76 | .15 | 4.91 | 5.06 | (.11 | ) | — | (.11 | ) | 21.71 | 30.32 | 1 | 1.12 | 1.09 | .72 | ||||||||||||||||||||||||||||||||||||||
| 10/31/20205,6 | 16.72 | .11 | .41 | .52 | (.26 | ) | (.22 | ) | (.48 | ) | 16.76 | 3.14 | 7,10 | — | 11 | 1.04 | 8,10 | 1.01 | 8,10 | .71 | 8,10 | ||||||||||||||||||||||||||||||||
| Class R-4: | |||||||||||||||||||||||||||||||||||||||||||||||||||||
| 10/31/2022 | 21.79 | .20 | (4.33 | ) | (4.13 | ) | (.18 | ) | — | (.18 | ) | 17.48 | (19.11 | ) | 1 | .81 | .81 | 1.05 | |||||||||||||||||||||||||||||||||||
| 10/31/2021 | 16.80 | .22 | 4.91 | 5.13 | (.14 | ) | — | (.14 | ) | 21.79 | 30.69 | 1 | .86 | .82 | 1.06 | ||||||||||||||||||||||||||||||||||||||
| 10/31/20205,6 | 16.72 | .16 | .40 | .56 | (.26 | ) | (.22 | ) | (.48 | ) | 16.80 | 3.39 | 7,10 | — | 11 | .89 | 8,10 | .69 | 8,10 | .98 | 8,10 | ||||||||||||||||||||||||||||||||
| Class R-5E: | |||||||||||||||||||||||||||||||||||||||||||||||||||||
| 10/31/2022 | 21.83 | .24 | (4.35 | ) | (4.11 | ) | (.18 | ) | — | (.18 | ) | 17.54 | (18.99 | ) | �� | 1 | .66 | .66 | 1.26 | ||||||||||||||||||||||||||||||||||
| 10/31/2021 | 16.81 | .26 | 4.92 | 5.18 | (.16 | ) | — | (.16 | ) | 21.83 | 30.95 | — | 11 | .69 | .63 | 1.23 | |||||||||||||||||||||||||||||||||||||
| 10/31/20205,6 | 16.72 | .18 | .39 | .57 | (.26 | ) | (.22 | ) | (.48 | ) | 16.81 | 3.45 | 7 | — | 11 | .87 | 8 | .61 | 8 | 1.11 | 8 | ||||||||||||||||||||||||||||||||
| Class R-5: | |||||||||||||||||||||||||||||||||||||||||||||||||||||
| 10/31/2022 | 21.85 | .27 | (4.36 | ) | (4.09 | ) | (.19 | ) | — | (.19 | ) | 17.57 | (18.89 | ) | — | 11 | .52 | .52 | 1.38 | ||||||||||||||||||||||||||||||||||
| 10/31/2021 | 16.81 | .25 | 4.94 | 5.19 | (.15 | ) | — | (.15 | ) | 21.85 | 31.03 | — | 11 | .61 | .55 | 1.22 | |||||||||||||||||||||||||||||||||||||
| 10/31/20205,6 | 16.72 | .16 | .41 | .57 | (.26 | ) | (.22 | ) | (.48 | ) | 16.81 | 3.46 | 7 | — | 11 | .73 | 8 | .63 | 8 | .94 | 8 | ||||||||||||||||||||||||||||||||
| Class R-6: | |||||||||||||||||||||||||||||||||||||||||||||||||||||
| 10/31/2022 | 21.85 | .28 | (4.36 | ) | (4.08 | ) | (.19 | ) | — | (.19 | ) | 17.58 | (18.82 | ) | 6,776 | .47 | .47 | 1.43 | |||||||||||||||||||||||||||||||||||
| 10/31/2021 | 16.81 | .28 | 4.92 | 5.20 | (.16 | ) | — | (.16 | ) | 21.85 | 31.14 | 7,384 | .52 | .47 | 1.32 | ||||||||||||||||||||||||||||||||||||||
| 10/31/20205,6 | 16.72 | .03 | .55 | .58 | (.27 | ) | (.22 | ) | (.49 | ) | 16.81 | 3.41 | 7 | — | 11 | .71 | 8 | .68 | 8 | .16 | 8 | ||||||||||||||||||||||||||||||||
| Year ended October 31, | ||||||||||
| 2022 | 2021 | 2020 | 2019 | 2018 | ||||||
| Portfolio turnover rate for all share classes14 | 20% | 6% | 18% | 22% | 28% | |||||
| 1 | Based on average shares outstanding. | |
| 2 | Total returns exclude any applicable sales charges, including contingent deferred sales charges. | |
| 3 | This column reflects the impact, if any, of certain reimbursements from CRMC. During one of the years shown, CRMC waived a portion of investment advisory services fees. In addition, during some of the years shown, CRMC reimbursed a portion of transfer agent services fees for certain share classes and/or reimbursed a portion of miscellaneous fees and expenses. | |
| 4 | Ratios do not include expenses of any Central Funds. The fund indirectly bears its proportionate share of the expenses of any Central Funds. | |
| 5 | Based on operations for a period that is less than a full year. | |
| 6 | This share class began investment operations on November 8, 2019. | |
| 7 | Not annualized. | |
| 8 | Annualized. | |
| 9 | Amount less than $.01. | |
| 10 | All or a significant portion of assets in this class consisted of seed capital invested by CRMC and/or its affiliates. Fees for distribution services are not charged or accrued on these seed capital assets. If such fees were paid by the fund on seed capital assets, fund expenses would have been higher and net income and total return would have been lower. | |
| 11 | Amount less than $1 million. | |
| 12 | Class M shares were converted to Class F-3 shares on November 8, 2019. | |
| 13 | Class 529-F-2 and 529-F-3 shares began investment operations on October 30, 2020. | |
| 14 | Rates do not include the fund’s portfolio activity with respect to any Central Funds. |
Refer to the notes to financial statements.
| American Funds Global Insight Fund | 25 |
Report of Independent Registered Public Accounting Firm
To the Board of Trustees and Shareholders of American Funds Global Insight Fund
Opinion on the Financial Statements
We have audited the accompanying statement of assets and liabilities, including the investment portfolio, of American Funds Global Insight Fund (the “Fund”) as of October 31, 2022, the related statement of operations for the year ended October 31, 2022, the statements of changes in net assets for each of the two years in the period ended October 31, 2022, including the related notes, and the financial highlights for each of the periods indicated therein (collectively referred to as the “financial statements”). In our opinion, the financial statements present fairly, in all material respects, the financial position of the Fund as of October 31, 2022, the results of its operations for the year then ended, the changes in its net assets for each of the two years in the period ended October 31, 2022 and the financial highlights for each of the periods indicated therein in conformity with accounting principles generally accepted in the United States of America.
Basis for Opinion
These financial statements are the responsibility of the Fund’s management. Our responsibility is to express an opinion on the Fund’s financial statements based on our audits. We are a public accounting firm registered with the Public Company Accounting Oversight Board (United States) (PCAOB) and are required to be independent with respect to the Fund in accordance with the U.S. federal securities laws and the applicable rules and regulations of the Securities and Exchange Commission and the PCAOB.
We conducted our audits of these financial statements in accordance with the standards of the PCAOB. Those standards require that we plan and perform the audit to obtain reasonable assurance about whether the financial statements are free of material misstatement, whether due to error or fraud.
Our audits included performing procedures to assess the risks of material misstatement of the financial statements, whether due to error or fraud, and performing procedures that respond to those risks. Such procedures included examining, on a test basis, evidence regarding the amounts and disclosures in the financial statements. Our audits also included evaluating the accounting principles used and significant estimates made by management, as well as evaluating the overall presentation of the financial statements. Our procedures included confirmation of securities owned as of October 31, 2022 by correspondence with the custodian, transfer agent and brokers; when replies were not received from brokers, we performed other auditing procedures. We believe that our audits provide a reasonable basis for our opinion.
/s/ PricewaterhouseCoopers LLP
Los Angeles, California
December 9, 2022
We have served as the auditor of one or more investment companies in The Capital Group Companies Investment Company Complex since 1934.
| 26 | American Funds Global Insight Fund |
| Expense example | unaudited |
As a fund shareholder, you incur two types of costs: (1) transaction costs, such as initial sales charges on purchase payments and contingent deferred sales charges on redemptions (loads), and (2) ongoing costs, including management fees, distribution and service (12b-1) fees, and other expenses. This example is intended to help you understand your ongoing costs (in dollars) of investing in the fund so you can compare these costs with the ongoing costs of investing in other mutual funds. The example is based on an investment of $1,000 invested at the beginning of the period and held for the entire six-month period (May 1, 2022, through October 31, 2022).
Actual expenses:
The first line of each share class in the table on the following page provides information about actual account values and actual expenses. You may use the information in this line, together with the amount you invested, to estimate the expenses that you paid over the period. Simply divide your account value by $1,000 (for example, an $8,600 account value divided by $1,000 = 8.6), then multiply the result by the number in the first line under the heading titled “Expenses paid during period” to estimate the expenses you paid on your account during this period.
Hypothetical example for comparison purposes:
The second line of each share class in the table on the following page provides information about hypothetical account values and hypothetical expenses based on the actual expense ratio for the share class and an assumed rate of return of 5.00% per year before expenses, which is not the actual return of the share class. The hypothetical account values and expenses may not be used to estimate the actual ending account balance or expenses you paid for the period. You may use this information to compare the ongoing costs of investing in the fund and other funds. To do so, compare this 5.00% hypothetical example with the 5.00% hypothetical examples that appear in the shareholder reports of the other funds.
Notes:
Retirement plan participants may be subject to certain fees charged by the plan sponsor, and Class F-1, F-2, F-3, 529-F-1, 529-F-2 and 529-F-3 shareholders may be subject to fees charged by financial intermediaries, typically ranging from 0.75% to 1.50% of assets annually depending on services offered. You can estimate the impact of these fees by adding the amount of the fees to the total estimated expenses you paid on your account during the period as calculated above. In addition, your ending account value would be lower by the amount of these fees.
Note that the expenses shown in the table on the following page are meant to highlight your ongoing costs only and do not reflect any transactional costs, such as sales charges (loads). Therefore, the second line of each share class in the table is useful in comparing ongoing costs only and will not help you determine the relative total costs of owning different funds. In addition, if these transactional costs were included, your costs would have been higher.
| American Funds Global Insight Fund | 27 |
Expense example (continued)
| Beginning account value 5/1/2022 | Ending account value 10/31/2022 | Expenses paid during period* | Annualized expense ratio | |||||||||||||
| Class A – actual return | $ | 1,000.00 | $ | 922.87 | $ | 4.22 | .87 | % | ||||||||
| Class A – assumed 5% return | 1,000.00 | 1,020.82 | 4.43 | .87 | ||||||||||||
| Class C – actual return | 1,000.00 | 920.09 | 7.60 | 1.57 | ||||||||||||
| Class C – assumed 5% return | 1,000.00 | 1,017.29 | 7.98 | 1.57 | ||||||||||||
| Class T – actual return | 1,000.00 | 924.69 | 2.72 | .56 | ||||||||||||
| Class T – assumed 5% return | 1,000.00 | 1,022.38 | 2.85 | .56 | ||||||||||||
| Class F-1 – actual return | 1,000.00 | 923.36 | 4.02 | .83 | ||||||||||||
| Class F-1 – assumed 5% return | 1,000.00 | 1,021.02 | 4.23 | .83 | ||||||||||||
| Class F-2 – actual return | 1,000.00 | 924.69 | 2.72 | .56 | ||||||||||||
| Class F-2 – assumed 5% return | 1,000.00 | 1,022.38 | 2.85 | .56 | ||||||||||||
| Class F-3 – actual return | 1,000.00 | 924.78 | 2.18 | .45 | ||||||||||||
| Class F-3 – assumed 5% return | 1,000.00 | 1,022.94 | 2.29 | .45 | ||||||||||||
| Class 529-A – actual return | 1,000.00 | 923.40 | 4.02 | .83 | ||||||||||||
| Class 529-A – assumed 5% return | 1,000.00 | 1,021.02 | 4.23 | .83 | ||||||||||||
| Class 529-C – actual return | 1,000.00 | 919.59 | 7.84 | 1.62 | ||||||||||||
| Class 529-C – assumed 5% return | 1,000.00 | 1,017.04 | 8.24 | 1.62 | ||||||||||||
| Class 529-E – actual return | 1,000.00 | 922.22 | 5.04 | 1.04 | ||||||||||||
| Class 529-E – assumed 5% return | 1,000.00 | 1,019.96 | 5.30 | 1.04 | ||||||||||||
| Class 529-T – actual return | 1,000.00 | 924.17 | 2.96 | .61 | ||||||||||||
| Class 529-T – assumed 5% return | 1,000.00 | 1,022.13 | 3.11 | .61 | ||||||||||||
| Class 529-F-1 – actual return | 1,000.00 | 924.17 | 3.15 | .65 | ||||||||||||
| Class 529-F-1 – assumed 5% return | 1,000.00 | 1,021.93 | 3.31 | .65 | ||||||||||||
| Class 529-F-2 – actual return | 1,000.00 | 924.46 | 2.81 | .58 | ||||||||||||
| Class 529-F-2 – assumed 5% return | 1,000.00 | 1,022.28 | 2.96 | .58 | ||||||||||||
| Class 529-F-3 – actual return | 1,000.00 | 924.98 | 2.52 | .52 | ||||||||||||
| Class 529-F-3 – assumed 5% return | 1,000.00 | 1,022.58 | 2.65 | .52 | ||||||||||||
| Class R-1 – actual return | 1,000.00 | 920.66 | 6.49 | 1.34 | ||||||||||||
| Class R-1 – assumed 5% return | 1,000.00 | 1,018.45 | 6.82 | 1.34 | ||||||||||||
| Class R-2 – actual return | 1,000.00 | 920.25 | 7.21 | 1.49 | ||||||||||||
| Class R-2 – assumed 5% return | 1,000.00 | 1,017.69 | 7.58 | 1.49 | ||||||||||||
| Class R-2E – actual return | 1,000.00 | 921.99 | 5.62 | 1.16 | ||||||||||||
| Class R-2E – assumed 5% return | 1,000.00 | 1,019.36 | 5.90 | 1.16 | ||||||||||||
| Class R-3 – actual return | 1,000.00 | 921.42 | 5.57 | 1.15 | ||||||||||||
| Class R-3 – assumed 5% return | 1,000.00 | 1,019.41 | 5.85 | 1.15 | ||||||||||||
| Class R-4 – actual return | 1,000.00 | 923.40 | 3.88 | .80 | ||||||||||||
| Class R-4 – assumed 5% return | 1,000.00 | 1,021.17 | 4.08 | .80 | ||||||||||||
| Class R-5E – actual return | 1,000.00 | 924.13 | 3.20 | .66 | ||||||||||||
| Class R-5E – assumed 5% return | 1,000.00 | 1,021.88 | 3.36 | .66 | ||||||||||||
| Class R-5 – actual return | 1,000.00 | 924.74 | 2.47 | .51 | ||||||||||||
| Class R-5 – assumed 5% return | 1,000.00 | 1,022.63 | 2.60 | .51 | ||||||||||||
| Class R-6 – actual return | 1,000.00 | 925.27 | 2.18 | .45 | ||||||||||||
| Class R-6 – assumed 5% return | 1,000.00 | 1,022.94 | 2.29 | .45 | ||||||||||||
| * | The “expenses paid during period” are equal to the “annualized expense ratio,” multiplied by the average account value over the period, multiplied by the number of days in the period, and divided by 365 (to reflect the one-half year period). |
| 28 | American Funds Global Insight Fund |
| Tax information | unaudited |
We are required to advise you of the federal tax status of certain distributions received by shareholders during the fiscal year. The fund hereby designates the following amounts for the fund’s fiscal year ended October 31, 2022:
| Qualified dividend income | 100% | ||
| Section 163(j) interest dividends | $ | 877,000 | |
| Corporate dividends received deduction | $ | 41,410,000 | |
| U.S. government income that may be exempt from state taxation | $ | 1,978,000 |
Individual shareholders should refer to their Form 1099 or other tax information, which will be mailed in January 2023, to determine the calendar year amounts to be included on their 2022 tax returns. Shareholders should consult their tax advisors.
| American Funds Global Insight Fund | 29 |
Board of trustees and other officers
Independent trustees1
| Name, year of birth and position with fund | Year first elected a trustee of the fund2 | Principal occupation(s) during the past five years | Number of portfolios in fund complex overseen by trustee | Other directorships3 held by trustee | ||||
| Vanessa C. L. Chang, 1952 Chair of the Board (Independent and Non-Executive) | 2019 | Former Director, EL & EL Investments (real estate) | 22 | Edison International/Southern California Edison; Transocean Ltd. (offshore drilling contractor) | ||||
| James G. Ellis, 1947 | 2019 | Former Dean and Professor of Marketing, Marshall School of Business, University of Southern California | 96 | Advanced Merger Partners; EVe Mobility Acquisition Corp (acquisitions of companies in the electric vehicle market); J. G. Boswell (agricultural production); Mercury General Corporation | ||||
| Jennifer C. Feikin, 1968 | 2019 | Business Advisor; previously held positions at Google, AOL, 20th Century Fox and McKinsey & Company; Trustee, The Nature Conservancy of Utah; former Trustee, The Nature Conservancy of California; former Director, First Descents | 15 | Hertz Global Holdings, Inc. | ||||
| Pablo R. González Guajardo, 1967 | 2019 | CEO, Kimberly-Clark de México, SAB de CV | 22 | América Móvil, SAB de CV (telecommunications company); Grupo Sanborns, SAB de CV (retail stores and restaurants); Kimberly-Clark de México, SAB de CV (consumer staples) | ||||
| Leslie Stone Heisz, 1961 | 2019 | Former Managing Director, Lazard (retired, 2010); Director, Edwards Lifesciences; Trustee, Public Storage; Director, Kaiser Permanente (California public benefit corporation); former Lecturer, UCLA Anderson School of Management | 15 | None | ||||
| William D. Jones, 1955 | 2019 | Real estate developer/owner, President and former CEO, CityLink Investment Corporation (acquires, develops and manages real estate ventures in urban communities) and for the former City Scene Management Company (provided commercial asset management services) | 23 | Biogen Inc. |
Interested trustees4,5
| Name, year of birth and position with fund | Year first elected a trustee of the fund2 | Principal occupation(s) during the past five years and positions held with affiliated entities or the principal underwriter of the fund | Number of portfolios in fund complex overseen by trustee | Other directorships3 held by trustee | ||||
| John S. Armour, 1957 Trustee | 2019 | President and Director, Capital Group Private Client Services, Inc.6 | 9 | None |
The fund’s statement of additional information includes further details about fund trustees and is available without charge upon request by calling American Funds Service Company at (800) 421-4225 or by visiting the Capital Group website at capitalgroup.com. The address for all trustees and officers of the fund is 333 South Hope Street, Los Angeles, CA 90071, Attention: Secretary.
Refer to page 31 for footnotes.
| 30 | American Funds Global Insight Fund |
Officers5
| Name, year of birth and position with fund | Year first elected an officer of the fund2 | Principal occupation(s) during the past five years and positions held with affiliated entities or the Principal Underwriter of the fund | ||
| William L. Robbins, 1968 President | 2019 | Partner – Capital International Investors, Capital Research and Management Company; Partner – Capital International Investors, Capital Bank and Trust Company6; Chair and Director, Capital Group International, Inc.6 | ||
| Walt Burkley, 1966 Principal Executive Officer | 2021 | Senior Vice President and Senior Counsel – Fund Business Management Group, Capital Research and Management Company; Director, Capital Research Company; Director, Capital Research and Management Company | ||
| Michael W. Stockton, 1967 Executive Vice President | 2021 | Senior Vice President – Fund Business Management Group, Capital Research and Management Company | ||
| Gerald Du Manoir, 1966 Senior Vice President | 2019 | Partner – Capital International Investors, Capital Research and Management Company; Partner – Capital International Investors, Capital Bank and Trust Company6; Vice President, Capital Guardian (Canada), Inc.6 | ||
| Gregory D. Fuss, 1959 Senior Vice President | 2019 | Partner – Capital International Investors, Capital Research and Management Company; Partner – Capital International Investors, Capital Bank and Trust Company6; Senior Vice President, Capital Group Private Client Services, Inc.6 | ||
| Steven T. Watson, 1955 Senior Vice President | 2019 | Partner – Capital International Investors, Capital International, Inc.6; Director, Capital International, Inc.6 | ||
| Philip Winston, 1955 Senior Vice President | 2019 | Partner – Capital International Investors, Capital Research and Management Company; Partner – Capital International Investors, Capital International Limited6; Senior Vice President, Capital International Limited6 | ||
| Timothy W. McHale, 1978 Vice President | 2019 | Senior Vice President and Senior Counsel – Fund Business Management Group, Capital Research and Management Company; Secretary, American Funds Distributors, Inc.6; Director, American Funds Service Company6 | ||
| Courtney R. Taylor, 1975 Secretary | 2019 | Assistant Vice President – Fund Business Management Group, Capital Research and Management Company | ||
| Gregory F. Niland, 1971 Treasurer | 2019 | Vice President – Investment Operations, Capital Research and Management Company | ||
| Susan K. Countess, 1966 Assistant Secretary | 2019 | Associate – Fund Business Management Group, Capital Research and Management Company | ||
| Sandra Chuon, 1972 Assistant Treasurer | 2019 | Vice President – Investment Operations, Capital Research and Management Company | ||
| Kyle J. Ilsley, 1980 Assistant Treasurer | 2020 | Assistant Vice President – Investment Operations, Capital Research and Management Company |
| 1 | The term independent trustee refers to a trustee who is not an “interested person” of the fund within the meaning of the Investment Company Act of 1940. |
| 2 | Trustees and officers of the fund serve until their resignation, removal or retirement. |
| 3 | This includes all directorships/trusteeships (other than those in the American Funds or other funds managed by Capital Research and Management Company or its affiliates) that are held by each trustee as a trustee or director of a public company or a registered investment company. |
| 4 | The term interested trustee refers to a trustee who is an “interested person” within the meaning of the Investment Company Act of 1940, on the basis of their affiliation with the fund’s investment adviser, Capital Research and Management Company, or affiliated entities (including the fund’s principal underwriter). |
| 5 | All of the trustees and/or officers listed are officers and/or directors/trustees of one or more of the other funds for which Capital Research and Management Company serves as an investment adviser. |
| 6 | Company affiliated with Capital Research and Management Company. |
| American Funds Global Insight Fund | 31 |
Board of trustees and other officers (continued)
Results of special meeting of shareholders
Held December 2, 2022
Shares outstanding (all classes) on October 3, 2022 (record date)
461,077,626
Total shares voting on December 2, 2022
452,759,788 (98.2% of shares outstanding)
The Proposal: to elect board members:
| Votes for | Percent of shares voting for | Votes withheld | Percent of shares withheld | |||||||||||
| John G. Freund, MD | 452,643,011 | 99.9 | % | 116,777 | 0.1 | % | ||||||||
| Pedro J. Greer, Jr. | 452,614,898 | 99.9 | 144,890 | 0.1 | ||||||||||
| Merit E. Janow | 452,644,467 | 99.9 | 115,321 | 0.1 | ||||||||||
| Winnie Kwan | 452,649,610 | 99.9 | 110,178 | 0.1 | ||||||||||
| Sung Lee | 452,626,467 | 99.9 | 133,321 | 0.1 | ||||||||||
| Earl Lewis, Jr. | 452,642,336 | 99.9 | 117,452 | 0.1 | ||||||||||
| Christopher E. Stone | 452,641,458 | 99.9 | 118,330 | 0.1 | ||||||||||
| Kathy J. Williams | 452,661,683 | 99.9 | 98,105 | 0.1 | ||||||||||
| Amy Zegart, PhD | 452,672,376 | 99.9 | 87,412 | 0.1 | ||||||||||
| 32 | American Funds Global Insight Fund |
Office of the fund
6455 Irvine Center Drive
Irvine, CA 92618-4518
Investment adviser
Capital Research and Management Company
333 South Hope Street
Los Angeles, CA 90071-1406
Transfer agent for shareholder accounts
American Funds Service Company
(Write to the address nearest you.)
P.O. Box 6007
Indianapolis, IN 46206-6007
P.O. Box 2280
Norfolk, VA 23501-2280
Custodian of assets
State Street Bank and Trust Company
One Lincoln Street
Boston, MA 02111-2900
Counsel
Morgan, Lewis & Bockius LLP
One Federal Street
Boston, MA 02110-1726
Independent registered public accounting firm
PricewaterhouseCoopers LLP
601 South Figueroa Street
Los Angeles, CA 90017-3874
Principal underwriter
American Funds Distributors, Inc.
333 South Hope Street
Los Angeles, CA 90071-1406
Investors should carefully consider investment objectives, risks, charges and expenses. This and other important information is contained in the fund prospectus and summary prospectus, which can be obtained from your financial professional and should be read carefully before investing. You may also call American Funds Service Company (AFS) at (800) 421-4225 or visit the Capital Group website at capitalgroup.com.
“American Funds Proxy Voting Procedures and Principles” — which describes how we vote proxies relating to portfolio securities — is available on our website or upon request by calling AFS. The fund files its proxy voting record with the U.S. Securities and Exchange Commission (SEC) for the 12 months ended June 30 by August 31. The proxy voting record is available free of charge on the SEC website at sec.gov and on our website.
American Funds Global Insight Fund files a complete list of its portfolio holdings with the SEC for the first and third quarters of each fiscal year on Form NPORT-P. The list of portfolio holdings is available free of charge on the SEC website and on our website.
This report is for the information of shareholders of American Funds Global Insight Fund, but it also may be used as sales literature when preceded or accompanied by the current prospectus or summary prospectus, which gives details about charges, expenses, investment objectives and operating policies of the fund. If used as sales material after December 31, 2022, this report must be accompanied by an American Funds statistical update for the most recently completed calendar quarter.
MSCI has not approved, reviewed or produced this report, makes no express or implied warranties or representations and is not liable whatsoever for any data in the report. You may not redistribute the MSCI data or use it as a basis for other indices or investment products.
American Funds Distributors, Inc., member FINRA.
The Capital Advantage®
Since 1931, Capital Group, home of American Funds, has helped investors pursue long-term investment success. Our consistent approach — in combination with The Capital SystemTM — has resulted in superior outcomes.
| Aligned with investor success | |
| We base our decisions on a long-term perspective, which we believe aligns our goals with the interests of our clients. Our portfolio managers average 27 years of investment industry experience, including 21 years at our company, reflecting a career commitment to our long-term approach.1 | |
| The Capital System | |
| The Capital System combines individual accountability with teamwork. Funds using The Capital System are divided into portions that are managed independently by investment professionals with diverse backgrounds, ages and investment approaches. An extensive global research effort is the backbone of our system. | |
| American Funds’ superior outcomes | |
| Equity funds have beaten their Lipper peer indexes in 92% of 10-year periods and 99% of 20-year periods.2 Fixed income funds have helped investors achieve diversification through attention to correlation between bonds and equities.3 Fund management fees have been among the lowest in the industry.4 |
| 1 | Investment industry experience as of December 31, 2021. | |
| 2 | Based on Class F-3 share results for rolling calendar-year periods starting the first full calendar year after each fund’s inception through December 31, 2021. Periods covered are the shorter of the fund’s lifetime or since the comparable Lipper index inception date (except Capital Income Builder and SMALLCAP World Fund, for which the Lipper average was used). Expenses differ for each share class, so results will vary. | |
| 3 | Based on Class F-3 share results as of December 31, 2021. Thirteen of the 17 fixed income American Funds that have been in existence for the three-year period showed a three-year correlation below 0.3. S&P 500 Index was used as an equity market proxy. Correlation based on monthly total returns. Correlation is a statistical measure of how two securities move in relation to each other. A correlation ranges from –1 to 1. A positive correlation close to 1 implies that as one security moves, either up or down, the other security will move in “lockstep,” in the same direction. A negative correlation close to –1 indicates that the securities have moved in the opposite direction. | |
| 4 | On average, our management fees were in the lowest quintile 63% of the time, based on the 20-year period ended December 31, 2021, versus comparable Lipper categories, excluding funds of funds. |
Class F-3 shares were first offered on January 27, 2017. Class F-3 share results prior to the date of first sale are hypothetical based on results of the original share class of the fund without a sales charge, adjusted for typical estimated expenses. Visit capitalgroup.com for more information on specific expense adjustments and the actual dates of first sale.
All Capital Group trademarks mentioned are owned by The Capital Group Companies, Inc., an affiliated company or fund. All other company and product names mentioned are the property of their respective companies.

ITEM 2 – Code of Ethics
The Registrant has adopted a Code of Ethics that applies to its Principal Executive Officer and Principal Financial Officer. The Registrant undertakes to provide to any person without charge, upon request, a copy of the Code of Ethics. Such request can be made by calling 800/421-4225 or to the Secretary of the Registrant, 6455 Irvine Center Drive, Irvine, California 92618.
ITEM 3 – Audit Committee Financial Expert
The Registrant’s board has determined that Leslie Stone Heisz, a member of the Registrant’s audit committee, is an “audit committee financial expert” and "independent," as such terms are defined in this Item. This designation will not increase the designee’s duties, obligations or liability as compared to his or her duties, obligations and liability as a member of the audit committee and of the board, nor will it reduce the responsibility of the other audit committee members. There may be other individuals who, through education or experience, would qualify as "audit committee financial experts" if the board had designated them as such. Most importantly, the board believes each member of the audit committee contributes significantly to the effective oversight of the Registrant’s financial statements and condition.
ITEM 4 – Principal Accountant Fees and Services
| GIF | ||
| Registrant: | ||
| a) Audit Fees: | ||
| Audit | 2021 | 43,000 |
| 2022 | 33,000 | |
| b) Audit-Related Fees: | ||
| 2021 | None | |
| 2022 | None | |
| c) Tax Fees: | ||
| 2021 | 8,000 | |
| 2022 | 8,000 | |
| The tax fees consist of professional services relating to the preparation of the Registrant’s tax returns. | ||
| d) All Other Fees: | ||
| 2021 | None | |
| 2022 | None | |
| Adviser and affiliates (includes only fees for non-audit services billed to the adviser and affiliates for engagements that relate directly to the operations and financial reporting of the Registrant and were subject to the pre-approval policies described below): | ||
| a) Audit Fees: | ||
| Not Applicable | ||
| b) Audit-Related Fees: | ||
| 2021 | None | |
| 2022 | None | |
| The audit-related fees consist of assurance and related services relating to the examination of the Registrant’s transfer agent, principal underwriter and investment adviser conducted in accordance with Statement on Standards for Attestation Engagements Number 18 issued by the American Institute of Certified Public Accountants. | ||
| c) Tax Fees: | ||
| 2021 | None | |
| 2022 | None |
| The tax fees consist of consulting services relating to the Registrant’s investments. | ||
| d) All Other Fees: | ||
| 2021 | 2,000 | |
| 2022 | None | |
| The other fees consist of subscription services related to an accounting research tool. | ||
| All audit and permissible non-audit services that the Registrant’s audit committee considers compatible with maintaining the independent registered public accounting firm’s independence are required to be pre-approved by the committee. The pre-approval requirement will extend to all non-audit services provided to the Registrant, the investment adviser, and any entity controlling, controlled by, or under common control with the investment adviser that provides ongoing services to the Registrant, if the engagement relates directly to the operations and financial reporting of the Registrant. The committee will not delegate its responsibility to pre-approve these services to the investment adviser. The committee may delegate to one or more committee members the authority to review and pre-approve audit and permissible non-audit services. Actions taken under any such delegation will be reported to the full committee at its next meeting. The pre-approval requirement is waived with respect to non-audit services if certain conditions are met. The pre-approval requirement was not waived for any of the non-audit services listed above provided to the Registrant, adviser and affiliates. | ||
| Aggregate non-audit fees paid to the Registrant’s auditors, including fees for all services billed to the Registrant, adviser and affiliates that provide ongoing services to the Registrant, were $10,000 for fiscal year 2021 and $8,000 for fiscal year 2022. The non-audit services represented by these amounts were brought to the attention of the committee and considered to be compatible with maintaining the auditors’ independence. |
ITEM 5 – Audit Committee of Listed Registrants
Not applicable to this Registrant, insofar as the Registrant is not a listed issuer as defined in Rule 10A-3 under the Securities Exchange Act of 1934.
ITEM 6 – Schedule of Investments
Not applicable, insofar as the schedule is included as part of the report to shareholders filed under Item 1 of this Form.
ITEM 7 – Disclosure of Proxy Voting Policies and Procedures for Closed-End Management Investment Companies
Not applicable to this Registrant, insofar as the Registrant is not a closed-end management investment company.
ITEM 8 – Portfolio Managers of Closed-End Management Investment Companies
Not applicable to this Registrant, insofar as the Registrant is not a closed-end management investment company.
ITEM 9 – Purchases of Equity Securities by Closed-End Management Investment Company and Affiliated Purchasers
Not applicable to this Registrant, insofar as the Registrant is not a closed-end management investment company.
ITEM 10 – Submission of Matters to a Vote of Security Holders
There have been no material changes to the procedures by which shareholders may recommend nominees to the Registrant’s board of trustees since the Registrant last submitted a proxy statement to its shareholders. The procedures are as follows. The Registrant has a nominating committee comprised solely of persons who are not considered ‘‘interested persons’’ of the Registrant within the meaning of the Investment Company Act of 1940, as amended. The committee periodically reviews such issues as the board’s composition, responsibilities, committees, compensation and other relevant issues, and recommends any appropriate changes to the full board of trustees. While the committee normally is able to identify from its own resources an ample number of qualified candidates, it will consider shareholder suggestions of persons to be considered as nominees to fill future vacancies on the board. Such suggestions must be sent in writing to the nominating committee of the Registrant, c/o the Registrant’s Secretary, and must be accompanied by complete biographical and occupational data on the prospective nominee, along with a written consent of the prospective nominee for consideration of his or her name by the nominating committee.
ITEM 11 – Controls and Procedures
| (a) | The Registrant’s Principal Executive Officer and Principal Financial Officer have concluded, based on their evaluation of the Registrant’s disclosure controls and procedures (as such term is defined in Rule 30a-3 under the Investment Company Act of 1940), that such controls and procedures are adequate and reasonably designed to achieve the purposes described in paragraph (c) of such rule. |
| (b) | There were no changes in the Registrant’s internal controls over financial reporting (as defined in Rule 30a-3(d) under the Investment Company Act of 1940) that occurred during the Registrant’s semi-annual period covered by this report that has materially affected, or is reasonably likely to materially affect, the Registrant’s internal control over financial reporting.
|
ITEM 12 – Exhibits
| (a)(1) | The Code of Ethics that is the subject of the disclosure required by Item 2 is attached as an exhibit hereto. |
| (a)(2) | The certifications required by Rule 30a-2 of the Investment Company Act of 1940 and Sections 302 and 906 of the Sarbanes-Oxley Act of 2002 are attached as exhibits hereto. |
SIGNATURES
Pursuant to the requirements of the Securities Exchange Act of 1934 and the Investment Company Act of 1940, the Registrant has duly caused this report to be signed on its behalf by the undersigned, thereunto duly authorized.
| AMERICAN FUNDS GLOBAL INSIGHT FUND | |
| By __/s/ Walter R. Burkley________________ | |
Walter R. Burkley, Principal Executive Officer | |
| Date: December 30, 2022 |
Pursuant to the requirements of the Securities Exchange Act of 1934 and the Investment Company Act of 1940, this report has been signed below by the following persons on behalf of the Registrant and in the capacities and on the dates indicated.
| By _ /s/ Walter R. Burkley_____________ |
Walter R. Burkley, Principal Executive Officer |
| Date: December 30, 2022 |
| By ___/s/ Gregory F. Niland__________________ |
Gregory F. Niland, Treasurer and Principal Financial Officer |
| Date: December 30, 2022 |