Exhibit 99.2
| February 2022 INVESTOR PRESENTATION |

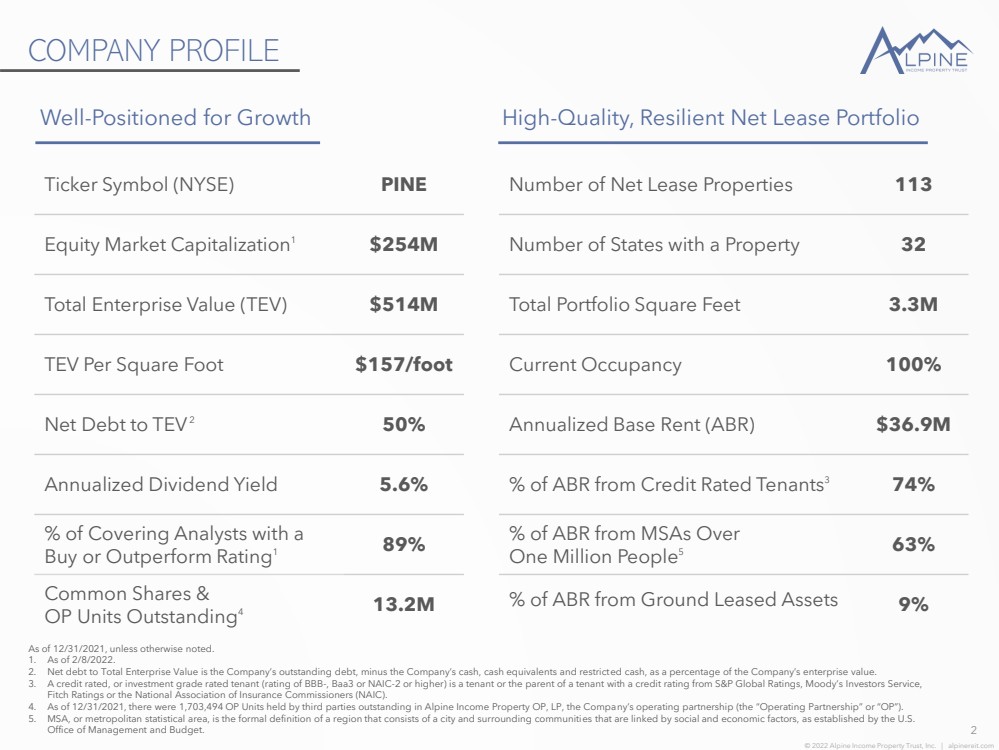
| © 2022 Alpine Income Property Trust, Inc. | alpinereit.com COMPANY PROFILE 2 Ticker Symbol (NYSE) PINE Equity Market Capitalization 1 $254M Total Enterprise Value (TEV) $514M TEV Per Square Foot $157/foot Net Debt to TEV 2 50% Annualized Dividend Yield 5.6% % of Covering Analysts with a Buy or Outperform Rating 1 89% Common Shares & OP Units Outstanding 4 13.2M Number of Net Lease Properties 113 Number of States with a Property 32 Total Portfolio Square Feet 3.3M Current Occupancy 100% Annualized Base Rent (ABR) $36.9M % of ABR from Credit Rated Tenants 3 74% % of ABR from MSAs Over One Million People 5 63% % of ABR from Ground Leased Assets 9% Well - Positioned for Growth High - Quality, Resilient Net Lease Portfolio As of 12/31/2021, unless otherwise noted. 1. As of 2/8/2022. 2. Net debt to Total Enterprise Value is the Company’s outstanding debt, minus the Company’s cash, cash equivalents and restrict ed cash, as a percentage of the Company’s enterprise value. 3. A credit rated, or investment grade rated tenant (rating of BBB - , Baa3 or NAIC - 2 or higher) is a tenant or the parent of a tenan t with a credit rating from S&P Global Ratings, Moody’s Investors Service, Fitch Ratings or the National Association of Insurance Commissioners (NAIC). 4. As of 12/31/2021, there were 1,703,494 OP Units held by third parties outstanding in Alpine Income Property OP, LP, the Compa ny’ s operating partnership (the “Operating Partnership” or “OP”). 5. MSA, or metropolitan statistical area, is the formal definition of a region that consists of a city and surrounding communiti es that are linked by social and economic factors, as established by the U.S. Office of Management and Budget. |
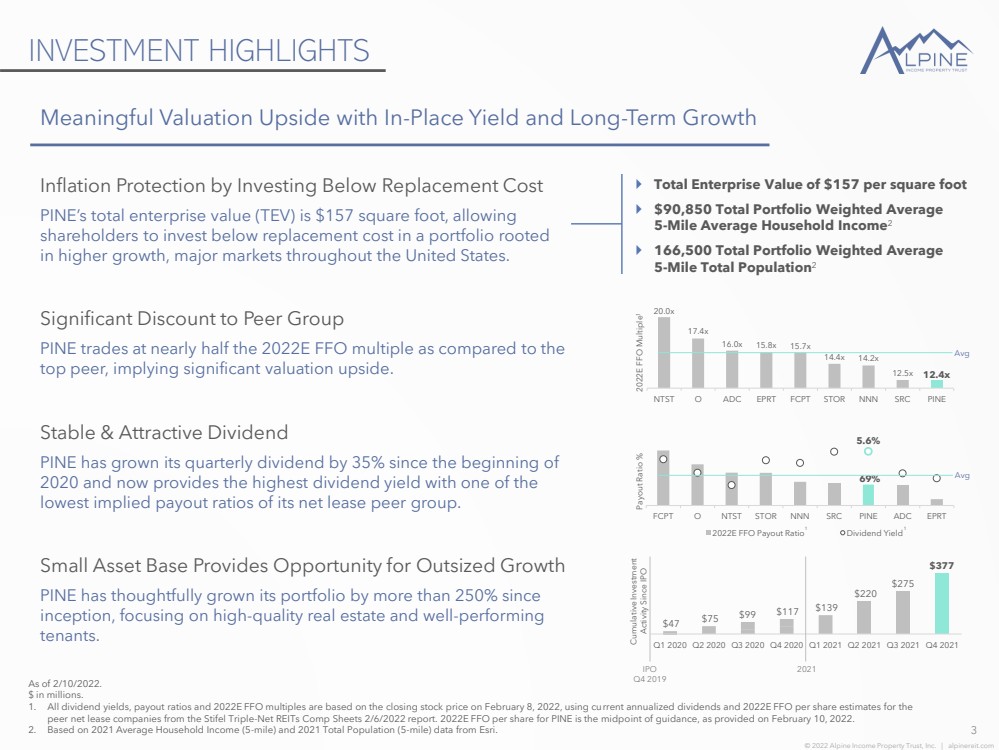
| © 2022 Alpine Income Property Trust, Inc. | alpinereit.com Payout Ratio % INVESTMENT HIGHLIGHTS 3 Meaningful Valuation Upside with In - Place Yield and Long - Term Growth As of 2/10/2022. $ in millions. 1. All dividend yields, payout ratios and 2022E FFO multiples are based on the closing stock price on February 8, 2022, using cu rre nt annualized dividends and 2022E FFO per share estimates for the peer net lease companies from the Stifel Triple - Net REITs Comp Sheets 2/6/2022 report. 2022E FFO per share for PINE is the midpo int of guidance, as provided on February 10, 2022. 2. Based on 2021 Average Household Income (5 - mile) and 2021 Total Population (5 - mile) data from Esri. Inflation Protection by Investing Below Replacement Cost PINE’s total enterprise value (TEV) is $157 square foot, allowing shareholders to invest below replacement cost in a portfolio rooted in higher growth, major markets throughout the United States. Significant Discount to Peer Group PINE trades at nearly half the 2022E FFO multiple as compared to the top peer, implying significant valuation upside. Stable & Attractive Dividend PINE has grown its quarterly dividend by 35% since the beginning of 2020 and now provides the highest dividend yield with one of the lowest implied payout ratios of its net lease peer group. Small Asset Base Provides Opportunity for Outsized Growth PINE has thoughtfully grown its portfolio by more than 250% since inception, focusing on high - quality real estate and well - performing tenants. 69% 5.6% FCPT O NTST STOR NNN SRC PINE ADC EPRT 2022E FFO Payout Ratio Dividend Yield 20.0x 17.4x 16.0x 15.8x 15.7x 14.4x 14.2x 12.5x 12.4x NTST O ADC EPRT FCPT STOR NNN SRC PINE $47 $75 $99 $117 $139 $220 $275 $377 Q1 2020 Q2 2020 Q3 2020 Q4 2020 Q1 2021 Q2 2021 Q3 2021 Q4 2021 2021 IPO Q4 2019 Cumulative Investment Activity Since IPO 2022E FFO Multiple 1 Avg Avg Total Enterprise Value of $157 per square foot $90,850 Total Portfolio Weighted Average 5 - Mile Average Household Income 2 166,500 Total Portfolio Weighted Average 5 - Mile Total Population 2 1 1 |
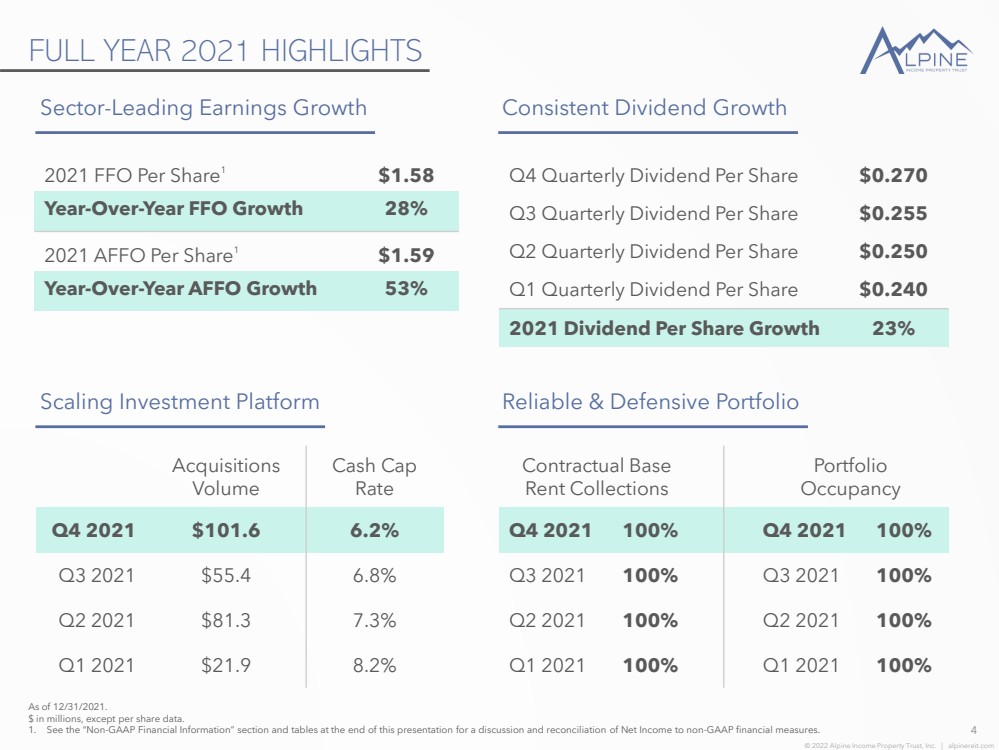
| © 2022 Alpine Income Property Trust, Inc. | alpinereit.com FULL YEAR 2021 HIGHLIGHTS 4 2021 FFO Per Share 1 $1.58 Year - Over - Year FFO Growth 28% 2021 AFFO Per Share 1 $1.59 Year - Over - Year AFFO Growth 53% Q4 Quarterly Dividend Per Share $0.270 Q3 Quarterly Dividend Per Share $0.255 Q2 Quarterly Dividend Per Share $0.250 Q1 Quarterly Dividend Per Share $0.240 2021 Dividend Per Share Growth 23% Sector - Leading Earnings Growth Consistent Dividend Growth As of 12/31/2021. $ in millions, except per share data. 1. See the “Non - GAAP Financial Information” section and tables at the end of this presentation for a discussion and reconciliation of Net Income to non - GAAP financial measures. Contractual Base Rent Collections Portfolio Occupancy Q4 2021 100% Q4 2021 100% Q3 2021 100% Q3 2021 100% Q2 2021 100% Q2 2021 100% Q1 2021 100% Q1 2021 100% Scaling Investment Platform Reliable & Defensive Portfolio Acquisitions Volume Cash Cap Rate Q4 2021 $101.6 6.2% Q3 2021 $55.4 6.8% Q2 2021 $81.3 7.3% Q1 2021 $21.9 8.2% |
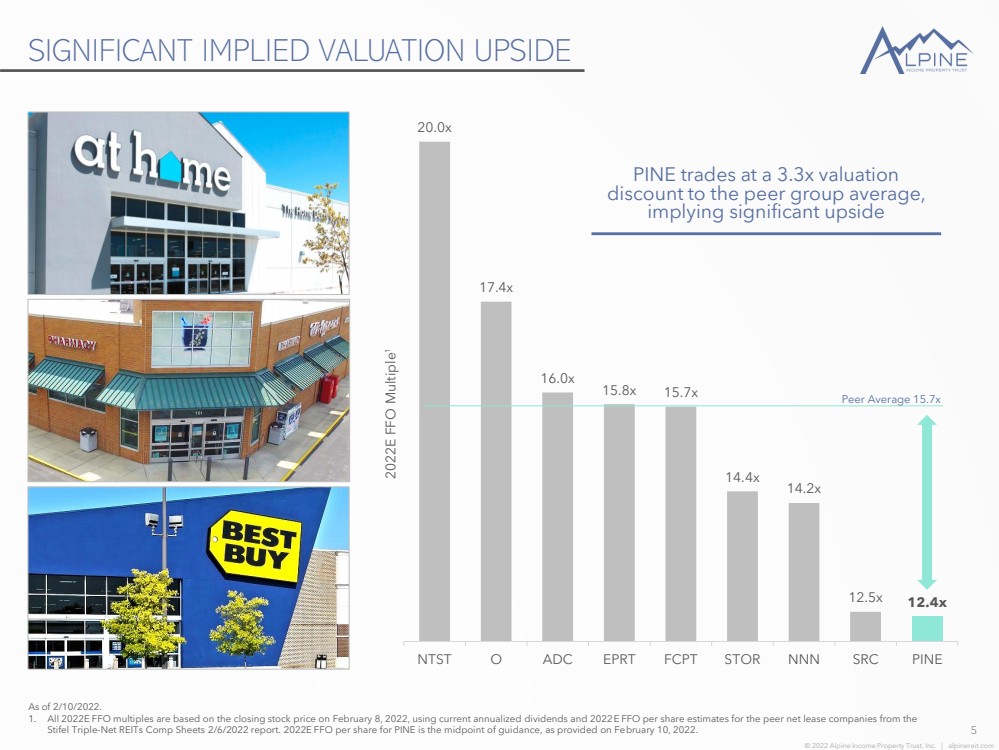
| © 2022 Alpine Income Property Trust, Inc. | alpinereit.com 20.0x 17.4x 16.0x 15.8x 15.7x 14.4x 14.2x 12.5x 12.4x NTST O ADC EPRT FCPT STOR NNN SRC PINE SIGNIFICANT IMPLIED VALUATION UPSIDE 5 As of 2/10/2022. 1. All 2022E FFO multiples are based on the closing stock price on February 8, 2022, using current annualized dividends and 2022 E F FO per share estimates for the peer net lease companies from the Stifel Triple - Net REITs Comp Sheets 2/6/2022 report. 2022E FFO per share for PINE is the midpoint of guidance, as provided on Fe bruary 10, 2022. 2022E FFO Multiple 1 Peer Average 15.7x PINE trades at a 3.3x valuation discount to the peer group average, implying significant upside |
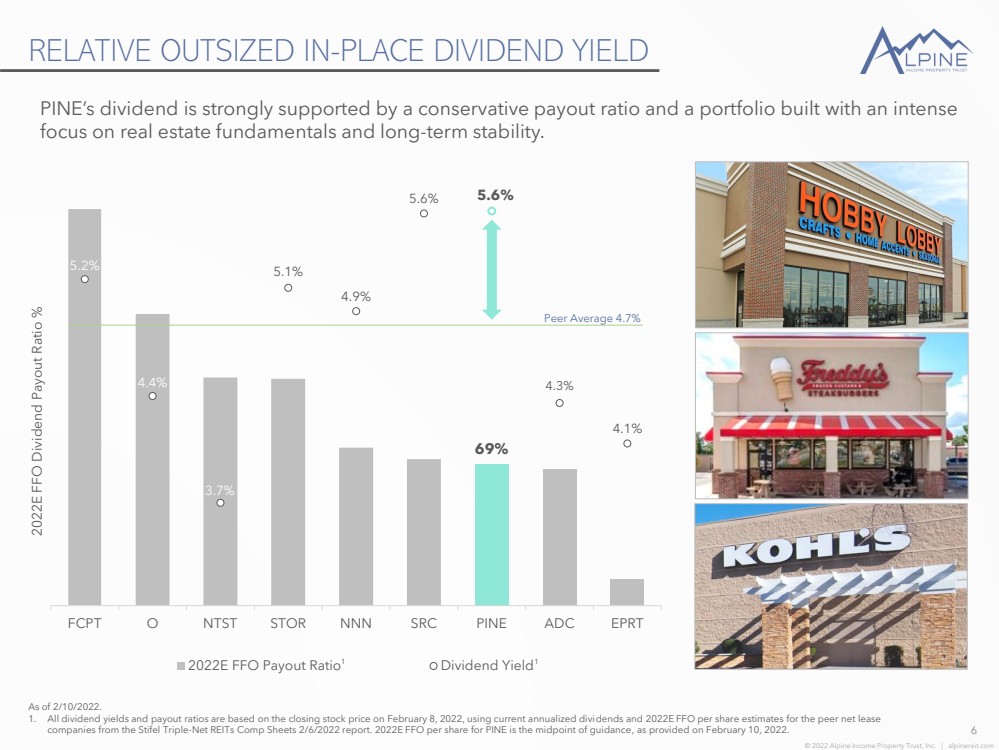
| © 2022 Alpine Income Property Trust, Inc. | alpinereit.com 69% 5.2% 4.4% 3.7% 5.1% 4.9% 5.6% 5.6% 4.3% 4.1% FCPT O NTST STOR NNN SRC PINE ADC EPRT 2022E FFO Payout Ratio Dividend Yield RELATIVE OUTSIZED IN - PLACE DIVIDEND YIELD 6 As of 2/10/2022. 1. All dividend yields and payout ratios are based on the closing stock price on February 8, 2022, using current annualized divi den ds and 2022E FFO per share estimates for the peer net lease companies from the Stifel Triple - Net REITs Comp Sheets 2/6/2022 report. 2022E FFO per share for PINE is the midpoint of guidance , as provided on February 10, 2022. 2022E FFO Dividend Payout Ratio % Peer Average 4.7% PINE’s dividend is strongly supported by a conservative payout ratio and a portfolio built with an intense focus on real estate fundamentals and long - term stability .. 1 1 |
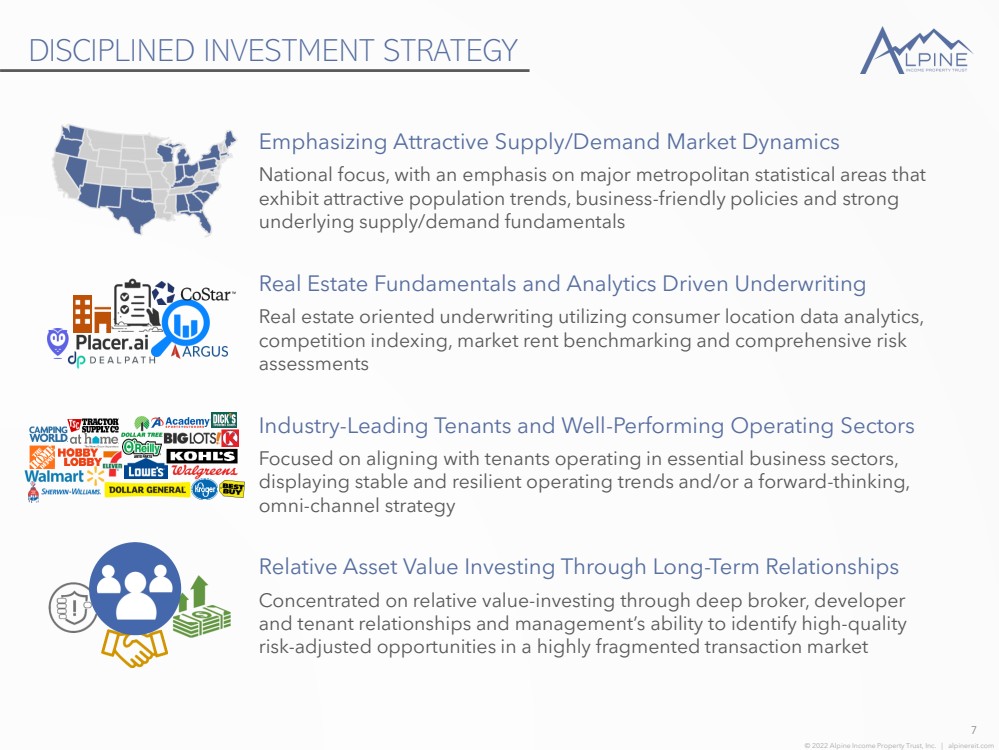
| © 2022 Alpine Income Property Trust, Inc. | alpinereit.com DISCIPLINED INVESTMENT STRATEGY 7 Emphasizing Attractive Supply/Demand Market Dynamics National focus, with an emphasis on major metropolitan statistical areas that exhibit attractive population trends, business - friendly policies and strong underlying supply/demand fundamentals Real Estate Fundamentals and Analytics Driven Underwriting Real estate oriented underwriting utilizing consumer location data analytics, competition indexing, market rent benchmarking and comprehensive risk assessments Industry - Leading Tenants and Well - Performing Operating Sectors Focused on aligning with tenants operating in essential business sectors, displaying stable and resilient operating trends and/or a forward - thinking, omni - channel strategy Relative Asset Value Investing Through Long - Term Relationships Concentrated on relative value - investing through deep broker, developer and tenant relationships and management’s ability to identify high - quality risk - adjusted opportunities in a highly fragmented transaction market |
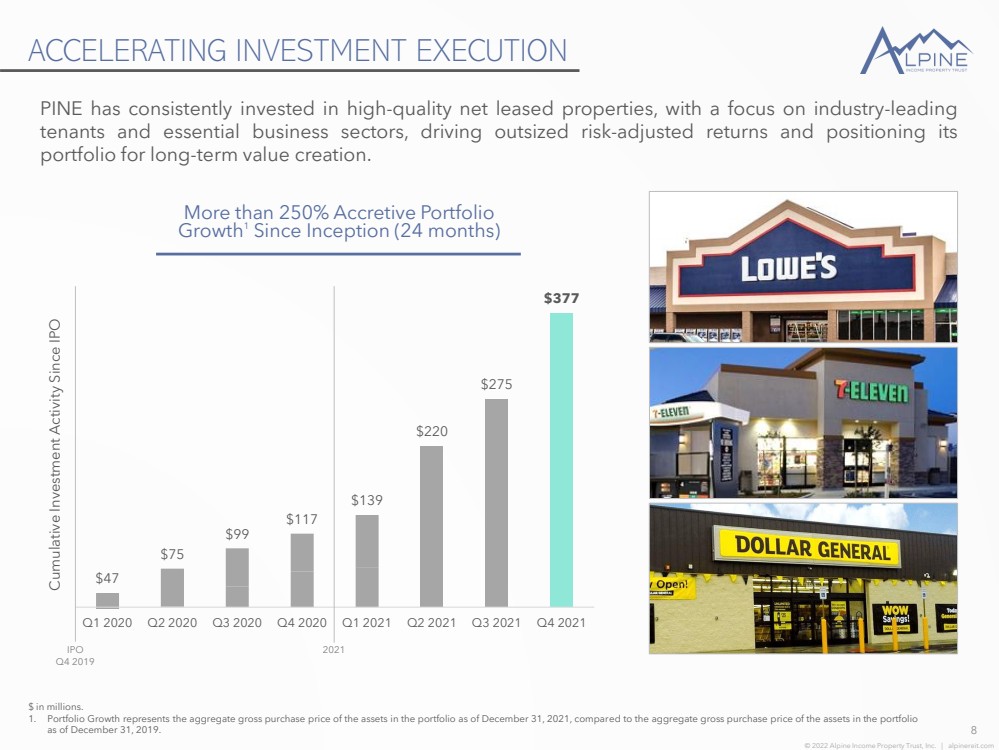
| © 2022 Alpine Income Property Trust, Inc. | alpinereit.com ACCELERATING INVESTMENT EXECUTION 8 $ in millions. 1. Portfolio Growth represents the aggregate gross purchase price of the assets in the portfolio as of December 31, 2021, compar ed to the aggregate gross purchase price of the assets in the portfolio as of December 31, 2019. $47 $75 $99 $117 $139 $220 $275 $377 Q1 2020 Q2 2020 Q3 2020 Q4 2020 Q1 2021 Q2 2021 Q3 2021 Q4 2021 2021 IPO Q4 2019 Cumulative Investment Activity Since IPO More than 250% Accretive Portfolio Growth 1 Since Inception (24 months) PINE has consistently invested in high - quality net leased properties, with a focus on industry - leading tenants and essential business sectors, driving outsized risk - adjusted returns and positioning its portfolio for long - term value creation .. |
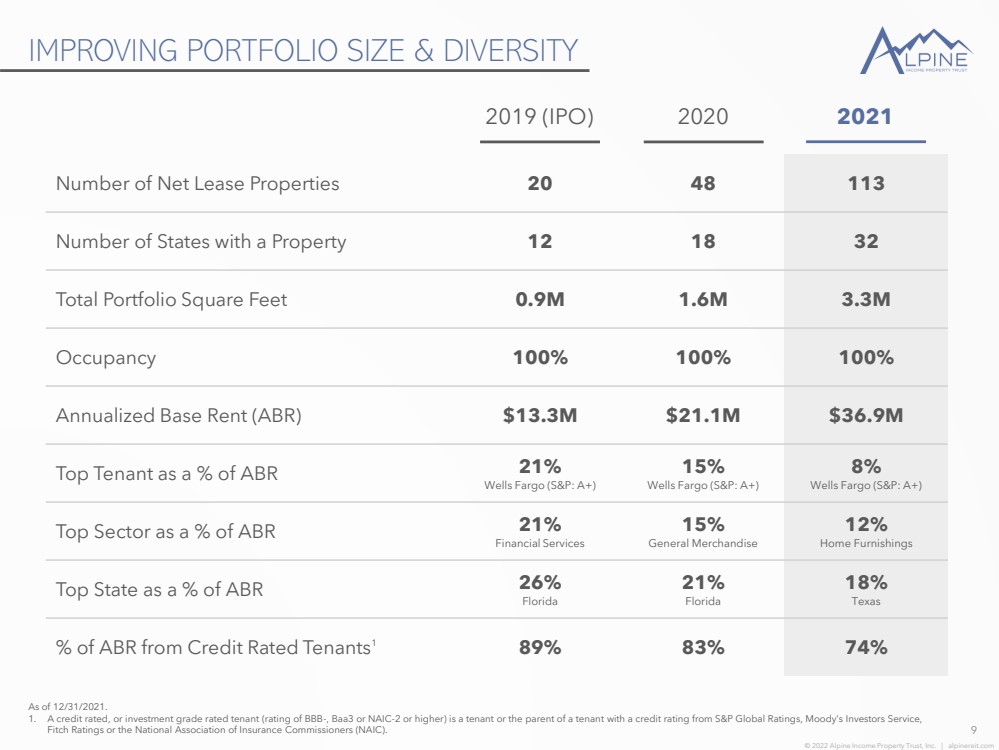
| © 2022 Alpine Income Property Trust, Inc. | alpinereit.com IMPROVING PORTFOLIO SIZE & DIVERSITY 9 2019 (IPO) As of 12/31/2021. 1. A credit rated, or investment grade rated tenant (rating of BBB - , Baa3 or NAIC - 2 or higher) is a tenant or the parent of a tenan t with a credit rating from S&P Global Ratings, Moody’s Investors Service, Fitch Ratings or the National Association of Insurance Commissioners (NAIC). Number of Net Lease Properties 20 48 113 Number of States with a Property 12 18 32 Total Portfolio Square Feet 0.9M 1.6M 3.3M Occupancy 100% 100% 100% Annualized Base Rent (ABR) $13.3M $21.1M $36.9M Top Tenant as a % of ABR 21% Wells Fargo (S&P: A+) 15% Wells Fargo (S&P: A+) 8% Wells Fargo (S&P: A+) Top Sector as a % of ABR 21% Financial Services 15% General Merchandise 12% Home Furnishings Top State as a % of ABR 26% Florida 21% Florida 18% Texas % of ABR from Credit Rated Tenants 1 89% 83% 74% 2020 2021 |
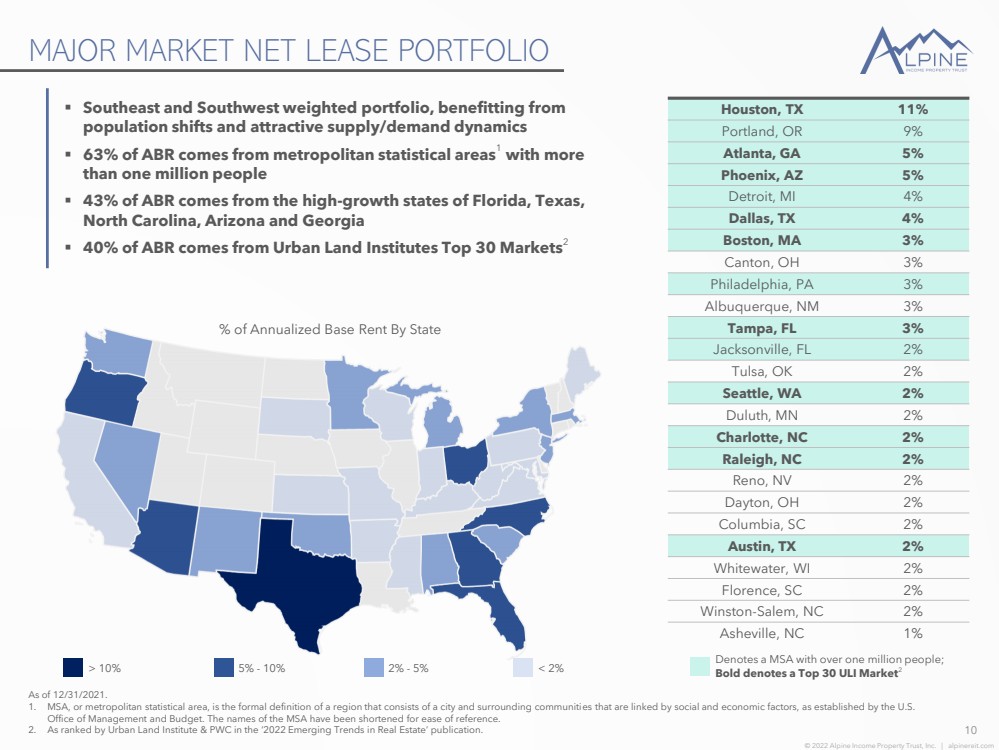
| © 2022 Alpine Income Property Trust, Inc. | alpinereit.com MAJOR MARKET NET LEASE PORTFOLIO 10 As of 12/31/2021. 1. MSA, or metropolitan statistical area, is the formal definition of a region that consists of a city and surrounding communiti es that are linked by social and economic factors, as established by the U.S. Office of Management and Budget. The names of the MSA have been shortened for ease of reference. 2. As ranked by Urban Land Institute & PWC in the ‘2022 Emerging Trends in Real Estate’ publication. > 10% 5% - 10% 2% - 5% < 2% ▪ Southeast and Southwest weighted portfolio, benefitting from population shifts and attractive supply/demand dynamics ▪ 63% of ABR comes from metropolitan statistical areas 1 with more than one million people ▪ 43% of ABR comes from the high - growth states of Florida, Texas, North Carolina, Arizona and Georgia ▪ 40% of ABR comes from Urban Land Institutes Top 30 Markets 2 % of Annualized Base Rent By State Houston, TX 11% Portland, OR 9% Atlanta, GA 5% Phoenix, AZ 5% Detroit, MI 4% Dallas, TX 4% Boston, MA 3% Canton, OH 3% Philadelphia, PA 3% Albuquerque, NM 3% Tampa, FL 3% Jacksonville, FL 2% Tulsa, OK 2% Seattle, WA 2% Duluth, MN 2% Charlotte, NC 2% Raleigh, NC 2% Reno, NV 2% Dayton, OH 2% Columbia, SC 2% Austin, TX 2% Whitewater, WI 2% Florence, SC 2% Winston - Salem, NC 2% Asheville, NC 1% Denotes a MSA with over one million people; Bold denotes a Top 30 ULI Market 2 |
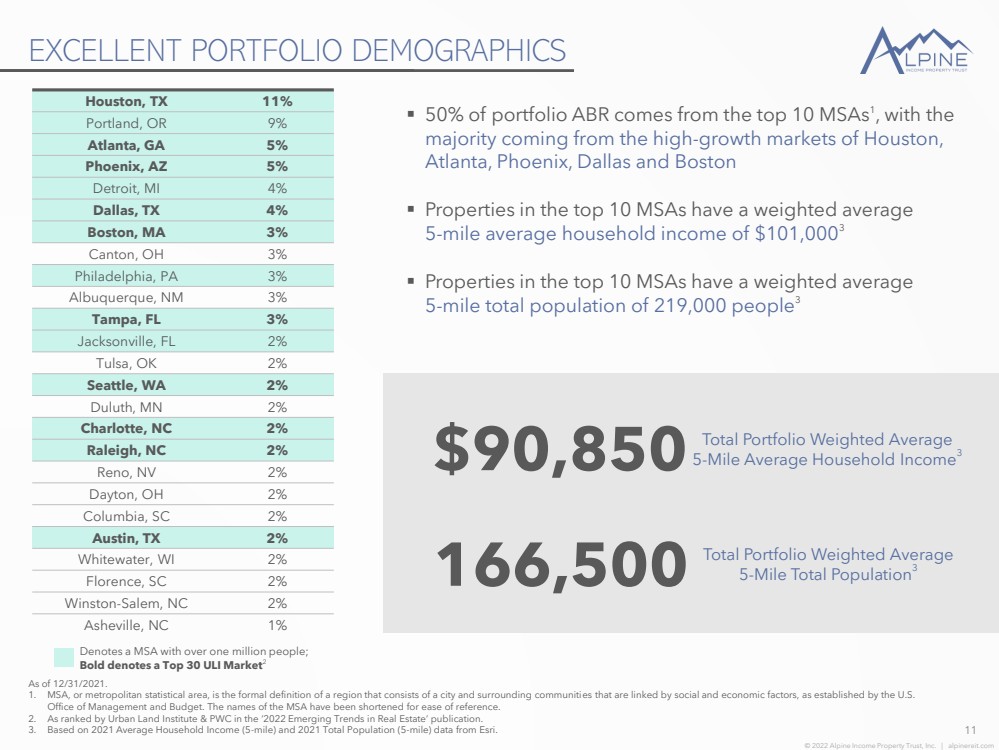
| © 2022 Alpine Income Property Trust, Inc. | alpinereit.com EXCELLENT PORTFOLIO DEMOGRAPHICS 11 As of 12/31/2021. 1. MSA, or metropolitan statistical area, is the formal definition of a region that consists of a city and surrounding communiti es that are linked by social and economic factors, as established by the U.S. Office of Management and Budget. The names of the MSA have been shortened for ease of reference. 2. As ranked by Urban Land Institute & PWC in the ‘2022 Emerging Trends in Real Estate’ publication. 3. Based on 2021 Average Household Income (5 - mile) and 2021 Total Population (5 - mile) data from Esri. Total Portfolio Weighted Average 5 - Mile Average Household Income 3 $90,850 ▪ 50% of portfolio ABR comes from the top 10 MSAs 1 , with the majority coming from the high - growth markets of Houston, Atlanta, Phoenix, Dallas and Boston ▪ Properties in the top 10 MSAs have a weighted average 5 - mile average household income of $101,000 3 ▪ Properties in the top 10 MSAs have a weighted average 5 - mile total population of 219,000 people 3 Houston, TX 11% Portland, OR 9% Atlanta, GA 5% Phoenix, AZ 5% Detroit, MI 4% Dallas, TX 4% Boston, MA 3% Canton, OH 3% Philadelphia, PA 3% Albuquerque, NM 3% Tampa, FL 3% Jacksonville, FL 2% Tulsa, OK 2% Seattle, WA 2% Duluth, MN 2% Charlotte, NC 2% Raleigh, NC 2% Reno, NV 2% Dayton, OH 2% Columbia, SC 2% Austin, TX 2% Whitewater, WI 2% Florence, SC 2% Winston - Salem, NC 2% Asheville, NC 1% Denotes a MSA with over one million people; Bold denotes a Top 30 ULI Market 2 Total Portfolio Weighted Average 5 - Mile Total Population 3 166,500 |
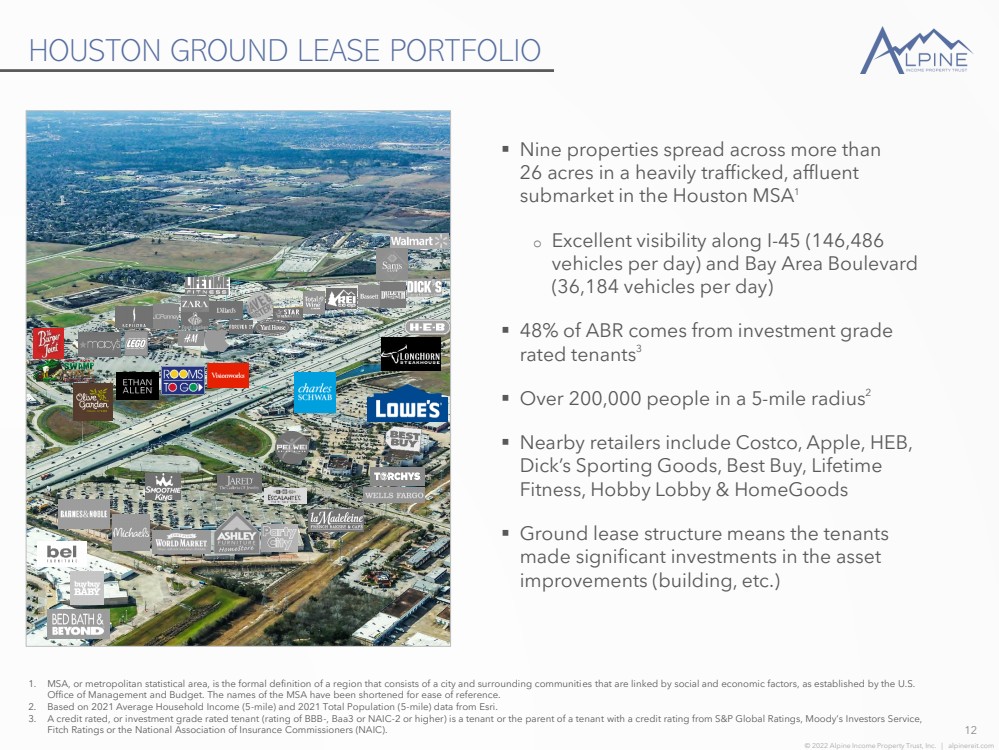
| © 2022 Alpine Income Property Trust, Inc. | alpinereit.com HOUSTON GROUND LEASE PORTFOLIO 12 1. MSA, or metropolitan statistical area, is the formal definition of a region that consists of a city and surrounding communiti es that are linked by social and economic factors, as established by the U.S. Office of Management and Budget. The names of the MSA have been shortened for ease of reference. 2. Based on 2021 Average Household Income (5 - mile) and 2021 Total Population (5 - mile) data from Esri. 3. A credit rated, or investment grade rated tenant (rating of BBB - , Baa3 or NAIC - 2 or higher) is a tenant or the parent of a tenan t with a credit rating from S&P Global Ratings, Moody’s Investors Service, Fitch Ratings or the National Association of Insurance Commissioners (NAIC). ▪ Nine properties spread across more than 26 acres in a heavily trafficked, affluent submarket in the Houston MSA 1 o Excellent visibility along I - 45 (146,486 vehicles per day) and Bay Area Boulevard (36,184 vehicles per day) ▪ 48% of ABR comes from investment grade rated tenants 3 ▪ Over 200,000 people in a 5 - mile radius 2 ▪ Nearby retailers include Costco, Apple, HEB, Dick’s Sporting Goods, Best Buy, Lifetime Fitness, Hobby Lobby & HomeGoods ▪ Ground lease structure means the tenants made significant investments in the asset improvements (building, etc.) |
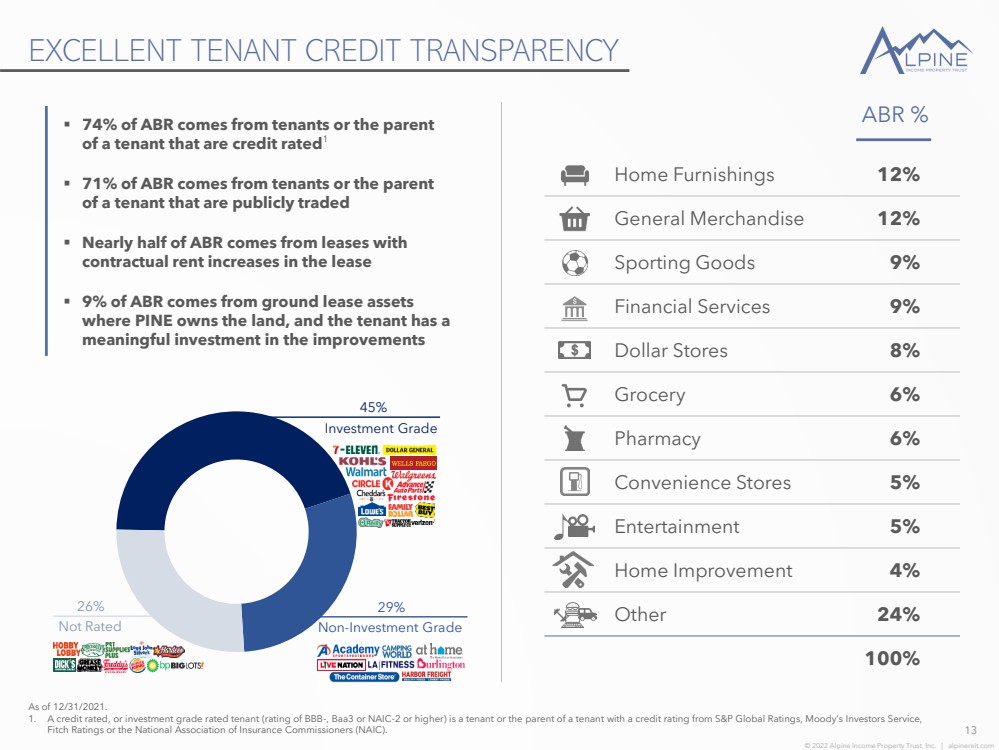
| © 2022 Alpine Income Property Trust, Inc. | alpinereit.com Home Furnishings 12% General Merchandise 12% Sporting Goods 9% Financial Services 9% Dollar Stores 8% Grocery 6% Pharmacy 6% Convenience Stores 5% Entertainment 5% Home Improvement 4% Other 24% 100% EXCELLENT TENANT CREDIT TRANSPARENCY 13 As of 12/31/2021. 1. A credit rated, or investment grade rated tenant (rating of BBB - , Baa3 or NAIC - 2 or higher) is a tenant or the parent of a tenan t with a credit rating from S&P Global Ratings, Moody’s Investors Service, Fitch Ratings or the National Association of Insurance Commissioners (NAIC). ▪ 74% of ABR comes from tenants or the parent of a tenant that are credit rated 1 ▪ 71% of ABR comes from tenants or the parent of a tenant that are publicly traded ▪ Nearly half of ABR comes from leases with contractual rent increases in the lease ▪ 9% of ABR comes from ground lease assets where PINE owns the land, and the tenant has a meaningful investment in the improvements ABR % Investment Grade 45% Not Rated 26% Non - Investment Grade 29% |
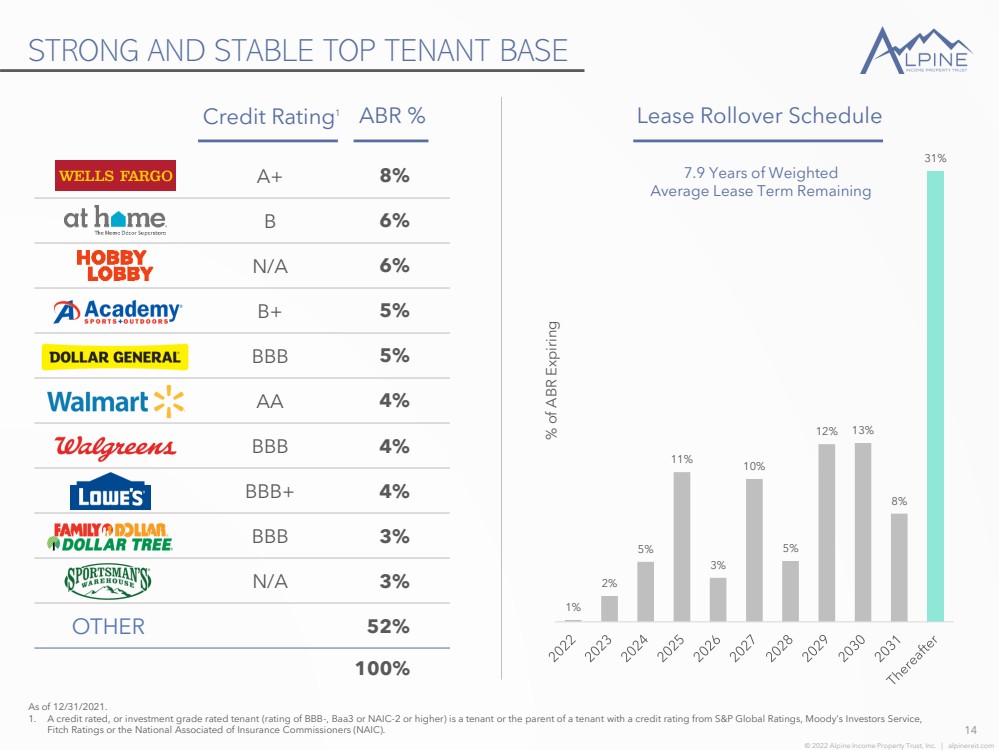
| © 2022 Alpine Income Property Trust, Inc. | alpinereit.com STRONG AND STABLE TOP TENANT BASE 14 Credit Rating 1 As of 12/31/2021. 1. A credit rated, or investment grade rated tenant (rating of BBB - , Baa3 or NAIC - 2 or higher) is a tenant or the parent of a tenan t with a credit rating from S&P Global Ratings, Moody’s Investors Service, Fitch Ratings or the National Associated of Insurance Commissioners (NAIC). A+ 8% B 6% N/A 6% B+ 5% BBB 5% AA 4% BBB 4% BBB+ 4% BBB 3% N/A 3% 52% 100% ABR % OTHER 1% 2% 5% 11% 3% 10% 5% 12% 13% 8% 31% Lease Rollover Schedule % of ABR Expiring 7.9 Years of Weighted Average Lease Term Remaining |
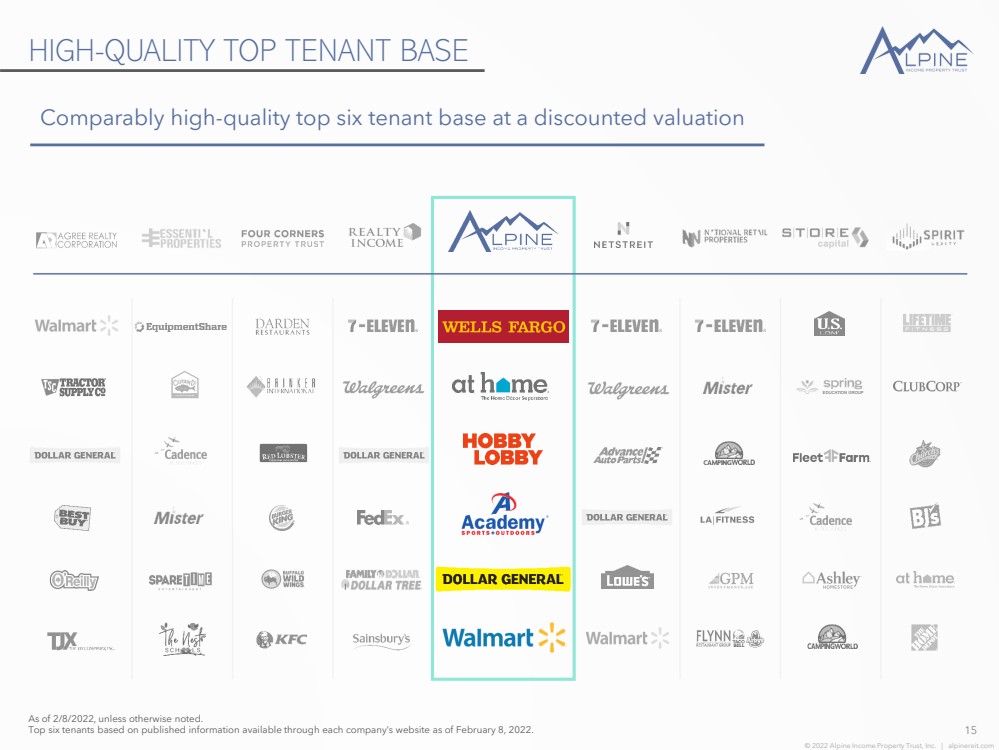
| © 2022 Alpine Income Property Trust, Inc. | alpinereit.com HIGH - QUALITY TOP TENANT BASE 15 As of 2/8/2022, unless otherwise noted. Top six tenants based on published information available through each company’s website as of February 8, 2022. Comparably high - quality top six tenant base at a discounted valuation EDUCATION GROUP |
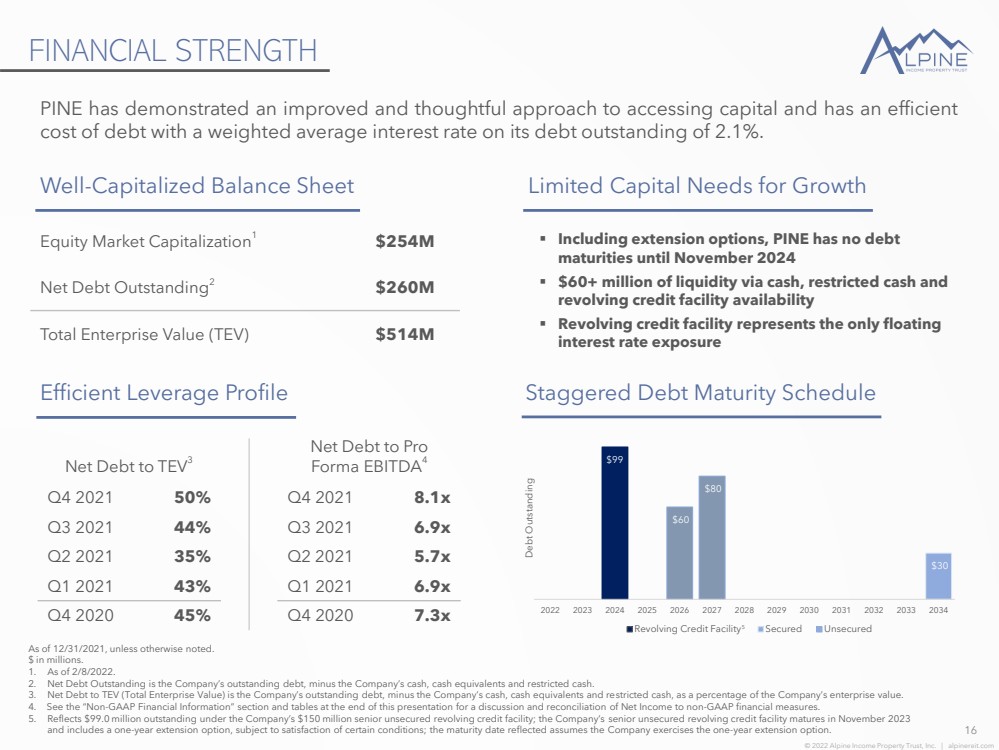
| © 2022 Alpine Income Property Trust, Inc. | alpinereit.com FINANCIAL STRENGTH 16 Equity Market Capitalization 1 $254M Net Debt Outstanding 2 $260M Total Enterprise Value (TEV) $514M Well - Capitalized Balance Sheet As of 12/31/2021, unless otherwise noted. $ in millions. 1. As of 2/8/2022. 2. Net Debt Outstanding is the Company’s outstanding debt, minus the Company’s cash, cash equivalents and restricted cash. 3. Net Debt to TEV (Total Enterprise Value) is the Company’s outstanding debt, minus the Company’s cash, cash equivalents and re str icted cash, as a percentage of the Company’s enterprise value. 4. See the “Non - GAAP Financial Information” section and tables at the end of this presentation for a discussion and reconciliation of Net Income to non - GAAP financial measures. 5. Reflects $99.0 million outstanding under the Company’s $150 million senior unsecured revolving credit facility; the Company’s se nior unsecured revolving credit facility matures in November 2023 and includes a one - year extension option, subject to satisfaction of certain conditions; the maturity date reflected assumes the Company exercises the one - year extension option. Q4 2021 50% Q4 2021 8.1x Q3 2021 44% Q3 2021 6.9x Q2 2021 35% Q2 2021 5.7x Q1 2021 43% Q1 2021 6.9x Q4 2020 45% Q4 2020 7.3x Limited Capital Needs for Growth Efficient Leverage Profile $99 $30 $60 $80 2022 2023 2024 2025 2026 2027 2028 2029 2030 2031 2032 2033 2034 Revolving Credit Facility Secured Unsecured Staggered Debt Maturity Schedule Net Debt to TEV 3 Net Debt to Pro Forma EBITDA 4 Debt Outstanding 5 PINE has demonstrated an improved and thoughtful approach to accessing capital and has an efficient cost of debt with a weighted average interest rate on its debt outstanding of 2 .. 1 % .. ▪ Including extension options, PINE has no debt maturities until November 2024 ▪ $60+ million of liquidity via cash, restricted cash and revolving credit facility availability ▪ Revolving credit facility represents the only floating interest rate exposure |
| © 2022 Alpine Income Property Trust, Inc. | alpinereit.com CONSISTENT DIVIDEND GROWTH 17 $0.060 $0.200 $0.200 $0.200 $0.220 $0.240 $0.250 $0.255 $0.270 Q4 2019 Q1 2020 Q2 2020 Q3 2020 Q4 2020 Q1 2021 Q2 2021 Q3 2021 Q4 2021 IPO Q4 2019 Dividend Per Share Paid 2020 2021 Growing, Well - Covered Dividend ▪ Current midpoint of guidance 1 implies a 69% 2022E FFO per share dividend payout ratio ▪ Six dividend raises since the IPO, five increases in the past five quarters ▪ 35% increase in the quarterly cash dividend since the beginning of 2020 Annualized Per Share Cash Dividend $1.08 Annualized Per Share Cash Dividend Yield 5.6% As of 2/9/2022, unless otherwise noted. 1. 2022E FFO per share for PINE is the midpoint of guidance, as provided on February 10, 2022. |

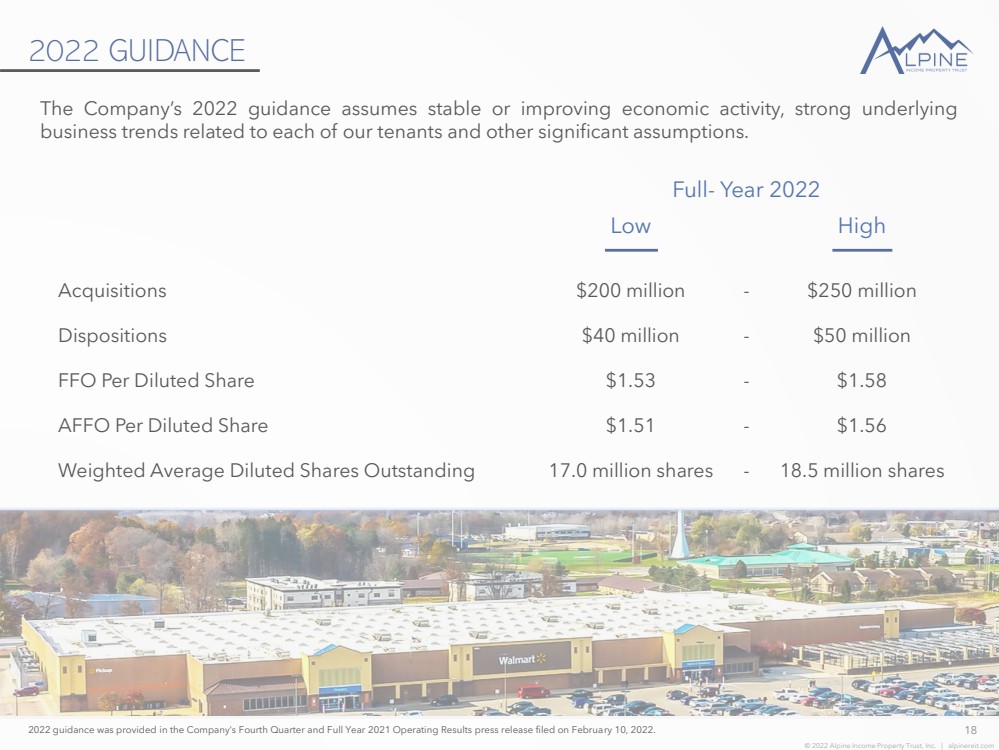
| © 2022 Alpine Income Property Trust, Inc. | alpinereit.com 2022 GUIDANCE 18 2022 guidance was provided in the Company’s Fourth Quarter and Full Year 2021 Operating Results press release filed on Februa ry 10, 2022. The Company’s 2022 guidance assumes stable or improving economic activity, strong underlying business trends related to each of our tenants and other significant assumptions .. Full - Year 2022 Low High Acquisitions $200 million - $250 million Dispositions $40 million - $50 million FFO Per Diluted Share $1.53 - $1.58 AFFO Per Diluted Share $1.51 - $1.56 Weighted Average Diluted Shares Outstanding 17.0 million shares - 18.5 million shares |
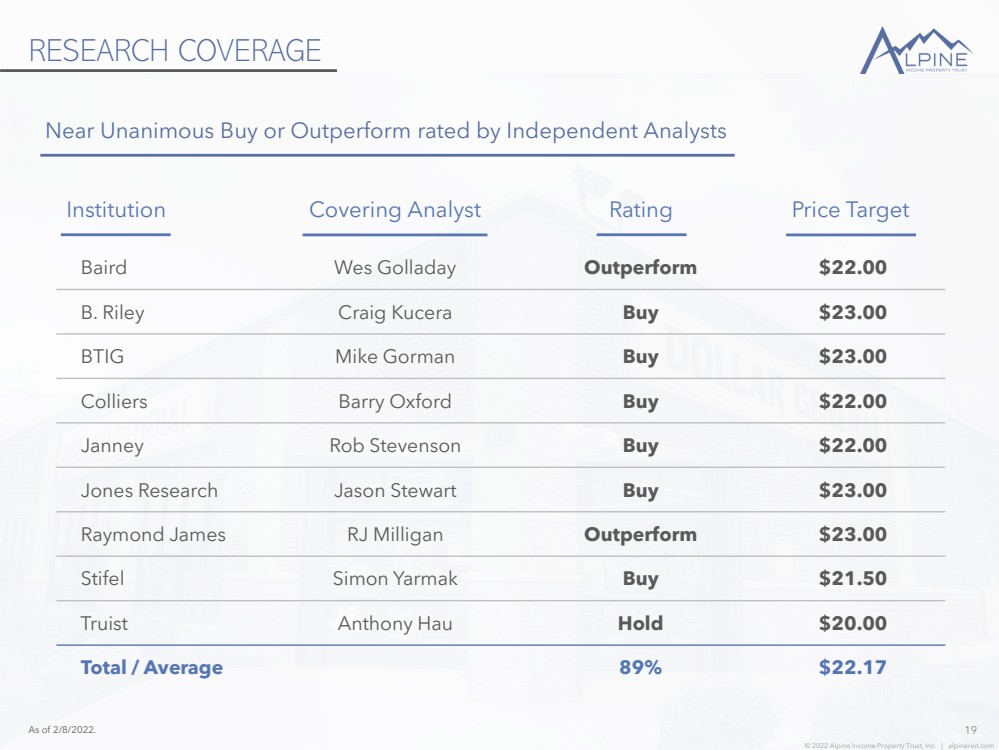
| © 2022 Alpine Income Property Trust, Inc. | alpinereit.com RESEARCH COVERAGE 19 Baird Wes Golladay Outperform $22.00 B. Riley Craig Kucera Buy $23.00 BTIG Mike Gorman Buy $23.00 Colliers Barry Oxford Buy $22.00 Janney Rob Stevenson Buy $22.00 Jones Research Jason Stewart Buy $23.00 Raymond James RJ Milligan Outperform $23.00 Stifel Simon Yarmak Buy $21.50 Truist Anthony Hau Hold $20.00 Total / Average 89% $22.17 Near Unanimous Buy or Outperform rated by Independent Analysts As of 2/8/2022. Institution Price Target Rating Covering Analyst |
| © 2022 Alpine Income Property Trust, Inc. | alpinereit.com 20 Aligned Ownership CTO currently owns an approximate 16% interest in PINE, meaningfully aligning its interests with PINE shareholders Independent Board of Directors PINE has its own independent Board of Directors and realizes significant economies of scale from the 18 - member CTO team without the corresponding G&A expense Shadow Pipeline for External Growth PINE has a potential shadow pipeline within the CTO portfolio as a result of its right of first refusal on all CTO single ten ant net lease asset sales Internalization on the Horizon Internalization of management for PINE is anticipated in the future when the Company approaches or exceeds critical mass Opportunities for Collaboration PINE reviews transaction opportunities resulting from CTO’s acquisition efforts that it otherwise would not see in the market th rough normal single tenant acquisition efforts and relationships Alpine Income Property Trust is externally managed by CTO Realty Growth (NYSE : CTO) under an agreement that, combined with CTO’s ownership in PINE, provides economies of scale, significant shareholder alignment and a flexible/collapsible structure .. Benefits and Alignment of External Management Notable Management Agreement Terms ▪ Five - year initial term, with one - year extension options thereafter ▪ Quarterly management fee of 0 .. 375 % , calculated on equity, net of share buybacks and issuance costs ▪ Terminable with payment of a one - time fee of 3 x the average management fee for the preceding 24 - months EXTERNAL MANAGEMENT ALIGNMENT |

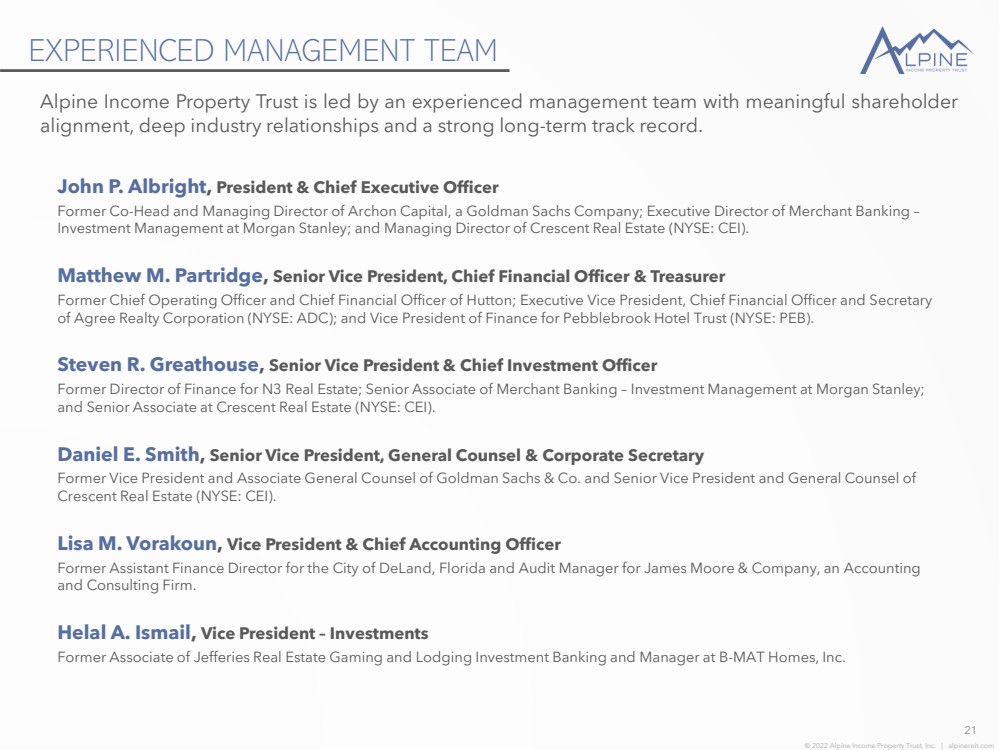
| © 2022 Alpine Income Property Trust, Inc. | alpinereit.com EXPERIENCED MANAGEMENT TEAM 21 John P. Albright , President & Chief Executive Officer Former Co - Head and Managing Director of Archon Capital, a Goldman Sachs Company; Executive Director of Merchant Banking – Investment Management at Morgan Stanley; and Managing Director of Crescent Real Estate (NYSE: CEI). Matthew M. Partridge , Senior Vice President, Chief Financial Officer & Treasurer Former Chief Operating Officer and Chief Financial Officer of Hutton; Executive Vice President, Chief Financial Officer and S ecr etary of Agree Realty Corporation (NYSE: ADC); and Vice President of Finance for Pebblebrook Hotel Trust (NYSE: PEB). Steven R. Greathouse , Senior Vice President & Chief Investment Officer Former Director of Finance for N3 Real Estate; Senior Associate of Merchant Banking – Investment Management at Morgan Stanley; and Senior Associate at Crescent Real Estate (NYSE: CEI). Daniel E. Smith , Senior Vice President, General Counsel & Corporate Secretary Former Vice President and Associate General Counsel of Goldman Sachs & Co. and Senior Vice President and General Counsel of Crescent Real Estate (NYSE: CEI). Lisa M. Vorakoun , Vice President & Chief Accounting Officer Former Assistant Finance Director for the City of DeLand, Florida and Audit Manager for James Moore & Company, an Accounting and Consulting Firm. Helal A. Ismail , Vice President – Investments Former Associate of Jefferies Real Estate Gaming and Lodging Investment Banking and Manager at B - MAT Homes, Inc. Alpine Income Property Trust is led by an experienced management team with meaningful shareholder alignment, deep industry relationships and a strong long - term track record .. |
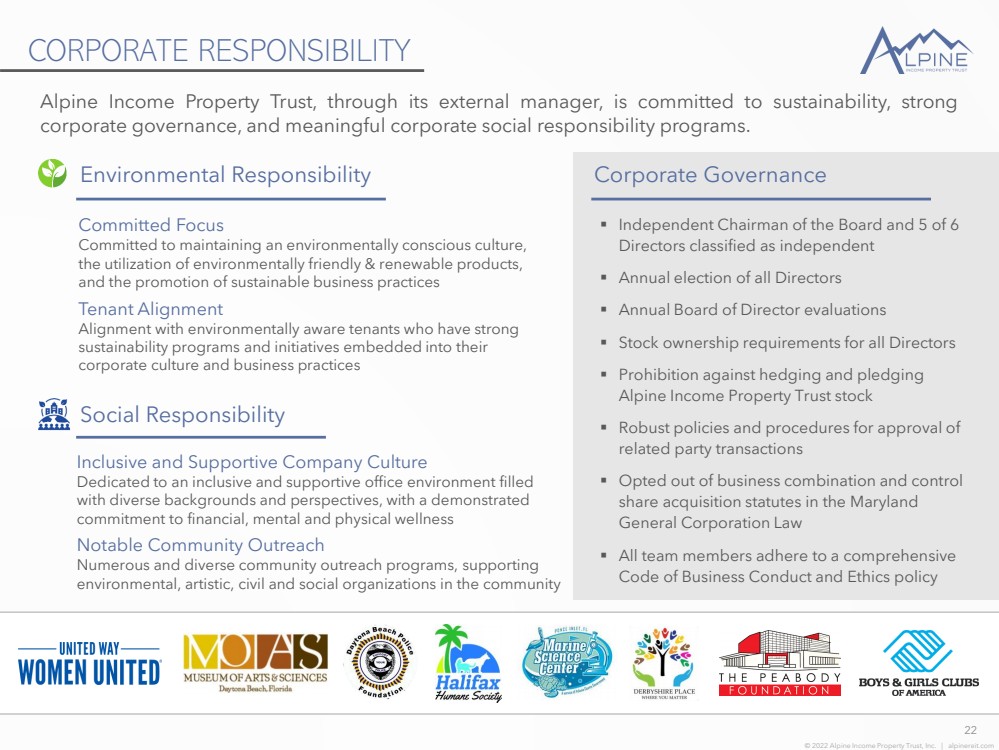
| © 2022 Alpine Income Property Trust, Inc. | alpinereit.com 22 Committed Focus Committed to maintaining an environmentally conscious culture, the utilization of environmentally friendly & renewable products, and the promotion of sustainable business practices Tenant Alignment Alignment with environmentally aware tenants who have strong sustainability programs and initiatives embedded into their corporate culture and business practices Alpine Income Property Trust, through its external manager, is committed to sustainability, strong corporate governance, and meaningful corporate social responsibility programs .. Social Responsibility Environmental Responsibility CORPORATE RESPONSIBILITY Corporate Governance ▪ Independent Chairman of the Board and 5 of 6 Directors classified as independent ▪ Annual election of all Directors ▪ Annual Board of Director evaluations ▪ Stock ownership requirements for all Directors ▪ Prohibition against hedging and pledging Alpine Income Property Trust stock ▪ Robust policies and procedures for approval of related party transactions ▪ Opted out of business combination and control share acquisition statutes in the Maryland General Corporation Law ▪ All team members adhere to a comprehensive Code of Business Conduct and Ethics policy Inclusive and Supportive Company Culture Dedicated to an inclusive and supportive office environment filled with diverse backgrounds and perspectives, with a demonstrated commitment to financial, mental and physical wellness Notable Community Outreach Numerous and diverse community outreach programs, supporting environmental, artistic, civil and social organizations in the community |
| © 2022 Alpine Income Property Trust, Inc. | alpinereit.com KEY TAKEAWAYS 23 As of 12/31/2021, unless otherwise noted. 1. 2022E FFO per share for PINE is the midpoint of guidance, as provided on February 10, 2022. Significant Discount to Peer Group Meaningful potential upside in valuation as PINE has the lowest 2022E FFO multiple of its net lease peer group. Stable & Growing Dividend PINE has grown its quarterly dividend by 35% since the beginning of 2020 and currently has a 2022E FFO 1 payout ratio of approximately 69%, one of the lowest implied payout ratios of the net lease peer group. Small Asset Base is an Opportunity for Outsized Growth Small asset denominator means management can drive outsized growth relative to its net lease peers. Disciplined Investment Strategy Real estate and credit - focused underwriting, targeting investments that exhibit strong demographic trends, leased to high - quality, industry - leading tenants. High - Quality, Stable and Growing Portfolio Portfolio rooted in publicly - traded/credit - rated tenants, and larger markets means there is a high - quality, stable asset base and an opportunity to add a diverse array of new tenants, markets and sectors. Financial Strength Balance sheet with ample liquidity and no near - term debt maturities provides financial stability and flexibility. Aligned Sponsorship & Management Externally managed by CTO Realty Growth (NYSE: CTO), a publicly traded REIT that owns 16% of PINE and is committed to internalization of management once critical mass is attained. |
| © 2022 Alpine Income Property Trust, Inc. | alpinereit.com DISCLAIMER 24 This presentation may contain “forward - looking statements .. ” Forward - looking statements include statements that may be identified by words such as “could,” “may,” “might,” “will,” “likely,” “anticipates,” “intends,” “plans,” “seeks,” “believes,” “estimates,” “expects,” “continues,” “projects” and similar references to future periods, or by the inclusion of forecasts or projections .. Forward - looking statements are based on the Company’s current expectations and assumptions regarding capital market conditions, the Company’s business, the economy and other future conditions .. Because forward - looking statements relate to the future, by their nature, they are subject to inherent uncertainties, risks and changes in circumstances that are difficult to predict .. As a result, the Company’s actual results may differ materially from those contemplated by the forward - looking statements .. Important factors that could cause actual results to differ materially from those in the forward - looking statements include general business and economic conditions, continued volatility and uncertainty in the credit markets and broader financial markets, risks inherent in the real estate business, including tenant defaults, potential liability relating to environmental matters, illiquidity of real estate investments and potential damages from natural disasters, the impact of the COVID - 19 Pandemic and its variants on the Company’s business and the business of its tenants and the impact on the U .. S .. economy and market conditions generally, other factors affecting the Company’s business or the business of its tenants that are beyond the control of the Company or its tenants, and the factors set forth under “Risk Factors” in the Company’s Annual Report on Form 10 - K for the year ended December 31 , 2021 and other risks and uncertainties discussed from time to time in the Company’s filings with the U .. S .. Securities and Exchange Commission .. Any forward - looking statement made in this presentation speaks only as of the date on which it is made .. The Company undertakes no obligation to publicly update or revise any forward - looking statement, whether as a result of new information, future developments or otherwise .. References in this presentation : 1. All information is as of December 31 , 2021 , unless otherwise noted .. 2. Annualized straight - line Base Rent (“ABR” or “Rent”) and the statistics based on ABR are calculated based on our current portfolio as of December 31 , 2021 .. 3. Dividends are set by the Board of Directors and declared on a quarterly basis and there can be no assurances as to the likelihood or amount of dividends in the future .. 4. A credit rated, or investment grade rated tenant (a tenant carrying a rating of BBB - , Baa 3 or NAIC - 2 or higher) is a tenant or the parent of a tenant with a credit rating from S&P Global Ratings, Moody’s Investors Service, Fitch Ratings or the National Associated of Insurance Commissioners (NAIC) .. 5. Contractual Base Rent (“CBR”) represents the amount owed to the Company under the terms of its lease agreements at the time referenced .. |

| © 2022 Alpine Income Property Trust, Inc. | alpinereit.com NON - GAAP FINANCIAL INFORMATION 25 Our reported results are presented in accordance with accounting principles generally accepted in the United States of America (“GAAP”) .. We also disclose Funds From Operations (“FFO”), Adjusted Funds From Operations (“AFFO”) and Pro Forma Earnings Before Interest, Taxes, Depreciation and Amortization (“Pro Forma EBITDA”), all of which are non - GAAP financial measures .. We believe these non - GAAP financial measures are useful to investors because they are widely accepted industry measures used by analysts and investors to compare the operating performance of REITs .. FFO, AFFO and Pro Forma EBITDA do not represent cash generated from operating activities and are not necessarily indicative of cash available to fund cash requirements ; accordingly, they should not be considered alternatives to net income as a performance measure or cash flows from operations as reported on our statement of cash flows as a liquidity measure and should be considered in addition to, and not in lieu of, GAAP financial measures .. We compute FFO in accordance with the definition adopted by the Board of Governors of the National Association of Real Estate Investment Trusts, or NAREIT .. NAREIT defines FFO as GAAP net income or loss adjusted to exclude extraordinary items (as defined by GAAP), net gain or loss from sales of depreciable real estate assets, impairment write - downs associated with depreciable real estate assets and real estate related depreciation and amortization, including the pro rata share of such adjustments of unconsolidated subsidiaries .. To derive AFFO, we modify the NAREIT computation of FFO to include other adjustments to GAAP net income related to non - cash revenues and expenses such as straight - line rental revenue, amortization of deferred financing costs, amortization of above - and below - market lease related intangibles, non - cash compensation, and other non - cash income .. Such items may cause short - term fluctuations in net income but have no impact on operating cash flows or long - term operating performance .. We use AFFO as one measure of our performance when we formulate corporate goals .. To derive Pro Forma EBITDA, GAAP net income or loss is adjusted to exclude extraordinary items (as defined by GAAP), net gain or loss from sales of depreciable real estate assets, impairment write - downs associated with depreciable real estate assets and real estate related depreciation and amortization, including the pro rata share of such adjustments of unconsolidated subsidiaries, non - cash revenues and expenses such as straight - line rental revenue, amortization of deferred financing costs, above - and below - market lease related intangibles, non - cash compensation, and other non - cash income or expense .. Cash interest expense is also excluded from Pro Forma EBITDA, and GAAP net income or loss is adjusted for the annualized impact of acquisitions, dispositions and other similar activities .. FFO is used by management, investors and analysts to facilitate meaningful comparisons of operating performance between periods and among our peers primarily because it excludes the effect of real estate depreciation and amortization and net gains or losses on sales, which are based on historical costs and implicitly assume that the value of real estate diminishes predictably over time, rather than fluctuating based on existing market conditions .. We believe that AFFO is an additional useful supplemental measure for investors to consider because it will help them to better assess our operating performance without the distortions created by other non - cash revenues or expenses .. We also believe that Pro Forma EBITDA is an additional useful supplemental measure for investors to consider as it allows for a better assessment of our operating performance without the distortions created by other non - cash revenues, expenses or certain effects of the Company’s capital structure on our operating performance .. FFO, AFFO, and Pro Forma EBITDA may not be comparable to similarly titled measures employed by other companies .. |

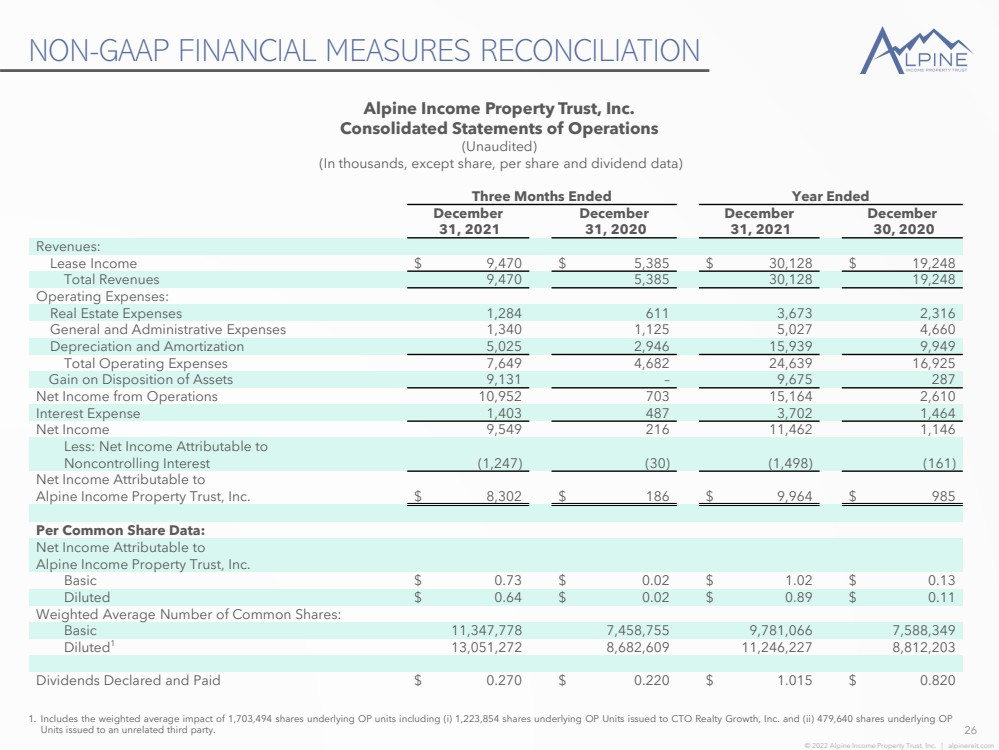
| © 2022 Alpine Income Property Trust, Inc. | alpinereit.com NON - GAAP FINANCIAL MEASURES RECONCILIATION 26 Alpine Income Property Trust, Inc. Consolidated Statements of Operations (Unaudited) (In thousands, except share, per share and dividend data) Three Months Ended Year Ended December 31, 2021 December 31, 2020 December 31, 2021 December 30, 2020 Revenues: Lease Income $ 9,470 $ 5,385 $ 30,128 $ 19,248 Total Revenues 9,470 5,385 30,128 19,248 Operating Expenses: Real Estate Expenses 1,284 611 3,673 2,316 General and Administrative Expenses 1,340 1,125 5,027 4,660 Depreciation and Amortization 5,025 2,946 15,939 9,949 Total Operating Expenses 7,649 4,682 24,639 16,925 Gain on Disposition of Assets 9,131 – 9,675 287 Net Income from Operations 10,952 703 15,164 2,610 Interest Expense 1,403 487 3,702 1,464 Net Income 9,549 216 11,462 1,146 Less: Net Income Attributable to Noncontrolling Interest (1,247) (30) (1,498) (161) Net Income Attributable to Alpine Income Property Trust, Inc. $ 8,302 $ 186 $ 9,964 $ 985 Per Common Share Data: Net Income Attributable to Alpine Income Property Trust, Inc. Basic $ 0.73 $ 0.02 $ 1.02 $ 0.13 Diluted $ 0.64 $ 0.02 $ 0.89 $ 0.11 Weighted Average Number of Common Shares: Basic 11,347,778 7,458,755 9,781,066 7,588,349 Diluted 1 13,051,272 8,682,609 11,246,227 8,812,203 Dividends Declared and Paid $ 0.270 $ 0.220 $ 1.015 $ 0.820 1 .. Includes the weighted average impact of 1 , 703 , 494 shares underlying OP units including ( i ) 1 , 223 , 854 shares underlying OP Units issued to CTO Realty Growth, Inc .. and (ii) 479 , 640 shares underlying OP Units issued to an unrelated third party .. |
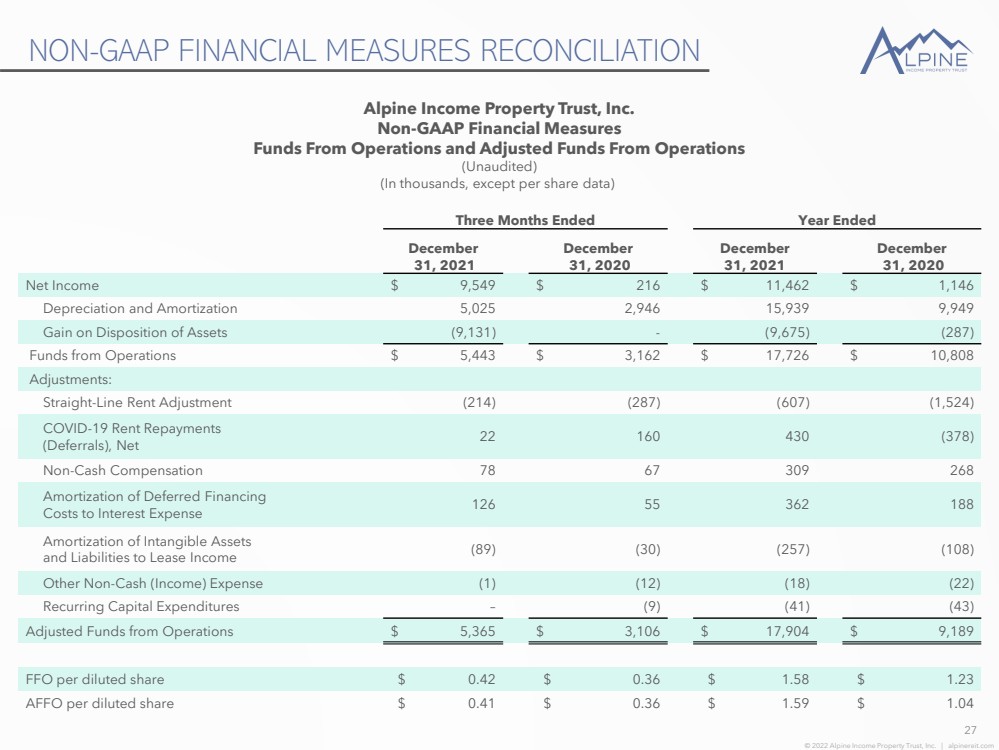
| © 2022 Alpine Income Property Trust, Inc. | alpinereit.com NON - GAAP FINANCIAL MEASURES RECONCILIATION 27 Three Months Ended Year Ended December 31, 2021 December 31, 2020 December 31, 2021 December 31, 2020 Net Income $ 9,549 $ 216 $ 11,462 $ 1,146 Depreciation and Amortization 5,025 2,946 15,939 9,949 Gain on Disposition of Assets (9,131) - (9,675) (287) Funds from Operations $ 5,443 $ 3,162 $ 17,726 $ 10,808 Adjustments: Straight - Line Rent Adjustment (214) (287) (607) (1,524) COVID - 19 Rent Repayments (Deferrals), Net 22 160 430 (378) Non - Cash Compensation 78 67 309 268 Amortization of Deferred Financing Costs to Interest Expense 126 55 362 188 Amortization of Intangible Assets and Liabilities to Lease Income (89) (30) (257) (108) Other Non - Cash (Income) Expense (1) (12) (18) (22) Recurring Capital Expenditures – (9) (41) (43) Adjusted Funds from Operations $ 5,365 $ 3,106 $ 17,904 $ 9,189 FFO per diluted share $ 0.42 $ 0.36 $ 1.58 $ 1.23 AFFO per diluted share $ 0.41 $ 0.36 $ 1.59 $ 1.04 Alpine Income Property Trust, Inc. Non - GAAP Financial Measures Funds From Operations and Adjusted Funds From Operations (Unaudited) (In thousands, except per share data) |
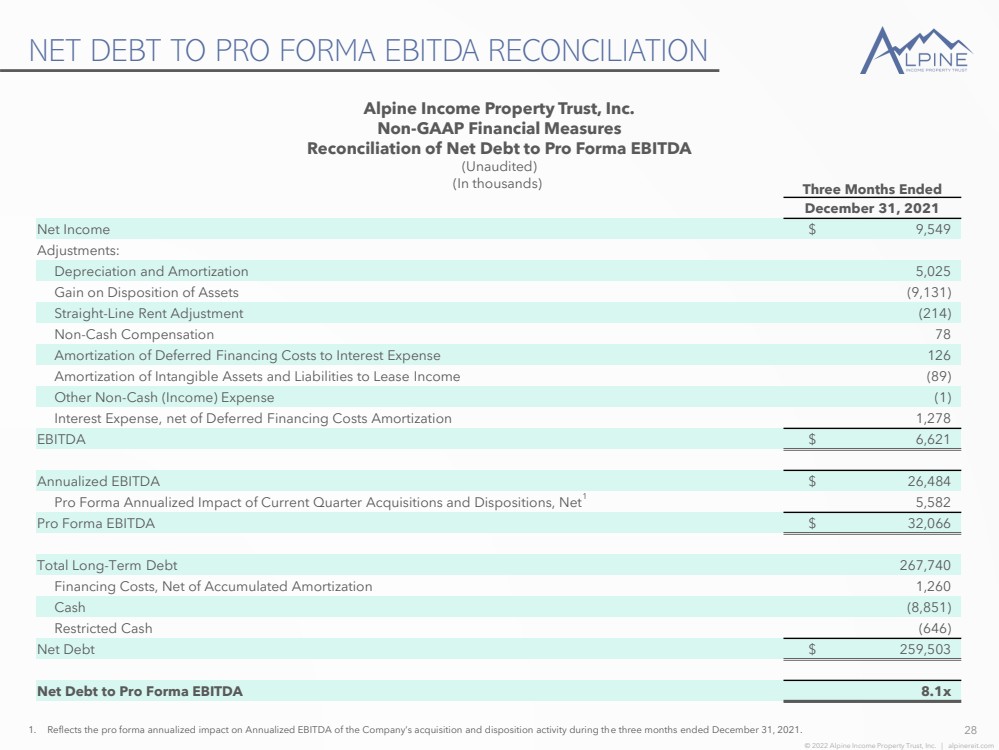
| © 2022 Alpine Income Property Trust, Inc. | alpinereit.com NET DEBT TO PRO FORMA EBITDA RECONCILIATION 28 Alpine Income Property Trust, Inc. Non - GAAP Financial Measures Reconciliation of Net Debt to Pro Forma EBITDA (Unaudited) (In thousands) 1. Reflects the pro forma annualized impact on Annualized EBITDA of the Company’s acquisition and disposition activity during th e t hree months ended December 31, 2021. Three Months Ended December 31, 2021 Net Income $ 9,549 Adjustments: Depreciation and Amortization 5,025 Gain on Disposition of Assets (9,131) Straight - Line Rent Adjustment (214) Non - Cash Compensation 78 Amortization of Deferred Financing Costs to Interest Expense 126 Amortization of Intangible Assets and Liabilities to Lease Income (89) Other Non - Cash (Income) Expense (1) Interest Expense, net of Deferred Financing Costs Amortization 1,278 EBITDA $ 6,621 Annualized EBITDA $ 26,484 Pro Forma Annualized Impact of Current Quarter Acquisitions and Dispositions, Net 1 5,582 Pro Forma EBITDA $ 32,066 Total Long - Term Debt 267,740 Financing Costs, Net of Accumulated Amortization 1,260 Cash (8,851) Restricted Cash (646) Net Debt $ 259,503 Net Debt to Pro Forma EBITDA 8.1x |
| INVESTOR PRESENTATION Investor Inquiries: Matthew M. Partridge, Chief Financial Officer, (386) 944 - 5643, mpartridge@alpinereit.com |