July 2023 Investor Presentation |
2 © 2023 Alpine Income Property Trust, Inc. | alpinereit.com National, Investment Grade Tenant-Focused Net Lease Portfolio Ticker Symbol (NYSE) PINE Equity Market Capitalization $256M Total Enterprise Value (TEV) $478M TEV Per Square Foot $124 Implied Cap Rate 8.1% Annualized Dividend Yield 6.8% Common Shares & OP Units Outstanding2 15.7M Number of Net Lease Properties 143 Number of States with a Property 34 Total Portfolio Square Feet 3.9M Current Occupancy 99.5% Annualized Base Rent (ABR) $39.7M % of ABR from Investment Grade-Rated Tenants1 63% % of ABR from Credit Rated Tenants1 82% As of June 30, 2023, unless otherwise noted. 1. A credit rated, or investment grade rated tenant (rating of BBB-, Baa3 or NAIC-2 or higher) is a tenant or the parent of a tenant with a credit rating from S&P Global Ratings, Moody’s Investors Service, Fitch Ratings or the National Association of Insurance Commissioners (NAIC). 2. As of July 20, 2023; includes 1,703,494 OP Units held by third parties in Alpine Income Property OP, LP, the Company’s operating partnership (the “Operating Partnership” or “OP”). |
3 © 2023 Alpine Income Property Trust, Inc. | alpinereit.com Alpine’s Value Proposition Meaningful Valuation Upside with In-Place Yield and Long-Term Growth Accretive Asset Recycling Driving Attractive Portfolio Metrics Pure play, 100% retail portfolio growing through accretive asset recycling of predominantly non-investment grade assets at attractive pricing, with reinvestment focused on investment grade-rated tenants and high-quality assets with strong real estate fundamentals. Opportunity to Invest Below Replacement Cost PINE’s total enterprise value (TEV) is $124 per square foot and book value is $19.30 per share, allowing shareholders to invest meaningfully below replacement cost in a portfolio rooted in higher credit quality tenants in largely major markets throughout the United States. Significant Discount to Peer Group PINE trades at a significant discount compared to its investment grade-focused peers, implying substantial valuation upside. Stable & Attractive Dividend PINE has grown its quarterly dividend by 37.5% since the beginning of 2020 and now provides one of the highest dividend yields of its net lease peer group. As of June 30, 2023, unless otherwise noted. 1. All dividend yields, payout ratios and 2023E FFO multiples are based on the closing stock price on June 30, 2023, using current annualized dividends and 2023E FFO per share estimates for the peer net lease companies from the Stifel Triple-Net REITs Comp Sheets 7/2/2023 report. 2023E FFO per share for PINE reflects the midpoint of guidance provided on July 20, 2023. 2. Based on 2022 Average Household Income (5-mile) and 2022 Total Population (5-mile) data from Esri. Payout Ratio % 72% 6.8% FCPT O ADC SRC PINE NTST NNN EPRT 2023E FFO Payout Ratio Dividend Yield 16.5x 15.7x 15.4x 14.4x 13.5x 13.2x 10.8x 10.7x ADC FCPT NTST O EPRT NNN SRC PINE 2023E FFO Multiple 1 Total Enterprise Value of $124 per square foot $97,300 Total Portfolio Weighted Average 5-Mile Average Household Income2 112,000 Total Portfolio Weighted Average 5-Mile Total Population2 1 1 PINE’s top 10 tenants now include investment grade-rated industry leaders such as: |
4 © 2023 Alpine Income Property Trust, Inc. | alpinereit.com Accretive Asset Recycling 5.8% 5.5% 5.8% 5.5% 6.5% 6.1% 6.2% Q3 2020 Q3 2021 Q2 2022 Q3 2022 Q4 2022 Q1 2023 Q2 2023 Retail Disposition Cap Rates Retail Properties Sold As of June 30, 2023. PINE has demonstrated a consistent ability to sell retail properties at attractive valuations, regardless of the tenant credit quality, to drive accretive acquisitions of predominantly investment grade-rated tenants at an average positive spread of 110 bps between its retail disposition and retail acquisition cap rates |
5 © 2023 Alpine Income Property Trust, Inc. | alpinereit.com Opportunity to Invest Below Replacement Cost High-Quality Portfolio with Valuation Upside PINE’s total enterprise value (TEV) is $124 per square foot, allowing shareholders to invest below estimated replacement cost in a portfolio rooted in higher growth, major markets throughout the United States with comparable tenants to the investment grade-focused net lease peers. Better Margin of Safety with Stickier Tenants With an average cash rent per square foot of $10.19, occupancy costs for PINE’s portfolio tenants are meaningfully below market rents given the inflationary pressure on building and land costs, suggesting tenants will be more likely to exercise their renewal options at expiration. Significant Valuation Discount to Peer Group Similar tenant exposures in comparable or better markets, with an underlying real estate valuation per square foot 54% below the peer average. Creating Value Through Capital Recycling PINE has increased its disposition guidance in order to monetize assets at attractive private market valuations, resulting in accretive net investment spreads once disposition proceeds are reinvested. 1. Value is based on Total Enterprise Value for each peer net lease company is from the Stifel Triple-Net REITs Comp Sheets 7/2/2023 report. 2. Portfolio size is based on total square feet and is from available information within each company’s published information available through each company’s website, as of June 30, 2023. Portfolio information for PINE is as of June 30, 2023. FCPT NNN EPRT O ADC NTST SRC PINE $0 $100 $200 $300 $400 $500 0 50 100 150 200 250 Value 1 Per Square Foot 2 Portfolio Size (Square Feet) 2 Peer Average $268 |
6 © 2023 Alpine Income Property Trust, Inc. | alpinereit.com Significant Implied Valuation Upside 16.5x 15.7x 15.4x 14.4x 13.5x 13.2x 10.8x 10.7x ADC FCPT NTST O EPRT NNN SRC PINE 2023E FFO Multiple 1 PINE trades at a 5.2x multiple discount to the investment grade-focused peer group average, implying significant valuation upside Investment Grade-Focused Peer Average 15.9x 68% 61% 67% 20% Not Disclosed 41% 18% 63% As of June 30, 2023, unless otherwise noted. 1. All dividend yields, payout ratios and 2023E FFO multiples are based on the closing stock price on June 30, 2023, using current annualized dividends and 2023E FFO per share estimates for the peer net lease companies from the Stifel Triple-Net REITs Comp Sheets 7/2/2023 report. 2023E FFO per share for PINE reflects the midpoint of guidance provided on July 20, 2023. 2. A credit rated, or investment grade (“IG”) rated tenant (rating of BBB-, Baa3 or NAIC-2 or higher) is a tenant or the parent of a tenant with a credit rating from S&P Global Ratings, Moody’s Investors Service, Fitch Ratings or the National Association of Insurance Commissioners. 3. Percentage of rents associated with investment grade-rated tenants based on published information available through each company’s website as of June 30, 2023. IGRATED Disclosed % of Rents from Investment Grade-Rated Tenants2,3 |
7 © 2023 Alpine Income Property Trust, Inc. | alpinereit.com Relative Outsized In-Place Dividend Yield 1. All dividend yields and payout ratios are based on the closing stock price on June 30, 2023, using current annualized dividends and 2023E FFO per share estimates for the peer net lease companies from the Stifel Triple-Net REITs Comp Sheets 6/30/2023 report. 2023E FFO per share for PINE reflects the midpoint of guidance provided on July 20, 2023. 84% 74% 74% 73% 72% 69% 68% 64% 5.4% 5.1% 4.5% 6.7% 6.8% 4.5% 5.1% 4.8% FCPT O ADC SRC PINE NTST NNN EPRT 2023E FFO Payout Ratio Dividend Yield Peer Average 5.2% PINE’s dividend is strongly supported by a conservative payout ratio and a portfolio built with an intense focus on real estate fundamentals, high-quality tenancy and long-term stability. |
8 © 2023 Alpine Income Property Trust, Inc. | alpinereit.com Attractive Entry Point Given Recent Stock Performance As of June 30, 2023, unless otherwise noted. Total Return data provided by Citadel Securities’ “REIT Sectors” report. (20.0%) (16.0%) (12.0%) (8.0%) (4.0%) 0.0% 4.0% 8.0% 12.0% Dec 2022 Jan 2023 Feb 2023 Mar 2023 Apr 2023 May 2023 Jun 2023 PINE’s YTD 2023 stock underperformance presents a historically attractive entry point for investors as the Company is well-positioned to drive attractive risk-adjusted returns through its capital recycling strategy in 2024 and beyond ADC 11.3% 3.5% (5.8%) EPRT 41.2% (14.6%) 2.6% FCPT 3.4% (7.2%) 0.5% NNN 23.0% (0.1%) (4.2%) NTST N/A (16.8%) (0.3%) O 24.1% (7.4%) (3.4%) SRC 26.6% (11.6%) 2.0% Peer Avg. 21.6% (7.7%) (1.2%) PINE 41.4% 0.9% (12.1%) YTD 2023 Total Return Ticker 2021 Total Return 2022 Total Return YTD 2023 Total Return |
9 © 2023 Alpine Income Property Trust, Inc. | alpinereit.com Disciplined Investment Strategy National Focus, Emphasizing Attractive Supply/Demand Dynamics National focus, with an emphasis on major metropolitan statistical areas that exhibit attractive population trends, business-friendly policies and strong underlying supply/demand fundamentals Real Estate Fundamentals and Analytics Driven Underwriting Real estate oriented underwriting utilizing consumer location data analytics, competition indexing, market rent benchmarking and comprehensive risk assessments Industry-Leading Tenants and Well-Performing Operating Sectors Focused on aligning with tenants operating in essential business sectors, displaying stable and resilient operating trends and/or a forward-thinking, omni-channel strategy Relative Asset Value Investing Through Long-Term Relationships Concentrated on relative value-investing through deep broker, developer and tenant relationships and management’s ability to identify high-quality risk-adjusted opportunities in a highly fragmented transaction market |
10 © 2023 Alpine Income Property Trust, Inc. | alpinereit.com Thoughtful Investment Execution $47 $75 $99 $117 $139 $220 $275 $377 $442 $486 $523 $564 $564 $625 Q1 2020 Q2 2020 Q3 2020 Q4 2020 Q1 2021 Q2 2021 Q3 2021 Q4 2021 Q1 2022 Q2 2022 Q3 2022 Q4 2022 Q1 2023 Q2 2023 IPO 2021 Q4 2019 Cumulative Investment Activity Since IPO 2022 PINE has prudently invested capital into stable tenants with attractive underlying real estate and strong demographics. As of June 30, 2023. $ in millions. 2023 |
11 © 2023 Alpine Income Property Trust, Inc. | alpinereit.com Improving Portfolio Size, Diversity and Quality As of June 30, 2023. 1. A credit rated, or investment grade (“IG”) rated tenant (rating of BBB-, Baa3 or NAIC-2 or higher) is a tenant or the parent of a tenant with a credit rating from S&P Global Ratings, Moody’s Investors Service, Fitch Ratings or the National Association of Insurance Commissioners. 2019 (IPO) Number of Net Lease Properties 20 48 113 148 143 Number of States with a Property 12 18 32 34 34 Total Portfolio Square Feet 0.9M 1.6M 3.3M 3.7M 3.9M Annualized Base Rent (ABR) $13.3M $21.1M $36.9M $40.4M $39.7M Top Tenant as a % of ABR 21% Wells Fargo (S&P: A+) 15% Wells Fargo (S&P: A+) 8% Wells Fargo (S&P: A+) 11% Walgreens (S&P: BBB) 12% Walgreens (S&P: BBB) Top Sector as a % of ABR 21% Financial Services 15% General Merchandise 12% Home Furnishings 13% Sporting Goods 13% Dollar Stores Top State as a % of ABR 26% Florida 21% Florida 18% Texas 17% Texas 12% New Jersey % of ABR from IG Rated Tenants1 36% 46% 45% 54% 63% % of ABR from Credit Rated Tenants1 89% 83% 74% 79% 82% % of ABR from Office Properties 43% 27% 8% - % - % 2020 2021 2022 2023 |
12 © 2023 Alpine Income Property Trust, Inc. | alpinereit.com Investment Grade-Focused Portfolio Credit Rating1 BBB 12% BBB+ 9% BBB 9% BBB 8% BBB 5% AA 5% N/A 4% BBB+ 4% N/A 4% A 3% 37% 100% ABR % Other 1% 5% 2% 4% 10% 10% 10% 8% 50% Lease Rollover Schedule % of ABR Expiring 7.3 Years of Weighted Average Lease Term Remaining As of June 30, 2023. 1. A credit rated, or investment grade rated tenant (rating of BBB-, Baa3 or NAIC-2 or higher) is a tenant or the parent of a tenant with a credit rating from S&P Global Ratings, Moody’s Investors Service, Fitch Ratings or the National Association of Insurance Commissioners (NAIC). |
13 © 2023 Alpine Income Property Trust, Inc. | alpinereit.com High-Quality Top Tenant Base Disclosed % of Rents from Investment Grade-Rated Tenants1,2 RATED IG 68% 67% 61% 20% 18% As of June 30, 2023, unless otherwise noted. 1. A credit rated, or investment grade (“IG”) rated tenant (rating of BBB-, Baa3 or NAIC-2 or higher) is a tenant or the parent of a tenant with a credit rating from S&P Global Ratings, Moody’s Investors Service, Fitch Ratings or the National Association of Insurance Commissioners. 2. Top ten tenants and percentage of rents associated with investment grade-rated tenants based on published information available through each company’s website as of June 30, 2023. Not Disclosed 63% 43% |
14 © 2023 Alpine Income Property Trust, Inc. | alpinereit.com Excellent Tenant Credit and Operational Transparency Investment Grade 63% Not Rated 18% Non-Investment Grade 19% Dollar Stores 13% Pharmacy 13% Home Improvement 13% Sporting Goods 12% Home Furnishings 7% Consumer Electronics 6% Grocery 5% General Merchandise 5% Entertainment 5% Off-Price Retail 4% Other 17% 100% ABR % As of June 30, 2023. 1. A credit rated, or investment grade (“IG”) rated tenant (rating of BBB-, Baa3 or NAIC-2 or higher) is a tenant or the parent of a tenant with a credit rating from S&P Global Ratings, Moody’s Investors Service, Fitch Ratings or the National Association of Insurance Commissioners. ▪ 82% of ABR comes from tenants or the parent of a tenant that are credit rated1 ▪ 81% of ABR comes from tenants or the parent of a tenant that are publicly traded, resulting in financial and operational transparency Sector |
15 © 2023 Alpine Income Property Trust, Inc. | alpinereit.com Major Market, Demographic-Driven Net Lease Portfolio ▪ Geographically diversified portfolio focused on major markets and areas benefitting from demographic shifts and attractive supply/demand dynamics ▪ 47% of ABR comes from metropolitan statistical areas1 with more than one million people % of Annualized Base Rent By State 3% - 7% > 7% 2% - 3% < 2% As of June 30, 2023. 1. MSA, or metropolitan statistical area, is the formal definition of a region that consists of a city and surrounding communities that are linked by social and economic factors, as established by the U.S. Office of Management and Budget. The names of the MSA have been shortened for ease of reference. 2. Based on 2022 Average Household Income (5-mile) and 2022 Total Population (5-mile) data from Esri. Total Portfolio Weighted Average 5-Mile Average Household Income $97,300 2 Total Portfolio Weighted Average 5-Mile Total Population 112,000 2 ▪ 40% of portfolio ABR comes from the top 10 MSAs1 , with nearly 50% of ABR from the top 10 MSA’s1 comes from the in-demand markets of Houston, Atlanta, Tampa, Philadelphia and New York ▪ Properties in the top 10 MSAs have a weighted average 5-mile average household income of $113,2002 ▪ Properties in the top 10 MSAs have a weighted average 5-mile total population of 141,200 people2 |
16 © 2023 Alpine Income Property Trust, Inc. | alpinereit.com Consistent Dividend Growth Stable, Well-Covered Dividend ▪ Current midpoint of 2023 guidance1 implies a 73% 2022E FFO per share dividend payout ratio ▪ 37.5% increase in the quarterly cash dividend since the beginning of 2020 Annualized Per Share Cash Dividend $1.10 Annualized Per Share Cash Dividend Yield 6.8% As of June 30, 2023, unless otherwise noted. 1. 2022E FFO per share for PINE is the midpoint of guidance, as provided on July 20, 2023. $0.060 $0.200 $0.200 $0.200 $0.220 $0.240 $0.250 $0.255 $0.270 $0.270 $0.270 $0.275 $0.275 $0.275 $0.275 Q4 2019 Q1 2020 Q2 2020 Q3 2020 Q4 2020 Q1 2021 Q2 2021 Q3 2021 Q4 2021 Q1 2022 Q2 2022 Q3 2022 Q4 2022 Q1 2023 Q2 2023 IPO Q4 2019 Dividend Per Share Paid 2020 2021 2022 2023 |
17 © 2023 Alpine Income Property Trust, Inc. | alpinereit.com Research Coverage Near Unanimous Buy or Outperform rated by Independent Analysts Baird Wes Golladay Outperform $22.00 B. Riley Craig Kucera Buy $20.00 BTIG Mike Gorman Buy $23.00 Colliers Barry Oxford Buy $20.00 Janney Rob Stevenson Buy $19.00 Jones Jason Stewart Buy $24.00 Raymond James RJ Milligan Outperform $19.00 Stifel Simon Yarmak Buy $20.00 Truist Anthony Hau Hold $17.00 Average $20.44 Institution Covering Analyst Rating Price Target As of June 30, 2023. |
18 © 2023 Alpine Income Property Trust, Inc. | alpinereit.com Financial Strength PINE has a demonstrated access to capital, is focused on maintaining reasonable leverage, and has completely fixed its attractive cost of debt through 2026. Equity Market Capitalization1 $256M Net Debt Outstanding1,2 $222M Total Enterprise Value (TEV)1 $478M Well-Capitalized Balance Sheet Q2 2023 46% Q2 2023 6.4x Q1 2023 41% Q1 2023 6.4x Q4 2022 47% Q4 2022 7.1x Q4 2021 50% Q4 2021 8.1x No Near-Term Capital Markets Exposure Improved Leverage Profile $50 $100 $100 2023 2024 2025 2026 2027 2028 2029 2030 Revolving Credit Facility Unsecured Term Loans Well-Staggered Debt Maturity Schedule Net Debt to TEV3 Net Debt to Pro Forma EBITDA4 Debt Outstanding 1 5 ▪ PINE has no debt maturities until May 2026 ▪ No current floating interest rate exposure ▪ More than $225 million1 of potential liquidity via cash, restricted cash and undrawn revolving credit facility commitments As of June 30, 2023, unless otherwise noted. $ in millions; any differences a result of rounding. 1. As of June 30, 2023. 2. Net Debt Outstanding is the Company’s outstanding debt, minus the Company’s cash, cash equivalents and restricted cash. 3. Net Debt to TEV (Total Enterprise Value) is the Company’s outstanding debt, minus the Company’s cash, cash equivalents and restricted cash, as a percentage of the Company’s enterprise value. 4. See the “Non-GAAP Financial Information” section and tables at the end of this presentation for a discussion and reconciliation of Net Income to non-GAAP financial measures. 5. Reflects $50.0 million outstanding under the Company’s $250 million senior unsecured revolving credit facility; the Company’s senior unsecured revolving credit facility matures in January 2027 and includes a one-year extension option, subject to satisfaction of certain conditions; the maturity date reflected assumes the Company exercises the one-year extension option. |
19 © 2023 Alpine Income Property Trust, Inc. | alpinereit.com 2023 Guidance Range Acquisitions $100 million - $150 million $100 million - $125 million — - ($25) million Dispositions $75 million - $125 million $100 million - $125 million $25 million - — FFO Per Diluted Share $1.50 - $1.55 $1.50 - $1.53 — - ($0.02) AFFO Per Diluted Share $1.52 - $1.57 $1.52 - $1.55 — - ($0.02) Weighted Average Diluted Shares Outstanding 15.8 million - 16.3 million 15.5 million - 16.0 million (0.3) million - (0.3) million Low High The Company’s 2023 revised guidance takes into account the Company’s year-to-date performance and revised expectations regarding the Company’s investment activities, forecasted capital markets transactions, and other significant assumptions. 2023 revised guidance was provided in the Company’s Second Quarter 2023 Operating Results press release filed on July 20, 2023. Low High Low High Previous Guidance Revised Guidance Increase (Decrease) |
20 © 2023 Alpine Income Property Trust, Inc. | alpinereit.com Corporate Responsibility Alpine Income Property Trust, through its external manager, is committed to sustainability, strong corporate governance, and meaningful corporate social responsibility programs. Committed Focus Committed to maintaining an environmentally conscious culture, the utilization of environmentally friendly & renewable products, and the promotion of sustainable business practices Tenant Alignment Alignment with environmentally aware tenants who have strong sustainability programs and initiatives embedded into their corporate culture and business practices Social Responsibility Environmental Responsibility Corporate Governance ▪ Independent Chairman of the Board and 5 of 6 Directors classified as independent ▪ Annual election of all Directors ▪ Annual Board of Director evaluations ▪ Stock ownership requirements for all Directors ▪ Prohibition against hedging and pledging Alpine Income Property Trust stock ▪ Robust policies and procedures for approval of related party transactions ▪ Opted out of business combination and control share acquisition statutes in the Maryland General Corporation Law ▪ All team members adhere to a comprehensive Code of Business Conduct and Ethics policy Inclusive and Supportive Company Culture Dedicated to an inclusive and supportive office environment filled with diverse backgrounds and perspectives, with a demonstrated commitment to financial, mental and physical wellness Notable Community Outreach Numerous and diverse community outreach programs, supporting environmental, artistic, civil and social organizations in the community |
21 © 2023 Alpine Income Property Trust, Inc. | alpinereit.com External Management Alignment As of July 20, 2023. Aligned Ownership CTO currently owns an approximate 15% interest in PINE, meaningfully aligning its interests with PINE shareholders Independent Board of Directors PINE has its own independent Board of Directors and realizes significant economies of scale from the 28-member CTO team without the corresponding G&A expense Shadow Pipeline for External Growth PINE has a potential shadow pipeline within the CTO portfolio as a result of its right of first refusal on all CTO single tenant net lease asset sales Internalization on the Horizon Internalization of management for PINE is anticipated in the future when the Company approaches or exceeds critical mass Opportunities for Collaboration PINE reviews transaction opportunities resulting from CTO’s acquisition efforts that it otherwise would not see in the market through normal single tenant acquisition efforts and relationships Benefits and Alignment of External Management Notable Management Agreement Terms ▪ Five-year initial term (initial expiration November 2024), with one-year extension options thereafter ▪ Quarterly management fee of 0.375%, calculated on equity, net of share buybacks and issuance costs ▪ Terminable with payment of a one-time fee of 3x the annualized average management fee for the preceding 24-months Alpine Income Property Trust is externally managed by CTO Realty Growth (NYSE: CTO) under an agreement that, combined with CTO’s ownership in PINE, provides economies of scale, significant shareholder alignment and a flexible/collapsible structure. |
22 © 2023 Alpine Income Property Trust, Inc. | alpinereit.com Board of Directors Our Board has a well-balanced mix of perspectives and experiences and maintains relevant policies to ensure shareholder alignment, risk management, corporate oversight and the highest ethical standards. Andrew C. Richardson Chairman of the Board, Independent Director Currently Chief Executive Officer of RMC Living. Former Chief Operating Officer of Waypoint Real Estate Investments, Chief Financial Officer and President of Land and Development of iStar, Inc. (NYSE: STAR), Chief Financial Officer of The Howard Hughes Corporation (NYSE: HHC) and Chief Financial Officer of NorthStar Realty Finance Corp. Chairman of the Board and Chairman of the Audit Committee. Mark O. Decker Jr. Independent Director Currently Managing Director of Proterra Investment Partners. Former President, Chief Executive Officer and Chief Investment Officer, and Director of CenterSpace and Former Managing Director and U.S. Group Head of Real Estate Investment and Corporate Banking at BMO Capital Markets. Member of the Audit and Governance Committees. Jeffrey S. Yarckin Independent Director Currently Founder, President, and COO of TriGate Capital, LLC. Former Co-President and Chief Executive Officer of ORIX Capital Markets, LLC. Former Founding Partner of the Lone Star Funds. Chairman of the Compensation Committee and a member of the Governance Committee. John P. Albright President & CEO Currently President & Chief Executive Officer of Alpine Income Property Trust (NYSE: PINE) and CTO Realty Growth (NYSE: CTO). Former Co-Head and Managing Director of Archon Capital, a Goldman Sachs Company; Executive Director of Merchant Banking – Investment Management at Morgan Stanley; and Managing Director of Crescent Real Estate (NYSE: CEI). Rachel Elias Wein Independent Director Currently Founder and Chief Executive Officer of WeinPlus. Former development executive with The Sembler Company and senior associate with Ernst & Young’s Real Estate Advisory practice. Member of the Audit Committee and the Compensation Committee. M. Carson Good Independent Director Currently President of Good Capital Group. Former Managing Director and Florida Broker of Record for Jones Lang LaSalle (NYSE: JLL) and current Chairman of the Board of the Greater Orlando Airport Authority (GOAA). Chairman of the Governance Committee and a member of the Compensation Committee |
23 © 2023 Alpine Income Property Trust, Inc. | alpinereit.com Key Takeaways Significant Discount to Peer Group Meaningful upside opportunity as PINE has the lowest 2023E FFO multiples of its net lease peer group. Stable & Growing Dividend PINE has grown its quarterly dividend by 37.5% since the beginning of 2020 and currently has a very efficient 2023E FFO1 implied payout ratio of approximately 73%. Small Asset Base is an Opportunity for Outsized Growth Small asset denominator means management can drive outsized growth relative to its net lease peers. Disciplined Investment Strategy Real estate and credit-focused underwriting, targeting investments that exhibit strong demographic trends, leased to high-quality, industry-leading tenants. High-Quality, Transparent and Growing Portfolio 100% retail portfolio rooted in publicly-traded/credit-rated tenants, and larger markets means there is a high-quality, stable asset base and an opportunity to add a diverse array of new tenants, markets and sectors. Financial Stability Balance sheet with ample liquidity and no near-term debt maturities provides financial stability and flexibility. Aligned Sponsorship & Management Externally managed by CTO Realty Growth (NYSE: CTO), a publicly traded REIT that owns 15% of PINE and is committed to internalization of management once critical mass is attained. As of June 30, 2023, unless otherwise noted. 1. 2023E FFO per share for PINE is the midpoint of guidance, as provided on July 20, 2023. |
24 © 2023 Alpine Income Property Trust, Inc. | alpinereit.com Disclaimer This presentation may contain “forward-looking statements.” Forward-looking statements include statements that may be identified by words such as “could,” “may,” “might,” “will,” “likely,” “anticipates,” “intends,” “plans,” “seeks,” “believes,” “estimates,” “expects,” “continues,” “projects” and similar references to future periods, or by the inclusion of forecasts or projections. Forward-looking statements are based on the Company’s current expectations and assumptions regarding capital market conditions, the Company’s business, the economy and other future conditions. Because forward-looking statements relate to the future, by their nature, they are subject to inherent uncertainties, risks and changes in circumstances that are difficult to predict. As a result, the Company’s actual results may differ materially from those contemplated by the forward-looking statements. Important factors that could cause actual results to differ materially from those in the forward-looking statements include general business and economic conditions, continued volatility and uncertainty in the credit markets and broader financial markets, risks inherent in the real estate business, including tenant defaults, potential liability relating to environmental matters, illiquidity of real estate investments and potential damages from natural disasters, the impact of the COVID-19 Pandemic and its variants on the Company’s business and the business of its tenants and the impact on the U.S. economy and market conditions generally, other factors affecting the Company’s business or the business of its tenants that are beyond the control of the Company or its tenants, and the factors set forth under “Risk Factors” in the Company’s Annual Report on Form 10-K for the year ended December 31, 2022 and other risks and uncertainties discussed from time to time in the Company’s filings with the U.S. Securities and Exchange Commission. Any forward-looking statement made in this presentation speaks only as of the date on which it is made. The Company undertakes no obligation to publicly update or revise any forward-looking statement, whether as a result of new information, future developments or otherwise. References in this presentation: 1. All information is as of June 30, 2023, unless otherwise noted. 2. Annualized straight-line Base Rent (“ABR” or “Rent”) and the statistics based on ABR are calculated based on our current portfolio as of June 30, 2023. 3. Dividends are set by the Board of Directors and declared on a quarterly basis and there can be no assurances as to the likelihood or amount of dividends in the future. 4. A credit rated, or investment grade rated tenant (a tenant carrying a rating of BBB-, Baa3 or NAIC-2 or higher) is a tenant or the parent of a tenant with a credit rating from S&P Global Ratings, Moody’s Investors Service, Fitch Ratings or the National Association of Insurance Commissioners (NAIC). |
25 © 2023 Alpine Income Property Trust, Inc. | alpinereit.com Non-GAAP Financial Information Our reported results are presented in accordance with accounting principles generally accepted in the United States of America (“GAAP”). We also disclose Funds From Operations (“FFO”), Adjusted Funds From Operations (“AFFO”) and Pro Forma Earnings Before Interest, Taxes, Depreciation and Amortization (“Pro Forma EBITDA”), all of which are non-GAAP financial measures. We believe these non-GAAP financial measures are useful to investors because they are widely accepted industry measures used by analysts and investors to compare the operating performance of REITs. FFO, AFFO, and Pro Forma EBITDA do not represent cash generated from operating activities and are not necessarily indicative of cash available to fund cash requirements; accordingly, they should not be considered alternatives to net income as a performance measure or cash flows from operations as reported on our statement of cash flows as a liquidity measure and should be considered in addition to, and not in lieu of, GAAP financial measures. We compute FFO in accordance with the definition adopted by the Board of Governors of the National Association of Real Estate Investment Trusts, or NAREIT. NAREIT defines FFO as GAAP net income or loss adjusted to exclude extraordinary items (as defined by GAAP), net gain or loss from sales of depreciable real estate assets, impairment write-downs associated with depreciable real estate assets and real estate related depreciation and amortization, including the pro rata share of such adjustments of unconsolidated subsidiaries. To derive AFFO, we modify the NAREIT computation of FFO to include other adjustments to GAAP net income related to non-cash revenues and expenses such as loss on extinguishment of debt, amortization of above- and below-market lease related intangibles, straight-line rental revenue, amortization of deferred financing costs, non-cash compensation, and other non-cash income or expense. Such items may cause short-term fluctuations in net income but have no impact on operating cash flows or long-term operating performance. We use AFFO as one measure of our performance when we formulate corporate goals. To derive Pro Forma EBITDA, GAAP net income or loss is adjusted to exclude extraordinary items (as defined by GAAP), net gain or loss from sales of depreciable real estate assets, impairment write-downs associated with depreciable real estate assets and real estate related depreciation and amortization, including the pro rata share of such adjustments of unconsolidated subsidiaries, non-cash revenues and expenses such as straight-line rental revenue, amortization of deferred financing costs, loss on extinguishment of debt, above- and below-market lease related intangibles, non-cash compensation, and other non-cash income or expense. Cash interest expense is also excluded from Pro Forma EBITDA, and GAAP net income or loss is adjusted for the annualized impact of acquisitions, dispositions and other similar activities. FFO is used by management, investors and analysts to facilitate meaningful comparisons of operating performance between periods and among our peers primarily because it excludes the effect of real estate depreciation and amortization and net gains or losses on sales, which are based on historical costs and implicitly assume that the value of real estate diminishes predictably over time, rather than fluctuating based on existing market conditions. We believe that AFFO is an additional useful supplemental measure for investors to consider because it will help them to better assess our operating performance without the distortions created by other non-cash revenues or expenses. We also believe that Pro Forma EBITDA is an additional useful supplemental measure for investors to consider as it allows for a better assessment of our operating performance without the distortions created by other non-cash revenues, expenses or certain effects of the Company’s capital structure on our operating performance. FFO, AFFO, and Pro Forma EBITDA may not be comparable to similarly titled measures employed by other companies. |
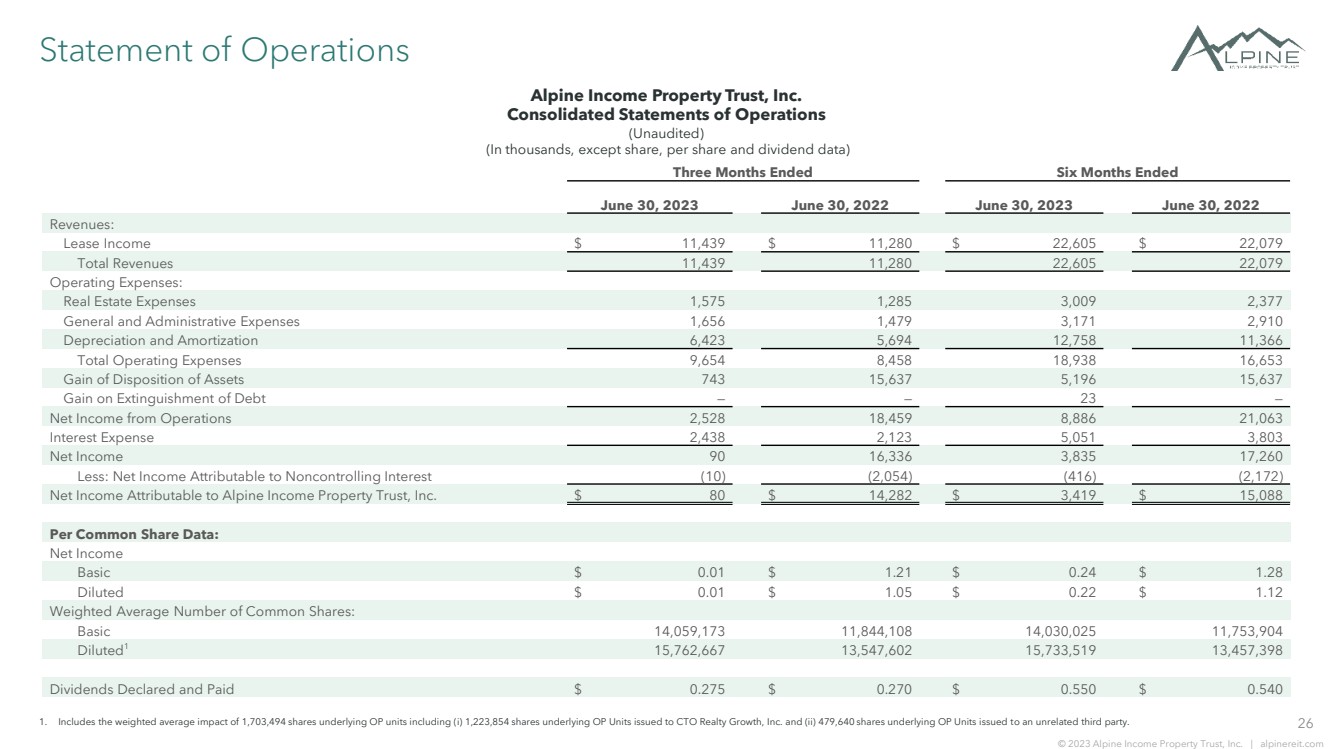
26 © 2023 Alpine Income Property Trust, Inc. | alpinereit.com Statement of Operations Alpine Income Property Trust, Inc. Consolidated Statements of Operations (Unaudited) (In thousands, except share, per share and dividend data) 1. Includes the weighted average impact of 1,703,494 shares underlying OP units including (i) 1,223,854 shares underlying OP Units issued to CTO Realty Growth, Inc. and (ii) 479,640 shares underlying OP Units issued to an unrelated third party. Three Months Ended Six Months Ended June 30, 2023 June 30, 2022 June 30, 2023 June 30, 2022 Revenues: Lease Income $ 11,439 $ 11,280 $ 22,605 $ 22,079 Total Revenues 11,439 11,280 22,605 22,079 Operating Expenses: Real Estate Expenses 1,575 1,285 3,009 2,377 General and Administrative Expenses 1,656 1,479 3,171 2,910 Depreciation and Amortization 6,423 5,694 12,758 11,366 Total Operating Expenses 9,654 8,458 18,938 16,653 Gain of Disposition of Assets 743 15,637 5,196 15,637 Gain on Extinguishment of Debt — — 23 — Net Income from Operations 2,528 18,459 8,886 21,063 Interest Expense 2,438 2,123 5,051 3,803 Net Income 90 16,336 3,835 17,260 Less: Net Income Attributable to Noncontrolling Interest (10) (2,054) (416) (2,172) Net Income Attributable to Alpine Income Property Trust, Inc. $ 80 $ 14,282 $ 3,419 $ 15,088 Per Common Share Data: Net Income Basic $ 0.01 $ 1.21 $ 0.24 $ 1.28 Diluted $ 0.01 $ 1.05 $ 0.22 $ 1.12 Weighted Average Number of Common Shares: Basic 14,059,173 11,844,108 14,030,025 11,753,904 Diluted1 15,762,667 13,547,602 15,733,519 13,457,398 Dividends Declared and Paid $ 0.275 $ 0.270 $ 0.550 $ 0.540 |
27 © 2023 Alpine Income Property Trust, Inc. | alpinereit.com Non-GAAP Financial Measures Reconciliation Alpine Income Property Trust, Inc. Non-GAAP Financial Measures Funds From Operations and Adjusted Funds From Operations (Unaudited) (In thousands, except per share data) Three Months Ended Six Months Ended June 30, 2023 June 30, 2022 June 30, 2023 June 30, 2022 Net Income $ 90 $ 16,336 $ 3,835 $ 17,260 Depreciation and Amortization 6,423 5,694 12,758 11,366 Gains on Disposition of Assets (743) (15,637) (5,196) (15,637) Funds from Operations $ 5,770 $ 6,393 $ 11,397 $ 12,989 Adjustments: Gain on Extinguishment of Debt — — (23) — Amortization of Intangible Assets and Liabilities to Lease Income (102) (69) (189) (170) Straight-Line Rent Adjustment (109) (234) (274) (528) COVID-19 Rent Repayments — 22 — 45 Non-Cash Compensation 79 78 159 157 Amortization of Deferred Financing Costs to Interest Expense 177 132 351 257 Other Non-Cash Expense 28 23 57 47 Adjusted Funds from Operations $ 5,843 $ 6,345 $ 11,478 $ 12,797 FFO per Diluted Share $ 0.37 $ 0.47 $ 0.72 $ 0.97 AFFO per Diluted Share $ 0.37 $ 0.47 $ 0.73 $ 0.95 |
28 © 2023 Alpine Income Property Trust, Inc. | alpinereit.com Net Debt-to-EBITDA Pro Forma Reconciliation Alpine Income Property Trust, Inc. Non-GAAP Financial Measures Reconciliation of Net Debt to Pro Forma EBITDA (Unaudited) (In thousands) Three Months Ended June 30, 2023 Net Income $ 90 Adjustments: Depreciation and Amortization 6,423 Gains on Disposition of Assets (743) Gain on Extinguishment of Debt — Straight-Line Rent Adjustment (109) Non-Cash Compensation 79 Amortization of Deferred Financing Costs to Interest Expense 177 Amortization of Intangible Assets and Liabilities to Lease Income (102) Other Non-Cash (Income) Expense 28 Interest Expense, net of Deferred Financing Costs Amortization 2,261 EBITDA $ 8,104 Annualized EBITDA $ 32,416 Pro Forma Annualized Impact of Current Quarter Acquisitions and Dispositions, Net1 2,515 Pro Forma EBITDA $ 34,931 Total Long-Term Debt $ 249,020 Financing Costs, Net of Accumulated Amortization 1,350 Cash and Cash Equivalents (7,755) Restricted Cash (20,100) Net Debt $ 222,515 Net Debt to Pro Forma EBITDA 6.4x 1. Reflects the pro forma annualized impact on Annualized EBITDA of the Company’s acquisition and disposition activities during the three months ended June 30, 2023. |
Investor Inquiries: Matthew M. Partridge, Chief Financial Officer, (407) 904-3324, mpartridge@alpinereit.com |