Exhibit 99.2
| Fourth Quarter 2024 Investor Presentation |
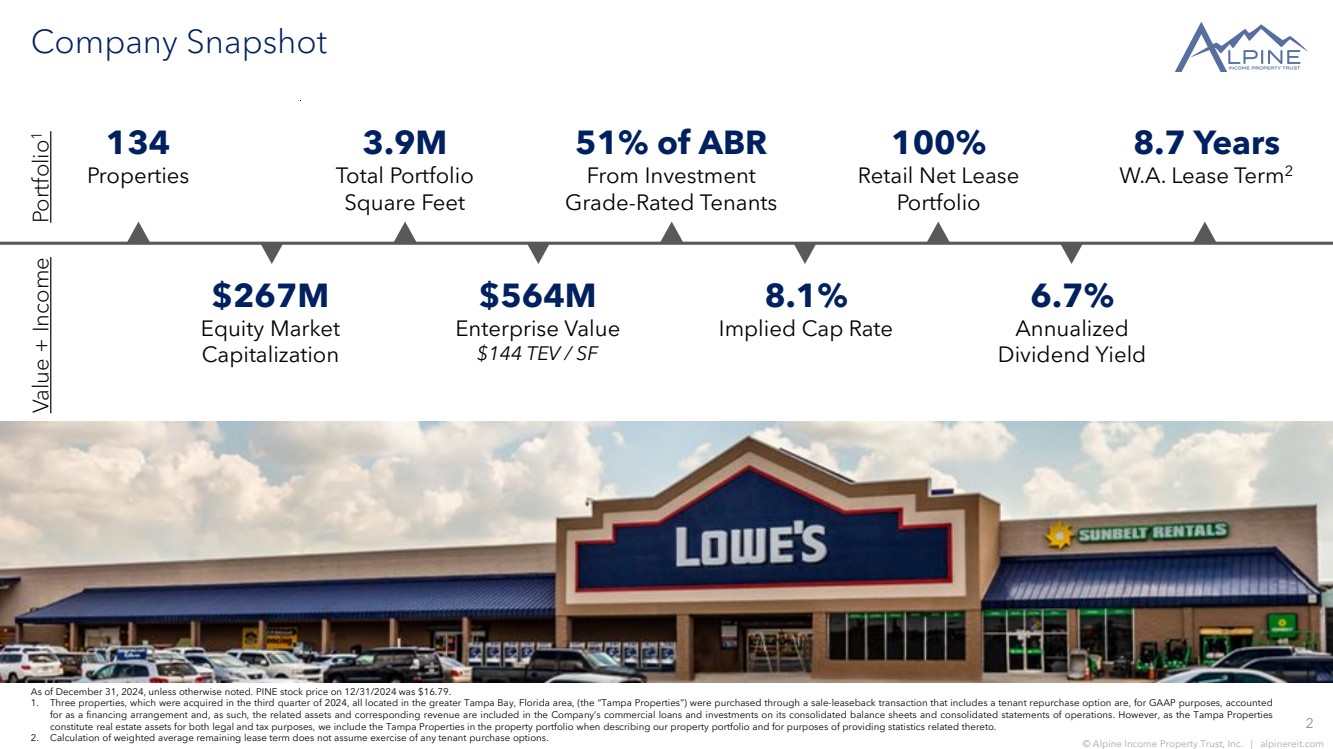
| 2 © Alpine Income Property Trust, Inc. | alpinereit.com Company Snapshot As of December 31, 2024, unless otherwise noted. PINE stock price on 12/31/2024 was $16.79. 1. Three properties, which were acquired in the third quarter of 2024, all located in the greater Tampa Bay, Florida area, (the “Tampa Properties”) were purchased through a sale-leaseback transaction that includes a tenant repurchase option are, for GAAP purposes, accounted for as a financing arrangement and, as such, the related assets and corresponding revenue are included in the Company’s commercial loans and investments on its consolidated balance sheets and consolidated statements of operations. However, as the Tampa Properties constitute real estate assets for both legal and tax purposes, we include the Tampa Properties in the property portfolio when describing our property portfolio and for purposes of providing statistics related thereto. 2. Calculation of weighted average remaining lease term does not assume exercise of any tenant purchase options. 134 Properties $564M Enterprise Value $144 TEV / SF 3.9M Total Portfolio Square Feet 8.1% Implied Cap Rate 100% Retail Net Lease Portfolio 51% of ABR From Investment Grade-Rated Tenants 6.7% Annualized Dividend Yield $267M Equity Market Capitalization Portfolio1 Value + Income 8.7 Years W.A. Lease Term2 |
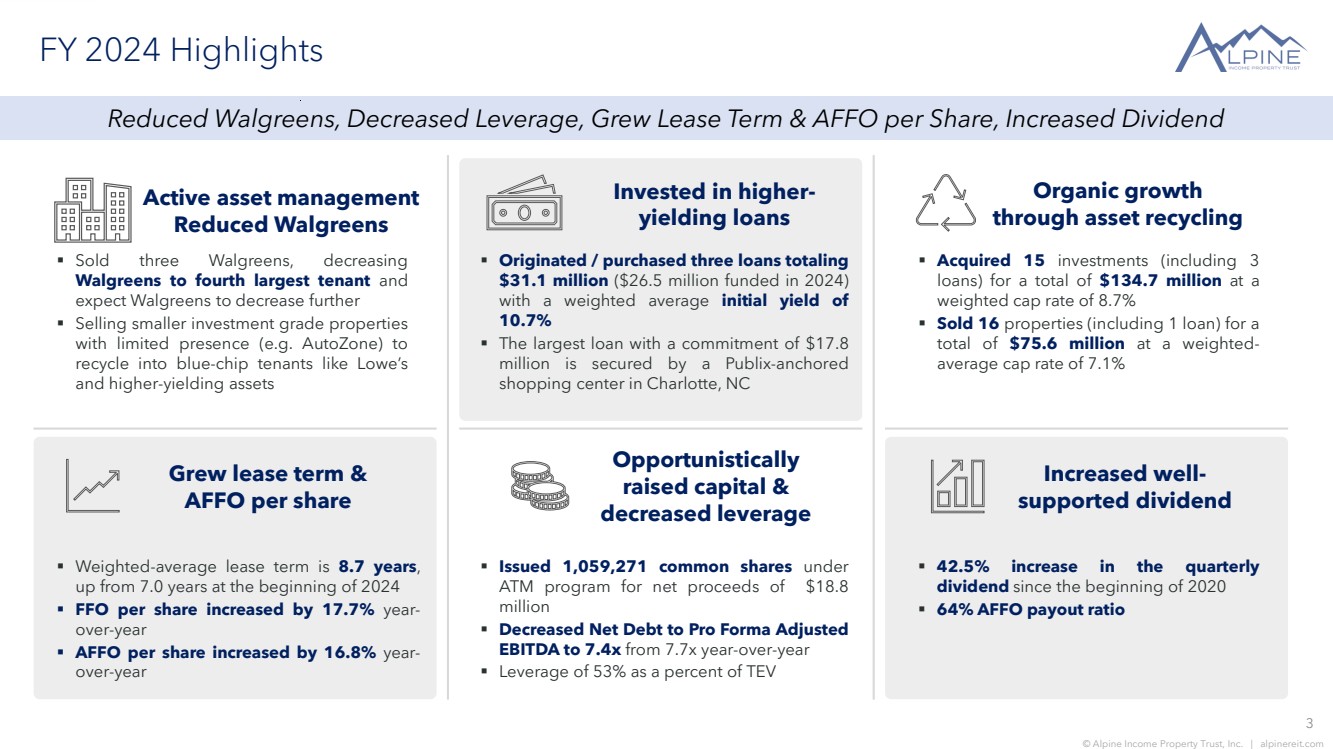
| 3 © Alpine Income Property Trust, Inc. | alpinereit.com FY 2024 Highlights ▪ Acquired 15 investments (including 3 loans) for a total of $134.7 million at a weighted cap rate of 8.7% ▪ Sold 16 properties (including 1 loan) for a total of $75.6 million at a weighted-average cap rate of 7.1% Active asset management Reduced Walgreens ▪ Originated / purchased three loans totaling $31.1 million ($26.5 million funded in 2024) with a weighted average initial yield of 10.7% ▪ The largest loan with a commitment of $17.8 million is secured by a Publix-anchored shopping center in Charlotte, NC Invested in higher-yielding loans ▪ Sold three Walgreens, decreasing Walgreens to fourth largest tenant and expect Walgreens to decrease further ▪ Selling smaller investment grade properties with limited presence (e.g. AutoZone) to recycle into blue-chip tenants like Lowe’s and higher-yielding assets Organic growth through asset recycling ▪ Weighted-average lease term is 8.7 years, up from 7.0 years at the beginning of 2024 ▪ FFO per share increased by 17.7% year-over-year ▪ AFFO per share increased by 16.8% year-over-year Grew lease term & AFFO per share Opportunistically raised capital & decreased leverage ▪ Issued 1,059,271 common shares under ATM program for net proceeds of $18.8 million ▪ Decreased Net Debt to Pro Forma Adjusted EBITDA to 7.4x from 7.7x year-over-year ▪ Leverage of 53% as a percent of TEV ▪ 42.5% increase in the quarterly dividend since the beginning of 2020 ▪ 64% AFFO payout ratio Increased well-supported dividend Reduced Walgreens, Decreased Leverage, Grew Lease Term & AFFO per Share, Increased Dividend |
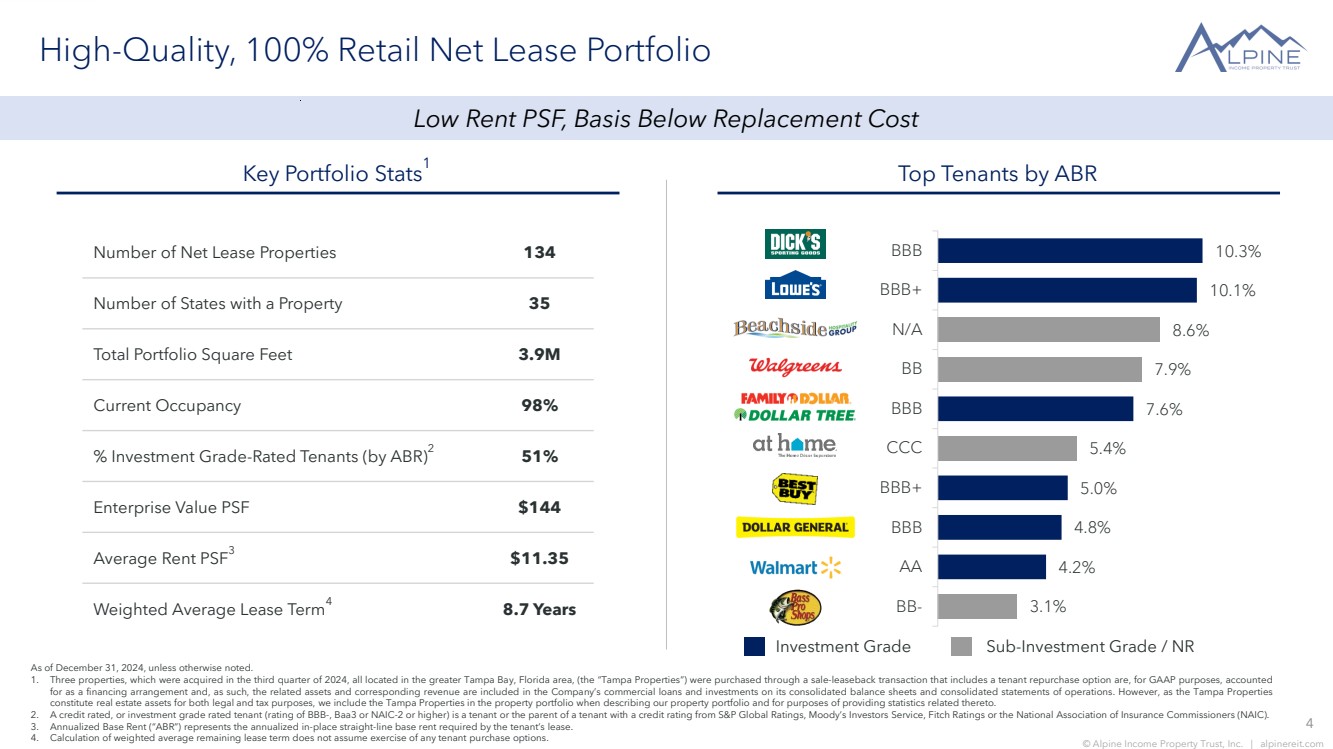
| 4 © Alpine Income Property Trust, Inc. | alpinereit.com 10.3% 10.1% 8.6% 7.9% 7.6% 5.4% 5.0% 4.8% 4.2% 3.1% BBB BBB+ N/A BB BBB CCC BBB+ BBB AA BB-High-Quality, 100% Retail Net Lease Portfolio Number of Net Lease Properties 134 Number of States with a Property 35 Total Portfolio Square Feet 3.9M Current Occupancy 98% % Investment Grade-Rated Tenants (by ABR)2 51% Enterprise Value PSF $144 Average Rent PSF3 $11.35 Weighted Average Lease Term4 8.7 Years Key Portfolio Stats1 Top Tenants by ABR Investment Grade Sub-Investment Grade / NR As of December 31, 2024, unless otherwise noted. 1. Three properties, which were acquired in the third quarter of 2024, all located in the greater Tampa Bay, Florida area, (the “Tampa Properties”) were purchased through a sale-leaseback transaction that includes a tenant repurchase option are, for GAAP purposes, accounted for as a financing arrangement and, as such, the related assets and corresponding revenue are included in the Company’s commercial loans and investments on its consolidated balance sheets and consolidated statements of operations. However, as the Tampa Properties constitute real estate assets for both legal and tax purposes, we include the Tampa Properties in the property portfolio when describing our property portfolio and for purposes of providing statistics related thereto. 2. A credit rated, or investment grade rated tenant (rating of BBB-, Baa3 or NAIC-2 or higher) is a tenant or the parent of a tenant with a credit rating from S&P Global Ratings, Moody’s Investors Service, Fitch Ratings or the National Association of Insurance Commissioners (NAIC). 3. Annualized Base Rent (“ABR”) represents the annualized in-place straight-line base rent required by the tenant’s lease. 4. Calculation of weighted average remaining lease term does not assume exercise of any tenant purchase options. Low Rent PSF, Basis Below Replacement Cost |
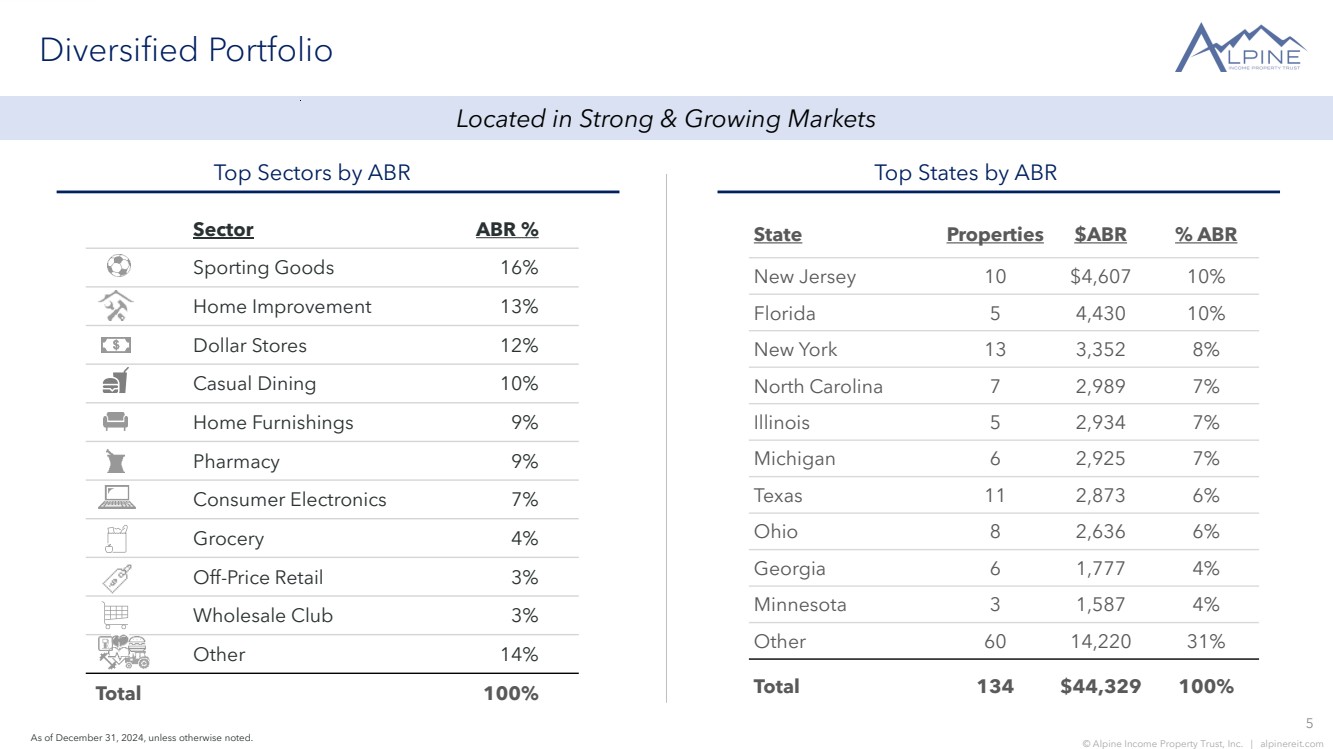
| 5 © Alpine Income Property Trust, Inc. | alpinereit.com Sector ABR % Sporting Goods 16% Home Improvement 13% Dollar Stores 12% Casual Dining 10% Home Furnishings 9% Pharmacy 9% Consumer Electronics 7% Grocery 4% Off-Price Retail 3% Wholesale Club 3% Other 14% Total 100% Diversified Portfolio Top States by ABR As of December 31, 2024, unless otherwise noted. Top Sectors by ABR State Properties $ABR % ABR New Jersey 10 $4,607 10% Florida 5 4,430 10% New York 13 3,352 8% North Carolina 7 2,989 7% Illinois 5 2,934 7% Michigan 6 2,925 7% Texas 11 2,873 6% Ohio 8 2,636 6% Georgia 6 1,777 4% Minnesota 3 1,587 4% Other 60 14,220 31% Total 134 $44,329 100% Located in Strong & Growing Markets |
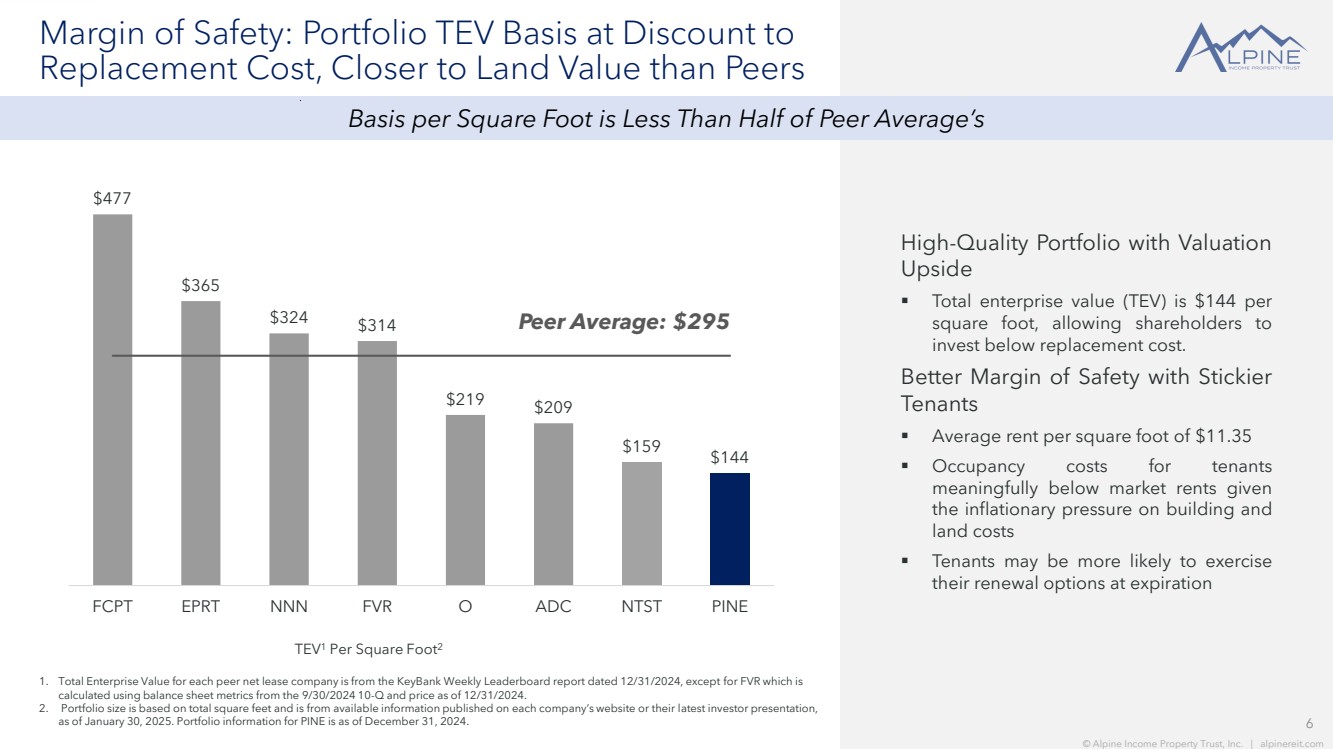
| 6 © Alpine Income Property Trust, Inc. | alpinereit.com $477 $365 $324 $314 $219 $209 $159 $144 Peer Average: $295 FCPT EPRT NNN FVR O ADC NTST PINE Margin of Safety: Portfolio TEV Basis at Discount to Replacement Cost, Closer to Land Value than Peers High-Quality Portfolio with Valuation Upside ▪ Total enterprise value (TEV) is $144 per square foot, allowing shareholders to invest below replacement cost. Better Margin of Safety with Stickier Tenants ▪ Average rent per square foot of $11.35 ▪ Occupancy costs for tenants meaningfully below market rents given the inflationary pressure on building and land costs ▪ Tenants may be more likely to exercise their renewal options at expiration 1. Total Enterprise Value for each peer net lease company is from the KeyBank Weekly Leaderboard report dated 12/31/2024, except for FVR which is calculated using balance sheet metrics from the 9/30/2024 10-Q and price as of 12/31/2024. 2. Portfolio size is based on total square feet and is from available information published on each company’s website or their latest investor presentation, as of January 30, 2025. Portfolio information for PINE is as of December 31, 2024. TEV1 Per Square Foot2 6 © Alpine Income Property Trust, Inc. | alpinereit.com Basis per Square Foot is Less Than Half of Peer Average’s |
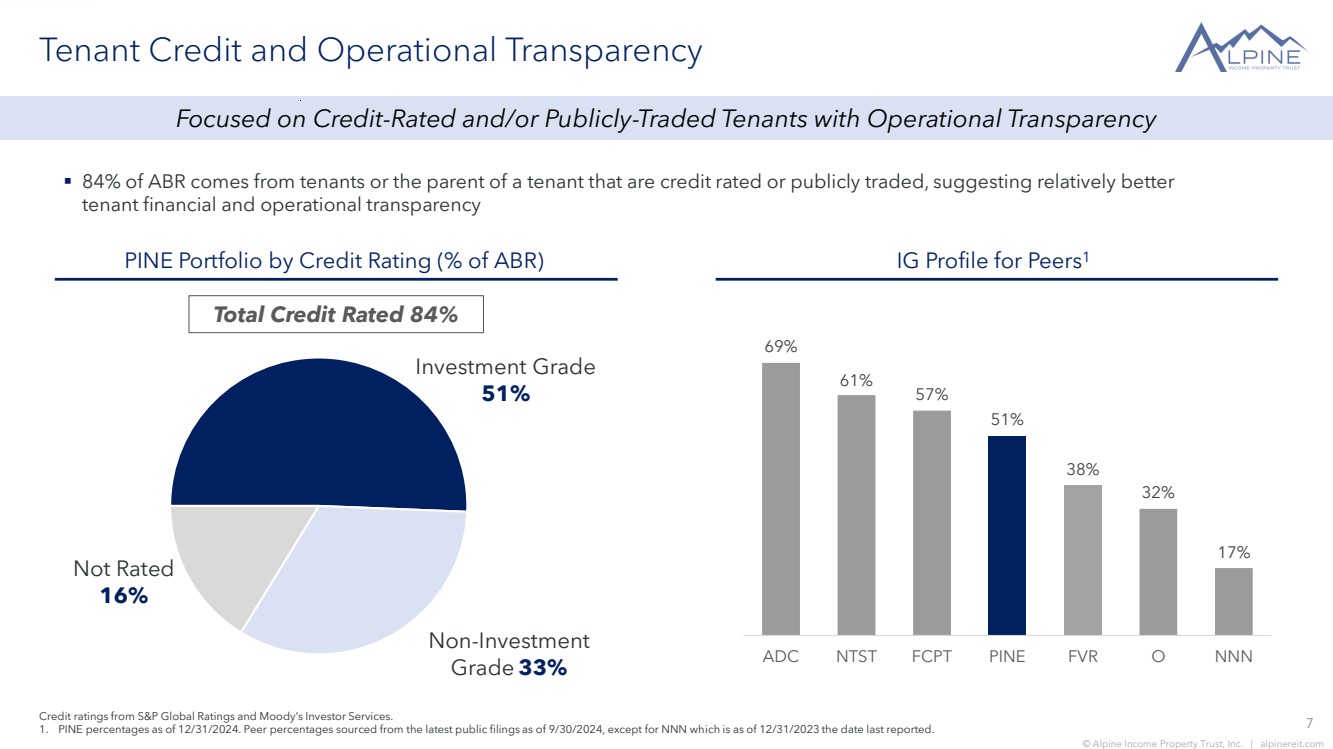
| 7 © Alpine Income Property Trust, Inc. | alpinereit.com Investment Grade 51% Non-Investment Grade 33% Not Rated 16% Tenant Credit and Operational Transparency ▪ 84% of ABR comes from tenants or the parent of a tenant that are credit rated or publicly traded, suggesting relatively better tenant financial and operational transparency Credit ratings from S&P Global Ratings and Moody’s Investor Services. 1. PINE percentages as of 12/31/2024. Peer percentages sourced from the latest public filings as of 9/30/2024, except for NNN which is as of 12/31/2023 the date last reported. IG Profile for Peers1 PINE Portfolio by Credit Rating (% of ABR) Total Credit Rated 84% 17% 32% 38% 51% 57% 61% 69% ADC NTST FCPT PINE FVR O NNN Focused on Credit-Rated and/or Publicly-Traded Tenants with Operational Transparency |
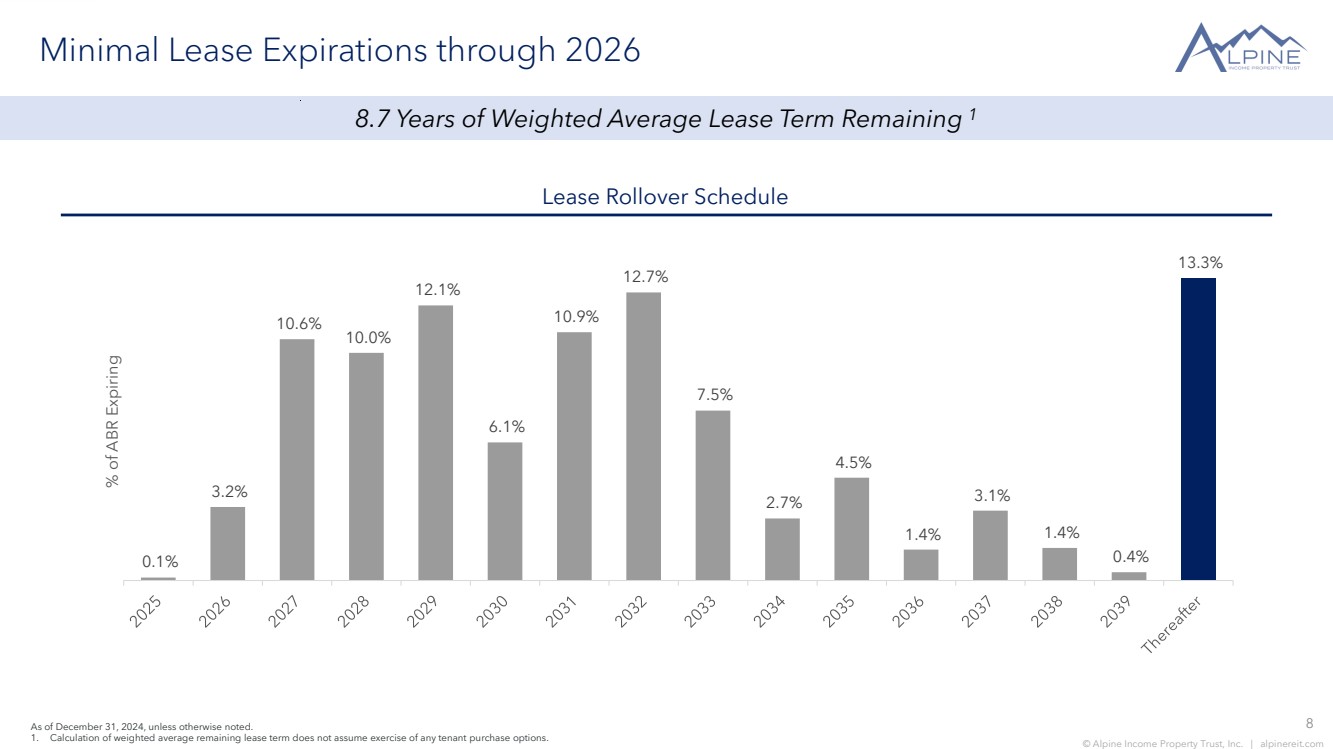
| 8 © Alpine Income Property Trust, Inc. | alpinereit.com Minimal Lease Expirations through 2026 Lease Rollover Schedule As of December 31, 2024, unless otherwise noted. 1. Calculation of weighted average remaining lease term does not assume exercise of any tenant purchase options. 0.1% 3.2% 10.6% 10.0% 12.1% 6.1% 10.9% 12.7% 7.5% 2.7% 4.5% 1.4% 3.1% 1.4% 0.4% 13.3% % of ABR Expiring 8.7 Years of Weighted Average Lease Term Remaining 1 |
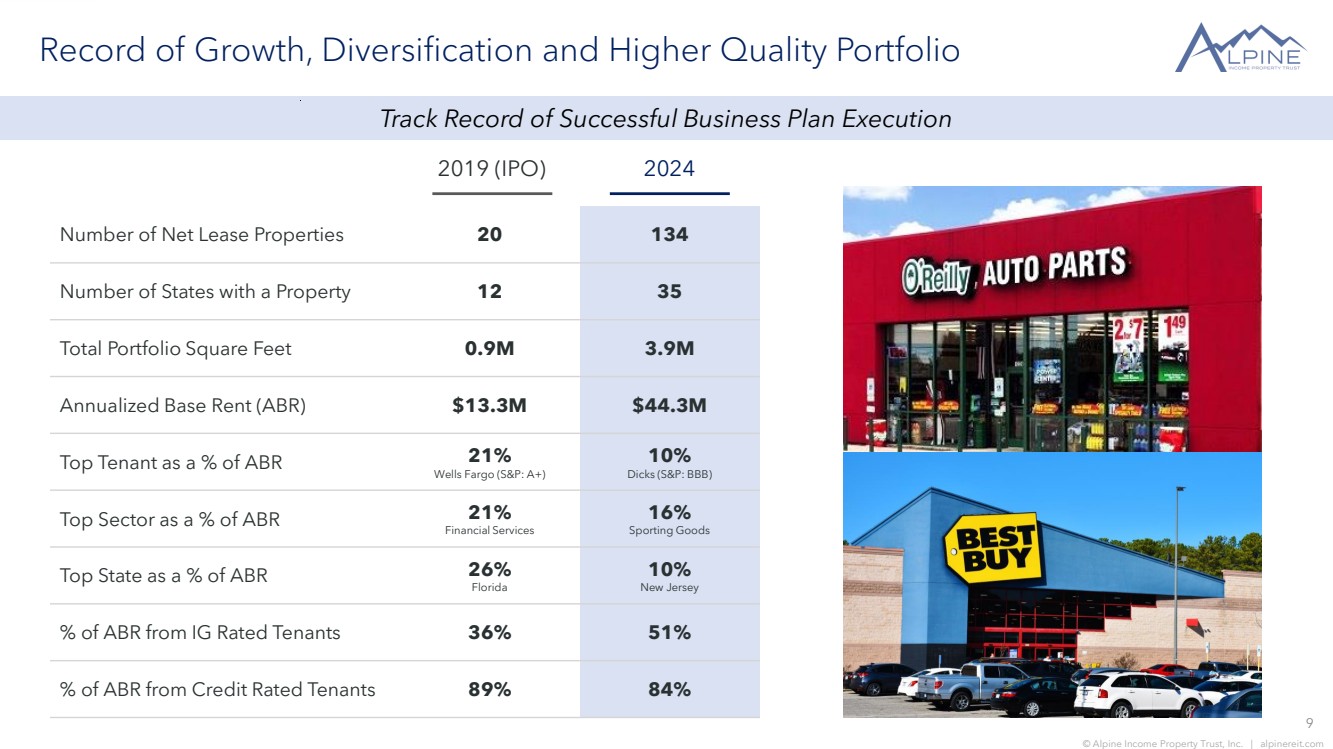
| 9 © Alpine Income Property Trust, Inc. | alpinereit.com Record of Growth, Diversification and Higher Quality Portfolio 2019 (IPO) Number of Net Lease Properties 20 134 Number of States with a Property 12 35 Total Portfolio Square Feet 0.9M 3.9M Annualized Base Rent (ABR) $13.3M $44.3M Top Tenant as a % of ABR 21% Wells Fargo (S&P: A+) 10% Dicks (S&P: BBB) Top Sector as a % of ABR 21% Financial Services 16% Sporting Goods Top State as a % of ABR 26% Florida 10% New Jersey % of ABR from IG Rated Tenants 36% 51% % of ABR from Credit Rated Tenants 89% 84% 2024 Track Record of Successful Business Plan Execution |
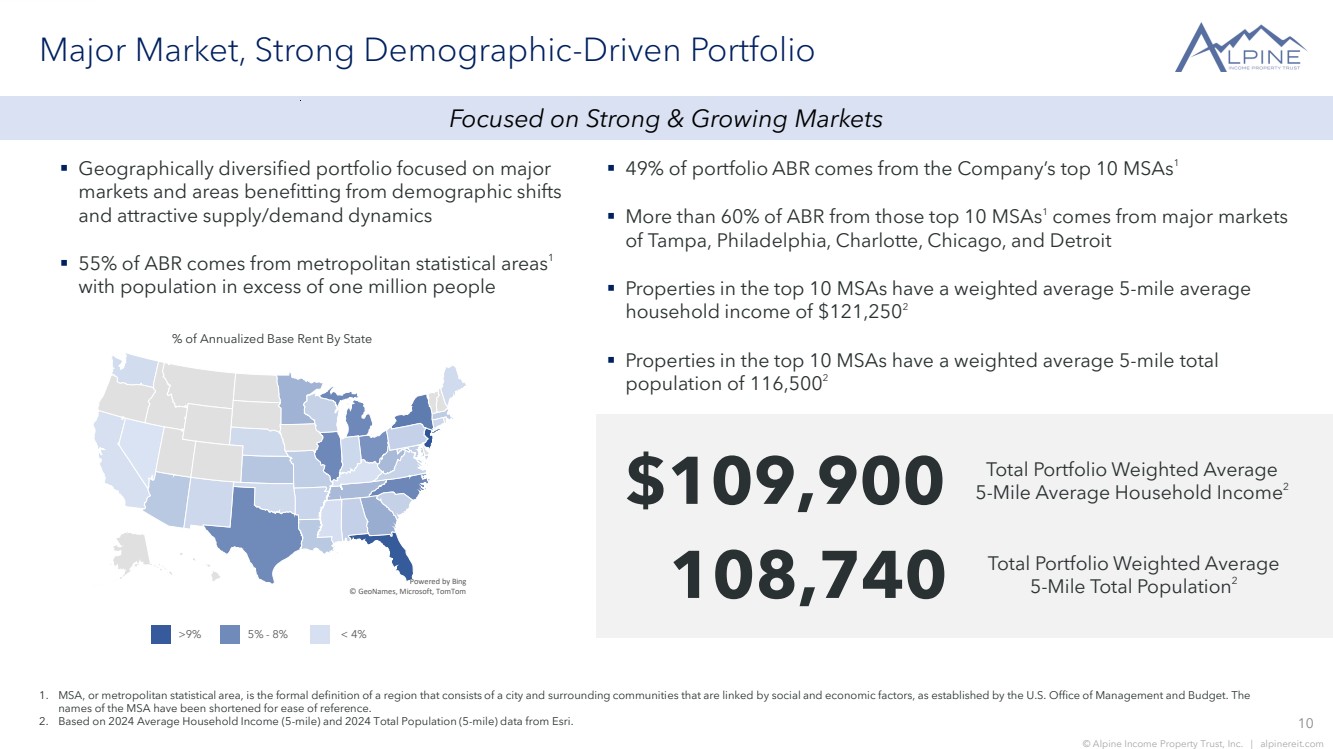
| 10 © Alpine Income Property Trust, Inc. | alpinereit.com © GeoNames, Microsoft, TomTom Powered by Bing Major Market, Strong Demographic-Driven Portfolio ▪ Geographically diversified portfolio focused on major markets and areas benefitting from demographic shifts and attractive supply/demand dynamics ▪ 55% of ABR comes from metropolitan statistical areas1 with population in excess of one million people % of Annualized Base Rent By State 1. MSA, or metropolitan statistical area, is the formal definition of a region that consists of a city and surrounding communities that are linked by social and economic factors, as established by the U.S. Office of Management and Budget. The names of the MSA have been shortened for ease of reference. 2. Based on 2024 Average Household Income (5-mile) and 2024 Total Population (5-mile) data from Esri. Total Portfolio Weighted Average 5-Mile Average Household Income $109,900 2 Total Portfolio Weighted Average 5-Mile Total Population 108,740 2 ▪ 49% of portfolio ABR comes from the Company’s top 10 MSAs1 ▪ More than 60% of ABR from those top 10 MSAs1 comes from major markets of Tampa, Philadelphia, Charlotte, Chicago, and Detroit ▪ Properties in the top 10 MSAs have a weighted average 5-mile average household income of $121,2502 ▪ Properties in the top 10 MSAs have a weighted average 5-mile total population of 116,5002 >9% 5% - 8% < 4% Focused on Strong & Growing Markets |
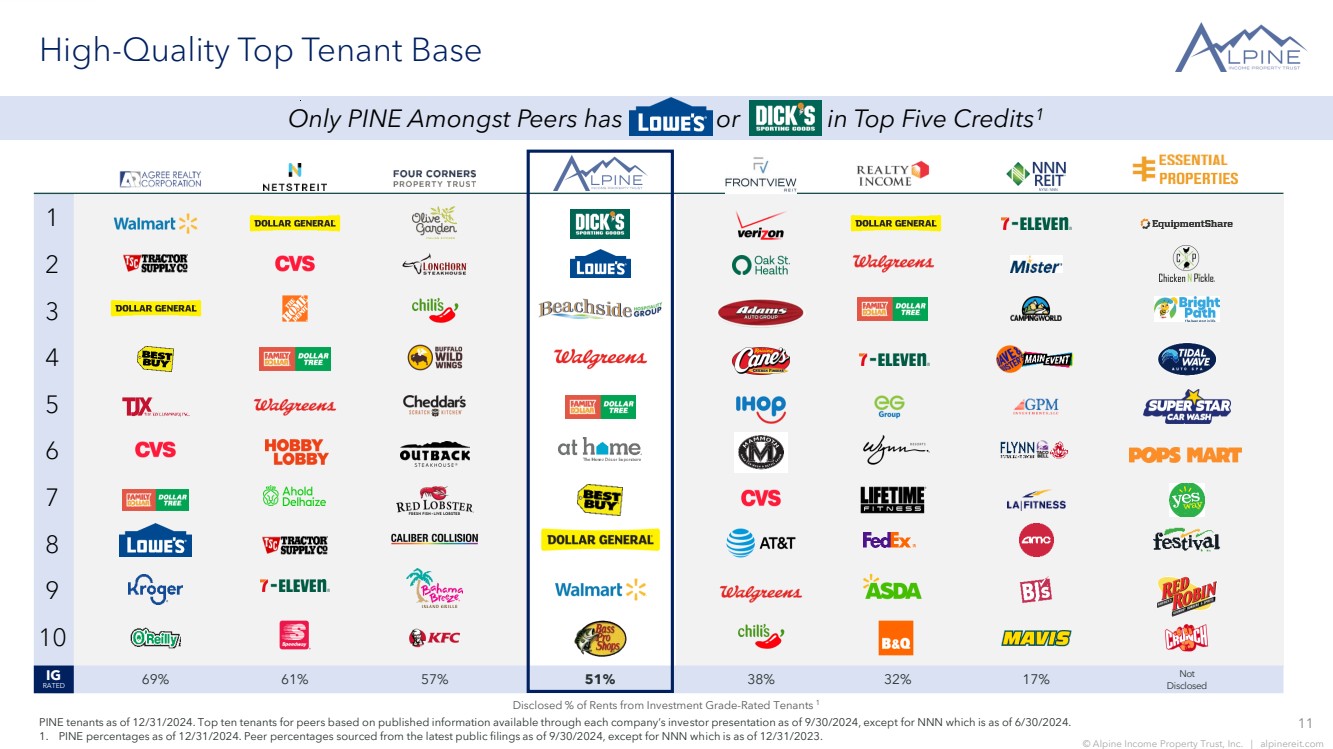
| 11 © Alpine Income Property Trust, Inc. | alpinereit.com 1 2 3 4 5 6 7 8 9 10 High-Quality Top Tenant Base Disclosed % of Rents from Investment Grade-Rated Tenants 1 IG RATED PINE tenants as of 12/31/2024. Top ten tenants for peers based on published information available through each company’s investor presentation as of 9/30/2024, except for NNN which is as of 6/30/2024. 1. PINE percentages as of 12/31/2024. Peer percentages sourced from the latest public filings as of 9/30/2024, except for NNN which is as of 12/31/2023. 69% 51% 17% Not Disclosed 57% 38% 32% Only PINE Amongst Peers has or in Top Five Credits1 61% |
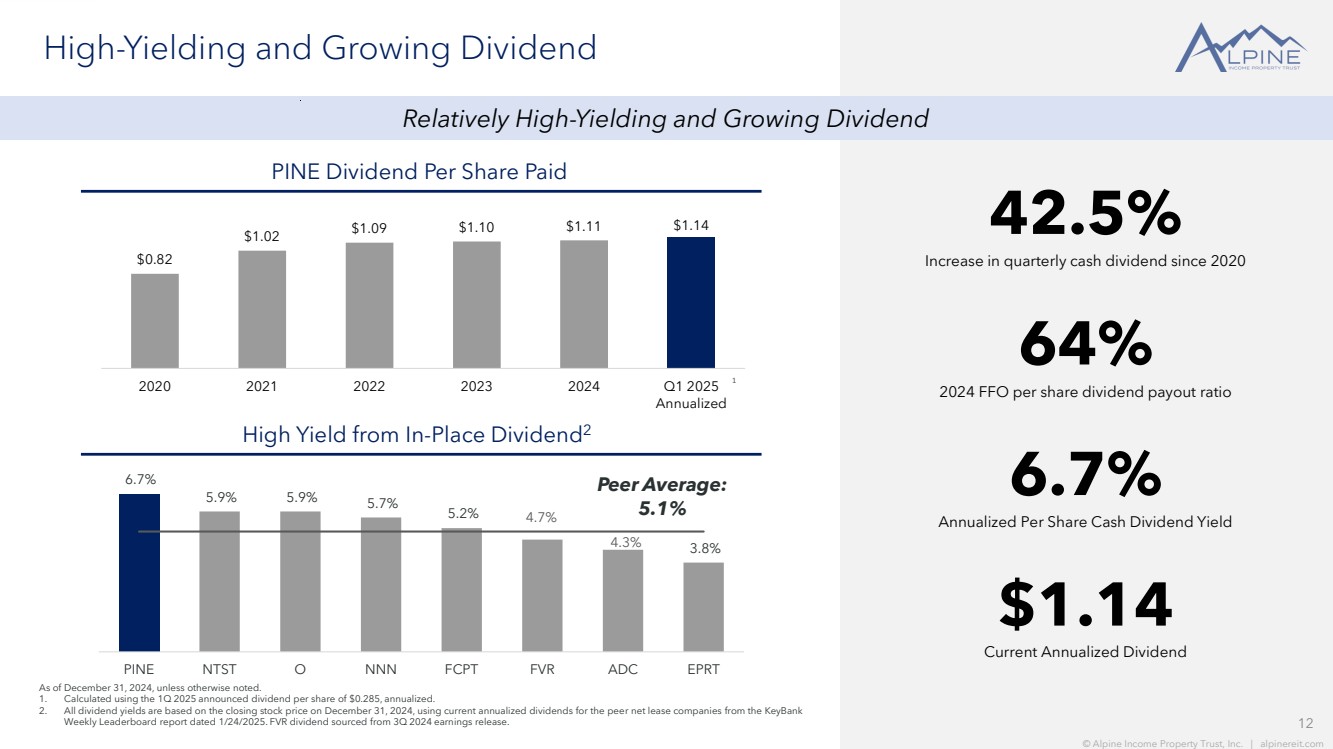
| 12 © Alpine Income Property Trust, Inc. | alpinereit.com 6.7% 5.9% 5.9% 5.7% 5.2% 4.7% 4.3% 3.8% Peer Average: 5.1% PINE NTST O NNN FCPT FVR ADC EPRT $0.82 $1.02 $1.09 $1.10 $1.11 $1.14 2020 2021 2022 2023 2024 Q1 2025 Annualized High-Yielding and Growing Dividend Annualized Per Share Cash Dividend Yield 6.7% As of December 31, 2024, unless otherwise noted. 1. Calculated using the 1Q 2025 announced dividend per share of $0.285, annualized. 2. All dividend yields are based on the closing stock price on December 31, 2024, using current annualized dividends for the peer net lease companies from the KeyBank Weekly Leaderboard report dated 1/24/2025. FVR dividend sourced from 3Q 2024 earnings release. Current Annualized Dividend $1.14 1 High Yield from In-Place Dividend2 12 © Alpine Income Property Trust, Inc. | alpinereit.com 2024 FFO per share dividend payout ratio 64% Increase in quarterly cash dividend since 2020 42.5% PINE Dividend Per Share Paid Relatively High-Yielding and Growing Dividend |
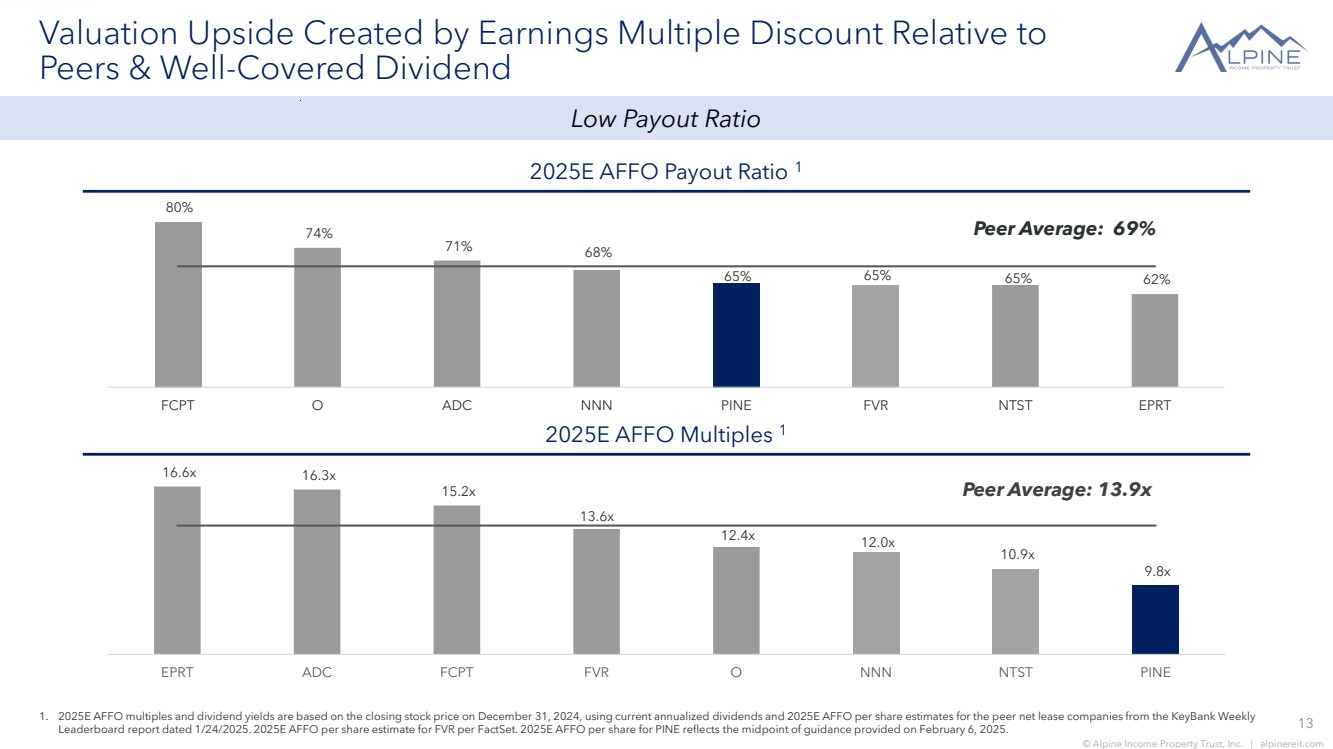
| 13 © Alpine Income Property Trust, Inc. | alpinereit.com 80% 74% 71% 68% 65% 65% 65% 62% Peer Average: 69% FCPT O ADC NNN PINE FVR NTST EPRT 16.6x 16.3x 15.2x 13.6x 12.4x 12.0x 10.9x 9.8x Peer Average: 13.9x EPRT ADC FCPT FVR O NNN NTST PINE Low Payout Ratio Valuation Upside Created by Earnings Multiple Discount Relative to Peers & Well-Covered Dividend 2025E AFFO Multiples 1 1. 2025E AFFO multiples and dividend yields are based on the closing stock price on December 31, 2024, using current annualized dividends and 2025E AFFO per share estimates for the peer net lease companies from the KeyBank Weekly Leaderboard report dated 1/24/2025. 2025E AFFO per share estimate for FVR per FactSet. 2025E AFFO per share for PINE reflects the midpoint of guidance provided on February 6, 2025. 2025E AFFO Payout Ratio 1 |
| 14 © Alpine Income Property Trust, Inc. | alpinereit.com Decreased Leverage & Grew Equity in 2024, No Near-Term Maturities, $95M of Liquidity $100 $100 $102 2024 2025 2026 2027 2028 2029 2030 Revolving Credit Facility Unsecured Term Loans Financial Strength Provides Solid Platform for Growth Staggered Debt Maturity Schedule 6 As of December 31, 2024. $ in millions; any differences a result of rounding. 1. As of December 31, 2024, the Company has utilized interest rate swaps to fix SOFR and achieve a weighted average fixed interest rate of 3.21% plus the SOFR adjustment of 0.10% and the applicable spread on $50 million of the outstanding balance on the Company’s Revolving Credit Facility. 2. As of December 31, 2024, the Company has utilized interest rate swaps to fix SOFR and achieve a weighted average fixed interest rate of 2.05% plus the SOFR adjustment of 0.10% and the applicable spread for the $100 million 2026 Term Loan balance. 3. As of December 31, 2024, the Company has utilized interest rate swaps to fix SOFR and achieve a weighted average fixed interest rate of 2.05% plus the SOFR adjustment of 0.10% and the applicable spread for the $100 million 2027 Term Loan balance. 4. See the “Non-GAAP Financial Information” section and tables at the end of this presentation for a discussion and reconciliation of Net Income to non-GAAP financial measures. 5. Net Debt to TEV (Total Enterprise Value) is the Company’s outstanding debt, minus the Company’s cash and cash equivalents, as a percentage of the Company’s enterprise value. 6. The Company’s senior unsecured revolving credit facility matures in January 2027 and includes a one-year extension option, subject to satisfaction of certain conditions; the maturity date reflected assumes the Company exercises the one-year extension option. Well-Capitalized Balance Sheet as of 12/31/2024 Debt Face Value Debt Stated Interest Rate Wtd. Avg. Rate as of December 31, 2024 Maturity Date Revolving Credit Facility 1 $102,000 SOFR + 0.10% + [1.25% - 2.20%] 5.31% January 2027 2026 Term Loan 2 $100,000 SOFR + 0.10% + [1.35% - 1.95%] 3.50% May 2026 2027 Term Loan 3 $100,000 SOFR + 0.10% + [1.25% - 1.90%] 3.45% January 2027 Total Debt/Weighted-Average Rate $302,000 4.10% Shares & Units Outstanding 15,916 Equity Market Capitalization $267 Net Debt Outstanding $297 Total Enterprise Value $564 Net Debt to TEV 4 52.6% Net Debt to Pro Forma Adjusted EBITDA 5 7.4x |

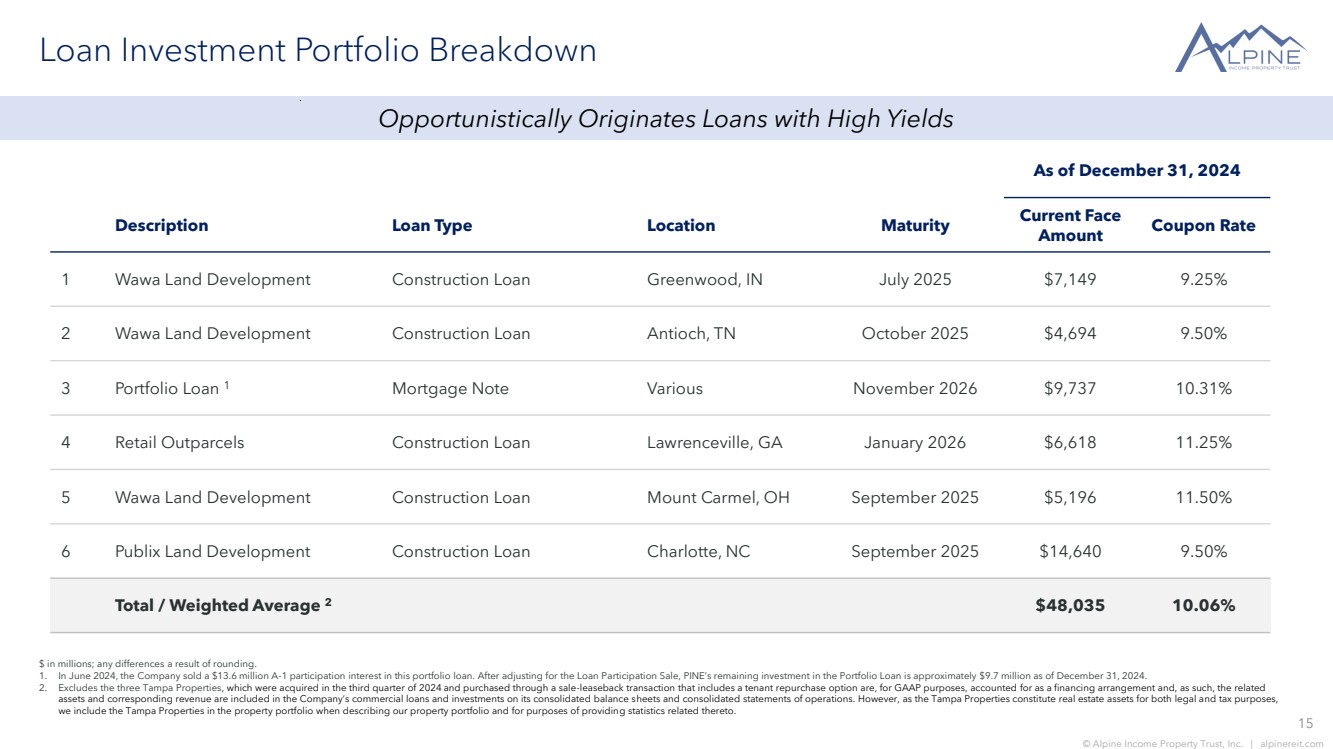
| 15 © Alpine Income Property Trust, Inc. | alpinereit.com Loan Investment Portfolio Breakdown $ in millions; any differences a result of rounding. 1. In June 2024, the Company sold a $13.6 million A-1 participation interest in this portfolio loan. After adjusting for the Loan Participation Sale, PINE’s remaining investment in the Portfolio Loan is approximately $9.7 million as of December 31, 2024. 2. Excludes the three Tampa Properties, which were acquired in the third quarter of 2024 and purchased through a sale-leaseback transaction that includes a tenant repurchase option are, for GAAP purposes, accounted for as a financing arrangement and, as such, the related assets and corresponding revenue are included in the Company’s commercial loans and investments on its consolidated balance sheets and consolidated statements of operations. However, as the Tampa Properties constitute real estate assets for both legal and tax purposes, we include the Tampa Properties in the property portfolio when describing our property portfolio and for purposes of providing statistics related thereto. As of December 31, 2024 Description Loan Type Location Maturity Current Face Amount Coupon Rate 1 Wawa Land Development Construction Loan Greenwood, IN July 2025 $7,149 9.25% 2 Wawa Land Development Construction Loan Antioch, TN October 2025 $4,694 9.50% 3 Portfolio Loan 1 Mortgage Note Various November 2026 $9,737 10.31% 4 Retail Outparcels Construction Loan Lawrenceville, GA January 2026 $6,618 11.25% 5 Wawa Land Development Construction Loan Mount Carmel, OH September 2025 $5,196 11.50% 6 Publix Land Development Construction Loan Charlotte, NC September 2025 $14,640 9.50% Total / Weighted Average 2 $48,035 10.06% Opportunistically Originates Loans with High Yields |
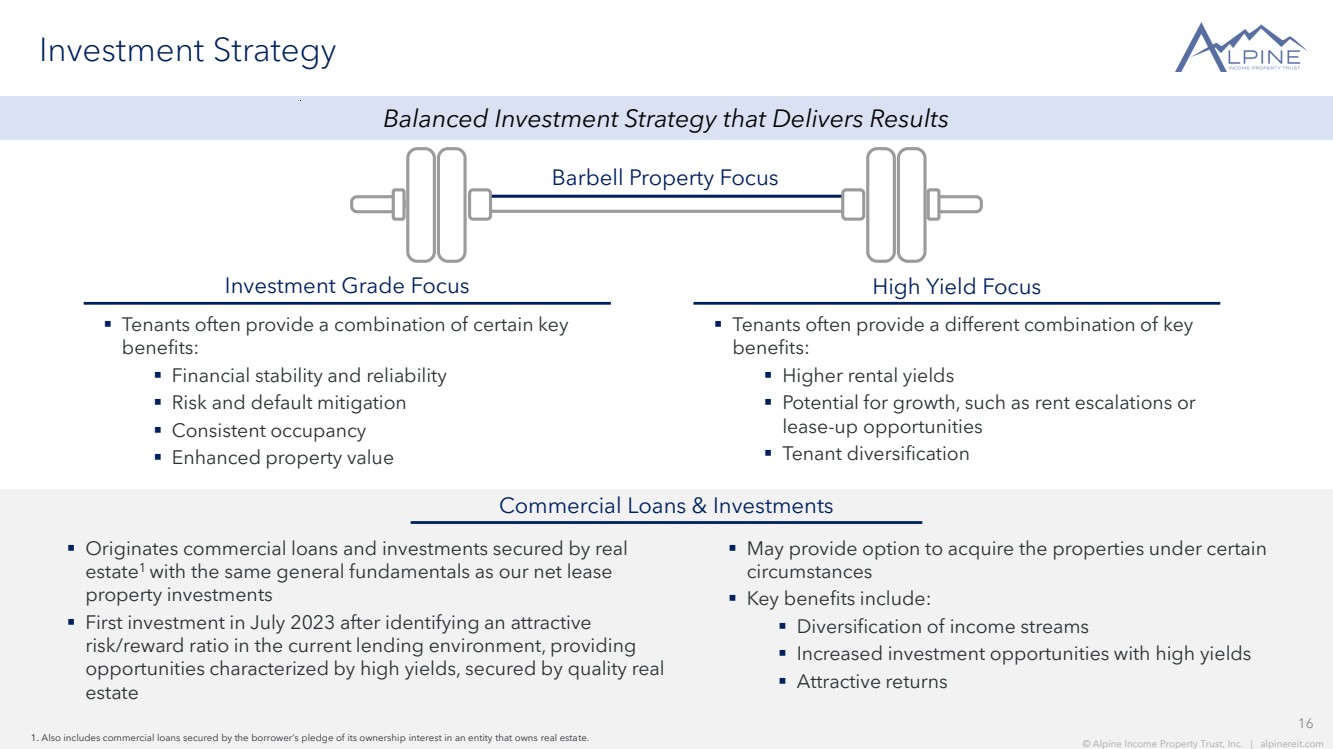
| 16 © Alpine Income Property Trust, Inc. | alpinereit.com Investment Grade Focus High Yield Focus Investment Strategy ▪ Tenants often provide a combination of certain key benefits: ▪ Financial stability and reliability ▪ Risk and default mitigation ▪ Consistent occupancy ▪ Enhanced property value ▪ Tenants often provide a different combination of key benefits: ▪ Higher rental yields ▪ Potential for growth, such as rent escalations or lease-up opportunities ▪ Tenant diversification ▪ Originates commercial loans and investments secured by real estate1 with the same general fundamentals as our net lease property investments ▪ First investment in July 2023 after identifying an attractive risk/reward ratio in the current lending environment, providing opportunities characterized by high yields, secured by quality real estate ▪ May provide option to acquire the properties under certain circumstances ▪ Key benefits include: ▪ Diversification of income streams ▪ Increased investment opportunities with high yields ▪ Attractive returns 1. Also includes commercial loans secured by the borrower’s pledge of its ownership interest in an entity that owns real estate. Commercial Loans & Investments Barbell Property Focus 16 © Alpine Income Property Trust, Inc. | alpinereit.com Balanced Investment Strategy that Delivers Results |
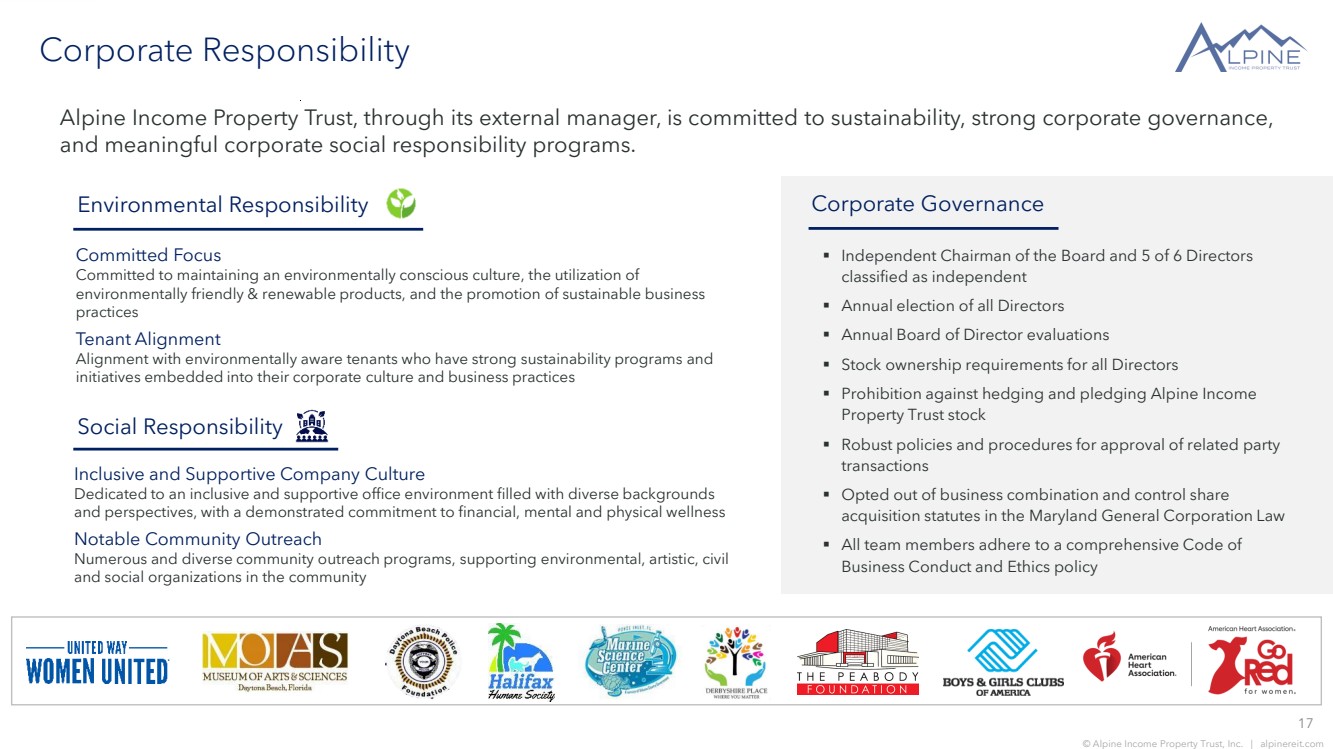
| 17 © Alpine Income Property Trust, Inc. | alpinereit.com Corporate Responsibility Alpine Income Property Trust, through its external manager, is committed to sustainability, strong corporate governance, and meaningful corporate social responsibility programs. Committed Focus Committed to maintaining an environmentally conscious culture, the utilization of environmentally friendly & renewable products, and the promotion of sustainable business practices Tenant Alignment Alignment with environmentally aware tenants who have strong sustainability programs and initiatives embedded into their corporate culture and business practices Social Responsibility Environmental Responsibility Corporate Governance ▪ Independent Chairman of the Board and 5 of 6 Directors classified as independent ▪ Annual election of all Directors ▪ Annual Board of Director evaluations ▪ Stock ownership requirements for all Directors ▪ Prohibition against hedging and pledging Alpine Income Property Trust stock ▪ Robust policies and procedures for approval of related party transactions ▪ Opted out of business combination and control share acquisition statutes in the Maryland General Corporation Law ▪ All team members adhere to a comprehensive Code of Business Conduct and Ethics policy Inclusive and Supportive Company Culture Dedicated to an inclusive and supportive office environment filled with diverse backgrounds and perspectives, with a demonstrated commitment to financial, mental and physical wellness Notable Community Outreach Numerous and diverse community outreach programs, supporting environmental, artistic, civil and social organizations in the community |
| 18 © Alpine Income Property Trust, Inc. | alpinereit.com External Management Alignment As of December 31, 2024. Aligned Ownership CTO currently owns an approximate 15% interest in PINE, meaningfully aligning its interests with PINE shareholders Independent Board of Directors PINE has its own independent Board of Directors and realizes economies of scale from the 37-member CTO team without the corresponding G&A expense Internalization Anticipated in the Future Internalization of management for PINE is anticipated in the future when the Company approaches or exceeds critical mass Opportunities for Collaboration PINE reviews transaction opportunities resulting from CTO’s acquisition efforts that it otherwise would not see in the market through normal single tenant acquisition efforts and relationships Benefits and Alignment of External Management Notable Management Agreement Terms ▪ Expires January 2026, with one-year extension options thereafter ▪ Quarterly management fee of 0.375%, calculated on equity, net of share buybacks and issuance costs ▪ Terminable with payment of a one-time fee of 3x the annualized average management fee for the preceding 24-months Alpine Income Property Trust is externally managed by CTO Realty Growth (NYSE: CTO) under an agreement that, combined with CTO’s ownership in PINE, provides economies of scale, significant shareholder alignment and a flexible/collapsible structure. |
| 19 © Alpine Income Property Trust, Inc. | alpinereit.com Disclaimer This press presentation may contain “forward-looking statements.” Forward-looking statements include statements that may be identified by words such as “could,” “may,” “might,” “will,” “likely,” “anticipates,” “intends,” “plans,” “seeks,” “believes,” “estimates,” “expects,” “continues,” “projects” and similar references to future periods, or by the inclusion of forecasts or projections. Forward-looking statements are based on the Company’s current expectations and assumptions regarding capital market conditions, the Company’s business, the economy and other future conditions. Because forward-looking statements relate to the future, by their nature, they are subject to inherent uncertainties, risks and changes in circumstances that are difficult to predict. As a result, the Company’s actual results may differ materially from those contemplated by the forward-looking statements. Important factors that could cause actual results to differ materially from those in the forward-looking statements include general business and economic conditions, continued volatility and uncertainty in the credit markets and broader financial markets, risks inherent in the real estate business, including tenant defaults, potential liability relating to environmental matters, credit risk associated with the Company investing in first mortgage investments, illiquidity of real estate investments and potential damages from natural disasters, the impact of epidemics or pandemics (such as the COVID-19 Pandemic and its variants) on the Company’s business and the business of its tenants and the impact of such epidemics or pandemics on the U.S. economy and market conditions generally, other factors affecting the Company’s business or the business of its tenants that are beyond the control of the Company or its tenants, and the factors set forth under “Risk Factors” in the Company’s Annual Report on Form 10-K for the year ended December 31, 2024 and other risks and uncertainties discussed from time to time in the Company’s filings with the U.S. Securities and Exchange Commission. Any forward-looking statement made in this presentation speaks only as of the date on which it is made. The Company undertakes no obligation to publicly update or revise any forward-looking statement, whether as a result of new information, future developments or otherwise. References in this presentation: 1. All information is as of December 31, 2024, unless otherwise noted and any differences in calculations are assumed to be a function of rounding. 2. Annualized straight-line Base Rent (“ABR” or “Rent”) and the statistics based on ABR are calculated based on our current portfolio as of December 31, 2024. 3. Dividends are set by the Board of Directors and declared on a quarterly basis and there can be no assurances as to the likelihood or amount of dividends in the future. 4. The Company defines an Investment Grade (“IG”) Rated Tenant as a tenant or the parent of a tenant with a credit rating from S&P Global Ratings, Moody’s Investors Service, Fitch Ratings or the National Association of Insurance Commissioners of Baa3, BBB-, or NAIC-2 or higher. If applicable, in the event of a split rating between S&P Global Ratings and Moody’s Investors Services, the Company utilizes the higher of the two ratings as its reference point as to whether a tenant is defined as an Investment Grade Rated Tenant. 5. The Company defines a Credit Rated Tenant as a tenant or the parent of a tenant with a credit rating from S&P Global Ratings, Moody’s Investors Service, Fitch Ratings or the National Association of Insurance Commissioners. |
| 20 © Alpine Income Property Trust, Inc. | alpinereit.com Non-GAAP Financial Information Our reported results are presented in accordance with accounting principles generally accepted in the United States of America (“GAAP”). We also disclose Funds From Operations (“FFO”) Adjusted Funds From Operations (“AFFO”), and Pro Forma Earnings Before Interest, Taxes, Depreciation and Amortization (“Pro Forma Adjusted EBITDA”), all of which are non-GAAP financial measures. We believe these non-GAAP financial measures are useful to investors because they are widely accepted industry measures used by analysts and investors to compare the operating performance of REITs. FFO, AFFO, and Pro Forma Adjusted EBITDA do not represent cash generated from operating activities and are not necessarily indicative of cash available to fund cash requirements; accordingly, they should not be considered alternatives to net income as a performance measure or cash flows from operations as reported on our statement of cash flows as a liquidity measure and should be considered in addition to, and not in lieu of, GAAP financial measures. We compute FFO in accordance with the definition adopted by the Board of Governors of the National Association of Real Estate Investment Trusts, or NAREIT. NAREIT defines FFO as GAAP net income or loss adjusted to exclude real estate related depreciation and amortization, as well as extraordinary items (as defined by GAAP) such as net gain or loss from sales of depreciable real estate assets, impairment write-downs associated with depreciable real estate assets and impairments associated with the implementation of current expected credit losses on commercial loans and investments at the time of origination, including the pro rata share of such adjustments of unconsolidated subsidiaries. To derive AFFO, we further modify the NAREIT computation of FFO to include other adjustments to GAAP net income related to non-cash revenues and expenses such as loss on extinguishment of debt, amortization of above- and below-market lease related intangibles, straight-line rental revenue, amortization of deferred financing costs, non-cash compensation, and other non-cash income or expense. Such items may cause short-term fluctuations in net income but have no impact on operating cash flows or long-term operating performance. We use AFFO as one measure of our performance when we formulate corporate goals. To derive Pro Forma Adjusted EBITDA, GAAP net income or loss is adjusted to exclude extraordinary items (as defined by GAAP), net gain or loss from sales of depreciable real estate assets, impairment write-downs associated with depreciable real estate assets and impairments associated with the implementation of current expected credit losses on commercial loans and investments at the time of origination and/or payoff, and real estate related depreciation and amortization including the pro rata share of such adjustments of unconsolidated subsidiaries, non-cash revenues and expenses such as straight-line rental revenue, amortization of deferred financing costs, loss on extinguishment of debt, above- and below-market lease related intangibles, non-cash compensation, other non-cash income or expense, and other non-recurring items such as disposition management fees and commission fees. Cash interest expense is also excluded from Pro Forma Adjusted EBITDA, and GAAP net income or loss is adjusted for the annualized impact of acquisitions, dispositions and other similar activities. FFO is used by management, investors and analysts to facilitate meaningful comparisons of operating performance between periods and among our peers primarily because it excludes the effect of real estate depreciation and amortization and net gains or losses on sales, which are based on historical costs and implicitly assume that the value of real estate diminishes predictably over time, rather than fluctuating based on existing market conditions. We believe that AFFO is an additional useful supplemental measure for investors to consider because it will help them to better assess our operating performance without the distortions created by other non-cash revenues or expenses. We also believe that Pro Forma Adjusted EBITDA is an additional useful supplemental measure for investors to consider as it allows for a better assessment of our operating performance without the distortions created by other non-cash revenues, expenses or certain effects of the Company’s capital structure on our operating performance. FFO, AFFO, and Pro Forma Adjusted EBITDA may not be comparable to similarly titled measures employed by other companies. |
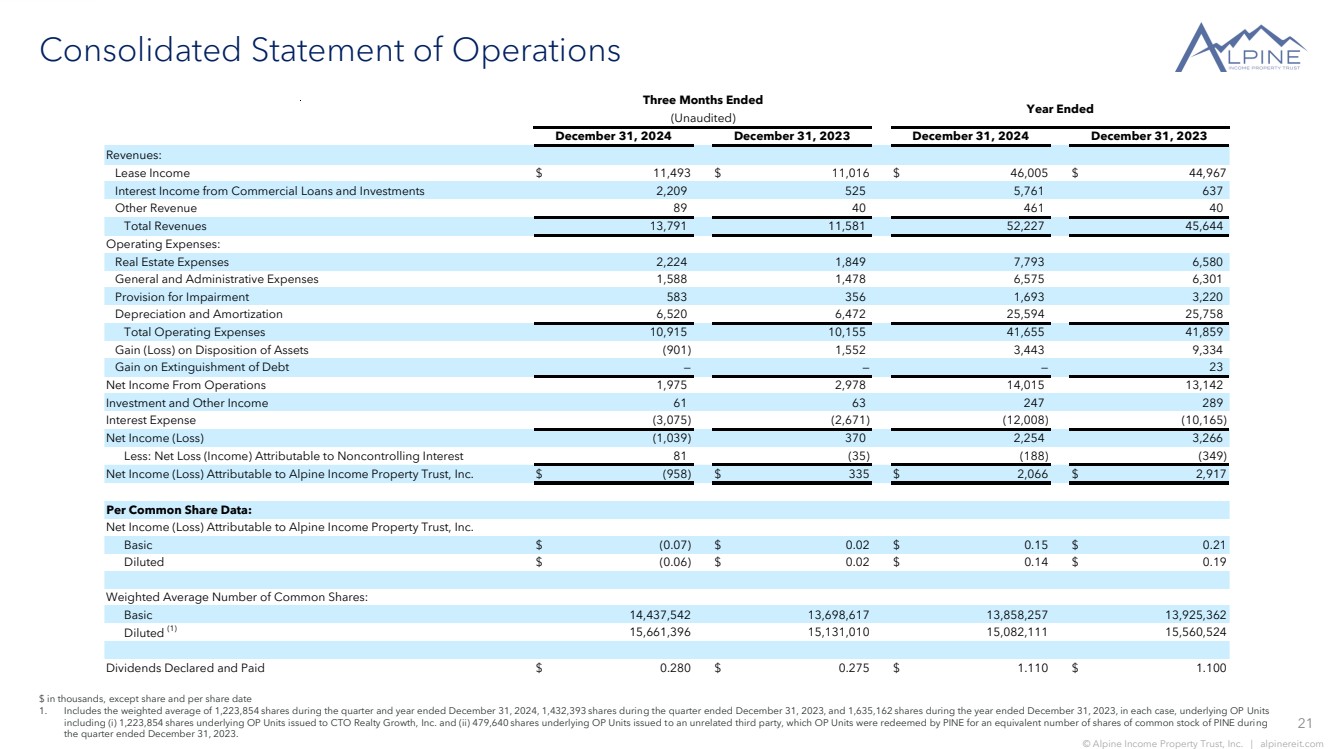
| 21 © Alpine Income Property Trust, Inc. | alpinereit.com Consolidated Statement of Operations $ in thousands, except share and per share date 1. Includes the weighted average of 1,223,854 shares during the quarter and year ended December 31, 2024, 1,432,393 shares during the quarter ended December 31, 2023, and 1,635,162 shares during the year ended December 31, 2023, in each case, underlying OP Units including (i) 1,223,854 shares underlying OP Units issued to CTO Realty Growth, Inc. and (ii) 479,640 shares underlying OP Units issued to an unrelated third party, which OP Units were redeemed by PINE for an equivalent number of shares of common stock of PINE during the quarter ended December 31, 2023. Revenues: Lease Income $ 11,493 $ 11,016 $ 46,005 $ 44,967 Interest Income from Commercial Loans and Investments 2,209 525 5,761 637 Other Revenue 89 40 461 40 Total Revenues 13,791 11,581 52,227 45,644 Operating Expenses: Real Estate Expenses 2,224 1,849 7,793 6,580 General and Administrative Expenses 1,588 1,478 6,575 6,301 Provision for Impairment 583 356 1,693 3,220 Depreciation and Amortization 6,520 6,472 25,594 25,758 Total Operating Expenses 10,915 10,155 41,655 41,859 Gain (Loss) on Disposition of Assets (901) 1,552 3,443 9,334 Gain on Extinguishment of Debt — — — 23 Net Income From Operations 1,975 2,978 14,015 13,142 Investment and Other Income 61 63 247 289 Interest Expense (3,075) (2,671) (12,008) (10,165) Net Income (Loss) (1,039) 370 2,254 3,266 Less: Net Loss (Income) Attributable to Noncontrolling Interest 81 (35) (188) (349) Net Income (Loss) Attributable to Alpine Income Property Trust, Inc. $ (958) $ 335 $ 2,066 $ 2,917 Per Common Share Data: Net Income (Loss) Attributable to Alpine Income Property Trust, Inc. Basic $ (0.07) $ 0.02 $ 0.15 $ 0.21 Diluted $ (0.06) $ 0.02 $ 0.14 $ 0.19 Weighted Average Number of Common Shares: Basic 14,437,542 13,698,617 13,858,257 13,925,362 Diluted (1) 15,661,396 15,131,010 15,082,111 15,560,524 Dividends Declared and Paid $ 0.280 $ 0.275 $ 1.110 $ 1.100 Year Ended December 31, 2024 December 31, 2023 December 31, 2024 December 31, 2023 (Unaudited) Three Months Ended |
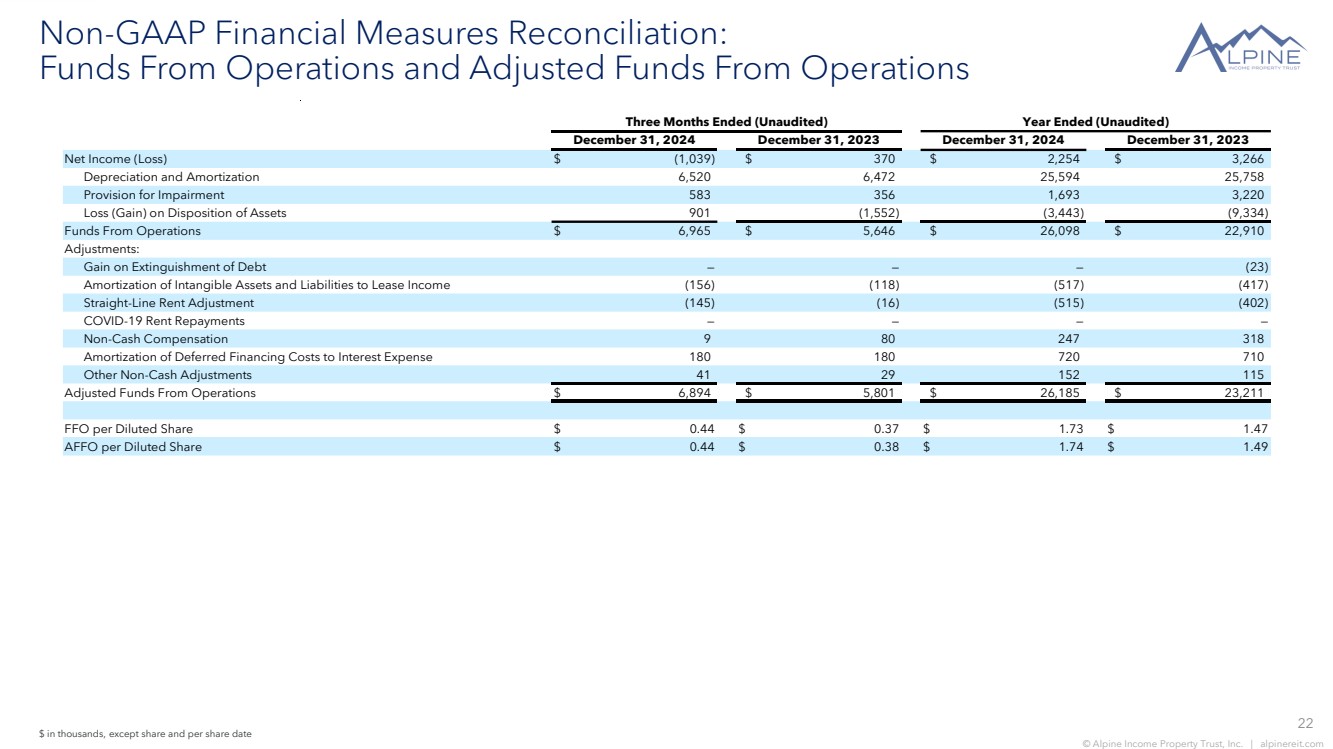
| 22 © Alpine Income Property Trust, Inc. | alpinereit.com Non-GAAP Financial Measures Reconciliation: Funds From Operations and Adjusted Funds From Operations $ in thousands, except share and per share date Net Income (Loss) $ (1,039) $ 370 $ 2,254 $ 3,266 Depreciation and Amortization 6,520 6,472 25,594 25,758 Provision for Impairment 583 356 1,693 3,220 Loss (Gain) on Disposition of Assets 901 (1,552) (3,443) (9,334) Funds From Operations $ 6,965 $ 5,646 $ 26,098 $ 22,910 Adjustments: Gain on Extinguishment of Debt — — — (23) Amortization of Intangible Assets and Liabilities to Lease Income (156) (118) (517) (417) Straight-Line Rent Adjustment (145) (16) (515) (402) COVID-19 Rent Repayments — — — — Non-Cash Compensation 9 80 247 318 Amortization of Deferred Financing Costs to Interest Expense 180 180 720 710 Other Non-Cash Adjustments 41 29 152 115 Adjusted Funds From Operations $ 6,894 $ 5,801 $ 26,185 $ 23,211 FFO per Diluted Share $ 0.44 $ 0.37 $ 1.73 $ 1.47 AFFO per Diluted Share $ 0.44 $ 0.38 $ 1.74 $ 1.49 Three Months Ended (Unaudited) Year Ended (Unaudited) December 31, 2024 December 31, 2023 December 31, 2024 December 31, 2023 |
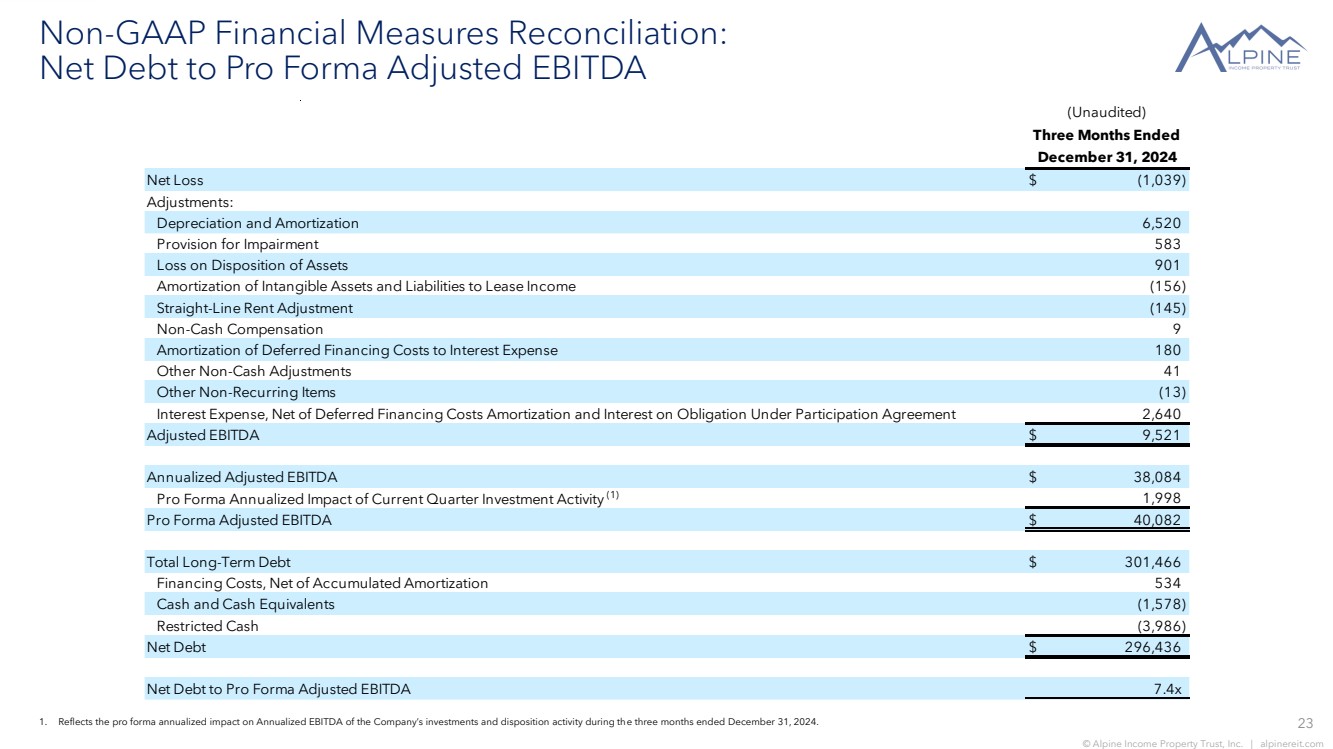
| 23 © Alpine Income Property Trust, Inc. | alpinereit.com 1. Reflects the pro forma annualized impact on Annualized EBITDA of the Company’s investments and disposition activity during the three months ended December 31, 2024. Net Loss $ (1,039) Adjustments: Depreciation and Amortization 6,520 Provision for Impairment 583 Loss on Disposition of Assets 901 Amortization of Intangible Assets and Liabilities to Lease Income (156) Straight-Line Rent Adjustment (145) Non-Cash Compensation 9 Amortization of Deferred Financing Costs to Interest Expense 180 Other Non-Cash Adjustments 4 1 Other Non-Recurring Items (13) Interest Expense, Net of Deferred Financing Costs Amortization and Interest on Obligation Under Participation Agreement 2,640 Adjusted EBITDA $ 9,521 Annualized Adjusted EBITDA $ 38,084 Pro Forma Annualized Impact of Current Quarter Investment Activity (1) 1,998 Pro Forma Adjusted EBITDA $ 40,082 Total Long-Term Debt $ 301,466 Financing Costs, Net of Accumulated Amortization 534 Cash and Cash Equivalents (1,578) Restricted Cash (3,986) Net Debt $ 296,436 Net Debt to Pro Forma Adjusted EBITDA 7.4x December 31, 2024 (Unaudited) Three Months Ended Non-GAAP Financial Measures Reconciliation: Net Debt to Pro Forma Adjusted EBITDA |
| Investor Inquiries: Philip R. Mays, Chief Financial Officer and Treasurer, (407) 904-3324, pmays@alpinereit.com |