Exhibit 99.2
Cautionary Statements
FORWARD LOOKING STATEMENTS
This presentation contains "forward-looking statements" within the meaning of the Private Securities Litigation Reform Act of 1995 that are based on management's current expectations, assumptions and beliefs. Forward-looking statements can often be identified by words such as "anticipate", "estimate", "expect," "intend," "may", "should" and similar expressions, and variations or negatives of these words. These forward-looking statements include, but are not limited to, statements regarding the Company’s business and industry in general, estimated yields on investment, guidance for financial results for the first quarter of 2022 and full year 2022, including the Company's estimated net income, earnings available for distribution (“EAD”), cash available for distribution (“CAD”) and dividend coverage ratios and related assumptions. They are not guarantees of future results and forward-looking statements are subject to risks, uncertainties and assumptions that could cause actual results to differ materially from those expressed in any forward-looking statement, including the ultimate duration and severity of the COVID-19 pandemic, and the effectiveness of actions taken, or actions that may be taken, by governmental authorities to contain the outbreak or treat its impact, as well as those described in greater detail in our filings with the Securities and Exchange Commission, particularly those described in our Annual Report on Form 10-K and Quarterly Reports on Form 10-Q. Readers should not place undue reliance on any forward-looking statements and are encouraged to review the Company’s Annual Report on Form 10-K and the Company's other filings with the SEC for a more complete discussion of risks and other factors that could affect any forward-looking statement. The statements made herein speak only as of the date of this presentation and except as required by law, the Company does not undertake any obligation to publicly update or revise any forward-looking statements.
NON-GAAP FINANCIAL MEASURES
This presentation contains non-GAAP financial measures. A “non-GAAP financial measure” is defined as a numerical measure of a company’s financial performance that excludes or includes amounts so as to be different than the most directly comparable measure calculated and presented in accordance with GAAP in the statements of income, balance sheets or statements of cash flows of the Company. The non-GAAP financial measures used within this presentation are EAD and CAD. EAD has replaced our prior presentation of Core Earnings. In addition, Core Earnings results from prior reporting periods have been relabeled EAD. In line with evolving industry practices, we believe EAD more accurately reflects the principal purpose of the measure than the term Core Earnings and will serve as a useful indicator for investors in evaluating our performance and our long-term ability to pay distributions.
EAD is defined as the net income (loss) attributable to our common stockholders computed in accordance with GAAP inlcuding net income (loss) attributable to non-controlling interests, including realized gains and losses not otherwise included in net income (loss), excluding any unrealized gains or losses or other similar non-cash items that are included in net income (loss) for the applicable reporting period, regardless of whether such items are included in other comprehensive income (loss), or in net income (loss) and adding back amortization of stock-based compensation. We use EAD to evaluate our performance which excludes the effects of certain GAAP adjustments and transactions that we believe are not indicative of our current operations and to assess our long-term ability to pay distributions. We believe providing EAD as a supplement to GAAP net income (loss) to our investors is helpful to their assessment of our performance and our long-term ability to pay distributions. We also use EAD as a component of the management fee paid to NREA (as defined below), our manager. EAD does not represent net income or cash flows from operating activities and should not be considered as an alternative to GAAP net income, an indication of our GAAP cash flows from operating activities, a measure of our liquidity or an indication of funds available for our cash needs. Our computation of EAD may not be comparable to EAD reported by other REITs.
We calculate CAD by adjusting EAD by adding back amortization of premiums and by removing accretion of discounts and non-cash items, such as stock dividends. We use CAD to evaluate our performance and our current ability to pay distributions. We also believe that providing CAD as a supplement to GAAP net income (loss) to our investors is helpful to their assessment of our performance and our current ability to pay distributions. CAD does not represent net income or cash flows from operating activities and should not be considered as an alternative to GAAP net income, an indication of our GAAP cash flows from operating activities, a measure of our liquidity or an indication of funds available for our cash needs. Our computation of CAD may not be comparable to CAD reported by other REITs.
ADDITIONAL INFORMATION
For additional information, see our filings with the SEC. Our filings with the SEC are available on our website, nref.nexpoint.com, under the “Financials" tab.
| NEXPOINT REAL ESTATE FINANCE | Page | 2 |
Company Overview
NexPoint Real Estate Finance, Inc. (“NREF” or the “Company”) is a publicly traded mortgage REIT (“mREIT”), with its shares listed on the New York Stock Exchange. The company concentrates on investments in real estate sectors where senior management has operating expertise, including multifamily, single-family rental (”SFR”), and self-storage, in the top 50 metropolitan statistical areas. The Company targets lending or investing in stabilized properties or properties with “light-transitional” business plans.
NREF is externally managed by NexPoint Real Estate Advisors VII, L.P. (“NREA”), an affiliate of NexPoint Advisors, L.P., an SEC-registered investment advisor with extensive real estate and fixed income experience.
2.8% DISCOUNT TO BOOK1 | 9.6% IMPLIED DIVIDEND YIELD2 | 8.2% INSIDER OWNERSHIP3 |
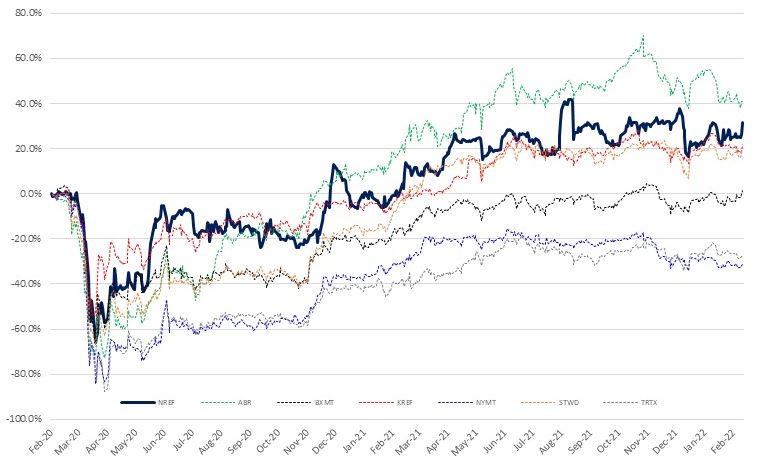
NREF Total Return Vs Peers
| (1) | BASED ON December 31, 2021, BOOK VALUE INCLUDING REDEEMABLE NCI IN THE OPERATING PARTNERSHIP AS REPORTED BY THE COMPANY IN THIS PRESENTATION AND THE SHARE PRICE AS OF CLOSE OF TRADING February 16, 2022 |
| (2) | IMPLIED DIVIDEND YIELD IS CALCULATED USING THE ANNOUNCED 1Q DIVIDEND OF $0.500 PER COMMON SHARE, ANNUALIZED, DIVIDED BY THE SHARE PRICE AS OF CLOSE OF TRADING ON February 16, 2022 |
| (3) | AS OF THE CLOSE OF TRADING ON December 31, 2021 |
| (4) | BLOOMBERG. TOTAL RETURN, INCLUDING DIVIDENDS, AS OF CLOSE OF TRADING ON February 16, 2022 |
| NEXPOINT REAL ESTATE FINANCE | Page | 3 |
Q4 2021 Highlights
FINANCIAL | ● | 4Q 2021 net income of $21.0MM, with net income attributable to redeemable noncontrolling interests of $7.6MM, net income attributable to common stockholders of $12.4MM, or $0.92 per diluted common share; compared to net income of $25.2MM, with net income attributable to redeemable noncontrolling interests of $11.1MM, net income attributable to common stockholders of $13.2MM, or $1.17 per diluted common share in 3Q 20211 |
| | ● | 4Q 2021 earnings available for distribution of $11.8MM, or $0.54 per diluted share compared to $10.5MM, or $0.51 per diluted share in 3Q 20212 |
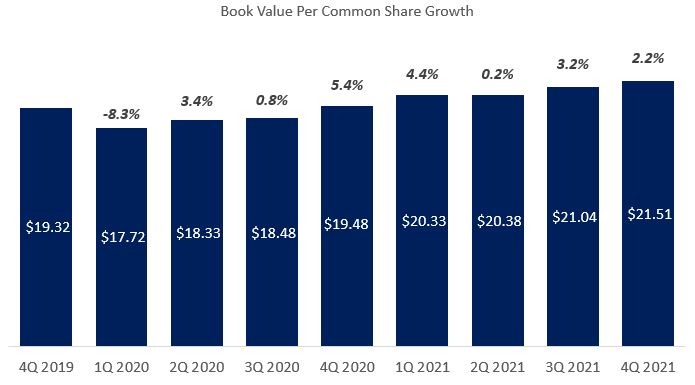
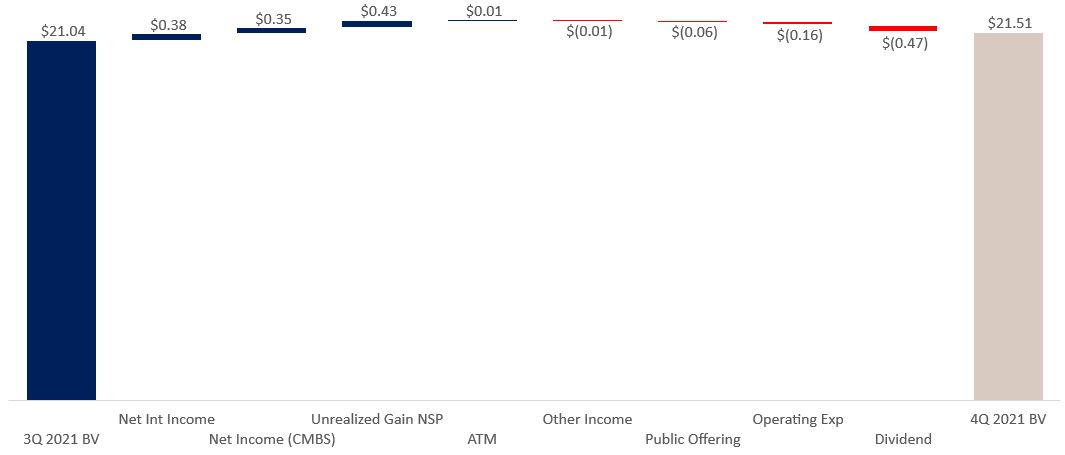
| | ● | Book value of $461.93MM, or $21.51 per common share, including redeemable non-controlling interests in the Operating Partnership and excluding Series A Preferred Stock; a 2.2% increase over 3Q 2021 book value on a per share basis |
| | ● | Paid a 4Q 2021 dividend of $0.475 per common share on December 30, 2021 |
| | ● | Announced 1Q 2022 dividend of $0.500 per common share to be paid on March 31, 2022 |
| | | |
| | | |
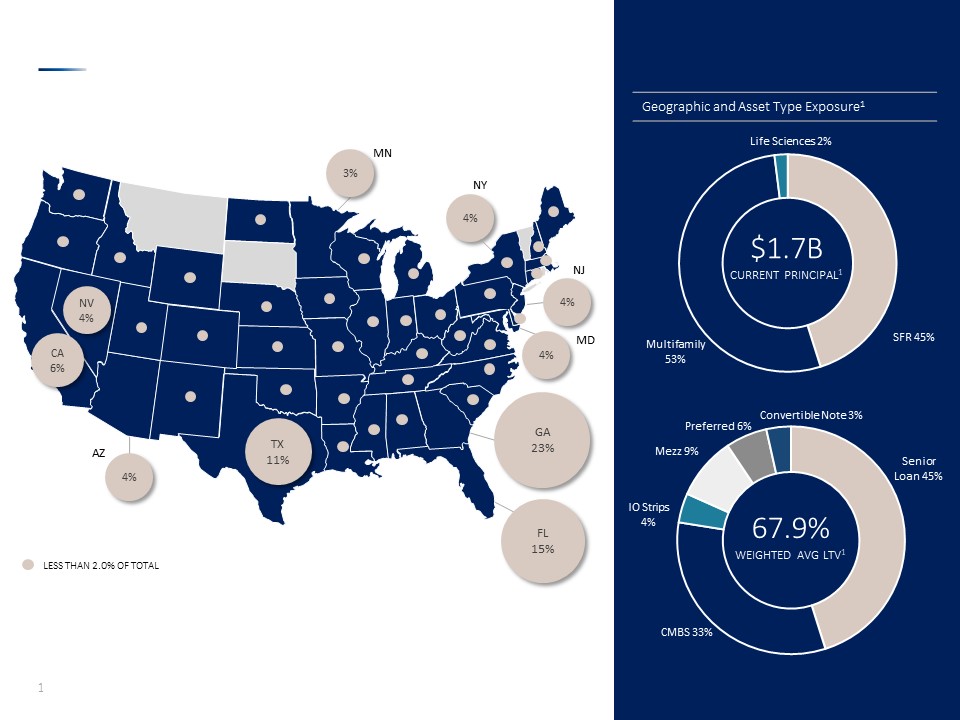
| PORTFOLIO | ● | Outstanding total portfolio of $1.7B, comprised of 69 investments 3 |
| | ● | SFR, multifamily and life sciences represent 44.9%, 53.2% and 1.9% of our debt portfolio, respectively |
| | ● | Weighted average loan to value (“LTV”) 4 and debt service coverage ratio (“DSCR”) on our SFR, CMBS, CMBS IO strips, preferred, mezz and convertible note investments are 67.9% and 1.99x3, respectively |
| | ● | As of February 16, 2022, there are no loans currently in forbearance in our portfolio |
| | ● | During 4Q 2021 we originated mezzanine and convertible notes with an aggregate principal amount of $40.8MM |
| | ● | On October 25, 2021, a $12.1MM single-family rental first mortgage loan was repaid in full |
| | ● | On November 8, 2021, we purchased $30.0MM of a preferred equity investment with a current yield of 10.0% |
| | ● | On December 9, 2021, we purchased a $61.3MM floating rate Freddie Mac K-Series B-Piece, with an estimated yield of SOFR +525 bps |
| | ● | On December 27, 2021, a $8.1 MM single-family rental first mortgage loan was repaid in full |
| | ● | On December 31, 2021, we purchased a 204-unit multifamily property in Charlotte, North Carolina for $62.0MM |
| | | |
CAPITALIZATION | ● | As of February 16, 2022, the Company’s debt to book value ratio was 2.53x |
| | ● | Secured credit facility, matched in structure and term of the underlying SFR loans, with a weighted average remaining term of 6.5 years as of December 31, 2021 |
| | ● | As of February 16, 2022, outstanding repo financing was $302.7MM, which equates to a 57.5% advance rate on our CMBS B-Piece and IO Strip portfolio5 |
| | ● | On December 20, 2021, NREF issued $60.0MM of 5.75% Senior Unsecured Notes due 2026 |
(1) | DILUTED EPS ASSUMES VESTING OF ALL OUTSTANDING UNVESTED RESTRICTED STOCK UNITS AND CONVERSION OF ALL REDEEMABLE NON-CONTROLLING INTERESTS |
(2) | EAD PER DILUTED SHARE ASSUMES VESTING OF ALL OUTSTANDING UNVESTED RESTRICTED STOCK UNITS AND CONVERSION OF ALL REDEEMABLE NON-CONTROLLING INTERESTS. SEE “RECONCILIATIONS” SLIDE |
(4) | LOAN TO VALUE IS GENERALLY BASED ON THE INITIAL LOAN AMOUNT DIVIDED BY THE AS–IS APPRAISED VALUE AS OF THE DATE THE LOAN WAS ORIGINATED OR BY THE CURRENT PRINCIPAL AMOUNT AS OF THE DATE OF THE MOST RECENT AS-IS APPRAISED VALUE. FOR OUR CMBS B-PIECES, LTV IS BASED ON THE WEIGHTED AVERAGE LTV OF THE UNDERLYING LOAN POOL |
(5) | BASED ON ACTUAL COLLATERAL POSTED |
| NEXPOINT REAL ESTATE FINANCE | Page | 4 |
4Q 2021 Earnings and Book Value
| | ● | Net interest income of $8.0MM, an increase of 22.0% over 3Q 2021 |
| | ● | Net income of $21.0MM, with net income attributable to redeemable noncontrolling interests of $7.6MM, net income attributable to common stockholders of $12.4MM, or $0.92 per diluted common share; compared to net income of $25.2MM, with net income attributable to redeemable noncontrolling interests of $11.1MM, net income attributable to common stockholders of $13.2MM, or $1.17 per diluted common share in 3Q 2021 |
| | ● | Earnings available for distribution of $11.8MM, or $0.54 per diluted common share; compared to $10.5MM, or $0.51 per diluted common share in 3Q 2021 |
| | ● | BV per common share including redeemable NCI in the Operating Partnership increased 2.2% to $21.51/share, compared to $21.04/share at the end of 3Q 2021 |
| NEXPOINT REAL ESTATE FINANCE | Page | 5 |
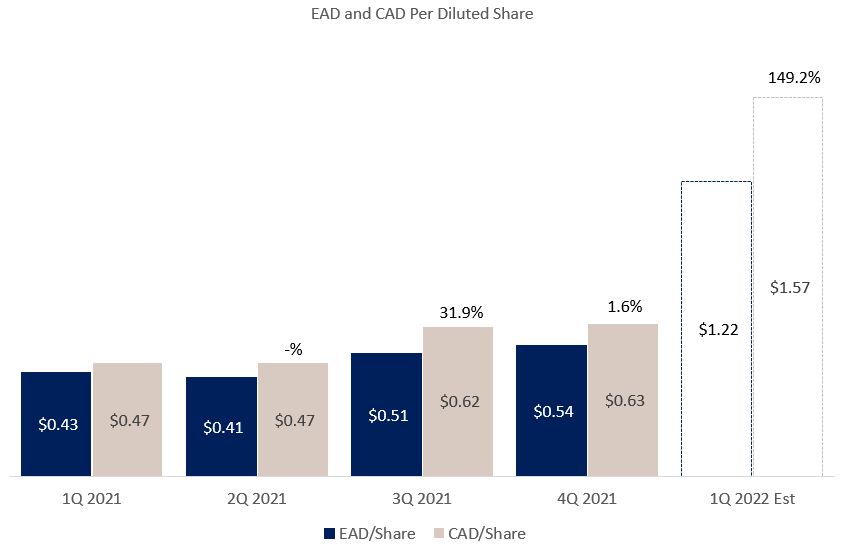
Net Income, EAD, CAD and Guidance
NET INCOME/EAD/CAD:
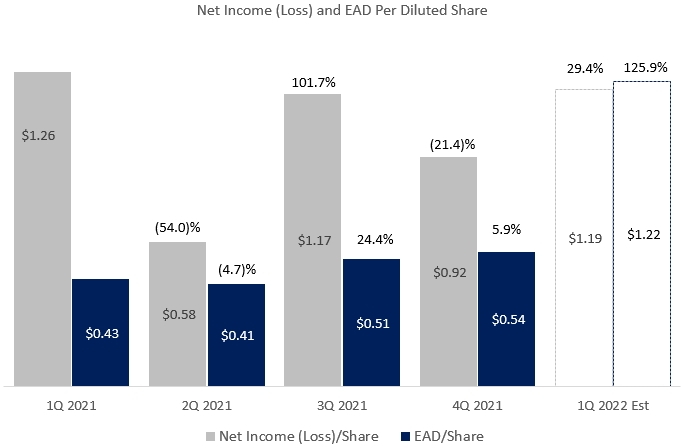
| | ● | Net income per diluted common share for the 4Q 2021 is $0.92, compared to $1.17 per diluted common share reported in 3Q 2021 |
| | ● | 4Q 2021 EAD per diluted share is $0.54, an increase of 5.9% compared to 3Q 2021 reported EAD per diluted share |
| | ● | 4Q 2021 CAD per diluted share is $0.63, an increase of 1.6% over 3Q 2021 reported CAD per diluted share |
Q1 GUIDANCE:
| | ● | 1Q 2022 EAD per diluted share guidance is $1.221 at the mid-point |
| | ● | 1Q 2022 CAD per diluted share guidance is $1.571 at the mid-point |
FULL YEAR GUIDANCE:
| | ● | 2022 EAD per diluted share guidance is $2.722 at the mid-point |
| | ● | 2022 CAD per diluted share guidance is $3.212 at the mid-point |
(1) | NET INCOME IN 1Q 2022 IS ESTIMATED TO BE BETWEEN $25.1MM AND $27.3MM. SEE “RECONCILIATIONS” SLIDES |
(2) | NET INCOME IN 2022 IS ESTIMATED TO BE BETWEEN $56.1MM AND $58.3MM. SEE “RECONCILIATIONS” SLIDES |
| NEXPOINT REAL ESTATE FINANCE | Page | 6 |
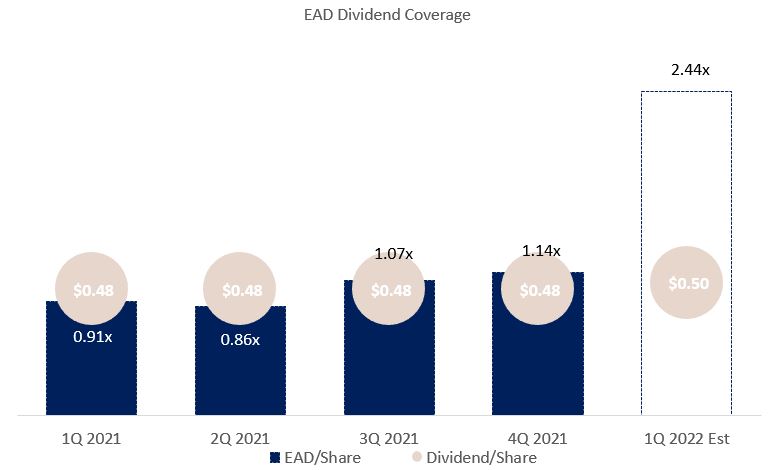
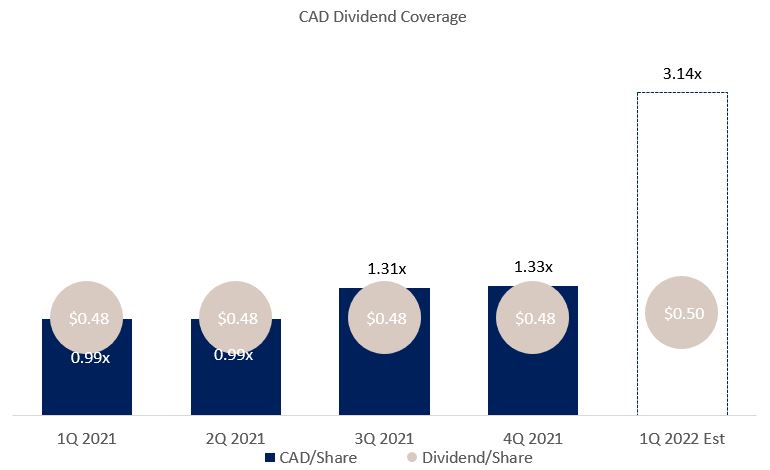
Dividend and EAD/CAD Coverage
4Q 2021 DIVIDEND:
| | ● | 4Q dividend of $0.475/common share was paid December 30, 2021 |
| | ● | 4Q 2021 EAD dividend coverage is 1.14x |
| | ● | 4Q 2021 CAD dividend coverage is 1.33x |
1Q 2022 DIVIDEND:
| | ● | 1Q 2022 dividend of $0.500 per common share declared by the Board of Directors to be paid on March 31, 2022, a 5.3% increase from 4Q 2021 dividend per common share |
| | ● | 1Q 2022 estimated EAD dividend coverage of 2.44x1 at the mid-point |
| | ● | 1Q 2022 estimated CAD dividend coverage of 3.14x1 at the mid-point |
(1) | NET INCOME IN 1Q 2022 IS ESTIMATED TO BE BETWEEN $25.1MM AND $27.3MM. SEE “RECONCILIATIONS” SLIDES |
| NEXPOINT REAL ESTATE FINANCE | Page | 7 |
Portfolio Commentary
Defensive Portfolio Characteristics
The current portfolio consists of senior loans, mezzanine debt, preferred equity and common stock investments in short-duration lease-term assets (multifamily, SFR, self-storage, life sciences) that are geographically diverse in the United States. The portfolio has minimal exposure to construction loans, no heavy transitional loans, no land loans and no for-sale loans. As of February 16, 2022, there are no loans currently in forbearance in our portfolio.
6.5 YEARS AVERAGE REMAINING TERM5 | 90.8% OF PORTFOLIO STABILIZED5 | 67.9% WEIGHTED AVG LOAN TO VALUE5 | 1.99x WEIGHTED AVG DSCR5 |
| MULTIFAMILY | | ● Historically low losses for Freddie Mac debt issuances secured by multifamily assets, including periods of market stress ● Aggregate losses in Freddie Mac’s origination history have averaged 5 bps per year dating back to 19941 ● Since 2009 and through December 2021, there have been $40.4MM in losses on $478B of combined issuance2 ● As of December 27, 2021, $2.1B of outstanding UPB, representing 0.6% of total securitized UPB, are currently in forbearance3 |
SINGLE-FAMILY RENTAL | | ● Although this is a relatively new asset class that was institutionalized in the wake of the global financial crisis, we believe SFR will exhibit resiliency akin to multifamily ● Current portfolio of SFR loans is capitalized by a secured credit facility with Freddie Mac, is matched in both duration and structure of the underlying loans, has 6.5 years of average weighted term to maturity and a 250 bps interest rate spread4 ● Subject to Freddie Mac forbearance program to help mitigate cash flow interruptions to the bondholders |
| SELF-STORAGE | | ● Sticky COVID-related demand continues to be a tailwind moving into 2022 ● Occupancies across the sector remain at all-time highs with other fundamentals remaining strong ● Historically, self-storage has outperformed other real estate asset types during economic downturns |
| LIFE SCIENCES | | ● Secular demand growth can be reliably estimated by looking into past performance over the last 10-15 years. ● Increases in technology, spending and medical talent have created strong demand for real estate that meets unique and specific requirements |
(2) | FREDDIE MAC; DECEMBER 2021 |
(3) | DECEMBER (2021) SECURITIZATION FORBEARANCE REPORT – FREDDIE MAC |
| (4) | AS OF DECEMBER 31, 2021 |
(5) | AS OF February 16, 2022, AND EXCLUDING THE NEXPOINT STORAGE PARTNERS, INC COMMON STOCK (FORMERLY, JCAP SERIES A PREFERRED), AND THE HUDSON MONTFORD MULTIFAMILY PROPERTY |
| NEXPOINT REAL ESTATE FINANCE | Page | 8 |
Geographic and Asset Type Exposure1
(1) | AS OF February 16, 2022 AND EXCLUDING THE NEXPOINT STORAGE PARTNERS, INC COMMON STOCK (FORMERLY, JCAP SERIES A PREFERRED), AND THE HUDSON MONTFORD MULTIFAMILY PROPERTY |
| NEXPOINT REAL ESTATE FINANCE | Page | 9 |
Portfolio
# | | Investment1 | Location | Property Type | Investment Date | | Current Principal | | | | Net Equity2 | | | Coupon3 | | | | Remaining Term4 | | | Loan to Value | | DSCR |
| 1 | | Senior Loan | Various | SFR | 2/11/2020 | | $ | 508,700 | | | | $ | 77,873 | | | | 4.65 | % | | | | 6.7 | | | | 68.11 | % | 1.30x |
| 2 | | Senior Loan | Various | SFR | 2/11/2020 | | | 62,023 | | | | | 9,597 | | | | 4.95 | % | | | | 7.2 | | | | 65.00 | % | 1.56x |
| 3 | | Senior Loan | Various | SFR | 2/11/2020 | | | 51,304 | | | | | 7,517 | | | | 4.74 | % | | | | 3.8 | | | | 54.10 | % | 1.89x |
| 4 | | Senior Loan | Various | SFR | 2/11/2020 | | | 37,639 | | | | | 6,014 | | | | 5.55 | % | | | | 6.8 | | | | 71.86 | % | 1.35x |
| 5 | | Senior Loan | Various | SFR | 2/11/2020 | | | 10,350 | | | | | 1,599 | | | | 4.72 | % | | | | 6.7 | | | | 68.45 | % | 1.13x |
| 6 | | Senior Loan | Various | SFR | 2/11/2020 | | | 10,401 | | | | | 1,627 | | | | 5.35 | % | | | | 6.1 | | | | 70.52 | % | 1.20x |
| 7 | | Senior Loan | Various | SFR | 2/11/2020 | | | 10,523 | | | | | 1,586 | | | | 5.30 | % | | | | 4.2 | | | | 63.16 | % | 1.91x |
| 8 | | Senior Loan | Various | SFR | 2/11/2020 | | | 9,583 | | | | | 1,473 | | | | 6.10 | % | | | | 6.8 | | | | 72.08 | % | 2.27x |
| 9 | | Senior Loan | Various | SFR | 2/11/2020 | | | 8,910 | | | | | 1,395 | | | | 5.88 | % | | | | 7.0 | | | | 54.48 | % | 1.05x |
| 10 | | Senior Loan | Various | SFR | 2/11/2020 | | | 7,601 | | | | | 1,187 | | | | 5.34 | % | | | | 7.1 | | | | 72.07 | % | 1.63x |
| 11 | | Senior Loan | Various | SFR | 2/11/2020 | | | 6,685 | | | | | 1,043 | | | | 5.46 | % | | | | 7.2 | | | | 70.22 | % | 1.42x |
| 12 | | Senior Loan | Various | SFR | 2/11/2020 | | | 6,086 | | | | | 938 | | | | 4.83 | % | | | | 6.8 | | | | 70.09 | % | 1.70x |
| 13 | | Senior Loan | Various | SFR | 2/11/2020 | | | 6,541 | | | | | 972 | | | | 5.47 | % | | | | 2.1 | | | | 66.97 | % | 1.01x |
| 14 | | Senior Loan | Various | SFR | 2/11/2020 | | | 5,760 | | | | | 885 | | | | 5.99 | % | | | | 6.9 | | | | 70.00 | % | 1.72x |
| 15 | | Senior Loan | Various | SFR | 2/11/2020 | | | 5,550 | | | | | 858 | | | | 5.24 | % | | | | 6.8 | | | | 56.12 | % | 1.42x |
| 16 | | Senior Loan | Various | SFR | 2/11/2020 | | | 5,487 | | | | | 766 | | | | 5.33 | % | | | | 1.6 | | | | 65.46 | % | 1.43x |
| 17 | | Senior Loan | Various | SFR | 2/11/2020 | | | 5,260 | | | | | 818 | | | | 5.46 | % | | | | 7.0 | | | | 72.05 | % | 1.35x |
| 18 | | Senior Loan | Various | SFR | 2/11/2020 | | | 4,684 | | | | | 730 | | | | 5.35 | % | | | | 7.1 | | | | 73.18 | % | 0.81x |
| | | Total SFR | | | 763,087 | | | | | 116,878 | | | | 4.83 | % | | | | 6.4 | | | | 66.99 | % | 1.38x |
| 1 | | CMBS B-Piece | Various | Multifamily | 2/11/2020 | | $ | 35,644 | | 5 | | $ | 15,476 | | | | 6.14 | % | 6 | | | 4.2 | | | | 64.01 | % | 6.36x |
| 2 | | CMBS B-Piece | Various | Multifamily | 2/11/2020 | | | 34,900 | | 5 | | | 16,302 | | | | 6.09 | % | 6 | | | 4.9 | | | | 62.69 | % | 5.35x |
| 3 | | CMBS B-Piece | Various | Multifamily | 4/23/2020 | | | 81,999 | | 5 | | | 25,163 | | | | 3.50 | % | | | | 8.2 | | | | 63.74 | % | 2.29x |
| 4 | | CMBS B-Piece | Various | Multifamily | 7/30/2020 | | | 51,428 | | 5 | | | 22,320 | | | | 9.09 | % | 7 | | | 5.5 | | | | 66.72 | % | 3.57x |
| 5 | | CMBS B-Piece | Various | Multifamily | 8/6/2020 | | | 108,643 | | 5 | | | 26,388 | | | | 11.43 | % | 8 | | | 8.5 | | | | 68.96 | % | 3.46x |
| 6 | | CMBS B-Piece | Various | Multifamily | 4/20/2021 | | | 76,047 | | 5 | | | 30,134 | | | | 6.30 | % | 9 | | | 9.2 | | | | 70.29 | % | 2.56x |
| 7 | | CMBS B-Piece | Various | Multifamily | 6/30/2021 | | | 108,035 | | 5 | | | 31,026 | | | | 6.88 | % | 8 | | | 5.0 | | | | 66.70 | % | 1.86x |
| 8 | | CMBS B-Piece | Various | Multifamily | 12/9/2021 | | | 61,277 | | 5 | | | 25,325 | | | | 5.30 | % | | | | 2.8 | | | | 74.92 | % | 2.16x |
| | | Total CMBS B-Pieces | | | 557,973 | | | | | 192,134 | | | | 7.12 | % | | | | 6.5 | | | | 67.68 | % | 3.03x |
| 1 | | CMBS IO Strip | Various | Multifamily | 5/18/2020 | | $ | 2,451 | | 10 | | $ | 871 | | | | 2.02 | % | | | | 24.7 | | | | 65.42 | % | 2.02x |
| 2 | | CMBS IO Strip | Various | Multifamily | 8/6/2020 | | | 8,046 | | 10 | | | 3,292 | | | | 0.10 | % | | | | 8.5 | | | | 68.96 | % | 3.46x |
| 3 | | CMBS IO Strip | Various | Multifamily | 8/6/2020 | | | 22,388 | | 10 | | | 8,323 | | | | 2.98 | % | | | | 8.5 | | | | 68.96 | % | 3.46x |
| 4 | | CMBS IO Strip | Various | Multifamily | 4/28/2021 | | | 7,439 | | 10 | | | 1,986 | | | | 1.59 | % | | | | 8.1 | | | | 63.74 | % | 2.29x |
| 5 | | CMBS IO Strip | Various | Multifamily | 5/27/2021 | | | 4,781 | | 10 | | | 1,537 | | | | 3.38 | % | | | | 8.4 | | | | 67.20 | % | 2.10x |
| 6 | | CMBS IO Strip | Various | Multifamily | 6/7/2021 | | | 596 | | 10 | | | 218 | | | | 2.31 | % | | | | 6.9 | | | | 63.87 | % | 2.44x |
| 7 | | CMBS IO Strip | Various | Multifamily | 6/11/2021 | | | 7,464 | | 10 | | | 3,079 | | | | 1.25 | % | | | | 6.9 | | | | 63.67 | % | 1.50x |
| 8 | | CMBS IO Strip | Various | Multifamily | 6/24/2021 | | | 2,020 | | 10 | | | 736 | | | | 1.20 | % | | | | 6.9 | | | | 64.06 | % | 1.65x |
| 9 | | CMBS IO Strip | Various | Multifamily | 8/10/2021 | | | 3,306 | | 10 | | | 1,201 | | | | 1.89 | % | | | | 7.8 | | | | 68.50 | % | 1.88x |
| 10 | | CMBS IO Strip | Various | Multifamily | 8/11/2021 | | | 1,713 | | 10 | | | 628 | | | | 3.10 | % | | | | 9.6 | | | | 67.12 | % | 2.24x |
| 11 | | CMBS IO Strip | Various | Multifamily | 8/24/2021 | | | 323 | | 10 | | | 317 | | | | 2.61 | % | | | | 9.1 | | | | 61.32 | % | 4.18x |
| 12 | | CMBS IO Strip | Various | Multifamily | 9/1/2021 | | | 4,912 | | 10 | | | 4,827 | | | | 1.92 | % | | | | 8.5 | | | | 67.59 | % | 2.07x |
| 13 | | CMBS IO Strip | Various | Multifamily | 9/11/2021 | | | 4,908 | | 10 | | | 4,884 | | | | 2.95 | % | | | | 9.6 | | | | 62.71 | % | 2.32x |
| | | Total CMBS IO Strip | | | 70,347 | | | | | 31,899 | | | | 2.13 | % | | | | 8.8 | | | | 66.79 | % | 2.65x |
$s IN 0,000s EXCEPT PER SHARE DATA
| NEXPOINT REAL ESTATE FINANCE | Page | 10 |
# | | Investment1 | Location | Property Type | Investment Date | | Current Principal | | | | Net Equity2 | | | Coupon3 | | | | Remaining Term4 | | | Loan to Value | | DSCR |
| 1 | | Mezzanine | Houston, TX | Multifamily | 6/12/2020 | | $ | 7,500 | | | | $ | 7,500 | | | | 11.00 | % | 11 | | | 1.5 | | | | 79.27 | % | 1.08x |
| 2 | | Mezzanine | Philadelphia, PA | Multifamily | 10/20/2020 | | | 14,253 | | | | | 5,975 | | | | 7.59 | % | | | | 7.4 | | | | 89.39 | % | 1.33x |
| 3 | | Mezzanine | Laurel, MD | Multifamily | 10/20/2020 | | | 12,000 | | | | | 5,021 | | | | 7.71 | % | | | | 9.3 | | | | 84.91 | % | 1.43x |
| 4 | | Mezzanine | White Marsh, MD | Multifamily | 10/20/2020 | | | 10,380 | | | | | 4,344 | | | | 7.42 | % | | | | 9.5 | | | | 84.78 | % | 1.44x |
| 5 | | Mezzanine | Cockeysville, MD | Multifamily | 10/20/2020 | | | 9,610 | | | | | 4,022 | | | | 7.42 | % | | | | 9.5 | | | | 84.26 | % | 1.47x |
| 6 | | Mezzanine | Laurel, MD | Multifamily | 10/20/2020 | | | 7,390 | | | | | 3,093 | | | | 7.42 | % | | | | 9.5 | | | | 80.29 | % | 1.61x |
| 7 | | Mezzanine | North Aurora, IL | Multifamily | 10/20/2020 | | | 6,829 | | | | | 2,850 | | | | 7.53 | % | | | | 7.0 | | | | 70.99 | % | 1.37x |
| 8 | | Mezzanine | Lakewood, NJ | Multifamily | 10/20/2020 | | | 5,540 | | | | | 2,313 | | | | 7.33 | % | | | | 7.3 | | | | 81.06 | % | 1.37x |
| 9 | | Mezzanine | Wilmington, DE | Multifamily | 10/20/2020 | | | 5,470 | | | | | 2,284 | | | | 7.50 | % | | | | 7.3 | | | | 89.27 | % | 1.25x |
| 10 | | Mezzanine | Urbandale, IA | Multifamily | 10/20/2020 | | | 4,010 | | | | | 1,674 | | | | 7.89 | % | | | | 6.9 | | | | 83.80 | % | 1.55x |
| 11 | | Mezzanine | Daytona Beach, FL | Multifamily | 10/20/2020 | | | 3,700 | | | | | 1,544 | | | | 7.83 | % | | | | 6.8 | | | | 81.48 | % | 1.47x |
| 12 | | Mezzanine | Rosedale, MD | Multifamily | 10/20/2020 | | | 3,620 | | | | | 1,515 | | | | 7.42 | % | | | | 9.5 | | | | 83.26 | % | 1.40x |
| 13 | | Mezzanine | Atlanta, GA | Multifamily | 10/20/2020 | | | 3,310 | | | | | 1,382 | | | | 6.91 | % | | | | 7.5 | | | | 80.31 | % | 1.28x |
| 14 | | Mezzanine | Temple Hills, MD | Multifamily | 10/20/2020 | | | 3,000 | | | | | 1,256 | | | | 7.32 | % | | | | 9.6 | | | | 83.09 | % | 1.59x |
| 15 | | Mezzanine | Des Moines, IA | Multifamily | 10/20/2020 | | | 2,880 | | | | | 1,202 | | | | 7.89 | % | | | | 6.9 | | | | 81.64 | % | 1.32x |
| 16 | | Mezzanine | Tyler, TX | Multifamily | 10/20/2020 | | | 2,135 | | | | | 891 | | | | 7.74 | % | | | | 6.8 | | | | 83.12 | % | 1.72x |
| 17 | | Mezzanine | Temple Hills, MD | Multifamily | 10/20/2020 | | | 1,500 | | | | | 628 | | | | 7.22 | % | | | | 9.6 | | | | 78.63 | % | 1.70x |
| 18 | | Mezzanine | Las Vegas, NV | Multifamily | 10/20/2020 | | | 1,190 | | | | | 497 | | | | 7.71 | % | | | | 7.2 | | | | 75.49 | % | 1.47x |
| 19 | | Mezzanine | Vancouver, WA | Multifamily | 10/20/2020 | | | 1,082 | | | | | 453 | | | | 8.70 | % | | | | 8.8 | | | | 84.32 | % | 1.77x |
| 20 | | Mezzanine | Los Angeles, CA | Multifamily | 1/21/2021 | | | 24,844 | | | | | 24,483 | | | | 13.25 | % | 12 | | | 2.1 | | | | N/A | | N/A |
| 21 | | Mezzanine | Irving , TX | Multifamily | 11/18/2021 | | | 12,600 | | | | | 12,476 | | | | 11.00 | % | | | | 6.9 | | | | 91.90 | % | 1.57x |
| 22 | | Mezzanine | Rogers, AR | Multifamily | 12/29/2021 | | | 7,760 | | | | | 7,682 | | | | 11.00 | % | | | | 3.0 | | | | 86.56 | % | 0.58x |
| | | Total Mezzanine | | | | | | 150,603 | | | | | 93,084 | | | | 9.12 | % | | | | 6.5 | | | | 70.30 | % | 1.37x |
| 1 | | Preferred Equity | Houston, TX | Multifamily | 5/29/2020 | | $ | 10,000 | | | | $ | 10,000 | | | | 11.00 | % | | | | 8.3 | | | | 73.44 | % | 1.45x |
| 2 | | Preferred Equity | Holly Springs, NC | Life Sciences | 9/29/2021 | | | 6,891 | | | | | 6,858 | | | | 10.00 | % | | | | 1.8 | | | | N/A | | N/A |
| 3 | | Preferred Equity | Atlanta , GA | Multifamily | 10/26/2021 | | | 9,750 | | | | | 9,656 | | | | 11.00 | % | | | | 2.8 | | | | 92.30 | % | 1.14x |
| 4 | | Preferred Equity | Danbury, CT | Life Sciences | 11/18/2021 | | | 6,878 | | | | | 6,809 | | | | 10.00 | % | | | | 1.7 | | | | 46.03 | % | 2.23x |
| 5 | | Preferred Equity | Las Vegas, NV | Multifamily | 12/28/2021 | | | 46,847 | | | | | 46,847 | | | | 10.50 | % | | | | 10.2 | | | | 98.65 | % | 1.09x |
| 6 | | Preferred Equity | Vacaville, CA | Life Sciences | 1/14/2022 | | | 19,594 | | | | | 19,496 | | | | 10.00 | % | | | | 1.7 | | | | 21.82 | % | 0.67x |
| | | Total Preferred Equity | | | | | | 99,960 | | | | | 99,666 | | | | 10.43 | % | | | | 6.5 | | | | 87.40 | % | 1.05x |
| 1 | | Convertible Note | Jersey City, NJ | Multifamily | 12/28/2021 | | | 20,478 | | | | | 20,377 | | | | 9.00 | % | | | | 2.0 | | | | N/A | | N/A |
| 2 | | Convertible Note | Bronx, NY | Multifamily | 1/12/2022 | | | 38,656 | | | | | 38,463 | | | | 9.00 | % | | | | 2.0 | | | | N/A | | N/A |
| | | Total Convertible Notes | | | | | | 59,134 | | | | | 58,840 | | | | 9.00 | % | | | | 2.0 | | | | N/A | | N/A |
| 1 | | Common Stock | N/A | Self-Storage | 11/6/2020 | | | N/A | | | | $ | 58,460 | | | | N/A | | | | | N/A | | | | N/A | | N/A |
| 1 | | Multifamily Property | Las Vegas , NV | Multifamily | 12/31/2021 | | | N/A | | | | $ | 30,094 | | | | N/A | | | | | N/A | | | | N/A | | N/A |
| | | Portfolio Total | | | | | $ | 1,701,104 | | | | $ | 681,055 | | | | 6.32 | % | | | | 6.5 | | | | 67.90 | % | 1.99x |
$s IN 0,000s EXCEPT PER SHARE DATA |
| (1) | AS OF February 16, 2022, OUR TOTAL PORTFOLIO REPRESENTS THE CURRENT PRINCIPAL AMOUNT OF THE CONSOLIDATED SFR LOANS, MEZZANINE LOANS, PREFERRED EQUITY, CONVERTIBLE NOTES, COMMON STOCK, AND MULTIFAMILY PROPERTY AS WELL AS THE NET EQUITY OF OUR CMBS B-PIECE INVESTMENTS |
| (2) | NET EQUITY REPREESENTS THE CARRYING VALUE LESS BORROWINGS |
| (3) | THE WEIGHTED AVERAGE COUPON IS WEIGHTED ON THE CURRENT PRINCIPAL BALANCE |
| (4) | THE WEIGHTED AVERAGE LIFE IS WEIGHTED ON THE CURRENT PRINCIPAL BALANCE AND ASSUMES NO PREPAYMENTS. THE MATURITY DATE USED FOR PREFERRED EQUITY INVESTMENTS REPRESENTS THE MATURITY DATE OF THE SENIOR MORTGAGE, AS THE PREFERRED EQUITY INVESTMENTS HAVE NO STATED MATURITY DATE AND REQUIRE REPAYMENT UPON THE SALE OR REFINANCING OF THE ASSET |
| (5) | THE CMBS B-PIECES ARE SHOWN ON AN UNCONSOLIDATED BASIS REFLECTING THE VALUE OF OUR INVESTMENTS |
| (6) | FLOATING RATE CMBS B-PIECE YIELDS 1M LIBOR PLUS 600 BPS. AS OF February 16, 2022, 1M LIBOR WAS 0.12% |
| (7) | FLOATING RATE CMBS B-PIECE YIELDS 1M LIBOR PLUS 900 BPS. AS OF February 16, 2022, 1M LIBOR WAS 0.12% |
| (8) | REPRESENTS THE BOND EQUIVALENT YIELD FOR THE FIXED RATE CMBS B-PIECE |
(10) | CURRENT PRINCIPAL FOR CMBS IO STRIPS ARE SHOWN AS CURRENT COST |
(11) | MEZZANINE INVESTMENT IS FIXED AND PAYS 6.5% CURRENT INTEREST, PAID MONTHLY, WITH THE REMAINING 4.50% ACCRUING AND DUE AT MATURITY |
| NEXPOINT REAL ESTATE FINANCE | Page | 11 |
$s IN 0,000s EXCEPT PER SHARE DATA OR AS OTHERWISE INDICATED
Income Statement
For the three months ended | | December 31, 2021 | | | September 30, 2021 | |
Interest income | | $ | 15,927 | | | $ | 14,372 | |
Interest expense | | | (7,896 | ) | | | (7,790 | ) |
Net interest income | | | 8,031 | | | | 6,582 | |
Other income (loss) | | | 16,433 | | | | 21,963 | |
Total operating expenses | | | (3,507 | ) | | | (3,354 | ) |
Net income | | | 20,957 | | | | 25,191 | |
Preferred stock dividends | | | (882 | ) | | | (874 | ) |
Net (income) attributable to redeemable NCI | | | (7,640 | ) | | | (11,084 | ) |
Net income attributable to common stockholders | | $ | 12,435 | | | $ | 13,233 | |
Weighted average common shares outstanding, diluted¹ | | | 21,911 | | | | 20,721 | |
Net income per share, diluted | | $ | 0.92 | | | $ | 1.17 | |
Balance Sheet
| | | December 31, 2021 | | | December 31, 2020 | |
Cash and cash equivalents | | $ | 26,459 | | | $ | 30,241 | |
Restricted cash | | | 6,773 | | | | 3,230 | |
Real estate investment, net | | | 62,269 | | | | - | |
Loans, held-for-investment, net | | | 241,517 | | | | 127,777 | |
Common stock investment, at fair value | | | 58,460 | | | | 44,626 | |
Mortgage loans, held-for-investment, net | | | 847,364 | | | | 918,114 | |
Accrued interest and dividends | | | 8,319 | | | | 5,078 | |
Mortgage loans held in variable interest entities, at fair value | | | 7,192,547 | | | | 5,007,515 | |
CMBS structured pass through certificates, at fair value | | | 69,816 | | | | 38,984 | |
Accounts receivable and other assets | | | 393 | | | | 745 | |
Total Assets | | $ | 8,513,917 | | | $ | 6,176,310 | |
Secured financing agreements, net | | $ | 786,226 | | | $ | 840,453 | |
Master repurchase agreements | | | 286,324 | | | | 161,465 | |
Unsecured notes, net | | | 168,325 | | | | 34,960 | |
Mortgages payable, net | | | 32,176 | | | | - | |
Accounts payable and other accrued liabilities | | | 3,903 | | | | 1,779 | |
Accrued interest payable | | | 3,985 | | | | 2,311 | |
Bonds payable held in variable interest entities, at fair value | | | 6,726,272 | | | | 4,731,429 | |
Total Liabilities | | | 8,007,211 | | | | 5,772,397 | |
Redeemable NCI in the Operating Partnership | | | 261,423 | | | | 275,670 | |
Total Stockholders Equity | | | 245,283 | | | | 128,243 | |
Total Liabilities and Stockholders’ Equity | | $ | 8,513,917 | | | $ | 6,176,310 | |
(1) | WEIGHTED AVERAGE DILUTED SHARES ASSUMES VESTING OF ALL OUTSTANDING UNVESTED RESTRICTED STOCK UNITS AND CONVERSION OF ALL REDEEMABLE NON-CONTROLLING INTERESTS |
Book Value
| | | December 31, 2021 | | | December 31, 2020 | |
Common stockholders' equity | | $ | 200,503 | | | $ | 90,733 | |
Redeemable noncontrolling interests in the OP | | | 261,423 | | | | 275,670 | |
Total equity | | $ | 461,926 | | | $ | 366,403 | |
| | | | | | | | |
Redeemable OP and Sub OP units | | | 12,308 | | | | 13,787 | |
Common shares outstanding | | | 9,164 | | | | 5,023 | |
Combined book value per share | | $ | 21.51 | | | $ | 19.48 | |
| NEXPOINT REAL ESTATE FINANCE | Page | 12 |
Reconciliations
$s IN 0,000s EXCEPT PER SHARE DATA OR AS OTHERWISE INDICATED |
Reconciliation of 1Q 2022 Net Income to EAD
| | | Low | | | Mid | | | High | |
For the three months ended | | Mar. 31, 2022 | | | Mar. 31, 2022 | | | Mar. 31, 2022 | |
Net income attributable to common stockholders | | $ | 18,952 | | | $ | 19,790 | | | $ | 20,628 | |
Net income attributable to redeemable noncontrolling interests | | | 6,163 | | | | 6,426 | | | | 6,689 | |
Adjustments: | | | | | | | | | | | | |
Amortization of stock-based compensation | | | 652 | | | | 652 | | | | 652 | |
EAD | | $ | 25,767 | | | $ | 26,868 | | | $ | 27,969 | |
| | | | | | | | | | | | | |
Weighted average common shares outstanding, basic | | | 14,214 | | | | 14,214 | | | | 14,214 | |
Weighted average common shares outstanding, diluted¹ | | | 22,023 | | | | 22,023 | | | | 22,023 | |
| | | | | | | | | | | | | |
EAD per diluted weighted average share | | $ | 1.17 | | | $ | 1.22 | | | $ | 1.27 | |
Announced 1Q dividend | | $ | 0.500 | | | $ | 0.500 | | | $ | 0.500 | |
Estimated 1Q dividend coverage ratio | | 2.34x | | | 2.44x | | | 2.54x | |
(1) | WEIGHTED AVERAGE DILUTED SHARES ASSUMES VESTING OF ALL OUTSTANDING UNVESTED RESTRICTED STOCK UNITS AND CONVERSION OF ALL REDEEMABLE NON-CONTROLLING INTERESTS |
Reconciliation of 1Q 2022 EAD to CAD
| | | Low | | | Mid | | | High | |
For the three months ended | | Mar. 31, 2022 | | | Mar. 31, 2022 | | | Mar. 31, 2022 | |
EAD | | $ | 25,767 | | | $ | 26,868 | | | $ | 27,969 | |
Adjustments: | | | | | | | | | | | | |
Amortization of premiums | | | 10,579 | | | | 10,579 | | | | 10,579 | |
Accretion of discounts | | | (2,871 | ) | | | (2,871 | ) | | | (2,871 | ) |
Cash Available for Distribution | | $ | 33,475 | | | $ | 34,576 | | | $ | 35,677 | |
| | | | | | | | | | | | | |
Weighted average common shares outstanding, basic | | | 14,214 | | | | 14,214 | | | | 14,214 | |
Weighted average common shares outstanding, diluted¹ | | | 22,023 | | | | 22,023 | | | | 22,023 | |
| | | | | | | | | | | | | |
CAD per diluted weighted average share | | $ | 1.52 | | | $ | 1.57 | | | $ | 1.62 | |
Announced 1Q dividend | | $ | 0.500 | | | $ | 0.500 | | | $ | 0.500 | |
Estimated 1Q dividend coverage ratio | | 3.04x | | | 3.14x | | | 3.24x | |
(1) | WEIGHTED AVERAGE DILUTED SHARES ASSUMES VESTING OF ALL OUTSTANDING UNVESTED RESTRICTED STOCK UNITS AND CONVERSION OF ALL REDEEMABLE NON-CONTROLLING INTERESTS |
| NEXPOINT REAL ESTATE FINANCE | Page | 13 |
$s IN 0,000s EXCEPT PER SHARE DATA OR AS OTHERWISE INDICATED |
Reconciliation of full year Net Income to EAD
| | | Low | | | Mid | | | High | |
For the year ended | | Dec. 31, 2022 | | | Dec. 31, 2022 | | | Dec. 31, 2022 | |
Net income attributable to common stockholders | | $ | 41,960 | | | $ | 42,804 | | | $ | 43,648 | |
Net income attributable to redeemable noncontrolling interests | | | 14,166 | | | | 14,431 | | | | 14,696 | |
Adjustments: | | | | | | | | | | | | |
Amortization of stock-based compensation | | | 3,103 | | | | 3,103 | | | | 3,103 | |
EAD | | $ | 59,229 | | | $ | 60,338 | | | $ | 61,447 | |
| | | | | | | | | | | | | |
Weighted average common shares outstanding, basic | | | 15,045 | | | | 15,045 | | | | 15,045 | |
Weighted average common shares outstanding, diluted¹ | | | 22,183 | | | | 22,183 | | | | 22,183 | |
| | | | | | | | | | | | | |
EAD per diluted weighted average share | | $ | 2.67 | | | $ | 2.72 | | | $ | 2.77 | |
Estimated 2022 dividend | | $ | 2.000 | | | $ | 2.000 | | | $ | 2.000 | |
Estimated 2022 dividend coverage ratio | | 1.34x | | | 1.36x | | | 1.39x | |
(1) | WEIGHTED AVERAGE DILUTED SHARES ASSUMES VESTING OF ALL OUTSTANDING UNVESTED RESTRICTED STOCK UNITS AND CONVERSION OF ALL REDEEMABLE NON-CONTROLLING INTERESTS |
Reconciliation of full year 2022 EAD to CAD
| | | Low | | | Mid | | | High | |
For the year ended | | Dec. 31, 2022 | | | Dec. 31, 2022 | | | Dec. 31, 2022 | |
EAD | | $ | 59,229 | | | $ | 60,338 | | | $ | 61,447 | |
Adjustments: | | | | | | | | | | | | |
Amortization of premiums | | | 23,158 | | | | 23,158 | | | | 23,158 | |
Accretion of discounts | | | (12,288 | ) | | | (12,288 | ) | | | (12,288 | ) |
Cash Available for Distribution | | $ | 70,099 | | | $ | 71,208 | | | $ | 72,317 | |
| | | | | | | | | | | | | |
Weighted average common shares outstanding, basic | | | 15,045 | | | | 15,045 | | | | 15,045 | |
Weighted average common shares outstanding, diluted¹ | | | 22,183 | | | | 22,183 | | | | 22,183 | |
| | | | | | | | | | | | | |
CAD per diluted weighted average share | | $ | 3.16 | | | $ | 3.21 | | | $ | 3.26 | |
Estimated 2022 dividend | | $ | 2.000 | | | $ | 2.000 | | | $ | 2.000 | |
Estimated 2022 dividend coverage ratio | | 1.58x | | | 1.61x | | | 1.63x | |
(1) | WEIGHTED AVERAGE DILUTED SHARES ASSUMES VESTING OF ALL OUTSTANDING UNVESTED RESTRICTED STOCK UNITS AND CONVERSION OF ALL REDEEMABLE NON-CONTROLLING INTERESTS |
| NEXPOINT REAL ESTATE FINANCE | Page | 14 |
Reconciliation of Net Income (Loss) to Earnings Available for Distribution
$s IN 0,000s EXCEPT PER SHARE DATA OR AS OTHERWISE INDICATED |
| | | 4Q 2021 | | | 3Q 2021 | | | 2Q 2021 | | | 1Q 2021 | |
Net income attributable to common stockholders | | $ | 12,435 | | | $ | 13,233 | | | $ | 5,542 | | | $ | 8,367 | |
Net income attributable to redeemable noncontrolling interests | | | 7,640 | | | | 11,084 | | | | 5,834 | | | | 15,829 | |
Adjustments: | | | | | | | | | | | | | | | | |
Amortization of stock-based compensation | | | 538 | | | | 538 | | | | 557 | | | | 391 | |
Loan loss provision, net | | | - | | | | - | | | | - | | | | 124 | |
Unrealized (gains) or losses | | | (8,832 | ) | | | (14,336 | ) | | | (3,859 | ) | | | (16,476 | ) |
EAD | | $ | 11,781 | | | $ | 10,519 | | | $ | 8,074 | | | $ | 8,235 | |
| | | | | | | | | | | | | | | | | |
Weighted average common shares outstanding, basic | | | 9,163 | | | | 6,863 | | | | 5,306 | | | | 5,023 | |
Weighted average common shares outstanding, diluted1 | | | 21,911 | | | | 20,721 | | | | 19,603 | | | | 19,199 | |
| | | | | | | | | | | | | | | | | |
EAD per diluted weighted average share | | $ | 0.54 | | | $ | 0.51 | | | $ | 0.41 | | | $ | 0.43 | |
Dividend per common share | | $ | 0.48 | | | $ | 0.48 | | | $ | 0.48 | | | $ | 0.48 | |
EAD dividend coverage ratio | | 1.14x | | | 1.07x | | | 0.87x | | | 0.91x | |
(1) | WEIGHTED AVERAGE DILUTED SHARES ASSUMES VESTING OF ALL OUTSTANDING UNVESTED RESTRICTED STOCK UNITS AND CONVERSION OF ALL REDEEMABLE NON-CONTROLLING INTERESTS |
Reconciliation of Earnings Available for Distribution to CAD
| | | 4Q 2021 | | | 3Q 2021 | | | 2Q 2021 | | | 1Q 2021 | |
Earnings Available for Distribution | | $ | 11,781 | | | $ | 10,519 | | | $ | 8,074 | | | $ | 8,235 | |
Adjustments: | | | | | | | | | | | | | | | | |
Amortization of premiums | | | 5,337 | | | | 5,390 | | | | 2,808 | | | | 2,516 | |
Accretion of discounts | | | (3,271 | ) | | | (2,976 | ) | | | (1,680 | ) | | | (1,668 | ) |
Cash Available for Distribution | | $ | 13,847 | | | $ | 12,933 | | | $ | 9,202 | | | $ | 9,083 | |
| | | | | | | | | | | | | | | | | |
Weighted average common shares outstanding, basic | | | 9,163 | | | | 6,863 | | | | 5,306 | | | | 5,023 | |
Weighted average common shares outstanding, diluted1 | | | 21,911 | | | | 20,721 | | | | 19,603 | | | | 19,199 | |
| | | | | | | | | | | | | | | | | |
CAD per diluted weighted average share | | $ | 0.63 | | | $ | 0.62 | | | $ | 0.47 | | | $ | 0.47 | |
Dividend per common share | | $ | 0.48 | | | $ | 0.48 | | | $ | 0.48 | | | $ | 0.48 | |
CAD dividend coverage ratio | | 1.33x | | | 1.31x | | | 0.99x | | | 0.99x | |
(1) | WEIGHTED AVERAGE DILUTED SHARES ASSUMES VESTING OF ALL OUTSTANDING UNVESTED RESTRICTED STOCK UNITS AND CONVERSION OF ALL REDEEMABLE NON-CONTROLLING INTERESTS |
| NEXPOINT REAL ESTATE FINANCE | Page | 15 |