September 28, 2023
Via EDGAR
United States Securities and Exchange Commission
Division of Corporation Finance
Office of Energy & Transportation
100 F Street, N.E.
Washington, D.C. 20549
Attention: John Coleman and Karl Hiller
| Re: | Sibanye Stillwater Limited |
Form 20-F for the Fiscal Year Ended December 31, 2022
Filed April 24, 2023
File No. 333-234096
Dear Messrs. Coleman and Hiller:
I refer to your letter dated August 23, 2023, setting forth comments of the Staff of the Division of Corporation Finance of the Securities and Exchange Commission (the “Staff”) relating to the annual report on Form 20-F for the fiscal year ended December 31, 2022 (the “2022 Form 20-F”) of Sibanye Stillwater Limited (the “Company” and, together with its subsidiaries, “Sibanye-Stillwater” or the “Group”) (File Number 333-234096).
Sibanye-Stillwater’s responses to the Staff’s comments on the 2022 Form 20-F are set forth below. To facilitate the Staff’s review, we have included in this letter the captions and numbered comments from the Staff’s comment letter in italicized text and have provided our responses immediately following each numbered comment.
Form 20-F for the Fiscal Year Ended December 31, 2022
Mineral Resources and Mineral Reserves Report, page R&R-1
| 1. | Please disclose the point of reference that has been utilized in estimating your mineral resources (e.g., in situ, mill feed, or saleable product), and specify the extent to which deductions have been made for mining losses, dilution, and processing losses to comply with Item 1303(b)(3)(v) and Item 1304(d)(1) of Regulation S-K. |
Response:
The Company respectfully acknowledges the Staff’s comment and confirms that the point of reference for its mineral resources is in-situ (prior to mining and processing losses) with the exception of tailings storage facility (“TSF”) Resources, which are declared as dry tonnes in place. In future Form 20-F filings, the Company proposes to amend the notes to its Mineral Resources and Mineral Reserves Summary to include this point of reference.
In Appendix A, the Company has reproduced the relevant notes to the Mineral Resources and Mineral Reserves Summary from the 2022 Form 20-F with the proposed additional note highlighted in yellow to disclose the point of reference that has been utilized in estimating our resources. The Company will include this information in its Form 20-F for the fiscal year ended December 31, 2023, and future Form 20-F filings.
Exhibits, page 64
| 2. | We have identified various disclosure deficiencies in the documents filed as exhibits 96.1 and 96.7 in the remaining comments in this letter. Please consult with the qualified persons involved in preparing the Technical Report Summary for each project and arrange to obtain and file amendments to these exhibits to resolve the concerns. |
Response:
The Company respectfully acknowledges the foregoing Staff comment and will make additions and adjustments in future technical report summaries filings as set out below.
96.1 Technical Report Summary of US PGM Operations, page 255
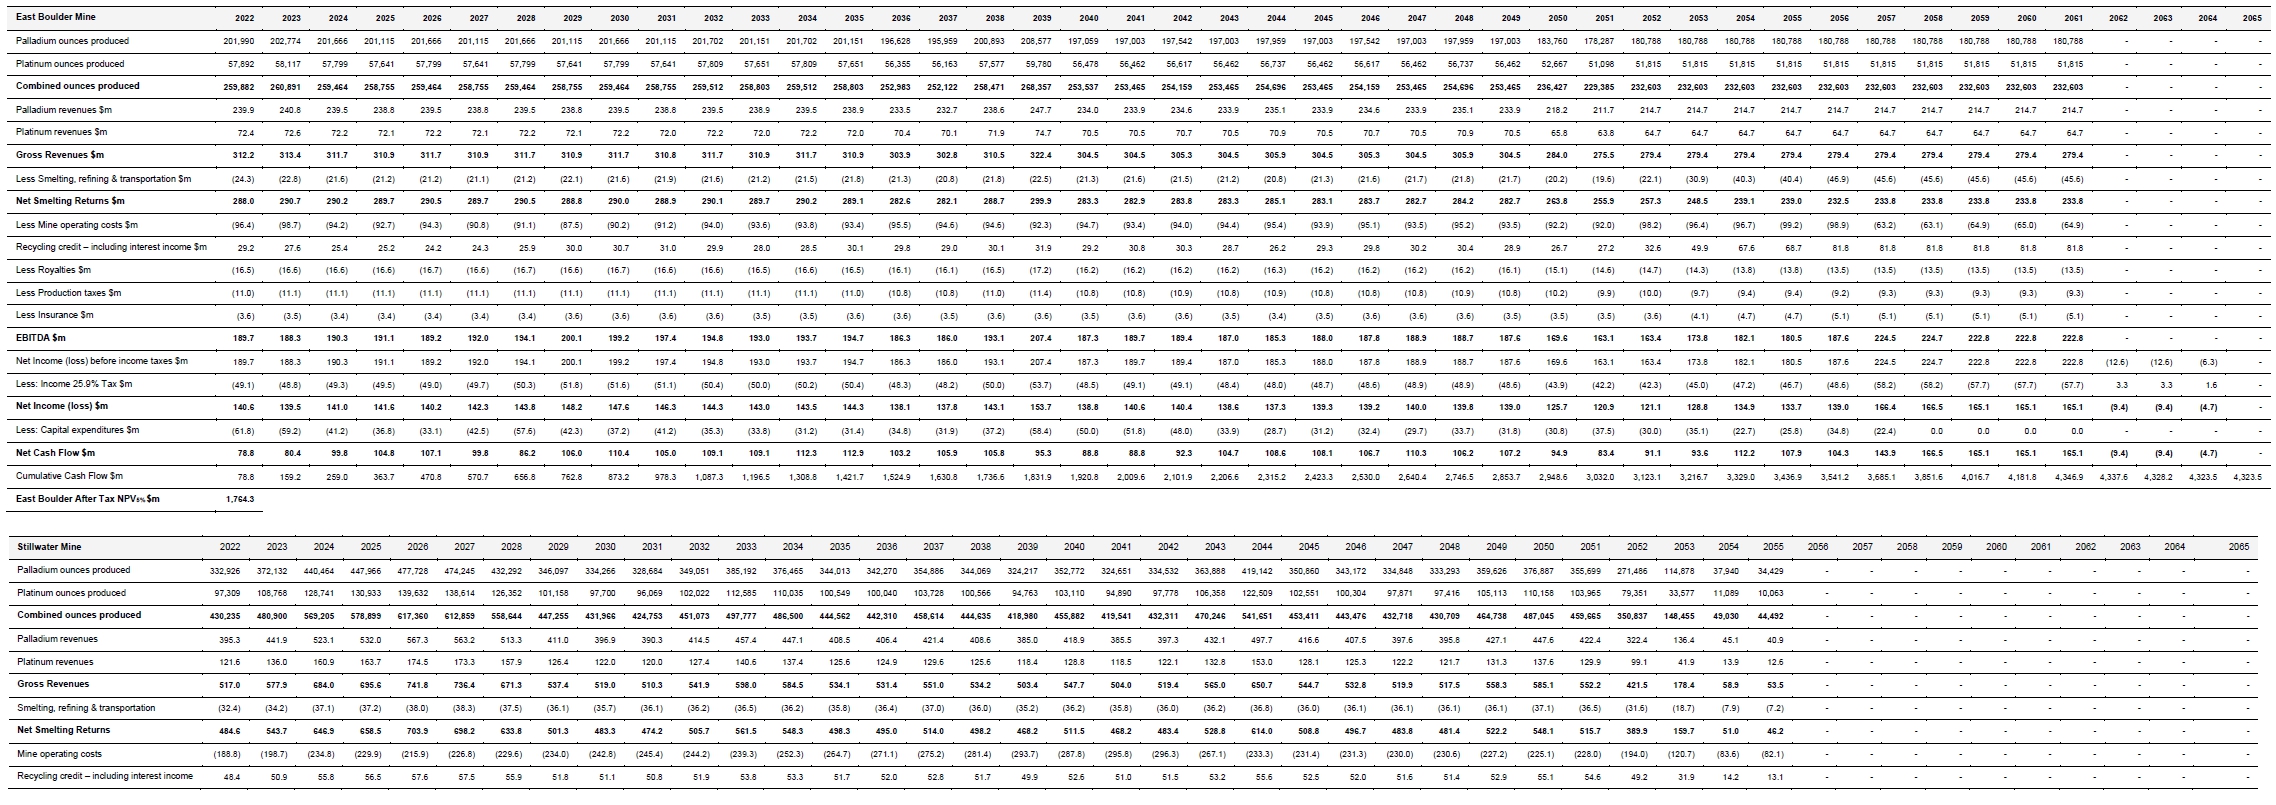
| 3. | The abridged cash flow information presented in Table 63 on page 255 should be modified or expanded to include further details to comply with Item 601(b)(96)(iii)(B)(19) of Regulation S-K, i.e. a cash flow forecast showing annual production for the life of the project and the associated revenue, operating and capital costs, taxes, and royalties. |
Response:
The Company respectfully acknowledges the Staff’s comment and will modify its presentation of cash flows in future filings of the technical report summary for the US PGM property (the “US PGM Operations Technical Report Summary”) to align with the particularized requirements of Item 601(b)(96)(iii)(B)(19) of Regulation S-K.
The Company notes that the abridged cash flow information presented in Table 63 of the US PGM Operations Technical Report Summary for the fiscal year ended December 31, 2022 (the “2022 US PGM Operations Technical Report Summary”) presents annual cash flow forecasts alongside measures of economic viability such as annual EBITDA, tax, profitability and NPV, as required by Item 601(b)(96)(iii)(B)(19)(ii). Additional disclosures in respect of Item 601(b)(96)(iii)(B)(19) are made elsewhere in the 2022 US PGM Operations Technical Report Summary, including in Section 20: “Capital and Operating Costs” and Section 4.3: “Royalties”.
However, the Company will modify its presentation of cash flows in future filings of the US PGM Operations Technical Report Summary to include the particularized disclosure requirements of Item 601(b)(96)(iii)(B)(19) of Regulation S-K in one table, including annual production for the life of the project and the associated revenue, operating and capital costs, taxes, and royalties.
In Appendix B, the Company has produced an indicative abridged cash flow table that will replace the aforementioned Table 63 of the 2022 US PGM Operations Technical Report Summary in future filings of the US PGM Operations Technical Report Summary.
96.7 Technical Report Summary of Keliber Lithium Project, page 66
| 4. | The report should include conversions and explanations of conversions associated with lithium content and lithium quantities, such as Li%, Li2O, lithium carbonate equivalent (LCE), and lithium hydroxide (LiOH). |
Response:
The Company respectfully acknowledges the Staff’s comment and submits that it will include the relevant lithium conversions currently disclosed on pages IR–124 and R&R–12, 15, 17, 38, 99, 100 of the 2022 Form 20-F in future filings of the technical report summary for the Keliber property (the “Keliber Technical Report Summary”) in order to comply with the disclosure requirements set out under Item 601(b)(96)(iii)(B)(11)(vi) of Regulation S-K.
Page 2 of 15
In Appendix C, the Company has reproduced the Executive Summary of the Keliber Technical Report Summary for the fiscal year ended December 31, 2022 (the “2022 Keliber Technical Report Summary”) with its indicative additions to be made in future filings of the Keliber Technical Report Summary highlighted in yellow.
| 5. | The disclosure in Table 12-2 on page 149, indicating the total ore production is expected to be 12.5 million tonnes, and the disclosure in Table 11-9 on page 144, indicating the declared mineral reserve is 8.20 million tonnes, should be modified as necessary to clarify or resolve this apparent inconsistency. |
Response:
The Company confirms that the disclosure of 12.5 million tonnes of total ore production in Table 12.2 is a typological error and that it will ensure such presentation of attributable Mineral Reserves is corrected in future filings of the Keliber Technical Report Summary. The Company submits that total attributable Mineral Reserves of 8.2Mt is correctly presented in the 2022 Keliber Technical Report Summary on pages xiii (Executive Summary) and 144 (Table 11-9) and in the 2022 Form 20-F on pages IR-124; R&R-14 and R&R-100.
In Appendix C, the Company has reproduced Table 12.2 of the 2022 Keliber Technical Report Summary with indicative revisions to be made in future filings of the Keliber Technical Report Summary highlighted in yellow.
| 6. | The disclosure on page 207, indicating there is demand for the 4.5% spodumene concentrate in Europe even though it is not a typical product, should be expanded to include further details of the market studies that were performed relative to demand and pricing to comply with Item 601(b)(96)(iii)(B)(16) of Regulation S-K. |
Response:
The Company respectfully acknowledges the Staff’s comment and confirms that it will include further details of the Wood Mackenzie (2021) market study (the “Wood Mackenzie Report”) and Fastmarkets (March 2022) market study (the “Fastmarkets Report”) from which spodumene concentrate demand information is derived in future filings of the Keliber Technical Report Summary. Further, the Company will amend Section 23.1 in future filings of the Keliber Technical Report Summary to include the Wood Mackenzie Report and Fastmarkets Report to the list of documents provided in connection with the preparation of the Keliber Technical Report Summary.
In Appendix C, the Company has reproduced the relevant paragraph of Section 18 and Section 23.1 of the 2022 Keliber Technical Report Summary with indicative additions to be made in future filings of the Keliber Technical Report Summary highlighted in yellow.
| 7. | The disclosure on page 208 indicates that cash flows presented in Table 18-2 and Table 18-3 include underground tonnes that are not in the declared mineral reserve. However, the volumes underlying the economic analysis of a feasibility or preliminary feasibility study should be limited to the estimated mineral reserves based on the guidance in Item 1302(e)(3) and 1302(e)(6) of Regulation S-K. The economic analysis and estimated reserves should be revised as necessary to adhere to these requirements. |
Response:
The Company respectfully acknowledges the Staff’s comment and confirms that it will remove Table 18-2 and Table 18-3 in future filings of the Keliber Technical Report.
Page 3 of 15
The Company notes that Keliber is an integrated project consisting of two parts, the mine and concentrator (“Mine and Concentrator”) and the lithium hydroxide refinery (the “Refinery”). The Refinery, which is currently under construction, will utilize newly developed lithium processing methods which have not been commercialized to date. As a result, the Company is required to exclude mineral reserves and resources derived from the Refinery pursuant to the requirements of Item 1302 of Regulation S-K. Table 18-1 provides a financial summary of the Mine and Concentrator portion of the project which supports the reserves declaration, and excludes underground tonnes derived from the Refinery. The disclosure provided in Tables 18-2 and 18-3 were intended to provide a fulsome presentation to investors and regulators of the integrated project in addition to the required data furnished in Table 18-1.
The Company will remove such tables in future filings of the Keliber Technical Report. In Appendix C, the Company has reproduced the relevant Tables 18-2 and 18-3 of the 2022 Keliber Technical Report Summary with its proposed deletions highlighted in orange.
*****
If you have any questions or further comments, please contact me at your earliest convenience at +27 11 278 9700.
Sincerely,
| /s/ Charl Keyter |
Charl Keyter
Chief Financial Officer
Sibanye Stillwater Limited
| cc: | Jacques le Roux, Sibanye Stillwater Limited Robert Van Niekerk, Sibanye Stillwater Limited Stephan Stander, Sibanye Stillwater Limited Jeffrey Cohen, Linklaters LLP Igor Rogovoy, Linklaters LLP Lance Tomlinson, Ernst & Young Inc. |
Page 4 of 15
Appendix A
Illustration of proposed changes to 2023 20-F
Proposed additions “Fundamental Notes” to Mineral Reserves and Mineral Resources Summary on page R&R-17
Proposed addition in yellow.
FUNDAMENTAL NOTES
| 1 | This Mineral Resources and Mineral Reserves Report for Sibanye-Stillwater covers a full description of all of the Group’s mineral property assets, as at 31 December 2022. | |
| 2 | The Mineral Resource and Mineral Reserve estimates are reported effective as at 31 December 2022 and year-on-year comparisons may be impacted by variations in commodity prices, currency exchange rates, legislation, permitting changes, costs and operating performance. | |
| 3 | All stated Mineral Resource and Mineral Reserve estimates are net of 12 month’s production depletion since 31 December 2021. The depletion applied to the managed operations includes the actual measured depletion up until end of September 2022, while the remaining depletion is estimated up to 31 December 2022. | |
| 4 | Mineral Resource and Mineral Reserve price assumptions for non-managed properties vary from those used for the managed operations. In those cases, the reader is directed to the notes provided below the estimation tables for detailed information. | |
| 5 | South African PGM operations Mineral Resource and Mineral Reserve reporting accounts for four elements (4E) of the basket of PGMs and gold (platinum, palladium, rhodium and gold), while the US PGM operations Mineral Resource and Mineral Reserve reporting only accounts for two elements (2E) of PGMs ( palladium and platinum). Other associated precious metals – such as iridium, ruthenium (SA PGM), gold and silver (US PGM) – occur in low concentrations and are generally not material to the estimations or calculations. The base metals (copper, nickel, cobalt and chromium) are also extracted as by-products in conjunction with these PGMs. These are not reported on individually, but their average concentrations in the various ores are provided as guidelines. Mineral Reserve and Mineral Resource economic calculations are based on a basket price taking into consideration all metals extracted and recovered. | |
| 6 | In line with industry practice, Lithium (Li) Mineral Resources and Mineral Reserves total metal content is quoted in Lithium Carbonate (Li2CO3) Equivalent (LCE), which is one of the final products produced in the lithium mining value chain. LCE is derived from in-situ Li content by multiplying by a factor of 5.323. Lithium Hydroxide Monohydrate (LiOH.H2O) can be derived from LCE by dividing by a factor of 0.88 | |
| 7 | No Inferred Mineral Resources have been included in any of the economic studies for the reporting of Mineral Reserves. | |
| 8 | Detailed financial models are used to estimate the Mineral Reserves. All modifying factors applied are all-inclusive from mine to mill. Mineral Reserves are reported as tonnes and contained metal reporting to the mill, with the exception of Lithium and Boron, where equivalent final produced product is included as well. | |
| 9 | All Mineral Resources are declared in in-situ tonnes with the exception of TSF (Tailings Storage Facility) resources, which are declared as dry tonnes in place. | |
| 10 | Attributable Mineral Resources and Mineral Reserves are reported on a legal, equity interest basis, considering both direct (project level) and indirect (holding entity level) interests, and also include indirect holdings via subsidiaries and treasury shares. In addition, the full (100% basis) Mineral Resources and Mineral Reserves for each property are also provided for full transparency. | |
| 11 | Rounding-off of figures in this report may result in minor computational discrepancies. Where this occurs, it is not deemed significant and reflects the level of accuracy of the estimate. | |
| 12 | All references to tonnes (t) are in metric units. |
Page 5 of 15
Appendix B
Amendments to Exhibit 96.1 – US PGM Operations Technical Report Summary
Proposed Table 63 in future filings of the US PGM Operations Technical Report Summary.
The forecasts below are provided as of the date of the 2021 US PGM Operations Technical Report Summary. Please note, non-material changes in such forecasts have occurred since the filing. In the event there is a material change to the 2021 US PGM Operations Technical Report Summary, an updated US PGM Operations Technical Report Summary will be filed.
Page 6 of 15
Page 7 of 15

Page 8 of 15

Page 9 of 15
Appendix C
Amendments to Exhibit 96.7 – Keliber Lithium Project Technical Report Summary
SEC Comment 4
Proposed new Section ES10: Conversions (page xiii of Keliber Technical Report Summary)
Proposed additions in yellow.
| ES9: | Mineral Reserve Estimates Sibanye-Stillwater announced on 28 November 2022, subsequent to securing an effective controlling interest of 84.96% in Keliber as announced on 3 October 2022, the approval of capital expenditure of EUR 588m for the Keliber Lithium Project, beginning with the construction of the Keliber Lithium Hydroxide Refinery at Kokkola. Based on the Project FS completed during February 2022 and updated in October 2022 confirmed the robust economics of the Keliber Lithium Project at hydroxide prices significantly lower than the average prevailing spot prices over the previous 12 months. The open pit Mineral Reserves for the Keliber operations are summarised in Table ES- 5. The Mineral Reserves are based on the Modifying Factors discussed in the previous sections and the attributable interest of Sibanye-Stillwater in Keliber.
Table ES- 5: Mineral Reserve Statement for Keliber Oy operations as at 31 December 2022 |
| Classification | Deposit | Mass (Mt) | Li grade (%) | LCE content (kt) |
| Proven | Syväjärvi | 1.3 | 0.5 | 37.2 |
| Rapasaari | 1.8 | 0.5 | 44.1 | |
| Länttä | 0.2 | 0.5 | 4.2 | |
| Total Proven | 3.3 | 0.5 | 85.4 | |
| Probable | Syväjärvi | 0.5 | 0.4 | 10.3 |
| Rapasaari | 4.1 | 0.4 | 89.0 | |
| Länttä | 0.1 | 0.5 | 2.1 | |
| Outovesi | 0.2 | 0.6 | 6.7 | |
| Total Probable | 4.9 | 0.4 | 108.2 | |
| Total Mineral Reserve | 8.2 | 0.4 | 193.6 |
Notes:
| 1. | Cut-off for open pit reserves 0.40% Li2O |
| 2. | Price EUR23 667/t LiOH.H2O |
| 3. | Measured material converted to Proven |
| 4. | Indicated Material Converted to Probable |
| 5. | No Inferred material included in the Mineral Reserve |
| 6. | The Rapasaari Mining permit has been granted but is under appeal |
ES10: Conversions
In line with industry practice, Lithium (Li) Mineral Resources and Mineral Reserves total metal content is quoted in Lithium Carbonate (Li2CO3) Equivalent (LCE), which is one of the final products produced in the lithium mining value chain. LCE is derived from in-situ Li content by multiplying by a factor of 5.323. Lithium Hydroxide Monohydrate (LiOH.H2O) can be derived from LCE by dividing by a factor of 0.88. Li has been derived from Li2O by multiplying by a factor of 0.464.
ES11: Infrastructure
Preparations are underway to construct the infrastructure, which will consist of a concentrator, a lithium hydroxide refinery and four open pit mines, together with access roads, power transmission lines, main electrical substations, electrical distribution, security, weighbridges, offices, laboratories, workshops, crushing units and internal roads.
Page 10 of 15
SEC Comment 5
Proposed amends to Table 12.2 (page 149 of Keliber Technical Report Summary)
Proposed additions in yellow and proposed deletions are shaded in orange.
Table 12-2: Keliber Lithium Project production summary(1)
| Site | Total (Mt) | Ore Production (Mt) | Stripping Ratio | Li2O (%) | Life-of-mine |
| Syväjärvi OP | 12.45 | 2.12 | 5.00 | 1.068 | Apr 2025 to July 2028 |
| Rapasaari OP | 63.49 | 7.01 | 8.23 | 0.901 | Jun 2026 to Dec 2037 |
| Länttä OP | 2.09 | 0.28 | 6.33 | 0.886 | Sep 2038 to Mar 2039 |
| Outovesi OP | 2.56 | 0.24 | 9.67 | 1.331 | Apr 2039 to Feb 2040 |
| Total | 80.59 | 9.65 | 5.76 | 0.911 | Apr 2025 to Nov 2041 |
| Note |
| 1. 100% of open cast mill feed. Attributable Reserves of 84.96%. |
SEC Comment 6
Proposed amends to Section 18 (page 207 of Keliber Technical Report Summary)
Proposed additions in yellow.
Plant recovery is a critical success factor. The factors that drive recovery are discussed in detail in the mining and processing sections and are not repeated here. The financial performance is reliant on the efficiency of the ore sorting, both through removal of waste and ensuring that there is no loss of contained lithium.
During the period when Keliber is operating as a vertically-integrated Mine, Concentrator and Refinery, the concentrate grade will be adjusted to optimised the overall economics. In this hypothetical case, a concentrate grade has been estimated to feed into the third-party concentrate market. Although a 4.5% spodumene concentrate is not a typical product, according to Wood Mackenzie (2021) and Fastmarkets March (2022), there is a demand for this product in Europe and this particular concentrate is appealing to glass manufacturers due to the low iron content. The potential premiums for the product and the low impurities are considered to offset the discount that could be applied for the lower product concentration (25% reduction).
The spodumene concentrate grade can be increased to 6% but this would introduce other uncertainties given that the detailed work has been done on the 4.5%, which is considered optimal for the integrated business.
The feed to the plant is driven by the production from the open pit sources. No changes have been made to the DFS schedules developed, the underground tonnes have just been omitted from the schedule. This is obviously not optimal but, absent a specific study to confirm new numbers, it is not possible to be certain that a new schedule would be achievable.
The concentrate production is as per the detailed DFS financial model but limited to the open pit ore. This directly drives the revenue along with the forecast price. The costs are based on the DFS but adjusted to reflect the lower tonnages for the periods where the underground tonnes are excluded.
The economic analysis is inherently a forward-looking exercise. These estimates rely upon a range of assumptions and forecasts that are subject to change depending upon macro-economic conditions, operating strategy and new data collected through future operations. The economic assessment described here is premised on a prefeasibility study that exploits only Mineral Reserves. There is no certainty that this economic assessment will be realized.
Page 11 of 15
The final cash flows presented are summarised cash flows. Detailed analysis of the mining and processing costs are presented in the respective sections.
Proposed additions to Section 23.1 - Documents provided by the Company (page 225 of Keliber Technical Report Summary)
Proposed additions in yellow.
23.1 Documents provided by the Company
Afry Finland Oy. (2021). Keliber Lithium Project – Definitive Feasibility Study Site Water Management Plan. Project ID: 101016050-003.
Alviola, R., Mänttari, I., Mäkitie, H. and Vaasjoki, M. (2001). Svecofennian rare-element granitic pegmatites of the Ostrobothnian region, Western Finland; their metamorphic environment and time of intrusion. Special paper 30:9- 29," Geological Survey of Finland, GTK, 2001.
Ahtola, T. (ed.), Kuusela, J., Käpyaho, A. & Kontoniemi, O. (2015). Overview of lithium pegmatite exploration in the Kaustinen area in 2003–2012. Geological Survey of Finland, Report of Investigation 20, 28 pages, 14 figures and 7 tables.
Bradley, D., and McCauley, A. (2016). A Preliminary Deposit Model for Lithium-Cesium-Tantalum.
Černý, P. and Ercit, T. S., (2005). The Classification of Granitic Pegmatites Revisited. The Canadian Mineralogist
43: 2005–26.
Fastmarkets. (2022). Lithium Market Study (Independent verification Study). March 2022.
Hatch (2019). Keliber Lithium Project Definitive Feasibility Study Report. p.64.
Hills, V. (2022). Email from Vic Hills to Andrew van Zyl and others, dated 07 February 2022.
Keliber (2022) Keliber_Economic_Model_v2.5.1_LoMvDFS21_SSW adjustments (ID 36372) RSa 18122022.xlsx Keliber (2023a), Email from Lassi Lammassaari entitled SRK SA:n tietopyyntö, 3 March 2023
London, D. (2016). Rare-Element Granitic Pegmatites. In. Reviews in Economic Geology v.18. pp 165-193. Society of Economic Geologists 2016
Pöyry Finland Oy. (2017).Preliminary Slope Design Study of Syväjärvi, Rapasaari, Länttä and Outovesi deposits.
Pöyry Finland Oy. (2018). Rock mechanical investigation of the Syväjärvi and Rapasaari Li-deposits. 13 November 2018. Project number 101009983-001. Confidential. 35pp.
Pöyry Finland Oy, (2019). Rock mechanical investigation of the Emmes and Outovesi Li deposits. Pöyry Finland Oy. (2019a). Rock mechanical investigation of the Länttä Li-deposit.
SRK Consulting (Finland) Oy ("SRK Finland"). (2015). Syväjärvi Pit, Geotechnical Slope Design. September 2015. Project number FI626. 24pp.
Vaasjoki, M., Korsman, K. & Koistinen, T. (2005). Overview. In: Precambrian geology of Finland: key to the evolution of the Fennoscandian Shield. Developments in Precambrian geology 14. Amsterdam: Elsevier, 1–17.
Wood Mackenzie. (2021). 2021 Lithium Market Study for Kaustinen/Kokkola DFS. 20 December 2021.
WSP Global Inc. (WSP) (2022). Keliber Lithium Project Definitive Feasibility Study Report.
WSP Global Inc. (2022a). Keliber Lithium Project. Definitive Feasibility Study Report. Volume 1: Executive Summary. Final. 1st February 2022. Confidential. 62pp.
Page 12 of 15
WSP Global Inc. (2022b). Keliber Lithium Project. Definitive Feasibility Study Report. Volume 2: Chapters 2-12. Draft. 11 January 2022. Confidential. 108pp.
WSP Global Inc. (2022c). Keliber Lithium Project. Definitive Feasibility Study Report. Volume 3: Chapters 13-17. Draft. 18 January 2022. Draft. Confidential. 411pp.
WSP Global Inc. (2022d). Keliber Lithium Project. Definitive Feasibility Study Report. Volume 4: Chapters 18-19. Draft. January 2022. Confidential. 255pp.
WSP Global Inc. (2022e). Keliber Lithium Project. Definitive Feasibility Study Report. Volume 5: Chapter 20. Draft. January 2022. Confidential. 114pp.
WSP Global Inc. (2022f). Keliber Lithium Project. Definitive Feasibility Study Report. Volume 6: Chapters 21-26. Draft. 27 January 2022. Confidential. 91pp.
WSP Global Inc. (2022g). Keliber Lithium Project. Definitive Feasibility Study Report. Volume 7: Appendices List. Draft. 11February 2022. Confidential. 1pp.
Page 13 of 15
SEC Comment 7
Proposed deletions of tables 18-2 and 18.3 (page 210 and 211 of Keliber Technical Report Summary)
Proposed deletions are shaded in orange.
| Table 18-2: Integrated Mine, Concentrator and Refinery 2023 to 2035 |
| Description | Total | 2023 | 2024 | 2025 | 2026 | 2027 | 2028 | 2029 | 2030 | 2031 | 2032 | 2033 | 2034 | 2035 |
| Tonnes milled (kt) | 12 503 | - | - | 472 | 718 | 700 | 735 | 755 | 692 | 718 | 779 | 816 | 827 | 821 |
| Lithium hydroxide produced (kt) | 316 | - | - | 1 | 7 | 13 | 16 | 16 | 16 | 16 | 16 | 16 | 15 | 14 |
| Revenue (EURm) | ||||||||||||||
| Lithium (Hydroxide) | 5453 | 0 | 0 | 22 | 169 | 210 | 273 | 273 | 273 | 273 | 273 | 273 | 263 | 245 |
| Heat | 30 | 0.0 | 0.0 | 0.2 | 1.4 | 1.4 | 1.4 | 1.4 | 1.4 | 1.4 | 1.4 | 1.4 | 1.4 | 1.4 |
| Total Revenue | 5 483 | 0 | 0 | 22 | 170 | 211 | 275 | 275 | 275 | 275 | 275 | 275 | 264 | 246 |
| Costs (EURm) | ||||||||||||||
| Landowner Payments (Fees) | 12 | 0.2 | 0.3 | 0.6 | 0.7 | 0.8 | 0.8 | 0.8 | 0.7 | 0.7 | 0.5 | 0.5 | 0.5 | 0.5 |
| Central Allocated Costs (Total SG&A) | 201 | 4.1 | 5.1 | 8.5 | 8.7 | 8.5 | 8.5 | 8.5 | 8.5 | 8.5 | 8.5 | 8.5 | 8.5 | 8.5 |
| Processing | 206 | - | - | 1.9 | 10.0 | 10.0 | 10.0 | 10.0 | 10.0 | 10.0 | 10.0 | 10.0 | 10.0 | 10.0 |
| Mining Costs | 410 | - | - | 9.1 | 19.3 | 18.7 | 18.1 | 17.6 | 19.8 | 21.3 | 32.8 | 39.2 | 32.3 | 19.3 |
| Stores (Loading & Transport; Transport & Packing) | 53 | - | - | 0.1 | 1.2 | 2.1 | 2.7 | 2.7 | 2.7 | 2.7 | 2.7 | 2.7 | 2.6 | 2.4 |
| Sundries (Other Variable Costs & Other Operating Costs) | 25 | - | - | 0.3 | 1.4 | 1.4 | 1.5 | 1.5 | 1.5 | 1.5 | 1.5 | 1.5 | 1.4 | 1.4 |
| Metallurgy (Conversion, Lithium Hydroxide Plant & LHP Water Treatment) | 735 | - | - | 2.3 | 20.1 | 30.4 | 36.8 | 36.8 | 36.8 | 36.8 | 36.8 | 36.8 | 35.7 | 33.7 |
| Processing Costs (Crushing & Sorting; Concentrator; Concentrator Water Treatment; Concentrate Purchase) | 942 | - | - | 1.2 | 10.4 | 11.9 | 11.9 | 11.0 | 10.0 | 10.1 | 10.6 | 11.0 | 11.2 | 11.2 |
| Lithium Hydroxide Shipment to Antwerp | 20 | - | - | 0.0 | 0.5 | 0.8 | 1.0 | 1.0 | 1.0 | 1.0 | 1.0 | 1.0 | 1.0 | 0.9 |
| Total Working Costs | 2 604 | 4 | 5 | 24 | 72 | 85 | 91 | 90 | 91 | 93 | 104 | 111 | 103 | 88 |
| Revenue less Total Working Costs | 2 879 | -4 | -5 | - 2 | 98 | 126 | 183 | 185 | 184 | 182 | 170 | 163 | 161 | 158 |
| Renewals and Replacements | 165 | - | 2.1 | 13.8 | 36.0 | 13.8 | 7.7 | 4.5 | 14.1 | 2.3 | 9.6 | 4.3 | 4.1 | 5.7 |
| Allocated Capital Expenditure | 516 | 259.9 | 227.5 | 28.6 | - | - | - | - | - | - | - | - | - | - |
| Total Capital Expenditure | 681 | 260 | 230 | 42 | 36 | 14 | 8 | 5 | 14 | 2 | 10 | 4 | 4 | 6 |
| Revenue less Total Working Costs and Capital | 2 197 | -264 | -235 | -44 | 62 | 113 | 176 | 180 | 170 | 180 | 161 | 159 | 157 | 153 |
| Total Other Expenditure | - | - | - | - | - | - | - | - | - | - | - | - | - | - |
| Operating Profit before Taxes | 2 197 | -264 | -235 | -44 | 62 | 113 | 176 | 180 | 170 | 180 | 161 | 159 | 157 | 153 |
| Royalties | 6.3 | - | - | 0.2 | 0.4 | 0.3 | 0.4 | 0.4 | 0.3 | 0.4 | 0.4 | 0.4 | 0.4 | 0.4 |
| Taxation | 568 | - | - | - | 10.3 | 25.2 | 36.6 | 36.9 | 36.7 | 36.3 | 34.0 | 32.6 | 32.1 | 31.6 |
| Free Cash Flow | 1 624 | -264 | -235 | -44 | 52 | 87 | 139 | 143 | 133 | 143 | 126 | 126 | 124 | 121 |
| NPV | 254 |
Page 14 of 15
| Table 18-3: Integrated Mine, Concentrator and Refinery 2035 to 2047 |
| Description | 2036 | 2037 | 2038 | 2039 | 2040 | 2041 | 2042 | 2043 | 2044 | 2045 | 2046 | 2047 |
| Tonnes milled (kt) | 822 | 833 | 831 | 752 | 723 | 511 | ||||||
| Lithium hydroxide produced (kt) | 14 | 13 | 14 | 15 | 12 | 6 | 16 | 16 | 16 | 16 | 16 | 16 |
| Revenue (EURm) | ||||||||||||
| Lithium (Hydroxide) | 275 | 244 | 264 | 291 | 241 | 124 | 311 | 311 | 311 | 311 | 311 | 311 |
| Heat | 1.4 | 1.4 | 1.4 | 1.4 | 1.4 | 1.4 | 1.4 | 1.4 | 1.4 | 1.4 | 1.4 | 1.4 |
| Total Revenue | 276 | 246 | 266 | 293 | 243 | 125 | 312 | 312 | 312 | 312 | 312 | 312 |
| Costs (EURm) | ||||||||||||
| Landowner Payments (Fees) | 0.5 | 0.7 | 0.6 | 0.6 | 0.6 | 0.5 | 0.3 | 0.2 | 0.2 | 0.2 | 0.2 | 0.2 |
| Central Allocated Costs (Total SG&A) | 8.5 | 8.5 | 8.5 | 8.5 | 8.5 | 8.5 | 7.9 | 7.9 | 7.9 | 7.9 | 7.9 | 7.9 |
| Labour (Processing) | 10.0 | 10.0 | 10.0 | 10.0 | 10.0 | 9.8 | 7.3 | 7.3 | 7.3 | 7.3 | 7.3 | 7.3 |
| Other (Mining Costs) | 28.4 | 31.8 | 30.0 | 32.0 | 23.0 | 17.2 | - | - | - | - | - | - |
| Stores (Loading & Transport; Transport & Packing) | 2.4 | 2.1 | 2.3 | 2.5 | 2.1 | 1.2 | 2.7 | 2.7 | 2.7 | 2.7 | 2.7 | 2.7 |
| Sundries (Other Variable Costs & Other Operating Costs) | 1.4 | 1.4 | 1.4 | 1.4 | 1.4 | 1.3 | 0.3 | 0.3 | 0.3 | 0.3 | 0.3 | 0.3 |
| Metallurgy (Conversion, Lithium Hydroxide Plant & LHP Water Treatment) | 33.4 | 30.4 | 32.3 | 34.9 | 30.1 | 18.7 | 35.4 | 35.4 | 35.4 | 35.4 | 35.4 | 35.4 |
| Processing Costs (Crushing & Sorting; Concentrator; Concentrator Water Treatment; Concentrate Purchase) | 11.3 | 11.5 | 11.5 | 9.8 | 8.7 | 16.3 | 127.1 | 127.1 | 127.1 | 127.1 | 127.1 | 127.1 |
| Lithium Hydroxide Shipment to Antwerp | 0.9 | 0.8 | 0.9 | 0.9 | 0.8 | 0.4 | 1.0 | 1.0 | 1.0 | 1.0 | 1.0 | 1.0 |
| Total Working Costs | 97 | 98 | 101 | 85 | 74 | 182 | 182 | 182 | 182 | 182 | 182 | 97 |
| Revenue less Total Working Costs | 119 | 136 | 157 | 128 | 36 | 93 | 93 | 93 | 93 | 93 | 93 | 146 |
| Renewals and Replacements | 7.5 | 8.0 | 8.7 | 3.1 | 3.2 | 3.8 | 2.3 | 1.2 | 1.2 | 1.2 | 1.2 | 5.9 |
| Total Capital Expenditure | 8 | 8 | 9 | 3 | 3 | 4 | 2 | 1 | 1 | 1 | 1 | 6 |
| Revenue less Total Working Costs and Capital | 111 | 128 | 148 | 125 | 33 | 89 | 91 | 92 | 92 | 92 | 92 | 140 |
| Total Other Expenditure | - | - | - | - | - | - | - | - | - | - | - | - |
| Operating Profit before Taxes | 111 | 128 | 148 | 125 | 33 | 89 | 91 | 92 | 92 | 92 | 92 | 140 |
| Royalties | 0.4 | 0.4 | 0.4 | 0.4 | 0 | - | - | - | - | - | - | 0.4 |
| Taxation | 23.7 | 27.1 | 31.2 | 25.6 | 7 | 19 | 19 | 19 | 19 | 19 | 19 | 29.2 |
| Free Cash Flow | 87 | 101 | 116 | 99 | 26 | 70 | 72 | 73 | 73 | 73 | 73 | 111 |
Page 15 of 15