Exhibit 99.1

JOHANNESBURG, 3 March 2022: Sibanye Stillwater Limited (Sibanye-Stillwater or the Group) (JSE: SSW and NYSE: SBSW) is pleased to report operating and financial results for the six months ended 31 December 2021, and reviewed condensed consolidated provisional financial statements for the year ended 31 December 2021.
SALIENT FEATURES FOR THE SIX MONTHS AND YEAR ENDED 31 DECEMBER 2021
•Record financial results:
–Profit attributable to owners of Sibanye-Stillwater increased by 13% to R33.1 bn (US$2.2 bn) from R29.3 bn (US$1.8 bn) for 2020
–Headline earnings for the year increased by 27% to R36.9 bn (US$2.5 bn) from R29.1 bn (US$1,8 bn) for 2020
•Solid operational performance with all operating segments achieving annual production guidance
•SA PGMs achieved lower AISC of R16,982/4Eoz (US$1,148/4Eoz), against industry trends. Consolidation synergy cost benefits continue
•19% increase in net cashflow from operating activities to R32.3 bn (US$2.2 bn) and an 88% increase in adjusted Free Cash Flow to R37.4 bn (US$2.5 bn)
•Strong balance sheet: net cash increased further to R11.5 bn (US$719 m) on 31 December 2021
•Final dividend of R5,3 bn (US$342 m) or 187cps (US48.68 cents per ADR). Full year dividend yield of 9.8%*
•Significant progress made on green metals strategy. Strategic positions secured in key jurisdictions
•Commenced with project capital expenditure on K4, Burnstone and Klipfontein projects for future operational sustainability
•BioniCCubE – new innovation and market development fund (R&D fund) approved
* Based on the closing share price of R49.10 for the year end 31 December 2021
| US dollar | SA rand | |||||||||||||||||||||||||||||||||||||||||||
| Year ended | Six months ended | Six months ended | Year ended | |||||||||||||||||||||||||||||||||||||||||
| Dec 2020 | Dec 2021 | Dec 2020 | Jun 2021 | Dec 2021 | KEY STATISTICS | Dec 2021 | Jun 2021 | Dec 2020 | Dec 2021 | Dec 2020 | ||||||||||||||||||||||||||||||||||
| UNITED STATES (US) OPERATIONS | ||||||||||||||||||||||||||||||||||||||||||||
PGM underground operations1,2 | ||||||||||||||||||||||||||||||||||||||||||||
| 603,067 | 570,400 | 305,327 | 298,301 | 272,099 | oz | 2E PGM production2 | kg | 8,463 | 9,278 | 9,497 | 17,741 | 18,758 | ||||||||||||||||||||||||||||||||
| 1,906 | 2,097 | 1,970 | 2,286 | 1,913 | US$/2Eoz | Average basket price | R/2Eoz | 28,755 | 33,261 | 32,026 | 31,021 | 31,373 | ||||||||||||||||||||||||||||||||
| 741 | 727 | 409 | 437 | 290 | US$m | Adjusted EBITDA3 | Rm | 4,408 | 6,358 | 6,661 | 10,766 | 12,205 | ||||||||||||||||||||||||||||||||
| 61 | 59 | 63 | 65 | 51 | % | Adjusted EBITDA margin3 | % | 51 | 65 | 63 | 59 | 61 | ||||||||||||||||||||||||||||||||
| 874 | 1,004 | 882 | 973 | 1,039 | US$/2Eoz | All-in sustaining cost4 | R/2Eoz | 15,619 | 14,153 | 14,342 | 14,851 | 14,385 | ||||||||||||||||||||||||||||||||
PGM recycling1,2 | ||||||||||||||||||||||||||||||||||||||||||||
| 840,170 | 755,148 | 442,698 | 402,872 | 352,276 | oz | 3E PGM recycling2 | kg | 10,957 | 12,531 | 13,769 | 23,488 | 26,132 | ||||||||||||||||||||||||||||||||
| 2,237 | 3,515 | 2,236 | 3,159 | 3,932 | US$/3Eoz | Average basket price | R/3Eoz | 59,098 | 45,963 | 36,357 | 51,987 | 36,821 | ||||||||||||||||||||||||||||||||
| 54 | 101 | 27 | 50 | 51 | US$m | Adjusted EBITDA3 | Rm | 757 | 733 | 420 | 1,490 | 878 | ||||||||||||||||||||||||||||||||
| 3 | 4 | 4 | 4 | 4 | % | Adjusted EBITDA margin3 | % | 4 | 4 | 4 | 4 | 3 | ||||||||||||||||||||||||||||||||
| 11 | 21 | 7 | 12 | 9 | US$m | Net interest received | Rm | 144 | 171 | 113 | 315 | 181 | ||||||||||||||||||||||||||||||||
| 65 | 122 | 34 | 62 | 60 | US$m | Profit before tax | Rm | 899 | 903 | 531 | 1,802 | 1,054 | ||||||||||||||||||||||||||||||||
| SOUTHERN AFRICA (SA) OPERATIONS | ||||||||||||||||||||||||||||||||||||||||||||
PGM operations2 | ||||||||||||||||||||||||||||||||||||||||||||
| 1,526,372 | 1,836,138 | 895,459 | 894,165 | 941,973 | oz | 4E PGM production2,5 | kg | 29,299 | 27,812 | 27,852 | 57,110 | 47,475 | ||||||||||||||||||||||||||||||||
| 2,227 | 3,182 | 2,396 | 3,686 | 2,696 | US$/4Eoz | Average basket price | R/4Eoz | 40,517 | 53,629 | 38,954 | 47,066 | 36,651 | ||||||||||||||||||||||||||||||||
| 1,765 | 3,490 | 1,221 | 2,154 | 1,336 | US$m | Adjusted EBITDA3 | Rm | 20,270 | 31,338 | 20,025 | 51,608 | 29,074 | ||||||||||||||||||||||||||||||||
| 53 | 61 | 60 | 66 | 54 | % | Adjusted EBITDA margin3 | % | 54 | 66 | 60 | 61 | 53 | ||||||||||||||||||||||||||||||||
| 1,081 | 1,148 | 1,053 | 1,163 | 1,134 | US$/4Eoz | All-in sustaining cost4 | R/4Eoz | 17,037 | 16,921 | 17,123 | 16,982 | 17,792 | ||||||||||||||||||||||||||||||||
| Gold operations | ||||||||||||||||||||||||||||||||||||||||||||
| 982,559 | 1,072,934 | 578,939 | 518,848 | 554,086 | oz | Gold produced | kg | 17,234 | 16,138 | 18,007 | 33,372 | 30,561 | ||||||||||||||||||||||||||||||||
| 1,747 | 1,787 | 1,850 | 1,792 | 1,780 | US$/oz | Average gold price | R/kg | 860,303 | 838,088 | 967,229 | 849,703 | 924,764 | ||||||||||||||||||||||||||||||||
| 471 | 346 | 371 | 162 | 184 | US$m | Adjusted EBITDA3 | Rm | 2,762 | 2,351 | 6,087 | 5,113 | 7,771 | ||||||||||||||||||||||||||||||||
| 28 | 18 | 36 | 18 | 18 | % | Adjusted EBITDA margin3 | % | 18 | 18 | 36 | 18 | 28 | ||||||||||||||||||||||||||||||||
| 1,406 | 1,689 | 1,347 | 1,691 | 1,685 | US$/oz | All-in sustaining cost4 | R/kg | 814,347 | 791,171 | 704,355 | 803,260 | 743,967 | ||||||||||||||||||||||||||||||||
| GROUP | ||||||||||||||||||||||||||||||||||||||||||||
| 1,782 | 2,234 | 1,220 | 1,707 | 527 | US$m | Basic earnings | Rm | 8,218 | 24,836 | 19,927 | 33,054 | 29,312 | ||||||||||||||||||||||||||||||||
| 1,771 | 2,493 | 1,209 | 1,707 | 787 | US$m | Headline earnings | Rm | 12,045 | 24,833 | 19,785 | 36,878 | 29,146 | ||||||||||||||||||||||||||||||||
| 2,998 | 4,639 | 2,008 | 2,787 | 1,852 | US$m | Adjusted EBITDA3 | Rm | 28,057 | 40,549 | 32,871 | 68,606 | 49,385 | ||||||||||||||||||||||||||||||||
| 16.46 | 14.79 | 16.26 | 14.55 | 15.03 | R/US$ | Average exchange rate using daily closing rate | ||||||||||||||||||||||||||||||||||||||
Sibanye-Stillwater Operating and financial results | Six months and year ended 31 December 2021 1
Previously, the level of rounding applied in the Group’s condensed consolidated provisional financial statements included a decimal for the nearest hundred thousand. During the year ended 31 December 2021, the Group changed the level of rounding to only reflect the nearest million by removing the hundred thousand decimal space. Immaterial rounding adjustments were made to comparative information as a result of this change.
1The US PGM operations’ underground production is converted to metric tonnes and kilograms, and performance is translated to SA rand (rand). In addition to the US PGM operations’ underground production, the operation treats recycling material which is excluded from the 2E PGM production, average basket price and All-in sustaining cost statistics shown. PGM recycling represents palladium, platinum, and rhodium ounces on spent autocatalysts fed to the furnace
2The Platinum Group Metals (PGM) production in the SA operations is principally platinum, palladium, rhodium and gold, referred to as 4E (3PGM+Au), and in the US operations is principally platinum and palladium, referred to as 2E (2PGM) and US PGM recycling is principally platinum, palladium and rhodium referred to as 3E (3PGM)
3The Group reports adjusted earnings before interest, taxes, depreciation and amortisation (EBITDA) based on the formula included in the facility agreements for compliance with the debt covenant formula. Adjusted EBITDA may not be comparable to similarly titled measures of other companies. Adjusted EBITDA is not a measure of performance under IFRS and should be considered in addition to and not as a substitute for other measures of financial performance and liquidity. For a reconciliation of profit/loss before royalties and tax to adjusted EBITDA, see note 11.1 of the condensed consolidated provisional financial statements. Adjusted EBITDA margin is calculated by dividing adjusted EBITDA by revenue
4See “Salient features and cost benchmarks” sections for the definition of All-in sustaining cost (AISC) and the “Reconciliation of AISC and AIC excluding third party PoC for Total US and SA PGM, Total SA PGM and Marikana” sections
5The SA PGM production excludes the production associated with the purchase of concentrate (PoC) from third parties. For a reconciliation of the production including third party PoC, refer to the "Reconciliation of operating cost excluding third party PoC for Total US and SA PGM, Total SA PGM and Marikana" sections
| Stock data for the six months ended 31 December 2021 | JSE Limited - (SSW) | ||||||||||
| Number of shares in issue | Price range per ordinary share (High/Low) | R45.58 to R64.52 | |||||||||
| - at 31 December 2021 | 2,808,406,269 | Average daily volume | 13,508,180 | ||||||||
| - weighted average | 2,853,494,503 | NYSE - (SBSW); one ADR represents four ordinary shares | |||||||||
| Free Float | 99 | % | Price range per ADR (High/Low) | US$11.51 to US$17.59 | |||||||
| Bloomberg/Reuters | SSWSJ/SSWJ.J | Average daily volume | 2,890,341 | ||||||||
Sibanye-Stillwater Operating and financial results | Six months and year ended 31 December 2021 2
STATEMENT BY NEAL FRONEMAN, CHIEF EXECUTIVE OFFICER OF SIBANYE-STILLWATER
The Group delivered another record financial performance for 2021, with revenue of R172.2 billion (US$11.6 billion) and adjusted EBITDA of R68.6 billion (US$4.6 billion), respectively 35% and 39% higher than for 2020. Record profit attributable to shareholders of Sibanye-Stillwater of R33.1 billion (US$2.2 billion) and adjusted free cash flow (AFCF) of R37.4 billion million (US$2.5 billion), underpinned increased returns to shareholders and successful delivery of all other elements of the Group's capital allocation framework exceeding expectations that were set at the beginning of the year. Our green metals strategy also advanced significantly during the year, with strategic positions secured in key jurisdictions close to rapidly growing battery production markets in Europe and North America.
Annual production guidance was achieved by all the operating segments for 2021, providing a solid base for improved Group profitability on the back of robust commodity prices. The operating performance from the SA PGM operations for 2021 was particularly strong, with production of 1,836,138 4Eoz above the upper end of the guided range for 2021 and all-in sustaining cost (AISC) well below the lower end of annual guidance and lower year-on-year. Gold production of 27,747kg (892,087oz) from the SA gold operations (excluding DRDGOLD) for 2021 was within annual guidance with production of 14,348kg (461,299oz) for H2 2021, 7% higher than for H1 2021, despite approximately 600kg (19,300oz) less production as a result of the safety stoppages towards the end of the year. 2E PGM production of 570,400 2Eoz from the US PGM operations for 2021 was within the lower end of revised annual guidance, with ongoing regulatory and self imposed restrictions after the fatal accident at the Stillwater West mine during June 2021 impacting throughout H2 2021. The US recycling business had another strong year, achieving planned throughput and generating strong cash flow through active supplier management and the drawdown of spent catalyst inventory towards the end of the year.
Normalised earnings for 2021 increased by 27% to R38.9 billion (US$2.6 billion) year-on-year , driven by the strong performance during H1 2021, with normalised earnings of R14.5 billion (US$963 million) for H2 2021, 34% lower than for H2 2020, primarily due to a sharp decline in precious metals prices during the period.
The Board approved a final dividend for H2 2021 of R5.3 billion (US$342 million) or 187 SA cents per share (48.68 US cents* per ADR), which is at the upper end of the Group dividend policy range of 25% to 35% of normalised earnings. Together with the record interim dividend of R8.5 billion (US$565 million) (292 SA cents per share/77.2 US cents per ADR) for H1 2021, this represents a leading annual dividend yield of 9.8% for 2021 (at the closing JSE share price of R49.10/share on 31 December 2021). In addition to the record dividends, the Group repurchased 5% of its issued capital between June and October 2021, signifying a substantial return of value for shareholders.
The Group ended the year in a robust financial position, with cash and cash equivalents of R30.3 billion (US$1.9 billion) exceeding borrowings (excluding non-recourse Burnstone debt) of R18.8 billion (US$1.2 billion), resulting in a R11.5 billion (US$719 million) net cash position with the net cash: Adjusted EBITDA ratio at 0.17x.
SAFE PRODUCTION
Following the implementation of additional, targeted safety initiatives, including our "Rules of Life" campaign towards the end of H1 2021, there has been a consistent improvement in all safety injury indicators which has continued during Q1 2022. These positive safety trends included a 27% improvement in the Serious Injury Frequency Rate (SIFR), a 33% improvement in the Lost Day Injury Frequency Rate (LDIFR) and a 31% improvement in the Total Recordable Injury Frequency Rate (TRIFR) from H1 2021 to H2 2021. These improved lagging safety indicators represent the best that the Group has achieved since 2013 and provide a strong indication of a likely reduction in high potential incident risks, in line with our overall focus on adherence to safety standards.
Tragically, and in direct contrast to these improving safety trends, fatal incidents persisted during H2 2021. Tragically, 12 colleagues were lost during the period. In total, the Group experienced 20 fatalities during 2021, which was inconsistent with previous Group performance, and a significant deterioration from the nine fatalities which occurred during 2020 and six fatalities during 2019. A similar regression in fatal incidents was evident throughout the South African mining industry in 2021, with 74 fatalities experienced in total compared with 60 lives lost during 2020. The reasons for this industry wide regression are unclear, but the extended burden of COVID-19 has been a mentally, emotionally and physically depleting factor.
The safety and health of our workforce of more than 80,000 people is our foremost priority and during Q4 2021, decisive action was taken to address the ongoing occurrence of fatal safety incidents. The interventions initiated by management included safety stoppages across the Group for a five-day period to enable full and comprehensive audits of all the operating areas and to re-emphasise the primary focus on safety for all employees. Subsequent to this Group wide intervention however, a series of fatal incidents occurred towards the end of November at the SA operations, and a decision was made to suspend specific high incident shafts which collectively accounted for 12 of the Group fatalities for 2021. On 3 December 2021, operations at the Kloof 1 and Beatrix 1 and 3 shafts at the SA Gold operations and the Rustenburg Khuseleka shaft at the SA PGM operations were suspended to address the regression in safety. In addition, the Omicron variant of the COVID-19 virus resulted in an increase in infections towards year end which impacted the availability of supervisor and senior management at the Rustenburg Thembelani shaft. In the interests of the safety of employees, production at this shaft was also suspended. Our primary objective is to continuously reduce operational risk and the company will not hesitate to halt operations should elevated risk require appropriate remedial action.
The disconnect between the increase in fatal incidents and ongoing improvements in underlying injury statistics has required an increased emphasis on eliminating fatalities while continuing to institutionalise the "Rules of Life" and other successful initiatives implemented earlier in the year. A recent independent review of our safety strategy and protocols, confirmed the suitability of our strategy and its alignment with global best practice, including the ICMM principles to which we subscribe. This study was supported by the noteworthy achievement of ISO 45001 and 14001 accreditation or recommendations for accreditation across all Group operations, confirming alignment with global best practice.
We are committed to achieving our goal of zero harm and the milestones achieved in 2019 to 2020 at our SA gold operations, which operated without any fatalities for close to two years, suggests that this goal is achievable. Some notable safety milestones have been achieved, including the Marikana operations recording 4 million fatality free shifts and the Kloof lower section (deepest operation) was injury free for six weeks, with the SA PGM concentrating and processing section achieving 13 million fatality free shifts.
Creating a pandemic resilient operating environment
Our efforts to reduce the risk of the COVID-19 pandemic in the workplace have met with significant success over the course of the last two years. During 2021, our operations in South Africa successfully managed to navigate another three waves of the COVID-19 pandemic with relatively minor disruptions.
Sibanye-Stillwater Operating and financial results | Six months and year ended 31 December 2021 3
Pleasingly, our vaccination roll-out has been industry-leading with over 53,000 employees and 12,000 contractors at our SA operations, fully vaccinated as of 27 February 2022. This equates to 83% of total SA employees (excluding contractors) being fully vaccinated, with 88% having received at least one dose of the vaccine. We continue to drive the vaccine roll out through high visibility communication campaigns and have extended it to dependents of our employees. There has however, been a noticeable slow-down in vaccination rates and due consideration has been given to the next steps that will be required to ensure healthy and safe working environments at our operations and to ensure that we create a culture and environment that is less susceptible to the risk associated with possible future pandemics.
In this regard, we have been engaging with the unions at our South African operations in preparation for the roll out of our COVID-19 certification checks policy, which will, from 1 April 2022, require people entering Sibanye-Stillwater workplaces to either furnish a valid vaccination certificate or a current negative COVID-19 test, to be granted access.
ENVIRONMENTAL, SOCIAL AND GOVERNANCE (ESG)
The Group made steady progress towards “embedding ESG excellence as our way of doing business” during 2021. Active steps have been taken to establish private renewable power production facilities at our operations with notable progress achieved in securing water independence at our SA gold and PGM operations.
Defining our path to carbon neutral by 2040
Primarily due to the exposure of our SA gold and PGM operations to unreliable supply, rising tariffs and carbon-intensive electricity generation from Eskom, our primary focus is on reducing the relatively high energy consumption and carbon footprint of. The SA operations account for 92% of total Group energy demand and contribute 89% and 97% of our Group scope 1 and 2 emissions respectively.
Focussed interventions during 2021 at the SA operations achieved a 201GWh reduction in energy consumption against the production adjusted energy plan. This reduction is equivalent to avoidance of 212,954 tCO2e in scope 2 emissions. In total, the Group achieved a commendable reduction in total energy intensity to 0.56 GJ/ tonne milled for 2021, which represented a 7.1% decline compared with 2020 and a 2.4% decline compared with the average total Group energy intensity for the last three years.
Grid-supplied electricity from Eskom accounted for approximately 93% of Group greenhouse gas emissions (scope 1 and 2) for 2021. As a result, the deployment of renewable energy remains our strongest decarbonisation lever. Easing regulatory constraints, including the "power for own use" generation license threshold being lifted to 100MW and positive indications on wheeling and the ability to trade surplus power with third parties, along with the approval of the K4 project which has significantly extended the life of the Marikana operation, has facilitated an increase in the scope of our planned renewable energy projects in South Africa to a total generation capacity of 557MW. This includes:
•50MW of solar generation at the SA gold operations: a local project developer has been appointed on the basis of a 20-year Power Purchase Agreement (PPA), with construction scheduled to begin during H2 2022 and commercial production planned for H2 2023
•175MW of solar generation at the SA PGM operations: An RFP process to appoint project developers for three separate sites will be held in H2 2022, with commercial operation planned for early 2025
•332MW of remote wind energy generation: three ‘shovel-ready’ projects have been secured through local project developers on a 15-year PPA basis. Financial close of these projects is targeted for H2 2022 with commercial operation anticipated during H2 2024
The total capital cost of the renewable projects is forecast at approximately R11 billion which will be fully funded through off-balance sheet PPA financing over a 15 to 20-year terms. The cost of power from the solar projects is expected to be 30% to 50% lower than forecast Eskom tariffs (escalating at CPI) from commercial production, with wind power expected to be 20% to 30% lower and allow partial reduction of operational risk associated with exposure to erratic supply and escalating energy costs in South Africa. Once fully operational, these projects will enable a 25% reduction in Scope 2 emissions by 2025 and exceed our target of 20% of total energy production from renewable energy by 2030.
The planned renewable projects will also create employment within our host communities during construction and operation and we are advancing plans to foster local socio-economic development through our ‘Infrastructure for Impact’ programme, which includes the provision of excess electricity supply to communities and social-development projects post the closure of the operations.
Effective management of our water resources
The responsible use and management of water resources at our operations is a critical component of our overall ESG strategy. We are committed to the efficient and effective utilisation and management of water resources in the regions we operate, to ensure sufficient availability for doorstep communities and to minimise the environmental impact of our operating activities.
The implementation of modern monitoring technology at our South African operations has resulted in an 8% reduction in potable water purchases for 2021. This included a 1,278 Ml (2021: 6,289 Ml; 2020: 7,567Ml; 2019: 8,735Ml) or 17% reduction in potable water purchases from our SA gold operations for 2021, with our SA PGM operations purchasing 344Ml (2.8%) less, despite the SA Gold and SA PGM operations respectively processing 4% and 15% more ore tonnes during the year.
Our SA gold operations on the West Rand are overlain by a substantial regional dolomitic aquifer, requiring continual pumping of significant volumes of fissure water from the operations. Better utilisation of this abundance of ground/fissure water presents an opportunity to significantly reduce the usage of potable water by our SA gold operation, with consequent cost benefits. Progress in this regard during 2021 included:
•The Cooke operations have largely achieved water independence through the commissioning of borehole supply to the plant and Cooke 2 and 3 shafts during 2021
•The upgrade of the Driefontein water treatment plant from 20Ml per day to 25Ml per day is in progress and will ensure complete independence from municipal supply by Q3 2022, delivering an annual cost benefit of R4 million per annum
•The commissioning of phase 1 of the Kloof water treatment plant (2.7Ml) during H2 2021 reduced requirements for Rand Water supply at the Kloof operations by approximately 33%, resulting in approximately R13 million of annual cost benefits. Full independence from Rand Water supply is expected by Q1 2023 on completion of the next 7Ml phase, with annualised savings expected to increase to R45 million
Sibanye-Stillwater Operating and financial results | Six months and year ended 31 December 2021 4
Pleasingly, our water management efforts resulted in the Group being awarded an A- rating for “Water Security” by CDP, a non-profit global environmental disclosure platform. It was the first time that the Group participated in the Water Security category and achieving a higher rating than the Global and Africa regional average of ‘B’, and the metallic mineral mining sector average of ‘B-‘ was a positive outcome.
OPERATING REVIEW
The SA PGM operations continued to deliver solid operating results, with 4E PGM production increasing by 20% year-on-year to 1,896,670 4Eoz (including 60,532 4Eoz of third-party concentrate treated at the Marikana smelting and refining operations). This was despite significant operational headwinds, including safety stoppages, employee unavailability due to the COVID-19 virus and ongoing power disruptions in South Africa.
Contrary to prevailing trends across the global mining industry, ongoing cost management and higher by-product revenues offset significant inflationary cost pressures and higher royalties, resulting in AISC for 2021 declining by 5% to R16,982/4Eoz (US$1,148/4Eoz) compared with 2020. This consistent cost management continues to enhance the relative competitiveness of the SA PGM operations, which have moved significantly towards the lower half of the global industry cost curves over the last five years, from the upper end of the curves prior to integration into the Group. This is the outcome of the ongoing realisation of synergies as envisaged, prior to consolidation of these assets. The SA PGM operations generated adjusted EBITDA of R51.6 billion (US$3.5 billion) for 2021 which was 78% higher than for the previous year and four-fold higher than the total acquisition cost of these assets, a substantial return on investment.
On 31 January 2022 the Group announced that agreements had been reached with Anglo American Platinum Limited (Anglo Plat) which:
•allow for the immediate and more efficient exploitation, from the Kroondal operation, of parts of the Rustenburg operation’s orebody across the boundary. This ore would otherwise only have been mined from the existing Rustenburg operation infrastructure much later in the future
•enable the full consolidation of the Kroondal operation under the Rustenburg operation, once certain conditions precedent have been met, (see https://thevault.exchange/?get_group_doc=245/1643606711-ssw-assume-full-ownership-kroondal-doubling-its-life-mine-31jan2022.pdf for more detail)
This has enabled the early conversion of approximately 1.32 million 4Eoz (attributable to Sibanye-Stillwater: 1.79Moz at 100%) of Rustenburg operation’s Mineral Resources into additional Mineral Reserves and, by allowing the lower cost and more efficient extraction of the project area orebody from the mechanised Kroondal infrastructure, will more than double the life of the Kroondal operation, thereby deferring the imminent closure of some of the Kroondal shafts. These mutually beneficial and rational agreements should sustain much needed employment and community development in the region and ensure significant value creation for all stakeholders.
Mined PGM production from the US PGM operations in 2021 of 570,400 2Eoz was towards the lower end of revised annual guidance, primarily due to the ongoing impact of the rail collision safety incident in June 2021, with production of 272,099 2Eoz for H2 2021, 9% lower than for H1 2021 as a result. The implementation of rail safety enhancements following the safety incident in June 2021, has necessitated shutting down mining blocks at the Stillwater West mine, which remains constrained by Mine Safety and Health Administration (MSHA) stop orders and new operating procedures. Additionally, production from the East Boulder mine was impacted by electrical outages in December 2021 because of severe weather conditions. AISC for the US PGM operations increased by 15% to US$1,004/2Eoz (R14,851/2Eoz), primarily due to the shortfall in production and above inflation cost increases on consumables due to global logistical constraints. Increasing skills shortages in North America and high employee attrition rates have also resulted in an increased reliance on contract employment at significantly higher costs. Adjusted EBITDA for the US PGM underground operations of US$727 million (R10.8 billion) was 2% lower year-on-year as a result.
3E PGM recycled production for 2021 declined by 10% to 755,148 3Eoz due to a reduction in concentrate feed from underground affecting blending, a slowdown in used car scrapping rates globally and continued supply chain logistic constraints affecting autocatalyst deliveries towards year end. The recycling operations fed an average of 23.8 tonnes per day of spent autocatalyst for 2021, 10% lower than for 2020 with the rate declining over the year from 24.7 tonnes per day for H1 2021 to 22.8 tonnes per day for H2 2021. This was however offset by a drawdown on recycling inventory from 432 tonnes at H1 2021 to 25 tonnes at year end, enabling a release of working capital and a 16% increase in recycling 3Eoz sold to 782,552 3Eoz. Recycling inventory is expected to normalise at around 200 tonnes once autocatalyst delivery backlogs dissipate. Adjusted EBITDA of US$101 million (R1.5 billion) increased by 87% compared with 2020. This was primarily due to the higher PGM basket prices, with interest on recycle supplier advances adding a further US$21 million (R315 million), partly offsetting the impact of the operational shortfall.
Gold production from the SA gold operations (excluding DRDGOLD) for 2021 of 27,747kg (892,087oz), was above the lower end of annual guidance, despite H2 2021 being impacted by safety stoppages. These included the self-imposed Group safety intervention and suspension of operations at Beatrix 1 and 3 shafts and Kloof 1 shaft, which resulted in approximately 600kg (19,300oz) less production during Q4 2021. AISC for the SA gold operations (excluding DRDGOLD) increased by 7% year-on-year to R831,454/kg (US$1,749) as a result of the shortfall in planned production and above inflation cost increases on electricity and some consumables. ORD expenditure and sustaining capital increased by 46% and 45% respectively due to increased spend to restore operational flexibility following constraints during 2020 due to COVID-19.
Wage negotiations
Wage negotiations with organised labour at our SA gold operations and East Boulder mine in the US commenced during H2 2021 and continued into Q1 2022.
Pleasingly, we were able to ratify a new collective bargaining agreement with the United Steel Workers International Union (USW) for the East Boulder mine on 23 February 2022. The contract, which is effective from 16 February 2022 through to 31 July 2024, covers a broad range of terms including average annual wage increases of 2.5% in 2022, 3% in 2023 and 3% in 2024. In addition to the base increase in 2022, an increase to benefits and incentive has been agreed, which will result in an effective average increase of 5.4% for 2022 if all safety and quality deliverables are met. This settlement amounts to an annual average increase of 3.8% per year for the next 3 years, which compares favourably with US inflation rates and is consistent with our approach to enter into agreements which are linked to inflation.
Despite extended negotiations, we have been unable to reach agreement with organised labour representatives at our SA gold operations. We continued to engage constructively with the unions during Q1 2022 in an effort to settle on increases that are fair, in line with inflation and take the long-term sustainability of our operations into consideration for the benefit of all stakeholders.
Sibanye-Stillwater Operating and financial results | Six months and year ended 31 December 2021 5
FINANCIAL OVERVIEW
Group revenue for 2021 increased by 35% year-on-year to a record R172.2 billion (US$11.6 billion), primarily due to a 20% increase in 4E PGM production from the SA PGM operations and a significantly higher average rhodium price for 2021 (80% increase compared with 2020), which drove higher average PGM basket prices for the SA PGM operations and US recycling operation. Revenue for H2 2021 of R82.2 billion (US$5.5 billion) was 8% lower than record revenues of R90.0 billion (US$6.2 billion) for H1 2021 due to lower PGM production from the US PGM and recycling operations and the sharp pullback in PGM prices during H2 2021 as the chip shortage impacted negatively on automotive manufacturing volumes.
Record Group adjusted EBITDA of R68.6 billion (US$4.6 billion) for 2021 was 39% higher than for 2020, primarily driven by the SA PGM operations, which comprised 75% of total Group adjusted EBITDA with the US PGM and SA gold operations comprising 18% and 7% of the Group total respectively.
Profit attributable to owners of Sibanye-Stillwater (attributable profit), increased by 13% from R29.3 billion (US$1.8 billion) for 2020 to R33.1 billion (US$2.2 billion) for 2021. Attributable profit for 2021 was impacted by substantial differences in income statement line items year-on-year, including:
•R656 million (US$22 million) or 21% lower finance expenses, primarily due to the further redemption of high-cost debt, which was restructured on more favourable terms during Q3 2021
•A R3.8 billion (US$276 million) increase in the “fair value loss on financial instruments" to R6.3 billion (US$425 million), primarily due to a revaluation of the Rustenburg liability (outstanding deferred payments to Anglo Platinum in terms of the purchase agreement, which will terminate in November 2022) due to a significant increase in forecast cash flow from the Rustenburg operation
•A R5.1 billion (US$348 million) impairment of the carrying value of property, plant and equipment to its deemed recoverable amount at the SA gold operations due to assumed above inflation increases in electricity and labour costs and an assumed long-term gold price forecast (based on sell side analyst consensus) of approximately R725,000/kg (US$1,500/oz) in real terms, which negatively affected the forecast cash flows from these operations
•A R9.9 billion (US$712 million) or 149% increase in royalties and mining and income taxes, primarily due to a significant increase in profitability at the SA PGM operations, along with the absence of unrecognised deferred tax assets from the Marikana operation, which were utilised during 2020, and the derecognition of deferred tax assets for the SA gold operations due to the impairment of the value of these operations
More detail on the above items are available in the Financial Review section.
Basic earnings per share (EPS) of 1,140 SA cents (77 US cents/308 US cents/ADR) and headline earnings per share (HEPS) of 1,272 SA cents (86 US cents/344 US cents/ADR), increased by 6% and 19% year-on-year respectively, but impacted by the items above which offset the benefits of the 5% buyback of issued shares which was concluded during Q3 2021.
Normalised earnings1, which are the basis for the declaration of dividends as per the Group dividend policy (see note 9 of the condensed consolidated provisional financial statements), and excludes many of these once off items, was significantly higher than profit attributable to shareholders, increasing by R8.3 billion (US$560 million) to R38.9 billion (US$2.6 billion) for 2021.
The Board approved a final dividend at the upper end of the 25% to 35% dividend pay-out range as per the Group dividend policy for 2021 of R5.3 billion (US$342 million) (187 SA cents per share/48.68 US cents per ADR), resulting in a substantial R13,796 million (US$907 million) (479 SA cents per share/125.89 US cents per ADR) total dividend for 2021. This is equivalent to a 9.8%2 dividend yield at the closing share price of R49.10 at 31 December 2021. The approximately R8.5 billion ($575 million) share buyback program for 5% of shares in issue at an average purchase cost of R57.57/share (compared with the closing price on 1 March 2022 of R74.13/share), further enhanced shareholder returns for the year. Total value accruing to shareholders for 2021 amounted to a substantial R22.3 billion (US$1.5 billion), consistent with Sibanye-Stillwater's commitment to create superior value for all stakeholders.
Group adjusted free cash flow3 increased substantially year-on-year, with AFCF for 2021 almost doubling to a record of R37.4 billion (US$2.5 billion) compared with R19.9 billion (US$1.2 billion) for 2020.
AFCF from the US PGM operations increased from R2.8 billion (US$169 million) for 2020 to R8.1 billion (US$551 million) for 2021, a 193% increase. This was primarily due to the release of R6.4 billion (US$425 million) from working capital due to the reduction in spent autocatalyst inventory at the US recycling operation, which had accumulated during 2020 and H1 2021.
AFCF from the SA PGM operations more than doubled year-on-year to R26.9 billion (US$1.8 billion) (before intercompany working capital account adjustments) for 2021, accounting for 72% of Group AFCF for the period. Adjusting for an intercompany working capital account outflow of R4.3 billion (US$288 million) to the SA gold operations, net AFCF for 2021 was R22.6 billion (US$1.5 billion) compared with R11.7 billion (US$714 million) for 2020. Notably, the AFCF generated by the SA PGM operations and is notably higher than the nominal purchase consideration for the SA PGM operations between 2016 and 2021.
As a result of production disruptions and a decline in the rand gold price, AFCF from the SA gold operations was negative for H1 2021, although the intercompany contribution of R4.3 billion (US$288 million) for H2 2021 from the SA PGM operations referred to above and net dividends received from Sibanye Gold subsidiary companies of R6.8 billion (US$454 million) resulted in positive reported AFCF for the year of R7.8 billion (US$526 million).
The Group ended 2021 in a robust financial position, with the balance sheet reflecting a net cash position of R11.5 billion (US$719 million), despite significant disbursements to shareholders and investment in the sustainability of the business. The improved financial position and favourable interest rates enabled the replacement of higher cost debt with the Group replacing its 2022 and 2025 notes raised at the time of the Stillwater acquisition, with new 2026 and 2029 notes, raising US$1.2 billion on significantly better terms.
Cash and cash equivalents increased to R30.3 billion (US$1.9 billion), well above the R20.0 billion reserve position defined in the capital allocation, which together with borrowings at the end of 2021 of R20.3 billion (US$1.3 billion), resulted in the Group ending 2021 in a net cash position. On a trailing 12-month basis, adjusted EBITDA increased by 39% to R68.6 billion (US$4.6 billion) resulting in a net cash: adjusted EBITDA ratio of 0.17x compared to net cash: adjusted EBITDA of 0.06x at the end of 2020.
In line with the Group commitment to embedding ESG excellence and being a Force for Good, the capital allocation framework has been extended to include ESG capital investments as a third constituent of the "stakeholder shared value" component of the
Sibanye-Stillwater Operating and financial results | Six months and year ended 31 December 2021 6
framework. We firmly believe that in addition to returning cash to shareholders in the form of superior dividends, appropriate ESG capital investment is likely to deliver additional sustainable shareholder value. More detail on the projects we have identified and will be focusing our capital allocation to, will be provided in due course.
Reference notes
1.Normalised earnings is defined as earnings attributable to the owners of Sibanye-Stillwater excluding gains and losses on financial instruments and foreign exchange differences, impairments, gain/loss on disposal of property, plant and equipment, occupational healthcare expense, restructuring costs, transactions costs, share-based payment on BEE transaction, gain on acquisition, net other business development costs, share of results of equity-accounted investees, all after tax and the impact of non-controlling interest, and changes in estimated deferred tax rate. This measure constitutes proforma financial information in terms of the JSE listings requirements and is the responsibility of the Board. For a reconciliation of profit attributable to shareholders to normalised earnings, see note 9 of the condensed consolidated provisional financial statements
2.Based on a closing exchange rate of R15.3650/US$ at 28 February 2022 from IRESS. However, the actual rate of payment will depend on the exchange rate on the date for currency conversion
3.Group adjusted free cash flow includes adjustments to segmental free cash flow for Group treasury and shared services activities, which eliminate on consolidation but are included in the segment totals
STRATEGY REVIEW
Strategic M&A
Significant progress was made advancing our green metals strategy during 2021, with a series of transactions announced during H2 2021 following the acquisition of an initial 26.6% holding in the Keliber lithium project during H1 2021. These transactions represent the outcome of two years of careful market analysis and engagement in our strategic path towards building a climate change resilient business, enabling further international diversification in high quality and strategic assets that is set to deliver substantial future value and earnings diversification.
In summary the transactions comprise:
•During 2021, the Group acquired a 26.6% stake in the Keliber Lithium project for EUR25 million. A further EUR5 million payment in March 2022 will secure a 30% interest in the project, with the option to increase this interest to over 50% following the conclusion of a definitive feasibility study which will dictate the funding requirements. Keliber is planned as the 1st fully integrated lithium producer in Europe with direct access to key European battery markets from the Port of Kokkola in Finland
•The acquisition of 100% of Eramet’s Sandouville nickel processing facilities in Le Havre, France was concluded on 4 February 2022 for an effective cash consideration of EUR85 million (adjusting for closing net debt and working capital). Following the investment in the Keliber lithium project in Finland, this acquisition consolidates Sibanye-Stillwater's presence in Europe, securing another strategic footprint in a favourable jurisdiction with strategic access to rapidly developing battery metal end user markets in Europe. Integration of the existing facility into the Group is underway with internal studies on optimisation of the facility and options for development of an adjacent property into a possible battery metals and recycling facility in progress
•On 16 September 2021 the Group announced a proposed 50:50 joint venture (JV) with ioneer with respect to the Rhyolite Ridge Lithium-Boron project in Nevada, USA. During Q4 2021, the Group acquired a 7.1% direct equity interest in ioneer for approximately US$70 million. The Group’s option to acquire a 50% interest in the Rhyolite Ridge project JV for a US$490 million contribution for the development of the proposed project, remains subject to various conditions being met, including obtaining all relevant permits required to develop the project. Rhyolite Ridge is a world-class lithium project with the potential to become the largest and lowest cost lithium mine in the US and is strategically positioned close to the rapidly developing battery production facilities in the region. ioneer management continues to work closely with the US Fish and Wildlife Services and Bureau of Land Management on the current propagation studies for the Tiehm's buckwheat as part of the conservation plan being developed for the project. The first seedling and propagation studies undertaken in 2020 were conducted by the University of Nevada – Reno
•In December 2021, the Group acquired a 19.9% stake in New Century, a leading Australian tailings reprocessing business for a cash consideration of A$61 million. The New Century investment is complementary to and enhances Sibanye-Stillwater’s established position as a leading global tailings retreatment business uniquely positioned to play a key role in green metal supply chains together with its investment in DRDGOLD, a leading international gold tailings retreatment business
On 24 January 2022 the Group announced the termination of the proposed acquisitions of the Santa Rita nickel and Serrote copper mines in Brazil from Appian Capital, which had been announced on 26 October 2021. Shortly after the announcement of the proposed transaction, Appian informed the Group that a geotechnical event had occurred at the Santa Rita mine. The Company subsequently assessed the event and concluded that it was likely to have a material and adverse effect on the business, financial condition, results of operations, the properties, assets, liabilities or operations of Santa Rita. As a result, a decision was taken to terminate the proposed transaction.
Key appointments
In December 2021, the Group appointed Mika Seitovirta as Chief Regional Officer: Europe to lead and drive strategic delivery for the Group in the European region, in line with the company’s growth strategy in battery and green metals focused predominantly on the European and North American regions. Mika’s expertise and experience will allow us to build a solid base for participating in the emerging European battery material supply chains that have been established through the recent acquisitions of Keliber in Finland and the Sandouville refinery in France. Mika will initially serve on a part time basis to allow him to honour his existing commitments, transitioning to a full-time Group executive appointment from 1 July 2022.
R&D innovation and market development
The Board has approved a new fund, the “BioniCCube” to foster research and development of new innovation/technologies and market development, by investing in and leveraging strategic partnerships. This will support the company on its path to becoming a climate change resilient business and a leading supplier of green metals and energy solutions. BioniCCube will operate as a closed end fund, fully financed by Sibanye-Stillwater with a capital budget of up to 1.5% per annum of Group adjusted EBITDA for appropriate investments.
Two initial investments have been made by the Group:
Sibanye-Stillwater Operating and financial results | Six months and year ended 31 December 2021 7
•Glint Pay Ltd. (Glint - glintpay.com): Glint is a fintech company, based in London, Boulder (US) and Tokyo, that uses gold as an alternative global currency to enable its clients instantly to buy, sell, save, spend, and send their physical gold and other currencies, through the Glint Mastercard® and Glint App. Glint offers no credit facilities, it allows users to transfer, receive and save real gold, which is secured in Brink’s vaults in Switzerland. The partnership with Glint enables Sibanye-Stillwater to support new end markets for gold on an innovative, digital and highly regulated platform, backed by physical gold supervised by a world-class regulator in Switzerland
•Verkor S.A. (Verkor): Verkor is a French industrial company that has the support of the Renault Group, Demeter, EIT InnoEnergy Groupe IDEC, Schneider Electric, Capgemini, Arkema and Tokai COBEX. Verkor intends to ramp up low-carbon battery manufacturing facilities in France and southern Europe to meet the growing demand for electric mobility and stationary battery storage in Europe. Verkor’s first Gigafactory will be built at the port city of Dunkirk (Hauts de France), with first delivery of low-carbon high performance batteries for electric vehicles planned for July 2025. Initial manufacturing capacity of 16 GWh in 2025 is expected to expand to 50 GWh by 2030. Sibanye-Stillwater has made a strategic EUR25 million investment in Verkor through a new convertible bond issuance. This strategic investment will pave the way for further technical and commercial cooperation between the Group and Verkor, with the timeline for the Keliber lithium project, the Sandouville extension to target specific nickel battery metal products and Verkor’s first Gigafactory largely in sync
The global shift towards more socially and environmentally aware behaviours and policies continues to gain momentum, with emphasis on climate change. Future investment in and renewable energy and other green industrial activity is likely to support the prices of commodities required for the green energy economy, and those produced in an environmentally friendly manner over an extended period. In particular, this includes the essential metals that Sibanye-Stillwater produces and is targeting as we position ourselves to create sustainable value through further delivery on our green metals strategy.
MARKET OVERVIEW
Green Metals
PGM market update
PGM prices increased significantly during Q1 2021 primarily due to ongoing primary supply constraints, with a shortfall in PGMs supply from South Africa during Q1 2021 due to further technical issues at Anglo Platinum’s Anglo Converter Plant (ACP) during Q4 2020. Despite the ACP coming back online during December 2020, PGM supply remained constrained during Q1 2021 with primary supply of rhodium, ruthenium and iridium particularly affected due to their longer refining lead times. Furthermore, in February 2021, flooding at Norilsk Nickel’s Oktyabrsky and Taimyrsky mines resulted in production being partially suspended and a fatal accident at its concentrator in the same month impacted palladium and platinum supply. Oktyabrsky resumed operations in May 2021, with Taimyrsky only back to full production in December 2021. Overall, primary supply had largely recovered to pre-COVID levels by year end.
The global semi-conductor chip shortage which began to emerge in 2020 worsened during H1 2021 and was at its most severe just as primary PGM supply began to normalise globally. The global supply of semi-conductor chips was impacted by severe winter storms in the US, ongoing COVID-19 disruptions in South East Asia and a fire at a chip fabrication facility in Japan. The chip shortages, combined with more general supply chain constraints which impacted OEMs across the world, resulting in temporary stoppages at many automobile production facilities. Light duty vehicle (LDV) production of approximately 74.5 million units is forecast for 2021, well below 2019 levels of 86.5 million and only 3% higher than 2020 levels of 72.2 million. Sales of LDVs were up by 4% to 25.5 million units in China, with sharply higher battery electric vehicle (BEV) sales driving the growth. Sales in the US were up by only 2.8% as the market was affected by low inventories and high vehicle prices (average new car price of $45,283 in December 2021). Sales in Western Europe were flat in 2021 as the semi-conductor shortages negatively impacted the market, especially in the second half of the year. BEV sales grew from 3% in 2020 to 5% of total LDV sales in 2021, primarily at the expense of gasoline LDV sales, further impacting palladium and rhodium demand.
Secondary supply was also constrained due to global logistical challenges during 2021. Port congestions, a shortage of trucks and truck drivers in the US remain key bottlenecks which are likely to continue during 2022. These factors may yield potential downside risk for global secondary PGM supply in 2022, with the palladium and rhodium markets most vulnerable. Supply chain and logistic challenges eased up somewhat during Q4 2021 at our US recycling operation, although receipt rates from collectors still remained below budgeted levels.
LDV production is expected to recover to 82.7 million units in 2022 which, along with the implementation of tighter emissions regulation over the rest of the decade in both the light and heavy duty vehicle sectors, should drive increased demand for PGMs. This is despite forecasts of further acceleration in BEV sales to 7% of the global LDV market for 2022 (vs 5% for 2021). Refined PGM production has returned to normal levels from the COVID-19 disruptions in 2020 and the operational disruptions at Anglo Platinum and Norilsk Nickel which impacted supply during 2021. The conflict in Ukraine and sanctions being imposed on Russia could impact on supply of palladium and platinum from Russia, which accounts for 37% and 9% of global production respectively, supporting higher PGM prices. Secondary supply is also expected to recover as supply chain challenges abate. Overall, platinum is forecast to remain in an industrial (excluding investment) surplus of approximately 1moz while palladium moves further into deficit of approximately 145koz and rhodium moves into a small surplus.
Battery Metals
BEV sales for 2021 beat market consensus forecasts, with BEV LDV sales increasing to an estimated 4.4 million units for the year, equivalent to 8% of total LDV sales from 2.0 million units or 4% for 2020. Market expectations regarding future BEV penetration have increased substantially over the last 12 months, with current forecasts for BEV’s share of total global auto production by 2030 ranging from 25% to 30%, significantly higher than pre-COVID levels, driven by increased global legislation and ICE bans driving adoption of BEVs by auto manufacturers. Increasingly however, concerns are building about the ability of supply to match projected demand for critical battery metals such as lithium, nickel and cobalt. And with the prices of many of the key metals increasing sharply during 2021, there are increasing concerns that elevated commodity prices could retard the further introduction of new competitive technologies and cap the rate of BEV market penetration. This is particularly relevant in the context of limited capital investment in new battery metal projects in recent years, which together with the long lead times required to ramp up the supply of relevant metals and the increasing difficulty of permitting new projects are becoming critical constraints, leading to significant deficits in most of these metals from 2025, with prices likely to increase further as a result and remain at elevated levels for an extended period.
Sibanye-Stillwater Operating and financial results | Six months and year ended 31 December 2021 8
For the first year in many, it is projected that the price per kWh of lithium-ion batteries will not decline year on year as a result of elevated lithium ore pricing despite ongoing technical improvement. In parallel, there is increasing uncertainty on the evolution of battery chemistries which could substantially affect the demand profile for key commodities, and especially nickel and cobalt. Absolute physical shortfalls of key metals may even necessitate the adoption of alternative routes to decarbonisation such as biofuels and synfuels that can prolong the era of the internal combustion engine into a circular low carbon economy with positive implications for the longer-term future of PGMs.
OPERATING GUIDANCE FOR 2022
Operational guidance for the US PGM operations for 2022, has taken into account current operational constraints. Mined 2E PGM production from the US PGM operations is forecast to be between 550,000 2Eoz and 580,000 2Eoz for 2022, with AISC of between US$980/2Eoz to US$1,030/2Eoz. Capital expenditure is forecast to be between US$290 million and US$310 million, including approximately US$70 million project capital.
Restrictions imposed by MSHA and management at the US PGM operations continue to constrain production, and together with the increased reliance on higher cost contract labour due to the skills shortage in Montana and the prevailing high inflation environment, have resulted in costs increasing well above planned and historical levels. This has prompted a need to reassess the optimal future production output from the US PGM operations, taking into account the current constraints, as well as the medium-term outlook for the palladium market. Management is currently undertaking an optimisation planning process to ensure an appropriate ongoing return on capital invested is achieved in the current and medium-term environment. The results of this study are expected by mid 2022.
3E PGM production for the US PGM recycling operations is forecast to be between 750,000 and 800,00 3Eoz fed for 2022. Capital expenditure is forecast at US$3 million.
After an initial slow return to work and start up at the Marikana operation, the SA PGM operations have ramped up well following the December 2021 break with the Khuseleka shaft (post the management-imposed safety suspension) and Thembelani shaft (temporarily suspended due to an increase in COVID-19 infections among supervisor and senior management), both resuming production as planned during January 2022. 4E PGM production from the SA PGM operations for 2022 is forecast to be between 1,750,000 4Eoz and 1,850,000 4Eoz (benefiting from additional production from the Klipfontein open cast operation and from mining into Rustenburg reserves from Kroondal) with AISC between R18,500/4Eoz and R19,200/4Eoz (US$1,233/4Eoz and US$1,280/4Eoz). Capital expenditure is forecast at R4.8 billion (US$317 million) for 2022, including R950 million (US$63 million) on the K4 project.
Processing operations at Beatrix have been temporarily suspended for approximately three months from 28 December 2021 whilst rehabilitation work is undertaken on a limited portion of an active tailings storage facility (TSF). A limited portion of the Beatrix TSF requires precautionary reinforcement and buttressing work. A decision to cease deposition while this work is being completed was taken in December 2021. It is expected that this work will be completed by April 2022 and during this period underground mining activities will continue with stockpiled ore processed over the remainder of 2022, once the TSF remediation has been completed. As a result of this, there will be no gold sales reported from the Beatrix operation during Q1 2021 and hence no financial contribution to the Group. Processing of stockpiled ore over the remainder of the year however, should result in the financial impact normalising resulting in a limited financial impact over the 2022 reporting period.
The suspension of production activity at the Beatrix operation from 3 December 2021 to address the prevalence of serious safety incidents, continued during Q1 2022, with underground operations resuming in February 2022. As a consequence, production from Beatrix is forecast to be approximately 1,400Kg (45,000oz) lower than planned. Gold production from the managed SA gold operations (excluding DRDGOLD) for 2022 is forecast at between 25,000kg (813,000oz) and 27,000kg (873,000oz) with AISC between R875,000/kg and R925,000/kg (US$1,810/oz and US$1,920/oz). Capital expenditure is forecast at R5.2 billion (US$347 million), including R1.5 billion (US$97 million) of project capital expenditure provided for the Burnstone project and R350 million (US$23 million) on the Kloof 4 deepening project).
The dollar costs are based on an average exchange rate of R15.00/US$.
NEAL FRONEMAN
CHIEF EXECUTIVE OFFICER
CHIEF EXECUTIVE OFFICER
Sibanye-Stillwater Operating and financial results | Six months and year ended 31 December 2021 9
SIBANYE-STILLWATER GROUP SAFETY AND OPERATING REVIEW
Safety
The health and safety of our employees is our first priority and we are committed to ensuring a safe work environment at all our operations. Additional Group safety interventions including implementing the “Rules of Life” campaign since June 2021 have positively impacted safety indicators during H2 2021, resulting in a 27% improvement in the Serious Injury Frequency Rate (SIFR) from 4.39 (per million hours worked) for H1 2021 to 3.20 for H2 2021, a 33% improvement in the Lost Day Injury Frequency Rate (LDIFR) from 7.23 in H1 2021 to 4.85 in H2 2021 and a 31% improvement in the Total Recordable Injury Frequency Rate (TRIFR) from 8.43 in H1 2021 to 5.82 in H2 2021. Despite this improved lagging indicator trend however, we experienced an increase in fatal incidents at our operations, with nine employees losing their lives in accidents during Q4 2021, in addition to the three employees who passed away in Q3 2021, taking the total number of fatalities to twenty for the year.
On 13 October 2021 at Kroondal Simunye shaft Mr. Tebogo Motlogelwa, a general worker passed away in a LHD related accident. On 25 October 2021 at Rustenburg Khuseleka Shaft Mr Pitso Maifala, an underground loco driver passed away when he fell down a shaft ore pass during tipping arrangements. On 27 October 2021 at Kroondal Kwezi shaft Mr Philasande Xabanisa, a general worker passed away when he was struck by a fall of ground whilst barring the hanging wall during entry examination. On 22 November 2021 at Marikana E3 shaft, Mr Motseki Langeni, a rock drill operator passed away when he was struck during a fall of ground while attempting to tension a support net. On 30 November 2021 at Beatrix 3 shaft, Mr. Stephen Nyoni, a winch operator passed away when a shot hole exploded while he was charging the hole with explosives. On 3 December 2021 at Beatrix 3 shaft, Mr Frank Swart, an underground fitter, Mr Alfred Ngalo, a secondary rock drill operator and Ms Mabohlokoa Tsoafo, a pump attendant passed away when a LHD ran out of control in a shaft bottom decline and collided with the employees. On 3 December 2021 at Rustenburg Khuseleka shaft, Mr Raimundo Augusto, a team supervisor passed away when he was struck by a fall of ground whilst barring the sidewall during entry examinations.
The Board and management of Sibanye-Stillwater extend their sincere condolences to the family, friends, and colleagues of our departed employees.
We remain committed to continuous improvement in health and safety at our operations. We are enhancing our risk approach to make fatality prevention our main priority.
US PGM operations
Mined 2E PGM production from the US PGM operations of 570,400 2Eoz for 2021 was 5% lower than for 2020, and at the lower end of revised guidance of 570,000 to 580,000 2Eoz, primarily due to the ongoing impact of the fatal incident in June 2021. Operational stop orders imposed by MSHA after the incident and ongoing operational constraints significantly impacted production during H2 2021 and continue to affect production and operational flexibility. In addition, during H2 2021, the operations were further affected by self-imposed Group wide safety stoppages, a high employee attrition rate and a critical skills shortage especially relating to miners, resulting in the reliance on higher cost contract labour, replacement of a bridge between Stillwater East and the concentrator which temporarily affected processing of ore from Stillwater East and electrical outages at the East Boulder mine during December 2021 as a result of severe weather conditions.
AISC for 2021 increased by 15% to US$1,004/2Eoz (R14,851/2Eoz) primarily due to the shortfall in production, increased labour costs, a 22% increase in ore reserve development costs to US$92 million (R1.4 billion) and sustaining capital (mining equipment and environmental) which increased by 11% to US$53 million (R791 million). In line with many other industries in the USA and globally, the US PGM Operations have experienced underlying inflationary pressures due to persistent supply chain issues, input price inflation and higher labour costs due to staffing shortages, which has resulted in an increased reliance on higher cost contractors. In addition, royalties, taxes and insurance increased by approximately US$6 million (R89 million) equivalent to US$16/2Eoz (R237/2Eoz) of the AISC increase, due to an increase in revenue due to the higher average 2E PGM price for 2021.
The average 2E PGM basket price increased by 10% to US$2,097/2Eoz (R31,021/2Eoz) compared with 2020 resulting in adjusted EBITDA from the US PGM operations of US$727 million (R10.8 billion).
Mined 2E PGM production for H2 2021of 272,099 2Eoz was 11% lower than for the comparable period in 2020 and 9% lower than H1 2021 as a result of the operational issues highlighted above. As a result of lower production, particularly in H2 2021, and inflationary costs pressures, AISC in H2 2021 increased by 18% year-on-year to US$1,039/2Eoz (R15,619/2Eoz) with ORD spending increasing by 34% to US$51 million (R772 million) as a result of having to use more contractors to do primary development but sustaining capital declined by 36% year-on-year to US$19 million (R290 million) as a result of the impact of global supply chain production delays and transport constraints. Growth capital increased by 18% year-on-year in H2 2021 to US$79 million (R1.2 billion).
US PGM recycling operation
Average spent autocatalyst fed by the US recycling operation declined by 10% to 23.8 tonnes per day for 2021 compared with 26.4 tonnes per day fed for 2020, with total 3E PGM ounces fed of 755,149 3Eoz, 10% lower year-on-year due to lower deliveries of autocatalysts towards year end due to continued supply chain logistic issues and lower than planned blending of concentrate feed from underground sources. Feed rates were also impacted by an industry wide slowdown in scrapping rates due to the ongoing chip shortage. Pleasingly 3E PGM sold in 2021 increased by 16% year-on-year to 782,552 3Eoz due to a drawdown of recycling inventory from approximately 400 tonnes at the end of 2020 to 25 tonnes at the end of 2021, resulting in a release of working capital which is discussed below. Recycling inventory is expected to normalise to around 200 tonnes once autocatalyst delivery backlogs dissipate.
The average 3E PGM basket price for the US recycling operations increased by 57% year-on-year to US$3,515/3Eoz (R51,987/3Eoz) due outturn delay in realizing prices, thereby capitalizing on higher palladium and rhodium prices earlier in the year, with adjusted EBITDA increasing by 87% to US$101 million (R1.5 billion).
For H2 2021 the Recycling operation fed 352,276 3Eoz, a 20% decline versus H2 2020, with a further decline in the feed rate from 24.7 tonnes per day in H1 2021 to 22.8 tonnes per day in H2 2021 as a result of inter alia the challenges highlighted above. This was a 17% decrease when compared to H2 2020, attributed to the 7% decrease in tonnes milled from underground and therefore lower concentrate produced for blending purposes, planned maintenance at the Columbus Met Complex, compounded by ongoing logistic challenges and lower vehicle scrapping rates globally. These factors saw receipt rates 19% lower than plan at 21 tonnes per day (tpd).
By using available inventory, the recycling operation maintained sales during H2 2021, ultimately delivering total sales of 360,167 3Eoz, a 13% increase compared to H2 2020. Given these production constraints, the operation focussed on inventory management during H2 2021 and pleasingly reduced working capital significantly year-on-year. This saw a favourable crystallisation of US$381 million (R5.7 billion)
Sibanye-Stillwater Operating and financial results | Six months and year ended 31 December 2021 10
in working capital for the half year. The focus on inventory management, with a particular focus on high carbon containing material, saw our recycling inventory reduce by 407 tonnes in H2 2021. At year end, recycling inventory approximated 25 tonnes, compared to 358 tonnes at the end of H2 2020.
The Recycling operation delivered a record financial performance in H2 2021, aided by strong sales and continued PGM price support. For H2 2021, the operation delivered EBITDA of US$51 million (R757 million), at an EBITDA margin of 4%. On a net profit basis, after net-financing income, the Recycling operation delivered US$60 million (R899 million) in H2 2021, 76% higher than H2 2020. Net profit margins approximated 4% for the majority of the financial half year under review.
At the end of H2 2021, recycle advances approximated US$441 million (R6.6 billion), a notable reduction from the US$822 million (R12.0 billion) in advances reported at H1 2021. The US$381 million (R5.7 billion) reduction in the Recycling operations customer advance balance has reduced the significant increase in working capital earlier in the year, resulting in stronger cashflow.
Given recycle receipt rates and current PGM prices, the Recycling operation is currently expending approximately US$7 million (R104 million) per day on recycle advances. The average purchase price on spent catalyst approximated US$3,993/3Eoz (R59,056/3Eoz) in H2 2021. This compares to US$3,247/3Eoz (R49,225/3Eoz) in January 2021 and US$2,170/3Eoz (R32,550/3Eoz) in January 2020. The operation remains completely self-funded, with no lines of credit currently drawn.
In order to further enhance the Group’s exposure to a circular economy, the Recycling operation continues to investigate growth options, across geographies and commodities. Although the global chip shortage crisis appears to be alleviating, recycle receipt rates in the United States are expected to remain constrained, driven by ongoing shipping constraints and logistic challenges. Port congestions, a shortage of trucks and haulage bottlenecks in the US and this is likely to remain for the foreseeable future.
SA PGM operations
The SA PGM operations again delivered consistently solid operating results despite the Group wide safety interventions and the suspension of operations at Khuseleka and Thembelani at the Rustenburg operations during December 2021, which resulted in approximately 21,000 4Eoz less production than planned. PGM production of 1,896,670 4Eoz for 2021 (including attributable ounces from Mimosa and third party purchase of concentrate (PoC) was 3% above the upper level of guidance. Production of 1,836,138 4Eoz for 2021, excluding PoC) was 20% higher year-on-year. 4E PGM PoC production increased by 21% to 60,532 4Eoz. All operations with the exception of Mimosa increased 4E PGM production by between 15% (Kroondal) and 35% (Platinum Mile), with only Mimosa reporting a decline of 3% year-on- year. 4E PGM sold increased by 20% to 1,885,610 oz which was around 49,000 4E oz higher than produced over the year.
Costs for 2021 were well contained with AISC (excluding PoC) of R16,982/4Eoz (US$1,148/4Eoz), 5% lower year-on-year and 8% below the lower level of market guidance of R18,500 to R19,500/4Eoz. AISC (including PoC) declined by 1% to R18,051/4Eoz (US$1,221/4Eoz). This was driven by significantly higher production and by-product credits which increased by 45% year-on-year, which offset higher royalties (57% higher year-on-year), ORD (40% higher year-on-year) and sustaining capital (92% higher year-on-year). This is an impressive achievement considering increasing global inflationary costs pressures which have impacted costs across the global mining industry recently. In particular Marikana's AISC (excluding PoC) declined by 8% year-on-year to R17,394/4Eoz (US$1,176/4Eoz).
Consistent with the messaging at the end of the 2020 year, the capital underspend in 2020 due largely to COVID-19 disruptions was carried over into 2021. As a result, capital expenditure for the SA PGM operations in 2021 increased by 73% to R3.8 billion (US$257 million) which was in line with guidance of R3.9 billion (US$257 million) with ore reserve development 40% higher at R1.6 billion (US$107 million), sustaining capital 92% higher at R2.0 billion (US$137 million) and project spend increasing from R20 million (US$1 million) in 2020 to R203 million (US$14 million) on the Kroondal Klipfontein and Marikana K4 projects.
The average PGM basket price for 2021 of R47,066/4Eoz (US$3,182/4Eoz) was 28% higher than for 2020 which, underpinned by the very strong operational performance from the SA PGM operations, resulted in the adjusted EBITDA margin increasing by 8% to 61% and adjusted EBITDA increasing by 78% year-on-year to R51.6 billion (US$3.5 billion). This is a significant achievement given that the entire SA PGM business was acquired for a total acquisition price of around R20.3 billion (US$1.4 billion) between April 2016 and December 2021.
With the recovery in PGM prices from Q4 2021 and the continuing strong operational momentum in the SA PGM, the outlook remains very positive.
4E PGM production from Rustenburg was 2% higher in H2 2021 year-on-year at 343,820oz, with surface production 3% higher and underground production 2% higher as a result of an improvement in output and build-up after the easing of COVID-19 lockdown regulations in H2 2020. The AISC for the Rustenburg operations increased only 5% year-on-year in H2 2021 to R18,835/4Eoz (US$1,253/4Eoz) as a result of a slight increase in unit operating costs, 22% higher ORD costs, 105% increase in sustaining capital but offset by lower royalties and significantly higher by-product credits. The 4E metal basket price increased by 3% from R38,903/4Eoz (US$2,393/4Eoz) in H2 2020 to R40,056/4Eoz (US$2,665/4Eoz).
Kroondal 4E PGM production for H2 2021 at 113,035oz, was 1% lower than the comparable period in 2020. The reduction can be mainly attributed to Kroondal mining through adverse ground conditions negatively affecting quality and output. Kroondal AISC of R13,774/4Eoz (US$916/4Eoz), was 5% higher than H2 2020 as a result of lower production and additional support required to mine through adverse ground conditions. The 4E metal basket price increased to R44,108/4Eoz (US$2,935/4Eoz), 3% higher year-on-year.
The Marikana operations continued to perform strongly , producing 421,632oz of 4E metals (including PoC) for H2 2021, 10% higher than for H2 2021 (381,836 4Eoz), with underground production 10% higher to 380,832 4Eoz and surface production 12% higher to 40,800 4Eoz, as a result of production having returned to normalised pre-COVID-19 levels during H2 2020. During H2 2021, the Marikana operation processed 25,705 4Eoz from third party sources,11% higher year-on-year. AISC (excluding PoC) of R17,069/4Eoz (US$1,136/4Eoz), was 5% lower than H2 2020 AISC of R17,983/4Eoz (US$1,106/4Eoz) primarily due to the increase in production and higher by-product credits. Project capital at Marikana increased to R196 million (US$13 million) in H2 2021 with expenditure ramping up at the Marikana K4 project.
Attributable 4E PGM production from Mimosa for H2 2021 declined by 6% year-on-year to 58,537 4Eoz due to slightly lower grades and plant recoveries. H2 2021 AISC increased by 17% year-on-year to US$1,055/4Eoz (R15,853/4Eoz) with lower production and sustaining capital increasing by 16% year-on-year. The current focus is to optimise the reagent suite and cell settings across the flotation circuit to improve recoveries.
Attributable 4E PGM production from Platinum Mile of 30,654 oz in H2 2021was 36% higher than H2 2020 due to additional surface tonnes added to the flotation output from the Rustenburg concentrator operations, coupled with 6% higher head grade and plant recoveries
Sibanye-Stillwater Operating and financial results | Six months and year ended 31 December 2021 11
which increased from 20% to 24%. The AISC at R8,482/4Eoz (US$564/4Eoz) was 28% lower than comparable period and is the lowest in the group.
H2 2021 Chrome sales of 1,116kt were 1% higher than H2 2020 (1,108kt). Chrome revenue of R1.2 billion (US$82 million) for H2 2021 was 33% higher year-on-year, mainly due to a 17% increase at Rustenburg in which all the metal was sold and the Kroondal and Marikana operations maintaining steady performance, as well as improved prices received. The Chrome price received improved by 19% from US$140/tonne in the comparable period to US$166/tonne in H2 2021.
Capital expenditure for H2 2021 was 72% higher at R2.4 billion (US$158 million) year-on-year with ORD expenditure increasing by 21% to R831 million (US$55 million) and sustaining capital 94% higher at R1.4 billion (US$90 million). The significant increase in H2 2021 sustaining capital expenditure was on projects to support safety initiatives, winch signalling upgrades and trackless mobile machinery (TMM) collision avoidance systems. ORD capital expenditure increased by 21% mainly due to the ramp up in production and return to normal output levels after the lockdown restrictions were lifted in November 2020. R196 million (US$13 million) of project capital was invested at the K4 project at Marikana. .
The K4 and Klipfontein PGM projects
The project setup phase that involved the approval of the scheduling and costing systems and development of the required Management plan documentation has been completed.
The following actions were also completed during H2 2021:
•Contracts for building works and electrical work for the upgrade and completion of the industrial change-houses, whilst on-boarding of these contractors completed and work commenced
•The tenders for the underground infrastructural work as well as for the electrical and Instrumentation work were adjudicated, on-boarding commenced
•Upgrades for the winder control systems design work was completed and contracts placed
•Various underground equipment orders have been placed and majority of the equipment has been delivered
The engineering design and compiling of scope of works and procurement is currently proceeding as per schedule. The K4 Project is on target to start capital development during Q2 2022.
The Klipfontein lay-down areas and site establishment were completed in Q4 2021 and the first blast was taken on 7 January 2022. The project is on track and is ramping up with full production expected in Q2 2022.
SA gold operations
Gold production from the SA gold operations (including DRDGOLD) for 2021 increased by 9% to 33,372kg (1,072,934oz) year-on-year with production from the managed SA gold operations (excluding DRDGOLD) increasing by 10% to 27,747kg (892,087oz). Production from the Beatrix and Kloof operations was impacted by several safety incidents during the year including the suspension of operations at Beatrix 1 and 3 shafts and Kloof 1 shaft on 3 December 2021, which reduced production by approximately 19,000 oz during Q4 2021. Tons milled from underground increased by 23% as the operations resumed normalised production rates, accompanied by a 8% decline in the average grade compared with 2020 when employees returning from the COVID-19 lockdowns were deployed to the higher grade mining areas in order to maximise revenue.
AISC for the SA gold operations (including DRDGOLD) increased by 8% to R803,260/kg (US$1,689/oz) compared to 2020, with increased production accompanied by higher variable costs and above inflation increases in consumable costs such as ammonia, fuel, steel and electricity tariffs. AISC for the SA gold operations (excluding DRDGOLD) increased by 7% year-on-year to R831,454/kg (US$1,749/oz) with ORD and sustaining capital expenditures 46% and 45% higher respectively year-on-year as a result of a planned increase in capital expenditure to restore flexibility post the COVID-19 impacted 2020. Capital expenditure on ORD and sustaining capital is likely to remain elevated until 2023 in order to restore operational flexibility arising from significant operational disruptions during 2019 and 2020. Project capital at SA Gold operations (including DRDGOLD) increased by 93% to R472 million (US$32 million) including project capital spent at Kloof on the Kloof 4 deepening project increasing by 27% year-on-year to R198 million (US$13 million) and capital invested at Burnstone project increasing to R186 million (US$13 million) with R174 million (US$12 million) spent in H2 2021.
The average rand gold price declined by 8% to R849,703/kg (US$1,787/oz) due to a 10% appreciation in the rand relative to the US dollar, resulting in a decrease in the adjusted EBITDA margins for the SA gold operations (including DRDGOLD) from 28% in 2020 to 18% in 2021, and the adjusted EBITDA for 2021 declining by 34% to R5.1 billion (US$346 million). Approximately 54% of adjusted EBITDA for 2021 was generated in H2 2021, despite the operational setbacks and providing operations normalise in 2022, with the gold price moving higher, the outlook is positive.
Production for H2 2021 (including DRDGOLD) decreased by 4% to 17,234kg (554,086oz) with production from the managed operations (excluding DRDGOLD) of 14,348kg (461,299oz) also 4% lower as a result of the operational issues highlighted above, underground yield weakening by 7% and 8% year-on-year at Driefontein and Kloof respectively, and surface tons milled decreasing by 41% and 23% at Kloof and Beatrix respectively. Total gold sold (including DRDGOLD) of 17,495kg (562,477oz) was 1% lower than for the same period in 2020.
AISC for the SA gold operations (including DRDGOLD) for H2 2021 increased by 16% to R814,347/kg (US$1,685/oz), whilst AISC for the managed operations (excluding DRDGOLD) increased by 15% to R843,057/kg (US$1,745/oz), a 25% increase in US$ terms as a result of the rand strengthening by 8% year-on-year versus the US dollar. This significant increase is primarily due to inflationary effects of higher labour, electricity and stores cost highlighted above. In addition, ORD costs and sustaining capital costs increased by 23% and 53% respectively.
Capital expenditure for H2 2021 for SA gold Operations (including DRDGOLD) increased by 33% year-on-year to R2.5 billion (US$167 million) despite capital expenditure at DRDGOLD declining by 9% year-on-year to R183 million (US$12 million). Capital expenditure at the managed SA gold operations in H2 2021 (excluding DRDGOLD) increased by 40% to R2.3 billion (US$154 million) with Driefontein and Beatrix capital expenditure 44% and 48% higher year-on-year respectively.
Underground production from the Driefontein operation for H2 2021 decreased by 7% to 4,604kg (148,022oz) year-on-year due to more normalised lower underground yield post higher grade mining in 2020. Stope face values in the previous period were elevated due to the focus on getting the higher grade areas started first in the post-lockdown period. The surface footprint reduction project, aimed at reducing fixed overhead costs at the operations, has delivered additional clean-up material for milling at Driefontein and amounted to surface production of 237kg (7,620oz) for H2 2021. AISC for H2 2021 was 15% higher at R807,427/kg (US$1,671/oz). ORD spending increased by 32% year-on-year due to development at 8 shaft not being capitalised during 2020.
Sibanye-Stillwater Operating and financial results | Six months and year ended 31 December 2021 12
Underground production at the Kloof operation for H2 2021 decreased by 8% to 5,033kg (161,815oz). Safety stoppages resulted in a build-up of underground ore in the last month of the year, reducing the tonnes milled. Seismicity at Kloof 3 together with its gradual planned closure also reduced the yield in H2 2021. A fire at the high grade Kloof 4 in early November also contributed to reduced production with 3 days lost. Surface production at the Kloof operations decreased 45% to 550kg (17,683oz) due to the steady depletion of available reserves. AISC at Kloof for H2 2021 was 21% higher at R876,079/kg (US$1,813/oz), due to a 14% decrease in production and 6% increase in operating cost. Sustaining capital increased by 26% after certain capital was delayed in 2020 due to the COVID-19 disruptions necessitating cash preservation. ORD spending increased by 9% due to a 9% increase in off-reef development meters.
Gold production from the Beatrix operation increased by 15% in H2 2021 due to higher volumes compared to the slower start-up post lockdown in 2020. Underground gold production at 3,229kg (103,815oz) increased due to higher throughput. Gold production from surface sources decreased by 19% to 121kg (3,890oz) due to the declining payable reserves. Beatrix’s AISC for H2 2021 increased 4% year-on-year to R845,981/kg (US$1,751/oz) largely due to the 28% increase in operating cost and higher sustaining capital which increased 96% year-on-year to R113 million (US$8 million) and a 33% increase in ORD due to a 41% increase in off-reef development.
Processing operations at Beatrix have been suspended for approximately three months from 28 December 2021 for rehabilitation work to be undertaken on part of an active tailings storage facility (TSF), which was identified during routine and continuous assessment of Group TSFs. Underground mining activities will continue during this time and stockpiled ore will be processed over the remainder of 2022 once the TSF remediation has been completed.
Gold production from the Cooke operation decreased by 11% to 574kg (18,455oz) due to a slightly lower yield and a decrease in volume related to the milling of higher grade 3rd party material on a toll basis in place of our own reserves. Care and maintenance costs at Cooke operations decreased by 4% to R303 million (US$20 million) for H2 2021 with the decommissioning of pumps at Cooke 3 with excess water handled by pumps at Cooke 2. Operating cost for H2 2021 to process surface material increased 13% to R409 million (US$27 million) mainly due a 26% increase in purchasing of aggregates.
The Burnstone project
The project setup phase that involved the approval of the scheduling and costing systems and development of the required Management plan documentation has been completed.
The following activities were also completed during H2 2021:
•Onboarding of Mining and Engineering crews started in October 2021
•RSV has been appointed as Engineering design team for the balance of the Engineering design
•DLC Town Plan has been appointed for the access surveying and registration of the new servitudes for the new access road to Burnstone
•DTS has been appointed for the design change to be able to remove the skips from the shaft using the Rock Winder bank area. The design was 90% complete by the end of December 2021
•Procurement order for the first new TMM machinery was placed and delivered in December 2021
Sibanye-Stillwater Operating and financial results | Six months and year ended 31 December 2021 13
FINANCIAL REVIEW OF THE SIBANYE-STILLWATER GROUP
FOR THE SIX MONTHS ENDED 31 DECEMBER 2021 (H2 2021) COMPARED WITH THE SIX MONTHS ENDED 31 DECEMBER 2020 (H2 2020)
The reporting currency for the Group is SA rand (rand) and the functional currency of the US PGM operations is US dollar. Direct comparability of the Group results between the two periods is distorted as the results of the US PGM operations are translated to rand at the average exchange rate, which for H2 2021 was R15.03/US$ or 8% stronger than for H2 2020 (R16.26/US$).
Group financial performance
Group revenue for H2 2021 increased by 14% to R82,241 million (US$5,461 million) mainly due to higher sales volumes and higher precious metal prices at both the SA PGM and US PGM Recycling operations. The higher sales volumes and higher precious metal prices, which impacts the cost of purchasing third-party concentrate (PoC) and recycling material at the SA PGM and US PGM Recycling operations respectively, were the primary reasons for the 39% increase in Group cost of sales, before amortisation and depreciation to R52,860 million (US$3,521 million). At the managed SA gold operations, higher underground production and associated input costs contributed to the increase in cost of sales. Group adjusted EBITDA for H2 2021 decreased by 15% or R4,814 million (US$156 million) to R28,057 million (US$1,852 million) due to lower sales volumes from both the US PGM underground and SA gold operations, coupled with a pullback in precious metal prices during H2 2021. In addition, the 8% stronger rand relative to the US dollar, negatively affected realised rand commodity prices for the SA operations. Group amortisation and depreciation increased by 8% to R4,495 million (US$300 million) following higher production volumes at the SA PGM operations and increased capital spend during the current year (FY2021) which was deferred in FY2020 due to the impact of the COVID-19 pandemic.
The revenue, cost of sales, before amortisation and depreciation, net other cash costs, adjusted EBITDA and amortisation and depreciation are set out in the tables below:
| Figures in million - SA rand | |||||||||||||||||||||||||||||||||||||||||||||||
| Revenue | Cost of sales, before amortisation and depreciation | Net other cash costs | Adjusted EBITDA | Amortisation and depreciation | |||||||||||||||||||||||||||||||||||||||||||
| H2 2021 | H2 2020 | % Change | H2 2021 | H2 2020 | % Change | H2 2021 | H2 2020 | % Change | H2 2021 | H2 2020 | % Change | H2 2021 | H2 2020 | % Change | |||||||||||||||||||||||||||||||||
| SA PGM operations | 37,412 | 33,477 | 12 | (16,367) | (12,647) | 29 | (775) | (805) | (4) | 20,270 | 20,025 | 1 | (1,353) | (1,168) | 16 | ||||||||||||||||||||||||||||||||
| US PGM underground operations | 8,622 | 10,552 | (18) | (4,216) | (3,872) | 9 | 2 | (19) | (111) | 4,408 | 6,661 | (34) | (1,427) | (1,395) | 2 | ||||||||||||||||||||||||||||||||
| US PGM Recycling | 21,296 | 11,586 | 84 | (20,539) | (11,166) | 84 | — | — | — | 757 | 420 | 80 | (2) | (2) | — | ||||||||||||||||||||||||||||||||
| Managed SA gold operations | 12,553 | 14,103 | (11) | (9,986) | (8,740) | 14 | (527) | (613) | (14) | 2,040 | 4,750 | (57) | (1,615) | (1,490) | 8 | ||||||||||||||||||||||||||||||||
| DRDGOLD | 2,498 | 2,977 | (16) | (1,752) | (1,626) | 8 | (24) | (14) | 71 | 722 | 1,337 | (46) | (98) | (94) | 4 | ||||||||||||||||||||||||||||||||
Group corporate1 | (140) | (322) | 57 | — | — | — | — | — | — | (140) | (322) | 57 | — | — | — | ||||||||||||||||||||||||||||||||
| Total Group | 82,241 | 72,373 | 14 | (52,860) | (38,051) | 39 | (1,324) | (1,451) | (9) | 28,057 | 32,871 | (15) | (4,495) | (4,149) | 8 | ||||||||||||||||||||||||||||||||
Figures in million - US dollars2 | |||||||||||||||||||||||||||||||||||||||||||||||
| Revenue | Cost of sales, before amortisation and depreciation | Net other cash costs | Adjusted EBITDA | Amortisation and depreciation | |||||||||||||||||||||||||||||||||||||||||||
| H2 2021 | H2 2020 | % Change | H2 2021 | H2 2020 | % Change | H2 2021 | H2 2020 | % Change | H2 2021 | H2 2020 | % Change | H2 2021 | H2 2020 | % Change | |||||||||||||||||||||||||||||||||
| SA PGM operations | 2,476 | 2,050 | 21 | (1,089) | (778) | 40 | (51) | (51) | — | 1,336 | 1,221 | 9 | (88) | (71) | 24 | ||||||||||||||||||||||||||||||||
| US PGM underground operations | 572 | 648 | (12) | (282) | (238) | 18 | — | (1) | (100) | 290 | 409 | (29) | (96) | (85) | 13 | ||||||||||||||||||||||||||||||||
| US PGM Recycling | 1,419 | 715 | 98 | (1,368) | (688) | 99 | — | — | — | 51 | 27 | 89 | — | — | — | ||||||||||||||||||||||||||||||||
| Managed SA gold operations | 837 | 863 | (3) | (666) | (537) | 24 | (35) | (37) | (5) | 136 | 289 | (53) | (109) | (92) | 18 | ||||||||||||||||||||||||||||||||
| DRDGOLD | 166 | 183 | (9) | (116) | (100) | 16 | (2) | (1) | 100 | 48 | 82 | (41) | (7) | (6) | 17 | ||||||||||||||||||||||||||||||||
Group corporate1 | (9) | (20) | 55 | — | — | — | — | — | — | (9) | (20) | 55 | — | — | — | ||||||||||||||||||||||||||||||||
| Total Group | 5,461 | 4,439 | 23 | (3,521) | (2,341) | 50 | (88) | (90) | (2) | 1,852 | 2,008 | (8) | (300) | (254) | 18 | ||||||||||||||||||||||||||||||||
1 The effect of the streaming transaction has been included under Group Corporate and not included in the US PGM operations' numbers. Please refer to note 17 of the condensed consolidated provisional financial statements
2 Convenience translations have been applied to convert the rand Income Statement amount into US dollars using a foreign exchange rate of R15.03 for H2 2021 and 16.26 for H2 2020
Revenue
Revenue from the SA PGM operations increased by 12% to R37,412 million (US$2,476 million) due to a 23% or 172,216 4Eoz increase in PGMs sold and a 4% higher average 4E basket price of R40,517/4Eoz. An 11% increase in the sale of third party PoC ounces contributed to the increase in SA PGM sales volumes.
At the US PGM underground operations revenue decreased by 12% to US$572 million (R8,622 million), due to a 11% decrease in mined ounces sold following the implementation of further rail safety enhancements. The decrease in ounces and the 8% stronger rand translated into an 18% decrease in rand revenue to R8,622 million. Revenue from the US PGM recycling operation increased by 98% from US$715 million (R11,586 million) to US$1,419 million (R21,296 million) due to a 76% higher average basket price of US$3,932/3Eoz and a 13% increase in recycled ounces sold. The 8% stronger rand translated into a 84% increase in recycling revenue to R21,296 million.
Revenue from the managed SA gold operations decreased by 11% to R12,553 million (US$837 million) mainly due to an 11% lower rand gold price of R860,303/kg while gold sold volumes were marginally lower by 49kg during H2 2021. Revenue from DRDGOLD decreased by 16% to R2,498 million (US$166 million) mainly due to a 13% lower rand gold price received of R864,407/kg and 4% lower sales volumes.
Sibanye-Stillwater Operating and financial results | Six months and year ended 31 December 2021 14
Cost of sales, before amortisation and depreciation
Cost of sales, before amortisation and depreciation at the SA PGM operations increased by 29% to R16,374 million (US$1,089 million) mainly due to a 23% increase in sales volumes to 905,882 4Eoz. Mined underground 4E PGM production increased by 5% to 802,909 4Eoz and surface production volumes excluding third-party PoC were 15% higher at 80,527 4Eoz. Third-party concentrate purchased and processed (PoC) at the Marikana smelting and refining operations increased by 11% to 25,705 4Eoz. PoC material is purchased at a higher cost, than own mined ore, due to the direct correlation to the basket price of PGM’s.
Cost of sales, before amortisation and depreciation at the US PGM underground operations increased by 18% to US$282 million (R4,216 million) due to higher stoping and unplanned maintenance costs. Sales volumes decreased by 11% to 277,562 2Eoz in line with production volumes which also decreased by 11% year-on-year to 272,099 2Eoz (H2 2020: 305,327 2Eoz), mainly due to rail safety enhancements following the fatal incident at the Stillwater West mine in June 2021 and weather related electrical outages in December at the East Boulder mine. Cost of sales, before amortisation and depreciation at the US PGM recycling operation increased, in line with revenue, by 99% from US$688 million (R11,166 million) to US$1,368 million (R20,539 million) due to a higher average basket price resulting in higher costs of purchasing spent autocatalysts, coupled with a 13% increase in volumes.
Cost of sales, before amortisation and depreciation at the managed SA gold operations increased by 14% to R9,986 million (US$666 million) due to a lower cost base in H2 2020 while safely mobilising employees, higher underground milled tons, annual salary increases and above inflationary increases on input costs such as electricity, steel and steel related consumables. The current period’s production was negatively impacted by safety stoppages, resulting in production being suspended at Kloof (~42kg) and Beatrix (~314kg), and a fire at Kloof (~39kg). Cost of sales, before amortisation and depreciation from DRDGOLD increased by 8% to R1,752 million (US$116 million) due to above inflationary cost increases, particularly for steel and reagents.
Adjusted EBITDA
Adjusted EBITDA includes other cash costs, care and maintenance costs; lease payments; strike costs and corporate social investment costs (CSI) (refer note 11.1 of the condensed consolidated provisional financial statements for a reconciliation of profit before royalties, carbon tax and tax to adjusted EBITDA). Care and maintenance costs for H2 2021 were R304 million (US$20 million) at Cooke (H2 2020: R315 million or US$19 million); R36 million (US$2 million) at Marikana (H2 2020: R56 million or US$3 million) and Rnil (US$nil) at Burnstone which is now in project development (H2 2020: R41 million or US$3 million). Lease payments of R70 million (US$5 million) (H2 2020: R75 million or US$5 million) are included in line with the debt covenant formula and corporate social investment costs were R206 million (US$14 million) (H2 2020: R165 million or US$10 million).
Adjusted EBITDA at the SA PGM operations was flat year-on-year with higher sales volumes being partially offset by higher production costs. The US PGM (underground) operations had a decrease in adjusted EBITDA due lower sales volumes resulting from the safety stoppages and correspondingly lower production and the US PGM (recycling) operations' adjusted EBITDA increased mainly due to a higher average PGM basket price and higher sales volumes. The lower average gold price and sales volume mainly contributed to the decrease in adjusted EBITDA at the SA gold operations.
Adjusted EBITDA is shown in the graph below:

Amortisation and depreciation
Amortisation and depreciation at the SA PGM operations increased by 16% to R1,353 million (US$88 million) due to increased capital spend post the deferral in FY2020 during the onset of the COVID-19 pandemic and a 5% increase in mined underground production volumes. Amortisation and depreciation at the US PGM operations’ also increased by 13% to US$96 million (R1,427 million), in line with increased capital spend at Stillwater East during FY 2020. Amortisation and depreciation at the managed SA gold operations increased by 8% to R1,615 million (US$109 million) due to increased capital spend post the deferral in FY2020 during the onset of the COVID-19 pandemic whereas the amortisation and depreciation of DRDGOLD increased by 4% to R98 million (US$7 million).
Interest Income
Interest income increased by R17 million (US$3 million) mainly due to an increase in interest received on higher average cash balances (R63 million or US$5 million), interest earned on recycling advances (R9 million or US$1 million) and interest on right of recovery assets (R8 million or US$1 million), partly offset by a decrease in interest received on rehabilitation funds (R21 million or US$1 million) and Rand Mutual Insurance (R43 million or US$3 million).
Sibanye-Stillwater Operating and financial results | Six months and year ended 31 December 2021 15
Finance expense
Finance expense decreased by R206 million (US$6 million) mainly due to a R204 million (US$10 million) net decrease in interest on borrowings, R31 million (US$2 million) decrease in Rustenburg deferred payment, R27 million (US$1 million) decrease in unwinding of the environmental rehabilitation obligation, R18 million (US$1 million) decrease in the unwinding of the finance costs on the deferred revenue transactions and R6 million (US$nil million) decrease in interest on the occupational healthcare obligation, all partially offset by an increases of R58 million (US$4 million) in the unwinding of the Marikana dividend obligation, R9 million (US$1 million) in the unwinding of amortised cost on borrowings and other interest of R16 million (US$1 million). Refer to note 3 of the condensed consolidated provisional financial statements for a breakdown of finance expenses.
Loss on financial instruments
The net loss on financial instruments of R5,437 million (US$367 million) for H2 2021 compared with the loss of R4,004 million (US$242 million) for H2 2020, represents a period-on-period increased net loss of R1,433 million (US$125 million). The net loss for H2 2021 is mainly attributable to fair value losses on the revised cash flow of the Anglo deferred payment of R4,658 million (US$310 million), the Rustenburg and Marikana operations BEE cash-settled share-based payment obligations of R534 million (US$36 million) and R179 million (US$12 million) respectively, and the Marikana dividend obligation of R468 million (US$31 million), partially offset by fair value gains on the Palladium hedge contract of R550 million (US$37 million). Refer to note 4 of the condensed consolidated provisional financial statements for a breakdown of the loss on financial instruments.
Mining and income tax
The mining and income tax expense increased by 67% to R4,697 million (US$307 million) which is mainly attributable to the impact at the Marikana operations from utilising/ recognising the previously unrecognised deferred tax assets during H2 2020. The current tax expense increased by 61% to R5,675 million (US$375 million) whereas the deferred tax credit increased in H2 2021 by 37% to R978 million (US$68 million). The effective tax rate of the Group increased from 12% to 36% in H2 2021 mainly due to the impact of the contrast between utilising or recognising the previously unrecognised deferred tax assets in H2 2020 (decreased effective tax rate by 15%) compared not recognising deferred tax assets in H2 2021 (increased effective tax rate by 8%).
The Group’s effective tax rate for H2 2021 is 8% higher than the South African statutory company tax rate of 28%. The higher effective tax rate is mainly attributable to the impact of the following: a non-deductible loss on financial instruments of 7% or R868 million (US$58 million) and the derecognition of deferred tax assets of 8% or R1,069 million (US$71 million); partially offset by the change in the estimated long-term deferred tax rate of 1% or R141 million (US$9 million); net other non-taxable income and non-deductible expenditure of 2% or R286 million (US$19 million); the non-taxable equity accounted income from associates of 1% or R164 million (US$11 million); and a tax adjustment in respect of prior periods of 3% or R439 million (US$29 million).
Non-recurring items
Impairments
At 31 December 2021, a number of factors were identified that negatively impacts the ability of the Driefontein, Kloof and Beatrix operations to recover the carrying value of mining assets over their respective remaining life-of-mines. Expected above inflation increases in major cost components, in particular electricity and labour costs, coupled with ageing infrastructure, declining life-of-mines and the consensus long-term gold price forecast lower than the current spot price, negatively affected the forecast cash flows of these operations. This led to the recognition of impairment losses at the Driefontein, Kloof and Beatrix reportable segments of R212 million, R3,642 million and R1,293 million, respectively. These operations are included under SA gold in the segment report and each represent a separate cash generating unit. Refer to note 6 of the condensed consolidated provisional financial statements for additional information on the Group's estimates and assumptions used in the impairment calculations.
Restructuring costs
Restructuring costs of R69 million (US$4 million) for H2 2021 mainly included professional fees of R21 million (US$1 million) at the SA gold and SA PGM segments respectively and provision for the Kloof 3 shaft closure of R43 million (US$3 million).
Transaction costs
Transaction costs of R102 million (US$6 million) for H2 2021 mainly included project and acquisition related legal and advisory fees of R79 million (US$5 million) and Platinum Guild International membership fees of R16 million (US$1 million).
Borrowings and net debt
Gross debt increased by 19% from R17,188 million (US$1,204 million) at 30 June 2021 to R20,380 million (US$1,279 million) at 31 December 2021. The higher outstanding debt was mainly due to the issuance of the 2026 and 2029 Notes for R18,208 million (US$1,211 million), a net increase of R1,525 million (US$101 million) on US dollar denominated debt due to the foreign exchange impact of a 3% weaker rand since 30 June 2021, partially offset by the early redemption of the 2022 and 2025 Notes for R10,840 million (US$721 million), and a repayment of R6,244 million (US$415 million) on the US$600 million RCF. Net debt, excluding the Burnstone Debt which has no recourse to Sibanye-Stillwater, is in a net cash position of R11,466 million (US$719 million) at 31 December 2021. The Group’s cash balance (excluding cash of Burnstone) increased by 16% to R30,257 million (US$1,898 million) since 30 June 2021, and includes US$1,042 million (R16,609 million) held by the US PGM operations mainly due to cash received from the issue of the 2026 and 2029 Notes. Refer to note 11 of the condensed consolidated provisional financial statements for a roll forward of the Gross debt for the year ended 31 December 2021.
The Group’s total equity increased to R81,345 million (US$5,102 million) at 31 December 2021 mainly due to total comprehensive income of R38,431 million (US$2,169 million) for the year and equity settled share based payment reserve of R151 million (US$11 million). These increases were partially offset by dividends paid (R18,176 million or US$1,229 million), share buy-backs (R8,503 million or US$575 million), the loss with the initial recognition (directly in equity) of the Marikana BEE restructuring transaction (R1,146 million or US$79 million) and the purchase of 8.3% shareholding from the non-controlling shareholders in Platinum Mile Resources Proprietary Limited (R128 million or US$9 million).
Sibanye-Stillwater Operating and financial results | Six months and year ended 31 December 2021 16
The graph below illustrates the Group's Gross Debt/Cash/Total Equity for H2 2021, H1 2021 and H2 2020:

Purchase of concentrate (PoC) and toll treatment
The Marikana operation has agreements in place to purchase concentrate from third parties or toll treat PGM bearing material on their behalf. The processing of third party material allows better utilisation of smelting and refining capacity. During FY2021 the Marikana operation entered into a further short-term purchase of concentrate and toll treatment arrangement that commenced on 1 February 2021 and ended on 31 December 2021. As part of this arrangement, Marikana agreed to buy and toll treat certain metals that are contained in the PGM concentrate and furnace matte. A percentage of the toll treated metals is also retained as partial payment for the toll treatment arrangement. During H2 2021 the Marikana operation produced 25,705 4Eoz (H2 2020: 23,220 4Eoz) from concentrate purchased from third parties.
US PGM Recycling
Despite numerous challenges during H2 2021, the Recycling Segment delivered a very strong operating and financial performance for the quarter, half-year and financial year. Lower than planned concentrate production from the US PGM Segment during the period, coupled with logistic challenges across the US, impeded the Segment’s ability to maintain at budget receipt and feed rates. Given these material constraints, the Segment focused on inventory management during H2 2021 and pleasingly reduced working capital significantly year-on-year. This saw a favourable reduction of US$381 million (R5,726 million) in working capital for H2 2021 to US$441 million (R7,030 million). The focus on inventory management, with a particular focus on high carbon containing material, saw the recycling inventory reduce by 385 tonnes in H2 2021. At year-end, recycling inventory approximated 25 tonnes (H2 2020: 358 tonnes) containing 2koz (3E) (H2 2020: 26koz (3E). Inventory at the end of H2 2021 was well below normalised levels of 300 tonnes. The graph below, in relation to the average basket price for purchased 3E PGM content of spent autocatalyst, indicates the quarterly cash advances (on receipt of spent catalysts) and final payment (on final assay) to recycle suppliers, and the cash receipts when the 3E PGM metal is outturned, illustrating the decrease in recycle working capital from 1 January 2021 to 31 December 2021.

Liquidity and capital resources
Cash flow analysis
Sibanye-Stillwater defines adjusted free cash flow as net cash from operating activities, before dividends paid, net interest paid and deferred revenue advance received, less additions to property, plant and equipment.
The following table shows the adjusted free cash flow per operating segment:
Sibanye-Stillwater Operating and financial results | Six months and year ended 31 December 2021 17
| Figures in million - SA rand | Six months ended | Year ended | ||||||||||||||||||
| H2 2021 | H1 2021 | H2 2020 | FY 2021 | FY 2020 | ||||||||||||||||
| US PGM operations | 8,000 | 148 | (2,165) | 8,148 | 2,780 | |||||||||||||||
| SA PGM operations | 8,250 | 14,300 | 4,393 | 22,550 | 11,746 | |||||||||||||||
SA gold operations1 | 4,409 | 3,373 | 7,300 | 7,782 | 6,348 | |||||||||||||||
| Group corporate | (533) | (499) | (532) | (1,032) | (958) | |||||||||||||||
| Adjusted free cash flow | 20,126 | 17,322 | 8,996 | 37,448 | 19,916 | |||||||||||||||
1Included in the adjusted free cash flow of the SA gold segment is the Group treasury and shared services function, together referred to as gold corporate. The SA PGM operations, through the intercompany working capital accounts which eliminate on consolidation, contributed R4,331 million (US$288 million) during H2 2021 (H1 2021: R3,718 million or US$256 million), H2 2020 (R4,743 million or US$292 million and FY 2020: R3,997 million or US$243 million) to the working capital increase (inflow) included in the SA gold operations
The US PGM operations generated adjusted free cash flow of R8,000 million (US$532 million). Net cash inflow from operating activities amounted to R9,919 million (US$660 million) and includes a net decrease (inflow) of R5,966 (US$397 million) in working capital, which was mainly attributable to the decrease in recycle inventory, and an increase in the intercompany working capital account due to the SA Gold operations of R237 million (US$ 16 million), partially offset by taxes paid of R869 million (US$58 million). The adjusted free cash flow includes additions to property, plant and equipment of R2,260 million (US$150 million).
Adjusted free cash flow from the SA PGM operations was R8,250 million (US$549 million). Net cash inflow from operating activities amounted to R3,795 million (US$252 million) and includes a net decrease (inflow) of R604 million (US$40 million) in working capital, payments of R6,463 million (US$430 million) towards royalty and income taxes, dividends paid of R6,986 million (US$465 million) and a net decrease (outflow) of R4,331 million (US$288 million) in the intercompany working capital accounts. The adjusted free cash flow includes additions to property, plant and equipment of R2,379 million (US$158 million).
The SA gold operations generated adjusted free cash flow of R4,409 million (US$293 million). Net cash inflow from operating activities amounted to R14,094 million (US$938 million) after a net increase (inflow) of R4,331 million (US$288 million) in intercompany working capital accounts funded by the SA PGM operations and a net dividend received of R6,817 million (US$454 million), partially offset by payments of R212 million (US$14 million) towards royalty and income taxes and an increase in the intercompany working capital account receivable from the US PGM operations of R237 million (US$ 16 million). The adjusted free cash flow includes additions to property, plant and equipment of R2,515 million (US$167 million).
Group corporate’s negative adjusted free cash flow was R533 million (US$35 million). Net cash outflow from operating activities amounted to R8,848 million (US$589 million) after taxes paid of R37 million (US$2 million) and net dividends paid of R8,346 million (US$555 million).
The following table shows a reconciliation from net cash from operating activities to adjusted free cash flow:
| Figures in million - SA rand | Six months ended | Year ended | ||||||||||||||||||
| H2 2021 | H1 2021 | H2 2020 | FY 2021 | FY 2020 | ||||||||||||||||
| Net cash from operating activities | 18,960 | 13,296 | 12,763 | 32,256 | 27,151 | |||||||||||||||
| Adjusted for: | ||||||||||||||||||||
| Dividends paid | 8,516 | 9,660 | 1,486 | 18,176 | 1,698 | |||||||||||||||
| Net interest (received)/paid | (145) | (34) | 228 | (179) | 667 | |||||||||||||||
| Deferred revenue advance received | (51) | (14) | — | (65) | (771) | |||||||||||||||
| BTT early settlement payment | — | — | — | — | 787 | |||||||||||||||
| Less: | ||||||||||||||||||||
| Additions to property, plant and equipment | (7,154) | (5,586) | (5,481) | (12,740) | (9,616) | |||||||||||||||
| Adjusted free cash flow | 20,126 | 17,322 | 8,996 | 37,448 | 19,916 | |||||||||||||||
Non-IFRS measures such as adjusted free cash flow is considered as pro forma financial information as per the JSE Listing Requirements. The pro forma financial information is the responsibility of the Group’s Board of Directors and is presented for illustration purposes only, and because of its nature, adjusted free cash flow should not be considered a representation of cash from operating activities. The pro forma financial information for the years ended 31 December 2021 and 31 December 2020 have been reported on by Ernst & Young Inc. in terms of ISAE 3420 and their unmodified report is available for inspection at the Company's registered office
Cash and cash equivalents at 31 December 2021 increased to R30,292 million (US$1,900 million) from R26,097 million (US$1,829 million) at 30 June 2021 (H2 2020: cash at 31 December 2020 increased to R20,240 million (US$1,378 million) from R12,041 million (US$694 million) at 30 June 2020), after net interest received of R145 million (US$10 million) (H2 2020: R228 million or US$14 million interest paid), additions to other investments of R1,781 million (US$120 million) (H2 2020: R12 million or US$1 million), net cash from other investing activities of R189 million (US$15 million) (H2 2020: R419 million or US$23 million), net loans raised of R1,150 million (US$79 million) (H2 2020: R948 million or US$56 million) and the share buy-back of R7,761 million (US$524 million) (H2 2020: R84 million or US$5 million).
DIVIDEND DECLARATION
The Sibanye-Stillwater board of directors has declared and approved a cash dividend of 187 SA cents per ordinary share (US 12.17 cents* per share or US 48.68 cents* per ADR) or approximately R5,252 million (US$342 million*) in respect of the six months ended 31 December 2021 (“Final dividend”). The Board applied the solvency and liquidity test and reasonably concluded that the company will satisfy that test immediately after completing the proposed distribution.
Sibanye-Stillwater dividend policy is to return at least 25% to 35% of normalised earnings to shareholders. Normalised earnings is defined as earnings attributable to the owners of Sibanye-Stillwater excluding gains and losses on financial instruments and foreign exchange differences, impairments, gain/loss on disposal of property, plant and equipment, occupational healthcare expense, restructuring costs, transactions costs, share-based payment on BEE transaction, gain on acquisition, net other business development costs, share of results of equity-accounted investees, all after tax and the impact of non-controlling interest, and changes in estimated deferred tax rate.
The total dividend declared of 479 cents (Final dividend: 187 SA cents and Interim dividend: 292 SA cents) equates to 35% of normalised earnings for the year ended 31 December 2021.
The final dividend will be subject to the Dividends Withholding Tax. In accordance with paragraphs 11.17 (a) (i) and 11.17 (c) of the JSE Listings Requirements the following additional information is disclosed:
•The dividend has been declared out of income reserves;
•The local Dividends Withholding Tax rate is 20% (twenty per centum);
•The gross local dividend amount is 187.00000 SA cents per ordinary share for shareholders exempt from the Dividends Tax;
•The net local dividend amount is 149.60000 SA cents (80% of 187 SA cents) per ordinary share for shareholders liable to pay the Dividends Withholding Tax;
Sibanye-Stillwater Operating and financial results | Six months and year ended 31 December 2021 18
•Sibanye-Stillwater currently has 2 808 406 269 ordinary shares in issue; and
•Sibanye-Stillwater’s income tax reference number is 9723 182 169.
Shareholders are advised of the following dates in respect of the final dividend:
Final dividend: 187 SA cents per share
Declaration date: Thursday, 3 March 2022
Last date to trade cum dividend: Tuesday, 22 March 2022
Shares commence trading ex-dividend: Wednesday, 23 March 2022
Record date: Friday, 25 March 2022
Payment of dividend: Monday, 28 March 2022
Please note that share certificates may not be dematerialised or rematerialised between Wednesday, 23 March 2022 and Friday, 25 March 2022 both dates inclusive.
To holders of American Depositary Receipts (ADRs):
•Each ADR represents 4 ordinary shares;
•ADRs trade ex-dividend on the New York Stock Exchange (NYSE): Thursday, 24 March 2022;
•Record Friday, 25 March 2022;
•Approximate date of currency conversion: Monday, 28 March 2022; and
•Approximate payment date of dividend: Monday, 11 April 2022
Assuming an exchange rate of R15.3650/US$1*, the dividend payable on an ADR is equivalent to 48.68 United States cents for Shareholders liable to pay dividend withholding tax. However, the actual rate of payment will depend on the exchange rate on the date for currency conversion.
* Based on an exchange rate of R15.3650/US$ at 28 February 2022 from IRESS. However, the actual rate of payment will depend on the exchange rate on the date for currency conversion
MINERAL RESOURCES AND MINERAL RESERVES
On 2 March 2022, Sibanye-Stillwater reported an update of its Mineral Resources and Mineral Reserves at 31 December 2021.
•Stable Mineral Resources (89.6Moz 2E) and Mineral Reserves (27.3Moz 2E) at our US PGM operations, with minor increases of 3.1% and 1.5% respectively
•A year-on-year reduction in attributable Mineral Reserves and Mineral Resources for our SA PGM operations; and the Cooke operation at our SA gold operations as a result of a change in the basis of accounting for minority holdings from an effective accounting interest in mineral properties basis to an effective legal interest basis
•Mineral Resources of 174.7Moz 4E and Mineral Reserves of 32.2M 4Eoz at SA PGM operations
◦Agreements with Anglo American Platinum (Anglo Plat) enable Kroondal to immediately mine parts of the Rustenburg lease area, added 1.32Moz 4E of attributable Mineral Reserves to the SA PGM base (1.79M oz 4E on a 100% basis)
◦This increase was offset by the change in the basis for reporting (as outlined above) which similarly impacted the SA PGM exploration properties
•Mineral Resources of 74.6Moz and Mineral Reserves of 13.1Moz for our SA gold operations (including DRDGOLD), a 7.0% and 15.9% decline respectively, primarily due to depletion and the exclusion of the De Bron Merriespruit Project Mineral Reserves (pending an updated feasibility Study), partly off-set by an increase in secondary reef Mineral Reserves due to successful exploration outcomes at Driefontein
•The execution and delivery on the Group’s green metals strategy has led to
◦A maiden lithium Mineral Resource of 78.5Kt of LiO2, due to the inclusion of the attributable interests in the Keliber (26.6%) and Rhyolite Ridge (through the 7.12% holding in ioneer) projects in Finland and the United States (US) respectively
◦A maiden company zinc Mineral Reserve of 1,016.3Mlb due to the inclusion of the attributable interest (19.99%) in the New Century tailings retreatment operation in Australia
CHANGE IN BOARD OF DIRECTORS
Sindiswa Victoria Zilwa was appointed as an Independent non-executive director of the Group with effect from 1 January 2021. Sindiswa is a Chartered Accountant by profession and an expert in the areas of accounting, auditing and business management. Sindiswa is also a Chartered Director (SA) and has vast experience as a director in both the public and private sectors. She currently serves as a non-executive director of Cell C Limited, Discovery Limited, Gijima Group Limited, Massmart Limited, Metrofile Holdings Limited, Mercedes-Benz South Africa Limited and Tourvest Group (Pty) Limited.
Sibanye-Stillwater Operating and financial results | Six months and year ended 31 December 2021 19
SALIENT FEATURES AND COST BENCHMARKS - SIX MONTHS
SA and US PGM operations
| US OPERA-TIONS | SA OPERATIONS | |||||||||||||||||||||||||||||||||||||||||||
Total US and SA PGM1 | Total US PGM | Total SA PGM1 | Rustenburg | Marikana1 | Kroondal | Plat Mile | Mimosa | |||||||||||||||||||||||||||||||||||||
| Attributable | Under- ground2 | Total | Under- ground | Surface | Under- ground | Surface | Under- ground | Surface | Attribu-table | Surface | Attribu-table | |||||||||||||||||||||||||||||||||
| Production | ||||||||||||||||||||||||||||||||||||||||||||
| Tonnes milled/treated | 000't | Dec 2021 | 20,361 | 710 | 19,651 | 9,183 | 10,468 | 3,220 | 2,920 | 3,499 | 2,043 | 1,756 | 5,505 | 708 | ||||||||||||||||||||||||||||||
| Jun 2021 | 19,415 | 759 | 18,656 | 8,907 | 9,749 | 3,121 | 2,792 | 3,303 | 1,826 | 1,769 | 5,131 | 714 | ||||||||||||||||||||||||||||||||
| Dec 2020 | 19,631 | 760 | 18,871 | 8,977 | 9,894 | 3,232 | 2,807 | 3,322 | 1,903 | 1,707 | 5,184 | 716 | ||||||||||||||||||||||||||||||||
| Plant head grade | g/t | Dec 2021 | 2.44 | 13.17 | 2.05 | 3.42 | 0.85 | 3.43 | 1.08 | 3.89 | 0.87 | 2.39 | 0.73 | 3.58 | ||||||||||||||||||||||||||||||
| Jun 2021 | 2.47 | 13.50 | 2.02 | 3.36 | 0.80 | 3.33 | 1.07 | 3.84 | 0.87 | 2.40 | 0.62 | 3.59 | ||||||||||||||||||||||||||||||||
| Dec 2020 | 2.47 | 13.69 | 2.02 | 3.34 | 0.81 | 3.36 | 1.00 | 3.70 | 0.87 | 2.50 | 0.69 | 3.61 | ||||||||||||||||||||||||||||||||
Plant recoveries3 | % | Dec 2021 | 76.05 | 89.96 | 72.69 | 85.32 | 28.15 | 87.03 | 34.30 | 87.03 | 26.42 | 83.77 | 23.73 | 71.83 | ||||||||||||||||||||||||||||||
| Jun 2021 | 77.34 | 89.49 | 73.80 | 85.85 | 27.18 | 88.40 | 34.52 | 87.40 | 25.77 | 83.15 | 21.36 | 73.67 | ||||||||||||||||||||||||||||||||
| Dec 2020 | 77.03 | 90.92 | 73.06 | 85.59 | 27.03 | 86.92 | 37.57 | 87.37 | 25.05 | 83.39 | 19.67 | 75.11 | ||||||||||||||||||||||||||||||||
Yield3 | g/t | Dec 2021 | 1.85 | 11.85 | 1.49 | 2.92 | 0.24 | 2.99 | 0.37 | 3.39 | 0.23 | 2.00 | 0.17 | 2.57 | ||||||||||||||||||||||||||||||
| Jun 2021 | 1.91 | 12.08 | 1.49 | 2.88 | 0.22 | 2.94 | 0.37 | 3.36 | 0.22 | 2.00 | 0.13 | 2.64 | ||||||||||||||||||||||||||||||||
| Dec 2020 | 1.90 | 12.45 | 1.48 | 2.86 | 0.22 | 2.92 | 0.38 | 3.23 | 0.22 | 2.08 | 0.14 | 2.71 | ||||||||||||||||||||||||||||||||
PGM production3,4 | 4Eoz - 2Eoz | Dec 2021 | 1,214,072 | 272,099 | 941,973 | 861,446 | 80,527 | 309,042 | 34,778 | 380,832 | 15,095 | 113,035 | 30,654 | 58,537 | ||||||||||||||||||||||||||||||
| Jun 2021 | 1,192,466 | 298,301 | 894,165 | 826,000 | 68,165 | 295,394 | 33,160 | 356,396 | 13,163 | 113,496 | 21,842 | 60,714 | ||||||||||||||||||||||||||||||||
| Dec 2020 | 1,200,786 | 305,327 | 895,459 | 825,603 | 69,855 | 303,489 | 33,903 | 345,285 | 13,332 | 114,412 | 22,620 | 62,417 | ||||||||||||||||||||||||||||||||
PGM sold5 | 4Eoz - 2Eoz | Dec 2021 | 1,237,050 | 277,562 | 959,488 | 311,967 | 31,680 | 418,546 | 113,035 | 30,654 | 53,606 | |||||||||||||||||||||||||||||||||
| Jun 2021 | 1,196,836 | 270,714 | 926,122 | 296,850 | 34,214 | 403,843 | 113,496 | 21,842 | 55,877 | |||||||||||||||||||||||||||||||||||
| Dec 2020 | 1,117,654 | 310,146 | 807,508 | 236,520 | 21,870 | 338,244 | 114,412 | 22,620 | 73,842 | |||||||||||||||||||||||||||||||||||
Price and costs6 | ||||||||||||||||||||||||||||||||||||||||||||
Average PGM basket price7 | R/4Eoz - R/2Eoz | Dec 2021 | 37,758 | 28,755 | 40,517 | 41,323 | 27,581 | 40,477 | 44,108 | 32,984 | 31,756 | |||||||||||||||||||||||||||||||||
| Jun 2021 | 48,796 | 33,261 | 53,629 | 54,451 | 32,007 | 53,959 | 59,455 | 39,958 | 39,202 | |||||||||||||||||||||||||||||||||||
| Dec 2020 | 36,895 | 32,026 | 38,954 | 39,854 | 28,612 | 38,305 | 43,027 | 28,635 | 32,642 | |||||||||||||||||||||||||||||||||||
| Average PGM basket price6 | US$/4Eoz - US$/2Eoz | Dec 2021 | 2,512 | 1,913 | 2,696 | 2,749 | 1,835 | 2,693 | 2,935 | 2,195 | 2,113 | |||||||||||||||||||||||||||||||||
| Jun 2021 | 3,354 | 2,286 | 3,686 | 3,742 | 2,200 | 3,709 | 4,086 | 2,746 | 2,694 | |||||||||||||||||||||||||||||||||||
| Dec 2020 | 2,269 | 1,970 | 2,396 | 2,451 | 1,760 | 2,356 | 2,646 | 1,761 | 2,008 | |||||||||||||||||||||||||||||||||||
Operating cost8 | R/t | Dec 2021 | 959 | 5,310 | 795 | 1,711 | 204 | 1,267 | 935 | 55 | 1,177 | |||||||||||||||||||||||||||||||||
| Jun 2021 | 940 | 5,046 | 766 | 1,574 | 185 | 1,281 | 858 | 44 | 1,069 | |||||||||||||||||||||||||||||||||||
| Dec 2020 | 981 | 5,133 | 807 | 1,549 | 208 | 1,403 | 873 | 47 | 1,167 | |||||||||||||||||||||||||||||||||||
| Operating cost7 | US$/t | Dec 2021 | 64 | 353 | 53 | 114 | 14 | 84 | 62 | 4 | 78 | |||||||||||||||||||||||||||||||||
| Jun 2021 | 65 | 347 | 53 | 108 | 13 | 88 | 59 | 3 | 73 | |||||||||||||||||||||||||||||||||||
| Dec 2020 | 60 | 316 | 50 | 95 | 13 | 86 | 54 | 3 | 72 | |||||||||||||||||||||||||||||||||||
| Operating cost7 | R/4Eoz - R/2Eoz | Dec 2021 | 16,302 | 13,855 | 17,056 | 17,826 | 17,109 | 17,733 | 14,518 | 9,852 | 14,230 | |||||||||||||||||||||||||||||||||
| Jun 2021 | 15,526 | 12,839 | 16,488 | 16,625 | 15,591 | 17,775 | 13,366 | 10,439 | 12,567 | |||||||||||||||||||||||||||||||||||
| Dec 2020 | 16,302 | 12,776 | 17,595 | 16,494 | 17,211 | 20,442 | 13,030 | 10,840 | 13,384 | |||||||||||||||||||||||||||||||||||
| Operating cost7 | US$/4Eoz - US$/2Eoz | Dec 2021 | 1,085 | 922 | 1,135 | 1,186 | 1,138 | 1,180 | 966 | 655 | 947 | |||||||||||||||||||||||||||||||||
| Jun 2021 | 1,067 | 882 | 1,133 | 1,143 | 1,072 | 1,222 | 919 | 717 | 864 | |||||||||||||||||||||||||||||||||||
| Dec 2020 | 1,003 | 786 | 1,082 | 1,014 | 1,058 | 1,257 | 801 | 667 | 823 | |||||||||||||||||||||||||||||||||||
Adjusted EBITDA Margin9 | % | Dec 2021 | 51 | 54 | 57 | 54 | 50 | 27 | 50 | |||||||||||||||||||||||||||||||||||
| Jun 2021 | 65 | 66 | 70 | 61 | 75 | 37 | 71 | |||||||||||||||||||||||||||||||||||||
| Dec 2020 | 63 | 60 | 60 | 56 | 69 | 32 | 59 | |||||||||||||||||||||||||||||||||||||
All-in sustaining cost10 | R/4Eoz - R/2Eoz | Dec 2021 | 16,703 | 15,619 | 17,037 | 18,835 | 17,069 | 13,774 | 8,482 | 15,853 | ||||||||||||||||||||||||||||||||||
| Jun 2021 | 16,192 | 14,153 | 16,921 | 18,061 | 17,745 | 12,115 | 10,805 | 13,275 | ||||||||||||||||||||||||||||||||||||
| Dec 2020 | 16,377 | 14,342 | 17,123 | 17,939 | 17,983 | 13,066 | 11,768 | 14,627 | ||||||||||||||||||||||||||||||||||||
| All-in sustaining cost8 | US$/4Eoz - US$/2Eoz | Dec 2021 | 1,111 | 1,039 | 1,134 | 1,253 | 1,136 | 916 | 564 | 1055 | ||||||||||||||||||||||||||||||||||
| Jun 2021 | 1,113 | 973 | 1,163 | 1,241 | 1,220 | 833 | 743 | 912 | ||||||||||||||||||||||||||||||||||||
| Dec 2020 | 1,007 | 882 | 1,053 | 1,103 | 1,106 | 804 | 724 | 900 | ||||||||||||||||||||||||||||||||||||
All-in cost10 | R/4Eoz - R/2Eoz | Dec 2021 | 17,915 | 20,007 | 17,270 | 18,835 | 17,589 | 13,774 | 8,482 | 15,853 | ||||||||||||||||||||||||||||||||||
| Jun 2021 | 17,275 | 18,233 | 16,932 | 18,061 | 17,770 | 12,115 | 10,805 | 13,275 | ||||||||||||||||||||||||||||||||||||
| Dec 2020 | 17,352 | 17,917 | 17,146 | 17,939 | 18,036 | 13,066 | 11,768 | 14,627 | ||||||||||||||||||||||||||||||||||||
| All-in cost8 | US$/4Eoz - US$/2Eoz | Dec 2021 | 1,192 | 1,331 | 1,149 | 1,253 | 1,170 | 916 | 564 | 1,055 | ||||||||||||||||||||||||||||||||||
| Jun 2021 | 1,187 | 1,253 | 1,164 | 1,241 | 1,221 | 833 | 743 | 912 | ||||||||||||||||||||||||||||||||||||
| Dec 2020 | 1,067 | 1,102 | 1,054 | 1,103 | 1,109 | 804 | 724 | 900 | ||||||||||||||||||||||||||||||||||||
Capital expenditure6 | ||||||||||||||||||||||||||||||||||||||||||||
| Total capital expenditure | Rm | Dec 2021 | 4,635 | 2,256 | 2,379 | 701 | 1,499 | 165 | 14 | 299 | ||||||||||||||||||||||||||||||||||
| Jun 2021 | 3,719 | 2,300 | 1,419 | 546 | 754 | 104 | 14 | 200 | ||||||||||||||||||||||||||||||||||||
| Dec 2020 | 3,589 | 2,206 | 1,383 | 447 | 792 | 126 | 19 | 259 | ||||||||||||||||||||||||||||||||||||
| Total capital expenditure | US$m | Dec 2021 | 308 | 150 | 158 | 47 | 100 | 11 | 1 | 20 | ||||||||||||||||||||||||||||||||||
| Jun 2021 | 256 | 158 | 98 | 38 | 52 | 7 | 1 | 14 | ||||||||||||||||||||||||||||||||||||
| Dec 2020 | 220 | 136 | 85 | 28 | 48 | 8 | 1 | 16 | ||||||||||||||||||||||||||||||||||||
Figures may not add as they are rounded independently
Sibanye-Stillwater Operating and financial results | Six months and year ended 31 December 2021 20
1The Total US and SA PGM, Total SA PGM and Marikana excludes the production and costs associated with the purchase of concentrate (PoC) from third parties. For a reconciliation of the Operating cost, AISC and AIC excluding third party PoC, refer to “Reconciliation of operating cost excluding third party PoC for Total US and SA PGM, Total SA PGM and Marikana - Six Months” and “Reconciliation of AISC and AIC excluding third party PoC for Total US and SA PGM, Total SA PGM and Marikana – Six Months”
2The US PGM operations’ underground production is converted to metric tonnes and kilograms, and performance is translated into rand. In addition to the US PGM operations’ underground production, the operation treats recycling material which is excluded from the statistics shown above and is detailed in the PGM recycling table on the next page
3The Eastern Tailings Treatment Plant (ETTP) processing facility ounce production resulting from the processing of material from the Marikana underground operation was previously reported under the surface operation. These produced ounces are now appropriately included in the Marikana underground production resulting in a revision of previously reported plant recoveries and yield for the Marikana underground and surface operations
4Production per product – see prill split in the table below
5PGM sold includes the third party PoC ounces sold
6The Total US and SA PGM and Total SA PGM operations’ unit cost benchmarks and capital expenditure exclude the financial results of Mimosa, which is equity accounted and excluded from revenue and cost of sales
7The average PGM basket price is the PGM revenue per 4E/2E ounce, prior to a purchase of concentrate adjustment
8Operating cost is the average cost of production and operating cost per tonne is calculated by dividing the cost of sales, before amortisation and depreciation and change in inventory in a period by the tonnes milled/treated in the same period, and operating cost per ounce (and kilogram) is calculated by dividing the cost of sales, before amortisation and depreciation and change in inventory in a period, by the PGM produced in the same period. The operating cost of Marikana operations for 2020 includes the purchase of concentrate from Rustenburg, Kroondal and Platinum Mile
9Adjusted EBITDA margin is calculated by dividing adjusted EBITDA by revenue
10All-in cost is calculated in accordance with the World Gold Council guidance. All-in cost excludes income tax, costs associated with merger and acquisition activities, working capital, impairments, financing costs, one-time severance charges and items needed to normalise earnings. All-in cost is made up of All-in sustaining cost, being the cost to sustain current operations, given as a sub-total in the All-in cost calculation, together with corporate and major capital expenditure associated with growth. All-in sustaining cost per ounce (and kilogram) and All-in cost per ounce (and kilogram) are calculated by dividing the All-in sustaining cost and All-in cost, respectively, in a period by the total 4E/2E PGM produced in the same period. For a reconciliation of cost of sales, before amortisation and depreciation to All-in cost, see “All-in costs - six months”
| Mining - PGM Prill split including third party PoC, excluding recycling operations | ||||||||||||||||||||||||||||||||||||||||||||||||||||||||
| GROUP PGM | SA OPERATIONS | US OPERATIONS | ||||||||||||||||||||||||||||||||||||||||||||||||||||||
| Dec 2021 | Jun 2021 | Dec 2020 | Dec 2021 | Jun 2021 | Dec 2020 | Dec 2021 | Jun 2021 | Dec 2020 | ||||||||||||||||||||||||||||||||||||||||||||||||
| % | % | % | % | % | % | % | % | % | ||||||||||||||||||||||||||||||||||||||||||||||||
| Platinum | 634,117 | 51 | % | 617,590 | 50 | % | 615,304 | 50 | % | 572,635 | 59 | % | 549,932 | 59 | % | 546,741 | 60 | % | 61,482 | 23 | % | 67,658 | 23 | % | 68,563 | 22 | % | |||||||||||||||||||||||||||||
| Palladium | 500,142 | 40 | % | 507,353 | 41 | % | 511,542 | 42 | % | 289,526 | 30 | % | 276,710 | 30 | % | 274,778 | 30 | % | 210,616 | 77 | % | 230,643 | 77 | % | 236,764 | 78 | % | |||||||||||||||||||||||||||||
| Rhodium | 84,248 | 7 | % | 81,206 | 7 | % | 77,365 | 6 | % | 84,248 | 9 | % | 81,206 | 9 | % | 77,365 | 8 | % | ||||||||||||||||||||||||||||||||||||||
| Gold | 21,270 | 2 | % | 21,144 | 2 | % | 19,795 | 2 | % | 21,270 | 2 | % | 21,144 | 2 | % | 19,795 | 2 | % | ||||||||||||||||||||||||||||||||||||||
| PGM production 4E/2E | 1,239,776 | 100 | % | 1,227,293 | 100 | % | 1,224,006 | 100 | % | 967,678 | 100 | % | 928,992 | 100 | % | 918,679 | 100 | % | 272,098 | 100 | % | 298,301 | 100 | % | 305,327 | 100 | % | |||||||||||||||||||||||||||||
| Ruthenium | 153,057 | 141,426 | 122,445 | 153,057 | 141,426 | 122,445 | ||||||||||||||||||||||||||||||||||||||||||||||||||
| Iridium | 35,012 | 33,222 | 30,253 | 35,012 | 33,222 | 30,253 | ||||||||||||||||||||||||||||||||||||||||||||||||||
| Total 6E/2E | 1,427,845 | 1,401,941 | 1,376,704 | 1,155,747 | 1,103,640 | 1,071,377 | 272,098 | 298,301 | 305,327 | |||||||||||||||||||||||||||||||||||||||||||||||
Figures may not add as they are rounded independently
| Recycling at US operations | ||||||||||||||
| Unit | Dec 2021 | Jun 2021 | Dec 2020 | |||||||||||
| Average catalyst fed/day | Tonne | 22.8 | 24.7 | 27.5 | ||||||||||
| Total processed | Tonne | 4,201 | 4,473 | 5,057 | ||||||||||
| Tolled | Tonne | 23 | 14 | 186 | ||||||||||
| Purchased | Tonne | 4,177 | 4,459 | 4,871 | ||||||||||
| PGM fed | 3Eoz | 352,276 | 402,872 | 442,698 | ||||||||||
| PGM sold | 3Eoz | 360,167 | 422,384 | 319,341 | ||||||||||
| PGM tolled returned | 3Eoz | 2,050 | 10,580 | 36,954 | ||||||||||
Sibanye-Stillwater Operating and financial results | Six months and year ended 31 December 2021 21
SA gold operations
| SA OPERATIONS | |||||||||||||||||||||||||||||||||||||||||
| Total SA gold | Driefontein | Kloof | Beatrix | Cooke | DRDGOLD | ||||||||||||||||||||||||||||||||||||
| Total | Under- ground | Surface | Under- ground | Surface | Under- ground | Surface | Under- ground | Surface | Surface | Surface | |||||||||||||||||||||||||||||||
| Production | |||||||||||||||||||||||||||||||||||||||||
| Tonnes milled/treated | 000't | Dec 2021 | 21,840 | 2,599 | 19,241 | 760 | 522 | 944 | 1,686 | 895 | 307 | 2,260 | 14,466 | ||||||||||||||||||||||||||||
| Jun 2021 | 22,562 | 2,563 | 19,999 | 714 | 41 | 918 | 2,455 | 931 | 343 | 2,382 | 14,778 | ||||||||||||||||||||||||||||||
| Dec 2020 | 22,569 | 2,478 | 20,091 | 760 | — | 950 | 2,861 | 768 | 399 | 2,498 | 14,333 | ||||||||||||||||||||||||||||||
| Yield | g/t | Dec 2021 | 0.79 | 4.95 | 0.23 | 6.06 | 0.45 | 5.33 | 0.33 | 3.61 | 0.39 | 0.25 | 0.20 | ||||||||||||||||||||||||||||
| Jun 2021 | 0.72 | 4.62 | 0.21 | 6.18 | 0.37 | 4.93 | 0.34 | 3.14 | 0.32 | 0.25 | 0.19 | ||||||||||||||||||||||||||||||
| Dec 2020 | 0.80 | 5.34 | 0.24 | 6.49 | — | 5.78 | 0.35 | 3.64 | 0.38 | 0.26 | 0.21 | ||||||||||||||||||||||||||||||
| Gold produced | kg | Dec 2021 | 17,234 | 12,866 | 4,368 | 4,604 | 237 | 5,033 | 550 | 3,229 | 121 | 574 | 2,886 | ||||||||||||||||||||||||||||
| Jun 2021 | 16,138 | 11,853 | 4,285 | 4,409 | 15 | 4,525 | 828 | 2,919 | 111 | 592 | 2,739 | ||||||||||||||||||||||||||||||
| Dec 2020 | 18,007 | 13,223 | 4,784 | 4,931 | — | 5,493 | 1,002 | 2,799 | 150 | 648 | 2,984 | ||||||||||||||||||||||||||||||
| oz | Dec 2021 | 554,086 | 413,651 | 140,434 | 148,022 | 7,620 | 161,815 | 17,683 | 103,815 | 3,890 | 18,455 | 92,787 | |||||||||||||||||||||||||||||
| Jun 2021 | 518,848 | 381,082 | 137,766 | 141,752 | 482 | 145,482 | 26,621 | 93,848 | 3,569 | 19,033 | 88,061 | ||||||||||||||||||||||||||||||
| Dec 2020 | 578,939 | 425,129 | 153,810 | 158,535 | — | 176,604 | 32,215 | 89,990 | 4,823 | 20,834 | 95,938 | ||||||||||||||||||||||||||||||
| Gold sold | kg | Dec 2021 | 17,495 | 13,173 | 4,322 | 4,705 | 223 | 5,031 | 529 | 3,437 | 121 | 558 | 2,891 | ||||||||||||||||||||||||||||
| Jun 2021 | 15,879 | 11,537 | 4,342 | 4,371 | 15 | 4,530 | 871 | 2,636 | 111 | 617 | 2,728 | ||||||||||||||||||||||||||||||
| Dec 2020 | 17,659 | 12,935 | 4,724 | 4,781 | — | 5,401 | 968 | 2,753 | 151 | 599 | 3,006 | ||||||||||||||||||||||||||||||
| oz | Dec 2021 | 562,477 | 423,522 | 138,955 | 151,269 | 7,170 | 161,750 | 17,008 | 110,502 | 3,890 | 17,940 | 92,948 | |||||||||||||||||||||||||||||
| Jun 2021 | 510,521 | 370,923 | 139,598 | 140,531 | 482 | 145,643 | 28,003 | 84,749 | 3,569 | 19,837 | 87,707 | ||||||||||||||||||||||||||||||
| Dec 2020 | 567,750 | 415,870 | 151,880 | 153,713 | — | 173,646 | 31,122 | 88,511 | 4,855 | 19,258 | 96,645 | ||||||||||||||||||||||||||||||
| Price and costs | |||||||||||||||||||||||||||||||||||||||||
| Gold price received | R/kg | Dec 2021 | 860,303 | 863,028 | 858,273 | 856,661 | 858,423 | 864,407 | |||||||||||||||||||||||||||||||||
| Jun 2021 | 838,088 | 838,805 | 837,252 | 835,457 | 842,788 | 840,176 | |||||||||||||||||||||||||||||||||||
| Dec 2020 | 967,229 | 967,245 | 966,588 | 939,842 | 986,811 | 990,486 | |||||||||||||||||||||||||||||||||||
| US$/oz | Dec 2021 | 1,780 | 1,786 | 1,776 | 1,773 | 1,776 | 1,789 | ||||||||||||||||||||||||||||||||||
| Jun 2021 | 1,792 | 1,793 | 1,790 | 1,786 | 1,802 | 1,796 | |||||||||||||||||||||||||||||||||||
| Dec 2020 | 1,850 | 1,850 | 1,849 | 1,798 | 1,888 | 1,895 | |||||||||||||||||||||||||||||||||||
Operating cost1 | R/t | Dec 2021 | 528 | 3,390 | 141 | 3,778 | 238 | 3,850 | 200 | 2,577 | 221 | 188 | 122 | ||||||||||||||||||||||||||||
| Jun 2021 | 480 | 3,229 | 127 | 3,777 | 195 | 3,685 | 210 | 2,358 | 143 | 162 | 107 | ||||||||||||||||||||||||||||||
| Dec 2020 | 464 | 3,172 | 130 | 3,549 | — | 3,402 | 182 | 2,514 | 196 | 158 | 112 | ||||||||||||||||||||||||||||||
| US$/t | Dec 2021 | 35 | 226 | 9 | 251 | 16 | 256 | 13 | 171 | 15 | 12 | 8 | |||||||||||||||||||||||||||||
| Jun 2021 | 33 | 222 | 9 | 260 | 13 | 253 | 14 | 162 | 10 | 11 | 7 | ||||||||||||||||||||||||||||||
| Dec 2020 | 29 | 195 | 8 | 218 | — | 209 | 11 | 155 | 12 | 10 | 7 | ||||||||||||||||||||||||||||||
| R/kg | Dec 2021 | 669,084 | 684,828 | 622,711 | 623,588 | 523,207 | 722,035 | 614,545 | 714,153 | 561,983 | 738,676 | 611,920 | |||||||||||||||||||||||||||||
| Jun 2021 | 670,405 | 698,135 | 593,699 | 611,703 | 533,333 | 747,624 | 623,188 | 751,970 | 441,441 | 650,338 | 579,043 | ||||||||||||||||||||||||||||||
| Dec 2020 | 581,113 | 594,434 | 544,293 | 546,988 | — | 588,403 | 519,261 | 689,889 | 520,667 | 610,802 | 539,444 | ||||||||||||||||||||||||||||||
| US$/oz | Dec 2021 | 1,385 | 1,417 | 1,289 | 1,290 | 1,083 | 1,494 | 1,272 | 1,478 | 1,163 | 1,529 | 1,266 | |||||||||||||||||||||||||||||
| Jun 2021 | 1,433 | 1,492 | 1,269 | 1,308 | 1,140 | 1,598 | 1,332 | 1,607 | 944 | 1,390 | 1,238 | ||||||||||||||||||||||||||||||
| Dec 2020 | 1,112 | 1,137 | 1,041 | 1,046 | — | 1,126 | 993 | 1,320 | 996 | 1,168 | 1,032 | ||||||||||||||||||||||||||||||
Adjusted EBITDA margin2 | % | Dec 2021 | 18 | 27 | 16 | 15 | (50) | 29 | |||||||||||||||||||||||||||||||||
| Jun 2021 | 18 | 28 | 13 | 11 | (34) | 30 | |||||||||||||||||||||||||||||||||||
| Dec 2020 | 36 | 41 | 39 | 25 | (16) | 45 | |||||||||||||||||||||||||||||||||||
All-in sustaining cost3 | R/kg | Dec 2021 | 814,347 | 807,427 | 876,079 | 845,981 | 802,867 | 667,243 | |||||||||||||||||||||||||||||||||
| Jun 2021 | 791,171 | 777,018 | 839,844 | 871,496 | 688,817 | 662,757 | |||||||||||||||||||||||||||||||||||
| Dec 2020 | 704,355 | 701,129 | 722,845 | 812,018 | 668,447 | 604,125 | |||||||||||||||||||||||||||||||||||
| All-in sustaining cost2 | US$/oz | Dec 2021 | 1,685 | 1,671 | 1,813 | 1,751 | 1,661 | 1,381 | |||||||||||||||||||||||||||||||||
| Jun 2021 | 1,691 | 1,661 | 1,795 | 1,863 | 1,472 | 1,417 | |||||||||||||||||||||||||||||||||||
| Dec 2020 | 1,347 | 1,341 | 1,383 | 1,553 | 1,279 | 1,156 | |||||||||||||||||||||||||||||||||||
All-in cost3 | R/kg | Dec 2021 | 836,639 | 807,427 | 895,324 | 847,948 | 802,867 | 680,387 | |||||||||||||||||||||||||||||||||
| Jun 2021 | 804,648 | 777,018 | 856,693 | 871,496 | 688,817 | 666,056 | |||||||||||||||||||||||||||||||||||
| Dec 2020 | 718,478 | 701,129 | 739,692 | 812,018 | 668,447 | 616,966 | |||||||||||||||||||||||||||||||||||
| US$/oz | Dec 2021 | 1,731 | 1,671 | 1,853 | 1,755 | 1,661 | 1,408 | ||||||||||||||||||||||||||||||||||
| Jun 2021 | 1,720 | 1,661 | 1,831 | 1,863 | 1,472 | 1,424 | |||||||||||||||||||||||||||||||||||
| Dec 2020 | 1,374 | 1,341 | 1,415 | 1,553 | 1,279 | 1,180 | |||||||||||||||||||||||||||||||||||
| Capital expenditure | |||||||||||||||||||||||||||||||||||||||||
Total capital expenditure4 | Rm | Dec 2021 | 2,515 | 828 | 947 | 368 | — | 183 | |||||||||||||||||||||||||||||||||
| Jun 2021 | 1,866 | 672 | 668 | 301 | — | 194 | |||||||||||||||||||||||||||||||||||
| Dec 2020 | 1,889 | 574 | 833 | 244 | — | 202 | |||||||||||||||||||||||||||||||||||
| Total capital expenditure | US$m | Dec 2021 | 167 | 55 | 63 | 24 | — | 12 | |||||||||||||||||||||||||||||||||
| Jun 2021 | 128 | 46 | 46 | 21 | — | 13 | |||||||||||||||||||||||||||||||||||
| Dec 2020 | 116 | 35 | 51 | 15 | — | 12 | |||||||||||||||||||||||||||||||||||
Average exchange rate for the six months ended 31 December 2021, 30 June 2021 and 31 December 2020 was R15.03/US$, R14.55/US$ and R16.26/US$, respectively
Figures may not add as they are rounded independently
1Operating cost is the average cost of production and operating cost per tonne is calculated by dividing the cost of sales, before amortisation and depreciation and change in inventory in a period, by the tonnes milled/treated in the same period, and operating cost per kilogram (and ounce) is calculated by dividing the cost of sales, before amortisation and depreciation and change in inventory in a period, by the gold produced in the same period
2Adjusted EBITDA margin is calculated by dividing adjusted EBITDA by revenue
3All-in cost is calculated in accordance with the World Gold Council guidance. All-in cost excludes income tax, costs associated with merger and acquisition activities, working capital, impairments, financing costs, one time severance charges and items needed to normalise earnings. All-in cost is made up of All-in sustaining cost, being the cost to sustain current operations, given as a sub-total in the All-in cost calculation, together with corporate and major capital expenditure associated with growth. All-in sustaining cost per kilogram (and ounce) and All-in cost per kilogram (and ounce) are calculated by dividing the All-in sustaining cost and All-in cost, respectively, in a period by the total gold sold over the same period. For a reconciliation of cost of sales before amortisation and depreciation to All-in cost, see “All-in costs – Six months”
4Corporate project expenditure for the six months ended 31 December 2021, 30 June 2021 and 31 December 2020 was R189 million (US$13 million), R31 million (US$2 million), and R35 million (US2 million), respectively, the majority of which related to the Burnstone project
Sibanye-Stillwater Operating and financial results | Six months and year ended 31 December 2021 22
CONDENSED CONSOLIDATED PROVISIONAL FINANCIAL STATEMENTS
Condensed consolidated income statement
Figures are in millions unless otherwise stated
| US dollar | SA rand | ||||||||||||||||||||||||||||||||||
| Year ended | Six months ended | Six months ended | Year ended | ||||||||||||||||||||||||||||||||
| Unaudited | Unaudited | Unaudited | Unaudited | Unaudited | Unaudited | Reviewed | Unaudited | Reviewed | Audited | ||||||||||||||||||||||||||
| Dec 2020 | Dec 2021 | Dec 2020 | Jun 2021 | Dec 2021 | Notes | Dec 2021 | Jun 2021 | Dec 2020 | Dec 2021 | Dec 2020 | |||||||||||||||||||||||||
| 7,739 | 11,643 | 4,439 | 6,182 | 5,461 | Revenue | 2 | 82,241 | 89,953 | 72,373 | 172,194 | 127,392 | ||||||||||||||||||||||||
| (5,065) | (7,391) | (2,595) | (3,570) | (3,821) | Cost of sales | (57,355) | (51,951) | (42,200) | (109,306) | (83,369) | |||||||||||||||||||||||||
| (4,604) | (6,830) | (2,341) | (3,309) | (3,521) | Cost of sales, before amortisation and depreciation | (52,860) | (48,153) | (38,051) | (101,013) | (75,776) | |||||||||||||||||||||||||
| (461) | (561) | (254) | (261) | (300) | Amortisation and depreciation | (4,495) | (3,798) | (4,149) | (8,293) | (7,593) | |||||||||||||||||||||||||
| 2,674 | 4,252 | 1,844 | 2,612 | 1,640 | 24,886 | 38,002 | 30,173 | 62,888 | 44,023 | ||||||||||||||||||||||||||
| 65 | 81 | 35 | 43 | 38 | Interest income | 578 | 624 | 561 | 1,202 | 1,065 | |||||||||||||||||||||||||
| (191) | (169) | (88) | (87) | (82) | Finance expense | 3 | (1,235) | (1,261) | (1,441) | (2,496) | (3,152) | ||||||||||||||||||||||||
| (31) | (26) | (13) | (20) | (6) | Share-based payments | (85) | (298) | (214) | (383) | (512) | |||||||||||||||||||||||||
| (149) | (425) | (242) | (58) | (367) | Loss on financial instruments | 4 | (5,437) | (842) | (4,004) | (6,279) | (2,450) | ||||||||||||||||||||||||
| (15) | 78 | 43 | (26) | 104 | Gain/(loss) on foreign exchange differences | 1,527 | (378) | 716 | 1,149 | (255) | |||||||||||||||||||||||||
| 103 | 134 | 74 | 96 | 38 | Share of results of equity-accounted investees after tax | 585 | 1,404 | 1,216 | 1,989 | 1,700 | |||||||||||||||||||||||||
| (65) | (153) | (24) | (80) | (73) | Net other costs | (1,077) | (1,177) | (382) | (2,254) | (1,069) | |||||||||||||||||||||||||
| (49) | (50) | (25) | (26) | (24) | - Care and maintenance | (352) | (385) | (420) | (737) | (814) | |||||||||||||||||||||||||
| 28 | 11 | 27 | — | 11 | - Change in estimate of environmental rehabilitation obligation, and right of recovery receivable and payable | 162 | 5 | 442 | 167 | 464 | |||||||||||||||||||||||||
| — | — | — | — | — | - Strike related costs | — | — | (1) | — | (1) | |||||||||||||||||||||||||
| (2) | (4) | (2) | 2 | (6) | - Service entity costs | (85) | 26 | (34) | (59) | (34) | |||||||||||||||||||||||||
| (6) | — | (3) | — | — | - Non-recurring COVID-19 costs | (2) | (1) | (39) | (3) | (97) | |||||||||||||||||||||||||
| 35 | — | 35 | — | — | - Income on settlement of dispute | — | — | 580 | — | 580 | |||||||||||||||||||||||||
| (71) | (110) | (56) | (56) | (54) | - Other | 5 | (800) | (822) | (910) | (1,622) | (1,167) | ||||||||||||||||||||||||
| 6 | 2 | 4 | — | 2 | Gain on disposal of property, plant and equipment | 30 | 6 | 70 | 36 | 99 | |||||||||||||||||||||||||
| 7 | (348) | 7 | — | (348) | (Impairments)/reversal of impairments | 6 | (5,148) | — | 122 | (5,148) | 121 | ||||||||||||||||||||||||
| (11) | — | — | — | — | Loss on Bulk Tailings re-Treatment (BTT) early settlement | — | — | — | — | (186) | |||||||||||||||||||||||||
| (26) | (7) | (11) | (3) | (4) | Restructuring costs | (69) | (38) | (179) | (107) | (436) | |||||||||||||||||||||||||
| (8) | (9) | (2) | (3) | (6) | Transaction costs | (102) | (38) | (43) | (140) | (139) | |||||||||||||||||||||||||
| (92) | (13) | (92) | — | (13) | Early redemption premium on the 2025 Notes/loss on settlement of US$ Convertible Bond | (196) | — | (1,507) | (196) | (1,507) | |||||||||||||||||||||||||
| (3) | 1 | (3) | 2 | (1) | Occupational healthcare (expense)/gain | (10) | 24 | (48) | 14 | (52) | |||||||||||||||||||||||||
| 2,264 | 3,398 | 1,532 | 2,476 | 922 | Profit before royalties, carbon tax and tax | 14,247 | 36,028 | 25,040 | 50,275 | 37,250 | |||||||||||||||||||||||||
| (107) | (184) | (81) | (113) | (71) | Royalties | (1,072) | (1,642) | (1,339) | (2,714) | (1,765) | |||||||||||||||||||||||||
| — | — | — | — | — | Carbon tax | (1) | (3) | (3) | (4) | (5) | |||||||||||||||||||||||||
| 2,157 | 3,214 | 1,451 | 2,363 | 851 | Profit before tax | 13,174 | 34,383 | 23,698 | 47,557 | 35,480 | |||||||||||||||||||||||||
| (295) | (930) | (172) | (623) | (307) | Mining and income tax | 7 | (4,697) | (9,064) | (2,807) | (13,761) | (4,858) | ||||||||||||||||||||||||
| (326) | (913) | (215) | (538) | (375) | - Current tax | (5,675) | (7,831) | (3,523) | (13,506) | (5,374) | |||||||||||||||||||||||||
| 31 | (17) | 43 | (85) | 68 | - Deferred tax | 978 | (1,233) | 716 | (255) | 516 | |||||||||||||||||||||||||
| 1,862 | 2,284 | 1,279 | 1,740 | 544 | Profit for the period | 8,477 | 25,319 | 20,891 | 33,796 | 30,622 | |||||||||||||||||||||||||
| Profit for the period attributable to: | |||||||||||||||||||||||||||||||||||
| 1,782 | 2,234 | 1,220 | 1,707 | 527 | - Owners of Sibanye-Stillwater | 8,218 | 24,836 | 19,927 | 33,054 | 29,312 | |||||||||||||||||||||||||
| 80 | 50 | 59 | 33 | 17 | - Non-controlling interests | 259 | 483 | 964 | 742 | 1,310 | |||||||||||||||||||||||||
| Earnings per ordinary share (cents) | |||||||||||||||||||||||||||||||||||
| 65 | 77 | 44 | 58 | 19 | Basic earnings per share | 8.1 | 288 | 843 | 716 | 1,140 | 1,074 | ||||||||||||||||||||||||
| 64 | 76 | 43 | 57 | 19 | Diluted earnings per share | 8.2 | 286 | 834 | 703 | 1,129 | 1,055 | ||||||||||||||||||||||||
| 2,728,891 | 2,898,804 | 2,783,583 | 2,944,865 | 2,853,495 | Weighted average number of shares ('000) | 8.1 | 2,853,495 | 2,944,865 | 2,783,583 | 2,898,804 | 2,728,891 | ||||||||||||||||||||||||
| 2,777,952 | 2,927,246 | 2,833,068 | 2,978,875 | 2,876,894 | Diluted weighted average number of shares ('000) | 8.2 | 2,876,894 | 2,978,875 | 2,833,068 | 2,927,246 | 2,777,952 | ||||||||||||||||||||||||
| 16.46 | 14.79 | 16.26 | 14.55 | 15.03 | Average R/US$ rate | ||||||||||||||||||||||||||||||
The condensed consolidated provisional financial statements for the year and six months ended 31 December 2021 have been prepared by Sibanye-Stillwater's Group financial reporting team headed by Jacques le Roux (CA (SA)). This process was supervised by the Group's Chief Financial Officer, Charl Keyter and approved by the Sibanye-Stillwater board of directors. A convenience translation has been applied to the primary statements into US dollar based on the average exchange rate for the period for the condensed consolidated income statement, statements of other comprehensive income and cash flows, and the period-end closing exchange rate for the statement of financial position and change rate differences on translation are accounted for in the statement of other comprehensive income. This information is provided as supplementary information only and has not been reviewed or reported on by the Company's external auditor. | ||
Sibanye-Stillwater Operating and financial results | Six months and year ended 31 December 2021 23
Condensed consolidated statement of other comprehensive income
Figures are in millions unless otherwise stated
| US dollar | SA rand | ||||||||||||||||||||||||||||||||||
| Year ended | Six months ended | Six months ended | Year ended | ||||||||||||||||||||||||||||||||
| Unaudited | Unaudited | Unaudited | Unaudited | Unaudited | Unaudited | Reviewed | Unaudited | Reviewed | Audited | ||||||||||||||||||||||||||
| Dec 2020 | Dec 2021 | Dec 2020 | Jun 2021 | Dec 2021 | Dec 2021 | Jun 2021 | Dec 2020 | Dec 2021 | Dec 2020 | ||||||||||||||||||||||||||
| 1,862 | 2,284 | 1,279 | 1,740 | 544 | Profit for the period | 8,477 | 25,319 | 20,891 | 33,796 | 30,622 | |||||||||||||||||||||||||
| 62 | (115) | 209 | 94 | (209) | Other comprehensive income, net of tax | 5,561 | (926) | (7,300) | 4,635 | (2,006) | |||||||||||||||||||||||||
| — | — | — | — | — | Foreign currency translation adjustments1 | 4,846 | (1,039) | (7,446) | 3,807 | (2,227) | |||||||||||||||||||||||||
| 13 | 56 | 9 | 8 | 48 | Fair value adjustment on other investments2 | 715 | 113 | 146 | 828 | 221 | |||||||||||||||||||||||||
| 49 | (171) | 200 | 86 | (257) | Currency translation adjustments3 | — | — | — | — | — | |||||||||||||||||||||||||
| 1,924 | 2,169 | 1,488 | 1,834 | 335 | Total comprehensive income | 14,038 | 24,393 | 13,591 | 38,431 | 28,616 | |||||||||||||||||||||||||
| Total comprehensive income attributable to: | |||||||||||||||||||||||||||||||||||
| 1,843 | 2,119 | 1,428 | 1,801 | 318 | - Owners of Sibanye-Stillwater | 13,790 | 23,908 | 12,616 | 37,698 | 27,287 | |||||||||||||||||||||||||
| 81 | 50 | 60 | 33 | 17 | - Non-controlling interests | 248 | 485 | 975 | 733 | 1,329 | |||||||||||||||||||||||||
| 16.46 | 14.79 | 16.26 | 14.55 | 15.03 | Average R/US$ rate | ||||||||||||||||||||||||||||||
1 These gains and losses will be reclassified to profit or loss upon disposal of the underlying operations
2 These gains and losses relate to other investments and will never be reclassified to profit or loss
3 These gains and losses relate to the convenience translation of the SA rand amounts to US dollar and will never be reclassified to profit or loss
Condensed consolidated statement of financial position
Figures are in millions unless otherwise stated
| US dollar | SA rand | ||||||||||||||||||||||
| Unaudited | Unaudited | Unaudited | Reviewed | Reviewed | Audited | ||||||||||||||||||
| Dec 2020 | Jun 2021 | Dec 2021 | Notes | Dec 2021 | Jun 2021 | Dec 2020 | |||||||||||||||||
| 5,573 | 5,790 | 5,531 | Non-current assets | 88,163 | 82,637 | 81,860 | |||||||||||||||||
| 4,125 | 4,295 | 3,921 | Property, plant and equipment | 62,494 | 61,292 | 60,600 | |||||||||||||||||
| 20 | 18 | 14 | Right-of-use assets | 222 | 256 | 296 | |||||||||||||||||
| 488 | 489 | 485 | Goodwill | 7,727 | 6,976 | 7,165 | |||||||||||||||||
| 383 | 456 | 476 | Equity-accounted investments | 7,594 | 6,512 | 5,621 | |||||||||||||||||
| 58 | 69 | 211 | Other investments | 10 | 3,367 | 990 | 847 | ||||||||||||||||
| 336 | 354 | 326 | Environmental rehabilitation obligation funds | 5,202 | 5,050 | 4,934 | |||||||||||||||||
| 56 | 61 | 41 | Other receivables | 651 | 877 | 821 | |||||||||||||||||
| 107 | 48 | 57 | Deferred tax assets | 906 | 684 | 1,576 | |||||||||||||||||
| 3,557 | 4,472 | 4,067 | Current assets | 64,831 | 63,820 | 52,243 | |||||||||||||||||
| 1,699 | 2,063 | 1,573 | Inventories | 25,080 | 29,437 | 24,952 | |||||||||||||||||
| 467 | 544 | 465 | Trade and other receivables | 7,411 | 7,764 | 6,866 | |||||||||||||||||
| 3 | 2 | 33 | Other receivables | 523 | 35 | 37 | |||||||||||||||||
| 10 | 34 | 78 | Tax receivable | 1,245 | 487 | 148 | |||||||||||||||||
| 1,378 | 1,829 | 1,900 | Cash and cash equivalents | 30,292 | 26,097 | 20,240 | |||||||||||||||||
| — | — | 18 | Asset held for sale | 10 | 280 | — | — | ||||||||||||||||
| 9,130 | 10,262 | 9,598 | Total assets | 152,994 | 146,457 | 134,103 | |||||||||||||||||
| 4,814 | 5,838 | 5,102 | Total equity | 81,345 | 83,339 | 70,716 | |||||||||||||||||
| 3,125 | 2,787 | 3,206 | Non-current liabilities | 51,108 | 39,771 | 45,900 | |||||||||||||||||
| 1,191 | 745 | 1,267 | Borrowings | 11 | 20,191 | 10,635 | 17,497 | ||||||||||||||||
| 15 | 13 | 11 | Lease liabilities | 177 | 186 | 223 | |||||||||||||||||
| 588 | 621 | 518 | Environmental rehabilitation obligation and other provisions | 8,263 | 8,860 | 8,634 | |||||||||||||||||
| 71 | 69 | 64 | Occupational healthcare obligation | 1,017 | 984 | 1,037 | |||||||||||||||||
| 109 | 152 | 177 | Share-based payment obligations | 12 | 2,829 | 2,175 | 1,595 | ||||||||||||||||
| 198 | 194 | 289 | Other payables | 13 | 4,599 | 2,773 | 2,911 | ||||||||||||||||
| 433 | 444 | 389 | Deferred revenue | 6,204 | 6,337 | 6,363 | |||||||||||||||||
| 1 | 1 | 1 | Tax and royalties payable | 10 | 8 | 9 | |||||||||||||||||
| 519 | 548 | 490 | Deferred tax liabilities | 7,818 | 7,813 | 7,631 | |||||||||||||||||
| 1,191 | 1,637 | 1,290 | Current Liabilities | 20,541 | 23,347 | 17,487 | |||||||||||||||||
| 60 | 459 | 7 | Borrowings | 11 | 107 | 6,553 | 886 | ||||||||||||||||
| 7 | 7 | 7 | Lease liabilities | 104 | 101 | 103 | |||||||||||||||||
| 11 | 8 | — | Occupational healthcare obligation | — | 110 | 157 | |||||||||||||||||
| 2 | 6 | 4 | Share-based payment obligations | 12 | 58 | 80 | 33 | ||||||||||||||||
| 899 | 1,040 | 951 | Trade and other payables | 15,162 | 14,843 | 13,207 | |||||||||||||||||
| 153 | 83 | 299 | Other payables | 13 | 4,765 | 1,188 | 2,246 | ||||||||||||||||
| 5 | 12 | 10 | Deferred revenue | 156 | 165 | 67 | |||||||||||||||||
| 54 | 22 | 12 | Tax and royalties payable | 189 | 307 | 788 | |||||||||||||||||
| 9,130 | 10,262 | 9,598 | Total equity and liabilities | 152,994 | 146,457 | 134,103 | |||||||||||||||||
| 14.69 | 14.27 | 15.94 | Closing R/US$ rate | ||||||||||||||||||||
Sibanye-Stillwater Operating and financial results | Six months and year ended 31 December 2021 24
Condensed consolidated statement of changes in equity
Figures are in millions unless otherwise stated
US dollar1 | SA rand | ||||||||||||||||||||||||||||||||||||||||
| Stated capital | Re- organisation reserve | Other reserves | Accum- ulated profit/(loss) | Non- controlling interests | Total equity | Note | Total equity | Non- controlling interests | Accum- ulated profit/(loss) | Other reserves | Re- organisation reserve | Stated capital | |||||||||||||||||||||||||||||
| -* | 3,776 | 446 | (2,105) | 106 | 2,223 | Balance at 31 December 2019 (Audited) | 31,138 | 1,468 | (15,434) | 4,442 | 40,662 | -* | |||||||||||||||||||||||||||||
| — | — | 62 | 1,782 | 81 | 1,925 | Total comprehensive income for the period | 28,616 | 1,329 | 29,312 | (2,025) | — | — | |||||||||||||||||||||||||||||
| — | — | — | 1,782 | 80 | 1,862 | Profit for the period | 30,622 | 1,310 | 29,312 | — | — | — | |||||||||||||||||||||||||||||
| — | — | 62 | — | 1 | 63 | Other comprehensive income, net of tax | (2,006) | 19 | — | (2,025) | — | — | |||||||||||||||||||||||||||||
| — | — | — | (81) | (22) | (103) | Dividends paid | (1,698) | (360) | (1,338) | — | — | — | |||||||||||||||||||||||||||||
| — | — | 9 | — | — | 9 | Share-based payments | 158 | 6 | — | 152 | — | — | |||||||||||||||||||||||||||||
| 1,177 | (1,177) | — | — | — | — | Reorganisation - 24 February 2020 | — | — | — | — | (17,661) | 17,661 | |||||||||||||||||||||||||||||
| 764 | — | — | — | — | 764 | Shares issued upon conversion of US$ Convertible Bond | 12,573 | — | — | — | — | 12,573 | |||||||||||||||||||||||||||||
| — | — | — | 13 | (13) | — | Transaction with DRDGOLD Limited shareholders | — | (220) | 220 | — | — | — | |||||||||||||||||||||||||||||
| (5) | — | — | — | — | (5) | Share buy-back | (84) | — | — | — | — | (84) | |||||||||||||||||||||||||||||
| — | — | — | — | 1 | 1 | Transaction with Lonmin Canada Inc shareholders | 13 | 13 | — | — | — | — | |||||||||||||||||||||||||||||
| 1,936 | 2,599 | 517 | (391) | 153 | 4,814 | Balance at 31 December 2020 (Audited) | 70,716 | 2,236 | 12,760 | 2,569 | 23,001 | 30,150 | |||||||||||||||||||||||||||||
| — | — | (115) | 2,234 | 50 | 2,169 | Total comprehensive income for the period | 38,431 | 733 | 33,054 | 4,644 | — | — | |||||||||||||||||||||||||||||
| — | — | — | 2,234 | 50 | 2,284 | Profit for the period | 33,796 | 742 | 33,054 | — | — | — | |||||||||||||||||||||||||||||
| — | — | (115) | — | — | (115) | Other comprehensive income, net of tax | 4,635 | (9) | — | 4,644 | — | — | |||||||||||||||||||||||||||||
| — | — | — | (1,206) | (23) | (1,229) | Dividends paid | (18,176) | (344) | (17,832) | — | — | — | |||||||||||||||||||||||||||||
| — | — | 10 | — | 1 | 11 | Share-based payments | 151 | 9 | — | 142 | — | — | |||||||||||||||||||||||||||||
| (575) | — | — | — | — | (575) | Share buy-back2 | (8,503) | — | — | — | — | (8,503) | |||||||||||||||||||||||||||||
| — | — | — | 2 | (81) | (79) | Marikana BEE transaction | 1.2 | (1,146) | (1,180) | 34 | — | — | — | ||||||||||||||||||||||||||||
| — | — | — | (6) | (3) | (9) | Transaction with Platinum Mile shareholders3 | (128) | (46) | (82) | — | — | — | |||||||||||||||||||||||||||||
| — | — | (2) | 2 | — | — | Adjustment due to sale of St Helena4 | — | — | 24 | (24) | — | — | |||||||||||||||||||||||||||||
| 1,361 | 2,599 | 412 | 633 | 97 | 5,102 | Balance at 31 December 2021 (Reviewed) | 81,345 | 1,408 | 27,958 | 7,331 | 23,001 | 21,647 | |||||||||||||||||||||||||||||
1 This information is unaudited
2 The Group commenced with a share buy-back programme on 2 June 2021 to repurchase up to 5% of its ordinary shares as at 31 May 2021 representing a maximum of 147,700,000 shares. At 4 October 2021, when the share repurchase programme concluded, 147,700,000 ordinary shares have been bought back at a total cost of R8,503 million, including transaction costs of R420 million. The average cost per share repurchased amounted to R57.57.
3 On 29 June 2021, the 8.3% shareholding held by non-controlling shareholders in Platinum Mile Resources Proprietary Limited (Platinum Mile) was repurchased for a consideration of R128 million
4 Effective 3 August 2021, the Group sold the trading license, movable assets, naming rights, trademarks and practice number under which St Helena Hospital Proprietary Limited (St Helena) operated to Africa Health Care Proprietary Limited for a cash consideration of R25 million. The R24 million is a transfer from other reserves (share-based payment reserve) to Accumulated profit /(loss)
* Less than R1 million and US$1 million
Sibanye-Stillwater Operating and financial results | Six months and year ended 31 December 2021 25
Condensed consolidated statement of cash flows
Figures are in millions unless otherwise stated
| US dollar | SA rand | ||||||||||||||||||||||||||||||||||||||||
| Year ended | Six months ended | Six months ended | Year ended | ||||||||||||||||||||||||||||||||||||||
| Unaudited | Unaudited | Unaudited | Unaudited | Unaudited | Unaudited | Reviewed | Unaudited | Reviewed | Audited | ||||||||||||||||||||||||||||||||
| Dec 2020 | Dec 2021 | Dec 2020 | Jun 2021 | Dec 2021 | Note | Dec 2021 | Jun 2021 | Dec 2020 | Dec 2021 | Dec 2020 | |||||||||||||||||||||||||||||||
| Cash flows from operating activities | |||||||||||||||||||||||||||||||||||||||||
| 2,745 | 4,583 | 1,786 | 2,731 | 1,852 | Cash generated by operations | 28,055 | 39,729 | 29,208 | 67,784 | 45,188 | |||||||||||||||||||||||||||||||
| 47 | 4 | 1 | 1 | 3 | Deferred revenue advance received | 51 | 14 | — | 65 | 771 | |||||||||||||||||||||||||||||||
| (48) | — | (1) | — | — | BTT early settlement payment | — | — | — | — | (787) | |||||||||||||||||||||||||||||||
| — | — | — | — | — | Post-retirement health care payments | (1) | — | — | (1) | (1) | |||||||||||||||||||||||||||||||
| 35 | — | 35 | — | — | Amount received on settlement of dispute | — | — | 580 | — | 580 | |||||||||||||||||||||||||||||||
| (17) | (16) | (15) | (9) | (7) | Cash-settled share-based payments paid | (113) | (127) | (244) | (240) | (275) | |||||||||||||||||||||||||||||||
| — | (11) | — | (11) | — | Payment of Marikana dividend obligation | — | (162) | — | (162) | — | |||||||||||||||||||||||||||||||
| — | (119) | — | (121) | 2 | Additional deferred payments relating to acquisition of a business | — | (1,754) | — | (1,754) | — | |||||||||||||||||||||||||||||||
| (573) | 166 | (631) | (307) | 473 | Change in working capital | 6,924 | (4,469) | (10,408) | 2,455 | (9,435) | |||||||||||||||||||||||||||||||
| 2,189 | 4,607 | 1,175 | 2,284 | 2,323 | 34,916 | 33,231 | 19,136 | 68,147 | 36,041 | ||||||||||||||||||||||||||||||||
| 44 | 65 | 23 | 35 | 30 | Interest received | 448 | 512 | 369 | 960 | 719 | |||||||||||||||||||||||||||||||
| (84) | (53) | (37) | (33) | (20) | Interest paid | (303) | (478) | (597) | (781) | (1,386) | |||||||||||||||||||||||||||||||
| (104) | (207) | (79) | (125) | (82) | Royalties paid | (1,237) | (1,818) | (1,294) | (3,055) | (1,707) | |||||||||||||||||||||||||||||||
| (293) | (1,003) | (206) | (584) | (419) | Tax paid | (6,348) | (8,491) | (3,365) | (14,839) | (4,818) | |||||||||||||||||||||||||||||||
| (103) | (1,229) | (90) | (664) | (565) | Dividends paid | (8,516) | (9,660) | (1,486) | (18,176) | (1,698) | |||||||||||||||||||||||||||||||
| 1,649 | 2,180 | 786 | 913 | 1,267 | Net cash from operating activities | 18,960 | 13,296 | 12,763 | 32,256 | 27,151 | |||||||||||||||||||||||||||||||
| Cash flow from investing activities | |||||||||||||||||||||||||||||||||||||||||
| (584) | (861) | (336) | (384) | (477) | Additions to property, plant and equipment | (7,154) | (5,586) | (5,481) | (12,740) | (9,616) | |||||||||||||||||||||||||||||||
| 6 | 5 | 4 | 2 | 3 | Proceeds on disposal of property, plant and equipment | 46 | 34 | 72 | 80 | 101 | |||||||||||||||||||||||||||||||
| 17 | 69 | 17 | 45 | 24 | Dividends received | 371 | 649 | 283 | 1,020 | 288 | |||||||||||||||||||||||||||||||
| (1) | (122) | (1) | (2) | (120) | Additions to other investments | (1,781) | (22) | (12) | (1,803) | (12) | |||||||||||||||||||||||||||||||
| — | (30) | — | (19) | (11) | Acquisition of equity-accounted investment | (168) | (278) | — | (446) | — | |||||||||||||||||||||||||||||||
| (4) | (5) | (4) | (1) | (4) | Contributions to environmental rehabilitation funds | (61) | (11) | (57) | (72) | (64) | |||||||||||||||||||||||||||||||
| (46) | (39) | (1) | (39) | — | Payment of Deferred Payment | (15) | (562) | — | (577) | (756) | |||||||||||||||||||||||||||||||
| — | (4) | — | (4) | — | Contributions to enterprise development fund | (14) | (51) | — | (65) | — | |||||||||||||||||||||||||||||||
| 7 | — | 7 | — | — | Preference shares redeemed | — | — | 114 | — | 114 | |||||||||||||||||||||||||||||||
| — | 2 | — | — | 2 | Proceeds on sale of St Helena | 25 | — | — | 25 | — | |||||||||||||||||||||||||||||||
| — | 1 | — | — | 1 | Proceeds from environmental rehabilitation funds | 5 | 5 | 7 | 10 | 7 | |||||||||||||||||||||||||||||||
| (605) | (984) | (314) | (402) | (582) | Net cash used in investing activities | (8,746) | (5,822) | (5,074) | (14,568) | (9,938) | |||||||||||||||||||||||||||||||
| Cash flow from financing activities | |||||||||||||||||||||||||||||||||||||||||
| 990 | 1,396 | 419 | 151 | 1,245 | Loans raised | 11 | 18,455 | 2,196 | 6,768 | 20,651 | 16,289 | ||||||||||||||||||||||||||||||
| (1,114) | (1,369) | (363) | (203) | (1,166) | Loans repaid | 11 | (17,305) | (2,947) | (5,820) | (20,252) | (18,335) | ||||||||||||||||||||||||||||||
| (7) | (8) | (3) | (4) | (4) | Lease payments | (56) | (56) | (41) | (112) | (114) | |||||||||||||||||||||||||||||||
| — | (9) | — | — | (9) | Acquisition of non-controlling interests | (128) | — | — | (128) | — | |||||||||||||||||||||||||||||||
| (5) | (575) | (5) | (51) | (524) | Share buy-back | (7,761) | (742) | (84) | (8,503) | (84) | |||||||||||||||||||||||||||||||
| (136) | (565) | 48 | (107) | (458) | Net cash (used in)/from financing activities | (6,795) | (1,549) | 823 | (8,344) | (2,244) | |||||||||||||||||||||||||||||||
| 908 | 631 | 520 | 404 | 227 | Net increase in cash and cash equivalents | 3,419 | 5,925 | 8,512 | 9,344 | 14,969 | |||||||||||||||||||||||||||||||
| 69 | (109) | 164 | 47 | (156) | Effect of exchange rate fluctuations on cash held | 776 | (68) | (313) | 708 | (348) | |||||||||||||||||||||||||||||||
| 401 | 1,378 | 694 | 1,378 | 1,829 | Cash and cash equivalents at beginning of the period | 26,097 | 20,240 | 12,041 | 20,240 | 5,619 | |||||||||||||||||||||||||||||||
| 1,378 | 1,900 | 1,378 | 1,829 | 1,900 | Cash and cash equivalents at end of the period | 30,292 | 26,097 | 20,240 | 30,292 | 20,240 | |||||||||||||||||||||||||||||||
| 16.46 | 14.79 | 16.26 | 14.55 | 15.03 | Average R/US$ rate | ||||||||||||||||||||||||||||||||||||
| 14.69 | 15.94 | 14.69 | 14.27 | 15.94 | Closing R/US$ rate | ||||||||||||||||||||||||||||||||||||
Sibanye-Stillwater Operating and financial results | Six months and year ended 31 December 2021 26
Notes to the condensed consolidated provisional financial statements
1. Basis of accounting and preparation
The condensed consolidated provisional financial statements are prepared in accordance with the requirements of the JSE Listings Requirements for provisional reports and the requirements of the Companies Act of South Africa. The JSE Listings Requirements require provisional reports to be prepared in accordance with framework concepts, and the measurement and recognition requirements of International Financial Reporting Standards (IFRS), and the South African Institute of Chartered Accountants Financial Reporting Guides as issued by the Accounting Practices Committee and Financial Pronouncements as issued by the Financial Reporting Standards Council and to also, as a minimum, contain information required by IAS 34 Interim Financial Reporting. The accounting policies applied in the preparation of these condensed consolidated provisional financial statements are in terms of IFRS and are consistent with those applied in the previous consolidated annual financial statements, included in the 31 December 2020 annual financial report.
The condensed consolidated income statement, and statements of other comprehensive income and cash flows for the six months ended
31 December 2020 were not reviewed by the Company’s external auditor and were prepared by subtracting the reviewed condensed consolidated financial statements for the six months ended 30 June 2020 from the audited comprehensive consolidated financial statements for the year ended 31 December 2020. The condensed consolidated income statement, and statements of other comprehensive income and cash flows for the six months ended 31 December 2021 have not been reviewed by the Company’s external auditor and were prepared by subtracting the reviewed condensed consolidated financial statements for the six months ended 30 June 2021 from the reviewed condensed consolidated provisional financial statements for the year ended 31 December 2021.
31 December 2020 were not reviewed by the Company’s external auditor and were prepared by subtracting the reviewed condensed consolidated financial statements for the six months ended 30 June 2020 from the audited comprehensive consolidated financial statements for the year ended 31 December 2020. The condensed consolidated income statement, and statements of other comprehensive income and cash flows for the six months ended 31 December 2021 have not been reviewed by the Company’s external auditor and were prepared by subtracting the reviewed condensed consolidated financial statements for the six months ended 30 June 2021 from the reviewed condensed consolidated provisional financial statements for the year ended 31 December 2021.
The translation of the primary statements into US dollar is based on the average exchange rate for the period for the condensed consolidated income statement, statements of other comprehensive income and cash flows, and the period-end closing exchange rate for the statement of financial position. Exchange differences on translation are accounted for in the statement of other comprehensive income. This information is provided as supplementary information only and has not been reviewed by the Company's external auditor.
1.1 Standards, interpretations and amendments to published standards effective on 1 January 2021 and adopted by the Group
The amendments to published standards effective on 1 January 2021 and adopted by the Sibanye Stillwater Limited (Sibanye-Stillwater) group (the Group) did not have a material effect on the Group’s condensed consolidated provisional financial statements for the year ended 31 December 2021.
1.2 Marikana BEE transaction
Effective 13 April 2021, the Group restructured the previously highly indebted Lonmin Limited (changed to Sibanye UK Limited on 25 March 2021) broad-based black economic empowerment (B-BBEE) structure in relation to Western Platinum Proprietary Limited (WPL) and Eastern Platinum Proprietary Limited (EPL) (collectively referred to as “Marikana”), so as to ensure the sustainability of the B-BBEE shareholding in Marikana and facilitate the realisation of value to the B-BBEE shareholders (Restructuring Transaction).
The Restructuring Transaction resulted in the cancellation of the previous preference share funding provided to a special purpose vehicle (Phembani SPV) held by the Phembani Group Proprietary Limited group (Phembani Group). As replacement, the Group subscribed for new preference shares at a nominal amount in Phembani SPV. These preference shares will earn dividends capped to R2.6 billion and will be funded through 90% of the dividends attributable to the Phembani Group as and when paid by Marikana. In addition, while the Sibanye UK Limited (Sibanye UK) loans to WPL are still outstanding, Rustenburg Eastern Operations Proprietary Limited (REO) will subscribe for additional preference shares as an additional funding mechanism to ensure Phembani SPV receives a minimum level of cash flows (as determined in terms of a formula). In essence the subscription price of the preference shares will be in the form of a top up payment to a maximum of R22 million for any annual period where the dividend payable by Marikana to Phembani SPV is less than R22 million and will be added to the capped dividend amount of the preference shares. The preference shares will be redeemed at the earlier of 12.5 years from the issue date or when the capped dividend amount is reached.
The new arrangement provides the Marikana shareholders with access to distributable Marikana profits in the short and medium term through the introduction of a 10% trickle dividend while any Marikana shareholder loans or loans from Sibanye UK to WPL are outstanding. At the effective date of the transaction, the Sibanye UK loans to WPL amounted to R12,533 million (denominated in $722 million and R2,057 million). There were no Marikana shareholder loans outstanding at the effective date of the Restructuring Transaction. Once the loans from Sibanye UK have been settled and while there are no Marikana shareholder loans outstanding, the Marikana shareholders will have a right to participate fully in their attributable portion of Marikana’s dividends over the remaining life-of-mine. However, a 90% portion of the Phembani Group’s attributable dividends will continue to be applied against the preference dividends until the preference shares have been redeemed.
The obligations to pay dividends to entities controlled by the Group, being REO and the Lonplats Employee Share Ownership Trust, Lonplats Marikana Community Development Trust and Bapo Ba Mogale Local Economic Development Trust (Marikana Trusts), eliminate on consolidation. At the effective date, the Restructuring Transaction resulted in the Group recognising the following liabilities:
•Cash-settled share-based payment obligation under IFRS 2 Share-based Payment (IFRS 2) amounting to R404 million (refer note 12.1); and
•Marikana dividend obligation under IFRS 9 Financial Instruments (IFRS 9) amounting to R1,146 million (refer note 13.2).
The tables below set out the shareholding structure and, for illustrative purposes only, the flow of R100 million distributable profits from Marikana while any Marikana shareholder loans or Sibanye UK loans are still outstanding and after these loans have been settled:
Sibanye-Stillwater Operating and financial results | Six months and year ended 31 December 2021 27
Before shareholder loans and Sibanye UK loans repaid
After shareholder loans and Sibanye UK loans repaid

1 R90 million (or 90%) of the distributable profits of Marikana applied towards the repayment of the Sibanye UK loans (or Marikana shareholder loans if any)
2 Distribution of remaining R10 million (10%) of the distributable profits of Marikana based on the proportionate shareholding
3 Distribution of the Incwala Platinum Proprietary Limited (Incwala Platinum) dividend received from Marikana based on proportionate shareholding
4 Subsequent subscription for additional “E” Preference Shares (top up payment) by REO in Phembani SPV, calculated in terms of the formula specified in the “E” Preference Shares subscription agreement for as long as the Sibanye UK loans are outstanding [R22 million less (R0.9 million Phembani SPV dividend – R0.8 million “E” Preference Share dividend)]
5 These dividend obligations, calculated in terms of the estimated future cash flows of Marikana (applying the assumptions disclosed in note 12.1), eliminate on consolidation against the receivables in these trusts that are consolidated by the Group
6 The Group recognises IFRS 9 dividend obligations, calculated in terms of the estimated future cash flows of Marikana (applying the assumptions disclosed in note 12.1), included in other payables. Refer note 13.2
7 The Group recognises an IFRS 2 cash-settled share-based payment obligation, calculated in terms of the estimated future cash flows of Marikana (applying the assumptions disclosed in note 12.1) and reduced by the estimated future preference dividends, included in cash-settled share-based payment obligations. Refer note 12.1
8 Dividends payable, directly by Marikana or indirectly through Incwala Resources Proprietary Limited (Incwala Resources), eliminate against the REO receivable on consolidation. The top up funding liability is calculated and recognised based on the estimated future cash flows of Marikana (applying the assumptions disclosed in note 12.1) for as long as the Sibanye UK loan is outstanding. Management expects that the Sibanye UK loan will be repaid in full by 31 December 2022 and up to settlement do not expect that a top up payment will be required. Therefore, no obligation to subscribe for additional preference shares was recognised
9 90% of the Marikana dividends indirectly received by Phembani SPV will be distributed to REO as an “E” Preference dividend until the earlier of 12.5 years from the issue date or when the capped dividend amount is reached. This receivable is recognised on a net basis against the Phembani SPV cash-settled share-based payment liability (refer footnote 7 above)
10 Distribution of the Marikana distributable profits based on proportionate shareholding
1.3 Change in level of rounding
Previously, the level of rounding applied in the Group’s condensed consolidated provisional financial statements included a decimal for the nearest hundred thousand. During the year ended 31 December 2021, the Group changed the level of rounding to only reflect the nearest million by removing the hundred thousand decimal space. Immaterial rounding adjustments were made to comparative information as a result of this change.
Sibanye-Stillwater Operating and financial results | Six months and year ended 31 December 2021 28
2. Revenue
The Group’s sources of revenue are:
| Figures in million - SA rand | Six months ended | Year ended | ||||||||||||||||||
| Unaudited | Reviewed | Unaudited | Reviewed | Audited | ||||||||||||||||
| Dec 2021 | June 2021 | Dec 2020 | Dec 2021 | Dec 2020 | ||||||||||||||||
| Gold mining activities | 15,051 | 13,307 | 17,080 | 28,358 | 27,869 | |||||||||||||||
PGM mining activities1 | 46,194 | 55,905 | 42,595 | 102,099 | 72,469 | |||||||||||||||
| Recycling activities | 21,296 | 19,414 | 11,586 | 40,710 | 25,296 | |||||||||||||||
Stream1 | 366 | 259 | 241 | 625 | 539 | |||||||||||||||
Toll treatment arrangement2 | 345 | 176 | — | 521 | — | |||||||||||||||
| Total revenue from contracts with customers | 83,252 | 89,061 | 71,502 | 172,313 | 126,173 | |||||||||||||||
Adjustments relating to sales of PGM concentrate3 | (1,011) | 892 | 871 | (119) | 1,219 | |||||||||||||||
| Total revenue | 82,241 | 89,953 | 72,373 | 172,194 | 127,392 | |||||||||||||||
1 The difference between revenue from PGM mining activities above and total revenue from PGM mining activities per the segment report relates to the separate disclosure of revenue from the gold and palladium streaming arrangement with Wheaton Precious Metals International (Wheaton International)(Wheaton Stream) in the above as well as the separate disclosure of revenue related to adjustments on the sales of PGM concentrate and the toll treatment arrangement entered into by Marikana. Revenue relating to the Wheaton Stream is incorporated in the Group corporate segment as described in the segment report (refer note 18)
2 This relates to revenue recognised in respect of a toll treatment arrangement entered into by Marikana during 2021
3 These adjustments relate to provisional pricing arrangements resulting in subsequent changes to the amount of revenue recognised
Revenue per geographical region of the relevant operations:
| Figures in million - SA rand | Six months ended | Year ended | ||||||||||||||||||
| Unaudited | Reviewed | Unaudited | Reviewed | Audited | ||||||||||||||||
| Dec 2021 | June 2021 | Dec 2020 | Dec 2021 | Dec 2020 | ||||||||||||||||
| Southern Africa | 52,463 | 61,049 | 50,557 | 113,512 | 82,781 | |||||||||||||||
| United States | 29,778 | 28,904 | 21,816 | 58,682 | 44,611 | |||||||||||||||
| Total revenue | 82,241 | 89,953 | 72,373 | 172,194 | 127,392 | |||||||||||||||
Percentage of revenue per segment based on the geographical location of customers purchasing from the Group:
| Six months ended | Year ended | ||||||||||||||||
| Unaudited | Reviewed | Unaudited | Reviewed | Audited | |||||||||||||
| Dec 2021 | June 2021 | Dec 2020 | Dec 2021 | Dec 2020 | |||||||||||||
| Gold | ||


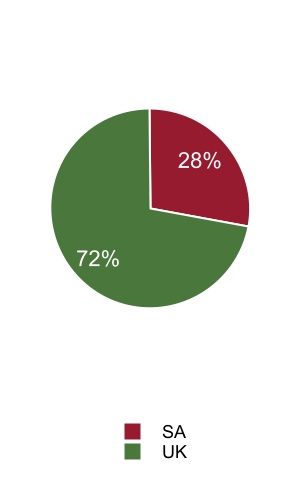


| PGM | ||


Sibanye-Stillwater Operating and financial results | Six months and year ended 31 December 2021 29
Revenue generated per product:
| Figures in million - SA rand | Six months ended | Year ended | ||||||||||||||||||
| Unaudited | Reviewed | Unaudited | Reviewed | Audited | ||||||||||||||||
| Dec 2021 | June 2021 | Dec 2020 | Dec 2021 | Dec 2020 | ||||||||||||||||
| Gold | 15,671 | 13,862 | 17,677 | 29,533 | 28,930 | |||||||||||||||
| PGMs | 63,922 | 74,036 | 52,945 | 137,958 | 95,573 | |||||||||||||||
| Platinum | 10,059 | 11,179 | 9,131 | 21,238 | 17,054 | |||||||||||||||
| Palladium | 25,216 | 27,643 | 24,399 | 52,859 | 47,281 | |||||||||||||||
| Rhodium | 26,685 | 33,143 | 18,622 | 59,828 | 29,865 | |||||||||||||||
| Iridium | 1,233 | 1,461 | 519 | 2,694 | 815 | |||||||||||||||
| Ruthenium | 729 | 610 | 274 | 1,339 | 558 | |||||||||||||||
| Chrome | 1,227 | 1,032 | 904 | 2,259 | 1,573 | |||||||||||||||
Other1 | 1,421 | 1,023 | 847 | 2,444 | 1,316 | |||||||||||||||
| Total revenue | 82,241 | 89,953 | 72,373 | 172,194 | 127,392 | |||||||||||||||
1 Other primarily includes revenue from nickel, silver, cobalt and copper sales. For the year and six months ended 31 December 2021, revenue from the Marikana toll treatment arrangement of R521 million and R345 million, respectively is included (for the six months ended 30 June 2021: R176 million)
3. Finance expense
| Figures in million - SA rand | Six months ended | Year ended | ||||||||||||||||||
| Unaudited | Reviewed | Unaudited | Reviewed | Audited | ||||||||||||||||
| Notes | Dec 2021 | June 2021 | Dec 2020 | Dec 2021 | Dec 2020 | |||||||||||||||
| Interest charge on: | ||||||||||||||||||||
| Borrowings - interest | (337) | (464) | (541) | (801) | (1,290) | |||||||||||||||
| - US$600 million revolving credit facility (RCF) | (15) | (98) | (73) | (113) | (232) | |||||||||||||||
| - R5.5 billion RCF | (36) | (30) | (55) | (66) | (200) | |||||||||||||||
| - 2022 and 2025 Notes | (187) | (336) | (379) | (523) | (764) | |||||||||||||||
| - 2026 and 2029 Notes | (99) | — | — | (99) | — | |||||||||||||||
| - US$ Convertible Bond | — | — | (34) | — | (94) | |||||||||||||||
| Borrowings - unwinding of amortised cost | 11 | (184) | (118) | (175) | (302) | (394) | ||||||||||||||
| - 2022 and 2025 Notes | (112) | (57) | (30) | (169) | (59) | |||||||||||||||
| - 2026 and 2029 Notes | (8) | — | — | (8) | — | |||||||||||||||
| - US$ Convertible Bond | — | — | (70) | — | (187) | |||||||||||||||
| - Burnstone Debt | (64) | (61) | (75) | (125) | (148) | |||||||||||||||
| Lease liabilities | (14) | (15) | (17) | (29) | (34) | |||||||||||||||
| Environmental rehabilitation obligation | (310) | (305) | (337) | (615) | (684) | |||||||||||||||
| Occupational healthcare obligation | (39) | (38) | (45) | (77) | (96) | |||||||||||||||
| Rustenburg Deferred Payment | 13.1 | (63) | (95) | (94) | (158) | (187) | ||||||||||||||
| Marikana dividend obligation | 13.2 | (58) | (29) | — | (87) | — | ||||||||||||||
| Deferred revenue | (151) | (158) | (169) | (309) | (349) | |||||||||||||||
| Other | (79) | (39) | (63) | (118) | (118) | |||||||||||||||
| Total finance expense | (1,235) | (1,261) | (1,441) | (2,496) | (3,152) | |||||||||||||||
4. Loss on financial instruments
| Figures in million - SA rand | Six months ended | Year ended | ||||||||||||||||||
| Unaudited | Reviewed | Unaudited | Reviewed | Audited | ||||||||||||||||
| Notes | Dec 2021 | June 2021 | Dec 2020 | Dec 2021 | Dec 2020 | |||||||||||||||
Fair value loss on gold hedge contracts1 | — | — | (2) | — | (458) | |||||||||||||||
Fair value gain/(loss) on palladium hedge contract2 | 550 | (316) | (3) | 234 | 36 | |||||||||||||||
| Fair value loss on derivative financial instrument | — | — | (2,165) | — | (71) | |||||||||||||||
| Fair value loss on share-based payment obligations | (713) | (551) | (37) | (1,264) | (129) | |||||||||||||||
| (Loss)/gain on the revised cash flow of the Rustenburg Deferred Payment | 13.1 | (4,658) | 5 | (2,081) | (4,653) | (2,081) | ||||||||||||||
| (Loss)/gain on the revised cash flow of the Burnstone Debt | 11 | (2) | — | 264 | (2) | 264 | ||||||||||||||
| (Loss) on the revised cash flow of the Marikana dividend obligation | 13.2 | (468) | — | — | (468) | — | ||||||||||||||
Other3 | (146) | 20 | 20 | (126) | (11) | |||||||||||||||
| Total loss on financial instruments | (5,437) | (842) | (4,004) | (6,279) | (2,450) | |||||||||||||||
1 On 9 March 2020, Sibanye-Stillwater concluded a gold hedge agreement which commenced on 1 April 2020, comprising the delivery of 1,800 kilograms of gold (150 kilograms per month) with a zero cost collar which establishes a minimum floor of R800,000 per kilogram and a maximum cap of R1,080,000 per kilogram. The gold hedge agreement concluded during March 2021. As hedge accounting is not applied, resulting gains or losses are accounted for as gains or losses on financial instruments in profit or loss
2 On 17 January 2020, Stillwater Mining Company (wholly owned subsidiary of Sibanye-Stillwater) concluded a palladium hedge agreement which commenced on 28 February 2020, comprising the delivery of 240,000 ounces of palladium over two years (10,000 ounces per month) with a zero cost collar which establishes a minimum and a maximum cap of US$1,500 and US$3,400 per ounce, respectively. For the twelve months ended 31 December 2020, the unrealised gain was R36 million and for the six months ended 31 December 2020, the unrealised loss was R3 million.
On 24 March 2021, Stillwater Mining Company concluded an additional palladium hedge agreement commencing on 28 February 2022, comprising the delivery of 140,000 ounces of palladium over a fourteen month period (10,000 ounces per month) with a zero cost collar which establishes a minimum floor and a maximum cap of US$1,800 and US$3,300 per ounce, respectively. For the twelve months ended 31 December 2021, the combined unrealised gain was R234 million. For the six months ended 31 December 2021, the unrealised gain was R550 million (six months ended 30 June 2021: unrealised loss of R316 million). As hedge accounting is not applied, resulting gains or losses are accounted for as gains or losses on financial instruments in profit or loss
3 Included in the amounts for the six months and year ended 31 December 2021 is a gain on initial recognition of the investment in ioneer Limited of R51 million and a loss on initial recognition of the investment in New Century Resources Limited of R85 million (refer note 10)
Sibanye-Stillwater Operating and financial results | Six months and year ended 31 December 2021 30
5. Other net other cost
| Figures in million - SA rand | Six months ended | Year ended | ||||||||||||||||||
| Unaudited | Reviewed | Unaudited | Reviewed | Audited | ||||||||||||||||
| Dec 2021 | June 2021 | Dec 2020 | Dec 2021 | Dec 2020 | ||||||||||||||||
| Corporate and social investment costs | (151) | (137) | (165) | (288) | (258) | |||||||||||||||
| Loss due to dilution of interest in joint operation | (2) | (2) | (30) | (4) | (30) | |||||||||||||||
| Cost incurred on employee and community trusts | (454) | (299) | (443) | (753) | (508) | |||||||||||||||
| Exploration costs | (9) | (3) | (19) | (12) | (33) | |||||||||||||||
Other1 | (184) | (381) | (253) | (565) | (338) | |||||||||||||||
| Total other costs | (800) | (822) | (910) | (1,622) | (1,167) | |||||||||||||||
1 Included in the amount for the six months and year ended 31 December 2021 is non-mining royalties of R120 million and R326 million respectively and R206 million for the six months ended 30 June 2021 (R130 million and R193 million for the six months and year ended 31 December 2020, respectively)
6. (Impairments)/reversal of impairments
The Group performed its annual impairment testing for goodwill and cash-generating units (CGUs) where impairment indicators were present at 31 December 2021. The below table is a breakdown of the impairment expense recognised for the period ended 31 December 2021.
| Figures in million - SA rand | Six months ended | Year ended | ||||||||||||||||||
| Unaudited | Reviewed | Unaudited | Reviewed | Audited | ||||||||||||||||
| Dec 2021 | June 2021 | Dec 2020 | Dec 2021 | Dec 2020 | ||||||||||||||||
| Impairment of mining assets | (5,148) | — | — | (5,148) | (1) | |||||||||||||||
| Reversal of impairment of equity-accounted investee | — | — | 120 | — | 120 | |||||||||||||||
| Other reversal of impairment | — | — | 2 | — | 2 | |||||||||||||||
| Total (impairments)/reversal of impairments | (5,148) | — | 122 | (5,148) | 121 | |||||||||||||||
The impairment expense for the six months and year ended 31 December 2021 relates to the following classes of assets:
| Figures in million - SA rand | Year ended | ||||
| Reviewed | |||||
| Dec 2021 | |||||
| Mine development, infrastructure and other | 5,025 | ||||
| Land, mineral rights and rehabilitation | 94 | ||||
| Exploration and evaluation assets | 1 | ||||
| Right-of-use assets | 28 | ||||
| Total impairment | 5,148 | ||||
Impairment to the Driefontein, Kloof and Beatrix mining assets
At 31 December 2021, a number of factors were identified that negatively impact the ability of the Driefontein, Kloof and Beatrix operations to recover the carrying value of mining assets over their respective remaining life-of-mines. The impairment calculation detailed below is most sensitive to cost base changes, commodity prices, production levels, discount rates and rand/US dollar exchange rates.
Above inflationary increases are expected in major cost components, in particular electricity and labour cost increases which affect all three operations. Consensus commodity long-term prices indicate that forecast gold prices are lower than the spot price of US$1,829/oz at 31 December 2021. Lower commodity prices will have a significant adverse impact on the ability of these already marginal operations to generate positive cash flows when considering the continued increase in the cost base of the operations. In FY2020, there was an overall decrease in market interest rates, while these rates showed a marginal increase in H1 2021 and further increases in H2 2021. The continued increases in market interest rates negatively impacts the value in use calculation by increasing the cost of debt element of the discount rate applied. Furthermore, the long-term consensus forecast rand exchange rate against the US dollar shows a strengthening of the rand in FY2022 compared to prior year forecasts. Since the revenue of the operations is converted to rand, a stronger rand will have an adverse impact on the profitability of the operations.
The above considerations, coupled with ageing infrastructure and declining life-of-mines, impacted forecast cash flows and led to the recognition of impairment losses at 31 December 2021 on the Driefontein, Kloof and Beatrix reportable segments of R212 million, R3,642 million and R1,293 million, respectively. These operations are included under SA gold in the segment report (refer note 18) and each represent a separate CGU.
The CGUs were impaired to their respective recoverable amounts based on a value in use calculation in which future expected cash flows are discounted to a present value based on an appropriate discount rate.
The assumptions applied in the value in use impairment calculation as well as the recoverable amount for each of the CGUs are set out below:
| Reviewed | ||||||||||||||
| Driefontein | Kloof | Beatrix | ||||||||||||
Weighted average gold price1 | R/kg | 770,182 | 764,176 | 816,271 | ||||||||||
Exchange rate1 | 15.0 | 15.0 | 15.0 | |||||||||||
Inflation rate2 | % | 6.0 | 6.0 | 6.0 | ||||||||||
Nominal discount rate3 | % | 13.3 | 13.5 | 11.5 | ||||||||||
Life-of-mine4 | years | 8 | 9 | 4 | ||||||||||
| Recoverable amount | R' million | 3,905 | 2,815 | 210 | ||||||||||
1 The weighted average gold prices and the exchange rate were derived by considering various bank and commodity broker consensus forecasts
2 The inflation rate is based on historical mining inflation, projected electricity and labour cost increases and the forecast South African inflation rate
3 The nominal discount rate is calculated as the weighted average cost of capital of the respective CGUs
4 Periods longer than five years are considered appropriate based on the nature of the operations since a formally approved life-of-mine plan is used to determine cash flows over the life of each mine based on the available reserves
Sibanye-Stillwater Operating and financial results | Six months and year ended 31 December 2021 31
Group impairment assumptions
The annual life-of-mine plan, used in the annual impairment assessment, takes into account the following:
•Proved and probable ore reserves of the CGUs;
•Cash flows based on the life-of-mine plan; and
•Sustaining capital expenditure estimates over the life-of-mine plan.
The Group's estimates and assumptions used in the 31 December 2021 calculations include:
| PGM operations | Gold operations | |||||||||||||||||||
| Audited | Reviewed | Reviewed | Audited | |||||||||||||||||
| Dec 2020 | Dec 2021 | Dec 2021 | Dec 2020 | |||||||||||||||||
| Average gold price | R/kg | 773,398 | 733,037 | |||||||||||||||||
| 23,278 | 24,422 | R/4Eoz | Average PGM (4E) basket price | |||||||||||||||||
| 1,202 | 1,180 | US$/2Eoz | Average PGM (2E) basket price | |||||||||||||||||
| 18.8 - 19.7 | 20.0 | % | Nominal discount rate - South Africa1 | % | 11.5 - 13.5 | 9.7 - 13.6 | ||||||||||||||
| 8.8 | 8.3 | % | Nominal discount rate - United States | |||||||||||||||||
| 6.0 | 6.0 | % | Inflation rate - South Africa | % | 6.0 | 6.0 | ||||||||||||||
| 2.0 | 2.0 | % | Inflation rate - United States | |||||||||||||||||
| 12 - 39 | 17 - 50 | years | Life-of-mine | years | 4 - 9 | 3 - 13 | ||||||||||||||
1 Nominal discount rate for the Burnstone project is 15.3% (2020: 16.8%) and for the equity-accounted joint venture Mimosa, 24.4% (2020: 28.4%)
Results of impairment assessments for other gold operations, PGM operations and goodwill allocated to CGUs
No impairment was identified for the Group's PGM CGUs or any CGUs with allocated goodwill. Sufficient headroom exists for all CGUs with allocated goodwill. Except for the impaired SA gold operations described above, management believes that currently there are no reasonably possible changes in any of the above assumptions, which would lead to an impairment for any CGUs not impaired during the year.
7. Mining and income tax
| Figures in million - SA rand | Six months ended | Year ended | ||||||||||||||||||
| Unaudited | Reviewed | Unaudited | Reviewed | Audited | ||||||||||||||||
| Dec 2021 | June 2021 | Dec 2020 | Dec 2021 | Dec 2020 | ||||||||||||||||
| Tax on profit before tax at maximum South African statutory company tax rate (28%) | (3,689) | (9,627) | (6,635) | (13,316) | (9,934) | |||||||||||||||
| South African gold mining tax formula rate adjustment | 16 | 47 | 165 | 63 | 118 | |||||||||||||||
| US statutory tax rate adjustment | (44) | 510 | 311 | 466 | 550 | |||||||||||||||
| Non-deductible amortisation and depreciation | (6) | (7) | (8) | (13) | (14) | |||||||||||||||
| Non-taxable dividend received | 7 | — | 20 | 7 | 21 | |||||||||||||||
| Non-deductible finance expense | (46) | (62) | 101 | (108) | 89 | |||||||||||||||
| Non-deductible share-based payments | (15) | (27) | (24) | (42) | (44) | |||||||||||||||
| Non-deductible loss on fair value of financial instruments | (868) | (153) | (850) | (1,021) | (890) | |||||||||||||||
| Non-taxable gain/(non-deductible loss) on foreign exchange differences | 48 | (1) | (15) | 47 | 3 | |||||||||||||||
| Non-taxable share of results of equity-accounted investees | 164 | 393 | 340 | 557 | 476 | |||||||||||||||
| (Non-deductible impairments)/non-taxable reversal of impairments | (22) | — | 33 | (22) | 33 | |||||||||||||||
| Non-deductible transaction costs | (39) | (30) | (20) | (69) | (50) | |||||||||||||||
| Tax adjustment in respect of prior periods | 439 | (53) | 25 | 386 | 133 | |||||||||||||||
| Net other non-taxable income and non-deductible expenditure | 286 | 65 | 136 | 351 | 258 | |||||||||||||||
| Change in estimated deferred tax rate | 141 | (55) | 1 | 86 | (54) | |||||||||||||||
(Deferred tax assets derecognised)/unrecognised deferred tax assets utilised1 | (1,069) | (64) | 3,613 | (1,133) | 4,447 | |||||||||||||||
| Mining and income tax | (4,697) | (9,064) | (2,807) | (13,761) | (4,858) | |||||||||||||||
| Effective tax rate | 36 | % | 26 | % | 12 | % | 29 | % | 14 | % | ||||||||||
1 The amounts for the six months and year ended 31 December 2021 include the derecognition of deferred tax assets of R837 million relating to deductible temporary differences, that can no longer be recognised due to the impairment of the mining assets in the SA gold operations
Sibanye-Stillwater Operating and financial results | Six months and year ended 31 December 2021 32
8. Earnings per share
8.1 Basic earnings per share
| Six months ended | Year ended | |||||||||||||||||||
| Unaudited | Reviewed | Unaudited | Reviewed | Audited | ||||||||||||||||
| Dec 2021 | June 2021 | Dec 2020 | Dec 2021 | Dec 2020 | ||||||||||||||||
| Ordinary shares in issue (’000) | 2,808,406 | 2,940,777 | 2,923,571 | 2,808,406 | 2,923,571 | |||||||||||||||
| Adjustment for weighting of ordinary shares in issue (’000) | 45,089 | 4,088 | (139,988) | 90,398 | (194,680) | |||||||||||||||
| Adjusted weighted average number of shares (’000) | 2,853,495 | 2,944,865 | 2,783,583 | 2,898,804 | 2,728,891 | |||||||||||||||
| Profit attributable to owners of Sibanye-Stillwater (SA rand million) | 8,218 | 24,836 | 19,927 | 33,054 | 29,312 | |||||||||||||||
| Basic earnings per share (EPS) (cents) | 288 | 843 | 716 | 1,140 | 1,074 | |||||||||||||||
8.2 Diluted earnings per share
Potential ordinary shares arising from the equity-settled share-based payment scheme resulted in a dilution for the six month periods ended 31 December 2021, 30 June 2021 and 31 December 2020 as well as the 12 month periods ended 31 December 2021 and 31 December 2020.
| Six months ended | Year ended | |||||||||||||||||||
| Unaudited | Reviewed | Unaudited | Reviewed | Audited | ||||||||||||||||
| Dec 2021 | June 2021 | Dec 2020 | Dec 2021 | Dec 2020 | ||||||||||||||||
| Weighted average number of shares | ||||||||||||||||||||
| Adjusted weighted average number of shares (’000) | 2,853,495 | 2,944,865 | 2,783,583 | 2,898,804 | 2,728,891 | |||||||||||||||
| Potential ordinary shares - equity-settled share plan (’000) | 23,399 | 34,010 | 49,485 | 28,442 | 49,061 | |||||||||||||||
| Diluted weighted average number of shares (’000) | 2,876,894 | 2,978,875 | 2,833,068 | 2,927,246 | 2,777,952 | |||||||||||||||
| Diluted earnings per share (DEPS) (cents) | 286 | 834 | 703 | 1,129 | 1,055 | |||||||||||||||
8.3 Headline earnings per share
| Figures in million - SA rand unless otherwise stated | Six months ended | Year ended | ||||||||||||||||||
| Unaudited | Reviewed | Unaudited | Reviewed | Audited | ||||||||||||||||
| Dec 2021 | June 2021 | Dec 2020 | Dec 2021 | Dec 2020 | ||||||||||||||||
| Profit attributable to owners of Sibanye-Stillwater | 8,218 | 24,836 | 19,927 | 33,054 | 29,312 | |||||||||||||||
| Gain on disposal of property, plant and equipment | (30) | (6) | (70) | (36) | (99) | |||||||||||||||
| Impairments/(reversal of impairments) | 5,148 | — | (122) | 5,148 | (121) | |||||||||||||||
| Derecognition of property, plant and equipment in Marathon project | — | 2 | 37 | 2 | 37 | |||||||||||||||
| Profit on sale of St Helena | (16) | — | — | (16) | — | |||||||||||||||
| Taxation effect of remeasurement items | (1,275) | 1 | 13 | (1,274) | 16 | |||||||||||||||
| Re-measurement items, attributable to non-controlling interest | — | — | — | — | 1 | |||||||||||||||
| Headline earnings | 12,045 | 24,833 | 19,785 | 36,878 | 29,146 | |||||||||||||||
| Adjusted weighted average number of shares (’000) | 2,853,495 | 2,944,865 | 2,783,583 | 2,898,804 | 2,728,891 | |||||||||||||||
| Headline EPS (cents) | 422 | 843 | 711 | 1,272 | 1,068 | |||||||||||||||
8.4 Diluted headline earnings per share
| Figures in million - SA rand unless otherwise stated | Six months ended | Year ended | ||||||||||||||||||
| Unaudited | Reviewed | Unaudited | Reviewed | Audited | ||||||||||||||||
| Dec 2021 | June 2021 | Dec 2020 | Dec 2021 | Dec 2020 | ||||||||||||||||
| Headline earnings | 12,045 | 24,833 | 19,785 | 36,878 | 29,146 | |||||||||||||||
| Diluted weighted average number of shares (’000) | 2,876,894 | 2,978,875 | 2,833,068 | 2,927,246 | 2,777,952 | |||||||||||||||
| Diluted headline EPS (cents) | 419 | 834 | 698 | 1,260 | 1,049 | |||||||||||||||
9. Dividends
Dividend policy
The Group’s dividend policy is to return between 25% to 35% of normalised earnings to shareholders and after due consideration of future requirements the dividend may be increased beyond these levels. The Board, therefore, considers normalised earnings in determining what value will be distributed to shareholders. The Board believes normalised earnings provides useful information to investors regarding the extent to which results of operations may affect shareholder returns. Normalised earnings is defined as earnings attributable to the owners of Sibanye-Stillwater excluding gains and losses on financial instruments and foreign exchange differences, impairments, gain/loss on disposal of property, plant and equipment, occupational healthcare expense, restructuring costs, transactions costs, share-based payment on BEE transaction, gain on acquisition, net other business development costs, share of results of equity-accounted investees, all after tax and the impact of non-controlling interest, and changes in estimated deferred tax rate.
In line with Sibanye-Stillwater’s Capital Allocation Framework, the Board of Directors resolved to declare a final dividend of 187 (2020: 321) SA cents per share. Together with the interim dividend of 292 (2020: 50) SA cents per share, which was declared and paid, this brings the total dividend for the year ended 31 December 2021 to 479 (2020: 371) SA cents per share and this amounts to a payout of 35% (2020: 35%) of normalised earnings.
Sibanye-Stillwater Operating and financial results | Six months and year ended 31 December 2021 33
| Figures in million - SA rand | Six months ended | Year ended | ||||||||||||||||||
| Unaudited | Reviewed | Unaudited | Reviewed | Audited | ||||||||||||||||
| Dec 2021 | June 2021 | Dec 2020 | Dec 2021 | Dec 2020 | ||||||||||||||||
| Profit attributable to the owners of Sibanye-Stillwater | 8,218 | 24,836 | 19,927 | 33,054 | 29,312 | |||||||||||||||
| Adjusted for: | ||||||||||||||||||||
| Loss on financial instruments | 5,437 | 842 | 4,004 | 6,279 | 2,450 | |||||||||||||||
| (Gain)/loss on foreign exchange differences | (1,527) | 378 | (716) | (1,149) | 255 | |||||||||||||||
| Gain on disposal of property, plant and equipment | (30) | (6) | (70) | (36) | (99) | |||||||||||||||
| Impairments/(reversal of impairments) | 5,148 | — | (122) | 5,148 | (121) | |||||||||||||||
| Restructuring costs | 69 | 38 | 179 | 107 | 436 | |||||||||||||||
| Transaction costs | 102 | 38 | 43 | 140 | 139 | |||||||||||||||
| Occupational healthcare expense/(gain) | 10 | (24) | 48 | (14) | 52 | |||||||||||||||
| Loss on BTT early settlement | — | — | — | — | 186 | |||||||||||||||
| Income on settlement of legal dispute | — | — | (580) | — | (580) | |||||||||||||||
| Loss due to dilution of interest in joint operation | 2 | 2 | 30 | 4 | 30 | |||||||||||||||
| Early redemption premium on the 2025 Notes/loss on settlement of US$ Convertible Bond | 196 | — | 1,507 | 196 | 1,507 | |||||||||||||||
| Profit on sale of St Helena | (16) | — | — | (16) | — | |||||||||||||||
| Change in estimated deferred tax rate | (141) | 55 | (1) | (86) | 54 | |||||||||||||||
| Share of results of equity-accounted investees after tax | (585) | (1,404) | (1,216) | (1,989) | (1,700) | |||||||||||||||
| Tax effect of the items adjusted above | (2,413) | (342) | (1,233) | (2,755) | (1,277) | |||||||||||||||
| Non-controlling interest effect of the items listed above | 2 | (2) | (38) | — | (37) | |||||||||||||||
Normalised earnings1 | 14,472 | 24,411 | 21,762 | 38,883 | 30,607 | |||||||||||||||
1 Normalised earnings is a pro forma performance measure and is not a measure of performance under IFRS, may not be comparable to similarly titled measures of other companies, and should not be considered in isolation or as alternatives to profit before tax, profit for the year, cash from operating activities or any other measure of financial performance presented in accordance with IFRS. This measure constitutes pro forma financial information in terms of the JSE Listing Requirements and is the responsibility of the Board
10. Other investments
The movement in the other investments balance for the period is largely due to the below:
Investment in ioneer Limited (ioneer)
On 28 October 2021, the Group successfully completed its US$70 million (R1,066 million) strategic investment in ioneer following approval by ioneer’s shareholders at an extraordinary general meeting on 21 October 2021, and approval from the Financial Surveillance Department of the South African Reserve Bank received on 13 October 2021. Payment was made on 27 October 2021, which is the day on which all conditions precedent were met, and the shares were allotted on 28 October 2021. The initial fair value of the investment was R1,117 million, excluding transaction costs of R17 million which were capitalised to the investment. The Group recognised a gain on initial recognition of R51 million. The Group holds approximately 145.9 million fully paid ordinary shares, or 7.12%, in ioneer. The fair value of this investment was R1,353 million at 31 December 2021.
Investment in New Century Resources Limited (New Century)
On 27 October 2021, Sibanye-Stillwater announced that it had entered into a subscription agreement with New Century where the Group agreed to purchase ordinary shares as part of a capital raising by New Century. The aggregate investment represents a 19.99% ownership interest obtained through a phased equity investment program, which was completed in December 2021. The aggregate subscription price for the 19.99% investment in New Century was R695 million. The initial fair value of the investment was R610 million, excluding transaction costs of R19 million which were capitalised to the investment. The Group recognised a loss on initial recognition of R85 million. The fair value of this investment was R698 million at 31 December 2021.
Asset held for sale
During November 2020, Generation Mining Limited (Gen Mining) increased its interest in the Marathon project (Marathon) to 80% following delivery of a preliminary economic assessment and completing the sole expenditure requirement of CAD10 million. Since then, the Group has elected to dilute its interest in Marathon rather than contribute proportionally to the continued expenditure to be incurred. As a result, the Group's current direct participation interest in Marathon equates to 16.5%. The parties subsequently reached an agreement through which Generation PGM Inc., a subsidiary of Gen Mining, would acquire from Stillwater Canada Inc. (a wholly-owned subsidiary of the Group) its 16.5% participation interest in Marathon in exchange for shares in Gen Mining, increasing the Group's effective interest in Gen Mining to 19.1%. The transaction became effective during January 2022. The investment in Marathon was classified as held for sale at 31 December 2021, and measured at fair value in accordance with IFRS 9 Financial Instruments. The fair value of the investment at 31 December 2021 was R280 million.
Sibanye-Stillwater Operating and financial results | Six months and year ended 31 December 2021 34
11. Borrowings
| Figures in million - SA rand | Six months ended | Year ended | ||||||||||||||||||
| Unaudited | Reviewed | Unaudited | Reviewed | Audited | ||||||||||||||||
| Notes | Dec 2021 | June 2021 | Dec 2020 | Dec 2021 | Dec 2020 | |||||||||||||||
| Balance at beginning of the period | 17,188 | 18,383 | 26,374 | 18,383 | 23,736 | |||||||||||||||
| Loans raised | 18,426 | 2,196 | 6,768 | 20,622 | 16,289 | |||||||||||||||
US$600 million RCF1 | — | 703 | 4,214 | 703 | 7,218 | |||||||||||||||
R5.5 billion RCF2 | — | — | — | — | 5,000 | |||||||||||||||
2026 and 2029 Notes3 | 18,208 | — | — | 18,208 | — | |||||||||||||||
Other borrowings4 | 218 | 1,493 | 2,554 | 1,711 | 4,071 | |||||||||||||||
| Loans repaid | (17,305) | (2,947) | (5,820) | (20,252) | (18,335) | |||||||||||||||
US$600 million RCF1 | (6,244) | (1,484) | (1,411) | (7,728) | (6,802) | |||||||||||||||
R5.5 billion RCF2 | — | — | (2,000) | — | (7,500) | |||||||||||||||
| US$ Convertible Bond settled in cash | — | — | (13) | — | (13) | |||||||||||||||
Other borrowings4 | (221) | (1,463) | (2,396) | (1,684) | (4,020) | |||||||||||||||
2022 and 2025 Notes5 | (10,840) | — | — | (10,840) | — | |||||||||||||||
| US$ Convertible Bond converted into shares | — | — | (5,578) | — | (5,578) | |||||||||||||||
| Early redemption premium on the 2025 Notes | 196 | — | — | 196 | — | |||||||||||||||
| Unwinding of loans recognised at amortised cost | 3 | 184 | 118 | 175 | 302 | 394 | ||||||||||||||
| Accrued interest (related to the 2022 and 2025 Notes, 2026 and 2029 Notes and US$ Convertible Bond) | 286 | 336 | 414 | 622 | 858 | |||||||||||||||
| Accrued interest paid | (204) | (323) | (405) | (527) | (866) | |||||||||||||||
| Loss/(gain) on the revised cash flow of the Burnstone Debt | 4 | 2 | — | (264) | 2 | (264) | ||||||||||||||
| Loss/(gain) on foreign exchange differences and foreign currency translation | 1,525 | (575) | (3,281) | 950 | 2,149 | |||||||||||||||
| Balance at end of the period | 20,298 | 17,188 | 18,383 | 20,298 | 18,383 | |||||||||||||||
1 During the six months ended 31 December 2021, Sibanye-Stillwater extended the maturity date for all of its lenders to April 2023
2 During the year ended 31 December 2021, the Group extended the R5.5 billion RCF maturity date, which now matures November 2024
3 On 16 November 2021 the Group completed a two-tranche corporate bond offering 4.0% Notes (US$675 million) due 16 November 2026 (the 2026 Notes) and 4.5% Notes (US$525 million) due 16 November 2029 (the 2029 Notes) (together the 2026 and 2029 Notes) with the proceeds applied towards the redemption of the 2025 Notes as well as for general corporate purposes, including advancing the Group’s green metals strategy through investments and accretive acquisitions. The new bonds were issued through the Group's wholly-owned subsidiary Stillwater Mining Company. At 31 December 2021, the portion of transaction costs accrued for and not yet settled amounted to R29 million
4 Other borrowings consist mainly of overnight facilities
5 Given surplus liquidity within the Group and in line with the Group’s capital allocation framework, it elected to redeem the 2022 Notes during Q3 of 2021. The redemption price was the full principal amount of the Notes, plus accrued and unpaid interest on the Notes, amounting to US$355.8 million and was settled on 2 August 2021. During Q4 of 2021, the Group also elected to redeem the 2025 Notes at a redemption price of 103.6% of the principal amount of the 2025 Notes, plus accrued and unpaid interest on the 2025 Notes, amounting to US$370.2 million which includes an early settlement penalty of R196 million recognised as a loss on settlement of the 2025 Notes. The 2025 Notes were settled on 6 December 2021
Borrowings consist of:
| Figures in million - SA rand | ||||||||||||||||||||
| Reviewed | Reviewed | Audited | ||||||||||||||||||
| Dec 2021 | June 2021 | Dec 2020 | ||||||||||||||||||
US$600 million RCF1,2 | — | 5,994 | 6,978 | |||||||||||||||||
R5.5 billion RCF1,2 | — | — | — | |||||||||||||||||
| 2022 and 2025 Notes | — | 9,902 | 10,136 | |||||||||||||||||
| 2026 and 2029 Notes | 18,785 | — | — | |||||||||||||||||
| Burnstone Debt | 1,507 | 1,287 | 1,263 | |||||||||||||||||
| Other borrowings | 6 | 5 | 6 | |||||||||||||||||
| Borrowings | 20,298 | 17,188 | 18,383 | |||||||||||||||||
| Current portion of borrowings | (107) | (6,553) | (886) | |||||||||||||||||
| Non-current borrowings | 20,191 | 10,635 | 17,497 | |||||||||||||||||
1 These facilities are both undrawn at 31 December 2021 and at the date of this report
2 The US$600 million RCF and the R5.5 billion RCF are affected by the IBOR reform which came into effect on 1 January 2021. The R5.5 billion RCF is linked to JIBAR and is not drawn down, however the JIBAR is only expected to be impacted by the reform at a later stage and any impact thereof is to be considered when this occurs. The US$600 million RCF is linked to a US LIBOR and will be refinanced or restructured depending on the developments in respect of the US LIBOR reform. Therefore the Group was not impacted when the amendment became effective
11.1 Capital management
Debt maturity
The following are contractually due, undiscounted cash flows resulting from maturities of borrowings, including interest payments:
| Figures in million - SA rand | ||||||||||||||||||||
| Total | Within one year | Between one and five years | After five years | |||||||||||||||||
| 31 December 2021 | ||||||||||||||||||||
| - Capital | ||||||||||||||||||||
| 2026 and 2029 Notes | 19,129 | — | 10,760 | 8,369 | ||||||||||||||||
| Burnstone Debt | 1,158 | — | — | 1,158 | ||||||||||||||||
| Other borrowings | 6 | 6 | — | — | ||||||||||||||||
| - Interest | 9,341 | 807 | 3,175 | 5,359 | ||||||||||||||||
Sibanye-Stillwater Operating and financial results | Six months and year ended 31 December 2021 35
Net cash to adjusted EBITDA
| Figures in million - SA rand | Rolling 12 months | |||||||||||||||||||
| Reviewed | Reviewed | Audited | ||||||||||||||||||
| Dec 2021 | June 2021 | Dec 2020 | ||||||||||||||||||
Borrowings1 | 18,791 | 15,901 | 17,120 | |||||||||||||||||
Cash and cash equivalents2 | 30,257 | 26,062 | 20,206 | |||||||||||||||||
Net cash3 | (11,466) | (10,161) | (3,086) | |||||||||||||||||
Adjusted EBITDA4 | 68,606 | 73,420 | 49,385 | |||||||||||||||||
Net cash to adjusted EBITDA (ratio)5 | (0.2) | (0.1) | (0.1) | |||||||||||||||||
1 Borrowings are only those borrowings that have recourse to Sibanye-Stillwater. Borrowings, therefore, exclude the Burnstone Debt.
2 Cash and cash equivalents exclude cash of Burnstone
3 Net cash represents borrowings and bank overdraft less cash and cash equivalents. Borrowings are only those borrowings that have recourse to Sibanye-Stillwater and, therefore, exclude the Burnstone Debt. Net cash excludes cash of Burnstone
4 The adjusted earnings before interest, taxes, depreciation and amortisation (EBITDA) calculation is based on the definitions included in the facility agreements for compliance with the debt covenant formula, except for impact of new accounting standards and acquisitions, where the facility agreements allow the results from the acquired operations to be annualised. Adjusted EBITDA may not be comparable to similarly titled measures of other companies. Adjusted EBITDA is not a measure of performance under IFRS and should be considered in addition to, and not as a substitute for, other measures of financial performance and liquidity
5 Net cash to adjusted EBITDA ratio is a pro forma performance measure and is defined as net cash as of the end of a reporting period divided by adjusted EBITDA of the 12 months ended on the same reporting date. This measure constitutes pro forma financial information in terms of the JSE Listing Requirements, and is the responsibility of the Board
Reconciliation of profit before royalties, carbon tax and tax to adjusted EBITDA
| Figures in million - SA rand | Six months ended | Year ended | ||||||||||||||||||
| Unaudited | Reviewed | Unaudited | Reviewed | Audited | ||||||||||||||||
| Dec 2021 | June 2021 | Dec 2020 | Dec 2021 | Dec 2020 | ||||||||||||||||
| Profit before royalties, carbon tax and tax | 14,247 | 36,028 | 25,040 | 50,275 | 37,250 | |||||||||||||||
| Adjusted for: | ||||||||||||||||||||
| Amortisation and depreciation | 4,495 | 3,798 | 4,149 | 8,293 | 7,593 | |||||||||||||||
| Interest income | (578) | (624) | (561) | (1,202) | (1,065) | |||||||||||||||
| Finance expense | 1,235 | 1,261 | 1,441 | 2,496 | 3,152 | |||||||||||||||
| Share-based payments | 85 | 298 | 214 | 383 | 512 | |||||||||||||||
| Loss/(gain) on financial instruments | 5,437 | 842 | 4,004 | 6,279 | 2,450 | |||||||||||||||
| (Gain)/loss on foreign exchange differences | (1,527) | 378 | (716) | (1,149) | 255 | |||||||||||||||
| Share of results of equity-accounted investees after tax | (585) | (1,404) | (1,216) | (1,989) | (1,700) | |||||||||||||||
| Change in estimate of environmental rehabilitation obligation, and right of recovery receivable and payable | (162) | (5) | (442) | (167) | (464) | |||||||||||||||
| Gain on disposal of property, plant and equipment | (30) | (6) | (70) | (36) | (99) | |||||||||||||||
| (Reversal of impairments)/impairments | 5,148 | — | (122) | 5,148 | (121) | |||||||||||||||
| Restructuring costs | 69 | 38 | 179 | 107 | 436 | |||||||||||||||
| Transaction costs | 102 | 38 | 43 | 140 | 139 | |||||||||||||||
| IFRS 16 lease payments | (71) | (71) | (75) | (142) | (148) | |||||||||||||||
| Occupational healthcare expense/(gain) | 10 | (24) | 48 | (14) | 52 | |||||||||||||||
| Loss on BTT early settlement | — | — | — | — | 186 | |||||||||||||||
| Income on settlement of dispute | — | — | (580) | — | (580) | |||||||||||||||
| Profit on sale of St Helena | (16) | — | — | (16) | — | |||||||||||||||
| Early redemption premium on the 2025 Notes/loss on settlement of US$ Convertible Bond | 196 | — | 1,507 | 196 | 1,507 | |||||||||||||||
| Loss due to dilution of interest in joint operation | 2 | 2 | 30 | 4 | 30 | |||||||||||||||
| Other non-recurring costs | — | — | (2) | — | — | |||||||||||||||
| Adjusted EBITDA | 28,057 | 40,549 | 32,871 | 68,606 | 49,385 | |||||||||||||||
12. Share-based payment obligations
The following table summarises the share-based payment obligations of the group:
| Figures in million - SA rand | ||||||||||||||
| Reviewed | Reviewed | Audited | ||||||||||||
| Note | Dec 2021 | June 2021 | Dec 2020 | |||||||||||
| Cash-settled share-based payment - Rustenburg operation BEE transaction | 2,067 | 1,533 | 1,468 | |||||||||||
| Cash-settled share-based payment - Marikana BEE transaction | 12.1 | 560 | 381 | — | ||||||||||
| Cash-settled share-based payment - employee incentive scheme | 260 | 341 | 160 | |||||||||||
| Balance at the end of the period | 2,887 | 2,255 | 1,628 | |||||||||||
| Current portion of cash-settled share-based payment obligations | (58) | (80) | (33) | |||||||||||
| Non-current portion of cash-settled share-based payment obligations | 2,829 | 2,175 | 1,595 | |||||||||||
12.1 Marikana BEE cash-settled share-based payment obligation
Marikana’s obligation to pay dividends to the Phembani Group through the Incwala Platinum holding structure is recognised as a cash-settled share-based payment liability measured at fair value. Changes in fair value is recognised in profit or loss.
The following assumptions were applied in the fair value calculation:
| Reviewed | Reviewed | Audited | ||||||||||||
| Dec 2021 | June 2021 | Dec 2020 | ||||||||||||
| Long-term PGM (4E) basket price | R/4Eoz | 23,957 | 22,697 | N/A | ||||||||||
| Real discount rate - South Africa | % | 13.2 | 11.6 - 11.7 | N/A | ||||||||||
| Inflation rate - South Africa | % | 6.0 | 6.0 | N/A | ||||||||||
| Life-of-mine | years | 18 - 50 | 16 - 52 | N/A | ||||||||||
Sibanye-Stillwater Operating and financial results | Six months and year ended 31 December 2021 36
The following table summarises the changes in the Marikana BEE cash-settled share-based payment obligation:
| Figures in million - SA rand | Six months ended | Year ended | ||||||||||||||||||
| Unaudited | Reviewed | Unaudited | Reviewed | Audited | ||||||||||||||||
| Note | Dec 2021 | June 2021 | Dec 2020 | Dec 2021 | Dec 2020 | |||||||||||||||
| Balance at the beginning of the period | 381 | — | — | — | — | |||||||||||||||
Initial recognition of the Marikana BEE cash-settled share-based payment obligation1 | 1.2 | — | 404 | — | 404 | — | ||||||||||||||
| Changes in fair value | 179 | 10 | — | 189 | — | |||||||||||||||
| Cash-settled share based payments made | — | (33) | — | (33) | — | |||||||||||||||
| Balance at end of the period | 560 | 381 | — | 560 | — | |||||||||||||||
| Current portion of cash-settled share-based payment obligation | (29) | (5) | — | (29) | — | |||||||||||||||
| Non-current portion of cash-settled share-based payment obligation | 531 | 376 | — | 531 | — | |||||||||||||||
1 Included in loss on financial instruments
13. Other payables
| Figures in million - SA rand | ||||||||||||||
| Reviewed | Reviewed | Audited | ||||||||||||
| Notes | Dec 2021 | June 2021 | Dec 2020 | |||||||||||
| Deferred Payment (related to the Rustenburg operations acquisition) (Rustenburg Deferred Payment) | 13.1 | 6,920 | 2,199 | 4,355 | ||||||||||
| Contingent consideration (related to the SFA (Oxford) Limited acquisition) | 100 | 89 | 88 | |||||||||||
| Right of recovery payable | 32 | 42 | 39 | |||||||||||
| Deferred consideration (related to Pandora acquisition) | 400 | 253 | 308 | |||||||||||
| Marikana dividend obligation | 13.2 | 1,539 | 1,013 | — | ||||||||||
| Other non-current payables | 373 | 365 | 367 | |||||||||||
| Other payables | 9,364 | 3,961 | 5,157 | |||||||||||
| Current portion of other payables | (4,765) | (1,188) | (2,246) | |||||||||||
| Non-current other payables | 4,599 | 2,773 | 2,911 | |||||||||||
13.1 Rustenburg Deferred Payment
| Figures in million - SA rand | Six months ended | Year ended | ||||||||||||||||||
| Unaudited | Reviewed | Unaudited | Reviewed | Audited | ||||||||||||||||
| Notes | Dec 2021 | June 2021 | Dec 2020 | Dec 2021 | Dec 2020 | |||||||||||||||
| Balance at the beginning of the period | 2,199 | 4,355 | 2,180 | 4,355 | 2,826 | |||||||||||||||
| Interest charge | 3 | 63 | 95 | 94 | 158 | 187 | ||||||||||||||
| Payment of Deferred Payment | — | (2,246) | — | (2,246) | (739) | |||||||||||||||
Loss on revised estimated cash flows1 | 4 | 4,658 | (5) | 2,081 | 4,653 | 2,081 | ||||||||||||||
Balance at end of the period2 | 6,920 | 2,199 | 4,355 | 6,920 | 4,355 | |||||||||||||||
| Current portion of liability | (4,315) | (1,014) | (2,155) | (4,315) | (2,155) | |||||||||||||||
| Non-current portion of liability | 2,605 | 1,185 | 2,200 | 2,605 | 2,200 | |||||||||||||||
1 The loss on revised estimated cash flows is primarily as a result of changes in the life-of-mine, changes in price inputs for 2022 life-of-mine and a significant increase in the FY2021 actual profitability compared to the 2021 life-of-mine due to the high price environment that existed in FY2021, which will impact the FY2022 payment
2 The Rustenburg Deferred Payment is calculated as being equal to 35% of the distributable free cash flow generated by the Rustenburg operation over a six year (1 January 2017 to 31 December 2022) period from inception (latest of transaction closing or 1 January 2017), subject to a minimum payment of R3 billion. The distributable free cash flow has been derived from forecast cash flow models. These models use several key assumptions, including estimates of future sales volumes, PGM prices, operating costs and capital expenditure
13.2 Marikana dividend obligation
The Marikana dividend obligation relates to amounts payable to other shareholders through the Incwala Platinum holding structure. The obligation is classified as a financial liability measured at amortised cost.
The obligation was measured applying the same assumptions as set out note 12.1.
The following table summarises the changes in the Marikana dividend obligation:
| Figures in million - SA rand | Six months ended | Year ended | ||||||||||||||||||
| Unaudited | Reviewed | Unaudited | Reviewed | Audited | ||||||||||||||||
| Notes | Dec 2021 | June 2021 | Dec 2020 | Dec 2021 | Dec 2020 | |||||||||||||||
| Balance at the beginning of the period | 1,013 | — | — | — | — | |||||||||||||||
| Initial recognition of the Marikana dividend obligation | — | 1,146 | — | 1,146 | ||||||||||||||||
| Interest - unwinding of amortised cost | 3 | 58 | 29 | — | 87 | — | ||||||||||||||
Loss on revised estimated cash flows1 | 4 | 468 | — | — | 468 | — | ||||||||||||||
| Payments made | — | (162) | — | (162) | — | |||||||||||||||
| Balance at end of the period | 1,539 | 1,013 | — | 1,539 | — | |||||||||||||||
| Current portion of liability | (173) | (23) | — | (173) | — | |||||||||||||||
| Non-current portion of liability | 1,366 | 990 | — | 1,366 | — | |||||||||||||||
1 The loss on revised estimated cash flows is primarily as a result of an increase in the long-term PGM basket price
Sibanye-Stillwater Operating and financial results | Six months and year ended 31 December 2021 37
14. Fair value of financial assets and financial liabilities, and risk management
14.1 Measurement of fair value
The Group uses the following hierarchy for determining and disclosing the fair value of financial instruments:
•Level 1: unadjusted quoted prices in active markets for identical assets or liabilities
•Level 2: inputs other than quoted prices in level 1 that are observable for the asset or liability, either directly (as prices) or indirectly (derived from prices)
•Level 3: inputs for the asset or liability that are not based on observable market data (unobservable inputs)
The following table sets out the Group’s significant financial instruments measured at fair value by level within the fair value hierarchy:
| Figures in million - SA rand | |||||||||||||||||||||||||||||
| Reviewed | Reviewed | Audited | |||||||||||||||||||||||||||
| Dec 2021 | June 2021 | Dec 2020 | |||||||||||||||||||||||||||
| Level 1 | Level 2 | Level 3 | Level 1 | Level 2 | Level 3 | Level 1 | Level 2 | Level 3 | |||||||||||||||||||||
| Financial assets measured at fair value | |||||||||||||||||||||||||||||
Environmental rehabilitation obligation funds1 | 4,477 | 725 | — | 4,347 | 703 | — | 4,111 | 823 | — | ||||||||||||||||||||
Trade receivables - PGM concentrate sales2 | — | 3,794 | — | — | 5,063 | — | — | 4,030 | — | ||||||||||||||||||||
Other investments3 | 3,143 | — | 224 | 727 | — | 263 | 603 | — | 244 | ||||||||||||||||||||
Asset held for sale4 | — | 280 | — | — | — | — | — | — | — | ||||||||||||||||||||
Palladium hedge contract5 | — | 286 | — | — | — | — | — | -* | — | ||||||||||||||||||||
| Financial liabilities measured at fair value | |||||||||||||||||||||||||||||
Palladium hedge contract5 | — | — | — | — | 293 | — | — | — | — | ||||||||||||||||||||
| Gold hedge contracts | — | — | — | — | — | — | — | -* | — | ||||||||||||||||||||
1 Environmental rehabilitation obligation funds comprise a fixed income portfolio of bonds as well as fixed and call deposits. The environmental rehabilitation obligation funds are stated at fair value based on the nature of the fund’s investments
2 The fair value for trade receivables measured at fair value through profit or loss are determined based on ruling market prices, volatilities and interest rates
3 The fair values of listed investments are based on the quoted prices available from the relevant stock exchanges. The carrying amounts of other short-term investment products with short maturity dates approximate fair value. The fair values of non-listed investments are determined through valuation techniques that include inputs that are not based on observable market data. These inputs include price/book ratios as well as marketability and minority shareholding discounts which are impacted by the size of the shareholding
4 The fair value of the asset held for sale was derived from the quoted Gen Mining share price (refer note 10)
5 The fair value of the palladium hedge is determined using on a monte carlo simulation model based on market forward prices, volatilities and interest rates
* Less than R1 million
Fair value of borrowings
The fair value of variable interest rate borrowings approximates its carrying amounts as the interest rates charged are considered market related. Fair value of fixed interest rate borrowings was determined through reference to ruling market prices and interest rates.
The table below shows the fair value and carrying amount of borrowings where the carrying amount does not approximate fair value:
| Figures in million - SA rand | ||||||||||||||
| Carrying value | Fair Value | |||||||||||||
| Level 1 | Level 2 | Level 3 | ||||||||||||
| 31 December 2021 (Reviewed) | ||||||||||||||
2026 and 2029 Notes1 | 18,785 | 18,664 | — | — | ||||||||||
Burnstone Debt2 | 1,507 | — | — | 2,996 | ||||||||||
| Total | 20,292 | 18,664 | — | 2,996 | ||||||||||
| 30 June 2021 (Reviewed) | ||||||||||||||
2022 and 2025 Notes1 | 9,902 | 10,177 | — | — | ||||||||||
Burnstone Debt2 | 1,287 | — | — | 2,086 | ||||||||||
| Total | 11,189 | 10,177 | — | 2,086 | ||||||||||
| 31 December 2020 (Audited) | ||||||||||||||
2022 and 2025 Notes1 | 10,136 | 10,637 | — | — | ||||||||||
Burnstone Debt2 | 1,263 | — | — | 2,075 | ||||||||||
| Total | 11,399 | 10,637 | — | 2,075 | ||||||||||
1 The fair value is based on the quoted market prices of the notes
2 The fair value of the Burnstone Debt has been derived from discounted cash flow models. These models use several key assumptions, including estimates of future sales volumes, Gold prices, operating costs, capital expenditure and discount rate. The fair value estimate is sensitive to changes in the key assumptions, for example, increases in the market related discount rate would decrease the fair value if all other inputs remain unchanged. The extent of the fair value changes would depend on how inputs change in relation to each other
14.2 Risk management activities
Liquidity risk: working capital and going concern assessment
For the year ended 31 December 2021, the Group realised a profit of R33,796 million (31 December 2020: R30,622 million). As at 31 December 2021 the Group’s current assets exceeded its current liabilities by R44,290 million (31 December 2020: R34,756 million) and the Group’s total assets exceeded its total liabilities by R81,345 million (31 December 2020: R70,716 million). During the year ended 31 December 2021 the Group generated net cash from operating activities of R32,256 million (31 December 2020: R27,151 million).
The Group currently has committed undrawn debt facilities of R15,749 million at 31 December 2021 (31 December 2020: R7,336 million) and cash balances of R30,292 million (31 December 2020: R20,240 million). The 2022 Notes, contractually due to be settled on 27 June 2022, were early settled on 2 August 2021 for the nominal value of US$354 million (R5,123 million). The 2025 Notes, were refinanced and upsized into a new bond issue on 16 November 2021 (refer note 11), securing reduced cost of debt, longer financing tenors and enhancing liquidity. The most immediate debt maturities are the US$600 million USD RCF maturing in April 2023 and the R5.5 billion ZAR RCF maturing in November 2024. Sibanye-Stillwater’s leverage ratio (net (cash)/debt to adjusted EBITDA) as at 31 December 2021 was (0.2):1 (31 December 2020 was (0.1):1) and its interest coverage ratio (adjusted EBITDA to net finance (income)/charges) was (5,281):1 (31 December 2020 was 80:1). Both considerably better than the maximum permitted leverage ratio of at most 2.5:1 and minimum required interest coverage ratio of 4.0:1, calculated on a quarterly basis, required under the US$600 million RCF and the R5.5 billion RCF. With the available RCF’s collectively 100% unutilised at 31 December 2021, high level of available cash balances and the Group’s strong liquidity position, no imminent refinancing of debt is required.
Sibanye-Stillwater Operating and financial results | Six months and year ended 31 December 2021 38
Notwithstanding the exceptionally strong liquidity position and good financial outlook, the Group could also, if necessary, consider options to increase funding flexibility which may include, amongst others, additional loan facilities or debt capital market issuances, streaming facilities, prepayment facilities or, in the event that other options are not deemed preferable or achievable by the Board, an equity capital raise. The Group could also, with lender approval, request covenant amendments or restructure facilities. During past adversity management has successfully implemented similar actions.
Management believes that the cash forecasted to be generated by operations, cash on hand, the committed unutilised debt facilities as well as additional funding opportunities will enable the Group to continue to meet its obligations as they fall due. The condensed consolidated provisional financial statements for the year ended 31 December 2021, therefore, have been prepared on a going concern basis.
15. Contingent liabilities
15.1 Arbitration case Redpath USA Corporation versus Stillwater Mining Company
In 2015, Redpath USA Corporation (the Contractor) was hired by the Stillwater Mining Company (the Company) to advance the Benbow decline as part of the Blitz project. During November 2019 the Contractor filed a claim wherein the contractor has raised a dispute over additional and rework costs of establishing a decline at the Stillwater Mine after drilling errors caused a water inundation that required significant remediation. The Contractor assumed the additional costs and is now seeking to recover those costs, in an amount of approximately US$20 million, from the Company. After engaging outside counsel and based on the terms of the contract that supports the Company’s position, management believes the Contractor’s claim is without merit and disputes the arbitration demand claim in the legal documents served on the Contractor. Extensive discovery is underway closing in March 2022 and the arbitration hearing has been scheduled for May 2022.
16. Events after the reporting period
There were no events that could have a material impact on the financial results of the Group after 31 December 2021 up to the date on which the condensed consolidated provisional financial statements for the six months and year ended 31 December 2021 were authorised for issue, other than those discussed below:
16.1 Sandouville acquisition
On 30 July 2021, Sibanye-Stillwater announced that it had entered into an exclusive put option agreement (Put Option) with French mining group Eramet SA (Eramet) for the acquisition of 100% of the Sandouville nickel hydrometallurgical processing facility (Sandouville), located in Normandy, France. The Sandouville facility is situated in the industrial heart of Europe at Le Havre, France’s second largest industrial port, with strategic access to extensive logistical infrastructure including shipping, rail and key motorways, supporting any future supply into the European end user markets.
The transaction is the second step in the Group's battery metals strategy, building on the investment in the Keliber lithium hydroxide project, in partnership with the State of Finland and the Finnish Minerals Group, announced in February 2021. The Sandouville site is a polyvalent facility which is already zoned for heavy industrial purposes. The site is scaleable for nickel, cobalt and lithium battery grade products, and will enable the Group to further advance its battery metals strategy and recycling activities.
On 4 November 2021, following the signing of the exclusive Put Option, Sibanye-Stillwater announced that the Share Purchase Agreement (SPA) had been signed to acquire 100% of Sandouville. The signature of the SPA followed the successful completion of the information-consultation process with the employee representative bodies of Sandouville and Eramet, who rendered a favourable opinion of the transaction. The transaction also received the key regulatory approvals of the South African Reserve Bank and clearance from the French Foreign Investment Control Office. The remaining conditions in respect of the acquisition were fulfilled on 4 February 2022, which resulted in an effective acquisition date of 4 February 2022.
Management is in the process of identifying and measuring the assets and liabilities in accordance with IFRS 3 Business Combinations for, amongst others, property, plant and equipment, contingent liabilities, inventory, provisions, as well as any deferred tax implications. In particular, management is still finalising the assessment of certain inputs and assumptions and gathering information that may impact the identification and fair value of the net assets. The purchase consideration is approximately €85 million, subject to any final post-closing adjustments.
16.2 Santa Rita and Serrote
On 26 October 2021, Sibanye-Stillwater entered into purchase and sale agreements with affiliates of funds advised by Appian Capital Advisory LLP (Appian) to purchase 100% of the Santa Rita nickel mine (Santa Rita) and the Serrote copper mine, both located in Brazil. The acquisition price was to be a cash consideration of US$1 billion and a 5% net smelter royalty over potential future underground production at Santa Rita (the Atlantic Nickel SPA and the MVV SPA, respectively).
Sibanye-Stillwater was advised by Appian that, subsequent to signing the Atlantic Nickel SPA and the MVV SPA, a geotechnical event occurred at Santa Rita. Management assessed the event and its effect and concluded that it was and was reasonably expected to be material and adverse to the business, financial condition, results of operations, the properties, assets, liabilities or operations of Santa Rita. Accordingly, pursuant to the terms of the Atlantic Nickel SPA, on 24 January 2022, Sibanye-Stillwater gave notice of termination of the Atlantic Nickel SPA. As the MVV SPA was conditional on the closing of the Atlantic Nickel SPA, which had become impossible to satisfy, on the same date Sibanye-Stillwater also gave notice of termination of the MVV SPA. As announced by Sibanye-Stillwater on 2 March 2022, if Appian commences proceedings, the Group will follow due course in defending any possible claims or litigation on the matter.
16.3 Rhyolite Ridge joint venture with ioneer
On 16 September 2021, Sibanye-Stillwater announced that it had reached an agreement with ioneer to establish a joint venture company with respect to the Rhyolite Ridge lithium-boron project. Following the satisfaction of all conditions precedent, the Group will contribute US$490 million for a 50% interest in Rhyolite Ridge. ioneer will also hold a 50% interest and retain the operational management responsibility. Management concluded that the transaction was not effective at 31 December 2021 since a number of conditions precedent were still outstanding, joint control was not obtained and no contractual rights or obligations were created.
16.4 Kroondal transaction
On 31 January 2022, Sibanye-Stillwater announced it had entered into an agreement with Rustenburg Platinum Mines Limited (RPM) a subsidiary of Anglo American Platinum Limited, through its subsidiary Sibanye Rustenburg Platinum Mines Limited (SRPM), which will result in SRPM assuming full ownership of the Kroondal operation. The Kroondal operation is subject to a 50/50 pool and share agreement (Kroondal PSA) between Kroondal Operations Proprietary Limited (a wholly-owned subsidiary of the Group) and RPM (collectively the PSA parties).
By the end of 2020 certain shafts at the Kroondal operation had reached the boundaries of the Kroondal PSA lease area. In order to allow the affected shafts to continue operating, with effect from January 2021, a contractor mining agreement was agreed between the PSA Parties and SRPM, providing for the mining of SRPM from the Kroondal operations (the “Contractor Agreement”).
Sibanye-Stillwater Operating and financial results | Six months and year ended 31 December 2021 39
In addition to the Contractor Agreement, SRPM and RPM have entered into a sale and purchase agreement in terms of which SRPM will acquire RPM’s 50% interest and all associated liabilities in respect of the Kroondal PSA for a cash consideration of R1.00 plus the assumption of RPM's portion of all associated liabilities, which include all associated closure costs and rehabilitation liabilities. This transaction will extend the life of the Kroondal operations to 2029 and ensure significant value creation for all stakeholders. Management is in the process of assessing the accounting impact of the transaction.
16.5 Wage agreement reached at East Boulder mine
The Group successfully ratified a new collective bargaining agreement, effective 16 February 2022 through to 31 July 2024, with the United Steel Workers International Union (USW) at its East Boulder mine in Montana in the United States. The agreement covers a broad range of terms including average annual wage increases of 2.5% in 2022, 3% in 2023 and 3% in 2024. In addition to the base increase in 2022, an increase to benefits and incentive has been agreed, which will result in an effective average increase of 5.4% for 2022 if all safety and quality deliverables are fully met. This settlement amounts to an annual average increase of 3.8% per year for the next 3 years, which compares favourably with US inflation rates.
16.6 SA gold operations wage dispute
On 14 January 2022, the Group announced that the Commission for Conciliation, Mediation and Arbitration (CCMA), has issued a certificate of non-resolution in respect of the dispute conciliation process between Sibanye-Stillwater and the labour unions, comprising AMCO, the NUM, Solidarity and UASA in respect of wage negotiations at the Group’s gold operations. This certificate permits the unions to embark on a strike and the Group to implement a lock-out within a twelve-month period from issuance. Both parties need to give the counterparty 48 hours’ notice prior to embarking on any action.
On 4 February 2022, Sibanye-Stillwater tabled its final offer to the unions, which confirmed the Group’s commitment to wage increases, which are sustainable and in the interest of all stakeholders as well as linked to inflation. If accepted, this offer means that category 4 - 8 employees will receive an average increase of 6% in year one, 5.7% in year two and 5.4% in year three. Miners, artisans and officials will receive an increase of 5% in year one, two and three.
Up to the date of this report, Sibanye-Stillwater has continued to engage with all stakeholders and has not received formal notice of strike action.
16.7 Verkor
During February 2022, Sibanye-Stillwater entered into a term sheet whereby the Group, through its wholly-owned subsidiary, Sibanye Battery Metals Proprietary Limited, will invest in Verkor S.A. (Verkor) through a €25 million convertible bond. Verkor is a French Gigafactory project aiming to enter the European battery materials market as a manufacturer of low-carbon footprint batteries for application in electric vehicles and large-scale stationary storage markets. At the date of this report, certain conditions precedent were still outstanding. Management is in the process of assessing the accounting impact of the transaction.
16.8 Change in future South African corporate income tax (CIT) rate
During his budget speech on 23 February 2022, the South African Minister of Finance confirmed the change in the South African CIT rate as announced in his February 2021 budget speech. For the financial year ended 31 December 2021, the CIT rate applicable to Sibanye-Stillwater and its South African subsidiaries, which apply a CIT rate, was 28% and will remain at 28% for the financial year ending 31 December 2022. For subsequent financial years the change will become effective and a 27% CIT rate will apply.
17. Review report of the independent auditor
These condensed consolidated provisional financial statements for the year ended 31 December 2021, have been reviewed by the Company’s external auditor, Ernst & Young Inc., who expressed an unmodified review conclusion.
The auditor’s report does not necessarily report on all of the information contained in these financial results. Shareholders are therefore advised that in order to obtain a full understanding of the nature of the auditor’s engagement they should obtain a copy of the auditor’s report together with the accompanying financial information from the Company’s registered office, by emailing the Company Secretary (lerato.matlosa@sibanyestillwater.com).
Sibanye-Stillwater Operating and financial results | Six months and year ended 31 December 2021 40
18. Segment reporting
Figures in million
| For the six months ended 31 Dec 2021 (Unaudited) | ||||||||||||||||||||||||||||||||||||||||||||||||||||||||||||||
| GROUP | US PGM OPERATIONS | SA OPERATIONS | GROUP | |||||||||||||||||||||||||||||||||||||||||||||||||||||||||||
| SA rand | Total | Total US PGM | Underground | Recycling | Total SA Operations | Total SA PGM | Rusten- burg | Marikana | Kroondal | Platinum Mile | Mimosa | Corporate and re- conciling items1 | Total SA gold | Drie- fontein | Kloof | Beatrix | Cooke | DRD- GOLD | Corporate and re- conciling items1 | Cor- porate1 | ||||||||||||||||||||||||||||||||||||||||||
| Revenue | 82,241 | 29,918 | 8,622 | 21,296 | 52,463 | 37,412 | 13,740 | 19,251 | 3,679 | 743 | 1,674 | (1,675) | 15,051 | 4,254 | 4,772 | 3,048 | 479 | 2,498 | — | (140) | ||||||||||||||||||||||||||||||||||||||||||
| Underground | 55,248 | 8,622 | 8,622 | — | 46,766 | 35,476 | 12,547 | 19,251 | 3,679 | — | 1,674 | (1,675) | 11,290 | 4,056 | 4,293 | 2,941 | — | — | — | (140) | ||||||||||||||||||||||||||||||||||||||||||
| Surface | 5,697 | — | — | — | 5,697 | 1,936 | 1,193 | — | — | 743 | — | — | 3,761 | 198 | 479 | 107 | 479 | 2,498 | — | — | ||||||||||||||||||||||||||||||||||||||||||
| Recycling | 21,296 | 21,296 | — | 21,296 | — | — | — | — | — | — | — | — | — | — | — | — | — | — | — | — | ||||||||||||||||||||||||||||||||||||||||||
| Cost of sales, before amortisation and depreciation | (52,860) | (24,755) | (4,216) | (20,539) | (28,105) | (16,367) | (5,952) | (8,328) | (1,785) | (303) | (813) | 814 | (11,738) | (3,056) | (3,961) | (2,561) | (408) | (1,752) | — | — | ||||||||||||||||||||||||||||||||||||||||||
| Underground | (28,802) | (4,216) | (4,216) | — | (24,586) | (15,539) | (5,427) | (8,328) | (1,785) | — | (813) | 814 | (9,047) | (2,932) | (3,623) | (2,492) | — | — | — | — | ||||||||||||||||||||||||||||||||||||||||||
| Surface | (3,519) | — | — | — | (3,519) | (828) | (525) | — | — | (303) | — | — | (2,691) | (124) | (338) | (69) | (408) | (1,752) | — | — | ||||||||||||||||||||||||||||||||||||||||||
| Recycling | (20,539) | (20,539) | — | (20,539) | — | — | — | — | — | — | — | — | — | — | — | — | — | — | — | — | ||||||||||||||||||||||||||||||||||||||||||
Net other cash costs2 | (1,324) | 2 | 2 | — | (1,326) | (775) | 108 | (554) | (48) | (243) | (21) | (17) | (551) | (49) | (47) | (38) | (312) | (24) | (81) | — | ||||||||||||||||||||||||||||||||||||||||||
| Adjusted EBITDA | 28,057 | 5,165 | 4,408 | 757 | 23,032 | 20,270 | 7,896 | 10,369 | 1,846 | 197 | 840 | (878) | 2,762 | 1,149 | 764 | 449 | (241) | 722 | (81) | (140) | ||||||||||||||||||||||||||||||||||||||||||
| Amortisation and depreciation | (4,495) | (1,429) | (1,427) | (2) | (3,066) | (1,353) | (462) | (595) | (275) | (18) | (142) | 139 | (1,713) | (672) | (545) | (368) | (6) | (98) | (24) | — | ||||||||||||||||||||||||||||||||||||||||||
| Interest income | 578 | 163 | 9 | 154 | 400 | 112 | 11 | 53 | 45 | 3 | 8 | (8) | 288 | 35 | 25 | 17 | 7 | 109 | 95 | 15 | ||||||||||||||||||||||||||||||||||||||||||
| Finance expense | (1,235) | (463) | (453) | (10) | (621) | (350) | (2,217) | (192) | (62) | — | (3) | 2,124 | (271) | (51) | (44) | (41) | (34) | (30) | (71) | (151) | ||||||||||||||||||||||||||||||||||||||||||
| Share-based payments | (85) | (8) | (8) | — | (77) | (10) | (4) | (5) | (1) | — | — | — | (67) | (4) | (5) | (5) | — | (10) | (43) | — | ||||||||||||||||||||||||||||||||||||||||||
Net other3 | (3,092) | 556 | 556 | — | (3,699) | (4,958) | (12,246) | (618) | 353 | 46 | (41) | 7,548 | 1,259 | 7 | 8 | 16 | 86 | 17 | 1,125 | 51 | ||||||||||||||||||||||||||||||||||||||||||
Non-underlying items4 | (5,481) | (230) | (230) | — | (5,171) | 4 | 1 | 2 | (1) | — | — | 2 | (5,175) | (210) | (3,680) | (1,286) | (1) | — | 2 | (80) | ||||||||||||||||||||||||||||||||||||||||||
| Royalties and carbon tax | (1,073) | — | — | — | (1,073) | (975) | (512) | (458) | (6) | — | (65) | 66 | (98) | (50) | (23) | (17) | (2) | — | (6) | — | ||||||||||||||||||||||||||||||||||||||||||
| Profit before tax | 13,174 | 3,754 | 2,855 | 899 | 9,725 | 12,740 | (7,533) | 8,556 | 1,899 | 228 | 597 | 8,993 | (3,015) | 204 | (3,500) | (1,235) | (191) | 710 | 997 | (305) | ||||||||||||||||||||||||||||||||||||||||||
| Current taxation | (5,675) | (582) | (5,084) | (4,937) | (1,748) | (2,497) | (558) | (124) | (157) | 147 | (147) | (6) | (7) | (3) | — | (141) | 10 | (9) | ||||||||||||||||||||||||||||||||||||||||||||
| Deferred taxation | 978 | (150) | 1,128 | 957 | 989 | (115) | 22 | 59 | (9) | 11 | 171 | 142 | 1,163 | 221 | — | (44) | (1,311) | — | ||||||||||||||||||||||||||||||||||||||||||||
| Profit/(loss) for the period | 8,477 | 3,022 | 5,769 | 8,760 | (8,292) | 5,944 | 1,363 | 163 | 431 | 9,151 | (2,991) | 340 | (2,344) | (1,017) | (191) | 525 | (304) | (314) | ||||||||||||||||||||||||||||||||||||||||||||
| Attributable to: | ||||||||||||||||||||||||||||||||||||||||||||||||||||||||||||||
| Owners of the parent | 8,218 | 3,022 | 5,510 | 8,760 | (8,292) | 5,944 | 1,363 | 163 | 431 | 9,151 | (3,250) | 340 | (2,344) | (1,017) | (191) | 266 | (304) | (314) | ||||||||||||||||||||||||||||||||||||||||||||
| Non-controlling interest holders | 259 | — | 259 | — | — | — | — | — | — | — | 259 | — | — | — | — | 259 | — | — | ||||||||||||||||||||||||||||||||||||||||||||
| Sustaining capital expenditure | (2,469) | (294) | (290) | (4) | (2,175) | (1,352) | (387) | (787) | (164) | (14) | (299) | 299 | (823) | (213) | (352) | (113) | — | (145) | — | — | ||||||||||||||||||||||||||||||||||||||||||
| Ore reserve development | (2,954) | (772) | (772) | — | (2,182) | (832) | (315) | (516) | — | — | — | (1) | (1,350) | (614) | (489) | (247) | — | — | — | — | ||||||||||||||||||||||||||||||||||||||||||
| Growth projects | (1,731) | (1,194) | (1,194) | — | (537) | (197) | — | (197) | — | — | — | — | (340) | — | (107) | (7) | — | (38) | (188) | — | ||||||||||||||||||||||||||||||||||||||||||
| Total capital expenditure | (7,154) | (2,260) | (2,256) | (4) | (4,894) | (2,381) | (702) | (1,500) | (164) | (14) | (299) | 298 | (2,513) | (827) | (948) | (367) | — | (183) | (188) | — | ||||||||||||||||||||||||||||||||||||||||||
Sibanye-Stillwater Operating and financial results | Six months and year ended 31 December 2021 41
| For the six months ended 31 Dec 2021 (Unaudited) | ||||||||||||||||||||||||||||||||||||||||||||||||||||||||||||||
| GROUP | US PGM OPERATIONS | SA OPERATIONS | GROUP | |||||||||||||||||||||||||||||||||||||||||||||||||||||||||||
US dollars5 | Total | Total US PGM | Underground | Recycling | Total SA Operations | Total SA PGM | Rusten- burg | Marikana | Kroondal | Platinum Mile | Mimosa | Corporate and re- conciling items1 | Total SA gold | Drie- fontein | Kloof | Beatrix | Cooke | DRD- GOLD | Corporate and re- conciling items1 | Cor- porate1 | ||||||||||||||||||||||||||||||||||||||||||
| Revenue | 5,461 | 1,991 | 572 | 1,419 | 3,479 | 2,476 | 910 | 1,276 | 241 | 50 | 110 | (111) | 1,003 | 283 | 317 | 205 | 32 | 166 | — | (9) | ||||||||||||||||||||||||||||||||||||||||||
| Underground | 3,662 | 572 | 572 | — | 3,099 | 2,346 | 830 | 1,276 | 241 | — | 110 | (111) | 753 | 270 | 286 | 197 | — | — | — | (9) | ||||||||||||||||||||||||||||||||||||||||||
| Surface | 380 | — | — | — | 380 | 130 | 80 | — | — | 50 | — | — | 250 | 13 | 31 | 8 | 32 | 166 | — | — | ||||||||||||||||||||||||||||||||||||||||||
| Recycling | 1,419 | 1,419 | — | 1,419 | — | — | — | — | — | — | — | — | — | — | — | — | — | — | — | — | ||||||||||||||||||||||||||||||||||||||||||
| Cost of sales, before amortisation and depreciation | (3,521) | (1,650) | (282) | (1,368) | (1,871) | (1,089) | (397) | (553) | (119) | (20) | (54) | 54 | (782) | (203) | (263) | (172) | (28) | (116) | — | — | ||||||||||||||||||||||||||||||||||||||||||
| Underground | (1,919) | (282) | (282) | — | (1,637) | (1,034) | (362) | (553) | (119) | — | (54) | 54 | (603) | (195) | (241) | (167) | — | — | — | — | ||||||||||||||||||||||||||||||||||||||||||
| Surface | (234) | — | — | — | (234) | (55) | (35) | — | — | (20) | — | — | (179) | (8) | (22) | (5) | (28) | (116) | — | — | ||||||||||||||||||||||||||||||||||||||||||
| Recycling | (1,368) | (1,368) | — | (1,368) | — | — | — | — | — | — | — | — | — | — | — | — | — | — | — | — | ||||||||||||||||||||||||||||||||||||||||||
Net other cash costs2 | (88) | — | — | — | (88) | (51) | 7 | (37) | (3) | (16) | (1) | (1) | (37) | (3) | (4) | (3) | (20) | (2) | (5) | — | ||||||||||||||||||||||||||||||||||||||||||
| Adjusted EBITDA | 1,852 | 341 | 290 | 51 | 1,520 | 1,336 | 520 | 686 | 119 | 14 | 55 | (58) | 184 | 77 | 50 | 30 | (16) | 48 | (5) | (9) | ||||||||||||||||||||||||||||||||||||||||||
| Amortisation and depreciation | (300) | (96) | (96) | — | (204) | (88) | (31) | (39) | (18) | (1) | (10) | 11 | (116) | (45) | (36) | (25) | (1) | (7) | (2) | — | ||||||||||||||||||||||||||||||||||||||||||
| Interest income | 38 | 11 | 1 | 10 | 26 | 8 | — | 3 | 3 | — | 1 | 1 | 18 | 2 | 1 | 1 | — | 7 | 7 | 1 | ||||||||||||||||||||||||||||||||||||||||||
| Finance expense | (82) | (31) | (30) | (1) | (41) | (22) | (148) | (13) | (4) | — | — | 143 | (19) | (4) | (3) | (3) | (2) | (2) | (5) | (10) | ||||||||||||||||||||||||||||||||||||||||||
| Share-based payments | (6) | (1) | (1) | — | (5) | (2) | — | — | — | — | — | (2) | (3) | — | — | — | — | — | (3) | — | ||||||||||||||||||||||||||||||||||||||||||
Net other3 | (208) | 38 | 38 | — | (249) | (335) | (828) | (42) | 24 | 3 | (3) | 511 | 86 | — | — | 1 | 6 | 1 | 78 | 3 | ||||||||||||||||||||||||||||||||||||||||||
Non-underlying items4 | (372) | (16) | (16) | — | (350) | — | — | — | — | — | — | — | (350) | (15) | (249) | (87) | — | — | 1 | (6) | ||||||||||||||||||||||||||||||||||||||||||
| Royalties and carbon tax | (71) | — | — | — | (71) | (65) | (34) | (30) | — | — | (4) | 3 | (6) | (3) | (1) | (1) | — | — | (1) | — | ||||||||||||||||||||||||||||||||||||||||||
| Profit before tax | 851 | 246 | 186 | 60 | 626 | 832 | (521) | 565 | 124 | 16 | 39 | 609 | (206) | 12 | (238) | (84) | (13) | 47 | 70 | (21) | ||||||||||||||||||||||||||||||||||||||||||
| Current taxation | (375) | (38) | (336) | (325) | (115) | (166) | (36) | (9) | (10) | 11 | (11) | (1) | (1) | — | — | (10) | 1 | (1) | ||||||||||||||||||||||||||||||||||||||||||||
| Deferred taxation | 68 | (10) | 78 | 68 | 67 | (7) | 2 | 4 | — | 2 | 10 | 9 | 78 | 15 | — | (3) | (89) | — | ||||||||||||||||||||||||||||||||||||||||||||
| Profit/(loss) for the period | 544 | 198 | 368 | 575 | (569) | 392 | 90 | 11 | 29 | 622 | (207) | 20 | (161) | (69) | (13) | 34 | (18) | (22) | ||||||||||||||||||||||||||||||||||||||||||||
| Attributable to: | ||||||||||||||||||||||||||||||||||||||||||||||||||||||||||||||
| Owners of the parent | 527 | 198 | 351 | 576 | (569) | 392 | 90 | 13 | 29 | 621 | (225) | 20 | (161) | (69) | (13) | 16 | (18) | (22) | ||||||||||||||||||||||||||||||||||||||||||||
| Non-controlling interest holders | 17 | — | 17 | (1) | — | — | — | (2) | — | 1 | 18 | — | — | — | — | 18 | — | — | ||||||||||||||||||||||||||||||||||||||||||||
| Sustaining capital expenditure | (165) | (19) | (19) | — | (146) | (91) | (26) | (53) | (11) | (1) | (20) | 20 | (55) | (15) | (24) | (7) | — | (9) | — | — | ||||||||||||||||||||||||||||||||||||||||||
| Ore reserve development | (198) | (52) | (52) | — | (146) | (55) | (21) | (34) | — | — | — | — | (91) | (41) | (33) | (17) | — | — | — | — | ||||||||||||||||||||||||||||||||||||||||||
| Growth projects | (115) | (79) | (79) | — | (36) | (14) | — | (14) | — | — | — | — | (22) | — | (7) | — | — | (2) | (13) | — | ||||||||||||||||||||||||||||||||||||||||||
| Total capital expenditure | (478) | (150) | (150) | — | (328) | (160) | (47) | (101) | (11) | (1) | (20) | 20 | (168) | (56) | (64) | (24) | — | (11) | (13) | — | ||||||||||||||||||||||||||||||||||||||||||
1Corporate and reconciling items represent the items to reconcile segment data to condensed consolidated financial statement totals. This does not represent a separate segment as it does not generate mining revenue. Group corporate includes the Wheaton Stream transaction, initial recognition of battery metal investment, corporate taxation, interest and corporate transaction costs
2Net other cash costs consist of net other costs as per the condensed consolidated income statement excluding change in estimate of environmental rehabilitation obligation, and right of recovery receivable and payable, profit on sale of St Helena (R16 million), non-cash loss due to dilution of interest in joint operation (R2 million), and include lease payments (R71 million) to conform with the adjusted EBITDA reconciliation disclosed in note 11.1
3Net other consists of gain on financial instruments, loss on foreign exchange differences, change in estimate of environmental rehabilitation obligation, and right of recovery receivable and payable as detailed in profit or loss and the add back of the lease payment referred to in footnote 2 above. Corporate and reconciling items net other includes the share of results of equity-accounted investees after tax as detailed in profit or loss
4Non-underlying items consists of gain on disposal of property, plant and equipment, impairments which include impairment to mining assets of Driefontein, Kloof and Beatrix of R212 million, R3,642 million and R1,293 million, respectively (refer note 6), restructuring costs, transaction costs, loss on settlement of US$ Convertible Bond/2022 and 2025 Notes, non-cash loss with dilution of interest in joint operation (R2 million), profit on sale of St Helena (R16 million) and occupational healthcare expense as detailed in profit or loss
5The average exchange rate for the six months ended 31 December 2021 was R15.03/US$
Sibanye-Stillwater Operating and financial results | Six months and year ended 31 December 2021 42
Figures in millions
| For the six months ended 30 Jun 2021 (Reviewed) | ||||||||||||||||||||||||||||||||||||||||||||||||||||||||||||||
| GROUP | US PGM OPERATIONS | SA OPERATIONS | GROUP | |||||||||||||||||||||||||||||||||||||||||||||||||||||||||||
| SA rand | Total | Total US PGM | Underground | Recycling | Total SA Operations | Total SA PGM | Rusten- burg | Marikana | Kroondal | Platinum Mile | Mimosa | Corporate and re- conciling items1 | Total SA gold | Drie- fontein | Kloof | Beatrix | Cooke | DRD- GOLD | Corporate and re- conciling items1 | Cor- porate1 | ||||||||||||||||||||||||||||||||||||||||||
| Revenue | 89,953 | 29,135 | 9,721 | 19,414 | 61,049 | 47,742 | 18,009 | 22,359 | 6,614 | 760 | 2,719 | (2,719) | 13,307 | 3,678 | 4,522 | 2,295 | 520 | 2,292 | — | (231) | ||||||||||||||||||||||||||||||||||||||||||
| Underground | 65,155 | 9,721 | 9,721 | — | 55,665 | 46,001 | 17,028 | 22,359 | 6,614 | — | 2,719 | (2,719) | 9,664 | 3,666 | 3,796 | 2,202 | — | — | — | (231) | ||||||||||||||||||||||||||||||||||||||||||
| Surface | 5,384 | — | — | — | 5,384 | 1,741 | 981 | — | — | 760 | — | — | 3,643 | 12 | 726 | 93 | 520 | 2,292 | — | — | ||||||||||||||||||||||||||||||||||||||||||
| Recycling | 19,414 | 19,414 | — | 19,414 | — | — | — | — | — | — | — | — | — | — | — | — | — | — | — | — | ||||||||||||||||||||||||||||||||||||||||||
| Cost of sales, before amortisation and depreciation | (48,153) | (22,032) | (3,351) | (18,681) | (26,121) | (15,604) | (5,512) | (8,233) | (1,631) | (228) | (774) | 774 | (10,517) | (2,635) | (3,883) | (2,004) | (400) | (1,595) | — | — | ||||||||||||||||||||||||||||||||||||||||||
| Underground | (26,187) | (3,351) | (3,351) | — | (22,836) | (14,891) | (5,027) | (8,233) | (1,631) | — | (774) | 774 | (7,945) | (2,627) | (3,363) | (1,955) | — | — | — | — | ||||||||||||||||||||||||||||||||||||||||||
| Surface | (3,285) | — | — | — | (3,285) | (713) | (485) | — | — | (228) | — | — | (2,572) | (8) | (520) | (49) | (400) | (1,595) | — | — | ||||||||||||||||||||||||||||||||||||||||||
| Recycling | (18,681) | (18,681) | — | (18,681) | — | — | — | — | — | — | — | — | — | — | — | — | — | — | — | — | ||||||||||||||||||||||||||||||||||||||||||
Net other cash costs2 | (1,251) | (12) | (12) | — | (1,239) | (800) | 26 | (482) | (43) | (249) | (21) | (31) | (439) | (29) | (36) | (35) | (299) | (16) | (24) | — | ||||||||||||||||||||||||||||||||||||||||||
| Adjusted EBITDA | 40,549 | 7,091 | 6,358 | 733 | 33,689 | 31,338 | 12,523 | 13,644 | 4,940 | 283 | 1,924 | (1,976) | 2,351 | 1,014 | 603 | 256 | (179) | 681 | (24) | (231) | ||||||||||||||||||||||||||||||||||||||||||
| Amortisation and depreciation | (3,798) | (1,172) | (1,171) | (1) | (2,626) | (1,162) | (423) | (504) | (220) | (13) | (132) | 130 | (1,464) | (493) | (519) | (323) | (5) | (90) | (34) | — | ||||||||||||||||||||||||||||||||||||||||||
| Interest income | 624 | 219 | 1 | 218 | 405 | 107 | 11 | 39 | 52 | 4 | 4 | (3) | 298 | 25 | 22 | 14 | 15 | 113 | 109 | — | ||||||||||||||||||||||||||||||||||||||||||
| Finance expense | (1,261) | (491) | (444) | (47) | (612) | (316) | (1,984) | (136) | (54) | — | (2) | 1,860 | (296) | (48) | (41) | (41) | (29) | (30) | (107) | (158) | ||||||||||||||||||||||||||||||||||||||||||
| Share-based payments | (298) | (65) | (65) | — | (233) | (79) | (31) | (37) | (11) | — | — | — | (154) | (16) | (27) | (16) | — | (9) | (86) | — | ||||||||||||||||||||||||||||||||||||||||||
Net other3 | 260 | (318) | (318) | — | 578 | 653 | 14 | (367) | (105) | (12) | (2) | 1,125 | (75) | 9 | 14 | 17 | 6 | 5 | (126) | — | ||||||||||||||||||||||||||||||||||||||||||
Non-underlying items4 | (48) | (48) | (48) | — | 18 | (2) | 3 | (3) | — | — | — | (2) | 20 | 8 | (6) | (4) | (2) | — | 24 | (18) | ||||||||||||||||||||||||||||||||||||||||||
| Royalties and carbon tax | (1,645) | — | — | — | (1,645) | (1,573) | (893) | (671) | (8) | — | (95) | 94 | (72) | (45) | (23) | (12) | (3) | — | 11 | — | ||||||||||||||||||||||||||||||||||||||||||
| Profit before tax | 34,383 | 5,216 | 4,313 | 903 | 29,574 | 28,966 | 9,220 | 11,965 | 4,594 | 262 | 1,697 | 1,228 | 608 | 454 | 23 | (109) | (197) | 670 | (233) | (407) | ||||||||||||||||||||||||||||||||||||||||||
| Current taxation | (7,831) | (840) | (6,930) | (6,808) | (3,116) | (2,271) | (1,327) | (94) | (417) | 417 | (122) | (7) | (6) | (4) | — | (122) | 17 | (61) | ||||||||||||||||||||||||||||||||||||||||||||
| Deferred taxation | (1,233) | 61 | (1,294) | (1,324) | (33) | (1,345) | 34 | 21 | (9) | 8 | 30 | (93) | (5) | 12 | — | (33) | 149 | — | ||||||||||||||||||||||||||||||||||||||||||||
| Profit/(loss) for the period | 25,319 | 4,437 | 21,350 | 20,834 | 6,071 | 8,349 | 3,301 | 189 | 1,271 | 1,653 | 516 | 354 | 12 | (101) | (197) | 515 | (67) | (468) | ||||||||||||||||||||||||||||||||||||||||||||
| Attributable to: | ||||||||||||||||||||||||||||||||||||||||||||||||||||||||||||||
| Owners of the parent | 24,836 | 4,437 | 20,867 | 20,600 | 6,071 | 8,131 | 3,301 | 173 | 1,271 | 1,653 | 267 | 354 | 12 | (101) | (197) | 261 | (62) | (468) | ||||||||||||||||||||||||||||||||||||||||||||
| Non-controlling interest holders | 483 | — | 483 | 234 | — | 218 | — | 16 | — | — | 249 | — | — | — | — | 254 | (5) | — | ||||||||||||||||||||||||||||||||||||||||||||
Sustaining capital expenditure5 | (1,650) | (502) | (501) | (1) | (1,148) | (667) | (232) | (317) | (104) | (14) | (200) | 200 | (481) | (109) | (136) | (51) | — | (185) | — | — | ||||||||||||||||||||||||||||||||||||||||||
| Ore reserve development | (2,581) | (582) | (582) | — | (1,999) | (745) | (314) | (431) | — | — | — | — | (1,254) | (563) | (441) | (250) | — | — | — | — | ||||||||||||||||||||||||||||||||||||||||||
| Growth projects | (1,355) | (1,217) | (1,217) | — | (138) | (6) | — | (6) | — | — | — | — | (132) | — | (91) | — | — | (9) | (32) | — | ||||||||||||||||||||||||||||||||||||||||||
| Total capital expenditure | (5,586) | (2,301) | (2,300) | (1) | (3,285) | (1,418) | (546) | (754) | (104) | (14) | (200) | 200 | (1,867) | (672) | (668) | (301) | — | (194) | (32) | — | ||||||||||||||||||||||||||||||||||||||||||
Sibanye-Stillwater Operating and financial results | Six months and year ended 31 December 2021 43
| For the six months ended 30 Jun 2021 (Unaudited) | ||||||||||||||||||||||||||||||||||||||||||||||||||||||||||||||
| GROUP | US PGM OPERATIONS | SA OPERATIONS | GROUP | |||||||||||||||||||||||||||||||||||||||||||||||||||||||||||
US dollars6 | Total | Total US PGM | Underground | Recycling | Total SA Operations | Total SA PGM | Rusten- burg | Marikana | Kroondal | Platinum Mile | Mimosa | Corporate and re- conciling items1 | Total SA gold | Drie- fontein | Kloof | Beatrix | Cooke | DRD- GOLD | Corporate and re- conciling items1 | Cor- porate1 | ||||||||||||||||||||||||||||||||||||||||||
| Revenue | 6,182 | 2,002 | 668 | 1,334 | 4,196 | 3,281 | 1,237 | 1,537 | 455 | 52 | 187 | (187) | 915 | 253 | 311 | 157 | 36 | 158 | — | (16) | ||||||||||||||||||||||||||||||||||||||||||
| Underground | 4,478 | 668 | 668 | — | 3,826 | 3,162 | 1,170 | 1,537 | 455 | — | 187 | (187) | 664 | 252 | 261 | 151 | — | — | — | (16) | ||||||||||||||||||||||||||||||||||||||||||
| Surface | 370 | — | — | — | 370 | 119 | 67 | — | — | 52 | — | — | 251 | 1 | 50 | 6 | 36 | 158 | — | — | ||||||||||||||||||||||||||||||||||||||||||
| Recycling | 1,334 | 1,334 | — | 1,334 | — | — | — | — | — | — | — | — | — | — | — | — | — | — | — | — | ||||||||||||||||||||||||||||||||||||||||||
| Cost of sales, before amortisation and depreciation | (3,309) | (1,514) | (230) | (1,284) | (1,795) | (1,072) | (378) | (566) | (112) | (16) | (53) | 53 | (723) | (182) | (267) | (137) | (27) | (110) | — | — | ||||||||||||||||||||||||||||||||||||||||||
| Underground | (1,799) | (230) | (230) | — | (1,569) | (1,023) | (345) | (566) | (112) | — | (53) | 53 | (546) | (181) | (231) | (134) | — | — | — | — | ||||||||||||||||||||||||||||||||||||||||||
| Surface | (226) | — | — | — | (226) | (49) | (33) | — | — | (16) | — | — | (177) | (1) | (36) | (3) | (27) | (110) | — | — | ||||||||||||||||||||||||||||||||||||||||||
| Recycling | (1,284) | (1,284) | — | (1,284) | — | — | — | — | — | — | — | — | — | — | — | — | — | — | — | — | ||||||||||||||||||||||||||||||||||||||||||
Net other cash costs2 | (86) | (1) | (1) | — | (85) | (55) | 2 | (33) | (3) | (17) | (2) | (2) | (30) | (2) | (2) | (2) | (21) | (1) | (2) | — | ||||||||||||||||||||||||||||||||||||||||||
| Adjusted EBITDA | 2,787 | 487 | 437 | 50 | 2,316 | 2,154 | 861 | 938 | 340 | 19 | 132 | (136) | 162 | 69 | 42 | 18 | (12) | 47 | (2) | (16) | ||||||||||||||||||||||||||||||||||||||||||
| Amortisation and depreciation | (261) | (80) | (80) | — | (181) | (81) | (29) | (35) | (15) | (1) | (9) | 8 | (100) | (34) | (36) | (22) | — | (6) | (2) | — | ||||||||||||||||||||||||||||||||||||||||||
| Interest income | 43 | 15 | — | 15 | 28 | 7 | 1 | 3 | 4 | — | — | (1) | 21 | 2 | 2 | 1 | 1 | 8 | 7 | — | ||||||||||||||||||||||||||||||||||||||||||
| Finance expense | (87) | (34) | (31) | (3) | (42) | (22) | (136) | (9) | (4) | — | — | 127 | (20) | (3) | (3) | (3) | (2) | (2) | (7) | (11) | ||||||||||||||||||||||||||||||||||||||||||
| Share-based payments | (20) | (4) | (4) | — | (16) | (5) | (2) | (3) | (1) | — | — | 1 | (11) | (1) | (2) | (1) | — | (1) | (6) | — | ||||||||||||||||||||||||||||||||||||||||||
Net other3 | 16 | (22) | (22) | — | 38 | 45 | 1 | (25) | (7) | (1) | — | 77 | (7) | 1 | 1 | 1 | — | — | (10) | — | ||||||||||||||||||||||||||||||||||||||||||
Non-underlying items4 | (2) | (3) | (3) | — | 2 | — | — | — | — | — | — | — | 2 | 1 | — | — | — | — | 1 | (1) | ||||||||||||||||||||||||||||||||||||||||||
| Royalties and carbon tax | (113) | — | — | — | (113) | (108) | (61) | (46) | (1) | — | (7) | 7 | (5) | (3) | (2) | (1) | — | — | 1 | — | ||||||||||||||||||||||||||||||||||||||||||
| Profit before tax | 2,363 | 359 | 297 | 62 | 2,032 | 1,990 | 635 | 823 | 316 | 17 | 116 | 83 | 42 | 32 | 2 | (7) | (13) | 46 | (18) | (28) | ||||||||||||||||||||||||||||||||||||||||||
| Current taxation | (538) | (58) | (476) | (469) | (214) | (156) | (91) | (6) | (29) | 27 | (7) | — | — | — | — | (8) | 1 | (4) | ||||||||||||||||||||||||||||||||||||||||||||
| Deferred taxation | (85) | 4 | (89) | (92) | (2) | (92) | 2 | 1 | (1) | — | 3 | (6) | — | 1 | — | (2) | 10 | — | ||||||||||||||||||||||||||||||||||||||||||||
| Profit/(loss) for the period | 1,740 | 305 | 1,467 | 1,429 | 419 | 575 | 227 | 12 | 86 | 110 | 38 | 26 | 2 | (6) | (13) | 36 | (7) | (32) | ||||||||||||||||||||||||||||||||||||||||||||
| Attributable to: | — | |||||||||||||||||||||||||||||||||||||||||||||||||||||||||||||
| Owners of the parent | 1,707 | 305 | 1,434 | 1,413 | 419 | 560 | 227 | 10 | 86 | 111 | 21 | 26 | 2 | (6) | (13) | 19 | (7) | (32) | ||||||||||||||||||||||||||||||||||||||||||||
| Non-controlling interest holders | 33 | — | 33 | 16 | — | 15 | — | 2 | — | (1) | 17 | — | — | — | — | 17 | — | — | ||||||||||||||||||||||||||||||||||||||||||||
Sustaining capital expenditure5 | (113) | (34) | (34) | — | (79) | (46) | (16) | (22) | (7) | (1) | (14) | 14 | (33) | (7) | (9) | (4) | — | (13) | — | — | ||||||||||||||||||||||||||||||||||||||||||
| Ore reserve development | (178) | (40) | (40) | — | (138) | (52) | (22) | (30) | — | — | — | — | (86) | (39) | (30) | (17) | — | — | — | — | ||||||||||||||||||||||||||||||||||||||||||
| Growth projects | (93) | (84) | (84) | — | (9) | — | — | — | — | — | — | — | (9) | — | (6) | — | — | (1) | (2) | — | ||||||||||||||||||||||||||||||||||||||||||
| Total capital expenditure | (384) | (158) | (158) | — | (226) | (98) | (38) | (52) | (7) | (1) | (14) | 14 | (128) | (46) | (45) | (21) | — | (14) | (2) | — | ||||||||||||||||||||||||||||||||||||||||||
1Corporate and reconciling items represent the items to reconcile segment data to condensed consolidated financial statement totals. This does not represent a separate segment as it does not generate mining revenue. Group corporate includes the Wheaton Stream transaction and corporate transaction costs
2Net other cash costs consist of net other costs as per the condensed consolidated income statement excluding change in estimate of environmental rehabilitation obligation, and right of recovery receivable and payable and non-cash loss due to dilution of interest in joint operation (R2 million); and include lease payments (R71 million) to conform with the adjusted EBITDA reconciliation disclosed in note 11.1
3Net other consists of loss on financial instruments, loss on foreign exchange differences, change in estimate of environmental rehabilitation obligation, and right of recovery receivable and payable as detailed in profit or loss and the add back of the lease payment referred to in footnote 2 above. Corporate and reconciling items net other includes the share of results of equity-accounted investees after tax as detailed in profit or loss
4Non-underlying items consists of gain on disposal of property, plant and equipment, impairments, restructuring costs, transaction costs, non-cash loss with dilution of interest in joint operation (R2 million) and occupational healthcare gain as detailed in profit or loss
5The average exchange rate for the six months ended 30 June 2021 was R14.55/US$
Sibanye-Stillwater Operating and financial results | Six months and year ended 31 December 2021 44
Figures are in millions
| For the six months ended 31 Dec 2020 (Unaudited) | ||||||||||||||||||||||||||||||||||||||||||||||||||||||||||||||
| GROUP | US PGM OPERATIONS | SA OPERATIONS | GROUP | |||||||||||||||||||||||||||||||||||||||||||||||||||||||||||
| SA rand | Total | Total US PGM | Underground | Recycling | Total SA Operations | Total SA PGM | Rusten- burg | Marikana | Kroondal | Platinum Mile | Mimosa | Corporate and re- conciling items1 | Total SA gold | Drie- fontein | Kloof | Beatrix | Cooke | DRD- GOLD | Corporate and re- conciling items1 | Cor- porate1 | ||||||||||||||||||||||||||||||||||||||||||
| Revenue | 72,373 | 22,138 | 10,552 | 11,586 | 50,557 | 33,477 | 11,830 | 15,930 | 5,239 | 577 | 2,631 | (2,730) | 17,080 | 4,624 | 6,156 | 2,730 | 592 | 2,977 | 1 | (322) | ||||||||||||||||||||||||||||||||||||||||||
| Underground | 54,642 | 10,552 | 10,552 | — | 44,412 | 31,978 | 10,817 | 15,933 | 5,239 | — | 2,631 | (2,642) | 12,434 | 4,624 | 5,220 | 2,589 | — | — | 1 | (322) | ||||||||||||||||||||||||||||||||||||||||||
| Surface | 6,145 | — | — | — | 6,145 | 1,499 | 1,013 | (3) | — | 577 | — | (88) | 4,646 | — | 936 | 141 | 592 | 2,977 | — | — | ||||||||||||||||||||||||||||||||||||||||||
| Recycling | 11,586 | 11,586 | — | 11,586 | — | — | — | — | — | — | — | — | — | — | — | — | — | — | — | — | ||||||||||||||||||||||||||||||||||||||||||
| Cost of sales, before amortisation and depreciation | (38,051) | (15,038) | (3,872) | (11,166) | (23,013) | (12,647) | (4,756) | (6,414) | (1,593) | (246) | (1,027) | 1,389 | (10,366) | (2,658) | (3,723) | (1,996) | (363) | (1,626) | — | — | ||||||||||||||||||||||||||||||||||||||||||
| Underground | (23,689) | (3,872) | (3,872) | — | (19,817) | (12,020) | (4,287) | (6,414) | (1,593) | — | (1,027) | 1,301 | (7,797) | (2,658) | (3,222) | (1,917) | — | — | — | — | ||||||||||||||||||||||||||||||||||||||||||
| Surface | (3,196) | — | — | — | (3,196) | (627) | (469) | — | — | (246) | — | 88 | (2,569) | — | (501) | (79) | (363) | (1,626) | — | — | ||||||||||||||||||||||||||||||||||||||||||
| Recycling | (11,166) | (11,166) | — | (11,166) | — | — | — | — | — | — | — | — | — | — | — | — | — | — | — | — | ||||||||||||||||||||||||||||||||||||||||||
Net other cash costs2 | (1,451) | (19) | (19) | — | (1,432) | (805) | 59 | (614) | (43) | (146) | (51) | (10) | (627) | (53) | (55) | (62) | (324) | (14) | (119) | — | ||||||||||||||||||||||||||||||||||||||||||
| Adjusted EBITDA | 32,871 | 7,081 | 6,661 | 420 | 26,112 | 20,025 | 7,133 | 8,902 | 3,603 | 185 | 1,553 | (1,351) | 6,087 | 1,913 | 2,378 | 672 | (95) | 1,337 | (118) | (322) | ||||||||||||||||||||||||||||||||||||||||||
| Amortisation and depreciation | (4,149) | (1,397) | (1,395) | (2) | (2,752) | (1,168) | (448) | (460) | (228) | (29) | (138) | 135 | (1,584) | (532) | (628) | (290) | (7) | (94) | (33) | — | ||||||||||||||||||||||||||||||||||||||||||
| Interest income | 561 | 154 | 1 | 153 | 407 | 111 | 10 | 60 | 39 | 2 | 2 | (2) | 296 | 39 | 34 | 22 | 24 | 102 | 75 | — | ||||||||||||||||||||||||||||||||||||||||||
| Finance expense | (1,441) | (480) | (440) | (40) | (798) | (314) | (1,412) | (125) | (65) | — | (5) | 1,293 | (484) | (62) | (63) | (49) | (48) | (27) | (235) | (163) | ||||||||||||||||||||||||||||||||||||||||||
| Share-based payments | (214) | (59) | (59) | — | (155) | (69) | (28) | (33) | (8) | — | — | — | (86) | (17) | (20) | (15) | — | 37 | (71) | — | ||||||||||||||||||||||||||||||||||||||||||
Net other3 | (1,555) | (13) | (13) | — | (1,542) | 296 | (3,833) | 1,475 | 22 | (15) | (6) | 2,653 | (1,838) | 12 | 17 | 18 | 25 | 6 | (1,916) | — | ||||||||||||||||||||||||||||||||||||||||||
Non-underlying items4 | (1,033) | (23) | (23) | — | (966) | 567 | 592 | (19) | (6) | — | — | — | (1,533) | (31) | (19) | (40) | (3) | — | (1,440) | (44) | ||||||||||||||||||||||||||||||||||||||||||
| Royalties and carbon tax | (1,342) | — | — | — | (1,342) | (1,239) | (602) | (630) | (7) | — | (86) | 86 | (103) | (62) | (97) | (35) | (3) | — | 94 | — | ||||||||||||||||||||||||||||||||||||||||||
| Profit before tax | 23,698 | 5,263 | 4,732 | 531 | 18,964 | 18,209 | 1,412 | 9,170 | 3,350 | 143 | 1,320 | 2,814 | 755 | 1,260 | 1,602 | 283 | (107) | 1,361 | (3,644) | (529) | ||||||||||||||||||||||||||||||||||||||||||
| Current taxation | (3,523) | (545) | (2,933) | (2,637) | (1,762) | (6) | (873) | 4 | (285) | 285 | (296) | (3) | 15 | (2) | — | (303) | (3) | (45) | ||||||||||||||||||||||||||||||||||||||||||||
| Deferred taxation | 716 | (357) | 1,073 | 838 | 76 | 951 | (72) | (44) | (33) | (40) | 235 | 15 | (273) | (73) | — | (86) | 652 | — | ||||||||||||||||||||||||||||||||||||||||||||
| Profit/(loss) for the period | 20,891 | 4,361 | 17,104 | 16,410 | (274) | 10,115 | 2,405 | 103 | 1,002 | 3,059 | 694 | 1,272 | 1,344 | 208 | (107) | 972 | (2,995) | (574) | ||||||||||||||||||||||||||||||||||||||||||||
| Attributable to: | ||||||||||||||||||||||||||||||||||||||||||||||||||||||||||||||
| Owners of the parent | 19,927 | 4,361 | 16,140 | 15,925 | (274) | 9,638 | 2,405 | 95 | 1,002 | 3,059 | 215 | 1,272 | 1,344 | 208 | (107) | 493 | (2,995) | (574) | ||||||||||||||||||||||||||||||||||||||||||||
| Non-controlling interest holders | 964 | — | 964 | 485 | — | 477 | — | 8 | — | — | 479 | — | — | — | — | 479 | — | — | ||||||||||||||||||||||||||||||||||||||||||||
| Sustaining capital expenditure | (1,799) | (496) | (493) | (3) | (1,303) | (696) | (188) | (363) | (127) | (18) | (259) | 259 | (607) | (107) | (278) | (58) | — | (164) | — | — | ||||||||||||||||||||||||||||||||||||||||||
| Ore reserve development | (2,410) | (622) | (622) | — | (1,788) | (687) | (259) | (428) | — | — | — | — | (1,101) | (466) | (448) | (187) | — | — | — | — | ||||||||||||||||||||||||||||||||||||||||||
| Growth projects | (1,271) | (1,091) | (1,091) | — | (180) | — | — | — | — | — | — | — | (180) | — | (107) | — | — | (38) | (35) | — | ||||||||||||||||||||||||||||||||||||||||||
| Total capital expenditure | (5,480) | (2,209) | (2,206) | (3) | (3,271) | (1,383) | (447) | (791) | (127) | (18) | (259) | 259 | (1,888) | (573) | (833) | (245) | — | (202) | (35) | — | ||||||||||||||||||||||||||||||||||||||||||
Sibanye-Stillwater Operating and financial results | Six months and year ended 31 December 2021 45
| For the six months ended 31 Dec 2020 (Unaudited) | ||||||||||||||||||||||||||||||||||||||||||||||||||||||||||||||
| GROUP | US PGM OPERATIONS | SA OPERATIONS | GROUP | |||||||||||||||||||||||||||||||||||||||||||||||||||||||||||
US dollars5 | Total | Total US PGM | Underground | Recycling | Total SA Operations | Total SA PGM | Rusten- burg | Marikana | Kroondal | Platinum Mile | Mimosa | Corporate and re- conciling items1 | Total SA gold | Drie- fontein | Kloof | Beatrix | Cooke | DRD- GOLD | Corporate and re- conciling items1 | Cor- porate1 | ||||||||||||||||||||||||||||||||||||||||||
| Revenue | 4,439 | 1,363 | 648 | 715 | 3,096 | 2,050 | 725 | 976 | 320 | 36 | 161 | (168) | 1,046 | 283 | 377 | 167 | 36 | 183 | — | (20) | ||||||||||||||||||||||||||||||||||||||||||
| Underground | 3,346 | 648 | 648 | — | 2,718 | 1,957 | 663 | 976 | 320 | — | 161 | (163) | 761 | 283 | 320 | 158 | — | — | — | (20) | ||||||||||||||||||||||||||||||||||||||||||
| Surface | 378 | — | — | — | 378 | 93 | 62 | — | — | 36 | — | (5) | 285 | — | 57 | 9 | 36 | 183 | — | — | ||||||||||||||||||||||||||||||||||||||||||
| Recycling | 715 | 715 | — | 715 | — | — | — | — | — | — | — | — | — | — | — | — | — | — | — | — | ||||||||||||||||||||||||||||||||||||||||||
| Cost of sales, before amortisation and depreciation | (2,341) | (926) | (238) | (688) | (1,415) | (778) | (292) | (395) | (97) | (15) | (63) | 84 | (637) | (163) | (228) | (123) | (23) | (100) | — | — | ||||||||||||||||||||||||||||||||||||||||||
| Underground | (1,456) | (238) | (238) | — | (1,218) | (739) | (263) | (395) | (97) | — | (63) | 79 | (479) | (163) | (198) | (118) | — | — | — | — | ||||||||||||||||||||||||||||||||||||||||||
| Surface | (197) | — | — | — | (197) | (39) | (29) | — | — | (15) | — | 5 | (158) | — | (30) | (5) | (23) | (100) | — | — | ||||||||||||||||||||||||||||||||||||||||||
| Recycling | (688) | (688) | — | (688) | — | — | — | — | — | — | — | — | — | — | — | — | — | — | — | — | ||||||||||||||||||||||||||||||||||||||||||
Net other cash costs2 | (90) | (1) | (1) | — | (89) | (51) | 3 | (38) | (3) | (9) | (4) | — | (38) | (3) | (3) | (4) | (20) | (1) | (7) | — | ||||||||||||||||||||||||||||||||||||||||||
| Adjusted EBITDA | 2,008 | 436 | 409 | 27 | 1,592 | 1,221 | 436 | 543 | 220 | 12 | 94 | (84) | 371 | 117 | 146 | 40 | (7) | 82 | (7) | (20) | ||||||||||||||||||||||||||||||||||||||||||
| Amortisation and depreciation | (254) | (85) | (85) | — | (169) | (71) | (28) | (29) | (14) | (2) | (8) | 10 | (98) | (33) | (38) | (18) | (1) | (6) | (2) | — | ||||||||||||||||||||||||||||||||||||||||||
| Interest income | 35 | 10 | — | 10 | 25 | 6 | 1 | 3 | 2 | — | — | — | 19 | 2 | 3 | 1 | 2 | 6 | 5 | — | ||||||||||||||||||||||||||||||||||||||||||
| Finance expense | (88) | (30) | (27) | (3) | (48) | (17) | (87) | (8) | (4) | — | — | 82 | (31) | (3) | (4) | (4) | (3) | (2) | (15) | (10) | ||||||||||||||||||||||||||||||||||||||||||
| Share-based payments | (13) | (4) | (4) | — | (9) | (3) | (2) | (2) | (1) | — | — | 2 | (6) | (1) | (2) | (1) | — | 2 | (4) | — | ||||||||||||||||||||||||||||||||||||||||||
Net other3 | (93) | (1) | (1) | — | (92) | 19 | (233) | 91 | 1 | (1) | — | 161 | (111) | 1 | 1 | 1 | 1 | 1 | (116) | — | ||||||||||||||||||||||||||||||||||||||||||
Non-underlying items4 | (63) | (2) | (2) | — | (59) | 34 | 36 | (1) | — | — | — | (1) | (93) | (2) | (1) | (2) | — | — | (88) | (2) | ||||||||||||||||||||||||||||||||||||||||||
| Royalties and carbon tax | (81) | — | — | — | (81) | (76) | (37) | (38) | (1) | — | (5) | 5 | (5) | (3) | (6) | (2) | — | — | 6 | — | ||||||||||||||||||||||||||||||||||||||||||
| Profit before tax | 1,451 | 324 | 290 | 34 | 1,159 | 1,113 | 86 | 559 | 203 | 9 | 81 | 175 | 46 | 78 | 99 | 15 | (8) | 83 | (221) | (32) | ||||||||||||||||||||||||||||||||||||||||||
| Current taxation | (215) | (33) | (179) | (160) | (108) | — | (53) | — | (17) | 18 | (19) | (1) | 1 | — | — | (19) | — | (3) | ||||||||||||||||||||||||||||||||||||||||||||
| Deferred taxation | 43 | (22) | 65 | 50 | 5 | 58 | (4) | (3) | (2) | (4) | 15 | 1 | (17) | (4) | — | (5) | 40 | — | ||||||||||||||||||||||||||||||||||||||||||||
| Profit/(loss) for the period | 1,279 | 269 | 1,045 | 1,003 | (17) | 617 | 146 | 6 | 62 | 189 | 42 | 78 | 83 | 11 | (8) | 59 | (181) | (35) | ||||||||||||||||||||||||||||||||||||||||||||
| Attributable to: | ||||||||||||||||||||||||||||||||||||||||||||||||||||||||||||||
| Owners of the parent | 1,220 | 269 | 986 | 973 | (17) | 587 | 146 | 5 | 62 | 190 | 13 | 78 | 83 | 11 | (8) | 30 | (181) | (35) | ||||||||||||||||||||||||||||||||||||||||||||
| Non-controlling interest holders | 59 | — | 59 | 30 | — | 30 | — | 1 | — | (1) | 29 | — | — | — | — | 29 | — | — | ||||||||||||||||||||||||||||||||||||||||||||
| Sustaining capital expenditure | (109) | (30) | (30) | — | (79) | (42) | (12) | (22) | (7) | (1) | (16) | 16 | (37) | (6) | (17) | (4) | — | (10) | — | — | ||||||||||||||||||||||||||||||||||||||||||
| Ore reserve development | (148) | (38) | (38) | — | (110) | (42) | (16) | (26) | — | — | — | — | (68) | (28) | (28) | (12) | — | — | — | — | ||||||||||||||||||||||||||||||||||||||||||
| Growth projects | (79) | (67) | (67) | — | (12) | — | — | — | — | — | — | — | (12) | — | (6) | — | — | (3) | (3) | — | ||||||||||||||||||||||||||||||||||||||||||
| Total capital expenditure | (336) | (135) | (135) | — | (201) | (84) | (28) | (48) | (7) | (1) | (16) | 16 | (117) | (34) | (51) | (16) | — | (13) | (3) | — | ||||||||||||||||||||||||||||||||||||||||||
1Corporate and reconciling items represent the items to reconcile segment data to condensed consolidated financial statement totals. This does not represent a separate segment as it does not generate mining revenue. Group corporate includes the Wheaton Stream transaction and corporate transaction costs
2Net other cash costs consist of net other costs as per the condensed consolidated income statement excluding change in estimate of environmental rehabilitation obligation, and right of recovery receivable and payable, income on settlement of dispute, non-cash loss due to dilution of interest in joint operation (R30 million) and other non-recurring costs; and include lease payments (R75 million) to conform with the adjusted EBITDA reconciliation disclosed in note 11.1
3Net other consists of loss on financial instruments, gain on foreign exchange differences, change in estimate of environmental rehabilitation obligation, and right of recovery receivable and payable as detailed in profit or loss and the add back of the lease payment referred to in footnote 2 above. Corporate and reconciling items net other includes the share of results of equity-accounted investees after tax as detailed in profit or loss
4Non-underlying items consists of gain on disposal of property, plant and equipment, impairments, loss on BTT early settlement, restructuring costs, transaction costs, loss on settlement of US$ Convertible Bond, income on settlement of legal dispute, non-cash loss with dilution of interest in joint operation (R30 million) and occupational healthcare expense as detailed in profit or loss
5The average exchange rate for the six months ended 31 December 2020 was R16.26/US$
Sibanye-Stillwater Operating and financial results | Six months and year ended 31 December 2021 46
Figures are in millions
| For the year ended 31 Dec 2021 (Reviewed) | ||||||||||||||||||||||||||||||||||||||||||||||||||||||||||||||
| GROUP | US PGM OPERATIONS | SA OPERATIONS | GROUP | |||||||||||||||||||||||||||||||||||||||||||||||||||||||||||
| SA rand | Total | Total US PGM | Underground | Recycling | Total SA Operations | Total SA PGM | Rusten- burg | Marikana | Kroondal | Platinum Mile | Mimosa | Corporate and re- conciling items1 | Total SA gold | Drie- fontein | Kloof | Beatrix | Cooke | DRD- GOLD | Corporate and re- conciling items1 | Cor- porate1 | ||||||||||||||||||||||||||||||||||||||||||
| Revenue | 172,194 | 59,053 | 18,343 | 40,710 | 113,512 | 85,154 | 31,749 | 41,610 | 10,293 | 1,503 | 4,393 | (4,394) | 28,358 | 7,932 | 9,294 | 5,343 | 999 | 4,790 | — | (371) | ||||||||||||||||||||||||||||||||||||||||||
| Underground | 120,403 | 18,343 | 18,343 | — | 102,431 | 81,477 | 29,575 | 41,610 | 10,293 | — | 4,393 | (4,394) | 20,954 | 7,722 | 8,089 | 5,143 | — | — | — | (371) | ||||||||||||||||||||||||||||||||||||||||||
| Surface | 11,081 | — | — | — | 11,081 | 3,677 | 2,174 | — | — | 1,503 | — | — | 7,404 | 210 | 1,205 | 200 | 999 | 4,790 | — | — | ||||||||||||||||||||||||||||||||||||||||||
| Recycling | 40,710 | 40,710 | — | 40,710 | — | — | — | — | — | — | — | — | — | — | — | — | — | — | — | — | ||||||||||||||||||||||||||||||||||||||||||
| Cost of sales, before amortisation and depreciation | (101,013) | (46,787) | (7,567) | (39,220) | (54,226) | (31,971) | (11,464) | (16,561) | (3,416) | (531) | (1,587) | 1,588 | (22,255) | (5,691) | (7,844) | (4,565) | (808) | (3,347) | — | — | ||||||||||||||||||||||||||||||||||||||||||
| Underground | (54,989) | (7,567) | (7,567) | — | (47,422) | (30,430) | (10,454) | (16,561) | (3,416) | — | (1,587) | 1,588 | (16,992) | (5,559) | (6,986) | (4,447) | — | — | — | — | ||||||||||||||||||||||||||||||||||||||||||
| Surface | (6,804) | — | — | — | (6,804) | (1,541) | (1,010) | — | — | (531) | — | — | (5,263) | (132) | (858) | (118) | (808) | (3,347) | — | — | ||||||||||||||||||||||||||||||||||||||||||
| Recycling | (39,220) | (39,220) | — | (39,220) | — | — | — | — | — | — | — | — | — | — | — | — | — | — | — | — | ||||||||||||||||||||||||||||||||||||||||||
Net other cash costs2 | (2,575) | (10) | (10) | — | (2,565) | (1,575) | 134 | (1,036) | (91) | (492) | (42) | (48) | (990) | (78) | (83) | (73) | (611) | (40) | (105) | — | ||||||||||||||||||||||||||||||||||||||||||
| Adjusted EBITDA | 68,606 | 12,256 | 10,766 | 1,490 | 56,721 | 51,608 | 20,419 | 24,013 | 6,786 | 480 | 2,764 | (2,854) | 5,113 | 2,163 | 1,367 | 705 | (420) | 1,403 | (105) | (371) | ||||||||||||||||||||||||||||||||||||||||||
| Amortisation and depreciation | (8,293) | (2,601) | (2,598) | (3) | (5,692) | (2,515) | (885) | (1,099) | (495) | (31) | (274) | 269 | (3,177) | (1,165) | (1,064) | (691) | (11) | (188) | (58) | — | ||||||||||||||||||||||||||||||||||||||||||
| Interest income | 1,202 | 382 | 10 | 372 | 805 | 219 | 22 | 92 | 97 | 7 | 12 | (11) | 586 | 60 | 47 | 31 | 22 | 222 | 204 | 15 | ||||||||||||||||||||||||||||||||||||||||||
| Finance expense | (2,496) | (954) | (897) | (57) | (1,233) | (666) | (4,201) | (328) | (116) | — | (5) | 3,984 | (567) | (99) | (85) | (82) | (63) | (60) | (178) | (309) | ||||||||||||||||||||||||||||||||||||||||||
| Share-based payments | (383) | (73) | (73) | — | (310) | (89) | (35) | (42) | (12) | — | — | — | (221) | (20) | (32) | (21) | — | (19) | (129) | — | ||||||||||||||||||||||||||||||||||||||||||
Net other3 | (2,832) | 238 | 238 | — | (3,121) | (4,305) | (12,232) | (985) | 248 | 34 | (43) | 8,673 | 1,184 | 16 | 22 | 33 | 92 | 22 | 999 | 51 | ||||||||||||||||||||||||||||||||||||||||||
Non-underlying items4 | (5,529) | (278) | (278) | — | (5,153) | 2 | 4 | (1) | (1) | — | — | — | (5,155) | (202) | (3,686) | (1,290) | (3) | — | 26 | (98) | ||||||||||||||||||||||||||||||||||||||||||
| Royalties and carbon tax | (2,718) | — | — | — | (2,718) | (2,548) | (1,405) | (1,129) | (14) | — | (160) | 160 | (170) | (95) | (46) | (29) | (5) | — | 5 | — | ||||||||||||||||||||||||||||||||||||||||||
| Profit before tax | 47,557 | 8,970 | 7,168 | 1,802 | 39,299 | 41,706 | 1,687 | 20,521 | 6,493 | 490 | 2,294 | 10,221 | (2,407) | 658 | (3,477) | (1,344) | (388) | 1,380 | 764 | (712) | ||||||||||||||||||||||||||||||||||||||||||
| Current taxation | (13,506) | (1,422) | (12,014) | (11,745) | (4,864) | (4,768) | (1,885) | (218) | (574) | 564 | (269) | (13) | (13) | (7) | — | (263) | 27 | (70) | ||||||||||||||||||||||||||||||||||||||||||||
| Deferred taxation | (255) | (89) | (166) | (367) | 956 | (1,460) | 56 | 80 | (18) | 19 | 201 | 49 | 1,158 | 233 | — | (77) | (1,162) | — | ||||||||||||||||||||||||||||||||||||||||||||
| Profit/(loss) for the year | 33,796 | 7,459 | 27,119 | 29,594 | (2,221) | 14,293 | 4,664 | 352 | 1,702 | 10,804 | (2,475) | 694 | (2,332) | (1,118) | (388) | 1,040 | (371) | (782) | ||||||||||||||||||||||||||||||||||||||||||||
| Attributable to: | ||||||||||||||||||||||||||||||||||||||||||||||||||||||||||||||
| Owners of the parent | 33,054 | 7,459 | 26,377 | 29,360 | (2,221) | 14,075 | 4,664 | 336 | 1,702 | 10,804 | (2,983) | 694 | (2,332) | (1,118) | (388) | 527 | (366) | (782) | ||||||||||||||||||||||||||||||||||||||||||||
| Non-controlling interest holders | 742 | — | 742 | 234 | — | 218 | — | 16 | — | — | 508 | — | — | — | — | 513 | (5) | — | ||||||||||||||||||||||||||||||||||||||||||||
| Sustaining capital expenditure | (4,119) | (796) | (791) | (5) | (3,323) | (2,019) | (619) | (1,104) | (268) | (28) | (499) | 499 | (1,304) | (322) | (488) | (164) | — | (330) | — | — | ||||||||||||||||||||||||||||||||||||||||||
| Ore reserve development | (5,535) | (1,354) | (1,354) | — | (4,181) | (1,577) | (629) | (947) | — | — | — | (1) | (2,604) | (1,177) | (930) | (497) | — | — | — | — | ||||||||||||||||||||||||||||||||||||||||||
| Growth projects | (3,086) | (2,411) | (2,411) | — | (675) | (203) | — | (203) | — | — | — | — | (472) | — | (198) | (7) | — | (47) | (220) | — | ||||||||||||||||||||||||||||||||||||||||||
| Total capital expenditure | (12,740) | (4,561) | (4,556) | (5) | (8,179) | (3,799) | (1,248) | (2,254) | (268) | (28) | (499) | 498 | (4,380) | (1,499) | (1,616) | (668) | — | (377) | (220) | — | ||||||||||||||||||||||||||||||||||||||||||
Sibanye-Stillwater Operating and financial results | Six months and year ended 31 December 2021 47
| For the year ended 31 Dec 2021 (Unaudited) | ||||||||||||||||||||||||||||||||||||||||||||||||||||||||||||||
| GROUP | US PGM OPERATIONS | SA OPERATIONS | GROUP | |||||||||||||||||||||||||||||||||||||||||||||||||||||||||||
US dollars5 | Total | Total US PGM | Underground | Recycling | Total SA Operations | Total SA PGM | Rusten- burg | Marikana | Kroondal | Platinum Mile | Mimosa | Corporate and re- conciling items1 | Total SA gold | Drie- fontein | Kloof | Beatrix | Cooke | DRD- GOLD | Corporate and re- conciling items1 | Cor- porate1 | ||||||||||||||||||||||||||||||||||||||||||
| Revenue | 11,643 | 3,993 | 1,240 | 2,753 | 7,675 | 5,757 | 2,147 | 2,813 | 696 | 102 | 297 | (298) | 1,918 | 536 | 628 | 362 | 68 | 324 | — | (25) | ||||||||||||||||||||||||||||||||||||||||||
| Underground | 8,140 | 1,240 | 1,240 | — | 6,925 | 5,508 | 2,000 | 2,813 | 696 | — | 297 | (298) | 1,417 | 522 | 547 | 348 | — | — | — | (25) | ||||||||||||||||||||||||||||||||||||||||||
| Surface | 750 | — | — | — | 750 | 249 | 147 | — | — | 102 | — | — | 501 | 14 | 81 | 14 | 68 | 324 | — | — | ||||||||||||||||||||||||||||||||||||||||||
| Recycling | 2,753 | 2,753 | — | 2,753 | — | — | — | — | — | — | — | — | — | — | — | — | — | — | — | — | ||||||||||||||||||||||||||||||||||||||||||
| Cost of sales, before amortisation and depreciation | (6,830) | (3,164) | (512) | (2,652) | (3,666) | (2,161) | (775) | (1,119) | (231) | (36) | (107) | 107 | (1,505) | (385) | (530) | (309) | (55) | (226) | — | — | ||||||||||||||||||||||||||||||||||||||||||
| Underground | (3,718) | (512) | (512) | — | (3,206) | (2,057) | (707) | (1,119) | (231) | — | (107) | 107 | (1,149) | (376) | (472) | (301) | — | — | — | — | ||||||||||||||||||||||||||||||||||||||||||
| Surface | (460) | — | — | — | (460) | (104) | (68) | — | — | (36) | — | — | (356) | (9) | (58) | (8) | (55) | (226) | — | — | ||||||||||||||||||||||||||||||||||||||||||
| Recycling | (2,652) | (2,652) | — | (2,652) | — | — | — | — | — | — | — | — | — | — | — | — | — | — | — | — | ||||||||||||||||||||||||||||||||||||||||||
Net other cash costs2 | (174) | (1) | (1) | — | (173) | (106) | 9 | (70) | (6) | (33) | (3) | (3) | (67) | (5) | (6) | (5) | (41) | (3) | (7) | — | ||||||||||||||||||||||||||||||||||||||||||
| Adjusted EBITDA | 4,639 | 828 | 727 | 101 | 3,836 | 3,490 | 1,381 | 1,624 | 459 | 33 | 187 | (194) | 346 | 146 | 92 | 48 | (28) | 95 | (7) | (25) | ||||||||||||||||||||||||||||||||||||||||||
| Amortisation and depreciation | (561) | (176) | (176) | — | (385) | (169) | (60) | (74) | (33) | (2) | (19) | 19 | (216) | (79) | (72) | (47) | (1) | (13) | (4) | — | ||||||||||||||||||||||||||||||||||||||||||
| Interest income | 81 | 26 | 1 | 25 | 54 | 15 | 1 | 6 | 7 | — | 1 | — | 39 | 4 | 3 | 2 | 1 | 15 | 14 | 1 | ||||||||||||||||||||||||||||||||||||||||||
| Finance expense | (169) | (65) | (61) | (4) | (83) | (44) | (284) | (22) | (8) | — | — | 270 | (39) | (7) | (6) | (6) | (4) | (4) | (12) | (21) | ||||||||||||||||||||||||||||||||||||||||||
| Share-based payments | (26) | (5) | (5) | — | (21) | (7) | (2) | (3) | (1) | — | — | (1) | (14) | (1) | (2) | (1) | — | (1) | (9) | — | ||||||||||||||||||||||||||||||||||||||||||
Net other3 | (192) | 16 | 16 | — | (211) | (290) | (827) | (67) | 17 | 2 | (3) | 588 | 79 | 1 | 1 | 2 | 6 | 1 | 68 | 3 | ||||||||||||||||||||||||||||||||||||||||||
Non-underlying items4 | (374) | (19) | (19) | — | (348) | — | — | — | — | — | — | — | (348) | (14) | (249) | (87) | — | — | 2 | (7) | ||||||||||||||||||||||||||||||||||||||||||
| Royalties and carbon tax | (184) | — | — | — | (184) | (173) | (95) | (76) | (1) | — | (11) | 10 | (11) | (6) | (3) | (2) | — | — | — | — | ||||||||||||||||||||||||||||||||||||||||||
| Profit before tax | 3,214 | 605 | 483 | 122 | 2,658 | 2,822 | 114 | 1,388 | 440 | 33 | 155 | 692 | (164) | 44 | (236) | (91) | (26) | 93 | 52 | (49) | ||||||||||||||||||||||||||||||||||||||||||
| Current taxation | (913) | (96) | (812) | (794) | (329) | (322) | (127) | (15) | (39) | 38 | (18) | (1) | (1) | — | — | (18) | 2 | (5) | ||||||||||||||||||||||||||||||||||||||||||||
| Deferred taxation | (17) | (6) | (11) | (24) | 65 | (99) | 4 | 5 | (1) | 2 | 13 | 3 | 78 | 16 | — | (5) | (79) | — | ||||||||||||||||||||||||||||||||||||||||||||
| Profit/(loss) for the year | 2,284 | 503 | 1,835 | 2,004 | (150) | 967 | 317 | 23 | 115 | 732 | (169) | 46 | (159) | (75) | (26) | 70 | (25) | (54) | ||||||||||||||||||||||||||||||||||||||||||||
| Attributable to: | ||||||||||||||||||||||||||||||||||||||||||||||||||||||||||||||
| Owners of the parent | 2,234 | 503 | 1,785 | 1,989 | (150) | 952 | 317 | 23 | 115 | 732 | (204) | 46 | (159) | (75) | (26) | 35 | (25) | (54) | ||||||||||||||||||||||||||||||||||||||||||||
| Non-controlling interest holders | 50 | — | 50 | 15 | — | 15 | — | — | — | — | 35 | — | — | — | — | 35 | — | — | ||||||||||||||||||||||||||||||||||||||||||||
| Sustaining capital expenditure | (278) | (53) | (53) | — | (225) | (137) | (42) | (75) | (18) | (2) | (34) | 34 | (88) | (22) | (33) | (11) | — | (22) | — | — | ||||||||||||||||||||||||||||||||||||||||||
| Ore reserve development | (376) | (92) | (92) | — | (284) | (107) | (43) | (64) | — | — | — | — | (177) | (80) | (63) | (34) | — | — | — | — | ||||||||||||||||||||||||||||||||||||||||||
| Growth projects | (208) | (163) | (163) | — | (45) | (14) | — | (14) | — | — | — | — | (31) | — | (13) | — | — | (3) | (15) | — | ||||||||||||||||||||||||||||||||||||||||||
| Total capital expenditure | (862) | (308) | (308) | — | (554) | (258) | (85) | (153) | (18) | (2) | (34) | 34 | (296) | (102) | (109) | (45) | — | (25) | (15) | — | ||||||||||||||||||||||||||||||||||||||||||
1Corporate and reconciling items represent the items to reconcile segment data to condensed consolidated financial statement totals. This does not represent a separate segment as it does not generate mining revenue. Group corporate includes the Wheaton Stream transaction, initial recognition of battery metal investment, corporate taxation, interest and corporate transaction costs
2Net other cash costs consist of net other costs as per the condensed consolidated income statement excluding change in estimate of environmental rehabilitation obligation, and right of recovery receivable and payable, profit on sale of St Helena (R16 million), non-cash loss due to dilution of interest in joint operation (R4 million), and include lease payments (R142 million) to conform with the adjusted EBITDA reconciliation disclosed in note 11.1
3Net other consists of gain on financial instruments, loss on foreign exchange differences, change in estimate of environmental rehabilitation obligation, and right of recovery receivable and payable as detailed in profit or loss and the add back of the lease payment referred to in footnote 2 above. Corporate and reconciling items net other includes the share of results of equity-accounted investees after tax as detailed in profit or loss
4Non-underlying items consists of gain on disposal of property, plant and equipment, impairments which include impairment to mining assets of Driefontein, Kloof and Beatrix of R212 million, R3,642 million and R1,293 million, respectively (refer note 6), restructuring costs, transaction costs, loss on settlement of US$ Convertible Bond/2022 and 2025 Notes, non-cash loss with dilution of interest in joint operation (R4 million), profit on sale of St Helena (R16 million) and occupational healthcare gain as detailed in profit or loss
5The average exchange rate for the year ended 31 December 2021 was R14.79/US$
Sibanye-Stillwater Operating and financial results | Six months and year ended 31 December 2021 48
Figures are in millions
| For the year ended 31 Dec 2020 (Audited) | ||||||||||||||||||||||||||||||||||||||||||||||||||||||||||||||
| GROUP | US PGM OPERATIONS | SA OPERATIONS | GROUP | |||||||||||||||||||||||||||||||||||||||||||||||||||||||||||
| SA rand | Total | Total US PGM | Underground | Recycling | Total SA Operations | Total SA PGM | Rusten- burg | Marikana | Kroondal | Platinum Mile | Mimosa | Corporate and re- conciling items1 | Total SA gold | Drie- fontein | Kloof | Beatrix | Cooke | DRD- GOLD | Corporate and re- conciling items1 | Cor- porate1 | ||||||||||||||||||||||||||||||||||||||||||
| Revenue | 127,392 | 45,154 | 19,858 | 25,296 | 82,781 | 54,912 | 20,429 | 26,865 | 7,973 | 950 | 3,894 | (5,199) | 27,869 | 6,793 | 9,795 | 4,664 | 1,040 | 5,051 | 526 | (543) | ||||||||||||||||||||||||||||||||||||||||||
| Underground | 91,369 | 19,858 | 19,858 | — | 72,054 | 52,142 | 18,521 | 26,865 | 7,973 | — | 3,894 | (5,111) | 19,912 | 6,793 | 8,109 | 4,500 | — | — | 510 | (543) | ||||||||||||||||||||||||||||||||||||||||||
| Surface | 10,727 | — | — | — | 10,727 | 2,770 | 1,908 | — | — | 950 | — | (88) | 7,957 | — | 1,686 | 164 | 1,040 | 5,051 | 16 | — | ||||||||||||||||||||||||||||||||||||||||||
| Recycling | 25,296 | 25,296 | — | 25,296 | — | — | — | — | — | — | — | — | — | — | — | — | — | — | — | — | ||||||||||||||||||||||||||||||||||||||||||
| Cost of sales, before amortisation and depreciation | (75,776) | (32,004) | (7,586) | (24,418) | (43,772) | (24,722) | (9,588) | (13,232) | (2,803) | (403) | (1,601) | 2,905 | (19,050) | (4,863) | (6,880) | (3,714) | (671) | (2,922) | — | — | ||||||||||||||||||||||||||||||||||||||||||
| Underground | (45,502) | (7,586) | (7,586) | — | (37,916) | (23,551) | (8,732) | (13,232) | (2,803) | — | (1,601) | 2,817 | (14,365) | (4,863) | (5,886) | (3,616) | — | — | — | — | ||||||||||||||||||||||||||||||||||||||||||
| Surface | (5,856) | — | — | — | (5,856) | (1,171) | (856) | — | — | (403) | — | 88 | (4,685) | — | (994) | (98) | (671) | (2,922) | — | — | ||||||||||||||||||||||||||||||||||||||||||
| Recycling | (24,418) | (24,418) | — | (24,418) | — | — | — | — | — | — | — | — | — | — | — | — | — | — | — | — | ||||||||||||||||||||||||||||||||||||||||||
Net other cash costs2 | (2,231) | (67) | (67) | — | (2,164) | (1,116) | 51 | (789) | (76) | (241) | (59) | (2) | (1,048) | (66) | (104) | (97) | (642) | (44) | (95) | — | ||||||||||||||||||||||||||||||||||||||||||
| Adjusted EBITDA | 49,385 | 13,083 | 12,205 | 878 | 36,845 | 29,074 | 10,892 | 12,844 | 5,094 | 306 | 2,234 | (2,296) | 7,771 | 1,864 | 2,811 | 853 | (273) | 2,085 | 431 | (543) | ||||||||||||||||||||||||||||||||||||||||||
| Amortisation and depreciation | (7,593) | (2,727) | (2,722) | (5) | (4,866) | (2,072) | (806) | (818) | (410) | (34) | (281) | 277 | (2,794) | (932) | (1,092) | (491) | (14) | (202) | (63) | — | ||||||||||||||||||||||||||||||||||||||||||
| Interest income | 1,065 | 279 | 1 | 278 | 786 | 221 | 27 | 106 | 84 | 3 | 4 | (3) | 565 | 67 | 59 | 36 | 45 | 178 | 180 | — | ||||||||||||||||||||||||||||||||||||||||||
| Finance expense | (3,152) | (1,057) | (960) | (97) | (1,773) | (662) | (2,841) | (259) | (137) | — | (14) | 2,589 | (1,111) | (156) | (151) | (107) | (100) | (58) | (539) | (322) | ||||||||||||||||||||||||||||||||||||||||||
| Share-based payments | (512) | (80) | (80) | — | (432) | (90) | (36) | (41) | (13) | — | — | — | (342) | (22) | (26) | (19) | — | (141) | (134) | — | ||||||||||||||||||||||||||||||||||||||||||
Net other3 | (393) | 31 | 31 | — | (424) | 1,224 | (3,847) | 2,132 | 122 | (14) | (16) | 2,847 | (1,648) | 20 | 30 | 28 | 36 | 30 | (1,792) | — | ||||||||||||||||||||||||||||||||||||||||||
Non-underlying items4 | (1,550) | (93) | (93) | — | (1,385) | 149 | 591 | (435) | (7) | — | — | — | (1,534) | (27) | (18) | (40) | (4) | (1) | (1,444) | (72) | ||||||||||||||||||||||||||||||||||||||||||
| Royalties and carbon tax | (1,770) | — | — | — | (1,770) | (1,625) | (924) | (691) | (10) | — | (135) | 135 | (145) | (73) | (115) | (46) | (5) | — | 94 | — | ||||||||||||||||||||||||||||||||||||||||||
| Profit before tax | 35,480 | 9,436 | 8,382 | 1,054 | 26,981 | 26,219 | 3,056 | 12,838 | 4,723 | 261 | 1,792 | 3,549 | 762 | 741 | 1,498 | 214 | (315) | 1,891 | (3,267) | (937) | ||||||||||||||||||||||||||||||||||||||||||
| Current taxation | (5,374) | (976) | (4,353) | (3,861) | (2,635) | 92 | (1,300) | (15) | (450) | 447 | (492) | (9) | 9 | (5) | — | (492) | 5 | (45) | ||||||||||||||||||||||||||||||||||||||||||||
| Deferred taxation | 516 | (682) | 1,198 | 958 | 98 | 951 | (34) | (58) | (42) | 43 | 240 | (233) | (322) | (89) | — | (97) | 981 | — | ||||||||||||||||||||||||||||||||||||||||||||
| Profit/(loss) for the year | 30,622 | 7,778 | 23,826 | 23,316 | 519 | 13,881 | 3,389 | 188 | 1,300 | 4,039 | 510 | 499 | 1,185 | 120 | (315) | 1,302 | (2,281) | (982) | ||||||||||||||||||||||||||||||||||||||||||||
| Attributable to: | ||||||||||||||||||||||||||||||||||||||||||||||||||||||||||||||
| Owners of the parent | 29,312 | 7,778 | 22,516 | 22,650 | 519 | 13,230 | 3,389 | 173 | 1,300 | 4,039 | (134) | 499 | 1,185 | 120 | (315) | 659 | (2,282) | (982) | ||||||||||||||||||||||||||||||||||||||||||||
| Non-controlling interest holders | 1,310 | — | 1,310 | 666 | — | 651 | — | 15 | — | — | 644 | — | — | — | — | 643 | 1 | — | ||||||||||||||||||||||||||||||||||||||||||||
| Sustaining capital expenditure | (2,816) | (798) | (795) | (3) | (2,018) | (1,052) | (326) | (515) | (188) | (23) | (414) | 414 | (966) | (186) | (392) | (93) | — | (295) | — | — | ||||||||||||||||||||||||||||||||||||||||||
| Ore reserve development | (4,150) | (1,239) | (1,239) | — | (2,911) | (1,125) | (417) | (708) | — | — | — | — | (1,786) | (742) | (722) | (322) | — | — | — | — | ||||||||||||||||||||||||||||||||||||||||||
| Growth projects | (2,648) | (2,385) | (2,385) | — | (263) | (20) | — | — | — | (20) | — | — | (243) | — | (155) | — | — | (46) | (42) | — | ||||||||||||||||||||||||||||||||||||||||||
| Total capital expenditure | (9,614) | (4,422) | (4,419) | (3) | (5,192) | (2,197) | (743) | (1,223) | (188) | (43) | (414) | 414 | (2,995) | (928) | (1,269) | (415) | — | (341) | (42) | — | ||||||||||||||||||||||||||||||||||||||||||
Sibanye-Stillwater Operating and financial results | Six months and year ended 31 December 2021 49
| For the year ended 31 Dec 2020 (Unaudited) | ||||||||||||||||||||||||||||||||||||||||||||||||||||||||||||||
| GROUP | US PGM OPERATIONS | SA OPERATIONS | GROUP | |||||||||||||||||||||||||||||||||||||||||||||||||||||||||||
US dollars5 | Total | Total US PGM | Underground | Recycling | Total SA Operations | Total SA PGM | Rusten- burg | Marikana | Kroondal | Platinum Mile | Mimosa | Corporate and re- conciling items1 | Total SA gold | Drie- fontein | Kloof | Beatrix | Cooke | DRD- GOLD | Corporate and re- conciling items1 | Cor- porate1 | ||||||||||||||||||||||||||||||||||||||||||
| Revenue | 7,739 | 2,743 | 1,206 | 1,537 | 5,029 | 3,336 | 1,241 | 1,632 | 484 | 58 | 237 | (316) | 1,693 | 413 | 595 | 283 | 63 | 307 | 32 | (33) | ||||||||||||||||||||||||||||||||||||||||||
| Underground | 5,550 | 1,206 | 1,206 | — | 4,377 | 3,167 | 1,125 | 1,632 | 484 | — | 237 | (311) | 1,210 | 413 | 493 | 273 | — | — | 31 | (33) | ||||||||||||||||||||||||||||||||||||||||||
| Surface | 652 | — | — | — | 652 | 169 | 116 | — | — | 58 | — | (5) | 483 | — | 102 | 10 | 63 | 307 | 1 | — | ||||||||||||||||||||||||||||||||||||||||||
| Recycling | 1,537 | 1,537 | — | 1,537 | — | — | — | — | — | — | — | — | — | — | — | — | — | — | — | — | ||||||||||||||||||||||||||||||||||||||||||
| Cost of sales, before amortisation and depreciation | (4,604) | (1,944) | (461) | (1,483) | (2,660) | (1,502) | (582) | (804) | (170) | (24) | (97) | 175 | (1,158) | (295) | (418) | (226) | (41) | (178) | — | — | ||||||||||||||||||||||||||||||||||||||||||
| Underground | (2,765) | (461) | (461) | — | (2,304) | (1,431) | (530) | (804) | (170) | — | (97) | 170 | (873) | (295) | (358) | (220) | — | — | — | — | ||||||||||||||||||||||||||||||||||||||||||
| Surface | (356) | — | — | — | (356) | (71) | (52) | — | — | (24) | — | 5 | (285) | — | (60) | (6) | (41) | (178) | — | — | ||||||||||||||||||||||||||||||||||||||||||
| Recycling | (1,483) | (1,483) | — | (1,483) | — | — | — | — | — | — | — | — | — | — | — | — | — | — | — | — | ||||||||||||||||||||||||||||||||||||||||||
Net other cash costs2 | (137) | (4) | (4) | — | (133) | (69) | 3 | (48) | (5) | (15) | (4) | — | (64) | (4) | (6) | (6) | (39) | (3) | (6) | — | ||||||||||||||||||||||||||||||||||||||||||
| Adjusted EBITDA | 2,998 | 795 | 741 | 54 | 2,236 | 1,765 | 662 | 780 | 309 | 19 | 136 | (141) | 471 | 114 | 171 | 51 | (17) | 126 | 26 | (33) | ||||||||||||||||||||||||||||||||||||||||||
| Amortisation and depreciation | (461) | (165) | (165) | — | (296) | (126) | (49) | (50) | (25) | (2) | (17) | 17 | (170) | (57) | (66) | (30) | (1) | (12) | (4) | — | ||||||||||||||||||||||||||||||||||||||||||
| Interest income | 65 | 17 | — | 17 | 48 | 13 | 2 | 6 | 5 | — | — | — | 35 | 4 | 4 | 2 | 3 | 11 | 11 | — | ||||||||||||||||||||||||||||||||||||||||||
| Finance expense | (191) | (64) | (58) | (6) | (107) | (39) | (173) | (16) | (8) | — | (1) | 159 | (68) | (9) | (9) | (7) | (6) | (4) | (33) | (20) | ||||||||||||||||||||||||||||||||||||||||||
| Share-based payments | (31) | (5) | (5) | — | (26) | (5) | (2) | (2) | (1) | — | — | — | (21) | (1) | (2) | (1) | — | (9) | (8) | — | ||||||||||||||||||||||||||||||||||||||||||
Net other3 | (24) | 2 | 2 | — | (26) | 74 | (234) | 130 | 7 | (1) | (1) | 173 | (100) | 1 | 2 | 2 | 2 | 2 | (109) | — | ||||||||||||||||||||||||||||||||||||||||||
Non-underlying items4 | (92) | (6) | (6) | — | (82) | 11 | 36 | (26) | — | — | — | 1 | (93) | (2) | (1) | (2) | — | — | (88) | (4) | ||||||||||||||||||||||||||||||||||||||||||
| Royalties and carbon tax | (107) | — | — | — | (107) | (99) | (56) | (42) | (1) | — | (8) | 8 | (8) | (4) | (7) | (3) | — | — | 6 | — | ||||||||||||||||||||||||||||||||||||||||||
| Profit before tax | 2,157 | 574 | 509 | 65 | 1,640 | 1,594 | 186 | 780 | 286 | 16 | 109 | 217 | 46 | 46 | 92 | 12 | (19) | 114 | (199) | (57) | ||||||||||||||||||||||||||||||||||||||||||
| Current taxation | (326) | (59) | (264) | (234) | (160) | 6 | (79) | (1) | (27) | 27 | (30) | (1) | 1 | — | — | (30) | — | (3) | ||||||||||||||||||||||||||||||||||||||||||||
| Deferred taxation | 31 | (41) | 72 | 57 | 6 | 58 | (2) | (4) | (3) | 2 | 15 | (14) | (20) | (5) | — | (6) | 60 | — | ||||||||||||||||||||||||||||||||||||||||||||
| Profit/(loss) for the year | 1,862 | 474 | 1,448 | 1,417 | 32 | 844 | 205 | 11 | 79 | 246 | 31 | 31 | 73 | 7 | (19) | 78 | (139) | (60) | ||||||||||||||||||||||||||||||||||||||||||||
| Attributable to: | ||||||||||||||||||||||||||||||||||||||||||||||||||||||||||||||
| Owners of the parent | 1,782 | 474 | 1,368 | 1,376 | 32 | 804 | 205 | 10 | 79 | 246 | (8) | 31 | 73 | 7 | (19) | 39 | (139) | (60) | ||||||||||||||||||||||||||||||||||||||||||||
| Non-controlling interest holders | 80 | — | 80 | 41 | — | 40 | — | 1 | — | — | 39 | — | — | — | — | 39 | — | — | ||||||||||||||||||||||||||||||||||||||||||||
Sustaining capital expenditure5 | (170) | (48) | (48) | — | (122) | (63) | (20) | (31) | (11) | (1) | (25) | 25 | (59) | (11) | (24) | (6) | — | (18) | — | — | ||||||||||||||||||||||||||||||||||||||||||
| Ore reserve development | (252) | (75) | (75) | — | (177) | (68) | (25) | (43) | — | — | — | — | (109) | (45) | (44) | (20) | — | — | — | — | ||||||||||||||||||||||||||||||||||||||||||
| Growth projects | (161) | (145) | (145) | — | (16) | (1) | — | — | — | (1) | — | — | (15) | — | (9) | — | — | (3) | (3) | — | ||||||||||||||||||||||||||||||||||||||||||
| Total capital expenditure | (583) | (268) | (268) | — | (315) | (132) | (45) | (74) | (11) | (2) | (25) | 25 | (183) | (56) | (77) | (26) | — | (21) | (3) | — | ||||||||||||||||||||||||||||||||||||||||||
1Corporate and reconciling items represent the items to reconcile segment data to condensed consolidated financial statement totals. This does not represent a separate segment as it does not generate mining revenue. Group corporate includes the Wheaton Stream transaction and corporate transaction costs
2Net other cash costs consist of net other costs as per the condensed consolidated income statement excluding change in estimate of environmental rehabilitation obligation, and right of recovery receivable and payable, income on settlement of dispute, non-cash loss due to dilution of interest in joint operation (R30 million) and other non-recurring costs; and include lease payments (R148 million) to conform with the adjusted EBITDA reconciliation disclosed in note 11.1
3Net other consists of loss on financial instruments, loss on foreign exchange differences, change in estimate of environmental rehabilitation obligation, and right of recovery receivable and payable as detailed in profit or loss and the add back of the lease payment referred to in footnote 2 above. Corporate and reconciling items net other includes the share of results equity-accounted investees after tax as detailed in profit or loss
4Non-underlying items consists of gain on disposal of property, plant and equipment, impairments, loss on BTT early settlement, restructuring costs, transaction costs, loss on settlement of US$ Convertible Bond, income on settlement of legal dispute, non-cash loss with dilution of interest in joint operation (R30 million) and occupational healthcare expense as detailed in profit or loss
5The average exchange rate for the year ended 31 December 2020 was R16.46/US$
Sibanye-Stillwater Operating and financial results | Six months and year ended 31 December 2021 50
ALL-IN COSTS - SIX MONTHS
US and SA PGM operations
| US OPERATIONS | SA OPERATIONS | ||||||||||||||||||||||||||||||||||
| R' million | Total US and SA PGM1 | Total US PGM2 | Total SA PGM1 | Rustenburg | Marikana1 | Kroondal | Plat Mile | Mimosa | Corporate | ||||||||||||||||||||||||||
Cost of sales, before amortisation and depreciation3 | Dec 2021 | 20,583 | 4,216 | 16,367 | 5,952 | 8,328 | 1,785 | 302 | 813 | (813) | |||||||||||||||||||||||||
| Jun 2021 | 18,955 | 3,351 | 15,604 | 5,512 | 8,233 | 1,631 | 228 | 774 | (774) | ||||||||||||||||||||||||||
| Dec 2020 | 16,520 | 3,872 | 12,648 | 4,757 | 6,415 | 1,593 | 245 | 1,027 | (1,389) | ||||||||||||||||||||||||||
| Royalties | Dec 2021 | 975 | — | 975 | 512 | 458 | 5 | — | 65 | (65) | |||||||||||||||||||||||||
| Jun 2021 | 1,571 | — | 1,571 | 893 | 670 | 8 | — | 95 | (95) | ||||||||||||||||||||||||||
| Dec 2020 | 1,238 | — | 1,238 | 602 | 630 | 6 | — | 86 | (86) | ||||||||||||||||||||||||||
| Carbon tax | Dec 2021 | — | — | — | — | — | — | — | — | — | |||||||||||||||||||||||||
| Jun 2021 | 1 | — | 1 | — | 1 | — | — | — | — | ||||||||||||||||||||||||||
| Dec 2020 | 1 | — | 1 | — | 1 | — | — | — | — | ||||||||||||||||||||||||||
| Community costs | Dec 2021 | 87 | — | 87 | 6 | 81 | — | — | — | — | |||||||||||||||||||||||||
| Jun 2021 | 74 | — | 74 | 6 | 68 | — | — | — | — | ||||||||||||||||||||||||||
| Dec 2020 | 74 | — | 74 | (9) | 83 | — | — | — | — | ||||||||||||||||||||||||||
Inventory change4 | Dec 2021 | 98 | (446) | 544 | 573 | (29) | — | — | 20 | (20) | |||||||||||||||||||||||||
| Jun 2021 | 1,229 | 479 | 750 | 243 | 507 | — | — | (11) | 11 | ||||||||||||||||||||||||||
| Dec 2020 | 3,291 | 29 | 3,262 | 1,048 | 1,852 | — | — | (192) | 554 | ||||||||||||||||||||||||||
Share-based payments5 | Dec 2021 | 97 | 40 | 57 | 23 | 27 | 7 | — | — | — | |||||||||||||||||||||||||
| Jun 2021 | 103 | 46 | 57 | 22 | 27 | 8 | — | — | — | ||||||||||||||||||||||||||
| Dec 2020 | 72 | 38 | 34 | 14 | 16 | 4 | — | — | — | ||||||||||||||||||||||||||
Rehabilitation interest and amortisation6 | Dec 2021 | 143 | 16 | 127 | — | 81 | 46 | — | 2 | (2) | |||||||||||||||||||||||||
| Jun 2021 | 131 | 15 | 116 | (1) | 81 | 36 | — | 2 | (2) | ||||||||||||||||||||||||||
| Dec 2020 | 144 | 14 | 130 | 5 | 79 | 46 | — | 2 | (2) | ||||||||||||||||||||||||||
| Leases | Dec 2021 | 29 | 1 | 28 | 5 | 19 | 4 | — | — | — | |||||||||||||||||||||||||
| Jun 2021 | 27 | 1 | 26 | 6 | 16 | 4 | — | — | — | ||||||||||||||||||||||||||
| Dec 2020 | 31 | 1 | 29 | 7 | 18 | 4 | — | — | — | ||||||||||||||||||||||||||
| Ore reserve development | Dec 2021 | 1,603 | 772 | 831 | 315 | 516 | — | — | — | — | |||||||||||||||||||||||||
| Jun 2021 | 1,327 | 582 | 745 | 314 | 431 | — | — | — | — | ||||||||||||||||||||||||||
| Dec 2020 | 1,309 | 622 | 687 | 259 | 428 | — | — | — | — | ||||||||||||||||||||||||||
| Sustaining capital expenditure | Dec 2021 | 1,642 | 290 | 1,352 | 386 | 787 | 165 | 14 | 299 | (299) | |||||||||||||||||||||||||
| Jun 2021 | 1,168 | 501 | 667 | 232 | 317 | 104 | 14 | 200 | (200) | ||||||||||||||||||||||||||
| Dec 2020 | 1,189 | 492 | 696 | 188 | 363 | 126 | 19 | 259 | (259) | ||||||||||||||||||||||||||
Less: By-product credit7 | Dec 2021 | (4,943) | (639) | (4,304) | (1,296) | (2,497) | (455) | (56) | (271) | 271 | |||||||||||||||||||||||||
| Jun 2021 | (4,347) | (753) | (3,594) | (1,293) | (1,879) | (416) | (6) | (254) | 254 | ||||||||||||||||||||||||||
| Dec 2020 | (4,431) | (690) | (3,742) | (818) | (2,642) | (285) | 3 | (269) | 270 | ||||||||||||||||||||||||||
Total All-in-sustaining costs8 | Dec 2021 | 20,314 | 4,250 | 16,064 | 6,476 | 7,771 | 1,557 | 260 | 928 | (928) | |||||||||||||||||||||||||
| Jun 2021 | 20,239 | 4,222 | 16,017 | 5,934 | 8,472 | 1,375 | 236 | 806 | (806) | ||||||||||||||||||||||||||
| Dec 2020 | 19,437 | 4,379 | 15,058 | 6,053 | 7,243 | 1,495 | 266 | 913 | (912) | ||||||||||||||||||||||||||
| Plus: Corporate cost, growth and capital expenditure | Dec 2021 | 1,400 | 1,194 | 206 | — | 206 | — | — | — | — | |||||||||||||||||||||||||
| Jun 2021 | 1,226 | 1,217 | 9 | — | 9 | — | — | — | — | ||||||||||||||||||||||||||
| Dec 2020 | 1,110 | 1,091 | 19 | — | 19 | — | — | — | — | ||||||||||||||||||||||||||
Total All-in-costs8 | Dec 2021 | 21,714 | 5,444 | 16,270 | 6,476 | 7,977 | 1,557 | 260 | 928 | (928) | |||||||||||||||||||||||||
| Jun 2021 | 21,465 | 5,439 | 16,026 | 5,934 | 8,481 | 1,375 | 236 | 806 | (806) | ||||||||||||||||||||||||||
| Dec 2020 | 20,547 | 5,470 | 15,077 | 6,053 | 7,262 | 1,495 | 266 | 913 | (912) | ||||||||||||||||||||||||||
| PGM production | 4Eoz - 2Eoz | Dec 2021 | 1,239,777 | 272,099 | 967,678 | 343,820 | 421,632 | 113,035 | 30,654 | 58,537 | — | ||||||||||||||||||||||||
| Jun 2021 | 1,227,293 | 298,301 | 928,992 | 328,554 | 404,386 | 113,496 | 21,842 | 60,714 | — | ||||||||||||||||||||||||||
| Dec 2020 | 1,224,006 | 305,327 | 918,679 | 337,392 | 381,838 | 114,412 | 22,620 | 62,417 | — | ||||||||||||||||||||||||||
| kg | Dec 2021 | 38,561 | 8,463 | 30,098 | 10,694 | 13,114 | 3,516 | 953 | 1,821 | — | |||||||||||||||||||||||||
| Jun 2021 | 38,173 | 9,278 | 28,895 | 10,219 | 12,578 | 3,530 | 679 | 1,888 | — | ||||||||||||||||||||||||||
| Dec 2020 | 38,071 | 9,497 | 28,574 | 10,494 | 11,877 | 3,559 | 704 | 1,941 | — | ||||||||||||||||||||||||||
| All-in-sustaining cost | R/4Eoz - R/2Eoz | Dec 2021 | 17,197 | 15,619 | 17,669 | 18,835 | 18,431 | 13,774 | 8,482 | 15,853 | — | ||||||||||||||||||||||||
| Jun 2021 | 17,349 | 14,153 | 18,447 | 18,061 | 20,950 | 12,115 | 10,805 | 13,275 | — | ||||||||||||||||||||||||||
| Dec 2020 | 16,733 | 14,342 | 17,586 | 17,939 | 18,970 | 13,066 | 11,768 | 14,627 | — | ||||||||||||||||||||||||||
| US$/4Eoz - US$/2Eoz | Dec 2021 | 1,144 | 1,039 | 1,176 | 1,253 | 1,226 | 916 | 564 | 1,055 | — | |||||||||||||||||||||||||
| Jun 2021 | 1,192 | 973 | 1,268 | 1,241 | 1,440 | 833 | 743 | 912 | — | ||||||||||||||||||||||||||
| Dec 2020 | 1,029 | 882 | 1,082 | 1,103 | 1,167 | 804 | 724 | 900 | — | ||||||||||||||||||||||||||
| All-in-cost | R/4Eoz - R/2Eoz | Dec 2021 | 18,382 | 20,007 | 17,896 | 18,835 | 18,919 | 13,774 | 8,482 | 15,853 | — | ||||||||||||||||||||||||
| Jun 2021 | 18,400 | 18,233 | 18,457 | 18,061 | 20,973 | 12,115 | 10,805 | 13,275 | — | ||||||||||||||||||||||||||
| Dec 2020 | 17,689 | 17,917 | 17,608 | 17,939 | 19,019 | 13,066 | 11,768 | 14,627 | — | ||||||||||||||||||||||||||
| US$/4Eoz - US$/2Eoz | Dec 2021 | 1,223 | 1,331 | 1,191 | 1,253 | 1,259 | 916 | 564 | 1,055 | — | |||||||||||||||||||||||||
| Jun 2021 | 1,265 | 1,253 | 1,269 | 1,241 | 1,441 | 833 | 743 | 912 | — | ||||||||||||||||||||||||||
| Dec 2020 | 1,088 | 1,102 | 1,083 | 1,103 | 1,170 | 804 | 724 | 900 | — | ||||||||||||||||||||||||||
Average exchange rate for the six months ended 31 December 2021, 30 June 2021 and 31 December 2020 was R15.03/US$, R14.55/US$ and R16.26/US$, respectively
Figures may not add as they are rounded independently
Sibanye-Stillwater Operating and financial results | Six months and year ended 31 December 2021 51
1The Total US and SA PGM, Total SA PGM and Marikana includes the production and costs associated with the purchase of concentrate (PoC) from third parties. For a reconciliation of the Operating cost, AISC and AIC excluding third party PoC, refer to “Reconciliation of operating cost excluding third party PoC for Total US and SA PGM, Total SA PGM and Marikana - Six Months” and “Reconciliation of AISC and AIC excluding third party PoC for Total US and SA PGM, Total SA PGM and Marikana – Six Months”
2The US PGM operations’ underground production is converted to metric tonnes and kilograms, and performance is translated into SA rand. In addition to the US PGM operations’ underground production, the operation processes various recycling material which is excluded from the 2E PGM production, All-in sustaining cost and All-in cost statistics shown
3Cost of sales, before amortisation and depreciation includes all mining and processing costs, third party refining costs, corporate general and administrative costs, and permitting costs. In addition to the Mimosa elimination (equity accounted), Corporate for the six months period of December 2020 includes the elimination of concentrate sales by Rustenburg, Kroondal and Platinum Mile to Marikana and the associated unrealised profit
4Inventory adjustment in Corporate for the six months period of December 2020 includes the elimination of concentrate sales by Rustenburg, Kroondal and Platinum Mile to Marikana and the associated unrealised profit
5Share-based payments are calculated based on the fair value at initial recognition and do not include the adjustment of the cash-settled share-based payment obligation to the reporting date fair value
6Rehabilitation includes the interest charge related to the environmental rehabilitation obligation and the amortisation of the related capitalised rehabilitation costs. The interest charge related to the environmental rehabilitation obligation and the amortisation of the capitalised rehabilitation costs reflect the periodic costs of rehabilitation associated with current PGM production
7The by-product credit for Marikana for the six months period of December 2020 includes the benefit from the sale of concentrate purchased from Rustenburg, Kroondal and Platinum Mile of R1,546 million. The cost associated with the purchase and processing of the intercompany concentrate is included in the Marikana cost of sales, before amortisation and depreciation
8All-in cost is calculated in accordance with the World Gold Council guidance. All-in cost excludes income tax, costs associated with merger and acquisition activities, working capital, impairments, financing costs, one-time severance charges and items needed to normalise earnings. All-in cost is made up of All-in sustaining cost, being the cost to sustain current operations, given as a sub-total in the All-in cost calculation, together with corporate and major capital expenditure associated with growth. All-in sustaining cost per ounce (and kilogram) and All-in cost per ounce (and kilogram) are calculated by dividing the All-in sustaining cost and All-in cost, respectively, in a period by the total 4E/2E PGM produced in the same period
| Reconciliation of operating cost excluding third party PoC for Total US and SA PGM, Total SA PGM and Marikana - Six Months | ||||||||||||||||||||||||||||||||
| Total US and SA PGM | Total SA PGM | Marikana | ||||||||||||||||||||||||||||||
| R' million | Dec 2021 | Jun 2021 | Dec 2020 | Dec 2021 | Jun 2021 | Dec 2020 | Dec 2021 | Jun 2021 | Dec 2020 | |||||||||||||||||||||||
| Cost of sales, before amortisation and depreciation as reported per table above | 20,583 | 18,955 | 16,520 | 16,367 | 15,604 | 12,648 | 8,328 | 8,233 | 6,415 | |||||||||||||||||||||||
| Inventory change as reported per table above | 98 | 1,229 | 3,291 | 544 | 750 | 3,262 | (29) | 507 | 1,852 | |||||||||||||||||||||||
| Less: Chrome cost of sales | (721) | (565) | (432) | (721) | (565) | (432) | (156) | (124) | (115) | |||||||||||||||||||||||
| Total operating cost including third party PoC | 19,960 | 19,619 | 19,379 | 16,190 | 15,789 | 15,478 | 8,143 | 8,616 | 8,152 | |||||||||||||||||||||||
| Less: Purchase cost of PoC | (1,122) | (2,047) | (821) | (1,122) | (2,047) | (821) | (1,122) | (2,047) | (821) | |||||||||||||||||||||||
| Total operating cost excluding third party PoC | 18,838 | 17,572 | 18,558 | 15,068 | 13,742 | 14,657 | 7,021 | 6,569 | 7,331 | |||||||||||||||||||||||
| PGM production as reported per table above | 4Eoz- 2Eoz | 1,239,777 | 1,227,293 | 1,224,006 | 967,678 | 928,992 | 918,679 | 421,632 | 404,386 | 381,838 | ||||||||||||||||||||||
| Less: Mimosa production | (58,537) | (60,714) | (62,417) | (58,537) | (60,714) | (62,417) | — | — | — | |||||||||||||||||||||||
| PGM production excluding Mimosa | 1,181,240 | 1,166,579 | 1,161,589 | 909,141 | 868,278 | 856,262 | 421,632 | 404,386 | 381,838 | |||||||||||||||||||||||
| Less: PoC production | (25,705) | (34,827) | (23,220) | (25,705) | (34,827) | (23,220) | (25,705) | (34,827) | (23,220) | |||||||||||||||||||||||
| PGM production excluding Mimosa and third party PoC | 1,155,535 | 1,131,752 | 1,138,369 | 883,436 | 833,451 | 833,042 | 395,927 | 369,559 | 358,618 | |||||||||||||||||||||||
| PGM production including Mimosa and excluding third party PoC | 1,214,072 | 1,192,466 | 1,200,786 | 941,973 | 894,165 | 895,459 | 395,927 | 369,559 | 358,618 | |||||||||||||||||||||||
| Tonnes milled/treated | 000't | 20,361 | 19,415 | 19,631 | 19,651 | 18,656 | 18,871 | 5,542 | 5,129 | 5,225 | ||||||||||||||||||||||
| Less: Mimosa tonnes | (708) | (714) | (716) | (708) | (714) | (716) | — | — | — | |||||||||||||||||||||||
| PGM tonnes excluding Mimosa and third party PoC | 19,653 | 18,701 | 18,915 | 18,943 | 17,942 | 18,155 | 5,542 | 5,129 | 5,225 | |||||||||||||||||||||||
| Operating cost including third party PoC | R/4Eoz-R/2Eoz | 16,897 | 16,818 | 16,683 | 17,808 | 18,184 | 18,076 | 19,313 | 21,306 | 21,350 | ||||||||||||||||||||||
| US$/4Eoz-US$/2Eoz | 1,124 | 1,156 | 1,026 | 1,185 | 1,250 | 1,112 | 1,285 | 1,464 | 1,313 | |||||||||||||||||||||||
| R/t | 1,016 | 1,049 | 1,025 | 855 | 880 | 853 | 1,469 | 1,680 | 1,560 | |||||||||||||||||||||||
| US$/t | 68 | 72 | 63 | 57 | 60 | 52 | 98 | 115 | 96 | |||||||||||||||||||||||
| Operating cost excluding third party PoC | R/4Eoz-R/2Eoz | 16,302 | 15,526 | 16,302 | 17,056 | 16,488 | 17,595 | 17,733 | 17,775 | 20,442 | ||||||||||||||||||||||
| US$/4Eoz-US$/2Eoz | 1,085 | 1,067 | 1,003 | 1,135 | 1,133 | 1,082 | 1,180 | 1,222 | 1,257 | |||||||||||||||||||||||
| R/t | 959 | 940 | 981 | 795 | 766 | 807 | 1,267 | 1,281 | 1,403 | |||||||||||||||||||||||
| US$/t | 64 | 65 | 60 | 53 | 53 | 50 | 84 | 88 | 86 | |||||||||||||||||||||||
| Reconciliation of AISC and AIC excluding third party PoC for Total US and SA PGM, Total SA PGM and Marikana - Six Months | ||||||||||||||||||||||||||||||||
| Total US and SA PGM | Total SA PGM | Marikana | ||||||||||||||||||||||||||||||
| R' million | Dec 2021 | Jun 2021 | Dec 2020 | Dec 2021 | Jun 2021 | Dec 2020 | Dec 2021 | Jun 2021 | Dec 2020 | |||||||||||||||||||||||
| Total All-in-sustaining cost as reported per table above | 20,314 | 20,239 | 19,437 | 16,064 | 16,017 | 15,058 | 7,771 | 8,472 | 7,243 | |||||||||||||||||||||||
| Less: Purchase cost of PoC | (1,122) | (2,047) | (821) | (1,122) | (2,047) | (821) | (1,122) | (2,047) | (821) | |||||||||||||||||||||||
| Add: By-product credit of PoC | 109 | 133 | 27 | 109 | 133 | 27 | 109 | 133 | 27 | |||||||||||||||||||||||
| Total All-in-sustaining cost excluding third party PoC | 19,301 | 18,325 | 18,643 | 15,051 | 14,103 | 14,264 | 6,758 | 6,558 | 6,449 | |||||||||||||||||||||||
| Plus: Corporate cost, growth and capital expenditure | 1,400 | 1,226 | 1,110 | 206 | 9 | 19 | 206 | 9 | 19 | |||||||||||||||||||||||
| Total All-in-cost excluding third party PoC | 20,701 | 19,551 | 19,753 | 15,257 | 14,112 | 14,283 | 6,964 | 6,567 | 6,468 | |||||||||||||||||||||||
| PGM production excluding Mimosa and third party PoC | 4Eoz- 2Eoz | 1,155,535 | 1,131,752 | 1,138,369 | 883,436 | 833,451 | 833,042 | 395,927 | 369,559 | 358,618 | ||||||||||||||||||||||
| All-in-sustaining cost excluding third party PoC | R/4Eoz-R/2Eoz | 16,703 | 16,192 | 16,377 | 17,037 | 16,921 | 17,123 | 17,069 | 17,745 | 17,983 | ||||||||||||||||||||||
| US$/4Eoz-US$/2Eoz | 1,111 | 1,113 | 1,007 | 1,134 | 1,163 | 1,053 | 1,136 | 1,220 | 1,106 | |||||||||||||||||||||||
| All-in-cost excluding third party PoC | R/4Eoz-R/2Eoz | 17,915 | 17,275 | 17,352 | 17,270 | 16,932 | 17,146 | 17,589 | 17,770 | 18,036 | ||||||||||||||||||||||
| US$/4Eoz-US$/2Eoz | 1,192 | 1,187 | 1,067 | 1,149 | 1,164 | 1,054 | 1,170 | 1,221 | 1,109 | |||||||||||||||||||||||
Sibanye-Stillwater Operating and financial results | Six months and year ended 31 December 2021 52
SA gold operations
| SA OPERATIONS | |||||||||||||||||||||||||||||
| R' million | Total SA gold | Driefontein | Kloof | Beatrix | Cooke | DRDGOLD | Corporate | ||||||||||||||||||||||
Cost of sales, before amortisation and depreciation1 | Dec 2021 | 11,739 | 3,056 | 3,962 | 2,560 | 409 | 1,752 | — | |||||||||||||||||||||
| Jun 2021 | 10,518 | 2,635 | 3,883 | 2,005 | 400 | 1,595 | — | ||||||||||||||||||||||
| Dec 2020 | 10,366 | 2,658 | 3,722 | 1,996 | 363 | 1,627 | — | ||||||||||||||||||||||
| Royalties | Dec 2021 | 96 | 49 | 24 | 15 | 2 | — | 6 | |||||||||||||||||||||
| Jun 2021 | 71 | 45 | 23 | 11 | 3 | — | (11) | ||||||||||||||||||||||
| Dec 2020 | 101 | 62 | 96 | 35 | 3 | — | (95) | ||||||||||||||||||||||
| Carbon tax | Dec 2021 | 1 | — | — | 1 | — | — | — | |||||||||||||||||||||
| Jun 2021 | 1 | — | — | 1 | — | — | — | ||||||||||||||||||||||
| Dec 2020 | 1 | — | — | 1 | — | — | — | ||||||||||||||||||||||
| Community costs | Dec 2021 | 65 | 23 | 19 | 17 | 1 | 5 | — | |||||||||||||||||||||
| Jun 2021 | 63 | 23 | 19 | 17 | 1 | 3 | — | ||||||||||||||||||||||
| Dec 2020 | 91 | 23 | 30 | 35 | — | 4 | — | ||||||||||||||||||||||
Share-based payments2 | Dec 2021 | 51 | 12 | 17 | 12 | — | 10 | — | |||||||||||||||||||||
| Jun 2021 | 49 | 11 | 18 | 11 | — | 9 | — | ||||||||||||||||||||||
| Dec 2020 | 34 | 9 | 10 | 7 | — | 8 | — | ||||||||||||||||||||||
Rehabilitation interest and amortisation3 | Dec 2021 | 96 | 11 | 7 | 33 | 31 | 10 | 4 | |||||||||||||||||||||
| Jun 2021 | 95 | 22 | 10 | 36 | 16 | 8 | 3 | ||||||||||||||||||||||
| Dec 2020 | 111 | 27 | 13 | 29 | 28 | 11 | 2 | ||||||||||||||||||||||
| Leases | Dec 2021 | 39 | 4 | 5 | 14 | 6 | 10 | — | |||||||||||||||||||||
| Jun 2021 | 42 | 4 | 9 | 14 | 6 | 9 | — | ||||||||||||||||||||||
| Dec 2020 | 41 | 4 | 9 | 14 | 7 | 8 | — | ||||||||||||||||||||||
| Ore reserve development | Dec 2021 | 1,352 | 615 | 489 | 248 | — | — | — | |||||||||||||||||||||
| Jun 2021 | 1,254 | 563 | 441 | 250 | — | — | — | ||||||||||||||||||||||
| Dec 2020 | 1,101 | 467 | 448 | 186 | — | — | — | ||||||||||||||||||||||
| Sustaining capital expenditure | Dec 2021 | 822 | 213 | 351 | 113 | — | 145 | — | |||||||||||||||||||||
| Jun 2021 | 481 | 109 | 136 | 51 | — | 185 | — | ||||||||||||||||||||||
| Dec 2020 | 607 | 108 | 278 | 58 | — | 164 | — | ||||||||||||||||||||||
| Less: By-product credit | Dec 2021 | (14) | (4) | (3) | (3) | (1) | (3) | — | |||||||||||||||||||||
| Jun 2021 | (11) | (4) | (3) | (2) | (1) | (1) | — | ||||||||||||||||||||||
| Dec 2020 | (16) | (5) | (3) | (3) | (1) | (5) | — | ||||||||||||||||||||||
Total All-in-sustaining costs4 | Dec 2021 | 14,247 | 3,979 | 4,871 | 3,010 | 448 | 1,929 | 10 | |||||||||||||||||||||
| Jun 2021 | 12,563 | 3,408 | 4,536 | 2,394 | 425 | 1,808 | (8) | ||||||||||||||||||||||
| Dec 2020 | 12,438 | 3,352 | 4,604 | 2,358 | 400 | 1,816 | (92) | ||||||||||||||||||||||
| Plus: Corporate cost, growth and capital expenditure | Dec 2021 | 390 | — | 107 | 7 | — | 38 | 238 | |||||||||||||||||||||
| Jun 2021 | 214 | — | 91 | — | — | 9 | 114 | ||||||||||||||||||||||
| Dec 2020 | 249 | — | 107 | — | — | 39 | 104 | ||||||||||||||||||||||
Total All-in-costs4 | Dec 2021 | 14,637 | 3,979 | 4,978 | 3,017 | 448 | 1,967 | 248 | |||||||||||||||||||||
| Jun 2021 | 12,777 | 3,408 | 4,627 | 2,394 | 425 | 1,817 | 106 | ||||||||||||||||||||||
| Dec 2020 | 12,688 | 3,352 | 4,711 | 2,358 | 400 | 1,855 | 11 | ||||||||||||||||||||||
| Gold sold | kg | Dec 2021 | 17,495 | 4,928 | 5,560 | 3,558 | 558 | 2,891 | — | ||||||||||||||||||||
| Jun 2021 | 15,879 | 4,386 | 5,401 | 2,747 | 617 | 2,728 | — | ||||||||||||||||||||||
| Dec 2020 | 17,659 | 4,781 | 6,369 | 2,904 | 599 | 3,006 | — | ||||||||||||||||||||||
| oz | Dec 2021 | 562,477 | 158,439 | 178,758 | 114,392 | 17,940 | 92,948 | — | |||||||||||||||||||||
| Jun 2021 | 510,521 | 141,013 | 173,646 | 88,318 | 19,837 | 87,707 | — | ||||||||||||||||||||||
| Dec 2020 | 567,750 | 153,713 | 204,768 | 93,366 | 19,258 | 96,645 | — | ||||||||||||||||||||||
| All-in-sustaining cost | R/kg | Dec 2021 | 814,347 | 807,427 | 876,079 | 845,981 | 802,867 | 667,243 | — | ||||||||||||||||||||
| Jun 2021 | 791,171 | 777,018 | 839,844 | 871,496 | 688,817 | 662,757 | — | ||||||||||||||||||||||
| Dec 2020 | 704,355 | 701,129 | 722,845 | 812,018 | 668,447 | 604,125 | — | ||||||||||||||||||||||
| All-in-sustaining cost | US$/oz | Dec 2021 | 1,685 | 1,671 | 1,813 | 1,751 | 1,661 | 1,381 | — | ||||||||||||||||||||
| Jun 2021 | 1,691 | 1,661 | 1,795 | 1,863 | 1,472 | 1,417 | — | ||||||||||||||||||||||
| Dec 2020 | 1,347 | 1,341 | 1,383 | 1,553 | 1,279 | 1,156 | — | ||||||||||||||||||||||
| All-in-cost | R/kg | Dec 2021 | 836,639 | 807,427 | 895,324 | 847,948 | 802,867 | 680,387 | — | ||||||||||||||||||||
| Jun 2021 | 804,648 | 777,018 | 856,693 | 871,496 | 688,817 | 666,056 | — | ||||||||||||||||||||||
| Dec 2020 | 718,478 | 701,129 | 739,692 | 812,018 | 668,447 | 616,966 | — | ||||||||||||||||||||||
| All-in-cost | US$/oz | Dec 2021 | 1,731 | 1,671 | 1,853 | 1,755 | 1,661 | 1,408 | — | ||||||||||||||||||||
| Jun 2021 | 1,720 | 1,661 | 1,831 | 1,863 | 1,472 | 1,424 | — | ||||||||||||||||||||||
| Dec 2020 | 1,374 | 1,341 | 1,415 | 1,553 | 1,279 | 1,180 | — | ||||||||||||||||||||||
Average exchange rate for the six months ended 31 December 2021, 30 June 2021 and 31 December 2020 was R15.03/US$, R14.55/US$ and R16.26/US$, respectively
Figures may not add as they are rounded independently
1Cost of sales, before amortisation and depreciation includes all mining and processing costs, third party refining costs, corporate general and administrative costs, and permitting costs
2Share-based payments are calculated based on the fair value at initial recognition and do not include the adjustment of the cash-settled share-based payment obligation to the reporting date fair value
3Rehabilitation includes the interest charge related to the environmental rehabilitation obligation and the amortisation of the related capitalised rehabilitation costs. The interest charge related to the environmental rehabilitation obligation and the amortisation of the capitalised rehabilitation costs reflect the periodic costs of rehabilitation associated with current gold production
4All-in cost is calculated in accordance with the World Gold Council guidance. All-in cost excludes income tax, costs associated with merger and acquisition activities, working capital, impairments, financing costs, one time severance charges and items needed to normalise earnings. All-in cost is made up of All-in sustaining cost, being the cost to sustain current operations, given as a sub-total in the All-in cost calculation, together with corporate and major capital expenditure associated with growth. All-in sustaining cost per kilogram (and ounce) and All-in cost per kilogram (and ounce) are calculated by dividing the All-in sustaining cost and All-in cost, respectively, in a period by the total gold sold over the same period
Sibanye-Stillwater Operating and financial results | Six months and year ended 31 December 2021 53
SALIENT FEATURES AND COST BENCHMARKS - YEAR
US and SA PGM operations
| US OPERA-TIONS | SA OPERATIONS | |||||||||||||||||||||||||||||||||||||||||||||||||||||||||||||||||||||||||||||||
Total US and SA PGM1 | Total US PGM | Total SA PGM1 | Rustenburg | Marikana1 | Kroondal | Plat Mile | Mimosa | |||||||||||||||||||||||||||||||||||||||||||||||||||||||||||||||||||||||||
| Attributable | Under- ground2 | Total | Under- ground | Surface | Under- ground | Surface | Under- ground | Surface | Attribu-table | Surface | Attribu-table | |||||||||||||||||||||||||||||||||||||||||||||||||||||||||||||||||||||
| Production | ||||||||||||||||||||||||||||||||||||||||||||||||||||||||||||||||||||||||||||||||
| Tonnes milled/treated | 000't | Dec 2021 | 39,776 | 1,469 | 38,307 | 18,090 | 20,217 | 6,341 | 5,712 | 6,802 | 3,869 | 3,525 | 10,636 | 1,422 | ||||||||||||||||||||||||||||||||||||||||||||||||||||||||||||||||||
| Dec 2020 | 33,903 | 1,487 | 32,416 | 15,424 | 16,992 | 5,404 | 5,056 | 5,609 | 3,447 | 2,997 | 8,489 | 1,414 | ||||||||||||||||||||||||||||||||||||||||||||||||||||||||||||||||||||
| Plant head grade | g/t | Dec 2021 | 2.45 | 13.33 | 2.03 | 3.39 | 0.82 | 3.38 | 1.07 | 3.87 | 0.87 | 2.40 | 0.67 | 3.58 | ||||||||||||||||||||||||||||||||||||||||||||||||||||||||||||||||||
| Dec 2020 | 2.56 | 13.84 | 2.04 | 3.34 | 0.86 | 3.38 | 1.02 | 3.70 | 0.86 | 2.46 | 0.77 | 3.60 | ||||||||||||||||||||||||||||||||||||||||||||||||||||||||||||||||||||
Plant recoveries3 | % | Dec 2021 | 76.78 | 89.71 | 73.31 | 85.59 | 27.90 | 87.72 | 34.57 | 87.11 | 26.11 | 83.28 | 22.91 | 72.86 | ||||||||||||||||||||||||||||||||||||||||||||||||||||||||||||||||||
| Dec 2020 | 76.38 | 90.38 | 71.78 | 84.92 | 25.63 | 85.83 | 34.70 | 87.22 | 25.60 | 83.05 | 18.48 | 75.02 | ||||||||||||||||||||||||||||||||||||||||||||||||||||||||||||||||||||
Yield3 | g/t | Dec 2021 | 1.88 | 11.96 | 1.49 | 2.90 | 0.23 | 2.96 | 0.37 | 3.37 | 0.23 | 2.00 | 0.15 | 2.61 | ||||||||||||||||||||||||||||||||||||||||||||||||||||||||||||||||||
| Dec 2020 | 1.95 | 12.51 | 1.46 | 2.83 | 0.22 | 2.90 | 0.35 | 3.23 | 0.22 | 2.04 | 0.14 | 2.70 | ||||||||||||||||||||||||||||||||||||||||||||||||||||||||||||||||||||
PGM production3,4 | 4Eoz - 2Eoz | Dec 2021 | 2,406,538 | 570,400 | 1,836,138 | 1,687,446 | 148,692 | 604,436 | 67,938 | 737,228 | 28,258 | 226,531 | 52,496 | 119,251 | ||||||||||||||||||||||||||||||||||||||||||||||||||||||||||||||||||
| Dec 2020 | 2,129,438 | 603,067 | 1,526,371 | 1,405,604 | 120,768 | 504,045 | 57,529 | 581,942 | 24,398 | 196,847 | 38,841 | 122,770 | ||||||||||||||||||||||||||||||||||||||||||||||||||||||||||||||||||||
PGM sold5 | 4Eoz - 2Eoz | Dec 2021 | 2,433,886 | 548,276 | 1,885,610 | 608,817 | 65,894 | 822,389 | 226,531 | 52,496 | 109,483 | |||||||||||||||||||||||||||||||||||||||||||||||||||||||||||||||||||||
| Dec 2020 | 2,170,522 | 594,024 | 1,576,498 | 504,451 | 43,329 | 677,458 | 196,847 | 38,841 | 115,572 | |||||||||||||||||||||||||||||||||||||||||||||||||||||||||||||||||||||||
Price and costs6 | ||||||||||||||||||||||||||||||||||||||||||||||||||||||||||||||||||||||||||||||||
Average PGM basket price7 | R/4Eoz - R/2Eoz | Dec 2021 | 43,281 | 31,021 | 47,066 | 47,841 | 29,774 | 47,251 | 51,938 | 35,852 | 35,628 | |||||||||||||||||||||||||||||||||||||||||||||||||||||||||||||||||||||
| Dec 2020 | 35,125 | 31,373 | 36,651 | 37,855 | 26,561 | 35,763 | 40,435 | 28,574 | 30,871 | |||||||||||||||||||||||||||||||||||||||||||||||||||||||||||||||||||||||
| Average PGM basket price6 | US$/4Eoz - US$/2Eoz | Dec 2021 | 2,926 | 2,097 | 3,182 | 3,235 | 2,013 | 3,195 | 3,512 | 2,424 | 2,409 | |||||||||||||||||||||||||||||||||||||||||||||||||||||||||||||||||||||
| Dec 2020 | 2,134 | 1,906 | 2,227 | 2,300 | 1,614 | 2,173 | 2,457 | 1,736 | 1,876 | |||||||||||||||||||||||||||||||||||||||||||||||||||||||||||||||||||||||
Operating cost8 | R/t | Dec 2021 | 949 | 5,174 | 781 | 1,643 | 195 | 1,273 | 896 | 50 | 1,122 | |||||||||||||||||||||||||||||||||||||||||||||||||||||||||||||||||||||
| Dec 2020 | 1,017 | 5,203 | 816 | 1,599 | 210 | 1,384 | 883 | 47 | 1,146 | |||||||||||||||||||||||||||||||||||||||||||||||||||||||||||||||||||||||
| Operating cost7 | US$/t | Dec 2021 | 64 | 350 | 53 | 111 | 13 | 86 | 61 | 3 | 76 | |||||||||||||||||||||||||||||||||||||||||||||||||||||||||||||||||||||
| Dec 2020 | 62 | 316 | 50 | 97 | 13 | 84 | 54 | 3 | 70 | |||||||||||||||||||||||||||||||||||||||||||||||||||||||||||||||||||||||
| Operating cost7 | R/4Eoz - R/2Eoz | Dec 2021 | 15,918 | 13,324 | 16,780 | 17,239 | 16,368 | 17,752 | 13,941 | 10,115 | 13,384 | |||||||||||||||||||||||||||||||||||||||||||||||||||||||||||||||||||||
| Dec 2020 | 16,458 | 12,829 | 18,019 | 17,144 | 18,478 | 20,678 | 13,440 | 10,365 | 13,198 | |||||||||||||||||||||||||||||||||||||||||||||||||||||||||||||||||||||||
| Operating cost7 | US$/4Eoz - US$/2Eoz | Dec 2021 | 1,076 | 901 | 1,135 | 1,166 | 1,107 | 1,200 | 943 | 684 | 905 | |||||||||||||||||||||||||||||||||||||||||||||||||||||||||||||||||||||
| Dec 2020 | 1,000 | 779 | 1,095 | 1,042 | 1,123 | 1,256 | 817 | 630 | 802 | |||||||||||||||||||||||||||||||||||||||||||||||||||||||||||||||||||||||
Adjusted EBITDA margin9 | % | Dec 2021 | 59 | 61 | 64 | 58 | 66 | 32 | 63 | |||||||||||||||||||||||||||||||||||||||||||||||||||||||||||||||||||||||
| Dec 2020 | 61 | 53 | 53 | 48 | 64 | 32 | 57 | |||||||||||||||||||||||||||||||||||||||||||||||||||||||||||||||||||||||||
All-in sustaining cost10 | R/4Eoz - R/2Eoz | Dec 2021 | 16,451 | 14,851 | 16,982 | 18,460 | 17,394 | 12,943 | 9,486 | 14,549 | ||||||||||||||||||||||||||||||||||||||||||||||||||||||||||||||||||||||
| Dec 2020 | 16,768 | 14,385 | 17,792 | 18,624 | 18,834 | 13,512 | 11,161 | 14,380 | ||||||||||||||||||||||||||||||||||||||||||||||||||||||||||||||||||||||||
| All-in sustaining cost8 | US$/4Eoz - US$/2Eoz | Dec 2021 | 1,112 | 1,004 | 1,148 | 1,248 | 1,176 | 875 | 641 | 984 | ||||||||||||||||||||||||||||||||||||||||||||||||||||||||||||||||||||||
| Dec 2020 | 1,019 | 874 | 1,081 | 1,131 | 1,144 | 821 | 678 | 874 | ||||||||||||||||||||||||||||||||||||||||||||||||||||||||||||||||||||||||
All-in cost10 | R/4Eoz - R/2Eoz | Dec 2021 | 17,599 | 19,078 | 17,108 | 18,460 | 17,675 | 12,943 | 9,486 | 14,549 | ||||||||||||||||||||||||||||||||||||||||||||||||||||||||||||||||||||||
| Dec 2020 | 17,983 | 18,339 | 17,830 | 18,624 | 18,889 | 13,512 | 11,668 | 14,380 | ||||||||||||||||||||||||||||||||||||||||||||||||||||||||||||||||||||||||
| All-in cost8 | US$/4Eoz - US$/2Eoz | Dec 2021 | 1,190 | 1,290 | 1,157 | 1,248 | 1,195 | 875 | 641 | 984 | ||||||||||||||||||||||||||||||||||||||||||||||||||||||||||||||||||||||
| Dec 2020 | 1,093 | 1,114 | 1,083 | 1,131 | 1,148 | 821 | 709 | 874 | ||||||||||||||||||||||||||||||||||||||||||||||||||||||||||||||||||||||||
Capital expenditure6 | ||||||||||||||||||||||||||||||||||||||||||||||||||||||||||||||||||||||||||||||||
| Ore reserve development | Rm | Dec 2021 | 2,930 | 1,354 | 1,576 | 629 | 947 | — | — | — | ||||||||||||||||||||||||||||||||||||||||||||||||||||||||||||||||||||||
| Dec 2020 | 2,364 | 1,239 | 1,125 | 417 | 708 | — | — | — | ||||||||||||||||||||||||||||||||||||||||||||||||||||||||||||||||||||||||
| Sustaining capital | Rm | Dec 2021 | 2,810 | 791 | 2,019 | 619 | 1,104 | 268 | 28 | 499 | ||||||||||||||||||||||||||||||||||||||||||||||||||||||||||||||||||||||
| Dec 2020 | 1,847 | 795 | 1,052 | 326 | 515 | 188 | 23 | 414 | ||||||||||||||||||||||||||||||||||||||||||||||||||||||||||||||||||||||||
| Corporate and projects | Rm | Dec 2021 | 2,614 | 2,411 | 203 | — | 203 | — | — | — | ||||||||||||||||||||||||||||||||||||||||||||||||||||||||||||||||||||||
| Dec 2020 | 2,405 | 2,385 | 20 | — | — | — | 20 | — | ||||||||||||||||||||||||||||||||||||||||||||||||||||||||||||||||||||||||
| Total capital expenditure | Rm | Dec 2021 | 8,354 | 4,556 | 3,798 | 1,248 | 2,254 | 268 | 28 | 499 | ||||||||||||||||||||||||||||||||||||||||||||||||||||||||||||||||||||||
| Dec 2020 | 6,615 | 4,419 | 2,197 | 743 | 1,223 | 188 | 43 | 414 | ||||||||||||||||||||||||||||||||||||||||||||||||||||||||||||||||||||||||
| Total capital expenditure | US$m | Dec 2021 | 565 | 308 | 257 | 84 | 152 | 18 | 2 | 34 | ||||||||||||||||||||||||||||||||||||||||||||||||||||||||||||||||||||||
| Dec 2020 | 402 | 269 | 133 | 45 | 74 | 11 | 3 | 25 | ||||||||||||||||||||||||||||||||||||||||||||||||||||||||||||||||||||||||
Average exchange rates for the year ended 31 December 2021 and 31 December 2020 were R14.79/US and R16.46/US$, respectively
Figures may not add as they are rounded independently
1The Total US and SA PGM, Total SA PGM and Marikana excludes the production and costs associated with the purchase of concentrate (PoC) from third parties. For a reconciliation of the Operating cost, AISC and AIC excluding third party PoC, refer to “Reconciliation of operating cost excluding third party PoC for Total US and SA PGM, Total SA PGM and Marikana - Year” and “Reconciliation of AISC and AIC excluding third party PoC for Total US and SA PGM, Total SA PGM and Marikana – Year”
2The US PGM operations’ underground production is converted to metric tonnes and kilograms, and performance is translated into rand. In addition to the US PGM operations’ underground production, the operation treats various recycling material which is excluded from the statistics shown above and is detailed in the PGM recycling table on the next page
3The Eastern Tailings Treatment Plant (ETTP) processing facility ounce production resulting from the processing of material from the Marikana underground operation was previously reported under the surface operation. These produced ounces are now appropriately included in the Marikana underground production resulting in a revision of previously reported plant recoveries and yield for the Marikana underground and surface operations
4The Production per product – see prill split table below
5PGM sold includes the third party PoC ounces sold
6The total US and SA PGM and Total SA PGM operations’ unit cost benchmarks and capital expenditure exclude the financial results of Mimosa, which is equity accounted and excluded from revenue and cost of sales
7The average PGM basket price is the PGM revenue per 4E/2E ounce, prior to a purchase of concentrate adjustment
8Operating cost is the average cost of production and operating cost per tonne is calculated by dividing costs of sales, before amortisation and depreciation and change in inventory in a period, by the tonnes milled/treated in the same period, and operating cost per ounce (and kilogram) is calculated by dividing the cost of sales, before amortisation and depreciation and change in inventory in a period, by the PGM produced in the same period. The operating cost of Marikana operations for 2020 includes the purchase of concentrate from Rustenburg, Kroondal and Platinum Mile
9Adjusted EBITDA margin is calculated by dividing adjusted EBITDA by revenue
Sibanye-Stillwater Operating and financial results | Six months and year ended 31 December 2021 54
10All-in cost is calculated in accordance with the World Gold Council guidance. All-in cost excludes income tax, costs associated with merger and acquisition activities, working capital, impairments, financing costs, one-time severance charges and items needed to normalise earnings. All-in cost is made up of All-in sustaining cost, being the cost to sustain current operations, given as a sub-total in the All-in cost calculation, together with corporate and major capital expenditure associated with growth. All-in sustaining cost per ounce (and kilogram)and All-in cost per ounce (and kilogram) are calculated by dividing the All-in sustaining cost and All-in cost, respectively, in a period by the total 4E/2E PGM produced in the same period. For a reconciliation of cost of sales before amortisation and depreciation to All-in cost, see “All-in costs – Year”
| Mining - PGM Prill split including third party PoC, excluding recycling operations | ||||||||||||||||||||||||||||||||||||||
| GROUP PGM | SA OPERATIONS | US OPERATIONS | ||||||||||||||||||||||||||||||||||||
| Dec 2021 | Dec 2020 | Dec 2021 | Dec 2020 | Dec 2021 | Dec 2020 | |||||||||||||||||||||||||||||||||
| % | % | % | % | % | % | |||||||||||||||||||||||||||||||||
| Platinum | 1,251,708 | 51 | % | 1,074,585 | 49 | % | 1,122,568 | 59 | % | 939,470 | 60 | % | 129,140 | 23 | % | 135,115 | 22 | % | ||||||||||||||||||||
| Palladium | 1,007,495 | 41 | % | 938,519 | 43 | % | 566,236 | 30 | % | 470,567 | 30 | % | 441,259 | 77 | % | 467,952 | 78 | % | ||||||||||||||||||||
| Rhodium | 165,454 | 7 | % | 132,079 | 6 | % | 165,454 | 9 | % | 132,079 | 8 | % | ||||||||||||||||||||||||||
| Gold | 42,414 | 2 | % | 34,391 | 2 | % | 42,414 | 2 | % | 34,391 | 2 | % | ||||||||||||||||||||||||||
| PGM production 4E/2E | 2,467,070 | 100 | % | 2,179,574 | 100 | % | 1,896,670 | 100 | % | 1,576,507 | 100 | % | 570,400 | 100 | % | 603,067 | 100 | % | ||||||||||||||||||||
| Ruthenium | 294,484 | 212,545 | 294,484 | 212,545 | ||||||||||||||||||||||||||||||||||
| Iridium | 68,234 | 52,547 | 68,234 | 52,547 | ||||||||||||||||||||||||||||||||||
| Total 6E/2E | 2,829,788 | 2,444,666 | 2,259,388 | 1,841,599 | 570,400 | 603,067 | ||||||||||||||||||||||||||||||||
Figures may not add as they are rounded independently
| Recycling at US operations | |||||||||||
| Unit | Dec 2021 | Dec 2020 | |||||||||
| Average catalyst fed/day | Tonne | 23.8 | 26.4 | ||||||||
| Total processed | Tonne | 8,673 | 9,675 | ||||||||
| Tolled | Tonne | 38 | 795 | ||||||||
| Purchased | Tonne | 8,636 | 8,881 | ||||||||
| PGM fed | 3Eoz | 755,149 | 840,170 | ||||||||
| PGM sold | 3Eoz | 782,552 | 673,893 | ||||||||
| PGM tolled returned | 3Eoz | 12,630 | 100,090 | ||||||||
Sibanye-Stillwater Operating and financial results | Six months and year ended 31 December 2021 55
SA gold operations
| SA OPERATIONS | |||||||||||||||||||||||||||||||||||||||||
| Total SA gold | Driefontein | Kloof | Beatrix | Cooke | DRDGOLD | ||||||||||||||||||||||||||||||||||||
| Total | Under- ground | Surface | Under- ground | Surface | Under- ground | Surface | Under- ground | Surface | Surface | Surface | |||||||||||||||||||||||||||||||
| Production | |||||||||||||||||||||||||||||||||||||||||
| Tonnes milled/treated | 000't | Dec 2021 | 44,402 | 5,162 | 39,240 | 1,474 | 563 | 1,862 | 4,141 | 1,826 | 650 | 4,642 | 29,244 | ||||||||||||||||||||||||||||
| Dec 2020 | 41,226 | 4,202 | 37,024 | 1,224 | — | 1,569 | 5,326 | 1,409 | 499 | 4,569 | 26,630 | ||||||||||||||||||||||||||||||
| Yield | g/t | Dec 2021 | 0.75 | 4.79 | 0.22 | 6.11 | 0.45 | 5.13 | 0.33 | 3.37 | 0.36 | 0.25 | 0.19 | ||||||||||||||||||||||||||||
| Dec 2020 | 0.74 | 5.22 | 0.23 | 6.36 | — | 5.77 | 0.36 | 3.62 | 0.35 | 0.26 | 0.20 | ||||||||||||||||||||||||||||||
| Gold produced | kg | Dec 2021 | 33,372 | 24,719 | 8,653 | 9,013 | 252 | 9,558 | 1,378 | 6,148 | 232 | 1,166 | 5,625 | ||||||||||||||||||||||||||||
| Dec 2020 | 30,561 | 21,953 | 8,608 | 7,790 | — | 9,057 | 1,891 | 5,106 | 174 | 1,172 | 5,371 | ||||||||||||||||||||||||||||||
| oz | Dec 2021 | 1,072,934 | 794,734 | 278,200 | 289,775 | 8,102 | 307,297 | 44,304 | 197,663 | 7,459 | 37,488 | 180,848 | |||||||||||||||||||||||||||||
| Dec 2020 | 982,559 | 705,805 | 276,754 | 250,454 | — | 291,189 | 60,797 | 164,162 | 5,594 | 37,681 | 172,682 | ||||||||||||||||||||||||||||||
| Gold sold | kg | Dec 2021 | 33,374 | 24,710 | 8,664 | 9,076 | 238 | 9,561 | 1,400 | 6,073 | 232 | 1,175 | 5,619 | ||||||||||||||||||||||||||||
| Dec 2020 | 30,136 | 21,551 | 8,585 | 7,554 | — | 8,887 | 1,865 | 5,110 | 176 | 1,125 | 5,419 | ||||||||||||||||||||||||||||||
| oz | Dec 2021 | 1,072,999 | 794,445 | 278,554 | 291,800 | 7,652 | 307,393 | 45,011 | 195,251 | 7,459 | 37,777 | 180,655 | |||||||||||||||||||||||||||||
| Dec 2020 | 968,895 | 692,881 | 276,014 | 242,867 | — | 285,724 | 59,961 | 164,290 | 5,659 | 36,170 | 174,225 | ||||||||||||||||||||||||||||||
| Price and costs | |||||||||||||||||||||||||||||||||||||||||
| Gold price received | R/kg | Dec 2021 | 849,703 | 851,621 | 847,915 | 847,423 | 850,213 | 852,465 | |||||||||||||||||||||||||||||||||
| Dec 2020 | 924,764 | 899,325 | 910,984 | 882,312 | 924,089 | 932,091 | |||||||||||||||||||||||||||||||||||
| Gold price received | US$/oz | Dec 2021 | 1,787 | 1,791 | 1,783 | 1,782 | 1,788 | 1,793 | |||||||||||||||||||||||||||||||||
| Dec 2020 | 1,747 | 1,699 | 1,721 | 1,667 | 1,746 | 1,761 | |||||||||||||||||||||||||||||||||||
Operating cost1 | R/t | Dec 2021 | 503 | 3,310 | 134 | 3,778 | 234 | 3,769 | 206 | 2,464 | 182 | 174 | 115 | ||||||||||||||||||||||||||||
| Dec 2020 | 470 | 3,487 | 128 | 4,091 | — | 3,831 | 190 | 2,580 | 195 | 155 | 110 | ||||||||||||||||||||||||||||||
| US$/t | Dec 2021 | 34 | 224 | 9 | 255 | 16 | 255 | 14 | 167 | 12 | 12 | 8 | |||||||||||||||||||||||||||||
| Dec 2020 | 29 | 212 | 8 | 249 | — | 233 | 12 | 157 | 12 | 9 | 7 | ||||||||||||||||||||||||||||||
| R/kg | Dec 2021 | 669,723 | 691,209 | 608,344 | 617,885 | 523,810 | 734,149 | 619,739 | 731,945 | 508,621 | 692,967 | 595,911 | |||||||||||||||||||||||||||||
| Dec 2020 | 634,596 | 667,508 | 550,662 | 642,721 | — | 663,741 | 535,748 | 712,045 | 560,345 | 602,645 | 544,256 | ||||||||||||||||||||||||||||||
| US$/oz | Dec 2021 | 1,408 | 1,454 | 1,279 | 1,299 | 1,102 | 1,544 | 1,303 | 1,539 | 1,070 | 1,457 | 1,253 | |||||||||||||||||||||||||||||
| Dec 2020 | 1,199 | 1,261 | 1,041 | 1,215 | — | 1,254 | 1,012 | 1,346 | 1,059 | 1,139 | 1,028 | ||||||||||||||||||||||||||||||
Adjusted EBITDA margin2 | R/kg | Dec 2021 | 18 | 27 | 15 | 13 | (42) | 29 | |||||||||||||||||||||||||||||||||
| Dec 2020 | 28 | 27 | 29 | 18 | (26) | 41 | |||||||||||||||||||||||||||||||||||
All-in sustaining cost3 | R/kg | Dec 2021 | 803,260 | 793,000 | 858,316 | 857,256 | 742,979 | 665,065 | |||||||||||||||||||||||||||||||||
| Dec 2020 | 743,967 | 788,708 | 764,007 | 816,591 | 661,422 | 604,650 | |||||||||||||||||||||||||||||||||||
| All-in sustaining cost2 | US$/oz | Dec 2021 | 1,689 | 1,668 | 1,805 | 1,803 | 1,562 | 1,399 | |||||||||||||||||||||||||||||||||
| Dec 2020 | 1,406 | 1,490 | 1,444 | 1,543 | 1,250 | 1,143 | |||||||||||||||||||||||||||||||||||
All-in cost3 | R/kg | Dec 2021 | 821,358 | 793,000 | 876,380 | 858,366 | 742,979 | 673,429 | |||||||||||||||||||||||||||||||||
| Dec 2020 | 756,351 | 788,708 | 778,460 | 816,629 | 661,422 | 613,176 | |||||||||||||||||||||||||||||||||||
| All-in cost2 | US$/oz | Dec 2021 | 1,727 | 1,668 | 1,843 | 1,805 | 1,562 | 1,416 | |||||||||||||||||||||||||||||||||
| Dec 2020 | 1,429 | 1,490 | 1,471 | 1,543 | 1,250 | 1,159 | |||||||||||||||||||||||||||||||||||
| Capital expenditure | |||||||||||||||||||||||||||||||||||||||||
| Ore reserve development | Rm | Dec 2021 | 2,604 | 1,177 | 930 | 497 | — | — | |||||||||||||||||||||||||||||||||
| Dec 2020 | 1,786 | 742 | 722 | 322 | — | — | |||||||||||||||||||||||||||||||||||
| Sustaining capital | Rm | Dec 2021 | 1,304 | 322 | 488 | 164 | — | 330 | |||||||||||||||||||||||||||||||||
| Dec 2020 | 967 | 187 | 392 | 93 | — | 295 | |||||||||||||||||||||||||||||||||||
Corporate and projects4 | Rm | Dec 2021 | 472 | — | 198 | 7 | — | 47 | |||||||||||||||||||||||||||||||||
| Dec 2020 | 244 | — | 155 | — | — | 46 | |||||||||||||||||||||||||||||||||||
| Total capital expenditure | Rm | Dec 2021 | 4,380 | 1,499 | 1,616 | 668 | — | 377 | |||||||||||||||||||||||||||||||||
| Dec 2020 | 2,997 | 929 | 1,270 | 415 | — | 341 | |||||||||||||||||||||||||||||||||||
| Total capital expenditure | US$m | Dec 2021 | 296 | 101 | 109 | 45 | — | 25 | |||||||||||||||||||||||||||||||||
| Dec 2020 | 182 | 56 | 77 | 25 | — | 21 | |||||||||||||||||||||||||||||||||||
Average exchange rates for the year ended 31 December 2021 and 31 December 2020 were R14.79/US and R16.46/US$, respectively
Figures may not add as they are rounded independently
1Operating cost is the average cost of production and operating cost per tonne is calculated by dividing the cost of sales, before amortisation and depreciation and change in inventory in a period, by the tonnes milled/treated in the same period, and operating cost per kilogram (and ounce) is calculated by dividing the cost of sales, before amortisation and depreciation and change in inventory in a period, by the gold produced in the same period
2Adjusted EBITDA margin is calculated by dividing adjusted EBITDA by revenue
3All-in cost is calculated in accordance with the World Gold Council guidance. All-in cost excludes income tax, costs associated with merger and acquisition activities, working capital, impairments, financing costs, one time severance charges and items needed to normalise earnings. All-in cost is made up of All-in sustaining cost, being the cost to sustain current operations, given as a sub-total in the All-in cost calculation, together with corporate and major capital expenditure associated with growth. All-in sustaining cost per kilogram (and ounce) and All-in cost per kilogram (and ounce) are calculated by dividing the All-in sustaining cost and All-in cost, respectively, in a period by the total gold sold over the same period. For a reconciliation of cost of sales before amortisation and depreciation to All-in cost, see “All-in costs – Year”
4Corporate project expenditure for the years ended 31 December 2021 and 31 December 2020 was R220 million (US$15 million) and R42 million (US$3 million), respectively, the majority of which related to the Burnstone project and various Corporate IT projects
Sibanye-Stillwater Operating and financial results | Six months and year ended 31 December 2021 56
ALL-IN COSTS - YEAR
SA and US PGM operations
| US OPERATIONS | SA OPERATIONS | ||||||||||||||||||||||||||||||||||
| R' million | Total US and SA PGM1 | Total US PGM2 | Total SA PGM1 | Rustenburg | Marikana1 | Kroondal | Plat Mile | Mimosa | Corporate | ||||||||||||||||||||||||||
Cost of sales, before amortisation and depreciation3 | Dec 2021 | 39,539 | 7,567 | 31,972 | 11,464 | 16,561 | 3,416 | 531 | 1,587 | (1,587) | |||||||||||||||||||||||||
| Dec 2020 | 32,308 | 7,586 | 24,723 | 9,589 | 13,232 | 2,803 | 403 | 1,601 | (2,905) | ||||||||||||||||||||||||||
| Royalties | Dec 2021 | 2,547 | — | 2,547 | 1,405 | 1,128 | 14 | — | 160 | (160) | |||||||||||||||||||||||||
| Dec 2020 | 1,623 | — | 1,623 | 924 | 689 | 10 | — | 135 | (135) | ||||||||||||||||||||||||||
| Carbon tax | Dec 2021 | 1 | — | 1 | — | 1 | — | — | — | — | |||||||||||||||||||||||||
| Dec 2020 | 3 | — | 3 | — | 2 | — | — | — | — | ||||||||||||||||||||||||||
| Community costs | Dec 2021 | 161 | — | 161 | 12 | 150 | — | — | — | (1) | |||||||||||||||||||||||||
| Dec 2020 | 107 | — | 107 | 8 | 100 | — | — | — | — | ||||||||||||||||||||||||||
Inventory change4 | Dec 2021 | 1,327 | 33 | 1,294 | 816 | 478 | — | — | 9 | (9) | |||||||||||||||||||||||||
| Dec 2020 | 3,189 | 151 | 3,039 | 553 | 1,182 | — | — | 19 | 1,285 | ||||||||||||||||||||||||||
Share-based payments5 | Dec 2021 | 199 | 86 | 113 | 45 | 53 | 15 | — | — | — | |||||||||||||||||||||||||
| Dec 2020 | 101 | 54 | 46 | 19 | 21 | 7 | — | — | — | ||||||||||||||||||||||||||
Rehabilitation interest and amortisation6 | Dec 2021 | 275 | 31 | 244 | — | 162 | 81 | — | 4 | (3) | |||||||||||||||||||||||||
| Dec 2020 | 271 | 29 | 242 | 5 | 152 | 86 | — | 4 | (4) | ||||||||||||||||||||||||||
| Leases | Dec 2021 | 54 | 1 | 53 | 11 | 35 | 7 | — | — | — | |||||||||||||||||||||||||
| Dec 2020 | 64 | 5 | 59 | 14 | 35 | 10 | — | — | — | ||||||||||||||||||||||||||
| Ore reserve development | Dec 2021 | 2,930 | 1,354 | 1,576 | 629 | 947 | — | — | — | — | |||||||||||||||||||||||||
| Dec 2020 | 2,364 | 1,239 | 1,125 | 417 | 708 | — | — | — | — | ||||||||||||||||||||||||||
| Sustaining capital expenditure | Dec 2021 | 2,810 | 791 | 2,019 | 619 | 1,104 | 268 | 28 | 499 | (499) | |||||||||||||||||||||||||
| Dec 2020 | 1,847 | 795 | 1,052 | 326 | 515 | 188 | 23 | 414 | (414) | ||||||||||||||||||||||||||
Less: By-product credit7 | Dec 2021 | (9,287) | (1,392) | (7,895) | (2,589) | (4,376) | (869) | (61) | (524) | 524 | |||||||||||||||||||||||||
| Dec 2020 | (6,627) | (1,183) | (5,444) | (1,395) | (3,614) | (443) | 8 | (408) | 409 | ||||||||||||||||||||||||||
Total All-in-sustaining costs8 | Dec 2021 | 40,556 | 8,471 | 32,085 | 12,412 | 16,243 | 2,932 | 498 | 1,735 | (1,735) | |||||||||||||||||||||||||
| Dec 2020 | 35,250 | 8,675 | 26,575 | 10,459 | 13,022 | 2,660 | 434 | 1,765 | (1,764) | ||||||||||||||||||||||||||
| Plus: Corporate cost, growth and capital expenditure | Dec 2021 | 2,626 | 2,411 | 215 | — | 215 | — | — | — | — | |||||||||||||||||||||||||
| Dec 2020 | 2,438 | 2,385 | 53 | — | 33 | — | 20 | — | — | ||||||||||||||||||||||||||
Total All-in-costs8 | Dec 2021 | 43,182 | 10,882 | 32,300 | 12,412 | 16,458 | 2,932 | 498 | 1,735 | (1,735) | |||||||||||||||||||||||||
| Dec 2020 | 37,688 | 11,060 | 26,628 | 10,459 | 13,055 | 2,660 | 453 | 1,765 | (1,764) | ||||||||||||||||||||||||||
| PGM production | 4Eoz - 2Eoz | Dec 2021 | 2,467,070 | 570,400 | 1,896,670 | 672,374 | 826,018 | 226,531 | 52,496 | 119,251 | — | ||||||||||||||||||||||||
| Dec 2020 | 2,179,574 | 603,067 | 1,576,507 | 561,574 | 656,475 | 196,847 | 38,841 | 122,770 | — | ||||||||||||||||||||||||||
| kg | Dec 2021 | 76,734 | 17,741 | 58,993 | 20,913 | 25,692 | 7,046 | 1,633 | 3,709 | — | |||||||||||||||||||||||||
| Dec 2020 | 67,792 | 18,757 | 49,035 | 17,467 | 20,419 | 6,123 | 1,208 | 3,819 | — | ||||||||||||||||||||||||||
| All-in-sustaining cost | R/4Eoz - R/2Eoz | Dec 2021 | 17,274 | 14,851 | 18,051 | 18,460 | 19,664 | 12,943 | 9,486 | 14,549 | — | ||||||||||||||||||||||||
| Dec 2020 | 17,138 | 14,385 | 18,280 | 18,624 | 19,836 | 13,512 | 11,161 | 14,380 | — | ||||||||||||||||||||||||||
| US$/4Eoz - US$/2Eoz | Dec 2021 | 1,168 | 1,004 | 1,221 | 1,248 | 1,330 | 875 | 641 | 984 | — | |||||||||||||||||||||||||
| Dec 2020 | 1,041 | 874 | 1,111 | 1,131 | 1,205 | 821 | 678 | 874 | — | ||||||||||||||||||||||||||
| All-in-cost | R/4Eoz - R/2Eoz | Dec 2021 | 18,392 | 19,078 | 18,172 | 18,460 | 19,925 | 12,943 | 9,486 | 14,549 | — | ||||||||||||||||||||||||
| Dec 2020 | 18,323 | 18,339 | 18,317 | 18,624 | 19,886 | 13,512 | 11,668 | 14,380 | — | ||||||||||||||||||||||||||
| US$/4Eoz - US$/2Eoz | Dec 2021 | 1,244 | 1,290 | 1,229 | 1,248 | 1,347 | 875 | 641 | 984 | — | |||||||||||||||||||||||||
| Dec 2020 | 1,113 | 1,114 | 1,113 | 1,131 | 1,208 | 821 | 709 | 874 | — | ||||||||||||||||||||||||||
Average exchange rates for the year ended 31 December 2021 and 31 December 2020 were R14.79/US and R16.46/US$, respectively
Figures may not add as they are rounded independently
1The Total US and SA PGM, Total SA PGM and Marikana includes the production and costs associated with the purchase of concentrate (PoC) from third parties. For a reconciliation of the Operating cost, AISC and AIC excluding third party PoC, refer to “Reconciliation of operating cost excluding third party PoC for Total US and SA PGM, Total SA PGM and Marikana - Year” and “Reconciliation of AISC and AIC excluding third party PoC for Total US and SA PGM, Total SA PGM and Marikana – Year”
2The US PGM operations’ underground production is converted to metric tonnes and kilograms, and performance is translated into SA rand. In addition to the US PGM operations’ underground production, the operation processes various recycling material which is excluded from the 2E PGM production, All-in sustaining cost and All-in cost statistics shown
3Cost of sales, before amortisation and depreciation includes all mining and processing costs, third party refining costs, corporate general and administrative costs, and permitting costs. In addition to the Mimosa elimination (equity accounted), Corporate for the year ended 31 December 2020 includes the elimination of concentrate sales by Rustenburg, Kroondal and Platinum Mile to Marikana and the associated unrealised profit
4Inventory adjustment in Corporate for the year ended 31 December 2020 includes the elimination of concentrate sales by Rustenburg, Kroondal and Platinum Mile to Marikana and the associated unrealised profit
5Share-based payments are calculated based on the fair value at initial recognition and do not include the adjustment of the cash-settled share-based payment obligation to the reporting date fair value
6Rehabilitation includes the interest charge related to the environmental rehabilitation obligation and the amortisation of the related capitalised rehabilitation costs. The interest charge related to the environmental rehabilitation obligation and the amortisation of the capitalised rehabilitation costs reflect the periodic costs of rehabilitation associated with current PGM production
7The by-product credit for Marikana for the year ended 31 December 2020 includes the benefit from the sale of concentrate purchased from Rustenburg, Kroondal and Platinum Mile of R1,674 million. The cost associated with the purchase and processing of the intercompany concentrate is included in the Marikana cost of sales, before amortisation and depreciation
8All-in cost is calculated in accordance with the World Gold Council guidance. All-in cost excludes income tax, costs associated with merger and acquisition activities, working capital, impairments, financing costs, one-time severance charges and items needed to normalise earnings. All-in cost is made up of All-in sustaining cost, being the cost to sustain current operations, given as a sub-total in the All-in cost calculation, together with corporate and major capital expenditure associated with growth. All-in sustaining cost per ounce (and kilogram) and All-in cost per ounce (and kilogram) are calculated by dividing the All-in sustaining cost and All-in cost, respectively, in a period by the total 4E/2E PGM produced in the same period
Non-IFRS measures such as All-in sustaining cost and All-in cost are considered as pro forma financial information as per the JSE Listing Requirements. The pro forma financial information is the responsibility of the Group’s Board of Directors and is presented for illustration purposes only, and because of its nature, All-in sustaining cost and All-in cost should not be considered as a representation of financial performance. This pro forma financial information has been reported on by Ernst & Young Inc. in terms of ISAE 3420 and their unmodified report is available for inspection at the Company’s registered office
Sibanye-Stillwater Operating and financial results | Six months and year ended 31 December 2021 57
| Reconciliation of operating cost excluding third party PoC for Total US and SA PGM, Total SA PGM and Marikana - Year | |||||||||||||||||||||||
| Total US and SA PGM | Total SA PGM | Marikana | |||||||||||||||||||||
| R' million | Dec 2021 | Dec 2020 | Dec 2021 | Dec 2020 | Dec 2021 | Dec 2020 | |||||||||||||||||
| Cost of sales, before amortisation and depreciation as reported per table above | 39,539 | 32,308 | 31,972 | 24,723 | 16,561 | 13,232 | |||||||||||||||||
| Inventory change as reported per table above | 1,327 | 3,189 | 1,294 | 3,039 | 478 | 1,182 | |||||||||||||||||
| Less: Chrome cost of sales | (1,286) | (804) | (1,286) | (804) | (280) | (209) | |||||||||||||||||
| Total operating cost including third party PoC | 39,580 | 34,693 | 31,980 | 26,958 | 16,759 | 14,205 | |||||||||||||||||
| Less: Purchase cost of PoC | (3,170) | (1,667) | (3,170) | (1,667) | (3,170) | (1,667) | |||||||||||||||||
| Total operating cost excluding third party PoC | 36,410 | 33,026 | 28,810 | 25,291 | 13,589 | 12,538 | |||||||||||||||||
| PGM production as reported per table above | 4Eoz- 2Eoz | 2,467,070 | 2,179,574 | 1,896,670 | 1,576,507 | 826,018 | 656,475 | ||||||||||||||||
| Less: Mimosa production | (119,251) | (122,770) | (119,251) | (122,770) | — | — | |||||||||||||||||
| PGM production excluding Mimosa | 2,347,819 | 2,056,804 | 1,777,419 | 1,453,737 | 826,018 | 656,475 | |||||||||||||||||
| Less: PoC production | (60,532) | (50,136) | (60,532) | (50,136) | (60,532) | (50,136) | |||||||||||||||||
| PGM production excluding Mimosa and third party PoC | 2,287,287 | 2,006,668 | 1,716,887 | 1,403,601 | 765,486 | 606,339 | |||||||||||||||||
| PGM production including Mimosa and excluding third party PoC | 2,406,538 | 2,129,438 | 1,836,138 | 1,526,371 | 765,486 | 606,339 | |||||||||||||||||
| Tonnes milled/treated | 000't | 39,776 | 33,903 | 38,307 | 32,416 | 10,671 | 9,056 | ||||||||||||||||
| Less: Mimosa tonnes | (1,422) | (1,414) | (1,422) | (1,414) | — | — | |||||||||||||||||
| PGM tonnes excluding Mimosa and third party PoC | 38,354 | 32,489 | 36,885 | 31,002 | 10,671 | 9,056 | |||||||||||||||||
| Operating cost including third party PoC | R/4Eoz-R/2Eoz | 16,858 | 16,868 | 17,992 | 18,543 | 20,289 | 21,638 | ||||||||||||||||
| US$/4Eoz-US$/2Eoz | 1,140 | 1,025 | 1,217 | 1,127 | 1,372 | 1,315 | |||||||||||||||||
| R/t | 1,032 | 1,068 | 867 | 870 | 1,571 | 1,569 | |||||||||||||||||
| US$/t | 70 | 65 | 59 | 53 | 106 | 95 | |||||||||||||||||
| Operating cost excluding third party PoC | R/4Eoz-R/2Eoz | 15,918 | 16,458 | 16,780 | 18,019 | 17,752 | 20,678 | ||||||||||||||||
| US$/4Eoz-US$/2Eoz | 1,076 | 1,000 | 1,135 | 1,095 | 1,200 | 1,256 | |||||||||||||||||
| R/t | 949 | 1,017 | 781 | 816 | 1,273 | 1,384 | |||||||||||||||||
| US$/t | 64 | 62 | 53 | 50 | 86 | 84 | |||||||||||||||||
| Reconciliation of AISC and AIC excluding third party PoC for Total US and SA PGM, Total SA PGM and Marikana - Year | |||||||||||||||||||||||
| Total US and SA PGM | Total SA PGM | Marikana | |||||||||||||||||||||
| R' million | Dec 2021 | Dec 2020 | Dec 2021 | Dec 2020 | Dec 2021 | Dec 2020 | |||||||||||||||||
| Total All-in-sustaining cost as reported per table above | 40,556 | 35,250 | 32,085 | 26,575 | 16,243 | 13,022 | |||||||||||||||||
| Less: Purchase cost of PoC | (3,170) | (1,667) | (3,170) | (1,667) | (3,170) | (1,667) | |||||||||||||||||
| Add: By-product credit of PoC | 242 | 65 | 242 | 65 | 242 | 65 | |||||||||||||||||
| Total All-in-sustaining cost excluding third party PoC | 37,628 | 33,648 | 29,157 | 24,973 | 13,315 | 11,420 | |||||||||||||||||
| Plus: Corporate cost, growth and capital expenditure | 2,626 | 2,438 | 215 | 53 | 215 | 33 | |||||||||||||||||
| Total All-in-cost excluding third party PoC | 40,254 | 36,086 | 29,372 | 25,026 | 13,530 | 11,453 | |||||||||||||||||
| PGM production excluding Mimosa and third party PoC | 4Eoz- 2Eoz | 2,287,287 | 2,006,668 | 1,716,887 | 1,403,601 | 765,486 | 606,339 | ||||||||||||||||
| All-in-sustaining cost excluding third party PoC | R/4Eoz-R/2Eoz | 16,451 | 16,768 | 16,982 | 17,792 | 17,394 | 18,834 | ||||||||||||||||
| US$/4Eoz-US$/2Eoz | 1,112 | 1,019 | 1,148 | 1,081 | 1,176 | 1,144 | |||||||||||||||||
| All-in-cost excluding third party PoC | R/4Eoz-R/2Eoz | 17,599 | 17,983 | 17,108 | 17,830 | 17,675 | 18,889 | ||||||||||||||||
| US$/4Eoz-US$/2Eoz | 1,190 | 1,093 | 1,157 | 1,083 | 1,195 | 1,148 | |||||||||||||||||
Sibanye-Stillwater Operating and financial results | Six months and year ended 31 December 2021 58
SA gold operations
| SA OPERATIONS | |||||||||||||||||||||||||||||
| R' million | Total SA gold | Driefontein | Kloof | Beatrix | Cooke | DRDGOLD | Corporate | ||||||||||||||||||||||
Cost of sales, before amortisation and depreciation1 | Dec 2021 | 22,256 | 5,691 | 7,845 | 4,565 | 808 | 3,347 | — | |||||||||||||||||||||
| Dec 2020 | 19,050 | 4,864 | 6,880 | 3,714 | 671 | 2,922 | — | ||||||||||||||||||||||
| Royalties | Dec 2021 | 167 | 95 | 46 | 27 | 5 | — | (6) | |||||||||||||||||||||
| Dec 2020 | 142 | 73 | 115 | 44 | 5 | — | (95) | ||||||||||||||||||||||
| Carbon tax | Dec 2021 | 2 | — | — | 2 | — | — | — | |||||||||||||||||||||
| Dec 2020 | 3 | — | — | 2 | — | — | — | ||||||||||||||||||||||
| Community costs | Dec 2021 | 127 | 46 | 38 | 34 | 1 | 8 | — | |||||||||||||||||||||
| Dec 2020 | 151 | 30 | 46 | 59 | — | 16 | — | ||||||||||||||||||||||
Share-based payments2 | Dec 2021 | 100 | 23 | 35 | 23 | — | 19 | — | |||||||||||||||||||||
| Dec 2020 | 50 | 11 | 13 | 10 | — | 16 | — | ||||||||||||||||||||||
Rehabilitation interest and amortisation3 | Dec 2021 | 189 | 32 | 17 | 70 | 47 | 18 | 5 | |||||||||||||||||||||
| Dec 2020 | 218 | 51 | 33 | 56 | 54 | 19 | 5 | ||||||||||||||||||||||
| Leases | Dec 2021 | 82 | 8 | 14 | 28 | 13 | 19 | — | |||||||||||||||||||||
| Dec 2020 | 78 | 8 | 18 | 21 | 16 | 16 | — | ||||||||||||||||||||||
| Ore reserve development | Dec 2021 | 2,604 | 1,177 | 930 | 497 | — | — | — | |||||||||||||||||||||
| Dec 2020 | 1,786 | 742 | 722 | 322 | — | — | — | ||||||||||||||||||||||
| Sustaining capital expenditure | Dec 2021 | 1,304 | 322 | 488 | 164 | — | 330 | — | |||||||||||||||||||||
| Dec 2020 | 967 | 187 | 392 | 93 | — | 295 | — | ||||||||||||||||||||||
| Less: By-product credit | Dec 2021 | (23) | (8) | (5) | (5) | (1) | (4) | — | |||||||||||||||||||||
| Dec 2020 | (24) | (7) | (5) | (4) | (1) | (7) | — | ||||||||||||||||||||||
Total All-in-sustaining costs4 | Dec 2021 | 26,808 | 7,386 | 9,408 | 5,405 | 873 | 3,737 | (1) | |||||||||||||||||||||
| Dec 2020 | 22,420 | 5,958 | 8,215 | 4,317 | 744 | 3,277 | (90) | ||||||||||||||||||||||
| Plus: Corporate cost, growth and capital expenditure | Dec 2021 | 604 | — | 198 | 7 | — | 47 | 352 | |||||||||||||||||||||
| Dec 2020 | 373 | — | 155 | — | — | 46 | 171 | ||||||||||||||||||||||
Total All-in-costs4 | Dec 2021 | 27,412 | 7,386 | 9,606 | 5,412 | 873 | 3,784 | 351 | |||||||||||||||||||||
| Dec 2020 | 22,793 | 5,958 | 8,370 | 4,317 | 744 | 3,323 | 82 | ||||||||||||||||||||||
| Gold sold | kg | Dec 2021 | 33,374 | 9,314 | 10,961 | 6,305 | 1,175 | 5,619 | — | ||||||||||||||||||||
| Dec 2020 | 30,136 | 7,554 | 10,752 | 5,286 | 1,125 | 5,419 | — | ||||||||||||||||||||||
| oz | Dec 2021 | 1,072,999 | 299,452 | 352,404 | 202,710 | 37,777 | 180,655 | — | |||||||||||||||||||||
| Dec 2020 | 968,895 | 242,867 | 345,685 | 169,949 | 36,170 | 174,225 | — | ||||||||||||||||||||||
| All-in-sustaining cost | R/kg | Dec 2021 | 803,260 | 793,000 | 858,316 | 857,256 | 742,979 | 665,065 | — | ||||||||||||||||||||
| Dec 2020 | 743,967 | 788,708 | 764,007 | 816,591 | 661,422 | 604,650 | — | ||||||||||||||||||||||
| All-in-sustaining cost | US$/oz | Dec 2021 | 1,689 | 1,668 | 1,805 | 1,803 | 1,562 | 1,399 | — | ||||||||||||||||||||
| Dec 2020 | 1,406 | 1,490 | 1,444 | 1,543 | 1,250 | 1,143 | — | ||||||||||||||||||||||
| All-in-cost | R/kg | Dec 2021 | 821,358 | 793,000 | 876,380 | 858,366 | 742,979 | 673,429 | — | ||||||||||||||||||||
| Dec 2020 | 756,351 | 788,708 | 778,460 | 816,629 | 661,422 | 613,176 | — | ||||||||||||||||||||||
| All-in-cost | US$/oz | Dec 2021 | 1,727 | 1,668 | 1,843 | 1,805 | 1,562 | 1,416 | — | ||||||||||||||||||||
| Dec 2020 | 1,429 | 1,490 | 1,471 | 1,543 | 1,250 | 1,159 | — | ||||||||||||||||||||||
Average exchange rates for the year ended 31 December 2021 and 31 December 2020 were R14.79/US and R16.46/US$, respectively
Figures may not add as they are rounded independently
1 Cost of sales, before amortisation and depreciation includes all mining and processing costs, third party refining costs, corporate general and administrative costs, and permitting costs
2 Share-based payments are calculated based on the fair value at initial recognition and do not include the adjustment of the cash-settled share-based payment obligation to the reporting date fair value
3 Rehabilitation includes the interest charge related to the environmental rehabilitation obligation and the amortisation of the related capitalised rehabilitation costs. The interest charge related to the environmental rehabilitation obligation and the amortisation of the capitalised rehabilitation costs reflect the periodic costs of rehabilitation associated with current gold production
4 All-in cost is calculated in accordance with the World Gold Council guidance. All-in cost excludes income tax, costs associated with merger and acquisition activities, working capital, impairments, financing costs, one time severance charges and items needed to normalise earnings. All-in cost is made up of All-in sustaining cost, being the cost to sustain current operations, given as a sub-total in the All-in cost calculation, together with corporate and major capital expenditure associated with growth. All-in sustaining cost per kilogram (and ounce) and All-in cost per kilogram (and ounce) are calculated by dividing the All-in sustaining cost and All-in cost, respectively, in a period by the total gold sold over the same period
Non-IFRS measures such as All-in sustaining cost and All-in cost are considered as pro forma financial information as per the JSE Listing Requirements. The pro forma financial information is the responsibility of the Group’s Board of Directors and is presented for illustration purposes only, and because of its nature, All-in sustaining cost and All-in cost should not be considered as a representation of financial performance. This pro forma financial information has been reported on by Ernst & Young Inc. in terms of ISAE 3420 and their unmodified report is available for inspection at the Company’s registered office
Sibanye-Stillwater Operating and financial results | Six months and year ended 31 December 2021 59
SALIENT FEATURES AND COST BENCHMARKS - QUARTERS
US and SA PGM operations
| US OPERA-TIONS | SA OPERATIONS | |||||||||||||||||||||||||||||||||||||||||||
Total US and SA PGM1 | Total US PGM | Total SA PGM1 | Rustenburg | Marikana1 | Kroondal | Plat Mile | Mimosa | |||||||||||||||||||||||||||||||||||||
| Attributable | Under- ground2 | Total | Under- ground | Surface | Under- ground | Surface | Under- ground | Surface | Attribu-table | Surface | Attribu-table | |||||||||||||||||||||||||||||||||
| Production | ||||||||||||||||||||||||||||||||||||||||||||
| Tonnes milled/treated | 000't | Dec 2021 | 9,614 | 326 | 9,288 | 4,219 | 5,069 | 1,442 | 1,478 | 1,610 | 999 | 811 | 2,592 | 356 | ||||||||||||||||||||||||||||||
| Sep 2021 | 10,747 | 384 | 10,363 | 4,964 | 5,399 | 1,778 | 1,442 | 1,889 | 1,044 | 945 | 2,913 | 352 | ||||||||||||||||||||||||||||||||
| Plant head grade | g/t | Dec 2021 | 2.42 | 13.46 | 2.03 | 3.45 | 0.85 | 3.52 | 1.00 | 3.90 | 0.87 | 2.39 | 0.75 | 3.57 | ||||||||||||||||||||||||||||||
| Sep 2021 | 2.46 | 12.92 | 2.08 | 3.40 | 0.86 | 3.37 | 1.17 | 3.89 | 0.87 | 2.40 | 0.71 | 3.58 | ||||||||||||||||||||||||||||||||
| Plant recoveries | % | Dec 2021 | 76.20 | 89.26 | 72.86 | 85.44 | 30.35 | 87.41 | 36.98 | 86.93 | 27.01 | 83.37 | 27.08 | 72.85 | ||||||||||||||||||||||||||||||
| Sep 2021 | 75.69 | 90.62 | 72.27 | 85.07 | 25.78 | 86.38 | 31.72 | 86.92 | 25.85 | 83.77 | 20.64 | 71.01 | ||||||||||||||||||||||||||||||||
| Yield | g/t | Dec 2021 | 1.84 | 12.01 | 1.48 | 2.95 | 0.26 | 3.08 | 0.37 | 3.39 | 0.23 | 1.99 | 0.20 | 2.60 | ||||||||||||||||||||||||||||||
| Sep 2021 | 1.86 | 11.71 | 1.50 | 2.89 | 0.22 | 2.91 | 0.37 | 3.38 | 0.22 | 2.01 | 0.15 | 2.54 | ||||||||||||||||||||||||||||||||
PGM production3 | 4Eoz - 2Eoz | Dec 2021 | 569,674 | 127,774 | 441,900 | 399,853 | 42,047 | 142,642 | 17,572 | 175,492 | 7,547 | 51,952 | 16,928 | 29,767 | ||||||||||||||||||||||||||||||
| Sep 2021 | 644,398 | 144,325 | 500,073 | 461,593 | 38,480 | 166,400 | 17,206 | 205,340 | 7,548 | 61,083 | 13,726 | 28,770 | ||||||||||||||||||||||||||||||||
PGM sold4 | 4Eoz - 2Eoz | Dec 2021 | 644,419 | 144,925 | 499,494 | 167,506 | 15,592 | 222,295 | 51,952 | 16,928 | 25,221 | |||||||||||||||||||||||||||||||||
| Sep 2021 | 592,631 | 132,637 | 459,994 | 144,461 | 16,088 | 196,251 | 61,083 | 13,726 | 28,385 | |||||||||||||||||||||||||||||||||||
Price and costs5 | ||||||||||||||||||||||||||||||||||||||||||||
Average PGM basket price6 | R/4Eoz - R/2Eoz | Dec 2021 | 35,418 | 26,661 | 38,094 | 38,904 | 26,850 | 38,071 | 41,043 | 31,693 | 30,074 | |||||||||||||||||||||||||||||||||
| Sep 2021 | 39,662 | 30,924 | 42,347 | 43,089 | 28,266 | 42,247 | 46,357 | 34,642 | 33,392 | |||||||||||||||||||||||||||||||||||
| Average PGM basket price6 | US$/4Eoz - US$/2Eoz | Dec 2021 | 2,297 | 1,729 | 2,470 | 2,523 | 1,741 | 2,469 | 2,662 | 2,055 | 1,950 | |||||||||||||||||||||||||||||||||
| Sep 2021 | 2,711 | 2,114 | 2,895 | 2,945 | 1,932 | 2,888 | 3,169 | 2,368 | 2,282 | |||||||||||||||||||||||||||||||||||
Operating cost7 | R/t | Dec 2021 | 993 | 5,755 | 819 | 1,879 | 164 | 1,305 | 980 | 63 | 1,180 | |||||||||||||||||||||||||||||||||
| Sep 2021 | 928 | 4,932 | 775 | 1,575 | 244 | 1,233 | 894 | 48 | 1,173 | |||||||||||||||||||||||||||||||||||
| Operating cost7 | US$/t | Dec 2021 | 64 | 373 | 53 | 122 | 11 | 85 | 64 | 4 | 77 | |||||||||||||||||||||||||||||||||
| Sep 2021 | 63 | 337 | 53 | 108 | 17 | 84 | 61 | 3 | 80 | |||||||||||||||||||||||||||||||||||
| Operating cost7 | R/4Eoz - R/2Eoz | Dec 2021 | 17,020 | 14,682 | 17,744 | 18,992 | 13,829 | 18,597 | 15,303 | 9,570 | 14,110 | |||||||||||||||||||||||||||||||||
| Sep 2021 | 15,673 | 13,123 | 16,454 | 16,833 | 20,458 | 16,990 | 13,834 | 10,200 | 14,355 | |||||||||||||||||||||||||||||||||||
| Operating cost7 | US$/4Eoz - US$/2Eoz | Dec 2021 | 1,104 | 952 | 1,151 | 1,232 | 897 | 1,206 | 992 | 621 | 915 | |||||||||||||||||||||||||||||||||
| Sep 2021 | 1,071 | 897 | 1,125 | 1,151 | 1,398 | 1,161 | 946 | 697 | 981 | |||||||||||||||||||||||||||||||||||
All-in sustaining cost8 | R/4Eoz - R/2Eoz | Dec 2021 | 18,001 | 17,265 | 18,230 | 20,148 | 18,379 | 15,437 | 6,971 | 16,394 | ||||||||||||||||||||||||||||||||||
| Sep 2021 | 15,561 | 14,156 | 15,992 | 17,701 | 15,933 | 12,327 | 10,345 | 15,294 | ||||||||||||||||||||||||||||||||||||
| All-in sustaining cost8 | US$/4Eoz - US$/2Eoz | Dec 2021 | 1,167 | 1,120 | 1,182 | 1,307 | 1,192 | 1,001 | 452 | 1,063 | ||||||||||||||||||||||||||||||||||
| Sep 2021 | 1,064 | 968 | 1,093 | 1,210 | 1,089 | 843 | 707 | 1045 | ||||||||||||||||||||||||||||||||||||
All-in cost8 | R/4Eoz - R/2Eoz | Dec 2021 | 19,400 | 22,047 | 18,579 | 20,148 | 19,165 | 15,437 | 6,971 | 16,394 | ||||||||||||||||||||||||||||||||||
| Sep 2021 | 16,609 | 18,195 | 16,123 | 17,701 | 16,224 | 12,327 | 10,345 | 15,294 | ||||||||||||||||||||||||||||||||||||
| All-in cost8 | US$/4Eoz - US$/2Eoz | Dec 2021 | 1,258 | 1,430 | 1,205 | 1,307 | 1,243 | 1,001 | 452 | 1,063 | ||||||||||||||||||||||||||||||||||
| Sep 2021 | 1,135 | 1,244 | 1,102 | 1,210 | 1,109 | 843 | 707 | 1,045 | ||||||||||||||||||||||||||||||||||||
Capital expenditure5 | ||||||||||||||||||||||||||||||||||||||||||||
| Ore reserve development | Rm | Dec 2021 | 864 | 476 | 388 | 148 | 240 | — | — | — | ||||||||||||||||||||||||||||||||||
| Sep 2021 | 739 | 296 | 443 | 168 | 275 | — | — | — | ||||||||||||||||||||||||||||||||||||
| Sustaining capital | Rm | Dec 2021 | 1,050 | 147 | 903 | 271 | 519 | 107 | 6 | 181 | ||||||||||||||||||||||||||||||||||
| Sep 2021 | 592 | 143 | 449 | 115 | 268 | 58 | 8 | 118 | ||||||||||||||||||||||||||||||||||||
| Corporate and projects | Rm | Dec 2021 | 751 | 611 | 140 | — | 140 | — | — | — | ||||||||||||||||||||||||||||||||||
| Sep 2021 | 639 | 583 | 56 | — | 56 | — | — | — | ||||||||||||||||||||||||||||||||||||
| Total capital expenditure | Rm | Dec 2021 | 2,665 | 1,234 | 1,431 | 419 | 899 | 107 | 6 | 181 | ||||||||||||||||||||||||||||||||||
| Sep 2021 | 1,970 | 1,022 | 948 | 283 | 599 | 58 | 8 | 118 | ||||||||||||||||||||||||||||||||||||
| Total capital expenditure | US$m | Dec 2021 | 173 | 80 | 93 | 27 | 58 | 7 | — | 12 | ||||||||||||||||||||||||||||||||||
| Sep 2021 | 135 | 70 | 65 | 19 | 41 | 4 | 1 | 8 | ||||||||||||||||||||||||||||||||||||
Average exchange rate for the quarters ended 31 December 2021 and 30 September 2021 was R15.42/US$ and R14.63/US$, respectively
Figures may not add as they are rounded independently
1The Total US and SA PGM, Total SA PGM and Marikana excludes the production and costs associated with the purchase of concentrate (PoC) from third parties. For a reconciliation of the Operating cost, AISC and AIC excluding third party PoC, refer to “Reconciliation of operating cost excluding third party PoC for Total US and SA PGM, Total SA PGM and Marikana - Quarters” and “Reconciliation of AISC and AIC excluding third party PoC for Total US and SA PGM, Total SA PGM and Marikana – Quarters”
2The US PGM operations’ underground production is converted to metric tonnes and kilograms, and performance is translated into SA rand. In addition to the US PGM operations’ underground production, the operation treats recycling material which is excluded from the statistics shown above and is detailed in the PGM recycling table on the next page
3Production per product – see prill split in the table on the next page
4PGM sold includes the third party PoC ounces sold
5The Total US and SA PGM and Total SA PGM operations’ unit cost benchmarks and capital expenditure exclude the financial results of Mimosa, which is equity accounted and excluded from revenue and cost of sales
6The average PGM basket price is the PGM revenue per 4E/2E ounce, prior to a purchase of concentrate adjustment
7Operating cost is the average cost of production and operating cost per tonne is calculated by dividing the cost of sales, before amortisation and depreciation and change in inventory in a period by the tonnes milled/treated in the same period, and operating cost per ounce (and kilogram) is calculated by dividing the cost of sales, before amortisation and depreciation and change in inventory in a period by the PGM produced in the same period.
8All-in cost is calculated in accordance with the World Gold Council guidance. All-in cost excludes income tax, costs associated with merger and acquisition activities, working capital, impairments, financing costs, one-time severance charges and items needed to normalise earnings. All-in cost is made up of All-in sustaining cost, being the cost to sustain current operations, given as a sub-total in the All-in cost calculation, together with corporate and major capital expenditure associated with growth. All-in sustaining cost per ounce (and kilogram) and All-in cost per ounce (and kilogram) are calculated by dividing the All-in sustaining cost and All-in cost, respectively, in a period by the total 4E/2E PGM produced in the same period. For a reconciliation of cost of sales, before amortisation and depreciation to All-in cost, see “All-in costs - Quarters”
Sibanye-Stillwater Operating and financial results | Six months and year ended 31 December 2021 60
| Mining - PGM Prill split including third party PoC, excluding recycling operations | ||||||||||||||||||||||||||||||||||||||
| GROUP PGM | SA OPERATIONS | US OPERATIONS | ||||||||||||||||||||||||||||||||||||
| Dec 2021 | Sep 2021 | Dec 2021 | Sep 2021 | Dec 2021 | Sep 2021 | |||||||||||||||||||||||||||||||||
| % | % | % | % | % | % | |||||||||||||||||||||||||||||||||
| Platinum | 297,498 | 51 | % | 336,620 | 51 | % | 268,519 | 59 | % | 304,116 | 59 | % | 28,979 | 23 | % | 32,504 | 23 | % | ||||||||||||||||||||
| Palladium | 234,266 | 40 | % | 265,876 | 40 | % | 135,471 | 30 | % | 154,055 | 30 | % | 98,795 | 77 | % | 111,821 | 77 | % | ||||||||||||||||||||
| Rhodium | 39,815 | 7 | % | 44,433 | 7 | % | 39,815 | 9 | % | 44,433 | 9 | % | ||||||||||||||||||||||||||
| Gold | 10,097 | 2 | % | 11,174 | 2 | % | 10,097 | 2 | % | 11,174 | 2 | % | ||||||||||||||||||||||||||
| PGM production 4E/2E | 581,676 | 100 | % | 658,103 | 100 | % | 453,902 | 100 | % | 513,778 | 100 | % | 127,774 | 100 | % | 144,325 | 100 | % | ||||||||||||||||||||
| Ruthenium | 72,993 | 80,065 | 72,993 | 80,065 | ||||||||||||||||||||||||||||||||||
| Iridium | 16,561 | 18,451 | 16,561 | 18,451 | ||||||||||||||||||||||||||||||||||
| Total 6E/2E | 671,230 | 756,619 | 543,456 | 612,294 | 127,774 | 144,325 | ||||||||||||||||||||||||||||||||
Figures may not add as they are rounded independently
| Recycling at US operations | |||||||||||
| Unit | Dec 2021 | Sep 2021 | |||||||||
| Average catalyst fed/day | Tonne | 23.0 | 22.7 | ||||||||
| Total processed | Tonne | 2,114 | 2,087 | ||||||||
| Tolled | Tonne | — | 23 | ||||||||
| Purchased | Tonne | 2,114 | 2,064 | ||||||||
| PGM fed | 3Eoz | 172,511 | 179,765 | ||||||||
| PGM sold | 3Eoz | 176,433 | 183,734 | ||||||||
| PGM tolled returned | 3Eoz | 1,951 | 99 | ||||||||
Sibanye-Stillwater Operating and financial results | Six months and year ended 31 December 2021 61
SA gold operations
| SA OPERATIONS | |||||||||||||||||||||||||||||||||||||||||
| Total SA gold | Driefontein | Kloof | Beatrix | Cooke | DRDGOLD | ||||||||||||||||||||||||||||||||||||
| Total | Under- ground | Surface | Under- ground | Surface | Under- ground | Surface | Under- ground | Surface | Surface | Surface | |||||||||||||||||||||||||||||||
| Production | |||||||||||||||||||||||||||||||||||||||||
| Tonnes milled/treated | 000't | Dec 2021 | 10,641 | 1,125 | 9,516 | 328 | 358 | 451 | 831 | 346 | 204 | 1,078 | 7,045 | ||||||||||||||||||||||||||||
| Sep 2021 | 11,199 | 1,474 | 9,725 | 432 | 164 | 493 | 855 | 549 | 103 | 1,182 | 7,421 | ||||||||||||||||||||||||||||||
| Yield | g/t | Dec 2021 | 0.76 | 5.17 | 0.24 | 6.51 | 0.47 | 4.95 | 0.36 | 4.20 | 0.45 | 0.26 | 0.20 | ||||||||||||||||||||||||||||
| Sep 2021 | 0.82 | 4.78 | 0.21 | 5.72 | 0.41 | 5.68 | 0.30 | 3.24 | 0.29 | 0.25 | 0.20 | ||||||||||||||||||||||||||||||
| Gold produced | kg | Dec 2021 | 8,097 | 5,818 | 2,279 | 2,134 | 170 | 2,232 | 297 | 1,452 | 91 | 284 | 1,437 | ||||||||||||||||||||||||||||
| Sep 2021 | 9,137 | 7,048 | 2,089 | 2,470 | 67 | 2,801 | 253 | 1,777 | 30 | 290 | 1,449 | ||||||||||||||||||||||||||||||
| oz | Dec 2021 | 260,325 | 187,053 | 73,272 | 68,610 | 5,466 | 71,760 | 9,549 | 46,683 | 2,926 | 9,131 | 46,201 | |||||||||||||||||||||||||||||
| Sep 2021 | 293,761 | 226,598 | 67,163 | 79,412 | 2,154 | 90,054 | 8,134 | 57,132 | 965 | 9,324 | 46,586 | ||||||||||||||||||||||||||||||
| Gold sold | kg | Dec 2021 | 8,426 | 6,148 | 2,278 | 2,330 | 176 | 2,289 | 282 | 1,529 | 91 | 266 | 1,463 | ||||||||||||||||||||||||||||
| Sep 2021 | 9,069 | 7,025 | 2,044 | 2,375 | 47 | 2,742 | 247 | 1,908 | 30 | 292 | 1,428 | ||||||||||||||||||||||||||||||
| oz | Dec 2021 | 270,902 | 197,663 | 73,239 | 74,911 | 5,659 | 73,593 | 9,067 | 49,158 | 2,926 | 8,552 | 47,037 | |||||||||||||||||||||||||||||
| Sep 2021 | 291,575 | 225,859 | 65,716 | 76,358 | 1,511 | 88,157 | 7,941 | 61,344 | 965 | 9,388 | 45,911 | ||||||||||||||||||||||||||||||
| Price and costs | |||||||||||||||||||||||||||||||||||||||||
| Gold price received | R/kg | Dec 2021 | 884,643 | 885,874 | 883,703 | 883,333 | 879,699 | 886,535 | |||||||||||||||||||||||||||||||||
| Sep 2021 | 837,799 | 839,389 | 836,066 | 834,881 | 842,466 | 841,737 | |||||||||||||||||||||||||||||||||||
| Gold price received | US$/oz | Dec 2021 | 1,784 | 1,787 | 1,783 | 1,782 | 1,774 | 1,788 | |||||||||||||||||||||||||||||||||
| Sep 2021 | 1,781 | 1,785 | 1,777 | 1,775 | 1,791 | 1,790 | |||||||||||||||||||||||||||||||||||
Operating cost1 | R/t | Dec 2021 | 519 | 3,695 | 143 | 4,223 | 274 | 3,787 | 148 | 3,075 | 230 | 191 | 126 | ||||||||||||||||||||||||||||
| Sep 2021 | 537 | 3,157 | 139 | 3,438 | 159 | 3,907 | 251 | 2,262 | 204 | 184 | 118 | ||||||||||||||||||||||||||||||
| US$/t | Dec 2021 | 34 | 240 | 9 | 274 | 18 | 246 | 10 | 199 | 15 | 12 | 8 | |||||||||||||||||||||||||||||
| Sep 2021 | 37 | 216 | 10 | 235 | 11 | 267 | 17 | 155 | 14 | 13 | 8 | ||||||||||||||||||||||||||||||
| R/kg | Dec 2021 | 681,857 | 714,507 | 598,508 | 649,016 | 576,471 | 765,233 | 414,141 | 732,782 | 516,484 | 725,352 | 619,346 | |||||||||||||||||||||||||||||
| Sep 2021 | 657,656 | 660,187 | 649,114 | 601,215 | 388,060 | 687,612 | 849,802 | 698,931 | 700,000 | 751,724 | 604,555 | ||||||||||||||||||||||||||||||
| US$/oz | Dec 2021 | 1,375 | 1,441 | 1,207 | 1,309 | 1,163 | 1,544 | 835 | 1,478 | 1,042 | 1,463 | 1,249 | |||||||||||||||||||||||||||||
| Sep 2021 | 1,398 | 1,404 | 1,380 | 1,278 | 825 | 1,462 | 1,807 | 1,486 | 1,488 | 1,598 | 1,285 | ||||||||||||||||||||||||||||||
All-in sustaining cost2 | R/kg | Dec 2021 | 833,848 | 822,426 | 908,207 | 869,753 | 819,549 | 684,211 | |||||||||||||||||||||||||||||||||
| Sep 2021 | 796,008 | 790,669 | 848,444 | 825,593 | 787,671 | 649,860 | |||||||||||||||||||||||||||||||||||
| All-in sustaining cost2 | US$/oz | Dec 2021 | 1,682 | 1,659 | 1,832 | 1,754 | 1,653 | 1,380 | |||||||||||||||||||||||||||||||||
| Sep 2021 | 1,692 | 1,681 | 1,804 | 1,755 | 1,675 | 1,382 | |||||||||||||||||||||||||||||||||||
All-in cost2 | R/kg | Dec 2021 | 865,061 | 822,426 | 933,100 | 872,840 | 819,549 | 700,615 | |||||||||||||||||||||||||||||||||
| Sep 2021 | 809,792 | 790,669 | 862,830 | 826,625 | 787,671 | 659,664 | |||||||||||||||||||||||||||||||||||
| All-in cost2 | US$/oz | Dec 2021 | 1,745 | 1,659 | 1,882 | 1,761 | 1,653 | 1,413 | |||||||||||||||||||||||||||||||||
| Sep 2021 | 1,722 | 1,681 | 1,834 | 1,757 | 1,675 | 1,402 | |||||||||||||||||||||||||||||||||||
| Capital expenditure | |||||||||||||||||||||||||||||||||||||||||
| Ore reserve development | Rm | Dec 2021 | 622 | 290 | 220 | 112 | — | — | |||||||||||||||||||||||||||||||||
| Sep 2021 | 729 | 324 | 270 | 135 | — | — | |||||||||||||||||||||||||||||||||||
| Sustaining capital | Rm | Dec 2021 | 480 | 119 | 223 | 68 | — | 70 | |||||||||||||||||||||||||||||||||
| Sep 2021 | 342 | 94 | 128 | 45 | — | 75 | |||||||||||||||||||||||||||||||||||
Corporate and projects3 | Rm | Dec 2021 | 243 | — | 64 | 5 | — | 24 | |||||||||||||||||||||||||||||||||
| Sep 2021 | 97 | — | 43 | 2 | — | 14 | |||||||||||||||||||||||||||||||||||
| Total capital expenditure | Rm | Dec 2021 | 1,345 | 409 | 507 | 185 | — | 94 | |||||||||||||||||||||||||||||||||
| Sep 2021 | 1,168 | 418 | 441 | 182 | — | 89 | |||||||||||||||||||||||||||||||||||
| Total capital expenditure | US$m | Dec 2021 | 87 | 27 | 33 | 12 | — | 6 | |||||||||||||||||||||||||||||||||
| Sep 2021 | 80 | 29 | 30 | 12 | — | 6 | |||||||||||||||||||||||||||||||||||
Average exchange rate for the quarters ended 31 December 2021 and 30 September 2021 was R15.42/US$ and R14.63/US$, respectively
Figures may not add as they are rounded independently
1Operating cost is the average cost of production and operating cost per tonne is calculated by dividing the cost of sales, before amortisation and depreciation and change in inventory in a period by the tonnes milled/treated in the same period, and operating cost per kilogram (and ounce) is calculated by dividing the cost of sales, before amortisation and depreciation and change in inventory in a period by the gold produced in the same period
2All-in cost is calculated in accordance with the World Gold Council guidance. All-in cost excludes income tax, costs associated with merger and acquisition activities, working capital, impairments, financing costs, one time severance charges and items needed to normalise earnings. All-in cost is made up of All-in sustaining cost, being the cost to sustain current operations, given as a sub-total in the All-in cost calculation, together with corporate and major capital expenditure associated with growth. All-in sustaining cost per kilogram (and ounce) and All-in cost per kilogram (and ounce) are calculated by dividing the All-in sustaining cost and All-in cost, respectively, in a period by the total gold sold over the same period. For a reconciliation of cost of sales before amortisation and depreciation to All-in cost, see “All-in costs – Quarters”
3Corporate project expenditure for the quarters ended 31 December 2021 and 30 September 2021 was R150 million (US$10 million) and R38 million (US$3 million), respectively, the majority of this expenditure was on Burnstone project
Sibanye-Stillwater Operating and financial results | Six months and year ended 31 December 2021 62
ALL-IN COSTS - QUARTERS
US and SA PGM operations
| US OPERATIONS | SA OPERATIONS | ||||||||||||||||||||||||||||||||||
| R' million | Total US and SA PGM1 | Total US PGM2 | Total SA PGM1 | Rustenburg | Marikana1 | Kroondal | Plat Mile | Mimosa | Corporate | ||||||||||||||||||||||||||
Cost of sales, before amortisation and depreciation3 | Dec 2021 | 10,986 | 2,396 | 8,590 | 3,306 | 4,251 | 871 | 162 | 394 | (394) | |||||||||||||||||||||||||
| Sep 2021 | 9,598 | 1,820 | 7,778 | 2,647 | 4,077 | 914 | 140 | 419 | (419) | ||||||||||||||||||||||||||
| Royalties | Dec 2021 | 401 | — | 401 | 242 | 156 | 3 | — | 23 | (23) | |||||||||||||||||||||||||
| Sep 2021 | 573 | — | 573 | 269 | 302 | 2 | — | 42 | (42) | ||||||||||||||||||||||||||
| Carbon tax | Dec 2021 | 1 | — | 1 | — | 1 | — | — | — | — | |||||||||||||||||||||||||
| Sep 2021 | (1) | — | (1) | — | (1) | — | — | — | — | ||||||||||||||||||||||||||
| Community costs | Dec 2021 | (5) | — | (5) | 3 | (8) | — | — | — | — | |||||||||||||||||||||||||
| Sep 2021 | 92 | — | 92 | 3 | 89 | — | — | — | — | ||||||||||||||||||||||||||
| Inventory change | Dec 2021 | (884) | (520) | (364) | (138) | (226) | — | — | 26 | (26) | |||||||||||||||||||||||||
| Sep 2021 | 982 | 74 | 908 | 711 | 197 | — | — | (6) | 6 | ||||||||||||||||||||||||||
Share-based payments4 | Dec 2021 | 47 | 19 | 28 | 11 | 13 | 3 | — | — | — | |||||||||||||||||||||||||
| Sep 2021 | 50 | 21 | 29 | 12 | 13 | 4 | — | — | — | ||||||||||||||||||||||||||
Rehabilitation interest and amortisation5 | Dec 2021 | 79 | 8 | 71 | 1 | 42 | 28 | — | 1 | (1) | |||||||||||||||||||||||||
| Sep 2021 | 64 | 8 | 56 | (1) | 40 | 17 | — | 1 | (1) | ||||||||||||||||||||||||||
| Leases | Dec 2021 | 14 | — | 14 | 3 | 9 | 2 | — | — | — | |||||||||||||||||||||||||
| Sep 2021 | 12 | — | 12 | 2 | 9 | 1 | — | — | — | ||||||||||||||||||||||||||
| Ore reserve development | Dec 2021 | 864 | 476 | 388 | 148 | 240 | — | — | — | — | |||||||||||||||||||||||||
| Sep 2021 | 739 | 296 | 443 | 168 | 275 | — | — | — | — | ||||||||||||||||||||||||||
| Sustaining capital expenditure | Dec 2021 | 1,050 | 147 | 903 | 271 | 519 | 107 | 6 | 181 | (181) | |||||||||||||||||||||||||
| Sep 2021 | 592 | 143 | 449 | 115 | 268 | 58 | 8 | 118 | (118) | ||||||||||||||||||||||||||
| Less: By-product credit | Dec 2021 | (2,351) | (320) | (2,031) | (619) | (1,150) | (212) | (50) | (137) | 137 | |||||||||||||||||||||||||
| Sep 2021 | (2,591) | (319) | (2,272) | (676) | (1,347) | (243) | (6) | (134) | 134 | ||||||||||||||||||||||||||
Total All-in-sustaining costs6 | Dec 2021 | 10,202 | 2,206 | 7,996 | 3,228 | 3,847 | 802 | 118 | 488 | (488) | |||||||||||||||||||||||||
| Sep 2021 | 10,110 | 2,043 | 8,067 | 3,250 | 3,922 | 753 | 142 | 440 | (440) | ||||||||||||||||||||||||||
| Plus: Corporate cost, growth and capital expenditure | Dec 2021 | 755 | 611 | 144 | — | 144 | — | — | — | — | |||||||||||||||||||||||||
| Sep 2021 | 645 | 583 | 62 | — | 62 | — | — | — | — | ||||||||||||||||||||||||||
Total All-in-costs6 | Dec 2021 | 10,957 | 2,817 | 8,140 | 3,228 | 3,991 | 802 | 118 | 488 | (488) | |||||||||||||||||||||||||
| Sep 2021 | 10,755 | 2,626 | 8,129 | 3,250 | 3,984 | 753 | 142 | 440 | (440) | ||||||||||||||||||||||||||
| PGM production | 4Eoz - 2Eoz | Dec 2021 | 581,676 | 127,774 | 453,902 | 160,214 | 195,041 | 51,952 | 16,928 | 29,767 | — | ||||||||||||||||||||||||
| Sep 2021 | 658,101 | 144,325 | 513,776 | 183,606 | 226,591 | 61,083 | 13,726 | 28,770 | — | ||||||||||||||||||||||||||
| kg | Dec 2021 | 18,092 | 3,974 | 14,118 | 4,983 | 6,066 | 1,616 | 527 | 926 | — | |||||||||||||||||||||||||
| Sep 2021 | 20,469 | 4,489 | 15,980 | 5,711 | 7,048 | 1,900 | 427 | 895 | — | ||||||||||||||||||||||||||
| All-in-sustaining cost | R/4Eoz - R/2Eoz | Dec 2021 | 18,485 | 17,265 | 18,852 | 20,148 | 19,724 | 15,437 | 6,971 | 16,394 | — | ||||||||||||||||||||||||
| Sep 2021 | 16,065 | 14,156 | 16,633 | 17,701 | 17,309 | 12,327 | 10,345 | 15,294 | — | ||||||||||||||||||||||||||
| US$/4Eoz - US$/2Eoz | Dec 2021 | 1,199 | 1,120 | 1,223 | 1,307 | 1,279 | 1,001 | 452 | 1,063 | — | |||||||||||||||||||||||||
| Sep 2021 | 1,098 | 968 | 1,137 | 1,210 | 1,183 | 843 | 707 | 1,045 | — | ||||||||||||||||||||||||||
| All-in-cost | R/4Eoz - R/2Eoz | Dec 2021 | 19,853 | 22,047 | 19,192 | 20,148 | 20,462 | 15,437 | 6,971 | 16,394 | — | ||||||||||||||||||||||||
| Sep 2021 | 17,090 | 18,195 | 16,761 | 17,701 | 17,582 | 12,327 | 10,345 | 15,294 | — | ||||||||||||||||||||||||||
| US$/4Eoz - US$/2Eoz | Dec 2021 | 1,287 | 1,430 | 1,245 | 1,307 | 1,327 | 1,001 | 452 | 1,063 | — | |||||||||||||||||||||||||
| Sep 2021 | 1,168 | 1,244 | 1,146 | 1,210 | 1,202 | 843 | 707 | 1,045 | — | ||||||||||||||||||||||||||
Average exchange rate for the quarters ended 31 December 2021 and 30 September 2021 was R15.42/US$ and R14.63/US$, respectively
Figures may not add as they are rounded independently
1The Total US and SA PGM, Total SA PGM and Marikana includes the production and costs associated with the purchase of concentrate (PoC) from third parties. For a reconciliation of the Operating cost, AISC and AIC excluding third party PoC, refer to “Reconciliation of operating cost excluding third party PoC for Total US and SA PGM, Total SA PGM and Marikana - Quarters” and “Reconciliation of AISC and AIC excluding third party PoC for Total US and SA PGM, Total SA PGM and Marikana – Quarters”
2The US PGM operations’ underground production is converted to metric tonnes and kilograms, and performance is translated into SA rand. In addition to the US PGM operations’ underground production, the operation processes various recycling material which is excluded from the 2E PGM production, All-in sustaining cost and All-in cost statistics shown
3Cost of sales, before amortisation and depreciation includes all mining and processing costs, third party refining costs, corporate general and administrative costs, and permitting costs
4Share-based payments are calculated based on the fair value at initial recognition and do not include the adjustment of the cash-settled share-based payment obligation to the reporting date fair value
5Rehabilitation includes the interest charge related to the environmental rehabilitation obligation and the amortisation of the related capitalised rehabilitation costs. The interest charge related to the environmental rehabilitation obligation and the amortisation of the capitalised rehabilitation costs reflect the periodic costs of rehabilitation associated with current PGM production
6All-in cost is calculated in accordance with the World Gold Council guidance. All-in cost excludes income tax, costs associated with merger and acquisition activities, working capital, impairments, financing costs, one-time severance charges and items needed to normalise earnings. All-in cost is made up of All-in sustaining cost, being the cost to sustain current operations, given as a sub-total in the All-in cost calculation, together with corporate and major capital expenditure associated with growth. All-in sustaining cost per ounce (and kilogram) and All-in cost per ounce (and kilogram) are calculated by dividing the All-in sustaining cost and All-in cost, respectively, in a period by the total 4E/2E PGM produced in the same period
Sibanye-Stillwater Operating and financial results | Six months and year ended 31 December 2021 63
| Reconciliation of operating cost excluding third party PoC for Total US and SA PGM, Total SA PGM and Marikana - Quarters | |||||||||||||||||||||||
| Total US and SA PGM | Total SA PGM | Marikana | |||||||||||||||||||||
| R' million | Dec 2021 | Sep 2021 | Dec 2021 | Sep 2021 | Dec 2021 | Sep 2021 | |||||||||||||||||
| Cost of sales, before amortisation and depreciation as reported per table above | 10,986 | 9,598 | 8,590 | 7,778 | 4,251 | 4,077 | |||||||||||||||||
| Inventory change as reported per table above | (884) | 982 | (364) | 908 | (226) | 197 | |||||||||||||||||
| Less: Chrome cost of sales | (384) | (338) | (384) | (338) | (92) | (64) | |||||||||||||||||
| Total operating cost including third party PoC | 9,718 | 10,242 | 7,842 | 8,348 | 3,933 | 4,210 | |||||||||||||||||
| Less: Purchase cost of PoC | (529) | (593) | (529) | (593) | (529) | (593) | |||||||||||||||||
| Total operating cost excluding third party PoC | 9,189 | 9,649 | 7,313 | 7,755 | 3,404 | 3,617 | |||||||||||||||||
| PGM production as reported per table above | 4Eoz- 2Eoz | 581,676 | 658,101 | 453,902 | 513,776 | 195,041 | 226,591 | ||||||||||||||||
| Less: Mimosa production | (29,767) | (28,770) | (29,767) | (28,770) | — | — | |||||||||||||||||
| PGM production excluding Mimosa | 551,909 | 629,331 | 424,135 | 485,006 | 195,041 | 226,591 | |||||||||||||||||
| Less: PoC production | (12,002) | (13,703) | (12,002) | (13,703) | (12,002) | (13,703) | |||||||||||||||||
| PGM production excluding Mimosa and third party PoC | 539,907 | 615,628 | 412,133 | 471,303 | 183,039 | 212,888 | |||||||||||||||||
| PGM production including Mimosa and excluding third party PoC | 569,674 | 644,398 | 441,900 | 500,073 | 183,039 | 212,888 | |||||||||||||||||
| Tonnes milled/treated | 000't | 9,614 | 10,747 | 9,288 | 10,363 | 2,609 | 2,933 | ||||||||||||||||
| Less: Mimosa tonnes | (356) | (352) | (356) | (352) | — | — | |||||||||||||||||
| PGM tonnes excluding Mimosa and third party PoC | 9,258 | 10,395 | 8,932 | 10,011 | 2,609 | 2,933 | |||||||||||||||||
| Operating cost including third party PoC | R/4Eoz-R/2Eoz | 17,608 | 16,274 | 18,489 | 17,212 | 20,165 | 18,580 | ||||||||||||||||
| US$/4Eoz-US$/2Eoz | 1,142 | 1,112 | 1,199 | 1,176 | 1,308 | 1,270 | |||||||||||||||||
| R/t | 1,050 | 985 | 878 | 834 | 1,507 | 1,435 | |||||||||||||||||
| US$/t | 68 | 67 | 57 | 57 | 98 | 98 | |||||||||||||||||
| Operating cost excluding third party PoC | R/4Eoz-R/2Eoz | 17,020 | 15,673 | 17,744 | 16,454 | 18,597 | 16,990 | ||||||||||||||||
| US$/4Eoz-US$/2Eoz | 1,104 | 1,071 | 1,151 | 1,125 | 1,206 | 1,161 | |||||||||||||||||
| R/t | 993 | 928 | 819 | 775 | 1,305 | 1,233 | |||||||||||||||||
| US$/t | 64 | 63 | 53 | 53 | 85 | 84 | |||||||||||||||||
| Reconciliation of AISC and AIC excluding third party PoC for Total US and SA PGM, Total SA PGM and Marikana - Quarters | |||||||||||||||||||||||
| Total US and SA PGM | Total SA PGM | Marikana | |||||||||||||||||||||
| R' million | Dec 2021 | Sep 2021 | Dec 2021 | Sep 2021 | Dec 2021 | Sep 2021 | |||||||||||||||||
| Total All-in-sustaining cost as reported per table above | 10,202 | 10,110 | 7,996 | 8,067 | 3,847 | 3,922 | |||||||||||||||||
| Less: Purchase cost of PoC | (529) | (593) | (529) | (593) | (529) | (593) | |||||||||||||||||
| Add: By-product credit of PoC | 46 | 63 | 46 | 63 | 46 | 63 | |||||||||||||||||
| Total All-in-sustaining cost excluding third party PoC | 9,719 | 9,580 | 7,513 | 7,537 | 3,364 | 3,392 | |||||||||||||||||
| Plus: Corporate cost, growth and capital expenditure | 755 | 645 | 144 | 62 | 144 | 62 | |||||||||||||||||
| Total All-in-cost excluding third party PoC | 10,474 | 10,225 | 7,657 | 7,599 | 3,508 | 3,454 | |||||||||||||||||
| PGM production excluding Mimosa and third party PoC | 4Eoz- 2Eoz | 539,907 | 615,628 | 412,133 | 471,303 | 183,039 | 212,888 | ||||||||||||||||
| All-in-sustaining cost excluding third party PoC | R/4Eoz-R/2Eoz | 18,001 | 15,561 | 18,230 | 15,992 | 18,379 | 15,933 | ||||||||||||||||
| US$/4Eoz-US$/2Eoz | 1,167 | 1,064 | 1,182 | 1,093 | 1,192 | 1,089 | |||||||||||||||||
| All-in-cost excluding third party PoC | R/4Eoz-R/2Eoz | 19,400 | 16,609 | 18,579 | 16,123 | 19,165 | 16,224 | ||||||||||||||||
| US$/4Eoz-US$/2Eoz | 1,258 | 1,135 | 1,205 | 1,102 | 1,243 | 1,109 | |||||||||||||||||
Sibanye-Stillwater Operating and financial results | Six months and year ended 31 December 2021 64
SA gold operations
| SA OPERATIONS | |||||||||||||||||||||||||||||
| R' million | Total SA gold | Driefontein | Kloof | Beatrix | Cooke | DRDGOLD | Corporate | ||||||||||||||||||||||
Cost of sales, before amortisation and depreciation1 | Dec 2021 | 5,760 | 1,605 | 1,860 | 1,189 | 192 | 914 | — | |||||||||||||||||||||
| Sep 2021 | 5,978 | 1,450 | 2,102 | 1,371 | 217 | 838 | — | ||||||||||||||||||||||
| Royalties | Dec 2021 | 49 | 30 | 11 | 7 | 1 | — | — | |||||||||||||||||||||
| Sep 2021 | 49 | 19 | 12 | 8 | 1 | — | 9 | ||||||||||||||||||||||
| Carbon tax | Dec 2021 | ��� | — | — | — | — | — | — | |||||||||||||||||||||
| Sep 2021 | — | — | — | — | — | — | — | ||||||||||||||||||||||
| Community costs | Dec 2021 | 31 | 11 | 9 | 8 | — | 3 | — | |||||||||||||||||||||
| Sep 2021 | 33 | 12 | 10 | 9 | — | 2 | — | ||||||||||||||||||||||
Share-based payments2 | Dec 2021 | 26 | 6 | 9 | 6 | — | 5 | — | |||||||||||||||||||||
| Sep 2021 | 26 | 6 | 9 | 6 | — | 5 | — | ||||||||||||||||||||||
Rehabilitation interest and amortisation3 | Dec 2021 | 43 | — | 1 | 13 | 22 | 5 | 2 | |||||||||||||||||||||
| Sep 2021 | 50 | 10 | 5 | 20 | 9 | 5 | 1 | ||||||||||||||||||||||
| Leases | Dec 2021 | 20 | 2 | 3 | 7 | 3 | 5 | — | |||||||||||||||||||||
| Sep 2021 | 19 | 2 | 2 | 7 | 3 | 5 | — | ||||||||||||||||||||||
| Ore reserve development | Dec 2021 | 622 | 290 | 220 | 112 | — | — | — | |||||||||||||||||||||
| Sep 2021 | 729 | 324 | 270 | 135 | — | — | — | ||||||||||||||||||||||
| Sustaining capital expenditure | Dec 2021 | 480 | 119 | 223 | 68 | — | 70 | — | |||||||||||||||||||||
| Sep 2021 | 342 | 94 | 128 | 45 | — | 75 | — | ||||||||||||||||||||||
| Less: By-product credit | Dec 2021 | (5) | (2) | (1) | (1) | — | (1) | — | |||||||||||||||||||||
| Sep 2021 | (7) | (2) | (2) | (1) | — | (2) | — | ||||||||||||||||||||||
Total All-in-sustaining costs4 | Dec 2021 | 7,026 | 2,061 | 2,335 | 1,409 | 218 | 1,001 | 2 | |||||||||||||||||||||
| Sep 2021 | 7,219 | 1,915 | 2,536 | 1,600 | 230 | 928 | 10 | ||||||||||||||||||||||
| Plus: Corporate cost, growth and capital expenditure | Dec 2021 | 263 | — | 64 | 5 | — | 24 | 170 | |||||||||||||||||||||
| Sep 2021 | 125 | — | 43 | 2 | — | 14 | 66 | ||||||||||||||||||||||
Total All-in-costs4 | Dec 2021 | 7,289 | 2,061 | 2,399 | 1,414 | 218 | 1,025 | 172 | |||||||||||||||||||||
| Sep 2021 | 7,344 | 1,915 | 2,579 | 1,602 | 230 | 942 | 76 | ||||||||||||||||||||||
| Gold sold | kg | Dec 2021 | 8,426 | 2,506 | 2,571 | 1,620 | 266 | 1,463 | — | ||||||||||||||||||||
| Sep 2021 | 9,069 | 2,422 | 2,989 | 1,938 | 292 | 1,428 | — | ||||||||||||||||||||||
| oz | Dec 2021 | 270,902 | 80,570 | 82,660 | 52,084 | 8,552 | 47,037 | — | |||||||||||||||||||||
| Sep 2021 | 291,575 | 77,869 | 96,099 | 62,308 | 9,388 | 45,911 | — | ||||||||||||||||||||||
| All-in-sustaining cost | R/kg | Dec 2021 | 833,848 | 822,426 | 908,207 | 869,753 | 819,549 | 684,211 | — | ||||||||||||||||||||
| Sep 2021 | 796,008 | 790,669 | 848,444 | 825,593 | 787,671 | 649,860 | — | ||||||||||||||||||||||
| All-in-sustaining cost | US$/oz | Dec 2021 | 1,682 | 1,659 | 1,832 | 1,754 | 1,653 | 1,380 | — | ||||||||||||||||||||
| Sep 2021 | 1,692 | 1,681 | 1,804 | 1,755 | 1,675 | 1,382 | — | ||||||||||||||||||||||
| All-in-cost | R/kg | Dec 2021 | 865,061 | 822,426 | 933,100 | 872,840 | 819,549 | 700,615 | — | ||||||||||||||||||||
| Sep 2021 | 809,792 | 790,669 | 862,830 | 826,625 | 787,671 | 659,664 | — | ||||||||||||||||||||||
| All-in-cost | US$/oz | Dec 2021 | 1,745 | 1,659 | 1,882 | 1,761 | 1,653 | 1,413 | — | ||||||||||||||||||||
| Sep 2021 | 1,722 | 1,681 | 1,834 | 1,757 | 1,675 | 1,402 | — | ||||||||||||||||||||||
Average exchange rate for the quarters ended 31 December 2021 and 30 September 2021 was R15.42/US$ and R14.63/US$, respectively
Figures may not add as they are rounded independently
1Cost of sales, before amortisation and depreciation includes all mining and processing costs, third party refining costs, corporate general and administrative costs, and permitting costs
2Share-based payments are calculated based on the fair value at initial recognition and do not include the adjustment of the cash-settled share-based payment obligation to the reporting date fair value
3Rehabilitation includes the interest charge related to the environmental rehabilitation obligation and the amortisation of the related capitalised rehabilitation costs. The interest charge related to the environmental rehabilitation obligation and the amortisation of the capitalised rehabilitation costs reflect the periodic costs of rehabilitation associated with current gold production
4All-in cost is calculated in accordance with the World Gold Council guidance. All-in cost excludes income tax, costs associated with merger and acquisition activities, working capital, impairments, financing costs, one time severance charges and items needed to normalise earnings. All-in cost is made up of All-in sustaining cost, being the cost to sustain current operations, given as a sub-total in the All-in cost calculation, together with corporate and major capital expenditure associated with growth. All-in sustaining cost per kilogram (and ounce) and All-in cost per kilogram (and ounce) are calculated by dividing the All-in sustaining cost and All-in cost, respectively, in a period by the total gold sold over the same period
Sibanye-Stillwater Operating and financial results | Six months and year ended 31 December 2021 65
DEVELOPMENT RESULTS
Development values represent the actual results of sampling and no allowance has been made for any adjustments which may be necessary when estimating ore reserves. All figures below exclude shaft sinking metres, which are reported separately where appropriate.
| US PGM operations | ||||||||||||||||||||||||||||||||||||||||||||||||||
| Quarter ended | Dec 2021 | Sep 2021 | Year ended 31 December 2021 | |||||||||||||||||||||||||||||||||||||||||||||||
| Reef | Stillwater incl Blitz | East Boulder | Stillwater incl Blitz | East Boulder | Stillwater incl Blitz | East Boulder | ||||||||||||||||||||||||||||||||||||||||||||
| Total US PGM | Unit | |||||||||||||||||||||||||||||||||||||||||||||||||
| Primary development (off reef) | (m) | 1,576 | 476 | 1,522 | 290 | 6,095 | 1,702 | |||||||||||||||||||||||||||||||||||||||||||
| Secondary development | (m) | 3,169 | 980 | 3,797 | 1,653 | 15,060 | 5,302 | |||||||||||||||||||||||||||||||||||||||||||
| SA PGM operations | ||||||||||||||||||||||||||||||||||||||||||||||||||
| Quarter ended | Dec 2021 | Sep 2021 | Year ended 31 December 2021 | |||||||||||||||||||||||||||||||||||||||||||||||
| Reef | Bathopele | Thembelani | Khuseleka | Siphumelele | Bathopele | Thembelani | Khuseleka | Siphumelele | Bathopele | Thembelani | Khuseleka | Siphumelele | ||||||||||||||||||||||||||||||||||||||
| Rustenburg | Unit | |||||||||||||||||||||||||||||||||||||||||||||||||
| Advanced | (m) | 426 | 1,817 | 2,417 | 699 | 487 | 2,192 | 3,276 | 825 | 1,550 | 7,115 | 11,213 | 3,049 | |||||||||||||||||||||||||||||||||||||
| Advanced on reef | (m) | 426 | 848 | 1,026 | 322 | 487 | 977 | 1,260 | 442 | 1,550 | 3,162 | 4,181 | 1,589 | |||||||||||||||||||||||||||||||||||||
| Height | (cm) | 223 | 305 | 282 | 287 | 210 | 282 | 285 | 283 | 217 | 291 | 286 | 280 | |||||||||||||||||||||||||||||||||||||
| Average value | (g/t) | 2.9 | 3.2 | 2.3 | 3.1 | 2.9 | 2.3 | 2.3 | 2.8 | 2.6 | 2.6 | 2.2 | 3.0 | |||||||||||||||||||||||||||||||||||||
| (cm.g/t) | 634 | 960 | 645 | 899 | 599 | 644 | 645 | 801 | 561 | 745 | 631 | 849 | ||||||||||||||||||||||||||||||||||||||
| Quarter ended | Dec 2021 | Sep 2021 | Year ended 31 December 2021 | |||||||||||||||||||||||||||||||||||||||||||||||
| Reef | K3 | Rowland | Saffy | E3 | 4B | K3 | Rowland | Saffy | E3 | 4B | K3 | Rowland | Saffy | E3 | 4B | |||||||||||||||||||||||||||||||||||
| Marikana | Unit | |||||||||||||||||||||||||||||||||||||||||||||||||
| Primary development | (m) | 7,419 | 5,632 | 3,607 | 957 | 969 | 8,563 | 7,107 | 3,846 | 857 | 1,181 | 30,742 | 24,967 | 15,619 | 3,761 | 4,633 | ||||||||||||||||||||||||||||||||||
| Primary development - on reef | (m) | 5,590 | 4,346 | 2,234 | 581 | 698 | 6,265 | 5,380 | 2,429 | 537 | 786 | 23,167 | 19,253 | 10,271 | 2,377 | 3,101 | ||||||||||||||||||||||||||||||||||
| Height | (cm) | 216 | 221 | 218 | 218 | 217 | 217 | 221 | 216 | 214 | 218 | 216 | 220 | 216 | 216 | 219 | ||||||||||||||||||||||||||||||||||
| Average value | (g/t) | 2.9 | 2.6 | 2.8 | 2.8 | 2.8 | 2.9 | 2.5 | 2.8 | 2.8 | 2.9 | 3.1 | 2.5 | 2.7 | 2.8 | 2.8 | ||||||||||||||||||||||||||||||||||
| (cm.g/t) | 628 | 563 | 606 | 603 | 612 | 624 | 549 | 599 | 601 | 630 | 669 | 555 | 593 | 604 | 608 | |||||||||||||||||||||||||||||||||||
| Quarter ended | Dec 2021 | Sep 2021 | Year ended 31 December 2021 | |||||||||||||||||||||||||||||||||||||||||||||||
| Reef | Kopaneng | Simunye1 | Bambanani | Kwezi | K6 | Kopaneng | Simunye1 | Bambanani | Kwezi | K6 | Kopaneng | Simunye1 | Bambanani | Kwezi | K6 | |||||||||||||||||||||||||||||||||||
| Kroondal | Unit | |||||||||||||||||||||||||||||||||||||||||||||||||
| Advanced | (m) | 488 | 570 | 496 | 369 | 864 | 546 | 622 | 406 | 2,601 | 110 | 2,101 | 2,046 | 1,653 | ||||||||||||||||||||||||||||||||||||
| Advanced on reef | (m) | 377 | 385 | 146 | 196 | 410 | 326 | 237 | 399 | 1,712 | — | 1,176 | 969 | 1,472 | ||||||||||||||||||||||||||||||||||||
| Height | (cm) | 236 | 219 | 220 | 243 | 236 | 216 | 217 | 234 | 239 | 291 | 217 | 220 | 235 | ||||||||||||||||||||||||||||||||||||
| Average value | (g/t) | 1.8 | 1.7 | 0.8 | 1.2 | 1.2 | 1.6 | 1.1 | 1.9 | 1.8 | — | 1.4 | 1.4 | 2.0 | ||||||||||||||||||||||||||||||||||||
| (cm.g/t) | 417 | 379 | 178 | 294 | 288 | 336 | 244 | 442 | 418 | — | 310 | 310 | 461 | |||||||||||||||||||||||||||||||||||||
1.1 The Simunye ore reserve was completely developed in the March 2021 quarter and is continuing with normal stoping activities until anticipated shaft closure
Sibanye-Stillwater Operating and financial results | Six months and year ended 31 December 2021 66
| SA gold operations | ||||||||||||||||||||||||||||||||||||||||||||||||||
| Quarter ended | Dec 2021 | Sep 2021 | Year ended 31 December 2021 | |||||||||||||||||||||||||||||||||||||||||||||||
| Reef | Carbon leader | Main | VCR | Carbon leader | Main | VCR | Carbon leader | Main | VCR | |||||||||||||||||||||||||||||||||||||||||
| Driefontein | Unit | |||||||||||||||||||||||||||||||||||||||||||||||||
| Advanced | (m) | 953 | 296 | 909 | 1,043 | 285 | 1,106 | 3,554 | 1,048 | 4,344 | ||||||||||||||||||||||||||||||||||||||||
| Advanced on reef | (m) | 117 | 50 | 267 | 21 | 48 | 212 | 307 | 231 | 1,300 | ||||||||||||||||||||||||||||||||||||||||
| Channel width | (cm) | 21 | 77 | 76 | 30 | 30 | 66 | 19 | 59 | 81 | ||||||||||||||||||||||||||||||||||||||||
| Average value | (g/t) | 34.9 | 17.2 | 49.1 | 41.7 | 22.8 | 41.6 | 44.7 | 13.6 | 46.7 | ||||||||||||||||||||||||||||||||||||||||
| (cm.g/t) | 736 | 1,332 | 3,735 | 1,254 | 685 | 2,738 | 865 | 798 | 3,783 | |||||||||||||||||||||||||||||||||||||||||
| Quarter ended | Dec 2021 | Sep 2021 | Year ended 31 December 2021 | |||||||||||||||||||||||||||||||||||||||||||||||
| Reef | Kloof | Main | VCR | Kloof | Main | VCR | Kloof | Main | VCR | |||||||||||||||||||||||||||||||||||||||||
| Kloof | Unit | |||||||||||||||||||||||||||||||||||||||||||||||||
| Advanced | (m) | 1,461 | 522 | 1,135 | 1,941 | 605 | 1,428 | 6,032 | 2,086 | 5,247 | ||||||||||||||||||||||||||||||||||||||||
| Advanced on reef | (m) | 334 | 188 | 157 | 421 | 145 | 258 | 1,362 | 659 | 797 | ||||||||||||||||||||||||||||||||||||||||
| Channel width | (cm) | 141 | 128 | 146 | 148 | 85 | 127 | 160 | 88 | 125 | ||||||||||||||||||||||||||||||||||||||||
| Average value | (g/t) | 8.5 | 9.4 | 6.4 | 8.5 | 10.5 | 9.4 | 7.2 | 11.3 | 11.5 | ||||||||||||||||||||||||||||||||||||||||
| (cm.g/t) | 1,192 | 1,201 | 931 | 1,263 | 892 | 1,187 | 1,143 | 997 | 1,431 | |||||||||||||||||||||||||||||||||||||||||
| Quarter ended | Dec 2021 | Sep 2021 | Year ended 31 December 2021 | |||||||||||||||||||||||||||||||||||||||||||||||
| Reef | Beatrix | Kalkoen-krans | Beatrix | Kalkoen-krans | Beatrix | Kalkoen-krans | ||||||||||||||||||||||||||||||||||||||||||||
| Beatrix | Unit | |||||||||||||||||||||||||||||||||||||||||||||||||
| Advanced | (m) | 2,792 | 67 | 2,976 | 245 | 11,638 | 529 | |||||||||||||||||||||||||||||||||||||||||||
| Advanced on reef | (m) | 777 | 36 | 1,168 | 51 | 3,338 | 158 | |||||||||||||||||||||||||||||||||||||||||||
| Channel width | (cm) | 153 | 53 | 164 | 123 | 155 | 110 | |||||||||||||||||||||||||||||||||||||||||||
| Average value | (g/t) | 9.0 | 16.2 | 6.1 | 12.8 | 7.2 | 12.0 | |||||||||||||||||||||||||||||||||||||||||||
| (cm.g/t) | 1,371 | 861 | 1,008 | 1,580 | 1,122 | 1,317 | ||||||||||||||||||||||||||||||||||||||||||||
Sibanye-Stillwater Operating and financial results | Six months and year ended 31 December 2021 67
ADMINISTRATION AND CORPORATE INFORMATION
SIBANYE STILLWATER LIMITED (SIBANYE-STILLWATER) Incorporated in the Republic of South Africa Registration number 2014/243852/06 Share code: SSW and SBSW Issuer code: SSW ISIN: ZAE000259701 LISTINGS JSE: SSW NYSE: SBSW WEBSITE  www.sibanyestillwater.com www.sibanyestillwater.comREGISTERED AND CORPORATE OFFICE Constantia Office Park Bridgeview House, Building 11,Ground floor Cnr 14th Avenue & Hendrik Potgieter Road Weltevreden Park 1709 South Africa Private Bag X5 Westonaria 1780 South Africa Tel: +27 11 278 9600 Fax: +27 11 278 9863 COMPANY SECRETARY Lerato Matlosa Tel: +27 10 493 6921 Email: lerato.matlosa@sibanyestillwater.com DIRECTORS Dr Vincent Maphai* (Chairman) Neal Froneman (CEO) Charl Keyter (CFO) Timothy Cumming* Savannah Danson* Dr Elaine Dorward-King* Harry Kenyon-Slaney* Richard Menell*^ Nkosemntu Nika* Keith Rayner* Susan van der Merwe* Jeremiah Vilakazi* Sindiswa Zilwa*# * Independent non-executive ^ Lead independent director # Appointed 1 January 2021 | INVESTOR ENQUIRIES James Wellsted Senior Vice President: Investor Relations Cell: +27 83 453 4014 Tel: +27 10 493 6923 Email: james.wellsted@sibanyestillwater.com or ir@sibanyestillwater.com JSE SPONSOR JP Morgan Equities South Africa Proprietary Limited Registration number 1995/011815/07 1 Fricker Road Illovo Johannesburg 2196 South Africa Private Bag X9936 Sandton 2146 South Africa AUDITORS Ernst & Young Inc. (EY) 102 Rivonia Road Sandton 2196 South Africa Private Bag X14 Sandton 2146 South Africa Tel: +27 11 772 3000 AMERICAN DEPOSITARY RECEIPTS TRANSFER AGENT BNY Mellon Shareowner Services PO Box 358516 Pittsburgh PA 15252-8516 US toll free: +1 888 269 2377 Tel: +1 201 680 6825 Email: shrrelations@bnymellon.com Tatyana Vesselovskaya Relationship Manager BNY Mellon Depositary Receipts Direct line: +1 212 815 2867 Mobile: +1 203 609 5159 Fax: +1 212 571 3050 Email: tatyana.vesselovskaya@bnymellon.com | TRANSFER SECRETARIES SOUTH AFRICA Computershare Investor Services Proprietary Limited Rosebank Towers 15 Biermann Avenue Rosebank 2196 PO Box 61051 Marshalltown 2107 South Africa Tel: +27 11 370 5000 Fax: +27 11 688 5248 | ||||||
Sibanye-Stillwater Operating and financial results | Six months and year ended 31 December 2021 68
FORWARD-LOOKING STATEMENTS
The information in this document may contain forward-looking statements within the meaning of the “safe harbour” provisions of the United States Private Securities Litigation Reform Act of 1995. These forward-looking statements, including, among others, those relating to Sibanye Stillwater Limited’s (“Sibanye-Stillwater” or the “Group”) financial positions, business strategies, plans and objectives of management for future operations, are necessarily estimates reflecting the best judgment of the senior management and directors of Sibanye-Stillwater and involve a number of risks and uncertainties that could cause actual results to differ materially from those suggested by the forward-looking statements. As a consequence, these forward-looking statements should be considered in light of various important factors, including those set forth in this document.
All statements other than statements of historical facts included in this document may be forward-looking statements. Forward-looking statements also often use words such as “will”, ““would”, “expect”, “forecast”, “potential”, “may”, “could” “believe”, “aim”, “anticipate”, “target”, “estimate” and words of similar meaning. By their nature, forward-looking statements involve risk and uncertainty because they relate to future events and circumstances and should be considered in light of various important factors, including those set forth in this disclaimer. Readers are cautioned not to place undue reliance on such statements.
The important factors that could cause Sibanye-Stillwater’s actual results, performance or achievements to differ materially from estimates or projections contained in the forward-looking statements include, without limitation, Sibanye-Stillwater’s future financial position, plans, strategies, objectives, capital expenditures, projected costs and anticipated cost savings, financing plans, debt position and ability to reduce debt leverage; economic, business, political and social conditions in South Africa, Zimbabwe, the United States and elsewhere; plans and objectives of management for future operations; Sibanye-Stillwater’s ability to obtain the benefits of any streaming arrangements or pipeline financing; the ability of Sibanye-Stillwater to comply with loan and other covenants and restrictions and difficulties in obtaining additional financing or refinancing; Sibanye-Stillwater’s ability to service its bond instruments (including high yield bonds and convertible bonds, if any); changes in assumptions underlying Sibanye-Stillwater’s estimation of its current mineral reserves; any failure of a tailings storage facility; the ability to achieve anticipated efficiencies and other cost savings in connection with, and the ability to successfully integrate, past, ongoing and future acquisitions, as well as at existing operations; the ability of Sibanye-Stillwater to complete any ongoing or future acquisitions; the success of Sibanye-Stillwater’s business strategy and exploration and development activities, including any proposed, anticipated or planned expansions into the battery metals or adjacent sectors and estimations or expectations of enterprise value; the ability of Sibanye-Stillwater to comply with requirements that it operate in ways that provide progressive benefits to affected communities; changes in the market price of gold, PGMs, battery metals (e.g., nickel, lithium, copper and zinc) and the cost of power, petroleum fuels, and oil, among other commodities and supply requirements; the occurrence of hazards associated with underground and surface mining; any further downgrade of South Africa’s credit rating; a challenge regarding the title to any of Sibanye-Stillwater’s properties by claimants to land under restitution and other legislation; Sibanye-Stillwater’s ability to implement its strategy and any changes thereto; the occurrence of labour disputes, disruptions and industrial actions; the availability, terms and deployment of capital or credit; changes in the imposition of industry standards, regulatory costs and relevant government regulations, particularly environmental, sustainability, tax, health and safety regulations and new legislation affecting water, mining, mineral rights and business ownership, including any interpretation thereof which may be subject to dispute; the outcome and consequence of any potential or pending litigation or regulatory proceedings, including in relation to any environmental, health or safety issues; failure to meet high and ethical standards, including actual or alleged instances of fraud, bribery or corruption; the effect of climate change on Sibanye-Stillwater’s business; the concentration of all final refining activity and a large portion of Sibanye-Stillwater’s PGM sales from mine production in the United States with one entity; the identification of a material weakness in disclosure and internal controls over financial reporting; the effect of US tax reform legislation on Sibanye-Stillwater and its subsidiaries; the effect of South African Exchange Control Regulations on Sibanye-Stillwater’s financial flexibility; operating in new geographies and regulatory environments where Sibanye-Stillwater has no previous experience; power disruptions, constraints and cost increases; supply chain disruptions and shortages and increases in the price of production inputs; the regional concentration of Sibanye-Stillwater’s operations; fluctuations in exchange rates, currency devaluations, inflation and other macro-economic monetary policies; the occurrence of temporary stoppages or precautionary suspension of operations at its mines for safety or environmental incidents (including natural disasters) and unplanned maintenance; Sibanye-Stillwater’s ability to hire and retain senior management or sufficient technically skilled employees, as well as its ability to achieve sufficient representation of historically disadvantaged South Africans in its management positions; failure of Sibanye-Stillwater’s information technology and communications systems; the adequacy of Sibanye-Stillwater’s insurance coverage; social unrest, sickness or natural or man-made disaster at informal settlements in the vicinity of some of Sibanye-Stillwater’s South African-based operations; and the impact of HIV, tuberculosis and the spread of other contagious diseases, such as the coronavirus disease (COVID-19).
Further details of potential risks and uncertainties affecting Sibanye-Stillwater are described in Sibanye-Stillwater’s filings with the Johannesburg Stock Exchange and the United States Securities and Exchange Commission, including the Integrated Annual Report 2020 and the annual report on Form 20-F filed with the United States Securities and Exchange Commission on 22 April 2021 (SEC File no. 333-234096).
These forward-looking statements speak only as of the date of the content. Sibanye-Stillwater expressly disclaims any obligation or undertaking to update or revise any forward-looking statement (except to the extent legally required). These forward-looking statements have not been reviewed or reported on by the Group’s external auditor.
Sibanye-Stillwater Operating and financial results | Six months and year ended 31 December 2021 69