0001786909sbsw:RandRefineryMembersbsw:SubordinatedShareholdersLoanMember2014-12-18
| | |
| As filed with the Securities and Exchange Commission on 22 April 2022 |
UNITED STATES
SECURITIES AND EXCHANGE COMMISSION
Washington, D.C. 20549
| | | | | | | | | | | | | | | | | | | | | | | | | | | | | |
| Form 20-F | |
(Mark One) ☐ REGISTRATION STATEMENT PURSUANT TO SECTION 12(b) OR 12(g) OF THE SECURITIES EXCHANGE ACT OF 1934 or ☒ ANNUAL REPORT PURSUANT TO SECTION 13 OR 15(d) OF THE SECURITIES EXCHANGE ACT OF 1934 For the fiscal year ended 31 December 2021 or ☐ TRANSITION REPORT PURSUANT TO SECTION 13 OR 15(d) OF THE SECURITIES EXCHANGE ACT OF 1934 or ☐ SHELL COMPANY REPORT PURSUANT TO SECTION 13 OR 15(d) OF THE SECURITIES EXCHANGE ACT OF 1934 Date of event requiring this shell company report
For the transition period from to
Commission file number: 333-234096 |
| Sibanye Stillwater Limited | |
| (Exact name of registrant as specified in its charter) | |
Republic of South Africa
(Jurisdiction of incorporation or organization)Constantia Office Park
Bridgeview House, Building 11, Ground Floor
Cnr 14th Avenue & Hendrik Potgieter Road
Weltevreden Park, 1709
South Africa
011-27-11-278-9600
(Address of principal executive offices)
with copies to:
Charl Keyter
Chief Financial Officer
Sibanye Stillwater Limited
Tel: 011-27-11-278-9700
Constantia Office Park
Bridgeview House, Building 11, Ground Floor
Cnr 14th Avenue & Hendrik Potgieter Road
Weltevreden Park, 1709
South Africa
Jeffrey Cohen
Igor Rogovoy
Linklaters LLP
Tel: 011-44-20-7456-3660
One Silk Street
London EC2Y 8HQ
United Kingdom
(Name, Telephone, E-mail and/or Facsimile number and Address of Company Contact Person)
Securities registered or to be registered pursuant to Section 12(b) of the Act
| | | | | | | | | | | | | | | | | | | | | | | | | | | | | | | | |
| Title of Each Class | Trading Symbol | Name of Each Exchange on Which Registered |
| American Depositary Shares, each representing four ordinary shares | SBSW | New York Stock Exchange |
| Ordinary shares of no par value each | 0 | New York Stock Exchange* |
| * Not for trading, but only in connection with the registration of the American Depositary Shares pursuant to the requirements of the Securities and Exchange Commission. |
| Securities registered or to be registered pursuant to Section 12(g) of the Act None (Title of Class) Securities for which there is a reporting obligation pursuant to Section 15(d) of the Act None (Title of Class) Indicate the number of outstanding shares of each of the issuer’s classes of capital
or common stock as of the close of the period covered by the Annual Report
2,808,406,269 ordinary shares of no par value | | |
| | |
Indicate by check mark if the registrant is a well-known seasoned issuer, as defined in Rule 405 of the Securities Act: Yes ☒ No ☐If this report is an annual or transition report, indicate by check mark if the registrant is not required to file reports pursuant to Section 13 or 15(d) of the Securities Exchange Act of 1934. Yes ☐ No ☒
Note – Checking the box above will not relieve any registrant required to file reports pursuant to Section 13 or 15(d) of the Securities Exchange Act of 1934 from their obligations under those Sections.
Indicate by check mark whether the registrant (1) has filed all reports required to be filed by Section 13 or 15(d) of the Securities Exchange Act of 1934 during the preceding 12 months (or for such shorter period that the registrant was required to file such reports), and (2) has been subject to such filing requirements for the past 90 days. Yes ☒ No ☐
Indicate by check mark whether the registrant has submitted electronically every Interactive Data File required to be submitted pursuant to Rule 405 of Regulation S-T (§232.405 of this chapter) during the preceding 12 months (or for such shorter period that the registrant was required to submit such files). Yes ☒ No ☐
Indicate by check mark whether the registrant is a large accelerated filer, an accelerated filer, a non-accelerated filer, or an emerging growth company. See definition of “large accelerated filer,” “accelerated filer,” and “emerging growth company” in Rule 12b-2 of the Exchange Act.
Large accelerated filer ☒ Accelerated filer ☐ Non-accelerated filer ☐ Emerging growth company ☐
If an emerging growth company that prepares its financial statements in accordance with U.S. GAAP, indicate by check mark if the registrant has elected not to use the extended transition period for complying with any new or revised financial accounting standards† provided pursuant to Section 13(a) of the Exchange Act. ☐
† The term “new or revised financial accounting standard” refers to any update issued by the Financial Accounting Standards Board to its Accounting Standards Codification after April 5, 2012.
Indicate by check mark whether the registrant has filed a report on and attestation to its management’s assessment of the effectiveness of its internal control over financial reporting under Section 404(b) of the Sarbanes-Oxley Act (15 U.S.C. 7262(b)) by the registered public accounting firm that prepared or issued its audit report. ☒
Indicate by check mark which basis of accounting the registrant has used to prepare the financial statements included in this filing:
U.S. GAAP ☐ International Financial Reporting Standards as issued by the International Accounting Standards Board ☒ Other ☐
If “Other” has been checked in response to the previous question, indicate by check mark which financial statement item the registrant has elected to follow: Item 17 ☐ Item 18 ☐
If this is an annual report, indicate by check mark whether the registrant is a shell company (as defined in Rule 12b-2 of the Exchange Act). Yes ☐ No ☒
(APPLICABLE ONLY TO ISSUERS INVOLVED IN BANKRUPTCY PROCEEDINGS DURING THE PAST FIVE YEARS)
Indicate by check mark whether the registrant has filed all documents and reports required to be filed by Sections 12, 13 or 15(d) of the Securities Exchange Act of 1934 subsequent to the distribution of securities under a plan confirmed by a court. Yes ☐ No ☐
FORM 20-F CROSS REFERENCE GUIDE
| | | | | | | | | | | | | | | | | | | | | | | |
| Item | | Form 20-F Caption | | Location in this document | | Page | |
| 1 | | Identity of directors, senior management and advisers | | NA | | — | |
| 2 | | Offer statistics and expected timetable | | NA | | NA | |
| 3 | | Key information | | | | | |
| | (a)Reserved | | NA | | NA | |
| | (b)Capitalisation and indebtedness | | NA | | NA | |
| | (c)Reasons for the offer and use of proceeds | | NA | | NA | |
| | (d)Risk factors | | Risk factors | | 1-27 | |
| 4 | | Information on the Company | | | | | |
| | (a)History and development of the Company | | Additional information—Memorandum of incorporation—General | | 44 | |
| | | | Forward-looking Statements | | xvi | |
| | | | Integrated Annual Report—What drives us—Leadership view—Chairman’s and CEO’s review | | 28-37 (IR) | |
| | | | Integrated Annual Report—Our performance—Chief Financial Officer’s report | | 90-94 (IR) | |
| | | | Integrated Annual Report—Our business and leadership—Our timeline—Our value creation journey | | 6 (IR) | |
| | | | Annual Financial Report—Overview—Management’s discussion and analysis of the financial statements—Liquidity and capital resources | | 24-26 (AFR) | |
| | | | Annual Financial Report—Consolidated financial statements—Notes to the consolidated financial statements—Note 16: Acquisitions | | 94-96 (AFR) | |
| | | | Integrated Annual Report—Our performance—Major investments in operational sustainability | | 110-111 (IR) | |
| | | | Annual Financial Report—Overview—Management’s discussion and analysis of the financial statements—Factors affecting Sibanye-Stillwater’s performance—Capital expenditure | | 12-13 (AFR) | |
Presentation of financial and other information
| | | | | | | | | | | | | | | | | | | | | | | |
| | | | Presentation of Financial and Other Information—The Lonmin acquisition | | xv | |
| | | | Annual Financial Report—Shareholder information | | 150-152 (AFR) | |
| | | | Additional information—Documents on display | | 53 | |
| | (b)Business overview | | Annual Financial Report—Overview—Management’s discussion and analysis of the financial statements—Introduction | | 5-7 (AFR) | |
| | | | Integrated Annual Report—Our business and leadership—About Sibanye-Stillwater | | 4-5 (IR) | |
| | | | Annual Financial Report—Overview—Management’s discussion and analysis of the financial statements—Factors affecting Sibanye-Stillwater’s performance | | 9-13 (AFR) | |
| | | | Annual Financial Report—Overview—Management’s discussion and analysis of the financial statements—Revenue | | 14 (AFR) | |
| | | | Integrated Annual Report—What drives us—Leadership view—Chairman’s and CEO’s review | | 28-37 (IR) | |
| | | | Environmental and regulatory matters | | 33-41 | |
| | | | Integrated Annual Report—Our performance—Chief Financial Officer’s report | | 90-94 (IR) | |
| | | | Integrated Annual Report—Our business and leadership—Our timeline | | 6 (IR) | |
| | | | Additional information—Refining and marketing | | 53 | |
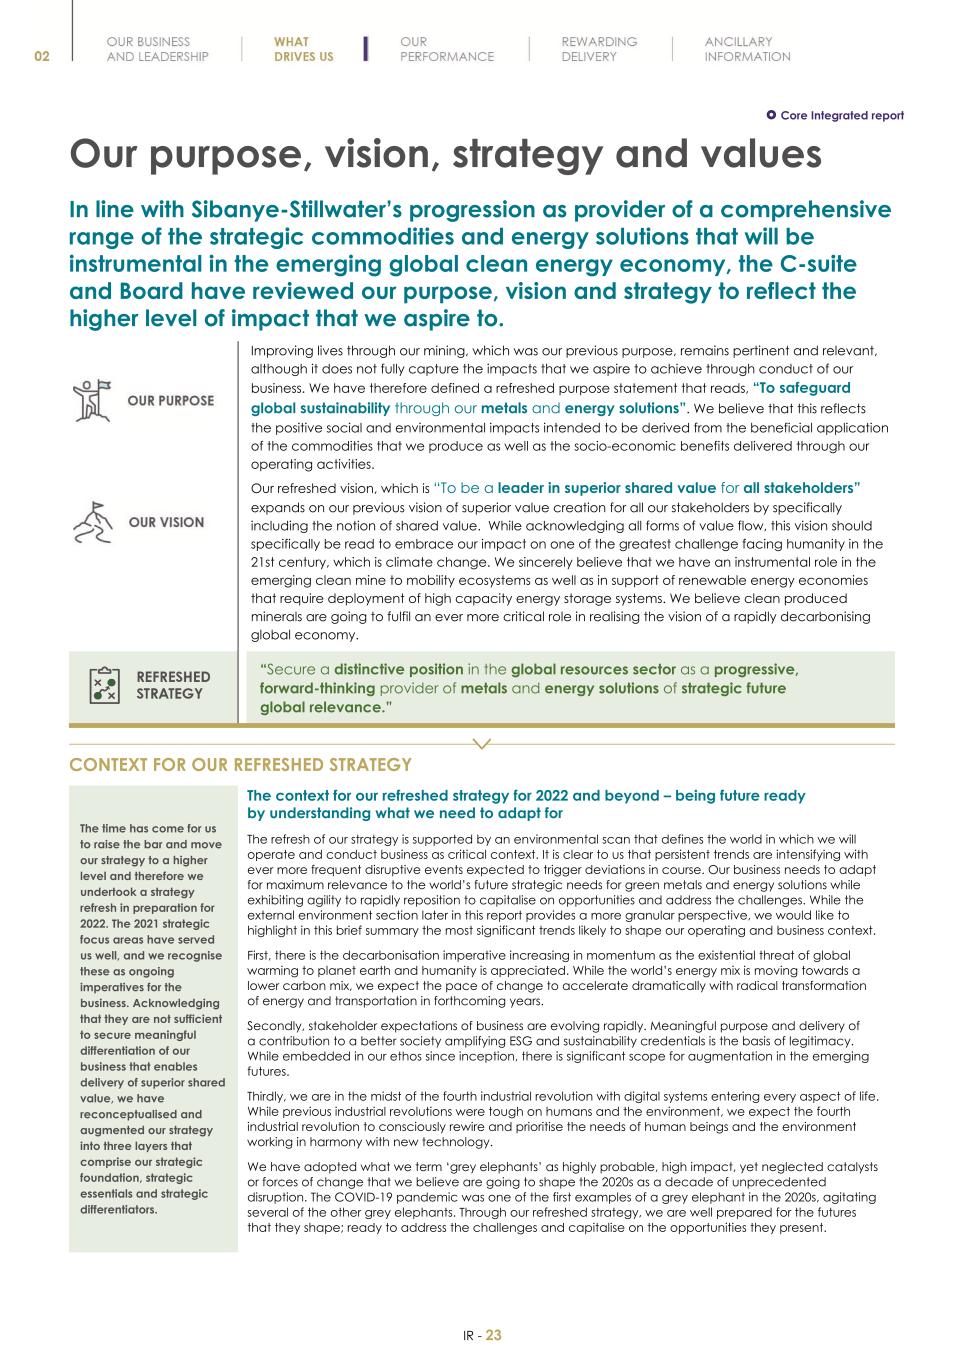
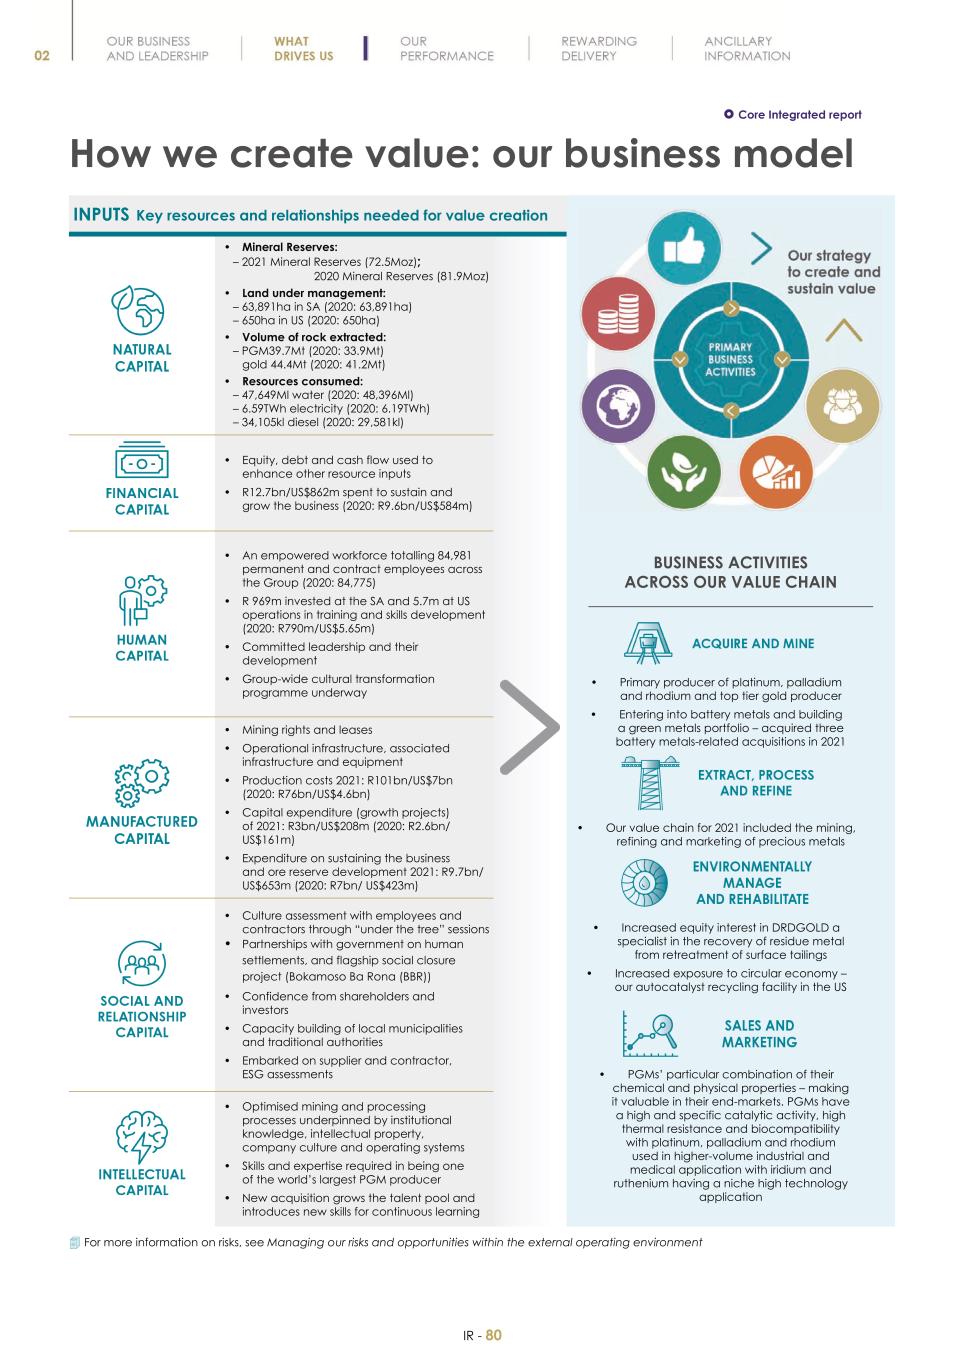
| | | | Integrated Annual Report—What drives us—Our purpose, vision, strategy and values | | 23-27 (IR) | |
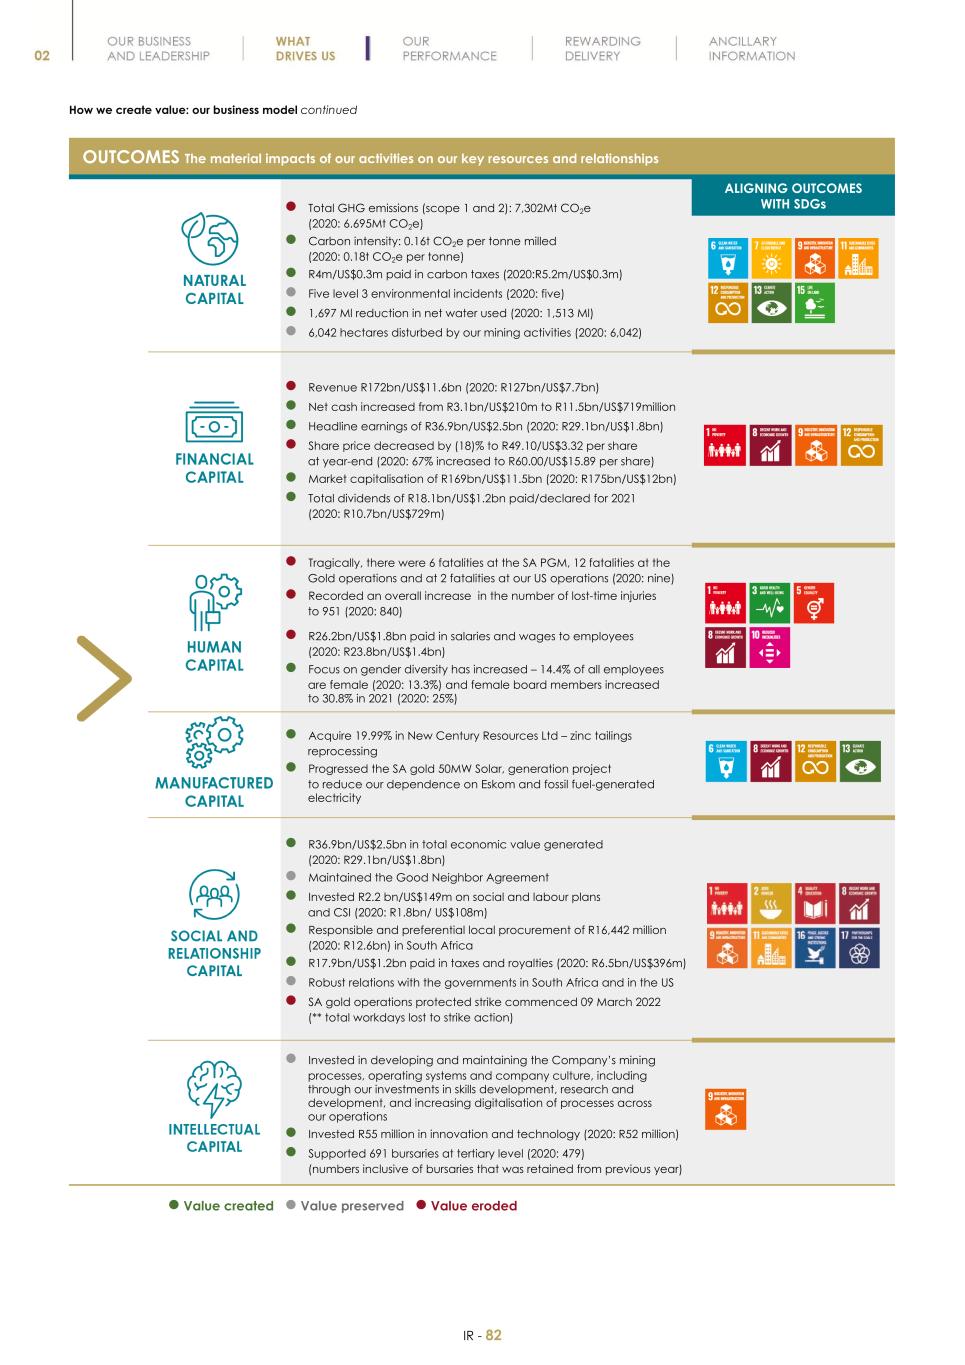
| | | | Integrated Annual Report—What drives us—How we create value–Our business model | | 80-83 (IR) | |
Presentation of financial and other information
| | | | | | | | | | | | | | | | | | | | | | | |
| | | | Integrated Annual Report—Our performance—Social upliftment and community development | | 216 (IR) | |
| | | | Integrated Annual Report—Our business and leadership—Corporate governance—Ethical leadership and corporate citizen | | 12-14 (IR) | |
| | (c)Organisational structure | | Integrated Annual Report—Ancillary information—Administrative and corporate information | | 282 (IR) | |
| | | | Exhibit 8.1—List of subsidiaries of the registrant | | | |
| | | | Annual Financial Report—Consolidated financial statements—Notes to the consolidated financial statements—Note 1.3: Consolidation | | 53-54 (AFR) | |
| | | | Annual Financial Report—Consolidated financial statements—Notes to the consolidated financial statements—Note 1.2: Basis of preparation | | 49-52 (AFR) | |
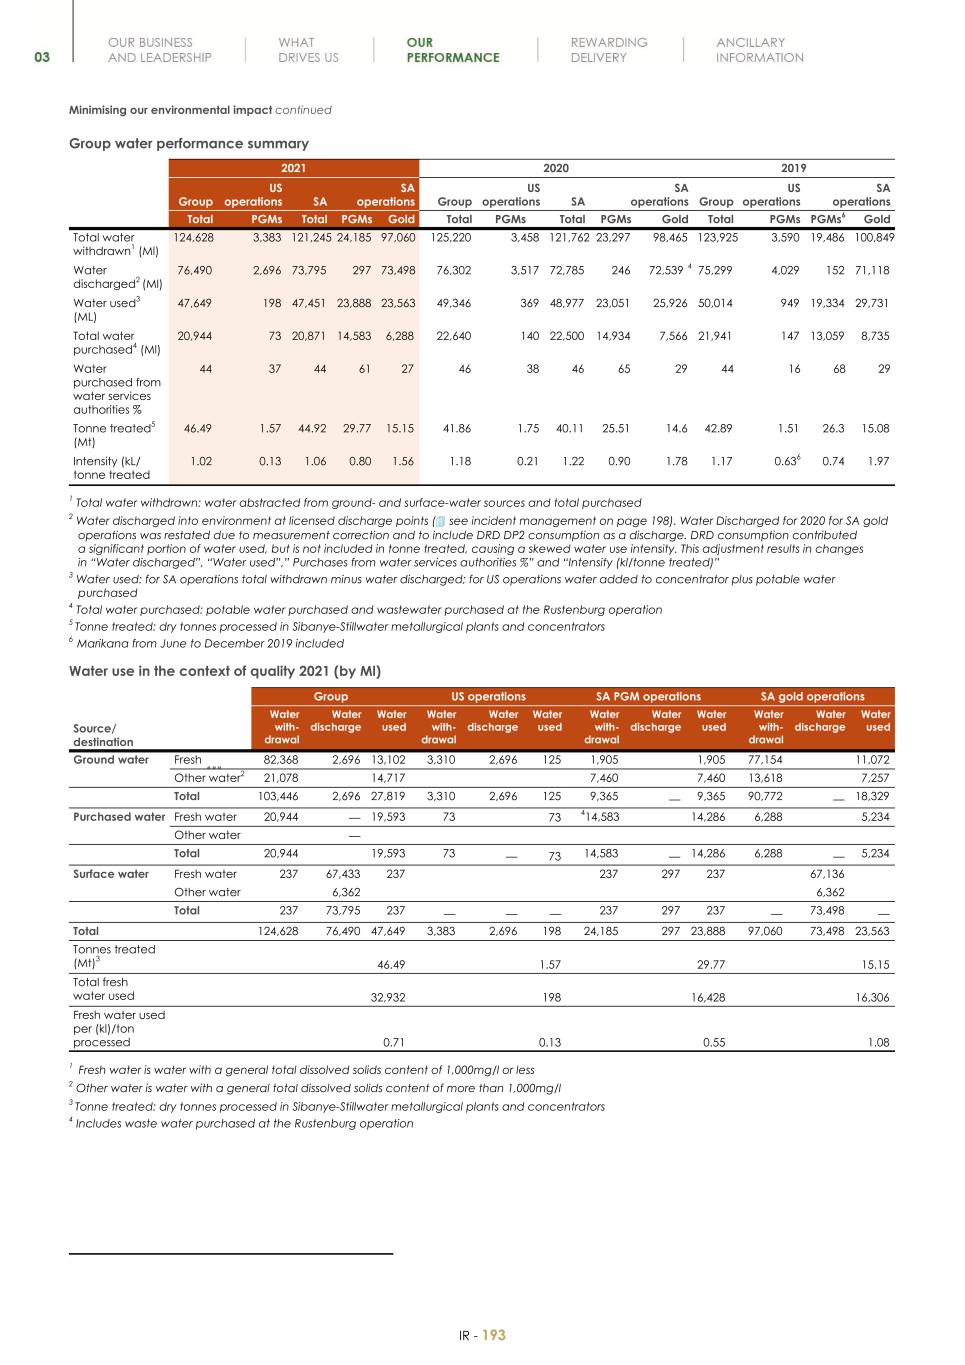
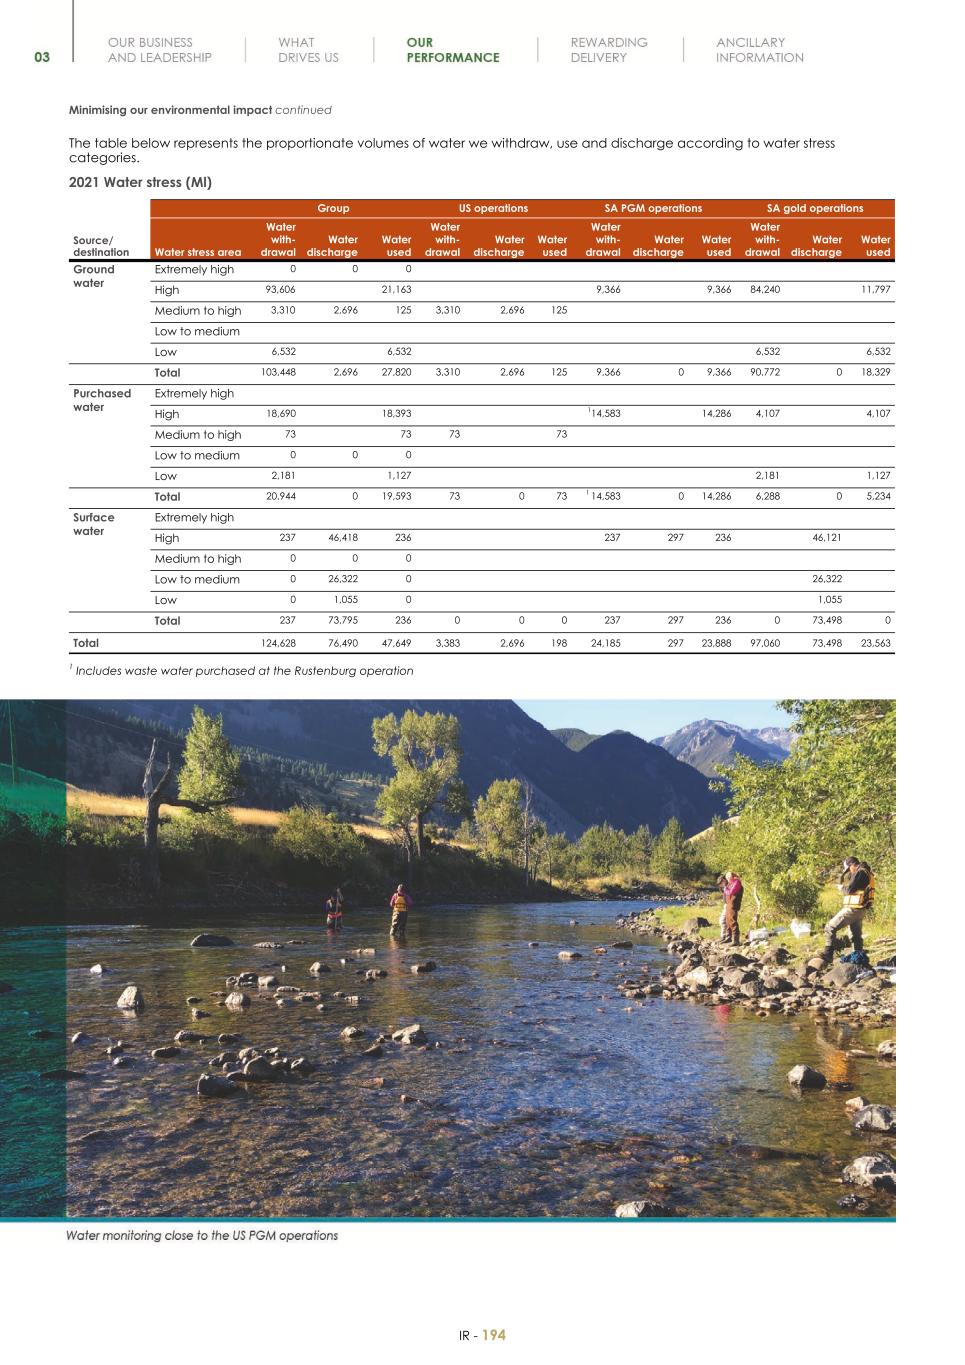
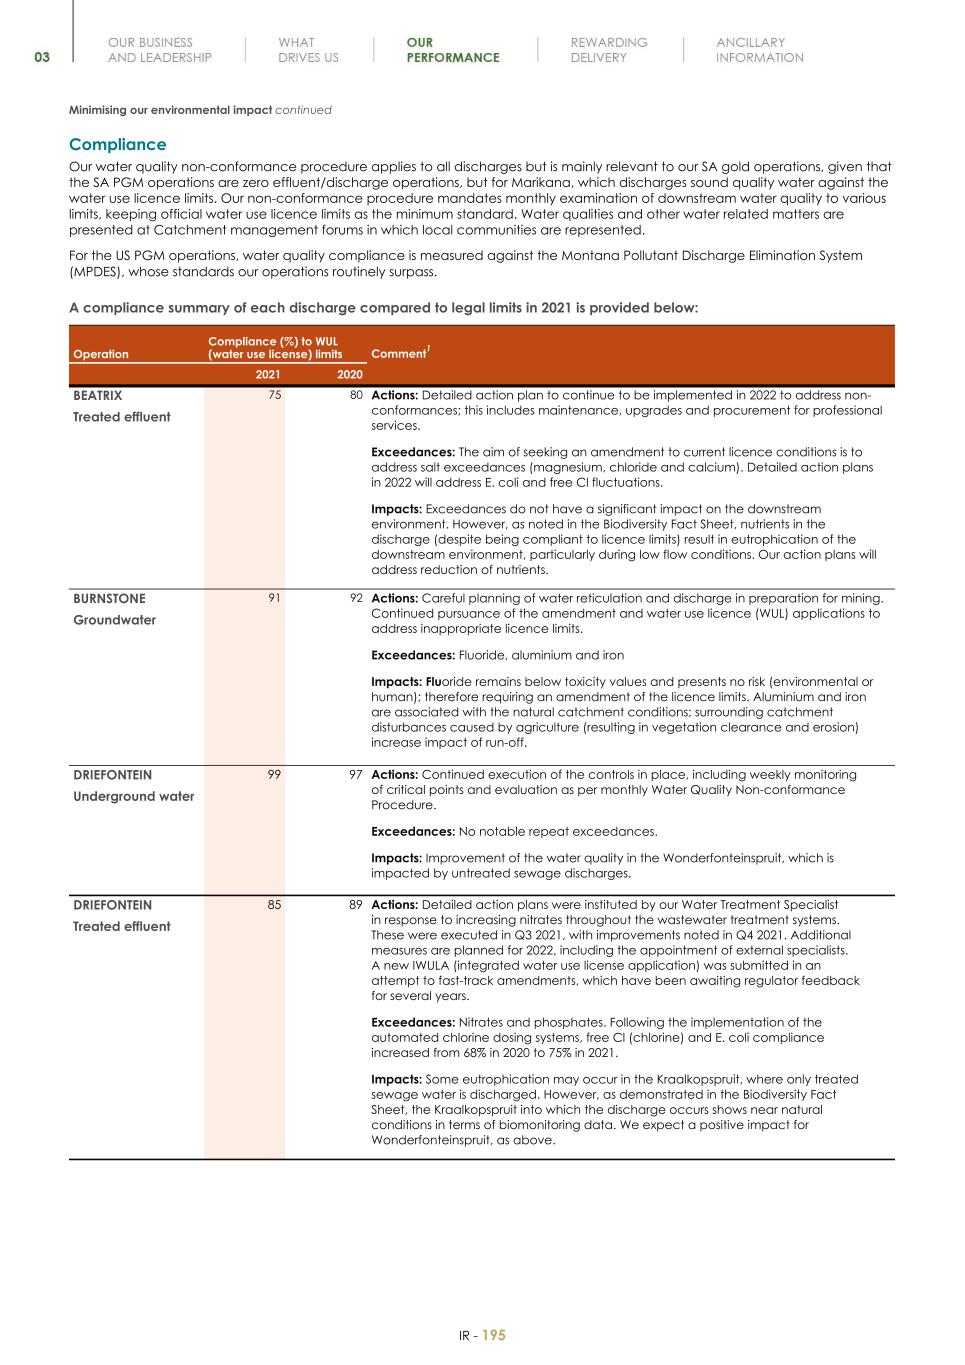
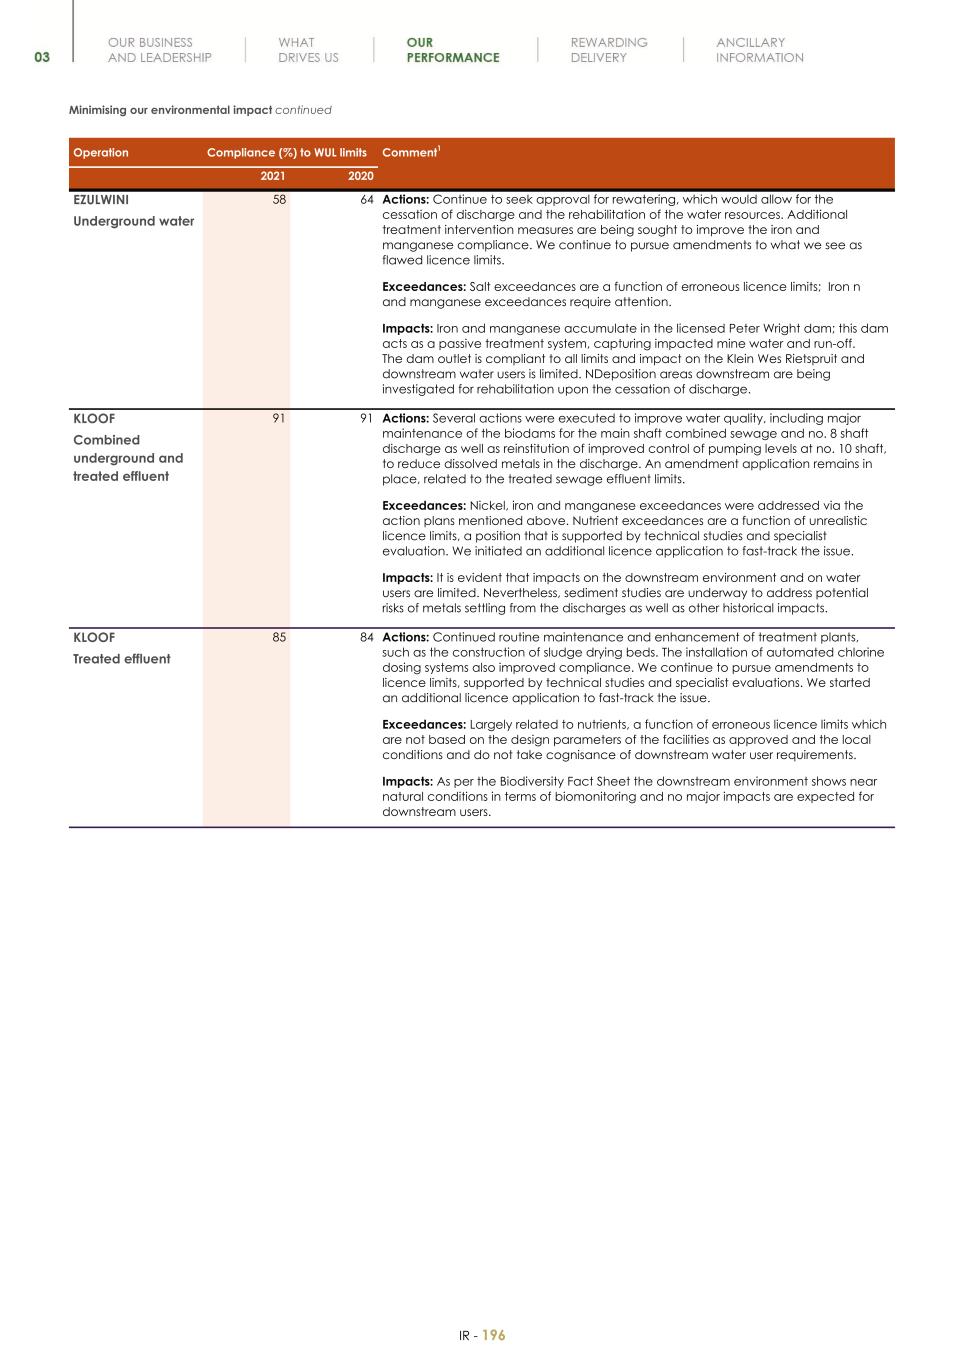
| | (d)Property, plant and equipment | | Integrated Annual Report—Delivering on our strategy and outlook—Minimising our environmental impact | | 180 (IR) | |
| | | | Environmental and regulatory matters | | 33-41 | |
| | | | Annual Financial Report—Consolidated financial statements—Notes to the consolidated financial statements—Note 14: Property, plant and equipment | | 87-92 (AFR) | |
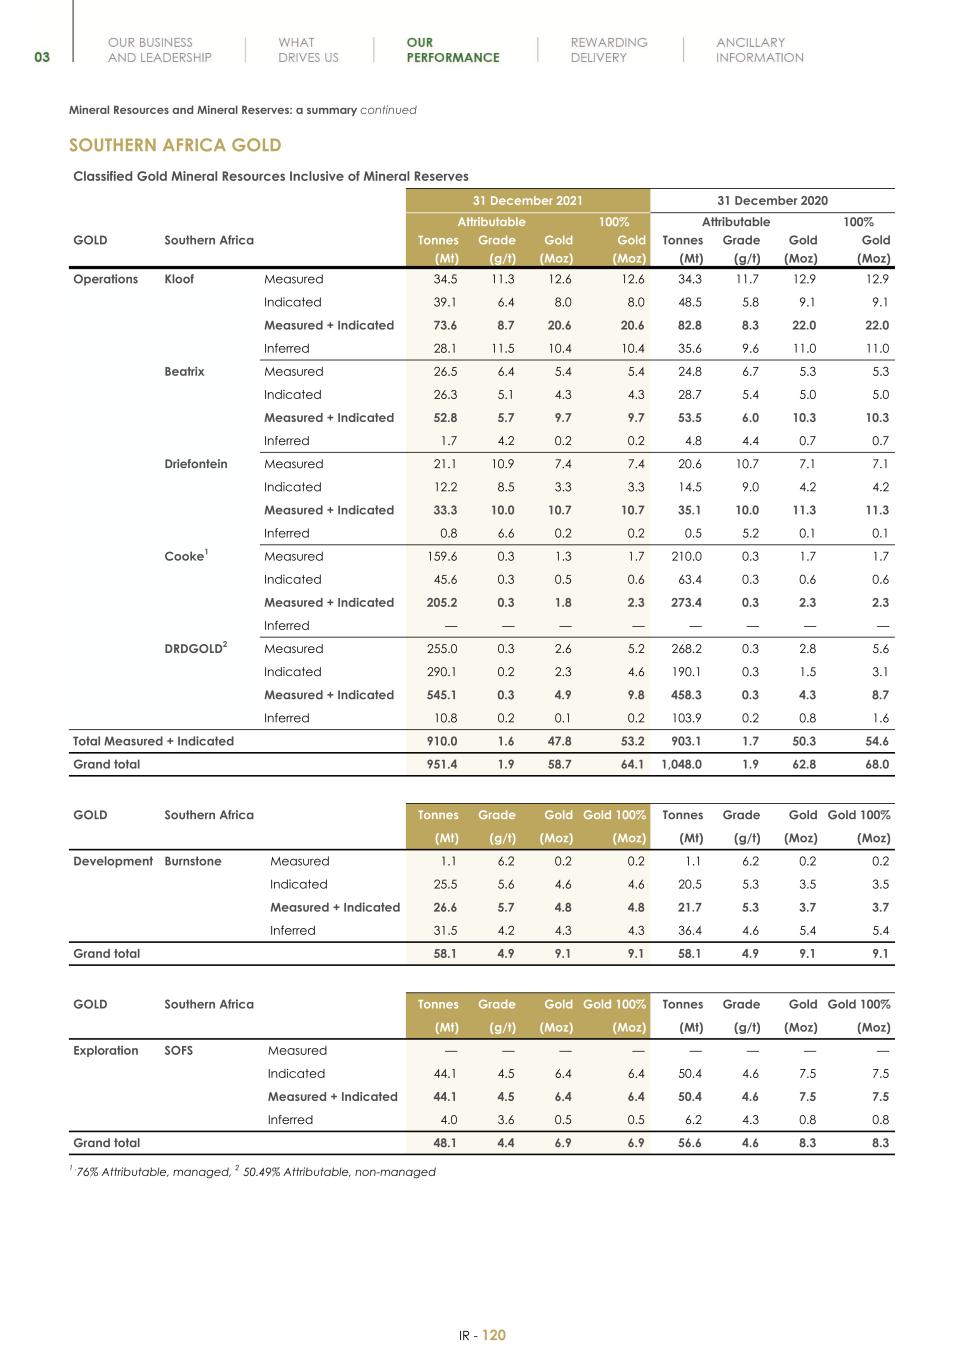
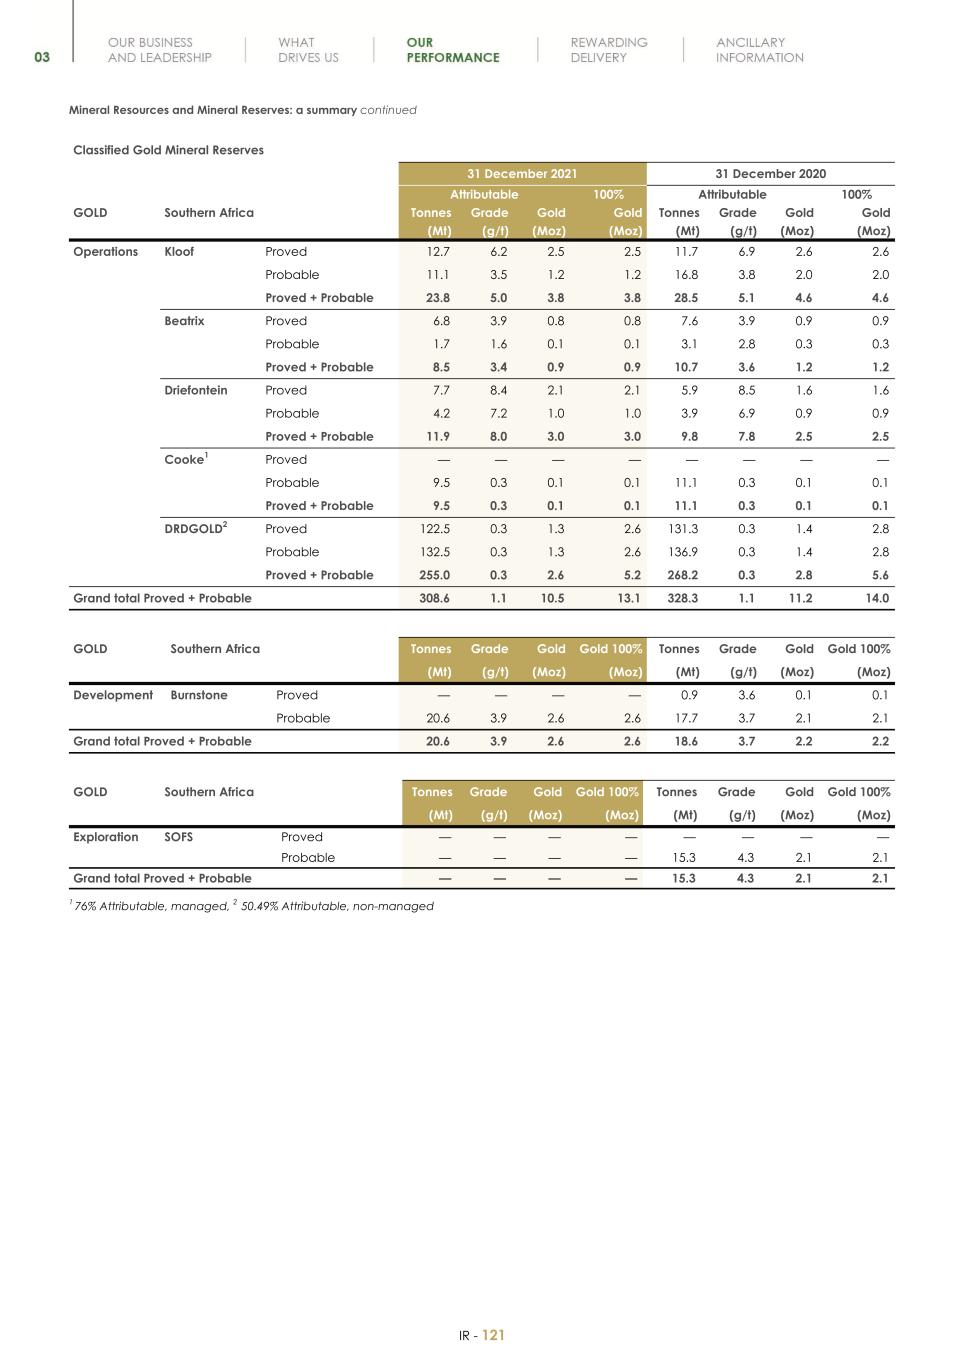
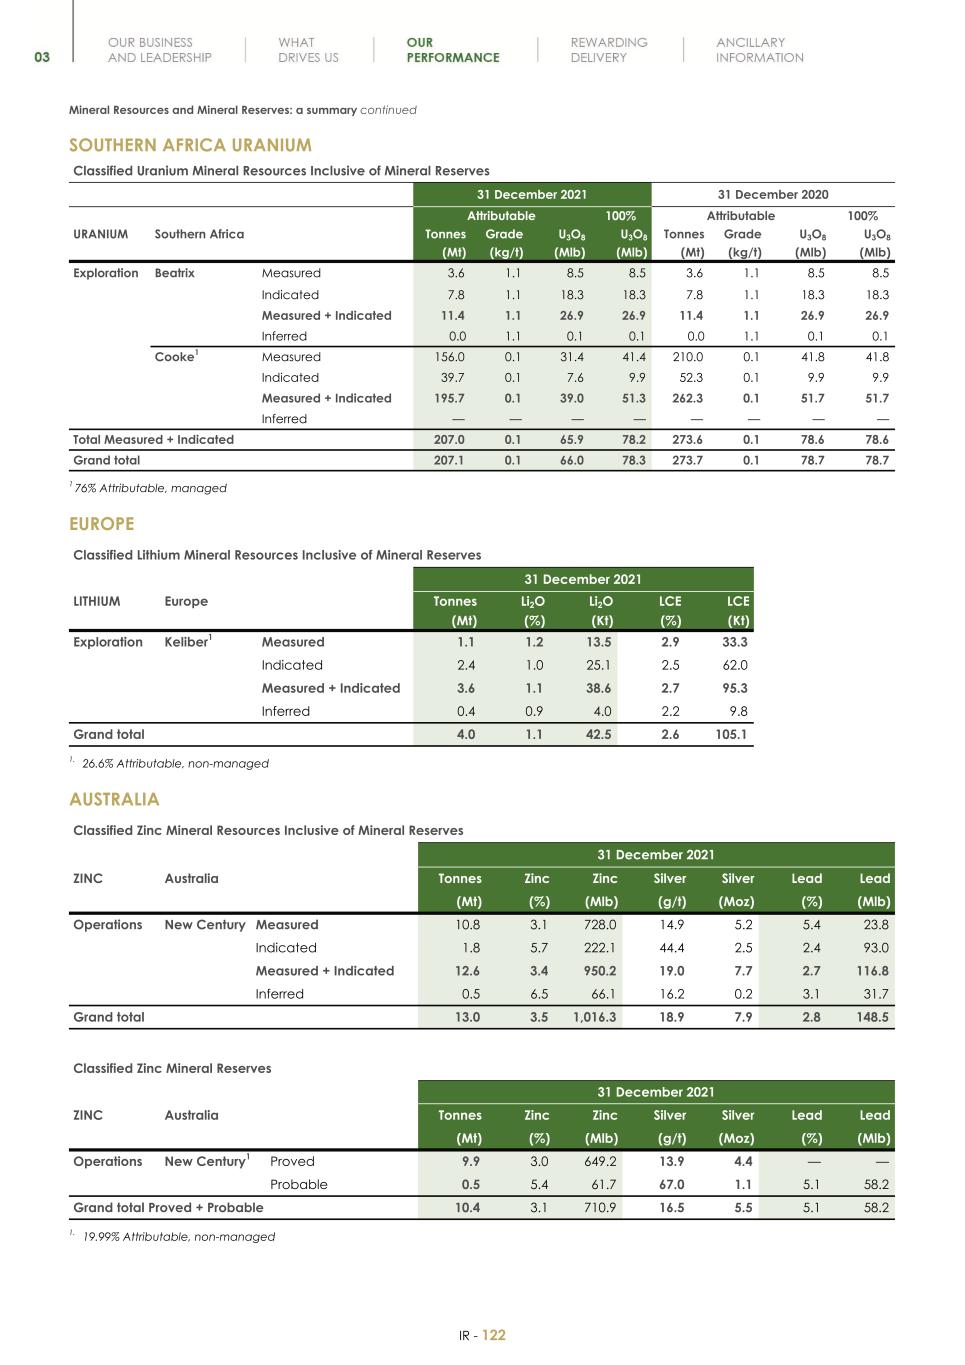
| | Summary Disclosure (Item 1304) | | Mineral Resources and Reserves Report—Section 1: Our business—Introduction | | 3-6 (R&R) | |
| | | | Mineral Resources and Reserves Report—Section 1: Our business—Group Summary | | 7-16 (R&R) | |
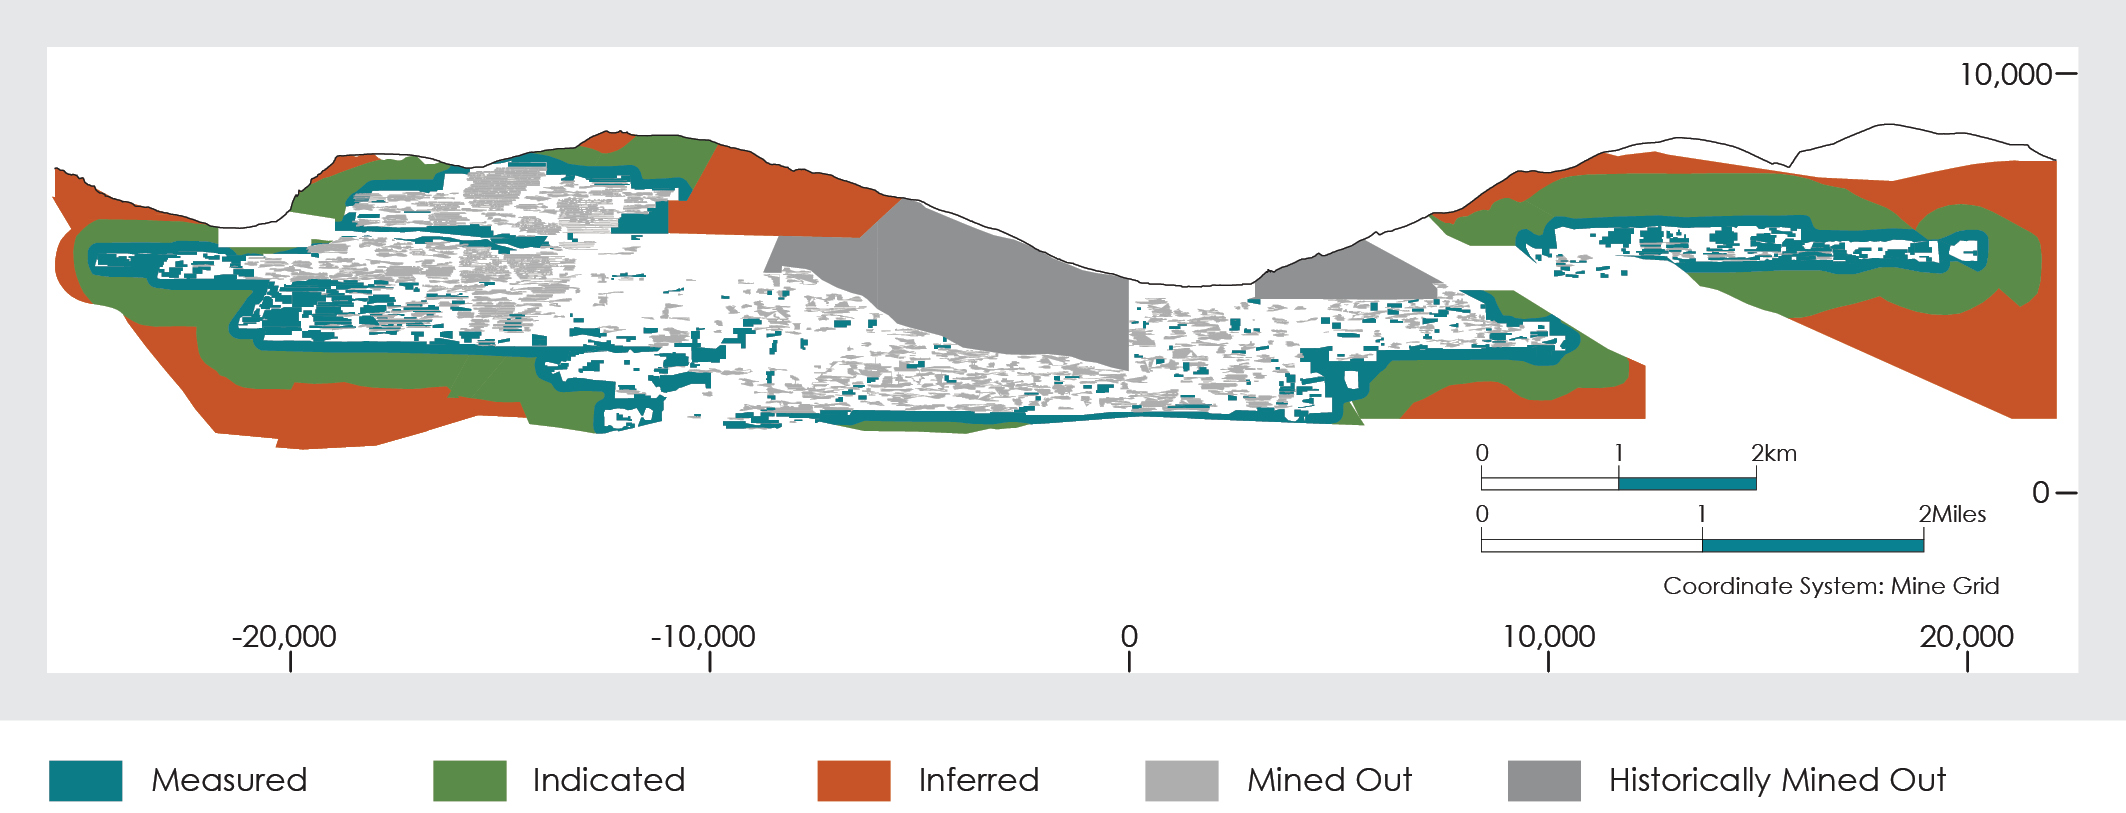
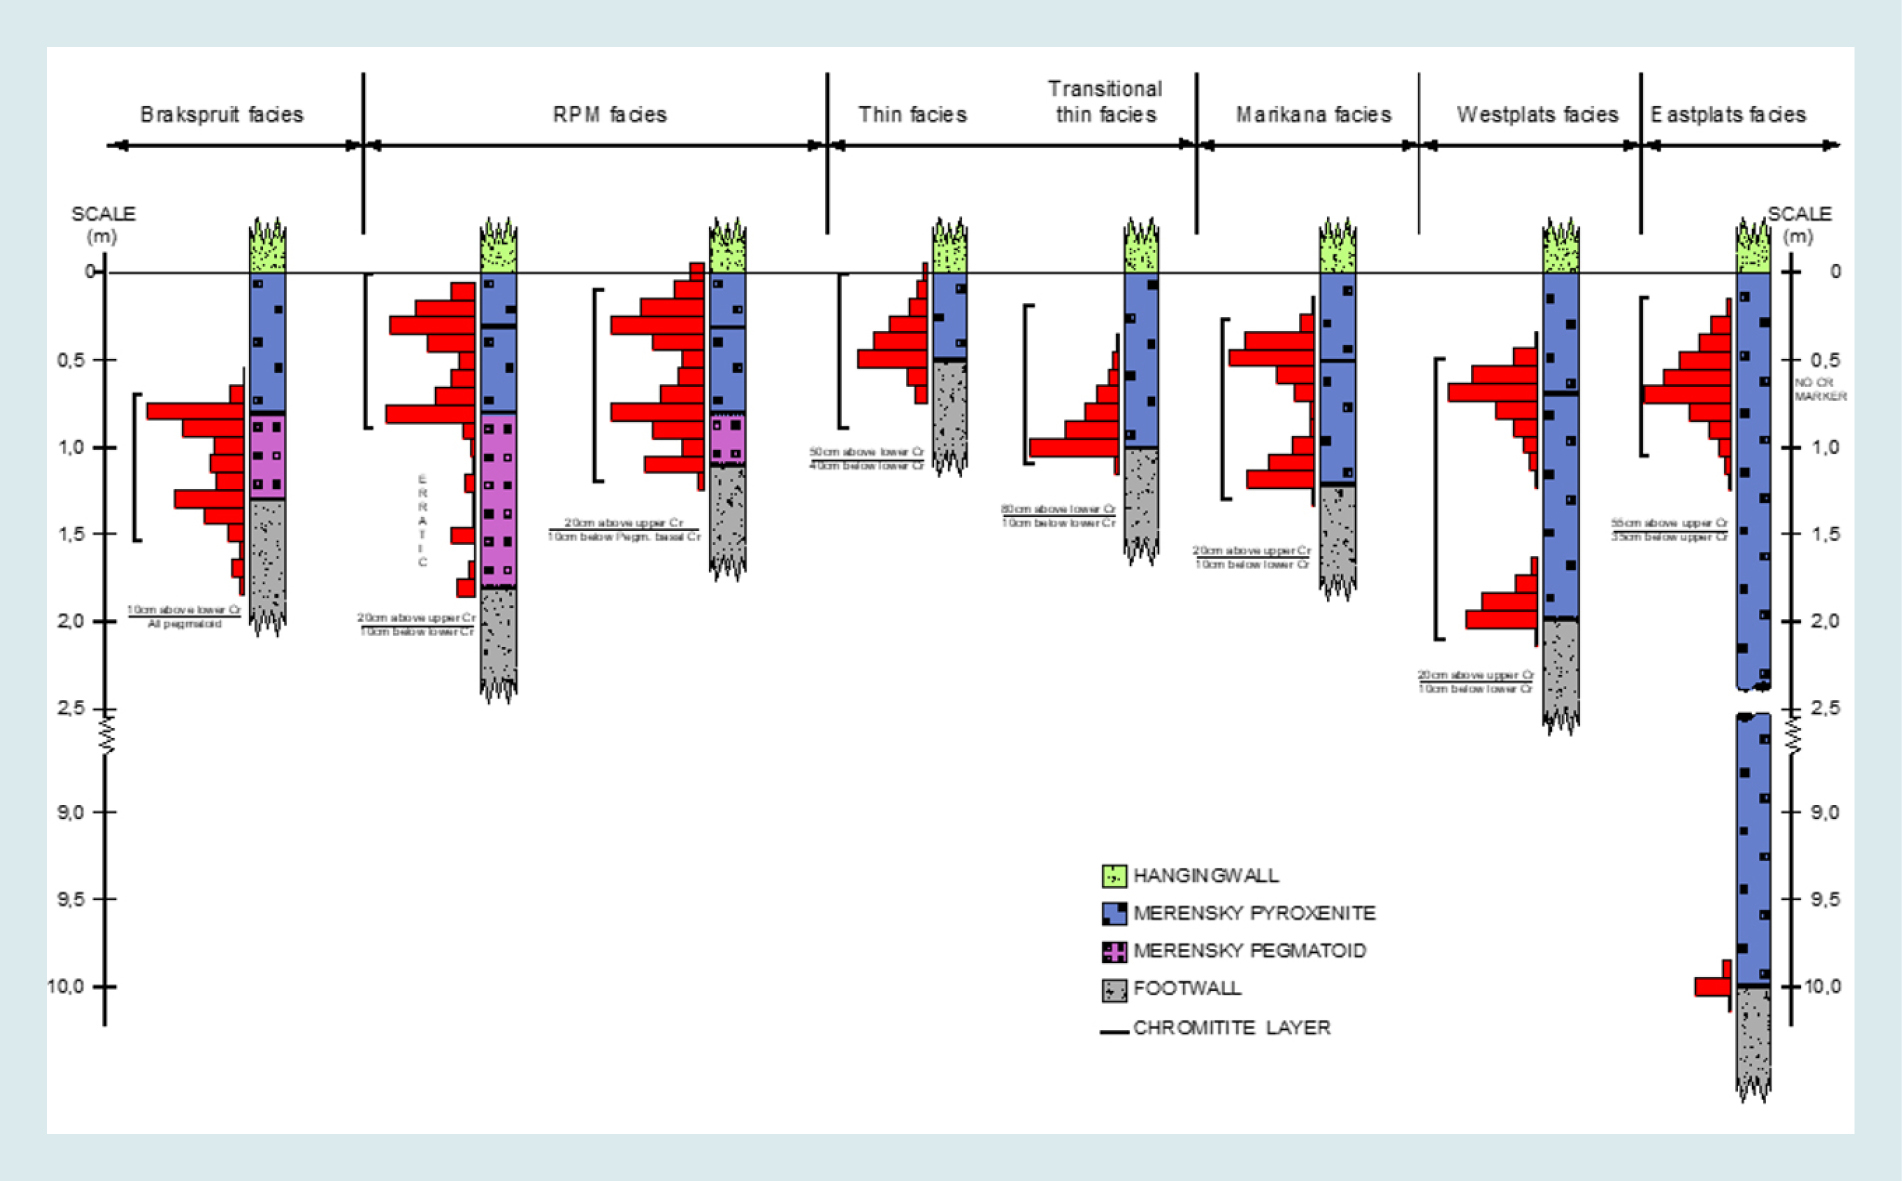
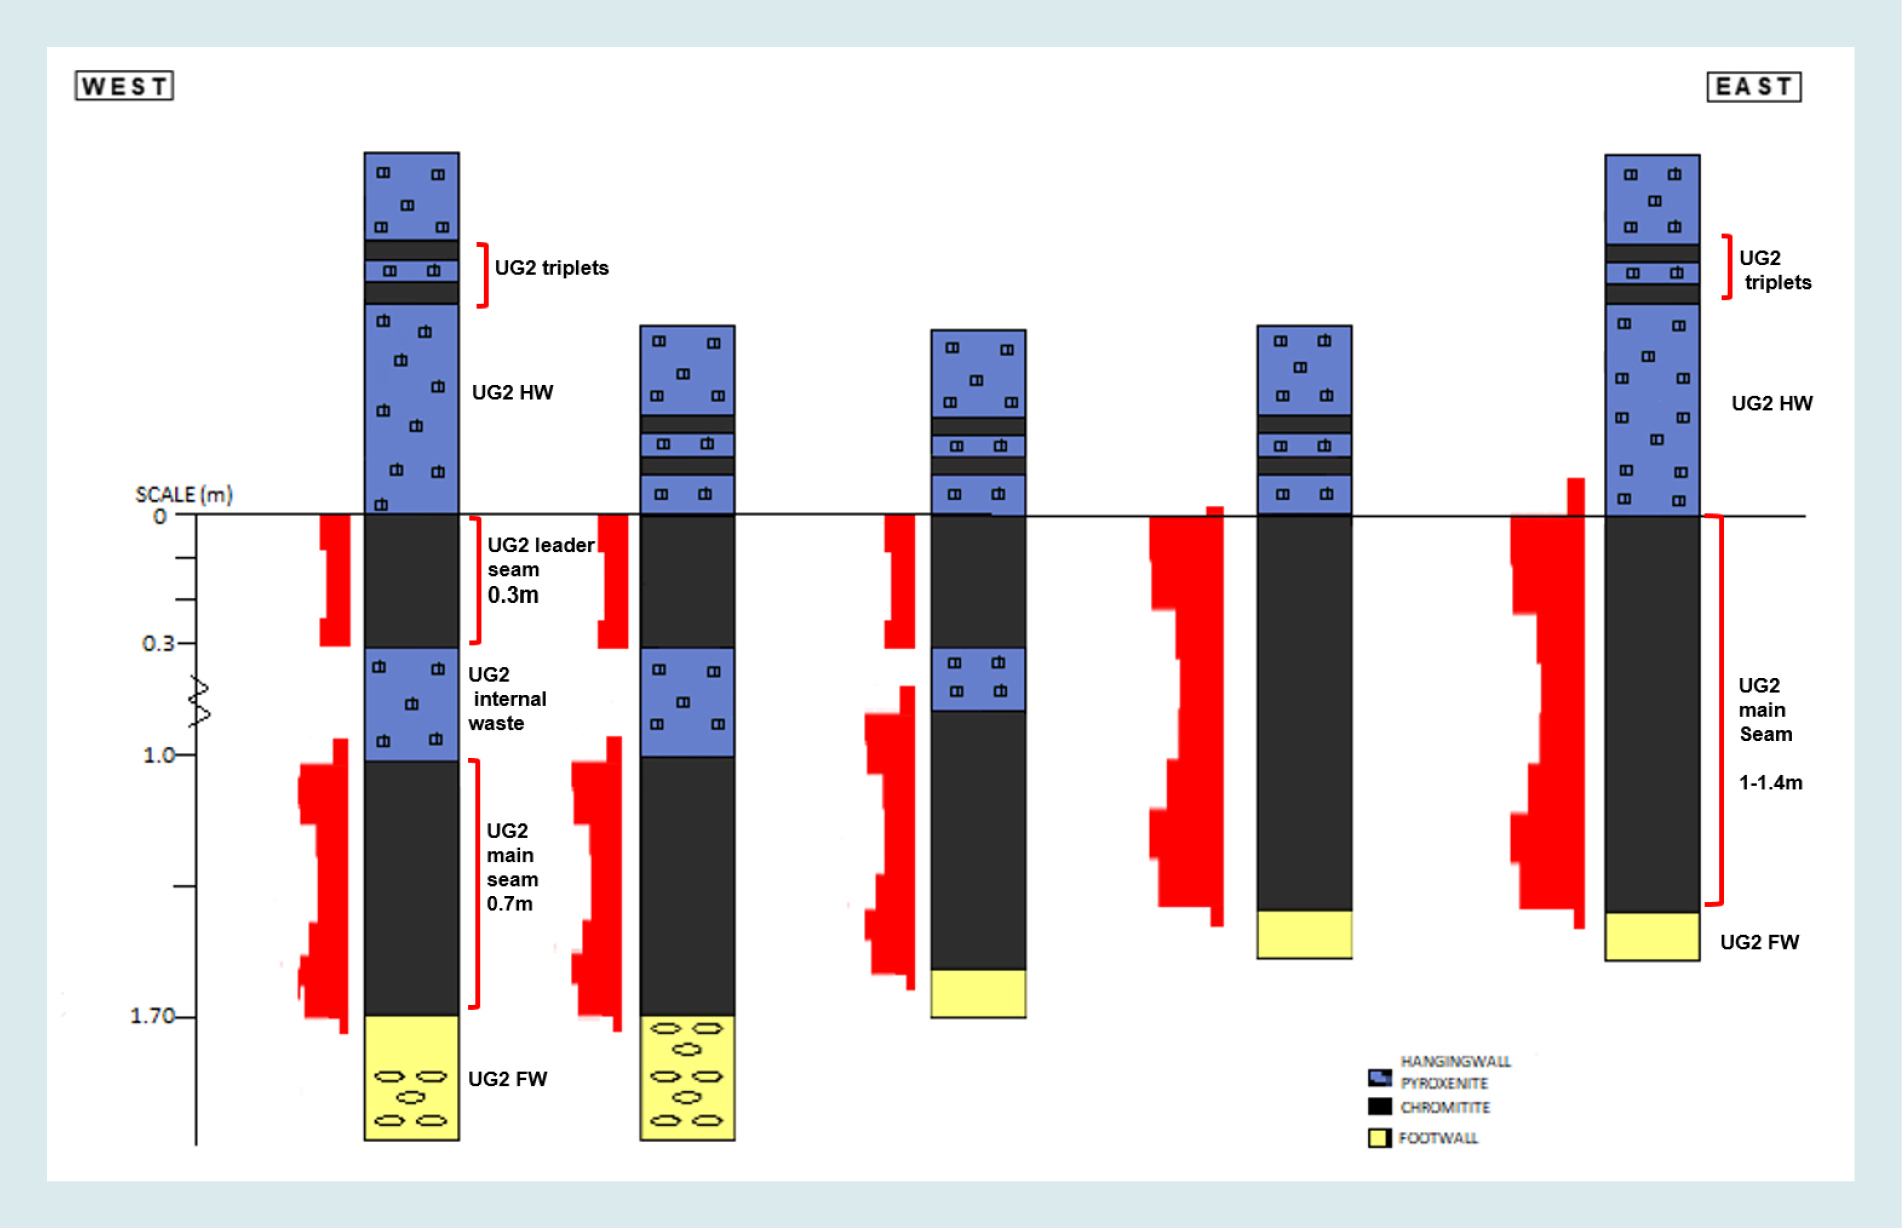
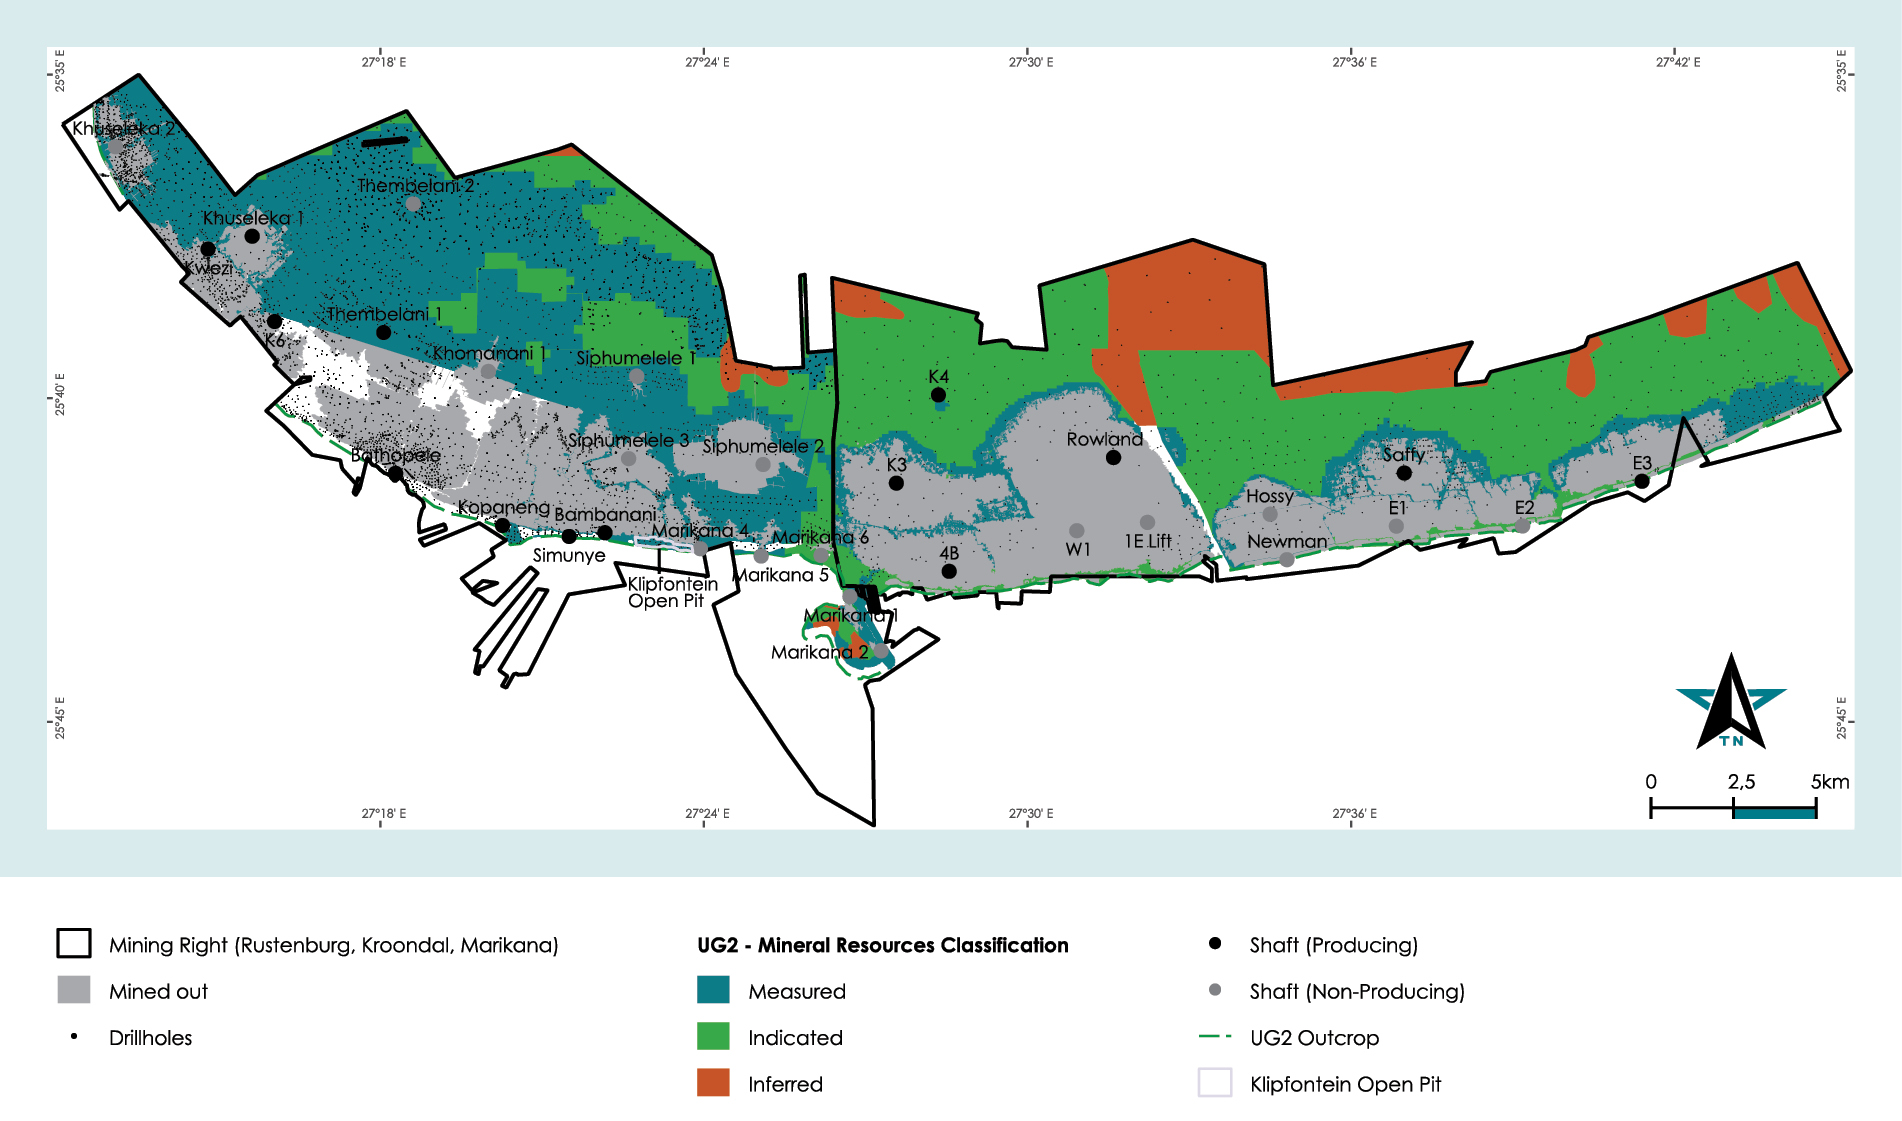
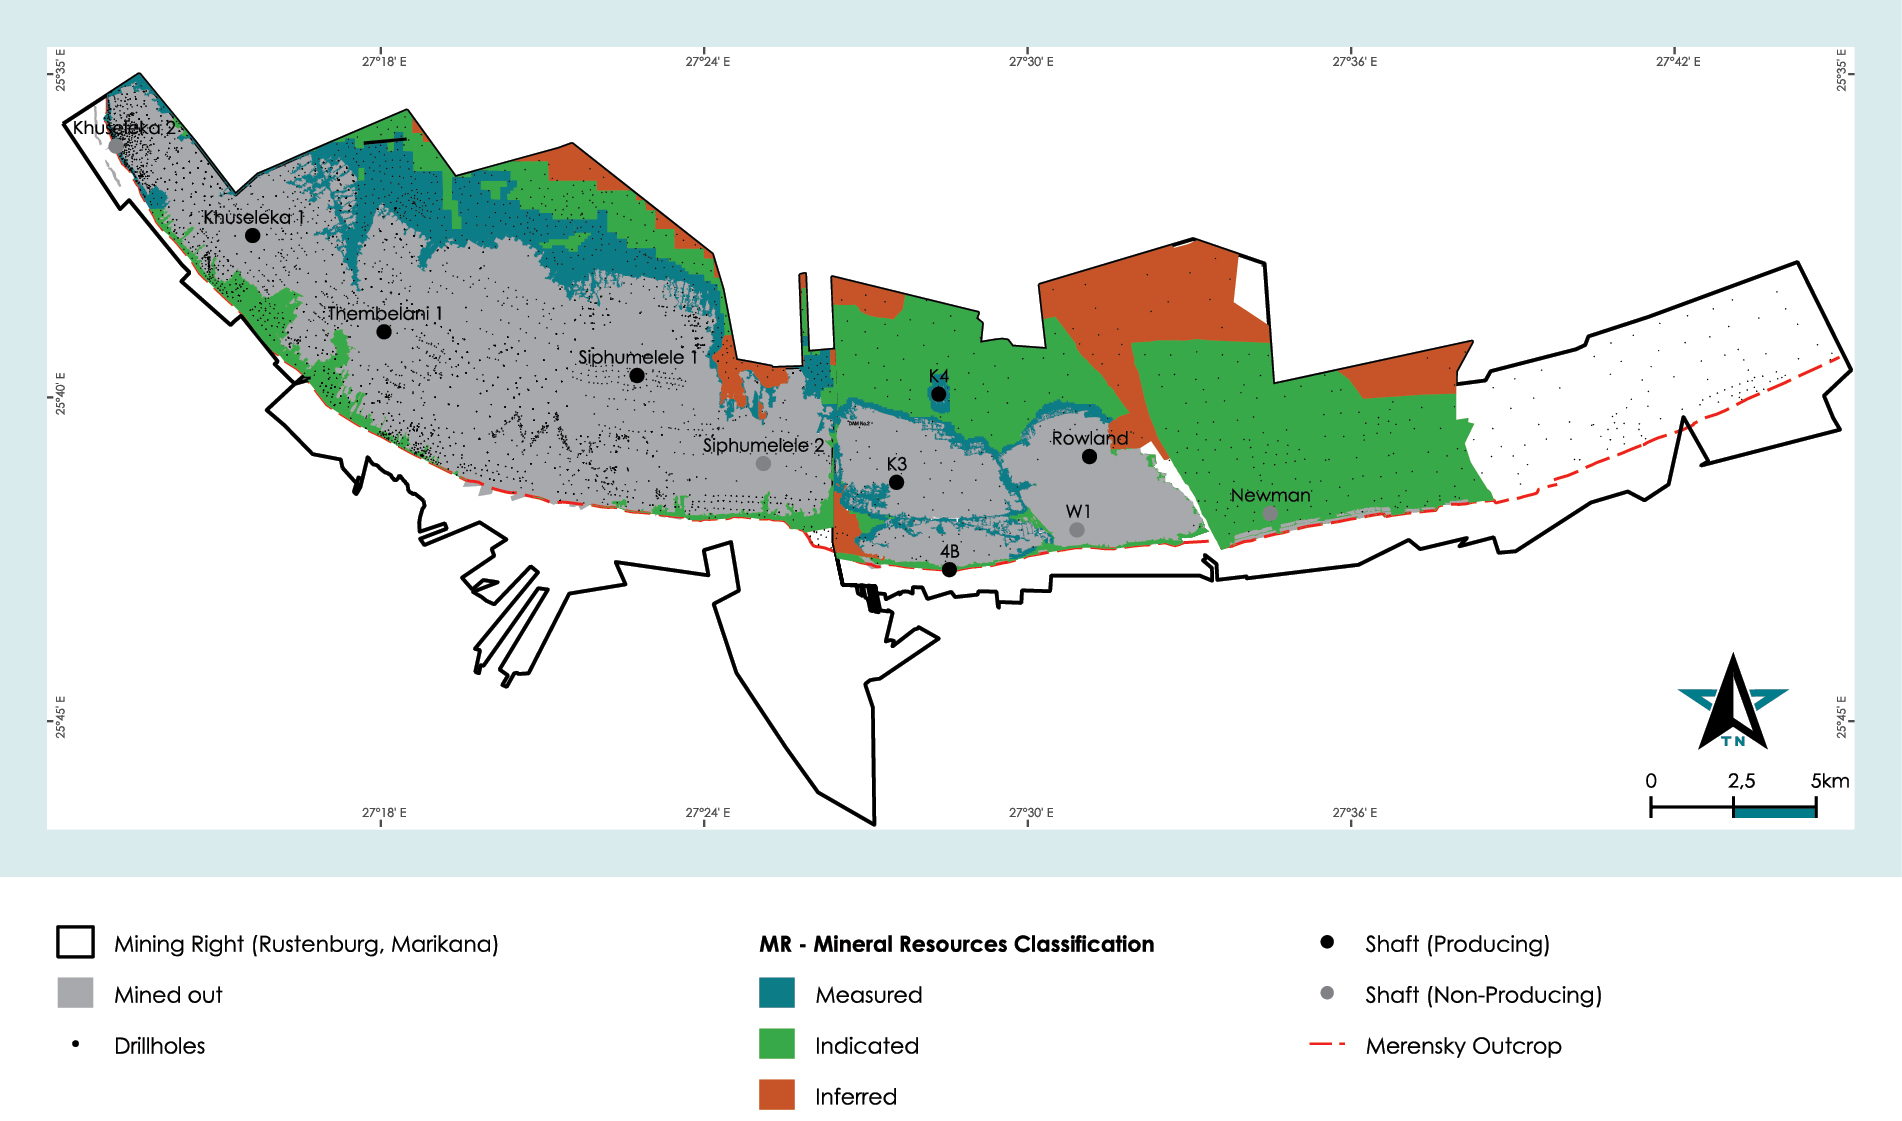
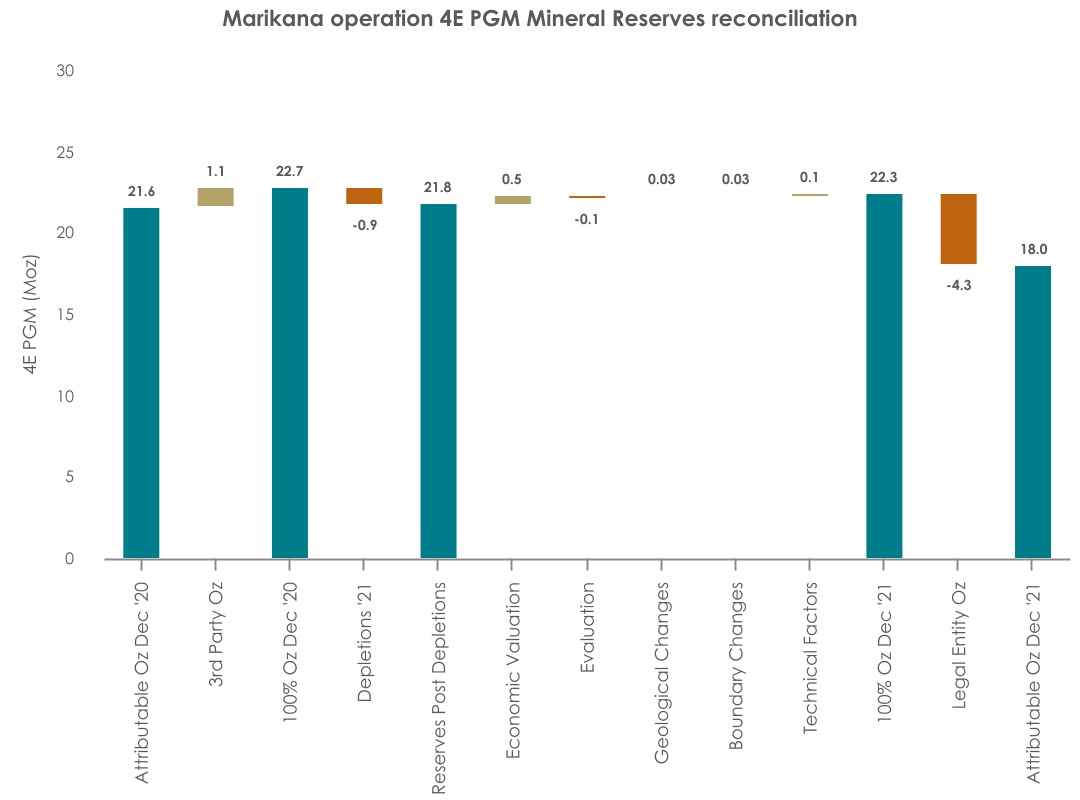
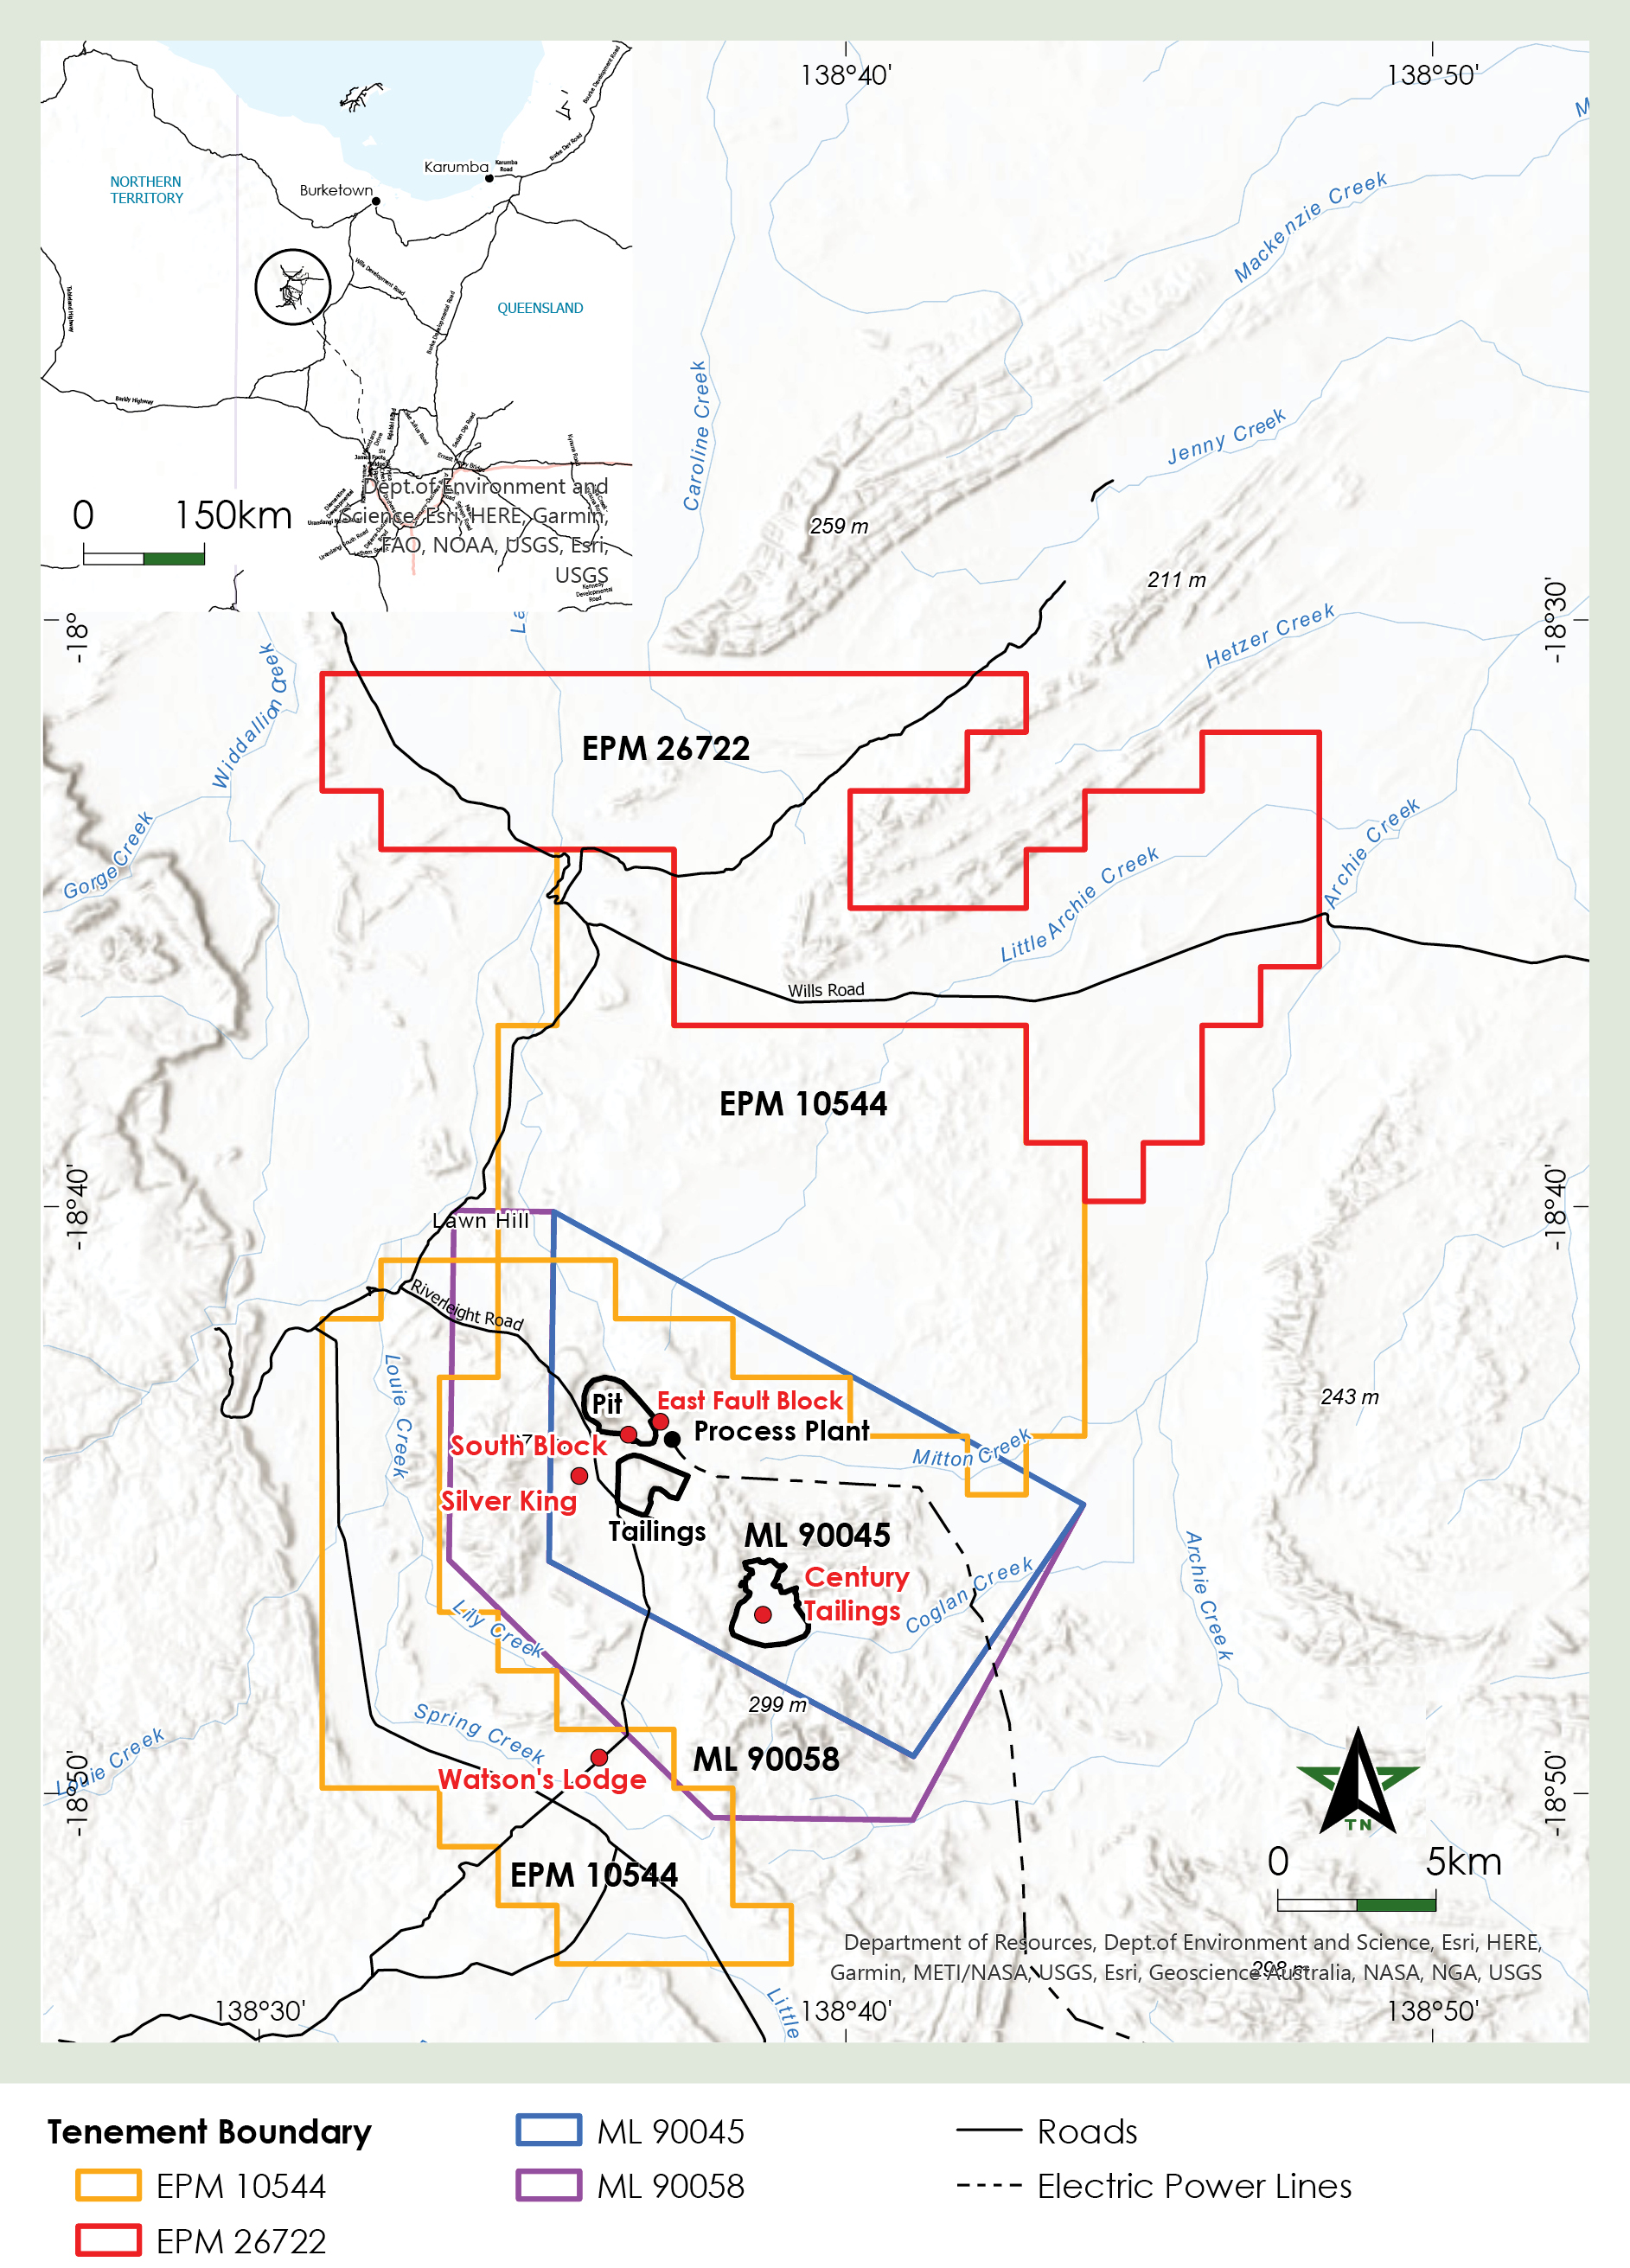
| | Individual Property Disclosure (Item 1304) | | Mineral Resources and Mineral Reserves Report—Section 2: Americas—PGM Operations—Stillwater and East Boulder | | 32-44 (R&R) | |
| | | | Mineral Resources and Mineral Reserves Report—Section 3: Southern Africa—SA PGMs—Marikana | | 67-74 (R&R) | |
Presentation of financial and other information
| | | | | | | | | | | | | | | | | | | | | | | |
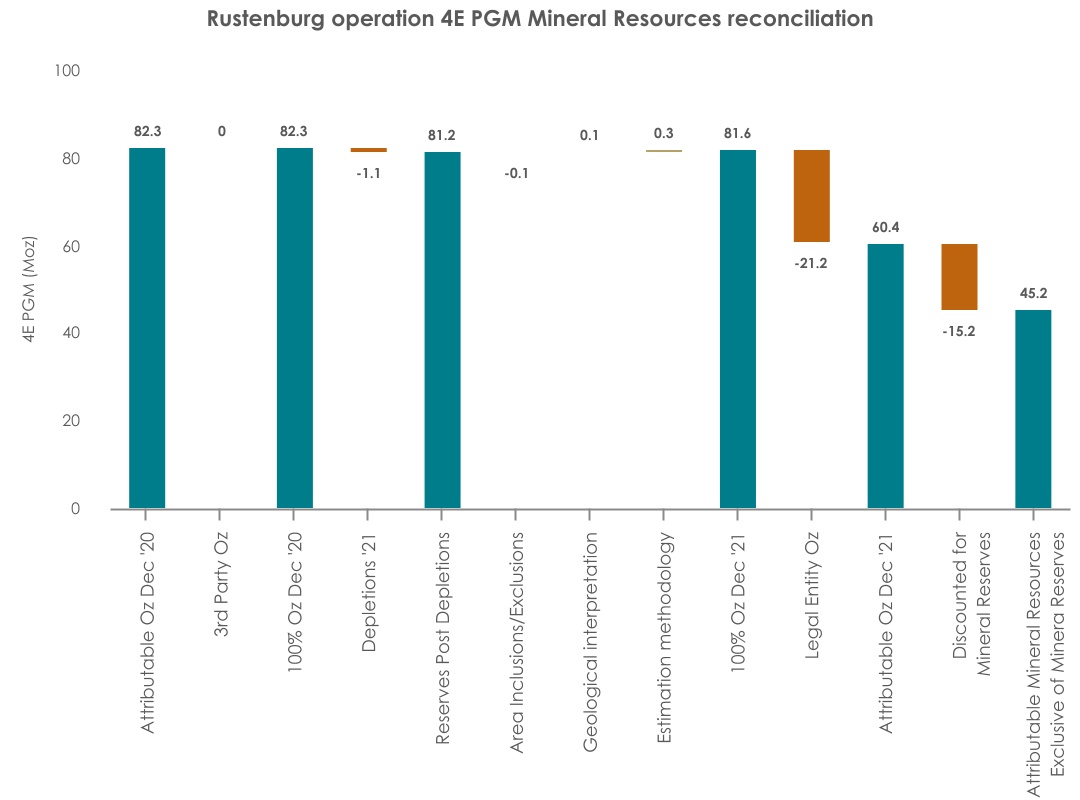
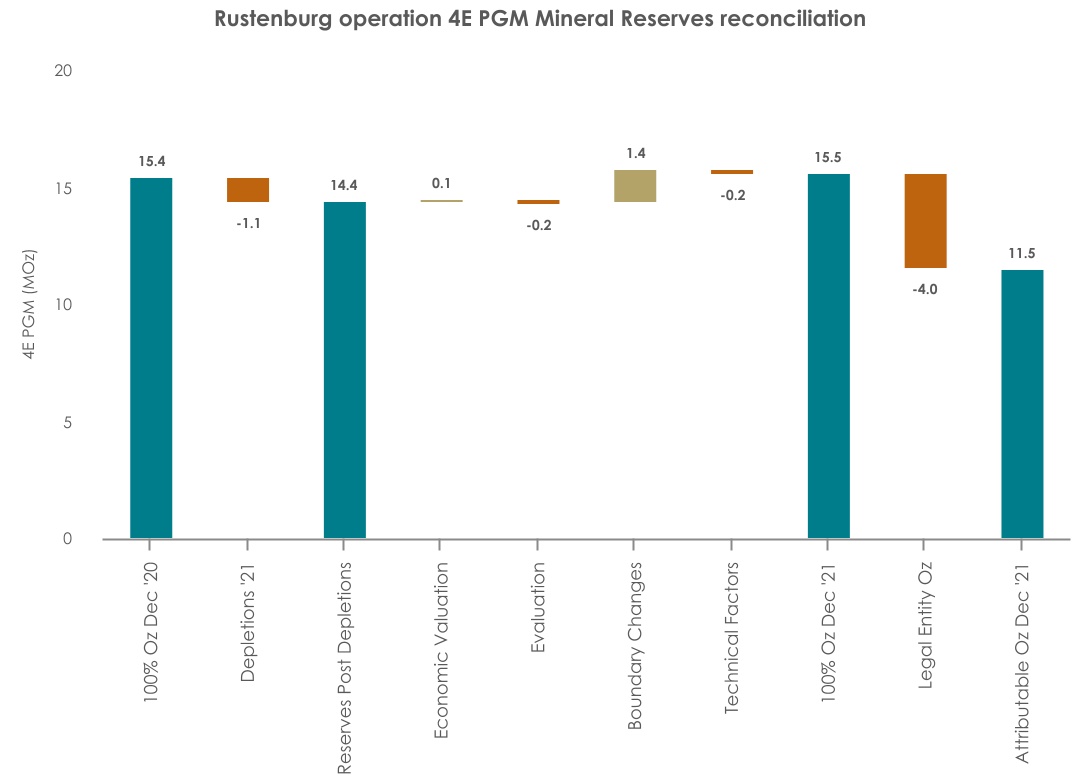
| | | | Mineral Resources and Mineral Reserves Report—Section 3: Southern Africa—SA PGMs—Rustenburg | | 75-81 (R&R) | |
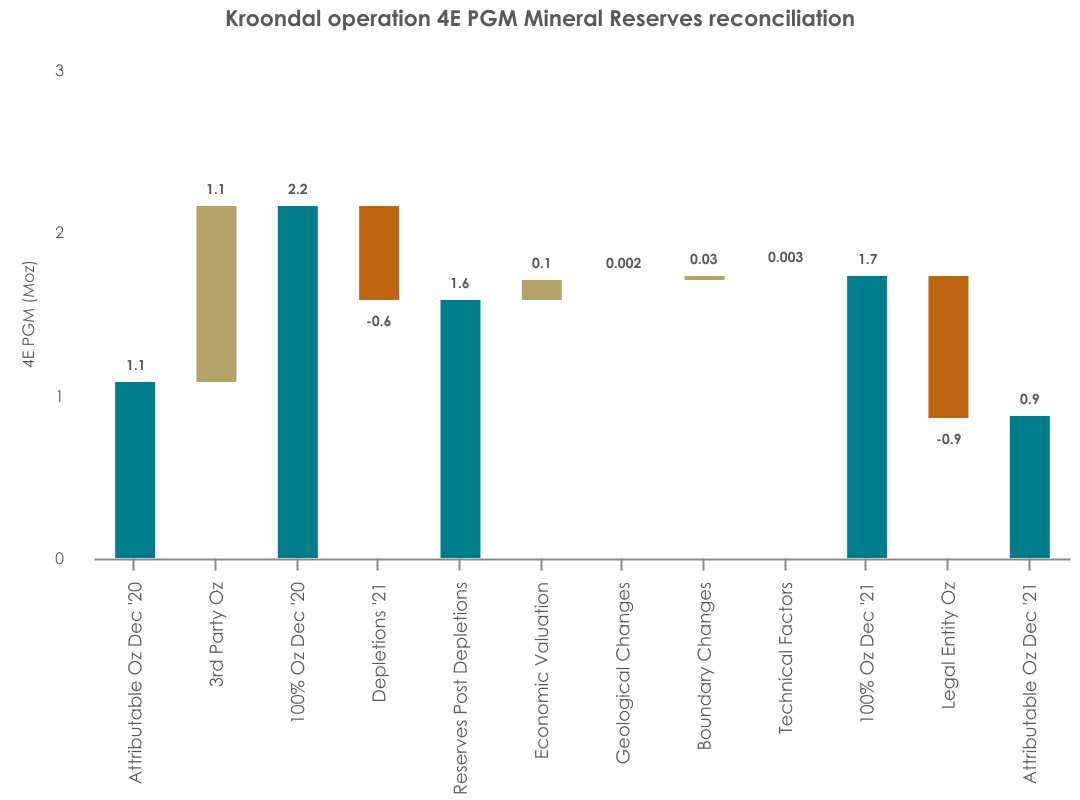
| | | | Mineral Resources and Mineral Reserves Report—Section 3: Southern Africa—SA PGMs—Kroondal | | 82-88 (R&R) | |
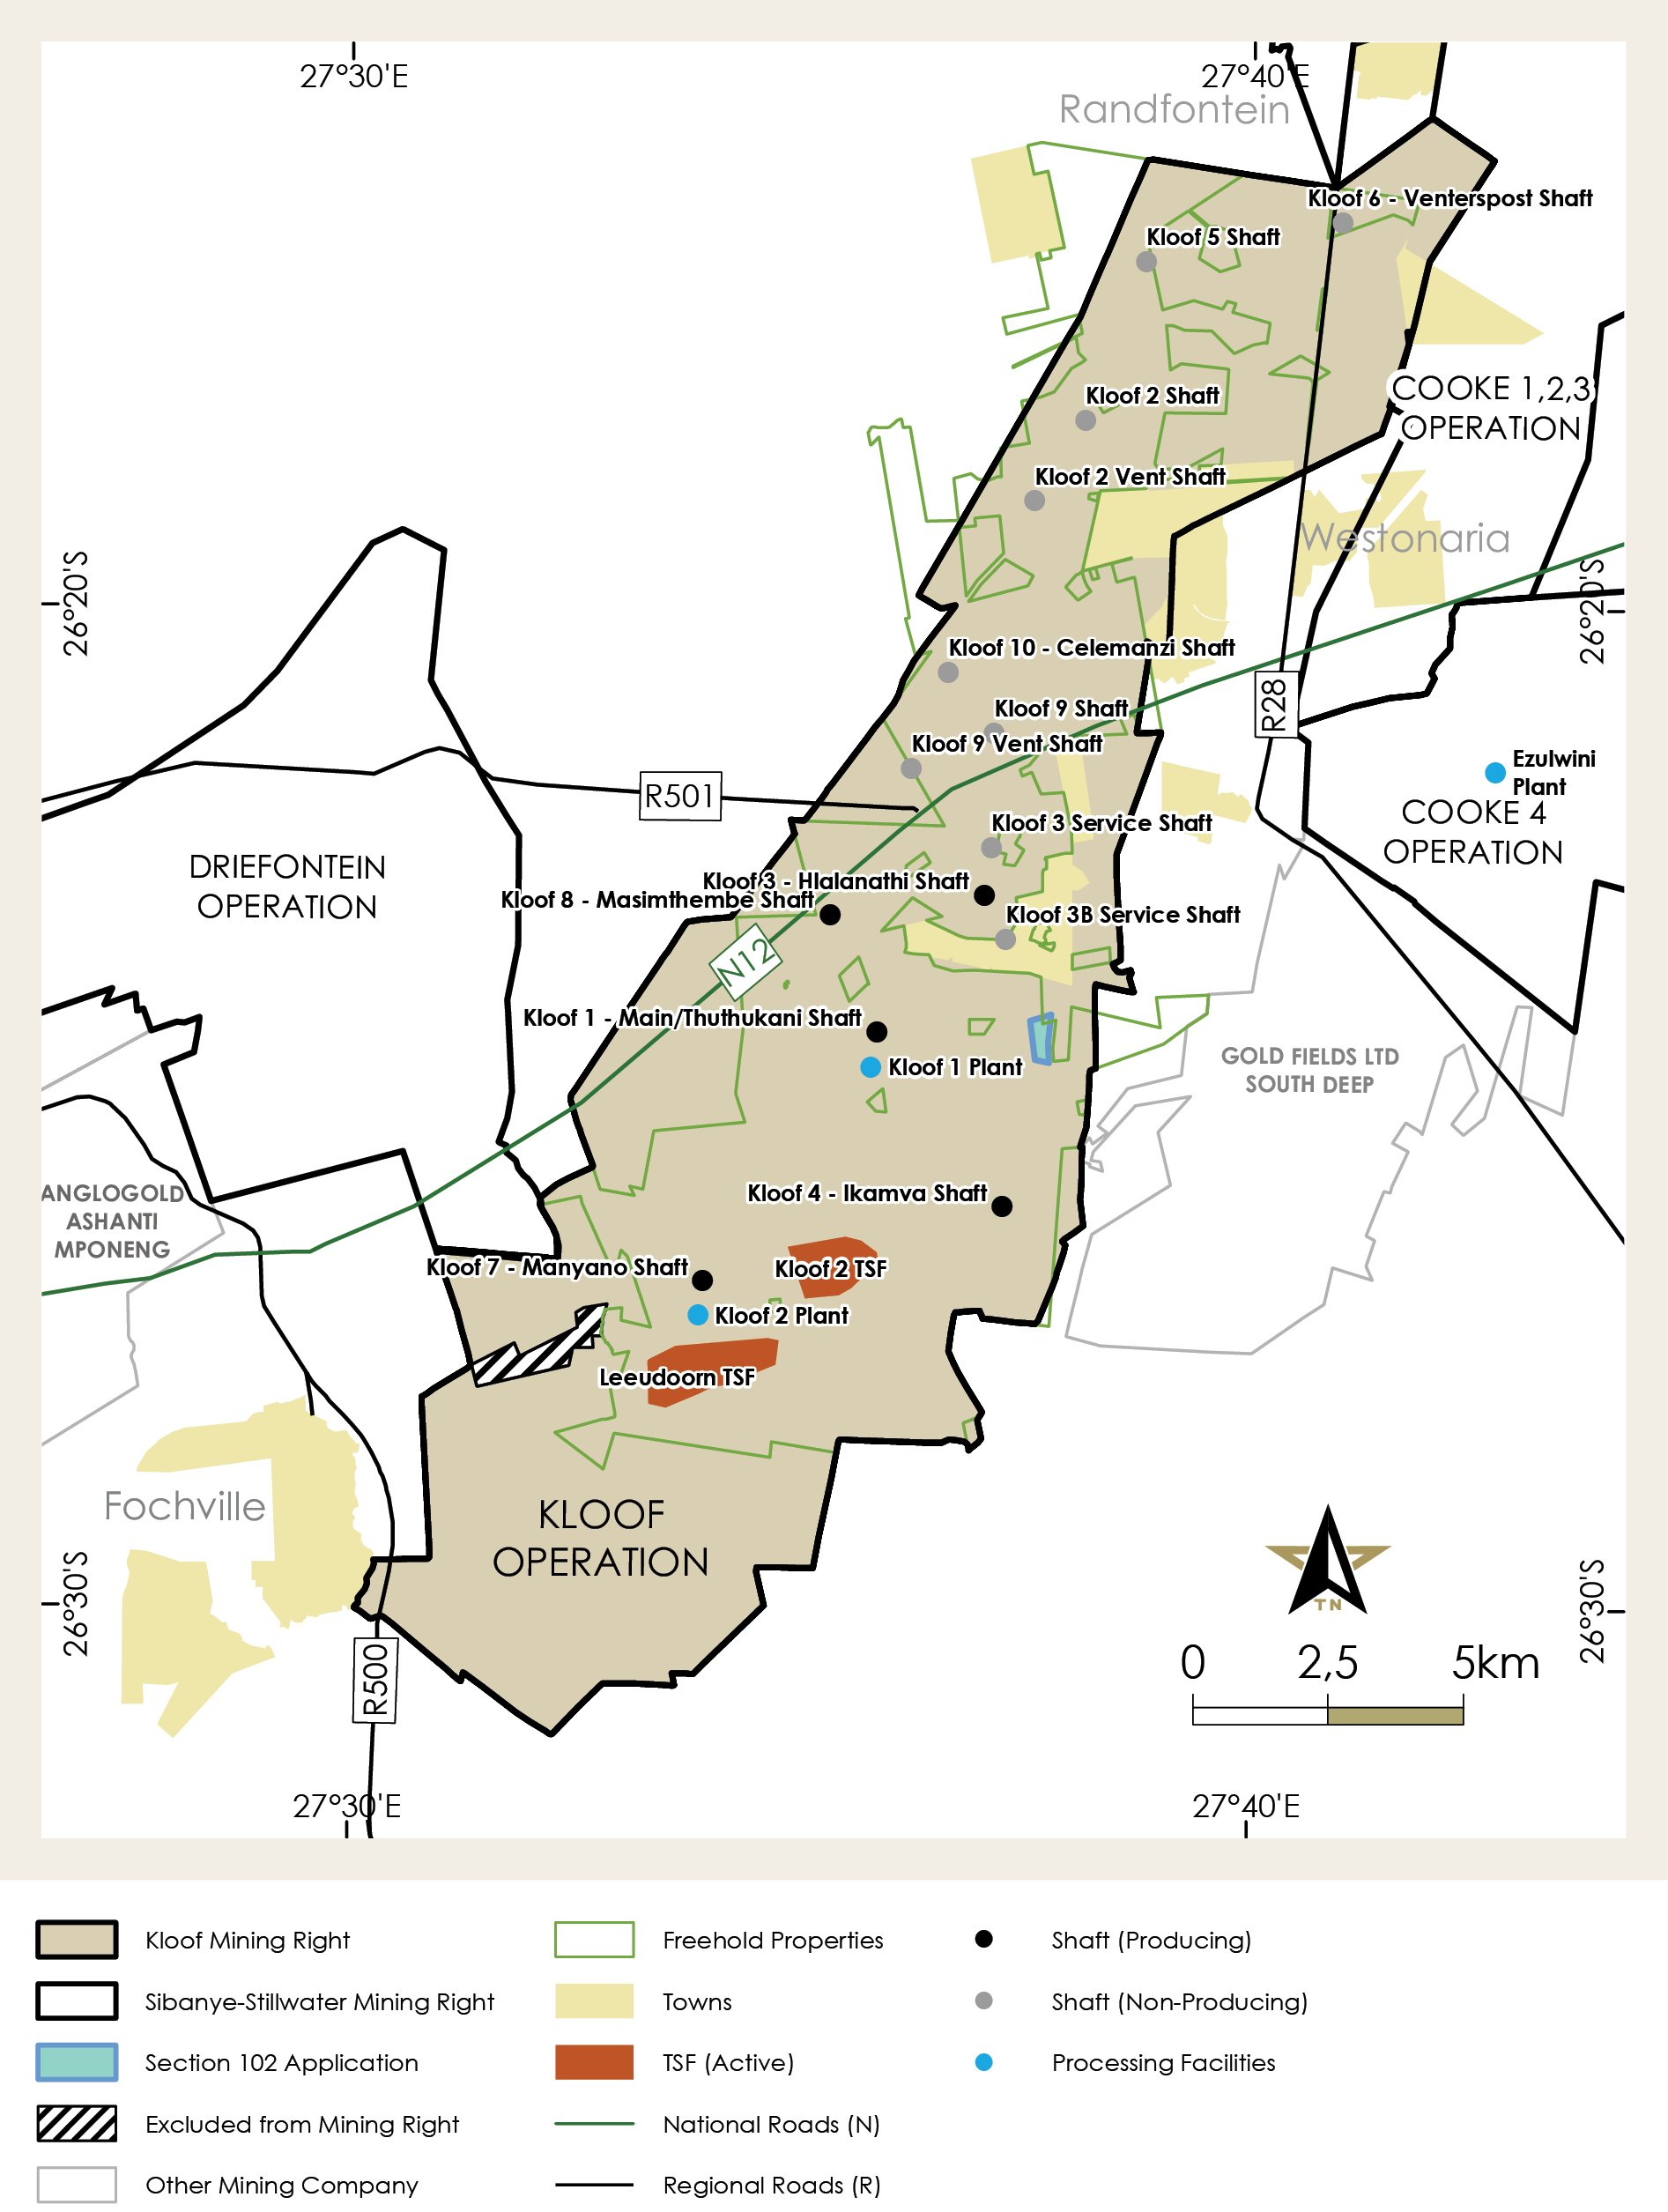
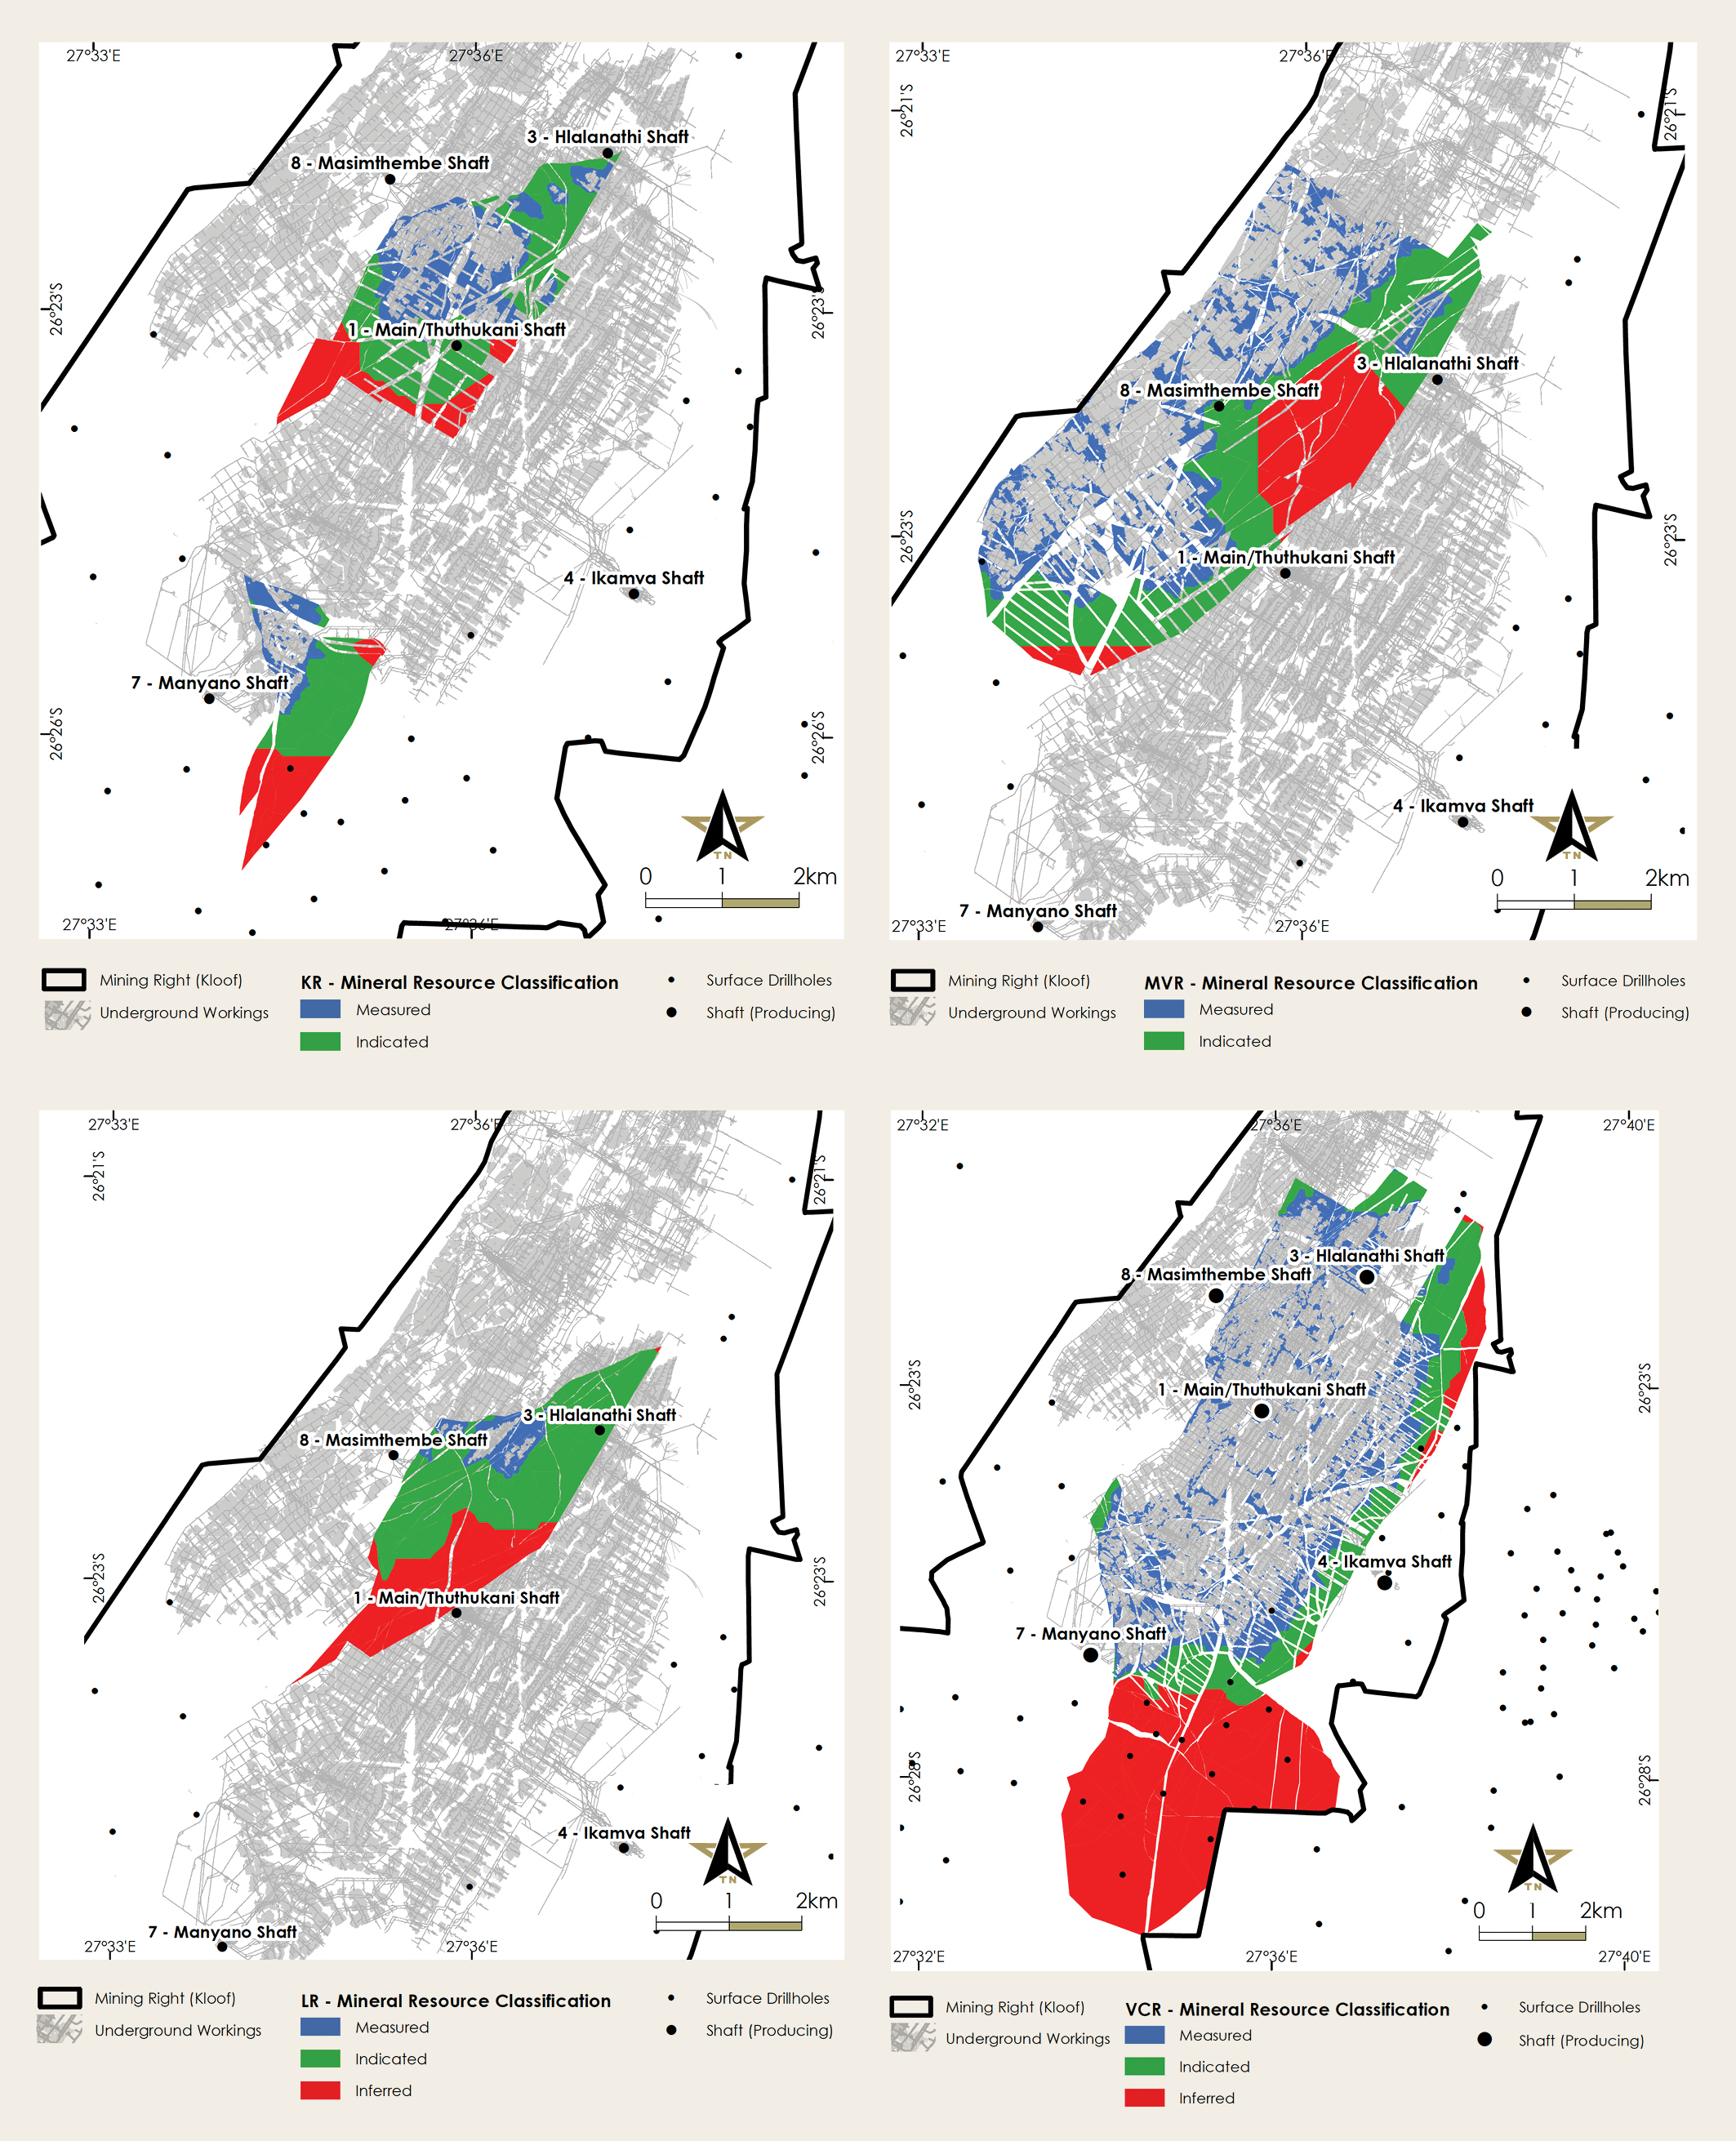
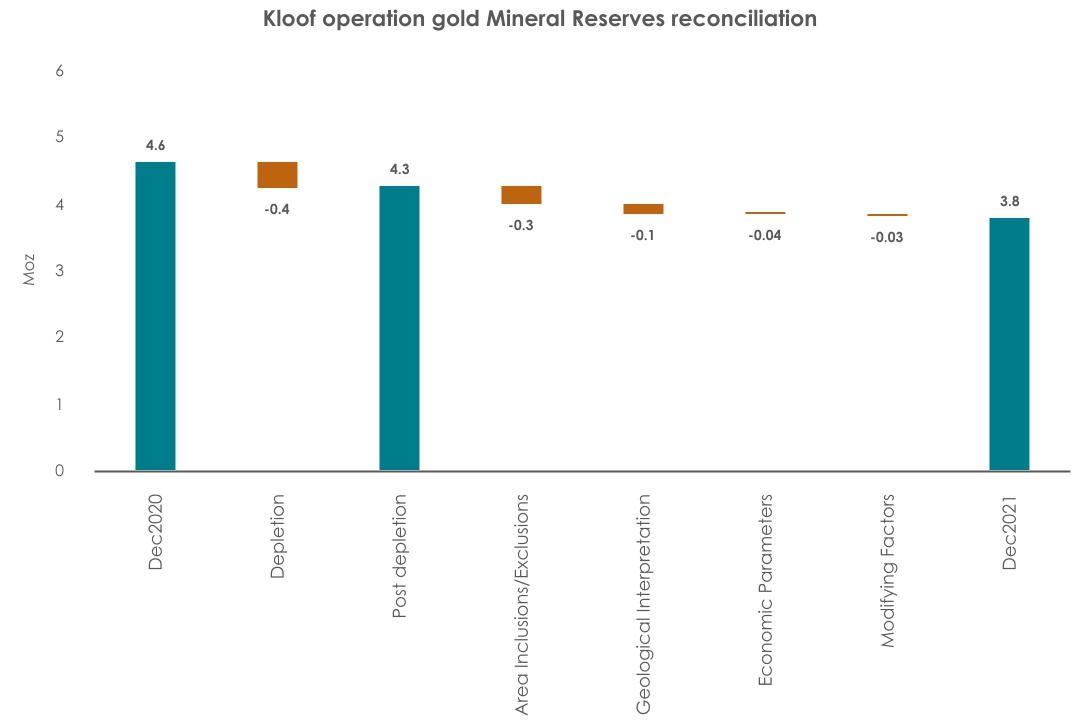
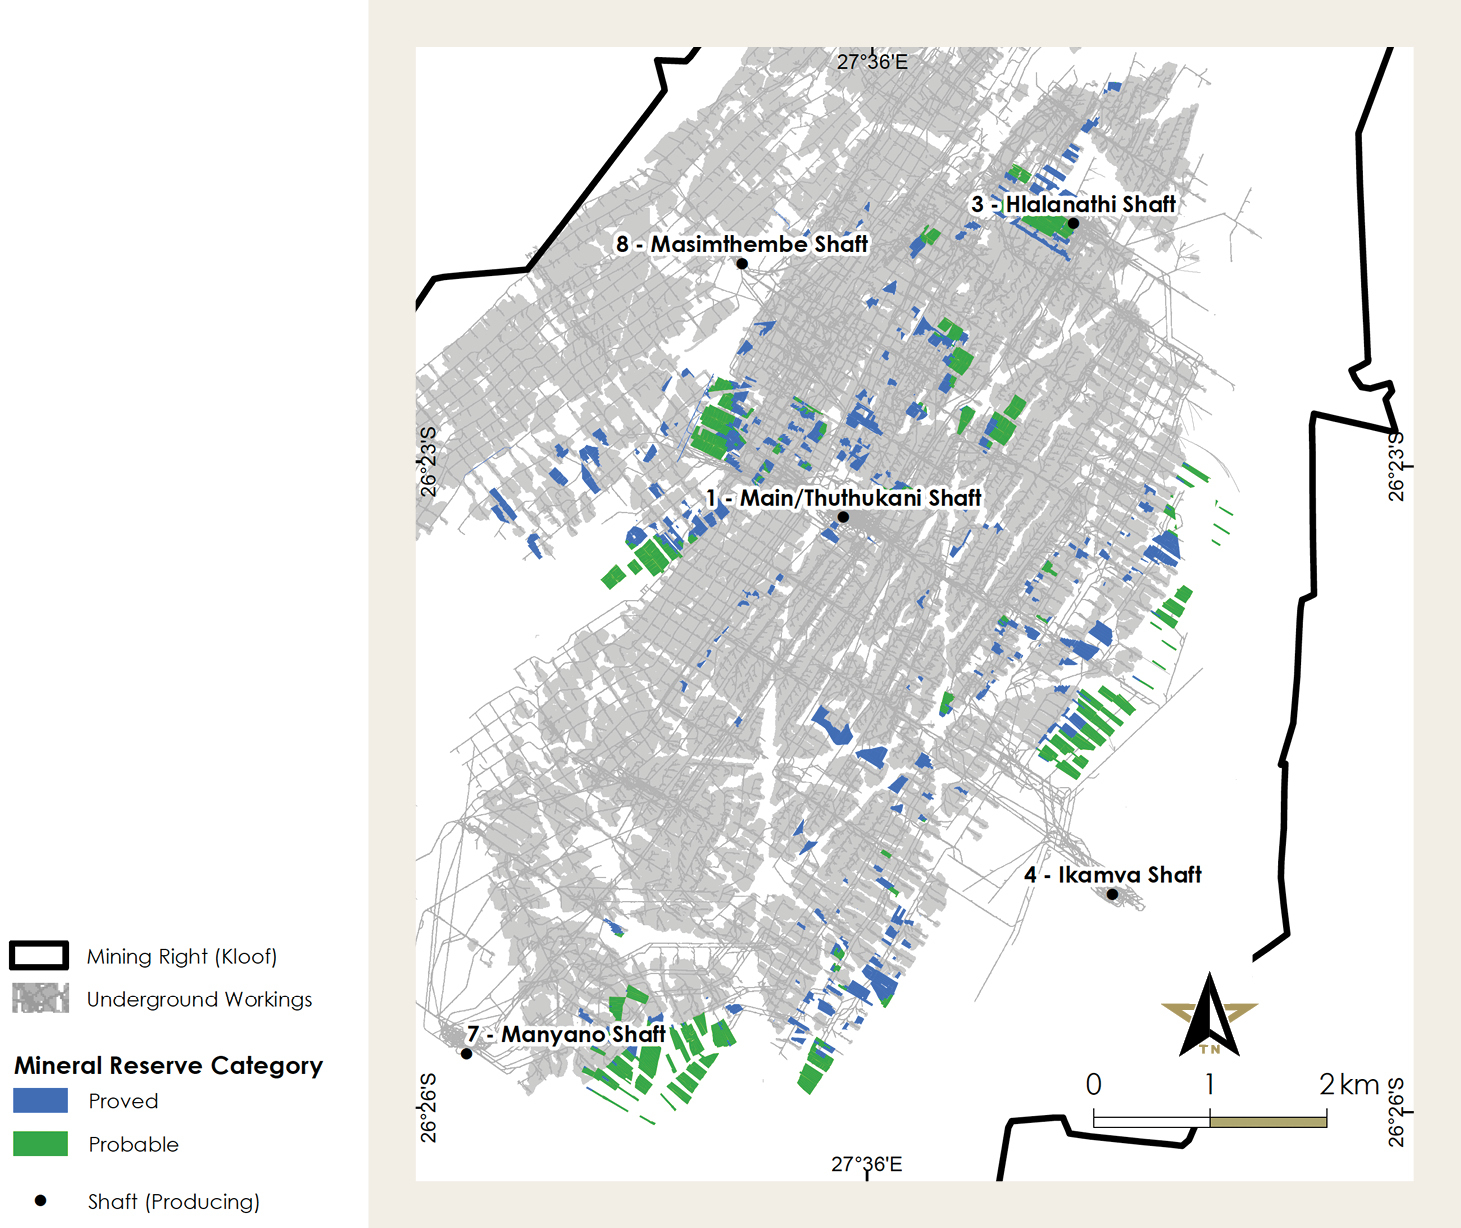
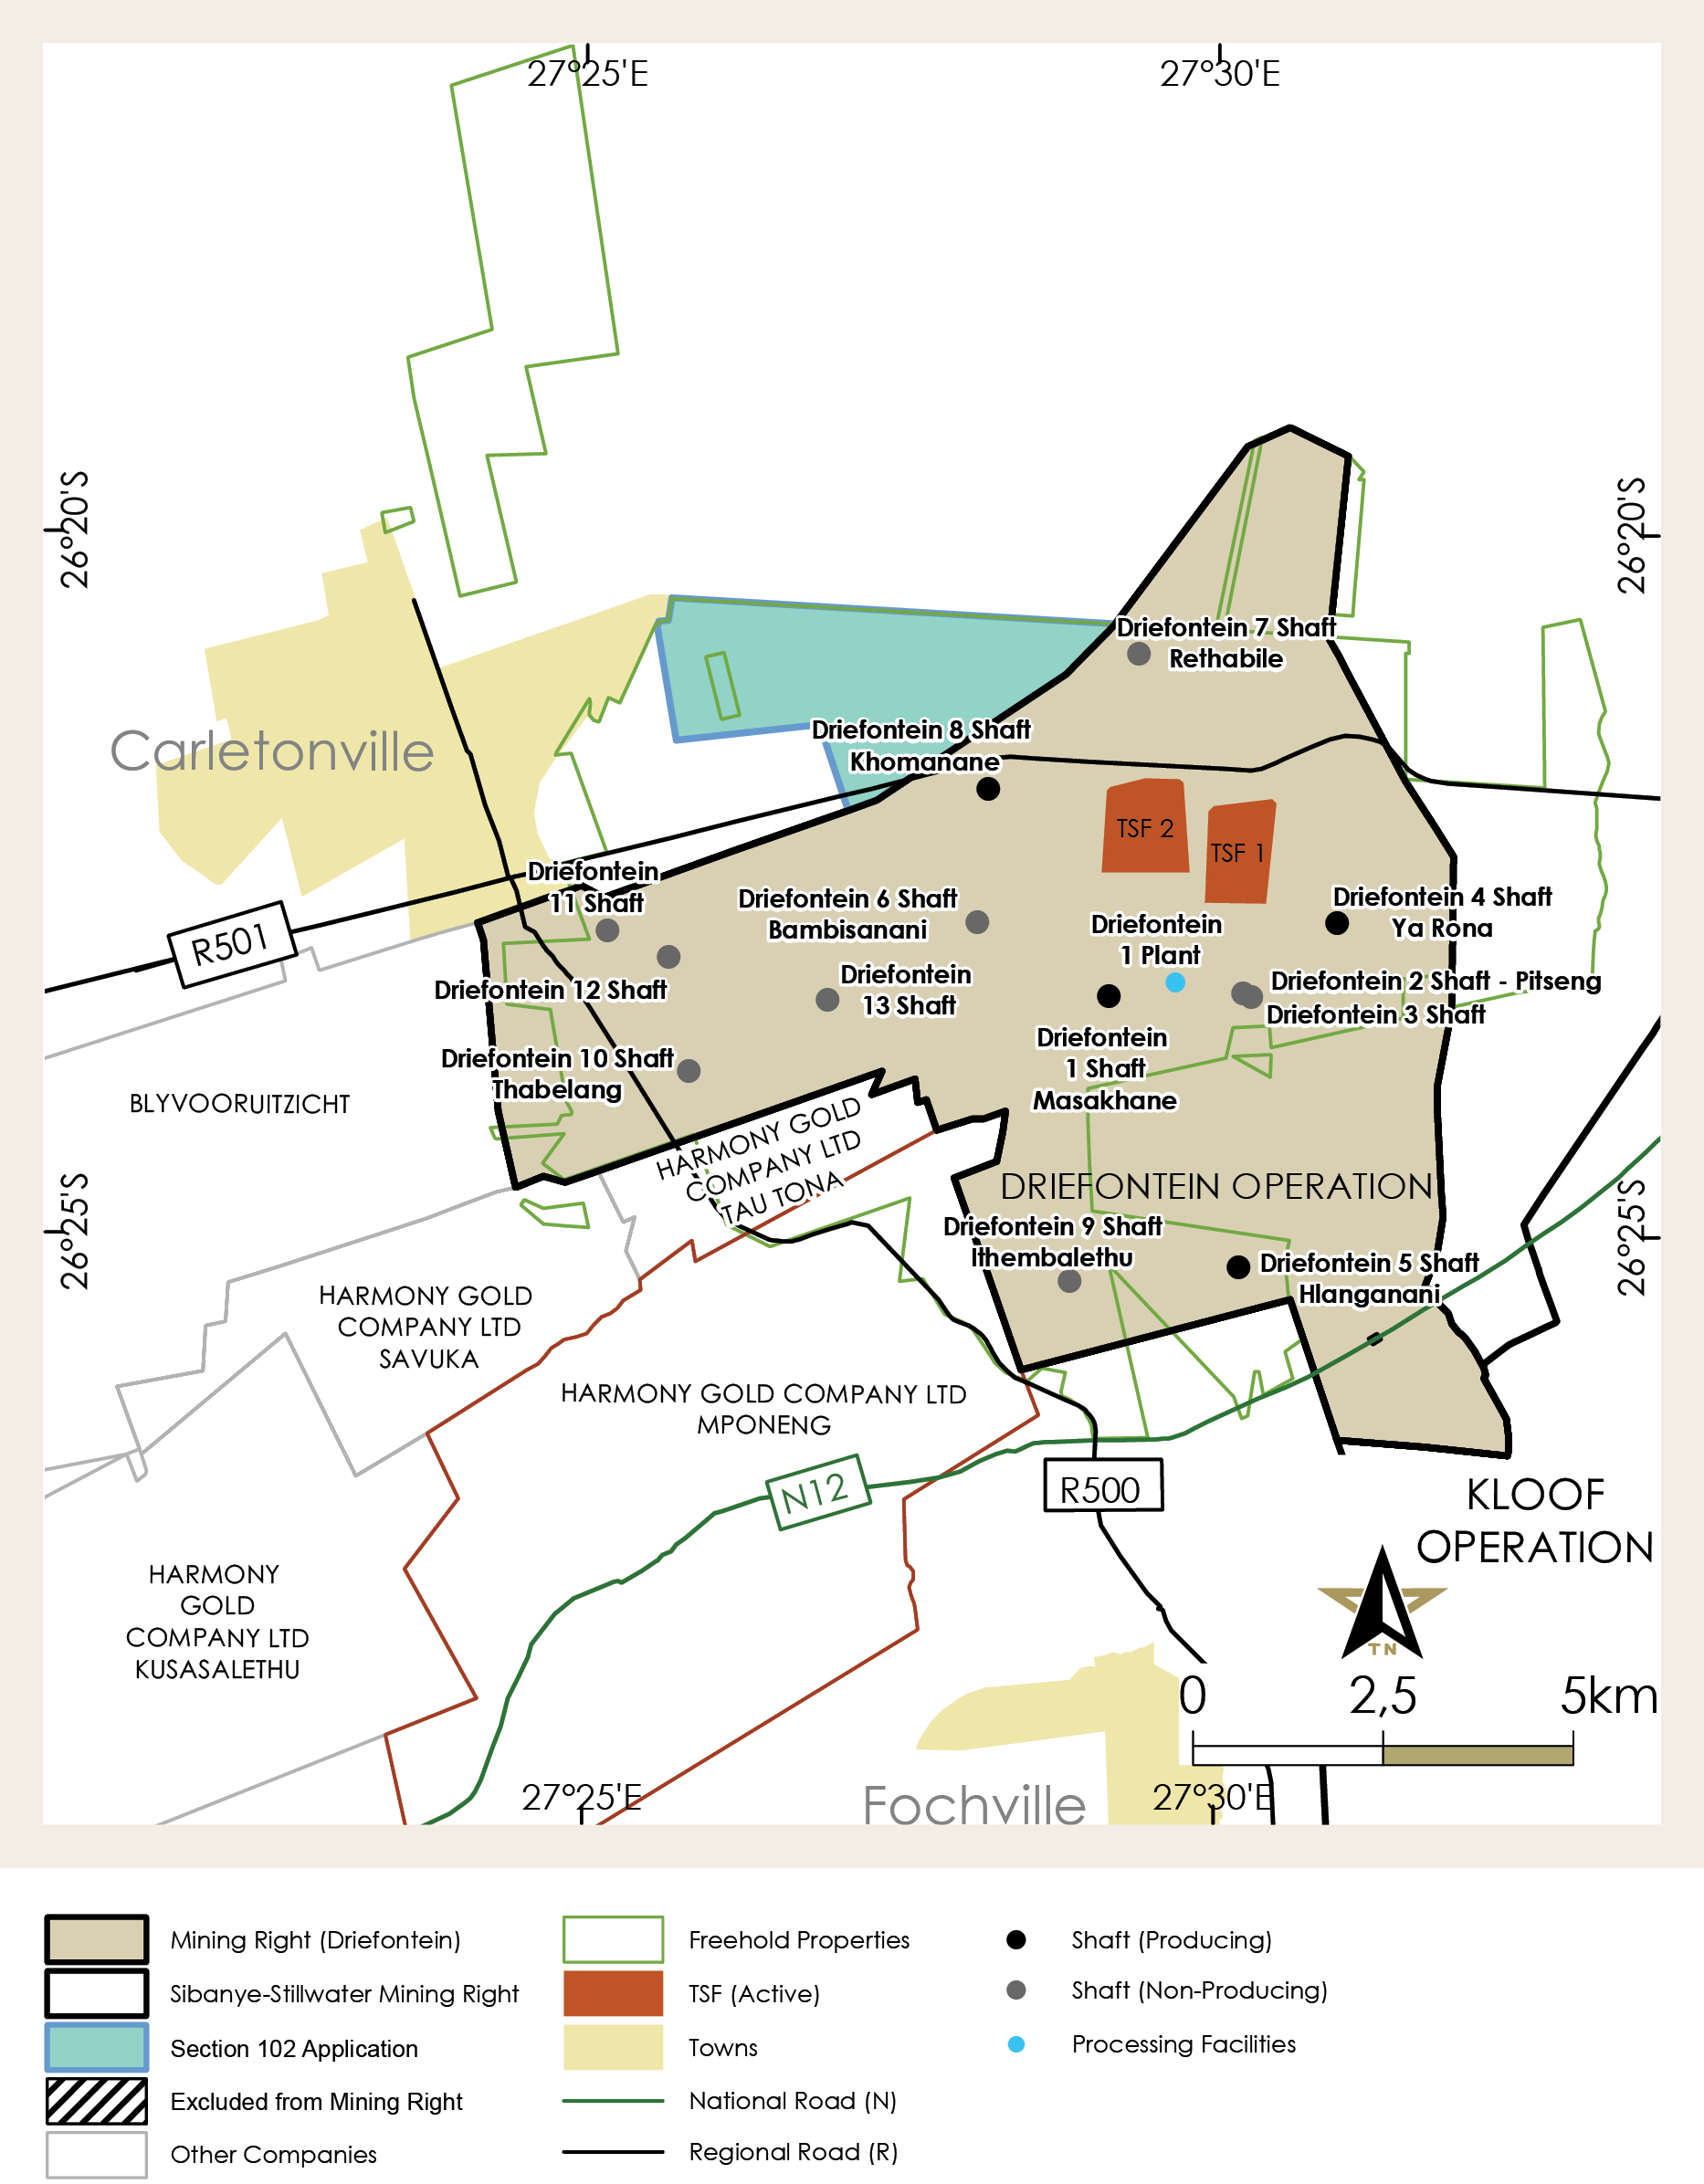
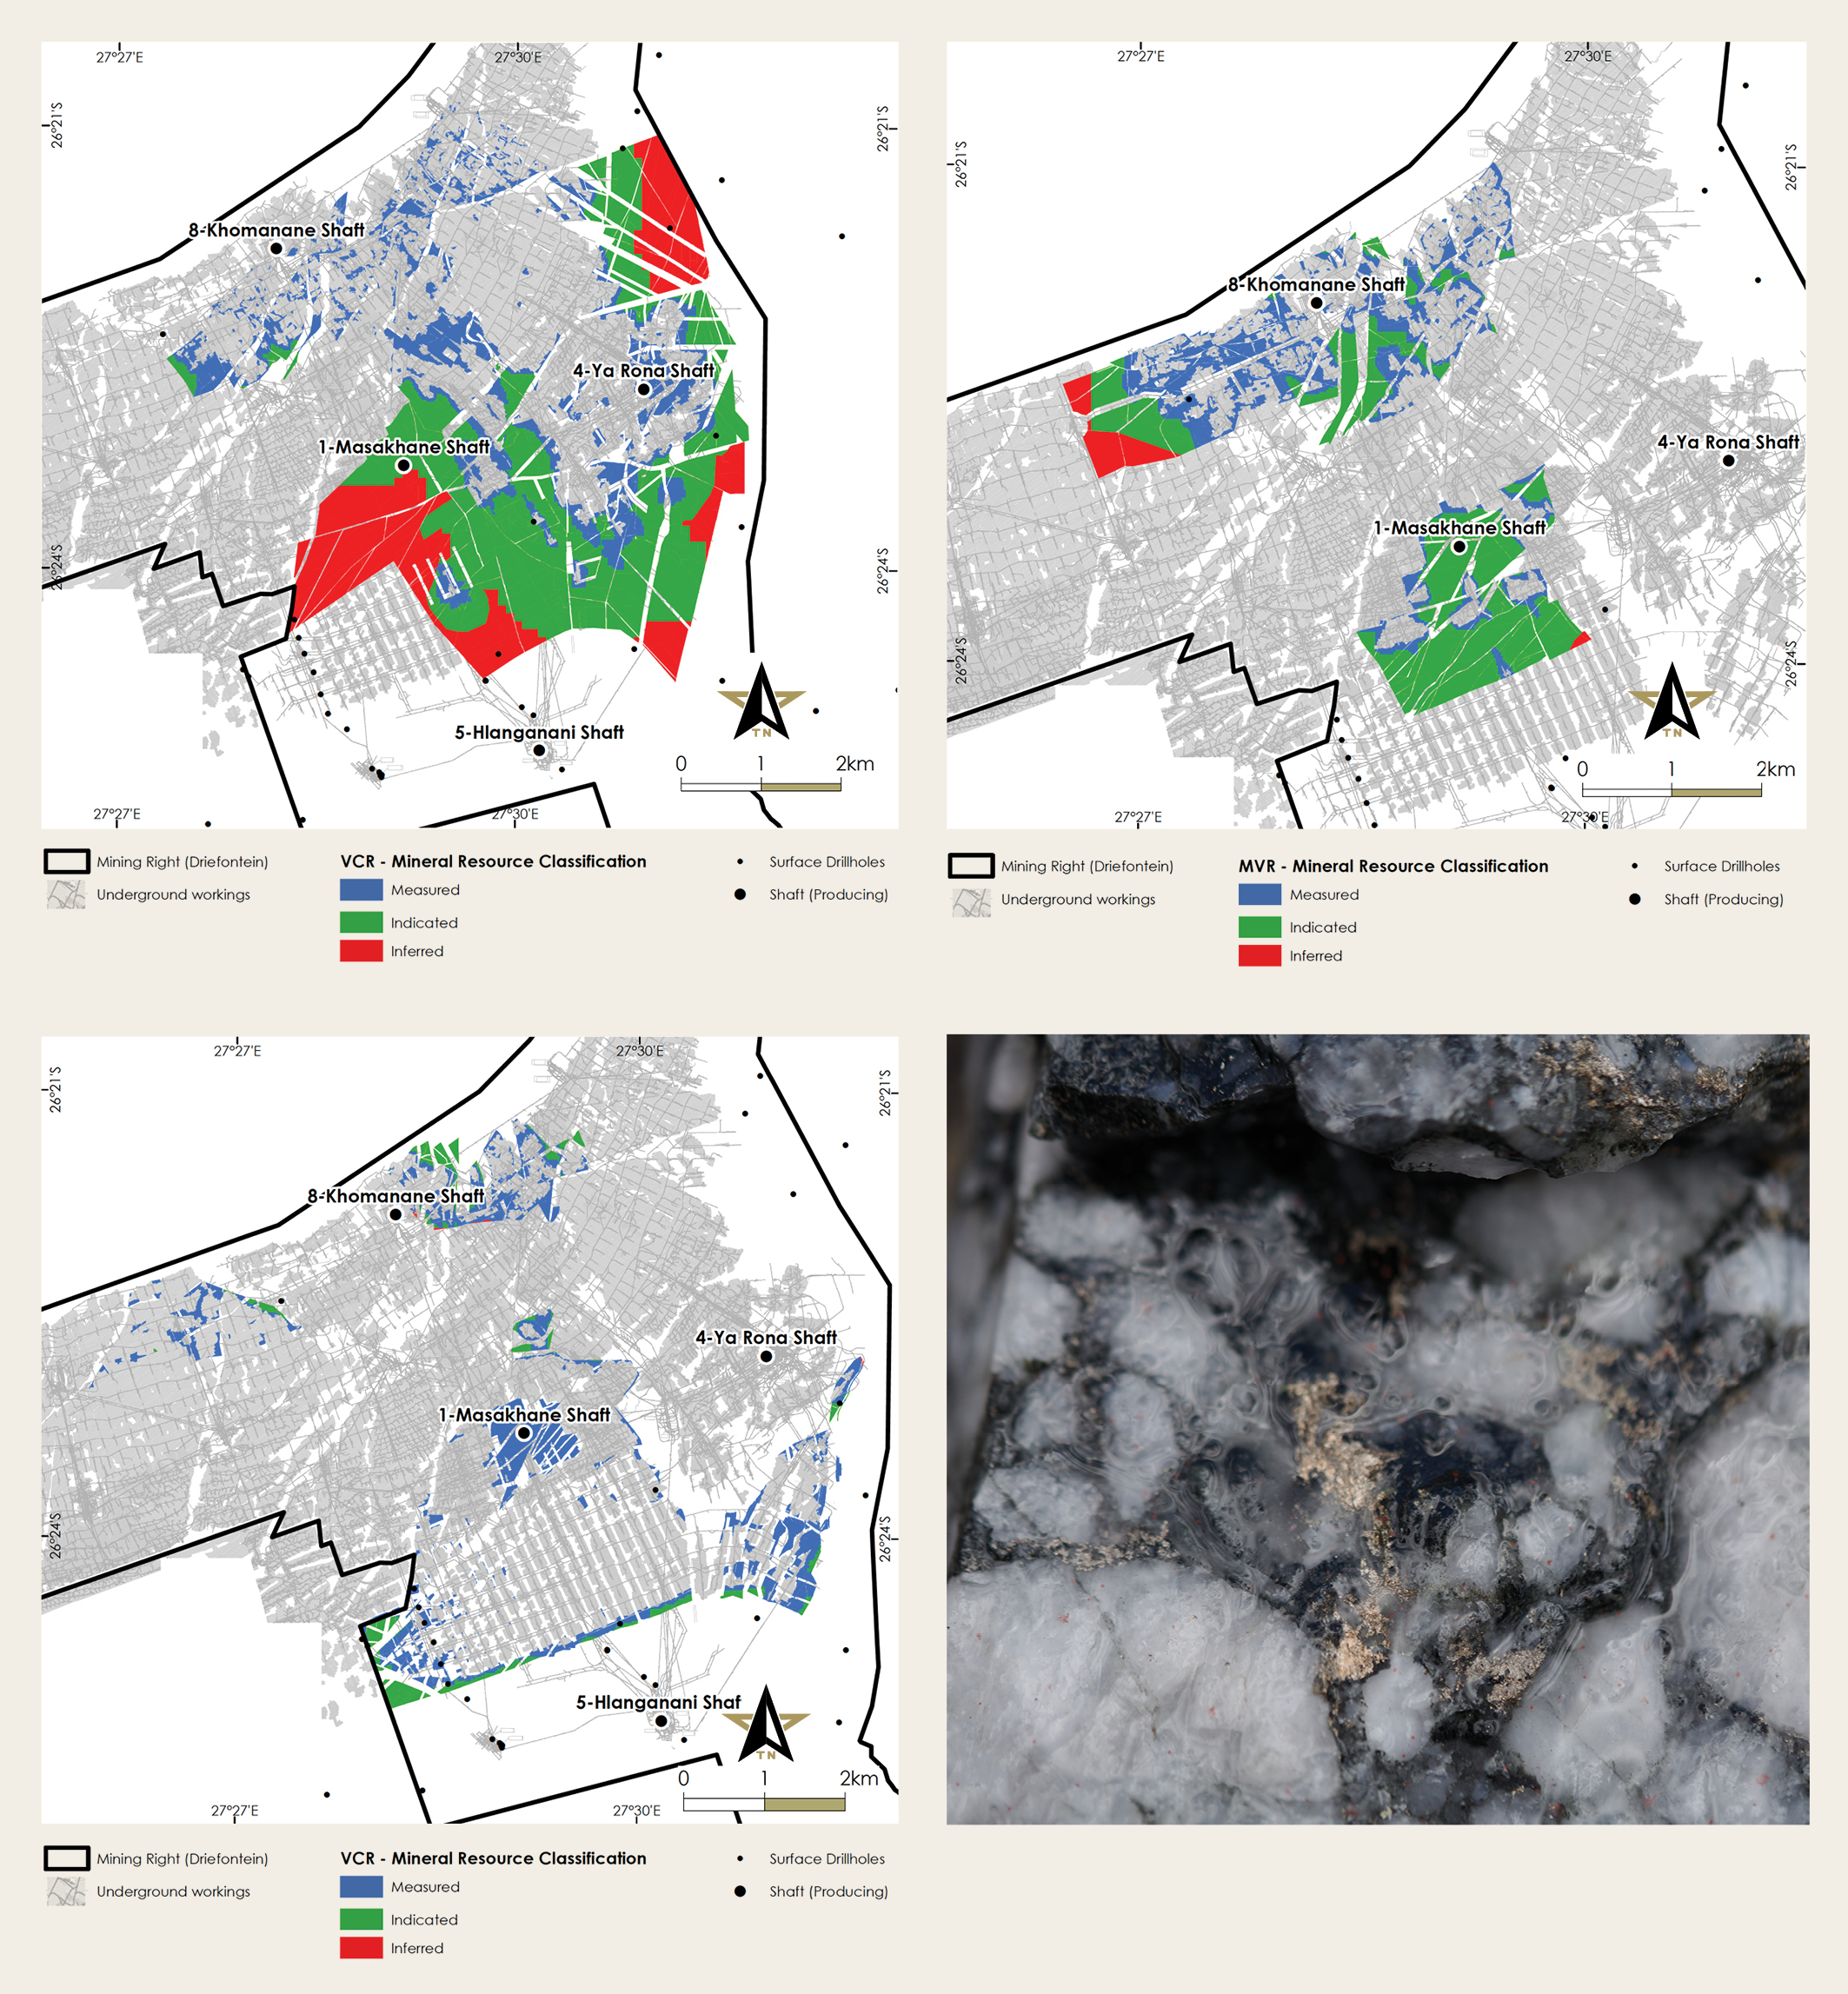
| | | | Mineral Resources and Mineral Reserves Report—Section 3: Southern Africa—Gold—Gold Operations—Kloof | | 108-116 (R&R) | |
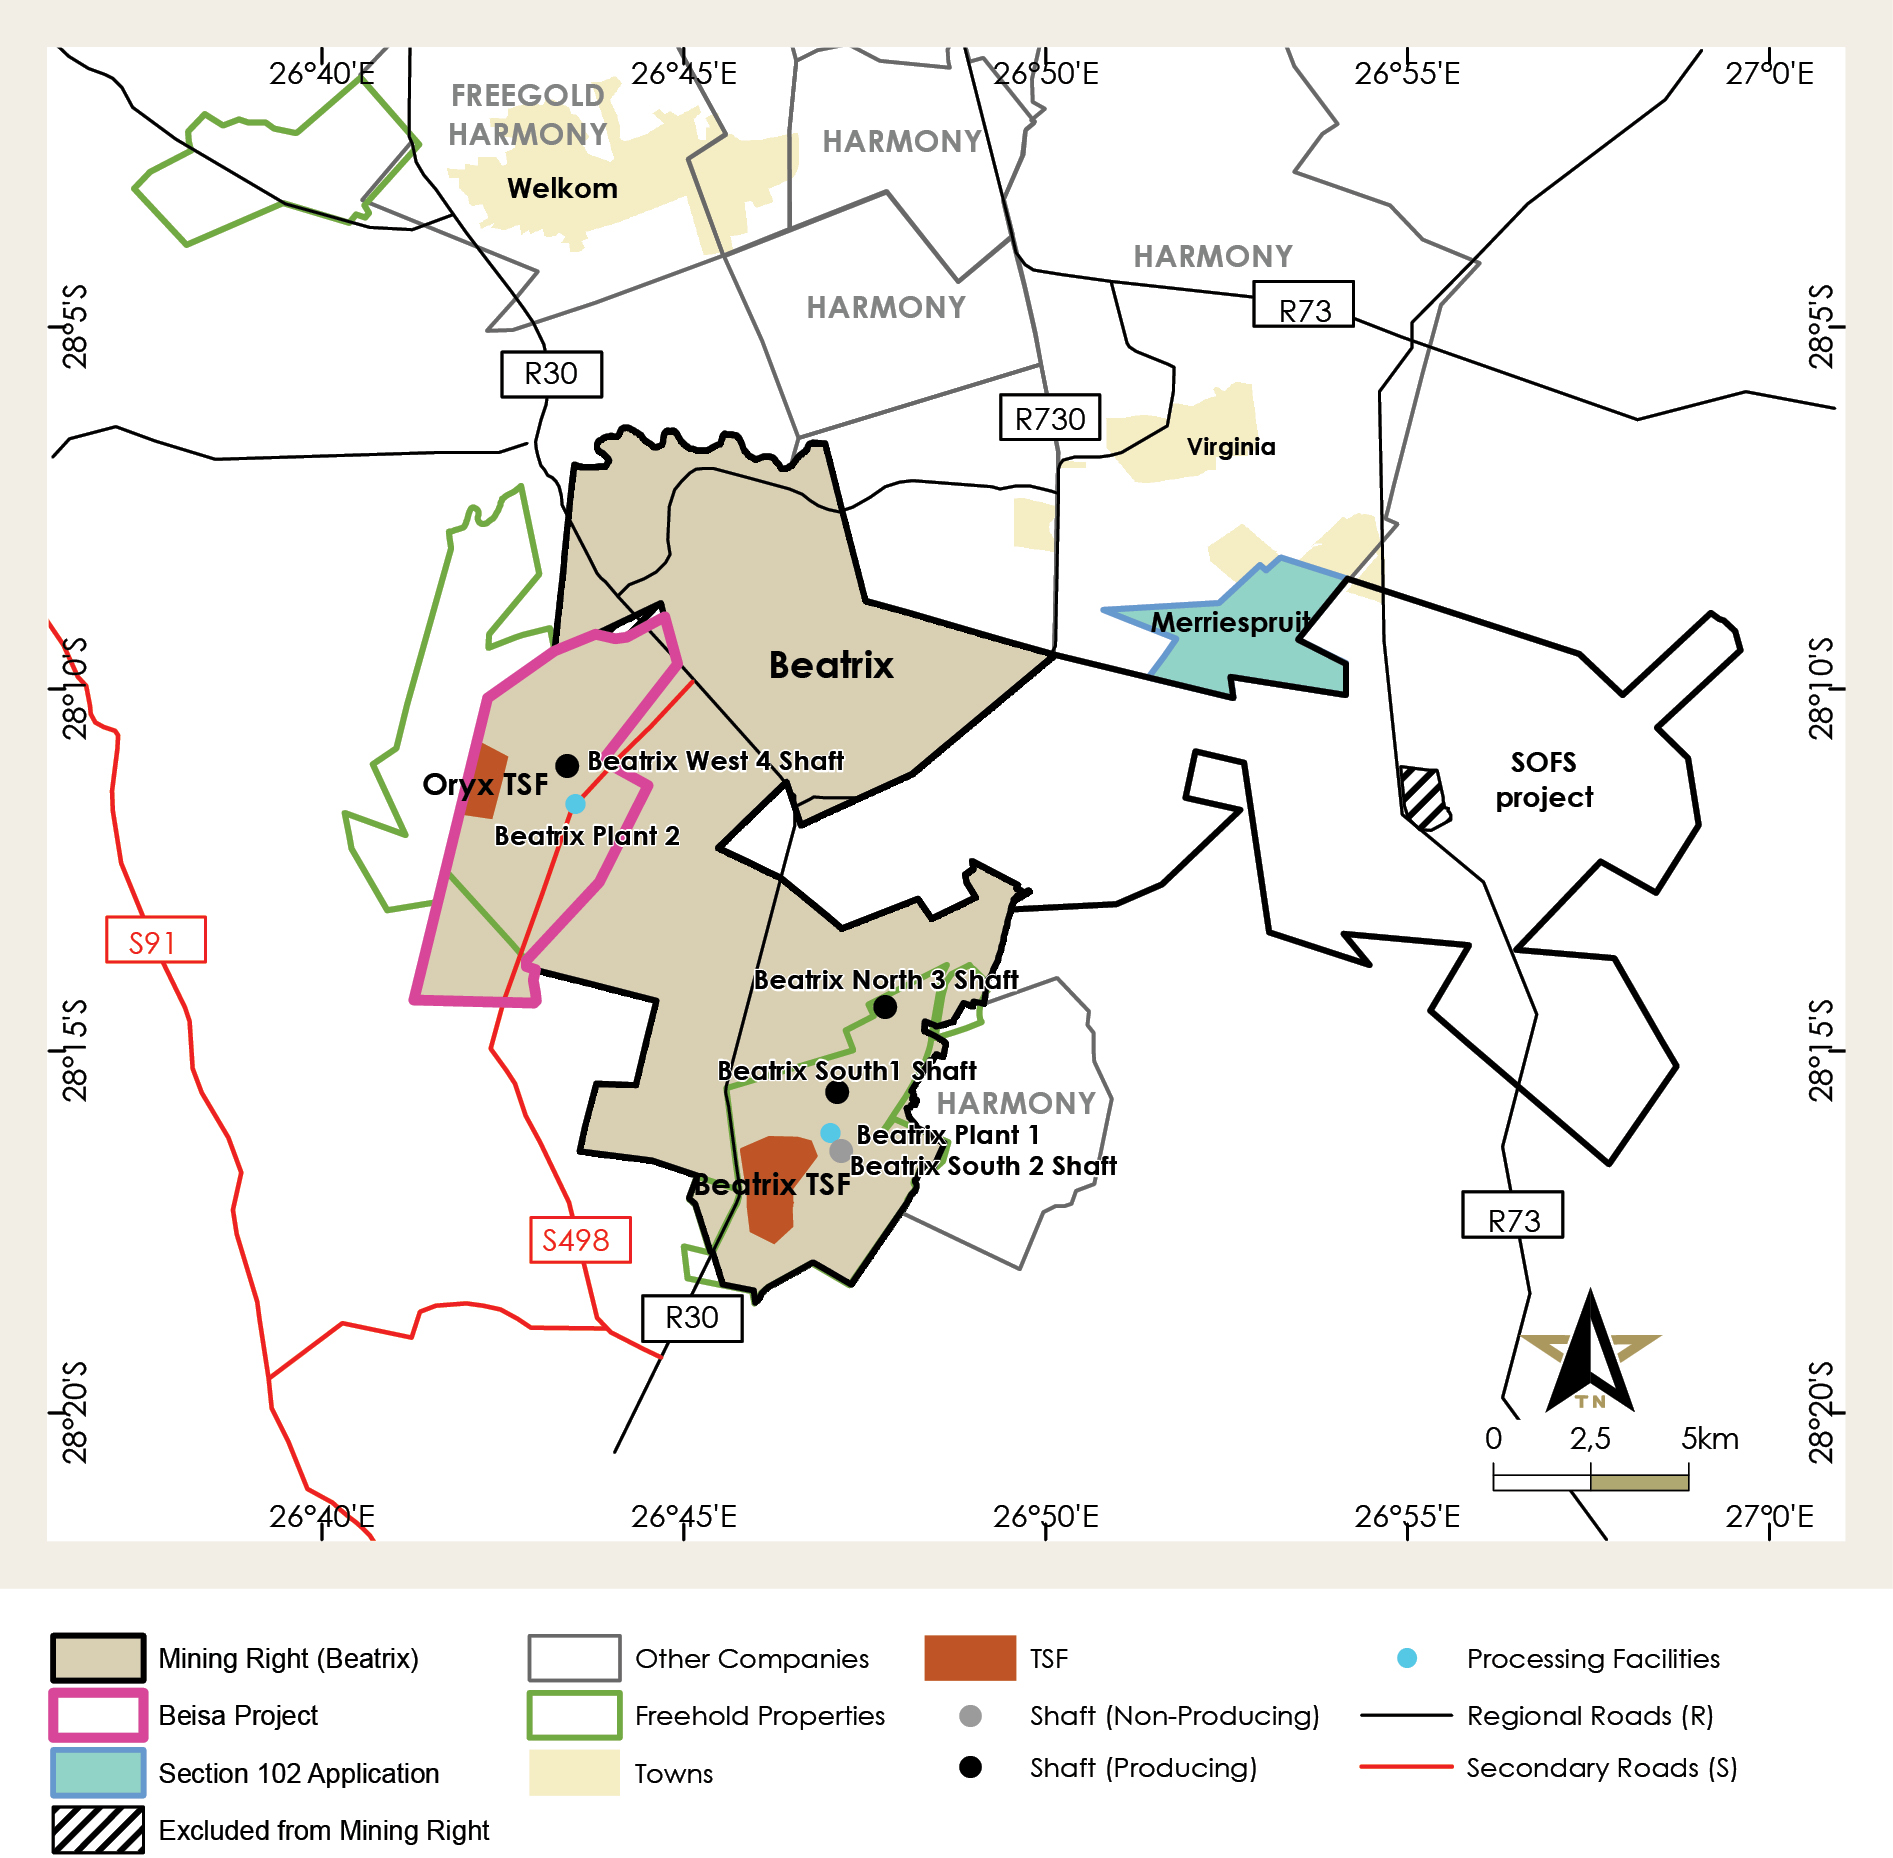
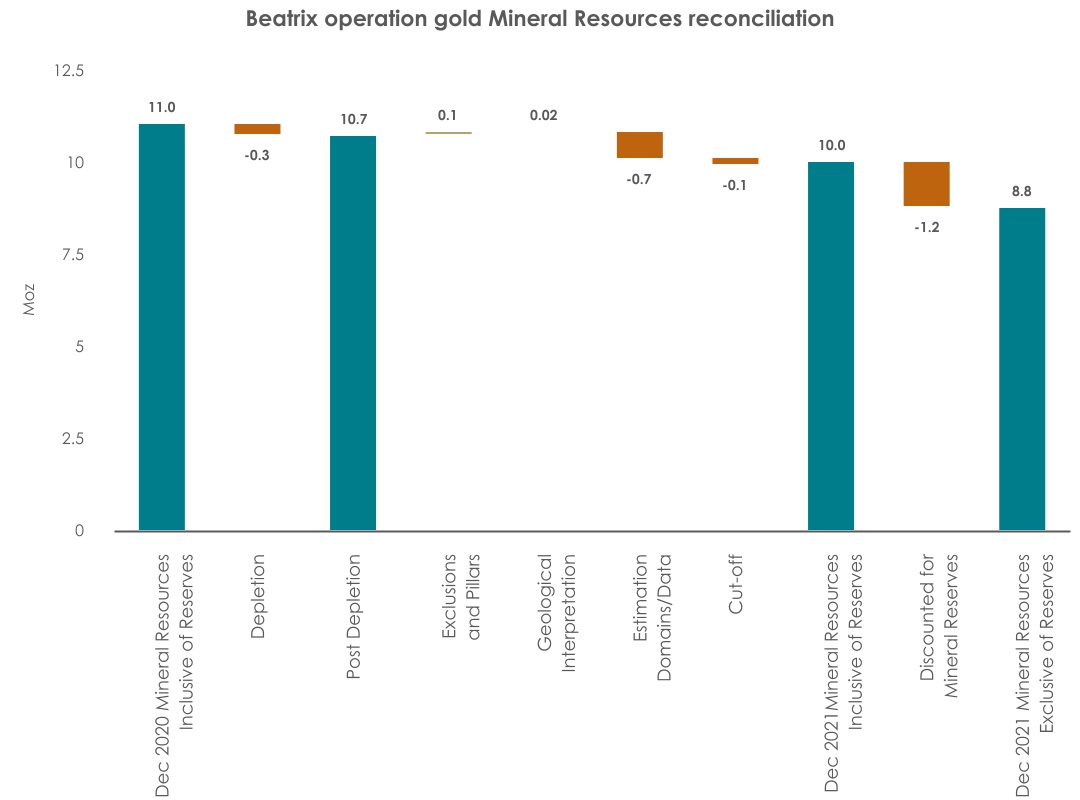
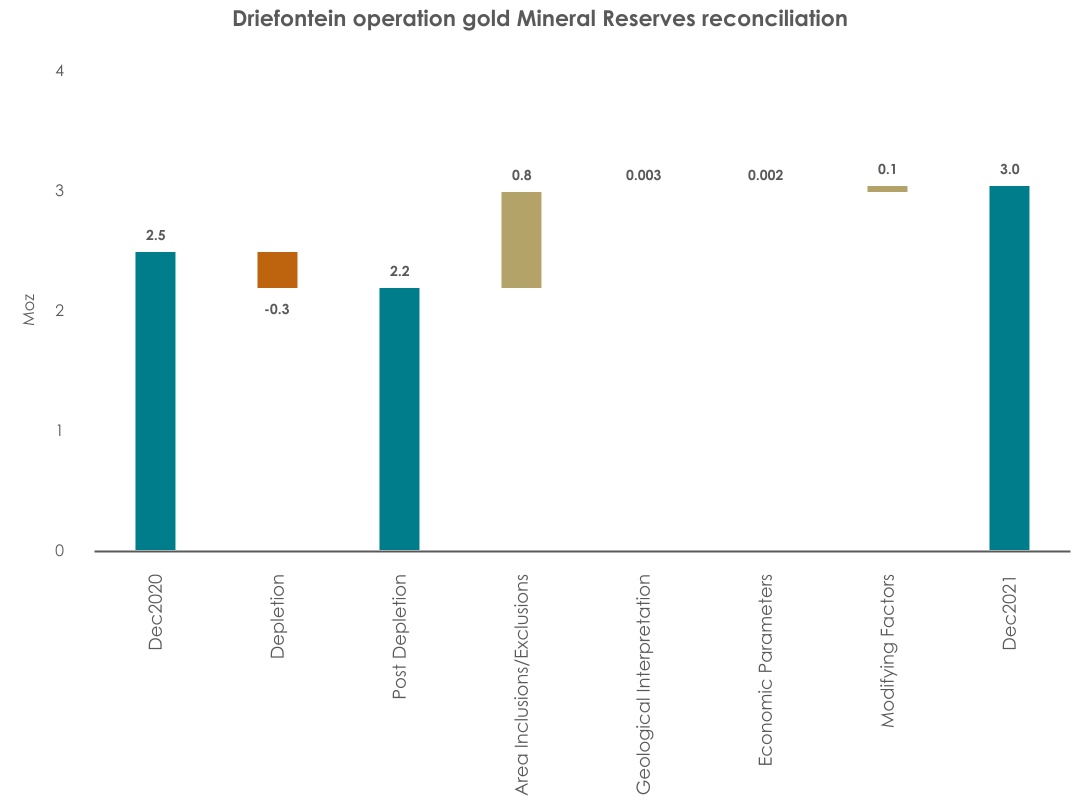
| | | | Mineral Resources and Mineral Reserves Report—Section 3: Southern Africa—Gold—Gold Operations—Dienfontein | | 127-135 (R&R) | |
| | Internal Controls Disclosure (Item 1305) | | Mineral Resources and Reserves Report—Section 1: Our business—Corporate Governance and Regulatory Compliance | | 18-19 (R&R) | |
| | | | Mineral Resources and Reserves Report—Section 2: Americas—PGM Operations—Internal Controls (QA/QC) | | 35 (R&R) | |
| | | | Mineral Resources and Reserves Report—Section 3: Southern Africa—SA PGMs—Overview—Quality assurance / quality control | | 64 (R&R) | |
| | | | Mineral Resources and Reserves Report—Section 3: Southern Africa—Gold—Overview—Quality assurance / quality control | | 106 (R&R) | |
| 4A | | Unresolved staff comments | | NA | | NA | |
| 5 | | Operating and financial review and prospects
| | | | | |
| | (a)Operating results | | Annual Financial Report—Overview—Management’s discussion and analysis of the financial statements | | 6-28 (AFR) | |
| | | | Annual Financial Report—Consolidated financial statements—Consolidated income statement | | 45 (AFR) | |
| | | | Annual Financial Report—Consolidated financial statements—Consolidated statement of financial position | | 46 (AFR) | |
| | | | Annual Financial Report—Consolidated financial statements—Consolidated statement of cash flows | | 47-48 (AFR) | |
| | | | Annual Financial Report—Consolidated financial statements—Notes to the consolidated financial statements—Note 28: Borrowings and derivative financial instrument | | 116-127 (AFR) | |
Presentation of financial and other information
| | | | | | | | | | | | | | | | | | | | | | | |
| | | | Annual Financial Report—Consolidated financial statements—Notes to the consolidated financial statements—Note 36: Financial instruments and risk management | | 138-142 (AFR) | |
| | | | Integrated Annual Report—Our performance—Chief Financial Officer’s report | | 90-94 (IR) | |
| | | | Environmental and regulatory matters | | 33-41 | |
| | (b)Liquidity and capital resources | | Annual Financial Report—Overview—Management’s discussion and analysis of the financial statements—Liquidity and capital resources | | 24-26 (AFR) | |
| | | | Annual Financial Report—Overview—Management’s discussion and analysis of the financial statements—Consolidated statement of financial position | | 46 (AFR) | |
| | | | Annual Financial Report—Consolidated financial statements—Notes to the consolidated financial statements—Note 28: Borrowings and derivative financial instrument | | 116-127 (AFR) | |
| | | | Annual Financial Report—Consolidated financial statements—Notes to the consolidated financial statements—Note 37: Commitments | | 143 (AFR) | |
| | (c)Research and development, patents and licences, etc. | | NA | | NA | |
| | (d)Trend information | | Annual Financial Report—Overview—Management’s discussion and analysis of the financial statements—Factors affecting Sibanye-Stillwater’s performance | | 9-13 (AFR) | |
| | (e)Critical accounting estimates | | NA
| | NA | |
| 6 | | Directors, senior management and employees | | | | | |
Presentation of financial and other information
| | | | | | | | | | | | | | | | | | | | | | | |
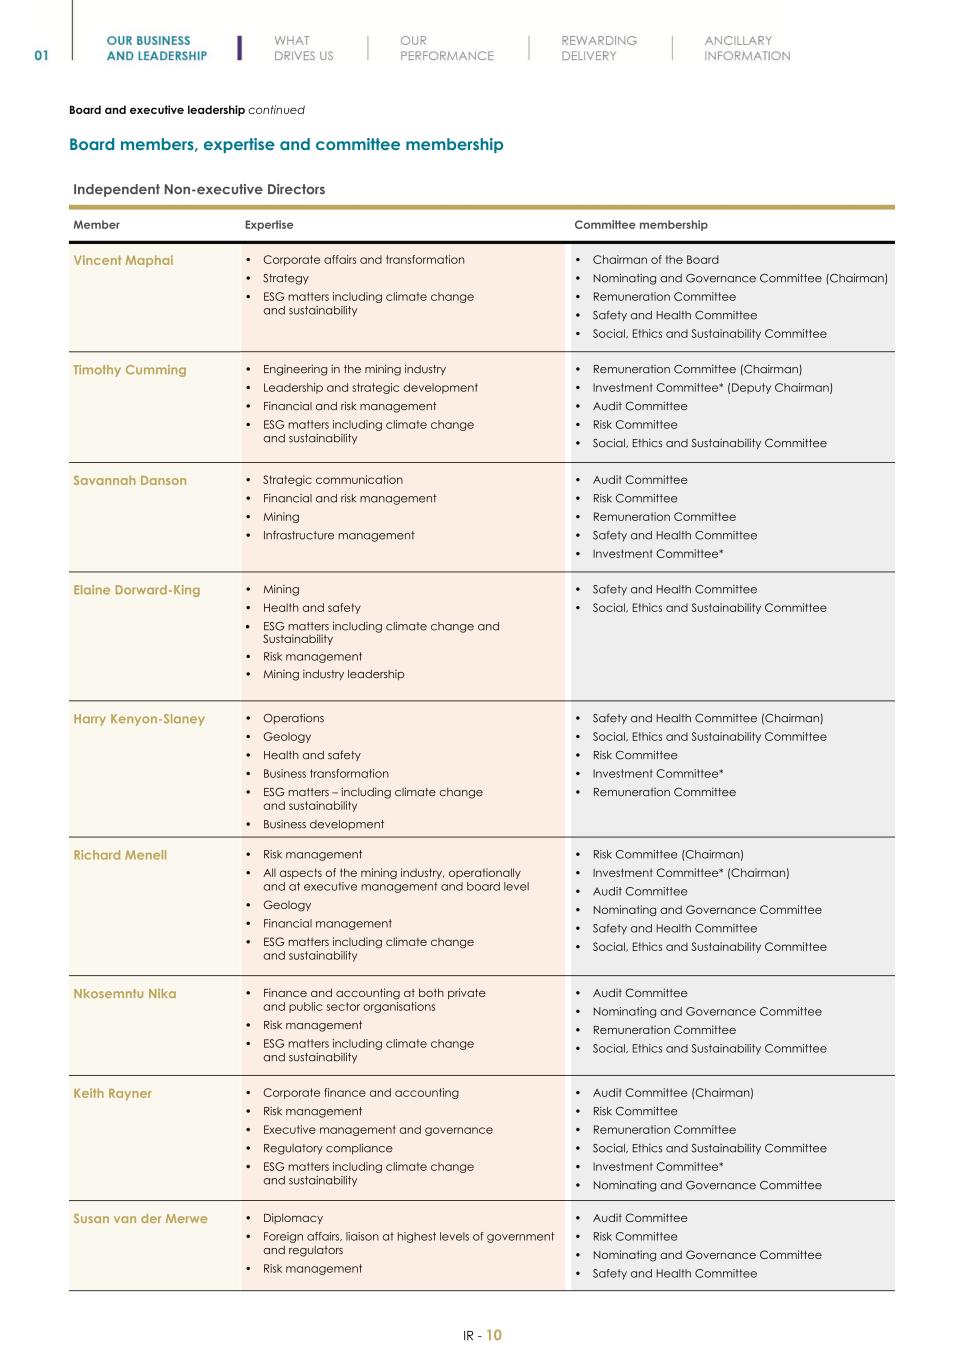
| | (a)Directors and senior management | | Integrated Annual Report—Our business and leadership—Corporate governance—Governance structures, effective control and delegation | | 15 (IR) | |
| | | | Integrated Annual Report—Our business and leadership—Board and executive leadership | | 7-11 (IR) | |
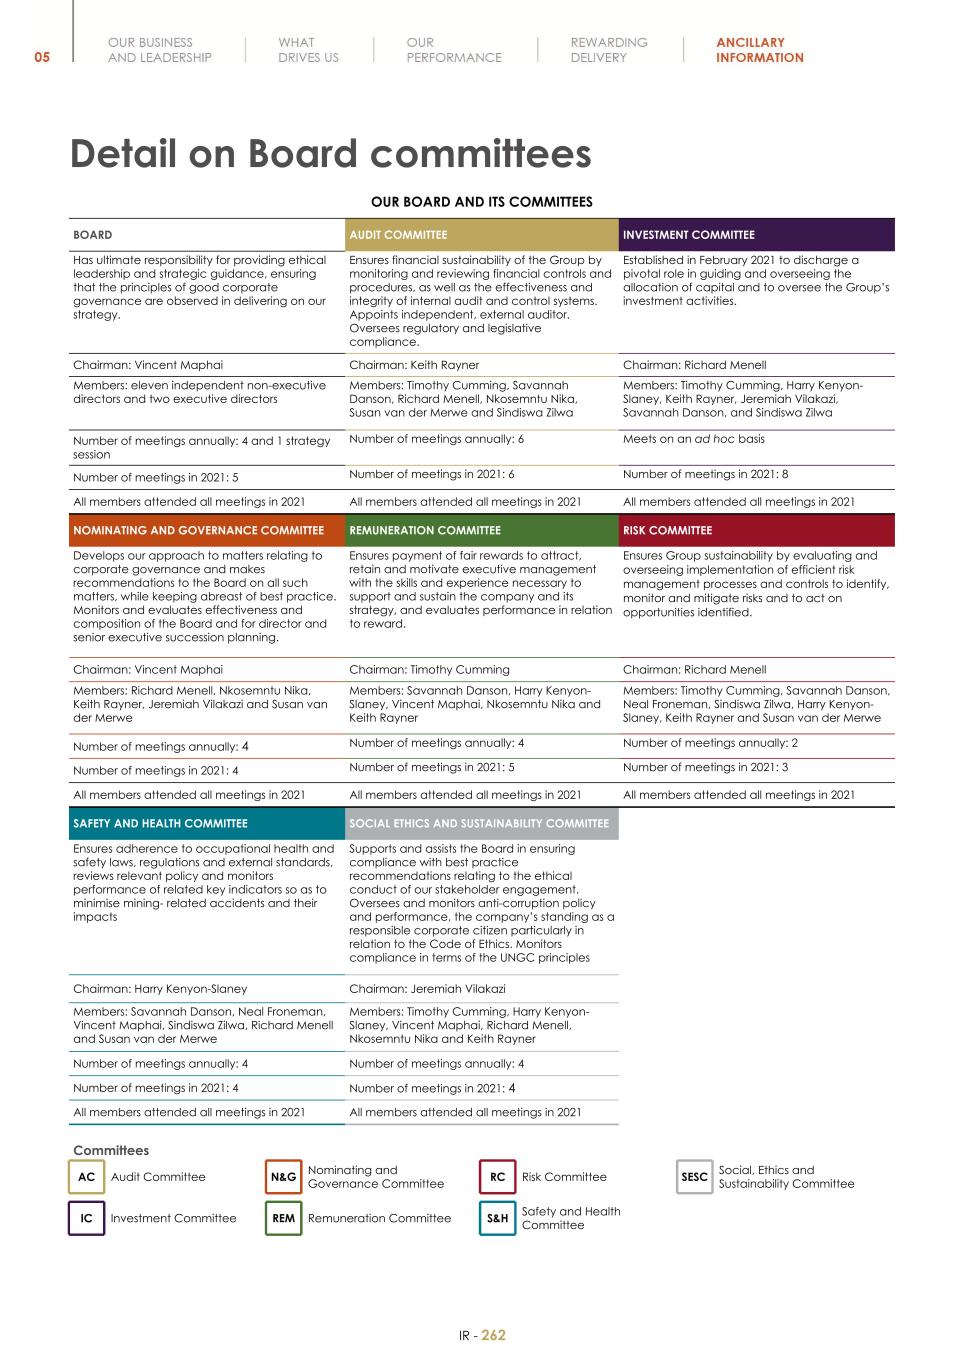
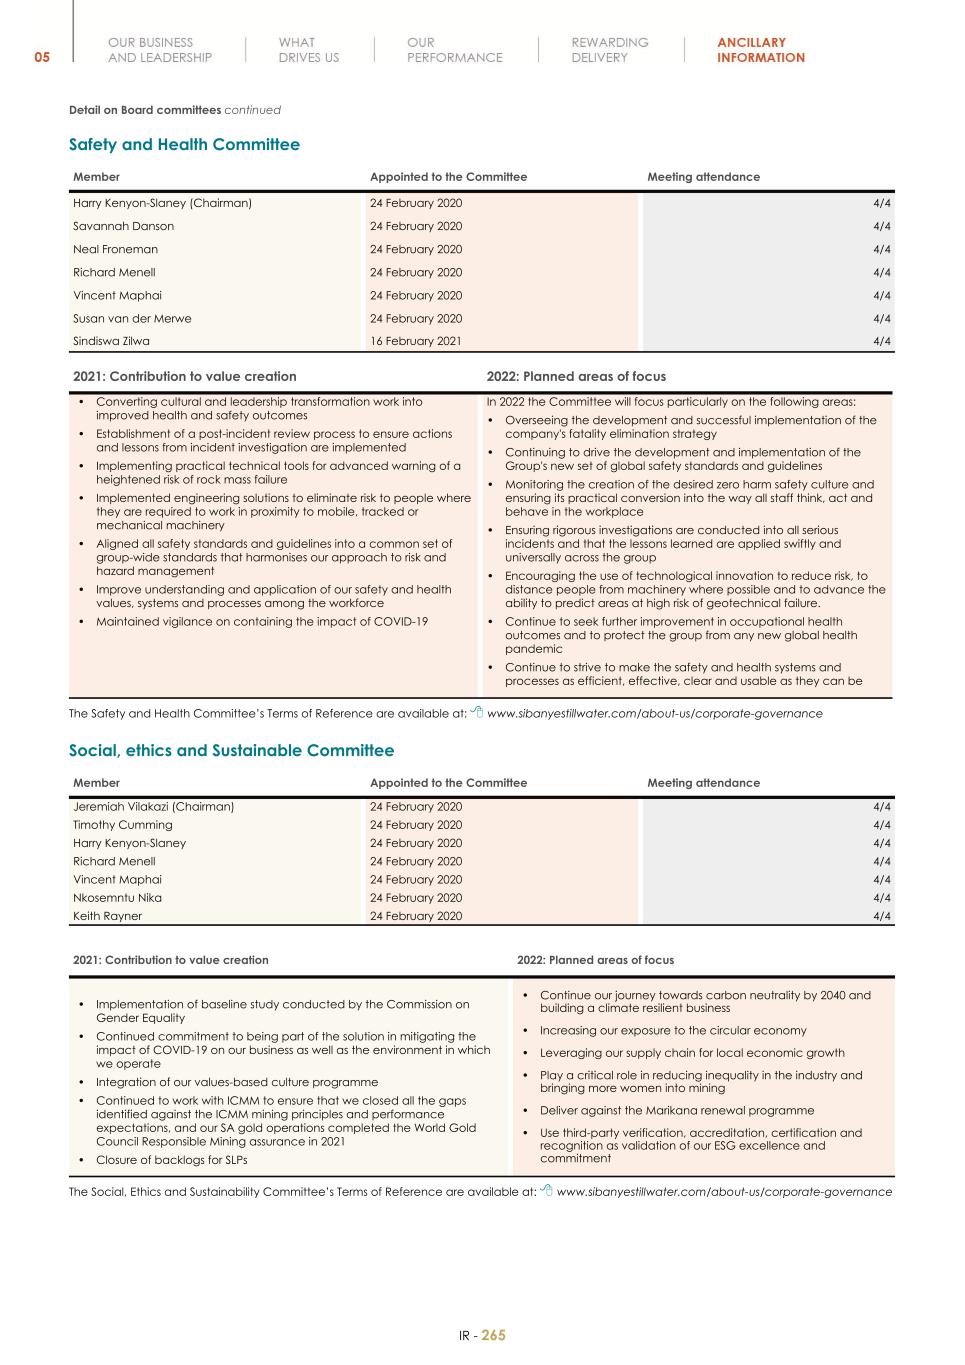
| | | | Integrated Annual Report—Ancillary Information—Details on board committees | | 263-266 (IR) | |
| | | | Directors and executive management | | 28-32 | |
| | | | Annual Financial Report—Directors’ report—Directorate | | 40 (AFR) | |
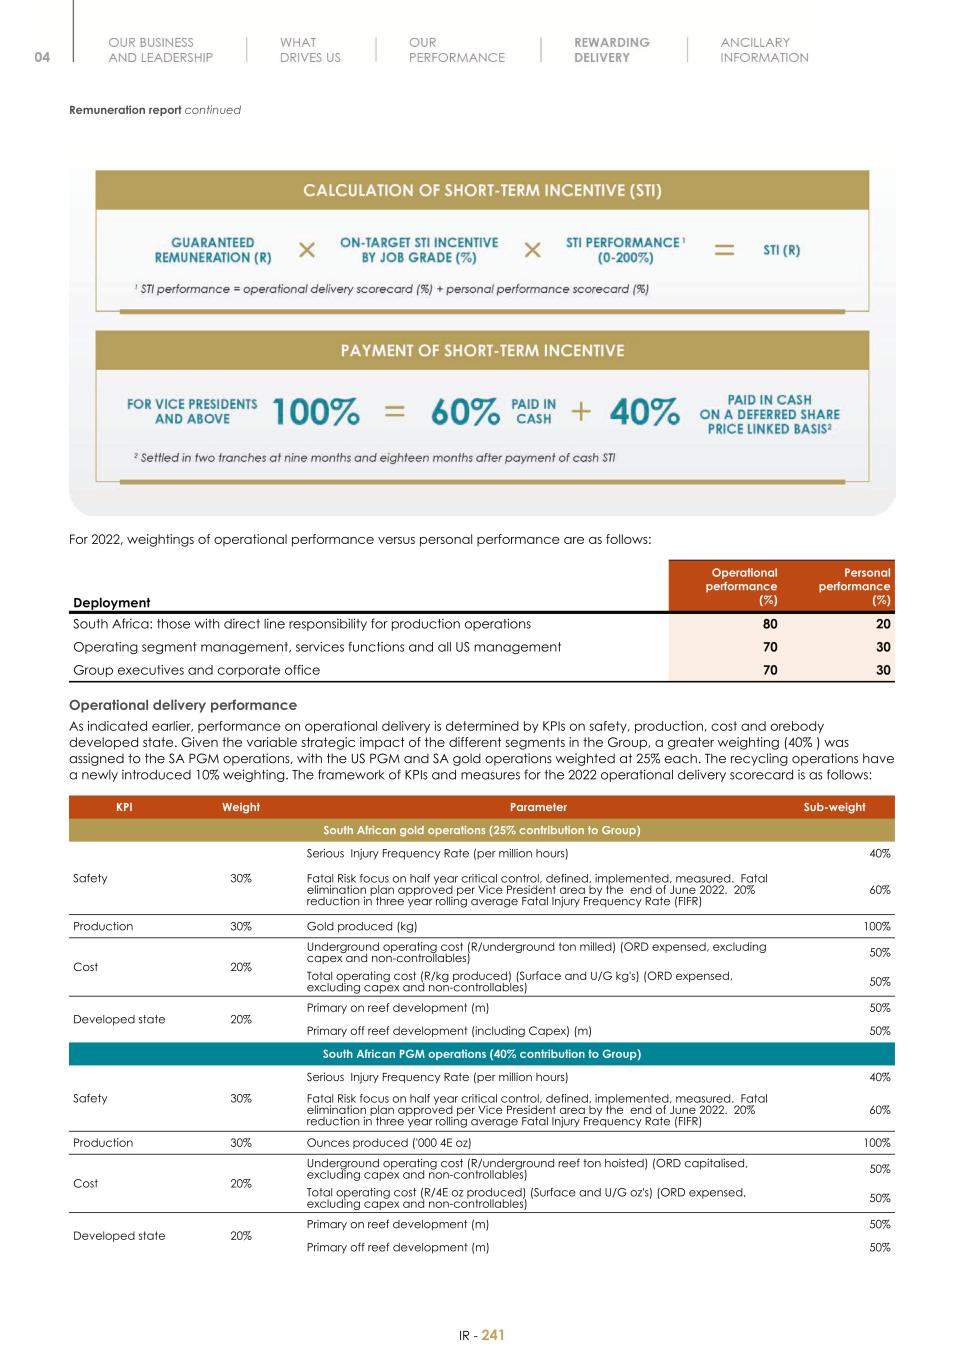
| | (b)Compensation | | Integrated Annual Report—Rewarding delivery—Remuneration report | | 228-261 (IR) | |
| | | | Annual Financial Report—Consolidated financial statements—Notes to the consolidated financial statements—Note 39: Related-party transactions | | 144 (AFR) | |
| | | | Annual Financial Report—Consolidated financial statements—Notes to the consolidated financial statements—Note 6: Share-based payments | | 65-75 (AFR) | |
| | (c)Board practices | | Integrated Annual Report—Rewarding delivery—Remuneration report | | 228-261 (IR) | |
| | | | Integrated Annual Report—Ancillary Information—Board committees | | 264-266 (IR) | |
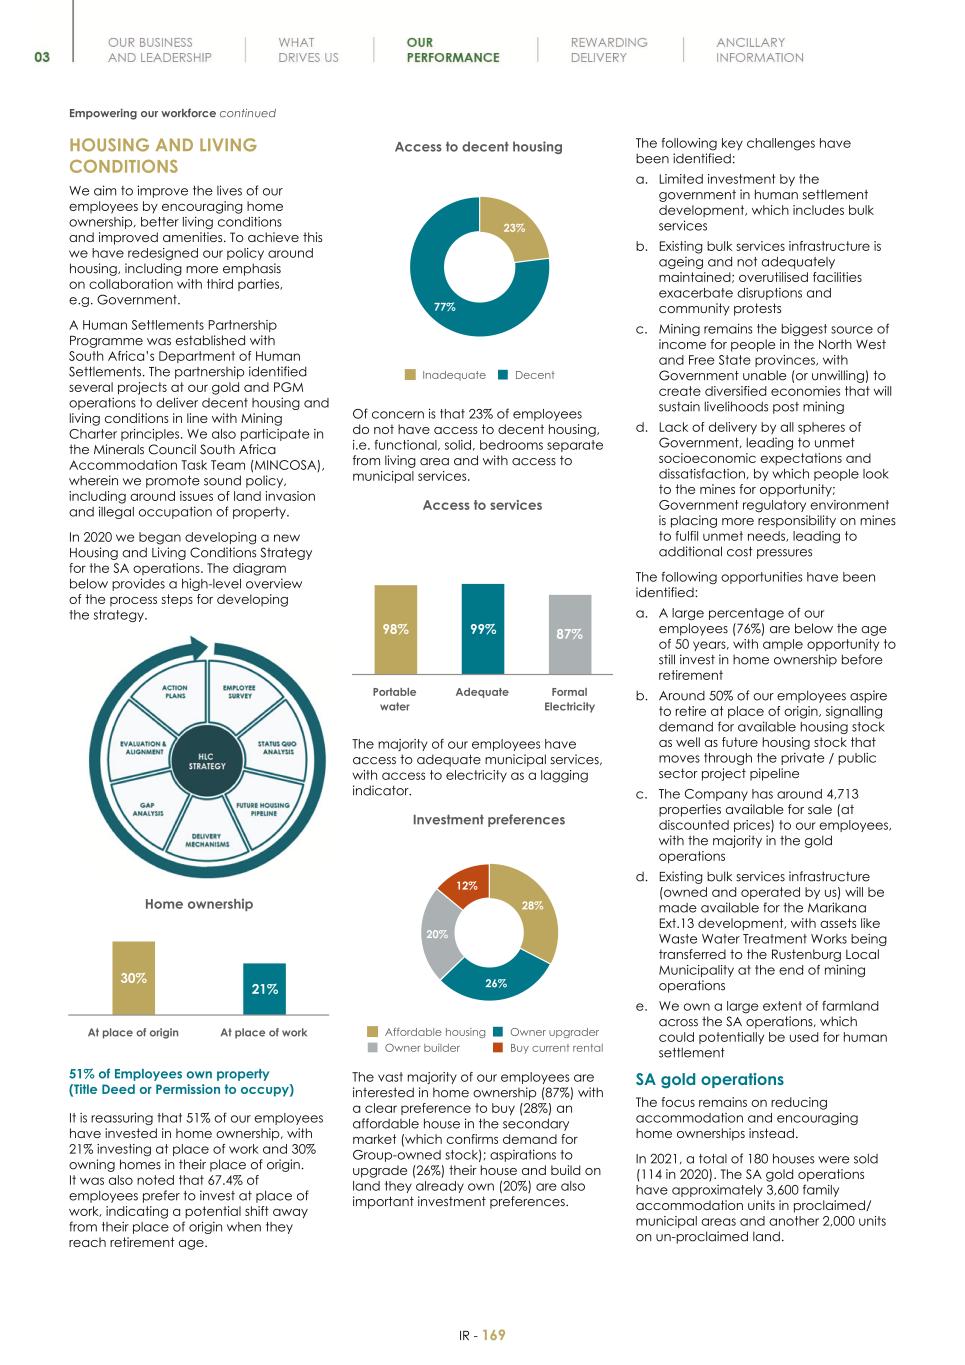
| | (d)Employees | | Integrated Annual Report—Delivering on our strategy and outlook—Empowering our workforce—Our workforce profile | | 159-161 (IR) | |
| | (e)Share ownership | | Annual Financial Report—Consolidated financial statements—Notes to the consolidated financial statements—Note 39: Related-party transactions | | 144 (AFR) | |
| | | | Additional information—Memorandum of incorporation—Voting rights | | 44-45 | |
Presentation of financial and other information
| | | | | | | | | | | | | | | | | | | | | | | |
| | | | Annual Financial Report—Consolidated financial statements—Notes to the consolidated financial statements—Note 6: Share-based payments | | 65-75 (AFR) | |
| | | | Integrated Annual Report—Delivering on our strategy and outlook—Empowering our workforce—Employee share ownership programme | | 169 (IR) | |
| 7 | | Major Shareholders and Related Party Transactions | | | | | |
| | (a)Major shareholders | | Annual Financial Report—Ancillary information—Shareholder information | | 150-152 (AFR) | |
| | | | Additional information—US holders | | 50 | |
| | | | Additional information—Memorandum of incorporation—Voting rights | | 44-45 | |
| | (b)Related party transactions | | Annual Financial Report—Directors’ report—Directors’ and officers’ disclosure of interests in contracts | | 40 (AFR) | |
| | | | Annual Financial Report—Consolidated financial statements—Notes to the consolidated financial statements—Note 39: Related-party transactions | | 144 (AFR) | |
| | | | Additional information—Refining and marketing | | 53 | |
| | (c)Interests of experts and counsel | | NA | | NA | |
| 8 | | Financial information | | | | | |
| | (a)Consolidated statements and other financial information | | Annual Financial Report—Overview—Management’s discussion and analysis of the financial statements | | 9-13 (AFR) | |
| | | | Annual Financial Report—Consolidated financial statements | | 44-48 (AFR) | |
| | | | Annual Financial Report—Directors’ report—Litigation | | 41 (AFR) | |
Presentation of financial and other information
| | | | | | | | | | | | | | | | | | | | | | | |
| | | | Annual Financial Report—Consolidated financial statements—Notes to the consolidated financial statements | | 49-150 (AFR) | |
| | | | Annual Financial Report—Report of independent registered public accounting firm | | 42 (AFR) | |
| | | | Annual Financial Report—Directors’ report—Financial affairs—Dividends | | 36 (AFR) | |
| | | | Financial information—Dividend policy and dividend distributions | | 42 | |
| | (b)Significant changes | | Presentation of financial and other information—Battery Metals Projects | | xiv | |
| | | | Annual Financial Report—Consolidated financial statements—Notes to the consolidated financial statements—Note 41: Events after reporting date | | 148-149 (AFR) | |
| 9 | | The Offer and listing | | | | | |
| | (a)Listing details | | The listing | | 43 | |
| | (b)Plan of distribution | | NA | | NA | |
| | (c)Markets | | The listing | | 43 | |
| | (c)Selling shareholders | | NA | | NA | |
| | (d)Dilution | | NA | | NA | |
| | (e)Expenses of the issue | | NA | | NA | |
| 10 | | Additional information | | | | | |
| | (a)Share capital | | NA | | NA | |
| | (b)Memorandum and articles of association | | Additional information—Memorandum of incorporation | | 43 | |
| | (c)Material contracts | | Additional information—Material contracts | | 48-49 | |
| | (d)Exchange controls | | Additional information—South African exchange control limitations affecting security holders | | 50 | |
| | | | Environmental and regulatory matters—Exchange controls | | 38-39 | |
| | (e)Taxation | | Additional information—Taxation | | 50-52 | |
Presentation of financial and other information
| | | | | | | | | | | | | | | | | | | | | | | |
| | (f)Dividends and paying agents | | NA | | NA | |
| | (g)Statement by experts | | NA | | NA | |
| | (h)Documents on display | | Additional information—Documents on display | | 53 | |
| | (i)Subsidiary information | | NA | | NA | |
| 11 | | Quantitative and qualitative disclosures about market risk | | Annual Financial Report—Consolidated financial statements—Notes to the consolidated financial statements—Note 36.2: Risk management activities | | 140-142 (AFR) | |
| 12 | | Description of securities other than equity securities | | | | | |
| | (a)Debt securities | | NA | | NA | |
| | (b)Warrants and rights | | NA | | NA | |
| | (c)Other securities | | NA | | NA | |
| | (d)American depositary shares | | Additional information—Material contracts—Deposit agreement | | 49 | |
| 13 | | Defaults, dividend arrearages and delinquencies | | NA | | NA | |
| 14 | | Material modifications to the rights of security holders and use of proceeds | | NA | | NA | |
| 15 | | Controls and procedures | | Controls and procedures | | 55 | |
| | | | Annual Financial Report—Report of independent registered public accounting firm | | 42 (AFR) | |
| 16A | | Audit Committee financial expert | | Integrated Annual Report—Ancillary Information—Board committees—Audit Committee | | 264 (IAR) | |
| | | | Directors and executive management | | 28-32 | |
| 16B | | Code of ethics | | Integrated Annual Report—Our business and leadership—Corporate governance—Ethical leadership and corporate governance | | 12-15 (IR) | |
| 16C | | Principal accountant fees and services | | Annual Financial Report—Auditor independence and fees | | 33 (AFR) | |
Presentation of financial and other information
| | | | | | | | | | | | | | | | | | | | | | | |
| 16D | | Exemptions from the listing standards for audit committees | | NA | | NA | |
| 16E | | Purchase of equity securities by the issuer and affiliated purchasers | | Purchase of equity securities by the company and affiliated purchasers | | 56 | |
| 16F | | Change in registrant’s certifying accountant | | NA | | NA | |
| 16G | | Corporate governance | | Additional information—JSE corporate governance practices compared with NYSE Listing Standards | | 54 | |
| 16H | | Mine safety disclosure | | Environmental and regulatory matters—Mine safety disclosure | | 41 | |
| 17 | | Financial statements | | NA | | NA | |
| 18 | | Financial statements | | Annual Financial Report—Accountability—Report of independent registered public accounting firm (PCAOB ID: 1698) | | 42 (AFR) | |
| | | | Annual Financial Report—Consolidated financial statements—Consolidated income statement | | 45 (AFR) | |
| | | | Annual Financial Report—Consolidated financial statements—Consolidated statement of other comprehensive income | | 45 (AFR) | |
| | | | Annual Financial Report—Consolidated financial statements—Consolidated statement of financial position | | 46 (AFR) | |
| | | | Annual Financial Report—Consolidated financial statements—Consolidated statement of changes in equity | | 47 (AFR) | |
| | | | Annual Financial Report—Consolidated financial statements—Consolidated statement of cash flows | | 48 (AFR) | |
| | | | Annual Financial Report—Consolidated financial statements—Notes to the consolidated financial statements | | 47 (AFR) | |
| 19 | | Exhibits | | Exhibits | | 57-58 | |
Presentation of financial and other information
Reorganisation
On 24 February 2020, Sibanye Stillwater Limited and Sibanye Gold Limited implemented a scheme of arrangement in terms of section 114 of the South African Companies Act, 2008 (Companies Act), which resulted in, among other things, Sibanye Gold Limited’s operations being reorganised under Sibanye Stillwater Limited, which became the parent company of the Sibanye Stillwater Group (the Reorganisation). See Annual Financial Report—Consolidated financial statements—Notes to the consolidated financial statements—Note 26: Stated share capital. The historical financial statements included in this report for fiscal year ended 31 December 2019 are those of Sibanye Gold Limited. See —Historical consolidated financial statements below. Accordingly, in this annual report, references to “Sibanye-Stillwater” shall include Sibanye Gold Limited and its subsidiaries prior to the implementation of the Reorganisation and, Sibanye Stillwater Limited and its subsidiaries, subsequent to the implementation of the Reorganisation, as the context requires.
Historical Consolidated Financial Statements
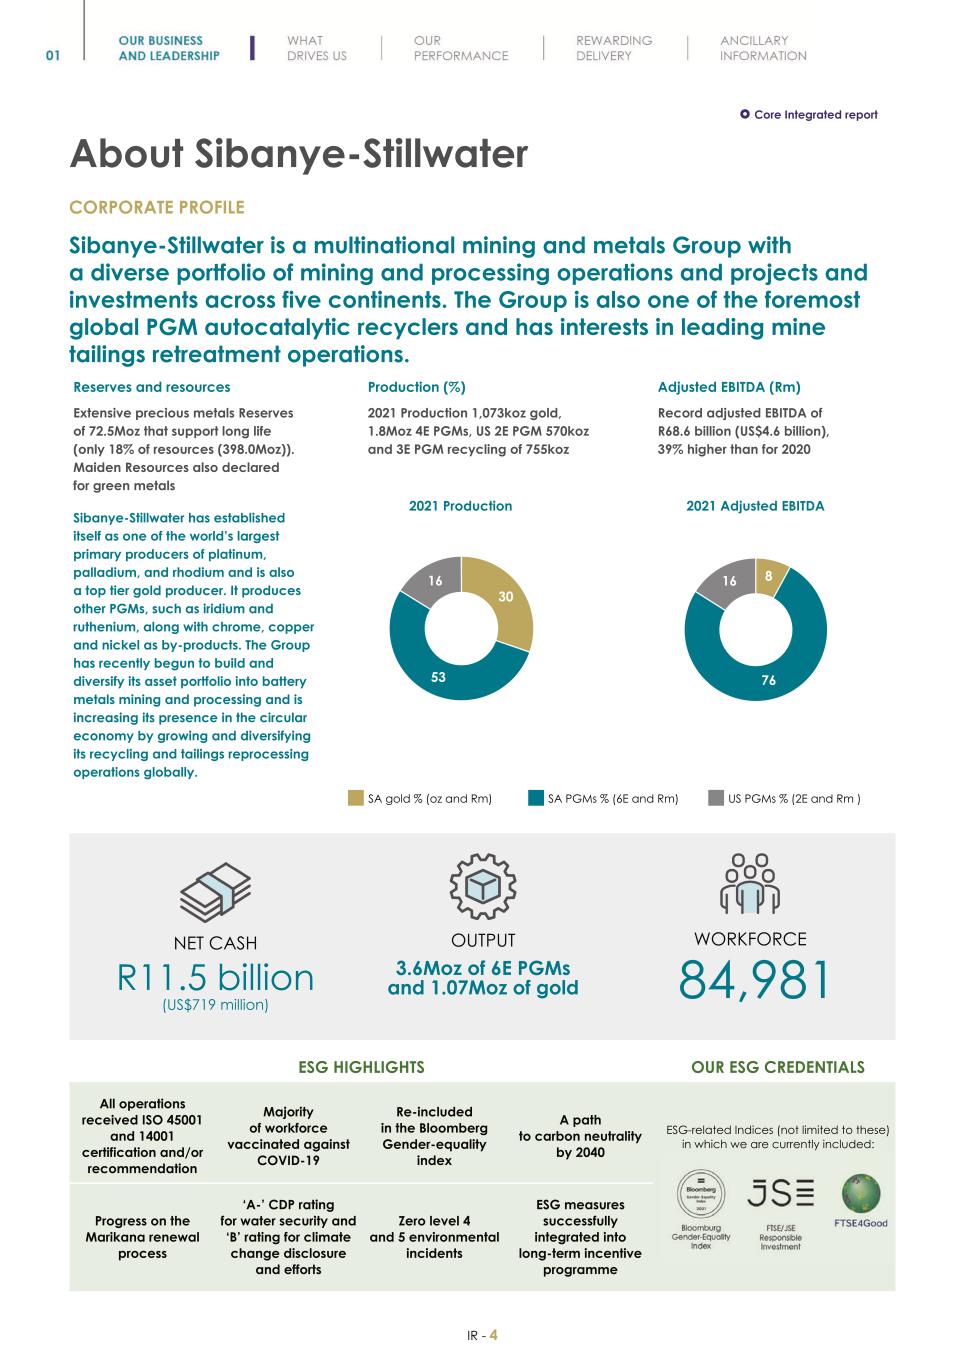
Sibanye-Stillwater is a multinational mining and metals processing group with a diverse portfolio of mining and processing operations, projects and investments across five continents. The Group is one of the foremost global producers of platinum group metals (PGMs) recycled from spent automotive catalytic converters and also has interests in leading mine tailings retreatment operations.
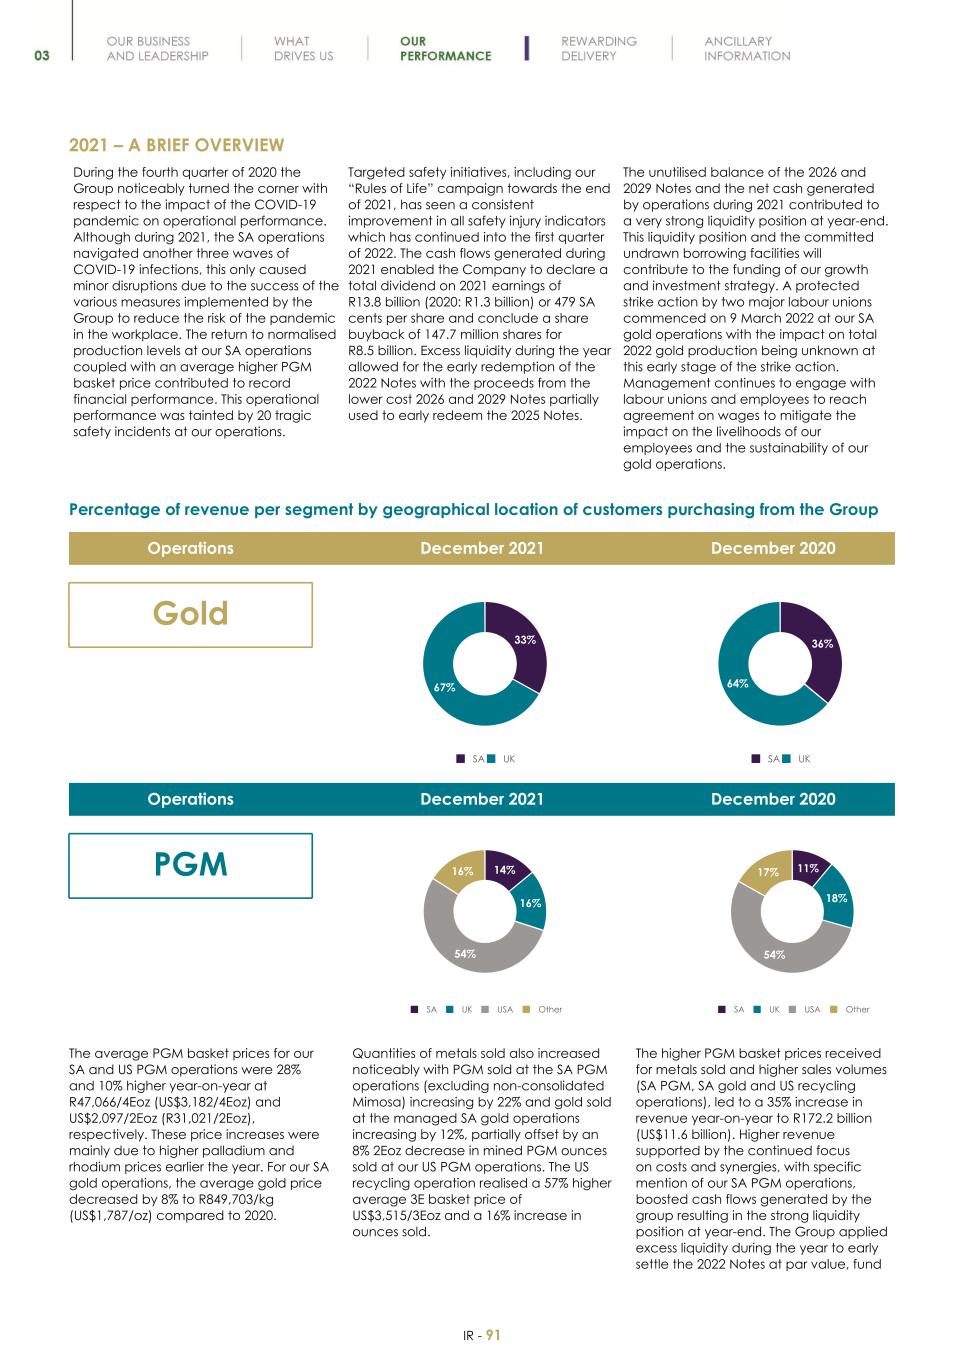
Domiciled and with its head office in South Africa, Sibanye-Stillwater has established itself as one of the world’s largest primary producers of platinum, palladium, and rhodium and is also a top tier gold producer. It produces other PGMs, such as iridium and ruthenium, along with chrome, copper and nickel as by-products. The Group has recently begun to build and diversify its asset portfolio into battery metals mining and processing and is increasing its presence in the sustainable circular economy by growing and diversifying its recycling and tailings reprocessing operations globally. The books of account of Sibanye-Stillwater are maintained in South African Rand and Sibanye-Stillwater’s annual financial statements are prepared in accordance with International Financial Reporting Standards (IFRS), as issued by the International Accounting Standards Board, as prescribed by law. These financial statements are distributed to shareholders and are submitted to the Johannesburg Stock Exchange (JSE) and the New York Stock Exchange (NYSE).
The historical consolidated financial statements in this report as at and for the fiscal years ended 31 December 2021 and 2020 are those for Sibanye-Stillwater and the historical consolidated financial statements in this report as at and for the fiscal year ended 31 December 2019 are those of Sibanye Gold Limited (together, the Consolidated Financial Statements). Sibanye Gold Limited is the predecessor of Sibanye-Stillwater for consolidated financial reporting purposes. The consolidated comparative information in this report is presented as if the Reorganisation had occurred before the start of the earliest period presented. The consolidated financial statements for Sibanye-Stillwater and Sibanye Gold Limited have been prepared using the historical results of operations, assets and liabilities attributable to Sibanye-Stillwater and all of its subsidiaries and Sibanye Gold Limited and all of its subsidiaries, respectively for the current and comparative periods. The Consolidated Financial Statements have been prepared under the historical cost convention, except for financial assets and financial liabilities (including derivative financial instruments), which are measured at fair value through profit or loss or through the mark to market reserve in equity.
Non-IFRS Measures
The financial information in this annual report includes certain measures that are not defined by IFRS, including “operating costs”, “adjusted earnings before interest, tax, depreciation and amortisation” (adjusted EBITDA), “adjusted EBITDA margin”, “All-in costs”, “All-in sustaining costs”, “All-in sustaining cost margin”, “All-in cost margin”, “net debt”, “net (cash)/debt”, “net (cash)/debt to adjusted EBITDA (ratio)”, “adjusted free cash flow”, “interest cover ratio”, “normalised earnings”, “headline earnings”, and “headline earnings per share” (each as defined below or in the Annual Financial Report—Overview—Four-year financial performance). These measures are not measures of financial performance or cash flows under IFRS and may not be comparable to similarly titled measures of other companies. These measures have been included for the reasons described below or in Annual Financial Report—Overview—Four-year financial performance and should not be considered by investors as alternatives to cost of sales, net operating profit, profit before taxation, cash from operating activities or any other measure of financial performance presented in accordance with IFRS.
Operating cost is defined as the average cost of production, and operating cost per tonne is calculated by dividing the cost of sales, before amortisation and depreciation and change in inventory in a period by the tonnes milled/treated in the same period, and operating cost per kilogram (and ounce) is calculated by dividing the cost of sales, before amortisation and depreciation and change in inventory in a period by the gold or PGM produced in the same period. See Annual Financial Report—Overview—Four-year financial performance—Group operating statistics—Footnote 2.
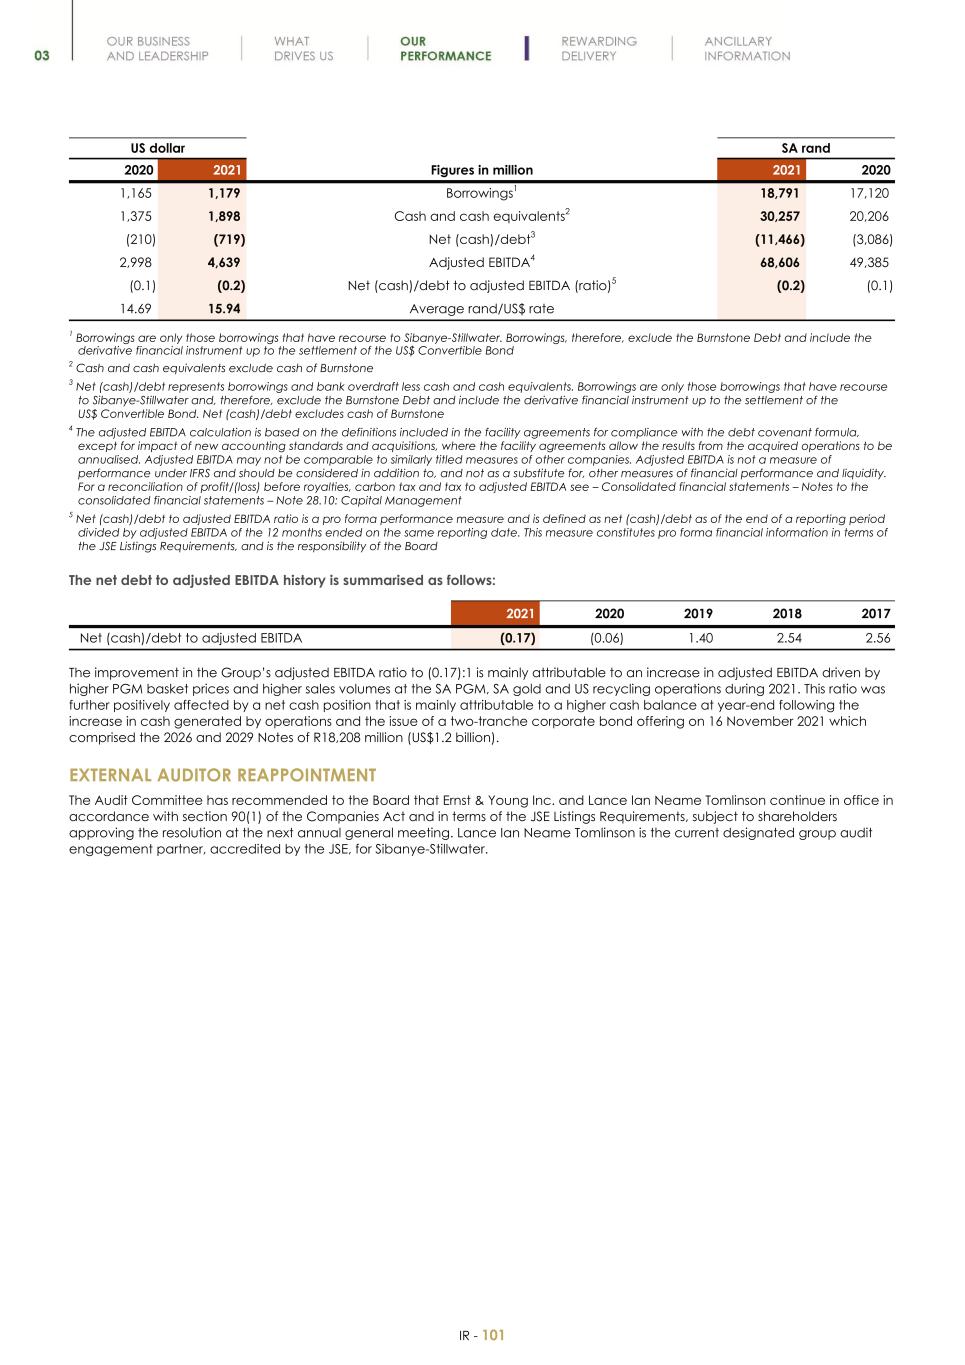
Sibanye-Stillwater reports adjusted EBITDA based on the formula included in the facility agreements for compliance with the debt covenant formula. See Annual Financial Report—Overview—Four-year financial performance—Group operating statistics—Footnote 3 and Annual Financial Report—Consolidated financial statements—Notes to the consolidated financial statements—Note 28.10: Capital management for a reconciliation of profit/(loss) before royalties, carbon tax and tax to adjusted EBITDA for more information. Adjusted EBITDA margin is calculated by dividing adjusted EBITDA by revenue. See Annual Financial Report—Overview—Four-year financial performance—Group operating statistics—Footnote 4. Adjusted EBITDA may not be comparable to similarly titled measures of other companies. Management believes that adjusted EBITDA is used by investors and analysts to evaluate companies in the mining industry. Adjusted EBITDA is not a measure of performance under IFRS and should be considered in addition to, and not as a substitute for, other measures of financial performance and liquidity reported in accordance with IFRS. Net (cash)/debt represents borrowings and bank overdraft less cash and cash equivalents. Borrowings are only those borrowings that have recourse to Sibanye-Stillwater and, therefore, exclude the Burnstone Debt and include the derivative financial instrument up to the settlement of the US$ Convertible Bond. For more information on the derivative financial instrument, see Annual Financial Report—Consolidated financial statements—Notes to the consolidated financial statements—Note 28: Borrowings and derivative financial instruments. “Net(cash)/debt” excludes Burnstone cash and cash equivalents. For more information, see Annual Financial Report—Consolidated financial statements—Notes to the consolidated financial statements—Note 28.10: Capital management. Net (cash)/debt to adjusted EBITDA (ratio) is defined as net (cash)/debt as of the end of a reporting period divided by adjusted EBITDA of the last 12 months ended on the same reporting date. Where a net asset position arises the Net debt to adjusted EBITDA
Presentation of financial and other information
(ratio) is negative and is shown in brackets. See Annual Financial Report—Consolidated financial statements—Notes to the consolidated financial statements—Note 28.10: Capital management.
All-in costs is made up of All-in sustaining costs, being the cost to sustain current operations, given as a sub-total in the All-in costs calculation, together with corporate and major capital expenditure associated with growth. For more information see Annual Financial Report—Overview—Four-year financial performance—Group operating statistics—Footnote 5. For a reconciliation of cost of sales, before amortisation and depreciation to All-in costs, see Annual Financial Report—Overview—Management’s discussion and analysis of the financial statements—2021 financial performance compared with 2020—Cost of sales—All-in sustaining costs and all-in costs. All-in sustaining cost margin is defined as revenue minus All-in sustaining costs divided by revenue. All-in cost margin is defined as revenue minus All-in costs divided by revenue. See Annual Financial Report—Overview—Four-year financial performance—Group operating statistics—Footnote 6.
Adjusted free cash flow is defined as net cash from operating activities before dividends paid, net interest paid and deferred revenue advance received and bulk tailings re-treatment early settlement payment, less additions to property, plant and equipment. Management considers adjusted free cash flow to be an indicator of cash available for repaying debt, other investing activities, and paying dividends. See Annual Financial Report—Overview—Management’s discussion and analysis of the financial statements—Liquidity and capital resources—Cash flow analysis for a reconciliation of net cash from operating activities to adjusted free cash flow.
Normalised earnings is defined as earnings attributable to the owners of Sibanye-Stillwater excluding gains and losses on financial instruments and foreign exchange differences, impairments, gain/loss on disposal of property, plant and equipment, occupational healthcare expense, restructuring costs, transactions costs, share-based payment on Black Economic Empowerment (BEE) transactions, gain on acquisition, net other business development costs, share of results of equity-accounted investees, all after tax and the impact of non-controlling interests (NCI), and changes in estimated deferred tax rate. See Annual Financial Report—Consolidated financial statements—Notes to the consolidated financial statements—Note 13: Dividends.
Headline earnings is a requirement of the JSE Listings Requirements. Headline earnings as defined in Circular 1/2019 issued by SAICA, separates from earnings all separately identifiable remeasurements. A remeasurement is an amount recognised in profit or loss relating to any change (whether realised or unrealised) in the carrying amount of an asset or liability that arose after the initial recognition of such asset or liability. Beginning on 1 January 2021, the Group adopted the definition of “headline earnings” as set out in SAICA Circular 1/2021, replacing the 1/2019 Circular applied in the Consolidated Financial Statements. The adoption of Circular 1/2021 had no impact on headline earnings. Headline earnings per share is calculated by dividing the headline earnings attributable to owners of Sibanye-Stillwater by the weighted average number of ordinary shares in issue during the year. See Annual Financial Report—Consolidated financial statements—Notes to the consolidated financial statements—Note 12.3: Headline earnings per share.
Conversion Rates
Certain information in this annual report presented in Rand has been translated into US dollars. Unless otherwise stated, the conversion rate for these translations in the consolidated statement of financial position is R15.94/US$1.00, which was the closing rate on 31 December 2021 and the conversion rate for translation in the consolidated income statement, consolidated statement of cash flows and for all-in-sustaining cost and all-in-cost is R14.79/US$1.00, which was the average rate for the fiscal year ended 31 December 2021. By including the US dollar equivalents, Sibanye-Stillwater is not representing that the Rand amounts actually represent the US dollar amounts shown or that these amounts could be converted into US dollars at the rates indicated.
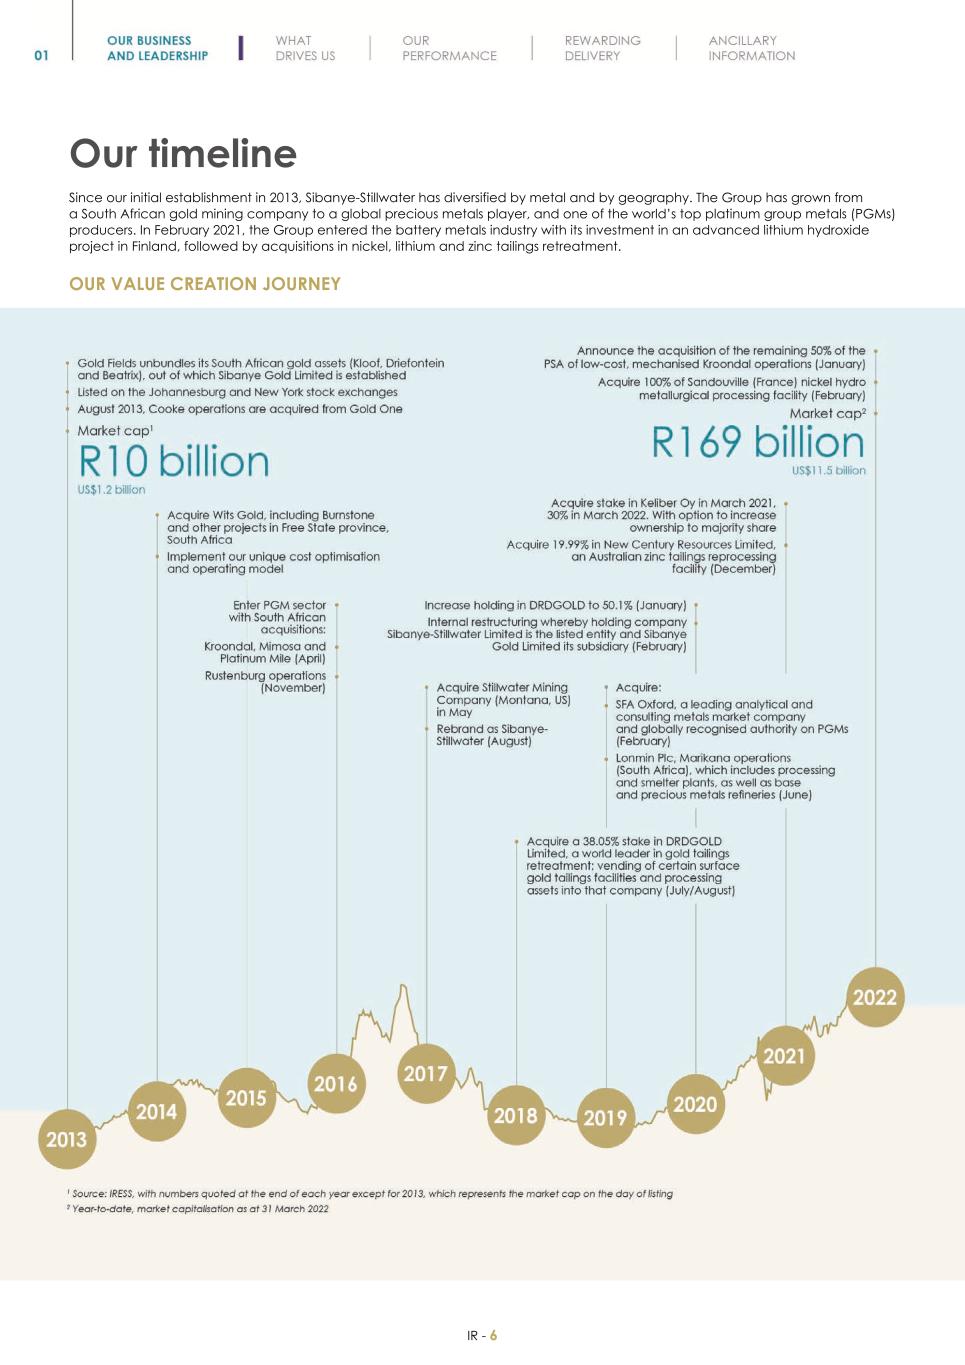
Battery Metals Projects
In 2021, the Group began its expansion into the battery metals space with a number of strategic acquisitions and investments in the United States and Europe. These transactions are summarised below:
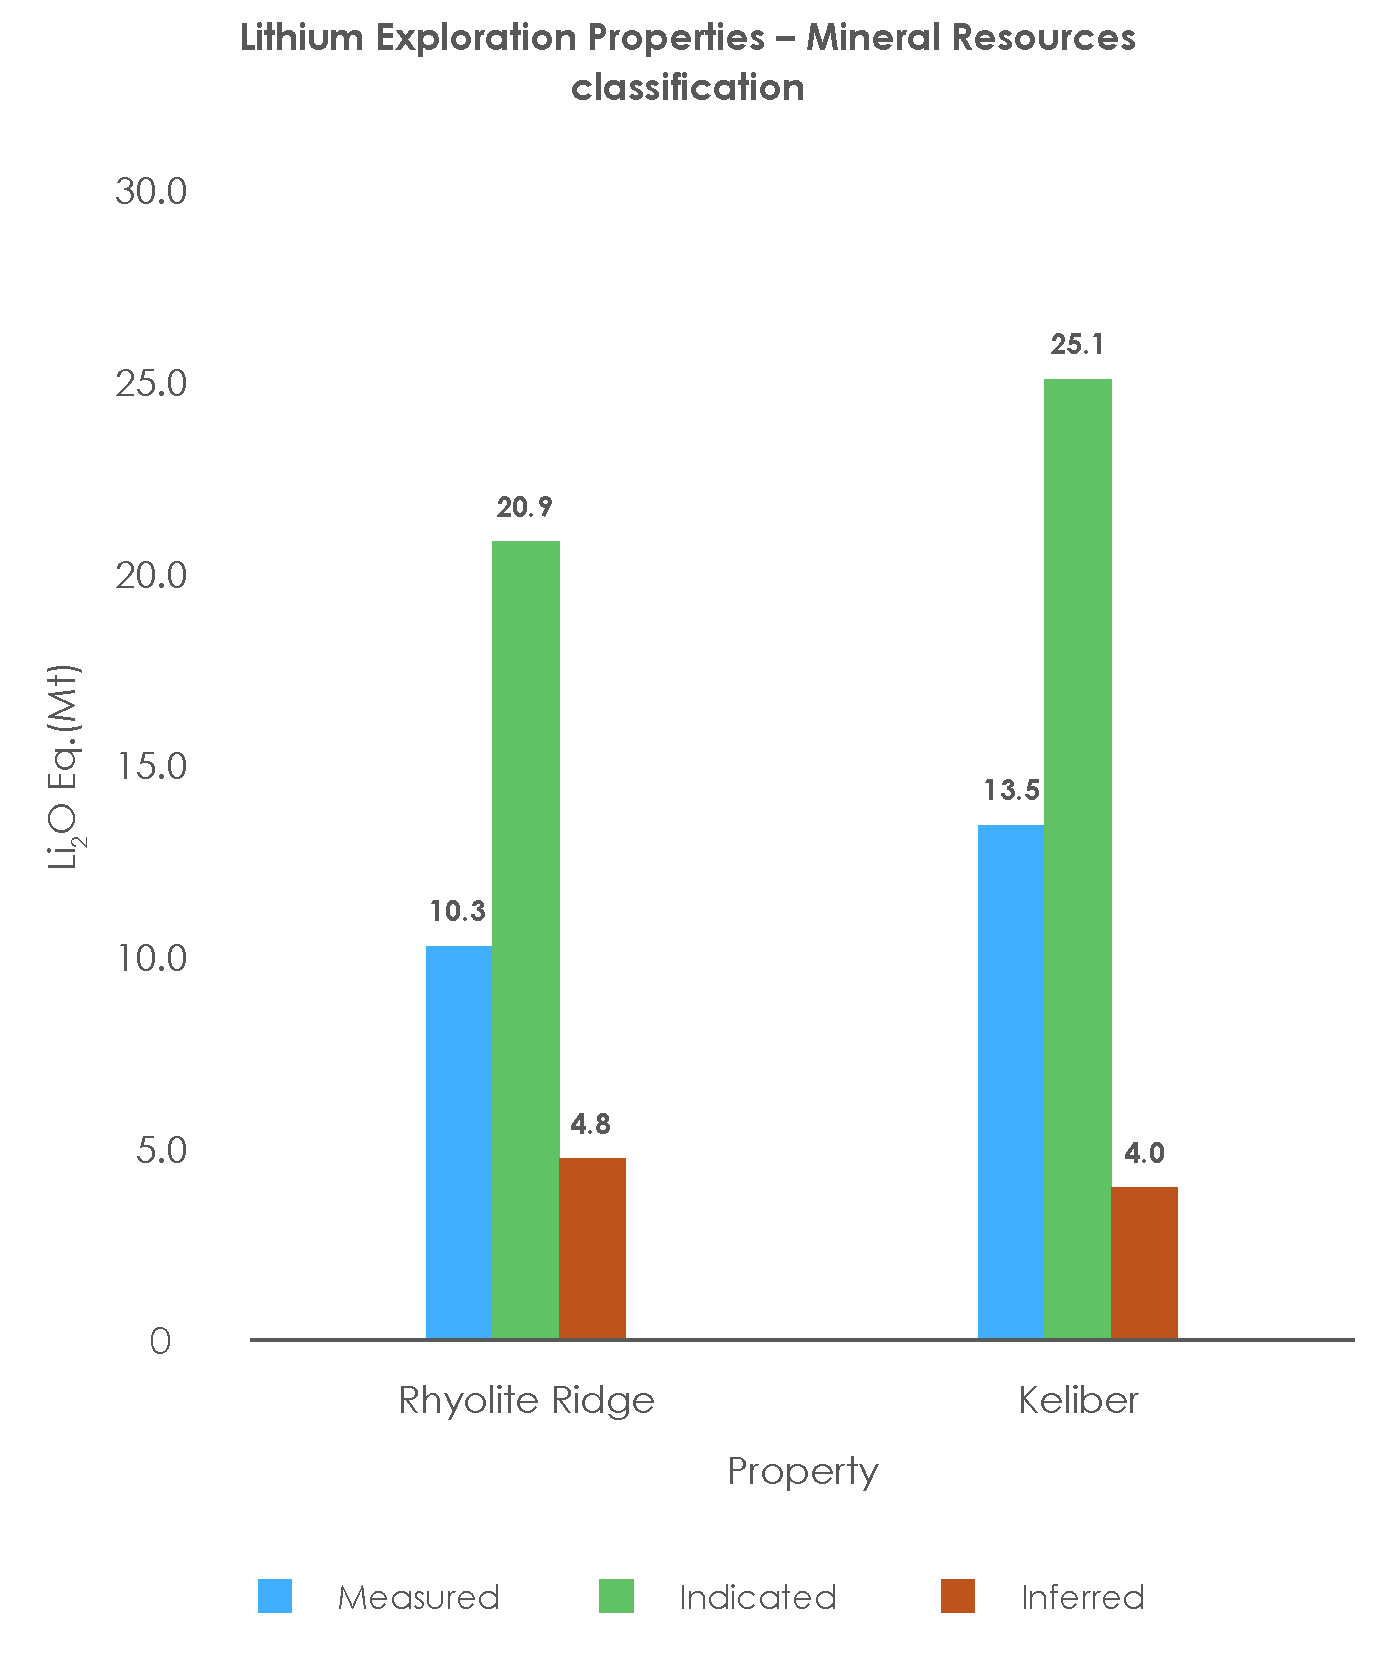
•Keliber: On 17 March 2021, the Group acquired a 26.6% stake in the Keliber Lithium project for EUR25 million through a two-tranche investment. A further EUR5 million third tranche payment in March 2022 secured a cumulative 30% interest in the project, with the option to increase this interest to over 50% following the conclusion of a definitive feasibility study which will dictate the funding requirements. See Annual Financial Report—Consolidated financial statements—Notes to the consolidated financial statements—Note 18.4 Keliber
•Sandouville: Sibanye-Stillwater acquired 100% of Eramet’s Sandouville nickel processing facilities in Le Havre, which completed on 4 February 2022 for an effective cash consideration of EUR85 million (adjusting for closing net debt and working capital). See Annual Financial Report—Consolidated financial statements—Notes to the consolidated financial statements—Note 41.1 Sandouville acquisition
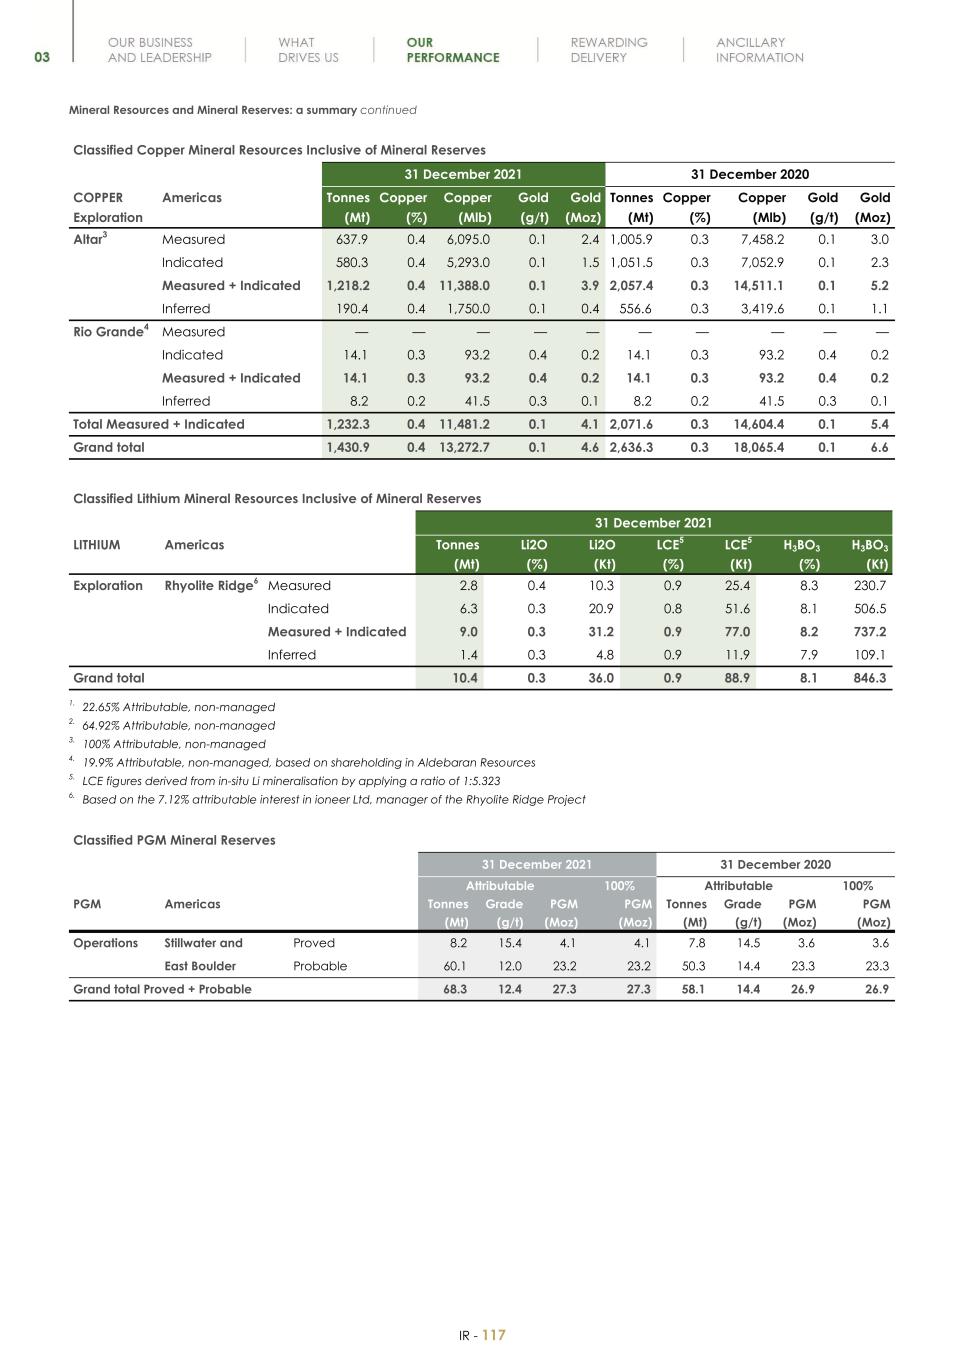
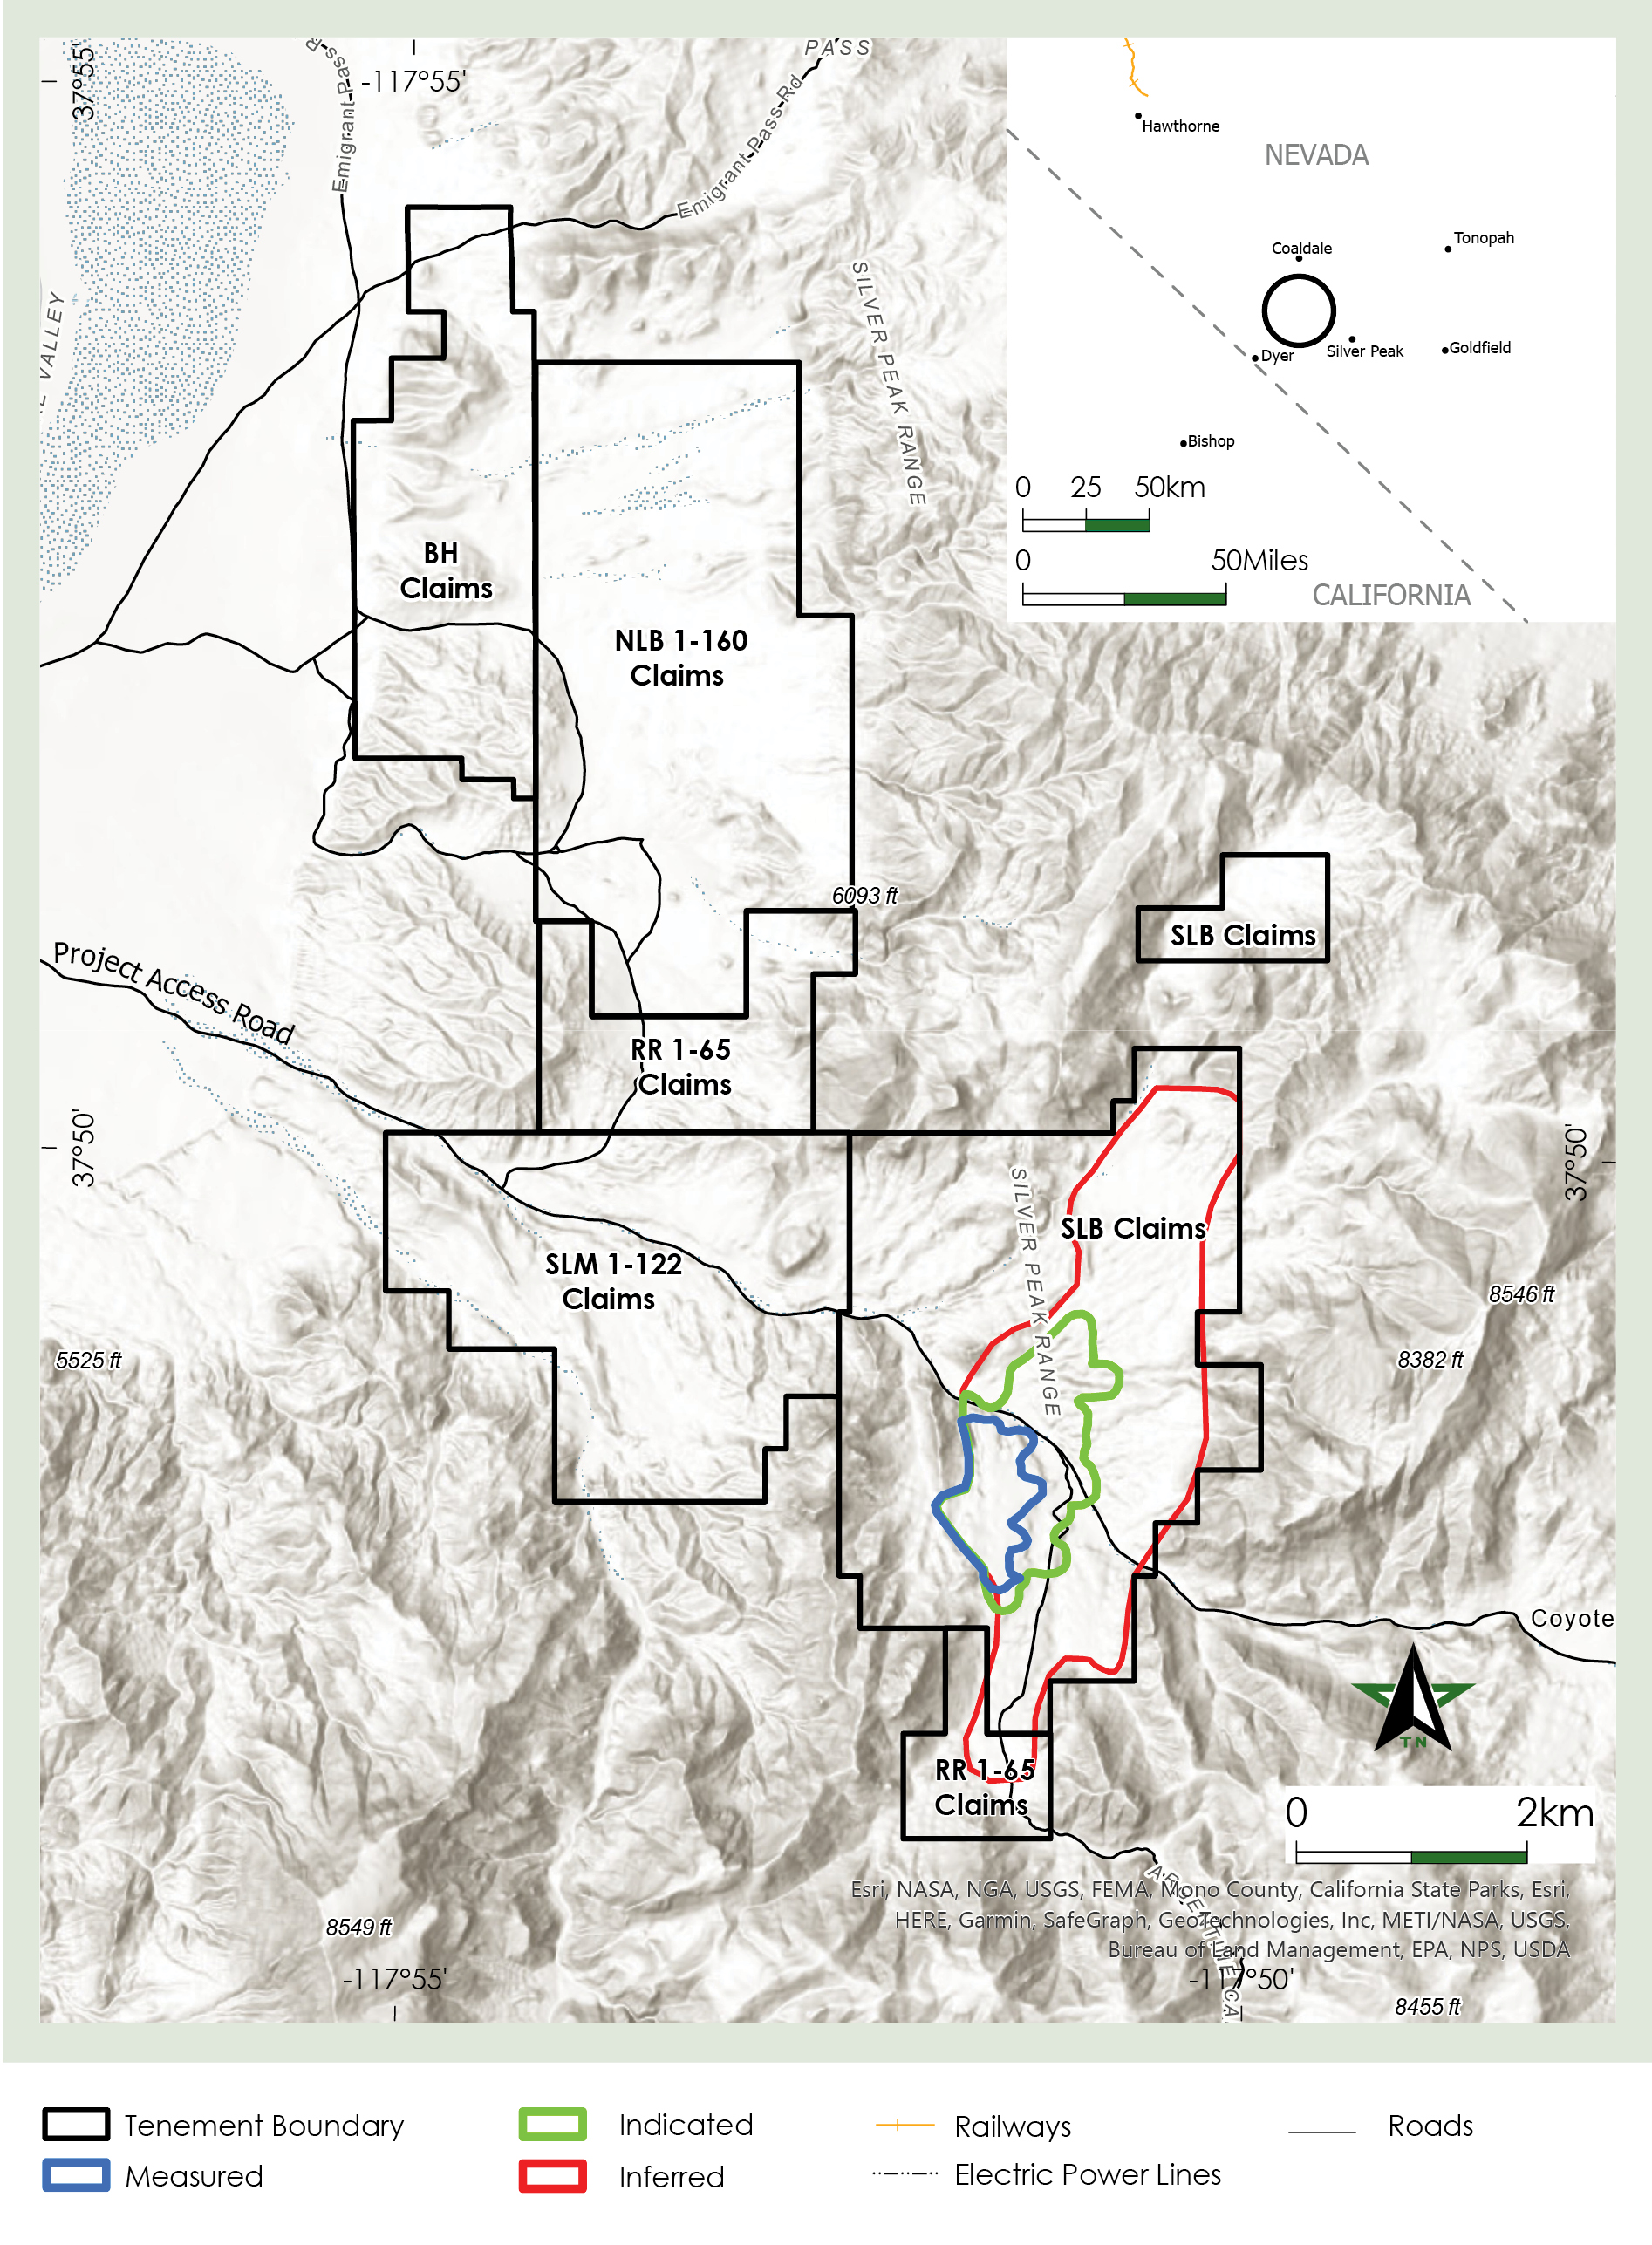
•Rhyolite Ridge: On 16 September 2021, the Group announced a proposed 50:50 joint venture (JV) with ioneer with respect to the Rhyolite Ridge Lithium-Boron project in Nevada, US. The Group also acquired a 7.12% direct equity interest in ioneer for approximately US$70 million. The Group’s has the option to acquire a further 50% interest in the Rhyolite Ridge project JV for a US$490 million subject to the satisfaction of all conditions precedent. See Annual Financial Report—Consolidated financial statements—Notes to the consolidated financial statements—Note 41.3 Rhyolite Ridge joint venture with ioneer
•New Century: The Group acquired a 19.9% stake in New Century, a leading Australian tailings reprocessing business for a cash consideration of A$61 million on 6 December 2021 See Annual Financial Report—Consolidated financial statements—Notes to the consolidated financial statements—Note 20: Other investments
Presentation of financial and other information
The Lonmin Acquisition
On 14 December 2017, the boards of Sibanye-Stillwater and Lonmin Plc (Lonmin or Marikana operations) announced that they had reached agreement on the terms of a recommended all-share offer pursuant to which Sibanye-Stillwater, and/or a wholly-owned subsidiary of Sibanye-Stillwater, would acquire the entire issued and to be issued ordinary share capital of Lonmin, which is a major mine-to-market producer of PGMs with core operations in South Africa (the Lonmin Acquisition). The Lonmin Acquisition was effected by means of a scheme of arrangement between Lonmin and Lonmin’s shareholders under Part 26 of the UK Companies Act which was sanctioned by the High Court of Justice in England & Wales on 7 June 2019 and became effective on that date, with the new Sibanye-Stillwater Shares being admitted to trading on the JSE on 10 June 2019. Under the terms of the Lonmin Acquisition, each Lonmin shareholder received one new Sibanye-Stillwater share for each Lonmin ordinary share that they held. See Annual Financial Report—Consolidated financial statements—Notes to the consolidated financial statements—Note 16.1: Lonmin acquisition.
DRDGOLD Limited Option
In July 2018, Sibanye-Stillwater acquired a 38.05% equity interest in DRDGOLD Limited (DRDGOLD), with a 24-month option to acquire an additional 12.05% in DRDGOLD, in exchange for selected gold surface processing assets and tailing storage facilities. On 8 January 2020, Sibanye-Stillwater exercised its option to increase its shareholding in DRDGOLD to 50.1% in exchange for a cash consideration. See Annual Financial Report—Consolidated financial statements—Notes to the consolidated financial statements—Note 1.3: Consolidation—Footnote 8.
Market Information
This annual report includes industry data about Sibanye-Stillwater’s markets obtained from industry surveys, industry publications, market research and other publicly available third-party information. Industry surveys and industry publications generally state that the information they contain has been obtained from sources believed to be reliable but that the accuracy and completeness of such information is not guaranteed. Sibanye-Stillwater and its advisers have not independently verified this data.
In addition, in many cases, statements in this annual report regarding the gold and PGM mining industry, and Sibanye-Stillwater’s position in these industries have been made based on internal surveys, industry forecasts, market research, as well as Sibanye-Stillwater’s own experiences. While these statements are believed by Sibanye-Stillwater to be reliable, they have not been independently verified.
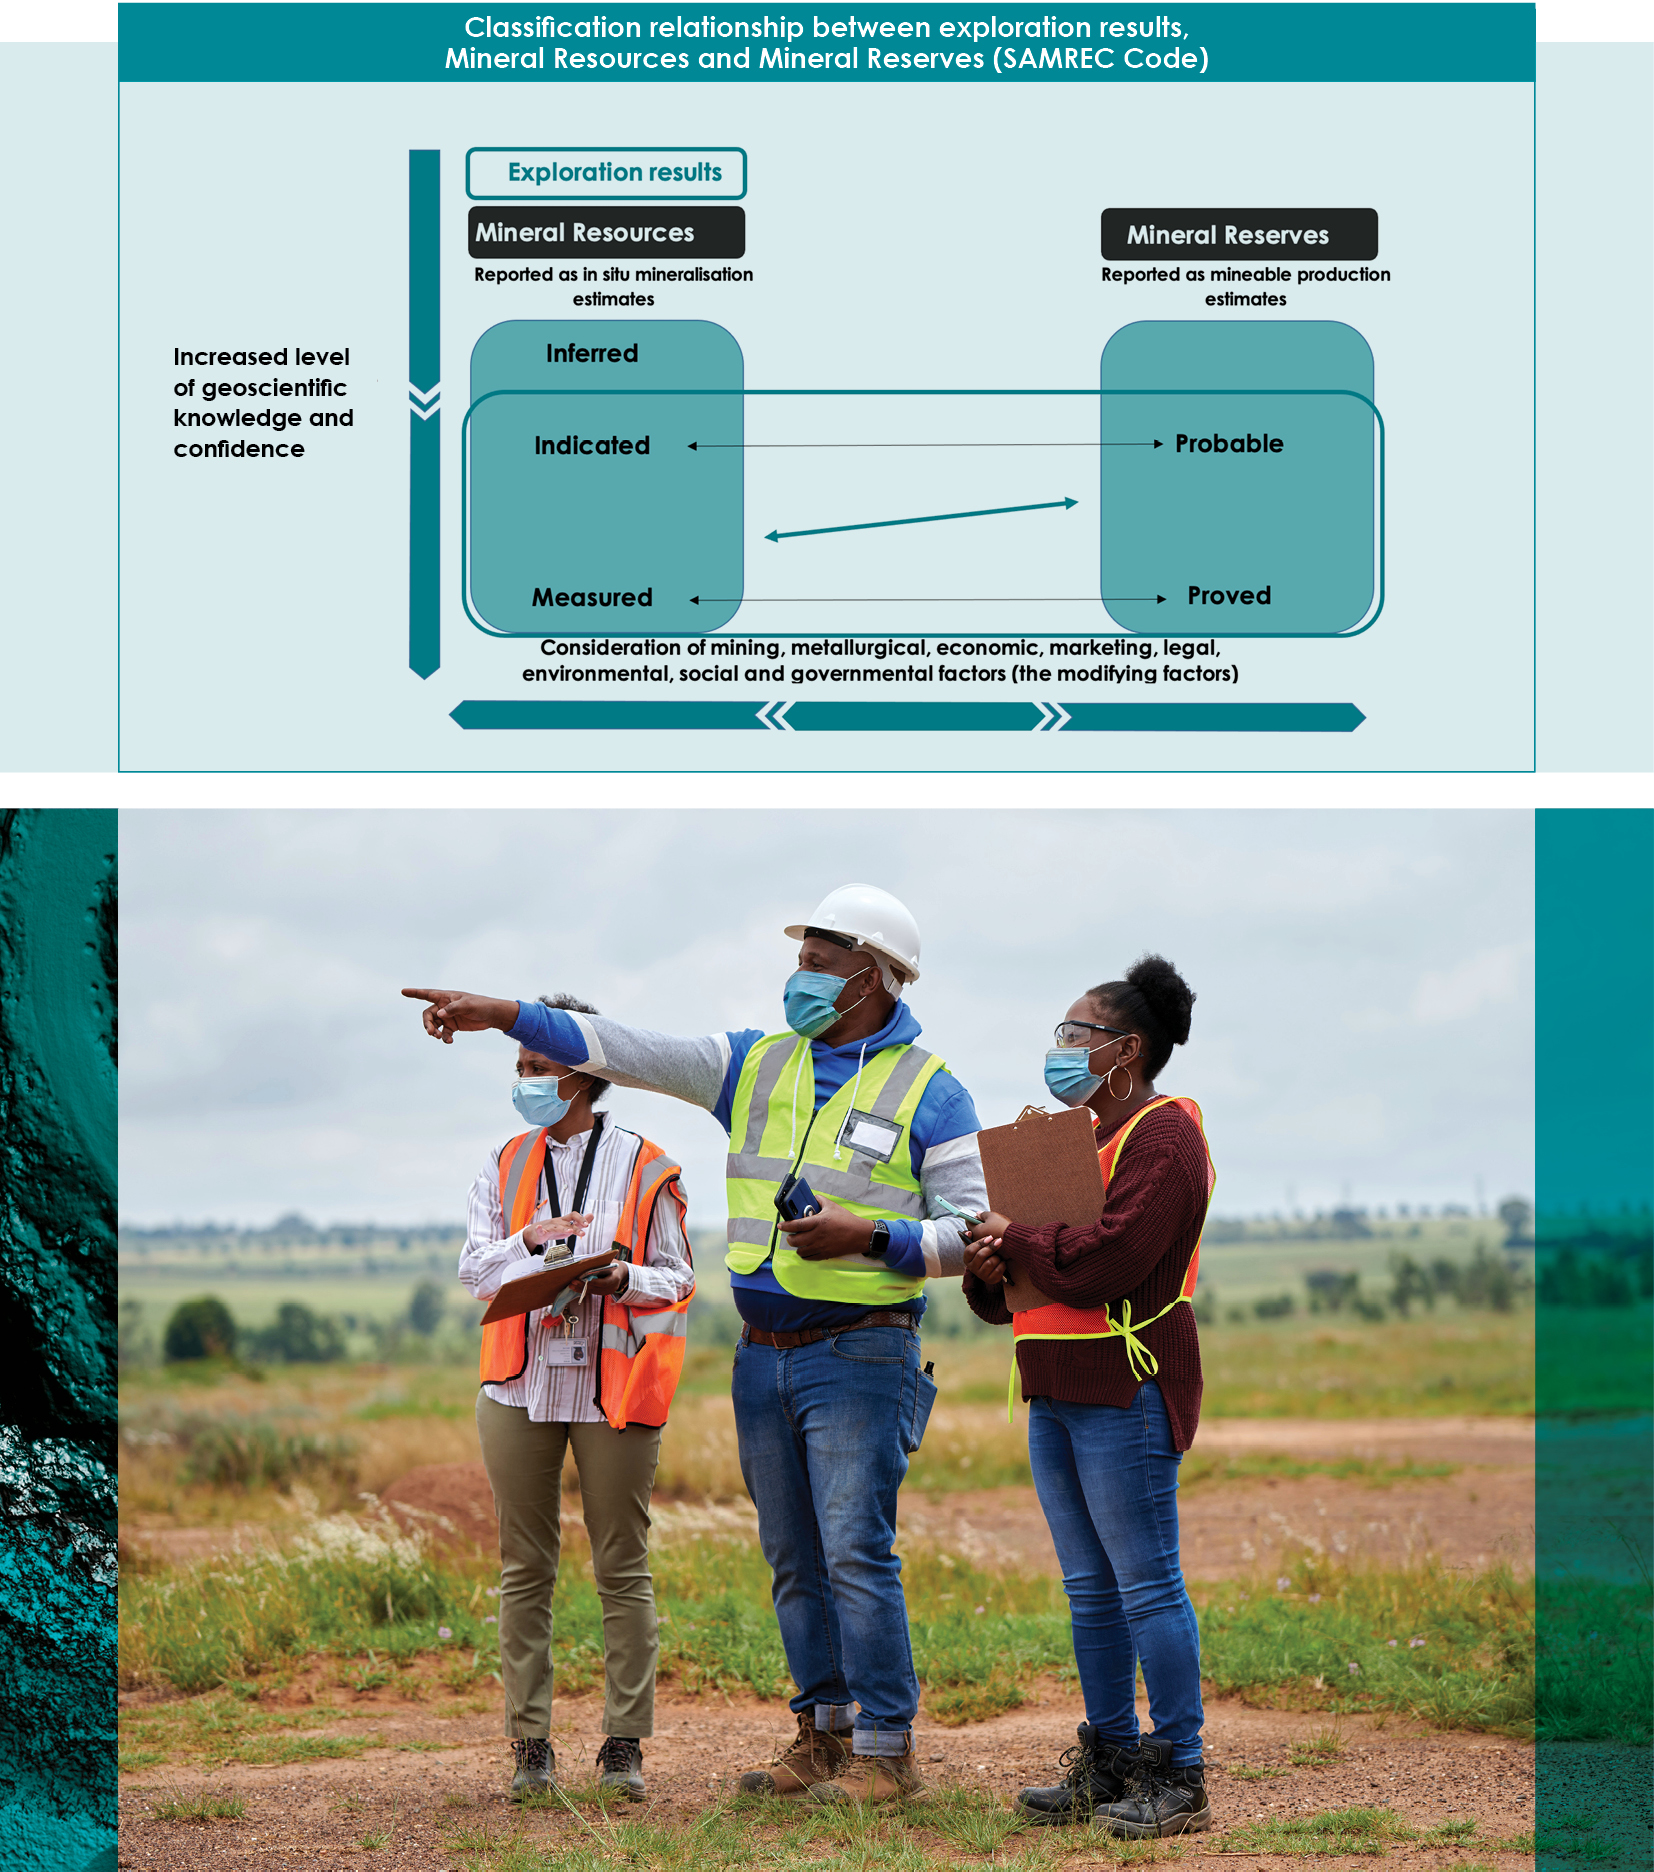
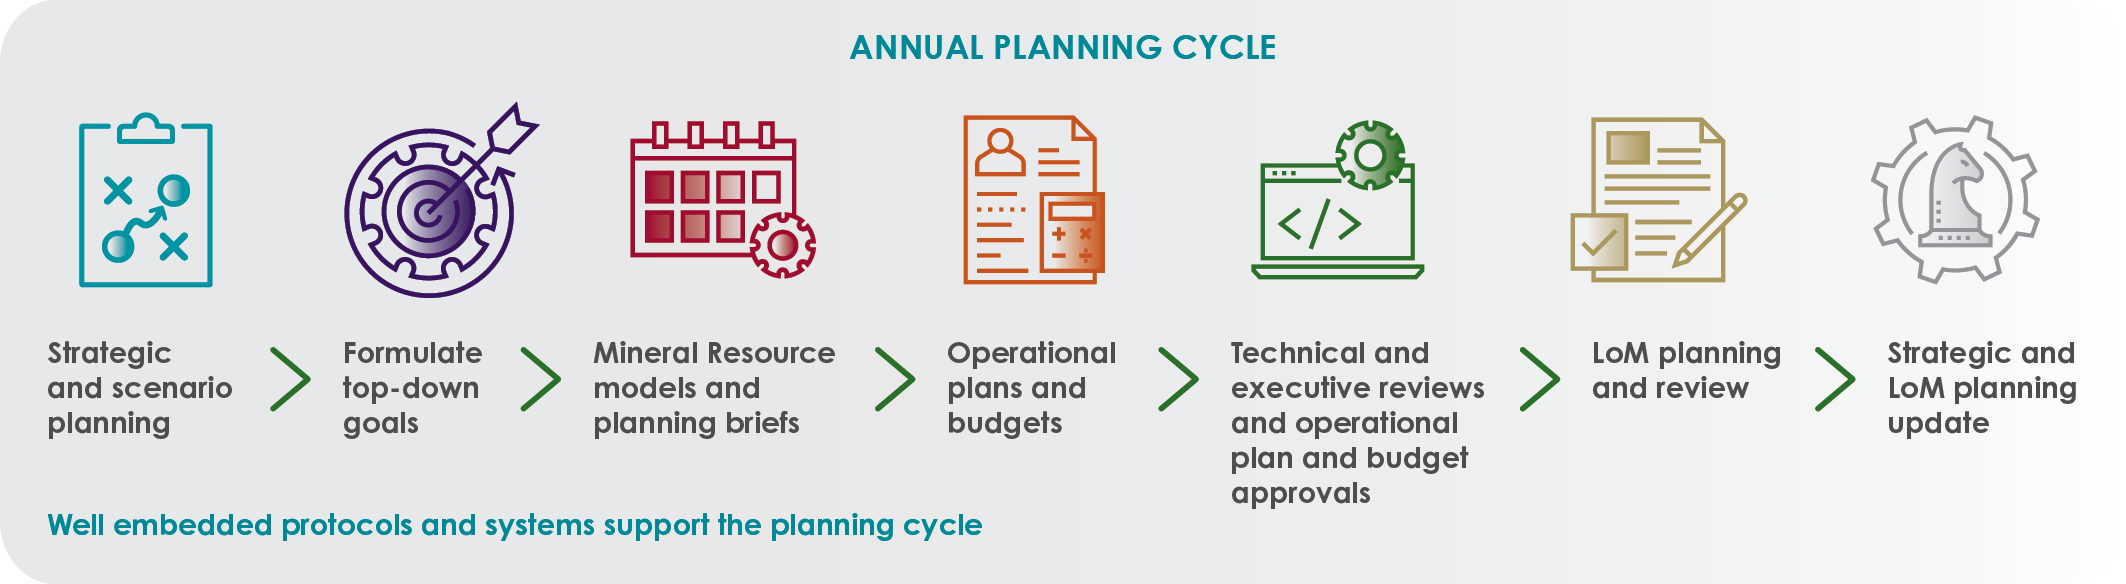
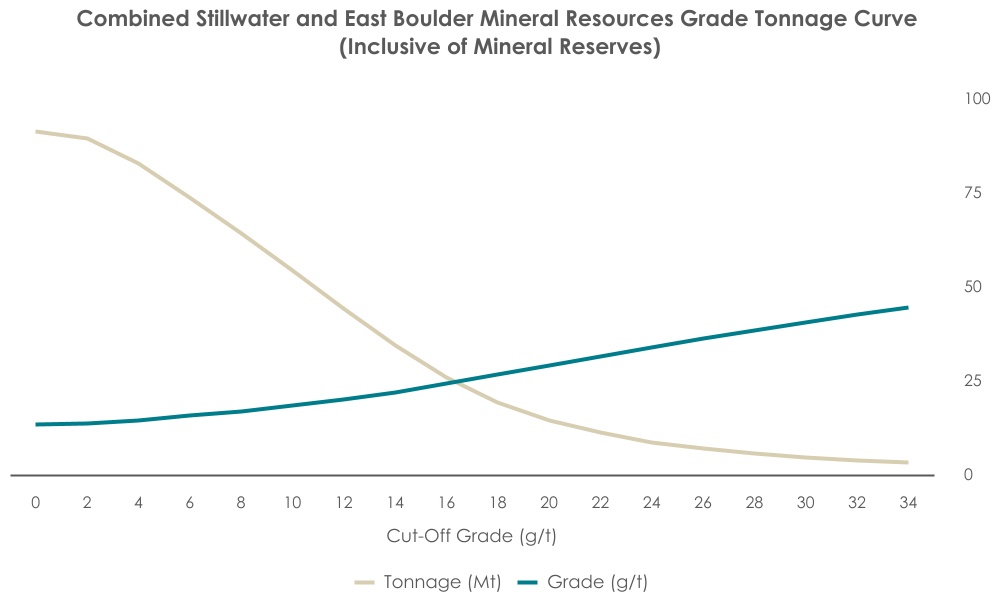
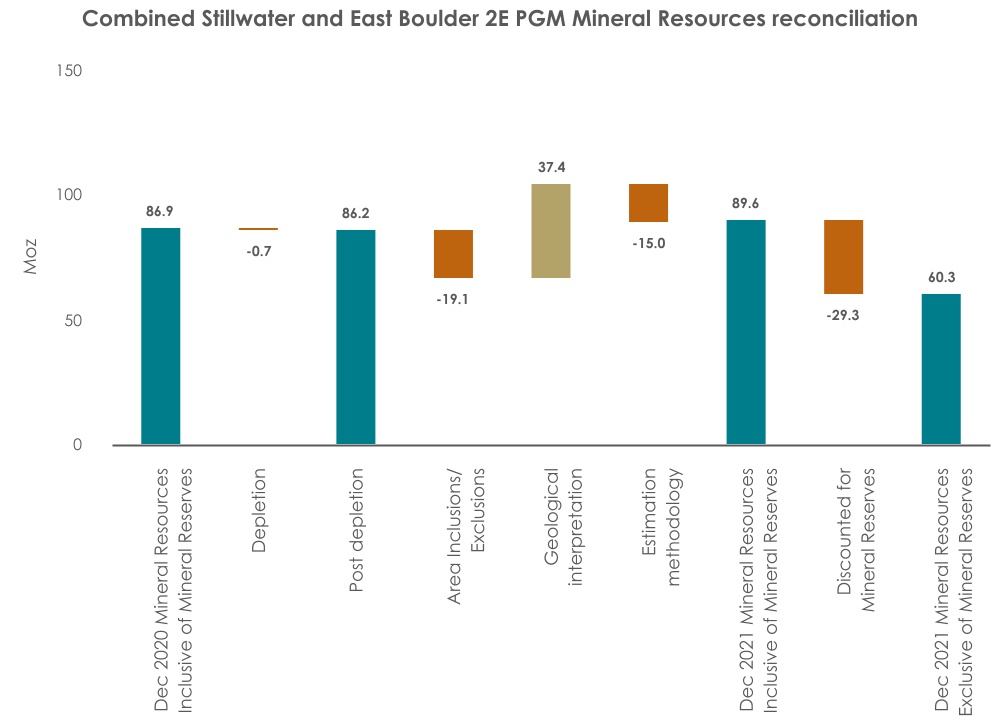
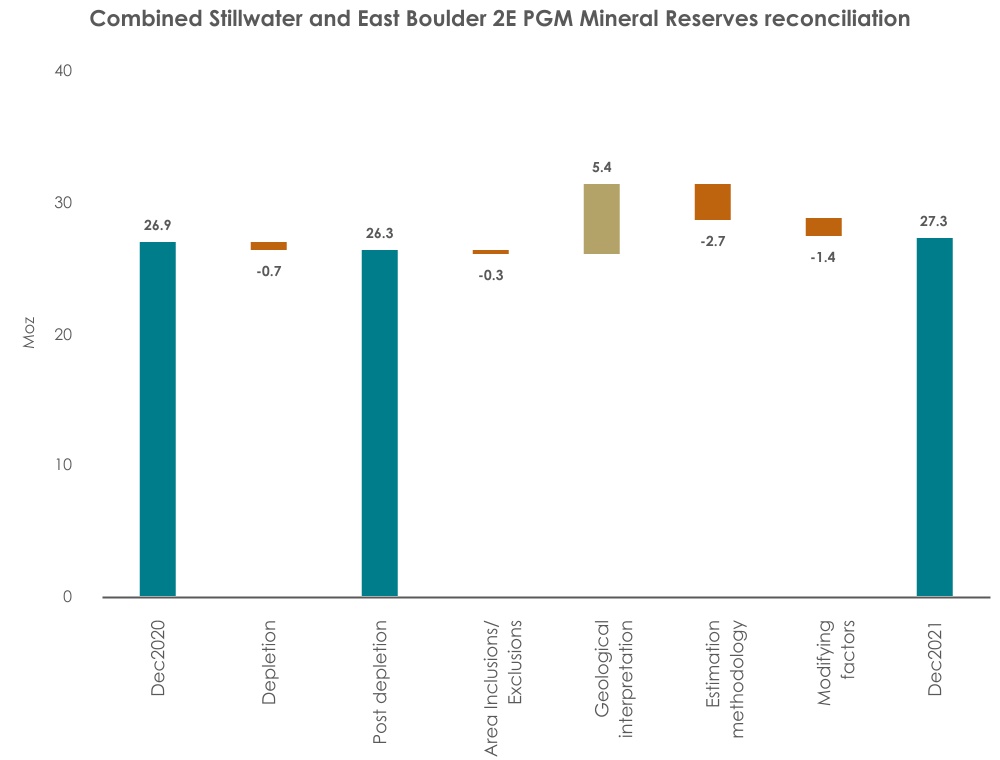
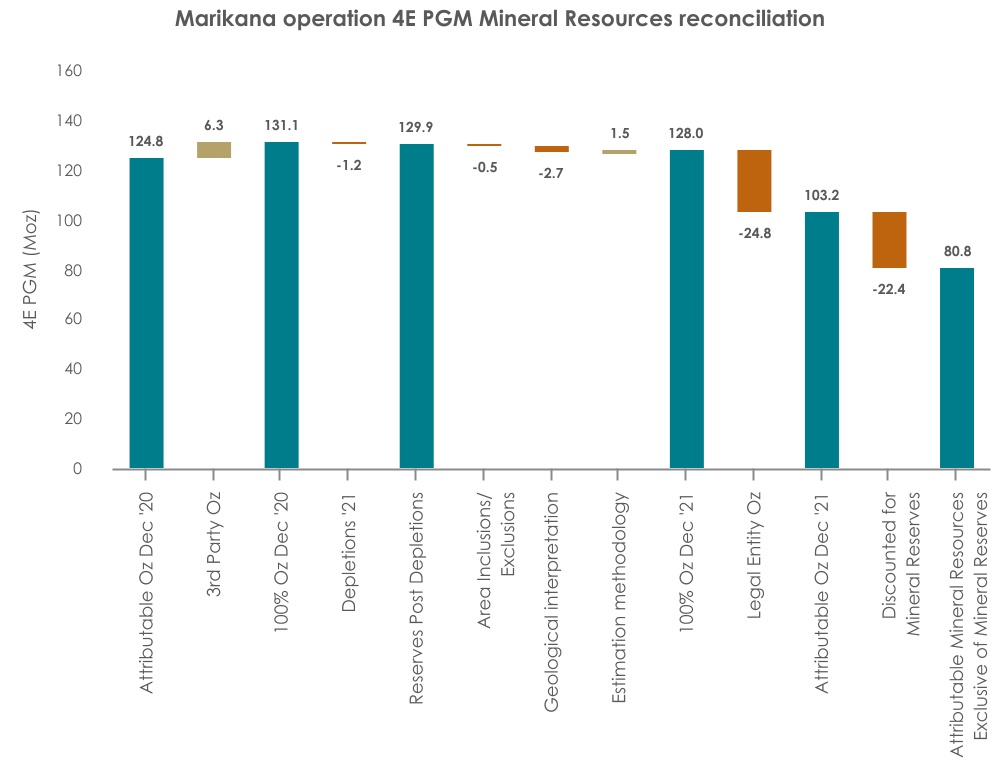
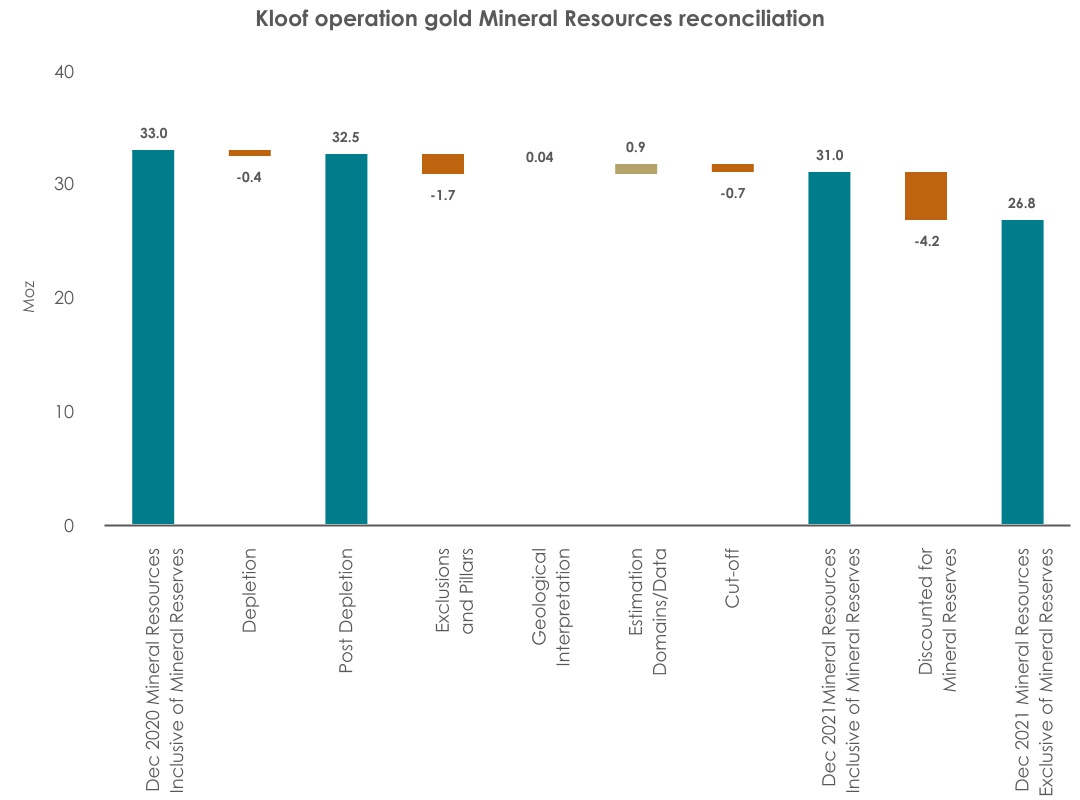
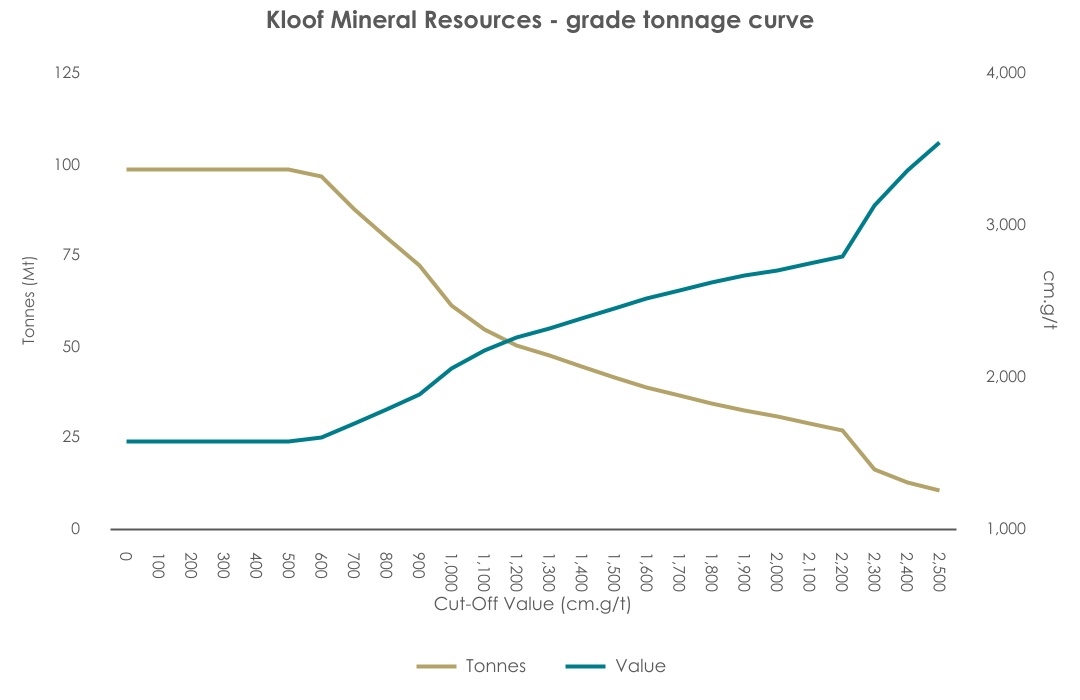
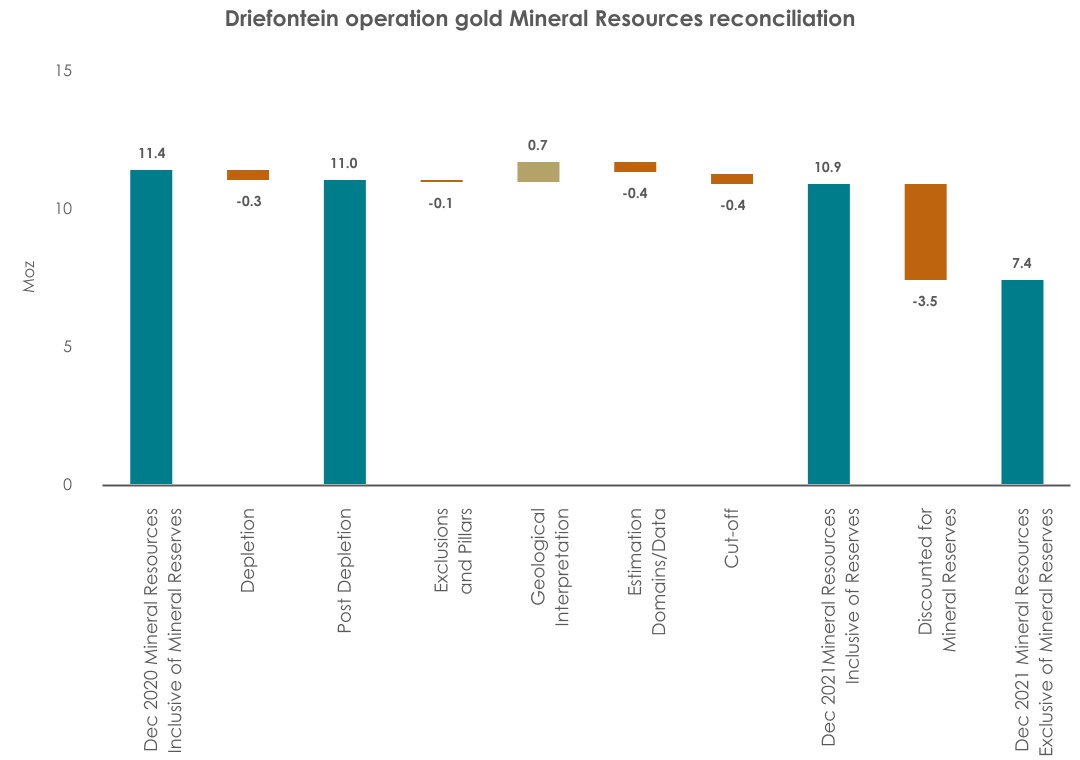
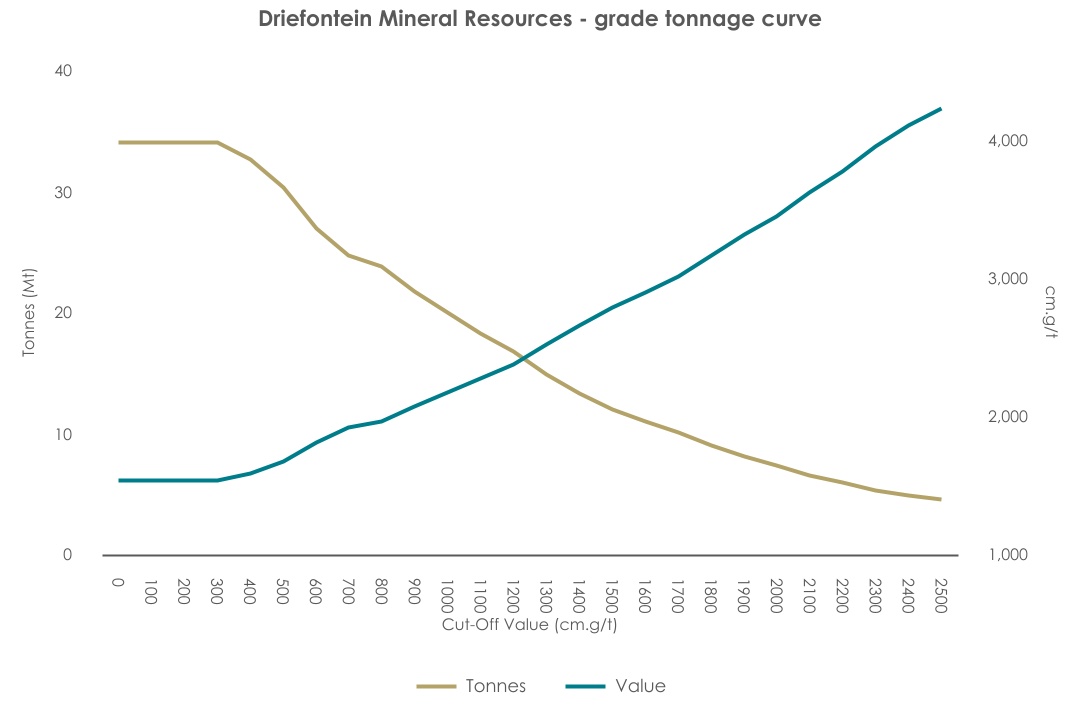
Mineral Resources and Mineral Reserves Estimations
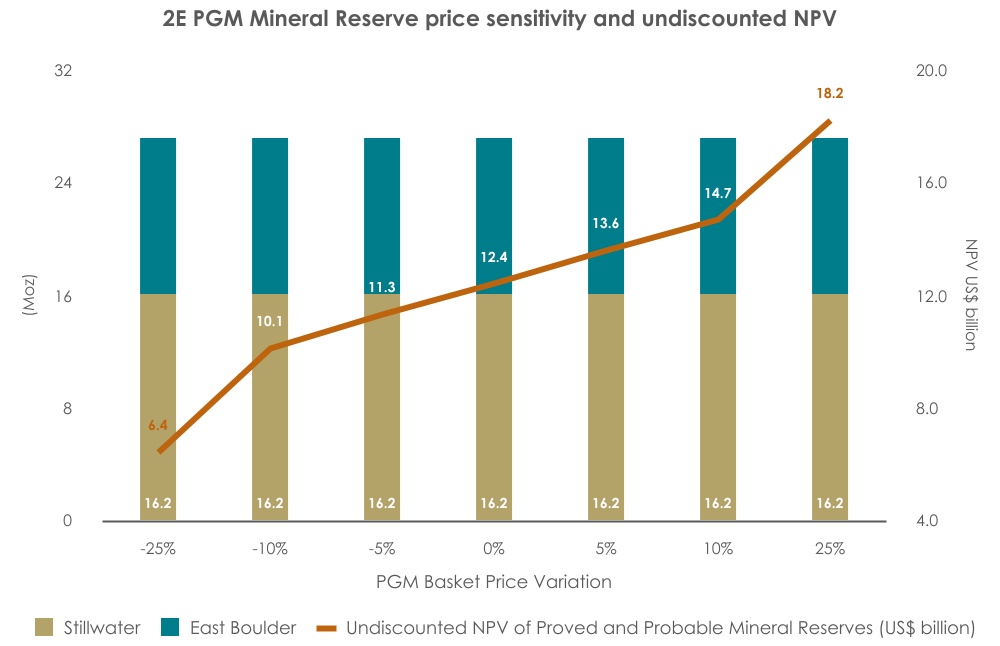
The financial and technical assumptions underlying the Mineral Resources and Mineral Reserves estimations contained in this report and in the Technical Report Summaries included as exhibits in this report are current as at 31 December 2021, the period covered by each of the respective reports. Such assumptions rely on various factors that may change after the reporting period, including as a result of operational reviews which Sibanye-Stillwater undertakes from time to time and when necessary. For example, in 2022, Sibanye-Stillwater initiated a comprehensive review of its US PGM Operations to reassess its existing budgets and Life of Mine (LoM) plans. Accordingly, the Mineral Reserves and Mineral Resources estimations contained in this report and in the Technical Report Summary included as exhibits in this report in respect of the Stillwater operations may be materially impacted by, among other things, the results of these assessments, including any changes to the underlying financial and technical assumptions in the future. In the event there is a material change to the Stillwater Technical Report Summary included as exhibits in this report, an updated Technical Report summary in respect of the Stillwater operations will be filed by Sibanye-Stillwater with the Securities and Exchange Commission pursuant to the requirements of subpart 1302 of Regulation S-K under the US Securities Act.
Websites
References in this document to information on websites (and/or social media sites) are included as an aid to their location and such information is not incorporated in, and does not form part of, this annual report.
Forward-looking statements
This annual report contains forward-looking statements within the meaning of Section 27A of the Securities Act and Section 21E of the US Securities Exchange Act of 1934 (the Exchange Act) with respect to our financial condition, results of operations, business strategies, operating efficiencies, competitive position, growth opportunities for existing services, plans and objectives of management, markets for stock and other matters.
These forward-looking statements, including, among others, those relating to our future business prospects, revenues and income, climate change-related targets and metrics, the potential benefits of past and future acquisitions (including statements regarding growth, cost savings, benefits from and access to international financing and financial re-ratings), PGM pricing expectations, levels of output, supply and demand, information relating to Sibanye-Stillwater’s new or ongoing development projects, including its underground Blitz PGM project designed to explore, define and extract the PGM resource along the far eastern extent of the J-M Reef (the Blitz Project), the K4 and Klipfontein projects at Sibanye-Stillwater’s SA PGM operations and capital development and equipping of the Burnstone gold project, any proposed, anticipated or planned expansions into the battery metals or adjacent sectors and estimations or expectations of enterprise value, adjusted EBITDA and net asset values wherever they may occur in this annual report and the exhibits to this annual report, are necessarily estimates reflecting the best judgment of our senior management and involve a number of risks and uncertainties that could cause actual results to differ materially from those suggested by the forward-looking statements. As a consequence, these forward-looking statements should be considered in light of various important factors, including those set forth in this annual report. All statements other than statements of historical facts included in this report may be forward-looking statements. Forward-looking statements also often use words such as “will”, “aim”, "anticipates”, “believes”, “goal”, “may”, “target”, “vision”, “forecast”, “potential”, “estimate”, “expect” and words of similar meaning. By their nature, forward-looking statements involve risk and uncertainty because they relate to future events and circumstances and should be considered in light of various important factors, including those set forth in this disclaimer. Readers are cautioned not to place undue reliance on such statements. Important factors that could cause actual results to differ materially from estimates or projections contained in the forward-looking statements include, without limitation:
•changes in the imposition of industry standards, regulatory costs and relevant government regulations, particularly environmental, tax, health and safety regulations and new legislation affecting water, mining, mineral rights and business ownership, including any interpretation thereof which may be subject to dispute
•economic, business, political and social conditions in South Africa, Zimbabwe, the United States and elsewhere
•increasing regulation of environmental and sustainability matters such as greenhouse gas emissions and climate change
•the effect of climate change on Sibanye-Stillwater’s business
•being subject to potential climate, environmental and other sustainability related litigation, including regulatory proceedings and investigations
•the ability of Sibanye-Stillwater to comply with requirements that it operates in ways that provide progressive benefits to affected communities
•the occurrence of temporary stoppages and precautionary suspension of operations at its mines for safety incidents and unplanned maintenance
•the occurrence of hazards associated with underground and surface mining
•the further downgrade of South Africa’s credit rating
•a challenge regarding the title to any of Sibanye-Stillwater’s properties by claimants to land under restitution and other legislation
•Sibanye-Stillwater’s ability to implement its strategy and any changes thereto
•plans and objectives of management for future operations
•the success of Sibanye-Stillwater’s business strategy, exploration and development activities
•Sibanye-Stillwater’s future financial position, plans, strategies, objectives, capital expenditures, projected costs and anticipated cost savings, financing plans, debt position and its ability to reduce debt leverage
•changes in the market price of gold, PGMs, battery metals (e.g, nickel, lithium, copper and zinc) and the cost of power, petroleum fuels, and oil, among other commodities, and supply requirements
•fluctuations in exchange rates, currency devaluations, inflation and other macro-economic monetary policies
•the ability of Sibanye-Stillwater to comply with loan and other covenants and restrictions and difficulties in obtaining additional financing or refinancing
•Sibanye-Stillwater’s ability to service its bond instruments (including high yield bonds and convertible bonds)
•the occurrence of labour disputes, disruptions and industrial actions
•changes in assumptions underlying Sibanye-Stillwater’s estimation of its current mineral reserves
•power disruption, constraints and cost increases
•Sibanye-Stillwater’s ability to hire and retain senior management or sufficient technically skilled employees, as well as its ability to achieve sufficient representation of historically disadvantaged South Africans (HDSAs) in its management positions
•the failure of a tailings storage facility
•the ability to achieve anticipated efficiencies and other cost savings in connection with, and the ability to successfully integrate, past, ongoing and future acquisitions, as well as at existing operations
•the ability of Sibanye-Stillwater to complete any ongoing or future acquisitions
Forward-looking statements
•supply chain shortages and increases in the price of production inputs
•the regional concentration of Sibanye-Stillwater’s operations
•social unrest, sickness or natural or man-made disasters at informal settlements in the vicinity of some of Sibanye-Stillwater’s South African-based operations
•the adequacy of Sibanye-Stillwater’s insurance coverage
•failure of Sibanye-Stillwater’s information technology and communications systems
•the outcome and consequence of any potential or pending litigation or regulatory proceedings or environmental, health or safety issues
•the concentration of all final refining activity and a large portion of Sibanye-Stillwater’s PGM sales from mine production in the United States with one entity
•the identification of a material weakness in disclosure and internal controls over financial reporting
•the effect of US tax reform legislation on Sibanye-Stillwater and its subsidiaries
•the effect of South African Exchange Control Regulations on Sibanye-Stillwater’s financial flexibility
•operating in new geographies and regulatory environments where Sibanye-Stillwater has no previous experience
•Sibanye-Stillwater’s ability to obtain the benefits of any streaming arrangements or pipeline financing
•the availability, terms and deployment of capital or credit
•the impact of HIV, tuberculosis (TB) and the spread of other contagious diseases, such as the ongoing coronavirus (COVID-19) pandemic
The foregoing factors and others described under “Risk Factors” should not be construed as exhaustive. There may be other factors that are unknown to us may cause our actual results to differ materially from the forward-looking statements. Moreover, new risk factors emerge from time to time and it is not possible for us to predict all such risk factors. We may not be able to assess the extent to which any factor, or combination of factors, may cause actual results to differ materially from those contained in any forward-looking statements. Given these risks and uncertainties, you should not place undue reliance on forward-looking statements as a prediction of actual results.
These forward-looking statements speak only as of the date they are made. We undertake no obligation and do not intend to update publicly or release any revisions to these forward-looking statements to reflect events or circumstances after the date of this annual report or to reflect the occurrence of unanticipated events, except as may be required by law.
Defined terms and conventions
In this annual report, all references to “we”, “us” and “our” refer to the Sibanye-Stillwater and the Sibanye-Stillwater Group, as applicable.
In this annual report, all references to “fiscal 2022” and “2022” are to the fiscal year ending 31 December 2022, all references to “fiscal 2021” and “2021” are to the fiscal year ending 31 December 2021, all references to “fiscal 2020” and “2020” are to the fiscal year ended 31 December 2020, and all references to “fiscal 2019” and “2019” are to the fiscal year ended 31 December 2019.
In this annual report, all references to “Argentina” are to the Republic of Argentina, all references to “Australia” are to the Commonwealth of Australia, all references to “Canada” are to the Dominion of Canada, all references to “Finland” are to the Republic of Finland, all references to “France” are to the French Republic, all references to “South Africa” are to the Republic of South Africa, all references to the “United Kingdom” and “UK” are to the United Kingdom of Great Britain and Northern Ireland, all references to the “United States” and “US” are to the United States of America, its territories and possessions and any state of the United States and the District of Columbia and all references to “Zimbabwe” are to the Republic of Zimbabwe.
In this annual report, all references to the “DMRE” are references to the South African Department of Mineral Resources and Energy, the government body responsible for regulating the mining industry in South Africa.
In this annual report, gold and PGM production figures are provided in kilograms, which are referred to as “kg”, or in troy ounces, which are referred as “ounces” or “oz”, or in kilo troy ounces, which are referred to as “kilo ounces” or “koz”. Ore grades are provided in grams per metric ton, which are referred to as “grams per ton” or “g/t”. All references to “tons”, “tonnes” or “t” in this annual report are to metric tons, and all references to “tpm” are to tons per month and “ktpm” are to thousand tons per month.
In this annual report, all references to “km” are to kilometres, “km2” are to square kilometres, “m” are to meters, and “cm” are to centimetres. All references to “ha” are to hectares.
In this annual report, all references to “W” are to watts, which is a unit of power used to quantify the rate of energy and is defined as 1 joule per second, and all references to “kW” are to kilowatts, which is a measure of one thousand watts of power.
In this annual report, “R”, “Rand” and “rand” refer to the South African Rand and “Rand cents” and “SA cents” refers to subunits of the South African Rand, “$”, “US$”, “US dollars” and “dollars” refer to United States dollars and “US cents” refers to subunits of the US dollar, “£”, “GBP” and “pounds sterling” refer to British pounds and “pence” refers to the subunits of the British pound, “CAD$” refers to Canadian dollars and “AUS$” refers to Australian dollars.
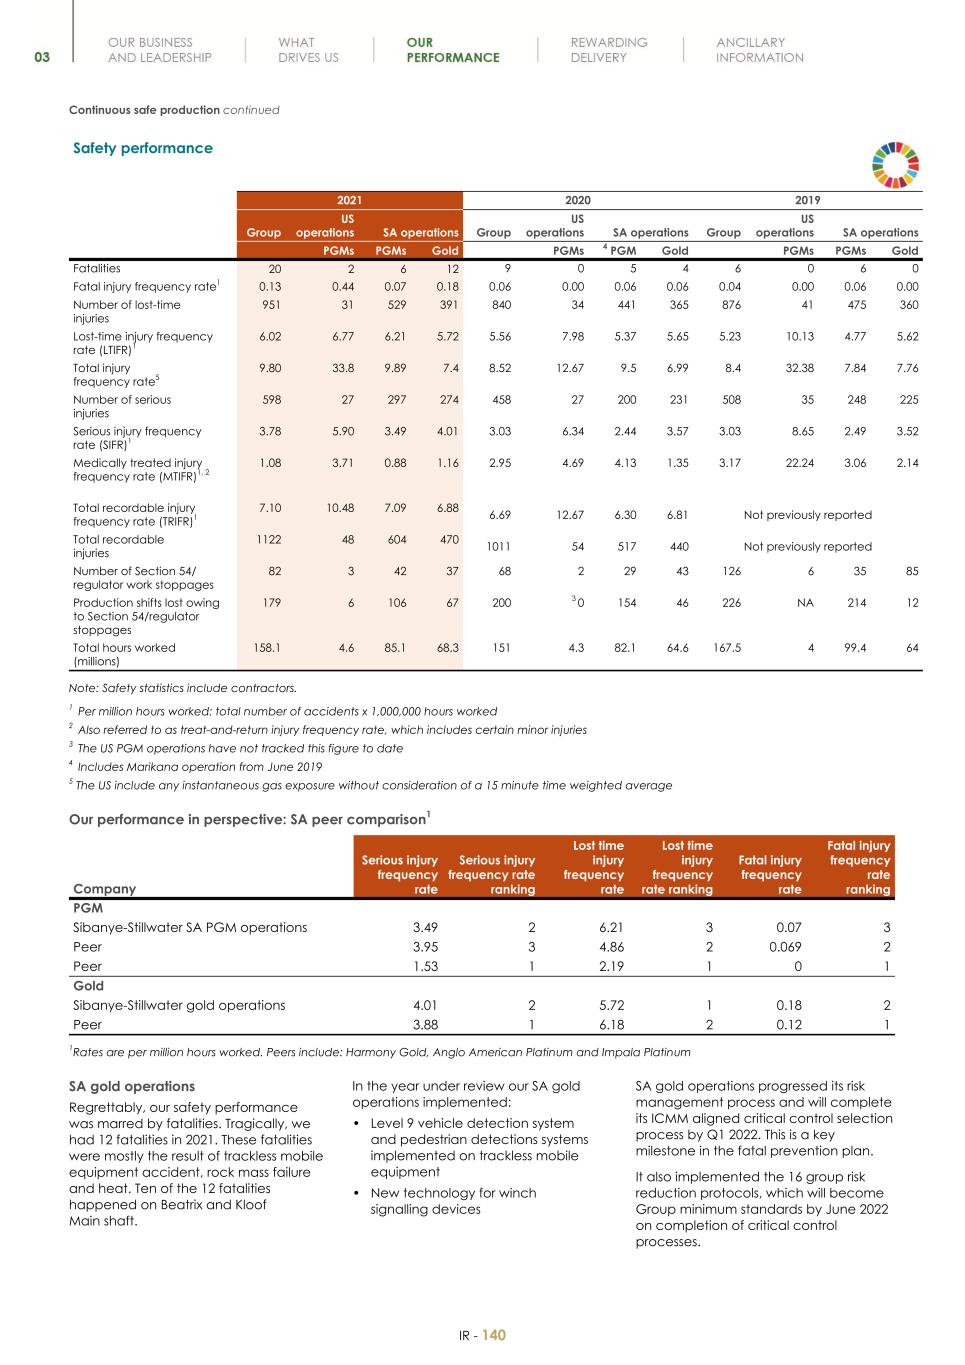
This annual report contains references to the “total recordable injury frequency rate” (TRIFR). TRIFR includes the total number of fatalities, lost time injuries, medically treated injuries and restricted work injuries per million man hours.
Contents
| | | | | |
| |
| Four-year financial performance | AFR – 2 |
| Management’s discussion and analysis of the financial statements | AFR – 6 |
| Statement of responsibility by the Board of Directors | AFR – 29 |
| Company secretary’s confirmation | AFR – 30 |
| Report of the Audit Committee | AFR – 31 |
| Directors’ report | AFR – 35 |
| Report of independent registered public accounting firm | AFR – 42 |
| Consolidated income statement | AFR – 45 |
| Consolidated statement of other comprehensive income | AFR – 45 |
| Consolidated statement of financial position | AFR – 46 |
| Consolidated statement of changes in equity | AFR – 47 |
| Consolidated statement of cash flows | AFR – 48 |
| Notes to the consolidated financial statements | AFR – 49 |
| Shareholder information | AFR – 150 |
| Administration and corporate information | AFR – 153 |
| |
| The audited consolidated financial statements for the year ended 31 December 2021 have been prepared by Sibanye-Stillwater’s group financial reporting team headed by Jacques le Roux. This process was supervised by the Group’s CFO, Charl Keyter and authorised for issue by Sibanye-Stillwater’s Board of Directors on 22 April 2022. |
Four-year financial performance
| | | | | | | | | | | | | | | | | |
| | 2021 | 2020 | 2019 | 2018 |
| Group operating statistics | | | | | |
US PGM operations1 | | | | | |
| Production | | | | | |
| Ore milled | ’000t | 1,469 | 1,487 | 1,411 | 1,339 |
| Platinum produced | ‘000oz | 129 | 135 | 133 | 134 |
| Palladium produced | ‘000oz | 441 | 468 | 460 | 459 |
| PGM produced | ‘000 2Eoz | 570 | 603 | 594 | 593 |
| PGM sold | ‘000 2Eoz | 548 | 594 | 578 | 594 |
| PGM recycled | ‘000 3Eoz | 755 | 840 | 853 | 687 |
| Price and costs | | | | | |
| Average basket price | R/2Eoz | 31,021 | 31,373 | 20,287 | 13,337 |
| US$/2Eoz | 2,097 | 1,906 | 1,403 | 1,007 |
Operating cost2 | R/t | 5,174 | 5,203 | 4,200 | 3,353 |
| US$/t | 350 | 316 | 290 | 253 |
| R/2Eoz | 13,324 | 12,829 | 9,978 | 7,576 |
| US$/2Eoz | 901 | 779 | 690 | 572 |
Adjusted EBITDA3 | Rm | 12,256 | 13,083 | 7,291 | 4,152 |
Adjusted EBITDA margin4 | % | 21 | | 29 | | 27 | 26 | |
All-in sustaining cost5 | R/2Eoz | 14,851 | 14,385 | 11,337 | 8,994 |
| US$/2Eoz | 1,004 | 874 | 784 | 677 |
All-in sustaining cost margin6 | % | 54 | 56 | 45 | 37 |
All-in cost5 | R/2Eoz | 19,078 | 18,339 | 14,763 | 11,651 |
| US$/2Eoz | 1,290 | 1,114 | 1,021 | 880 |
All-in cost margin6 | % | 41 | 44 | 29 | 18 |
| Capital expenditure | | | | | |
| Total capital expenditure | Rm | 4,556 | 4,419 | 3,393 | 2,833 |
SA PGM operations7 | | | | | |
| Production | | | | | |
| Ore milled | ’000t | 38,307 | 32,416 | 31,624 | 25,841 |
| Platinum produced | ‘000oz | 1,123 | 939 | 948 | 685 |
| Palladium produced | ‘000oz | 566 | 471 | 489 | 364 |
| PGM produced | ‘000 4Eoz | 1,836 | 1,526 | 1,608 | 1,176 |
| PGM sold including PoC | ‘000 4Eoz | 1,886 | 1,576 | 1,306 | 1,176 |
Price and costs8 | | | | | |
| Average basket price | R/4Eoz | 47,066 | 36,651 | 19,994 | 13,838 |
| US$/4Eoz | 3,182 | 2,227 | 1,383 | 1,045 |
Operating cost2 | R/t | 781 | 816 | 724 | 474 |
| US$/t | 53 | 50 | 50 | 36 |
| R/4Eoz | 16,780 | 18,019 | 14,699 | 11,019 |
| US$/4Eoz | 1,135 | 1,095 | 1,017 | 832 |
Adjusted EBITDA3 | Rm | 51,608 | 29,074 | 8,796 | 2,882 |
Adjusted EBITDA margin4 | % | 61 | | 53 | | 32 | 19 | |
All-in sustaining cost5 | R/4Eoz | 16,982 | 17,792 | 14,857 | 10,417 |
| US$/4Eoz | 1,148 | 1,081 | 1,027 | 787 |
All-in sustaining cost margin6 | % | 58 | 46 | 20 | 28 |
All-in cost5 | R/4Eoz | 17,108 | 17,830 | 14,875 | 10,472 |
| US$/4Eoz | 1,157 | 1,083 | 1,029 | 791 |
All-in cost margin6 | % | 58 | 46 | 20 | 27 |
| Capital expenditure | | | | | |
| Total capital expenditure | Rm | 3,799 | 2,197 | 2,248 | 1,000 |
| | | | | |
Four-year financial performance continued
| | | | | | | | | | | | | | | | | |
| | 2021 | 2020 | 2019 | 2018 |
| SA gold operations | | | | | |
| Production | | | | | |
| Ore milled | ’000t | 44,402 | 41,226 | 41,498 | 27,199 |
| Gold produced | kg | 33,372 | 30,561 | 29,009 | 36,600 |
| ’000oz | 1,073 | 983 | 933 | 1,177 |
| Gold sold | kg | 33,374 | 30,136 | 28,743 | 36,489 |
| ’000oz | 1,073 | 969 | 924 | 1,173 |
| | | | | |
| Price and costs | | | | | |
| Gold price | R/kg | 849,703 | 924,764 | 648,662 | 535,929 |
| US$/oz | 1,787 | 1,747 | 1,395 | 1,259 |
Operating cost2 | R/t | 503 | 470 | 446 | 648 |
| US$/t | 34 | 29 | 31 | 49 |
| R/kg | 669,723 | 634,596 | 637,681 | 490,209 |
| US$/oz | 1,408 | 1,199 | 1,372 | 1,151 |
Adjusted EBITDA3 | Rm | 5,113 | 7,771 | (970) | 1,362 |
Adjusted EBITDA margin4 | % | 18 | | 28 | | (5) | 7 | |
All-in sustaining cost5 | R/kg | 803,260 | 743,967 | 717,966 | 557,530 |
| US$/oz | 1,689 | 1,406 | 1,544 | 1,309 |
All-in sustaining cost margin6 | % | 5 | 20 | (11) | (4) |
All-in cost5 | R/kg | 821,358 | 756,351 | 735,842 | 583,409 |
| US$/oz | 1,727 | 1,429 | 1,583 | 1,370 |
All-in cost margin6 | % | 3 | 18 | (13) | (9) |
| Capital expenditure | | | | | |
| Total capital expenditure | Rm | 4,380 | 2,997 | 2,066 | 3,248 |
1 The US PGM operations’ underground production is converted to metric tonnes and kilograms, and performance is translated into SA rand. In addition to the US PGM operations’ underground production, the operation processes recycling material which is excluded from the 2E PGM production, average basket price, operating cost, total capital expenditure,, All-in sustaining cost and All-in cost statistics shown. PGM recycling represents palladium, platinum, and rhodium ounces fed to the furnace
2 Operating cost is the average cost of production, and operating cost per tonne is calculated by dividing the cost of sales, before amortisation and depreciation and change in inventory in a period by the tonnes milled in the same period, and operating cost per kilogram and ounce is calculated by dividing the cost of sales, before amortisation and depreciation and change in inventory in a period by the gold or platinum group metals (PGM) produced in the same period
3 The Group reports adjusted earnings before interest, taxes, depreciation and amortisation (EBITDA) based on the formula included in the facility agreements for compliance with the debt covenant formula. Adjusted EBITDA may not be comparable to similarly titled measures of other companies. Adjusted EBITDA is not a measure of performance under IFRS and should be considered in addition to, and not as a substitute for, other measures of financial performance and liquidity. For a reconciliation of profit/(loss) before royalties and tax to adjusted EBITDA, see –Consolidated financial statements–Notes to the consolidated financial statements– Note 28.10 Capital management
4 Adjusted EBITDA margin is calculated by dividing adjusted EBITDA by revenue
5 Sibanye-Stillwater presents the financial measures “All-in sustaining costs”, “All-in costs”, “All-in sustaining cost per kilogram”, “All-in sustaining cost per ounce”, “All- in cost per kilogram” and “All-in cost per ounce”, which were introduced during the year ended 31 December 2013 by the World Gold Council (the Council). Despite not being a member of the Council at the time, Sibanye-Stillwater adopted the principles prescribed by the Council. The Council is a non-profit association of the world’s leading gold mining companies established in 1987 to promote the use of gold from industry, consumers and investors and is not a regulatory organisation. The Council has worked with its member companies to develop a metric that expands on International Financial Reporting Standards (IFRS) measures such as cost of goods sold and currently accepted non-IFRS measures to provide relevant information to investors, governments, local communities and other stakeholders in understanding the economics of gold mining operations related to expenditures, operating performance and the ability to generate cash flow from operations. This is especially true with reference to capital expenditure associated with developing and maintaining gold mines, which has increased significantly in recent years and is reflected in this metric
All-in sustaining costs, All-in costs, All-in sustaining cost per kilogram, All-in sustaining cost per ounce, All-in cost per kilogram and All-in cost per ounce metrics are intended to provide additional information only, do not have any standardised meaning prescribed by IFRS and should not be considered in isolation or as alternatives to cost of sales, profit before tax, profit for the year, cash from operating activities or any other measure of financial performance presented in accordance with IFRS. All-in sustaining costs, All-in costs, All-in sustaining cost per kilogram, All-in sustaining cost per ounce, All-in cost per kilogram and All-in cost per ounce as presented in this document may not be comparable to other similarly titled measures of performance of other companies. Other companies may calculate these measures differently as a result of differences in the underlying accounting principles, policies applied and accounting frameworks such as in US GAAP. Differences may also arise related to definitional differences of sustaining versus development capital activities based upon each company’s internal policies
All-in costs excludes income tax, costs associated with merger and acquisition activities, working capital, impairments, financing costs, one-time severance charges and items needed to normalise earnings
All-in costs is made up of All-in sustaining costs, being the cost to sustain current operations, given as a sub-total in the All-in costs calculation, together with corporate and major capital expenditure associated with growth
For a reconciliation of cost of sales, before amortisation and depreciation to All-in costs, see –Overview–Management’s discussion and analysis of the financial statements–2021 financial performance compared with 2020–Cost of sales–All-in costs
6 All-in sustaining cost margin is defined as revenue minus All-in sustaining costs divided by revenue. All-in cost margin is defined as revenue minus All-in costs divided by revenue
7 SA PGM operations excludes the production and costs associated with the purchase of concentrate (PoC) from third parties from 1 January 2020 onwards. During 2021, the SA PGM operations produced 60,532 4Eoz (2020: 50,136 4Eoz) of PoC at a cost of R3,170 million (2020: R1,667 million)
8 The total SA PGM operations unit cost benchmarks (including capital expenditure) exclude the financial results of Mimosa, which is equity accounted, and excluded from revenue and cost of sales
Four-year financial performance continued
| | | | | | | | | | | | | | | | | |
| | 2021 | 2020 | 2019 | 2018 |
Group financial statistics1 | | | | | |
| Income statement | | | | | |
| Revenue | Rm | 172,194 | 127,392 | 72,925 | 50,656 |
| Cost of sales, before amortisation and depreciation | Rm | (101,013) | (75,776) | (56,100) | 41,515 |
| Amortisation and depreciation | Rm | (8,293) | (7,593) | (7,214) | (6,614) |
| Profit/(loss) for the year | Rm | 33,796 | 30,622 | 433 | (2,521) |
| Profit/(loss) for the year attributable to owners of Sibanye-Stillwater | Rm | 33,054 | 29,312 | 62 | (2,500) |
| Basic earnings per share | cents | 1,140 | 1,074 | 2 | (110) |
| Diluted earnings per share | cents | 1,129 | 1,055 | 2 | (110) |
| Headline earnings per share | cents | 1,272 | 1,068 | (40) | (1) |
| Dividend per share | cents | 5 | 4 | — | — |
| Weighted average number of shares | ’000 | 2,898,804 | 2,728,891 | 2,507,583 | 2,263,857 |
| Diluted weighted average number of shares | ’000 | 2,927,246 | 2,777,952 | 2,578,954 | 2,263,857 |
| Number of shares in issue at end of period | ’000 | 2,808,406 | 2,923,571 | 2,670,030 | 2,266,261 |
| Statement of financial position | | | | | |
| Property, plant and equipment | Rm | 62,494 | 60,600 | 57,480 | 54,558 |
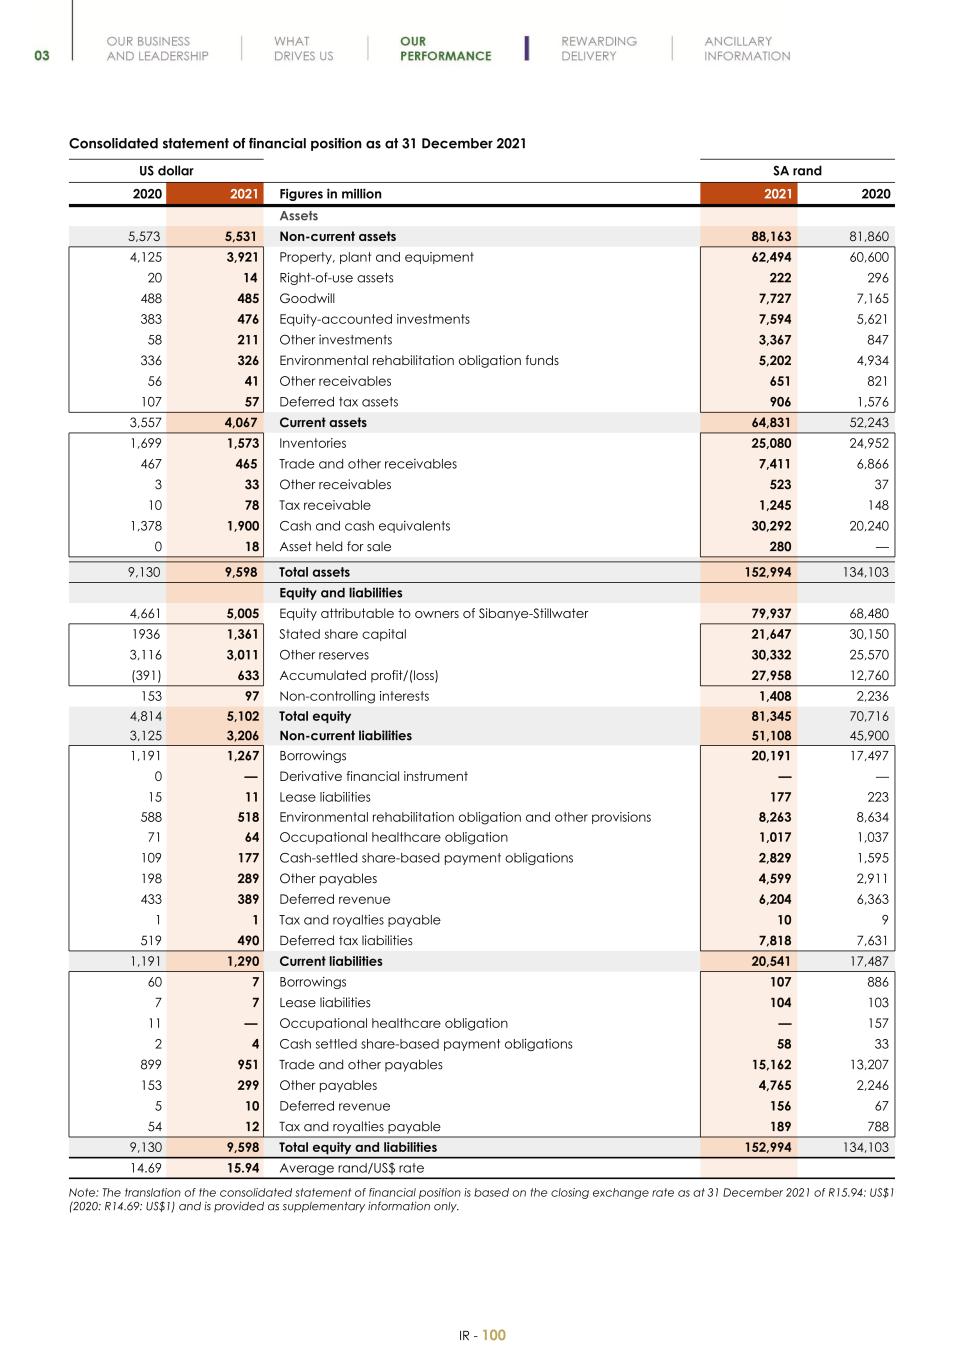
| Cash and cash equivalents | Rm | 30,292 | 20,240 | 5,619 | 2,549 |
| Total assets | Rm | 152,994 | 134,103 | 101,072 | 84,923 |
| Net assets | Rm | 81,345 | 70,716 | 31,138 | 24,724 |
| Stated share capital | Rm | 21,647 | 30,150 | 40,662 | 34,667 |
Borrowings2 | Rm | 20,298 | 18,383 | 23,736 | 24,505 |
| Total liabilities | Rm | 71,649 | 63,387 | 69,934 | 60,199 |
| Statement of cash flows | | | | | |
| Net cash from operating activities | Rm | 32,256 | 27,151 | 9,463 | 12,197 |
| Net cash used in investing activities | Rm | (14,568) | (9,938) | (4,864) | (7,744) |
| Net cash used in financing activities | Rm | (8,344) | (2,244) | (1,470) | (4,101) |
| Net increase in cash and cash equivalents | Rm | 9,344 | 14,969 | 3,129 | 352 |
| Other financial data | | | | | |
Adjusted EBITDA3 | Rm | 68,606 | 49,385 | 14,956 | 8,369 |
Net (cash)/debt4 | Rm | (11,466) | (3,087) | 20,964 | 21,269 |
Net (cash)/debt to adjusted EBITDA5 | ratio | (0.17) | (0.06) | 1.40 | 2.54 |
Net asset value per share6 | R | 28.96 | 24.19 | 11.66 | 10.91 |
Average exchange rate7 | R/US$ | 14.79 | 16.46 | 14.46 | 13.24 |
Closing exchange rate8 | R/US$ | 15.94 | 14.69 | 14.00 | 14.35 |
| Share data | | | | | |
| Ordinary share price – high | R | 74.67 | 60.40 | 35.89 | 17.16 |
| Ordinary share price – low | R | 45.58 | 16.53 | 16.76 | 6.82 |
| Ordinary share price at year end | R | 49.10 | 60.00 | 35.89 | 10.02 |
| Average daily volume of shares traded | ’000 | 14,175 | 19,488 | 21,383 | 10,567 |
| Market capitalisation at year end | Rbn | 138 | 175 | 96 | 23 |
1 The selected historical consolidated financial data set out above have been derived from Sibanye-Stillwater’s consolidated financial statements for those periods and as at those dates which have been prepared in accordance with IFRS taking into account any changes in accounting principles. Headline earnings per share is calculated in terms of the guidance issued by the South African Institute of Chartered Accountants (SAICA), see –Consolidated financial statements–Notes to the consolidated financial statements–Note 12.3 Headline earnings per share
2 This represents total borrowings as per the consolidated financial statements, see–Consolidated financial statements–Notes to the consolidated financial statements–Note 28 Borrowings and derivative financial instrument
3 The adjusted EBITDA is based on the formula included in the facility agreements for compliance with the debt covenant formula. Adjusted EBITDA may not be comparable to similarly titled measures of other companies. Adjusted EBITDA is not a measure of performance under IFRS and should be considered in addition to, and not as a substitute for, other measures of financial performance and liquidity. For a reconciliation of profit/(loss) before royalties and tax to adjusted EBITDA, see – Consolidated financial statements–Notes to the consolidated financial statements–Note 28.10 Capital management
4 Net (cash)/debt represents borrowings and bank overdraft less cash and cash equivalents. Borrowings are only those borrowings that have recourse to Sibanye- Stillwater, and, therefore, exclude the Burnstone Debt and include the derivative financial instrument up to the settlement of the US$ Convertible Bond. Net debt excludes cash of Burnstone. Where cash and cash equivalents exceed borrowings and bank overdraft this represents a net cash position and the negative amount is shown in brackets
5 Net (cash)/debt to adjusted EBITDA (ratio) is defined as net (cash)/debt as at the end of a reporting period divided by adjusted EBITDA of the last 12 months ending on the same reporting date. Where a net cash position arises the Net (cash)/debt to adjusted EBITDA (ratio) is negative and the amount is shown in brackets
6 Net asset value per share (ratio) is defined as total assets as at the end of a reporting period minus total liabilities as at the end of a reporting period divided by the total number of shares in issue on the same reporting date
7 The average exchange rate during the relevant period as reported by IRESS. The average exchange rate for the period through 14 April 2022 was R15.13/US$. The following table sets forth the high and low exchange rates for each month during the previous six months
Four-year financial performance continued
| | | | | | | | |
| Month ended | High | Low |
| 31 October 2021 | R | 15.33 | R | 14.35 |
| 30 November 2021 | R | 16.37 | R | 14.86 |
| 31 December 2021 | R | 16.28 | R | 15.49 |
| 31 January 2022 | R | 16.11 | R | 15.07 |
| 28 February 2022 | R | 15.60 | R | 14.91 |
| 31 March 2022 | R | 15.63 | R | 14.40 |
| Through 14 April 2022 | R | 16.11 | R | 14.40 |
8 The closing exchange rate at period end. The closing exchange rate on 14 April 2022, as reported by IRESS, was R14.67/US$. Fluctuations in the exchange rate between the rand and the US dollar will affect the US dollar equivalent of the price of the ordinary shares on the JSE, which may affect the market price of the American Depositary Receipts (ADRs) on the NYSE. These fluctuations will also affect the US dollar amounts received by owners of ADRs on the conversion of any dividends paid in rand on the ordinary shares
Management’s discussion and analysis of the financial statements
The following discussion and analysis should be read together with Sibanye Stillwater Limited's Group (the "Group" or "Sibanye-Stillwater") consolidated financial statements including the notes, which appear elsewhere in this annual financial report. Certain information contained in the discussion and analysis set forth below includes forward-looking statements that involve risks and uncertainties. For a discussion of important factors that could cause actual results to differ materially from the results described in or implied by the forward-looking statements contained in this annual financial report, See –Forward-looking statements. The comparison of the Group’s 2020 financial performance to the Group’s 2019 financial performance can be found on pages 294 to 316 of Sibanye Stillwater Limited’s Annual Report on Form 20-F for the year ended 31 December 2020 that was filed with United States Securities and Exchange Commission on 22 April 2021.
Introduction
Sibanye-Stillwater is a multinational mining and metals processing Group with a diverse portfolio of mining and processing operations, projects and investments across five continents. The Group is one of the foremost global producers of platinum group metals (PGMs) recycled from spent automotive catalytic converters and also has interests in leading mine tailings retreatment operations.
Domiciled and with its head office in South Africa, Sibanye-Stillwater has established itself as one of the world’s largest primary producers of platinum, palladium, and rhodium and is also a top tier gold producer. It produces other PGMs, such as iridium and ruthenium, along with chrome, copper and nickel as by- products. The Group has recently begun to build and diversify its asset portfolio into battery metals mining and processing and is increasing its presence in the sustainable circular economy by growing and diversifying its recycling and tailings reprocessing operations globally.
Our Operations
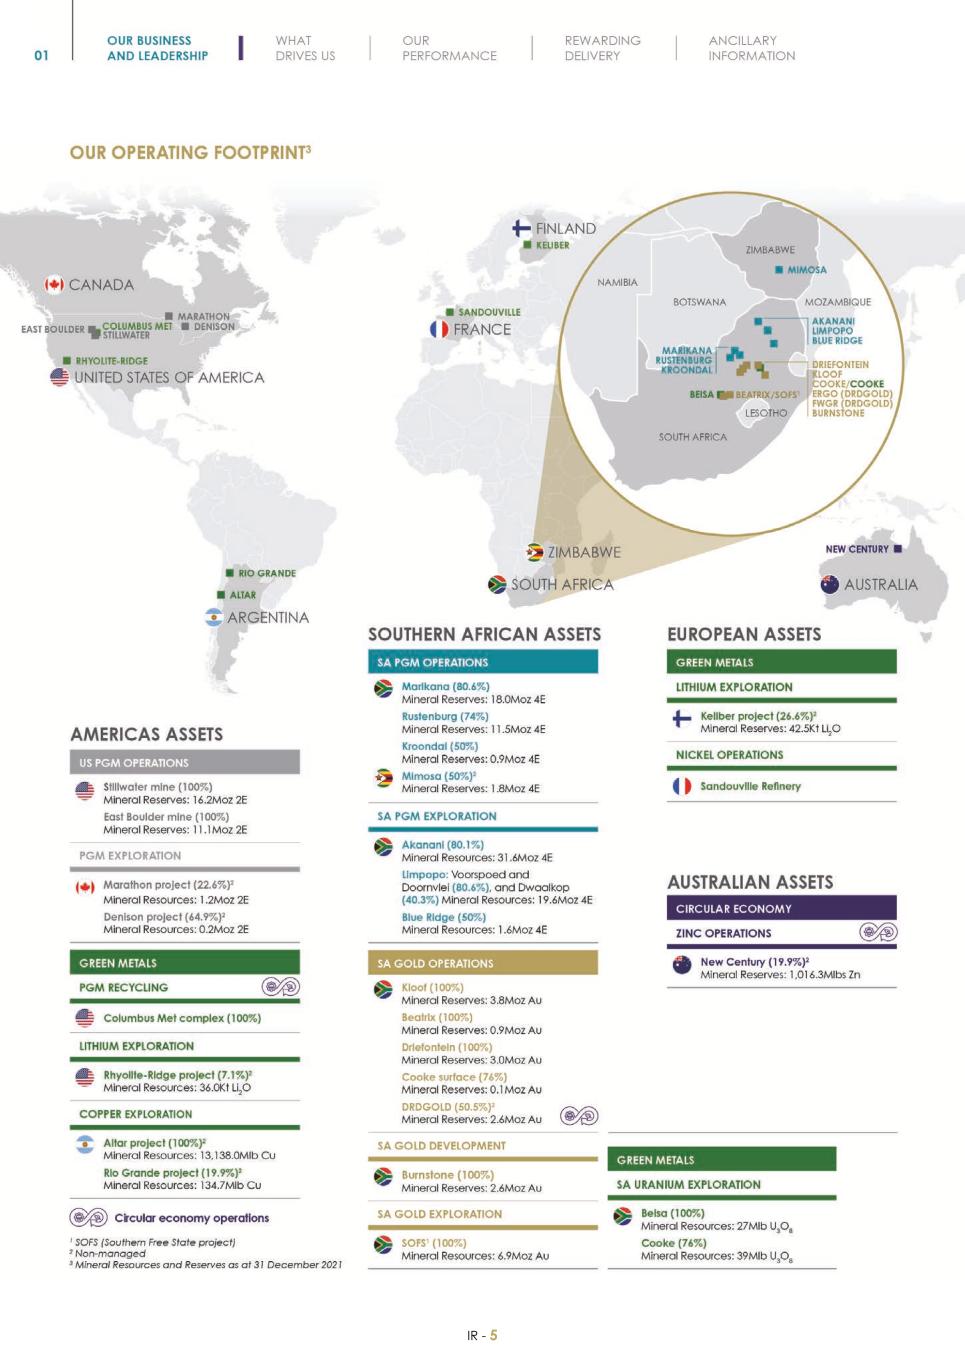
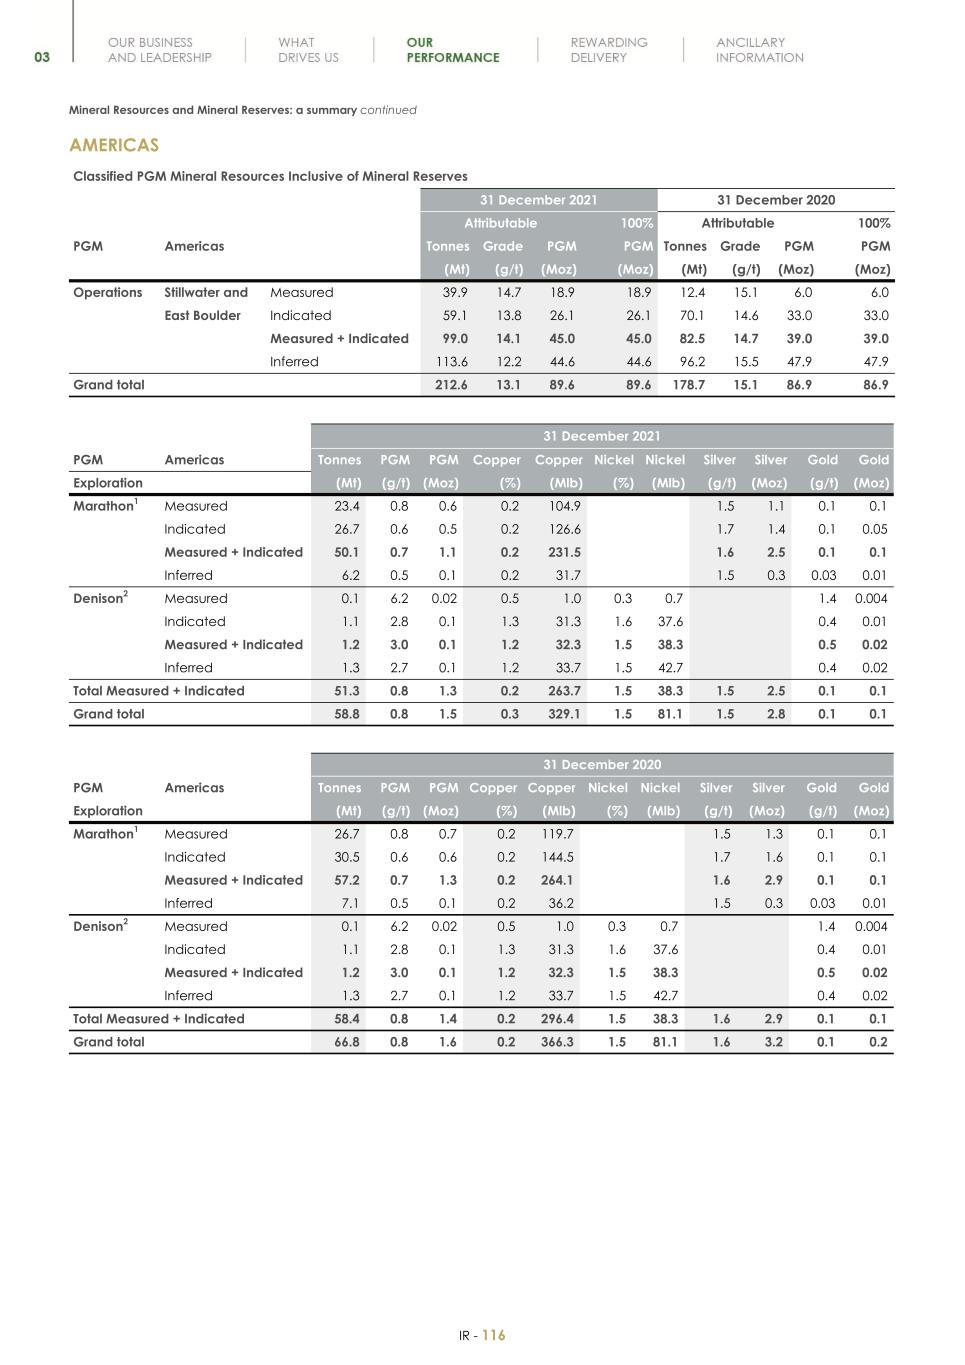
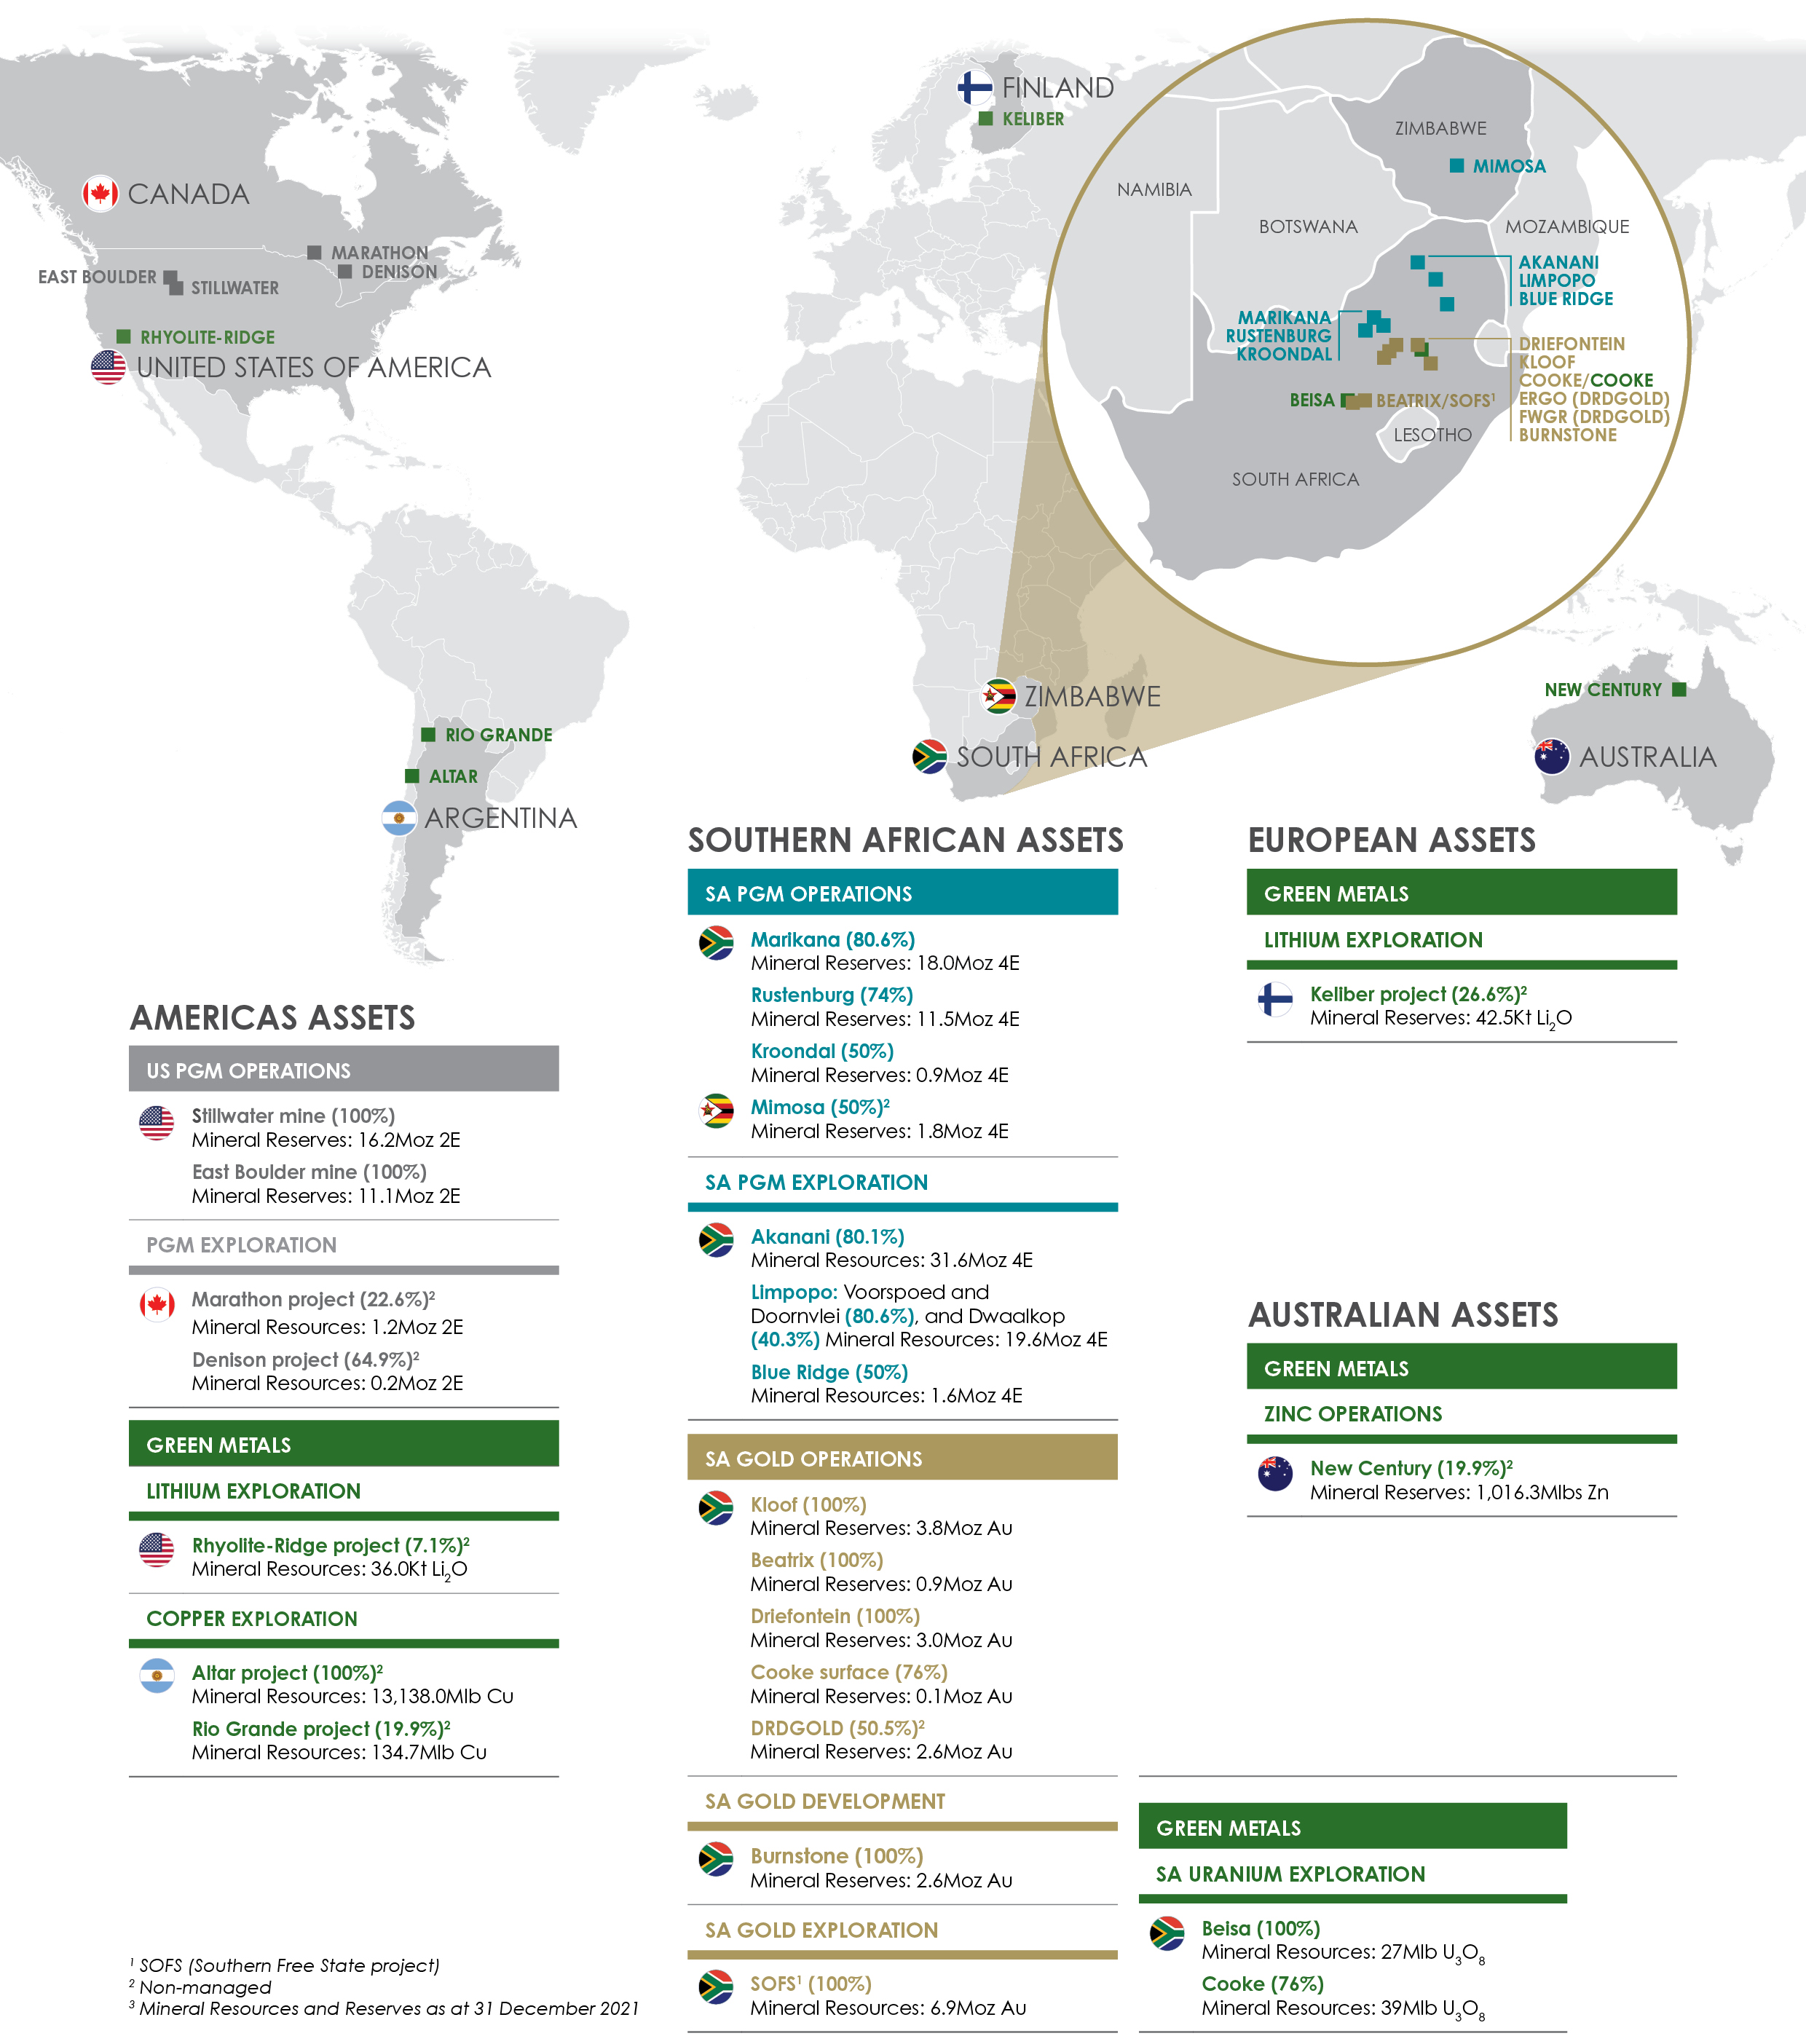
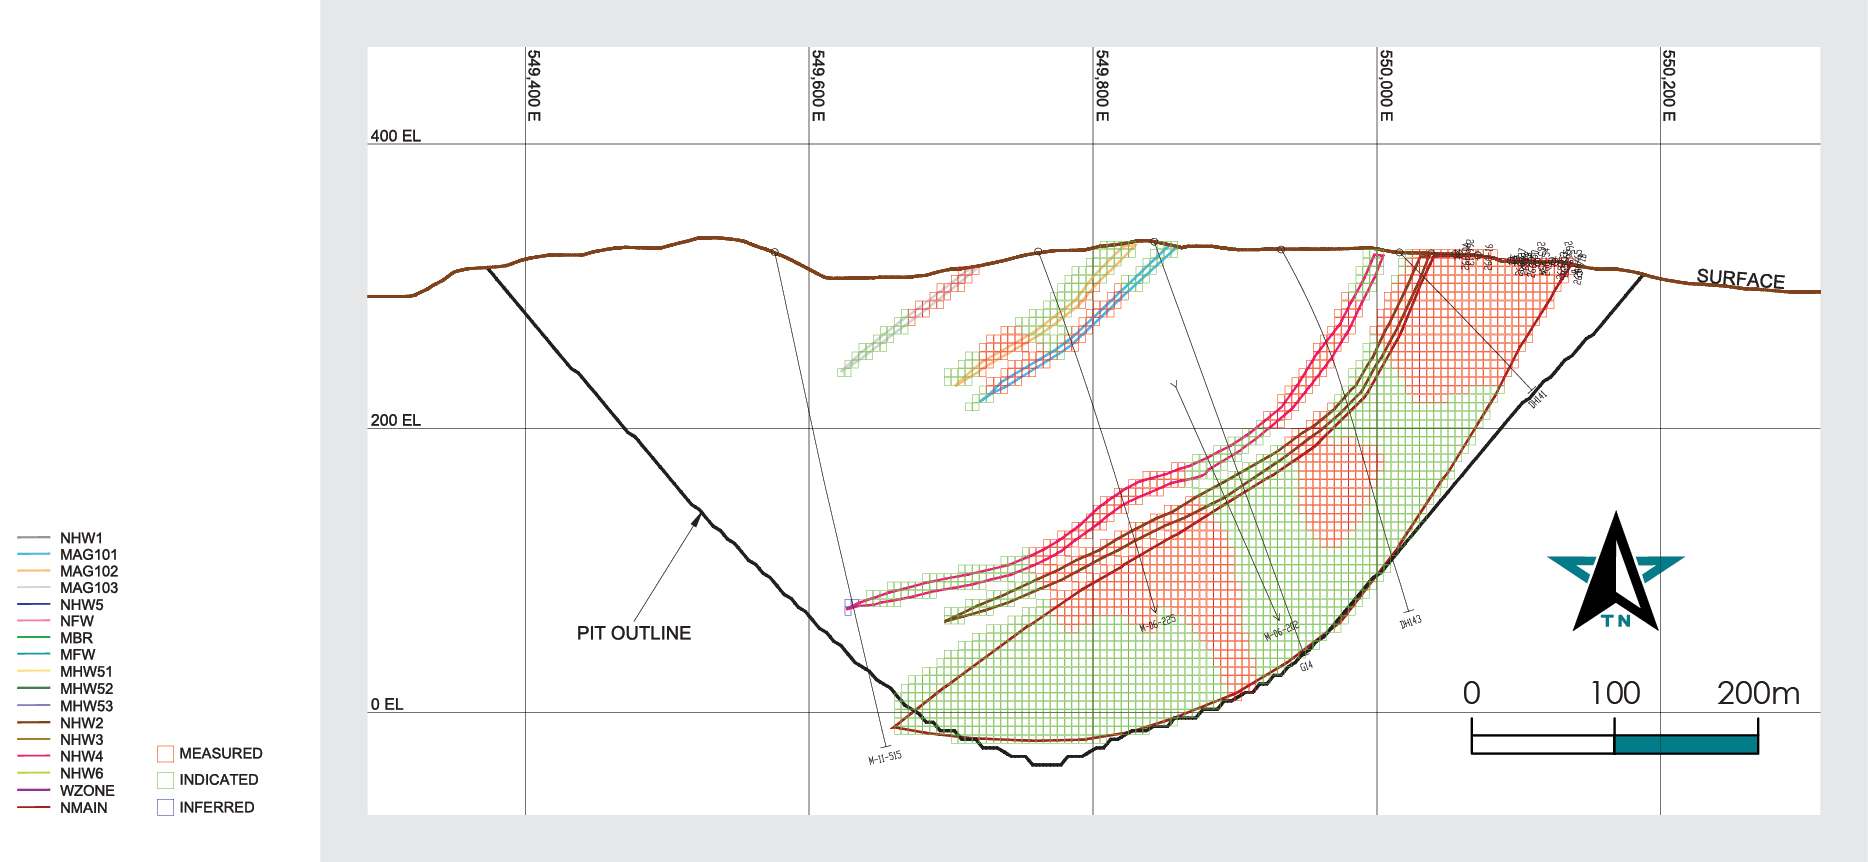
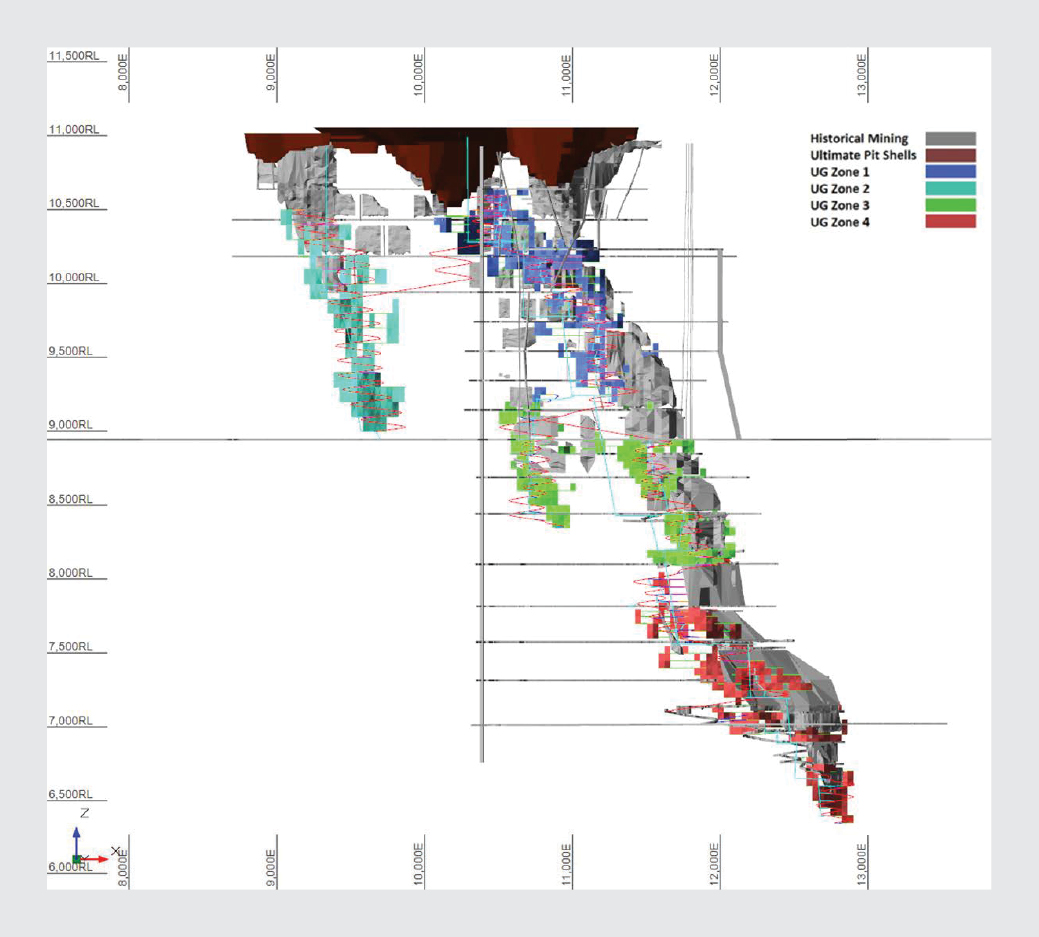
Americas
PGMs:
Sibanye-Stillwater wholly owns and operates PGM mining and ore beneficiation operations and mining claims (together known as the Stillwater operations) that are located in Montana, United States of America (US). These operations include the Stillwater operation, the East Boulder operation, two concentrator plants, and the surrounding PGM mining claims located near the town of Nye. These operations primarily produce palladium and platinum. In addition, the Group owns and operates the Columbus Metallurgical Complex situated in the town of Columbus, Montana, which smelts the mined material to produce PGM-rich filter cake and also serves as the base for its PGM recycling business, that recovers PGMs from recycled catalytic converters on a purchase and toll treatment basis.
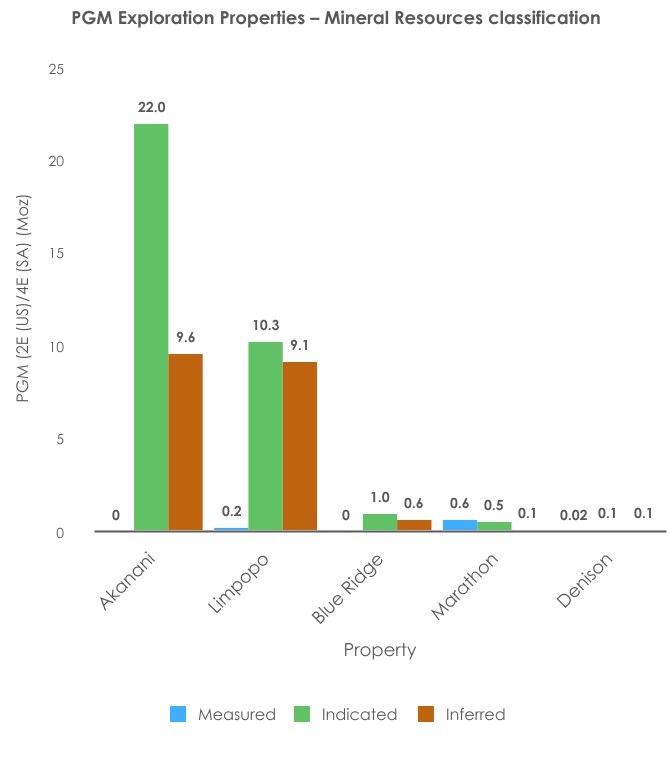
PGM Projects:
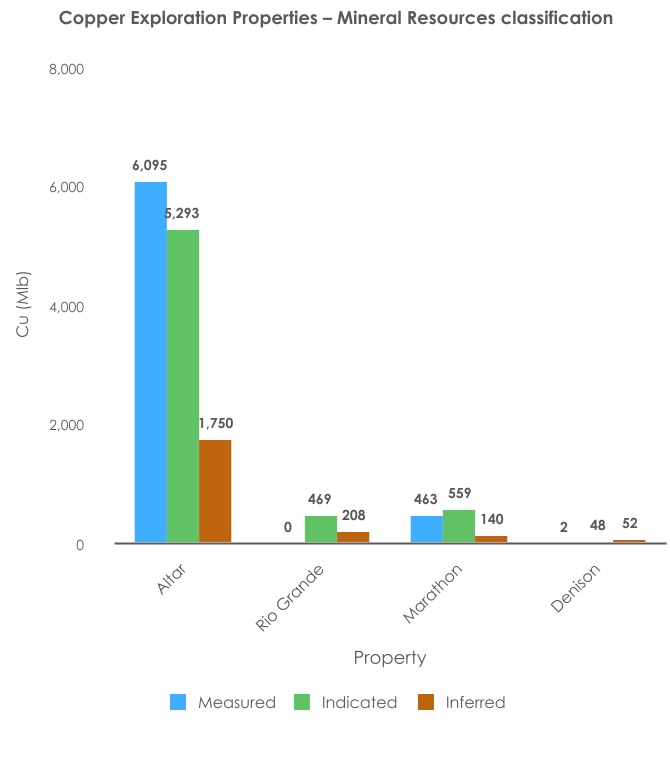
Sibanye-Stillwater also has non-managed interests in two PGM exploration projects in Canada, namely Marathon and Denison.
Green Metals Projects:
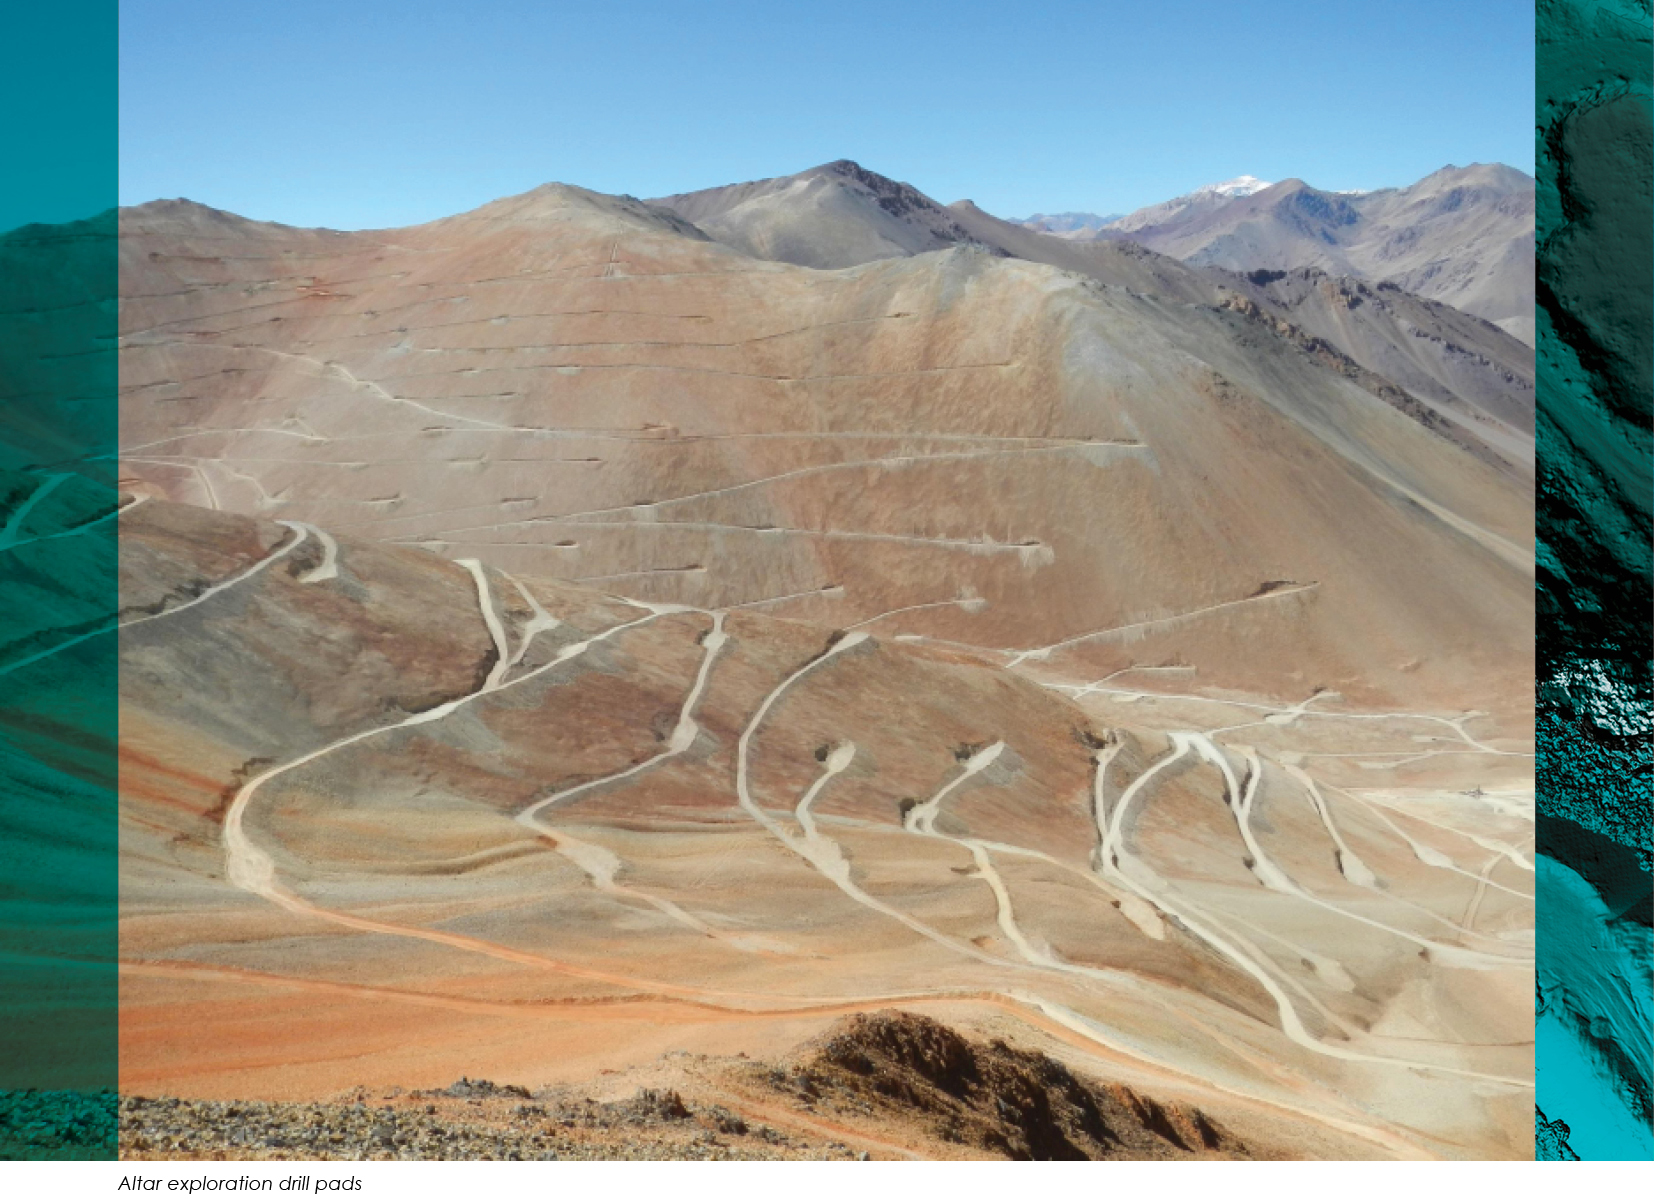
During the 2021 year, the Company acquired a 7.12% interest in ioneer Limited (ioneer), the owner and operator of the Rhyolite Ridge Lithium project in Nevada, with an option to enter into a 50:50 JV on the project. Sibanye-Stillwater also has non-managed interests in two Copper-Gold porphyry exploration projects in Argentina, namely Altar and Rio Grande.
Southern Africa
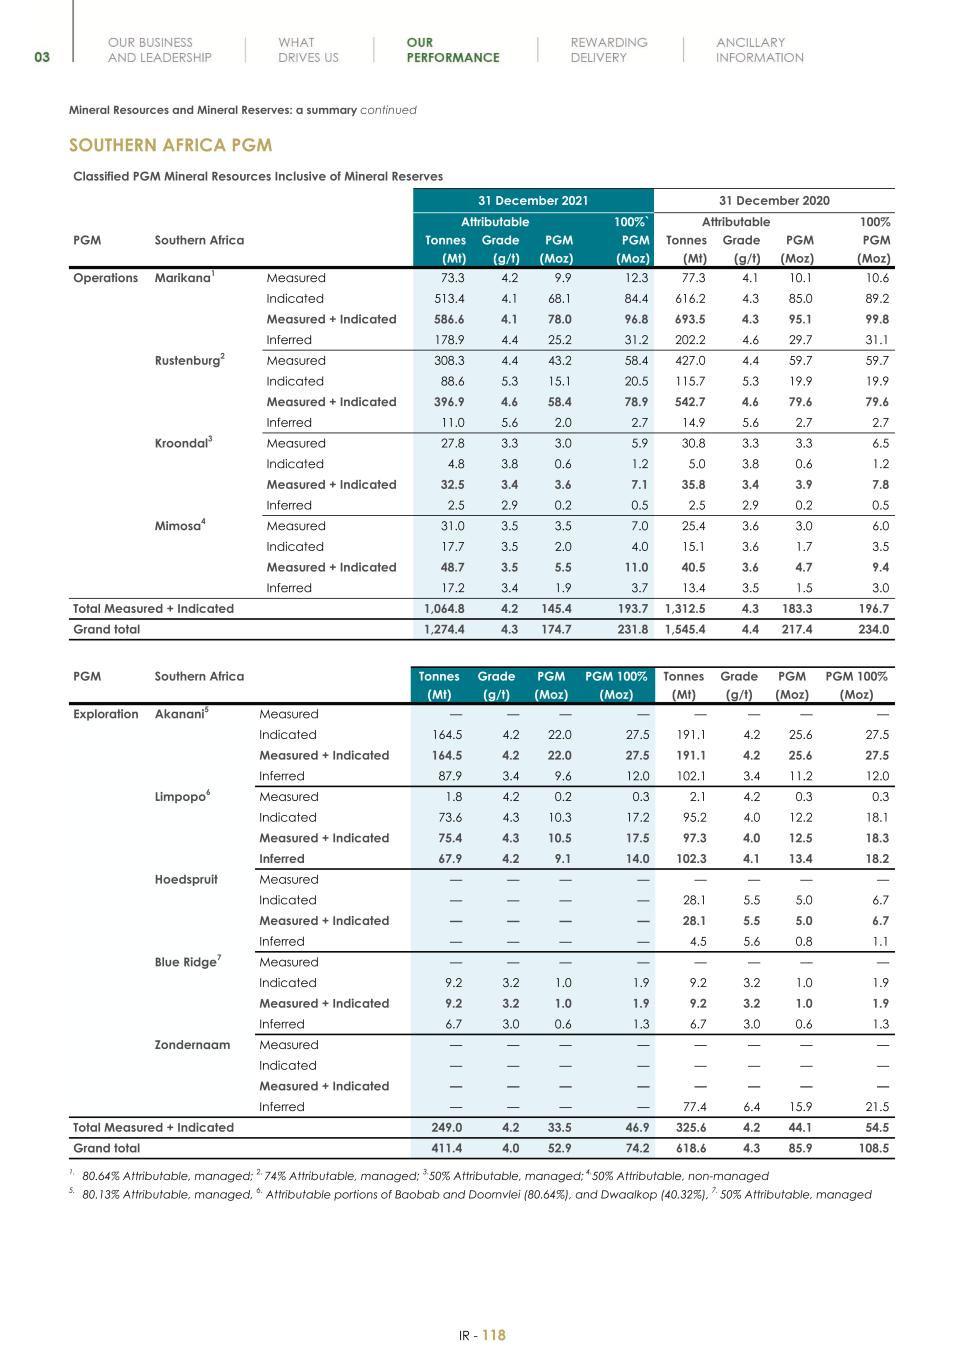
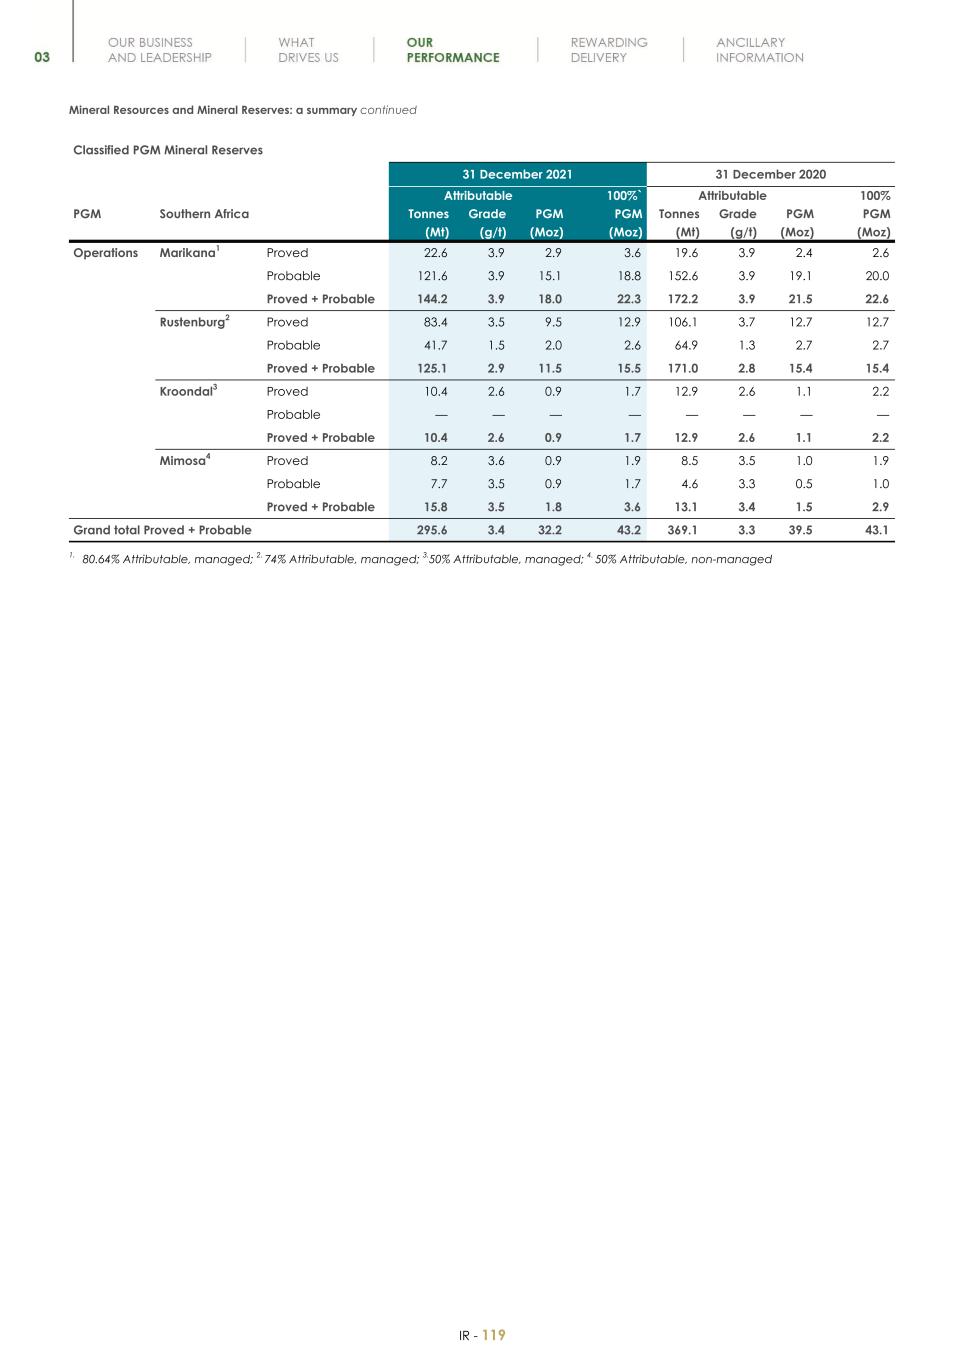
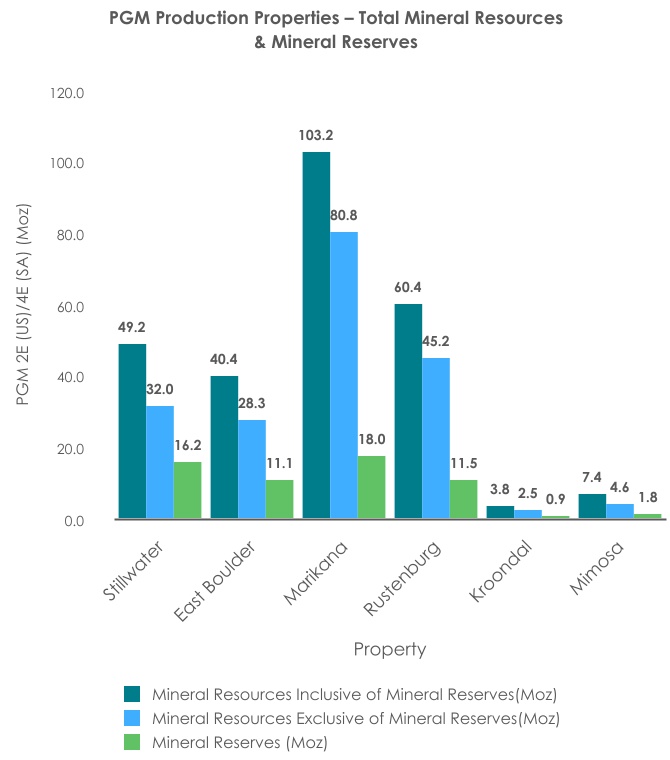
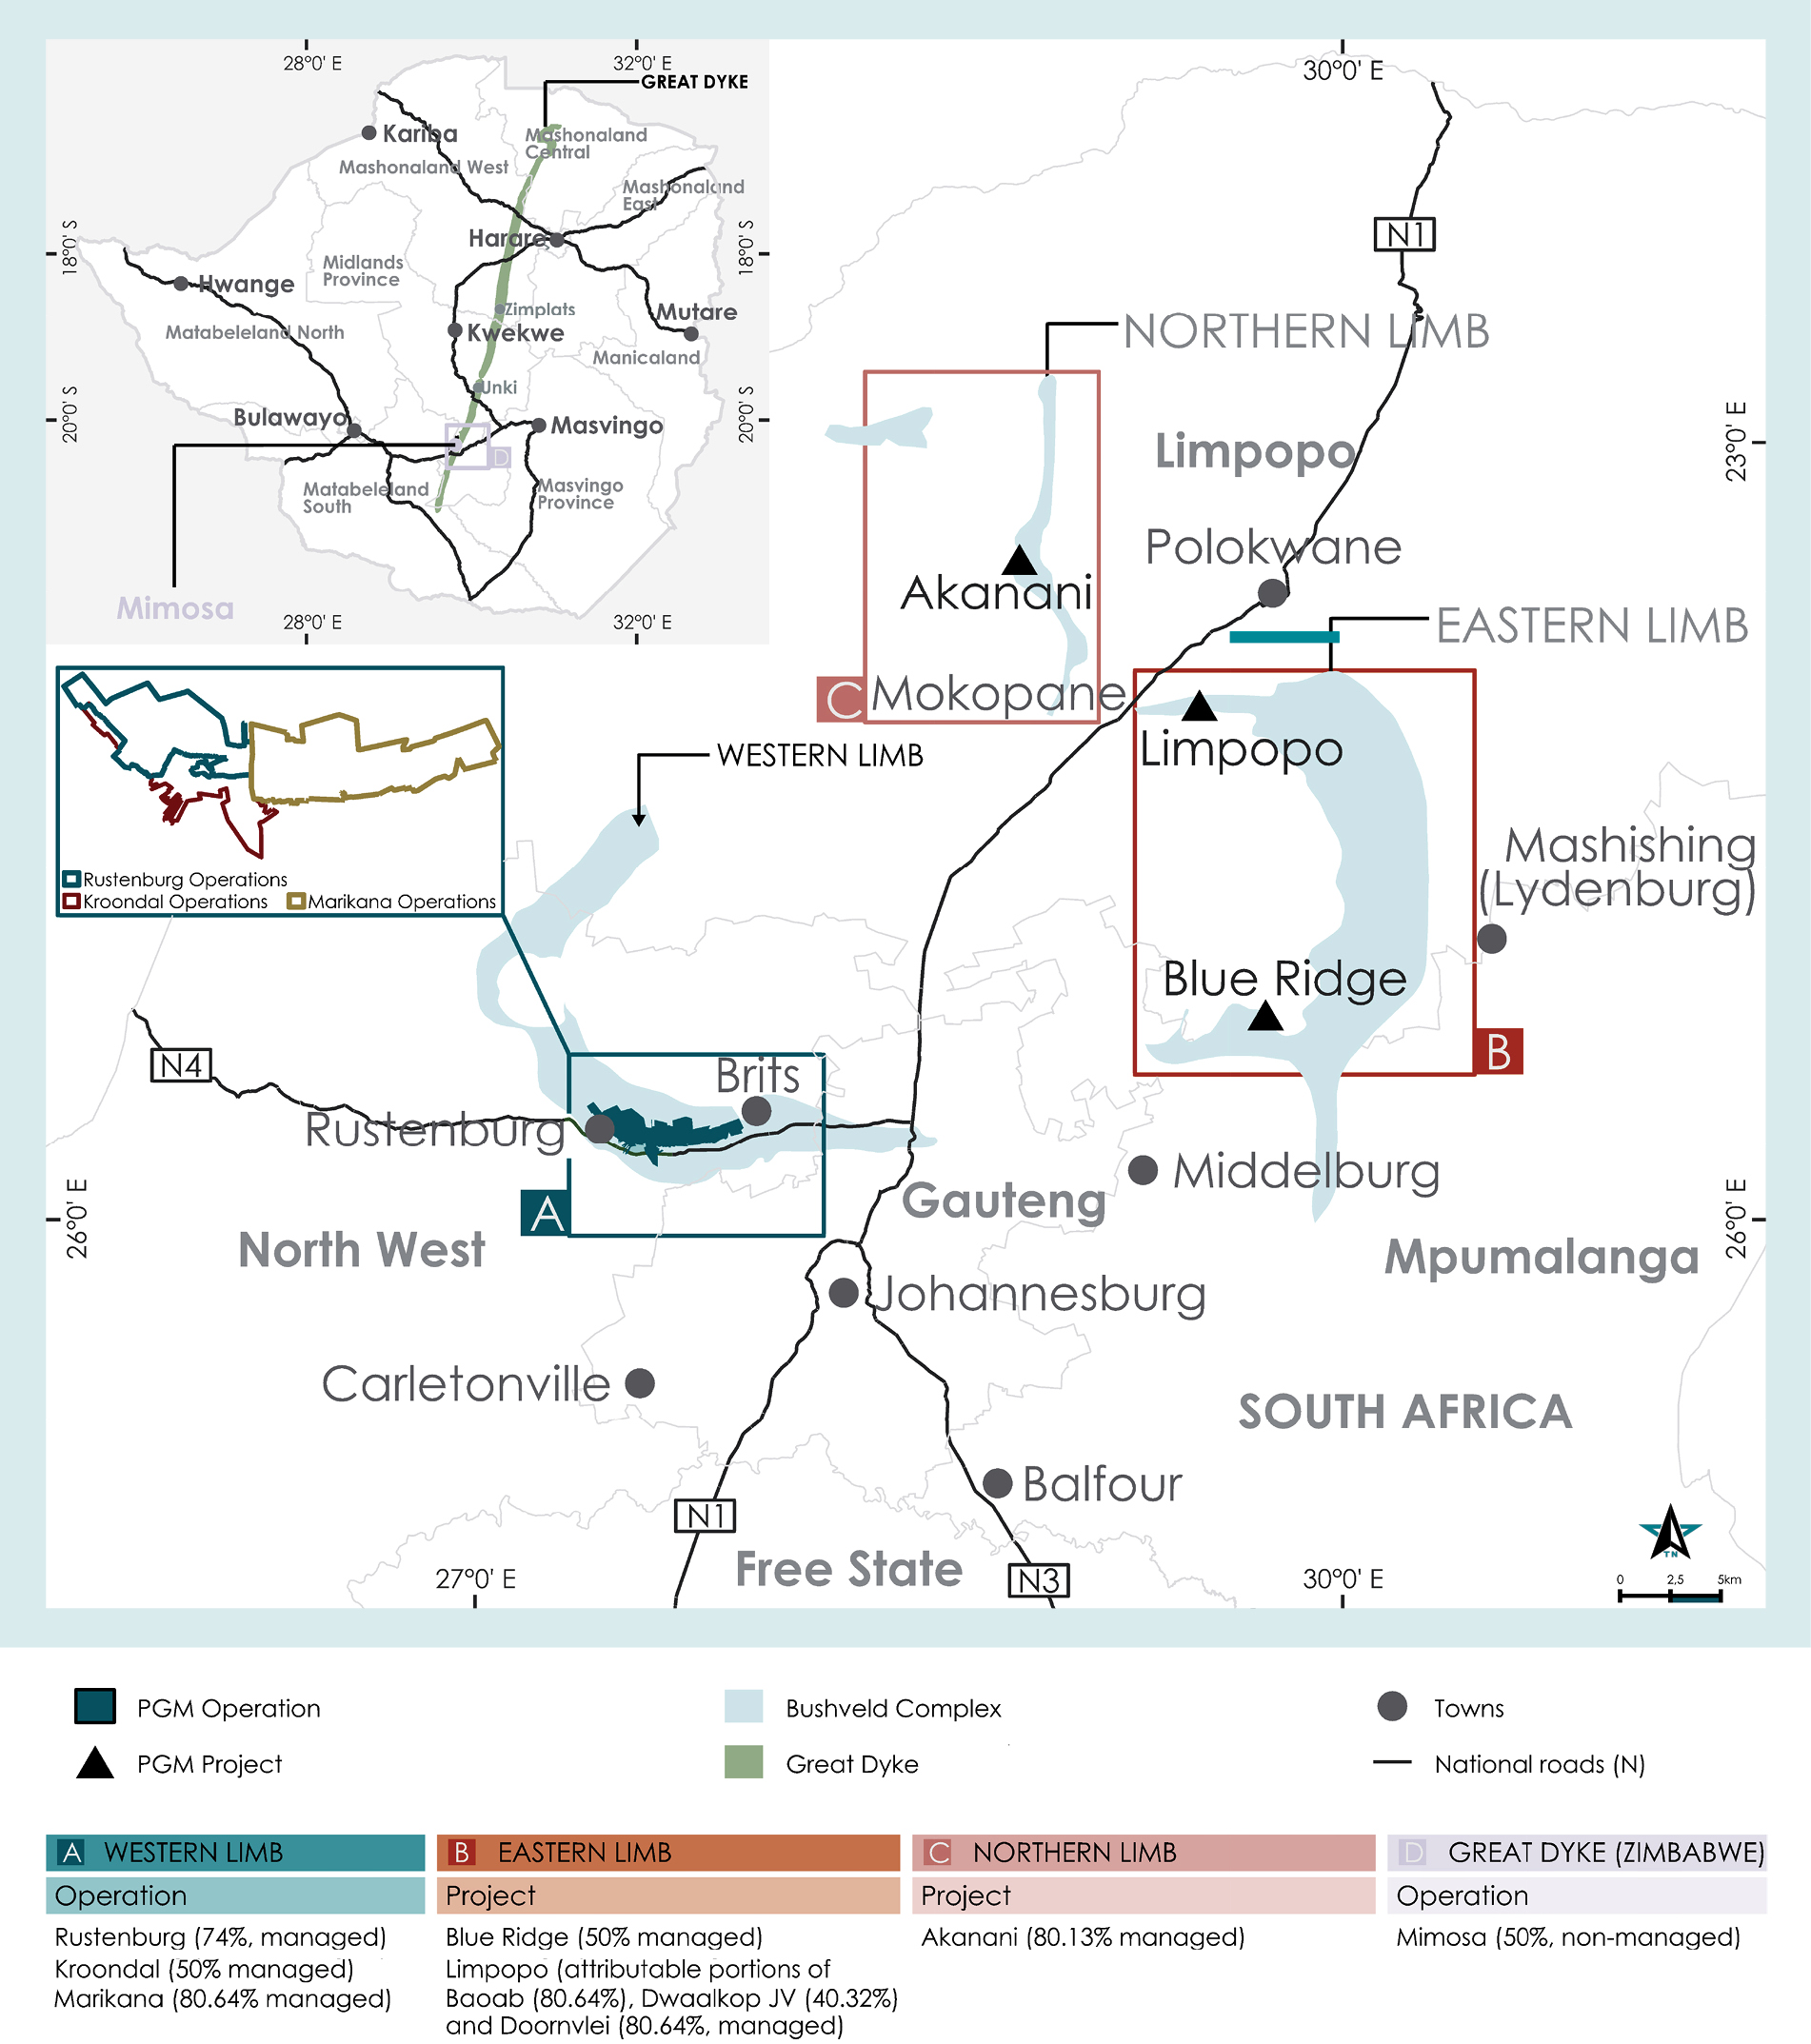
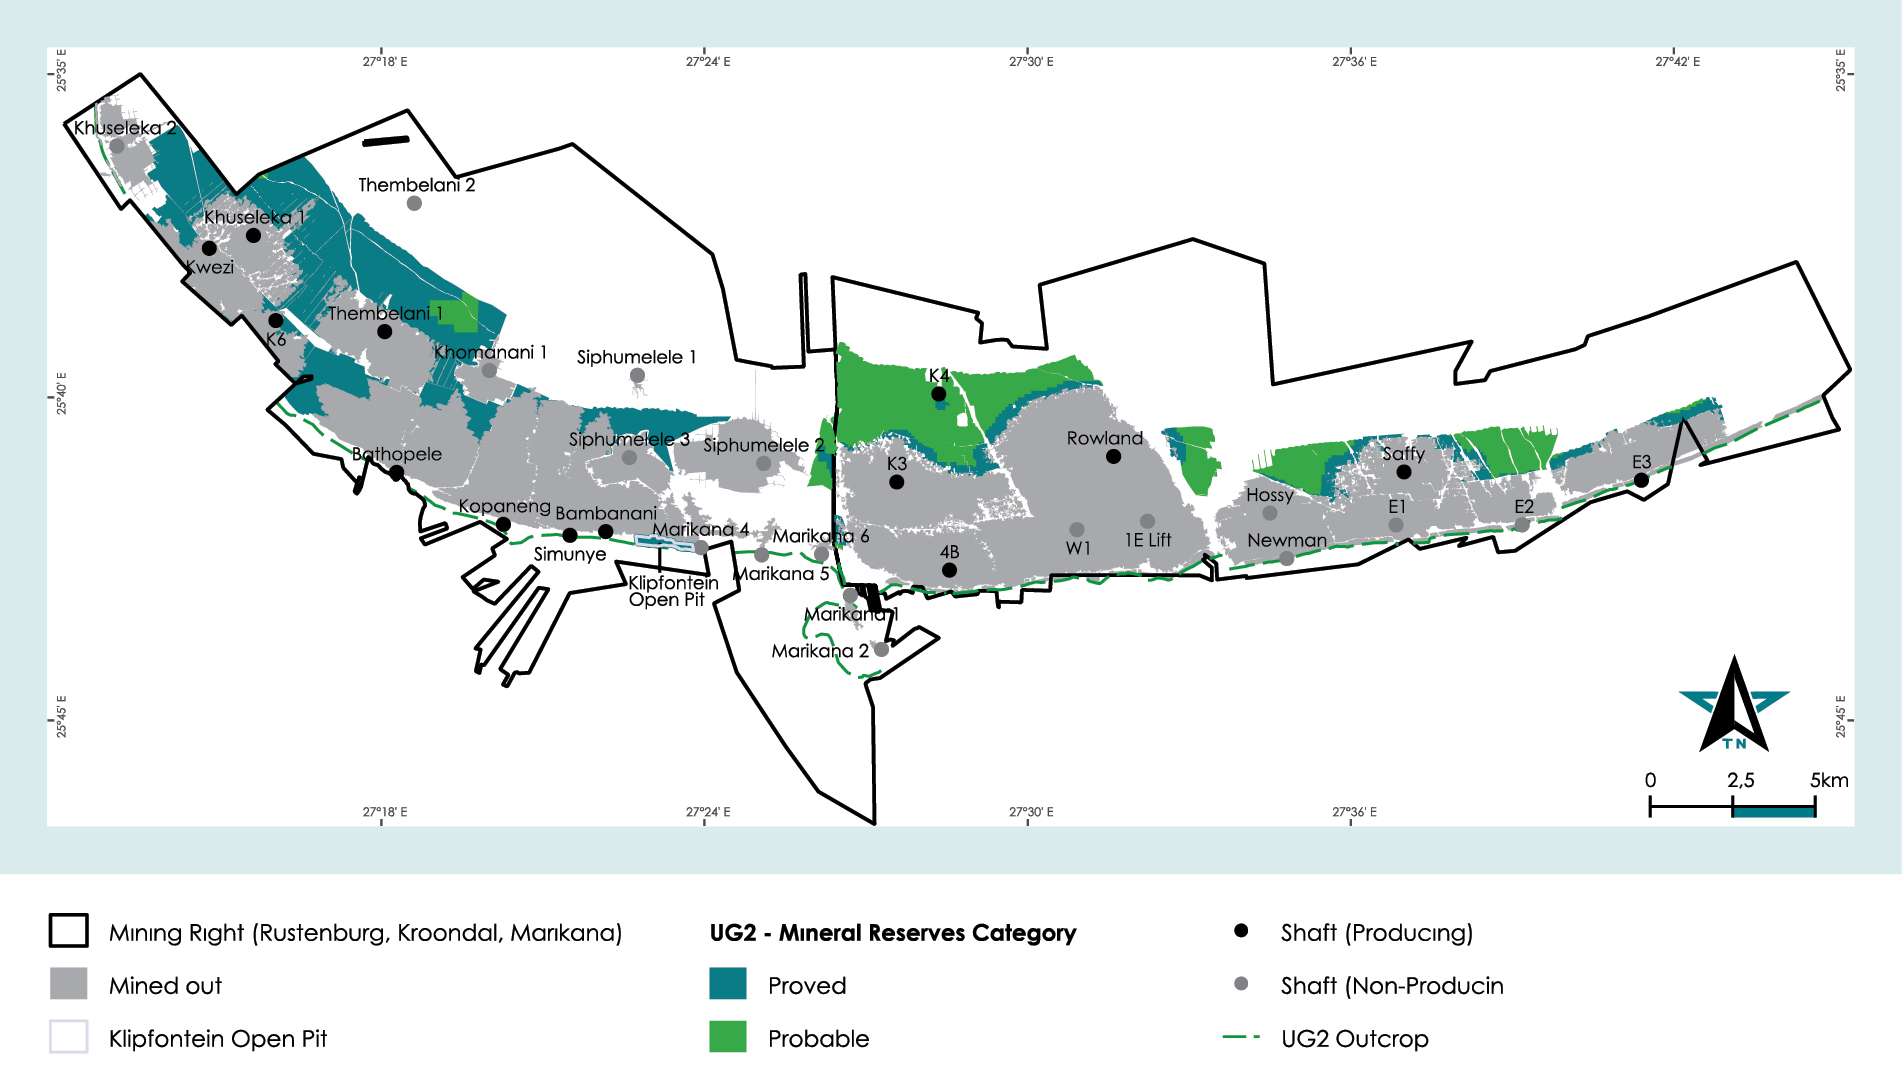
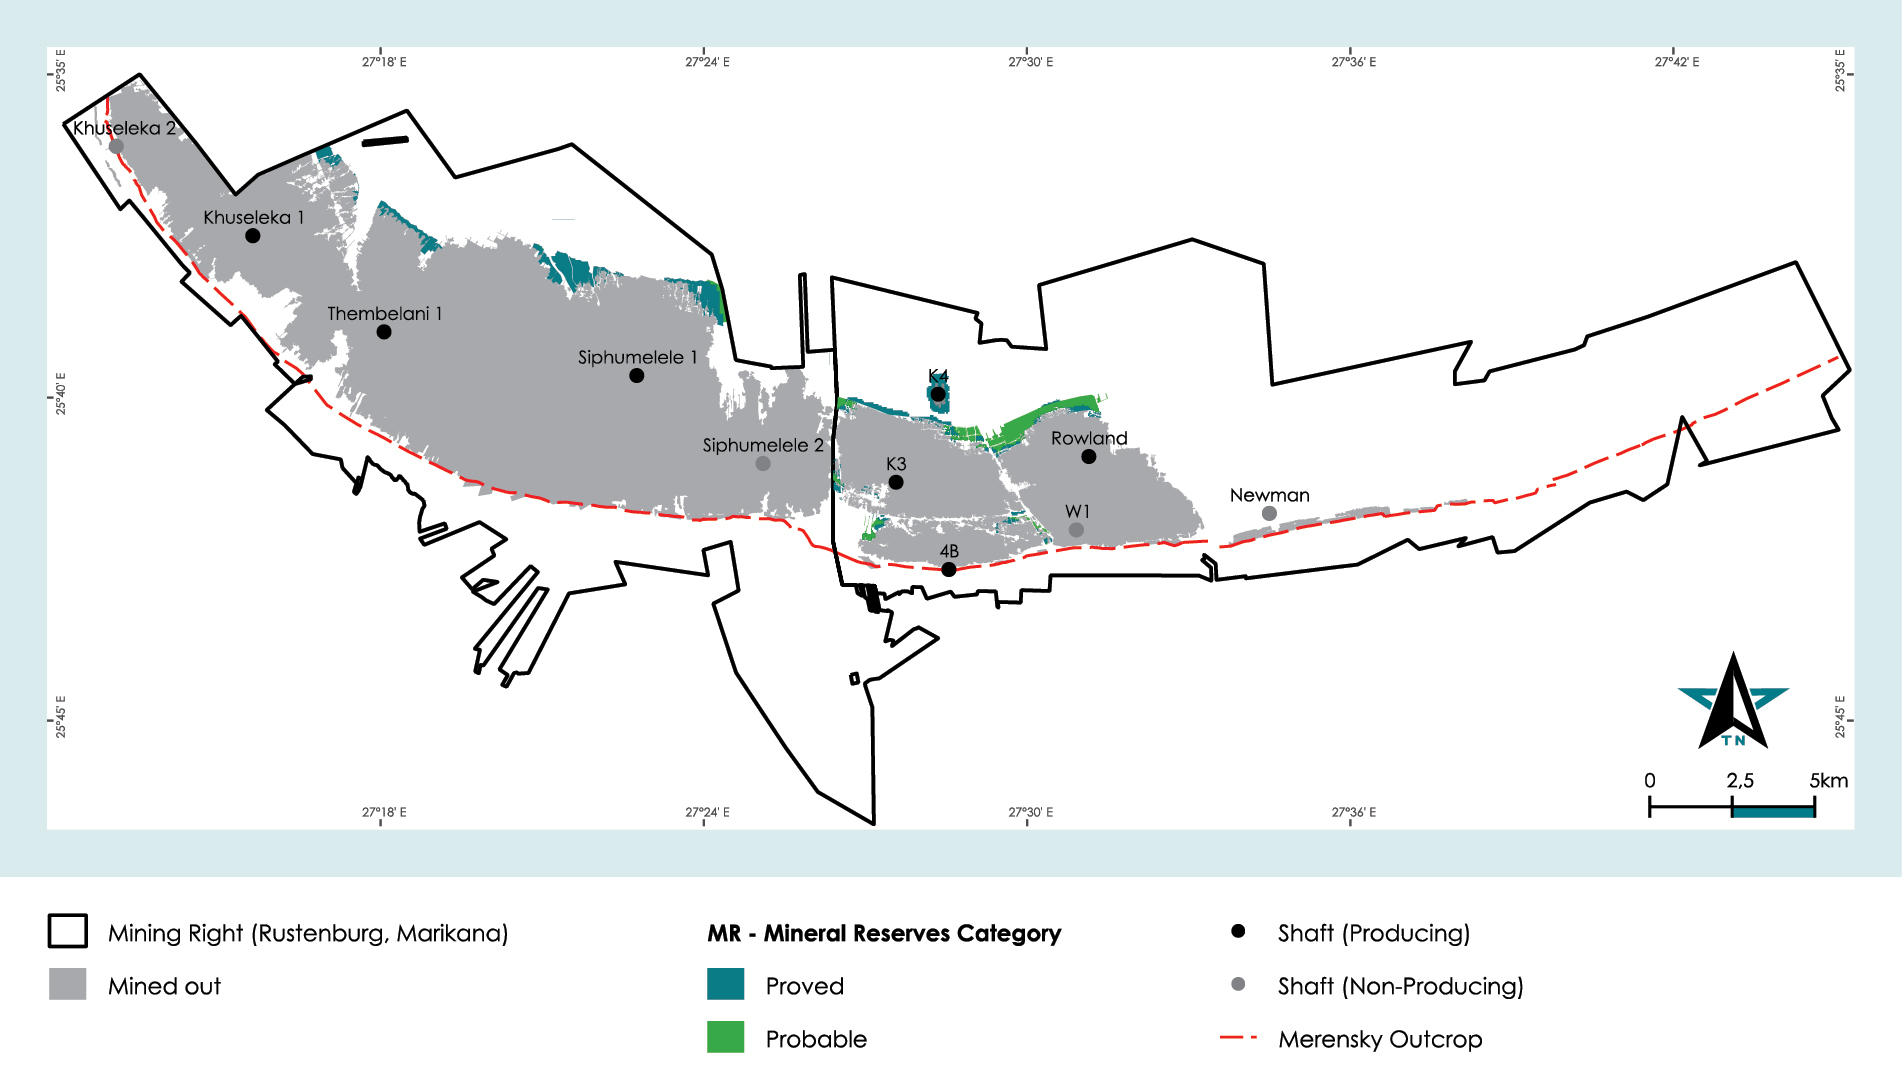
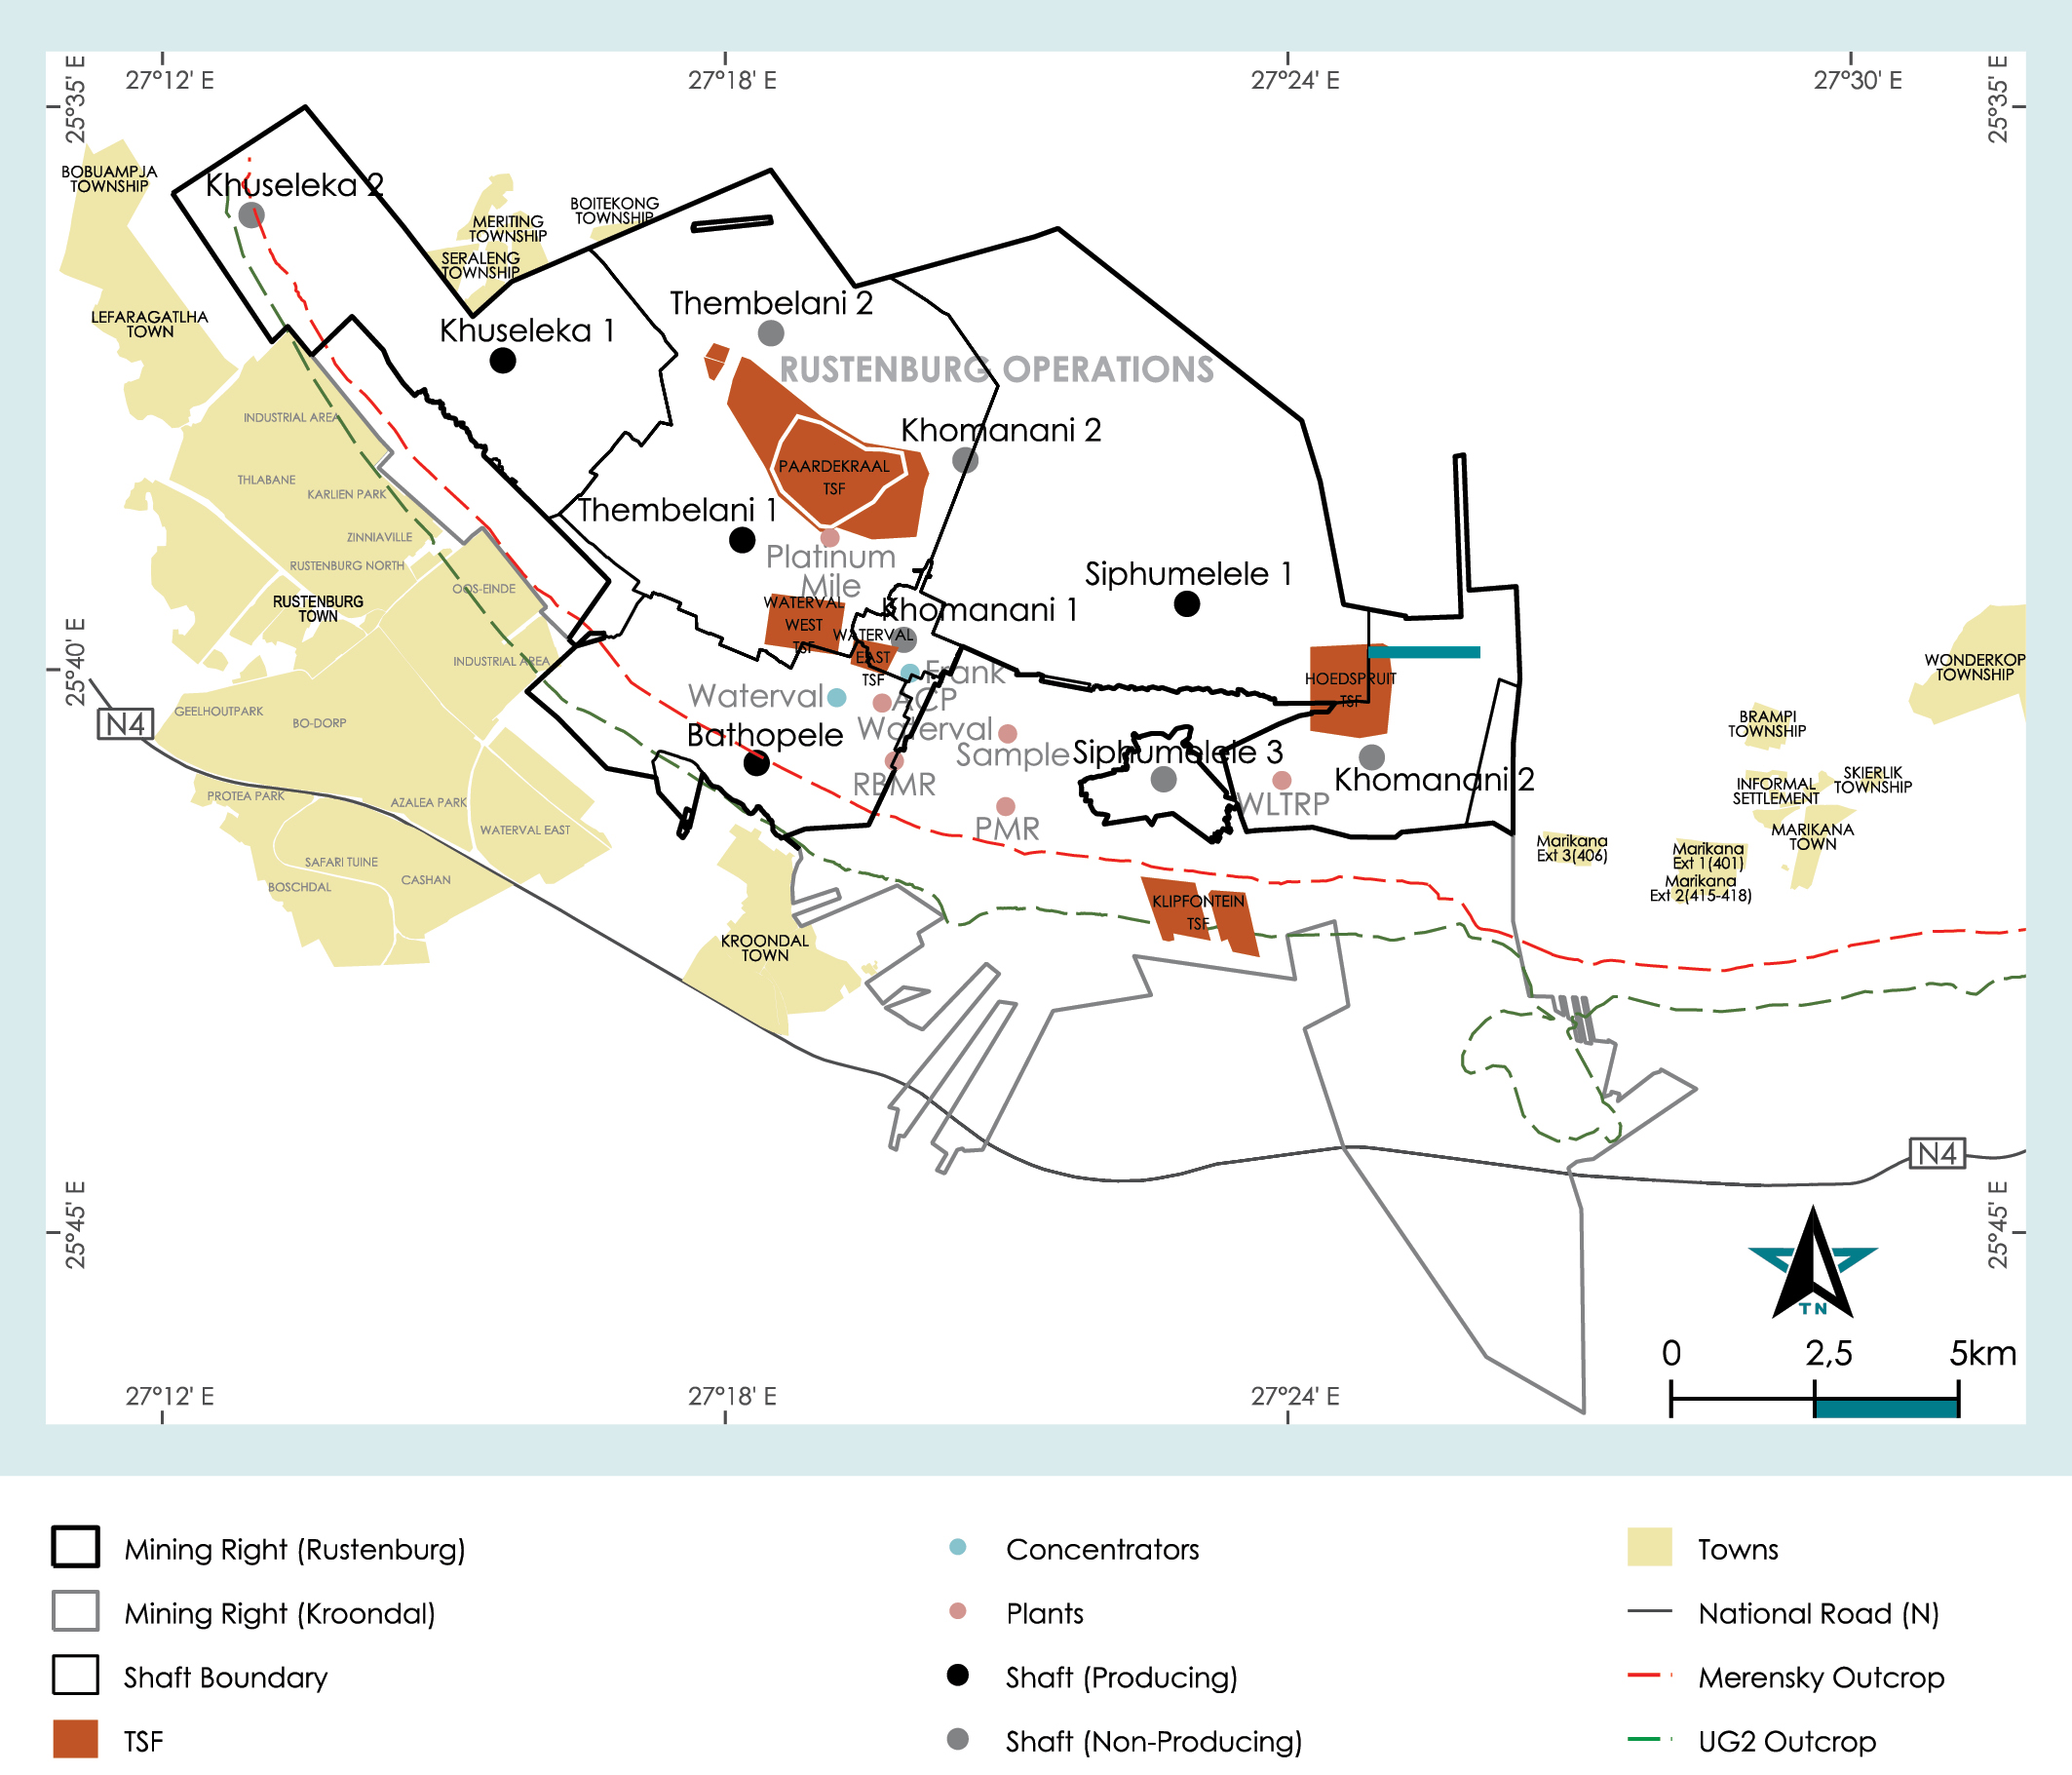
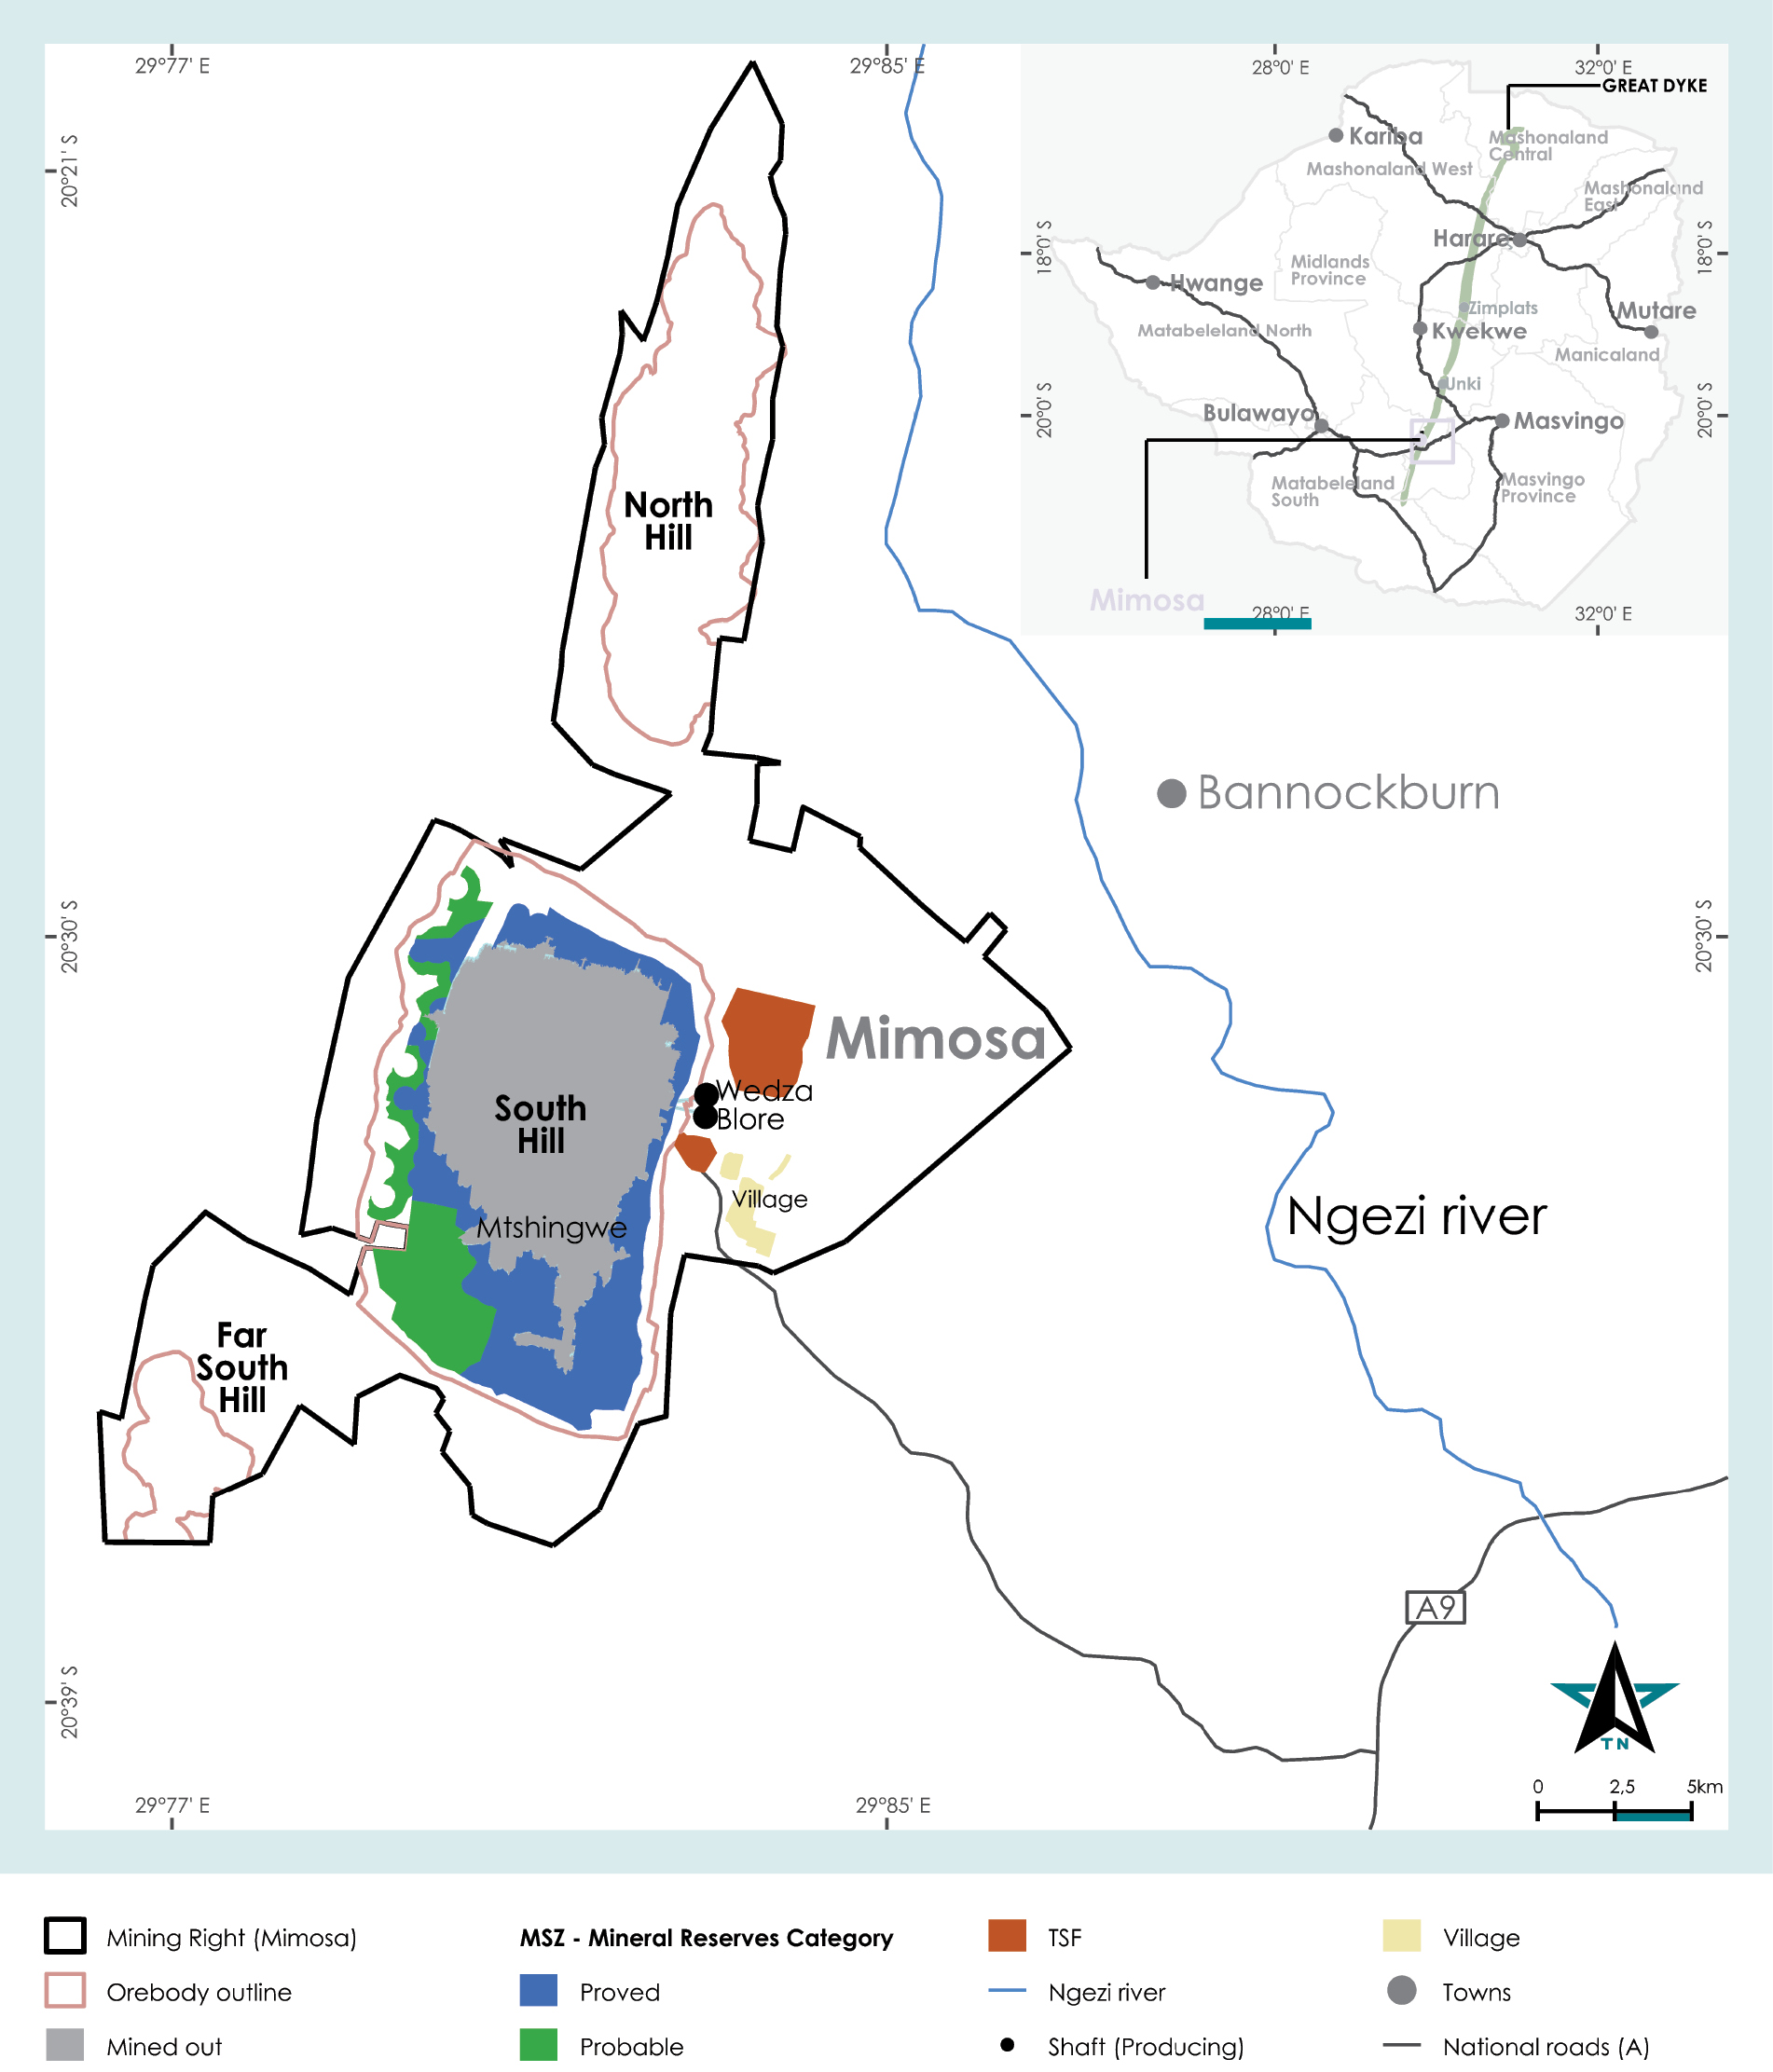
PGMs:
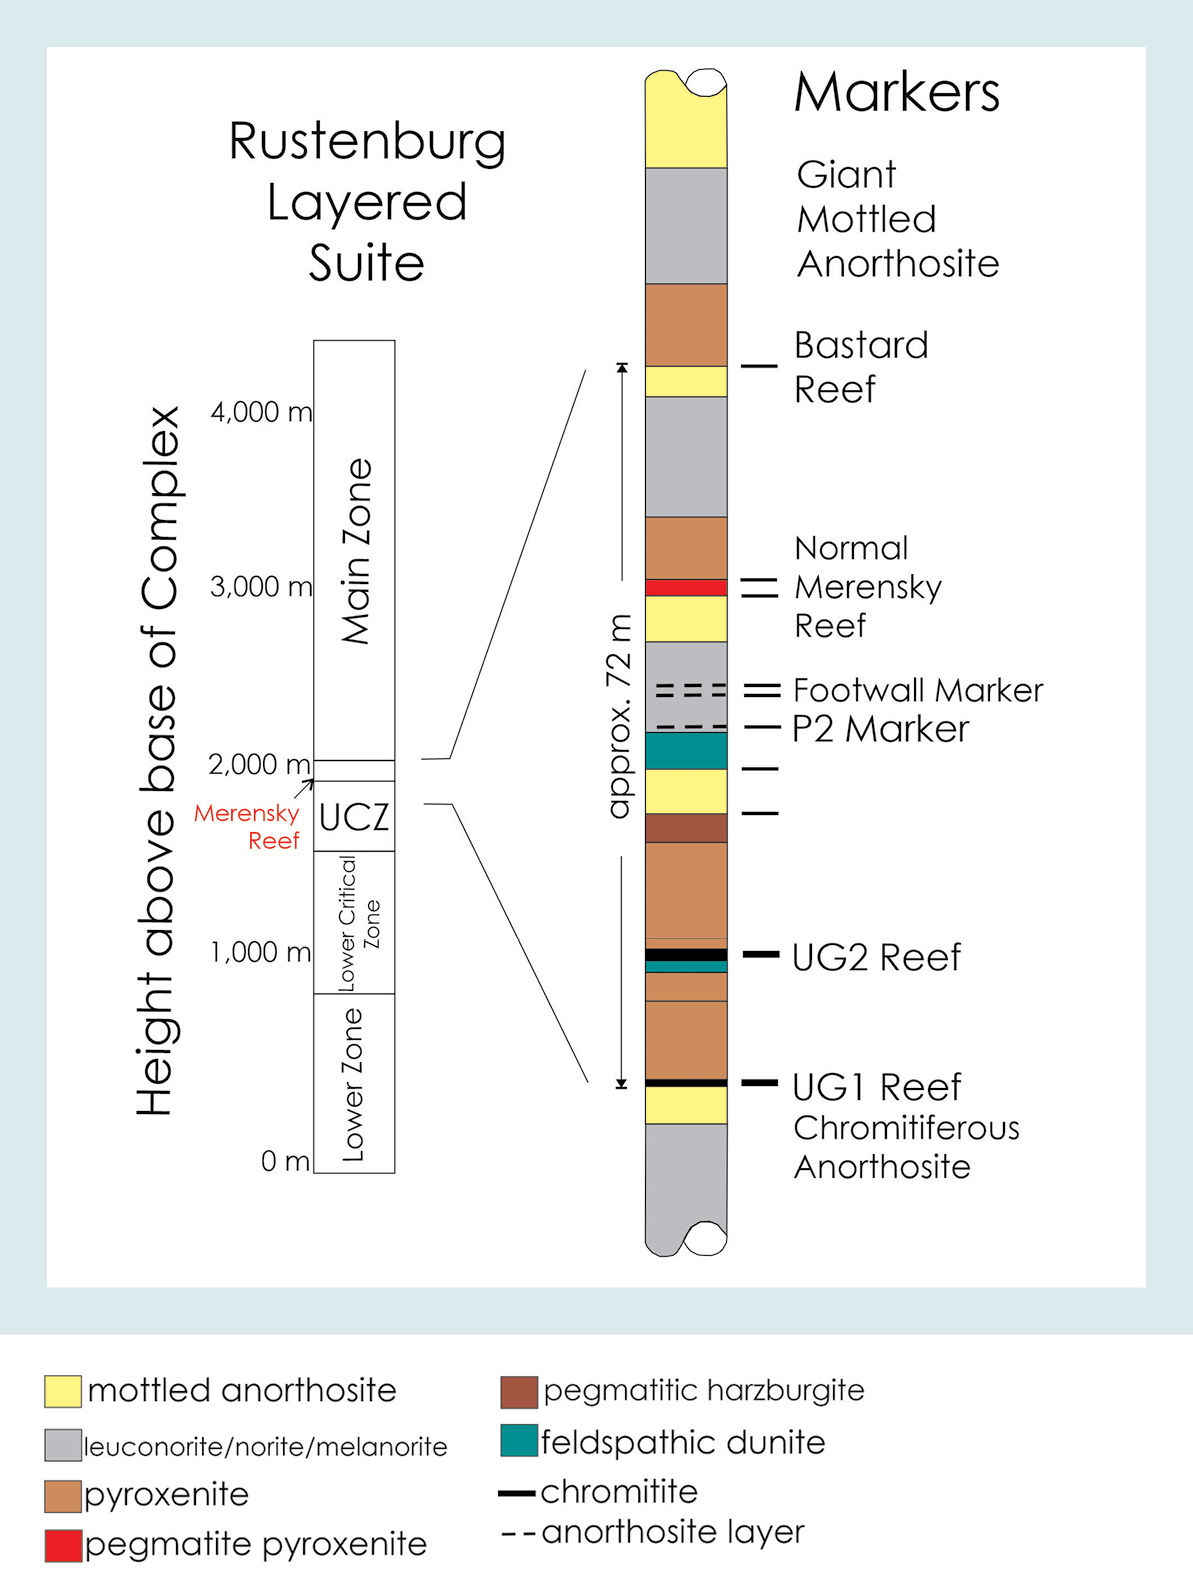
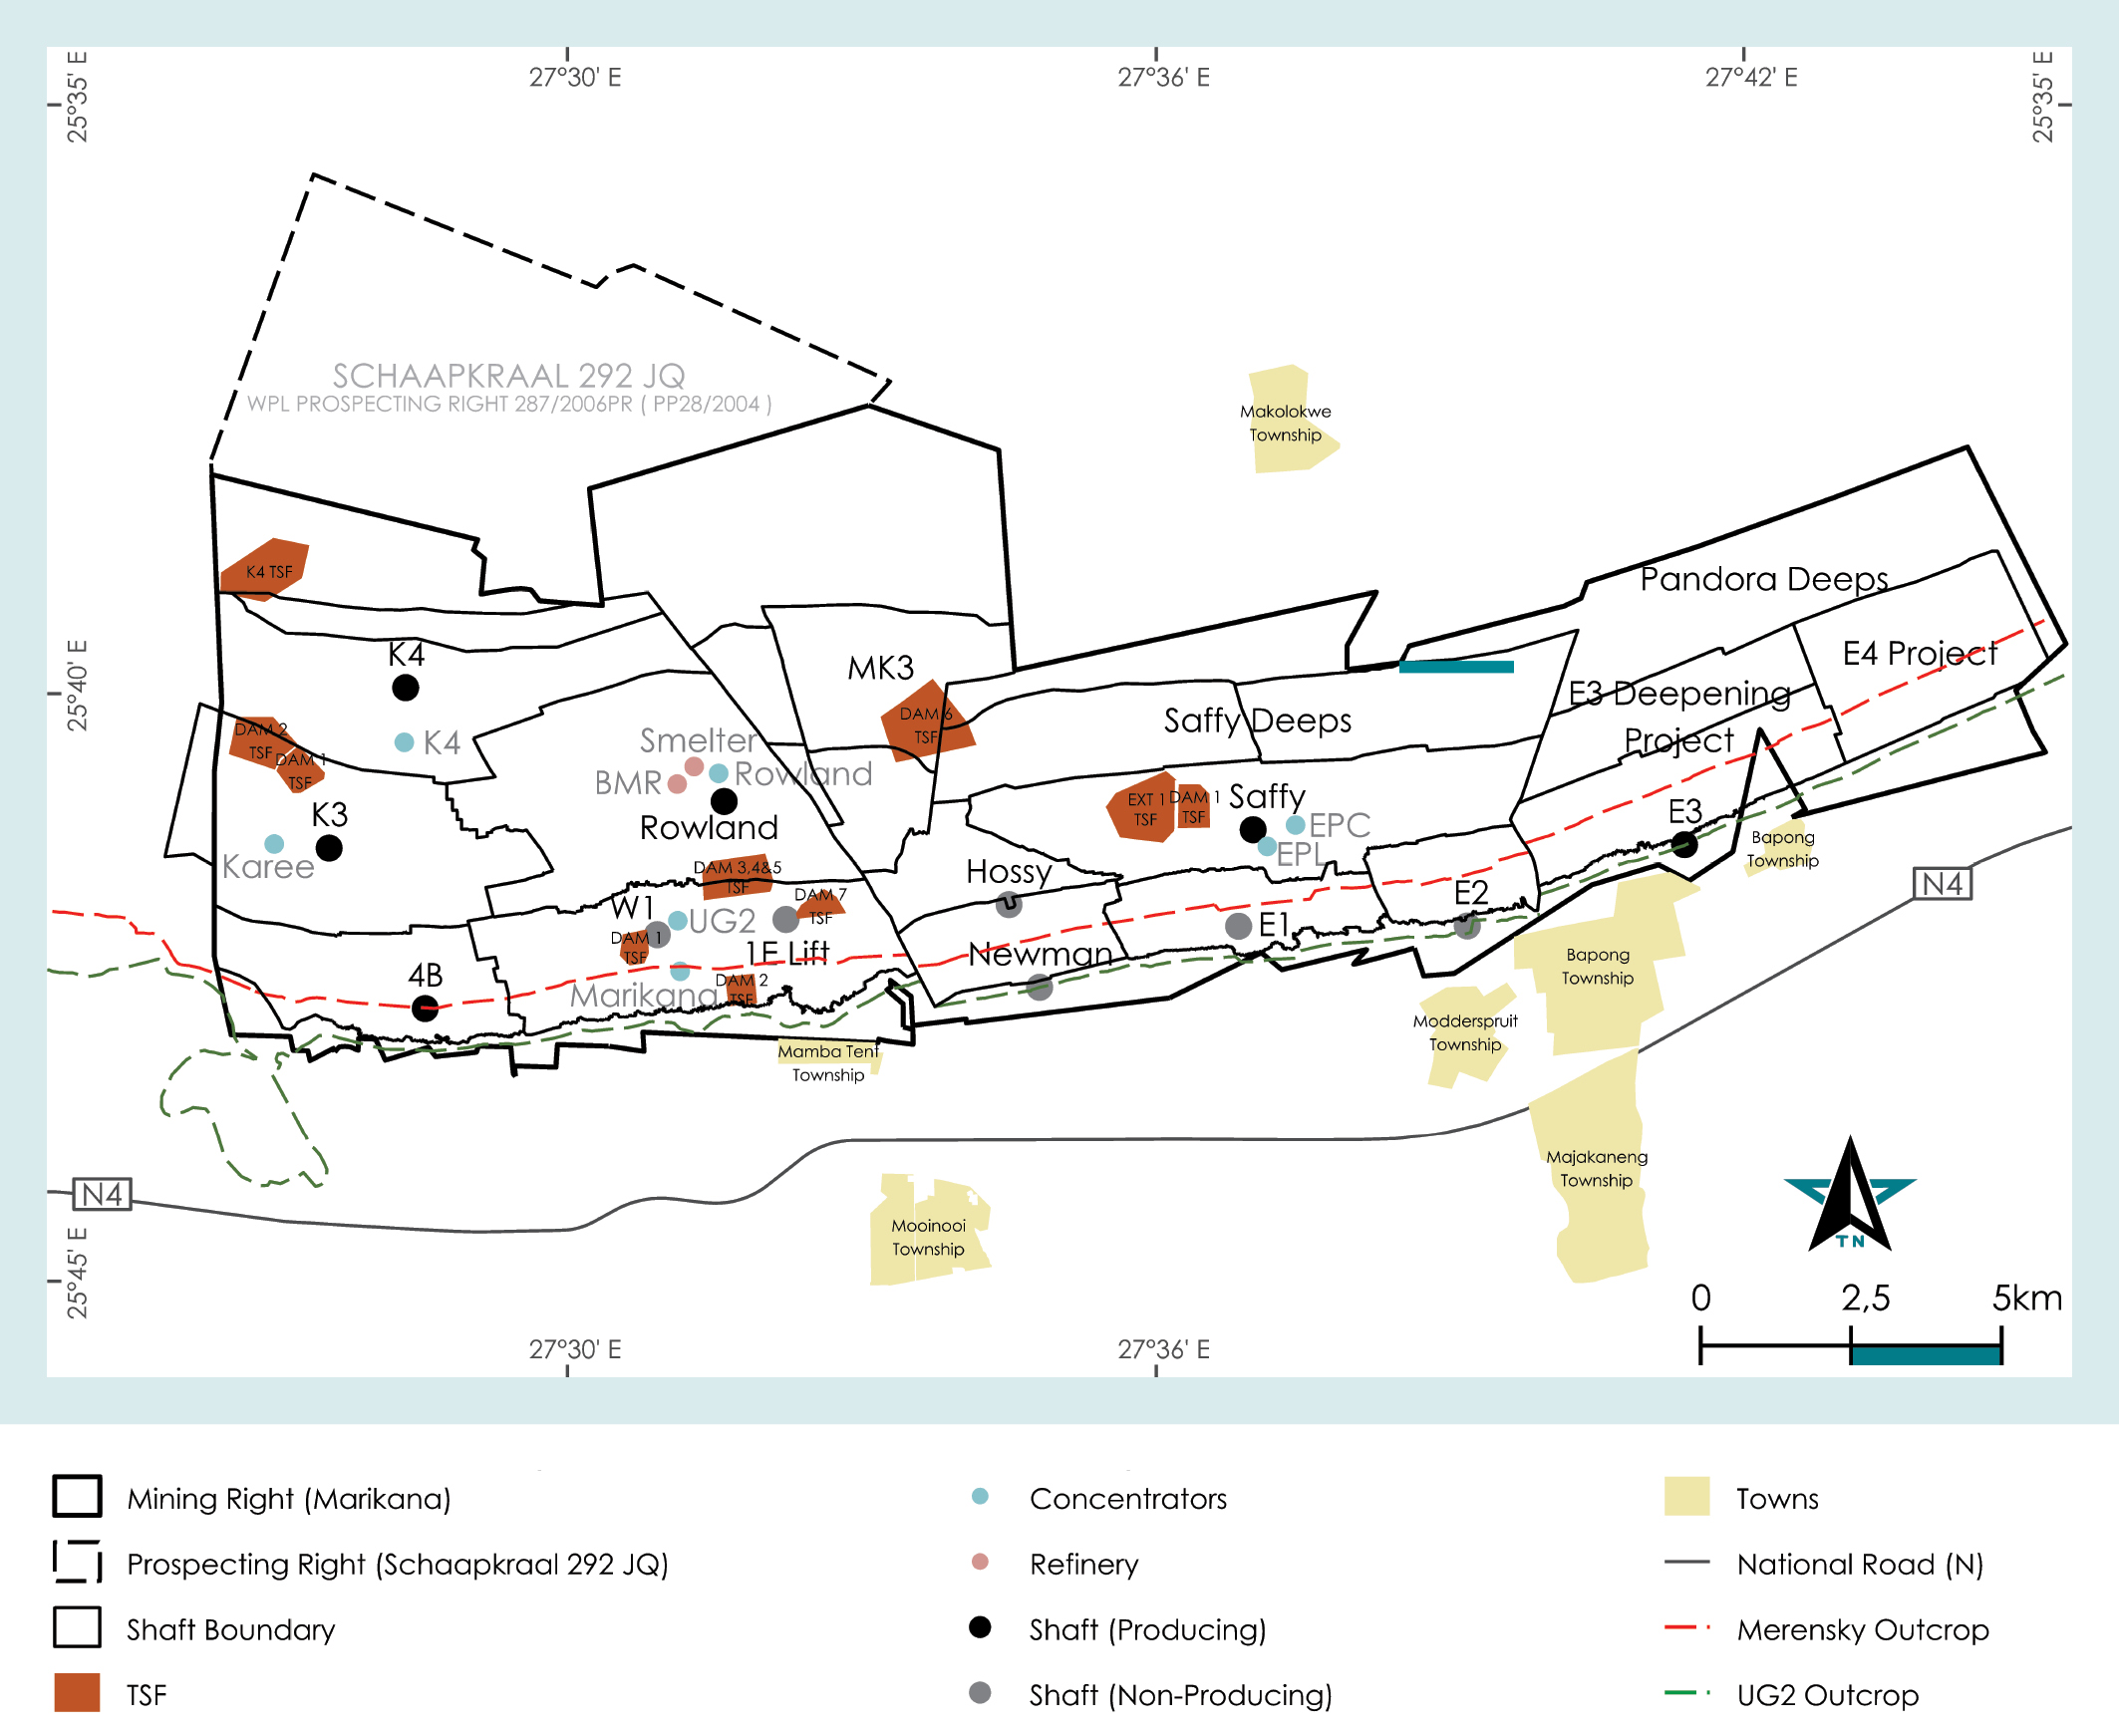
The SA PGM operations consist of three managed PGM producing underground operations (Marikana, Rustenburg and Kroondal) and related surface treatment facilities in South Africa and a 50% attributable, non-managed, underground operation in Mimosa Investments Limited (Mimosa) located in Zimbabwe. Sibanye-Stillwater also owns the Platinum Mile tailings retreatment facility adjacent to the Rustenburg operations, which recovers PGMs from the tailing streams of the Rustenburg operations.
The Rustenburg and Kroondal operations are serviced by four integrated concentrator plants, from where the concentrate is subjected to a purchase of concentrate and a toll-treatment agreement with Anglo American Platinum. The ore mined at the Marikana operations is processed through five concentrator plants, metallurgical smelter and base metals refinery, all located on site at Marikana, and a precious metals refinery located in Brakpan. At the Rustenburg, Kroondal and Marikana operations, chrome concentrate is extracted as a by-product from concentrator tailings.
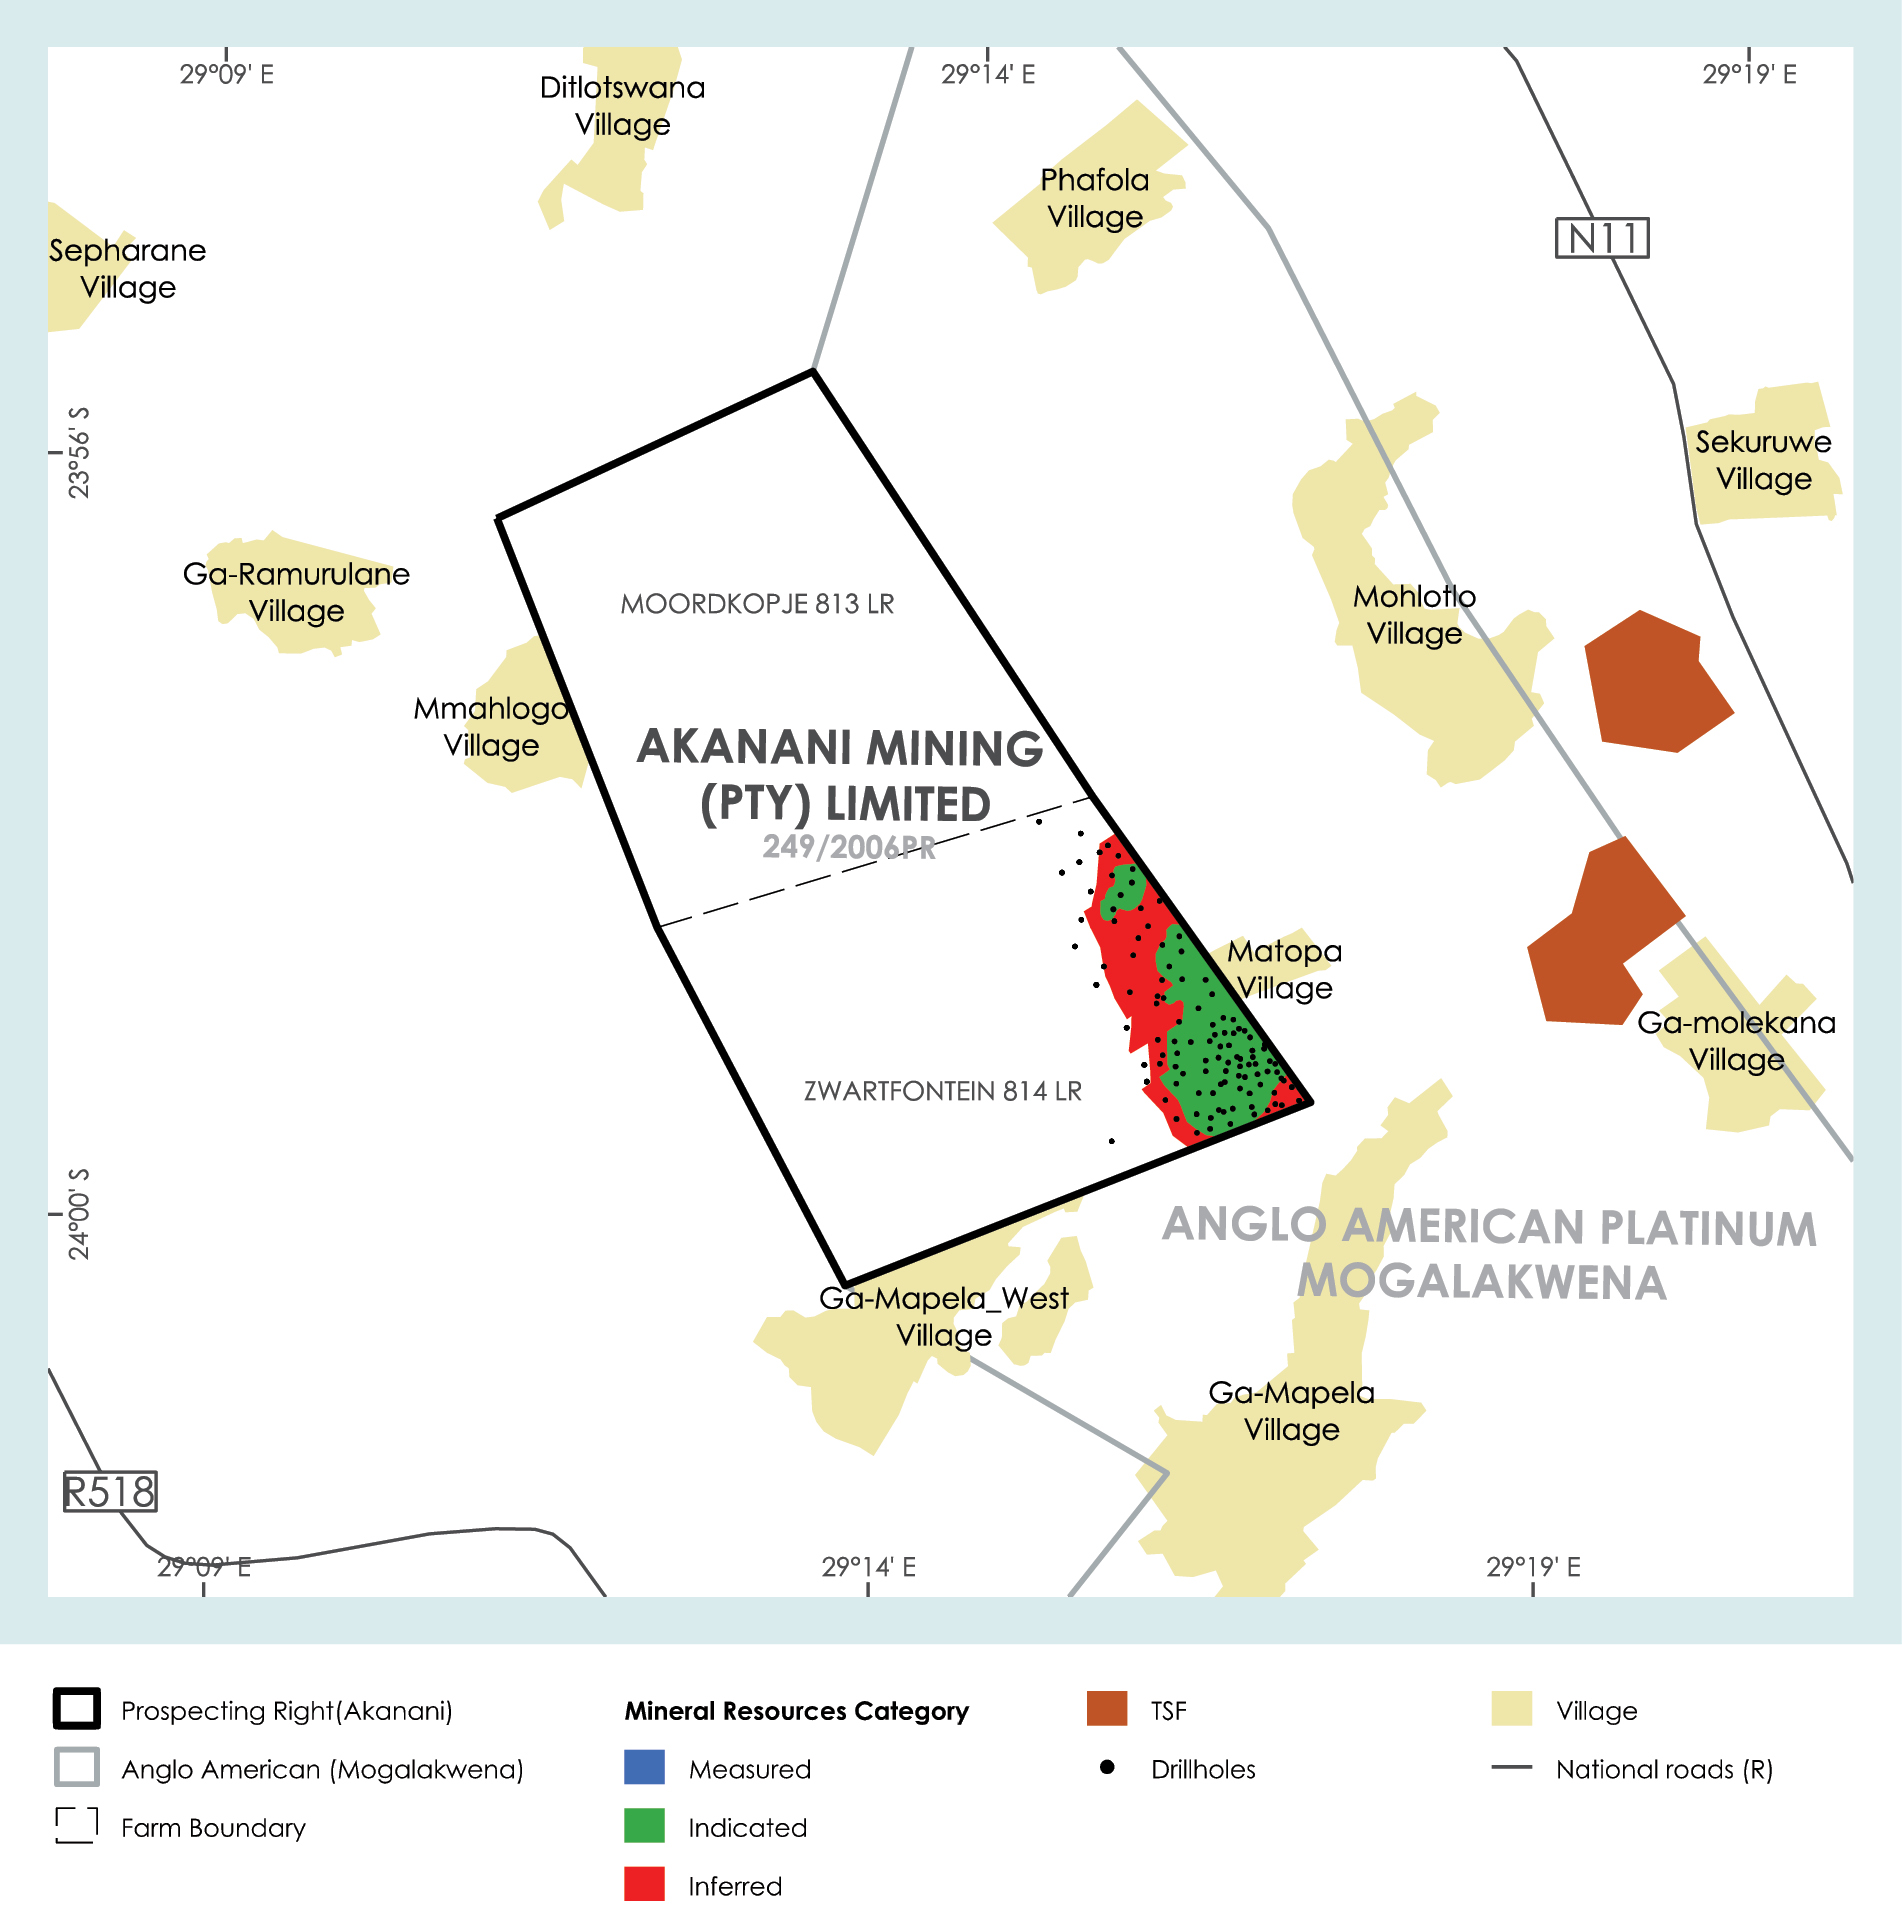
PGM Projects:
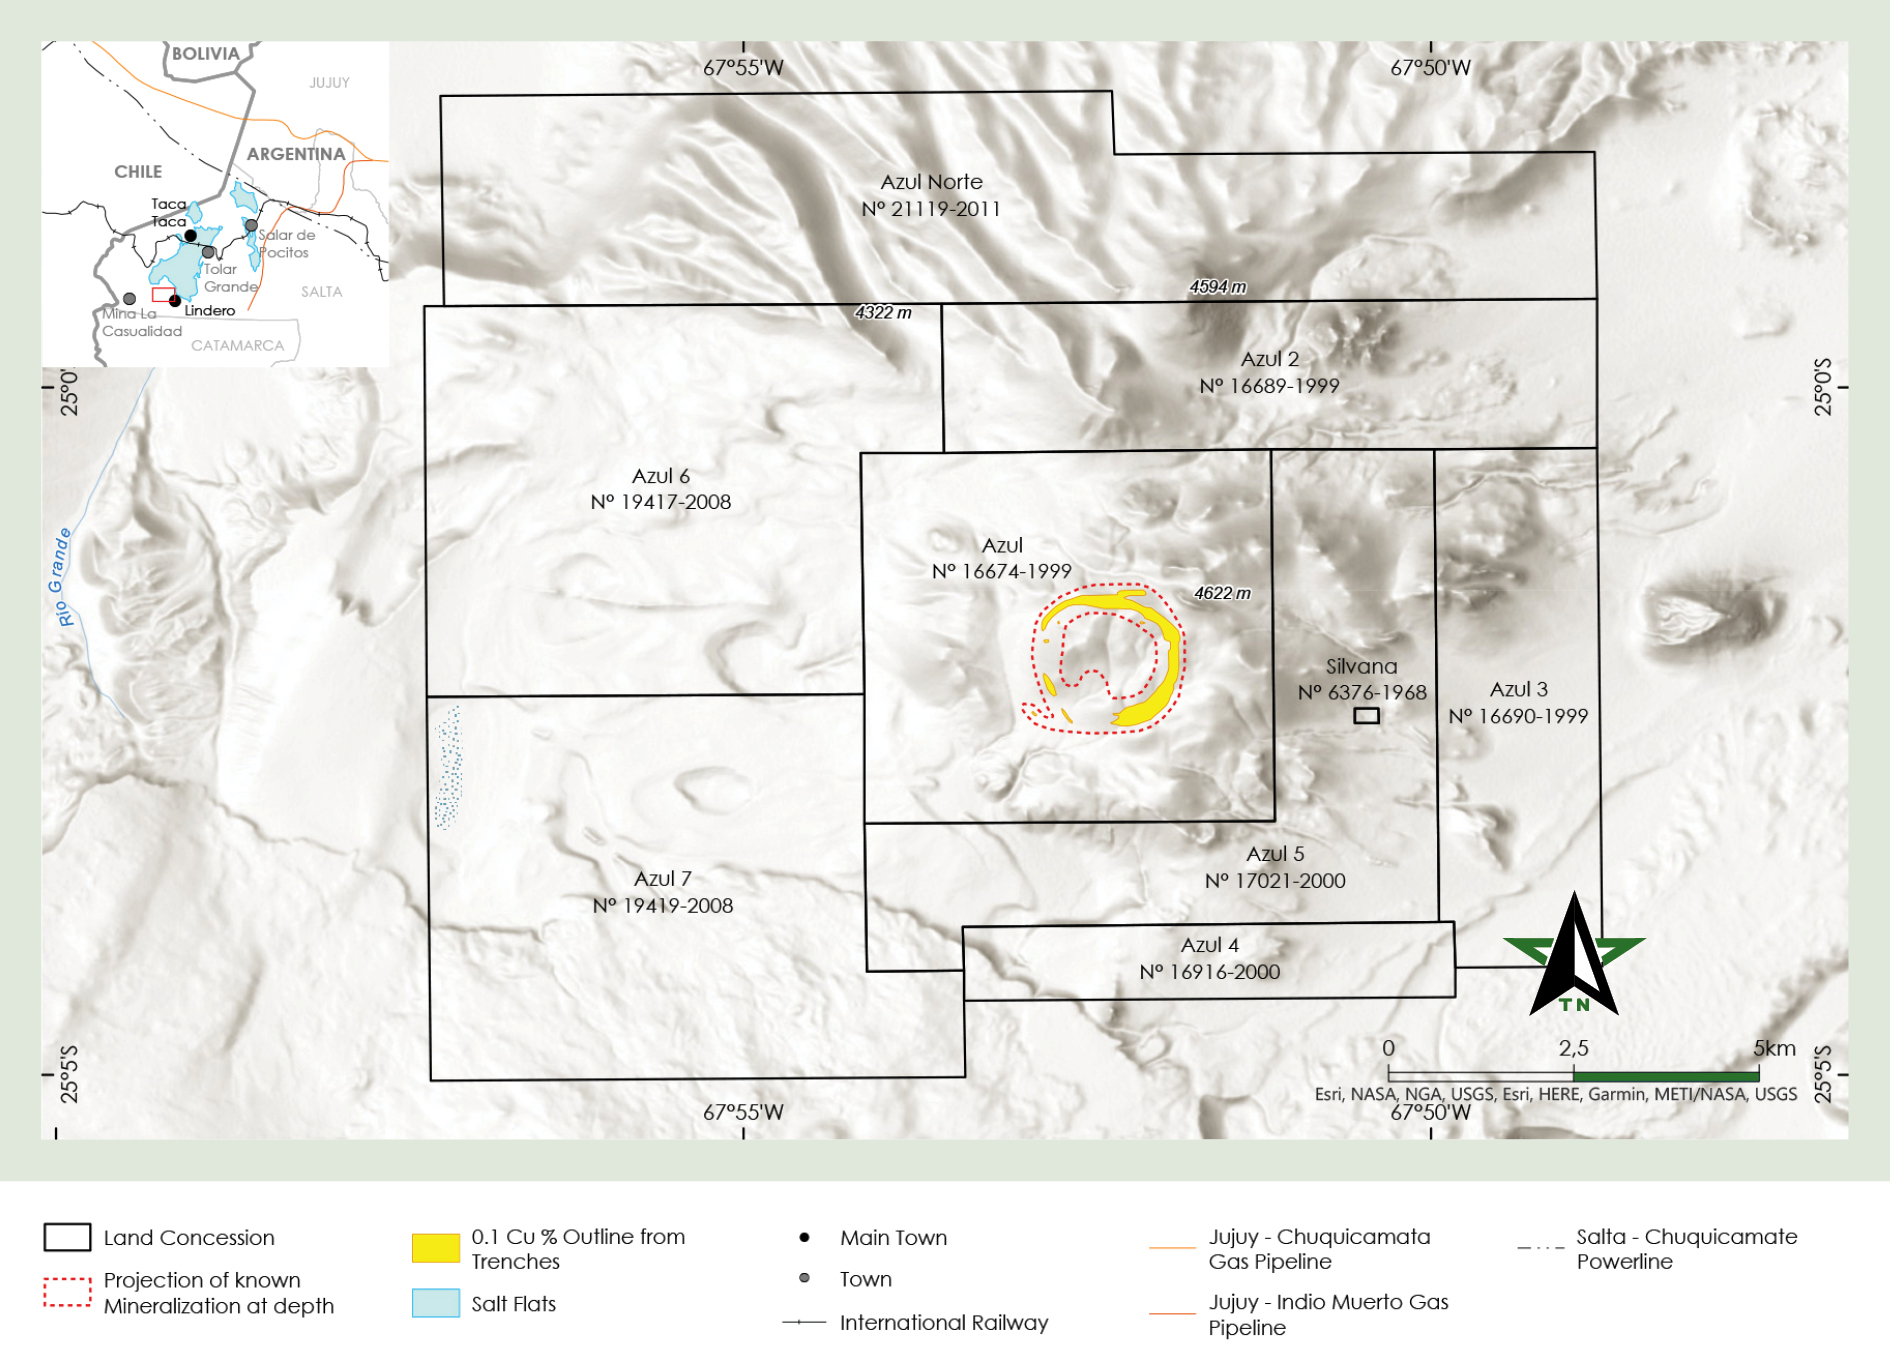
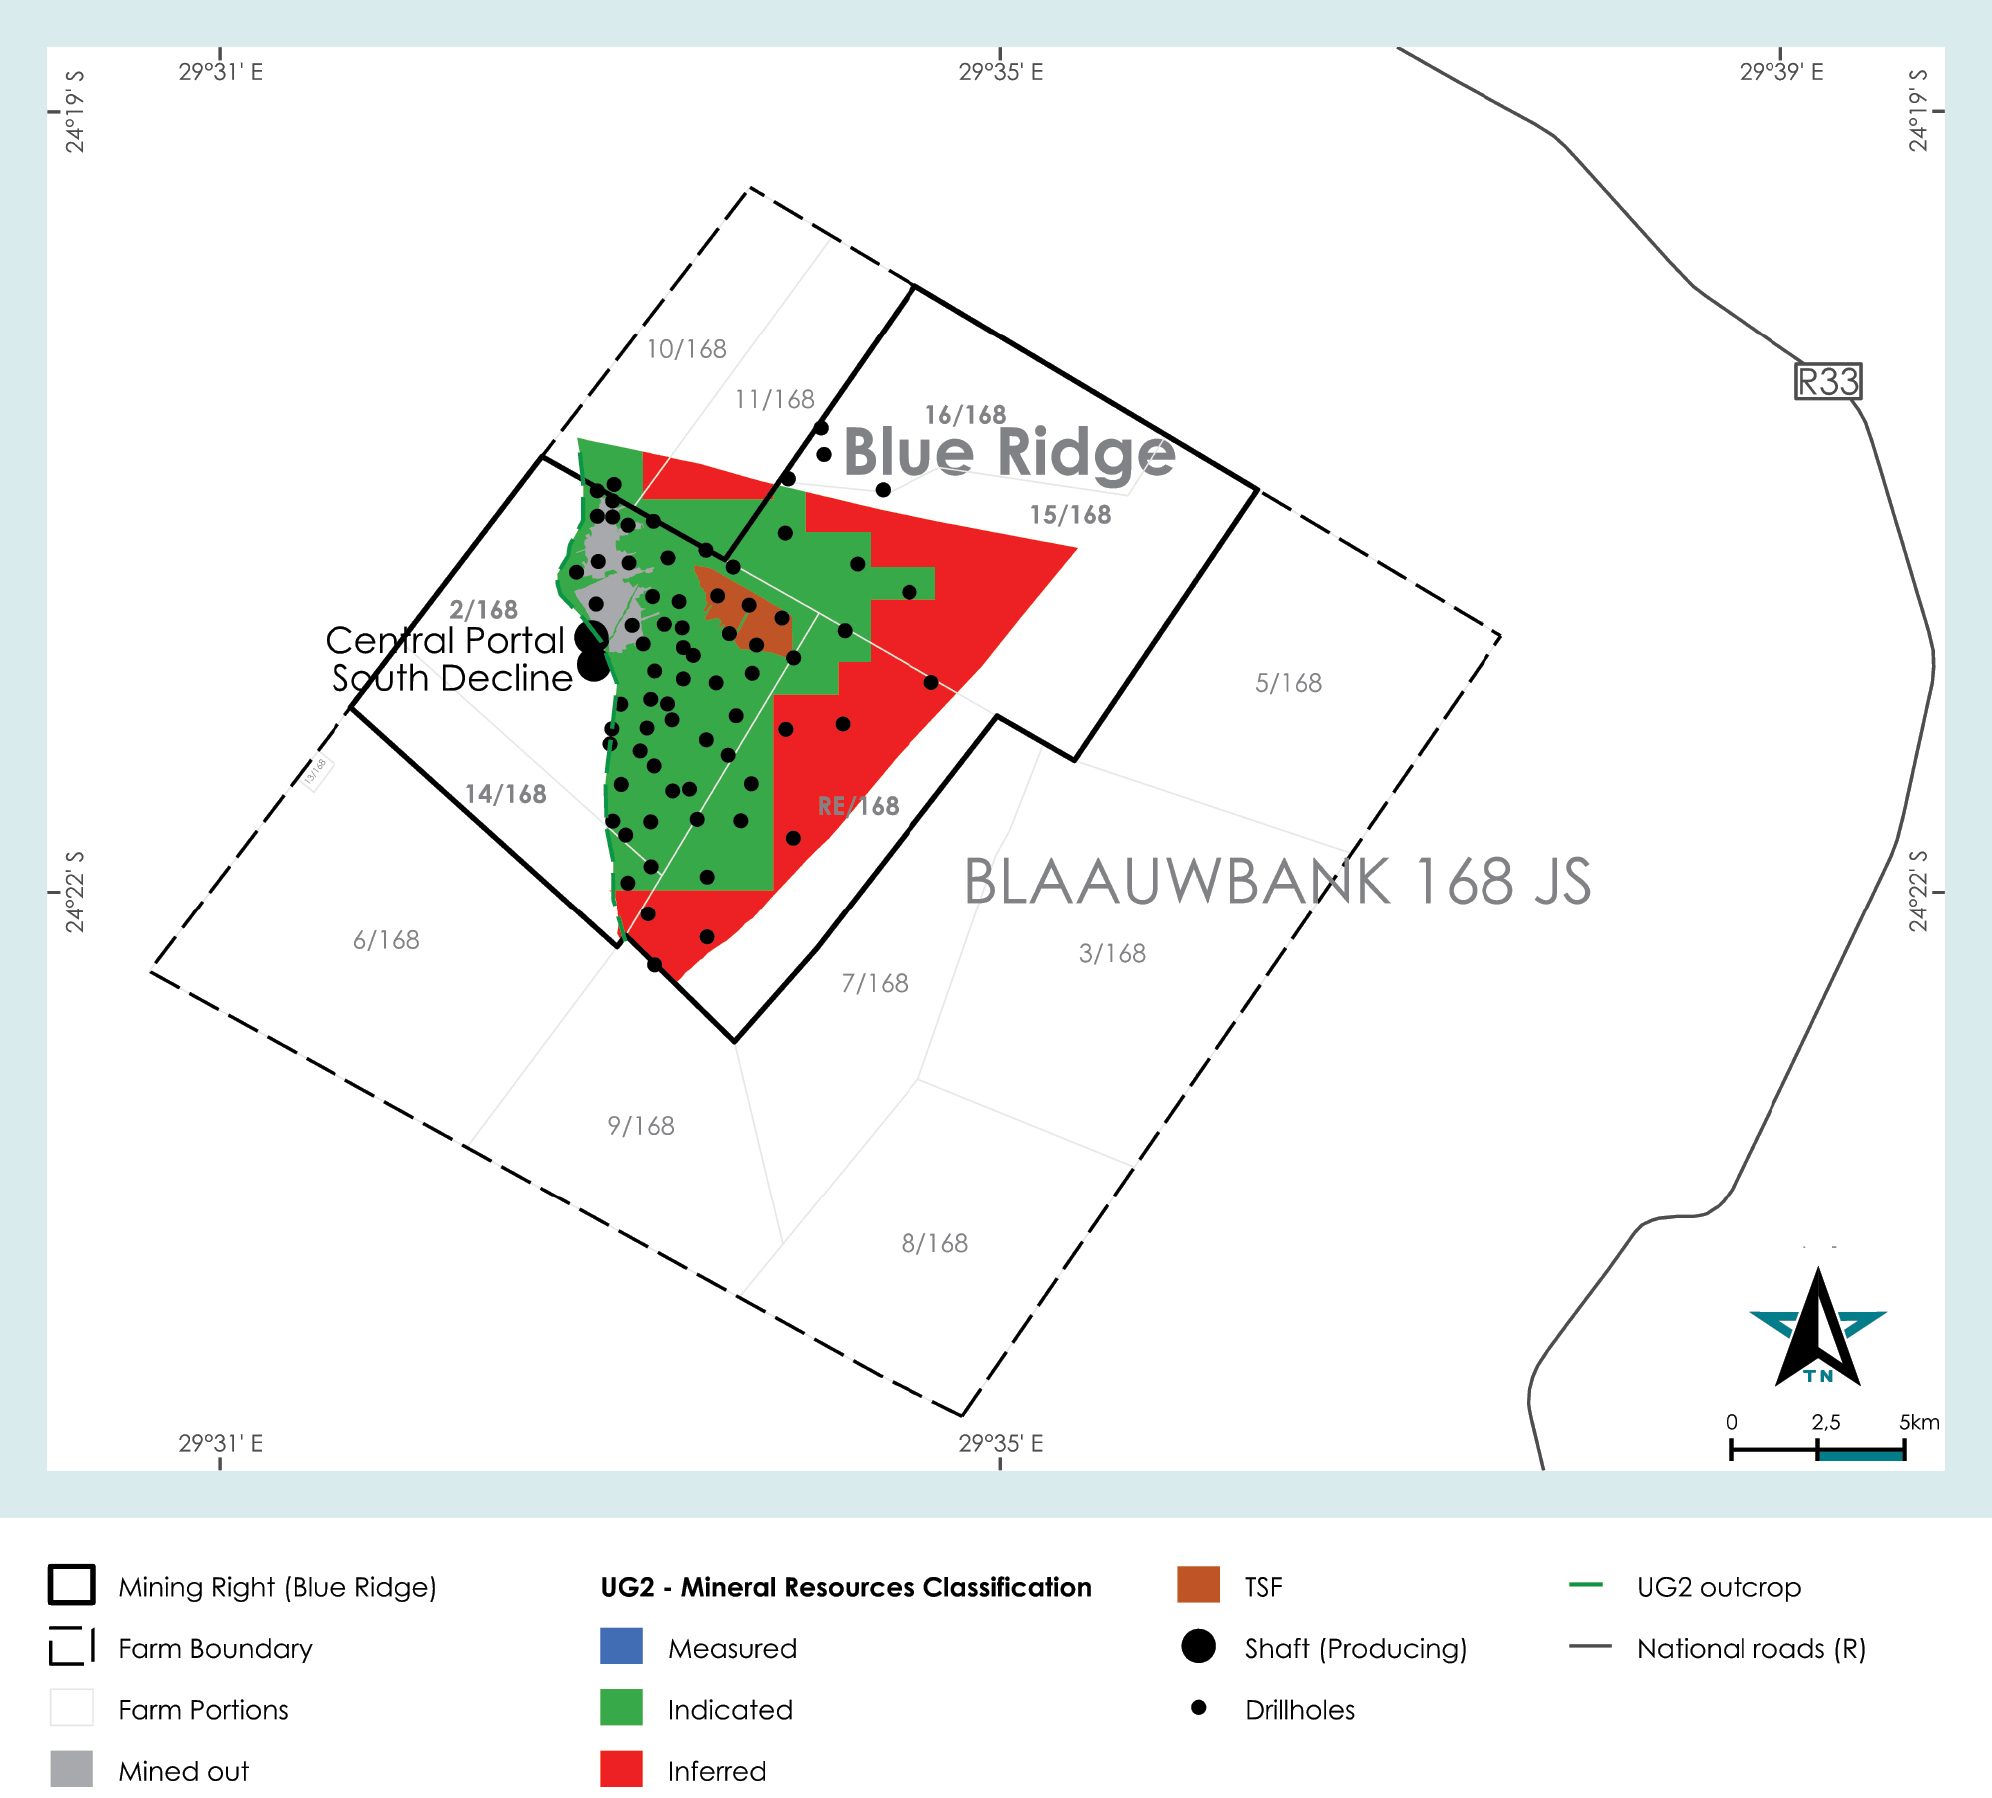
Sibanye-Stillwater also has interests in three PGM exploration projects in Southern Africa, namely Akanani, Limpopo and Blue Ridge.
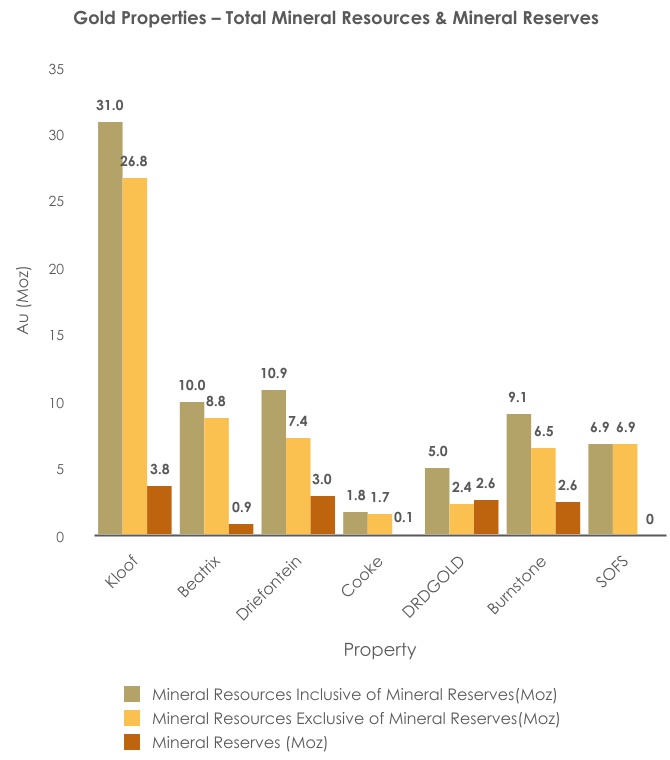
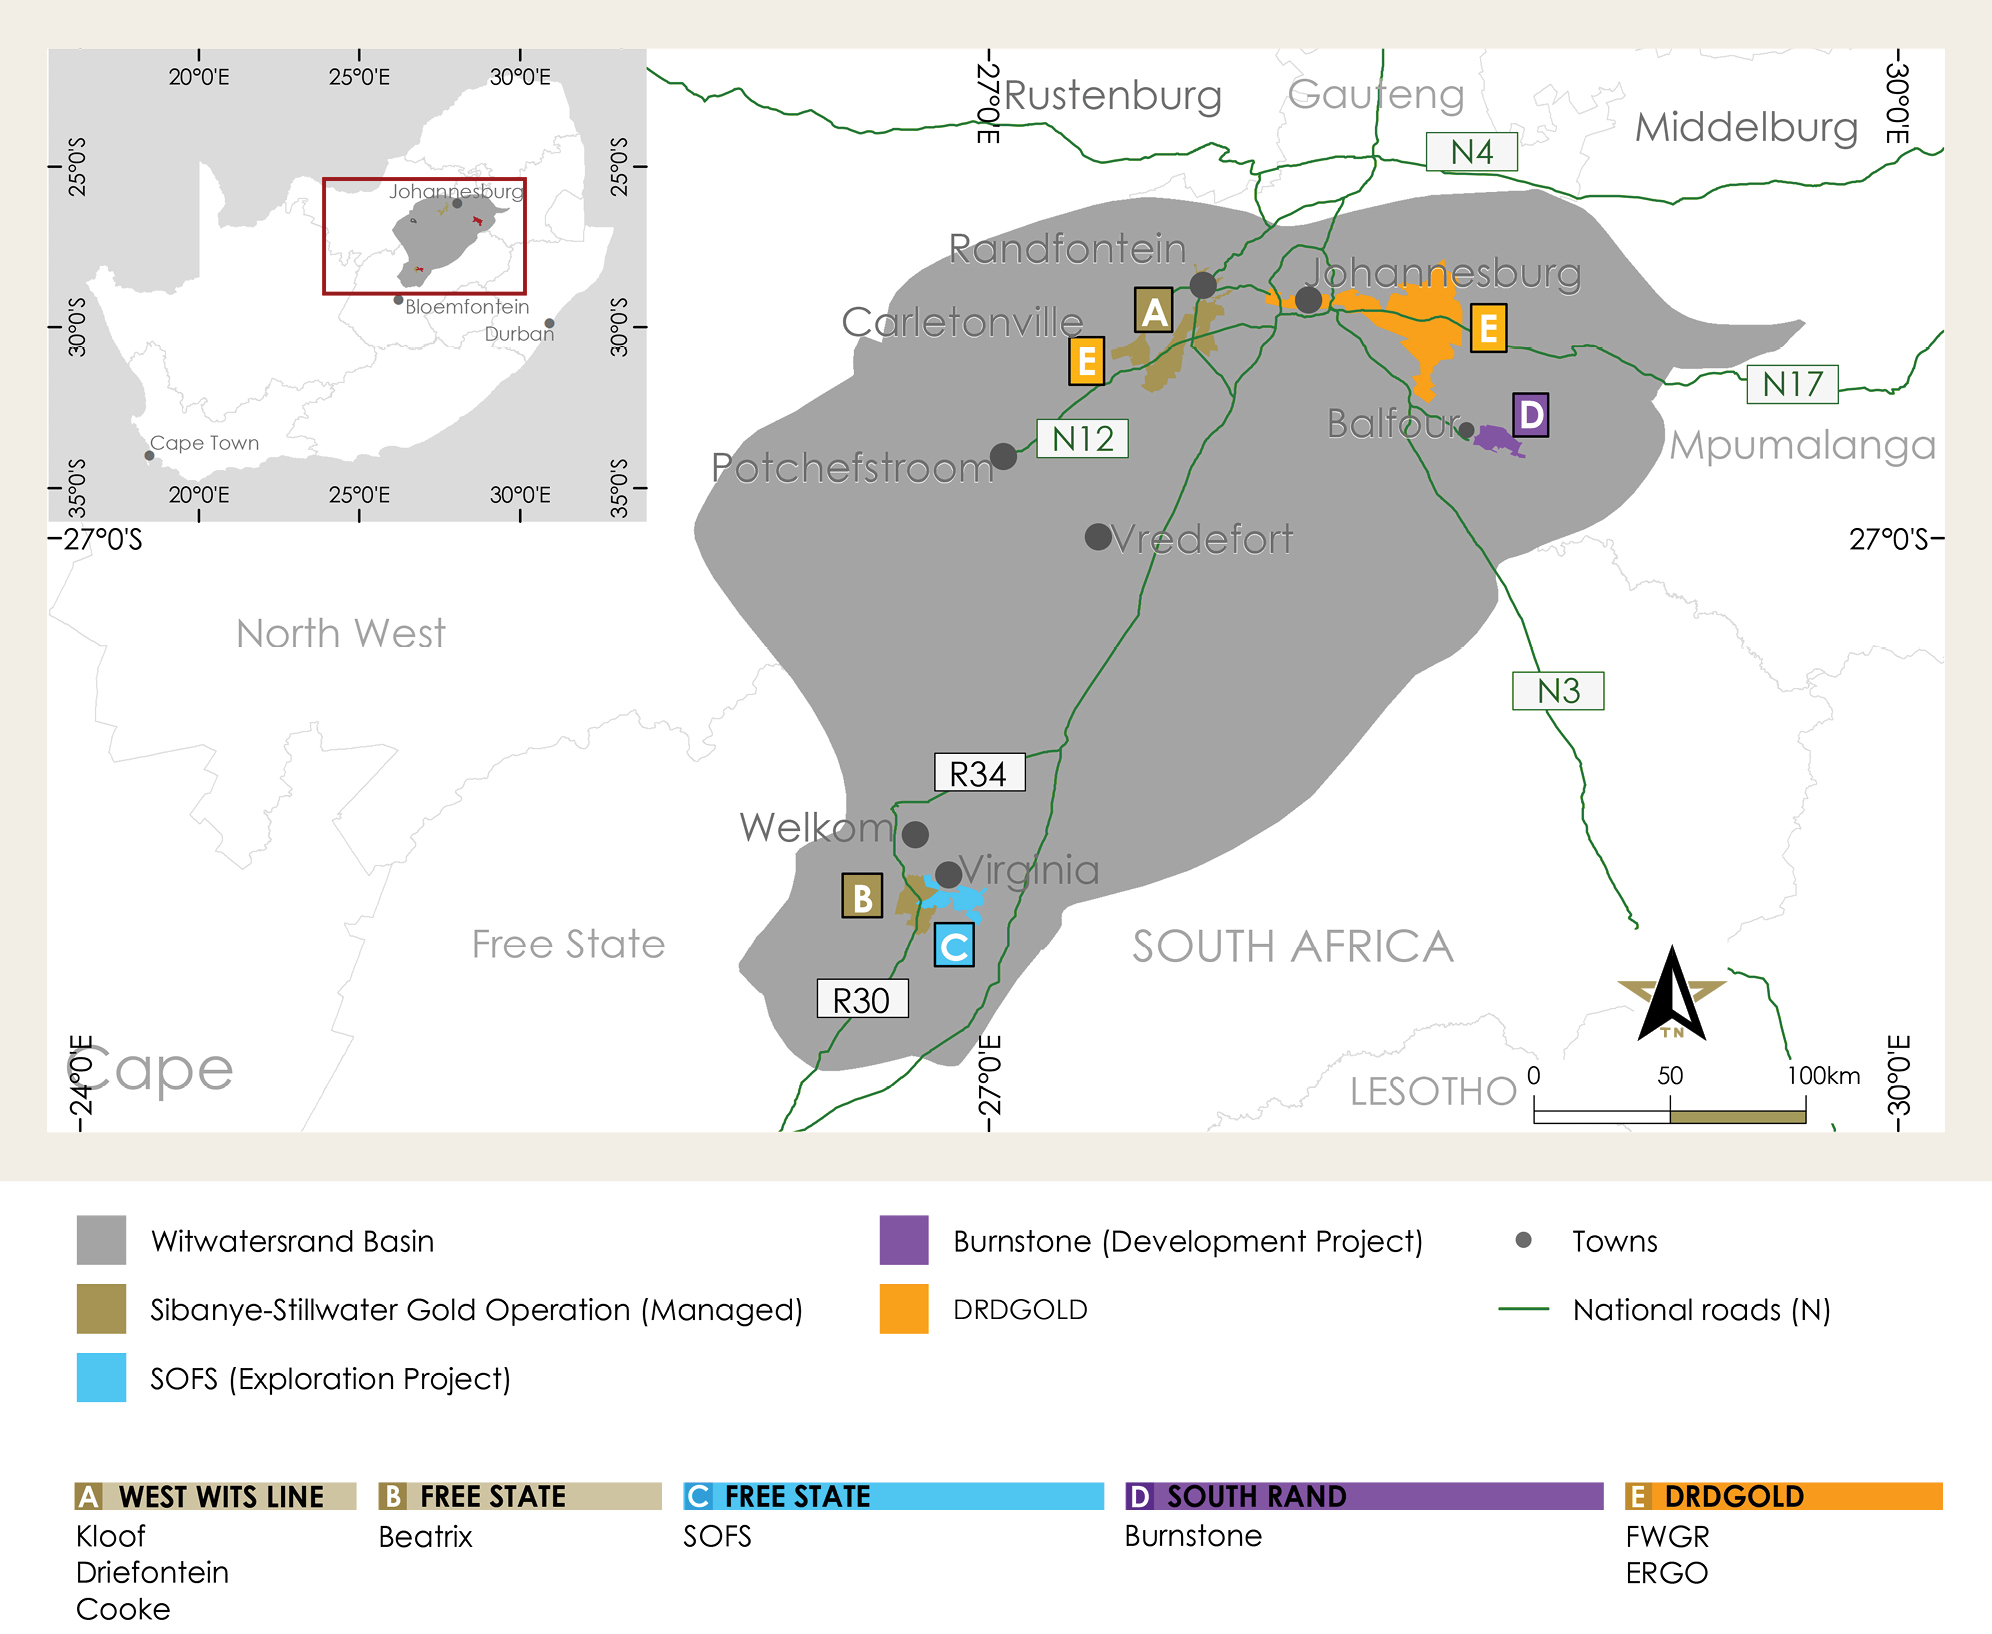
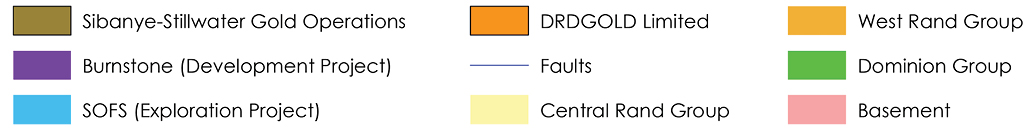
GOLD:
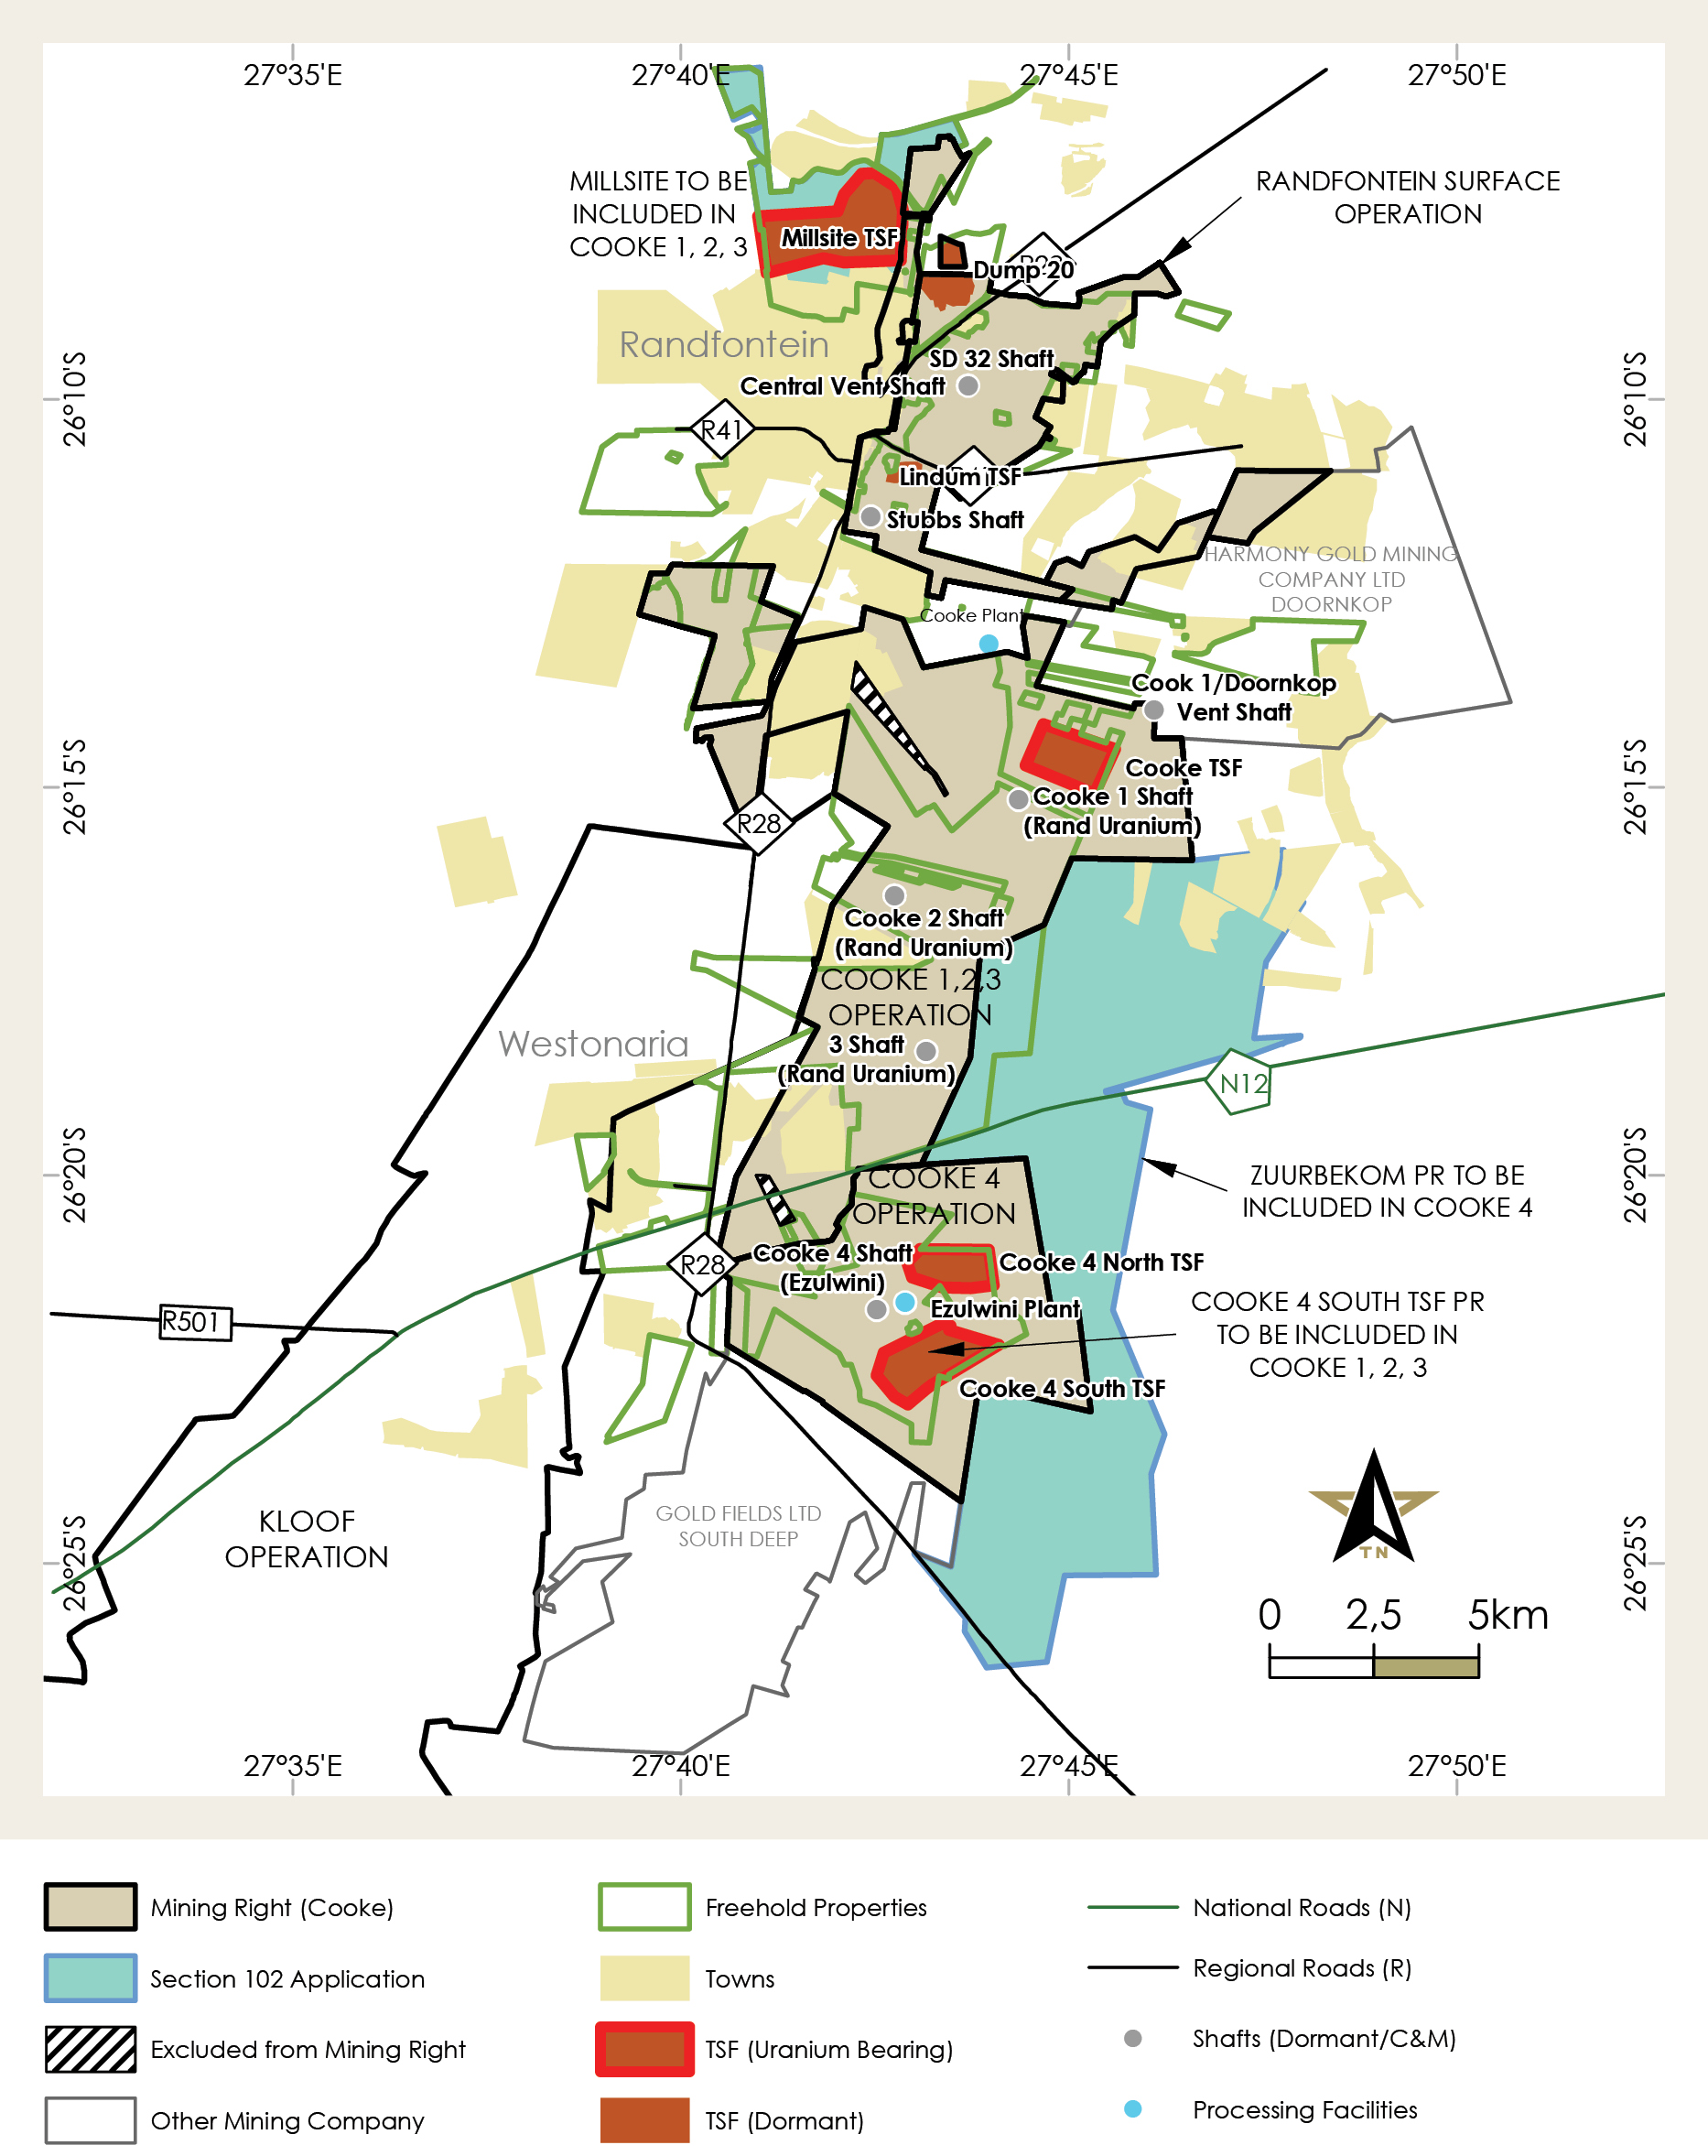
The gold operations consist of four managed, gold producing, underground and surface operations in South Africa, namely the Kloof, Driefontein and Cooke operations in the West Wits region and the Beatrix operation in the Free State province. In addition to its mining activities, Sibanye-Stillwater owns and manages significant metallurgical processing facilities at all its operations where gold-bearing ore is treated, and gold extracted. Sibanye-Stillwater also has an effective 50.66% stake in DRDGOLD Limited, which operates surface tailings retreatment facilities at the Far West Gold Recoveries operation and the ERGO Gold Recoveries operation.
Gold Projects:
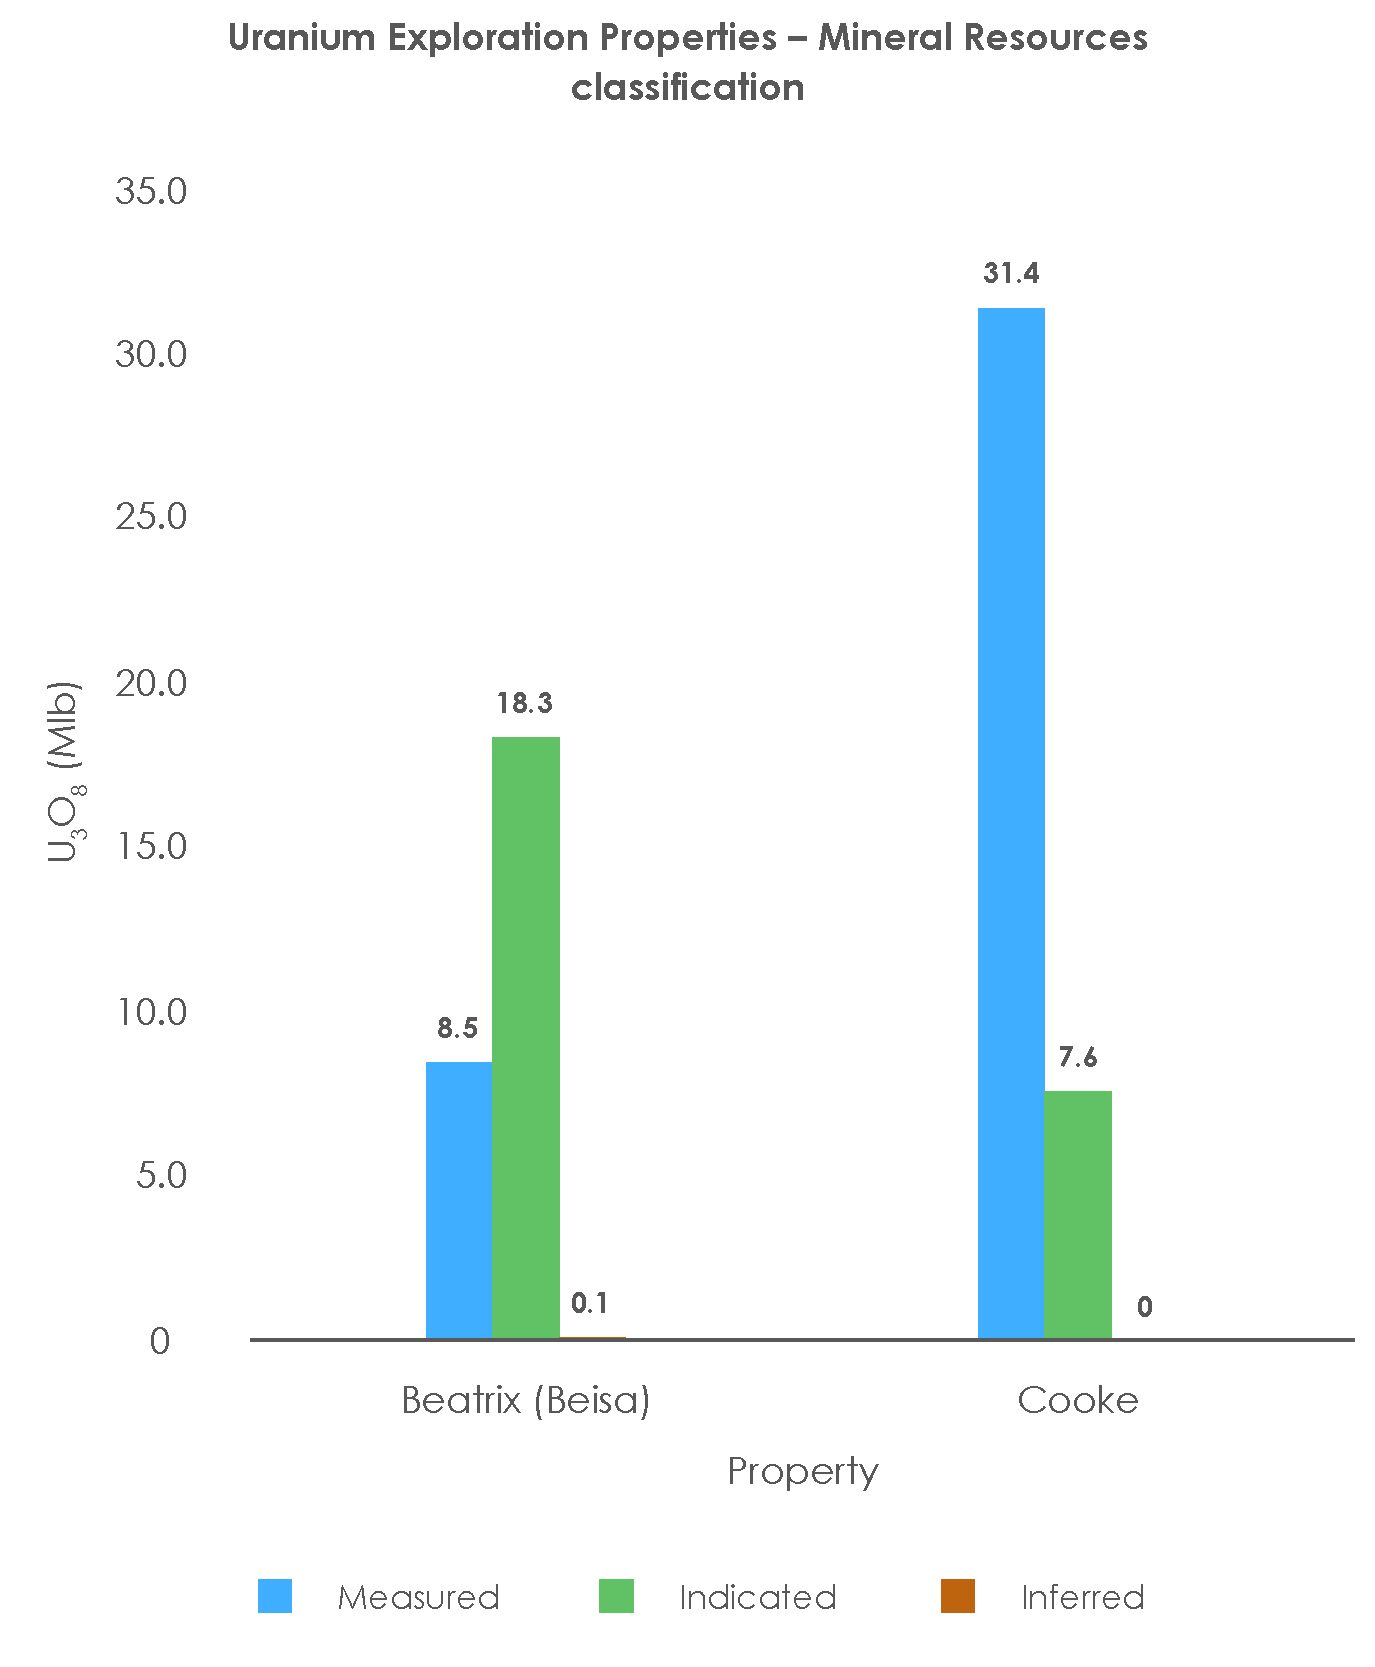
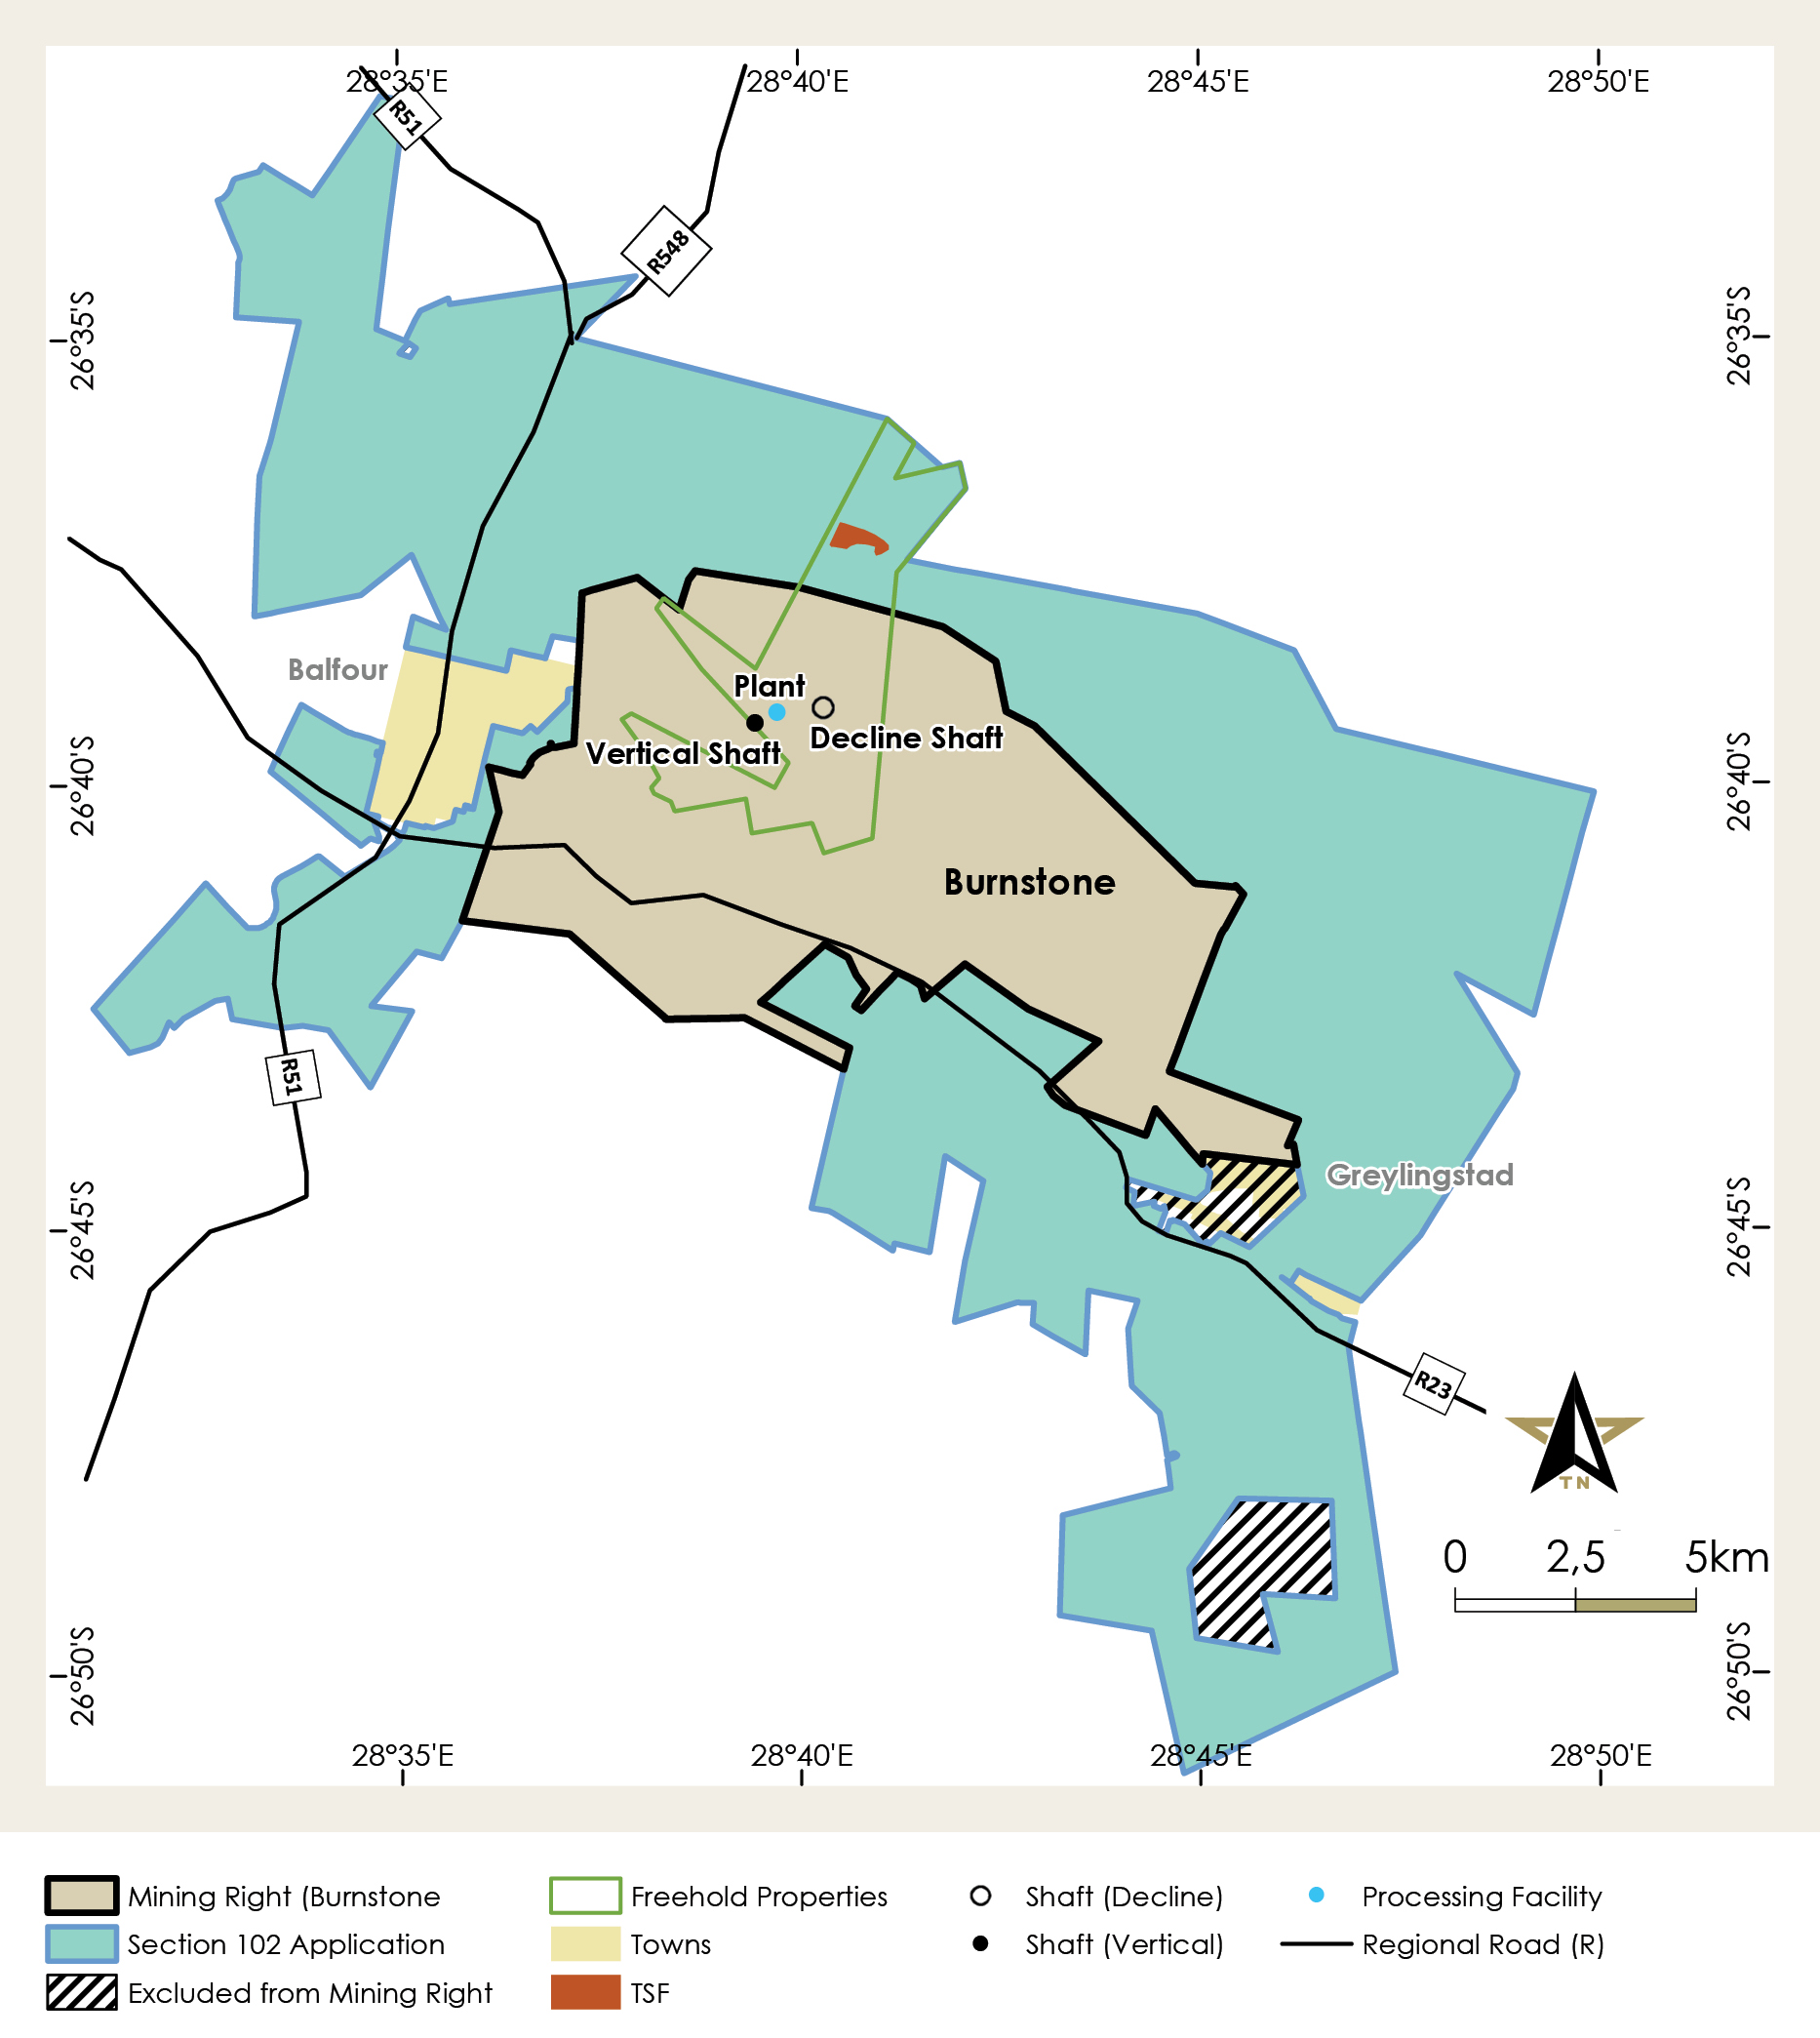
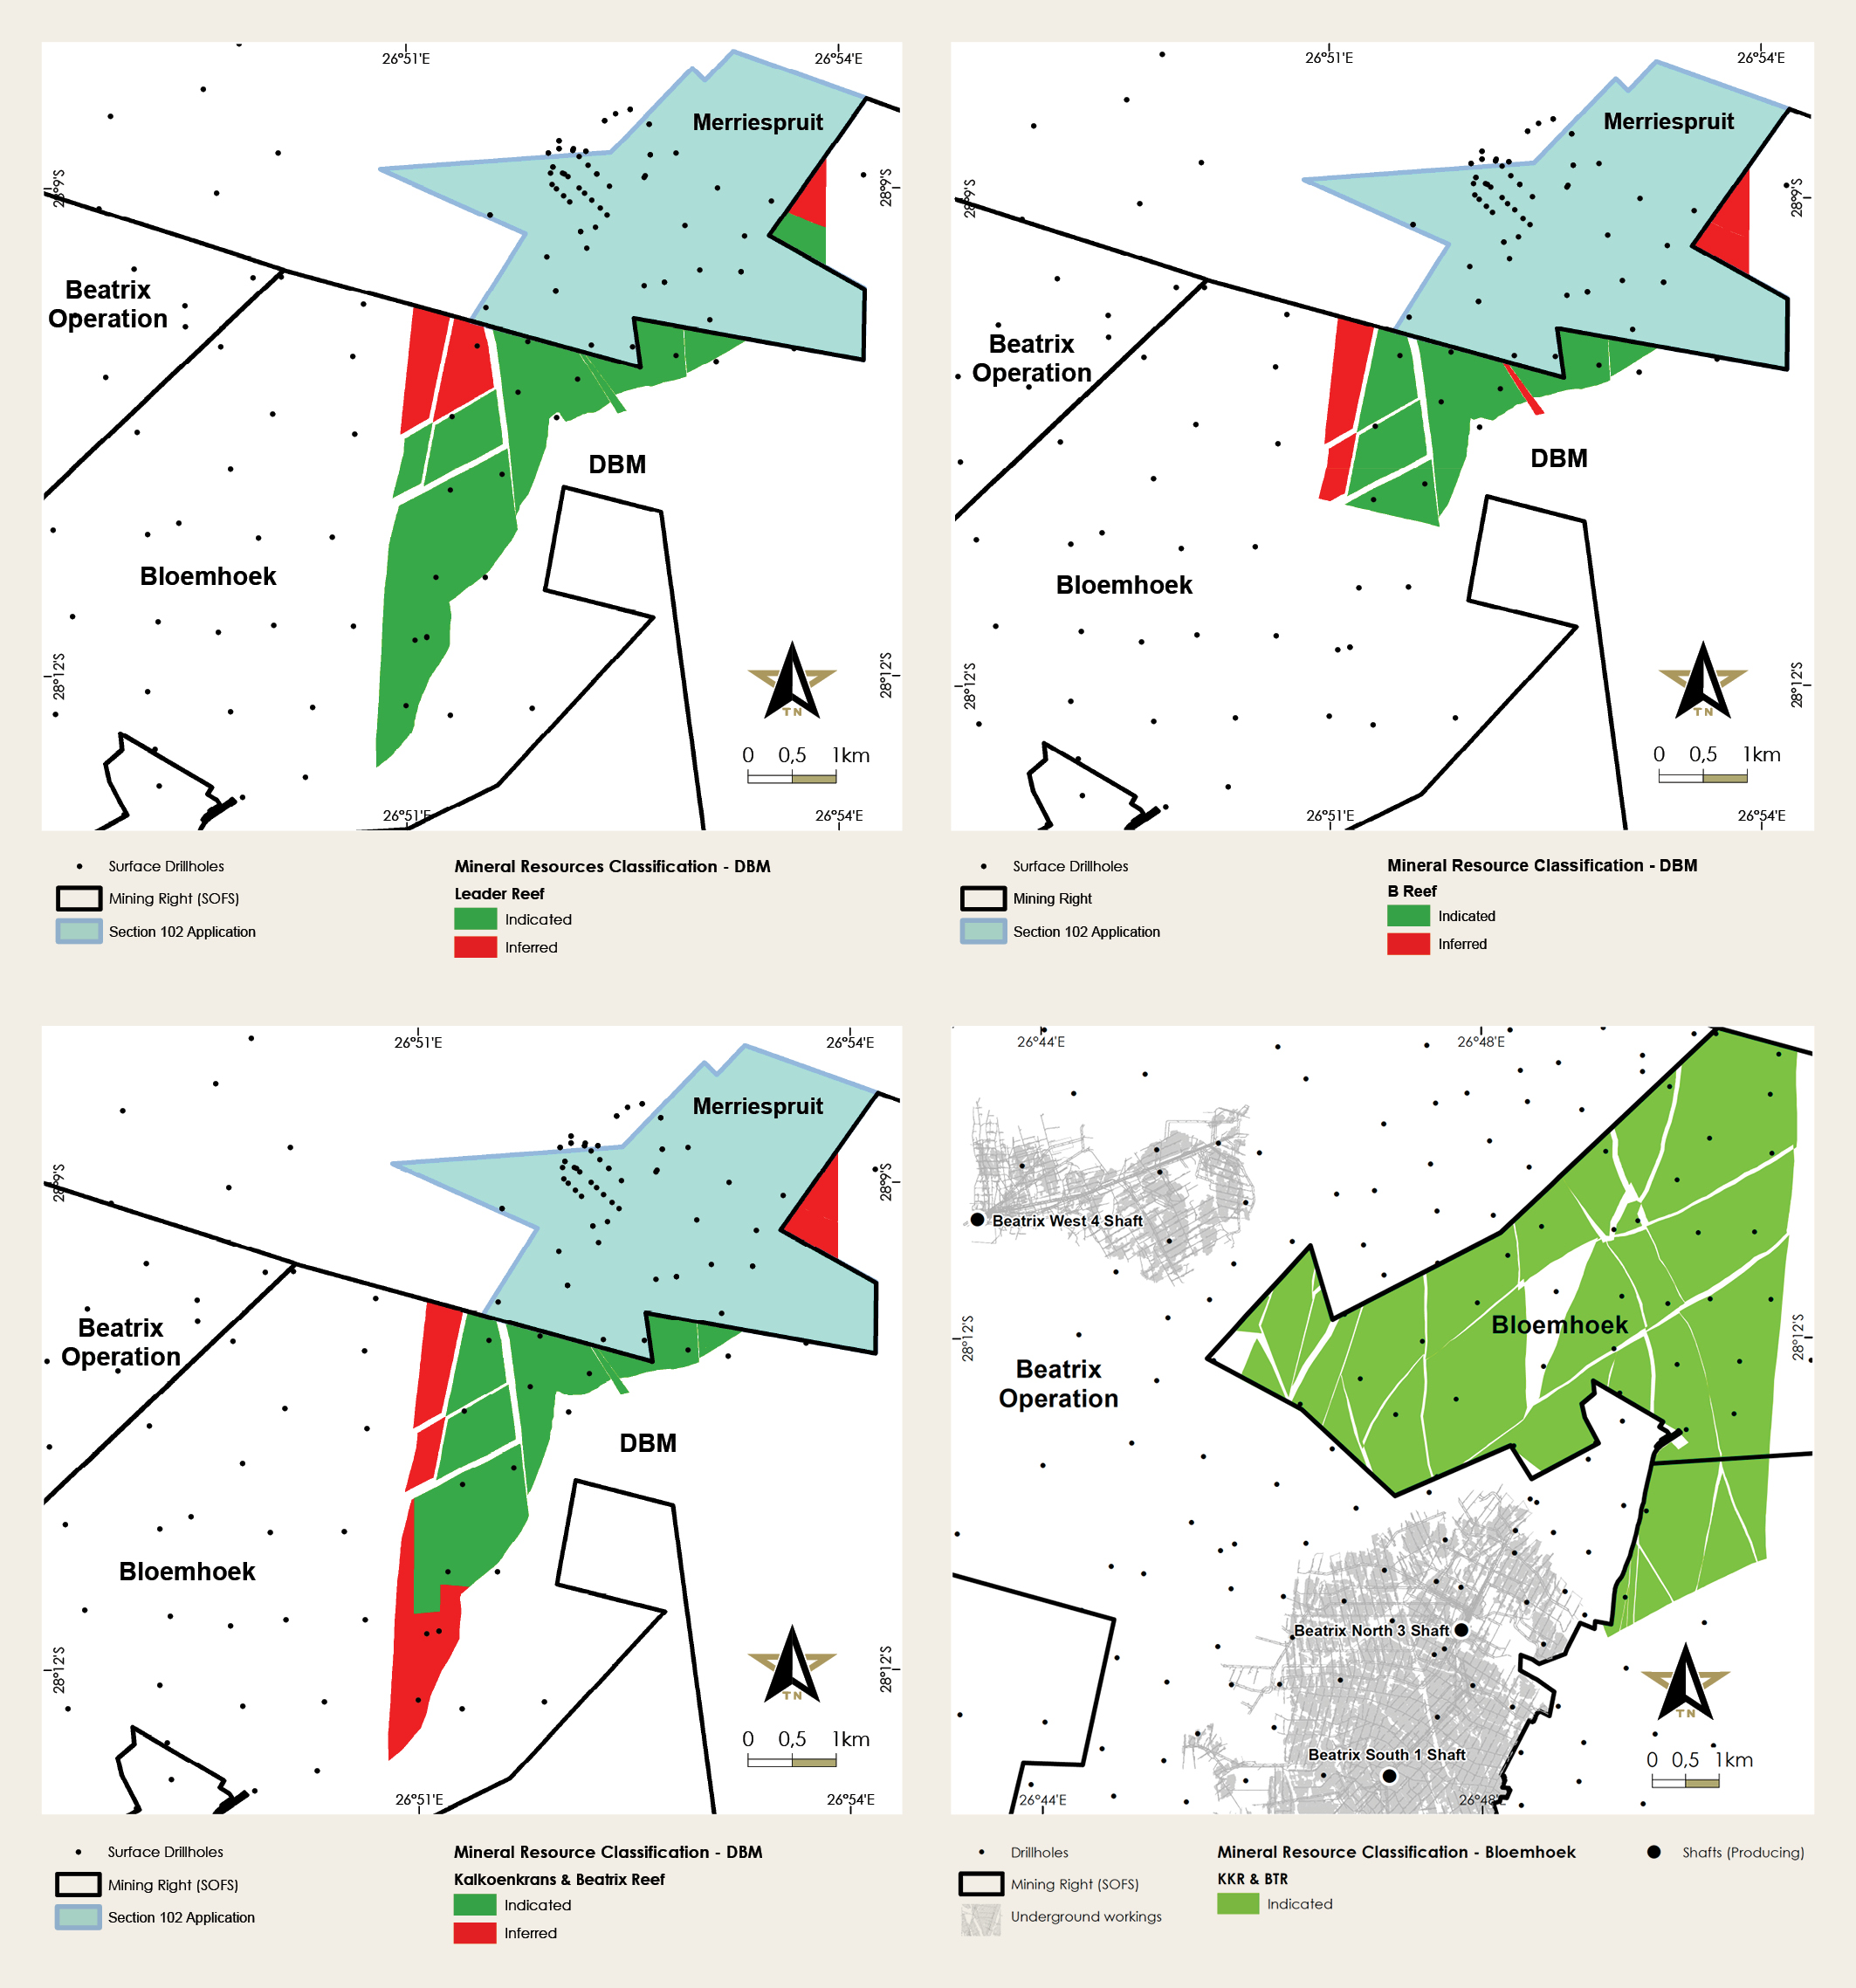
The Burnstone project, located in Mpumalanga province, is now in the project development phase. The Group's wholly-owned and managed projects in study phase include Bloemhoek, De Bron Merriespruit and Beisa. Bloemhoek and De Bron are both gold projects and Beisa is a uranium project.
Green Metal Projects:
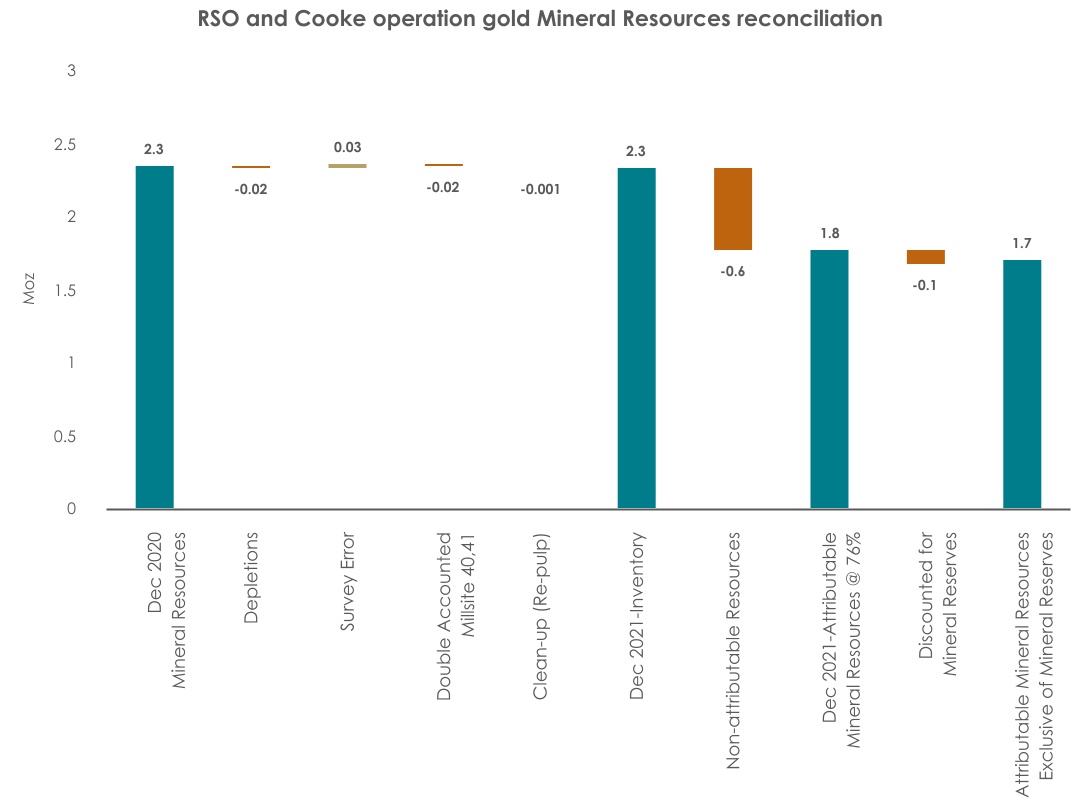
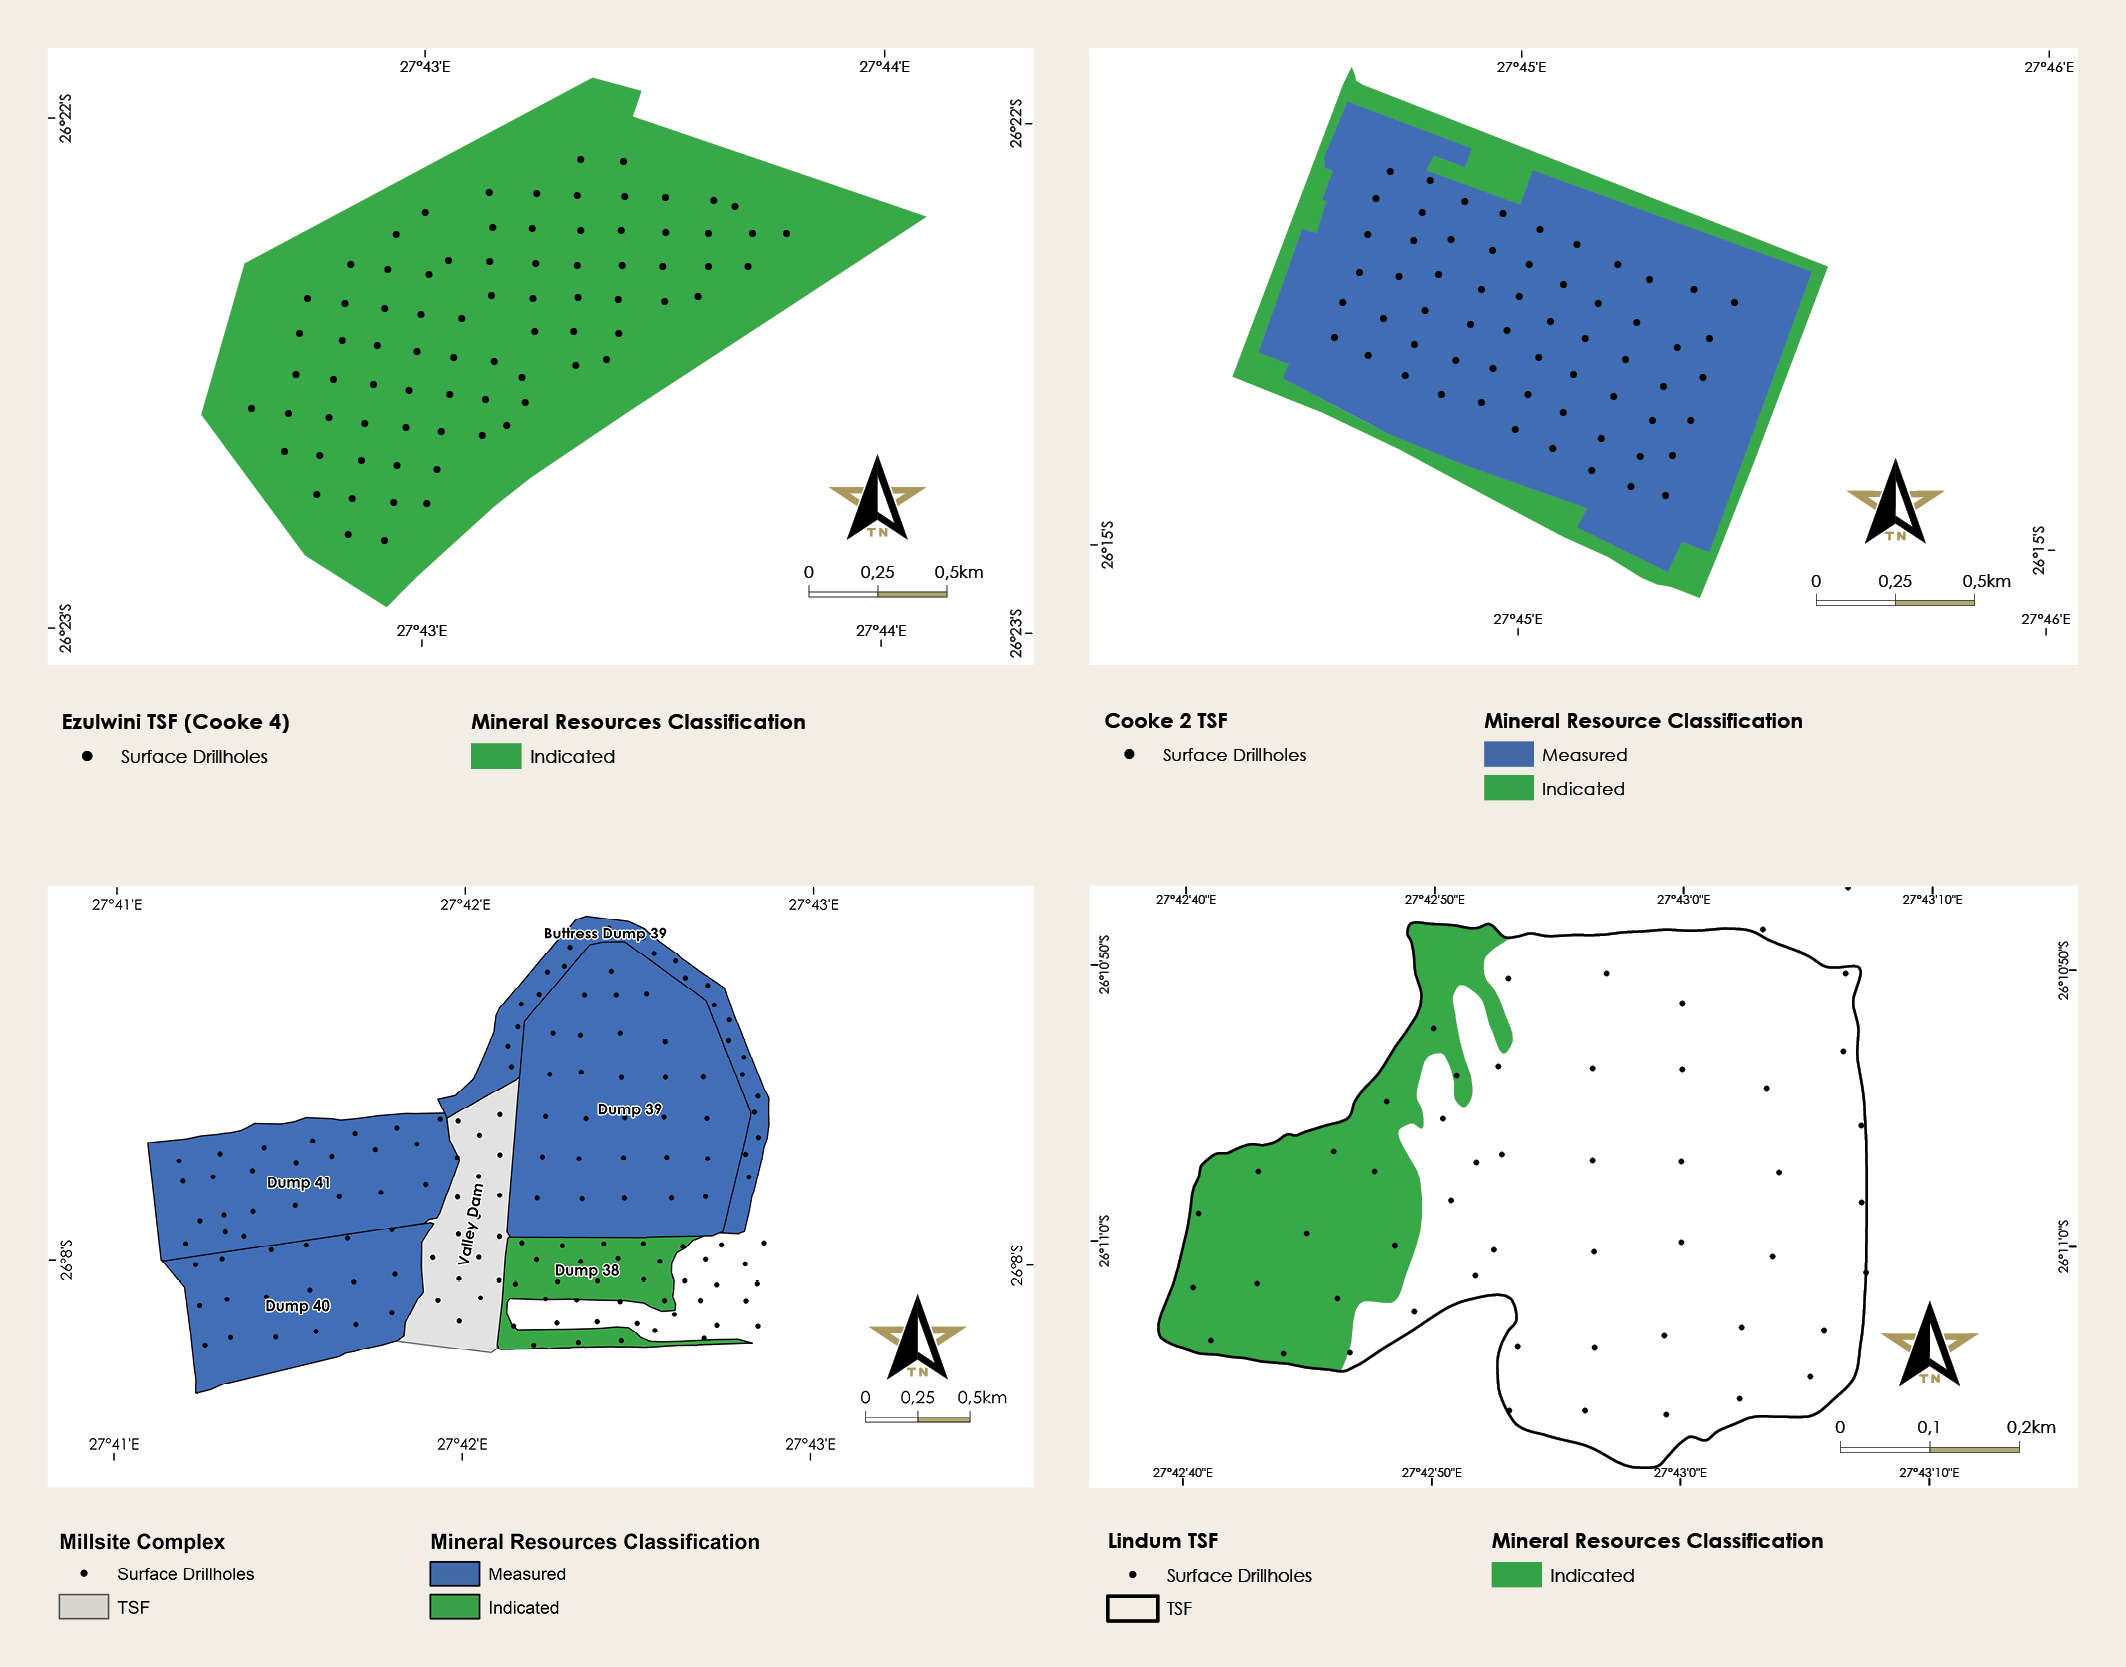
Significant deposits of uranium are present in the historic tailings storage facilities of the Cooke Operation, as well as in the Beisa Reef at the Beatrix operation. These are considered exploration projects even though they occur within existing, operational mining rights.
Europe
Management’s discussion and analysis of the financial statements continued
Green Metal Project:
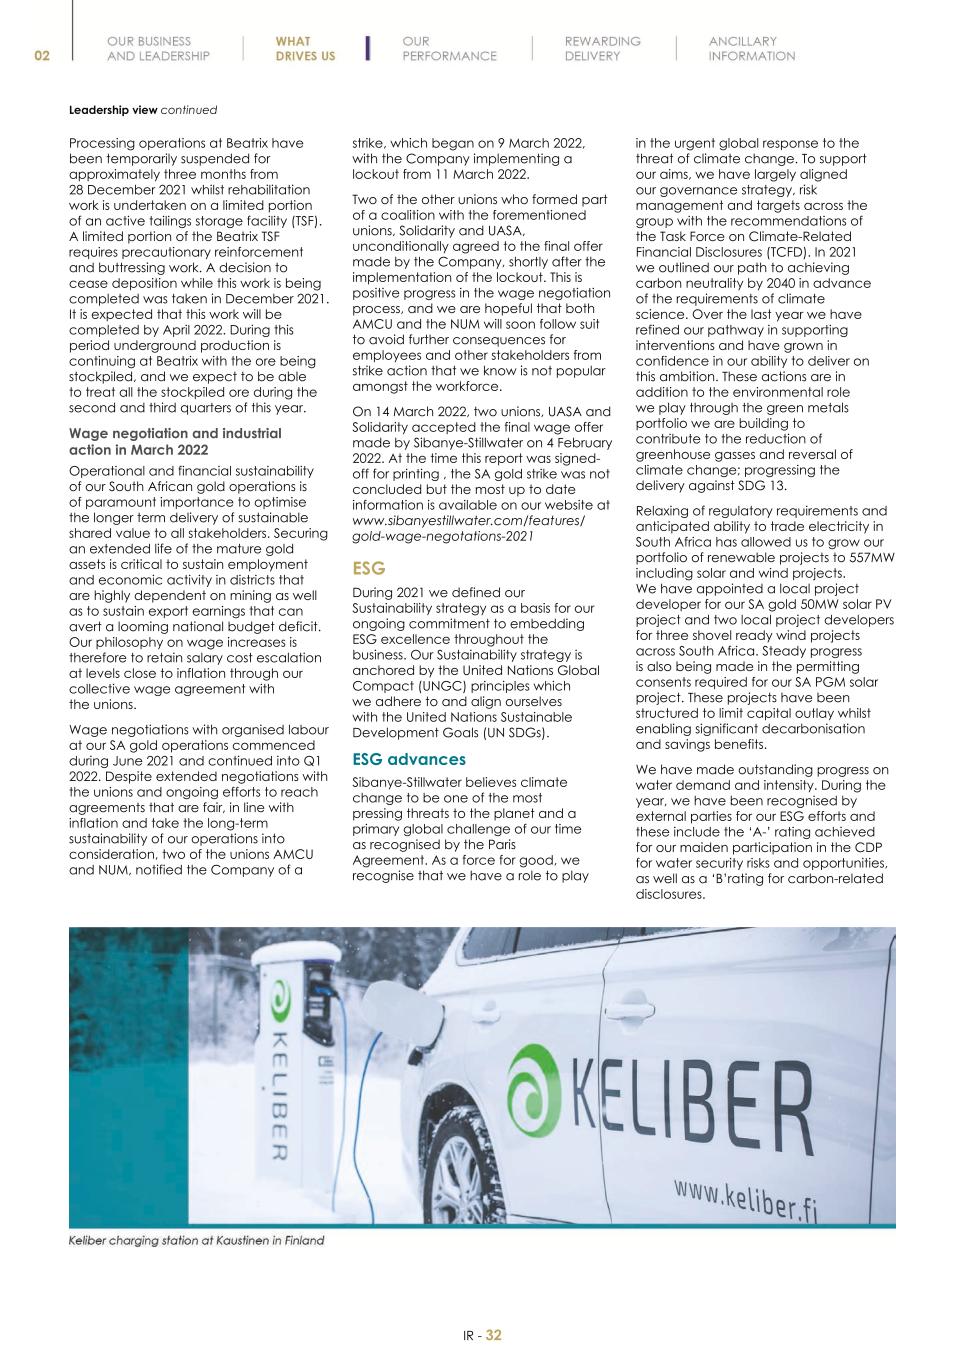
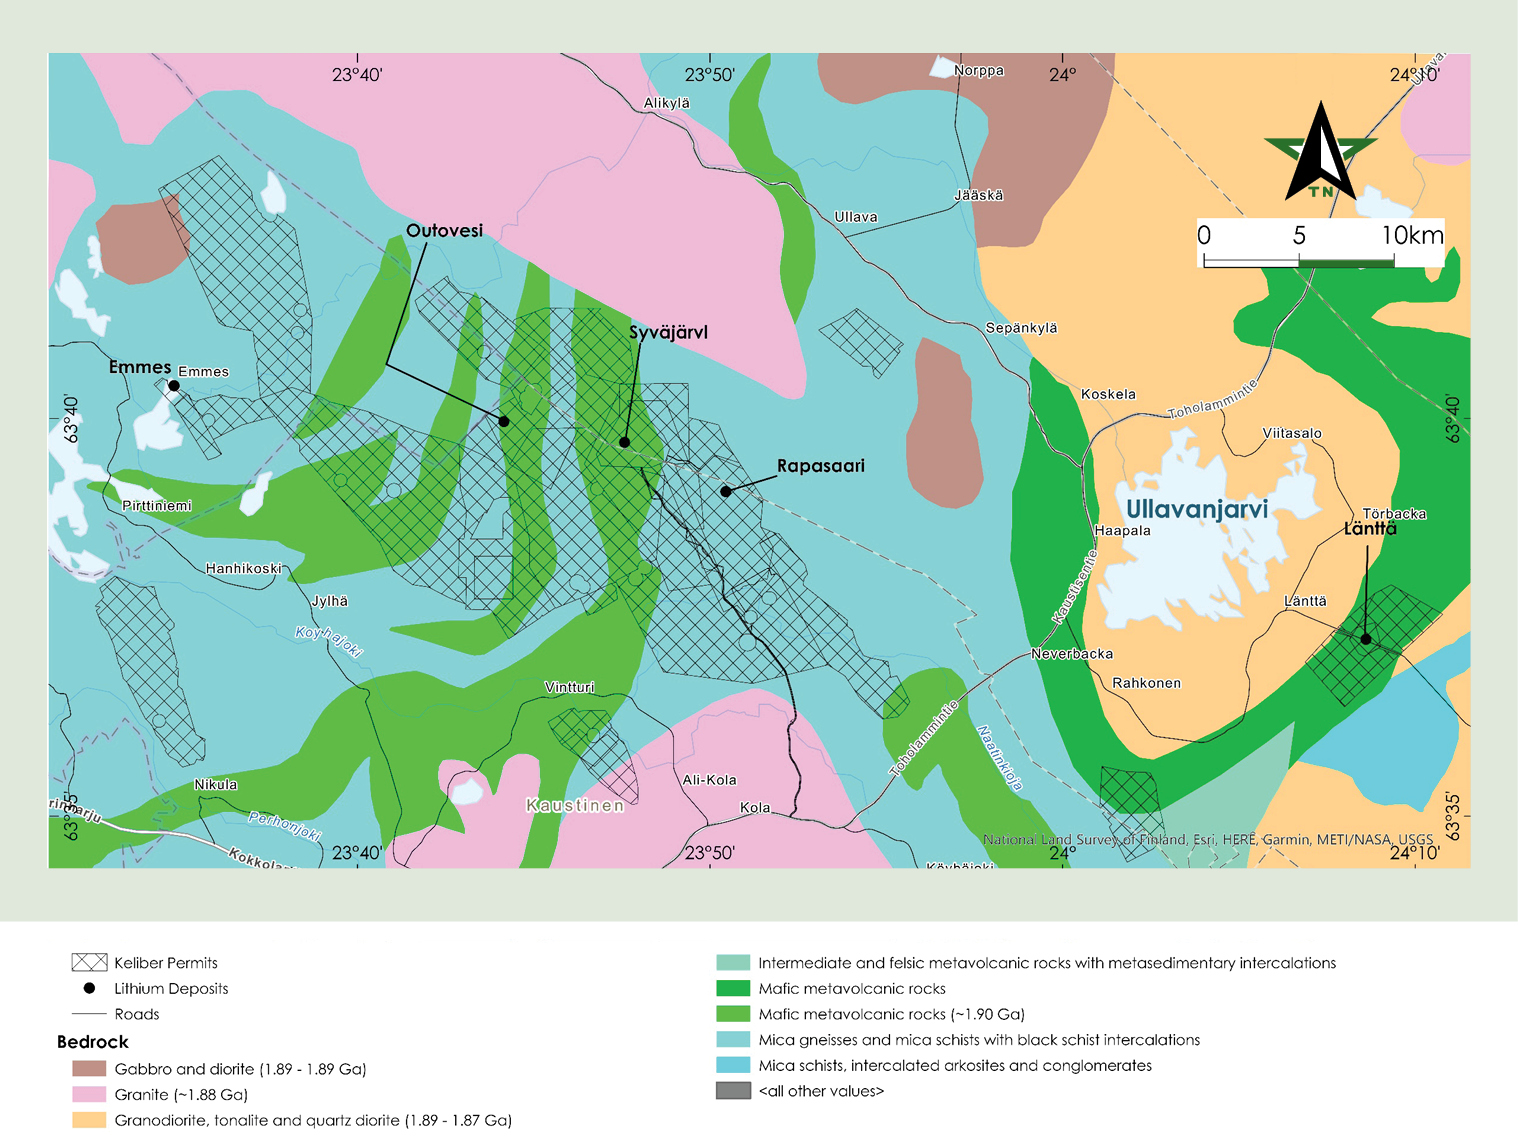
During the first quarter of 2021, Sibanye-Stillwater secured an entry into the battery metals sector through a partnership with and investment into Keliber, a leading European lithium project in Finland. The Company holds a 26.6% stake in the project, with an option to increase its shareholding to greater than 50% on completion of a definitive feasibility study.
Australia
Green Metal Investment:
During the fourth quarter of 2021, Sibanye-Stillwater acquired a 19.99% equity interest in New Century Resources Limited (New Century), an Australian company focused on the economic re-treatment and rehabilitation of tailings storage facilities and which currently operates the largest tailings retreatment operation in Australia, i.e. the Century Zinc Mine in Queensland.
Metals and Production Summary
At our PGM operations in South Africa and Zimbabwe, the primary PGMs produced are platinum, palladium and rhodium, which together with gold, are referred to as 4E (3PGM+Au). Production by ratio in 2021 was approximately 59% (2020: 60%) platinum (Pt), 30% (2020: 30%) palladium (Pd), 9% (2020: 8%) rhodium (Rh) and 2% (2020: 2%) gold (Au). During 2019 Sibanye-Stillwater changed from a purchase of concentrate (POC) to a toll treatment (Toll) arrangement with Anglo American Platinum Limited (Anglo Plats) to smelt and refine concentrate from its Rustenburg operation but retains ownership of the refined 4E metal produced. At our Marikana operation all concentrate is refined by the precious metal refinery, Kroondal and Platinum mile operations remain on a POC agreement. The Marikana operation has agreements in place to purchase concentrate from third parties or toll treat PGM bearing material on their behalf. The processing of third party material allows better utilisation of smelting and refining capacity. During 2021 the Marikana operation entered into a further short-term purchase of concentrate and toll treatment arrangement that commenced on 1 February 2021 and ended on 31 December 2021. As part of this arrangement, Marikana agreed to buy and toll treat certain metals that are contained in the PGM concentrate and furnace matte. A percentage of the toll treated metals is also retained as partial payment for the toll treatment arrangement.
For 2021 the US PGM operations primarily produce palladium 77% (2020: 78%) and platinum 23% (2020: 22%), referred to as 2E (or 2PGM). The PGM-bearing ore mined is processed and smelted to produce a PGM-rich filter cake. A third party refines the filter cake to produce refined PGMs.
The major sources of demand for PGMs are for use in autocatalysts and jewellery. Combined, these two areas accounted for around 64% (2020: 53%) of gross platinum demand in 2021. Gross autocatalyst demand alone accounted for 39% (2020: 30%) of platinum demand and for 85% (2020: 89%) of palladium demand in 2021.
Sibanye-Stillwater mines, extracts and processes gold-bearing ore at its SA gold operations to produce a beneficiated product, doré, which is then refined at Rand Refinery Proprietary Limited (Rand Refinery) into gold bars with a purity of at least 99.9% in accordance with the London Bullion Market Association’s standards of Good Delivery. Sibanye-Stillwater holds a 44% interest in Rand Refinery, one of the largest refiners of gold globally, and the largest in Africa. Sibanye-Stillwater sells the refined gold to its customers who are international and local banks based in South Africa and a residual amount, below 5%, is sold to Rand Refinery.
The main sources of demand for gold are as a store of value (such as central bank holdings), as an investment (exchange traded funds, bars and coins), jewellery and for various industrial purposes.
In 2021, Sibanye-Stillwater delivered attributable PGM production of 0.57Moz (2E) (2020: 0.60Moz (2E)) and 1.90Moz (4E) (2020: 1.58Moz (4E)), and produced 33,372kg (1.07Moz) (2020: 30,561kg (0.97Moz)) of gold, from its US PGM, SA PGM and SA gold operations respectively.
During the 2021 year, Sibanye-Stillwater recognised a record profit of R33,796 million (2020: profit of R30,622 million), of which R33,054 million (2020: R29,312 million) is attributable to the owners of Sibanye-Stillwater.
At 31 December 2021, Sibanye-Stillwater had the following mineral reserves:
•2E PGM mineral reserves of 27.3Moz (2020: 26.9Moz);
•4E PGM mineral reserves of 32.2Moz (2020: 39.5Moz);
•Gold mineral reserves of 13.1Moz (2020: 15.5Moz); and
•Zinc mineral reserve of 1,016.3Mlb (2020: nil).
The Zinc reserve was due to the inclusion of the attributable interest of 19.99% in the New Century tailings retreatment operation in Australia for the first time during 2021.
Management’s discussion and analysis of the financial statements continued
Strategy
Sibanye-Stillwater’s new three dimensional strategy includes:
1.Strategic foundation – Why we exist
2.Strategic essentials – How we operate
•Ensuring safety and well-being
•Prospering in every region in which we operate
•Achieving operational excellence and optimising long term resource value
•Maintaining a profitable business and optimising capital allocation
3. Strategic differentiators – How we grow, prosper and deliver sustainable impact
•Recognised as a force for good
•Unique global portfolio of green metals and energy solutions that reverse climate change
•Inclusive, diverse and enabling employees through harnessing innovation and technology ("bionic")
•Building pandemic-resilient ecosystems
Strategic M&A
Significant progress was made advancing our green metals strategy during 2021, with a series of transactions announced during H2 2021 following the acquisition of an initial 26.6% holding in the Keliber lithium project during H1 2021. These transactions represent the outcome of two years of careful market analysis and engagement in our strategic path towards building a climate change resilient business, enabling further international diversification in high quality and strategic assets that is set to deliver substantial future value and earnings diversification.
In summary the transactions comprise:
•During 2021, the Group acquired a 26.6% stake in the Keliber Lithium project for EUR25 million through a two tranche investment. A further EUR5 million third tranche payment in March 2022 secured a cumulative 30% interest in the project, with the option to increase this interest to over 50% following the conclusion of a definitive feasibility study which will dictate the funding requirements. Keliber is planned as the first fully integrated lithium producer in Europe with direct access to key European battery markets from the Port of Kokkola in Finland
•The acquisition of 100% of Eramet’s Sandouville nickel processing facilities in Le Havre, France was concluded on 4 February 2022 for an effective cash consideration of EUR85 million (adjusting for closing net debt and working capital). Following the investment in the Keliber lithium project in Finland, this acquisition consolidates Sibanye-Stillwater's presence in Europe, securing another strategic footprint in a favourable jurisdiction with strategic access to rapidly developing battery metal end user markets in Europe. Integration of the existing facility into the Group is underway with internal studies on optimisation of the facility and options for development of an adjacent property into a possible battery metals and recycling facility in progress
•On 16 September 2021 the Group announced a proposed 50:50 joint venture (JV) with ioneer with respect to the Rhyolite Ridge Lithium-Boron project in Nevada, USA. During quarter four 2021, the Group acquired a 7.1% direct equity interest in ioneer for approximately US$70 million. The Group’s option to acquire a 50% interest in the Rhyolite Ridge project JV for a US$490 million contribution for the development of the proposed project, remains subject to various conditions being met, including obtaining all relevant permits required to develop the project. Rhyolite Ridge is a world-class lithium project with the potential to become the largest and lowest cost lithium mine in the US and is strategically positioned close to the rapidly developing battery production facilities in the region. ioneer management continues to work closely with the US Fish and Wildlife Services and Bureau of Land Management on the current propagation studies for the Tiehm's buckwheat as part of the conservation plan
Management’s discussion and analysis of the financial statements continued
being developed for the project. The first seedling and propagation studies undertaken in 2020 were conducted by the University of Nevada – Reno
•In December 2021, the Group acquired a 19.9% stake in New Century, a leading Australian tailings reprocessing business for a cash consideration of A$61 million. The New Century investment is complementary to and enhances Sibanye-Stillwater’s established position as a leading global tailings retreatment business uniquely positioned to play a key role in green metal supply chains together with its investment in DRDGOLD, a leading international gold tailings retreatment business
The following financial review provides stakeholders with greater insight into the financial performance and position of the Group during the periods indicated.
Factors affecting Sibanye-Stillwater’s performance
Commodity prices
Sibanye-Stillwater’s revenues are primarily derived from the sale of the PGMs and gold that it produces, from its own mines and its recycling facilities. For mined production, Sibanye-Stillwater does not generally enter into forward sales, commodity derivatives or other hedging arrangements in order to establish a price in advance of the sale of its production, unless these derivatives are used for risk mitigation and project funding initiatives. As a result, Sibanye-Stillwater is normally fully exposed to changes in commodity prices for its mined production. Metals from recycled material, which is solely produced at the Columbus metallurgical facilities in Montana, are sold forward at the time the material is purchased and they are delivered against the forward sales contracts when the ounces are recovered. This negates commodity price volatility and exposure during the outturn period of approximately sixty to ninety days.
As detailed previously, PGM and gold hedging is considered under one or more of the following circumstances: to protect cash flows at times of significant capital expenditures; financing projects; or to safeguard the viability of higher cost operations, see –Consolidated financial statements– Notes to the consolidated financial statements–Note 36.2: Risk management activities.
Historically, platinum, palladium and rhodium prices have been subject to wide fluctuations and are affected by numerous factors beyond Sibanye-Stillwater’s control, including international macroeconomic conditions and outlook, levels of supply and/or demand, any actual or potential threats to the stability of supply and/or demand, inventory levels maintained by users and producers, liquidity of above ground excess inventories, actions of participants in the commodities markets and currency exchange rates, particularly the rand to the US dollar. 2021 was no exception which saw PGM metal prices peaking during H1 2021 and then experiencing a pullback in H2 2021.
In addition, platinum, palladium and rhodium exchange-traded funds (ETFs) have added a further element of unpredictability and volatility to the pricing environment and may increase volatility in PGM prices, particularly during structurally tight markets. ETF investors may exhibit procyclical behavior, purchasing shares in ETFs during times of rising prices and selling holdings during periods of declining prices. This behavior may exacerbate short term price volatility. The market prices of platinum, palladium, rhodium and other PGMs have been, and may in the future be, subject to rapid short-term changes.
The volatility of the price of platinum is illustrated in the platinum price table below (which shows the annual high, low and average of the market price of platinum). Over the period from 2019 to 2021, the platinum price has fluctuated between a high price of US$1,340/oz and a low price US$605/oz.
| | | | | | | | | | | |
| US$/oz1,2 |
| Platinum | High | Low | Average |
| 2019 | 985 | 777 | 864 |
| 2020 | 1,074 | 605 | 885 |
| 2021 | 1,340 | 906 | 1,091 |
| 2022 (through 31 March 2022) | 1,181 | 944 | 1,031 |
1Rounded to the nearest US dollar | | | |
2Metal price sourced from IRESS | | | |
The market price of platinum was US$969/oz at 31 December 2021 and was US$990oz on 14 April 2022.
The volatility of the price of palladium is illustrated in the palladium price table below (which shows the annual high, low and average of the market price of palladium). Over the period from 2019 to 2021, the palladium price has fluctuated between a high price of US$3,020/oz and a low price US$1,260/oz.
| | | | | | | | | | | |
| US$/oz1,2 |
| Palladium | High | Low | Average |
| 2019 | 1,993 | 1,260 | 1,570 |
| 2020 | 2,814 | 1,589 | 2,203 |
| 2021 | 3,020 | 1,594 | 2,398 |
| 2022 (through 31 March 2022) | 3,433 | 1,821 | 2,334 |
1Rounded to the nearest US dollar | | | |
2Metal price sourced from IRESS | | | |
The market price of palladium was US$1,897/oz at 31 December 2021 and was US$2,367/oz on 14 April 2022.
Management’s discussion and analysis of the financial statements continued
The volatility of the price of rhodium is illustrated in the rhodium price table below (which shows the annual high, low and average of the market price of rhodium). Over the period from 2019 to 2021, the rhodium price has fluctuated between a high price of US$29,800/oz and a low price US$2,460/oz.
| | | | | | | | | | | |
| US$/oz1,2 |
| Rhodium | High | Low | Average |
| 2019 | 6,150 | 2,460 | 4,040 |
| 2020 | 16,650 | 5,500 | 11,174 |
| 2021 | 29,800 | 11,250 | 20,155 |
| 2022 (through 31 March 2022) | 22,200 | 14,100 | 17,932 |
1Rounded to the nearest US dollar | | | |
2Metal price sourced from IRESS | | | |
The market price of rhodium was US$14,100/oz at 31 December 2021 and was US$19,200/oz on 14 April 2022.
The market price of gold has historically been volatile and is affected by numerous factors over which Sibanye-Stillwater has no control, such as general supply and demand, speculative trading activity and global economic drivers. Further, over the period from 2019 to 2021, the gold price has fluctuated between a high price of US$2,067/oz and a low price US$1,270/oz.
The volatility of the price of gold is illustrated in the gold price table below (which shows the annual high, low and average of the London afternoon fixing price of gold).
| | | | | | | | | | | |
| US$/oz1,2 |
| Gold | High | Low | Average |
| 2019 | 1,546 | 1,270 | 1,393 |
| 2020 | 2,067 | 1,472 | 1,770 |
| 2021 | 1,967 | 1,684 | 1,799 |
| 2022 (through 31 March 2022) | 2,039 | 1,788 | 1,877 |
1Rounded to the nearest US dollar | | | |
2Metal price sourced from IRESS | | | |
The London afternoon fixing price of gold was US$1,820/oz at 31 December 2021 and was US$1,963/oz on 14 April 2022.
Exchange rate
Sibanye-Stillwater’s SA PGM and gold operations (with the exception of Mimosa) are all located in South Africa, and its revenues are equally sensitive to changes in the US dollar PGM (4E) basket and gold prices, and the rand/US dollar exchange rate (the exchange rate). Depreciation of the rand against the US dollar results in Sibanye-Stillwater’s revenues and operating margins increasing. Conversely, should the rand appreciate against the US dollar, revenues and operating margins would decrease. The impact on profitability of any change in the exchange rate can be substantial. Furthermore, the exchange rates obtained when converting US dollars to rand are set by foreign exchange markets, over which Sibanye-Stillwater has no control. The relationship between currencies and commodities, which includes the PGM (4E) basket and gold prices, is complex, and changes in exchange rates can influence commodity prices, and vice versa.
As a general rule, Sibanye-Stillwater does not enter into long-term currency hedging arrangements and is mainly exposed to the spot market exchange rate. Sibanye-Stillwater’s SA PGM and gold operations’ costs are primarily denominated in rand (with the exception of Mimosa), and forward cover could be considered for significant expenditures based in foreign currency or those items which have long lead times to production or delivery, see –Consolidated financial statements–Notes to the consolidated financial statements–Note 36.2: Risk management activities.
Costs
Sibanye-Stillwater’s cost of sales, before amortisation and depreciation comprise mainly labour and contractor costs, power and water, processing and smelting and consumable stores which include, inter alia, explosives, timber, cyanide, chemicals, steel balls, flotation collector, and other consumables. Sibanye-Stillwater expects that its cost of sales, particularly the input costs noted above, are likely to continue to increase in the near future and will be driven by inflation, general economic trends, market dynamics and other regulatory changes. In order to restrict these cost inputs, there is a continuous programme driven by operational initiatives throughout the Group to improve efficiencies and productivity.
The Marikana operational synergies project was closed out at the end of 2020 having realised R1,830 million, well above the initial transaction estimates of approximately R730 million per annum with the cost savings becoming part of the new cost base.
Following the outbreak of COVID-19 in South Africa, on 23 March 2020, there was a normalisation of the operations post COVID-19 disruptions, carrying through into 2021 with all segments having been able to successfully manage both operational performance and adherence to COVID-19 protocols in 2021.
Higher capital expenditure incurred during 2021 was partly due to the capital carry-over from 2020, as a result of COVID-19 when a decision was taken to defer capital expenditure.
The South African inflation rate or Consumer Price Index (CPI) was 4.5% in 2021 (2020: 3.3%). Inflation in the mining industry has historically been higher than CPI driven by above inflation wage increases, electricity tariffs, steel and steel related consumables.
Management’s discussion and analysis of the financial statements continued
Sibanye-Stillwater’s operations are labour intensive. Labour represented 26% and 31% of cost of sales, before amortisation and depreciation during 2021 and 2020, respectively.
At the US PGM operations the collective bargaining agreement covering certain employees at the Stillwater Mine and the Metallurgical Processing facilities concluded the wage negotiations in April 2019. The new five-year agreement has similar terms to the prior agreement, with minor revisions. In terms of the agreement there was a 2.75% increase for all job categories effective from 15 April 2019, followed by annual increases of 2.5% for 2020, 3.0% in 2021, 2.5% in 2022 and 3.0% in 2023, all of which are effective annually on 1 June.
Negotiations with the United Steel Workers International Union (USW) regarding East Boulder were concluded during February 2022. A new wage contract was signed that covers the period from 16 February 2022 to 31 July 2024. The next wage negotiations will be in June 2024. The agreed wage increases were a 2.5% increase 2022, 3.0% in 2023 and 3.0% in 2024. In addition to the base increase in 2022, an increase to benefits and incentive has been agreed, which will result in an effective average increase of 5.4% for 2022 if all safety and quality deliverables are fully met.
Sibanye-Stillwater concluded a three-year wage agreement for its Kroondal operation on 23 October 2020. The wage agreement was signed with the National Union of Mineworkers and the Association of Mineworkers and Construction Union (AMCU), in respect of wages and conditions of service for a three-year period from 1 July 2020 to 30 June 2023. The basic wage increase for Category 4-9 surface and underground employees for the first year, is 5% or R1000 per month whichever is higher for each of the three years. Miners, artisans and officials will also receive 5% or R1,000 per month whichever is higher per annum over the three-year period.
Sibanye-Stillwater concluded a three-year wage agreement at the SA PGM operations on 15 November 2019, for its Rustenburg and Marikana operations which comprise the majority of its SA PGM operations, with the AMCU at the Marikana operation and AMCU and UASA (formerly known as United Association of South Africa) at the Rustenburg operation in respect of wages and conditions of service for the period 1 July 2019 to 30 June 2022. The agreement allows for increases to the basic wage of Category 4-9 surface and underground employees for both the Marikana and Rustenburg operations of R1,000 per month or 5% whichever is the higher in the first year, R1,000 per month or 5% whichever is the higher in the second year and R1,000 per month or 5% whichever is the higher in the third year. The pensionable base pay will increase by 3.5% for the Marikana operation over each of the next three years while the Rustenburg pensionable base pay and allowance base will increase by 5% over each of the next three years. In both operations the rock drill operators’ allowance also increases by R100 per month for each of the three years. Miners, artisans and officials will receive R1,000 per month or 5% whichever is the higher per year for the three years.
The SA gold operations, signed a three-year wage agreement on 14 November 2018 with the National Union of Mineworkers (NUM), Solidarity and UASA and on 17 April 2019 with AMCU, in respect of wages and conditions of service for the period from 1 July 2018 to 30 June 2021. The agreement allows for increases to the basic wage of Category 4-8 surface and underground employees of R700 per month in the first and second years, and R825 per month in the third year. Miners, artisans and officials will receive increases of 5.5% in year one and 5.5% or CPI (whichever is greater) in years two and three of the agreement. In addition to the basic wage, the parties agreed to an increase in the current living-out allowance and Sibanye-Stillwater also agreed to increase incrementally the current minimum medical incapacity benefit. Following the expiration of 2018 Wage Agreement on 30 June 2021, Sibanye-Stillwater commenced contract negotiations with AMCU, the NUM, Solidarity and UASA. Solidarity and UASA formally accepted the proposed wage agreement on 10 March 2022. On 8 March 2022, AMCU and NUM announced strike action at Sibanye-Stillwater’s gold mines commencing on 9 March 2022. The Group continues to engage with the national leadership of AMCU and NUM in an effort to reach a final settlement.
In recent years, the South African mining industry has experienced increased union unrest. The entry of unions such as AMCU, which has become a significant rival to the traditionally dominant NUM, has resulted in more frequent industrial disputes, including violent protests, intra- union violence and clashes with police authorities. Such disputes, and resulting industrial actions, are difficult to control, can disrupt Sibanye-Stillwater’s business and expose Sibanye-Stillwater to liability.
Despite above inflation increases in electricity tariffs, power and water, in total they comprised only 8% and 9% of cost of sales, before amortisation and depreciation in 2021 and 2020, respectively. The higher cost of sales was mainly attributable to the high purchasing costs of spent catalytic material incurred by the recycling operation correlated with the higher PGM prices that prevailed during the year.
The effect of the above mentioned increases, especially being above the average inflation rate, has adversely affected and, may continue to adversely affect, the profitability of Sibanye-Stillwater’s SA PGM and gold operations. Further, Sibanye-Stillwater’s SA PGM and gold operations’ costs are primarily denominated in rand, while revenues from PGM and gold sales are in US dollars. Generally when inflation is high the rand tends to devalue, thereby increasing rand revenues, and potentially offsetting any increase in costs. However, there can be no guarantee that any cost saving measures or the effects of any potential devaluation will offset the effects of increased inflation and production costs.
Production
Sibanye-Stillwater’s revenues are driven by its production levels and the price it realises from the sale of PGMs, gold and associated co- and by- products, as discussed above. Production can be affected by a number of factors including mining grades, safety related work stoppages, industrial action, and other mining related incidents and any global black swan event such as the COVID-19 pandemic. These factors could have an impact on production levels in the future.
The SA PGM operations again delivered consistently solid operating results despite the Group wide safety interventions and the suspension of operations at Khuseleka and Thembelani at the Rustenburg operations during December 2021, which resulted in approximately 21,000 4Eoz lost production. PGM production of 1,896,670 4Eoz for 2021 (including attributable ounces from Mimosa and third party purchase of concentrate (PoC)) was 21% higher than 2020. 4E PGM PoC production increased by 21% in 2021 to 60,532 4Eoz. All operations with the exception of Mimosa increased 4E PGM production. 4E PGM production of 1,576,507 4Eoz (including attributable ounces from Mimosa and PoC) for 2020 was 2% lower than 2019, with production building back to pre COVID-19 rates by November 2020, well ahead of expectation. 4E PGM production for H2 2020 was 40% higher than H1 2020.
Mined PGM production from the US PGM operations in 2021 of 570,400 2Eoz was 5% lower than for the comparable period in 2020, primarily due to the ongoing impact of the rail collision safety incident in June 2021. The implementation of rail safety
Management’s discussion and analysis of the financial statements continued
enhancements following the safety incident in June 2021, has necessitated shutting down mining blocks at the Stillwater West mine, which remains constrained by Mine Safety and Health Administration (MSHA) stop orders and new operating procedures. Additionally, production from the East Boulder mine was impacted by electrical outages in December 2021 because of severe weather conditions. 3E PGM recycled production for 2021 declined by 10% to 755,148 3Eoz due to a reduction in concentrate feed from underground affecting blending, a slowdown in used car scrapping rates globally and continued supply chain logistic constraints affecting autocatalyst deliveries towards the end of 2021. The recycling operations fed an average of 23.8 tonnes per day of spent autocatalyst for 2021, 10% lower than for 2020, which was partly due to a decision taken to reduce recycle inventory in anticipation of a slowdown in receipt and feed rates over the festive season which allowed a continued reduction in exposure to higher carbon containing inventory.
Gold production at the managed SA gold operations of 27,747kg (892,086oz) for 2021 was 10% higher than 2020, despite being impacted by safety stoppages during the year which included the self-imposed Group safety intervention and suspension of operations at Beatrix 1 and 3 shafts and Kloof 1 shaft.
Stringent enforcement of relatively new environmental legislation is on the rise in South Africa. Regulators, such as the Department of Mineral Resources and Energy in South Africa, can and do issue, in the ordinary course of operations, instructions, such as Section 54 work stoppages, after routine visits or following safety incidents or accidents to partially or completely halt operations at affected mines until corrective measures are agreed and implemented. In 2021, Sibanye-Stillwater’s South African gold operations experienced 37 Section 54 work stoppages (2020: 43) and 42 Section 54 work stoppages at the South African PGM operations (2020: 29). In the United States, underground mines, including the Stillwater and East Boulder Operations, are continuously inspected by the MSHA, which can lead to notices of violation. Any of Sibanye-Stillwater’s US mines could be subject to a temporary or extended shut down as a result of a violation alleged by the MSHA, known as “k-orders”. For example, the Stillwater operations have been operating at reduced operating levels under a k-order since a fatal incident in June 2021.
Royalties, carbon tax and mining tax
South African mining operations pay a royalty tax to the South African government. Revenue from mineral resources in South Africa are subject to the Mineral and Petroleum Resource Royalty Act 2008 (Royalty Act). The Royalty Act imposes a royalty on refined (mineral resources that have undergone a comprehensive level of beneficiation such as smelting and refining as defined in Schedule 1 of the Royalty Act) and unrefined (mineral resources that have undergone limited beneficiation as defined in Schedule 2 of the Royalty Act) minerals payable to the State. The formula for calculating royalties takes into account whether the mineral is refined or unrefined and the profitability of individual operations. The maximum royalty payable on refined minerals and unrefined minerals is 5% and 7%, respectively.
Carbon tax is a tax in response to climate change, which is aimed at reducing greenhouse gas emissions in a sustainable, cost effective and affordable manner. In South Africa the Carbon Tax Act of 2019 came into effect on 1 June 2019. The South African Government introduced Carbon tax based on a polluter-pays-principle and the aim of which is to help ensure that companies and consumers take the negative adverse costs (externalities) of climate change into account in their future production, consumption and investment decisions. Phase 1 of the Carbon Tax has been extended by three years to 31 December 2025. The Carbon Tax Rate increases from R134/ton CO2e in 2021 to R144/ton CO2e from 1 January 2022. The group has provided for carbon tax of R4 million for 2021 (2020: R5 million).
Under South African tax legislation, gold mining companies and non-gold mining companies are taxed at different rates. Sibanye- Stillwater’s SA gold operations are subject to the gold tax formula on their respective mining incomes. The formula calculating tax payable, is affected by the profitability of the applicable gold mining operation. In addition, these gold mining operations are ring fenced from a capital expenditure perspective. As a result, only taxable losses can be offset between these operations to reduce taxable income from another operation. Depending on the profitability of the operations, the tax rate can vary significantly from year to year. Sibanye-Stillwater’s SA PGM operations are subject to the tax at the statutory rate of 28% and the mining operations are also ring fenced from a capital expenditure perspective. On 23 February 2022, the South African Minister of Finance confirmed the change in the South African corporate income tax (CIT) rate as announced in his February 2021 budget speech. For the financial year ended 31 December 2021, the CIT rate applicable to Sibanye-Stillwater and its South African subsidiaries, which apply a CIT rate, was 28% and will remain at 28% for the financial year ending 31 December 2022. For subsequent financial years the change will become effective and a 27% CIT rate will apply.
Under United States tax legislation there are no federal taxes specific to minerals extraction. General federal, state, county and municipal taxes apply to mining companies, including income taxes, payroll taxes, sales taxes, property taxes and use taxes. Federal tax laws generally do not distinguish between domestic and foreign mining operators. Sibanye-Stillwater’s US PGM operations are subject to a statutory tax rate of 21% and are subject to tax in the states of Montana, New Jersey and Pennsylvania.
Capital expenditure
Sibanye-Stillwater will continue to invest capital in new and existing infrastructure and possible growth opportunities. In South Africa only the best projects inter alia those with low capital intensity, relatively short lead time and quick payback currently meet the required investment hurdle rates.
Therefore, management will be required to consider, on an ongoing basis, the capital expenditure necessary to achieve its sustainable production objectives against other demands on cash.
As part of its strategy, Sibanye-Stillwater may investigate the potential exploitation of mineralisation below its current infrastructure limits as well as other capital-intensive projects.
In 2021, Sibanye-Stillwater’s total capital expenditure was R12,740 million (2020: R9,616 million), an increase of 32%. The capital underspend in 2020 largely due to COVID-19 disruptions was carried over into 2021 for both the SA PGM and SA gold operations. The Group also commenced with project capital expenditure on the K4 and Klipfontein projects (SA PGM operations) and Burnstone (SA gold operations) in 2021 and continued to invest in growth at Stillwater East on the Blitz project (US PGM operations). These investments will contribute towards the future operational sustainability of the Group and deliver significant economic value to all stakeholders over the long term.
Management’s discussion and analysis of the financial statements continued
SA PGM operations
Capital expenditure at the SA PGM operations increased significantly by 73% from R2,197 million in 2020 to R3,799 million in 2021 with ore reserve development 40% higher at R1,577 million, sustaining capital 92% higher at R2,019 million and project spend increasing from R20 million in 2020 to R203 million in 2021 on both the Kroondal Klipfontein and Marikana K4 projects. The significant increase in sustaining capital expenditure was on projects to support safety initiatives, winch signalling upgrades and trackless mobile machinery collision avoidance systems while ORD capital expenditure increased mainly due to the return to normalised production output levels in 2021.
K4 and Klipfontein PGM projects:
The project setup phase that involved the approval of the scheduling and costing systems and development of the required Management plan documentation has been completed.
The following actions were also completed during H2 2021:
•Contracts for building works and electrical work for the upgrade and completion of the industrial change-houses, whilst on- boarding of these contractors completed and work commenced
•The tenders for the underground infrastructural work as well as for the electrical and Instrumentation work were adjudicated, whilst on-boarding commenced
•Upgrades for the winder control systems design work was completed and contracts placed
•Various underground equipment orders have been placed and the majority of the equipment has been delivered
The engineering design and compiling of scope of works and procurement is currently proceeding as per schedule. The K4 Project is on target to start capital development during Q2 2022.
The Klipfontein lay-down areas and site establishment were completed in Q4 2021 and the first blast was taken on 7 January 2022. The project is on track and is ramping up with full production expected in Q2 2022.
US PGM operations
Capital expenditure at the US PGM operations for 2021 was 3% higher than 2020 at R4,561 million with sustaining capital flat at R796 million and growth capital 1% higher at R2,411 million which mainly included spend at Stillwater East (SWE) on the Blitz project of R2,162 million (2020: R2,385 million).
SA gold operations
Capital expenditure at the managed SA gold operations increased by 51% from R2,654 million in 2020 to R4,003 million in 2021 mainly driven by ore reserve development expenditure increasing by 46% to R2,604 million and sustaining capital increasing by 45% to R974 million as a result of a planned increase in capital expenditure to restore flexibility post the COVID-19 impact of 2020. While project capital at the managed SA Gold operations increased by 116% to R425 million and included project capital spend on the Kloof 4 deepening project of R198 million and capital spend on the Burnstone project of R220 million.
The Burnstone project
The project setup phase that involved the approval of the scheduling and costing systems and development of the required Management plan documentation has been completed.
The following activities were also completed during H2 2021:
•Onboarding of Mining and Engineering crews started in October 2021
•An engineering design team has been appointed for the remainder of the Engineering design
•A vendor has been appointed for the access surveying and registration of the new servitudes for the new access road to Burnstone
•A vendor has been appointed for the design change to be able to remove the skips from the shaft using the Rock Winder bank area. The design was 90% complete by the end of December 2021
•Procurement order for the first new trackless mobile machinery was placed in December 2021
Sibanye-Stillwater expects to spend approximately R16.6 billion on capital in 2022, which includes the capital expenditure of DRDGOLD.
The actual amount of capital expenditure will depend on a number of factors, such as production volumes, the commodity prices and general economic conditions and may differ from the amount forecast above. Some of these factors are outside of the control of Sibanye-Stillwater.
Scheme of arrangement
On 4 October 2019 Sibanye Gold Limited (SGL) and Sibanye-Stillwater, a previously dormant wholly owned subsidiary of SGL, announced the intention to implement a scheme of arrangement to reorganise SGL’s operations under a new parent company, Sibanye-Stillwater (the “Scheme”). The Scheme was implemented through the issue of Sibanye-Stillwater shares (tickers: JSE – SSW and NYSE – SBSW) in exchange for the existing shares of SGL (JSE – SGL and NYSE – SBGL). For additional information see –Consolidated financial statements–Notes to the consolidated financial statements–Note 26: Stated share capital.
2021 financial performance compared with 2020
Group profit for the year increased from R30,622 million in 2020 to R33,796 million in 2021. The reasons for this increase are discussed below. The primary factors explaining the movements in profit are set out in the table below.
Management’s discussion and analysis of the financial statements continued
| | | | | | | | | | | |
| Figures in million – SA rand | 2021 | 2020 | % Change 2021/2020 |
| Revenue | 172,194 | | 127,392 | | 35 | |
| Cost of sales | (109,306) | | (83,369) | | 31 | |
| Interest income | 1,202 | | 1,065 | | 13 | |
| Finance expense | (2,496) | | (3,152) | | (21) | |
| Share-based payment expenses | (383) | | (512) | | (25) | |
| Loss on financial instruments | (6,279) | | (2,450) | | 156 | |
| Gain/(loss) on foreign exchange differences | 1,149 | | (255) | | (551) | |
| Share of results of equity-accounted investees after tax | 1,989 | | 1,700 | | 17 | |
| (Impairments)/reversal of impairments | (5,148) | | 121 | | (4,355) | |
| | | |
| Occupational healthcare gain/(expense) | 14 | | (52) | | (127) | |
| | | |
| Restructuring costs | (107) | | (436) | | (75) | |
| Transaction costs | (140) | | (139) | | 1 | |
| Care and maintenance | (737) | | (814) | | (9) | |
| Change in estimate of environmental rehabilitation obligation, and right of recovery receivable and payable | 167 | | 464 | | (64) | |
| Strike related costs | — | | (1) | | (100) | |
| Loss on settlement of US$ Convertible Bond | — | | (1,507) | | (100) | |
| Cost incurred on employee and community trusts | (744) | | (508) | | 46 | |
| Corporate and social investment costs | (288) | | (258) | | 12 | |
| Non-recurring COVID-19 costs | (3) | | (97) | | (97) | |
| Early redemption premium on the 2025 Notes | (196) | | — | | — | |
| Net other (costs)/income | (613) | | 58 | | (1,157) | |
| Profit before royalties, carbon tax and tax | 50,275 | | 37,250 | | 35 | |
| Royalties | (2,714) | | (1,765) | | 54 | |
| Carbon tax | (4) | | (5) | | (20) | |
| Profit before tax | 47,557 | | 35,480 | | 34 | |
| Mining and income tax | (13,761) | | (4,858) | | 183 | |
| Profit for the year | 33,796 | | 30,622 | | 10 | |
The SA PGM and SA gold operations achieved higher production levels during 2021 following the return to more normalised operating levels following the COVID-19 hard lockdown in 2020, along with effective measures implemented by management to reduce the impact of the pandemic on continued production.
Group financial performance
Group revenue for 2021 increased by 35% to R172,194 million mainly due to higher sales volumes at the SA PGM, SA gold and US PGM Recycling operations and higher PGM prices. The higher sales volumes and higher precious metal prices, which impacts the cost of purchasing third-party concentrate (PoC) and recycling material, at the SA PGM and US PGM Recycling operations were the primary reasons for the 31% increase to R109,306 million in the Group cost of sales, before amortisation and depreciation. At the managed SA gold operations, higher underground production and associated input costs contributed to the increase in cost of sales. Group adjusted EBITDA for 2021 increased by 39% or R19,221 million to R68,606 million despite a pullback in precious metal prices during H2 2021. In addition, the 10% stronger rand relative to the US dollar, negatively affected realised rand commodity prices for the SA operations. Group amortisation and depreciation increased by 9% to R8,293 million following higher production volumes at both the SA PGM and SA gold operations and increased capital spend during 2021 which was deferred in 2020 due to the impact of the COVID-19 pandemic.
Revenue
Revenue increased by 35% to R172,194 million in 2021 from R127,392 million in 2020, driven by higher PGM metals prices and higher sales volumes at the SA PGM, SA gold and US PGM Recycling operations during 2021.
Revenue from the SA PGM operations increased by 55% to R85,154 million in 2021 from R54,912 million in 2020, due to a 22% or 315,201 4Eoz increase in PGMs sold and a 28% higher average 4E basket price of R47,066/4Eoz which was partially offset by a 10% stronger rand. A 21% increase in the sale of third party PoC ounces contributed to the increase in SA PGM revenue.
Revenue from the US PGM underground operations decreased by 8% to R18,343 million (2020: R19,858 million) in 2021, notwithstanding a 10% higher average 2E basket price of US$2,097/2Eoz, due to an 8% decrease in mined ounces sold following the implementation of further rail safety enhancements and a 10% stronger rand. Revenue from recycling increased by 61% to R40,710 million (2020: R25,296 million) in 2021, due to the 57% higher average 3E basket price of US$3,515/3Eoz and 16% higher sales volumes, partially offset by the 10% stronger rand.
Revenue from the managed SA gold operations increased by 6% to R23,568 million (2020: R22,292 million) in 2021, mainly due to the 12% or 3,038 kg higher gold sold volumes, partially offset by a 6% lower rand gold price of R849,144/kg. Revenue from DRDGOLD decreased by 5% to R4,790 million in 2021 mainly due to a 9% lower rand gold price received of R852,465/ kg partially offset by 4% higher sales volumes.
Management’s discussion and analysis of the financial statements continued
Cost of sales
Cost of sales increased by 31% to R109,306 million (2020: R83,369 million) in 2021, mainly due to the higher sales volumes at all operations excluding the US PGM underground operations and higher PGM precious metal prices which impacts the cost of purchasing third-party concentrate (PoC) and recycling material at both the SA PGM and US PGM Recycling operations, respectively.
The primary drivers of cost of sales are set out in the table below.
The analysis that follows provides a more detailed discussion of cost of sales, together with the total cash cost, All-in sustaining cost and All-in cost.
| | | | | | | | | | | |
| Figures in million – SA rand | 2021 | 2020 | % Change 2021/2020 |
| Salaries and wages | (26,214) | | (23,850) | | 10 | |
| Consumable stores | (18,847) | | (16,404) | | 15 | |
| Utilities | (8,099) | | (6,801) | | 19 | |
| Mine contracts | (5,193) | | (3,790) | | 37 | |
Recycling1 | (39,220) | | (24,418) | | 61 | |
| Other | (8,975) | | (4,663) | | 92 | |
| Ore reserve development costs capitalised | 5,535 | | 4,150 | | 33 | |
| Cost of sales, before amortisation and depreciation | (101,013) | | (75,776) | | 33 | |
| | | |
| | | |
| - SA PGM operations | (31,971) | | (24,722) | | 29 | |
| - US PGM operations | (46,787) | | (32,004) | | 46 | |
| | | |
| - Managed SA gold operations | (18,908) | | (16,128) | | 17 | |
| | | |
| - DRDGOLD | (3,347) | | (2,922) | | 15 | |
| Amortisation and depreciation | (8,293) | | (7,593) | | 9 | |
| - SA PGM operations | (2,515) | | (2,072) | | 21 | |
| - US PGM operations | (2,601) | | (2,727) | | (5) | |
| | | |
| | | |
| | | |
| - Managed SA gold operations | (2,989) | | (2,592) | | 15 | |
| | | |
| - DRDGOLD | (188) | | (202) | | (7) | |
| Total cost of sales | (109,306) | | (83,369) | | 31 | |
| - SA PGM operations | (34,486) | | (26,794) | | 29 | |
| - US PGM operations | (49,388) | | (34,731) | | 42 | |
| | | |
| | | |
| | | |
| - Managed SA gold operations | (21,897) | | (18,720) | | 17 | |
| | | |
| - DRDGOLD | (3,535) | | (3,124) | | 13 | |
Cost of sales, before amortisation and depreciation
Cost of sales, before amortisation and depreciation at the SA PGM operations increased by 29% to R31,971 million, mainly due to a 22% increase in sales volumes to 1,776,127 4Eoz. Mined underground 4E PGM production increased by 22% to 1,568,195 4Eoz and surface production volumes excluding third-party PoC were 23% higher at 148,692 4Eoz. Third-party concentrate purchased and processed (PoC) at the Marikana smelting and refining operations increased by 21% to 60,532 4Eoz. PoC material is purchased at a higher cost, than own mined ore, due to the direct correlation to the basket price of PGM’s.
Cost of sales, before amortisation and depreciation at the US PGM underground operations decreased marginally to R7,567 million due to a decrease of 8% in sales volumes to 548,276 2Eoz in line with production volumes which also decreased by 5% year- on-year to 570,400 2Eoz, mainly due to rail safety enhancements following the fatal incident at the Stillwater West mine in June 2021 and weather related electrical outages in December at the East Boulder mine. Cost of sales, before amortisation and depreciation at the US PGM recycling operation increased, in line with the increase in revenue, by 61% from R24,418 million to R39,220 million due to a higher average basket price resulting in higher purchasing costs of spent autocatalysts, coupled with a 16% increase in volumes.
Cost of sales, before amortisation and depreciation at the managed SA gold operations increased by 17% to R18,908 million due to a 12% increase in sales volumes, annual salary increases and above inflationary increases on input costs such as electricity, steel and steel related consumables. Mined underground volumes increased by 13% to 24,719 kg (794,734 oz) despite the 2021 production which was negatively impacted by safety stoppages, that resulted in production being suspended at Kloof and Beatrix and a fire at Kloof. Cost of sales, before amortisation and depreciation from DRDGOLD increased by 15% to R3,347 million due to above inflationary cost increases, particularly for steel and reagents.
Amortisation and depreciation
Amortisation and depreciation at the SA PGM operations increased by 21% to R2,515 million due to increased capital spend post the deferral in FY2020 during the onset of the COVID-19 pandemic and a 22% increase in mined underground production volumes. Amortisation and depreciation at the US PGM operations’ decreased by 5% to R2,601 million, in line with a 5% decrease in production volumes in 2021. Amortisation and depreciation at the managed SA gold operations increased by 15% to R2,989 million due to increased capital spend post the deferral in FY2020 during the onset of the COVID-19 pandemic, whereas the amortisation and depreciation of DRDGOLD decreased by 7% to R188 million.
All-in sustaining cost and All-in cost
All-in cost per ounce, was introduced in 2013 by the members of the World Gold Council. Sibanye-Stillwater has adopted the principle prescribed by the Council. This non-IFRS measure provides more transparency into the total costs associated with mining.
Management’s discussion and analysis of the financial statements continued
The All-in cost per ounce metric provides relevant information to investors, governments, local communities and other stakeholders in understanding the economics of mining.
This is especially true with reference to capital expenditure associated with developing and maintaining mines, which has increased significantly in recent years and is reflected in this metric. All-in cost excludes income tax, costs associated with merger and acquisition activities, working capital, impairments, financing costs, one-time severance charges and items needed to normalise earnings. All-in cost is made up of All-in sustaining cost, being the cost to sustain current operations, given as a sub-total in the All-in cost calculation, together with corporate and major capital expenditure associated with growth. All-in sustaining cost per kilogram (and ounce) and All-in cost per kilogram (and ounce) are calculated by dividing the All-in sustaining cost and All-in cost, respectively, in a period by the total PGM produced/gold sold over the same period.
Non-IFRS measures such as All-in sustaining cost and All-in cost are the responsibility of the Group's Board of Directors and is presented for illustration purposes only, and because of its nature, All-in sustaining cost and All-in cost should not be considered as a representation of financial performance under IFRS.
Management’s discussion and analysis of the financial statements continued
| | | | | | | | | | | | | | | | | | | | | | | | | | | | | | | | | | | | | | | | | | | | | | | | | | |
| Figures in million - SA rand | | Total US PGM operations Stillwater1,2 | Total SA PGM operations2 | Rustenburg
operations | Marikana operation2 | Kroondal | Platinum
Mile | Mimosa | Corporate
and re-
conciling
items | Total
SA gold
operations | Driefontein | Kloof | Beatrix | Cooke | DRDGOLD | Group Corporate
and
reconciling
items |
| 2021 | | | | | | | | | | | | | | | | |
Cost of sales, before amortisation and depreciation3 | Rm | 7,567 | | 31,972 | | 11,464 | | 16,561 | | 3,416 | | 531 | | 1,587 | | (1,587) | | 22,256 | | 5,691 | | 7,845 | | 4,565 | | 808 | | 3,347 | | — | |
| Plus: | | | | | | | | | | | | | | | | |
Community costs4 | Rm | — | | 161 | | 12 | | 150 | | — | | — | | — | | (1) | | 127 | | 46 | | 38 | | 34 | | 1 | | 8 | | — | |
Inventory change5 | Rm | 33 | | 1,294 | | 816 | | 478 | | — | | — | | 9 | | (9) | | | | | | | | |
Share-based payments6 | Rm | 86 | | 113 | | 45 | | 53 | | 15 | | — | | — | | — | | 100 | | 23 | | 35 | | 23 | | — | | 19 | | — | |
Royalties7 | Rm | — | | 2,547 | | 1,405 | | 1,128 | | 14 | | — | | 160 | | (160) | | 167 | | 95 | | 46 | | 27 | | 5 | | — | | (6) | |
Carbon tax8 | Rm | — | | 1 | | — | | 1 | | — | | — | | — | | — | | 2 | | — | | — | | 2 | | — | | — | | — | |
Rehabilitation9 | Rm | 31 | | 244 | | — | | 162 | | 81 | | — | | 4 | | (3) | | 189 | | 32 | | 17 | | 70 | | 47 | | 18 | | 5 | |
Leases10 | Rm | 1 | | 53 | | 11 | | 35 | | 7 | | — | | — | | — | | 82 | | 8 | | 14 | | 28 | | 13 | | 19 | | — | |
ORD11 | Rm | 1,354 | | 1,576 | | 629 | | 947 | | — | | — | | — | | — | | 2,604 | | 1,177 | | 930 | | 497 | | — | | — | | — | |
Sustaining capital expenditure12 | Rm | 791 | | 2,019 | | 619 | | 1,104 | | 268 | | 28 | | 499 | | (499) | | 1,304 | | 322 | | 488 | | 164 | | — | | 330 | | — | |
| Less: | | | | | | | | | | | | | | | | |
By-product credit13 | Rm | (1,392) | | (7,895) | | (2,589) | | (4,376) | | (869) | | (61) | | (524) | | 524 | | (23) | | (8) | | (5) | | (5) | | (1) | | (4) | | — | |
All-in sustaining cost14 | Rm | 8,471 | | 32,085 | | 12,412 | | 16,243 | | 2,932 | | 498 | | 1,735 | | (1,735) | | 26,808 | | 7,386 | | 9,408 | | 5,405 | | 873 | | 3,737 | | (1) | |
| Plus: | | | | | | | | | | | | | | | | |
| Corporate cost, growth and other capital expenditure | Rm | 2,411 | | 215 | | — | | 215 | | — | | — | | — | | — | | 604 | | — | | 198 | | 7 | | — | | 47 | | 352 | |
All-in cost14 | Rm | 10,882 | | 32,300 | | 12,412 | | 16,458 | | 2,932 | | 498 | | 1,735 | | (1,735) | | 27,412 | | 7,386 | | 9,606 | | 5,412 | | 873 | | 3,784 | | 351 | |
| Gold sold/4E PGM produced/2E PGM produced | kg | 17,741 | | 58,993 | | 20,913 | | 25,692 | | 7,046 | | 1,633 | | 3,709 | | — | | 33,374 | | 9,314 | | 10,961 | | 6,305 | | 1,175 | | 5,619 | | — | |
| ‘000oz | 570 | | 1,897 | | 672 | | 826 | | 227 | | 52 | | 119 | | — | | 1,073 | | 299 | | 352 | | 203 | | 38 | | 181 | | — | |
All-in sustaining cost14 | R/kg | | | | | | | | | 803,260 | | 793,000 | | 858,316 | | 857,256 | | 742,979 | | 665,065 | | — | |
| R/oz | 14,851 | | 18,051 | | 18,460 | | 19,664 | | 12,943 | | 9,486 | | 14,549 | | — | | | | | | | | |
| US$/oz | 1,004 | | 1,221 | | 1,248 | | 1,330 | | 875 | | 641 | | 984 | | — | | 1,689 | | 1,668 | | 1,805 | | 1,803 | | 1,562 | | 1,399 | | — | |
All-in cost14 | R/kg | | | | | | | | | | | | | | | |
| R/oz | 19,078 | | 18,172 | | 18,460 | | 19,925 | | 12,943 | | 9,486 | | 14,549 | | — | | 821,358 | | 793,000 | | 876,380 | | 858,366 | | 742,979 | | 673,429 | | — | |
| US$/oz | 1,290 | | 1,229 | | 1,248 | | 1,347 | | 875 | | 641 | | 984 | | — | | 1,727 | | 1,668 | | 1,843 | | 1,805 | | 1,562 | | 1,416 | | — | |
Management’s discussion and analysis of the financial statements continued
| | | | | | | | | | | | | | | | | | | | | | | | | | | | | | | | | | | | | | | | | | | | | | | | | | |
| Figures in million - SA rand | | Total US PGM operations Stillwater1,2 | Total SA PGM operations2 | Rustenburg
operations | Marikana operation2 | Kroondal | Platinum
Mile | Mimosa | Corporate
and re-
conciling
items | Total
SA gold
operations | Driefontein | Kloof | Beatrix | Cooke | DRDGOLD | Group Corporate
and
reconciling
items |
| 2020 | | | | | | | | | | | | | | | | |
Cost of sales, before amortisation and depreciation3 | Rm | 7,586 | | 24,723 | | 9,589 | | 13,232 | | 2,803 | | 403 | | 1,601 | | (2,905) | | 19,050 | | 4,864 | | 6,880 | | 3,714 | | 671 | | 2,922 | | — | |
| Plus: | | | | | | | | | | | | | | | | |
Community costs4 | Rm | — | | 107 | | 8 | | 100 | | — | | — | | — | | — | | 151 | | 30 | | 46 | | 59 | | — | | 16 | | — | |
Inventory change5 | Rm | 151 | | 3,039 | | 553 | | 1,182 | | — | | — | | 19 | | 1,285 | | | | | | | | |
Share-based payments6 | Rm | 54 | | 46 | | 19 | | 21 | | 7 | | — | | — | | — | | 50 | | 11 | | 13 | | 10 | | — | | 16 | | — | |
Royalties7 | Rm | — | | 1,623 | | 924 | | 689 | | 10 | | — | | 135 | | (135) | | 142 | | 73 | | 115 | | 44 | | 5 | | — | | (95) | |
Carbon tax8 | Rm | — | | 3 | | — | | 2 | | — | | — | | — | | — | | 3 | | — | | — | | 2 | | — | | — | | — | |
Rehabilitation9 | Rm | 29 | | 242 | | 5 | | 152 | | 86 | | — | | 4 | | (4) | | 218 | | 51 | | 33 | | 56 | | 54 | | 19 | | 5 | |
Leases10 | Rm | 5 | | 59 | | 14 | | 35 | | 10 | | — | | — | | — | | 78 | | 8 | | 18 | | 21 | | 16 | | 16 | | — | |
ORD11 | Rm | 1,239 | | 1,125 | | 417 | | 708 | | — | | — | | — | | — | | 1,786 | | 742 | | 722 | | 322 | | — | | — | | — | |
Sustaining capital expenditure12 | Rm | 795 | | 1,052 | | 326 | | 515 | | 188 | | 23 | | 414 | | (414) | | 967 | | 187 | | 392 | | 93 | | — | | 295 | | — | |
| Less: | | | | | | | | | | | | | | | | |
By-product credit13 | Rm | (1,183) | | (5,444) | | (1,395) | | (3,614) | | (443) | | 8 | | (408) | | 409 | | (24) | | (7) | | (5) | | (4) | | (1) | | (7) | | — | |
All-in sustaining cost14 | Rm | 8,675 | | 26,575 | | 10,459 | | 13,022 | | 2,660 | | 434 | | 1,765 | | (1,764) | | 22,420 | | 5,958 | | 8,215 | | 4,317 | | 744 | | 3,277 | | (90) | |
| Plus: | | | | | | | | | | | | | | | | |
| Corporate cost, growth and other capital expenditure | Rm | 2,385 | | 53 | | — | | 33 | | — | | 20 | | — | | — | | 373 | | — | | 155 | | — | | — | | 46 | | 171 | |
All-in cost14 | Rm | 11,060 | | 26,628 | | 10,459 | | 13,055 | | 2,660 | | 453 | | 1,765 | | (1,764) | | 22,793 | | 5,958 | | 8,370 | | 4,317 | | 744 | | 3,323 | | 82 | |
| Gold sold/4E PGM produced/2E PGM produced | kg | 18,757 | | 49,035 | | 17,467 | | 20,419 | | 6,123 | | 1,208 | | 3,819 | | — | | 30,136 | | 7,554 | | 10,752 | | 5,286 | | 1,125 | | 5,419 | | |
| ‘000oz | 603 | | 1,577 | | 562 | | 656 | | 197 | | 39 | | 123 | | — | | 969 | | 243 | | 346 | | 170 | | 36 | | 174 | | — | |
All-in sustaining cost14 | R/kg | | | | | | | | | 743,967 | | 788,708 | | 764,007 | | 816,591 | | 661,422 | | 604,650 | | — | |
| R/oz | 14,385 | | 18,280 | | 18,624 | | 19,836 | | 13,512 | | 11,161 | | 14,380 | | — | | | | | | | | |
| US$/oz | 874 | | 1,111 | | 1,131 | | 1,205 | | 821 | | 678 | | 874 | | — | | 1,406 | | 1,490 | | 1,444 | | 1,543 | | 1,250 | | 1,143 | | — | |
All-in cost14 | R/kg | | | | | | | | | 756,351 | | 788,708 | | 778,460 | | 816,629 | | 661,422 | | 613,176 | | — | |
| R/oz | 18,339 | | 18,317 | | 18,624 | | 19,886 | | 13,512 | | 11,668 | | 14,380 | | — | | | | | | | | |
| US$/oz | 1,114 | | 1,113 | | 1,131 | | 1,208 | | 821 | | 709 | | 874 | | — | | 1,429 | | 1,490 | | 1,471 | | 1,543 | | 1,250 | | 1,159 | | — | |
The average exchange rate for the year ended 31 December 2021 was R14.79/US$ (2020: R16.46/US$)
1 The US PGM operations’ underground production is converted to metric tonnes and kilograms, and performance is translated into rand. In addition to the US PGM operations’ underground production, the operation processes various recycling material which is excluded from the 2E PGM production, All-in sustaining cost and All-in cost statistics shown
2 The Total US and SA PGM, Total SA PGM and Marikana includes the production and costs associated with the purchase of concentrate (PoC) from third parties.
3 Cost of sales, before amortisation and depreciation includes all mining and processing costs, third party refining costs, corporate general and administrative costs and permitting costs. Corporate relates to the elimination of concentrate sales by Rustenburg, Kroondal and Platinum Mile to Marikana and the associated unrealised profit
4 Community costs includes costs related to community development
5 Inventory adjustment in Corporate includes the elimination of concentrate sales by Rustenburg, Kroondal and Platinum Mile to Marikana and the associated unrealised profit
Management’s discussion and analysis of the financial statements continued
6 Share-based payments are calculated based on the fair value at initial recognition and do not include the adjustment of the cash-settled share-based payment obligation to the reporting date fair value
7 Royalties are the current royalty on refined and unrefined minerals payable to the South African government
8 In South Africa the Carbon Tax Act of 2019 came into effect on 1 June 2019. The South African Government introduced Carbon tax based on a polluter-pays-principle and the aim of which is to help ensure that companies and consumers take the negative adverse costs (externalities) of climate change into account in their future production, consumption and investment decisions. The first phase of the Carbon Tax Act applies to the so-called “Scope 1” emissions from 1 June 2019 to 31 December 2022. Under the first phase, the introduction of the carbon tax is not expected to have an immediate impact on the price of electricity. Accordingly, although the statutory rate of carbon tax in 2021 was R134 per tonne (2020: R127 per tonne) of carbon dioxide equivalent (CO2e) emissions, allowances under the Carbon Tax Act resulted in an effective carbon tax rate ranging from R7 to R54 per tonne of CO2e emissions (2020: R6 to R51). Phase 1 of the Carbon Tax has been extended by three years to 31 December 2025
9 Rehabilitation includes the interest charge related to the environmental rehabilitation obligation and the amortisation of the related capitalised rehabilitation costs recorded as an asset. The interest charge related to the environmental rehabilitation obligation and the amortisation of the capitalised rehabilitation costs do not reflect annual cash outflows and are calculated in accordance with IFRS. The interest charge and amortisation reflect the periodic costs of rehabilitation associated with current production and are, therefore, included in the measure
10 Leases represent the lease payment costs for the year
11 ORD are those capital expenditures that allow access to reserves that are economically recoverable in the future, including, but not limited to, crosscuts, footwalls, return airways and box holes which will avail production or reserves
12 Sustaining capital expenditure are those capital expenditures that are necessary to maintain current production and execute the current mine plan. Sustaining capital costs are relevant to the All-in sustaining cost metric as these are needed to maintain Sibanye-Stillwater’s current operations and provide improved transparency related to Sibanye-Stillwater’s ability to finance these expenditures
13 By-product credit—The All-in cost metric is focused on the cost associated with producing and selling a kilogram of gold or an ounce of 4E/2E PGMs, and therefore the metric captures the benefit of mining other metals when gold and 4E/2E PGMs are produced and sold. In determining the All-in cost, the costs associated with producing and selling a kilogram of gold or an ounce of 4E/2E PGMs are reduced by the benefit received from the sale of co-products and by-products, recognised as product sales, which is extracted and processed along with the gold and 4E/2E PGMs produced. At the SA gold operations, the sale of silver is recognised as product sales, and at the PGM operations in both regions, the minor PGMs – iridium and ruthenium – are produced as co-products, which together with the three primary PGMs, are referred to as 6E (5PGM+Au). In addition, nickel, copper and chrome, among other minerals, are by-products at these operations. This is relevant to the All-in cost metric as it aids in the investor’s analysis of the profitability of producing a kilogram of gold or an ounce of 4E/2E PGMs, without the need to consider multiple metal prices. The by-product credit of Marikana for the year ended December 2020 includes the benefit from the sale of concentrate purchased from Rustenburg, Kroondal and Platinum Mile of R1,674 million. The cost associated with the purchase and processing of the intercompany concentrate is included in the Marikana cost of sales, before amortisation and depreciation
14 For information on how Sibanye-Stillwater has calculated All-in sustaining costs, All-in costs, All-in sustaining cost per kilogram, All-in sustaining cost per ounce, All-in cost per kilogram and All-in cost per ounce, see –Management’s discussion and analysis of the financial statements-2021 financial performance compared with 2020- All-in sustaining cost and All-in cost
Management’s discussion and analysis of the financial statements continued
Cost of production
The AISC at the SA PGM operations of R18,051/4Eoz decreased by 1% from R18,280/4Eoz primarily due to higher production. The All-in sustaining cost (AISC) at the US PGM operations increased by 15% to 1,004 US$/2Eoz in 2021 primarily due to increased PGM prices which drives an increase in royalties. Increases in sustaining capital accounted for approximately 17% of the increase in AISC at the US PGM operations. Royalties payable increases AISC by approximately US$9/2Eoz for every US$100/2Eoz change in the prevailing PGM basket. Unit costs at the SA gold operations increased by 8% to R 803,260/kg in 2021and was mainly due to annual salary increases and above inflationary increases on input costs such as electricity, steel and steel related consumables.
Adjusted EBITDA
Group Adjusted EBITDA of R68,606 million in 2021 increased by 39% from R49,385 million in 2020. Adjusted EBITDA for the SA PGM operations increased by 78% due to higher PGM basket prices and higher sales volumes. Adjusted EBITDA from the US PGM underground operations decreased by 12% to R10,766 million due to lower sales volumes and for the US PGM recycling operations increased by 70% to R1,490 million due to higher sales volumes and PGM basket prices. The adjusted EBITDA decreased by 34% at the SA gold operations to R5,113 million, mainly due to an 8% decrease in the rand gold price and the higher production costs, partially offset by the higher volumes sold.
Adjusted EBITDA includes other cash costs, strike costs and care and maintenance expenditures. Care and maintenance at Cooke and Burnstone which was only incurred in H1 2021 were R594 million and R46 million for 2021, respectively, compared with R623 million and R81 million, respectively in 2020. Care and maintenance costs at the Marikana operations were R79 million (2020: R92 million). Strike costs at the SA gold operations were Rnil (2020: R1 million). Other costs include corporate and social expenditure of R288 million (2020: R258 million) and non-production royalties of R327 million (2020: R193 million).
Non-IFRS measure such as Adjusted EBITDA is the responsibility of the Group's Board of Directors and is presented for illustration purposes only, and because of its nature, Adjusted EBITDA should not be considered as a representation of financial performance under IFRS see – Consolidated financial statements – Notes to the consolidated financial statements – Note 2: Segment reporting.
Interest income
Interest income increased by 13% to R1,202 million in 2021 from R1,065 million in 2020 mainly due to higher cash balances being maintained during the year and interest earned on recycling advances due to higher average PGM basket prices. Interest income mainly includes interest received on cash deposits amounting to R948 million (2020: R714 million and 2019: R264 million), interest received on rehabilitation obligation funds of R174 million (2020: R245 million and 2019: R265 million); interest earned on right of recovery asset of R32 million (2020: R16 million and 2019: R16 million) and other interest earned of R48 million (2020: R90 million and 2019: R15 million). For additional information on finance income see –Consolidated financial statements–Notes to the consolidated financial statements–Note 5.1: Finance income.
Finance expense
Finance expense decreased by R656 million mainly due to a R489 million decrease in interest on borrowings following a decrease in average outstanding borrowings for 2021, R92 million decrease in the unwinding of amortised cost on borrowings, R29 million decrease in Rustenburg deferred payment, R69 million decrease in unwinding of the environmental rehabilitation obligation, R40 million decrease in the unwinding of the finance costs on the deferred revenue transactions, R5 million decrease in interest on lease liabilities and R19 million decrease in interest on the occupational healthcare obligation, all partially offset by an increases of R87 million in the unwinding of the Marikana dividend obligation, R5 million increase in the Pandora deferred payment and an
Management’s discussion and analysis of the financial statements continued
increase of R5m in sundry interest. For additional information on finance expense see –Consolidated financial statements–Notes to the consolidated financial statements–Note 5.2: Finance expense.
Finance expense decreased by R151 million mainly due to a R155 million decrease in interest on borrowings following a decrease in average outstanding borrowings for 2020, R20 million decrease in interest on the occupational healthcare obligation, R21 million decrease related to the dissenting shareholders, R3 million decrease in the unwinding of the deferred revenue related to the streaming transactions (Wheaton and Marikana operation platinum forward sale) and a R93 million decrease in sundry interest, all partially offset by an increases of R20 million in the unwinding of amortised cost on borrowings, R105 million increase in unwinding of the environmental rehabilitation obligation, R8 million increase unwinding of the Pandora deferred payment and an increase of R8 million related to the Rustenburg deferred payment.
Sibanye-Stillwater’s gross debt outstanding, excluding the Burnstone Debt was R18.8 billion as at 31 December 2021 compared with approximately R17.1 billion at 31 December 2020.
Share-based payments
The share-based payments expense decreased by 25% to R383 million (2020: R512 million) in 2021. The share-based payments expense includes Rnil (2020: R128 million) and R19 million (2020: R13 million) relating to the DRDGOLD cash-settled and equity-settled share options respectively, and R132 million (2020: R145 million) relating to equity-settled share options granted under the Sibanye-Stillwater Share Plans and R232 million (2020: R226 million) relating to the cash-settled Sibanye-Stillwater Share Plan. For additional information on share- based payments see –Consolidated financial statements–Notes to the consolidated financial statements–Note 6: Share-based payments.
Loss on financial instruments
The net loss on financial instruments increased from R2,450 million to R6,279 million for 2021, representing a year-on-year increase of 156% or R3,829 million. The net loss for 2021 is mainly attributable to fair value losses on the revised cash flow of the Anglo deferred payment of R4,653 million, the Rustenburg and Marikana operations B-BBEE cash-settled share- based payment obligations of R671 million and R593 million respectively, and the Marikana dividend obligation of R468 million, mainly due to higher forecasted 4E PGM basket prices. The losses were partially offset by fair value gains on the Palladium hedge contract of R234 million. For additional information on the loss on financial instruments see –Consolidated financial statements–Notes to the consolidated financial statements–Note 7: Loss on financial instruments.
The loss on financial instruments decreased from R6,015 million in 2019 to R2,450 million in 2020. This decrease was mainly attributable to the decrease of R1,089 million in the fair value loss on the Sibanye Rustenburg Platinum B-BBEE share-based payment obligation and the decrease of R3,842 million in the fair value loss on the derivative financial instrument relating to US$ Convertible Bond which was settled during October 2020. These decreases in 2020 were partially offset by an increase of R1,357 million in the loss on the revised cash flows of the deferred payments which was mainly due to higher forecasted 4E PGM basket prices.
Gain/(loss) on foreign exchange differences
The gain on foreign exchange differences of R1,149 million in 2021 compared with a loss of R255 million in 2020. The gain on foreign exchange differences in 2021 was mainly due to foreign exchange gains of R1,367 million on intra-group loans with a real foreign exchange exposure, partially offset by a R117 million loss on the Burnstone debt due to a weaker rand.
The loss on foreign exchange differences in 2020 was mainly due to a foreign exchange loss of R2,130 million on the US$ Convertible Bond and the derivative financial instrument and a R49 million loss on the Burnstone debt, both due to a weaker rand in 2020 compared to 2019, partially offset by foreign exchange gains on intra-group loans with a real foreign exchange exposure.
Share of results of equity-accounted investees after tax
The profit from share of results of associates of R1,989 million in 2021 (2020: R1,700 million) was primarily due to share of profits of R1,702 million (2020: R1,300 million) relating to Sibanye-Stillwater’s 50% attributable share in Mimosa and R287 million (2020: R400 million) relating to its 44% interest in Rand Refinery. For additional information on the share of results of equity-accounted investees after tax, see –Consolidated financial statements–Notes to the consolidated financial statements–Note 18: Equity-accounted investments.
(Impairments)/Reversal of impairments
During 2021 the Group recognised an impairments of R5,148 million compared to an impairments reversal of R121 million in 2020. At 31 December 2021, a number of factors were identified that negatively impacts the ability of the Driefontein, Kloof and Beatrix operations to recover the carrying value of mining assets over their respective remaining life-of-mines. Expected above inflation increases in major cost components, in particular electricity and labour costs, coupled with ageing infrastructure, declining life-of-mines and the consensus long-term gold price forecast lower than the spot price, negatively affected the forecast cash flows of these operations. This led to the recognition of impairment losses at the Driefontein, Kloof and Beatrix reportable segments of R212 million, R3,642 million and R1,293 million, respectively. These operations are included under SA gold in the segment report and each represent a separate cash generating unit. For additional information on the Group's estimates and assumptions used in the impairment calculations, see –Consolidated financial statements– Notes to the consolidated financial statements–Note 10: (Impairments)/reversal of impairments.
Impairment reversals in 2020 mainly related to the historical impairment of R120 million on Rand Refinery, an equity accounted investee, which was reversed due to improved profitability and a forecasted return to stable dividend payments.
Occupational healthcare expense
On 26 July 2019 the Gauteng High Court in Johannesburg approved the R5 billion settlement agreement in the silicosis class case. At 31 December 2021 Sibanye-Stillwater has provided R1,017 million (2020: R1,194 million) for its share of the settlement cost. The estimated costs at 31 December 2021 and 2020 was determined by an actuarial specialist and as a result, a change in estimate of R14 million income was recognised in profit or loss for the year (2020: R52 million expense). For additional information on the
Management’s discussion and analysis of the financial statements continued
occupational healthcare expense, see –Consolidated financial statements–Notes to the consolidated financial statements–Note 31: Occupational healthcare obligation.
Restructuring costs
Maintaining loss-making operations is not sustainable over an extended period. Cross-subsidising loss making operations erodes value, is a drain on cash flows and, as a result, threatens the sustainability and economic viability of other operations. The Group, therefore, continually reviews and assesses the operating and financial performance of its assets. Restructuring costs of R107 million comprised mainly the costs of mutual separation packages offered to employees with high COVID-19 risk due to comorbidities or ill health at the SA PGM and SA gold operations of R14 million and R20 million, respectively, professional fees of R21 million at the SA operations and provision for the Kloof 3 shaft closure of R43 million.
Restructuring costs of R436 million for 2020 comprised mainly of R235 million related to S189 restructuring at the Marikana operation which was completed on 16 January 2020 and R75 million and R100 million respectively at the SA PGM and SA gold operations mainly related to fragile health voluntary separations in light of the COVID-19 pandemic.
Transaction costs
Transaction costs were R140 million in 2021 compared with R139 million in 2020. The transaction costs in 2021 mainly included acquisition related advisory and legal fees of R103 million (2020: R42 million), and platinum jewellery membership costs of R27 million (2020: R47 million), advisory and legal fees of Rnil (2020: R8 million) related to the restructuring of the Lonmin legal entities, advisory and legal fees of Rnil (2020: R 30 million) related to the Marathon transaction and advisory and legal fees of Rnil million (2020: R25 million) related to the Sibanye Gold Limited internal restructuring, partially offset by the reversal of a provision for legal costs relating to the dissenting shareholder claim of Rnil (2020: R26 million).
Care and maintenance costs
Care and maintenance costs were R737 million in 2021 compared with R814 million in 2020. The care and maintenance costs included R594 million (2020: R623 million) at Cooke, R79 million (2020: R92 million) at Marikana operation, R46 million (2020: R81 million) at Burnstone, R14 million (2020: R8 million) at Kroondal and R4 million (2020: R10 million) at DRDGOLD.
Change in estimate of environmental rehabilitation obligation, and right of recovery receivable and payable
Change in estimate of environmental rehabilitation obligation, and right of recovery receivable and payable was an income of R167 million in 2021 compared with an income of R464 million in 2020. The decrease in the income is mainly due to changes in gross closure cost estimates, changes in discount rates and changes in expected timing of rehabilitation for operations on care and maintenance and operations that are being rehabilitated (recognised through profit or loss).
Strike related costs
Strike related costs were Rnil in 2021 compared to R1 million at SA gold in 2020.
Loss on settlement of the US$ Convertible Bond
By the end of October 2020 the US$ Convertible Bond was settled through cash of R13 million and the issue of 248,040,434 ordinary shares of the Group with an aggregate fair value of R12,573 million, resulting in a loss on settlement of R1,507 million, see –Consolidated financial statements–Notes to the consolidated financial statements–Note 28.6: US$ Convertible Bond.
Non-recurring COVID-19 costs
The Group incurred non-recurring COVID-19 costs of R3 million (2020: R97 million) relating to once-off costs incurred to ensure the safe return to work of employees at the South African operations following the COVID-19 lockdown in South Africa, including implemented measures at all the Group’s operations to prevent the spread of the pandemic, detect infections and care for those infected.
Early redemption premium on the 2025 Notes
During the fourth quarter of 2021, the Group elected to early redeem the 2025 Notes at a redemption price of 103.6% of the principal amount of the 2025 Notes, plus accrued and unpaid interest on the 2025 Notes, amounting to US$370.2 million which includes an early settlement premium of R196 million recognised as a premium on settlement of the 2025 Notes in profit or loss. The 2025 Notes were settled on 6 December 2021 see –Consolidated financial statements–Notes to the consolidated financial statements–Note 28.4: 2022 and 2025 Notes.
Royalties
Royalties increased by 54% to R2,714 million in 2021 from R1,765 million in 2020. The increases in both 2021 and 2020 were mainly due to the increase in SA PGM revenue and profitability as a result of higher precious metal prices.
Mining and income tax
Mining and income tax charge increased to R13,761 million in 2021 compared to R4,858 million in 2020. The table below indicates Sibanye-Stillwater’s effective tax expense rate in 2021 and 2020.
| | | | | | | | | | | |
| | 2021 | 2020 |
| Mining and income tax | Rm | 13,761 | 4,858 |
| Effective tax rate | % | 29 | 14 |
In 2021, the tax charge on the profit before tax at the South African statutory company tax rate of 28.0%, or R13,316 million, compared with a charge R13,761 million is mainly due to the impact on the statutory tax rate of the following:
Management’s discussion and analysis of the financial statements continued
•R1,021 million non-deductible loss on fair value of financial instruments
•R1,133 million deferred tax assets derecognised
•R108 million non-deductible finance expense
•R351 million net other non-taxable income and non-deductible expenditure
•R13 million non-deductible amortisation and depreciation
•R42 million non-deductible share-based payments
•R22 million non-taxable impairments
•R69 million Non-deductible transaction costs
The above was partially offset by the following:
•R466 million US statutory rate change
•R63 million SA gold mining tax formula rate adjusted
•R7 million non-taxable dividend received
•R47 million non-taxable gain on foreign exchange differences
•R557 million non-taxable share of results of equity-accounted investees
•R386 million tax adjustment in respect of prior periods
•R86 million change in estimated deferred tax rate
In 2020, the tax charge on the profit before tax at the South African statutory company tax rate of 28.0%, or R9,934 million, compared with a charge of R4,858 million is mainly due to the impact on the statutory tax rate of the following:
•R4,447 million previously unrecognised deferred tax assets utilised/ recognised
•R550 million US statutory rate change
•R118 million SA gold mining tax formula rate adjusted
•R258 million net other non-taxable income and non-deductible expenditure
•R89 million non-deductible finance expenses, which is presented net after the reversal of an uncertain income tax treatment amounting to R181.5 million
•R476 million non-taxable share of results of equity-accounted investees
•R33 million non-taxable reversal of impairments
The above was partially offset by the following:
•R890 million non-deductible loss on fair value of financial instruments
•R44 million non-deductible share-based payments
Profit for the year
As a result of the factors discussed above, the profit in 2021 was R33,796 million compared with the profit in 2020 of R30,622 million. The following table depicts contributions from various segments to the profit.
| | | | | | | | |
| Figures in million – SA rand | 2021 | 2020 |
| | |
| | |
| SA PGM operations | 29,594 | | 23,316 | |
Rustenburg operation1 | (2,221) | | 519 | |
| Marikana | 14,293 | | 13,881 | |
| Kroondal | 4,664 | | 3,389 | |
| Platinum Mile | 352 | | 188 | |
| Mimosa | 1,702 | | 1,300 | |
Corporate and reconciling items1 | 10,804 | | 4,039 | |
| US PGM operations | 7,459 | | 7,778 | |
| Stillwater | 7,459 | | 7,778 | |
| SA gold operations | (2,475) | | 510 | |
| Driefontein | 694 | | 499 | |
| Kloof | (2,332) | | 1,185 | |
| Beatrix | (1,118) | | 120 | |
| Cooke | (388) | | (315) | |
| DRDGOLD | 1,040 | | 1,302 | |
| Corporate and reconciling items | (371) | | (2,281) | |
| Group Corporate and reconciling items | (782) | | (982) | |
| Total profit for the year | 33,796 | | 30,622 | |
1 The net (loss)/profit)on the Rustenburg operation in 2021 and 2020 was impacted by the change of the obligation for future dividends payable to its shareholders in terms of the B-BBEE SPV structure of R7,615 million (2020: R1,686 million) and the fair value adjustment of R4,653 million (2020: R2,081 million) on the deferred payment to Rustenburg Platinum Mines Limited due to the higher long term PGM basket prices expected over the life of mine. This fair value adjustment eliminates in the corporate and reconciling items at a SA PGM operations level.
Management’s discussion and analysis of the financial statements continued
Liquidity and capital resources
Cash flow analysis
Net increase in cash and cash equivalents in 2021 was R9,344 million compared with R14,969 million in 2020. The principal factors explaining the changes in net cash flow for the year are set out in the table below.
| | | | | | | | | | | |
| Figures in million - SA rand | 2021 | 2020 | % Change 2021/2020 |
| Net cash from operating activities | 32,256 | 27,151 | 19 |
| Adjusted for: | | | |
| Dividends paid | 18,176 | 1,698 | 970 |
| Net interest (received)/paid | (179) | 667 | (127) |
| Deferred revenue advance received | (65) | (771) | (92) |
| Bulk Tailings re-Treatment transaction (BTT) early settlement payment | — | 787 | (100) |
| Less: | | | |
| Additions to property, plant and equipment | (12,740) | (9,616) | 32 |
Adjusted free cash flow1 | 37,448 | 19,916 | 88 |
| Acquisition of subsidiaries, net of cash acquired | — | — | — |
| Payments to dissenting shareholders | — | — | — |
| Net proceeds from shares issued | — | — | — |
| Payment of Deferred Payment | (577) | (756) | (24) |
| Net borrowings repaid | 399 | (2,046) | (120) |
1 One of the drivers to sustain and increase shareholder value is adjusted free cash flow generation as that determines the cash available for dividends and other investing activities. Adjusted free cash flow is defined as net cash from operating activities before dividends paid, net interest paid, deferred revenue advance received and BTT early settlement payment, less additions to property, plant and equipment
Non-IFRS measure such as adjusted free cash flow is the responsibility of the Group's Board of Directors and is presented for illustration purposes only, and because of its nature, adjusted free cash flow should not be considered as a representation of financial performance under IFRS
Net cash from operating activities
Net cash from operating activities increased by R5,105 million to R32,256 million in 2021 from R27,151 million in 2020. The items contributing to the increase in 2021 and decrease in 2020 are indicated in the table below.
| | | | | | | | |
| Figures in million - SA rand | 2021 | 2020 |
| Increase in cash generated by operations¹ | 22,596 | 34,622 |
| Decrease in deferred revenue advance received² | (706) | (2,088) |
| Decrease/(increase) in cash-settled share-based payments paid | 35 | (184) |
| Decrease/(increase) in BTT early settlement payment² | 787 | (787) |
| Decrease/(increase) in change in working capital | 11,890 | (8,809) |
| Decrease in interest paid | 605 | 217 |
| Increase in royalties and tax paid³ | (11,369) | (4,706) |
Increase in dividends paid4 | (16,478) | (1,613) |
Additional deferred payments relating to acquisition of a business5 | (1,754) | — |
| Other | (501) | 1,036 |
| Increase in net cash from operating activities | 5,105 | 17,688 |
1 The increase in cash generated by operations in 2021 and 2020 was mainly due to the increase in the average realised PGM basket prices and gold price for 2020, negatively impacted by the operational disruptions experienced by the SA operations due to COVID-19 during 2020
2 The Marikana operations entered into a short-term purchase of concentrate and toll treatment arrangement with a third party that commenced on 1 February 2021 and concluded on 31 December 2021. As part of the arrangement, Marikana agreed to buy and toll treat certain metals. A percentage of the toll treated metals is also retained as partial payment for the toll treatment arrangement. Marikana accounts for the inventory received as partial payment for the toll treatment arrangement as deferred revenue at fair value. A further deferred revenue balance is recognised to the extent that cash payment is received for the toll treatment before the performance obligation is satisfied. During 2021 cash payments of R65 million was received in advance under the terms of this agreement. On 24 January 2020, Western Platinum Proprietary Limited (WPL), Eastern Platinum Limited and Lonmin Limited (collectively the “Purchasers”), subsidiaries of Sibanye-Stillwater, entered into a Release and Cancellation Agreement (“the Release Agreement”) with RFW Lonmin Investments Limited (“the Seller”) in respect of the BTT. The BTT transaction was implemented and the liability settled on 6 March 2020. WPL concluded a forward platinum sale arrangement on 3 March 2020 to fund the settlement of the BTT liability. WPL received a cash prepayment of US$50 million (R771 million) in exchange for the future delivery of 72,886 ounces of platinum on set dates between June and December 2020. The platinum price delivered under the prepayment was hedged with a cap price of US$1,050 per ounce and a floor price of US$700 per ounce. The Group received, and recognised, the difference between the floor price and the monthly average price (subject to a maximum of the cap price) on delivery of the platinum. The final delivery under the forward platinum sale arrangement was made on 7 December 2020. On 21 October 2019, Sibanye-Stillwater concluded a forward gold sale arrangement where the Group received a cash prepayment of R1.1 billion in exchange for the future delivery of 8,482 ounces (263.8 kilograms) of gold every two weeks from 10 July 2020 to 16 October 2020 subject to an initial reference price of R17,371/oz comprising 80% of the prevailing price on execution date. This was offset by the decrease of R6,555 million (US$500 million) received through a streaming agreement with Wheaton International, a wholly-owned subsidiary of Wheaton Precious Metals Corp on closing of the transaction in 2018
Management’s discussion and analysis of the financial statements continued
3 The increase in royalties and tax paid in 2021 and 2020 was due to the increase in revenue and taxable mining income as a result of increased precious metal prices during both 2021 and 2020. In addition, during 2020 the tax expense decreased by R4,447 million due to the utilisation and recognition of previously unrecognised deferred tax assets
4 Included in dividends paid for 2021 is a final dividend for 2020 and interim dividend for 2021 of R9,485 million and R8,347 million, respectively declared and paid by the Group and dividends paid by subsidiary companies to their non-controlling shareholders of R344 million and for 2020 is an interim dividend of R1,338 million declared and paid by the Group and dividends paid by subsidiary companies to their non-controlling shareholders of R360 million
5 The acquisition date fair value of deferred payments and contingent consideration relating to business combinations is part of the aggregate consideration for obtaining control of the underlying net assets. Therefore, unless the obligations are clearly part of the borrowing structure of the group, repayments of the acquisition date fair value are classified as investing activities. Additional deferred/ contingent payments in excess of the grant date fair value are considered to be operating activity cash flows by nature and amounted to R1,754 million in 2020 relating to the acquisition of the Sibanye Rustenburg Platinum Mines Proprietary Limited
Adjusted free cash flow
Adjusted free cash flow during 2021 increased with cash received due to higher precious metal prices. The Group recorded adjusted free cash flow of R37,448 million in 2021, which was an improvement of R17,532 million compared with 2020. In 2021, the US PGM operations recorded a 193% increase in adjusted free cash flow to R8,148 million, the SA PGM operations recorded a 92% increase in adjusted free cash flow to R22,550 million (after providing funding of R232 million to the US PGM operations and R7,817 million to the SA gold operations on the intercompany working capital account) and the SA gold operations recorded a 23% increase in adjusted free cash flow to R7,782 million after receiving R7,817 million from the SA PGM operations on the intercompany working capital account. Excluding the receipt of intercompany funding from the adjusted free cash flow, the SA gold operations had a negative adjusted free cash flow of R34 million.
| | | | | | | | |
| Figures in million - SA rand | 2021 | 2020 |
| Net cash from operating activities | 32,256 | 27,151 |
| Adjusted for: | | |
| Dividends paid | 18,176 | 1,698 |
| Net interest (received)/paid | (179) | 667 |
| Deferred revenue advance received | (65) | (771) |
| BTT early settlement payment | — | 787 |
| Less: | | |
| Additions to property, plant and equipment | (12,740) | (9,616) |
| Adjusted free cash flow | 37,448 | 19,916 |
Cash flows from investing activities
Net cash used in investing activities increased to R14,568 million in 2021 from R9,938 million in 2020. The increase in cash used in investing activities was mainly due to additions to property, plant and equipment of R12,740 million in 2021 compared to R9,616 million in 2020. Net cash used in investing activities increased to R9,937 million in 2020 from R4,865 million in 2019. The increase in the 2020 net cash used in investing activities was mainly due to additions to property, plant and equipment of R9,616 million, compared to R7,706 million in 2019, and the cash of R3,004 million acquired on acquisition of subsidiaries in 2019.
Capital expenditure at the individual mines is shown in the table below.
Management’s discussion and analysis of the financial statements continued
| | | | | | | | |
| Figures in million - SA rand | 2021 | 2020 |
| | |
| | |
| SA PGM operations | 3,799 | 2,197 |
| Rustenburg operation | 1,248 | 743 |
| Marikana | 2,254 | 1,223 |
| Kroondal | 268 | 188 |
| Platinum Mile | 28 | 43 |
| Corporate and reconciling items | 1 | — |
| US PGM operations | 4,561 | 4,422 |
| Stillwater | 4,561 | 4,422 |
| SA gold operations | 4,380 | 2,997 |
| Driefontein | 1,499 | 929 |
| Kloof | 1,616 | 1,269 |
| Beatrix | 668 | 415 |
| Cooke | — | — |
| DRDGOLD | 377 | 341 |
| Corporate and reconciling items | 220 | 43 |
| Total Capital Expenditure | 12,740 | 9,616 |
Capital expenditure increased to R12,740 million in 2021 from R9,616 million in 2020, for additional information refer to the Capital expenditure section above.
Cash flows from financing activities
Net cash used in financing activities of R8,344 million in 2021 compared with R2,244 million in 2020. Net cash used in financing activities comprised lease payments of R112 million (2020: R114 million), loans repaid of R20,252 million (2020: R18,335 million), partially offset by loans raised of R20,651 million (2020: R16,289 million), acquisition of non-controlling interests of R128 million (2020: Rnil) and share buy-back of R8,503 million (2020: R84 million).
The Group commenced with a share buy-back programme on 2 June 2021 to repurchase up to 5% of its ordinary shares as at 31 May 2021 representing a maximum of 147,700,000 shares. The programme concluded on 4 October 2021 when the maximum number of shares were reached. The total cost amounted to R8,503 million, including transaction costs. The average cost per share repurchased amounted to R57.57 see –Consolidated financial statements–Notes to the consolidated financial statements–Note 26:Stated share capital.
On 29 June 2021, the 8.3% shareholding held by non-controlling shareholders in Platinum Mile was repurchased for a consideration of R128 million see –Consolidated financial statements–Notes to the consolidated financial statements–Note 27: Non-controlling interests.
Given surplus liquidity within the Group and in line with the Group’s capital allocation framework, it elected to redeem the 2022 Notes on 2 August 2021 for an amount of US$355.8 million, which were also settled on 2 August 2021. During December 2021, the Group also elected to early redeem the 2025 Notes for an amount of US$370.2 million, which were settled on 6 December 2021 including an early settlement premium of R196 million recognised in profit or loss. For additional information see –Consolidated financial statements–Notes to the consolidated financial statements–Note 28.4: 2022 and 2025 Notes.
On 16 November 2021 the Group completed a two-tranche corporate bond offering 4.0% Notes (US$675 million) due 16 November 2026 (the 2026 Notes) and 4.5% Notes (US$525 million) due 16 November 2029 (the 2029 Notes) (together the 2026 and 2029 Notes). The proceeds were applied towards the early redemption of the 2025 Notes and will also be applied for general corporate purposes, including advancing the Group’s green metals strategy through investments and accretive acquisitions. The bonds were issued through the Group's wholly-owned subsidiary Stillwater Mining Company. For additional information see –Consolidated financial statements–Notes to the consolidated financial statements–Note 28.5: 2026 and 2029 Notes.
During October 2020 the US$383.8 million convertible bond was settled through cash (R13 million) and the issue of shares (R12,573 million) see –Consolidated financial statements–Notes to the consolidated financial statements–Note 28.6: US$ Convertible Bond.
Net increase in cash and cash equivalents
As a result of the above, net cash and cash equivalents (excluding the effect of exchange rate fluctuations on cash held) increased by R9,344 million in 2021 compared with an increase of R14,969 million in 2020.
Total Group cash and cash equivalents amounted to R30,292 million at 31 December 2021 (2020: R20,240 million).
Statement of financial position
Borrowings
Total borrowings (short- and long-term) excluding R1,507 million (2020: R1,263 million) attributable to Burnstone, which has no recourse to Sibanye-Stillwater’s balance sheet, increased to R18,791 million at 31 December 2021 from R17,119 million at 31 December 2020.
Management’s discussion and analysis of the financial statements continued
During the 2021 year borrowings decreased with loans repaid of R20,252 million following repayments on the US$600 million revolving credit facility (RCF) (R7,728 million), redemption of both the 2022 and 2025 Notes for an amount of US$355.8 million and US$370.2 million, respectively (R10,840 million) and settlement of other borrowings (R1,684 million). Borrowings increased with loans raised of R20,622 million during the 2021 year, following drawdowns on the US$600 million RCF (R703 million), issue of a two-tranche corporate bond offering on 16 November 2021 which comprised the 2026 and 2029 Notes (R18,208 million) and other borrowings raised (R1,711 million).
At 31 December 2021, Sibanye-Stillwater had committed undrawn facilities of R15,749 million (31 December 2020: R7,336 million) available under the US$600 million RCF and R5.5 billion RCF.
For a description of borrowings, see –Consolidated financial statements–Notes to the consolidated financial statements–Note 28: Borrowings and derivative financial instrument.
Working capital and going concern assessment
For the year ended 31 December 2021, the Group realised a profit of R33,796 million (31 December 2020: R30,622 million, 31 December 2019: profit of R433 million). As at 31 December 2021, the Group’s current assets exceeded its current liabilities by R44,290 million (31 December 2020: R34,756 million, 31 December 2019: R11,836 million) and the Group’s total assets exceeded its total liabilities by R81,345 million (31 December 2020: R70,716 million, 31 December 2019: R31,138million). During the year ended 31 December 2021 the Group generated net cash from operating activities of R32,256 million (31 December 2020: R27,151 million, 31 December 2019: R9,463 million).
The Group had committed undrawn debt facilities of R15,749 million at 31 December 2021 (31 December 2020: R7,336 million, 31 December 2019: R5,688 million) and cash balances of R30,292 million (31 December 2020: R20,240 million, 31 December 2019: R5,619 million). The 2022 Notes, contractually due to be settled on 27 June 2022, were early settled on 2 August 2021 for the nominal value of US$354 million (R5,123 million). The 2025 Notes, were refinanced and upsized into a new bond issue on 16 November 2021, see –Consolidated financial statements–Notes to the consolidated financial statements–Note28.5 US$ Convertible Bond, securing reduced cost of debt, longer financing tenors and enhancing liquidity. The most immediate debt maturities are the US$600 million USD RCF maturing in April 2023 and the R5.5 billion ZAR RCF maturing in November 2024.
The Group’s leverage ratio (net (cash)/debt to adjusted EBITDA) as at 31 December 2021 was (0.2):1 (31 December 2020 was (0.1):1, 31 December 2019 was 1.4:1) and its interest coverage ratio (adjusted EBITDA to net finance (income)/charges) was (5,281:1) (31 December 2020 was 80:1, 31 December 2019 was 7:1). Both considerably better than the maximum permitted leverage ratio of at most 2.5:1 (up to 31 December 2019: 3.5:1); and minimum required interest coverage ratio of 4.0:1, calculated on a quarterly basis, required under the US$600 million RCF and the R5.5 billion RCF. With the available RCF’s collectively 100% unutilised at 31 December 2021, high level of available cash balances and the Group’s strong liquidity position, no imminent refinancing of debt is required.
Notwithstanding the exceptionally strong liquidity position and good financial outlook, the Group could also, if necessary, consider options to increase funding flexibility which may include, amongst others, additional loan facilities or debt capital market issuances, streaming facilities, prepayment facilities or, in the event that other options are not deemed preferable or achievable by the Board, an equity capital raise. The Group could also, with lender approval, request covenant amendments or restructure facilities. During past adversity, management had successfully implemented similar actions.
Management believes that the cash forecasted to be generated by operations, cash on hand, the committed unutilised debt facilities as well as additional funding opportunities will enable the Group to continue to meet its obligations as they fall due. The consolidated financial statements for the year ended 31 December 2021, therefore, have been prepared on a going concern basis.
Off balance sheet arrangements and contractual commitments
At 31 December 2021, Sibanye-Stillwater had no off balance sheet items. For a description of Sibanye-Stillwater’s contractual commitments, see the following notes to the consolidated financial statements:
| | | | | |
| Contractual commitments | Note to the consolidated financial statements |
| Environmental rehabilitation obligation | 30 - Environmental rehabilitation obligation and other provisions |
| Occupational healthcare obligation | 31 - Occupational healthcare obligation |
| Commercial commitments | 37 - Commitments |
| Contingent liabilities | 38 - Contingent liabilities |
| Debt | |
| - capital | 28 - Borrowings and derivative financial instrument |
| - interest | 28 - Borrowings and derivative financial instrument |
| Leases | 29 - Lease liabilities |
These contractual commitments for expenditure will be met from internal cash flow and, to the extent necessary, from the existing facilities.
Critical accounting policies and estimates
Sibanye-Stillwater’s significant accounting policies are fully described in the various notes to its consolidated financial statements. Some of the Group’s accounting policies require the application of significant judgements and estimates by management that can affect the amounts reported in the consolidated financial statements.
Management’s discussion and analysis of the financial statements continued
These judgements and estimates are based on management’s best knowledge of the relevant facts and circumstances, having regard to previous experience, but actual results may differ from the amounts included in the consolidated financial statements.
For Sibanye-Stillwater’s significant accounting policies that are subject to significant judgements, estimates and assumptions, see the following notes to the consolidated financial statements:
| | | | | |
| Significant accounting policy | Note to the consolidated financial statements |
| Revenue | 3 - Revenue |
| Cash-settled share-based payment obligation | 6 - Share-based payments |
| Royalties, mining and income tax, and deferred tax | 11 - Royalties, mining and income tax, and deferred tax |
| Property, plant and equipment | 14 - Property, plant and equipment |
| Business combinations | 16 - Acquisitions |
| Goodwill | 17 - Goodwill |
| Equity-accounted investments | 18 - Equity-accounted investments |
| Other receivables and other payables | 22 - Other receivables and other payables |
| Inventories | 23 - Inventories |
| Borrowings and derivative financial instrument | 28 - Borrowings and derivative financial instrument |
| Environmental rehabilitation obligation | 30 - Environmental rehabilitation obligation and other provisions |
| Occupational healthcare obligation | 31 - Occupational healthcare obligation |
| Deferred revenue | 32 - Deferred revenue |
| Contingent liabilities | 38 - Contingent liabilities |
Statement of responsibility by the Board of directors
The directors are responsible for the preparation and fair presentation of the consolidated annual financial statements of Sibanye-Stillwater, comprising the consolidated statement of financial position as at 31 December 2021, and consolidated income statement and consolidated statements of other comprehensive income, changes in equity and cash flows for the year then ended, and the notes to the consolidated financial statements, which include a summary of significant accounting policies, and other explanatory notes, in accordance with International Financial Reporting Standards (IFRS), as issued by the International Accounting Standards Board (IASB), the South African Institute of Chartered Accountants Financial Reporting Guides issued by the Accounting Practices Committee and Financial Reporting Pronouncements issued by the Financial Reporting Standards Council, as well as the requirements of the South African Companies Act, 71 of 2008 (the Companies Act) and the JSE Listings Requirements.
In addition, the directors are responsible for preparing the directors’ report.
The directors consider that, in preparing the consolidated financial statements, they have used the most appropriate accounting policies, consistently applied and supported by reasonable and prudent judgements and estimates, and that all IFRS standards that they consider to be applicable have been complied with for the financial year ended 31 December 2021. The directors are satisfied that the information contained in the consolidated financial statements fairly presents the results of operations for the year and the financial position of the Group at year end. The directors are responsible for the information included in the annual financial report, and are responsible for both its accuracy and its consistency with the consolidated annual financial statements.
The directors have responsibility for ensuring that accounting records are kept. The accounting records should disclose with reasonable accuracy the financial position of the Group to enable the directors to ensure that the consolidated annual financial statements comply with the relevant legislation.
The Group operated in a well-established control environment, which is well documented and regularly reviewed. This incorporates risk management and internal control procedures, which are designed to provide reasonable assurance that assets are safeguarded and that the material risks facing the business are being controlled.
The directors have made an assessment of the ability of the Company and its subsidiaries to continue as going concerns and based on this assessment concluded that the basis for preparation of the consolidated annual financial statements is appropriate to that of a going concern.
The Group’s external auditors, Ernst & Young Inc. audited the consolidated annual financial statements. For their report, see– Independent Auditor’s Report.
The consolidated annual financial statements were approved by the Board of Directors and are signed on its behalf by:
| | | | | | | | |
| Neal Froneman | | Charl Keyter |
| Chief Executive Officer | | Chief Financial Officer |
22 April 2022
Company secretary’s confirmation
In terms of section 88(2)(e) of the Companies Act, as amended, I certify that to the best of my knowledge, the Company has lodged with the Companies and Intellectual Property Commission all such returns as are required to be lodged by a public company in terms of the Companies Act, and that all such returns are true, correct and up to date.
Lerato Matlosa
Company Secretary
22 April 2022
Report of the audit committee
Introduction
The Audit Committee has formal terms of reference which are updated on an annual basis. The Board is satisfied that the Audit Committee has complied with these terms, and with its legal and regulatory responsibilities as set out in the South African Companies Act (Companies Act), King IVTM, the JSE Listings Requirements (JSE LR) and the requirements of the Securities and Exchange Commission (SEC).
The Audit Committee consisted of seven independent non-executive directors for the period from 1 January 2021 to 31 December 2021. For membership, see –Accountability–Directors’ report–Directorate–Composition of the Board and sub-committees.
The Board believes that the members collectively possess the knowledge and experience to supervise Sibanye-Stillwater’s financial management, internal and external auditors, the quality of Sibanye-Stillwater’s financial controls, the preparation and evaluation of Sibanye- Stillwater’s audited consolidated financial statements and Sibanye-Stillwater’s periodic financial reporting.
The Board has established and maintains internal controls and procedures, which are reviewed on a regular basis. These are designed to manage the risk of business failures and to provide reasonable assurance against such failures. However, this is not a guarantee that such risks are eliminated.
Responsibility
It is the duty of the Audit Committee, inter alia, to monitor and review on a Company and Group (Company, Group or Company and Group) basis:
•the effectiveness of the internal audit function and by extension, the effectiveness of Group internal controls, see – Internal Audit (below)
•external auditor suitability and recommendation for appointment, see – Auditor suitability review (below)
•external auditor independence and fees, see – Auditor independence and fees (below)
•reports of both internal and external auditors
•evaluation of the expertise and experience of the Chief Financial Officer (CFO)
•financial reporting systems and ensure that Group reporting procedures are functioning properly
•the governance of information technology (IT) and the effectiveness of the Group’s information systems
•interim results and report (Interim Report), quarterly operating reports, company and consolidated annual financial statements (Audited AFS) and all other widely distributed financial documents
•the Form 20-F filing with the SEC
•accounting policies of the Company and Group and proposed revisions
•compliance with applicable legislation, requirements of appropriate regulatory authorities and Sibanye-Stillwater’s Code of Ethics
•policies and procedures for preventing and detecting fraud
•the integrity of the content of the Interim Report, Audited AFS and the integrated annual report and associated reports (IAR) and then recommending same to the Board for approval
Access and meetings
Internal and external auditors have unrestricted access to the Audit Committee, the Audit Committee Chairman and the Chairman of the Board, ensuring that auditors are able to maintain their independence. Both the internal and external auditors report at Audit Committee meetings. The Audit Committee meets with internal audit and the SOX division on a quarterly basis without other invitees being present and the Audit committee Chairman meets with the external auditors on a quarterly basis without other invitees being present. Management attend Audit Committee meetings by invitation.
Annual financial statements
The Committee has reviewed and is satisfied that the consolidated Audited AFS, including accounting policies, are appropriate and comply with International Financial Reporting Standards (IFRS), as issued by the International Accounting Standards Board (IASB), the South African Institute of Chartered Accountants (SAICA) Financial Reporting Guides issued by the Accounting Practices Committee and Financial Reporting Pronouncements issued by the Financial Reporting Standards Council, as well as the requirements of the Companies Act, JSE LR and the requirements of the SEC.
The significant audit and accounting matters in respect of the Group considered by the Committee during the financial year were:
•the physical quantities of Western Platinum Proprietary Limited’s (WPL) Platinum Group Metals (PGM) in process
•the impairment assessment of property, plant and equipment, right-of-use assets, goodwill arising from business combinations, and equity-accounted investments
•the accounting implications of restructuring the broad-based black economic empowerment (B-BBEE) structure in relation to WPL and Eastern Platinum Proprietary Limited (EPL) (collectively referred to as Marikana)
The above matters were addressed by management and by the Audit Committee on review basis are as follows:
Report of the audit committee continued
| | | | | |
| The physical quantities of WPL’s Platinum Group Metals (PGMs) in process | For the year ended 31 December 2021, management determined the physical quantities of PGMs in process at WPL as follows: •performed physical inventory counts at the metal processing areas, attended by management and a management appointed third party metallurgical specialist •determined an allowance for estimation uncertainty depending on the degree to which the nature and state of material allows for accurate measurement and sampling •reconciled quantities per the physical inventory count to theoretical inventory quantities and adjust to physical inventory quantities •performed a mass balance reconciliation of inventory from the beginning of the year to the closing balance of inventory Management determined that the PGMs in process are accurate and exist at 31 December 2021. Significant accounting judgements and estimates are appropriately disclosed in note 23 to the consolidated Audited AFS. |
| The impairment assessment of property, plant and equipment, right-of-use assets, goodwill arising from business combinations, and equity-accounted investments | For the year ended 31 December 2021, management performed an impairment assessment over the property, plant and equipment, right-of-use assets, goodwill and equity-accounted investments as follows: •assessed whether there is an indication, based on either internal or external sources of information, that an asset or cash-generating unit (CGU) may be impaired •where indications of impairment were identified or the CGU has allocated goodwill, calculated the recoverable amount of the CGU, based on expected discounted net forecast cash flows arising from the expected mining of the ore reserves •considered the excess of recoverable amount over the carrying value for each CGU Management concluded that the carrying value of property, plant and equipment and right-of-use assets included in the Driefontein, Kloof and Beatrix CGUs exceed their estimated recoverable amounts. As disclosed in note 10 to the consolidated Audited AFS, impairment losses of R212 million, R3,642 million and R1,293 million were recognised for Driefontein, Kloof and Beatrix, respectively. |
| The accounting implications of restructuring the B-BBEE structure in relation to Marikana | For the year ended 31 December 2021, management considered the accounting impacts of the Marikana B-BBEE restructure as follows: •determined whether the obligations to pay dividends as created by the revised shareholders’ agreements result in obligations for the Group •assessed the appropriateness of eliminating on consolidation the dividend obligations payable to entities controlled by the Group •determined the nature of the obligations to pay dividends •at the effective date of the restructure and subsequent measurement periods determined the appropriate valuation methodology Management determined that the dividend obligations created by the shareholders’ agreements result in, depending on its nature, cash settled share-based payment obligations under IFRS 2 Share-based Payment (IFRS 2) and financial liabilities under IFRS 9 Financial Instruments (IFRS 9). Management concluded that the dividend obligations payable to entities controlled by the Group should eliminate on consolidation. The dividend obligations were valued in terms of discounted free cash flow models derived from the Marikana life-of-mine free cash flow models. As disclosed in note 6.6 to the consolidated Audited AFS, at the effective date the Group recognised an IFRS 2 obligation and IFRS 9 financial liability of R404 million and R1,146 million, respectively. |
External Auditor suitability review
In terms of section 90(1) of the Companies Act, each year at its annual general meeting (AGM), the Company must appoint an external audit firm and designated individual partner in compliance with the requirements of the Companies Act and the JSE LR, respectively.
In terms of the JSE LR, the Audit Committee has the responsibility to review the Company’s current appointed audit firm and designated individual audit partner for re-appointment. After such review, the Audit Committee makes a recommendation to the Board, and the Board in turn considers same and then makes a recommendation to shareholders in the notice of AGM.
Accordingly, in compliance with paragraph 3.84(g)(iii) of the JSE LR, the Audit Committee assessed the suitability for reappointment of the current appointed audit firm, being Ernst & Young Inc., and the designated individual partner, being Lance Ian Neame Tomlinson (Auditor Suitability Review).
The Auditor Suitability Review performed by the Audit Committee included an examination and review of:
•the results of the most recent Independent Regulatory Board for Auditors (IRBA) inspections of Ernst & Young Inc., including the responses of the firm on observations / findings on the firm and on selected audit files raised by IRBA
Report of the audit committee continued
•the results of the most recent IRBA inspection of the designated individual auditor
•a summary of the audit firms ISQC 1 internal inspection process and the process to analyse and conclude on the results of the internal inspection (Internal Quality Review)
•a summary of the outcome of the designated individual partner’s latest Internal Quality Review
•the results of the most recent Public Company Accounting Oversight Board (PCAOB) inspection review of Ernst & Young Inc.
•a summary and results of all legal and disciplinary proceedings concluded within the past seven years, which were instituted in terms of any legislation or by any professional body of which the audit firm and/or designated individual auditor are a member or regulator to whom they are accountable, including where the matter is settled by consent order or payment of a fine
The Audit Committee has satisfied itself that both Ernst & Young Inc. and Lance Ian Neame Tomlinson are accredited in terms of the JSE LR. Based on the results of the Auditor Suitability Review and a review of the independence of Ernst & Young Inc. and the designated individual audit partner, the Audit Committee recommended to the Board that Ernst & Young Inc. be re-appointed as the auditors of the Company and that Lance Ian Neame Tomlinson be reappointed as the designated individual partner. The Board concurred with the recommendation.
Auditor independence and fees
The Audit Committee is also responsible for determining that the external audit firm and designated individual audit partner have the necessary independence, experience, qualifications and skills, and that audit and other fees are reviewed and approved.
The Audit Committee has reviewed and assessed the independence of the external auditor, that has confirmed in writing that the criteria for independence, as set out in the rules of IRBA, the PCAOB, and other relevant international bodies, have been followed. The Audit Committee is satisfied that Ernst & Young Inc. is independent of the Company and Group. The following aggregate audit fees, audit-related fees, tax fees and all other fees were approved by the Audit Committee and billed by the Group’s external auditors for 2021, 2020 and 2019 as follows:
| | | | | | | | | | | |
| Figures in million - SA rand | 2021 | 2020 | 2019 |
Audit fees1 | 65.0 | 58.5 | 53.7 |
Audit-related fees2 | 5.3 | 0.6 | 1.0 |
Tax fees3 | 0.5 | — | 0.2 |
All other fees4 | 5.6 | — | — |
| Total | 76.4 | 59.1 | 54.9 |
1 Audit fees consist of the aggregate fees billed for the annual audit of Sibanye-Stillwater’s respective Company and Group consolidated financial statements, audit of the Group’s internal controls over financial reporting in accordance with section 404 of the Sarbanes-Oxley Act (SOX Act) and the audit of statutory financial statements of the Company’s subsidiaries, including fees billed for assurance and related services that are reasonably related to the performance of the audit or reviews of the Company’s financial statements that are services that only an external auditor can reasonably provide. The 2021 audit fees include an inflationary increase and fees for the review of the interim results for the six months ended 30 June 2021 and 2020, respectively. The interim results for the six months ended 30 June 2020 was reviewed during 2021 for the purpose of issuing comfort letters associated with the 2026 and 2029 Notes offering.
2 Audit-related fees consist of the aggregate fees billed in each fiscal year for factual findings reports and the review of documents filed with regulatory authorities, including issuing of comfort letters for debt offerings
3 Tax fees include the aggregate fees billed in each fiscal year for tax compliance, tax advice, tax planning and other tax-related services
4 All other fees consist of the aggregate fees billed in each fiscal year for all other services not included under audit fees, audit related fees or tax fees
The Audit Committee determines the nature and extent of non-audit services that the auditor can provide and pre-approves all permitted non-audit assignments by the Group’s external auditor. In accordance with the SEC rules regarding auditor independence, the Audit Committee has established policies and procedures for audit and non-audit services provided by the Group’s external auditor. The rules apply to Sibanye-Stillwater and it’s legally controlled unlisted subsidiaries engaging any accounting firms for audit services and the auditor who audits the accounts filed with the SEC (the Group’s independent external auditor) for permissible non-audit services. When engaging the Group’s external auditor for permissible non-audit services (audit related services, tax services, and all other services), pre-approval is obtained prior to the commencement of the services.
The Audit Committee approves the respective annual audit plans presented by both the internal and external auditors and monitors progress against the plans. These audit plans provide the Audit Committee with the necessary assurance on risk management, internal control environments and IT governance.
Internal Audit
The internal control systems of the Group are monitored by Internal Audit, which reports findings and recommendations to the Audit Committee and to senior management. The Audit Committee determines the purpose, authority and responsibility of the Internal Audit function in an Internal Audit Charter. The Internal Audit function is headed by the Vice President: Internal Audit, who may be appointed or dismissed by the Audit Committee. The Audit Committee is satisfied that the incumbent Vice President: Internal Audit has the requisite skills and experience and that she is supported by a sufficient staff complement with appropriate skills and training.
Sibanye-Stillwater’s Internal Audit operates in accordance with the International Standards for the Professional Practice of Internal Auditing as prescribed by the Institute of Internal Auditors. Internal Audit activities carried out during the year were identified and planned through a combination of the Sibanye-Stillwater Risk Management framework and the risk-based methodologies adopted by
Report of the audit committee continued
Internal Audit. The Audit Committee approves the annual internal audit assurance plan presented by Internal Audit and monitors progress against the plan.
Internal Audit reports deficiencies to the Audit Committee every quarter together with recommended remedial actions, which are then followed up. Internal Audit provided the Audit Committee with a written report, which assessed as adequate the internal controls over financial reporting, IT governance and the risk management process during 2021.
The Audit Committee is responsible for IT governance on behalf of the Board and reviews the report of the Vice President: Group ICT at each Audit Committee meeting.
JSE LR
In accordance with the JSE LR, the Audit Committee reports and confirms that it has:
•evaluated the expertise, experience and performance of the Group CFO during 2021 and is satisfied that he has the appropriate expertise and experience to carry out his duties, and is supported by qualified and competent senior staff
•ensured that the Group has established appropriate financial reporting procedures and that those procedures are operating, this included consideration of all entities consolidated into the group financial statements, ensuring that management had access to all the required financial information to allow the effective preparation and report on consolidated Audited AFS
•has performed the Auditor Suitability Review of both the current appointed external audit firm and designated individual audit partner as detailed above
•notwithstanding the provisions of Section 90(6) of the Companies Act, ensured that the proposed re-appointment of the audit firm and designated individual partner is presented and included as a resolution in the notice of annual general meeting pursuant to Section 61(8) of the Companies Act
•ensured that the Chief Executive Officer and Chief Financial Officer have complied with the requirements of the attestation statement as per paragraph 3.84(k) of the JSE LR
Audit Committee statement
Based on information from, and discussions with, management and external auditors, the Audit Committee has no reason to believe that there were any material breakdowns in the design and operating effectiveness of internal financial controls of the Group during the year and therefore the financial records may be relied upon as the basis for preparation of the consolidated Audited AFS.
With respect to the financial year ended 31 December 2021, no material weakness was identified due to control deficiencies. Management strives to continuously improve the diligence in the identification and documentation of key controls.
The Audit Committee has considered and discussed the consolidated Audited AFS and associated reports with both management and the external auditors. During this process, the Audit Committee:
•evaluated significant judgements and reporting decisions
•determined that the going-concern basis of reporting is appropriate
•evaluated the material factors and risks that could impact on the consolidated Audited AFS
•evaluated the completeness of the financial and sustainability discussion and disclosures
•discussed the treatment of significant and unusual transactions with management and the external auditors
The Audit Committee considers that the IAR and consolidated Audited AFS comply in all material respects with all compliance requirements detailed earlier in this report. In addition, the Audit Committee considers whether the company Audited AFS comply in all material respects with all compliance requirements relevant to those financial statements (refer to the company Audited AFS which include the Report of the Audit Committee dealing with the responsibilities of the Audit Committee relevant to the Company Audited AFS). The Audit Committee recommended to the Board that the IAR and consolidated Audited AFS be adopted and approved by the Board. The Board subsequently adopted and approved the IAR and consolidated Audited AFS.
Keith Rayner CA(SA)
Chairman: Audit Committee
22 April 2022
The directors have pleasure in submitting this report and the consolidated annual financial statements of Sibanye-Stillwater for the year ended 31 December 2021.
Group profile and location of our operations
Sibanye-Stillwater is a multinational mining and metals processing Group with a diverse portfolio of mining and processing operations, projects and investments across five continents. The Group is one of the foremost global producers of platinum group metals (PGMs) recycled from spent automotive catalytic converters and also has interests in leading mine tailings retreatment operations.
Domiciled and with its head office in South Africa, Sibanye-Stillwater has established itself as one of the world’s largest primary producers of platinum, palladium, and rhodium and is also a top tier gold producer. It produces other PGMs, such as iridium and ruthenium, along with chrome, copper and nickel as by-products. The Group has recently begun to build and diversify its asset portfolio into battery metals mining and processing and is increasing its presence in the sustainable circular economy by growing and diversifying its recycling and tailings reprocessing operations globally.
Americas
PGMs:
Sibanye-Stillwater wholly owns and operates PGM mining and ore beneficiation operations and mining claims (together known as the Stillwater operations) that are located in Montana, United States of America (US). These operations include the Stillwater operation, the East Boulder operation, two concentrator plants, and the surrounding PGM mining claims located near the town of Nye. The operations primarily produce palladium and platinum. In addition, the Group owns and operates the Columbus Metallurgical Complex situated in the town of Columbus, Montana, which smelts the mined material to produce PGM-rich filter cake and also serves as the base for its PGM recycling business, that recovers PGMs from recycled catalytic converters on a purchased and toll-treatment basis.
Projects:
Sibanye-Stillwater also has non-managed interests in two PGM exploration projects in Canada, namely Marathon and Denison.
Green Metals Projects:
During the 2021 year, the Company acquired a 7.12% interest in ioneer Limited (ioneer), the owner and operator of the Rhyolite Ridge Lithium project in Nevada, with an option to enter into a 50:50 JV on the project. Sibanye-Stillwater also has non-managed interests in two Copper-Gold porphyry exploration projects in Argentina, namely Altar and Rio Grande.
Southern Africa
PGMs:
The SA PGM operations consist of three managed PGM producing, underground operations (Marikana, Rustenburg and Kroondal) and related surface treatment facilities in South Africa and a 50% attributable, non-managed, underground operation in Mimosa Investments Limited (Mimosa) located in Zimbabwe. Sibanye-Stillwater also owns the Platinum Mile tailings retreatment facility adjacent to the Rustenburg operations, which recovers PGMs from the tailing streams of the Rustenburg operations.
The Rustenburg and Kroondal operations are serviced by four integrated concentrator plants, from where the concentrate is subjected to a purchase of concentrate and a toll-treatment agreement with Anglo American Platinum. The ore mined at the Marikana operations is processed through five concentrator plants, a metallurgical smelter and base metals refinery, all located on site at Marikana, and a precious metals refinery located in Brakpan. At the Rustenburg, Kroondal and Marikana operations, chrome concentrate is extracted as a by-product from concentrator tailings.
PGM Projects:
Sibanye-Stillwater also has interests in three PGM exploration projects in Southern Africa, namely Akanani, Limpopo and Blue Ridge.
GOLD:
The gold operations consists of four managed, gold producing, underground and surface operations in South Africa, namely the Kloof, Driefontein and Cooke operations in the West Wits region and the Beatrix operation in the Free State province. In addition to its mining activities, Sibanye-Stillwater owns and manages significant metallurgical processing facilities at all its operations where gold-bearing ore is treated, and gold extracted. The Burnstone project, located in Mpumalanga province, is now in the development phase. Sibanye-Stillwater also has an effective 50.49% stake in DRDGOLD Limited, which operates surface tailings retreatment facilities at the Far West Gold Recoveries operation and the ERGO Gold Recoveries operation.
Gold Projects:
The Group's wholly-owned and managed projects in the study phase include Bloemhoek, De Bron Merriespruit and Beisa. Bloemhoek and De Bron are both gold projects and Beisa is an uranium project.
Green Metal Projects:
Significant deposits of uranium are present in the historic tailings storage facilities of the Cooke Operation, as well as in the Beisa Reef at the Beatrix operation. These are considered exploration projects even though they occur within existing, operational mining rights.
Europe
Green Metal Project:
During the first quarter of 2021, Sibanye-Stillwater secured an entry into the battery metals sector through a partnership with and investment into Keliber, a leading European lithium project in Finland. The Company holds a 26.6% stake in the project, with an option to increase its shareholding to greater than 50% on completion of a definitive feasibility study.
Directors’ report continued
Australia
Green Metal project:
During the fourth quarter of 2021, Sibanye-Stillwater acquired a 19.99% equity interest in New Century Resources Limited (New Century), an Australian company focussed on the economic re-treatment and rehabilitation of tailings storage facilities and which currently operates the largest tailings retreatment operation in Australia, i.e. the Century Zinc Mine in Queensland.
Financial affairs
Results for the year
The Group profit increased by 10% from R30,622 million to R33,796 million in 2021. The major source of earnings for 2021 was the SA PGM operations, which accounted for approximately 75% (2020: 59%) of Group adjusted EBITDA due to a combination of higher sales volumes which increased by 20% or 309,112 4Eoz and a 28% higher 2021 average 4E PGM basket price received of R47,066/4Eoz . The adjusted EBITDA contribution from the US PGM operations decreased by 6%, contributing 18% (2020: 26%) to Group adjusted EBITDA, mainly due to 8% lower sales volumes of mined 2E PGM following the implementation of further rail safety enhancements and operational constraints after a safety related incident during June 2021. The adjusted EBITDA contribution from the SA gold operations decreased by 34% to R5,113 million (2020: R7,771 million) mainly due to an 8% lower average rand gold price of R849,703/kg and above inflationary increases on input costs such as electricity, steel and steel related consumables. For a review of Sibanye-Stillwater’s financial performance for 2021, see –Overview–Management’s discussion and analysis of the financial statements
Dividends
Sibanye-Stillwater’s dividend policy is to return between 25% to 35% of normalised earnings to shareholders and after due consideration of future requirements the dividend may be increased beyond these levels. Normalised earnings is defined as earnings attributable to the owners of Sibanye-Stillwater excluding gains and losses on financial instruments and foreign exchange differences, impairments, gain/loss on disposal of property, plant and equipment, occupational healthcare expense, restructuring costs, transactions costs, share-based payment on B-BBEE transaction, gain on acquisition, net other business development costs, share of results of equity-accounted investees, all after tax and the impact of NCI, and changes in estimated deferred tax rate. Non-IFRS measure such as normalised earnings is the responsibility of the Group’s Board of Directors and is presented for illustration purposes only, and because of its nature, normalised earnings should not be considered as a representation of financial performance under IFRS.
In line with Sibanye-Stillwater’s Capital Allocation Framework, the Board declared a final dividend of 187 (2020: 321) SA cents per share. Together with the interim dividend of 292 (2020: 50) SA cents per share, which was declared and paid, this brings the total dividend for the year ended 31 December 2021 to 479 (2020: 371) SA cents per share and this amounts to a payout of 35% (2020: 35%) of normalised earnings.
Borrowing powers
In terms of Clause 4 of the Company’s Memorandum of Incorporation, the borrowing powers of the Sibanye Stillwater Limited (the Company) are unlimited. As at 31 December 2021, the borrowings of the Group, excluding the Burnstone Debt, was R18,791 million (2020: R17,120 million), see –Consolidated financial statements–Notes to the consolidated financial statements–Note 28: Borrowings and derivative financial instrument.
Sibanye-Stillwater is subject to financial and other covenants and restrictions under its credit facilities from time to time. Such covenants may include restrictions on Sibanye-Stillwater incurring additional financial indebtedness and obligations to maintain certain financial covenant ratios for as long as any amount is outstanding under such facilities.
Events after reporting date
There were no events that could have a material impact on the financial results of the Group after 31 December 2021 up to the date on which the consolidated financial statements for the year ended 31 December 2021 were authorised for issue, other than those disclosed in the consolidated financial statements, see –Consolidated financial statements–Notes to the consolidated financial statements–Note 40: Events after reporting date.
Working capital and going concern assessment
The consolidated financial statements have been prepared using appropriate accounting policies, supported by reasonable judgements and estimates. The directors believe that the Group has adequate resources to continue as a going concern for the foreseeable future.
The directors believe that the cash generated by its operations, cash on hand, the committed unutilised debt facilities as well as additional funding opportunities will enable the Group to continue to meet its obligations as they fall due. The consolidated financial statements for the year ended 31 December 2021, therefore, have been prepared on a going concern basis, see –Consolidated financial statements–Notes to the consolidated financial statements– Note 36.2: Risk management activities–Liquidity risk–Working capital and going concern assessment.
Significant announcements
Establishment of Board Investment Committee and Committee appointments
On 17 February 2021, Sibanye-Stillwater announced in accordance with Section 3.59(c) of the Listings Requirements of the JSE Limited, that pursuant to good corporate governance and its strategy, Sibanye-Stillwater’s Board of Directors ("Board”) has established a Board Investment Committee (“BIC”) to discharge a pivotal role in guiding and overseeing the allocation of capital and the Company’s
Directors’ report continued
investment activities. The Committee is Chaired by Mr R P Menell (Lead Independent Director) and Mr T J Cumming as the Deputy Chairman of the BIC. The BIC members comprise Mr K A Rayner, Ms S N Danson, Mr H J R Kenyon-Slaney, Mr J S Vilakazi and Ms S V Zilwa. As such, the BIC constitutes entirely of Independent Non-Executive Directors.
In addition to above, Sibanye-Stillwater announced that Ms S V Zilwa has been appointed as an additional member to the Audit, Risk and Safety and Health Committees and Mr K A Rayner as an additional member of the Nominating and Governance Committee, all these appointments were effective from 16 February 2021.
Sibanye-Stillwater re-structures the historical Lonmin black economic empowerment structure
On 14 April 2021, Sibanye-Stillwater advised that effective 13 April 2021, it has re-structured the previously highly indebted Lonmin Plc (subsequently changed to Lonmin Limited and now renamed Sibanye UK Limited) (“Lonmin”) broad-based black economic empowerment (“B-BBEE”) structure in relation to Western Platinum Proprietary Limited (“WPL”) and Eastern Platinum Limited (“EPL”) (WPL and EPL hereinafter collectively referred to as “Marikana”), with a view to ensuring the sustainability of the B-BBEE shareholding in Marikana and facilitating the realisation of value to the B-BBEE shareholders. For additional information, see –Consolidated financial statements–Notes to the consolidated financial statements– Note 6.6: Marikana B-BBEE cash-settled share-based payment obligation.
Sibanye-Stillwater announces share buy-back program
On 1 June 2021, Sibanye-Stillwater advised that it will be implementing an on-market repurchase of up to, but not exceeding, 5% of its ordinary shares in issue as at 31 May 2021 (the “buy-back program”). The buy-back program was consequential to the successful financial deleveraging and resumption of industry leading dividend payments by the Group during 2020 and is consistent with the strategic capital allocation framework approved by the Board in February 2021. The Group’s capital allocation framework for 2021 prioritises investing in operational sustainability, maintaining appropriate cash reserves, paying industry leading dividends and prudent debt management.
The announcement indicated that the Board considers the repurchase of our undervalued shares in the market as the most appropriate and value enhancing allocation of surplus capital at that stage, to ensure ongoing delivery of superior returns to shareholders. It was advised that the buy-back program is complementary to and will not compromise our industry leading dividend or other capital allocation priorities.
In accordance with paragraph 5.72(h) of the JSE Listings Requirements, Sibanye-Stillwater advised that it has appointed Morgan Stanley, as independent third party, to conduct the buy-back programme, and Morgan Stanley will make investment decisions in relation to the Company's shares independently of, and uninfluenced by, the Company, during the buy-back period. Shares repurchased by the Company in terms of the buy-back programme will be cancelled from the Company's issued share capital.
On 13 September 2021, Sibanye-Stillwater advised that in terms of paragraph 11.27 of the Listings Requirements, that at the close of business on 10 September 2021, it had, in a series of unrelated transactions, cumulatively repurchased c.3% or 90,206,710 ordinary shares, in accordance with the general authority granted by shareholders at the Company’s annual general meeting held on 25 May 2021 (“AGM”).
On 5 October 2021, Sibanye-Stillwater announced that it had successfully concluded the on-market repurchase of its ordinary shares up to, but not exceeding, 5% of its ordinary shares in issue, in accordance with the general authority granted by shareholders at the AGM. For additional information, see –Consolidated financial statements–Notes to the consolidated financial statements– Note 26: Stated share capital.
Notification of early redemption of Sibanye-Stillwater’s 2022 bonds
On 2 July 2021, Sibanye-Stillwater advised that in line with its capital allocation framework it has elected to redeem its US$353,670,000 June 2022 Bonds (the Bonds) on 02 August 2021 (the Redemption Date). The redemption will be done through its wholly owned subsidiary, Stillwater Mining Company (SMC) and the redemption price is 100 % of the principal amount of the Bonds, plus accrued and unpaid interest on the Bonds up to, but excluding, the Redemption Date, amounting to US$355,776,055.73 (US$1,005.954861 per US$1,000 stated principal amount of Bonds).
The 2022 Bonds were issued by SMC for an aggregate nominal value of US$500,000,000 on 27 June 2017, with a maturity date of 27 June 2022. The issued nominal value was reduced to US$353,670,000 in September 2018, following a partial repurchase of the Bonds. Given surplus liquidity within the Group the Bonds were settled in full. For additional information, see –Consolidated financial statements–Notes to the consolidated financial statements– Note 28.4: 2022 and 2025 Notes.
Sibanye-Stillwater progresses battery metals strategy with the exclusive put option to acquire Eramet’s Sandouville nickel processing facilities
On 30 July 2021, Sibanye-Stillwater announced that it had entered into an exclusive put option agreement (“Put Option”) with French mining group Eramet SA (Eramet) for the acquisition of 100% of the Sandouville nickel hydrometallurgical processing facility, located in Normandy, France for an effective cash cost of circa €65million1(“the Transaction”). Sibanye-Stillwater advised that the share purchase agreement which had been agreed together with the Put Option would be entered into upon conclusion of the consultation process with the works council of Eramet Sandouville and thereafter the Transaction was expected to conclude by year end, subject to inter alia, the approval of the South African Reserve Bank and other regulatory approvals.
On 4 November 2021, Sibanye-Stillwater announced that following the signing of the exclusive Put Option Agreement, which was announced on 30 July 2021, the Share Purchase Agreement (SPA) was signed to acquire 100% of the Sandouville nickel hydrometallurgical processing facility from Eramet SA.
Directors’ report continued
The signature of the SPA followed the successful completion of the information-consultation process with the employee representative bodies of Eramet Sandouville and Eramet, who have rendered a favourable opinion of the Transaction. The Transaction has also received the key regulatory approvals of the South African Reserve Bank and clearance from the French Foreign Investment Control Office.
On 7 February 2022, Sibanye-Stillwater announced that on 4 February 2022 it completed the acquisition of the Sandouville nickel hydrometallurgical processing facility from Eramet SA following the successful fulfilment of the conditions precedent as set out in the SPA signed on 3 November 2021. The cash cost payable on closing is approximately €85 million2. For additional information, see –Consolidated financial statements–Notes to the consolidated financial statements– Note 40.1: Sandouville acquisition.
1 Subject to closing adjustments
2 As adjusted for closing net debt and working capital
Sibanye-Stillwater and ioneer to establish a 50:50 joint venture with respect to ioneer’s US-based Rhyolite Ridge Lithium-Boron project
On 16 September 2021, Sibanye-Stillwater announced that it had reached agreement with ioneer Limited (“ioneer”) to establish a joint venture company (the “Joint Venture”) with respect to the Rhyolite Ridge Lithium-Boron Project (“Rhyolite Ridge”). Following the satisfaction of all conditions precedent, Sibanye-Stillwater will contribute US$490 million for a 50% interest in the Joint Venture, with ioneer maintaining a 50% interest and retaining the operational management responsibility for the Joint Venture.
In addition, Sibanye-Stillwater had agreed to subscribe for a strategic placement of new ordinary shares in ioneer equal to 7.1% of ioneer’s ordinary share capital post placement (“Placement Shares”), for approximately US$70 million1 (“ioneer Placement”). The Placement Shares would be issued to Sibanye-Stillwater at an issue price of A$0.655 per share, being ioneer’s 10-day VWAP as of ASX market close on 15 September 2021. The ioneer Placement was subject to (among other conditions precedent) the approval of ioneer shareholders at an Extraordinary General Meeting on 21 October 2021.
On 28 October 2021, Sibanye-Stillwater announced it had successfully completed its US$70 million2 strategic investment in ioneer following approval by ioneer’s shareholders at an Extraordinary General Meeting on 21 October 2021, with 99.9% of the votes cast in favour of the transaction, and approval from the Financial Surveillance Department of the South African Reserve Bank.
The strategic investment was completed at a price of A$0.6553 per share, equivalent to the ioneer 10-day volume weighted average price as at ASX market close on 15 September 2021. Sibanye-Stillwater now holds approximately 145.9 million fully paid ordinary shares, or 7.12%, in ioneer. For additional information, see –Consolidated financial statements–Notes to the consolidated financial statements– Note 20: Other investments.
1 Being an aggregate subscription amount of A$95.6 million and an assumed AUD/USD exchange rate of 0.7323
2 US$71.7 million at the exchange rate of AUD/USD of 0.7505 as at 27 October 2021
Sibanye-Stillwater to acquire the Santa Rita nickel mine and the Serrote copper mine in Brazil and a withdrawal of cautionary
On 25 October 2021, Sibanye-Stillwater advised its shareholders that the Company had entered into negotiations with affiliates of funds advised by Appian Capital Advisory LLP, regarding the acquisition of both the Santa Rita nickel and the Serrote copper mines, located in Brazil. If these negotiations are successfully concluded, they may have a material effect on the price of the Company’s securities. Accordingly, shareholders of Sibanye-Stillwater were advised to exercise caution when dealing in the Company’s securities until a full announcement is made.
On 26 October 2021, Sibanye-Stillwater announced that it had signed definitive purchase and sale agreements (Transaction Agreements) with affiliates of funds advised by Appian Capital Advisory LLP (Appian) to purchase 100% of both the Santa Rita nickel mine (Santa Rita) and the Serrote copper mine, located in Brazil, for a cash consideration of US$1.0 billion and a 5.0% net smelter return (NSR) royalty over potential future underground production at Santa Rita (the Transaction).
On 24 January 2022, Sibanye-Stillwater announced pursuant to the terms of the Atlantic Nickel Share Purchase Agreement (SPA), Sibanye BM Brazil (Proprietary) Limited (the "Purchaser"), a wholly owned subsidiary of Sibanye-Stillwater, had today given notice of termination of the Atlantic Nickel SPA. As the Mineração Vale Verde do Brasil Ltda (MVV) SPA is conditional on the contemporaneous closing of the Atlantic Nickel SPA, and that condition has become impossible to satisfy, the Purchaser has also today given notice of termination of the MVV SPA.
On 2 March 2022, Sibanye-Stillwater, in compliance with paragraphs 3.63 to 3.74 of the JSE Limited Listings Requirements, disclosed the following:
•Sibanye-Stillwater understands that Appian has made public statements concerning the Santa Rita termination that was announced to the market on 24 January 2022, in an apparent effort to disrupt the announcement of the Group’s results, and to engage in litigation via the media
•Sibanye-Stillwater rejects both Appian’s apparent strategy, and the substance of its comments. Its public characterisation of the geotechnical event experienced at Santa Rita is both superficial and wrong
•As Appian is aware, disputes arising from recent events are to be resolved by the English High Court. If Appian decides to commence proceedings, Sibanye-Stillwater shall vigorously defend its position and is confident that we will prevail
Directors’ report continued
Sibanye-Stillwater also advised that it intends not to comment publicly each time Appian attempts to disrupt the public or market perception of Sibanye-Stillwater. For additional information, see –Consolidated financial statements–Notes to the consolidated financial statements– Note 40.2: Santa Rita and Serrote
Sibanye-Stillwater invests further in the circular economy as it expands its tailings retreatment exposure through a 19.99% investment in New Century Resources
On 27 October 2021, Sibanye-Stillwater announced that it had entered into investment agreements to acquire a 19.99% shareholding in New Century Resources Limited (Ticker ASX: NCZ) (New Century) through a new equity placement, and sub-underwriting of a New Century entitlement offer, for a maximum cash consideration of US$46 million1 (the Transaction). It was further advised that the Transaction is expected to be completed during December 2021, with a portion subject to approval by New Century shareholders.
On 8 December 2021, Sibanye-Stillwater announced that it holds a 19.99% equity interest in New Century Resources Limited acquired for A$61million2. This followed the overwhelming approval vote of 99.6% by the New Century shareholders at its Annual General Meeting on 30 November 2021. For additional information, see –Consolidated financial statements–Notes to the consolidated financial statements–Note 20: Other investments.
1 Being a maximum subscription amount of A$61.39 million and at an assumed exchange rate of A$1.00/US$07517
2 Being a total subscription amount of A$60.88 million, equal to US$42.8 million at an assumed exchange rate of AUD/USD of (0.70 at 6 December 2021) and equivalent to 26.185 million shares at a share price of A$2.325 per share (post a 1 for 15 share consolidation completed by New Century on 6 December 2021)
Sibanye-Stillwater prices an oversubscribed, dual tranche US$1.2 billion Senior Notes offering
On 10 November 2021, Sibanye-Stillwater reported that it has priced an upsized US$1.2 billion senior notes offering (“New Bonds”). The New Bonds will be issued through the Group’s wholly owned subsidiary, Stillwater Mining Company (“SMC”). The offering is subject to customary closing conditions, and the settlement was expected to occur on or around 16 November 2021.
The New Bonds comprise two tranches: a US$675 million 5 year (non-call 2) tranche that will carry a 4.000% per annum coupon and a US$525 million 8 year (non-call 4) tranche that will carry a 4.500% per annum coupon.
Sibanye-Stillwater advised that the net proceeds of the New Bonds will be used to redeem the 2025 Notes (as defined below), as well as for general corporate purposes, including advancing the Group’s green metals strategy through investments and accretive acquisitions to improve earnings diversification. For additional information, see –Consolidated financial statements–Notes to the consolidated financial statements–Note 28.5: 2026 and 2029 Notes.
Sibanye-Stillwater has concurrently elected to issue a notice of redemption for SMC’s US$346,919,000 June 2025 Notes (“2025 Notes”) on 6 December 2021 (“Redemption Date”). The redemption price was 103.5625% of the principal amount of the 2025 Notes, plus accrued and unpaid interest on the 2025 Notes up to, but excluding, the Redemption Date, amounting to US$370,195,096.66 (US$1,067.093750 per US$1,000 stated principal amount of the 2025 Notes). For additional information, see –Consolidated financial statements–Notes to the consolidated financial statements–Note 28.4: 2022 and 2025 Notes.
Sibanye-Stillwater to assume full ownership of Kroondal, doubling its life of mine
On 31 January 2022, Sibanye-Stillwater announced that it had entered into an agreement with Rustenburg Platinum Mines Limited, a subsidiary of Anglo American Platinum Limited, through its subsidiary, Sibanye Rustenburg Platinum Mines Limited (“Rustenburg operation”), which will result in the Rustenburg operation assuming full ownership of the low cost, mechanised Kroondal operation. This transaction will facilitate the life of the Kroondal operation being extended to 2029 and ensure significant value creation for all stakeholders. For additional information, see –Consolidated financial statements–Notes to the consolidated financial statements–Note 40.4: Kroondal transaction.
Sibanye-Stillwater secures inflation linked wage agreement at its East Boulder mine through to July 2024
On 23 February 2022, Sibanye-Stillwater announced that it had successfully ratified a new collective bargaining agreement, effective 16 February 2022 through to 31 July 2024, with the United Steel Workers International Union (USW) at its East Boulder mine in Montana in the United States.
The contract covers a broad range of terms including average annual wage increases of 2.5% in 2022, 3% in 2023 and 3% in 2024. In addition to the base increase in 2022, an increase to benefits and incentive has been agreed, which will result in an effective average increase of 5.4% for 2022 if all safety and quality deliverables are fully met. This settlement amounts to an annual average increase of 3.8% per year for the next 3 years, which compares favourably with US inflation rates.
Sibanye-Stillwater receives strike notice from NUM and AMCU
On 8 March 2022, Sibanye-Stillwater advised that it had received notice from the Association of Mineworkers and Construction Union (AMCU) and the National Union of Mineworkers (NUM) that the unions intend to embark on protected strike action at Sibanye- Stillwater’s South African (SA) gold operations, from the evening shift on Wednesday, 9 March 2022.
Directors’ report continued
Directorate
| | | | | | | | |
| Name | Position | Date appointed |
Vincent Maphai1 | Chairman and independent non-executive director | 24 February 2020 |
Neal Froneman1 | Chief Executive Officer | 24 February 2020 |
Charl Keyter1 | Chief Financial Officer | 24 February 2020 |
| Elaine Dorward-King | Independent non-executive director | 27 March 2020 |
Harry Kenyon-Slaney1 | Independent non-executive director | 24 February 2020 |
Jeremiah Vilakazi1 | Independent non-executive director | 24 February 2020 |
Keith Rayner1 | Independent non-executive director | 24 February 2020 |
Nkosemntu Nika1 | Independent non-executive director | 24 February 2020 |
Richard Menell1 | Lead Independent and non-executive director | 24 February 2020 |
Savannah Danson1 | Independent non-executive director | 24 February 2020 |
Susan van der Merwe1 | Independent non-executive director | 24 February 2020 |
Timothy Cumming1 | Independent non-executive director | 24 February 2020 |
Sindiswa Zilwa2 | Independent non-executive director | 01 January 2021 |
1 Director appointed to the Board of Sibanye Stillwater Limited on 24 February 2020 pursuant to the scheme of arrangement between Sibanye Gold Limited and Sibanye Stillwater Limited, which was implemented on the same day. On the date of implementing the scheme of arrangement, the existing directors of Sibanye Stillwater Limited resigned and the directors of Sibanye Gold Limited were appointed to the board of Sibanye Stillwater Limited
2 Sindiswa Victoria Zilwa was appointed as an Independent non-executive director of the Group with effect from 1 January 2021. Sindiswa is a Chartered Accountant by profession and an expert in the areas of accounting, auditing and business management. Sindiswa is also a Chartered Director (SA) and has vast experience as a director in both the public and private sectors. She currently serves as a non-executive director of Cell C Limited, Discovery Group, Gijima Group, Massmart Limited, Metrofile Limited, Mercedes-Benz South Africa Limited and Tourvest Group
Rotation of directors
Directors retiring in terms of the Company’s Memorandum of Incorporation (MOI) are Neal Froneman, Susan van der Merwe, Savannah Danson, and Harry Kenyon-Slaney. All the directors are eligible and offer themselves for re-election.
Directors’ and officers’ disclosure of interest in contracts
As of the date of this report, none of the directors, officers or major shareholders of Sibanye-Stillwater or, to the knowledge of Sibanye-Stillwater’s management, their families, had any interest, direct or indirect, in any transaction during the last fiscal year or in any proposed transaction which has affected or will materially affect Sibanye-Stillwater or its investment interests or subsidiaries.
None of the directors or officers of Sibanye-Stillwater or any associate of such director or officer is currently or has been at any time during the past fiscal year materially indebted to Sibanye-Stillwater.
For related party information, see –Consolidated financial statements–Notes to the consolidated financial statements – Note 39: Related-party transactions.
Subsidiary companies
For details of major subsidiary companies in which the Company has a direct or indirect interest, see –Consolidated financial statements–Notes to the consolidated financial statements–Note 1.3: Consolidation.
Special resolutions passed by subsidiary companies
The following special resolutions were passed by subsidiary companies during the year ended 31 December 2021:
1.Special resolution passed by a subsidiary company
Special resolution passed by the shareholders of the subsidiary companies listed below, approving that the directors of the company may at any time and from time to time during the two years from the passing hereof authorise the company, in terms of and subject to the provisions of section 45(3)(b) of the Companies Act, to provide any type of direct or indirect financial assistance as defined in section 45(1) of the Companies Act, to any company or corporation that is related or inter-related to the company, on such terms and conditions and for such amounts as the directors may determine.
•Newshelf 1335 Proprietary Limited
•Hoedspruit Platinum Holdings Proprietary Limited
•Sibanye Rustenburg Platinum Mines Proprietary Limited
•Eastern Platinum Proprietary Limited
•Western Platinum Proprietary Limited
2.Special resolutions passed by various subsidiaries
Directors’ report continued
Special resolutions passed by the sole shareholder of the subsidiary companies listed below, approving that the directors of the company may at any time and from time to time during the two years from the passing hereof authorise the company in terms of and subject to the provisions of section 45(3)(b) of the Companies Act, to provide any type of direct or indirect financial assistance as defined in section 45(1) of the Companies Act, to any company or corporation that is related or inter-related to the company, on such terms and conditions and for such amounts as the directors may determine.
•Ezulwini Mining Company Proprietary Limited
•K2013164354 Proprietary Limited
•M Janse van Rensburg Proprietary Limited
•Milen Mining Proprietary Limited
•Puma Gold Proprietary Limited
•Sibanye Gold Academy Proprietary Limited
•Sibanye Gold Eastern Operations Proprietary Limited
•Sibanye Gold Protection Services Limited
•Sibanye Gold Shared Services Proprietary Limited
•Sibanye Solar PV Proprietary Limited
•Witwatersrand Consolidated Gold Resources Proprietary Limited
•Witwatersrand Deep Investments Proprietary Limited
•Kroondal Operations Proprietary Limited
•Kroondal Operations Corporate Services Proprietary Limited
•Magaliesburg Properties Proprietary Limited
•Platinum Mile Resources Proprietary Limited
•Ridge Mining Proprietary Limited
•Ridge Mining Services Proprietary Limited
•Rustenburg Eastern Operations Proprietary Limited
•Sibanye Platinum Bermuda Proprietary Limited
•Sibanye Platinum International Holdings Proprietary Limited
•Sibanye Platinum Proprietary Limited
•Braggite Resources Proprietary Limited
•Everest Platinum Mines Proprietary Limited
•Hoedspruit Platinum Exploration Proprietary Limited
•Magaliesburg Properties Proprietary Limited
•Southern Era Mining and Exploration South Africa Proprietary Limited
•Afriore Proprietary Limited
•Kwagga Gold Proprietary Limited
•Messina Proprietary Limited
•Messina Platinum Mines Proprietary Limited
•Vlakfontein Nickel Proprietary Limited
Litigation
Arbitration case Redpath USA Corporation versus Stillwater Mining Company
IIn 2015, Redpath USA Corporation (the Contractor) was hired by the Stillwater Mining Company (the Company) to advance the Benbow decline as part of the Blitz project. During November 2019 the Contractor filed a claim wherein it raised a dispute over additional and rework costs of establishing a decline at the Stillwater Mine after drilling errors caused a water inundation that required significant remediation. The Contractor assumed the additional costs and was seeking to recover those costs, in an amount of approximately US$20 million, from the Company. After engaging outside counsel and based on the terms of the contract that supports the Company’s position, management believed the Contractor’s claim was without merit and disputed the arbitration demand claim in the legal documents served on the Contractor. Although an arbitration hearing was scheduled for May 2022, the Contractor and the Company has subsequent to the reporting date agreed to settle the dispute at no cost to the Company.
Company Secretary
Lerato Matlosa was appointed Company Secretary of Sibanye-Stillwater with effect from 1 June 2018.
Auditors
The Audit Committee has recommended to the Board that Ernst & Young Inc. continues in office in accordance with section 90(1) of the Companies Act and in terms of the JSE Listings Requirements, subject to shareholders approving the resolution at the next annual general meeting. For additional information see –Accountability–Report of the Audit Committee–External Auditor suitability review.
Report of Independent Registered Public Accounting Firm
To the Shareholders and the Board of Directors of Sibanye Stillwater Limited
Opinion on the Financial Statements
We have audited the accompanying consolidated statements of financial position of Sibanye Stillwater Limited (the Company) as of 31 December 2021, 2020, and 2019, the related consolidated income statements, statements of other comprehensive income, changes in equity and cash flows for each of the three years in the period ended 31 December 2021, and the related notes (collectively referred to as the “consolidated financial statements”). In our opinion, the consolidated financial statements present fairly, in all material respects, the financial position of the Company at 31 December 2021, 2020 and 2019, and the results of its operations and its cash flows for each of the three years in the period ended 31 December 2021, in conformity with International Financial Reporting Standards as issued by the International Accounting Standards Board.
We also have audited, in accordance with the standards of the Public Company Accounting Oversight Board (United States) (PCAOB), the Company's internal control over financial reporting as of 31 December 2021, based on criteria established in Internal Control-Integrated Framework issued by the Committee of Sponsoring Organizations of the Treadway Commission (2013 framework) and our report dated 22 April 2022 expressed an unqualified opinion thereon.
Basis for Opinion
These financial statements are the responsibility of the Company's management. Our responsibility is to express an opinion on the Company’s financial statements based on our audits. We are a public accounting firm registered with the PCAOB and are required to be independent with respect to the Company in accordance with the U.S. federal securities laws and the applicable rules and regulations of the Securities and Exchange Commission and the PCAOB.
We conducted our audits in accordance with the standards of the PCAOB. Those standards require that we plan and perform the audit to obtain reasonable assurance about whether the financial statements are free of material misstatement, whether due to error or fraud. Our audits included performing procedures to assess the risks of material misstatement of the financial statements, whether due to error or fraud, and performing procedures that respond to those risks. Such procedures included examining, on a test basis, evidence regarding the amounts and disclosures in the financial statements. Our audits also included evaluating the accounting principles used and significant estimates made by management, as well as evaluating the overall presentation of the financial statements. We believe that our audits provide a reasonable basis for our opinion.
Critical Audit Matters
The critical audit matters communicated below are matters arising from the current period audit of the financial statements that were communicated or required to be communicated to the audit committee and that: (1) relate to accounts or disclosures that are material to the financial statements and (2) involved our especially challenging, subjective or complex judgments. The communication of critical audit matters does not alter in any way our opinion on the consolidated financial statements, taken as a whole, and we are not, by communicating the critical audit matters below, providing separate opinions on the critical audit matters or on the accounts or disclosures to which they relate.
| | | | | |
| Impairment testing of Driefontein, Kloof and Beatrix Cash Generating Units (CGUs) |
| Description of the Matter | As described in Note 10, 14 and 15 to the consolidated financial statements, Driefontein, Kloof and Beatrix mining assets (‘SA gold operations CGUs’) have carrying values of R3,905m, R2,815m and R210m, respectively, and include mine development and infrastructure costs, mine plant facilities and right of use assets. For the purpose of assessing impairment of mining assets, assets are grouped at the lowest level for which there are separately identifiable cash flows (cash generating units or CGUs), which generally for the Group, represents an individual operating mine, including mines which are part of a larger mine complex Impairment indicators were identified for the above-mentioned SA gold operations CGUs and an aggregate impairment loss of R 5,148m relating to the mining assets and right of use assets of these SA gold operations CGUs was recognised for the year ended 31 December 2021. In determining the recoverable amount of the SA gold operations CGUs, management used a value in use calculation, which is the future cash flows expected to be derived from each SA gold operations CGU over its life-of-mine discounted to a present value. Auditing management’s impairment assessments was complex and judgmental due to the significant estimation applied by management in determining the recoverable amount, which is sensitive to the underlying significant assumptions to the future cash flows and the effect changes in these assumptions would have on the recoverable amounts. The estimated cash flows are sensitive to changes in significant assumptions such as discount rate, future commodity prices, foreign currency exchange rates, and life-of-mine plans. The life-of-mine plans include projected operating cash flows and stay in business capital expenditures, based on reserves and estimates of future production. These significant assumptions are forward-looking and could be affected by future economic, operating and market conditions. In addition, significant judgment and specialised industry knowledge were required to assess management's estimate of the SA gold operating CGU reserves used in the life-of-mine plans. |
| | | | | |
| How We Addressed the Matter In Our Audit | We obtained an understanding, evaluated the design and tested the operating effectiveness of controls over the Company’s CGU impairment assessment process. For example, we tested the controls over management’s review of the significant assumptions used in determining the recoverable amount. To test the recoverable amounts of the SA gold operating CGUs, our audit procedures included, among others, an assessment of the methodologies applied in the cash flow models against the requirements of IAS 36, Impairment of Assets. We inquired of management and assessed the consistency of the Company’s calculation and method in relation to the prior year. We involved our valuation specialists to assist in our evaluation of significant assumptions such as the discount rates by calculating an independent range using available market information and comparing it against management’s discount rates. We also performed independent sensitivity analyses on discount rates to determine how that would impact the recoverable amounts. In addition, our valuation specialists assisted in evaluating future commodity price assumptions, and foreign currency exchange rates, comparing them against observable market data and current industry and economic forecasts. We compared the projected operating cash flows and stay in business capital expenditures movements included in the life of mine plan against historical trends. We also performed trend analyses to evaluate the correlation of future production against both projected operating cost and capital expenditures. We involved our mining technical specialists for certain SA gold operating CGU’s to analyse management’s reserve estimation procedures and evaluate the application of their methodology and primary inputs into the reserve estimation in the context of industry practices and the regulatory reserves reporting requirements. We assessed the adequacy of the Company’s disclosures in the consolidated financial statements over the SA gold operations CGU’s, including the description of the estimates and judgements used in impairment testing and indicators leading to impairment. |
| Physical quantities of Marikana’s Platinum Group Metals (PGM) inventory in process |
| Description of the Matter | As described in Note 23 to the consolidated financial statements, PGM inventory in process is weighed and assayed on a sample basis to determine the metal content and how this is split by metal. Measurement of the physical quantities is complex and requires significant estimation. Specifically, determining the metal content contained in PGM inventory in process requires estimation by metallurgical specialists. Only the Marikana operations process their own refined metal inventory, and Marikana’s PGM inventory in process amounted to R6,715m as of 31 December 2021. The audit of the physical quantities of Marikana’s PGM inventory in process is complex due to the highly technical nature of the process and the specialized knowledge required to evaluate the results. To determine the metal content and composition of the metals the Company samples inventory through assays. The accuracy of the mass and assay results can vary significantly depending on the nature of the vessel in which the materials are contained and the state of the conversion of material. There is inherent uncertainty in the sampling and assays which could impact the valuation of PGM inventory in process at year end. |
| How We Addressed the Matter in Our Audit | We obtained an understanding, evaluated the design and tested the operating effectiveness of controls over the Company’s measurement of the physical quantities of Marikana’s PGM inventory in process. For example, we tested the controls over management’s review of inventory movement reconciliations performed and assay sample data and assay results. To test the Company’s physical quantity of PGM inventory in process at the Marikana operations, our audit procedures included, among others, an evaluation of the Company’s estimation process and the data used by the Company from the assay results to estimate the total amount of PGM inventory in process. We, together with our metallurgical specialists, observed inventory counts at the metal inventory processing areas including management’s sampling and assaying of the carrier material. To assess the information gathered from the inventory counts, we also involved our metallurgical specialists to assist us in evaluating the adequacy of the measurements performed by the Company and the assay methodologies applied to determine the PGM inventory quantity. We assessed the accuracy of management’s adjustment to the PGM inventory in process balance resulting from the inventory counts, by comparing the adjustment to historical adjustments made by the Company. We tested the mass balance reconciliation of inventory, by agreeing the opening balance of inventory adjusted for movements during the year to the closing balance of inventory as determined by the inventory count procedures. We assessed the adequacy of the Company’s disclosures in respect to the metal inventories, including the description of the estimates and judgements in estimating the quantity of metal inventories. |
/s/ Ernst & Young Incorporated
We have served as the Company’s auditor since 2019.
Johannesburg, Republic of South Africa
22 April 2022
Report of Independent Registered Public Accounting Firm
To the Shareholders and the Board of Directors of Sibanye Stillwater Limited
Opinion on Internal Control Over Financial Reporting
We have audited Sibanye Stillwater Limited’s internal control over financial reporting as of 31 December 2021, based on criteria established in Internal Control—Integrated Framework issued by the Committee of Sponsoring Organizations of the Treadway Commission (2013 framework) (the COSO criteria). In our opinion, Sibanye Stillwater Limited (the Company) maintained, in all material respects, effective internal control over financial reporting as of 31 December 2021, based on the COSO criteria.
We also have audited, in accordance with the standards of the Public Company Accounting Oversight Board (United States) (PCAOB), the consolidated statement of financial position as of 31 December 2021, the related consolidated income statement, other comprehensive income, changes in equity and the cash flows for each of the three years in the period ended 31 December 2021, and the related notes and our report dated 22 April 2022 expressed an unqualified opinion thereon.
Basis for Opinion
The Company’s management is responsible for maintaining effective internal control over financial reporting and for its assessment of the effectiveness of internal control over financial reporting included in the accompanying “Controls and procedures” section of Form 20-F. Our responsibility is to express an opinion on the Company’s internal control over financial reporting based on our audit. We are a public accounting firm registered with the PCAOB and are required to be independent with respect to the Company in accordance with the U.S. federal securities laws and the applicable rules and regulations of the Securities and Exchange Commission and the PCAOB.
We conducted our audit in accordance with the standards of the PCAOB. Those standards require that we plan and perform the audit to obtain reasonable assurance about whether effective internal control over financial reporting was maintained in all material respects.
Our audit included obtaining an understanding of internal control over financial reporting, assessing the risk that a material weakness exists, testing and evaluating the design and operating effectiveness of internal control based on the assessed risk, and performing such other procedures as we considered necessary in the circumstances. We believe that our audit provides a reasonable basis for our opinion.
Definition and Limitations of Internal Control Over Financial Reporting
A company’s internal control over financial reporting is a process designed to provide reasonable assurance regarding the reliability of financial reporting and the preparation of financial statements for external purposes in accordance with generally accepted accounting principles. A company’s internal control over financial reporting includes those policies and procedures that (1) pertain to the maintenance of records that, in reasonable detail, accurately and fairly reflect the transactions and dispositions of the assets of the company; (2) provide reasonable assurance that transactions are recorded as necessary to permit preparation of financial statements in accordance with generally accepted accounting principles, and that receipts and expenditures of the company are being made only in accordance with authorizations of management and directors of the company; and (3) provide reasonable assurance regarding prevention or timely detection of unauthorized acquisition, use, or disposition of the company’s assets that could have a material effect on the financial statements.
Because of its inherent limitations, internal control over financial reporting may not prevent or detect misstatements. Also, projections of any evaluation of effectiveness to future periods are subject to the risk that controls may become inadequate because of changes in conditions, or that the degree of compliance with the policies or procedures may deteriorate.
/s/ Ernst & Young Incorporated
Johannesburg, Republic of South Africa
22 April 2022
Consolidated income statement
For the year ended 31 December 2021
| | | | | | | | | | | | | | | | | | | | | | | | | | |
| Figures in million – SA rand | | Notes | | 2021 | | 2020 | | 2019 |
| Revenue | | 3 | | 172,194 | | | 127,392 | | | 72,925 | |
| Cost of sales | | 4 | | (109,306) | | | (83,369) | | | (63,314) | |
| Interest income | | 5.1 | | 1,202 | | | 1,065 | | | 560 | |
| Finance expense | | 5.2 | | (2,496) | | | (3,152) | | | (3,303) | |
| Share-based payment expenses | | 6.8 | | (383) | | | (512) | | | (363) | |
| Loss on financial instruments | | 7 | | (6,279) | | | (2,450) | | | (6,015) | |
| Gain/(loss) on foreign exchange differences | | | | 1,149 | | | (255) | | | 325 | |
| Share of results of equity-accounted investees after tax | | | | 1,989 | | | 1,700 | | | 721 | |
| Other costs | | 8.1 | | (3,018) | | | (2,727) | | | (2,310) | |
| Other income | | 8.2 | | 764 | | | 1,658 | | | 484 | |
| Gain on disposal of property, plant and equipment | | | | 36 | | | 99 | | | 77 | |
| (Impairments)/reversal of impairments | | 10 | | (5,148) | | | 121 | | | (86) | |
| Loss on settlement of US$ Convertible Bond | | 28.6 | | — | | | (1,507) | | | — | |
| Early redemption premium on the 2025 Notes | | 28.4 | | (196) | | | — | | | — | |
| Occupational healthcare gain/(expense) | | 31 | | 14 | | | (52) | | | 40 | |
| Restructuring costs | | 9 | | (107) | | | (436) | | | (1,252) | |
| Loss on Bulk Tailings re-Treatment (BTT) early settlement | | 32 | | — | | | (186) | | | — | |
| Transaction costs | | | | (140) | | | (139) | | | (448) | |
| Gain on acquisition | | 16.1 | | — | | | — | | | 1,103 | |
| Profit before royalties, carbon tax and tax | | | | 50,275 | | | 37,250 | | | (856) | |
| Royalties | | 11.1 | | (2,714) | | | (1,765) | | | (431) | |
| Carbon tax | | | | (4) | | | (5) | | | (13) | |
| Profit before tax | | | | 47,557 | | | 35,480 | | | (1,300) | |
| Mining and income tax | | 11.2 | | (13,761) | | | (4,858) | | | 1,733 | |
| Profit for the year | | | | 33,796 | | | 30,622 | | | 433 | |
| Attributable to: | | | | | | | | |
| Owners of Sibanye-Stillwater | | | | 33,054 | | | 29,312 | | | 62 | |
| Non-controlling interests (NCI) | | | | 742 | | | 1,310 | | | 371 | |
| Earnings per share attributable to owners of Sibanye-Stillwater | | | | | | | | |
| Basic earnings per share - cents | | 12.1 | | 1,140 | | | 1,074 | | | 2 | |
| Diluted earnings per share - cents | | 12.2 | | 1,129 | | | 1,055 | | | 2 | |
The accompanying notes form an integral part of these consolidated financial statements
Consolidated statement of other comprehensive income
For the year ended 31 December 2021
| | | | | | | | | | | | | | | | | | | | |
| Figures in million – SA rand | 2021 | | 2020 | | 2019 | |
| Profit for the year | 33,796 | | | 30,622 | | | 433 | | |
| Other comprehensive income, net of tax | 4,635 | | | (2,006) | | | (466) | | |
Foreign currency translation1 | 3,807 | | | (2,227) | | | (595) | | |
Fair value adjustment on other investments2 | 828 | | | 221 | | | 129 | | |
| | | | | | |
| Total comprehensive income | 38,431 | | | 28,616 | | | (33) | | |
| Attributable to: | | | | | | |
| Owners of Sibanye-Stillwater | 37,698 | | | 27,287 | | | (403) | | |
| Non-controlling interests | 733 | | | 1,329 | | | 370 | | |
1 These gains and losses will be reclassified to profit or loss in accordance with the accounting policy in note 1.4
2 These gains and losses relate to other investments and will never be reclassified to profit or loss
The accompanying notes form an integral part of these consolidated financial statements
Consolidated statement of financial position
As at 31 December 2021
| | | | | | | | | | | | | | | | | | | | | | | | | | | | | | | | | | | | | | |
| Figures in million – SA rand | Notes | | 2021 | | | | 2020 | | | | 2019 | |
| Assets | | | | | | | | | | | | |
| Non-current assets | | | 88,163 | | | | | 81,860 | | | | | 74,909 | | |
| Property, plant and equipment | 14 | | 62,494 | | | | | 60,600 | | | | | 57,480 | | |
| Right-of-use assets | 15 | | 222 | | | | | 296 | | | | | 361 | | |
| Goodwill | 17 | | 7,727 | | | | | 7,165 | | | | | 6,855 | | |
| Equity-accounted investments | 18 | | 7,594 | | | | | 5,621 | | | | | 4,039 | | |
| Other investments | 20 | | 3,367 | | | | | 847 | | | | | 599 | | |
| Environmental rehabilitation obligation funds | 21 | | 5,202 | | | | | 4,934 | | | | | 4,602 | | |
| Other receivables | 22.1 | | 651 | | | | | 821 | | | | | 684 | | |
| Deferred tax assets | 11.3 | | 906 | | | | | 1,576 | | | | | 289 | | |
| | | | | | | | | | | | |
| Current assets | | | 64,831 | | | | | 52,243 | | | | | 26,163 | | |
| Inventories | 23 | | 25,080 | | | | | 24,952 | | | | | 15,503 | | |
| Trade and other receivables | 24 | | 7,411 | | | | | 6,866 | | | | | 4,635 | | |
| Other receivables | 22.1 | | 523 | | | | | 37 | | | | | 51 | | |
| Tax receivable | 11.4 | | 1,245 | | | | | 148 | | | | | 355 | | |
| Cash and cash equivalents | 25 | | 30,292 | | | | | 20,240 | | | | | 5,619 | | |
| Asset held for sale | 20 | | 280 | | | | | — | | | | | — | | |
| | | | | | | | | | | | |
| Total assets | | | 152,994 | | | | | 134,103 | | | | | 101,072 | | |
| | | | | | | | | | | | |
| Equity and liabilities | | | | | | | | | | | | |
| Equity attributable to owners of Sibanye-Stillwater | | | 79,937 | | | | | 68,480 | | | | | 29,670 | | |
| Stated share capital | 26 | | 21,647 | | | | | 30,150 | | * | | | — | | * |
| Other reserves | | | 30,332 | | | | | 25,570 | | | | | 45,104 | | |
| Accumulated profit/(loss) | | | 27,958 | | | | | 12,760 | | | | | (15,434) | | |
| Non-controlling interests | 27 | | 1,408 | | | | | 2,236 | | | | | 1,468 | | |
| Total equity | | | 81,345 | | | | | 70,716 | | | | | 31,138 | | |
| | | | | | | | | | | | |
| Non-current liabilities | | | 51,108 | | | | | 45,900 | | | | | 55,607 | | |
| Borrowings | 28 | | 20,191 | | | | | 17,497 | | | | | 23,698 | | |
| Derivative financial instrument | 28 | | — | | | | | — | | | | | 4,145 | | |
| Lease liabilities | 29 | | 177 | | | | | 223 | | | | | 273 | | |
| Environmental rehabilitation obligation and other provisions | 30 | | 8,263 | | | | | 8,634 | | | | | 8,715 | | |
| Occupational healthcare obligation | 31 | | 1,017 | | | | | 1,037 | | | | | 1,133 | | |
| Cash-settled share-based payment obligations | 6.7 | | 2,829 | | | | | 1,595 | | | | | 1,343 | | |
| Other payables | 22.2 | | 4,599 | | | | | 2,911 | | | | | 2,688 | | |
| Deferred revenue | 32 | | 6,204 | | | | | 6,363 | | | | | 6,896 | | |
| Tax and royalties payable | 11.4 | | 10 | | | | | 9 | | | | | 59 | | |
| Deferred tax liabilities | 11.3 | | 7,818 | | | | | 7,631 | | | | | 6,657 | | |
| | | | | | | | | | | | |
| Current liabilities | | | 20,541 | | | | | 17,487 | | | | | 14,327 | | |
| Borrowings | 28 | | 107 | | | | | 886 | | | | | 38 | | |
| Lease liabilities | 29 | | 104 | | | | | 103 | | | | | 110 | | |
| Occupational healthcare obligation | 31 | | — | | | | | 157 | | | | | 149 | | |
| Cash-settled share-based payment obligations | 6.7 | | 58 | | | | | 33 | | | | | 82 | | |
| Trade and other payables | 33 | | 15,162 | | | | | 13,207 | | | | | 11,466 | | |
| Other payables | 22.2 | | 4,765 | | | | | 2,246 | | | | | 761 | | |
| Deferred revenue | 32 | | 156 | | | | | 67 | | | | | 1,271 | | |
| Tax and royalties payable | 11.4 | | 189 | | | | | 788 | | | | | 450 | | |
| | | | | | | | | | | | |
| Total equity and liabilities | | | 152,994 | | | | | 134,103 | | | | | 101,072 | | |
* Less than R1 million
The accompanying notes form an integral part of these consolidated financial statements
Consolidated statement of changes in equity
For the year ended 31 December 2021
| | | | | | | | | | | | | | | | | | | | | | | | | | | | | | | | | | | | | | | | | | | | | | | | | | | | | | | | | | | | | | | | | | | | | | | | | | | | | | | | | | | | | | | | | |
| Figures in million – SA rand | | Notes | | | Stated share capital | | | Re- organisation reserve | | | Share- based payment reserve | | | Mark-to- market reserve | | | Foreign currency translation reserve | | | Accumulated profit/(loss) | | | Equity attributable to owners of Sibanye-Stillwater | | | Non- controlling interests | | Total equity | |
| Balance at 31 December 2018 | | | | | — | | * | | 34,667 | | | | 3,610 | | | | 52 | | | | 955 | | | | (15,496) | | | | 23,788 | | | | 936 | | | 24,724 | | |
| Total comprehensive income for the year | | | | | — | | | | — | | | | — | | | | 130 | | | | (595) | | | | 62 | | | | (403) | | | | 370 | | | (33) | | |
| Profit for the year | | | | | — | | | | — | | | | — | | | | — | | | | — | | | | 62 | | | | 62 | | | | 371 | | | 433 | | |
| Other comprehensive income | | | | | — | | | | — | | | | — | | | | 130 | | | | (595) | | | | — | | | | (465) | | | | (1) | | | (466) | | |
| Equity-settled share-based payments | | 6.8 | | | — | | | | — | | | | 290 | | | | — | | | | — | | | | — | | | | 290 | | | | — | | | 290 | | |
| Dividends | | 13 | | | — | | | | — | | | | — | | | | — | | | | — | | | | — | | | | — | | | | (85) | | | (85) | | |
| Shares issued for cash | | | | | — | | | | 1,688 | | | | — | | | | — | | | | — | | | | — | | | | 1,688 | | | | — | | | 1,688 | | |
| Shares issued on Lonmin acquisition | | | | | — | | | | 4,307 | | | | — | | | | — | | | | — | | | | — | | | | 4,307 | | | | — | | | 4,307 | | |
| Acquisition of subsidiary with non-controlling interests (Lonmin) | | | | | — | | | | — | | | | — | | | | — | | | | — | | | | — | | | | — | | | | 247 | | | 247 | | |
| Transaction with DRDGOLD shareholders | | | | | — | | | | — | | | | — | | | | — | | | | — | | | | — | | | | — | | | | — | | * | — | | * |
| Balance at 31 December 2019 | | | | | — | | * | | 40,662 | | | | 3,900 | | | | 182 | | | | 360 | | | | (15,434) | | | | 29,670 | | | | 1,468 | | | 31,138 | | |
| Total comprehensive income for the year | | | | | — | | | | — | | | | — | | | | 202 | | | | (2,227) | | | | 29,312 | | | | 27,287 | | | | 1,329 | | | 28,616 | | |
| Profit for the year | | | | | — | | | | — | | | | — | | | | — | | | | — | | | | 29,312 | | | | 29,312 | | | | 1,310 | | | 30,622 | | |
| Other comprehensive income | | | | | — | | | | — | | | | — | | | | 202 | | | | (2,227) | | | | — | | | | (2,025) | | | | 19 | | | (2,006) | | |
| Equity-settled share-based payments | | 6.8 | | | — | | | | — | | | | 152 | | | | — | | | | — | | | | — | | | | 152 | | | | 6 | | | 158 | | |
| Dividends | | 13 | | | — | | | | — | | | | — | | | | — | | | | — | | | | (1,338) | | | | (1,338) | | | | (360) | | | (1,698) | | |
| Reorganisation - 24 February 2020 | | | | | 17,661 | | | | (17,661) | | | | — | | | | — | | | | — | | | | — | | | | — | | | | — | | | — | | |
| Shares issued upon conversion of US$ Convertible Bond | | 28.6 | | | 12,573 | | | | — | | | | — | | | | — | | | | — | | | | — | | | | 12,573 | | | | — | | | 12,573 | | |
| Share buy-back | | 26 | | | (84) | | | | — | | | | — | | | | — | | | | — | | | | — | | | | (84) | | | | — | | | (84) | | |
| Transaction with DRDGOLD shareholders | | 27 | | | — | | | | — | | | | — | | | | — | | | | — | | | | 220 | | | | 220 | | | | (220) | | | — | | |
| Transaction with Lonmin Canada shareholders | | | | | — | | | | — | | | | — | | | | — | | | | — | | | | — | | | | — | | | | 13 | | | 13 | | |
| Balance at 31 December 2020 | | | | | 30,150 | | | | 23,001 | | | | 4,052 | | | | 384 | | | | (1,867) | | | | 12,760 | | | | 68,480 | | | | 2,236 | | | 70,716 | | |
| Total comprehensive income for the year | | | | | — | | | | — | | | | — | | | | 837 | | | | 3,807 | | | | 33,054 | | | | 37,698 | | | | 733 | | | 38,431 | | |
| Profit for the year | | | | | — | | | | — | | | | — | | | | — | | | | — | | | | 33,054 | | | | 33,054 | | | | 742 | | | 33,796 | | |
| Other comprehensive income | | | | | — | | | | — | | | | — | | | | 837 | | | | 3,807 | | | | — | | | | 4,644 | | | | (9) | | | 4,635 | | |
| Equity-settled share-based payments | | 6.8 | | | — | | | | — | | | | 142 | | | | — | | | | — | | | | — | | | | 142 | | | | 9 | | | 151 | | |
| Dividends | | 13 | | | — | | | | — | | | | — | | | | — | | | | — | | | | (17,832) | | | | (17,832) | | | | (344) | | | (18,176) | | |
| Marikana B-BBEE transaction | | 6.6 | | | — | | | | — | | | | — | | | | — | | | | — | | | | 34 | | | | 34 | | | | (1,180) | | | (1,146) | | |
| Share buy-back | | 26 | | | (8,503) | | | | — | | | | — | | | | — | | | | — | | | | — | | | | (8,503) | | | | — | | | (8,503) | | |
| Transaction with Platinum Mile shareholders | | 27 | | | — | | | | — | | | | — | | | | — | | | | — | | | | (82) | | | | (82) | | | | (46) | | | (128) | | |
Adjustment due to sale of St Helena1 | | | | | — | | | | — | | | | (24) | | | | — | | | | — | | | | 24 | | | | — | | | | — | | | — | | |
| Balance at 31 December 2021 | | | | | 21,647 | | | | 23,001 | | | | 4,170 | | | | 1,221 | | | | 1,940 | | | | 27,958 | | | | 79,937 | | | | 1,408 | | | 81,345 | | |
1 Effective 3 August 2021, the Group sold the trading licence, movable assets, naming rights, trademarks and practice number under which St Helena Hospital Proprietary Limited (St Helena) operated to Africa Health Care Proprietary Limited for a cash consideration of R25 million. The R24 million is a transfer from other reserves (share-based payment reserve) to accumulated profit/(loss)
* Less than R1 million
The accompanying notes form an integral part of these consolidated financial statements
Consolidated statement of cash flows
For the year ended 31 December 2021
| | | | | | | | | | | | | | | | | | | | | | | | | | | | | | | | | | | | | | | | | |
| Figures in million – SA rand | | Notes | | | | 2021 | | 2020 | | | | 2019 | |
| Cash flows from operating activities | | | | | | | | | | | | | |
| Cash generated by operations | | 34 | | | | 67,784 | | | 45,188 | | | | | 10,566 | | |
| Deferred revenue advance received | | 32 | | | | 65 | | | 771 | | | | | 2,859 | | |
| BTT early settlement payment | | 32 | | | | — | | | (787) | | | | | — | | |
| Amount received on settlement of dispute | | | | | | — | | | 580 | | | | | — | | |
| Post-retirement health care payments | | | | | | (1) | | | (1) | | | | | (6) | | |
| Cash-settled share-based payments paid | | 6.7 | | | | (240) | | | (275) | | | | | (91) | | |
| Payment of Marikana dividend obligation | | | | | | (162) | | | — | | | | | — | | |
| Additional deferred payments relating to acquisition of a business | | | | | | (1,754) | | | — | | | | | — | | |
| Change in working capital | | 35 | | | | 2,455 | | | (9,435) | | | | | (626) | | |
| | | | | | 68,147 | | | 36,041 | | | | | 12,702 | | |
| Interest received | | | | | | 960 | | | 719 | | | | | 268 | | |
| Interest paid | | | | | | (781) | | | (1,386) | | | | | (1,603) | | |
| Royalties paid | | 11.4 | | | | (3,055) | | | (1,707) | | | | | (412) | | |
| Tax paid | | 11.4 | | | | (14,839) | | | (4,818) | | | | | (1,407) | | |
| Dividends paid | | | | | | (18,176) | | | (1,698) | | | | | (85) | | |
| Net cash from operating activities | | | | | | 32,256 | | | 27,151 | | | | | 9,463 | | |
| Cash flow from investing activities | | | | | | | | | | | | | |
| Additions to property, plant and equipment | | | | | | (12,740) | | | (9,616) | | | | | (7,706) | | |
| Proceeds on disposal of property, plant and equipment | | | | | | 80 | | | 101 | | | | | 101 | | |
| Acquisition of subsidiaries | | | | | | — | | | — | | | | | (129) | | |
| Cash acquired on acquisition of subsidiaries | | | | | | — | | | — | | | | | 3,004 | | |
| Proceeds with transfer of assets to joint operation | | | | | | — | | | — | | | | | 31 | | |
| Dividends received | | | | | | 1,020 | | | 288 | | | | | 111 | | |
| Additions to other investments | | | | | | (1,803) | | | (12) | | | | | — | | |
| Acquisition of equity-accounted investment | | | | | | (446) | | | — | | | | | — | | |
| Contributions to environmental rehabilitation funds | | 21 | | | | (72) | | | (64) | | | | | (13) | | |
| Payment of Deferred Payment | | | | | | (577) | | | (756) | | | | | (283) | | |
| Contributions to enterprise development fund | | | | | | (65) | | | — | | | | | — | | |
| Payments to dissenting shareholders | | | | | | — | | | — | | | | | (319) | | |
| Preference shares redeemed by equity-accounted investee | | 18.1 | | | | — | | | 114 | | | | | 187 | | |
| Proceeds on disposal of St Helena | | | | | | 25 | | | — | | | | | — | | |
| Receipts from environmental rehabilitation funds | | 21 | | | | 10 | | | 7 | | | | | 152 | | |
| Net cash used in investing activities | | | | | | (14,568) | | | (9,938) | | | | | (4,864) | | |
| Cash flow from financing activities | | | | | | | | | | | | | |
| Loans raised | | 28 | | | | 20,651 | | | 16,289 | | | | | 18,982 | | |
| Loans repaid | | 28 | | | | (20,252) | | | (18,335) | | | | | (22,008) | | |
| Lease payments | | | | | | (112) | | | (114) | | | | | (132) | | |
| Proceeds from shares issued | | | | | | — | | | — | | | | | 1,688 | | |
| Acquisition of non-controlling interests | | 27 | | | | (128) | | | — | | | | | — | | |
| Share buy-back | | 26 | | | | (8,503) | | | (84) | | | | | — | | |
| Net cash used in financing activities | | | | | | (8,344) | | | (2,244) | | | | | (1,470) | | |
| Net increase in cash and cash equivalents | | | | | | 9,344 | | | 14,969 | | | | | 3,129 | | |
| Effect of exchange rate fluctuations on cash held | | | | | | 708 | | | (348) | | | | | (59) | | |
| Cash and cash equivalents at beginning of the year | | | | | | 20,240 | | | 5,619 | | | | | 2,549 | | |
| Cash and cash equivalents at end of the year | | 25 | | | | 30,292 | | | 20,240 | | | | | 5,619 | | |
The accompanying notes form an integral part of these consolidated financial statements
Notes to the consolidated financial statements continued
For the year ended 31 December 2021
1. Accounting policies
The principal accounting policies applied in the preparation of these consolidated financial statements are set out below. Where an accounting policy is specific to a note, the policy is described in the note which it relates to. These policies have been consistently applied to all the periods presented.
1.1 Reporting entity
Sibanye Stillwater Limited (the Company) and its subsidiaries (together referred to as the Group or Sibanye-Stillwater), an independent, global, precious metals mining company, produces a mix of metals that includes gold and platinum group metals (PGM). Domiciled in South Africa, Sibanye-Stillwater currently owns and operates a portfolio of high-quality operations and projects, which are grouped into 2 regions: the Southern Africa (SA) region and the United States (US) region.
The SA region houses the gold and PGM operations and projects located in South Africa and Zimbabwe. The underground and surface gold mining operations in South Africa are the Driefontein, Kloof and Cooke operations in the West Witwatersrand (West Wits) region and DRDGOLD Limited (DRDGOLD) with surface tailings treatment plant in the East of Johannesburg in Gauteng, and the Beatrix operation in the southern Free State. Sibanye-Stillwater also owns and manages significant gold extraction and processing facilities where ore is treated and beneficiated to produce gold doré. In addition, several organic projects currently underway are aimed at sustaining these gold mining operations into the long term. In 2021, Sibanye-Stillwater’s Board approved a new major capital project for Burnstone to complete necessary infrastructure and bring the mine to full development. Burnstone is a developmental stage gold mine and processing operation located in the South Rand Goldfield of the Witwatersrand Basin, and comprises 2 established shaft complexes, a carbon-in-leach gold processing plant, tailings storage facility and related surface infrastructure and mining rights.
The PGM assets in the SA region are Kroondal (50%) (refer note 41.4), the Rustenburg operation, the Marikana operation (Marikana) and the tailings retreatment entity, Platinum Mile in North West Province, and Mimosa (50%) in Zimbabwe. Marikana currently has 5 contributing shafts namely 4Belt, K3, Rowland, Saffy and E3 and the ore mined at the Marikana operations is processed through 5 concentrators on site. The PGM concentrate produced is dispatched to the smelter for further processing at the Base Metal Refinery (BMR). At the BMR, base metals are removed and the resulting PGM-rich residue is sent to Precious Metal Refinery (PMR) for final treatment. Marikana therefore sells refined metals to customers. Sibanye-Stillwater’s Board approved the K4 capital growth project in 2021 to complete the mine’s vertical shaft infrastructure. K4 is a large, long-life, high-grade Merensky and UG2 proposition situated on the western limb of the Bushveld Complex, in South Africa’s North West Province. It is a partially completed project with an equipped main production shaft and ventilation shaft, some underground infrastructure installed and underground developed workings. Work at K4 started in 2021 with maintenance and preparation of underground areas, leading to first production in 2022.
The Rustenburg operation comprise of 3 operating vertical shafts (Siphumelele 1, Khuseleka 1 and Thembelani 1), 2 declines at Bathopele, 2 concentrating plants (the Waterval UG2 concentrator and the Waterval retrofit concentrator), a chrome recovery plant, the Western Limb tailings retreatment plant and related surface infrastructure and assets. In addition, mining operations are carried out on 2 mining tailings dams. Ore is processed through the Waterval UG2 concentrator and Waterval retrofit concentrator. Tailings are treated at the Western Limb Tailings Retreatment Plant, Platinum Mile and at the Chrome retreatment plant where a saleable chromite concentrate is recovered. Tailings from the Rustenburg operation are piped to storage facilities. The Rustenburg operation has a tolling agreement with a third party and currently sells refined metals as well as PGM concentrate to customers. Kroondal comprises of 5 operating decline shafts. Ore is processed at Kroondal through 2 concentrator plants (K1 and K2). Tailings from the K1 and K2 plants are piped to three adjacent tailings storage facilities and at a fourth tailings storage facility at Marikana, which has been recommissioned. Platinum Mile is a tailings retreatment facility located on the Rustenburg lease area adjacent to our Kroondal operations. The facility recovers PGMs from our Rustenburg operations. Kroondal and Platinum Mile currently only sells PGM concentrate to customers.
The US region houses the PGM operations and projects located in the US, Canada and Argentina. These include the East Boulder and Stillwater mining operations and the Blitz project in Montana, in the US, and exploration-stage projects, Altar (joint venture) in Argentina and Marathon (fair value through other comprehensive income (OCI) investment), a PGM-copper porphyry in Ontario, Canada. The assets in this region also include the Metallurgical complex in Columbus, Montana. This complex houses the smelter, base metal refinery and an analytical laboratory which produces a PGM-rich filter cake that is further refined by a third-party precious metal refinery. These processing and metallurgical facilities are also used to process recycled material such as spent autocatalytic convertors and petroleum refinery catalysts. Subsequent to the reporting date, the investment in the Marathon project was disposed of in exchange for shares in Generation Mining Limited (Gen Mining) (refer note 20).
1.2 Basis of preparation
The consolidated financial statements for the year ended 31 December 2021 have been prepared on a going concern basis in accordance with International Financial Reporting Standards (IFRS), as issued by the International Accounting Standards Board (IASB), the South African Institute of Chartered Accountants Financial Reporting Guides issued by the Accounting Practices Committee and Financial Reporting Pronouncements issued by the Financial Reporting Standards Council, as well as the requirements of the South African Companies Act and JSE Listings Requirements. The consolidated financial statements have been prepared under the historical cost convention, except for certain financial assets and financial liabilities (including derivative instruments) which are measured at fair value through profit or loss or other comprehensive income.
Notes to the consolidated financial statements continued
For the year ended 31 December 2021
Standards, interpretations and amendments to published standards effective for the year ended 31 December 2021
During the financial year, the following new and revised accounting standards and amendments to standards applicable to the Group, became effective and had no material impact on the Group’s financial statements:
| | | | | | | | |
| Pronouncement | Details of amendments | Effective date1 |
| COVID-19-Related Rent Concessions (Amendment to IFRS 16) | In response to the COVID-19 coronavirus pandemic, the IASB has issued amendments to IFRS 16 Leases (IFRS 16) to allow lessees not to account for rent concessions as lease modifications if they are a direct consequence of COVID-19 and meet certain conditions. Rent concessions included in the ambit of the amendment might take a variety of forms, including payment holidays and deferral of lease payments. In many cases, this will result in accounting for the concessions as variable lease payments in the period in which they are granted. The Group did not receive any material rent concessions as a direct result of COVID-19. | 1 June 2020 |
| Interest Rate Benchmark Reform – Phase 2 (Amendments to IFRS 9, IAS 39, IFRS 7, IFRS 4 and IFRS 16) | Interbank offered rates (IBOR) reform refers to the global reform of interest rate benchmarks, which includes the replacement of some interbank offered rates with alternative benchmark rates. Under the detailed rules of IFRS 9 Financial Instruments (IFRS 9), modifying a financial contract can require recognition of a significant gain or loss in the income statement. However, the amendments introduce a practical expedient if a change results directly from IBOR reform and occurs on an ‘economically equivalent’ basis. In these cases, changes will be accounted for by updating the effective interest rate. A similar practical expedient applies under IFRS 16 for lessees when accounting for lease modifications required by IBOR reform. IBOR reform will generally result in a change in the basis for determining the contractual cash flows of that financial asset or financial liability. The US$600 million RCF and the R5.5 billion RCF (refer note 28) are both linked to IBOR and therefore subject to the IBOR reform amendment, which came into effect on 1 January 2021. However, at the reporting date, none of the Group's IBOR-linked interest rates had been changed due to IBOR reform. The R5.5 billion RCF is linked to JIBAR and is not drawn down, however the JIBAR is only expected to be impacted by the reform at a later stage and any impact thereof is to be considered when this occurs. The US$600 million RCF is linked to a US LIBOR and will be refinanced or restructured depending on the developments in respect of the US LIBOR reform. Therefore, the Group was not impacted when the amendment became effective. The Group will assess the impact on the balances and cash flows linked to rates changes arising from IBOR reform when more information is available on the quoted rates that will replace the current IBOR applicable to the Group. The potential future impact arising from these amendments was not yet known at the reporting date. | 1 January 2021 |
1 Effective date refers to annual period beginning on or after said date
Notes to the consolidated financial statements continued
For the year ended 31 December 2021
Standards, interpretations and amendments to published standards which are not yet effective
Certain new standards, amendments and interpretations to existing standards have been published that apply to the accounting periods beginning on or after 1 January 2022 but have not been early adopted by the Group. The standards, amendments and interpretations that are applicable to the Group are:
| | | | | | | | |
| Pronouncement | Details of amendments | Effective date1 |
COVID-19-Related Rent Concessions beyond 30 June 2021 (Amendment to IFRS 16 – the 2021 Amendment)2 | A one-year extension to the practical expedient for COVID-19 related rent concessions under IFRS 16 has been published by the IASB. This amendment is a response to the ongoing economic challenges resulting from the COVID-19 coronavirus pandemic. The extension is available for adoption immediately, subject to any local endorsement requirements. | 1 April 2021 |
Annual Improvements to IFRS Standards 2018-20202 | As part of its process to make non-urgent but necessary amendments to IFRS Standards, the IASB has issued the Annual Improvements to IFRS Standards 2018–2020. The amendments applicable to the Group relate to: •IFRS 9 - clarifies which fees should be included in the 10% test for derecognition of financial liabilities; and •IFRS 16 - amendment of illustrative example 13 to remove the illustration of payments from the lessor relating to leasehold improvements, to remove any confusion about the treatment of lease incentives. | 1 January 2022 |
Property, Plant and Equipment: Proceeds before Intended Use (Amendments to IAS 16)2 | In the process of making an item of property, plant or equipment (PPE) available for its intended use, an entity may produce and sell items. Under the amendments, proceeds from selling items before the related item of PPE is available for use should be recognised in profit or loss, together with the costs of producing those items. IAS 2 Inventories should be applied in identifying and measuring these production costs. | 1 January 2022 |
Onerous Contracts – Cost of Fulfilling a Contract (Amendments to IAS 37)2 | The amendment to IAS 37 Provisions, Contingent Liabilities and Contingent Assets (IAS 37) clarifies that the direct costs of fulfilling a contract include both the incremental costs of fulfilling the contract and an allocation of other costs directly related to fulfilling contracts. Before recognising a separate provision for an onerous contract, an entity recognises any impairment loss that has occurred on assets used in fulfilling the contract. | 1 January 2022 |
Reference to the Conceptual Framework (Amendments to IFRS 3)2 | Minor amendments were made to IFRS 3 Business Combinations (IFRS 3) to update the references to the Conceptual Framework for Financial Reporting and add an exception for the recognition of liabilities and contingent liabilities within the scope of IAS 37 and IFRIC 21 Levies. The amendments also confirm that contingent assets should not be recognised at the acquisition date. | 1 January 2022 |
Classification of Liabilities as Current or Non-current (Amendments to IAS 1)2 | To promote consistency in application and clarify the requirements on determining if a liability is current or non-current, the IASB has amended IAS 1 Presentation of Financial Statements (IAS 1) to clarify that liabilities are classified as either current or non-current, depending on the rights that exist at the end of the reporting period. Classification is unaffected by the expectations of the entity or events after the reporting date (e.g. the receipt of a waiver or a breach of covenant). The amendments also clarify what IAS 1 means when it refers to the “settlement” of a liability. | 1 January 2023 |
Definition of Accounting Estimate (Amendments to IAS 8)2 | The IASB has issued amendments to IAS 8 Accounting Policies, Changes in Accounting Estimates and Errors (IAS 8) to clarify how entities should distinguish changes in accounting policies from changes in accounting estimates, with a primary focus on the definition of and clarifications on accounting estimates. This is due to the term "accounting estimate" not being defined and the previous definition of a "change in accounting estimate" being unclear. The amendments introduce a new definition for accounting estimates, clarifying that they are monetary amounts in the financial statements that are subject to measurement uncertainty. | 1 January 2023 |
1 Effective date refers to annual period beginning on or after said date
2 No material impact expected
Notes to the consolidated financial statements continued
For the year ended 31 December 2021
Standards, interpretations and amendments to published standards which are not yet effective (continued)
| | | | | | | | |
| Pronouncement | Details of amendments | Effective date1 |
Deferred Tax Related to Assets and Liabilities Arising from a Single Transaction (Amendments to IAS 12)2 | The amendments narrow the scope of the initial recognition exemption so that it does not apply to transactions that give rise to equal and offsetting temporary differences. As a result, entities will need to recognise a deferred tax asset and a deferred tax liability for temporary differences arising on initial recognition of a lease and a decommissioning provision. | 1 January 2023 |
Disclosure of Accounting Policies (Amendments to IAS 1 and IFRS Practice Statement 2)2 | To assist preparers of financial statements, the IASB had previously refined its definition of ‘material’ (effective 1 Jan 2020) and issued non-mandatory practical guidance on applying the concept of materiality. As the final step of the materiality improvements, the IASB issued amendments on the application of materiality to the disclosure of accounting policies. The key amendments include requirements for entities to disclose their material accounting policies rather than their significant accounting policies as well as certain clarifications regarding accounting policies related to material transactions or events. | 1 January 2023 |
1 Effective date refers to annual period beginning on or after said date
2 No material impact expected
Significant accounting judgements and estimates
The preparation of the financial statements requires the Group’s management to make estimates and assumptions that affect the reported amounts of assets and liabilities and disclosure of contingent assets and liabilities at the date of the financial statements, and the reported amounts of revenues and expenses during the reporting period. The determination of estimates requires the exercise of judgement based on various assumptions and other factors such as historical experience, current and expected economic conditions, and in some cases valuation techniques. Actual results could differ from those estimates.
For significant accounting policies that are subject to significant judgement, estimates and assumptions, see the following notes to the consolidated financial statements:
| | | | | |
| Significant accounting policy | Note to the consolidated financial statements |
| Revenue | 3 - Revenue |
| Cash-settled share-based payment obligation | 6 - Share-based payments |
| Royalties, mining and income tax, and deferred tax | 11 - Royalties, mining and income tax, and deferred tax |
| Property, plant and equipment | 14 - Property, plant and equipment |
| Business combinations | 16 - Acquisitions |
| Goodwill | 17 - Goodwill |
| Equity-accounted investments | 18 - Equity-accounted investments |
| Other receivables and other payables | 22 - Other receivables and other payables |
| Inventories | 23 - Inventories |
| Borrowings and derivative financial instrument | 28 - Borrowings and derivative financial instrument |
| Environmental rehabilitation obligation | 30 - Environmental rehabilitation obligation and other provisions |
| Occupational healthcare obligation | 31 - Occupational healthcare obligation |
| Deferred revenue | 32 - Deferred revenue |
| Contingent liabilities | 38 - Contingent liabilities |
Estimates and judgements are continually evaluated and are based on historical experience and other factors, including expectations of future events that are believed to be reasonable under the circumstances.
The estimates and assumptions that have a significant risk of causing a material adjustment to the carrying amounts of assets and liabilities within the financial period are discussed under the relevant note of the item affected.
Notes to the consolidated financial statements continued
For the year ended 31 December 2021
1.3 Consolidation
Notes to the consolidated financial statements continued
For the year ended 31 December 2021
1 The non-controlling interests (NCI) in the statement of changes in equity relates to the attributable share of accumulated profits of DRDGOLD, Group Technical Security Management Proprietary Limited (GTSM), Platinum Mile Resources Proprietary Limited (Platinum Mile), Western Platinum Proprietary Limited (WPL) and all WPL subsidiaries, Eastern Platinum Proprietary Limited (EPL) and Akanani Mining Proprietary Limited (Akanani) (refer note 27)
2 Witwatersrand Consolidated Gold Resources Proprietary Limited (Wits Gold) has ceded and pledged its shares in K2013164354 Proprietary Limited (K2013) (a dormant entity) and K2013 has ceded and pledged it shares in Sibanye Gold Eastern Operations Proprietary Limited (SGEO) in favour of the lenders of the Burnstone Debt (refer note 28.7)
3 Rand Uranium Proprietary Limited (Rand Uranium) and Ezulwini Mining Company Proprietary Limited (Ezulwini) together own a number of underground and surface mining operations. These operations report to the Group’s chief operating decision maker (the Executive Committee) as a separate segment, namely Cooke
4 In terms of the Rustenburg operation transaction, a 26% stake in Sibanye Rustenburg Platinum Mines Proprietary Limited (SRPM) was acquired through Newshelf 1335 Proprietary Limited (B-BBEE SPV). The shareholders of B-BBEE SPV are Rustenburg Mine Employees Trust (30.4%), Rustenburg Mine Community Development Trust (24.8%), Bakgatla-Ba-Kgafela Investment Holdings (24.8%) and Siyanda Resources Proprietary Limited (20.0%). The Rustenburg Mine Employees Trust and the Rustenburg Mine Community Development Trust are controlled and consolidated by Sibanye-Stillwater and liabilities amounting to R1,402 million and R1,144 million are eliminated upon consolidation
5 The Group has no current or contractual obligation to provide financial support to any of its structured entities
6 Sibanye-Stillwater recognises no NCI in Akanani on a similar basis as described for WPL and EPL below (refer footnote 7 below), since a revised shareholders' agreement replaced the equity interests with a right to receive dividends.
7 Sibanye-Stillwater recognises no NCI in WPL and EPL. The shareholding of Lonplats Employee Share Ownership Trust (Employee Trust) (3.8%), Lonplats Marikana Community Development Trust (Community Trust) (0.9%) and Bapo Ba Mogale Local Economic Development Trust (Bapo Trust) (0.9%) (together Marikana Trusts) is not considered since these trusts are controlled and consolidated by Sibanye-Stillwater. Liabilities amounting to R1,671 million relating to the Marikana Trusts are eliminated upon consolidation. In addition, as a result of the Marikana broad-based black economic empowerment (B-BBEE) transaction (refer note 6.6), the equity interests of shareholders in WPL and EPL, including all non-controlling shareholders, were replaced with the right to receive dividends. As a result, the effective shareholding interests were replaced by a share-based payment obligation and dividend obligation (refer note 6.6 and 22.2)
8 Effective 10 January 2020, the Group exercised its option to acquire an additional 12.05% in DRDGOLD. The consideration amounted to R1,086 million for the subscription of 168,158,944 additional new ordinary shares resulting in a 50.1% shareholding in DRDGOLD. The effective shareholding at 31 December 2021 was 50.49% (2020: 50.66% and 2019: 38.60%) after considering treasury shares held by DRDGOLD (refer note 27). The Group calculated the net asset value of DRDGOLD at the option exercise date to which the additional ownership percentage was applied to determine the reattribution between NCI and the Group
9 On 17 June 2020, the Company and Sibanye Gold Proprietary Limited (SGL) entered into an unbundling agreement wherein SGL unbundled its entire shareholding in Sibanye Platinum Proprietary Limited (SPPL) for no value to the Company
10 During 2020, the Group reorganised its internal legal structure to house the Marikana PGM related companies (previously owned by LSA UK Limited) under a new intermediate holding company, being Rustenburg Eastern Operations Proprietary Limited (REO), which is a wholly owned subsidiary of SPPL. The reorganisation had no impact to the consolidated financial statements of the Group
11 At 31 December 2021, the Group had a 100% legal interest in Peregrine Metals Limited (Peregrine), which is subject to an Initial Earn-in arrangement of 60% by Aldebaran Resources Inc. (Aldebaran) (refer note 18.3)
12 The Group has a 76% legal interest in the Newshelf 1114 Proprietary Limited (Newshelf 1114) group and the NCI can acquire a further 2% legal shareholding once they have implemented the necessary funding structure. However, no accounting NCI is recognised, since the NCI’s vendor loan financing exceeds their proportionate interest in Newshelf 1114 and therefore no effective shareholding exists
13 During 2021, the Group formed Sibanye Battery Metals Proprietary Limited in order to hold the Group's investments in battery metal entities
Subsidiaries
Subsidiaries are all entities over which the Group exercises control. The Group controls an entity when it is exposed to, or has rights to, variable returns from its involvement with the entity and has the ability to affect those returns through its power over the entity. Subsidiaries are consolidated from the date on which control is obtained by the Group until the date on which control ceases. Control is reassessed if facts and circumstances indicate that there are changes to one or more of the elements of control.
Inter-company transactions, balances and unrealised gains on transactions between Group companies are eliminated. Unrealised losses are also eliminated. Accounting policies of subsidiaries have been changed where necessary to ensure consistency with the policies adopted by the Group.
Transactions with shareholders
Transactions with owners in the capacity as equity participants are not recognised in profit or loss, but instead are recognised in equity with a corresponding change in assets or liabilities. Changes in a parent’s ownership interest in a subsidiary that do not result in the parent losing control of the subsidiary are equity transactions.
Notes to the consolidated financial statements continued
For the year ended 31 December 2021
1.4 Foreign currencies
Functional and presentation currency
Items included in the financial statements of each of the Group’s entities are measured using the currency of the primary economic environment in which the entity operates (the functional currency). The consolidated financial statements are presented in South African rand, which is the Group’s presentation currency.
Transactions and balances
Foreign currency transactions are translated into the functional currency using the exchange rates prevailing at the dates of the transactions. Monetary assets and liabilities are translated into the functional currency at each reporting date. Foreign exchange gains and losses resulting from the settlement of such transactions and from the translation of monetary assets and liabilities denominated in foreign currencies, are recognised in profit or loss.
Foreign operations
The results and financial position of all the Group entities that have a functional currency different from the presentation currency are translated into the presentation currency as follows:
•Assets and liabilities are translated at the exchange rate ruling at the reporting date. Equity items are translated at historical rates. The income and expenses are translated at the average exchange rate for the year, unless this average was not a reasonable approximation of the rates prevailing on the transaction dates, in which case these items were translated at the rate prevailing on the date of the transaction. Exchange differences on translation are accounted for in other comprehensive income. These differences will be recognised in profit or loss upon realisation of the underlying operation.
•Exchange differences arising from the translation of the net investment in foreign operations, which includes certain long-term borrowings (i.e. the reporting entity’s interest in the net assets of that operation), are taken to other comprehensive income. When a foreign operation is sold, exchange differences that were recorded in other comprehensive income are recognised in profit or loss as part of the gain or loss on disposal. If the Group disposes of part of its interest in a subsidiary but retains control, then the relevant proportion of the cumulative amount is reattributed to NCI. When the Group disposes of only part of an associate or joint venture while retaining significant influence or joint control, the relevant proportion of the cumulative amount is reclassified to profit or loss. If a company in the Group repays a portion of long-term borrowings forming part of a net investment in foreign operations, amounts previously recorded in other comprehensive income are only recognised in profit or loss upon disposal of the relevant operation.
•Goodwill and fair value adjustments arising on the acquisition of a foreign operation are treated as assets and liabilities of the foreign operation and are translated at each reporting date at the closing rate.
1.5 Comparatives
Where necessary, comparative periods have been revised to conform to current period changes in presentation. Previously, the level of rounding applied in the Group's consolidated annual financial statements included a decimal for the nearest hundred thousand. During the year ended 31 December 2021, the Group changed the level of rounding to only reflect the nearest million by removing the hundred thousand decimal space. Immaterial rounding adjustments were made to comparative information as a result of this change.
Notes to the consolidated financial statements continued
For the year ended 31 December 2021
2. Segment reporting
| | |
Accounting Policy Operating segments are reported in a manner consistent with the internal reporting provided to the chief operating decision maker and is based on individual mining operations. The chief operating decision maker, who is responsible for allocating resources and assessing performance of the operating segments, has been identified as the executive management team that makes strategic decisions. |
| | | | | | | | | | | | | | | | | | | | | | | | | | | | | | | | | | | | | | | | | | | | | | | | | | | | | | | | | | | | | | |
| Figures in million – SA rand | Group | Total US PGM operations1 | Underground | Recycling | Total SA
operations | Total
SA PGM | Rustenburg | Marikana | Kroondal | Platinum
Mile | Mimosa | Corporate and reconciling items2 | Total
SA gold | Driefontein | Kloof | Beatrix | Cooke | DRD-
GOLD | Corporate and reconciling items2 | Group Corporate and reconciling items2 |
| 2021 | | | | | | | | | | | | | | | | | | | | |
| Revenue | 172,194 | | 59,053 | | 18,343 | | 40,710 | | 113,512 | | 85,154 | | 31,749 | | 41,610 | | 10,293 | | 1,503 | | 4,393 | | (4,394) | | 28,358 | | 7,932 | | 9,294 | | 5,343 | | 999 | | 4,790 | | — | | (371) | |
| Underground | 120,403 | | 18,343 | | 18,343 | | — | | 102,431 | | 81,477 | | 29,575 | | 41,610 | | 10,293 | | — | | 4,393 | | (4,394) | | 20,954 | | 7,722 | | 8,089 | | 5,143 | | — | | — | | — | | (371) | |
| Surface | 11,081 | | — | | — | | — | | 11,081 | | 3,677 | | 2,174 | | — | | — | | 1,503 | | — | | — | | 7,404 | | 210 | | 1,205 | | 200 | | 999 | | 4,790 | | — | | — | |
| Recycling | 40,710 | | 40,710 | | — | | 40,710 | | — | | — | | — | | — | | — | | — | | — | | — | | — | | — | | — | | — | | — | | — | | — | | — | |
| Cost of sales, before amortisation and depreciation | (101,013) | | (46,787) | | (7,567) | | (39,220) | | (54,226) | | (31,971) | | (11,464) | | (16,561) | | (3,416) | | (531) | | (1,587) | | 1,588 | | (22,255) | | (5,691) | | (7,844) | | (4,565) | | (808) | | (3,347) | | — | | — | |
| Underground | (54,989) | | (7,567) | | (7,567) | | — | | (47,422) | | (30,430) | | (10,454) | | (16,561) | | (3,416) | | — | | (1,587) | | 1,588 | | (16,992) | | (5,559) | | (6,986) | | (4,447) | | — | | — | | — | | — | |
| Surface | (6,804) | | — | | — | | — | | (6,804) | | (1,541) | | (1,010) | | — | | — | | (531) | | — | | — | | (5,263) | | (132) | | (858) | | (118) | | (808) | | (3,347) | | — | | — | |
| Recycling | (39,220) | | (39,220) | | — | | (39,220) | | — | | — | | — | | — | | — | | — | | — | | — | | — | | — | | — | | — | | — | | — | | — | | — | |
Net other cash costs3 | (2,575) | | (10) | | (10) | | — | | (2,565) | | (1,575) | | 134 | | (1,036) | | (91) | | (492) | | (42) | | (48) | | (990) | | (78) | | (83) | | (73) | | (611) | | (40) | | (105) | | — | |
| Adjusted EBITDA | 68,606 | | 12,256 | | 10,766 | | 1,490 | | 56,721 | | 51,608 | | 20,419 | | 24,013 | | 6,786 | | 480 | | 2,764 | | (2,854) | | 5,113 | | 2,163 | | 1,367 | | 705 | | (420) | | 1,403 | | (105) | | (371) | |
| Amortisation and depreciation | (8,293) | | (2,601) | | (2,598) | | (3) | | (5,692) | | (2,515) | | (885) | | (1,099) | | (495) | | (31) | | (274) | | 269 | | (3,177) | | (1,165) | | (1,064) | | (691) | | (11) | | (188) | | (58) | | — | |
| Interest income | 1,202 | | 382 | | 10 | | 372 | | 805 | | 219 | | 22 | | 92 | | 97 | | 7 | | 12 | | (11) | | 586 | | 60 | | 47 | | 31 | | 22 | | 222 | | 204 | | 15 | |
| Finance expense | (2,496) | | (954) | | (897) | | (57) | | (1,233) | | (666) | | (4,201) | | (328) | | (116) | | — | | (5) | | 3,984 | | (567) | | (99) | | (85) | | (82) | | (63) | | (60) | | (178) | | (309) | |
| Share-based payments | (383) | | (73) | | (73) | | — | | (310) | | (89) | | (35) | | (42) | | (12) | | — | | — | | — | | (221) | | (20) | | (32) | | (21) | | — | | (19) | | (129) | | — | |
Net other4 | (2,832) | | 238 | | 238 | | — | | (3,121) | | (4,305) | | (12,232) | | (985) | | 248 | | 34 | | (43) | | 8,673 | | 1,184 | | 16 | | 22 | | 33 | | 92 | | 22 | | 999 | | 51 | |
Non-underlying items5 | (5,529) | | (278) | | (278) | | — | | (5,153) | | 2 | | 4 | | (1) | | (1) | | — | | — | | — | | (5,155) | | (202) | | (3,686) | | (1,290) | | (3) | | — | | 26 | | (98) | |
| Royalties and carbon tax | (2,718) | | — | | — | | — | | (2,718) | | (2,548) | | (1,405) | | (1,129) | | (14) | | — | | (160) | | 160 | | (170) | | (95) | | (46) | | (29) | | (5) | | — | | 5 | | — | |
| Profit before tax | 47,557 | | 8,970 | | 7,168 | | 1,802 | | 39,299 | | 41,706 | | 1,687 | | 20,521 | | 6,493 | | 490 | | 2,294 | | 10,221 | | (2,407) | | 658 | | (3,477) | | (1,344) | | (388) | | 1,380 | | 764 | | (712) | |
| Current taxation | (13,506) | | (1,422) | | | | (12,014) | | (11,745) | | (4,864) | | (4,768) | | (1,885) | | (218) | | (574) | | 564 | | (269) | | (13) | | (13) | | (7) | | — | | (263) | | 27 | | (70) | |
| Deferred taxation | (255) | | (89) | | | | (166) | | (367) | | 956 | | (1,460) | | 56 | | 80 | | (18) | | 19 | | 201 | | 49 | | 1,158 | | 233 | | — | | (77) | | (1,162) | | — | |
| Profit/(loss) for the year | 33,796 | | 7,459 | | | | 27,119 | | 29,594 | | (2,221) | | 14,293 | | 4,664 | | 352 | | 1,702 | | 10,804 | | (2,475) | | 694 | | (2,332) | | (1,118) | | (388) | | 1,040 | | (371) | | (782) | |
| Attributable to: | | | | | | | | | | | | | | | | | | | | |
| Owners of the parent | 33,054 | | 7,459 | | | | 26,377 | | 29,360 | | (2,221) | | 14,075 | | 4,664 | | 336 | | 1,702 | | 10,804 | | (2,983) | | 694 | | (2,332) | | (1,118) | | (388) | | 527 | | (366) | | (782) | |
| Non-controlling interest holders | 742 | | — | | | | 742 | | 234 | | — | | 218 | | — | | 16 | | — | | — | | 508 | | — | | — | | — | | — | | 513 | | (5) | | — | |
| Sustaining capital expenditure | (4,119) | | (796) | | (791) | | (5) | | (3,323) | | (2,019) | | (619) | | (1,104) | | (268) | | (28) | | (499) | | 499 | | (1,304) | | (322) | | (488) | | (164) | | — | | (330) | | — | | — | |
| Ore reserve development | (5,535) | | (1,354) | | (1,354) | | — | | (4,181) | | (1,577) | | (629) | | (947) | | — | | — | | — | | (1) | | (2,604) | | (1,177) | | (930) | | (497) | | — | | — | | — | | — | |
| Growth projects | (3,086) | | (2,411) | | (2,411) | | — | | (675) | | (203) | | — | | (203) | | — | | — | | — | | — | | (472) | | — | | (198) | | (7) | | — | | (47) | | (220) | | — | |
| Total capital expenditure | (12,740) | | (4,561) | | (4,556) | | (5) | | (8,179) | | (3,799) | | (1,248) | | (2,254) | | (268) | | (28) | | (499) | | 498 | | (4,380) | | (1,499) | | (1,616) | | (668) | | — | | (377) | | (220) | | — | |
1 The presentation of the US PGM operating segment has been revised to separately disclose the underground mining and recycling operations
2 Corporate and reconciling items represent the items to reconcile segment data to consolidated financial statement totals. This does not represent a separate segment as it does not generate mining revenue. Group corporate includes the Wheaton Stream transaction, initial recognition of battery metal investment, corporate tax, interest and corporate transaction costs
3 Net other cash costs consist of service entity income, sundry income (refer note 8.2) and other costs as detailed in profit or loss, excluding loss due to dilution of interest in joint operation (refer note 8.1). Lease payments (R142 million) are included in net other cash costs to conform with the adjusted EBITDA reconciliation disclosed in note 28.10
4 Net other consists of loss on financial instruments, loss on foreign exchange differences, change in estimate of environmental rehabilitation obligation and right of recovery receivable and payable (refer note 8.2) as detailed in profit or loss and the add back of the lease payment referred to in footnote 3 above. Corporate and reconciling items net other includes the share of results of equity-accounted investees after tax as detailed in profit or loss
5 Non-underlying items consists of gain on disposal of property, plant and equipment, impairments which include impairments to mining assets of Driefontein, Kloof and Beatrix of R212 million, R3,642 million and R1,293 million, respectively (refer note 10), restructuring costs, transaction costs, early redemption premium on the 2025 Notes, profit on sale of St Helena (refer note 8.2), non-cash loss with dilution of interest in joint operation (refer note 8.1) and occupational healthcare expense as detailed in profit or loss
Notes to the consolidated financial statements continued
For the year ended 31 December 2021
| | | | | | | | | | | | | | | | | | | | | | | | | | | | | | | | | | | | | | | | | | | | | | | | | | | | | | | | | | | | | | |
| Figures in million – SA rand | Group | Total US PGM operations | Underground | Recycling | Total SA operations | Total SA PGM | Rustenburg | Marikana | Kroondal | Platinum Mile | Mimosa | Corporate and reconciling items1 | Total SA gold | Driefontein | Kloof | Beatrix | Cooke | DRD-GOLD | Corporate and reconciling items1 | Group Corporate and reconciling items1 |
| 2020 | | | | | | | | | | | | | | | | | | | | |
| Revenue | 127,392 | | 45,154 | | 19,858 | | 25,296 | | 82,781 | | 54,912 | | 20,429 | | 26,865 | | 7,973 | | 950 | | 3,894 | | (5,199) | | 27,869 | | 6,793 | | 9,795 | | 4,664 | | 1,040 | | 5,051 | | 526 | | (543) | |
| Underground | 91,369 | | 19,858 | | 19,858 | | — | | 72,054 | | 52,142 | | 18,521 | | 26,865 | | 7,973 | | — | | 3,894 | | (5,111) | | 19,912 | | 6,793 | | 8,109 | | 4,500 | | — | | — | | 510 | | (543) | |
| Surface | 10,727 | | — | | — | | — | | 10,727 | | 2,770 | | 1,908 | | — | | — | | 950 | | — | | (88) | | 7,957 | | — | | 1,686 | | 164 | | 1,040 | | 5,051 | | 16 | | — | |
| Recycling | 25,296 | | 25,296 | | — | | 25,296 | | — | | — | | — | | — | | — | | — | | — | | — | | — | | — | | — | | — | | — | | — | | — | | — | |
| Cost of sales, before amortisation and depreciation | (75,776) | | (32,004) | | (7,586) | | (24,418) | | (43,772) | | (24,722) | | (9,588) | | (13,232) | | (2,803) | | (403) | | (1,601) | | 2,905 | | (19,050) | | (4,863) | | (6,880) | | (3,714) | | (671) | | (2,922) | | — | | — | |
| Underground | (45,502) | | (7,586) | | (7,586) | | — | | (37,916) | | (23,551) | | (8,732) | | (13,232) | | (2,803) | | — | | (1,601) | | 2,817 | | (14,365) | | (4,863) | | (5,886) | | (3,616) | | — | | — | | — | | — | |
| Surface | (5,856) | | — | | — | | — | | (5,856) | | (1,171) | | (856) | | — | | — | | (403) | | — | | 88 | | (4,685) | | — | | (994) | | (98) | | (671) | | (2,922) | | — | | — | |
| Recycling | (24,418) | | (24,418) | | — | | (24,418) | | — | | — | | — | | — | | — | | — | | — | | — | | — | | — | | — | | — | | — | | — | | — | | — | |
Net other cash costs2 | (2,231) | | (67) | | (67) | | — | | (2,164) | | (1,116) | | 51 | | (789) | | (76) | | (241) | | (59) | | (2) | | (1,048) | | (66) | | (104) | | (97) | | (642) | | (44) | | (95) | | — | |
| Adjusted EBITDA | 49,385 | | 13,083 | | 12,205 | | 878 | | 36,845 | | 29,074 | | 10,892 | | 12,844 | | 5,094 | | 306 | | 2,234 | | (2,296) | | 7,771 | | 1,864 | | 2,811 | | 853 | | (273) | | 2,085 | | 431 | | (543) | |
| Amortisation and depreciation | (7,593) | | (2,727) | | (2,722) | | (5) | | (4,866) | | (2,072) | | (806) | | (818) | | (410) | | (34) | | (281) | | 277 | | (2,794) | | (932) | | (1,092) | | (491) | | (14) | | (202) | | (63) | | — | |
| Interest income | 1,065 | | 279 | | 1 | | 278 | | 786 | | 221 | | 27 | | 106 | | 84 | | 3 | | 4 | | (3) | | 565 | | 67 | | 59 | | 36 | | 45 | | 178 | | 180 | | — | |
| Finance expense | (3,152) | | (1,057) | | (960) | | (97) | | (1,773) | | (662) | | (2,841) | | (259) | | (137) | | — | | (14) | | 2,589 | | (1,111) | | (156) | | (151) | | (107) | | (100) | | (58) | | (539) | | (322) | |
| Share-based payments | (512) | | (80) | | (80) | | — | | (432) | | (90) | | (36) | | (41) | | (13) | | — | | — | | — | | (342) | | (22) | | (26) | | (19) | | — | | (141) | | (134) | | — | |
Net other3 | (393) | | 31 | | 31 | | — | | (424) | | 1,224 | | (3,847) | | 2,132 | | 122 | | (14) | | (16) | | 2,847 | | (1,648) | | 20 | | 30 | | 28 | | 36 | | 30 | | (1,792) | | — | |
Non-underlying items4 | (1,550) | | (93) | | (93) | | — | | (1,385) | | 149 | | 591 | | (435) | | (7) | | — | | — | | — | | (1,534) | | (27) | | (18) | | (40) | | (4) | | (1) | | (1,444) | | (72) | |
| Royalties and carbon tax | (1,770) | | — | | — | | — | | (1,770) | | (1,625) | | (924) | | (691) | | (10) | | — | | (135) | | 135 | | (145) | | (73) | | (115) | | (46) | | (5) | | — | | 94 | | — | |
| Profit before tax | 35,480 | | 9,436 | | 8,382 | | 1,054 | | 26,981 | | 26,219 | | 3,056 | | 12,838 | | 4,723 | | 261 | | 1,792 | | 3,549 | | 762 | | 741 | | 1,498 | | 214 | | (315) | | 1,891 | | (3,267) | | (937) | |
| Current taxation | (5,374) | | (976) | | | | (4,353) | | (3,861) | | (2,635) | | 92 | | (1,300) | | (15) | | (450) | | 447 | | (492) | | (9) | | 9 | | (5) | | — | | (492) | | 5 | | (45) | |
| Deferred taxation | 516 | | (682) | | | | 1,198 | | 958 | | 98 | | 951 | | (34) | | (58) | | (42) | | 43 | | 240 | | (233) | | (322) | | (89) | | — | | (97) | | 981 | | — | |
| Profit/(loss) for the year | 30,622 | | 7,778 | | | | 23,826 | | 23,316 | | 519 | | 13,881 | | 3,389 | | 188 | | 1,300 | | 4,039 | | 510 | | 499 | | 1,185 | | 120 | | (315) | | 1,302 | | (2,281) | | (982) | |
| Attributable to: | | | | | | | | | | | | | | | | | | | | |
| Owners of the parent | 29,312 | | 7,778 | | | | 22,516 | | 22,650 | | 519 | | 13,230 | | 3,389 | | 173 | | 1,300 | | 4,039 | | (134) | | 499 | | 1,185 | | 120 | | (315) | | 659 | | (2,282) | | (982) | |
| Non-controlling interest holders | 1,310 | | — | | | | 1,310 | | 666 | | — | | 651 | | — | | 15 | | — | | — | | 644 | | — | | — | | — | | — | | 643 | | 1 | | — | |
| Sustaining capital expenditure | (2,817) | | (798) | | (795) | | (3) | | (2,019) | | (1,052) | | (326) | | (515) | | (188) | | (23) | | (414) | | 414 | | (967) | | (187) | | (392) | | (93) | | — | | (295) | | — | | — | |
| Ore reserve development | (4,150) | | (1,239) | | (1,239) | | — | | (2,911) | | (1,125) | | (417) | | (708) | | — | | — | | — | | — | | (1,786) | | (742) | | (722) | | (322) | | — | | — | | — | | — | |
| Growth projects | (2,649) | | (2,385) | | (2,385) | | — | | (264) | | (20) | | — | | — | | — | | (20) | | — | | — | | (244) | | — | | (155) | | — | | — | | (46) | | (43) | | — | |
| Total capital expenditure | (9,616) | | (4,422) | | (4,419) | | (3) | | (5,194) | | (2,197) | | (743) | | (1,223) | | (188) | | (43) | | (414) | | 414 | | (2,997) | | (929) | | (1,269) | | (415) | | — | | (341) | | (43) | | — | |
1 Corporate and reconciling items represent the items to reconcile segment data to consolidated financial statement totals. This does not represent a separate segment as it does not generate mining revenue. Group corporate includes the Wheaton Stream transaction, corporate transaction costs and corporate tax
2 Net other cash costs consist of service entity income, sundry income (refer note 8.2) and other costs as detailed in profit or loss, excluding loss due to dilution of interest in joint operation (refer note 8.1). Lease payments (R148 million) are included in net other cash costs to conform with the adjusted EBITDA reconciliation disclosed in note 28.10
3 Net other consists of loss on financial instruments, loss on foreign exchange differences, change in estimate of environmental rehabilitation obligation, right of recovery receivable and payable (refer note 8.2) as detailed in profit or loss and the add back of the lease payment referred to in footnote 2 above. Corporate and reconciling items net other includes the share of results of equity-accounted investees after tax as detailed in profit or loss
4 Non-underlying items consists of gain on disposal of property, plant and equipment, impairments, loss on BTT early settlement, restructuring costs, transaction costs, loss on settlement of US$ Convertible Bond, income on settlement of legal dispute (refer note 8.2), non-cash loss with dilution of interest in joint operation (refer note 8.1) and occupational healthcare expense as detailed in profit or loss
Notes to the consolidated financial statements continued
For the year ended 31 December 2021
| | | | | | | | | | | | | | | | | | | | | | | | | | | | | | | | | | | | | | | | | | | | | | | | | | | | | | | | | | | | | | |
| Figures in million – SA rand | Group | Total US PGM operations | Underground | Recycling | Total SA operations | Total SA PGM | Rustenburg | Marikana1 | Kroondal | Platinum
Mile | Mimosa | Corporate and reconciling items2 | Total SA gold | Driefontein | Kloof | Beatrix | Cooke | DRD-GOLD | Corporate and reconciling items2 | Group Corporate and reconciling items2 |
| 2019 | | | | | | | | | | | | | | | | | | | | |
| Revenue | 72,925 | | 26,864 | | 12,343 | | 14,521 | | 46,223 | | 27,579 | | 10,499 | | 11,188 | | 5,591 | | 301 | | 2,343 | | (2,343) | | 18,644 | | 3,303 | | 6,809 | | 3,798 | | 828 | | 3,621 | | 285 | | (162) | |
| Underground | 51,528 | | 12,343 | | 12,343 | | — | | 39,347 | | 26,617 | | 9,901 | | 11,125 | | 5,591 | | — | | 2,343 | | (2,343) | | 12,730 | | 3,301 | | 5,553 | | 3,577 | | 21 | | — | | 278 | | (162) | |
| Surface | 6,876 | | — | | — | | — | | 6,876 | | 962 | | 598 | | 63 | | — | | 301 | | — | | — | | 5,914 | | 2 | | 1,256 | | 221 | | 807 | | 3,621 | | 7 | | — | |
| Recycling | 14,521 | | 14,521 | | — | | 14,521 | | — | | — | | — | | — | | — | | — | | — | | — | | — | | — | | — | | — | | — | | — | | — | | — | |
| Cost of sales, before amortisation and depreciation | (56,100) | | (19,569) | | (5,601) | | (13,968) | | (36,531) | | (18,197) | | (6,467) | | (8,440) | | (3,076) | | (214) | | (1,336) | | 1,336 | | (18,334) | | (4,439) | | (6,873) | | (3,669) | | (617) | | (2,736) | | — | | — | |
| Underground | (36,520) | | (5,601) | | (5,601) | | — | | (30,919) | | (17,208) | | (5,692) | | (8,440) | | (3,076) | | — | | (1,336) | | 1,336 | | (13,711) | | (4,429) | | (5,741) | | (3,525) | | (16) | | — | | — | | — | |
| Surface | (5,612) | | — | | — | | — | | (5,612) | | (989) | | (775) | | — | | — | | (214) | | — | | — | | (4,623) | | (10) | | (1,132) | | (144) | | (601) | | (2,736) | | — | | — | |
| Recycling | (13,968) | | (13,968) | | — | | (13,968) | | — | | — | | — | | — | | — | | — | | — | | — | | — | | — | | — | | — | | — | | — | | — | | — | |
Net other cash costs3 | (1,869) | | (4) | | (4) | | — | | (1,865) | | (585) | | (156) | | (300) | | (103) | | (25) | | (8) | | 7 | | (1,280) | | (197) | | (153) | | (180) | | (569) | | (31) | | (150) | | — | |
| Adjusted EBITDA | 14,956 | | 7,291 | | 6,738 | | 553 | | 7,827 | | 8,797 | | 3,876 | | 2,448 | | 2,412 | | 62 | | 999 | | (1,000) | | (970) | | (1,333) | | (217) | | (51) | | (358) | | 854 | | 135 | | (162) | |
| Amortisation and depreciation | (7,214) | | (2,286) | | (2,286) | | — | | (4,928) | | (1,919) | | (914) | | (500) | | (495) | | (5) | | (219) | | 214 | | (3,009) | | (920) | | (1,201) | | (640) | | (15) | | (172) | | (61) | | — | |
| Interest income | 560 | | 145 | | 145 | | — | | 415 | | 146 | | 45 | | 31 | | 67 | | 1 | | 2 | | — | | 269 | | 60 | | 53 | | 31 | | 40 | | 64 | | 21 | | — | |
| Finance expense | (3,303) | | (921) | | (921) | | — | | (2,071) | | (704) | | (1,408) | | (282) | | (147) | | — | | (22) | | 1,155 | | (1,367) | | (243) | | (243) | | (141) | | (74) | | (73) | | (593) | | (311) | |
| Share-based payments | (363) | | (53) | | (53) | | — | | (310) | | — | | — | | — | | — | | — | | — | | — | | (310) | | — | | — | | — | | — | | (64) | | (246) | | — | |
Net other4 | (4,926) | | 8 | | 8 | | — | | (4,934) | | (1,513) | | (11,382) | | 13 | | — | | 1 | | (137) | | 9,992 | | (3,421) | | 18 | | 31 | | 13 | | (114) | | 81 | | (3,450) | | — | |
Non-underlying items5 | (566) | | (74) | | (74) | | — | | (123) | | 259 | | 2 | | 213 | | 45 | | — | | (27) | | 26 | | (382) | | (170) | | (35) | | (112) | | (7) | | 5 | | (63) | | (369) | |
| Royalties and carbon tax | (444) | | — | | — | | — | | (444) | | (358) | | (296) | | (54) | | (8) | | — | | (77) | | 77 | | (86) | | (17) | | (34) | | (31) | | (4) | | — | | — | | — | |
| Profit before tax | (1,300) | | 4,110 | | 3,557 | | 553 | | (4,568) | | 4,708 | | (10,077) | | 1,869 | | 1,874 | | 59 | | 519 | | 10,464 | | (9,276) | | (2,605) | | (1,646) | | (931) | | (532) | | 695 | | (4,257) | | (842) | |
| Current taxation | (1,849) | | (481) | | | | (1,368) | | (1,305) | | (780) | | 13 | | (536) | | — | | (136) | | 134 | | (63) | | (23) | | (5) | | (13) | | — | | (69) | | 47 | | — | |
| Deferred taxation | 3,582 | | 1,436 | | | | 2,146 | | 14 | | 30 | | — | | (1) | | (16) | | (6) | | 7 | | 2,132 | | 75 | | 150 | | 90 | | — | | (130) | | 1,947 | | — | |
| Profit/(loss) for the year | 433 | | 5,065 | | | | (3,790) | | 3,417 | | (10,827) | | 1,882 | | 1,337 | | 43 | | 377 | | 10,605 | | (7,207) | | (2,553) | | (1,501) | | (854) | | (532) | | 496 | | (2,263) | | (842) | |
| Attributable to: | | | | | | | | | | | | | | | | | | | | |
| Owners of the parent | 62 | | 5,065 | | | | (4,161) | | 3,355 | | (10,827) | | 1,823 | | 1,337 | | 39 | | 377 | | 10,606 | | (7,516) | | (2,553) | | (1,501) | | (854) | | (532) | | 189 | | (2,265) | | (842) | |
| Non-controlling interest holders | 371 | | — | | | | 371 | | 62 | | — | | 59 | | — | | 4 | | — | | (1) | | 309 | | — | | — | | — | | — | | 307 | | 2 | | — | |
| Sustaining capital expenditure | (2,039) | | (322) | | (322) | | — | | (1,717) | | (1,202) | | (316) | | (660) | | (213) | | (13) | | (343) | | 343 | | (515) | | (163) | | (238) | | (71) | | — | | (43) | | — | | — | |
| Ore reserve development | (3,402) | | (1,036) | | (1,036) | | — | | (2,366) | | (1,030) | | (501) | | (529) | | — | | — | | — | | — | | (1,336) | | (513) | | (590) | | (233) | | — | | — | | — | | — | |
| Growth projects | (2,265) | | (2,035) | | (2,035) | | — | | (230) | | (15) | | (2) | | — | | — | | (13) | | — | | — | | (215) | | — | | (109) | | (2) | | — | | (39) | | (65) | | — | |
| Total capital expenditure | (7,706) | | (3,393) | | (3,393) | | — | | (4,313) | | (2,247) | | (819) | | (1,189) | | (213) | | (26) | | (343) | | 343 | | (2,066) | | (676) | | (937) | | (306) | | — | | (82) | | (65) | | — | |
1 The SA PGM operations’ results for the year ended 31 December 2019 include Marikana for the seven months since acquisition (refer to note 16.1)
2 Corporate and reconciling items represent the items to reconcile segment data to consolidated financial statement totals. This does not represent a separate segment as it does not generate mining revenue. Group corporate includes the Wheaton Stream transaction and corporate transaction costs.
3 Net other cash costs consist of other costs and other income as detailed in profit or loss, excluding change in estimate of environmental rehabilitation obligation and right of recovery receivable and payable (refer note 8.1). Lease payments (R132 million) are included in net other cash costs to conform with the adjusted EBITDA reconciliation disclosed in note 28.10
4 Net other consists of loss on financial instruments, gain on foreign exchange differences, change in estimate of environmental rehabilitation obligation, right of recovery receivable and payable (refer note 8.1) as detailed in profit or loss and the add back of the lease payment referred to in footnote 3 above. Corporate and reconciling items net other includes the share of results of equity-accounted investees after tax as detailed in profit or loss
5 Non-underlying items consists of gain on disposal of property, plant and equipment, impairments, gain on acquisition, occupational healthcare expense, restructuring costs and transaction costs as detailed in profit or loss
Notes to the consolidated financial statements continued
For the year ended 31 December 2021
3. Revenue
| | |
Significant accounting judgements and estimates Revenue from PGM mining activities The determination of PGM concentrate sales revenue from the time of initial recognition of the sale on a provisional basis through to final pricing requires management to continuously re-estimate the fair value of the price adjustment features. Management determines this with reference to estimated forward prices using consensus forecasts. Accounting policy Revenue from mining activities Revenue from gold sales is measured and recognised based on the consideration specified in a contract with a customer. The Group recognises revenue from gold sales when the customer obtains control of the gold. These criteria are typically met when the gold is credited to the customer’s bullion account by Rand Refinery Proprietary Limited (Rand Refinery). The transaction price is determined based on the agreed upon market price and number of ounces delivered. Revenue from PGM concentrate and metal sales is recognised when the buyer, pursuant to a sales contract, obtains control of the mined product which is typically upon delivery. The sales price is determined on a provisional basis at the date of delivery. Adjustments to the selling price occur based on changes in the metal content quantities and penalties, which represents variable transaction price components, as well as changes in the metal market price up to the date of final pricing. Final pricing is based on the monthly average market price in the month of settlement. For PGM metal sales, pricing is finalised within the month of sale. For PGM concentrate sales, the period between provisional invoicing and final pricing is typically between one and four months. Revenue on provisionally priced sales is initially recognised at the amount of consideration that the Group expects to be entitled to. The revenue adjustment mechanism relating to changes in metal market prices, embedded within provisionally priced PGM concentrate sale arrangements, has the characteristics of a commodity derivative. Accordingly, the fair value of the final sales price adjustment is re- estimated continuously and changes in fair value are recognised as an adjustment to revenue in profit or loss and trade receivables in the statement of financial position. In all cases, fair value is determined with reference to estimated forward prices using consensus forecasts. Revenue arising from these price adjustments is disclosed separately from revenue from contracts with customers. Revenue from PGM recycling consists of the sales of recycled palladium, platinum and rhodium derived from spent catalytic material and is recognised when control is transferred, which is when metal is transferred from the Group’s metal account to the 3rd party’s metal account. Revenue from PGM recycling also includes revenue from toll processing, which is recognised at the time the returnable metals are returned to the supplier at a third party refinery. Wheaton streaming revenue In 2018, Wheaton Precious Metals International Limited (Wheaton International) and the Group entered into a streaming transaction. 100% of refined mined gold and 4.5% of refined mined palladium from the Stillwater Mining Company (Stillwater) operations will be delivered to Wheaton International over the life-of-mine of the US PGM operations. Each ounce is identified as a separate performance obligation. In exchange for this, Wheaton International paid the Group R6,555 million (US$500 million) on 25 July 2018. In addition to the advance payment, Wheaton International currently pays the Group 18% cash based on the value of gold and palladium deliveries each month (refer to note 32 for additional detail on the monthly cash percentage). The contract will be settled by the Group delivering metal credits to Wheaton International representing underlying refined, mined gold and palladium. The transaction price, being the advance payment and the cash payment to be received, is recognised as revenue each month when the metal credit is allocated to the appropriate Wheaton International account. It is from this date that Wheaton International has effectively accepted the metal, has physical control of the metal and has the risk and reward of the metal (i.e. control has transferred). Revenue will be recognised over the life-of-mine of the US PGM operations in line with the timing of control transfer discussed above. To the extent that the life-of-mine changes or other key inputs are changed (refer note 32), these changes are recognised prospectively as a cumulative catch-up in revenue in the year that the change occurs. BTT streaming revenue Lonmin entered into a metal streaming transaction in 2016 to deliver between 23% - 38% of 6E PGM from its BTT project based on a weighted 6E PGM basket price. Lonmin received $50 million upfront, which was recognised as deferred revenue. Lonmin received between $106 and $280 per ounce of 6E PGM metals based on basket price of 6E PGM for each ounce delivered. The performance obligations under the contract were to be satisfied through delivery of the 6E PGM metals ounces. At the acquisition of Lonmin (2019), the Group accounted for the deferred revenue at fair value of R628 million under IFRS 3, including a significant financing component. |
Notes to the consolidated financial statements continued
For the year ended 31 December 2021
| | |
The transaction price under IFRS 15 Revenue from Contracts with Customers (IFRS 15), being the advance payment and further cash payments received, were recognised as revenue when the metal ounces were delivered and Lonmin no longer had physical control of the metal, which is also when the risk and rewards were transferred (i.e. control has transferred). Revenue was recognised over the life of the bulk tailing re-treatment project operations based on the ounces delivered. To the extent that the life of project changed or other key inputs changed (refer note 32), these changes were recognised prospectively as a cumulative catch-up in revenue in the year that the change occurred. The BTT project was early cash-settled by the Group during March 2020 (refer note 32). Other forward sale and prepayment transactions The Group also enters into other forward sale or prepayment transactions with counterparties in which a cash payment is received in advance for future delivery of gold and PGM ounces to the relevant counterparty. Each ounce is identified as a separate performance obligation. The transaction price under IFRS 15, being the advance payment and further cash payments received, is recognised as revenue when the metal ounces are delivered or credited to the customer’s account and Sibanye-Stillwater no longer has physical control of the metal, which is also when the risk and rewards are transferred (i.e. control has transferred). |
The Group’s sources of revenue are:
| | | | | | | | | | | | | | | | | | | | | | | | | | | | | | | | | | | | | | |
| Figures in million – SA rand | | | 2021 | | | | 2020 | | | | 2019 | |
| Gold mining activities | | | 28,358 | | | | | 27,869 | | | | | 18,644 | | |
PGM mining activities1 | | | 102,099 | | | | | 72,469 | | | | | 38,418 | | |
| Recycling activities | | | 40,710 | | | | | 25,296 | | | | | 14,521 | | |
Stream1 | | | 625 | | | | | 539 | | | | | 541 | | |
Toll treatment arrangement2 | | | 521 | | | | | — | | | | | — | | |
| Total revenue from contracts with customers | | | 172,313 | | | | | 126,173 | | | | | 72,124 | | |
Adjustments relating to sales of PGM concentrate3 | | | (119) | | | | | 1,219 | | | | | 801 | | |
| Total revenue | | | 172,194 | | | | | 127,392 | | | | | 72,925 | | |
1 The difference between revenue from PGM mining activities above and total revenue from PGM mining activities per the segment report relates to the separate disclosure of revenue from the gold and palladium streaming arrangement with Wheaton International (Wheaton Stream) in the above as well as the separate disclosure of revenue related to adjustments on the sales of PGM concentrate. Revenue relating to the Wheaton Stream is incorporated in the Group corporate segment as described in the segment report (refer note 2)
2 This relates to revenue recognised in respect of a toll treatment arrangement entered into by Marikana (refer note 32)
3 These adjustments relate to provisional pricing arrangements resulting in subsequent changes to the amount of revenue recognised
Revenue per geographical region of the relevant operations:
| | | | | | | | | | | | | | | | | | | | | | | | | | | | | | | | | | | | | | |
| Figures in million – SA rand | | | 2021 | | | | 2020 | | | | 2019 | |
| Southern Africa | | | 113,512 | | | | | 82,781 | | | | | 46,223 | | |
United States1 | | | 58,682 | | | | | 44,611 | | | | | 26,702 | | |
| Total revenue | | | 172,194 | | | | | 127,392 | | | | | 72,925 | | |
1 The difference between revenue generated by operations in the US and the revenue in the US PGM operations segment relates to the Wheaton Stream
Notes to the consolidated financial statements continued
For the year ended 31 December 2021
Percentage of revenue per segment based on the geographical location of customers purchasing from the Group
PGM
Notes to the consolidated financial statements continued
For the year ended 31 December 2021
Revenue generated per product:
| | | | | | | | | | | | | | |
| Figures in million – SA rand | | 2021 | 2020 | 2019 |
| Gold | | 29,533 | | 28,930 | | 18,882 | |
PGMs1 | | 137,958 | | 95,573 | | 51,505 | |
| Platinum | | 21,238 | | 17,054 | | 13,013 | |
| Palladium | | 52,859 | | 47,281 | | 28,031 | |
| Rhodium | | 59,828 | | 29,865 | | 9,338 | |
| Iridium | | 2,694 | | 815 | | 650 | |
| Ruthenium | | 1,339 | | 558 | | 473 | |
| Chrome | | 2,259 | | 1,573 | | 1,749 | |
Other2 | | 2,444 | | 1,316 | | 789 | |
| Total revenue | | 172,194 | | 127,392 | | 72,925 | |
1 In line with Sibanye-Stillwater’s mine-to-market PGM strategy and according to the processing agreements entered into, the processing arrangement for SRPM production changed from a purchase of concentrate arrangement to a Toll processing arrangement from 1 January 2019
2 Other primarily includes revenue from nickel, silver, cobalt and copper sales. For the year ended 31 December 2021, revenue from the Marikana toll treatment arrangement of R521 million is included (refer note 32)
Major customers
During 2021, total revenue from customers A, B and C, which is reported in the Group’s US PGM and SA PGM operating segments, amounted to approximately R52,128 million, R29,160 million and R28,056 million, respectively. During 2020, total revenue from customers A and B, which is reported in the Group’s US PGM and SA PGM operating segments, amounted to approximately R49,455 million and R15,234 million, respectively. During 2019, total revenue from a single customer which is reported in the Group’s US PGM and SA PGM operating segments, amounted to approximately R30,598 million.
Market risk
Foreign currency sensitivity
The US PGM operations’ revenue (and expenses) are translated from its functional currency (US dollars) to the Group’s presentation currency (SA rand) and, therefore, the Group’s “presentation currency” earnings are sensitive to changes in the exchange rate. A one percentage point change in the SA rand average exchange rate for the year ended 31 December 2021 of R14.79/US$ would have changed profit for the year by approximately R75 million.
Notes to the consolidated financial statements continued
For the year ended 31 December 2021
4. Cost of sales
| | |
Accounting policy Cost of sales include all costs generally associated with the production of inventory whereas other costs are disclosed separately or included in other costs. The carrying amount of metal inventory is recognised in cost of sales when the related sale is recognised. The cost of consumable stores is included in cost of sales when consumed. The accounting policy relating to inventory is included in note 23 and amortisation and depreciation in note 14 and note 15.
The following accounting policies relate to employee costs that are included in cost of sales: |
Short-term employee benefits Short-term employee benefits are expensed as the related service is provided. A liability is recognised for the amount expected to be paid if the Group has a present legal or constructive obligation to pay this amount as a result of past service provided by the employee and the obligation can be reliably estimated.
|
Pension and provident funds The Group operates a defined contribution retirement plan and contributes to a number of industry-based defined contribution retirement plans. The retirement plans are funded by payments from employees and Group companies. Contributions to defined contribution funds are expensed as incurred. |
| | | | | | | | | | | | | | |
| Figures in million – SA rand | Notes | 2021 | 2020 | 2019 |
| Salaries and wages | | (26,214) | | (23,850) | | (21,216) | |
| Consumable stores | 23 | (18,847) | | (16,404) | | (12,784) | |
| Utilities | | (8,099) | | (6,801) | | (6,089) | |
| Mine contracts | | (5,193) | | (3,790) | | (3,566) | |
Recycling1 | | (39,220) | | (24,418) | | (13,968) | |
| Other | | (8,975) | | (4,663) | | (1,879) | |
| Ore reserve development costs capitalised | | 5,535 | | 4,150 | | 3,402 | |
| Cost of sales, before amortisation and depreciation | | (101,013) | | (75,776) | | (56,100) | |
| Amortisation and depreciation | 14,15 | (8,293) | | (7,593) | | (7,214) | |
| Total cost of sales | | (109,306) | | (83,369) | | (63,314) | |
1 Recycling cost consists of cost relating to the purchasing of spent catalytic material and the cost incurred to convert the spent catalytic material into finished PGMs
The SA region employees are members of various defined contribution retirement plans. The cost of providing retirement benefits for the year amounted to R1,520 million (2020: R1,351 million and 2019: R1,234 million).
Notes to the consolidated financial statements continued
For the year ended 31 December 2021
5. Interest income and finance expense
| | |
Accounting policy Interest income comprises interest income on cash deposits, rehabilitation obligation funds and the right of recovery asset. Interest income is recognised using the effective interest method. Finance expense comprises interest on borrowings, lease liabilities, environmental rehabilitation obligation, occupational healthcare obligation, deferred payment, dissenting shareholder liability, deferred revenue, deferred consideration and the Marikana dividend obligation and is offset by borrowing costs capitalised on qualifying assets where applicable. Interest payable on borrowings is recognised in profit or loss over the term of the borrowings using the effective interest method. Cash flows from interest paid are classified under operating activities in the statement of cash flows. |
5.1 Interest income
| | | | | | | | | | | | | | |
| Figures in million – SA rand | Note | 2021 | 2020 | 2019 |
| Interest received on cash deposits | | 948 | | 714 | | 264 | |
| Interest received on rehabilitation obligation funds | 21 | 174 | | 245 | | 265 | |
| Interest on right of recovery asset | | 32 | | 16 | | 16 | |
| Other | | 48 | | 90 | | 15 | |
| Total interest income | | 1,202 | | 1,065 | | 560 | |
5.2 Finance expense
| | | | | | | | | | | | | | |
| Figures in million – SA rand | Notes | 2021 | 2020 | 2019 |
| Interest charge on: | | | | |
| Borrowings (interest) | | (801) | | (1,290) | | (1,445) | |
| Borrowings (accrued interest and unwinding of amortised cost) | 28 | (302) | | (394) | | (374) | |
| Lease liabilities | 29 | (29) | | (34) | | (34) | |
| Environmental rehabilitation obligation | 30 | (615) | | (684) | | (579) | |
| Occupational healthcare obligation | 31 | (77) | | (96) | | (116) | |
| Deferred Payment (related to the Rustenburg operation acquisition) | 22.2 | (158) | | (187) | | (179) | |
| Dissenting shareholders | | — | | — | | (21) | |
Deferred revenue1 | 32 | (309) | | (349) | | (352) | |
| Deferred consideration (related to Pandora acquisition) | 22.2 | (54) | | (49) | | (41) | |
| Marikana dividend obligation | 22.2 | (87) | | — | | — | |
| Other | | (64) | | (69) | | (162) | |
| Total finance expense | | (2,496) | | (3,152) | | (3,303) | |
1 For the year ended 31 December 2021, interest expense includes non-cash interest of R309 million (2020: R322 million, 2019: R311 million) relating to the Wheaton Stream. In addition, interest expense for the year ended 31 December 2020 includes non-cash interest of R13 million (2019: R41 million) relating to the BTT project. Although there is no cash financing cost related to this arrangement, IFRS 15 requires the Group to recognise a notional financing charge due to the significant time delay between receiving the upfront streaming payment and satisfying the related performance obligations. A discount rate of 4.6% and 5.2% was used for the Wheaton palladium and gold stream respectively and 11.5% was used for the BTT stream in determining the finance costs to be recognised as part of the streaming transactions entered into. For the year ended 31 December 2020, interest expense also includes R14 million non-cash interest relating to the platinum forward sale entered into by WPL on 3 March 2020
Notes to the consolidated financial statements continued
For the year ended 31 December 2021
6. Share-based payments
| | |
Significant accounting judgements and estimates For cash-settled share-based payment instruments issued to B-BBEE shareholders, the measurement of the share-based payment obligations depend on various key inputs. These include estimates of future cash flows, which depend on inputs such as production profiles, future metal prices, exchange rates, loan repayments as well as estimates of appropriate discount rates. Changes in key inputs may result in changes in the recognised share-based payment obligations and are therefore regarded as significant judgements and estimates. Accounting policy Equity-settled share-based payments The Group operates equity-settled compensation plans in which certain employees of the Group participate. The fair value of the equity-settled instruments is measured by reference to the fair value of the relevant equity instruments granted, taking into account the terms and conditions upon which those equity-settled instruments were granted. The fair value of equity-settled instruments granted is estimated using appropriate valuation models and appropriate assumptions at the grant date. Service and non-market performance conditions are not taken into account when estimating the fair value of the equity-settled instruments at grant date. Market conditions are taken into account in determining the fair value at grant date. The grant date fair value of the equity-settled instruments is recognised as share-based payment expenses over the vesting period based on the Group’s estimate of the number of instruments that will eventually vest, with a corresponding increase in the share-based payment reserve. Vesting assumptions for service and non-market performance conditions are reviewed at each reporting date to ensure they reflect current expectations. Cash-settled share-based payments The Group also operates cash-settled compensation plans in which certain employees of the Group participate. These awards entitle the participants to cash payments based on a relevant share price. The fair value of the cash-settled instruments is measured by reference to the fair value of the underlying shares using appropriate valuation models and assumptions, taking into account the terms and conditions upon which the instruments were granted. The grant date fair value of the cash-settled instruments is recognised as share-based payment expenses over the vesting period based on the Group’s estimate of the number of instruments that will eventually vest, with a corresponding increase in the share-based payment obligation. At each reporting date, the obligation is remeasured to the fair value of the instruments, to reflect the potential outflow of cash resources to settle the liability, with a corresponding adjustment to the share-based payment expense. Vesting assumptions for service and non-market performance conditions are reviewed at each reporting date to ensure they reflect current expectations. The Group also issued cash-settled instruments to B-BBEE shareholders in terms of the Rustenburg operation B-BBEE transaction (refer note 6.5) and the Marikana B-BBEE transaction (refer note 6.6). The fair value of these instruments are determined using appropriate valuation models and assumptions, taking into account the terms and conditions upon which the instruments were granted. At each reporting date, the obligation is remeasured to the fair value of the instruments, to reflect the potential outflow of cash resources to settle the liability. There are no vesting conditions and fair value changes are recognised as part of gains or losses on financial instruments in profit or loss. Modifications to share-based payment schemes Where the terms of an equity-settled or a cash-settled award are modified, the originally determined expense is recognised as if the terms had not been modified. In addition, an expense is recognised for any modification, which increases the total fair value of the share-based payment arrangement, or is otherwise beneficial to the participant as measured at the date of the modification. |
6.1 Equity-settled share-based payments - Sibanye-Stillwater
On 21 November 2012, the shareholders of Sibanye-Stillwater approved the adoption of the Sibanye Gold Limited (SGL) 2013 share plan (2013 Share Plan) with effect from the date of the listing of SGL. The 2013 Share Plan provided for 2 methods of participation, namely Bonus Shares and Performance Shares. This plan sought to attract, retain, motivate and reward participating employees on a basis which seeks to align the interest of such employees with those of the shareholders. On 23 May 2017, the shareholders of Sibanye-Stillwater approved the adoption of the Sibanye-Stillwater 2017 share plan (2017 Share Plan) on essentially similar terms to the previous 2013 Share Plan. At the annual general meeting on 30 May 2018, the directors of Sibanye-Stillwater were authorised to issue and allot all or any of such shares required for the 2017 Share Plan, up to a maximum not exceeding 86,748,850 shares. Under the 2017 Share Plan, an individual participant’s awards were limited to an aggregate 8,674,885 shares. From the implementation of a scheme of arrangement (refer note 26), any awards vesting under the equity-settled share plans are settled in the Company’s shares. The 2017 Share Plan was replaced by the 2020 cash-settled plan (2020 Share Plan) for all awards issued from March 2020 (refer note 6.3).
Notes to the consolidated financial statements continued
For the year ended 31 December 2021
Bonus Shares - as part of the short-term incentive
The Remuneration Committee makes an annual award of Bonus Shares to eligible participants as a share-based component of the short-term incentive scheme, with the last awards granted in 2019.
The total annual bonus was determined by reference to the actual performance ratings of individuals against predetermined targets for the preceding cycle and comprised of cash plus the face value of restricted Bonus Shares in the ratio of 60:40.
In other words, 40% of the annual bonus was awarded using the Company’s shares as the “currency”, as opposed to cash, access to which is deferred. As such, the Bonus Shares vest in 2 equal tranches, nine months and 18 months after the award date. Except for the right to dispose of the shares, participants have full shareholder rights in the unvested Bonus Shares during the restricted period, including the right to receive dividends.
The number of shares awarded is determined by dividing the face value of the Bonus Shares portion of the annual bonus by the volume-weighted average price (VWAP) of the Company’s shares over the three days immediately prior to the award date.
Performance Shares - for the long-term incentive
The Remuneration Committee made an annual award of Performance Shares to eligible participants as part of its long-term incentive scheme. The last of these awards were granted in 2019. The number of Performance Shares awarded to an employee was based on the employee’s annual guaranteed pay and job grade combined with a factor related to the employee’s assessed performance rating for the prior year and using the relevant share price calculation (as for the Bonus Shares) at the award date, with ultimate vesting of those awards subject to performance conditions as approved by the Remuneration Committee.
With effect from March 2016, in respect of the award of Performance Shares at that time and at any time thereafter (subject to any future agreed changes), an updated methodology was approved by the Remuneration Committee regarding the performance conditions applicable to the determination of the amount of Performance Shares that will vest at the end of the vesting period (which is three years from the date of the award).
Essentially, the number of shares that vest depends on the extent to which Sibanye-Stillwater has performed over the intervening three year period relative to 2 performance criteria, Total Shareholder Return (TSR) and Return on Capital Employed (ROCE). These are among the most widely acceptable vesting performance measures suited to aligning the outcome of long-term share incentive awards with shareholders’ interests.
In addition, at the sole discretion of the Remuneration Committee, up to 20% of the determined number of vesting shares using the two performance criteria is liable to forfeiture in the event of any extreme environmental, social, and governance (ESG) incidents occurring during the vesting period.
The number of the Performance Shares awarded that will finally vest three years after the award will range between 0% and 100% dependent on the extent to which the 2 performance criteria have been met and whether the Remuneration Committee has applied its further discretion to reduce the award on the basis mentioned above.
The details of these 2 performance conditions are provided below.
Total Shareholder Return (TSR) - 70% Weighting
TSR has been widely recognised as an appropriate indicator of shareholder value creation. It is used extensively internationally and increasingly in South Africa, sometimes as a single metric but most often as one of two or three weighted performance metrics. In some company share plans, an absolute target is set, but more often it is referenced in relation to the company’s share price relative to those of a group of peers or ‘comparator companies’.
In Sibanye-Stillwater’s case, the TSR element is measured against a benchmark of 8 peer group mining and resource companies that can be deemed to collectively represent an alternative investment portfolio for Sibanye-Stillwater’s shareholders (Peer Group). The Peer Group comprises similar market capitalisation companies that are reflective of the expected positioning of Sibanye-Stillwater over the medium term as a value driven multi-commodity resources company with a specific focus on gold and platinum.
Notes to the consolidated financial statements continued
For the year ended 31 December 2021
The Peer Group is set out in the table below.
| | | | | | | | | | | | | | |
| Peer group companies for TSR comparison | | | | |
| AngloGold Ashanti Limited | | | | |
| Anglo American Platinum Limited | | | | |
| Gold Fields Limited | | | | |
| Impala Platinum Holdings Limited | | | | |
| Northam Platinum Limited | | | | |
| Exxaro Resources Limited | | | | |
| Harmony Gold Mining Company Limited | | | | |
| African Rainbow Minerals Limited | | | | |
Sibanye-Stillwater’s TSR over the vesting period is compared with the Peer Group TSR curve constructed on a market capitalisation weighted basis. The annualised TSR over the vesting period (TSRANN) is determined for each of the companies in the Peer Group. The Peer Group companies are sorted from lowest to highest TSRANN. The average market capitalisation based on daily closing price is determined for each company, and each peer company is assigned its proportion of the overall average market capitalisation of the Peer Group. The peer company TSR curve is plotted at the midpoint of each company’s percentage of Peer Group market capitalisation on a cumulative basis above the worse performing companies in the Peer Group. In the event that one or more of the peer companies become ineligible for comparison, a peer company curve based on the companies remaining in the Peer Group is utilised.
The cumulative position of Sibanye-Stillwater’s TSRANN is then mapped onto the TSR curve for the Peer Group to determine the percentile at which Sibanye-Stillwater performed over the vesting period. The performance curve governing vesting is set out in the table below with linear interpolation applied between the indicated levels.
| | | | | |
TSR element of performance conditions
Percentile on peer group TSR curve | % vesting |
| 0% | 0 | % |
| 10% | 0 | % |
| 20% | 0 | % |
| 30% | 5 | % |
| 40% | 20 | % |
| 50% | 35 | % |
| 60% | 55 | % |
| 70% | 75 | % |
| 80% | 90 | % |
| 90% | 100 | % |
| 100% | 100 | % |
Return On Capital Employed (ROCE) - 30% Weighting
ROCE is a profitability metric that measures how efficiently a company generates profits from its capital employed. There is an increased focus on measuring the returns earned by businesses on the capital deployed by shareholders over and above the steady low risk returns typically available on financial markets.
For Sibanye-Stillwater, ROCE is evaluated against the company’s cost of equity (Ke). A minimum threshold on the performance scale for ROCE is set as equalling the cost of equity, Ke, which would lead to the ROCE element contributing 0% towards the performance condition. Delivering a return that exceeds Ke by 6% or more would be regarded as a superior return representing the maximum 100% on the performance scale and full vesting in respect of the ROCE element. The performance curve governing vesting is set out in the table below, with linear interpolation between the indicated levels.
| | | | | |
ROCE element of performance condition
Annual ROCE | % vesting |
| ≤Ke | 0 | % |
| Ke + 1% | 16.7 | % |
| Ke + 2% | 33.3 | % |
| Ke + 3% | 50.0 | % |
| Ke + 4% | 66.7 | % |
| Ke + 5% | 83.3 | % |
| Ke + 6% | 100.0 | % |
Notes to the consolidated financial statements continued
For the year ended 31 December 2021
The overall vesting is determined by applying the TSR performance condition to 70% of awarded shares element and the ROCE performance condition to 30% of awarded shares – plus any further discretionary reduction in the award based on the Remuneration Committee’s judgement regarding ESG issues mentioned above.
Valuation model and inputs
A Monte Carlo Simulation model was used to value equity-settled share-based payment awards. The inputs to the valuation model for share awards granted were as follows:
| | | | | | | | | | | | | | | | | | | | |
Performance
shares | | Bonus
shares |
| 2019 | 2020 | 2021 | MONTE CARLO SIMULATION | 2021 | 2020 | 2019 |
| 54.82 | n/a | n/a | Weighted average historical volatility (based on a statistical analysis of the share price on a weighted moving average basis for the expected term of the option) % | n/a | n/a | n/a |
| 3 | n/a | n/a | Expected term (years) | n/a | n/a | n/a |
| n/a | n/a | n/a | Expected term (months) | n/a | n/a | 9 - 18 |
| 1.22 | n/a | n/a | Expected dividend yield % | n/a | n/a | 0.00 | |
| 7.19 | n/a | n/a | Weighted average three-year risk-free interest rate (based on SA interest rates) % | n/a | n/a | 7.06 / 7.07 |
| 11.17 | | n/a | n/a | Weighted average fair value | n/a | n/a | 15.58 | |
Share awards granted, exercised and forfeited under the 2017 Share Plan
| | | | | | | | | | | | | | | | | | | | |
Performance
shares | | Bonus
shares |
| 2019 | 2020 | 2021 | Number of instruments | 2021 | 2020 | 2019 |
| 48,535,348 | | 68,236,442 | | 62,597,425 | | Outstanding at beginning of the year | — | | 2,582,489 | | 3,269,210 | |
| | | Movement during the year: | | | |
| 30,512,439 | | — | | — | | Granted during the year | — | | — | | 3,994,507 | |
| — | | (1,005,668) | | (32,299,213) | | Vested | — | | (2,541,680) | | (5,823,174) | |
| (10,811,345) | | (4,633,349) | | (5,098,696) | | Forfeited | — | | (40,809) | | 1,141,946 | |
| 68,236,442 | | 62,597,425 | | 25,199,516 | | Outstanding at end of the year | — | | — | | 2,582,489 | |
Share awards granted, exercised and forfeited under the 2013 Share Plan
| | | | | | | | | | | | | | | | | | | | |
Performance
shares | | Bonus
shares |
| 2019 | 2020 | 2021 | Number of instruments | 2021 | 2020 | 2019 |
| 15,215,982 | | 11,157,460 | | — | | Outstanding at beginning of the year | — | | — | | — | |
| | | Movement during the year: | | | |
| — | | — | | — | | Granted during the year | — | | — | | — | |
| (467,017) | | (5,055,647) | | — | | Vested | — | | — | | — | |
| (3,591,505) | | (6,101,813) | | — | | Forfeited | — | | — | | — | |
| 11,157,460 | | — | | — | | Outstanding at end of the year | — | | — | | — | |
Notes to the consolidated financial statements continued
For the year ended 31 December 2021
Directors' and prescribed officers' equity-settled instruments
The directors and prescribed officers of Sibanye-Stillwater held the following equity-settled instruments in the above 2017 Share Plan and 2013 Share Plan at 31 December 2021:
| | | | | | | | | | | | | | | | | | | | | | | |
| 2020¹ | Instruments granted | Equity-settled instruments vested during the year | Instruments forfeited | 2021 |
| Number of instruments | Number of instruments | Number of instruments | Average price | Share proceeds (rand)2 | Number of instruments | Number of instruments |
| Executive directors | | | | | | | |
Neal Froneman3 | 7,367,415 | | — | | 4,002,071 | | 66.04 | | 264,277,984 | | 438,753 | | 2,926,591 | |
| Charl Keyter | 3,537,172 | | — | | 2,037,730 | | 62.99 | | 128,348,469 | | 223,401 | | 1,276,041 | |
Prescribed officers4 | | | | | | | |
| Dawie Mostert | 1,806,597 | | — | | 989,754 | | 62.99 | | 62,340,634 | | 108,510 | | 708,333 | |
| Themba Nkosi | 1,545,938 | | — | | 795,975 | | 62.99 | | 50,135,281 | | 87,265 | | 662,698 | |
| Richard Stewart | 2,092,644 | | — | | 1,135,892 | | 62.99 | | 71,545,294 | | 124,531 | | 832,221 | |
| Robert van Niekerk | 2,977,711 | | — | | 1,633,445 | | 62.99 | | 102,884,170 | | 175,258 | | 1,169,008 | |
1 Prior to the implementation of a scheme of arrangement (refer note 26), the share awards were issued and settled by SGL. From 24 February 2020, all share awards are settled by the Company. No new equity-settled instruments were issued since 2019
2 Amounts represent earnings taxable in the hands of the participants. These were calculated by taking vesting date closing share prices of the Company multiplied by the number of vested units
3 Numbers include American Depositary Receipts (ADRs) and JSE listed shares and as a result of the dual service contract
4 In 2021, Sibanye-Stillwater introduced a new executive level of management (referred to as the C-suite). Therefore from 2021, only C-suite members are disclosed as prescribed officers of Sibanye-Stillwater. In 2020, the following individuals were also disclosed as prescribed officers:
•Chris Bateman - 827,604 number of instruments at 31 December 2020 (ceased performing an Executive Vice President (EVP) role on 6 September 2020)
•Shadwick Bessit - 1,319,721 number of instruments at 31 December 2020 (ceased performing an EVP role on 16 January 2021)
•Wayne Robinson - 1,848,201 number of instruments at 31 December 2020 (not a C-suite member)
6.2 Equity-settled share-based payments - DRDGOLD
On 2 December 2019, the shareholders of DRDGOLD approved a new equity-settled long-term incentive scheme (New DRDGOLD LTI Scheme) to replace the cash-settled long-term incentive scheme established in November 2015. Under the New DRDGOLD LTI Scheme, qualifying employees are awarded conditional shares on an annual basis, comprising performance shares (80% of the total conditional shares awarded) and retention shares (20% of the total conditional shares awarded). Conditional shares will vest 3 years after grant date and will be settled in the form of DRDGOLD shares at a zero-exercise price.
The first grant was made on 2 December 2019. 50% of the grant vested on 2 December 2021 and the remaining 50% will vest on the 3rd anniversary of the grant. The second and third grants under the New DRDGOLD LTI Scheme were made on 22 October 2020 and 20 October 2021 and will vest on their respective 3rd anniversaries, depending on performance conditions having been met.
The key conditions are as follows:
•Retention shares: 100% of the retention shares will vest if the employee remains in the employ of DRDGOLD at vesting date and individual performance criteria are met.
•Performance shares: Vesting is dependent on a total shareholder return measure referencing DRDGOLD’s weighted average cost of capital and considering a peer group of companies.
6.3 Cash-settled share-based payments - Sibanye-Stillwater
2020 Share Plan and 2021 Revised Share Plan
With effect from the March 2020 remuneration cycle, long-term incentive awards are made on a cash-settled basis rather than equity- settled. This includes awards of both Forfeitable Share Units (FSUs) and Conditional Share Units (CSUs) (previously referred to as Bonus Shares and Performance Shares awards under the equity-settled schemes).
Apart from the change in manner of settlement to cash, the terms and conditions of 2020 Share Plan are the same as the 2017 Share Plan. The FSUs have the same terms as the previous Bonus Shares and CSUs have the same terms as the previous Performance Shares. The value of the cash settlement is therefore the same as the value of the shares that would have vested according to the rules in previous arrangements. Existing unvested equity-settled awards under the 2017 Share Plan remain unchanged and will be settled in the Company’s shares to the extent that they vest.
Notes to the consolidated financial statements continued
For the year ended 31 December 2021
Revisions were introduced to cash-settled awards from the March 2021 remuneration cycle for new awards granted (2021 Revised Share Plan). The 2021 Revised Share Plan is similar to the 2020 Share Plan as it remains cash-settled, consists of FSU and CSU awards and contain the same service conditions as the 2020 Share Plan. However, key revisions include updated peer companies, changes in the assessment of the total shareholders’ return (TSR) performance condition, introduction of an Environmental, Social and Governance (ESG) performance condition and a change from return on capital employed (ROCE) to a return on invested capital (ROIC) performance condition. The weighting of the performance conditions for the TSR, ESG and ROIC measures are 50%, 20% and 30% respectively. The performance conditions also have super-stretch targets that could result in vesting of up to 250% of the relevant weighting if the target is achieved.
The key terms of each performance condition relating to the 2021 Revised Share Plan are as follows:
•TSR: The performance condition is similar to the 2020 Share Plan, except that it is measured on a weighted average basis following an index-like approach. Both platinum and gold companies are included in the peer group and performance is measured over the three year measurement period. In selecting the appropriate peer companies, factors such as market capitalisation, geographical exposure, listing on multiple exchanges as well as gold and platinum commodity exposure were taken into account.
•ROIC: Like ROCE, ROIC is a capital efficiency measure which calculates how efficiently the Group allocates its controllable capital to profitable investments. It provides an indication of the Group’s quality of earnings with reference to the risk categorisation of its underlying asset portfolio. ROIC will be calculated on an annualised basis over the three year vesting period as net operating profit after tax divided by invested capital, which is defined as total assets less current liabilities less cash.
•ESG: Performance will be assessed over the three year performance period using an ESG scorecard, applicable to each year of the performance period. The performance condition on vesting will be determined as the average performance over the three years.
•The peer companies under the 2021 Revised Share Plan that relate to the TSR performance condition are as follows:
| | |
| Peer group companies for TSR comparison |
| AngloGold Ashanti Limited |
| Anglo American Platinum Limited |
| Gold Fields Limited |
| Impala Platinum Holdings Limited |
| Northam Platinum Limited |
| Fresnilo Plc |
| Harmony Gold Mining Company Limited |
| Kinross Gold Corporation |
At each reporting date, on vesting date and on settlement date, the liability for the cash payment relating to the FSUs and CSUs awarded is measured/ remeasured at fair value. Similar to the equity-settled schemes, fair value is determined using a Monte Carlo Simulation model, with key inputs including the Company’s share price, risk free rate, dividend yield and volatility.
Awards granted, exercised and forfeited under the 2020 Share Plan
| | | | | | | | | | | | | | | | | | | | |
Conditional
Share Units | | Forfeitable
Share Units |
| 2019 | 2020 | 2021 | Number of units | 2021 | 2020 | 2019 |
| — | | — | | 15,319,984 | | Outstanding at beginning of the year | 950,220 | | — | | — | |
| | | Movement during the year: | | | |
| — | | 16,199,788 | | 10,814 | | Granted during the year | 125,693 | | 1,985,819 | | — | |
| — | | (10,891) | | (351,069) | | Vested | (997,390) | | (965,294) | | — | |
| — | | (868,913) | | (1,225,520) | | Forfeited | (24,655) | | (70,305) | | — | |
| — | | 15,319,984 | | 13,754,209 | | Outstanding at end of the year | 53,868 | | 950,220 | | — | |
Awards granted, exercised and forfeited under the 2021 Revised Share Plan
Notes to the consolidated financial statements continued
For the year ended 31 December 2021
| | | | | | | | | | | | | | | | | | | | |
Conditional
Share Units | | Forfeitable
Share Units |
| 2019 | 2020 | 2021 | Number of units | 2021 | 2020 | 2019 |
| — | — | — | Outstanding at beginning of the year | — | — | — |
| | | Movement during the year: | | | |
| — | — | 3,672,565 | Granted during the year | 1,510,599 | — | — |
| — | — | — | Vested | (722,474) | — | — |
| — | — | (227,078) | Forfeited | (91,811) | — | — |
| — | | — | | 3,445,487 | | Outstanding at end of the year | 696,314 | | — | | — | |
Valuation model and inputs
A Monte Carlo Simulation model was used to value cash-settled share-based payment awards. The inputs to the valuation model for share awards granted were as follows:
| | | | | | | | | | | | | | | | | | | | |
Conditional
Share Units | | Forfeitable
Share Units |
| 2019 | 2020 | 2021 | MONTE CARLO SIMULATION | 2021 | 2020 | 2019 |
| - | 70.10 | | 44.29 - 68.56 | Weighted average historical volatility (based on a statistical analysis of the share price on a weighted moving average basis for the expected term of the option) % | n/a | n/a | - |
| - | 3 | 1 - 3 | Expected term (years) | n/a | n/a | - |
| - | 36 | 14 - 36 | Expected term (months) | 9 - 18 | 9 - 18 | - |
| - | 7.82 | | 4.62 - 8.99 | Expected dividend yield (USA/SA) % | 27.67/6.39 | 12.92/6.66 | - |
| - | 3.62 | | 4.81 - 5.68 | Risk-free interest rate (USA/SA) % | 0.56/4.35 | 0.14/3.40 | - |
| - | R60.00 | | R49.10 | | Weighted average share price (ADR/JSE) | US$12.54/R49.10 | US$15.89/R60 | - |
| - | 40.38 | | 29.95 | | Weighted average fair value (SA rand) | 53.14 | | 67.72 | | - |
Directors' and prescribed officers’ cash-settled instruments
The directors and prescribed officers of Sibanye-Stillwater held the following cash-settled instruments in the above 2020 Share Plan and 2021 Revised Share Plan as at 31 December 2021:
| | | | | | | | | | | | | | | | | | | | | | | |
| 2020 | Instruments granted | Cash-settled instruments vested during the year | Instruments forfeited | 2021 |
| Number of instruments | Number of instruments | Number of instruments | Average price | Cash proceeds (rand)¹ | Number of instruments | Number of instruments |
| Executive directors | | | | | | | |
Neal Froneman2 | 1,633,633 | | 468,784 | | 162,869 | | 54.20 | | 8,827,342 | | — | | 1,939,548 | |
| Charl Keyter | 729,148 | | 233,594 | | 78,423 | | 53.91 | | 4,227,681 | | — | | 884,319 | |
Prescribed officers3 | | | | | | | |
| Dawie Mostert | 405,098 | | 118,646 | | 44,056 | | 53.91 | | 2,375,175 | | — | | 479,688 | |
| Themba Nkosi | 326,499 | | 94,611 | | 38,113 | | 53.90 | | 2,054,441 | | — | | 382,997 | |
| Richard Stewart | 407,957 | | 165,783 | | 44,285 | | 53.92 | | 2,387,830 | | — | | 529,455 | |
| Laurent Charbonnier | 138,895 | | 173,081 | | 75,421 | | 55.32 | | 4,171,990 | | — | | 236,555 | |
| Lerato Legong | 148,362 | | 72,267 | | 8,922 | | 50.11 | | 447,095 | | — | | 211,707 | |
| Robert van Niekerk | 655,174 | | 186,830 | | 69,455 | | 54.03 | | 3,752,841 | | — | | 772,549 | |
1 Amounts represents pre-tax earnings paid to participants. For South African participants, these amounts were calculated by taking the Company’s VWAP share price on vesting date multiplied by the number of vested units
2 Numbers include ADRs and JSE listed shares as a result of the dual service contract
3 In 2021, Sibanye-Stillwater introduced a new executive level of management (referred to as the C-suite). Therefore from 2021, only C-suite members are disclosed as prescribed officers of Sibanye-Stillwater. In 2020, the following individuals were also disclosed as prescribed officers:
•Chris Bateman - 34,920 number of instruments at 31 December 2020 (ceased performing an EVP role on 6 September 2020)
•Shadwick Bessit - 458,278 number of instruments at 31 December 2020 (ceased performing an EVP role on 16 January 2021)
•Hartley Dikgale - 1,646 number of instruments at 31 December 2020 (ceased performing an EVP role on 31 March 2020)
•Wayne Robinson - 390,937 number of instruments at 31 December 2020 (not a C-suite member)
Notes to the consolidated financial statements continued
For the year ended 31 December 2021
6.4 Cash-settled share-based payments - DRDGOLD
DRDGOLD’s outgoing cash-settled long-term incentive scheme (Cash-settled LTI Scheme) consisted of a grant made in November 2015 with a finite term of 5 years. No top-up awards were made as the awards vested. The awards were issued at an exercise price of nil and vested in three tranches of 20%, 30% and 50% on the 3rd, 4th and 5th anniversaries respectively, subject to individual service and performance conditions being met. The awards were settled at the 7 day volume weighted average price of the DRDGOLD share. The last tranche of the November 2015 grant vested during November 2020. The outgoing Cash-settled LTI Scheme was replaced by the New DRDGOLD LTI Scheme (refer 6.2 above).
6.5 Cash-settled share-based payments - Rustenburg B-BBEE transaction
In terms of the Rustenburg operation transaction, a 26% equity stake in SRPM was acquired by the B-BBEE SPV (the Rustenburg B-BBEE Transaction) by a vendor financed facility from Sibanye Platinum Proprietary Limited (Sibanye Platinum), on the following terms:
•Interest at up to 0.2% above Sibanye-Stillwater’s highest cost of debt. Once the capped amount is reached, interest ceases to accrue so that the capped amount is not exceeded. However, once the facility reduces below R3.5bn, interest starts to accrue again
•Post payment of the annual Deferred Payment to Rustenburg Platinum Mines Limited (RPM) and in respect of any repayment by SRPM of shareholder loans or the distribution of dividends, 74% will be paid to Sibanye Platinum and 26% to B-BBEE SPV
•Of the 26% payment to B-BBEE SPV, 85% will be used to service the facility owing by B-BBEE SPV to Sibanye Platinum
•The remaining 15% of any such payment or 100%, once the facility owing by B-BBEE SPV to Sibanye Platinum is repaid, will be declared by B-BBEE SPV as a dividend to the B-BBEE SPV shareholders
•The facility will be capped at R3,500 million
The IFRS 2 expense is based on 44.8% of the 26% interest relating to Bakgatla-Ba-Kgafela Investment Holdings and Siyanda Resources Proprietary Limited, as the Rustenburg Mine Community Trust and Rustenburg Mine Employees Trust are controlled and consolidated by Sibanye-Stillwater. The 44.8% interest was based on the expected discounted future cash flows of the expected PGM reserves and costs to extract the PGMs.
6.6 Cash-settled share-based payments - Marikana B-BBEE transaction
Effective 13 April 2021, the Group restructured the previously highly indebted Lonmin Limited (changed to Sibanye UK Limited on 25 March 2021) broad-based black economic empowerment (B-BBEE) structure in relation to WPL and EPL (collectively referred to as “Marikana”), so as to ensure the sustainability of the B-BBEE shareholding in Marikana and facilitate the realisation of value to the B-BBEE shareholders (Restructuring Transaction).
The Restructuring Transaction resulted in the cancellation of the previous preference share funding provided to a special purpose vehicle (Phembani SPV) held by the Phembani Group Proprietary Limited group (Phembani Group). As replacement, the Group subscribed for new preference shares at a nominal amount in Phembani SPV. These preference shares will earn dividends capped to R2.6 billion and will be funded through 90% of the dividends attributable to the Phembani Group as and when paid by Marikana. In addition, while the Sibanye UK Limited (Sibanye UK) loans to WPL are still outstanding, REO will subscribe for additional preference shares as an additional funding mechanism to ensure Phembani SPV receives a minimum level of cash flows (as determined in terms of a formula). In essence the subscription price of the preference shares will be in the form of a top up payment to a maximum of R22 million for any annual period where the dividend payable by Marikana to Phembani SPV is less than R22 million and will be added to the capped dividend amount of the preference shares. The preference shares will be redeemed at the earlier of 12.5 years from the issue date or when the capped dividend amount is reached.
The new arrangement provides the Marikana shareholders with access to distributable Marikana profits in the short and medium term through the introduction of a 10% trickle dividend while any Marikana shareholder loans or loans from Sibanye UK to WPL are outstanding. At the effective date of the transaction, the Sibanye UK loans to WPL amounted to R12,533 million (denominated in $722 million and R2,057 million). There were no Marikana shareholder loans outstanding at the effective date of the Restructuring Transaction. Once the loans from Sibanye UK have been settled and while there are no Marikana shareholder loans outstanding, the Marikana shareholders will have a right to participate fully in their attributable portion of Marikana’s dividends over the remaining life-of-mine. However, a 90% portion of the Phembani Group’s attributable dividends will continue to be applied against the preference dividends until the preference shares have been redeemed.
The obligations to pay dividends to entities controlled by the Group, being REO and the Marikana Trusts, eliminate on consolidation. At the effective date, the Restructuring Transaction resulted in the Group recognising the following liabilities:
•Cash-settled share-based payment obligation under IFRS 2 Share-based Payment (IFRS 2) amounting to R404 million (refer table below)
•Marikana dividend obligation under IFRS 9 Financial Instruments (IFRS 9) amounting to R1,146 million (refer note 22.2)
Notes to the consolidated financial statements continued
For the year ended 31 December 2021
The tables below set out the shareholding structure and, for illustrative purposes only, the flow of R100 million distributable profits from Marikana while any Marikana shareholder loans or Sibanye UK loans are still outstanding and after these loans have been settled:
Before shareholder loans and Sibanye UK loans repaid
After shareholder loans and Sibanye UK loans repaid
1 R90 million (or 90%) of the distributable profits of Marikana applied towards the repayment of the Sibanye UK loans (or Marikana shareholder loans if any)
2 Distribution of remaining R10 million (10%) of the distributable profits of Marikana based on the proportionate shareholding
3 Distribution of the Incwala Platinum Proprietary Limited (Incwala Platinum) dividend received from Marikana based on proportionate shareholding
4 Subsequent subscription for additional “E” Preference Shares (top up payment) by REO in Phembani SPV, calculated in terms of the formula specified in the “E” Preference Shares subscription agreement for as long as the Sibanye UK loans are outstanding [R22 million less (R0.9 million Phembani SPV dividend – R0.8 million “E” Preference Share dividend)]
5 These dividend obligations, calculated in terms of the estimated future cash flows of Marikana (applying the assumptions disclosed below), eliminate on consolidation against the receivables in these trusts that are consolidated by the Group
6 The Group recognises IFRS 9 dividend obligations, calculated in terms of the estimated future cash flows of Marikana, included in other payables (refer note 22.2)
7 The Group recognises an IFRS 2 cash-settled share-based payment obligation, calculated in terms of the estimated future cash flows of Marikana (applying the assumptions disclosed below) and reduced by the estimated future preference dividends, included in cash-settled share-based payment obligations (refer below)
8 Dividends payable, directly by Marikana or indirectly through Incwala Resources Proprietary Limited (Incwala Resources), eliminate against the REO receivable on consolidation. The top up funding liability is calculated and recognised based on the estimated future cash flows of Marikana (applying the assumptions disclosed below) for as long as the Sibanye UK loan is outstanding. Management expects that the Sibanye UK loan will be repaid in full by 31 December 2022 and up to settlement do not expect that a top up payment will be required. Therefore, no obligation to subscribe for additional preference shares was recognised
9 90% of the Marikana dividends indirectly received by Phembani SPV will be distributed to REO as an “E” Preference dividend until the earlier of 12.5 years from the issue date or when the capped dividend amount is reached. This receivable is recognised on a net basis against the Phembani SPV cash-settled share-based payment liability (refer footnote 7 above)
10 Distribution of the Marikana distributable profits based on proportionate shareholding
Notes to the consolidated financial statements continued
For the year ended 31 December 2021
Marikana’s obligation to pay dividends to the Phembani Group through the Incwala Platinum holding structure is recognised as a cash-settled share-based payment liability measured at fair value. Changes in fair value is recognised in profit or loss.
The following assumptions were applied in the 31 December 2021 calculation:
| | | | | | | | | | | | | | |
| | 2021 | 2020 | 2019 |
| Long-term PGM (4E) basket price | R/4Eoz | 23,957 | — | — |
| Real discount rate - South Africa | % | 13.2 | | — | — |
| Inflation rate - South Africa | % | 6.0 | | — | — |
| Life-of-mine | years | 18 - 50 | — | — |
The following table summarises the changes in the Marikana B-BBEE cash-settled share-based payment obligation:
| | | | | | | | | | | | | | |
| Figures in million – SA rand | | 2021 | 2020 | 2019 |
| Balance at the beginning of the year | | — | — | — |
Initial recognition of the Marikana B-BBEE cash-settled share-based payment obligation1 | | 404 | — | — |
| Changes in fair value | | 189 | — | — |
| Cash-settled share-based payments made | | (33) | — | — |
| Balance at end of the year | | 560 | — | — |
| Current portion of cash-settled share-based payment obligation | | (29) | — | — |
| Non-current portion of cash-settled share-based payment obligation | | 531 | — | — |
1 Included in gains/loss on financial instruments
6.7 Cash-settled share-based payments obligations
The following table shows a reconciliation of the total cash-settled share-based payment obligation of the Group for the year ended 31 December 2021:
| | | | | | | | | | | | | | |
| Figures in million – SA rand | Notes | 2021 | 2020 | 2019 |
| Reconciliation of the cash-settled share-based payment obligations | | | | |
| Balance at beginning of the year | | 1,628 | | 1,425 | | 226 | |
Cash-settled share-based payments expense1 | | 232 | | 353 | | 73 | |
| Fair value loss on recognition of Marikana B-BBEE cash-settled share-based payment obligation | 6.6, 7 | 404 | | — | | — | |
Fair value loss on obligations2 | 7 | 860 | | 129 | | 1,218 | |
Cash-settled share-based payments paid3 | | (240) | | (275) | | (91) | |
| Foreign currency translation | | 3 | | (4) | | (1) | |
| Balance at end of the year | | 2,887 | | 1,628 | | 1,425 | |
| Reconciliation of the cash-settled share-based payment obligations in the Group | | | | |
| Cash-settled share-based payment - Rustenburg B-BBEE transaction | | 2,067 | | 1,468 | | 1,367 | |
| Cash-settled share-based payment - Marikana B-BBEE transaction | | 560 | | — | | — | |
| Cash-settled share-based payment - Employee incentive schemes | | 260 | | 160 | | 58 | |
| Balance at end of the year | | 2,887 | | 1,628 | | 1,425 | |
| Current portion of cash-settled share-based payment obligations | | (58) | | (33) | | (82) | |
| Non-current portion of cash-settled share-based payment obligations | | 2,829 | | 1,595 | | 1,343 | |
1 Included in the amount is a cash-settled share-based payment expense for the year ended 31 December 2021 relating to the 2020 Share Plan and 2021 Revised Share Plan amounting to R232 million. For the year ended 31 December 2020, the expense includes cash-settled share-based payment expenses of Stillwater of R1 million (31 December 2019: R9 million) and DRDGOLD Limited of R128 million (31 December 2019: R64 million), with the remainder of FY2020 relating to the 2020 Share Plan
2 The fair value adjustment relates to the Rustenburg and Marikana B-BBEE Transaction and is included in the loss on financial instruments in profit or loss
3 Payments made during the year relate to vesting of cash-settled awards to employees, payments made on the Rustenburg and Marikana B-BBEE Transactions as well as the vesting of the last tranche of the November 2015 grant relating to DRDGOLD
Notes to the consolidated financial statements continued
For the year ended 31 December 2021
6.8 Share-based payment expenses
Share based payment expenses for the year consisted of the following:
| | | | | | | | | | | | | | |
| Figures in million – SA rand | Notes | 2021 | 2020 | 2019 |
| Sibanye-Stillwater 2020 Share Plan and 2021 Revised Share Plan (cash-settled scheme) | 6.3 | (232) | | (226) | | — | |
| Sibanye-Stillwater 2017 Share Plan (equity-settled scheme) | 6.1 | (132) | | (145) | | (194) | |
| Sibanye-Stillwater 2013 Share Plan (equity-settled scheme) | 6.1 | — | | — | | (96) | |
| Stillwater (cash-settled scheme) | | — | | — | | (9) | |
| DRDGOLD (equity-settled scheme) | 6.2 | (19) | | (13) | | — | |
| DRDGOLD (cash-settled scheme) | 6.4 | — | | (128) | | (64) | |
| Total share-based payment expense | | (383) | | (512) | | (363) | |
| Reconciliation of the cash-settled and equity-settled share-based payment expense: | | | | |
Cash-settled share-based payment expense1 | | (232) | | (354) | | (73) | |
| Equity-settled share-based payment expense | | (151) | | (158) | | (290) | |
| Total share-based payment expense | | (383) | | (512) | | (363) | |
1 Included in the cash-settled share-based payment expense for the year ended 31 December 2021 are grant date fair value losses of R267 million (2020: R120 million) and fair value gains after grant date of R35 million (2020: fair value losses after grant date of R232 million) relating to the 2020 Share Plan and 2021 Revised Share Plan
7. Loss on financial instruments
| | | | | | | | | | | | | | |
| Figures in million – SA rand | Notes | 2021 | 2020 | 2019 |
Fair value loss on gold hedge contracts1 | | — | | (458) | | (110) | |
Fair value gain on palladium hedge contract2 | | 234 | | 36 | | — | |
| Fair value loss on derivative financial instrument | 28.6 | — | | (70) | | (3,912) | |
| Fair value loss on cash-settled share-based payment obligations (Rustenburg and Marikana B-BBEE transactions) | 6.7 | (1,264) | | (129) | | (1,218) | |
| Loss on the revised cash flow of the Rustenburg Deferred Payment | 22.2 | (4,653) | | (2,081) | | (724) | |
| (Loss)/gain on the revised cash flow of the Burnstone Debt | 28.7 | (2) | | 264 | | (97) | |
| Loss on the revised cash flow of the Marikana dividend obligation | 22.2 | (468) | | — | | — | |
Other3 | | (126) | | (12) | | 46 | |
| Total loss on financial instruments | | (6,279) | | (2,450) | | (6,015) | |
1 On 9 March 2020, Sibanye-Stillwater concluded a gold hedge agreement which commenced on 1 April 2020, comprising the delivery of 1,800 kilograms of gold (150 kilograms per month) with a zero cost collar which establishes a minimum floor of R800,000 per kilogram and a maximum cap of R1,080,000 per kilogram. The gold hedge agreement concluded during March 2021. As hedge accounting is not applied, resulting gains or losses are accounted for as gains or losses on financial instruments in profit or loss
2 On 17 January 2020, Stillwater Mining Company (wholly-owned subsidiary of Sibanye-Stillwater) concluded a palladium hedge agreement which commenced on 28 February 2020, comprising the delivery of 240,000 ounces of palladium over two years (10,000 ounces per month) with a zero cost collar which establishes a minimum and a maximum cap of US$1,500 and US$3,400 per ounce, respectively. On 24 March 2021, Stillwater Mining Company concluded an additional palladium hedge agreement commencing on 28 February 2022, comprising the delivery of 140,000 ounces of palladium over a 14-month period (10,000 ounces per month) with a zero cost collar which establishes a minimum floor and a maximum cap of US$1,800 and US$3,300 per ounce, respectively. For the year ended 31 December 2021 the combined unrealised gain was R234 million (2020: R36 million). As hedge accounting is not applied, resulting gains or losses are accounted for as gains or losses on financial instruments in profit or loss
3 Included in the amount for the year ended 31 December 2021 is a gain on initial recognition of the investment in ioneer Limited of R51 million and a loss on initial recognition of the investment in New Century Resources Limited of R85 million (refer note 20)
Notes to the consolidated financial statements continued
For the year ended 31 December 2021
8. Other costs and other income
8.1 Other costs
| | | | | | | | | | | |
| Figures in million – SA rand | 2021 | 2020 | 2019 |
| Care and maintenance | (737) | | (814) | | (766) | |
| Change in estimate of environmental rehabilitation obligation, and right of recovery receivable and payable | — | | — | | (89) | |
| Loss due to dilution of interest in joint operation | (4) | | (30) | | — | |
| Non-recurring COVID-19 costs | (3) | | (97) | | — | |
| Corporate and social investment costs | (288) | | (258) | | (150) | |
| Cost incurred on employee and community trusts | (744) | | (508) | | (50) | |
| Exploration costs | (12) | | (33) | | (11) | |
| Non-mining royalties | (327) | | (193) | | (87) | |
| Strike related costs | — | | (1) | | (402) | |
| Service entity costs | (534) | | (501) | | (404) | |
| Other | (369) | | (292) | | (351) | |
| Total other costs | (3,018) | | (2,727) | | (2,310) | |
8.2 Other income
| | | | | | | | | | | |
| Figures in million – SA rand | 2021 | 2020 | 2019 |
| Income on settlement of legal dispute | — | | 580 | | — | |
| Change in estimate of environmental rehabilitation obligation, and right of recovery receivable and payable | 167 | | 464 | | — | |
| Service entity income | 398 | | 383 | | 264 | |
| Sundry income | 183 | | 231 | | 220 | |
| Profit on sale of St Helena | 16 | | — | | — | |
| Total other income | 764 | | 1,658 | | 484 | |
9. Restructuring costs
Restructuring costs of R107 million (2020: R436 million, 2019: R1,252 million) were incurred in 2021 and included voluntary separation packages. The restructuring costs mainly related to the SA gold operations and the SA PGM operations, which amounted to R69 million (2020: R108 million, 2019: R357 million) and R27 million (2020: R310 million, 2019: R867 million), respectively.
Notes to the consolidated financial statements continued
For the year ended 31 December 2021
10. (Impairments)/reversal of impairments
| | | | | | | | | | | | | | |
| Figures in million – SA rand | Note | 2021 | 2020 | 2019 |
| Impairment of mining assets | | (5,148) | | (1) | | (6) | |
| Impairment of goodwill | 17 | — | | — | | (54) | |
| Reversal of impairment/(impairment) of equity-accounted investee | | — | | 120 | | (12) | |
| Other reversal of impairment | | — | | 2 | | — | |
| Impairment of loan to equity-accounted investee | | — | | — | | (14) | |
| Total (impairments)/reversal of impairments | | (5,148) | | 121 | | (86) | |
31 December 2021
Impairment to the Driefontein, Kloof and Beatrix mining assets
At 31 December 2021, a number of factors were identified that negatively impact the ability of the Driefontein, Kloof and Beatrix operations to recover the carrying value of mining assets over their respective remaining life-of-mines. The impairment calculation detailed below is most sensitive to cost base changes, commodity prices, production levels, discount rates and rand/US dollar exchange rates.
Above inflationary increases are expected in major cost components, in particular electricity and labour cost increases which affect all three operations. Consensus commodity long-term prices indicate that forecast gold prices are lower than the spot price of US$1,829/oz at 31 December 2021. Lower commodity prices will have a significant adverse impact on the ability of these already marginal operations to generate positive cash flows when considering the continued increase in the cost base of the operations. In FY2020, there was an overall decrease in market interest rates, while these rates showed a marginal increase in H1 2021 and further increases in H2 2021. The continued increases in market interest rates negatively impacts the value in use calculation by increasing the cost of debt element of the discount rate applied. Furthermore, the long-term consensus forecast rand exchange rate against the US dollar shows a strengthening of the rand in FY2022 compared to prior year forecasts. Since the revenue of the operations is converted to rand, a stronger rand will have an adverse impact on the profitability of the operations.
The above considerations, coupled with ageing infrastructure and declining life-of-mines, impacted forecast cash flows and led to the recognition of impairment losses at 31 December 2021 on the Driefontein, Kloof and Beatrix reportable segments of R212 million, R3,642 million and R1,293 million, respectively. These operations are included under SA gold in the segment report (refer note 2) and each represent a separate cash-generating unit (CGU).
The CGUs were impaired to their respective recoverable amounts based on a value in use calculation in which future expected cash flows are discounted to a present value based on an appropriate discount rate.
The assumptions applied in the value in use impairment calculation as well as the recoverable amount for each of the CGUs are set out below:
| | | | | | | | | | | | | | |
| | Driefontein | Kloof | Beatrix |
Weighted average gold price1 | R/kg | 770,182 | 764,176 | 816,271 |
Exchange rate1 | | 15.0 | 15.0 | 15.0 |
Inflation rate2 | % | 6.0 | | 6.0 | | 6.0 | |
Nominal discount rate3 | % | 13.3 | | 13.5 | | 11.5 | |
Life-of-mine4 | years | 8 | 9 | 4 |
| Recoverable amount | R million | 3,905 | 2,815 | 210 |
1 The weighted average gold prices and the exchange rate were derived by considering various bank and commodity broker consensus forecasts
2 The inflation rate is based on historical mining inflation, projected electricity and labour cost increases and the forecast South African inflation rate
3 The nominal discount rate is calculated as the weighted average cost of capital of the respective CGUs
4 Periods longer than five years are considered appropriate based on the nature of the operations since a formally approved life-of-mine plan is used to determine cash flows over the life of each mine based on the available reserves
Notes to the consolidated financial statements continued
For the year ended 31 December 2021
31 December 2020
Reversal of impairment on investment in Rand Refinery Proprietary Limited (Rand Refinery)
Historically recognised impairment of the Group’s investment in the equity-accounted Rand Refinery amounting to R120 million was reversed at 31 December 2020 due to improvement in the investees financial position and forecasted return to stable dividend payments. The investment in Rand Refinery is accounted for in the SA gold corporate segment.
31 December 2019
Impairment of Qinisele Resources
The goodwill that arose on the acquisition of Qinisele Resources cannot be attributed to any current Sibanye-Stillwater operating CGUs (refer note 16.3). Qinisele Resources will perform an internal corporate function, mostly responsible for identifying, assessing and executing corporate actions. The business acquired will not generate external cash flows and has no future external mandates. Due to the factors mentioned, the recoverable amount of goodwill resulting from the application of IFRS 3 has been calculated at zero and fully impaired at year-end.
Notes to the consolidated financial statements continued
For the year ended 31 December 2021
11. Royalties, mining and income tax, and deferred tax
| | |
Significant accounting judgements and estimates The Group is subject to income tax in South Africa, Zimbabwe, the United Kingdom (UK) and the US. Significant judgement is required in determining the liability for income tax due to the complexity of legislation. There are many transactions and calculations for which the ultimate tax determination is uncertain during the ordinary course of business. The Group recognises liabilities for anticipated tax audit issues based on the best estimates of whether additional taxes will be due. The Group reassesses its judgements and estimates if facts and circumstances change. Where the facts and circumstances change or when the final tax outcome of these matters are different from the amounts that were initially recorded, such differences will impact the income tax and deferred tax provisions in the period in which such determination is made. The Group recognises the net future tax benefit related to deferred tax assets to the extent that it is probable that the deductible temporary differences will reverse in the foreseeable future. Assessing the recoverability of deferred tax assets requires the Group to make significant estimates related to expectations of future taxable income. Estimates of future taxable income are based on forecast cash flows from operations and the application of existing tax laws. To the extent that future cash flows and taxable income differ significantly from estimates, the ability of the Group to realise the net deferred tax assets recorded at the reporting date could be impacted. The Group’s gold mining operations are taxed on a variable rate that increases as the profitability of the operation increases. The deferred tax rate used to calculate deferred tax is based on the current estimate of future profitability when the temporary differences will reverse based on tax rates and laws that have been enacted or substantively enacted at the reporting date. Depending on the profitability of the operations, the deferred tax rate can consequently be significantly different from year to year. Calculating the future profitability of the operations is inherently uncertain and could materially change over time. Additionally, future changes in tax laws in South Africa, Zimbabwe, the UK and the US could limit the ability of the Group to obtain tax deductions in future periods. Accounting policy Income tax comprises current and deferred tax. Current tax and deferred tax is recognised in profit or loss except to the extent that it relates to a business combination, or items recognised directly in equity or in other comprehensive income. Current tax is measured on taxable income at the applicable statutory rate enacted or substantively enacted at the reporting date and is the best estimate of the tax amount expected to be paid or received that reflects uncertainty related to income taxes, if any. Deferred tax is provided on temporary differences existing at each reporting date between the tax values of assets and liabilities and their carrying amounts and reflects uncertainty related to income taxes, if any. Enacted and substantively enacted tax rates are used to determine future anticipated effective tax rates which in turn are used in the determination of deferred tax. These temporary differences are expected to result in taxable or deductible amounts in determining taxable profits for future periods when the carrying amount of the asset is recovered or the liability is settled. The principal temporary differences arise from depreciation of property, plant and equipment, provisions, unutilised capital allowances and tax losses carried forward. Deferred tax is not recognised for: •temporary differences on the initial recognition of assets or liabilities in a transaction that is not a business combination and that affects neither accounting nor taxable profit or loss •temporary differences related to investments in subsidiaries, and interests in associates and joint ventures to the extent that the Group is able to control the timing of the reversal of the temporary differences and it is probable that these will not reverse in the foreseeable future •taxable temporary differences arising on the initial recognition of goodwill Deferred tax assets and liabilities are offset if there is a legally enforceable right to offset current tax liabilities and assets, and relate to taxes levied by the same tax authority on the same taxable entity, or on different tax entities, but intend to settle current tax liabilities and assets on a net basis or their tax assets and liabilities will be realised simultaneously. Deferred tax assets relating to the carry forward of unutilised tax losses and/or unutilised capital allowances are recognised to the extent it is probable that future taxable profit will be available against which the unutilised tax losses and/or unutilised capital allowances can be recovered. Deferred tax assets are reviewed at each reporting date and are adjusted if recovery is no longer probable. Unrecognised deferred tax assets are reassessed at each reporting date and recognised to the extent that it has become probable that future taxable profits will be available against which they can be utilised. |
Notes to the consolidated financial statements continued
For the year ended 31 December 2021
11.1 Royalties
Revenue from mineral resources in South Africa are subject to the Mineral and Petroleum Resource Royalty Act 2008 (Royalty Act). The Royalty Act imposes a royalty on refined (mineral resources that have undergone a comprehensive level of beneficiation such as smelting and refining as defined in Schedule 1 of the Royalty Act) and unrefined (mineral resources that have undergone limited beneficiation as defined in Schedule 2 of the Royalty Act) minerals payable to the State. The royalty in respect of refined and unrefined minerals (which include gold refined to 99.5% and above, and PGMs) is calculated by dividing earnings before interest and taxes (EBIT) by the product of 12.5 times, in respect of refined, and 9 times, in respect of unrefined, gross revenue calculated as a percentage, plus an additional 0.5%. EBIT refers to taxable mining income (with certain exceptions such as no deduction for interest payable and foreign exchange losses) before assessed losses but after capital expenditure. A maximum royalty of 5% of mining revenue has been introduced on refined minerals and 7% on unrefined minerals. The effective rate of royalty tax payable for the year ended 31 December 2021 was approximately 0.6% (2020: 0.5% and 2019: 0.4%) of revenue at the SA gold operations and 3.0% (2020: 3.0% and 2019: 1.3%) of revenue at the SA PGM operations.
| | | | | | | | | | | |
| Figures in million – SA rand | 2021 | 2020 | 2019 |
| Current charge | (2,923) | | (1,768) | | (431) | |
| SA gold royalties | (167) | | (142) | | (74) | |
| SA PGM royalties | (2,756) | | (1,626) | | (357) | |
| Prior year royalty tax refund | 209 | | 3 | | — | |
| Total royalties | (2,714) | | (1,765) | | (431) | |
11.2 Mining and income tax
South African statutory tax rates
Gold mining, mining and non-mining tax
Gold mining tax is determined according to a formula which takes into account the profit and revenue attributable to gold mining operations. Mining taxable income (SA PGM and SA gold) is determined after the deduction of all mining capital expenditure, with the provision that this cannot result in an assessed loss. Capital expenditure amounts not deducted are carried forward as unredeemed capital expenditure to be deducted from future mining income. Accounting depreciation is ignored for the purpose of calculating mining tax. In the gold mining tax formula, the percentage rate of tax payable and the ratio of gold mining profit, after the deduction of redeemable capital expenditure, to gold mining revenue is expressed as a percentage.
Non-mining income consists primarily of interest income, third party gold processing and rental income and is taxed at the South African company tax rate of 28%.
Company tax rate
Companies, other than gold mining companies, are subject to the maximum South African company tax rate of 28%.
US statutory tax rates
The US PGM operations are subject to tax in the states of Montana, New Jersey and Pennsylvania. During the year ended 31 December 2018, the New Jersey Governor signed a number of bills that implement numerous tax changes which affected the US PGM operations. The most significant change in the law resulted in tax being calculated together on all US entities under common control (greater than 50% ownership). As a result of contract changes, US PGM operations experienced a shift of its state tax exposure out of New Jersey, effective 15 March 2019.
Uncertainty over Income Tax treatments
SRPM:
The previously reported uncertain tax treatment relating to SRPM on the deductibility of a portion of the purchase consideration for the acquisition of the SRPM assets was resolved during 2021. The outcome of the South African Revenue Services (SARS) audit was primarily in favour of SRPM and additional deductions were allowed.
Lonmin Management Services (LMS), South African branch of Sibanye UK:
During January 2021, SARS issued an assessment to the Group relating to a transfer pricing audit on LMS for the years of assessment 2011-2014. Applying the same principles as those applied by SARS, a further exposure could exist for subsequent years of assessment. Management is of the opinion that the basis on which the deductions under consideration were claimed was correct and is following due process on the matter. No material payment is anticipated.
Notes to the consolidated financial statements continued
For the year ended 31 December 2021
Mining and income tax
The components of mining and income tax are the following:
| | | | | | | | | | | | | | |
| Figures in million – SA rand | Note | 2021 | 2020 | 2019 |
| Current tax | | (13,506) | | (5,374) | | (1,849) | |
| Mining tax | | (11,816) | | (4,442) | | (1,364) | |
| Non-mining tax | | (220) | | 68 | | 3 | |
| Company and capital gains tax | | (1,470) | | (1,000) | | (488) | |
| Deferred tax | 11.3 | (255) | | 516 | | 3,582 | |
| Deferred tax charge | | (593) | | 570 | | 2,031 | |
| Prior year adjustment | | 252 | | — | | — | |
Deferred tax rate adjustment1 | | 86 | | (54) | | 1,551 | |
| Total mining and income tax | | (13,761) | | (4,858) | | 1,733 | |
1 The deferred tax rate adjustment in South Africa and the US was:
| | | | | | | | | | | |
| Figures in million – SA rand | 2021 | 2020 | 2019 |
| South Africa | 200 | | (54) | | (23) | |
| United States | (114) | | — | | 1,574 | |
| Deferred tax rate adjustment | 86 | | (54) | | 1,551 | |
The change in the estimated long-term deferred tax rate at which the temporary differences will reverse as a result of applying the mining tax formula at the SA gold operations, amounted to a deferred tax benefit of R200 million for the year ended 31 December 2021 (2020: charge of R54 million and 2019: charge of R23 million)
With contract changes during 2019, the US PGM operations experienced a shift of its state tax exposure out of New Jersey state resulting in a deferred tax rate adjustment of R1,574 million (benefit)
Reconciliation of the Group’s mining and income tax to the South African statutory company tax rate of 28%:
| | | | | | | | | | | |
| Figures in million – SA rand | 2021 | 2020 | 2019 |
| Tax on (profit)/loss before tax at maximum South African statutory company tax rate (28%) | (13,316) | | (9,934) | | 364 | |
| South African gold mining tax formula rate adjustment | 63 | | 118 | | (193) | |
| US statutory tax rate adjustment | 466 | | 550 | | 205 | |
| Non-deductible amortisation and depreciation | (13) | | (14) | | (15) | |
| Non-taxable dividend received | 7 | | 21 | | 2 | |
Non-deductible finance expense1 | (108) | | 89 | | (86) | |
| Non-deductible share-based payments | (42) | | (44) | | (81) | |
| Non-deductible loss on fair value of financial instruments | (1,021) | | (890) | | (571) | |
| Non-taxable gain on foreign exchange differences | 47 | | 3 | | — | |
| Non-taxable share of results of equity-accounted investees | 557 | | 476 | | 202 | |
| (Non-deductible impairments)/non-taxable reversal of impairments | (22) | | 33 | | (22) | |
| Non-taxable gain on acquisition | — | | — | | 309 | |
| Non-deductible transaction costs | (69) | | (50) | | (94) | |
| Tax adjustment in respect of prior periods | 386 | | 133 | | 12 | |
| Net other non-taxable income and non-deductible expenditure | 351 | | 258 | | 534 | |
| Change in estimated deferred tax rate | 86 | | (54) | | 1,551 | |
(Deferred tax assets derecognised)/unrecognised deferred tax assets utilised2 | (1,133) | | 4,447 | | (384) | |
| Mining and income tax | (13,761) | | (4,858) | | 1,733 | |
| Effective tax rate | 29 | % | 14 | % | 133 | % |
1 The non-deductible finance expense for the year ended 31 December 2020 is presented net after the reversal of an uncertain income tax treatment amounting to R182 million. This represents the conclusion on the section 163(j) interest limitation provided for by the US PGM operations under IFRIC 23 Uncertainty over Income Tax Treatments as at 31 December 2019
2 The amount for year ended 31 December 2021 include the derecognition of deferred tax assets of R837 million relating to deductible temporary differences, that can no longer be recognised due to the impairment of the mining assets in the SA gold operations
Notes to the consolidated financial statements continued
For the year ended 31 December 2021
11.3 Deferred tax
| | | | | | | | | | | | | | |
| Figures in million – SA rand | Note | 2021 | 2020 | 2019 |
| Included in the statement of financial position as follows: | | | | |
| Deferred tax assets | | (906) | | (1,576) | | (289) | |
| Deferred tax liabilities | | 7,818 | | 7,631 | | 6,657 | |
| Net deferred tax liabilities | | 6,912 | | 6,055 | | 6,368 | |
| Reconciliation of the deferred tax balance: | | | | |
| Balance at beginning of the year | | 6,055 | | 6,368 | | 10,076 | |
| Deferred tax recognised in profit or loss | 11.2 | 255 | | (516) | | (3,582) | |
| Deferred tax recognised in other comprehensive income | | 99 | | 6 | | — | |
| Foreign currency translation | | 503 | | 197 | | (126) | |
| Balance at end of the year | | 6,912 | | 6,055 | | 6,368 | |
The detailed components of the net deferred tax liabilities which result from the differences between the amounts of assets and liabilities recognised for financial reporting and tax purposes are:
| | | | | | | | | | | |
| Figures in million – SA rand | 2021 | 2020 | 2019 |
| Deferred tax liabilities | | | |
| Mining assets | 10,763 | | 11,910 | | 9,759 | |
| Environmental rehabilitation obligation funds | 587 | | 962 | | 682 | |
| Other | 300 | | 207 | | 209 | |
Gross deferred tax liabilities1 | 11,650 | | 13,079 | | 10,650 | |
| Deferred tax assets | | | |
| Environmental rehabilitation obligation | (1,229) | | (1,704) | | (1,109) | |
| Occupational healthcare obligation | — | | (275) | | (333) | |
| Other provisions | (922) | | (1,143) | | (483) | |
| Financial instruments | (19) | | (427) | | (1,351) | |
| Tax losses and unredeemed capital expenditure | (2,518) | | (3,437) | | (990) | |
| Share-based payment obligation | (50) | | (38) | | (16) | |
Gross deferred tax assets2,3 | (4,738) | | (7,024) | | (4,282) | |
| Net deferred tax liabilities | 6,912 | | 6,055 | | 6,368 | |
1 The aggregate amount of temporary differences associated with investments in subsidiaries, for which no deferred tax liabilities have been recognised under the IAS 12.39 exemption at 31 December 2021, amounts to R7,599 million (2020: R25,955 million and 2019: R12,075 million)
2 Historically, deferred tax assets in WPL and EPL were only recognised to the extent of deferred tax liabilities since it was not considered probable that taxable profit would be available against which the future tax deductions could be utilised. At 31 December 2020, management recognised deferred tax assets on WPL and EPL in excess of deferred tax liabilities for the first time since it became probable that sufficient future taxable profits will be available. In total, net deferred tax assets of R951 million was recognised at 31 December 2020. The deferred tax asset recognition is supported by the profit history of WPL and EPL and a positive future taxable profit outlook
3 The amount of deductible temporary differences, unused tax losses as well as unredeemed capital expenditure for which no deferred tax asset is recognised in the statement of financial position, amounted to R43,061 million (2020: R36,408 million and 2019: R46,220 million). Tax losses are available to be utilised against income generated by the relevant tax entity and do not expire unless the tax entity concerned ceases to operate for a period of longer than one year for the South African operations. Under South African mining tax ring-fencing legislation, each tax entity is treated separately and as such these deductions can only be utilised by the tax entities in which the deductions have been generated. In Canada, tax losses expire after 20 years
Notes to the consolidated financial statements continued
For the year ended 31 December 2021
11.4 Net tax, carbon tax and royalties (receivable)/payable
| | | | | | | | | | | | | | |
| Figures in million – SA rand | Notes | 2021 | 2020 | 2019 |
| Included in the statement of financial position as follows: | | | | |
| Tax receivable | | (1,245) | | (148) | | (355) | |
| Tax, carbon tax and royalties payable | | 199 | | 797 | | 509 | |
| Non-current portion of tax, carbon tax and royalties payable | | 10 | | 9 | | 59 | |
| Current portion of tax, carbon tax and royalties payable | | 189 | | 788 | | 450 | |
| Net tax, carbon tax and royalties (receivable)/payable | | (1,046) | | 649 | | 154 | |
| | | | |
| Reconciliation of the net tax, carbon tax and royalties payable/(receivable) balance: | | | | |
| Balance at beginning of the year | | 649 | | 154 | | (395) | |
| Royalties, carbon tax and current tax | 11.1, 11.2 | 16,224 | | 7,145 | | 2,293 | |
| Royalties and tax paid | | (17,894) | | (6,525) | | (1,819) | |
| Royalties paid | | (3,055) | | (1,707) | | (412) | |
| Tax paid | | (14,839) | | (4,818) | | (1,407) | |
| Tax payable on acquisition of subsidiaries | | — | | — | | 69 | |
| Other | | — | | — | | 19 | |
| Foreign currency translation | | (25) | | (125) | | (13) | |
| Balance at end of the year | | (1,046) | | 649 | | 154 | |
12. Earnings per share
| | |
Accounting policy Headline earnings is presented as an additional earnings number allowed by IAS 33 Earnings per Share (IAS 33) and is calculated based on the requirements set out in SAICA Circular 1/2021. Earnings, as determined in IAS 33, is the starting point and certain remeasurements net of related tax (current and deferred) and NCI are excluded. A remeasurement is an amount recognised in profit or loss relating to any change (whether realised or unrealised) in the carrying amount of an asset or liability that arose after the initial recognition of such asset or liability. |
12.1 Basic earnings per share
Basic earnings per share (EPS) is calculated by dividing the profit or loss attributable to owners of Sibanye-Stillwater by the weighted average number of ordinary shares in issue during the year.
| | | | | | | | | | | |
| 2021 | 2020 | 2019 |
| Weighted average number of shares | | | |
| Ordinary shares in issue (’000) | 2,808,406 | | 2,923,571 | | 2,670,030 | |
| Adjustment for weighting of ordinary shares in issue (’000) | 90,398 | | (194,680) | | (162,447) | |
| Weighted average number of shares (’000) | 2,898,804 | | 2,728,891 | | 2,507,583 | |
| Profit attributable to owners of Sibanye-Stillwater (SA rand million) | 33,054 | | 29,312 | | 62 | |
| Basic EPS (cents) | 1,140 | | 1,074 | | 2 | |
Notes to the consolidated financial statements continued
For the year ended 31 December 2021
12.2 Diluted earnings per share
Diluted EPS is calculated by dividing the profit attributable to owners of Sibanye-Stillwater by the diluted number of ordinary shares in issue during the year.
Dilutive shares are the number of potentially dilutive ordinary shares that could be issued as a result of share awards granted to employees under the equity-settled share-based payment schemes (refer note 6). The US$ Convertible Bond was converted during October 2020 and was antidilutive for the years ended 31 December 2020 and 2019.
| | | | | | | | | | | |
| 2021 | 2020 | 2019 |
| Diluted weighted average number of shares | | | |
| Weighted average number of shares (’000) | 2,898,804 | | 2,728,891 | | 2,507,583 | |
| Potential ordinary shares (’000) | 28,442 | | 49,061 | | 71,371 | |
| Diluted weighted average number of shares (’000) | 2,927,246 | | 2,777,952 | | 2,578,954 | |
| Diluted basic EPS (cents) | 1,129 | | 1,055 | | 2 | |
12.3 Headline earnings per share
Headline EPS is calculated by dividing the headline earnings attributable to owners of Sibanye-Stillwater by the weighted average number of ordinary shares in issue during the year.
Reconciliation of profit attributable to owners of Sibanye-Stillwater to headline earnings:
| | | | | | | | | | | |
| Figures in million – SA rand unless otherwise stated | Notes | Gross | Net of tax |
| 2021 | | | |
| Profit attributable to owners of Sibanye-Stillwater | | | 33,054 | |
| Gain on disposal of property, plant and equipment | | (36) | | (27) | |
| Impairments | 10 | 5,148 | | 3,861 | |
| Profit on sale of St Helena | | (16) | | (12) | |
| Derecognition of property, plant and equipment in Marathon project | 14 | 2 | | 2 | |
| Re-measurement items, attributable to NCI | | | — | |
| Headline earnings | | | 36,878 | |
| Weighted average number of shares (’000) | | | 2,898,804 | |
| Headline EPS (cents) | | | 1,272 | |
| 2020 | | | |
| Profit attributable to owners of Sibanye-Stillwater | | | 29,312 | |
| Gain on disposal of property, plant and equipment | | (99) | | (74) | |
| Reversal of impairment | 10 | (121) | | (121) | |
| Derecognition of property, plant and equipment in Marathon project | 14 | 37 | 28 | |
| Re-measurement items, attributable to NCI | | | 1 | |
| Headline earnings | | | 29,146 | |
| Weighted average number of shares (’000) | | | 2,728,891 | |
| Headline EPS (cents) | | | 1,068 | |
| 2019 | | | |
| Profit attributable to owners of Sibanye-Stillwater | | | 62 | |
| Gain on disposal of property, plant and equipment | | (77) | | (58) | |
| Impairments | 10 | 86 | | 67 | |
| Impairment of equity accounted associate | | 21 | | 21 | |
| Gain on acquisition | 16.1 | (1,103) | | (1,103) | |
| Re-measurement items, attributable to NCI | | | 3 | |
| Headline earnings | | | (1,008) | |
| Weighted average number of shares (’000) | | | 2,507,583 | |
| Headline EPS (cents) | | | (40) | |
Notes to the consolidated financial statements continued
For the year ended 31 December 2021
12.4 Diluted headline earnings per share
Diluted headline EPS is calculated by dividing the headline earnings attributable to owners of Sibanye-Stillwater by the diluted weighted average number of ordinary shares in issue during the year.
| | | | | | | | | | | |
| 2021 | 2020 | 2019 |
| Diluted headline earnings (R' million) | 36,878 | | 29,146 | | (1,008) | |
| Diluted weighted average number of shares (’000) | 2,927,246 | | 2,777,952 | | 2,578,954 | |
| Diluted headline EPS (cents) | 1,260 | | 1,049 | | (40) | |
13. Dividends
| | |
Accounting policy Dividends are recognised as a liability on the date on which such dividends are declared. Dividends withholding tax is a tax on shareholders receiving dividends and is applicable to all dividends paid which are subject to dividend withholding tax based on the relevant tax requirements. The Group withholds dividend tax on behalf of its shareholders at a rate of 20% on dividends paid. Amounts withheld are not recognised as part of the Group’s tax charge but rather as part of the dividend paid, recognised in equity. Cash flows from dividends paid are classified under operating activities in the statement of cash flows. |
The below table illustrates the dividends declared and paid:
| | | | | | | | | | | |
| Figures in million – SA rand unless stated otherwise | 2021 | 2020 | 2019 |
| Dividend declared and paid (interim) | 8,347 | | 1,338 | | — | |
| Dividend declared after 31 December (final) | 5,252 | | 9,485 | | — | |
| Total dividends declared for the year | 13,599 | | 10,823 | | — | |
| Dividend per share (interim) - cents | 292 | | 50 | | — | |
| Dividend per share (final) - cents | 187 | | 321 | | — | |
| Dividends declared and paid during the financial year | 17,832 | | 1,338 | | — | |
| Dividends declared and paid to NCI of subsidiaries during the financial year | 344 | | 360 | | 85 | |
| Total dividends declared and paid for the year | 18,176 | | 1,698 | | 85 | |
Dividend policy
Sibanye-Stillwater’s dividend policy is to return at least 25% to 35% of normalised earnings to shareholders and after due consideration of future requirements the dividend may be increased beyond these levels. The Board, therefore, considers normalised earnings in determining what value will be distributed to shareholders. The Board believes normalised earnings provides useful information to investors regarding the extent to which results of operations may affect shareholder returns.
Normalised earnings is defined as earnings attributable to the owners of Sibanye-Stillwater excluding gains and losses on financial instruments and foreign exchange differences, impairments, gain/loss on disposal of property, plant and equipment, occupational healthcare expense, restructuring costs, transactions costs, share-based payment on B-BBEE transactions, gain on acquisition, net other business development costs, share of results of equity-accounted investees, after tax and the impact of NCI, and changes in estimated deferred tax rate.
In line with Sibanye-Stillwater’s capital allocation framework, the Board of Directors resolved to pay a final dividend of 187 (2020: 321) SA cents per share. Together with the interim dividend of 292 (2020: 50) SA cents per share, which was declared and paid, this brings the total dividend for the year ended 31 December 2021 to 479 (2020: 371) cents per share and this amounts to a payout of 35% (2020: 35%) of normalised earnings.
Notes to the consolidated financial statements continued
For the year ended 31 December 2021
Reconciliation of profit attributable to the owners of Sibanye-Stillwater to normalised earnings
| | | | | | | | | | | |
| Figures in million – SA rand | 2021 | 2020 | 2019 |
| Profit attributable to the owners of Sibanye-Stillwater | 33,054 | | 29,312 | | 62 | |
| Adjusted for: | | | |
| Loss on financial instruments | 6,279 | | 2,450 | | 6,015 | |
| (Gain)/loss on foreign exchange differences | (1,149) | | 255 | | (325) | |
| Gain on disposal of property, plant and equipment | (36) | | (99) | | (77) | |
| Impairments/(reversal of impairments) | 5,148 | | (121) | | 86 | |
| Gain on acquisition | — | | — | | (1,103) | |
| Restructuring costs | 107 | | 436 | | 1,252 | |
| Transaction costs | 140 | | 139 | | 448 | |
| Occupational healthcare (gain)/expense | (14) | | 52 | | (40) | |
| Loss on BTT early settlement | — | | 186 | | — | |
| Income on settlement of legal dispute | — | | (580) | | — | |
| Loss due to dilution of interest in joint operation | 4 | | 30 | | — | |
| Early redemption premium on the 2025 Notes | 196 | | — | | — | |
| Loss on settlement of US$ Convertible Bond | — | | 1,507 | | — | |
| Change in estimated deferred tax rate | (86) | | 54 | | (1,551) | |
| Share of results of equity-accounted investees after tax | (1,989) | | (1,700) | | (721) | |
| Profit on sale of St Helena | (16) | | — | | — | |
| Tax effect of the items adjusted above | (2,755) | | (1,277) | | (1,644) | |
| NCI effect of the items listed above | — | | (37) | | (42) | |
Normalised earnings1 | 38,883 | | 30,607 | | 2,360 | |
1 Non-IFRS measure such as normalised earnings is the responsibility of the Group’s Board of Directors and presented for illustration purposes only, and because of its nature, normalised earnings should not be considered as a representation of financial performance under IFRS
Notes to the consolidated financial statements continued
For the year ended 31 December 2021
14. Property, plant and equipment
| | |
Significant accounting judgements and estimates Carrying value of property, plant and equipment All mining assets are amortised using the units-of-production method where the mine operating plan calls for production from proved and probable Mineral Reserves. Mobile and other equipment are depreciated over the shorter of the estimated useful life of the asset or the estimate of mine life based on proved and probable Mineral Reserves. The calculation of the units-of-production rate of amortisation could be impacted to the extent that actual production in the future is different from current forecast production based on proved and probable Mineral Reserves. This would generally result from the extent that there are significant changes in any of the factors or assumptions used in estimating Mineral Reserves. These factors could include: •changes in proved and probable Mineral Reserves •differences between actual commodity prices and commodity price assumptions •unforeseen operational issues at mine sites •changes in capital, operating, mining, processing and reclamation costs, discount rates and foreign exchange rates •changes in Mineral Reserves could similarly impact the useful lives of assets depreciated on a straight-line basis, where those lives are limited to the life of the mine The recoverable amounts of cash generating units (CGUs) and individual assets have been determined based on the higher of value in use calculations and fair value less cost to sell. These calculations require the use of estimates and assumptions. It is reasonably possible that the gold and PGM price assumptions may change which may then impact the Group estimated life-of-mine determinant and may then require a material adjustment to the carrying value of property, plant and equipment. The Group reviews and tests the carrying value of assets when events or changes in circumstances suggest that the carrying amount may not be recoverable by comparing expected future cash flows to these carrying values. Assets are grouped at the lowest level for which identifiable cash flows are largely independent of cash flows of other assets and liabilities. If there are indications that impairment may have occurred, estimates are prepared of expected future cash flows of each group of assets. Expected future cash flows used to determine the value in use and fair value less costs to sell of property, plant and equipment are inherently uncertain and could materially change over time. They are significantly affected by a number of factors including reserves and production estimates, together with economic factors such as spot and future gold and PGM prices, discount rates, foreign currency exchange rates, estimates of costs to produce reserves and future capital expenditure (refer note 10). Pre-production The Group assesses the stage of each mine construction project to determine when a mine moves into the production stage. The criteria used to assess the start date are determined based on the unique nature of each mine construction project. The Group considers various relevant criteria to assess when the mine is substantially complete, ready for its intended use and moves into the production stage. Some of the criteria would include, but are not limited to the following: •the level of capital expenditure compared to the construction cost estimates •ability to produce metal in saleable form (within specifications) •ability to sustain commercial levels of production of metal When a mine construction project moves into the production stage, the capitalisation of certain mine construction costs ceases and costs are expensed, except for capitalisable costs related to mining asset additions or improvements, underground mine development or ore reserve development. Mineral Reserves estimates Mineral Reserves are estimates of the amount of product that can be economically and legally extracted from the Group’s properties. In order to calculate the reserves, estimates and assumptions are required about a range of geological, technical and economic factors, including but not limited to quantities, grades, production techniques, recovery rates, production costs, transport costs, commodity demand, commodity prices and exchange rates. Estimating the quantity and grade of the Mineral Reserves requires the size, shape and depth of ore bodies to be determined by analysing geological data such as the logging and assaying of drill samples. This process may require complex and difficult geological judgements and calculations to interpret the data. The Group is required to determine and report, inter alia, on the Mineral Reserves in accordance with the South African Code for Reporting of Exploration Results, Mineral Resources and Mineral Reserves (SAMREC Code). |
Notes to the consolidated financial statements continued
For the year ended 31 December 2021
| | |
Estimates of Mineral Reserves may change from period to period due to the change in economic assumptions used to estimate Mineral Reserves and due to additional geological data becoming available during the course of operations. Changes in reported proven and probable reserves may affect the Group’s financial results and position in a number of ways, including the following: •asset carrying values may be affected due to changes in estimated cash flows •depreciation and amortisation charges to profit or loss may change where these are calculated on the units-of production method, or where the useful lives of assets change •decommissioning site restoration and environmental provisions may change where changes in ore reserves affect expectations about the timing or cost of these activities •the carrying value of deferred tax assets may change due to changes in estimates of the likely recovery of the tax benefits Accounting policy Mineral and surface rights Mineral and surface rights are recorded at cost less accumulated amortisation and accumulated impairment losses. When there is little likelihood of a mineral right being exploited, or the carrying amount has exceeded its recoverable amount, impairment is recognised in profit or loss in the year that such determination is made. Mine development and infrastructure Mining assets, including mine development and infrastructure costs and mine plant facilities, are recorded at cost less accumulated depreciation and accumulated impairment losses. Costs include the purchase price of assets used in the construction of the mine, expenditure incurred to evaluate and develop new ore bodies, as well as expenditure to define mineralisation in existing ore bodies and to establish or expand productive capacity. These costs are capitalised until commercial levels of production are achieved, at which times the costs are amortised as set out below. Development of ore bodies includes the development of shaft systems and waste rock removal that allows access to reserves that are economically recoverable in the future. Subsequent to this, costs are capitalised if the criteria for recognition as an asset are met. Access to individual ore bodies exploited by the Group is limited to the time span of the respective mining leases. Land Land is shown at cost and is not depreciated. Other assets Non-mining assets are recorded at cost less accumulated depreciation and accumulated impairment losses, except for land which is not depreciated. These assets include the assets of the mining operations that are not included in mine development and infrastructure. It also includes borrowing costs, mineral and surface rights, land and all the assets of the non-mining operations. Amortisation and depreciation of mining assets Amortisation and depreciation is determined to give a fair and systematic charge in profit or loss taking into account the nature of a particular ore body and the method of mining that ore body. To achieve this, the following calculation methods are used: •Mining assets, including mine development and infrastructure costs, mine plant facilities and evaluation costs, are amortised over the life of the mine using the units-of-production method, based on estimated proved and probable Mineral Reserves •Proved and probable Mineral Reserves reflect estimated quantities of economically recoverable reserves, which can be recovered in future from known mineral deposits •Certain mining plant and equipment included in mine development and infrastructure is depreciated on a straight-line basis over their estimated useful lives •For certain shafts, which have a short life and/or are marginal, the depreciation is accelerated based on an adjustment to the reserves for accounting purposes |
Notes to the consolidated financial statements continued
For the year ended 31 December 2021
| | |
Depreciation of non-mining assets Non-mining assets are recorded at cost and depreciated on a straight-line basis over their current expected useful lives to their residual values as follows: •Vehicles: 5 years •Computers: 3 years •Furniture and equipment: 1 - 10 years The assets’ useful lives, depreciation methods and residual values are reassessed at each reporting date and adjusted if appropriate. Impairment Recoverability of the carrying values of long-term assets or CGUs of the Group are reviewed whenever events or changes in circumstances indicate that such carrying value may not be recoverable. To determine whether a long-term asset or CGU may be impaired, the higher of value in use (defined as: the present value of future cash flows expected to be derived from an asset or CGU) or fair value less costs to sell (defined as: the price that would be received to sell an asset in an orderly transaction between market participants at the measured rate, less the costs of disposal) is compared to the carrying value of the CGU. A CGU is defined by the Group as the smallest identifiable group of assets that generates cash inflows that are largely independent of the cash inflows from other assets or groups of assets. Generally for the Group this represents an individual operating mine, including mines which are part of a larger mine complex. The costs attributable to individual shafts of a mine are impaired if the shaft is closed. Impairment losses are recognised in profit or loss. Impairment recognised in respect of a CGU is allocated first to goodwill to that particular CGU and thereafter to the individual assets in the CGU. When any infrastructure is closed down or placed on care and maintenance during the year, any carrying value attributable to that infrastructure is impaired. Expenditure incurred on care and maintenance is recognised in profit or loss. When the review of the events or changes in circumstances of an asset or CGU that was previously impaired indicate that such historical carrying value is recoverable, the impairment is reversed. The reversal is limited so that the carrying value of the asset does not exceed its recoverable amount, nor exceed what the historical carrying amount would have been should the asset not have been impaired. Reversal of impairment losses are recognised in profit or loss. Reversal of impairment recognised in respect of a CGU is allocated to the individual assets in the CGU. Derecognition of property, plant and equipment Property, plant and equipment is derecognised on disposal or closure of a shaft when no future economic benefits are expected from its use or disposal. Any gain or loss on derecognition of an item of property, plant and equipment (calculated as the net proceeds from disposal and the carrying amount of the item) is recognised in profit or loss. Exploration and evaluation expenditure All exploration and evaluation expenditure, prior to obtaining the legal rights to explore a specific area, is recognised in profit or loss. After the legal rights to explore are obtained, exploration and evaluation expenditure, comprising the costs of acquiring prospecting rights and directly attributable exploration expenditure, is capitalised as a separate class of property, plant and equipment or intangible assets, on a project-by-project basis, pending determination of the technical feasibility and commercial viability. The technical feasibility and commercial viability of extracting a mineral resource is generally considered to be determinable through a feasibility study and when proven reserves are determinable to exist. Upon determination of proven reserves, exploration and evaluation assets attributable to those reserves are first tested for impairment and then reclassified from exploration and evaluation assets to another appropriate class of property, plant and equipment. Subsequently, all cost directly incurred to prepare an identified mineral asset for production is capitalised to mine development assets. Amortisation of these assets commences once these assets are available for use, which is expected to be when the mine is in commercial production. These assets will be measured at cost less accumulated amortisation and impairment losses. |
Notes to the consolidated financial statements continued
For the year ended 31 December 2021
| | | | | | | | | | | | | | | | | |
Figures in million – SA rand | Notes | Total | Mine development, infrastructure and other | Land, mineral rights and rehabilitation | Exploration and evaluation assets |
| 2021 | | | | | |
| Cost | | | | | |
| Balance at beginning of the year | | 115,954 | | 90,093 | | 23,823 | | 2,038 | |
Additions1 | | 12,809 | | 12,794 | | (3) | | 18 | |
Change in estimates of rehabilitation assets2 | | (612) | | 29 | | (639) | | (2) | |
| Disposals | | (254) | | (231) | | (23) | | — | |
Derecognition of property, plant and equipment3 | | (2,065) | | (2,062) | | (3) | | — | |
| Transfers between classes of property, plant and equipment | | — | | 161 | | 105 | | (266) | |
| Assets derecognised on loss with dilution of interest in joint operation | | (2) | | — | | — | | (2) | |
| Assets dercognised on classification to other investments | | (22) | | — | | — | | (22) | |
| Foreign currency translation | | 4,138 | | 2,432 | | 1,695 | | 11 | |
| Balance at end of the year | | 129,946 | | 103,216 | | 24,955 | | 1,775 | |
| Accumulated depreciation, amortisation and impairment | | | | | |
| Balance at beginning of the year | | 55,354 | | 48,657 | | 4,998 | | 1,699 | |
| Amortisation and depreciation | 4 | 8,181 | | 7,467 | | 650 | | 64 | |
| Impairment | 10 | 5,120 | | 5,025 | | 94 | | 1 | |
| Disposals | | (210) | | (189) | | (21) | | — | |
| Derecognition of property, plant and equipment | | (2,056) | | (2,056) | | — | | — | |
| Depreciation capitalised to inventory | | 120 | | 120 | | — | | — | |
| Foreign currency translation | | 943 | | 694 | | 238 | | 11 | |
| Balance at end of the year | | 67,452 | | 59,718 | | 5,959 | | 1,775 | |
| Carrying value at end of the year | | 62,494 | | 43,498 | | 18,996 | | — | |
1 During the year, amortisation and depreciation on assets used in the development of the Blitz project was capitalised. As a result, additions include non-cash additions (or amortisation and depreciation capitalised) of R69 million
2 Includes a decrease to the environmental rehabilitation obligation of R638 million (refer note 30), decrease to the right of recoverability liability of R9 million and a decrease to the right of recoverability asset of R35 million
3 During the year, short-term ore reserve development, which was capitalised up to 31 December 2019 and fully depreciated by 2021, was derecognised as no future economic benefits are expected from its use
Notes to the consolidated financial statements continued
For the year ended 31 December 2021
| | | | | | | | | | | | | | | | | |
Figures in million – SA rand | Notes | Total | Mine development, infrastructure and other | Land, mineral rights and rehabilitation | Exploration and evaluation assets |
| 2020 | | | | | |
| Cost | | | | | |
| Balance at beginning of the year | | 107,285 | | 82,046 | | 23,210 | | 2,029 | |
Additions1 | | 9,712 | | 9,656 | | 14 | | 42 | |
Change in estimates of rehabilitation assets2 | | (384) | | (108) | | (270) | | (6) | |
| Disposals | | (63) | | (43) | | (20) | | — | |
Derecognition of property, plant and equipment3 | | (1,968) | | (1,905) | | (63) | | — | |
| Transfers between classes of property, plant and equipment | | — | | (29) | | 29 | | — | |
| Transfers to right-of-use assets | | (2) | | (2) | | — | | — | |
| Assets derecognised on loss with dilution of interest in joint operation | | (37) | | — | | (1) | | (36) | |
| Foreign currency translation | | 1,411 | | 478 | | 924 | | 9 | |
| Balance at end of the year | | 115,954 | | 90,093 | | 23,823 | | 2,038 | |
| Accumulated depreciation, amortisation and impairment | | | | | |
| Balance at beginning of the year | | 49,805 | | 43,877 | | 4,303 | | 1,625 | |
| Amortisation and depreciation | 4 | 7,468 | | 6,647 | | 753 | | 68 | |
| Impairment | 10 | 1 | | — | | — | | 1 | |
| Disposals | | (60) | | (41) | | (19) | | — | |
| Derecognition of property, plant and equipment | | (1,968) | | (1,905) | | (63) | | — | |
| Depreciation capitalised to inventory | | 117 | | 117 | | — | | — | |
| Foreign currency translation | | (9) | | (38) | | 24 | | 5 | |
| Balance at end of the year | | 55,354 | | 48,657 | | 4,998 | | 1,699 | |
| Carrying value at end of the year | | 60,600 | | 41,436 | | 18,825 | | 339 | |
1 During the year, amortisation and depreciation on assets used in the development of the Blitz project was capitalised. As a result, additions include non-cash additions (or amortisation and depreciation capitalised) of R96 million
2 Includes a decrease to the environmental rehabilitation obligation of R318 million (refer note 30), decrease to the right of recoverability liability of R40 million and an increase to the right of recoverability asset of R26 million
3 During the year, short-term ore reserve development, which was capitalised up to 31 December 2018 and fully depreciated by 2020, was derecognised as no future economic benefits are expected from its use
Notes to the consolidated financial statements continued
For the year ended 31 December 2021
| | | | | | | | | | | | | | | | | |
Figures in million – SA rand | Notes | Total | Mine development, infrastructure and other | Land, mineral rights and rehabilitation | Exploration and evaluation assets |
| 2019 | | | | | |
| Cost | | | | | |
| Balance at beginning of the year | | 99,995 | | 72,811 | | 25,096 | | 2,088 | |
Additions1 | | 7,803 | | 7,791 | | — | | 12 | |
Change in estimates of rehabilitation assets2 | | 101 | | (99) | | 200 | | — | |
| Disposals | | (282) | | (281) | | (1) | | — | |
Derecognition of property, plant and equipment3 | | (2,410) | | (695) | | (1,715) | | — | |
| Transfers between classes of property, plant and equipment | | — | | (95) | | 95 | | — | |
| Transfers to right-of-use assets | | (19) | | (19) | | — | | — | |
| Assets acquired on acquisition of subsidiaries | | 3,159 | | 3,152 | | 7 | | — | |
| Assets derecognised on loss of control of subsidiary | | (63) | | — | | — | | (63) | |
| Foreign currency translation | | (999) | | (519) | | (472) | | (8) | |
| Balance at end of the year | | 107,285 | | 82,046 | | 23,210 | | 2,029 | |
| Accumulated depreciation, amortisation and impairment | | | | | |
| Balance at beginning of the year | | 45,437 | | 38,576 | | 5,277 | | 1,584 | |
| Amortisation and depreciation | 4 | 7,102 | | 6,275 | | 788 | | 39 | |
| Impairment | 10 | 5 | | — | | — | | 5 | |
| Disposals | | (257) | | (257) | | — | | — | |
| Derecognition of property, plant and equipment | | (2,410) | | (695) | | (1,715) | | — | |
| Transfers to right-of-use assets | | (16) | | (16) | | — | | — | |
| Depreciation capitalised to inventory | | 111 | | 111 | | — | | — | |
| Foreign currency translation | | (167) | | (117) | | (47) | | (3) | |
| Balance at end of the year | | 49,805 | | 43,877 | | 4,303 | | 1,625 | |
| Carrying value at end of the year | | 57,480 | | 38,169 | | 18,907 | | 404 | |
1 During the year, amortisation and depreciation on assets used in the development of the Blitz project was capitalised. As a result, additions include non-cash additions (or amortisation and depreciation capitalised) of R86 million
2 Includes an increase to the environmental rehabilitation obligation of R105 million (refer note 30), decrease to the right of recoverability liability of R11 million and a decrease to the right of recoverability asset of R7 million
3 During the year, short-term ore reserve development, which was capitalised up to 31 December 2017 and fully depreciated by 2019, was derecognised as no future economic benefits are expected from its use
Notes to the consolidated financial statements continued
For the year ended 31 December 2021
15. Right-of-use assets
| | |
Accounting policy Right-of-use assets comprise mining equipment, vehicles and office rentals (included in the mine development, infrastructure and other asset class) of which none meet the definition of investment property. These right-of-use assets comprise the initial measurement of the corresponding lease liability, any initial direct costs incurred by the lessee, and an estimate of costs to be incurred by the lessee in dismantling and removing the underlying asset, restoring the site on which it is located or restoring the underlying asset. Right-of-use assets are subsequently measured at cost less accumulated depreciation and impairment losses if applicable. The assets are depreciated over the shorter period of the lease term and useful life of the underlying asset. If a lease transfers ownership of the underlying asset, or the cost of the right-of-use asset reflects that the Group expects to exercise a purchase option, the related right-of use asset is depreciated over the useful life of the underlying asset. The depreciation starts at the commencement date of the lease. |
Refer to the lease liabilities note (refer note 29) for additional detail.
| | | | | | | | | | | | | | |
| Figures in million – SA rand | Notes | 2021 | 2020 | 2019 |
| Balance at beginning of the year | | 296 | | 361 | | — | |
| Impact of adopting IFRS 16 on 1 January 2019 | | — | | — | | 302 | |
| Additions and modifications | | 65 | | 66 | | 44 | |
| Right-of-use assets acquired on acquisition of subsidiaries (Lonmin acquisition) | 16.1 | — | | — | | 133 | |
| Impairment of mining assets | 10 | (28) | | — | | — | |
| Depreciation | | (112) | | (124) | | (112) | |
| Transfers and other movements | | — | | (8) | | (6) | |
| Foreign currency translation | | 1 | | 1 | | — | |
| Balance at end of the year | | 222 | | 296 | | 361 | |
Notes to the consolidated financial statements continued
For the year ended 31 December 2021
16. Acquisitions
| | |
Significant accounting judgements and estimates Expected future cash flows used to determine the fair value of, inter alia, property, plant and equipment and contingent consideration are inherently uncertain and could materially change over time. The fair value is significantly affected by a number of factors including reserves and production estimates, together with economic factors such as the expected commodity price, foreign currency exchange rates, and estimates of production costs, future capital expenditure and discount rates. Accounting policy Business combinations The acquisition method of accounting is used to account for business combinations by the Group. The consideration transferred for the acquisition of a business is the fair value of the assets transferred, the liabilities incurred and the equity interests issued by the Group. The consideration transferred includes the fair value of any asset or liability resulting from a contingent consideration arrangement. Any contingent consideration is measured at fair value at the date of acquisition. Acquisition-related costs are expensed as incurred. Identifiable assets acquired and liabilities and contingent liabilities assumed in a business combination are measured initially at their fair values at the acquisition date. On an acquisition-by-acquisition basis, the Group recognises any NCI in the acquiree either at fair value or at the non- controlling interest’s proportionate share of the acquiree’s net assets. Subsequently, the carrying amount of NCI is the amount of the interest at initial recognition plus the NCI’s share of the subsequent changes in equity, plus or minus changes in the portion of interest of the equity of the subsidiary not attributable, directly or indirectly, to Sibanye-Stillwater shareholders. The excess of the consideration transferred, the amount of any NCI in the acquiree and the acquisition-date fair value of any previous equity interest in the acquiree over the fair value of the identifiable net assets acquired is recorded as goodwill. If this is less than the fair value of the net assets of the subsidiary acquired in the case of a bargain purchase, the difference is a gain recognised directly in profit or loss. Statement of cash flows The acquisition date fair value of deferred payments and contingent consideration relating to business combinations is part of the aggregate consideration for obtaining control of the underlying net assets. Therefore, unless the obligations are clearly part of the borrowing structure of the group, repayments of the acquisition date fair value are classified as investing activities. Additional deferred/ contingent payments in excess of the grant date fair value are considered to be operating activity cash flows by nature. |
016.1 Lonmin acquisition
On 14 December 2017, Sibanye-Stillwater announced that it had reached an agreement with Lonmin Plc (Lonmin) on the terms of a recommended all-share offer to acquire the entire issued and to be issued ordinary share capital of Lonmin (the Lonmin Acquisition). The Lonmin Acquisition was effected by means of a scheme of arrangement between Lonmin and the Lonmin shareholders under Part 26 of the UK Companies Act. Under the initial terms of the Lonmin Acquisition, each Lonmin shareholder was entitled to receive: 0.967 new Sibanye-Stillwater shares for each Lonmin share (Initial offer).
On 15 May 2018, Sibanye-Stillwater received South African Reserve Bank approval for the proposed acquisition of Lonmin and on 28 June 2018, the proposed Lonmin transaction was unconditionally cleared by the UK Competition and Markets Authority. On 21 November 2018, Sibanye-Stillwater announced that the Competition Tribunal had approved the proposed acquisition of Lonmin, subject to specific conditions. In addition to the conditions agreed between Sibanye-Stillwater and the Competition Commission, a further condition had been imposed by the Competition Tribunal, namely a moratorium on retrenchments at the Lonmin operations for a period of six months from the implementation date.
On 25 April 2019, the boards of Sibanye-Stillwater and Lonmin reached agreement on the terms of an increased recommended all-share offer pursuant to which Sibanye-Stillwater, and/or a wholly owned subsidiary of Sibanye-Stillwater, was to acquire the entire issued and to be issued ordinary share capital of Lonmin (the Increased Offer). Under the terms of the Increased Offer, Lonmin shareholders was entitled to receive one new Sibanye-Stillwater share for each Lonmin share.
The Lonmin Transaction (or scheme) was approved by the UK Court and on 7 June 2019 (effective date) and all the conditions precedent to the Lonmin Transaction were fulfilled. Sibanye-Stillwater obtained control of Lonmin on this date. The effective date of the implementation of the Lonmin Transaction was 10 June 2019, when Lonmin's listing on the Financial Conduct Authority's Official List and the trading of Lonmin shares on the London Stock Exchange's Main Market for listed securities was suspended, and 290,394,531 new Sibanye-Stillwater shares were listed on the Johannesburg Stock Exchange.
The year end of Lonmin has been changed to 31 December 2019 and Lonmin was consolidated from the effective date. For the seven months ended 31 December 2019, the Marikana operations contributed revenue of R11,188 million and a net profit of R1,881 million to the Group’s results.
Notes to the consolidated financial statements continued
For the year ended 31 December 2021
The purchase price allocation (PPA) on the effective date was prepared on a provisional basis in accordance with IFRS 3 Business Combinations. During the measurement period, management provisionally revised the initial PPA due to new information obtained in accordance with IFRS 3. Since provisionally revising the initial PPA and up to one year of the acquisition date, no further information was obtained that required adjustments to the amounts recognised.
Consideration
The fair value of the consideration is as follows:
| | | | | |
| Figures in million – SA rand | 2019 |
| Equity instruments (290,394,531 ordinary shares) | 4,307 | |
| Total consideration | 4,307 | |
Acquisition related costs
The Group incurred total acquisition related costs of R437 million (2020: R8 million, 2019: R284 million, 2018: R117 million, and prior to 2018: R28 million) on advisory and legal fees. These costs are recognised as transaction costs in profit or loss during the period in which incurred.
Identified assets acquired and liabilities assumed
The following table summarises the recognised amounts of assets acquired and liabilities assumed at the acquisition date:
| | | | | | | | |
| Figures in million – SA rand | Notes | 2019 |
| Property, plant and equipment | 14 | 3,159 | |
| Right-of-use assets | 15 | 133 | |
| Other investments | | 321 | |
| Environmental rehabilitation obligation funds | 21 | 443 | |
| Other non-current assets | | 395 | |
| Inventories | | 5,220 | |
| Trade and other receivables | | 925 | |
| Other current assets | | 15 | |
| Cash and cash equivalents | | 2,999 | |
| Lease liabilities | 29 | (133) | |
| Environmental rehabilitation obligation and other provisions | 30 | (1,697) | |
| Other non-current liabilities | | (863) | |
| Borrowings | 28 | (2,575) | |
| Trade and other payables | | (2,586) | |
| Other current liabilities | | (99) | |
Total fair value of identifiable net assets acquired1 | | 5,657 | |
1 Fair value of assets and liabilities excluding property, plant and equipment, inventories, borrowings, non-current liabilities and environmental rehabilitation obligation approximate the carrying value
The fair value of property, plant and equipment was based on the expected discounted cash flows of the expected ore reserves and costs to extract the ore discounted at a real discount rate of 13.5% for the Marikana operations, an average platinum price of US$1,025/oz and an average palladium price of US$1,170/oz
The fair value of inventories was based on the estimated selling price less costs to complete and costs to sell
The fair value of borrowings is based on the settlement price. The Group restructured the Lonmin group entities funding arrangements to optimise financing costs. The Lonmin Pangaea Investments Management Limited (PIM) prepayment arrangement of US$174.3 million was fully settled by cash on hand and available within the Lonmin group on 5 July 2019
The fair value of other non-current liabilities is calculated based on a discounted cash flows using an effective discount rate of 12.5%
The fair value of environmental rehabilitation obligation is calculated with updated life-of-mines used in the discounted cash flows of property, plant and equipment
Notes to the consolidated financial statements continued
For the year ended 31 December 2021
Gain on acquisition
A gain on acquisition has been recognised as follows:
| | | | | |
| Figures in million – SA rand | 2019 |
| Consideration | 4,307 | |
| Fair value of identifiable net assets acquired | (5,657) | |
Non-controlling interest, based on the proportionate interest in the recognised amounts of assets and liabilities1 | 247 | |
| Gain on acquisition | (1,103) | |
1 The amount recognised as NCI represents the NCI holders’ effective proportionate share in the fair value of the identifiable net assets acquired
The excess of the fair value of the net assets acquired over the consideration is recognised immediately in profit or loss as a gain on acquisition. The gain on acquisition is attributable to the transaction being attractively priced, and is consistent with the statement by the boards of Sibanye-Stillwater and Lonmin, that the purchase price reflected the recovery in PGM prices at the time of the increased offer, balanced against the fact that Lonmin, pre-acquisition, was financially constrained and unable to fund the significant investment required to sustain its business and associated employment.
16.2 SFA (Oxford) acquisition
On 21 February 2019, Sibanye-Stillwater announced it had agreed to acquire SFA (Oxford) Limited (SFA Oxford), an established analytical consulting company that is a globally recognised authority on PGMs and has for several years provided in-depth market intelligence on battery materials and precious metals for industrial, automotive, and smart city technologies.
The purchase consideration comprised an upfront payment of GBP4 million (R74.7 million) at the closing of the transaction and a deferred payment (contingent consideration), subject to a maximum payment of GBP6 million (refer note 22.2).
The acquisition was subject to the fulfilment of various conditions precedent which were completed on 4 March 2019. Sibanye-Stillwater obtained control (100%) on this date.
The PPA was prepared on a provisional basis in accordance with IFRS 3 at the effective date. No new information was obtained within one year of the acquisition date that required adjustments to the amounts recognised.
| | | | | |
| Figures in million – SA rand | 2019 |
| Consideration | 127 | |
| Fair value of identifiable net assets acquired | (4) | |
| Goodwill | 123 | |
The goodwill is attributable to the talent and skills of SFA (Oxford)’s workforce.
The goodwill has been allocated to the Stillwater, Rustenburg and Kroondal cash generating units (refer note 17). None of the goodwill recognised is expected to be deducted for tax purposes.
16.3 Qinisele Resources acquisition
On 29 October 2019, Sibanye-Stillwater entered in to a sale of shares agreement to buy the entire issued share capital of Qinisele Resources, a boutique advisory company that specialises in corporate finance, investor relations and research for a total of R55 million.
The acquisition was subject to the fulfilment of various conditions precedent which were completed on 31 October 2019 and Sibanye- Stillwater obtained control (100%) on 1 November 2019 (acquisition date).
The PPA was prepared on a provisional basis in accordance with IFRS 3 at the effective date. No new information was obtained within one year of the acquisition date that required adjustments to the amounts recognised.
| | | | | |
| Figures in million – SA rand | 2019 |
| Consideration | 55 | |
| Fair value of identifiable net assets acquired | (1) | |
| Goodwill | 54 | |
The goodwill is attributable to the experience and skills of Qinisele’s workforce (refer note 17).
Notes to the consolidated financial statements continued
For the year ended 31 December 2021
17. Goodwill
| | |
Significant accounting judgements and estimates Goodwill is tested for impairment on an annual basis and whenever impairment indicators are identified. Expected future cash flows used to determine the recoverable amount of property, plant and equipment and goodwill are inherently uncertain and could materially change over time. The recoverable amount is significantly affected by a number of factors including reserves and production estimates, together with economic factors such as the expected commodity price, foreign currency exchange rates, and estimates of production costs, future capital expenditure and discount rates. An individual operating mine does not have an indefinite life because of the finite life of its reserves. The allocation of goodwill to an individual mine will result in an eventual goodwill impairment due to the wasting nature of the mine. Accounting policy Goodwill is stated at cost less accumulated impairment losses. In accordance with the requirements of IAS 36 Impairment of Assets, the Group performs its annual impairment review of goodwill at each financial year end or whenever there are impairment indicators to establish whether there is any indication of impairment to goodwill. Goodwill is allocated to CGUs for the purpose of impairment testing. The allocation is made to those CGUs or groups of CGUs that are expected to benefit from the business combination in which the goodwill arose. An impairment is made if the carrying amount exceeds the recoverable amount. The recoverable amount is determined as the higher of “value in use” and “fair value less cost to sell”, based on the cash flows over the life of the CGUs and discounted to present value at an appropriate discount rate. Impairment losses on goodwill are not reversed. Gains and losses on the disposal of an entity include the carrying amount of goodwill allocated to the entity sold. |
0
| | | | | | | | | | | | | | |
| Figures in million – SA rand | Note | 2021 | 2020 | 2019 |
| Balance at beginning of the year | | 7,165 | | 6,855 | | 6,890 | |
| Impairment | 10 | — | | — | | (54) | |
| Goodwill on acquisition of subsidiaries | | — | | — | | 177 | |
| Foreign currency translation | | 562 | | 310 | | (158) | |
| Balance at end of the year | | 7,727 | | 7,165 | | 6,855 | |
The goodwill arose on the acquisition of Cooke, Aquarius, Stillwater, DRDGOLD, SFA (Oxford) and Qinisele Resources. The goodwill on acquisition of:
•SFA (Oxford), amounting to R123 million, is attributable to the talent and skills of SFA (Oxford)’s workforce. At year-end, the goodwill on acquisition of SFA (Oxford) is allocated to the Stillwater (R60 million), Rustenburg (R44 million) and Kroondal (R18 million) CGUs, where it is tested for impairment. No impairment has been recognised
•Qinisele Resources, amounting to R54 million, cannot be attributed to any current Sibanye-Stillwater operating cash generating units. Qinisele Resources will perform an internal corporate function, mostly responsible for identifying, assessing and executing corporate actions. The business acquired will not generate external cash flows and has no future external mandates. None of the goodwill recognised is expected to be deducted for tax purposes. Due to the factors mentioned, the recoverable amount of goodwill resulting from the application of IFRS 3 has been calculated at zero at acquisition in 2019 and fully impaired at year-end (refer note 10)
•Cooke, amounting to R737 million, was attributable to the synergies at the Group’s other operations, and the underlying assets of Cooke and the West Rand Tailings Retreatment Project (WRTRP). During the year ended 31 December 2016, the goodwill allocated to the Cooke CGU was impaired by R201 million. During the year ended 31 December 2017, the goodwill allocated to the WRTRP CGU was impaired by R99 million. During the year ended 31 December 2018, the goodwill allocated to the Driefontein, Kloof and Beatrix CGUs was impaired by R436 million
•Aquarius, amounting to R401 million, was attributable to the synergies between the PGM assets in the Rustenburg area. At year end, the goodwill on acquisition of Aquarius is allocated to the Kroondal (R134 million) and the Rustenburg operation (R267 million) CGUs, where it is tested for impairment. No impairment has been recognised
•Stillwater, amounting to R5,874 million (US$450 million), was attributable to the premium paid, and the talent and skills of Stillwater’s workforce, and is allocated to the Stillwater CGU, where it is tested for impairment. No impairment has been recognised
•DRDGOLD, amounting to R35 million, was attributable to DRDGOLD’s proven surface retreatment capabilities, and is allocated to the DRDGOLD CGU, where it is tested for impairment. No impairment has been recognised
The recoverable amount of goodwill was calculated based on the value in use of the CGUs to which to goodwill was allocated.
None of the goodwill recognised is expected to be deductible for tax purposes.
Notes to the consolidated financial statements continued
For the year ended 31 December 2021
The Group’s estimates and assumptions used in the 31 December 2021 impairment testing include:
| | | | | | | | | | | | | | | | | | | | | | | | | | |
| PGM operations | | | | Gold operations1 |
| 2019 | 2020 | 2021 | | | | 2021 | 2020 | 2019 |
| | | | Average gold price2 | R/kg | 773,398 | | 733,037 | | 686,225 | |
| 20,600 | | 23,278 | | 24,422 | | R/4Eoz | Average PGM (4E) basket price | | | | |
| 1,250 | | 1,202 | | 1,180 | | US$/2Eoz | Average PGM (2E) basket price | | | | |
| 13.6 | | 18.8 - 19.7 | 20.0 | | % | Nominal discount rate – South Africa3 | % | 11.5- 13.5 | 9.7 - 13.6 | 12.4 | |
| 7.6 | | 8.8 | | 8.3 | | % | Nominal discount rate – US | | | | |
| 5.0 | | 6.0 | | 6.0 | | % | Inflation rate – South Africa2 | % | 6.0 | | 6.0 | | 5.0 | |
| 2.0 | | 2.0 | | 2.0 | | % | Inflation rate – US | | | | |
| 13 - 35 | 12 - 39 | 17 - 50 | years | Life-of-mine2 | years | 4 - 9 | 3 - 13 | 6 - 14 |
1 Include the operating gold mines Driefontein, Kloof and Beatrix
2 The estimates and assumptions used in the impairment assessment of the Burnstone project include an average gold price of R729,270/kg (2020: R733,037/kg, 2019: R686,225/kg), inflation rate of 6% (2020: 6%, 2019: 5%) and life-of-mine of 24 years (2020: 21 years, 2019: 18 years)
3 Nominal discount rate for the Burnstone project is 15.3% (2020: 16.8%, 2019: 17.1%) and for the equity-accounted joint venture Mimosa, 24.4% (2020: 28.4%, 2019: 23.3%)
The cash flows are based on the annual life-of-mine plan that takes into account the following:
•Proved and probable ore reserves of the CGUs
•Cash flows are based on the life-of-mine plan
•Sustaining capital expenditure estimates over the life-of-mine plan
Results of impairment assessments for other gold operations, PGM operations and goodwill allocated to CGUs
No impairment was identified for the Group's PGM CGUs or any CGUs with allocated goodwill. Sufficient headroom exists for all CGUs with allocated goodwill. Except for the impaired SA gold operations (refer note 10), management believes that currently there are no reasonably possible changes in any of the above assumptions, which would lead to an impairment for any CGUs not impaired during the year.
Notes to the consolidated financial statements continued
For the year ended 31 December 2021
18. Equity-accounted investments
| | |
Significant accounting judgements and estimates Joint arrangements Judgement is required to determine when the Group has joint control, which requires an assessment of the relevant activities and when the decisions in relation to those activities require unanimous consent. The Group has determined that the relevant activities for its joint arrangements are those relating to the operating and capital decisions of the arrangement, such as the approval of the capital expenditure programme for each year, and appointing, remunerating and terminating the key management personnel or service providers of the joint arrangement. The considerations made in determining joint control are similar to those necessary to determine control over subsidiaries. Judgement is also required to classify a joint arrangement as either a joint operation or a joint venture. Classifying the arrangement requires the Group to assess their rights and obligations arising from the arrangement. Specifically, it considers: •The structure of the joint arrangement – whether it is structured through a separate vehicle •When the arrangement is structured through a separate vehicle, the Group also considers the rights and obligations arising from: –the legal form of the separate vehicle –the terms of the contractual arrangement This assessment often requires significant judgement, and a different conclusion on joint control and also whether the arrangement is a joint operation or a joint venture may materially impact the accounting. Carrying value of Mimosa and related Mineral Reserves and Mineral Resources estimates The Group reviews and tests the carrying value when events or changes in circumstances suggest that the carrying amount may not be recoverable by comparing expected future cash flows to the carrying value. Expected future cash flows used to determine the value in use and fair value less costs to sell of Mimosa are inherently uncertain and could materially change over time. These are significantly affected by a number of factors including reserves and production estimates, together with economic factors such as spot and future PGM prices, discount rates, foreign currency exchange rates, estimates of costs to produce reserves and future capital expenditure. Mineral resources outside the approved mine plans are valued based on the in situ 4E ounce value. Comparable market transactions are used as a source of evidence adjusting specifically for the nature of each underlying ore body. Mimosa functional currency The functional currency of Mimosa, which is domiciled in Zimbabwe, has been determined as US dollar. The local currency in Zimbabwe changed to RTGS dollar during February 2019. As a result of this change, management reassessed whether there is a change in the functional currency of Mimosa. This assessment depends on the primary economic environment in which the company operates, which is considered to be the environment in which it generates and expends cash. These considerations include the currency primarily influencing sales prices, the country whose competitive forces and regulations mainly determine sales prices and the currency that influences labour, material and other costs of production. Judgements and assumptions made in determining the functional currency may have a significant impact on the results presented for the Group. The determining factors in the above assessment were: •The currency that mainly influences sales prices: Sales are invoiced and settled in US dollar; •The currency of the country whose competitive forces and regulations mainly determine the sales prices: The competitive forces and regulations of the US primarily influences sales prices; and •The currency that mainly influences labour, material and other costs: The majority of operating costs are settled in US dollar. Accounting policy The Group’s interest in equity-accounted investees comprise interests in associates and joint ventures. Associates are those entities in which the Group has significant influence, but not control or joint control, over the financial and operating policies. Joint ventures are arrangements in which the Group has joint control, whereby the Group has rights to the net assets of the arrangement, rather than rights to its assets and obligations for its liabilities. Interests in associates and joint ventures are accounted for using the equity method. The interests are initially recognised at cost using the same principles as with business combinations. Subsequent to initial recognition, the consolidated financial statements include the Group’s share of profit or loss and other comprehensive income of equity-accounted investees until the date on which significant influence or joint control ceases. |
Notes to the consolidated financial statements continued
For the year ended 31 December 2021
| | |
Results of associates and joint ventures are equity-accounted using the results of their most recent audited annual financial statements or unaudited management accounts. Any losses from associates are brought to account in the consolidated financial statements until the interest in such associates is written down to zero. The interest includes any long-term interests that in substance form part of the entity’s net investment in the equity-accounted investee, for example long-term receivables for which settlement is neither planned nor likely to occur in the foreseeable future. Thereafter, losses are accounted for only insofar as the Group is committed to providing financial support to such associates. The carrying value of an equity-accounted investment represents the cost of the investment, including goodwill, the proportionate share of the post-acquisition retained earnings and losses, any other movements in reserves, any impairment losses and loans to or from the equity-accounted investee. The carrying value together with any long-term interests that in substance form part of the net investment in the equity-accounted investee is assessed annually for existence of indicators of impairment and if such exist, the carrying amount is compared to the recoverable amount, being the higher of value in use or fair value less costs to sell. If an impairment in value has occurred, it is recognised in the period in which the impairment arose. Indicators of impairment include a significant or prolonged decline in the investments fair value below its carrying value. |
The Group holds the following equity-accounted investments:
| | | | | | | | | | | | | | | | | | | | | | | |
| Figures in million – SA rand | Notes | 2021 | | 2020 | | 2019 | |
Rand Refinery1 | 18.1 | 649 | | | 691 | | | 397 | | |
Mimosa2 | 18.2 | 5,413 | | | 3,929 | | | 2,688 | | |
Peregrine2 | 18.3 | 1,086 | | | 1,001 | | | 954 | | |
Keliber Oy (Keliber)1 | 18.4 | 446 | | | — | | | — | | |
| Other equity-accounted investments | | — | | * | — | | * | — | | * |
| Total equity-accounted investments | | 7,594 | | | 5,621 | | | 4,039 | | |
1 Associate
2 Joint venture
* Less than R1 million
18.1 Rand Refinery
Sibanye-Stillwater has a 44.4% interest in Rand Refinery Proprietary Limited (Rand Refinery), a company incorporated in South Africa, which is involved in the refining of bullion and by-products sourced from, inter alia, South African and foreign gold producing mining companies. Rand Refinery is accounted for using the equity method.
On 18 December 2014, Rand Refinery drew down R1.029 billion under a R1.2 billion subordinated shareholders loan (the Facility), with Sibanye-Stillwater’s proportional share being R385 million. Amounts drawn down under the Facility were repayable within two years from the first draw down date. If the loan was not repaid within two years, it would automatically convert into equity in Rand Refinery. During February 2017, Rand Refinery resolved to convert the Facility to redeemable preference shares.
There were no fixed repayment terms for the preference shares. The preference shares had a preferential right to distributions. No ordinary dividends could be declared by Rand Refinery until the preference shares have been fully redeemed. The preference shareholders did not have voting rights at shareholders' meetings. The Group accounted for the preference shares as part of the investment in Rand Refinery. The preference shares were fully redeemed during 2020.
Historical impairment of R120 million on Rand Refinery was reversed at 31 December 2020 (refer note 10).
The equity-accounted investment in Rand Refinery movement for the year is as follows:
| | | | | | | | | | | | | | |
| Figures in million – SA rand | Note | 2021 | 2020 | 2019 |
| Balance at beginning of the year | | 691 | | 397 | | 239 | |
Share of results of equity-accounted investee after tax1 | | 287 | | 400 | | 345 | |
| Dividends received | | (329) | | (112) | | — | |
| Preference shares redeemed | | — | | (114) | | (187) | |
| Reversal of impairment | 10 | — | | 120 | | — | |
| Balance at end of the year | | 649 | | 691 | | 397 | |
1 Rand Refinery is equity accounted based on its latest management accounts for the period ended 30 November, since Rand Refinery has a 31 August year end
Notes to the consolidated financial statements continued
For the year ended 31 December 2021
The Group’s interest in the summarised financial statements of Rand Refinery are:
| | | | | | | | | | | | | | |
| Figures in million – SA rand | | 2021 | 2020 | 2019 |
| Revenue | | 1,276 | | 1,131 | | 811 | |
| Total comprehensive income | | 646 | | 903 | | 777 | |
| Non-current assets | | 524 | | 724 | | 667 | |
| Current assets | | 2,022 | | 2,079 | | 1,433 | |
| Non-current liabilities | | (87) | | (56) | | (111) | |
| Current liabilities | | (475) | | (462) | | (104) | |
| Net assets (100%) | | 1,984 | | 2,285 | | 1,885 | |
| Reconciliation of the total investment in Rand Refinery with attributable net assets: | | | | |
| Net assets (44.4%) | | 882 | | 1,016 | | 837 | |
| Preference shares redeemed | | — | | (114) | | (187) | |
Dividend received1 | | (156) | | (112) | | (8) | |
Fair value adjustment2 | | (36) | | (36) | | (36) | |
| Impairment | | — | | — | | (120) | |
Redeemable preference shares below 44.4% interest3 | | — | | — | | 15 | |
Reconciling items4 | | (41) | | (63) | | (104) | |
| Total investment in Rand Refinery | | 649 | | 691 | | 397 | |
1 The dividend received relates to the dividend received from Rand Refinery after 30 November 2021, total dividend received for 2021 of R329 million
2 The investment in equity-accounted investee was fair valued at 1 July 2002, the date when significant influence was obtained
3 Sibanye-Stillwater took up 37.4% of the Facility, which is less than its current proportional interest in Rand Refinery. Rand Refinery converted the Facility into redeemable preference shares, classified within equity, and therefore Sibanye-Stillwater shares in less than its current 44.4% proportional interest of the net asset value of Rand Refinery
4 Reconciling items relate to adjustments on consolidation of DRDGOLD’s interest in Rand Refinery
18.2 Mimosa
Sibanye-Stillwater has a 50% interest in Mimosa Investments Limited (Mimosa), which owns and operates the Mimosa mine, which is a Platinum mine situated in Zimbabwe and has a functional currency of US dollar.
The equity-accounted investment in Mimosa movement for the year is as follows:
| | | | | | | | | | | | | | |
| Figures in million – SA rand | | 2021 | 2020 | 2019 |
| Balance at the beginning of the year | | 3,929 | | 2,688 | | 2,492 | |
| Share of results of equity-accounted investee after tax | | 1,702 | | 1,300 | | 376 | |
| Dividends received | | (667) | | (103) | | (111) | |
| Foreign currency translation | | 449 | | 44 | | (69) | |
| Balance at end of the year | | 5,413 | | 3,929 | | 2,688 | |
Notes to the consolidated financial statements continued
For the year ended 31 December 2021
The Group’s interest in the summarised financial statements of Mimosa are:
| | | | | | | | | | | | | | |
| Figures in million – SA rand | | 2021 | 2020 | 2019 |
| Revenue | | 8,786 | | 7,789 | | 4,685 | |
| Amortisation and depreciation | | (549) | | (563) | | (437) | |
| Interest income | | 24 | | 8 | | 5 | |
| Finance expense | | (10) | | (28) | | (44) | |
| Income and royalty tax | | (1,503) | | (1,254) | | (436) | |
| Income tax | | (1,183) | | (984) | | (282) | |
| Royalty tax | | (320) | | (270) | | (154) | |
| Profit or loss | | 3,405 | | 2,599 | | 754 | |
| Other comprehensive income | | 896 | | 89 | | (141) | |
| Total comprehensive income | | 4,301 | | 2,688 | | 613 | |
| Non-current assets | | 6,095 | | 5,178 | | 4,724 | |
Property, plant and equipment1 | | 6,095 | | 5,178 | | 4,705 | |
| Right-of-use assets | | — | | — | | 19 | |
| Current assets | | 6,728 | | 4,635 | | 2,535 | |
| Cash and cash equivalents | | 1,131 | | 469 | | 28 | |
| Other current assets | | 5,597 | | 4,166 | | 2,507 | |
| Non-current liabilities | | (1,443) | | (1,304) | | (1,236) | |
Non-current financial liabilities2 | | — | | (12) | | (129) | |
| Other non-current liabilities | | (1,443) | | (1,292) | | (1,107) | |
| Current liabilities | | (456) | | (556) | | (554) | |
Current financial liabilities2 | | (334) | | (476) | | (447) | |
| Other current liabilities | | (122) | | (80) | | (107) | |
| Net assets (100%) | | 10,924 | | 7,953 | | 5,469 | |
| Reconciliation of the total investment in Mimosa with attributable net assets: | | | | |
| Net assets (50%) | | 5,462 | | 3,977 | | 2,735 | |
Reconciling items1 | | (49) | | (48) | | (47) | |
| Total investment in Mimosa | | 5,413 | | 3,929 | | 2,688 | |
1 The reconciling items include the difference between the carrying amount and fair value of the Mimosa’s identifiable assets and liabilities on acquisition less accumulated amortisation, and foreign exchange differences on translation of assets and liabilities of the foreign joint venture
2 Non-current and current financial liabilities (excluding trade and other payables and provisions) amounted to Nil (2020: R12 million, 2019: R129 million) and R9 million (2020: R53 million, 2019: R32 million), respectively
Repatriation of funds from Zimbabwe is subject to regulatory approval in Zimbabwe.
18.3 Peregrine
On 29 June 2018, Sibanye-Stillwater announced that it had entered into an agreement with Regulus Resources Inc. (Regulus) and a newly formed subsidiary of Regulus, Aldebaran Resources Inc. (Aldebaran), creating a strategic partnership in order to unlock value at its Altar copper-gold project in San Juan Province, Argentina (Altar Project), currently held in the US PGM operations. Under the terms of the agreement, Stillwater Canada LLC, an indirect, wholly-owned subsidiary of Sibanye-Stillwater (Stillwater Canada), entered into an option and joint venture agreement with Aldebaran, whereby Aldebaran has the option to earn into a maximum 80% interest in a wholly-owned subsidiary of Stillwater Canada, Peregrine Metals Limited (Peregrine) which owns the Altar Project (Arrangement Agreement).
The consideration for Aldebaran to acquire up to an 80% interest in the Altar Project, included:
•An upfront cash payment of US$15 million to Sibanye-Stillwater on closing of the Arrangement Agreement
•19.9% of the shares of Aldebaran
•A commitment from Aldebaran to carry the next US$30 million of spend at the Altar Project over a maximum of five years(inclusive of 2018 drilling that was conducted between February and May of 2018) as an initial earn-in of a 60% interest in the Altar Project (the Initial Earn-in)
Pursuant to the Arrangement Agreement, Aldebaran may also elect to earn-in an additional 20% interest in the Altar Project by spending an additional US$25 million over a three-year period following the Initial Earn-in.
Notes to the consolidated financial statements continued
For the year ended 31 December 2021
Peregrine was a subsidiary of Stillwater Canada. On 25 October 2018, Aldebaran issued an aggregate of 15,449,555 Aldebaran shares to Sibanye-Stillwater, representing 19.9% of the current 77,635,957 issued and outstanding Aldebaran shares, and made an upfront cash payment of US$15 million to Sibanye-Stillwater in accordance with the Arrangement Agreement. From this date, Stillwater Canada and Aldebaran act together to direct the relevant activities of and, therefore, collectively control Peregrine. As a result of the loss of control, Peregrine was derecognised as a subsidiary and accounted for as an equity-accounted investment. At 31 December 2021, the Group had a 100% legal interest in Peregrine, which is subject to an Initial Earn-in arrangement of 60% as described above (2020: 100%; 2019: 100%). At 31 December 2021, Aldebaran who is earning into the Altar Project, was not in breach of the earn-in requirements.
The equity-accounted investment in Peregrine movement for the year is as follows:
| | | | | | | | | | | |
| Figures in million – SA rand | 2021 | 2020 | 2019 |
| Balance at the beginning of the year | 1,001 | | 954 | | 978 | |
| Foreign currency translation | 85 | | 47 | | (24) | |
| Balance at end of the year | 1,086 | | 1,001 | | 954 | |
The Group’s interest in the summarised financial statements of Peregrine is:
| | | | | | | | | | | |
| Figures in million – SA rand | 2021 | 2020 | 2019 |
| Non-current assets | 2,788 | | 1,541 | | 1,472 | |
| Current assets | — | | 7 | | 3 | |
| Non-current liabilities | (409) | | (382) | | (369) | |
| Current liabilities | (15) | | (18) | | (1) | |
| Net assets (100%) | 2,364 | | 1,148 | | 1,105 | |
| Reconciliation of the total investment in Peregrine with attributable net assets: | | | |
Net assets (40%)1 | 946 | | 459 | | 442 | |
Reconciling items2 | 140 | | 542 | | 512 | |
| Total investment in Peregrine | 1,086 | | 1,001 | | 954 | |
1 Disclosed on the basis that Aldebaran will successfully complete their earn-in obligation in terms of the agreement as described above
2 The reconciling items include the difference between the carrying amount and fair value of the Peregrine’s identifiable assets and liabilities on acquisition less accumulated amortisation, and foreign exchange differences on translation of assets and liabilities of the foreign equity-accounted investment
18.4 Keliber
On 23 February 2021, Keliber and the Group entered into an investment agreement that enables Keliber to significantly advance its lithium project in Central Ostrobothnia, Finland. The Keliber project consists of several advanced stage lithium spodumene deposits, with significant exploration upside in close proximity to the existing project. Based on a feasibility study completed in 2019 and improved in 2020, Keliber currently has 12.3 million tonnes of ore reserves. The planned annual production is 15,000 tonnes of battery grade lithium hydroxide. The project includes the development of a chemical plant in Kokkola, approximately 50 kilometres from the mining area, which will produce battery grade lithium hydroxide.
Under the investment agreement, the Group will make an initial phased equity investment of €30 million for an approximate 30% equity shareholding into Keliber. In the first tranche the Group subscribed for shares in Keliber for €15 million and simultaneously, on the same terms as Sibanye-Stillwater’s €30 million phased investment, a further €10 million equity issuance was offered to the existing Keliber shareholders, which was fully subscribed. The investment agreement allows the Group to finance development work of a further €15 million in 2 tranches over a twelve-month period. The second tranche subscription payment was made on 16 September 2021 and the third tranche payment on 14 March 2022 (refer note 41.9). In addition to, and subject to the completion of the initial investment and funding, the Group has a guaranteed option to achieve the majority shareholding in Keliber, should it wish to do so, by contributing further equity financing for the development of the project.
The investment in Keliber resulting from the €15 million subscription in the first tranche and the €10 million in the second tranche was treated as an equity accounted associate from 17 March 2021, being the date on which the closing conditions on the first tranche subscription were met. The first and second tranche subscriptions resulted in an aggregate 26.6% shareholding as at 31 December 2021, which allows for representation on the board of Keliber as well as significant involvement in the technical committee of the company. The transaction was entered into at fair value, and the difference between the net asset value and the fair value paid by the Group was attributed to the mineral reserve.
Notes to the consolidated financial statements continued
For the year ended 31 December 2021
The equity-accounted investment in Keliber movement for the year is as follows:
| | | | | | | | | | | | | | |
| Figures in million – SA rand | | 2021 | 2020 | 2019 |
| Balance at the beginning of the year | | — | — | — |
| Acquisition of Keliber investment | | 446 | — | — |
| Balance at end of the year | | 446 | — | — |
The Group’s interest in the summarised financial statements of Keliber is:
| | | | | | | | | | | | | | |
| Figures in million – SA rand | | 2021 | 2020 | 2019 |
| Non-current assets | | 445 | — | — |
| Current assets | | 388 | — | — |
| Non-current liabilities | | (71) | — | — |
| Current liabilities | | (90) | — | — |
| Net assets (100%) | | 672 | — | — |
| Reconciliation of the total investment in Keliber with attributable net assets: | | | | |
| Net assets (26.6%) | | 179 | — | — |
Reconciling items1 | | 267 | — | — |
| Total investment in Keliber | | 446 | — | — |
1 The reconciling items are due to the difference between the net asset value and the fair value paid by the Group which was attributed to the mineral reserve as well as foreign exchange differences on translation of assets and liabilities of the foreign equity-accounted investment
19. Interests in joint operations
| | |
Accounting policy A joint operation is a joint arrangement in which the parties that share joint control have rights to the assets, and obligations for the liabilities, relating to the arrangement. In relation to the Group’s interests in joint operations, the following are recognised in the financial statements: •the Group’s share of the jointly controlled assets, classified according to the nature of the assets •any liabilities that the Group has incurred •the Group’s share of any liabilities incurred jointly with the other ventures in relation to the joint operation •any income from the sale or use of the Group’s share of the output of the joint operation, together with the Group’s share of any expenses incurred by the joint operation •any expenses that the Group has incurred in respect of its interest in the joint operation |
The Group’s interests in joint operations includes a 50% interest in 2 joint operations each referred to as the “Notarial Pooling and Sharing Agreements”. The principal activities of the joint operations are to extend the Kroondal mine over the boundary of the properties covering the Kroondal mine and expand the Marikana mine operations through mineral rights contributed by Anglo American Platinum Limited through its subsidiary, RPM (refer note 41.4).
The Group’s share of the assets, liabilities, revenue and expenses of the joint operations which are included in the consolidated financial statements is as follows:
Kroondal Mine
| | | | | | | | | | | |
| Figures in million – SA rand | 2021 | 2020 | 2019 |
| Gain/(loss) on foreign exchange differences | 127 | | (16) | | (63) | |
| Profit before tax | 6,557 | | 4,814 | | 2,062 | |
| Profit for the year | 6,556 | | 4,814 | | 2,061 | |
| Non-current assets | 636 | | 800 | | 946 | |
| Current assets | 3,357 | | 3,894 | | 2,303 | |
| Non-current liabilities | (13) | | (7) | | — | |
| Current liabilities | (493) | | (436) | | (353) | |
| Net assets (50%) | 3,487 | | 4,251 | | 2,896 | |
Notes to the consolidated financial statements continued
For the year ended 31 December 2021
20. Other investments
| | |
Accounting policy On initial recognition of an equity investment that is not held for trading, the Group may make an irrevocable election to present subsequent changes in the investment’s fair value in other comprehensive income. This election is made on an investment-by-investment basis. These investments are subsequently measured at fair value, with dividends recognised in profit or loss unless the dividend clearly represents a recovery of part of the cost of the investment. Other net gains and losses are recognised in OCI (in the mark-to-market reserve) and are never reclassified to profit or loss. Judgement on other investments Where the Group holds a close to 20% interest in a company, the assessment of whether there is significant influence and hence an equity-accounted investment may involve judgement. These judgements typically include the extent of representation on the board of directors, other involvement in the company such as technical committee, any other contractual arrangements as well as the effective influence that the particular shareholding interest provides. A different conclusion could have a significant impact in the measurement, presentation and disclosure of the particular investment. |
The Group holds the following investments measured at fair value through OCI:
| | | | | | | | | | | |
| Figures in million – SA rand | 2021 | 2020 | 2019 |
| Rand Mutual Assurance Company Limited | 140 | | 158 | | 112 | |
| Furuya Metals Company Limited | 668 | | 343 | | 303 | |
| Aldebaran Resources Inc. | 241 | | 98 | | 78 | |
| Generation Mining Limited | 144 | | 101 | | 33 | |
Ioneer Limited1 | 1,353 | | — | | — | |
New Century Resources Limited2 | 698 | | — | | — | |
| Other | 123 | | 147 | | 73 | |
| Total other investments | 3,367 | | 847 | | 599 | |
1 On 28 October 2021, the Group successfully completed its US$70 million (R1,066 million) strategic investment in ioneer Limited (ioneer) following approval by ioneer’s shareholders at an extraordinary general meeting on 21 October 2021, and approval from the Financial Surveillance Department of the South African Reserve Bank received on 13 October 2021. Payment was made on 27 October 2021, which is the day on which all conditions precedent were met, and the shares were allotted on 28 October 2021. The initial fair value of the investment was R1,117 million, excluding transaction costs of R17 million which were capitalised to the investment. The Group recognised a gain on initial recognition of R51 million. The Group holds approximately 145.9 million fully paid ordinary shares, or 7.12%, in ioneer
2 On 27 October 2021, Sibanye-Stillwater announced that it had entered into a subscription agreement with New Century Resources Limited (New Century) where the Group agreed to purchase ordinary shares as part of a capital raising by New Century. The aggregate investment represents a 19.99% ownership interest obtained through a phased equity investment programme, which was completed in December 2021. Management concluded that the ownership interest does not represent significant influence due to a lack of representation on the board. The aggregate subscription price for the 19.99% investment in New Century was R695 million. The initial fair value of the investment was R610 million, excluding transaction costs of R19 million which were capitalised to the investment. The Group recognised a loss on initial recognition of R85 million
Asset held for sale
During November 2020, Gen Mining increased its interest in the Marathon project (Marathon) to 80% following delivery of a preliminary economic assessment and completing the sole expenditure requirement of CAD10 million. Since then, the Group has elected to dilute its interest in Marathon rather than contribute proportionally to the continued expenditure to be incurred. As a result, the Group's current direct participation interest in Marathon equates to 16.5%. The parties subsequently reached an agreement through which Generation PGM Inc., a subsidiary of Gen Mining, would acquire from Stillwater Canada Inc. (a wholly-owned subsidiary of the Group) its 16.5% participation interest in Marathon in exchange for shares in Gen Mining, increasing the Group's effective interest in Gen Mining to 19.1%. The transaction became effective during January 2022. The investment in Marathon was classified as held for sale at 31 December 2021, and measured at fair value in accordance with IFRS 9 Financial Instruments. The fair value of the investment at 31 December 2021 was R280 million.
Fair value of other investments
Other investments consists primarily of other listed investments and other short-term investment products, which are measured at fair value or which carrying amounts approximates fair value. The fair values of non-listed investments included in other investments are determined through valuation techniques that include inputs that are not based on observable market data. Fair value measurements of listed investments are categorised as level 1 under the fair value hierarchy and non-listed investments as level 3 (refer note 36.1).
Notes to the consolidated financial statements continued
For the year ended 31 December 2021
21. Environmental rehabilitation obligation funds
| | |
Accounting policy The Group’s rehabilitation obligation funds includes equity-linked investments that are fair valued at each reporting date. The fair value is calculated with reference to underlying equity instruments using industry valuation techniques and appropriate models. Annual contributions are made to dedicated environmental rehabilitation obligation funds to fund the estimated cost of rehabilitation during and at the end of the life of the relevant mine. The amounts contributed to these funds are included under non-current assets and are measured at fair value through profit or loss. Interest earned on monies paid to rehabilitation funds is accrued on a time proportion basis and is recorded as interest income. In addition, bank guarantees are provided for funding shortfalls of the environmental rehabilitation obligations. |
| | | | | | | | | | | | | | |
| Figures in million – SA rand | Notes | 2021 | 2020 | 2019 |
| Balance at beginning of the year | | 4,934 | | 4,602 | | 3,999 | |
| Contributions made | | 72 | | 64 | | 13 | |
| Payments received | | (10) | | (7) | | (152) | |
| Interest income | 5.1 | 174 | | 245 | | 265 | |
Fair value gain1 | | 32 | | 30 | | 34 | |
| Environmental rehabilitation obligation funds on acquisition of subsidiaries | 16.1 | — | | — | | 443 | |
| Balance at end of the year | | 5,202 | | 4,934 | | 4,602 | |
| | | | |
| Environmental rehabilitation obligation funds comprise of the following: | | | | |
Restricted cash2 | | 1,135 | | 703 | | 610 | |
| Funds | | 4,067 | | 4,231 | | 3,992 | |
1 The environmental rehabilitation trust fund includes equity-linked investments that are fair valued at each reporting date
2 The funds are set aside to serve as collateral against the guarantees made to the Department of Minerals and Resources for environmental rehabilitation obligations
Fair value of environmental rehabilitation obligation funds
Environmental rehabilitation obligation funds comprise fixed income portfolio of bonds as well as fixed and call deposits. The environmental rehabilitation obligation funds are stated at fair value based on the nature of the fund’s investments (refer note 36.1).
Credit risk
The Group is exposed to credit risk on the total carrying value of the investments held in the environmental rehabilitation obligation funds. The Group has reduced its exposure to credit risk by investing in funds with a limited number of major financial institutions.
Notes to the consolidated financial statements continued
For the year ended 31 December 2021
22. Other receivables and other payables
| | |
Significant accounting judgements and estimates Expected future cash flows used to determine the carrying value of the other payables (namely the Deferred Payment, right of recovery payable, Marikana dividend obligation and contingent consideration) and the right of recovery receivable are inherently uncertain and could materially change over time. The expected future cash flows are significantly affected by a number of factors including reserves and production estimates, together with economic factors such as the expected commodity price, currency exchange rates, and estimates of production costs, future capital expenditure and discount rates. Accounting policy Financial instruments included in other receivables are categorised as financial assets measured at amortised cost and those included in other payables are categorised as other financial liabilities as applicable. These assets and liabilities are initially recognised at fair value. Subsequent to initial recognition, financial instruments included in other receivables and other payables are measured at amortised cost, except where fair value through profit or loss measurement is appropriate (for example, contingent consideration and derivative financial instruments). Reimbursements, such as rehabilitation reimbursements from other parties are not financial instruments, and are recognised as a separate asset where recovery is virtually certain. The amount recognised is limited to the amount of the relevant rehabilitation provision. If the party that will make the reimbursement cannot be identified, then the reimbursement is generally not virtually certain and cannot be recognised. If the only uncertainty regarding the recovery relates to the amount of the recovery, the reimbursement amount often qualifies to be recognised as an asset. Other receivables and payables that do not arise from contractual rights and obligations, such as receivables on rates and taxes, are recognised and measured at the amount expected to be received or paid. |
22.1 Other receivables
| | | | | | | | | | | |
| Figures in million – SA rand | 2021 | 2020 | 2019 |
| Right of recovery receivable | 319 | | 340 | | 187 | |
| Rates and taxes receivable | 106 | | 105 | | 103 | |
| Pre-paid royalties | 336 | | 364 | | 393 | |
| Palladium hedge derivative asset | 286 | | — | | — | |
| Other | 127 | | 49 | | 52 | |
| Total other receivables | 1,174 | | 858 | | 735 | |
| Reconciliation of the non-current and current portion of the other receivables: | | | |
| Other receivables | 1,174 | | 858 | | 735 | |
| Current portion of other receivables | (523) | | (37) | | (51) | |
| Non-current portion of other receivables | 651 | | 821 | | 684 | |
22.2 Other payables
| | | | | | | | | | | |
| Figures in million – SA rand | 2021 | 2020 | 2019 |
| Deferred Payment (related to Rustenburg operations acquisition) | 6,920 | | 4,355 | | 2,826 | |
| Contingent consideration (related to SFA (Oxford) acquisition) | 100 | | 88 | | 56 | |
| Right of recovery payable | 32 | | 39 | | 79 | |
| Deferred consideration (related to Pandora acquisition) | 400 | | 308 | | 276 | |
| Marikana dividend obligation | 1,539 | | — | | — | |
| Other | 373 | | 367 | | 212 | |
| Total other payables | 9,364 | | 5,157 | | 3,449 | |
| Reconciliation of the non-current and current portion of the other receivables: | | | |
| Other payables | 9,364 | | 5,157 | | 3,449 | |
| Current portion of other payables | (4,765) | | (2,246) | | (761) | |
| Non-current portion of other payables | 4,599 | | 2,911 | | 2,688 | |
Notes to the consolidated financial statements continued
For the year ended 31 December 2021
Right of recovery receivable and payable
Based on the first and second Notarial Pooling and Sharing agreements (PSAs) with Anglo American Platinum, Kroondal (previously Aquarius Platinum (South Africa) Proprietary Limited) holds a contractual right to recover 50% of the rehabilitation obligation relating to environmental rehabilitation resulting from PSA operations from RPM (subsidiary of Anglo American Platinum), where this rehabilitation relates to property owned by Kroondal Operations. Likewise RPM holds a contractual right to recover 50% of the rehabilitation obligation relating to environmental rehabilitation resulting from PSA operations from Kroondal Operations, where the rehabilitation relates to property owned by RPM. With respect to the opencast section of the Marikana mine that is on Kroondal Operations’ property, RPM have limited the contractual liability to approximately R194 million (2020: R185 million, 2019: R179 million), being a negotiated liability in terms of an amendment to the second PSA.
Deferred Payment (related to Rustenburg operations acquisition)
In terms of the Rustenburg operations transaction, the purchase consideration includes a Deferred Payment, calculated as being equal to 35% of the distributable free cash flow generated by the Rustenburg operation over a six year (1 January 2017 to 31 December 2022) period from inception (latest of transaction closing or 1 January 2017), subject to a minimum payment of R3.0 billion. The distributable free cash flow has been derived from forecast cash flow models. These models use several key assumptions, including estimates of future sales volumes, PGM prices, operating costs and capital expenditure.
The Deferred Payment movement for the year is as follows:
| | | | | | | | | | | | | | |
| Figures in million – SA rand | Note | 2021 | 2020 | 2019 |
| Balance at the beginning of the year | | 4,355 | | 2,826 | | 2,206 | |
| Interest charge | 5.2 | 158 | | 187 | | 179 | |
| Payment of Deferred Payment | | (2,246) | | (739) | | (283) | |
Loss on revised estimated cash flows1 | | 4,653 | | 2,081 | | 724 | |
| Balance at end of the year | | 6,920 | | 4,355 | | 2,826 | |
1 The loss on revised estimated cash flows for the year ended 31 December 2021 is primarily as a result of changes in the life-of-mine, changes in price inputs for 2022 life-of-mine and a significant increase in the FY2021 actual profitability compared to the 2021 life-of-mine due to the high price environment that existed in FY2021, which will impact the FY2022 payment
Deferred consideration (related to Pandora acquisition)
Lonmin acquired the remaining 50% stake in Pandora Joint Venture in 2017. The purchase price included a deferred and contingent consideration element. The deferred payment element represents a minimum consideration of R400 million, which is settled through a cash payment based on 20% of the distributable free cash flows generated from the Pandora E3 operations on an annual basis for a period of 6 years, ending on 30 November 2023. The fair value of the deferred consideration at acquisition of Lonmin by the Group was determined using the present value of the future cash flows at a discount rate of 12.5%. The contingent consideration element is based on the extent to which 20% of the distributable free cash flows exceed R400 million. This element was valued at R124 million at 31 December 2021. The distributable free cash flow has been derived from forecast cash flow models. These models use several key assumptions, including estimates of future sales volumes, PGM prices, operating costs and capital expenditure.
The Pandora deferred consideration movement for the year is as follows:
| | | | | | | | | | | | | | |
| Figures in million – SA rand | Note | 2021 | 2020 | 2019 |
| Balance at the beginning of the year | | 308 | | 276 | | — | |
| Deferred consideration on acquisition of subsidiary | | — | | — | | 235 | |
| Interest charge | 5.2 | 54 | | 49 | | 41 | |
| Loss on revised estimated cash flows | | 123 | | — | | — | |
| Payment made | | (85) | | (17) | | — | |
| Balance at end of the year | | 400 | | 308 | | 276 | |
Marikana dividend obligation
The Marikana dividend obligation relates to amounts payable to other shareholders through the Incwala Platinum holding structure. The obligation is classified as a financial liability measured at amortised cost. At year end the dividend obligation, except for the discount rates of 11.64% (EPL) and 11.71% (WPL) which remains consistent over the life of the obligation, was measured applying the same assumptions as set out in note 6.6. Refer note 6.6 for additional detail regarding the Marikana B-BBEE transaction.
Notes to the consolidated financial statements continued
For the year ended 31 December 2021
The following table summarises the changes in the Marikana dividend obligation:
| | | | | | | | | | | | | | |
| Figures in million – SA rand | Notes | 2021 | 2020 | 2019 |
| Balance at the beginning of the year | | — | — | — |
| Initial recognition of the Marikana dividend obligation | | 1,146 | — | — |
| Interest - unwinding of amortised cost | 5.2 | 87 | — | — |
Loss on revised estimated cash flows1 | 7 | 468 | — | — |
| Payments made | | (162) | — | — |
| Balance at end of the year | | 1,539 | — | — |
1 The loss on revised estimated cash flow is primarily as a result of an increase in the long-term PGM basket price
Fair value of other receivables and other payables
Due to the approaches applied in calculating the carrying values as described above, the fair values approximate the carrying value (refer note 36.1).
Market risk
The Deferred Payment relating to Rustenburg, the deferred consideration relating to Pandora and the Marikana dividend obligation are sensitive to changes in the 4E basket price. A 1 percentage point increase in the 4E basket price would have impacted profit or loss by R101 million (2020: R74 million, 2019: R96 million).
Credit risk
The carrying value of the other receivables represents the maximum credit risk exposure of the Group in relation to these receivables. The Group has reduced its exposure to credit risk by dealing with a limited number of approved counterparties (refer note 36.2).
23. Inventories
| | |
Significant accounting judgements and estimates Inventory is held in a wide variety of forms across the value chain reflecting the stage of refinement. Prior to production as final metal, the inventory is always contained within a carrier material. As such, inventory is typically sampled and assays taken to determine the metal content and how this is split by metal. Measurement and sampling accuracy can vary quite significantly depending on the nature of the vessels and the state of the material. An allowance for estimation uncertainty is applied to the various categories of inventory and is dependent on the degree to which the nature and state of material allows for accurate measurement and sampling. The range used for the estimation allowance varies based on the stage of refinement. The range is based on independent metallurgists’ level of confidence obtained from the outcome of the stocktake. Those results are applied in arriving at the appropriate quantities of inventory. Accounting policy Inventory is valued at the lower of cost and net realisable value. The Group values ore stockpiles and metal-in-process when it can be reliably measured. Cost is determined on the following basis: •Gold reef ore stockpiles and gold-in-process are valued using weighted average cost. Cost includes production, amortisation, depreciation and related administration costs •PGM inventory is valued using weighted average cost by allocating cost, based on the joint cost of production, apportioned according to the relative sales value of each of the PGMs produced. The group recognises the metal produced in each development phase in inventory with an appropriate proportion of cost. Cost includes production, amortisation, depreciation and related administration costs •By-product metals are valued at the incremental cost of production from the point of split-off from the PGM processing stream •Consumable stores are valued at weighted average cost after appropriate provision for surplus and slow-moving items |
Notes to the consolidated financial statements continued
For the year ended 31 December 2021
| | | | | | | | | | | |
| Figures in million – SA rand | 2021 | 2020 | 2019 |
Consumable stores1 | 1,923 | | 1,627 | | 1,581 | |
| PGM ore and mill inventory | 189 | | 142 | | 128 | |
PGM in process2 | 13,081 | | 13,742 | | 10,497 | |
| Gold in process | 819 | | 616 | | 310 | |
| PGM finished goods | 9,012 | | 8,710 | | 2,959 | |
| Other | 56 | | 115 | | 28 | |
| Total inventories | 25,080 | | 24,952 | | 15,503 | |
1 The cost of consumable stores consumed during the year and included in operating cost amounted to R18,847 million (2020: R16,404 million and 2019: R12,784 million)
2 Included in PGM in process, is R4,725 million (2020: R4,225 million, 2019: R3,827 million) relating to the Marikana operations. It also includes R4,357 million (2020: R3,847 million, 2019: R4,182 million) relating to SRPM operations due to the change of certain processing arrangements from a purchase of concentrate arrangement to a toll processing arrangement from 1 January 2019
24. Trade and other receivables
| | |
Accounting policy Trade and other receivables, excluding trade receivables for PGM concentrate sales, prepayments and value added tax, are non-derivative financial assets categorised as financial assets measured at amortised cost. The above non-derivative financial assets are initially recognised at fair value and subsequently carried at amortised cost less allowance for impairment. Estimates made for impairment are based on a review of all outstanding amounts at year end in line with the impairment policy described in note 36. Irrecoverable amounts are written off during the period in which they are identified. In addition to other types of PGM sales, trade receivables include actual invoiced sales of PGM concentrate, as well as sales not yet invoiced for which deliveries have been made and the control has transferred. The PGM concentrate receivables are financial assets measured at fair value through profit or loss, as the solely payments of principle and interest criteria is not met. The receivable amount calculated for the PGM concentrate delivered but not yet invoiced is recorded at the fair value of the consideration receivable at the date of delivery. At each subsequent reporting date the receivable is restated to reflect the fair value movements in the pricing mechanism which are recognised in revenue. Foreign exchange movements on foreign currency denominated receivables are recognised as a foreign exchange gain or loss in profit or loss subsequent to the recognition of a sale. |
| | | | | | | | | | | |
| Figures in million – SA rand | 2021 | 2020 | 2019 |
| Trade receivables - gold sales | 44 | | 42 | | — | |
| Trade receivables - PGM sales | 4,823 | | 4,655 | | 2,681 | |
| PGM sales concentrate | 3,794 | | 4,030 | | 2,342 | |
| PGM sales other | 1,029 | | 625 | | 339 | |
| Other trade receivables | 904 | | 1,021 | | 889 | |
| Payroll debtors | 322 | | 268 | | 251 | |
| Interest receivable | 54 | | 57 | | 15 | |
| Financial assets | 6,147 | | 6,043 | | 3,836 | |
| Prepayments | 335 | | 369 | | 443 | |
| Value added tax | 929 | | 454 | | 356 | |
| Total trade and other receivables | 7,411 | | 6,866 | | 4,635 | |
Fair value of trade and other receivables
The fair value of trade receivables for PGM concentrate sales are determined based on ruling market prices, volatilities and interest rates, and constitutes level 2 on the fair value hierarchy (refer note 36.1).
The fair value of trade and other receivables measured at amortised cost approximate the carrying value due to the short maturity.
Credit risk
The Group is exposed to credit risk on the total carrying value of trade and other receivables.
Notes to the consolidated financial statements continued
For the year ended 31 December 2021
Trade receivables measured at amortised cost are reviewed on a regular basis and an allowance for impairment is raised when they are not considered recoverable based on an expected credit loss assessment. The Group transacts exclusively with a limited number of large international institutions and other organisations with strong credit ratings and the negligible historical level of customer default. Trade receivables are currently in a sound financial position and no impairment has been recognised.
The below table summarises the impairment allowance raised on other receivables that are considered to be impaired:
| | | | | | | | | | | |
| Figures in million – SA rand | 2021 | 2020 | 2019 |
| Balance at beginning of the year | 199 | 140 | 16 |
| Lonmin acquisition | — | — | 95 |
| Impairment allowance recognised in profit or loss for the year | 3 | 59 | 29 |
| Impaired financial assets recovered during the year | (1) | — | — |
| Balance at end of the year | 201 | 199 | 140 |
Commodity price risk
The Group is exposed to commodity price risk on PGM concentrate receivables that are still subject to provisional pricing adjustments after the reporting date. A change in the 4E basket price of 1 percent would impact revenue and the related PGM concentrate receivables by R28 million.
Foreign currency sensitivity
Certain of the Group’s components with SA rand as their functional currency have trade and other receivables which are settled in US dollars. The balances are sensitive to changes in the rand/US dollar exchange rate. A 1 percentage point change in the SA rand closing exchange rate of R15.94/US$ would have impacted profit for the year by R42 million.
25. Cash and cash equivalents
| | |
Accounting policy Cash and cash equivalents comprise cash on hand, demand deposits and short-term, highly liquid investments readily convertible to known amounts of cash and subject to insignificant risk of changes in value, and are measured at amortised cost which is deemed to be fair value due to its short-term maturity. |
| | | | | | | | | | | |
| Figures in million – SA rand | 2021 | 2020 | 2019 |
| Cash at the bank and on hand | 30,292 | | 20,240 | | 5,619 | |
| Total cash and cash equivalents | 30,292 | | 20,240 | | 5,619 | |
Fair value of cash and cash equivalents
The fair value of cash and cash equivalents approximate the carrying value due to the short maturity.
Credit risk
The Group is exposed to credit risk on the total carrying value of cash and cash equivalents. The Group has reduced its exposure to credit risk by dealing and investing with a number of major financial institutions.
26. Stated share capital
| | |
Accounting policy Ordinary share capital Ordinary shares are classified as equity. Incremental costs directly attributable to the issue of ordinary shares are recognised as a deduction from equity, net of any tax effects. |
Scheme of arrangement
On 4 October 2019, SGL and the Company, a previously dormant wholly owned subsidiary of SGL, announced the intention to implement a scheme of arrangement to reorganise SGL’s operations under a new parent company, the Company (the “Scheme”). The Scheme was implemented through the issue of the Company’s shares (tickers: JSE – SSW and NYSE – SBSW) in exchange for the existing shares of SGL (previous tickers: JSE – SGL and NYSE – SBGL). On 23 January 2020 SGL and Sibanye- Stillwater announced that all resolutions for the approval of the Scheme, were passed by the requisite majority votes at the Scheme meeting held at the SGL Academy. The Scheme was implemented on 24 February 2020.
Notes to the consolidated financial statements continued
For the year ended 31 December 2021
Sibanye-Stillwater determined that the acquisition of SGL did not represent a business combination as defined by IFRS 3. This is because neither party to the Scheme could be identified as an accounting acquirer in the transaction, and post the implementation there would be no change of economic substance or ownership in the SGL Group.
The SGL shareholders have the same commercial and economic interest as they had prior to the implementation of the Scheme and no additional new ordinary shares of SGL were issued as part of the Scheme. Following the implementation of the Scheme, the consolidated financial statements of Sibanye-Stillwater therefore reflects that the arrangement is in substance a continuation of the existing SGL Group. SGL is the predecessor of the Company for financial reporting purposes and following the implementation of the Scheme, Sibanye- Stillwater's consolidated comparative information is presented as if the reorganisation had occurred before the start of the earliest period presented.
In order to affect the reorganisation in the Group at the earliest period presented in the 31 December 2020 consolidated financial statements, a reorganisation reserve was recognised at 31 December 2017 to adjust the previously stated share capital of SGL of R34,667 million to reflect the stated share capital of the Company of R1 at that date. The reorganisation reserve was adjusted for previously recognised movements in the stated share capital of SGL between 31 December 2017 and 24 February 2020. The issue of shares at the effective date of the Scheme, was recorded at an amount equal to the net asset value of the unconsolidated SGL company at that date, with the difference recognised as a reorganisation reserve.
Since the consolidated financial statements of Sibanye-Stillwater are in substance a continuation of the existing SGL Group, the shares used in calculating the weighted average number of issued shares (refer note 12.1) was based on the issued stated share capital of the listed entity at that stage.
As a result of the above, earnings per share measures are based on SGL's issued shares for the 31 December 2019 comparative period. For purposes of Sibanye-Stillwater’s earnings per share measures for 31 December 2020, shares issued as part of the Scheme were treated as issued from the beginning of the reporting period so as to reflect the unchanged continuation of the Group. No weighting was required in 2020 as there were no changes in the issued share capital of SGL from the beginning of 2020 up to the effective date of the Scheme. Shares issued after the implementation of the Scheme were time-weighted as appropriate.
Authorised and issued
Although the Scheme was retrospectively implemented for accounting purposes, the roll forward below shows the movement of the legally issued shares of the Company and SGL for the periods indicated.
| | | | | | | | | | | | | | |
| Company | | SGL |
| Figures in thousand | 2021 | 2020 | | 2019 |
| Authorised number of shares | 10,000,000 | | 10,000,000 | | | 10,000,000 | |
| | | | |
| Reconciliation of issued number of shares: | | | | |
Number of shares in issue at beginning of the year1 | 2,923,571 | | — | | * | 2,266,261 | |
Scheme implemented2 | — | | 2,670,030 | | | — | |
Shares issued under Sibanye-Stillwater/SGL Share Plan3 | 32,535 | | 6,932 | | | 4,442 | |
Issued upon conversion of US$ Convertible Bond4 | — | | 248,040 | | | — | |
Shares delisted (share buy-back)5 | (147,700) | | (1,431) | | | — | |
Shares issued for cash6 | — | | — | | | 108,932 | |
Shares issued with acquisition of subsidiary7 | — | | — | | | 290,395 | |
| Number of shares in issue at end of the year | 2,808,406 | | 2,923,571 | | | 2,670,030 | |
1 Since the Scheme was retrospectively implemented when it became effective in FY2020, the stated share capital presented in the consolidated statement of changes in equity reflects the legally issued shares of the Company from the earliest period presented, being one ordinary share at 31 December 2018 and 31 December 2019
2 From 1 January 2020 to 23 February 2020, shares of the listed entity presented for the Group were those of SGL. From 24 February 2020, these were exchanged for shares of the Company retrospectively presented for the Group in the consolidated statement of changes in equity. The Scheme was implemented on a share-for-share basis with no change in the total number of issued listed shares
3 Upon implementation of the Scheme, the SGL equity-settled share plan was transferred to the Company and is settled in the Company’s shares from the effective date onwards (refer note 6.1)
4 Refer note 28.6
5 The Group entered into a repurchase and cancellation of shares transactions with certain shareholders which resulted in the total issued shares of Sibanye-Stillwater decreasing by 147,700,000 shares in 2021 and 1,431,197 shares in 2020 (refer below)
6 On 15 April 2019, Sibanye-Stillwater raised net capital of R1.7 billion from a placing of 108,932,356 new ordinary no par value shares to existing and new institutional investors
7 On 10 June 2019, 290,394,531 shares were issued to the shareholders of Lonmin Limited (refer note 16.1)
* Less than one thousand
Notes to the consolidated financial statements continued
For the year ended 31 December 2021
The Company’s ordinary no par value shares rank pari passu in all respects, there being no conversion or exchange rights attached thereto, and all of the ordinary shares will have equal rights to participate in capital, dividend and profit distributions by the Company.
Retrospective roll forward of stated share capital and reorganisation reserve:
| | | | | | | | | | | | | | | | | | | | | | | | | | |
| SGL | Scheme impact | Regorgani- sation reserve |
Company | |
| Amount
(million) | Shares
(thousand) | Amount
(million) | Amount
(million) | Amount
(million) | | Shares
(thousand) | |
| Balance at 31 December 2018 | 34,667 | | 2,266,261 | | (34,667) | | 34,667 | | — | | * | — | | * |
| Shares issued for cash | 1,688 | | 108,932 | | (1,688) | | 1,688 | | — | | | — | | |
| Shares issued on Lonmin acquisition | 4,307 | | 290,395 | | (4,307) | | 4,307 | | — | | | — | | |
| Shares issued under SGL Share Plan | — | | 4,442 | | — | | — | | — | | | — | | |
| Balance at 31 December 2019 | 40,662 | | 2,670,030 | | (40,662) | | 40,662 | | — | | * | — | | * |
Scheme implemented1 | | | | (17,661) | | 17,661 | | | 2,670,030 | | |
| Shares issued under Company Share Plan | | | | — | | — | | | 6,932 | | |
Issued upon conversion of US$ Convertible Bond2 | | | | — | | 12,573 | | | 248,040 | | |
| Shares delisted (share buy-back) | | | | — | | (84) | | | (1,431) | | |
| Balance at 31 December 2020 | | | | 23,001 | | 30,150 | | | 2,923,571 | | |
| Shares issued under Company Share Plan | | | | | — | | | 32,535 | | |
| Shares delisted (share buy-back) | | | | | (8,503) | | | (147,700) | | |
| Balance at 31 December 2021 | | | | 23,001 | | 21,647 | | | 2,808,406 | | |
1 The stated share capital value of the Company on Scheme implementation amounts to the net asset value of the unconsolidated SGL company on the effective date of the Scheme. The reorganisation reserve is the balance between the previously presented stated share capital and the revised stated share capital value of the Company. There was no change in the issued share capital of the SGL Group from 31 December 2019 to the effective date of the Scheme
2 Refer note 28.6
* Less than R1 million or one thousand shares as indicated
Repurchase of shares
On 2 November 2020, the directors of the Company decided to make an offer to certain holders of the Company’s ordinary shares, via an Odd-lot offer to holders of fewer than 100 shares of the Company and a specific repurchase in terms of the JSE Listings Requirements and the South African Companies Act, 2008 to holders of 100 to 400 Company shares. This resulted in a total repurchase to the value of R84 million including directly attributable incremental transaction costs and a decrease of 1,431,197 in the issued shares of the Company. The average price paid for the repurchased shares amounted to R58.80 per share.
The Group commenced with a share buy-back programme on 2 June 2021 to repurchase up to 5% of its ordinary shares as at 31 May 2021 representing a maximum of 147,700,000 shares. The programme concluded on 4 October 2021 when the maximum number of shares were reached. The total cost amounted to R8,503 million, including transaction cost. The average cost per share repurchased amounted to R57.57.
Notes to the consolidated financial statements continued
For the year ended 31 December 2021
27. Non-controlling interests
| | |
Accounting policy Non-controlling interests The Group recognises any NCI in an acquiree either at fair value or at the NCI's proportionate share of the acquiree’s net assets on an acquisition-by-acquisition basis. Subsequently, the carrying amount of NCI is the amount of the interest at initial recognition plus the NCI’s subsequent share of changes in equity. Transactions with non-controlling interests The Group treats transactions with NCI as transactions with equity owners of the Group. For purchases from NCI, the difference between any consideration paid and the relevant share acquired of the carrying value of net assets of the subsidiary is recorded in equity. Gains or losses on disposals to NCI where control is not lost are also recorded in equity. Where control is lost over a subsidiary, the gains or losses are recognised in profit or loss. |
The Group’s NCI relates to the following subsidiaries
| | | | | | | | | | | |
| Figures in million – SA rand | 2021 | 2020 | 2019 |
| NCI of DRDGOLD | 1,395 | | 1,224 | | 1,135 | |
NCI of Platinum Mile1 | — | | 37 | | 21 | |
| NCI of Group Technical Security Management | 5 | | 5 | | 6 | |
NCI of Marikana2 | 8 | | 970 | | 306 | |
| Total NCI | 1,408 | | 2,236 | | 1,468 | |
1 On 29 June 2021, the 8.3% shareholding held by non-controlling shareholders in Platinum Mile was repurchased for a consideration of R128 million
2 Included in Marikana’s NCI is NCI of WPL amounting to Rnil (2020: R690 million, 2019: R253 million). Refer below
DRDGOLD is a company incorporated in South Africa with its head office in Johannesburg. DRDGOLD’s primary listing is on the JSE Limited and its secondary listing is on the New York Stock Exchange. It’s gold production is derived from retreatment of surface tailings in South Africa. Following Sibanye-Stillwater’s exercise of its option to acquire an additional 12.05% in DRDGOLD effective 10 January 2020, NCI held a 49.90% at 31 December 2021 (2020: 49.90% and 2019: 61.95%) with an effective holding of 49.51% at 31 December 2021 (2020:49.34% and 2019: 61.40%) after considering the impact of treasury shares held by DRDGOLD. The Group calculated the net asset value of DRDGOLD at the effective date of the option exercise, to which the additional ownership percentage was applied to determine the re-attribution between NCI and the Group amounting to R220 million.
WPL, acquired as part of the Lonmin acquisition, consists of PGM mining and processing operations located on the Western Limb of the Bushveld Complex, close to the town of Rustenburg, in the North West province of South Africa and smelting and refining operations located in Brakpan, East of Johannesburg. As a result of the Marikana B-BBEE transaction (refer note 6.6), the NCI's equity interest changed to a right to receive dividends. Therefore, a cash-settled share-based payment obligation and dividend obligation was recognised at 31 December 2021, instead of NCI (refer note 6.6 and 22.2). At 31 December 2021, NCI hold an effective 0% (2020: 4.75%, 2019: 4.75%) interest in WPL. The same considerations apply to EPL. The remaining NCI is attributable to small non-operating entities.
The summarised financial information of these subsidiary groups is provided below. This information is based on amounts before intercompany eliminations.
Notes to the consolidated financial statements continued
For the year ended 31 December 2021
| | | | | | | | | | | | | | |
| Figures in million – SA rand | 2021 | | 2020 | 2019 |
| DRDGOLD Limited | | | | |
| Revenue | 4,790 | | | 5,051 | | 3,621 | |
| Profit for the year | 987 | | | 1,255 | | 460 | |
| Total comprehensive income | 907 | | | 1,485 | | 459 | |
| Profit attributable to NCI | 487 | | | 619 | | 285 | |
| Net increase in cash and cash equivalents | 70 | | | 1,626 | | 334 | |
| Dividends paid | 338 | | | 359 | | 85 | |
| Non-current assets | 3,741 | | | 3,620 | | 3,393 | |
| Current Assets | 2,821 | | | 2,671 | | 972 | |
| Non-current liabilities | (1,120) | | | (1,055) | | (1,109) | |
| Current liabilities | (553) | | | (593) | | (463) | |
| Net assets | 4,889 | | | 4,643 | | 2,793 | |
| Western Platinum Proprietary Limited | | | | |
| Revenue | — | | * | 26,781 | | 11,125 | |
| Profit for the year | — | | * | 7,239 | | 764 | |
| Total comprehensive income | — | | * | 7,251 | | 764 | |
| Profit attributable to NCI | — | | * | 444 | | 17 | |
| Net increase/(decrease) in cash and cash equivalents | — | | * | 6,249 | | (2,070) | |
| Dividends paid | — | | * | — | | — | |
| Non-current assets | — | | * | 5,094 | | 7,750 | |
| Current Assets | — | | * | 14,737 | | 6,832 | |
| Non-current liabilities | — | | * | (20,738) | | (22,462) | |
| Current liabilities | — | | * | (2,626) | | (2,202) | |
| Net assets | — | | * | (3,533) | | (10,082) | |
* Since NCI reduced to zero in FY2021, no summarised financial information is provided
Notes to the consolidated financial statements continued
For the year ended 31 December 2021
28. Borrowings and derivative financial instrument
| | |
Significant accounting judgements and estimates Borrowings Expected future cash flows used to determine the carrying amount of the Burnstone Debt are inherently uncertain and could materially change over time. They are significantly affected by a number of factors including reserves and production estimates, together with economic factors such as the expected commodity price, foreign currency exchange rates, and estimates of production costs, future capital expenditure and discount rates. Derivative financial instrument Up to the date of settlement, gains and losses on the derivative financial instrument were attributable to changes in various valuation inputs, including the movement in the Company share price, change in US dollar/ rand exchange rate, bond market value and credit risk spreads. Although many inputs into the valuation are observable, the valuation method separates the fair value of the derivative from the quoted fair value of the US$ Convertible Bond by adjusting certain observable inputs. These adjustments require the application of judgement and certain estimates. Changes in the relevant inputs impact the fair value gains and losses recognised. Accounting policy Borrowings Borrowings are non-derivative financial liabilities categorised as other financial liabilities. Borrowings are recognised initially at fair value, net of transaction costs incurred, where applicable and subsequently measured at amortised cost using the effective interest method. Borrowings are classified as current liabilities unless the Group has an unconditional right to defer settlement of the liability for at least 12 months after the reporting date. Derivative financial instruments Derivatives are initially recognised at fair value using option pricing methodologies. Any directly attributable transaction costs are recognised in profit or loss as incurred. Subsequent to initial recognition, derivatives are measured at fair value, and changes are recognised in profit or loss. For assets and liabilities that are recognised at fair value in the financial statements on a recurring basis, the Group determines whether transfers have occurred between levels in the fair value hierarchy by re-assessing categorisation (based on the lowest level input that is significant to the fair value measurement as a whole) at the end of each reporting period. |
Borrowings
| | | | | | | | | | | | | | |
| Figures in million – SA rand | Notes | 2021 | 2020 | 2019 |
| US$600 million RCF | 28.1 | — | | 6,978 | | 5,712 | |
| R6.0 billion RCF | 28.2 | — | | — | | — | |
| R5.5 billion RCF | 28.3 | — | | — | | 2,500 | |
| 2022 and 2025 Notes | 28.4 | — | | 10,136 | | 9,610 | |
| 2026 and 2029 Notes | 28.5 | 18,785 | | — | | — | |
| US$ Convertible Bond | 28.6 | — | | — | | 4,579 | |
| Burnstone Debt | 28.7 | 1,507 | | 1,263 | | 1,330 | |
| Other borrowings | 28.8 | — | | — | | — | |
| Franco-Nevada liability | | 2 | | 2 | | 2 | |
| Stillwater Convertible Debentures | | 4 | | 4 | | 3 | |
| Total borrowings | | 20,298 | | 18,383 | | 23,736 | |
| Reconciliation of the non-current and current portion of the borrowings: | | | | |
| Borrowings | | 20,298 | | 18,383 | | 23,736 | |
| Current portion of borrowings | | (107) | | (886) | | (38) | |
| Non-current portion of borrowings | | 20,191 | | 17,497 | | 23,698 | |
The current portion of borrowings will be repaid out of operational cash flows or it will be refinanced by utilising available Group facilities.
Notes to the consolidated financial statements continued
For the year ended 31 December 2021
Derivative financial instrument
| | | | | | | | | | | | | | |
| Figures in million – SA rand | Note | 2021 | 2020 | 2019 |
| Reconciliation of the non-current and current portion of the derivative financial instrument: | | | | |
| Derivative financial instrument | 28.6 | — | | — | | 4,145 | |
| Non-current portion of derivative financial instrument | | — | | — | | 4,145 | |
Roll forward of borrowings in the current year were as follows:
| | | | | | | | | | | | | | |
| Figures in million - SA rand | Notes | 2021 | 2020 | 2019 |
| Balance at beginning of the year | | 18,383 | | 23,736 | | 24,505 | |
| Borrowings acquired on acquisition of subsidiary | 16.1 | — | | — | | 2,575 | |
Loans raised1 | | 20,622 | | 16,289 | | 18,982 | |
| Loans repaid | | (20,252) | | (18,335) | | (22,008) | |
| US$ Convertible Bond converted into shares | | — | | (5,578) | | — | |
| Unwinding of loans recognised at amortised cost | 5.2 | 302 | | 394 | | 374 | |
| Accrued interest (related to the 2022 and 2025 Notes, 2026 and 2029 Notes, and US$ Convertible Bond) | | 622 | | 858 | | 770 | |
| Accrued interest paid | | (527) | | (866) | | (778) | |
| Early redemption premium on the 2025 Notes | 28.4 | 196 | | — | | — | |
| Loss/(gain) on the revised cash flow of the Burnstone Debt | 28.7 | 2 | | (264) | | 97 | |
| Loss/(gain) on foreign exchange differences and foreign currency translation | | 950 | | 2,149 | | (781) | |
| Balance at end of the year | | 20,298 | | 18,383 | | 23,736 | |
1 At 31 December 2021, the portion of transaction costs accrued for and not yet settled in respect of the 2026 and 2029 Notes amounted to R29 million
28.1 US$600 million RCF
On 21 May 2018, Sibanye-Stillwater cancelled and refinanced the US$350 million revolving credit facility (RCF) by drawing under the US$600 million RCF. The purpose of the facility was to refinance the US$350 million RCF, finance ongoing capital expenditure and working capital.
| | | | | | | | |
| Terms of the US$600 million RCF |
| Facility: | US$600 million | |
| Interest rate: | LIBOR | |
| Interest rate margin: | 1.85% if net debt to adjusted EBITDA is equal to or less than 2.50x | |
| 2.00% if net debt to adjusted EBITDA is greater than 2.50x | |
| Term of facility: | Three years, subject to 2 one-year extensions at the lenders option. As at 31 December 2021, all lenders in the facility have extended the maturity date to April 2023. | |
| Borrowers: | The Company, SGL, Stillwater, Kroondal, SRPM and WPL. | |
| Security and/or guarantors: | The facility is unsecured and guaranteed by the Company, SGL, Stillwater, Kroondal, SRPM and WPL. | |
| | | | | | | | | | | |
| Figures in million – SA rand | 2021 | 2020 | 2019 |
| Balance at beginning of the year | 6,978 | | 5,712 | | 2,727 | |
| Loans raised | 703 | | 7,218 | | 9,067 | |
| Loans repaid | (7,728) | | (6,802) | | (5,826) | |
| Loss on foreign exchange differences | — | | — | | 6 | |
| Loss/(gain) on foreign exchange differences | 47 | | 850 | | (262) | |
| Balance at end of the year | — | | 6,978 | | 5,712 | |
Notes to the consolidated financial statements continued
For the year ended 31 December 2021
28.2 R6.0 billion RCF
On 15 November 2016, Sibanye-Stillwater cancelled and refinanced a R4.5 billion Facility by drawing under the R6.0 billion RCF. The purpose of the facility was to refinance the R4.5 billion Facility, finance ongoing capital expenditure, working capital and general corporate expenditure requirements which may include the financing of future acquisitions of business combinations. This facility was refinanced and cancelled in November 2019.
| | | | | | | | |
| Terms of the R6.0 billion RCF | |
| Facility: | R6.0 billion | |
| Interest rate: | JIBAR | |
| Interest rate margin: | A margin of between 2.4% and 2.9% dependent on the net debt to adjusted EBITDA ratio. |
| Term of facility: | Three years | |
| Borrowers: | SGL, SRPM and Kroondal | |
| Security and/or guarantors: | The facility was unsecured and guaranteed by SGL, Stillwater, SRPM and Kroondal. |
| | | | | | | | | | | |
| Figures in million – SA rand | 2021 | 2020 | 2019 |
| Balance at beginning of the year | — | | — | | 5,896 | |
| Loans raised | — | | — | | 1,150 | |
| Loans repaid | — | | — | | (5,046) | |
| Inter Bank transfer | — | | — | | (2,000) | |
| Balance at end of the year | — | | — | | — | |
28.3 R5.5 billion RCF
Sibanye-Stillwater refinanced its R6.0 billion Revolving Credit Facility (RCF), which matured on 15 November 2019, by entering into a new R5.5 billion RCF on 25 October 2019 and drawing under the new RCF on 11 November 2019. The purpose of the facility was to refinance facilities, finance ongoing capital expenditure and general corporate expenditure requirements.
| | | | | |
| Terms of the R5.5 billion RCF |
| Facility: | R5.5 billion |
| Interest rate: | JIBAR |
| Interest rate margin: | A margin of between 2.4% and 2.9% dependent on the net debt to adjusted EBITDA ratio. |
| Term of facility: | Three, subject to 2 one-year extensions at the lenders option. All facility lenders have approved the first and second extension with the loan facility now maturing on 11 November 2024. |
| Borrowers: | The Company, SGL, Kroondal, SRPM and WPL. |
| Security and/or guarantors: | The facility is unsecured and guaranteed by the Company, SGL, Stillwater, Kroondal, SRPM and WPL. |
| | | | | | | | | | | |
| Figures in million –SA rand | 2021 | 2020 | 2019 |
| Balance at beginning of the year | — | | 2,500 | | — | |
| Loans raised | — | | 5,000 | | 500 | |
| Loans repaid | — | | (7,500) | | — | |
| Inter Bank transfer | — | | — | | 2,000 | |
| Balance at end of the year | — | | — | | 2,500 | |
Notes to the consolidated financial statements continued
For the year ended 31 December 2021
28.4 2022 and 2025 Notes
On 27 June 2017, Stillwater completed a 2-tranche international corporate bond offering 6.125% Notes due on 27 June 2022 (the 2022 Notes) and 7.125% Notes due on 27 June 2025 (the 2025 Notes) (together the 2022 and 2025 Notes) with the proceeds applied towards the partial repayment of the Stillwater Bridge Facility, raised for the acquisition of Stillwater. On 19 September 2018, Sibanye-Stillwater concluded the repurchase of a portion of the 2022 and 2025 Notes issued by Stillwater. The total purchase price was US$345 million (nominal value of US$349 million) and was funded from existing cash resources, including the US$500 million advance proceeds from the Wheaton Stream.
Given surplus liquidity within the Group and in line with the Group’s capital allocation framework, it elected to redeem the 2022 Notes on 2 August 2021 (the Redemption Date). The redemption price was the principal amount of the 2022 Notes, plus accrued and unpaid interest on the 2022 Notes up to, but excluding, the Redemption Date, amounting to US$355.8 million and was settled on 2 August 2021. During December 2021, the Group also elected to redeem the 2025 Notes at a redemption price of 103.6% of the principal amount of the 2025 Notes, plus accrued and unpaid interest on the 2025 Notes, amounting to US$370.2 million which includes an early settlement premium of R196 million recognised as an early redemption premium on the 2025 Notes in profit or loss. The 2025 Notes were settled on 6 December 2021.
| | | | | |
| Terms of the 2022 and 2025 Notes |
| Facility: | US$500 million 6.125% Senior Notes due 2022 (the 2022 Notes) |
| US$550 million 7.125% Senior Notes due 2025 (the 2025 Notes) |
| Outstanding nominal value: | 2022 Notes: Nil |
| 2025 Notes: Nil |
| Interest rate: | 2022 Notes: 6.125% |
| 2025 Notes: 7.125% |
| Term of the Notes: | 2022 Notes: Five years |
| 2025 Notes: Eight years |
| Issuer: | Stillwater |
| Guarantors: | Each of the Notes were fully and unconditionally guaranteed, jointly and severally by the Guarantors (the Company, SGL, Kroondal, SRPM and WPL). The Guarantees rank equally in right of payment to all existing and future senior debt of the Guarantors. |
| | | | | | | | | | | |
| Figures in million – SA rand | 2021 | 2020 | 2019 |
| Balance at beginning of the year | 10,136 | | 9,610 | | 9,809 | |
| Loans repaid | (10,840) | | — | | — | |
| Accrued interest paid | (527) | | (741) | | (672) | |
| Interest charge | 523 | | 764 | | 665 | |
| Unwinding of amortised cost | 169 | | 59 | | 48 | |
| Early redemption premium on the 2025 Notes | 196 | | — | | — | |
| Loss/(gain) on foreign exchange differences | 343 | | 444 | | (240) | |
| Balance at end of the year | — | | 10,136 | | 9,610 | |
Notes to the consolidated financial statements continued
For the year ended 31 December 2021
28.5 2026 and 2029 Notes
On 16 November 2021 the Group completed a two-tranche corporate bond offering 4.0% Notes (US$675 million) due 16 November 2026 (the 2026 Notes) and 4.5% Notes (US$525 million) due 16 November 2029 (the 2029 Notes) (together the 2026 and 2029 Notes). The proceeds were applied towards the redemption of the 2025 Notes and will also be applied for general corporate purposes, including advancing the Group’s green metals strategy through investments and accretive acquisitions. The bonds were issued through the Group's wholly-owned subsidiary Stillwater Mining Company.
Terms of the 2026 and 2029 Notes
| | | | | | | | |
| Facility: | US$675 million 4.0% Senior Notes due 2026 | |
| US$525 million 4.5% Senior Notes due 2029 | |
| Interest rate: | 2026 Notes: 4.0% | |
| 2029 Notes: 4.5% | |
| Term of the Notes: | 2026 Notes: Five years | |
| 2029 Notes: Eight years | |
| Issuer: | Stillwater | |
| Guarantors: | Each of the Notes are fully and unconditionally guaranteed, jointly and severally by the Guarantors (the Company, SGL, Kroondal, SRPM and WPL). The Guarantees rank equally in right of payment to all existing and future senior debt of the Guarantors. |
| | | | | | | | | | | | | | |
| Figures in million – SA rand | | 2021 | 2020 | 2019 |
| Balance at beginning of the year | | — | — | — |
| Loans raised | | 18,208 | — | — |
| Interest charge | | 99 | — | — |
| Unwinding of amortised cost | | 8 | — | — |
| Loss on foreign exchange differences | | 470 | — | — |
| Balance at end of the year | | 18,785 | — | — |
28.6 US$ Convertible Bond
The US$ Convertible Bond was launched and priced on 19 September 2017 with the proceeds applied towards the partial repayment of the Stillwater Bridge Facility, raised for the acquisition of Stillwater (the “Bonds”). On 11 September 2018, Sibanye-Stillwater concluded the repurchase of a portion of the Bonds. An aggregate principal amount of US$66 million for a total purchase price of approximately US$50 million was repurchased. Following the repurchase, the outstanding nominal value amounted to US$384 million.
On 11 September 2020 a bondholder elected to convert a US$200,000 bond into 127,967 ordinary shares of the Company. On 18 September 2020, SGL issued notice to exercise its rights to redeem all the Bonds in full on 19 October 2020 (Optional Redemption Notice). Following the issue of the Optional Redemption Notice and subject to the conditions of the Bonds, bondholders could still exercise their conversion rights by delivering a conversion notice. Following receipt of the conversion notices, SGL could elect to settle the Bonds in shares of the Company or in cash to the value of the shares, subject to the conditions of the Bonds. Conversion notices were received for Bonds with a nominal value of US$383 million and all converted bonds were settled through the issue of 247,912,467 ordinary shares in the Company. No conversion notices were received for Bonds to the value of $0.8 million and these were redeemed for cash at nominal value, including unpaid accrued interest.
Upon implementation of the Scheme on 24 February 2020, SGL became a subsidiary of the Company, which in turn became the new holding company of the Group (refer note 26). Consequently, the converted Bonds were settled in shares of the Company.
The Bonds consisted of two components under IFRS. The conversion option component was recognised as a derivative financial liability measured at fair value through profit or loss. The bond component was recognised as a financial liability measured at amortised cost using the effective interest method. Both financial liabilities were extinguished upon settlement of the Bonds. Before derecognition, interest was accrued up to the settlement date on the amortised cost component based on the original effective interest rate.
The loss on settlement was attributed to the derivative component and measured as the difference between the fair value of the Company shares issued on the respective settlement dates, the carrying amount of the amortised cost component immediately before settlement and the carrying amount of the derivative component. Company shares issued on settlement of the Bonds were measured at the fair value on the dates of issue to the bondholders by applying a volume weighted average price (VWAP) on the day.
Notes to the consolidated financial statements continued
For the year ended 31 December 2021
| | | | | |
| Terms of the US$ Convertible Bond |
| Issue size: | US$450 million |
| Outstanding nominal value: | Nil |
| Coupon: | 1.875% |
| Maturity date: | Original maturity date: 26 September 2023 (six years), early redemption finalised: 19 October 2020 |
| Conversion premium: | 35% |
| Reference share price: | US$1.2281, being the volume weighted average price of a share on the JSE from launch to pricing on 19 September 2017, converted at a fixed exchange rate. |
| Initial conversion price: | US$1.6580 |
| Issuer: | SGL |
| Guarantors: | The Company, Stillwater and Kroondal |
The table below sets out the details relating to the settlement of the Bonds:
| | | | | |
| 2020 |
| Number of shares issued ('thousands) | 248,040 | |
| Number of bonds settled | 1,916 | |
| Fair value of Company shares issued ('millions) | 12,573 | |
| Range of VWAPs on settlement (ZAR) | 46.5 - 51.5 |
| Cash redemption amount ('millions) | 13 | |
| Derivative element settlement value ('millions) | 6,995 | |
| Bond element settlement value ('millions) | 5,578 | |
The tables below illustrate the movement in the amortised cost element and the derivative element respectively:
Convertible bond at amortised cost
| | | | | | | | | | | |
| Figures in million – SA rand | 2021 | 2020 | 2019 |
| Balance at beginning of the year | — | | 4,579 | | 4,497 | |
Loans repaid1 | — | | (13) | | — | |
Loans converted into shares2 | — | | (5,578) | | — | |
| Accrued interest paid | — | | (125) | | (106) | |
| Interest charge | — | | 94 | | 105 | |
| Unwinding of amortised cost | — | | 187 | | 197 | |
| Loss/(gain) on foreign exchange differences | — | | 856 | | (114) | |
| Balance at end of the year | — | | — | | 4,579 | |
1 The amount for the year ended 31 December 2020 relates to the redemption of Bonds for which no conversion notice was received
2 Calculated as the amortised cost on the date of settlement
Derivative financial instrument at fair value
| | | | | | | | | | | | | | |
| Figures in million – SA rand | Note | 2021 | 2020 | 2019 |
| Balance at beginning of the year | | — | | 4,145 | | 409 | |
Loss on financial instruments1 | 7 | — | | 70 | | 3,912 | |
| Settlement of derivative financial instrument | | — | | (6,995) | | — | |
Loss on settlement of US$ Convertible Bond2 | | — | | 1,507 | | — | |
| Loss/(gain) on foreign exchange differences | | — | | 1,273 | | (176) | |
| Balance at end of the year | | — | | — | | 4,145 | |
1 The loss on the financial instrument is attributable to changes in various valuation inputs, including in the movement in the Company’s share price, change in USD/ZAR exchange rate, bond market value and credit risk spreads
2 Relates to the difference between the fair value of the Company shares issued on date of settlement, carrying value of the derivative liability before settlement and the carrying value of the amortised cost element on date of settlement
Notes to the consolidated financial statements continued
For the year ended 31 December 2021
28.7 Burnstone Debt
Sibanye Gold Eastern Operations (SGEO) has bank debt of US$178 million (the Burnstone Debt) outstanding as part of the net assets acquired on 1 July 2014.
Terms of the Burnstone Debt
| | | | | |
| Facility: | A1: US$0.2 million |
| A2: US$7.8 million |
| A3: US$51.0 million |
| A4: US$119.1 million |
| Interest rate: | A1 and A2: Interest free |
| A3 and A4: Interest free until 1 July 2017, then at LIBOR |
| Interest rate margin: | A3 and A4: 4% from 1 July 2017 |
| Term of loan: | No fixed term |
| Repayment period: | A1: Repaid on 1 July 2014 |
| A2: From 1 July 2017 the first 50% of Burnstone’s free cash flow (as defined in the settlement agreement) will be used to repay the Wits Gold Loan and the balance of 50% to repay A2. |
| A3 and A4: On settlement of A2, 90% of Burnstone’s free cash flow will be used to repay the Wits Gold Loan and the balance of 10% to repay the Burnstone Debt. On settlement of the Wits Gold Loan and interest, 30% of Burnstone’s free cash flow will be used to repay the Burnstone Debt and the balance will be distributed to Wits Gold. |
| The Bank Lenders will continue to participate in 10% of Burnstone’s free cash flow after the Burnstone Debt has been repaid in full to a maximum amount of US$63.0 million under a revenue participation agreement. |
| Security: | The Burnstone Debt is fully secured against the assets of Burnstone (of R2.0 billion) and there is no recourse to the Group. The security package includes a cession over the bank accounts, insurance policies’ proceeds, special and general notarial bonds over movable assets and mortgage bonds over property. |
The Burnstone Debt facilities of US$178 million were initially recognised at the acquisition fair value using level 3 assumptions, being R1,008 million, in terms of IFRS 13 at acquisition date. The expected free cash flows to repay the loan as detailed above were based on the estimates and assumptions to determine the fair value at acquisition:
•A US$ swap forward curve adjusted with the 4% interest rate margin above
•The annual life-of-mine plan that takes into account the following:
◦Proved and probable ore reserves of Burnstone
–Cash flows are based on the life-of-mine plan of 20 years
–Capital expenditure estimates over the life-of-mine plan
| | | | | | | | | | | | | | |
| Figures in million – SA rand | Note | 2021 | 2020 | 2019 |
| Balance at beginning of the year | | 1,263 | | 1,330 | | 1,145 | |
| Accrued interest and unwinding of amortised cost | | 125 | | 148 | | 120 | |
Loss/(gain) on revised estimated cash flows1 | 7 | 2 | | (264) | | 97 | |
| Loss/(gain) on foreign exchange differences | | 117 | | 49 | | (32) | |
| Balance at end of the year | | 1,507 | | 1,263 | | 1,330 | |
1 At 31 December 2021, the expected free cash flows expected to repay the loan as detailed above were revised as a result of revised cash flows over the life-of-mine plan due to:
•Revised forecast costs and capital expenditure; and
•Revised weighted average gold prices 2021: R729,270/kg (2020: R733,037/kg and 2019: R686,225/kg) and exchange rates 2021: R15.00/US$ (2020: R16.00/US$ and 2019: R14.00/US$) based on a LOM of 24 years. A2 is discounted using a 5.9% discount rate and A3 and A4 is discounted at 9.5%
Notes to the consolidated financial statements continued
For the year ended 31 December 2021
28.8 Other borrowings
Short-term credit facilities
Sibanye-Stillwater has committed and uncommitted short term loan facilities with various banks to fund capital expenditure and working capital requirements at its operations. These facilities have no fixed terms, are short-term in nature and interest rates are market related.
| | | | | | | | | | | |
| Figures in million – SA rand | 2021 | 2020 | 2019 |
| Balance at beginning of the year | — | | — | | 425 | |
| Loans raised | 1,711 | | 4,071 | | 8,265 | |
| Loans repaid | (1,684) | | (4,020) | | (11,136) | |
| Unwinding of amortised cost | — | | — | | 10 | |
| Borrowings acquired on acquisition of subsidiary | — | | — | | 2,575 | |
| Other | — | | — | | 1 | |
| Gain on foreign exchange differences | (27) | | (51) | | (140) | |
| Balance at end of the year | — | | — | | — | |
28.9 Fair value of financial instruments and risk management
Fair value of borrowings
The fair value of variable interest rate borrowings approximates its carrying amounts as the interest rates charged are considered marked related. Fair value of fixed interest rate borrowings was determined through reference to ruling market prices and interest rates.
The table below shows the fair value and carrying amount of borrowings where the carrying amount does not approximate fair value:
| | | | | | | | | | | | | | |
| Carrying value | Fair value |
| Figures in million - SA rand | | Level 1 | Level 2 | Level 3 |
| 31 December 2021 | | | | |
2026 and 2029 Notes1 | 18,785 | | 18,664 | | — | | — | |
Burnstone Debt2 | 1,507 | | — | | — | | 2,996 | |
| Total | 20,292 | | 18,664 | | — | | 2,996 | |
| 31 December 2020 | | | | |
2022 and 2025 Notes1 | 10,136 | | 10,637 | | — | | — | |
Burnstone Debt2 | 1,263 | | — | | — | | 2,075 | |
| Total | 11,399 | | 10,637 | | — | | 2,075 | |
| 31 December 2019 | | | | |
2022 and 2025 Notes1 | 9,610 | | 10,138 | | — | | — | |
US$ Convertible Bond3 | 4,579 | | — | | 4,725 | | — | |
Burnstone Debt2 | 1,330 | | — | | — | | 1,441 | |
| Total | 15,519 | | 10,138 | | 4,725 | | 1,441 | |
1 The fair value is based on the quoted market prices of the notes
2 The fair value of the Burnstone Debt has been derived from discounted cash flow models. These models use several key assumptions, including estimates of future sales volumes, gold prices, operating costs, capital expenditure and discount rate. The fair value estimate is sensitive to changes in the key assumptions, for example, increases in the market related discount rate would decrease the fair value if all other inputs remain unchanged. The extent of the fair value changes would depend on how inputs change in relation to each other
3 The fair value of the amortised cost component of the US$ Convertible Bond is based on the quoted price of the instrument after separating the fair value of the derivative component
Notes to the consolidated financial statements continued
For the year ended 31 December 2021
Liquidity risk
The following are contractually due, undiscounted cash flows resulting from maturities of financial liabilities including interest payments:
| | | | | | | | | | | | | | |
| Figures in million – SA rand | Total | Within one
year | Between one and five years | After five years |
| 31 December 2021 | | | | |
| Other payables | 12,661 | | 4,915 | | 4,060 | | 3,686 | |
| Trade and other payables | 10,443 | | 10,443 | | — | | — | |
| Borrowings | | | | |
| - Capital | | | | |
| 2026 and 2029 Notes | 19,129 | | — | | 10,760 | | 8,369 | |
| Burnstone Debt | 1,158 | | — | | — | | 1,158 | |
| Franco-Nevada liability | 2 | | 2 | | — | | — | |
| Stillwater Convertible Debentures | 4 | | 4 | | — | | — | |
| - Interest | 9,341 | | 807 | | 3,175 | | 5,359 | |
| Total | 52,738 | | 16,171 | | 17,995 | | 18,572 | |
| 31 December 2020 | | | | |
| Other payables | 5,089 | | 2,308 | | 2,723 | | 58 | |
| Trade and other payables | 8,523 | | 8,523 | | — | | — | |
| Borrowings | | | | |
| - Capital | | | | |
| US$600 million RCF | 6,978 | | 873 | | 6,105 | | — | |
| 2022 and 2025 Notes | 10,292 | | — | | 10,292 | | — | |
| Burnstone Debt | 114 | | — | | 12 | | 102 | |
| Franco-Nevada liability | 2 | | 2 | | — | | — | |
| Stillwater Convertible Debentures | 4 | | 4 | | — | | — | |
| - Interest | 6,681 | | 809 | | 1,564 | | 4,308 | |
| Total | 37,683 | | 12,519 | | 20,696 | | 4,468 | |
| 31 December 2019 | | | | |
| Other payables | 3,808 | | 775 | | 2,919 | | 114 | |
| Trade and other payables | 7,740 | | 7,740 | | — | | — | |
| Borrowings | | | | |
| - Capital | | | | |
| US$600 million RCF | 5,712 | | — | | 5,712 | | — | |
| R6.0 billion RCF | 2,500 | | — | | 2,500 | | — | |
| 2022 and 2025 Notes | 9,809 | | — | | 4,952 | | 4,857 | |
| US$ Convertible Bond | 5,376 | | — | | 5,376 | | — | |
| Burnstone Debt | 109 | | — | | 109 | | — | |
| Franco-Nevada liability | 2 | | 2 | | — | | — | |
| Stillwater Convertible Debentures | 4 | | 4 | | — | | — | |
| - Interest | 7,820 | | 1,184 | | 2,698 | | 3,938 | |
| Total | 42,880 | | 9,705 | | 24,266 | | 8,909 | |
Market risk
Foreign currency sensitivity
Certain of the Group’s US dollar borrowing facilities have been drawn down by companies with SA rand as their functional currency, therefore some of the Group’s borrowings are sensitive to changes in the rand/US dollar exchange rate. The Group is also exposed to foreign currency risk on intercompany loans denominated in foreign currencies to the extent that foreign exchange differences are recognised in profit or loss. A one percentage point change in the SA rand closing exchange rate of R15.94/US$ (2020: R14.69/US$ and 2019: R14.00/US$) would have changed the profit for the year by R50 million (2020: R148 million and 2019: R102 million).
Notes to the consolidated financial statements continued
For the year ended 31 December 2021
Interest rate sensitivity
As at 31 December 2021, the Group’s total borrowings amounted to R20,298 million (2020: R18,383 million and 2019: R23,736 million). The Group generally does not undertake any specific action to cover its exposure to interest rate risk, although it may do so in specific circumstances.
The portion of Sibanye-Stillwater’s interest-bearing borrowings at period end that is exposed to interest rate fluctuations is R1,416 million (2020: R8,157 million and 2019: R9,454 million). This debt is normally rolled for periods between one and three months and is therefore exposed to the rate changes in this period.
At 31 December 2021, of the total borrowings, Rnil (2020: RNaN and 2019: R2,500 million) is exposed to changes in the JIBAR rate and R1,416 million (2020: R8,157 million and 2019: R6,954 million) is exposed to changes in the LIBOR rate.
The US$600 million RCF and the R5.5 billion RCF are affected by the IBOR reform which came into effect on 1 January 2021. The R5.5 billion RCF is linked to JIBAR and is not drawn down at 31 December 2021, however the JIBAR is only expected to be impacted by the reform at a later stage and any impact thereof is to be considered when this occurs. The US$600 million RCF is linked to a US LIBOR and will be refinanced or restructured depending on the developments in respect of the US LIBOR reform. Therefore, the Group was not impacted when the amendment became effective.
The table below summarises the effect of a change in finance expense on the Group’s profit or loss had JIBAR and LIBOR differed as indicated. The analysis is based on the assumption that the applicable interest rate increased/decreased with all other variables held constant. All financial instruments with fixed interest rates that are carried at amortised cost are not subject to the interest rate sensitivity analysis.
Interest rate sensitivity analysis
| | | | | | | | | | | | | | | | | | | | |
| Change in interest expenses for a change in interest rate1 |
| Figures in million - SA rand | (1.5) | % | (1.0) | % | (0.5) | % | 0.5 | % | 1.0 | % | 1.5 | % |
| 31 December 2021 | | | | | | |
| - JIBAR | — | | — | | — | | — | | — | | — | |
| - LIBOR | 21 | | 14 | | 7 | | (7) | | (14) | | (21) | |
| Change in finance expense | 21 | | 14 | | 7 | | (7) | | (14) | | (21) | |
| 31 December 2020 | | | | | | |
| - JIBAR | — | | — | | — | | — | | — | | — | |
| - LIBOR | 122 | | 82 | | 41 | | (41) | | (82) | | (122) | |
| Change in finance expense | 122 | | 82 | | 41 | | (41) | | (82) | | (122) | |
| 31 December 2019 | | | | | | |
| - JIBAR | 38 | | 25 | | 13 | | (13) | | (25) | | (38) | |
| - LIBOR | 106 | | 70 | | 35 | | (35) | | (70) | | (106) | |
| Change in finance expense | 144 | | 95 | | 48 | | (48) | | (95) | | (144) | |
1 Interest rate sensitivity analysis is performed on the borrowings balance at 31 December
Notes to the consolidated financial statements continued
For the year ended 31 December 2021
The exposure to interest rate changes and the contractual repricing dates
The exposure of the Group’s borrowings to interest rate changes and the contractual repricing dates at the reporting dates is as follows
| | | | | | | | | | | |
| Figures in million - SA rand | 2021 | 2020 | 2019 |
| Floating rate with exposure to change in JIBAR | — | | — | | 2,500 | |
| Floating rate with exposure to change in LIBOR | 1,416 | | 8,157 | | 6,954 | |
| Non-current borrowings exposed to interest rate changes | 1,416 | | 8,157 | | 9,454 | |
| | | |
| The Group has the following undrawn borrowing facilities: | | | |
| Committed | 15,749 | | 7,336 | | 5,688 | |
| Uncommitted | 2,276 | | 2,460 | | 1,050 | |
| Total undrawn facilities | 18,025 | | 9,796 | | 6,738 | |
| | | |
| All of the above facilities have floating rates. The undrawn committed facilities have the following expiry dates: | | | |
| - within one year | 685 | | 229 | | — | |
| - later than one year and not later than two years | 9,564 | | 229 | | 672 | |
| - later than two years and not later than three years | 5,500 | | 6,878 | | 5,016 | |
| Total undrawn committed facilities | 15,749 | | 7,336 | | 5,688 | |
28.10 Capital management
The Group’s primary objective with regards to managing its capital is to ensure that there is sufficient capital available to support the funding requirements of the Group, including capital expenditure, in a way that: optimises the cost of capital; maximises shareholders’ returns; and ensures that the Group remains in a sound financial position.
The Group manages and makes adjustments to the capital structure as and when borrowings mature or as and when funding is required. This may take the form of raising equity, market or bank debt or hybrids thereof. Opportunities in the market are also monitored closely to ensure that the most efficient funding solutions are implemented.
The Group monitors capital using the ratio of net (cash)/debt to adjusted earnings before interest, taxes, depreciation and amortisation (EBITDA), but does not set absolute limits for this ratio.
| | | | | | | | | | | |
| Figures in million - SA rand | 2021 | 2020 | 2019 |
Borrowings1 | 18,791 | | 17,119 | | 26,551 | |
Cash and cash equivalents2 | 30,257 | | 20,206 | | 5,586 | |
Net (cash)/debt3 | (11,466) | | (3,087) | | 20,964 | |
Adjusted EBITDA4 | 68,606 | | 49,385 | | 14,956 | |
Net (cash)/debt to adjusted EBITDA (ratio)5 | (0.2) | | (0.1) | | 1.4 | |
1 Borrowings are only those borrowings that have recourse to Sibanye-Stillwater. Borrowings, therefore, exclude the Burnstone Debt and include the derivative financial instrument up to the settlement of the US$ Convertible Bond
2 Cash and cash equivalents exclude cash of Burnstone
3 Net (cash)/debt represents borrowings and bank overdraft less cash and cash equivalents. Borrowings are only those borrowings that have recourse to Sibanye-Stillwater and, therefore, exclude the Burnstone Debt and include the derivative financial instrument up to the settlement of the US$ Convertible Bond. Net (cash)/debt excludes cash of Burnstone
4 The adjusted EBITDA calculation is based on the definitions included in the facility agreements for compliance with the debt covenant formula, except for impact of new accounting standards and acquisitions, where the facility agreements allow the results from the acquired operations to be annualised. Adjusted EBITDA may not be comparable to similarly titled measures of other companies. Adjusted EBITDA is not a measure of performance under IFRS and should be considered in addition to, and not as a substitute for, other measures of financial performance and liquidity
5 Net (cash)/debt to adjusted EBITDA ratio is defined as net (cash)/debt as of the end of a reporting period divided by adjusted EBITDA of the 12 months ended on the same reporting date. Non-IFRS measure such as net (cash)/debt to adjusted EBITDA is the responsibility of the Group’s Board of Directors and is presented for illustration purposes only, and because of its nature, net (cash)/ debt to adjusted EBITDA should not be considered as a representation of financial performance under IFRS and should be considered in addition to, and not as a substitute for, other measures of financial performance and liquidity
Notes to the consolidated financial statements continued
For the year ended 31 December 2021
Reconciliation of profit/(loss) before royalties, carbon tax and tax to adjusted EBITDA:
| | | | | | | | | | | |
| Figures in million - SA rand | 2021 | 2020 | 2019 |
| Profit/(loss) before royalties, carbon tax and tax | 50,275 | | 37,250 | | (856) | |
| Adjusted for: | | | |
| Amortisation and depreciation | 8,293 | | 7,593 | | 7,214 | |
| Interest income | (1,202) | | (1,065) | | (560) | |
| Finance expense | 2,496 | | 3,152 | | 3,303 | |
| Share-based payments | 383 | | 512 | | 363 | |
| Loss on financial instruments | 6,279 | | 2,450 | | 6,015 | |
| (Gain)/loss on foreign exchange differences | (1,149) | | 255 | | (325) | |
| Share of results of equity-accounted investees after tax | (1,989) | | (1,700) | | (721) | |
| Change in estimate of environmental rehabilitation obligation, and right of recovery receivable and payable | (167) | | (464) | | 89 | |
| Gain on disposal of property, plant and equipment | (36) | | (99) | | (77) | |
| Impairments/(reversal of impairments) | 5,148 | | (121) | | 86 | |
| Early redemption premium on the 2025 Notes | 196 | | — | | — | |
| Gain on acquisition | — | | — | | (1,103) | |
| Loss on BTT early settlement | — | | 186 | | — | |
| Restructuring costs | 107 | | 436 | | 1,252 | |
| Transaction costs | 140 | | 139 | | 448 | |
| Loss on settlement of US$ Convertible Bond | — | | 1,507 | | — | |
| Loss due to dilution of interest in joint operation | 4 | | 30 | | — | |
| Income on settlement of dispute | — | | (580) | | — | |
| IFRS 16 lease payments | (142) | | (148) | | (132) | |
| Profit on sale of St Helena | (16) | | — | | — | |
| Occupational healthcare (gain)/expense | (14) | | 52 | | (40) | |
| Adjusted EBITDA | 68,606 | | 49,385 | | 14,956 | |
Notes to the consolidated financial statements continued
For the year ended 31 December 2021
29. Lease liabilities
| | |
Accounting policy At the inception of a contract, the Group assesses whether a contract is, or contains, a lease. A contract is, or contains, a lease if the contract conveys the right to control the use of an identified asset for a period of time in exchange for consideration. Lease liabilities are initially measured at the present value of the future lease payments at the commencement date, discounted using the interest rate implicit in the lease or, if that rate cannot be readily determined, the relevant incremental borrowing rate. Subsequently, lease liabilities are measured at amortised cost using the effective interest method. Lease liabilities are remeasured when there is a change in future lease payments arising from a change in an index or rate, if there is a change in the Group’s estimate of the amount expected to be payable under a residual value guarantee, or if the Group changes its assessment of whether it will exercise a purchase, extension or termination option. When the lease liability is remeasured in this way, a corresponding adjustment is made to the carrying amount of the right-of-use asset, or is recorded in profit or loss if the carrying amount of the right-of-use asset has been reduced to zero. The Group also elected to apply the recognition exemptions for lease contracts that, at the commencement date, have a lease term of 12 months or less and do not contain a purchase option, and lease contracts for which the underlying asset is of low value. The Group recognises the lease payments associated with these leases as an expense on a straight-line basis over the lease term to the extent applicable. In addition, certain variable lease payments are not permitted to be recognised as lease liabilities and are expensed as incurred. |
| | | | | | | | | | | | | | |
| Figures in million - SA rand | Notes | 2021 | 2020 | 2019 |
| Balance at beginning of the year | | 326 | | 383 | | — | |
| Impact of adopting IFRS 16 on 1 January 2019 | | — | | — | | 302 | |
| New leases and modifications | | 67 | | 66 | | 52 | |
| Lease liabilities on acquisition of subsidiaries | 16.1 | — | | — | | 133 | |
| Repayment of lease liabilities | | (142) | | (148) | | (132) | |
| Interest charge | 5.2 | 29 | | 34 | | 34 | |
| Re-classification and other | | — | | (9) | | (6) | |
| Foreign currency translation | | 1 | | — | | — | |
| Balance at end of the year | | 281 | | 326 | | 383 | |
| Current portion of lease liabilities | | (104) | | (103) | | (110) | |
| Non-current lease liabilities | | 177 | | 223 | | 273 | |
Lease payments not recognised as a liability but expensed during the year
| | | | | | | | | | | |
| Figures in million - SA rand | 2021 | 2020 | 2019 |
| Short-term leases | 22 | | 17 | | 9 | |
| Leases of low value assets | 39 | | 83 | | 34 | |
| Variable lease payments | 29 | | 11 | | 7 | |
| Total | 90 | | 111 | | 50 | |
Maturity Analysis
The lease liabilities are secured by the related underlying assets. The undiscounted maturity analysis of lease liabilities at 31 December is as follows:
| | | | | | | | | | | | | | |
| Figures in million - SA rand | Total | Within one year | Between one and five years | After five years |
| Contractual undiscounted cash flows - 2021 | 325 | | 126 | | 191 | | 8 | |
| Contractual undiscounted cash flows - 2020 | 391 | | 131 | | 245 | | 15 | |
| Contractual undiscounted cash flows - 2019 | 475 | | 140 | | 298 | | 37 | |
Notes to the consolidated financial statements continued
For the year ended 31 December 2021
30. Environmental rehabilitation obligation and other provisions
| | |
Significant accounting judgements and estimates The Group’s mining and exploration activities are subject to various laws and regulations governing the protection of the environment. The Group recognises management’s best estimate for asset retirement obligations in the period in which they are incurred. Actual costs incurred in future periods could differ materially from the estimates. Additionally, future changes to environmental laws and regulations, life-of-mine estimates and discount rates could affect the carrying amount of this provision. The provision is calculated using the following assumptions: |
| | | | | | | | | | | |
| Inflation rate | Discount rate | Discount period |
| 2021 | | | |
| SA gold operations | 6% | 5.1% - 10.6% | 1 - 24 years |
| SA PGM operations | 6% | 5.1% - 10.6% | 1 - 50 years |
| US PGM operations | 2% | 1.9% | 35 - 40 years |
| 2020 | | | |
| SA gold operations | 6% | 4.0% - 10.9% | 1 – 21 years |
| SA PGM operations | 6% | 4.0% - 10.8% | 1 – 32 years |
| US PGM operations | 2% | 1.5% - 1.7% | 24 – 38 years |
| 2019 | | | |
| SA gold operations | 6% | 6.7% - 10.0% | 1 – 19 years |
| SA PGM operations | 6% | 6.7% - 10.1% | 1 – 31 years |
| US PGM operations | 2% | 2.3% - 2.4% | 25 – 37 years |
| | |
Accounting Policy Provisions are recognised when the Group has a present obligation, legal or constructive, resulting from past events and it is probable that an outflow of resources embodying economic benefits will be required to settle the obligation and a reliable estimate can be made of the amount of the obligation. Long-term environmental obligations are based on the Group’s environmental management plans, in compliance with applicable environmental and regulatory requirements. The estimated costs of rehabilitation are reviewed annually and adjusted as appropriate for changes in legislation, technology or other circumstances. Cost estimates are not reduced by the potential proceeds from the sale of assets or from plant clean up at closure. Based on disturbances to date, the net present value of expected rehabilitation cost estimates is recognised and provided for in full in the financial statements. The estimates are reviewed annually and are discounted using a risk-free rate that is adjusted to reflect the current market assessments of the time value of money. Annual changes in the provision consist of finance costs relating to the change in the present value of the provision and inflationary increases in the provision estimate, as well as changes in estimates. Changes in estimates are capitalised or reversed against the relevant asset or liability to the extent that it meets the definition of dismantling and removing the item and restoring the site on which it is located. Costs that relate to an existing condition caused by past operations and do not have a future economic benefit are recognised in profit or loss. If a decrease in the liability exceeds the carrying amount of the asset, the excess is recognised immediately in profit or loss. The present value of environmental disturbances created are capitalised to mining assets against an increase in the environmental rehabilitation obligation. Rehabilitation projects undertaken, included in the estimates are charged to the provision as incurred. The cost of ongoing current programmes to prevent and control environmental disturbances is recognised in profit or loss as incurred. The unwinding of the discount due to the passage of time is recognised as finance cost, and the capitalised cost is amortised over the remaining lives of the mines. |
Notes to the consolidated financial statements continued
For the year ended 31 December 2021
| | | | | | | | | | | | | | |
| Figures in million - SA rand | Notes | 2021 | 2020 | 2019 |
| Balance at beginning of the year | | 8,634 | | 8,715 | | 6,294 | |
| Interest charge | 5.2 | 615 | | 684 | | 579 | |
Utilisation of environmental rehabilitation obligation1 | | (236) | | (97) | | (35) | |
Change in estimates charged to profit or loss2 | | (178) | | (375) | | 89 | |
Change in estimates capitalised2 | | (638) | | (318) | | 105 | |
| Environmental rehabilitation obligation on acquisition of subsidiaries | 16 | — | | — | | 1,697 | |
| Foreign currency translation | | 66 | | 25 | | (14) | |
| Balance at end of the year | | 8,263 | | 8,634 | | 8,715 | |
| Environmental rehabilitation obligation and other provisions consists of: | | | | |
| Environmental rehabilitation obligation | | 8,146 | | 8,517 | | 8,598 | |
| Other provisions | | 117 | | 117 | | 117 | |
| Environmental rehabilitation obligation and other provisions | | 8,263 | | 8,634 | | 8,715 | |
1 The cost of ongoing current programmes to prevent and control environmental disturbances, including reclamation activities, is charged to cost of sales as incurred
2 Changes in estimates result from changes in reserves and corresponding changes in life-of-mine, changes in discount rates, changes in closure cost estimates and changes in laws and regulations governing environmental matters
The Group’s mining operations are required by law to undertake rehabilitation works as part of their ongoing operations. The Group makes contributions into environmental rehabilitation obligation funds (refer note 21) and holds guarantees to fund the estimated costs.
Post closure water management liability
The Group continues to monitor the potential risk of long-term acid and non-acidic mine impacted water and other groundwater pollution challenges also experienced by peer mining groups. Acid mine drainage (AMD) specifically relates to the acidification and contamination of naturally occurring water resources by pyrite-bearing ore contained in underground mines, rock dumps, tailings facilities and pits on surface. As yet, the Group has not been able to reliably determine the financial impact that AMD and groundwater pollution may have on the Group, nor the timing of possible outflow due to the need to understand the final footprint of impacted areas on surface and the mine void upon re-watering.
The potential for acidic and non-acidic mine impacted water and other groundwater impacts, how, where and if they will manifest and the associated environmental/closure liability will be determined as part of the Group’s quantification of any post-closure residual environmental impacts using a robust and defendable risk assessment process. This will be a requirement in the proposed amended Financial Provisioning (FP) Regulations that comes into effect in June 2022. As per the recent closure process undertaken at our Cooke Operations, detailed studies to understand the hydrology and hydrogeology were undertaken, including the modelling of worst-case scenarios assuming waste on surface cannot be removed. These studies further included the modelling of the mined out void, re-watering rate and natural groundwater flow in the dolomite aquifer overlaying the mined-out area, including the relationship with adjacent mining areas and surface water resources to understand cumulative impacts.
The conclusions from the studies were used to inform a risk assessment and closure strategy to reliably predict water quality impacts as part of long term sustainable closure solution. In addition, in the December 2021 closure liability assessments, the Group makes financial provision of R880 million (undiscounted) for what it specifically termed “Post Closure Aspects” – this includes but is not limited to amongst others, post-closure water management aspects such as initial and post-decant surface and groundwater monitoring, wetlands, biomonitoring and aquatics monitoring and care-and-maintenance monitoring. During the operational life-of-mine, we aim at investigating and implementing practical, sustainable and cost-effective solutions that, where possible, reduces post-closure impacts as effectively as possible, whilst also promoting the establishment and implementation of self-sustaining ecosystems and processes, respectively, that would require very limited or no ongoing active management by the mine, in a post-closure scenario.
Notes to the consolidated financial statements continued
For the year ended 31 December 2021
31. Occupational healthcare obligation
| | |
Significant accounting judgements and estimates The Group recognises management’s best estimates to settle any occupational healthcare claims against the Group’s operations. The ultimate outcome of the number, timing and amount of successful claims to be paid out remains uncertain. The provision is consequently subject to adjustment in the future and actual costs incurred in future periods could differ materially from the estimates. Estimates that were used in the assessment include value of benefits per claimant, disease progression rates, required contributions, timing of payments, tracing pattern, period discount rates, period inflation rates and a 60% take-up rate. These estimates were informed by a professional opinion. Management discounted the possible cash outflows using a discount rate of 7.83% (2020: 6.65% and 2019: 8.25%). In assessing whether the Group has control, joint control or significant influence over the trust that administers the claim settlement process (refer below), judgement was applied in determining whether voting rights are relevant to determine power over the key activities of the trust, as well as analysing the influence of the various parties. No control, joint control or significant influence was identified, however should any key considerations change in future periods, these conclusions will be reassessed. Accounting policy Provisions are recognised when the Group has a present obligation, legal or constructive resulting from past events and it is probable that an outflow of resources embodying economic benefits will be required to settle the obligation and a reliable estimate can be made of the amount of the obligation. The estimated costs of settlement claims are reviewed at least annually and adjusted as appropriate for changes in cash flow predictions or other circumstances. Based on estimates to date, the net present value of expected settlement claims is recognised and provided for in full in the financial statements. The estimated cash flows are discounted using a risk-free rate with similar terms to the obligation to reflect the current market assessments of the time value of money. Annual changes in the provision consist of finance costs relating to the change in the present value of the provision and changes in estimates. |
On 3 May 2018, the Occupational Lung Disease Working Group (the Working Group), including Sibanye-Stillwater, agreed to an approximately R5 billion class action settlement with the claimants (Settlement Agreement).
On 26 July 2019 the Gauteng High Court in Johannesburg approved the R5 billion Settlement Agreement in the silicosis class action suit. This Settlement Agreement provides compensation to all eligible workers suffering from silicosis and/or tuberculosis who worked in the Occupational Lung Disease Working Group companies’ mines from 12 March 1965 to the date of the Settlement Agreement.
The Settlement Agreement required the formation of the Tshiamiso Trust (the Trust) to administer the claim settlement process, which includes tracing claimants, assessing and processing submitted claims and paying benefits to eligible claimants. The Trust will be funded by the participants to the Working Group through contributions determined in accordance with the Settlement Agreement. In addition, a special purpose vehicle was created with the objective of performing certain functions on behalf of the Working Group as set out in the deed of the Trust and Settlement Agreement. The special purpose vehicle and Trust are not controlled by the Group.
On 19 December 2019 Sibanye-Stillwater provided a guarantee for an amount not exceeding R1,372 million in respect of administration contributions, initial benefit contributions and benefit contributions to the Trust as required by the trust deed.
Sibanye-Stillwater currently has provided R1,017 million for its share of the settlement cost. The provision is consequently subject to adjustment in the future based on the number of eligible workers and changes in other assumptions.
Notes to the consolidated financial statements continued
For the year ended 31 December 2021
| | | | | | | | | | | | | | |
| Figures in million - SA rand | Notes | 2021 | 2020 | 2019 |
| Balance at beginning of the year | | 1,194 | | 1,282 | | 1,274 | |
| Interest charge | 5.2 | 77 | | 96 | | 116 | |
| Change in estimate recognised in profit or loss | | (14) | | 52 | | (40) | |
| Payments made | 34 | (240) | | (236) | | (68) | |
| Balance at the end of the year | | 1,017 | | 1,194 | | 1,282 | |
| Reconciliation of the non-current and current portion of the occupational healthcare obligation: | | | | |
| Occupational healthcare obligation | | 1,017 | | 1,194 | | 1,282 | |
| Current portion of occupational healthcare obligation | | — | | (157) | | (149) | |
| Non-current portion of occupational healthcare obligation | | 1,017 | | 1,037 | | 1,133 | |
DRDGOLD is not a party to the Working Group’s mediated settlement agreement and DRDGOLD maintains the view that it is too early to consider settlement of the matter, mainly for the following reasons:
•the applicants have as yet not issued and served a summons (claim) in the matter to DRDGOLD
•there is no indication of the number of potential claimants that may join the class action against the DRDGOLD respondents
•many principles upon which legal responsibility may be founded, are required to be substantially developed by the trial court (and possibly subsequent courts of appeal) to establish liability on the bases alleged by the applicants
In light of the above there is inadequate information for DRDGOLD to determine if a sufficient legal and factual basis exists to establish liability, and to quantify such potential liability.
32. Deferred revenue
| | |
Significant accounting judgements and estimates Upfront cash deposits received for streaming transactions have been accounted for as contract liabilities (deferred revenue) in the scope of IFRS 15. These contracts are not financial instruments because they will be satisfied through the delivery of non-financial items (i.e. delivering of metal ounces) as part of the Group’s expected sale requirements, rather than cash or financial assets. It is the intention to satisfy the performance obligations under these streaming arrangements through the Group’s production, and revenue will be recognised over duration of the contracts as the Group satisfies its obligation to deliver metal ounces. Where these contracts are of a long-term nature and the Group received a portion of the consideration at the inception, these contracts contain a significant financing component under IFRS 15. The Group therefore made a critical estimate of the discount rate that should be applied to the contract liabilities over the life of contracts where applicable. Inputs to the model to unwind the Wheaton International advance received to revenue The advance received has been recognised on the statement of financial position as deferred revenue. The deferred revenue will be recognised as revenue in profit or loss based on the metal ounces/credits in relation to the expected total amount of metal credits to be delivered over the term of the arrangement. Each period management estimates the cumulative amount of the deferred revenue obligation that has been satisfied and, therefore, recognised as revenue. Key inputs into the model are: |
Notes to the consolidated financial statements continued
For the year ended 31 December 2021
| | | | | | | | |
| Key input | Estimate at year end | Further information |
| Estimated financing rate over life of arrangement | 4.6% - 5.2% | Refer note 5.2 |
| Remaining life of stream | 94 years | The starting point for the life of the stream is the approved life-of-mine for the US PGM operations. However, as IFRS 15 requires the constraint on revenue recognition to be considered, it is more prudent to include a portion of resources in the life of stream for the purposes of revenue recognition. This will reduce the chance of having a significant decrease in revenue recognised in the future, when the life-of-mine is updated to include a conversion of resources to reserves. As such, Sibanye-Stillwater management have determined that is it appropriate to include 50% of inferred resources. |
| Palladium entitlement percentage | 4.5% | The palladium entitlement percentage will be either 4.5%, 2.25% or 1% over the life of the mine, depending on whether or not the advance has been fully reduced, and a certain number of contractual ounces have been delivered (375,000 ounces for the first trigger drop down to 2.25%and 550,000 ounces for the second trigger drop down rate to 1%). |
| Gold entitlement percentage | 100% | The gold entitlement percentage will be 100% over the life of the mine. |
| Monthly cash percentage | 18% | The monthly cash payment to be received is 18%, 16%, 14% or 10% of the market price of the metal credit delivery to Wheaton International while the advance is not fully reduced. After the advance has been fully reduced, the cash percentage is 22%, 20%, 18% or 14%. The percentage applicable depends on the investment grade of the Group and its leverage ratio. As long as Sibanye-Stillwater’s current investment grade conditions as stipulated in the contract have been satisfied, the monthly cash percentage decreases if the Group’s leverage ratio increases above 3.5:1. The balance of the ounces in the monthly delivery (i.e. 100%-18%= 82%) is then used to determine the utilisation of the deferred revenue balance. |
| Commodity prices | Five day simple average calculated the day before delivery | The value of each metal credit delivery is determined in terms of the contract. |
| | |
Any changes to the above key inputs could significantly change the quantum of the cumulative revenue amount recognised in profit or loss. Any changes in the life-of-mine are accounted for prospectively as a cumulative catch-up in the year that the life-of-mine estimate above changes, or the inclusion of resources changes. |
| | |
Inputs to the model to unwind the BTT advance received to revenue The advance received was recognised on the statement of financial position as deferred revenue. Before the early settlement of the BTT project (refer below), the deferred revenue was recognised as revenue in profit or loss based on the metal ounces/credits in relation to the expected total amount of metal credits to be delivered over the term of the arrangement. Each period, up to the early settlement of the BTT project, management estimated the cumulative amount of the deferred revenue obligation that had been satisfied and, therefore, recognised as revenue. Key inputs into the model before settlement were: |
| | | | | | | | |
| Key input | | Further information |
| Estimated financing rate over life of arrangement | 11.5% | Refer note 5.2 |
| Remaining life of stream | 6 years | The life of the stream was determined by the reserves of the Marikana Easterns' Tailings Dam no.1. |
| 6E PGM entitlement percentage | 23.0% | The 6E PGM entitlement percentage ranged from 23% to 38% based on a weighted 6E PGM basket price that was determined monthly. |
| Monthly cash percentage | 20.0% | The monthly cash payment received was a percentage of the 6E PGM weighted basket price, ranging from 16% to 20%, and was based on a weighted 6E PGM basket price that is determined monthly. This cash payment was capped at a minimum of $106 per ounce and a maximum of $280 per ounce. |
| Commodity prices | Average monthly basket price | The monthly basket price for any calendar month was calculated by dividing the sum of the monthly average value of weighted 6E PGM basket by the total number of ounces for such calendar month. |
Notes to the consolidated financial statements continued
For the year ended 31 December 2021
| | |
Since the BTT project was early settled (refer below), there are no remaining significant accounting judgements or estimates at 31 December 2021 relating to this stream.
|
Accounting policy Consideration received in advance is recognised as a contract liability (deferred revenue) under IFRS 15 as control has not yet transferred. Where a significant financing component is identified as a result of the difference in the timing of advance consideration received and when control of the metal promised transfers, interest expenses on the deferred revenue balance are recognised in finance costs. Where a contract has a period of a year or less between receiving advance consideration and when control of the metal promised transfers, the group may elect on a contract-by-contract basis to apply the IFRS 15 practical expedient not to adjust for the effects of a significant financing component. |
Wheaton Stream
In July 2018, the Group entered into a gold and palladium supply arrangement in exchange for an upfront advance payment of US$500 million (Wheaton Stream). The arrangement has been accounted for as a contract in the scope of IFRS 15 whereby the advance payment has been recorded as deferred revenue. The revenue from the advance payment is recognised as the gold and palladium is allocated to the appropriate Wheaton International account. An interest cost, representing the significant financing component of the upfront deposit on the deferred revenue balance, is also recognised as part of finance costs. This finance cost increases the deferred revenue balance, ultimately resulting in revenue when the deferred revenue is recognised over the life-of-mine.
Forward gold sale - April 2019
On 11 April 2019, the Group concluded a forward gold sale arrangement whereby the Group received a cash prepayment of US$125 million(approximately R1.75 billion) in exchange for 4 fortnightly deliveries of 26,476 ounces of gold (totalling 105,906 ounces or 3,294 kilograms) between 1 October 2019 and 15 November 2019. The revenue from the prepayment was recognised in 4 equal parts on delivery of the gold. The gold price delivered under the prepayment was hedged with a cap price of $1,323 per ounce and a floor price of $1,200 per ounce. The Group received, and recognised, the difference between the floor price and the spot price (subject to a maximum of the cap price) on delivery of the gold. The final delivery was made on 15 November 2019.
Forward gold sale - October 2019
On 21 October 2019, the Group concluded a forward gold sale arrangement whereby the Group received a cash prepayment of R1.1 billion in exchange for future delivery of 8,482 ounces (263.8 kilograms) of gold every two weeks from 10 July 2020 to 16 October 2020 subject to an initial reference price of R17,371 per ounce comprising 80% of the prevailing price on execution date. The initial forward sale was unhedged and the Group would have received (or paid) the difference between the spot price and the prepayment price of R17,371/oz. On 6 July 2020, before the first delivery date, the Group agreed revised terms in which the ounces to be delivered every two weeks were reduced from 8,482 ounces (263.8 kilograms) to 6,523.2 ounces (202.9 kilograms), totalling 52,185.2 ounces (1,623.1 kilograms). In addition, a floor of R27,700/oz and a cap of R33,386/oz was introduced. The final delivery was made on 15 October 2020.
BTT stream and WPL forward platinum sale
During 2016 Lonmin secured funding of US$50 million to build the BTT plant, through a finance metal streaming arrangement receivable in instalments. The US$50 million was accounted for as deferred revenue as it would be repaid by way of discounted value of PGM metal sales. Contractual deliveries were at a discounted price and the value of the discount over and above the US$50 million upfront payment was prorated over the project lifetime and charged to the consolidated income statement as a finance expense. The plant was commissioned during February 2018. The Group determined the fair value of the BTT deferred revenue to be R628 million at acquisition and R607 million at 31 December 2019.
On 24 January 2020, WPL, EPL and Sibanye UK (collectively the “Purchasers”), subsidiaries of Sibanye-Stillwater, entered into a Release and Cancellation Agreement (“the Release Agreement”) with RFW Lonmin Investments Limited (“the Seller”) in respect of the BTT stream. The Release Agreement sets out the terms and conditions upon which the Purchasers have purchased the Seller’s entire interest in the metals purchase agreement for an amount of US$50 million to be settled in cash. The BTT transaction was implemented and the liability settled on 6 March 2020. WPL concluded a forward platinum sale arrangement on 3 March 2020 to fund the settlement of the BTT liability. WPL received a cash prepayment of US$50 million (R771 million) in exchange for the future delivery of 72,886 ounces of platinum on set dates between June and December 2020. The platinum price delivered under the prepayment was hedged with a cap price of US$1,050 per ounce and a floor price of US$700 per ounce. The Group received, and recognised, the difference between the floor price and the monthly average price (subject to a maximum of the cap price) on delivery of the platinum. The final delivery under the forward platinum sale arrangement was made on 7 December 2020.
Notes to the consolidated financial statements continued
For the year ended 31 December 2021
Marikana toll treatment arrangement
The Marikana operations entered into a short-term purchase of concentrate and toll treatment arrangement with a third party that commenced on 1 February 2021 and concluded on 31 December 2021. As part of the arrangement, Marikana agreed to buy and toll treat certain metals. A percentage of the toll treated metals is also retained as partial payment for the toll treatment arrangement. Marikana accounts for the inventory received as partial payment for the toll treatment arrangement as deferred revenue at fair value. A further deferred revenue balance is recognised to the extent that cash payment is received for the toll treatment before the performance obligation is satisfied. Deferred revenue is recognised as revenue on a straight-line basis over the term of the performance obligation.
The following table summarises the changes in deferred revenue:
| | | | | | | | | | | | | | |
| Figures in million - SA rand | Note | 2021 | 2020 | 2019 |
| Balance at beginning of the year | | 6,430 | | 8,167 | | 6,555 | |
Deferred revenue advance received1 | | 468 | | 771 | | 2,859 | |
| BTT early settlement payment | | — | | (787) | | — | |
Deferred revenue recognised during the period2 | | (847) | | (2,256) | | (2,227) | |
| Interest charge | 5.2 | 309 | | 349 | | 352 | |
| Loss on BTT early settlement | | — | | 186 | | — | |
| Deferred revenue recognised on acquisition of subsidiary | | — | | — | | 628 | |
| Balance at the end of the year | | 6,360 | | 6,430 | | 8,167 | |
| Reconciliation of the non-current and current portion of the deferred revenue: | | | | |
| Deferred revenue | | 6,360 | | 6,430 | | 8,167 | |
| Current portion of deferred revenue | | (156) | | (67) | | (1,271) | |
| Non-current portion of deferred revenue | | 6,204 | | 6,363 | | 6,896 | |
1 The amount received for the year ended 31 December 2021 relates to the toll treatment arrangement entered into by Marikana, representing cash receipts of R65 million and the fair value of inventory received of R403 million. The R771 million received relates to the WPL forward platinum sale arrangement entered into on 3 March 2020. The R2,859 million received relates to R1,751 million received on the April 2019 forward gold sale and R1,108 million received on the October 2019 forward gold sale, respectively
2 Revenue recognised during the year of R847 million relates to R447 million recognised on the Wheaton Stream (2020: R344 million, 2019: R414 million) and R400 million recognised on the toll treatment arrangement entered into by Marikana during the year. The remaining revenue recognised for the years ended 31 December 2020 and 2019 relates to R785 million (2019: Rnil) recognised in respect of the WPL forward platinum sale arrangement entered into on 3 March 2020, R1,108 million recognised in respect of the October 2019 forward gold sale arrangement (2019: R1,751 million recognised in respect of the April 2019 forward gold sale arrangement) and R19 million (2019: R62 million) recognised in respect of the BTT, respectively
Notes to the consolidated financial statements continued
For the year ended 31 December 2021
33. Trade and other payables
| | |
Accounting policy Trade and other payables, excluding payroll creditors and leave pay accruals are non-derivative financial liabilities categorised as other financial liabilities. Trade and other payables are recognised initially at fair value and subsequently measured at amortised cost using the effective interest method. Provision is made for employee entitlement benefits accumulated as a result of employees rendering services up to the reporting date. Liabilities arising in respect of wages and salaries, annual leave and other benefits due to be settled within 12 months of the reporting date are measured at rates which are expected to be paid when the liability is settled. Termination benefits are expensed and an accrual raised at the earlier of when the Group can no longer withdraw the offer of those benefits and when the Group recognises costs for a restructuring. If benefits are not expected to be settled wholly within 12 months of the reporting date, they are discounted. All other employee entitlement liabilities are measured at the present value of estimated payments to be made in respect of services rendered up to reporting date. |
| | | | | | | | | | | |
| Figures in million - SA rand | 2021 | 2020 | 2019 |
| Trade creditors | 3,670 | | 4,325 | | 3,208 | |
| Accruals and other creditors | 5,192 | | 4,166 | | 3,196 | |
| Other | 1,581 | | 32 | | 1,336 | |
| Financial liabilities | 10,443 | | 8,523 | | 7,740 | |
| Payroll creditors | 2,485 | | 2,492 | | 1,898 | |
| Leave pay accrual | 2,045 | | 2,016 | | 1,692 | |
| VAT payable | 189 | | 176 | | 136 | |
| Total trade and other payables | 15,162 | | 13,207 | | 11,466 | |
Fair value of trade and other payables
The fair value of trade and other payables approximate the carrying value due to the short maturity.
Liquidity risk
Trade and other creditors are expected to be settled within 12 months from the reporting date.
Notes to the consolidated financial statements continued
For the year ended 31 December 2021
34. Cash generated by operations
| | | | | | | | | | | | | | |
| Figures in million - SA rand | Notes | 2021 | 2020 | 2019 |
| Profit for the year | | 33,796 | | 30,622 | | 433 | |
| Royalties | 11.1 | 2,714 | | 1,765 | | 431 | |
| Carbon tax | | 4 | | 5 | | 13 | |
| Mining and income tax | 11.2 | 13,761 | | 4,858 | | (1,733) | |
| Interest income | 5.1 | (1,202) | | (1,065) | | (560) | |
| Finance expense | 5.2 | 2,496 | | 3,152 | | 3,303 | |
| Profit before interest, royalties, carbon tax and tax | | 51,569 | | 39,337 | | 1,887 | |
| Non-cash adjusting items: | | | | |
| Amortisation and depreciation | 4 | 8,293 | | 7,593 | | 7,214 | |
| Share-based payments | 6.8 | 383 | | 512 | | 363 | |
| Loss on financial instruments | | 6,279 | | 1,905 | | 5,731 | |
| Foreign currency exchange adjustment | | (394) | | (410) | | (461) | |
| Share of results of equity-accounted investees after tax | | (1,989) | | (1,700) | | (721) | |
| Impairments/(reversal of impairments) | 10 | 5,148 | | (121) | | 86 | |
| Loss on settlement of US$ Convertible Bond | 28.6 | — | | 1,507 | | — | |
| Early redemption premium on the 2025 Notes | 28.4 | 196 | | — | | — | |
| Occupational healthcare (gain)/expense | 31 | (14) | | 52 | | (40) | |
| Change in estimate of environmental rehabilitation obligation | | (162) | | (464) | | 89 | |
| Gain on acquisition | 16.1 | — | | — | | (1,103) | |
| Deferred revenue recognised | 32 | (847) | | (2,256) | | (2,227) | |
| Loss on BTT early settlement | 32 | — | | 186 | | — | |
| Cash adjusting items: | | | | |
| Income on settlement of dispute | 8.2 | — | | (580) | | — | |
| Payment of occupational healthcare liability | 31 | (240) | | (236) | | (68) | |
| Other non-cash and cash adjusting items | | (438) | | (137) | | (184) | |
| Total cash generated by operations | | 67,784 | | 45,188 | | 10,566 | |
35. Change in working capital
| | | | | | | | | | | |
| Figures in million - SA rand | 2021 | 2020 | 2019 |
| Inventories | 1,384 | | (9,027) | | (5,000) | |
| Trade and other receivables | (510) | | (2,167) | | 3,115 | |
| Trade and other payables | 1,581 | | 1,759 | | 1,259 | |
| Total change in working capital | 2,455 | | (9,435) | | (626) | |
Notes to the consolidated financial statements continued
For the year ended 31 December 2021
36. Financial instruments and risk management
| | |
Accounting policy On initial recognition, a financial asset is classified as measured at either amortised cost, fair value through other comprehensive income, or fair value through profit or loss. The Group initially recognises debt instruments issued and trade and other receivables, on the date these are originated. All other financial assets and financial liabilities are recognised initially when the Group becomes a party to the contractual provisions of the instrument. The classification of financial assets at initial recognition that are debt instruments depends on the financial asset’s contractual cash flow characteristics and the Group’s business model for managing them. In order for a financial asset to be classified and measured at amortised cost, it needs to give rise to cash flows that are solely payments of principal and interest (SPPI) on the principal amount outstanding. This assessment is performed at an instrument level. Financial assets with cash flows that are not SPPI are classified and measured at fair value through profit or loss, irrespective of the business model. The Group’s business model for managing financial assets that are debt instruments refers to how it manages its financial assets in order to generate cash flows. The business model determines whether cash flows will result from collecting contractual cash flows, selling the financial assets, or both. Financial assets classified and measured at amortised cost are held within a business model with the objective to hold financial assets in order to collect contractual cash flows. The Group recognises an allowance for expected credit losses (ECLs) on all debt instruments not held at fair value through profit or loss to the extent applicable. ECLs are based on the difference between the contractual cash flows due in accordance with the contract and all the cash flows that the Group expects to receive, discounted at an approximation of the original effective interest rate. ECLs are recognised in two stages. For credit exposures for which there has not been a significant increase in credit risk since initial recognition, ECLs are provided for credit losses that result from default events that are possible within the next 12-months (a 12-month ECL). For those credit exposures for which there has been a significant increase in credit risk since initial recognition, a loss allowance is required for credit losses expected over the remaining life of the exposure, irrespective of the timing of the default (a lifetime ECL). For trade and other receivables due in less than 12 months, the Group applies the simplified approach in calculating ECLs, as permitted by IFRS 9. Therefore, the Group does not track changes in credit risk, but instead, recognises a loss allowance based on the financial asset’s lifetime ECL at each reporting date. Impairment losses are recognised through profit or loss. The Group derecognises a financial asset when the contractual rights to the cash flows from the financial asset expire, or it transfers the rights to receive the contractual cash flows in a transaction in which substantially all the risks and rewards of the ownership of the financial asset are transferred. The Group derecognises a financial liability when its contractual obligations are discharged, cancelled or expired. Any interest in such transferred financial asset that is created or retained by the Group is recognised as a separate asset or liability. The particular recognition and measurement methods adopted are disclosed in the individual policy statements associated with each item. On derecognition of a financial liability, the difference between the carrying amount extinguished and the consideration paid is recognised in profit or loss. |
36.1 Accounting classifications and measurement of fair values
The following methods and assumptions were used to estimate the fair value of each class of financial instrument:
•Other receivables and other payables
Due to the approaches applied in calculating the carrying values as described in note 22, the fair values approximate the carrying value.
•Trade and other receivables/payables, and cash and cash equivalents
The carrying amounts approximate fair values due to the short maturity of these instruments for financial instruments measured at amortised cost. The fair value for trade receivables measured at fair value through profit or loss (PGM concentrate sales) are determined based on ruling market prices, volatilities and interest rates.
Notes to the consolidated financial statements continued
For the year ended 31 December 2021
•Environmental rehabilitation obligation funds
Environmental rehabilitation obligation funds comprise fixed income portfolio of bonds as well as fixed and call deposits. The environmental rehabilitation obligation funds are stated at fair value based on the nature of the fund’s investments. The fair value of publicly traded instruments is based on quoted market values.
For the environmental rehabilitation obligation funds categorised as level two on the fair value hierarchy, fixed income portfolio consists of instruments such as government bonds and inflation-linked bonds. Valuations are performed by the fund manager based on the composition of the portfolio, the relevant investment terms and through reference to market related interest rates.
•Other investments
The fair values of listed investments are based on the quoted prices available from the relevant stock exchanges. The carrying amounts of other short-term investment products with short maturity dates approximate fair value. The fair values of non-listed investments are determined through valuation techniques that include inputs that are not based on observable market data. These inputs include price/book ratios as well as marketability and minority shareholding discounts which are impacted by the size of the shareholding.
•Asset held for sale
The fair value of the asset held for sale was derived from the quoted Gen Mining share price (refer note 20).
•Borrowings
The fair value of variable interest rate borrowings approximates its carrying amounts as the interest rates charged are considered marked related. However, since there are also fixed interest rate borrowings, fair values are disclosed in note 28.
•Derivative financial instruments
The fair value of derivative financial instruments is estimated based on ruling market prices, volatilities and interest rates, and option pricing methodologies based on observable quoted inputs. All derivatives are carried on the statement of financial position at fair value. The fair value of the palladium hedge is determined using a Monte Carlo simulation model based on market forward prices, volatilities and interest rates.
The Group uses the following hierarchy for determining and disclosing the fair value of financial instruments:
•Level 1: unadjusted quoted prices in active markets for identical asset or liabilities
•Level 2: inputs other than quoted prices in level 1 that are observable for the asset or liability, either directly (as prices) or indirectly (derived from prices)
•Level 3: inputs for the asset or liability that are not based on observable market data (unobservable inputs)
The following table set out the Group’s significant financial instruments measured at fair value by level within the fair value hierarchy:
| | | | | | | | | | | | | | | | | | | | | | | | | | | | | | | | |
| Figures in million - SA rand | 2021 | 2020 | 2019 |
| Level 1 | Level 2 | Level 3 | Level 1 | Level 2 | | Level 3 | Level 1 | Level 2 | Level 3 |
| Financial assets measured at fair value | | | | | | | | | | |
| - Environmental rehabilitation obligation funds | 4,477 | | 725 | | — | | 4,111 | | 823 | | | — | | 3,578 | | 1,024 | | — | |
| - Trade receivables - PGM concentrate sales | — | | 3,794 | | — | | — | | 4,030 | | | — | | — | | 2,342 | | — | |
| - Other investments | 3,143 | | — | | 224 | | 603 | | — | | | 244 | | 415 | | — | | 184 | |
| - Asset held for sale | — | | 280 | | — | | — | | — | | | — | | — | | — | | — | |
| - Palladium hedge contract | — | | 286 | | — | | — | | — | | * | — | | — | | — | | — | |
| Financial liabilities measured at fair value | | | | | | | | | | |
| - Derivative financial instrument | — | | — | | — | | — | | — | | | — | | — | | 4,145 | | — | |
| - Gold hedge contracts | — | | — | | — | | — | | — | | * | — | | — | | 68 | | — | |
* Less than R1 million
Notes to the consolidated financial statements continued
For the year ended 31 December 2021
36.2 Risk management activities
Controlling and managing risk in the Group
In the normal course of its operations, the Group is exposed to market risks, including commodity price, foreign currency, interest rate, liquidity and credit risk associated with underlying assets, liabilities and anticipated transactions. In order to manage these risks, the Group has developed a comprehensive risk management process to facilitate control and monitoring of these risks
Sibanye-Stillwater has policies in areas such as counterparty exposure, hedging practices and prudential limits which have been approved by Sibanye-Stillwater’s Board of Directors (the Board). Management of financial risk is centralised at Sibanye-Stillwater's treasury department (Treasury), which acts as the interface between Sibanye-Stillwater’s Operations and counterparty banks. Treasury manages financial risk in accordance with the policies and procedures established by the Board and executive committee.
The Board has approved dealing limits for money market, foreign exchange and commodity transactions, which Treasury is required to adhere to. Among other restrictions, these limits describe which instruments may be traded and demarcate open position limits for each category as well as indicating counterparty credit-related limits. The dealing exposure and limits are checked and controlled each day and reported to the CFO.
The objective of Treasury is to manage all financial risks arising from the Group’s business activities in order to protect profit and cash flows. Treasury activities of Sibanye-Stillwater and its subsidiaries are guided by the Treasury Policy, the Treasury Framework as well as domestic and international financial market regulations. Treasury activities are currently performed within the Treasury Framework with appropriate resolutions from the Board, which are reviewed and approved annually by the Audit Committee.
The financial risk management objectives of the Group are defined as follows:
•Counterparty exposure: the objective is to only deal with a limited number of approved counterparts that are of a sound financial standing and who have an official credit rating. The Group is limited to a maximum investment of 2.5% of the financial institutions’ equity, which is dependent on the institutions’ credit rating. The credit rating used is Fitch Ratings’ short-term credit rating for financial institutions.
•Liquidity risk management: the objective is to ensure that the Group is able to meet its short-term commitments through the effective and efficient management of cash and usage of credit facilities.
•Funding risk management: the objective is to meet funding requirements timeously and at competitive rates by adopting reliable liquidity management procedures.
•Currency risk management: the objective is to maximise the Group’s profits by minimising currency fluctuations.
•Commodity price risk management: commodity risk management takes place within limits and with counterparts as approved in the treasury framework.
•Interest rate risk management: the objective is to identify opportunities to prudently manage interest rate exposures.
•Investment risk management: the objective is to achieve optimal returns on surplus funds.
Credit risk
Credit risk represents risk that an entity will suffer a financial loss due to the other party of a financial instrument not discharging its obligation.
The Group has reduced its exposure to credit risk by dealing with a limited number of approved counterparties. The Group approves these counterparties according to its risk management policy and ensures that they are of good credit quality.
The carrying value of the financial assets represents the combined maximum credit risk exposure of the Group. Concentration of credit risk on cash and cash equivalents and non-current assets is considered minimal due to the above mentioned investment risk management and counterparty exposure risk management policies (refer notes 21, 22, 24 and 25).
Liquidity risk
In the ordinary course of business, the Group receives cash proceeds from its operations and is required to fund working capital and capital expenditure requirements. The cash is managed to ensure surplus funds are invested to maximise returns whilst ensuring that capital is safeguarded to the maximum extent possible by investing only with top financial institutions (refer note 28.9).
Uncommitted borrowing facilities are maintained with several banking counterparties to meet the Group’s normal and contingency funding requirements (refer note 28.9).
Notes to the consolidated financial statements continued
For the year ended 31 December 2021
Working capital and going concern assessment
For the year ended 31 December 2021, the Group realised a profit of R33,796 million (2020: R30,622 million and 2019: profit of R433 million). As at 31 December 2021, the Group’s current assets exceeded its current liabilities by R44,290 million (2020: R34,756 million and 2019: R11,836 million) and the Group’s total assets exceeded its total liabilities by R81,345 million (2020: R70,716 million and 2019: R31,138 million). During the year ended 31 December 2021 the Group generated net cash from operating activities of R32,256 million (2020: R27,151 million and 2019: R9,463 million).
The Group had committed undrawn debt facilities of R15,749 million at 31 December 2021 (2020: R7,336 million and 2019: R5,688 million) and cash balances of R30,292 million (2020: R20,240 million and 2019: R5,619 million). The 2022 Notes, contractually due to be settled on 27 June 2022, were early settled on 2 August 2021 for the nominal value of US$354 million (R5,123 million). The 2025 Notes, were refinanced and upsized into a new bond issue on 16 November 2021 (refer note 28.5), securing reduced cost of debt, longer financing tenors and enhancing liquidity. The most immediate debt maturities are the US$600 million USD RCF maturing in April 2023 and the R5.5 billion ZAR RCF maturing in November 2024.
The Group’s leverage ratio (net (cash)/debt to adjusted EBITDA) as at 31 December 2021 was (0.2):1 (2020 was (0.1):1 and 2019 was 1.4:1) and its interest coverage ratio (adjusted EBITDA to net finance (income)/charges) was (5,281):1 (2020 was 80:1 and 2019 was 7:1). Both considerably better than the maximum permitted leverage ratio of at most 2.5:1 (up to 31 December 2019: 3.5:1); and minimum required interest coverage ratio of 4.0:1, calculated on a quarterly basis, required under the US$600 million RCF and the R5.5 billion RCF. With the available RCF’s collectively 100% unutilised at 31 December 2021, high level of available cash balances and the Group’s strong liquidity position, no imminent refinancing of debt is required.
Notwithstanding the exceptionally strong liquidity position and good financial outlook, the Group could also, if necessary, consider options to increase funding flexibility which may include, amongst others, additional loan facilities or debt capital market issuances, streaming facilities, prepayment facilities or, in the event that other options are not deemed preferable or achievable by the Board, an equity capital raise. The Group could also, with lender approval, request covenant amendments or restructure facilities. During past adversity, management had successfully implemented similar actions.
Management believes that the cash forecasted to be generated by operations, cash on hand, the committed unutilised debt facilities as well as additional funding opportunities will enable the Group to continue to meet its obligations as they fall due. The consolidated financial statements for the year ended 31 December 2021, therefore, have been prepared on a going concern basis.
Market risk
The Group is exposed to market risks, including foreign currency, commodity price and interest rate risk associated with underlying assets, liabilities and anticipated transactions. Following periodic evaluation of these exposures, the Group may enter into derivative financial instruments to manage some of these exposures.
The effects of reasonable possible changes of relevant risk variables on profit or loss or shareholders’ equity are determined by relating the reasonable possible change in the risk variable to the balance of financial instruments at period end date.
The amounts generated from the sensitivity analyses are forward-looking estimates of market risks assuming certain adverse or favourable market conditions occur. Actual results in the future may differ materially from those projected results and therefore should not be considered a projection of likely future events and gains/losses.
Foreign currency risk
Sibanye-Stillwater’s operations are all located in South Africa except for Stillwater and Mimosa, which are located in the US and Zimbabwe, respectively, and its revenues are sensitive to changes in the US dollar gold and PGM price and the rand/US dollar exchange rate (the exchange rate). Depreciation of the rand against the US dollar results in Sibanye-Stillwater’s revenues and operating margin increasing. Conversely, should the rand appreciate against the US dollar, revenues and operating margins would decrease. The impact on profitability of any change in the exchange rate can be substantial. Furthermore, the exchange rates obtained when converting US dollars to rand are set by foreign exchange markets over which Sibanye-Stillwater has no control. The relationship between currencies and commodities, which includes the gold price, is complex and changes in exchange rates can influence commodity prices and vice versa.
In the ordinary course of business, the Group enters into transactions, such as gold sales and PGM sales, denominated in foreign currencies, primarily US dollar. Although this exposes the Group to transaction and translation exposure from fluctuations in foreign currency exchange rates, the Group does not generally hedge this exposure, although it could be considered for significant expenditures based in foreign currency or those items which have long lead times to produce or deliver. Also, the Group on occasion undertakes currency hedging to take advantage of favourable short-term fluctuations in exchange rates when management believes exchange rates are at unsustainably high levels.
Currency risk also exists on account of financial instruments being denominated in a currency that is not the functional currency and being of a monetary nature. This includes but is not limited to US$600 million RCF, to the extent drawn (refer note 28.1), Burnstone Debt (refer note 28.7) and Franco-Nevada liability.
For additional disclosures, refer notes 3 and 28.
Notes to the consolidated financial statements continued
For the year ended 31 December 2021
Foreign currency economic hedging experience
During 2021, a number of intra month (i.e. up to 21 days) forward exchange rate contracts were executed to hedge a known currency inflow. During 2020 the same principle was applied to known currency inflows related to PGM sales.
At 31 December 2021, Sibanye-Stillwater had a foreign currency contract position of US$18 million at a weighted average rate of R15.89/US$. As at 31 December 2020 and 31 December 2019, Sibanye-Stillwater had no outstanding foreign currency contract positions.
Commodity price risk
The market price of commodities has a significant effect on the results of operations of the Group and the ability of the Group to pay dividends and undertake capital expenditures. The gold and PGM basket prices have historically fluctuated widely and are affected by numerous industry factors over which the Group does not have any control (refer note 24). The aggregate effect of these factors on the gold and PGM basket prices, all of which are beyond the control of the Group, is difficult for the Group to predict.
Commodity price hedging policy
As a general rule, the Group does not enter into forward sales, derivatives or other hedging arrangements to establish a price in advance for future gold and PGM production. Commodity hedging could, however, be considered in future under one or more of the following circumstances: to protect cash flows at times of significant capital expenditure; financing projects or to safeguard the viability of higher cost operations.
To the extent that it enters into commodity hedging arrangements, the Group seeks to use different counterparty banks consisting of local and international banks to spread risk. None of the counterparties is affiliated with, or related to parties of the Group.
Commodity price hedging experience
At 31 December 2021, Sibanye-Stillwater had the following palladium commodity price hedges outstanding:
•A total of 10,000oz palladium at a floor price of R1,500/kg and capped price of R3,400/kg which matures in January 2022
•A total of 140,000oz palladium at a floor price of US$1,800/oz and capped price of US$3,300/oz which commences in February 2022 and matures in March 2023
Commodity price contract position
As of 31 December 2021, 2020 and 2019, Sibanye-Stillwater had no outstanding commodity forward sale contracts for mined production.
Interest rate risk
The Group’s income and operating cash flows are dependent of changes in market interest rates. The Group’s interest rate risk arises from long-term borrowings.
For additional disclosures, refer to note 28.9.
Notes to the consolidated financial statements continued
For the year ended 31 December 2021
37. Commitments
| | | | | | | | | | | | | | | | | |
| Figures in million - SA rand | 2021 | | 2020 | | 2019 |
| Capital expenditure | | | | | |
| Authorised | 19,983 | | | 7,535 | | | 5,971 | |
| Kloof | 1,593 | | | 1,516 | | | 1,290 | |
| Driefontein | 877 | | | 885 | | | 846 | |
| Beatrix | 317 | | | 169 | | | 232 | |
| SGL corporate | 1,086 | | | 961 | | | 762 | |
| Cooke | 3 | | | 54 | | | 55 | |
| Burnstone | 4,353 | | | 8 | | | 5 | |
| Kroondal | 395 | | | 319 | | | 220 | |
| Platinum Mile | 17 | | | — | | | 20 | |
| Rustenburg operation | 3,348 | | | 2,574 | | | 2,033 | |
| Marikana | 6,841 | | | 63 | | | 153 | |
Other1 | 1,153 | | | 986 | | | 355 | |
| Contracted for | 2,733 | | | 773 | | | 595 | |
| Other guarantees | 2,653 | | | 1,488 | | | 1,421 | |
1 Includes authorised capital expenditure relating to DRDGOLD of R549 million (2020: R605 million, 2019: R134 million)
Commitments will be funded from internal sources and to the extent necessary from borrowings. This expenditure primarily relates to hostel upgrades, mining activities and infrastructure.
38. Contingent liabilities
| | |
Significant accounting judgements and estimates Contingencies can be either possible assets or possible liabilities arising from past events which, by their nature, will only be resolved when one or more future events not wholly within the control of the Group occur or fail to occur or for contingent liabilities where a present obligation arising from a past event exists but is not recognised because either it is not probable that an out-flow of resources embodying economic benefits will be required to settle the obligation or the amount of the obligation cannot be determined with sufficient reliability. The assessment of such contingencies inherently involves the exercise of significant judgement and estimates of the outcome of future events. |
Arbitration case Redpath USA Corporation versus Stillwater Mining Company
In 2015, Redpath USA Corporation (the Contractor) was hired by the Stillwater Mining Company (the Company) to advance the Benbow decline as part of the Blitz project. During November 2019 the Contractor filed a claim wherein it raised a dispute over additional and rework costs of establishing a decline at the Stillwater Mine after drilling errors caused a water inundation that required significant remediation. The Contractor assumed the additional costs and was seeking to recover those costs, in an amount of approximately US$20 million, from the Company. After engaging outside counsel and based on the terms of the contract that supports the Company’s position, management believed the Contractor’s claim was without merit and disputed the arbitration demand claim in the legal documents served on the Contractor. Although an arbitration hearing was scheduled for May 2022, the Contractor and the Company has subsequent to the reporting date agreed to settle the dispute at no cost to the Company.
Notes to the consolidated financial statements continued
For the year ended 31 December 2021
39. Related-party transactions
Sibanye-Stillwater entered into related-party transactions with Rand Refinery, and its subsidiaries during the year as detailed below. The transactions with these related parties are generally conducted with terms comparable to transactions with third parties, however in certain circumstances such as related-party loans, the transactions were not at arm’s length.
Refer to note 1.3 for the Group structure which provides further detail on the relationship between parent and subsidiary companies.
Rand Refinery
Rand Refinery, in which Sibanye-Stillwater holds a 44.4% interest, has an agreement with the Group whereby it refines all the Group’s gold production. No dividends were received during the year ended 31 December 2019. For the year ended 31 December 2021, the Group received a dividend of R329 million (2020: R112 million) from Rand Refinery, and sold gold and paid refining fees to Rand Refinery. Refer note 18.1 for additional information in respect of the Group’s investment in Rand Refinery.
The table below details the transactions and balances between the Group and its related-parties:
| | | | | | | | | | | | | | | | | |
| Figures in million - SA rand | 2021 | | 2020 | | 2019 |
| Rand Refinery | | | | | |
| Gold sales | 319 | | | 298 | | | 506 | |
| Refining fees paid | (40) | | | (31) | | | (25) | |
| Trade payable | (7) | | | (6) | | | (5) | |
Key management remuneration
Total key management personnel compensation recognised under IFRS1:
| | | | | | | | | | | | | | | | | |
| Figures in thousands - SA rand | 2021 | | 2020 | | 2019 |
| Short-term employee benefits | 90,179 | | 110,134 | | 106,605 |
| Post-employment benefits | 4,421 | | 6,009 | | 5,300 |
| Share-based payment | 104,550 | | 127,097 | | 120,478 |
| Total | 199,150 | | 243,240 | | 232,383 |
1 In 2021, Sibanye-Stillwater introduced a new executive level of management (referred to as the C-suite). Therefore from 2021, only C-suite members and executive directors are disclosed under IFRS as key management personnel of Sibanye-Stillwater. For 2020, key management personnel included EVPs and executive directors
Notes to the consolidated financial statements continued
For the year ended 31 December 2021
40. Directors' and prescribed officers' remuneration
The disclosure below incorporates remuneration for services rendered to various companies within the Group during the year.
The executive directors and prescribed officers were paid the following remuneration during the year:
| | | | | | | | | | | | | | | | | | | | | | | | | | | | | | | | | | | | | | | | | | | | | | | |
| Figures in thousands - SA rand | Salary | | Cash bonus accrued for 2021 paid in 2022 | | Accrual of share-based payment benefits | | Pension scheme total contributions | | Expense allowance and other benefits | | 2021 | | 2020 | | 2019 |
| Executive directors | | | | | | | | | | | | | | | |
Neal Froneman1 | 12,427 | | | 7,793 | | | 269,473 | | | 825 | | | 1,064 | | | 291,582 | | | 57,973 | | | 31,917 | |
| Charl Keyter | 6,601 | | | 4,204 | | | 131,151 | | | 943 | | | 529 | | | 143,428 | | | 28,963 | | | 16,024 | |
Prescribed officers2 | | | | | | | | | | | | | | | |
| Chris Bateman | | | | | | | | | | | | | 66,959 | | | 25,289 | |
| Shadwick Bessit | | | | | | | | | | | | | 14,789 | | | 10,595 | |
| Hartley Dikgale | | | | | | | | | | | | | 29,159 | | | 7,898 | |
| Dawie Mostert | 4,206 | | | 2,590 | | | 64,068 | | | 573 | | | 297 | | | 71,734 | | | 16,655 | | | 9,284 | |
| Themba Nkosi | 3,930 | | | 2,378 | | | 51,720 | | | 362 | | | 258 | | | 58,648 | | | 15,286 | | | 8,117 | |
| Wayne Robinson | 0 | | 0 | | 0 | | 0 | | 0 | | 0 | | 19,272 | | | 10,044 | |
| Richard Stewart | 5,175 | | | 3,251 | | | 73,712 | | | 575 | | | 298 | | | 83,011 | | | 18,873 | | | 9,428 | |
| Robert van Niekerk | 5,331 | | | 3,254 | | | 105,053 | | | 592 | | | 456 | | | 114,686 | | | 22,975 | | | 13,547 | |
Laurent Charbonnier3 | 10,084 | | | 4,870 | | | 3,247 | | | 81 | | | 5,190 | | | 23,472 | | | 2,614 | | | — | |
Lerato Legong4 | 3,447 | | | 2,192 | | | 1,461 | | | 470 | | | 109 | | | 7,679 | | | 2,875 | | | — | |
Mika Seitovirta5 | 245 | | | — | | | — | | | — | | | — | | | 245 | | | — | | | — | |
| Total | 51,446 | | | 30,532 | | | 699,885 | | | 4,421 | | | 8,201 | | | 794,485 | | | 296,393 | | | 142,143 | |
1 Entered into a dual service contract with effect 1 January 2020. Remuneration paid by Stillwater in US dollars was converted at the average exchange rate of R14.79/US$ (2020: R16.46/US$) for the year ended 31 December 2021
2 In 2021, Sibanye-Stillwater introduced a new executive level of management (referred to as the C-suite). Therefore from 2021, only C-suite members are disclosed as prescribed officers of Sibanye-Stillwater. In 2020, the following individuals were also disclosed as prescribed officers:
•Chris Bateman - ceased performing an EVP role on 6 September 2020
•Shadwick Bessit - ceased performing an EVP role on 16 January 2021
•Hartley Dikgale - ceased performing an EVP role on 31 March 2020
•Wayne Robinson - not a C-suite member
3 Assumed a prescribed officer role on 16 November 2020, remuneration paid in GBP was converted at the average exchange rate of R20.33/GBP (2020: R21.10/GBP) for the year ended 31 December 2021
4 Assumed a prescribed officer role on 1 September 2020
5 Assumed a prescribed officer role on 14 December 2021
Notes to the consolidated financial statements continued
For the year ended 31 December 2021
The non-executive directors were paid the following fees during the year:
| | | | | | | | | | | | | | | | | | | | | | | | | | | | | | | | | | | |
| Figures in thousands - SA rand | Directors fees | | Committee fees | | Expense allowance | | 2021 | | 2020 | | 2019 |
| Timothy Cumming | 1,081 | | | 1,140 | | | 8 | | | 2,229 | | | 1,909 | | | 1,795 | |
| Savannah Danson | 1,081 | | | 981 | | | — | | | 2,062 | | | 1,680 | | | 1,609 | |
Barry Davison1 | — | | | — | | | — | | | — | | | — | | | 666 | |
| Harry Kenyon-Slaney | 1,243 | | | 1,102 | | | 24 | | | 2,369 | | | 2,114 | | | 1,699 | |
| Richard Menell | 2,194 | | | 525 | | | — | | | 2,719 | | | 2,114 | | | 1,831 | |
Sello Moloko2 | — | | | — | | | — | | | — | | | — | | | 1,407 | |
| Nkosemntu Nika | 1,081 | | | 661 | | | — | | | 1,742 | | | 1,708 | | | 1,609 | |
| Keith Rayner | 1,081 | | | 1,304 | | | — | | | 2,385 | | | 1,864 | | | 1,881 | |
| Susan van der Merwe | 1,081 | | | 661 | | | — | | | 1,742 | | | 1,716 | | | 1,609 | |
| Jeremiah Vilakazi | 1,081 | | | 714 | | | — | | | 1,795 | | | 1,422 | | | 1,362 | |
| Vincent Maphai | 3,265 | | | — | | | — | | | 3,265 | | | 2,756 | | | 822 | |
Elaine Dorward-King3 | 1,243 | | | 351 | | | 24 | | | 1,618 | | | 1,107 | | | — | |
Sindiswa Zilwa4 | 1,081 | | | 726 | | | — | | | 1,807 | | | — | | | — | |
Wang Bin5 | — | | | — | | | — | | | — | | | 327 | | | — | |
Lu Jiongjie5 | — | | | — | | | — | | | — | | | 327 | | | — | |
| Total | 15,512 | | | 8,165 | | 56 | | 23,733 | | 19,044 | | 16,290 |
1 Resigned as a non-executive director on 28 May 2019
2 Resigned as a non-executive director on 30 September 2019
3 Appointed as a non-executive director 27 March 2020
4 Appointed as a non-executive director 1 January 2021
5 Appointed and resigned as a non-executive director on 24 February 2020 and 27 March 2020, respectively
Notes to the consolidated financial statements continued
For the year ended 31 December 2021
The directors’ and prescribed officers’ (including their associates) direct and indirect share ownership at 31 December 2021 was1:
| | | | | | | | | | | | | | | | | | | | | | | | | | | | | | | | | | | |
| Number of shares | | % |
| 2021 | | 2020 | | 2019 | | 2021 | | 2020 | | 2019 |
| Executive directors | | | | | | | | | | | |
Neal Froneman2,3 | 6,636,286 | | | 4,829,128 | | | 4,858,723 | | | 0.24 | | | 0.17 | | | 0.18 | |
Charl Keyter3 | 2,866,791 | | | 1,775,994 | | | 1,673,316 | | | 0.10 | | | 0.06 | | | 0.06 | |
| Non-executive directors | | | | | | | | | | | |
Timothy Cumming3 | 6,000 | | | 1,242 | | | 242 | | | — | | | — | | | — | |
Richard Menell3 | 15,125 | | | 84,625 | | | 108,625 | | | — | | | — | | | — | |
Keith Rayner3 | 68,992 | | | 68,992 | | | 68,992 | | | — | | | — | | | — | |
Susan van der Merwe3 | 1,028 | | | 1,027 | | | 1,028 | | | — | | | — | | | — | |
Jeremiah Vilakazi3 | 2,000 | | | — | | | — | | | — | | | — | | | — | |
Vincent Maphai3 | 152,135 | | | 50,000 | | | — | | | 0.01 | | | — | | | — | |
Savannah Danson3 | 2,519 | | | 2,519 | | | — | | | — | | | — | | | — | |
Harry Kenyon-Slaney3,4 | 16,852 | | | 16,852 | | | — | | | — | | | — | | | — | |
Elaine Dorward-King3,5 | 10,000 | | | 4,800 | | | — | | | — | | | — | | | — | |
| Total share ownership by directors | 9,777,728 | | | 6,835,179 | | | 6,710,926 | | | 0 | | 0 | | 0 |
Prescribed officers6 | | | | | | | | | | | |
| Chris Bateman | 0 | | — | | | 32,747 | | | — | | | — | | | — | |
| Shadwick Bessit | 0 | | 94,707 | | | 31,652 | | | — | | | — | | | — | |
| Hartley Dikgale | 0 | | — | | | 184,311 | | | — | | | — | | | 0.01 | |
Dawie Mostert3 | 26,466 | | | 38,975 | | | 38,975 | | | — | | | — | | | — | |
Themba Nkosi3 | 204,533 | | | 59,022 | | | 796 | | | 0.01 | | | — | | | — | |
| Wayne Robinson | 0 | | 184,333 | | | 73,292 | | | — | | | 0.01 | | | — | |
Richard Stewart3 | 739,633 | | | 105,303 | | | 362,747 | | | 0.03 | | | — | | | 0.01 | |
Robert van Niekerk3 | 875,261 | | | 24,341 | | | 257,732 | | | 0.03 | | | — | | | 0.01 | |
Laurent Charbonnier3,7 | 151,012 | | | 35,620 | | | — | | | 0.01 | | | — | | | — | |
| Total | 11,774,633 | | | 7,377,480 | | | 7,693,178 | | | 0 | | 0 | | 0 |
1 Following the implementation of the Scheme (refer note 26), the Directors’ shareholdings are in Sibanye Stillwater Limited
2 Neal Froneman and his associates holds 90,479 ADRs at 31 December 2021 (2020: 3,213, 2019: 28,440) which convert to 361,916 (2020: 12,852, 2019: 113,760) ordinary shares in the Company
3 Share ownership (including shares held by associates) in the Company at the date of this report was unchanged, except for the following:
•Neal Froneman - 8,230,978
•Charl Keyter - 1,466,181
•Savannah Danson - 16,519
•Dawie Mostert - 26,585
•Richard Stewart - 788,771
•Robert van Niekerk - 1,364,690
4 Harry Kenyon-Slaney and his associates holds 4,213 ADRs at 31 December 2021 (2020: 4,213) which convert to 16,852 (2020: 16,852) ordinary shares in the Company
5 Appointed during 2020. Elaine Dorward-King and her associates holds 2,500 ADRs at 31 December 2021 (2020: 1,200) which convert to 10,000 (2020: 4,800) ordinary shares in the Company
6 In 2021, Sibanye-Stillwater introduced a new executive level of management (referred to as the C-suite). Therefore from 2021, only C-suite members are disclosed as prescribed officers of Sibanye-Stillwater. In 2020, the following individuals were also disclosed as prescribed officers:
•Chris Bateman - ceased performing an EVP role on 6 September 2020
•Shadwick Bessit - ceased performing an EVP role on 16 January 2021
•Hartley Dikgale - ceased performing an EVP role on 31 March 2020
•Wayne Robinson - not a C-suite member
7 Appointed during 2020. Laurent Charbonnier and his associates holds 37,753 ADRs at 31 December 2021 (2020: 8,905) which convert to 151,012 (2020: 35,620) ordinary shares in the Company
Notes to the consolidated financial statements continued
For the year ended 31 December 2021
41. Events after reporting date
There were no events that could have a material impact on the financial results of the Group after 31 December 2021 up to the date on which the consolidated financial statements for the year ended 31 December 2021 were authorised for issue, other than those disclosed below.
41.1 Sandouville acquisition
On 30 July 2021, Sibanye-Stillwater announced that it had entered into an exclusive put option agreement (Put Option) with French mining group Eramet SA (Eramet) for the acquisition of 100% of the Sandouville nickel hydrometallurgical processing facility (Sandouville), located in Normandy, France. The Sandouville facility is situated in the industrial heart of Europe at Le Havre, France’s second largest industrial port, with strategic access to extensive logistical infrastructure including shipping, rail and key motorways, supporting any future supply into the European end user markets.
The transaction is the second step in the Group's battery metals strategy, building on the investment in the Keliber lithium hydroxide project, in partnership with the State of Finland and the Finnish Minerals Group, announced in February 2021. The Sandouville site is a polyvalent facility which is already zoned for heavy industrial purposes. The site is scaleable for nickel, cobalt and lithium battery grade products, and will enable the Group to further advance its battery metals strategy and recycling activities.
On 4 November 2021, following the signing of the exclusive Put Option, Sibanye-Stillwater announced that the Share Purchase Agreement (SPA) had been signed to acquire 100% of Sandouville. The signature of the SPA followed the successful completion of the information-consultation process with the employee representative bodies of Sandouville and Eramet, who rendered a favourable opinion of the transaction. The transaction also received the key regulatory approvals of the South African Reserve Bank and clearance from the French Foreign Investment Control Office. The remaining conditions in respect of the acquisition were fulfilled on 4 February 2022, which resulted in an effective acquisition date of 4 February 2022.
Management is in the process of identifying and measuring the assets and liabilities in accordance with IFRS 3 for, amongst others, property, plant and equipment, contingent liabilities, inventory, provisions, as well as any deferred tax implications. In particular, management is still finalising the assessment of certain inputs and assumptions and gathering information that may impact the identification and fair value of the net assets. The cash purchase consideration is approximately €85 million, subject to any final post-closing adjustments.
41.2 Santa Rita and Serrote
On 26 October 2021, Sibanye-Stillwater entered into purchase and sale agreements with affiliates of funds advised by Appian Capital Advisory LLP (Appian) to purchase 100% of the Santa Rita nickel mine (Santa Rita) and the Serrote copper mine, both located in Brazil. The acquisition price was to be a cash consideration of US$1 billion and a 5% net smelter royalty over potential future underground production at Santa Rita (the Atlantic Nickel SPA and the MVV SPA, respectively).
Sibanye-Stillwater was advised by Appian that, subsequent to signing the Atlantic Nickel SPA and the MVV SPA, a geotechnical event occurred at Santa Rita. Management assessed the event and its effect and concluded that it was and was reasonably expected to be material and adverse to the business, financial condition, results of operations, the properties, assets, liabilities or operations of Santa Rita. Accordingly, pursuant to the terms of the Atlantic Nickel SPA, on 24 January 2022, Sibanye-Stillwater gave notice of termination of the Atlantic Nickel SPA. As the MVV SPA was conditional on the closing of the Atlantic Nickel SPA, which had become impossible to satisfy, on the same date Sibanye-Stillwater also gave notice of termination of the MVV SPA. As announced by Sibanye-Stillwater on 2 March 2022, if Appian commences proceedings, the Group will follow due course in defending any possible claims or litigation on the matter.
41.3 Rhyolite Ridge joint venture with ioneer
On 16 September 2021, Sibanye-Stillwater announced that it had reached an agreement with ioneer to establish a joint venture company with respect to the Rhyolite Ridge lithium-boron project. Following the satisfaction of all conditions precedent, the Group will contribute US$490 million for a 50% interest in Rhyolite Ridge. ioneer will also hold a 50% interest and retain the operational management responsibility. Management concluded that the transaction was not effective at 31 December 2021 since a number of conditions precedent were still outstanding, joint control was not obtained and no contractual rights or obligations were created.
Notes to the consolidated financial statements continued
For the year ended 31 December 2021
41.4 Kroondal transaction
On 31 January 2022, Sibanye-Stillwater announced it had entered into an agreement with Rustenburg Platinum Mines Limited (RPM) a subsidiary of Anglo American Platinum Limited, through its subsidiary Sibanye Rustenburg Platinum Mines Limited (SRPM), which will result in SRPM assuming full ownership of the Kroondal operation. The Kroondal operation is subject to a 50/50 pool and share agreement (Kroondal PSA) between Kroondal Operations Proprietary Limited (a wholly-owned subsidiary of the Group) and RPM (collectively the PSA parties).
By the end of 2020 certain shafts at the Kroondal operation had reached the boundaries of the Kroondal PSA lease area. In order to allow the affected shafts to continue operating, with effect from January 2021, a contractor mining agreement was agreed between the PSA Parties and SRPM, providing for the mining of SRPM from the Kroondal operations (the “Contractor Agreement”).
In addition to the Contractor Agreement, SRPM and RPM have entered into a sale and purchase agreement in terms of which SRPM will acquire RPM’s 50% interest and all associated liabilities in respect of the Kroondal PSA for a cash consideration of R1.00 plus the assumption of RPM's portion of all associated liabilities, which include all associated closure costs and rehabilitation liabilities. This transaction will extend the life of the Kroondal operations to 2029 and ensure significant value creation for all stakeholders. Management is in the process of assessing the accounting impact of the transaction.
41.5 Wage agreement reached at East Boulder mine
The Group successfully ratified a new collective bargaining agreement, effective 16 February 2022 through to 31 July 2024, with the United Steel Workers International Union (USW) at its East Boulder mine in Montana in the United States. The agreement covers a broad range of terms including average annual wage increases of 2.5% in 2022, 3% in 2023 and 3% in 2024. In addition to the base increase in 2022, an increase to benefits and incentive has been agreed, which will result in an effective average increase of 5.4% for 2022 if all safety and quality deliverables are fully met. This settlement amounts to an annual average increase of 3.8% per year for the next three years, which compares favourably with US inflation rates.
41.6 SA gold operations wage dispute
On 14 January 2022, the Group announced that the Commission for Conciliation, Mediation and Arbitration (CCMA), has issued a certificate of non-resolution in respect of the dispute conciliation process between Sibanye-Stillwater and the labour unions, comprising AMCU, the NUM, Solidarity and UASA in respect of wage negotiations at the Group’s gold operations. This certificate permits the unions to embark on a strike and the Group to implement a lock-out within a 12-month period from issuance. Both parties need to give the counterparty 48 hours’ notice prior to embarking on any action.
On 4 February 2022, Sibanye-Stillwater tabled an offer to the unions, which confirmed the Group’s commitment to wage increases, which are sustainable and in the interest of all stakeholders as well as linked to inflation. If accepted, this offer means that category 4 to 8 employees will receive an average increase of 6% in year one, 5.7% in year two and 5.4% in year three. Miners, artisans and officials will receive an increase of 5% in year one, two and three.
On 8 March 2022, Sibanye-Stillwater advised that it received notice from AMCU and NUM that the unions intended to embark on a protected strike action from 9 March 2022. By the date of this report, the wage offer had been unconditionally accepted by Solidarity and UASA. The Group continues to engage with the national leadership of AMCU and NUM in an effort to reach a final settlement.
41.7 Verkor
During February 2022, Sibanye-Stillwater entered into a term sheet whereby the Group, through its wholly-owned subsidiary, Sibanye Battery Metals Proprietary Limited, would invest in Verkor S.A. (Verkor) through a €25 million convertible bond. Verkor is a French Gigafactory project aiming to enter the European battery materials market as a manufacturer of low-carbon footprint batteries for application in electric vehicles and large-scale stationary storage markets. The Group subscribed for the convertible bond on 22 March 2022. Management is in the process of assessing the accounting impact of the transaction.
41.8 Change in future South African corporate income tax (CIT) rate
During his budget speech on 23 February 2022, the South African Minister of Finance confirmed the change in the South African CIT rate as announced in his February 2021 budget speech. For the financial year ended 31 December 2021, the CIT rate applicable to Sibanye-Stillwater and its South African subsidiaries, which apply a CIT rate, was 28% and will remain at 28% for the financial year ending 31 December 2022. For subsequent financial years the change will become effective and a 27% CIT rate will apply.
41.9 Keliber investment
On 14 March 2022, the Group made payment for the third tranche of the initial phased equity investment in Keliber. The subscription price amounted to €5 million for an additional 125 000 shares in Keliber, representing an approximately 30% shareholding at the time of subscription. The Group now holds a guaranteed option to achieve the majority shareholding in Keliber, should it wish to do so, by contributing further equity financing for the development of the project. Since the Group obtained a substantive ability to acquire a majority shareholding in Keliber upon subscription for the third tranche share investment, management concluded that control was obtained at the time of subscription. Management is in the process of assessing the accounting impact of the transaction.
Registered shareholder spread at 31 December 2021
| | | | | | | | | | | | | | |
| Number of holders | % of total shareholders | Number of shares2 | % of shares in issue1,3 |
| 1-1,000 shares | 32,527 | | 69.25 | | 7,940,839 | | 0.28 |
| 1,001-10,000 shares | 11,360 | | 24.19 | | 34,572,144 | | 1.23 |
| 10,001-100,000 shares | 2,045 | | 4.35 | | 64,697,500 | | 2.30 |
| 100,001-1,000,000 shares | 809 | | 1.72 | | 264,042,817 | | 9.40 |
| 1,000,001 shares and above | 230 | | 0.49 | | 2,437,152,969 | | 86.78 |
| Total | 46,971 | | 100.00 | | 2,808,406,269 | | 100.00 |
1 Figures may not add due to rounding
2 As of 25 March 2022, the issued share capital of Sibanye-Stillwater consisted of 2,829,789,481 ordinary shares
3 To our knowledge: (1) Sibanye-Stillwater is not directly or indirectly owned or controlled (a) by another entity or (b) by any foreign government; and (2) there are no arrangements the operation of which may at a subsequent date result in a change in control of Sibanye-Stillwater. To the knowledge of Sibanye-Stillwater’s management, there is no controlling shareholder of Sibanye-Stillwater
Public and non-public shareholdings at 31 December 2021
| | | | | | | | | | | | | | |
| Shareholder type | Number of holders | % of total shareholders | Number of
shares | % of shares
in issue |
| Non-public shareholders | 28 | 0.06 | 529,137,455 | 18.84 |
| Directors and associates | 11 | 0.02 | 9,777,728 | 0.35 |
| Prescribed Officers and associates | 5 | 0.01 | 1,996,905 | 0.07 |
| Share trust | 1 | 0.00 | 19,233,755 | 0.68 |
Government Employees Pension Fund (PIC)1 | 11 | 0.02 | 498,129,067 | 17.74 |
| Public shareholders | 46,943 | 99.94 | 2,279,268,814 | 81.16 |
| Total | 46,971 | 100.00 | 2,808,406,269 | 100.00 |
1 This is the aggregate shareholding for the Government Employees Pension Fund the majority of which is managed by the Public Investment Corporation (PIC)
Foreign custodians above 5% at 31 December 2021
| | | | | | | | |
| Number of
shares | % of shares in issue |
| Bank of New York Depositary Receipts | 395,607,358 | | 14.09 |
| JPMorgan Chase Bank | 197,218,007 | | 7.02 |
| CitiBank | 150,063,738 | | 5.34 |
| | |
Shareholder information continued
Beneficial shareholder categories at 31 December 2021
| | | | | | | | | | | | | | |
| Number of holders | % of shareholders | Number of shares | % of shares in issue |
| Other Managed Funds | 44,834 | 95.44 | 46,918,073 | 1.67 |
| Unit Trusts/Mutual Fund | 700 | 1.49 | 747,659,363 | 26.62 |
| Pension Funds | 464 | 0.99 | 737,823,145 | 26.27 |
| Private Investor | 463 | 0.99 | 112,805,155 | 4.02 |
| American Depository Receipts | 98 | 0.21 | 395,607,358 | 14.09 |
| Custodians | 98 | 0.21 | 85,694,332 | 3.05 |
| Insurance Companies | 56 | 0.12 | 74,333,247 | 2.65 |
| Exchange-Traded Fund | 55 | 0.12 | 70,626,089 | 2.51 |
| Trading Position | 41 | 0.09 | 160,445,985 | 5.71 |
| Sovereign Wealth | 34 | 0.07 | 211,163,144 | 7.52 |
| Medical Aid Scheme | 34 | 0.07 | 6,887,805 | 0.25 |
| Hedge Fund | 25 | 0.05 | 15,332,075 | 0.55 |
| University | 22 | 0.05 | 4,282,771 | 0.15 |
| Charity | 14 | 0.03 | 1,255,124 | 0.04 |
| Stock Brokers | 8 | 0.02 | 2,162,683 | 0.08 |
| Investment Trust | 6 | 0.01 | 34,331,458 | 1.22 |
| Local Authority | 6 | 0.01 | 3,900,341 | 0.14 |
| Corporate Holding | 4 | 0.01 | 95,067,743 | 3.39 |
| ESG | 4 | 0.01 | 1,459,652 | 0.05 |
| Foreign Government | 4 | 0.01 | 548,591 | 0.02 |
| Black Economic Empowerment | 1 | 0.00 | 102,135 | 0.00 |
| Total | 46,971 | 100.00 | 2,808,406,269 | 100.00 |
The tables below show the change in the percentage ownership of Sibanye-Stillwater’s major shareholders, to the knowledge of Sibanye- Stillwater’s management, between 2019 and 2021.
Investment management shareholdings more than 5% at 31 December1
| | | | | | | | | | | | | | | | | | | | |
| 2021 | 2020 | 2019 |
| Beneficial shareholding | Number of shares | % of shares in issue | Number of shares | % of shares in issue | Number of shares | % of shares in issue |
Government Employees Pension Fund (PIC)2 | 422,136,705 | 15.03 | 336,133,667 | 11.50 | 244,814,334 | 9.17 |
| Allan Gray Proprietary Limited | 167,557,050 | 5.97 | 114,906,710 | 3.93 | 29,366,475 | 1.10 |
| BlackRock Inc | 150,428,228 | 5.36 | 195,153,251 | 6.67 | 95,256,378 | 3.57 |
Ninety One plc3 | 48,777,512 | 1.74 | 112,240,906 | 3.84 | 158,890,234 | 5.95 |
| Exor Capital LLP | — | | 0.00 | 69,604,441 | 2.38 | 176,159,937 | 6.60 |
1 A list of the investment managers holding, to the knowledge of Sibanye-Stillwater’s management, directly or indirectly, 5% or more of the issued share capital of Sibanye-Stillwater as of 25 March 2022 is set forth below:
| | | | | | | | |
| Number of shares | % of shares in issue |
Government Employees Pension Fund (PIC)2 | 424,044,879 | 14.99 |
| Allan Gray Proprietary Limited | 161,399,019 | 5.70 |
| | |
| | |
2 This represents funds managed by the PIC as an investment fund manager, which holds the majority of its shares in the Government Employees Pension Fund
3 Investec Asset Management changed its name to Ninety One Plc during March 2020
Shareholder information continued
Beneficial shareholdings more than 5% at 31 December1
| | | | | | | | | | | | | | | | | | | | |
| 2021 | 2020 | 2019 |
| Number of shares | % | Number of shares | % | Number of shares | % |
| Gold One South Africa SPV (RF) Proprietary Limited | 81,331,203 | 2.90 | 148,390,135 | 5.08 | 448,891,942 | 16.81 |
Government Employees Pension Fund (PIC)2 | 498,129,067 | 17.72 | 400,925,568 | 13.71 | 270,816,493 | 10.14 |
1 A list of the individuals and organisations holding, to the knowledge of Sibanye-Stillwater’s management, directly or indirectly, 5% or more of the issued share capital of Sibanye-Stillwater as of 25 March 2022 is set forth below:
| | | | | | | | |
| Number of shares | % of shares in issue |
Government Employees Pension Fund (PIC)2 | 499,529,665 | 17.65 | |
2 This is the aggregate shareholding for the Government Employees Pension Fund the majority of which is managed by the Public Investment Corporation (PIC)
Sibanye-Stillwater’s ordinary shares are subject to dilution as a result of any non-pre-emptive share issuance, including upon the exercise of Sibanye-Stillwater’s outstanding share options, issues of shares by the Board in compliance with B-BBEE legislation or in connection with acquisitions.
The principal non-United States trading market for the ordinary shares of Sibanye-Stillwater is the JSE Limited, on which they trade under the symbol “SSW”. Sibanye-Stillwater’s American depositary shares (ADSs) trade in the United States on the NYSE under the symbol “SBSW”. The ADRs representing the ADSs were issued by the Bank of New York Mellon (BNYM) as Depositary. Each ADS represents four ordinary shares.
No public takeover offers by third parties have been made in respect of Sibanye-Stillwater’s shares or by Sibanye-Stillwater in respect of other companies’ shares during the last and current fiscal year.
Administration and corporate information
| | | | | |
SIBANYE STILLWATER LIMITED (SIBANYE-STILLWATER) Incorporated in the Republic of South Africa Registration number 2014/243852/06 Share code: SSW and SBSW Issuer code: SSW ISIN: ZAE000259701 LISTINGS JSE: SSW NYSE: SBSW WEBSITE www.sibanyestillwater.com REGISTERED AND CORPORATE OFFICE Constantia Office Park Bridgeview House, Building 11, Ground floor, Cnr 14th Avenue & Hendrik Potgieter Road Weltevreden Park 1709 South Africa Private Bag X5 Westonaria 1780 South Africa Tel: +27 11 278 9600 Fax: +27 11 278 9863 COMPANY SECRETARY Lerato Matlosa Email: lerato.matlosa@sibanyestillwater.com DIRECTORS Dr Vincent Maphai* (Chairman) Neal Froneman (CEO) Charl Keyter (CFO) Dr Elaine Dorward-King* Harry Kenyon-Slaney* Jeremiah Vilakazi* Keith Rayner* Nkosemntu Nika* Richard Menell*^ Savannah Danson* Susan van der Merwe* Timothy Cumming* Sindiswa Zilwa*# * Independent non-executive ^ Lead independent director # Appointed 1 January 2021 INVESTOR ENQUIRIES James Wellsted Executive Vice President: Investor Relations and Corporate Affairs Mobile: +27 83 453 4014 Email: james.wellsted@sibanyestillwater.com or ir@sibanyestillwater.com | JSE SPONSOR JP Morgan Equities South Africa Proprietary Limited Registration number 1995/011815/07 1 Fricker Road Illovo Johannesburg 2196 South Africa Private Bag X9936 Sandton 2146 South Africa AUDITORS Ernst & Young Inc. (EY) 102 Rivonia Road Sandton 2196 South Africa Private Bag X14 Sandton 2146 South Africa Tel: +27 11 772 3000 AMERICAN DEPOSITARY RECEIPTS TRANSFER AGENT BNY Mellon Shareowner Services PO Box 358516 Pittsburgh PA 15252-8516 US toll free: +1 888 269 2377 Tel: +1 201 680 6825 Email: shrrelations@bnymellon.com Tatyana Vesselovskaya Relationship Manager BNY Mellon Depositary Receipts Direct line: +1 212 815 2867 Mobile: +1 203 609 5159 Fax: +1 212 571 3050 Email: tatyana.vesselovskaya@bnymellon.com TRANSFER SECRETARIES SOUTH AFRICA Computershare Investor Services Proprietary Limited Rosebank Towers 15 Biermann Avenue Rosebank 2196 PO Box 61051 Marshalltown 2107 South Africa Tel: +27 11 370 5000 Fax: +27 11 688 5248 |
| | | | | | | | | | | |
| | | |
| MINERAL RESOURCES AND MINERAL RESERVES REPORT 2021 | |
| About our full suite of reports | |
| This Mineral Resources and Mineral Reserves Report 2021, together with the other reports produced for the financial year from 1 January 2021 to 31 December 2021, covers Sibanye-Stillwater’s progress and achievements in delivering on our strategic objectives and our vision to be a leader in superior shared value for all stakeholders and support climate change reversal. This report should be read in conjunction with the Integrated Annual Report 2021, Summarised Report and Notice of Annual General Meeting 2021, Annual Financial Report 2021 and Company Financial Statements 2021. | |
| 2021 Overview | |
| 2.7Moz & 0.4Moz | 1.3Moz | |
| Increase respectively in 2E PGM Mineral Resources (89.6Moz) and Mineral Reserves (27.3Moz) at the US PGM operations. The US Mineral Resource and Mineral Reserve base remains stable and strong, assisted by an enhancement in 3D geological modelling practices. | Increase in 4E PGM Mineral Reserves at the SA PGM Rustenburg (SRPM) operation. An agreement with Anglo Platinum allow SRPM ground to be accessed earlier, across the PSA boundary, utilising lower cost Kroondal infrastructure, improving the LoM of Kroondal operation from 11 to 16 years. | |
| 39.6Moz | 13.1Moz | |
| Mineral Reserves (100% basis) at our managed SA PGM operations, which remain stable, net of depletions. On an attributable basis, a year-on-year decrease of 20.2% is recorded due to an adjustment to the basis for calculating the attributable reported interest due to applying an equity. | Attributable Mineral Reserves at our SA Gold Segment, a decrease of 15.9%. Driven by depletion, and the exclusion of the De Bron Merriespruit Project Mineral Reserves (pending an updated feasibility Study), and partly off-set by an increase in secondary reef Mineral Reserves due to a successful exploration programme at Driefontein. | |
| 78.5Kt | 1,016.3Mlb | |
| Maiden lithium oxide (Li2O) Mineral Resource. Due to the inclusion of the attributable interests in the Keliber (26.6%) and Rhyolite Ridge (7.1%) projects in Finland and the United States (US) respectively. | Maiden zinc (Zn) Mineral Resource. Due to the inclusion of the attributable interest (19.9%) in the New Century tailings retreatment operation in Australia. | |
| Note: Some of the photographs used in this report were taken before the COVID-19 pandemic and do not reflect Sibanye-Stillwater’s standard operating protocols for the pandemic | |
| | | | | | | | | | | |
| OUR 2021 REPORTS | |
| These reports cover the financial year from 1 January to 31 December 2021* | |
| | | |
| INTEGRATED REPORT | SUMMARISED REPORT AND NOTICE OF ANNUAL GENERAL MEETING | |
| | | |
| GROUP ANNUAL FINANCIAL REPORT | COMPANY FINANCIAL STATEMENTS | |
| | About our cover designs: Inspired by the earth’s strata and the characteristics of layered rocks at different depths; an abstract interpretation of the ‘alchemical’ transformation of raw materials into useful commodities. The covers also include images of employees, the people who embody our purpose and vision. | |
| MINERAL RESOURCES AND MINERAL RESERVES REPORT | |
| 8 All of our 2021 reports, together with supporting documents, are available on our website at: www.sibanyestillwater.com/newsinvestors/reports/annual | |
| | | |
| SUPPORTING FACT SHEETS AND SUPPLEMENTARY INFORMATION AVAILABLE ONLINE | |
| •Progressing the UN’s SDGs | |
| •Environmental incidents in 2021 | |
| •Biodiversity management | |
| •Social and Labour Plans: Summary of projects in South Africa | |
| •Care for iMali: Taking care of personal finance | |
| •GRI content index | |
| •Tailings management | |
| •Combating illegal mining | |
| •ICMM self-assessment | |
| •Working together: The Good Neighbor Agreement | |
| •Definitions for sustainability/ESG indicators | |
| •King IV disclosure | |
| •Climate change related disclosure: TCFD recommendations | |
|
| |
| *Inclusive of information of year to date 22 April 2022 and forward- looking guidance | |
| | | | | |
‘01 | |
OUR BUSINESS |
| |
| Introduction | |
Location of our operations and projects | |
Group Mineral Resources and Mineral Reserves summary | |
| Fundamental notes | |
Corporate governance and regulatory compliance | |
| Auditing and risk | |
| Mineral title | |
| Exploration | |
| Annual planning process | |
| Commodity price assumptions | |
| Sustainability management | |
Competent persons’ declaration and consent | |
| | | | | |
‘02 | |
| AMERICAS |
| |
| Location | |
| PLATINUM GROUP METALS | |
| US OPERATIONS | |
| Stillwater and East Boulder | |
| EXPLORATION STAGE | |
| Marathon | |
| Denison | |
| GREEN METALS EXPLORATION | |
| LITHIUM | |
| Rhyolite Ridge | |
| COPPER | |
| Altar | |
| Rio Grande | |
| | | | | |
‘03 | |
SOUTHERN AFRICA |
| |
| PLATINUM GROUP METALS | |
| Location | |
| Overview | |
| OPERATIONS | |
| Marikana | |
| Rustenburg | |
| Kroondal | |
| Mimosa | |
| EXPLORATION STAGE | |
| Akanani | |
| Limpopo | |
| Blue Ridge | |
| GOLD | |
| Location | |
| Overview | |
| OPERATIONS | |
| Kloof | |
| Beatrix | |
| Driefontein | |
| Cooke | |
| DRDGOLD | |
| DEVELOPMENT STAGE | |
| Burnstone | |
| EXPLORATION STAGE | |
| SOFS | |
| | | | | |
‘04 | |
| EUROPE |
| |
| GREEN METALS EXPLORATION | |
| LITHIUM | |
| Keliber | |
| |
| |
| | | | | |
| 05 | |
| AUSTRALIA |
| |
| GREEN METALS OPERATIONS | |
| ZINC | |
| New Century | |
| | | | | |
‘06 | |
ANCILLARY INFORMATION |
| |
| Professional Organisations | |
| SAMREC Code definitions | |
| Glossary of terms | |
| Abbreviations | |
| Forward looking statement | |
Administration and company information | |
| RSA Generic Mining Permit Conditions | |
| | | | | | | | |
We welcome your feedback Your feedback and suggestions are welcome. Please direct them to James Wellsted, Head of Investor Relations: ir@sibanyestillwater.com 8 www.sibanyestillwater.com |
| | | | | | | | |
| OUR BUSINESS |
| Introduction | |
| Location of our operations and projects | |
| Group Mineral Resources and Mineral Reserves summary | |
| Fundamental notes | |
| Corporate governance and regulatory compliance | |
| Auditing and risk | |
| Mineral title | |
| Exploration | |
| Annual planning process | |
| Commodity price assumptions | |
| Sustainability management | |
| Competent persons’ declaration and consent | |
Introduction
Sibanye-Stillwater is a multinational mining and metals processing Group with a diverse portfolio of mining and processing operations, projects and investments, across five continents. The Group is also one of the foremost global PGM auto catalytic recyclers and has interests in leading mine tailings retreatment operations.
Sibanye-Stillwater has established itself as one of the world’s largest primary producers of platinum, palladium, and rhodium and is also a top tier gold producer. It produces other PGMs, such as iridium and ruthenium, along with chrome, copper and nickel as by-products. The Group has recently begun to build and diversify its asset portfolio into battery metals mining and processing and is increasing its presence in the circular economy by growing and diversifying its recycling and tailings reprocessing operations globally.
Our fundamental strategic goal is to ensure that we consistently deliver on our purpose to ‘safeguard global sustainability through our metals and energy solutions’ while strengthening our position as a leading international mining company and ensuring we are true to our vision ‘to be a leader in superior shared value for all stakeholders and support climate change reversal’. Everything we do is driven by our C.A.R.E.S. values of Commitment, Accountability, Respect, Enabling and Safety.
Location of our operations and projects3
AMERICAS
PGMs
Sibanye-Stillwater wholly owns and operates PGM mining and processing operations and mining claims (together known as the US PGM operations) that are located in Montana, US. These wholly-owned assets include the Stillwater mine (inclusive of the Stillwater East expansion project, which is under development), the East Boulder mine, two concentrator plants, and the surrounding PGM mining claims located near the town of Nye. In addition, we own and operate a metallurgical smelter and base metals refinery complex situated in the town of Columbus, Montana, which also serves as the base for our PGM recycling business, which recovers PGMs from recycled catalytic converters.
We also have non-managed interests in two PGM projects, in exploration phase, in Canada: Marathon (22.6%) and Denison (64.9%).
Green metals
During 2022, the Group acquired a 7.1% interest in ioneer Limited, the owner and operator of the Rhyolite Ridge Lithium project in Nevada, with an option to enter into a 50:50 JV on the project.
The Group also holds non-managed interests in two Copper-Gold porphyry exploration projects in Argentina, namely Altar (100%) and Rio Grande (19.9%).
SOUTHERN AFRICA
PGMs
The SA PGM operations consist of three managed PGM-producing underground operations (Marikana, Rustenburg and Kroondal), as well as an open pit operation situated at Kroondal and all related surface treatment facilities in South Africa. In addition, the PGM segment has a 50% attributable, non-managed, underground operation (Mimosa) in Zimbabwe.
The Rustenburg (74% attributable) operations are serviced by four concentrator plants and the Kroondal (50% attributable) operations by two concentrator plants. Kroondal concentrate is processed in terms of a purchase of concentrate (POC) agreement and Rustenburg concentrate in terms of a toll-treatment agreement by Rustenburg Platinum Mines Ltd, a division of Anglo American Platinum. The Marikana operations (80.64% attributable) own eight concentrator plants of which five are used for processing, with two on care and maintenance and one being used for third processing, as well as a metallurgical smelter and base metals refinery situated at the operations and a precious metals refinery complex located in Brakpan, to the east of Johannesburg.
Apart from the primary mining operations, significant tailings retreatment operations exist:
•The Platinum Mile concentrator , located adjacent to the Rustenburg operations Paardekraal tailings storage facility (TSF), is a tailings retreatment facility (plant) that recovers PGMs from the tailings streams of the Rustenburg Waterval and Retrofit concentrator plants. As it is a current tailings retreatment operation, no Mineral Resources or Mineral Reserves are declared. Sibanye-Stillwater has a 100% stake in Platinum Mile
•The Western Limb Tailings Retreatment (WLTR) recovers PGMs from historic TSFs at the Rustenburg operation
•The Bulk Tailings Retreatment (BTT) is a tailings retreatment facility that recovers chrome and PGMs from the ETD1 TSF at the Marikana operation
•The Eastern Tailings Retreatment (ETTP) treats fresh tailings material from the EPL concentrator at the Marikana operation
•At the Rustenburg, Kroondal and Marikana operations, a chrome concentrate is extracted as a by-product from the UG2 concentrator tailings
The Akanani exploration project (80.13% attributable) is an advanced staged exploration asset on the Northern Limb of the Bushveld Igneous Complex (BIC) near the town of Mokopane. The Limpopo exploration project, located approximately 50km southeast of Mokopane, consists of the care and maintenance Baobab operation (80.64%), the recently (2021) granted Dwaalkop mining right (50:50 JV area with Northam, 40.32% attributable), and the Doornvlei mining right (80.64% attributable).
The Blue Ridge Platinum exploration project – a 50% attributable joint venture (JV) with Imbani Platinum (Pty) Ltd – is a historic operation that has been on care and maintenance since 2011.
Gold
The gold operations are made up of four managed, gold producing, underground and surface operations in South Africa, namely the Kloof (100% attributable), Driefontein (100% attributable) and Cooke (76% attributable)operations in the West Wits region, and Beatrix (100% attributable) operation in the Free State province.
Burnstone (100% attributable) is a development project in Mpumalanga province. In addition to its mining activities, Sibanye-Stillwater owns and manages significant metallurgical processing facilities at all its operations where gold-bearing ore is treated, and gold extracted. Wholly-owned and managed projects in study phase include Bloemhoek, De Bron Merriespruit and Beisa. Bloemhoek and De Bron Merriespruit are both gold projects, which form part of the Southern Free State (SOFS) exploration project area. Beisa is a uranium/gold project that can be accessed from the Beatrix No. 4 Shaft.
In addition to these managed operations, the Group also reports Mineral Resources and Mineral Reserves on an attributable basis for DRDGOLD Limited (DRDGOLD) due to its 50.5% equity interest (as at 31 December 2021, taking into account the Treasury shares of DRDGOLD). DRDGOLD operates the Far West Gold Recoveries (FWGR) operation, which incorporates TSF assets previously acquired from Sibanye-Stillwater in exchange for a portion of this shareholding, as well as the ERGO Gold Recoveries operation.
Green metals
Significant quantities of uranium are present in the historic TSFs of the Cooke Operation, as well as in the Beisa Reef at the Beatrix operation. These are considered exploration projects even though they occur within existing operational mining rights.
EUROPE
Green metals
During the first quarter of 2021, Sibanye-Stillwater secured an entry into the battery metals sector through a partnership with and investment into Keliber, a leading European lithium project in Finland. The companies holds a 26.6% stake in the project, with an option to increase its shareholding to +50% on completion of a definitive feasibility study (DFS).
AUSTRALIA
Green metals
During the third quarter of 2021, Sibanye-Stillwater acquired a 19.9% equity position in New Century Resources Limited, an Australian company focused on the economic re-treatment and rehabilitation of TSFs, which currently operates the largest tailings retreatment operation in Australia, the Century Zinc Mine in Queensland.
Group Mineral Resources and
Mineral Reserves summary
Group mineral property summary
| | | | | | | | | | | | | | | | | | | | | | | |
| Commodity | Region | Stage | Property Name | Area (ha) | AttributableOwnership | Mine Type | Mineralisation
Style |
| PGM | Americas | Production | Stillwater and East Boulder | 9,775 | 100% | Underground | Magmatic |
| PGM | Americas | Exploration | Marathon* | 19,625 | 22.6% | Open pit | Magmatic |
| PGM | Americas | Exploration | Denison* | 256 | 64.9% | Underground & Open pit | Magmatic |
| PGM | Southern Africa | Production | Marikana | 26,270 | 80.6% | Underground | Magmatic |
| PGM | Southern Africa | Production | Rustenburg | 15,300 | 74% | Underground | Magmatic |
| PGM | Southern Africa | Production | Kroondal | 4,910 | 50% | Underground & Open pit | Magmatic |
| PGM | Southern Africa | Production | Mimosa* | 6,594 | 50% | Underground | Magmatic |
| PGM | Southern Africa | Exploration | Akanani | 4,095 | 80.1% | Underground | Magmatic |
| PGM | Southern Africa | Exploration | Limpopo | 5,706 | 40.3/80.1% | Underground | Magmatic |
| PGM | Southern Africa | Exploration | Blue Ridge | 1,889 | 50% | Underground | Magmatic |
| Gold | Southern Africa | Production | Kloof | 20,087 | 100% | Underground | Paleoplacer |
| Gold | Southern Africa | Production | Driefontein | 8,561 | 100% | Underground | Paleoplacer |
| Gold | Southern Africa | Production | Beatrix | 16,821 | 100% | Underground | Paleoplacer |
| Gold | Southern Africa | Production | Cooke | 14,724 | 76% | Surface operation | Tailings |
| Gold | Southern Africa | Production | DRDGOLD* | 31,566 | 50% | Surface operation | Paleoplacer |
| Gold | Southern Africa | Development | Burnstone | 13,136 | 100% | Underground | Paleoplacer |
| Gold | Southern Africa | Exploration | SOFS | 17,022 | 100% | Underground | Paleoplacer |
| Uranium | Southern Africa | Exploration | Beisa (Beatrix) | 16,821 | 100% | Underground | Paleoplacer |
| Uranium | Southern Africa | Exploration | Cooke (TSF's) | 8,119 | 76% | Surface operation | Tailings |
| Lithium | Americas | Exploration | Rhyolite Ridge* | 3,160 | 7.1% | Open pit | Sedimentary |
| Lithium | Europe | Exploration | Keliber* | 3,038 | 26.6% | Underground & Open pit | Magmatic |
| Copper | Americas | Exploration | Altar* | 8,440 | 100% | Underground & Open pit | Magmatic |
| Copper | Americas | Exploration | Rio Grande* | 16,953 | 19.9% | Underground & Open pit | Magmatic |
| Zinc | Australia | Production | Century* | 75,784 | 19.9% | Surface operation | Tailings |
* Non-Managed
Group production summary
| | | | | | | | | | | | | | | | | | | | | | | | | | | | | | | | | | | |
| Year ended 31 December |
| Region | 2021 | | 2020 | | 2019 |
| Milled | Yield | Produced | | Milled | Yield | Produced | | Milled | Yield | Produced |
| kt | g/t | 2E/4E/AU koz | | kt | g/t | 2E/4E/AU koz | | kt | g/t | 2E/4E/AU koz |
| US PGM | 1,469 | 12.1 | 570 | | 1,487 | 12.6 | 603 | | 1,411 | 13.1 | 594 |
| SA PGM* | 38,307 | 1.5 | 1,836 | | 32,416 | 1.5 | 1,527 | | 31,624 | 1.6 | 1,610 |
| SA Gold | 44,402 | 0.8 | 1,073 | | 41,226 | 0.7 | 983 | | 41,498 | 0.7 | 933 |
*Includes Platinum Mile
Encumbrances
Group significant and material encumbrances in the mineral properties licensing tenure are restricted to the following:
US PGM Operations: Planned operations will result in the need for the next phase of tailings and waste rock storage to be permitted in the next five to seven years. Such permitting efforts have begun at both sites and will continue through formal Environmental Impact Statements. While the company is diligently pursuing these permitting efforts, it cannot guarantee the outcome of such efforts.
Beatrix: The mining right expired on 6 February 2019. An application for renewal was submitted to the DMRE on 27 July 2018, which is still pending. A mining right in respect of which an application for renewal has been lodged shall, despite its expiry date, remain in force until such time as it has been granted or refused. Although renewal is not guaranteed, there is no reason to believe it will not be granted.
Group Mineral Resources and Mineral Reserves summary continued
Classified Mineral Resource and Mineral Reserve estimates at 31 December 2021
| | | | | | | | | | | | | | | | | | | | | | | | | | | | | | | | |
| Mineral Resources Inclusive of Mineral Reserves |
| | | 31 December 2021 | 31 December 2020 |
| | | Attributable | 100% | Attributable | 100% |
| PGM OPERATIONS | | | Tonnes | Grade | PGM | PGM | Tonnes | Grade | PGM | PGM |
| | | (Mt) | (g/t) | (Moz) | (Moz) | (Mt) | (g/t) | (Moz) | (Moz) |
| Americas | Stillwater and | Measured | 39.9 | | 14.7 | | 18.9 | | 18.9 | | 12.4 | | 15.1 | 6.0 | 6.0 |
| East Boulder | Indicated | 59.1 | | 13.8 | | 26.1 | | 26.1 | | 70.1 | | 14.6 | 33.0 | 33.0 |
| | Measured + Indicated | 99.0 | | 14.1 | | 45.0 | | 45.0 | | 82.5 | | 14.7 | 39.0 | 39.0 |
| | Inferred | 113.6 | | 12.2 | | 44.6 | | 44.6 | | 96.2 | | 15.5 | 47.9 | 47.9 |
| Southern Africa | Marikana | Measured | 73.3 | | 4.2 | | 9.9 | | 12.3 | | 77.3 | | 4.1 | 10.1 | 10.6 |
| | Indicated | 513.4 | | 4.1 | | 68.1 | | 84.4 | | 616.2 | | 4.3 | 85.0 | 89.2 |
| | Measured + Indicated | 586.6 | | 4.1 | | 78.0 | | 96.8 | | 693.5 | | 4.3 | 95.1 | 99.8 |
| | Inferred | 178.9 | | 4.4 | | 25.2 | | 31.2 | | 202.2 | | 4.6 | 29.7 | 31.1 |
| Rustenburg | Measured | 308.3 | | 4.4 | | 43.2 | | 58.4 | | 427.0 | | 4.4 | 59.7 | 59.7 |
| | Indicated | 88.6 | | 5.3 | | 15.1 | | 20.5 | | 115.7 | | 5.3 | 19.9 | 19.9 |
| | Measured + Indicated | 396.9 | | 4.6 | | 58.4 | | 78.9 | | 542.7 | | 4.6 | 79.6 | 79.6 |
| | Inferred | 11.0 | | 5.6 | | 2.0 | | 2.7 | | 14.9 | | 5.6 | 2.7 | 2.7 |
| Kroondal | Measured | 27.8 | | 3.3 | | 3.0 | | 5.9 | | 30.8 | | 3.3 | 3.3 | 6.5 |
| | Indicated | 4.8 | | 3.8 | | 0.6 | | 1.2 | | 5.0 | | 3.8 | 0.6 | 1.2 |
| | Measured + Indicated | 32.5 | | 3.4 | | 3.6 | | 7.1 | | 35.8 | | 3.4 | 3.9 | 7.8 |
| | Inferred | 2.5 | | 2.9 | | 0.2 | | 0.5 | | 2.5 | | 2.9 | 0.2 | 0.5 |
| Mimosa | Measured | 31.0 | | 3.5 | | 3.5 | | 7.0 | | 25.4 | | 3.6 | 3.0 | 6.0 |
| | Indicated | 17.7 | | 3.5 | | 2.0 | | 4.0 | | 15.1 | | 3.6 | 1.7 | 3.5 |
| | Measured + Indicated | 48.7 | | 3.5 | | 5.5 | | 11.0 | | 40.5 | | 3.6 | 4.7 | 9.4 |
| | Inferred | 17.2 | | 3.4 | | 1.9 | | 3.7 | | 13.4 | | 3.5 | 1.5 | 3.0 |
| OPERATIONS Total Measured + Indicated | 1,163.8 | | 5.1 | | 190.5 | | 238.7 | | 1,395.0 | | 5.0 | | 222.3 | | 235.6 | |
| OPERATIONS – Grand total | 1,486.9 | | 5.5 | | 264.3 | | 321.4 | | 1,724.1 | | 5.5 | | 304.3 | | 320.9 | |
| PGM EXPLORATION | | | | | | | | | | |
| Americas | Marathon | Measured | 23.4 | 0.8 | 0.6 | 2.8 | 26.7 | 0.8 | 0.7 | 2.8 |
| | Indicated | 26.7 | 0.6 | 0.5 | 2.3 | 30.5 | 0.6 | 0.6 | 2.3 |
| | Measured + Indicated | 50.1 | 0.7 | 1.1 | 5.1 | 57.2 | 0.7 | 1.3 | 5.1 |
| | Inferred | 6.2 | 0.5 | 0.1 | 0.4 | 7.1 | 0.5 | 0.1 | 0.4 |
| Denison | Measured | 0.1 | 6.2 | 0.0 | 0.0 | 0.1 | | 6.2 | 0.0 | 0.0 |
| | Indicated | 1.1 | 2.8 | 0.1 | 0.1 | 1.1 | | 2.8 | 0.1 | 0.1 |
| | Measured + Indicated | 1.2 | 3.0 | 0.1 | 0.2 | 1.2 | | 3.0 | 0.1 | 0.2 |
| | Inferred | 1.3 | 2.7 | 0.1 | 0.2 | 1.3 | | 2.7 | 0.1 | 0.2 |
| Southern Africa | Akanani | Measured | — | | — | | — | | — | | — | | — | | — | | — | |
| | Indicated | 164.5 | | 4.2 | | 22.0 | | 27.5 | | 191.1 | | 4.2 | 25.6 | 27.5 |
| | Measured + Indicated | 164.5 | | 4.2 | | 22.0 | | 27.5 | | 191.1 | | 4.2 | 25.6 | 27.5 |
| | Inferred | 87.9 | | 3.4 | | 9.6 | | 12.0 | | 102.1 | | 3.4 | 11.2 | 12.0 |
| Limpopo | Measured | 1.8 | | 4.2 | | 0.2 | | 0.3 | | 2.1 | | 4.2 | 0.3 | 0.3 |
| | Indicated | 73.6 | | 4.3 | | 10.3 | | 17.2 | | 95.2 | | 4.0 | 12.2 | 18.1 |
| | Measured + Indicated | 75.4 | | 4.3 | | 10.5 | | 17.5 | | 97.3 | | 4.0 | 12.5 | 18.3 |
| | Inferred | 67.9 | | 4.2 | | 9.1 | | 14.0 | | 102.3 | | 4.1 | 13.4 | 18.2 |
| Blue Ridge | Measured | — | | — | | — | | — | | — | | — | | — | | — | |
| | Indicated | 9.2 | | 3.2 | | 1.0 | | 1.9 | | 9.2 | | 3.2 | 1.0 | 1.9 |
| | Measured + Indicated | 9.2 | | 3.2 | | 1.0 | | 1.9 | | 9.2 | | 3.2 | 1.0 | 1.9 |
| | Inferred | 6.7 | | 3.0 | | 0.6 | | 1.3 | | 6.7 | | 3.0 | 0.6 | 1.3 |
| Hoedspruit | Measured | — | | — | | — | | — | | — | | — | | — | | — | |
| | Indicated | — | | — | | — | | — | | 28.1 | | 5.5 | 5.0 | 6.7 |
| | Measured + Indicated | — | | — | | — | | — | | 28.1 | | 5.5 | 5.0 | 6.7 |
| | Inferred | — | | — | | — | | — | | 4.5 | | 5.6 | 0.8 | 1.1 |
| Zondernaam | Measured | — | | — | | — | | — | | — | | — | | — | | — | |
| | Indicated | — | | — | | — | | — | | — | | — | | — | | — | |
| | Measured + Indicated | — | | — | | — | | — | | — | | — | | — | | — | |
| | Inferred | — | | — | | — | | — | | 77.4 | | 6.4 | 15.9 | 21.5 |
| EXPLORATION Total Measured + Indicated | 300.3 | | 3.6 | | 34.8 | | 52.1 | | 384.0 | | 3.7 | | 45.5 | | 59.7 | |
| EXPLORATION - Grand Total | 470.3 | | 3.6 | | 54.4 | | 80.0 | | 685.4 | | 4.0 | | 87.6 | | 114.4 | |
| PGM TOTAL Measured + Indicated | 1,464.1 | | 4.8 | | 225.2 | | 290.9 | | 1,779.0 | | 4.7 | | 267.8 | | 295.4 | |
| PGM TOTAL | 1,957.2 | | 5.1 | | 318.7 | | 401.5 | | 2,409.5 | | 5.1 | | 391.9 | | 435.3 | |
Group Mineral Resources and Mineral Reserves summary continued
| | | | | | | | | | | | | | | | | | | | | | | | | | | | | | | | |
| Mineral Resources Exclusive of Mineral Reserves |
| | | 31 December 2021 | 31 December 2020 |
| | | Attributable | 100% | Attributable | 100% |
| PGM OPERATIONS | | | Tonnes | Grade | PGM | PGM | Tonnes | Grade | PGM | PGM |
| | | (Mt) | (g/t) | (Moz) | (Moz) | (Mt) | (g/t) | (Moz) | (Moz) |
| Americas | Stillwater and | Measured | 15.1 | | 14.3 | | 6.9 | | 6.9 | | 4.7 | | 14.1 | 2.1 | 2.1 |
| East Boulder | Indicated | 19.9 | | 13.7 | | 8.8 | | 8.8 | | — | | — | | — | | — | |
| | Measured + Indicated | 35.0 | | 14.0 | | 15.7 | | 15.7 | | 4.7 | | 14.1 | 2.1 | 2.1 |
| | Inferred | 113.6 | | 12.2 | | 44.6 | | 44.6 | | 96.2 | | 15.5 | 47.9 | 47.9 |
| Southern Africa | Marikana | Measured | 47.7 | | 3.9 | | 6.0 | | 7.5 | | 55.5 | | 3.9 | 6.9 | 7.2 |
| | Indicated | 392.6 | | 3.9 | | 49.6 | | 61.5 | | 455.3 | | 4.1 | 60.4 | 63.4 |
| | Measured + Indicated | 440.3 | | 3.9 | | 55.6 | | 69.0 | | 510.8 | | 4.1 | 67.3 | 70.6 |
| | Inferred | 178.6 | | 4.4 | | 25.1 | | 31.2 | | 202.0 | | 4.6 | 29.6 | 31.1 |
| Rustenburg | Measured | 177.7 | | 5.1 | | 29.0 | | 39.1 | | 253.8 | | 5.1 | 41.3 | 41.3 |
| | Indicated | 82.9 | | 5.4 | | 14.3 | | 19.3 | | 110.0 | | 5.4 | 18.9 | 18.9 |
| | Measured + Indicated | 260.6 | | 5.2 | | 43.2 | | 58.4 | | 363.8 | | 5.1 | 60.2 | 60.2 |
| | Inferred | 11.0 | | 5.6 | | 2.0 | | 2.7 | | 14.9 | | 5.6 | 2.7 | 2.7 |
| Kroondal | Measured | 15.8 | | 3.4 | | 1.7 | | 3.4 | | 17.0 | | 3.4 | 1.9 | 3.7 |
| | Indicated | 4.8 | | 3.8 | | 0.6 | | 1.2 | | 4.7 | | 3.8 | 0.6 | 1.2 |
| | Measured + Indicated | 20.5 | | 3.5 | | 2.3 | | 4.6 | | 21.8 | | 3.5 | 2.4 | 4.9 |
| | Inferred | 2.5 | | 2.9 | | 0.2 | | 0.5 | | 2.5 | | 2.9 | 0.2 | 0.5 |
| Mimosa | Measured | 16.0 | | 3.4 | | 1.8 | | 3.5 | | 11.7 | | 3.5 | 1.3 | 2.6 |
| | Indicated | 8.4 | | 3.5 | | 1.0 | | 1.9 | | 9.7 | | 3.6 | 1.1 | 2.2 |
| | Measured + Indicated | 24.4 | | 3.5 | | 2.7 | | 5.4 | | 21.4 | | 3.6 | 2.4 | 4.9 |
| | Inferred | 17.2 | | 3.4 | | 1.9 | | 3.7 | | 13.4 | | 3.5 | 1.5 | 3.0 |
| OPERATIONS Total Measured + Indicated | 780.9 | | 4.8 | | 119.6 | | 153.2 | | 922.4 | | 4.5 | | 134.5 | | 142.8 | |
| OPERATIONS – Grand total | 1,103.8 | | 5.4 | | 193.4 | | 235.8 | | 1,251.4 | | 5.4 | | 216.5 | | 228.0 | |
| PGM EXPLORATION | | | | | | | | | | |
| Americas | Marathon | Measured | 23.4 | 0.8 | 0.6 | 2.8 | 26.7 | 0.8 | 0.7 | 2.8 |
| | Indicated | 26.7 | 0.6 | 0.5 | 2.3 | 30.5 | 0.6 | 0.6 | 2.3 |
| | Measured + Indicated | 50.1 | 0.7 | 1.1 | 5.1 | 57.2 | 0.7 | 1.3 | 5.1 |
| | Inferred | 6.2 | 0.5 | 0.1 | 0.4 | 7.1 | 0.5 | 0.1 | 0.4 |
| Denison | Measured | 0.1 | 6.2 | 0.02 | 0.03 | 0.1 | | 6.2 | 0.02 | 0.03 |
| | Indicated | 1.1 | 2.8 | 0.1 | 0.1 | 1.1 | | 2.8 | 0.1 | 0.1 |
| | Measured + Indicated | 1.2 | 3.0 | 0.1 | 0.2 | 1.2 | | 3.0 | 0.1 | 0.2 |
| | Inferred | 1.3 | 2.7 | 0.1 | 0.2 | 1.3 | | 2.7 | 0.1 | 0.2 |
| Southern Africa | Akanani | Measured | — | | — | | — | | — | | — | | — | | — | | — | |
| | Indicated | 164.5 | | 4.2 | | 22.0 | | 27.5 | | 191.1 | | 4.2 | 25.6 | 27.5 |
| | Measured + Indicated | 164.5 | | 4.2 | | 22.0 | | 27.5 | | 191.1 | | 4.2 | 25.6 | 27.5 |
| | Inferred | 87.9 | | 3.4 | | 9.6 | | 12.0 | | 102.1 | | 3.4 | 11.2 | 12.0 |
| Limpopo | Measured | 1.8 | | 4.2 | | 0.2 | | 0.3 | | 2.1 | | 4.2 | 0.3 | 0.3 |
| | Indicated | 73.6 | | 4.3 | | 10.3 | | 17.2 | | 95.2 | | 4.0 | 12.2 | 18.1 |
| | Measured + Indicated | 75.4 | | 4.3 | | 10.5 | | 17.5 | | 97.3 | | 4.0 | 12.5 | 18.3 |
| | Inferred | 67.9 | | 4.2 | | 9.1 | | 14.0 | | 102.3 | | 4.1 | 13.4 | 18.2 |
| Blue Ridge | Measured | — | | — | | — | | — | | — | | — | | — | | — | |
| | Indicated | 9.2 | | 3.2 | | 1.0 | | 1.9 | | 9.2 | | 3.2 | 1.0 | 1.9 |
| | Measured + Indicated | 9.2 | | 3.2 | | 1.0 | | 1.9 | | 9.2 | | 3.2 | 1.0 | 1.9 |
| | Inferred | 6.7 | | 3.0 | | 0.6 | | 1.3 | | 6.7 | | 3.0 | 0.6 | 1.3 |
| Hoedspruit | Measured | — | | — | | — | | — | | — | | — | | — | | — | |
| | Indicated | — | | — | | — | | — | | 28.1 | | 5.5 | 5.0 | 6.7 |
| | Measured + Indicated | — | | — | | — | | — | | 28.1 | | 5.5 | 5.0 | 6.7 |
| | Inferred | — | | — | | — | | — | | 4.5 | | 5.6 | 0.8 | 1.1 |
| Zondernaam | Measured | — | | — | | — | | — | | — | | — | | — | | — | |
| | Indicated | — | | — | | — | | — | | — | | — | | — | | — | |
| | Measured + Indicated | — | | — | | — | | — | | — | | — | | — | | — | |
| | Inferred | — | | — | | — | | — | | 77.4 | | 6.4 | 15.9 | 21.5 |
| EXPLORATION Total Measured + Indicated | 300.3 | | 3.6 | | 34.8 | | 52.1 | | 384.0 | | 3.7 | | 45.5 | | 59.7 | |
| EXPLORATION - Grand Total | 470.3 | | 3.6 | | 54.4 | | 80.0 | | 685.4 | | 4.0 | | 87.6 | | 114.4 | |
| PGM TOTAL Measured + Indicated | 1,081.3 | | 4.4 | | 154.4 | | 205.3 | | 1,306.4 | | 4.3 | | 180.0 | | 202.5 | |
| PGM TOTAL | 1,574.1 | | 4.9 | | 247.8 | | 315.8 | | 1,936.8 | | 4.9 | | 304.1 | | 342.3 | |
Group Mineral Resources and Mineral Reserves summary continued
| | | | | | | | | | | | | | | | | | | | | | | | | | | | | | | | |
| Mineral Reserves |
| | | 31 December 2021 | 31 December 2020 |
| | | Attributable | 100% | Attributable | 100% |
| PGM OPERATIONS | | | Tonnes | Grade | PGM | PGM | Tonnes | Grade | PGM | PGM |
| | | (Mt) | (g/t) | (Moz) | (Moz) | (Mt) | (g/t) | (Moz) | (Moz) |
| Americas | Stillwater and | Proved | 8.2 | | 15.4 | | 4.1 | | 4.1 | | 7.8 | | 14.5 | | 3.6 | | 3.6 | |
| East Boulder | Probable | 60.1 | | 12.0 | | 23.2 | | 23.2 | | 50.3 | | 14.4 | | 23.3 | | 23.3 | |
| | Proved + Probable | 68.3 | | 12.4 | | 27.3 | | 27.3 | | 58.1 | | 14.4 | | 26.9 | | 26.9 | |
| Southern Africa | Marikana | Proved | 22.6 | | 3.9 | | 2.9 | | 3.6 | | 19.6 | | 3.9 | | 2.4 | | 2.6 | |
| | Probable | 121.6 | | 3.9 | | 15.1 | | 18.8 | | 152.6 | | 3.9 | | 19.1 | | 20.0 | |
| | Proved + Probable | 144.2 | | 3.9 | | 18.0 | | 22.3 | | 172.2 | | 3.9 | | 21.5 | | 22.6 | |
| Rustenburg | Proved | 83.4 | | 3.5 | | 9.5 | | 12.9 | | 106.1 | | 3.7 | | 12.7 | | 12.7 | |
| | Probable | 41.7 | | 1.5 | | 2.0 | | 2.6 | | 64.9 | | 1.3 | | 2.7 | | 2.7 | |
| | Proved + Probable | 125.1 | | 2.9 | | 11.5 | | 15.5 | | 171.0 | | 2.8 | | 15.4 | | 15.4 | |
| Kroondal | Proved | 10.4 | | 2.6 | | 0.9 | | 1.7 | | 12.9 | | 2.6 | | 1.1 | | 2.2 | |
| | Probable | — | | — | | — | | — | | — | | — | | — | | — | |
| | Proved + Probable | 10.4 | | 2.6 | | 0.9 | | 1.7 | | 12.9 | | 2.6 | | 1.1 | | 2.2 | |
| Mimosa | Proved | 8.2 | | 3.6 | | 0.9 | | 1.9 | | 8.5 | | 3.5 | | 1.0 | | 1.9 | |
| | Probable | 7.7 | | 3.5 | | 0.9 | | 1.7 | | 4.6 | | 3.3 | | 0.5 | | 1.0 | |
| | Proved + Probable | 15.8 | | 3.5 | | 1.8 | | 3.6 | | 13.1 | | 3.4 | | 1.5 | | 2.9 | |
| PGM TOTAL Proved + Probable | 363.9 | | 5.1 | | 59.4 | | 70.5 | | 427.2 | | 4.8 | | 66.4 | | 70.0 | |

Group Mineral Resources and Mineral Reserves summary continued
| | | | | | | | | | | | | | | | | | | | | | | | | | | | | | | | |
| Mineral Resources Inclusive of Mineral Reserves |
| | | 31 December 2021 | 31 December 2020 |
| | | Attributable | 100% | Attributable | 100% |
| GOLD OPERATIONS | | | Tonnes | Grade | Gold | Gold | Tonnes | Grade | Gold | Gold |
| | | (Mt) | (g/t) | (Moz) | (Moz) | (Mt) | (g/t) | (Moz) | (Moz) |
| Southern Africa | Kloof | Measured | 34.5 | | 11.3 | | 12.6 | | 12.6 | | 34.3 | | 11.7 | | 12.9 | | 12.9 | |
| | Indicated | 39.1 | | 6.4 | | 8.0 | | 8.0 | | 48.5 | | 5.8 | | 9.1 | | 9.1 | |
| | Measured + Indicated | 73.6 | | 8.7 | | 20.6 | | 20.6 | | 82.8 | | 8.3 | | 22.0 | | 22.0 | |
| | Inferred | 28.1 | | 11.5 | | 10.4 | | 10.4 | | 35.6 | | 9.6 | | 11.0 | | 11.0 | |
| Beatrix | Measured | 26.5 | | 6.4 | | 5.4 | | 5.4 | | 24.8 | | 6.7 | | 5.3 | | 5.3 | |
| | Indicated | 26.3 | | 5.1 | | 4.3 | | 4.3 | | 28.7 | | 5.4 | | 5.0 | | 5.0 | |
| | Measured + Indicated | 52.8 | | 5.7 | | 9.7 | | 9.7 | | 53.5 | | 6.0 | | 10.3 | | 10.3 | |
| | Inferred | 1.7 | | 4.2 | | 0.2 | | 0.2 | | 4.8 | | 4.4 | | 0.7 | | 0.7 | |
| Driefontein | Measured | 21.1 | | 10.9 | | 7.4 | | 7.4 | | 20.6 | | 10.7 | | 7.1 | | 7.1 | |
| | Indicated | 12.2 | | 8.5 | | 3.3 | | 3.3 | | 14.5 | | 9.0 | | 4.2 | | 4.2 | |
| | Measured + Indicated | 33.3 | | 10.0 | | 10.7 | | 10.7 | | 35.1 | | 10.0 | | 11.3 | | 11.3 | |
| | Inferred | 0.8 | | 6.6 | | 0.2 | | 0.2 | | 0.5 | | 5.2 | | 0.1 | | 0.1 | |
| Cooke | Measured | 159.6 | | 0.3 | | 1.3 | | 1.7 | | 210.0 | | 0.3 | | 1.7 | | 1.7 | |
| | Indicated | 45.6 | | 0.3 | | 0.5 | | 0.6 | | 63.4 | | 0.3 | | 0.6 | | 0.6 | |
| | Measured + Indicated | 205.2 | | 0.3 | | 1.8 | | 2.3 | | 273.4 | | 0.3 | | 2.3 | | 2.3 | |
| | Inferred | — | | — | | — | | — | | — | | — | | — | | — | |
| DRDGOLD | Measured | 255.0 | | 0.3 | | 2.6 | | 5.2 | | 268.2 | | 0.3 | | 2.8 | | 5.6 | |
| | Indicated | 290.1 | | 0.2 | | 2.3 | | 4.6 | | 190.1 | | 0.3 | | 1.5 | | 3.1 | |
| | Measured + Indicated | 545.1 | | 0.3 | | 4.9 | | 9.8 | | 458.3 | | 0.3 | | 4.3 | | 8.7 | |
| | Inferred | 10.8 | | 0.2 | | 0.1 | | 0.2 | | 103.9 | | 0.2 | | 0.8 | | 1.6 | |
| OPERATIONS Total Measured + Indicated | 910.0 | | 1.6 | | 47.8 | | 53.2 | | 903.1 | | 1.7 | | 50.3 | | 54.6 | |
| OPERATIONS - Grand total | 951.4 | | 1.9 | | 58.7 | | 64.1 | | 1,048.0 | | 1.9 | | 62.8 | | 68.0 | |
| GOLD DEVELOPMENT | | | | | | | | | |
| Southern Africa | Burnstone | Measured | 1.1 | | 6.2 | | 0.2 | | 0.2 | | 1.1 | | 6.2 | | 0.2 | | 0.2 | |
| | Indicated | 25.5 | | 5.6 | | 4.6 | | 4.6 | | 25.5 | | 5.6 | | 4.6 | | 4.6 | |
| | Measured + Indicated | 26.6 | | 5.7 | | 4.8 | | 4.8 | | 26.6 | | 5.7 | | 4.8 | | 4.8 | |
| | Inferred | 31.5 | | 4.2 | | 4.3 | | 4.3 | | 31.5 | | 4.2 | | 4.3 | | 4.3 | |
| DEVELOPMENT Total Measured + Indicated | 58.1 | | 4.9 | | 9.1 | | 9.1 | | 58.1 | | 4.9 | | 9.1 | | 9.1 | |
| DEVELOPMENT - Grand Total | 58.1 | | 4.9 | | 9.1 | | 9.1 | | 58.1 | | 4.9 | | 9.1 | | 9.1 | |
| GOLD EXPLORATION | | | | | | | | | |
| Southern Africa | SOFS | Measured | — | | — | | — | | — | | — | | — | | — | | — | |
| | Indicated | 44.1 | | 4.5 | | 6.4 | | 6.4 | | 50.4 | | 4.6 | | 7.5 | | 7.5 | |
| | Measured + Indicated | 44.1 | | 4.5 | | 6.4 | | 6.4 | | 50.4 | | 4.6 | | 7.5 | | 7.5 | |
| | Inferred | 4.0 | | 3.6 | | 0.5 | | 0.5 | | 6.2 | | 4.3 | | 0.8 | | 0.8 | |
| Americas | Altar | Measured | 637.9 | | 0.1 | | 2.4 | | 2.4 | | 1,005.9 | | 0.1 | | 3.0 | | 3.0 | |
| | Indicated | 580.3 | | 0.1 | | 1.5 | | 1.5 | | 1,051.5 | | 0.1 | | 2.3 | | 2.3 | |
| | Measured + Indicated | 1,218.2 | | 0.1 | | 3.9 | | 3.9 | | 2,057.4 | | 0.1 | | 5.2 | | 5.2 | |
| | Inferred | 190.4 | | 0.1 | | 0.4 | | 0.4 | | 556.6 | | 0.1 | | 1.1 | | 1.1 | |
| Rio Grande | Measured | — | | — | | — | | — | | — | | — | | — | | — | |
| | Indicated | 14.1 | | 0.4 | | 0.2 | | 0.8 | | 14.1 | | 0.4 | | 0.2 | | 0.8 | |
| | Measured + Indicated | 14.1 | | 0.4 | | 0.2 | | 0.8 | | 14.1 | | 0.4 | | 0.2 | | 0.8 | |
| | Inferred | 8.2 | | 0.3 | | 0.1 | | 0.4 | | 8.2 | | 0.3 | | 0.1 | | 0.4 | |
| Marathon | Measured | 23.4 | | 0.1 | | 0.1 | | 0.2 | | 26.7 | | 0.1 | | 0.1 | | 0.2 | |
| | Indicated | 26.7 | | 0.1 | | 0.05 | 0.2 | | 30.5 | | 0.1 | | 0.1 | | 0.2 | |
| | Measured + Indicated | 50.1 | | 0.1 | | 0.1 | | 0.4 | | 57.2 | | 0.1 | | 0.1 | | 0.4 | |
| | Inferred | 6.2 | | 0.03 | 0.01 | 0.03 | 7.1 | 0.03 | 0.01 | 0.03 |
| Denison | Measured | 0.1 | | 1.4 | 0.004 | 0.01 | 0.1 | 1.4 | 0.004 | 0.01 |
| | Indicated | 1.1 | | 0.4 | 0.01 | 0.02 | 1.1 | 0.4 | 0.01 | 0.02 |
| | Measured + Indicated | 1.2 | | 0.5 | 0.02 | 0.03 | 1.2 | 0.5 | 0.02 | 0.03 |
| | Inferred | 1.3 | | 0.4 | 0.02 | 0.03 | 1.3 | 0.4 | 0.02 | 0.03 |
| EXPLORATION Total Measured + Indicated | 1,327.7 | | 0.2 | | 10.6 | | 11.6 | | 2,180.3 | | 0.2 | | 13.0 | | 14.0 | |
| EXPLORATION - Grand Total | 1,537.8 | | 0.2 | | 11.6 | | 12.9 | | 2,759.6 | | 0.2 | | 15.0 | | 16.4 | |
| GOLD TOTAL Measured + Indicated | 2,295.8 | | 0.9 | | 67.5 | | 73.9 | | 3,141.6 | | 0.7 | | 72.4 | | 77.7 | |
| GOLD TOTAL | 2,547.3 | | 1.0 | | 79.4 | | 86.2 | | 3,865.7 | | 0.7 | | 87.0 | | 93.4 | |
Group Mineral Resources and Mineral Reserves summary continued
| | | | | | | | | | | | | | | | | | | | | | | | | | | | | | | | |
| Mineral Resources Exclusive of Mineral Reserves |
| | | 31 December 2021 | 31 December 2020 |
| | | Attributable | 100 | % | Attributable | 100% |
| GOLD OPERATIONS | | | Tonnes | Grade | Gold | Gold | Tonnes | Grade | Gold | Gold |
| | | (Mt) | (g/t) | (Moz) | (Moz) | (Mt) | (g/t) | (Moz) | (Moz) |
| Southern Africa | Kloof | Measured | 26.7 | | 11.1 | | 9.5 | | 9.5 | | 24.9 | | 11.5 | | 9.2 | | 9.2 | |
| | Indicated | 32.0 | | 6.7 | | 6.9 | | 6.9 | | 38.3 | | 6.2 | | 7.6 | | 7.6 | |
| | Measured + Indicated | 58.7 | | 8.7 | | 16.4 | | 16.4 | | 63.2 | | 8.3 | | 16.8 | | 16.8 | |
| | Inferred | 28.1 | | 11.5 | | 10.4 | | 10.4 | | 35.6 | | 9.6 | | 11.0 | | 11.0 | |
| Beatrix | Indicated | 21.7 | | 6.3 | | 4.4 | | 4.4 | | 19.9 | | 6.5 | | 4.2 | | 4.2 | |
| | Measured | 24.7 | | 5.2 | | 4.2 | | 4.2 | | 27.0 | | 5.5 | | 4.8 | | 4.8 | |
| | Measured + Indicated | 46.4 | | 5.7 | | 8.5 | | 8.5 | | 46.9 | | 5.9 | | 9.0 | | 9.0 | |
| | Inferred | 1.7 | | 4.2 | | 0.2 | | 0.2 | | 4.8 | | 4.4 | | 0.7 | | 0.7 | |
| Driefontein | Measured | 16.0 | | 9.1 | | 4.7 | | 4.7 | | 16.6 | | 9.7 | | 5.2 | | 5.2 | |
| | Indicated | 10.0 | | 7.9 | | 2.5 | | 2.5 | | 12.6 | | 8.4 | | 3.4 | | 3.4 | |
| | Measured + Indicated | 26.0 | | 8.7 | | 7.2 | | 7.2 | | 29.2 | | 9.1 | | 8.6 | | 8.6 | |
| | Inferred | 0.8 | | 6.6 | | 0.2 | | 0.2 | | 0.5 | | 5.1 | | 0.1 | | 0.1 | |
| Cooke | Measured | 156.0 | | 0.3 | | 1.3 | | 1.7 | | 210.0 | | 0.3 | | 1.7 | | 1.7 | |
| | Indicated | 39.7 | | 0.3 | | 0.4 | | 0.5 | | 52.3 | | 0.3 | | 0.5 | | 0.5 | |
| | Measured + Indicated | 195.7 | | 0.3 | | 1.7 | | 2.2 | | 262.3 | | 0.3 | | 2.2 | | 2.2 | |
| | Inferred | — | | — | | — | | — | | — | | — | | — | | — | |
| DRDGOLD | Measured | — | | — | | — | | — | | — | | — | | — | | — | |
| | Indicated | 290.1 | | 0.2 | | 2.3 | | 4.6 | | 190.1 | | 0.3 | | 1.5 | | 3.1 | |
| | Measured + Indicated | 290.1 | | 0.2 | | 2.3 | | 4.6 | | 190.1 | | 0.3 | | 1.5 | | 3.1 | |
| | Inferred | 10.8 | | 0.2 | | 0.1 | | 0.2 | | 103.9 | | 0.2 | | 0.8 | | 1.6 | |
| OPERATIONS Total Measured + Indicated | 617.0 | | 1.8 | | 36.2 | | 39.0 | | 591.7 | | 2.0 | | 38.1 | | 39.7 | |
| OPERATIONS - Grand total | 658.3 | | 2.2 | | 47.1 | | 50.0 | | 736.6 | | 2.1 | | 50.7 | | 53.0 | |
| GOLD DEVELOPMENT | | | | | | | | | |
| Southern Africa | Burnstone | Measured | 0.3 | | 13.8 | | 0.1 | | 0.1 | | 0.4 | | 10.2 | | 0.1 | | 0.1 | |
| | Indicated | 5.8 | | 11.5 | | 2.1 | | 2.1 | | 9.0 | | 8.7 | | 2.5 | | 2.5 | |
| | Measured + Indicated | 6.0 | | 11.6 | | 2.2 | | 2.2 | | 9.4 | | 8.7 | | 2.6 | | 2.6 | |
| | Inferred | 31.5 | | 4.2 | | 4.3 | | 4.3 | | 31.5 | | 4.2 | | 4.3 | | 4.3 | |
| DEVELOPMENT Total Measured + Indicated | 37.5 | | 5.4 | | 6.5 | | 6.5 | | 41.0 | | 5.3 | | 6.9 | | 6.9 | |
| DEVELOPMENT - Grand Total | 37.5 | | 5.4 | | 6.5 | | 6.5 | | 41.0 | | 5.3 | | 6.9 | | 6.9 | |
| GOLD EXPLORATION | | | | | | | | | |
| Southern Africa | SOFS | Measured | — | | — | | — | | — | | — | | — | | — | | — | |
| | Indicated | 44.1 | | 4.5 | | 6.4 | | 6.4 | | 36.9 | | 4.5 | | 5.4 | | 5.4 | |
| | Measured + Indicated | 44.1 | | 4.5 | | 6.4 | | 6.4 | | 36.9 | | 4.5 | | 5.4 | | 5.4 | |
| | Inferred | 4.0 | | 3.6 | | 0.5 | | 0.5 | | 5.8 | | 3.8 | | 0.7 | | 0.7 | |
| Americas | Altar | Measured | 637.9 | | 0.1 | | 2.4 | | 2.4 | | 1,005.9 | | 0.1 | | 3.0 | | 3.0 | |
| | Indicated | 580.3 | | 0.1 | | 1.5 | | 1.5 | | 1,051.5 | | 0.1 | | 2.3 | | 2.3 | |
| | Measured + Indicated | 1,218.2 | | 0.1 | | 3.9 | | 3.9 | | 2,057.4 | | 0.1 | | 5.2 | | 5.2 | |
| | Inferred | 190.4 | | 0.1 | | 0.4 | | 0.4 | | 556.6 | | 0.1 | | 1.1 | | 1.1 | |
| Denison | Measured | 0.1 | 1.4 | 0.004 | 0.01 | 0.1 | 1.4 | 0.004 | 0.01 |
| | Indicated | 1.1 | 0.4 | 0.01 | 0.02 | 1.1 | 0.4 | 0.01 | 0.02 |
| | Measured + Indicated | 1.2 | 0.5 | 0.02 | 0.03 | 1.2 | 0.5 | 0.02 | 0.03 |
| | Inferred | 1.3 | 0.4 | 0.02 | 0.03 | 1.3 | 0.4 | 0.02 | 0.03 |
| Marathon | Measured | 23.4 | 0.1 | 0.1 | 0.2 | 26.7 | 0.1 | 0.1 | 0.2 |
| | Indicated | 26.7 | 0.1 | 0.05 | 0.2 | 30.5 | 0.1 | 0.1 | 0.2 |
| | Measured + Indicated | 50.1 | 0.1 | 0.1 | 0.4 | 57.2 | 0.1 | 0.1 | 0.4 |
| | Inferred | 6.2 | 0.03 | 0.01 | 0.03 | 7.1 | 0.03 | 0.01 | 0.03 |
| Rio Grande | Measured | — | | — | | — | | — | | — | | — | | — | | — | |
| | Indicated | 14.1 | | 0.4 | | 0.2 | | 0.8 | | 14.1 | | 0.4 | | 0.2 | | 0.8 | |
| | Measured + Indicated | 14.1 | | 0.4 | | 0.2 | | 0.8 | | 14.1 | | 0.4 | | 0.2 | | 0.8 | |
| | Inferred | 8.2 | | 0.3 | | 0.1 | | 0.4 | | 8.2 | | 0.3 | | 0.1 | | 0.4 | |
| EXPLORATION Total Measured + Indicated | 1,327.7 | | 0.2 | | 10.6 | | 11.6 | | 2,166.8 | | 0.2 | | 10.9 | | 11.9 | |
| EXPLORATION - Grand Total | 1,537.8 | | 0.2 | | 11.6 | | 12.9 | | 2,745.7 | | 0.1 | | 12.8 | | 14.1 | |
| GOLD TOTAL Measured + Indicated | 1,982.2 | | 0.8 | | 53.3 | | 57.1 | | 2,799.5 | | 0.6 | | 55.9 | | 58.5 | |
| GOLD TOTAL | 2,233.6 | | 0.9 | | 65.2 | | 69.4 | | 3,523.2 | | 0.6 | | 70.4 | | 74.0 | |
Group Mineral Resources and Mineral Reserves summary continued
| | | | | | | | | | | | | | | | | | | | | | | | | | | | | | | | |
| Mineral Reserves |
| | | 31 December 2021 | 31 December 2020 |
| | | Attributable | 100% | Attributable | 100% |
| GOLD OPERATIONS | | | Tonnes | Grade | Gold | Gold | Tonnes | Grade | Gold | Gold |
| | | (Mt) | (g/t) | (Moz) | (Moz) | (Mt) | (g/t) | (Moz) | (Moz) |
| Southern Africa | Kloof | Proved | 12.7 | | 6.2 | | 2.5 | | 2.5 | | 11.7 | | 6.9 | | 2.6 | | 2.6 | |
| | Probable | 11.1 | | 3.5 | | 1.2 | | 1.2 | | 16.8 | | 3.8 | | 2.0 | | 2.0 | |
| | Proved + Probable | 23.8 | | 5.0 | | 3.8 | | 3.8 | | 28.5 | | 5.1 | | 4.6 | | 4.6 | |
| Beatrix | Proved | 6.8 | | 3.9 | | 0.8 | | 0.8 | | 7.6 | | 3.9 | | 0.9 | | 0.9 | |
| | Probable | 1.7 | | 1.6 | | 0.1 | | 0.1 | | 3.1 | | 2.8 | | 0.3 | | 0.3 | |
| | Proved + Probable | 8.5 | | 3.4 | | 0.9 | | 0.9 | | 10.7 | | 3.6 | | 1.2 | | 1.2 | |
| Driefontein | Proved | 7.7 | | 8.4 | | 2.1 | | 2.1 | | 5.9 | | 8.5 | | 1.6 | | 1.6 | |
| | Probable | 4.2 | | 7.2 | | 1.0 | | 1.0 | | 3.9 | | 6.9 | | 0.9 | | 0.9 | |
| | Proved + Probable | 11.9 | | 8.0 | | 3.0 | | 3.0 | | 9.8 | | 7.8 | | 2.5 | | 2.5 | |
| Cooke | Proved | — | | — | | — | | — | | — | | — | | — | | — | |
| | Probable | 9.5 | | 0.3 | | 0.1 | | 0.1 | | 11.1 | | 0.3 | | 0.1 | | 0.1 | |
| | Proved + Probable | 9.5 | | 0.3 | | 0.1 | | 0.1 | | 11.1 | | 0.3 | | 0.1 | | 0.1 | |
| DRDGOLD | Proved | 122.5 | | 0.3 | | 1.3 | | 2.6 | | 131.3 | | 0.3 | | 1.4 | | 2.8 | |
| | Probable | 132.5 | | 0.3 | | 1.3 | | 2.6 | | 136.9 | | 0.3 | | 1.4 | | 2.8 | |
| | Proved + Probable | 255.0 | | 0.3 | | 2.6 | | 5.2 | | 268.2 | | 0.3 | | 2.8 | | 5.6 | |
| OPERATIONS Total Proved + Probable | 308.6 | | 1.1 | | 10.5 | | 13.1 | | 328.3 | | 1.1 | | 11.2 | | 14.0 | |
| GOLD DEVELOPMENT | | | | | | | | | |
| Southern Africa | Burnstone | Proved | — | | — | | — | | — | | 0.9 | | 3.6 | | 0.1 | | 0.1 | |
| | Probable | 20.6 | | 3.9 | | 2.6 | | 2.6 | | 17.7 | | 3.7 | | 2.1 | | 2.1 | |
| | Proved + Probable | 20.6 | | 3.9 | | 2.6 | | 2.6 | | 18.6 | | 3.7 | | 2.2 | | 2.2 | |
| DEVELOPMENT Total Proved + Probable | 20.6 | | 3.9 | | 2.6 | | 2.6 | | 18.6 | | 3.7 | | 2.2 | | 2.2 | |
| GOLD EXPLORATION | | | | | | | | | |
| Southern Africa | SOFS | Proved | — | | — | | — | | — | | — | | — | | — | | — | |
| | Probable | — | | — | | — | | — | | 15.3 | | 4.3 | | 2.1 | | 2.1 | |
| | Proved + Probable | — | | — | | — | | — | | 15.3 | | 4.3 | | 2.1 | | 2.1 | |
| EXPLORATION Total Proved + Probable | — | | — | | — | | — | | 15.3 | | 4.3 | | 2.1 | | 2.1 | |
| GOLD TOTAL Proved + Probable | 329.2 | | 1.2 | | 13.1 | | 15.7 | | 362.2 | | 1.3 | | 15.5 | | 18.3 | |
Note: SOFS was classified as a development property in 2020, but since no Mineral Reserves are declared in 2021, it is now reported as an exploration property
| | | | | | | | | | | | | | | | | | | | | | | | | | | | | | | | |
| Mineral Resources |
| | | 31 December 2021 | 31 December 2020 |
| | | Attributable | 100% | Attributable | 100% |
| URANIUM EXPLORATION | Tonnes | Grade | U3O8 | U3O8 | Tonnes | Grade | U3O8 | U3O8 |
| | | (Mt) | (kg/t) | (Mlb) | (Mlb) | (Mt) | (kg/t) | (Mlb) | (Mlb) |
| Southern Africa | Beatrix | Measured | 3.6 | | 1.1 | | 8.5 | | 8.5 | | 3.6 | | 1.1 | | 8.5 | | 8.5 | |
| | Indicated | 7.8 | | 1.1 | | 18.3 | | 18.3 | | 7.8 | | 1.1 | | 18.3 | | 18.3 | |
| | Measured + Indicated | 11.4 | | 1.1 | | 26.9 | | 26.9 | | 11.4 | | 1.1 | | 26.9 | | 26.9 | |
| | Inferred | 0.0 | 1.1 | | 0.1 | | 0.1 | | 0.0 | 1.1 | | 0.1 | | 0.1 | |
| Cooke | Measured | 156.0 | | 0.1 | | 31.4 | | 41.4 | | 210.0 | | 0.1 | | 41.8 | | 41.8 | |
| | Indicated | 39.7 | | 0.1 | | 7.6 | | 9.9 | | 52.3 | | 0.1 | | 9.9 | | 9.9 | |
| | Measured + Indicated | 195.7 | | 0.1 | | 39.0 | | 51.3 | | 262.3 | | 0.1 | | 51.7 | | 51.7 | |
| | Inferred | — | | — | | — | | — | | — | | — | | — | | — | |
| URANIUM TOTAL Measured + Indicated | 207.0 | | 0.1 | | 65.9 | | 78.2 | | 273.6 | | 0.1 | | 78.6 | | 78.6 | |
| URANIUM TOTAL | 207.1 | | 0.1 | | 66.0 | | 78.3 | | 273.7 | | 0.1 | | 78.7 | | 78.7 | |
Group Mineral Resources and Mineral Reserves summary continued
| | | | | | | | | | | | | | | | | | | | | | | | | | | | | | | | |
| Mineral Resources |
| | | 31 December 2021 | 31 December 2020 |
| | | Attributable | 100% | Attributable | 100% |
| LITHIUM EXPLORATION | Tonnes | Li2O | Li2O | Li2O | Tonnes | Li2O | Li2O | Li2O |
| | | (Mt) | (%) | (Kt) | (Kt) | (Mt) | (%) | (Kt) | (Kt) |
| Americas | Rhyolite Ridge | Measured | 2.8 | | 0.4 | | 10.3 | | 144.4 | | — | | — | | — | | — | |
| | Indicated | 6.3 | | 0.3 | | 20.9 | | 293.5 | | — | | — | | — | | — | |
| | Measured + Indicated | 9.0 | | 0.3 | | 31.2 | | 438.0 | | — | | — | | — | | — | |
| | Inferred | 1.4 | | 0.3 | | 4.8 | | 67.5 | | — | | — | | — | | — | |
| Europe | Keliber | Measured | 1.1 | | 1.2 | | 13.5 | | 50.7 | | — | | — | | — | | — | |
| | Indicated | 2.4 | | 1.0 | | 25.1 | | 94.3 | | — | | — | | — | | — | |
| | Measured + Indicated | 3.6 | | 1.1 | | 38.6 | | 145.0 | | — | | — | | — | | — | |
| | Inferred | 0.4 | | 0.9 | | 4.0 | | 14.9 | | — | | — | | — | | — | |
| LITHIUM TOTAL Measured + Indicated | 12.6 | | 0.6 | | 69.7 | | 582.9 | | — | | — | | — | | — | |
| LITHIUM TOTAL | 14.4 | | 0.5 | | 78.5 | | 665.4 | | — | | — | | — | | — | |
| | | | | | | | | | | | | | | | | | | | | | | | | | | | | | | | |
| Mineral Resources |
| | | 31 December 2021 | 31 December 2020 |
| | | Attributable | 100% | Attributable | 100% |
| COPPER EXPLORATION | Tonnes | Grade | Copper | Copper | Tonnes | Grade | Copper | Copper |
| | | (Mt) | (%) | (Mlb) | (Mlb) | (Mt) | (%) | (Mlb) | (Mlb) |
| Americas | Altar | Measured | 637.9 | | 0.4 | | 6,095.0 | | 6,095.0 | | 1,005.9 | | 0.3 | | 7,458.2 | | 7,458.2 | |
| | Indicated | 580.3 | | 0.4 | | 5,293.0 | | 5,293.0 | | 1,051.5 | | 0.3 | | 7,052.9 | | 7,052.9 | |
| | Measured + Indicated | 1,218.2 | | 0.4 | | 11,388.0 | | 11,388.0 | | 2,057.4 | | 0.3 | | 14,511.1 | | 14,511.1 | |
| | Inferred | 190.4 | | 0.4 | | 1,750.0 | | 1,750.0 | | 556.6 | | 0.3 | | 3,419.6 | | 3,419.6 | |
| Rio Grande | Measured | — | | — | | — | | — | | — | | — | | — | | — | |
| | Indicated | 14.1 | | 0.3 | | 93.2 | | 468.5 | | 14.1 | | 0.3 | | 93.2 | | 468.5 | |
| | Measured + Indicated | 14.1 | | 0.3 | | 93.2 | | 468.5 | | 14.1 | | 0.3 | | 93.2 | | 468.5 | |
| | Inferred | 8.2 | | 0.2 | | 41.5 | | 208.4 | | 8.2 | | 0.2 | | 41.5 | | 208.4 | |
| Marathon | Measured | 23.4 | | 0.2 | | 104.9 | | 463.0 | | 26.7 | | 0.2 | | 119.7 | | 463.0 | |
| | Indicated | 26.7 | | 0.2 | | 126.6 | | 559.0 | | 30.5 | | 0.2 | | 144.5 | | 559.0 | |
| | Measured + Indicated | 50.1 | | 0.2 | | 231.5 | | 1,022.0 | | 57.2 | | 0.2 | | 264.1 | | 1,022.0 | |
| | Inferred | 6.2 | | 0.2 | | 31.7 | | 140.0 | | 7.1 | | 0.2 | | 36.2 | | 140.0 | |
| Denison | Measured | 0.1 | | 0.5 | | 1.0 | | 1.5 | | 0.1 | | 0.5 | | 1.0 | | 1.5 | |
| | Indicated | 1.1 | | 1.3 | | 31.3 | | 48.2 | | 1.1 | | 1.3 | | 31.3 | | 48.2 | |
| | Measured + Indicated | 1.2 | | 1.2 | | 32.3 | | 49.7 | | 1.2 | | 1.2 | | 32.3 | | 49.7 | |
| | Inferred | 1.3 | | 1.2 | | 33.7 | | 51.9 | | 1.3 | | 1.2 | | 33.7 | | 51.9 | |
| COPPER TOTAL Measured + Indicated | 1,283.6 | | 0.4 | | 11,745.0 | | 12,928.2 | | 2,129.9 | | 0.3 | | 14,900.8 | | 16,051.3 | |
| COPPER TOTAL | 1,489.7 | | 0.4 | | 13,601.8 | | 15,078.5 | | 2,703.1 | | 0.3 | | 18,431.7 | | 19,871.2 | |
| | | | | | | | | | | | | | | | | | | | | | | | | | | | | | | | |
| Mineral Resources Inclusive of Mineral Reserves |
| | | 31 December 2021 | 31 December 2020 |
| | | Attributable | 100% | Attributable | 100% |
| ZINC OPERATIONS | | = | Tonnes | Grade | Zinc | Zinc | Tonnes | Grade | Zinc | Zinc |
| | | (Mt) | (%) | (Mlb) | (Mlb) | (Mt) | (%) | (Mlb) | (Mlb) |
| Australia | New Century | Measured | 10.8 | | 3.1 | | 728.0 | | 3,642.0 | | — | | — | | — | | — | |
| | Indicated | 1.8 | | 5.7 | | 222.1 | | 1,111.1 | | — | | — | | — | | — | |
| | Measured + Indicated | 12.6 | | 3.4 | | 950.2 | | 4,753.2 | | — | | — | | — | | — | |
| | Inferred | 0.5 | | 6.5 | | 66.1 | | 330.7 | | — | | — | | — | | — | |
| ZINC TOTAL Measured + Indicated | 12.6 | | 3.4 | | 950.2 | | 4,753.2 | | — | | — | | — | | — | |
| ZINC TOTAL | | | 13.0 | | 3.5 | | 1,016.3 | | 5,083.9 | | — | | — | | — | | — | |
Group Mineral Resources and Mineral Reserves summary continued
| | | | | | | | | | | | | | | | | | | | | | | | | | | | | | | | |
| Mineral Resources Exclusive of Mineral Reserves |
| | | 31 December 2021 | 31 December 2020 |
| | | Attributable | 100% | Attributable | 100% |
| ZINC OPERATIONS | | | Tonnes | Grade | Zinc | Zinc | Tonnes | Grade | Zinc | Zinc |
| | | (Mt) | (%) | (Mlb) | (Mlb) | (Mt) | (%) | (Mlb) | (Mlb) |
| Australia | New Century | Measured | 0.0 | 6.0 | | 2.6 | | 13.2 | | — | | — | | — | | — | |
| | Indicated | 1.5 | | 5.3 | | 175.4 | | 877.4 | | — | | — | | — | | — | |
| | Measured + Indicated | 1.5 | | 5.3 | | 178.0 | | 890.7 | | — | | — | | — | | — | |
| | Inferred | 0.5 | | 6.6 | | 66.5 | | 332.9 | | — | | — | | — | | — | |
| ZINC TOTAL Measured + Indicated | 1.5 | | 5.3 | | 178.0 | | 890.7 | | — | | — | | — | | — | |
| ZINC TOTAL | | | 2.0 | | 5.6 | | 244.6 | | 1,223.6 | | — | | — | | — | | — | |
| | | | | | | | | | | | | | | | | | | | | | | | | | | | | | | | |
| Mineral Reserves |
| | | 31 December 2021 | 31 December 2020 |
| | | Attributable | 100% | Attributable | 100% |
| ZINC OPERATIONS | | | Tonnes | Grade | Zinc | Zinc | Tonnes | Grade | Zinc | Zinc |
| | | (Mt) | (%) | (Mlb) | (Mlb) | (Mt) | (%) | (Mlb) | (Mlb) |
| Australia | New Century | Proved | 9.9 | | 3.0 | | 649.2 | | 3,247.4 | | — | | — | | — | | — | |
| | Probable | 0.5 | | 5.4 | | 61.7 | | 308.6 | | — | | — | | — | | — | |
| ZINC TOTAL Proved + Probable | 10.4 | | 3.1 | | 710.9 | | 3,556.1 | | — | | — | | — | | — | |
Group Mineral Resources and Mineral Reserves summary continued
Fundamental notes
| | | | | | | | |
| 1 | | This Mineral Resources and Mineral Reserves Report for Sibanye-Stillwater covers a full description of all of the Group’s mineral assets, as at 31 December 2021. |
| 2 | | The Mineral Resource and Mineral Reserve estimates are reported as at 31 December 2021 and may be impacted by variations in commodity prices, currency exchange rates, legislation and permitting changes and cost and operating parameters. |
| 3 | | All stated Mineral Resource and Mineral Reserve estimates are net of 12 month’s production depletion since 31 December 2020. The depletion applied to the managed operations includes the actuals up until September 2021 (SA PGM), October 2021 (SA gold and US PGM), while the remaining depletions were estimates up to 31 December 2021. |
| 4 | | Mineral Resource and Mineral Reserve price assumptions for non-managed properties vary from those used for the managed operations. In those cases, the reader is directed to the notes provided below the estimation tables for detailed information. |
| 5 | | South African PGM operations Mineral Resource and Mineral Reserve reporting accounts for four elements (4E) of the basket of PGMs and gold (platinum, palladium, rhodium and gold), while the US PGM operations Mineral Resource and Mineral Reserve reporting only accounts for two elements (2E) of PGMs, palladium and platinum. Other associated precious metals – such as iridium, ruthenium (SA PGM), gold and silver (US PGM) – occur in low concentrations and are generally not material to the estimation or calculations. The base metals (copper, nickel, cobalt and chromium) are also extracted as by-products in conjunction with these PGMs. These are not reported on individually, but their average concentrations in the various ores are provided as guidelines. Mineral Reserve and Mineral Resource economic calculations are based on a basket price taking into consideration all metals extracted and recovered. |
| 6 | | No Inferred Mineral Resources have been included in any of the economic studies for the reporting of Mineral Reserves. |
| 7 | | Detailed financial models are used to estimate the Mineral Reserves, which include modifying factors. The modifying factors are all-inclusive from mine to mill. Mineral Reserves are reported as tonnes and contained metal reporting to the mill, with the exception of Lithium and Boron, where equivalent final produced product is included as well. |
| 8 | | Attributable Mineral Resources and Mineral Reserves are reported on a legal, equity interest basis, considering both direct (project level) and indirect (holding entity level) interests, and also include indirect holdings via subsidiaries and treasury shares. In addition, the full (100% basis) Mineral Resources and Mineral Reserves for each property are also provided for full transparency. |
| 9 | | Rounding-off of figures in this report may result in minor computational discrepancies. Where this occurs, it is not deemed significant and reflects the level of accuracy of the estimate. |
| 10 | | All reference to tonnes (t) is metric units. |
Corporate governance and regulatory compliance
Sibanye-Stillwater is listed on the Johannesburg Stock Exchange (JSE) and the New York Stock Exchange (NYSE) and is therefore required to comply with both Section 12.13 of the JSE Listings Requirements and the requirements of the United States Securities and Exchange Commission (SEC) regulation SK Subpart 1300.
For the Southern Africa (SA) production, development and exploration properties, including the non-managed properties (DRDGOLD and Mimosa), the Mineral Resources and Mineral Reserves, and the mineral asset valuations supporting the Mineral Reserve estimates, have been prepared in compliance with the South African Code for Reporting of the Exploration Results, Mineral Resources and Mineral Reserves (SAMREC 2016 edition, including Table 1 and Appendices) and the South African Code for the Reporting of Mineral Asset Valuation (SAMVAL 2016 edition), and all requirements thereof have been complied with. This disclosure is also compliant with JSE listing Requirements Section 12.13.
For the international, non-managed Marathon, Altar, Rio Grande and Denison exploration properties (all non-material assets), the original estimates were prepared in compliance with the Canadian NI43-101; and for the New Century, Rhyolite Ridge and Keliber properties in compliance with the Australian JORC Code, which are both Committee for Mineral Reserves International Reporting Standards (CRIRSCO) sister codes of SAMREC and SAMVAL. The Company has had these estimates independently verified for accuracy, and compliance to SAMREC/SAMVAL.
In complying with the requirements of subpart 1300 of Regulation S-K of the US Securities Act of 1933 (SK-1300) for the first time, this document serves to satisfy both the Summary disclosure requirements under §1303 (see section 1) and Individual Material Property disclosure requirements under §1304 (see sections 2-3). In support of the material property disclosure, compliant technical report summaries (TRS) have been prepared and filed for all material properties. These TRS can be accessed via EDGAR, and are also available on our corporate website. The estimates under SK-1300 align with the SAMREC-compliant estimates, and Mineral Resources are reported both inclusive and exclusive of Mineral Reserves to satisfy both reporting jurisdictions. The properties considered material for the purpose of SK-1300 are listed below.
PGM:
•Americas: the US PGM operations consisting of the East Boulder and Stillwater mines
•Southern Africa: the Marikana, Rustenburg (SRPM), and Kroondal operations
Gold:
•Southern Africa: the Kloof and Driefontein operations
The Group has changed its policy regarding the basis for reporting attributable Mineral Resources and Mineral Reserves for 2021.
Previously the Group reported attributable Mineral Resources and Mineral Reserves based on the effective accounting interest in mineral properties. This approach considered the recognition of minority shareholder liabilities when determining attributable interest in an asset. This approach results in annual changes in effective interests, and as such the Group has changed this practice going forward to report on attributable portions of Mineral Resources and Mineral Reserves based on the Group’s effective legal interest in mineral properties, with no consequence to the Group’s effective accounting interest.
This change in policy has the following effect on the reported attributable percentages of mineral properties:
•Rustenburg: reported at 74% attributable (2020: 100%)
•Cooke: reported at 76% attributable (2020: 100%)
•Marikana: reported at 80.64% attributable (2020: 95.25%)
•Limpopo (Baobab & Doornvlei): reported at 80.64% attributable (2020: 95.25%)
•Limpopo (Dwaalkop): reported at 40.32% attributable (2020: 45.30%)
•Akanani: reported at 80.13% attributable (2020: 93.13%)
The net impact of this change in policy is evident in the Mineral Reserves reconciliation for the relevant segments of our business. These assets remains fully under the Group’s management.
This change in policy has no impact on the underlying mineral assets available for mining, and therefore does not impact the LoM or profitability of any operations or development projects.
The historic (2020) stated attributable numbers have not been adjusted in the tables to reflect the revised interest, but for ease of reference and comparison purposes, both the 2020 and 2021 100% basis numbers are illustrated.
Corporate governance and regulatory compliance continued
Auditing and risk
Sibanye-Stillwater manages risk effectively in order to protect the Group’s assets, stakeholders, environment and reputation and to ensure achievement of the business objectives.
The Group maintains sound risk management practices and systems that are consistent with international best practice and in line with the following three risk management frameworks and guidelines:
| | | | | | | | |
| 1 | | Committee of Sponsoring Organizations of the Treadway Commission (COSO) |
| 2 | | ISO 31000:2009 Risk Management: Principles and Guidelines |
| 3 | | The King IV: Report on Corporate Governance 2016 |
In addition, the process followed in producing the declaration is in alignment with the guiding principles of the Sarbanes-Oxley Act of 2002 (SOX); there are SOX controls in place that cover the entire Group’s Mineral Resource management function.
This integrated compliance, governance and risk management framework is managed and overseen by the Group internal audit function. Both internal and external audits are regularly conducted to ensure that corporate governance best practices are being followed. For the 2021 reporting period, external verification of the Mineral Resources and Mineral Reserves for all our managed operations have been conducted, and a copy of the final certified sign-offs by the independent consultancy, verifying the published numbers, are provided on page 9 as evidence.
Risk registers are kept for each operation, covering key risks pertaining to, but not limited to, technical, environmental, social, health, safety, economic and political aspects. Mitigation measures are put in place to address the material risks at each operation.
| | | | | |
| Group-wide risk is addressed in detail in the Integrated Annual Report 2021, the form 20-F and the Annual Financial Report 2021. These reports cover the remedial or preventative actions to mitigate or manage any identified risks. These documents can be accessed in the investor section of our corporate website: www.sibanyestillwater.com/investors. An abbreviated summary of the key Group risks is provided below. |
| Occupational health and/or safety performance falling short of global mining benchmarks |
| Operations and business management systems compromised or leaks of sensitive information creating liabilities |
| Sustainability as part of ESG not robust enough to lead to a strategic differentiator (Only compliance) |
| Operational excellence not sufficiently embedded to achieve operational performance outperforming peer benchmarks |
| Failure to transform into a digital first organisation (Not evolving fast enough and lagging behind competitors in terms of mobility, digitalisation, automation and AI) |
| Geographical concentration with high social, political and regulatory risks |
| Departure from planned projected economic parameters – commodity prices and exchange rates |
| Adverse strategic actions by competitors and other role players |
| Failure to maintain an attractive equity and credit investment case |
| Values based culture is insufficiently functional to secure operational performance outperforming peer benchmarks |
| Unavailability of required technical skills |
| Unrealised value due to strategic misalignment at JVs, associates or partnerships |
| Failure to realise expected value from structured capital allocation |
AUDIT LETTER
Mineral title
Sibanye-Stillwater has legal entitlement to all the properties and minerals being reported on. For a managed production properties, all the required operating permits have been obtained and are in good standing with the regulators. In certain cases, where licenses and permits have expired, but are the subject of renewal or conversion applications, there are reasonable grounds to believe that those will be granted, and hence the Mineral Reserves and Mineral Reserves continue to be reported. For all non managed properties, the Group has confirmed that the mineral titles being reported on, are in good standing. The directors of the Group confirm that there are no material legal proceedings or other material conditions that will impact on the Group’s ability to continue its mining or exploration activities. More detailed information on the various properties mineral tile can be found under the “license status and holdings” section of the individual property disclosures.
Exploration
The majority of the Group’s exploration activities are aimed at further delineating Mineral Resources for ultimate conversion to Mineral Reserves at our existing mining operations. In addition, extensive Mineral Reserve definition drilling is conducted on all operations. Greenfields exploration activities are predominantly being conducted at the non-managed properties where we have interests. Detail on quantities, annual spend and material results are provided within the individual property disclosures in Sections 2 and 3 of this report.
Annual planning process
For the managed mining operations (production properties), the reported Mineral Resources and Mineral Reserves are derived through a comprehensive annual operational planning process. The annual planning process is cyclic in nature, starting in January and running through to December. It begins with a review of the previous LoM plan and the development of a strategic plan based on that portion of the Mineral Resource for which technical and economic studies have demonstrated justified extraction at the time of disclosure, to a minimum pre-feasibility study (PFS) level.
Strategic plan directives, parameters and factors are issued to guide the operations. The analysis of historical performance is done to assist with the development of realistic productivity and cost parameters and modifying factors. All operations document the guidelines and then focus on producing a business plan.
All mine design and planning is based on the latest geological and Mineral Resource models, which are updated prior to the commencement of the operating and LoM plans. Mineral Resource classification categories guide and constrain the mining layouts. Measured and Indicated Mineral Resources typically become Proved and Probable Mineral Reserves respectively, but additional mining risk can be factored in and used to downgrade Mineral Reserve confidence.
The operational plan is based on detailed monthly scheduling and zero-based costing. All underground mine design, sequencing, scheduling and evaluation is done in an appropriate 3D software package.
Estimates of tonnages and grades quoted as Mineral Reserves include allowances for modifying factors and consequently are reported as net tonnes and grades expected to be delivered to the mill.
Once detailed 12 month production profiles, operating and capital cost estimates, and the required stay-in-business capital estimates to sustain and the business have been prepared, these are extended to five-year and LoM production schedules.
Multi-disciplinary review processes are conducted at stage-gate intervals during the planning process. During these reviews all mining, support and service departments are involved in the verification of the inputs and the modifying factors that are incorporated into the business plan. Ultimately, all business plans and LoM plans are approved and signed off by both the commodity segment management, competent persons, as well as the Group executives.
Technical economic modelling is undertaken using the discounted cash-flow approach. The detailed one-year operating budget is used to determine cost drivers, down to shaft level, which are then applied to the remainder of the LoM plan. Sensitivities are calculated based on a range of commodity prices, and operating and capital costs to assess the robustness of the plan.
The financial and technical assumptions underlying the Mineral Resources and Mineral Reserves estimations contained in this report are current as at 31 December 2021, the period covered by this report. Such assumptions rely on various factors that may change after the reporting period, including as a result of operational reviews which Sibanye-Stillwater undertakes from time to time and when necessary. For example, in 2022, Sibanye-Stillwater initiated a comprehensive review of its US PGM Operations to reassess its existing budgets and LoM plans. Accordingly, the Mineral Reserves and Mineral Resources estimations contained in this report may be materially impacted by, among other things, the results of these assessments, including any changes to the underlying financial and technical assumptions in the future.
Commodity price assumptions
The Group reports in accordance with both the JSE and the US Securities and Exchange Commission (SEC) guidelines on commodity prices used for the estimation of Mineral Resources and Mineral Reserves at all managed operations, development, and exploration properties. For the 2021 disclosure the company has taken note of the SEC allowance under the new subpart 1300 of Regulation S-K allowing the use of forward-looking prices as opposed to three-year average trailing prices previously required. We believe forward-looking prices based on extensive market research more accurately capture changes in market dynamics and hence we have opted to apply forward-looking prices that reflect “through the cycle” pricing. Mineral Resource price assumptions, which focus on longer timeframes, are based on higher prices than for Mineral Reserves. These assumptions facilitate long term planning but still consider reasonable prospect for economic extraction.
Sibanye-Stillwater uses prices that will stay stable for at least three to five years, and will only change if there is a fundamental, perceived long-term shift in the market,
as opposed to basing it only on short term analyst consensus forecasts. Sibanye-Stillwater has also in the process considered our general view of the market, the relative position of our operations on the costs curve; as well as our operational and company strategy. Within this context, a slightly more optimistic (closer to market consensus) view has been taken on copper (Cu), nickel (Ni) and cobalt (Co), which are considered as metals of the future and a growth area for the company; as opposed to our existing, mature gold and Platinum Group Metals (PGM) operations, where we are trying to position lower on the cost curve for sustainability purposes. In general, within a global economic climate of continuously increasing commodity prices, we believe we have taken a safer approach, by not building overly optimistic price outlooks into our estimations.
The rand;US dollar exchange rate used for the Mineral Resource and Mineral Reserve declaration, as at 31 December 2021 is R15.00/US$.
The commodity price assumptions for the 31 December 2021 Mineral Resource and Mineral Reserve estimates, are summarised below:
Forward looking price assumptions for 2021
| | | | | | | | | | | | | | | | | | | | | | | | | | | | | |
| 31 Dec 2021 | 31 Dec 2020 |
| Mineral Resources | Mineral Reserves | Mineral Reserves |
| Precious metals | US$/oz | R/oz | R/kg | US$/oz | R/oz | R/kg | US$/oz | R/oz | R/kg |
| Gold | 1,800 | | 27,000 | | 868,000 | | 1,659 | | 24,885 | | 800,000 | | 1,500 | 22,500 | 720,000 |
| Platinum | 1,500 | | 22,500 | | 723,391 | | 1,250 | | 18,750 | | 602,826 | | 880 | | 13,200 | 424,389 |
| Palladium | 1,500 | | 22,500 | | 723,391 | | 1,250 | | 18,750 | | 602,826 | | 1,600 | 24,000 | 771,617 |
| Rhodium | 10,000 | | 150,000 | | 4,822,605 | | 8,000 | | 120,000 | | 3,858,084 | | 5,650 | 84,750 | 2,724,772 |
| Iridium | 3,000 | | 45,000 | | 1,446,782 | | 2,500 | | 37,500 | | 1,205,651 | | 1,450 | 21,750 | 699,278 |
| Ruthenium | 350 | | 5,250 | | 168,791 | | 300 | | 4,500 | | 144,678 | | 260 | | 3,900 | 125,388 |
| Base metals | US$/lb | US$/tonne | R/tonne | US$/lb | US$/tonne | R/tonne | US$/lb | US$/tonne | R/tonne |
| Nickel | 7.94 | | 17,500 | | 262,500 | | 7.35 | | 16,200 | | 243,000 | | 5.9 | 13,000 | 195,000 |
| Copper | 4.54 | | 10,000 | | 150,000 | | 4.06 | | 8,950 | | 134,250 | | 2.72 | 6,000 | 90,000 |
| Cobalt | 25 | | 55,116 | | 826,733 | | 22 | | 48,502 | | 727,525 | | 15 | 33,069 | 496,040 |
Uranium oxide (U3O8) 1 | 50 | | 110,231 | | 1,653,465 | | 40 | | 88,185 | | 1,322,772 | | 32 | 70,548 | 960,000 |
Chromium oxide (Cr2O3), (42% concentrate) 1 | 0.07 | | 165 | | 2,475 | | 0.07 | | 150 | | 2,250 | | 0.07 | 160 | 2,400 |
1.Long-term contract prices used
Sustainability management
ENVIRONMENTAL, SOCIAL AND GOVERNANCE (ESG) MANAGEMENT
Sibanye-Stillwater has an established a ESG Framework that provides clear direction on the Group’s commitment to environmental, social and governance commitments. These commitments are underpinned by formally adopted policy positions on each functional area addressing material ESG matters. These form part of the suite of formally available public documents.
To strengthen the connection to the broader Sibanye-Stillwater strategy, the ESG framework has been further developed into a Sibanye-Stillwater Sustainability Strategy. The Sustainability Strategy outlines strategic themes that embed our commitment to ESG principles.
| | | | | | | | | | | | | | |
Embedding human rights and ethics: Inside and out1 | |
Develop a climate change resilient business2 | |
Entrenching long-term economic sustainability: Integrated post mining economy3 | |
Data driven and considered decision-making4 | |
1 Empowering our workforce; Safe production; Health, Well-being and Occupational Hygiene and Socio economic development
2 Minimising our environmental impact
3 Minimising our environmental impact and Socioeconomic development
4 Corporate governance and Governance in sustainability: Considered decision making
See section 03 of the Integrated report available at www.sibanyestillwater.com/newsinvestors/reports/annual
In each of these themes, are a synergistic set of interventions tightly woven together to maximise our work on environmental consciousness, social and economic impact, and robust governance.
CLIMATE CHANGE AND CARBON MANAGEMENT
Climate change and decarbonisation continue to be central global themes. Since announcing our commitment to achieve carbon neutrality by 2040, we continue to progress various initiatives outlined in our energy and decarbonisation road map (Scope 1 and 2). Sibanye-Stillwater received a CDP B-rating (classified as “taking coordinated action on climate issues”) for its carbon and climate disclosure. We rank among the top 28% of companies by achieving this level in its activity group, with no A-list ratings awarded in the metallic mineral mining activity group during 2021.
While our commitments to our energy and decarbonisation strategy span the Group, 92% of our current Group operational greenhouse gas emissions (Scope 1 and 2) stem from our South African operations, which have been our initial primary focus. We have made notable progress in our journey to being carbon neutral:
a.We have been supporting decarbonisation advocacy through our industry associations, leading to electricity supply industry (ESI) reforms, ESI restructuring, and positive sentiment towards private power generation. This includes the lifting of the generation license threshold to 100MW, a strategic win for the sector with evidence of further positive policy changes in the pipeline.
b.We have developed five-year demand-side energy management (DSEM) plans for the SA Gold and SA PGM operations, including priority interventions and their decarbonisation potential. A similar intervention is due for completion for the US PGM operations and will inform their DSEM plans.
c.We have developed a portfolio of renewable energy projects, including 225MW of solar and >250MW of wind, that will enable a 25% reduction in Scope 2 emissions by 2025. Independent third party developers will be appointed to construct and manage the projects on competitive terms.
d.We have investigated enabling decarbonisation technologies, including digital, storage and hydrogen, and incorporated these into our strategic thinking. Digital twins continued to play a material role in eliminating energy waste at our South African operations.
e.We are exploring carbon offset opportunities and will communicate our conclusion in line with progress on other commitments
f.We are applying the recommendations of the Task Force on Climate-related Financial Disclosures aimed at ensuring more effective climate-related disclosures. From a water perspective, we aim to make decision-useful disclosures that support building a climate-resilient business.
WATER USE MANAGEMENT
Recognising that efficient water use is critical to ensure preservation and sustainability of this resource for the benefit of all stakeholders, An integrated approach to managing our water footprint and water systems infrastructure has been adopted.
Our water conservation and water demand management plan drives continuous improvement in water usage. The plan consists of the following components:
a.Increasing independence on potable water (clean water that is suitable for human consumption and may be used within mine processes) by improving security of supply and minimising our impact on external water resources using alternative available ground water sources and rainwater harvesting, thereby reducing reliance on purchased water sources.
b.Reducing water loss by:
i.creating water footprint visibility through the implementation of effective real time metering (Zednet), water balance management reporting, proactive leak detection, and immediate repair initiatives
ii.minimising water losses through evaporation and seepage by optimising the density of tailings deposition and recovering and recycling water at our tailing facilities
iii.optimising water use efficiency by tracking and managing water use efficiency KPIs for all consumers
c.Implementing water quality management measures – we have comprehensive water quality monitoring programmes, minimising pollution of the resource through separation of clean and impacted water streams, recycling of impacted streams, treatment where required
TAILINGS MANAGEMENT
The Group’s alignment with the Global Industry Standard for Tailings Management has progressed well, and we are on track to deliver full conformance by August 2023. Progress has been made in multiple areas, including the development and competence of our Metallurgical Managers as the legal appointees for the safety of our tailings facilities, the design and implementation of the Group Tailings Management System, and monthly compliance audits against the GISTM requirements. In addition, various technology solutions are being developed and adopted to enhance tailings management practices, including through the rollout of the K2Fly platform, a new application to centralise management and reporting and enable more pro-active risk management of all our tailings facilities across the Group.
The investment in New Century, that currently owns the Century tailings zinc retreatment operations in Queensland, further diversifies Sibanye-Stillwater geographically, providing a foothold in Australia, a high-quality international mining jurisdiction. This acquisition together with DRDGOLD, will potentially enable the sharing of technological best practice and synergy realisation across Sibanye-Stillwater’s various investment platforms, further advancing the company as a global ESG-focused industry leader in tailings reprocessing.
AIR QUALITY MANAGEMENT
The continuous improvement of our air quality management profile remains a fundamental element in our commitment towards a cleaner environment. Our air quality vision is to promote a sustainable, cleaner environment through continuous improvement of our air quality management practices, and the implementation of initiatives to combat climate change and reduce air pollution in line with global, national and local air quality legislation and protocols.
The Group continues to focus on a set of clear strategic objectives to responsibly manage air quality to:
a.maintain compliance to all air emission licenses
b.effectively report and manage air emission targets
c.drive strategic initiatives to reduce emissions
d.proactively engage our stakeholders
WASTE MANAGEMENT
Our Waste Position Statement signed off by the CEO in June 2021, describes our vision for mineral and non-mineral waste management as being “to ensure that Sibanye-Stillwater is fully compliant with national waste legislation, transparent in reporting and innovative, efficient and effective in our waste management practices”.
We support responsible environmental management of all waste streams, and to minimising waste to landfill in line with our long-term objective of zero-waste-to-landfill. A waste management procedure and position paper has been developed and integrated into the business. The procedure covers the suite of waste streams that we generate, as well as all new and emerging waste legislation requirements. We will continue with the development of a comprehensive Waste Minimisation Plan/Roadmap in 2022. An important component of the plan is the introduction of the circular economy concept, aimed at creating sustainable value from waste and promoting recycling. In addition, in 2022 we will be embedding the waste hierarchy principles and driving their practical implementation at our operations.
BIODIVERSITY MANAGEMENT
We recognise that climate change and biodiversity are interconnected and interdependent, with each affecting and being affected by the other, with negative consequences for human well-being and the ecosystems upon which we rely.
Sibanye-Stillwater’s vision of promoting natural resources and improving life further strongly advocates for the reduction in the degradation of natural habitats, halting the loss of biodiversity and protecting species on land and in water. Our management processes contribute to the conservation of biodiversity and take integrated approaches to land use planning, as guided by the ICMM and other best practice guidelines and standards.
We have developed a Biological Diversity Procedure that integrates science-based monitoring and assessment measures to inform the implementation of option analyses that embody the mitigation hierarchy throughout the life of the mine, from feasibility to post mining. The results inform management decisions that lead to the improvement of measures that enhance the resilience of these systems to allow for the protection of all water users including the environment, and aim at ensuring we are able to meet our net gain and no net loss targets.
Sibanye-Stillwater is committed to driving a net gain in biodiversity for all existing acquired operations and a no net loss for new (greenfields) operations, this will will be measured through the Biological Diversity Protocol hectare equivalents. This entails:
a.undertaking specialist assessment of the biotic and abiotic resources
b.driving clear, implementable, scientifically-based action plans to drive resilience of ecosystems
c.implementing integrated catchment management programmes which include the associated forums.
LAND AND HERITAGE MANAGEMENT
We have developed and rolled out a Heritage resource management position statement that sets out Sibanye-Stillwater’s approach towards responsible heritage resource management. Our vision with heritage resources management is to ensure the adequate and innovative management and protection of our land and heritage resources where respect, mindfulness, inclusivity and prosperity underpin our approach within the communities that we operate.
Our respectful approach to effective heritage resource management aims to pay tribute to the rich history of the customs and traditions of communities that live around our operations. Sibanye-Stillwater complies with national heritage and associated legislation, and subscribes to and supports other guidelines and principles such as the ICMM, World Gold Council, and UN Sustainable Development Goals.
REHABILITATION AND CLOSURE
We have initiated a process to incorporate socio-economic factors into our closure plans and to position the Group to contribute to a sustainable regional post mining closure solution within our operational areas. This process was undertaken in accordance with the principles outlined in the draft National Mine Closure Strategy currently being developed by the Department of Minerals Resources & Energy (DMRE). Although the framework is South African specific, the principles extend beyond borders.
To date, we have initiated various work streams and adopted a systematic approach to ensure that sustainable closure plans are developed together with our internal and external stakeholders. We have defined closure provisions in accordance with closure plans.
Key milestones in the development of sustainable closure plans include the following:
a.understanding the regions in which we operate
b.identifying key stakeholders
c.conducting specialist studies
d.engaging with stakeholders
e.developing and assessing closure plans and closure liability
We retained external specialists (Golder Associates) to align the closure planning and associated closure liability costs for the South African gold and platinum operations with the requirements of GN R. 1147, for submission to the DMRE, as well as Ernst & Young for external audit and assurance purposes. Total closure liability for the SA operations, as at 31 December 2021 (including our portion of environmental liability in JV and projects) was R10.34 billion (bn). Of this, R5.701 bn was for the PGM operations (inclusive of the Marikana operations and third-party Pool and Share Agreements) and R4.642 bn for the gold operations. The US PGM operations have a closure liability of US$74m.
In theory, this balance has to be funded before operations cease such that the provisions can be met with the funding that has been set aside. In the meantime, the shortfall is covered by guarantees provided by third parties. Sibanye-Stillwater sets aside funds for the management, remediation and rehabilitation of the environmental impacts of our mining operations. A provision on the liability side of the balance sheet is created to cover the present value of future rehabilitation expenses. The provision is enough to cover the various rehabilitation requirements specified in the National Environmental Management Act. These are independently reviewed and adjusted annually as mining occurs and mining plans develop. The provision is offset on the asset side of the balance sheet by the value of the respective mines.
As mining takes place, the asset will decline in value as the economic potential of the mine diminishes.
Sibanye-Stillwater ensures that it has sufficient assets to cover the provision for rehabilitation and therefore sets aside funds out of its earnings. These accumulate as an asset, such that at the end of the life of the mine, and following concurrent rehabilitation activities, there are sufficient funds to cover the cost of rehabilitation. These funds are held in a trust, separate from the company and cannot be accessed by the company’s creditors with the balance in guarantees. These assure the DMRE that the mine will be able to fund the rehabilitation costs either when required or according to the mining plan.
Competent persons’ declaration and consent
The Mineral Resources and Mineral Reserves are estimated by teams of appointed Competent Persons, who have sufficient experience relative to the type and style of the mineral deposits under consideration.
In addition, corporate governance on the overall compliance of the Group’s figures and responsibility for the generation of a Group consolidated statement has been overseen by the group lead Competent Persons, included in the list below.
The Group has the written confirmation of the Competent Persons that the information, as disclosed in this report, is compliant with the relevant security exchanges’ requirements (Section 12 of the JSE listings requirements, SAMREC Table 1 and SK-1300), and that it may be published in the form and context in which it was intended.
The names, qualifications, job titles, relationship with the Group, professional registrations, work address, area of competency, and years of relevant experience, are defined in the table below.
| | | | | | | | | | | | | | | | | | | | |
| Name | Relationship with Group | Professional registrations | Work address | Area of responsibility | Competency/ specialisation | Years of relevant experience |
| SIBANYE-STILLWATER GROUP |
| Group Lead Competent Persons |
Stephan Stander B.Sc. Hons – Geochemistry, B.Com, MBL, GDE, Dipl.PM. Vice President –Commercial Geology | Full-time employee | SACNASP
400089/96 | Constantia Office Park Cnr 14th Avenue & Hendrik Potgieter Road Bridgeview House, Ground Floor (Lakeview Avenue) Weltevreden Park 1709 South Africa | Sibanye-Stillwater Group | Mineral Resources | 29 |
Tom Van Den Berg B.Tech (Mining Eng.), MBL, EDP. Senior Vice President – Mining | Full-time employee | SAIMM (Fellow)
70097
| Constantia Office Park Cnr 14th Avenue & Hendrik Potgieter Road Bridgeview House, Ground Floor (Lakeview Avenue) Weltevreden Park 1709 South Africa | Sibanye-Stillwater Group | Mineral Reserves | 30 |
| AMERICAS PGM OPERATIONS |
| Lead Competent Person |
Justus Deen MSc (Minerals Engineering), BSc (Geological Sciences) Technical Services Manager – Engineering Montana Mines | Full-time employee | SME 04227906RM | Sibanye-Stillwater, US PGM Operations, 242 S Diamond St PO Box 1330, Columbus MT 59019, USA | Stillwater and East Boulder Operations | Mineral Reserves | 23 |
| Team of Competent Persons |
Jeff Hughs BSc (Geology) Technical Services Manager – Geology Montana Mines | Full-time employee | AIPG CPG 11792 | Sibanye-Stillwater US PGM Operations 242 S Diamond St PO Box 1330, Columbus MT 59019, USA | Stillwater and East Boulder Operations | Mineral Resources | 17 |
Jennifer Evans BSc (Geology) Senior Geologist | Full-time employee | AIPG CPG 11669 | Sibanye-Stillwater US PGM Operations 242 S Diamond St PO Box 1330, Columbus MT 59019, USA | East Boulder Operation Geology | Mineral Resources | 17 |
Matt Ladvala BSc (Geology) Senior Geologist | Full-time employee | AIPG
CPG 11941
| Sibanye-Stillwater US PGM Operations 242 S Diamond St PO Box 1330, Columbus MT 59019, USA | Stillwater Operation Geology | Mineral Resources | 14 |
Kevin Butak MSc (Geology) Senior Geologist | Full-time employee | AIPG CPG 12012 | Sibanye-Stillwater US PGM Operations 242 S Diamond St PO Box 1330, Columbus MT 59019, USA | Stillwater Operation Geology | Mineral Resources | 14 |
Competent persons’ declaration and consent continued
| | | | | | | | | | | | | | | | | | | | |
| Name | Relationship with Group | Professional registrations | Work address | Area of responsibility | Competency/ specialisation | Years of relevant experience |
| AMERICAS PGM EXPLORATION |
| Competent Persons |
Rodney Thomas M.A.Sc Vice President: Exploration – Generation Mining | External –
Full time employee and of Generation Mining | PGO
31
| First Canadian Place
Suite 7010 –
100 King Street West
PO Box 70, Toronto, ON, Canada M5X 1B1 | Marathon | Mineral Resources | 41 |
David Smith BSc (Geology/ Earth Science) Senior Geologist –Wallbridge Mining | External –
Full-time employee of Wallbridge Mining Company Ltd. | PGO
2096
| Wallbridge Mining Company Ltd. 129 Fielding Road, Lively ON P3Y 1L7 | Denison | Mineral Resources | 15 |
| AMERICAS GREEN METALS EXPLORATION |
| Competent Persons |
Antonio Umpire P. Engineer BSc (Hon) Geology BA (Hon) Professional IT MBA, GDE (Conditional Simulation) Unit Manager Group Resource Estimation & Reporting | Full-time employee | SACNASP
400372/12
GASA 12104
GSSA 967709
CIP 91856 | Constantia Office Park Cnr 14th Avenue & Hendrik Potgieter Road Bridgeview House, Ground Floor (Lakeview Avenue) Weltevreden Park 1709 South Africa | Rhyolite Ridge | Mineral Resources | 26 |
Stanford Foy BSc (Geological Engineering) Vice President: Project Development – Aldebaran Resources | External –
Full time employee of Aldebaran Resources | AIPG CPG-10946 SME 4140727 | 38 Bannock Cir 1449,
Red Lodge, MT 59068 USA | Altar and Rio Grande | Mineral Resources | 29 |
| SOUTHERN AFRICA PGM OPERATIONS & EXPLORATION |
| Lead Competent Person |
Andrew Brown MSc (Mining Engineering) Vice President: Mine Technical Services | Full-time employee | SAIMM 705060 | Sibanye-Stillwater Hex River Complex Old Mine Road, Rustenburg Bleskop, 0292 | All managed SA PGM operations and projects | Mineral Resources and Mineral Reserves | 37 |
| Team of Competent Persons |
Nicole Wansbury MSc (Geology) Unit Manager: Geology | Full-time employee | SACNASP 400060/11 | Sibanye-Stillwater Hex River Complex Old Mine Road, Rustenburg Bleskop, 0292 | All managed SA PGM operations and projects | Mineral Resources | 16 |
Leon Koorsse GDE (Mining Engineering) Unit Manager: Survey | Full-time employee | SAGC GPr MS 0134 | Sibanye-Stillwater Hex River Complex Old Mine Road, Rustenburg Bleskop, 0292 | Marikana | Mineral Reserves | 37 |
Brian Smith MEng MRM Unit Manager: Survey | Full-time employee | SAGC GPr MS 0218 | Sibanye-Stillwater Hex River Complex Old Mine Road, Rustenburg Bleskop, 0292 | Marikana, Rustenburg and Kroondal | Mineral Reserves | 35 |
Leonard Changara MSc (Geology); MBA Unit Manager: Geology | Full-time employee | SACNASP 400089/08 | Sibanye-Stillwater
Hex River Complex
Old Mine Road, Rustenburg
Bleskop, 0292 | Rustenburg and Kroondal | Mineral Resources | 23 |
Competent persons’ declaration and consent continued
| | | | | | | | | | | | | | | | | | | | |
| Name | Relationship with Group | Professional registrations | Work address | Area of responsibility | Competency/ specialisation | Years of relevant experience |
| SOUTHERN AFRICA GOLD OPERATIONS, DEVELOPMENT & EXPLORATION |
| Lead Competent Person |
Gerhard Janse van Vuuren GDE (Mining Engineering), B Tech MRM, MBA, MSCC Vice President: Mine Technical Services | Full-time employee | SAIMM 706705 | Sibanye Gold Limited – Corporate Division
Sibanye Gold
Libanon Business Park, Hospital Street
(off Cedar Ave), Libanon, Westonaria, 1780 | All managed gold operations and projects | Mineral Resources and Mineral Reserves | 34 |
| Team of Competent Persons |
Janine Fleming BSc (Hon) Geology, GDE (Mining Engineering) Unit Manager: Mineral Resource Geology | Full-time employee | SACNASP 400051/05 GSSA 963109 | Sibanye Gold Limited – Corporate Division Sibanye Gold Libanon Business Park, Hospital Street (off Cedar Ave), Libanon, Westonaria, 1780 | All managed gold operations and projects | Mineral Resources | 26 |
Lindelani Mudimeli BSc (Hon) Geology, GDE (Mining Engineering) Unit Manager: Geology | Full-time employee | GSSA 967582 SACNASP 13678 | Sibanye Gold Limited – Corporate Division Sibanye Gold Libanon Business Park, Hospital Street (off Cedar Ave), Libanon, Westonaria, 1780 | All managed gold operations and projects | Mineral Resources | 15 |
Steven Wild NHD MRM, GDE (Mining Engineering) Unit Manager: Planning | Full-time employee | SAIMM 706556 | Sibanye Gold Limited – Corporate Division
Sibanye Gold
Libanon Business Park, Hospital Street
(off Cedar Ave), Libanon,
Westonaria, 1780 | All managed gold operations and projects | Mineral Reserves | 26 |
Mpfariseni Mudau MSc Eng. Director/Resource Geology Manager – RVN Group | External – Independent consultant to DRDGOLD | SACNASP 400305/12 | 21 Willowbrook Villas, Willowbrook, Roodepoort, 1724, Gauteng, South Africa | DRD – Ergo Mining Proprietary Limited | Mineral Resources | 15 |
Prof. Steven Rupprecht PhD (Mech. Eng.) Independent Mining Engineer: RVN Group | External – Independent consultant to DRDGOLD | SAIMM
701013
| 21 Willowbrook Villas, Willowbrook, Roodepoort, 1724, Gauteng, South Africa | DRD – Ergo Mining Proprietary Limited | Mineral Reserves | 23 |
Vaughn Duke BSc Mining Engineering Partner: Sound Mining | External – Independent consultant to DRDGOLD | SAIMM 37179 ECSA 940314 | 2A Fifth avenue, Rivonia, 2128, Johannesburg, Gauteng, South Africa | Far West Gold Recoveries Proprietary Limited | Mineral Reserves and Mineral Resources | 37 |
| EUROPE GREEN METALS EXPLORATION |
| Competent Persons |
Paul Payne BAppSc (Geology), Grad Dip (Min Ec), Grad Cert (Geostatistics) Principal Geologist at Payne Geological Services | External –
Full-time employee of Payne Geological Services Pty Ltd. | FAusIMM 105622 | PO Box 480
Cowaramup 6884
Western Australia | Keliber – Syväjärvi & Rapasaaris deposits | Mineral Resources | 25 |
Pekka Lovén M.Sc. (Mining) Principal Mining Engineer at PL Mineral Reserve Services | External –
Full-time employee of PL Mineral Reserve Services | AusIMM 301822 | Alkutie 10 A 1
FI-00660 Helsinki
Finland | Keliber –Länttä, Outovesi and Emmes | Mineral Resources | 30 |
| AUSTRALIA GREEN METALS OPERATIONS |
| Competent Persons |
Damian O’Donohue BSc Geology Geology Manager | Full-time employee of NCR | AusIMM 308436 | L4, 360 Collins St, Melbourne, VIC 3000 AUSTRALIA | New Century | Mineral Resources and Reserves | 14 |
| | | | | | | | |
| AMERICAS |
| Location | |
| PLATINUM GROUP METALS | |
| US OPERATIONS | |
| Stillwater and East Boulder | |
| EXPLORATION STAGE | |
| Marathon | |
| Denison | |
| GREEN METALS EXPLORATION | |
| LITHIUM | |
| Rhyolite Ridge | |
| COPPER | |
| Altar | |
| Rio Grande | |
Americas
LOCATION
US PGM operations
STILLWATER AND EAST BOULDER MINES
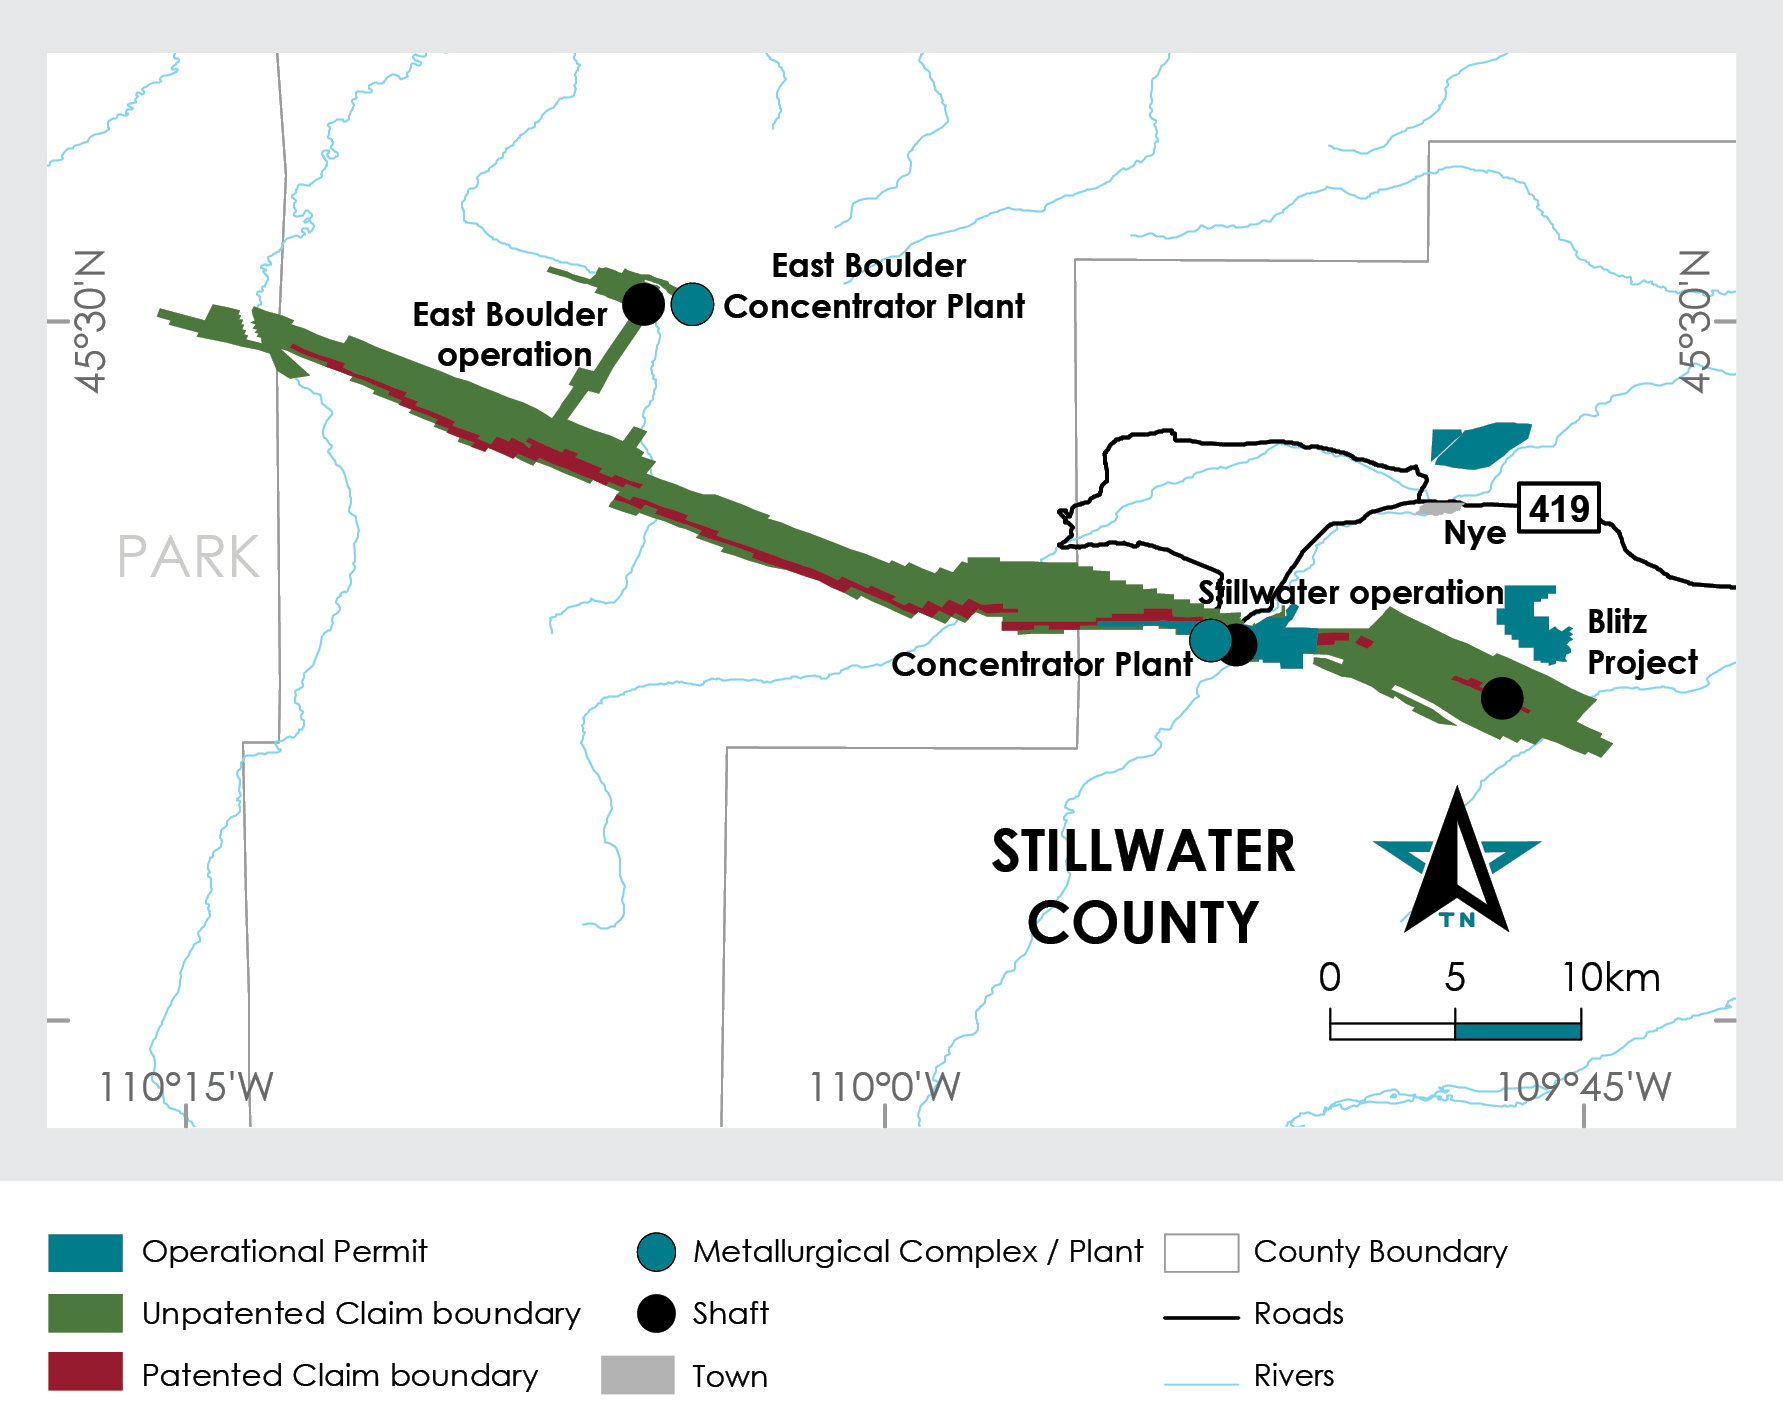
| | |
| PROPERTY DESCRIPTION |
Stillwater (including the Stillwater East expansion project) and East Boulder are underground mining operations, located near the towns of Nye and McLeod in Montana, US. The mining assets are located on the front range of the Beartooth Mountains with elevations exceeding 2,700m amsl. The two operations are located within the Custer and Gallatin national forests. The mines both target the J-M Reef zone, predominantly via selective mechanised ramp and fill mining methods. Ore from the operations is milled and treated at integrated concentrator complexes located at each operation. Concentrate smelting and refining takes place at the Columbus smelter complex, situated in the town of Columbus, Montana. The Stillwater mine has two principal mining sections: the current (Western) section, which has been in operation since 1986, produces approximately 250-300koz per annum of platinum and palladium in concentrate; and the Stillwater East section, a major project currently under development, started ore production in 2017. The western section of the operation is accessed by a 580m deep shaft and five surface portals, while the Stillwater East section is accessed via three portals. The East Boulder mine has been in operation since 2002, and currently produces approximately 240Koz per annum of platinum and palladium in concentrate. The East Boulder mine is accessed via twin 5,800m long tunnel bored portal drives. |
US PGM operations STILLWATER AND EAST BOULDER MINES continued
| | |
| MINERAL TITLE |
Sibanye-Stillwater holds or leases 1,704 patented and unpatented lode, placer, tunnel or mill site claims in the Stillwater, Sweet Grass and Park counties of south-central Montana, encompassing 97,75km2. These claims cover the entirety of the known J-M Reef occurrence; the East Boulder Mine’s access adits and plant site; and the Benbow Decline access and surface portal. The 1,704 claims are in good standing and have no expiration date. Of the 1,704 claims, 1,498 unpatented claims must be renewed annually with the Bureau of Land Management (BLM) and county offices, and an annual maintenance fee per claim is paid to the BLM to keep these claims valid. For operations involving more than 5 acres (~0.2km2), a detailed plan of operations must be filed with the appropriate BLM field office. Sibanye-Stillwater has a plan of operations for Stillwater and East Boulder Mines approved by the US Forest Service and the Montana Department of Environmental Quality. The 13.96km2 of permitted operating areas are in good standing. |
Stillwater and East Boulder operations surface geological map
US PGM operations STILLWATER AND EAST BOULDER MINES continued
| | |
| MINERALISATION CHARACTERISTICS |
•The J-M Reef is a magmatic reef type PGM bearing deposit defined as the palladium-platinum rich stratigraphic interval, mainly occurring within a troctolite (OB-I zone) of the Lower Banded Series •Palladium and platinum are the main PGMs, both constituting between 7g/t to 40g/t over a variable economic mineralised thickness ranging from 0.9m – 2.7m and averaging 1.8m •Ratios of palladium to platinum in metallurgical concentrate are known to range from 3.4:1 (in situ 3.5:1) at Stillwater to 3.5:1 (in situ 3.6:1) at East Boulder |
Stillwater and East Boulder operations typical drilling section looking west
US PGM operations STILLWATER AND EAST BOULDER MINES continued
| | |
| MINERAL RESOURCE ESTIMATION |
Diamond drilling data combined with geological mapping and underground face mapping are used to derive the Mineral Resource estimates. The drilling data is a combination of widely spaced surface drilling and underground definition drilling (typically at a 15m x 15m spacing), drilled off levels spaced vertically between 91m to 122m. Zones of continuous ore-grade mineralisation are identified in drilling, flagged, and composited with respect to their length to yield single values for platinum and palladium for each reef intersection. The composited grade is then multiplied by the width of the composite to get a grade thickness value for each reef intersection to be used in resource estimation. Based on the distribution of each individual domain, grade thickness is capped at the ninety-eighth percentile to keep high-grade composites from influencing the estimation. Wireframe models are constructed implicitly using Leapfrog™ software for all resource categories and are separated by individual domains. Block models are constructed based on the wireframes for the individual resource domains. A minimum mining width, and a 6.8g/t grade cut-off at Stillwater or a 1.7g/t grade cut-off at East Boulder, is applied to all resource categories. Mineral Resource estimations are divided into three confidence categories: Measured, Indicated, and Inferred. The criteria that separate these three categories is predominantly the density of drilling and range of the grade continuity from the variograms. Definition drilling at 15-meter spacing is used to define the metal distribution with adequate geological certainty for estimating the Measured Resource. The Measured Resource also includes the area outside the definition drilled area, but within a range of around 100m based on the first spheric range of the variograms, from the nearest credible sample point. The Indicated Mineral Resource is that area outside the Measured Mineral Resource, but within a range around 300m based on 1.5 to 1.8 times the first spheric range of the variograms, from the nearest credible sample point. Inferred Mineral Resources are limited by faults and geological continuity of the J-M Reef where it can be reasonably expected to occur based on surface drilling, geological mapping, and regional and local geological structure. The 2E (Pt and Pd) metal within the Mineral Resource is reasonably constant, as illustrated in the table below. |
2E PGM prill split
| | | | | | | | | | | | | | |
| Metal | Unit | Stillwater | East Boulder | Average |
| Platinum | % | 22.2 | 21.7 | 22 |
| Palladium | % | 77.8 | 78.3 | 78 |
| | |
| INTERNAL CONTROLS (QAQC) |
Diamond drilling is proposed by an experienced geologist, and drilling locations are assigned and surveyed. The proposal is entered into a tracking database (OREQMS™). After drilling, the final angles and setup are measured and recorded underground by a surveyor and a geologist. Geologists log the core, which is then reviewed by a senior geologist. Waste blanks, as well as selected pulp repeats, are submitted to the internal laboratory. Selected pulps for re-assay are submitted to an outside laboratory to assure data integrity. 2.5% of the pulps are sent back for re-assay in the areas with mature production, and 5% are sent from areas of newer production (Stillwater East and East Boulder). Samples are recorded and bar coded into the OREQMS database, which is linked to an internal Laboratory Information Management System (LIMS). Final assays are reviewed and approved by an experienced geologist. The geologist compares visual sulphides to assay results and also checks platinum/palladium ratios for reasonableness. Assays are checked into OREQMS once approved by a geologist. As key data is received into the OREQMS database, a timestamp is applied. Data is then exported to Vulcan™ by the geologist. The mines utilises their own internal assay laboratory. Samples are received into LIMS, crushed, split and pulverised. XRF and fire assay with acid digestion and dilution is used for final induction coupled plasma mass spectrometry (ICP) analysis. Each set of geology samples is fire assayed with two reference standards. Balances used for charging fire assay samples are tested for accuracy at each shift, using certified check weights. A third party performs preventative maintenance and calibration on the scales on an annual basis. A density of 0.353m3/t is used to calculate tonnage. Since the start of 2018, density has been measured on reef samples on 20% of all production holes. This data led to a change in density from 0.362m3/t to 0.353m3/t in 2020. |
US PGM operations STILLWATER AND EAST BOULDER MINES continued
Grade control and Mineral Resource definition drilling summary
| | | | | | | | | | | | | | | | | | | | |
| Exploration drilling summary | | | | | | |
| Planned 2022 | Actual 2021 | Actual 2020 |
| Operation | Drilled (m) | Expenditure (Rm) | Drilled (m) | Expenditure (Rm) | Drilled (m) | Expenditure (Rm) |
| Stillwater | | | | | | |
| Grade control and ore definition | 312,686 | 283.6 | 229,415 | 190.8 | 182,517 | 139.5 |
| Total | 312,686 | 283.6 | 229,415 | 190.8 | 182,517 | 139.5 |
| East Boulder | | | | | | |
| Grade control and ore definition | 49,704 | 26.7 | 35,615 | 20.1 | 48,913 | 16.1 |
| Total | 49,704 | 26.7 | 35,615 | 20.1 | 48,913 | 16.1 |
Classified Mineral Resource estimate at 31 December 2021
| | | | | | | | | | | | | | | | | | | | | | | | | | | | | |
| Mineral Resources Inclusive of Mineral Reserves |
| | | | 31 December 2021 | 31 December 2020 |
| PGM | Americas | | | Tonnes | Grade | PGM | Tonnes | Grade | PGM |
| Stillwater and East Boulder | (Mt) | (g/t) | (Moz) | (Mt) | (g/t) | (Moz) |
| Operations | Stillwater | Underground | Measured | 21.7 | | 15.6 | | 10.9 | | 6.7 | | 17.0 | | 3.7 | |
| | | Indicated | 31.3 | | 14.2 | | 14.3 | | 31.5 | | 17.6 | | 17.8 | |
| | | Measured + Indicated | 53.0 | | 14.8 | | 25.2 | | 38.2 | | 17.5 | | 21.5 | |
| | | Inferred | 61.5 | | 12.1 | | 24.0 | | 48.3 | | 17.2 | | 26.8 | |
| East Boulder | Underground | Measured | 18.1 | | 13.6 | | 7.9 | | 5.7 | | 12.9 | | 2.4 | |
| | | Indicated | 27.8 | | 13.3 | | 11.8 | | 38.6 | | 12.2 | | 15.1 | |
| | | Measured + Indicated | 45.9 | | 13.4 | | 19.8 | | 44.3 | | 12.3 | | 17.5 | |
| | | Inferred | 52.2 | | 12.3 | | 20.6 | | 47.9 | | 13.7 | | 21.2 | |
| Total Measured + Indicated | 99.0 | | 14.1 | | 45.0 | | 82.5 | | 14.7 | | 39.0 | |
| Grand total | 212.6 | | 13.1 | | 89.6 | | 178.7 | | 15.1 | | 86.9 | |
| | | | | | | | | | | | | | | | | | | | | | | | | | | | | |
| Mineral Resources Exclusive of Mineral Reserves |
| | | | 31 December 2021 | 31 December 2020 |
| PGM | Americas | | | Tonnes | Grade | PGM | Tonnes | Grade | PGM |
| Stillwater and East Boulder | | | (Mt) | (g/t) | (Moz) | (Mt) | (g/t) | (Moz) |
| Operations | Stillwater | Underground | Measured | 7.9 | | 15.0 | | 3.8 | | 2.9 | | 14.1 | | 1.3 | |
| | | Indicated | 9.0 | | 14.6 | | 4.2 | | — | | — | | — | |
| | | Measured + Indicated | 16.9 | | 14.8 | | 8.0 | | 2.9 | | 14.1 | | 1.3 | |
| | | Inferred | 61.5 | | 12.1 | | 24.0 | | 48.3 | | 17.2 | | 26.8 | |
| East Boulder | Underground | Measured | 7.2 | | 13.6 | | 3.1 | | 1.8 | | 13.9 | | 0.8 | |
| | | Indicated | 10.9 | | 13.0 | | 4.6 | | — | | — | | — | |
| | | Measured + Indicated | 18.2 | | 13.2 | | 7.7 | | 1.8 | | 13.9 | | 0.8 | |
| | | Inferred | 52.2 | | 12.3 | | 20.6 | | 47.9 | | 13.7 | | 21.2 | |
| Total Measured + Indicated | 35.0 | | 14.0 | | 15.7 | | 4.7 | | 14.1 | | 2.1 | |
| Grand total | 148.6 | | 12.6 | | 60.3 | | 100.9 | | 15.4 | | 50.0 | |
US PGM operations STILLWATER AND EAST BOULDER MINES continued
Stillwater mine Mineral Resource classification areas
East Boulder mine Mineral Resource classification areas
US PGM operations STILLWATER AND EAST BOULDER MINES continued
Notes:
The +3% change year-on-year in the stated Mineral Resources (Inclusive of Mineral Reserves) is attributed to an enhancement of the Mineral Resource estimation methodology to align with modern best practices, which led to:
–a decrease of 19.1Moz due to the exclusion of previous Inferred Resource areas, at depth, due to geological structure re-interpretation
–an increase of 37.4Moz due to a revised, comprehensive 3D geological model that covers the entire anticipated deposit, providing greater ore body continuity than before
–a decrease of 15Moz, due to a rigorous review and geostatistical analysis of the estimation parameters, which led to a better understanding of anisotropy in the ore body; this led to grades with better support, and simple kriging with a declustered mean for less informed areas
On a Mineral Resources exclusive of Mineral Reserves basis, the year-on-year change is +20% also attributed to the overhaul of the Mineral Resource estimation methodology.
US PGM operations STILLWATER AND EAST BOULDER MINES continued
| | |
| MINERAL RESERVE ESTIMATION |
Mineral Reserves are derived from detailed operational planning exercises that envisage mining from existing Stillwater and East Boulder mine infrastructure. Annual operation design, production and development schedules are completed utilising various software programmes including Deswik™, MS Excel™, Xeras™, AutoCAD™ and Vulcan™. Mine planning utilises and takes into consideration historical technical parameters achieved. In addition, Mineral Resource to Mineral Reserve modifying factors – such as dilution, ore loss (deletion) and minimum mining widths associated with different mining methods – are employed during planning and scheduling. Initially, the design and scheduling include all secondary development to access the potential stope (ore) blocks identified in the detailed drilled-out portion of the Measured Resource category. This informs the Proved Mineral Reserves. Probable Mineral Reserves are derived from the area outside the definition-drilled area but within the Measured and Indicated Mineral Resource envelope. Within each domain, blocks are estimated using simple kriging which uses the available drilling data but relies heavily on the global mean for the areas further from drilling data. A mining mix is applied to the Probable Reserve to account for the percentages of different mining methods to be used. A domain specific mineability factor and modifying factors are then applied to reach the final Probable Mineral Reserve estimate. Mineability is defined as the proportion of mineable ore in stope blocks to total ore within each domain’s Proved Mineral Reserve at current economic conditions. Each stope block is subjected to an economic test, which results in the determination of a net profit and, a net present value (NPV) of the planned stope and a payback period. An economic viability test (ORET test) is completed for the LoM plans for the operations. |
| | |
| MINING METHOD |
The two principal mining methods are: •mechanised ramp and fill (both overhand and underhand) (80% – 90%) •sub-level extraction by long hole, open stoping with hydraulic backfilling (10% – 20%) |
| | | | | | | | | | | |
| Annual development results | | | |
| Financial year totals |
| Category | Unit | 2021 | 2020 |
| Stillwater | | | |
| Primary off-reef development (declines, inclines, haulage, crosscuts) | m | 4,366 | 8,020 |
| Footwall lateral | m | 7,690 | 4,553 |
| Secondary off reef development (stope access and stope ramps) | m | 9,100 | 7,759 |
| Total | m | 21,156 | 20,332 |
| East Boulder | | | |
| Primary off-reef development (declines, inclines, haulage, crosscuts) | m | 1,512 | 1,740 |
| Footwall lateral | m | 1,702 | 1,022 |
| Secondary off reef development (stope access and stope ramps) | m | 3,792 | 3,943 |
| Total | m | 7,006 | 6,705 |
US PGM operations STILLWATER AND EAST BOULDER MINES continued
Modifying factors applied in converting Mineral Resources to Mineral Reserves
| | | | | | | | | | | |
| | | |
| Parameter | Unit | 2021 | 2020 |
| Stillwater | | | |
| Mineral Reserve cut-off | g/t | 6.8 | 6.8 |
| Mineability factor | % | 68 | 68 |
| Sub-level extraction loss factor | % | 25 | 25 |
| Ramp and fill stoping | % | 93 | 93 |
| Sub-level stoping | % | 7 | 7 |
| Dilution factor in model | % | 20 | 20 |
| Additional dilution (average) | % | 13 | 15 |
| Deletion factor | % | 6 | 4 |
| Minimum mining width | cm | 229 | 229 |
| Diluted mining width | cm | 274 | 274 |
| concentrator recovery | % | 92 | 92 |
| Smelter/base metal refinery recovery | % | 99 | 99 |
| East Boulder | | | |
| Mineral Reserve cut-off | g/t | 1.7 | 1.7 |
| Mineability factor | % | 64 | 71 |
| Sub-level extraction loss factor | % | 25 | 25 |
| Ramp and fill stoping | % | 85 | 76 |
| Sub-level stoping | % | 15 | 24 |
| Dilution factor in model | % | 20 | 20 |
| Additional dilution (average) | % | 3 | 0 |
| Deletion factor | % | 8.5 | 0 |
| Minimum mining width | cm | 229 | 229 |
| Diluted mining width | cm | 274 | 274 |
| concentrator recovery | % | 91 | 91 |
| Smelter/base metal refinery recovery | % | 99 | 99 |
Classified Mineral Reserve estimate at 31 December 2021
| | | | | | | | | | | | | | | | | | | | | | | | | | | | | |
| Mineral Reserves |
| | | | 31 December 2021 | 31 December 2020 |
| PGM | Americas | | | Tonnes | Grade | PGM | Tonnes | Grade | PGM |
| Stillwater and East Boulder | | | (Mt) | (g/t) | (Moz) | (Mt) | (g/t) | (Moz) |
| Operations | Stillwater | Underground | Proved | 4.6 | | 17.2 | | 2.6 | | 4.3 | | 15.8 | | 2.2 | |
| | | Probable | 35.8 | | 11.9 | | 13.7 | | 26.6 | | 16.0 | | 13.7 | |
| | | Proved + Probable | 40.4 | | 12.5 | | 16.2 | | 30.9 | | 16.0 | | 15.9 | |
| East Boulder | Underground | Proved | 3.5 | | 13.0 | | 1.5 | | 3.5 | | 12.8 | | 1.4 | |
| | | Probable | 24.3 | | 12.3 | | 9.6 | | 23.7 | | 12.6 | | 9.6 | |
| | | Proved + Probable | 27.9 | | 12.4 | | 11.1 | | 27.2 | | 12.6 | | 11.0 | |
| Grand total Proved + Probable | 68.3 | | 12.4 | | 27.3 | | 58.1 | | 14.4 | | 26.9 | |
US PGM operations STILLWATER AND EAST BOULDER MINES continued
Notes:
The +1.5% change year-on-year in the stated Mineral Reserves are attributed to the change in Mineral Resource estimation methodology, which also impacted the Mineral Reserve estimation methodology. This led to individual components of the estimate changing significantly as follows:
–an increase of 5.4Moz due to a revised, comprehensive 3D geological model that covers the entire anticipated deposit, providing greater ore body continuity than before
–a decrease of 2.7Moz, due to a rigorous review and geostatistical analysis of the estimation parameters, which led to a better understanding of anisotropy in the ore body; this led to grades with better support, and simple kriging with a declustered mean for less informed areas
–a decrease of 1.4Moz attributed to an adjustment of the modifying factors to keep Mineral Reserve estimates in line with production results
US PGM operations STILLWATER AND EAST BOULDER MINES continued
| | |
| LIFE OF MINE |
THE STILLWATER MINE It is estimated that current Mineral Reserves will sustain the Stillwater mine until 2055 and the Stillwater East project has the potential to significantly expand Mineral Reserves beyond 2055. EAST BOULDER It is estimated that the current Mineral Reserves will sustain East Boulder until 2061. |
| | |
| ESTIMATION RISKS |
•Geological: The grade distribution is generally erratic, and in areas where drilling density is low, localised estimation might be inaccurate. Globally though, the repetition of mineralised areas is more consistent, decreasing the risk over the LoM. •Geohydrological: Although mining operations at Stillwater and East Boulder have not experienced material interruptions due to groundwater problems, a significant amount of groundwater was encountered at the Stillwater East project during the development of the main access adits and the Benbow decline. Stillwater Mine has initiated a multi-pronged approach to mitigating this risk. •Geotechnical: Stillwater and East Boulder Mines have accumulated an extensive geotechnical database and developed ground classifications and support measures that are suited to the rock mass. The extensive support systems and standards in place at both mines are sufficient to minimise the potential impact of any geotechnical associated risk. •Execution gap on LoM plans: Slower than planned production build-ups, underestimating manpower requirements, regulatory changes, grade and tonnage underestimation and unknown geological conditions can all contribute to a gap between planned and achieved production rates, which could impact the execution of LoM plans. Short interval controls are in place to enable the implementation of timeous interventions and, therefore, correction of deviations to the plans. •Cost escalation: Since 2020 and coinciding with the COVID-19 pandemic, the operations have experienced cost pressures and COVID-19 related production disruptions. Continuous improvement initiatives adopted to contain cost escalation are in place to mitigate this risk. •Inadequate tailings storage capacity: Tailings storage facilities at Stillwater and East Boulder Mines have adequate storage capacity for the medium term (seven to ten-year range). Permitting for the construction of a new tailings storage facility may require periods up to five years. It is unlikely that the operations will run out of tailings storage facility capacity before Sibanye-Stillwater receives approvals for the construction of new tailings storage facilities or the upgrading of the existing tailings storage facilities. |
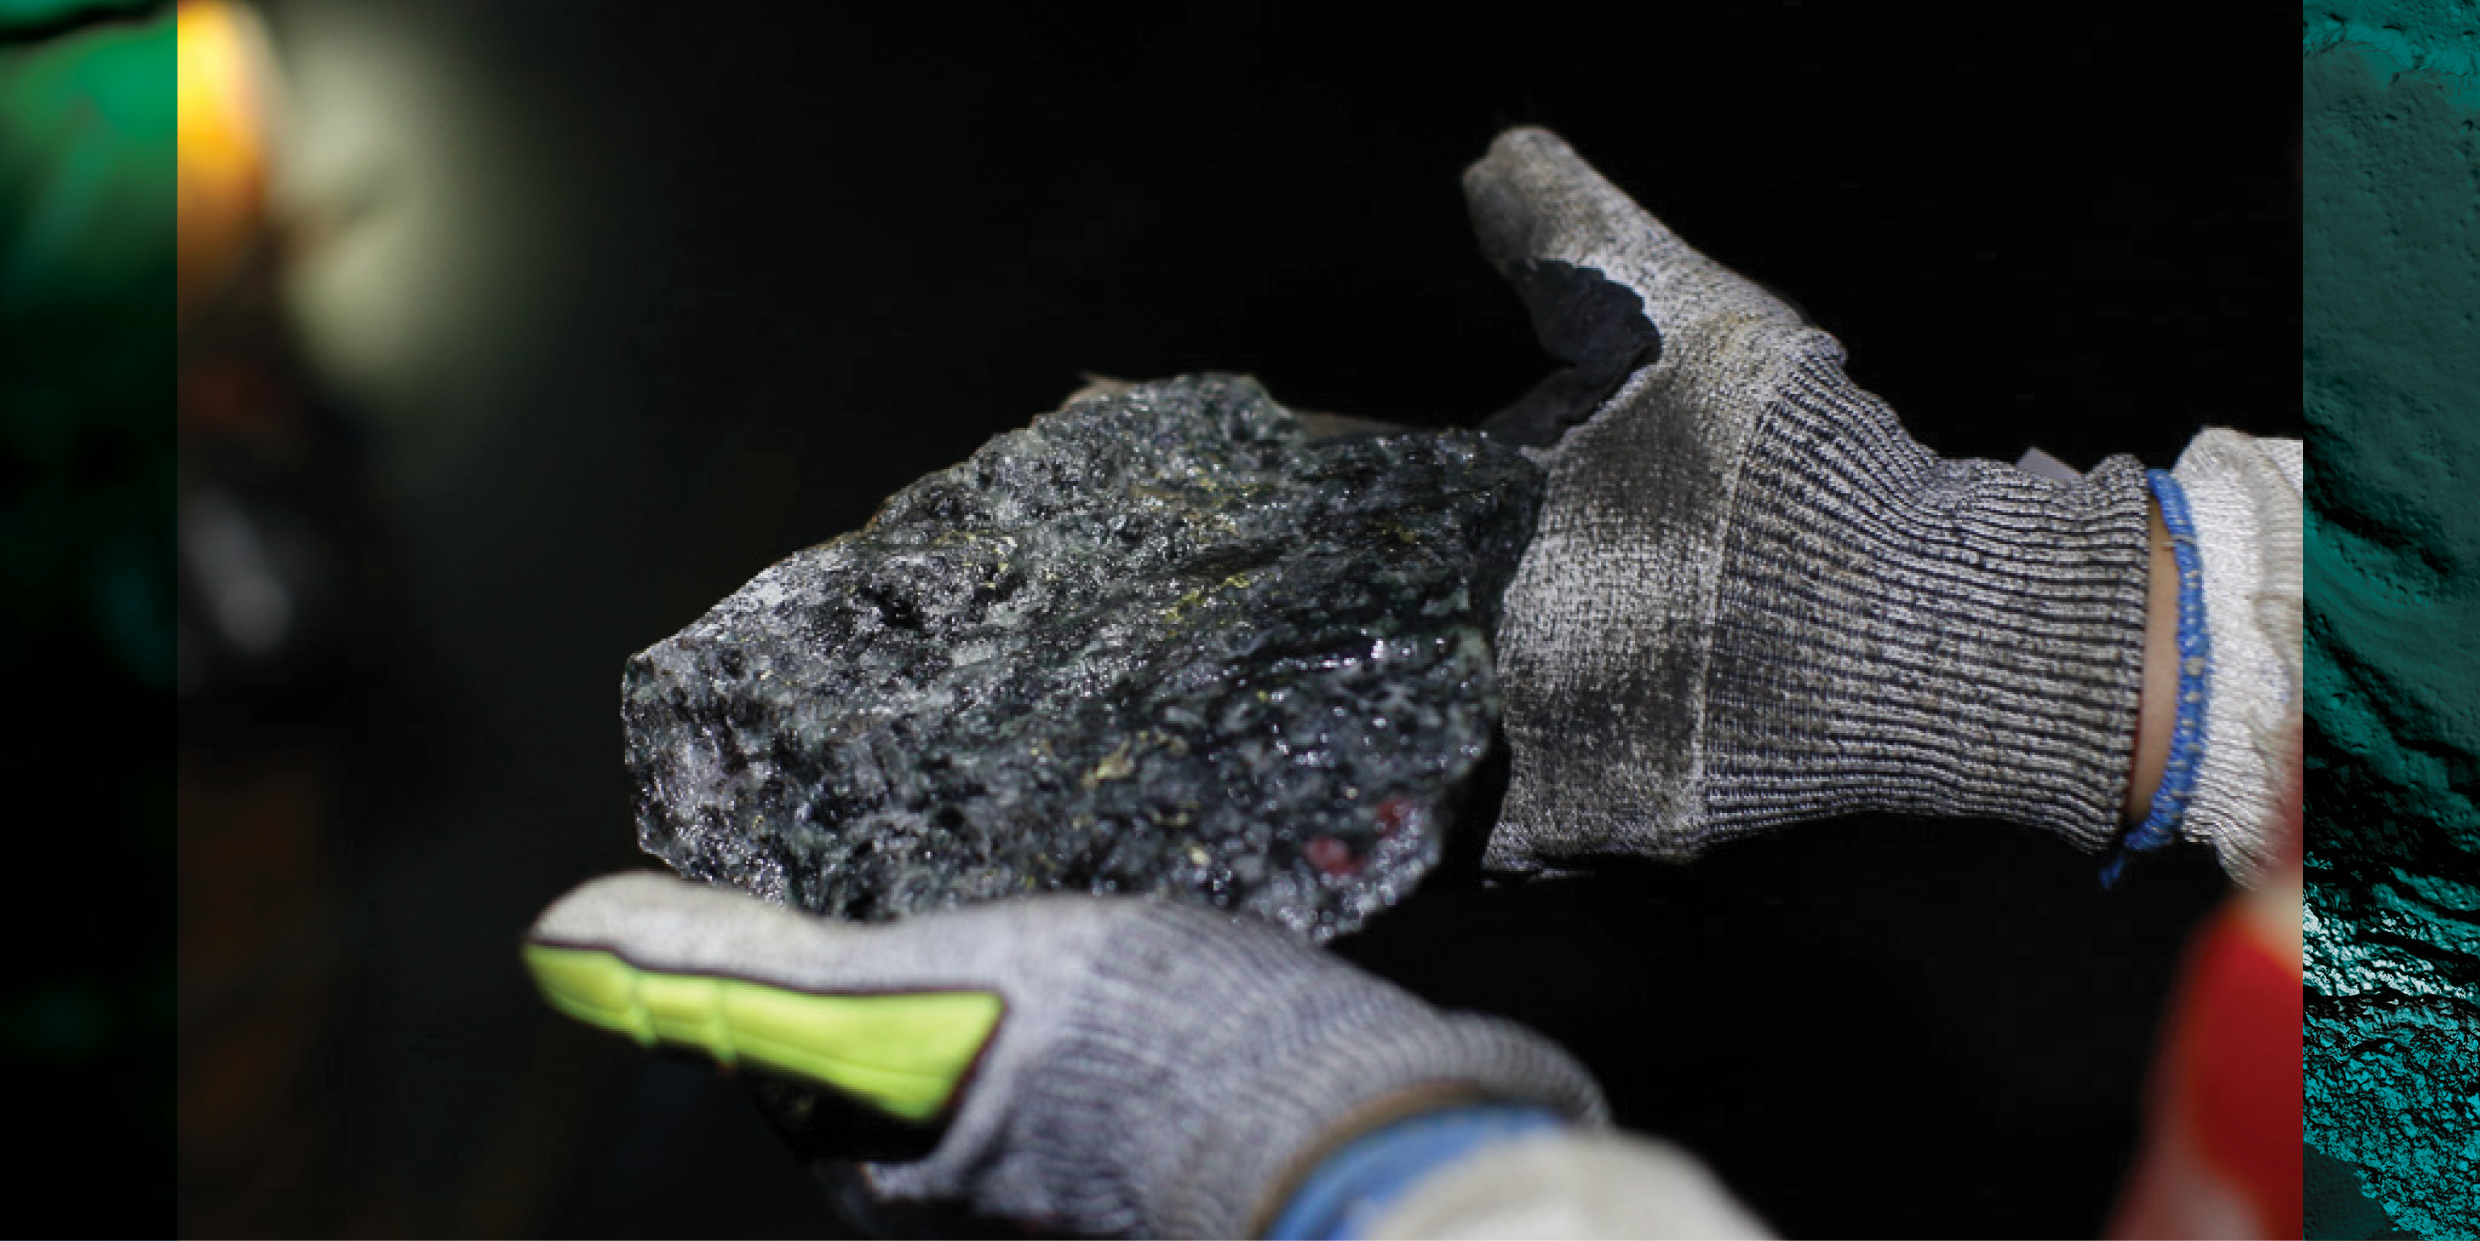
US PGM operations STILLWATER AND EAST BOULDER MINES continued
| | |
| INFRASTRUCTURE AND EQUIPMENT |
THE STILLWATER MINE Key infrastructure includes the mining operations and ancillary buildings that contain the concentrator, workshop, warehouse, changing facilities, headframe, hoist house, sand, paste plants, water treatment, storage facilities, and offices. Underground development represents 68% of the Stillwater Mine property, plant and equipment book value which sits at US$549 million. The concentrator plant was built in the mid 1980s and is 35 plus years old. A new concentrate handling system was added in 2021 as part of a new plant. The balance of the new processing facility will be commissioned in 2022. Currently, the plant and adjoining properties comprise 18% of the asset value. The underground mining fleet ranges in age from 24 years to one year, with the average age of eight years and contributing 13% of the property’s book value. Overall the condition of the asset is improving with a new concentrator and recent underground equipment purchases. THE EAST BOULDER MINE Key infrastructure includes the mining operations and ancillary buildings that contain the concentrator, workshop, warehouse, changing facilities, twin tunnels to access mine, sand plant, water treatment, storage facilities and offices. Underground development represents 80% of the East Boulder Mine property , plant and equipment book value which sits at US$188 million. The concentrator plant was built in the early 2000s and is 20 years old. Currently, the plant with adjoining properties comprise 16% of the East Boulder book value. The underground mining fleet ranges in age from 22 years to one year, with the average age of 16 years and 4% of the property’s book value. Overall, the asset is in average condition. THE COLUMBUS METALLURGICAL COMPLEX Key infrastructure includes the smelting, base refining, laboratory and recycling facilities. The plants were constructed in the early to mid-1990s with many improvements as recently as the past two years. The property, plant and equipment book value of the metallurgical complex and surrounding properties is US$82.3 million. |
| | | | | | | | |
| HOISTING AND PRODUCTION CAPACITIES |
| Operating shaft | Operating hoisting capacity (ktpm) | 5-year planned production (ktpm)* |
| Stillwater shaft | 135 | 121 |
| Stillwater East rail | 144 | 122 |
| East Boulder rail | 137 | 96 |
*Planned production is five-year hoisted average from 2022 onwards
| | | | | | | | | | | | | | | | | |
| MINERAL PROCESSING AND CAPACITY |
| Plant name | Type | Design capacity (ktpm) | Current operational capacity (ktpm) | Average recovery factor (%) | Material treated |
| Stillwater | Flotation | 75 | 79 | 92.2 | UG |
| East Boulder | Flotation | 64 | 54 | 90.8 | UG |
| | |
| TAILINGS DISPOSAL AND CAPACITY |
STILLWATER Currently 60% (2021) of all concentrator tailings are returned underground for backfill. The remaining 40% is sent via pipeline to Hertzler TSF situated 11km north of Stillwater. The current storage facility has 4,740kt of storage remaining with expansion planned to add an additional 10,200kt of storage in 2029. The Hertzler storage facility, with the planned expansion, will have adequate storage for current Proved and Probable Mineral Reserves. EAST BOULDER Currently 48% of all concentrator tailings are returned underground for backfill, with the remaining 52% sent via pipeline to a TSF adjacent to the mine site. The current storage facility has 4,600kt of storage remaining in Stages 4-6. In addition, an expansion is planned to add an additional 5,460kt of storage in 2030 at the Lewis Gulch facility. This facility, including another planned expansion, will accommodate the current Proved and Probable Mineral Reserves. Site teams are currently evaluating dry stacked tails for the Lewis Gulch facility which would essentially double the life of that facility. |
US PGM operations STILLWATER AND EAST BOULDER MINES continued
| | |
| KEY DEVELOPMENTS AND BROWNFIELDS PROJECTS |
STILLWATER EAST PROJECT The Stillwater mine has a current run-of-mine (RoM) ore production level of 74kt (2020 average) per month. The Stillwater East expansion section will result in the projected RoM ore production from the operation reaching a steady state level of 103kt per month by 2024. Ultimate production targeted is 110kt per month in 2028. In 2021 the Stillwater East expansion project at the Stillwater mine realised 114koz. The current plan puts targeted production of 300koz in 2024. This addition will bring the Stillwater Mine production to 600koz annually. |
|
| HISTORY AND OPERATIONAL STATISTICS |
•The JM reef was discovered in 1974, and production commenced from the Stillwater mine in 1986 •By 1990 the smelter was commissioned and in 1994 the Stillwater Mining Company was listed •In 1996, the vertical shaft at the Stillwater mine was completed •In 2000, the Hertzler tailings impoundment was constructed •The East Boulder mine was established in 2002 •The PGM recycling business was established in 2010 •Sibanye-Stillwater acquired the Stillwater Mining Company in 2017, the year which also saw the first production from the Stillwater East Project •In 2019, the “Fill the Mill” Project at East Boulder Mine was launched •In March 2021, East Boulder reaches “Fill the Mill” run rate of 830,000 tpy •Benbow Decline project reaches 5600 level at Stillwater East in Q4 2021 |
| | | | | | | | | | | |
| Operational Statistics | 2019 | 2020 | 2021 |
| Underground tonnes milled (kt) | 1,411 | 1,487 | 1,469 |
| Underground yield (g/t) | 13.09 | 12.51 | 11.96 |
| Surface tonnes milled (kt) | 0 | 0 | 0 |
| Surface yield (g/t) | N/A | N/A | N/A |
| Annual 2E PGM production - Underground (koz) | 594 | 603 | 570 |
| Annual 2E PGM production - surface (koz) | 0 | 0 | 0 |
| Total Annual 2E production (koz) | 594 | 603 | 570 |
| Operating cost underground (R/t) | 4,200 | 5,203 | 5,174 |
| Operating cost surface (R/t) | N/A | N/A | N/A |
| Total capital expenditure (Rm) | 3,393 | 4,419 | 4,556 |
| AISC (R/oz) | 11,337 | 14,385 | 14,851 |
| AISC (US$/oz) | 784 | 874 | 1,004 |
Note: AISC calculated based on produced Oz
PGM exploration
MARATHON
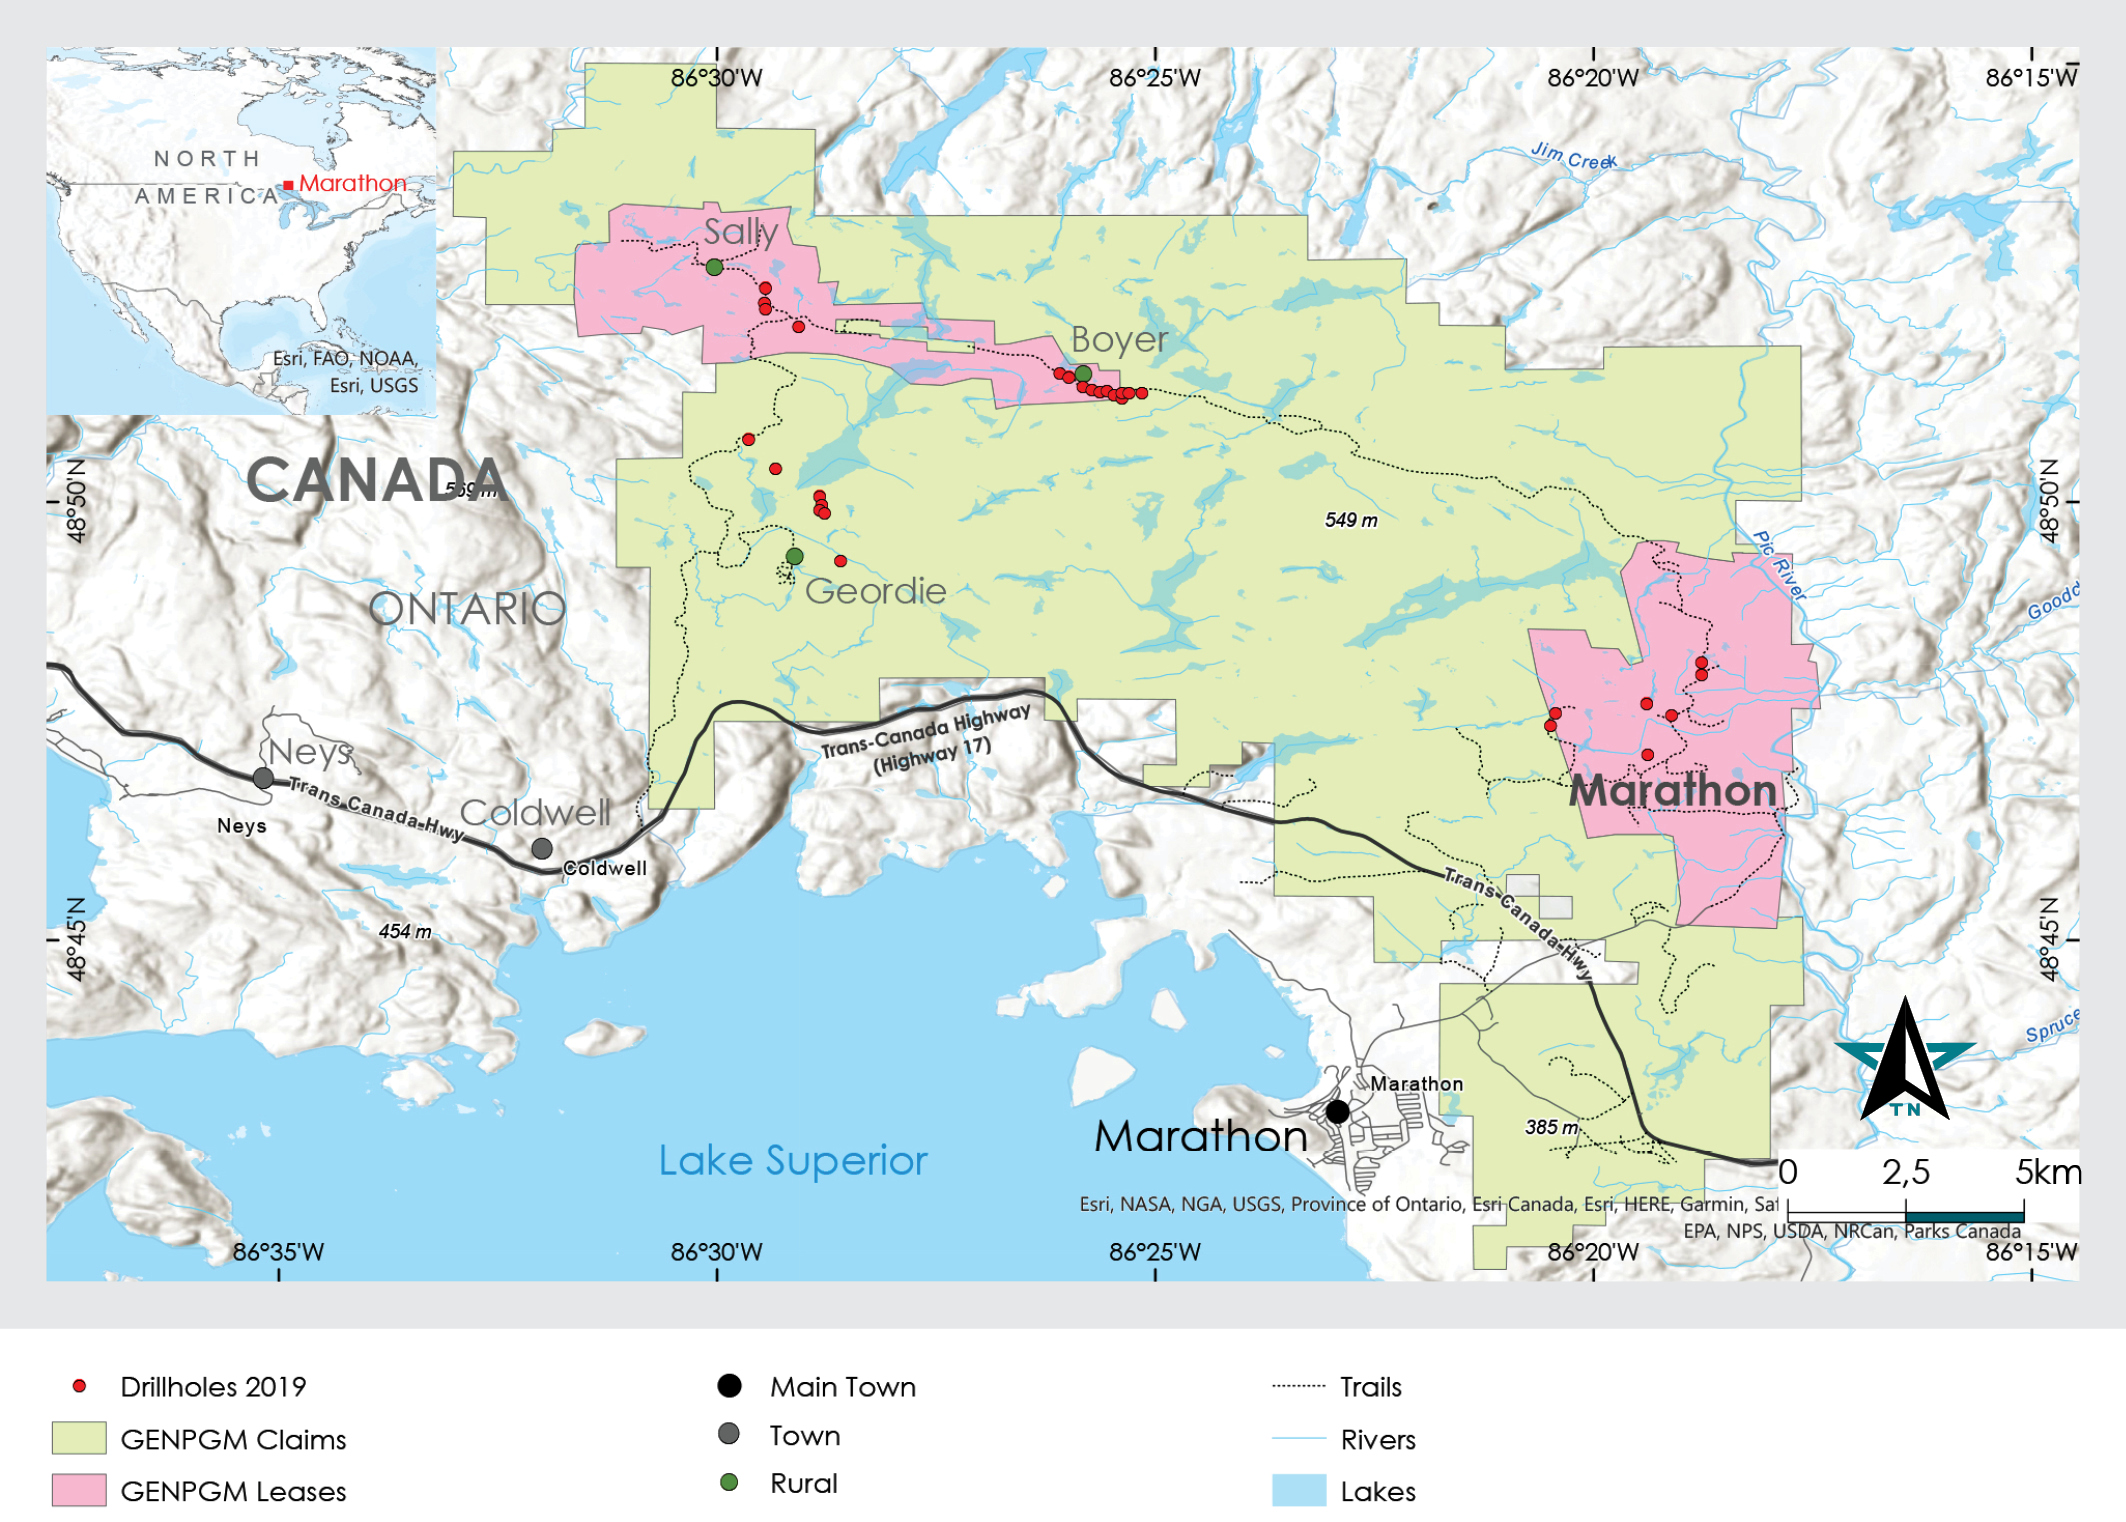
| | |
| PROPERTY DESCRIPTION |
The Marathon project is an advanced stage PGM-gold-copper exploration project, located approximately 10km north of the town of Marathon, Ontario, Canada, situated adjacent to the Trans-Canada Highway No 17 on the northeast shore of Lake Superior. The project is at mining FS level. Exploration for copper and nickel deposits in the greater Marathon area started in the 1920s and continued until the 1940s with the discovery of several titaniferous magnetite and disseminated chalcopyrite occurrences. During the past four decades, the Marathon PGM-copper project has undergone several phases of exploration and economic evaluation, including geophysical surveys, prospecting, trenching, a diamond drilling programme, geological studies, resource estimates, metallurgical studies, mining studies and economic analyses. The project is managed and operated by Generation Mining. As at 31 December 2021, Sibanye-Stillwater owned an effective attributable share of 22.65%, via its project level shareholding of 16.5% and a corporate level shareholding in Generation Mining of 7.36%. In quarter one of 2022, post the effective date of this statement, the JV parties agreed to Sibanye-Stillwater exchanging its project level ownership for a combined total corporate level equity interest of approximately 19.1% in Generation Mining. |
| | |
| MINERAL TITLE |
Generation Mining’s land position includes 46 leases covering 66.03 km2, and 924 mining claims covering 196.25km2. The expiry dates of the leases vary between 2031 and 2041, while the mining claims expires between 2023 and 2025. The claims are registered in the name of Generation PGM Inc, a subsidiary of Generation Mining. All exploration activities are required to follow Schedule 1 of Ontario Regulations 308/12 and applicable Provincial Standards for Early Exploration. All claims have been renewed to their respective anniversary dates. Assessment reporting and transfer of work credits are required for claims to keep them in good standing. To renew leases is via an application, along with a fee and a written report of past activities justifying the need for renewal. This is required to be completed three months before the respective expiry dates. |
| | |
| GEOLOGY AND MINERALISATION CHARACTERISTICS |
The Marathon deposit consists of several large, thick and continuous zones of disseminated sulphide mineralisation hosted within the Two Duck Lake Gabbro. The mineralised zones occur as shallow dipping sub-parallel lenses that follow the basal gabbro contact and are labelled as footwall, main, hanging wall zones and the W-horizon. The main zone is the thickest and most continuous zone. For 516 drill hole intersections, with intervals greater than 4m thick, the average thickness is 35m and the maximum is 183m. Sulphides in the Two Duck Lake Gabbro consist predominantly of chalcopyrite, pyrrhotite and minor amounts of bornite, pentlandite, cobaltite and pyrite. The proportions of sulphide minerals as determined in a QEMSCAN survey of a bulk sample are 3% pyrrhotite, 1% copper-iron sulphides (chalcopyrite and bornite), 0.1% pentlandite and trace amounts of pyrite, galena and sphalerite. The Marathon PGM-copper deposit formed by sulphide accumulation in basins and troughs of the magma conduit underwent significant upgrading of copper and PGM content by the process of multistage dissolution upgrading that was described for similar disseminated mineralisation in the Norilsk region by Kerr and Leitch (2005). The Geordie deposit is hosted by the Geordie Lake Gabbro which has a north trending strike length of 2.5km and varies in thickness from 50m to 600m. Mineralisation consists primarily of disseminated chalcopyrite and bornite and occurs within a thick continuous basal zone that dips 45° to 60° west and can be traced over a strike length of 1.7km. The Sally deposit is situated on the north-eastern margin of the complex, and strikes east-southeast, dips 45° to 50° south, and extends over a 1.2km strike length and is open in all directions. Drilling has identified four main mineralised zones at Sally. The second and third mineralised zones are typically 40m to 50m and 40m thick respectively, and are hosted by the Two Duck Lake Gabbro, which is the same host rock as at the Marathon deposit. |
| | |
| KEY DEVELOPMENTS |
A March 2021 feasibility study, based on open-pit mining of the principle Marathon deposit, has indicated the project could have a robust rate of return at forecast palladium prices, and could produce an average of 245,000 ounces of palladium equivalent (PdEq) annually over a minimum 13-year mine life. Approximately 58% of the revenue will come from palladium, and a further 26% from copper, based on prices of US$1725/oz for palladium and US$3.20 for copper. During 2021, Generation Mining continued the environmental approval process, while initiating detail engineering on the project as well as arranging the production financing. Generation Mining has published Mineral Reserves for the project. Sibanye-Stillwater is only publishing attributable Mineral Resources until such stage as the project has been approved for construction and fully permitted and funded. |
Typical cross-section through the Marathon deposit showing the pit outline and surface topography
Classified Marathon Mineral Resource estimate at 31 December 2021
| | | | | | | | | | | | | | | | | | | | | | | | | | | | | | | | | | | | | | |
| Mineral Resources |
| | 31 December 2021 |
| PGM | Americas | Tonnes | PGM | PGM | Copper | Copper | Nickel | Nickel | Silver | Silver | Gold | Gold |
| Exploration | | (Mt) | (g/t) | (Moz) | (%) | (Mlb) | (%) | (Mlb) | (g/t) | (Moz) | (g/t) | (Moz) |
| Marathon | Measured | 23.4 | | 0.8 | | 0.6 | | 0.2 | | 104.9 | | — | | — | | 1.5 | | 1.1 | | 0.1 | | 0.1 | |
| Indicated | 26.7 | | 0.6 | | 0.5 | | 0.2 | | 126.6 | | — | | — | | 1.7 | | 1.4 | | 0.1 | | 0.05 |
| Measured + Indicated | 50.1 | | 0.7 | | 1.1 | | 0.2 | | 231.5 | | — | | — | | 1.6 | | 2.5 | | 0.1 | | 0.1 | |
| Inferred | 6.2 | | 0.5 | | 0.1 | | 0.2 | | 31.7 | | — | | — | | 1.5 | | 0.3 | | 0.03 | | 0.01 | |
| Grand total | | 56.4 | | 0.7 | | 1.2 | | 0.2 | | 263.2 | | — | | — | | 1.6 | | 2.8 | | 0.1 | | 0.1 | |
Classified Marathon Mineral Resource estimate at 31 December 2020
| | | | | | | | | | | | | | | | | | | | | | | | | | | | | | | | | | | | | | |
| Mineral Resources |
| | 31 December 2020 |
| PGM | Americas | Tonnes | PGM | PGM | Copper | Copper | Nickel | Nickel | Silver | Silver | Gold | Gold |
| Exploration | | (Mt) | (g/t) | (Moz) | (%) | (Mlb) | (%) | (Mlb) | (g/t) | (Moz) | (g/t) | (Moz) |
| Marathon | Measured | 26.7 | | 0.8 | | 0.7 | | 0.2 | | 119.7 | | — | | — | | 1.5 | | 1.3 | | 0.1 | | 0.1 | |
| Indicated | 30.5 | | 0.6 | | 0.6 | | 0.2 | | 144.5 | | — | | — | | 1.7 | | 1.6 | | 0.1 | | 0.1 | |
| Measured + Indicated | 57.2 | | 0.7 | | 1.3 | | 0.2 | | 264.1 | | — | | — | | 1.6 | | 2.9 | | 0.1 | | 0.1 | |
| Inferred | 7.1 | | 0.5 | | 0.1 | | 0.2 | | 36.2 | | — | | — | | 1.5 | | 0.3 | | 0.03 | | 0.01 | |
| Grand total | | 64.3 | | 0.7 | | 1.4 | | 0.2 | | 300.3 | | — | | — | | 1.6 | | 3.2 | | 0.1 | | 0.1 | |
Notes:
•PGM = Pt+Pd
•The attributable Marathon Mineral Resources changed (-12.3%) from 2020 to 2021 due to changes in attributable interest (direct project shareholding down from 19.3% to 16.5%, and an indirect shareholding in Generation Mining from 8.1% to 7.4%.)
•Estimate includes the main Marathon, and the satellite Geordie and Sally deposits
•Marathon deposit Mineral Resources are reported within an optimised pit shell at a cut-off NSR value of C$13/t, and Geordie and Sally at C$15/t
•The Mineral Resource estimate was based on US$ metal prices of US$1,100/oz for palladium, US$900/oz for platinum, US$3/lb for copper, US$1,300/oz for gold and US$16/oz for silver and the US$:C$ exchange rate used was 0.77
•The NSR estimates use flotation recoveries of 93% for copper, 82% for palladium, 80% for platinum, 80% for gold, 75% for silver and smelter payables of 96% for copper, 93% for palladium, 88% for platinum, 90% for gold and 90% for silver
•The pit optimisation used a mining cost of C$2/t, combined processing, general and administration and off-site concentrate costs of C$15/t and pit slopes of 50º
PGM exploration continued
DENISON
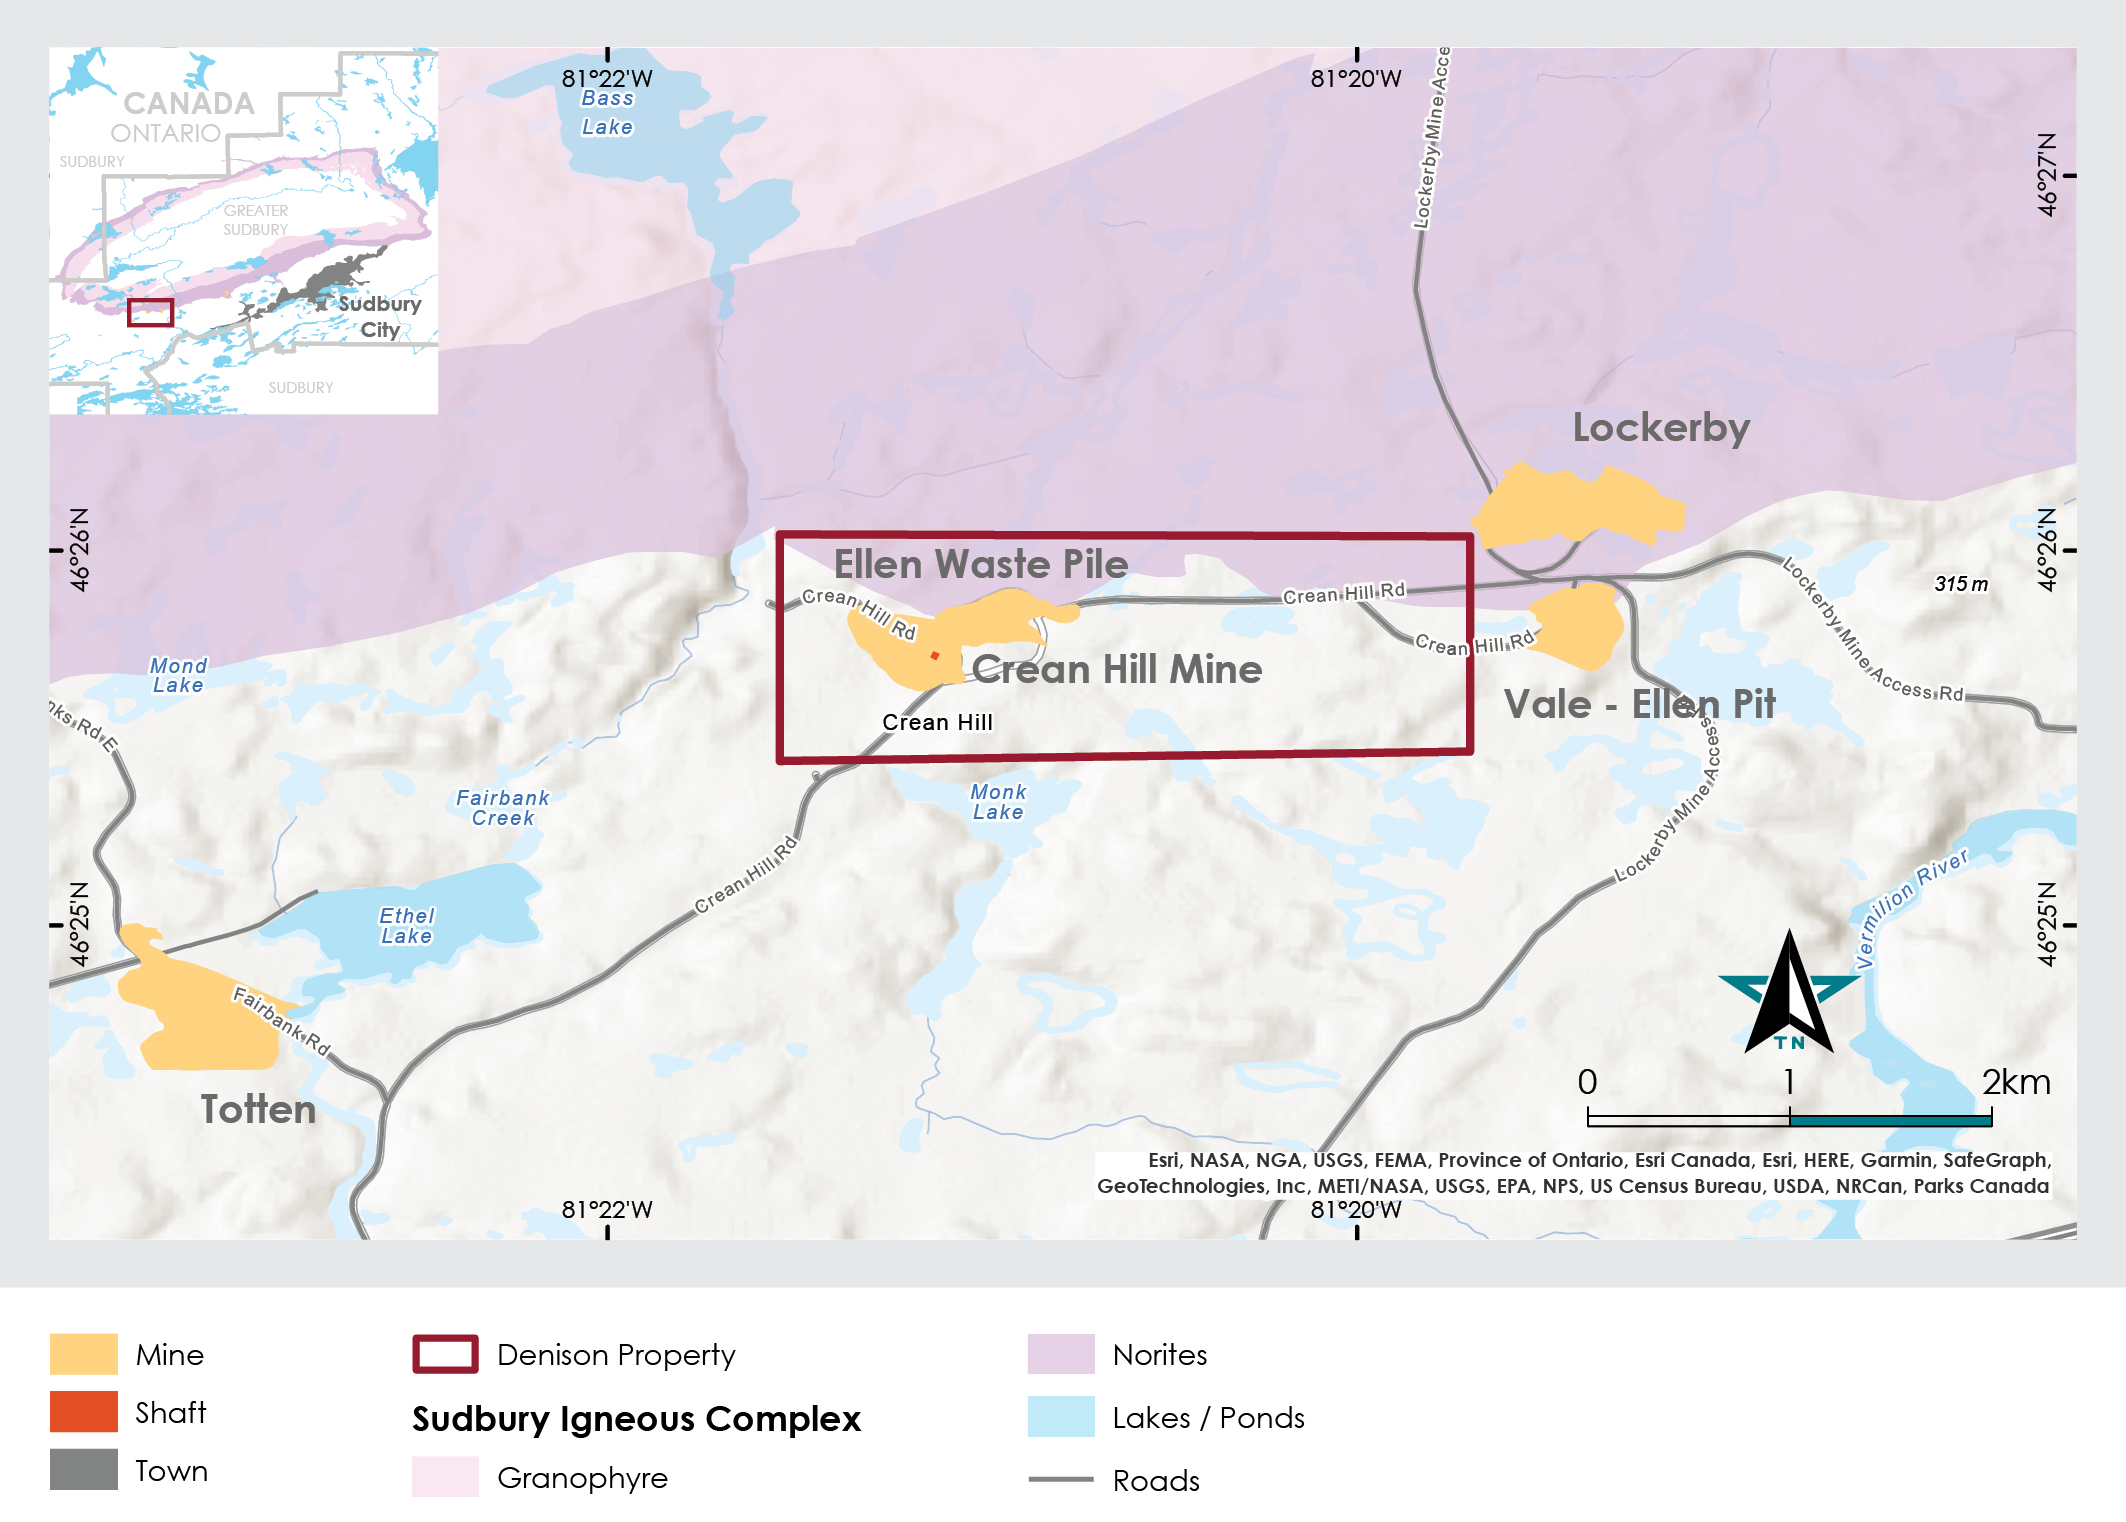
| | |
| PROPERTY DESCRIPTION |
The Denison project is a nickel-copper-PGM (Ni-Cu-PGM) exploration project associated with the Sudbury Igneous Complex (SIC) approximately 30km to the west-southwest of the town of Sudbury, Canada. The Denison property is 64.9% owned by Lonmin Canada Inc. (Loncan), a wholly-owned subsidiary of Sibanye UK Limited, which in turn is a wholly-owned subsidiary of Sibanye-Stillwater. The project is managed and operated, under agreement, by Walbridge Mining, who owned 17.8% of the project at the effective date. The remaining 17.3% is held by other external parties. The targeted Mineral Resource for the property consists of twelve zones, all of which are proximal to the historic workings of the Crean Hill mine development. The historic Crean Hill mine consisted of the main, intermediate, and west nickel-copper deposits. All three deposits have been mined by both underground and open pit methods. The earliest workings at Crean Hill mine date back over 130 years and mine production officially began in 1906. Since then, the deposit has had on-again, off-again production. In its most recent iteration, the mine was operated by Inco (now Vale) as an underground mine. The mine closed in 2002. The Denison 109FW zone rests in the immediate footwall of the Crean Hill massive to semi-massive contact nickel-copper (-PGM) main orebody, which has been largely mined out. |
PGM exploration DENISON continued
| | |
| MINERAL TITLE |
As part of the 2018 termination of the JV agreement between Loncan and Vale, Vale Canada transferred to Loncan a 100% beneficial right, title and interest in and to the mining rights within the Denison property boundary to a depth of 4,500 feet below the collar of the Crean Hill mine shaft. These rights, PIN No. 73382-0487(LT), PIN No. 73382-0537(LT) and PIN No. 73382-550(LT), for a total of 2.56km2, are for the extraction of all metals/minerals with no expiry date, provided mining taxes are paid on the property. Vale Canada holds the legal title to the revised Denison property as nominee titleholder until such time as the strata survey has been completed and deposited in the applicable land titles office, and Vale Canada has completed the transfer of legal title to the revised Denison property to Loncan. The surface rights for the Denison property are held as patented ground by Vale. As Denison is on patented land, exploration plan and permit applications are not required by Ontario’s Ministry of Northern Mines and Development for exploration and advanced exploration work. The property is also considered an active mining area, where any mining activities that fit within the current closure plan may commence without additional permitting. It is, however, likely that additional studies and/or permitting would be required before commencing any mining activity. |
| | |
| GEOLOGY AND MINERALISATION CHARACTERISTICS |
Most of the ore previously mined at Denison and several zones of the current Mineral Resource on the Denison property consist of Ni-Cu-PGM contact mineralisation hosted along the basal contact of the SIC; however, several zones of the current Mineral Resource include Cu-PGM-rich mineralisation largely hosted in the Huronian metasediment and metavolcanic sequence in the immediate footwall to the SIC. The contact of the SIC with the host sequence is near vertical in the Denison area and is locally overturned. The Cu-PGM mineralisation referred to as the 109FW zone was delineated after the mine closed in 2002. The zone is located along two intersecting linear structures close to this contact and plunges approximately 70º to the east-northeast. The mineralisation has been continually traced by drilling from its surface outcrop to a depth of 400m below surface. The approximately ‘V-shaped’ orebody comprises two linear zones of approximately 80m and 150m in length, which vary between approximately 3m and 30m in thickness. The Mineral Resource is at its widest point where the zones intersect. The 9400 Zone was discovered prior to the mine closure and is interpreted as a westwards extension of the Crean Hill west orebody; subsequent exploration drilling has, however, significantly added to the Mineral Resource. The zone is near vertical in disposition and trends obliquely to the SIC contact. The mineralisation plunges approximately 75º to the east-southeast and has been continually traced from near surface to a depth of 760m below surface. The orebody is tabular, thin at the eastern margin and thickens and branches into two to three limbs at the western margin with a strike length of around 200m on average. The thickness varies from 3m to 39m, with the widest point where the branches intersect. The 9400 zone transition from Ni-Cu-PGM contact mineralisation in the east to low sulphide PGM-rich footwall mineralisation at the western extent. |
|
| KEY DEVELOPMENTS |
In October 2019, WSP Canada Inc was commissioned by Loncan to review the existing historical Mineral Resource estimates and to generate Mineral Resource estimates for the remaining unestimated mineral zones, identify significant targets for future exploration and provide a technical report summarising the entire project. The updated Mineral Resource estimate has an effective date of 29 September 2020. In May of 2020 Loncan commissioned SRK to complete a PEA based upon the block model developed by WSP and to provide a report that aligns with the requirements of CIM NI 43-101. The PEA includes both open pit and underground components and the technical reports’ effective date is March 2021. The outcome of the PEA, which considered open pit mining, a combination of open pit and underground mining, and solely underground mining, demonstrated that there are reasonable prospects for economic extraction, under reasonable costs and price assumptions, of portions of several zones of the 2020 Mineral Resource including the 101, 109FW, 9400, and Remnant zones. The PEA also identified opportunities, such as incorporating ore sorting technology, that could have the potential to significantly improve the economics of the project. The work conducted for the PEA is however, insufficient to support Mineral Reserve declaration at this stage. |
PGM exploration DENISON continued
Cross section showing the Mineral Resource outline and the mining design for the Denison project
Classified Denison Mineral Resource estimate as at 31 December 2021
| | | | | | | | | | | | | | | | | | | | | | | | | | | | | | | | | | | | | | |
| Mineral Resources |
| | 31 December 2021 |
| PGM | Americas | Tonnes | PGM | PGM | Copper | Copper | Nickel | Nickel | Silver | Silver | Gold | Gold |
| Exploration | | (Mt) | (g/t) | (Moz) | (%) | (Mlb) | (%) | (Mlb) | (g/t) | (Moz) | (g/t) | (Moz) |
| Denison | Measured | 0.1 | | 6.2 | | 0.02 | 0.5 | | 1.0 | | 0.3 | | 0.7 | | — | | — | | 1.4 | | 0.004 |
| Indicated | 1.1 | | 2.8 | | 0.1 | | 1.3 | | 31.3 | | 1.6 | | 37.6 | | — | | — | | 0.4 | | 0.01 |
| Measured + Indicated | 1.2 | | 3.0 | | 0.1 | | 1.2 | | 32.3 | | 1.5 | | 38.3 | | — | | — | | 0.5 | | 0.02 |
| Inferred | 1.3 | | 2.7 | | 0.1 | | 1.2 | | 33.7 | | 1.5 | | 42.7 | | — | | — | | 0.4 | | 0.02 |
| Grand total | | 2.5 | | 2.9 | | 0.2 | | 1.2 | | 66.0 | | 1.5 | | 81.1 | | — | | — | | 0.5 | | 0.04 |
Classified Denison Mineral Resource estimate as at 31 December 2020
| | | | | | | | | | | | | | | | | | | | | | | | | | | | | | | | | | | | | | |
| Mineral Resources |
| | 31 December 2020 |
| PGM | Americas | Tonnes | PGM | PGM | Copper | Copper | Nickel | Nickel | Silver | Silver | Gold | Gold |
| Exploration | | (Mt) | (g/t) | (Moz) | (%) | (Mlb) | (%) | (Mlb) | (g/t) | (Moz) | (g/t) | (Moz) |
| Denison | Measured | 0.1 | | 6.2 | | 0.02 | 0.5 | | 1.0 | | 0.3 | | 0.7 | | — | | — | | 1.4 | | 0.004 |
| Indicated | 1.1 | | 2.8 | | 0.1 | | 1.3 | | 31.3 | | 1.6 | | 37.6 | | — | | — | | 0.4 | | 0.01 |
| Measured + Indicated | 1.2 | | 3.0 | | 0.1 | | 1.2 | | 32.3 | | 1.5 | | 38.3 | | — | | — | | 0.5 | | 0.02 |
| Inferred | 1.3 | | 2.7 | | 0.1 | | 1.2 | | 33.7 | | 1.5 | | 42.7 | | — | | — | | 0.4 | | 0.02 |
| Grand total | | 2.5 | | 2.9 | | 0.2 | | 1.2 | | 66.0 | | 1.5 | | 81.1 | | — | | — | | 0.5 | | 0.04 |
Notes:
•Mineral Resources that have reasonable prospects for economic extraction were extracted from the grade model based on an economic test, on a net smelter return basis within an open pit shell
•Combined open pit and underground Mineral Resources are reported. open pit Mineral Resources are reported within a pit constrained NSR cut-off of US$125, and underground Mineral Resources are reported using underground constrained NSR cut-off of US$222.50
•Mineral Resource parameters include 5% mining dilution, 95% mining recovery, metallurgical recoveries of 96% for copper, 78% for nickel, 69% for platinum, 68% for palladium, and 68% for gold; and metal price assumptions of US$2.5/lb for copper, US$6.5/lb for nickel, US$900/oz for platinum, US$1,600/oz for palladium and US$1,500/oz for gold
•The values represent the Mineral Resource estimates for the combined mineral zones, including 109FW, 109HW, 9400, 101, Remnant, 109 West Remnant, 9400 FW Extension, 109FW2, 109FW4, 110, 115, and 99
•The underground Mineral Resources form relatively contiguous zones and are generally accessible from current underground development
Green metals exploration
LITHIUM
RHYOLITE RIDGE
Green metals exploration LITHIUM: RHYOLITE RIDGE continued
| | |
| PROPERTY DESCRIPTION |
Rhyolite Ridge is an advanced stage exploration project located in Esmeralda County, Nevada, US. Rhyolite Ridge aims to extract a large, shallow lithium-boron deposit, located close to existing infrastructure, and centrally located between Las Vegas and Reno, Nevada. It is expected to be one of the first large scale US lithium projects to enter production. The 50:50 JV agreement between Sibanye-Stillwater and ioneer Limited, whereby ioneer would maintain the operational management responsibility, is subject to the satisfaction of certain conditions precedent before Sibanye-Stillwater will commit funding to the project. Until such time as the conditions are met, the attributable disclosure is based on Sibanye-Stillwater's 7.12% equity stake in ioneer Limited. |
| | |
| MINERAL TITLE |
ioneer holds 386 unpatented relevant mining claims, located on US federal land administered by the Bureau of Land Management (BLM), totalling 31.6 km2. For the permitting of the mining operation, ioneer has acquired two of the four major/critical permits and authorisations: 1.The Nevada Division of Environmental Protection (NDEP) – Bureau of Mining Regulation and Reclamation (NDEP-BMRR) Water Pollution Control Permit (WPCP), was issued on July 1, 2021. 2.The NDEP – Bureau of Air Pollution Control (BAPC) Class II Air Quality Operating Permit, was issued on June 14, 2021. ioneer is currently in the process of finalising its Mine Plan of Operations (MPO) application for Stage 1 mining, to be reviewed by the BLM. Following authorisation from Washington D.C., a Notice of Intent will be published in the Federal Register and work can commence on the environmental impact statement (EIS) and public engagement process in accordance with the requirements of the National Environmental Policy Act (NEPA). A key aspect that will influence the Stage 1 design and potentially the approval of the MPO, or the conditions associated with the approvals permit, relates to Tiehm’s buckwheat (Eriogonum tiehmii), which grows on a small portion of the ore-body outcrop. The U.S. Fish & Wildlife Service (FWS) has listed Tiehm’s buckwheat as an endangered or threatened species under the Endangered Species Act. This could potentially lead to modifications of the mine plan in order to protect this species. On completion of the NEPA process, once the MPO has been finalised, a NDEP-BMRR Reclamation Permit will be applied for, which would be the final major permit required. |
| | |
| GEOLOGY AND MINERALISATION CHARACTERISTICS |
Rhyolite Ridge is a sediment hosted lithium-boron deposit. The mineralisation is hosted within carbonate-rich, fine-grained sediments (marl) of Tertiary age, that were deposited in a shallow lake environment. The tenements cover two sedimentary basins (North and South) containing thick, shallow, flat-lying zones of lithium-boron-potassium mineralisation. The Lithium occurs within mixed illite-smectite layers, while the boron occurs in the mineral searlesite. The mineralised layers vary in thickness from 13 to 40m, outcrops towards the west, is relatively flat dipping, and is typically overlain by ~21 meters thick overburden. |
| | |
| KEY DEVELOPMENTS |
A definitive feasibility study was completed by Fluor in April 2020 and is undergoing refinement. The study was based on a mining rate of 2.5Mtpa mined, over a 26y LoM, producing more than 20ktpa of Li Carbonate (y1-3) or Li Hydroxide (y4 onwards), and Boric Acid of 74,400 Tonnes (Years 1-26). The key current ioneer work-streams relate to obtaining all necessary environmental and mining permits for the development of the project. Further ongoing work relates to up-front engineering procurement and progressing debt funding for the balance of the project, where ioneer has been invited into the due diligence process for the U.S. Department of Energy’s Advanced Technology Vehicles Manufacturing Loan Programme. ioneer Limited has published Mineral Reserves for the property based on the 2020 study. Sibanye-Stillwater is declaring the Mineral Resources, as reviewed and audited by its team of Qualified Persons, until such time as the project has been fully funded, permitted and approved for construction. |
Green metals exploration LITHIUM: RHYOLITE RIDGE continued
Classified Rhyolite Ridge Mineral Resource estimate at 31 December 2021
| | | | | | | | | | | | | | | | | | | | | | | | | | | | | |
| Mineral Resources |
| | | 31 December 2021 |
| LITHIUM | Americas | | Tonnes | Li2O | Li2O | LCE | LCE | H3BO3 | H3BO3 |
| | | (Mt) | (%) | (Kt) | (%) | (Kt) | (%) | (Kt) |
| Exploration | Rhyolite | Measured | 2.8 | | 0.4 | | 10.3 | | 0.9 | | 25.4 | | 8.3 | | 230.7 | |
| Ridge | Indicated | 6.3 | | 0.3 | | 20.9 | | 0.8 | | 51.6 | | 8.1 | | 506.5 | |
| | Measured + Indicated | 9.0 | | 0.3 | | 31.2 | | 0.9 | | 77.0 | | 8.2 | | 737.2 | |
| | Inferred | 1.4 | | 0.3 | | 4.8 | | 0.9 | | 11.9 | | 7.9 | | 109.1 | |
| Grand total | | | 10.4 | | 0.3 | | 36.0 | | 0.9 | | 88.9 | | 8.1 | | 846.3 | |
Notes:
•The reported Mineral Resource has been adjusted to reflect Sibanye-Stillwater’s 7.1% interest in ioneer Limited
•Mineral Resources are constrained to an optimised open pit shell making us of a co-product cut-off grade of 5000ppm Boron
•Li2O is an equivalent figure derived from in the situ lithium % concentration by applying a multiplication factor of 2.153
•LCE (Lithium Carbonate Equivalent) is derived from in the situ lithium % concentration by applying a multiplication factor of 5.323
•Li price assumption for the overall project ranged between US$10,443/t and US$14,334/t LiCO3
Green metals exploration continued
COPPER
ALTAR
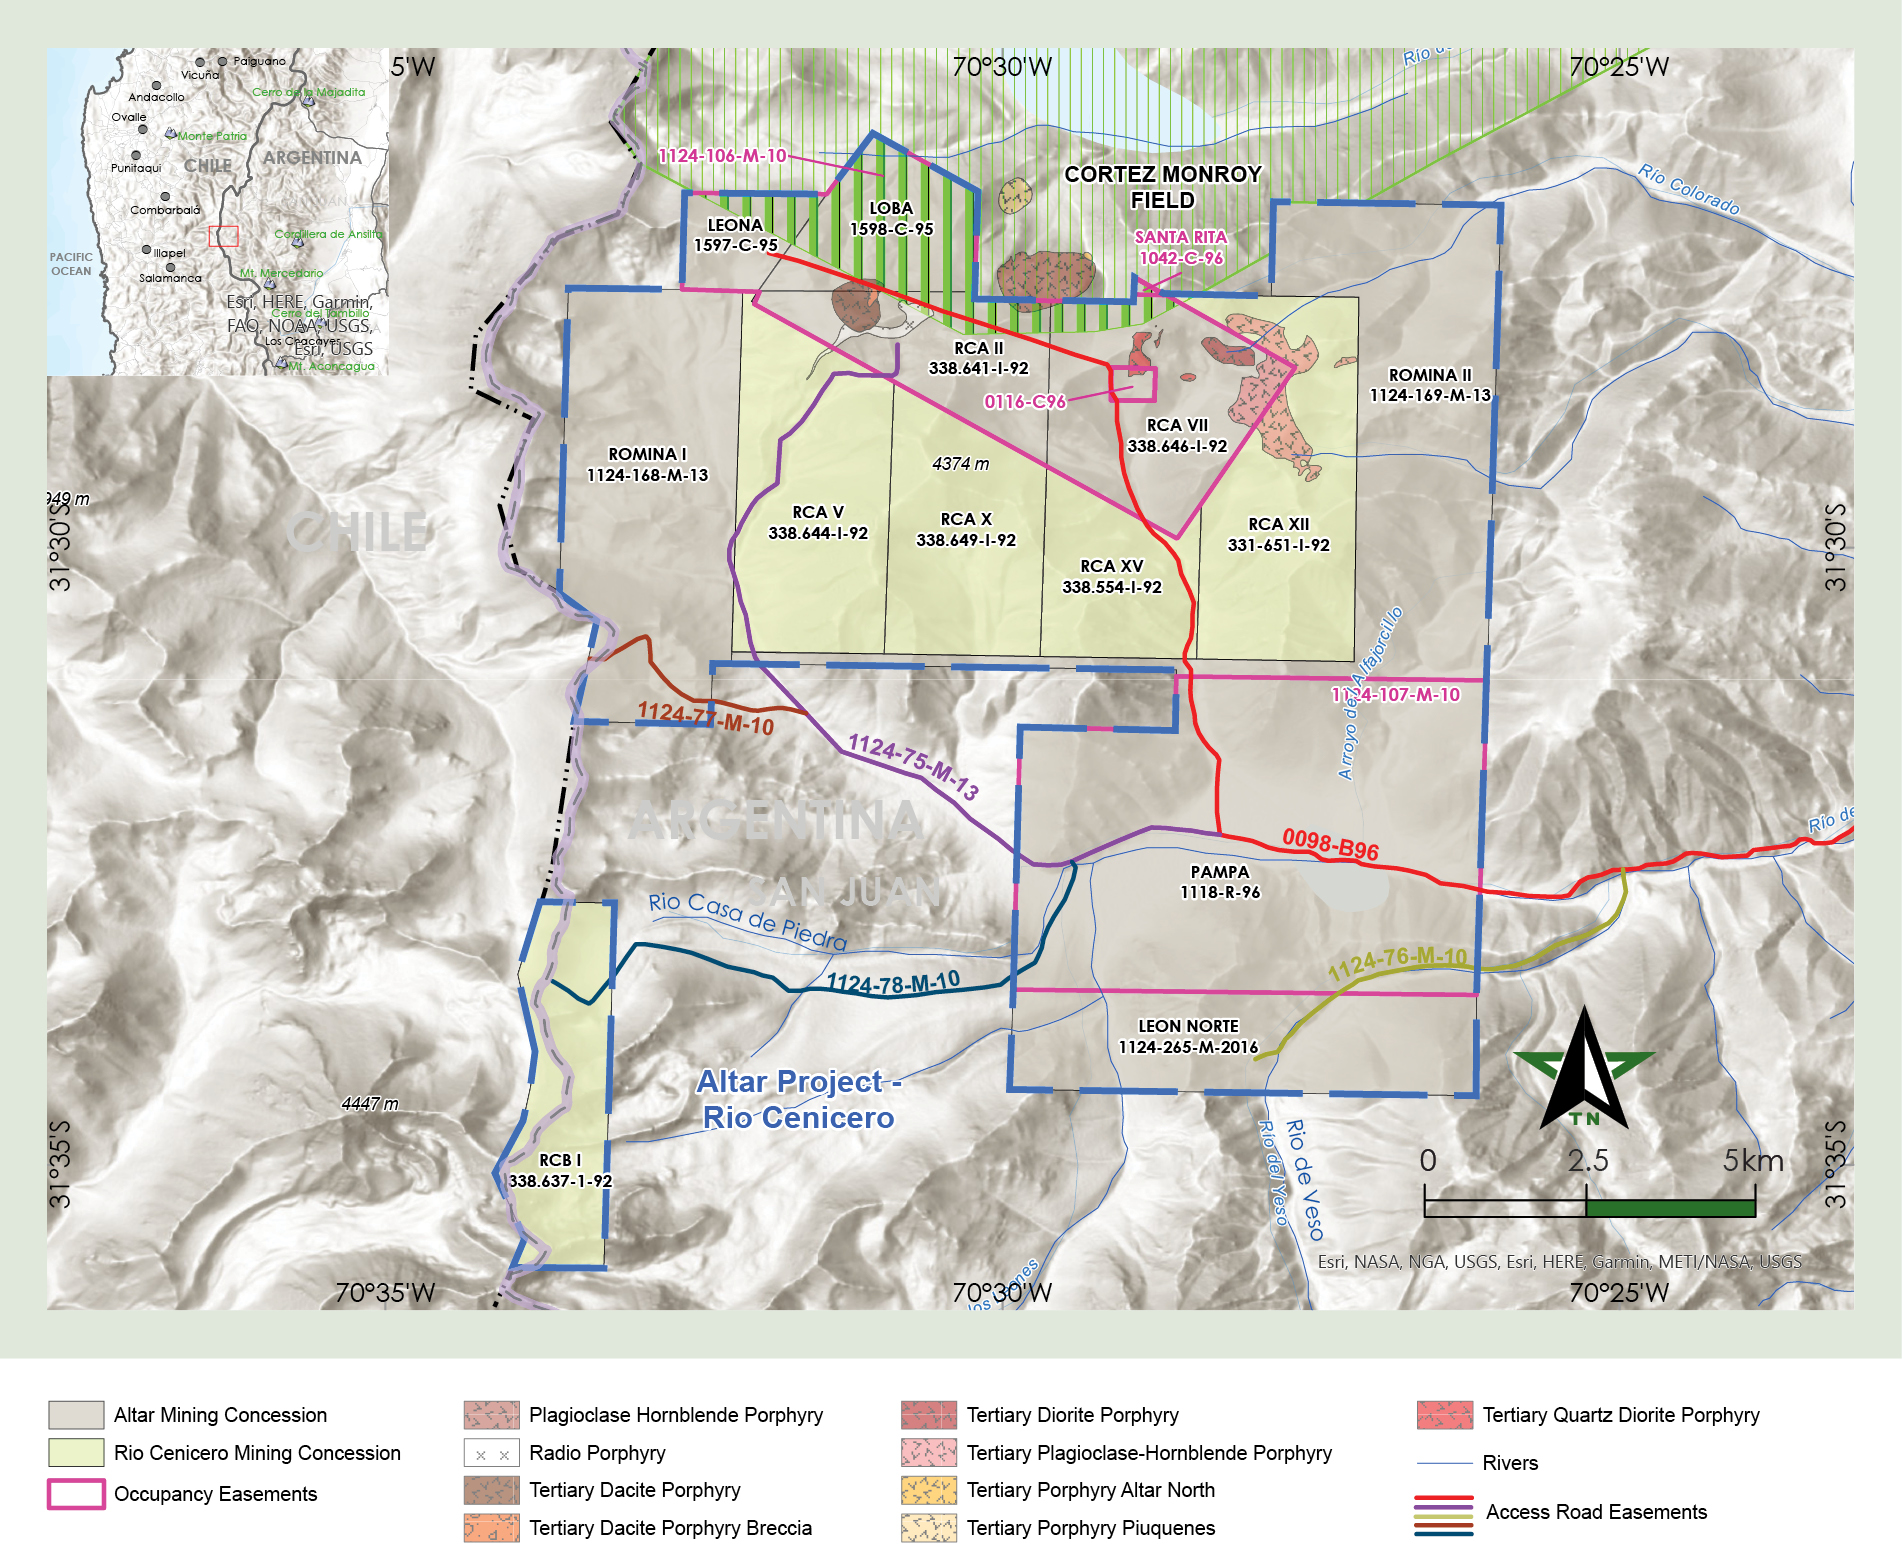
| | |
| PROPERTY DESCRIPTION |
The Altar project is a shallow to intermediate depth, copper-gold porphyry deposit located in San Juan province, Argentina, approximately 10km from the Argentine-Chile border and 180km west of the city of San Juan. The Altar deposit was discovered in the mid-1990s and early-phase exploration and access continued until 1999. Project evaluation work to date has primarily focused on assessing the feasibility of an open pit and/or underground operation. Sibanye-Stillwater acquired the Altar project in 2017 as part of the Stillwater acquisition. Aldebaran Resources entered into a JV Agreement with Sibanye-Stillwater in 2018 to acquire a 60%, and eventually 80%, interest in the Altar project, subject to funding certain exploration expenditures. Aldebaran Resources also assumed management of the JV. As at 31 December, Aldebaran Resources has not as yet earned the initial 60% interest, and for this reason 100% of the Mineral Resources are still reported as attributable to Sibanye-Stillwater. |
Green metals exploration COPPER: ALTAR continued
| | |
| MINERAL TITLE |
The property and mineral concessions are held by Peregrine Metals Ltd, which includes the Argentine subsidiary Minera Peregrine Argentina. The Altar project consists of nine mining concessions and nine land easements comprising rights of way or occupancy. It also includes an option on the five adjacent Rio Cenicero concessions, four of which are adjacent to the Altar property and one located to the south-west. The Altar concessions and exploration permits collectively cover about 84.4km2 and the Rio Cenicero concessions cover an additional 37.2ha. In addition, permits to open and service the camp, as well as access water for exploration purposes, are maintained annually. All legal aspects and tenure are in order. |
| | |
| GEOLOGY AND MINERALISATION CHARACTERISTICS |
The two main ore zones within the Altar area of the deposit are the Altar Central and the Altar East zones. The Quebrada de la Mina (QDM) Mineral Resource (inclusive of the Altar project) is located 3km west of the main Altar deposit and is a near-surface gold resource hosted in pyrite within a dacite porphyry. The Altar porphyry was deposited in an environment that transitions from the basal roots of a high sulfidation epithermal lithocap to a sub-volcanic porphyry copper environment at depth. The deposit is described as telescoped because of the close spatial distance between the porphyry and the high sulfidation alteration systems. Mineralisation at the Altar deposits is closely associated with the different porphyry stocks and related hydrothermal breccias, but is also found in rhyolites, andesites and volcanic breccias. The well-developed copper mineralisation shows a strong relationship to the distribution and intensity of sericitic and potassic alteration. The copper mineralisation associated with the potassic alteration, mainly porphyry style chalcopyrite–bornite mineralisation, was reconstituted as hypogene assemblages of pyrite, chalcocite and bornite within the sericitic alteration zone. |
| | |
| KEY DEVELOPMENTS AND INTENTIONS |
The historical Mineral Resource estimate at Altar (2018) used a low cut-off grade and was aimed at a large volume, low-grade operation. As such, the mineralisation model was geostatistically constrained and did not make use of a geological model to constrain and define zones of higher-grade mineralisation. During March 2021, an update Mineral Resource estimate was completed, making use of geological constraints, aimed at highlighting the location, geometry and volume of the higher-grade copper-gold zones. This has resulted in a reduction in tonnage and contained metal (-26.7%), but at a higher grade, allowing for improved exploration targeting and would facilitate a more targeted, higher-grade mining approach, delivering superior economics. This estimate has been independently reviewed and confirmed to be reasonable and representative of the data by SRK South Africa. |
| | |
| KEY DEVELOPMENTS |
The principal exploration activities carried out in 2021 are as follows: •diamond drilling (4,880m @ 5 holes) •surface mapping of unmapped areas •talus fine sampling programme •ground magnetometry Survey •3D-MT-IP Survey •environmental baseline studies and glacial features monitoring and research •detailed core relogging programme was completed (~115,000m) The planned exploration programme for the 2022 season entails: •QDM-Radio Mineral Resource definition drilling •step-out, Mineral Resource expansion drilling from the existing Altar deposit •test drilling new, previously undrilled targets |
Green metals exploration COPPER: ALTAR continued
Classified Altar Mineral Resource estimate as at 31 December 2021
| | | | | | | | | | | | | | | | | | | | | | | | | | | | | | | | | | | |
| Mineral Resources |
| | 31 December 2021 | 31 December 2020 |
| COPPER | Americas | Tonnes | Copper | Copper | Gold | Gold | Tonnes | Copper | Copper | Gold | Gold |
| Exploration | | (Mt) | (%) | (Mlb) | (g/t) | (Moz) | (Mt) | (%) | (Mlb) | (g/t) | (Moz) |
| Altar | Measured | 637.9 | | 0.4 | | 6,095.0 | | 0.1 | | 2.4 | | 1,005.9 | | 0.3 | | 7,458.2 | | 0.1 | | 3.0 | |
| Indicated | 580.3 | | 0.4 | | 5,293.0 | | 0.1 | | 1.5 | | 1,051.5 | | 0.3 | | 7,052.9 | | 0.1 | | 2.3 | |
| Measured + Indicated | 1,218.2 | | 0.4 | | 11,388.0 | | 0.1 | | 3.9 | | 2,057.4 | | 0.3 | | 14,511.1 | | 0.1 | | 5.2 | |
| Inferred | 190.4 | | 0.4 | | 1,750.0 | | 0.1 | | 0.4 | | 556.6 | | 0.3 | | 3,419.6 | | 0.1 | | 1.1 | |
| Grand total | | 1,408.6 | | 0.4 | | 13,138.0 | | 0.1 | | 4.3 | | 2,614.0 | | 0.3 | | 17,930.7 | | 0.1 | | 6.3 | |
Notes:
•Combined estimate for the deposits of Altar Central, Altar East and QDM
•Copper reflects the estimated grade of copper that could be processed by sulphide flotation
•The Mineral Resources for Altar Central, East, and QDM were based on the application of the floating cone algorithm to the block models to establish the component of the deposit that has “reasonable prospects of economic extraction”. The Mineral Resources are therefore contained within computer generated open pit geometries where economic value has been assigned to measured, indicated, and inferred material
•The parameters used to determine mineral resource cut-off grade results in calculated values for internal or breakeven cut-off in the range of 0.11 to 0.18% Equivalent Copper (EqCu). Considering the remote location of Altar and the capital burden that would be required for a project of this scale, the resource cut-off grade was effectively doubled to 0.30% EqCu = $13.99 NSR
•2021 Resource Cone Metal Prices Copper US$3.00/lb, Gold US$1,500.00/troy ounce, Silver US$20.00/troy ounce
RIO GRANDE
Green metals exploration COPPER: RIO GRANDE continued
| | |
| PROPERTY DESCRIPTION |
The Rio Grande exploration project is located in north-western Argentina, approximately 250km west of the provincial capital of Salta and approximately 1,400km northwest of Buenos Aires. The project has been explored by various operators since 1999, including Mansfield Minerals Inc, Teck-Cominco, Antares and Regulus from 2011 to June 2018. Exploration activities have included prospecting, mapping, trenching geophysics, geochemistry and drilling. From 2001 to 2012, 130 drill holes totalling 74,210m were completed on the property. The most recent drilling was conducted in 2013 when Regulus drilled four holes of 1,200m at Cerro Cori, located east of Rio Grande. Sibanye-Stillwater owes it’s interest in the project to the transaction in 2018 through which it acquired a 19.9% interest in Aldebaran Resources, the owner of the Rio Grande Project. |
| | |
| MINERAL TITLE |
The project consists of one contiguous block comprised of nine individual mining concessions, totalling 180 claims, and covering an area of approximately 169,53km2. All the claims are current and valid, and in good legal standing. |
| | |
| GEOLOGY AND MINERALISATION CHARACTERISTICS |
The Rio Grande area consists of two overlapping andesitic volcanic centres, as well as numerous flanking shallow intrusive plugs, dykes and sills. Both are constructed of dacitic to andesitic flows, sills and dykes, intruding and flanked by volcaniclastic rocks, including breccias, agglomerates, and lahars, generally dipping away from the volcanic centres. Alteration is roughly concentrically zoned and is strongly influenced by rock type. The occurrence of veining and mineralisation in Rio Grande is associated with the development of several distinctive hypogene events during the evolution of the deposit. In addition, supergene types of mineralisation in Rio Grande were developed during the uplift and erosion of the deposit in younger stages and up to the present day. The Rio Grande deposit has been the subject of much debate concerning the origin of the mineralisation and deposit type. Different styles of copper-gold mineralisation with associated alteration have been recognised. There is an early mineralised system with affinities to IOCG type deposits and a later mineralised system with affinities to porphyry style copper-gold deposits. |
| | |
| KEY DEVELOPMENTS |
| Roscoe Postle Associates Inc prepared an independent technical report on the Rio Grande project in 2018, which forms the basis for Mineral Resource disclosure. The reported Mineral Resources are based on a potential open pit scenario, with a combination heap leaching and flotation envisaged for the processing of oxide, transition and sulphide material types. Sibanye-Stillwater has had the estimate independently verified by SRK in 2021. No current exploration activities are being conducted or planned by Aldebaran Resources on this property. |
Classified Rio Grande Mineral Resource estimate at 31 December 2021
| | | | | | | | | | | | | | | | | | | | | | | | | | | | | | | | | | | |
| Mineral Resources |
| | 31 December 2021 | 31 December 2020 |
| COPPER | Americas | Tonnes | Copper | Copper | Gold | Gold | Tonnes | Copper | Copper | Gold | Gold |
| Exploration | | (Mt) | (%) | (Mlb) | (g/t) | (Moz) | (Mt) | (%) | (Mlb) | (g/t) | (Moz) |
| Rio Grande | Americas | — | | — | | — | | — | | — | | — | | — | | — | | — | | — | |
| Indicated | 14.1 | | 0.3 | 93.2 | 0.4 | 0.2 | 14.1 | 0.3 | 93.2 | 0.4 | 0.2 |
| Measured + Indicated | 14.1 | | 0.3 | 93.2 | 0.4 | 0.2 | 14.1 | 0.3 | 93.2 | 0.4 | 0.2 |
| Inferred | 8.2 | | 0.2 | 41.5 | 0.3 | 0.1 | 8.2 | 0.2 | 41.5 | 0.3 | 0.1 |
| Grand total | | 22.3 | | 0.3 | 134.7 | 0.3 | 0.2 | 22.3 | 0.3 | 134.7 | 0.3 | 0.2 |
Notes:
•Attributable portion to Sibanye-Stillwater based on a 19.9% equity interest in Aldebaran Resources Ltd
•Mineral Resources are estimated at a NSR cut-off grade of US$8.00/t for oxide, US$12.00/t for transition and US$7.50/t for sulphide. No sulphide material was captured in the Mineral Resource shell
•The Mineral Resource statement is included within a floating cone defined with the following metal prices: gold price of US$1,400/oz, copper price of US$3.50/lb
| | | | | | | | | | | | | | | | | |
| SOUTHERN AFRICA |
| PLATINUM GROUP METALS | | | GOLD | |
| Location | | | Location | |
| Overview | | | Overview | |
| OPERATIONS | | | OPERATIONS | |
| Marikana | | | Kloof | |
| Rustenburg | | | Beatrix | |
| Kroondal | | | Driefontein | |
| Mimosa | | | Cooke | |
| EXPLORATION STAGE | | | DRDGOLD | |
| Akanani | | | DEVELOPMENT STAGE | |
| Limpopo | | | Burnstone | |
| Blue Ridge | | | EXPLORATION STAGE | |
| | | SOFS | |
Southern Africa Platinum Group Metals
LOCATION
OVERVIEW
Geological setting
South African operations
The bushveld igneous complex (BIC) is the world’s largest known mafic igneous layered intrusion and contains more than 85% of the world’s known Mineral Resources of PGMs.
The mineralised Merensky and UG2 Reefs are host to the PGMs at the Rustenburg, Kroondal and Marikana operations and contained within the Rustenburg layered suite (RLS) of ultramafic to mafic rocks. These reefs are laterally continuous and extensive.
The BIC occurs geographically as discrete compartments categorised as limbs. Sibanye-Stillwater’s PGM operations (Marikana, Rustenburg and Kroondal) are located on the Western Limb, south east of the Pilanesberg Complex, while the PGM exploration projects are located on the Eastern and Northern Limbs of the BIC.
The Merensky Reef typically consists of a pegmatoidal feldspathic pyroxenite layer, bounded on the top and bottom by thin chromitite layers (stringers) dipping approximately 9º to 12º in a north-easterly direction. The Merensky Reef transitions across the Sibanye-Stillwater operations, from a thin pegmatoidal reef to a thick non-pegmatoidal wide reef, with a major transition at the Marikana operation. The Merensky Reef contains economically significant base metal sulphide and PGM mineralisation.
The UG2 Reef is rich in chromitite, but with lower gold, copper and nickel values, as compared to that of the Merensky Reef. The main UG2 layer (Main Seam) has an average thickness varying between 55cm and 75cm. The top of the UG2 Reef consists of a thin layer of chromitite averaging 20cm in thickness generally referred to as the Leader Seam, separated from the Main Seam by a non-mineralised pyroxenite layer of variable thickness of 5cm to 6m.
Across the PGM operations, the UG2 Reef occurs vertically between 90m and 180m below the Merensky Reef. The Merensky and the UG2 Reefs are affected by structural and other geological features, including potholes and iron-rich ultramafic pegmatoids (IRUPs), which result in geological losses and have an impact on mining.
Simplified stratigraphy of the Rustenburg layered suite (after Smith et al. 2004)
SA PGMs overview continued
Merensky Reef facies variations and PGM value distribution across the Marikana operation
UG2 facies variations and typical PGM value distribution across the PGM operations
SA PGMs overview continued
Zimbabwean operation
The Mimosa mine is located on the Wedza sub-chamber of the southern portion of the Great Dyke in Zimbabwe, approximately 32km from the town of Zvishavane. The Great Dyke is divided vertically into a lower ultramafic sequence, and an upper mafic unit.
Economic PGM mineralisation occurs within the main sulphide zone (MSZ). The MSZ is typically 2m to 3m thick, but can reach up to 20m thick locally, resulting in a marked decrease in grade with thickening of the zone. Although mineralisation is very consistent, localised disruption to reef due to pegmatoids and washout channels have been encountered in some areas of the operation. Unlike the BIC, the reef is not in contact with or within chromitite seams. The MSZ has definitive metal profiles that are consistent.
Mineral Resource estimation (Managed operations)
The Mineral Resource estimates are based on data generated from underground and surface diamond drilling, underground channel sampling, geological mapping, 3D surface seismic surveys and aerial magnetic surveys. Sampling data is captured in the MineRP™ MRM digital database and drilling data is captured in Sable™ Data Management digital database. Mineral Resource estimation is carried out using Datamine™ geological software.
The Merensky and UG2 Reefs are subdivided into a number of geozones, which relate primarily to reef width, differences in reef elevation within the stratigraphic succession, and mineralisation alignment. These are used as separate geostatistical domains for estimation. This geostatistical domaining is also a function of the structural models, where no interpolation takes place across significant geological structures.
Detailed exploratory data analysis – including sample verification, histogram and cumulative frequency plots for distributional analysis, additive constant estimates, outlier checks, trend analysis and declustering – are carried out on individual domains.
The optimum estimation parameters are determined using a kriging neighbourhood analysis in combination with the variogram models defined for the Merensky and UG2 domains. The kriging neighbourhood analysis tests the impact of different estimation parameters on the estimate by interpreting changes in the kriging efficiency and kriging variance. Variography studies are carried out on different domains, with traditional variograms used for kriging purposes.
The main interpolation methodology utilised is ordinary kriging. Modelling is done on platinum, palladium, rhodium, gold, ruthenium, iridium, density and true width using ordinary kriging; and inverse distance for copper, nickel and chromium oxide (Cr2O3) for both the Merensky and UG2 Reefs. Where insufficient data exists for an element, inverse distance, to the power of two, estimates are done. At Marikana, for the UG2 Reef and some of the Merensky Reef domains where the thickness of the resource cut was variable, the final 4E grade is a back calculated value from accumulation and thickness estimates. This method of estimation using accumulation is done to appropriately weight the grade based on thickness. All of the above elements are estimated at Marikana using ordinary kriging.
Modelling at Rustenburg, Kroondal and Marikana is completed using 2D Block models, except for a small section of the Kroondal operations, where a historical 3D block model was created using Surpac™ geological software.
Detailed checks are carried out on the estimates by compiling kriging efficiencies and slopes of regression on an individual kriged block basis. The validated data files are regressed and then composited over the different reef elements.
The Mineral Resource block widths are compiled over a minimum practical mining cut for both Merensky and UG2 Reefs. It includes additional varying thickness overbreak material to a minimum mining width. The minimum mining widths are determined by a number of parameters, namely: reef width, mineralisation of the hanging wall and footwall, mining method, rock quality, location of weak parting planes, support systems, and associated equipment required for support installation.
At the Rustenburg operations, for both the Merensky and UG2 Reef’s, a minimum 105cm mining width was adopted. At the Kroondal operation, a minimum 200cm mining width was modelled for all areas where a high-profile trackless mining method is applied. At the Marikana operation, for both the Merensky and UG2 Reef, a minimum 110cm mining width was modelled based on a combination of the reef width and rock engineering considerations.
Geological losses are split into known and unknown (anticipated) losses and determined for each structural domain and per shaft. All Mineral Resources reported are exclusive of geological losses.
The final Mineral Resource quantities are determined by projecting the 2D estimated parameters onto the 3D structural polygons, exclusive of the geological losses, and reporting them on a 4E and 6E composite grade basis. Due to the persistent grade distribution across the operations and no mining selectivity, typical cut-off grades are not applied. On a regional scale, >99.9% of Mineral Resource blocks meets reasonable prospect for eventual economic extraction (RPEEE) criteria; those blocks that don’t meet this prospect would have to be extracted to reach the balance. As a result, in effect a zero cut-off grade is applied. Areas that are deemed unmineable due to aspects such as IRUP, structural complexity and facies, are excluded.
Resource classifications are based on the scoring and rating of five statistical parameters (kriging variance, kriging efficiency, slopes of regression, search volume, and number of samples) and seven non-statistical parameters (aeromagnetic survey, seismic interpretation, structural model, facies interpretation, geological loss estimates, historical data (mining history), and quality assurance/quality control (QA/QC) reports).
Prill splits
The 4E PGMs (platinum, palladium, rhodium and gold) at the Southern Africa PGM operations occur together with other elements including ruthenium and iridium, copper, nickel, cobalt and chromium.
The table below provides details the ratio of occurrence of the elements in the various ore types, also called the “prill split”, on a 4E and 6E basis.
SA PGMs overview continued
4E PGM prill split
| | | | | | | | | | | | | | | | | | | | | | | |
| | Marikana | Rustenburg | Kroondal | Mimosa |
| Metal | Unit | MER | UG2 | MER | UG2 | UG2 | MSZ |
| Platinum | % | 61.63 | 59.32 | 63.67 | 52.29 | 57.84 | 49.23 |
| Palladium | % | 28.07 | 28.93 | 27.38 | 33.00 | 31.37 | 38.33 |
| Rhodium | % | 3.20 | 11.17 | 3.99 | 13.82 | 10.08 | 4.10 |
| Gold | % | 7.10 | 0.57 | 4.97 | 0.89 | 0.71 | 8.34 |
6E PGM prill split and base metal concentrations
| | | | | | | | | | | | | | | | | | | | | | | |
| | Marikana | Rustenburg | Kroondal | Mimosa |
| Metal | Unit | MER | UG2 | MER | UG2 | UG2 | MSZ |
| Prill split | | | | | | | |
| Platinum | % | 57.23 | 47.89 | 58.15 | 43.87 | 48.62 | 45.71 |
| Palladium | % | 26.07 | 23.36 | 25.00 | 27.69 | 26.36 | 35.59 |
| Rhodium | % | 2.97 | 9.02 | 3.64 | 11.60 | 8.47 | 3.81 |
| Gold | % | 6.59 | 0.46 | 4.54 | 0.74 | 0.60 | 7.74 |
| Iridium | % | 1.05 | 3.77 | 1.94 | 3.20 | 3.11 | 3.07 |
| Ruthenium | % | 6.09 | 15.50 | 6.73 | 12.90 | 12.83 | 4.08 |
| Base metal concentrations | | | | | | | |
| Copper | % | 0.09 | 0.01 | 0.10 | 0.01 | 0.01 | 0.11 |
| Nickel | % | 0.16 | 0.03 | 0.21 | 0.11 | 0.08 | 0.14 |
| Cobalt | % | - | - | - | 0.06 | 0.08 | 0.05 |
Chromium oxide (Cr2O3) | % | - | 19.45 | 1.04 | 24.10 | 13.90 | - |
Notes:
•MER – Merensky Reef
•UG2 – Upper Group 2 chromitite
•MSZ – Main Sulphide Zone
SA PGMs overview continued
Quality assurance/quality control (Managed operations)
Quality assurance/quality control (QA/QC) is a key component of the Mineral Resource estimation process spanning from data sources to the final assay data accepted for modelling. All data is acquired through standard acceptable procedures with inbuilt QA/QC protocols.
Certified reference material (CRM) and blanks are inserted into each batch sent to the laboratory, and makes up five percent of total sample numbers. The standards used have been prepared specifically for UG2 and Merensky Reefs with different PGM grade ranges. In depth QA/QC analysis is performed in preparation for Mineral Resource modelling using customised software (Sable™) for the evaluation of assay results. Extensive data audits and QA/QC reporting is undertaken and documented for all operations centrally, prior to Mineral Resource estimation.
All current samples from both the Rustenburg and Kroondal operations are analysed at Quality Laboratory Services (Pty) Ltd (Rustenburg), Reg No. 2008/004664/07), which is fully accredited with the South African National Accreditation System (SANAS), Ref No T0487 for Chemical and Microbiological Analysis, reference ISO/IEC 17025:2005. All underground channel samples at the Marikana operation are analysed at the on-site laboratory, which received full accreditation in March 2021 with the South African National Accreditation System (SANAS), Ref No T0930 for Chemical Analysis, reference ISO/IEC 17025:2017. All surface drilling samples are sent to appropriately accredited external laboratories.
Mineral Reserve estimation (Managed operations)
Mineral Reserves are estimated via the detailed operational planning process explained in Section 1.
Due to the high level of continuity and consistent grade distribution of the two ore-bodies across the operations, with moderate grade changes typically only occurring regionally, typical cut-off grades are not applicable. Mineral Reserves are assessed for economic feasibility on a shaft by shaft basis, based on total volumes planned, and ore is not mined selectively.
Normal Mineral Resource to Mineral Reserve modifying factors are applied, based on the type of mining method applied, which varies from shaft to shaft. Typically, the shallow UG2 operations are accessed via decline shafts and mined via low profile mechanised bord-and-pillar method, while deeper ore, both Merensky and UG2, is accessed via vertical shafts and conventionally mined via breast and down-dip methods.
Resource to reserve modifying factors applied include provision for off-reef mining due to geological disturbances, dilution to mining widths to cater for historical, realistically achieved, widths, waste scalping in the case of mechanised mining to cater for DMS waste removal, and a mine call factor to make provision for unaccounted for but realised metal losses.
Estimation risks (Managed operations)
There are no deemed material risks to the Mineral Resource Estimation. The key operational risks that could impact the Mineral Reserves are listed below.
Commodity prices and exchange rate assumptions: Sibanye-Stillwater has adopted forward-looking price assumptions. Any material deviations from these assumptions could impact the Mineral Reserves, especially at marginal operations. We are of the view that these prices applied to our LoM valuations are realistic considering the external guidance received.
ESG and social unrest: The SA PGM operations are situated in close proximity to large communities with high unemployment rates and low incomes. As such, it is continually at risk to social unrest events. From a social and governance perspective, the Group has implemented appropriate objectives and initiates to address this risk. From an environmental perspective, the area experiences significant pressure on potable and fresh water supply. The adoption of the PGM water stewardship, GHG and footprint reduction during 2022 will enable these operations to meet the requirements defined by our ESG commitments.
Cost escalation: Cost escalation assumptions relating to factors such as wages, utilities like electricity and operational consumables (explosives and steel) are aligned with Group estimates. Continuous improvement initiatives adopted to contain cost escalation are in place to mitigate this risk.
Operational Risk: Operational underperformance and slower than planned production build-up at projects may result in variations between planned and achieved production rates. Short interval controls are in place to enable the implementation of timeous interventions and, therefore, correction of deviations to plans.

SA PGMs overview continued
UG2 Mineral Resource classification map for the combined South African PGM operations (Inclusive of Mineral Reserves)
Merensky Mineral Resource classification map for the combined South African PGM operations
(Inclusive of Mineral Reserves)
SA PGMs overview continued
UG2 Mineral Reserve classification map for the combined South African PGM operations
Merensky Mineral Reserve classification map for the combined South African PGM operations
PGM operations
MARIKANA
PGM operations MARIKANA continued
| | |
| PROPERTY DESCRIPTION |
The Marikana operations (Western Platinum Limited and Eastern Platinum Limited) are located in the Marikana district, 40km to the east of the town of Rustenburg in the North West province of South Africa. The lease area covers approximately 214km2 and extends in excess of 30km from east to west and 15km from north to south. Marikana currently has five contributing shafts: 4 Belt, K3, Rowland, Saffy, and E3. The Merensky and the UG2 reefs are mined simultaneously at an average depth of 500m and are accessed via infrastructure consisting of shallow incline and deeper vertical shafts. The 4 Belt shallow incline, K3 and Rowland vertical shafts target both the Merensky Reef and UG2 Reef horizons, while the E3 shallow incline and Saffy vertical shaft target only the UG2 Reef. The vertical shaft complexes account for the largest portion of the Mineral Reserves. The Mineral Reserves are accessed from the surface using conventional underground mining methods. The 4 Belt and E3 shallow incline shafts extend to depths of approximately 400m below surface and the K3, Rowland and Saffy vertical shafts to approximately 900m below surface. 45% or 48.3Moz of the total Mineral Resources are above infrastructure (AI) and 55% or 54.9Moz are below infrastructure (BI). The main contributing factor to this being the large Mineral Resource base in the Merensky Reef that has not yet been mined. The ore mined at the Marikana operations is processed through eight concentrators on site (of which five are used for processing, with two on care and maintenance and one being used for third processing) with a combined milling capacity of approximately 600,000t per month. In addition, two concentrators treat tailings material. The concentrate is dispatched to the smelter where a sulphide-rich matte is produced for further processing at the Base Metal Refinery (BMR). At the BMR, base metals (nickel and copper) are extracted and the resulting PGM-rich product is sent to the Precious Metal Refinery (PMR) in Brakpan for final treatment. The PMR produces the final refined precious metal products. Apart from the underground operations, there is one tailings retreatment operation. The re-mining of eastern tailings dam 1 (ETD1) occurs by hydraulic mining with high pressure water guns and the tailings are retreated at the bulk tailings treatment (BTT) plant. |
| | |
| MINERAL TITLE |
The mineral rights for the Marikana operations comprise several mining rights. There are four mining rights within Western Platinum Limited, which have been converted to new order mining rights NW30/5/1/2/2/107MR (29.3 km2, expires 03 September 2037), NW30/5/1/2/2/106MR (101.7 km2, expires 03 September 2037), NW30/5/1/2/2/161MR (1.8 km2, expires 20 December 2036) and NW30/5/1/2/2/190MR (0.3 km2, expires 20 December 2036). The mining rights within Eastern Platinum Limited were converted to new order mining rights NW30/5/1/2/2/109MR (38.2 km2, expires 03 September 2037), NW30/5/1/2/2/110MR (0.6 km2, expires 03 September 2037) and NW30/5/1/2/2/111MR (1.7 km2, expires 03 September 2037). The mining rights NW30/5/1/2/2/292MR (46.2km2, expires 22 January 2044) and NW30/5/1/2/2/433MR (42.9 km2, expires 22 January 2044) cover the Pandora area. These mining rights are for the extraction of PGMs and associated minerals. The ETD1 is located within the area covered by new order mining right NW30/5/1/2/2/109 MR on the farm Turffontein 462JQ. The renewal of the Schaapkraal prospecting right (NW30/5/1/1/2/12331PR, 41.74Km2), which covers the western down-dip extension at Marikana, was granted on the 22 August 2019 and executed on 10 February 2021. The prospecting right expires in August 2022. No Mineral Resources are declared for Schaapkraal at this stage. |
PGM operations MARIKANA continued
| | |
| INFRASTRUCTURE AND EQUIPMENT |
The Marikana operation is a large, established shallow to moderate depth PGM mining complex that is accessed from surface through numerous incline and vertical shaft systems. All facilities are in good condition. All the permanent infrastructure required to access and mine the LoM plan is already established and in use. Major infrastructure consists of: •five vertical shafts, of which four are in production and one on care and maintenance •five incline shafts of which two are in operation and the remainder are on care and maintenance •eight PGM concentrator plants: six of the concentrators treat underground material and two of the concentrators treat surface or tailings material; the Rowland and EPC concentrators were placed on care and maintenance in 2019. Since acquisition by SSW, the operating concentrators efficiencies have been enhanced through improved operational excellence •a smelter plant with five furnaces, a base metal refinery plant, and a precious metal refinery plant •three hospitals/ medical centres •workshops, office blocks, a laboratory, and equipment stores •accommodation quarters and hostels •water treatment plants
The mining complex has been in operation since 1987 and the age and modernisation of these assets varies greatly. The most recent additions were the K4 shaft in 2006, and the BTT plant which was commissioned in 2017. In line with our ESG and enhanced efficiency requirements, several projects will be considered during 2022 on the smelter and the PMR and BMR. The equipment used is extensive. The vertical and incline shafts make use of conventional handheld equipment, combined with rail-bound equipment for logistical movement of ore, men and material. The smelter has five furnaces. The two larger furnaces (Furnace 1 and 2) are usually in operation, with the three smaller Pyromet furnaces being utilised as back-up or spare capacity. The BMR which was commissioned in 1985, extracts base metals (nickel and copper) and the resulting PGM-rich product, is refined at the precious metal refinery (PMR) in Brakpan. The PMR produces the final precious metal products. The equipment at all operations, including the plants, are subject to a detailed planned maintenance programmes; SIB capital provisions are made on an annual basis to cater for both repairs and replacements as needed. The property, plant and equipment book value (100%) of all the mine’s assets, net of depreciation, as at 31 December 2021, was R4.7bn. |
| | | | | | | | |
| HOISTING AND PRODUCTION CAPACITIES |
| Operating shaft | Operating hoisting | 5-year planned |
| capacity (ktpm) | production (ktpm) |
| K3 | 290 | 181 |
| 4B | 168 | 73 |
| Rowland | 260 | 141 |
| Saffy | 220 | 164 |
| E3 | 110 | 49 |
| Planned production is five-year hoisted average from 2022 onwards. |
| | |
| MINING METHOD |
•Vertical shafts: conventional up-dip and down-dip mining with a limited amount of conventional breast mining •Shallow inclines: conventional breast mining with a limited amount of conventional up-dip and down-dip mining •TSF: Hydraulic (Hydrojet) |
| | |
| LIFE OF MINE |
•17 years (until 2038) based on current Mineral Reserves, but with significant upside potential (to over 40 years) based on the significant brownfields project pipeline currently undergoing studies |
PGM operations MARIKANA continued
| | | | | | | | | | | | | | |
| MINERAL PROCESSING AND CAPACITY |
| Concentrator Plant | Design capacity (ktpm) | Current operational capacity (ktpm) | Average recovery factor (%) | Material treated |
|
| Karee A | 140 | 148 | 87 | MER underground |
| Karee B | 101 | 125 | 87 | UG2 underground |
| K4 | 125 | 135 | 85 | MER and UG2 underground |
| EPL | 180 | 225 | 80 | UG2 underground |
| BTT | 300 | 300 | 25 | Historic tailings |
| ETTP | 274 | 223 | 24 | Tailings |
| | | | | | | | | | | | | | |
| Chrome processing |
| Concentrator Plant | Design | Current operational capacity (ktpm) | Average recovery factor (%) | Material |
| capacity (ktpm) | treated |
| Glencore (EPL) | 300 | 225 | 51 | EP UG2 tailings |
| Arxo (K3 B) | 120 | 125 | 35 | WP UG2 tailings |
| Glencore (K4) | 130 | 135 | 24 | WP UG2 tailings |
| Chrometech (BTT) | 300 | 300 | 12 | EP UG2 tailings |
| | | | | | | | | | | | | | |
| PGM and Base Metal processing |
| Refinery | Planned feed capacity (t/m) | Achieved operational capacity (t/m) | Average 3yr recovery factor (%) | Material treated |
|
| Smelter | 11,143 | | 12,932 | | 101.14 | | concentrate and filter cake from various internal and external plants |
| BMR | 392 | 624 | 99.15 | smelter converter matte |
| PMR | 387 | | 406 | | 99.59 | BMR PGM concentrate |
1Smelter recovery over 100% is due to historical material processed
| | |
| TAILINGS DISPOSAL AND CAPACITY |
| Tailings deposition is managed across the Tailings Storage Facilities detailed below: |
•Karee Tailings Dam 2 – Fed from K3 UG2 plant at 101ktpm (life of TSF until 2025 at current deposition rate) •Karee Tailings Dam 3 – Fed from K3 Mix plant at 147ktpm (life of TSF until 2024 at current deposition rate) •Karee Tailings Dam 4 – Fed from K4 plant at 116ktpm (life of TSF until 2044 at current deposition rate) •Eastern Tailings Dam 2 – Fed from EPL and ETTP plants at 160ktpm after Chrometech extraction (life of TSF until 2028 at current deposition rate) •Western Platinum Tailings Dam 6 – Fed from BTT plant at 270ktpm (life of TSF until 2039 at current deposition rate) |
The Marikana TSF’s have a remaining capacity of 117.8Mt. The LoM requires 178.8Mt TSF capacity, resulting in a shortfall of 61.1Mt. The current capacity constraints will be mitigated through the elevating of penstocks to gain additional capacity as well as diverting tailings to other existing Group facilities with in the PGM operations. The construction of a new TSF (TD8) is envisaged in due course, but is not a short term requirement. |
| | |
| KEY DEVELOPMENTS AND BROWNFIELD PROJECTS |
The K4 Shaft Project, is currently in execution with project focus on infrastructure and primary development. Ore mining is planned to commence during 2022. At steady state, mining production is planned at 2.3Mtpa, yielding approximately 250Koz 4E PGMs per annum. During 2021, a feasibility study on the E3 UG2 inclined shaft deepening and extension project was advanced. This project is a brownfields expansion of the current E3 mine, down-dip to current workings and will serve as replacement ground for E3. The target is for the implementation of a mechanised mining section as an extension of the existing conventional mine. Other brownfields studies that will be advanced during 2022 are the Marikana E4 (UG2), Marikana Tailings and Saffy Deeps (UG2) projects. The Marikana E4 (UG2) project is planned to be taken to a “Stage 2” feasibility study. |
PGM operations MARIKANA continued
Classified 4E PGM Mineral Resource estimate at 31 December 2021
| | | | | | | | | | | | | | | | | | | | | | | | | | | | | |
| Mineral Resources Inclusive of Mineral Reserves |
| | | | 31 December 2021 | 31 December 2020 |
| PGM | Southern Africa | | | Tonnes | Grade | PGM | Tonnes | Grade | PGM |
| Marikana | | | | (Mt) | (g/t) | (Moz) | (Mt) | (g/t) | (Moz) |
| Operations | | Underground | Measured | 73.3 | | 4.2 | | 9.9 | | 77.3 | | 4.1 | | 10.1 | |
| | | Indicated | 504.9 | | 4.2 | | 67.8 | | 605.2 | | 4.3 | | 84.5 | |
| | | Measured + Indicated | 578.2 | | 4.2 | | 77.7 | | 682.5 | | 4.3 | | 94.7 | |
| | | Inferred | 178.9 | | 4.4 | | 25.2 | | 202.2 | | 4.6 | | 29.7 | |
| | TSF Surface | Measured | — | | — | | — | | — | | — | | — | |
| | | Indicated | 8.4 | | 1.2 | | 0.3 | | 11.0 | | 1.2 | | 0.4 | |
| | | Measured + Indicated | 8.4 | | 1.2 | | 0.3 | | 11.0 | | 1.2 | | 0.4 | |
| | | Inferred | — | | — | | — | | — | | — | | — | |
| Total Measured + Indicated | 586.6 | | 4.1 | | 78.0 | | 693.5 | | 4.3 | | 95.1 | |
| Grand total | 765.5 | | 4.2 | | 103.2 | | 895.7 | | 4.3 | | 124.8 | |
| | | | | | | | | | | | | | | | | | | | | | | | | | | | | |
| Mineral Resources Exclusive of Mineral Reserves |
| | | | 31 December 2021 | 31 December 2020 |
| PGM | Southern Africa | | | Tonnes | Grade | PGM | Tonnes | Grade | PGM |
| Marikana | | | | (Mt) | (g/t) | (Moz) | (Mt) | (g/t) | (Moz) |
| Operations | | Underground | Measured | 47.7 | | 3.9 | | 6.0 | | 55.5 | | 3.9 | | 6.9 | |
| | | Indicated | 392.6 | | 3.9 | | 49.6 | | 455.3 | | 4.1 | | 60.4 | |
| | | Measured + Indicated | 440.3 | | 3.9 | | 55.6 | | 510.8 | | 4.1 | | 67.3 | |
| | | Inferred | 178.6 | | 4.4 | | 25.1 | | 202.0 | | 4.6 | | 29.6 | |
| Total Measured + Indicated | 440.3 | | 3.9 | | 55.6 | | 510.8 | | 4.1 | | 67.3 | |
| Grand total | 618.9 | | 4.1 | | 80.8 | | 712.9 | | 4.2 | | 96.9 | |
PGM operations MARIKANA continued
Notes:
The -17.3% change year-on-year in the stated Mineral Resources (Inclusive of Mineral Reserves) is attributed to:
–-1.2Moz in depletions
–-0.5Moz in area exclusions (remnants removed from operating shafts)
–-2.7Moz due to changes in geological losses and interpretation
–-1.5Moz due to the addition of new data and subsequent change to the resource models
–-22.4Moz due to the change in attributable interest from 95.25% to 80.64%
On a Mineral Resources exclusive of Mineral Reserves basis, the year-on-year change is -16.6%.
Grade control and Mineral Resource definition drilling summary
| | | | | | | | | | | | | | | | | | | | |
| Planned 2022 | Actual 2021 | Actual 2020 |
| Drilled | Expenditure | Drilled | Expenditure | Drilled | Expenditure |
| OPERATIONS - MARIKANA | (m) | (Rm) | (m) | (Rm) | (m) | (Rm) |
Marikana1 | 22,828 | 36.74 | 2,392.16 | 1.99 | 2,297.00 | 2.30 |
| Total | 22,828 | 36.74 | 2,392.16 | 1.99 | 2,297.00 | 2.30 |
1 Includes surface and underground holes
Annual development results
| | | | | | | | | | | |
| Financial year total |
| Category | Unit | 2021 | 2020 |
| Primary waste development (capital, declines, haulages, crosscuts, boxholes, travelling ways) | m | 58,169 | 17,606 |
| Primary reef development (raise, winzes, wide raises) | m | 21,552 | 53,024 |
| Total | m | 79,721 | 70,630 |
PGM operations MARIKANA continued
Modifying factors (underground) in converting Mineral Resources to Mineral Reserves
| | | | | | | | | | | |
| Parameter | Unit | 2021 | 2020 |
| Off-reef | % | 1.4 | 1 |
| Dilution | cm | 14.7 | 20.9 |
| Ave. Stoping width | cm | 132.7 | 136 |
| Mine call factor | % | 98.2 | 100 |
Classified 4E PGM Mineral Reserves estimate as at 31 December 2021
| | | | | | | | | | | | | | | | | | | | | | | | | | | | | |
| Mineral Reserves |
| | | | 31 December 2021 | 31 December 2020 |
| PGM | Southern Africa | | | Tonnes | Grade | PGM | Tonnes | Grade | PGM |
| Marikana | | | | (Mt) | (g/t) | (Moz) | (Mt) | (g/t) | (Moz) |
| Operations | | Underground | Proved | 22.6 | | 3.9 | | 2.9 | | 19.6 | | 3.9 | | 2.4 | |
| | | Probable | 113.2 | | 4.1 | | 14.9 | | 141.6 | | 4.1 | | 18.6 | |
| | | Proved + Probable | 135.8 | | 4.1 | | 17.8 | | 161.2 | | 4.1 | | 21.1 | |
| | TSF Surface | Proved | — | | — | | — | | — | | — | | — | |
| | | Probable | 8.4 | | 0.9 | | 0.2 | | 11.0 | | 1.3 | | 0.5 | |
| | | Proved + Probable | 8.4 | | 0.9 | | 0.2 | | 11.0 | | 1.3 | | 0.5 | |
| Grand total Proved + Probable | 144.2 | | 3.9 | | 18.0 | | 172.2 | | 3.9 | | 21.5 | |
Notes:
The -16.4% change year-on-year in the stated Mineral Reserves is attributed to:
–-0.9Moz in depletions
–+0.5Moz due to LoM gains associated with tail end optimisation
–+0.1Moz associated with a change in technical factors
–-4.3Moz due to the change in basis of reporting attributable interest from 95.25% to 80.64%
PGM operations MARIKANA continued
| | |
| HISTORY AND OPERATIONAL STATISTICS |
•In 1987, the London and Rhodesian Mining and Land Company Limited (Lonhro) commissioned the sinking of the Rowland Shaft •By 1989 the Karee Mine shafts were operational •In 1998, Lonrho PLC split and Lonrho Africa PLC was formed •In 1999, Lonrho PLC was renamed to Lonmin PLC •In 2000, Lonmin PLC sold off all non-PGM assets and became a primary PGM producer •In 2001, the Eastern declines were sunk, Saffy shaft was commissioned and Lonmin entered into a JV with Anglo American Platinum for the Pandora property •By 2003, the Hossy Shaft was commissioned with the K4 Shaft commissioned in 2006 •In 2011, the K3 Shaft decline was sunk •in 2012, the K4 Shaft was placed on care and maintenance •In 2016, Saffy Shaft began to produce at full capacity •In 2018, Lonmin acquired 100% of the Pandora JV from Anglo American Platinum. •In 2019, Sibanye-Stillwater acquired Lonmin Plc •In 2021, the resumption of the K4 Project was approved |
| | | | | | | | | | | |
| Operational Statistics | 2019 | 2020 | 2021 |
| Underground tonnes milled (kt) | 4,717 | 5,609 | 6,802 |
| Underground yield (g/t) | 3.08 | 3.23 | 3.37 |
| Surface tonnes milled (kt) | 2,076 | 3,447 | 3,869 |
| Surface yield (g/t) | 0.29 | 0.22 | 0.23 |
| Annual 4E PGM production - Underground (koz) | 468 | 582 | 737 |
| Annual 4E PGM production - surface (koz) | 39 | 24 | 28 |
| Total Annual 4E PGM production (koz) | 508 | 606 | 765 |
| Operating cost underground (R/t) | 1,283 | 1,569 | 1,571 |
| | | |
| Total capital expenditure (Rm) | 1,189 | 1,223 | 2,254 |
| AISC (R/oz) | 17,735 | 19,836 | 19,664 |
| AISC (US$/oz) | 1,226 | 1,205 | 1,330 |
| Operating cost (R/t) excluding 3rd party purchase of concentrate (PoC) | N/A | 1,384 | 1,273 |
| AISC (R/oz) excluding (PoC) | N/A | 18,834 | 17,394 |
| AISC (US$/oz) excluding (PoC) | N/A | 1,144 | 1,176 |
Notes:
•AISC calculated based on produced Oz
•Historic ounces were restated between surface and underground, impacting the reported yield
•2019 statistics only for period under Sibanye-Stillwater management
RUSTENBURG
PGM operations RUSTENBURG continued
| | |
| PROPERTY DESCRIPTION |
The Rustenburg operation is located in the North West province, north-east of the towns of Rustenburg and Kroondal, 123km west of Pretoria and 126km north-west of Johannesburg. The lease area covers approximately 130km2 and is in excess of 20km from east to west and 15km from north to south. Rustenburg consists of three intermediate depth operating vertical shafts that utilise a conventional mining method – Siphumelele 1, Khuseleka 1, and Thembelani 1 – and Bathopele Shaft, a shallow inclined bord and pillar mining method. The Mineral Resource is accessed to 34 Level (the lowest working level) at Siphumelele 1 Shaft, approximately 1,350m below surface, to 28 Level (the lowest working level) at Khuseleka 1 Shaft, approximately 950m below surface, and 29 Level (the lowest working level) at Thembelani 1 Shaft. The Mineral Resource at Bathopele Shaft is accessed via two decline clusters to a depth of approximately 500m below surface. 66% or 54.55Moz of the total Mineral Resources are above infrastructure and 34% or 27.78Moz are below infrastructure. The vertical shafts mine both the Merensky Reef and UG2 Reef horizons, while the shallow, mechanised Bathopele Shaft only mines the UG2 Reef. The underground ore is treated at the Waterval UG2 and Waterval Retrofit concentrators, with the concentrate processed in terms of a toll agreement by Anglo American Platinum. The Waterval UG2 concentrator has an integrated chrome recovery circuit, which recovers a chrome concentrate from the ore. In addition to the underground operations, there are also two tailings retreatment operations: •WLTRP (Western Limb Tailings Retreatment Plant) treats tailings from the old Waterval TSF, via hydro mining •tailings from the Waterval TSFs and Waterval UG2 and Retrofit concentrators are retreated at the Platinum Mile plant |
|
| MINERAL TITLE |
Sibanye Rustenburg Platinum Mines (Pty) Ltd (SRPM) is the holder of a converted mining right under the DMRE Ref No NW30/5/1/2/2/82MR (SRPM MR) measuring 153.0 km2 in extent and valid from 29 July 2010 to 28 July 2040. A notarial deed of cession was executed on 1 November 2016 in terms whereof the SRPM mining right was ceded from Rustenburg Platinum Mines Limited to SRPM. The SRPM mining right was registered in the Mineral and Petroleum Titles Registration Office (MPTRO) on 3 October 2011 under Ref No 67/2011. |
| | |
| INFRASTRUCTURE AND EQUIPMENT |
The Rustenburg Operations consist of shallow to intermediate depth PGM mines that are accessed from surface via incline and vertical shaft infrastructure. Key infrastructure consists of: •eleven vertical shafts, of which three are in production and the rest on care and maintenance •two incline shafts in operation mined on a bord-and-pillar system with mechanised equipment •four PGM concentrator plants, two of the concentrators treat underground material and two of the concentrators treat surface or tailings material •one hospital/ medical centre •workshops, office blocks and equipment stores •accommodation and hostels •water treatment plants The Rustenburg mining complex has been in operation since the 1940s and the age and modernization of these assets are varied. A combination of mechanised and conventional mining methods are used. The vertical shafts make use of conventional handheld equipment, combined with rail-bound equipment for logistical movement of ore, men and material. The equipment at all operations, including the plants, are subject to a detailed planned maintenance programs; SIB capital provisions are made on an annual basis to cater for both repairs and replacements as needed. The property, plant and equipment book value (100%) for the assets of Rustenburg, as at 31 December 2021 was R4.8bn. |
PGM operations RUSTENBURG continued
| | | | | | | | |
| HOISTING AND PRODUCTION CAPACITIES |
| Operating | Operating hoisting | 5-year planned |
| shaft | capacity (ktpm) | production (ktpm) |
| Siphumelele | 195 | 65 |
| Khuseleka | 225 | 140 |
| Thembelani | 220 | 140 |
| Bathopele | 280 | 260 |
| Planned production is five-year hoisted average from 2022 onwards. |
| | |
| MINING METHOD |
•Vertical shafts: conventional scattered breast mining •Mechanised declines: bord-and-pillar •TSF: Hydraulic (Hydrojet) |
| | |
| LIFE OF MINE |
•30 years (until 2051) based on current Mineral Reserves |
| | | | | | | | | | | | | | |
| MINERAL PROCESSING AND CAPACITY |
| Plant name | Design | Current operational capacity (ktpm) | Average recovery factor (%) | Material |
| capacity (ktpm) | treated |
| Waterval UG2 concentrator | 450 | 420 | 85 | UG2 |
| Waterval retrofit concentrator | 650 | 130-180 | 85 | MER and UG2 |
|
| CRP 1 | 440 | 440 | 30-35 | Fresh UG2 tailings |
| WLTR plant | 450 | 380 | 28 | Historic tailings |
| Platinum Mile | 800 | 650 | 15 | Fresh and historic tailings |
| 1 Chrome retreatment plant (CRP) treats UG2 rougher middlings to recover a saleable chromite concentrate |
| | |
| TAILINGS DISPOSAL AND CAPACITY |
| Tailings deposition is managed across the Tailings Storage Facilities detailed below: |
•Paardekraal TSF – Fed from Waterval UG2 and Waterval Retrofit plants at 750ktpm (life of TSF until 2051 with activation of PK5 dormant area) |
•Hoedspruit TSF – Fed from WLTR plants at 480ktpm (life of TSF until 2043 at the current deposition rate, and further life to 2053 with an extension of the current TSF) |
| The Rustenburg TSF’s have a remaining capacity of 225Mt. The LoM requires 169.1Mt TSF capacity, resulting in a surplus of 56.6Mt. The current capacity can be increased further through the activation of PK5 dormant area. |
| | |
| KEY DEVELOPMENTS AND BROWNFIELD PROJECTS |
| During 2021, a feasibility study was initiated, to be finalised in 2022, on the Siphumelele UG2 project. The Merensky reef horizon at Siphumelele 1 shaft is nearing depletion and the study considers replacing Merensky production with UG2 which extends from 23 level down to 29 level. In addition, the Thembelani Deeps (MER) project will be under study during 2022, which could enhance the Merensky tonnage output production beyond the current LoM estimates and is planned to be taken to a “Stage 2” Feasibility study. |
PGM operations RUSTENBURG continued
Classified 4E PGM Mineral Resources estimate as at 31 December 2021
| | | | | | | | | | | | | | | | | | | | | | | | | | | | | |
| Mineral Resources Inclusive of Mineral Reserves |
| | | | 31 December 2021 | 31 December 2020 |
| PGM | Southern Africa | | | Tonnes | Grade | PGM | Tonnes | Grade | PGM |
| Rustenburg | | | | (Mt) | (g/t) | (Moz) | (Mt) | (g/t) | (Moz) |
| Operations | | Underground | Measured | 272.4 | | 4.8 | | 41.9 | | 366.5 | | 4.9 | | 57.6 | |
| | | Indicated | 88.6 | | 5.3 | | 15.1 | | 115.7 | | 5.3 | | 19.9 | |
| | | Measured + Indicated | 361.0 | | 4.9 | | 57.1 | | 482.2 | | 5.0 | | 77.5 | |
| | | Inferred | 11.0 | | 5.6 | | 2.0 | | 14.9 | | 5.6 | | 2.7 | |
| | TSF Surface | Measured | 35.9 | | 1.1 | | 1.3 | | 60.5 | | 1.1 | | 2.1 | |
| | | Indicated | — | | — | | — | | — | | — | | — | |
| | | Measured + Indicated | 35.9 | | 1.1 | | 1.3 | | 60.5 | | 1.1 | | 2.1 | |
| | | Inferred | — | | — | | — | | — | | — | | — | |
| Total Measured + Indicated | 396.9 | | 4.6 | | 58.4 | | 542.7 | | 4.6 | | 79.6 | |
| Grand total | 407.9 | | 4.6 | | 60.4 | | 557.6 | | 4.6 | | 82.3 | |
| | | | | | | | | | | | | | | | | | | | | | | | | | | | | |
| Mineral Resources Exclusive of Mineral Reserves |
| | | | 31 December 2021 | 31 December 2020 |
| PGM | Southern Africa | | | Tonnes | Grade | PGM | Tonnes | Grade | PGM |
| Rustenburg | | | | (Mt) | (g/t) | (Moz) | (Mt) | (g/t) | (Moz) |
| Operations | | Underground | Measured | 177.7 | | 5.1 | | 29.0 | | 253.8 | | 5.1 | | 41.3 | |
| | | Indicated | 82.9 | | 5.4 | | 14.3 | | 110.0 | | 5.4 | | 18.9 | |
| | | Measured + Indicated | 260.6 | | 5.2 | | 43.2 | | 363.8 | | 5.1 | | 60.2 | |
| | | Inferred | 11.0 | | 5.6 | | 2.0 | | 14.9 | | 5.6 | | 2.7 | |
| Total Measured + Indicated | 260.6 | | 5.2 | | 43.2 | | 363.8 | | 5.1 | | 60.2 | |
| Grand total | 271.7 | | 5.2 | | 45.2 | | 378.7 | | 5.2 | | 62.9 | |
PGM operations RUSTENBURG continued
Notes:
The -36% change year-on-year in the stated Mineral Resources (Inclusive of Mineral Reserves) is attributed to:
–-1.1Moz in depletions
–-0.1Moz in area exclusions
–0.1Moz increase due to changes in geological losses and interpretation
–0.3Moz due to the addition of new data and subsequent change to the Mineral Resource models
–-15.2Moz due to the change in attributable interest from 100% to 74%
On a Mineral Resources exclusive of Mineral Reserves basis, the year-on-year change is -28%.
Grade control and Mineral Resource definition drilling summary
| | | | | | | | | | | | | | | | | | | | |
| Planned 2022 | Actual 2021 | Actual 2020 |
| Drilled | Expenditure | Drilled | Expenditure | Drilled | Expenditure |
| OPERATIONS - RUSTENBURG | (m) | (Rm) | (m) | (Rm) | (m) | (Rm) |
Rustenburg1 | 13,574 | 14.69 | 6,260 | 6.41 | 4,371 | 4.48 |
| Total | 13,574 | 14.69 | 6,260 | 6.41 | 4,371 | 4.48 |
1 Includes surface and underground holes
Annual development results
| | | | | | | | | | | |
| Financial year total |
| Category | Unit | 2021 | 2020 |
| Primary waste development (capital, declines, haulages, crosscuts, boxholes, travelling ways) | m | 10,481 | 8,660 |
|
| Primary reef development (raise, winzes, wide raises) | m | 12,445 | 7,745 |
| Total | m | 22,927 | 16,404 |
PGM operations RUSTENBURG continued
Modifying factors in converting Mineral Resources to Mineral Reserves
| | | | | | | | | | | |
| Parameter | Unit | 2021 | 2020 |
| Off-reef | % | 3.8 | 4 |
| Dilution | cm | 7.8 | 10.9 |
| Ave. Stoping width | cm | 146 | 147 |
| Scalping | % | 2 | 2 |
| Mine call factor | % | 96 | 96 |
Classified 4E PGM Mineral Reserve estimate as at 31 December 2021
| | | | | | | | | | | | | | | | | | | | | | | | | | | | | |
| Mineral Reserves |
| | | | 31 December 2021 | 31 December 2020 |
| PGM | Southern Africa | | | Tonnes | Grade | PGM | Tonnes | Grade | PGM |
| Rustenburg | | | | (Mt) | (g/t) | (Moz) | (Mt) | (g/t) | (Moz) |
| Operations | | Underground | Proved | 83.4 | | 3.5 | | 9.5 | | 106.1 | | 3.7 | | 12.7 | |
| | | Probable | 6.0 | | 4.2 | | 0.8 | | 4.5 | | 4.4 | | 0.6 | |
| | | Proved + Probable | 89.4 | | 3.6 | | 10.3 | | 110.5 | | 3.7 | | 13.3 | |
| | TSF Surface | Proved | — | | — | | — | | — | | — | | — | |
| | | Probable | 35.8 | | 1.0 | | 1.2 | | 60.5 | | 1.1 | | 2.1 | |
| | | Proved + Probable | 35.8 | | 1.0 | | 1.2 | | 60.5 | | 1.1 | | 2.1 | |
| Grand total Proved + Probable | 125.1 | | 2.9 | | 11.5 | | 171.0 | | 2.8 | | 15.4 | |
Notes:
The -25.5% change year-on-year in the stated Mineral Reserves is attributed to:
–-1.1Moz in depletions
–+0.1Moz due to LoM gains associated with tail end optimisation
–+1.4Moz due to boundary changes arising from the Kroondal PSA agreement with Anglo American, which allows Kroondal to mine further into the SRPM ground
–-4.0Moz due to the change in attributable interest from 100% to 74%
PGM operations RUSTENBURG continued
| | |
| HISTORY AND OPERATIONAL STATISTICS |
•In 1925, exploration on the Eastern Limb of the Bushveld Igneous Complex started •In 1929, the first vertical shaft at Rustenburg section was sunk at what was to become Rustenburg Platinum Mines Ltd •In 1935, the Waterfall vertical shaft was constructed, while the Central deep shaft and the Siphumelele 3 Shaft were constructed in 1951 and 1953 respectively •Johannesburg Consolidated Investments (JCI) acquired a controlling interest in Rustenburg Platinum Mines and eventually the principal shareholder of JCI was Anglo American, which acquired a controlling interest in JCI in 1960 •The control ultimately passed on from JCI when Anglo American Platinum came into being in 1995 when JCI was unbundled •In 2016, Sibanye-Stillwater acquired Rustenburg Platinum Operations from Anglo American Platinum |
| | | | | | | | | | | |
| Operational Statistics | 2019 | 2020 | 2021 |
| Underground tonnes milled (kt) | 6,995 | 5,404 | 6,341 |
| Underground yield (g/t) | 2.88 | 2.9 | 2.96 |
| Surface tonnes milled (kt) | 4,384 | 5,056 | 5,712 |
| Surface yield (g/t) | 0.35 | 0.35 | 0.37 |
| Annual 4E PGM production - Underground (koz) | 648 | 504 | 604 |
| Annual 4E PGM production - surface (koz) | 49 | 58 | 68 |
| Total Annual 4E PGM production (koz) | 698 | 562 | 672 |
| Operating cost underground (R/t) | 1,289 | 1,599 | 1,643 |
| Operating cost surface (R/t) | 247 | 210 | 195 |
| Total capital expenditure (Rm) | 819 | 743 | 1,248 |
| AISC (R/oz) | 14,429 | 18,624 | 18,460 |
| AISC (US$/oz) | 998 | 1,131 | 1,248 |
Note: AISC calculated based on produced Oz
KROONDAL
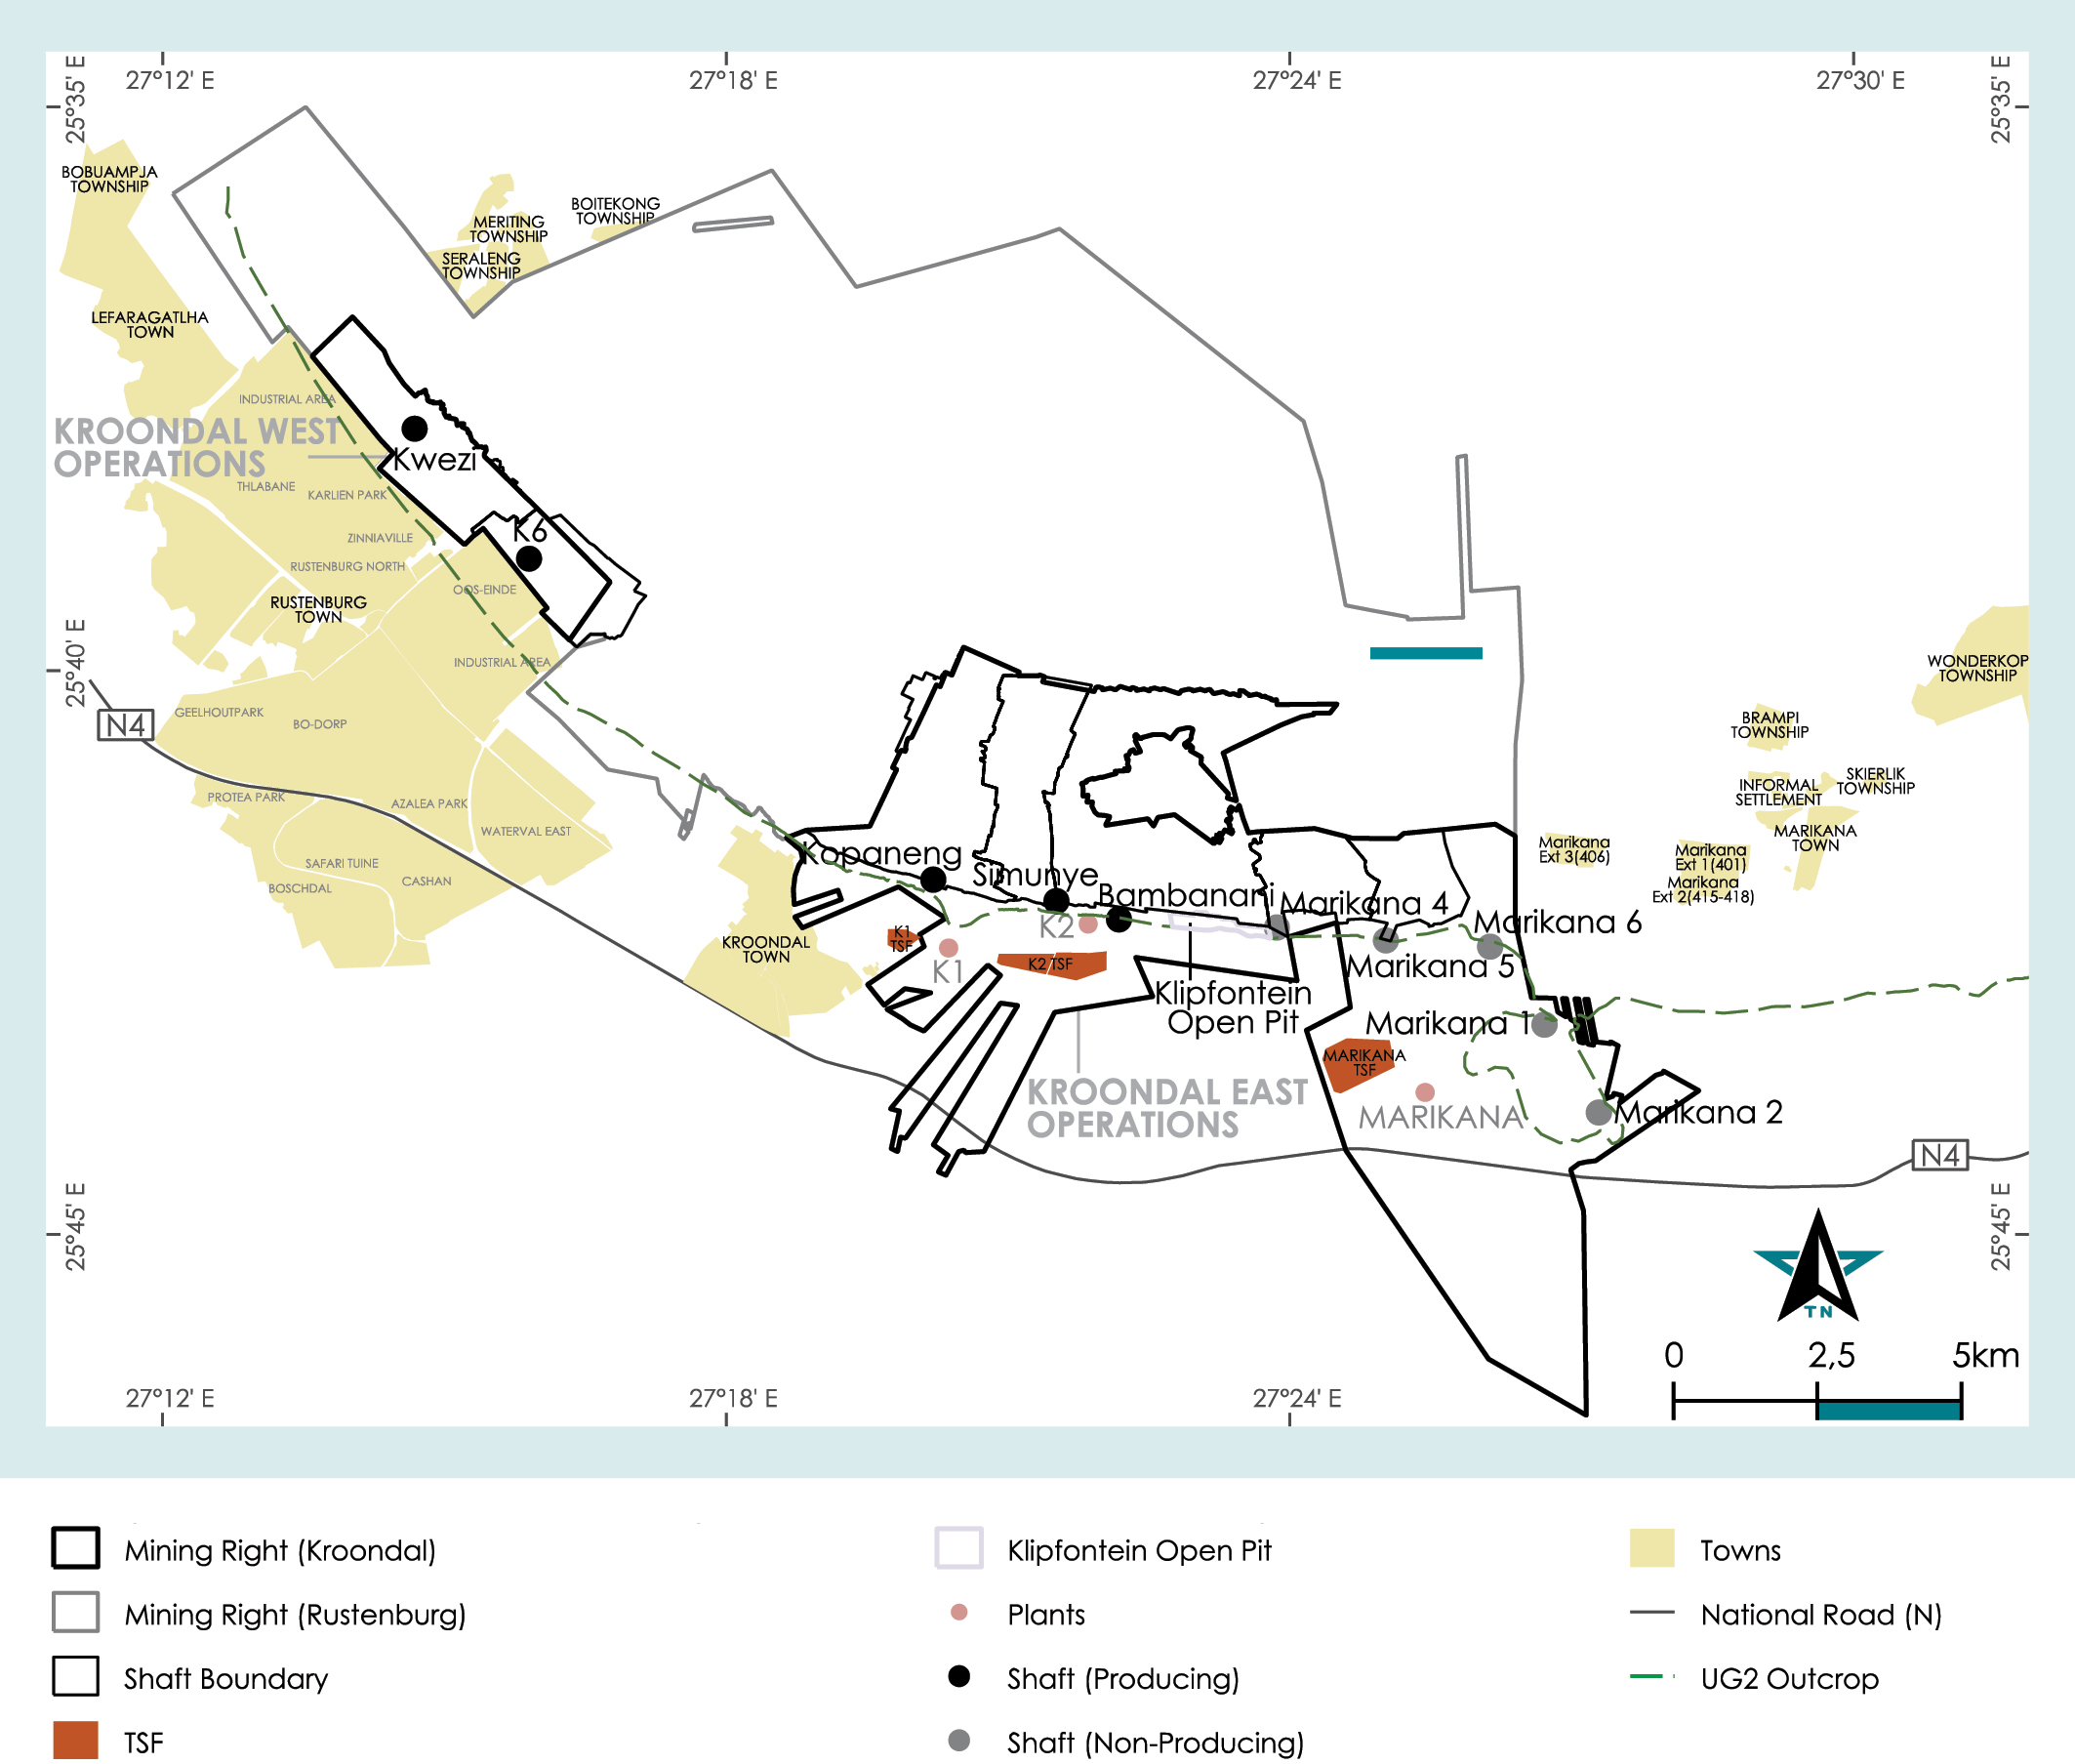
| | |
| PROPERTY DESCRIPTION |
Kroondal is situated in the magisterial district of Rustenburg, approximately 120km northwest of Johannesburg and about 120km west of Pretoria (Tshwane) in the North West province of South Africa. The Kroondal mine is a 50/50 JV with Anglo American Platinum and is subject to a pool and share agreement (PSA), whereby the Kroondal infrastructure accessed Mineral Reserves on the Anglo American Platinum mining right. The JV is currently managed by Sibanye-Stillwater. Kroondal consists of five shallow, mechanised operations and an open pit section in the Western Limb of the BIC. The UG2 Reef is exploited from surface using decline systems and mining takes place at depths of between 250m and 550m below surface. RoM ore is treated via two concentrator processing plants (K1 and K2). The concentrate is sold to RPM, a wholly-owned subsidiary of Anglo American Platinum, under a purchase of Concentrate off-take agreement. Depth extensions from the Kroondal infrastructure into the Siphumelele (SRPM mining right area) ground as well as boundary optimisation between Kroondal and Bathopele shafts (SRPM mining right area) form part of a new commercial agreement with Anglo American Platinum. In January 2022 the Group announced that it has entered into an agreement with Rustenburg Platinum Mines Limited (RPM) a subsidiary of Anglo American Platinum Limited (AAP), through its subsidiary, Sibanye Rustenburg Platinum Mines Limited (“Rustenburg operation”), to assume full ownership of the low cost, mechanised Kroondal operation. |
PGM operations KROONDAL continued
| | |
| MINERAL TITLE |
Apart from the principal mining right (NW30/5/1/2/2/80MR, 32.1 km2, expiring 28 July 2040), which is being administered by Anglo American Platinum, Kroondal Operations (Pty) Ltd is the holder of a converted mining right under DMRE Ref No NW30/5/1/2/2/104MR, (Kroondal MR), valid from 17 October 2006 to 16 October 2022, in respect of a mining area, totalling approximately 17.0 km2. The Kroondal mining right was registered on 26 April 2007 under Ref No 35/2007 MRC. The NW30/5/1/2/2/104MR (which houses the Kroondal East shaft infrastructure, plants and TSF’s) and the NW30/5/1/2/2/113MR, 25.0km2 (which houses shafts on care and maintenance, Open Pits and the Marikana TSF) are due for renewal in October 2022. All regulatory requirements are being addressed for these renewals. The Klipfontein open pit project, is situated on the NW 80 Mining Right, held by Anglo American Platinum’s Rustenburg Platinum Mines Limited (“RPM”). The section 102 application to amend the Mining Work Programme (MWP) to include the open pit mining was submitted by RPM as the holder of the right in October 2020. The open pit Mineral Reserve forms part of the original PSA between Sibanye-Stillwater and Anglo American Platinum (AAP). DMRE approval for the MWP was received in mid-2021 with project execution commencing shortly thereafter. |
| | |
| INFRASTRUCTURE AND EQUIPMENT |
The Kroondal operation is a shallow PGM mines with access from surface through numerous decline systems, inclusive of an open pit surface operation; Klipfontein. All facilities are in good condition. All the permanent infrastructure required to access and mine the LoM plan is already established and in use. Major infrastructure consists of: •nine decline shafts, of which six are in production - mined on a bord-and-pillar system with mechanised equipment and the rest are on care and maintenance •two PGM concentrator plants treating the underground and open pit material •a dense media separation (DMS) plant processing all underground material prior to the concentrator •workshops, office blocks, and equipment stores •water treatment plants The mining complex has been in operation since early 2000 and the age and modernization of these assets vary. The equipment used for mining consists of various suites of mechanised drilling, loading and hauling equipment underground. The ore is hoisted to the surface via conveyor belt systems and trammed to the concentrators by rail and truck. All the concentrate from Kroondal is treated through a PoC agreement with AAP. The equipment at all operations, including the plants, are subject to a detailed planned maintenance programs; and SIB capital provisions are made on an annual basis to cater for both repairs and replacements as needed. The property, plant and equipment book value (100% basis) for the assets of Kroondal, as at 31 December 2021 was R1.2bn. |
| | | | | | | | |
| HOISTING AND PRODUCTION CAPACITIES |
| Operating shaft | Operating hoisting | 5-year planned |
| capacity (ktpm) | production (ktpm) |
| Kwezi | 150 | 145 |
| K6 | 140 | 125 |
| Kopaneng | 186 | 144 |
| Simunye | 160 | 141 |
| Bambanani | 130 | 120 |
| Planned production is five-year hoisted average from 2022 onwards. |
| | |
| MINING METHOD |
•Underground operations: Bord-and-pillar |
•Klipfontein open pit operation: Roll-over, truck and shovel |
| | |
| LIFE OF MINE |
•It is estimated that the current Mineral Reserves will sustain the individual operations for periods varying between 2022 (Simunye), 2025 (Klipfontein), 2026 (Kwezi), 2027 (K6), 2028 (Kopaneng) and 2037 (Bambanani). Ongoing optimisation work in the boundary areas between Kroondal and SRPM could lead to further improvements on selected shafts |
PGM operations KROONDAL continued
| | | | | | | | | | | | | | |
| MINERAL PROCESSING AND CAPACITY |
| Plant name | Design capacity (ktpm) | Current operational capacity (ktpm) | Average recovery factor (%) | Material treated |
|
| K1 concentrator | 290 | 290 | 82 | UG2 |
| K2 concentrator (missing data?)300 | 300 | 300 | 79.5 | UG2 |
•Ore from Kwezi, Bambanani and K6 shaft, including the open pit, is processed at the K2 plant |
•Ore from K6, Kopaneng and Simunye shaft is processed at the K1 plant |
| | |
| TAILINGS DISPOSAL AND CAPACITY |
Tailings deposition is managed across the Tailings Storage Facilities detailed below: •K1 TSF – Fed from K1 plant at 28ktpm (life of TSF until 2026 at current deposition rate) •K150 TSF – Fed from K1 plant at 86ktpm (life of TSF until 2029 at current deposition rate) •K2 TSF – Fed from K1 (80%) and K2 (20%) plants at 86ktpm (life of TSF until 2028 at current deposition rate) •Marikana TSF – Fed from K2 plant at 200ktpm (life of TSF until 2031 at current deposition rate) The Kroondal TSF’s have a remaining capacity of 15.8Mt. The LoM requires 20.8Mt TSF capacity, resulting in a shortfall of 5.0Mt. Studies have been concluded that consider deposition in redundant, worked-out opencast pits, that mitigate the need to continue depositing on surface TSFs from 2025. This is currently undergoing the necessary permitting. All delivered ore from underground goes through a dense media separation plant that removes ±35% of total volume delivered, which is principally waste material (pyroxenite). This process enhances the feed grade of the ore received by the concentrators and also assists in minimising the tailings depositional requirements. |
| | |
| KEY DEVELOPMENTS AND BROWNFIELD PROJECTS |
| Project opportunities are limited. The Kroondal West Shallows (UG2) project will be assessed during 2022 and 2023. This project is targeting smaller blocks of ground closer to the sub-outcrop of the UG2 reef horizon which has the potential to enhance the LoM of Kroondal West. The Kroondal MK5 (UG2) study has been undertaken during 2021 and will be finalised during 2022. This project is situated towards the eastern boundary of Kroondal and up dip to Bambanani shaft, and targets an area with complex geological structures. |
Classified 4E PGM Mineral Resources estimate at 31 December 2021
| | | | | | | | | | | | | | | | | | | | | | | | | | | | | |
| Mineral Resources Inclusive of Mineral Reserves |
| | | | 31 December 2021 | 31 December 2020 |
| PGM | Southern Africa | | | Tonnes | Grade | PGM | Tonnes | Grade | PGM |
| Kroondal | | | | (Mt) | (g/t) | (Moz) | (Mt) | (g/t) | (Moz) |
| Operations | Kroondal | Underground | Measured | 26.8 | | 3.3 | | 2.8 | | 29.7 | | 3.3 | | 3.1 | |
| | | Indicated | 4.8 | | 3.8 | | 0.6 | | 4.7 | | 3.8 | | 0.6 | |
| | | Measured + Indicated | 31.6 | | 3.4 | | 3.4 | | 34.5 | | 3.4 | | 3.7 | |
| | | Inferred | 2.5 | | 2.9 | | 0.2 | | 2.5 | | 2.9 | | 0.2 | |
| Klipfontein | Open Pit | Measured | 1.0 | | 4.3 | | 0.1 | | 1.0 | | 3.7 | | 0.1 | |
| | Surface | Indicated | — | | — | | — | | 0.3 | | 3.6 | | 0.03 | |
| | | Measured + Indicated | 1.0 | | 4.3 | | 0.1 | | 1.3 | | 3.7 | | 0.2 | |
| | | Inferred | — | | — | | — | | — | | — | | — | |
| Total Measured + Indicated | 32.5 | | 3.4 | | 3.6 | | 35.8 | | 3.4 | | 3.9 | |
| Grand total | 35.0 | | 3.4 | | 3.8 | | 38.3 | | 3.3 | | 4.1 | |
PGM operations KROONDAL continued
| | | | | | | | | | | | | | | | | | | | | | | | | | | | | |
| Mineral Resources Exclusive of Mineral Reserves |
| | | | 31 December 2021 | 31 December 2020 |
| PGM | Southern Africa | | | Tonnes | Grade | PGM | Tonnes | Grade | PGM |
| Kroondal | | | | (Mt) | (g/t) | (Moz) | (Mt) | (g/t) | (Moz) |
| Operations | Kroondal | Underground | Measured | 15.8 | | 3.4 | | 1.7 | | 17.0 | | 3.4 | | 1.9 | |
| | | Indicated | 4.8 | | 3.8 | | 0.6 | | 4.7 | | 3.8 | | 0.6 | |
| | | Measured + Indicated | 20.5 | | 3.5 | | 2.3 | | 21.8 | | 3.5 | | 2.4 | |
| | | Inferred | 2.5 | | 2.9 | | 0.2 | | 2.5 | | 2.9 | | 0.2 | |
| Total Measured + Indicated | 20.5 | | 3.5 | | 2.3 | | 21.8 | | 3.5 | | 2.4 | |
| Grand total | 23.0 | | 3.4 | | 2.5 | | 24.2 | | 3.4 | | 2.7 | |
Notes:
The -8% change year-on-year to the stated Mineral Resources (Inclusive of Mineral Reserves) is attributed to:
–-0.9Moz in depletions
–0.3Moz in area inclusions
–-0.2Moz decrease due to changes in geological losses and interpretation
–-0.1Moz due to the addition of new data and subsequent change to the Mineral Resource models
On a Mineral Resources exclusive of Mineral Reserves basis, the year-on-year change is -6.9%.
PGM operations KROONDAL continued
Grade control and ore definition drilling summary
| | | | | | | | | | | | | | | | | | | | |
| Planned 2022 | Actual 2021 | Actual 2020 |
| Drilled | Expenditure | Drilled | Expenditure | Drilled | Expenditure |
| OPERATIONS - KROONDAL | (m) | (Rm) | (m) | (Rm) | (m) | (Rm) |
| | | | | | |
Kroondal1 | 21,869 | 27.23 | 7,308 | 5.89 | 5,983 | 4.55 |
| Total | 21,869 | 27.23 | 7,308 | 5.89 | 5,983 | 4.55 |
1 Includes surface drilling
Annual development results
| | | | | | | | | | | |
| Financial year total |
| Category | Unit | 2021 | 2020 |
| Primary waste development (vent shafts) | m | 7,427 | 1,336 |
|
| Primary reef development (declines and supporting excavations) | m | 1,083 | 7,028 |
| Total | m | 8,511 | 8,364 |
Modifying factors (underground) in converting Mineral Resources to Mineral Reserves
| | | | | | | | | | | |
| Parameter | Unit | 2021 | 2020 |
| Off-reef | % | 7.6 | 6 |
| Dilution | cm | 8.8 | 18.9 |
| Ave. Stoping width | cm | 220.8 | 223 |
| Scalping | % | 3.4 | 3 |
| Mine call factor | % | 95 | 95 |
Classified 4E PGM Mineral Reserve estimate at 31 December 2021
| | | | | | | | | | | | | | | | | | | | | | | | | | | | | |
| Mineral Reserves |
| | | | 31 December 2021 | 31 December 2020 |
| PGM | Southern Africa | | | Tonnes | Grade | PGM | Tonnes | Grade | PGM |
| Kroondal | | | | (Mt) | (g/t) | (Moz) | (Mt) | (g/t) | (Moz) |
| Operations | | Underground | Proved | 9.6 | | 2.5 | | 0.8 | | 12.0 | | 2.6 | | 1.0 | |
| | | Probable | — | | — | | — | | — | | — | | — | |
| | | Proved + Probable | 9.6 | | 2.5 | | 0.8 | | 12.0 | | 2.6 | | 1.0 | |
| | Open Pit Surface | Proved | 0.8 | | 3.3 | | 0.1 | | 0.8 | | 3.3 | | 0.1 | |
| | | Probable | — | | — | | — | | — | | — | | — | |
| | | Proved + Probable | 0.8 | | 3.3 | | 0.1 | | 0.8 | | 3.3 | | 0.1 | |
| Grand total Proved + Probable | 10.4 | | 2.6 | | 0.9 | | 12.9 | | 2.6 | | 1.1 | |
PGM operations KROONDAL continued
Notes:
The -19.7% change year-on-year in the stated Mineral Reserves is attributed to:
–-0.6Moz in depletions
–+0.1Moz due to LoM gains associated with tail end optimisation
| | |
| HISTORY AND OPERATIONAL STATISTICS |
•In 1996, a PFS on the Kroondal platinum project, in which Aquarius had a 45% stake, was completed •Mine development began in 1998 and an initial off-take agreement was signed with Implats that continued until 2008 •Mining via two decline shafts began in March 1999 •In 2000, Aquarius increased its stake in Kroondal to 100% •Between 2001 and 2003, Aquarius entered into JV (50:50) agreements with Rustenburg Platinum Mines, a subsidiary of Anglo American platinum, to extract mineral reserves located on adjacent Anglo American platinum mining rights. This included the construction of a second concentrator plant and enabled doubling of production. This agreement included a PoC off-take agreement with Anglo American Platinum •By 2005, the second concentrator plant was commissioned and by 2011, five decline shafts were in production •In 2013, the extent of the Mineral Resource included in the PSA was extended, prolonging Kroondal’s LoM •Sibanye-Stillwater acquired a 50% stake in Kroondal in 2016, via the acquisition of Aquarius platinum in 2016 •In 2021 agreements with Anglo American Platinum were concluded allowing Kroondal to mine into the Rustenburg (SRPM) mining right. During 2022, the Group reached an agreement with Anglo American Platinum to take full ownership of Kroondal |
PGM operations KROONDAL continued
| | | | | | | | | | | |
| Operational Statistics | 2019 | 2020 | 2021 |
| Underground tonnes milled (kt) | 4,060 | 2,997 | 3,525 |
| Underground yield (g/t) | 2.03 | 2.04 | 2 |
| Surface tonnes milled (kt) | 0 | 0 | 0 |
| Surface yield (g/t) | N/A | N/A | N/A |
| Annual 4E PGM production - Underground (koz) | 265 | 197 | 227 |
| Annual 4E PGM production - surface (koz) | N/A | N/A | N/A |
| Total Annual 4E PGM production (koz) | 265 | 197 | 227 |
| Operating cost underground (R/t) | 709 | 883 | 896 |
| Operating cost surface (R/t) | N/A | N/A | N/A |
| Total capital expenditure (Rm) | 213 | 188 | 268 |
| AISC (R/oz) | 10,771 | 13,512 | 12,943 |
| AISC (US$/oz) | 745 | 821 | 875 |
Note: AISC calculated based on produced Oz
MIMOSA
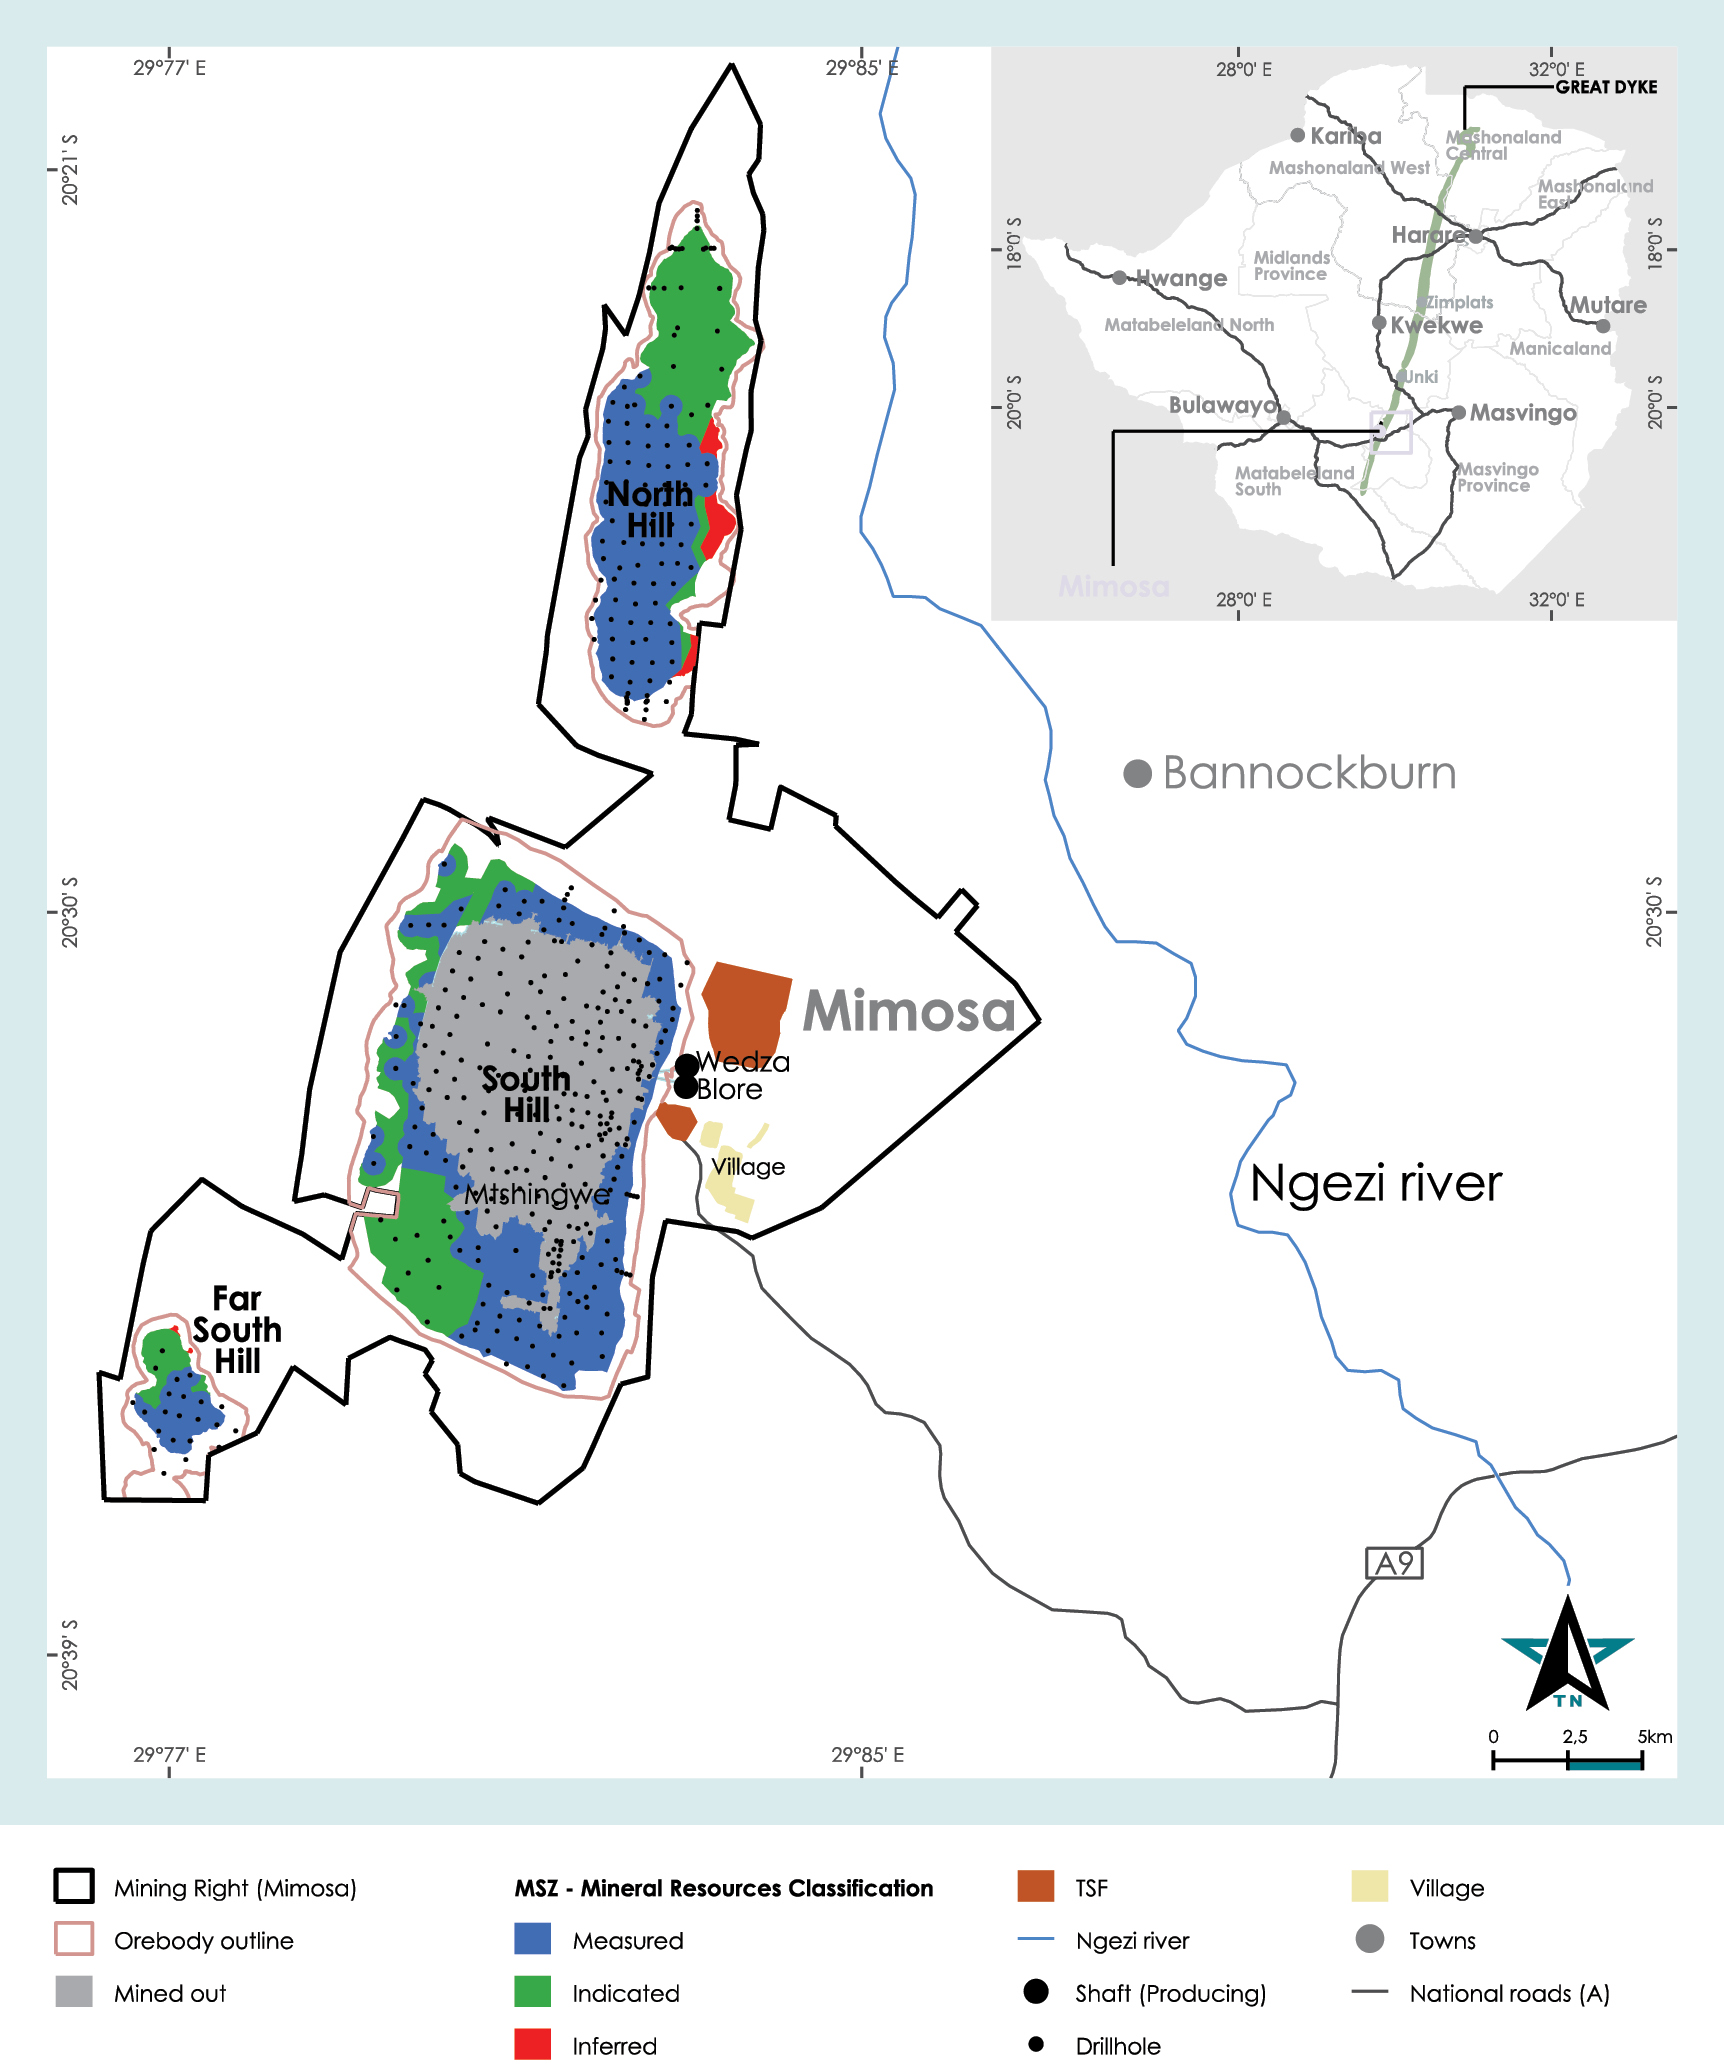
| | |
| PROPERTY DESCRIPTION |
Mimosa is a shallow, mechanised PGM and base metal mining operation located in the Wedza sub-chamber of the Great Dyke of Zimbabwe, some 32km west of Zvishavane, a major mining centre situated 340km southwest of Harare, the capital city of Zimbabwe. Mimosa Mining Company is jointly owned by Impala Platinum and Sibanye-Stillwater in terms of a 50:50 JV shareholding. Aquarius Platinum was acquired by Sibanye-Stillwater on 12 April 2016. The Mimosa mine has four mineralised areas separated by major faults and erosional surfaces namely: North Hill, South Hill, Far South Hill and the Mtshingwe Block. Mimosa is an underground operation on the South Hill ore deposit, consisting of two shafts, namely the Blore Shaft and the Wedza Shaft. The Wedza Shaft, on the northern part of South Hill, has been extensively mined. At Mimosa, focus is being given to developing the Mtshingwe Shaft and further evaluating the Mtshingwe Block. There are two mineralised horizons at Mimosa, of which only the MSZ is economical and being mined. |
PGM operations MIMOSA continued
| | |
| MINERAL TITLE |
The Mimosa mining right is covered by a mining lease covering an area of 65.94km2. The mining lease, Lease No 24, was granted to Mimosa Mining Company on 5 September 1996. The lease was registered for nickel, copper, cobalt, gold, silica, chromite and PGMs, and Mimosa Mines (Pvt) Ltd currently holds the mining right to that lease. The lease agreement gives Mimosa Mining Company exclusive mining rights for PGMs and base metals within the vertical limits of its boundary. As per Zimbabwean law, the mining right does not expire under the provisor that annual renewal fees are up to date. In addition to Lease No 24, Mimosa holds the following claims ; Fifty (50) KV Platinum Claims (4.84km2) - (Acquired recently from Anglo American and now referred to as the Wedza West), Thirty-seven (37) SR Platinum Claims (3.70km2) - (Acquired recently from Anglo American), Seven (7) Chrome Claims (1.75km2) - (Acquired recently from Anglo American) and a 0.30km2 block pegged in 2020 over the Mtshingwe Fault block. |
| | |
| INFRASTRUCTURE AND EQUIPMENT |
Mimosa is an established mining operation, with all the facilities and equipment to mine and produce precious and base metals concentrate. All facilities are in good condition. All the permanent infrastructure required to access and mine the LoM plan is already established and in use. There are two decline shafts, and a small vertical shaft at 26 Level South which is equipped for hoisting people to surface in case of an emergency. Underground infrastructure includes an ore bunker, main and satellite workshops, pump stations, strike and dip conveyors as well as the main conveyor in Blore shaft. A fleet of trackless mining machinery (TMM) to enable the mechanised bord-and-pillar operation. The fleet of TMM equipment is serviced and repaired in the main underground workshop, which is adequately equipped for the purpose. Minor services and inspections are done in the satellite workshops in the various sections of the mine. Major overhauls and repairs are conducted in the surface workshop, which is appropriately equipped for that purpose. Planned Maintenance is conducted and the machinery is well maintained. Surface Infrastructure includes an ore stockpile, concentrator plant, garage, workshops, dirty water settling ponds, service and potable water storage tanks, a clinic and housing for selected essential staff. The mine runs a fleet of busses that are critical in the transport of employees, most of whom live in Zvishavane, 32 km from the mine. The concentrator treats about 2.8 Mtpa, which is its full capacity. The concentrator receives ore from the mining stockpile and has ample redundancy in its crushing and milling sections. Regular inspections, which include NDT and oil sampling, are conducted on all critical equipment and structures, such as crushers, mill drives and shells, concentrate thickener and support steelwork. The floatation section is vulnerable to rust and corrosion due to the presence of corrosive chemicals. There are sections of structural steelwork that require some attention within the next 2 or 3 years. The Plant has made plans for the availability of sustaining capital to affect the necessary repairs. The property, plant and equipment book value (100%) for the assets of Mimosa, as at 31 December 2021 was USD0.364bn. |
| | | | | | | | |
| HOISTING AND PRODUCTION CAPACITIES |
| Operating shaft | Operating hoisting capacity (ktpm) | 5-year planned production (ktpm) |
| Blore Shaft | 270 | 250 |
| Planned production is five-year hoisted average from 2022 onwards. |
| | |
| MINING METHOD |
| Mechanised bord-and-pillar |
| | |
| LIFE OF MINE |
| It is estimated that the current South Hill Mineral Reserves will sustain the operations until 2034, with the new North Hill study area having the potential to extend this by a further eight years. |
PGM operations MIMOSA continued
| | | | | | | | | | | | | | |
| MINERAL PROCESSING AND CAPACITY |
| Plant name | Design capacity (ktpm) | Current operational capacity (ktpm) | Average recovery factor (%) | Material treated |
| Mimosa Concentrator | 185 | 230 | 77.8 | UG MSZ |
| Concentrates are transported by road to South Africa for smelting and refining at the Impala Platinum facilities |
| | |
| TAILINGS DISPOSAL AND CAPACITY |
Tailings deposition is managed across the Tailings Storage Facilities detailed below: •Mimosa TSF3 – Fed from Mimosa plant at 229ktpm (life of TSF until 2024 at current deposition rate) •Mimosa TSF4 – currently under construction (life of TSF until 2044 at 233ktpm deposition rate) The Mimosa TSF3 has a remaining capacity of 6.9Mt. The LoM requires 31.7Mt TSF capacity, resulting in a shortfall of 24.8Mt. This is mitigated through the elevating of penstocks to run TSF3 until decommissioning once TSF4 construction is complete. TSF4 will provide additional capacity of 55.0Mt, a surplus capacity of 31Mt. |
| | |
| KEY DEVELOPMENTS AND BROWNFIELD PROJECTS |
The North Hill Bankable Feasibility Study has been completed and presented to the JV Board Technical Committee. The area is being considered as a life extension for Mimosa due to inherent mining risks at the South Hill from 2029 onwards. It targets an area with 6.65Moz 4E Mineral Resources, and will extend the LoM at current rates (+230kOz per year) to ~2044. Approvals from the respective Shareholder Investment Committees ahead of Board approval for funding and project implementation is expected during 2022. Surface exploration is being carried out to upgrade an additional portion of the Mtshingwe Shaft mining block to a Measured Resource. In addition, Infill drilling was carried out in the recently acquired Wedza West claims on the western part of South Hill from AAP. |
Classified 4E PGM Mineral Resources estimate at 31 December 2021
| | | | | | | | | | | | | | | | | | | | | | | | | | | | | |
| Mineral Resources Inclusive of Mineral Reserves |
| | | | 31 December 2021 | 31 December 2020 |
| PGM | Southern Africa | | | Tonnes | Grade | PGM | Tonnes | Grade | PGM |
| Mimosa | | | | (Mt) | (g/t) | (Moz) | (Mt) | (g/t) | (Moz) |
| Operations | | Underground | Measured | 31.0 | | 3.5 | | 3.5 | | 25.4 | | 3.6 | | 3.0 | |
| | | Indicated | 17.7 | | 3.5 | | 2.0 | | 15.1 | | 3.6 | | 1.7 | |
| | | Measured + Indicated | 48.7 | | 3.5 | | 5.5 | | 40.5 | | 3.6 | | 4.7 | |
| | | Inferred | 17.2 | | 3.4 | | 1.9 | | 13.4 | | 3.5 | | 1.5 | |
| Total Measured + Indicated | 48.7 | | 3.5 | | 5.5 | | 40.5 | | 3.6 | | 4.7 | |
| Grand total | 65.9 | | 3.5 | | 7.4 | | 53.9 | | 3.6 | | 6.2 | |
| | | | | | | | | | | | | | | | | | | | | | | | | | | | | |
| Mineral Resources Exclusive of Mineral Reserves |
| | | | 31 December 2021 | 31 December 2020 |
| PGM | Southern Africa | | | Tonnes | Grade | PGM | Tonnes | Grade | PGM |
| Mimosa | | | | (Mt) | (g/t) | (Moz) | (Mt) | (g/t) | (Moz) |
| Operations | | Underground | Measured | 16.0 | | 3.4 | | 1.8 | | 11.7 | | 3.5 | | 1.3 | |
| | | Indicated | 8.4 | | 3.5 | | 1.0 | | 9.7 | | 3.6 | | 1.1 | |
| | | Measured + Indicated | 24.4 | | 3.5 | | 2.7 | | 21.4 | | 3.6 | | 2.4 | |
| | | Inferred | 17.2 | | 3.4 | | 1.9 | | 13.4 | | 3.5 | | 1.5 | |
| Total Measured + Indicated | 24.4 | | 3.5 | | 2.7 | | 21.4 | | 3.6 | | 2.4 | |
| Grand total | 41.6 | | 3.4 | | 4.6 | | 34.7 | | 3.5 | | 4.0 | |
Note: Mining is non-selective on a regional scale, and cut off grades have not been applied, but mineralised cuts are optimised for economic metal extraction
PGM operations MIMOSA continued
Notes:
The +18.4% change year-on-year to the stated Mineral Resources (Inclusive of Mineral Reserves) is attributed to:
–-0.4Moz in depletions
–1.9Moz in area inclusions
–0.4Moz increase due to changes in geological losses and interpretation
–0.4Moz due to the addition of new data and subsequent change to the Mineral Resource models
On a Mineral Resources exclusive of Mineral Reserves basis, the year-on-year change is +13%.
Grade control and ore definition drilling summary
| | | | | | | | | | | | | | | | | | | | |
| Planned 2022 | Actual 2021 | Actual 2020 |
| Drilled | Expenditure | Drilled | Expenditure | Drilled | Expenditure |
| OPERATIONS - MIMOSA | (m) | (Rm) | (m) | (Rm) | (m) | (Rm) |
| | | | | | |
Mimosa1 | 4131 | 12.865 | 3520 | 6.975 | 4285 | 9.145 |
| Total | 4131 | 12.865 | 3520 | 6.975 | 4285 | 9.145 |
1 Includes surface drilling
Annual development results
| | | | | | | | | | | |
| Financial year total |
| Category | Unit | 2021 | 2020 |
| Primary waste development (vent shafts) | m | 573 | 453 |
| | | |
| Primary reef development (declines, strikes and supporting excavations) | m | 6,951 | 4,868 |
| Total | m | 7,524 | 5,321 |
PGM operations MIMOSA continued
Modifying factors in converting Mineral Resources to Mineral Reserves
| | | | | | | | | | | |
| Parameter | Unit | 2021 | 2020 |
| Off-reef (inclusive of dilution) | % | 6 | 6 |
| Ave. Stoping width | cm | 215 | 215 |
| Mine call factor | % | 91.4 | 93 |
Classified 4E PGM Mineral Reserves estimate at 31 December 2021
| | | | | | | | | | | | | | | | | | | | | | | | | | | | | |
| Mineral Reserves |
| | | | 31 December 2021 | 31 December 2020 |
| PGM | Southern Africa | | | Tonnes | Grade | PGM | Tonnes | Grade | PGM |
| Mimosa | | | | (Mt) | (g/t) | (Moz) | (Mt) | (g/t) | (Moz) |
| Operations | | Underground | Proved | 8.2 | | 3.6 | | 0.9 | | 8.5 | | 3.5 | | 1.0 | |
| | | Probable | 7.7 | | 3.5 | | 0.9 | | 4.6 | | 3.3 | | 0.5 | |
| Grand total Proved + Probable | 15.8 | | 3.5 | | 1.8 | | 13.1 | | 3.4 | | 1.5 | |
Notes: Based on a commodity price (USD/oz) assumption of Platinum 1,087; Palladium 1,194; Rhodium 8,624; Ruthenium 294 and an exchange rate R/US$ of 14.51
Notes:
The +23.4% change year-on-year in the stated Mineral Reserves is attributed to:
–-0.3Moz in depletions
–+0.3Moz increase due to geological changes and technical factors
–+0.6Moz due to land addition at Wedza West
PGM operations MIMOSA continued
Mineral Reserves classification map for Mimosa
PGM operations MIMOSA continued
| | |
| HISTORY AND OPERATIONAL STATISTICS |
•Mining operations at the Mimosa platinum mine started in 1926 •Two vertical shafts were sunk with trial mining starting in 1966 •The operations were suspended in 1971 •Blore Shaft was established in 1975 •The mining operations were again suspended in 1978 •Mimosa was acquired by Zimasco from Union Carbide in 1993. Zimasco managed to stabilise the operation and increased production to 1,000 tonnes per day by 1998 •Implats acquired a 35% stake in Mimosa in 2001, which was increased to 50% in 2002 •Aquarius acquired a 50% stake in Mimosa during the same year •In 2016, Sibanye-Stillwater acquired Aquarius and became a 50% partner in the JV |
| | | | | | | | | | | |
| Operational Statistics | 2019 | 2020 | 2021 |
| Underground tonnes milled (kt) | 1,357 | 1,414 | 1,422 |
| Underground yield (g/t) | 2.69 | 2.7 | 2.61 |
| Surface tonnes milled (kt) | 0 | 0 | 0 |
| Surface yield (g/t) | N/A | N/A | N/A |
| Annual 4E PGM production - Underground (koz) | 118 | 123 | 119 |
| Annual 4E PGM production - surface (koz) | N/A | N/A | N/A |
| Total Annual 4E PGM production (koz) | 118 | 123 | 119 |
| Operating cost underground (R/t) | 985 | 1,146 | 1,122 |
| Operating cost surface (R/t) | N/A | N/A | N/A |
| Total capital expenditure (Rm) | 343 | 414 | 499 |
| AISC (R/oz) | 12,058 | 14,380 | 14,549 |
| AISC (US$/oz) | 834 | 874 | 984 |
Note: AISC calculated based on produced Oz
PGM exploration
The southern Africa PGM operations are supported by a pipeline of three exploration stage properties . These projects present significant optionality to sustain and/or enhance the current production profile.
AKANANI
PGM exploration AKANANI continued
| | |
| PROPERTY DESCRIPTION |
Akanani is an exploration project located on the Northern Limb of the BIC, in the Limpopo province of South Africa, 30km northeast of the town of Mokopane. The project was acquired by Sibanye-Stillwater in 2019 as part of the Lonmin transaction. Extensive exploration drilling has been conducted on the property, confirming significant Mineral Resources which offers the potential for a long-life, low-cost operation. The wide orebody (>20m thick for P2 Unit) would enable a mechanised, long-hole, open-stope mining operation. |
|
| MINERAL TITLE |
Akanani Mining (Propriety) Limited (“Akanani”) is the holder of a new order (converted) prospecting right MPT No. 249/2006 for Platinum Group Metals, Gold, Silver, Nickel, Copper and Cobalt on the Farms Moordkopje and Zwartfonteinwhich covering 40,95km2. The right was registered in the Mining Titles Registration Office on 28 June 2006, which, following renewals, ultimately expired on 3 April 2021. An application for conversion to a mining right was submitted in March 2021, and the Draft EIA is currently being assessed by the DMR. |
| | |
| GEOLOGY AND MINERALISATION CHARACTERISTICS |
The Mineral Resource is contained within the Platreef Pyroxenite unit that is considered to represent the Upper Critical Zone in this area and starts at approximately 750m below surface. The Platreef Pyroxenite, which can be hundreds of metres thick, contains zones of PGM mineralisation that are associated with various lithological subdivisions. The higher grade mineralisation is generally well constrained within a geological unit towards the top of the Platreef known as the P2 Unit that has an average thickness of approximately 20m. Mineralisation in the P1 Unit occurs over a wider interval (30m) and appears to be less continuous than that of the P2 Unit. The P1 Unit is generally of lower grade than the P2 Unit. Potholes and IRUP intrusions, such as those that occur on the Merensky and UG2 Reefs, have not been recognised on the Platreef at the Akanani project. Losses in the Mineral Resource area are anticipated to occur as a result of dykes and veins, faults and localised alteration, particularly calc-silicate alteration. Such alteration is rare in the P2 Unit and more common in the P1 Unit. Major discontinuities, such as faults and dykes, have been identified throughout the deposit, via the interpretation of magnetic survey and diamond drilling information. A unique feature of the Platreef mineralisation, is the ratio of platinum:palladium, which is close to 1:1, as well as the high concentration in base metal by-products, with nickel and copper grading 0.24% and 0.13% respectively, making for a very attractive and diversified metal mix. Cross section and plan view of mine design Source: Sound Mining (2017) |
PGM exploration AKANANI continued
| | |
| KEY DEVELOPMENTS AND INTENT |
| The key focus on the project for 2022 remains on advancing the Mining Right application, which is currently under consideration by the DMRE. The necessary exploration activities to support the initial 20 years of mining has been concluded, and subject to the granting of the Mining Right, Akanani will become a strategic investment and development option to the Group. |
Classified 4E PGM Mineral Resources estimate at 31 December 2021
| | | | | | | | | | | | | | | | | | | | | | | | | | | | | |
| Mineral Resources Inclusive of Mineral Reserves |
| | | | 31 December 2021 | 31 December 2020 |
| PGM | Southern Africa | | | Tonnes | Grade | PGM | Tonnes | Grade | PGM |
| Akanani | | | | (Mt) | (g/t) | (Moz) | (Mt) | (g/t) | (Moz) |
| Exploration | | Underground | Measured | — | | — | | — | | — | | — | | — | |
| | | Indicated | 164.5 | | 4.2 | | 22.0 | | 191.1 | | 4.2 | | 25.6 | |
| | | Measured + Indicated | 164.5 | | 4.2 | | 22.0 | | 191.1 | | 4.2 | | 25.6 | |
| | | Inferred | 87.9 | | 3.4 | | 9.6 | | 102.1 | | 3.4 | | 11.2 | |
| Total Measured + Indicated | 164.5 | | 4.2 | | 22.0 | | 191.1 | | 4.2 | | 25.6 | |
| Grand total | 252.4 | | 3.9 | | 31.6 | | 293.3 | | 3.9 | | 36.8 | |
Notes:
•Reflects Sibanye-Stillwater’s 80.13% effective interest
•The -14.1% change year-on-year in the stated Mineral Resource is due to the revised basis for calculating attributable interest
•The Mineral Resource estimates were completed for both the P2 and P1 Units at Akanani using 3D modelling techniques and ordinary kriging
•A percentage of the area has been removed as an allowance to cater for anticipated geological losses. Geological losses include those from dykes and veins, fault loss and localised alteration. 10% geological losses were applied to the P2 model. 20% geological losses were applied to the P1 model in order to account for the greater occurrences of calc-silicate in this unit
•Geostatistical estimation criteria were used to guide the definition of the P2 and P1 Indicated Mineral Resource area. These were typically declared where drill hole spacing is less than 200m and within the variogram range, depending on knowledge of the orebody continuity in individual areas
•Inferred Mineral Resources were extrapolated at a maximum of 465m in the reef plane outside the drill hole grid to a maximum depth below surface of 2,000m, depending on knowledge of the reef continuity in individual areas
•The Mineral Resources in the project occur from approximately 800m below surface and are shallower than 2,000m below surface. The average thickness of the P2 Unit Mineral Resource is approximately 20m. The thickness of the P1 Unit mineralisation declared as Mineral Resource is variable due to its irregular shape but is typically in the order of 30m thick on average
•Mineral Resources were estimated within a mineralised envelope. The P2 Unit hanging wall was defined by a lithological boundary and the foot wall normally forms the P1 hanging wall. There being no distinct change in lithology, the foot wall of the P1 mineralisation was defined by a 2g/t 3PGE+Au assay cut-off using indicator kriging
PGM exploration continued
LIMPOPO
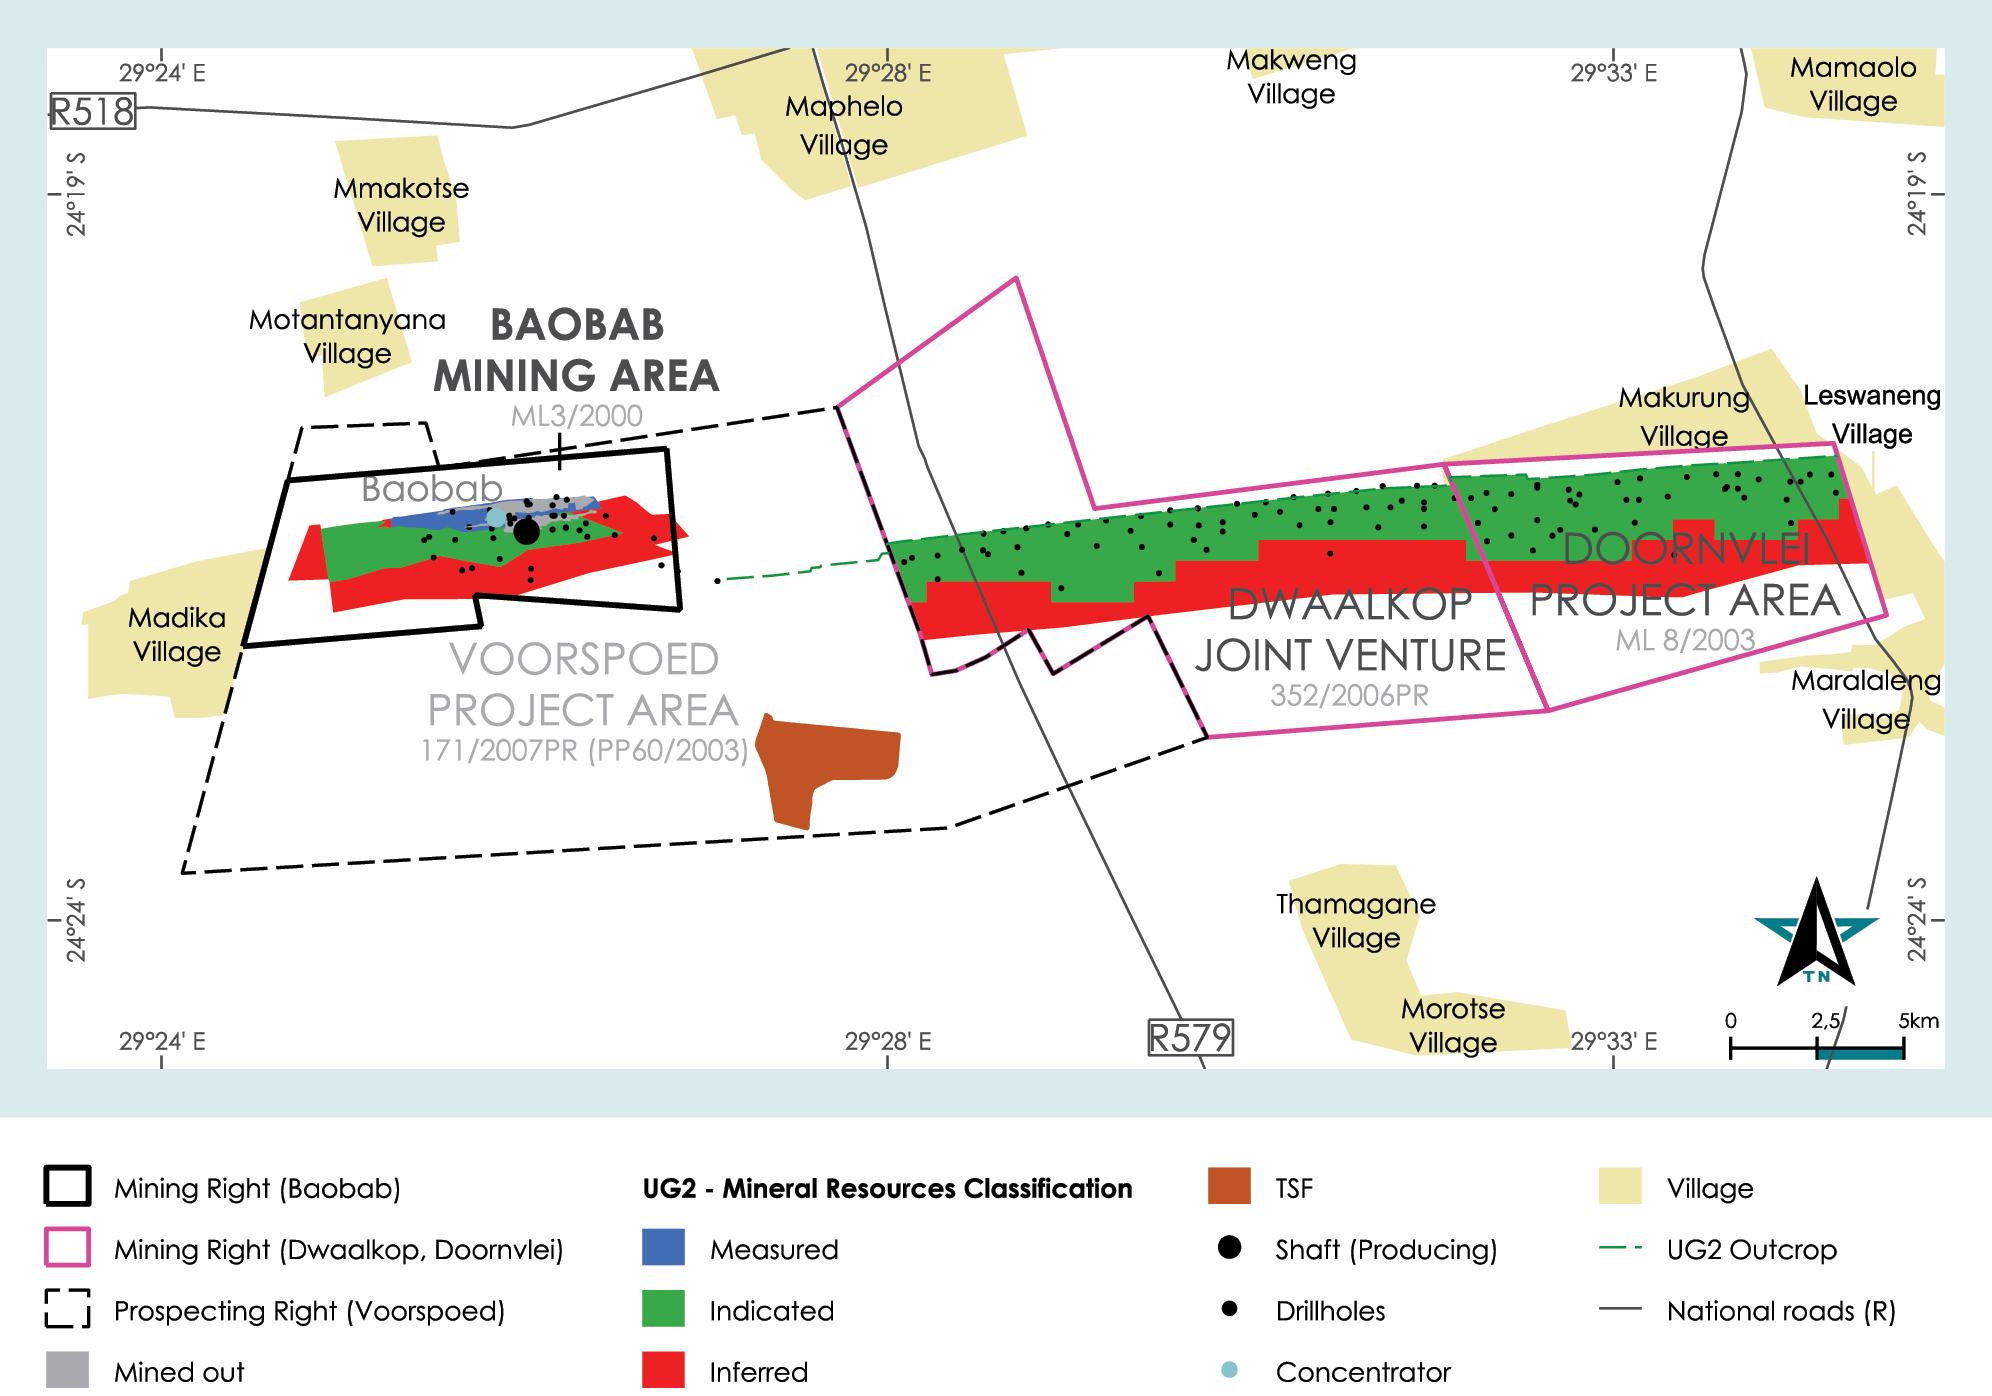
| | |
| PROPERTY DESCRIPTION |
The Limpopo project is located on the northern sector of the Eastern Limb of the BIC in the Limpopo province, approximately 50km south of the city of Polokwane. The project area consists of three mineral titles areas, Voorspoed (Including the Baobab mining right and the Voorspoed prospecting area), and the Dwaalkop and Doornvlei mining right areas, centred around the care and maintenance Baobab mining property. The Baobab property has the full surface and underground infrastructure to support the designed mining rate of 90ktpm. It has a vertical shaft to a depth of 450m. There is a 90,000tpm concentrator on the property. Concentrate has been historically processed at Sibanye-Stillwater’s (formerly Lonmin’s) smelting and refining operations. The Limpopo Baobab property was a producing operation that reached a maximum extraction rate of 75,000tpm, before being placed on care and maintenance in early 2009. The mining methods applied when the operation started were conventional down-dip stoping, conventional apparent dip raise, long-hole stoping and mechanised, long-hole stoping. The concentrator plant is currently being leased to Anglo American Platinum. There are no mining development activities on the balance of the properties as yet. The Dwaalkop Project is a 50:50 JV with Northam Platinum (via Mvelaphanda Resources). |
| | |
| MINERAL TITLE |
Voorspoed is owned by Western Platinum Limited and holds a new order mining right (LP30/5/1/2/2/77MR), covering 60.24km2 and expiring on 25 February 2044. The Dwaalkop Mineral Resource block, directly to the east of Voorspoed, has been granted a Mining Right (LP30/5/1/2/2/99MR) by the DMRE during 2021, which is currently awaiting execution. Doornvlei is held by WPL and holds a new order mining right (LP30/5/1/2/2/140MR) expiring on 25 February 2044. |
PGM exploration LIMPOPO continued
| | |
| GEOLOGY AND MINERALISATION CHARACTERISTICS |
Mineralisation occurs in two parallel ore zones, the UG2 and Merensky Reefs. The two reefs are approximately 130m apart and are part of the northern portion of the Eastern Limb of the BIC. The average width of the UG2 Reef for each property varies between approximately 1.90m and 3.05m, and the average width of the Merensky Reef for each property varies between approximately 0.90m and 2.25m. The reef dip is relatively steep in this area, with the dip in the Baobab and Dwaalkop-Doornvlei blocks being approximately 60° to the south. The Mineral Resources occur over a strike length of approximately 15km and are dislocated by several large faults, which form the lateral boundaries of the delineated Mineral Resource blocks namely Baobab and Baobab East, Dwaalkop and Doornvlei. The UG2 Reef Mineral Resources in the northern sector of the Eastern Limb differ from other areas in the BIC in that the concentrations of both copper and nickel are relatively high, visible sulphide mineralisation being a feature of this UG2 ore type. These base metals form an important by-product of PGM mining. Merensky and UG2 Reef profiles at the Limpopo project. |
| | |
| KEY DEVELOPMENTS AND INTENT |
Due to the steep dip of the UG2 and Merensky Reefs, the project remains an attractive mechanisation option, which fits well with Sibanye-Stillwater’s strategic goals. Development of the project remains subject to group capital expenditure ranking, and no Mineral Reserves have been declared on these assets. No exploration work was conducted on the Limpopo properties in the 2021 financial year, but following a thorough external review of the historic Mineral Resource estimate to determine its validity and currency, an adjustment has been made to the estimate to reflect current views on classification and continuity. |
| | | | | |
Vertical profile of the Baobab shaft, showing the steep ore-body dip | Conceptual, mechanised mining lay-out at the down dip extension to the ore-body at the Baobab shaft |
|
PGM exploration LIMPOPO continued
Classified 4E PGM Mineral Resources estimate as at 31 December 2021
| | | | | | | | | | | | | | | | | | | | | | | | | | | | | |
| Mineral Resources Inclusive of Mineral Reserves |
| | | | 31 December 2021 | 31 December 2020 |
| PGM | Southern Africa | | | Tonnes | Grade | PGM | Tonnes | Grade | PGM |
| Limpopo | | | | (Mt) | (g/t) | (Moz) | (Mt) | (g/t) | (Moz) |
| Exploration | Baobab | Underground | Measured | 1.8 | | 4.2 | | 0.2 | | 2.1 | | 4.2 | | 0.3 | |
| | | Indicated | 16.9 | | 4.0 | | 2.2 | | 20.0 | | 4.0 | | 2.6 | |
| | | Measured + Indicated | 18.7 | | 4.0 | | 2.4 | | 22.1 | | 4.0 | | 2.8 | |
| | | Inferred | 33.1 | | 3.9 | | 4.1 | | 39.1 | | 3.9 | | 4.9 | |
| Doornvlei | Underground | Measured | — | | — | | — | | — | | — | | — | |
| | | Indicated | 29.2 | | 4.8 | | 4.5 | | 36.5 | | 4.4 | | 5.2 | |
| | | Measured + Indicated | 29.2 | | 4.8 | | 4.5 | | 36.5 | | 4.4 | | 5.2 | |
| | | Inferred | 18.3 | | 4.8 | | 2.8 | | 33.3 | | 4.6 | | 4.9 | |
| Dwaalkop | Underground | Measured | — | | — | | — | | — | | — | | — | |
| | | Indicated | 27.5 | | 4.0 | | 3.6 | | 38.7 | | 3.6 | | 4.5 | |
| | | Measured + Indicated | 27.5 | | 4.0 | | 3.6 | | 38.7 | | 3.6 | | 4.5 | |
| | | Inferred | 16.4 | | 4.2 | | 2.2 | | 29.9 | | 3.7 | | 3.6 | |
| Total Measured + Indicated | 75.4 | | 4.3 | | 10.5 | | 97.3 | | 4.0 | | 12.5 | |
| Grand total | 143.2 | | 4.3 | | 19.6 | | 199.5 | | 4.0 | | 25.9 | |
Notes:
•Based on an effective attributable interest of 80.64% in Baobab and Doornvlei, and 40.32% in Dwaalkop
•The grades and/or metal accumulations, density and thicknesses of the individual reef layers are estimated into block models using ordinary kriging. The Mineral Resource cut is then selected from the individual reef layers, and therefore may include some diluting material
•Mineral Resource estimates are based on a practical mining cut of not less than 90cm
•Confidence in the geological model, reef continuity, drilling density and geostatistical analysis is used to classify the Mineral Resources. Typically, the Measured Resource estimates are declared in, and immediately adjacent to, areas where the reef has been exposed by underground development and has been sampled. Indicated and Inferred Resource estimates are predominantly informed by surface diamond drill holes. Indicated Resources at Limpopo are typically declared in areas where drill spacing is less than 600m
•The Mineral Resources at Dwaalkop and Doornvlei occur from surface to a maximum depth of 800m beyond the last line of surface drill holes. The Baobab Mineral Resources occur to a depth of 1,500m for Merensky Reef and 1,650m for the UG2 Reef. Isolated drill holes have confirmed the presence of the UG2 Reef at greater than 1,500m below surface at Baobab, and in all areas the mineralisation remains open at depth
•The widths of the individual layers that comprise the reef, vary across the property and the reef widths also vary according to the layers incorporated into the reef cut. The average width of the UG2 Reef for each property varies between approximately 1.90m and 3.05m and the average width of the Merensky Reef for each property varies between approximately 0.90 m and 2.25m
•An average of between 18% to 25% geological loss has been applied to the Merensky and UG2 Reef areas. Geological losses are applied to individual areas and vary according to known and anticipated geological conditions. Geological losses include those from dykes, fault loss, potholes and IRUP
PGM exploration LIMPOPO continued
Notes:
The -24.3% change year-on-year to the stated Mineral Resources (Inclusive of Mineral Reserves) is attributed to:
–-5.0Moz due to the revised estimation methodology at Dwaalkop, reducing the Inferred category depth projection to between 1,550m (MR) and 1,750m (UG2)
–-11.9Moz decrease due to the change in attributable reporting methodology
PGM exploration continued
BLUE RIDGE
| | |
| PROPERTY DESCRIPTION |
This 50:50 JV with Imbani Platinum is situated on the Blaauwbank farm, approximately 30km southeast of Groblersdal on the Eastern Limb of the BIC. It entails a shallow, mechanised PGM mine, with integrated concentrator, targeting the UG2 orebody. The project was originally owned by Ridge Mining, which developed it in partnership with Imbani Platinum. Ridge Mining started exploration in 2001, completed a feasibility study by the end of 2005, and mine development started in January 2007. Aquarius acquired Ridge Mining in July 2009. The operation was placed on care and maintenance in 2011 on the back of depressed PGM prices, and has remained on care and maintenance ever since. Sibanye-Stillwater owns its 50% stake in the JV following its acquisition of Aquarius in 2016. |
| | |
| MINERAL TITLE |
Blue Ridge Platinum (Pty) Ltd is the holder of a converted mining right under DMRE Ref No LP30/5/1/2/2/177 MR (Blue Ridge MR), valid from 21 May 2014 to 20 May 2044, in respect of a mining area totalling approximately 18.89km2. The DMRE has been notified of the care and maintenance status and ongoing engagements are taking place to ensure compliance with environmental and SLP conditions. |
PGM exploration BLUE RIDGE continued
| | |
| DEPOSIT TYPE AND MINERALISATION CHARACTERISTICS |
The UG2 Reef is targeted, with the thickness of the mineralisation varying from 60cm to 130cm. Mineralisation occurs as A, B and C chromitites locally separated by internal pyroxenites. The average dip of the reef is 18º. The Blue Ridge orebody is preserved in an enclave on the eastern flank of the Dennilton Dome, a positive feature in the floor rocks to the BIC, which outcrops southeast of Groblersdal. The UG2 Reef at the Blue Ridge Mine shown below depicting the UG2 Reef sub-division. |
| | |
| KEY DEVELOPMENTS AND INTENT |
Due to the relatively low grade nature of the ore-body, the complex nature of the shareholding, and the historic project finance agreements, which included substantial external debt holders, significant barriers exist to the restart of this operation. This mining operation remains under care and maintenance while the Group engages with its partners and stakeholders to find an optimum way to maximise value for all stakeholders. No exploration work has been undertaken at this operation since being placed under care and maintenance in 2011. |
Classified 4E PGM Mineral Resources estimate at 31 December 2021
| | | | | | | | | | | | | | | | | | | | | | | | | | | | | |
| Mineral Resources Inclusive of Mineral Reserves |
| | | | 31 December 2021 | 31 December 2020 |
| PGM | Southern Africa | | | Tonnes | Grade | PGM | Tonnes | Grade | PGM |
| Blue Ridge | | | | (Mt) | (g/t) | (Moz) | (Mt) | (g/t) | (Moz) |
| Exploration | | Underground | Measured | — | | — | | — | | — | | — | | — | |
| | | Indicated | 9.2 | | 3.2 | | 1.0 | | 9.2 | | 3.2 | | 1.0 | |
| | | Measured + Indicated | 9.2 | | 3.2 | | 1.0 | | 9.2 | | 3.2 | | 1.0 | |
| | | Inferred | 6.7 | | 3.0 | | 0.6 | | 6.7 | | 3.0 | | 0.6 | |
| Total Measured + Indicated | 9.2 | | 3.2 | | 1.0 | | 9.2 | | 3.2 | | 1.0 | |
| Grand total | 15.8 | | 3.2 | | 1.6 | | 15.8 | | 3.2 | | 1.6 | |
Notes:
•Average resource width of 1.38m
•Excluded depletion due to historic mining
•Provision made for losses around known dykes and known faults
•Implicit geological losses of 15% applied
Southern Africa gold
LOCATION
OVERVIEW
GEOLOGICAL SETTING
Gold occurs in quartz-pebble conglomeritic units (or reefs) in a thick succession of metamorphosed sediments in the Witwatersrand Basin. The basin is geographically located in the central north to northeastern part of South Africa and extends from Johannesburg in the north to some 40km south of Welkom and covers an area of approximately 70,000km2. More than 150 operations have operated in the basin since gold was first discovered in 1886, primarily producing gold. Uranium has been intermittently produced, often as by-product, since the early 1950s.
The reefs, which are generally less than 2m thick, are widely considered to represent extensive alluvial fan deposits with structurally controlled basin edges. The gold is considered to have been syngenetically deposited with the conglomerates. Although the gold generally occurs in native form and is usually associated with pyrite, carbon and uranium, most of it has been subsequently modified and remobilised during secondary hydrothermal alteration. This is the generally accepted model for the origin of gold and uranium mineralisation of the Witwatersrand Basin.
The most fundamental control to the gold distribution remains the association with mature quartz- pebble conglomerates on intra-basinal unconformity surfaces. The reefs typically are laterally continuous, as a consequence of the regional nature of the erosional surfaces. Consequently, the identification and modelling of erosional/sedimentary features are the key to in situ resource estimation.
An artist’s conceptual illustration of how the reefs were formed at the time of the VCR formation
Mineral Resources estimation (Managed operations)
Diamond drillhole and underground chip sample data forms the bulk of the analytical data used in the estimation. The data used in the Mineral Resource estimation is stored in a SQL (Fusion™) database (IRRIS) and becomes available after QA/QC validation processes are completed.
Geological facies and 3D structural modelling are completed, based on data gathered from drill holes, chip sampling and underground mapping. The facies interpretation is considered in the statistical analysis and estimation process. The resulting statistical domains may be further sub-divided or combined to ensure homogeneity of data and are used as hard boundaries in the estimation for the block sizes of 10m by 10m; 25m by 25m and 100m by 100m.
Detailed exploratory data analysis is carried out on data within individual domains. The main interpolation methodology utilised is ordinary kriging for the 10m by 10m, and 25m by 25m blocks. Simple kriging is only used for 100m by 100m blocks.
Mineral Resource tonnages and grades are estimated in situ over an estimated minimum mining width and may include mineralisation below the selected cut-off grade to ensure that the Mineral Resources comprise practical mining blocks of adequate size and continuity.
Mineral Resource estimations are depleted within defined 2D structurally modelled blocks, and dip corrections are applied to reflect true tonnages. The Mineral Resources are reported using a cut-off for cm.g/t (grade x thickness).
Mineral Resource classification is based on the robustness of various data sources available including the confidence in the geological interpretation, variography and other estimation parameters. A Measured Resource classification was based on slope of regression on average greater than 95% in the first range of variograms for the block models of 10m by 10m and 25m by 25m. An Indicated Resource classification was based on the first and/or second search ellipse ranges and the number of samples averaging 19 within the 100m by 100m block models. The areas in the third range of the variograms on the block size of 100m by 100m are classified as Inferred.
Stoping and development is measured monthly to provide an accurate broken ore and gold estimate, which is compared to the gold produced and the tailings grade measured, providing a mine call factor (MCF). Belt sampling is also done continuously to verify underground mined grades.
Quality assurance / quality control (Managed operations)
The Gold operations follow industry best practice in data acquisition, ensuring data reliability, and utilise accredited analytical laboratories, which are frequently audited, both internally and externally. QA/QC procedures are followed on all drilling and sampling programmes (including underground chip sampling). The database system in use at Sibanye-Stillwater is SQL (Fusion™). This has various levels of security and is managed by an onsite database administrator as well as the Fusion service providers.
Analytical QA/QC is maintained and enforced through the submission of blanks, certified reference material and duplicate samples; on average at least one QA/QC sample is inserted in every batch of 100 samples. This approximates to 1% of the total sampling database.
Analysis of the QA/QC samples consists of checks on the certified reference materials’ expected values, and analysis of blank material and pulp duplicate material. An internal procedure to check the deviation from the expected value for the reference materials of samples are accepted within two standard deviations for geology drilling and three standard deviations for underground chip sampling.
Laboratory reporting of underground sampling results is not split into separate gold and silver assays. A combined grade is reported. For chip sampling, a “bullion” factor is then generated by the laboratory and released periodically to the operations to account for the silver content in the analysis.
The laboratory is required to participate in various round robin exercises as part of maintaining their accreditation status. Internal audits of the laboratories are conducted every three months by the Mineral Resource department.
The laboratory currently used by Sibanye-Stillwater Gold operations and its related South African National Accreditation System (SANAS) facility accreditation number is Sibanye-Stillwater Analytical Laboratory, Driefontein Reg No 2002/031431/07, SANAS Facility Accreditation No T0379.
Mineral Reserve estimation (Managed operations)
The calculation of the Mineral Reserves from the Mineral Resource estimate includes the application of cut-off grades to ensure an average mining value that is above the pay limit. The pay limit can be defined as the average value at which an orebody can be mined at break-even based on the planned mining volumes, updated modifying factors and the estimated working cost. Pay limits are calculated per operation or shaft and are re-assessed every cycle. The cut-off grades, which are the absolute minimum mining grades that can be mined in order to maintain a value aligned with the pay limit, are calculated using the latest pay limits per mining area.
Mining area selection is based on the cut-off grades, structural models, pillar requirements together with other practical mining considerations. Plans are developed with an approach that encourages the production team’s input into the process with
guidance from all technical departments at multiple points in the planning process. At all times the strategic and management guidelines, issued at the start of the process, are used to direct the mine planning.
The sensitivities of gold Mineral Reserve ounces at all operations are shown in the accompanying chart at -10%, -5%, base (R800,000/kg), +5% and +10%, and are derived from a factored application of the base-case scheduled Mineral Reserves, reflecting the impact of a changing gold price on the prevailing cut-offs.
The Mineral Reserve sensitivities are not based on detailed depletion schedules and should be considered on a relative and indicative basis only.
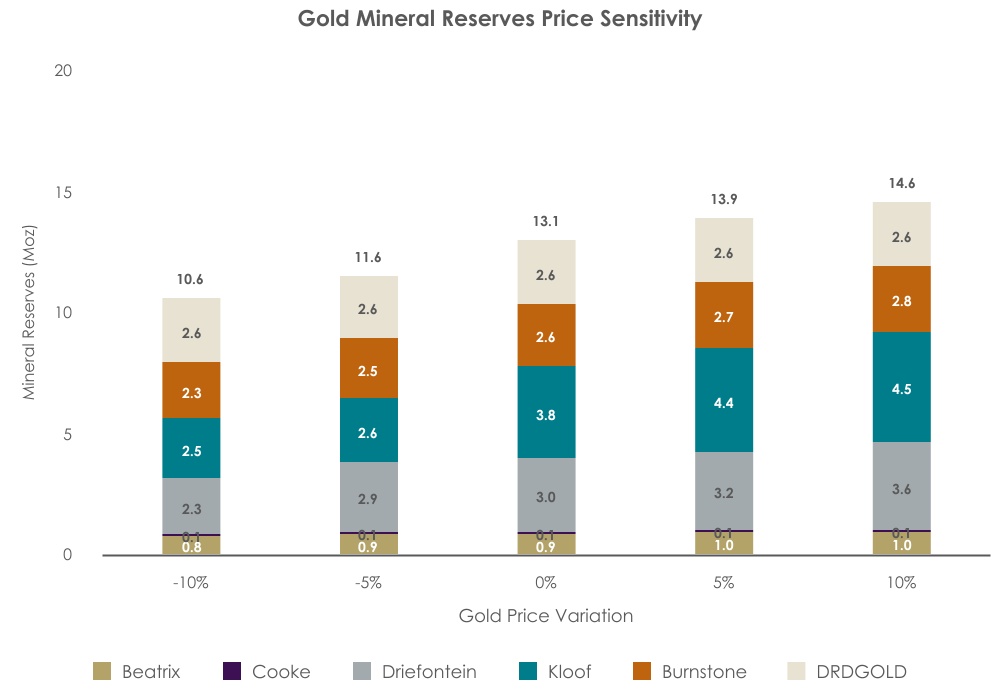
Gold operations
KLOOF
Gold operations KLOOF continued
| | |
| PROPERTY DESCRIPTION |
Kloof is an intermediate to ultra-deep level gold mine, situated in the West Wits Line of the Witwatersrand Basin, near the towns of Randfontein and Westonaria, approximately 60km west of Johannesburg, in the Gauteng province of South Africa. Kloof consists of five producing shafts, namely No.1 Shaft, No. 3 Shaft (in the process of closing), No. 4 Shaft, No. 7 Shaft and No. 8 Shaft. The reef horison is accessed from surface from vertical shafts to 45 Level (currently the lowest working level) at No. 4 Shaft, approximately 3,347m below surface. Ore is processed at two mineral processing plants. No. 1 Plant is situated near No. 1 Shaft and is used primarily for the treatment of surface material. No. 2 Plant, formerly the Leeudoorn Plant, is situated near No. 7 Shaft and is used to treat the underground material. In addition, selected Kloof surface rock dump material (SRD) is toll treated at the Ezulwini processing plant. |
| | |
| MINERAL TITLE |
Kloof is operated under a converted mining right, held in terms of the provisions of the MPRDA under DMRE Ref No GP30/5/1/2/2(66) MR (Kloof MR). The Kloof MR is valid from 30 January 2007 to 29 January 2027, for gold ore and associated minerals, in respect of a mining area totalling 200.87km2. Based on the current LoM and subject to prevailing economic conditions at the time, Kloof will need to request an extension of the Kloof mining right through a renewal application in terms of the provisions of the MPRDA from 2027. Kloof held a prospecting right with DMRE Ref. No. GP30/5/1/1/2(10096) PR in respect of a small area (0.24km2) confined within the Kloof mining right boundary. An application was submitted in terms of the provisions of Section 102 of the MPRDA to amend the Kloof mining right to incorporate this area into the Kloof MR. The application is pending. A Section 102 application for ministerial consent to incorporate surface dumps situated on various farm portions has been granted and is awaiting execution. |
| | |
| MINERALISATION CHARACTERISTICS |
The Kloof ore bodies comprise four gold-bearing reefs, namely the Ventersdorp Contact Reef (VCR), the Middelvlei Reef (MVR), the Kloof Reef (KR), and the Libanon Reef (LR). The VCR, located at the top of the Central Rand Group, is the main exploited reef accounting for 70% of ore mining at Kloof, while the KR, MVR, and LR account for 19%, 9% and 2%, respectively. The average dip of the reefs is 25 to 35 degrees to the south-east and strike is approximately north-east south-west. The reefs are generally less than two metres thick. . Approximately 1% of the total planned gold production comes from the surface Mineral Resources in the form of SRDs, which is primarily constituted from development waste rock, contaminated with misallocated ore. |
| | |
| INFRASTRUCTURE AND EQUIPMENT |
The Kloof operation is a mature, established mine with all the permanent infrastructure required to access and mine the underground ore. In addition, all the surface infrastructure required to process the material and produce doré is in place. Kloof comprises five producing shaft systems, one shaft for pumping, and one that is on care-and-maintenance and two mineral processing plants. Underground development is extensive, as can be expected of a mature mine of this size. Underground infrastructure include access infrastructure to convey personnel, materials and equipment to and from the working areas and associated services to support mining operations. Horizontal infrastructure includes crosscuts, return airway drives, footwall haulage levels and declines/inclines. Infrastructure required for ore flow and services include ore and waste passes, conveyor belts, battery powered rail conveyances, ore bins, loading stations, water dams, dewatering pump stations, secondary ventilation and workshops. Electrical, compressed air, and water reticulation are also part of the installed underground infrastructure All equipment required to mine is already in place and being used. SIB provisions are made in the LoM and Technical-Economic Model for all major equipment upgrades, replacements and maintenance to support the LoM. The property, plant and equipment book value (100%) of all the mine’s assets as at 31 December 2021, was R2.8bn. The infrastructure on these mines is maintained using sophisticated computerised maintenance management systems, critical spares are maintained and shared where necessary. Despite the age of the general infrastructure, all surface and underground infrastructure is reasonably maintained and equipped. A project to optimise surface and underground infrastructure is in process to reduce fixed overhead costs and capital. |
Gold operations KLOOF continued
| | | | | | | | |
| HOISTING AND PRODUCTION CAPACITIES |
| Operating shaft (No) | Operating hoisting capacity (ktpm) | 5-year planned production (ktpm) |
| No. 1 Shaft | 115 | 78 |
| No. 3* Shaft | 0 | 0 |
| No. 4 Shaft | 71 | 63 |
| No. 7** Shaft | 23 | 9 |
| No. 8 Shaft | 40 | 25 |
*Closed Q1 2022
**3 years' production
| | |
| MINING METHOD |
•Underground: Scattered-conventional breast mining •Surface SRD’s: Load, Haul and Dump (LHD) trucks |
| | |
| LIFE OF MINE |
•11 years (until 2032) based on current Mineral Reserves |
| | | | | | | | | | | | | | | | | |
| MINERAL PROCESSING AND CAPACITY |
| Plant | Design capacity (ktpm) | Operational capacity (ktpm) | Type | Average recovery
factor (%) | Material
treated |
| Kloof No.1 Plant | 180 | 165 | CIL | 82.9 | UG waste and SRD |
| Kloof No.2 Plant | 165 | 165 | CIP | 97.7 | UG ore |
| | |
| TAILINGS DISPOSAL AND CAPACITY |
There are two active TSFs, the Leeudoorn TSF and the Kloof No. 2 TSF. No. 2 TSF has a capacity of 6.3Mt and is fed with SRD tailings coming from the No. 1 Plant totalling 2.2Mt over LoM. There is 4.1Mt of surplus capacity. The Leeudoorn TSF has a capacity of 38.4Mt and is situated next to the No. 2 Plant which deposits underground tailings on it. The LoM requirements for this TSF are 20.3Mt, resulting in a surplus capacity of 18.1Mt. |
| | |
| ESTIMATION RISKS |
There are no deemed material risks to the Mineral Resource Estimation. The key operational risks that could impact the Mineral Reserves are listed below. •Ageing infrastructure resulting in business interruptions: As the mine was developed in the late 1960s, most of the original infrastructure needs regular replacement and upgrade. All major installations are continuously reviewed and a comprehensive planned maintenance system, and a SIMMS (Sustainable Integrated Mine Management System) is in place •Seismic risk: Mining at depth and the extraction of high stressed areas can cause fatalities, injuries and damage to working areas. All areas planned to mine are reviewed for suitable mine design and layouts by qualified rock engineers, who conduct rock engineering modelling and support design. A comprehensive seismic monitoring system is in place and the seismic response to production is monitored daily. Designs are audited on an ongoing basis and are monitored for effectiveness •Power supply interruptions and cost increases: Eskom (the national power supplier) has proven to be unreliable over recent years, causing loss of power supply at certain times and having tariff increases above inflation. The operation has emergency generators available for evacuation if required and conducts load shifting in order to optimise available power supply. New initiatives are continuously implemented to reduce demand and the Group is expanding its portfolio of renewable energy projects •Failure to deliver on operational plans: The impact of seismicity, unknown geological conditions and business interruptions can all contribute to a gap between planned and achieved production rates. A Mineral Reserve management programme comprising an opening up and equipping plan in addition to normal grid development is in place to ensure mineable and replacement face length is created. Short interval controls are in place to enable the implementation of timeous interventions on productivity, cost and correction of deviations from the plans |
Gold operations KLOOF continued
| | |
| KEY DEVELOPMENTS AND BROWNFIELD PROJECTS |
The Kloof Integration Project aims to optimise and rationalise the infrastructure between No. 3 and No. 4 Shafts, and between No. 1 and No. 3 Shafts, resulting in significant cost savings. Rationalisation of infrastructure between No. 3 and No. 4 Shaft has allowed for the phased closure of No. 3 Sub Vertical Shaft by Q1 2022. The final phase requires the closure of the main barrel in 2023. This phase entails the re-opening of old development between No. 1 and No. 3 Shafts which will allow the mining of the remaining VCR at No. 3 Shaft, as well as significant secondary reef potential on the LR and KR from No. 1 Shaft, well into the latter part of the Kloof LoM. The Kloof Integration Project also involves the development of inclined access between 41 Level at No. 4 Shaft up to 40 Level at No. 7 Shaft. The development of this phase is complete and equipping is in progress. An additional phase of the same project entails a similar access to link 42 and 43 Levels. This project will allow access via No. 7 Shaft resulting in more face time for crews. The access development for this phase started in 2021. The Kloof No. 4 Shaft Depth Extension Project, consists of a decline two levels below infrastructure. The decline between 45 and 46 Levels has been developed, and the remaining portion of the decline to 47 Level is in progress. The access ramp is being developed by means of mechanised mining equipment. Once the access has been completed, raisebore drill holes will be drilled and reamed back up to 45 Level for infrastructure and return ventilation purposes. The first raisebore hole will be completed early in 2022. |
Classified Gold Mineral Resource estimate at 31 December 2021
| | | | | | | | | | | | | | | | | | | | | | | | | | | | | |
| Mineral Resources Inclusive of Mineral Reserves |
| | | | 31 December 2021 | 31 December 2020 |
| GOLD | Southern Africa | | | Tonnes | Grade | Gold | Tonnes | Grade | Gold |
| Kloof | | | | (Mt) | (g/t) | (Moz) | (Mt) | (g/t) | (Moz) |
| Operations | | Underground | Measured | 34.5 | | 11.3 | | 12.6 | | 34.3 | | 11.7 | | 12.9 | |
| | | Indicated | 35.7 | | 7.0 | | 8.0 | | 42.7 | | 6.6 | | 9.0 | |
| | | Measured + Indicated | 70.2 | | 9.1 | | 20.6 | | 77.0 | | 8.9 | | 21.9 | |
| | | Inferred | 28.1 | | 11.5 | | 10.4 | | 35.6 | | 9.6 | | 11.0 | |
| | SRD Surface | Measured | — | | — | | — | | — | | — | | — | |
| | | Indicated | 3.4 | | 0.4 | | 0.0 | 5.9 | | 0.3 | | 0.1 | |
| | | Measured + Indicated | 3.4 | | 0.4 | | 0.0 | 5.9 | | 0.3 | | 0.1 | |
| | | Inferred | 0.0 | 1.2 | 0.0 | — | | — | | — | |
| Total Measured + Indicated | 73.6 | | 8.7 | | 20.6 | | 82.8 | | 8.3 | | 22.0 | |
| Grand total | 101.8 | | 9.5 | | 31.0 | | 118.5 | | 8.7 | | 33.0 | |
| | | | | | | | | | | | | | | | | | | | | | | | | | | | | |
| Mineral Resources Exclusive of Mineral Reserves |
| | | | 31 December 2021 | 31 December 2020 |
| GOLD | Southern Africa | | | Tonnes | Grade | Gold | Tonnes | Grade | Gold |
| Kloof | | | | (Mt) | (g/t) | (Moz) | (Mt) | (g/t) | (Moz) |
| Operations | | Underground | Measured | 26.7 | | 11.1 | | 9.5 | | 24.9 | | 11.5 | | 9.2 | |
| | | Indicated | 32.0 | | 6.7 | | 6.9 | | 38.3 | | 6.2 | | 7.6 | |
| | | Measured + Indicated | 58.7 | | 8.7 | | 16.4 | | 63.2 | | 8.3 | | 16.8 | |
| | | Inferred | 28.1 | | 11.5 | | 10.4 | | 35.6 | | 9.6 | | 11.0 | |
| Total Measured + Indicated | 58.7 | | 8.7 | | 16.4 | | 63.2 | | 8.3 | | 16.8 | |
| Grand total | 86.8 | | 9.6 | | 26.8 | | 98.8 | | 8.7 | | 27.8 | |
Gold operations KLOOF continued
Notes:
The -6% change year-on-year in the stated Mineral Resources (Inclusive of Mineral Reserves) is attributed to:
–-0.4Moz in depletions
–-1.7Moz in exclusion and pillars: shaft scenario updates at No. 4 Shaft (+0.6Moz); exclusion of KR at No. 1 Shaft (-0.4Moz)
–+0.9Moz in estimation domains/data: data review at No. 1 Shaft (-0.84Moz); addition of drilling deflections to the EBA area (+1.1Moz); No. 3 Shaft estimation parameters were updated (+0.6Moz)
–-0.7Moz due to a revised cut-off grade: increase in the cut-off grades for No. 1, No. 3, No. 4 Shaft and No. 7 Shaft (-0.9Moz); cut-off grades were decreased for EBA and No. 8 Shaft (+0.2Moz)
On a Mineral Resources exclusive of Mineral Reserves basis, the year-on-year change is -3.5%.
Note: This grade tonnage curve pertains to the underground portion of the Mineral Resources only
Gold operations KLOOF continued
Mineral Resources classification maps for Kloof operation per reef
Gold operations KLOOF continued
Grade control and ore definition drilling summary
| | | | | | | | | | | | | | | | | | | | |
| Planned 2022 | 2021 | 2020 |
| OPERATION – KLOOF | Drilled (m) | Expenditure (Rm) | Drilled (m) | Expenditure (Rm) | Drilled (m) | Expenditure (Rm) |
| Grade control and ore definition | 23,751 | 24.89 | 14,282 | 15.96 | 10,508 | 13.17 |
| Total | 23,751 | 24.89 | 14,282 | 15.96 | 10,508 | 13.17 |
Annual development results
| | | | | | | | | | | |
| Financial year total |
| Category | Unit | 2021 | 2020 |
Primary waste development (capital, declines, haulages, crosscuts,
boxholes, travelling ways) | m | 10,546 | 8,585 |
| Primary reef development (raise, winzes, wide raises) | m | 2,819 | 2,173 |
| Total | m | 13,365 | 10,758 |
Modifying factors (Underground) in converting Mineral Resources to Mineral Reserves
| | | | | | | | | | | |
| Parameter | Unit | 2021 | 2020 |
| Average Mined Value (over LoM) | (cm.g/t) | 1,589 | 1,708 |
| Waste Mining Percentage | (%) | 3.5 | 3.8 |
| Mine Call Factor | (%) | 85.3 | 85.8 |
| Plant Recovery Factor | (%) | 97.7 | 98.2 |
| Development to Mill | (%) | 13 | 11.0 |
| Survey Discrepancy | (%) | 10.6 | 10.9 |
| Resource Channel Width | (cm) | 119 | 121 |
| Average Stoping Width | (cm) | 171 | 171 |
| Average Weighted Resource Cut-off | (cm.g/t) | 700 | 660 |
| Mineral Reserves Pay Limit (Year 1) | (cm.g/t) | 1,550 | 1,710 |
Classified Gold Mineral Reserve estimate at 31 December 2021
| | | | | | | | | | | | | | | | | | | | | | | | | | | | | |
| Mineral Reserves |
| | | | 31 December 2021 | 31 December 2020 |
| GOLD | Southern Africa | | | Tonnes | Grade | Gold | Tonnes | Grade | Gold |
| Kloof | | | | (Mt) | (g/t) | (Moz) | (Mt) | (g/t) | (Moz) |
| Operations | | Underground | Proved | 12.7 | | 6.2 | | 2.5 | | 11.7 | | 6.9 | | 2.6 | |
| | | Probable | 7.7 | | 4.9 | | 1.2 | | 10.9 | | 5.6 | | 2.0 | |
| | | Proved + Probable | 20.3 | | 5.7 | | 3.8 | | 22.6 | | 6.3 | | 4.6 | |
| | SRD Surface | Proved | — | | — | | — | | — | | — | | — | |
| | | Probable | 3.4 | | 0.4 | | 0.0 | 5.9 | | 0.3 | | 0.1 | |
| | | Proved + Probable | 3.4 | | 0.4 | | 0.0 | 5.9 | | 0.3 | | 0.1 | |
| Grand total Proved + Probable | 23.8 | | 5.0 | | 3.8 | | 28.5 | | 5.1 | | 4.6 | |
Gold operations KLOOF continued
Notes:
The -18% change year-on-year in the stated Mineral Reserves is attributed to:
–-0.4Moz in depletions
–-0.3Moz in area exclusions on the No. 4 Shaft VCR due to tail optimisation
–-0.1Moz in geological interpretation due to changes in the estimation model on the VCR affecting No. 1 and No. 4 Shafts
–-0.04Moz due to change inn economic parameters resulting from the closure of No. 3 Shaft earlier than previously planned and offset by positive pay limit changes to the surface mining
–-0.03Moz decrease due to modifying factors informed by Mine Call Factor changes, primarily at No. 1 and No. 8 Shafts
Mineral Reserves classification map for Kloof operation (all reefs)
Gold operations KLOOF continued
| | |
| HISTORY AND OPERATIONAL STATISTICS |
•In 1898, exploration drilling by the Pullinger brothers discovered the VCR and MVR at depth in the Far West Rand area (later renamed the West Wits Line) •By 1934, shaft sinking commenced at Venterspost, and by 1936, at Libanon •First gold from the West Wits Line Goldfield was poured at Venterspost in 1939 •In 1964, Kloof’s main twin-shaft complex was initiated and the mine was officially opened in 1968 •In 2000, the formation of the Kloof Gold Mine in its present form commenced with the amalgamation of the Venterspost, Libanon, Kloof and Leeudoorn Gold Mines •In 2012, the conventional South African assets of Gold Fields were unbundled into Sibanye Gold Limited •The No. 4 Shaft drop-down project feasibility study was completed in 2015 •In 2017, the No. 4 Shaft depth extension project commenced •An integration project for the optimisation of current infrastructure was approved in 2018. The project aimed to shut down expensive and ageing infrastructure and create alternative access points for the remaining Mineral Reserves •Production returned to normal levels following a protracted strike, which saw limited production taking place between December 2018 and May 2019. The shaft integration project and the No. 4 Shaft depth extension project continued as planned •The COVID-19 Pandemic and the associated national lockdown halted all production from April to the middle of May 2020, at which point a gradual build-up in production was initiated with a slow return of employees continuing right into December •In 2021, the No. 4 Shaft depth extension project development was completed to 46 Level, development continues down to 47 Level. The No. 3 Shaft was placed on care-and-maintenance |
| | | | | | | | | | | |
| Operational Statistics | 2019 | 2020 | 2021 |
| Underground tonnes milled (kt) | 1,489 | 1,569 | 1,862 |
| Underground yield (g/t) | 5.96 | 5.77 | 5.13 |
| Surface tonnes milled (kt) | 5,868 | 5,326 | 4,141 |
| Surface yield (g/t) | 0.34 | 0.36 | 0.33 |
| Annual Au production - Underground (koz) | 285 | 291 | 307 |
| Annual Au production - surface (koz) | 64 | 61 | 44 |
| Total Annual Au production (koz) | 349 | 352 | 352 |
| Operating cost underground (R/t) | 3,882 | 3,831 | 3,769 |
| Operating cost surface (R/t) | 193 | 190 | 206 |
| Total capital expenditure (Rm) | 937 | 1,270 | 1,616 |
| AISC (R/kg) | 722,698 | 764,007 | 858,316 |
| AISC (US$/oz) | 1,555 | 1,444 | 1,805 |
Note: AISC calculated based on Oz sold
Gold operations continued
BEATRIX
| | |
| PROPERTY DESCRIPTION |
The Beatrix operation, a mature, shallow to intermediate level underground gold operation, is located in the district municipality of Lejweleputswa, near the towns of Welkom and Virginia, approximately 280km southwest of Johannesburg, in the Free State province of South Africa. The Beatrix operation consists of three operating shafts, namely No. 1 Shaft, No. 3 Shaft, and No. 4 Shaft. The reef is accessed from surface usingvertical shaft systems down to 26 Level (the lowest working level at No. 3 Shaft), approximately 1,350m below surface, and 22 Level (the lowest working level at No. 4 Shaft), approximately 2,105m below surface. The No. 1 Shaft will remain open in support of No. 3 Shaft. Ore from all three shafts is processed at the Beatrix No. 1 Plant. |
Gold operations BEATRIX continued
| | |
| MINERAL TITLE |
Beatrix is operated under a converted mining right in terms of the Mineral and Petroleum Resources Development Act (MPRDA), with DMRE Ref No FS30/5/1/2/2 81 MR (Beatrix MR). The Beatrix mining right was valid from 7 February 2007 to 6 February 2019, for gold ore and associated minerals, in respect of a mining area totalling 168.21km2. A renewal application for the Beatrix mining right was submitted on 27 July 2018 in order to extend the period of validity of the Beatrix mining right by a further 30 years. The Beatrix mining right renewal is still pending. There is a reasonable and realistic expectation that the renewal of the Beatrix MR will be granted by the DMRE. It must be noted that in terms of the provisions of Section 24(5), a mining right in respect of which an application for renewal has been lodged, shall remain in force, despite its expiry date, until such time as such application has been granted or refused. |
| | |
| MINERALISATION CHARACTERISTICS |
The Beatrix operation exploits two primary reefs, namely the VS5/Beatrix reefs (VS5/BXR) at the base of the Eldorado Formation and the Kalkoenkrans Reef / Aandenk Reef (KKR / AAR) at the base of the Aandenk Formation.The orebodies are laterally continuous with relatively long-range predictability. This leads to clear patterns of mineralisation governed by sedimentary characteristics. The VS5/BXR forms the bulk of the planned mining at 75% with the remaining 25% mined from No. 4 Shaft on the KKR/AAR. In general, the Composite VS5/AAR Reefs range between 130cm and 350cm in width. The orebody is shallow dipping at 10º to 15º, with typical open fold structures. In most cases the reefs are deemed to be bottom loaded, with most of the gold grade concentrated along the basal contact. |
| | |
| INFRASTRUCTURE AND EQUIPMENT |
Beatrix is a large, well established, shallow to deep level gold operation that has been in production since the 1980s. All the permanent infrastructure required to access and mine the underground and surface operations is in place and the surface processing facilities are well established and in use. Three vertical shaft systems are in place to provide access to the underground workings from surface. No. 1 and No. 3 Shafts to the south at the main mine site are situated close to the operational metallurgical plant. No. 4 Shaft is situated approximately 10km away and has its own No. 2 Plant which is currently on care-and-maintenance. Material is trucked from No. 4 Shaft to the main mine site. Beatrix No. 3 Shaft and Kloof No. 4 Shaft are equipped with gravity hydropower drilling systems. In the case of Beatrix, this is boosted by surface pumps. Where mining continues below the current infrastructure, declines or winzes are developed for access. The underground development is extensive and most of the development is already in place to support the current four-year LoM. All footwall access development is mined using mechanical rail-bound methods that are well understood. All stoping is completed using conventional, narrow tabular methods and because of the relatively shallow mining conditions, much better mining efficiencies are achieved when compared to Driefontein and Kloof operations. Underground infrastructure include access infrastructure to convey personnel, materials and equipment to and from the working areas and associated services to support mining operations. Horizontal infrastructure includes crosscuts, return airway drives, footwall haulage levels and declines/inclines. Infrastructure required for ore flow and services include ore and waste passes, conveyor belts, battery powered rail conveyances, ore bins, loading stations, water dams, dewatering pump stations, secondary ventilation and workshops. Electrical, compressed air, and water reticulation are also part of the installed underground infrastructure. All equipment required to mine is in place and being used. Provision is made in the LoM and Technical-Economic Model for all major equipment upgrades, replacements and maintenance to support the LoM. The property, plant and equipment book value (100%) of all the mine’s assets, net of depreciation, as at 31 December 2021, was R0.46bn. Surface infrastructure at Beatrix include headgears and winding systems, primary ventilation, process facilities, office blocks and training centres, workshops and stores, lamp rooms change houses and accommodation. Equipment to provide services such as air compressor plants, refrigeration plants pumping stations and workshops are installed. There are two processing plants; No. 1 Plant, which is operational and No. 2 Plant, under care and maintenance. Beatrix operates a methane extraction plant which extracts methane from areas in the South Section to power generators on surface. Despite the age of the general infrastructure, all surface and underground infrastructure is reasonably maintained and equipped. The infrastructure on these mines is maintained using sophisticated computerised maintenance management systems, critical spares are maintained and shared where necessary. |
Gold operations BEATRIX continued
| | | | | | | | |
| HOISTING AND PRODUCTION CAPACITIES |
| Operating Shaft (No) | Operating capacity (ktpm) | 4 year planned production (ktpm) |
| No. 1 Shaft | 72 | 10 |
| No. 3 Shaft | 144 | 134 |
| No. 4 Shaft | 93 | 27 |
* Planned production is four-year hoisted average from 2022 onwards
| | |
| MINING METHOD |
| Conventional breast mining |
| | |
| LIFE OF MINE |
| 4 years (until 2025) based on current Mineral Reserves |
| | | | | | | | | | | | | | | | | |
| MINERAL PROCESSING AND CAPACITY |
| Plant | Design capacity (ktpm) | Operational capacity (ktpm) | Type | Average recovery
factor (%) | Material
treated |
| No.1 Plant | 233 | 240 | CIL | 95.5 | UG and SRD |
| No. 2 Plant | 130 | 0 | CIP | n/a | Care-and-maintenance |
| | |
| TAILINGS DISPOSAL AND CAPACITY |
There is one active TSFs, the Beatrix TSF; and one dormant TSF, the No. 4 Shaft TSF. The Beatrix TSF is situated close to the Beatrix No. 1 Plant and has a capacity of 14.6Mt. It is fed from the same plant and is a combination of underground and SRD tailings with an expected LoM deposition of 8.5Mt, which is 6.1Mt surplus to LoM requirements. The No. 4 Shaft TSF is situated next to the No. 2 Plant and still has additional capacity of 45.6Mt. |
| | |
| ESTIMATION RISKS |
There are no deemed material risks to the Mineral Resource Estimation. The key operational risks that could impact the Mineral Reserves are listed below. •Failure to deliver on Mining Charter requirements: The operation has only delivered partially on its Social and Labour Plan (“SLP”) commitments, which could impact on its license to mine. A SLP has been implemented, and a Joint SLP forum has been established to track progress and to ensure alignment on the initiatives. Third party audits are conducted by the DMRE, and a compliance matrix is tracked in order to ensure all the different departments are adhering to their respective commitments •Social community unrest disrupting the business: Primarily due to a lack of service delivery from government, transport to the operation is interrupted from time to time. The company has a stakeholder engagement policy and strategy, and accordingly participates in community forums and interest groups •Power supply interruptions and cost increases: Eskom (the national power supplier) has proven to be unreliable over recent years, causing loss of power supply at certain times and having tariff increases above inflation. The operation has emergency generators available for evacuation if required and conducts load shifting in order to optimise available power supply. New initiatives are continuously implemented to reduce demand and the Group is expanding its portfolio of renewable energy projects •Ageing infrastructure resulting in business interruptions: As the mine was developed in the late 1980s most of the original infrastructure needs regular replacement and upgrade. All major installations are continuously reviewed and a comprehensive planned maintenance system, and a sustainable integrated mine management system is in place |
| | |
| KEY DEVELOPMENTS AND BROWNFIELD PROJECTS |
| The operation is at a mature stage with the current LoM plan ending in 2025, excluding potential future life extending projects. No. 1 Shaft is being kept open on an incremental contribution basis in the LoM plan. At No. 3 Shaft, previously unmined (white) areas have been included based on an intensive underground investigation programme and are used to underpin the economic plan. The Bloemhoek Project DFS, which involves accessing a portion of the SOFS project towards the north of No. 3 Shaft, and would extend the No. 3 Shaft LoM by five years, was concluded in 2021, but has not yet been approved for execution. As a result, this is excluded from the Mineral Reserves. |
Gold operations BEATRIX continued
Classified Gold Mineral Resource estimate at 31 December 2021
| | | | | | | | | | | | | | | | | | | | | | | | | | | | | |
| Mineral Resources Inclusive of Mineral Reserves |
| | | | 31 December 2021 | 31 December 2020 |
| GOLD | Southern Africa | | | Tonnes | Grade | Gold | Tonnes | Grade | Gold |
| Beatrix | | | | (Mt) | (g/t) | (Moz) | (Mt) | (g/t) | (Moz) |
| Operations | Beatrix | Underground | Measured | 22.9 | | 6.9 | | 5.1 | | 21.2 | | 7.3 | | 5.0 | |
| | | Indicated | 17.8 | | 6.1 | | 3.5 | | 20.5 | | 6.3 | | 4.2 | |
| | | Measured + Indicated | 40.7 | | 6.5 | | 8.5 | | 41.8 | | 6.8 | | 9.2 | |
| | | Inferred | 1.7 | | 4.2 | | 0.2 | | 4.8 | | 4.4 | | 0.7 | |
| | SRD Surface | Measured | — | | — | | — | | — | | — | | — | |
| | | Indicated | 0.8 | 0.3 | 0.01 | 0.4 | 0.2 | 0.003 |
| | | Measured + Indicated | 0.8 | 0.3 | 0.01 | 0.4 | 0.2 | 0.003 |
| | | Inferred | — | | — | | — | | — | | — | | — | |
| Beisa | Underground | Measured | 3.6 | | 3.2 | | 0.4 | | 3.6 | | 3.2 | | 0.4 | |
| | | Indicated | 7.8 | | 3.3 | | 0.8 | | 7.8 | | 3.3 | | 0.8 | |
| | | Measured + Indicated | 11.4 | | 3.3 | | 1.2 | | 11.4 | | 3.3 | | 1.2 | |
| | | Inferred | 0.04 | 3.3 | 0.004 | 0.04 | 3.3 | 0.004 |
| Total Measured + Indicated | 52.8 | | 5.7 | | 9.7 | | 53.5 | | 6.0 | | 10.3 | |
| Grand total | 54.5 | | 5.7 | | 10.0 | | 58.3 | | 5.9 | | 11.0 | |
| | | | | | | | | | | | | | | | | | | | | | | | | | | | | |
| Mineral Resources Exclusive of Mineral Reserves |
| | | | 31 December 2021 | 31 December 2020 |
| GOLD | Southern Africa | | | Tonnes | Grade | Gold | Tonnes | Grade | Gold |
| Beatrix | | | | (Mt) | (g/t) | (Moz) | (Mt) | (g/t) | (Moz) |
| Operations | Beatrix | Underground | Measured | 18.2 | | 6.9 | | 4.0 | | 16.3 | | 7.3 | | 3.8 | |
| | | Indicated | 16.9 | | 6.1 | | 3.3 | | 19.3 | | 6.4 | | 4.0 | |
| | | Measured + Indicated | 35.1 | | 6.5 | | 7.3 | | 35.6 | | 6.8 | | 7.8 | |
| | | Inferred | 1.7 | | 4.2 | | 0.2 | | 4.8 | | 4.4 | | 0.7 | |
| Beisa | Underground | Measured | 3.6 | | 3.2 | | 0.4 | | 3.6 | | 3.2 | | 0.4 | |
| | | Indicated | 7.8 | | 3.3 | | 0.8 | | 7.8 | | 3.3 | | 0.8 | |
| | | Measured + Indicated | 11.4 | | 3.3 | | 1.2 | | 11.4 | | 3.3 | | 1.2 | |
| | | Inferred | 0.04 | 3.3 | 0.004 | 0.04 | 3.3 | 0.004 |
| Total Measured + Indicated | 46.4 | | 5.7 | | 8.5 | | 46.9 | | 5.9 | | 9.0 | |
| Grand total | 48.2 | | 5.7 | | 8.8 | | 51.7 | | 5.8 | | 9.6 | |
Gold operations BEATRIX continued
Notes:
The -9.5% change year-on-year in the stated Mineral Resources (Inclusive of Mineral Reserves) is attributable to:
–-0.3Moz in depletions
–-0.1Moz in area exclusions and pillars: changes in reporting shaft with No. 1 Shaft below 18 Level changed to No. 3 Shaft (+0.02Moz)
–-0.7Moz in estimation domain/data changes: -0.1Moz at No. 3 Shaft; -0.6Moz at No. 4 Shaft due to data clean up and new assay grades
–-0.1Moz related to a change in cut-off grades: economic parameters (-0.1Moz) changes include an increase in the cut-off values at No. 1 Shaft (-0.1Moz); -0.1Moz at No. 4 Shaft
On a Mineral Resources exclusive of Mineral Reserves basis, the year-on-year change is -8.7%.
Gold operations BEATRIX continued
Note: This grade tonnage curve pertains to the underground portion of Mineral Resources only
Mineral Resources classification map for the Beatrix operation
Gold operations BEATRIX continued
Grade control and ore definition drilling summary
| | | | | | | | | | | | | | | | | | | | |
| Planned 2022 | 2021 | 2020 |
| OPERATION – BEATRIX | Drilled (m) | Expenditure (Rm) | Drilled (m) | Expenditure (Rm) | Drilled (m) | Expenditure (Rm) |
| Grade control and ore definition | 5,482 | 4.9 | 5,043 | 4.63 | 4,464 | 4.62 |
| Total | 5,482 | 4.9 | 5,043 | 4.63 | 4,464 | 4.62 |
Annual development results
| | | | | | | | | | | |
| Financial year total |
| Category | Unit | 2021 | 2020 |
Primary waste development (capital, declines, haulages, crosscuts, boxholes,
travelling ways) | m | 8,671 | 5,615 |
| Primary reef development (raise, winzes, wide raises) | m | 3,497 | 3,312 |
| Total | m | 12,167 | 8,927 |
Modifying factors (underground) in converting Mineral Resources to Mineral Reserves
| | | | | | | | | | | |
| Parameter | Unit | 2021 | 2020 |
| Average Mined Value (over LoM) | (cm.g/t) | 1,014 | 1,054 |
| Waste Mining Percentage | (%) | 3.8 | 5.3 |
| Mine Call Factor | (%) | 73.7 | 74.6 |
| Plant Recovery Factor | (%) | 94.5 | 94.6 |
| Development to Mill | (%) | 4.7 | 7.9 |
| Survey Discrepancy | (%) | 4.1 | 4.1 |
| Resource Channel Width | (cm) | 138 | 130 |
| Average Stoping Width | (cm) | 176 | 176 |
| Average Weighted Resource Cut-off | (cm.g/t) | 550 | 550 |
| Mineral Reserves Pay Limit (Year 1) | (cm.g/t) | 1,010 | 1,090 |
Classified Gold Mineral Reserve estimate at 31 December 2021
| | | | | | | | | | | | | | | | | | | | | | | | | | | | | |
| Mineral Reserves |
| | | | 31 December 2021 | 31 December 2020 |
| GOLD | Southern Africa | | | Tonnes | Grade | Gold | Tonnes | Grade | Gold |
| Beatrix | | | | (Mt) | (g/t) | (Moz) | (Mt) | (g/t) | (Moz) |
| Operations | Beatrix | Underground | Proved | 6.8 | | 3.9 | | 0.8 | | 7.6 | | 3.9 | | 0.9 | |
| | | Probable | 0.9 | | 2.7 | | 0.1 | | 2.8 | | 3.2 | | 0.3 | |
| | | Proved + Probable | 7.7 | | 3.7 | | 0.9 | | 10.3 | | 3.7 | | 1.2 | |
| | SRD Surface | Proved | — | | — | | — | | — | | — | | — | |
| | | Probable | 0.8 | | 0.3 | | 0.01 | 0.4 | 0.2 | 0.003 |
| | | Proved + Probable | 0.8 | | 0.3 | | 0.01 | 0.4 | 0.2 | 0.003 |
| Grand total Proved + Probable | 8.5 | | 3.4 | | 0.9 | | 10.7 | | 3.6 | | 1.2 | |
Gold operations BEATRIX continued
Notes:
The 24% change year-on-year in the stated Mineral Reserves is attributed to:
–-0.2Moz in depletions
–-0.1Moz in area exclusions through reduction in some of the lower grade Vlakpan areas
–-0.01Moz due to changes in geological interpretation with a change in the estimation models at No. 4 Shaft
–+0.01Moz in changes to economic parameters through the addition of payable surface material
Gold operations BEATRIX continued
Beatrix Mineral Reserves classification map
| | |
| URANIUM AT BEATRIX |
| The Beisa uranium Mineral Resource is contained in the Beisa reef that occurs in the western portion (4#) of the Beatrix operation’s mining right. An initial concept study was conducted in 2013 into the feasibility of re-starting gold and uranium co-production by accessing the Beisa reef from the Beatrix No. 4 Shaft. The feasibility of this project is continually being monitored and it remains an important, strategic uranium development opportunity under the correct market conditions. |
Gold operations BEATRIX continued
Classified Uranium Mineral Resource estimate at 31 December 2021
| | | | | | | | | | | | | | | | | | | | | | | | | | | | | |
| Mineral Resources |
| | | | 31 December 2021 | 31 December 2020 |
| URANIUM | Southern Africa | | | Tonnes | Grade | U3O8 | Tonnes | Grade | U3O8 |
| BEATRIX | | | | (Mt) | (kg/t) | (Mlb) | (Mt) | (kg/t) | (Mlb) |
| Exploration | Beisa | Underground | Measured | 3.6 | | 1.1 | | 8.5 | | 3.6 | | 1.1 | | 8.5 | |
| | | Indicated | 7.8 | | 1.1 | | 18.3 | | 7.8 | | 1.1 | | 18.3 | |
| | | Measured + Indicated | 11.4 | | 1.1 | | 26.9 | | 11.4 | | 1.1 | | 26.9 | |
| | | Inferred | 0.04 | 1.1 | 0.1 | 0.04 | 1.1 | | 0.1 | |
| Total Measured + Indicated | 11.4 | | 1.1 | | 26.9 | | 11.4 | | 1.1 | | 26.9 | |
| Grand total | 11.4 | | 1.1 | | 27.0 | | 11.4 | | 1.1 | | 27.0 | |
Note: No year-on-year change
| | |
| HISTORY AND OPERATIONAL STATISTICS |
•In 1969, the exploration drilling for gold and uranium commenced in the southern limits of the Free State Goldfields •In 1981, the Beisa Shaft was commissioned to exploit uranium and the sinking of Beatrix No. 1 and No. 2 Shafts commenced •In 1984, the Beisa uranium mine closed due to the low prevailing uranium price •The Beatrix No. 1 and No. 2 Shafts were commissioned in 1985 •In 1987, a sub-vertical shaft was sunk at the Beisa mine, renamed Oryx mine, to exploit the gold bearing Kalkoenkrans reef •1995 saw the sinking of the Beatrix No. 3 Shaft complex and three ventilation shafts, as well as commencement of the down dip expansion of the mine •In 1998, the gold assets of Gold Fields of South Africa Limited and those of the unbundled Gencor merged to form Goldco. Goldco was later renamed Gold Fields Limited •In 2002, the Beatrix and Oryx mines merged to form the Beatrix gold operation •In 2012, the conventional South African assets of Gold Fields were unbundled into Sibanye Gold Limited •In 2013, the Beisa reef concept study was undertaken to establish the economic potential of re-opening the Beisa mine (upper levels of Beatrix No. 4 Shaft) to exploit gold and uranium |
| | | | | | | | | | | |
| Operational Statistics | 2019 | 2020 | 2021 |
| Underground tonnes milled (kt) | 1,622 | 1,409 | 1,826 |
| Underground yield (g/t) | 3.54 | 3.62 | 3.37 |
| Surface tonnes milled (kt) | 867 | 499 | 650 |
| Surface yield (g/t) | 0.43 | 0.35 | 0.36 |
| Annual Au production - Underground (koz) | 185 | 164 | 198 |
| Annual Au production - surface (koz) | 12 | 6 | 7 |
| Total Annual Au production (koz) | 197 | 170 | 205 |
| Operating cost underground (R/t) | 2,223 | 2,580 | 2,464 |
| Operating cost surface (R/t) | 166 | 195 | 182 |
| Total capital expenditure (Rm) | 306 | 415 | 668 |
| AISC (R/kg) | 685,346 | 816,591 | 857,256 |
| AISC (US$/oz) | 1,474 | 1,543 | 1,803 |
Note: AISC calculated based on Oz sold
Gold operations continued
DRIEFONTEIN
Gold operations DRIEFONTEIN continued
| | |
| PROPERTY DESCRIPTION |
Driefontein, a mature intermediate to ultra-deep level gold mine, started production in 1952. It is located in the West Wits Line of the Witwatersrand Basin, near Carletonville, approximately 70km west of Johannesburg, in the Gauteng province of South Africa. Driefontein consists of four operating shafts, No. 1, No. 4, No. 5, and No. 8 Shafts. The deposit is accessed from surface using shaft systems down to 50 Level (the lowest working level) at No. 5 Shaft, approximately 3,300m below surface. Ore from all the shafts is processed at Driefontein, No. 1 Plant. The production from No. 4 Shaft and No. 5 Shaft is conveyed to No. 2 Shaft on 22 and 24 Level, and is hoisted to surface. The Driefontein mining complex has three fissure water pumping shafts at No. 8 Shaft, No. 10 Shaft, and North Shaft (next to No. 8 Shaft), of which No. 8 Shaft is still operational. North Shaft pumps bulk fissure water for treatment to potable water standards for own use. Driefontein No. 10 Shaft has been placed on care and maintenance and is only maintained to pump fissure water. These shafts need to pump approximately 100ML/day fissure water ingress for safety reasons to prevent the operations from flooding. |
| | |
| MINERAL TITLE |
Driefontein is operated under a converted mining right in terms of the MPRDA with DMRE Ref No GP30/5/1/2/2(51) MR (Driefontein MR), valid from 30 January 2007 to 29 January 2037, for gold ore and associated minerals, in respect of a mining area totalling 85.61km2. In October 2015, SGL submitted a Section 102 application for amendment of the Driefontein MR to incorporate Portion 2 of the farm Driefontein 113 IR and Portion 6 and the remaining extent of the farm Vlakplaats 112 IR. The mentioned Section 102 application was granted on 25 August 2021 and SGL is awaiting execution of the amendment deed. There are no material legal proceedings in relation to the Sibanye-Stillwater Driefontein operation. |
| | |
| MINERALISATION CHARACTERISTICS |
Driefontein operations exploits three primary reefs, namely the Ventersdorp Contact Reef (VCR) located at the top of the Central Rand Group, the Carbon Leader Reef (CLR) near the base of the Group, and the Middelvlei Reef (MVR), which stratigraphically occurs some 50 to 75 metres above the CLR. These reefs are laterally continuous with relatively long-range predictability and have clear patterns of mineralisation governed by sedimentary characteristics. Most of mining take place on the VCR, which constitutes 60% of the Mineral Reserves, the CLR 33%, and MVR the remaining 7%.
The VCR strikes east-northeast and has a regional dip of about 21° to the south-southeast, CLR strikes west-southwest and dips to the south at approximately 25°, and MVR strikes west-southwest with a regional dip of approximately 22° to the south-southeast. The reefs are generally less than two metres thick, and are widely considered to represent extensive fluvial fans. |
| | |
| INFRASTRUCTURE AND EQUIPMENT |
Driefontein is a large, well established, intermediate to ultra-deep level gold mine typical to similar mines on the far West Rand mining narrow tabular ore bodies. It has been in production since the 1950s with the last shafts being commissioned in the late 1990s. It includes all the permanent infrastructure required to access and mine the underground areas. All the mineral processing infrastructure is also well established and in use. The underground workings are accessed through a number of vertical shaft systems from surface, ranging from depths of ~800m at No. 8 Shaft to a maximum of ~3,300m at No. 5 Shaft. The shafts are well maintained and will support mining operations over the LoM. The underground development is extensive, as can be expected of a mature mine of this size. All footwall access development is mined using mechanical rail-bound methods that are well understood. All stoping is completed using conventional, narrow tabular methods and as such is relatively labour intensive. All equipment required to mine is already in place and being used. Provision is made in the LoM and Technical-Economic Model for all major equipment upgrades, replacements and maintenance to support the LoM. The property, plant and equipment book value (100%) of all the mine’s assets, net of depreciation, as at 31 December 2021, was R2.94bn. The four producing shaft systems mine various contributions from pillars and open ground. No. 2 Shaft is being used solely for hoisting purposes and a further two are being utilised for pumping. Some of the older shafts are on care-and-maintenance and have been planned for closure in 2022 following a footprint optimisation project to contain costs. There is one mineral processing plant situated close to the centre of operations, which is being used to treat underground material. |
Gold operations DRIEFONTEIN continued
| | | | | | | | |
| HOISTING AND PRODUCTION CAPACITIES |
| Operating shaft (No) | Operating capacity (ktpm) | 5-year planned production (ktpm)* |
| No. 1 Shaft | 43 | 25 |
| No. 2 Shaft** | 89 | 61 |
| No. 4 Shaft | 25 | 23 |
| No. 5 Shaft | 106 | 38 |
| No. 8 Shaft | 29 | 28 |
* Planned production is five-year hoisted average from 2022 onwards
** Includes No. 4 and No. 5 Shafts production
| | |
| MINING METHOD |
Underground •Scattered-conventional breast mining •Pillars extraction (white areas) |
| | |
| LIFE OF MINE |
•Ten years (until 2031) based on current Mineral Reserves |
| | | | | | | | | | | | | | | | | |
| MINERAL PROCESSING AND CAPACITY |
| Plant | Design capacity (ktpm) | Operational capacity (ktpm) | Type | Average recovery
factor (%) | Material
treated |
| No.1 Plant | 240 | 120 | CIP | 97 | UG |
| | |
| TAILINGS DISPOSAL AND CAPACITY |
There are two active TSFs, Driefontein TSF 1 and 2 both being fed with a mix of underground and SRD tailings from Driefontein No. 1 Plant. •Driefontein TSF 1 has a capacity of 11.7Mt with an estimated LoM deposition of 5.9Mt resulting in surplus capacity of 5.8Mt •Driefontein TSF 2 has a capacity of 11.5Mt with an estimated LoM deposition of 5.9Mt resulting in surplus capacity of 5.6Mt |
| | |
| ESTIMATION RISKS |
There are no deemed material risks to the Mineral Resource Estimation. The key operational risks that could impact the Mineral Reserves are listed below. •Underground fire risk: Underground fires due to electrical faults, combustible material, arson and contraband could lead to loss of life and stoppages. Fire detection systems are established across the operation and are continuously monitored. Every shaft has escape strategies, fire prevention standards and use fire retardant belts. Older areas are continuously sealed off, and emergency control room and fire detection audits are conducted on a regular basis •Seismic risk: Mining at depth and the extraction of high stressed areas can cause fatalities, injuries and damage to working areas. All areas planned to mine are reviewed for suitable mine design and layouts by qualified rock engineers, who conduct rock engineering modelling and support design. A comprehensive seismic monitoring system is in place and the seismic response to production is monitored daily. Designs are audited on an ongoing basis and are monitored for effectiveness •Illegal mining: Mining activities are continually disrupted by illegal miners who gain access to the underground workings. All shafts are completely fenced off with access controls, are monitored via closed circuit television (CCTV) and are patrolled by security personnel •Ageing infrastructure resulting in business interruptions: As the mine was developed in the late 1980’s most of the original infrastructure needs regular replacement and upgrade. All major installations are continuously reviewed and a comprehensive planned maintenance system, and a Sustainable Integrated Mine Management System is in place •Power supply interruptions and cost increases: Eskom (the national power supplier) has proven to be unreliable over recent years, causing loss of power supply at certain times and having tariff increases above inflation. The operation has emergency generators available for evacuation if required and conducts load shifting in order to optimise available power supply. New initiatives are continuously implemented to reduce demand and the Group is expanding its portfolio of renewable energy projects |
Gold operations DRIEFONTEIN continued
| | |
| KEY DEVELOPMENTS AND BROWNFIELD PROJECTS |
The No. 4 Shaft Pillar Extraction Project is currently in execution and has seen some revision during the C2022 LoM process. The original extraction plan has been revised following a geotechnical review and has resulted in a small reduction in the mineable Mineral Reserves. The Driefontein No. 1 Shaft Rim-Pillar Project, a smaller project designed to extend the LoM of No. 1 Shaft commenced in 2020. Successful exploration drilling of the VCR at No. 1 and No. 5 Shafts led to an increase in Mineral Reserves of more than 0.3Moz. This exploration programme is ongoing and is likely to continue playing a critical role in securing LoM extensions at these shafts. |
Classified Gold Mineral Resource estimate at 31 December 2021
| | | | | | | | | | | | | | | | | | | | | | | | | | | | | |
| Mineral Resources Inclusive of Mineral Reserves |
| | | | 31 December 2021 | 31 December 2020 |
| GOLD | Southern Africa | | | Tonnes | Grade | Gold | Tonnes | Grade | Gold |
| Driefontein | | | | (Mt) | (g/t) | (Moz) | (Mt) | (g/t) | (Moz) |
| Operations | | Underground | Measured | 21.1 | | 10.9 | | 7.4 | | 20.6 | | 10.7 | | 7.1 | |
| | | Indicated | 12.2 | | 8.5 | | 3.3 | | 14.2 | | 9.2 | | 4.2 | |
| | | Measured + Indicated | 33.3 | | 10.0 | | 10.7 | | 34.8 | | 10.1 | | 11.3 | |
| | | Inferred | 0.8 | | 6.6 | | 0.2 | | 0.5 | | 5.2 | | 0.1 | |
| | SRD Surface | Measured | — | | — | | — | | — | | — | | — | |
| | | Indicated | — | | — | | — | | 0.3 | 0.4 | 0.004 |
| | | Measured + Indicated | — | | — | | — | | 0.3 | 0.4 | 0.004 |
| | | Inferred | — | | — | | — | | — | | — | | — | |
| Total Measured + Indicated | 33.3 | | 10.0 | | 10.7 | | 35.1 | | 10.0 | | 11.3 | |
| Grand total | 34.1 | | 9.9 | | 10.9 | | 35.6 | | 9.9 | | 11.4 | |
| | | | | | | | | | | | | | | | | | | | | | | | | | | | | |
| Mineral Resources Exclusive of Mineral Reserves |
| | | | 31 December 2021 | 31 December 2020 |
| GOLD | Southern Africa | | | Tonnes | Grade | Gold | Tonnes | Grade | Gold |
| Driefontein | | | | (Mt) | (g/t) | (Moz) | (Mt) | (g/t) | (Moz) |
| Operations | | Underground | Measured | 16.0 | | 9.1 | | 4.7 | | 16.6 | | 9.7 | | 5.2 | |
| | | Indicated | 10.0 | | 7.9 | | 2.5 | | 12.6 | | 8.4 | | 3.4 | |
| | | Measured + Indicated | 26.0 | | 8.7 | | 7.2 | | 29.2 | | 9.1 | | 8.6 | |
| | | Inferred | 0.8 | | 6.6 | | 0.2 | | 0.5 | | 5.1 | | 0.1 | |
| Total Measured + Indicated | 26.0 | | 8.7 | | 7.2 | | 29.2 | | 9.1 | | 8.6 | |
| Grand total | 26.7 | | 8.6 | | 7.4 | | 29.7 | | 9.1 | | 8.7 | |
Gold operations DRIEFONTEIN continued
Notes:
The 4.2% change year-on-year in the stated Mineral Resources (Inclusive of Mineral Reserves) is attributed to:
–-0.3Moz in depletions
–-0.1Moz in exclusions and pillars
–+0.7Moz in changes to the geological Interpretation: re-interpretation of facies at No. 1 Shaft (+0.5Moz); facies changes at No. 5 Shaft (+0.1Moz)
–-0.4Moz in estimation domains/data: No. 1 Shaft new assay data and data clean up (-0.3Moz)
–-0.4Moz in cut-off value changes: cut-off values increased at No. 1 Shaft (-0.2Moz); cut-off value increased at No. 5 Shaft (-0.2Moz)
On a Mineral Resources exclusive of Mineral Reserves basis, the year-on-year change is -14.9%.
Note: This grade tonnage curve pertains to the underground portion of these Mineral Resources only
Gold operations DRIEFONTEIN continued
Mineral Resources classification maps for Driefontein operation per reef
Gold operations DRIEFONTEIN continued
Grade control and definition drilling summary
| | | | | | | | | | | | | | | | | | | | |
| Planned 2022 | 2021 | 2020 |
| OPERATION – DRIEFONTEIN | Drilled (m) | Expenditure (Rm) | Drilled (m) | Expenditure (Rm) | Drilled (m) | Expenditure (Rm) |
| Grade control and ore definition | 25,875 | 30.48 | 20,028 | 22.54 | 14,568 | 14.57 |
| Total | 25,875 | 30.48 | 20,028 | 22.54 | 14,568 | 14.57 |
Annual development results
| | | | | | | | | | | |
| Financial year total |
| Category | Unit | 2021 | 2020 |
Primary waste development (capital, declines, haulages, crosscuts, boxholes,
travelling ways) | m | 7,107 | 6,105 |
| Primary reef development (raise, winzes, wide raises) | m | 1,838 | 1,559 |
| Total | m | 8,945 | 7,664 |
Modifying factors (underground) in converting Mineral Resource to Mineral Reserves
| | | | | | | | | | | |
| Parameter | Unit | 2021 | 2020 |
| Average Mined Value (over LoM) | (cm.g/t) | 1,925 | 1,886 |
| Waste Mining Percentage | (%) | 5.9 | 6.3 |
| Mine Call Factor | (%) | 84.9 | 83.9 |
| Plant Recovery Factor | (%) | 97 | 97 |
| Development to Mill | (%) | 10.7 | 11.1 |
| Survey Discrepancy | (%) | 11.6 | 8.6 |
| Resource Channel Width | (cm) | 71 | 67 |
| Average Stoping Width | (cm) | 152 | 150 |
| Average Weighted Resource Cut-off | (cm.g/t) | 810 | 730 |
| Mineral Reserves Pay Limit (Year 1) | (cm.g/t) | 1,820 | 1880 |
Classified Gold Mineral Reserve estimate at 31 December 2021
| | | | | | | | | | | | | | | | | | | | | | | | | | | | | |
| Mineral Reserves |
| | | | 31 December 2021 | 31 December 2020 |
| GOLD | Southern Africa | | | Tonnes | Grade | Gold | Tonnes | Grade | Gold |
| Driefontein | | | | (Mt) | (g/t) | (Moz) | (Mt) | (g/t) | (Moz) |
| Operations | | Underground | Proved | 7.7 | | 8.4 | | 2.1 | | 5.9 | | 8.5 | | 1.6 | |
| | | Probable | 4.2 | | 7.2 | | 1.0 | | 3.6 | | 7.4 | | 0.9 | |
| | | Proved + Probable | 11.9 | | 8.0 | | 3.0 | | 9.6 | | 8.0 | | 2.5 | |
| | SRD Surface | Proved | — | | — | | — | | — | | — | | — | |
| | | Probable | — | | — | | — | | 0.3 | | 0.4 | | — | |
| | | Proved + Probable | — | | — | | — | | 0.3 | | 0.4 | | — | |
| Grand total Proved + Probable | 11.9 | | 8.0 | | 3.0 | | 9.8 | | 7.8 | | 2.5 | |
Gold operations DRIEFONTEIN continued
Notes:
The +22% change year-on-year in the stated Mineral Reserves is attributed to:
–-0.3Moz in depletions
–+0.8Moz in area inclusions driven largely by the secondary VCR increases at No. 1 and No. 5 Shafts as well as some primary VCR inclusions at No. 4 Shaft from the optimisation of the tail
–+0.1Moz on modifying factors from a MCF improvement throughout the year at No. 5 and No. 8 Shafts
Gold operations DRIEFONTEIN continued
Mineral Reserves classification map for the Driefontein operation (all reefs)
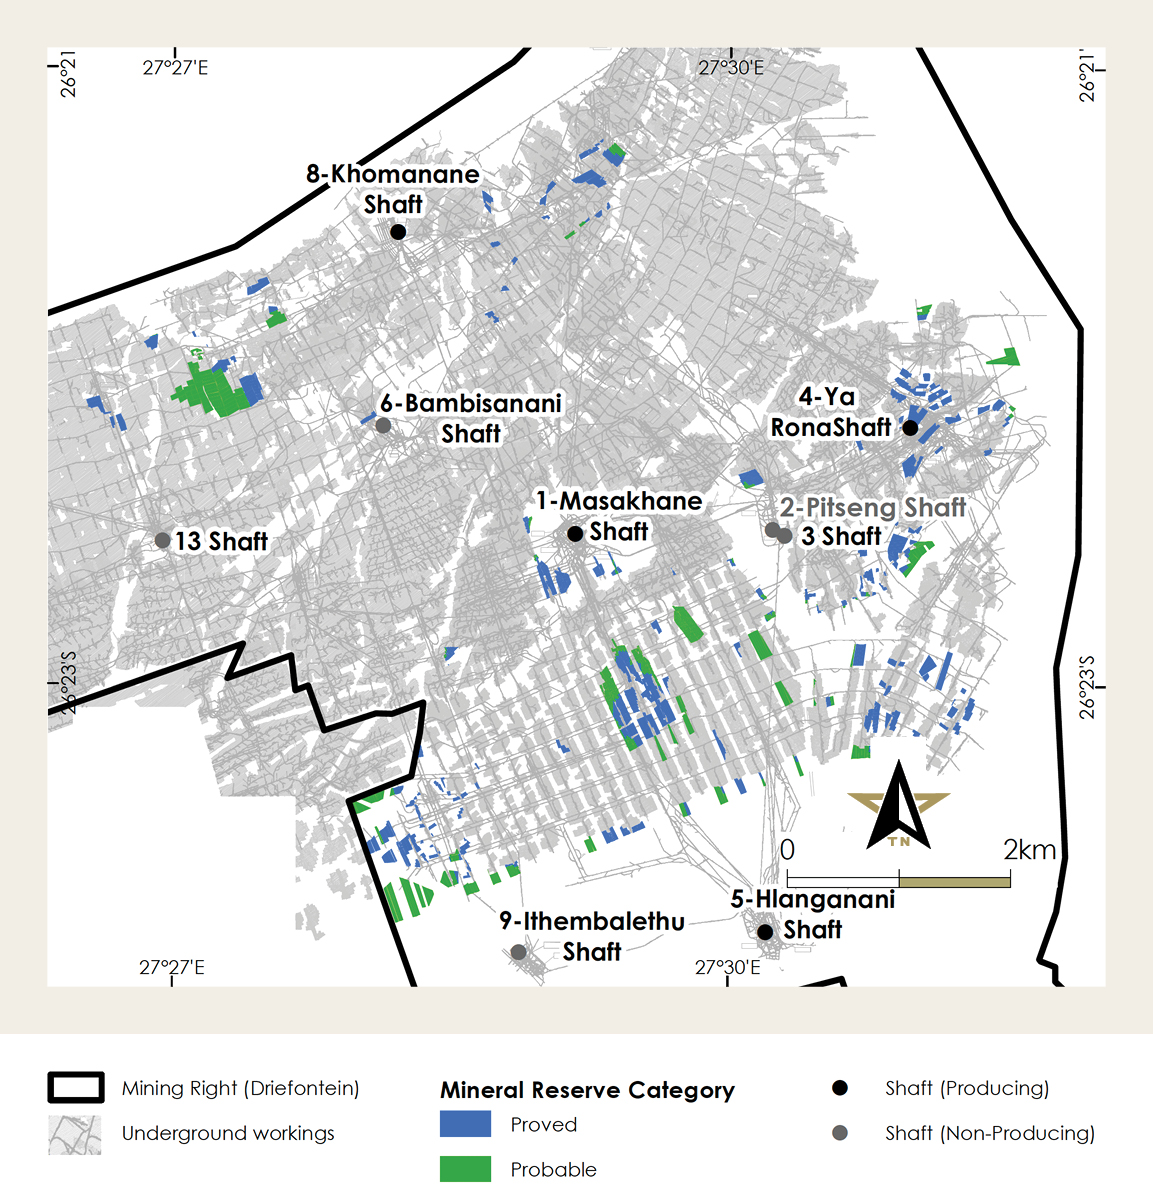
| | |
| HISTORY AND OPERATIONAL STATISTICS |
•Exploration activities from 1933 to 1939 culminated in the registration of the West Driefontein Mining Company in 1945 •Shaft sinking followed and West Driefontein started milling ore in 1952 •Further exploration lead to the adjoining East Driefontein Gold Mining Company Limited being registered in 1968, with first production in 1972 •In 1981 the East Driefontein Gold Mining Company Ltd became a wholly-owned subsidiary of Driefontein Consolidated Ltd •In 1999, Gold Fields obtained full control of the Driefontein Gold Mine by buying AngloGold Ashanti’s 21.5% shareholding •In 2012, the conventional South African assets of Gold Fields were unbundled into Sibanye Gold Limited •In 2014, Sibanye-Stillwater completed the PFS into the Driefontein No. 5 Shaft Drop-down Project and drop-down development commenced. This decline project was deferred in 2018 •2019 saw the commencement of the No. 4 Shaft Pillar extraction project |
| | | | | | | | | | | |
| Operational Statistics | 2019 | 2020 | 2021 |
| Underground tonnes milled (kt) | 898 | 1,224 | 1,474 |
| Underground yield (g/t) | 5.74 | 6.36 | 6.11 |
| Surface tonnes milled (kt) | 8 | 0 | 563 |
| Surface yield (g/t) | 0.38 | N/A | 0.45 |
| Annual Au production - Underground (koz) | 166 | 250 | 290 |
| Annual Au production - surface (koz) | 0 | N/A | 8 |
| Total Annual Au production (koz) | 166 | 250 | 298 |
| Operating cost underground (R/t) | 4,974 | 4,091 | 3,778 |
| Operating cost surface (R/t) | 1,250 | N/A | 234 |
| Total capital expenditure (Rm) | 676 | 929 | 1,499 |
| AISC (R/kg) | 1,016,288 | 788,708 | 793,000 |
| AISC (US$/oz) | 2,186 | 1,490 | 1,668 |
Note: AISC calculated based on Oz sold
Gold operations continued
COOKE
Gold operations COOKE continued
| | |
| PROPERTY DESCRIPTION |
The Cooke operation is situated in the West Wits Line of the Witwatersrand Basin, near the town of Randfontein approximately 35km southwest of Johannesburg, in the Gauteng province of South Africa. The underground operations have been placed on care and maintenance with one of two gold processing plants (one with an integrated uranium recovery circuit) still active. The underground workings were placed on care and maintenance (C&M) during 2017. Current operations comprise the Cooke plant and the Randfontein Surface Operation (RSO), an active tailings mining and retreatment operation. In addition, the Ezulwini gold plant (at No. 4 Shaft) is used as a toll treating facility, catering to both external and internal operations. The Cooke underground operations have been earmarked for legal closure and rewatering, and various cost-saving initiatives have been implemented to reduce C&M costs, mostly relating to the pumping of water. |
| | |
| MINERAL TITLE |
The Cooke operation has three separate mining rights in terms of the MPRDA. Rand Uranium (Pty) Ltd (a subsidiary of Sibanye Gold Limited) holds a converted mining right over the operation known as Cooke No. 1, No. 2 and No. 3 in terms of the MPRDA, under DMRE Ref No GP30/5/1/2/2/07 MR (Cooke No. 1, No. 2 and No. 3 MR), valid from 18 December 2007 to 17 December 2037 and covering a total area of 78.75km2. An application was submitted in terms of the provisions of Section 102 of the MPRDA in 2015 for the areas covering Cooke 4 South TSF and Millsite tailings complex, to be incorporated into the Cooke No. 1, No. 2 and No. 3 mining right area. This application is not yet finalised. Rand Uranium (Pty) Ltd also holds a converted mining right over the operation known as Randfontein Surface Operation in terms of the MPRDA, under DMRE Ref No GP30/5/1/2/2/173 MR (RSO MR) valid from 7 May 2009 to 6 May 2039, with a total area of 31.30km2. Ezulwini Mining Company (Pty) Ltd (a subsidiary of Sibanye Gold Limited) holds a mining right in terms of the provisions of Section 23 of the MPRDA over the operation known as Cooke No. 4 (Ezulwini), under DMRE Ref No GP30/5/1/2/2/38 MR (Ezulwini MR), valid from 20 November 2006 to 19 November 2036 and covering a total area of 37.18km2. Ezulwini Mining Company (Pty) Ltd (Ezulwini) also submitted an application in terms of the provisions of Section 102 of the MPRDA to incorporate the Zuurbekom prospecting right area into the Ezulwini mining right area. The Section 102 application is yet to be finalised. All required operating permits have been obtained and are in good standing. |
| | |
| MINERALISATION CHARACTERISTICS |
The mineral assets are historical gold plant tailings material from the mining of auriferous and uraniferous ore from the Witwatersrand Basin. The typical composition is quartz (70% to 80%), mica (10%), chlorite and chloritoid (9% to 18%) and pyrite (1% to 2%). The composition of a TSF depends on the geochemical make-up of the material being mined and the chemicals used in the mining and extraction process. Further, the internal structure of the TSF reflects the historic mining strategy and depositional methodologies employed. The bulk density of tailings material and the lateral and vertical variation in moisture content is a critical factor in the accurate estimation of tonnages. In addition, secondary processes such as metal remobilisation, erosion, weathering, leaching and acid mine drainage can affect the geochemical characteristics of a TSF. Gold can undergo mobilisation within the TSF over time, and hence, may exhibit areas of reconcentration, and even be present in the sub-structure (footprint) soil. |
| | |
| INFRASTRUCTURE AND EQUIPMENT |
| The Rand Surface Operation (RSO) is a mature, established and ongoing reprocessing operation, combining the joint operations of Rand Uranium (Pty) Ltd (RU) and Ezulwini Mining Company (Pty) Ltd. The key remaining assets relate to the reprocessing of the tailings. The RSO incorporates the Cooke Plant, situated between the Cooke TSF and Lindum TSF North of the Cooke No. 1 Shaft and the Ezulwini Plant, situated at the Ezulwini/Cooke No. 4 Shaft Complex. Both these plants are aged, but well maintained. At the Ezulwini plant, there is an independent uranium recovery circuit, which is currently on care and maintenance, constructed in the early 2000s. All the permanent infrastructure required to mine and process the surface Mineral Reserves declared in support of the LoM plan, is already established and in use. The mining method is via monitored high-pressure water jets. The product is transferred in a slurry form to a collection sump via a system of launders and/or drains. Satellite pumps then transfer this material to the main pump station, where it is pumped away to a processing plant. The full property, plant and equipment book value (100%) of all the mine’s assets, net of depreciation, as at 31 December 2021 has been written down. |
Gold operations COOKE continued
| | |
| MINING METHOD |
•Mining of the TSF material is via hydro (waterjet) methods •Mining of SRDs takes place with front-end loaders and LHD trucks |
| | |
| LIFE OF MINE |
The RSO operation currently has four years LOM (until 2025), with the potential to be extended significantly, subject to financial feasibility and the ability to deposit the tailings safely. The Millsite TSF complex, which is currently being exploited, and represents the bulk of the reported Mineral Resources, contains a total of more than 100Mt, of which only 9.1Mt is currently being reported as Mineral Reserves. In addition, clean-up is being done of the vlei area at Ezulwini as well as the footprint of the old Dump 20 area.
Several surface sources are being treated on a toll-basis for third-party operations. |
| | | | | | | | | | | | | | | | | |
| MINERAL PROCESSING AND CAPACITY |
| Plant | Design capacity (ktpm) | Operational capacity (ktpm) | Type | Average recovery
factor (%) | Material
treated |
| Cooke Plant | 400 | 380 | CIP/CIL | 56.7 | TSF |
| Ezulwini Plant | 200 | 130 | CIL | 84.6 | SRD |
| | |
| TAILINGS DISPOSAL AND CAPACITY |
There are two active TSF sites for the RSO. Tailings from Cooke Plant are deposited into historic, unrehabilitated open pits connected to the old underground workings of the Randfontein Estates Gold Mine (REGM) operation as part of the approved EMPR. An estimated 14.9Mt of depositional capacity is available in these pits assuming there is no further storage capacity in the connected underground workings. To date however, there is no indication that the tailings are beginning to beach and the material is still filling the underground voids. The LoM Mineral Reserves are being constrained by this capacity at 14.9Mt. The Ezulwini North TSF is situated next to the Ezulwini Plant and has an available capacity of 18.8Mt. The LoM depositional requirements for this TSF are 1.8Mt which leaves a surplus capacity of 17.0Mt. |
| | |
| ESTIMATION RISKS |
There are no deemed material risks to the Mineral Resource Estimation. The key operational risks that could impact the Mineral Reserves are listed below. •Risk of flooding: The Cooke underground operations pump fissure water to surface and could flood should there be a breakdown or extended power failure. There is adequate pumping capability in place and an emergency power plant is available. Appropriate action plans, procedures and standards are in place to manage the risk •Ageing infrastructure resulting in business interruptions: As the mine was developed in the late 1960’s most of the original infrastructure needs regular replacement and upgrade. All major installations are continuously reviewed and a comprehensive planned maintenance system, and a Sustainable Integrated Mine Management System is in place •Power supply interruptions and cost increases: Eskom (the national power supplier) has proven to be unreliable over recent years, causing loss of power supply at certain times and having tariff increases above inflation. The operation has emergency generators available for evacuation if required and conducts load shifting in order to optimise available power supply. New initiatives are continuously implemented to reduce demand and the Group is expanding its portfolio of renewable energy projects •Criminal activity: Mining activities and surface infrastructure are regularly disrupted by illegal miners and criminals who steal copper, scrap and gold bearing material. Access control is in place at all the shafts and plants. In addition, continuous guarding, CCTV and security patrols are in place |
| | |
| KEY DEVELOPMENTS AND BROWNFIELD PROJECTS |
| An important focus for the operations is to secure additional tailings depositional capacity that could support an increase in the reported four year LoM (0.1Moz). The considerable Mineral Resource (1.8Moz) has the potential to support ~20 years of mine life, subject to resolving this bottleneck. This is the subject of ongoing investigations. In parallel, the legal closure process of the underground operations are being pursued. |
Gold operations COOKE continued
Classified Gold Mineral Resource estimate at 31 December 2021
| | | | | | | | | | | | | | | | | | | | | | | | | | | | | |
| Mineral Resources Inclusive of Mineral Reserves |
| | | | 31 December 2021 | 31 December 2020 |
| GOLD | Southern Africa | | | Tonnes | Grade | Gold | Tonnes | Grade | Gold |
| Cooke | | | | (Mt) | (g/t) | (Moz) | (Mt) | (g/t) | (Moz) |
| Operations | Cooke | TSF Surface | Measured | 60.3 | | 0.3 | | 0.5 | | 79.3 | | 0.3 | | 0.7 | |
| | | Indicated | 5.3 | | 0.4 | | 0.1 | | 7.0 | | 0.4 | | 0.1 | |
| | | Measured + Indicated | 65.6 | | 0.3 | | 0.6 | | 86.3 | | 0.3 | | 0.8 | |
| | | Inferred | — | | — | | — | | — | | — | | — | |
| RSO-Millsite | TSF Surface | Measured | 99.3 | | 0.2 | | 0.8 | | 130.7 | | 0.2 | | 1.0 | |
| | | Indicated | 5.9 | | 0.3 | | 0.1 | | 11.1 | | 0.3 | | 0.1 | |
| | | Measured + Indicated | 105.2 | | 0.3 | | 0.8 | | 141.8 | | 0.3 | | 1.1 | |
| | | Inferred | — | | — | | — | | — | | — | | — | |
| Cooke 4 | TSF Surface | Measured | — | | — | | — | | — | | — | | — | |
| | | Indicated | 34.4 | | 0.3 | | 0.3 | | 45.3 | | 0.3 | | 0.4 | |
| | | Measured + Indicated | 34.4 | | 0.3 | | 0.3 | | 45.3 | | 0.3 | | 0.4 | |
| | | Inferred | — | | — | | — | | — | | — | | — | |
| Total Measured + Indicated | 205.2 | | 0.3 | | 1.8 | | 273.4 | | 0.3 | | 2.3 | |
| Grand total | 205.2 | | 0.3 | | 1.8 | | 273.4 | | 0.3 | | 2.3 | |
| | | | | | | | | | | | | | | | | | | | | | | | | | | | | |
| Mineral Resources Exclusive of Mineral Reserves |
| | | | 31 December 2021 | 31 December 2020 |
| GOLD | Southern Africa | | | Tonnes | Grade | Gold | Tonnes | Grade | Gold |
| Cooke | | | | (Mt) | (g/t) | (Moz) | (Mt) | (g/t) | (Moz) |
| Operations | Cooke | TSF Surface | Measured | 60.3 | | 0.3 | | 0.5 | | 79.3 | | 0.3 | | 0.7 | |
| | | Indicated | 5.3 | | 0.4 | | 0.1 | | 7.0 | | 0.4 | | 0.1 | |
| | | Measured + Indicated | 65.6 | | 0.3 | | 0.6 | | 86.3 | | 0.3 | | 0.8 | |
| | | Inferred | — | | — | | — | | — | | — | | — | |
| RSO-Millsite | TSF Surface | Measured | 95.7 | | 0.2 | | 0.8 | | 130.7 | | 0.2 | | 1.0 | |
| | | Indicated | — | | — | | — | | — | | — | | — | |
| | | Measured + Indicated | 95.7 | | 0.2 | | 0.8 | | 130.7 | | 0.2 | | 1.0 | |
| | | Inferred | — | | — | | — | | — | | — | | — | |
| Cooke 4 | TSF Surface | Measured | — | | — | | — | | — | | — | | — | |
| | | Indicated | 34.4 | | 0.3 | | 0.3 | | 45.3 | | 0.3 | | 0.4 | |
| | | Measured + Indicated | 34.4 | | 0.3 | | 0.3 | | 45.3 | | 0.3 | | 0.4 | |
| | | Inferred | — | | — | | — | | — | | — | | — | |
| Total Measured + Indicated | 195.7 | | 0.3 | | 1.7 | | 262.3 | | 0.3 | | 2.2 | |
| Grand total | 195.7 | | 0.3 | | 1.7 | | 262.3 | | 0.3 | | 2.2 | |
Gold operations COOKE continued
Notes:
The -24.4% change year-on-year in the stated Mineral Resources (Inclusive of Mineral Reserves) is attributed to:
–24% decrease (-0.6Moz) due to the change in attributable reporting basis from 100% to 76%.
–-0.02Moz in depletions
–Survey error which accounted for under-reporting in 2020 of 0.03Moz
–Previous double accounting where Millsite Dump 41 was reported for both RSO and Cooke areas (-0.02Moz)
On a Mineral Resources exclusive of Mineral Reserves basis, the year-on-year change is -22.7%.
Gold operations COOKE continued
Mineral Resources classification maps for RSO and Cooke operations per TSF
Gold operations COOKE continued
Modifying factors in converting Mineral Resources to Mineral Reserves
| | | | | | | | | | | |
| Parameter | Unit | 2021 | 2020 |
| Mineral Reserve Pay Limit | g/t | 0.27 | 0.28 |
| Plant Recovery Factor (Cooke Plant) | % | 56.7 | 56.6 |
| Plant Recovery Factor (Ezulwini Plant) | % | 84.6 | 86.0 |
Classified Gold Mineral Reserve estimate at 31 December 2021
| | | | | | | | | | | | | | | | | | | | | | | | | | | | | |
| Mineral Reserves |
| | | | 31 December 2021 | 31 December 2020 |
| GOLD | Southern Africa | | | Tonnes | Grade | Gold | Tonnes | Grade | Gold |
| Cooke | | | | (Mt) | (g/t) | (Moz) | (Mt) | (g/t) | (Moz) |
| Operations | | TSF Surface | Proved | — | | — | | — | | — | | — | | — | |
| | | Probable | 9.5 | | 0.3 | | 0.1 | | 11.1 | | 0.3 | | 0.1 | |
| Grand total Proved + Probable | 9.5 | | 0.3 | | 0.1 | | 11.1 | | 0.3 | | 0.1 | |
Notes:
The 14% change year-on-year in the stated Mineral Reserves is attributed to:
–-0.1Moz in depletions
–-0.03Moz due to the change in attributable reporting basis from 100% to 76%
–+0.1Moz (economic parameters) due to the revised status of the tailings deposition capacity in the old pits
Gold operations COOKE continued
Mineral Reserves classification map for the RSO
| | |
| URANIUM AT COOKE |
| The Cooke uranium Mineral Resources are contained within four historic TSFs situated on the Cooke mineral rights. They are classified as “moveable assets” and as such the right to mine is not tied to the mining right. The uranium Mineral Resources are a by product of gold mining at the historic Cooke operations. These surface uranium Mineral Resources represents a key strategic opportunity due to the proximity of the existing Cooke and Ezulwini gold and uranium processing plants. A new study has been initiated to determine the optimal extraction strategy. |
Classified Uranium Mineral Resource estimate at 31 December 2021
| | | | | | | | | | | | | | | | | | | | | | | | | | | | | |
| Mineral Resources |
| | | | 31 December 2021 | 31 December 2020 |
| URANIUM | Southern Africa | | | Tonnes | Grade | U3O8 | Tonnes | Grade | U3O8 |
| COOKE | | | | (Mt) | (kg/t) | (Mlb) | (Mt) | (kg/t) | (Mlb) |
| Exploration | Cooke | TSF Surface | Measured | 60.3 | | 0.2 | | 24.7 | | 79.3 | | 0.2 | | 32.5 | |
| | | Indicated | 5.3 | | 0.1 | | 1.4 | | 7.0 | | 0.1 | | 1.8 | |
| | | Measured + Indicated | 65.6 | | 0.2 | | 26.1 | | 86.3 | | 0.2 | | 34.3 | |
| | | Inferred | — | | — | | — | | — | | — | | — | |
| Cooke 4 | TSF Surface | Measured | — | | — | | — | | — | | — | | — | |
| | | Indicated | 34.4 | | 0.1 | | 6.2 | | 45.3 | | 0.1 | | 8.1 | |
| | | Measured + Indicated | 34.4 | | 0.1 | | 6.2 | | 45.3 | | 0.1 | | 8.1 | |
| | | Inferred | — | | — | | — | | — | | — | | — | |
| RSO-Millsite | TSF Surface | Measured | 95.7 | | 0.0 | 6.7 | 130.7 | 0.0 | 9.3 | |
| | | Indicated | — | | — | | — | | — | | — | | — | |
| | | Measured + Indicated | 95.7 | | 0.0 | 6.7 | 130.7 | 0.0 | 9.3 | |
| | | Inferred | — | | — | | — | | — | | — | | — | |
| Total Measured + Indicated | 195.7 | | 0.1 | | 39.0 | | 262.3 | | 0.1 | | 51.7 | |
| Grand total | 195.7 | | 0.1 | | 39.0 | | 262.3 | | 0.1 | | 51.7 | |
Note: The year-on-year decrease of 24% in the total Mineral Resources was due to the change in attributable reporting basis from 100% to 76%
Gold operations COOKE continued
| | |
| HISTORY AND OPERATIONAL STATISTICS |
•In 1889, the Randfontein Estates Gold Mining Company Limited (REGM) was established •The Cooke No. 1, No. 2 and No. 3 Shaft operations were established as sections of REGM between 1971 and 1981 •In 1997, the Cooke No. 4 Shaft was purchased by REGM, but subsequently sold to Harmony Gold Mine Limited in 2000 •The Cooke 4 shaft was subsequently acquired in 2005 by Simmer and Jack Limited (as the Ezulweni Mining Company Pty Ltd) (EMC), which commenced constructing a new gold and uranium plant. Simmer and Jack Limited then sold its 90% interest in EMC to First Uranium Limited •In 2007, Harmony and Pamodzi acquired the Cooke operations from Randfontein Estates Limited in a special purpose vehicle called Rand Uranium (Pty) Limited •Gold One International Limited acquired Rand Uranium in 2007 •In 2012, Gold One acquired 100% of EMC •Sibanye Gold acquired Rand Uranium and EMC from Gold One in May 2012 •The Cooke No. 4 Shaft underground operations were suspeneded during 2016 and the uranium plant placed under care and maintenance. •During 2017, the Cooke 1-3 underground operations were placed under care and maintenance. The processing of third-party toll material commenced at the Ezulwini Plant |
| | | | | | | | | | | |
| Operational Statistics | 2019 | 2020 | 2021 |
| Underground tonnes milled (kt) | 75 | 0 | 0 |
| Underground yield (g/t) | 0.43 | N/A | N/A |
| Surface tonnes milled (kt) | 4,253 | 4,569 | 4,642 |
| Surface yield (g/t) | 0.3 | 0.26 | 0.25 |
| Annual Au production - Underground (koz) | 1 | N/A | N/A |
| Annual Au production - surface (koz) | 40 | 38 | 37 |
| Total Annual Au production (koz) | 42 | 38 | 38 |
| Operating cost underground (R/t) | 221 | N/A | N/A |
| Operating cost surface (R/t) | 143 | 155 | 174 |
| Total capital expenditure (Rm) | 0 | 0 | 0 |
| AISC (R/kg) | 520,497 | 661,422 | 742,979 |
| AISC (US$/oz) | 1,120 | 1,250 | 1,562 |
Note: AISC calculated based on Oz sold
Gold operations continued
DRDGOLD
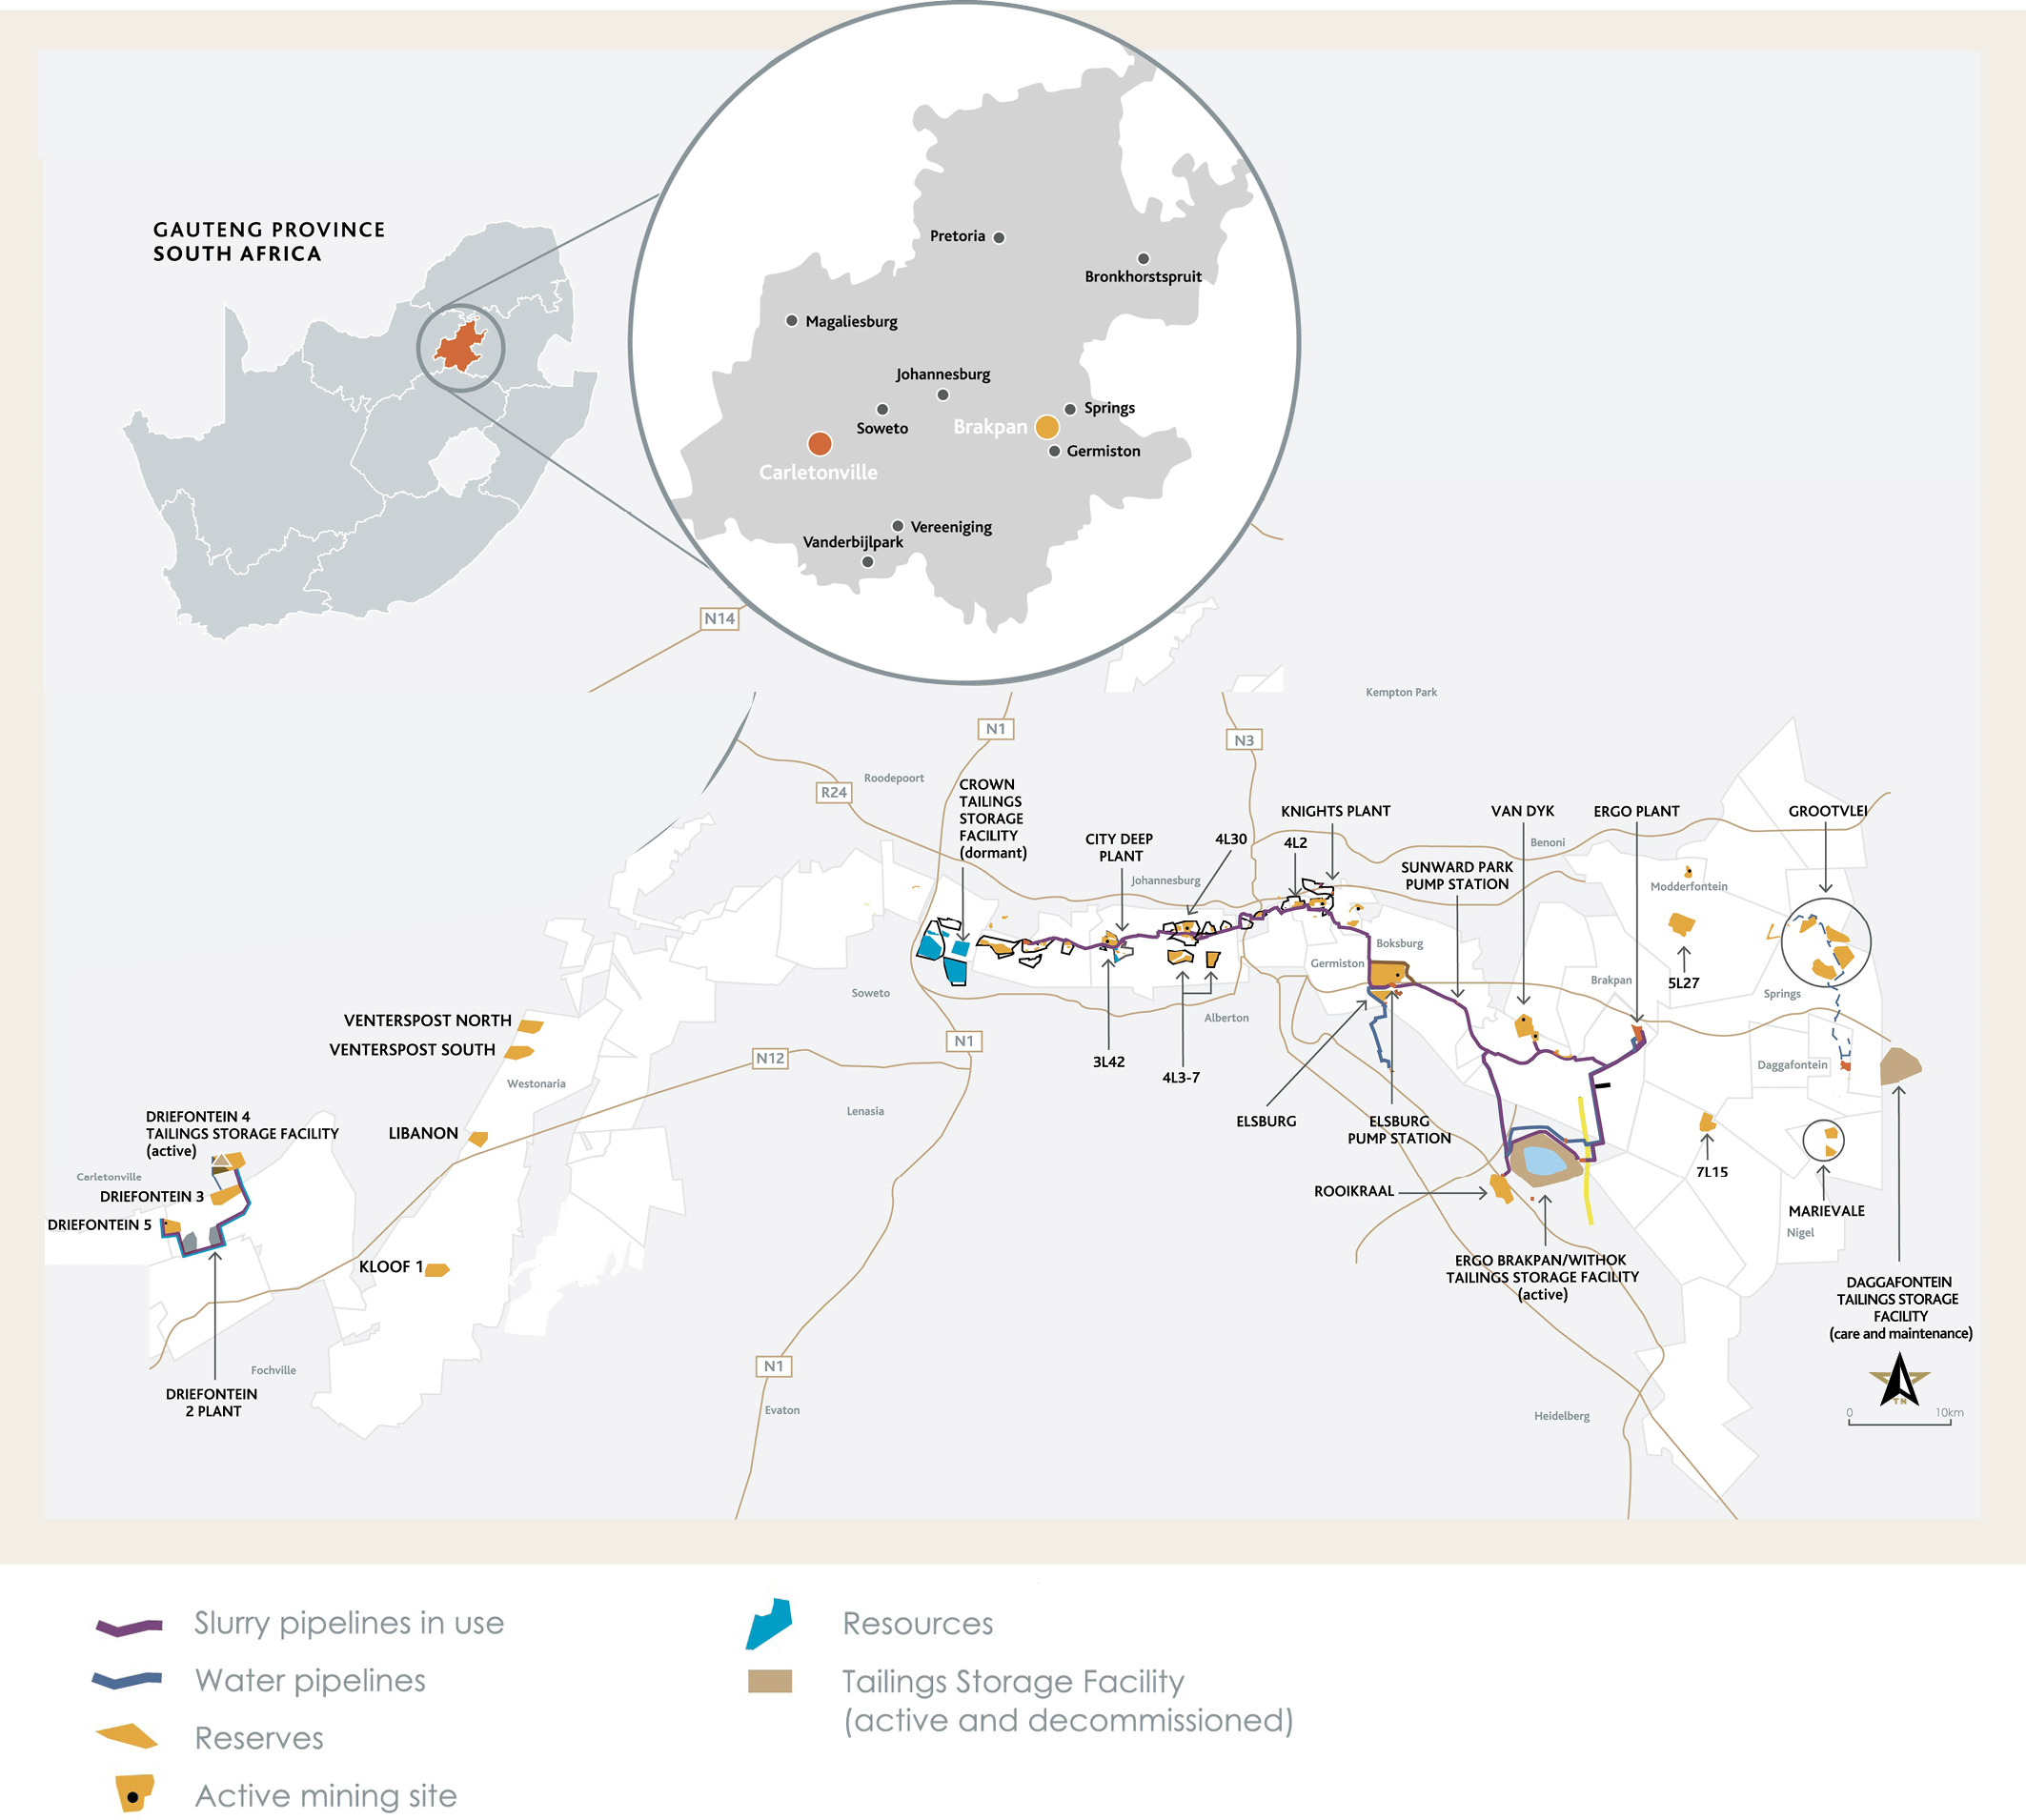
| | |
| PROPERTY DESCRIPTION |
DRDGOLD is a JSE-listed tailings reprocessing organisation that operates the Ergo Mining (Pty) Ltd (Ergo) and Far West Gold Recoveries (Pty) Ltd (FWGR) operations focused on recovering gold from the retreatment of historic gold operation surface tailings facilities. •The Ergo plant, and its associated TSFs are located 70km east of Johannesburg in the Gauteng province and are accessed via the N17 Johannesburg-Springs highway, near Benoni and Brakpan •The Knights plant is located 25km east of Johannesburg, off the R29 Main Reef Road •The Driefontein 2 metallurgical plant is located 30Km south west of Johannesburg, off the N12 highway. The Ergo and Knights plants. Operate as metallurgical plants, with all treated material deposited onto the Brakpan/Withok TSF. City Deep is a milling plant which operates as a pump/milling station feeding the Ergo and Knights metallurgical plants The FWGR assets, acquired in 2018 from Sibanye-Stillwater, are situated in the West Rand of the Gauteng province, 30km south west of Johannesburg in the vicinity of Randfontein, Westonaria, Fochville and Carletonville. The FWGR includes historical TSFs with a total area of 4.1km2 and includes the Driefontein 2 metallurgical plant. Material is deposited onto the Driefontein 4 TSF. |
Gold operations DRDGOLD continued
| | |
| MINERAL TITLE |
DRDGOLD’s mining and prospecting rights consist of the Ergo surface rights and mine dumps and FWRGR assets. The necessary agreements are in place for all properties in the LoM plan. The DRDGOLD FWGR assets, situated at Kloof and Driefontein, have existing mining rights registered under Sibanye-Stillwater. The FWGR assets were acquired from Sibanye-Stillwater in exchange for shares in DRDGOLD. FWGR assets were acquired from Sibanye-Stillwater, in a transaction in which common law ownership was established over the various TSFs. A use and access agreement with Sibanye Gold in terms of which FWGR operates is in place pending the transfer to FWGR of those that are transferable. The historical TSFs are classified as moveable assets and as such there is no requirement to transfer any part of the mining rights to DRDGOLD. Rehabilitation liability of the TSFs were transferred to the Special Purpose Vehicle (SPV), along with existing environmental funds held by Sibanye-Stillwater. |
| | |
| MINERALISATION CHARACTERISTICS |
DRDGOld’s mineral assets are historical gold plant tailings material from the mining of auriferous and uraniferous ore from the gold-bearing, late Archaean (2.7Ga to 3.2Ga), Witwatersrand Basin in the East and West Rand Goldfield. The composition of a TSF depends on the geochemical make-up of the material being mined and the chemicals used in the mining and extraction process. Further, the internal structure of the TSF reflects the mining strategy and depositional methodologies employed for each operation. The bulk density of tailings material and the lateral and vertical variation in moisture content is a critical factor in the accurate estimation of tonnages. In addition, secondary processes such as metal remobilisation, erosion, weathering, leaching and acid mine drainage can affect the geochemical characteristics of a TSF. Gold can undergo mobilisation within the TSF over time, and hence, may exhibit areas of reconcentration, and even be present in the sub-structure (footprint) soil. These factors can result in a considerable variation in gold content and distribution throughout the TSF and such variation has an impact on final recoveries and projected revenues for the operation. |
| | |
| INFRASTRUCTURE AND EQUIPMENT |
Ergo’s assets include multiple TSFs, a 50km pipeline, and tailings deposition facilities including the significant Brakpan/Withok TSF. Sandy material is reclaimed using mechanical front-end loaders, re-pulped with water and pumped to the plant. Tailings are reclaimed hydraulically using high pressure water monitoring guns. The re-pulped slime is pumped to the plant and the reclaimed material is treated using screens, cyclones, ball mills, and Carbon-in-Leach (“CIL”) technology to extract the gold. At the Ergo plant, material is delivered via two feeder lines from the Elsburg tailings complex, Van Dyk and the 4L30 reclamation sites. A further 0.5Mtpm is delivered from the City Deep area (including 4L2, 3L42 and externally sourced material). Material treated at the Knight plant is deposited onto the Brakpan/Withok TSF shared with the Ergo plant. At FWGR, the upgraded Driefontein No. 2 Plant currently treats around 0.5Mtpm of material from Driefontein 5 TSF. Tailings is reclaimed hydraulically using high pressure water monitoring guns. The re-pulped slime is pumped to the Driefontein plant and the reclaimed material is treated using screens, cyclones, ball mills, and CIL technology to extract the gold. The FWGR operations makes use of and require access to Sibanye-Stillwater’s mining infrastructure and related services. FWGR entered into a smelting agreement with Sibanye-Stillwater to smelt and recover gold from gold loaded carbon produced at the Driefontein No. 2 Plant, and deliver the gold to Rand Refinery. In exchange for this service, Sibanye-Stillwater receives a fee based on the smelting costs, plus 10% of the smelting costs. The Driefontein 4 TSF is a TSF that was converted from an upstream daywall TSF with a capacity of approximately 200ktpm to one of an upstream cyclone depositioning TSF at a capacity of 500ktpm. During the year, the upper compartment was successfully converted to cyclone depositioning. The conversion of the dam to cycloning allows a deposition capacity of 500ktpm until at least the end of 2025, after which it is planned to deposit onto the newly constructed regional TSF. The book value (100%) of property, plant and equipment for the combine Ergo, and FWGR, as at 31 December 2021 was R2.1bn, no material encumbrances exist on Ergo’s or FWGR’s property. |
| | |
| MINING METHOD |
•Hydraulic mining (hydro-mining) is used, with high-pressure water cannons to hydraulically excavate tailings material. A second mining method employed by Ergo is the use of front-end loaders (FEL) to load slimes/sand. The FEL loads directly into a truck, which then transports the ore to the processing plant |
Gold operations DRDGOLD continued
| | |
| LIFE OF MINE |
•Ergo LoM is estimated at 13 years (until 2034) •FWGR has sufficient Mineral Reserves to allow processing of an eventual 1.2Mtpm for approximately 17 years (until 2038) |
| | | | | | | | | | | | | | | | | |
| Mineral processing and capacity |
| Plant | Design capacity (ktpm) | Operational capacity (ktpm) | Type | Average recovery
factor (%) | Material
treated |
| Ergo and Knights Plant | 2,100 | | 1,800 | | CIL | 49 | Slime/Sand |
| Driefontein No. 2 Plant | 600 | 500 | CIL | 53 | Slime/Sand |
| | |
| TAILINGS DISPOSAL AND CAPACITY |
•Ergo currently deposits tailings on the Brakpan/Withok TSF, which has sufficient capacity for the planned 13 year LoM. Planning for the expansion of the Brakpan/Withok TSF to accommodate higher grade TSFs in the far East Rand area and extend Ergo’s life of mine is currently under way •FWGR phase one production tailings are deposited on Driefontein 4 TSF, which has sufficient capacity for six years’ production at 500ktpm. To fully exploit the larger FWGR Mineral Resources, feasibility studies have been conducted into the construction of a large, centralised, regional deposition facility |
| | |
| ESTIMATION RISKS |
There are no deemed material risks to the Mineral Resource Estimation. The key operational risks that could impact the Mineral Reserves are listed below. •Eskom power supply constraints and rising electricity prices: The operational power supply is provided by Eskom. The Eskom national power supply and distribution infrastructure is currently stressed resulting in frequent power disruption to industry. At FWGR no alternative power supply arrangements have been put in place and therefore consider the threat of production losses resulting from power disruption to represent a significant production risk. The risk can be largely ameliorated through the use of secondary diesel generation sets •Water supply: South Africa is a relatively dry area and predictions are that dry conditions will continue. The business of surface retreatment is highly reliant on water as it is used to transport material over large distances and for processing. Reliance is placed on third parties to provide any shortfall in water. Water shortages will also result in higher cost of water that may adversely affect operational and financial results. Currently, adequate water supply will be secured through a combination of harvested return water from the treated tailings, dewatering from local shaft systems and local wellfields •Lower than forecast plant metallurgical recoveries: The management of low plant recovery risk will be managed through ensuring that optimal grind sizes are prepared by the Driefontein No. 2 Plant and Central Processing Plant (CPP) facilities. This approach has successfully been undertaken on the Driefontein No. 2 Plant where metallurgical recovery improvements have been demonstrated •Low-grade areas associated with the potential future TSFs: All future TSFs will be evaluated prior to production and where necessary additional sampling and resource modelling will be carried out to confirm the economic viability of the new Mineral Resources areas •Regional TSF (RTSF) design risk: The main design risk of the RTSF is the effectiveness of the proposed scavenger well system to contain future cyanide groundwater plumes. This system replaces the use of a synthetic liner, installed at the base of the RTSF would be to create a third ‘perched’ aquifer above the current weathered zone aquifer. It provides an elegant solution to cyanide pollution containment and has been demonstrated to operate successfully on other South African TSFs •Delayed commissioning of key infrastructure including the CPP and the RTSF: Any delays in the future commissioning of the CPP and the RTSF will impact on the proposed eventual ramp up of the operation to its eventually planned 3.0Mtpm treatment capacity. Delays related to the permitting and licencing of the CPP and RTSF facilities are likely and that current production ramp up guidelines will eventually be impacted •Limited tailings capacity DRDGOLD is a volume-driven business. The large volumes of material that are processed at our operations are deposited on tailings storage facilities •Social unrest and increased crime: The growing frustration of society due to lack of government service delivery and slow reformative action against unemployment (heightened by the impact of the COVID-19 pandemic) lead to increased protests and conflict, affecting communities in and around our operations. This may result in operational disruptions. The current strained economic and uncertain political environment contribute to the adverse crime trends
|
Gold operations DRDGOLD continued
| | |
| KEY DEVELOPMENTS AND BROWNFIELD PROJECTS |
| DRDGOLD intends to develop the FWGR assets into a large scale (1.2Mtpm), long life (20 years) operation through a phased approach. Phase one of the development of the assets is in full production. This involves the treatment of Driefontein 5 TSF through the Driefontein No. 2 Plant and deposition on the Driefontein 4 TSF. Phase two of the development of the asset involves the construction of a regional storage facility for treatment of the remaining historical TSFs acquired and with the potential of future expansion into the far west area. Phase two definitive feasibility study was completed in January 2021, however, delays have been experienced with the development of the project as a result of the Department of Water and Sanitation (DWS) rejecting the new design of the regional tailings storage facility proposed. FWGR is now investigating the feasibility of an interim phase to, at considerably reduced capital expenditure, extend and consolidate existing deposition capacity and upgrade the existing Driefontein No. 2 Plant to 1.0Mtpm, doubling its current volume capacity. Ergo is currently evaluating options to increase the deposition capacity of the Brakpan/Withok TSF and a preliminary design for the re-instatement of the Withok compartment of the Brakpan/Withok TSF is underway. The Daggafontein TSF remains an option as an additional TSF. |
Classified Gold Mineral Resource estimate at 31 December 2021
| | | | | | | | | | | | | | | | | | | | | | | | | | | | | |
| Mineral Resources Inclusive of Mineral Reserves |
| | | | 31 December 2021 | 31 December 2020 |
| GOLD | Southern Africa | | | Tonnes | Grade | Gold | Tonnes | Grade | Gold |
| DRDGOLD | | | | (Mt) | (g/t) | (Moz) | (Mt) | (g/t) | (Moz) |
| Operations | ERGO | TSF Surface | Measured | 137.7 | | 0.3 | | 1.4 | | 150.6 | | 0.3 | | 1.5 | |
| | | Indicated | 290.1 | | 0.2 | | 2.3 | | 190.1 | | 0.3 | | 1.5 | |
| | | Measured + Indicated | 427.8 | | 0.3 | | 3.7 | | 340.7 | | 0.3 | | 3.0 | |
| | | Inferred | 10.8 | | 0.2 | | 0.1 | | 103.9 | | 0.2 | | 0.8 | |
| FWGR | TSF Surface | Measured | 117.2 | | 0.3 | | 1.3 | | 117.6 | | 0.3 | | 1.3 | |
| | | Indicated | — | | — | | — | | — | | — | | — | |
| | | Measured + Indicated | 117.2 | | 0.3 | | 1.3 | | 117.6 | | 0.3 | | 1.3 | |
| | | Inferred | — | | — | | — | | — | | — | | — | |
| Total Measured + Indicated | 545.1 | | 0.3 | | 4.9 | | 458.3 | | 0.3 | | 4.3 | |
| Grand total | 555.8 | | 0.3 | | 5.0 | | 562.2 | | 0.3 | | 5.1 | |
| | | | | | | | | | | | | | | | | | | | | | | | | | | | | |
| Mineral Resources Exclusive of Mineral Reserves |
| | | | 31 December 2021 | 31 December 2020 |
| GOLD | Southern Africa | | | Tonnes | Grade | Gold | Tonnes | Grade | Gold |
| DRDGOLD | | | | (Mt) | (g/t) | (Moz) | (Mt) | (g/t) | (Moz) |
| Operations | ERGO | TSF Surface | Measured | — | | — | | — | | — | | — | | — | |
| | | Indicated | 290.1 | | 0.2 | | 2.3 | | 190.1 | | 0.3 | | 1.5 | |
| | | Measured + Indicated | 290.1 | | 0.2 | | 2.3 | | 190.1 | | 0.3 | | 1.5 | |
| | | Inferred | 10.8 | | 0.2 | | 0.1 | | 103.9 | | 0.2 | | 0.8 | |
| Total Measured + Indicated | 290.1 | | 0.2 | | 2.3 | | 190.1 | | 0.3 | | 1.5 | |
| Grand total | 300.9 | | 0.2 | | 2.4 | | 294.0 | | 0.2 | | 2.3 | |
Gold operations DRDGOLD continued
Notes:
The -1.9% change year-on-year in the stated Mineral Resources (Inclusive of Mineral Reserves) is attributed to:
–-0.2Moz in depletions
–Increase in attributable Mineral Resources from 50.1% in 2020 to 50.49% in 2021 (+0.045Moz)
On a Mineral Resources exclusive of Mineral Reserves basis, the year-on-year change is +4.3%.
Modifying factors in converting Mineral Resources to Mineral Reserves
| | | | | | | | | | | |
| Parameter | Unit | FWGR | Ergo |
| Mineral Reserves cut-off | g/t | 0.13 - 0.18 | 0.2 |
| Plant recovery factor (TSF) | % | 53.7 | 48.9 |
Classified Gold Mineral Reserves estimate as at 31 December 2021
| | | | | | | | | | | | | | | | | | | | | | | | | | | | | |
| Mineral Reserves |
| | | | 31 December 2021 | 31 December 2020 |
| GOLD | Southern Africa | | | Tonnes | Grade | Gold | Tonnes | Grade | Gold |
| DRDGOLD | | | | (Mt) | (g/t) | (Moz) | (Mt) | (g/t) | (Moz) |
| Operations | ERGO | TSF Surface | Proved | 11.7 | | 0.3 | | 0.1 | | 20.1 | | 0.3 | | 0.2 | |
| | | Probable | 126.0 | | 0.3 | | 1.3 | | 130.6 | | 0.3 | | 1.3 | |
| | | Proved + Probable | 137.7 | | 0.3 | | 1.4 | | 150.6 | | 0.3 | | 1.5 | |
| FWGR | TSF Surface | Proved | 110.7 | | 0.3 | | 1.2 | | 111.2 | | 0.3 | | 1.2 | |
| | | Probable | 6.5 | | 0.3 | | 0.1 | | 6.4 | | 0.3 | | 0.1 | |
| | | Proved + Probable | 117.2 | | 0.3 | | 1.3 | | 117.6 | | 0.3 | | 1.3 | |
| Grand total Proved + Probable | 255.0 | | 0.3 | | 2.6 | | 268.2 | | 0.3 | | 2.8 | |
Gold operations DRDGOLD continued
Notes:
The 6.8% change year-on-year in the stated Mineral Reserves is attributed to:
–-0.2Moz in depletions
–-0.03Moz from minor changes offset by a change in the attributable percentage from 50.1% to 50.49%
| | |
| HISTORY AND OPERATIONAL STATISTICS |
•Founded in 1895, DRDGOLD remains the oldest listed gold company on the JSE •DRDGOLD limited (formerly Durban Roodepoort Deep Limited) previously focused on underground gold mining in South Africa, but over time has transformed itself into a world-leading specialist in the recovery of gold from the retreatment of surface tailings •Ergo was formed in June 2007. Ergo is the surface tailings retreatment operation that consists of what was historically the Crown Gold Recoveries Proprietary Limited (“Crown”), ERPM Cason Dump operation and the ErgoGold business units. On July 1, 2012, Ergo acquired the mining assets and certain liabilities of Crown and all the surface assets and liabilities of ERPM as part of the restructuring of our surface operations •Sibanye-Stillwater obtained an initial 38% in DRDGOLD through an asset swap deal in 2017, in which it exchanged surface gold processing assets and TSFs for a stake in DRDGOLD •On July 31, 2018, DRDGOLD acquired certain gold TSFs and surface processing assets. The TSFs included Driefontein 3, Driefontein 5, Kloof 1, Venterspost North, South, Libanon and Driefontein 4. The surface processing assets included Driefontein No. 2 Plant, Driefontein No. 3 Plant, WRTRP pilot plant, and the land owned by Sibanye-Stillwater that was earmarked for the future development of a central processing plant, regional tailings storage facility and return water dam (together, the “WRTRP Assets”) associated with Sibanye-Stillwater’s WRTRP, subsequently renamed FWGR • In 2020 Sibanye-Stillwater increased its holding in DRDGOLD from 38% to 50.1%, based on the conditions contained in the 2017 agreement, which was increased to 50.49% subsequently in 2021 |
Gold operations DRDGOLD continued
| | | | | | | | | | | |
| Operational Statistics | 2019 | 2020 | 2021 |
| | | |
| | | |
| Surface tonnes milled (kt) | 26,418 | 26,630 | 29,244 |
| Surface yield (g/t) | 0.21 | 0.20 | 0.19 |
| | | |
| Annual Au production - surface (koz) | 179 | 173 | 181 |
| Total Annual Au production (koz) | 179 | 173 | 181 |
| | | |
| Operating cost surface (R/t) | 104 | 110 | 115 |
| Total capital expenditure (Rm) | 82 | 341 | 377 |
| AISC (R/kg) | 514,932 | 604,650 | 665,065 |
| AISC (US$/oz) | 1,108 | 1,143 | 1,399 |
Note: AISC calculated based on Oz sold
Gold development
BURNSTONE
Gold development BURNSTONE continued
| | |
| PROPERTY DESCRIPTION |
Burnstone is a shallow gold development project, situated near Balfour in the Mpumalanga province, South Africa, 80km southeast of Johannesburg. The Burnstone project has two established access points into the underground workings: a three-legged decline shaft and vertical shaft, as well as an established metallurgical processing facility. The project targets the UK9A Kimberley reef orebody, and aims to produce approximately 12kozpm over a 24-year LoM and is scheduled for steady state production by 2030. Sibanye acquired the development project via its takeover of WitsGold in 2014 and has proceed with limited development and infrastructure upgrades since 2016. Following a detailed, updated study, the Sibanye-Stillwater Board gave approval for the continuation of the construction of the Burnstone project in quarter one 2021. |
| | |
| MINERAL TITLE |
Sibanye Gold Eastern Operations (Pty) Ltd is the holder of a mining right in respect of the Burnstone project under DMRE reference number: MP30/5/1/2/2/(248)MR (Burnstone MR). The Burnstone MR is valid from 17 February 2009 to 16 February 2027 in respect of an area totalling 131.36km2, and is located in the Dipaleseng District Municipality (Balfour) in the Mpumalanga Province of South Africa. An application in terms of Section 11 of the Mineral and Petroleum Resources Development Act 28 of 2002 (MPRDA) was submitted for written consent from the Minister of Mineral Resources and Energy for Witwatersrand Consolidated Gold Resources (Pty) Ltd (Wits Gold) to acquire a controlling interest (100%) in Sibanye Gold Eastern Operations (Pty) Ltd (previously known as Southgold Exploration (Pty) Ltd). Simultaneously, a Section 102 application for the incorporation of prospecting rights adjacent to the Burnstone MR was submitted to the DMRE. The DMRE acknowledged receipt of both applications in 2013. The Section 11 application was granted on the 19th of May 2014, but the Section 102 application is still pending and is yet to be finalised. All required operating permits have been obtained and are in good standing. |
| | |
| MINERALISATION CHARACTERISTICS |
| Burnstone is a shallow gold deposit exploiting the UK9A reef of the Kimberley Formation. The UK9A reef is a thin (less than 1 metre), highly channelised and shallow dipping (<10°) conglomerate orebody. |
| | |
| INFRASTRUCTURE AND EQUIPMENT |
Burnstone is a shallow trackless / conventional hybrid project in development phase, which was significantly pre developed by previous owners. The project was acquired in 2014 . The planned mining layout was revised with trackless access development and conventional stoping with the aim of being able to negotiate the complex geological structure. Development was halted in 2018 due to capital constraints, with infrastructure upgrades continuing until 2021 when the decision was taken to resume development. The mine is accessible via an existing decline shaft and an equipped vertical shaft. To access the down-dip extents of the orebody a number of declines have been planned and development is progressing. Underground infrastructure includes the shaft, silos, conveyors, chutes and rock breakers on the main rock handling levels at the shaft, loading boxes in the shaft, workshops, clarification and pumping systems, water dams and electrical reticulation and communication systems. Excavations include pump stations, settlers, declines, horizontal drives and stoping infrastructure. There is a limited fleet of underground trackless mining machines (TMM) including one roof bolter, one dump truck, one development rig, one long hole rig, two LHDs, two graders, utility vehicles, Manitou forklifts, and LDVs. Provision is made in the capital requirements to complete the infrastructure, re-equip the TMM fleet and for the installation of declines and chairlifts to access production below the current infrastructure. Production and development drilling are by hydropower and power packs. All surface infrastructure to support the underground mining is in place or has been planned in the LoM with an appropriate capital estimate. The current trackless fleet, which will be used to develop, has been scheduled for replacement or refurbishment in the LoM capital estimate. A mineral processing plant is situated next to the vertical shaft where the bulk of the tonnage will be hoisted. It is currently on care-and-maintenance and will be started after a year of mining when a suitable stockpile has been established. A TSF has also been established a short distance from the processing facility. Other surface infrastructure at Burnstone includes the headgear and winders, primary ventilation fans, compressors, the processing plant, office blocks, training centre, workshops and stores, lamp room, change house, stores and store yards. There are also established roads, a sewage treatment plant, potable water plant and surface water reticulation. Electrical infrastructure consists of a main incoming substation and surface reticulation. The mine is using the Pragma CMM System for maintenance management. The book value of property, plant and equipment, as at 31 Dec 2021 was R2.48bn. |
Gold development BURNSTONE continued
| | | | | | | | |
| Hoisting and production capacities |
| Operating Shaft (No) | Operating capacity (ktpm) | Peak planned production (ktpm)* |
| Burnstone | 165.0 | 154 |
*At peak in 2028
| | |
| MINING METHOD |
| Hybrid of conventional selective scattered breast mining with scraper cleaning, together with mechanised footwall infrastructure |
| | |
| LIFE OF MINE |
| 24 years (until 2045) based on current Mineral Reserves |
| | | | | | | | | | | | | | | | | |
| Mineral processing and capacity |
| Plant | Design capacity (ktpm)* | Operational capacity (ktpm) | Type | Average recovery
factor (%) | Material
treated |
| Burnstone Plant | 125 | 125 | CIL | 96 | UG Ore |
*175kt with addition of extra mill
| | |
| TAILINGS DISPOSAL AND CAPACITY |
| There is one TSF with a capacity of 24.1Mt, which is a surplus of 3.5Mt over LoM requirements. |
| | |
| ESTIMATION RISKS |
The key risk relating to the Mineral Resource Estimation relates to the fact that the UK9A is a highly channelised deposit, which will require the accurate delineation and selective mining of the higher grade pay-shoots. This risk has been ameliorated by adopting a novel approach to the estimation that relies on a population grade distribution. The key operational risks that could impact the Mineral Reserves are listed below. •Housing / Accommodation shortage: Burnstone is not situated in an area where skilled mining labour is readily available and the company has implemented a plan, as far as practically possible, to recruit and train labour from local communities. •Geological risk: The orebody is channelised, with large areas only being 30% payable. In addition, the orebody is structurally complex, with an anticline, a major sill and numerous large faults present. As a result, an intensive exploration drilling programme, as well as closely spaced raise lines, are an integral part of the extraction plan to ensure sufficient payable ground is continually available for mining. •Availability of Trackless Mechanised Machines (TMM): TMM are imported and are affected by global supply chain issues at present. Orders are placed timeously, and the development plan is continually optimised in line with the availability of equipment. •Power supply interruptions and cost increases: Eskom (the national power supplier) has proven to be unreliable over recent years, causing loss of power supply at certain times and having tariff increases above inflation. The operation has emergency generators available for evacuation if required and conducts load shifting in order to optimise available power supply. New initiatives are continuously implemented to reduce demand and the Group is expanding its portfolio of renewable energy projects. |
| | |
| KEY DEVELOPMENTS AND BROWNFIELD PROJECTS |
| In the first quarter of 2021 the Sibanye-Stillwater Board gave approval to restart the Burnstone project, following the completion of the revised mining study. The project has current Mineral Reserves of approximately 2.6Moz, and will target steady state production of approximately 90ktpm (~0.14Moz) within eight years. |
Gold development BURNSTONE continued
Classified Gold Mineral Resource estimate at 31 December 2021
| | | | | | | | | | | | | | | | | | | | | | | | | | | | | |
| Mineral Resources Inclusive of Mineral Reserves |
| | | | 31 December 2021 | 31 December 2020 |
| GOLD | Southern Africa | | | Tonnes | Grade | Gold | Tonnes | Grade | Gold |
| Burnstone | | | | (Mt) | (g/t) | (Moz) | (Mt) | (g/t) | (Moz) |
| Development | | Underground | Measured | 1.1 | | 6.2 | | 0.2 | | 1.1 | | 6.2 | | 0.2 | |
| | | Indicated | 25.5 | | 5.6 | | 4.6 | | 25.5 | | 5.6 | | 4.6 | |
| | | Measured + Indicated | 26.6 | | 5.7 | | 4.8 | | 26.6 | | 5.7 | | 4.8 | |
| | | Inferred | 31.5 | | 4.2 | | 4.3 | | 31.5 | | 4.2 | | 4.3 | |
| Total Measured + Indicated | 26.6 | | 5.7 | | 4.8 | | 26.6 | | 5.7 | | 4.8 | |
| Grand total | 58.1 | | 4.9 | | 9.1 | | 58.1 | | 4.9 | | 9.1 | |
| | | | | | | | | | | | | | | | | | | | | | | | | | | | | |
| Mineral Resources Exclusive of Mineral Reserves |
| | | | 31 December 2021 | 31 December 2020 |
| GOLD | Southern Africa | | | Tonnes | Grade | Gold | Tonnes | Grade | Gold |
| Burnstone | | | | (Mt) | (g/t) | (Moz) | (Mt) | (g/t) | (Moz) |
| Development | | Underground | Measured | 0.3 | | 13.8 | | 0.1 | | 0.4 | | 10.2 | | 0.1 | |
| | | Indicated | 5.8 | | 11.5 | | 2.1 | | 9.0 | | 8.7 | | 2.5 | |
| | | Measured + Indicated | 6.0 | | 11.6 | | 2.2 | | 9.4 | | 8.7 | | 2.6 | |
| | | Inferred | 31.5 | | 4.2 | | 4.3 | | 31.5 | | 4.2 | | 4.3 | |
| Total Measured + Indicated | 6.0 | | 11.6 | | 2.2 | | 9.4 | | 8.7 | | 2.6 | |
| Grand total | 37.5 | | 5.4 | | 6.5 | | 41.0 | | 5.3 | | 6.9 | |
Notes:
There are no changes year-on-year for the Burnstone Mineral Resources inclusive of Mineral Reserves.
The final Mineral Resources Exclusive of Mineral Reserves are 6.5Moz and show a decrease of 5.8%. This is as a result of the optimisation of the Mineral Reserve and extension of the LoM to 24 years.
Gold development BURNSTONE continued
Mineral Resources classification map for the Burnstone development project
Gold development BURNSTONE continued
Grade control and definition drilling summary
| | | | | | | | | | | | | | | | | | | | | | | |
| Planned 2022 | Actual 2021 | Actual 2020 |
| OPERATION – BURNSTONE | Drilled
(m) | Expenditure (Rm) | Drilled
(m) | Expenditure (Rm) | Drilled
(m) | Expenditure (Rm) |
| Grade control and ore definition | 9,150 | 7.17 | 0 | 0 | 0 | 0 |
| Total | 9,150 | 7.17 | 0 | 0 | 0 | 0 |
Modifying Factors (Underground) in converting Mineral Resources to Mineral Reserves
| | | | | | | | | | | |
| Parameter | Unit | 2021 | 2020 |
| Average Mined Value (over LoM) | (cm.g/t) | 577 | 591 |
| Waste Mining Percentage | (%) | 3.0 | 3.0 |
| Mine Call Factor | (%) | 86.0 | 85.7 |
| Plant Recovery Factor | (%) | 96.0 | 96.0 |
| Development to Mill | (%) | 11.7 | 19.1 |
| Survey Discrepancy | (%) | 0.0 | 0.0 |
| Resource Channel Width | (cm) | 54 | 55 |
| Average Stoping Width | (cm) | 111 | 110 |
| Average Weighted Resource cut-off | (cm.g/t) | 450 | 450 |
| Mineral Reserves Pay Limit (Year 1) | (cm.g/t) | 560 | 530 |
Classified Gold Mineral Reserve estimate at 31 December 2021
| | | | | | | | | | | | | | | | | | | | | | | | | | | | | |
| Mineral Reserves |
| | | | 31 December 2021 | 31 December 2020 |
| GOLD | Southern Africa | | | Tonnes | Grade | Gold | Tonnes | Grade | Gold |
| Burnstone | | | | (Mt) | (g/t) | (Moz) | (Mt) | (g/t) | (Moz) |
| Operations | | Underground | Proved | — | | — | | — | | 0.9 | | 3.6 | | 0.1 | |
| | | Probable | 20.6 | | 3.9 | | 2.6 | | 17.7 | | 3.7 | | 2.1 | |
| Grand total Proved + Probable | 20.6 | | 3.9 | | 2.6 | | 18.6 | | 3.7 | | 2.2 | |
Notes
The +19% change year-on-year in the stated Mineral Reserves is attributed to:
–+0.4Moz in area inclusions as a result of tail optimisation to 24 years through a revised mining mix
Gold development BURNSTONE continued
Mineral Reserves classification map for the Burnstone development project
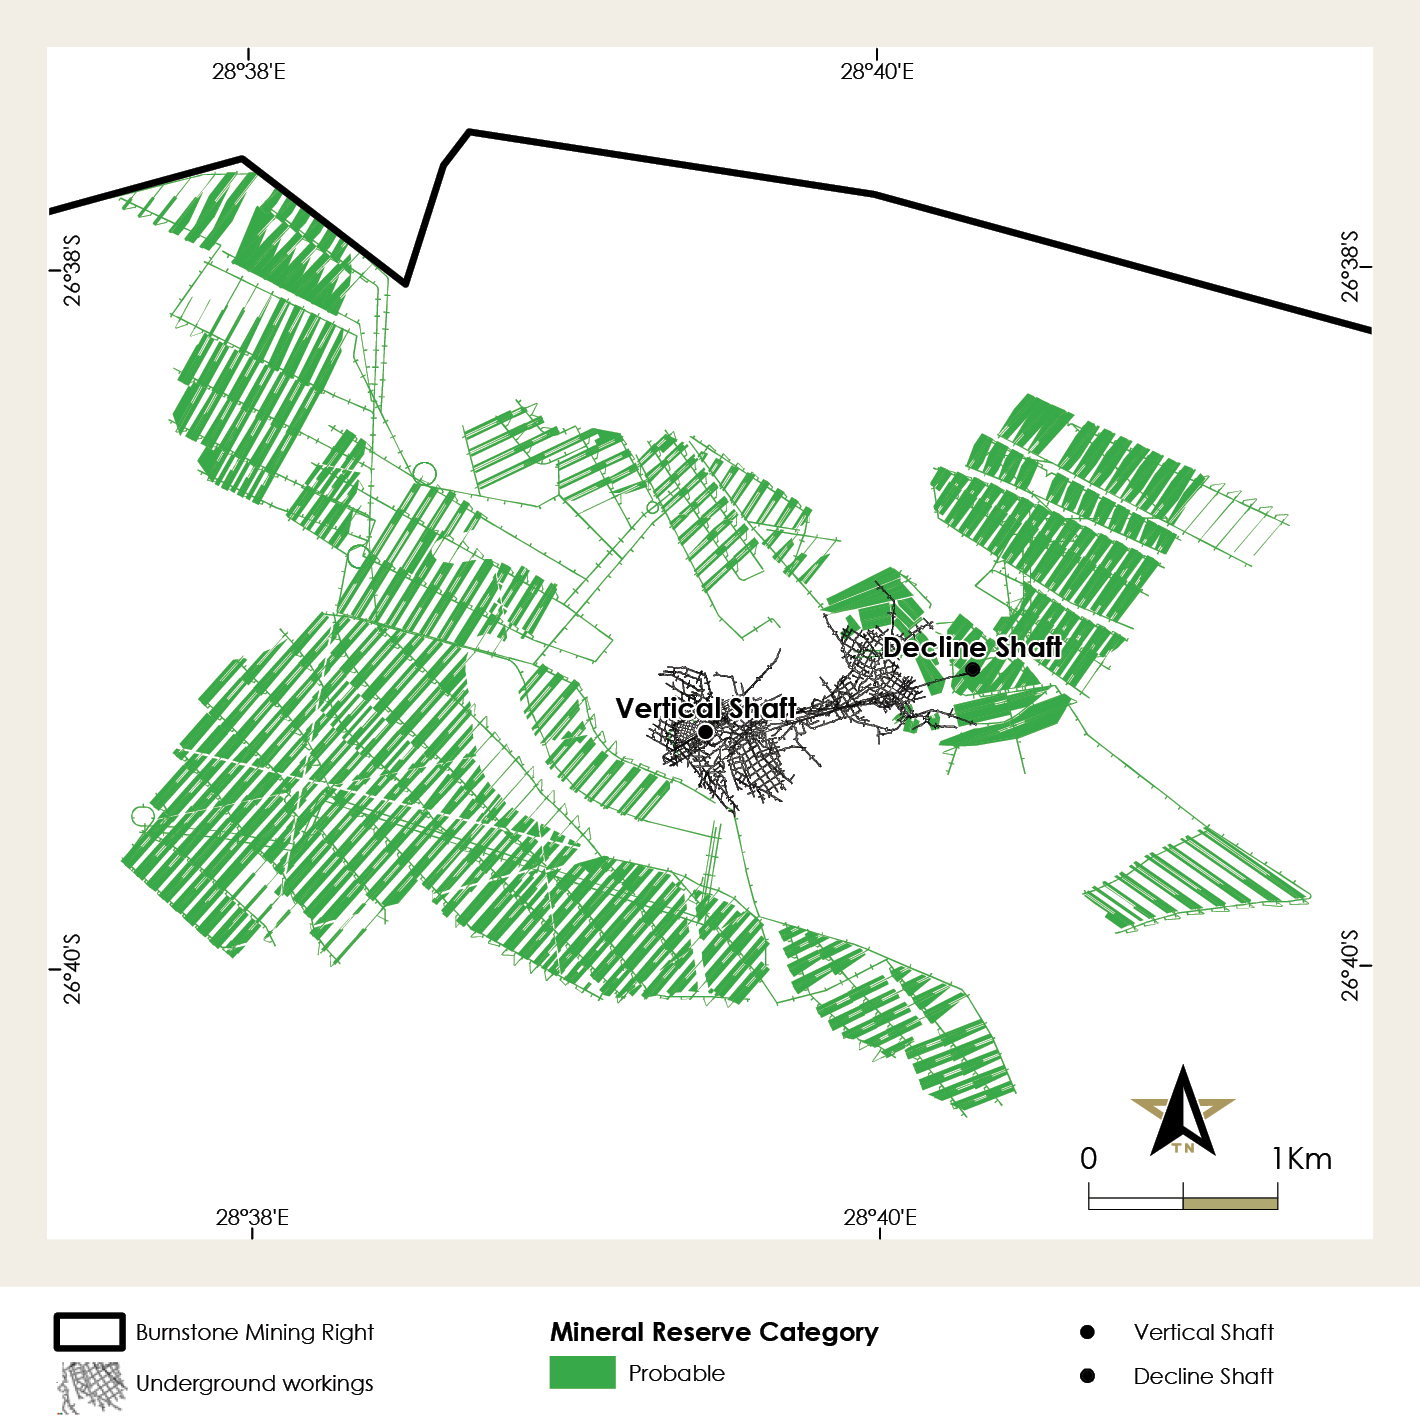
| | |
| HISTORY AND OPERATIONAL STATISTICS |
•Gold was first discovered within the South Rand Basin in outcrops of the Kimberley reef in 1887. Early exploration in this basin focused on the outcrops of the Kimberley reef and led to the establishment of several small mines around its shallow rim. These mines operated between 1892 and 1962, and produced approximately 45,700 oz between them. The demise of these mines was due to a structural complexity and a lack of continuity in grade •In the 1970s, a steep rise in the gold price sparked renewed interest in the South Rand Basin, with Union Corporation/Gencor and Anglovaal conducting fairly extensive drilling programmes between 1974 and 1993 •Southgold Exploration (Pty) Ltd (Southgold), incorporated in 2000, drilled an additional 18 holes to 2002. These were primarily within the current Burnstone MR •In November 2002, Great Basin Gold (GBG) acquired 100% of Southgold and immediately embarked on an extensive surface diamond drilling programme. Until September 2012, they drilled a further 374 holes, either within or near the current Burnstone MR. In May 2006 they completed a positive final feasibility study •Construction of the Burnstone decline shaft started in July 2006 and this 2.8km-long tunnel intersected the Kimberley Reef in June 2009. In 2008, Burnstone was granted a new order mining right •In late 2012, Southgold was placed in a business rescue process, in terms of which Witwatersrand Gold Mining Company Limited (WitsGold) was awarded an option to acquire this company •Sibanye-Stillwater, following its takeover of WitsGold in 2014, exercised the option to acquire Burnstone and proceded with limited development and infrastructure upgrades in 2016. •In 2017, Sibanye submitted a Section 102 to incorporate various prospecting rights into the Burnstone MR •A decision to proceed with development of the mine was made in quarter one 2021 |
| | | | | | | | | | | |
| Operational Statistics | 2019 | 2020 | 2021 |
| Underground tonnes milled (kt) | 0 | 0 | 0 |
| | | |
| Surface tonnes milled (kt) | 0 | 0 | 0 |
| | | |
| | | |
| | | |
| | | |
| | | |
| | | |
| Total capital expenditure (Rm) | 49 | 6 | 186 |
| | | |
| | | |
Gold exploration
SOUTHERN FREE STATE (SOFS)
Gold exploration SOUTHERN FREE STATE (SOFS) continued
| | |
| PROPERTY DESCRIPTION |
| SOFS is an advanced stage exploration project, including the Bloemhoek, De Bron-Merriespruit (DBM), Robijn, Merriespruit and Hakkies areas, situated close to Virginia in the Free State province of South Africa adjacent and contiguous to the Beatrix operation. |
| | |
| MINERAL TITLE |
SOFS holds various mining rights including De Bron Merriespruit Ref No FS30/5/1/2/2/10005 MR to extract gold, silver and uranium from a 170.22km2 area. The right was granted on 25 February 2014 and executed on 14 June 2017. Registration of the SOFS MR at the Mineral and Petroleum Titles Registration Office remains outstanding. An application was submitted in terms of Section 102 of the MPRDA on 30 November 2018 to include various properties, including Merriespruit, into the SOFS MR area. The relevant Section 102 application is yet to be finalised. Sibanye-Stillwater submitted an application in terms of Section 25(2)(b) of the MPRDA to the DMRE in the name of WitsGold for the extension of the period to commence mining activities, as mining activities had not commenced on the SOFS MR within 180 days after execution of the right. The above mentioned application in terms of Section 25(2)(b) of the MPRDA was initially refused. However, an appeal has been lodged against the refusal of the application in terms of Section 96 of the MPRDA; the appeal has yet to be finalised. This is not deemed material due to the fact that no Mineral Reserves are declared at SOFS. |
| | |
| MINERALISATION CHARACTERISTICS |
| Four primary reef horizons containing gold and uranium are present on well-defined regional unconformities in the SOFS area. These include the Beatrix/VS5, Aandenk, B, and Leader reefs, all of which have been mined extensively in the southern Free State Goldfields. The four reefs are developed within a 20m to 40m stratigraphic interval on the DBM property and are preserved at depths of between 500m and 1,200m below surface. The Beatrix/VS5 and AAR constitute the principal economic orebodies, while the less extensive Leader and B reefs are regarded as secondary reefs. The reefs are generally characterised by shallow dips of between 10° and 25° and a thickness of 60cm to 210cm. |
| | |
| KEY DEVELOPMENTS |
The Beatrix No. 3 Shaft depth extension below 26 Level, which could extend into the Bloemhoek area of SOFS, is under assessment. A PFS was completed in 2019 which indicated the feasibility for inclusion into the Beatrix LoM. A positive definitive feasibility study (DFS) has been completed for this project but, subject to project approval for construction, has not been included in the Mineral Reserves. The DBM Project, for a which a historical PFS was completed, was previously included in the Mineral Reserves, but has been excluded from the declaration, as at 31 December 2021 pending an updated PFS. |
Classified Gold Mineral Resource estimate at 31 December 2021
| | | | | | | | | | | | | | | | | | | | | | | | | | | | | |
| Mineral Resources Inclusive of Mineral Reserves |
| | | | 31 December 2021 | 31 December 2020 |
| GOLD | Southern Africa | | | Tonnes | Grade | Gold | Tonnes | Grade | Gold |
| SOFS | | | | (Mt) | (g/t) | (Moz) | (Mt) | (g/t) | (Moz) |
| Exploration | Bloemhoek | Underground | Measured | — | | — | | — | | — | | — | | — | |
| | | Indicated | 27.4 | | 4.7 | | 4.2 | | 27.4 | | 4.7 | | 4.2 | |
| | | Measured + Indicated | 27.4 | | 4.7 | | 4.2 | | 27.4 | | 4.7 | | 4.2 | |
| | | Inferred | 0.9 | | 4.9 | | 0.1 | | 0.9 | | 4.9 | | 0.1 | |
| De Bron | Underground | Measured | — | | — | | — | | — | | — | | — | |
| Merriespruit | | Indicated | 16.7 | | 4.2 | | 2.3 | | 23.0 | | 4.5 | | 3.3 | |
| | | Measured + Indicated | 16.7 | | 4.2 | | 2.3 | | 23.0 | | 4.5 | | 3.3 | |
| | | Inferred | 3.1 | | 3.2 | | 0.3 | | 5.3 | | 4.2 | | 0.7 | |
| Total Measured + Indicated | 44.1 | | 4.5 | | 6.4 | | 50.4 | | 4.6 | | 7.5 | |
| Grand total | 48.1 | | 4.4 | | 6.9 | | 56.6 | | 4.6 | | 8.3 | |
Gold exploration SOUTHERN FREE STATE (SOFS) continued
| | | | | | | | | | | | | | | | | | | | | | | | | | | | | |
| Mineral Resources Exclusive of Mineral Reserves |
| | | | 31 December 2021 | 31 December 2020 |
| GOLD | Southern Africa | | | Tonnes | Grade | Gold | Tonnes | Grade | Gold |
| SOFS | | | | (Mt) | (g/t) | (Moz) | (Mt) | (g/t) | (Moz) |
| Exploration | Bloemhoek | Underground | Measured | — | | — | | — | | — | | — | | — | |
| | | Indicated | 27.4 | | 4.7 | | 4.2 | | 27.4 | | 4.7 | | 4.2 | |
| | | Measured + Indicated | 27.4 | | 4.7 | | 4.2 | | 27.4 | | 4.7 | | 4.2 | |
| | | Inferred | 0.9 | | 4.9 | | 0.1 | | 0.9 | | 4.9 | | 0.1 | |
| De Bron | Underground | Measured | — | | — | | — | | — | | — | | — | |
| Merriespruit | | Indicated | 16.7 | | 4.2 | | 2.3 | | 9.5 | | 3.9 | | 1.2 | |
| | | Measured + Indicated | 16.7 | | 4.2 | | 2.3 | | 9.5 | | 3.9 | | 1.2 | |
| | | Inferred | 3.1 | | 3.2 | | 0.3 | | 4.9 | | 3.6 | | 0.6 | |
| Total Measured + Indicated | 44.1 | | 4.5 | | 6.4 | | 36.9 | | 4.5 | | 5.4 | |
| Grand total | 48.1 | | 4.4 | | 6.9 | | 42.6 | | 4.4 | | 6.1 | |
Notes:
The -16.9% change year-on-year in the stated Mineral Resources is attributed to:
–the removal of the Merriespruit Mineral Resources from the DBM Mineral Resources due to the pending Section 102 (-1.4Moz)
On a Mineral Resources exclusive of Mineral Reserves basis, the year-on-year change is +13.1%, due to the removal of DBM from the Mineral Reserves Estimate.
Gold exploration SOUTHERN FREE STATE (SOFS) continued
Mineral Resources classification maps for the Southern Free State exploration project per reef
Classified Gold Mineral Reserve estimate at 31 December 2021
| | | | | | | | | | | | | | | | | | | | | | | | | | | | | |
| Mineral Reserves |
| | | | 31 December 2021 | 31 December 2020 |
| GOLD | Southern Africa | | | Tonnes | Grade | Gold | Tonnes | Grade | Gold |
| SOFS | | | | (Mt) | (g/t) | (Moz) | (Mt) | (g/t) | (Moz) |
| Exploration | De Bron | Underground | Proved | — | | — | | — | | — | | — | | — | |
| Merriespruit | | Probable | — | | — | | — | | 15.3 | | 4.3 | | 2.1 | |
| Grand total Proved + Probable | — | | — | | — | | 15.3 | | 4.3 | | 2.1 | |
Notes: The major change year-on-year has been that no Mineral Reserves are declared in 2021, pending an update to the PFS
| | | | | | | | |
| EUROPE |
| GREEN METALS EXPLORATION | |
| LITHIUM | |
| Keliber | |
| |
| |
| |
| |
| |
| |
| |
| |
| |
Green metals exploration
LITHIUM
KELIBER
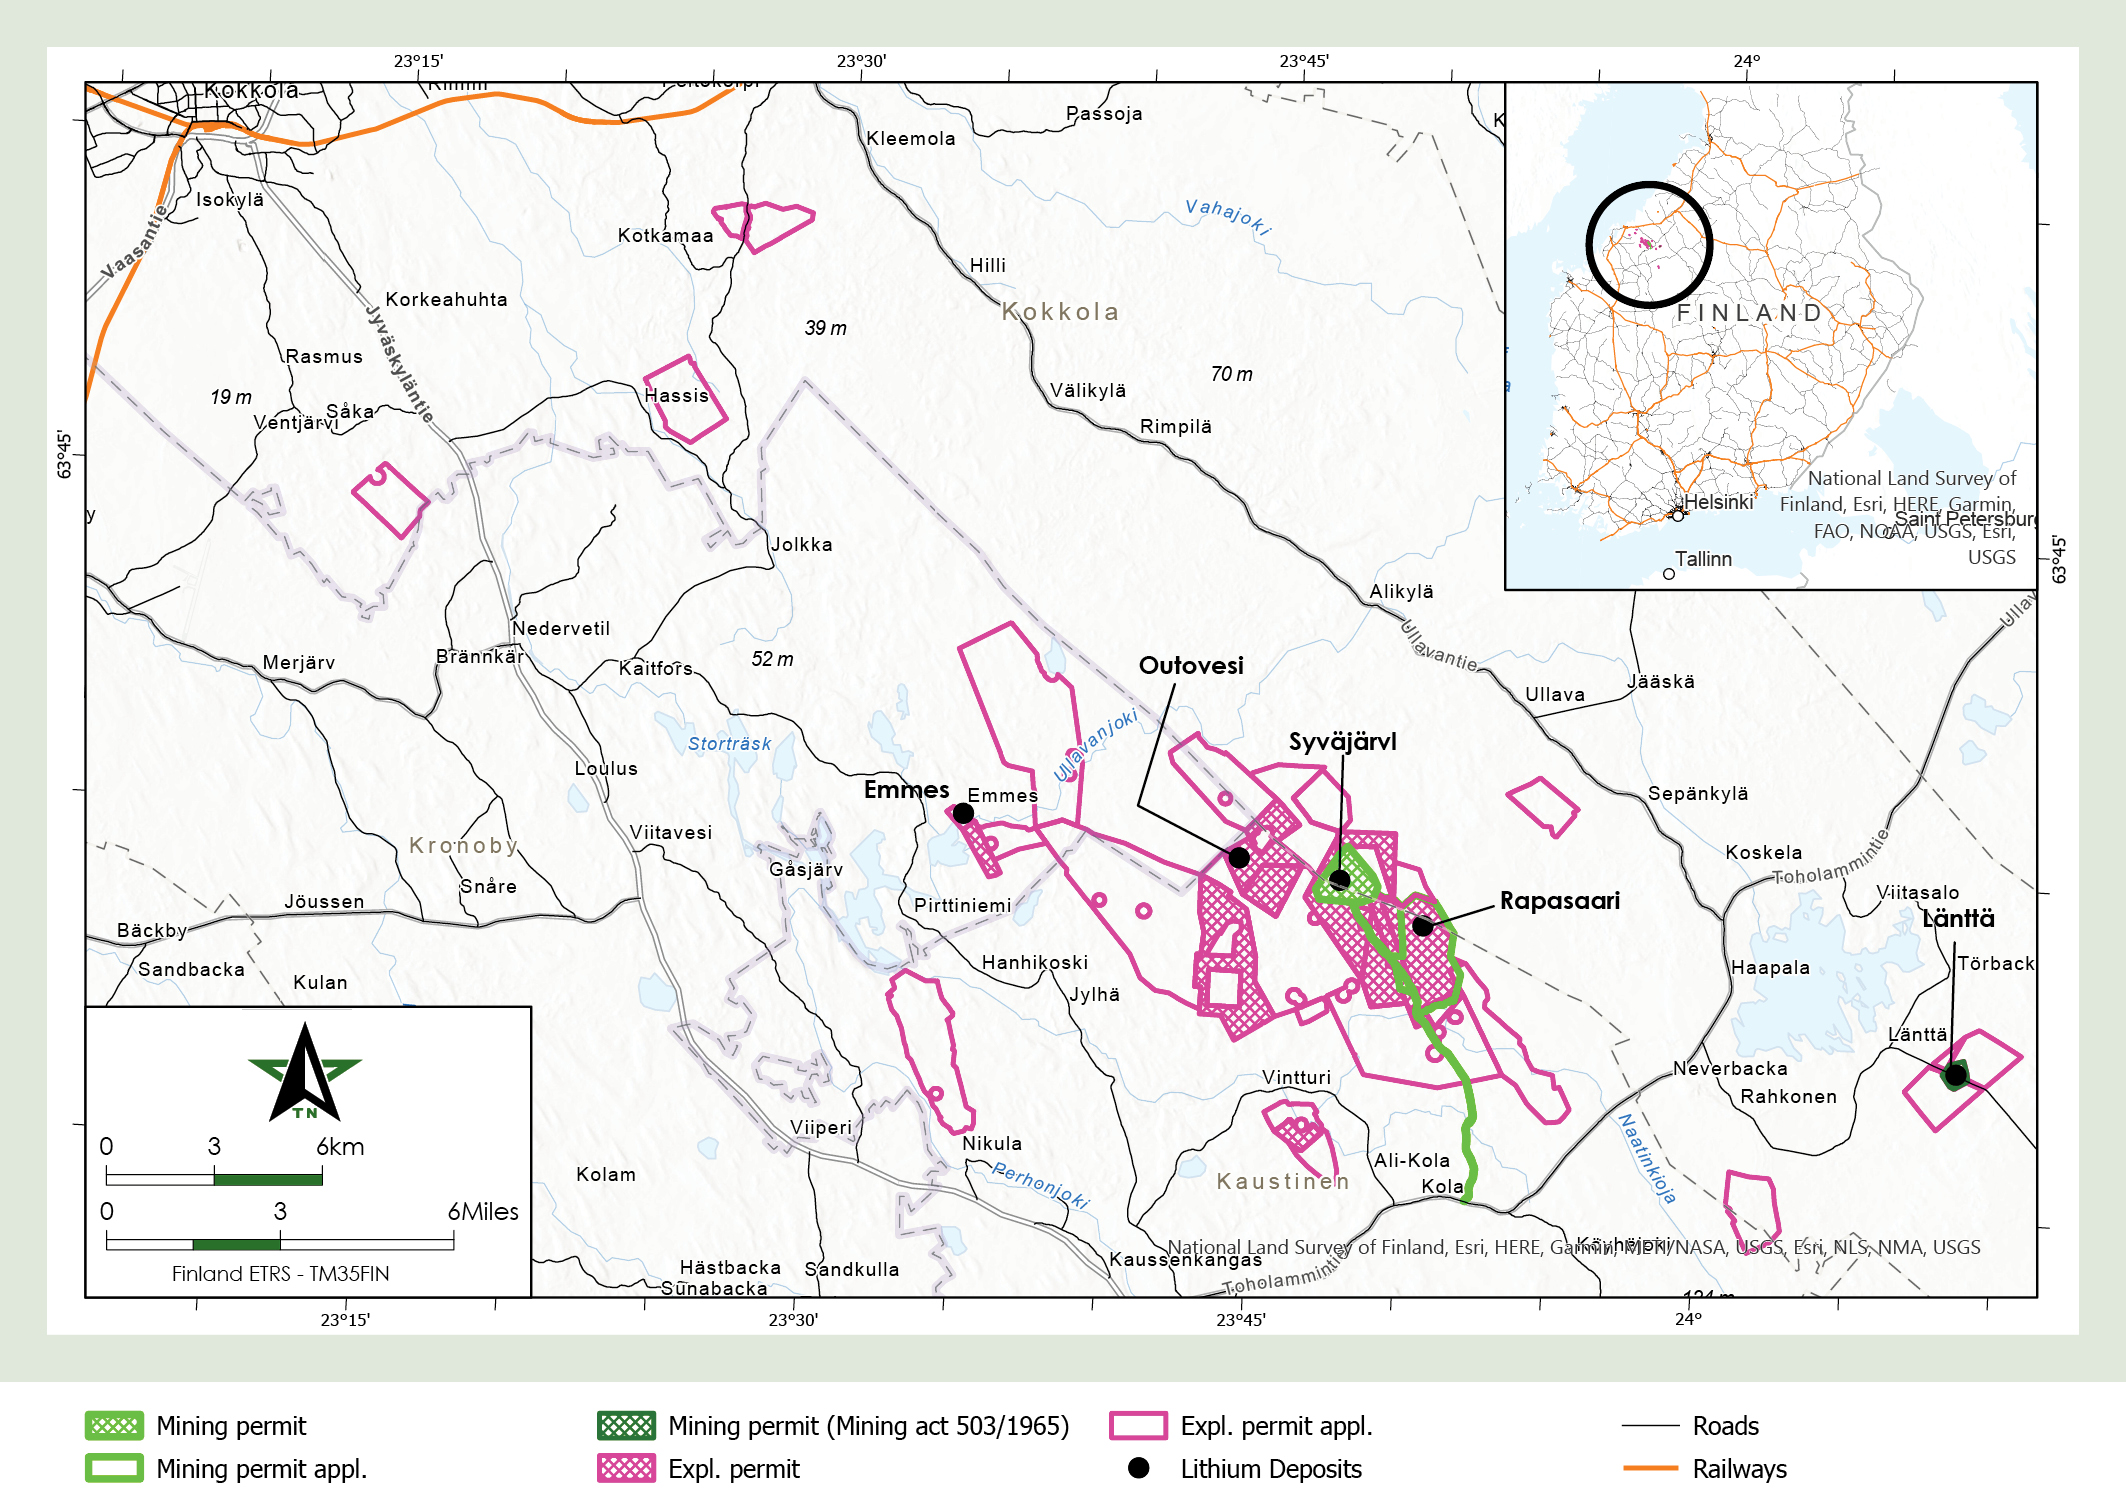
| | |
| PROPERTY DESCRIPTION |
The Keliber Lithium Project is an advanced stage exploration project, currently undergoing DFS level studies. It is located in the Central Ostrobothnian area, Kaustinen, Kokkola and Kruunupyy municipalities, Western Finland. The planned open pit and underground mining operation targets the spodumene-rich Syväjärvi and Rapasaari pegmatite deposits. Keliber has defined Mineral Resources in six separate deposits. The Keliber deposits are all within 25km of the village of Kaustinen. Access to all project areas is via local roads and a network of forestry tracks that are readily accessible by light vehicle and trucks for most of the year. Sibanye-Stillwater has a 26.6% stake in Keliber Oy (Keliber), the Finnish mining and chemical company that owns and manages the project and has an option to increase its share in the project to over 50% by financing an appropriate share of the project development costs of the Keliber project. Tranche 3 investment of Euro5 million during March 2022 increased the % holding to approximately 30%. |
|
| MINERAL TITLE AND FUTURE PERMITTING REQUIREMENTS |
Keliber has three mining permit (7.09km2)and fifteen exploration permit areas covering a total area of 30.38km2, for the element lithium. The Rapasaari mining permit was granted in early 2022 and is not legally valid yet. Three of the exploration permits (3.92km2) are being appealed and are not legally valid yet. In addition there are a further twenty three exploration permits (121.3km2) under application. All the exploration and mining permit, accept fir the ones under application, are either valid or granted, and all tenures are in good standing. The expiry date for the exploration permits varies between 2023-2025. Renewal is however, possible under standard conditions under the Finnish Mining Act. |
Green metals exploration LITHIUM: KELIBER continued
| | |
| GEOLOGY AND MINERALISATION CHARACTERISTICS |
The Kaustinen Lithium pegmatite area occurs in the Paleoproterozoic Pohjanmaa Schist Belt. Lithium mineralisation in the region is hosted within spodumene bearing pegmatite intrusions. Mineral Resources have been delineated in six deposits. The spodumene rich pegmatite veins varies in thickness between 1m and 20m. Pegmatites in this region have been classified into the albite-spodumene subgroup of the Li, Cs, Ta pegmatite family and are typically coarse grained, light colored and mineralogically similar. Spodumene is the only economic mineral identified in the pegmatite veins. Columbite-tantalite is an important accessory mineral having potentially some economic significance. At most of the deposits, no weathering is observed; however, at the Rapasaari deposit, partial weathering or fracture oxidation occurs to a depth of 20m to 30m. At each deposit, bedrock is covered by sandy till and peat with a mean thickness of about 5m. |
Keliber region surface geology map
Keliber typical drill and geological section – Rapasaari deposit
Green metals exploration LITHIUM: KELIBER continued
| | |
| KEY DEVELOPMENTS AND INTENTIONS |
The original DFS, dated 2018, envisaged the production of lithium carbonate. Following further market studies, the production of battery grade lithium hydroxide monohydrate (LiOH-H2O) is now envisaged. An update of the definitive feasibility study is in progress and scheduled for finalisation during the first quarter of 2022. The planned operations include an open pit and underground lithium mine, a concentrator plant in Kaustinen, and a lithium hydroxide plant in Kokkola. The planned annual production is 15,000 tonnes of battery grade lithium hydroxide. Subject to a positive DFS update, and successful financing, Keliber aims to start production in 2024. As part of the mining permitting process, an EIA process is currently in process, aiming to establish the necessary environmental, mining permit, water abstracting and discharging and mining safety license requirements to enable the construction of the mine. Other work streams relate to securing the required funding to ultimately construct the mining operation. |
Classified Lithium PGM Mineral Resource estimate as at 31 December 2021
| | | | | | | | | | | | | | | | | | | | | | | |
| Mineral Resources |
| | | 31 December 2021 |
| LITHIUM | Europe | | Tonnes | Li2O | Li2O | LCE | LCE |
| | | (Mt) | (%) | (Kt) | (%) | (Kt) |
| Exploration | Keliber | Measured | 1.1 | | 1.2 | | 13.5 | | 2.9 | | 33.3 | |
| | Indicated | 2.4 | | 1.0 | | 25.1 | | 2.5 | | 62.0 | |
| | Measured + Indicated | 3.6 | | 1.1 | | 38.6 | | 2.7 | | 95.3 | |
| | Inferred | 0.4 | | 0.9 | | 4.0 | | 2.2 | | 9.8 | |
| Grand total | | | 4.0 | | 1.1 | | 42.5 | | 2.6 | | 105.1 | |
Notes:
•This is a maiden disclosure for Sibanye-Stillwater, so no year-on-year comparisons
•LCE (Lithium Carbonate Equivalent) is derived from in the situ Li2O % concentration by applying a multiplication factor of 2.473
•Mineral Resource has been reported at a 0.5% Li2O lower cut-off grade to reflect assumed exploitation by open pit mining
•Li price assumption for the overall project ranged between US$10,443/t and US$14,334/t LiCO3
| | | | | | | | |
| AUSTRALIA |
| GREEN METALS OPERATIONS | |
| ZINC | |
| New Century | |
| |
| |
| |
| |
| |
| |
| |
| |
Green metals operations
ZINC
NEW CENTURY
Green metals operations ZINC: NEW CENTURY continued
| | |
| INTRODUCTION AND BRIEF DESCRIPTION |
The Century mine is a tailings reprocessing operation located at Lawn Hill, 250km north-west of Mount Isa in the Lower Gulf of Carpentaria, Queensland, Australia. The Century mine began open-pit production in 1999 and was one of the largest zinc mines in the world. Following the depletion of the original ore reserve, the mine was put on care and maintenance in 2016. New Century acquired the operation in 2017 from MMG Ltd, focusing on reprocessing the historic mine tailings. In October 2021, Sibanye-Stillwater acquired a 19.99% shareholding in New Century Resources Limited. |
| | |
| MINERAL TITLE |
The Century TSF lies within the mining lease ML90045, which is owned by Century Mining Limited, a solely owned subsidiary of New Century Resources. The tenure of ML90045 is currently in good standing. There are also one further ML and two exploration permits granted. •ML90045, Century Mine, granted 19/09/1997, expiring on 18/09/2037, for 146.88 km2 •ML90058, Century Mine, granted 19/09/1997, expiring on 18/09/2037, for 84.96 km2 •EPM10544, Lawn Hill, granted 23/06/1995, expiring on 31/12/2016, for 368 km2 •EPM26722, Lawn Hill, granted 25/09/2017, expiring on 24/09/2023, for 158km2 |
|
| GEOLOGY AND MINERALISATION CHARACTERISTICS |
A single substantial tailings deposit exists at Century, generated from 16 years of large-scale operations from the Century open pit zinc mine. Substantial recoverable zinc mineralisation exists due to the historical focus on throughput maximisation as opposed to recovery maximisation. The in-situ Century deposit consists of sediment hosted stratiform Zn-Pb-Ag mineralisation hosted within a sequence of shale, siltstone and sandstone marine sediments. The deposit is dislocated by faulting, and unconformably overlain by up to 100m of Cambrian limestones in the north. The mineralized units extended 1500 m north to south, and 1500 m east to west. Mineralisation outcropped at surface (South Block) and extended to a maximum depth of 310 m. The mineralised sequence has a thickness of approximately 40m; it is fault-bound to the north and south, and truncated by erosional unconformities in the east and west, and is a synclinal tabular body in geometry. The large-scale Century deposit is located in the middle of a 20km diameter cluster of smaller high-grade vein-breccia lodes. Over 40 of these lode targets have been recorded to date, with the largest being the already defined Silver King Deposit. Beyond the significant tailings resource, three in-situ resources have been defined. The remaining South Block mineralization is an elongated tabular body that is approximately 1km in length, between 80m and 150m wide, and approximately 30m thick. The South Block mineralization is visible in the southern wall of the Century Open Pit, and ranges from 20m to 218m below natural surface. Discovered in 1897, Silver King had a rich history of small scale mining until 1961, having been accessed by 15 shafts and associated underground workings to a depth of approximately 60m. The Silver King mineralisation consists of a series of moderately to steeply dipping quartz-galena-sphaleritesiderite veins associated with a NE trending dextral strike-slip fault. Further sphalerite and galena mineralisation occurs within shale hosted breccia also associated with the veins. The East Fault Block is a small deposit located 35m below the surface of the run-of-mine stockpile area at the mine site and extends to a depth of 112m. The Watsons Lode deposit occurs ~10km south of the Century deposit, also within the Burketown Mineral field, and consists of a series of steeply dipping quartz-galena-sphalerite-siderite hydrothermal veins associated with a northeast trending sinistral strike-slip fault. Mineralisation is structurally controlled, being focused in dilatant zones associated with fault flexures. As such, the veins display well developed breccia textures, with abundant quartz and carbonate veining. |
Green metals operations ZINC: NEW CENTURY continued
| | |
| INFRASTRUCTURE AND EQUIPMENT |
Key equipment includes: Primary crushing facilities, grinding facilities consisting of one SAG mill and two balls mills; fifteen ultrafine sand mills; a conventional froth flotation circuit, Full site laboratory capable of handling all exploration and plant samples; and Equipment workshops and stores for all mobile and fixed plant maintenance.
Lawn Hill also has a 400-man camp (including wet/dry mess, recreational facilities and water treatment facilities) and its own private airport with sealed runway (suitable for medium-sized jet aircraft). |
| | |
| MINING METHOD |
| Top down hydraulic mining. |
| | |
| LIFE OF MINE |
| 6 years, up to 2027 based on available historic tailings material, with upside from fresh ore. |
| | |
| MINERAL PROCESSING AND CAPACITY |
| The historic Lawn Hill Processing Plant, a 7.0Mtpa capacity hard rock processing plant, has been refurbished to process up to 12Mtpa of tailings. The plant also has latent capacity to process up to 1Mtpa of hard rock ore concurrently with tailings. |
| | |
| TAILINGS DISPOSAL AND CAPACITY |
| The existing, historical Century Mine open pit workings has been licensed as a TSF to deposit the reprocessed tailings. Sufficient capacity exists for the LoM. |
| | |
| ESTIMATION RISKS |
| No Mineral Resource risk exists. The only material Mineral Reserve risks relates to metallurgical recoveries, input costs, climatic events, and commodity prices. |
| | |
| KEY DEVELOPMENTS AND BROWNFIELDS PROJECTS |
A feasibility study has been completed by New Century Resources during 2021, designed to determine the economic viability of the Silver King and East Fault Block deposits. The study investigated the incorporation of Silver King and East Fault Block in-situ deposits into the existing mine plan (in addition to the current tailings reprocessing) to produce zinc concentrate and a new lead concentrate. The feasibility LoM production profile for the in-situ operations targets 2.9Mt at 5.2% zinc, 5.7% lead and 66g/t silver (approx.86% probable reserves status, 14% inferred & unclassified mining inventory). The project would result in a 65% increase in annualised Zn equivalent metal production from Century to over 200ktpa. The study resulted in a Maiden Mineral Reserve for the Silver King and East Fault deposits and added 140kt of zinc, 133kt of lead and 5.5Moz of silver to the company’s reserves. The positive results from the study has allowed the company to immediately commence front end engineering and design work, procure long lead items, early works programs, lodge amendments to environmental authorities, advance financing and sales agreements prior to making a final investment decision. |
Green metals operations ZINC: NEW CENTURY continued
Classified Mineral Resource estimate at 31 December 2021
| | | | | | | | | | | | | | | | | | | | | | | | | | | | | | | | |
| Mineral Resources Inclusive of Mineral Reserves |
| | | | 31 December 2021 |
| Australia | | | Tonnes | Zinc | Zinc | Silver | Silver | Lead | Lead |
| New Century | | | | (Mt) | (%) | (Mlb) | (g/t) | (Moz) | (%) | (Mlb) |
| Operations | Century Tailings | TSF Surface | Measured | 10.6 | | 3.0 | | 706.9 | | 14.1 | | 4.8 | | — | | — | |
| | | Indicated | — | | — | | — | | — | | — | | — | | — | |
| | | Measured + Indicated | 10.6 | | 3.0 | | 706.9 | | 14.1 | | 4.8 | | — | | — | |
| | | Inferred | — | | — | | — | | — | | — | | — | | — | |
| Silver King | Open Pit | Measured | 0.2 | | 4.8 | | 21.2 | | 56.0 | | 0.4 | | 5.4 | | 23.8 | |
| | | Indicated | — | | — | | — | | — | | — | | — | | — | |
| | | Measured + Indicated | 0.2 | | 4.8 | | 21.2 | | 56.0 | | 0.4 | | 5.4 | | 23.8 | |
| | | Inferred | — | | — | | — | | — | | — | | — | | — | |
| | Underground | Measured | | | | | | | |
| | | Indicated | 0.4 | | 5.0 | | 46.7 | | 44.4 | | 0.6 | | 5.3 | | 48.9 | |
| | | Measured + Indicated | 0.4 | | 5.0 | | 46.7 | | 44.4 | | 0.6 | | 5.3 | | 48.9 | |
| | | Inferred | 0.1 | | 2.7 | | 7.1 | | 31.1 | | 0.1 | | 6.2 | | 16.3 | |
| East Fault Block | Open Pit | Measured | — | | — | | — | | — | | — | | — | | — | |
| | | Indicated | 0.1 | | 10.5 | | 27.8 | | 57.0 | | 0.2 | | 1.2 | | 3.1 | |
| | | Measured + Indicated | 0.1 | | 10.5 | | 27.8 | | 57.0 | | 0.2 | | 1.2 | | 3.1 | |
| | | Inferred | — | | — | | — | | — | | — | | — | | — | |
| South Block | Underground | Measured | — | | — | | — | | — | | — | | — | | — | |
| | | Indicated | 1.2 | | 5.4 | | 147.6 | | 43.1 | | 1.7 | | 1.5 | | 41.0 | |
| | | Measured + Indicated | 1.2 | | 5.4 | | 147.6 | | 43.1 | | 1.7 | | 1.5 | | 41.0 | |
| | | Inferred | — | | — | | — | | — | | — | | — | | — | |
| Watson's Lode | Underground | Measured | — | | — | | — | | — | | — | | — | | — | |
| | | Indicated | — | | — | | — | | — | | — | | — | | — | |
| | | Measured + Indicated | — | | — | | — | | — | | — | | — | | — | |
| | | Inferred | 0.3 | | 7.9 | | 59.1 | | 11.0 | | 0.1 | | 2.1 | | 15.4 | |
| Total Measured + Indicated | 12.6 | | 3.4 | | 950.2 | | 19.0 | | 7.7 | | 2.7 | | 116.8 | |
| Grand total | | | | 13.0 | | 3.5 | | 1,016.3 | | 18.9 | | 7.9 | | 2.8 | | 148.5 | |
Green metals operations ZINC: NEW CENTURY continued
| | | | | | | | | | | | | | | | | | | | | | | | | | | | | | | | |
| Mineral Resources Exclusive of Mineral Reserves |
| | | | 31 December 2021 |
| Australia | | | Tonnes | Zinc | Zinc | Silver | Silver | Lead | Lead |
| New Century | | | | (Mt) | (%) | (Mlb) | (g/t) | (Moz) | (%) | (Mlb) |
| Operations | Century Tailings | TSF Surface | Measured | — | | — | | — | | — | | — | | — | | — | |
| | | Indicated | — | | — | | — | | — | | — | | — | | — | |
| | | Measured + Indicated | — | | — | | — | | — | | — | | — | | — | |
| | | Inferred | — | | — | | — | | — | | — | | — | | — | |
| Silver King | Open Pit | Measured | 0.02 | | 6.0 | | 2.6 | | 31.1 | | 0.02 | | 5.0 | | 2.2 | |
| | | Indicated | — | | — | | — | | — | | — | | — | | — | |
| | | Measured + Indicated | 0.02 | | 6.0 | | 2.6 | | 31.1 | | 0.02 | | 5.0 | | 2.2 | |
| | | Inferred | — | | — | | — | | — | | — | | — | | — | |
| | Underground | Measured | | | | | | | |
| | | Indicated | 0.3 | | 4.8 | | 27.8 | | 38.3 | | 0.3 | | 4.4 | | 25.1 | |
| | | Measured + Indicated | 0.3 | 4.8 | | 27.8 | | 38.3 | | 0.3 | 4.4 | | 25.1 | |
| | | Inferred | 0.1 | | 2.8 | | 7.5 | | 41.5 | | 0.2 | | 7.5 | | 19.8 | |
| East Fault Block | Open Pit | Measured | — | | — | | — | | — | | — | | — | | — | |
| | | Indicated | — | | — | | — | | — | | — | | — | | — | |
| | | Measured + Indicated | — | | — | | — | | — | | — | | — | | — | |
| | | Inferred | — | | — | | — | | — | | — | | — | | — | |
| South Block | Underground | Measured | — | | — | | — | | — | | — | | — | | — | |
| | | Indicated | 1.2 | | 5.4 | | 147.6 | | 43.1 | | 1.7 | | 1.5 | | 41.0 | |
| | | Measured + Indicated | 1.2 | | 5.4 | | 147.6 | | 43.1 | | 1.7 | | 1.5 | | 41.0 | |
| | | Inferred | — | | — | | — | | — | | — | | — | | — | |
| Watson's Lode | Underground | Measured | — | | — | | — | | — | | — | | — | | — | |
| | | Indicated | — | | — | | — | | — | | — | | — | | — | |
| | | Measured + Indicated | — | | — | | — | | — | | — | | — | | — | |
| | | Inferred | 0.3 | | 7.9 | | 59.1 | | 11.0 | | 0.1 | | 2.1 | | 15.4 | |
| Total Measured + Indicated | 1.5 | | 5.3 | | 178.0 | | 42.2 | | 2.1 | | 2.0 | | 68.3 | |
| Grand total | | | | 2.0 | | 5.6 | | 244.6 | | 36.8 | | 2.3 | | 2.4 | | 103.6 | |
Notes:
•No cut-off grades applied
•TSF Mineral Resource constrained within a boundary string defining the dam walls and excluding outflow areas
•This is a maiden disclosure for Sibanye-Stillwater, so no year-on-year comparisons
Green metals operations ZINC: NEW CENTURY continued
Classified 2E PGM Mineral Reserve
| | | | | | | | | | | | | | | | | | | | | | | | | | | | | | | | |
| Mineral Reserves |
| | | | 31 December 2021 |
| Australia | | | Tonnes | Zinc | Zinc | Silver | Silver | Lead | Lead |
| New Century | | | | (Mt) | (%) | (Mlb) | (g/t) | (Moz) | (%) | (Mlb) |
| Operations | Century Tailings | TSF Surface | Proved | 9.9 | | 3.0 | | 649.2 | | 13.9 | | 4.4 | | — | | — | |
| | | Probable | — | | — | | — | | — | | — | | — | | — | |
| | | Proved + Probable | 9.9 | | 3.0 | | 649.2 | | 13.9 | | 4.4 | | — | | — | |
| Silver King | Open Pit | Proved | — | | — | | — | | — | | — | | — | | — | |
| | | Probable | 0.1 | | 8.2 | | 21.6 | | 36.3 | | 0.1 | | 0.8 | | 2.2 | |
| | | Proved + Probable | 0.1 | | 8.2 | | 21.6 | | 36.3 | | 0.1 | | 0.8 | | 2.2 | |
| | Underground | Proved | — | | — | | — | | — | | — | | — | | — | |
| | | Probable | 0.3 | | 4.6 | | 34.4 | | 82.3 | | 0.9 | | 6.7 | | 50.2 | |
| | | Proved + Probable | 0.3 | | 4.6 | | 34.4 | | 82.3 | | 0.9 | | 6.7 | | 50.2 | |
| East Fault Block | Open Pit | Proved | — | | — | | — | | — | | — | | — | | — | |
| | | Probable | 0.1 | | 4.3 | | 5.7 | | 41.5 | | 0.1 | | 4.3 | | 5.7 | |
| | | Proved + Probable | 0.1 | | 4.3 | | 5.7 | | 41.5 | | 0.1 | | 4.3 | | 5.7 | |
| Grand total Proved + Probable | 10.4 | | 3.1 | | 710.9 | | 16.5 | | 5.5 | | 5.1 | | 58.2 | |
Notes:
•Based on metal price assumptions for Zn: $2.75/t and Ag $17.8/t
•Assumed metallurgical recoveries of Zn 63% and Ag 61%
•This is a maiden disclosure for Sibanye-Stillwater, so no year-on-year comparisons
| | | | | | | | |
| ANCILLARY
INFORMATION |
| Professional Organisations | |
| SAMREC Code definitions | |
| Glossary of terms | |
| Abbreviations | |
| Forward looking statement | |
| Administration and company information | |
| Generic Key South African Permit Conditions | |
| |
| |
Professional organisations
| | | | | | | | |
GEOLOGICAL SOCIETY OF SOUTH AFRICA (GSSA) Mandela Mining Precinct (formerly CSIR Miningtek) Corner Rustenburg and Carlow Roads, Melville Johannesburg, South Africa Tel: +27 11 358 0028 Email: info@gssa.org.za Website: www.gssa.org.za | SOCIETY FOR MINING METALLURGY AND EXPLORATION (SME) 12999 E. Adam Aircraft Circle Englewood, CO 80112 United States Tel: +1 303 948 4200 / +1 720 738 4085 Email: cs@smenet.org Website: www.smenet.org/ | THE ASSOCIATION OF PROFESSIONAL ENGINEERS AND GEOSCIENTISTS OF ALBERTA (APEGA) 1500 Tower One 10060 Jasper Avenue NW Edmonton, Alberta T5J 4A2 Canada Tel: 780 426 3990 Website: www.apega.ca/ |
SOUTH AFRICAN COUNCIL FOR NATURAL SCIENTIFIC PROFESSIONS (SACNASP) 280 Pretoria Street, Silverton Pretoria, 0184, South Africa Tel: +27 12 748 6500 Fax: +27 86 206 0427 Email: sacnasp@sacnasp.org.za Website: www.sacnasp.org.za/ | ENGINEERING COUNCIL OF SOUTH AFRICA (ECSA) 1st Floor, Waterview Corner Building, 2 Ernest Oppenheimer Avenue Bruma Lake Office Park, Bruma, Johannesburg, 2198, South Africa Tel: +27 86 122 5555 Fax: +27 11 607 9556 Email: engineer@ecsa.co.za Website: www.ecsa.co.za | PROFESSIONAL GEOSCIENTIST ONTARIO (PGO) 25 Adelaide Street East, Suite 1100 Toronto, Ontario M5C 3A1 Canada Tel: +1-416-203-2746 Email: info@pgo.ca Website: www.pgo.ca |
AMERICAN INSTITUTE OF PROFESSIONAL GEOLOGISTS (AIPG) 1333 W. 120th Avenue, Suite 211 Westminster, Colorado 80234-2710 United States Tel: +1 404 303 412 6205 Email: aipg@aipg.org Website: www.aipg.org | SOUTHERN AFRICAN INSTITUTE OF MINING AND METALLURGY (SAIMM) The Minerals Council South Africa 5th Floor, 5 Hollard Street Corner Sauer & Marshall Streets Johannesburg, South Africa Tel: +27 11 834 1273/7 Fax: +27 11 838 5923 Email: naomi@saimm.co.za Website: www.saimm.co.za | PERUVIAN ENGINEERS ASSOCIATION (CIP) Av. Arequipa Nº 4947, Miraflores, Lima Peru Tel: +51 939 357 540 Email: mesadepartes.cn@cip.org.pe Website: www.cip.org.pe |
SOUTH AFRICAN GEOMATICS COUNCIL (SAGC) Unit 3, Building 2 Bruma Boulevard Office Park 20 Zulberg Close Bruma, Johannesburg South Africa Tel: +27 11 626 1040 Email: admin@sagc.org.za Website: www.sagc.org.za/ | AUSTRALASIAN INSTITUTE OF MINING AND METALLURGY (AusIMM) Carlton, Victoria Australia Tel: +61 3 9658 6100 Website: www.ausimm.com | |
Samrec code definitions
| | | | | |
| TERM | DEFINITION |
| Competency | The public report is based on work that is the responsibility of suitably qualified and experienced persons who are subject to an enforceable professional code of ethics. |
| Competent Person | A Competent Person is a person who is registered with SACNASP, the Engineering Council of South Africa, or is a member or fellow of the Southern African Institute of Mining and Metallurgy (SAIMM), the Geological Society of South Africa (GSSA) or a Recognised Professional Organisation (RPO). The Competent Person must comply with the provisions of the relevant promulgated acts, have a minimum of five years experience relevant to the style of mineralisation and type of deposit or class of deposit under consideration and to the activity he or she is undertaking. Persons being called upon to sign as a Competent Person must be clearly satisfied in their own minds that they are able to face their peers and demonstrate competence in the commodity, type of deposit and the situation under consideration. |
| Deposit | A concentration (or occurrence) of material of possible economic interest, in or on the earth crust, that may include mineralised material that cannot be estimated with sufficient confidence to be classified in the Inferred category. Portions of a deposit that do not have reasonable and realistic prospects for eventual economic extraction are not included in a Mineral Resource. |
| Materiality | A public report contains all the relevant information that investors and their professional advisors would reasonably require, and expect to find, for the purpose of making a reasoned and balanced judgement regarding the exploration results, Mineral Resources and Mineral Reserves reported on. |
| Mineral Resource | A concentration or occurrence of material of economic interest in or on the earth’s crust in such form, quality and quantity that there are reasonable and realistic prospects for eventual economic extraction. The location, quantity, grade, continuity and other geological characteristics of a Mineral Resource are known, or estimated from specific geological evidence, sampling and knowledge interpreted from an appropriately constrained and portrayed geological model. Mineral Resources are subdivided, and must be so reported, in order of increasing confidence in respect of geoscientific evidence, into Inferred, Indicated and Measured categories. |
| Measured Mineral Resource | That part of a Mineral Resource for which tonnage, densities, shape, physical characteristics, grade and mineral content can be estimated with a high level of confidence. It is based on detailed and reliable information from exploration, sampling and testing of material from locations such as outcrops, trenches, pits, workings and drillholes. The locations are spaced closely enough to confirm geological and grade continuity. |
| Indicated Mineral Resource | That part of a Mineral Resource for which tonnage, densities, shape, physical characteristics, grade and mineral content can be estimated with a reasonable level of confidence. It is based on information from exploration, sampling and testing of material gathered from locations such as outcrops, trenches, pits, workings and drillholes. The locations are too widely or inappropriately spaced to confirm geological and/or grade continuity but are spaced closely enough for continuity to be assumed. |
| Inferred Mineral Resource | That part of a Mineral Resource for which tonnage, grade and mineral content can be estimated with a low level of confidence. It is inferred from geological evidence and sampling, and assumed but not verified geologically or through analysis of grade continuity. It is based on information gathered through appropriate techniques from locations such as outcrops, trenches, pits, workings and drillholes that may be limited or of uncertain quality and reliability. |
| Mineral Reserve | The economically mineable material derived from a Measured and/or Indicated Mineral Resource. It is inclusive of diluting and contaminating materials and allows for losses that are expected to occur when the material is mined. Appropriate assessments to a minimum of a PFS for a project and a LoM plan for an operation must have been completed, including consideration of, and modification by, realistically assumed mining, metallurgical, economic, marketing, legal, environmental, social and governmental factors (the modifying factors). Such modifying factors must be disclosed. |
| |
Samrec code definitions continued
| | | | | |
| TERM | DEFINITION |
| Proved Mineral Reserve | Economically mineable material derived from a Measured Mineral Resource. It is estimated with a high level of confidence. It includes diluting and contaminating materials and allows for losses that are expected to occur when the material is mined. Appropriate assessments to a minimum of a PFS for a project or a LoM plan for an operation must have been carried out, including consideration of, and modification by, realistic assumed mining, metallurgical, economic, marketing, legal, environmental, social and governmental factors. Such modifying factors must be disclosed. |
| Probable Mineral Reserve | Economically mineable material derived from a Measured or Indicated Mineral Resource or both. It is estimated with a lower level of confidence than a Proved Mineral Reserve. It includes diluting and contaminating materials and allows for losses that are expected to occur when the material is mined. Appropriate assessments to a minimum of a PFS for a project or a LoM plan for an operation must have been carried out, including consideration of, and modification by, realistic assumed mining, metallurgical, economic, marketing, legal, environmental, social and governmental factors. Such modifying factors must be disclosed. |
| Transparency | The reader of a public report must be provided with sufficient information, the presentation of which is clear and unambiguous, to understand the report and not to be misled. |
Glossary of terms
| | | | | |
| TERM | DEFINITION |
| Above infrastructure (AI) | That part of the Mineral Resources and/or Mineral Reserves, which are above the lowest mining level and can be accessed via the current mine infrastructure (shafts and underground haulages). |
| Below infrastructure (BI) | That part of the Mineral Resources and/or Mineral Reserves which are below the lowest mining level and that can only be accessed following approved capital expenditure. |
| Brownfield | A mineral deposit, not yet exploited but conceptualised as an extractable orebody. |
| Bushveld Igneous Complex | World’s largest known layered mafic-ultramafic intrusive complex, covering an area of approximately 67,000km2, containing more than 80% of all known PGM resource. |
| Carbon-in-leach (CIL) | Gold is leached from a gold ore slurry with cyanide in agitation tanks and absorbed onto carbon granules in the same circuit. The carbon granules are separated from the slurry and treated in an elution circuit to extract the gold. |
| Carbon-in-pulp (CIP) | Gold is leached conventionally from a gold ore slurry with cyanide in agitation tanks. The leached slurry then passes into the CIP circuit where carbon granules are mixed with the slurry and gold is absorbed onto the carbon. The carbon granules are separated from the slurry and treated in an elution circuit to extract the gold. |
| Concept study | A study of the viability of options to determine the potential value of the opportunity and confirm alignment with the business strategy. The study details the required work to fully define the opportunity, and outlines the economic potential of that being studied. |
| Cut-off grade | The grade of ore that would result in direct mining costs to be covered. |
| Depletion | The decrease in the quantity of ore in a deposit or property (mining right) resulting from extraction or production. |
| Dilution | Waste or material below the cut-off grade that contaminates the ore during the course of mining operations and thereby reduces the average grade mined. |
| Feasibility study (FS) | A comprehensive design and costing study of a project. Appropriate assessments have been made of realistically assumed geological, mining, metallurgical, economic, marketing, legal, environmental, social, governmental, engineering, operational and all other modifying factors, which are considered in sufficient detail to demonstrate at the time of reporting that extraction is reasonably justified (economically mineable) and the factors reasonably serve as the basis for a final decision by a proponent or financial institution to proceed with, or finance, the development of the project. The overall confidence of the study should be stated. |
| Life of mine (LoM) | Number of years that an operation is currently planning to mine and treat ore and is derived from the current mining plan. |
| Mine call factor (MCF) | The ratio expressed as a percentage in which the specific product accounted for in ‘recovery plus residue’ bears the corresponding product ‘called for’ by the mine’s measuring and evaluation methods. |
| Pay limit | The average mining grade for a mine that would result in all direct and indirect costs being covered. |
| Pillars | Pillars comprise of: •Dip and strike stability pillars •Water and ventilation pillars •Regional stability pillars as defined by rock engineering •Bracket pillars adjacent to seismically active areas or large structures •Boundary and remnant pillars •Abandoned pillars Inter alia, some pillars may become available to mine once appropriate investigations and rehabilitation have taken place. |
Glossary of terms continued
| | | | | |
|
| TERM | DEFINITION |
| Plant recovery factor | The ratio expressed as a percentage of the mass of the specific mineral product actually recovered from ore treated at the plant to its total specific mineral content before treatment. |
| Post depletion | 2020 Mineral Resources and Mineral Reserves, as at December 2020, minus 2019 mined-out areas. |
| Prefeasibility study (PFS) | A comprehensive study of the viability of options for a mineral project that has advanced to a stage at which the preferred mining method in the case of underground mining or the pit configuration in the case of an open pit has been established. Additionally, an effective method of mineral processing has been determined. It includes a financial analysis based on realistic assumptions of technical, engineering, operating, economic factors and the evaluation of other relevant factors that are sufficient for a Competent Person, acting reasonably, to determine if all or part of the Mineral Resource may be classified as a Mineral Reserve. The overall confidence of the study should be stated. A PFS is at a lower confidence level than a FS. |
| Prill Split | The ratio of co-occurring precious metals present in ore expressed as a percentage. |
| Reef | A geological horizon or stratigraphic horizon that may contain economic levels of mineralisation. |
| Stope | Underground excavation where the orebody is extracted. |
| Survey shortfall | Difference between the tonnage hoisted as ore and that accounted for by the plant measuring methods. Discrepancy is referred to as a shortfall when the calculated tonnage is less than the tonnage accounted for by the plant, or an excess when the opposite occurs. |
| Unconformity | An erosional marker surface indicating a lapse in time between two differing aged stratigraphic units. |
| White areas | Areas that were excluded from previous LoM plans that have since been proven to have realistic expectation of safe economic extraction, with the required investigations, rock engineering modelling and detail mining plan to support it. White areas include open ground, areas that were excluded due to economics or lack of information and pillars. |
| | | | | |
| TERM | DEFINITION |
| 2D | Two dimensional |
| 2E PGM | Platinum, palladium |
| 3D | Three dimensional |
| 4E PGM | Platinum, palladium, rhodium, gold |
| 6E PGM | Platinum, palladium, rhodium, gold, ruthenium, iridium |
| AAP | Anglo American Platinum |
| AAR | Aandenk Reef |
| Ag | Silver |
| AI | Above infrastructure |
| AIPG | American Institute of Professional Geologists |
| AISC | All-in sustaining costs |
| Amsl | Above mean sea level |
| Aquarius | Aquarius Platinum Ltd |
| Au | Gold |
| BI | Below infrastructure |
| BIC | Bushveld Igneous Complex |
| BR | Beatrix Reef |
| BTTP | Bulk Tailing Treatment Project |
| C$ | Canadian dollar |
| C&F | Cut and fill |
| C2022 BP | 2022 Business Plan |
| CCTV | Closed Circuit Television |
| CDP | Community Development Programme |
| CEO | Chief Executive Officer |
| CIL | Carbon-in-leach |
| CIM | Canadian Institute of Mining, Metallurgy and Petroleum |
| CIM NI 43-101 | Canadian Institute of Mining - National Instrument 43-101 |
| CIP | Carbon-in-pulp |
| cm | Centimetre |
| cm.g/t | Centimetre gramme per tonne |
| COVID-19 | Coronavirus Disease |
| CP/QP | Competent Person/Qualified Person |
| CPG | Certified Professional Geologists for the AIPG |
| CPG | Certified Professional Geologist |
| CPR | Competent Persons Report |
Cr2O3 | Chromium oxide |
| CRIRSCO | Committee for Mineral Reserves International Reporting Standards |
| CRM | Certified reference materials |
| CRP | Chrome retreatment plant |
| Cs | Caesium |
| Cu | Copper |
| | | | | |
| TERM | DEFINITION |
| Cu | Copper |
| CW | Channel width |
| DBM | De Bron Merriespruit |
| DFS | Definitive feasibility study |
| DMRE | Department of Mineral Resources and Energy |
| DRDGOLD | DRDGOLD Limited |
| DWS | Department of Water and Sanitation |
| EDGAR | Electronic data gathering, analysis, and retrieval system |
| EIA | Environmental Impact Assessment |
| EIS | Environmental impact statement |
| EL | Exploration License |
| EMC | Ezulwini Mining Company |
| EPL | Eastern Platinum Limited |
| EqCu | Copper Equivalent |
| ESG | Environmental Social and Governance |
| ETD1 | Eastern Tailings Dam One |
| FS | Feasibility study |
| FWGR | Far West Gold Recoveries |
| g | Gramme |
| g/t | Grammes per tonne |
| Ga | (Giga-annum) billion years |
| GBG | Great Basin Gold |
| GDE | Graduate Diploma Engineering |
| GHG | Green House Gas |
| GISTM | Global Industry Standard on Tailings Management |
| GSSA | Geological Society of South Africa |
| GTC | Grade tonnage curve |
| Guide 7 | SEC Industry Guide 7 |
| ha | Hectare |
| ICMM | International Council on Mining and Metals |
| ICP | Induction Coupled Plasma Mass Spectrometry |
| IOCG | Iron-oxide copper-gold |
| Ir | Iridium |
| IRUP | Iron-rich ultramafic pegmatoids |
| ISO/IEC | International standard on how to manage information security |
| JCI | Johannesburg Consolidated Investments |
| JM | Johns Manville (a manufacturer) |
| JSE | Johannesburg Stock Exchange Limited |
| JV | Joint venture |
| kg | Kilogramme |
| kg/t | Kilogrammes per tonne |
| KKR | Kalkoenkrans Reef |
| km | Kilometre |
Km2 | Square kilometers |
| koz | Thousand ounces |
| | | | | |
| TERM | DEFINITION |
| KPM | Kroondal Platinum Mines |
| KR | Kloof Reef |
| kt | Thousand tonnes |
| Ktpm | Thousand tonnes per month |
| lb | Pounds |
| LCE | Lithium Carbonate Equivalent |
| LHD | Load haul dump truck |
| Li | Lithium |
| LIMS | Lab Information Management System |
| LoM | Life of mine |
| LR | Libanon Reef |
| m | Metre |
m2 | Square metre |
| Ma | (Mega annum) million years |
| MBA | Master of Business Administration |
| MBCCR | Multiband Carbon Leader Reef |
| MCF | Mine call factor |
| MER | Merensky Reef |
| Mlb | Million pounds |
| mm | Millimetre |
| MMSA | Mining and Metallurgical Society of America |
| Moz | Million ounces |
| MPO | Mine Plan of Operations |
| MPRDA | Minerals and Petroleum Resources Development Act |
| MPTRO | Mineral and Petroleum Titles Registration Office |
| MR | Mining right |
| MRM | Mineral Resource Management |
| MSCC | Mine Surveyor Certificate of Competency |
| MSZ | Main Sulphide Zone |
| Mt | Million tonnes |
| Mtpa | Million tonnes per annum |
| MVR | Middelvlei Reef |
| MWP | Mine Works Programme |
| NDEP | Nevada Division of Environmental Protection |
| NDEP-BMRR | Nevada Bureau of Mining Regulation and Reclamation |
| NDT | Non-destructive testing |
| NEPA | National Environmental Protection Authority |
| Ni | Nickel |
| NPV | Net present value |
| NSR | Net Smelter Royalty |
| NYSE | New York Stock Exchange |
| OB-I | Olivine occurrence |
| Opt | Ounces per tonne |
| ORET | Ore reserves economic test |
| Os | Osmium |
| oz | Ounces (troy) |
| | | | | |
| TERM | DEFINITION |
| P&SA | Pool and Share Agreement |
| Pb | Lead |
| Pd | Palladium |
| PdEq | Paladium equivalent |
| PEA | Preliminary economic assessment |
| PFS | Prefeasibility study |
| PGM | Platinum Group Metals |
| PGO | Professional Geoscientist Ontario |
| POC | Purchase of concentrate |
| PR | Prospecting right |
| Pr.Sci.Nat | Professional Natural Scientist |
| Pt | Platinum |
| QA/QC | Quality assurance / quality control |
| QDM | Quebrada de la Mina |
| QEMSCAN | Quantitative evaluation of minerals by scanning electron microscopy |
| R | South African Rand |
| R/kg | South African Rand per kilogramme |
| REGM | Randfontein Estates Gold Mine |
| Rh | Rhodium |
| RLS | Rustenburg Layered Suite |
| ROM | Run-of-mine |
| RPA | Roscoe Postle Associates Inc |
| RPEEE | Reasonable prospects for eventual economic extraction |
| RPM | Rustenburg Platinum Mines |
| RPO | Recognised Professional Organisation |
| RSO | Randfontein Surface Operation |
| Ru | Ruthenium |
| SACNASP | South African Council for Natural Scientific Professions |
| SAGC | South African Geomatics Council |
| SAIMM | Southern African Institute of Mining and Metallurgy |
| SAMREC CODE | The South African Code for the Reporting of Exploration Results, Mineral Resources and Mineral Reserves |
| SAMVAL CODE | The South African Code for the Reporting of Mineral Asset Valuation |
| SANAS | South African National Accreditation System |
| SCI | Stillwater Canada Incorporated |
| SDG’s | Sustainable development goals |
| SEC | The United States Securities and Exchange Commission |
| SIB | Stay in business |
| SIC | Stillwater Igneous Complex |
| S-K1300 | Regulation S-K, sub section1300 |
| SLE | Sub-level extraction |
| SLP | Social and labour plan |
| SMC | Stillwater Mining Company |
| SME | Society for Mining Metallurgy and Exploration |
| SMU | Selective mining unit |
| | | | | |
| TERM | DEFINITION |
| SOFS | Southern Free State projects |
| SOX | Sarbanes-Oxley Act of 2002 |
| SRD | Surface rock dump |
| SRPM | Sibanye Rustenburg Platinum Mine |
| SV | Sub-vertical |
| SW | Stoping width |
| SWE | Stillwater East |
| t | Metric tonne |
| Ta | Tantalum |
| TCFD | Task force on climate-related financial disclosures |
| TMM | Trackless Mining Machinery |
| tpm | Tonnes per month |
| TSF | Tailings storage facility |
| U | Uranium |
U3O8 | Uranium oxide |
| UG | Underground |
| UG2 | Upper group two chromium layer |
| US | United States |
| US$ | United States dollar |
| US$/oz | United States dollar per ounce |
| VCR | Ventersdorp Contact Reef |
| VS5 | VS5 Reef of the Eldorado Formation |
| WCWDM | Water conservation and water demand management |
| Wits Gold | Witswatersrand Consolidated Gold Resources Limited |
| WLTRP | Western Limb Tailings Retreatment Project |
| WPL | Western Platinum Limited |
| WRTRP | West Rand Tailings Retreatment Project |
| XRF | X-ray fluorescence |
| Zn | Zinc |
Forward-looking statements
The information in this report may contain forward-looking statements within the meaning of the “safe harbour” provisions of the United States Private Securities Litigation Reform Act of 1995. These forward-looking statements, including, among others, those relating to Sibanye Stillwater Limited’s (“Sibanye-Stillwater” or the “Group”) financial positions, business strategies, plans and objectives of management for future operations, are necessarily estimates reflecting the best judgment of the senior management and directors of Sibanye-Stillwater and involve a number of risks and uncertainties that could cause actual results to differ materially from those suggested by the forward-looking statements. As a consequence, these forward-looking statements should be considered in light of various important factors, including those set forth in this report.
All statements other than statements of historical facts included in this report may be forward-looking statements. Forward-looking statements also often use words such as “will”, ““would”, “expect”, “forecast”, “potential”, “may”, “could” “believe”, “aim”, “anticipate”, “target”, “estimate” and words of similar meaning. By their nature, forward-looking statements involve risk and uncertainty because they relate to future events and circumstances and should be considered in light of various important factors, including those set forth in this disclaimer. Readers are cautioned not to place undue reliance on such statements.
The important factors that could cause Sibanye-Stillwater’s actual results, performance or achievements to differ materially from estimates or projections contained in the forward-looking statements include, without limitation, Sibanye-Stillwater’s future financial position, plans, strategies, objectives, capital expenditures, projected costs and anticipated cost savings, financing plans, debt position and ability to reduce debt leverage; economic, business, political and social conditions in South Africa, Zimbabwe, the United States and elsewhere; plans and objectives of management for future operations; Sibanye-Stillwater’s ability to obtain the benefits of any streaming arrangements or pipeline financing; the ability of Sibanye-Stillwater to comply with loan and other covenants and restrictions and difficulties in obtaining additional financing or refinancing; Sibanye-Stillwater’s ability to service its bond instruments (including high yield bonds and convertible bonds, if any); changes in assumptions underlying Sibanye-Stillwater’s estimation of its current mineral reserves; any failure of a tailings storage facility; the ability to achieve anticipated efficiencies and other cost savings in connection with, and the ability to successfully integrate, past, ongoing and future acquisitions, as well as at existing operations; the ability of Sibanye-Stillwater to complete any ongoing or future acquisitions; the success of Sibanye- Stillwater’s business strategy and exploration and development activities, including any proposed, anticipated or planned expansions into the battery metals or adjacent sectors and estimations or expectations of enterprise value; the ability of Sibanye- Stillwater to comply with requirements that it operate in ways that provide progressive benefits to affected communities; changes in the market price of gold, PGMs, battery metals (e.g., nickel, lithium, copper and zinc) and the cost of power, petroleum fuels, and oil, among other commodities and supply requirements; the occurrence of hazards associated with underground and surface mining; any further downgrade of South Africa’s credit rating; a challenge regarding the title to any of Sibanye-Stillwater’s properties by claimants to land under restitution and other legislation; Sibanye-Stillwater’s ability to implement its strategy and any changes thereto; the occurrence of labour disputes, disruptions and industrial actions; the availability, terms and deployment of capital or credit; changes in the imposition of industry standards, regulatory costs and relevant government regulations, particularly environmental, sustainability, tax, health and safety regulations and new legislation affecting water, mining, mineral rights and business ownership, including any interpretation thereof which may be subject to dispute; the outcome and consequence of any potential or pending litigation or regulatory proceedings, including in relation to any environmental, health or safety issues; failure to meet ethical standards, including actual or alleged instances of fraud, bribery or corruption; the effect of climate change on Sibanye-Stillwater’s business; the concentration of all final refining activity and a large portion of Sibanye-Stillwater’s PGM sales from mine production in the United States with one entity; the identification of a material weakness in disclosure and internal controls over financial reporting; the effect of US tax reform legislation on Sibanye-Stillwater and its subsidiaries; the effect of South African Exchange Control Regulations on Sibanye-Stillwater’s financial flexibility; operating in new geographies and regulatory environments where Sibanye-Stillwater has no previous experience; power disruptions, constraints and cost increases; supply chain disruptions and shortages and increases in the price of production inputs; the regional concentration of Sibanye-Stillwater’s operations; fluctuations in exchange rates, currency devaluations, inflation and other macro-economic monetary policies; the occurrence of temporary stoppages or precautionary suspension of operations at its mines for safety or environmental incidents (including natural disasters) and unplanned maintenance; Sibanye-Stillwater’s ability to hire and retain senior management or sufficient technically skilled employees, as well as its ability to achieve sufficient representation of historically disadvantaged South Africans in its management positions; failure of Sibanye-Stillwater’s information technology, communications and security systems; the adequacy of Sibanye- Stillwater’s insurance coverage; social unrest, sickness or natural or man-made disaster at informal settlements in the vicinity of some of Sibanye-Stillwater’s South African-based operations; and the impact of HIV, tuberculosis and the spread of other contagious diseases, such as the coronavirus disease (COVID-19).
Further details of potential risks and uncertainties affecting Sibanye-Stillwater are described in Sibanye-Stillwater’s filings with the Johannesburg Stock Exchange and the United States Securities and Exchange Commission, including the Integrated Annual Report 2021 and the annual report on Form 20-F filed with the United States Securities and Exchange Commission on 22 April 2022 (SEC File no. 333-234096).
These forward-looking statements speak only as of the date of the content. Sibanye-Stillwater expressly disclaims any obligation or undertaking to update or revise any forward-looking statement (except to the extent legally required). These forward-looking statements have not been reviewed or reported on by the Group’s external auditors.
Administration and corporate information
SIBANYE STILLWATER LIMITED (SIBANYE-STILLWATER)
Incorporated in the Republic of South Africa
Registration number 2014/243852/06
Share code: SSW and SBSW
Issuer code: SSW ISIN: ZAE000259701
LISTINGS
JSE: SSW NYSE: SBSW
WEBSITE
www.sibanyestillwater.com
REGISTERED AND CORPORATE OFFICE
Constantia Office Park
Bridgeview House, Building 11,
Ground floor, Cnr 14th Avenue & Hendrik Potgieter Road
Weltevreden Park
1709, South Africa
Private Bag X5, Westonaria, 1780, South Africa
Tel: +27 11 278 9600
Fax: +27 11 278 9863
COMPANY SECRETARY
Lerato Matlosa
Email: lerato.matlosa@sibanyestillwater.com
DIRECTORS
Dr Vincent Maphai1 (Chairman)
Neal Froneman (CEO)
Charl Keyter (CFO)
Elaine Dorward-King1
Harry Kenyon-Slaney1
Jeremiah Vilakazi1
Keith Rayner1
Nkosemntu Nika1
Richard Menell1,3
Savannah Danson1
Susan van der Merwe1
Timothy Cumming1
Sindiswa Zilwa1,2
1.Independent non-executive
2.Appointed 1 January 2021
3.Lead independent director
INVESTOR ENQUIRIES
James Wellsted
Executive Vice President: Investor Relations and Corporate Affairs
Cell: +27 83 453 4014
Email: james.wellsted@sibanyestillwater.com
or ir@sibanyestillwater.com
JSE SPONSOR
JP Morgan Equities South Africa Proprietary Limited
Registration number 1995/011815/07
1 Fricker Road
Illovo
Johannesburg, 2196
South Africa
Private Bag X9936, Sandton, 2146, South Africa
AUDITORS
Ernst & Young Inc (EY)
102 Rivonia Road
Sandton, 2196
South Africa
Private Bag X14, Sandton, 2146, South Africa
Tel: +27 11 772 3000
AMERICAN DEPOSITARY RECEIPTS
TRANSFER AGENT
BNY Mellon Shareowner Services
PO Box 358516
Pittsburgh
PA 15252-8516
US toll free: +1 888 269 2377
Tel: +1 201 680 6825
Email: shrrelations@bnymellon.com
Tatyana Vesselovskaya
Relationship Manager BNY Mellon
Depositary Receipts
Direct line: +1 212 815 2867
Mobile: +1 203 609 5159
Fax: +1 212 571 3050
Email: tatyana.vesselovskaya@bnymellon.com
TRANSFER SECRETARIES SOUTH AFRICA
Computershare Investor Services Proprietary Limited
Rosebank Towers
15 Biermann Avenue
Rosebank, 2196
PO Box 61051
Marshalltown, 2107
South Africa
Tel: +27 11 370 5000
Fax: +27 11 688 5248
Generic Key South African Permit Conditions
1.Mining right renewal applications to be submitted 60 working days prior to the date of expiry of the right.
2.Holder of MR must continue with mining operations, failing which the right may be suspended or cancelled.
3.The terms of the right may not be varied or amended without the consent of the Minister of Mineral Resources and Energy.
4.The Holder shall be entitled to abandon or relinquish the right or the area covered by the right entirely or in part. Upon abandonment or relinquishment the Holder must:
a.Furnish the Regional Manager with all prospecting and/or mining results and/or information, as well as the general evaluation of the geological, geophysical and borehole data in respect of such abandoned area; and
b.Apply for a closure certificate in terms of section 43(3) of the MPRDA.
1.The holder shall pay royalties to the State in accordance with section 25(2)g of the MPRDA throughout the duration of the mining right.
2.Mining Operations must be conducted in accordance with the Mining Work Programme and any amendment to the MWP and an approved EMP.
3.The holder shall not trespass or enter into any homestead, house or its curtilage nor interfere with or prejudice the interests of the occupiers and/or owners of the surface of the Mining Area except to the extent to which such interference or prejudice is necessary for the purposes of t enabling the Holder to properly exercise the Holder’s rights under the mining right.
4.The holder must dispose of all minerals derived from mining at competitive market prices which shall mean in all cases, non-discriminatory prices or non-export parity prices.
5.A shareholding, an equity, an interest or participation in the mining right or joint venture, or a controlling interest in a company/JV may not be encumbered, ceded, transferred, mortgaged, let, sublet, assigned, alienated or otherwise disposed of without the written consent of the Minister, except in the case of a change of controlling interest in listed companies.
6.All boreholes, shafts, adits, excavations and openings created by the holder shall be sealed, closed, fenced and made safe in accordance with the approved Environmental Management Programme and the Mine Health and Safety Act.
7.The holder of the mining right, while carrying out mining operations should safeguard and protect the environment, the mining area and any person using to entitled to use the surface of the mining area for possible damage or injury.
8.The Minister or a person authorised by the Minister shall be entitled to inspect the Mining Area and the execution of the approved mining right conditions.
9.A mining right may be cancelled or suspended subject to S47 of the MPRDA if the holder:
a.Submits inaccurate, incorrect and/or misleading information in connection with any matter required to be submitted under this Act;
b.fails to honour or carry out any agreement, arrangement or undertaking, including the undertaking made by the Holder in terms of the Broad Based Socio Economic Empowerment Charter and Social and Labour Plan;
c.Breaches any material term and condition of the mining right;
d.Conducts mining in contravention of the MPRDA;
e.Contravenes the requirements of the approved Environmental Management Programme;
f.Contravenes any provisions of this Act in any other manner.
1.The holder shall submit monthly returns contemplated in S 28 (2) A of the MPRDA no later than the 15th of every month and maintain all such books, plans and records in regard to mining on the mining area as may be required by the Act.
2.The Holder shall, at the end of each year, following commencement of this mining right, inform the Regional Manager in writing of any new developments and of the future mining activities planned in connection with the exploitation/mining of the minerals in the mining area.
3.Provisions relating to section 2(d) and section 2(f) of the MPRDA, relating to the Broad Based Socio Economic Empowerment Charter differs in each mining right.
4.The Mining right does not exempt the holder from complying with the MHSA or any Act in South Africa.
5.Annually, no later than three months before financial year end submit a detailed implementation plan to give effect to Regulation 46(e)(i), (ii) and (iii) in line with the Social and Labour Plan.
6.Annually, no later than three months after finalization of its audited annual report submit a detailed report on the implementation previous year’s SLP.
SLP COMPLIANCE REQUIREMENTS
1.New Social and Labour Plan to be submitted and reviewed every 5 years.
2.Social and Labour Plan Implementation Plans to be submitted annually.
3.Social and Labour Plan Annual Report to be submitted annually.
ENVIRONMENTAL MANAGEMENT COMPLIANCE REQUIREMENTS
1.Performance assessment relating to Environmental Management Programme to be conducted Biannualy.
2.Performance assessment relating to Water Use License to be conducted annually.
3.Performance assessment relating to Atmospheric Emission License to be conducted annually.
In addition to the other information included in this annual report, the considerations listed below could have a material adverse effect on Sibanye-Stillwater's business, operating results and financial condition, resulting in a decline in the trading price of Sibanye-Stillwater’s ordinary shares or American Depositary Shares (ADSs). The risks set forth below comprise all material risks currently known to us. These factors should be considered carefully, together with the information and financial data set forth in this document.
Risk Factors Summary
There are six categories of risks which could have a material effect on Sibanye-Stillwater. The following is an outline of the key risks within these categories:
Risks related to environmental, social and corporate governance (ESG)
•Mining is inherently hazardous and the related events may cause disruptions to Sibanye-Stillwater’s mining operations and result in increased production costs, financial and regulatory liabilities and reputational damage.
•Sibanye-Stillwater’s operations are subject to extensive environmental, health and safety regulations, which could impose additional costs and compliance requirements, and Sibanye-Stillwater has faced, and may face further, claims and liability for breaches, or alleged breaches, of such regulations and other applicable laws.
•The failure of a tailings storage facility could negatively impact Sibanye-Stillwater’s business, reputation, operating results and financial condition.
•Sibanye-Stillwater’s operations are subject to water use and waste regulations, which could impose significant costs and burdens.
•Social unrest, including the risk of service delivery protests, sickness or natural or man-made disasters at informal settlements in the vicinity of some of Sibanye-Stillwater’s South African-based operations may disrupt its business or may lead to greater social or regulatory impositions on Sibanye-Stillwater
•Sibanye-Stillwater utilises information, communication and technology systems, on which it records commercially sensitive information and personal data. Failure of these systems, or the failure to protect personal data, could significantly impact Sibanye-Stillwater’s operations and business
Legal, regulatory and compliance risks
•Sibanye-Stillwater’s mining rights are subject to legislation, which could impose significant costs and burdens and which impose certain ownership requirements, the interpretation of which is the subject of dispute
•Title to Sibanye-Stillwater’s properties may be subject to challenge
•If Sibanye-Stillwater loses senior management or is unable to hire and/or retain sufficient technically skilled employees or sufficient HDSA representation in management positions in South Africa, Sibanye-Stillwater’s business may be materially adversely affected
•Sibanye-Stillwater is subject to risks associated with litigation and regulatory proceedings
Risks Related to Production Delivery from Operations
•Economic, political or social factors affecting the regions where Sibanye-Stillwater operates may have a material adverse effect on Sibanye-Stillwater’s operations and profits
•Power deficits, fluctuations and usage constraints may force Sibanye-Stillwater to halt or curtail operations
•Sibanye-Stillwater may experience unforeseen difficulties, delays or costs in implementing its business strategy and operational plan
•Due to the mature infrastructure at Sibanye-Stillwater’s mining operations, unplanned breakdowns, statutory mandated modifications and stoppages may result in production delays, increased costs and industrial accidents
•The impact from, and measures taken to address, the COVID-19 pandemic may adversely affect Sibanye-Stillwater’s people, and may impact Sibanye-Stillwater’s business continuity, operating results, cash flows and financial condition
•Sibanye-Stillwater’s operations and profits have been and may be adversely affected by labour unrest and union activity
Risks Related to Earnings Delivery
•Changes in the market price for gold and PGMs, which in the past have fluctuated widely, affect the profitability of Sibanye-Stillwater’s gold and PGM mining operations and the cash flows generated by those operations
•Because gold and PGMs are generally sold in US Dollars, while the majority of Sibanye-Stillwater’s gold production and a substantial amount of Sibanye-Stillwater’s PGM production costs are denominated in Rand, Sibanye-Stillwater’s operating results and financial condition will be materially affected if there is a material change in the value of the Rand
•Sibanye-Stillwater has had, and may in the future have, a large amount of indebtedness, thereby potentially impacting profitability
Risks related to realisation of value from strategic acquisitions and business ventures
•Our growth strategy, including the pursuit of value accretive acquisitions and joint ventures, may not deliver anticipated outcomes
•Acquisitions, business combinations, development projects and joint ventures, including the Sibanye-Stillwater’s battery metals projects, may expose Sibanye-Stillwater to new or increased regulatory oversight or requirements, including in geographies in which it is unfamiliar
•To the extent that Sibanye-Stillwater seeks to further expand its existing mining operations, it may experience problems associated with mineral exploration or development of mining projects
Risks related to Sibanye-Stillwater's shares and ADSs
•Sibanye-Stillwater’s non-South African shareholders face additional investment risk from currency exchange rate fluctuations since any dividends will be paid in Rand
•Sibanye-Stillwater may not pay dividends or make similar payments to its shareholders in the future due to various factors and any dividend payments made may be subject to withholding tax
Risks related to ESG
Mining is inherently hazardous and the related events may cause disruptions to Sibanye-Stillwater’s mining operations and result in increased production costs, financial and regulatory liabilities and reputational damage
Mining by its nature involves significant risks and hazards, including environmental hazards, as well as industrial and mining accidents. These include, for example, seismic events, extreme heat, unusual or unexpected rock formations affecting ore or rock characteristics, ground or slope failures, rock bursts, sink holes, fires, falls of ground and blockages, flooding, discharges of gasses and toxic substances, contamination of water, air or soil resources, radioactivity and other accidents or conditions resulting from mining activities including, among other things, blasting and the transport, loading, storage and handling of hazardous and other materials.
Sibanye-Stillwater has experienced and continue to remain at risk of experiencing such events, which have and may continue to result in work stoppages, the precautionary suspension of operations and loss of life. Sibanye-Stillwater is more susceptible than other mining operations, particularly at its South African operations, to certain of these risks due to mining at depth. In 2021, there were several safety incidents recorded at Sibanye-Stillwater’s operations, including two fatalities from an underground locomotive accident at the Stillwater Mine, the first fatalities recorded at Sibanye-Stillwater’s US operations since 2011. There were a further 18 fatalities at Sibanye-Stillwater’s South African operations resulting from incidents related to seismicity; mobile equipment; fire; rescue; rail and other incidents. Following these incidents, certain of Sibanye-Stillwater’s operations were temporarily suspended. Any future such incidents could have a material adverse effect on Sibanye-Stillwater’s business, operating results and financial condition.
Seismic activity is of particular concern in the underground mining environment, particularly in South Africa, as a consequence of the extent and depth of mining. Seismic events have intermittently in the past caused death and injury to employees and contractors, and can result in safety-related stoppages which Sibanye-Stillwater experienced at its Kloof operations in 2021, resulting in the death of an employee. Seismic activity has also caused a loss of mining equipment, damage to and destruction of mineral properties and production facilities, monetary losses, environmental damage and potential legal liabilities.
Mining activity may also result in heat-related incidents, which has and could continue to lead to employee injuries or fatalities, the suspension of operations and mine closures. For example, in 2021, three employees died following prolonged heat exposure at the Kloof operations.
Furthermore, there are risks that relevant regulators, such as the DMRE in South Africa and the Mine Safety and Health Administration (MSHA) or the US Occupational Safety and Health Administration (OSHA) in the United States, may impose fines and work stoppages (known as section 54 stoppages in South Africa (Section 54) and “k-orders” in the United States). This could reduce or halt production, increase production costs and result in financial and regulatory liability for Sibanye-Stillwater, which could have a material adverse effect on its business, operating results and financial condition. For example, Stillwater operated at reduced capacity under a k-order following a fatal incident in June 2021. See also —Sibanye-Stillwater’s operations are subject to extensive environmental, health and safety regulations, which could impose additional costs and compliance requirements, and Sibanye-Stillwater has faced, and may face further, claims and liability for breaches, or alleged breaches, of such regulations and other applicable laws.
Sibanye-Stillwater’s operations are subject to extensive environmental, health and safety regulations, which could impose additional costs and compliance requirements, and Sibanye-Stillwater has faced, and may face further, claims and liability for breaches, or alleged breaches, of such regulations and other applicable laws
Sibanye-Stillwater’s operations are subject to extensive environmental, health and safety laws, regulations, permitting requirements and standards in the jurisdictions in which it operates. These regulations oversee, among other things, the protection of the environment, pollution, water management, waste disposal, occupational health and safety, including mine safety, toxic substances, the management and sustainable closure of operations, and protection of endangered and other special status species.
The legislative framework that governs such matters includes the National Environmental Management Act, 1998 (Act No. 107 of 1998) (NEMA), the National Water Act, 1998 (Act No. 36 of 1998) (NWA), the NEMA Amendment Act, the National Environmental Management: Air Quality Act, 2004 (Act No. 39 of 2004) (Air Quality Act), the National Environmental Management: Waste Act, 2008 (Act No. 59 of 2008) (Waste Act), the National Heritage Resources Act (Act No. 25 of 1999) (National Heritage Resources Act) and the National Environmental Management: Biodiversity Act (Act No. 10 of 2004) (the Biodiversity Act) and the National Nuclear Regulator Act (Act No 47 of 1999) (NNR Act), amongst others, in South Africa, as well as the Clean Air Act (Clean Air Act), the Federal Water Pollution Control Act (Clean Water Act), the Resource Conservation and Recovery Act (RCRA), the Emergency Planning and Community Right-to-Know Act (EPCRA), the Endangered Species Act (Endangered Species Act), the National Environmental Policy Act (NEPA), the Comprehensive Environmental Response, Metals Mines Reclamation Act, the Compensation and Liability Act (CERCLA) and analogous state laws in the United States as well as numerous permit stipulations across all of the jurisdictions where Sibanye-Stillwater operates, including Finland, France and Australia. In addition to laws and regulatory requirements, Sibanye-Stillwater is party to environmental and social collaborations with local communities and interest groups, such as the Good Neighbor Agreement (GNA) in the United States, which legally bind Sibanye-Stillwater and hold it to higher standards than regulations require. For further details, see Environmental and regulatory matters.
In addition to compliance with local laws and regulations, Sibanye-Stillwater's operations are also increasingly subject to stakeholder expectations concerning the application of stringent internationally recognised environmental, health and safety and social standards and benchmarks. Such standards include the Responsible Gold Mining Principles, IFC Performance Standards and other World Bank guidelines.
The environmental and health and safety laws and regulations applicable to Sibanye-Stillwater impose significant compliance costs and may subject Sibanye-Stillwater to enforcement actions and potential litigation.
Compliance costs
Sibanye-Stillwater has incurred and may in the future incur significant costs to comply with environmental, health and safety requirements imposed under existing or new legislation, regulations or permit requirements, or to comply with changes in existing laws and regulations or the manner in which they are applied. For example, under the applicable environmental legislative framework, Sibanye-Stillwater may be required to take specific anti-pollution measures, remove or remediate previously disposed wastes (including wastes disposed of or released by prior owners or operators, or wastes disposed of by Sibanye-Stillwater’s operations in compliance with laws in effect in the past that have been subsequently amended), to clean up contaminated property (including contaminated soil and groundwater) or to perform remedial operations to prevent future contamination.
Existing South African legislation requires Sibanye-Stillwater to fund its closure liabilities and obligations, environmental rehabilitation and remediation costs, which may be significant. Under the current legislative framework, there is a risk that Sibanye-Stillwater may be unable to fully extinguish environmental liability in respect of its mining operations if the regulator is unwilling to issue closure authorisations. This would result in Sibanye-Stillwater incurring additional costs relating to prolonged care and maintenance and other related costs. Further, under current proposals in South Africa, Sibanye-Stillwater would be required to set aside financial provisions, by June 2022, for annual environmental rehabilitation and remediation costs, decommissioning and closure activities and latent or residual environmental impacts (including the pumping and treatment of polluted or extraneous water), which mining companies have not fully quantified or provided for in the past. In addition, financial provision regulations that were published for comment in 2021 proposed the inclusion of a 15% value added tax for all closure provisions, which if adopted, would add approximately an additional R1.0 billion (US$65 million) to Sibanye-Stillwater’s total closure liability for its South African operations as at 31 December 2021. Generally, these proposals are strongly opposed by the mining industry, and there has been industry-wide concern about their ambiguity and implementation. In the United States, Sibanye-Stillwater is required to post and maintain surety bonds for its reclamation obligations, which are substantial. As at 31 December 2021, Sibanye-Stillwater had US$56 million of outstanding environmental surety bonds in the United States. Such reclamation obligations generally increase over time as costs rise and the physical extent of mining operations expands. Failure to secure and maintain adequate surety coverage could result in the operating permits of such mines being revoked and mining operations terminated.
Enforcement actions
Regulators are increasingly focusing on the enforcement of applicable environmental, health and safety laws and regulations and permitting requirements, including in South Africa, the United States and other jurisdictions where Sibanye-Stillwater operates. Enforcement actions may cause Sibanye-Stillwater’s operations to cease or to be suspended, and may include corrective measures requiring capital expenditures, installation of additional equipment or remedial actions. Non-renewal of permits, the inability to secure new permits, or the imposition of additional conditions could eliminate or severely restrict Sibanye-Stillwater’s ability to conduct its operations.
Stringent enforcement of relatively new environmental legislation is on the rise in South Africa. Regulators, such as the DMRE in South Africa, can and do issue, in the ordinary course of operations, instructions, such as Section 54 work stoppages, after routine visits or following safety incidents or accidents to partially or completely halt operations at affected mines until corrective measures are agreed and implemented. In 2021, Sibanye-Stillwater’s South African gold operations experienced 37 Section 54 work stoppages (2020: 43; 2019: 85) and 42 Section 54 work stoppages at the South African PGM operations (2020: 29; 2019: 35). In the United States, underground mines, including the Stillwater and East Boulder Operations, are continuously inspected by the MSHA, which can lead to notices of violation. Any of Sibanye-Stillwater’s US mines could be subject to a temporary or extended shut down as a result of a violation alleged by the MSHA, known as “k-orders”. For example, the Stillwater operations had been operating under a k-order that limited rail transport availability from June 2021 until March 2022 after fatal incident in June 2021. The MSHA issued Sibanye-Stillwater a related citation on 1 March, which it is currently assessing. Sibanye-Stillwater halts production at its operations when serious accidents occur.
In addition, there can be no assurance that unions will not take industrial action in response to such accidents, which could lead to losses in Sibanye-Stillwater’s production. Any additional stoppages in production as a result of regulatory enforcement or union actions may negatively affect Sibanye-Stillwater’s reputation with regulators and stakeholders.
Sibanye-Stillwater’s mining operations in the United States are located adjacent to the Absaroka-Beartooth Wilderness Area and are situated approximately 30 miles from the northern boundary of Yellowstone National Park. While Sibanye-Stillwater works closely and cooperatively with local environmental organisations, the Montana Department of Environmental Quality and the United States Forest Services, there can be no assurance that future political or regulatory efforts will not further restrict or seek to terminate Sibanye-Stillwater’s operations in this sensitive area.
Litigation
Sibanye-Stillwater has been, and may in the future also be subject to litigation and other costs as well as actions by authorities relating to environmental, climate change, health and safety matters, including mine closures, the suspension of operations, legal representation during accident inquiries and prosecution for mining accidents as well as significant penalties and fines for non-compliance. South African legislation grants legal standing to a wide range of interest groups to institute legal proceedings to enforce their environmental rights, which are enforceable against private entities. In the future, Sibanye-Stillwater may also be subject to litigation in South Africa brought by members of the community affected by environmental-related impacts, as well as non-governmental organisations (NGOs) and public bodies. In this regard, recent case law in South Africa has provided a precedent for private prosecution by environmental NGOs for environmental infringements and non-compliance with key environmental legislation. South African legislation also provides for potential director, shareholder and lender liability for environmental damage in certain circumstances. Further, contravention of environmental and health and safety laws and regulations may also constitute a criminal offence and result in a fine or imprisonment, or both in addition to administrative penalties.
Some of the principal health risks associated with Sibanye-Stillwater’s mining operations arise from occupational exposure and community environmental exposure to silica dust, noise and certain hazardous substances, including toxic gases and radioactive particulates. The most significant occupational diseases affecting Sibanye-Stillwater’s workforce include lung diseases (such as silicosis, TB, a combination of the two and chronic obstructive airways disease (COAD)) as well as noise induced hearing loss (NIHL). Employees and communities have sought and may continue to seek, compensation for certain illnesses, such as silicosis, from Sibanye-Stillwater.
In 2018, several South African mining companies, including Sibanye-Stillwater (collectively, the Gold Working Group) agreed to an approximately R5 billion settlement agreement with all eligible workers suffering from silicosis or TB who worked in the Gold Working Group’s mines from 12 March 1965 to the effective date of the Settlement Agreement. For further information, see—Annual Financial Report—Consolidated financial statements—Notes to the consolidated financial statements—Note 31: Occupational healthcare obligation. In 2019, Sibanye-Stillwater entered into a R1.4 billion guarantee facility with Nedbank Limited in relation to the obligations under the Settlement Agreement. The payment of compensation for the claims may have an adverse financial impact on Sibanye-Stillwater.
As environmental, health and safety laws and regulations are becoming more complex and stringent, Sibanye-Stillwater may face increased regulatory and stakeholder scrutiny, which may lead to increased capital expenditures and subject Sibanye-Stillwater to potential enforcement actions and litigation proceedings. Any significant cost increases, potential enforcement actions or litigation relating to environmental, health and safety laws and regulations could have a material adverse effect on Sibanye-Stillwater’s business, results of operations and financial condition.
The failure of a tailings storage facility could negatively impact Sibanye-Stillwater’s business, reputation, operating results and financial condition
Mining companies face inherent risks in their operation of tailings storage facilities. Tailings storage facilities are engineered structures built for the containment of the uneconomical milled ore residue and water, known as tailings. The use of tailings storage facilities exposes Sibanye-Stillwater to certain risks, including the failure of a tailings dam due to events such as high rainfall, snow melt, overtopping, piping or seepage failures. The potential occurrence of a tailings storage failure at one of Sibanye-Stillwater’s facilities could lead to the loss of human life and/or extensive property and environmental damage.
Sibanye-Stillwater maintains measures to manage its dams’ safety, including compliance with the International Council on Mining and Metals’ Tailings Governance Position Statement, Sibanye-Stillwater’s Code of Practice, and undertakes routine reviews by independent consulting companies. Although Sibanye-Stillwater has a tailings storage facility management system, the effectiveness of its designs, construction quality or regular monitoring cannot be guaranteed throughout its operations and it cannot be guaranteed that these measures will prevent the failure of one or more of its tailings storage facilities or that such potential failure will be detected in advance. Sibanye-Stillwater may also be required to undertake remedial work to reinforce its dams if a vulnerability is discovered, which may require it to reduce or suspend operations while remediation takes place. For example, in December 2021, Sibanye-Stillwater announced the temporary suspension of processing operations at the Beatrix tailing storage facility to complete rehabilitation work, including precautionary reinforcement and buttressing work.
In addition, although Sibanye-Stillwater generally requires its partners to maintain such systems, it cannot guarantee that its partners maintain similar safety precautions or monitoring systems on their tailings storage facilities. There is no assurance that any safety measures implemented will prevent the failure of any tailings storage facility.
The failure of a tailings storage facility will lead to multiple legal proceedings and investigations, which could include securities class actions, criminal proceedings and public civil actions (against Sibanye-Stillwater or individuals) for significant amounts of damages. Furthermore, the elimination of the “conventional” practice of storing wet tailings (e.g. by alternatively filtering, “dry” stacking and compacting the tailings) could require the research and development of new technologies, which could lead to additional large expenditures. As a result of the 2015 and January 2019 tailings storage facility failures in Brazil and in Canada in 2014 (none of which are associated with Sibanye-Stillwater) or as a result of future tailing storage facility failures, additional environmental and health and safety laws and regulations may be forthcoming globally, including in jurisdictions where Sibanye-Stillwater operates, which may ban the storage of wet tailings completely. In addition, changes in laws and regulations may impose more stringent conditions in connection with the construction of tailings storage facilities, particularly with respect to upstream tailings storage facilities which could also be made illegal, the licensing process of projects and operations and increased criminal and civil liability for companies, officers and contractors. For example, in 2020, the International Council on Mining and Metals (ICMM), the United Nations Environment Programme (UNEP) and the Principles for Responsible Investment (PRI) established an international tailings standard, the Global Industry Standard on Tailings Management (Global Tailings Standard). ICMM members, including Sibanye-Stillwater, have committed to conform with the Global Tailing Standard by August 2023 for all facilities with “extreme” or “very high” potential consequences and to conform by August 2025 for all of their facilities. Sibanye-Stillwater may incur significant costs to comply with such standards or may be unable to comply by committed timeframes.
Furthermore, the unexpected failure of a tailings storage facility could lead to the need for a large expenditure on contingencies and on recovering the regions and people affected, extensive and permanent environmental damage and the payment of penalties, fines or other money damages or civil claims.
The occurrence of any of such risks could have a material adverse effect on Sibanye-Stillwater’s business, operating results and financial condition.
Sibanye-Stillwater’s operations are subject to water use and waste regulations, which could impose significant costs and burden
Sibanye-Stillwater’s operations are subject to regulatory controls on their usage and disposal of water and waste. Under South African and US law, mining operations are subject to water use licences and/or authorisations that govern each operation’s water usage and that require, among other things, mining operations to achieve and maintain certain water quality limits regarding all water discharges. All of Sibanye-Stillwater’s operations hold the required water-related permits, although certain operations in South Africa (water use licences for Driefontein, Beatrix, Burnstone, Kloof, Rand Uranium, Ezulwini and Kwezi) are currently subject to review by the Department of Water and Sanitation (DWS) for minor amendments and corrections or consolidation.
Sibanye-Stillwater expects to incur significant expenditure to achieve and maintain compliance with the licence requirements at each of its operations. Any failure on Sibanye-Stillwater’s part to achieve or maintain compliance with the requirements of these licences with respect to any of its operations could result in Sibanye-Stillwater being subject to substantial claims, penalties, fees and expenses, significant delays in operations, criminal proceedings or the revocation of the relevant water use licence, which could curtail or halt production at the affected operation. Any of the above, and any significant constraints to availability of water, particularly at Sibanye-Stillwater's SA PGM operations, could have a material adverse effect on Sibanye-Stillwater’s business, operating results and financial condition.
Sibanye-Stillwater has identified a risk of potential long-term acid mine drainage (AMD) issues which are currently being experienced by peer mining groups. AMD relates to the acidification and contamination of naturally occurring water resources by pyrite-bearing ore contained in underground mines and in rock dumps, tailings dams and pits on the surface. Should Sibanye-Stillwater’s current preventative and active management measures not be successful, such that Sibanye-Stillwater were to experience any AMD or other waste-related challenges, it could result in failure to comply with its water use licence requirements and could expose Sibanye-Stillwater to potential liabilities, and unforeseen costs associated with the pumping and treatment of polluted or extraneous water.
Social unrest, including the risk of service delivery protests, sickness or natural or man-made disasters at informal settlements in the vicinity of some of Sibanye-Stillwater’s South African-based operations may disrupt its business or may lead to greater social or regulatory impositions on Sibanye-Stillwater
There are a number of informal settlements located in the vicinity of some of Sibanye-Stillwater’s South African-based operations. These settlements are populated by mining company employees (including Sibanye-Stillwater employees), the families of mining company employees and others. As at 31 December 2021, approximately 57% (2020: 50%) of Sibanye-Stillwater’s South African-based workforce opted to receive a “living out allowance” and management expects that a number of these individuals reside in informal settlements. In recent years, the size of these settlements has grown substantially. Poor living conditions in these settlements may lead to the spread of disease or other health hazards, which may increase absences or affect the productivity of employees. The population of such settlements or the surrounding communities may also demand jobs, improved delivery of social services or infrastructure from the local mining operations, including Sibanye-Stillwater. Any such demands or other demands from these communities may lead to increased costs or regulatory burdens on Sibanye-Stillwater. Such demands may also lead to protests, including service delivery protests related to poor service delivery in such communities, or other actions that may hinder Sibanye-Stillwater’s ability to operate, including incurring expenses to defend its rights through initiating or defending against litigation proceedings.
In addition, in December 2020, the Minister of the DMRE (DMRE Minister) published the Housing and Living Conditions Standard, requiring Sibanye-Stillwater to revise its current housing and living condition plans in terms of its social and labour plans (SLPs). The Housing and Living Conditions Standards were submitted to the DMRE and are being implemented, including applications by Sibanye-Stillwater for the eviction of illegally occupied houses earmarked for employee ownership. Sibanye-Stillwater estimates spend on its Housing and Living Conditions Plans for the SA PGM and SA gold segment to amount to R5.2 billion (US$328 million) and R1.5 billion (US$95 million), respectively, over the next five years.
Any of the above factors could have a material adverse effect on Sibanye-Stillwater’s business, reputation, operating results and financial condition.
Sibanye-Stillwater utilises information, communication and technology systems, on which it records commercially sensitive information and personal data. Failure of these systems, or the failure to protect personal data, could significantly impact Sibanye-Stillwater’s operations and business
Sibanye-Stillwater utilises and is reliant on various internal and external information, communication and technology system applications, such as SAP, Microsoft, mine technical and other applications, to support its business activities. Damage or interruption of Sibanye-Stillwater’s information, communication and technology systems, whether due to accidents, old or obsolete information technology systems and equipment, human error, natural events or malicious acts, may lead to important data, including commercially sensitive information, being irretrievably lost, exposed or damaged, thereby adversely affecting Sibanye-Stillwater’s business, operating results and financial condition.
Sibanye-Stillwater’s information technology systems store voluminous personal information related to employees, as well as sensitive information relating to suppliers and customers. The information security management system protecting Sibanye-Stillwater’s information, communication and technology infrastructure and network may be subject to security breaches (e.g. cyber-crime or activists) or other incidents that can result in misappropriation of funds, increased health and safety risks to people, disruption to its operations, environmental damage, loss of intellectual property, disclosure of commercially or personally sensitive information, legal or regulatory breaches and liability, other costs and reputational damage. While no material losses related to cyber-security breaches have been discovered, given the increasing sophistication and evolving nature of this threat, the possibility of them
occurring in the future cannot be ruled out. Sibanye-Stillwater performs periodic penetration and annual disaster recovery testing which includes reviews of recovery procedures and security controls, and there are currently plans to replicate applications with critical and high availability requirements at alternative data centres throughout Sibanye-Stillwater’s operation. Even with this testing, there is still a risk of inadequate or failed disaster recovery. An extended failure of critical system components, caused by accidental actions, such as failed hardware or failed network infrastructure, or malicious actions, including those resulting from a cyber-security attack, could result in a significant environmental incident, commercial loss or interruption to operations. Sibanye-Stillwater may also incur significant costs to protect against or repair damage caused by disruptions or security breaches in the future, such as rebuilding internal systems, implementing additional threat protection measures, defending against litigation, responding to regulatory inquiries or taking remedial steps with respect to third parties, among others. In addition, Sibanye-Stillwater will need to comply with legislation relating to cyber-security breaches, such as the South African Cybercrimes Bill which came into force in 2021. The law criminalises certain actions or omissions and creates offences in relation to cyber-related crimes.
In addition, the interpretation and application of consumer, privacy and data protection laws in South Africa, the United States and elsewhere are uncertain and evolving. It is possible that regulators may interpret and apply these laws in a manner that is inconsistent with Sibanye-Stillwater’s data processes and practices. Complying with these various laws is difficult and could cause Sibanye-Stillwater to incur substantial costs or require it to change its business practices in a manner adverse to its business, for example following the introduction of the General Data Protection Regulation (GDPR) in May 2018. Failure to comply with such legislation may also lead to substantial penalties and fines, proceedings or other actions as well as reputational damage. Confidentiality breaches have historically been a significant risk for the mining sector. Compliance with South Africa’s data privacy legislation, the Protection of Personal Information Act, 2013 (POPIA), was required from 1 July 2021. As with the GDPR, failure to comply with POPIA may lead to significant penalties, fines and/or imprisonment, depending on the severity of the infraction. Sibanye-Stillwater may also have insufficient insurance coverage for any data protection breaches, including in relation to POPIA. See —Sibanye-Stillwater’s insurance coverage may not adequately satisfy all potential claims and exposures.
Sibanye-Stillwater's business may be harmed if it fails to adapt to technological advances in a timely and cost-effective manner
The industry in which Sibanye-Stillwater operates is characterised by rapid technological advancements, including industry-wide digitalisation, robotic process automation (RBA), machine-learning and advances in artificial intelligence. Sibanye-Stillwater’s ability to compete effectively and in a cost-effective manner depends, in part, on its ability to adapt to, and adequately invest in, new technology and related personnel. Insufficient or untimely investment in new technology or personnel may require prolonged use of labour-intensive modes of work or require it to retain legacy infrastructure that cannot be easily or cost-effectively serviced or upgraded. In addition, the Group may be required to undertake certain technological upgrades in response to heightened safety, environmental or security requirements and failure to pre-empt such requirements may delay or increase the cost of compliance. For example, Sibanye-Stillwater determined to modify its standard operating procedures (SOP) at its Stillwater operations in 2021 until it could complete the introduction of proximity detection safety technology. Sibanye-Stillwater anticipates that this process will take 18 months to complete, during which time it will operate under a constrained SOP.
Adapting to new technologies may also pose integration-related risks. For example, Sibanye-Stillwater has recently adopted a hybrid cloud-based model in order to facilitate the integration of its information technology systems into a single, integrated business platform. Under this model, a centrally hosted data centre will hold the core of Sibanye-Stillwater’s business systems in each region in which it operates. The integration and transition to cloud-based computing could be susceptible to delays or disruptions, which could result in failing network infrastructure, network outages and a breach of privacy. Cloud-based computing may also increase Sibanye-Stillwater’s exposure to cyber-related threats.
Any of the foregoing may impact Sibanye-Stillwater’s ability to deliver on its strategic objectives, including sustainability, safety and cost optimisation targets, and have a material adverse effect on Sibanye-Stillwater's business, operating results and financial condition.
Mining companies are required to operate in ways that provide benefits to affected communities. Failure to comply with these requirements can result in legal suits, additional operational costs, investor divestment and loss of “social licence to operate”, which could adversely impact Sibanye-Stillwater’s business, operating results and financial condition
Mining companies face increasing pressure over their “social licence to operate”, which can be interpreted as the acceptance of the activities of these companies by stakeholders. While formal permission to operate is ultimately granted by host governments, many mining activities require social permission from host communities and influential stakeholders to carry out operations effectively and profitably.
Mining companies are under pressure to demonstrate that, while they seek a satisfactory return on investment for shareholders, the environment, human rights and other key sustainability issues are responsibly managed and stakeholders, such as employees, host communities and the governments of the countries in which they operate, also benefit from their commercial activities. The potential consequences of these pressures and the adverse publicity in cases where companies are believed to be creating insufficient social and economic benefit or are perceived to not be responsibly managing other sustainability issues may result in additional operating costs, higher capital expenditures, reputational damage, active community opposition (possibly resulting in delays, disruptions and stoppages), allegations of human rights abuses, legal suits, regulatory intervention and investor withdrawal.
In order to maintain its social licence to operate, Sibanye-Stillwater may need to design or redesign parts of its mining operations to minimise their impact on such communities and the environment, either by changing mining plans to avoid such impact, by modifying operations, by changing planned capital expenditures or by relocating the affected people to an agreed location. Anti-mining sentiments in some of the communities in which Sibanye-Stillwater operates have been exacerbated by high unemployment and violent crime rates, forced resettlement of residents, environmental incidents and blasting. For example, unemployment rates in South Africa reached an all-time high of 34.9% in September 2021 due to continued COVID-19 related economic downturn. There is no assurance that a prolonged economic downturn will not result in an extended period of high unemployment, further exacerbating anti-mining sentiments in South Africa. Furthermore, the rise of ESG factors in investment decisions may result in divestment in the mining sector (as a result of voluntary or regulatory ESG measures that are being introduced).
Responsive measures may require Sibanye-Stillwater to take costly and time-consuming remedial measures, including the full restoration of livelihoods of those impacted, and remediation of the environment. In addition, Sibanye-Stillwater is obliged to comply with the terms and conditions of all the mining rights it holds in South Africa. In this regard, the SLP provisions of Sibanye-Stillwater's mining rights must make provision for local economic development, among other obligations. See —Sibanye-Stillwater’s mining rights are subject to legislation, which could impose significant costs and burdens and which impose certain ownership requirements, the interpretation of which is the subject of dispute. In addition, Sibanye-Stillwater has several joint venture arrangements and associated investments, and the companies which Sibanye-Stillwater partners with may apply different corporate governance standards and responsible citizen procedures. As Sibanye-Stillwater has a long history of mining operations in certain regions or has purchased operations that have a long history, issues may arise regarding historical as well as potential future environmental or health impacts in those areas.
In the United States, two environmental groups had an anti-mining initiative, the Citizen Initiative 186, placed on the ballot in the November 2018 general election in the state of Montana. Citizen Initiative 186 would have required the state’s Department of Environmental Equality to deny a permit for any new hard-rock mine, unless the mine’s reclamation plan provided clear and convincing evidence that the mine would not require perpetual treatment of water polluted by AMD or other contaminants. Although Montana voted down the initiative in the general election, there is no guarantee that similar regulatory challenges will not be encountered in the future.
Delays in projects attributable to a lack of community support or other community-related disruptions or delays can translate directly into a decrease in the value of a project or into an inability to bring the project to, or maintain, production. The cost of measures and other issues relating to the sustainable development of mining operations has placed significant demands on Sibanye-Stillwater’s resources and could increase capital and operating costs and have a material adverse effect on Sibanye-Stillwater's reputation, business, operating results and financial condition.
An actual or alleged breach or breaches in governance processes, or fraud, bribery and corruption may lead to public and private censure, regulatory penalties and loss of licences or permits and may impact negatively upon Sibanye-Stillwater's empowerment status and may damage Sibanye-Stillwater’s reputation
The legal and regulatory framework in which Sibanye-Stillwater operates is complex, and its governance and compliance policies and processes may not prevent potential breaches of law or accounting or other governance practices. Sibanye-Stillwater’s operating and ethical codes, among other standards and guidance, may not prevent instances of fraudulent behaviour and dishonesty, nor guarantee compliance with legal and regulatory requirements.
To the extent that Sibanye-Stillwater suffers from any actual or alleged breach or breaches of relevant laws (including South African anti-bribery and corruption legislation or the US Foreign Corrupt Practices Act of 1977) under any circumstances, they may lead to regulatory, civil or criminal fines, litigation, public and private censure and loss of operating licences or permits and may impact negatively upon Sibanye-Stillwater’s empowerment status and may damage its reputation. The occurrence of any of these events could have a material adverse effect on Sibanye-Stillwater’s business, operating results and financial condition.
Regulation of greenhouse gas (GHG) emissions may materially adversely affect Sibanye-Stillwater’s operations
Energy is a significant production input and input cost to Sibanye-Stillwater’s mining and processing operations, with its principal energy sources being electricity, purchased petroleum products, coal, propane and natural gas. A number of governments or governmental bodies, including the United Nations Framework Convention on Climate Change (UNFCCC), have introduced or are contemplating regulatory changes in response to the impact of climate change, including restricting GHG emissions in jurisdictions in which Sibanye-Stillwater operates.
The South African government introduced a carbon tax under the Carbon Tax Act (Carbon Tax Act) with effect from 2019. The first phase of the Carbon Tax Act applies to the so-called “Scope 1” emissions from 1 June 2019 to 31 December 2022. Under the first phase, the introduction of the carbon tax is not expected to have an immediate impact on the price of electricity. Accordingly, although the statutory rate of carbon tax in 2021 was R134 per tonne (2020: R127 per tonne; 2019: R120 per tonne) of carbon dioxide equivalent (CO2e) emissions, allowances under the Carbon Tax Act resulted in an effective carbon tax rate ranging from R7 to R54 per tonne of CO2e emissions (2020: R6 to R51; 2019: R6 to R48). Phase 1 of the Carbon Tax has been extended to 31 December 2025.
In addition, the South African Department of Forestry and Fisheries and the Environment (DFFE) has published the Climate Change Bill, 2021 (Climate Change Bill) which imposes carbon budgets on entities in certain high-emitting industries, such as mining. It also requires companies, including Sibanye-Stillwater to submit pollution prevention plans covering the period from 1 January 2021 to 31 December 2025. The carbon budgets are intended to operate as statutory limits for CO2e, emissions in excess of which may entail a fine, or other punitive measures. It is expected that the Carbon Tax Act will be aligned with the Climate Change Bill, such that it will set out the amount that companies will be required to pay for CO2e emissions exceeding the applicable carbon budget. Further, if the Climate Change Bill is enacted, it is expected that the South African government will phase out the current carbon budget allowance of 5% provided for under the Carbon Tax Act.
Sibanye-Stillwater’s costs under the existing and proposed legislation will be impacted by the finalisation of the GHG reporting regulations and the extent to which it is able to make use of the allowances that are built into the carbon tax design. Sibanye-Stillwater’s carbon tax expense for the year ended 31 December 2021 was R4 million (2020: 5 million; 2019: R12 million).
A number of other regulatory initiatives are underway in countries in which Sibanye-Stillwater operates that seek to reduce or limit industrial GHG emissions. These regulatory initiatives will be either voluntary or mandatory and are likely to impact Sibanye-Stillwater’s operations directly or indirectly by affecting the cost of doing business, for example by increasing the costs of its suppliers or customers. Inconsistency of regulations particularly between developed and developing countries may affect both Sibanye-Stillwater’s decision to pursue opportunities in certain countries and its cost of operations.
Sibanye-Stillwater’s reliance on fossil fuel-based electricity from Eskom Limited (Eskom) may give rise to additional costs in the future should any of the countries into which it exports its products introduce carbon border adjustment mechanisms. For example, South African carbon taxpayers who reduce the South African carbon tax liabilities through permissible allowances and deductions may then pay a higher import carbon tax when their goods are imported into the European Union (EU).
In the United States, Sibanye-Stillwater is also subject to legislative and regulatory initiatives that are underway to limit GHG emissions. The US Congress has considered legislation that would control GHG emissions through a “cap and trade” programme and several US states have already implemented programmes to reduce GHG emissions. In addition, the US Supreme Court determined in a 2007 ruling that GHG emissions are “air pollutants” within the meaning of the federal Clean Air Act. In response the US Environmental Protection Agency (the EPA) issued a final rule, known as the “Tailoring Rule”, which makes certain large stationary sources and modification projects subject to permitting requirements for GHG emissions under the Clean Air Act. In 2014, the US Supreme Court invalidated portions of the federal Tailoring Rule, but the ruling upheld the EPA’s authority to require new or modified facilities that are already subject to permitting requirements for conventional pollutants to comply with Best Available Control Technologies (BACT) for GHGs, as well. New or modified sources subject to permitting for conventional pollutants will be required to access BACT for GHG if the new source or the modification will result in an annual increase of 75,000 tons per year of CO2e.
Sibanye-Stillwater is also subject to GHG reporting requirements for specified large GHG emission sources in the United States. Sibanye-Stillwater’s US PGM operations hold a Title V Major Air Quality Permit, which requires Sibanye-Stillwater to annually calculate the GHG emissions from its US PGM operations and compare these amounts against reporting thresholds. Because current levels are below reporting thresholds, the US PGM operations are not currently required to report GHG emissions. Additionally, the assessment of GHG emissions is becoming an increasingly important part of NEPA assessments, and as a result, Sibanye-Stillwater may be required to mitigate its GHG emissions in connection with any future NEPA review.
In 2021, the Biden administration issued an executive order directing all federal agencies to review and take action to address any federal regulations, orders, guidance documents, policies and any similar agency actions promulgated during the prior administration that may be inconsistent with the administration’s policies. As a result, it is unclear the degree to which certain recent regulatory developments may be modified or rescinded. The executive order also established the Inter-agency Working Group on the Social Cost of Greenhouse Gases, which is called on to, among other things, develop methodologies for calculating the “social cost of carbon,” “social cost of nitrous oxide” and “social cost of methane.” Final recommendations from the working group are due by 1 June 2022. As the debate surrounding GHG regulation in the US continues to ensue, further regulatory, legislative and judicial developments are difficult to predict. Due to the uncertainties surrounding the regulation of and other risks associated with GHG emissions, Sibanye-Stillwater cannot predict the financial impact of future US GHG regulations and related developments on its US PGM operations.
There can be no assurance that Sibanye-Stillwater will be able to meet its voluntary targets relating to GHG emissions or comply with targets that may be imposed upon the mining industry by external regulators. Furthermore, additional, new and/or different regulations in this area, such as the imposition of stricter limits than those currently contemplated, could be enacted, all of which could have a material adverse effect on Sibanye-Stillwater’s business, financial condition, results of operations and prospects.
Regulation of GHG emissions in the jurisdictions of Sibanye-Stillwater’s end-user customers and value chain participants could also have an adverse effect on the demand for certain of its products, which may in turn, have a material adverse effect on Sibanye-Stillwater’s production levels, business, operating results and financial condition.
The physical impacts of climate change may adversely affect Sibanye-Stillwater’s mining operations, workforce and supply chain
Sibanye-Stillwater’s operations, workforce and supply chain may be exposed to changes in the frequency, intensity and/or duration of intense storms, drought, flooding, wildfire, and other extreme weather events and patterns. For example, in December 2021, severe weather conditions caused electrical outages at Sibanye-Stillwater’s East Bolder mine, contributing to a reduction in mined 2E PGMs in the second quarter of 2021. Such potential physical impacts of climate change on Sibanye-Stillwater’s operations are highly uncertain, and would vary by operation based on particular geographic circumstances. As a result, Sibanye-Stillwater may face increased operational costs associated with power and supply chain disruption, delays and increased pricing. In addition, the potential for overall decreases in precipitation could affect the availability of water needed for Sibanye-Stillwater’s operations, leading to increased operating costs, or in extreme cases, disruptions to mining operations.
In addition, as part of Sibanye-Stillwater’s commitment to implementing the Global Tailings Standard, it may be required to undertake additional measures to mitigate the environmental impact at its tailings facilities, including those arising from climate change. Any such obligations could increase operational expenses or increase required capital investments.
Legal, regulatory and compliance risks
Sibanye-Stillwater’s mining rights are subject to legislation, which could impose significant costs and burdens and which impose certain ownership requirements, the interpretation of which is the subject of dispute
Sibanye-Stillwater’s right to own and exploit mineral reserves and deposits is governed by the laws and regulations of the jurisdictions in which the mineral properties are located. Sibanye-Stillwater’s reserves and deposits are located in countries where mining rights could be suspended or cancelled should it breach its obligations in respect of the acquisition and exploitation of these rights.
In all of the countries where Sibanye-Stillwater operates, the formulation or implementation of governmental policies on certain issues may be unpredictable. This may include changes in laws relating to mineral rights and ownership of mining assets and the right to prospect and mine, and, in extreme cases, nationalisation, expropriation or nullification of existing rights, concessions, licences, permits, agreements and contracts.
Our operations in South Africa are subject to legislation regulating the exploitation of mineral resources through the granting of rights required to prospect and mine for minerals, which includes the Mineral and Petroleum Resources Development Act, 2002 (MPRDA) as well as Broad-Based Black Economic Empowerment, 2003 (B-BBEE) legislation designed to effect the entry and participation of HDSAs into the mining industry and increase their participation in the South African economy.
The MPRDA, requires, among other things, that mining companies submit SLPs to the DMRE, which set out their commitments relating to human resource development, labour planning and socio-economic development planning. In addition to significant reputational damage, companies that fail to comply with such commitments may be sanctioned, required to undertake remedial action and ultimately, may have their mining licences revoked.
South Africa’s changing BEE policies may adversely affect Sibanye-Stillwater’s mining rights and its ability to conduct operations. Mining rights are linked to compliance with various empowerment obligations, including the B-BBEE Charter for the South African Mining and Minerals Industry, 2018 (2018 Mining Charter) (as read with the Implementation Guidelines for the 2018 Mining Charter (Implementation Guidelines)). It is widely considered that the 2018 Mining Charter did not bring about the legal certainty in the South African mining industry that it sought to create. Some of the salient features of the 2018 Mining Charter are:
•existing right holders who have achieved a minimum of 26% BEE shareholding shall be recognised as compliant for the duration of the mining right;
•existing right holders whose BEE partners exited prior to the commencement of the 2018 Mining Charter shall be recognised as compliant for the duration of the mining right (the once empowered, always empowered principle);
•the once empowered, always empowered principle will not be applicable to the renewal and transfer of a mining right; and
•a new mining right must have a minimum of 30% BEE shareholding.
Accordingly, in 2019, the Minerals Council filed an application in the Gauteng Division High Court of South Africa for the judicial review and setting aside of certain clauses of the 2018 Mining Charter. In 2021, the Gauteng Division High Court of South Africa issued a judgement addressing certain key elements of the Mineral Council’s application. Among other things, the court held that:
•the 2018 Mining Charter is a policy document and does not, by itself, bind holders of mining rights and prospecting rights;
•the 2018 Mining Charter is only binding on holders of mining rights to the extent that its terms have been lawfully incorporated by the DMRE Minister into such rights;
•a renewal of an existing mining right shall not be subject to the Mining Charter requirements applicable at the time that a mining right renewal application is lodged;
•continuing consequences shall be recognised in relation to applications for new mining rights, renewals and transfer of mining rights; and
•the distribution of the minimum 30% BEE shareholding and provisions in respect to the equity equivalent benefit for host communities is no longer prescribed.
In addition, the court set aside a number of specific clauses of the 2018 Mining Charter. Following the judgement, the DMRE indicated that it intends to consider steps to achieve the empowerment objectives through amendments to the MPRDA. For further details, see Environmental and regulatory matters—Mining rights. It is uncertain how the MPRDA will be applied and interpreted by the DMRE and the courts in the future, and what changes, if any, Sibanye-Stillwater will be required to make in order comply with this legislation.
Any adjustment to the ownership structure of Sibanye-Stillwater’s mining assets in order to meet B-BBEE requirements could have a material adverse effect on the value of Sibanye-Stillwater’s securities. Further, Sibanye-Stillwater may in the future incur significant costs or have to issue additional shares as a result of changes in the interpretation of existing laws and guidelines or the imposition of new laws relating to HDSA ownership requirements, which may have a material adverse effect on Sibanye-Stillwater’s business, operating results and financial condition.
Under section 47 of the MPRDA, the DMRE Minister may suspend or cancel the existing mining rights or, under section 23(3) of the MPRDA, refuse to grant applications for new mining rights by mining companies, including Sibanye-Stillwater, should such holders of mining rights be deemed not to be in compliance with the requirements of the MPRDA as read with South Africa’s mining industry empowerment requirements. If the DMRE Minister were to determine that Sibanye-Stillwater is not in compliance with the requirements of the MPRDA and its empowerment requirements, Sibanye-Stillwater may be required to engage in remedial steps, including changes to management and actions that require shareholder approval.
If the DMRE were to determine that Sibanye-Stillwater is not in compliance with the MPRDA, for any reason, including HDSA ownership, Sibanye-Stillwater may challenge such a decision in court which may be costly and unsuccessful.
There is no guarantee that any steps Sibanye-Stillwater has already taken or might take in the future will ensure the retention of its existing mining rights, the successful renewal of its existing mining rights, the granting of applications for new mining rights or that the terms of renewals of its mining rights would not be significantly less favourable than the terms of its current mining rights. Failure by Sibanye-Stillwater to comply with mineral rights legislation or to renew mining leases in any of the jurisdictions in which it operates may cause it to lose the right to mine, fail to acquire new rights to mine and may have a material adverse effect on Sibanye-Stillwater’s business, operating results and financial condition.
Title to Sibanye-Stillwater’s properties may be subject to challenge
Certain of Sibanye-Stillwater’s properties may be subject to the rights or the asserted rights of various occupants or claimants to land under restitution and other legislation, which could have an impact on Sibanye-Stillwater’s ability to develop or operate its mining interests. For example, in South Africa, the Extension of Security of Tenure Act (1997), the Restitution of Land Rights Act (1994) and the Prevention of Illegal Eviction from and Unlawful Occupation of Land Act (1998) and the Labour Tenants Act (1996) protect various rights to claim and occupy land. Such legislation is complex and sets out the requirements as to how landowners are to deal with certain rights. There is no assurance that Sibanye-Stillwater will be able to successfully predict when these landowner rights will be challenged, which could therefore negatively affect the business results of new or existing projects. Where consultation with occupants or claimants to land is statutorily or otherwise mandated, relations may not remain amicable and disputes may lead to reduced access to properties or delays in operations. For example, in 2018, Sibanye-Stillwater published a notice of a land claim over part of the Kroondal operations property occupied by certain former contractors of Aquarius Platinum Limited (Aquarius). Sibanye-Stillwater was initially unsuccessful in the Land Claims Court, and the Supreme Court of Appeals ruled that termination notices under section 8 of Extension of Security of Tenure Act (ESTA) needed to be served on these occupants. Sibanye-Stillwater has since re-initiated its claim and the dispute remains ongoing. Title to Sibanye-Stillwater’s properties, particularly undeveloped ones, may also be defective or subject to challenge. Title review does not necessarily preclude third parties from contesting ownership.
Sibanye-Stillwater’s US properties in Montana include a number of unpatented mining and mill site claims. The validity of unpatented mining claims on public lands is often uncertain, and possessory rights of claimants may be subject to challenge.
In addition, Sibanye-Stillwater pays annual maintenance fees and has obtained mineral title reports and legal opinions for some of the unpatented mining claims or mill sites making up portions of its US properties, in accordance with applicable laws and what Sibanye-Stillwater believes is standard industry practice. However, Sibanye-Stillwater cannot be certain that applicable laws will not be changed nor that Sibanye-Stillwater’s possessory rights to any of its unpatented claims may not be deemed defective and challenged.
As a result, any such legislation could change the cost of holding unpatented mining claims and could significantly affect Sibanye-Stillwater’s ability to develop ore reserves located on unpatented mining claims. All of the foregoing could adversely affect the economic and financial viability of future mining operations at such mines. Although it is impossible to predict at this point what any legislated royalties might be, enactment could adversely affect the potential for development of such federal unpatented mining claims.
If Sibanye-Stillwater loses senior management or is unable to hire and/or retain sufficient technically skilled employees or sufficient HDSA representation in management positions in South Africa, Sibanye-Stillwater’s business may be materially adversely affected
Our ability to operate or expand effectively depends largely on the experience, skills and performance of its senior management team and technically skilled employees. However, the global mining industry, including Sibanye-Stillwater, continues to experience a shortage of qualified senior management and technically skilled employees. To the extent that Sibanye-Stillwater is unable to hire or retain (due to departure or unavailability) appropriate senior management, technically skilled employees or other management personnel, or it may be required to pay higher levels of remuneration than it currently intends in order to do so. For example, critical skills shortages at Sibanye-Stillwater’s US operations resulted in its increased reliance on high cost contract employment, impacting its profitability for the period. In the United States, Sibanye-Stillwater also depends on experienced management and other key personnel in order to maintain its operations and support its projects and loss of key management or other personnel at Sibanye-Stillwater’s US operations could have a material adverse impact on Sibanye-Stillwater.
Additionally, as a condition of Sibanye-Stillwater’s mining rights in South Africa, it must ensure sufficient HDSA participation in its management and core and critical skills and failure to do so could result in fines or the loss or suspension of its mining rights. See—Sibanye-Stillwater’s mining rights are subject to legislation, which could impose significant costs and burdens and which impose certain ownership requirements, the interpretation of which is the subject of dispute. Sibanye-Stillwater is also legislatively required to take proactive steps to achieve an equitable representation of HDSAs at all occupational levels and to report on the extent to which its plan is being achieved. If Sibanye-Stillwater is unable to hire or retain appropriate management and technically skilled personnel or is unable to obtain sufficient HDSA representation in management positions, or if there are not sufficient succession plans in place, this could have a material adverse effect on Sibanye-Stillwater’s business, result in the imposition of fines and have a negative effect on production levels, operating results and financial position.
Sibanye-Stillwater is subject to risks associated with litigation and regulatory proceedings
As with most large corporations, Sibanye-Stillwater is, from time to time, involved as a party in litigation, arbitration, regulatory proceedings and other disputes. Litigation, arbitration, regulatory proceedings and other types of disputes involve inherent uncertainties and, as a result, Sibanye-Stillwater faces risks associated with adverse judgments or outcomes in such cases. Even where Sibanye-Stillwater may ultimately prevail on the merits of any such dispute, Sibanye-Stillwater may face significant costs defending its rights, lose certain rights or benefits during the pendency of any such litigation, arbitration, regulatory proceeding or other dispute, or suffer negative publicity or reputational damage as a result of its involvement. Sibanye-Stillwater is currently engaged in a number of legal and regulatory proceedings, including as described in Accountability—Directors’ report—Litigation, the outcome of which remains uncertain. For example, in February 2022, Sibanye-Stillwater received a claim notice and letter before claim from Appian Capital Advisory (Appian) in relation to Sibanye-Stillwater’s decision to exercise its termination rights in respect of the proposed acquisition of two Brazilian mining assets owned by Appian. Sibanye-Stillwater responded to Appian’s notice of claim, and as at the date of this filing, it has not been served with a claim by Appian. If Appian decides to commence formal proceedings, Sibanye-Stillwater will vigorously defend its position. There can be no assurance as to the outcome of any litigation, arbitration, regulatory proceeding or other dispute, and the adverse determination of material litigation could have a materially adverse effect on Sibanye-Stillwater’s business, operating results and financial condition.
Uncertainty relating to the LIBOR calculation process and phasing out of LIBOR after 2021 may adversely affect the amounts of interest Sibanye-Stillwater pays under its debt arrangements and adversely affect Sibanye-Stillwater’s business, operating results and financial condition
LIBOR is the basic rate of interest used in lending between banks on the London interbank market and has widely been used as a reference for setting the interest rate on loans globally. Sibanye-Stillwater has used LIBOR as a reference rate in certain of Sibanye-Stillwater's credit facilities and metal sales such that the interest due to its debtors pursuant to debt arrangements is calculated using LIBOR. Sibanye-Stillwater’s debt outstanding indexed to LIBOR comprises the US$600 million RCF (maturing in April 2023) and R1.5 billion (US$95 million) of Burnstone debt outstanding as part of assets acquired.
LIBOR has been the subject of regulatory guidance and proposals for reform, and in 2021, ICE Benchmark Administration (ICE), the administrator for LIBOR, confirmed its intention to cease publishing one week and two-month US Dollar LIBOR after December 2021 and all remaining US Dollar LIBOR tenors in mid-2023. Concurrently, the Financial Conduct Authority announced the cessation or loss of representativeness of the US Dollar LIBOR tenors from those dates. The US Federal Reserve, in conjunction with the Alternative Reference Rates Committee, a steering committee comprised of large US financial institutions, is considering replacing LIBOR with the Secured Overnight Financing Rate (SOFR), a new index calculated based on transactions in the market for short-term treasury securities. On 5 March 2021, the ICE announced its intention to cease the publication of US LIBOR settings extended on 30 June 2023. At this time, it is not known whether or when SOFR or other alternative reference rates will attain market traction as replacements for LIBOR.
These reforms may cause LIBOR to perform differently than it has in the past, and it is expected that LIBOR will cease to be available after 2021 or mid-2023, as applicable. After the cessation of LIBOR, alternative benchmark rates will replace LIBOR and could affect Sibanye-Stillwater's debt securities and debt payments.
At this time, it is not possible to predict the effect of the cessation of LIBOR or the establishment of alternative benchmark rates. Any new benchmark rate will likely not replicate LIBOR exactly, which could impact our contracts that terminate after 2021 or mid-2023, as applicable. There is uncertainty about how applicable law and the courts will address the replacement of LIBOR with alternative rates on variable rate retail loan contracts and other contracts that do not include alternative rate fallback provisions.
At this time, it is not currently possible to predict the effect of the cessation of LIBOR, or resulting plans by other regulatory authorities, including how any alternative methods for calculating benchmark interest rates would be applied to Sibanye-Stillwater’s existing debt arrangements containing terms based on LIBOR. Any such changes or developments may result in an increase in the amount of interest Sibanye-Stillwater will be required to pay under its debt arrangements, which may adversely affect Sibanye-Stillwater’s business, operating results and financial condition.
Sibanye-Stillwater’s financial flexibility could be constrained by South African Exchange Control Regulations
South Africa’s Exchange Control Regulations restrict the export of capital from South Africa. Transactions between South African residents (including companies) and non-residents (excluding residents of the Republic of Namibia and the Kingdoms of Lesotho and Eswatini, known collectively as the Common Monetary Area (CMA)) are subject to exchange controls enforced by the South African Reserve Bank (SARB). While South African exchange controls have been relaxed in recent years, South African companies remain subject to restrictions on their ability to deploy capital outside of the CMA. As a result, Sibanye-Stillwater’s ability to raise and deploy capital outside the CMA is restricted. These restrictions could hinder Sibanye-Stillwater’s financial and strategic flexibility, particularly its ability to raise funds outside South Africa.
Certain rules and regulations in Zimbabwe that limit Sibanye-Stillwater's ability to export unrefined platinum or to remit revenue generated out of the country may also impact the ownership structure of these operations
One of Sibanye-Stillwater’s joint ventures, the Mimosa Operations, is located in Zimbabwe. The Mimosa Operations delivered attributable production for the year ended 31 December 2021 of 119,251oz (4E) and contributed a profit of R1.7 billion (US$115 million). Under Zimbabwean exchange control legislation, Sibanye-Stillwater is limited in its ability to remit profits from Zimbabwe to South Africa, as this is dependent on the supply of foreign currency available at the Central Bank of Zimbabwe, which has historically experienced, and continues to experience, low levels of such supply. Further, due to the short supply of US dollars in Zimbabwe, the funds retained in Zimbabwe create increased exposure to economic and inflationary risks.
The Mimosa Operations have commissioned feasibility studies to explore expanding its smelter operations in Zimbabwe. The construction of such facilities would be subject to several challenges including, among others, the time required, the substantial capital expenditure and a lack of adequate infrastructure.
The Zimbabwean Indigenisation and Economic Empowerment Act (the Indigenisation Act) promulgated in 2008 previously required the transfer of a 51% shareholding in all foreign-owned companies to indigenous Zimbabweans. The Indigenisation Act was amended in 2017 to clarify that foreign-owned companies can retain ownership provided that 75% of the gross value of exploited resources is retained in Zimbabwe. This requirement could have a material adverse effect on the Mimosa Operations.
The Indigenisation Act was further amended in 2018, mandating that Zimbabwe (through certain designated entities) have at least a 51% ownership interest in a designated extractive business, which comprises of entities involved in the extraction of platinum. Although the scope was extended in 2020 to any extraction of minerals (i.e. not only limited to platinum and diamond mining), based on public statements by government officials, it is expected that this amendment will be removed from the Indigenisation Act. In addition, the Indigenisation Act provides that the 51% ownership requirement may be achieved through the use of credits, and for a duration that the Zimbabwean Minister of Industry, Commerce and Enterprise Development can prescribe.
Social, political and economic uncertainty and instability in Zimbabwe and targeted sanctions against certain Zimbabwean entities may affect future foreign investment in the country
Zimbabwe’s social, political and economic climate is currently highly uncertain, with the economy having been in decline since 1999. Many sectors, including the health sector, have virtually collapsed. There is a general shortage of clean water owing to non-functional facilities and a lack of chemicals.
Zimbabwe is the subject of targeted sanctions by the United States, EU and the United Kingdom. The sanctions are limited in scope, targeting only designated individuals and entities, including certain members of the government, who are deemed to be undermining democratic institutions and processes in Zimbabwe.
In terms of the Minerals Marketing Corporation Act, 1983 (MMCZ Act), the Mineral Marketing Corporation of Zimbabwe (MMCZ) is the sole legal exporter of all minerals mined in Zimbabwe and is entitled to a commission in relation to all sales, as an agent to the mining companies, which is stipulated by the MMCZ Act. The Mimosa Operations paid a commission to MMCZ of US$5 million in fiscal 2021. The MMCZ is an entity specifically sanctioned by the US Office of Foreign Assets Control and listed on its Specially Designated Nationals list. Under the sanctions, MMCZ’s assets are blocked and US persons are prohibited from dealing with the entity. There is no requirement, legal or otherwise, for MMCZ to be involved in the Mimosa Operations management or operations and Sibanye-Stillwater has no contractual or other relationship with MMCZ outside of the MMCZ Act requirements.
Continued economic and political uncertainty in Zimbabwe and targeted sanctions against certain Zimbabwean entities may affect future foreign investment in the country and may lead to the imposition of further exchange controls, restrictions on the ownership of Sibanye-Stillwater’s assets and its ability to raise funds for or operate its business and export minerals and metals from Zimbabwe. Should such events occur, they may have an adverse effect on Sibanye-Stillwater’s business and operations in Zimbabwe as well as its financial condition.
Risks Related to Production Delivery from Operations
Economic, political or social factors affecting the regions where Sibanye-Stillwater operates may have a material adverse effect on Sibanye-Stillwater’s operations and profits
Sibanye-Stillwater principal operations are in southern Africa and the United States, with its domicile and a majority of its operations located within South Africa. Changes to or increased instability in the economic, political or social environment in these regions, particularly in South Africa or surrounding countries, could create uncertainty, which discourages investment in the region and may affect an investment in Sibanye-Stillwater. In addition, socio-political instability and unrest may also disrupt Sibanye-Stillwater’s business and operations, compromise safety and security, increase costs, affect employee morale, impact Sibanye-Stillwater’s ability to deliver under its operational plans, create uncertainty regarding mining licences and cause reputational damage, any of which could have a material adverse effect on Sibanye-Stillwater’s business, operating results and financial condition.
High levels of unemployment, particularly among the youth, and a shortage of critical skills in South Africa, despite increased government expenditure on education and training, remain issues and deterrents to foreign investment. The volatile and uncertain labour environment, which severely impacts on the local economy and investor confidence, has led to downgrades in national credit ratings to non-investment grade, making investment more expensive and difficult to secure. See —Sibanye-Stillwater’s operations and profits have been and may be adversely affected by labour unrest and union activity and —The continued status of South Africa’s credit rating as non-investment grade may have an adverse effect on Sibanye-Stillwater’s ability to secure financing or could result in any such financing being available only at greater cost. This may restrict Sibanye-Stillwater’s future access to international financing and could have a material adverse effect on Sibanye-Stillwater’s business, operating results and financial condition.
In 2019, the President of South Africa announced that South Africa will proceed with nationalising the SARB. Subsequently, the indications are that this process has been put on hold. While the SARB’s independence is constitutionally guaranteed, any economic or political instability caused by a nationalisation process, may create complications relating to the movement of funds into or out of South Africa and impact the general business environment in South Africa, including for companies such as Sibanye-Stillwater. Any such negative impact on the South African economy may adversely affect Sibanye-Stillwater’s business, operating results and financial condition.
In addition, while the South African government has stated that it does not intend to nationalise mining assets or mining companies, certain political parties favour a policy of nationalisation. See —Sibanye-Stillwater is subject to the imposition of various regulatory costs, such as income taxes and royalties, changes to which may have a material adverse effect on Sibanye-Stillwater’s operations and profits. Any potential, or actual proceedings, to nationalise any of Sibanye-Stillwater’s assets could halt or curtail operations, resulting in a material adverse effect on Sibanye-Stillwater’s business, operating results and financial condition and could cause the value of Sibanye-Stillwater’s securities to decline rapidly and dramatically, possibly causing investors to lose the entirety of their respective investments.
In addition, changes in presidential or congressional administrations in the United States may result in legislative priority shifts that create significant uncertainty relating to the demand for PGMs, gold and battery metals. For example, in 2015, the United States, along with 195 other countries signed the Paris Agreement. The Trump administration formally withdrew the United States from the Paris Agreement in 2020. In 2021, the Biden administration issued an executive order that commenced the process of re-entering the Paris Agreement. The terms on which the United States may re-enter the Paris Agreement, including its emissions pledges, are uncertain at this time as are the impacts to Sibanye-Stillwater’s business. In addition, while the current congressional administration, through the 2021 Infrastructure Investment and Jobs Act, has earmarked more than US$350 billion of funding for states and local governments to promote infrastructure modernisation, including upgrading energy and water infrastructure and investing in the future green economy (such as Electric Vehicle (EV) charging infrastructure), any reversal of such investment may negatively impact demand for the Sibanye-Stillwater’s battery metal portfolio, and as a result, have an adverse effect on its growth strategy.
In addition, economic and political instability in regions outside jurisdictions where Sibanye-Stillwater operates, including in surrounding countries or geopolitical events, such as the invasion of Ukraine by Russia, may result in unavoidable uncertainties and events that could negatively affect costs of business, cause volatility in currency exchange rates, commodity prices, interest rates and worldwide political, regulatory, economic or market conditions and contribute instability in political institutions, regulatory agencies and financial markets any of which could have a material adverse effect on Sibanye-Stillwater’s business, operating results and financial condition.
Power deficits, fluctuations and usage constraints may force Sibanye-Stillwater to halt or curtail operations
In South Africa, Sibanye-Stillwater's operations depend on electrical power generated by the South African state utility, Eskom, which holds a monopoly in the South African market. Electricity supply in South Africa has been constrained over the past decade, leading to multiple power disruptions as a result of various factors, including load curtailment, adverse weather events, regulatory action as well as continued poor generation performance and reliability.
Between 2018 and 2021, Eskom, implemented intermittent load curtailment and shedding as a result of continued poor generation performance and reliability. This was primarily driven by ineffective capital spend and maintenance. Under load curtailment, Sibanye-Stillwater’s South African operations are required to reduce power demand which can result in production losses. Although Sibanye-Stillwater has complied with the curtailment requirements in response to the load curtailment events without incurring material production losses, there can be no guarantee that Sibanye-Stillwater will be able to comply with future curtailment requirements without incurring material production losses in the future.
Eskom’s inability to fully meet the country’s demand has led, and may continue to lead, to further load shedding, load curtailment, or rolling blackouts. There is no assurance that Eskom’s efforts to protect the national electricity grid will prevent a partial or complete national blackout, which would have a material adverse effect on Sibanye-Stillwater’s business, operating results and financial condition.
In addition to supply constraints, severe weather events and labour unrest in South Africa has disrupted, and may in the future disrupt, the supply of coal to power stations operated by Eskom or may incapacitate the power stations directly, resulting in curtailed supply. For example, in February 2021, Cyclone Eloise caused extensive rainfall which, in turn, led to constraints in the quality and supply of coal, national power constraints and load curtailment.
Power disruptions may also persist as a consequence of the announced vertical unbundling of Eskom. See —Power cost increases in South Africa and elsewhere may adversely affect Sibanye-Stillwater’s results of operations. Eskom may also face regulatory enforcement action that may disrupt its supply of electricity. For example, in 2021, Eskom received unfavourable decisions from the DFFE for multiple power generation facilities in response to its applications for the postponement of air quality Minimum Emission Standards set out in terms of the National Environment Management: Air Quality Act. If implemented, the decisions will result in Eskom having to shut down 16,000MW of installed coal fired capacity.
In addition, to a lesser degree, power fluctuations have occurred and do occur at Sibanye-Stillwater’s US operations, which can cause operational outages.
Any further disruption or constraint in the electrical power supply available to Sibanye-Stillwater’s South African-based operations or power fluctuations at Sibanye-Stillwater’s US operations could have a material adverse effect on its business, operating results and financial condition.
Sibanye-Stillwater may experience unforeseen difficulties, delays or costs in implementing its business strategy and operational plan
The ability to grow the business will depend on the successful implementation of Sibanye-Stillwater’s existing and proposed strategic initiatives and operational plans at its historical operations, recently acquired operations and proposed acquisitions.
The successful implementation of Sibanye-Stillwater’s strategic initiatives and operational plans depends upon many factors, including those outside its control. Sibanye-Stillwater may prove unable to deliver on production targets and other strategic initiatives. Unforeseen difficulties, delays or costs may adversely affect the successful implementation of Sibanye-Stillwater’s business strategy and plans, and such strategy and plans may not result in the anticipated benefits. For example, factors such as volatility in commodity pricing, high fixed costs, safety related issues, organised labour action and technical issues may result in a failure to meet operations targets or strategic goals. See — Mining is inherently hazardous and the related risks of events that cause disruptions to Sibanye-Stillwater’s mining operations could result in increased production costs, financial and regulatory liabilities and reputational damage, —Sibanye-Stillwater’s operations and profits have been and may be adversely affected by labour unrest and union activity, —Sibanye-Stillwater’s mineral reserves are estimates based on a number of assumptions, which, if changed, may require Sibanye-Stillwater to lower estimated mineral reserves, —Our business is subject to high fixed costs which may impact its profitability, —Power deficits, fluctuations and usage constraints may force Sibanye-Stillwater to halt or curtail operations and —Power cost increases in South Africa and elsewhere may adversely affect Sibanye-Stillwater’s results of operations. Any such difficulties, delays or costs could prevent Sibanye-Stillwater from fully implementing its business strategy, which could have a material adverse effect on its business, operating results and financial condition.
In addition, any existing or future initiatives may not be implemented as planned; turn out to be less effective than anticipated; only become effective later than anticipated; or not be effective at all. Any of the above could have a negative impact on Sibanye-Stillwater’s business, operating results and financial condition.
Due to the mature infrastructure at Sibanye-Stillwater’s mining operations, unplanned breakdowns, statutory mandated modifications and stoppages may result in production delays, increased costs and industrial accidents
Nearly all of Sibanye-Stillwater's operating shafts and processing plants at its gold and PGM operations, including those of our recently acquired assets (including the Marikana operations), are relatively mature. Maintaining this infrastructure requires skilled people, capital allocation, management and regular, planned maintenance. Once a shaft or a processing plant has reached the end of its intended lifespan or needs modification to comply with the applicable regulatory standards, more than normal maintenance, care and remediation is required. Regulatory uncertainty with respect to concurrent rehabilitation may inhibit Sibanye-Stillwater from accessing financial provision to undertake remediation activities. Although Sibanye-Stillwater has a comprehensive maintenance strategy in place, incidents resulting in production delays, increased costs or industrial accidents may occur. There is also a risk that delays in procuring critical spares for major repairs may result in disruptions to production. Such incidents may have a material adverse effect on Sibanye-Stillwater's business, operating results and financial condition.
The impact from, and measures taken to address, the COVID-19 pandemic may adversely affect Sibanye-Stillwater’s people, and may impact Sibanye-Stillwater’s business continuity, operating results, cash flows and financial condition
Sibanye-Stillwater’s operations have been and may continue to be impacted by the COVID-19 pandemic. The continued spread of COVID-19 could continue to result in serious illness (including incapacity) or death, or quarantine of Sibanye-Stillwater’s employees and contractors. These effects have been exacerbated by employees and contractors working in close proximity to each other in underground and surface mines and living in close quarters. In addition, certain underlying health conditions including conditions which compromise the immune system, such as HIV/AIDS, have worsened the outcomes among the individuals infected with COVID-19. Since March 2020, Sibanye-Stillwater recorded 7,362 positive COVID-19 cases across its operations, which resulted in 145 deaths. Further employee or contractor absences due to COVID-19 could continue to lead to labour shortages or instability and disruptions to Sibanye-Stillwater’s production (including potential temporary cessation) and increased operational costs. Although COVID-19 vaccines are being rolled out globally, including in the regions where Sibanye-Stillwater operates, it is too early to determine how effective these vaccines will be, including in relation to new strains of COVID-19 and waning immunity of available vaccines. In addition, while vaccines reduce disease severity, they do not prevent infection with the virus that requires absence from work to isolate, which may contribute to work stoppages or reduced operational capacity.
Any actions taken by governments or regulators in response to the COVID-19 pandemic, including in response to emerging variants or waning vaccine effectiveness, could have a further material impact, on Sibanye-Stillwater's operations and lead to an increase in its costs.
Sibanye-Stillwater’s operational costs have increased as a result of the wide-ranging protective measures it has adopted, including, among others, screening, testing and contact tracing, closure of offices and imposition of travel restrictions, procedures on return to work, operational accreditation, mandating social distancing, sanitation and mask wearing, education and awareness communication to employees about COVID-19, assisting employees with remote working and supporting the mental wellbeing of employees.
However, the continuation of any measures, or the introduction of additional travel-related restrictions, could result in the inability of Sibanye-Stillwater’s suppliers to deliver components or raw materials on a timely basis and may limit or prevent Sibanye-Stillwater’s management and employees and other important third-parties from traveling to, or visiting, Sibanye-Stillwater’s operations. Further, any lockdowns or mandatory business shutdowns could result in a suspension of Sibanye-Stillwater’s operations and could bring its business to a standstill. Sibanye-Stillwater’s property and business interruption insurance and liability may not cover or be sufficient to fully cover any of Sibanye-Stillwater’s losses resulting from public health emergencies and other events that could disrupt its operations, such as COVID-19. See —Sibanye-Stillwater’s insurance coverage may not adequately satisfy all potential claims and exposures.
The full extent to which the COVID-19 pandemic will continue to impact Sibanye-Stillwater’s operational and financial performance will depend on future developments, which are highly uncertain and cannot be predicted. Any disruption to production or increased operational costs as a result of COVID-19 could have a material adverse effect on Sibanye-Stillwater’s business, operating results and financial condition.
Sibanye-Stillwater’s operations and profits have been and may be adversely affected by labour unrest and union activity
Sibanye-Stillwater’s workforce is unionised across all its operations, with a total of approximately 90.6% unionised employees (excluding DRDGOLD) as of 31 December 2021. Organised labour dynamics in the mining sector, particularly in South Africa, are volatile and uncertain and, as such, they have had, and may in the future have, a material adverse impact on Sibanye-Stillwater's operations, production and financial performance. Union activity and labour unrest in South Africa has resulted in more frequent industrial disputes and extended negotiations that have, along with other factors, negatively affected South Africa’s sovereign debt rating and subsequently the credit ratings of the country’s leading mining companies. Sibanye-Stillwater has in the past, and may in future, experience strikes and work stoppages, including both protected and unprotected industrial action. For example, between 6 June 2017 and 3 July 2017, despite communication with employees and agreement with the National Union of Mineworkers (NUM), employees at Cooke embarked on an unprotected strike following the implementation of measures to combat illegal mining following signs of collusion between illegal miners and employees which threatened the sustainability of the Cooke operations and posed a significant risk to the safety of employees and the surrounding communities. Despite obtaining a court interdict on 8 June 2017, over the course of the strike 300kg of planned gold production, equivalent to about R160 million in revenue, was lost at the Cooke operations. Disciplinary action taken in light of the unprotected actions resulted in the dismissal of 99 employees and other disciplinary action to compensate for non-productive shifts, including forfeiture of salary and annual leave, the matter is currently before the Labour Court. See also —Theft of gold, PGM and production inputs, as well as illegal artisanal mining, may occur on some of Sibanye-Stillwater’s properties. These activities are difficult to control and can disrupt Sibanye-Stillwater’s business and expose it to liability.
Sibanye-Stillwater has recently experienced several industrial action events, some of which are ongoing.
In November 2018, AMCU announced strike action at Sibanye-Stillwater’s gold mines, followed in January 2019 by a secondary strike at Sibanye-Stillwater’s South African PGM operations in support of the primary strike at its gold operations. The November 2018 strike ended on 17 April 2019, as a result of a settlement agreement between AMCU and Sibanye-Stillwater (Strike Settlement Agreement). As part of the Strike Settlement Agreement, AMCU and Sibanye-Stillwater agreed to a facilitated post-strike conflict relationship building programme, AMCU committed to sign the 2018 Wage Agreement and Sibanye-Stillwater agreed to an ex-gratia payment of R4,000 for each employee at Sibanye-Stillwater’s South African gold operations.
Following the expiration of 2018 Wage Agreement in 2021, Sibanye-Stillwater commenced contract negotiations with AMCU, the NUM, Solidarity and UASA. Solidarity and UASA formally accepted Sibanye-Stillwater's proposed wage agreement on 9 March 2022. In March 2022, AMCU and NUM announced a strike action at Sibanye-Stillwater’s gold mines that commenced on 9 March 2022. Sibanye-Stillwater is further scheduled to commence wage negotiations at its SA PGM operations in July 2022. Wage disputes, and any resulting industrial actions, are difficult to control and can lead to significant disruptions at Sibanye-Stillwater’s operations, expose it to liability and materially and adversely affect its business, operating results and financial condition.
In addition, rivalries between unions, such as AMCU and the NUM, may also destabilise labour relations in the mining sector. For example, for the period between 21 November 2018 to 15 March 2019, there were seven employee fatalities, several employees sustained injuries as well as the arrest of 153 striking employees for various incidents of unlawful conduct that constitute criminal offences in connection with the November 2018 strike action at Sibanye-Stillwater’s gold mines described above. Despite an apparent decline of incidents of violence following an interdict on violence from the Labour Court and the establishment of picketing rules by the Commission for Conciliation, Mediation and Arbitration (CCMA) at the end of November 2018, violent episodes, including the burning of houses occupied by non-AMCU members, resumed in 2019. Although such incidents were not related to Sibanye-Stillwater’s normal operations, they may impact its ongoing labour relations at Sibanye-Stillwater and in South Africa, in general.
From time to time, Sibanye-Stillwater undertakes Section 189A of the LRA (Section 189A Processes), which may result in retrenchment of employees and may impact production levels at affected operations. Factors that influence the decision to undertake such Section 189A Processes include, among other things, the cost structure of an operation, commodity prices and currency exchange rates. A low Rand commodity price environment may increase the likelihood that Sibanye-Stillwater will determine that undertaking Section 189A Processes at one or more of its operations is advisable. For example, Sibanye-Stillwater began a Section 189A for care and maintenance at the Cooke 1, 2 and 3 shafts in October 2017. As a result, 1,510 employees were transferred internally as care and maintenance personnel for the Cooke underground operations, 620 employees replaced terminated contractors involved in non-critical activities across the Company and approximately 2,025 employees were retrenched, with an additional 1,350 employees electing to take voluntary separation packages. On 14 February 2019, Sibanye-Stillwater issued a notice to commence a Section 189A Process regarding the possible restructuring of its gold operations and associated services, pursuant to ongoing
financial losses experienced at Sibanye-Stillwater’s Beatrix and Driefontein operations. Approximately 4,950 employees and 850 contractors were directly impacted.
Section 189A processes initiated in connection with Sibanye-Stillwater’s business plan may also coincide with acquisitions or business combinations it pursues. For example, in connection with the Lonmin Acquisition, Sibanye-Stillwater estimated headcount reductions of approximately 890 employees (including approximately 320 contractors) during the first three years following the completion of the acquisition, in addition to estimated headcount reductions of approximately 12,600 employees and contractors as part of the Lonmin business plan. Ultimately, on 16 January 2020, Sibanye-Stillwater announced that it completed its Section 189A Process in relation to Marikana, as a result of which, approximately 1,142 employees were retrenched and the number of contractors was reduced by approximately 1,709. Any future Section 189A Process may lead to labour unrest, reduced production levels and reputational harm to Sibanye-Stillwater, which could have a material adverse effect on Sibanye-Stillwater’s business, operating results and financial condition. There is no guarantee that any such Section 189A Process will provide the cost savings or other benefits anticipated by management whether due to labour unrest, reduced production or other factors.
In the United States, Sibanye-Stillwater’s employees located at the Sibanye-Stillwater US PGM operations and the Metallurgical Processing facilities are covered by a five-year collective bargaining agreement with the United Steel Workers Local 11-001 (USW Local 11-0001) expiring in 2024. Sibanye-Stillwater’s employees at the East Boulder Operation are covered by a separate collective bargaining agreement with USW Local 11-0001, which was renewed in February 2022. Effective 16 February 2022 through to 31 July 2024, the agreement provides employees at Sibanye-Stillwater’s East Boulder operation an annual average increase of 3.8% per year over a three year period. Sibanye-Stillwater is subject to a risk of strikes and other labour disputes at its US operations, and its ability to alter labour costs is restricted by the fact that unionised employees are party to collective bargaining agreements.
In the event that further industrial relations-related interruptions were to occur at any of Sibanye-Stillwater’s operations, other mines’ operations or in other industries that impact its operations, or that increased employment-related costs were to occur due to union or employee activity, these may have a material adverse effect on its business, production levels, production targets, results of operations, financial condition, reputation and future prospects. In addition, lower levels of mining activity can have a longer-term impact on production levels and operating costs, which may affect operating life. Mining conditions can deteriorate during extended periods without production and Sibanye-Stillwater will not recommence mining until health and safety conditions are considered appropriate to do so.
On 27 November 2018, the President of South Africa signed into law the National Minimum Wage Act 9 of 2018 (the National Minimum Wage Act), the Labour Laws Amendment Act 10 of 2018 (the Labour Laws Amendment Act), the Basic Conditions of Employment Amendment Act 7 of 2018 (the Basic Conditions of Employment Amendment Act) and the Labour Relations Amendment Act 8 of 2018 (the Labour Relations Amendment Act), all of which became effective 1 January 2019.
The National Minimum Wage Act introduced a national minimum wage applicable to all employees of R20 per hour, and on 1 March 2021, the national minimum wage increased to R21.69 per hour. The Basic Conditions of Employment Amendment Act contains enforcement mechanisms for the National Minimum Wage Act. The wages of Sibanye-Stillwater’s unionised South African employees are regulated by the collective agreements described above, which exceed the minimum wages prescribed by the provisions of the National Minimum Wage Act. The Labour Relations Amendment Act amended the LRA, instituting changes mainly related to collective bargaining, the extension of bargaining council agreements to non-parties by the Minister of Labour, the prescribing of picketing rules, including providing for the extension of the meaning of ballot for a strike or lock-out to include a secret vote and the creation of an advisory arbitration panel to resolve strikes or lockouts that are, among other things, violent or cause national or local crisis affecting the conditions for the normal social and economic functioning of the community or society. The Labour Laws Amendment Act primarily seeks to amend the Basic Conditions of Employment Act, by introducing new types of leave that employees will be entitled to, such as parental, adoption and surrogacy leave, which varies between ten days and ten weeks.
Any of the above could have a material adverse effect on Sibanye-Stillwater’s business, operating results and financial condition.
Because Sibanye-Stillwater’s operations are regionally concentrated, disruptions in these regions could have a material adverse impact on the operations
The majority of Sibanye-Stillwater’s gold mining operations are located in the north western and south western margins of the Witwatersrand Basin in South Africa. While Sibanye-Stillwater has recently diversified its operations into a number of new jurisdictions, including Finland, France and Australia and new metals, there is no guarantee that this diversification will reduce its reliance on existing production. As a result, any adverse economic, political or social conditions affecting these regions or surrounding regions, as well as natural disasters or coordinated strikes or other work stoppages, could have a material adverse effect on Sibanye-Stillwater’s business, operating results and financial condition.
HIV/AIDS, TB and other contagious diseases pose risks to Sibanye-Stillwater in terms of lost productivity and increased costs
The prevalence of HIV/AIDS in South Africa poses risks to Sibanye-Stillwater in terms of potentially reduced productivity and increased medical and other costs. Compounding this are the concomitant infections, such as TB, that can accompany HIV illness, particularly during the latter stages, and cause additional healthcare-related costs. Further, certain underlying health conditions including conditions which compromise the immune system, such as HIV/AIDS, have worsened the outcomes among the individuals infected with COVID-19. See —The impact from, and measures taken to address, the COVID-19 pandemic may adversely affect Sibanye-Stillwater’s people, and may impact Sibanye-Stillwater’s business continuity, operating results, cash flows and financial condition. Additionally, the spread of contagious diseases such as respiratory diseases is exacerbated by communal housing and close quarters. The spread of such diseases could impact employees’ productivity, treatment costs and, therefore, operational costs.
If there is a significant increase in the incidence of HIV/AIDS infection, a decrease in viral suppression rates and related diseases among the workforce may have a material adverse effect on Sibanye-Stillwater’s business, operating results and financial condition.
Sibanye-Stillwater’s mineral reserves are estimates based on a number of assumptions, which, if changed, may require Sibanye-Stillwater to lower estimated mineral reserves
The mineral reserves of Sibanye-Stillwater are estimates based on assumptions regarding, among other things, Sibanye-Stillwater’s costs, expenditures, commodity prices, currency exchange rates, metallurgical and mining recovery assumptions, which may prove inaccurate due to a number of factors, many of which are beyond its control. For example, at Sibanye-Stillwater’s US PGM operations, unexpected geologic conditions, particularly faulting, have been, and can expect to be encountered as mining proceeds. The effect of faulting and its effects on geologic units that are close to the J-M Reef in some areas can result in additional dilution of ore grade during mining operations. In the event that Sibanye-Stillwater adversely revises any of the assumptions that underlie its mineral reserves, this may result in a revision of mineral reserves. In addition, mineral reserve estimates depend to some extent on statistical inferences drawn from limited drilling samples, which may prove to be unreliable or unrepresentative. Should Sibanye-Stillwater encounter mineralisation or formations at any of its mines or projects different from those predicted by drilling, sampling and similar examinations, mineral reserve estimates may have to be adjusted and mining plans may have to be altered. Any downward revision in Sibanye-Stillwater’s mineral reserves and, over the longer term, any failure to replace reserve ounces as they are mined may lead to an impairment or write down of assets, and may have a material adverse effect on its business, operating results, life of operations and financial condition.
Risks Related to Earnings Delivery
Changes in the market price for gold and PGMs, which in the past have fluctuated widely, affect the profitability of Sibanye-Stillwater’s gold and PGM mining operations and the cash flows generated by those operations
Sibanye-Stillwater’s revenue from its gold and platinum mining operations are primarily derived from the sale of gold and PGMs that it produces. Sibanye-Stillwater does not generally enter into commodity derivatives or other hedging arrangements in order to establish a price in advance of the sale of its gold or PGM production. However, Sibanye-Stillwater may consider commodity derivatives or other hedging from time to time. As a result, it is generally exposed to changes in the gold and PGM prices, which could lead to reduced revenue should the gold or PGM basket price decline. For example, during the year ended 31 December 2021, the gold price fluctuated between US$1,684/oz and US$1,957/oz. During the year ended 31 December 2021, the platinum price fluctuated between US$906/oz and US$1,340/oz, the palladium price fluctuated between US$1,594/oz and US$3,020/oz and the rhodium price fluctuated between US$11,250/oz and US$29,800/oz. In its US recycling business, Sibanye-Stillwater regularly enters into fixed forward sales contracts for metal produced from catalyst recycling, normally making these commitments at the time the catalyst material is purchased. For Sibanye-Stillwater’s fixed forward sales related to recycling of catalysts, Sibanye-Stillwater is subject to the customers’ compliance with the terms of the agreements, their ability to terminate or suspend the agreements and their willingness and ability to pay.
The market price for gold has historically been volatile and is affected by numerous factors over which Sibanye-Stillwater has no control, such as general supply and demand, speculative trading activity and global economic drivers. For example, gold has historically been used as a hedge against unstable or lower economic performance, thus improved economic performance, particularly in the United States, may have a negative impact on the price for gold. After falling 45% between September 2011 and December 2015, when it hit a low of US$1,060/oz, the gold price recovered in fiscal 2017 hitting US$1,300/oz, before slightly declining again to US$1,285/oz at the end of fiscal 2018. At 31 December 2019, the gold price was US$1,528/oz. The market price for PGMs has been similarly volatile. In fiscal 2020, the market price for PGMs experienced long periods of volatility, primarily due to the COVID-19 pandemic. As of 31 December 2020, the gold, platinum, palladium and rhodium prices were US$1,891/oz, US$1,074/oz, US$2,203/oz and US$16,650/oz, respectively. This volatility continued in 2021, with gold, platinum, palladium and rhodium prices of US$1,820, US$969, US$1,897 and US$14,100, respectively, as of 31 December 2021.
Should the gold or PGM price decline below Sibanye-Stillwater’s production costs, it may experience losses and, should this situation remain for an extended period, Sibanye-Stillwater may be forced to curtail or suspend some or all of its projects, operations and/or reduce operational capital expenditures. Sibanye-Stillwater might not be able to recover any losses incurred during, or after, such events. A sustained period of significant gold or PGM price volatility may also adversely affect Sibanye-Stillwater’s ability to undertake new capital projects or to make other long-term strategic decisions. The use of lower gold and PGM prices in reserve calculations and Life of Mine plans could also result in material impairments of Sibanye-Stillwater’s investment in gold or PGM mining properties or a reduction in its reserve estimates and corresponding restatements of its reserves and increased amortisation, reclamation and closure charges.
In addition, changes in demand drivers for PGMs may cause the prices of PGMs to fall over the short or long term. For example, PGM prices are linked to demand for catalytic converters in automobiles, among other things. In 2021, the demand for PGMs decreased as a result of production stoppages at many automobile production facilities resulting from the global shortage of semiconductor chips, a critical component of new vehicle manufacturing. Any economic downturn or other event that reduces the sale of automobiles will also likely impact the price of PGMs. In addition, high PGM prices may cause demand destruction, which would cause the price of such PGMs to fall. In addition, the increase in the number of electric cars in the future may reduce the price for PGMs by reducing demand for catalytic converters (which require PGMs) used in gasoline powered vehicles.
Any of the above could have a material adverse effect on Sibanye-Stillwater’s business, operating results and financial condition.
Because gold and PGMs are generally sold in US Dollars, while the majority of Sibanye-Stillwater’s gold production and a substantial amount of Sibanye-Stillwater’s PGM production costs are denominated in Rand, Sibanye-Stillwater’s operating results and financial condition will be materially affected if there is a material change in the value of the Rand
Gold and PGMs are principally sold throughout the world in US dollars, but Sibanye-Stillwater’s costs of production at its operations in South Africa are primarily incurred in Rand. Recent volatility in the Rand has made Sibanye-Stillwater's costs and results of operations less predictable than when currency exchange rates are more stable. The Rand has experienced significant devaluation against the US dollar falling from R10.34/US$ as at 31 December 2013 to R15.54/US$ as at 31 December 2015, before strengthening again to R14.00/US$ as at 31 December 2019. On 27 March 2020, following Moody’s downgrade of South Africa’s sovereign credit rating to non-investment grade, the value of the Rand was further devalued to R17.62/US$, followed by a gradual strengthening in the second half of fiscal 2020 by 16.6% against the US dollar to R14.69/US$ as at 31 December 2020. During 2021, the Rand weakened by 8.5% to R15.94/US$ as at 31 December 2021. See —The continued status of South Africa’s credit rating as non-investment grade may have an adverse effect on Sibanye-Stillwater’s ability to secure financing or could result in any such financing being available only at greater cost. Any significant appreciation of the Rand against the US dollar would increase Sibanye-Stillwater's operating costs in US dollar terms, and reduce revenue in Rand terms, which could materially adversely affect its operating results and financial condition from the South African operations. Conversely, a weakening of the Rand may result in higher inflation in South Africa, which would increase the prices Sibanye-Stillwater pays for products and services. In light of these factors and the likely impact on cash flow, its management regularly re-evaluates its current growth capital expenditure plans. Certain projects may be deferred or placed on care and maintenance until commodity prices sustainably improve, and/or currency exchange rate volatility has subsided. Should a strong Rand/US dollar exchange rate persist without a corresponding gain in commodity prices, Sibanye-Stillwater may consider increasing operational flexibility by adjusting mine plans, reducing capital expenditure or selling assets and, if necessary, consider options to increase funding flexibility. Also see —Sibanye-Stillwater has had, and may in the future have, a large amount of indebtedness, thereby potentially impacting profitability. All of the above could have a material adverse effect on Sibanye-Stillwater’s business, operating results and financial condition.
Sibanye-Stillwater has had, and may in the future have, a large amount of indebtedness, thereby potentially impacting profitability
As at 31 December 2021, Sibanye-Stillwater had committed undrawn debt facilities of R15.7 billion (US$988 million) (2020: R7.3 billion; 2019: R5.7 billion). Sibanye-Stillwater’s credit facilities contain financial and/or other covenants and restrictions. Such covenants may include restrictions on Sibanye-Stillwater incurring additional financial indebtedness and obligations to maintain certain financial covenant ratios for as long as any amount is outstanding under such facilities. Specifically, Sibanye-Stillwater’s borrowing facilities permit a leverage ratio of 2.5:1, calculated on a quarterly basis. Although Sibanye-Stillwater has deleveraged to its targeted leverage ratio of no greater than 1.0:1, there can be no guarantee that this leverage ratio will be maintained, particularly if Sibanye-Stillwater undertakes significant financing in the future (e.g. in connection with an acquisition). Further, Sibanye-Stillwater’s ability to maintain its leverage ratio may be impacted by the COVID-19 pandemic or prolonged industrial action at Sibanye-Stillwater’s SA gold operations, including as a result of any impact to production. For more information see —The impact from, and measures taken to address, the COVID-19 pandemic may adversely affect Sibanye-Stillwater’s people, and may impact Sibanye-Stillwater’s business continuity, operating results, cash flows and financial condition and —Sibanye-Stillwater’s operations and profits have been and may be adversely affected by labour unrest and union activity.
Sibanye-Stillwater is also required to make production deliveries under the precious metals purchase agreement with Wheaton Precious Metals International Ltd. (Wheaton International) (the Agreement with Wheaton), which could make obtaining additional financing on favourable terms more difficult to arrange. Furthermore, there is no certainty that Sibanye-Stillwater will be able to meet its delivery obligations thereunder.
In the near-term, Sibanye-Stillwater expects to manage its liquidity needs from cash generated by its operations, cash on hand, the committed and unutilised debt facilities, as well as additional funding opportunities. Sibanye-Stillwater, if necessary, in order to manage its covenants, may also consider options to increase funding flexibility which may include, among others, streaming facilities, prepayment facilities, facility restructuring, or in the event that other options are not deemed preferable by the Board, an equity capital raise. However, there can be no assurance that funding will be available to Sibanye-Stillwater on acceptable terms, if at all, and that any of the measures which Sibanye-Stillwater may undertake to increase liquidity or actively manage its covenants would be successful. If Sibanye-Stillwater’s cost of debt were to increase or if it were to encounter other difficulties in obtaining financing, its sources of funding may not match its financing needs, which could have a material adverse effect on Sibanye-Stillwater’s business, operating results and financial condition.
The continued status of South Africa’s credit rating as non-investment grade may have an adverse effect on Sibanye-Stillwater’s ability to secure financing or could result in any such financing being available only at greater cost
Prior to 2018, the challenges facing the mining industry and other sectors, among other factors, had resulted in the downgrading of South Africa’s sovereign credit rating to non-investment grade by Standard & Poor’s and Fitch Ratings. On 23 March 2018, Moody’s affirmed its Baa3 sovereign credit rating for South Africa and upgraded its outlook to stable, listing the beginning of reform under president Ramaphosa. On 26 May 2018, Standard & Poor’s affirmed its non-investment sovereign credit rating for South Africa of BB with a stable outlook and on 23 November 2018 kept South Africa’s sovereign credit ratings unchanged at non-investment grade. On 26 July 2019, Fitch Ratings affirmed its sub-investment grade sovereign credit rating of BB+ for South Africa and downgraded its outlook from stable to negative. On 27 March 2020, Moody’s downgraded South Africa’s sovereign credit rating to the non-investment grade credit rating of Ba1 with a negative outlook, citing the continuing deterioration in fiscal strength and structurally very weak growth. On 3 April 2020, Fitch Ratings downgraded South Africa’s sovereign credit rating to BB, maintaining a negative outlook. On 29 April 2020, Standard & Poor’s downgraded South Africa’s sovereign credit rating to BB-, with a stable outlook. On 20 November 2020, each of Moody’s and Fitch Ratings downgraded South Africa’s sovereign credit rating further to Ba2 with a negative outlook, and BB- with a negative outlook, respectively. On 15 December 2021, Fitch Ratings revised its outlook from negative to stable and re-affirmed South Africa’s sovereign credit rating of BB-.
The continued status of South Africa’s sovereign credit rating as non-investment grade by Standard & Poor’s, Moody’s or Fitch Ratings may adversely affect the South African mining industry, including Sibanye-Stillwater, by making it more difficult to obtain external financing or could result in any such financing being available only at greater cost or on more restrictive terms than might otherwise be available. The recent downgrades of South Africa’s sovereign credit rating could also have a material adverse effect on the South African economy as many pension funds and other large investors are required by internal rules to sell bonds once two separate agencies rate them as non-investment grade. Any such negative impact on the South African economy may adversely affect the South African mining industry and Sibanye-Stillwater’s business, operating results and financial condition.
Power cost increases in South Africa and elsewhere may adversely affect Sibanye-Stillwater’s results of operations
Sibanye-Stillwater’s mining operations in South Africa depend upon electrical power generated by the state-owned power supply utility, Eskom. Eskom, which supplied approximately 89% of the country’s electricity needs during 2021, has historically experienced financial difficulties that have been caused by several factors. For example, during certain periods of supply-constraint, Eskom has utilised significant amounts of diesel to run its gas turbines while concurrently losing electricity sales as a result of load shedding or curtailment, which has contributed to above inflation tariff applications. See —Power deficits, fluctuations and usage constraints may force Sibanye-Stillwater to halt or curtail operations.
The electricity supply industry in South Africa, including Eskom tariffs, is regulated by National Energy Regulator of South Africa (NERSA). Eskom tariffs are determined through a consultative multi-year price determination application (MYPD) process, with occasional tariff increase adjustments under the regulatory clear account (RCA) mechanism. In the MYPD 4 process, NERSA granted Eskom tariff increases of 9.42% (later adding an additional 4.4%) for the year ended 31 March 2020, 8.1% (later adding an additional 0.66%) for the year ended 31 March 2021 and 5.22% (later adding an additional 9.9%) for the year ended 31 March 2022. In February 2022, NERSA granted Eskom a 9.61% tariff increase for the period 2022 to 2023 as part of the MYPD 5 application, including a R8 billion RCA amount for the year 2014 to 2018 and for the year 2019 to 2021, and a RCA amount of R6 billion arising from the year 2018 to 2019.
The tariff increases are subject to multiple adjustments and challenge by NERSA, any of which could result in higher tariffs. For example, in 2020, the South African government provided Eskom with an additional R69 billion bailout over a three-year period, from 2019 to 2021, which was later approved by a court. NERSA has additionally allowed the revenue recovery of R6.6 billion in the 2021 to 2022 year (half of NERSA’s determination of a R13.3 billion RCA amount for the period from 2018 to 2019), instead of the R27.3 billion amount that Eskom had applied for.
Combined, these outcomes create uncertainty as to the tariff rates that will ultimately be applicable to Sibanye-Stillwater, and in the event that existing conditions persist or are exacerbated, the electricity tariff will continue to increase significantly in coming years.
In February 2019, the President of South Africa announced the vertical unbundling of Eskom. While full state ownership will be maintained, the unbundling is expected to result in the separation of Eskom’s generation, transmission and distribution functions into separate entities, which may require legislative and/or policy reform. The unbundling is currently underway and is expected to be completed by December 2021 for the legal separation of the transmission function, and December 2022 for the generation and distribution functions. Poor reliability of the supply of electricity and instability in prices through the unbundling process is expected to continue. Should Sibanye-Stillwater experience further power tariff increases, its business operating results and financial condition may be adversely impacted.
In the United States, power costs are openly traded and can fluctuate based on power outages across the United States. Over the longer term, changes in the US energy market, including a potential movement away from coal power, may increase the operating cost of Sibanye-Stillwater’s US operations, which could have a material adverse effect on its business, operating results and financial condition.
If any of Sibanye-Stillwater’s operations do not perform in line with its expectations, Sibanye-Stillwater may be required to write down the carrying value of its long term assets, which could affect Sibanye-Stillwater’s profitability and the ability to pay dividends
In terms of IFRS, Sibanye-Stillwater is required to test the carrying value of long term assets or cash-generating units for impairment at least annually and more frequently if it has reason to believe that its expectations for the future cash flows generated by these assets may no longer be valid. If the results of operations and cash flows generated by Sibanye-Stillwater’s gold and PGM operations are not in line with its expectations, it may be required to write down the carrying value of the investment. Any write down could materially affect Sibanye-Stillwater’s profits and financial condition.
Our business is subject to high fixed costs which may impact its profitability
The mining industry, particularly the gold and PGM mining industry, is generally labour intensive and characterised by high fixed costs on a short-term operating basis. The majority of operating costs of each mining operation does not vary significantly with the production rate and, therefore, a relatively small change in productivity as a result of, for example, strikes or other work stoppages could have a disproportionate effect on operating and financial results. Costs are generally more stable than revenues, the latter being driven by commodity price and currency exchange rates, which can be volatile. Accordingly, changes in revenue due to commodity price or currency exchange rate movements could have a material adverse effect on Sibanye-Stillwater’s growth or financial performance. Above-inflation increases in fixed costs such as labour or electricity costs may cause parts of Sibanye-Stillwater’s resources to become uneconomical to mine and lead to the closure of marginal shafts or other areas at its operations. This would impact on planned production levels and declared reserves and could have a material adverse effect on Sibanye-Stillwater’s business, operating results and financial condition. See Annual Financial Report—Overview—Management’s discussion and analysis of the financial statements—Factors affecting Sibanye-Stillwater’s performance—Costs.
Theft of gold, PGM and production inputs, as well as illegal artisanal mining, may occur on some of Sibanye-Stillwater’s properties. These activities are difficult to control, can disrupt Sibanye-Stillwater’s business and can expose Sibanye-Stillwater to liability
Sibanye-Stillwater has experienced and will continue to experience illegal and artisanal mining activities and theft of precious metals bearing materials (which may be by employees or third parties) at its South African-based properties. The South African government has called for increased security at all mines following an explosion that resulted in several fatalities and trapped illegal miners underground at a mine in Middleburg, South Africa, that is not associated with Sibanye-Stillwater. Incidences of illegal mining and theft have escalated as a result of social and economic conditions intensified by the COVID-19 pandemic. As a result, in 2021, Sibanye-Stillwater experienced 375 incidents of illegal mining at its underground operations (an increase from 226 in 2020), resulting in the arrests of 473 illegal miners and 238 employees for assisting illegal mining activities. During the same period, there has been an increase in the number of incidents at Sibanye-Stillwater’s surface operations, with 573 incidents of illegal mining detected (2020: 683) which resulted in the arrests of 226 illegal miners.
In addition, despite security controls being in place, Sibanye-Stillwater has experienced incidents of attempted theft at processing plants and concentrators, which contain material bearing gold and PGMs. In 2021, the Minerals Council members reported 18 attacks on the gold processing facilities and operations of other gold producers. Seven attacks were recorded at Marikana in 2021.
Rising gold or PGM prices have been known to result in an increase in gold or PGM theft, expected to be principally at its South African-based mines. It is possible that mine owners may be held responsible for the actions of such illegal miners or for any damages, injuries or fatalities that occur due to their actions. The activities of illegal and artisanal miners could also lead to a reduction of mineral reserves, potentially affecting the economic viability of mining certain areas and shortening the lives of the operations, as well as causing possible operational disruption, project delays, disputes with illegal miners and communities, pollution or damage to property for which Sibanye-Stillwater could potentially be held responsible, leading to fines or other costs. Furthermore, regulatory uncertainty relating to the legalisation of currently illegal surface mining activities in South Africa may result in an increase in the scale and extent of such illegal surface mining activities in the future. The occurrence of any of these events could have a material adverse effect on Sibanye-Stillwater’s business, operating results and financial condition.
Sibanye-Stillwater is subject to the imposition of various regulatory costs, such as income taxes and royalties, changes to which may have a material adverse effect on Sibanye-Stillwater’s operations and profits
In recent years, governments, communities, NGOs and trade unions in several jurisdictions have sought and, in some cases, have implemented greater cost imposts on the mining industry, including through the imposition of additional taxes and royalties. Such resource nationalism, whether in the form of cost imposts, interference in project management, mandatory social investment requirements, local content requirements or creeping expropriation could impact the global mining industry and Sibanye-Stillwater’s business, operating results and financial condition.
In December 2017, during the African National Congress’ (ANC) national conference, the ANC resolved that as a matter of policy, the ANC should pursue the expropriation of land without compensation, provided that such expropriation is carried out without destabilising the agricultural sector, endangering food security or undermining economic growth and job creation. On 27 February 2018, the National Assembly assigned the Constitutional Review Committee (CRC) to review section 25 of the South African Constitution and other relevant clauses to make it possible for the state to expropriate land in the public interest without compensation.
The CRC’s report was adopted by Parliament in December 2019. In September 2021, the Constitution Eighteenth Amendment Bill (Constitution Eighteenth Amendment Bill) was introduced to the National Assembly, which proposed to authorise the state to expropriate land for the purposes of land reform, including any improvements to land, without compensation. In December 2021 the National Assembly rejected the second reading of the Constitution Eighteenth Amendment Bill, and it has therefore lapsed.
Separately, in October 2020, the Expropriation Bill, 2020 (Expropriation Bill) was introduced in the National Assembly, which would allow the state to expropriate land without compensation where doing so would be for a public purpose or in the public interest. Public hearings on the Expropriation Bill were held during March and September 2021, and it remains under consideration by the National Assembly.
Section 5(3) of the MPRDA provides a statutory right of access for the mining right holder to the mining area for the purposes of conducting mining operations and does not require the holder to own the land on which it conducts operations.
In South Africa, the ANC has adopted two recommended approaches to interacting with the mining industry. While the ANC has rejected the possibility of mine nationalisation for now, the first approach contemplates, among other things, greater state intervention in the mining industry, including the revision of existing royalties and the imposition of new taxes. For example, Sibanye-Stillwater is engaged in disputes with South African municipalities regarding the valuation of certain property for the purposes of property-related taxes calculation. The second approach contemplates the South African government taking a more active role in the mining sector, including through the introduction of a state mining company to be involved in new projects either through partnerships or individually.
The adopted policies may impose additional restrictions, obligations, operational costs, taxes or royalty payments on mining companies, including Sibanye-Stillwater, any of which could have a material adverse effect on Sibanye-Stillwater’s business, operating results and financial condition.
The former South African Minister of Finance appointed the Davis Tax Committee to review the mining corporate income tax regime at the time. The committee’s final report on mining, which was issued in 2017, proposed no changes to the royalty regime but recommended the discontinuation of the upfront capital expenditure write-off regime in favour of an accelerated capital expenditure depreciation regime. In addition, the report recommended retaining the so called “gold formula” for existing gold mines only, as new gold mines would be unlikely to be established in circumstances where profits are marginal or where gold mines would conduct mining of the type intended to be encouraged by the formula. The committee also recommended the phasing out of additional capital allowances available to gold mines in order to bring the gold mining corporate income tax regime in line with the tax system applicable to all taxpayers. In 2020, the South African National Treasury published for public comment the 2020 Draft Taxation Laws Amendments Bill which proposed, amongst others, amendments to disallow contract miners from benefitting from the accelerated capital expenditure allowance and the elimination of the Minister of Finance’s discretion to uplift the ring-fencing of capital expenditure per mine. Various stakeholders raised issues with the draft bill during the public consultation period. Consequently, in October 2020, the South African National Treasury decided to postpone the adoption of the amendments until the 2021 legislative cycle as it continues to review the comments raised. No proposed amendments were introduced in the 2021 legislative cycle, or to date. It is not clear whether any further proposals will be made in this regard in future.
Any of the above could have a material adverse effect on Sibanye-Stillwater’s business, operating results and financial condition.
Actual and potential supply chain shortages and increases in the prices of production inputs may have a material adverse effect on Sibanye-Stillwater’s operations and profits
Sibanye-Stillwater’s results of operations may be affected by the availability and pricing of raw materials and other essential production inputs, including, for example, explosives, fuel, steel, cyanide and other reagents required at its mining and processing operations. The price and quality of raw materials may be substantially affected by changes in global supply and demand, along with weather conditions, governmental controls and other factors. A sustained interruption in the supply of any of these materials could require Sibanye-Stillwater to find acceptable substitute suppliers and could require Sibanye-Stillwater to pay higher prices for such materials. The prices of certain of Sibanye-Stillwater’s production inputs are impacted by, among other things, the prices of oil and steel, which may be volatile. For example, the price of oil fluctuated between US$68.66 and US$19.33 per barrel of Brent Crude in 2020, and between US$51.68 and US$79.32 per barrel of Brent Crude in 2021. This volatility has and is expected to continue following the imposition of sanctions and embargoes on natural gas and oil resulting from Russia’s invasion of Ukraine. As at 31 March 2022, the price of oil was US$104.71 per barrel of Brent Crude.
Any significant increase in the prices of these materials will increase Sibanye-Stillwater’s operating costs and affect production considerations.
Sibanye-Stillwater’s insurance coverage may not adequately satisfy all potential claims and exposures
Sibanye-Stillwater has an insurance programme, including partial self-insurance. However, Sibanye-Stillwater may become subject to liability (including that which arises out of class-action or other litigation) against which it has not been insured, cannot insure or is insufficiently insured, including those relating to past mining activities, tailing disasters, data protection and cybersecurity breaches. In addition, Sibanye-Stillwater’s existing property and business interruption insurance and liability may not cover a particular event at all or be sufficient to fully cover Sibanye-Stillwater’s losses, including, without limitation, as a result of natural disasters, public health emergencies and other events that could disrupt Sibanye-Stillwater's operations, such as COVID-19 and climate change related incidents. See —The impact from, and measures taken to address, the COVID-19 pandemic may adversely affect Sibanye-Stillwater’s people, and may impact Sibanye-Stillwater’s business continuity, operating results, cash flows and financial condition. Sibanye-Stillwater’s existing property and liability insurance contains specific exclusions and limitations on coverage. For example, should Sibanye-Stillwater be subject to any regulation or criminal fines or penalties, these amounts would not be covered under its insurance programme. Should Sibanye-Stillwater suffer a major loss, which is insufficiently covered, future earnings could be affected. In addition, certain classes of insurance may not continue to be available at economically acceptable premiums. As a result, in the future, Sibanye-Stillwater’s insurance coverage may not fully cover the extent of claims against it or any cross-claims made.
Sibanye-Stillwater’s US recycling business relies on maintaining relationships with third-party suppliers and has other credit and operational risks
In the United States, Sibanye-Stillwater sources automotive and industrial catalyst materials from third-parties through both purchase and tolling arrangements. Sibanye-Stillwater has entered into sourcing arrangements for recycled materials with various suppliers, and it depends on those suppliers to provide catalyst and other industrial sources for recycling. Sibanye-Stillwater is subject to the suppliers’ compliance with the terms of these arrangements and to their contractual right to terminate or suspend the agreement. Should one or more of these sourcing arrangements be terminated, Sibanye-Stillwater might be unable to source replacement recyclable materials on terms that are acceptable to Sibanye-Stillwater. If Sibanye-Stillwater is unable to source sufficient quantities of recycled materials, the US recycling business would become less profitable, and this loss could negatively affect Sibanye-Stillwater’s business and results of operations. Similarly, these suppliers in turn typically source material from various other third parties in a competitive market, and there can be no assurance of the suppliers’ continuing ability or willingness to source material on behalf of Sibanye-Stillwater at current volumes and prices. Any constraint on the suppliers’ ability to source material could reduce the profitability of Sibanye-Stillwater’s US recycling business.
From time to time, Sibanye-Stillwater may advance cash to third-party brokers and suppliers to support the purchase and collection of spent catalyst materials and other industrial sources. These advances are normally made at the time that material arrives at or is ready for shipment to Sibanye-Stillwater’s facilities. In some cases, Sibanye-Stillwater has a security interest in the materials that the suppliers have procured but which Sibanye-Stillwater has not yet received. The unsecured portion of these advances is fully at risk.
Sibanye-Stillwater regularly advances money to its established recycling suppliers for catalyst material that Sibanye-Stillwater has physically received and carries in its processing inventories. These advances typically represent some portion of the estimated total value of each shipment until final assays are completed determining the actual PGM content of the shipment. Upon completion of the shipment assays, a final settlement takes place based on the actual value of the shipment. However, pending completion of the assays, the payments are based on the estimated PGM content of each shipment, which could vary from the actual PGM content upon assay. Should the estimated PGM content upon assay significantly exceed the actual PGM content, Sibanye-Stillwater may be at risk for a portion of the amount advanced. Should the supplier be unable to settle such an overpayment or seek protection from creditors, Sibanye-Stillwater could incur a loss to the extent of any overpayment.
In its US recycling business, Sibanye-Stillwater regularly enters into fixed forward sales contracts for metal produced from catalyst recycling, normally making these commitments at the time the catalyst material is purchased. For Sibanye-Stillwater’s fixed forward sales related to recycling of catalysts, Sibanye-Stillwater is subject to the customers’ compliance with the terms of the agreements, their ability to terminate or suspend the agreements and their willingness and ability to pay. The loss of any of these agreements or failure of a counterparty to perform could require Sibanye-Stillwater to sell or purchase the contracted metal in the open market, potentially at a significant loss. Sibanye-Stillwater’s revenues for the year ended 31 December 2021, included 24% from recycling sales and tolling fees in the United States.
Many of Sibanye-Stillwater’s US recycling suppliers are comparatively small businesses with limited assets and relatively little credit capacity. While Sibanye-Stillwater monitors funds being advanced to such businesses and seeks to limit its exposure to any one supplier, if a problem develops with such a supplier, Sibanye-Stillwater might not be able to fully recover amounts previously advanced to that supplier.
Volumes of recycling materials available in the marketplace fluctuate substantially in response to changes in commodity prices. Lower PGM and steel prices normally reduce the volume of recycling material available in the market, resulting in less earnings and cash flow from the recycling segment, and therefore less economic support for the mining operations. Should it become necessary at any point to reduce or suspend operations at the mines, the proportion of processing costs allocated to the recycling segment would increase substantially. Further, the ability to operate the smelter and refinery without significant volumes of mine concentrates and the contained copper and nickel has never been demonstrated and is likely to require modification to the processing facilities. There is no assurance that the recycling facilities can operate profitably in the absence of significant mine concentrates, or that capital would be available to complete necessary modifications to the processing facilities.
For its PGMs mined in the United States, Sibanye-Stillwater’s sales arrangements concentrate all its final refining activity and a large portion of its PGM sales from mine production with one entity
Sibanye-Stillwater utilises a single company for all of its precious metals refining services for Sibanye-Stillwater’s US mining operations, and, with the exception of certain pre-existing platinum sales commitments, all of Sibanye-Stillwater’s current mined palladium and platinum in the United States is committed for sale to such company. In addition, this company has the right to bid on any recycling PGM ounces Sibanye-Stillwater has available in the United States.
This significant concentration of business with a single company could leave Sibanye-Stillwater without precious metal refining services in the United States should such company experience significant financial or operating difficulties during the contract period. Under such circumstances, it is not clear that sufficient alternate processing capacity would be available to cover Sibanye-Stillwater’s requirements, nor that the terms of any such alternative processing arrangements as might be available would be financially acceptable to Sibanye-Stillwater. Any such disruption in refining services could have a negative effect on Sibanye-Stillwater’s ability to generate revenues, profits and cash flows.
Value chain standards are becoming more stringent and may result in increased capital and operating expenditures and decreased production
In addition to rapidly evolving legal and regulatory requirements in the jurisdictions in which it operates, Sibanye-Stillwater is also subject to evolving industry and value chain standards, including increasingly stringent offtaker and supply chain requirements. As environmental, health and safety regulations become stricter globally, the value chains in which Sibanye-Stillwater participates have increasingly adopted heightened requirements. For example, downstream users of PGMs such as automobile manufacturers are starting to insist on stringent accreditation of all commodities to the extent of specifying Initiative for Responsible Mining Assurance (IRMA) as the required standard to demonstrate site-level ESG performance. In extreme cases, there is a risk that costs could exceed the production value in certain of the markets in which the Group participates or is expanding, such as in respect of its battery metals projects. As a result, Sibanye-Stillwater may experience “stranded production” wherein revenues, profit and cash flows cannot support the high cost of production. To the extent that Sibanye-Stillwater is unable to conform with such standards or incurs significant capital expenditures or investments to do so, its business, operating results and financial condition may be materially impacted.
Sibanye-Stillwater may discover contingent or other liabilities within its acquired companies or other facts of which it is not aware that could expose Sibanye-Stillwater to loss
Although Sibanye-Stillwater has typically received representations, warranties and indemnities in the context of its acquisitions under the terms of the agreements regarding those acquisitions, and it typically conducts general due diligence in connection with its acquisitions, such due diligence was necessarily limited. There can be no assurance that Sibanye-Stillwater identified all the liabilities of, and risks associated with, its acquisitions or that it will not be subject to unknown liabilities of, and risks associated with, the entities acquired, including liabilities and risks that may become evident only after Sibanye-Stillwater has been involved in the operational management of the relevant entities. Sibanye-Stillwater may incur losses in excess of this maximum amount provided for in the relevant indemnities, or the matters giving rise to the losses may not be recoverable against the relevant warranties or indemnities or at all. Examples of such claims include actions instituted for contracting silicosis.
The effect of US tax reform legislation on Sibanye-Stillwater and its subsidiaries is uncertain
In April 2021, the US Department of Treasury released the “Made in America Tax Plan Report”, which describes President Biden’s Made in America tax plan, part of the newly announced American Jobs Plan. The report seeks to reform the existing US tax legislation by, among other things, proposing to increase the corporate tax rate in the United States from 21% to 28%. In addition, it proposes a minimum tax of 15% on worldwide book income for corporations with such income in excess of US$2 billion. There are also provisions in the plan that could potentially impact the ability to deduct expenses paid to foreign related parties and could eliminate the percentage depletion deduction for tax purposes. The percentage depletion deduction is a permanent tax deduction which has reduced Sibanye-Stillwater’s taxable income in recent years. While the plan does not specifically address this deduction, the Biden administration is focused on the fossil fuel industry and may look to eliminate incentives, including tax incentives, to the mining industry in general. While the tax plan remains subject to extensive legislative process, it could be adopted in some form. It is uncertain whether the approved legislation will reflect the current proposals or any other changes to the existing US tax regime. The future finalisation of these proposed tax measures may have a significant impact on future US cash taxes and may require a remeasurement of future deferred tax assets and liabilities in the period of enactment, which in turn could have a material adverse effect on Sibanye-Stillwater’s business, operating results and financial condition.
Risks related to realisation of value from strategic acquisitions and business ventures
Sibanye-Stillwater's growth strategy, including the pursuit of value accretive acquisitions and joint ventures, may not deliver anticipated outcomes
As part of its growth strategy, Sibanye-Stillwater pursues, from time to time, growth opportunities through acquisitions and business combination transactions, in order to enhance or sustain its ability to pay an industry-leading dividend and to allow it to consolidate operations, diversify its minerals portfolio, expand into new markets, increase scale and implement best practices across operations. For example, between 2016 and 2019, Sibanye-Stillwater acquired the Rustenburg, Aquarius, Stillwater and Marikana operations. More recently, beginning in 2021, Sibanye-Stillwater began its strategic expansion into battery metals projects in the Keliber Oy lithium project (February 2021), the proposed acquisition of the Sandouville nickel processing facility (July 2021), investment in ioneer Limited (ioneer) (September 2021) and the acquisition of a 19.9% stake in New Century, an Australian tailings management and rehabilitation company (November 2021).
The acquisition of operating assets for commodities other than gold or PGMs, including for example, the Sandouville Nickel processing facility, expose Sibanye-Stillwater to the risk of operating in an environment and market with which its management has less experience. In addition, to the extent Sibanye-Stillwater participates in the development of a project through a joint venture or any other multi-party commercial structure, there could be disagreements, legal or otherwise, or divergent interests or goals among the parties, which could jeopardise the success of the project. There can be no assurance that any acquisition, business combination or joint venture, or the acquisition of any new mining assets or operations, will achieve the results intended, and, as such, could have a material adverse effect on Sibanye-Stillwater’s business, operating results and financial condition.
Sibanye-Stillwater faces intense competition for the acquisition of attractive mining properties. From time to time, Sibanye-Stillwater evaluates the acquisition of ore reserves, development properties or operating mines, either as stand-alone assets or as part of existing companies. The decision to acquire these properties may be based on a variety of factors, including historical operating results, estimates and assumptions regarding the extent of the ore reserve, cash and other operating costs, mineral prices, projected economic returns and evaluations of existing or potential liabilities (including environment liabilities) associated with the relevant property and its operations and how these factors may change in the future. Other than historical operating results, these factors are uncertain and could have an impact on revenue, cash and other operating costs, as well as the process used to estimate the ore reserve. To the extent that Sibanye-Stillwater is unable to realise the anticipated benefits of its acquisitions, its growth strategy, along with its business, operating results and financial condition, may be materially impacted.
Sibanye-Stillwater may face challenges in the integration of acquired assets, such as the Sandouville nickel processing facility, which could disrupt its current operations or result in higher costs or worse overall performance than anticipated. If Sibanye-Stillwater is unable to successfully integrate its acquired assets in a timely and cost-effective manner, the potential benefits of the acquisition, including the estimated revenue and cost synergies Sibanye-Stillwater expects to achieve, may not be realised. Additionally, the integration of any acquired assets requires management capacity. There can be no assurance that Sibanye-Stillwater’s current management team will have sufficient capacity to successfully integrate existing or future assets and operations into Sibanye-Stillwater.
Acquisitions, business combinations, development projects and joint ventures, including Sibanye-Stillwater’s battery metals projects, may expose Sibanye-Stillwater to new or increased regulatory oversight or requirements, including in geographies in which it is unfamiliar
Sibanye-Stillwater has in the past, and may in the future, pursue opportunities for expansion into new geographies or markets where it has limited to no prior experience, and which may subject it to new or increased regulatory oversight or requirements. For example, the Stillwater Acquisition expanded Sibanye-Stillwater’s operations into the United States, wherein Sibanye-Stillwater was subject to new and additional reporting requirements. At a corporate level, Sibanye-Stillwater has historically had limited experience with the MSHA, which oversees and enforces regulations pertaining to the health and safety of workers at Sibanye-Stillwater’s US operations. During 2022, as part of its battery metals strategy, Sibanye-Stillwater initiated direct operations in France, where it has no prior operational experience. Such expansions may lead to increased costs related to ensuring governance, regulatory, legal and accounting compliance across multiple regions. In addition, future acquisitions, business combinations or joint ventures may change the scale of Sibanye-Stillwater’s business and operations and may expose it to new geographical, geological, commodity, political, social, labour, operational, financial, legal, regulatory and contractual risks.
To the extent that Sibanye-Stillwater seeks to further expand its existing mining operations, it may experience problems associated with mineral exploration or development of mining projects
Sibanye-Stillwater aims to expand its operations and reserve base through targeted acquisitions, joint ventures and development projects as well as organically, through its existing exploration programmes and investigations. However, such projects may be capital intensive, have a long lead time and are subject to risks relating to the location of economic ore bodies, the development of appropriate extractive processes, cost overruns and delays, the receipt of necessary governmental permits and regulatory approvals and the extension of mining and processing facilities at the mining site. For example, Sibanye-Stillwater requires, from time to time, new or amended permits to expand water, rock and tailing storage facilities in respect of its Stillwater operations. If it is unable to obtain such permits, or do so in a timely manner, its operations would be significantly impacted.
Sibanye-Stillwater may continue to investigate the exploitation of mineralisation below the current mining levels and infrastructure limits at its operations, including brownfields exploration at selected operations in South Africa as well as ongoing drilling at the Blitz Project to further refine existing reserves as well as for the definition of future reserves. Sibanye-Stillwater has also been undertaking exploration activities in conjunction with its joint venture partner, Regulus Resources Ltd (Regulus), at the Altar project, a large porphyry-style copper-gold deposit in Argentina, and the Marathon project, a porphyry-style PGM-copper deposit in Canada. There can be no assurance that any exploration or expansion projects will be successful, partially or at all, and the failure of Sibanye-Stillwater to expand its reserves through such projects could have a material adverse effect on its business, operating results and financial condition.
Sibanye-Stillwater’s battery metals strategy is subject to certain risks, and Sibanye-Stillwater may never develop minerals in sufficient grade or quantities to justify commercial operations
As part of its battery metals strategy, Sibanye-Stillwater has made, and may continue to make, strategic investments in battery metals development projects to enhance its positioning in the future green economy. In 2021, Sibanye-Stillwater made two such investments: purchasing a stake in Keliber Oy, a Finnish mining and chemical company with an aim of producing battery grade lithium hydroxide and acquired a 7.1% stake in ioneer with an option to acquire a 50% interest in the joint venture to develop the Rhyolite Ridge, a strategic lithium-boron asset in the United States. Mineral resource exploration, development, and operations are highly speculative and are characterised by a number of significant risks, including, among other things, unprofitable efforts resulting not only from the failure to discover mineral resources, and from finding mineral resources which, though present, are insufficient in quantity and quality to return a profit from production. Once mineralisation is discovered, it may take a number of years from the initial exploration phases before production is possible, during which time the potential feasibility of the project may change adversely.
Sibanye-Stillwater’s direct investment in ioneer and proposed joint venture in respect of development at the Rhyolite Ridge is expected to be one of the first large scale US lithium projects to enter production. However, no assurance can be given that minerals will be discovered in sufficient grade or quantities to justify commercial operations. Whether an exploration property will be commercially viable depends on a number of factors, including: the particular attributes of the deposit, such as size, grade and proximity to infrastructure; metal prices, which are highly cyclical; availability of and effectiveness of technology to recover, trans-ship, transport and process modules; availability of required personnel, third-party partners and contractors, any required financing; commercial demand in the marketplace for such metals and government regulations, including regulations relating to prices, taxes, royalties, land tenure, land use, and environmental protection. For example, a threatened species of buckwheat is native to parts of the Rhyolite Ridge. Although Sibanye-Stillwater’s investment is conditional upon the receipt of an operating permit at the site, this process may be significantly delayed and may require the preparation and presentation of data to governmental authorities pertaining to the potential adverse impact that any proposed mining and processing activities may have on the environment, individually or in the aggregate. Compliance with these regulatory requirements may be expensive and significantly lengthens the time needed to develop the site.
The precise impact of these factors cannot accurately be predicted, but the combination of these factors may result in the inability of Sibanye-Stillwater's strategic investments to operate or generate an adequate return on invested capital. In addition, value chain requirements are rapidly evolving in such markets, which may require Sibanye-Stillwater to expend significant time and resources to conform with, as a result of which the profitability of such investments may decline.
The prevailing market prices of nickel, lithium, copper zinc and other commodities will have a material impact on the commercial success of Sibanye-Stillwater's battery metals strategy
The profitability of Sibanye-Stillwater's battery metals strategy will be significantly affected by changes in the market price of green metals (e.g. nickel, lithium, copper and zinc) and the cost of power, petroleum fuels, and oil, among other commodities and supply requirements. Prices of such metals are affected by numerous factors beyond Sibanye-Stillwater's control, including: prevailing interest rates and returns on other asset classes; expectations regarding inflation, monetary policy and currency values; speculation; governmental and exchange decisions regarding the disposal of metal stockpiles; political and economic conditions; available supplies of battery metals from mine production, inventories and recycled metal; sales by holders and producers of battery metals; and demand for products containing nickel, lithium, copper and zinc. The price of such battery metals and other minerals and oil has fluctuated widely in recent years, and if prices decline, this could have a material adverse impact on Sibanye-Stillwater's business, operating results and financial condition.
The success of Sibanye-Stillwater’s battery metals strategy may be impacted if the electric vehicles sector does not develop as anticipated
The minerals Sibanye-Stillwater intends to collect and process as part of its expansion into the battery metals sector, including lithium, nickel and copper, are contemplated to be significantly linked to growing metals demand in batteries for electric vehicles. As a result, the success of Sibanye-Stillwater's battery metals strategy is partially dependent upon the adoption by consumers of alternative fuel vehicles in general and electric vehicles in particular. While it has been projected that demand for such electric vehicles will surge over time, if the market for electric vehicles does not develop as it expects, or develops slower than it expects, Sibanye-Stillwater's battery metals strategy, along with the climate change resiliency of its business, may be impacted. Factors that may influence the adoption of alternative fuel vehicles, and specifically electric vehicles, include:
•perceptions about electric vehicle quality, safety, design, performance and cost, especially if adverse events or accidents occur that are linked to the quality or safety of electric vehicles;
•the material composition necessary for electric vehicle batteries and the potential of change in chemistry and engineering requirements that may move away from expected demand for nickel and cobalt;
•the decline of an electric vehicle’s range resulting from deterioration over time in the battery’s ability to hold a charge;
•insufficient investment in production causing concerns about the ability of supply to match projected demand for critical battery metals, which may delay the further introduction of new competitive technologies and cap the rate of EV market penetration;
•concerns about electric grid capacity and reliability;
•the availability of alternative fuel vehicles, including plug-in hybrid electric vehicles;
•government regulations and economic incentives promoting fuel efficiency and alternate forms of energy;
•access to charging stations, standardisation of electric vehicle charging systems and consumers’ perceptions about convenience and cost to charge an electric vehicle;
•the availability of tax and other governmental incentives to purchase and operate electric vehicles or future regulation requiring increased use of non-polluting vehicles; and
•perceptions about and the actual cost of alternative fuel.
To the extent that the electric vehicle sector does not develop as anticipated, Sibanye-Stillwater’s battery metals strategy, including demand for its mineral portfolio may be adversely affected, which may in turn materially impact its business, operating results and financial condition.
Risks Related to Sibanye-Stillwater’s Shares and ADSs
Sibanye-Stillwater’s non-South African shareholders face additional investment risk from currency exchange rate fluctuations since any dividends will be paid in Rand
Dividends or distributions with respect to Sibanye-Stillwater’s shares have historically been paid in Rand. The US dollar or other currency equivalent of future dividends or distributions with respect to Sibanye-Stillwater’s shares, if any, will be adversely affected by potential future reductions in the value of the Rand against the US dollar or other currencies. While South African Exchange Control Regulations have been relaxed in recent years, in the future, it is possible that there will be further changes in South African exchange controls, such that dividends paid out of trading profits will not be freely transferable outside South Africa to shareholders who are not residents of the CMA. See Further Information—Additional Information—South African Exchange Control limitations affecting security holders.
Sibanye-Stillwater may not pay dividends or make similar payments to its shareholders in the future due to various factors and any dividend payments made may be subject to withholding tax
Sibanye-Stillwater’s expected dividend policy is to return at least 25% to 35% of normalised earnings to shareholders. Sibanye-Stillwater may pay cash dividends only if funds are available for that purpose. Whether funds are available depends on a variety of factors, including the amount of cash available and Sibanye-Stillwater’s capital expenditures on both existing infrastructure, as well as on exploration and other projects and other cash requirements existing at the time. Under South African law, Sibanye-Stillwater will be entitled to pay a dividend or similar payment to its shareholders only if it meets the solvency and liquidity tests set out in the Companies Act, and is permitted to do so in terms of the Memorandum of Incorporation. Given these factors and the Sibanye-Stillwater Board’s discretion to declare cash dividends or other similar payments, dividends may not be paid in the future. It should be noted that a 20% withholding tax is required to be withheld on dividends paid by, among others, certain South African resident companies (including Sibanye-Stillwater) to any person.
The withholding tax on dividends is subject to domestic exemptions or relief in terms of an applicable double taxation treaty. The application of such domestic exemptions or relief in terms of an applicable double taxation treaty is subject to the making of certain declarations and undertakings by the beneficial owner of the dividends and providing the same to Sibanye-Stillwater or regulated intermediary making payment of the dividend. In terms of the US Treaty, the dividends tax rate is reduced to 5% of the gross amount of the dividends if a corporate US holder holds directly at least 10% of the voting stock of a South African company, or 15% of the gross amount of the dividend in all other cases. Based on current legislation, the declaration and undertaking entitling the holder to a reduced dividend tax must be renewed at least every five years, subject to certain exemptions. See Additional information—Taxation—Certain South African tax considerations—Withholding tax on dividends and Financial information—Dividend policy and dividend distributions.
Sibanye-Stillwater’s shares are subject to dilution, which could adversely affect their trading price
Shareholders’ equity interests in Sibanye-Stillwater will be diluted to the extent of future exercises or settlements of rights under the 2017 Sibanye-Stillwater Share Plan and any additional rights. Sibanye-Stillwater shares are also subject to dilution in the event that the Sibanye-Stillwater Board is required to issue new shares in compliance with applicable B-BBEE legislation. See —Sibanye-Stillwater’s mining rights are subject to legislation, which could impose significant costs and burdens and which impose certain ownership requirements, the interpretation of which is the subject of dispute.
The Sibanye-Stillwater Board has the authority to authorise certain offers and sales of the securities without the vote of, or prior notice to, Sibanye-Stillwater shareholders. Such additional issuances may involve the issuance of a significant number of ordinary no par value shares at prices less than the current market price.
Sales of substantial amounts of securities, or the availability of the securities for sale, could adversely affect the prevailing market prices for the securities and dilute investors’ earnings per share. A decline in the market prices of the securities could impair Sibanye-Stillwater’s ability to raise additional capital through the sale of additional securities should Sibanye-Stillwater desire to do so.
Further, the issuance of shares in connection with any acquisition (whether in the form of consideration or otherwise) may result in dilution to existing shareholders. For example, on 7 June 2019, Sibanye-Stillwater concluded the Lonmin Acquisition. As consideration for the acquisition, Sibanye-Stillwater issued 290,394,531 new Sibanye-Stillwater shares at R14.83 (the opening price on 10 June 2019), representing 10.9% of Sibanye-Stillwater’s issued share capital on a fully diluted basis.
A large volume of sales of Sibanye-Stillwater’s shares all at once or in tranches, could decrease the prevailing market price of Sibanye-Stillwater’s shares and could impair Sibanye-Stillwater’s ability to raise capital through the sale of equity securities in the future. Additionally, even if substantial sales are not affected, the mere perception of the possibility of these sales could decrease the market price of Sibanye-Stillwater’s shares and could have a negative effect on Sibanye-Stillwater’s ability to raise capital in the future. Further, anticipated downward pressure on Sibanye-Stillwater’s ordinary share price due to actual or anticipated sales of shares could cause some institutions or individuals to engage in short sales of Sibanye-Stillwater’s shares, which may itself cause the price of the shares to decline.
Shareholders outside South Africa may not be able to participate in future issues of securities (including ordinary shares) carried out by or on behalf of Sibanye-Stillwater
Securities laws of certain jurisdictions may restrict Sibanye-Stillwater’s ability to allow participation by certain shareholders in future issues of securities (including ordinary shares) carried out by or on behalf of Sibanye-Stillwater. In particular, holders of Sibanye-
Stillwater securities who are located in the United States (including those who hold Sibanye-Stillwater Shares or Sibanye-Stillwater ADSs) may not be able to participate in securities offerings by or on behalf of Sibanye-Stillwater unless a registration statement under the Securities Act is effective with respect to such securities or an exemption from the registration requirements of the Securities Act is available thereunder.
Securities laws of certain other jurisdictions may also restrict Sibanye-Stillwater’s ability to allow the participation of all holders in such jurisdictions in future issues of securities carried out by Sibanye-Stillwater. Holders who have a registered address or are resident in, or who are citizens of, countries other than South Africa should consult their professional advisers as to whether they require any governmental or other consent or approvals or need to observe any other formalities to enable them to participate in any offering of Sibanye-Stillwater securities.
Investors in the United States and other jurisdictions outside South Africa may have difficulty bringing actions, and enforcing judgments, against Sibanye-Stillwater, the directors and the executive officers based on the civil liabilities provisions of the federal securities laws or other laws of the United States or any state thereof or under the laws of other jurisdictions outside South Africa
Sibanye-Stillwater is incorporated in South Africa. Most of the directors and executive officers reside outside of the United States and substantially all of the assets of these persons and approximately 65% of the assets of Sibanye-Stillwater are located outside the United States. As a result, it may be difficult for investors to enforce against these persons or Sibanye-Stillwater a judgment obtained in a US court predicated upon the civil liabilities provisions of the federal securities or other laws of the United States or any state thereof. In addition, investors in other jurisdictions outside South Africa may face similar difficulties.
Investors should be aware that, as a matter of South African law, courts may only award compensation for the loss or damage actually sustained by the person to whom the compensation is awarded. Awards of punitive damages are unknown to the South African legal system, and are regarded as being contrary to public policy. Whether a judgment is contrary to public policy will depend on the facts of each case. Exorbitant, unconscionable or excessive awards may be contrary to public policy and contractually stipulated penalties are subject to and limited by the provisions of the Conventional Penalties Act, 1962. In instances where a party seeks to have a foreign judgment recognised and enforced in South Africa, South African courts will not enter into the merits of a foreign judgment and cannot act as a court of appeal or review over the foreign court. South African courts will usually implement their own procedural laws in relation to recognition of foreign judgments before enforcing and, where an action based on an international contract is brought before a South African court, the capacity of the parties to the contract will usually be determined in accordance with South African law. Where a party relies on a foreign law, the content of that foreign law must be proved to the South African’s satisfaction and the court may, in certain circumstances, require expert evidence in that regard. It is doubtful whether an original action based on US federal securities laws or the laws of other jurisdictions outside South Africa may be brought before South African courts. Further, a plaintiff who is not resident in South Africa may be required to provide security for costs in the event of proceedings being initiated in South Africa. In addition, the Rules of the High Court of South Africa require that documents executed outside South Africa must be authenticated for the purpose of use in South Africa.
Investors should also be aware that a foreign judgment is not directly enforceable in South Africa, but only constitutes a cause of action. Such a judgment will be enforced by South African courts only if certain conditions are met.
DIRECTORS AND EXECUTIVE MANAGEMENT
On 24 February 2020, Sibanye Stillwater Limited (SSW) and Sibanye Gold Limited (SGL) implemented a scheme of arrangement (the Scheme) in terms of section 114 of the South African Companies Act, 2008, which resulted in, amongst other things, SGL’s operations being reorganised under SSW, which became the parent company of the Sibanye-Stillwater Group. In terms of the scheme, the directors on the board of SGL resigned and were appointed as directors of SSW. In terms of the Companies Act and resolutions passed by the Board, the directors of SSW were appointed to the Board and its Committees with effect from the Implementation Date of the Scheme, which occurred on 24 February 2020.
Chairman and Independent Non-Executive Director
Dr. Thabane Vincent Maphai (70)
BA, BA (Hons), M Phil, D Phil, Catholic University of Leuven, Advanced Management Programme, Harvard University
Dr. Vincent Maphai is the Chairman of the Sibanye-Stillwater Board. Dr. Maphai was appointed a director of Sibanye-Stillwater on 1 June 2019, and appointed as non-executive Chairman of Sibanye-Stillwater, effective on 30 September 2019. He is a non-executive director of Discovery Limited. Previously, he was the Director of Corporate Affairs and Transformation at The South African Breweries Limited. In addition, he served as the southern African Chairperson of BHP Billiton (South African region). Dr. Maphai has accumulated over 20 years’ experience in the academic profession, and 17 years as a senior executive in the private sector. He has served on the boards of various companies as non-executive chairperson, including the South African Broadcasting Corporation and the Presidential Review Commission into the restructuring of the public sector. Dr. Maphai has also held a two-year academic position at Williams College in Massachusetts.
Executive Directors
Neal John Froneman (62)
Chief Executive Officer
BSc Mech Eng (Ind Opt), University of the Witwatersrand; BCompt, University of South Africa; PrEng
Neal Froneman was appointed executive director and CEO of Sibanye-Stillwater on 1 January 2013. Over the past eight years he has led the transformation of Sibanye-Stillwater from a 1.5Moz South Africa-based gold producer into a leading precious metals miner with an international operating footprint. The company now ranks as the world’s top primary producer of PGM metals with a leading position in the PGM recycling industry. Under Neal’s leadership, Sibanye-Stillwater has now started building an international portfolio of battery metal operations along with growing involvement in the circular economy and tailings reprocessing businesses. Neal’s career spans nearly 40 years during which time he worked at Gold Fields Limited (Gold Fields), Harmony Gold Mining Company Limited (Harmony) and JCI Limited. In April 2003, Neal was appointed CEO of Aflease Gold Limited (Aflease Gold), which, through a series of reverse take-overs, became Gold One International Limited (Gold One) in May 2009. He was primarily responsible for the creation of Uranium One Incorporated (Uranium One) from the Aflease Gold uranium assets. During this period, he was CEO of Aflease Gold and Uranium One until his resignation from Uranium One in February 2008. He held the CEO position at Gold One until his appointment at Sibanye-Stillwater. In May 2016, he was elected to serve as a Vice President of the Minerals Council South Africa and has, since 2021, been appointed as a member of the Wits Foundation Board of Governors. He also serves on the Councils of international mining bodies including the ICMM and the World Gold Council.
Charl Keyter (48)
Chief Financial Officer
BCom, University of Johannesburg; MBA, North-West University; ACMA and CGMA
Charl Keyter was appointed a director of Sibanye-Stillwater on 9 November 2012, and executive director and CFO on 1 January 2013. Previously, he was Vice President and Group Head of International Finance at Gold Fields. Charl has more than 27 years’ mining experience, having begun his career at Gold Fields in February 1995.
Independent Non-Executive Directors
Richard Peter Menell (66)
MA (Natural Sciences, Geology), Trinity College, University of Cambridge; MSc (Mineral Exploration and Management), Stanford University FGS, FSAIMM, FAusIMM
Richard (Rick) Menell is a Sibanye-Stillwater Lead Independent non-Executive Director. He was appointed as a non-executive director on 1 January 2013 and as the Lead Independent non-Executive Director on 14 February 2020. He has over 40 years’ experience in the mining industry. Previously, he occupied the positions of President of the Minerals Council, President and CEO of TEAL Exploration & Mining Inc., Chairman of Anglovaal Mining Limited and of Avgold Limited, Chairman of Bateman Engineering Limited, non-executive director and Chairman of Credit Suisse Securities Johannesburg Proprietary Limited, deputy Chairman of Harmony and of African Rainbow Minerals Limited. He has also been a director of Telkom SA SOC Limited, Standard Bank of South Africa Limited, Weir Group PLC and Mutual and Federal Insurance Company Limited. He recently retired as Deputy Chairman and non-executive director of Gold Fields. Rick is a trustee of the Carrick Foundation and of the Claude Leon Foundation. He is co-Chairman of the City Year South Africa Youth Service Organisation, and Chairman and trustee of the Palaeontological Scientific Trust. He serves on the Council of the University of the Western Cape.
Timothy John Cumming (64)
BSc (Hons) (Engineering), University of Cape Town; BA (PPE); MA (Oxford)
Timothy (Tim) Cumming is a Sibanye-Stillwater Independent non-Executive Director. He was appointed as a non-executive director on 21 February 2013. He is the founder and executive director of Scatterlinks Proprietary Limited, a South African-based company providing leadership development services to senior business executives as well as strategic advisory services to companies. He has a wealth of experience in financial services, including periods as an executive at Old Mutual Limited (Old Mutual), HSBC Bank PLC and Allan Gray Limited, and is currently also an independent non-executive director of Nedgroup Investments Limited and non-executive Chairman of RisCura Holdings Proprietary Limited. Tim started his career as an engineer at Anglo American Corporation of South Africa Limited. He worked on a number of diamond mines and gold mines in South Africa. He is also the Chairman of the Woodside Endowment Trust and of the Investment Committee of the Mandela Rhodes Foundation.
Savannah Nonhlanhla Danson (54)
BA (Hons) Communication Science and Finance, Bridgewater University, United States; MBA (Strategic Planning and Finance) DeMontford University
Savannah Danson is a Sibanye-Stillwater Independent non-Executive Director. She was appointed as a non-executive director on 23 May 2017. As the founder and executive chairperson of Bunengi Investment Group, she brings a wealth of experience from the finance, mining, infrastructure and media sectors. Savannah is the chairperson of WSP Group Africa, a Canadian-listed engineering group, and serves on the boards of Wilson Bayly Holmes-Ovcon Limited, a JSE listed company and Rand Water.
Elaine Jay Dorward-King (64)
B.Sc., Chemistry, Maryville College; Ph.D., Analytical Chemistry, Colorado State University
Elaine Dorward-King is a Sibanye-Stillwater Independent non-Executive Director. She was appointed as a non-executive director on 27 March 2020. She is a retired executive with over 30 years of leadership experience in developing and implementing sustainable development, safety, health and environmental strategies and programmes in the mining, chemical and engineering consulting sectors. From 2013 to June 2019, Elaine served as the executive vice president of sustainability and external relations for Newmont Mining Corporation (Newmont), where she led the development and implementation of strategy, policy, and standards across the company in environmental, social responsibility, community relations, external affairs, government relations and communications areas. She was a member of the Newmont’s executive leadership team (ELT) and was one of four ELT members on the Company’s investment committee. From June 2019 until January 2020, Elaine was executive vice president of ESG strategy for Newmont. Prior to joining Newmont, Elaine spent 20 years at Rio Tinto, where she held a variety of leadership roles including two years as managing director of Richards Bay Minerals Proprietary Limited (Richards Bay Minerals), one of the world’s largest producers of mineral sands products, including titanium dioxide feedstock, zircon, rutile and high-grade iron. She also served as the global head of health, safety and environment for Rio Tinto, a role she held for eight years following other roles of increasing responsibility. Prior to that, Elaine worked for an engineering consulting firm, EBASCO Trading Corporation, and for Monsanto Chemical Company, in the agricultural products division. Since retiring from Newmont, Elaine has joined the boards of Kenmare Resources PLC, a leading producer of titanium minerals and zircon; Great Lakes Dredge and Dock Company LLC, an American company providing construction services in dredging and land reclamation and NOVAGOLD Resources Inc., a North American gold exploration and development company. In addition, Elaine serves on the Board of Resources for the Future a non-profit organisation.
Harry James Rodolph Kenyon-Slaney (61)
BSc (Hons) (Geology), Southampton University, International Executive Programme, INSEAD (France)
Harry Kenyon-Slaney is a Sibanye-Stillwater Independent non-Executive Director. He was appointed a non-executive director on 16 January 2019. He is currently Chairman of Gem Diamonds Limited, a member of the Advisory Board of Schenck Process Holding GmbH and a senior advisor to McKinsey & Co., in which roles he uses his wide experience to support operational, health and safety and business transformation programmes. Harry, who has more than 39 years of experience in the mining industry, principally with Rio Tinto PLC (Rio Tinto), is a geologist by training and his experience spans operations, marketing, projects and business development. Until 2015 and as a member of Rio Tinto’s Group Executive committee, he held the roles of Chief Executive – Energy, and before that, Chief Executive – Diamonds and Minerals. Prior to this, he led Rio Tinto’s global titanium dioxide business, was chief executive of Rio Tinto’s listed subsidiary, Energy Resources of Australia Limited, and General Manager Operations at Phalaborwa Mining Company Limited in South Africa, and he has held senior marketing roles in copper, uranium and industrial minerals. He began his career as an underground production geologist on the gold mines in South Africa where he has lived and worked for more than 15 years.
Nkosemntu Gladman Nika (64)
BCom, University of Fort Hare; BCompt (Hons), University of South Africa Advanced Management Programme, INSEAD (France); CA (SA)
Nkosemntu Nika is a Sibanye-Stillwater Independent non-Executive Director. He was appointed as a non-executive director on 21 February 2013. He is currently an independent non-executive director and chairman of Grinding Media South Africa Proprietary Limited and Chairman of the Audit and Risk Committee of Foskor Proprietary Limited. He also serves as an independent non-executive director of Trollope Mining Services 6000 Proprietary Limited, Engen Limited and Coega Dairy Holdings Limited. He was previously CFO and Finance Director of PetroSA (SOC) Limited and Executive Manager: Finance at the Development Bank of Southern Africa. He has held various internal auditing positions at Eskom Holdings (SOC) Limited, Shell Company of South Africa Limited and Anglo American Corporation of South Africa Limited. He was also a non-executive board member of the Industrial Development Corporation of South Africa Limited, and previously chaired its Audit and Risk Committee and Governance and Ethics Committee.
Keith Alfred Rayner (65)
BCom, Rhodes University; CTA; CA (SA)
Keith Rayner is a Sibanye-Stillwater Independent non-Executive Director. He was appointed as a non-executive director on 1 January 2013. Keith is CEO of KA Rayner Presentations CC, an advisory and presentation corporation specialising in corporate finance and regulatory advice. He is an independent non-executive director of Telkom SA SOC Limited. He is a non-executive director of Nexus Intertrade Proprietary Limited, Sabi Gold Proprietary Limited (dormant), Keidav Properties Proprietary Limited (dormant) and Appropriate Process Technologies Proprietary Limited. He is a member of the JSE Limited’s Issuer Regulation Advisory Committee and is a member of the Investment Analysts Society. He was previously a director of Afristrat Investment Holdings Limited and 2 Quins Engineered Business Information Proprietary Limited.
In compliance with the Sarbanes-Oxley Act, the Board has identified Keith Rayner as the Audit Committee’s financial expert.
Susan Comber van der Merwe (67)
BA, University of Cape Town
Susan (Sue) van der Merwe is a Sibanye-Stillwater Independent non-Executive Director. She was appointed as a non-executive director on 21 February 2013. She served as a member of Parliament for 18 years until October 2013, and held various positions, including Deputy Minister of Foreign Affairs from 2004 to 2010 and previously served as a trustee and Chair of the Kay Mason Foundation, which is a non-profit organisation assisting disadvantaged scholars in Cape Town. She has participated in various civil society organisations and since 2014, has been a member of the National Council of the South African Institute of International Affairs, a non-governmental research institute focused on South Africa’s and Africa’s international relations.
Jeremiah Skhulumi Vilakazi (61)
BA, University of South Africa; MA, Thames Valley University; MA, University of London; MBA, California Coast University
Jeremiah (Jerry) Vilakazi is a Sibanye-Stillwater Independent non-Executive Director. He was appointed a non-executive director on 1 January 2013. He is Chairman of Palama Investment Holdings Proprietary Limited, which he co-founded to facilitate investments in strategic sectors. He is a past CEO of Business Unity South Africa NPC and Managing Director of the Black Management Forum NPC. In 2009, Jerry was appointed to the Presidential Broad-based Black Economic Empowerment Advisory Council and, in 2010, he was appointed as a Commissioner of the National Planning Commission. He completed both terms in 2015. Previously, he was appointed Public Service Commissioner in 1999 and played a critical role in shaping major public service policies in post-1994 South Africa. Jerry was Chairman of the Mpumalanga Gambling Board and of the State Information Technology Agency (SOC) Proprietary Limited. He previously held the position of Chairman of Netcare Limited and directorships of Pretoria Portland Cement Company Limited, Goliath Gold Limited, General Healthcare Group PLC and Computershare Limited. He is currently a non-executive director in Blue Label Telecoms Limited, Cell C Limited and Palama Industrial Proprietary Limited.
Sindiswa Victoria Zilwa (54)
BCompt (Hons) University of South Africa; CTA; CA (SA); CD(SA); Advanced Taxation Certificate; Advanced Diploma in Financial Planning; Advanced Diploma in Banking
Sindiswa (Sindi) Zilwa is a Sibanye-Stillwater Independent non-Executive Director. She was appointed as a non-executive director on 1 January 2021. A chartered accountant by profession, Sindi is an expert in the areas of accounting, auditing and business management. Sindi is also a chartered director (SA) and has vast experience as a director in the public and private sectors, currently serving as a non-executive director of Cell C Limited, Discovery Group, Gijima Group, Massmart Limited, Mercedes-Benz South Africa Limited, Metrofile Limited and Tourvest Group. She is an author of “The ACE Model-Winning Formula for Audit Committees”, formerly used by the Institute of Directors to train audit committee members in South Africa, and the author of “Creating Board and Committee Effectiveness”. She is a member of the South African Institute of Chartered Accountants and Institute of Directors. Sindi was the co-founder and retired Chief Executive Officer of Nkonki Incorporated, having held the position from 1993 to 2016. Her other former non-executive directorships over the past five years included AngloGold Ashanti Limited (AngloGold Ashanti), Aspen Pharmacare Holdings Limited, Consol Holdings Proprietary Limited, Consol Glass Proprietary Limited, Hoba Funeral Financial Services Proprietary Limited, Redefine Properties Limited, TPN Group Proprietary Limited and Air Traffic and Navigation Services SOC Limited.
Rotation of directors
In accordance with the MOI, one third of the directors shall retire from office at each AGM. The first to retire are those directors appointed as additional members of the Board, followed by the longest-serving members. The Board, assisted by the Nominating and Governance Committee, can recommend the eligibility of retiring directors (subject to availability and their contribution to the business) for re-appointment. Retiring directors can be immediately re-elected by the shareholders at the AGM. The directors retiring in terms of the Company’s MOI are Neal Froneman, Sue van der Merwe, Savannah Danson, and Harry Kenyon-Slaney. All of the directors are eligible and offer themselves for re-election.
C-Suite Management
Richard Andrew Stewart (46)
Chief Operating Officer
BSc (Hons), PhD (Geology), University of the Witwatersrand; MBA, Warwick Business School (UK); PrSciNat FGSSA.
Richard Stewart, previously Executive Vice President: Business Development, was appointed Chief Operating Officer effective 1 December 2020. Richard has more than 22 years’ experience in South Africa’s geological and mining industries and is a Fellow of the Geological Society of South Africa and a Registered Natural Scientist. He joined the Group in 2014, and has contributed significantly to successful and value-accretive acquisition and growth strategy. Prior to joining Sibanye-Stillwater, he served on the Gold One Executive Committee from 2009, where his last appointment was Executive Vice President: Technical Services. Prior to this Richard served as CEO of Goliath Gold Limited, held management positions at the Council for Scientific and Industrial Research Mining Technology division, Dunrose Trading 186 Proprietary Limited trading as Shango Solutions and Uranium One, and was an investment consultant for African Global Capital Proprietary Limited.
Robert van Niekerk (57)
Chief Technical Officer
National Higher Diploma (Metalliferous Mining), Technikon Witwatersrand; BSc (Mining Engineering), University of the Witwatersrand; South African Mine Manager’s Certificate of Competency
Robert van Niekerk was appointed as Chief Technical Officer for the Group on 1 December 2020. Previously he served as the Executive Vice President: Group Technical Services (from April 2020), Executive Vice President: SA PGM operations (from July 2017 to April 2020), Divisional CEO: Platinum and Executive Vice President: Organisational Effectiveness. Prior to joining Sibanye-Stillwater (in February 2013), he was the Senior Vice President and Group Technical Head of Mining at Gold Fields. He previously occupied several senior operational and executive management positions at Harmony, Anglo American Platinum, Uranium One and Gold One. Robert began his mining career in 1982 as a Learner Official and progressed through the ranks at a number of South African underground and surface mining operations locally and outside of South Africa.
Themba George Nkosi (49)
Chief Social Performance Officer
BA Hons (Employment Relations), University of Johannesburg; BTech (Human Resources), Peninsula Technikon; Human Resources Executive Programme, University of Michigan
Themba Nkosi is the Chief Social Performance Officer at Sibanye-Stillwater. He was appointed on 4 July 2016 as Executive Vice President: Human Capital and more recently as Executive Vice President: Corporate Affairs. He has more than 25 years’ experience across various industries in human resources, corporate affairs, communication and stakeholder management. Prior to joining Sibanye-Stillwater, he was Head: Human Resources, Transformation and Corporate Communications at ArcelorMittal South Africa Limited (ArcelorMittal) from June 2009. He previously occupied several senior management positions at ArcelorMittal and Human Resources Director for sub-Saharan Africa at the PepsiCo Incorporated.
Mika Seitovirta (59)
Chief Regional Officer: Europe
MSc (Econ), University of Vaasa, Finland
Mika Seitovirta was appointed Chief Regional Officer: Europe on 14 December 2021. Mika has gained extensive international experience through his senior leadership roles in global companies across a wide range of industries. In addition to his current roles as Executive Chairman of Keliber Oy, and Chairman of Metroauto Oy and K. Hartwall Oy Ab, he has previously served as Executive Chairman of Ferrovan Oy, CEO of Outokumpu Oyj and Glaston Corporation and as Managing Director of Hartwall / Scottish & Newcastle. Mika also currently serves as a Senior Advisor and Executive Coach for the Boston Consulting Group. Mika’s significant experience in the European automobile industry, including various positions held for more than a decade at Volvo and in the European ferroalloys industry, will prove invaluable to the growth of Sibanye-Stillwater’s battery metals business in Europe. Initially, Mika will lead and drive strategic delivery for Sibanye-Stillwater in the European region on a part time basis, allowing him to honour his existing commitments. He will transition to a full-time member of the Group executive from 1 July 2022.
Lerato Legong (43)
Chief Legal Officer
LLB, University of Pretoria
Lerato Legong is the Chief Legal Officer of Sibanye-Stillwater. He has over 19 years’ experience and has served both in South African and international private practice and as in-house counsel in the mining industry. Prior to joining Sibanye-Stillwater on 16 March 2020, he held management positions at South32 Limited and served as head of legal at the Minerals Council South Africa. He has also held legal positions at the Mintails Limited, Anglo Operations Limited and Sasol Oil Proprietary Limited.
Jacob Dawid Mostert (52)
Chief Organisational Growth Officer
Diploma in Labour Relations; MDP (Adv Labour Law); MBA, University of South Africa
Jacob Dawid (Dawie) Mostert is the Chief Organisational Growth Officer of Sibanye-Stillwater. He has more than 25 years’ experience in the mining industry and was appointed on 1 January 2013 as Senior Vice President: Organisational Effectiveness, focused on introducing new operating and business models in support and directing the turnaround at Sibanye-Stillwater post the unbundling from Gold Fields. With Sibanye-Stillwater adopting value creation as its strategic intent and consequently entering the PGM mining sector, he accepted the position and role as Executive Vice President: Commercial Services and more recently, Executive Vice President: Organisational Growth, focused primarily on leading the organisational culture development strategy and development of business systems that enable the development of top and senior management, senior talent and succession management culminating in future ready leaders. Prior to joining Sibanye-Stillwater, he served as Vice President: Commercial Services at Gold One in 2012 and Vice President: Human Capital at Great Basin Gold Limited (Great Basin Gold) from 2006 to 2012. Prior to joining Great Basin Gold in 2006, he was Executive: Organisational Development and Employee Relations at Harmony from 2002 to 2006. Dawie joined Harmony in 1996 as part of the merger and acquisition transformational team playing a leading organisational integration role. During 2001 to 2002 he was appointed Mine Manager at the then Elandsrand mine leading a management team post the integration phase.
Laurent Charbonnier (47)
Chief Commercial and Development Officer
École Centrale Paris, Institut d’Etudes Politiques de Paris
Laurent Charbonnier is the Chief Commercial and Development Officer at Sibanye-Stillwater. He has over 20 years’ experience in investment banking and was appointed on 16 November 2020. Prior to joining Sibanye-Stillwater, Laurent worked at UBS Group AG, Credit Suisse Group AG and HSBC Bank PLC, where he was Managing Director and Global Head for Metals and Mining. Laurent was involved in numerous large M&A deals, initial public offerings, rights issues, bonds and other structured financings for the metals and mining sector. In particular, he was the lead advisor to Sibanye-Stillwater on the acquisitions and related financings (bridge financing, rights issue and bonds) of Aquarius, Rustenburg, Stillwater and Lonmin.
ENVIRONMENTAL AND REGULATORY MATTERS
South Africa
Environmental
Overview
Sibanye-Stillwater’s operations in South Africa are subject to various laws and regulations relating to the protection of the environment. In particular, South Africa’s Constitution of 1996 grants the right to an environment that is not harmful to human health or well-being to its people, and to the protection of that environment for the benefit of present and future generations through reasonable legislation and other measures that secure ecologically sustainable development. In addition, the South African Constitution and various environmental legislation enacted and implemented since 1996, grant legal standing to a wide range of interest groups to enforce their environmental rights against private entities as well as the South African government.
South African environmental legislation requires companies with activities that are reasonably expected to have environmental impacts to obtain authorisations, permits, licences and other approvals to ensure such companies assess the extent of such impacts and put reasonable and practicable measures in place to manage and mitigate these impacts.
The most critical and applicable environmental legislation for the mining industry in South Africa are the MPRDA, the NEMA and the NWA. Under the “One Environmental System” (OES), which came into effect in December 2014, the DMRE Minister (and thus by delegation, the prescribed officials of the DMRE) is the Competent Authority for all environmental issues within the mining industry, including the approval or rejection of environmental authorisations under the NEMA framework for listed activities pertaining to prospecting and mining operations. The Minister of DFFE is the Appeal Authority for applications/authorisations rejected by the DMRE Minister. Under the transitional arrangement between the MPRDA and the NEMA, all Environmental Management Programme Reports (EMPRs) previously approved under the MPRDA, are currently deemed to be approved environmental authorisations as if approved under the subsequent NEMA framework. The Constitutional Court recently dismissed a challenge to this principle, although similar challenges have yet to be decided. Proposed amendments to NEMA, discussed below, aim to clarify this legal position.
NEMA contains the following four key provisions: (i) company directors, in their personal capacity, may be held liable for any environmental degradation and/or the remediation thereof; (ii) every holder of a mining right will remain responsible for any environmental liability, pollution or ecological degradation, the pumping and treatment of polluted or extraneous water and the management and sustainable closure thereof, notwithstanding the issuance of a closure certificate; (iii) the DMRE Minister is obliged to appoint environmental mineral resource inspectors to monitor the compliance of mining companies, as well as the enforcement of provisions insofar as it relates to prospecting, exploration, mining or production; and (iv) a duty of care to the environment is imposed on all persons to take reasonable measures to prevent pollution and environmental degradation.
The Regulations on Financial Provisioning first issued under NEMA in November 2015, and most recently amended in 2021, remain controversial to industry, primarily due to impracticalities around implementation and significant financial implications. The Regulations on Financial Provisioning require mining companies to make financial provision available prior to the commencement of mining activities in respect of environmental degradation and rehabilitation in order to ensure that the mining company is able to fund environmental liabilities upon mine closure. Various vehicles may be utilised, including rehabilitation guarantees and rehabilitation trust funds. Mining companies are also required to undertake progressive rehabilitation on an ongoing basis in respect of environmental rehabilitation. As a result of widespread criticism from industry, in 2021, the Minister of DFFE published regulations that extended the transitional period for certain existing rights and permit holders and deferred the implementation date to June 2022. Sibanye-Stillwater will assess the quantum of its financial provision in line with the updated methodologies stipulated by the Regulations on Financial Provisioning.
In 2022, the National Environmental Management Laws Amendment Bill (NEMLA IV) was approved by the National Assembly and National Council of Provinces and has been sent to the President for assent. NEMLA IV proposes to amend the NEMA as well as a number of other specific environmental laws, including the NWA, Waste Act and the Air Quality Act. Should NEMLA IV become law, the following notable amendments will come into force:
•NEMA will be amended to expressly provide for “progressive rehabilitation”, expand vehicles that may be utilised for financial provision (which includes a rehabilitation trust fund) and to enable drawdowns of financial provision up to ten years before the final decommissioning and closure;
•regulation of residue stockpiles and deposits will be shifted from the Waste Act to NEMA; and
•NEMA will be amended to clarify that an EMPR approved in terms of the MPRDA on or before 8 December 2014 is valid under NEMA, thereby removing uncertainty in the case law discussed above.
Carbon Tax
Energy is a significant input and cost to Sibanye-Stillwater’s mining and processing operations, with its principal energy sources being electricity and purchased petroleum products. A number of governments or governmental bodies, including the UNFCCC, have introduced or are contemplating regulatory changes in response to the potential impact of climate change, including in jurisdictions in which Sibanye-Stillwater operates.
To give effect to the UNFCCC, the 2015 Paris Agreement and the Nationally Determined Contributions (NDCs) towards the set targets, the South African government introduced a carbon tax under the Carbon Tax Act with effect from June 2019. The carbon tax was designed to fix liability on the person who conducts an activity in South Africa that results in GHG emissions above a certain threshold. The carbon tax design requires the calculation of liability to be based on the sum of GHG emissions, which results from fuel combustion, industrial processes and fugitive emissions. Taxpayers must determine emissions in accordance with the reporting methodology approved by the DFFE. For further information regarding Carbon Tax, see Risk Factors—Regulation of GHG emissions may materially adversely affect Sibanye-Stillwater’s operations.
To effectuate the Carbon Tax Act, in November 2019, the South African government introduced the Carbon Offset Regulations, which outline the eligibility criteria for offset projects (which includes certain types of renewable energy, energy efficiency and on-site co-generation projects) and the procedures for claiming offset allowances. Companies are allowed to use carbon offsets to a maximum of 10% of their total GHG emissions to reduce their tax liability. For carbon offsetting projects that are within the scope of the Carbon Tax Act, the offset allowances must be used within the first phase (up to 31 December 2025), except for qualifying renewable energy projects. For all other projects, the offset allowances can be used until the end of the crediting period as stipulated under the relevant standard. Other features of the Carbon Offset Regulations include the exclusion of temporary credits, clarification that offset allowances are non-transferable and a specification of the tax period for which the offset allowance will be used.
Sibanye-Stillwater’s final carbon tax liability is affected by its emission output as reported on in terms of the GHG reporting regulations and the extent to which it is able to make use of the full suite of allowances that are built into the carbon tax design. Sibanye-Stillwater’s carbon tax expense for the year ended 31 December 2021 was R4 million (2020: R5 million; 2019: R13 million).
It is expected that Sibanye-Stillwater’s carbon tax liability will increase with Phase 2 of the carbon tax implementation (planned for 2026), during which some or all of the Phase 1 carbon tax allowances are anticipated to fall away and Scope 2 direct carbon emissions will be included in the carbon tax net. The implementation and roll-out of Sibanye-Stillwater’s Energy and Decarbonisation Strategy, which includes the introduction of renewable energy in the form of solar and wind into Sibanye-Stillwater's energy mix, is expected to reduce its GHG emissions leading to a relative reduction in carbon tax liability, which in turn is anticipated to reduce the materiality of the carbon tax.
Air Quality Act
Under the Air Quality Act, the South African government has established minimum emission standards for certain activities that result in air emissions and for which atmospheric emissions licences (AELs) must be held. Non-compliance with the conditions of an AEL as well as the minimum emissions standards under the Air Quality Act, is an offence. Emissions are reported to the regulator in accordance with the licence conditions. Air dispersion modelling is conducted as part of air quality impact assessments. This is used to predict air quality concentrations at receptor locations in nearby communities. The AEL reports, which include results of stack emissions, are in place to demonstrate levels of conformance.
Waste Act
The Waste Act, among other things, regulates the identification, investigation, remediation, rehabilitation and inventorying of contaminated land. Though historically under the scope of the MPRDA’s mineral laws, as of December 2014, residue deposits and residue stockpiles became subject to regulation under the Waste Act, and accordingly, waste management licences for activities relating to their establishment and reclamation became required. Regulations regarding the Planning and Management of Residue Deposits and Stockpiles (MRDS) were published in July 2015, which had financial implications for the management of residue deposits and residue stockpiles since they imposed various classifications and associated liner requirements for new residue deposits and residue stockpiles. Due to the onerous nature and the anticipated financial impact these regulations would have on industry with little or no benefit from a pollution control/containment perspective, the regulations were amended in September 2018 to provide for a case-by-case analysis of the pollution control measures required for residue stockpiles and residue deposits. In addition, NEMLA IV proposes key changes including amending the “residue deposits”, “residue stockpiles” and “waste”, such that the items no longer in the scope of the Waste Act and instead become subject to the NEMA. This development is considered beneficial to the industry from a technical and legal perspective given the existing regulation of MRDS in legislation other than the Waste Act. This process still needs to be finalised.
The Waste Act also provides for waste licensing requirements for general and hazardous waste for listed activities ranging from storage of waste salvage yards and wastewater treatment plants through to disposal by landfill. Sibanye-Stillwater currently has a number of licenced waste management facilities, such as its Beatrix operations, Rustenburg Platinum Mines, Marikana Operations and Precious Metals Refinery. These facilities are managed in accordance with the Waste Act. In addition, the waste management activities at some of Sibanye-Stillwater’s facilities are regulated by and managed through the existing approved EMPRs, in accordance with the transitional provisions contained in the Waste Act and its regulations.
The Waste Act, pursuant to further regulations, also provides for registration with the DFFE of all operations generating hazardous waste or operating waste disposal facilities; quarterly reporting by disposal facilities of quantities of waste received for disposal; classification of waste and landfills which determines the disposal obligations and other requirements according to the waste classification regulations. Detailed waste classifications and associated safety data sheets have been developed for all of Sibanye-Stillwater’s hazardous wastes where relevant (e.g. the PGM operations, and waste disposed to landfills have been assessed and are directed to the relevant class of landfill).
The Waste Act further defines the requirements and risk-based assessment process to be undertaken, to have waste streams excluded from the definition of waste, provided there is a defined beneficial use for this waste. Sibanye-Stillwater has identified waste ash as a waste stream that is applicable to these regulations, with submission to be made to obtain approval on exclusions.
Water Use
Under South African law, mining operations are subject to water use licences and/or authorisations that govern each operation’s water usage and that require, among other things, mining operations to achieve and maintain certain water quality limits regarding all water discharges. The NWA provides for the management of all surface and groundwater resources including the protection of the water systems for ecological requirements. The NWA as well as the associated notices published in relation to the Act provide for conditions that must be adhered to and dictate the requirements for water use authorisation for various water uses that contain activity specific requirements based on the specialist information submitted by means of the application process. Sibanye-Stillwater has obtained and/or applied for these water use licenses. See also Risk Factors—Risks related to environmental, social and corporate governance—Sibanye-Stillwater’s operations are subject to water use regulation, which could impose significant costs and burdens.
Biodiversity Act
The Biodiversity Act aims to protect the natural diversity within South Africa, particularly threatened and endangered species, as well as the protection of essential ecosystems and the associated services. The Biodiversity Act necessitates certain management requirements and permits.
National Nuclear Regulator Act
Sibanye-Stillwater undertakes activities which are regulated by the NNR Act. The NNR Act requires Sibanye-Stillwater to obtain authorisation from the National Nuclear Regulator and undertake activities in accordance with the conditions of such authorisations. Each of Sibanye-Stillwater’s South Africa gold operations possesses and maintains a Certificate of Registration (CoR) as required by the NNR Act.
Enforcement of Environmental Laws
The NEMA (for the mining industry enforced by the DMRE), the MPRDA (enforced by the DMRE) and the NWA (enforced by the DWS) all contain provisions for the appointment of environmental management inspectors, which have sweeping authority and mandates to enforce environmental legislation. There are certain new environmental laws and regulations, such as the Regulations on Financial Provisioning (2015), which were viewed as having a negative impact on the growth and development of the mining industry. To date, Sibanye-Stillwater’s approach has been to work with the South African government and the Minerals Council to positively influence new and emerging legislation as far as possible in the interest of the industry as well as in the interest of the environment.
Health and Safety
Mining health and safety performance is regulated by the South African Mine Health and Safety Act, 1996 (MHSA). The MHSA, among others, requires the holder of a mining right to ensure that their operating and non-operating mines maintain a safe and healthy working environment. Employees have the right to refuse to perform hazardous work or enter into an unsafe working place. The MHSA describes the powers and functions of the Mine Health and Safety Inspectorate (MHSI), within the jurisdiction of the DMRE, as part of the process of enforcement.
As legally required, all employees are represented in formal joint management/worker health and safety committees, through their representatives, to help monitor and advise on occupational health and safety programmes.
In terms of the MHSA, an employer is obligated, among others, to ensure, as far as reasonably practicable, that mines are designed, constructed and equipped to provide conditions for safe operation and a healthy working environment, and the mines are commissioned, operated, maintained and decommissioned in such a way that employees can perform their work without endangering their health and safety or that of any other person. Every employer must ensure, as far as reasonably practicable, that people who are not employees, but who may be directly affected by the activities at a mine, are not exposed to any health and safety hazards. The MHSA authorises the inspectors in the MHSI, if there is reason to believe that any occurrence, practice or condition at a mine endangers or may endanger the health or safety of any person, to restrict or stop, partially or wholly, operations at any mine or a workplace, and require an employer to take steps to rectify the occurrence, practice or condition before such restriction or stoppage can be lifted. The principal safety risks associated with mining operations in South Africa include technical complexity, depth of operations, intensity of labour, the narrow nature of ore body and mature mines.
The principal health risks arise from occupational exposure to silica dust, noise, heat and certain hazardous chemicals. The most significant occupational diseases affecting Sibanye-Stillwater's workforce include lung diseases such as silicosis, TB, a combination of both, and COAD, as well as NIHL.
The Occupational Diseases in Mines and Works Act, 1973 (ODMWA) governs compensation paid to mining employees who contract certain occupational illnesses, such as silicosis. The South African Constitutional Court has ruled that a claim for compensation under ODMWA does not prevent an employee from seeking compensation from an employer in a civil action under common law (either as individuals or as a class). In 2018, the Gold Working Group, including Sibanye-Stillwater, agreed to the Settlement Agreement, which was approved by the Gauteng High Court in Johannesburg, to provide compensation to all eligible workers suffering from silicosis and/or TB who worked in the Occupational Lung Disease Working Group companies’ mines from 12 March 1965 to the date of the Settlement Agreement. The terms of the Settlement Agreement are confidential. For additional information see Annual Financial Report—Consolidated financial statements—Notes to the consolidated financial statements—Note 31: Occupational healthcare obligation.
A failure to comply with MHSA is a criminal offence for which an employer, or any responsible person, may be charged and, if successfully prosecuted, be fined or imprisoned, or both. The MHSI also has the power to impose administrative fines upon an employer in the event of a breach of the MHSA. The maximum administrative fine that may be imposed is R1 million per transgression.
Mining Rights
The MPRDA
Under the MPRDA, which came into effect in 2004, prospecting rights may be granted for an initial maximum period of five years and can be renewed once upon application for a further period not exceeding three years. Mining rights are valid for a maximum period of 30 years, and can be renewed upon application for further periods, each of which may not exceed 30 years. A wide range of factors and principles, including proposals relating to BBE and social responsibility, will be considered by the DMRE Minister when exercising his discretion whether to grant these rights. A prospecting or mining right can be suspended or cancelled if the holder conducts prospecting or mining operations in breach of the MPRDA, a term or condition of the right or an environmental management plan, programme or environmental authorisation (as may be applicable), or if the holder of the right submits false, incorrect or misleading information to the DMRE. The MPRDA sets out a process which must be followed before the DMRE Minister is entitled to suspend or cancel the prospecting or mining right.
In November 2006, the DMRE approved the conversion of Sibanye-Stillwater’s mining licences under the previous regulatory regime (old order rights) at Kloof, Driefontein and Beatrix into new-order mining rights under the new regime. All Sibanye-Stillwater’s SA operations have been granted their new-order mining rights.
The MPRDA empowers the DMRE Minister to develop a Broad-Based Economic Empowerment Charter for the South African Mining Industry to set the framework, targets and timetable for effecting entry of HDSAs into the mining industry and to allow such South Africans to benefit from the exploitation of the country’s mineral resources.
The MPRDA also requires mining companies to submit annual reports on HDSA ownership and implementation of the approved SLP applicable to the mining right in question, in which the SLP sets out their commitments including, among other things, those relating to human resource development and local economic development.
In March 2020, the DMRE Minister published amendments to the MPRDA (Amended MPRDA Regulations). The amendments include, among other things:
•expansion of the definition of interested and affected parties who may be impacted by the proposed or existing prospecting or mining operation to include host communities, landowners (traditional and title deed owners); traditional authority; land claimants; lawful land occupier; holder of informal land rights; the Department of Agriculture, Land Reform and Rural Development; any other person (including on adjacent and non-adjacent properties) whose socio-economic conditions may be directly affected by the proposed prospecting or mining operation; the local municipality and the relevant Government Departments, agencies and institutions responsible for the various aspects of the environment and for infrastructure which may be affected by the proposed project
•requirement of “meaningful consultation” with interested or affected parties in applying for mining rights, including giving such parties a reasonable opportunity to provide comment in respect of the land subject to the application about the impact the prospecting or mining activities would have to his right of use of the land in order to enable the parties to make an informed decision regarding the impact of the proposed activity
•introduction of a new requirement that mining companies be obliged to publish SLPs relating to their operations in English and one other dominant official language commonly used in the mine community on its website, in local newspapers, as well as in certain offices and libraries within 30 days of approval, and the availability and content of the approved SLP must be announced, where feasible, in local radio stations and relevant news outlets
•repeal of regulations that have been incorporated into NEMA and the EIA Regulations
•amendments to require mining right holders to prepare closure reports in accordance with the provisions of NEMA and EIA Regulations
•introduction of new procedures for lodging internal appeals in terms of section 96 of the MPRDA which overhauls the appeal procedure provided in the MPRDA
2018 Mining Charter
On 27 September 2018, the Broad-Based Socio-Economic Empowerment Charter for the Mining and Minerals Industry, 2018 (2018 Mining Charter) was published and came into effect on the same day. In September 2021, the High Court of South Africa held that the 2018 Mining Charter is a policy document and does not, per se, bind holders of mining titles, unless its terms have been lawfully incorporated into such mining titles. The High Court also set aside various provisions of the 2018 Mining Charter. Following the judgment, the 2018 Mining Charter recognises the “once empowered, always empowered” principle in relation to existing rights and requires that all applications for new mining rights must have a minimum of 30% HDSA ownership.
For further information on the 2018 Mining Charter see Risk Factors—Sibanye-Stillwater’s mining rights are subject to legislation, which could impose significant costs and burdens and which impose certain ownership requirements, the interpretation of which is the subject of dispute.
While the constitutional and legislative processes required for the amendments to the MRPDA may be lengthy, to the extent necessary to comply with legislative changes, Sibanye-Stillwater may be required to adjust the ownership structure of the company’s mining assets in order to meet B-BBEE requirements. Sibanye-Stillwater may also incur significant costs or have to issue additional shares as a result of changes in the interpretation of existing laws and guidelines or the imposition of new laws relating to HDSA ownership requirements, which may have a material adverse effect on Sibanye-Stillwater’s business, operating results and financial condition.
The Broad-Based Black Economic Empowerment Act, 2003 and the Broad-Based Black Economic Empowerment Amendment Act, 2013 (B-BBEE Amendment Act)
The B-BBEE Act established a national policy on broad-based black economic empowerment with the objective of increasing the participation of HDSAs in the economy. The B-BBEE Act provides for various measures to promote black economic empowerment, including empowering the Minister of Trade and Industry to issue the Codes of Good Practice for Broad based Black Economic Empowerment (B-BBEE Codes), with which organs of state and public entities and parties interacting with them or obtaining rights and licences from them would be required to comply. There has been some debate as to whether or to what extent the mining industry was subject to the B-BBEE Act and the policies and codes provided for thereunder, which apply generally to other industries in South Africa. The B-BBEE Act and the B-BBEE Codes do not require the DMRE to apply the B-BBEE Codes when determining the qualification criteria for the issuing of mining rights, nor do they require that the DMRE apply the B-BBEE Codes as a requirement for the retention of existing mining rights. The B-BBEE Codes will nevertheless apply to mining companies if they wish to be scored for the purpose of contracting with state institutions.
In 2014, the B-BBEE Amendment Act, 2013 was brought into operation. The B-BBEE Amendment Act inserted a new provision in the B-BBEE Act, whereby the B-BBEE Act would trump the provisions of any other law in South Africa which conflicts with the provisions of the B-BBEE Act, provided such conflicting law was in force immediately prior to the effective date of the B-BBEE Amendment Act. The B-BBEE Amendment Act also stipulates that this provision would only be effective one year after the B-BBEE Amendment Act is brought into effect. This provision came into effect on 24 October 2015 and, on 27 October 2015, the Minister for Trade and Industry published a government gazette notice declaring an exemption in favour of the DMRE from applying the requirements contained in section 10(1) of the B-BBEE Act for a period of 12 months. The exemption can be read as confirmation that the Department of Trade and Industry sees the B-BBEE codes as “applicable” to the Mining Industry after the exemption was lifted on 27 October 2016. It is not clear whether the DMRE is likely to continue implementing the Mining Charter in its current form or whether it will apply the B-BBEE Act and follow the B-BBEE Codes.
This raises the question of whether the B-BBEE Act and the B-BBEE Codes may overrule the Mining Charter (which for the purposes of comparison with the B-BBEE Act, would include later iterations of the Mining Charter) in the future. There is no clarity on this point at this stage. The revised Broad-Based Black Economic Empowerment Codes of Good Practice (the Revised BEE Codes) became available for voluntary use on 11 October 2013 and became effective on 1 May 2015. Both the B-BBEE Amendment Act and the Revised BEE Codes expressly stipulate that where an economic sector in South Africa has a sector code in place for BEE purposes, companies in that sector must comply with the Sector Code. For purposes of the B-BBEE Act, the Mining Charter (as amended) is not a Sector Code. It is not clear at this stage how the Mining Charter and Revised BEE Codes relate to each other. On 17 February 2016, the Minister of Trade and Industry published a gazette notice which repealed and confirmed the validity of a number of Sector Codes. The omission of the Mining Charter from the notice can be interpreted as confirmation that the Mining Charter is not contemplated as a Sector Code. This supports the interpretation that the B-BBEE Act was not intended to trump the Mining Charter. While it remains to be seen how this will be interpreted, it appears that the B-BBEE Act and the BEE Codes will not overrule the Mining Charter in the future.
Housing and Living Conditions Standard
The Housing and Living Conditions Standard (Housing Standard) was published by the DMRE Minister in December 2020. Among other things, the Housing Standard provides that:
•an existing mining right holder must, within a period of twelve months from the date of publication of the Housing Standard, submit a detailed Housing and Living Conditions Plan;
•a new mining right holder must, within a period of twelve months from the date of granting of the mining right, consult with organised labour, the relevant municipality and the Department of Human Settlements regarding its mine employee housing and living conditions needs;
•a mining right holder who intends developing accommodation for its mine employees shall, after consultation with relevant stakeholders, where feasible, acquire land within close proximity of the mine operations and plan housing needs in support of compact, integrated and mixed land use environment; and
•a mining right holder must offer employees a range of housing options, which includes amongst others rental accommodation, private home ownership, government subsidised home ownership and living out allowance.
Under South African case law, the Housing Standard (as with the Mining Charter) does not have the status of law, as would be the case with legislation and regulations. As such, the MPRDA does not entitle the DMRE to cancel or suspend a mining right in terms of section 47 of the MPRDA on the basis of a failure to comply with the Housing Standard. Furthermore, section 93 of the MPRDA does not authorise the DMRE to issue directives for failures to comply with the Housing Standard. However, in practice the DMRE may issue directives in the absence of the requisite statutory authority. In this instance, the mining right holder would be entitled to challenge that exercise of public power by the DMRE.
Draft Mine Community Resettlement Guidelines, 2019
The DMRE Minister published the Draft Mine Community Resettlement Guidelines, 2019 (Guidelines) for public comment on 4 December 2019. Some of the key provisions of the Guidelines are as follows:
•the Guidelines will apply to both applicants and existing holders of mining rights, prospecting rights and mining permits (both applicants and holders) in terms of the MPRDA where prospecting or mining activities will have the effect of displacement or resettlement of the affected parties; and
•the Guidelines require applicants and holders to make provision for development of a Resettlement Plan, Resettlement Action Plan and Resettlement Agreement. Further, the Guidelines provide that no mining activity shall commence until a Resettlement Agreement is reached on the appropriate amount of compensation as a result of resettlement of the affected parties. An applicant or holder, where feasible, must provide financial assistance to affected parties. The Guidelines also envisage a “party to party dispute resolution process” that must be invoked prior to embarking on the regional manager-led process in section 54 of the MPRDA.
The Royalty Act
The Mineral and Petroleum Resources Royalty Act, 2008 (Royalty Act) imposes a royalty on refined and unrefined minerals payable to the South African government.
The royalty in respect of refined minerals (which include gold and PGMs) is calculated by multiplying the gross sales of the refined mineral during the year of assessment by the percentage determined by dividing EBIT by the product of 12.5 times gross sales plus an additional 0.5. EBIT refers to taxable mining income (with certain exceptions such as no deduction for interest payable and foreign exchange losses) before assessed losses but after capital expenditure. A maximum royalty of 5% of revenue is applicable in respect of refined minerals.
The royalty in respect of unrefined minerals (including PGMs) is calculated by multiplying the gross sales of the unrefined mineral during the year of assessment by the percentage determined by dividing EBIT by the product of 9 times gross sales plus an additional 0.5. EBIT refers to taxable mining income (with certain exceptions such as no deduction for interest payable and foreign exchange losses) before assessed losses but after capital expenditure. A maximum royalty of 7% of revenue is applicable in respect of unrefined minerals.
Sibanye-Stillwater currently pays a royalty based on the refined and unrefined minerals royalty calculation as applied to its gross sales.
The South African Minister of Finance appointed the Davis Tax Committee to investigate and review the current mining tax regime. The committee’s first interim report on mining, which was released for public comment on 13 August 2015, proposed no changes to the royalty regime but recommended the discontinuation of the upfront capital expenditure write-off regime in favour of an accelerated capital expenditure depreciation regime. In addition, the report recommended retaining the so called “gold formula” for existing gold mines only, as new gold mines would be unlikely to be established in circumstances where profits are marginal or where gold mines would conduct mining of the type intended to be encouraged by the formula. The committee also recommended the phasing out of additional capital allowances available to gold mines in order to bring the gold mining corporate income tax regime in line with the tax system applicable to all taxpayers. In November 2017, following a period of public comment, the Davis Tax Committee issued its final report which largely reaffirmed its initial recommendations. The South African National Treasury will continue to consider the Davis Tax Committee’s final recommendations. It is not clear at this stage which, if any, of the recommendations will be adopted as legislation in the future. For further information regarding the Davis Tax Committee’s final recommendations, see Risk Factors—Sibanye-Stillwater is subject to the imposition of various regulatory costs, such as income taxes and royalties, changes to which may have a material adverse effect on Sibanye-Stillwater’s operations and profits.
Exchange Controls
South African law provides for Exchange Control Regulations which, among other things, restrict the outward flow of capital from South Africa to countries not forming part of the Common Monetary Area (CMA), the latter consisting of South Africa, Namibia, Lesotho and Eswatini. The Exchange Control Regulations, which are administered by the Financial Surveillance Department of the SARB, regulate international transactions involving South African residents, including companies.
SARB approval is required for Sibanye-Stillwater and its subsidiaries to receive and/or repay loans to non-South African residents. Sibanye-Stillwater and its South African subsidiaries would require SARB approval in order to provide guarantees for the obligations of any of Sibanye-Stillwater’s subsidiaries with regard to funds obtained from non-residents of the CMA. Absent SARB approval, income earned in South Africa by Sibanye-Stillwater and its South African subsidiaries cannot be used to repay or service foreign debts.
Transfers of funds from South Africa for the purchase of shares in offshore entities or for the creation or expansion of business ventures offshore require exchange control approval. However, if the investment is a new outward foreign direct investment where the total cost does not exceed R1 billion per company per calendar year, the investment application may be processed by an authorised dealer, subject to all existing criteria and reporting obligations.
Sibanye-Stillwater must obtain approval from the SARB regarding any capital-raising involving a currency other than the Rand. In connection with its approval, it is possible that the SARB may impose conditions on Sibanye-Stillwater’s use of the proceeds of any such capital-raising, such as limits on Sibanye-Stillwater’s ability to retain the proceeds of the capital-raising outside South Africa or requirements that Sibanye-Stillwater seeks further SARB approval prior to applying any such funds to a specific use.
Historically, certain restrictions were imposed on the creation of so-called loop structures. A loop structure could occur where a South African exchange control resident (such as Sibanye-Stillwater, or one of its South African subsidiaries) sets up an offshore structure which re-invests into the CMA by acquiring shares or other interests (e.g. loans) in a CMA company or CMA asset. The full loop structure restriction has been lifted with effect from 1 January 2021, on the conditions that an existing loop structure be placed on record with the SARB, or any new loop structure similarly be placed on record subsequent to the finalisation of the transaction and that, where South African assets are acquired through the loop structure, that this takes place on an arm’s length basis. Annual reporting to the SARB will also be required in relation to the loop structure.
United States
Environmental
Overview
In the United States, Sibanye-Stillwater’s US PGM operations are subject to extensive federal, state and local government controls and regulations, including regulation of mining and exploration activities which could involve the discharge of materials and contaminants into the environment, the investigation and clean-up of such discharges, disturbance of land, reclamation of disturbed lands, associated potential impacts to threatened or endangered species, management of waste materials, and other environmental concerns.
In particular, statutes including, but not limited to, the Clean Air Act, the Clean Water Act, the RCRA, the EPCRA, the Endangered Species Act, the NEPA and CERCLA impose permit requirements, effluent standards, air emission standards, waste handling and disposal restrictions and other design and operational requirements, as well as record keeping and reporting requirements, upon various aspects of mineral exploration, extraction and processing. In addition, the existing mining operations may become subject to additional environmental control and mitigation requirements if applicable federal, state and local laws and regulations governing environmental protection, land use and species protection are amended or become more stringent in the future.
In addition, the federal regulation under the RCRA governing the manner in which secondary materials and by-products of mineral extraction and beneficiation are handled, stored and reclaimed or reused is subject to frequent review by regulatory agencies.
Generally, compliance with the applicable environmental rules and regulations in the United States requires Sibanye-Stillwater US PGM operations to obtain permits issued by federal, state and local regulatory agencies and to file various and numerous reports that track operational monitoring, compliance, performance and records maintenance activities, measuring its operational effect on the environment. Certain permits require periodic renewal or review of their conditions.
Climate Change and GHG Emissions Regulations
In the United States, Sibanye-Stillwater is subject to legislative and regulatory initiatives that are underway to limit GHG emissions. The US Congress has considered legislation that would control GHG emissions through a “cap and trade” program and several US states have already implemented programs to reduce GHG emissions. In addition, the US Supreme Court determined in a 2007 ruling that GHG emissions are “air pollutants” within the meaning of the federal Clean Air Act. In response, the EPA promulgated an endangerment finding paving the way for regulation of GHG emissions under the Clean Air Act. In 2010, the EPA issued a final rule, known as the “Tailoring Rule”, which makes certain large stationary sources and modification projects subject to permitting requirements for GHG emissions under the Clean Air Act. In June 2014, the US Supreme Court invalidated portions of the federal Tailoring Rule, but the ruling upheld the EPA’s authority to require new or modified facilities that are already subject to permitting requirements for conventional pollutants to comply with BACT for GHGs, as well. New or modified sources subject to permitting for conventional pollutants will be required to access BACT for GHG if the new source or the modification will result in an annual increase of 75,000 tons per year of CO2e.
Sibanye-Stillwater is also subject to GHG reporting requirements for specified large GHG emission sources in the United States. Sibanye-Stillwater’s US PGM operations hold a Title V Major Air Quality Permit, which requires Sibanye-Stillwater to annually calculate the GHG emissions from the US PGM operations and compare these amounts against reporting thresholds. Because current levels are well below reporting thresholds, the Sibanye-Stillwater’s US PGM operations are not currently required to report GHG emissions. Additionally, the assessment of GHG emissions is becoming an increasingly important part of NEPA assessments, and as a result, Sibanye-Stillwater may be required to mitigate its GHG emissions in connection with any future NEPA review.
President Biden has made climate change a central focus of his administration. In addition to re-entering the Paris Agreement on 20 January 2021, the Biden administration issued an executive order directing all federal agencies to review and take action to address any federal regulations, orders, guidance documents, policies and any similar agency actions promulgated during the prior administration that may be inconsistent with the administration’s policies. As a result, it is unclear the degree to which certain recent regulatory developments may be modified or rescinded. The executive order also established the inter-agency working group, which is called on to, among other things, develop methodologies for calculating the “social cost of carbon,” “social cost of nitrous oxide” and “social cost of methane.” Final recommendations from the working group are due by June 2022.
Clean Air Act
In the United States, Sibanye-Stillwater’s US PGM operations are subject to the federal Clean Air Act and comparable state and local laws and regulations. These laws and regulations regulate emissions of air pollutants from various industrial sources, including ventilation exhaust, rock crushing activities, and mill processing used at Sibanye-Stillwater’s US PGM operations’ mines as well as smelting and refining stack emissions from its processing operations, and also imposes various monitoring and reporting requirements. For example, the smelting and refining operations are subject to particulate matter, carbon monoxide and nitrogen oxide limits under the federal New Source Performance Standards (NSPS), in addition to stringent sulphur dioxide (SO2) limits at the Sibanye-Stillwater’s US PGM operations smelting operations.
Additionally, as mines continue to grow and expand, ventilation demands, and associated emissions continue to escalate resulting in increases in ventilation exhaust emissions. Air quality laws and regulations may require that Sibanye-Stillwater’s US PGM operations obtain pre-approval for the construction or modification of certain projects or facilities expected to produce or significantly increase air emissions, obtain and strictly comply with air permits containing various emission and operational limitations and utilise specific emission control technologies to limit emissions.
Hazardous Substances and Waste
In the United States, Sibanye-Stillwater’s US PGM operations are subject to environmental laws and regulations relating to the management and release of hazardous substances, solid wastes and hazardous wastes. These laws generally regulate the generation, storage, treatment, transportation and disposal of solid and hazardous wastes and may impose strict joint and several liability for the investigation and remediation of affected areas where hazardous substances may have been released or disposed. For instance, the CERCLA, and comparable state laws impose liability, without regard to fault or the legality of the original conduct, on certain classes of persons that contributed to the release of a hazardous substance into the environment.
While some of the industrial wastes generated by the Sibanye-Stillwater’s US PGM operations are excluded from hazardous wastes regulations, it also generates industrial wastes that are subject to the requirements of the RCRA, and comparable state statutes.
Sibanye-Stillwater’s US PGM operations annually reports to the EPA, the United States Forest Service (USFS), and the Montana Department of Environmental Quality (Montana DEQ) in relation to releases of hazardous or toxic substances to the extent they exceed certain federal and state thresholds.
Water Discharges
In the United States, Sibanye-Stillwater’s US PGM operations are subject to the federal Clean Water Act and analogous state laws that impose restrictions and strict controls on the discharge of pollutants into waters, and construction activities in waters and wetlands. Certain state regulations and the general permits issued under the Federal National Pollutant Discharge Elimination System program prohibit the discharge of pollutants and chemicals. Spill prevention, control and countermeasure requirements of federal laws require appropriate containment berms and similar structures to help prevent the contamination of regulated waters in the event of a tank spill, rupture or leak.
In addition, the Clean Water Act and analogous state laws require individual permits or coverage under general permits for discharges of storm water runoff from certain types of facilities. These permits may require Sibanye- Stillwater’s US PGM operations to monitor and sample the storm water runoff from certain of its facilities. Federal and state regulatory agencies can impose administrative, civil and criminal penalties for non-compliance with discharge permits or other requirements of the Clean Water Act and analogous state laws and regulations.
During 2015, Sibanye-Stillwater’s US PGM operations completed renewal of water discharge permits at both its Stillwater and East Boulder mines. In 2020, these permits were administratively extended until 2023. These renewed permits include more stringent water quality discharge limits including a compliance schedule for Sibanye-Stillwater’s US PGM operations to meet compliance with the new permits.
Endangered Species Act
The Endangered Species Act was established to protect endangered and threatened species. Pursuant to that act, if a species is listed as threatened or endangered, restrictions may be imposed on activities that would harm the species or that would adversely affect that species’ habitat. Similar protections are offered to migratory birds under the Migratory Bird Treaty Act. The US Fish and Wildlife Service designates the species’ protected habitat as part of the effort to protect the species. A protected habitat designation or the mere presence of threatened or endangered species could result in material restrictions to use of land.
Diesel Particulate Matter
In an effort to protect the health of Sibanye-Stillwater’s US PGM operations employs various measures to comply with the MSHA’s limits on diesel particulate matter (DPM) exposure for underground miners. These measures include using catalytic converters, filters, and enhanced ventilation regimens, modifying certain mining practices underground that tend to create concentrations of DPM, and utilising various blends of biodiesel fuel.
Permitting and Reclamation
Operating Permits 00118 and 00149 issued by Montana DEQ encompass approximately 2,414 acres at the Stillwater Mine located in Stillwater County, Montana and 1631 acres at the East Boulder Mine located in Sweet Grass County, Montana. The permits delineate lands that may be subject to surface disturbance. Sibanye-Stillwater’s US PGM operations employs concurrent reclamation wherever feasible.
Reclamation regulations affecting Sibanye-Stillwater’s US PGM operations are promulgated and enforced jointly by the Montana DEQ and the USFS. For regulatory purposes, reclamation means returning the post-mining land to a state which has stability and utility comparable to adjacent, undisturbed areas. Major reclamation requirements include stabilisation and re-vegetation of disturbed lands, controlling storm water and drainage from portals and waste rock dumps, removal of roads and structures, the treatment and elimination of process solutions, the reclamation of major tailings storage facilities and the treatment and management of mine water prior to discharge in compliance with standards and visual mitigation.
Permits governing air and water quality are issued to Sibanye-Stillwater’s US PGM operations by the Montana DEQ, which has been delegated such authority by the federal government. Operating permits issued to the Company by the Montana DEQ and the USFS do not have an expiration date but are subject to periodic reviews. The reviews evaluate bonding levels, monitor reclamation progress, and assess compliance with all applicable permit requirements, mitigation measures and state and federal environmental standards. Closure and reclamation obligations are reviewed and reassessed by the agencies on a five-year rotating schedule. Bonding and financial guarantees are posted with the agencies to cover final reclamation costs at the end of the reconciliation and reassessment process.
Mine Safety Disclosure
Sibanye-Stillwater’s US PGM operations are subject to regulation by the MSHA under the Federal Mine Safety and Health Act (FMSH Act). MSHA inspects Sibanye-Stillwater’s US PGM mine operations on a regular basis and issues various citations and orders when it believes a violation has occurred under the FMSH Act.
Under the Dodd-Frank Wall Street Reform and Consumer Protection Act (Dodd-Frank Act), each operator of a coal or other mine is required to include certain mine safety results within its periodic reports filed with the SEC. In accordance with the reporting requirements included in Section 1503(a) of the Dodd-Frank Act and Item 104 of Regulation S-K (17 CFR 229.104), the required mine safety results regarding certain mining safety and health matters for each of Sibanye-Stillwater’s mine locations that are covered under the scope of the Dodd-Frank Act are included in Exhibit 16 Mine Safety Disclosures of this Annual Report on Form 20-F. In 2021, Sibanye-Stillwater received a total of 52 violations of mandatory health or safety standards that could significantly and substantially contribute to the cause and effect of a coal or other mine safety or health hazard under section 104 of the FMSH Act. See Exhibit 16 Mine Safety Disclosures of this Annual Report on Form 20- F for more information.
FINANCIAL INFORMATION
Dividend Policy and Dividend Distribution
Sibanye-Stillwater may make distributions from time to time, provided that any such distribution is pursuant to an existing legal obligation of Sibanye-Stillwater or a court order or has been authorised by resolution of the Board (save in the case of a pro rata distribution to all shareholders (except one which results in shareholders holding shares in an unlisted entity which requires the sanction of an ordinary resolution), cash dividends paid out of retained income, capitalisation issues or scrip dividends incorporating an election to receive either capitalisation shares or cash), and provided further that:
•dividends be paid to shareholders registered as at a date subsequent to the date of declaration or date of confirmation of the dividend, whichever is the later;
•it reasonably appears that Sibanye-Stillwater will satisfy the ‘solvency and liquidity’ test as set out in the Companies Act immediately after completing the proposed distribution; and
•no obligation is imposed by Sibanye-Stillwater, if it is a distribution of capital, that such capital be used to subscribe for shares in Sibanye-Stillwater.
Sibanye-Stillwater must complete any such distribution fully within 120 business days after the Board acknowledges that the ‘solvency and liquidity’ test has been applied as aforesaid, failing which it must again comply with the above.
Sibanye-Stillwater must hold all unclaimed distributions due to the shareholders of Sibanye-Stillwater in trust subject to the laws of prescription, and accordingly may release any distributions once the prescriptive period of three years in relation to those dividends has expired.
Sibanye-Stillwater’s dividend policy is to return at least 25% to 35% of normalised earnings to shareholders and after due consideration of future requirements the dividend may be increased beyond these levels. The Board, therefore, considers normalised earnings in determining what value will be distributed to shareholders. The Board believes normalised earnings provides useful information to investors regarding the extent to which results of operations may affect shareholder returns. Normalised earnings is defined as earnings attributable to the owners of Sibanye-Stillwater excluding gains and losses on financial instruments and foreign exchange differences, impairments, gain/loss on disposal of property, plant and equipment, occupational healthcare expense, restructuring costs, transaction costs, share-based payment on BEE transaction, gain on acquisition, net other business development costs, share of results of equity-accounted investees, all after tax, the impact of non-controlling interest and changes in estimated deferred tax rate. For a reconciliation of profit attributable to the owners of Sibanye-Stillwater to normalised earnings, see Annual Financial Report—Consolidated financial statements—Notes to the consolidated financial statements—Note 13: Dividends.
In line with Sibanye-Stillwater’s Capital Allocation Framework, the Board declared a final dividend of 187 (2020: 321) SA cents per share. Together with the interim dividend of 292 (2020: 50) SA cents per share, which was declared and paid, this brings the total dividend for the year ended 31 December 2021 to 479 (2020: 370) cents per share and this amounts to a payout of 35% (2020: 35%) of normalised earnings.
Under South African law, Sibanye-Stillwater will be entitled to pay a dividend or similar payment to its shareholders only if it meets the solvency and liquidity tests set out in the Companies Act, and it is permitted to do so in terms of the Memorandum of Incorporation.
There is no arrangement under which future dividends are waived or agreed to be waived.
THE LISTING
Sibanye-Stillwater’s ordinary shares trade on the JSE under the trading symbol “SSW”. Sibanye-Stillwater’s ADSs trade on the NYSE under the trading symbol “SBSW”.
ADDITIONAL INFORMATION
Memorandum of Incorporation
General
Sibanye-Stillwater is a public company registered in South Africa under the Companies Act, which limits the liability of Sibanye-Stillwater shareholders, and is governed by the Sibanye-Stillwater Memorandum of Incorporation. Sibanye-Stillwater was registered as a public company in South Africa on 6 July 2018. Sibanye-Stillwater’s registration number is 2014/243852/06.
The Sibanye-Stillwater Memorandum of Incorporation is not required to include and does not include, the details of the objects and purposes of Sibanye-Stillwater.
Dividends and payments to Sibanye-Stillwater Shareholders
Sibanye-Stillwater may make payments (including the payment of dividends) to the Sibanye-Stillwater Shareholders from time to time in accordance with provisions of the Companies Act, the JSE Listing Requirements and the Sibanye-Stillwater Memorandum of Incorporation. The Companies Act prohibits any payment (including the payment of any dividend) to a company’s shareholders if there are reasonable grounds for believing that:
•the company is, or would be, after the payment, unable to pay its debts as they become due in the ordinary course of business for a period of 12 months after the date of making such payment; or
•the consolidated assets of the company fairly valued would, after the payment, be less than the consolidated liabilities of the company, fairly valued.
Subject to the above requirements, and, in certain circumstances, approval of Sibanye-Stillwater Shareholders by way of an ordinary resolution, the Sibanye-Stillwater Board may from time to time declare a dividend or any other payment to be paid to Sibanye-Stillwater Shareholders and to the holders of share warrants (if any) in proportion to the number of the Sibanye-Stillwater Shares held by them.
Sibanye-Stillwater must hold all unclaimed dividends due to the shareholders in trust indefinitely, subject to the laws of prescription, and accordingly may release any dividends once the prescriptive period of three years in relation to those dividends has prescribed. Sibanye-Stillwater shall be entitled at any time to delegate its obligations in respect of unclaimed dividends or other unclaimed distributions, to any one of its bankers from time to time.
Sibanye-Stillwater Directors may resolve that any return of capital made to all or any shareholders whose registered addresses are outside South Africa will, subject to any exchange control regulations then in force, be paid in such other currencies as may be stipulated by the Sibanye-Stillwater Directors. The Sibanye-Stillwater Directors may also stipulate the date for converting Rand to those currencies and the provisional rate of exchange, provided that the date for conversion must be within a period of thirty days prior to the date of payment.
Voting rights
Every Sibanye-Stillwater Shareholder, or representative of a Sibanye-Stillwater Shareholder, who is present at a Sibanye-Stillwater Shareholders’ meeting has one vote on a show of hands, regardless of the number of Sibanye-Stillwater Shares he or she holds or represents or, in the case of a proxy, the number of Sibanye-Stillwater Shareholders he or she represents, unless a poll is demanded. Every Sibanye-Stillwater Shareholder is, on a poll, entitled to one vote per Sibanye-Stillwater Share held. A poll may be demanded by: (i) not less than five persons having the right to vote on that matter; or (ii) a person or persons entitled to exercise not less than one-tenth of the total voting rights entitled to vote on that matter; or (iii) the chairperson of the meeting. Neither the Companies Act nor the Sibanye-Stillwater Memorandum of Incorporation provide for cumulative voting.
A Sibanye-Stillwater Shareholder is entitled to appoint a proxy to attend, speak and vote at any meeting on his or her behalf. The proxy need not be a Sibanye-Stillwater Shareholder.
To the knowledge of management, none of the beneficial shareholders listed in the Shareholder Information section hold voting rights which are different from those held by other Sibanye-Stillwater shareholders. See Annual Financial Report—Ancillary Information—Shareholder Information for more information.
Issue of additional shares and pre-emptive rights
Sibanye-Stillwater Shareholder approval is required for any issuance of additional Sibanye-Stillwater Shares, other than if Sibanye-Stillwater Shares are issued pursuant to a pro rata rights offer to all Sibanye-Stillwater Shareholders, provided that the Sibanye-Stillwater Shares subject to the offer are less than 30% of Sibanye-Stillwater’s issued share capital.
Sibanye-Stillwater Shareholders, by ordinary or special resolution passed by a 75% majority, which requires an independent vote in the case of specific authority, may either convey a general or specific authority to the Sibanye-Stillwater Board to issue Sibanye-Stillwater Shares for cash. Such authority is valid for the period provided in the applicable resolution, but may be revoked by ordinary or special resolution, as the case may be, at any time. General authority may only be valid until the earlier of the next annual general meeting and 15 months after the authority was granted.
The JSE Listings Requirements as read with the Sibanye-Stillwater Memorandum of Incorporation require that any new issue of equity shares by Sibanye-Stillwater must first be offered to existing Sibanye-Stillwater Shareholders in proportion to their shareholding in Sibanye-Stillwater unless, among other things, the issuance to new Sibanye-Stillwater Shareholders is:
•pursuant to a Sibanye-Stillwater Shareholder approved employee share incentive scheme;
•to raise cash through a general issuance at the discretion of the Sibanye-Stillwater Board to the general public of up to 30% of the issued share capital in any one fiscal year at an issue price with a discount not exceeding 10% of the 30 business day weighted average trading price prior to the date that the application is made to the JSE to list the shares, provided that a 75% majority of the votes cast by Sibanye-Stillwater Shareholders at a general meeting or annual general meeting must approve the granting of such authority to the Sibanye-Stillwater Board;
•to raise cash through a specific issuance of Sibanye-Stillwater Shares for cash, provided that 75% of majority of votes cast by Sibanye-Stillwater Shareholder, other than parties and their associates participating in the specific issue for cash, vote in favour of the resolution to issue the shares;
•a capitalisation issue, an issue for an acquisition of assets (including another company) or an amalgamation or merger in terms of the Companies Act; or
•in terms of option or conversion rights.
In terms of the Companies Act, an issue of equity shares by Sibanye-Stillwater must be approved by a special resolution of Sibanye-Stillwater Shareholders if the Sibanye-Stillwater Shares are issued, among other things, to approve the issue to:
•a Sibanye-Stillwater Director, future director, prescribed officer or future prescribed officer of Sibanye-Stillwater; or
•a person related or inter-related to Sibanye-Stillwater, or to a Sibanye-Stillwater Director or prescribed officer of Sibanye-Stillwater:
unless the issue of Sibanye-Stillwater Shares is, among other things:
•under an agreement underwriting the Sibanye-Stillwater Shares;
•in proportion to existing holdings, and on the same terms and conditions that have been offered to all the Sibanye-Stillwater Shareholders;
•pursuant to an employee share scheme that satisfies the requirements of section 97 of the Companies Act; or
•pursuant to an offer to the public as defined in section 95(1)(h), read with section 96 of the Companies Act.
Furthermore, in terms of the Companies Act, an issue of shares requires approval of the shareholders by special resolution if the voting power of the class of shares that are issued or issuable as a result of the transaction will be equal to or exceed 30% of the voting power of all the shares of that class held by shareholders immediately before the transaction.
Transfer of Sibanye-Stillwater Shares
The transfer of any Sibanye-Stillwater certificated share will be implemented in accordance with the provisions of the Companies Act using the then common form of transfer. Dematerialised Sibanye-Stillwater Shares which have been traded on the JSE are transferred on the STRATE system and delivered three business days after each trade. The transferor of any Sibanye-Stillwater Share is deemed to remain the holder of that share until the name of the transferee is entered in Sibanye-Stillwater’s Register for that Sibanye-Stillwater Share. Since Sibanye-Stillwater Shares are traded through STRATE, only shares which have been Dematerialised may be traded on the JSE. Accordingly, Sibanye-Stillwater Shareholders who hold shares in certificated form will need to Dematerialise their Sibanye-Stillwater Shares in order to trade on the JSE.
General meetings of Sibanye-Stillwater Shareholders
The Sibanye-Stillwater Board may convene general meetings of Sibanye-Stillwater Shareholders and a general meeting may also be convened on a requisition by Sibanye-Stillwater Shareholders made pursuant to the Companies Act. Sibanye-Stillwater is obligated to hold an annual general meeting once in every calendar year, but no more than 15 months after the date of the previous annual general meeting.
All general meetings require 15 business days’ notice in writing of, among other things, the place, day and time of the meeting to Sibanye-Stillwater Shareholders.
Business may be transacted at any meeting of Sibanye-Stillwater Shareholders only while a quorum of Sibanye-Stillwater Shareholders is present. Sibanye-Stillwater Shareholders representing at least 25% of the voting rights which are entitled to be exercised in respect of at least one matter to be decided at that Sibanye-Stillwater Shareholder’s meeting present personally or by representative and entitled to vote constitute a quorum for a general meeting and an annual general meeting. However, a shareholder’s meeting may not begin unless there are three Sibanye-Stillwater Shareholders present at a meeting.
The annual general meeting deals with and disposes of all matters prescribed by the Memorandum of Incorporation and the Companies Act, including, among other things:
•the consideration of the audited financial statements and report of the independent external auditors; and
•the election of new and rotating Sibanye-Stillwater Directors.
Annual report and accounts
Sibanye-Stillwater is required to keep the accounting records and books of accounts as are necessary to present the state of affairs of Sibanye-Stillwater and to explain the financial position of Sibanye-Stillwater as prescribed by the Companies Act. Apart from the Sibanye-Stillwater Shareholders and holders of a beneficial interest in Sibanye-Stillwater, no person has the right to inspect any account or book or document of Sibanye-Stillwater (other than the share register), except as conferred by the Companies Act or authorised by Sibanye-Stillwater Directors.
The Sibanye-Stillwater Directors will cause to be prepared annual financial statements and an annual report as required by the Companies Act and the JSE Listings Requirements. Sibanye-Stillwater make the same available to every shareholder who so requests a copy of the annual report and annual financial statements. Not later than three months after the first six months of its fiscal year, Sibanye-Stillwater will make available to every Sibanye-Stillwater Shareholder an interim report for the previous six-month period.
Changes in capital or objects and powers of Sibanye-Stillwater
The Sibanye-Stillwater Shareholders may, by the passing of a special resolution, among other things:
•increase Sibanye-Stillwater’s authorised share capital;
•consolidate and reduce the number of the issued no par value Sibanye-Stillwater Shares, if any;
•subdivide all or any portion of Sibanye-Stillwater Shares into shares of a smaller amount than is fixed by the Sibanye-Stillwater Memorandum of Incorporation;
•reduce Sibanye-Stillwater’s authorised share capital and, if required by law, its issued share capital, stated capital;
•alter the provisions of the Sibanye-Stillwater Memorandum of Incorporation with respect to the objects and powers of Sibanye-Stillwater; and
•subject to the provisions of the Companies Act or any other South African law governing companies and the JSE Listings Requirements and any other stock exchange upon which the shares of Sibanye-Stillwater may be quoted or listed from time to time, allow Sibanye-Stillwater to acquire shares issued by itself or in any subsidiary of Sibanye-Stillwater from time to time.
Variation of rights
All or any of the rights, privileges or conditions attached to Sibanye-Stillwater Shares may be varied by a special resolution of Sibanye-Stillwater Shareholders passed in accordance with the provisions of the Companies Act; provided that, in circumstances where a Sibanye-Stillwater Shareholder dissents to such variation which materially and adversely affects his rights, that Sibanye-Stillwater Shareholder shall be entitled to be paid the fair value for his or her shares in accordance with the provisions of section 37(8) of the Companies Act as read with the appraisal rights provided for in section 164 of the Companies Act.
Distribution of assets on liquidation
In the event of a voluntary or compulsory liquidation, dissolution or winding-up, the assets remaining after payment of all the debts and liabilities of Sibanye-Stillwater, including the cost of liquidation, shall be dealt with by a liquidator who may, among other things, divide among the Sibanye-Stillwater Shareholders any part of the assets of Sibanye-Stillwater, and may vest any part of the assets of Sibanye-Stillwater as instructed at a meeting of Sibanye-Stillwater Shareholders in an inter vivos trust for the benefit of Sibanye-Stillwater Shareholders. If so resolved at a meeting of Sibanye-Stillwater Shareholders, the division of assets is not required to be done in accordance with the legal rights of Sibanye-Stillwater Shareholders in their capacities as shareholders of Sibanye-Stillwater.
Corporate objects and interests
The Memorandum of Incorporation of Sibanye-Stillwater is not required to, and does not, include the details of the object and purposes of Sibanye-Stillwater.
Purchase of shares
The Companies Act and the JSE Listings Requirements permit the establishment of share incentive schemes for the purpose of purchasing shares of a company for the benefit of its employees, including salaried directors. These share incentive schemes are permitted to extend loans to company employees, other than non-salaried Sibanye-Stillwater Directors, for the purpose of purchasing or subscribing for Sibanye-Stillwater Shares.
Sibanye-Stillwater may, if authorised by special resolution, acquire its own shares; provided that there are no reasonable grounds for believing that Sibanye-Stillwater is or would be, after the payment, unable to pay its debts or that Sibanye-Stillwater’s consolidated assets would, after the payment, be less than its consolidated liabilities. The procedure for acquisition of shares by Sibanye-Stillwater is regulated by the Sibanye-Stillwater Memorandum of Incorporation, the Companies Act and the JSE Listings Requirements.
Directors
The minimum number of Sibanye-Stillwater Directors shall be four and the maximum shall be 15. However, the failure by Sibanye-Stillwater to have the prescribed number of Sibanye-Stillwater Directors shall not invalidate anything done by the Sibanye-Stillwater Board. If the number of Sibanye-Stillwater Directors falls below the minimum in the MOI, the remaining Sibanye-Stillwater Directors shall not act after a period of three months from the date the deficiency in the minimum number of Sibanye-Stillwater Directors arose, except for the purpose of filling such vacancy or for the purpose of calling a meeting of Sibanye-Stillwater Shareholders in order to fill such vacancy. One-third of the Sibanye-Stillwater Board shall be required to retire from office at the annual general meeting held each year. The retiring Sibanye-Stillwater Director shall be eligible for re-election.
There are no qualifications prescribed by Sibanye-Stillwater for a person to serve as a Sibanye-Stillwater Director or alternate director, other than the requirements stipulated in the Companies Act.
Sibanye-Stillwater non-executive Directors may be paid their travelling and other expenses which are necessarily incurred by them in connection with the business of Sibanye-Stillwater, and in attending the meetings of Sibanye-Stillwater non-executive Directors or of
committees thereof, and if any Sibanye-Stillwater non-executive Director shall be required to perform extra services, to go or to reside abroad or otherwise, or be specially occupied about Sibanye-Stillwater’s business, such Sibanye-Stillwater non-executive Director shall be entitled to receive remuneration as approved by a special resolution by Sibanye-Stillwater’s Shareholders.
If a Sibanye-Stillwater Director has a personal financial interest in a matter to be considered by the Sibanye-Stillwater Board, the Sibanye-Stillwater Director must disclose such personal financial interest before the matter is considered at the meeting and must, inter alia, disclose any information relating to the matter, and known to the Sibanye-Stillwater Director, disclose any insights and not take part in the decision to execute any documents on behalf of Sibanye-Stillwater in relation to the matter. However, a decision by the Sibanye-Stillwater Board or a transaction/agreement approved by the Sibanye-Stillwater Board will be valid despite any personal financial interest of a Sibanye-Stillwater Director or a person related to a director if it was ratified or approved by ordinary resolution of the Sibanye-Stillwater Shareholders or declared valid by a court of law.
Borrowing powers
The Sibanye-Stillwater Board may exercise all the powers of Sibanye-Stillwater to borrow money and to give all or any part of its property as security whether outright or as security for any debt, liability or obligation of Sibanye-Stillwater or of any third party. Sibanye-Stillwater has unlimited borrowing powers. Furthermore, the Sibanye-Stillwater Board may create and issue debt instruments, as contemplated in section 43(1)(a) of the Companies Act, on such terms and conditions and in such manner as the Sibanye-Stillwater Board may from time to time determine, in accordance with the requirements of section 43 of the Companies Act, provided that, for so long as Sibanye-Stillwater is listed on the JSE, a debt instrument issued by Sibanye-Stillwater may not grant special privileges regarding attending and voting at general meetings and the appointment of Sibanye-Stillwater Directors, as contemplated in the JSE Listings Requirements.
The Sibanye-Stillwater Board’s borrowing powers may only be changed by special resolution of the Sibanye-Stillwater Shareholders amending the Sibanye-Stillwater Memorandum of Incorporation.
Non-South African shareholders
There are no limitations imposed by South African law or by the Sibanye-Stillwater Memorandum of Incorporation on the rights of non-South African shareholders to hold or vote Sibanye-Stillwater Shares.
Rights of minority shareholders and directors’ duties
Majority shareholders of South African companies have no fiduciary obligations under South African common law to non-controlling shareholders. However, under the Companies Act, a shareholder may, under certain circumstances, seek relief from the court if he or she has been unfairly prejudiced by the company. There may also be common law personal actions available to a shareholder of a company.
In South Africa, the common law and the Companies Act impose on directors duties to, among other things, act with care, skill and diligence and to conduct the company’s affairs honestly and in the best interests of the company.
Disclosure requirements under the JSE Listings Requirements
Under the JSE Listings Requirements and the Companies Act, as the case may be, as a public company listed on the JSE, Sibanye-Stillwater is required to disclose, among other things, beneficial interests in Sibanye-Stillwater Shares that amount to 5% or more, as described in the section entitled —Disclosure of Interest in Sibanye-Stillwater Shares, and is required to publish accounting records as part of its annual reporting obligations, as described in the section entitled —Memorandum of Incorporation—Annual Report and Accounts.
Disclosure of interest in Sibanye-Stillwater Shares
Under South African law, a registered holder of Sibanye-Stillwater Shares who is not the beneficial owner of such shares is required to disclose the identity of the person on whose behalf that security is held and the identity of each person with a beneficial interest in the securities so held, the number and class of securities held for each such person with a beneficial interest, and the extent of each such person with a beneficial interest. This information must be disclosed in writing to Sibanye-Stillwater within five business days after the end of every month during which a change has occurred in the information or more promptly or frequently to the extent so provided by the requirements of a central securities depository or otherwise be provided on payment of a prescribed fee charged by the registered holder of securities. Moreover, Sibanye-Stillwater may, by notice in writing, require a person who is a registered Sibanye-Stillwater Shareholder, or whom Sibanye-Stillwater knows or has reasonable cause to believe has a beneficial interest in Sibanye-Stillwater Shares, to confirm or deny whether or not such person holds the Sibanye-Stillwater Shares or beneficial interest and, if the Sibanye-Stillwater Shares are held for another person, to disclose to Sibanye-Stillwater the identity of the person on whose behalf the Sibanye-Stillwater Shares are held. Sibanye-Stillwater may also require the person to give particulars of the extent of the beneficial interest held during the three years preceding the date of the notice. Sibanye-Stillwater is obligated to establish and maintain a register of the disclosures described above and to publish in its annual financial statements a list of the persons who hold a beneficial interest equal to or in excess of 5% of the total number of ordinary shares issued by Sibanye-Stillwater, together with the extent of those beneficial interests. Further, in terms of section 122 of the Companies Act, a shareholder is required to notify Sibanye-Stillwater within three business days if its shareholding crosses a 5% multiple measured against the issued shares at that time. Sibanye-Stillwater is then required to disclose this notification to the South African Takeover Regulation Panel and deliver to the Sibanye-Stillwater Shareholders such notification by means of a SENS announcement, unless it relates to the disposal of any beneficial interest of less than 1% of the issued Sibanye-Stillwater Shares at that time.
Periodic and beneficial ownership reporting under US securities laws
Under the Exchange Act, for so long as Sibanye-Stillwater continues to qualify as a “foreign private issuer”, Sibanye-Stillwater is required to publicly file with the SEC annual reports on Form 20-F within four months of the end of the financial year covered by the report. As a foreign private issuer, Sibanye-Stillwater is also required to publicly file with the SEC on Form 6-K material information that it makes or is required to make public pursuant to South African law, files or is required to file with any stock exchange on which the Sibanye-Stillwater Shares trade and which was made public by that exchange, or is otherwise distributed or required to be distributed to Sibanye-Stillwater Shareholders.
Any person who acquires more than 5% of Sibanye-Stillwater Shares (whether in the form of Sibanye-Stillwater Shares or Sibanye-Stillwater ADSs) is subject to an obligation to file reports of beneficial ownership with the SEC, the NYSE and Sibanye-Stillwater. Generally, these reports are filed on a Schedule 13D. However, a short form, Schedule 13G, may be filed in lieu of Schedule 13D in certain circumstances. A Schedule 13D must be filed within ten days after an acquisition of securities that brings the acquirer above the 5% level, and must be amended promptly after any material change in the facts disclosed in the filing. As a general rule, a Schedule 13G must be filed (by the shareholder, as it is the individual responsibility of each beneficial owner of more than 5% of company shares to make the filing and not Sibanye-Stillwater’s responsibility) within 45 calendar days of the end of each calendar year, although shareholders who are the beneficial owner of 20% or less of a relevant class of equity securities, and who did not acquire the securities with the purpose or effect of changing or influencing control of the issuer must file within ten days of the acquisition of securities that triggers the obligation. “Beneficial owner”, a technical term defined in Rule 13d-3 under the Exchange Act, generally encompasses not only the record owner of securities, but also any person who has the power to either direct the investment of, or exercise the power to vote, such securities. In addition, a person is deemed to be a beneficial owner of a security if he or she has the right to acquire beneficial ownership of the security, including through the exercise of an option, within 60 days.
Material Contracts
The following are material contracts not entered into in the ordinary course of business that were entered into, novated or amended by Sibanye-Stillwater in the period under review.
2026 and 2029 Notes
On 16 November 2021 Stillwater Mining Company (Stillwater), as a subsidiary of Sibanye-Stillwater, issued at face value US$1.2 billion of senior notes (the 2021 Senior Notes) to an indenture dated 16 November 2021 among Sibanye-Stillwater, The Bank of New York Mellon and certain guarantors. The 2021 Senior Notes offering comprises of two tranches, US$675 million 4.000 percent senior notes due 2026, which bear interest at a rate of 4.000 percent per annum (the 2026 Notes) and US$525 million 4.500% senior notes due 2029, which bear interest at a rate of 4.500 percent per annum (the 2029 Notes) (together the 2026 and 2029 Notes). The 2026 and 2029 Notes are denominated in US Dollars, mature and become due and payable in arrears in equal semi-annual instalments on 16 May and 16 November of each year. The 2026 and 2029 Notes are fully and unconditionally guaranteed, jointly and severally by Sibanye Stillwater Limited, Kroondal Operations Proprietary Limited, Sibanye Rustenburg Platinum Mines Proprietary Limited, Sibanye Gold Proprietary Limited and Western Platinum Proprietary Limited. The guarantees rank equally in right of payment to all existing and future senior debt of the guarantors.
At any time on or after 16 November 2023, in the case of the 2026 Notes, or 16 November 2025, in the case of the 2029 Notes, Stillwater may redeem all or part of the 2026 Notes or 2029 Notes by paying the relevant price (expressed as a percentage of the principal amount of the 2026 Notes or 2029 Notes plus an applicable premium) plus accrued and unpaid interest on the 2026 Notes or 2029 Notes. In addition, prior to 16 November 2023, Stillwater may redeem up to 35% of the original aggregate principal amount of the 2026 Notes or 2025 Notes with the net proceeds from certain equity offerings. If Sibanye-Stillwater undergoes a change of control, Sibanye-Stillwater or Stillwater will be required to make an offer to purchase each of the 2026 Notes and 2029 Notes at a purchase price equal to 101% of the principal amount of each of the Notes, plus accrued and unpaid interest to the date of purchase. In the event of certain developments affecting taxation, Stillwater may redeem all, but not less than all, of the 2026 and 2029 Notes.
Sibanye-Stillwater used the proceeds of the 2026 and 2029 Notes to redeem the 2025 Notes (as described below), as well as general corporate purposes, including advancing Sibanye-Stillwater’s battery metals strategy through, among other things, investments and accretive acquisitions and improving earnings diversification. For information on Sibanye-Stillwater’s 2026 and 2029 Notes, see Annual Financial Report—Consolidated financial statements—Notes to the consolidated financial statements—Note 28.5: 2026 and 2029 Notes.
2022 and 2025 Notes
On 27 June 2017, Stillwater, as a subsidiary of Sibanye-Stillwater, issued US$1.05 billion of senior notes (the 2017 Senior Notes) pursuant to an indenture dated 16 March 2017 among Sibanye, The Bank of New York Mellon and certain guarantors. The 2017 Senior Notes offering comprises of two tranches, US$500 million 6.125 percent senior notes due 2022, which bear interest at a rate of 8.125 percent per annum (the 2022 Notes) and US$550 million 7.125 percent senior notes due 2025, which bear interest at a rate of 7.125 percent per annum (the 2025 Notes) (together the 2022 and 2025 Notes). The 2022 and 2025 Notes were fully and unconditionally guaranteed, jointly and severally by Kroondal Operations Proprietary Limited, Sibanye Rustenburg Platinum Mines Proprietary Limited and Sibanye Gold Limited. Sibanye-Stillwater used the proceeds of the 2022 and 2025 Notes for the partial repayment of the US$350 million Bridge Facility Agreement between Sibanye Gold Limited, Citibank NA and HSBC Bank plc, dated 5 October 2015, raised for the acquisition of Stillwater.
On 19 September 2018, Sibanye-Stillwater completed its offer to purchase the 2022 Notes and 2025 Notes, in which it repurchased a principal amount of US$146.3 million of the 2022 Notes and US$231.1 million of the 2025 Notes.
Following the completion of the Lonmin Acquisition, on 8 January 2020, Western Platinum Proprietary Limited acceded to the 2017 Senior Notes as an additional guarantor. Following completion of the Scheme, on 24 February 2020 Sibanye-Stillwater acceded to the 2017 Senior Notes as an additional guarantor.
Given Sibanye-Stillwater’s surplus liquidity and in line with its capital allocation framework, Sibanye-Stillwater elected to early redeem the 2022 Notes on 2 August 2021 (the Redemption Date). The redemption price was the principal amount of the 2022 Notes, plus accrued and unpaid interest on the 2022 Notes up to, but excluding, the Redemption Date, amounting to US$355.8 million (with a nominal value of US$353.7 million) and was settled on 2 August 2021. On 6 December 2021, Stillwater early redeemed the 2025 Notes, with a nominal value of US$346.9 million, accrued interest of US$10.9 million and a redemption premium of US$12.4 million, were redeemed in full using the proceeds of the 2021 Senior Notes. For information on the 2022 and 2025 Notes, see Annual Financial Report—Consolidated financial statements—Notes to the consolidated financial statements—Note 28.4: 2022 and 2025 Notes.
US$600 million revolving credit facility
Following discussions with its lenders during January 2019, Sibanye-Stillwater secured an extension of the temporary uplift of the net debt to EBITDA covenant limit to 3.5x through to and including 31 December 2019. The covenant limit returned to 2.5x from 31 March 2020. As provided for in the terms of the facility, as of 31 December 2021, all lenders have approved both one-year maturity extension options. As a result of these extensions, the US$600 million facility remains set to mature on 5 April 2023. For information on Sibanye-Stillwater’s US$600 million revolving credit facility, see Annual Financial Report—Consolidated financial statements—Notes to the consolidated financial statements—Note 28.1: US$600 million RCF and Annual Financial Report—Consolidated financial statements—Notes to the consolidated financial statements—Note 36.2: Risk management activities—Liquidity risk—Working capital and going concern assessment.
Scheme implementation agreement
On 24 February 2020, Sibanye-Stillwater and Sibanye Gold Limited implemented a scheme of arrangement in terms of section 114 of the South African Companies Act, 2008, which resulted in, among other things, Sibanye Gold Limited’s operations being reorganised under Sibanye-Stillwater, which became the parent company of the Sibanye-Stillwater Group (the Reorganisation). See Annual Financial Report—Consolidated financial statements—Notes to the consolidated financial statements—Note 26: Stated share capital. The scheme of arrangement was implemented pursuant to a scheme implementation agreement between Sibanye-Stillwater and Sibanye Gold Limited on 4 October 2019 (the Scheme Implementation Agreement). The Scheme Implementation Agreement contained certain condition precedents relating to the implementation of the scheme of arrangement, which have been either satisfied or waived. In addition, the Scheme Implementation Agreement contained certain customary representations and warranties given by each of Sibanye-Stillwater and Sibanye Gold Limited.
R5.5 billion revolving credit facility
In November 2019, a new R5.5 billion revolving credit facility was entered into by Sibanye-Stillwater on similar terms to the maturing R6.0 billion revolving credit facility. The facility includes two one-year maturity extension options at the discretion of the lenders. All facility lenders have approved the first and second one-year extension options with the loan facility now set to mature on 11 November 2024. See Annual Financial Report—Consolidated financial statements—Notes to the consolidated financial statements—Note 28.3: R5.5 billion RCF.
Deposit agreement
In connection with the establishment of an ADS facility in respect of Sibanye-Stillwater Shares, Sibanye-Stillwater entered into the Sibanye-Stillwater Deposit Agreement with the ADS Depositary among Sibanye-Stillwater, the ADS Depositary, you, as a Sibanye-Stillwater ADS Holder, and all owners and holders from time to time of ADSs issued thereunder (the Sibanye-Stillwater Deposit Agreement). The Sibanye-Stillwater Deposit Agreement sets out Sibanye-Stillwater ADS Holders’ rights, as well as the rights and obligations of the ADS Depositary. New York law governs the Sibanye-Stillwater Deposit Agreement and the Sibanye-Stillwater ADSs. See Exhibits—2.5 Description of securities registered under Section 12 of the Exchange Act.
Fees and expenses
The Depositary will charge any party depositing or withdrawing ordinary shares or any party surrendering ADSs or to whom ADSs are issued:
| | | | | | | | |
| Persons depositing or withdrawing shares or ADS holders must pay | | For |
| US$5.00 (or less) per 100 Sibanye-Stillwater ADSs (or portion of 100 Sibanye-Stillwater ADSs) | | Issuance of Sibanye-Stillwater ADSs, including issuances resulting from a distribution of ordinary shares or rights or other property or cancellation of Sibanye-Stillwater ADSs for the purpose of withdrawal, including if the deposit agreement terminates |
| US$.05 (or less) per ADS (or a portion thereof) | | Any cash distribution pursuant to the Deposit Agreement |
| A fee equivalent to the fee that would be payable if securities distributed to you had been ordinary shares and those ordinary shares had been deposited for issuance of ADSs | | Distribution of securities distributed to holders of deposited securities which are distributed by the Depositary to Sibanye-Stillwater’s ADS holders |
| US$.05 (or less) per ADSs per calendar year | | Depositary services |
| Registration or transfer fees | | Transfer and registration of shares on Sibanye-Stillwater’s share register to or from the name of the Depositary or its agent when you deposit or withdraw ordinary shares |
| Expenses of the Depositary | | Cable, telex and facsimile transmissions (when expressly provided in the deposit agreement) converting foreign currency to US dollars |
| Taxes and other governmental charges the Depositary or the custodian have to pay on any ADS or share underlying an ADS, for example, stock transfer taxes, stamp duty or withholding taxes | | As necessary |
| Any charges incurred by the Depositary or its agents for servicing the deposited securities | | As necessary |
The Depositary collects its fees for delivery and surrender of ADSs directly from investors depositing shares or surrendering ADSs for the purpose of withdrawal or from intermediaries acting for them. The Depositary collects fees for making distributions to investors by deducting those fees from the amounts distributed or by selling a portion of distributable property to pay the fees. The Depositary may collect its annual fee for depositary services by deduction from cash distributions or by directly billing investors or by charging the book-entry system accounts of participants acting for them. The Depositary may generally refuse to provide fee-attracting services until its fees for those services are paid.
From time to time, the Depositary may make payments to Sibanye-Stillwater to reimburse and/or share revenue from the fees collected from ADS holders, or waive fees and expenses for services provided, generally relating to costs and expenses arising out of establishment and maintenance of the ADS program. In performing its duties under the Deposit Agreement, the Depositary may use brokers, dealers or other service providers that are affiliates of the Depositary and that may earn or share fees or commissions.
The Depositary may convert currency itself or through any of its affiliates and, in those cases, acts as principal for its own account and not as agent, adviser, broker or fiduciary on behalf of any other person and earns revenue, including, without limitation, transaction spreads, that it will retain for its own account. The revenue is based on, among other things, the difference between the exchange rate assigned to the currency conversion made under the Deposit Agreement and the rate that the Depositary or its affiliate receives when buying or selling foreign currency for its own account. The Depositary makes no representation that the exchange rate used or obtained in any currency conversion under the Deposit Agreement will be the most favourable rate that could be obtained at the time or that the method by which that rate will be determined will be the most favourable to ADS holders, subject to the Depositary’s obligations under the Deposit Agreement. The methodology used to determine exchange rates used in currency conversions is available upon request.
In fiscal 2021, BNYM paid US$1.1 million to Sibanye-Stillwater as reimbursement for costs incurred over the year in connection with the ADS program.
Payment of taxes
You will be responsible for any taxes or other governmental charges payable on your ADSs or on the deposited securities underlying your ADSs. The Depositary may deduct the amount of any taxes owed from any payments to you. It may also restrict or refuse the transfer of your Sibanye-Stillwater ADSs or restrict or refuse the withdrawal of your underlying deposited securities until you pay any taxes owed on your Sibanye-Stillwater ADSs or underlying securities. It may also sell deposited securities to pay any taxes owed.
You will remain liable if the proceeds of the sale are not enough to pay the taxes. If the Depositary sells deposited securities, it will, if appropriate, reduce the number of Sibanye-Stillwater ADSs held by you to reflect the sale and pay to you any proceeds, or send to you any property, remaining after it has paid the taxes.
US Holders
As of 26 March 2022, 1,012 record holders of Sibanye-Stillwater’s ordinary shares, holding an aggregate of 446,297,792 ordinary shares (15.8%), including shares underlying Sibanye-Stillwater’s ADSs, were listed as having addresses in the United States.
South African Exchange Control Limitations Affecting Security Holders
The discussion below relates to exchange controls in force as of the date of this annual report. These controls are subject to change at any time without notice. It is not possible to predict whether existing exchange controls will be abolished, continued or amended by the South African government in the future. Investors are urged to consult a professional adviser as to the exchange control implications of their particular investments.
South African law provides for Exchange Control Regulations which, among other things, restrict the outward flow of capital from the Common Monetary Area (CMA) consisting of South Africa, Namibia, Lesotho and Eswatini. The Exchange Control Regulations, which are administered by the Financial Surveillance Department of the SARB, regulate international transactions involving South African residents, including companies.
There are no exchange control restrictions on the remittance, in full, of cash dividends declared out of trading profits to non-residents of the CMA by Sibanye-Stillwater, provided the share certificates held by non-resident Sibanye-Stillwater shareholders have been endorsed with the words “non-resident” or, where dematerialised, the residential status of the electronic record is flagged accordingly (i.e. non-resident or emigrant) by the various participants in the central depository. The same endorsement requirement, however, will not be applicable non-resident holders of ADSs. Pre-approval by the SARB is required where dividends in specie are declared by Sibanye-Stillwater.
ADSs representing ordinary shares of Sibanye-Stillwater are freely transferable outside South Africa between persons who are not residents of the CMA. The proceeds from the sale of ordinary shares on the JSE by shareholders who are not residents of the CMA are freely remittable to such shareholders, provided that the shares are flagged as non-resident held (the shares on the JSE have been dematerialised). Additionally, where ordinary shares are sold on the JSE on behalf of shareholders of Sibanye-Stillwater who are not residents of the Common Monetary Area, the proceeds of such sales will be freely exchangeable into foreign currency and remittable to them. In such case no share certificates need to be endorsed as the shares on the JSE have been dematerialised.
Acquisitions of Sibanye-Stillwater's ordinary shares held by South African residents by non-South African purchasers solely for a cash consideration equal to the fair value of the ordinary shares is generally permissible. Such acquisitions would require SARB pre-approval in certain circumstances, such as if the consideration for the acquisition is shares in a non-South African company or if the acquisition is financed by a loan from a South African lender. If SARB denies approval of an acquisition of assets of a South African company, this may result in an inability to complete the acquisition. Subject to this limitation, there are no restrictions on equity investments in South African companies and a foreign investor may invest freely in the ordinary shares and ADSs of Sibanye-Stillwater.
Taxation
Certain South African tax considerations
The discussion in this section sets out the material South African tax consequences of the purchase, ownership and disposition of Sibanye-Stillwater’s ordinary shares or ADSs under current South African law. Changes in the law may alter the tax treatment of Sibanye-Stillwater’s ordinary shares or ADSs, possibly on a retroactive basis.
The following summary is not a comprehensive description of all of the tax considerations that may be relevant to a decision to purchase, own or dispose of Sibanye-Stillwater’s ordinary shares or ADSs and does not cover tax consequences that depend upon your particular tax circumstances. In particular, the following summary addresses tax consequences for holders of ordinary shares or ADSs who are not residents of, or who do not carry on business in, South Africa and who hold ordinary shares or ADSs as capital assets (that is, for investment purposes). For the purposes of the income tax treaty between South Africa and the United States and South African tax law, a United States resident that owns Sibanye-Stillwater ADSs will be treated as the owner of the Sibanye-Stillwater ordinary shares represented by such ADSs. Sibanye-Stillwater recommends that you consult your own tax adviser about the consequences of holding Sibanye-Stillwater’s ordinary shares or ADSs, as applicable, in your particular situation.
Withholding tax on dividends
It should be noted that the withholding tax on dividends declared by South African resident companies to non-resident shareholders or non-resident ADS holders was introduced with effect from 1 April 2012 and the percentage was increased on 22 February 2017 from 15% to 20% Generally, under the terms of the double tax treaty entered into between South Africa and the United States (the Treaty) the withholding tax on dividends may be reduced to 5% of the gross amount of the dividends if the beneficial owner of the shares is a company holding directly at least 10% of the voting stock of the company paying the dividends and to 15% of the gross amount of the dividends in all other cases, provided certain requirements in terms of the Treaty are met. The reduction of the rate of the withholding tax on dividends in terms of the Treaty is subject to the beneficial owner of the dividends making certain declarations and undertakings and providing same to the company or regulated intermediary making payment of the dividend.
Income tax and capital gains tax
Non-resident holders of ordinary shares or ADSs should not be subject to capital gains tax in South Africa with respect to the disposal of those ordinary shares or ADSs unless (i) that non-resident shareholder holds 20% or more of the equity shares in a company that derives 80% or more of its value from immovable property, which includes mining and prospecting rights, situated in South Africa; or (ii) the shares are effectively connected with a permanent establishment of that non-resident shareholder in South Africa.
As Sibanye-Stillwater operates in the mining sector, it is highly probable that 80% or more of the market value of the ordinary shares or ADSs are directly or indirectly derived from immovable property located in South Africa. Where the non-resident shareholder is subject to capital gains tax in South Africa as envisaged above and disposes of the shares, the purchaser of the ordinary shares or ADSs will be obliged to withhold a percentage (between 7.5% and 10%, depending on the nature of the seller) of the purchase consideration for the ordinary shares or ADSs payable to the non-resident shareholders and pay such amount over to the South African Revenue Service within 14 days where the purchaser is a South African resident or within 28 days where the purchaser is a non-resident. The taxing right of the capital gain could, however, be awarded to the specific jurisdiction of the seller (and not South Africa) depending on the wording and application of the applicable Double Taxation Treaty.
Securities transfer tax
No Securities Transfer Tax (STT) is payable in South Africa with respect to the issue of a security.
STT is charged at a rate of 0.25% upon the transfer of every security issued by a company or a close corporation incorporated in South Africa, or a company incorporated outside South Africa but listed on an exchange in South Africa, subject to certain exemptions.
A “transfer” is broadly defined and includes the transfer, sale, assignment or cession or disposal in any other manner of a security. The cancellation or redemption of a security is also regarded as a transfer unless the company is being liquidated. However, the transfer of a security that does not result in a change in beneficial ownership of such security is not regarded as a transfer.
In respect of the transfer of a listed security, STT is levied on the amount of the consideration for that security declared by the person who acquires that security, or if no amount of consideration is declared, or if the amount so declared is less than the lowest price of the security, the closing price of that security. With regard to the transfer of an unlisted security, STT is levied on the greater of the consideration given for the acquisition of the security or the market value of an unlisted security. In the case of a transfer of a listed security, either the member, the participant or the person to whom the security is transferred is liable for the tax. The tax must be paid by the 14th day of the month following the transfer.
Interest withholding tax
Interest withholding tax has been introduced into the South African tax regime with effect from 1 March 2015. Although not specifically applicable to non-resident shareholders or non-resident ADS holders, interest withholding tax will be levied at a rate of 15% on any interest paid for the benefit of any foreign person to the extent that the interest is regarded as being from a source within South Africa. There is, however, a specific exemption from interest withholding tax on any interest incurred on a listed debt (i.e. debt listed on a recognised exchange). In addition, where interest withholding tax is levied, such interest withholding tax may be reduced by the applicable Double Taxation Treaty.
US federal income tax considerations
The following discussion summarises the material US federal income tax consequences of the acquisition, ownership and disposition of ordinary shares and ADSs by a US Holder. As used herein, the term “US Holder” means a beneficial owner of ordinary shares or ADSs that is for US federal income tax purposes:
•a citizen or resident of the United States;
•a corporation created or organised under the laws of the United States, any state thereof or the District of Columbia;
•an estate the income of which is subject to US federal income tax without regard to its source; or
•a trust if a court within the United States is able to exercise primary supervision over the administration of the trust and one or more US persons have the authority to control all substantial decisions of the trust, or the trust has validly elected to be treated as a domestic trust for US federal income tax purposes.
The US federal income tax treatment of a partner in an entity or arrangement treated as a partnership for US federal income tax purposes that holds ordinary shares or ADSs will depend upon the status of the partner and the activities of the partnership. If you are an entity or arrangement treated as a partnership for US federal income tax purposes, you should consult your tax adviser concerning the US federal income tax consequences to you and your partners of the acquisition, ownership and disposition of ordinary shares or ADSs by you.
This summary only applies to US Holders that hold ordinary shares or ADSs as capital assets. This summary is based upon:
•the current federal income tax laws of the United States, including the Internal Revenue Code of 1986, as amended (the Code), its legislative history, and existing and proposed regulations promulgated thereunder;
•current US Internal Revenue Service (the IRS) practice and applicable US court decisions; and
•the income tax treaty between the United States and South Africa (the Treaty) all as of the date hereof and all subject to change at any time, possibly with retroactive effect.
This summary assumes that the obligations of the Depositary under the Deposit Agreement and any related agreements will be performed in accordance with their terms.
This summary is of a general nature and does not address all US federal income tax consequences that may be relevant to you in light of your particular situation (including consequences under the alternative minimum tax or the net investment income tax), and does not address state, local, non-US or other tax laws (such as estate and gift tax laws). For example, this summary does not apply to:
•investors that own (directly, indirectly, or by attribution) 5% or more of Sibanye-Stillwater’s stock (by vote or value);
•financial institutions;
•insurance companies;
•individual retirement accounts and other tax-deferred accounts;
•tax-exempt organisations;
•dealers in securities or currencies;
•investors that hold ordinary shares or ADSs as part of straddles, hedging transactions or conversion transactions for US federal income tax purposes;
•persons that have ceased to be US citizens or lawful permanent residents of the United States;
•investors that hold ordinary shares or ADSs in connection with a trade or business conducted outside the United States;
•US citizens or lawful permanent residents living abroad; or
•investors whose functional currency is not the US dollar.
Sibanye-Stillwater does not believe that it was a passive foreign investment company (PFIC) for US federal income tax purposes for its most recent taxable year, and does not expect to be a PFIC for its current taxable year or in the foreseeable future. However, Sibanye-Stillwater’s possible status as a PFIC must be determined annually and therefore may be subject to change. If Sibanye-Stillwater were to be treated as a PFIC, US Holders of ordinary shares or ADSs would be required (i) to pay a special US addition to tax on certain distributions and gains on sale and (ii) to pay tax on any gain from the sale of ordinary shares or ADSs at ordinary income (rather than capital gains) rates in addition to paying the special addition to tax on this gain. Additionally, dividends paid by Sibanye-Stillwater would not be eligible for the reduced rate of tax described below under “Taxation of Dividends”. The remainder of this discussion assumes that Sibanye-Stillwater is not a PFIC for US federal income tax purposes. You should consult your own tax advisers regarding the potential application of the PFIC regime.
The summary of US federal income tax consequences set out below is for general information only. You are urged to consult your tax advisers as to the particular tax consequences to you of acquiring, owning and disposing of the ordinary shares or ADSs, including your eligibility for the benefits of the Treaty and the applicability and effect of state, local, non-US and other tax laws and possible changes in tax law.
US Holders of ADSs
For US federal income tax purposes, a US Holder of ADSs generally will be treated as the owner of the corresponding number of underlying ordinary shares held by the Depositary for the ADSs, and references to ordinary shares in the following discussion refer also to ADSs representing the ordinary shares.
Deposits and withdrawals of ordinary shares by US Holders in exchange for ADSs will not result in the realisation of gain or loss for US federal income tax purposes. Your tax basis in withdrawn ordinary shares will be the same as your tax basis in the ADSs surrendered, and your holding period for the ordinary shares will include the holding period of the ADSs.
Taxation of dividends
Distributions paid out of Sibanye-Stillwater’s current or accumulated earnings and profits (as determined for US federal income tax purposes), before reduction for any South African withholding tax paid by Sibanye-Stillwater with respect thereto, will generally be taxable to you as dividend income, and will not be eligible for the dividends received deduction allowed to corporations.
Distributions that exceed Sibanye-Stillwater’s current and accumulated earnings and profits will be treated as a non-taxable return of capital to the extent of your basis in the ordinary shares and thereafter as capital gain. However, we do not maintain calculations of our earnings and profits in accordance with US federal income tax accounting principles. You should therefore assume that any distribution by us with respect to the shares will be reported as ordinary dividend income. You should consult your own tax advisers with respect to the appropriate US federal income tax treatment of any distribution received from us.
Dividends paid by Sibanye-Stillwater generally will be taxable to non-corporate US Holders at the reduced rate normally applicable to long-term capital gains, provided that either (i) Sibanye-Stillwater qualifies for the benefits of the Treaty, or (ii) with respect to dividends paid on the ADSs, the ADSs are considered to be “readily tradable” on the NYSE. You will be eligible for this reduced rate only if you are an individual, and have held the ordinary shares or ADSs for more than 60 days during the 121-day period beginning 60 days before the ex-dividend date.
For US federal income tax purposes, the amount of any dividend paid in Rand will be included in income in a US dollar amount calculated by reference to the exchange rate in effect on the date the dividends are received by you or the Depositary (in the case of ADSs), regardless of whether they are converted into US dollars at that time. If you or the Depositary, as the case may be, convert dividends received in Rand into US dollars on the day they are received, you generally will not be required to recognise foreign currency gain or loss in respect of this dividend income.
Effect of South African withholding taxes
A US Holder will generally be entitled, subject to certain limitations, to a foreign tax credit against its US federal income tax liability, or a deduction in computing its US federal taxable income, for South African income taxes withheld by Sibanye-Stillwater. The rules governing foreign tax credits are complex. You should consult your tax adviser concerning the foreign tax credit implications of the payment of South African withholding taxes.
Taxation of a sale or other disposition
Upon a sale or other disposition of ordinary shares or ADSs, other than an exchange of ADSs for ordinary shares and vice versa, you will generally recognise US source capital gain or loss for US federal income tax purposes equal to the difference between the amount realised and your adjusted tax basis in the ordinary shares or ADSs, in each case as determined in US dollars. This capital gain or loss will be long-term capital gain or loss if your holding period in the ordinary shares or ADSs exceeds one year. The deductibility of capital losses is subject to significant limitations. You should consult your tax adviser about how to account for proceeds received on the sale or other disposition of ordinary shares or ADSs that are not paid in US dollars.
To the extent you incur Securities Transfer Tax in connection with a transfer or withdrawal of ordinary shares as described under —Certain South African Tax Considerations—Securities Transfer Tax above, such securities transfer tax will not be a creditable tax for US foreign tax credit purposes.
Backup withholding and information reporting
Payments of dividends and other proceeds with respect to ordinary shares or ADSs by US persons will be reported to you and to the IRS as may be required under applicable US Treasury Regulations. Backup withholding may apply to these payments if you fail to provide an accurate taxpayer identification number or certification of exempt status or fail to comply with applicable certification requirements. Some holders are not subject to backup withholding. You should consult your tax adviser about these rules and any other reporting obligations that may apply to the ownership or disposition of ordinary shares or ADSs, including requirements related to the holding of certain “specified foreign financial assets”.
Documents on Display
Sibanye-Stillwater will also file annual and special reports and other information with the SEC. You may read and copy any reports or other information on file at the SEC’s public reference room at the following location:
100 F Street, N.E.
Washington, D.C. 20549
Please call the SEC at 1-800-SEC-0330 for further information on the public reference room. The SEC filings are also available to the public from commercial document retrieval services. Sibanye-Stillwater’s SEC filings may also be obtained electronically via the EDGAR system on the website maintained by the SEC at http://www.sec.gov.
The above information may also be obtained at the registered office of Sibanye-Stillwater and on its website accessible at http://www.sibanyestillwater.com/news-investors/reports/annual/2021.
Subsidiary information
Not applicable.
Refining and Marketing
Sibanye-Stillwater has appointed Rand Refinery Proprietary Limited (Rand Refinery) to refine all of Sibanye-Stillwater’s South African-produced gold. Rand Refinery is a private company in which Sibanye-Stillwater together with its subsidiary DRDGOLD Limited holds an effective 44.4% interest, with the remaining interests held by other South African gold producers. Treasury, then sells the gold at a price benchmarked against the London morning or afternoon fixing price. Two business days after the sale of gold, Sibanye-Stillwater receives an amount in US dollars equal to the value of the gold at the London afternoon fixing price, Rand Refinery invoices Sibanye-Stillwater for the refining charges. For details on the transactions and balances between Sibanye-Stillwater and Rand Refinery for the fiscal years ended 31 December 2021, 2020 and 2019, see Annual Financial Report—Consolidated financial statements—Notes to the consolidated financial statements—Note 39 Related-party transactions. For the period between 1 January 2022 and 31 March 2022, the following are the transactions and balances between Sibanye-Stillwater and Rand Refinery: Sibanye-Stillwater did not receive any dividends or interest income, Sibanye-Stillwater sold R84 million of gold and Sibanye-Stillwater paid R6 million in refining fees. As of 31 March 2022, Sibanye-Stillwater had R6 million of trade payables relating to Rand Refinery.
Sibanye-Stillwater’s US PGM operations and recycling segment make use of a single company for all of its precious metals refining services, and, with the exception of certain platinum sales commitments, all of the US PGM operations’ current mined palladium and platinum is committed for sale to such company.
This significant concentration of business with a single company could leave the US PGM operations without precious metal refining services should such company experience significant financial or operating difficulties during the contract period. Under such circumstances, it is not clear that sufficient alternative processing capacity would be available to cover the US PGM operations’ requirements, nor that the terms of any such alternate processing arrangements as might be available would be financially acceptable to the US PGM operations. See Risk Factors—Risks related to Earnings Delivery—For its PGMs mined in the United States, Sibanye-Stillwater’s sales arrangements concentrate all its final refining activity and a large portion of its PGM sales from mine production with one entity.
Concentrate from the Kroondal and Platinum mile PGM operations are purchased by Anglo American Platinum. 4E PGMs from the Rustenburg operations are toll refined and returned to Sibanye-Stillwater for sale by Anglo American Platinum. Refined PGMs are sold directly to customers (4E from Rustenburg and 6E from Marikana) with Incoterms varying based on specific customer requirements. Payments are received in US dollars, and payment terms vary depending on the nature of the sale and a customer’s credit rating and range from pre-payment up to four days from delivery.
JSE Corporate Governance Practices Compared with NYSE Listing Standards
Sibanye-Stillwater’s corporate governance practices are regulated by the JSE Listings Requirements. The following is a summary of the significant ways in which South Africa’s corporate governance standards and Sibanye-Stillwater’s corporate governance practices differ from those followed by domestic companies under the NYSE Listing Standards.
The NYSE Listing Standards require that the non-management directors of US-listed companies meet at regularly scheduled executive sessions without management. The JSE Listings Requirements do not require such meetings of listed company non-executive directors. Sibanye-Stillwater’s non-management directors meet regularly without management.
The NYSE Listing Standards require US-listed companies to have a nominating/corporate governance committee composed entirely of independent directors. The JSE Listings Requirements do not require the appointment of such a committee. Sibanye-Stillwater has a Nominating and Governance Committee, which is currently comprised of six non-executive directors, all of whom are independent under the JSE Listings Requirements and NYSE Listing Standards. The Nominating and Governance Committee is chaired by the Chairman of the Sibanye-Stillwater Board.
The NYSE Listing Standards require US-listed companies to have a compensation committee composed entirely of independent directors. The JSE Listings Requirements require compliance with the King IV Governance Code, which states that the remuneration committee should comprise solely of non-executive members, with the majority of such members being independent. Sibanye-Stillwater has appointed a Remuneration Committee, currently comprised of six Board members, all of whom are independent under the King IV Governance Code and JSE Listings Requirements.
The NYSE Listings Standards require US-listed companies to have an audit committee composed entirely of independent directors. The Companies Act requires that the Audit Committee be approved by shareholders on an annual basis at a company’s annual general meeting. The Companies Act and the JSE Listings Requirements also require an audit committee composed entirely of independent directors. Sibanye-Stillwater has appointed an Audit Committee, currently comprised of seven Board members, all of whom are independent non-executive, as defined under the Companies Act and the JSE Listings Requirements. One of these non-executive directors was a non-executive director of Gold Fields during the fiscal year ended 31 December 2021, the former parent of Sibanye-Stillwater; however, Sibanye-Stillwater believes he satisfied the requirements of Rule 10A-3 under the Exchange Act and applicable NYSE Listing Standards. This non-executive director subsequently resigned as a non-executive director of Gold Fields on 10 March 2021.
The Companies Act and the JSE Listings Requirements require the appointment of a Social and Ethics Committee. Sibanye-Stillwater has appointed a Social Ethics and Sustainability Committee, comprising eight independent non-executive directors.
CONTROLS AND PROCEDURES
Disclosure Controls and Procedures
Sibanye-Stillwater has carried out an evaluation, under the supervision and with the participation of management, including the CEO and CFO of Sibanye-Stillwater, of the effectiveness of the design and operation of Sibanye-Stillwater’s disclosure controls and procedures (as defined in Exchange Act Rule 13a – 15(e)) as of the end of the period covered by this annual report. Based upon that evaluation, Sibanye-Stillwater’s CEO and CFO concluded that, as of 31 December 2021, Sibanye-Stillwater’s disclosure controls and procedures were effective.
Management’s Report on Internal Control over Financial Reporting
Sibanye-Stillwater’s management is responsible for establishing and maintaining adequate internal control over financial reporting. The Exchange Act defines internal control over financial reporting in Rule 13a – 15(f) and 15d – 15(f) as a process designed by, or under the supervision of, the company’s principal executive and principal financial officers and effected by the company’s board of directors, management and other personnel, to provide reasonable assurance regarding the reliability of financial reporting and the preparation of financial statements for external purposes in accordance with IFRS, as issued by the IASB, and includes those policies and procedures that:
•pertain to the maintenance of records that in reasonable detail accurately and fairly reflect the transactions and dispositions of the assets of the company;
•provide reasonable assurance that transactions are recorded as necessary to permit preparation of financial statements in accordance with IFRS, as issued by the IASB, and that receipts and expenditures of the company are being made only in accordance with authorisations of management and directors of the company; and
•provide reasonable assurance regarding prevention or timely detection of unauthorised acquisition, use or disposition of the company’s assets that could have a material effect on the consolidated financial statements.
Because of its inherent limitations, internal control over financial reporting may not prevent or detect misstatements. Also, projections of any evaluation of effectiveness to future periods are subject to risk that controls may become inadequate because of changes in conditions, or that the degree of compliance with the policies or procedures may deteriorate.
Sibanye-Stillwater’s management, under the supervision and with the participation of its CEO and CFO, assessed the effectiveness of its internal control over financial reporting as of 31 December 2021. In making this assessment, Sibanye-Stillwater’s management used the criteria set forth in Internal Control — Integrated Framework (2013) issued by the Committee of Sponsoring Organisations of the Treadway Commission (COSO). Based upon its assessment, Sibanye-Stillwater’s management concluded that, as of 31 December 2021, its internal control over financial reporting is effective based upon those criteria.
Attestation Report of the Registered Public Accounting Firm
Ernst & Young Incorporated (EY), an independent registered public accounting firm that audited the consolidated financial statements included in this annual report on Form 20-F, has issued an attestation report on management’s assessment of Sibanye-Stillwater’s internal control over financial reporting as of 31 December 2021.
See Annual Financial Report—Accountability—Report of independent registered public accounting firm.
Changes in Internal Control Over Financial Reporting
There have been no change in Sibanye-Stillwater's internal control over financial reporting (as such term is defined in Rules 13a-15(f) and 15d-15(f) under the Exchange Act) that occurred during fiscal 2021 that has materially affected, or is reasonably likely to materially affect, Sibanye-Stillwater's internal control over financial reporting.
PURCHASES OF EQUITY SECURITIES BY THE COMPANY AND AFFILIATED PURCHASERS
| | | | | | | | | | | | | | |
| Calendar month | Total Number of Shares Purchased | Average Price Paid per Share in Rand | Total Number of Shares Purchased as Part of Publicly Announced Plans or Programs | Maximum Number of Shares (or Units) that May Yet Be Purchased Under the Plans or Programs |
| April 2021 | — | — | — | — |
| May 2021 | — | — | — | — |
June 2021(1) | 13,760,227 | 61.94 | 13,760,227 | 133,939,773 |
| July 2021 | 20,736,906 | 59.65 | 34,497,133 | 113,202,867 |
| August 2021 | 29,717,405 | 60.06 | 64,214,538 | 83,485,462 |
| September 2021 | 75,274,503 | 50.87 | 139,489,041 | 8,210,959 |
| October 2021 | 8,210,959 | 46.09 | 147,700,000 | — |
| November 2021 | — | — | — | — |
| December 2021 | — | — | — | — |
| January 2022 | — | — | — | — |
| February 2022 | — | — | — | — |
| March 2022 | — | — | — | — |
| Total: | 147,700,000 | 54.72 | 147,700,000 | — |
| | | | | |
| Notes: | |
(1) (a)Sibanye-Stillwater initiated the on-market repurchase of up to, but not exceeding, 5% of its ordinary shares in issue (Share Repurchase Programme) on 2 June 2021 (b)The Share Repurchase Programme concluded on 4 October 2021, at which point Sibanye-Stillwater had, in a series of unrelated transactions, cumulatively repurchased 5% or 147,700,000 of its ordinary shares for an aggregate purchase price of R8,081,618,197 (excluding costs) (c)The programme was conducted in accordance with the general authority granted by shareholders at the Sibanye-Stillwater’s annual general meeting on 25 May 2021 (d)There are no plans or programmes Sibanye-Stillwater has determined to terminate prior to expiration, or under which it does not intend to make further purchases |
EXHIBITS
The following instruments and documents are included as Exhibits to this annual report.
| | | | | | | | |
| No. | | Exhibit |
| | |
| | |
| | |
| | |
| | |
| | |
| | |
| | |
| | |
| | |
| | Revolving Credit Facility Agreement between Sibanye Gold Limited, the subsidiaries of Sibanye Gold Limited listed in schedule 1 as original borrowers, the subsidiaries of Sibanye Gold Limited listed in Schedule 1 as original guarantors, Nedbank Limited (acting through its Nedbank Corporate and Investment Banking Division, ABSA Bank Limited (acting through its Corporate and Investment Banking Division), FirstRand Bank Limited (acting through its Rand Merchant Bank Division), The Standard Bank of South Africa Limited (acting through its Corporate and Investment Banking Division), Bank of China Limited, Johannesburg Branch and the financial institutions listed in part 2 of schedule 1 as lenders, dated 25 October 2019 (incorporated by reference to Exhibit 4.20 to the annual report on Form 20-F (File No. 333-234096), filed by Sibanye Stillwater Limited with the SEC on 28 April 2020) |
| | Supplemental Agreement Relating to the Revolving Credit Facility Agreement, originally dated 25 October 2019, between Sibanye Gold Limited, the subsidiaries of Sibanye Gold Limited listed in schedule 1 as original borrowers, the subsidiaries of Sibanye Gold Limited listed in Schedule 1 as original guarantors, Nedbank Limited (acting through its Nedbank Corporate and Investment Banking Division, ABSA Bank Limited (acting through its Corporate and Investment Banking Division), FirstRand Bank Limited (acting through its Rand Merchant Bank Division), The Standard Bank of South Africa Limited (acting through its Corporate and Investment Banking Division), Bank of China Limited, Johannesburg Branch and the financial institutions listed in part 2 of schedule 1 as lenders, dated 25 November 2019 (incorporated by reference to Exhibit 4.13 to the annual report on Form 20-F (File No. 333-234096), filed by Sibanye Stillwater Limited with the SEC on 22 April 2021) |
| | |
| | |
| | |
| | |
| | |
| | |
| | |
| | |
| | |
| | |
| | |
| | | | | | | | |
| | |
| | |
| | |
| 101.INS | | XBRL Instance Document |
| 101.SCH | | XBRL Taxonomy Extension Scheme Linkbase Document |
| 101.CAL | | XBRL Taxonomy Extension Calculation Linkbase Document |
| 101.DEF | | XBRL Taxonomy Extension Definition Linkbase Document |
| 101.LAB | | XBRL Taxonomy Extension Label Linkbase Document |
| 101.PRE | | XBRL Taxonomy Extension Presentation Linkbase Document |
________________________
† Confidential portions of this exhibit have been omitted.
SIGNATURES
The registrant hereby certifies that it meets all of the requirements for filing on Form 20-F and that it has duly caused and authorised the undersigned to sign this annual report on its behalf.
| | | | | | | | | | | |
| SIBANYE STILLWATER LIMITED | | |
| | |
| /s/ Charl Keyter | | |
| Name: | Charl Keyter | | |
| Title: | Chief Financial Officer | | |
| Date: | 22 April 2022 | | |