Exhibit 99.1
 JOHANNESBURG, 25 August 2022: Sibanye Stillwater Limited (Sibanye-Stillwater or the Group) (JSE: SSW and NYSE: SBSW) is pleased to report operating results and condensed consolidated interim financial statements for the six months ended 30 June 2022.
SALIENT FEATURES FOR THE SIX MONTHS ENDED 30 JUNE 2022
•Significant safety performance improvements with reducing injury and fatality rate trends
•Profit of R12.3 billion (US$803 million)
•Net cash position maintained with 0.16 x Net cash: adjusted EBITDA*
• Interim dividend declared of 138 SA cps (32.46 US cents** per ADR) representing an annualised dividend yield of 7%
•Inflation-related three-year wage settlement reached at the SA gold operations
•Good cost control at SA PGM operations despite lower volume
• Acquisition of a majority stake in the Keliber project progressing well with an anticipated ownership of more than 80%
• Sandouville nickel refinery – integration well advanced
*
* Refer note 11.1 (footnote 5) of the condensed consolidated interim financial statements
** Based on the closing share price of R40.67 at 30 June 2022 and an exchange rate of R17.0034/US$ at 22 August 2022 from IRESS
| US dollar | SA rand | |||||||||||||||||||||||||||||||
| Six months ended | Six months ended | |||||||||||||||||||||||||||||||
| Jun 2021 | Dec 2021 | Jun 2022 | KEY STATISTICS | Jun 2022 | Dec 2021 | Jun 2021 | ||||||||||||||||||||||||||
| GROUP | ||||||||||||||||||||||||||||||||
| 1,707 | 527 | 782 | US$m | Basic earnings | Rm | 12,016 | 8,218 | 24,836 | ||||||||||||||||||||||||
| 1,707 | 787 | 775 | US$m | Headline earnings | Rm | 11,938 | 12,045 | 24,833 | ||||||||||||||||||||||||
| 2,787 | 1,852 | 1,465 | US$m | Adjusted EBITDA1 | Rm | 22,561 | 28,057 | 40,549 | ||||||||||||||||||||||||
| 14.55 | 15.03 | 15.40 | R/US$ | Average exchange rate using daily closing rate | ||||||||||||||||||||||||||||
| AMERICAS REGION | ||||||||||||||||||||||||||||||||
US PGM underground operations2,3 | ||||||||||||||||||||||||||||||||
| 298,301 | 272,099 | 230,039 | oz | 2E PGM production2,3 | kg | 7,155 | 8,463 | 9,278 | ||||||||||||||||||||||||
| 2,286 | 1,913 | 1,935 | US$/2Eoz | Average basket price | R/2Eoz | 29,799 | 28,755 | 33,261 | ||||||||||||||||||||||||
| 437 | 290 | 261 | US$m | Adjusted EBITDA1 | Rm | 4,021 | 4,408 | 6,358 | ||||||||||||||||||||||||
| 973 | 1,039 | 1,366 | US$/2Eoz | All-in sustaining cost4 | R/2Eoz | 21,036 | 15,619 | 14,153 | ||||||||||||||||||||||||
US PGM recycling2,3 | ||||||||||||||||||||||||||||||||
| 402,872 | 352,276 | 361,333 | oz | 3E PGM recycling2,3 | kg | 11,239 | 10,957 | 12,531 | ||||||||||||||||||||||||
| 3,159 | 3,932 | 2,906 | US$/3Eoz | Average basket price | R/3Eoz | 44,752 | 59,098 | 45,963 | ||||||||||||||||||||||||
| 50 | 51 | 39 | US$m | Adjusted EBITDA1 | Rm | 598 | 757 | 733 | ||||||||||||||||||||||||
| SOUTHERN AFRICA (SA) REGION | ||||||||||||||||||||||||||||||||
PGM operations3 | ||||||||||||||||||||||||||||||||
| 894,165 | 941,973 | 823,806 | oz | 4E PGM production3,5 | kg | 25,623 | 29,299 | 27,812 | ||||||||||||||||||||||||
| 3,686 | 2,696 | 2,817 | US$/4Eoz | Average basket price | R/4Eoz | 43,379 | 40,517 | 53,629 | ||||||||||||||||||||||||
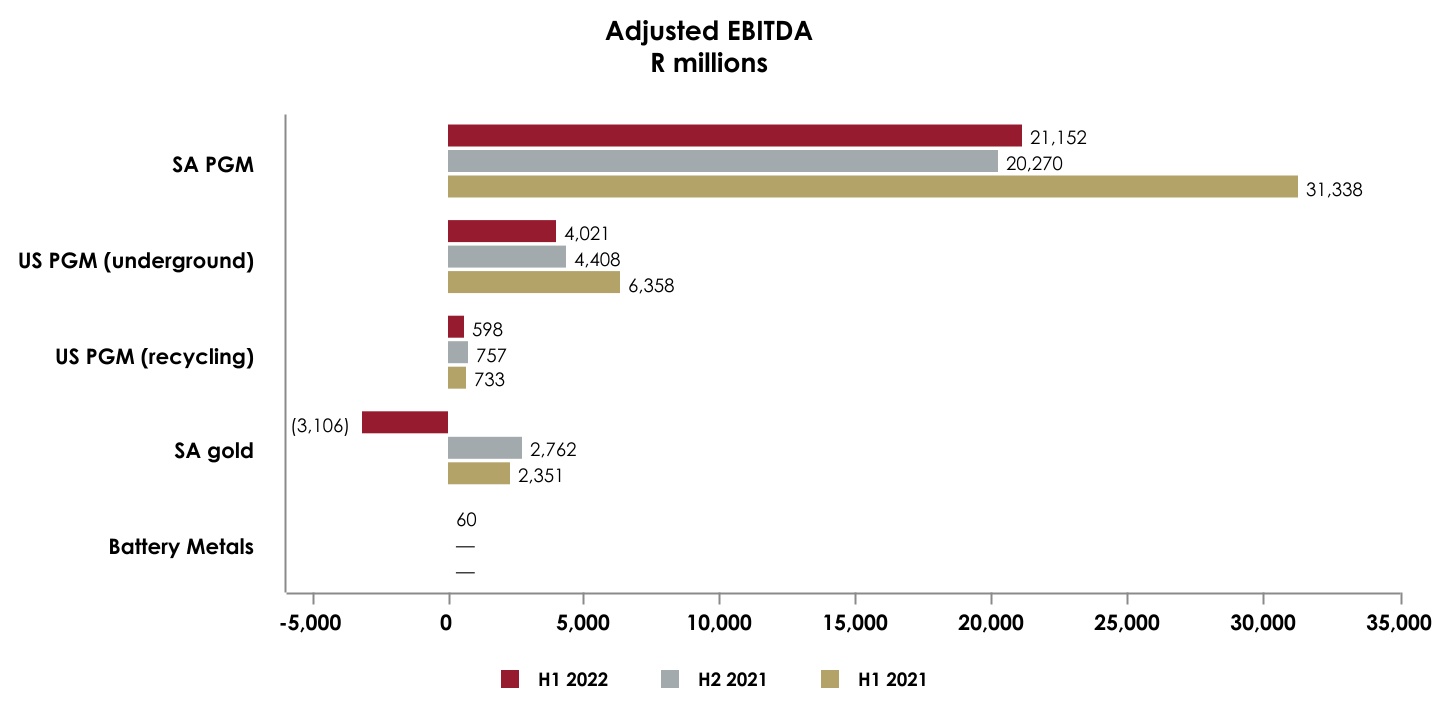
| 2,154 | 1,336 | 1,374 | US$m | Adjusted EBITDA1 | Rm | 21,152 | 20,270 | 31,338 | ||||||||||||||||||||||||
| 1,163 | 1,134 | 1,179 | US$/4Eoz | All-in sustaining cost4 | R/4Eoz | 18,160 | 17,037 | 16,921 | ||||||||||||||||||||||||
| Gold operations | ||||||||||||||||||||||||||||||||
| 518,848 | 554,086 | 191,683 | oz | Gold produced | kg | 5,962 | 17,234 | 16,138 | ||||||||||||||||||||||||
| 1,792 | 1,780 | 1,864 | US$/oz | Average gold price | R/kg | 922,851 | 860,303 | 838,088 | ||||||||||||||||||||||||
| 162 | 184 | (202) | US$m | Adjusted EBITDA1 | Rm | (3,106) | 2,762 | 2,351 | ||||||||||||||||||||||||
| 1,691 | 1,685 | 3,115 | US$/oz | All-in sustaining cost4 | R/kg | 1,542,355 | 814,347 | 791,171 | ||||||||||||||||||||||||
| EUROPEAN REGION | ||||||||||||||||||||||||||||||||
Battery Metals - Sandouville refinery6 | ||||||||||||||||||||||||||||||||
| — | — | 4,565 | tNi | Nickel production7 | tNi | 4,565 | — | — | ||||||||||||||||||||||||
| — | — | 30,789 | US$/tNi | Nickel equivalent average basket price8 | R/tNi | 474,144 | — | — | ||||||||||||||||||||||||
| — | — | 4 | US$m | Adjusted EBITDA1 | Rm | 60 | — | — | ||||||||||||||||||||||||
| — | — | 29,896 | US$/tNi | Nickel equivalent sustaining cost9 | R/tNi | 460,397 | — | — | ||||||||||||||||||||||||
1.The Group reports adjusted earnings before interest, taxes, depreciation and amortisation (EBITDA) based on the formula included in the facility agreements for compliance with the debt covenant formula. Adjusted EBITDA may not be comparable to similarly titled measures of other companies. Adjusted EBITDA is not a measure of performance under IFRS and should be considered in addition to and not as a substitute for other measures of financial performance and liquidity. For a reconciliation of profit before royalties and tax to adjusted EBITDA, see note 11.1 of the condensed consolidated interim financial statements
Sibanye-Stillwater Operating and financial results | Six months ended 30 June 2022 1
2.The US PGM operations’ underground production is converted to metric tonnes and kilograms, and performance is translated to SA rand (rand). In addition to the US PGM operations’ underground production, the operation treats various recycling material which is excluded from the 2E PGM production, average basket price and All-in sustaining cost statistics shown. PGM recycling represents palladium, platinum and rhodium ounces fed to the furnace
3.The Platinum Group Metals (PGM) production in the SA operations is principally platinum, palladium, rhodium and gold, referred to as 4E (3PGM+Au), and in the US underground operations is principally platinum and palladium, referred to as 2E (2PGM) and US PGM recycling is principally platinum, palladium and rhodium referred to as 3E (3PGM)
4.See “Salient features and cost benchmarks - Six months ” for the definition of All-in sustaining cost (AISC)
5.The SA PGM production excludes the production associated with the purchase of concentrate (PoC) from third parties. For a reconciliation of the production including third party PoC, refer to the "Reconciliation of operating cost excluding third party PoC for Total US and SA PGM, Total SA PGM and Marikana - Six months"
6.The Sandouville refinery processes nickel matte and is included in the Group results since the effective date of the acquisition on 4 February 2022
7.The nickel production at the Sandouville refinery operations is principally nickel metal and nickel salts (liquid form), together referred to as nickel equivalent products
8.The nickel equivalent average basket price per ton is the total nickel revenue adjusted for other income - non-product sales divided by the total nickel equivalent tons sold
9.See "Salient features and cost benchmarks - Six months Sibanye-Stillwater Sandouville Refinery" for a reconciliation of cost of sales before amortisation and depreciation to nickel equivalent sustaining cost
| Share data for the Six months ended 30 June 2022 | JSE Limited - (SSW) | ||||||||||
| Number of shares in issue | Price range per ordinary share (High/Low) | R40.67 to R75.40 | |||||||||
| - at 30 June 2022 | 2,830,018,926 | Average daily volume | 13,823,127 | ||||||||
| - weighted average | 2,821,904,716 | NYSE - (SBSW); one ADR represents four ordinary shares | |||||||||
| Free Float | 99 | % | Price range per ADR (High/Low) | US$9.97 to US$20.32 | |||||||
| Bloomberg/Reuters | SSWSJ/SSWJ.J | Average daily volume | 4,471,911 | ||||||||
STATEMENT BY NEAL FRONEMAN, CHIEF EXECUTIVE OFFICER OF SIBANYE-STILLWATER
The Group performance for the six-months ended 30 June 2022 (H1 2022) reflects the deterioration in the global economic and political environment during the first half of 2022, and a challenging period for the Group due to significant disruptions experienced at the SA gold and US PGM operations.
The safety improvement initiatives which commenced during H2 2021 were extended into H1 2022, with meaningful improvements on all safety indicators. Tragically two fatal accidents were experienced early in the period; pleasingly however the group achieved a fatal free quarter in Q2 2022.
Production from the SA gold operations was 63% lower year-on-year, primarily due to industrial action which extended for more than three months, while the US PGM operations reported a 23% decline in 2E PGM production in H1 2022 compared with H1 2021, as a result of ongoing operational constraints and the temporary suspension of operations at the Stillwater mine following severe regional flooding that occurred in Montana from mid-June 2022.
4E PGM production from the SA PGM operations was 8% lower than for H1 2021, but remains well within guidance, with a continued cost management focus and higher by-product credits, resulting in AISC being maintained in line with inflation. This continued focus on cost management has resulted in the SA PGM operations migrating meaningfully down the industry cost curve since they were acquired.
Considering the significant operational disruptions during the period, and the deterioration in the macro-economic environment, the Group's financial performance for H1 2022 was notable. Group adjusted EBITDA of R22.6 billion (US$1.5 billion) for H1 2022 was only 19% lower than adjusted EBITDA of R28.1 billion (US$1.9 billion) for H2 2021, albeit 44% lower than adjusted EBITDA of R40.5 billion (US$2.8 billion) for the comparable period in 2021. H1 2021 was a record 6-month financial result for the Group by a substantial margin, driven by record PGM basket prices and strong operational performance by all the Group operating segments.
Profit for the period of R12.3 billion (US$803 million) was 51% lower than record profit for H1 2021 of R25.3 billion (US$1.7 billion), but compares favourably with profit achieved for H2 2021 of R8.5 billion (US$544 million), when average precious metals prices were at similar levels. This represents the third highest six-month period profit achieved since the Group's initial listing in 2013. Basic earnings per share and headline earnings per share of 426 SA cents (28 US cents) and 423 SA cents (27 US cents) were both approximately 49% lower year-on-year.
Normalised earnings1 of R11.2 billion (US$726 million) supported the declaration of an interim dividend by the Board of directors of R3.9 billion (US$230 million) (138 cents per share/US 32.46 cents** per ADR), which is at the upper end of the range of the Group dividend policy and equivalent to an annualised dividend yield of 7%.
The Group has maintained its strong financial position, with cash and cash equivalents of R27.2 billion (US$1.7 billion) only marginally lower than at the end of 2021 and exceeding borrowings (excluding non-recourse Burnstone debt) of R19.3 billion (US$1.2 billion), resulting in a R7.9 billion (US$487 million) net cash position and net cash: adjusted EBITDA* of 0.2x at H1 2022.
With both the SA gold and US PGM operations resuming production from suspended operations during H2 2022, the outlook for the remainder of 2022 is significantly improved. The Group is financially sound, generating positive cash flow, with a robust balance sheet offering significant financial flexibility. We are well positioned both to endure the prevailing economic down-cycle, and also benefit from value opportunities which may eventuate.
1 Non-IFRS measures such as normalised earnings are the responsibility of the Group’s Board of Directors and are presented for illustration purposes only, and because of its nature, normalised earnings should not be considered as a representation of financial performance under IFRS. Refer note 8 of the condensed consolidated interim financial statements for the definition and reconciliation of normalised earnings
SAFE PRODUCTION
Reflecting on H1 2022, we have made significant steps in our safety journey, with the improving trends in all safety indicators observed during H2 2021, continuing into H1 2022. While institutionalising the "Rules of Life" and other successful initiatives implemented in H2 2021 in order to maintain these positive trends is ongoing, a specific priority for 2022, is the elimination of fatal incidents, underpinned by the implementation of our Group wide Fatal Elimination Strategy.
Sibanye-Stillwater Operating and financial results | Six months ended 30 June 2022 2
This resulted in the Group achieving a fatality free quarter for Q2 2022, a notable milestone. Despite this encouraging decline in fatal incidents, the loss of two colleagues during Q1 2022 is a stark reminder that continued implementation and monitoring of our safety controls and behaviours to mitigate risk and stop unsafe work must remain our foremost priority.
The health and safety of our employees is of fundamental importance for the Group, and as a leading international mining company responsible for the wellbeing and safety of more than 80,000 employees and contractors, we have committed to achieving world-class safety standards comparable to our international peers.
Following a relaxation in COVID-19 related restrictions by most countries and a significant decline in COVID-19 infections in our workforce, we have reviewed the overall risk at all our operations. Based on our risk assessment, including in excess of 90% vaccination rate in the majority of our operations, we are currently ensuring that our COVID-19 dedicated facilities are embedded into our Health Care operating practices. In line with our focus on becoming a pandemic resilient organisation, these learnings, including our vaccination strategy, are being incorporated into a newly developed “Pandemic Preparedness Response Plan” that will ensure we are able to respond rapidly to mitigate future risks associated with the COVID-19 or any other health related pandemics.
ENVIRONMENTAL, SOCIAL AND GOVERNANCE (ESG)
Marikana renewal
Following the acquisition of Lonmin in June 2019, Sibanye-Stillwater committed to a process of renewal at Marikana for the co-creation of a better future for all stakeholders at Marikana.
In 2020, the Marikana renewal process was launched to address the tragic Marikana legacy, rebuild trust between stakeholders and facilitate socio-economic redress. Guided by the themes of “Honour”, “Engage” and “Create”, the primary aim of the Marikana renewal process is the co-creation of a shared vision and the delivery of tangible socio-economic opportunities and value to the Marikana communities and the broader district, which will be sustainable long after mining has ceased.
In August 2020 Sibanye-Stillwater hosted the first Marikana Commemoration lecture. These annual lectures mark and commemorate the anniversary of the Marikana tragedy and seek to encourage and stimulate thought leadership and critical discourse on the issues that face us as a society today, particularly in the mining industry and in our operating districts.
In 2020 the keynote address was delivered by Adv Thuli Madonsela, who shared a Message of Renewal, Healing and Hope. For the second commemoration lecture held in August 2021, Dr Mamphela Ramphele delivered a message of Honour through Healing. The third lecture in August 2022 commemorated the 10th anniversary of the Marikana massacre. Professor Adam Habib discussed the Social Compact and the Importance of Rebuilding. On 16 August 2022, the entire South African mining industry came together, pausing for a moment of silence and reflection in honour of those who died in 2012 – a solemn occasion marking our collective commitment.
We continue to make progress on the commitments made to the widows and families of the deceased. Not least, this includes the completion and delivery of 16 houses to the widows and families of the deceased of which eight houses have been completed and handed over with the remaining eight houses scheduled for handover by the end of 2022.
We also continue to fund and in other ways support the education of the children impacted by the tragedy, many of whom are now young adults, through the Sixteen-Eight Memorial Trust. The Trust currently supports 139 beneficiaries, ranging in age from 9 to 41 years old. To date, the Trust has contributed R64.5 million in all to beneficiaries, averaging close on R460,000 per beneficiary since its inception. Six beneficiaries began their tertiary studies in 2022, bringing the total number studying at tertiary level to 25 (excluding post-graduates). One of the Trust’s first tertiary-level beneficiaries, Mandla Yawa, recently graduated with a PhD in Agriculture and Animal Science from Fort Hare University. He initially joined Sibanye-Stillwater as an intern in September 2020 and in December 2021 was appointed as a Social Responsibility Supervisor, overseeing several of the projects falling under the Marikana Renewal and the social and labour plans.
Associated with the Marikana Renewal is the Letsema engagement process, a programme of engagement with a broad range of stakeholders in the region facilitated independently by a social facilitation organisation, ReimagineSA. The Letsema process uses South Africa's rich cultural heritage to collectively find solutions to common problems. In a multi-stakeholder initiative, the families, elected representatives, traditional leaders, NGOs, and communities have been brought into the process as part of the healing required to rebuild trust. Sibanye-Stillwater has a long-term vision for the Marikana region and has significant investments underway to create opportunities that change lives through investment, employment, and supporting local community development.
This year, a series of multi-stakeholder dialogues, or Pitsos, were launched as part of the Letsema process, to encourage information sharing relating to the realities faced by stakeholders. The first Pitso was held in May 2022 and attended by 94 family members of the deceased, as well as government officials, and NGOs. This Pitso encouraged engagements relating to the healing journey thus far and a dialogue dealing with memorialisation. Discussions occurred in the context of six focus areas identified as critical by the families: Justice, Memorial, Livelihoods, Education, Health, and Housing. These dialogues have the aim of fostering accountability and shared responsibility among stakeholders. Subsequent to these engagements, the families have established a task force to conceive and build a memorial site at the Koppie in Marikana.
The Marikana Renewal Programme supported by the Letsema process is a truly unique private sector initiative in terms of its inclusivity. Its aim is to come to terms with and learn from tragedy, while actively building on the seeds of hope and reconciliation. This is not a journey that we have travelled alone. We are very pleased to have received an overwhelmingly constructive response from those affected by the tragedy, and those in the district who live under its shadow. We are also pleased that, to mark the 10th anniversary, the South African government recognised Sibanye-Stillwater's work and expressly acknowledged its responsibilities. The government's statement can be read at: Government commemorates the Marikana tragedy.
The history of mining abounds with practices that damaged the fabric of society in the interests of a few. But we believe that we have learned since that era that mining must be conducted in a way that builds social and economic capital for all stakeholders. And by doing this in both a socially and environmentally responsible way companies, and especially mining companies, have the capacity to drive change, to achieve social justice and create enduring value.
We remain committed to honour, engage and create in collaboration with other stakeholders to ensure a positive future and legacy for Marikana and its people collectively. Significant detail on the Marikana Renewal can be found at: https://www.marikanarenewal.co.za.
Wage negotiations
Sibanye-Stillwater Operating and financial results | Six months ended 30 June 2022 3
SA gold wage negotiations
On 9 March 2022 AMCU and the NUM (the Unions) gave notice that their members would be embarking on industrial action. This followed engagement with union representatives over a ten-month period including facilitation by the Commission for Conciliation, Mediation and Arbitration (CCMA) during which the Unions stuck rigidly to their demands for annual increases significantly above inflation. A decision was taken to implement a concurrent lockout of all employees on strike, partly in the interests of the safety of employees as well as to safeguard company infrastructure and assets. After more than three months of industrial action, an agreement was finally reached with the unions on 13 June 2022, following successful intervention by the CCMA at the behest of Sibanye-Stillwater.
The final wage agreement provides for inflation-linked annual increases (an average increase of 6.3% pa), which caters for the current elevated inflationary environment, and is fair to employees and protects the interests of other stakeholders. Importantly, improvements in several ancillary terms which are of significant strategic advantage were negotiated, including a wage averaging agreement that has been subject to dispute for several years.
Despite the significant disruption of this protracted industrial action, the firm position taken was a necessary investment in protecting the future of our gold operations. The above inflation increases demanded by the unions would have significantly impacted on the sustainability of the operations, with adverse consequences for all stakeholders, including employees, in the long term.
Pleasingly, the levels of violence and intimidation which characterised previous industrial action were significantly reduced, which can be largely attributed to the lockout effected by management at the start of the strike as well as reduced rivalry between the Unions. The proactive implementation of strike plans and management of fixed costs to contain the financial cost and preserve value, further mitigated the impact.
The return to work after the industrial action and safe resumption of operations is progressing according to plan with normalised production rates expected during October 2022 and the outlook for the remainder of the year significantly improved.
SA PGM wage negotiations
Initial engagement with representative unions at our Rustenburg and Marikana PGM operations commenced in early August, following pre-engagement sessions which included information sharing by economists and industry experts to establish a shared understanding of the prevailing operating and macro-economic environment. Multi-year agreements reached between the same representative unions and industry peers have already been achieved without disruptions.
Our positioning will continue to be based on inflation-related increases that accommodate the cost pressures facing our employees and ensure fair pay, while protecting the sustainability of the business for a lower PGM pricing environment than has been prevalent during the last two years. We are hopeful that the experience at the gold operations has set the scene for a smooth negotiation on reasonable terms.
OPERATING OVERVIEW (for more detail refer to the Group Safety and Operating Review)
SA PGM operations
The SA PGM operations' operating result for H1 2022 was below the levels reported during H1 2021 due to various operational challenges including seismicity, mining through the Hex River fault at the Bathopele mine and power constraints associated with load curtailment and copper cable theft. 4E PGM production including PoC of 849,152 4Eoz for H1 2022, was 9% lower than for H1 2021. Excluding PoC, 4E PGM production of 823,806 4Eoz, was 8% lower.
Costs were once again well managed with AISC (excluding PoC) of R18,160/4Eoz (US$1,179/4Eoz), benefiting from higher by-product credits, only 7% higher year-on-year despite 8% lower production. AISC including PoC of R18,804/4Eoz (US$1,221/4Eoz), was only 2% higher than for H1 2021, due to lower volumes of concentrate purchased.
The average 4E PGM basket price of R43,379/4Eoz (US$2,817/4Eoz) was 19% lower than for H1 2021. As a result of the lower average 4E basket price and lower production, adjusted EBITDA of R21.2 billion (US$1.4 billion) for H1 2022 was 33% lower than the record adjusted EBITDA of R31.3 billion (US$2.2 billion) for H1 2021, but was the second highest adjusted EBITDA achieved from the SA PGM operations and marginally higher than for H2 2021.
This solid financial contribution from the SA PGM operations more than offset the losses at the SA gold operations and was largely responsible for the positive cash flow recorded for the period, despite the operational challenges at the other operations. The deferred acquisition payment of 35% of cash flow from the Rustenburg operations to Anglo Platinum, will conclude during Q4 2022, further enhancing cash flow from the SA PGM operations.
US PGM operations
Mined 2E PGM production from the US PGM operations of 230,039 2Eoz for H1 2022 was 23% lower year-on-year due to ongoing operating constraints and the temporary cessation of operations at the Stillwater mine resulting from the flooding event on 12 and 13 June 2022 which restricted access to the Stillwater mine. AISC of US$1,366/2Eoz (R21,036/2Eoz) was 40% higher than for the comparable period in 2021 primarily due to reduced production, the reclassification of Stillwater East development from growth capital (Included in AIC) to sustaining capital (ore reserve development (ORD), included in AISC), continued inflationary pressures on stores, and premiums on contractor costs.
In addition to these factors, a 15% decrease in the average 2E PGM basket price to US$1,935/2Eoz (R29,799/2Eoz) resulted in adjusted EBITDA declining by 40% to US$261 million (R4.0 billion) for H1 2022.
Optimisation review
On 11 August 2022, a detailed overview of the repositioned US PGM operational plan was presented to the market by management. This strategic revision of the US PGM operations and expansion plans was prompted by various operational constraints together with changing macro environment and changing palladium market conditions.
The US PGM operations have delivered on the initial strategic intent and repaid the acquisition cost, hence repositioning the operations for greater flexibility and optimal long-term value, was deemed prudent. The revised plan envisages a production build-up to over 700,000 2Eoz by 2027 and AISC being maintained at below US$1,000/2Eoz (in 2022 real terms). Detail on the repositioning is available at: US PGM operations - repositioning for the changing market environment.
Sibanye-Stillwater Operating and financial results | Six months ended 30 June 2022 4
US PGM recycling operation
The US PGM recycling operation fed an average of 22.9 tonnes of spent autocatalyst per day for H1 2022, 7% lower than for H1 2021 mainly due to ongoing global logistical constraints as well as reduced vehicle scrapping rates. During H1 2022, 4,235 tonnes of recycle material was received and 4,136 tonnes fed with recycle inventory increasing by approximately 100 tonnes.
Adjusted EBITDA from PGM recycling decreased by 22% year-on-year to US$39 million (R598 million) at a margin of 4%. The decrease was mainly due to an 8% decrease in the 3E PGM basket price received by the recycling operations to US$2,906/3Eoz (R44,752/3Eoz) and 14% lower 3Eoz sales.
SA gold operations
Operating activities across all managed SA gold operations (excluding DRDGOLD) ceased from 9 March 2022 due to industrial action until agreement was reached with the Unions and the lock-out was lifted on 13 June 2022. Underground production resumed from 28 June 2022 following medical screening, training and acclimatisation of returning employees, before being reintroduced in a phased manner in order to ensure safe resumption of underground mining activities. Surface mining operations were also curtailed during the industrial action with only Ezulwini plant processing material on a toll basis. It is expected that the surface operations will be fully operational by the end of August 2022, with the underground operations will ramping up to full production during October 2022.
Production was also impacted by the suspension of mining operations at Beatrix prior to the industrial action due to the self-imposed safety stoppage that continued from the previous year and also the suspension of milling operations at the Beatrix operation from 28 December 2021 to allow precautionary reinforcement and buttressing work to the tailings storage facilities (TSF). While this was completed by the end of May 2022, due to the industrial action mining was not feasible limiting the previously anticipated establishment of a stockpile.
As a result of the above factors, adjusted EBITDA (including DRDGOLD) declined from R2.4 billion (US$162 million) for H1 2021 to a negative R3.1 billion (negative US$202 million) for H1 2022, with DRDGOLD contributing R840 million (US$54 million).
Sandouville Nickel refinery
The acquisition of the Sandouville nickel refinery in Le Havre, France was concluded on 4 February 2022. Sandouville produced 3,499 tonnes of nickel metal, 1,066 tonnes of nickel salts and 113 tonnes of cobalt chloride at an average nickel equivalent sustaining cost of R460,397/tNi (US$29,896/tNi). Integration of the Sandouville refinery is progressing in line with expectations with a 10% increase in volumes produced year-on-year resulting from efficiency improvements and good recoveries. Recent increases in electricity and gas prices have reduced gross operating margin and will be a risk to costs depending on the direction of future European energy and gas supplies. The focus is on continuity and stability of production by de-bottlenecking the plant to increase throughput to nameplate capacity of ~12kt of Ni metal, ~4kt of Ni salts and ~600t of CoCl2 by 2026.
H1 2022 adjusted EBITDA was US$4 million (R60 million).
MARKET OVERVIEW
PGMs
The outlook for global auto production for H2 2022 appears more constructive, primarily due to resilience in the sector in China and an expected easing of supply chain constraints towards year-end. Improving inflation numbers from the US following a series of interest rate hikes during H1 2022 has resulted in some market optimism and an improvement in PGM prices since mid-year. Global macro-economic and political risks remain elevated however, with the probability of further disruption and an extended economic recession remaining high.
Global light duty vehicle (LDV) sales for H1 2022 declined by 8.5% year-on-year to 38.5 million units due to ongoing production constraints including continued semiconductor chip shortages, COVID-19 lockdowns in China and the war in Ukraine. PGM markets have been affected by the deteriorating global economic outlook and rising inflation.
Chinese LDV sales fell by 2.3% year-on-year to 11.9 million units with over 1 million passenger car sales estimated to have been lost between March and May due to regional lockdowns and quarantine measures imposed, although sales have improved since May 2022. The Chinese government recently halved the purchase duty for internal combustion engines and hybrid cars (with engine displacement of less than or equal to 2L and priced below CNY300,000 or approximately $45,000). This policy is expected to further incentivise LDV sales during H2 2022.
US LDV sales fell 18.2% year-on-year to 6.8 million units in H1 2022 as low inventories, rising inflation and interest rates drove LDV prices to record levels, with the average transaction price reaching a record high of approximately $47,000 in May 2022. Inventories averaged about 1 million units during H1 2022. Light vehicle registrations in Western Europe were down 15.5% year-on-year to approximately 5.8 million units in H1 2022. Major European markets all experienced double-digit contractions, with the overall passenger vehicle market falling by 16.3% in France, 11.0% in Germany, 22.7% in Italy, 10.7% in Spain and 11.9% in the United Kingdom.
Global LDV production forecasts have been downgraded since the end of 2021 with the latest global LDV production forecast by LMC Automotive consultants further reduced to 79.5 million units in 2022.
Despite initial market concerns about the possible impact of the war in Ukraine, sanctions imposed (primarily the LPPM removing Russian producers from its Good Delivery list earlier this year and sanctions being imposed by the UK government on Vladimir Potanin, the CEO and a significant shareholder in Norilsk Nickel) have resulted in relatively limited impact on global PGM supply. The availability of supply of capital equipment and critical parts into Russia may however constrain production and future growth plans in the near to medium term.
PGM supply from North America was affected by the regional flooding in Montana in mid-June reducing production from the region by approximately 60k 2Eoz for 2022.
PGM supply from South Africa is also anticipated to be lower in 2022 compared to the previous year due to the impact of prolonged power disruptions at Eskom, the state electricity utility and processing issues flagged by peers. Although many of the SA PGM producers have concluded wage negotiations, any social disruption or industrial action could further impact supply.
Sibanye-Stillwater Operating and financial results | Six months ended 30 June 2022 5
Secondary supply from autocatalyst recycling remains constrained in the medium term as auto sales remain weak, resulting in higher used car prices and extending average vehicle retention periods. Global logistical and supply chain disruptions, with higher logistics costs and lower PGM prices impacting collector cost structures are also expected to impact. Recycling volumes are expected to decline by approximately 10% for 2022 compared with 2021.
Battery metals
Battery electric vehicle (BEV) sales growth continued to significantly outperform overall light-duty vehicle (LDV) sales growth, with global BEV sales for H1 2022 up 75% year-on-year in contrast to total LDV sales which declined 8.5% during H1 2021. Consequently, BEV penetration increased to almost 9% of the total LDV market in the first half of 2022.
China remains the largest EV market, representing almost two thirds of global BEV sales for H1 2022, despite the economic impact of the country's zero-COVID-19 policy. Expanded fiscal incentives supported 100% growth in BEV sales year-on-year for H1 2022. Incentives were extended to some gasoline vehicles, but total LDV sales fell 2% over the same period. BEV sales in Europe and North America also grew significantly in contrast to declining total LDV sales.
Efforts to regionalise battery supply chains continued in Europe and North America, with the Inflation Reduction Act (IRA), signed in to law in the United States on 16 August 2022. The IRA incentivises North American battery and BEV production by introducing qualification criteria for federal tax credits (40% of battery metals sourced in the US or from countries with Free Trade Agreements (FTA) from 2024 increasing to 80% from 2027). In the short-term, this could negatively impact regional BEV sales as the majority of BEVs on the market would no longer qualify for the federal tax credit due to the minimal sourcing of battery raw materials from North America or FTA countries with free trade agreements with the US. However, longer term benefits to US based battery metal producers are expected, with the Rhyolite Ridge project well positioned to capitalise.
Another interesting development is the increasing investment by OEMs in mines to secure battery metals amid emerging shortages, with BMW, BYD and Ford the most recent examples of OEMs investing upstream, and some going as far as to pre-pay to secure offtake of lithium.
BUSINESS AND MARKET DEVELOPMENT
The disruptive impact of the COVID-19 pandemic and subsequent political and economic events have exposed the risks associated with the prior increasing reliance on a global logistics and supply chain model. The Group previously identified the probability of greater regionalisation of supply chains and a more nationalistic approach to foreign affairs and trade. As such, the Group's green metals strategy has prioritised growth in or close to, North America and Europe, in order to establish a preferential position supplying critical metals to the growing battery ecosystems in these regions.
The recent signing into law of the IRA in the United States, as mentioned above, serves as further support of our Green Metals strategy , which management believes is likely to bring long term value benefits to Sibanye-Stillwater and stakeholders.
Sibanye-Stillwater's focus remains on growth in these ecosystems. However, the significant increase in battery metal prices since early 2021, has required a more cautious approach to M&A growth. Management believes that a strategy focussed on specific acquisition opportunities make sense both strategically and from a value perspective, such as the increased stake in Keliber outlined below and the expected acquisition of 50% in the Rhyolite Ridge project once all conditions precedent have been met, including, but not limited to, permits and debt financing having been secured.
Increased shareholding in Keliber
On 30 June 2022, the Group announced its intention to exercise its pre-emptive right to increase its shareholding in Keliber to 50% plus one share. A simultaneous voluntary cash offer was made to minority shareholders of Keliber, other than the Finnish Minerals Group, which if fully accepted, will increase our shareholding in Keliber to over 80%.
The Finnish Minerals Group, a Finnish State-owned holding and development company which manages the state’s mining industry shareholdings, is the second largest shareholder in Keliber behind Sibanye-Stillwater with a current approximately 20% shareholding. The Finnish Minerals Group is expected to remain as a cornerstone shareholder and future strategic partner for the business, potentially maintaining its current level of shareholding through an equalization transaction during a potential project equity capital raise.
Approximately EUR176 million has been invested by Sibanye-Stillwater to acquire a majority shareholding in Keliber, with an additional maximum consideration of EUR196 million required should all minorities accept the voluntary offer.
Keliber is aiming to be the first fully integrated lithium producer in Europe supplying approximately 15,000 tonnes of lithium hydroxide monohydrate per annum into the developing European battery industry. A recent definitive feasibility study and a 31% increase in ore reserves has confirmed the quality and inherent value of the Keliber project with the fundamental outlook for the lithium market improving significantly since Sibanye-Stillwater acquired its initial stake in Q1 2021.
R&D, innovation and market development
The Group continued to invest in innovative market development opportunities with strategic partners:
Heraeus Precious Metals
In August 2022, Sibanye-Stillwater and Heraeus Precious Metals entered into a partnership to develop and commercialise novel electrolyser catalysts for the production of green hydrogen. The partnership enables collaboration on research and development of novel electrocatalysts containing platinum group metals with high activity and stability for Proton Exchange Membrane (PEM) electrolysers used in the production of green hydrogen. The project will be equally funded by Sibanye-Stillwater and Heraeus over a three-year period during which both companies will cooperate on communication and marketing of the novel catalyst.
EnHywhere
During May 2022, the Group invested €1.6 million into a tranched €5 million convertible bond in EnHywhere, a French start-up that has developed a novel hydrogen refuelling technology for small footprints to serve all vehicles (e.g. light duty vehicles, commercial fleets, trucks, buses). EnHywhere's hydrogen refuelling technology comprises a compact, autonomous hydrogen generation and refuelling station which produces its own green hydrogen using a PGM-containing PEM electrolyser. It has a low voltage grid connection and uses standard domestic water supply to produce up to 80kg/day of hydrogen. The technology also benefits from ease of implementation, as there are minimal permitting requirements for individual station roll-outs, saving time and cost. On 5 July 2022, the Group made a second tranche investment of €2.6 million into the convertible bond.
Sibanye-Stillwater Operating and financial results | Six months ended 30 June 2022 6
OPERATING GUIDANCE1
As previously announced on 11 August 2022, forecast mined 2E PGM production from the US PGM operations for 2022 was revised to between 445,000 2Eoz and 460,000 2Eoz, with AISC of between US$1,380/2Eoz and US$1,425/2Eoz due to the impact of the regional flood and the repositioning of the operations following the optimisation planning carried out during H1 2022. Capital expenditure is forecast to be between US$275 million and US$285 million (including US$70 million of project capital).
The US Recycling operations are forecast to feed between 700,000 and 730,000 3Eoz. Capital expenditure is forecast at approximately
US$3 million.
Forecast 4E PGM production from the SA PGM operations2 for 2022 remains at between 1,750,000 4Eoz and 1,850,000 4Eoz with AISC between R18,500/4Eoz and R19,200/4Eoz (US$1,233/4Eoz and US$1,280/4Eoz). Capital expenditure is forecast at R4.8 billion (US$320 million) including R950 million (US$63 million) for the K4 project during 2022.
Guidance for gold production from the managed SA gold operations (excluding DRDGOLD) for 2022 was suspended due to the industrial action. Guidance has been revised to between 14,000kg (450,000oz) and 14,500kg (466,000oz) with AISC between R1,390,000/kg (US$2,880/oz) and R1,470,000/kg (US$3,060/oz). Capital expenditure is forecast at R3.9billion (US$260 million), including R1.1 billion (US$73 million) on the Burnstone Project and R270 million (US$18 million) on the Kloof 4 deepening project.
1 The dollar cost conversions for 2022 are based on an average exchange rate of R15.00/US$.
2 SA PGM guidance includes third party PoC
NEAL FRONEMAN
CHIEF EXECUTIVE OFFICER
SIBANYE-STILLWATER GROUP SAFETY AND OPERATING REVIEW
SAFETY
Group safety trends continued to improve during H1 2022, following interventions in mid-2021. The Group fatal injury frequency rate (FIFR) (per million hours worked) improved by 70% from 0.1 in H1 2021 to 0.03 in H1 2022. The serious injury frequency rate (SIFR) decreased from 4.39 to 3.16, a 28% improvement, the lost day injury frequency rate (LDIFR) improved by 34% from 7.23 to 4.77, and the total recordable injury frequency rate (TRIFR) was 32% lower year-on-year declining from 8.43 to 5.71. These are sizeable improvements driven through intense management focus, and our challenge going forward is to secure further improvement and make safety excellence sustainable across all our operations.
The Safe production strategy has become our pathway to excellence and several leading indicators have been developed around interventions from the strategy. In particular, the Group's focus is on addressing high potential incidents and our Fatal Elimination Strategy. As part of this journey, roll-out of the Life-saving Commitment booklet commenced during the first half of 2022. The purpose of this booklet is to provide an overview of the Fatal Risk Critical Controls, Critical Life-saving Behaviours and Critical Management Routines. These are key to becoming a fatal-free workplace organisation on our journey to zero harm. The Accident Investigation Committee, where leaders collectively present and assess some of the significant incidents (injuries or incidents with the potential for loss of life), continues to enhance the understanding of accident causation to root cause level and places ownership at all levels in the organisation.
There has been a notable reduction in fatalities year-on-year, with two fatalities during H1 2022 compared with eight for H1 2021. Both fatalities occurred during Q1 2022, with the Group recording a fatal free quarter during Q2 2022.
The US PGM operations safety performance for H1 2022 improved considerably, with reportable injuries reducing from 33 to 20 injuries year-on-year. For H1 2022, the US PGM operations reported a 39% improvement in Total Recordable Injury Frequency Rate (TRIFR) from 14.4 in H1 2021 to 8.9 in H1 2022.
Similarly the SA PGM operations also reported an improved safety performance for H1 2022 with the TRIFR improving by 33% year-on-year to 5.83. Sadly, one fatality occurred during Q1 2022. Mr Mashudu Mphaphuli, who worked as a train driver assistant at Rustenburg Central service railway operations, passed away on 15 March 2022 following serious injuries sustained in a surface railway accident on 14 February 2022.
The SA PGM mining operations achieved 4 million fatality free shifts on 21 June 2022 with the fatal free performance continued unbroken into H2.
Despite lower production at the SA gold operations in H1 2022 due to industrial action, there was also an improved safety performance for H1 2022 with the TRIFR improving by 37% to 4.86. Unfortunately the SA gold operations had an underground rail-bound equipment related fatality at the Driefontein operation during the first quarter of H1 2022. On 19 January 2022, Mr. Thabile Cele, a locomotive driver sustained serious injuries in a rail accident and succumbed from his injuries.
Both incidents have been thoroughly investigated together with the relevant stakeholders to prevent the reoccurrence of similar incidents. The Board and management extend their sincere condolences to the family, friends, and colleagues of our departed colleagues. The appropriate support and care is being provided to the families of the deceased.
The Sandouville Refinery is now integrated into the Group's safety reporting processes, recording 15.95 for its TRIFR and a LDIFR of 11.96, although definitions are yet to be standardised to allow for meaningful comparison. As these rates are currently higher than the Group average of 5.71 and 4.77 respectively, additional focus is being directed to the contractor staff, with three of four injuries originating from sub-contractors.
Sibanye-Stillwater Operating and financial results | Six months ended 30 June 2022 7
OPERATING REVIEW
US PGM operations
Mined 2E PGM production from the US PGM operations of 230,039 2Eoz for H1 2022 was 23% lower year-on-year due to ongoing operational constraints and the temporary cessation of operations at the Stillwater mine resulting from the significant flooding event on 12 and 13 June 2022 which restricted access to the Stillwater mine.
Production from the Stillwater mine of 143,420 2E for H1 2022, was 19% lower, due to operating constraints and the impact of the flood which reduced production by approximately 15,000 2Eoz. Production from Stillwater West was constrained prior to the flood by reduced mining flexibility associated with revised operating procedures following the Mine Safety and Health Administration (MSHA) orders on the main 35- production and tramming level. The focus at Stillwater West is on additional development to re-establish two mining fronts beyond the Depression zone in the west and the Stillwater fault in the east which will increase the developed state to 12 months by 2024 providing greater mining flexibility. Production from Stillwater East has been impacted by challenging ground conditions which require greater than expected use of an engineered (cemented) backfill support solution. Mining areas requiring cemented backfill have been suspended until the anticipated completion of a permanent backfill plant within the next 3 years.
Production from the East Boulder mine of 86,618 2Eoz, was 29% lower than H1 2021 as a result of higher geological and geotechnical complexity as mining migrates to the West. This is compounded by a shortage of critical miner skills and ongoing supply chain challenges, affecting operational productivity. The focus at East Boulder is on increasing miner training and attraction and retention of skills in these critical areas. The developed state at East Boulder will be maintained at the current 18 month level.
Total development of 12,534 meters was 15% lower than H1 2021 with the focus being on primary development which increased 9% year-on-year offsetting secondary development which declined by 23% year-on-year as a result of the challenges highlighted. Total project development at 1,010 meters was 76% lower than H1 2021 following the decision to curtail additional development pending the completion of the cemented backfill solution.
AISC of US$1,366/2Eoz (R21,036/4Eoz) was 40% higher than for the comparable period in 2021 primarily due to reduced production, continued inflationary pressures on stores, premiums on contractor costs, and the change in classification of Stillwater East development from growth capital to sustaining capital (ORD). As a result of this change in classification and the focus on primary development, ORD increased from US$40 million (R582 million) for H1 2021 to US$83 million (R1.3 billion) for H1 2022, with ORD contributing US$360/2Eoz (R5,551/2Eoz) to AISC or US$226/2Eoz (R3,600/2Eoz) higher year-on-year. Royalties and insurance added US$196/2Eoz (R3,018/2Eoz) to the AISC in H1 2022 compared to the US$203/2Eoz (R2,954/2Eoz) in H1 2021.
Adjusted EBITDA from the US PGM underground operations of US$261 million (R4.0 billion) for H1 2022 decreased by 40% from US$437 million (R6.4 billion) for H1 2021 due to a 15% decline in the average 2E PGM basket price for H1 2022 to US$1,935/2Eoz (R29,799/2Eoz), higher costs and 12% lower 2Eoz sales year-on-year.
Capital expenditure declined by 10% year-on-year in H1 2022 to US$142 million (R2.2 billion) with the majority of this spend (76% or US$107 million) attributed to ORD and sustaining capital. Project capital declined by 59% year-on-year to US$34 million (R530 million) as a result of reduced spending on the Stillwater East project. The results of the new operational plan and the above mentioned change in classification to ORD confirmed that the rate of development of Stillwater East would be curtailed in the light of the significant development costs arising from the premiums on contractor costs and the decision to postpone development of several stoping blocks until the completion of the cemented backfill plant. Consequently the completion of the 56 level holing to the Benbow decline later this year and the completion of the upgraded concentrator will be the only remaining growth capex left in the short term.
US PGM recycling operation
The recycling operation fed an average of 22.9 tonnes of spent autocatalyst per day for H1 2022, 7% lower than for H1 2021 mainly due to ongoing logistical constraints globally and adjustments to the blend ratio of high grade recycle feed following the reduction in volumes of mined concentrate post the flood event. During H1 2022, 4,235 tonnes of recycle material was received and 4,136 tonnes fed.
Adjusted EBITDA from PGM recycling decreased by 22% year-on-year to US$39 million (R598 million) at a margin of 4%. The decrease was mainly due to an 8% decrease in 3E PGM recycle basket price to US$2,906/3Eoz (R44,752/3Eoz) and 14% lower 3Eoz sales.
SA PGM operations
Production from the SA PGM operations for H1 2022 was impacted by various operational challenges, including a slow start-up after the New Year, self-imposed safety stoppages, seismicity at the Siphumelele shaft, mining through the Hex River Fault at the Bathopele mine which affected -productivity, and power disruptions due to Eskom load curtailment and copper cable theft. 4E PGM production of 849,152 4Eoz for H1 2022, was 9% lower than for H1 2021 including PoC. Excluding PoC, 4E PGM production of 823,806 4Eoz, was 8% lower year-on-year. Surface production (excluding PoC) in H1 2022 increased by 6% year-on-year partially offsetting underground production which was 9% lower at 751,717 4Eoz. Concentrate purchases from third parties reduced by 27% in H1 2022 compared to H1 2021 due to the expiry of two contracts at the end of 2021.
Costs were once again well managed with AISC (excluding PoC) of R18,160/4Eoz (US$1,179/4Eoz) benefiting from higher by-product credits, only 7% higher year-on-year despite 8% lower production. H1 2022 AISC including PoC of R18,804/4Eoz (US$1,221/4Eoz), was only 2% higher than H1 2021 due to lower volumes of concentrate purchased.
Capital expenditure for H1 2022 increased by 52% year-on-year to R2.2 billion (US$140 million) compared to H1 2021, including R405 million (US$26 million) spent on project capital versus only R6 million (US$0.4 million) in H1 2021 with spending on the Marikana K4 project only commencing in Q2 2021. Significant progress was made in H1 2022 with catch up on both ORD and sustaining capital post the COVID-19 era at SA PGM's with ORD also increasing as a result of Marikana K4 ramping up off-reef development.
The average 4E PGM basket price for H1 2022 of R43,379/4Eoz (US$2,817/4Eoz) was 19% lower than for H1 2021. Adjusted EBITDA from the SA PGM operations of R21.2 billion (US$1.4 billion) for H1 2022 was 33% lower than the record adjusted EBITDA of R31.3 billion (US$2.2 billion) for H1 2021, due to the combined impact of lower production and the lower average 4E PGM basket prices. This was nevertheless higher than the preceding H2 2021 and the second highest adjusted EBITDA achieved from the SA PGM operations.
Sibanye-Stillwater Operating and financial results | Six months ended 30 June 2022 8
PGM production from the Rustenburg operation was 7% lower for H1 2022 at 304,872 4Eoz compared to H1 2021, with surface production 4% higher and underground production 8% lower as a result of the slow start-up, safety stoppages and cable theft. Bathopele production output was negatively impacted by mining through the Hex River fault as well as fleet and mining equipment availability. Siphumelele was impacted by seismicity which lowered output. Costs were well controlled with AISC/4Eoz only 5% higher year-on-year at R19,054/4Eoz (US$1,237/4Eoz) despite lower production and above inflationary cost increases on imported spares, steel related products, ammonia- based products, fuel and oil. Rustenburg AISC for H1 2022 benefited from by-product credits which were 34% higher, and 49% lower royalties which was partially offset by a 31% increase in sustaining capital relative to H1 2021.
PGM production from the Kroondal operation of 101,315 4Eoz was 11% lower than for H1 2021 largely due to the gradual ramp-down at Simunye shaft (forecast for shutdown towards Q4 2022) and geologically challenging ground at Bambanani and Kwezi shafts, which also negatively impacted the 4E built-up head grade. A two shift cycle was implemented at Bambanani during Q2 2022 to improve face time for crews and improve output. AISC of R14,874/4Eoz (US$966/4Eoz) was 23% higher than for H1 2021 due to lower production and additional expenditure on underground support to cater for the eastern shafts mining through a shear zone together with above inflation price increases on steel, ammonia, and fuel products. H1 2022 AISC benefited from higher by-product credits, which increased by 8% which offset an 11% increase in sustaining capital.
Production from the Marikana operation was impacted by a slow start-up after the New Year, safety stoppages and cable theft, with production (including PoC) of 360,609 4Eoz for H1 2022, 11% lower than for H1 2021. PGM production from third party PoC sources declined by 27% year-on year to 25,346 4Eoz due the expiry of two offtake contracts during Q4 2021. Production for H1 2022 excluding PoC declined by 9% to 335,263 4Eoz with surface production of 12,930 4Eoz only 2% lower and underground production declining by 10% year-on-year to 322,333 4Eoz. AISC (excluding PoC) for H1 2022 of R18,949/4Eoz (US$1,230/4Eoz), was only 7% higher year-on-year despite lower output and higher inflationary costs, particularly steel, ammonia and fuel related products. AISC for H1 2022 including PoC declined by 3% year-on-year to R20,307/4Eoz (US$1,319/4Eoz) with PoC purchase costs declining by 46% to R1.1 billion (US$0.1billion). Marikana AISC for H1 2022 benefited from 27% lower royalties and a 25% increase in by-product credits which was partially offset by sustaining capital increase of 23% relative to H1 2021
Attributable PGM production from Mimosa for H1 2022 of 57,554 4Eoz was 5% lower than for H1 2021, with the focus continuing to be optimising the reagent suite and cell settings across the flotation circuit. Mimosa maintained a steady performance in H1 2022 with AISC increasing 7% to US$976/4Eoz (R15,029/4Eoz) due to lower production, and sustaining capital increasing by 47%, partially offsetting the increase in by-product credits.
PGM production from Platinum Mile of 24,802 4Eoz was 14% higher compared to H1 2021 due to additional feed tonnes coupled with a 16% increase in the build-up head grade and steady recoveries. This resulted in AISC declining by 9% to R9,878/4Eoz (US$641/4Eoz).
H1 2022 chrome sales of 1,326kt were 36% higher than for H1 2021 (977kt). Chrome revenue of R1.8 billion (US$117 million) for H1 2022 was considerably higher than H1 2021 (R1.0 billion; US$71 million), due to higher production from the Marikana operation as a result of improved recoveries from the plants processing underground ore, higher surface plant head grade and a further inventory release. Rustenburg and Kroondal both maintained steady production. The chrome price received increased by 51% from $157/tonne in H1 2021 to $237/tonne in H1 2022.
The K4 project
The project is on schedule. K4 hoisted its first ore during H1 2022. Project capital guidance is R950 million in 2022 with R420 million spent in H1 2022.
SA gold operations
The SA gold operations were significantly disrupted in H1 2022 due to the industrial action and related lock-out, and comparison of operational statistics with H1 2021 is not meaningful. Gold production (excluding DRDGOLD) for H1 2022 decreased by 77% to 3,128kg (100,568 oz) for H1 2022 compared to H1 2021.
Operating activities across all managed SA gold operations ceased from 9 March 2022 due to industrial action until the lock-out was lifted on 13 June. With employees returning after the lifting of the lock-out, there was no underground production until 28 June 2022 with medical screening, training and acclimatisation having to be completed before work crews were introduced back underground in a phased manner in order that comprehensive underground safety checks could be done in order to ensure safe resumption of underground activities. Surface mining operations were also curtailed during the industrial action with only Ezulwini processing material delivered on a toll basis. It is expected that underground operations will ramp up to full production by November, with surface operations by end August 2022.
The Beatrix TSF, where deposition was suspended for precautionary reinforcement and buttressing work from 28 December 2021, was completed by the end of May 2022, with all milling operations suspended during this period. Mining operations had already been suspended for a self-imposed safety stoppage in Q4 2021 that continued until soon before the commencement of the industrial action.
In spite of a 10% increase in the average gold price received to R922,851/kg (US$ 1,864/oz) in H1 2022, lower production resulted in adjusted EBITDA (including DRDGOLD) declining from R2.4 billion (US$162 million)in H1 2021 to negative R3.1 billion (US$202 million) in H1 2022. Adjusted EBITDA (excluding DRDGOLD) was negative R3.9 billion (US$256 million).
Gold production from DRDGOLD increased by 3% in H1 2022 to 2,834kg (91,115oz) with tonnes milled declining by 7% offset by yield increasing by 11%. Inflationary cost pressures resulted in operating cost/tonne milled increasing by 26% to R135/tonne (US$9/tonne) as a result of above-inflation increases in the costs of key consumables, diesel, steel and cyanide. This resulted in AISC increasing by 22% to 808,360/kg (US$1,633/oz) with sustaining capital increasing by 122% to R410 million (US$27 million) with additional spending on new pump stations and piping at ERGO. The average rand gold price received by DRDGOLD in H1 2022 increased by 10% year-on-year to R928,091/kg (US$1,874/oz) and, despite the higher AISC, adjusted EBITDA increased by 23% to R840 million (US$54 million).
The Burnstone project
Progress on the project was adversely affected during H1 2022 by the industrial action and project capital guidance for 2022 has been reduced. Capital development subsequently commenced with progress hampered by labour and skills shortages in the region. Project capital guidance is R1.1 billion (US$73 million) in 2022 with R329 million (US$21 million) spent in H1 2022.
Sibanye-Stillwater Operating and financial results | Six months ended 30 June 2022 9
Sandouville
The acquisition of the Sandouville nickel refinery in Le Havre, France was concluded on 4 February 2022. Since acquisition, Sandouville produced 3,499 tonnes of nickel metal, 1,066 tonnes of nickel salts and 113 tonnes of cobalt chloride at a nickel equivalent sustaining cost of R460,397/tNi (US$29,896/tNi). Integration of the Sandouville refinery is progressing in line with expectations with a 10% increase in volumes produced year-on-year resulting from good recoveries and efficiency improvements. Recent increases in electricity and gas prices have reduced gross operating margin and will be a risk to costs depending on the direction of future European energy and gas supplies. The focus is on continuity and stability of production by de-bottlenecking the plant to increase throughput to nameplate capacity of c.12kt of Ni metal, c.4kt of Ni salts and c.600t of CoCl2 by 2026. In parallel with the current plant, Sibanye-Stillwater is conducting feasibility studies on three processes:
•Producing battery grade nickel sulphate with the intention of producing 44,000 tonnes per year in 2 stages
•PGM autocatalysts recycling using European feedstocks
•Battery metals recycling
Further announcements will be made on these developments when the studies have been concluded.
H1 2022 adjusted EBITDA was US$4million (R60 million). US$2 million (R29 million) was spent on sustaining capital and $11 million (R174 million) on growth capital.
Sibanye-Stillwater Operating and financial results | Six months ended 30 June 2022 10
FINANCIAL REVIEW OF THE SIBANYE-STILLWATER GROUP
For the six months ended 30 June 2022 (H1 2022) compared with the six months ended 30 June 2021 (H1 2021)
The reporting currency for the Group is SA rand (rand) and the functional currency of the US PGM operations is US dollar. Direct comparability of the Group results between the two periods is distorted as the results of the US PGM operations are translated to rand at the average exchange rate, which for H1 2022 was R15.40/US$ or 6% weaker than for H1 2021 (R14.55/US$). The functional currency of the Battery Metals operations, comprising of Sandouville Refinery and Keliber, is the Euro and the results of Sandouville Refinery were translated to rand at the average exchange rate, which for H1 2022 was €16.70/ZAR (average exchange rate for the period from 4 February 2022, the effective date of the acquisition). Keliber is a project in development phase and development expenses are capitalised in accordance with the Group’s accounting policies to property, plant and equipment.
Group financial performance
Group revenue for H1 2022 decreased by 22% to R70,379 million (US$4,570 million) mainly due to lower sales volumes at all operations (excluding Platinum Mile) and a lower average basket price received by the PGM operations following the pullback in precious metal prices during Q2 2022. Group cost of sales, before amortisation and depreciation decreased by 2% to R47,025 million (US$3,054 million) mainly due to the lower production volumes which was partially offset by above inflation cost increases at the SA PGM operations and higher underground support costs at the US PGM underground operations. The decrease in Revenue caused Group adjusted EBITDA for H1 2022 to decrease by 44% or R17,988 million (US$1,322 million) to R22,561 million (US$1,465 million). The 6% weaker rand relative to the US dollar, partially offset the effect of the lower average basket price at the PGM operations. Group amortisation and depreciation decreased by 15% to R3,224 million (US$209 million) following lower production volumes, partially offset by higher amortisation and depreciation at the US PGM underground operations where higher progressive capital expenditure from prior periods contributed to the higher amortisation and depreciation.
The revenue, cost of sales, before amortisation and depreciation, net other cash costs, adjusted EBITDA and amortisation and depreciation are set
out in the table below:
| Figures in million - SA rand | |||||||||||||||||||||||||||||||||||||||||||||||
| Revenue | Cost of sales, before amortisation and depreciation | Net other cash costs | Adjusted EBITDA | Amortisation and depreciation | |||||||||||||||||||||||||||||||||||||||||||
| H1 2022 | H1 2021 | % Change | H1 2022 | H1 2021 | % Change | H1 2022 | H1 2021 | % Change | H1 2022 | H1 2021 | % Change | H1 2022 | H1 2021 | % Change | |||||||||||||||||||||||||||||||||
| SA PGM operations | 38,259 | 47,742 | (20) | (16,781) | (15,604) | 8 | (326) | (800) | (59) | 21,152 | 31,338 | (33) | (1,162) | (1,162) | — | ||||||||||||||||||||||||||||||||
| US PGM underground operations | 7,812 | 9,721 | (20) | (3,840) | (3,351) | 15 | 49 | (12) | (512) | 4,021 | 6,358 | (37) | (1,422) | (1,171) | 21 | ||||||||||||||||||||||||||||||||
| US PGM Recycling | 16,318 | 19,414 | (16) | (15,720) | (18,681) | (16) | — | — | — | 598 | 733 | (18) | (2) | (1) | 23 | ||||||||||||||||||||||||||||||||
| Managed SA gold operations | 3,361 | 11,015 | (69) | (6,717) | (8,922) | (25) | (590) | (423) | 40 | (3,946) | 1,670 | (336) | (480) | (1,374) | (65) | ||||||||||||||||||||||||||||||||
| DRDGOLD | 2,620 | 2,292 | 14 | (1,842) | (1,595) | 15 | 62 | (16) | (486) | 840 | 681 | 23 | (97) | (90) | 8 | ||||||||||||||||||||||||||||||||
Battery Metals operations1 | 2,173 | — | 100 | (2,125) | — | 100 | 12 | — | (100) | 60 | — | 100 | (61) | — | 100 | ||||||||||||||||||||||||||||||||
Group corporate2 | (164) | (231) | 29 | — | — | — | — | — | — | (164) | (231) | 29 | — | — | — | ||||||||||||||||||||||||||||||||
| Total Group | 70,379 | 89,953 | (22) | (47,025) | (48,153) | (2) | (793) | (1,251) | (37) | 22,561 | 40,549 | (44) | (3,224) | (3,798) | (15) | ||||||||||||||||||||||||||||||||
Figures in million - US dollars3 | |||||||||||||||||||||||||||||||||||||||||||||||
| Revenue | Cost of sales, before amortisation and depreciation | Net other cash costs | Adjusted EBITDA | Amortisation and depreciation | |||||||||||||||||||||||||||||||||||||||||||
| H1 2022 | H1 2021 | % Change | H1 2022 | H1 2021 | % Change | H1 2022 | H1 2021 | % Change | H1 2022 | H1 2021 | % Change | H1 2022 | H1 2021 | % Change | |||||||||||||||||||||||||||||||||
| SA PGM operations | 2,485 | 3,281 | (24) | (1,090) | (1,072) | 2 | (21) | (55) | (62) | 1,374 | 2,154 | (36) | (76) | (81) | (6) | ||||||||||||||||||||||||||||||||
| US PGM underground operations | 507 | 668 | (24) | (249) | (230) | 8 | 3 | (1) | (486) | 261 | 437 | (40) | (92) | (80) | 15 | ||||||||||||||||||||||||||||||||
| US PGM Recycling | 1,060 | 1,334 | (21) | (1,021) | (1,284) | (20) | — | — | — | 39 | 50 | (22) | — | — | 89 | ||||||||||||||||||||||||||||||||
| Managed SA gold operations | 218 | 757 | (71) | (436) | (613) | (29) | (38) | (29) | 32 | (256) | 115 | (323) | (31) | (94) | (67) | ||||||||||||||||||||||||||||||||
| DRDGOLD | 170 | 158 | 8 | (120) | (110) | 9 | 4 | (1) | (466) | 54 | 47 | 15 | (6) | (6) | 2 | ||||||||||||||||||||||||||||||||
Battery Metals operations1 | 141 | — | 100 | (138) | — | 100 | 1 | — | (100) | 4 | — | 100 | (4) | — | 100 | ||||||||||||||||||||||||||||||||
Group corporate2 | (11) | (16) | 31 | — | — | — | — | — | — | (11) | (16) | 31 | — | — | — | ||||||||||||||||||||||||||||||||
| Total Group | 4,570 | 6,182 | (26) | (3,054) | (3,309) | (8) | (51) | (86) | (41) | 1,465 | 2,787 | (47) | (209) | (261) | (20) | ||||||||||||||||||||||||||||||||
1 The Battery Metals operations results for the six months ended 30 June 2022 includes the results of Sandouville for the five months since 4 February 2022, the effective date of acquisition. Please refer to note 10.2 of the condensed consolidated interim financial statements
2 The effect of the streaming transaction is included under Group Corporate. Please refer to note16 of the condensed consolidated interim financial statements
3 Convenience translations have been applied to convert the rand Income Statement amounts into US dollars using a foreign exchange rate of 15.40 for H1 2022 and 14.55 for H1 2021
Revenue
Revenue from the SA PGM operations decreased by 20% to R38,259 million (US$2,485 million) due to a 19% lower average 4E basket price of R43,379/4Eoz (US$2,817/4Eoz) and a 9% or 79,415 4Eoz decrease in PGMs sold, which include a 27% decrease in the sale of third-party purchase of concentrate (PoC) ounces. The decrease in 4Eoz sold was the consequence of lower production volumes.
At the US PGM underground operations revenue decreased by 24% to US$507 million (R7,812 million), due to a 12% decrease in mined ounces sold and a 15% decrease in the average 2E basket price to US$1,935 partially offset by the 6% weaker rand. The rand average 2E basket price decreased by 10% to R29,799/2Eoz, combined with the lower sales volumes resulted in a 20% decrease in rand revenue to R7,812 million. Revenue from the US PGM recycling operation decreased by 21% from US$1,334 million (R19,414 million) to US$1,060 million (R16,318 million) due to an 8% lower average realised basket price of US$2,906/3Eoz and a 14% decrease in recycled ounces sold. The 6% weaker rand translated into a 16% decrease in recycling revenue to R16,318 million.
Revenue from the managed SA gold operations decreased by 69% to R3,361 million (US$218 million) mainly due to the wage-related strike which lasted for approximately three months and resulted in gold sold volumes declining by 72% or 9,493kg during H1 2022, partially offset by a 10% higher rand gold price of R918,808/kg (US$1,856/oz). Revenue from DRDGOLD increased by 14% to R2,620 million (US$170 million) due to a 10% higher rand gold price received of R928,091/kg (US$1,874/oz) and 3% higher sales volumes.
The Sandouville Refinery sold 3,599 tonnes of Nickel metal and 984 tonnes of Nickel salts at a nickel equivalent basket price of R474,144/tNi (US$30,789/tNi), generating revenue of R2,173 million (US$141 million) since acquisition.
Sibanye-Stillwater Operating and financial results | Six months ended 30 June 2022 11
Cost of sales, before amortisation and depreciation
Cost of sales, before amortisation and depreciation at the SA PGM operations increased by 8% to R16,781 million (US$1,090 million) mainly due to above inflation cost increases on imported spares, steel related and ammonia-based products, fuel and oil. Mined underground 4E PGM production decreased by 9% to 694,163 4Eoz due to lower development and stoping following safety stoppages. These safety stoppages were imposed by management due to poor ground conditions at the Hex River fault at Rustenburg. The adverse ground conditions caused by the Shear zone at Kroondal negatively affected productivity and head grades. The production at both the Rustenburg and Marikana operations was negatively impacted by a slower than expected post-Christmas start-up and is increasingly affected by instances of copper theft. Surface production volumes excluding third-party PoC were 6% higher at 72,089 4Eoz. Third-party PoC at the Marikana smelting and refining operations decreased by 27% to 25,346 4Eoz due to a contract that ended on 31 December 2021. PoC material is purchased at a higher cost, than own mined ore, due to the direct correlation to the basket price of PGM’s.
Cost of sales, before amortisation and depreciation at the US PGM underground operations increased by 8% to US$249 million (R3,840 million) due to higher stoping and unplanned maintenance costs. Sales volumes decreased by 12% to 238,200 2Eoz with production volumes decreasing by 23% to 230,039 2Eoz, mainly due to the impact of constrained rail safety operating procedures coupled with the flooding event at the Stillwater Mine on 13 June 2022. Cost of sales, before amortisation and depreciation at the US PGM recycling operation decreased, in line with revenue, by 20% from US$1,284 million (R18,681 million) to US$1,021 million (R15,720 million) due to a lower average basket price resulting in decreased purchasing costs of spent autocatalysts, coupled with a 14% decrease in ounces sold due to lower purchased volumes (industry wide slowdown in receipt rates of spent autocatalysts).
Cost of sales, before amortisation and depreciation at the managed SA gold operations decreased by 25% to R6,717 million (US$436 million) mainly due to the impact of the strike which resulted in lower labour, non-essential contractor, consumables and electricity costs. The strike resulted in the production for H1 2022 decreasing by 77% or 10,271kg. Cost of sales, before amortisation and depreciation from DRDGOLD increased by 15% to R1,842 million (US$120 million) due to an increase of 3% (95kg) in gold sold and substantial increases in the cost of key consumables, diesel, steel and cyanide.
The Sandouville Refinery produced 3,499 tonnes of Nickel metal and 1,066 tonnes of Nickel salts since acquisition, at a nickel equivalent sustaining cost R460,397/tNi (US$29,896/tNi), contributing R2,125 million (US$138 million) to cost of sales.
Adjusted EBITDA
Adjusted EBITDA includes other cash costs, care and maintenance costs; lease payments; strike costs and corporate social investment costs (refer note 11.1 of the condensed consolidated interim financial statements for a reconciliation of profit before royalties, carbon tax and tax to adjusted EBITDA). Care and maintenance costs for H1 2022 were R303 million (US$20 million) at Cooke (H1 2021: R292 million or US$20 million); R3 million (US$nil million) at Beatrix (H1 2021: Rnil million or US$nil million); R2 million (US$nil million) at DRDGOLD (H1 2021: Rnil million or US$nil million); R44 million (US$3 million) at Marikana (H1 2021: R43 million or US$3 million); R6 million (US$nil million) at Kroondal (H1 2021: R4 million or US$nil million) and Rnil (US$nil) at Burnstone which is now in project development (H1 2021: R46 million or US$3 million). Lease payments of R89 million (US$6 million) (H1 2021: R71 million or US$5 million) are included in line with the debt covenant formula and corporate social investment costs were R160 million (US$10 million) (H1 2021: R137 million or US$9 million).
Adjusted EBITDA at the SA PGM, US PGM (underground) and US PGM (recycling) operations decreased due to the lower average PGM basket prices received and a decrease in sales volumes stemming from lower production. Adjusted EBITDA at the SA gold operations decreased significantly due to the strike that impacted both production and sales volumes, which was partially offset by a higher average gold price.
Adjusted EBITDA is shown in the graph below:
Amortisation and depreciation
Amortisation and depreciation at the SA PGM operations was flat at R1,162 million (US$76 million) when compared to H1 2021 and despite remaining flat was lower than expected due to lower production volumes. Amortisation and depreciation at the US PGM operations increased by 15% to US$92 million (R1,422 million), in line with higher progressive capital expenditure at the underground operations during both H2 2021 and H1 2022. Amortisation and depreciation at the managed SA gold operations decreased by 65% to R480 million (US$31 million) mainly attributable to a 77% decrease in production volumes due to the impact of the strike which resulted in lower ORD and capitalised costs, whereas the amortisation and depreciation of DRDGOLD increased by 8% to R97 million (US$6 million) due higher production volumes and higher capital expenditure during H1 2022.
Sibanye-Stillwater Operating and financial results | Six months ended 30 June 2022 12
Interest income
Interest income decreased by R35 million (US$5 million) to R589 million (US$38 million) mainly due to a decrease in interest earned on recycling advances (R59 million or US$5 million) and interest received on lower average cash balances (R7 million or US$1 million), partly offset by an increase in interest received on rehabilitation funds (R17 million or US$1 million).
Finance expense
Finance expense increased by R201 million (US$8 million) to R1,462 million (US$95 million) mainly due to a R67 million (US$3 million) net increase in interest on borrowings, R79 million (US$5 million) increase in interest unwinding on the Rustenburg deferred payment, R61 million (US$4 million) increase in the unwinding of the Marikana dividend obligation, R2 million (US$nil million) increase in interest on the occupational healthcare obligation, R2 million (US$nil million) increase in unwinding of interest on lease liabilities and R16 million (US$1 million) increase in other interest, all partially offset by a decrease of R18 million (US$2 million) in the unwinding of amortised cost on borrowings, R4 million (US$1 million) decrease in the unwinding of the finance costs on the deferred revenue transactions and R3 million (US$1 million) decrease in unwinding of the environmental rehabilitation obligation. Refer to note 3 of the condensed consolidated interim financial statements for a breakdown of finance expenses.
Loss on financial instruments
The net loss on financial instruments of R399 million (US$26 million) for H1 2022 compared with the loss of R842 million (US$58 million) for H1 2021, represents a period-on-period decreased net loss of R443 million (US$32 million). The net loss for H1 2022 is mainly attributable to fair value losses on the revised cash flows of the Rustenburg and Marikana operations BEE cash-settled share-based payment obligations of R204 million (US$13 million) and R91 million (US$6 million) respectively, the Marikana dividend obligation of R25 million (US$2 million) and fair value losses on the Palladium hedge contract of R91 million (US$6 million). Refer to note 4 of the condensed consolidated interim financial statements for a breakdown of the loss on financial instruments.
Mining and income tax
The mining and income tax expense decreased by 38% to R5,628 million (US$366 million) which is attributable to the Group’s decreased profitability. The current tax expense decreased by 37% to R4,937 million (US$321 million) and the deferred tax expense decreased in H2 2022 by 44% to R691 million (US$45 million). The effective tax rate of the Group increased from 26% to 31% in H1 2022 mainly due to deferred tax assets not recognised relating to Sibanye Gold Limited and the Cooke operations during H1 2022 (increased the effective tax rate by 6%).
The Group’s effective tax rate for H1 2022 is 3% higher than the South African statutory company tax rate of 28%. The higher effective tax rate is mainly attributable to the impact of the following: the deferred tax assets not recognised of 6% or R1,003 million (US$65 million) and other reconciling items collectively resulting in a 1% increase in the effective tax rate (non-deductible loss on fair value of financial instruments: R70 million or US$5 million; non-deductible finance expense: R92 million or US$6 million; non-deductible depreciation: R45 million or US$3 million); partially offset by the change in the estimated long-term deferred tax rate of 2% or R323 million (US$21 million); non-taxable equity accounted income from associates of 1% or R215 million (US$14 million); and the US statutory tax rate adjustment of 1% or R149 million (US$10 million).
Non-recurring items
Strike costs
During H1 2022 the SA gold operations incurred costs of R223 million (US$14 million) related to the strike which commenced on 10 March 2022 and ended on 11 June 2022.
Flood costs
On 13 June 2022 the US PGM operations incurred costs of R26 million (US$2 million) related to the significant flood event which occurred at the Stillwater mining operations in Montana.
Restructuring costs
Restructuring costs of R36 million (US$2 million) for H1 2022 included retrenchment costs of R11 million (US$1 million) and professional fees of R25 million (US$2 million) at the SA gold and SA PGM segments, respectively. Retrenchment costs of R11 million (US$1 million) for H1 2022 included the costs of mutual separation packages offered to employees at the SA PGM, US PGM and SA gold operations of R2 million (US$nil million), R2 million (US$nil million) and R7 million (US$nil million), respectively.
Transaction costs
Transaction costs of R108 million (US$7 million) for H1 2022 consisted of legal and advisory fees of R107 million (US$7 million).
Borrowing and net debt
Gross debt increased by 3% from R20,298 million (US$1,273 million) at 31 December 2021 to R20,887 million (US$1,282 million) at 30 June 2022. The marginal increase in outstanding debt was due to a net increase of R465 million (US$29 million) on US dollar denominated debt due to a weaker rand since 31 December 2021. Net debt, excluding the Burnstone Debt which has no recourse to Sibanye-Stillwater, is in a net cash position of R7,935 million (US$487 million) at 30 June 2022. The Group’s cash balance (excluding cash of Burnstone) decreased by 10% to R27,211 million (US$1,670 million) since 31 December 2021, and includes US$931 million (R15,161 million) held by the US PGM operations mainly due to cash received from the issue of the 2026 and 2029 Notes during FY2021. Refer to note 11 of the condensed consolidated interim financial statements for a roll forward of the Gross debt for the six months ended 30 June 2022.
The Group’s total equity increased to R89,358 million (US$5,487 million) at 30 June 2022 due to total comprehensive income of R12,159 million (US$655 million) for the six months ended 30 June 2022, non-controlling interest recognised with the acquisition of Keliber Oy of R1,219 million (US$79 million) and equity settled share based payment reserve of R14 million (US$1 million). These increases were partially offset by dividends paid of R5,378 million (US$350 million).
Sibanye-Stillwater Operating and financial results | Six months ended 30 June 2022 13
The graph below illustrates the Group's Gross Debt/Cash/Total Equity for H1 2022, H2 2021 and H1 2021:
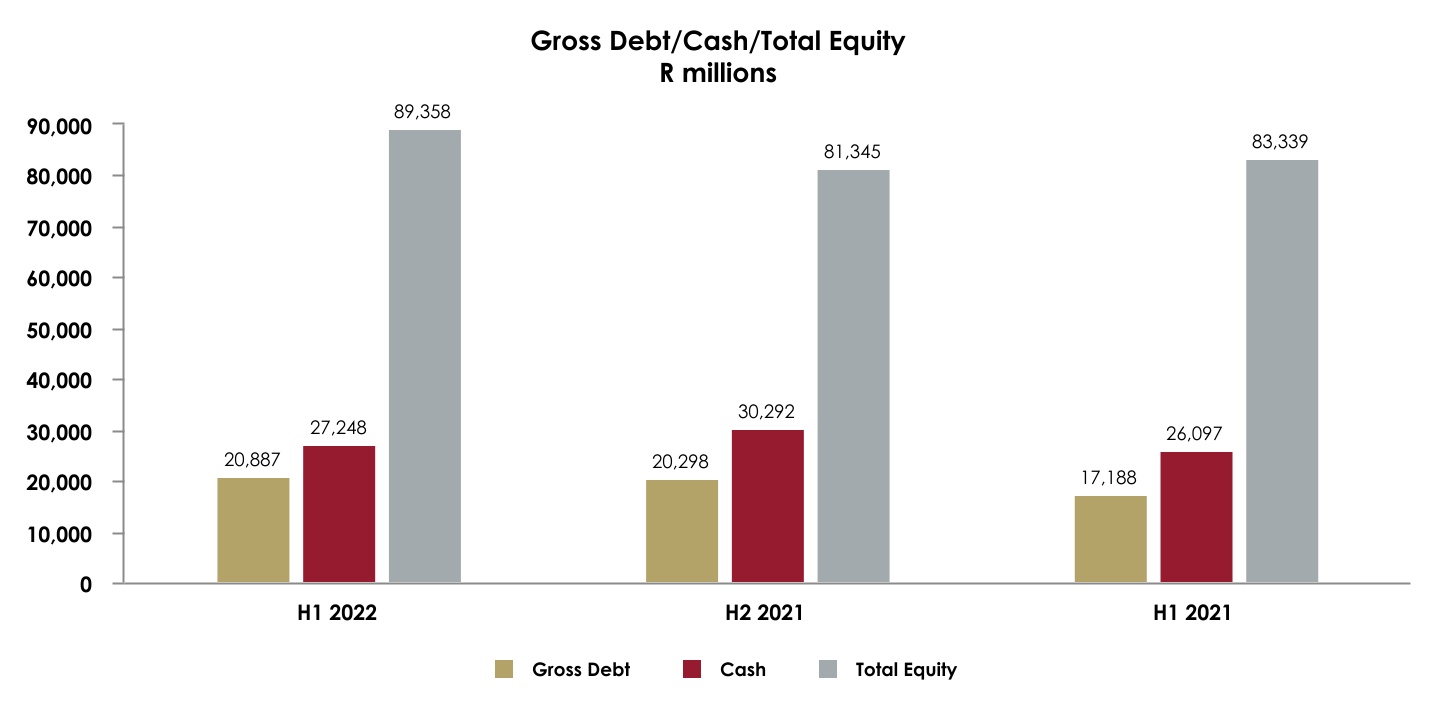
Purchase of concentrate (PoC) and toll treatment
The Marikana operation has agreements in place to purchase concentrate from third parties or toll treat PGM bearing material on their behalf. The processing of third party material allows effective utilisation of smelting and refining capacity. A percentage of the material from toll agreements ls is also retained as partial payment for the toll treatment arrangement. During H1 2022 the Marikana operation produced 25,346 4Eoz (H1 2021: 34,827 4Eoz) from concentrate purchased from third parties with the reduction in volumes attributable to the completion of a contract at the end of H2 2021.
US PGM Recycling
The US PGM Recycling operation delivered a favourable operating and financial performance for H1 2022. Delivery rates were impacted by a constrained autocatalyst market during H1 2022. Inventory continues to remain below normalised levels due to the reduction in global industry wide activity and the segment continues to focus on proactive collector engagements to shore up volumes for the remainder of the year. Working capital for H1 2022 increased from US$441 million (R7,030 million) at 31 December 2021 to US$511 million (R8,324 million) at 30 June 2022 and the segment continues to remain self-funded with no lines of credit drawn. At 30 June 2022, recycling inventory approximated 124 tonnes (H2 2021: 25 tonnes) containing an estimated 12koz (3E) (H2 2021: 2koz (3E)). The graph below, in relation to the average basket price for purchased 3E PGM content of spent autocatalyst, indicates the quarterly cash advances (on receipt of spent catalysts) and final payment (on final assay) to recycle suppliers, and the cash receipts when the 3E PGM metal is outturned, illustrating the 16% increase in recycle working capital from 1 January 2022 to 30 June 2022.
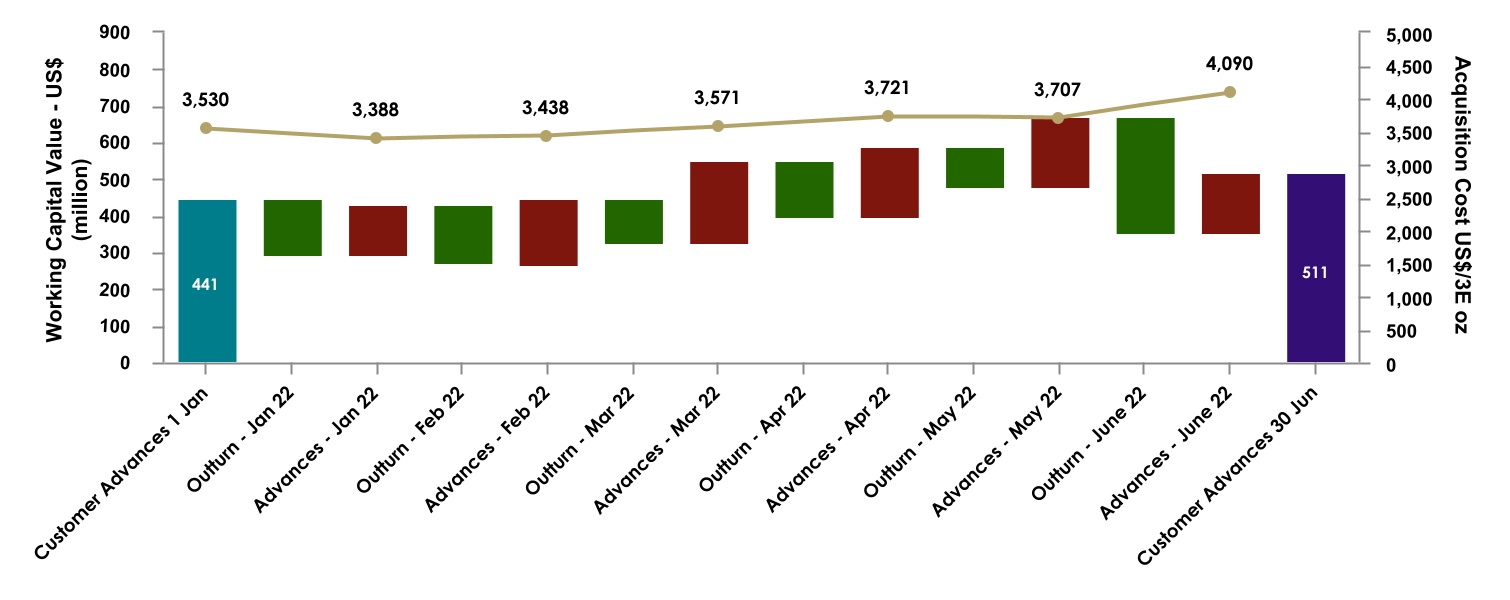
Adjusted EBITDA of the US PGM recycling operation decreased by 22% to $39 million (R598 million) for H1 2022 converting into a 15% (H1 2021: 12%) annualised adjusted EBITDA return on the closing balance recycle working capital.
Sibanye-Stillwater Operating and financial results | Six months ended 30 June 2022 14
Cash flow analysis
Sibanye-Stillwater defines adjusted free cash flow as net cash from operating activities, before dividends paid, net interest paid and deferred revenue advance received, less additions to property, plant and equipment.
The following table shows the adjusted free cash flow per operating segment:
| Figures in million - SA rand | Six months ended | |||||||||||||
| H1 2022 | H2 2021 | H1 2021 | ||||||||||||
| US PGM operations | 1,405 | 8,000 | 148 | |||||||||||
| SA PGM operations | 11,156 | 8,250 | 14,300 | |||||||||||
SA gold operations1 | (7,744) | 4,409 | 3,373 | |||||||||||
| Battery Metals | (662) | — | — | |||||||||||
| Group corporate | (433) | (533) | (499) | |||||||||||
Adjusted free cash flow2 | 3,722 | 20,126 | 17,322 | |||||||||||
1Included in the adjusted free cash flow of the SA gold segment is the Group treasury and shared services function, together referred to as gold corporate. The SA gold operations, through the
intercompany working capital accounts which eliminate on consolidation, contributed R2,545 million (US$165 million) during H1 2022 (H1 2021: R3,718 million or US$256 million received from SA PGM operations) to the working capital increase (inflow) included in the SA PGM operations
2 Non-IFRS measures such as adjusted free cash flow as defined above and reconciled below, are the responsibility of the Group’s Board of Directors and are presented for illustration purposes only, and because of its nature, adjusted free cash flow should not be considered as a representation of financial performance under IFRS
The US PGM operations generated adjusted free cash flow of US$91 million (R1,405 million). Net cash inflow from operating activities amounted to US$200 million (R3,077 million) and includes a net increase (outflow) of US$42 million (R644 million) in working capital which was mainly attributable to the increase in recycle inventory, a net decrease (outflow) of US$16 million (R239 million) in intercompany working capital accounts and taxes paid of US$6 million (R97 million). The adjusted free cash flow includes additions to property, plant and equipment of US$142 million (R2,185 million).
Adjusted free cash flow from the SA PGM operations was R11,156 million (US$724 million). Net cash inflow from operating activities amounted to R13,484 million (US$876 million) and includes a net increase (outflow) of R288 million (US$19 million) in working capital, payments of R5,341 million (US$347 million) towards royalty and income taxes, additional deferred consideration paid of R4,544 million (US$295 million) and after a net decrease (inflow) of R2,784 million (US$181 million) in the intercompany working capital funded by both the SA and US PGM operations. The adjusted free cash flow includes additions to property, plant and equipment of R2,161 million (US$140 million).
The SA gold operations generated negative adjusted free cash flow of R7,744 million (US$503 million). Net cash outflow from operating activities amounted to R5,982 million (US$389 million) and includes a net increase (outflow) of R235 million (US$15 million) in working capital, a net decrease (outflow) of R2,545 million (US$165 million) in intercompany working capital accounts, net dividends paid of R86 million (US$6 million) and payments of R188 million (US$12 million) towards royalty and income taxes. The adjusted free cash flow includes additions to property, plant and equipment of R1,595 million (US$104 million).
The Battery Metals operations generated negative adjusted free cash flow of R662 million (US$43 million). Net cash outflow from operating activities amounted to R465 million (US$30 million) after a net increase (outflow) of R487 million (US$32 million) in working capital, partially offset by a refund of R3 million (US$nil million) from income taxes. The adjusted free cash flow includes additions to property, plant and equipment of R203 million (US$13 million).
Group corporate’s negative adjusted free cash flow was R433 million (US$28 million). Net cash outflow from operating activities amounted to R5,725 million (US$372 million) after net dividends paid of R5,292 million (US$344 million).
The following table shows a reconciliation from net cash from operating activities to adjusted free cash flow:
| Figures in million - SA rand | Six months ended | |||||||||||||
| H1 2022 | H2 2021 | H1 2021 | ||||||||||||
| Net cash from operating activities | 4,389 | 18,960 | 13,296 | |||||||||||
| Adjusted for: | ||||||||||||||
| Dividends paid | 5,378 | 8,516 | 9,660 | |||||||||||
| Net interest paid/(received) | 123 | (145) | (34) | |||||||||||
| Deferred revenue advance received | (24) | (51) | (14) | |||||||||||
| Less: | ||||||||||||||
| Additions to property, plant and equipment | (6,144) | (7,154) | (5,586) | |||||||||||
| Adjusted free cash flow | 3,722 | 20,126 | 17,322 | |||||||||||
Non-IFRS measures such as adjusted free cash flow as defined and reconciled above, are the responsibility of the Group’s Board of Directors and are presented for illustration purposes only, and because of its nature, adjusted free cash flow should not be considered as a representation of financial performance under IFRS
After net interest paid of R123 million (US$10 million) (H1 2021: R34 million (US$2 million) net interest received), net cash utilised in other investing activities of R1,380 million (US$89 million) (H1 2021: R236 million (US$18 million)) and net loans repaid of R1 million (US$nil million) (H1 2021: R751 million (US$52 million)), cash at 30 June 2022 decreased to R27,248 million (US$1,673 million) from R30,292 million (US$1,900 million) at 31 December 2021 (H1 2021: cash at 30 June 2021 increased to R26,097 million (US$1,829 million) from R20,240 million (US$1,378 million) at 31 December 2020).
DIVIDEND DECLARATION
The Sibanye-Stillwater board of directors has declared and approved a cash dividend of 138 SA cents per ordinary share (8.1160 US cents* per share or US 32.4640 cents* per ADR) or approximately R3,914 million (US$230 million*) in respect of the six months ended 30 June 2022 (Interim dividend). The Board applied the solvency and liquidity test and reasonably concluded that the company will satisfy that test immediately after completing the proposed distribution.
Sibanye-Stillwater’s dividend policy is to return between 25% to 35% of normalised earnings to shareholders and after due consideration of future requirements the dividend may be increased beyond these levels.
Normalised earnings is defined as earnings attributable to the owners of Sibanye-Stillwater excluding gains and losses on financial instruments and foreign exchange differences, impairments, gain/loss on disposal of property, plant and equipment, occupational healthcare expense, restructuring costs, transactions costs, share-based payment on BEE transaction, gain on acquisition, net other business development costs, share of results of equity-accounted investees, all after tax and the impact of non-controlling interest, and changes in estimated deferred tax rate.
The interim dividend declared of 138 SA cents (H1 2021: 292 cents) equates to 35% of normalised earnings for the period ended June 2022.
The interim dividend will be subject to the Dividends Withholding Tax. In accordance with paragraphs 11.17 of the JSE Listings Requirements the following additional information is disclosed:
•The dividend has been declared out of income reserves;
•The local Dividends Withholding Tax rate is 20% (twenty per centum);
Sibanye-Stillwater Operating and financial results | Six months ended 30 June 2022 15
•The gross local dividend amount is138.00000 SA cents per ordinary share for shareholders exempt from the Dividends Tax;
•The net local dividend amount is 110.40000 SA cents (80% of 138 SA cents) per ordinary share for shareholders liable to pay the Dividends Withholding Tax;
•Sibanye-Stillwater currently has 2,830,018,926 ordinary shares in issue; and
•Sibanye-Stillwater’s income tax reference number is 9723 182 169.
Shareholders are advised of the following dates in respect of the final dividend:
Interim dividend: 138 SA cents per share
Declaration date: Thursday, 25 August 2022
Last date to trade cum dividend: Tuesday, 13 September 2022
Shares commence trading ex-dividend: Wednesday, 14 September 2022
Record date: Friday, 16 September 2022
Payment of dividend: Monday, 19 September 2022
Please note that share certificates may not be dematerialised or rematerialised between Wednesday, 14 September 2022 and Friday, 16 September 2022 both dates inclusive.
To holders of American Depositary Receipts (ADRs):
•Each ADR represents 4 ordinary shares;
•ADRs trade ex-dividend on the New York Stock Exchange (NYSE): Thursday, 15 September 2022;
•Record date: Friday, 16 September 2022;
•Approximate date of currency conversion: Monday, 19 September 2022; and
•Approximate payment date of dividend: Monday, 3 October 2022
Assuming an exchange rate of R17.0034/US$1*, the dividend payable on an ADR is equivalent to 25.9712 US cents for Shareholders liable to pay dividend withholding tax. However, the actual rate of payment will depend on the exchange rate on the date for currency conversion.
* Based on an exchange rate of R17.0034/US$ at 22 August 2022 from IRESS. However, the actual rate of payment will depend on the exchange rate on the date for currency conversion
MINERAL RESOURCES AND MINERAL RESERVES
There were no material changes to the Mineral Resources and Mineral Reserves from what was previously reported by the Group at 31 December 2021.
Sibanye-Stillwater through its subsidiary Akanani Mining Proprietary Limited (Akanani), held a prospecting right over the Akanani Project area which contains an attributable Mineral Resource of 252.4Mt at 3.9g/t 4E PGM’s for a total of 31.6Moz 4E PGM. Akanani submitted an application for a mining right in terms of the Mineral and Petroleum Resources Development Act, 2002 which was rejected. Akanani has launched an appeal and will take any legal steps necessary to secure its position.
CHANGE IN BOARD OF DIRECTORS
There was no change to the Board of Sibanye Stillwater Limited during the six month period ended 30 June 2022.
Sibanye-Stillwater Operating and financial results | Six months ended 30 June 2022 16
SALIENT FEATURES AND COST BENCHMARKS - SIX MONTHS
US and SA PGM operations
| US OPERA-TIONS | SA OPERATIONS | |||||||||||||||||||||||||||||||||||||||||||
Total US and SA PGM1 | Total US PGM | Total SA PGM1 | Rustenburg | Marikana1 | Kroondal | Plat Mile | Mimosa | |||||||||||||||||||||||||||||||||||||
| Attributable | Under- ground2 | Total | Under- ground | Surface | Under- ground | Surface | Under- ground | Surface | Attribu-table | Surface | Attribu-table | |||||||||||||||||||||||||||||||||
| Production | ||||||||||||||||||||||||||||||||||||||||||||
| Tonnes milled/treated | 000't | Jun 2022 | 18,932 | 627 | 18,305 | 8,459 | 9,846 | 2,972 | 2,807 | 3,140 | 1,880 | 1,647 | 5,159 | 700 | ||||||||||||||||||||||||||||||
| Dec 2021 | 20,361 | 710 | 19,651 | 9,183 | 10,468 | 3,220 | 2,920 | 3,499 | 2,043 | 1,756 | 5,505 | 708 | ||||||||||||||||||||||||||||||||
| Jun 2021 | 19,415 | 759 | 18,656 | 8,907 | 9,749 | 3,121 | 2,792 | 3,303 | 1,826 | 1,769 | 5,131 | 714 | ||||||||||||||||||||||||||||||||
| Plant head grade | g/t | Jun 2022 | 2.31 | 12.58 | 1.96 | 3.26 | 0.84 | 3.27 | 1.03 | 3.67 | 0.86 | 2.33 | 0.72 | 3.53 | ||||||||||||||||||||||||||||||
| Dec 2021 | 2.44 | 13.17 | 2.05 | 3.42 | 0.85 | 3.43 | 1.08 | 3.89 | 0.87 | 2.39 | 0.73 | 3.58 | ||||||||||||||||||||||||||||||||
| Jun 2021 | 2.47 | 13.50 | 2.02 | 3.36 | 0.80 | 3.33 | 1.07 | 3.84 | 0.87 | 2.40 | 0.62 | 3.59 | ||||||||||||||||||||||||||||||||
Plant recoveries3 | % | Jun 2022 | 74.95 | 90.47 | 71.48 | 84.79 | 27.11 | 86.58 | 36.96 | 87.00 | 24.87 | 82.12 | 20.77 | 72.45 | ||||||||||||||||||||||||||||||
| Dec 2021 | 76.05 | 89.96 | 72.69 | 85.32 | 28.15 | 87.03 | 34.30 | 87.03 | 26.42 | 83.77 | 23.73 | 71.83 | ||||||||||||||||||||||||||||||||
| Jun 2021 | 77.34 | 89.49 | 73.80 | 85.85 | 27.18 | 88.40 | 34.52 | 87.40 | 25.77 | 83.15 | 21.36 | 73.67 | ||||||||||||||||||||||||||||||||
Yield3 | g/t | Jun 2022 | 1.73 | 11.38 | 1.40 | 2.76 | 0.23 | 2.83 | 0.38 | 3.19 | 0.21 | 1.91 | 0.15 | 2.56 | ||||||||||||||||||||||||||||||
| Dec 2021 | 1.85 | 11.85 | 1.49 | 2.92 | 0.24 | 2.99 | 0.37 | 3.39 | 0.23 | 2.00 | 0.17 | 2.57 | ||||||||||||||||||||||||||||||||
| Jun 2021 | 1.91 | 12.08 | 1.49 | 2.88 | 0.22 | 2.94 | 0.37 | 3.36 | 0.22 | 2.00 | 0.13 | 2.64 | ||||||||||||||||||||||||||||||||
PGM production3,4 | 4Eoz - 2Eoz | Jun 2022 | 1,053,845 | 230,039 | 823,806 | 751,717 | 72,089 | 270,515 | 34,357 | 322,333 | 12,930 | 101,315 | 24,802 | 57,554 | ||||||||||||||||||||||||||||||
| Dec 2021 | 1,214,072 | 272,099 | 941,973 | 861,446 | 80,527 | 309,042 | 34,778 | 380,832 | 15,095 | 113,035 | 30,654 | 58,537 | ||||||||||||||||||||||||||||||||
| Jun 2021 | 1,192,466 | 298,301 | 894,165 | 826,000 | 68,165 | 295,394 | 33,160 | 356,396 | 13,163 | 113,496 | 21,842 | 60,714 | ||||||||||||||||||||||||||||||||
PGM sold5 | 4Eoz - 2Eoz | Jun 2022 | 1,084,907 | 238,200 | 846,707 | 266,589 | 35,054 | 364,441 | 101,315 | 24,802 | 54,506 | |||||||||||||||||||||||||||||||||
| Dec 2021 | 1,237,050 | 277,562 | 959,488 | 311,967 | 31,680 | 418,546 | 113,035 | 30,654 | 53,606 | |||||||||||||||||||||||||||||||||||
| Jun 2021 | 1,196,836 | 270,714 | 926,122 | 296,850 | 34,214 | 403,843 | 113,496 | 21,842 | 55,877 | |||||||||||||||||||||||||||||||||||
Price and costs6 | ||||||||||||||||||||||||||||||||||||||||||||
Average PGM basket price7 | R/4Eoz - R/2Eoz | Jun 2022 | 40,240 | 29,799 | 43,379 | 44,640 | 29,326 | 43,595 | 46,368 | 34,311 | 33,418 | |||||||||||||||||||||||||||||||||
| Dec 2021 | 37,758 | 28,755 | 40,517 | 41,323 | 27,581 | 40,477 | 44,108 | 32,984 | 31,756 | |||||||||||||||||||||||||||||||||||
| Jun 2021 | 48,796 | 33,261 | 53,629 | 54,451 | 32,007 | 53,959 | 59,455 | 39,958 | 39,202 | |||||||||||||||||||||||||||||||||||
| Average PGM basket price6 | US$/4Eoz - US$/2Eoz | Jun 2022 | 2,613 | 1,935 | 2,817 | 2,899 | 1,904 | 2,831 | 3,011 | 2,228 | 2,170 | |||||||||||||||||||||||||||||||||
| Dec 2021 | 2,512 | 1,913 | 2,696 | 2,749 | 1,835 | 2,693 | 2,935 | 2,195 | 2,113 | |||||||||||||||||||||||||||||||||||
| Jun 2021 | 3,354 | 2,286 | 3,686 | 3,742 | 2,200 | 3,709 | 4,086 | 2,746 | 2,694 | |||||||||||||||||||||||||||||||||||
Operating cost8 | R/t | Jun 2022 | 1,007 | 6,073 | 827 | 1,832 | 191 | 1,326 | 998 | 53 | 1,247 | |||||||||||||||||||||||||||||||||
| Dec 2021 | 959 | 5,310 | 795 | 1,711 | 204 | 1,267 | 935 | 55 | 1,177 | |||||||||||||||||||||||||||||||||||
| Jun 2021 | 940 | 5,046 | 766 | 1,574 | 185 | 1,281 | 858 | 44 | 1,069 | |||||||||||||||||||||||||||||||||||
| Operating cost7 | US$/t | Jun 2022 | 65 | 394 | 54 | 119 | 12 | 86 | 65 | 3 | 81 | |||||||||||||||||||||||||||||||||
| Dec 2021 | 64 | 353 | 53 | 114 | 14 | 84 | 62 | 4 | 78 | |||||||||||||||||||||||||||||||||||
| Jun 2021 | 65 | 347 | 53 | 108 | 13 | 88 | 59 | 3 | 73 | |||||||||||||||||||||||||||||||||||
| Operating cost7 | R/4Eoz - R/2Eoz | Jun 2022 | 18,430 | 16,554 | 18,994 | 20,128 | 15,601 | 19,850 | 16,217 | 11,088 | 15,168 | |||||||||||||||||||||||||||||||||
| Dec 2021 | 16,302 | 13,855 | 17,056 | 17,826 | 17,109 | 17,733 | 14,518 | 9,852 | 14,230 | |||||||||||||||||||||||||||||||||||
| Jun 2021 | 15,526 | 12,839 | 16,488 | 16,625 | 15,591 | 17,775 | 13,366 | 10,439 | 12,567 | |||||||||||||||||||||||||||||||||||
| Operating cost7 | US$/4Eoz - US$/2Eoz | Jun 2022 | 1,197 | 1,075 | 1,233 | 1,307 | 1,013 | 1,289 | 1,053 | 720 | 985 | |||||||||||||||||||||||||||||||||
| Dec 2021 | 1,085 | 922 | 1,135 | 1,186 | 1,138 | 1,180 | 966 | 655 | 947 | |||||||||||||||||||||||||||||||||||
| Jun 2021 | 1,067 | 882 | 1,133 | 1,143 | 1,072 | 1,222 | 919 | 717 | 864 | |||||||||||||||||||||||||||||||||||
Adjusted EBITDA Margin9 | % | Jun 2022 | 51 | 55 | 56 | 55 | 59 | 34 | 61 | |||||||||||||||||||||||||||||||||||
| Dec 2021 | 51 | 54 | 57 | 54 | 50 | 27 | 50 | |||||||||||||||||||||||||||||||||||||
| Jun 2021 | 65 | 66 | 70 | 61 | 75 | 37 | 71 | |||||||||||||||||||||||||||||||||||||
All-in sustaining cost10 | R/4Eoz - R/2Eoz | Jun 2022 | 18,824 | 21,036 | 18,160 | 19,054 | 18,949 | 14,874 | 9,878 | 15,029 | ||||||||||||||||||||||||||||||||||
| Dec 2021 | 16,703 | 15,619 | 17,037 | 18,835 | 17,069 | 13,774 | 8,482 | 15,853 | ||||||||||||||||||||||||||||||||||||
| Jun 2021 | 16,192 | 14,153 | 16,921 | 18,061 | 17,745 | 12,115 | 10,805 | 13,275 | ||||||||||||||||||||||||||||||||||||
| All-in sustaining cost8 | US$/4Eoz - US$/2Eoz | Jun 2022 | 1,222 | 1,366 | 1,179 | 1,237 | 1,230 | 966 | 641 | 976 | ||||||||||||||||||||||||||||||||||
| Dec 2021 | 1,111 | 1,039 | 1,134 | 1,253 | 1,136 | 916 | 564 | 1055 | ||||||||||||||||||||||||||||||||||||
| Jun 2021 | 1,113 | 973 | 1,163 | 1,241 | 1,220 | 833 | 743 | 912 | ||||||||||||||||||||||||||||||||||||
All-in cost10 | R/4Eoz - R/2Eoz | Jun 2022 | 19,770 | 23,340 | 18,699 | 19,054 | 20,181 | 14,874 | 9,878 | 15,029 | ||||||||||||||||||||||||||||||||||
| Dec 2021 | 17,915 | 20,007 | 17,270 | 18,835 | 17,589 | 13,774 | 8,482 | 15,853 | ||||||||||||||||||||||||||||||||||||
| Jun 2021 | 17,275 | 18,233 | 16,932 | 18,061 | 17,770 | 12,115 | 10,805 | 13,275 | ||||||||||||||||||||||||||||||||||||
| All-in cost8 | US$/4Eoz - US$/2Eoz | Jun 2022 | 1,284 | 1,516 | 1,214 | 1,237 | 1,310 | 966 | 641 | 976 | ||||||||||||||||||||||||||||||||||
| Dec 2021 | 1,192 | 1,331 | 1,149 | 1,253 | 1,170 | 916 | 564 | 1,055 | ||||||||||||||||||||||||||||||||||||
| Jun 2021 | 1,187 | 1,253 | 1,164 | 1,241 | 1,221 | 833 | 743 | 912 | ||||||||||||||||||||||||||||||||||||
Capital expenditure6 | ||||||||||||||||||||||||||||||||||||||||||||
| Total capital expenditure | Rm | Jun 2022 | 4,346 | 2,185 | 2,161 | 620 | 1,420 | 115 | 6 | 294 | ||||||||||||||||||||||||||||||||||
| Dec 2021 | 4,635 | 2,256 | 2,379 | 701 | 1,499 | 165 | 14 | 299 | ||||||||||||||||||||||||||||||||||||
| Jun 2021 | 3,719 | 2,300 | 1,419 | 546 | 754 | 104 | 14 | 200 | ||||||||||||||||||||||||||||||||||||
| Total capital expenditure | US$m | Jun 2022 | 282 | 142 | 140 | 40 | 92 | 7 | — | 19 | ||||||||||||||||||||||||||||||||||
| Dec 2021 | 308 | 150 | 158 | 47 | 100 | 11 | 1 | 20 | ||||||||||||||||||||||||||||||||||||
| Jun 2021 | 256 | 158 | 98 | 38 | 52 | 7 | 1 | 14 | ||||||||||||||||||||||||||||||||||||
Average exchange rate for the six months ended 30 June 2022, 31 December 2021 and 30 June 2021 was R15.40/US$, R15.03/US$ and R14.55/US$, respectively
Figures may not add as they are rounded independently
1The Total US and SA PGM, Total SA PGM and Marikana excludes the production and costs associated with the purchase of concentrate (PoC) from third parties. For a reconciliation of the Operating cost, AISC and AIC excluding third party PoC, refer to “Reconciliation of operating cost excluding third party PoC for Total US and SA PGM, Total SA PGM and Marikana - Six Months” and “Reconciliation of AISC and AIC excluding third party PoC for Total US and SA PGM, Total SA PGM and Marikana – Six Months”
2The US PGM operations’ underground production is converted to metric tonnes and kilograms, and performance is translated into rand. In addition to the US PGM operations’ underground production, the operation treats various recycling material which is excluded from the statistics shown above and is detailed in the PGM recycling table on the next page
Sibanye-Stillwater Operating and financial results | Six months ended 30 June 2022 17
3The Eastern Tailings Treatment Plant (ETTP) processing facility ounce production resulting from the processing of material from the Marikana underground operation was previously reported under the surface operation. These produced ounces are now appropriately included in the Marikana underground production resulting in a revision of June 2021 reported plant recoveries and yield for the Marikana underground and surface operations
4Production per product – see prill split in the table below
5PGM sold includes the third party PoC ounces sold
6The Group and Total SA PGM operations’ unit cost benchmarks and capital expenditure exclude the financial results of Mimosa, which is equity accounted and excluded from revenue and cost of sales
7The average PGM basket price is the PGM revenue per 4E/2E ounce, prior to a purchase of concentrate adjustment
8Operating cost is the average cost of production and operating cost per tonne is calculated by dividing the cost of sales, before amortisation and depreciation and change in inventory in a period by the tonnes milled/treated in the same period, and operating cost per ounce (and kilogram) is calculated by dividing the cost of sales, before amortisation and depreciation and change in inventory in a period, by the PGM produced in the same period
9Adjusted EBITDA margin is calculated by dividing adjusted EBITDA by revenue
10All-in cost is calculated in accordance with the World Gold Council guidance. All-in cost excludes income tax, costs associated with merger and acquisition activities, working capital, impairments, financing costs, one-time severance charges and items needed to normalise earnings. All-in cost is made up of All-in sustaining cost, being the cost to sustain current operations, given as a sub-total in the All-in cost calculation, together with corporate and major capital expenditure associated with growth. All-in sustaining cost per ounce (and kilogram) and All-in cost per ounce (and kilogram) are calculated by dividing the All-in sustaining cost and All-in cost, respectively, in a period by the total 4E/2E PGM produced in the same period. For a reconciliation of cost of sales, before amortisation and depreciation to All-in cost, see “All-in costs - Six months”
| Mining - PGM Prill split including third party PoC, excluding recycling operations | ||||||||||||||||||||||||||||||||||||||||||||||||||||||||
| GROUP PGM | SA OPERATIONS | US OPERATIONS | ||||||||||||||||||||||||||||||||||||||||||||||||||||||
| Jun 2022 | Dec 2021 | Jun 2021 | Jun 2022 | Dec 2021 | Jun 2021 | Jun 2022 | Dec 2021 | Jun 2021 | ||||||||||||||||||||||||||||||||||||||||||||||||
| % | % | % | % | % | % | % | % | % | ||||||||||||||||||||||||||||||||||||||||||||||||
| Platinum | 556,770 | 52 | % | 634,117 | 51 | % | 617,590 | 50 | % | 504,400 | 59 | % | 572,635 | 59 | % | 549,932 | 59 | % | 52,370 | 23 | % | 61,482 | 23 | % | 67,658 | 23 | % | |||||||||||||||||||||||||||||
| Palladium | 431,750 | 40 | % | 500,142 | 40 | % | 507,353 | 41 | % | 254,081 | 30 | % | 289,526 | 30 | % | 276,710 | 30 | % | 177,669 | 77 | % | 210,616 | 77 | % | 230,643 | 77 | % | |||||||||||||||||||||||||||||
| Rhodium | 74,618 | 7 | % | 84,248 | 7 | % | 81,206 | 7 | % | 74,618 | 9 | % | 84,248 | 9 | % | 81,206 | 9 | % | ||||||||||||||||||||||||||||||||||||||
| Gold | 16,054 | 1 | % | 21,270 | 2 | % | 21,144 | 2 | % | 16,054 | 2 | % | 21,270 | 2 | % | 21,144 | 2 | % | ||||||||||||||||||||||||||||||||||||||
| PGM production 4E/2E | 1,079,191 | 100 | % | 1,239,776 | 100 | % | 1,227,293 | 100 | % | 849,152 | 100 | % | 967,678 | 100 | % | 928,992 | 100 | % | 230,039 | 100 | % | 272,098 | 100 | % | 298,301 | 100 | % | |||||||||||||||||||||||||||||
| Ruthenium | 118,711 | 153,057 | 141,426 | 118,711 | 153,057 | 141,426 | ||||||||||||||||||||||||||||||||||||||||||||||||||
| Iridium | 29,865 | 35,012 | 33,222 | 29,865 | 35,012 | 33,222 | ||||||||||||||||||||||||||||||||||||||||||||||||||
| Total 6E/2E | 1,227,767 | 1,427,845 | 1,401,941 | 997,728 | 1,155,747 | 1,103,640 | 230,039 | 272,098 | 298,301 | |||||||||||||||||||||||||||||||||||||||||||||||
| Recycling at US operations | ||||||||||||||
| Unit | Jun 2022 | Dec 2021 | Jun 2021 | |||||||||||
| Average catalyst fed/day | Tonne | 22.9 | 22.8 | 24.7 | ||||||||||
| Total processed | Tonne | 4,136 | 4,201 | 4,473 | ||||||||||
| Tolled | Tonne | — | 23 | 14 | ||||||||||
| Purchased | Tonne | 4,136 | 4,177 | 4,459 | ||||||||||
| PGM fed | 3Eoz | 361,333 | 352,276 | 402,872 | ||||||||||
| PGM sold | 3Eoz | 361,560 | 360,167 | 422,384 | ||||||||||
| PGM tolled returned | 3Eoz | 1,878 | 2,050 | 10,580 | ||||||||||
Sibanye-Stillwater Operating and financial results | Six months ended 30 June 2022 18
SA gold operations
| SA OPERATIONS | |||||||||||||||||||||||||||||||||||||||||
| Total SA gold | Driefontein | Kloof | Beatrix | Cooke | DRDGOLD | ||||||||||||||||||||||||||||||||||||
| Total | Under- ground | Surface | Under- ground | Surface | Under- ground | Surface | Under- ground | Surface | Surface | Surface | |||||||||||||||||||||||||||||||
| Production | |||||||||||||||||||||||||||||||||||||||||
| Tonnes milled/treated | 000't | Jun 2022 | 16,871 | 492 | 16,379 | 236 | 205 | 256 | 663 | — | — | 1,788 | 13,723 | ||||||||||||||||||||||||||||
| Dec 2021 | 21,840 | 2,599 | 19,241 | 760 | 522 | 944 | 1,686 | 895 | 307 | 2,260 | 14,466 | ||||||||||||||||||||||||||||||
| Jun 2021 | 22,562 | 2,563 | 19,999 | 714 | 41 | 918 | 2,455 | 931 | 343 | 2,382 | 14,778 | ||||||||||||||||||||||||||||||
| Yield | g/t | Jun 2022 | 0.35 | 5.05 | 0.21 | 5.98 | 0.39 | 3.97 | 0.30 | — | — | 0.20 | 0.21 | ||||||||||||||||||||||||||||
| Dec 2021 | 0.79 | 4.95 | 0.23 | 6.06 | 0.45 | 5.33 | 0.33 | 3.61 | 0.39 | 0.25 | 0.20 | ||||||||||||||||||||||||||||||
| Jun 2021 | 0.72 | 4.62 | 0.21 | 6.18 | 0.37 | 4.93 | 0.34 | 3.14 | 0.32 | 0.25 | 0.19 | ||||||||||||||||||||||||||||||
| Gold produced | kg | Jun 2022 | 5,962 | 2,486 | 3,476 | 1,411 | 79 | 1,016 | 200 | 59 | 9 | 354 | 2,834 | ||||||||||||||||||||||||||||
| Dec 2021 | 17,234 | 12,866 | 4,368 | 4,604 | 237 | 5,033 | 550 | 3,229 | 121 | 574 | 2,886 | ||||||||||||||||||||||||||||||
| Jun 2021 | 16,138 | 11,853 | 4,285 | 4,409 | 15 | 4,525 | 828 | 2,919 | 111 | 592 | 2,739 | ||||||||||||||||||||||||||||||
| oz | Jun 2022 | 191,683 | 79,927 | 111,756 | 45,365 | 2,540 | 32,665 | 6,430 | 1,897 | 289 | 11,381 | 91,115 | |||||||||||||||||||||||||||||
| Dec 2021 | 554,086 | 413,651 | 140,434 | 148,022 | 7,620 | 161,815 | 17,683 | 103,815 | 3,890 | 18,455 | 92,787 | ||||||||||||||||||||||||||||||
| Jun 2021 | 518,848 | 381,082 | 137,766 | 141,752 | 482 | 145,482 | 26,621 | 93,848 | 3,569 | 19,033 | 88,061 | ||||||||||||||||||||||||||||||
| Gold sold | kg | Jun 2022 | 6,481 | 2,958 | 3,523 | 1,503 | 100 | 1,199 | 225 | 256 | 9 | 366 | 2,823 | ||||||||||||||||||||||||||||
| Dec 2021 | 17,495 | 13,173 | 4,322 | 4,705 | 223 | 5,031 | 529 | 3,437 | 121 | 558 | 2,891 | ||||||||||||||||||||||||||||||
| Jun 2021 | 15,879 | 11,537 | 4,342 | 4,371 | 15 | 4,530 | 871 | 2,636 | 111 | 617 | 2,728 | ||||||||||||||||||||||||||||||
| oz | Jun 2022 | 208,369 | 95,102 | 113,267 | 48,323 | 3,215 | 38,549 | 7,234 | 8,231 | 289 | 11,767 | 90,762 | |||||||||||||||||||||||||||||
| Dec 2021 | 562,477 | 423,522 | 138,955 | 151,269 | 7,170 | 161,750 | 17,008 | 110,502 | 3,890 | 17,940 | 92,948 | ||||||||||||||||||||||||||||||
| Jun 2021 | 510,521 | 370,923 | 139,598 | 140,531 | 482 | 145,643 | 28,003 | 84,749 | 3,569 | 19,837 | 87,707 | ||||||||||||||||||||||||||||||
| Price and costs | |||||||||||||||||||||||||||||||||||||||||
| Gold price received | R/kg | Jun 2022 | 922,851 | 917,031 | 916,433 | 939,623 | 920,765 | 928,091 | |||||||||||||||||||||||||||||||||
| Dec 2021 | 860,303 | 863,028 | 858,273 | 856,661 | 858,423 | 864,407 | |||||||||||||||||||||||||||||||||||
| Jun 2021 | 838,088 | 838,805 | 837,252 | 835,457 | 842,788 | 840,176 | |||||||||||||||||||||||||||||||||||
| Gold price received | US$/oz | Jun 2022 | 1,864 | 1,852 | 1,851 | 1,898 | 1,860 | 1,874 | |||||||||||||||||||||||||||||||||
| Dec 2021 | 1,780 | 1,786 | 1,776 | 1,773 | 1,776 | 1,789 | |||||||||||||||||||||||||||||||||||
| Jun 2021 | 1,792 | 1,793 | 1,790 | 1,786 | 1,802 | 1,796 | |||||||||||||||||||||||||||||||||||
Operating cost1 | R/t | Jun 2022 | 488 | 11,624 | 153 | 9,191 | 288 | 9,563 | 347 | — | — | 180 | 135 | ||||||||||||||||||||||||||||
| Dec 2021 | 528 | 3,390 | 141 | 3,778 | 238 | 3,850 | 200 | 2,577 | 221 | 188 | 122 | ||||||||||||||||||||||||||||||
| Jun 2021 | 480 | 3,229 | 127 | 3,777 | 195 | 3,685 | 210 | 2,358 | 143 | 162 | 107 | ||||||||||||||||||||||||||||||
| US$/t | Jun 2022 | 32 | 755 | 10 | 597 | 19 | 621 | 23 | — | — | 12 | 9 | |||||||||||||||||||||||||||||
| Dec 2021 | 35 | 226 | 9 | 251 | 16 | 256 | 13 | 171 | 15 | 12 | 8 | ||||||||||||||||||||||||||||||
| Jun 2021 | 33 | 222 | 9 | 260 | 13 | 253 | 14 | 162 | 10 | 11 | 7 | ||||||||||||||||||||||||||||||
| R/kg | Jun 2022 | 1,379,906 | 2,300,483 | 721,519 | 1,537,208 | 746,835 | 2,409,449 | 1,150,000 | 18,677,966 | 4,222,222 | 909,605 | 655,963 | |||||||||||||||||||||||||||||
| Dec 2021 | 669,084 | 684,828 | 622,711 | 623,588 | 523,207 | 722,035 | 614,545 | 714,153 | 561,983 | 738,676 | 611,920 | ||||||||||||||||||||||||||||||
| Jun 2021 | 670,405 | 698,135 | 593,699 | 611,703 | 533,333 | 747,624 | 623,188 | 751,970 | 441,441 | 650,338 | 579,043 | ||||||||||||||||||||||||||||||
| US$/oz | Jun 2022 | 2,787 | 4,646 | 1,457 | 3,105 | 1,508 | 4,866 | 2,323 | 37,724 | 8,528 | 1,837 | 1,325 | |||||||||||||||||||||||||||||
| Dec 2021 | 1,385 | 1,417 | 1,289 | 1,290 | 1,083 | 1,494 | 1,272 | 1,478 | 1,163 | 1,529 | 1,266 | ||||||||||||||||||||||||||||||
| Jun 2021 | 1,433 | 1,492 | 1,269 | 1,308 | 1,140 | 1,598 | 1,332 | 1,607 | 944 | 1,390 | 1,238 | ||||||||||||||||||||||||||||||
Adjusted EBITDA margin2 | % | Jun 2022 | (52) | (64) | (124) | (451) | (94) | 32 | |||||||||||||||||||||||||||||||||
| Dec 2021 | 18 | 27 | 16 | 15 | (50) | 29 | |||||||||||||||||||||||||||||||||||
| Jun 2021 | 18 | 28 | 13 | 11 | (34) | 30 | |||||||||||||||||||||||||||||||||||
All-in sustaining cost3 | R/kg | Jun 2022 | 1,542,355 | 1,692,452 | 2,252,809 | 5,415,094 | 969,945 | 808,360 | |||||||||||||||||||||||||||||||||
| Dec 2021 | 814,347 | 807,427 | 876,079 | 845,981 | 802,867 | 667,243 | |||||||||||||||||||||||||||||||||||
| Jun 2021 | 791,171 | 777,018 | 839,844 | 871,496 | 688,817 | 662,757 | |||||||||||||||||||||||||||||||||||
| All-in sustaining cost2 | US$/oz | Jun 2022 | 3,115 | 3,418 | 4,550 | 10,937 | 1,959 | 1,633 | |||||||||||||||||||||||||||||||||
| Dec 2021 | 1,685 | 1,671 | 1,813 | 1,751 | 1,661 | 1,381 | |||||||||||||||||||||||||||||||||||
| Jun 2021 | 1,691 | 1,661 | 1,795 | 1,863 | 1,472 | 1,417 | |||||||||||||||||||||||||||||||||||
All-in cost3 | R/kg | Jun 2022 | 1,610,091 | 1,692,452 | 2,290,730 | 5,430,189 | 969,945 | 810,485 | |||||||||||||||||||||||||||||||||
| Dec 2021 | 836,639 | 807,427 | 895,324 | 847,948 | 802,867 | 680,387 | |||||||||||||||||||||||||||||||||||
| Jun 2021 | 804,648 | 777,018 | 856,693 | 871,496 | 688,817 | 666,056 | |||||||||||||||||||||||||||||||||||
| All-in cost2 | US$/oz | Jun 2022 | 3,252 | 3,418 | 4,627 | 10,967 | 1,959 | 1,637 | |||||||||||||||||||||||||||||||||
| Dec 2021 | 1,731 | 1,671 | 1,853 | 1,755 | 1,661 | 1,408 | |||||||||||||||||||||||||||||||||||
| Jun 2021 | 1,720 | 1,661 | 1,831 | 1,863 | 1,472 | 1,424 | |||||||||||||||||||||||||||||||||||
| Capital expenditure | |||||||||||||||||||||||||||||||||||||||||
Total capital expenditure4 | Rm | Jun 2022 | 1,595 | 347 | 391 | 103 | — | 416 | |||||||||||||||||||||||||||||||||
| Dec 2021 | 2,515 | 828 | 947 | 368 | — | 183 | |||||||||||||||||||||||||||||||||||
| Jun 2021 | 1,866 | 672 | 668 | 301 | — | 194 | |||||||||||||||||||||||||||||||||||
| Total capital expenditure | US$m | Jun 2022 | 104 | 23 | 25 | 7 | — | 27 | |||||||||||||||||||||||||||||||||
| Dec 2021 | 167 | 55 | 63 | 24 | — | 12 | |||||||||||||||||||||||||||||||||||
| Jun 2021 | 128 | 46 | 46 | 21 | — | 13 | |||||||||||||||||||||||||||||||||||
Average exchange rate for the six months ended 30 June 2022, 31 December 2021 and 30 June 2021 was R15.40/US$, R15.03/US$ and R14.55/US$, respectively
Figures may not add as they are rounded independently
1Operating cost is the average cost of production and operating cost per tonne is calculated by dividing the cost of sales, before amortisation and depreciation and change in inventory in a period, by the tonnes milled/treated in the same period, and operating cost per kilogram (and ounce) is calculated by dividing the cost of sales, before amortisation and depreciation and change in inventory in a period, by the gold produced in the same period
2Adjusted EBITDA margin is calculated by dividing adjusted EBITDA by revenue
3All-in cost is calculated in accordance with the World Gold Council guidance. All-in cost excludes income tax, costs associated with merger and acquisition activities, working capital, impairments, financing costs, one time severance charges and items needed to normalise earnings. All-in cost is made up of All-in sustaining cost, being the cost to sustain current operations, given as a sub-total in the All-in cost calculation, together with corporate and major capital expenditure associated with growth. All-in sustaining cost per kilogram (and ounce) and All-in cost per kilogram (and ounce) are calculated by dividing the All-in sustaining cost and All-in cost, respectively, in a period by the total gold sold over the same period. For a reconciliation of cost of sales before amortisation and depreciation to All-in cost, see “All-in costs – Six months”
4Corporate project expenditure for the six months ended 30 June 2022, 31 December 2021 and 30 June 2021 was R338 million (US$22 million), R189 million (US$13 million), and R31 million (US$2 million), respectively, the majority of which related to the Burnstone project
Sibanye-Stillwater Operating and financial results | Six months ended 30 June 2022 19
European operations
| Sibanye-Stillwater Sandouville Refinery | ||||||||||||||||||||
| Battery Metals Split | ||||||||||||||||||||
Jun 20221 | ||||||||||||||||||||
| Volumes produced (tonnes) | % | |||||||||||||||||||
Nickel Salts2 | 1,066 | 23 | % | |||||||||||||||||
| Nickel Metal | 3,499 | 77 | % | |||||||||||||||||
| Total Nickel Production tNi | 4,565 | 100 | % | |||||||||||||||||
Nickel Cakes3 | 193 | |||||||||||||||||||
Cobalt Chloride (CoCl2)4 | 113 | |||||||||||||||||||
Ferric Chloride (FeCl3)4 | 968 | |||||||||||||||||||
| Volumes sales (tonnes) | ||||||||||||||||||||
Nickel Salts2 | 984 | 21 | % | |||||||||||||||||
| Nickel Metal | 3,599 | 79 | % | |||||||||||||||||
| Total Nickel Sold tNi | 4,583 | 100 | % | |||||||||||||||||
Cobalt Chloride (CoCl2)4 | 145 | |||||||||||||||||||
Ferric Chloride (FeCl3)4 | 968 | |||||||||||||||||||
| Nickel equivalent basket price | Unit | Jun 20221 | ||||||||||||
| Revenue from sale of products | Rm | 2,173 | ||||||||||||
| Nickel Products sold | tNi | 4,583 | ||||||||||||
| Nickel equivalent average basket price | R/tNi | 474,144 | ||||||||||||
| Nickel equivalent average basket price | US$/tNi | 30,789 | ||||||||||||
| Nickel equivalent sustaining cost | Unit | Jun 20221 | ||||||||||||
| Cost of sales, before amortisation and depreciation | Rm | 2,125 | ||||||||||||
| Carbon tax | Rm | — | ||||||||||||
| Community costs | Rm | — | ||||||||||||
| Share-based payments | Rm | — | ||||||||||||
| Rehabilitation interest and amortisation | Rm | 3 | ||||||||||||
| Leases | Rm | 12 | ||||||||||||
| Sustaining capital expenditure | Rm | 29 | ||||||||||||
| Less: By-product credit | Rm | (59) | ||||||||||||
| Nickel equivalent sustaining cost | Rm | 2,110 | ||||||||||||
| Nickel Products sold | tNi | 4,583 | ||||||||||||
| Nickel equivalent sustaining cost | R/tNi | 460,397 | ||||||||||||
| Nickel equivalent sustaining cost | US$/tNi | 29,896 | ||||||||||||
Nickel recovery yield5 | % | 98.79 | % | |||||||||||
Average exchange rate for the six months ended 30 June 2022 was R15.40
1.Amounts included since effective date of the acquisition on 4 February 2022
2.Nickel salts consist of anhydrous nickel, nickel chloride low sodium, nickel chloride standard, nickel carbonate and nickel chloride solution
3.Nickel cakes occur during the processing of nickel matte and are recycled back into the nickel refining process
4.Cobalt chloride and ferric chloride are obtained from nickel matte through a different refining process on an order basis
5.Nickel recovery yield is the percentage of total nickel recovered from the matte relative to the nickel contained in the matte received
Sibanye-Stillwater Operating and financial results | Six months ended 30 June 2022 20
CONDENSED CONSOLIDATED INTERIM FINANCIAL STATEMENTS
Condensed consolidated income statement
Figures are in millions unless otherwise stated
| US dollar | SA rand | ||||||||||||||||||||||
| Six months ended | Six months ended | ||||||||||||||||||||||
| Unaudited | Unaudited | Unaudited | Unaudited | Unaudited | Unaudited | ||||||||||||||||||
| Jun 2021 | Dec 2021 | Jun 2022 | Notes | Jun 2022 | Dec 2021 | Jun 2021 | |||||||||||||||||
| 6,182 | 5,461 | 4,570 | Revenue | 2 | 70,379 | 82,241 | 89,953 | ||||||||||||||||
| (3,570) | (3,821) | (3,263) | Cost of sales | (50,249) | (57,355) | (51,951) | |||||||||||||||||
| (3,309) | (3,521) | (3,054) | Cost of sales, before amortisation and depreciation | (47,025) | (52,860) | (48,153) | |||||||||||||||||
| (261) | (300) | (209) | Amortisation and depreciation | (3,224) | (4,495) | (3,798) | |||||||||||||||||
| 2,612 | 1,640 | 1,307 | 20,130 | 24,886 | 38,002 | ||||||||||||||||||
| 43 | 38 | 38 | Interest income | 589 | 578 | 624 | |||||||||||||||||
| (87) | (82) | (95) | Finance expense | 3 | (1,462) | (1,235) | (1,261) | ||||||||||||||||
| (20) | (6) | (7) | Share-based payments | (112) | (85) | (298) | |||||||||||||||||
| (58) | (367) | (26) | Loss on financial instruments | 4 | (399) | (5,437) | (842) | ||||||||||||||||
| (26) | 104 | 9 | Gain/(loss) on foreign exchange differences | 140 | 1,527 | (378) | |||||||||||||||||
| 96 | 38 | 50 | Share of results of equity-accounted investees after tax | 770 | 585 | 1,404 | |||||||||||||||||
| (80) | (73) | (44) | Net other costs | (703) | (1,077) | (1,177) | |||||||||||||||||
| (26) | (24) | (23) | - Care and maintenance | (358) | (352) | (385) | |||||||||||||||||
| — | 11 | — | - Change in estimate of environmental rehabilitation obligation, and right of recovery receivable and payable | — | 162 | 5 | |||||||||||||||||
| — | — | (14) | - Strike related costs | (223) | — | — | |||||||||||||||||
| 2 | (6) | 4 | - Service entity income/(costs) | 55 | (85) | 26 | |||||||||||||||||
| — | — | — | - Non-recurring COVID-19 costs | — | (2) | (1) | |||||||||||||||||
| (56) | (54) | (11) | - Other | 5 | (177) | (800) | (822) | ||||||||||||||||
| — | 2 | 6 | Gain on disposal of property, plant and equipment | 94 | 30 | 6 | |||||||||||||||||
| — | (348) | — | Impairments | — | (5,148) | — | |||||||||||||||||
| (3) | (4) | (2) | Restructuring costs | (36) | (69) | (38) | |||||||||||||||||
| (3) | (6) | (7) | Transaction costs | (108) | (102) | (38) | |||||||||||||||||
| — | (13) | — | Early redemption premium on the 2025 Notes | 11 | — | (196) | — | ||||||||||||||||
| 2 | (1) | 2 | Occupational healthcare income/(expense) | 25 | (10) | 24 | |||||||||||||||||
| 2,476 | 922 | 1,231 | Profit before royalties, carbon tax and tax | 18,928 | 14,247 | 36,028 | |||||||||||||||||
| (113) | (71) | (63) | Royalties | (970) | (1,072) | (1,642) | |||||||||||||||||
| — | — | 1 | Carbon tax | 11 | (1) | (3) | |||||||||||||||||
| 2,363 | 851 | 1,169 | Profit before tax | 17,969 | 13,174 | 34,383 | |||||||||||||||||
| (623) | (307) | (366) | Mining and income tax | 6 | (5,628) | (4,697) | (9,064) | ||||||||||||||||
| (538) | (375) | (321) | - Current tax | (4,937) | (5,675) | (7,831) | |||||||||||||||||
| (85) | 68 | (45) | - Deferred tax | (691) | 978 | (1,233) | |||||||||||||||||
| 1,740 | 544 | 803 | Profit for the period | 12,341 | 8,477 | 25,319 | |||||||||||||||||
| Profit for the period attributable to: | |||||||||||||||||||||||
| 1,707 | 527 | 782 | - Owners of Sibanye-Stillwater | 12,016 | 8,218 | 24,836 | |||||||||||||||||
| 33 | 17 | 21 | - Non-controlling interests | 325 | 259 | 483 | |||||||||||||||||
| Earnings per ordinary share (cents) | |||||||||||||||||||||||
| 58 | 19 | 28 | Basic earnings per share | 7.1 | 426 | 288 | 843 | ||||||||||||||||
| 57 | 19 | 28 | Diluted earnings per share | 7.2 | 424 | 286 | 834 | ||||||||||||||||
| 2,944,865 | 2,853,495 | 2,821,905 | Weighted average number of shares ('000) | 7.1 | 2,821,905 | 2,853,495 | 2,944,865 | ||||||||||||||||
| 2,978,875 | 2,876,894 | 2,830,908 | Diluted weighted average number of shares ('000) | 7.2 | 2,830,908 | 2,876,894 | 2,978,875 | ||||||||||||||||
| 14.55 | 15.03 | 15.40 | Average R/US$ rate | ||||||||||||||||||||
The condensed consolidated interim financial statements for the six months ended 30 June 2022 have been prepared by Sibanye-Stillwater's Group financial reporting team headed by Jacques le Roux (CA (SA)). This process was supervised by the Group's Chief Financial Officer, Charl Keyter and approved by the Sibanye-Stillwater board of directors. A convenience translation has been applied to the primary statements into US dollar based on the average exchange rate for the period for the condensed consolidated income statement, statements of other comprehensive income and cash flows, and the period-end closing exchange rate for the condensed consolidated statement of financial position and exchange differences on translation are accounted for in the condensed consolidated statement of other comprehensive income. This information is provided as supplementary information only and has not been reviewed or reported on by the Company's external auditors. | ||
Sibanye-Stillwater Operating and financial results | Six months ended 30 June 2022 21
Condensed consolidated statement of other comprehensive income
Figures are in millions unless otherwise stated
| US dollar | SA rand | ||||||||||||||||||||||
| Six months ended | Six months ended | ||||||||||||||||||||||
| Unaudited | Unaudited | Unaudited | Unaudited | Unaudited | Unaudited | ||||||||||||||||||
| Jun 2021 | Dec 2021 | Jun 2022 | Jun 2022 | Dec 2021 | Jun 2021 | ||||||||||||||||||
| 1,740 | 544 | 803 | Profit for the period | 12,341 | 8,477 | 25,319 | |||||||||||||||||
| 94 | (209) | (148) | Other comprehensive income, net of tax | (182) | 5,561 | (926) | |||||||||||||||||
| — | — | — | Foreign currency translation adjustments1 | 1,167 | 4,846 | (1,039) | |||||||||||||||||
| 8 | 48 | (88) | Fair value adjustment on other investments2 | (1,349) | 715 | 113 | |||||||||||||||||
| 86 | (257) | (60) | Currency translation adjustments3 | — | — | — | |||||||||||||||||
| 1,834 | 335 | 655 | Total comprehensive income | 12,159 | 14,038 | 24,393 | |||||||||||||||||
| Total comprehensive income attributable to: | |||||||||||||||||||||||
| 1,801 | 318 | 633 | - Owners of Sibanye-Stillwater | 11,821 | 13,790 | 23,908 | |||||||||||||||||
| 33 | 17 | 22 | - Non-controlling interests | 338 | 248 | 485 | |||||||||||||||||
| 14.55 | 15.03 | 15.40 | Average R/US$ rate | ||||||||||||||||||||
1These gains and losses will be reclassified to profit or loss upon disposal of the underlying operations
2These gains and losses relate to other investments and will never be reclassified to profit or loss
3These gains and losses relate to the convenience translation of the SA rand amounts to US dollar and will never be reclassified to profit or loss
Condensed consolidated statement of financial position
Figures are in millions unless otherwise stated
| US dollar | SA rand | ||||||||||||||||||||||
| Unaudited | Unaudited | Unaudited | Unaudited | Audited | Unaudited | ||||||||||||||||||
| Jun 2021 | Dec 2021 | Jun 2022 | Notes | Jun 2022 | Dec 2021 | Jun 2021 | |||||||||||||||||
| 5,790 | 5,531 | 5,857 | Non-current assets | 95,407 | 88,163 | 82,637 | |||||||||||||||||
| 4,295 | 3,921 | 4,246 | Property, plant and equipment | 69,166 | 62,494 | 61,292 | |||||||||||||||||
| 18 | 14 | 19 | Right-of-use assets | 306 | 222 | 256 | |||||||||||||||||
| 489 | 485 | 490 | Goodwill and other intangibles | 7,987 | 7,727 | 6,976 | |||||||||||||||||
| 456 | 476 | 481 | Equity-accounted investments | 7,830 | 7,594 | 6,512 | |||||||||||||||||
| 69 | 211 | 171 | Other investments | 9 | 2,788 | 3,367 | 990 | ||||||||||||||||
| 354 | 326 | 320 | Environmental rehabilitation obligation funds | 5,219 | 5,202 | 5,050 | |||||||||||||||||
| 61 | 41 | 61 | Other receivables | 994 | 651 | 877 | |||||||||||||||||
| 48 | 57 | 69 | Deferred tax assets | 1,117 | 906 | 684 | |||||||||||||||||
| 4,472 | 4,067 | 3,879 | Current assets | 63,182 | 64,831 | 63,820 | |||||||||||||||||
| 2,063 | 1,573 | 1,658 | Inventories | 27,005 | 25,080 | 29,437 | |||||||||||||||||
| 544 | 465 | 437 | Trade and other receivables | 7,124 | 7,411 | 7,764 | |||||||||||||||||
| 2 | 33 | 14 | Other receivables | 221 | 523 | 35 | |||||||||||||||||
| 34 | 78 | 97 | Tax receivable | 1,584 | 1,245 | 487 | |||||||||||||||||
| 1,829 | 1,900 | 1,673 | Cash and cash equivalents | 27,248 | 30,292 | 26,097 | |||||||||||||||||
| — | 18 | — | Asset held for sale | — | 280 | — | |||||||||||||||||
| 10,262 | 9,598 | 9,736 | Total assets | 158,589 | 152,994 | 146,457 | |||||||||||||||||
| 5,838 | 5,102 | 5,487 | Total equity | 89,358 | 81,345 | 83,339 | |||||||||||||||||
| 2,787 | 3,206 | 3,097 | Non-current liabilities | 50,436 | 51,108 | 39,771 | |||||||||||||||||
| 745 | 1,267 | 1,275 | Borrowings | 11 | 20,772 | 20,191 | 10,635 | ||||||||||||||||
| 13 | 11 | 15 | Lease liabilities | 240 | 177 | 186 | |||||||||||||||||
| 621 | 518 | 531 | Environmental rehabilitation obligation and other provisions | 8,655 | 8,263 | 8,860 | |||||||||||||||||
| 69 | 64 | 53 | Occupational healthcare obligation | 868 | 1,017 | 984 | |||||||||||||||||
| 152 | 177 | 174 | Cash-settled share-based payment obligations | 2,833 | 2,829 | 2,175 | |||||||||||||||||
| 194 | 289 | 125 | Other payables | 2,029 | 4,599 | 2,773 | |||||||||||||||||
| 444 | 389 | 379 | Deferred revenue | 6,175 | 6,204 | 6,337 | |||||||||||||||||
| 1 | 1 | 1 | Tax and royalties payable | 10 | 10 | 8 | |||||||||||||||||
| 548 | 490 | 544 | Deferred tax liabilities | 8,854 | 7,818 | 7,813 | |||||||||||||||||
| 1,637 | 1,290 | 1,152 | Current Liabilities | 18,795 | 20,541 | 23,347 | |||||||||||||||||
| 459 | 7 | 7 | Borrowings | 11 | 115 | 107 | 6,553 | ||||||||||||||||
| 7 | 7 | 7 | Lease liabilities | 119 | 104 | 101 | |||||||||||||||||
| 8 | — | 9 | Occupational healthcare obligation | 140 | — | 110 | |||||||||||||||||
| 6 | 4 | 15 | Cash-settled share-based payment obligations | 252 | 58 | 80 | |||||||||||||||||
| 1,040 | 951 | 883 | Trade and other payables | 14,392 | 15,162 | 14,843 | |||||||||||||||||
| 83 | 299 | 175 | Other payables | 2,856 | 4,765 | 1,188 | |||||||||||||||||
| 12 | 10 | 6 | Deferred revenue | 102 | 156 | 165 | |||||||||||||||||
| 22 | 12 | 50 | Tax and royalties payable | 819 | 189 | 307 | |||||||||||||||||
| 10,262 | 9,598 | 9,736 | Total equity and liabilities | 158,589 | 152,994 | 146,457 | |||||||||||||||||
| 14.27 | 15.94 | 16.29 | Closing R/US$ rate | ||||||||||||||||||||
Sibanye-Stillwater Operating and financial results | Six months ended 30 June 2022 22
Condensed consolidated statement of changes in equity
Figures are in millions unless otherwise stated
US dollar1 | SA rand | ||||||||||||||||||||||||||||||||||||||||
| Stated capital | Re- organisation reserve | Other reserves | Accum- ulated (loss)/profit | Non- controlling interests | Total equity | Note | Total equity | Non- controlling interests | Accum- ulated profit | Other reserves | Re- organisation reserve | Stated capital | |||||||||||||||||||||||||||||
| 1,936 | 2,599 | 517 | (391) | 153 | 4,814 | Balance at 31 December 2020 (Audited) | 70,716 | 2,236 | 12,760 | 2,569 | 23,001 | 30,150 | |||||||||||||||||||||||||||||
| — | — | 94 | 1,707 | 33 | 1,834 | Total comprehensive income for the period | 24,393 | 485 | 24,836 | (928) | — | — | |||||||||||||||||||||||||||||
| — | — | — | 1,707 | 33 | 1,740 | Profit for the period | 25,319 | 483 | 24,836 | — | — | — | |||||||||||||||||||||||||||||
| — | — | 94 | — | — | 94 | Other comprehensive income, net of tax | (926) | 2 | — | (928) | — | — | |||||||||||||||||||||||||||||
| — | — | — | (652) | (12) | (664) | Dividends paid | (9,660) | (175) | (9,485) | — | — | — | |||||||||||||||||||||||||||||
| — | — | 6 | — | — | 6 | Share-based payments | 96 | 5 | — | 91 | — | — | |||||||||||||||||||||||||||||
| (64) | — | — | — | — | (64) | Share buy-back | (932) | — | — | — | — | (932) | |||||||||||||||||||||||||||||
| — | — | — | 2 | (81) | (79) | Marikana BEE transaction | (1,146) | (1,180) | 34 | — | — | — | |||||||||||||||||||||||||||||
| — | — | — | (6) | (3) | (9) | Transaction with Platinum Mile shareholders | (128) | (46) | (82) | — | — | — | |||||||||||||||||||||||||||||
| 1,872 | 2,599 | 617 | 660 | 90 | 5,838 | Balance at 30 June 2021 (Unaudited) | 83,339 | 1,325 | 28,063 | 1,732 | 23,001 | 29,218 | |||||||||||||||||||||||||||||
| — | — | (209) | 527 | 17 | 335 | Total comprehensive income for the period | 14,038 | 248 | 8,218 | 5,572 | — | — | |||||||||||||||||||||||||||||
| — | — | — | 527 | 17 | 544 | Profit for the period | 8,477 | 259 | 8,218 | — | — | — | |||||||||||||||||||||||||||||
| — | — | (209) | — | — | (209) | Other comprehensive income, net of tax | 5,561 | (11) | — | 5,572 | — | — | |||||||||||||||||||||||||||||
| — | — | — | (554) | (11) | (565) | Dividends paid | (8,516) | (169) | (8,347) | — | — | — | |||||||||||||||||||||||||||||
| — | — | 4 | — | 1 | 5 | Share-based payments | 55 | 4 | — | 51 | — | — | |||||||||||||||||||||||||||||
| (511) | — | — | — | — | (511) | Share buy-back | (7,571) | — | — | — | — | (7,571) | |||||||||||||||||||||||||||||
| — | — | (2) | 2 | — | — | Adjustment due to sale of St Helena Hospital Proprietary Limited (St Helena Hospital) | — | — | 24 | (24) | — | — | |||||||||||||||||||||||||||||
| 1,361 | 2,599 | 410 | 635 | 97 | 5,102 | Balance at 31 December 2021 (Audited) | 81,345 | 1,408 | 27,958 | 7,331 | 23,001 | 21,647 | |||||||||||||||||||||||||||||
| — | — | (149) | 782 | 22 | 655 | Total comprehensive income for the period | 12,159 | 338 | 12,016 | (195) | — | — | |||||||||||||||||||||||||||||
| — | — | — | 782 | 21 | 803 | Profit for the period | 12,341 | 325 | 12,016 | — | — | — | |||||||||||||||||||||||||||||
| — | — | (149) | — | 1 | (148) | Other comprehensive income, net of tax | (182) | 13 | — | (195) | — | — | |||||||||||||||||||||||||||||
| — | — | — | (344) | (6) | (350) | Dividends paid | (5,378) | (86) | (5,292) | — | — | — | |||||||||||||||||||||||||||||
| — | — | 1 | — | — | 1 | Share-based payments | 14 | 5 | — | 9 | — | — | |||||||||||||||||||||||||||||
| — | — | — | — | 79 | 79 | Keliber Oy (Keliber) asset acquisition | 10.1 | 1,219 | 1,219 | — | — | — | — | ||||||||||||||||||||||||||||
| — | — | — | — | — | — | Foreign exchange movement recycled through profit or loss | (1) | — | — | (1) | — | — | |||||||||||||||||||||||||||||
| 1,361 | 2,599 | 262 | 1,073 | 192 | 5,487 | Balance at 30 June 2022 (Unaudited) | 89,358 | 2,884 | 34,682 | 7,144 | 23,001 | 21,647 | |||||||||||||||||||||||||||||
1 This information is unaudited
Sibanye-Stillwater Operating and financial results | Six months ended 30 June 2022 23
Condensed consolidated statement of cash flows
Figures are in millions unless otherwise stated
| US dollar | SA rand | ||||||||||||||||||||||
| Six months ended | Six months ended | ||||||||||||||||||||||
| Unaudited | Unaudited | Unaudited | Unaudited | Unaudited | Unaudited | ||||||||||||||||||
| Jun 2021 | Dec 2021 | Jun 2022 | Notes | Jun 2022 | Dec 2021 | Jun 2021 | |||||||||||||||||
| Cash flows from operating activities | |||||||||||||||||||||||
| 2,731 | 1,852 | 1,436 | Cash generated by operations | 22,107 | 28,055 | 39,729 | |||||||||||||||||
| 1 | 3 | 2 | Deferred revenue advance received | 24 | 51 | 14 | |||||||||||||||||
| — | — | — | Post-retirement health care payments | (1) | (1) | — | |||||||||||||||||
| (9) | (7) | (13) | Cash-settled share-based payments paid | (198) | (113) | (127) | |||||||||||||||||
| (11) | — | (15) | Payment of Marikana dividend obligation | (225) | — | (162) | |||||||||||||||||
| (121) | 2 | (295) | Additional deferred/contingent payments relating to acquisition of a business1 | (4,545) | — | (1,754) | |||||||||||||||||
| (307) | 473 | (107) | Change in working capital | (1,648) | 6,924 | (4,469) | |||||||||||||||||
| 2,284 | 2,323 | 1,008 | 15,514 | 34,916 | 33,231 | ||||||||||||||||||
| 35 | 30 | 30 | Interest received | 461 | 448 | 512 | |||||||||||||||||
| (33) | (20) | (38) | Interest paid | (584) | (303) | (478) | |||||||||||||||||
| (125) | (82) | (64) | Royalties paid | (979) | (1,237) | (1,818) | |||||||||||||||||
| (584) | (419) | (302) | Tax paid | (4,645) | (6,348) | (8,491) | |||||||||||||||||
| (664) | (565) | (349) | Dividends paid | (5,378) | (8,516) | (9,660) | |||||||||||||||||
| 913 | 1,267 | 285 | Net cash from operating activities | 4,389 | 18,960 | 13,296 | |||||||||||||||||
| Cash flow from investing activities | |||||||||||||||||||||||
| (384) | (477) | (399) | Additions to property, plant and equipment | (6,144) | (7,154) | (5,586) | |||||||||||||||||
| 2 | 3 | 8 | Proceeds on disposal of property, plant and equipment | 116 | 46 | 34 | |||||||||||||||||
| — | — | (74) | Acquisition of subsidiaries, net of cash acquired | 10 | (1,132) | — | — | ||||||||||||||||
| 45 | 24 | 24 | Dividends received | 363 | 371 | 649 | |||||||||||||||||
| (2) | (120) | (29) | Additions to other investments | (450) | (1,781) | (22) | |||||||||||||||||
| (19) | (11) | (6) | Acquisition of equity-accounted investment | (92) | (168) | (278) | |||||||||||||||||
| (1) | (4) | (1) | Contributions to environmental rehabilitation funds | (23) | (61) | (11) | |||||||||||||||||
| (39) | — | (12) | Payment of deferred/contingent payment1 | (185) | (15) | (562) | |||||||||||||||||
| (4) | — | (1) | Contributions to enterprise development fund | (10) | (14) | (51) | |||||||||||||||||
| — | 2 | — | Proceeds on sale of St Helena Hospital | — | 25 | — | |||||||||||||||||
| — | 1 | 2 | Proceeds from environmental rehabilitation funds | 33 | 5 | 5 | |||||||||||||||||
| (402) | (582) | (488) | Net cash used in investing activities | (7,524) | (8,746) | (5,822) | |||||||||||||||||
| Cash flow from financing activities | |||||||||||||||||||||||
| 151 | 1,245 | 357 | Loans raised | 11 | 5,500 | 18,455 | 2,196 | ||||||||||||||||
| (203) | (1,166) | (357) | Loans repaid | 11 | (5,501) | (17,305) | (2,947) | ||||||||||||||||
| (4) | (4) | (5) | Lease payments | (72) | (56) | (56) | |||||||||||||||||
| — | (9) | — | Acquisition of non-controlling interest | — | (128) | — | |||||||||||||||||
| (51) | (524) | — | Share buy-back | — | (7,761) | (742) | |||||||||||||||||
| (107) | (458) | (5) | Net cash used in financing activities | (73) | (6,795) | (1,549) | |||||||||||||||||
| 404 | 227 | (208) | Net (decrease)/increase in cash and cash equivalents | (3,208) | 3,419 | 5,925 | |||||||||||||||||
| 47 | (156) | (19) | Effect of exchange rate fluctuations on cash held | 164 | 776 | (68) | |||||||||||||||||
| 1,378 | 1,829 | 1,900 | Cash and cash equivalents at beginning of the period | 30,292 | 26,097 | 20,240 | |||||||||||||||||
| 1,829 | 1,900 | 1,673 | Cash and cash equivalents at end of the period | 27,248 | 30,292 | 26,097 | |||||||||||||||||
| 14.55 | 15.03 | 15.40 | Average R/US$ rate | ||||||||||||||||||||
| 14.27 | 15.94 | 16.29 | Closing R/US$ rate | ||||||||||||||||||||
1 Included in the payments made is R4,441 million, R179 million and R110 million related to the Rustenburg Deferred Payment, Pandora acquisition and SFA (Oxford) acquisition, respectively. Payments made up to the original fair value of the liability are classified as investing cash flows, with any amount paid above the original fair value of the liability classified as operating cash flows
Sibanye-Stillwater Operating and financial results | Six months ended 30 June 2022 24
Notes to the condensed consolidated interim financial statements
1. Basis of accounting and preparation
The condensed consolidated interim financial statements are prepared in accordance with the requirements of the JSE Listings Requirements for interim reports and the requirements of the Companies Act of South Africa. The JSE Listings Requirements require interim reports to be prepared in accordance with framework concepts, and the measurement and recognition requirements of International Financial Reporting Standards (IFRS), the South African Institute of Chartered Accountants Financial Reporting Guides as issued by the Accounting Practices Committee and Financial Pronouncements as issued by the Financial Reporting Standards Council and to also, as a minimum, contain information required by IAS 34 Interim Financial Reporting. The accounting policies applied in the preparation of these condensed consolidated interim financial statements are in terms of IFRS and are consistent with those applied in the previous consolidated annual financial statements, included in the 31 December 2021 annual financial report.
The condensed consolidated income statement, and statements of other comprehensive income and cash flows for the six months ended 31 December 2021 were not reviewed by the Company’s auditor and were prepared by subtracting the reviewed condensed consolidated financial statements for the six months ended 30 June 2021 from the audited consolidated financial statements for the year ended 31 December 2021.
The translation of the primary statements into US dollar is based on the average exchange rate for the period for the condensed consolidated income statement, statements of other comprehensive income and cash flows, and the period-end closing exchange rate for the condensed statement of financial position. Exchange differences on translation are accounted for in the condensed consolidated statement of other comprehensive income. This information is provided as supplementary information only and has not been reviewed by the Company's external auditor.
1.1 Standards, interpretations and amendments to published standards effective on 1 January 2022 and adopted by the Group
The amendments to published standards effective on 1 January 2022 and adopted by the Sibanye Stillwater Limited (Sibanye-Stillwater) group (the Group) did not have a material effect on the Group’s condensed consolidated interim financial statements for the six months ended 30 June 2022.
2. Revenue
The Group’s sources of revenue are:
| Figures in million - SA rand | Six months ended | |||||||||||||
| Unaudited | Unaudited | Unaudited | ||||||||||||
| Jun 2022 | Dec 2021 | Jun 2021 | ||||||||||||
| Gold mining activities | 5,981 | 15,051 | 13,307 | |||||||||||
PGM mining activities1 | 45,342 | 46,194 | 55,905 | |||||||||||
| Battery Metals activities | 2,173 | — | — | |||||||||||
| Recycling activities | 16,318 | 21,296 | 19,414 | |||||||||||
Stream1 | 241 | 366 | 259 | |||||||||||
Toll treatment arrangement2 | 105 | 345 | 176 | |||||||||||
| Total revenue from contracts with customers | 70,160 | 83,252 | 89,061 | |||||||||||
Adjustments relating to sales of PGM concentrate3 | 219 | (1,011) | 892 | |||||||||||
| Total revenue | 70,379 | 82,241 | 89,953 | |||||||||||
1 The difference between revenue from PGM mining activities above and total revenue from PGM mining activities per the segment report relates to the separate disclosure of revenue from the gold and palladium streaming arrangement with Wheaton Precious Metals International (Wheaton International)(Wheaton Stream) in the above as well as the separate disclosure of revenue related to adjustments on the sales of PGM concentrate. Revenue relating to the Wheaton Stream is incorporated in the Group corporate segment as described in the segment report (refer note 15)
2 This relates to revenue recognised in respect of a toll treatment arrangement entered into by Marikana during 2021. This arrangement concluded on 31 December 2021 and toll treatment revenue recognised for the six months ended 30 June 2022 represents revenue earned for the processing of material received before 31 December 2021
3 These adjustments relate to provisional pricing arrangements resulting in subsequent changes to the amount of revenue recognised
Revenue per geographical region of the relevant operations:
| Figures in million - SA rand | Six months ended | |||||||||||||
| Unaudited | Unaudited | Unaudited | ||||||||||||
| Jun 2022 | Dec 2021 | Jun 2021 | ||||||||||||
| Southern Africa | 44,240 | 52,463 | 61,049 | |||||||||||
| United States | 23,966 | 29,778 | 28,904 | |||||||||||
| Europe | 2,173 | — | — | |||||||||||
| Total revenue | 70,379 | 82,241 | 89,953 | |||||||||||
Sibanye-Stillwater Operating and financial results | Six months ended 30 June 2022 25
Percentage of revenue per segment based on the geographical location of customers purchasing from the Group:
| Six months ended | |||||||||||
| Unaudited | Unaudited | Unaudited | |||||||||
| Jun 2022 | Dec 2021 | Jun 2021 | |||||||||
| Gold | ||
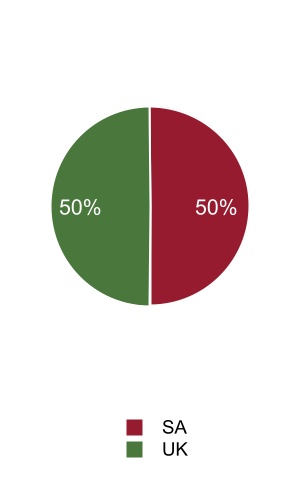
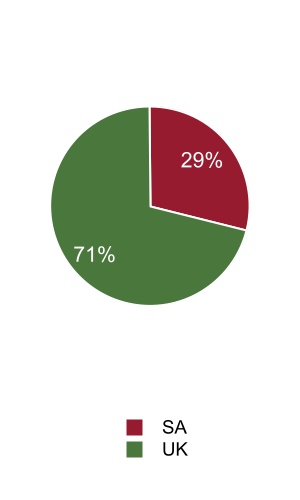
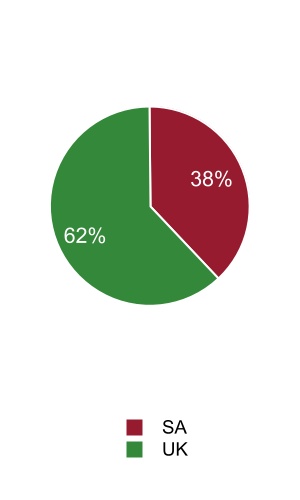
| PGM | ||
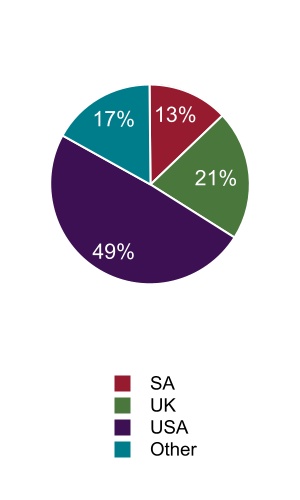
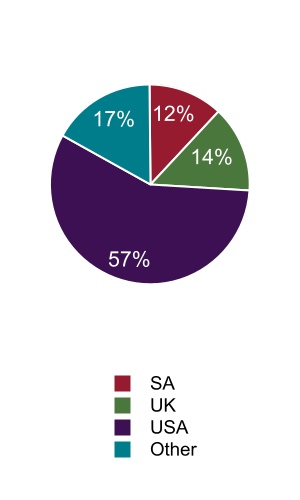
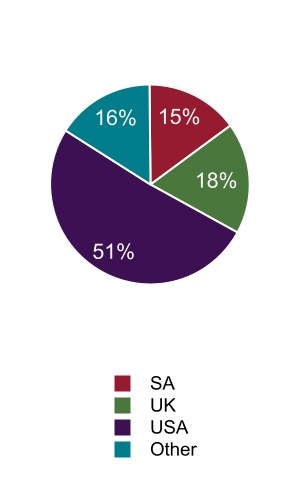
| Battery Metals | ||
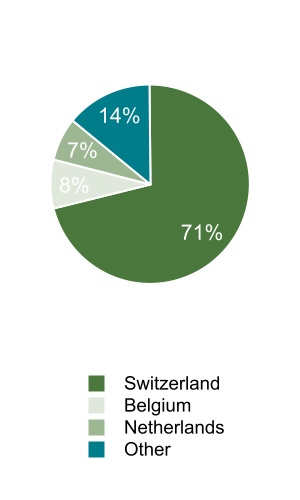
Sibanye-Stillwater Operating and financial results | Six months ended 30 June 2022 26
Revenue generated per product:
| Figures in million - SA rand | Six months ended | |||||||||||||
| Unaudited | Unaudited | Unaudited | ||||||||||||
| Jun 2022 | Dec 2021 | Jun 2021 | ||||||||||||
| Gold | 6,525 | 15,671 | 13,862 | |||||||||||
| PGMs | 58,792 | 63,922 | 74,036 | |||||||||||
| Platinum | 9,009 | 10,059 | 11,179 | |||||||||||
| Palladium | 22,735 | 25,216 | 27,643 | |||||||||||
| Rhodium | 25,042 | 26,685 | 33,143 | |||||||||||
| Iridium | 1,328 | 1,233 | 1,461 | |||||||||||
| Ruthenium | 678 | 729 | 610 | |||||||||||
| Chrome | 1,806 | 1,227 | 1,032 | |||||||||||
Nickel1 | 2,765 | 811 | 609 | |||||||||||
Other2 | 491 | 610 | 414 | |||||||||||
| Total revenue | 70,379 | 82,241 | 89,953 | |||||||||||
1 For the six months ended 30 June 2022, Nickel includes R451 million Nickel salts and R1,596 million Nickel metal sold from the Battery Metals operations. The remaining Nickel is sold from the Group's SA PGM and US PGM operations
2 Other primarily includes revenue from silver, cobalt and copper sales. For the six months ended 30 June 2022, revenue from the Marikana toll treatment arrangement of R105 million is also included (R345 million and R176 million for the six months ended 31 December 2021 and 30 June 2021, respectively)
3. Finance expense
| Figures in million - SA rand | Six months ended | |||||||||||||
| Unaudited | Unaudited | Unaudited | ||||||||||||
| Note | Jun 2022 | Dec 2021 | Jun 2021 | |||||||||||
| Interest charge on: | ||||||||||||||
| Borrowings (interest) | (531) | (337) | (464) | |||||||||||
| - US$600 million revolving credit facility (RCF) | (28) | (15) | (98) | |||||||||||
| - R5.5 billion RCF | (115) | (36) | (30) | |||||||||||
| - 2022 and 2025 Notes | — | (187) | (336) | |||||||||||
| - 2026 and 2029 Notes | (388) | (99) | — | |||||||||||
| Borrowings (unwinding of amortised cost) | 11 | (100) | (184) | (118) | ||||||||||
| - 2022 and 2025 Notes | — | (112) | (57) | |||||||||||
| - 2026 and 2029 Notes | (32) | (8) | — | |||||||||||
| - Burnstone Debt | (68) | (64) | (61) | |||||||||||
| Lease liabilities | (17) | (14) | (15) | |||||||||||
| Environmental rehabilitation obligation | (302) | (310) | (305) | |||||||||||
| Occupational healthcare obligation | (40) | (39) | (38) | |||||||||||
| Deferred Payment (related to the Rustenburg operation acquisition) | (174) | (63) | (95) | |||||||||||
| Marikana dividend obligation | (89) | (58) | (29) | |||||||||||
| Deferred revenue | (154) | (151) | (158) | |||||||||||
| Other | (55) | (79) | (39) | |||||||||||
| Total finance expense | (1,462) | (1,235) | (1,261) | |||||||||||
4. Loss on financial instruments
| Figures in million - SA rand | Six months ended | |||||||||||||
| Unaudited | Unaudited | Unaudited | ||||||||||||
| Note | Jun 2022 | Dec 2021 | Jun 2021 | |||||||||||
Fair value (loss)/gain on palladium hedge contract1 | (91) | 550 | (316) | |||||||||||
| Fair value adjustment on share-based payment obligations | (295) | (713) | (551) | |||||||||||
| (Loss)/gain on the revised cash flow of the Deferred Payment | — | (4,658) | 5 | |||||||||||
| Loss on the revised cash flow of the Burnstone Debt | 11 | — | (2) | — | ||||||||||
| Loss on revised cash flow of the Marikana dividend obligation | (25) | (468) | — | |||||||||||
| Other | 12 | (146) | 20 | |||||||||||
| Total loss on financial instruments | (399) | (5,437) | (842) | |||||||||||
1On 17 January 2020, Stillwater Mining Company (wholly owned subsidiary of Sibanye-Stillwater) concluded a palladium hedge agreement which commenced on 28 February 2020, comprising the delivery of 240,000 ounces of palladium over two years (10,000 ounces per month) with a zero cost collar which establishes a minimum and a maximum cap of US$1,500 and US$3,400 per ounce, respectively. The hedge agreement concluded on 31 January 2022.
On 24 March 2021, Stillwater Mining Company concluded an additional palladium hedge agreement commencing on 28 February 2022, comprising the delivery of 140,000 ounces of palladium over a fourteen month period (10,000 ounces per month) with a zero cost collar which establishes a minimum floor and a maximum cap of US$1,800 and US$3,300 per ounce, respectively.
For the six months ended 30 June 2022, the combined unrealised loss was R91 million. For the six months ended 31 December 2021 and 30 June 2021, a combined unrealised gain of R550 million and a combined unrealised loss of R316 million was recognised, respectively. As hedge accounting is not applied, resulting gains or losses are accounted for as gains or losses on financial instruments in profit or loss
Sibanye-Stillwater Operating and financial results | Six months ended 30 June 2022 27
5. Other net other cost
| Figures in million - SA rand | Six months ended | |||||||||||||
| Unaudited | Unaudited | Unaudited | ||||||||||||
| Jun 2022 | Dec 2021 | Jun 2021 | ||||||||||||
| Corporate and social investment costs | (160) | (151) | (137) | |||||||||||
| Loss due to dilution of interest in joint operation | — | (2) | (2) | |||||||||||
| Cost incurred on employee and community trusts | (66) | (454) | (299) | |||||||||||
| Exploration costs | (8) | (9) | (3) | |||||||||||
| Other | 57 | (184) | (381) | |||||||||||
| Total other costs | (177) | (800) | (822) | |||||||||||
6. Mining and income tax
| Figures in million - SA rand | Six months ended | |||||||||||||
| Unaudited | Unaudited | Unaudited | ||||||||||||
| Jun 2022 | Dec 2021 | Jun 2021 | ||||||||||||
| Tax on profit before tax at maximum South African statutory company tax rate (28%) | (5,031) | (3,689) | (9,627) | |||||||||||
| South African gold mining tax formula rate adjustment | (58) | 16 | 47 | |||||||||||
| US statutory tax rate adjustment | 149 | (44) | 510 | |||||||||||
| Non-deductible amortisation and depreciation | (45) | (6) | (7) | |||||||||||
| Non-taxable dividend received | — | 7 | — | |||||||||||
| Non-deductible finance expense | (92) | (46) | (62) | |||||||||||
| Non-deductible share-based payments | (4) | (15) | (27) | |||||||||||
| Non-deductible loss on fair value of financial instruments | (70) | (868) | (153) | |||||||||||
| Non-taxable gain/(non-deductible loss) on foreign exchange differences | 7 | 48 | (1) | |||||||||||
| Non-taxable share of results of equity-accounted investees | 215 | 164 | 393 | |||||||||||
| Non-deductible impairments | — | (22) | — | |||||||||||
| Non-deductible transaction costs | — | (39) | (30) | |||||||||||
| Tax adjustment in respect of prior periods | (35) | 439 | (53) | |||||||||||
| Net other non-taxable income and non-deductible expenditure | 16 | 286 | 65 | |||||||||||
| Change in estimated deferred tax rate | 323 | 141 | (55) | |||||||||||
Deferred tax assets unrecognised/derecognised1 | (1,003) | (1,069) | (64) | |||||||||||
| Mining and income tax | (5,628) | (4,697) | (9,064) | |||||||||||
| Effective tax rate | 31.3 | % | 35.7 | % | 26.4 | % | ||||||||
1 The amount for the six months ended 30 June 2022 relates to deferred tax assets not recognised which includes R863 million and R99 million relating to Sibanye Gold Limited and the Cooke operations, respectively . The amount for the six months ended 31 December 2021 includes the derecognition of deferred tax assets of R837 million relating to deductible temporary differences, that can no longer be recognised due to the impairment of the mining assets in the SA gold operations
7. Earnings per share
7.1 Basic earnings per share
| Six months ended | ||||||||||||||
| Unaudited | Unaudited | Unaudited | ||||||||||||
| Jun 2022 | Dec 2021 | Jun 2021 | ||||||||||||
| Ordinary shares in issue (’000) | 2,830,019 | 2,808,406 | 2,940,777 | |||||||||||
| Adjustment for weighting of ordinary shares in issue (’000) | (8,114) | 45,089 | 4,088 | |||||||||||
| Adjusted weighted average number of shares (’000) | 2,821,905 | 2,853,495 | 2,944,865 | |||||||||||
| Profit attributable to owners of Sibanye-Stillwater (SA rand million) | 12,016 | 8,218 | 24,836 | |||||||||||
| Basic earnings per share (EPS) (cents) | 426 | 288 | 843 | |||||||||||
7.2 Diluted earnings per share
Potential ordinary shares arising from the equity-settled share-based payment scheme resulted in a dilution for the six month periods ended 30 June 2022, 31 December 2021 and 30 June 2021.
| Six months ended | ||||||||||||||
| Unaudited | Unaudited | Unaudited | ||||||||||||
| Jun 2022 | Dec 2021 | Jun 2021 | ||||||||||||
| Weighted average number of shares | ||||||||||||||
| Adjusted weighted average number of shares (’000) | 2,821,905 | 2,853,495 | 2,944,865 | |||||||||||
| Potential ordinary shares - equity-settled share plan (’000) | 9,003 | 23,399 | 34,010 | |||||||||||
| Diluted weighted average number of shares (’000) | 2,830,908 | 2,876,894 | 2,978,875 | |||||||||||
| Diluted earnings per share (DEPS) (cents) | 424 | 286 | 834 | |||||||||||
Sibanye-Stillwater Operating and financial results | Six months ended 30 June 2022 28
7.3 Headline earnings per share
| Figures in million - SA rand unless otherwise stated | Six months ended | |||||||||||||
| Unaudited | Unaudited | Unaudited | ||||||||||||
| Jun 2022 | Dec 2021 | Jun 2021 | ||||||||||||
| Profit attributable to owners of Sibanye-Stillwater | 12,016 | 8,218 | 24,836 | |||||||||||
| Gain on disposal of property, plant and equipment | (94) | (30) | (6) | |||||||||||
| Impairments | — | 5,148 | — | |||||||||||
| Derecognition of property, plant and equipment in Marathon project | — | — | 2 | |||||||||||
| Gain on deregistration of subsidiary | (1) | — | — | |||||||||||
| Foreign exchange movement recycled through profit or loss | (1) | — | — | |||||||||||
| Profit on sale of St Helena Hospital | — | (16) | — | |||||||||||
| Taxation effect of re-measurement items | 13 | (1,275) | 1 | |||||||||||
| Re-measurement items, attributable to non-controlling interest | 5 | — | — | |||||||||||
| Headline earnings | 11,938 | 12,045 | 24,833 | |||||||||||
| Adjusted weighted average number of shares (’000) | 2,821,905 | 2,853,495 | 2,944,865 | |||||||||||
| Headline EPS (cents) | 423 | 422 | 843 | |||||||||||
7.4 Diluted headline earnings per share
| Figures in million - SA rand unless otherwise stated | Six months ended | |||||||||||||
| Unaudited | Unaudited | Unaudited | ||||||||||||
| Jun 2022 | Dec 2021 | Jun 2021 | ||||||||||||
| Headline earnings | 11,938 | 12,045 | 24,833 | |||||||||||
| Diluted weighted average number of shares (’000) | 2,830,908 | 2,876,894 | 2,978,875 | |||||||||||
| Diluted headline EPS (cents) | 422 | 419 | 834 | |||||||||||
8. Dividends
Dividend policy
The Group’s dividend policy is to return between 25% to 35% of normalised earnings to shareholders and after due consideration of future requirements the dividend may be increased beyond these levels. The Board, therefore, considers normalised earnings in determining what value will be distributed to shareholders. The Board believes normalised earnings provides useful information to investors regarding the extent to which results of operations may affect shareholder returns. Normalised earnings is defined as earnings attributable to the owners of Sibanye-Stillwater excluding gains and losses on financial instruments and foreign exchange differences, impairments, gain/loss on disposal of property, plant and equipment, occupational healthcare expense, restructuring costs, transactions costs, share-based payment on BEE transaction, gain on acquisition, net other business development costs, share of results of equity-accounted investees, all after tax and the impact of non-controlling interest, and changes in estimated deferred tax rate.
In line with Sibanye-Stillwater’s Capital Allocation Framework, the Board of Directors resolved to pay an interim dividend of 138 SA cents per share after 30 June 2022 (187 SA cents per share after 31 December 2021 and 292 SA cents per share after 30 June 2021), which represents 35% of normalised earnings for the period.
| Figures in million - SA rand | Six months ended | |||||||||||||
| Unaudited | Unaudited | Unaudited | ||||||||||||
| Jun 2022 | Dec 2021 | Jun 2021 | ||||||||||||
| Profit attributable to the owners of Sibanye-Stillwater | 12,016 | 8,218 | 24,836 | |||||||||||
| Adjusted for: | ||||||||||||||
| Loss on financial instruments | 399 | 5,437 | 842 | |||||||||||
| (Gain)/loss on foreign exchange differences | (140) | (1,527) | 378 | |||||||||||
| Gain on disposal of property, plant and equipment | (94) | (30) | (6) | |||||||||||
| Impairments | — | 5,148 | — | |||||||||||
| Restructuring costs | 36 | 69 | 38 | |||||||||||
| Transaction costs | 108 | 102 | 38 | |||||||||||
| Occupational healthcare (income)/expense | (25) | 10 | (24) | |||||||||||
| Loss due to dilution of interest in joint operation | — | 2 | 2 | |||||||||||
| Early redemption premium on the 2025 Notes | — | 196 | — | |||||||||||
| Gain on deregistration of subsidiary | (1) | — | — | |||||||||||
| Profit on sale of St Helena Hospital | — | (16) | — | |||||||||||
| Change in estimated deferred tax rate | (323) | (141) | 55 | |||||||||||
| Share of results of equity-accounted investees after tax | (770) | (585) | (1,404) | |||||||||||
| Tax effect of the items adjusted above | (53) | (2,413) | (342) | |||||||||||
| Non-controlling interest effect of the items listed above | 29 | 2 | (2) | |||||||||||
Normalised earnings1 | 11,182 | 14,472 | 24,411 | |||||||||||
1 Non-IFRS measures such as normalised earnings as defined and reconciled above, are the responsibility of the Group's Board of Directors and are presented for illustration purposes only, and because of its nature, normalised earnings should not be considered as a representation of financial performance under IFRS
Sibanye-Stillwater Operating and financial results | Six months ended 30 June 2022 29
9. Other investments
Verkor S.A. (Verkor)
During February 2022, the Group entered into a term sheet whereby the Group, through its wholly-owned subsidiary, Sibanye Battery Metals Proprietary Limited, invested in Verkor by subscribing for a €25 million convertible bond. Verkor is a French Gigafactory project aiming to enter the European battery materials market as a manufacturer of low-carbon footprint batteries for application in electric vehicles and large-scale stationary storage markets. The Group subscribed for the convertible bond on 22 March 2022 amounting to R409 million, and subject to early repayment events, will be redeemable in full on 30 June 2024. The convertible bond is recognised as an investment and measured at fair value, with net gains and losses recognised in profit or loss. The fair value of the investment at 30 June 2022 amounted to R432 million with R23 million recognised as a fair value gain for the period.
10. Acquisitions
10.1 Keliber asset acquisition
On 23 February 2021, Keliber Oy (Keliber) and the Group entered into an investment agreement that enables Keliber to significantly advance its lithium project in Central Ostrobothnia, Finland. The Keliber project consists of several advanced stage lithium spodumene deposits, with significant exploration upside potential in close proximity to the existing project. Based on an updated feasibility study announced subsequent to the effective date of the transaction in March 2022, Keliber currently has 12.3 million tonnes of ore reserves. The planned annual production is 15,000 tonnes of battery grade lithium hydroxide. The project includes the development of a chemical plant in Kokkola, at 66 kilometres from the mining area, which will produce battery grade lithium hydroxide.
Under the investment agreement, the Group made an initial phased equity investment of €30 million for an approximate 30% equity shareholding into Keliber. In the first tranche the Group subscribed for shares in Keliber for €15 million and simultaneously, on the same terms as Sibanye-Stillwater’s €30 million phased investment, a further €10 million equity issuance was offered to the existing Keliber shareholders, which was fully subscribed. The investment agreement allows the Group to finance development work of a further €15 million in two tranches over a twelve-month period. The second tranche subscription payment was made on 16 September 2021.
The investment in Keliber resulting from the €15 million subscription in the first tranche and the €10 million in the second tranche was treated as an equity accounted associate from 17 March 2021, being the date on which the closing conditions on the first tranche subscription were met. The first and second tranche subscriptions resulted in an aggregate 26.6% shareholding as at 31 December 2021, which allowed for representation on the board of Keliber as well as significant involvement in the technical committee of the company. The transaction was entered into at fair value, and the difference between the net asset value and the fair value paid by the Group was attributed to the mineral reserve.
On 14 March 2022, the Group made payment for the third tranche of the initial phased equity investment in Keliber. The subscription price amounted to €5 million for an additional 125,000 shares in Keliber, resulting in an aggregate shareholding of approximately 30% at the time of subscription. Subsequent to 30 June 2022, the Group has exercised its option to achieve the majority shareholding in Keliber by contributing further equity financing for the development of the project (refer note 14.1). Since the Group obtained substantive ability to acquire a majority shareholding in Keliber upon subscription for the third tranche share investment, management concluded that control was obtained at the time of subscription. At the date of acquisition, Keliber did not meet the definition of a business in terms of IFRS 3 Business Combinations (IFRS 3), and is therefore accounted for as an asset acquisition.
Allocation of purchase consideration
Since the acquisition is outside the scope of IFRS 3, the purchase consideration was allocated to identifiable assets and liabilities based on their relative fair values. Assets and liabilities that are initially measured at an amount other than cost, such as financial instruments recognised at fair value, were recognised at their respective carrying amounts as specified in the applicable accounting standards. The functional currency of Keliber is Euro.
The below table summarises the value of the consideration paid and non-controlling interests recognised at the date of acquisition:
| Figures in million - SA rand | ||||||||
| Unaudited | ||||||||
| Jun 2022 | ||||||||
Consideration (30.3%)1 | 530 | |||||||
| Gross value of allocated purchase consideration | 1,749 | |||||||
| Non-controlling interest recognised (69.7%) | 1,219 | |||||||
1 The consideration is determined as the carrying value of the equity accounted investment at 14 March 2022 (i.e. the effective date) of R446 million and the cost of the €5 million third tranche payment made on the effective date amounting to R84 million. Net cash of R261 million was acquired at the effective date
The following table summarises the allocation of the gross purchase consideration to identifiable assets and liabilities:
| Figures in million - SA rand | ||||||||
| Unaudited | ||||||||
| Jun 2022 | ||||||||
| Property, plant and equipment | 1,481 | |||||||
| Right-of-use assets | 31 | |||||||
| Other receivables - non-current | 2 | |||||||
| Trade and other receivables | 31 | |||||||
| Cash and cash equivalents | 345 | |||||||
| Borrowings | (30) | |||||||
| Other payables - non-current | (34) | |||||||
| Trade and other payables | (77) | |||||||
| Total purchase consideration allocated on relative fair value basis | 1,749 | |||||||
Sibanye-Stillwater Operating and financial results | Six months ended 30 June 2022 30
10.2 Sandouville business combination
On 30 July 2021, Sibanye-Stillwater announced that it had entered into an exclusive put option agreement (Put Option) with French mining group Eramet SA (Eramet) for the acquisition of 100% of the Sandouville nickel hydrometallurgical processing facility (Sandouville), located in Normandy, France. The Sandouville facility is situated in the industrial heart of Europe at Le Havre, France’s second largest industrial port, with strategic access to extensive logistical infrastructure including shipping, rail and key motorways, supporting any future supply into the European end user markets.
The transaction is the second step in the Group's battery metals strategy, building on the investment in the Keliber lithium hydroxide project, in partnership with the State of Finland and the Finnish Minerals Group, announced in February 2021. The Sandouville site is a polyvalent facility which is already zoned for heavy industrial purposes. The site is scaleable for nickel, cobalt and lithium battery grade products, and will enable the Group to further advance its battery metals strategy and recycling activities.
On 4 November 2021, following the signing of the exclusive Put Option, Sibanye-Stillwater announced that the Share Purchase Agreement (SPA) had been signed to acquire 100% of Sandouville. The signature of the SPA followed the successful completion of the information-consultation process with the employee representative bodies of Sandouville and Eramet, who rendered a favourable opinion of the transaction. The transaction also received the key regulatory approvals of the South African Reserve Bank and clearance from the French Foreign Investment Control Office. The remaining conditions in respect of the acquisition were fulfilled on 4 February 2022, the effective acquisition date.
Sandouville’s financial results were consolidated from the effective date. For the five months ended 30 June 2022, the Sandouville operations contributed revenue of R2,173 million and a net loss of R28 million to the Group’s results. Sandouville’s pro forma revenue and net loss would have been R2,357 million and R84 million, respectively, had the acquisition been effective from 1 January 2022. In determining these amounts, management has assumed that the fair value adjustments, determined provisionally, that arose on the date of acquisition would have been the same if the acquisition had occurred on 1 January 2022. The functional currency of Sandouville is Euro.
The purchase price allocation on the effective date was prepared on a provisional basis in accordance with IFRS 3 for, amongst others, property, plant and equipment, contingent liabilities, provisions, as well as any deferred tax implications. If new information obtained within one year of the acquisition date, about facts and circumstances that existed at the acquisition date, identifies adjustments to the below amounts or any additional provisions that existed at the date of acquisition, then the accounting for the acquisition will be revised.
Consideration
The fair value of the consideration is as follows:
| Figures in million - SA rand | ||||||||
| Unaudited | ||||||||
| Jun 2022 | ||||||||
Cash1 | 1,501 | |||||||
| Total consideration | 1,501 | |||||||
1 The cash consideration is made up of an initial payment on 4 February 2022 of EUR81 million (R1,390 million) and an additional payment of EUR6 million (R111 million) on 11 May 2022
Acquisition related costs
The Group incurred total acquisition related costs of R25 million for the six months ended 30 June 2022 (R28 million for the six months ended 31 December 2021) on advisory and legal fees. These costs are recognised as transaction costs in profit or loss during the period in which incurred.
Identified assets acquired and liabilities assumed
The following table summarises the recognised amounts of assets acquired and liabilities assumed at the acquisition date:
| Figures in million - SA rand | ||||||||
| Unaudited | ||||||||
| Jun 2022 | ||||||||
| Property, Plant and equipment | 1,257 | |||||||
| Right-of-use assets | 78 | |||||||
| Intangible assets | 83 | |||||||
| Other receivables - non-current | 11 | |||||||
| Inventories | 601 | |||||||
| Trade and other receivables | 104 | |||||||
Cash and cash equivalents1 | 108 | |||||||
| Tax receivable | 3 | |||||||
| Lease liabilities | (88) | |||||||
| Environmental rehabilitation obligation and other provisions | (97) | |||||||
| Other payables - non-current | (164) | |||||||
| Borrowings | (9) | |||||||
| Trade and other payables | (409) | |||||||
Fair value of identifiable net assets acquired2 | 1,478 | |||||||
1 The transaction results in net cash paid of R1,393 million as a result of cash and cash equivalents acquired of R108 million and cash consideration paid of R1,501 million
2 Fair value of assets and liabilities, excluding those not within the IFRS 3 measurement scope, were determined as follows:
•The fair value of property, plant and equipment was based on an income approach consisting of a discounted cash flow model, as well as considering the depreciated replacement cost of the plant
•Lease liabilities and right-of-use assets approximate fair value, based on an assessment of the present value of the remaining lease payments at the effective date of the transaction using a market related discount rate
•Intangible assets includes software, patents, trademarks and customer relationships acquired from Eramet SA. The majority of the asset value is attributable to the customer relationships acquired and trademarks, which were valued based on the discounted future cash flows of commission contracts
•Inventories approximate fair value, based on the short inventory cycle and an assessment of net realisable value
•Trade and other receivables and trade and other payables approximate fair value due to their short-term nature
•The fair value of the decommissioning obligation is calculated on a discounted cash flow model considering the cost of decommissioning of the plant
•Borrowings approximate fair value based on an assessment of the discounted future cash flows at the effective date using a market related discount rate
Sibanye-Stillwater Operating and financial results | Six months ended 30 June 2022 31
Goodwill
Goodwill arising from the business combination has been recognised as follows:
| Figures in million - SA rand | ||||||||
| Unaudited | ||||||||
| Jun 2022 | ||||||||
| Consideration | 1,501 | |||||||
| Fair value of identifiable net assets acquired | (1,478) | |||||||
Goodwill1 | 23 | |||||||
1 The goodwill is attributable to the premium paid for the synergies and benefits expected to be derived from implementing the Group's battery metals strategy. None of the goodwill amount is deductible for tax purposes
11. Borrowings
| Figures in million - SA rand | Six months ended | |||||||||||||
| Unaudited | Unaudited | Unaudited | ||||||||||||
| Notes | Jun 2022 | Dec 2021 | Jun 2021 | |||||||||||
| Balance at beginning of the period | 20,298 | 17,188 | 18,383 | |||||||||||
| Borrowings acquired on acquisition of subsidiaries | 10 | 39 | — | — | ||||||||||
| Loans raised | 5,500 | 18,426 | 2,196 | |||||||||||
US$600 million RCF1 | — | — | 703 | |||||||||||
R5.5 billion RCF2 | 5,500 | — | — | |||||||||||
2026 and 2029 Notes3 | — | 18,208 | — | |||||||||||
Other borrowings4 | — | 218 | 1,493 | |||||||||||
| Loans repaid | (5,501) | (17,305) | (2,947) | |||||||||||
US$600 million RCF1 | — | (6,244) | (1,484) | |||||||||||
R5.5 billion RCF2 | (5,500) | — | — | |||||||||||
| 2022 and 2025 Notes | — | (10,840) | — | |||||||||||
Other borrowings4 | (1) | (221) | (1,463) | |||||||||||
| Early redemption premium on the 2025 Notes | — | 196 | — | |||||||||||
| Unwinding of loans recognised at amortised cost | 3 | 100 | 184 | 118 | ||||||||||
| Accrued interest (related to the 2022 and 2025 Notes and 2026 and 2029 Notes) | 388 | 286 | 336 | |||||||||||
| Accrued interest paid | (402) | (204) | (323) | |||||||||||
| Loss on the revised cash flow of the Burnstone Debt | 4 | — | 2 | — | ||||||||||
| Loss/(gain) on foreign exchange differences and foreign currency translation | 465 | 1,525 | (575) | |||||||||||
| Balance at end of the period | 20,887 | 20,298 | 17,188 | |||||||||||
1 During the six months ended 31 December 2021, the Group extended the US$600 million RCF maturity date for all of its lenders to 5 April 2023
2 During the six months ended 31 December 2021, the Group extended the R5.5 billion RCF maturity date, which now matures 11 November 2024
3 On 16 November 2021 the Group completed a two-tranche corporate bond offering of 4.0% Notes (US$675 million) due 16 November 2026 (the 2026 Notes) and 4.5% Notes (US$525 million) due 16 November 2029 (the 2029 Notes) (together the 2026 and 2029 Notes). At 31 December 2021, the portion of transaction costs accrued for and not yet settled amounted to R29 million
4 Other borrowings consist mainly of overnight facilities
Borrowings consist of:
| Figures in million - SA rand | Six months ended | |||||||||||||
| Unaudited | Audited | Unaudited | ||||||||||||
| Jun 2022 | Dec 2021 | Jun 2021 | ||||||||||||
US$600 million RCF1 | — | — | 5,994 | |||||||||||
R5.5 billion RCF1 | — | — | — | |||||||||||
| 2022 and 2025 Notes | — | — | 9,902 | |||||||||||
| 2026 and 2029 Notes | 19,229 | 18,785 | — | |||||||||||
| Burnstone Debt | 1,611 | 1,507 | 1,287 | |||||||||||
| Other borrowings | 47 | 6 | 5 | |||||||||||
| Borrowings | 20,887 | 20,298 | 17,188 | |||||||||||
| Current portion of borrowings | (115) | (107) | (6,553) | |||||||||||
| Non-current borrowings | 20,772 | 20,191 | 10,635 | |||||||||||
1 The US$600 million RCF and the R5.5 billion RCF are affected by the IBOR reform which came into effect on 1 January 2021. The R5.5 billion RCF is linked to JIBAR, however the JIBAR is only expected to be impacted by the reform at a later stage and any impact thereof is to be considered when this occurs. The US$600 million RCF is linked to a US LIBOR and will be refinanced or restructured depending on the developments in respect of the US LIBOR reform. Therefore the Group was not impacted when the amendment became effective
Sibanye-Stillwater Operating and financial results | Six months ended 30 June 2022 32
11.1 Capital management
Debt maturity
The following are contractually due, undiscounted cash flows resulting from maturities of borrowings, including interest payments:
| Figures in million - SA rand | |||||||||||||||||
| Total | Within one year | Between one and five years | After five years | ||||||||||||||
| 30 June 2022 (Unaudited) | |||||||||||||||||
| - Capital | |||||||||||||||||
| 2026 and 2029 Notes | 19,548 | — | 10,996 | 8,552 | |||||||||||||
| Burnstone Debt | 1,183 | — | 75 | 1,108 | |||||||||||||
| Other borrowings | 47 | 14 | 21 | 12 | |||||||||||||
| - Interest | 9,136 | 825 | 3,026 | 5,285 | |||||||||||||
Net (cash)/debt to adjusted EBITDA
| Figures in million - SA rand | Rolling 12 months | |||||||||||||
| Unaudited | Audited | Unaudited | ||||||||||||
| Jun 2022 | Dec 2021 | Jun 2021 | ||||||||||||
Borrowings1 | 19,276 | 18,791 | 15,901 | |||||||||||
Cash and cash equivalents2 | 27,211 | 30,257 | 26,062 | |||||||||||
Net cash3 | (7,935) | (11,466) | (10,161) | |||||||||||
Adjusted EBITDA4 (12 months) | 50,618 | 68,606 | 73,420 | |||||||||||
Net cash to adjusted EBITDA (ratio)5 | (0.2) | (0.2) | (0.1) | |||||||||||
1Borrowings are only those borrowings that have recourse to Sibanye-Stillwater. Borrowings, therefore, exclude the Burnstone Debt
2Cash and cash equivalents exclude cash of Burnstone
3Net cash represents borrowings and bank overdraft less cash and cash equivalents. Borrowings are only those borrowings that have recourse to Sibanye-Stillwater and, therefore, exclude the Burnstone Debt. Net cash excludes cash of Burnstone
4The adjusted earnings before interest, taxes, depreciation and amortisation (EBITDA) calculation included is based on the definitions included in the facility agreements for compliance with the debt covenant formula, except for impact of new accounting standards and acquisitions, where the facility agreements allow the results from the acquired operations to be annualised. Adjusted EBITDA may not be comparable to similarly titled measures of other companies. Adjusted EBITDA as defined and reconciled below, is not a measure of performance under IFRS and should be considered in addition to, and not as a substitute for, other measures of financial performance and liquidity
5Net cash to adjusted EBITDA ratio is defined as net debt as of the end of a reporting period divided by adjusted EBITDA of the 12 months ended on the same reporting date. Non-IFRS measures such as net (cash)/debt to adjusted EBITDA ratio are the responsibility of the Group’s Board of Directors and are presented for illustration purposes only, and because of its nature, net (cash)/ debt to adjusted EBITDA should not be considered as a representation of financial performance under IFRS
Reconciliation of profit before royalties, carbon tax and tax to adjusted EBITDA
| Figures in million - SA rand | Six months ended | |||||||||||||
| Unaudited | Unaudited | Unaudited | ||||||||||||
| Jun 2022 | Dec 2021 | Jun 2021 | ||||||||||||
| Profit before royalties, carbon tax and tax | 18,928 | 14,247 | 36,028 | |||||||||||
| Adjusted for: | ||||||||||||||
| Amortisation and depreciation | 3,224 | 4,495 | 3,798 | |||||||||||
| Interest income | (589) | (578) | (624) | |||||||||||
| Finance expense | 1,462 | 1,235 | 1,261 | |||||||||||
| Share-based payments | 112 | 85 | 298 | |||||||||||
| Loss on financial instruments | 399 | 5,437 | 842 | |||||||||||
| (Gain)/loss on foreign exchange differences | (140) | (1,527) | 378 | |||||||||||
| Share of results of equity-accounted investees after tax | (770) | (585) | (1,404) | |||||||||||
| Change in estimate of environmental rehabilitation obligation, and right of recovery receivable and payable | — | (162) | (5) | |||||||||||
| Gain on disposal of property, plant and equipment | (94) | (30) | (6) | |||||||||||
| Impairments | — | 5,148 | — | |||||||||||
| Restructuring costs | 36 | 69 | 38 | |||||||||||
| Transaction costs | 108 | 102 | 38 | |||||||||||
| IFRS 16 lease payments | (89) | (71) | (71) | |||||||||||
| Occupational healthcare (income)/expense | (25) | 10 | (24) | |||||||||||
| Profit on sale of St Helena Hospital | — | (16) | — | |||||||||||
| Early redemption premium on the 2025 Notes | — | 196 | — | |||||||||||
| Gain on deregistration of subsidiary | (1) | — | — | |||||||||||
| Loss due to dilution of interest in joint operation | — | 2 | 2 | |||||||||||
| Adjusted EBITDA | 22,561 | 28,057 | 40,549 | |||||||||||
12. Fair value of financial assets and financial liabilities, and risk management
12.1 Measurement of fair value
The Group uses the following hierarchy for determining and disclosing the fair value of financial instruments:
•Level 1: unadjusted quoted prices in active markets for identical assets or liabilities
•Level 2: inputs other than quoted prices in level 1 that are observable for the asset or liability, either directly (as prices) or indirectly (derived from prices)
•Level 3: inputs for the asset or liability that are not based on observable market data (unobservable inputs)
Sibanye-Stillwater Operating and financial results | Six months ended 30 June 2022 33
The following table sets out the Group’s significant financial instruments measured at fair value by level within the fair value hierarchy:
| Figures in million - SA rand | |||||||||||||||||||||||||||||
| Unaudited | Audited | Unaudited | |||||||||||||||||||||||||||
| Jun 2022 | Dec 2021 | Jun 2021 | |||||||||||||||||||||||||||
| Level 1 | Level 2 | Level 3 | Level 1 | Level 2 | Level 3 | Level 1 | Level 2 | Level 3 | |||||||||||||||||||||
| Financial assets measured at fair value | |||||||||||||||||||||||||||||
Environmental rehabilitation obligation funds1 | 4,469 | 750 | — | 4,477 | 725 | — | 4,347 | 703 | — | ||||||||||||||||||||
Trade receivables - PGM concentrate sales2 | — | 3,570 | — | — | 3,794 | — | — | 5,063 | — | ||||||||||||||||||||
Other investments3 | 2,111 | — | 677 | 3,143 | — | 224 | 727 | — | 263 | ||||||||||||||||||||
Asset held for sale4 | — | — | — | — | 280 | — | — | — | — | ||||||||||||||||||||
Palladium hedge contract5 | — | 193 | — | — | 286 | — | — | — | — | ||||||||||||||||||||
| Financial liabilities measured at fair value | |||||||||||||||||||||||||||||
Palladium hedge contract5 | — | — | — | — | — | — | — | 293 | — | ||||||||||||||||||||
1 Environmental rehabilitation obligation funds comprise a fixed income portfolio of bonds as well as fixed and notice deposits. The environmental rehabilitation obligation funds are stated at fair value based on the nature of the fund’s investments
2 The fair value for trade receivables measured at fair value through profit or loss are determined based on ruling market prices, volatilities and interest rates
3 The fair values of listed investments are based on the quoted prices available from the relevant stock exchanges. The carrying amounts of other short-term investment products with short maturity dates approximate fair value. The fair values of non-listed investments are determined through valuation techniques that include inputs that are not based on observable market data. These inputs include price/book ratios as well as marketability and minority shareholding discounts which are impacted by the size of the shareholding
4 The fair value of the asset held for sale was derived from the quoted Gen Mining share price
5 The fair value of the palladium hedge is determined using a Monte Carlo simulation model based on market forward prices, volatilities and interest rates
Fair value of borrowings
The fair value of variable interest rate borrowings approximates its carrying amounts as the interest rates charged are considered market related. Fair value of fixed interest rate borrowings was determined through reference to ruling market prices and interest rates.
The table below shows the fair value and carrying amount of borrowings where the carrying amount does not approximate fair value:
| Figures in million - SA rand | ||||||||||||||
| Carrying value | Fair Value | |||||||||||||
| Level 1 | Level 2 | Level 3 | ||||||||||||
| 30 June 2022 (Unaudited) | ||||||||||||||
2026 and 2029 Notes1 | 19,229 | 15,965 | — | — | ||||||||||
Burnstone Debt2 | 1,611 | — | — | 2,614 | ||||||||||
| Total | 20,840 | 15,965 | — | 2,614 | ||||||||||
| 31 December 2021 (Audited) | ||||||||||||||
2026 and 2029 Notes1 | 18,785 | 18,664 | — | — | ||||||||||
Burnstone Debt2 | 1,507 | — | — | 2,996 | ||||||||||
| Total | 20,292 | 18,664 | — | 2,996 | ||||||||||
| 30 June 2021 (Unaudited) | ||||||||||||||
2022 and 2025 Notes1 | 9,902 | 10,177 | — | — | ||||||||||
Burnstone Debt2 | 1,287 | — | — | 2,086 | ||||||||||
| Total | 11,189 | 10,177 | — | 2,086 | ||||||||||
1 The fair value is based on the quoted market prices of the notes
2 The fair value of the Burnstone Debt has been derived from discounted cash flow models. These models use several key assumptions, including estimates of future sales volumes, Gold prices, operating costs, capital expenditure and discount rate. The fair value estimate is sensitive to changes in the key assumptions, for example, increases in the market related discount rate would decrease the fair value if all other inputs remain unchanged. The extent of the fair value changes would depend on how inputs change in relation to each other
12.2 Risk management activities
Liquidity risk: working capital and going concern assessment
For the six months ended 30 June 2022, the Group realised a profit of R12,341 million (31 December 2021: R8,477 million and 30 June 2021: R25,319 million). As at 30 June 2022 the Group’s current assets exceeded its current liabilities by R44,387 million (31 December 2021: R44,290 million) and the Group’s total assets exceeded its total liabilities by R89,358 million (31 December 2021: R81,345 million). During the six months ended 30 June 2022 the Group generated net cash from operating activities of R4,389 million (31 December 2021: R18,960 million and 30 June 2021: R13,296 million).
The Group currently has committed undrawn debt facilities of R15,959 million at 30 June 2022 (31 December 2021: R15,749 million) and cash balances of R27,248 million (31 December 2021: R30,292 million). The most immediate debt maturities are the US$600 million USD RCF maturing in April 2023 and R5.5 billion ZAR RCF maturing in November 2024. The Group’s leverage ratio (net (cash)/debt to adjusted EBITDA) as at 30 June 2022 was (0.2):1 (31 December 2021 was (0.2):1 and 30 June 2021 was (0.1):1) and its interest coverage ratio (adjusted EBITDA to net finance charges) was (2,532.0):1 (31 December 2021 was (5,281.0):1 and 30 June 2021 was 305.0:1). Both considerably better than the maximum permitted leverage ratio of at most 2.5:1 and minimum required interest coverage ratio of 4.0:1, calculated on a quarterly basis, required under the US$600 million USD RCF and the R5.5 billion ZAR RCF. With the available RCF’s collectively undrawn, high level of available cash balances and the Group’s strong liquidity position, no imminent refinancing of debt is required.
Wage negotiations at our SA PGM operations commenced between the Rustenburg and Marikana operations and the representative labour unions comprising the Association of Mineworkers and Construction Union (AMCU), the National Union of Mineworkers (NUM) and UASA. Negotiations between stakeholders are ongoing with the timing and outcome currently unknown. In addition, the outbreak of infectious diseases or uncontrolled COVID-19 infection rates could impose restrictions on both our US PGM and SA operations. Notwithstanding the exceptionally strong liquidity position and financial outlook, these events could negatively impact the production outlook, and deteriorate the Group’s forecasted liquidity position which may require the Group to further increase operational flexibility by adjusting mine plans and reducing capital expenditure. The Group could also, if necessary, be required to consider options to increase funding flexibility which may include, amongst others, additional loan facilities or debt capital market issuances, streaming facilities, prepayment facilities or, in the event that other options are not deemed preferable or achievable by the Board, an equity capital raise. The Group could also, with lender approval, request covenant amendments or restructure facilities. During past adversity management has successfully implemented similar actions.
Sibanye-Stillwater Operating and financial results | Six months ended 30 June 2022 34
Management believes that the cash forecasted to be generated by operations, cash on hand, the unutilised debt facilities as well as additional funding opportunities will enable the Group to continue to meet its obligations as they fall due. The condensed consolidated interim financial statements for the six months ended 30 June 2022, therefore, have been prepared on a going concern basis.
13. Contingent liabilities
13.1 Notice from Appian Capital to commence legal proceedings
On 26 October 2021, Sibanye-Stillwater entered into share purchase agreements to acquire the Santa Rita nickel mine and Serrote copper mine (the Atlantic Nickel SPA and the MVV SPA, respectively) from affiliates of Appian Capital Advisory LLP (Appian). Subsequent to signing the agreements, Appian informed Sibanye-Stillwater that a geotechnical event occurred at the Santa Rita open pit operation. After becoming aware of the geotechnical event, Sibanye-Stillwater assessed the event and its effect and concluded that the event was and was reasonably expected to be material and adverse to the business, financial condition, results of operations, the properties, assets, liabilities or operations of Santa Rita. Accordingly, pursuant to the terms of the Atlantic Nickel SPA, on 24 January 2022, Sibanye-Stillwater gave notice of termination of the Atlantic Nickel SPA. As the MVV SPA was conditional on the closing of the Atlantic Nickel SPA, which had become impossible to satisfy, on the same date Sibanye-Stillwater also gave notice of termination of the MVV SPA.
On 27 May 2022, Appian initiated legal proceedings before the High Court of England and Wales against Sibanye-Stillwater. On 3 August 2022, the Group filed its defence. Sibanye-Stillwater’s view is that the Atlantic Nickel SPA and the MVV SPA were rightfully terminated and the Group is confident that the claim will be defended successfully. Since the proceedings are in early stages, additional information and estimates of potential outcomes are unavailable.
14. Events after the reporting period
There were no events that could have a material impact on the financial results of the Group after 30 June 2022, up to the date on which the condensed consolidated interim financial statements for the six months ended 30 June 2022 was authorised for issue, other than those discussed below:
14.1 Majority shareholding achieved in Keliber
Upon subscribing for the third tranche of the initial equity investment in Keliber during March 2022, the Group’s pre-emptive right to obtain a majority shareholding and majority board representation in Keliber became exercisable. On 30 June 2022, Sibanye-Stillwater announced its intention to exercise the pre-emptive right, and subsequently exercised this right on 29 July 2022 for a cash consideration of €146 million. Upon exercise of the pre-emptive right, the Group subscribed for new shares in Keliber increasing its shareholding to 50% plus one share.
On 30 June 2022, the Group also announced its wholly-owned subsidiary Keliber Lithium Proprietary Limited's intention to make a voluntary cash offer to minority shareholders of Keliber, which could initially increase its shareholding in Keliber to over 80% (Voluntary Offer). The Voluntary Offer was made on 30 June 2022 with an offer period which lapsed on 19 August 2022. By the end of the offer period, a number of shareholders had irrevocably accepted the offer, implying an increase in the Group's shareholding of Keliber to over 80%, once the share transfers are settled. Subsequent to completion of the Voluntary Offer, a capital raise by Keliber will be executed, however if required, an equalization mechanism may be implemented in order for the Group to achieve its targeted 80% shareholding in Keliber.
Since the Group had already obtained control over Keliber with the third tranche subscription (refer note 10.1), subsequent share subscriptions will be accounted for directly in equity as transactions with non-controlling shareholders on their respective effective dates.
14.2 Sale of Lonmin Canada Incorporated (Lonmin Canada)
The Group entered into an arrangement to dispose of its interest in Lonmin Canada Incorporated (Lonmin Canada) to Magna Mining Inc. for approximately CAD10 million (Canadian dollars). Lonmin Canada holds the Denison PGM exploration project in Canada and was acquired as part of the Lonmin plc (subsequently renamed to Sibanye UK Limited) acquisition on 7 June 2019. At 30 June 2022, Wallbridge Mining Company Limited held 17.8% of the shares in Lonmin Canada, Sibanye-Stillwater held 64.9% and the remainder was held by various other parties. The net asset value of Lonmin Canada recognised by the Group at 30 June 2022 was negligible.
14.3 Revised mine plans for the US PGM operations
On 11 August 2022, the Group announced that the cumulative operational constraints, skills shortages, the prevailing macro-economic environment and changing palladium market conditions have prompted a strategic revision of the US PGM operations and expansion plans. In line with this strategic review, management considered it prudent to re-prioritise capital investment on the original growth project and re-engineer the operations to protect margins and long-term value. The updated plan had no impact on the consolidated financial position of the Group at 30 June 2022, and its consolidated financial performance and consolidated cash flows for the six month period then ended.
14.4 SA PGM labour negotiations
On 3 August 2022, wage negotiations at the Group’s SA PGM operations commenced between the Rustenburg and Marikana operations and the representative labour unions comprising AMCU, the NUM and UASA. Negotiations between stakeholders are ongoing with the timing and outcome currently unknown.
Sibanye-Stillwater Operating and financial results | Six months ended 30 June 2022 35
15. Segment reporting
Figures are in millions
| For the six months ended 30 Jun 2022 (Unaudited) | |||||||||||||||||||||||||||||||||||||||||||||||||||||||||||||||||||||||
| GROUP | US PGM OPERATIONS | SA OPERATIONS | EUROPE | GROUP | |||||||||||||||||||||||||||||||||||||||||||||||||||||||||||||||||||
| SA rand | Total | Total US PGM | Underground | Recycling | Total SA Operations | Total SA PGM | Rusten- burg | Marikana | Kroondal | Platinum Mile | Mimosa | Corporate and re- conciling items1 | Total SA gold | Drie- fontein | Kloof | Beatrix | Cooke | DRD- GOLD | Corporate and re- conciling items1 | Total Battery Metals | Sandouville2 | Corporate and re- conciling items1,3 | Cor- porate1 | ||||||||||||||||||||||||||||||||||||||||||||||||
| Revenue | 70,379 | 24,130 | 7,812 | 16,318 | 44,240 | 38,259 | 14,754 | 18,323 | 4,408 | 774 | 2,339 | (2,339) | 5,981 | 1,470 | 1,305 | 249 | 337 | 2,620 | — | 2,173 | 2,173 | — | (164) | ||||||||||||||||||||||||||||||||||||||||||||||||
| Underground | 46,888 | 7,812 | 7,812 | — | 39,240 | 36,524 | 13,793 | 18,323 | 4,408 | — | 2,339 | (2,339) | 2,716 | 1,377 | 1,098 | 241 | — | — | — | — | — | — | (164) | ||||||||||||||||||||||||||||||||||||||||||||||||
| Surface | 5,000 | — | — | — | 5,000 | 1,735 | 961 | — | — | 774 | — | — | 3,265 | 93 | 207 | 8 | 337 | 2,620 | — | — | — | — | — | ||||||||||||||||||||||||||||||||||||||||||||||||
| Recycling/processing | 18,491 | 16,318 | — | 16,318 | — | — | — | — | — | — | — | — | — | — | — | — | — | — | — | 2,173 | 2,173 | — | — | ||||||||||||||||||||||||||||||||||||||||||||||||
| Cost of sales, before amortisation and depreciation | (47,025) | (19,560) | (3,840) | (15,720) | (25,340) | (16,781) | (6,659) | (8,073) | (1,774) | (275) | (890) | 890 | (8,559) | (2,292) | (2,817) | (1,282) | (326) | (1,842) | — | (2,125) | (2,125) | — | — | ||||||||||||||||||||||||||||||||||||||||||||||||
| Underground | (25,837) | (3,840) | (3,840) | — | (21,997) | (15,953) | (6,106) | (8,073) | (1,774) | — | (890) | 890 | (6,044) | (2,233) | (2,567) | (1,244) | — | — | — | — | — | — | — | ||||||||||||||||||||||||||||||||||||||||||||||||
| Surface | (3,343) | — | — | — | (3,343) | (828) | (553) | — | — | (275) | — | — | (2,515) | (59) | (250) | (38) | (326) | (1,842) | — | — | — | — | — | ||||||||||||||||||||||||||||||||||||||||||||||||
| Recycling/processing | (17,845) | (15,720) | — | (15,720) | — | — | — | — | — | — | — | — | — | — | — | — | — | — | — | (2,125) | (2,125) | — | — | ||||||||||||||||||||||||||||||||||||||||||||||||
Net other cash costs4 | (793) | 49 | 49 | — | (854) | (326) | 162 | (181) | (46) | (239) | (21) | (1) | (528) | (118) | (111) | (90) | (327) | 62 | 56 | 12 | 13 | (1) | — | ||||||||||||||||||||||||||||||||||||||||||||||||
| Adjusted EBITDA | 22,561 | 4,619 | 4,021 | 598 | 18,046 | 21,152 | 8,257 | 10,069 | 2,588 | 260 | 1,428 | (1,450) | (3,106) | (940) | (1,623) | (1,123) | (316) | 840 | 56 | 60 | 61 | (1) | (164) | ||||||||||||||||||||||||||||||||||||||||||||||||
| Amortisation and depreciation | (3,224) | (1,424) | (1,422) | (2) | (1,739) | (1,162) | (470) | (577) | (89) | (19) | (152) | 145 | (577) | (239) | (158) | (63) | (3) | (97) | (17) | (61) | (61) | — | — | ||||||||||||||||||||||||||||||||||||||||||||||||
| Interest income | 589 | 166 | 7 | 159 | 422 | 195 | 22 | 113 | 49 | 8 | 18 | (15) | 227 | 23 | 21 | 12 | 16 | 110 | 45 | — | — | — | 1 | ||||||||||||||||||||||||||||||||||||||||||||||||
| Finance expense | (1,462) | (445) | (445) | — | (856) | (502) | (2,665) | (169) | (52) | — | (19) | 2,403 | (354) | (50) | (48) | (44) | (43) | (44) | (125) | (7) | (7) | — | (154) | ||||||||||||||||||||||||||||||||||||||||||||||||
| Share-based payments | (112) | (30) | (30) | — | (82) | (39) | (14) | (17) | (7) | (1) | — | — | (43) | (9) | (4) | (2) | — | (9) | (19) | — | — | — | — | ||||||||||||||||||||||||||||||||||||||||||||||||
Net other5 | 600 | (87) | (87) | — | 687 | 500 | 101 | (112) | 62 | (3) | (324) | 776 | 187 | 6 | 13 | 17 | 3 | 15 | 133 | (5) | (21) | 16 | 5 | ||||||||||||||||||||||||||||||||||||||||||||||||
Non-underlying items6 | (24) | 2 | 2 | — | 81 | 8 | 5 | 5 | (16) | — | (1) | 15 | 73 | (6) | (2) | — | (1) | 10 | 72 | — | — | — | (107) | ||||||||||||||||||||||||||||||||||||||||||||||||
| Royalties and carbon tax | (959) | — | — | — | (959) | (954) | (458) | (490) | (7) | — | (70) | 71 | (5) | (7) | (6) | 10 | (2) | — | — | — | — | — | — | ||||||||||||||||||||||||||||||||||||||||||||||||
| Profit before tax | 17,969 | 2,801 | 2,046 | 755 | 15,600 | 19,198 | 4,778 | 8,822 | 2,528 | 245 | 880 | 1,945 | (3,598) | (1,222) | (1,807) | (1,193) | (346) | 825 | 145 | (13) | (28) | 15 | (419) | ||||||||||||||||||||||||||||||||||||||||||||||||
| Current taxation | (4,937) | (337) | (4,600) | (4,470) | (1,403) | (2,270) | (702) | (74) | (173) | 152 | (130) | (5) | (3) | — | — | (120) | (2) | — | — | — | — | ||||||||||||||||||||||||||||||||||||||||||||||||||
| Deferred taxation | (691) | 113 | (804) | (968) | (627) | (339) | (12) | 7 | (46) | 49 | 164 | 8 | 37 | 26 | — | (46) | 139 | — | — | — | — | ||||||||||||||||||||||||||||||||||||||||||||||||||
| Profit/(loss) for the period | 12,341 | 2,577 | 10,196 | 13,760 | 2,748 | 6,213 | 1,814 | 178 | 661 | 2,146 | (3,564) | (1,219) | (1,773) | (1,167) | (346) | 659 | 282 | (13) | (28) | 15 | (419) | ||||||||||||||||||||||||||||||||||||||||||||||||||
| Attributable to: | |||||||||||||||||||||||||||||||||||||||||||||||||||||||||||||||||||||||
| Owners of the parent | 12,016 | 2,577 | 9,871 | 13,760 | 2,748 | 6,213 | 1,814 | 178 | 661 | 2,146 | (3,889) | (1,219) | (1,773) | (1,167) | (346) | 334 | 282 | (13) | (28) | 15 | (419) | ||||||||||||||||||||||||||||||||||||||||||||||||||
| Non-controlling interest holders | 325 | — | 325 | — | — | — | — | — | — | — | 325 | — | — | — | — | 325 | — | — | — | — | — | ||||||||||||||||||||||||||||||||||||||||||||||||||
| Sustaining capital expenditure | (1,949) | (378) | (378) | — | (1,542) | (817) | (305) | (391) | (115) | (6) | (294) | 294 | (725) | (95) | (152) | (68) | — | (410) | — | (29) | (29) | — | — | ||||||||||||||||||||||||||||||||||||||||||||||||
| Ore reserve development | (2,684) | (1,277) | (1,277) | — | (1,407) | (939) | (315) | (624) | — | — | — | — | (468) | (252) | (185) | (31) | — | — | — | — | — | — | — | ||||||||||||||||||||||||||||||||||||||||||||||||
| Growth projects | (1,511) | (530) | (530) | — | (807) | (405) | — | (405) | — | — | — | — | (402) | — | (54) | (4) | — | (6) | (338) | (174) | — | (174) | — | ||||||||||||||||||||||||||||||||||||||||||||||||
| Total capital expenditure | (6,144) | (2,185) | (2,185) | — | (3,756) | (2,161) | (620) | (1,420) | (115) | (6) | (294) | 294 | (1,595) | (347) | (391) | (103) | — | (416) | (338) | (203) | (29) | (174) | — | ||||||||||||||||||||||||||||||||||||||||||||||||
Sibanye-Stillwater Operating and financial results | Six months ended 30 June 2022 36
| For the six months ended 30 Jun 2022 (Unaudited) | |||||||||||||||||||||||||||||||||||||||||||||||||||||||||||||||||||||||
| GROUP | US PGM OPERATIONS | SA OPERATIONS | EUROPE | GROUP | |||||||||||||||||||||||||||||||||||||||||||||||||||||||||||||||||||
US dollars7 | Total | Total US PGM | Underground | Recycling | Total SA Operations | Total SA PGM | Rusten- burg | Marikana | Kroondal | Platinum Mile | Mimosa | Corporate and re- conciling items1 | Total SA gold | Drie- fontein | Kloof | Beatrix | Cooke | DRD- GOLD | Corporate and re- conciling items1 | Total Battery Metals | Sandouville2 | Corporate and re- conciling items1,3 | Cor- porate1 | ||||||||||||||||||||||||||||||||||||||||||||||||
| Revenue | 4,570 | 1,567 | 507 | 1,060 | 2,873 | 2,485 | 958 | 1,190 | 286 | 50 | 152 | (151) | 388 | 95 | 84 | 17 | 22 | 170 | — | 141 | 141 | — | (11) | ||||||||||||||||||||||||||||||||||||||||||||||||
| Underground | 3,045 | 507 | 507 | — | 2,549 | 2,373 | 896 | 1,190 | 286 | — | 152 | (151) | 176 | 89 | 71 | 16 | — | — | — | — | — | — | (11) | ||||||||||||||||||||||||||||||||||||||||||||||||
| Surface | 324 | — | — | — | 324 | 112 | 62 | — | — | 50 | — | — | 212 | 6 | 13 | 1 | 22 | 170 | — | — | — | — | — | ||||||||||||||||||||||||||||||||||||||||||||||||
| Recycling/processing | 1,201 | 1,060 | — | 1,060 | — | — | — | — | — | — | — | — | — | — | — | — | — | — | — | 141 | 141 | — | — | ||||||||||||||||||||||||||||||||||||||||||||||||
| Cost of sales, before amortisation and depreciation | (3,054) | (1,270) | (249) | (1,021) | (1,646) | (1,090) | (432) | (524) | (115) | (18) | (58) | 57 | (556) | (149) | (183) | (83) | (21) | (120) | — | (138) | (138) | — | — | ||||||||||||||||||||||||||||||||||||||||||||||||
| Underground | (1,678) | (249) | (249) | — | (1,429) | (1,036) | (396) | (524) | (115) | — | (58) | 57 | (393) | (145) | (167) | (81) | — | — | — | — | — | — | — | ||||||||||||||||||||||||||||||||||||||||||||||||
| Surface | (217) | — | — | — | (217) | (54) | (36) | — | — | (18) | — | — | (163) | (4) | (16) | (2) | (21) | (120) | — | — | — | — | — | ||||||||||||||||||||||||||||||||||||||||||||||||
| Recycling/processing | (1,159) | (1,021) | — | (1,021) | — | — | — | — | — | — | — | — | — | — | — | — | — | — | — | (138) | (138) | — | — | ||||||||||||||||||||||||||||||||||||||||||||||||
Net other cash costs4 | (51) | 3 | 3 | — | (55) | (21) | 11 | (12) | (3) | (16) | (1) | — | (34) | (8) | (7) | (6) | (21) | 4 | 4 | 1 | 1 | — | — | ||||||||||||||||||||||||||||||||||||||||||||||||
| Adjusted EBITDA | 1,465 | 300 | 261 | 39 | 1,172 | 1,374 | 537 | 654 | 168 | 16 | 93 | (94) | (202) | (62) | (106) | (72) | (20) | 54 | 4 | 4 | 4 | — | (11) | ||||||||||||||||||||||||||||||||||||||||||||||||
| Amortisation and depreciation | (209) | (92) | (92) | — | (113) | (76) | (31) | (37) | (6) | (1) | (10) | 9 | (37) | (16) | (10) | (4) | — | (6) | (1) | (4) | (4) | — | — | ||||||||||||||||||||||||||||||||||||||||||||||||
| Interest income | 38 | 10 | — | 10 | 28 | 14 | 1 | 7 | 3 | 1 | 1 | 1 | 14 | 1 | 1 | 1 | 1 | 7 | 3 | — | — | — | — | ||||||||||||||||||||||||||||||||||||||||||||||||
| Finance expense | (95) | (29) | (29) | — | (56) | (33) | (173) | (11) | (3) | — | (1) | 155 | (23) | (3) | (3) | (3) | (3) | (3) | (8) | — | — | — | (10) | ||||||||||||||||||||||||||||||||||||||||||||||||
| Share-based payments | (7) | (2) | (2) | — | (5) | (2) | (1) | (1) | — | — | — | — | (3) | (1) | — | — | — | (1) | (1) | — | — | — | — | ||||||||||||||||||||||||||||||||||||||||||||||||
Net other5 | 40 | (6) | (6) | — | 46 | 34 | 7 | (7) | 4 | — | (21) | 51 | 12 | — | 1 | 1 | — | 1 | 9 | — | (1) | 1 | — | ||||||||||||||||||||||||||||||||||||||||||||||||
Non-underlying items6 | (1) | — | — | — | 6 | — | — | — | (1) | — | — | 1 | 6 | — | — | — | — | 1 | 5 | — | — | — | (7) | ||||||||||||||||||||||||||||||||||||||||||||||||
| Royalties and carbon tax | (62) | — | — | — | (62) | (63) | (30) | (32) | — | — | (5) | 4 | 1 | — | — | 1 | — | — | — | — | — | — | — | ||||||||||||||||||||||||||||||||||||||||||||||||
| Profit before tax | 1,169 | 181 | 132 | 49 | 1,016 | 1,248 | 310 | 573 | 165 | 16 | 57 | 127 | (232) | (81) | (117) | (76) | (22) | 53 | 11 | — | (1) | 1 | (28) | ||||||||||||||||||||||||||||||||||||||||||||||||
| Current taxation | (321) | (22) | (299) | (291) | (91) | (147) | (46) | (5) | (11) | 9 | (8) | — | — | — | — | (8) | — | — | — | — | — | ||||||||||||||||||||||||||||||||||||||||||||||||||
| Deferred taxation | (45) | 7 | (52) | (63) | (41) | (22) | (1) | — | (3) | 4 | 11 | 1 | 2 | 2 | — | (3) | 9 | — | — | — | — | ||||||||||||||||||||||||||||||||||||||||||||||||||
| Profit/(loss) for the period | 803 | 166 | 665 | 894 | 178 | 404 | 118 | 11 | 43 | 140 | (229) | (80) | (115) | (74) | (22) | 42 | 20 | — | (1) | 1 | (28) | ||||||||||||||||||||||||||||||||||||||||||||||||||
| Attributable to: | |||||||||||||||||||||||||||||||||||||||||||||||||||||||||||||||||||||||
| Owners of the parent | 782 | 166 | 644 | 894 | 178 | 404 | 118 | 11 | 43 | 140 | (250) | (80) | (115) | (74) | (22) | 21 | 20 | — | (1) | 1 | (28) | ||||||||||||||||||||||||||||||||||||||||||||||||||
| Non-controlling interest holders | 21 | — | 21 | — | — | — | — | — | — | — | 21 | — | — | — | — | 21 | — | — | — | — | — | ||||||||||||||||||||||||||||||||||||||||||||||||||
| Sustaining capital expenditure | (126) | (25) | (25) | — | (99) | (52) | (20) | (25) | (7) | — | (19) | 19 | (47) | (6) | (10) | (4) | — | (27) | — | (2) | (2) | — | — | ||||||||||||||||||||||||||||||||||||||||||||||||
| Ore reserve development | (174) | (83) | (83) | — | (91) | (61) | (20) | (41) | — | — | — | — | (30) | (16) | (12) | (2) | — | — | — | — | — | — | — | ||||||||||||||||||||||||||||||||||||||||||||||||
| Growth projects | (97) | (34) | (34) | — | (52) | (26) | — | (26) | — | — | — | — | (26) | — | (4) | — | — | — | (22) | (11) | — | (11) | — | ||||||||||||||||||||||||||||||||||||||||||||||||
| Total capital expenditure | (397) | (142) | (142) | — | (242) | (139) | (40) | (92) | (7) | — | (19) | 19 | (103) | (22) | (26) | (6) | — | (27) | (22) | (13) | (2) | (11) | — | ||||||||||||||||||||||||||||||||||||||||||||||||
1Corporate and reconciling items represent the items to reconcile segment data to condensed consolidated financial statement totals. This does not represent a separate segment as it does not generate mining revenue. Group corporate includes the Wheaton Stream transaction and corporate transaction costs
2The Battery Metals results for the six months ended 30 June 2022 includes the results of Sandouville for the five months since acquisition (refer note 10.2)
3Corporate and reconciling items for Battery Metals includes Keliber since the effective date of acquisition (refer note 10.1)
4Net other cash costs consist of net other costs as per the condensed consolidated income statement excluding change in estimate of environmental rehabilitation obligation, and right of recovery receivable and payable and non-cash gain on deregistration of subsidiary in the Group (R1 million), and include lease payments (R89 million) to conform with the adjusted EBITDA reconciliation disclosed in note 11.1
5Net other consists of loss on financial instruments, loss on foreign exchange differences, change in estimate of environmental rehabilitation obligation, and right of recovery receivable and payable as detailed in profit or loss and the add back of the lease payment referred to in footnote 4 above. Corporate and reconciling items net other includes the share of results of equity-accounted investees after tax as detailed in profit or loss
6Non-underlying items consists of gain on disposal of property, plant and equipment, impairments, restructuring costs, transaction costs, non-cash gain on deregistration of subsidiary in the Group (R1 million)and occupational healthcare income as detailed in profit or loss
7The average exchange rate for the six months ended 30 June 2022 was R15.40/US$
Sibanye-Stillwater Operating and financial results | Six months ended 30 June 2022 37
Figures are in millions
| For the six months ended 31 Dec 2021 (Unaudited) | ||||||||||||||||||||||||||||||||||||||||||||||||||||||||||||||
| GROUP | US PGM OPERATIONS | SA OPERATIONS | GROUP | |||||||||||||||||||||||||||||||||||||||||||||||||||||||||||
| SA rand | Total | Total US PGM | Underground | Recycling | Total SA Operations | Total SA PGM | Rusten- burg | Marikana | Kroondal | Platinum Mile | Mimosa | Corporate and re- conciling items1 | Total SA gold | Drie- fontein | Kloof | Beatrix | Cooke | DRD- GOLD | Corporate and re- conciling items1 | Cor- porate1 | ||||||||||||||||||||||||||||||||||||||||||
| Revenue | 82,241 | 29,918 | 8,622 | 21,296 | 52,463 | 37,412 | 13,740 | 19,251 | 3,679 | 743 | 1,674 | (1,675) | 15,051 | 4,254 | 4,772 | 3,048 | 479 | 2,498 | — | (140) | ||||||||||||||||||||||||||||||||||||||||||
| Underground | 55,248 | 8,622 | 8,622 | — | 46,766 | 35,476 | 12,547 | 19,251 | 3,679 | — | 1,674 | (1,675) | 11,290 | 4,056 | 4,293 | 2,941 | — | — | — | (140) | ||||||||||||||||||||||||||||||||||||||||||
| Surface | 5,697 | — | — | — | 5,697 | 1,936 | 1,193 | — | — | 743 | — | — | 3,761 | 198 | 479 | 107 | 479 | 2,498 | — | — | ||||||||||||||||||||||||||||||||||||||||||
| Recycling | 21,296 | 21,296 | — | 21,296 | — | — | — | — | — | — | — | — | — | — | — | — | — | — | — | — | ||||||||||||||||||||||||||||||||||||||||||
| Cost of sales, before amortisation and depreciation | (52,860) | (24,755) | (4,216) | (20,539) | (28,105) | (16,367) | (5,952) | (8,328) | (1,785) | (303) | (813) | 814 | (11,738) | (3,056) | (3,961) | (2,561) | (408) | (1,752) | — | — | ||||||||||||||||||||||||||||||||||||||||||
| Underground | (28,802) | (4,216) | (4,216) | — | (24,586) | (15,539) | (5,427) | (8,328) | (1,785) | — | (813) | 814 | (9,047) | (2,932) | (3,623) | (2,492) | — | — | — | — | ||||||||||||||||||||||||||||||||||||||||||
| Surface | (3,519) | — | — | — | (3,519) | (828) | (525) | — | — | (303) | — | — | (2,691) | (124) | (338) | (69) | (408) | (1,752) | — | — | ||||||||||||||||||||||||||||||||||||||||||
| Recycling | (20,539) | (20,539) | — | (20,539) | — | — | — | — | — | — | — | — | — | — | — | — | — | — | — | — | ||||||||||||||||||||||||||||||||||||||||||
Net other cash costs2 | (1,324) | 2 | 2 | — | (1,326) | (775) | 108 | (554) | (48) | (243) | (21) | (17) | (551) | (49) | (47) | (38) | (312) | (24) | (81) | — | ||||||||||||||||||||||||||||||||||||||||||
| Adjusted EBITDA | 28,057 | 5,165 | 4,408 | 757 | 23,032 | 20,270 | 7,896 | 10,369 | 1,846 | 197 | 840 | (878) | 2,762 | 1,149 | 764 | 449 | (241) | 722 | (81) | (140) | ||||||||||||||||||||||||||||||||||||||||||
| Amortisation and depreciation | (4,495) | (1,429) | (1,427) | (2) | (3,066) | (1,353) | (462) | (595) | (275) | (18) | (142) | 139 | (1,713) | (672) | (545) | (368) | (6) | (98) | (24) | — | ||||||||||||||||||||||||||||||||||||||||||
| Interest income | 578 | 163 | 9 | 154 | 400 | 112 | 11 | 53 | 45 | 3 | 8 | (8) | 288 | 35 | 25 | 17 | 7 | 109 | 95 | 15 | ||||||||||||||||||||||||||||||||||||||||||
| Finance expense | (1,235) | (463) | (453) | (10) | (621) | (350) | (2,217) | (192) | (62) | — | (3) | 2,124 | (271) | (51) | (44) | (41) | (34) | (30) | (71) | (151) | ||||||||||||||||||||||||||||||||||||||||||
| Share-based payments | (85) | (8) | (8) | — | (77) | (10) | (4) | (5) | (1) | — | — | — | (67) | (4) | (5) | (5) | — | (10) | (43) | — | ||||||||||||||||||||||||||||||||||||||||||
Net other3 | (3,092) | 556 | 556 | — | (3,699) | (4,958) | (12,246) | (618) | 353 | 46 | (41) | 7,548 | 1,259 | 7 | 8 | 16 | 86 | 17 | 1,125 | 51 | ||||||||||||||||||||||||||||||||||||||||||
Non-underlying items4 | (5,481) | (230) | (230) | — | (5,171) | 4 | 1 | 2 | (1) | — | — | 2 | (5,175) | (210) | (3,680) | (1,286) | (1) | — | 2 | (80) | ||||||||||||||||||||||||||||||||||||||||||
| Royalties and carbon tax | (1,073) | — | — | — | (1,073) | (975) | (512) | (458) | (6) | — | (65) | 66 | (98) | (50) | (23) | (17) | (2) | — | (6) | — | ||||||||||||||||||||||||||||||||||||||||||
| Profit before tax | 13,174 | 3,754 | 2,855 | 899 | 9,725 | 12,740 | (7,533) | 8,556 | 1,899 | 228 | 597 | 8,993 | (3,015) | 204 | (3,500) | (1,235) | (191) | 710 | 997 | (305) | ||||||||||||||||||||||||||||||||||||||||||
| Current taxation | (5,675) | (582) | (5,084) | (4,937) | (1,748) | (2,497) | (558) | (124) | (157) | 147 | (147) | (6) | (7) | (3) | — | (141) | 10 | (9) | ||||||||||||||||||||||||||||||||||||||||||||
| Deferred taxation | 978 | (150) | 1,128 | 957 | 989 | (115) | 22 | 59 | (9) | 11 | 171 | 142 | 1,163 | 221 | — | (44) | (1,311) | — | ||||||||||||||||||||||||||||||||||||||||||||
| Profit/(loss) for the year | 8,477 | 3,022 | 5,769 | 8,760 | (8,292) | 5,944 | 1,363 | 163 | 431 | 9,151 | (2,991) | 340 | (2,344) | (1,017) | (191) | 525 | (304) | (314) | ||||||||||||||||||||||||||||||||||||||||||||
| Attributable to: | ||||||||||||||||||||||||||||||||||||||||||||||||||||||||||||||
| Owners of the parent | 8,218 | 3,022 | 5,510 | 8,760 | (8,292) | 5,944 | 1,363 | 163 | 431 | 9,151 | (3,250) | 340 | (2,344) | (1,017) | (191) | 266 | (304) | (314) | ||||||||||||||||||||||||||||||||||||||||||||
| Non-controlling interest holders | 259 | — | 259 | — | — | — | — | — | — | — | 259 | — | — | — | — | 259 | — | — | ||||||||||||||||||||||||||||||||||||||||||||
| Sustaining capital expenditure | (2,469) | (294) | (290) | (4) | (2,175) | (1,352) | (387) | (787) | (164) | (14) | (299) | 299 | (823) | (213) | (352) | (113) | — | (145) | — | — | ||||||||||||||||||||||||||||||||||||||||||
| Ore reserve development | (2,954) | (772) | (772) | — | (2,182) | (832) | (315) | (516) | — | — | — | (1) | (1,350) | (614) | (489) | (247) | — | — | — | — | ||||||||||||||||||||||||||||||||||||||||||
| Growth projects | (1,731) | (1,194) | (1,194) | — | (537) | (197) | — | (197) | — | — | — | — | (340) | — | (107) | (7) | — | (38) | (188) | — | ||||||||||||||||||||||||||||||||||||||||||
| Total capital expenditure | (7,154) | (2,260) | (2,256) | (4) | (4,894) | (2,381) | (702) | (1,500) | (164) | (14) | (299) | 298 | (2,513) | (827) | (948) | (367) | — | (183) | (188) | — | ||||||||||||||||||||||||||||||||||||||||||
Sibanye-Stillwater Operating and financial results | Six months ended 30 June 2022 38
| For the six months ended 31 Dec 2021 (Unaudited) | ||||||||||||||||||||||||||||||||||||||||||||||||||||||||||||||
| GROUP | US PGM OPERATIONS | SA OPERATIONS | GROUP | |||||||||||||||||||||||||||||||||||||||||||||||||||||||||||
US dollars5 | Total | Total US PGM | Underground | Recycling | Total SA Operations | Total SA PGM | Rusten- burg | Marikana | Kroondal | Platinum Mile | Mimosa | Corporate and re- conciling items1 | Total SA gold | Drie- fontein | Kloof | Beatrix | Cooke | DRD- GOLD | Corporate and re- conciling items1 | Cor- porate1 | ||||||||||||||||||||||||||||||||||||||||||
| Revenue | 5,461 | 1,991 | 572 | 1,419 | 3,479 | 2,476 | 910 | 1,276 | 241 | 50 | 110 | (111) | 1,003 | 283 | 317 | 205 | 32 | 166 | — | (9) | ||||||||||||||||||||||||||||||||||||||||||
| Underground | 3,662 | 572 | 572 | — | 3,099 | 2,346 | 830 | 1,276 | 241 | — | 110 | (111) | 753 | 270 | 286 | 197 | — | — | — | (9) | ||||||||||||||||||||||||||||||||||||||||||
| Surface | 380 | — | — | — | 380 | 130 | 80 | — | — | 50 | — | — | 250 | 13 | 31 | 8 | 32 | 166 | — | — | ||||||||||||||||||||||||||||||||||||||||||
| Recycling | 1,419 | 1,419 | — | 1,419 | — | — | — | — | — | — | — | — | — | — | — | — | — | — | — | — | ||||||||||||||||||||||||||||||||||||||||||
| Cost of sales, before amortisation and depreciation | (3,521) | (1,650) | (282) | (1,368) | (1,871) | (1,089) | (397) | (553) | (119) | (20) | (54) | 54 | (782) | (203) | (263) | (172) | (28) | (116) | — | — | ||||||||||||||||||||||||||||||||||||||||||
| Underground | (1,919) | (282) | (282) | — | (1,637) | (1,034) | (362) | (553) | (119) | — | (54) | 54 | (603) | (195) | (241) | (167) | — | — | — | — | ||||||||||||||||||||||||||||||||||||||||||
| Surface | (234) | — | — | — | (234) | (55) | (35) | — | — | (20) | — | — | (179) | (8) | (22) | (5) | (28) | (116) | — | — | ||||||||||||||||||||||||||||||||||||||||||
| Recycling | (1,368) | (1,368) | — | (1,368) | — | — | — | — | — | — | — | — | — | — | — | — | — | — | — | — | ||||||||||||||||||||||||||||||||||||||||||
Net other cash costs2 | (88) | — | — | — | (88) | (51) | 7 | (37) | (3) | (16) | (1) | (1) | (37) | (3) | (4) | (3) | (20) | (2) | (5) | — | ||||||||||||||||||||||||||||||||||||||||||
| Adjusted EBITDA | 1,852 | 341 | 290 | 51 | 1,520 | 1,336 | 520 | 686 | 119 | 14 | 55 | (58) | 184 | 77 | 50 | 30 | (16) | 48 | (5) | (9) | ||||||||||||||||||||||||||||||||||||||||||
| Amortisation and depreciation | (300) | (96) | (96) | — | (204) | (88) | (31) | (39) | (18) | (1) | (10) | 11 | (116) | (45) | (36) | (25) | (1) | (7) | (2) | — | ||||||||||||||||||||||||||||||||||||||||||
| Interest income | 38 | 11 | 1 | 10 | 26 | 8 | — | 3 | 3 | — | 1 | 1 | 18 | 2 | 1 | 1 | — | 7 | 7 | 1 | ||||||||||||||||||||||||||||||||||||||||||
| Finance expense | (82) | (31) | (30) | (1) | (41) | (22) | (148) | (13) | (4) | — | — | 143 | (19) | (4) | (3) | (3) | (2) | (2) | (5) | (10) | ||||||||||||||||||||||||||||||||||||||||||
| Share-based payments | (6) | (1) | (1) | — | (5) | (2) | — | — | — | — | — | (2) | (3) | — | — | — | — | — | (3) | — | ||||||||||||||||||||||||||||||||||||||||||
Net other3 | (208) | 38 | 38 | — | (249) | (335) | (828) | (42) | 24 | 3 | (3) | 511 | 86 | — | — | 1 | 6 | 1 | 78 | 3 | ||||||||||||||||||||||||||||||||||||||||||
Non-underlying items4 | (372) | (16) | (16) | — | (350) | — | — | — | — | — | — | — | (350) | (15) | (249) | (87) | — | — | 1 | (6) | ||||||||||||||||||||||||||||||||||||||||||
| Royalties and carbon tax | (71) | — | — | — | (71) | (65) | (34) | (30) | — | — | (4) | 3 | (6) | (3) | (1) | (1) | — | — | (1) | — | ||||||||||||||||||||||||||||||||||||||||||
| Profit before tax | 851 | 246 | 186 | 60 | 626 | 832 | (521) | 565 | 124 | 16 | 39 | 609 | (206) | 12 | (238) | (84) | (13) | 47 | 70 | (21) | ||||||||||||||||||||||||||||||||||||||||||
| Current taxation | (375) | (38) | (336) | (325) | (115) | (166) | (36) | (9) | (10) | 11 | (11) | (1) | (1) | — | — | (10) | 1 | (1) | ||||||||||||||||||||||||||||||||||||||||||||
| Deferred taxation | 68 | (10) | 78 | 68 | 67 | (7) | 2 | 4 | — | 2 | 10 | 9 | 78 | 15 | — | (3) | (89) | — | ||||||||||||||||||||||||||||||||||||||||||||
| Profit/(loss) for the year | 544 | 198 | 368 | 575 | (569) | 392 | 90 | 11 | 29 | 622 | (207) | 20 | (161) | (69) | (13) | 34 | (18) | (22) | ||||||||||||||||||||||||||||||||||||||||||||
| Attributable to: | ||||||||||||||||||||||||||||||||||||||||||||||||||||||||||||||
| Owners of the parent | 527 | 198 | 351 | 576 | (569) | 392 | 90 | 13 | 29 | 621 | (225) | 20 | (161) | (69) | (13) | 16 | (18) | (22) | ||||||||||||||||||||||||||||||||||||||||||||
| Non-controlling interest holders | 17 | — | 17 | (1) | — | — | — | (2) | — | 1 | 18 | — | — | — | — | 18 | — | — | ||||||||||||||||||||||||||||||||||||||||||||
| Sustaining capital expenditure | (165) | (19) | (19) | — | (146) | (91) | (26) | (53) | (11) | (1) | (20) | 20 | (55) | (15) | (24) | (7) | — | (9) | — | — | ||||||||||||||||||||||||||||||||||||||||||
| Ore reserve development | (198) | (52) | (52) | — | (146) | (55) | (21) | (34) | — | — | — | — | (91) | (41) | (33) | (17) | — | — | — | — | ||||||||||||||||||||||||||||||||||||||||||
| Growth projects | (115) | (79) | (79) | — | (36) | (14) | — | (14) | — | — | — | — | (22) | — | (7) | — | — | (2) | (13) | — | ||||||||||||||||||||||||||||||||||||||||||
| Total capital expenditure | (478) | (150) | (150) | — | (328) | (160) | (47) | (101) | (11) | (1) | (20) | 20 | (168) | (56) | (64) | (24) | — | (11) | (13) | — | ||||||||||||||||||||||||||||||||||||||||||
1Corporate and reconciling items represent the items to reconcile segment data to condensed consolidated financial statement totals. This does not represent a separate segment as it does not generate mining revenue. Group corporate includes the Wheaton Stream transaction, initial recognition of battery metal investment, corporate taxation, interest and corporate transaction costs
2Net other cash costs consist of net other costs as per the condensed consolidated income statement excluding change in estimate of environmental rehabilitation obligation, and right of recovery receivable and payable, profit on sale of St Helena (R16 million), non-cash loss due to dilution of interest in joint operation (R2 million), and include lease payments (R71 million) to conform with the adjusted EBITDA reconciliation disclosed in note 11.1
3Net other consists of gain on financial instruments, loss on foreign exchange differences, change in estimate of environmental rehabilitation obligation, and right of recovery receivable and payable as detailed in profit or loss and the add back of the lease payment referred to in footnote 2 above. Corporate and reconciling items net other includes the share of results of equity-accounted investees after tax as detailed in profit or loss
4Non-underlying items consists of gain on disposal of property, plant and equipment, impairments which include impairment to mining assets of Driefontein, Kloof and Beatrix of R212 million, R3,642 million and R1,293 million, respectively, restructuring costs, transaction costs, early redemption premium on the 2025 Notes, non-cash loss with dilution of interest in joint operation (R2 million), profit on sale of St Helena (R16 million) and occupational healthcare expense as detailed in profit or loss
5The average exchange rate for the six months ended 31 December 2021 was R15.03/US$
Sibanye-Stillwater Operating and financial results | Six months ended 30 June 2022 39
Figures are in millions
| For the six months ended 30 Jun 2021 (Unaudited) | ||||||||||||||||||||||||||||||||||||||||||||||||||||||||||||||
| GROUP | US PGM OPERATIONS | SA OPERATIONS | GROUP | |||||||||||||||||||||||||||||||||||||||||||||||||||||||||||
| SA rand | Total | Total US PGM | Underground | Recycling | Total SA Operations | Total SA PGM | Rusten- burg | Marikana | Kroondal | Platinum Mile | Mimosa | Corporate and re- conciling items1 | Total SA gold | Drie- fontein | Kloof | Beatrix | Cooke | DRD- GOLD | Corporate and re- conciling items1 | Cor- porate1 | ||||||||||||||||||||||||||||||||||||||||||
| Revenue | 89,953 | 29,135 | 9,721 | 19,414 | 61,049 | 47,742 | 18,009 | 22,359 | 6,614 | 760 | 2,719 | (2,719) | 13,307 | 3,678 | 4,522 | 2,295 | 520 | 2,292 | — | (231) | ||||||||||||||||||||||||||||||||||||||||||
| Underground | 65,155 | 9,721 | 9,721 | — | 55,665 | 46,001 | 17,028 | 22,359 | 6,614 | — | 2,719 | (2,719) | 9,664 | 3,666 | 3,796 | 2,202 | — | — | — | (231) | ||||||||||||||||||||||||||||||||||||||||||
| Surface | 5,384 | — | — | — | 5,384 | 1,741 | 981 | — | — | 760 | — | — | 3,643 | 12 | 726 | 93 | 520 | 2,292 | — | — | ||||||||||||||||||||||||||||||||||||||||||
| Recycling | 19,414 | 19,414 | — | 19,414 | — | — | — | — | — | — | — | — | — | — | — | — | — | — | — | — | ||||||||||||||||||||||||||||||||||||||||||
| Cost of sales, before amortisation and depreciation | (48,153) | (22,032) | (3,351) | (18,681) | (26,121) | (15,604) | (5,512) | (8,233) | (1,631) | (228) | (774) | 774 | (10,517) | (2,635) | (3,883) | (2,004) | (400) | (1,595) | — | — | ||||||||||||||||||||||||||||||||||||||||||
| Underground | (26,187) | (3,351) | (3,351) | — | (22,836) | (14,891) | (5,027) | (8,233) | (1,631) | — | (774) | 774 | (7,945) | (2,627) | (3,363) | (1,955) | — | — | — | — | ||||||||||||||||||||||||||||||||||||||||||
| Surface | (3,285) | — | — | — | (3,285) | (713) | (485) | — | — | (228) | — | — | (2,572) | (8) | (520) | (49) | (400) | (1,595) | — | — | ||||||||||||||||||||||||||||||||||||||||||
| Recycling | (18,681) | (18,681) | — | (18,681) | — | — | — | — | — | — | — | — | — | — | — | — | — | — | — | — | ||||||||||||||||||||||||||||||||||||||||||
Net other cash costs2 | (1,251) | (12) | (12) | — | (1,239) | (800) | 26 | (482) | (43) | (249) | (21) | (31) | (439) | (29) | (36) | (35) | (299) | (16) | (24) | — | ||||||||||||||||||||||||||||||||||||||||||
| Adjusted EBITDA | 40,549 | 7,091 | 6,358 | 733 | 33,689 | 31,338 | 12,523 | 13,644 | 4,940 | 283 | 1,924 | (1,976) | 2,351 | 1,014 | 603 | 256 | (179) | 681 | (24) | (231) | ||||||||||||||||||||||||||||||||||||||||||
| Amortisation and depreciation | (3,798) | (1,172) | (1,171) | (1) | (2,626) | (1,162) | (423) | (504) | (220) | (13) | (132) | 130 | (1,464) | (493) | (519) | (323) | (5) | (90) | (34) | — | ||||||||||||||||||||||||||||||||||||||||||
| Interest income | 624 | 219 | 1 | 218 | 405 | 107 | 11 | 39 | 52 | 4 | 4 | (3) | 298 | 25 | 22 | 14 | 15 | 113 | 109 | — | ||||||||||||||||||||||||||||||||||||||||||
| Finance expense | (1,261) | (491) | (444) | (47) | (612) | (316) | (1,984) | (136) | (54) | — | (2) | 1,860 | (296) | (48) | (41) | (41) | (29) | (30) | (107) | (158) | ||||||||||||||||||||||||||||||||||||||||||
| Share-based payments | (298) | (65) | (65) | — | (233) | (79) | (31) | (37) | (11) | — | — | — | (154) | (16) | (27) | (16) | — | (9) | (86) | — | ||||||||||||||||||||||||||||||||||||||||||
Net other3 | 260 | (318) | (318) | — | 578 | 653 | 14 | (367) | (105) | (12) | (2) | 1,125 | (75) | 9 | 14 | 17 | 6 | 5 | (126) | — | ||||||||||||||||||||||||||||||||||||||||||
Non-underlying items4 | (48) | (48) | (48) | — | 18 | (2) | 3 | (3) | — | — | — | (2) | 20 | 8 | (6) | (4) | (2) | — | 24 | (18) | ||||||||||||||||||||||||||||||||||||||||||
| Royalties and carbon tax | (1,645) | — | — | — | (1,645) | (1,573) | (893) | (671) | (8) | — | (95) | 94 | (72) | (45) | (23) | (12) | (3) | — | 11 | — | ||||||||||||||||||||||||||||||||||||||||||
| Profit before tax | 34,383 | 5,216 | 4,313 | 903 | 29,574 | 28,966 | 9,220 | 11,965 | 4,594 | 262 | 1,697 | 1,228 | 608 | 454 | 23 | (109) | (197) | 670 | (233) | (407) | ||||||||||||||||||||||||||||||||||||||||||
| Current taxation | (7,831) | (840) | (6,930) | (6,808) | (3,116) | (2,271) | (1,327) | (94) | (417) | 417 | (122) | (7) | (6) | (4) | — | (122) | 17 | (61) | ||||||||||||||||||||||||||||||||||||||||||||
| Deferred taxation | (1,233) | 61 | (1,294) | (1,324) | (33) | (1,345) | 34 | 21 | (9) | 8 | 30 | (93) | (5) | 12 | — | (33) | 149 | — | ||||||||||||||||||||||||||||||||||||||||||||
| Profit/(loss) for the year | 25,319 | 4,437 | 21,350 | 20,834 | 6,071 | 8,349 | 3,301 | 189 | 1,271 | 1,653 | 516 | 354 | 12 | (101) | (197) | 515 | (67) | (468) | ||||||||||||||||||||||||||||||||||||||||||||
| Attributable to: | ||||||||||||||||||||||||||||||||||||||||||||||||||||||||||||||
| Owners of the parent | 24,836 | 4,437 | 20,867 | 20,600 | 6,071 | 8,131 | 3,301 | 173 | 1,271 | 1,653 | 267 | 354 | 12 | (101) | (197) | 261 | (62) | (468) | ||||||||||||||||||||||||||||||||||||||||||||
| Non-controlling interest holders | 483 | — | 483 | 234 | — | 218 | — | 16 | — | — | 249 | — | — | — | — | 254 | (5) | — | ||||||||||||||||||||||||||||||||||||||||||||
| Sustaining capital expenditure | (1,650) | (502) | (501) | (1) | (1,148) | (667) | (232) | (317) | (104) | (14) | (200) | 200 | (481) | (109) | (136) | (51) | — | (185) | — | — | ||||||||||||||||||||||||||||||||||||||||||
| Ore reserve development | (2,581) | (582) | (582) | — | (1,999) | (745) | (314) | (431) | — | — | — | — | (1,254) | (563) | (441) | (250) | — | — | — | — | ||||||||||||||||||||||||||||||||||||||||||
| Growth projects | (1,355) | (1,217) | (1,217) | — | (138) | (6) | — | (6) | — | — | — | — | (132) | — | (91) | — | — | (9) | (32) | — | ||||||||||||||||||||||||||||||||||||||||||
| Total capital expenditure | (5,586) | (2,301) | (2,300) | (1) | (3,285) | (1,418) | (546) | (754) | (104) | (14) | (200) | 200 | (1,867) | (672) | (668) | (301) | — | (194) | (32) | — | ||||||||||||||||||||||||||||||||||||||||||
Sibanye-Stillwater Operating and financial results | Six months ended 30 June 2022 40
| For the six months ended 30 Jun 2021 (Unaudited) | ||||||||||||||||||||||||||||||||||||||||||||||||||||||||||||||
| GROUP | US PGM OPERATIONS | SA OPERATIONS | GROUP | |||||||||||||||||||||||||||||||||||||||||||||||||||||||||||
US dollars5 | Total | Total US PGM | Underground | Recycling | Total SA Operations | Total SA PGM | Rusten- burg | Marikana | Kroondal | Platinum Mile | Mimosa | Corporate and re- conciling items1 | Total SA gold | Drie- fontein | Kloof | Beatrix | Cooke | DRD- GOLD | Corporate and re- conciling items1 | Cor- porate1 | ||||||||||||||||||||||||||||||||||||||||||
| Revenue | 6,182 | 2,002 | 668 | 1,334 | 4,196 | 3,281 | 1,237 | 1,537 | 455 | 52 | 187 | (187) | 915 | 253 | 311 | 157 | 36 | 158 | — | (16) | ||||||||||||||||||||||||||||||||||||||||||
| Underground | 4,478 | 668 | 668 | — | 3,826 | 3,162 | 1,170 | 1,537 | 455 | — | 187 | (187) | 664 | 252 | 261 | 151 | — | — | — | (16) | ||||||||||||||||||||||||||||||||||||||||||
| Surface | 370 | — | — | — | 370 | 119 | 67 | — | — | 52 | — | — | 251 | 1 | 50 | 6 | 36 | 158 | — | — | ||||||||||||||||||||||||||||||||||||||||||
| Recycling | 1,334 | 1,334 | — | 1,334 | — | — | — | — | — | — | — | — | — | — | — | — | — | — | — | — | ||||||||||||||||||||||||||||||||||||||||||
| Cost of sales, before amortisation and depreciation | (3,309) | (1,514) | (230) | (1,284) | (1,795) | (1,072) | (378) | (566) | (112) | (16) | (53) | 53 | (723) | (182) | (267) | (137) | (27) | (110) | — | — | ||||||||||||||||||||||||||||||||||||||||||
| Underground | (1,799) | (230) | (230) | — | (1,569) | (1,023) | (345) | (566) | (112) | — | (53) | 53 | (546) | (181) | (231) | (134) | — | — | — | — | ||||||||||||||||||||||||||||||||||||||||||
| Surface | (226) | — | — | — | (226) | (49) | (33) | — | — | (16) | — | — | (177) | (1) | (36) | (3) | (27) | (110) | — | — | ||||||||||||||||||||||||||||||||||||||||||
| Recycling | (1,284) | (1,284) | — | (1,284) | — | — | — | — | — | — | — | — | — | — | — | — | — | — | — | — | ||||||||||||||||||||||||||||||||||||||||||
Net other cash costs2 | (86) | (1) | (1) | — | (85) | (55) | 2 | (33) | (3) | (17) | (2) | (2) | (30) | (2) | (2) | (2) | (21) | (1) | (2) | — | ||||||||||||||||||||||||||||||||||||||||||
| Adjusted EBITDA | 2,787 | 487 | 437 | 50 | 2,316 | 2,154 | 861 | 938 | 340 | 19 | 132 | (136) | 162 | 69 | 42 | 18 | (12) | 47 | (2) | (16) | ||||||||||||||||||||||||||||||||||||||||||
| Amortisation and depreciation | (261) | (80) | (80) | — | (181) | (81) | (29) | (35) | (15) | (1) | (9) | 8 | (100) | (34) | (36) | (22) | — | (6) | (2) | — | ||||||||||||||||||||||||||||||||||||||||||
| Interest income | 43 | 15 | — | 15 | 28 | 7 | 1 | 3 | 4 | — | — | (1) | 21 | 2 | 2 | 1 | 1 | 8 | 7 | — | ||||||||||||||||||||||||||||||||||||||||||
| Finance expense | (87) | (34) | (31) | (3) | (42) | (22) | (136) | (9) | (4) | — | — | 127 | (20) | (3) | (3) | (3) | (2) | (2) | (7) | (11) | ||||||||||||||||||||||||||||||||||||||||||
| Share-based payments | (20) | (4) | (4) | — | (16) | (5) | (2) | (3) | (1) | — | — | 1 | (11) | (1) | (2) | (1) | — | (1) | (6) | — | ||||||||||||||||||||||||||||||||||||||||||
Net other3 | 16 | (22) | (22) | — | 38 | 45 | 1 | (25) | (7) | (1) | — | 77 | (7) | 1 | 1 | 1 | — | — | (10) | — | ||||||||||||||||||||||||||||||||||||||||||
Non-underlying items4 | (2) | (3) | (3) | — | 2 | — | — | — | — | — | — | — | 2 | 1 | — | — | — | — | 1 | (1) | ||||||||||||||||||||||||||||||||||||||||||
| Royalties and carbon tax | (113) | — | — | — | (113) | (108) | (61) | (46) | (1) | — | (7) | 7 | (5) | (3) | (2) | (1) | — | — | 1 | — | ||||||||||||||||||||||||||||||||||||||||||
| Profit before tax | 2,363 | 359 | 297 | 62 | 2,032 | 1,990 | 635 | 823 | 316 | 17 | 116 | 83 | 42 | 32 | 2 | (7) | (13) | 46 | (18) | (28) | ||||||||||||||||||||||||||||||||||||||||||
| Current taxation | (538) | (58) | (476) | (469) | (214) | (156) | (91) | (6) | (29) | 27 | (7) | — | — | — | — | (8) | 1 | (4) | ||||||||||||||||||||||||||||||||||||||||||||
| Deferred taxation | (85) | 4 | (89) | (92) | (2) | (92) | 2 | 1 | (1) | — | 3 | (6) | — | 1 | — | (2) | 10 | — | ||||||||||||||||||||||||||||||||||||||||||||
| Profit/(loss) for the year | 1,740 | 305 | 1,467 | 1,429 | 419 | 575 | 227 | 12 | 86 | 110 | 38 | 26 | 2 | (6) | (13) | 36 | (7) | (32) | ||||||||||||||||||||||||||||||||||||||||||||
| Attributable to: | ||||||||||||||||||||||||||||||||||||||||||||||||||||||||||||||
| Owners of the parent | 1,707 | 305 | 1,434 | 1,413 | 419 | 560 | 227 | 10 | 86 | 111 | 21 | 26 | 2 | (6) | (13) | 19 | (7) | (32) | ||||||||||||||||||||||||||||||||||||||||||||
| Non-controlling interest holders | 33 | — | 33 | 16 | — | 15 | — | 2 | — | (1) | 17 | — | — | — | — | 17 | — | — | ||||||||||||||||||||||||||||||||||||||||||||
| Sustaining capital expenditure | (113) | (34) | (34) | — | (79) | (46) | (16) | (22) | (7) | (1) | (14) | 14 | (33) | (7) | (9) | (4) | — | (13) | — | — | ||||||||||||||||||||||||||||||||||||||||||
| Ore reserve development | (178) | (40) | (40) | — | (138) | (52) | (22) | (30) | — | — | — | — | (86) | (39) | (30) | (17) | — | — | — | — | ||||||||||||||||||||||||||||||||||||||||||
| Growth projects | (93) | (84) | (84) | — | (9) | — | — | — | — | — | — | — | (9) | — | (6) | — | — | (1) | (2) | — | ||||||||||||||||||||||||||||||||||||||||||
| Total capital expenditure | (384) | (158) | (158) | — | (226) | (98) | (38) | (52) | (7) | (1) | (14) | 14 | (128) | (46) | (45) | (21) | — | (14) | (2) | — | ||||||||||||||||||||||||||||||||||||||||||
1Corporate and reconciling items represent the items to reconcile segment data to condensed consolidated financial statement totals. This does not represent a separate segment as it does not generate mining revenue. Group corporate includes the Wheaton Stream transaction and corporate transaction costs
2Net other cash costs consist of net other costs as per the condensed consolidated income statement excluding change in estimate of environmental rehabilitation obligation, and right of recovery receivable and payable and non-cash loss due to dilution of interest in joint operation (R2 million), and include lease payments (R71 million) to conform with the adjusted EBITDA reconciliation disclosed in note 11.1
3Net other consists of loss on financial instruments, loss on foreign exchange differences, change in estimate of environmental rehabilitation obligation, and right of recovery receivable and payable as detailed in profit or loss and the add back of the lease payment referred to in footnote 2 above. Corporate and reconciling items net other includes the share of results of equity-accounted investees after tax as detailed in profit or loss
4Non-underlying items consists of gain on disposal of property, plant and equipment, impairments, restructuring costs, transaction costs, non-cash loss with dilution of interest in joint operation (R2 million) and occupational healthcare gain as detailed in profit or loss
5The average exchange rate for the six months ended 30 June 2021 was R14.55/US$
Sibanye-Stillwater Operating and financial results | Six months ended 30 June 2022 41
ALL-IN COSTS - SIX MONTHS
US and SA PGM operations
Figures are in millions unless otherwise stated
| US OPERA-TIONS | SA OPERATIONS | ||||||||||||||||||||||||||||||||||
| R' million | Total US and SA PGM1 | Total US PGM2 | Total SA PGM1 | Rustenburg | Marikana1 | Kroondal | Plat Mile | Mimosa | Corporate | ||||||||||||||||||||||||||
Cost of sales, before amortisation and depreciation3 | Jun 2022 | 20,623 | 3,842 | 16,781 | 6,659 | 8,073 | 1,774 | 275 | 890 | (890) | |||||||||||||||||||||||||
| Dec 2021 | 20,583 | 4,216 | 16,367 | 5,952 | 8,328 | 1,785 | 302 | 813 | (813) | ||||||||||||||||||||||||||
| Jun 2021 | 18,955 | 3,351 | 15,604 | 5,512 | 8,233 | 1,631 | 228 | 774 | (774) | ||||||||||||||||||||||||||
| Royalties | Jun 2022 | 953 | — | 953 | 458 | 488 | 7 | — | 70 | (70) | |||||||||||||||||||||||||
| Dec 2021 | 975 | — | 975 | 512 | 458 | 5 | — | 65 | (65) | ||||||||||||||||||||||||||
| Jun 2021 | 1,571 | — | 1,571 | 893 | 670 | 8 | — | 95 | (95) | ||||||||||||||||||||||||||
| Carbon tax | Jun 2022 | — | — | — | (1) | 1 | — | — | — | — | |||||||||||||||||||||||||
| Dec 2021 | — | — | — | — | — | — | — | — | — | ||||||||||||||||||||||||||
| Jun 2021 | 1 | — | 1 | — | 1 | — | — | — | — | ||||||||||||||||||||||||||
| Community costs | Jun 2022 | 95 | — | 95 | — | 95 | — | — | — | — | |||||||||||||||||||||||||
| Dec 2021 | 87 | — | 87 | 6 | 81 | — | — | — | — | ||||||||||||||||||||||||||
| Jun 2021 | 74 | — | 74 | 6 | 68 | — | — | — | — | ||||||||||||||||||||||||||
| Inventory change | Jun 2022 | (385) | (34) | (351) | (245) | (106) | — | — | (17) | 17 | |||||||||||||||||||||||||
| Dec 2021 | 98 | (446) | 544 | 573 | (29) | — | — | 20 | (20) | ||||||||||||||||||||||||||
| Jun 2021 | 1,229 | 479 | 750 | 243 | 507 | — | — | (11) | 11 | ||||||||||||||||||||||||||
Share-based payments4 | Jun 2022 | 182 | 81 | 101 | 37 | 45 | 17 | 1 | — | — | |||||||||||||||||||||||||
| Dec 2021 | 97 | 40 | 57 | 23 | 27 | 7 | — | — | — | ||||||||||||||||||||||||||
| Jun 2021 | 103 | 46 | 57 | 22 | 27 | 8 | — | — | — | ||||||||||||||||||||||||||
Rehabilitation interest and amortisation5 | Jun 2022 | 105 | 24 | 81 | 2 | 40 | 39 | — | 12 | (12) | |||||||||||||||||||||||||
| Dec 2021 | 143 | 16 | 127 | — | 81 | 46 | — | 2 | (2) | ||||||||||||||||||||||||||
| Jun 2021 | 131 | 15 | 116 | (1) | 81 | 36 | — | 2 | (2) | ||||||||||||||||||||||||||
| Leases | Jun 2022 | 32 | 3 | 29 | 6 | 19 | 4 | — | — | — | |||||||||||||||||||||||||
| Dec 2021 | 29 | 1 | 28 | 5 | 19 | 4 | — | — | — | ||||||||||||||||||||||||||
| Jun 2021 | 27 | 1 | 26 | 6 | 16 | 4 | — | — | — | ||||||||||||||||||||||||||
| Ore reserve development | Jun 2022 | 2,216 | 1,277 | 939 | 315 | 624 | — | — | — | — | |||||||||||||||||||||||||
| Dec 2021 | 1,603 | 772 | 831 | 315 | 516 | — | — | — | — | ||||||||||||||||||||||||||
| Jun 2021 | 1,327 | 582 | 745 | 314 | 431 | — | — | — | — | ||||||||||||||||||||||||||
| Sustaining capital expenditure | Jun 2022 | 1,195 | 378 | 817 | 305 | 391 | 115 | 6 | 294 | (294) | |||||||||||||||||||||||||
| Dec 2021 | 1,642 | 290 | 1,352 | 386 | 787 | 165 | 14 | 299 | (299) | ||||||||||||||||||||||||||
| Jun 2021 | 1,168 | 501 | 667 | 232 | 317 | 104 | 14 | 200 | (200) | ||||||||||||||||||||||||||
| Less: By-product credit | Jun 2022 | (5,292) | (732) | (4,560) | (1,727) | (2,347) | (449) | (37) | (384) | 384 | |||||||||||||||||||||||||
| Dec 2021 | (4,943) | (639) | (4,304) | (1,296) | (2,497) | (455) | (56) | (271) | 271 | ||||||||||||||||||||||||||
| Jun 2021 | (4,347) | (753) | (3,594) | (1,293) | (1,879) | (416) | (6) | (254) | 254 | ||||||||||||||||||||||||||
Total All-in-sustaining costs6 | Jun 2022 | 19,724 | 4,839 | 14,885 | 5,809 | 7,323 | 1,507 | 245 | 865 | (865) | |||||||||||||||||||||||||
| Dec 2021 | 20,314 | 4,250 | 16,064 | 6,476 | 7,771 | 1,557 | 260 | 928 | (928) | ||||||||||||||||||||||||||
| Jun 2021 | 20,239 | 4,222 | 16,017 | 5,934 | 8,472 | 1,375 | 236 | 806 | (806) | ||||||||||||||||||||||||||
| Plus: Corporate cost, growth and capital expenditure | Jun 2022 | 943 | 530 | 413 | — | 413 | — | — | — | — | |||||||||||||||||||||||||
| Dec 2021 | 1,400 | 1,194 | 206 | — | 206 | — | — | — | — | ||||||||||||||||||||||||||
| Jun 2021 | 1,226 | 1,217 | 9 | — | 9 | — | — | — | — | ||||||||||||||||||||||||||
Total All-in-costs6 | Jun 2022 | 20,667 | 5,369 | 15,298 | 5,809 | 7,736 | 1,507 | 245 | 865 | (865) | |||||||||||||||||||||||||
| Dec 2021 | 21,714 | 5,444 | 16,270 | 6,476 | 7,977 | 1,557 | 260 | 928 | (928) | ||||||||||||||||||||||||||
| Jun 2021 | 21,465 | 5,439 | 16,026 | 5,934 | 8,481 | 1,375 | 236 | 806 | (806) | ||||||||||||||||||||||||||
| PGM production | 4Eoz - 2Eoz | Jun 2022 | 1,079,191 | 230,039 | 849,152 | 304,872 | 360,609 | 101,315 | 24,802 | 57,554 | — | ||||||||||||||||||||||||
| Dec 2021 | 1,239,777 | 272,099 | 967,678 | 343,820 | 421,632 | 113,035 | 30,654 | 58,537 | — | ||||||||||||||||||||||||||
| Jun 2021 | 1,227,293 | 298,301 | 928,992 | 328,554 | 404,386 | 113,496 | 21,842 | 60,714 | — | ||||||||||||||||||||||||||
| kg | Jun 2022 | 33,567 | 7,155 | 26,412 | 9,483 | 11,216 | 3,151 | 771 | 1,790 | — | |||||||||||||||||||||||||
| Dec 2021 | 38,561 | 8,463 | 30,098 | 10,694 | 13,114 | 3,516 | 953 | 1,821 | — | ||||||||||||||||||||||||||
| Jun 2021 | 38,173 | 9,278 | 28,895 | 10,219 | 12,578 | 3,530 | 679 | 1,888 | — | ||||||||||||||||||||||||||
| All-in-sustaining cost | R/4Eoz - R/2Eoz | Jun 2022 | 19,306 | 21,036 | 18,804 | 19,054 | 20,307 | 14,874 | 9,878 | 15,029 | — | ||||||||||||||||||||||||
| Dec 2021 | 17,197 | 15,619 | 17,669 | 18,835 | 18,431 | 13,774 | 8,482 | 15,853 | — | ||||||||||||||||||||||||||
| Jun 2021 | 17,349 | 14,153 | 18,447 | 18,061 | 20,950 | 12,115 | 10,805 | 13,275 | — | ||||||||||||||||||||||||||
| US$/4Eoz - US$/2Eoz | Jun 2022 | 1,254 | 1,366 | 1,221 | 1,237 | 1,319 | 966 | 641 | 976 | — | |||||||||||||||||||||||||
| Dec 2021 | 1,144 | 1,039 | 1,176 | 1,253 | 1,226 | 916 | 564 | 1,055 | — | ||||||||||||||||||||||||||
| Jun 2021 | 1,192 | 973 | 1,268 | 1,241 | 1,440 | 833 | 743 | 912 | — | ||||||||||||||||||||||||||
| All-in-cost | R/4Eoz - R/2Eoz | Jun 2022 | 20,229 | 23,340 | 19,325 | 19,054 | 21,453 | 14,874 | 9,878 | 15,029 | — | ||||||||||||||||||||||||
| Dec 2021 | 18,382 | 20,007 | 17,896 | 18,835 | 18,919 | 13,774 | 8,482 | 15,853 | — | ||||||||||||||||||||||||||
| Jun 2021 | 18,400 | 18,233 | 18,457 | 18,061 | 20,973 | 12,115 | 10,805 | 13,275 | — | ||||||||||||||||||||||||||
| US$/4Eoz - US$/2Eoz | Jun 2022 | 1,314 | 1,516 | 1,255 | 1,237 | 1,393 | 966 | 641 | 976 | — | |||||||||||||||||||||||||
| Dec 2021 | 1,223 | 1,331 | 1,191 | 1,253 | 1,259 | 916 | 564 | 1,055 | — | ||||||||||||||||||||||||||
| Jun 2021 | 1,265 | 1,253 | 1,269 | 1,241 | 1,441 | 833 | 743 | 912 | — | ||||||||||||||||||||||||||
Average exchange rate for the six months ended 30 June 2022, 31 December 2021 and 30 June 2021 was R15.40/US$, R15.03/US$ and R14.55/US$, respectively
Sibanye-Stillwater Operating and financial results | Six months ended 30 June 2022 42
Figures may not add as they are rounded independently
1The Total US and SA PGM, Total SA PGM and Marikana includes the production and costs associated with the purchase of concentrate (PoC) from third parties. For a reconciliation of the Operating cost, AISC and AIC excluding third party PoC, refer to “Reconciliation of operating cost excluding third party PoC for Total US and SA PGM, Total SA PGM and Marikana - Six Months” and “Reconciliation of AISC and AIC excluding third party PoC for Total US and SA PGM, Total SA PGM and Marikana – Six Months”
2The US PGM operations’ underground production is converted to metric tonnes and kilograms, and performance is translated into SA rand. In addition to the US PGM operations’ underground production, the operation processes various recycling material which is excluded from the 2E PGM production, All-in sustaining cost and All-in cost statistics shown
3Cost of sales, before amortisation and depreciation includes all mining and processing costs, third party refining costs, corporate general and administrative costs, and permitting costs
4Share-based payments are calculated based on the fair value at initial recognition and do not include the adjustment of the cash-settled share-based payment obligation to the reporting date fair value
5Rehabilitation includes the interest charge related to the environmental rehabilitation obligation and the amortisation of the related capitalised rehabilitation costs. The interest charge related to the environmental rehabilitation obligation and the amortisation of the capitalised rehabilitation costs reflect the periodic costs of rehabilitation associated with current PGM production
6All-in cost is calculated in accordance with the World Gold Council guidance. All-in cost excludes income tax, costs associated with merger and acquisition activities, working capital, impairments, financing costs, one-time severance charges and items needed to normalise earnings. All-in cost is made up of All-in sustaining cost, being the cost to sustain current operations, given as a sub-total in the All-in cost calculation, together with corporate and major capital expenditure associated with growth. All-in sustaining cost per ounce (and kilogram) and All-in cost per ounce (and kilogram) are calculated by dividing the All-in sustaining cost and All-in cost, respectively, in a period by the total 4E/2E PGM produced in the same period
| Reconciliation of operating cost excluding third party PoC for Total US and SA PGM, Total SA PGM and Marikana - Six Months | ||||||||||||||||||||||||||||||||
| Total US and SA PGM | Total SA PGM | Marikana | ||||||||||||||||||||||||||||||
| R' million | Jun 2022 | Dec 2021 | Jun 2021 | Jun 2022 | Dec 2021 | Jun 2021 | Jun 2022 | Dec 2021 | Jun 2021 | |||||||||||||||||||||||
| Cost of sales, before amortisation and depreciation as reported per table above | 20,623 | 20,583 | 18,955 | 16,781 | 16,367 | 15,604 | 8,073 | 8,328 | 8,233 | |||||||||||||||||||||||
| Inventory change as reported per table above | (385) | 98 | 1,229 | (351) | 544 | 750 | (106) | (29) | 507 | |||||||||||||||||||||||
| Less: Chrome cost of sales | (776) | (721) | (565) | (776) | (721) | (565) | (212) | (156) | (124) | |||||||||||||||||||||||
| Total operating cost including third party PoC | 19,462 | 19,960 | 19,619 | 15,654 | 16,190 | 15,789 | 7,755 | 8,143 | 8,616 | |||||||||||||||||||||||
| Less: Purchase cost of PoC | (1,100) | (1,122) | (2,047) | (1,100) | (1,122) | (2,047) | (1,100) | (1,122) | (2,047) | |||||||||||||||||||||||
| Total operating cost excluding third party PoC | 18,362 | 18,838 | 17,572 | 14,554 | 15,068 | 13,742 | 6,655 | 7,021 | 6,569 | |||||||||||||||||||||||
| PGM production as reported per table above | 4Eoz- 2Eoz | 1,079,191 | 1,239,777 | 1,227,293 | 849,152 | 967,678 | 928,992 | 360,609 | 421,632 | 404,386 | ||||||||||||||||||||||
| Less: Mimosa production | (57,554) | (58,537) | (60,714) | (57,554) | (58,537) | (60,714) | — | — | — | |||||||||||||||||||||||
| PGM production excluding Mimosa | 1,021,637 | 1,181,240 | 1,166,579 | 791,598 | 909,141 | 868,278 | 360,609 | 421,632 | 404,386 | |||||||||||||||||||||||
| Less: PoC production | (25,346) | (25,705) | (34,827) | (25,346) | (25,705) | (34,827) | (25,346) | (25,705) | (34,827) | |||||||||||||||||||||||
| PGM production excluding Mimosa and third party PoC | 996,291 | 1,155,535 | 1,131,752 | 766,252 | 883,436 | 833,451 | 335,263 | 395,927 | 369,559 | |||||||||||||||||||||||
| PGM production including Mimosa and excluding third party PoC | 1,053,845 | 1,214,072 | 1,192,466 | 823,806 | 941,973 | 894,165 | 335,263 | 395,927 | 369,559 | |||||||||||||||||||||||
| Tonnes milled/treated | 000't | 18,932 | 20,361 | 19,415 | 18,305 | 19,651 | 18,656 | 5,020 | 5,542 | 5,129 | ||||||||||||||||||||||
| Less: Mimosa tonnes | (700) | (708) | (714) | (700) | (708) | (714) | — | — | — | |||||||||||||||||||||||
| PGM tonnes excluding Mimosa and third party PoC | 18,232 | 19,653 | 18,701 | 17,605 | 18,943 | 17,942 | 5,020 | 5,542 | 5,129 | |||||||||||||||||||||||
| Operating cost including third party PoC | R/4Eoz-R/2Eoz | 19,050 | 16,897 | 16,818 | 19,775 | 17,808 | 18,184 | 21,505 | 19,313 | 21,306 | ||||||||||||||||||||||
| US$/4Eoz-US$/2Eoz | 1,237 | 1,124 | 1,156 | 1,284 | 1,185 | 1,250 | 1,396 | 1,285 | 1,464 | |||||||||||||||||||||||
| R/t | 1,067 | 1,016 | 1,049 | 889 | 855 | 880 | 1,545 | 1,469 | 1,680 | |||||||||||||||||||||||
| US$/t | 69 | 68 | 72 | 58 | 57 | 60 | 100 | 98 | 115 | |||||||||||||||||||||||
| Operating cost excluding third party PoC | R/4Eoz-R/2Eoz | 18,430 | 16,302 | 15,526 | 18,994 | 17,056 | 16,488 | 19,850 | 17,733 | 17,775 | ||||||||||||||||||||||
| US$/4Eoz-US$/2Eoz | 1,197 | 1,085 | 1,067 | 1,233 | 1,135 | 1,133 | 1,289 | 1,180 | 1,222 | |||||||||||||||||||||||
| R/t | 1,007 | 959 | 940 | 827 | 795 | 766 | 1,326 | 1,267 | 1,281 | |||||||||||||||||||||||
| US$/t | 65 | 64 | 65 | 54 | 53 | 53 | 86 | 84 | 88 | |||||||||||||||||||||||
| Reconciliation of AISC and AIC excluding third party PoC for Total US and SA PGM, Total SA PGM and Marikana - Six Months | ||||||||||||||||||||||||||||||||
| Total US and SA PGM | Total SA PGM | Marikana | ||||||||||||||||||||||||||||||
| R' million | Jun 2022 | Dec 2021 | Jun 2021 | Jun 2022 | Dec 2021 | Jun 2021 | Jun 2022 | Dec 2021 | Jun 2021 | |||||||||||||||||||||||
| Total All-in-sustaining cost as reported per table above | 19,724 | 20,314 | 20,239 | 14,885 | 16,064 | 16,017 | 7,323 | 7,771 | 8,472 | |||||||||||||||||||||||
| Less: Purchase cost of PoC | (1,100) | (1,122) | (2,047) | (1,100) | (1,122) | (2,047) | (1,100) | (1,122) | (2,047) | |||||||||||||||||||||||
| Add: By-product credit of PoC | 130 | 109 | 133 | 130 | 109 | 133 | 130 | 109 | 133 | |||||||||||||||||||||||
| Total All-in-sustaining cost excluding third party PoC | 18,754 | 19,301 | 18,325 | 13,915 | 15,051 | 14,103 | 6,353 | 6,758 | 6,558 | |||||||||||||||||||||||
| Plus: Corporate cost, growth and capital expenditure | 943 | 1,400 | 1,226 | 413 | 206 | 9 | 413 | 206 | 9 | |||||||||||||||||||||||
| Total All-in-cost excluding third party PoC | 19,697 | 20,701 | 19,551 | 14,328 | 15,257 | 14,112 | 6,766 | 6,964 | 6,567 | |||||||||||||||||||||||
| PGM production excluding Mimosa and third party PoC | 4Eoz- 2Eoz | 996,291 | 1,155,535 | 1,131,752 | 766,252 | 883,436 | 833,451 | 335,263 | 395,927 | 369,559 | ||||||||||||||||||||||
| All-in-sustaining cost excluding third party PoC | R/4Eoz-R/2Eoz | 18,824 | 16,703 | 16,192 | 18,160 | 17,037 | 16,921 | 18,949 | 17,069 | 17,745 | ||||||||||||||||||||||
| US$/4Eoz-US$/2Eoz | 1,222 | 1,111 | 1,113 | 1,179 | 1,134 | 1,163 | 1,230 | 1,136 | 1,220 | |||||||||||||||||||||||
| All-in-cost excluding third party PoC | R/4Eoz-R/2Eoz | 19,770 | 17,915 | 17,275 | 18,699 | 17,270 | 16,932 | 20,181 | 17,589 | 17,770 | ||||||||||||||||||||||
| US$/4Eoz-US$/2Eoz | 1,284 | 1,192 | 1,187 | 1,214 | 1,149 | 1,164 | 1,310 | 1,170 | 1,221 | |||||||||||||||||||||||
Sibanye-Stillwater Operating and financial results | Six months ended 30 June 2022 43
SA gold operations
Figures are in millions unless otherwise stated
| SA OPERATIONS | |||||||||||||||||||||||||||||
| R' million | Total SA gold | Driefontein | Kloof | Beatrix | Cooke | DRDGOLD | Corporate | ||||||||||||||||||||||
Cost of sales, before amortisation and depreciation1 | Jun 2022 | 8,557 | 2,292 | 2,816 | 1,281 | 326 | 1,842 | — | |||||||||||||||||||||
| Dec 2021 | 11,739 | 3,056 | 3,962 | 2,560 | 409 | 1,752 | — | ||||||||||||||||||||||
| Jun 2021 | 10,518 | 2,635 | 3,883 | 2,005 | 400 | 1,595 | — | ||||||||||||||||||||||
| Royalties | Jun 2022 | 17 | 7 | 7 | 1 | 2 | — | — | |||||||||||||||||||||
| Dec 2021 | 96 | 49 | 24 | 15 | 2 | — | 6 | ||||||||||||||||||||||
| Jun 2021 | 71 | 45 | 23 | 11 | 3 | — | (11) | ||||||||||||||||||||||
| Carbon tax | Jun 2022 | (11) | — | — | (11) | — | — | — | |||||||||||||||||||||
| Dec 2021 | 1 | — | — | 1 | — | — | — | ||||||||||||||||||||||
| Jun 2021 | 1 | — | — | 1 | — | — | — | ||||||||||||||||||||||
| Community costs | Jun 2022 | 66 | 24 | 20 | 17 | — | 5 | — | |||||||||||||||||||||
| Dec 2021 | 65 | 23 | 19 | 17 | 1 | 5 | — | ||||||||||||||||||||||
| Jun 2021 | 63 | 23 | 19 | 17 | 1 | 3 | — | ||||||||||||||||||||||
Share-based payments2 | Jun 2022 | 70 | 25 | 22 | 14 | — | 9 | — | |||||||||||||||||||||
| Dec 2021 | 51 | 12 | 17 | 12 | — | 10 | — | ||||||||||||||||||||||
| Jun 2021 | 49 | 11 | 18 | 11 | — | 9 | — | ||||||||||||||||||||||
Rehabilitation interest and amortisation3 | Jun 2022 | 69 | 17 | (2) | 20 | 24 | 7 | 3 | |||||||||||||||||||||
| Dec 2021 | 96 | 11 | 7�� | 33 | 31 | 10 | 4 | ||||||||||||||||||||||
| Jun 2021 | 95 | 22 | 10 | 36 | 16 | 8 | 3 | ||||||||||||||||||||||
| Leases | Jun 2022 | 42 | 2 | 9 | 14 | 3 | 14 | — | |||||||||||||||||||||
| Dec 2021 | 39 | 4 | 5 | 14 | 6 | 10 | — | ||||||||||||||||||||||
| Jun 2021 | 42 | 4 | 9 | 14 | 6 | 9 | — | ||||||||||||||||||||||
| Ore reserve development | Jun 2022 | 468 | 252 | 185 | 31 | — | — | — | |||||||||||||||||||||
| Dec 2021 | 1,352 | 615 | 489 | 248 | — | — | — | ||||||||||||||||||||||
| Jun 2021 | 1,254 | 563 | 441 | 250 | — | — | — | ||||||||||||||||||||||
| Sustaining capital expenditure | Jun 2022 | 725 | 95 | 152 | 68 | — | 410 | — | |||||||||||||||||||||
| Dec 2021 | 822 | 213 | 351 | 113 | — | 145 | — | ||||||||||||||||||||||
| Jun 2021 | 481 | 109 | 136 | 51 | — | 185 | — | ||||||||||||||||||||||
| Less: By-product credit | Jun 2022 | (7) | (1) | (1) | — | — | (5) | — | |||||||||||||||||||||
| Dec 2021 | (14) | (4) | (3) | (3) | (1) | (3) | — | ||||||||||||||||||||||
| Jun 2021 | (11) | (4) | (3) | (2) | (1) | (1) | — | ||||||||||||||||||||||
Total All-in-sustaining costs4 | Jun 2022 | 9,996 | 2,713 | 3,208 | 1,435 | 355 | 2,282 | 3 | |||||||||||||||||||||
| Dec 2021 | 14,247 | 3,979 | 4,871 | 3,010 | 448 | 1,929 | 10 | ||||||||||||||||||||||
| Jun 2021 | 12,563 | 3,408 | 4,536 | 2,394 | 425 | 1,808 | (8) | ||||||||||||||||||||||
| Plus: Corporate cost, growth and capital expenditure | Jun 2022 | 439 | — | 54 | 4 | — | 6 | 375 | |||||||||||||||||||||
| Dec 2021 | 390 | — | 107 | 7 | — | 38 | 238 | ||||||||||||||||||||||
| Jun 2021 | 214 | — | 91 | — | — | 9 | 114 | ||||||||||||||||||||||
Total All-in-costs4 | Jun 2022 | 10,435 | 2,713 | 3,262 | 1,439 | 355 | 2,288 | 378 | |||||||||||||||||||||
| Dec 2021 | 14,637 | 3,979 | 4,978 | 3,017 | 448 | 1,967 | 248 | ||||||||||||||||||||||
| Jun 2021 | 12,777 | 3,408 | 4,627 | 2,394 | 425 | 1,817 | 106 | ||||||||||||||||||||||
| Gold sold | kg | Jun 2022 | 6,481 | 1,603 | 1,424 | 265 | 366 | 2,823 | — | ||||||||||||||||||||
| Dec 2021 | 17,495 | 4,928 | 5,560 | 3,558 | 558 | 2,891 | — | ||||||||||||||||||||||
| Jun 2021 | 15,879 | 4,386 | 5,401 | 2,747 | 617 | 2,728 | — | ||||||||||||||||||||||
| oz | Jun 2022 | 208,369 | 51,538 | 45,783 | 8,520 | 11,767 | 90,762 | — | |||||||||||||||||||||
| Dec 2021 | 562,477 | 158,439 | 178,758 | 114,392 | 17,940 | 92,948 | — | ||||||||||||||||||||||
| Jun 2021 | 510,521 | 141,013 | 173,646 | 88,318 | 19,837 | 87,707 | — | ||||||||||||||||||||||
| All-in-sustaining cost | R/kg | Jun 2022 | 1,542,355 | 1,692,452 | 2,252,809 | 5,415,094 | 969,945 | 808,360 | — | ||||||||||||||||||||
| Dec 2021 | 814,347 | 807,427 | 876,079 | 845,981 | 802,867 | 667,243 | — | ||||||||||||||||||||||
| Jun 2021 | 791,171 | 777,018 | 839,844 | 871,496 | 688,817 | 662,757 | — | ||||||||||||||||||||||
| All-in-sustaining cost | US$/oz | Jun 2022 | 3,115 | 3,418 | 4,550 | 10,937 | 1,959 | 1,633 | — | ||||||||||||||||||||
| Dec 2021 | 1,685 | 1,671 | 1,813 | 1,751 | 1,661 | 1,381 | — | ||||||||||||||||||||||
| Jun 2021 | 1,691 | 1,661 | 1,795 | 1,863 | 1,472 | 1,417 | — | ||||||||||||||||||||||
| All-in-cost | R/kg | Jun 2022 | 1,610,091 | 1,692,452 | 2,290,730 | 5,430,189 | 969,945 | 810,485 | — | ||||||||||||||||||||
| Dec 2021 | 836,639 | 807,427 | 895,324 | 847,948 | 802,867 | 680,387 | — | ||||||||||||||||||||||
| Jun 2021 | 804,648 | 777,018 | 856,693 | 871,496 | 688,817 | 666,056 | — | ||||||||||||||||||||||
| All-in-cost | US$/oz | Jun 2022 | 3,252 | 3,418 | 4,627 | 10,967 | 1,959 | 1,637 | — | ||||||||||||||||||||
| Dec 2021 | 1,731 | 1,671 | 1,853 | 1,755 | 1,661 | 1,408 | — | ||||||||||||||||||||||
| Jun 2021 | 1,720 | 1,661 | 1,831 | 1,863 | 1,472 | 1,424 | — | ||||||||||||||||||||||
Average exchange rate for the six months ended 30 June 2022, 31 December 2021 and 30 June 2021 was R15.40/US$, R15.03/US$ and R14.55/US$, respectively
Figures may not add as they are rounded independently
1Cost of sales, before amortisation and depreciation includes all mining and processing costs, third party refining costs, corporate general and administrative costs, and permitting costs
2Share-based payments are calculated based on the fair value at initial recognition and do not include the adjustment of the cash-settled share-based payment obligation to the reporting date fair value
3Rehabilitation includes the interest charge related to the environmental rehabilitation obligation and the amortisation of the related capitalised rehabilitation costs. The interest charge related to the environmental rehabilitation obligation and the amortisation of the capitalised rehabilitation costs reflect the periodic costs of rehabilitation associated with current gold production
4All-in cost is calculated in accordance with the World Gold Council guidance. All-in cost excludes income tax, costs associated with merger and acquisition activities, working capital, impairments, financing costs, one time severance charges and items needed to normalise earnings. All-in cost is made up of All-in sustaining cost, being the cost to sustain current operations, given as a sub-total in the All-in cost calculation, together with corporate and major capital expenditure associated with growth. All-in sustaining cost per kilogram (and ounce) and All-in cost per kilogram (and ounce) are calculated by dividing the All-in sustaining cost and All-in cost, respectively, in a period by the total gold sold over the same period
Sibanye-Stillwater Operating and financial results | Six months ended 30 June 2022 44
SALIENT FEATURES AND COST BENCHMARKS - QUARTERS
US and SA PGM operations
| US OPERA-TIONS | SA OPERATIONS | |||||||||||||||||||||||||||||||||||||||||||
Total US and SA PGM1 | Total US PGM | Total SA PGM1 | Rustenburg | Marikana1 | Kroondal | Plat Mile | Mimosa | |||||||||||||||||||||||||||||||||||||
| Attributable | Under- ground2 | Total | Under- ground | Surface | Under- ground | Surface | Under- ground | Surface | Attribu-table | Surface | Attribu-table | |||||||||||||||||||||||||||||||||
| Production | ||||||||||||||||||||||||||||||||||||||||||||
| Tonnes milled/treated | 000't | Jun 2022 | 9,641 | 299 | 9,342 | 4,328 | 5,014 | 1,552 | 1,385 | 1,602 | 952 | 814 | 2,677 | 360 | ||||||||||||||||||||||||||||||
| Mar 2022 | 9,291 | 328 | 8,963 | 4,131 | 4,832 | 1,420 | 1,422 | 1,538 | 928 | 833 | 2,482 | 340 | ||||||||||||||||||||||||||||||||
| Plant head grade | g/t | Jun 2022 | 2.25 | 12.41 | 1.92 | 3.23 | 0.79 | 3.26 | 0.95 | 3.57 | 0.87 | 2.39 | 0.68 | 3.49 | ||||||||||||||||||||||||||||||
| Mar 2022 | 2.38 | 12.74 | 2.00 | 3.29 | 0.89 | 3.29 | 1.11 | 3.78 | 0.85 | 2.28 | 0.77 | 3.57 | ||||||||||||||||||||||||||||||||
| Plant recoveries | % | Jun 2022 | 74.79 | 90.93 | 71.59 | 84.87 | 24.75 | 86.28 | 36.61 | 86.90 | 23.91 | 82.81 | 16.50 | 73.06 | ||||||||||||||||||||||||||||||
| Mar 2022 | 75.15 | 90.08 | 71.42 | 84.74 | 29.35 | 86.66 | 37.18 | 86.96 | 25.87 | 81.09 | 24.65 | 71.86 | ||||||||||||||||||||||||||||||||
| Yield | g/t | Jun 2022 | 1.68 | 11.28 | 1.37 | 2.74 | 0.20 | 2.81 | 0.35 | 3.10 | 0.21 | 1.98 | 0.11 | 2.55 | ||||||||||||||||||||||||||||||
| Mar 2022 | 1.79 | 11.48 | 1.43 | 2.79 | 0.26 | 2.85 | 0.41 | 3.29 | 0.22 | 1.85 | 0.19 | 2.57 | ||||||||||||||||||||||||||||||||
PGM production3 | 4Eoz - 2Eoz | Jun 2022 | 520,608 | 107,650 | 412,958 | 381,445 | 31,513 | 140,344 | 15,487 | 159,793 | 6,368 | 51,797 | 9,658 | 29,511 | ||||||||||||||||||||||||||||||
| Mar 2022 | 533,237 | 122,389 | 410,848 | 370,272 | 40,576 | 130,171 | 18,870 | 162,540 | 6,562 | 49,518 | 15,144 | 28,043 | ||||||||||||||||||||||||||||||||
PGM sold4 | 4Eoz - 2Eoz | Jun 2022 | 521,579 | 127,047 | 394,532 | 111,494 | 17,887 | 176,830 | 51,797 | 9,658 | 26,866 | |||||||||||||||||||||||||||||||||
| Mar 2022 | 563,328 | 111,153 | 452,175 | 155,095 | 17,167 | 187,611 | 49,518 | 15,144 | 27,640 | |||||||||||||||||||||||||||||||||||
Price and cost5 | ||||||||||||||||||||||||||||||||||||||||||||
Average PGM basket price6 | R/4Eoz - R/2Eoz | Jun 2022 | 38,309 | 28,499 | 41,699 | 42,844 | 28,408 | 42,147 | 44,461 | 30,080 | 32,363 | |||||||||||||||||||||||||||||||||
| Mar 2022 | 42,210 | 31,323 | 45,061 | 46,559 | 29,993 | 45,007 | 48,327 | 36,793 | 34,514 | |||||||||||||||||||||||||||||||||||
| Average PGM basket price6 | US$/4Eoz - US$/2Eoz | Jun 2022 | 2,457 | 1,828 | 2,675 | 2,748 | 1,822 | 2,703 | 2,852 | 1,929 | 2,076 | |||||||||||||||||||||||||||||||||
| Mar 2022 | 2,773 | 2,058 | 2,961 | 3,059 | 1,971 | 2,957 | 3,175 | 2,417 | 2,268 | |||||||||||||||||||||||||||||||||||
Operating cost7 | R/t | Jun 2022 | 1,037 | 6,478 | 856 | 1,843 | 229 | 1,374 | 1,053 | 53 | 1,292 | |||||||||||||||||||||||||||||||||
| Mar 2022 | 977 | 5,704 | 797 | 1,820 | 155 | 1,277 | 945 | 53 | 1,203 | |||||||||||||||||||||||||||||||||||
| Operating cost7 | US$/t | Jun 2022 | 67 | 416 | 55 | 118 | 15 | 88 | 68 | 3 | 83 | |||||||||||||||||||||||||||||||||
| Mar 2022 | 64 | 375 | 52 | 120 | 10 | 84 | 62 | 3 | 79 | |||||||||||||||||||||||||||||||||||
| Operating cost7 | R/4Eoz - R/2Eoz | Jun 2022 | 19,593 | 17,993 | 20,042 | 20,378 | 20,469 | 21,118 | 16,545 | 14,703 | 15,757 | |||||||||||||||||||||||||||||||||
| Mar 2022 | 17,306 | 15,287 | 17,952 | 19,858 | 11,659 | 18,616 | 15,893 | 8,716 | 14,585 | |||||||||||||||||||||||||||||||||||
| Operating cost7 | US$/4Eoz - US$/2Eoz | Jun 2022 | 1,257 | 1,154 | 1,286 | 1,307 | 1,313 | 1,355 | 1,061 | 943 | 1,011 | |||||||||||||||||||||||||||||||||
| Mar 2022 | 1,137 | 1,004 | 1,179 | 1,305 | 766 | 1,223 | 1,044 | 573 | 958 | |||||||||||||||||||||||||||||||||||
All-in sustaining cost8 | R/4Eoz - R/2Eoz | Jun 2022 | 19,534 | 23,437 | 18,438 | 18,129 | 20,107 | 14,904 | 13,667 | 16,062 | ||||||||||||||||||||||||||||||||||
| Mar 2022 | 18,142 | 18,940 | 17,886 | 20,041 | 17,806 | 14,863 | 7,462 | 13,979 | ||||||||||||||||||||||||||||||||||||
| All-in sustaining cost8 | US$/4Eoz - US$/2Eoz | Jun 2022 | 1,253 | 1,503 | 1,183 | 1,163 | 1,290 | 956 | 877 | 1,030 | ||||||||||||||||||||||||||||||||||
| Mar 2022 | 1,192 | 1,244 | 1,175 | 1,317 | 1,170 | 977 | 490 | 918 | ||||||||||||||||||||||||||||||||||||
All-in cost8 | R/4Eoz - R/2Eoz | Jun 2022 | 20,389 | 25,397 | 18,983 | 18,129 | 21,365 | 14,904 | 13,667 | 16,062 | ||||||||||||||||||||||||||||||||||
| Mar 2022 | 19,177 | 21,546 | 18,419 | 20,041 | 19,012 | 14,863 | 7,462 | 13,979 | ||||||||||||||||||||||||||||||||||||
| All-in cost8 | US$/4Eoz - US$/2Eoz | Jun 2022 | 1,308 | 1,629 | 1,218 | 1,163 | 1,370 | 956 | 877 | 1,030 | ||||||||||||||||||||||||||||||||||
| Mar 2022 | 1,260 | 1,416 | 1,210 | 1,317 | 1,249 | 977 | 490 | 918 | ||||||||||||||||||||||||||||||||||||
Capital expenditure5 | ||||||||||||||||||||||||||||||||||||||||||||
| Ore reserve development | Rm | Jun 2022 | 1,196 | 641 | 555 | 173 | 382 | — | — | — | ||||||||||||||||||||||||||||||||||
| Mar 2022 | 1,021 | 637 | 384 | 142 | 242 | — | — | — | ||||||||||||||||||||||||||||||||||||
| Sustaining capital | Rm | Jun 2022 | 640 | 211 | 429 | 148 | 208 | 68 | 5 | 181 | ||||||||||||||||||||||||||||||||||
| Mar 2022 | 552 | 166 | 386 | 156 | 183 | 46 | 1 | 113 | ||||||||||||||||||||||||||||||||||||
| Corporate and projects | Rm | Jun 2022 | 412 | 211 | 201 | — | 201 | — | — | — | ||||||||||||||||||||||||||||||||||
| Mar 2022 | 523 | 319 | 204 | — | 204 | — | — | — | ||||||||||||||||||||||||||||||||||||
| Total capital expenditure | Rm | Jun 2022 | 2,248 | 1,063 | 1,185 | 321 | 791 | 68 | 5 | 181 | ||||||||||||||||||||||||||||||||||
| Mar 2022 | 2,096 | 1,122 | 974 | 298 | 629 | 46 | 1 | 113 | ||||||||||||||||||||||||||||||||||||
| Total capital expenditure | US$m | Jun 2022 | 144 | 68 | 76 | 21 | 51 | 4 | — | 12 | ||||||||||||||||||||||||||||||||||
| Mar 2022 | 138 | 74 | 64 | 20 | 41 | 3 | — | 7 | ||||||||||||||||||||||||||||||||||||
Average exchange rate for the quarters ended 30 June 2022 and 31 March 2022 was R15.59/US$ and R15.22/US$, respectively
Figures may not add as they are rounded independently
1The Total US and SA PGM, Total SA PGM and Marikana excludes the production and costs associated with the purchase of concentrate (PoC) from third parties. For a reconciliation of the Operating cost, AISC and AIC excluding third party PoC, refer to “Reconciliation of operating cost excluding third party PoC for Total US and SA PGM, Total SA PGM and Marikana - Quarters” and “Reconciliation of AISC and AIC excluding third party PoC for Total US and SA PGM, Total SA PGM and Marikana – Quarters”
2The US PGM operations’ underground production is converted to metric tonnes and kilograms, and performance is translated into SA rand. In addition to the US PGM operations’ underground production, the operation treats various recycling material which is excluded from the statistics shown above and is detailed in the PGM recycling table on the next page
3Production per product – see prill split in the table below
4PGM sold includes the third party PoC ounces sold
5The Total US and SA PGM and Total SA PGM operations’ unit cost benchmarks and capital expenditure exclude the financial results of Mimosa, which is equity accounted and excluded from revenue and cost of sales
6The average PGM basket price is the PGM revenue per 4E/2E ounce, prior to a purchase of concentrate adjustment
7Operating cost is the average cost of production and operating cost per tonne is calculated by dividing the cost of sales, before amortisation and depreciation and change in inventory in a period by the tonnes milled/treated in the same period, and operating cost per ounce (and kilogram) is calculated by dividing the cost of sales, before amortisation and depreciation and change in inventory in a period by the PGM produced in the same period.
8All-in cost is calculated in accordance with the World Gold Council guidance. All-in cost excludes income tax, costs associated with merger and acquisition activities, working capital, impairments, financing costs, one-time severance charges and items needed to normalise earnings. All-in cost is made up of All-in sustaining cost, being the cost to sustain current operations, given as a sub-total in the All-in cost calculation, together with corporate and major capital expenditure associated with growth. All-in sustaining cost per ounce (and kilogram) and All-in cost per ounce (and kilogram) are calculated by dividing the All-in sustaining cost and All-in cost, respectively, in a period by the total 4E/2E PGM produced in the same period. For a reconciliation of cost of sales, before amortisation and depreciation to All-in cost, see “All-in costs - Quarters”
Sibanye-Stillwater Operating and financial results | Six months ended 30 June 2022 45
| Mining - PGM Prill split including third party PoC, excluding recycling operations | ||||||||||||||||||||||||||||||||||||||
| GROUP PGM | SA OPERATIONS | US OPERATIONS | ||||||||||||||||||||||||||||||||||||
| Jun 2022 | Mar 2022 | Jun 2022 | Mar 2022 | Jun 2022 | Mar 2022 | |||||||||||||||||||||||||||||||||
| % | % | % | % | % | % | |||||||||||||||||||||||||||||||||
| Platinum | 278,511 | 52 | % | 278,259 | 51 | % | 253,999 | 59 | % | 250,401 | 59 | % | 24,512 | 23 | % | 27,858 | 23 | % | ||||||||||||||||||||
| Palladium | 210,930 | 39 | % | 220,820 | 41 | % | 127,792 | 30 | % | 126,289 | 30 | % | 83,138 | 77 | % | 94,531 | 77 | % | ||||||||||||||||||||
| Rhodium | 37,880 | 7 | % | 36,738 | 7 | % | 37,880 | 9 | % | 36,738 | 9 | % | ||||||||||||||||||||||||||
| Gold | 7,942 | 2 | % | 8,112 | 1 | % | 7,942 | 2 | % | 8,112 | 2 | % | ||||||||||||||||||||||||||
| PGM production 4E/2E | 535,262 | 100 | % | 543,929 | 100 | % | 427,612 | 100 | % | 421,540 | 100 | % | 107,650 | 100 | % | 122,389 | 100 | % | ||||||||||||||||||||
| Ruthenium | 59,933 | 58,777 | 59,933 | 58,777 | ||||||||||||||||||||||||||||||||||
| Iridium | 15,299 | 14,566 | 15,299 | 14,566 | ||||||||||||||||||||||||||||||||||
| Total 6E/2E | 610,494 | 617,272 | 502,844 | 494,883 | 107,650 | 122,389 | ||||||||||||||||||||||||||||||||
| Recycling at US operations | |||||||||||
| Unit | Jun 2022 | Mar 2022 | |||||||||
| Average catalyst fed/day | Tonne | 22.0 | 23.7 | ||||||||
| Total processed | Tonne | 2,004 | 2,132 | ||||||||
| Tolled | Tonne | — | — | ||||||||
| Purchased | Tonne | 2,004 | 2,132 | ||||||||
| PGM fed | 3Eoz | 170,462 | 190,871 | ||||||||
| PGM sold | 3Eoz | 213,988 | 147,571 | ||||||||
| PGM tolled returned | 3Eoz | 1,878 | — | ||||||||
Sibanye-Stillwater Operating and financial results | Six months ended 30 June 2022 46
SA gold operations
| SA OPERATIONS | |||||||||||||||||||||||||||||||||||||||||
| Total SA gold | Driefontein | Kloof | Beatrix | Cooke | DRDGOLD | ||||||||||||||||||||||||||||||||||||
| Total | Under- ground | Surface | Under- ground | Surface | Under- ground | Surface | Under- ground | Surface | Surface | Surface | |||||||||||||||||||||||||||||||
| Production | |||||||||||||||||||||||||||||||||||||||||
| Tonnes milled/treated | 000't | Jun 2022 | 8,123 | — | 8,123 | — | 5 | — | 40 | — | — | 1,014 | 7,064 | ||||||||||||||||||||||||||||
| Mar 2022 | 8,748 | 492 | 8,256 | 236 | 200 | 256 | 623 | — | — | 774 | 6,659 | ||||||||||||||||||||||||||||||
| Yield | g/t | Jun 2022 | 0.21 | — | 0.20 | — | — | — | 0.28 | — | — | 0.19 | 0.20 | ||||||||||||||||||||||||||||
| Mar 2022 | 0.49 | 4.95 | 0.22 | 5.95 | 0.40 | 3.89 | 0.30 | — | — | 0.21 | 0.21 | ||||||||||||||||||||||||||||||
| Gold produced | kg | Jun 2022 | 1,698 | 49 | 1,649 | 7 | — | 20 | 11 | 22 | — | 195 | 1,443 | ||||||||||||||||||||||||||||
| Mar 2022 | 4,264 | 2,437 | 1,827 | 1,404 | 79 | 996 | 189 | 37 | 9 | 159 | 1,391 | ||||||||||||||||||||||||||||||
| oz | Jun 2022 | 54,592 | 1,575 | 53,017 | 225 | — | 643 | 354 | 707 | — | 6,269 | 46,394 | |||||||||||||||||||||||||||||
| Mar 2022 | 137,091 | 78,351 | 58,739 | 45,140 | 2,540 | 32,022 | 6,076 | 1,190 | 289 | 5,112 | 44,722 | ||||||||||||||||||||||||||||||
| Gold sold | kg | Jun 2022 | 1,735 | 129 | 1,606 | 9 | — | 14 | 1 | 106 | — | 159 | 1,446 | ||||||||||||||||||||||||||||
| Mar 2022 | 4,746 | 2,829 | 1,917 | 1,494 | 100 | 1,185 | 224 | 150 | 9 | 207 | 1,377 | ||||||||||||||||||||||||||||||
| oz | Jun 2022 | 55,782 | 4,147 | 51,634 | 289 | — | 450 | 32 | 3,408 | — | 5,112 | 46,490 | |||||||||||||||||||||||||||||
| Mar 2022 | 152,587 | 90,954 | 61,633 | 48,033 | 3,215 | 38,099 | 7,202 | 4,823 | 289 | 6,655 | 44,272 | ||||||||||||||||||||||||||||||
| Price and costs | |||||||||||||||||||||||||||||||||||||||||
| Gold price received | R/kg | Jun 2022 | 940,634 | 1,000,000 | 1,000,000 | 962,264 | 930,818 | 939,142 | |||||||||||||||||||||||||||||||||
| Mar 2022 | 916,351 | 916,562 | 915,543 | 924,528 | 913,043 | 916,485 | |||||||||||||||||||||||||||||||||||
| Gold price received | US$/oz | Jun 2022 | 1,877 | 1,995 | 1,995 | 1,920 | 1,857 | 1,874 | |||||||||||||||||||||||||||||||||
| Mar 2022 | 1,873 | 1,873 | 1,871 | 1,889 | 1,866 | 1,873 | |||||||||||||||||||||||||||||||||||
Operating cost1 | R/t | Jun 2022 | 463 | — | 151 | — | — | — | 1,825 | — | — | 178 | 136 | ||||||||||||||||||||||||||||
| Mar 2022 | 511 | 6,486 | 155 | 5,301 | 295 | 5,637 | 254 | — | — | 183 | 135 | ||||||||||||||||||||||||||||||
| US$/t | Jun 2022 | 30 | — | 10 | — | — | — | 117 | — | — | 11 | 9 | |||||||||||||||||||||||||||||
| Mar 2022 | 34 | 426 | 10 | 348 | 19 | 370 | 17 | — | — | 12 | 9 | ||||||||||||||||||||||||||||||
| R/kg | Jun 2022 | 2,214,370 | 51,632,653 | 745,907 | 131,285,714 | — | 50,200,000 | 6,636,364 | 27,590,909 | — | 923,077 | 664,588 | |||||||||||||||||||||||||||||
| Mar 2022 | 1,048,077 | 1,309,397 | 699,507 | 891,026 | 746,835 | 1,448,795 | 835,979 | 13,432,432 | 2,111,111 | 893,082 | 647,017 | ||||||||||||||||||||||||||||||
| US$/oz | Jun 2022 | 4,418 | 103,012 | 1,488 | 261,927 | — | 100,154 | 13,240 | 55,046 | — | 1,842 | 1,326 | |||||||||||||||||||||||||||||
| Mar 2022 | 2,142 | 2,676 | 1,430 | 1,821 | 1,526 | 2,961 | 1,708 | 27,450 | 4,314 | 1,825 | 1,322 | ||||||||||||||||||||||||||||||
All-in sustaining cost2 | R/kg | Jun 2022 | 2,522,190 | 110,222,222 | 76,266,667 | 7,264,151 | 1,056,604 | 899,723 | |||||||||||||||||||||||||||||||||
| Mar 2022 | 1,183,944 | 1,080,928 | 1,462,030 | 4,188,679 | 908,213 | 712,418 | |||||||||||||||||||||||||||||||||||
| All-in sustaining cost2 | US$/oz | Jun 2022 | 5,032 | 219,903 | 152,159 | 14,493 | 2,108 | 1,795 | |||||||||||||||||||||||||||||||||
| Mar 2022 | 2,420 | 2,209 | 2,988 | 8,560 | 1,856 | 1,456 | |||||||||||||||||||||||||||||||||||
All-in cost2 | R/kg | Jun 2022 | 2,663,977 | 110,222,222 | 77,600,000 | 7,264,151 | 1,056,604 | 887,967 | |||||||||||||||||||||||||||||||||
| Mar 2022 | 1,224,821 | 1,080,928 | 1,486,870 | 4,213,836 | 908,213 | 729,121 | |||||||||||||||||||||||||||||||||||
| All-in cost2 | US$/oz | Jun 2022 | 5,315 | 219,903 | 154,819 | 14,493 | 2,108 | 1,772 | |||||||||||||||||||||||||||||||||
| Mar 2022 | 2,503 | 2,209 | 3,039 | 8,611 | 1,856 | 1,490 | |||||||||||||||||||||||||||||||||||
| Capital expenditure | |||||||||||||||||||||||||||||||||||||||||
| Ore reserve development | Rm | Jun 2022 | — | — | — | — | — | — | |||||||||||||||||||||||||||||||||
| Mar 2022 | 468 | 252 | 185 | 31 | — | — | |||||||||||||||||||||||||||||||||||
| Sustaining capital | Rm | Jun 2022 | 455 | 35 | 58 | 32 | — | 330 | |||||||||||||||||||||||||||||||||
| Mar 2022 | 270 | 61 | 94 | 35 | — | 80 | |||||||||||||||||||||||||||||||||||
Corporate and projects3 | Rm | Jun 2022 | 220 | — | 20 | — | — | (17) | |||||||||||||||||||||||||||||||||
| Mar 2022 | 183 | — | 35 | 4 | — | 23 | |||||||||||||||||||||||||||||||||||
| Total capital expenditure | Rm | Jun 2022 | 675 | 35 | 78 | 32 | — | 313 | |||||||||||||||||||||||||||||||||
| Mar 2022 | 921 | 313 | 314 | 70 | — | 103 | |||||||||||||||||||||||||||||||||||
| Total capital expenditure | US$m | Jun 2022 | 43 | 2 | 5 | 2 | — | 20 | |||||||||||||||||||||||||||||||||
| Mar 2022 | 61 | 21 | 21 | 5 | — | 7 | |||||||||||||||||||||||||||||||||||
Average exchange rate for the quarters ended 30 June 2022 and 31 March 2022 was R15.59/US$ and R15.22/US$, respectively
Figures may not add as they are rounded independently
1Operating cost is the average cost of production and operating cost per tonne is calculated by dividing the cost of sales, before amortisation and depreciation and change in inventory in a period by the tonnes milled/treated in the same period, and operating cost per kilogram (and ounce) is calculated by dividing the cost of sales, before amortisation and depreciation and change in inventory in a period by the gold produced in the same period
2All-in cost is calculated in accordance with the World Gold Council guidance. All-in cost excludes income tax, costs associated with merger and acquisition activities, working capital, impairments, financing costs, one time severance charges and items needed to normalise earnings. All-in cost is made up of All-in sustaining cost, being the cost to sustain current operations, given as a sub-total in the All-in cost calculation, together with corporate and major capital expenditure associated with growth. All-in sustaining cost per kilogram (and ounce) and All-in cost per kilogram (and ounce) are calculated by dividing the All-in sustaining cost and All-in cost, respectively, in a period by the total gold sold over the same period. For a reconciliation of cost of sales before amortisation and depreciation to All-in cost, see “All-in costs – Quarters”
3Corporate project expenditure for the quarters ended 30 June 2022 and 31 March 2022 was R217 million (US$14 million) and R121 million (US$8 million), respectively, the majority of this expenditure was on Burnstone project
Sibanye-Stillwater Operating and financial results | Six months ended 30 June 2022 47
European operations
| Sibanye-Stillwater Sandouville Refinery | ||||||||||||||
| Battery Metal Split | ||||||||||||||
| Jun 2022 | Mar 20221 | |||||||||||||
| Volumes produced (tonnes) | % | % | ||||||||||||
Nickel Salts2 | 668 | 23 | % | 398 | 24 | % | ||||||||
| Nickel Metal | 2,251 | 77 | % | 1,248 | 76 | % | ||||||||
| Total Nickel Production tNi | 2,919 | 100 | % | 1,646 | 100 | % | ||||||||
Nickel Cakes3 | 123 | 70 | ||||||||||||
Cobalt Chloride (CoCl2)4 | 78 | 35 | ||||||||||||
Ferric Chloride (FeCl3)4 | 608 | 360 | ||||||||||||
| Volumes sales (tonnes) | ||||||||||||||
Nickel Salts2 | 609 | 20 | % | 376 | 23 | % | ||||||||
| Nickel Metal | 2,367 | 80 | % | 1,232 | 77 | % | ||||||||
| Total Nickel Sold tNi | 2,976 | 100 | % | 1,608 | 100 | % | ||||||||
Cobalt Chloride (CoCl2)4 | 95 | 50 | ||||||||||||
Ferric Chloride (FeCl3)4 | 608 | 360 | ||||||||||||
| Nickel equivalent basket price | Unit | Jun 2022 | Mar 20221 | ||||||||
| Nickel equivalent average basket price | R/tNi | 471,774 | 478,856 | ||||||||
| US$/tNi | 30,261 | 31,462 | |||||||||
| Nickel equivalent sustaining cost | Unit | Jun 2022 | Mar 20221 | ||||||||
| Cost of sales, before amortisation and depreciation | Rm | 1,260 | 864 | ||||||||
| Carbon tax | Rm | — | — | ||||||||
| Community costs | Rm | — | — | ||||||||
| Share-based payments | Rm | — | — | ||||||||
| Rehabilitation interest and amortisation | Rm | 1 | 1 | ||||||||
| Leases | Rm | 10 | 2 | ||||||||
| Sustaining capital expenditure | Rm | 19 | 10 | ||||||||
| Less: By-product credit | Rm | (44) | (15) | ||||||||
| Nickel equivalent sustaining cost | Rm | 1,246 | 862 | ||||||||
| Nickel Products sold | tNi | 2,976 | 1,608 | ||||||||
| Nickel equivalent sustaining cost | R/tNi | 418,683 | 536,070 | ||||||||
| US$/tNi | 26,856 | 35,221 | |||||||||
Nickel recovery yield5 | % | 99.36 | % | 98.22 | % | ||||||
Average exchange rate for the quarters ended 30 June 2022 and 31 March 2022 was R15.59/US$ and R15.22/US$, respectively
1.Amounts included since effective date of the acquisition on 4 February 2022
2.Nickel salts consist of anhydrous nickel, nickel chloride low sodium, nickel chloride standard, nickel carbonate and nickel chloride solution
3.Nickel cakes occur during the processing of nickel matte and are recycled back into the nickel refining process
4.Cobalt chloride and ferric chloride are obtained from nickel matte through a different refining process on an order basis
5.Nickel recovery yield is the percentage of total nickel recovered from the matte relative to the nickel contained in the matte received
Sibanye-Stillwater Operating and financial results | Six months ended 30 June 2022 48
ALL-IN COSTS - QUARTERS
SA and US PGM operations
Figures are in millions unless otherwise stated
| US OPERA-TIONS | SA OPERATIONS | ||||||||||||||||||||||||||||||||||
| R' million | Total US and SA PGM1 | Total US PGM2 | Total SA PGM1 | Rustenburg | Marikana1 | Kroondal | Plat Mile | Mimosa | Corporate | ||||||||||||||||||||||||||
Cost of sales, before amortisation and depreciation3 | Jun 2022 | 9,696 | 2,045 | 7,651 | 3,208 | 3,364 | 937 | 142 | 461 | (461) | |||||||||||||||||||||||||
| Mar 2022 | 10,927 | 1,797 | 9,130 | 3,451 | 4,709 | 838 | 132 | 430 | (430) | ||||||||||||||||||||||||||
| Royalties | Jun 2022 | 316 | — | 316 | 94 | 219 | 3 | — | 39 | (39) | |||||||||||||||||||||||||
| Mar 2022 | 638 | — | 638 | 365 | 269 | 4 | — | 31 | (31) | ||||||||||||||||||||||||||
| Carbon tax | Jun 2022 | 1 | — | 1 | — | 1 | — | — | — | — | |||||||||||||||||||||||||
| Mar 2022 | — | — | — | (1) | 1 | — | — | — | — | ||||||||||||||||||||||||||
| Community costs | Jun 2022 | 54 | — | 54 | — | 54 | — | — | — | — | |||||||||||||||||||||||||
| Mar 2022 | 40 | — | 40 | — | 40 | — | — | — | — | ||||||||||||||||||||||||||
| Inventory change | Jun 2022 | 913 | (108) | 1,021 | 232 | 789 | — | — | 4 | (4) | |||||||||||||||||||||||||
| Mar 2022 | (1,297) | 74 | (1,371) | (476) | (895) | — | — | (21) | 21 | ||||||||||||||||||||||||||
Share-based payments4 | Jun 2022 | 147 | 68 | 79 | 29 | 35 | 14 | 1 | — | — | |||||||||||||||||||||||||
| Mar 2022 | 35 | 14 | 21 | 8 | 10 | 3 | — | — | — | ||||||||||||||||||||||||||
Rehabilitation interest and amortisation5 | Jun 2022 | 53 | 13 | 40 | 1 | 20 | 19 | — | 11 | (11) | |||||||||||||||||||||||||
| Mar 2022 | 55 | 13 | 42 | 2 | 19 | 21 | — | 1 | (1) | ||||||||||||||||||||||||||
| Leases | Jun 2022 | 15 | 1 | 14 | 3 | 9 | 2 | — | — | — | |||||||||||||||||||||||||
| Mar 2022 | 16 | 2 | 14 | 3 | 9 | 2 | — | — | — | ||||||||||||||||||||||||||
| Ore reserve development | Jun 2022 | 1,196 | 641 | 555 | 173 | 382 | — | — | — | — | |||||||||||||||||||||||||
| Mar 2022 | 1,021 | 637 | 384 | 142 | 242 | — | — | — | — | ||||||||||||||||||||||||||
| Sustaining capital expenditure | Jun 2022 | 640 | 211 | 429 | 148 | 208 | 68 | 5 | 181 | (181) | |||||||||||||||||||||||||
| Mar 2022 | 552 | 166 | 386 | 156 | 183 | 46 | 1 | 113 | (113) | ||||||||||||||||||||||||||
| Less: By-product credit | Jun 2022 | (2,940) | (348) | (2,592) | (1,063) | (1,242) | (271) | (16) | (222) | 222 | |||||||||||||||||||||||||
| Mar 2022 | (2,350) | (385) | (1,965) | (663) | (1,104) | (178) | (20) | (162) | 162 | ||||||||||||||||||||||||||
Total All-in-sustaining costs6 | Jun 2022 | 10,091 | 2,523 | 7,568 | 2,825 | 3,839 | 772 | 132 | 474 | (474) | |||||||||||||||||||||||||
| Mar 2022 | 9,637 | 2,318 | 7,319 | 2,987 | 3,483 | 736 | 113 | 392 | (392) | ||||||||||||||||||||||||||
| Plus: Corporate cost, growth and capital expenditure | Jun 2022 | 420 | 211 | 209 | — | 209 | — | — | — | — | |||||||||||||||||||||||||
| Mar 2022 | 523 | 319 | 204 | — | 204 | — | — | — | — | ||||||||||||||||||||||||||
Total All-in-costs6 | Jun 2022 | 10,511 | 2,734 | 7,777 | 2,825 | 4,048 | 772 | 132 | 474 | (474) | |||||||||||||||||||||||||
| Mar 2022 | 10,160 | 2,637 | 7,523 | 2,987 | 3,687 | 736 | 113 | 392 | (392) | ||||||||||||||||||||||||||
| PGM production | 4Eoz - 2Eoz | Jun 2022 | 535,262 | 107,650 | 427,612 | 155,831 | 180,815 | 51,797 | 9,658 | 29,511 | — | ||||||||||||||||||||||||
| Mar 2022 | 543,929 | 122,389 | 421,540 | 149,041 | 179,794 | 49,518 | 15,144 | 28,043 | — | ||||||||||||||||||||||||||
| kg | Jun 2022 | 16,649 | 3,348 | 13,300 | 4,847 | 5,624 | 1,611 | 300 | 918 | — | |||||||||||||||||||||||||
| Mar 2022 | 16,918 | 3,807 | 13,111 | 4,636 | 5,592 | 1,540 | 471 | 872 | — | ||||||||||||||||||||||||||
| All-in-sustaining cost | R/4Eoz - R/2Eoz | Jun 2022 | 19,953 | 23,437 | 19,010 | 18,129 | 21,232 | 14,904 | 13,667 | 16,062 | — | ||||||||||||||||||||||||
| Mar 2022 | 18,680 | 18,940 | 18,600 | 20,041 | 19,372 | 14,863 | 7,462 | 13,979 | — | ||||||||||||||||||||||||||
| US$/4Eoz - US$/2Eoz | Jun 2022 | 1,280 | 1,503 | 1,219 | 1,163 | 1,362 | 956 | 877 | 1,030 | — | |||||||||||||||||||||||||
| Mar 2022 | 1,227 | 1,244 | 1,222 | 1,317 | 1,273 | 977 | 490 | 918 | — | ||||||||||||||||||||||||||
| All-in-cost | R/4Eoz - R/2Eoz | Jun 2022 | 20,783 | 25,397 | 19,535 | 18,129 | 22,388 | 14,904 | 13,667 | 16,062 | — | ||||||||||||||||||||||||
| Mar 2022 | 19,694 | 21,546 | 19,118 | 20,041 | 20,507 | 14,863 | 7,462 | 13,979 | — | ||||||||||||||||||||||||||
| US$/4Eoz - US$/2Eoz | Jun 2022 | 1,333 | 1,629 | 1,253 | 1,163 | 1,436 | 956 | 877 | 1,030 | — | |||||||||||||||||||||||||
| Mar 2022 | 1,294 | 1,416 | 1,256 | 1,317 | 1,347 | 977 | 490 | 918 | — | ||||||||||||||||||||||||||
Average exchange rate for the quarters ended 30 June 2022 and 31 March 2022 was 15.59/US$ and R15.22/US$, respectively
Figures may not add as they are rounded independently
1 The Total US and SA PGM, Total SA PGM and Marikana includes the production and costs associated with the purchase of concentrate (PoC) from third parties. For a reconciliation of the Operating cost, AISC and AIC excluding third party PoC, refer to “Reconciliation of operating cost excluding third party PoC for Total Us and SA PGM, Total SA PGM and Marikana - Quarters” and “Reconciliation of AISC and AIC excluding third party PoC for Total US and SA PGM, Total SA PGM and Marikana – Quarters”
2 US PGM operations’ underground production is converted to metric tonnes and kilograms, and performance is translated into SA rand. In addition to the US PGM operations’ underground production, the operation processes various recycling material which is excluded from the 2E PGM production, All-in sustaining cost and All-in cost statistics shown
3 Cost of sales, before amortisation and depreciation includes all mining and processing costs, third party refining costs, corporate general and administrative costs, and permitting costs
4 Share-based payments are calculated based on the fair value at initial recognition and do not include the adjustment of the cash-settled share-based payment obligation to the reporting date fair value
5 Rehabilitation includes the interest charge related to the environmental rehabilitation obligation and the amortisation of the related capitalised rehabilitation costs. The interest charge related to the environmental rehabilitation obligation and the amortisation of the capitalised rehabilitation costs reflect the periodic costs of rehabilitation associated with current PGM production
6 All-in cost is calculated in accordance with the World Gold Council guidance. All-in cost excludes income tax, costs associated with merger and acquisition activities, working capital, impairments, financing costs, one-time severance charges and items needed to normalise earnings. All-in cost is made up of All-in sustaining cost, being the cost to sustain current operations, given as a sub-total in the All-in cost calculation, together with corporate and major capital expenditure associated with growth. All-in sustaining cost per ounce (and kilogram) and All-in cost per ounce (and kilogram) are calculated by dividing the All-in sustaining cost and All-in cost, respectively, in a period by the total 4E/2E PGM produced in the same period
Sibanye-Stillwater Operating and financial results | Six months ended 30 June 2022 49
| Reconciliation of operating cost excluding third party PoC for Total US and SA PGM, Total SA PGM and Marikana - Quarters | |||||||||||||||||||||||
| Total US and SA PGM | Total SA PGM | Marikana | |||||||||||||||||||||
| R' million | Jun 2022 | Mar 2022 | Jun 2022 | Mar 2022 | Jun 2022 | Mar 2022 | |||||||||||||||||
| Cost of sales, before amortisation and depreciation as reported per table above | 9,696 | 10,927 | 7,651 | 9,130 | 3,364 | 4,709 | |||||||||||||||||
| Inventory change as reported per table above | 913 | (1,297) | 1,021 | (1,371) | 789 | (895) | |||||||||||||||||
| Less: Chrome cost of sales | (422) | (353) | (422) | (353) | (79) | (132) | |||||||||||||||||
| Total operating cost including third party PoC | 10,187 | 9,277 | 8,250 | 7,406 | 4,074 | 3,682 | |||||||||||||||||
| Less: Purchase cost of PoC | (565) | (534) | (565) | (534) | (565) | (534) | |||||||||||||||||
| Total operating cost excluding third party PoC | 9,622 | 8,743 | 7,685 | 6,872 | 3,509 | 3,148 | |||||||||||||||||
| PGM production as reported per table above | 4Eoz- 2Eoz | 535,262 | 543,929 | 427,612 | 421,540 | 180,815 | 179,794 | ||||||||||||||||
| Less: Mimosa production | (29,511) | (28,043) | (29,511) | (28,043) | — | — | |||||||||||||||||
| PGM production excluding Mimosa | 505,751 | 515,886 | 398,101 | 393,497 | 180,815 | 179,794 | |||||||||||||||||
| Less: PoC production | (14,654) | (10,692) | (14,654) | (10,692) | (14,654) | (10,692) | |||||||||||||||||
| PGM production excluding Mimosa and third party PoC | 491,097 | 505,194 | 383,447 | 382,805 | 166,161 | 169,102 | |||||||||||||||||
| PGM production including Mimosa and excluding third party PoC | 520,608 | 533,237 | 412,958 | 410,848 | 166,161 | 169,102 | |||||||||||||||||
| Tonnes milled/treated | 000't | 9,641 | 9,291 | 9,342 | 8,963 | 2,554 | 2,466 | ||||||||||||||||
| Less: Mimosa tonnes | (360) | (340) | (360) | (340) | — | — | |||||||||||||||||
| PGM tonnes excluding Mimosa and third party PoC | 9,281 | 8,951 | 8,982 | 8,623 | 2,554 | 2,466 | |||||||||||||||||
| Operating cost including third party PoC | R/4Eoz-R/2Eoz | 20,142 | 17,983 | 20,723 | 18,821 | 22,531 | 20,479 | ||||||||||||||||
| US$/4Eoz-US$/2Eoz | 1,292 | 1,182 | 1,329 | 1,237 | 1,445 | 1,346 | |||||||||||||||||
| R/t | 1,098 | 1,036 | 919 | 859 | 1,595 | 1,493 | |||||||||||||||||
| US$/t | 70 | 68 | 59 | 56 | 102 | 98 | |||||||||||||||||
| Operating cost excluding third party PoC | R/4Eoz-R/2Eoz | 19,593 | 17,306 | 20,042 | 17,952 | 21,118 | 18,616 | ||||||||||||||||
| US$/4Eoz-US$/2Eoz | 1,257 | 1,137 | 1,286 | 1,179 | 1,355 | 1,223 | |||||||||||||||||
| R/t | 1,037 | 977 | 856 | 797 | 1,374 | 1,277 | |||||||||||||||||
| US$/t | 67 | 64 | 55 | 52 | 88 | 84 | |||||||||||||||||
| Reconciliation of AISC and AIC excluding third party PoC for Total US and SA PGM, Total SA PGM and Marikana - Quarters | |||||||||||||||||||||||
| Total US and SA PGM | Total SA PGM | Marikana | |||||||||||||||||||||
| R' million | Jun 2022 | Mar 2022 | Jun 2022 | Mar 2022 | Jun 2022 | Mar 2022 | |||||||||||||||||
| Total All-in-sustaining cost as reported per table above | 10,091 | 9,637 | 7,568 | 7,319 | 3,839 | 3,483 | |||||||||||||||||
| Less: Purchase cost of PoC | (565) | (534) | (565) | (534) | (565) | (534) | |||||||||||||||||
| Add: By-product credit of PoC | 67 | 62 | 67 | 62 | 67 | 62 | |||||||||||||||||
| Total All-in-sustaining cost excluding third party PoC | 9,593 | 9,165 | 7,070 | 6,847 | 3,341 | 3,011 | |||||||||||||||||
| Plus: Corporate cost, growth and capital expenditure | 420 | 523 | 209 | 204 | 209 | 204 | |||||||||||||||||
| Total All-in-cost excluding third party PoC | 10,013 | 9,688 | 7,279 | 7,051 | 3,550 | 3,215 | |||||||||||||||||
| PGM production excluding Mimosa and third party PoC | 4Eoz- 2Eoz | 491,097 | 505,194 | 383,447 | 382,805 | 166,161 | 169,102 | ||||||||||||||||
| All-in-sustaining cost excluding third party PoC | R/4Eoz-R/2Eoz | 19,534 | 18,142 | 18,438 | 17,886 | 20,107 | 17,806 | ||||||||||||||||
| US$/4Eoz-US$/2Eoz | 1,253 | 1,192 | 1,183 | 1,175 | 1,290 | 1,170 | |||||||||||||||||
| All-in-cost excluding third party PoC | R/4Eoz-R/2Eoz | 20,389 | 19,177 | 18,983 | 18,419 | 21,365 | 19,012 | ||||||||||||||||
| US$/4Eoz-US$/2Eoz | 1,308 | 1,260 | 1,218 | 1,210 | 1,370 | 1,249 | |||||||||||||||||
Sibanye-Stillwater Operating and financial results | Six months ended 30 June 2022 50
SA gold operations
| SA OPERATIONS | |||||||||||||||||||||||||||||
| R' million | Total SA gold | Driefontein | Kloof | Beatrix | Cooke | DRDGOLD | Corporate | ||||||||||||||||||||||
Cost of sales, before amortisation and depreciation1 | Jun 2022 | 3,784 | 915 | 1,059 | 701 | 154 | 955 | — | |||||||||||||||||||||
| Mar 2022 | 4,775 | 1,378 | 1,757 | 581 | 172 | 887 | — | ||||||||||||||||||||||
| Royalties | Jun 2022 | 2 | — | — | 1 | 1 | — | — | |||||||||||||||||||||
| Mar 2022 | 15 | 7 | 6 | 1 | 1 | — | — | ||||||||||||||||||||||
| Carbon tax | Jun 2022 | 1 | — | — | 1 | — | — | — | |||||||||||||||||||||
| Mar 2022 | (12) | — | — | (12) | — | — | — | ||||||||||||||||||||||
| Community costs | Jun 2022 | 33 | 12 | 10 | 8 | — | 3 | — | |||||||||||||||||||||
| Mar 2022 | 34 | 13 | 10 | 9 | — | 2 | — | ||||||||||||||||||||||
Share-based payments2 | Jun 2022 | 51 | 21 | 15 | 10 | — | 5 | — | |||||||||||||||||||||
| Mar 2022 | 19 | 4 | 6 | 4 | — | 5 | — | ||||||||||||||||||||||
Rehabilitation interest and amortisation3 | Jun 2022 | 31 | 8 | (2) | 10 | 12 | 2 | 1 | |||||||||||||||||||||
| Mar 2022 | 36 | 8 | (1) | 10 | 13 | 5 | 1 | ||||||||||||||||||||||
| Leases | Jun 2022 | 21 | 1 | 4 | 7 | 1 | 8 | — | |||||||||||||||||||||
| Mar 2022 | 19 | 1 | 4 | 7 | 2 | 5 | — | ||||||||||||||||||||||
| Ore reserve development | Jun 2022 | — | — | — | — | — | — | — | |||||||||||||||||||||
| Mar 2022 | 468 | 252 | 185 | 31 | — | — | — | ||||||||||||||||||||||
| Sustaining capital expenditure | Jun 2022 | 455 | 35 | 58 | 32 | — | 330 | — | |||||||||||||||||||||
| Mar 2022 | 270 | 61 | 94 | 35 | — | 80 | — | ||||||||||||||||||||||
| Less: By-product credit | Jun 2022 | (2) | — | — | — | — | (2) | — | |||||||||||||||||||||
| Mar 2022 | (5) | (1) | (1) | — | — | (3) | — | ||||||||||||||||||||||
Total All-in-sustaining costs4 | Jun 2022 | 4,376 | 992 | 1,144 | 770 | 168 | 1,301 | 1 | |||||||||||||||||||||
| Mar 2022 | 5,619 | 1,723 | 2,060 | 666 | 188 | 981 | 1 | ||||||||||||||||||||||
| Plus: Corporate cost, growth and capital expenditure | Jun 2022 | 246 | — | 20 | — | — | (17) | 243 | |||||||||||||||||||||
| Mar 2022 | 194 | — | 35 | 4 | — | 23 | 132 | ||||||||||||||||||||||
Total All-in-costs4 | Jun 2022 | 4,622 | 992 | 1,164 | 770 | 168 | 1,284 | 244 | |||||||||||||||||||||
| Mar 2022 | 5,813 | 1,723 | 2,095 | 670 | 188 | 1,004 | 133 | ||||||||||||||||||||||
| Gold sold | kg | Jun 2022 | 1,735 | 9 | 15 | 106 | 159 | 1,446 | — | ||||||||||||||||||||
| Mar 2022 | 4,746 | 1,594 | 1,409 | 159 | 207 | 1,377 | — | ||||||||||||||||||||||
| oz | Jun 2022 | 55,782 | 289 | 482 | 3,408 | 5,112 | 46,490 | — | |||||||||||||||||||||
| Mar 2022 | 152,587 | 51,248 | 45,300 | 5,112 | 6,655 | 44,272 | — | ||||||||||||||||||||||
| All-in-sustaining cost | R/kg | Jun 2022 | 2,522,190 | 110,222,222 | 76,266,667 | 7,264,151 | 1,056,604 | 899,723 | — | ||||||||||||||||||||
| Mar 2022 | 1,183,944 | 1,080,928 | 1,462,030 | 4,188,679 | 908,213 | 712,418 | — | ||||||||||||||||||||||
| All-in-sustaining cost | US$/oz | Jun 2022 | 5,032 | 219,903 | 152,159 | 14,493 | 2,108 | 1,795 | — | ||||||||||||||||||||
| Mar 2022 | 2,420 | 2,209 | 2,988 | 8,560 | 1,856 | 1,456 | — | ||||||||||||||||||||||
| All-in-cost | R/kg | Jun 2022 | 2,663,977 | 110,222,222 | 77,600,000 | 7,264,151 | 1,056,604 | 887,967 | — | ||||||||||||||||||||
| Mar 2022 | 1,224,821 | 1,080,928 | 1,486,870 | 4,213,836 | 908,213 | 729,121 | — | ||||||||||||||||||||||
| All-in-cost | US$/oz | Jun 2022 | 5,315 | 219,903 | 154,819 | 14,493 | 2,108 | 1,772 | — | ||||||||||||||||||||
| Mar 2022 | 2,503 | 2,209 | 3,039 | 8,611 | 1,856 | 1,490 | — | ||||||||||||||||||||||
Average exchange rate for the quarters ended 30 June 2022 and 31 March 2022 was R15.59/US$ and R15.22/US$, respectively
Figures may not add as they are rounded independently
1 Cost of sales, before amortisation and depreciation includes all mining and processing costs, third party refining costs, corporate general and administrative costs, and permitting costs
2 Share-based payments are calculated based on the fair value at initial recognition and do not include the adjustment of the cash-settled share-based payment obligation to the reporting date fair value
3 Rehabilitation includes the interest charge related to the environmental rehabilitation obligation and the amortisation of the related capitalised rehabilitation costs. The interest charge related to the environmental rehabilitation obligation and the amortisation of the capitalised rehabilitation costs reflect the periodic costs of rehabilitation associated with current gold production
4 All-in cost is calculated in accordance with the World Gold Council guidance. All-in cost excludes income tax, costs associated with merger and acquisition activities, working capital, impairments, financing costs, one time severance charges and items needed to normalise earnings. All-in cost is made up of All-in sustaining cost, being the cost to sustain current operations, given as a sub-total in the All-in cost calculation, together with corporate and major capital expenditure associated with growth. All-in sustaining cost per kilogram (and ounce) and All-in cost per kilogram (and ounce) are calculated by dividing the All-in sustaining cost and All-in cost, respectively, in a period by the total gold sold over the same period
Sibanye-Stillwater Operating and financial results | Six months ended 30 June 2022 51
DEVELOPMENT RESULTS
Development values represent the actual results of sampling and no allowance has been made for any adjustments which may be necessary when estimating ore reserves. All figures below exclude shaft sinking metres, which are reported separately where appropriate.
| US PGM operations | |||||||||||||||||||||||||||||||||||||||||||||||||||||||||||
| Quarter ended | Jun 2022 | Mar 2022 | Six months ended 30 June 2022 | ||||||||||||||||||||||||||||||||||||||||||||||||||||||||
| Reef | Stillwater incl Blitz | East Boulder | Stillwater incl Blitz | East Boulder | Stillwater incl Blitz | East Boulder | |||||||||||||||||||||||||||||||||||||||||||||||||||||
| Total US PGM | Unit | ||||||||||||||||||||||||||||||||||||||||||||||||||||||||||
| Primary development (off reef) | (m) | 1,576 | 206 | 1,852 | 667 | 3,428 | 872 | ||||||||||||||||||||||||||||||||||||||||||||||||||||
| Secondary development | (m) | 2,755 | 1,495 | 2,899 | 1,086 | 5,653 | 2,581 | ||||||||||||||||||||||||||||||||||||||||||||||||||||
| SA PGM operations | |||||||||||||||||||||||||||||||||||||||||||||||||||||||||||
| Quarter ended | Jun 2022 | Mar 2022 | Six months ended 30 June 2022 | ||||||||||||||||||||||||||||||||||||||||||||||||||||||||
| Reef | Bathopele | Thembe- lani | Khuseleka | Siphume-lele | Bathopele | Thembe-lani | Khuseleka | Siphume-lele | Bathopele | Thembe-lani | Khuseleka | Siphume-lele | |||||||||||||||||||||||||||||||||||||||||||||||
| Rustenburg | Unit | ||||||||||||||||||||||||||||||||||||||||||||||||||||||||||
| Advanced | (m) | 404 | 1,695 | 3,015 | 712 | 343 | 1,393 | 2,220 | 559 | 747 | 3,088 | 5,235 | 1,271 | ||||||||||||||||||||||||||||||||||||||||||||||
| Advanced on reef | (m) | 404 | 756 | 1,129 | 339 | 343 | 604 | 892 | 317 | 747 | 1,360 | 2,022 | 656 | ||||||||||||||||||||||||||||||||||||||||||||||
| Height | (cm) | 212 | 300 | 285 | 275 | 212 | 293 | 281 | 274 | 212 | 296 | 284 | 274 | ||||||||||||||||||||||||||||||||||||||||||||||
| Average value | (g/t) | 3.0 | 2.4 | 2.2 | 3.1 | 2.8 | 2.4 | 2.1 | 2.9 | 2.9 | 2.4 | 2.2 | 3.1 | ||||||||||||||||||||||||||||||||||||||||||||||
| (cm.g/t) | 643 | 717 | 617 | 860 | 601 | 691 | 600 | 806 | 622 | 704 | 610 | 835 | |||||||||||||||||||||||||||||||||||||||||||||||
| Quarter ended | Jun 2022 | Mar 2022 | Six months ended 30 June 2022 | ||||||||||||||||||||||||||||||||||||||||||||||||||||||||
| Reef | K3 | Rowland | Saffy | E3 | 4B | K4 | K3 | Rowland | Saffy | E3 | 4B | K4 | K3 | Rowland | Saffy | E3 | 4B | K4 | |||||||||||||||||||||||||||||||||||||||||
| Marikana | Unit | ||||||||||||||||||||||||||||||||||||||||||||||||||||||||||
| Primary development | (m) | 8,535 | 4,928 | 4,049 | 780 | 968 | 908 | 6,678 | 4,641 | 3,122 | 649 | 789 | 29 | 15,213 | 9,569 | 7,171 | 1,429 | 1,757 | 936 | ||||||||||||||||||||||||||||||||||||||||
| Primary development - on reef | (m) | 6,322 | 3,168 | 2,378 | 343 | 623 | 169 | 5,138 | 3,366 | 2,049 | 381 | 565 | 2 | 11,460 | 6,535 | 4,427 | 724 | 1,189 | 171 | ||||||||||||||||||||||||||||||||||||||||
| Height | (cm) | 216 | 219 | 234 | 217 | 221 | 237 | 217 | 220 | 224 | 215 | 222 | 230 | 216 | 219 | 229 | 216 | 222 | 236 | ||||||||||||||||||||||||||||||||||||||||
| Average value | (g/t) | 2.8 | 2.6 | 2.5 | 2.9 | 2.9 | 2.9 | 2.8 | 2.6 | 2.5 | 2.8 | 2.8 | 3.0 | 2.8 | 2.6 | 2.5 | 2.9 | 2.8 | 2.9 | ||||||||||||||||||||||||||||||||||||||||
| (cm.g/t) | 602 | 570 | 574 | 635 | 635 | 676 | 607 | 572 | 553 | 603 | 620 | 700 | 604 | 571 | 564 | 619 | 627 | 678 | |||||||||||||||||||||||||||||||||||||||||
| Quarter ended | Jun 2022 | Mar 2022 | Six months ended 30 June 2022 | ||||||||||||||||||||||||||||||||||||||||||||||||||||||||
| Reef | Kopaneng | Bamba-nani | Kwezi | K6 | Kopaneng | Bamba-nani | Kwezi | K6 | Kopaneng | Bamba-nani | Kwezi | K6 | |||||||||||||||||||||||||||||||||||||||||||||||
| Kroondal | Unit | ||||||||||||||||||||||||||||||||||||||||||||||||||||||||||
| Advanced | (m) | 527 | 843 | 501 | 395 | 478 | 533 | 553 | 210 | 1,005 | 1,376 | 1,054 | 605 | ||||||||||||||||||||||||||||||||||||||||||||||
| Advanced on reef | (m) | 376 | 422 | 250 | 331 | 261 | 390 | 210 | 82 | 637 | 812 | 461 | 413 | ||||||||||||||||||||||||||||||||||||||||||||||
| Height | (cm) | 245 | 215 | 222 | 229 | 229 | 214 | 213 | 261 | 238 | 215 | 218 | 243 | ||||||||||||||||||||||||||||||||||||||||||||||
| Average value | (g/t) | 1.5 | 1.5 | 1.3 | 1.9 | 1.2 | 1.9 | 1.1 | 0.7 | 1.4 | 1.7 | 1.2 | 1.3 | ||||||||||||||||||||||||||||||||||||||||||||||
| (cm.g/t) | 376 | 325 | 278 | 424 | 270 | 415 | 224 | 173 | 329 | 361 | 250 | 323 | |||||||||||||||||||||||||||||||||||||||||||||||
Sibanye-Stillwater Operating and financial results | Six months ended 30 June 2022 52
| SA gold operations | |||||||||||||||||||||||||||||||||||||||||||||||||||||||||||
| Quarter ended | Jun 2022 | Mar 2022 | Six months ended 30 June 2022 | ||||||||||||||||||||||||||||||||||||||||||||||||||||||||
| Reef | Carbon leader | Main | VCR | Carbon leader | Main | VCR | Carbon leader | Main | VCR | ||||||||||||||||||||||||||||||||||||||||||||||||||
| Driefontein | Unit | ||||||||||||||||||||||||||||||||||||||||||||||||||||||||||
| Advanced | (m) | — | — | — | 676 | 293 | 958 | 676 | 293 | 958 | |||||||||||||||||||||||||||||||||||||||||||||||||
| Advanced on reef | (m) | — | — | — | 118 | 90 | 258 | 118 | 90 | 258 | |||||||||||||||||||||||||||||||||||||||||||||||||
| Channel width | (cm) | — | — | — | 22 | 59 | 72 | 22 | 59 | 72 | |||||||||||||||||||||||||||||||||||||||||||||||||
| Average value | (g/t) | — | — | — | 36.3 | 11.0 | 47.3 | 36.3 | 11.0 | 47.3 | |||||||||||||||||||||||||||||||||||||||||||||||||
| (cm.g/t) | — | — | — | 818 | 644 | 3,422 | 818 | 644 | 3,422 | ||||||||||||||||||||||||||||||||||||||||||||||||||
| Quarter ended | Jun 2022 | Mar 2022 | Six months ended 30 June 2022 | ||||||||||||||||||||||||||||||||||||||||||||||||||||||||
| Reef | Kloof | Main | Libanon | VCR | Kloof | Main | Libanon | VCR | Kloof | Main | Libanon | VCR | |||||||||||||||||||||||||||||||||||||||||||||||
| Kloof | Unit | ||||||||||||||||||||||||||||||||||||||||||||||||||||||||||
| Advanced | (m) | — | — | — | — | 998 | 375 | 20 | 839 | 998 | 375 | 20 | 839 | ||||||||||||||||||||||||||||||||||||||||||||||
| Advanced on reef | (m) | — | — | — | — | 266 | 102 | 20 | 122 | 266 | 102 | 20 | 122 | ||||||||||||||||||||||||||||||||||||||||||||||
| Channel width | (cm) | — | — | — | — | 143 | 99 | 110 | 99 | 143 | 99 | 110 | 99 | ||||||||||||||||||||||||||||||||||||||||||||||
| Average value | (g/t) | — | — | — | — | 13.0 | 10.8 | 2.5 | 13.4 | 13.0 | 10.8 | 2.5 | 13.4 | ||||||||||||||||||||||||||||||||||||||||||||||
| (cm.g/t) | — | — | — | — | 1,861 | 1,061 | 279 | 1,321 | 1,861 | 1,061 | 279 | 1,321 | |||||||||||||||||||||||||||||||||||||||||||||||
| Quarter ended | Jun 2022 | Mar 2022 | Six months ended 30 June 2022 | ||||||||||||||||||||||||||||||||||||||||||||||||||||||||
| Reef | Beatrix | Kalkoen-krans | Beatrix | Kalkoen-krans | Beatrix | Kalkoen-krans | |||||||||||||||||||||||||||||||||||||||||||||||||||||
| Beatrix | Unit | ||||||||||||||||||||||||||||||||||||||||||||||||||||||||||
| Advanced | (m) | — | — | 787 | 53 | 787 | 53 | ||||||||||||||||||||||||||||||||||||||||||||||||||||
| Advanced on reef | (m) | — | — | 231 | — | 231 | — | ||||||||||||||||||||||||||||||||||||||||||||||||||||
| Channel width | (cm) | — | — | 132 | — | 132 | — | ||||||||||||||||||||||||||||||||||||||||||||||||||||
| Average value | (g/t) | — | — | 9 | — | 8.7 | — | ||||||||||||||||||||||||||||||||||||||||||||||||||||
| (cm.g/t) | — | — | 1,141 | — | 1,141 | — | |||||||||||||||||||||||||||||||||||||||||||||||||||||
| Quarter ended | Jun 2022 | Mar 2022 | Six months ended 30 June 2022 | ||||||||||||||||||||||||||||||||||||||||||||||||||||||||
| Reef | Kimberley | Kimberley | Kimberley | ||||||||||||||||||||||||||||||||||||||||||||||||||||||||
| Burnstone | Unit | ||||||||||||||||||||||||||||||||||||||||||||||||||||||||||
| Advanced | (m) | — | 38 | 38 | |||||||||||||||||||||||||||||||||||||||||||||||||||||||
| Advanced on reef | (m) | — | — | — | |||||||||||||||||||||||||||||||||||||||||||||||||||||||
| Channel width | (cm) | — | — | — | |||||||||||||||||||||||||||||||||||||||||||||||||||||||
| Average value | (g/t) | — | — | — | |||||||||||||||||||||||||||||||||||||||||||||||||||||||
| (cm.g/t) | — | — | — | ||||||||||||||||||||||||||||||||||||||||||||||||||||||||
Sibanye-Stillwater Operating and financial results | Six months ended 30 June 2022 53
ADMINISTRATION AND CORPORATE
SIBANYE STILLWATER LIMITED (SIBANYE-STILLWATER) Incorporated in the Republic of South Africa Registration number 2014/243852/06 Share code: SSW and SBSW Issuer code: SSW ISIN: ZAE000259701 LISTINGS JSE: SSW NYSE: SBSW WEBSITE  www.sibanyestillwater.com www.sibanyestillwater.comREGISTERED AND CORPORATE OFFICE Constantia Office Park Bridgeview House, Building 11, Ground floor, Cnr 14th Avenue & Hendrik Potgieter Road Weltevreden Park 1709 South Africa Private Bag X5 Westonaria 1780 South Africa Tel: +27 11 278 9600 Fax: +27 11 278 9863 COMPANY SECRETARY Lerato Matlosa Email: lerato.matlosa@sibanyestillwater.com DIRECTORS Dr Vincent Maphai* (Chairman) Neal Froneman (CEO) Charl Keyter (CFO) Dr Elaine Dorward-King* Harry Kenyon-Slaney* Jeremiah Vilakazi* Keith Rayner* Nkosemntu Nika* Richard Menell*^ Savannah Danson* Susan van der Merwe* Timothy Cumming* Sindiswa Zilwa* * Independent non-executive ^ Lead independent director INVESTOR ENQUIRIES James Wellsted Executive Vice President: Investor Relations and Corporate Affairs Mobile: +27 83 453 4014 Email: james.wellsted@sibanyestillwater.com or ir@sibanyestillwater.com | JSE SPONSOR JP Morgan Equities South Africa Proprietary Limited Registration number 1995/011815/07 1 Fricker Road Illovo Johannesburg 2196 South Africa Private Bag X9936 Sandton 2146 South Africa AUDITORS Ernst & Young Inc. (EY) 102 Rivonia Road Sandton 2196 South Africa Private Bag X14 Sandton 2146 South Africa Tel: +27 11 772 3000 AMERICAN DEPOSITARY RECEIPTS TRANSFER AGENT BNY Mellon Shareowner Correspondence (ADR) PO Box 505000 Louisville KY 40233-5000 US toll free: +1 866 247 3871 Tel: +1 201 680 6825 Email: shrrelations@cpushareownerservices.com Tatyana Vesselovskaya Relationship Manager BNY Mellon Depositary Receipts Direct line: +1 212 815 2867 Mobile: +1 203 609 5159 Fax: +1 212 571 3050 Email: tatyana.vesselovskaya@bnymellon.com TRANSFER SECRETARIES SOUTH AFRICA Computershare Investor Services Proprietary Limited Rosebank Towers 15 Biermann Avenue Rosebank 2196 PO Box 61051 Marshalltown 2107 South Africa Tel: +27 11 370 5000 Fax: +27 11 688 5248 | ||||
Sibanye-Stillwater Operating and financial results | Six months ended 30 June 2022 54
DISCLAIMER
FORWARD LOOKING STATEMENTS
The information in this document may contain forward-looking statements within the meaning of the “safe harbour” provisions of the United States Private Securities Litigation Reform Act of 1995. These forward-looking statements, including, among others, those relating to Sibanye Stillwater Limited’s (“Sibanye-Stillwater” or the “Group”) financial positions, business strategies, plans and objectives of management for future operations, are necessarily estimates reflecting the best judgment of the senior management and directors of Sibanye-Stillwater and involve a number of risks and uncertainties that could cause actual results to differ materially from those suggested by the forward-looking statements. As a consequence, these forward-looking statements should be considered in light of various important factors, including those set forth in this document.
All statements other than statements of historical facts included in this document may be forward-looking statements. Forward-looking statements also often use words such as “will”, “would”, “expect”, “forecast”, “potential”, “may”, “could”, “believe”, “aim”, “anticipate”, “target”, “estimate” and words of similar meaning. By their nature, forward-looking statements involve risk and uncertainty because they relate to future events and circumstances and should be considered in light of various important factors, including those set forth in this disclaimer. Readers are cautioned not to place undue reliance on such statements.
The important factors that could cause Sibanye-Stillwater’s actual results, performance or achievements to differ materially from estimates or projections contained in the forward-looking statements include, without limitation, Sibanye-Stillwater’s future financial position, plans, strategies, objectives, capital expenditures, projected costs and anticipated cost savings, financing plans, debt position and ability to reduce debt leverage; economic, business, political and social conditions in South Africa, Zimbabwe, the United States and elsewhere; plans and objectives of management for future operations; Sibanye-Stillwater’s ability to obtain the benefits of any streaming arrangements or pipeline financing; the ability of Sibanye-Stillwater to comply with loan and other covenants and restrictions and difficulties in obtaining additional financing or refinancing; Sibanye-Stillwater’s ability to service its bond instruments; changes in assumptions underlying Sibanye-Stillwater’s estimation of its current mineral reserves; any failure of a tailings storage facility; the ability to achieve anticipated efficiencies and other cost savings in connection with, and the ability to successfully integrate, past, ongoing and future acquisitions, as well as at existing operations; the ability of Sibanye-Stillwater to complete any ongoing or future acquisitions; the success of Sibanye-Stillwater’s business strategy and exploration and development activities, including any proposed, anticipated or planned expansions into the battery metals or adjacent sectors and estimations or expectations of enterprise value; the ability of Sibanye-Stillwater to comply with requirements that it operate in ways that provide progressive benefits to affected communities; changes in the market price of gold, PGMs, battery metals (e.g., nickel, lithium, copper and zinc) and the cost of power, petroleum fuels, and oil, among other commodities and supply requirements; the occurrence of hazards associated with underground and surface mining; any further downgrade of South Africa’s credit rating; a challenge regarding the title to any of Sibanye-Stillwater’s properties by claimants to land under restitution and other legislation; Sibanye-Stillwater’s ability to implement its strategy and any changes thereto; the outcome of legal challenges to the Group's mining or other land use rights; the occurrence of labour disputes, disruptions and industrial actions; the availability, terms and deployment of capital or credit; changes in the imposition of industry standards, regulatory costs and relevant government regulations, particularly environmental, sustainability, tax, health and safety regulations and new legislation affecting water, mining, mineral rights and business ownership, including any interpretation thereof which may be subject to dispute; the outcome and consequence of any potential or pending litigation or regulatory proceedings, including in relation to any environmental, health or safety issues; failure to meet ethical standards, including actual or alleged instances of fraud, bribery or corruption; the effect of climate change or other extreme weather events on Sibanye-Stillwater’s business; the concentration of all final refining activity and a large portion of Sibanye-Stillwater’s PGM sales from mine production in the United States with one entity; the identification of a material weakness in disclosure and internal controls over financial reporting; the effect of US tax reform legislation on Sibanye-Stillwater and its subsidiaries; the effect of South African Exchange Control Regulations on Sibanye-Stillwater’s financial flexibility; operating in new geographies and regulatory environments where Sibanye-Stillwater has no previous experience; power disruptions, constraints and cost increases; supply chain disruptions and shortages and increases in the price of production inputs; the regional concentration of Sibanye-Stillwater’s operations; fluctuations in exchange rates, currency devaluations, inflation and other macro-economic monetary policies; the occurrence of temporary stoppages or precautionary suspension of operations at its mines for safety or environmental incidents (including natural disasters) and unplanned maintenance; Sibanye-Stillwater’s ability to hire and retain senior management or sufficient technically skilled employees, as well as its ability to achieve sufficient representation of historically disadvantaged South Africans in its management positions; failure of Sibanye-Stillwater’s information technology, communications and systems; the adequacy of Sibanye-Stillwater’s insurance coverage; social unrest, sickness or natural or man-made disaster at informal settlements in the vicinity of some of Sibanye-Stillwater’s South African-based operations; and the impact of HIV, tuberculosis and the spread of other contagious diseases, such as the coronavirus disease (COVID-19). Further details of potential risks and uncertainties affecting Sibanye-Stillwater are described in Sibanye-Stillwater’s filings with the Johannesburg Stock Exchange and the United States Securities and Exchange Commission, including the 2021 Integrated Report and the annual report on Form 20-F for the fiscal year ended 31 December 2021.
These forward-looking statements speak only as of the date of the content. Sibanye-Stillwater expressly disclaims any obligation or undertaking to update or revise any forward-looking statement (except to the extent legally required). These forward-looking statements have not been reviewed or reported on by the Group’s external auditors.
NON-IFRS MEASURES
The information in this document contains certain non-IFRS measures, including adjusted EBITDA, AISC and AIC. These measures may not be comparable to similarly-titled measures used by other companies and are not measures of Sibanye-Stillwater’s financial performance under IFRS. These measures should not be considered in isolation or as a substitute for measures of performance prepared in accordance with IFRS. Sibanye-Stillwater is not providing a reconciliation of the forecast non-IFRS financial information presented in this report because it is unable to provide this reconciliation without unreasonable effort.
WEBSITES
References in this document to information on websites (and/or social media sites) are included as an aid to their location and such information is not incorporated in, and does not form part of, this report.
Sibanye-Stillwater Operating and financial results | Six months ended 30 June 2022 55