Exhibit 99.1
Johannesburg, 3 November 2022: Sibanye Stillwater Limited (Sibanye-Stillwater or the Group) (JSE: SSW and NYSE: SBSW) is pleased to provide an operating update for the quarter ended 30 September 2022, Group financial results are only provided on a six-monthly basis.
SALIENT FEATURES - QUARTER ENDED 30 SEPTEMBER 2022 (Q3 2022) COMPARED TO QUARTER ENDED 30 SEPTEMBER 2021 (Q3 2021)
•Production build-up to planned levels at the SA gold and Stillwater operation achieved during October 2022
•SA PGM operations impacted by Eskom load curtailment
•Five-year wage agreements concluded at the SA PGM Marikana and Rustenburg operations
•The K4 project is slightly ahead of budget and schedule and delivered initial 4E PGM production of 914 4Eoz during Q3 2022
•Increase stake in Keliber to 84.96%, securing majority control of the advanced Finnish lithium hydroxide project
| US dollar | SA rand | |||||||||||||||||||||||||||||||
| Quarter ended | Quarter ended | |||||||||||||||||||||||||||||||
| Sep 2021 | Jun 2022 | Sep 2022 | KEY STATISTICS | Sep 2022 | Jun 2022 | Sep 2021 | ||||||||||||||||||||||||||
| GROUP | ||||||||||||||||||||||||||||||||
| 1,017 | 571 | 496 | US$m | Adjusted EBITDA1 | Rm | 8,455 | 8,897 | 14,877 | ||||||||||||||||||||||||
| 14.63 | 15.59 | 17.05 | R/US$ | Average exchange rate using daily closing rate | ||||||||||||||||||||||||||||
| AMERICAS REGION | ||||||||||||||||||||||||||||||||
US PGM underground operations2,3 | ||||||||||||||||||||||||||||||||
| 144,325 | 107,650 | 85,889 | oz | 2E PGM production2,3 | kg | 2,671 | 3,348 | 4,489 | ||||||||||||||||||||||||
| 2,114 | 1,828 | 1,811 | US$/2Eoz | Average basket price | R/2Eoz | 30,878 | 28,499 | 30,924 | ||||||||||||||||||||||||
| 179 | 122 | 52 | US$m | Adjusted EBITDA1 | Rm | 895 | 1,909 | 2,622 | ||||||||||||||||||||||||
| 968 | 1,503 | 1,815 | US$/2Eoz | All-in sustaining cost4 | R/2Eoz | 30,947 | 23,437 | 14,156 | ||||||||||||||||||||||||
US PGM recycling2,3 | ||||||||||||||||||||||||||||||||
| 179,765 | 170,462 | 141,560 | oz | 3E PGM recycling2,3 | kg | 4,403 | 5,302 | 5,591 | ||||||||||||||||||||||||
| 4,386 | 2,799 | 3,378 | US$/3Eoz | Average basket price | R/3Eoz | 57,595 | 43,636 | 64,167 | ||||||||||||||||||||||||
| 30 | 21 | 22 | US$m | Adjusted EBITDA1 | Rm | 371 | 335 | 436 | ||||||||||||||||||||||||
| SOUTHERN AFRICA (SA) OPERATIONS | ||||||||||||||||||||||||||||||||
PGM operations3 | ||||||||||||||||||||||||||||||||
| 500,073 | 412,958 | 432,143 | oz | 4E PGM production3,5 | kg | 13,441 | 12,844 | 15,554 | ||||||||||||||||||||||||
| 2,895 | 2,675 | 2,479 | US$/4Eoz | Average basket price | R/4Eoz | 42,269 | 41,699 | 42,347 | ||||||||||||||||||||||||
| 721 | 578 | 489 | US$m | Adjusted EBITDA1 | Rm | 8,332 | 9,012 | 10,542 | ||||||||||||||||||||||||
| 1,093 | 1,183 | 1,127 | US$/4Eoz | All-in sustaining cost4 | R/4Eoz | 19,211 | 18,438 | 15,992 | ||||||||||||||||||||||||
| Gold operations | ||||||||||||||||||||||||||||||||
| 293,761 | 54,592 | 204,672 | oz | Gold produced | kg | 6,366 | 1,698 | 9,137 | ||||||||||||||||||||||||
| 1,781 | 1,877 | 1,723 | US$/oz | Average gold price | R/kg | 944,316 | 940,634 | 837,799 | ||||||||||||||||||||||||
| 97 | (156) | (48) | US$m | Adjusted EBITDA1 | Rm | (811) | (2,426) | 1,421 | ||||||||||||||||||||||||
| 1,692 | 5,032 | 2,207 | US$/oz | All-in sustaining cost4 | R/kg | 1,210,049 | 2,522,190 | 796,008 | ||||||||||||||||||||||||
| EUROPEAN REGION | ||||||||||||||||||||||||||||||||
| Battery Metals - Sandouville refinery | ||||||||||||||||||||||||||||||||
| — | 2,919 | 1,653 | tNi | Nickel Production6 | tNi | 1,653 | 2,919 | — | ||||||||||||||||||||||||
| — | 30,261 | 22,553 | US$/tNi | Nickel equivalent average basket price7 | R/tNi | 384,525 | 471,774 | — | ||||||||||||||||||||||||
| — | 9 | (14) | US$m | Adjusted EBITDA1 | Rm | (246) | 148 | — | ||||||||||||||||||||||||
| — | 26,856 | 30,185 | US$/tNi | Nickel equivalent sustaining cost8 | R/tNi | 514,654 | 418,683 | — | ||||||||||||||||||||||||
1The Group reports adjusted earnings before interest, taxes, depreciation and amortisation (EBITDA) based on the formula included in the facility agreements for compliance with the debt covenant formula. Adjusted EBITDA may not be comparable to similarly titled measures of other companies. Adjusted EBITDA is not a measure of performance under IFRS and should be considered in addition to and not as a substitute for other measures of financial performance and liquidity. For a reconciliation of profit/(loss) before royalties and tax to adjusted EBITDA, see "Adjusted EBITDA reconciliation - Quarters"
2The US PGM operations’ underground production is converted to metric tonnes and kilograms, and performance is translated to SA rand (rand). In addition to the US PGM operations’ underground production, the operation treats recycling material which is excluded from the 2E PGM production, average basket price and All-in sustaining cost statistics shown. PGM recycling represents palladium, platinum, and rhodium ounces fed to the furnace
3The Platinum Group Metals (PGM) production in the SA operations is principally platinum, palladium, rhodium and gold, referred to as 4E (3PGM+Au), and in the US operations is principally platinum and palladium, referred to as 2E (2PGM) and US PGM recycling is principally platinum, palladium and rhodium referred to as 3E (3PGM)
4See “Salient features and cost benchmarks - Quarters” for the definition of All-in sustaining cost (AISC)
Sibanye-Stillwater Operating update | Quarter ended 30 September 2022 1
5The SA PGM production excludes the production associated with the purchase of concentrate (PoC) from third parties. For a reconciliation of the production including third party PoC, refer to the "Reconciliation of operating cost excluding third party PoC for Total US and SA PGM, Total SA PGM and Marikana - Quarters"
6The nickel production at the Sandouville refinery operations is principally nickel metal and nickel salts (liquid form), together referred to as nickel equivalent products
7The nickel equivalent average basket price per ton is the total nickel revenue adjusted for other income - non-product sales divided by the total nickel equivalent tons sold
8See "Salient features and cost benchmarks - Quarters Sibanye-Stillwater Sandouville Refinery" for a reconciliation of cost of sales before amortisation and depreciation to nickel equivalent sustaining cost
| Stock data for the Quarter ended 30 September 2022 | JSE Limited - (SSW) | ||||||||||
| Number of shares in issue | Price range per ordinary share (High/Low) | R35.74 to R43.67 | |||||||||
| - at 30 September 2022 | 2,830,238,200 | Average daily volume | 11,117,281 | ||||||||
| - weighted average | 2,830,102,345 | NYSE - (SBSW); one ADR represents four ordinary shares | |||||||||
| Free Float | 99 | % | Price range per ADR (High/Low) | US$8.16 to US$10.66 | |||||||
| Bloomberg/Reuters | SSWSJ/SSWJ.J | Average daily volume | 3,251,823 | ||||||||
Sibanye-Stillwater Operating update | Quarter ended 30 September 2022 2
OVERVIEW FOR THE QUARTER ENDED 30 SEPTEMBER 2022 COMPARED TO QUARTER ENDED 30 SEPTEMBER 2021
The Group has successfully navigated a challenging period, with production from the SA gold and the Stillwater operation building up during Q3 2022 from the operational disruptions which occurred in the first half of the year and returning to normalised levels of production during October 2022 at both of these operations. The SA PGM operations continued to deliver consistent operational results despite challenges associated with Eskom load curtailment and the increased incidence of copper cable theft, which disrupted operations during Q3 2022.
Significantly, a five-year wage agreement has been reached with the representative unions at the Rustenburg and Marikana operations. This historic agreement, which was achieved peacefully, timeously and without the disruption experienced during the SA gold operations' wage negotiations earlier this year, is expected to set the scene for five years of relative stability.
Despite deterioration in the global political and economic environment during the course of 2022, precious metals prices have remained well supported and within historically high price ranges. Greater operational stability across the Group, should enable improved cost management for 2023, ensuring more stable earnings and cash flow and consolidating the already robust Group financial position.
SAFE PRODUCTION
The improvement in Group safety indicators following reprioritisation of safety initiatives from mid-2021 and subsequent roll out of the "Fatal Elimination Strategy" in January 2022, has been maintained during Q3 2022. The Group fatal injury frequency rate (FIFR) (per million hours worked), excluding Sandouville (which was incorporated from Q1 2022) improved from 0.07 for Q3 2021 to 0.05 for Q3 2022, with the serious injury frequency rate (SIFR) improving by 10% to 2.83 from 3.13 for Q3 2021. The Group lost day injury frequency rate (LDIFR) also improved, by 9%, from 5.08 to 4.65, with the Group total recordable injury frequency rate (TRIFR) improving 13% year-on-year, from 6.20 to 5.40.
Not only has the sustained focus on and implementation of the "Fatal Elimination Strategy" led to reduced fatalities, but also to improved injury metrics. Group fatalities have reduced by 64%, from eleven for the first nine months of 2021, to four for the same period in 2022. The SA gold and US PGM operations also recorded another fatality free quarter despite the risks associated with resuming operations. This follows Q2 2022, which was fatality free Group wide. Sadly, two fatalities were suffered at the SA PGM operations, which reaffirm the need to maintain a relentless safety focus across the Group.
On 29 August 2022 at the Saffy shaft, Marikana operation, Mr. S. Tyobeka, a general worker, was involved in a winch and rigging related incident. On 30 August 2022 a second fatality occurred at the Rowland shaft, Marikana operation, when Mr. M. Msiya, a fitter, was involved in a mud rush incident. The board and management of Sibanye-Stillwater extend heartfelt condolences to the families, friends and colleagues of Mr Tyobeka and Mr Msiya. Both incidents are being investigated with all relevant stakeholders and appropriate support is being provided to the families of the deceased.
US PGM operations
Mined 2E PGM production from the US PGM operations of 85,889 2Eoz for Q3 2022 was 40% lower than for Q3 2021, primarily as a result of the suspension of production at the Stillwater operation (Stillwater East and Stillwater West mine) for seven weeks following regional flooding in Montana in mid-June 2022. The East Boulder operation was issued a Mine Health and Safety Administration (MSHA) stop order which was in full effect from 18 to 29 September 2022, due to reporting of elevated nitrous oxide exposures. Subsequent investigations highlighted gas testing equipment calibration issues and contaminated fuel as the primary concerns. This order remains in force, with most restrictions eased following comprehensive feedback to MSHA on the investigation findings. Following thorough investigation, the Group is assessing the introduction of battery powered equipment and the establishment of an additional intake airway.
As per the revised plan presented to the market during August 2022, lower planned production across the US PGM operations year-on-year complicates comparisons (see https://www.sibanyestillwater.com/features/us-pgm-operations-review/) for detail.
Tonnes milled for Q3 2022 totalled 241kt, 37% lower than for Q3 2021 with plant head grade of 12.2g/t for Q3 2022 , 5% lower than for Q3 2021. The Stillwater operations grade was affected by feeding and milling low grade reef sand to ensure adequate volumes of backfill for stope support purposes post the flood event. Ongoing attrition amongst more experienced miners and geological and geotechnical complexity affecting productivity at East Boulder is receiving increased management and supervisory input. Following the successful ramp-up the grade normalised at the Stillwater operation in September with the East Boulder operation's grade expected to normalise in November 2022.
The Stillwater operation resumed production in a phased manner from the end of July 2022, with production rates normalising during October 2022. Production of 47,423 2Eoz, was 47% lower than for Q3 2021, with production approximately 34,000 2Eoz lower due to the ramp up after the flooding event.
Production from East Boulder of 38,467 2Eoz, was 29% lower than for Q3 2021, primarily due to the MSHA stop order, compounded by the issues detailed in the US PGM operations' repositioning presented in August 2022.
2E PGM sold for Q3 2022 of 69,534 2Eoz, was 48% lower year-on-year and 19% lower than 2E PGM mined production for the quarter, due to the timing of deliveries in September 2022 which will reflect in sold ounces for Q4 2022.
AISC of US$1,815/2Eoz (R30,947/2Eoz) for Q3 2022 was 88% higher than for Q3 2021 (US$968, R14,156/2Eoz) due to lower production and inflationary cost pressures, with ORD capital increasing by 110% year-on-year to US$42 million (R723 million) and sustaining capital increasing by 76% to US$17 million (R293 million), primarily as a result of the repositioning of the US underground operations, with Stillwater East expenditure which had previously been classified as project capital now reclassified as ORD and sustaining capital. Costs at the Stillwater operation have been impacted by additional once-off flood recovery costs including road, piping and infrastructure repairs. At East Boulder the availability of skills continues to be a challenge and therefore costs relating to contractors have risen. Continued inflationary pressure on stores and premiums on contractor costs also contributed to the higher costs.
Implementation of the repositioned operational plan and accelerated development to restore operational flexibility, will result in elevated costs in the medium term. As production begins to build up again and stope face availability improves, costs are expected to reduce significantly with AISC planned to reduce to below US$1,000 (real 2022 terms) from 2026.
Sibanye-Stillwater Operating update | Quarter ended 30 September 2022 3
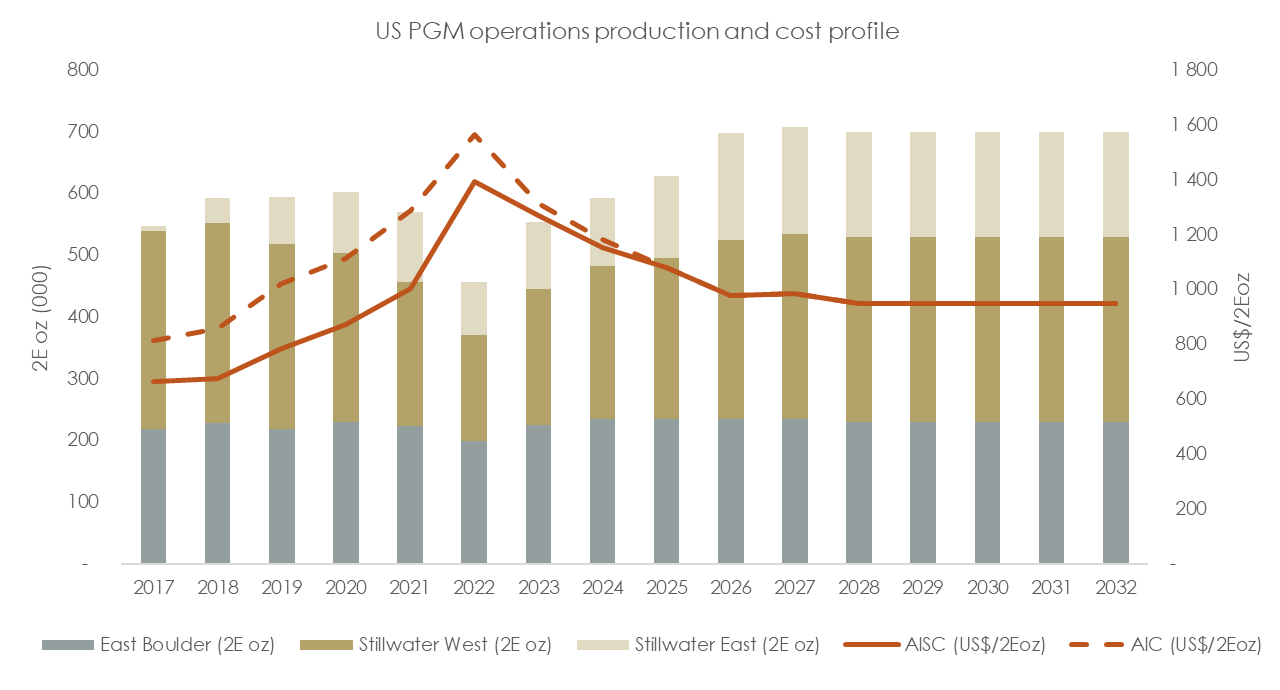
Source: Company information available at https://www.sibanyestillwater.com/features/us-pgm-operations-review/
Notes: Forward costs are represented in 2022 real terms; AISC: all-in sustaining cost; AIC: all-in cost
Total capital expenditure increased by 22% year-on-year for Q3 2022 to US$85 million (R1,450 million), with the increase in ORD and sustaining capital comprising 70% or US$60 million (R1,016 million) of this and project capital 36% lower at US$25 million(R434 million) in line with the reduced spending on the Stillwater East project and change in the classification of development from growth capital to ORD. A major milestone for the quarter was the completion of the 56 East Footwall level which now ties into the Benbow decline, completed on 16 September 2022.
PGM recycling operations
Logistical issues affecting delivery of autocatalyst material highlighted during H1 2022 have continued into Q3 2022 and it is estimated that there has been a significant reduction in receipts year-on year due to logistics issues and lower scrappage of cars, with higher 3E PGM prices in Q3 2021 also incentivising used auto catalyst collection and strong scrap flows. The recycling operations fed an average of 17.7 tonnes per day (tpd) for Q3 2022, 22% lower than for the comparable period in 2021. During Q3 2022, 1,548 tonnes of recycle material was received while 1,630 tonnes was treated. At the end of Q3 2022, approximately 42 tonnes of recycle inventory was on hand, an 82 tonne decrease versus the Q2 2022 ending inventory of 124 tonnes at the end of June 2022.
SA PGM operations
4E PGM production from the SA PGM operations was impacted by unprecedented power curtailment imposed by Eskom during Q3 and a significant rise in copper cable theft. In addition, reduced output has been planned at the Siphumelele shaft owing to increased levels of seismicity. Pleasingly, mining has safely progressed through the challenging ground conditions associated with the Hex River Fault at the Bathopele mine, which has negatively impacted production during Q2 2022 and Q3 2022 and is expected to normalise by the end of Q4 2022.
Production of 432,143 4Eoz (excluding third party purchase of concentrate (PoC) for Q3 2022 was 14% lower than for the comparable period in 2021, although production was 5% higher than for Q2 2022 despite the increased load curtailment. Severe load shedding imposed by Eskom during September 2022 necessitated the curtailment of concentrator capacity across the SA PGM operations, impacting processed output and sales for the quarter. Underground mining was less impacted by the load curtailment, resulting in underground ore containing approximately 33,000 4Eoz being stockpiled on surface by the end of the quarter.
Third party PoC processed at the Marikana smelting and refining operations of 16,720 4Eoz was 22% higher year-on-year although the toll concentrate processed during Q3 2021 fell away due to the tolling contract concluding. Total 4E PGM production (including PoC) was 13% lower year-on-year at 448,863 4Eoz. Had the 33,000 4Eoz stockpile of mined material been processed, we estimate PGM production from SA PGM operations (including PoC) would have been around 482,000 4Eoz, compared to 513,778 4Eoz for Q3 2021.
AISC (excluding PoC) for Q3 2022 of R19,211/4Eoz (US$1,127/4Eoz), was 20% higher than for Q3 2021 at R15,992/4Eoz (US$1,093/4Eoz) primarily due to lower production, lower by-product credits and inflationary cost pressures. AISC (including PoC) of R20,143/4Eoz (US$1,181/4Eoz) was also 21% higher year-on-year, with ORD 33% higher, largely as a result of the inclusion of K4 development and 6% lower by-product credits due to lower production and specific third party processing agreements concluding.
4E PGM production from the Rustenburg operation for Q3 2022 of 179,438 4Eoz, was 2% lower year-on-year despite operational challenges including severe Eskom load curtailment. Surface production increased by 43% due to processing of smelter slag from a third party with underground production decreasing by 7% primarily due to power disruptions from Eskom load curtailment and cable theft. Production from the Bathopele mine continued to be impacted by mining through the Hexriver fault and loss of available face at Siphumelele due to seismicity. The Hexriver fault has largely been traversed and production is expected to improve from Q4 2022. A stockpile of ore containing approximately 6,000 4Eoz built up as a result of Eskom load curtailment, impacted Q3 2022 production and unit
Sibanye-Stillwater Operating update | Quarter ended 30 September 2022 4
costs, contributing to a 4% year-on-year increase in AISC to R18,435/4Eoz (US$1,081/4Eoz). In addition to this, a 31% increase in by-product credits (driven mainly by higher chrome revenue) more than offset a 15% increase in ORD and a 22% increase in sustaining capital year-on-year.
4E PGM production from the Kroondal operation of 48,120 4Eoz for Q3 2022 was 21% lower than for the comparable period in 2021. This declining production output is expected due to the gradual ramp-down of the Simunye shaft, compounded by the load curtailment with Kroondal building an ore stockpile containing approximately 7,000 4Eoz at the end of the quarter. AISC of R15,399/4Eoz (US$903/4Eoz) was 25% higher than for Q3 2021 primarily due to lower production and stockpile being built up at the end of the quarter.
4E PGM production for Q3 2022 from the Marikana operation (excluding third party PoC) of 163,596 4Eoz, was 23% lower than for Q3 2021, with underground production 24% lower and surface production 11% lower. Underground production was impacted by safety stoppages, cable theft and Eskom load curtailment. 4E PGM production (including PoC) of 180,316 4Eoz for Q3 2022 was 20% lower than for Q3 2021. Third party concentrate processed at Marikana increased by 22% year-on-year to 16,720 4Eoz. The Marikana operation ended the quarter with an ore stockpile containing approximately 20,000 4Eoz. Had this material been processed, PGM production from Marikana (incl PoC) would have been around 200,000 4Eoz, compared to 226,591/4Eoz for Q3 2021. AISC (excluding third party PoC) for Q3 2022 of R21,785/4Eoz (US$1,278/4Eoz), was 37% higher than for Q3 2021, primarily due to lower production, inflationary costs, ORD (+44%) and lower by-product credits (-27%). Key inflationary costs were due to the high cost of steel, ammonia, chemicals, fuel and related products, with AISC (including PoC) also increasing by 37% to R23,719/4Eoz (US$1,391/4Eoz) due to higher purchase of concentrate costs (+33%). ORD costs increased with the ramp-up of K4 shaft as well as an increase in off-reef development at other shafts.
Attributable 4E PGM production from Mimosa of 28,670 4Eoz was in line with production for Q3 2021. AISC increased by 18% year-on-year to US$1,234/4Eoz (R21,032/4Eoz) primarily due to a 119% increase in sustaining capital expenditure associated with the approved life of mine extension project, which includes optimisation of the plant, construction of a new tailings storage facility and life of mine extension development, which is expected to be completed in Q1 2024.
Attributable 4E PGM production from Platinum Mile of 12,319 4Eoz was 10% lower year-on-year due to 6% less tons processed, a decrease in the built-up head grade and lower recoveries. AISC at Platinum Mile increased by 9% year-on-year to R11,283/4Eoz (US$662/4Eoz).
Chrome sales from the SA PGM operations for Q3 2022 of approximately 560kt were in line with Q3 2021. The chrome price received increased by 33% to US$227/tonne (Q3 2021: US$171/tonne), underpinning a 37% increase in chrome revenue.
Capital expenditure of R1,263 million (US$74 million) for Q3 2022 was 33% higher than for the corresponding period in 2021 with ORD 33% higher at R590 million (US$35 million), sustaining capital 4% higher at R465 million (US$27 million) and project capital 271% higher at R208 million (US$12 million). The increase in project capital is linked to the K4 project at the Marikana operation during Q3 2022.
The K4 Project
The K4 project remains on schedule. First ore was hoisted during H1 2022 with first production of 914 4Eoz achieved during Q3 2022. Development and reef tonnes hoisted was significantly higher for Q3 2022 than for Q2 2022. Project capital expenditure was R207 million (US$12 million) in Q3 2022 (R56 million (US$4 million) in Q3 2021) project capital expenditure of R612 (US$48 million) million for the first three months.
Five-year wage agreement secures operational stability
On 28 October 2022 a five-year wage agreement was reached with the representative unions at the Marikana and Rustenburg operations, marking the conclusion of annual wage negotiations for 2022 to 2027.
The wage agreement is consistent with the recent inflation linked wage increases concluded in June 2022 at the SA gold operations. The wage agreement comprises annual wage increases of 6% and above for bargaining unit employees (year one: R1,050 per month or 6%, year two: R1,100 per month or 6%, year three: R1,250 per month or 6%, year four: R1,300 per month or 6% and year five: R1,400 per month or 6%). Miners and artisans will receive average annual wage increases of 6% per annum for each of the five years.
The annual wage and benefit increases that have been agreed are in line with inflation and represents a total estimated average increase in the wage bill, including all benefits, over the five-year period of approximately 6.3% per annum, which is in line with inflation and the wage agreement reached at the SA gold operations in June 2022. Importantly the agreement secures a five-year period of greater stability at the Rustenburg and Marikana operations and reduced risk of labour related disruptions, which will be beneficial for all stakeholders.
SA gold operations
The build up to normalised levels of production at the SA gold operations following the industrial action from 9 March to 13 June 2022, proceeded according to plan. Underground production commenced on 1 July after medical screening, training and acclimatisation of returning employees was concluded, and comprehensive underground safety audits were completed, with work crews resuming operating activities in a phased manner. Normalised production rates were achieved during October 2022. As a result, we believe that comparison of operational statistics has limited value for this period.
Production from the SA gold operations (including DRDGOLD) for Q3 2022 of 6,366kg (204,672oz) was 30% lower compared with Q3 2021. Gold production in Q3 2022 (excluding DRDGOLD) decreased by 36% to 4,913kg (157,957oz) due to the phased resumption of safe production over the quarter.
AISC (including DRDGOLD) of R1,210,049/kg (US$2,207/oz) was 52% higher than for Q3 2021 with AISC (excluding DRDGOLD) 64% higher at R1,348,531/kg (US$2,460/oz). The increase was a direct function of the 39% decrease in gold sold year-on-year with a working cost and SIB capital increasing by 4% and 11% respectively, offset by a 35% decrease in ORD due to the reduced mining activity.
Normalisation of production over an extended period is expected to result in a significant reduction in unit cost during 2023. For Q3 2021, AISC (excluding DRDGOLD) averaged R822,144/kg (US$1,748/oz).
Capital expenditure for Q3 2022 (excluding DRDGOLD) increased by 10% to R1,188 million (US$70 million) compared to the same period in 2021 due to a four-fold increase in project capital which offset a 35% decrease in ORD to R472 million (US$28 million). ORD declined due to
Sibanye-Stillwater Operating update | Quarter ended 30 September 2022 5
lower development metres in 2022 compared to 2021 as a result of the slow start-up process after the industrial action. SIB capital increased 11% to R296 million (US$17 million) mainly due to expenditure on regulatory lamp room upgrades at all operations and electrical and winder upgrades which commenced during the industrial action when the facilities and equipment were not in use. Project capital increased to R420 million (US$25 million) with R315 million (US$18 million) spent on the Burnstone project and R105 million (US$6 million) on the Kloof shaft deepening project.
Underground production from the Driefontein operation decreased by 34% to 1,640kg (52,727oz) compared to the same period in 2021 as a result of the phased return to work post industrial action, while surface production of 50kg (1,608oz) was 25% lower due to depletion of surface reserves. AISC of R1,215,013/kg (US$2,216/oz) was 54% higher than for Q3 2021 primarily as a result of the 35% decrease in gold sold.
Underground production from the Kloof operation decreased by 50% to 1,393kg (44,786oz) with the underground yield 27% lower due to a slower start at the higher grade 4 and 8 shafts. Production from surface sources of 190kg (6,109oz), was 25% lower year-on-year due to a slow onboarding of a surface transport contractor after the strike as well as depletion of the surface rock dump reserves. AISC of R1,527,554/kg (US$2,787/oz) was 80% higher than for Q3 2021, primarily due to 50% lower gold sold as a result of the phased build-up after the industrial action.
Underground production of 1,321kg (42,471oz) in Q3 2022 from the Beatrix operation was 26% lower than Q3 2021 with tonnes milled only 11% lower year-on-year despite the industrial action and the gradual return to work. This was due to the processing of underground ore which was stockpiled from late January 2022 while precautionary reinforcement and buttressing work was being done on the Beatrix tailings storage facility. The underground yield declined by 17% due to less production from the higher grade 4 Shaft which was affected by a loss of face length and safety stoppages. Gold production from surface sources was suspended for the period as the focus was placed on milling underground stockpile tonnages first. AISC of R1,424,025/kg (US$2,598/oz) was 72% higher than Q3 2021, primarily due to 35% less gold sold during the production build-up after the industrial action and higher working cost due to above inflationary increases, and the additional cost associated with ramping up the operations to normalised production levels.
Surface gold production from Cooke operations increased by 10% to 319kg (10,256oz) due to slightly increased tonnes milled and yield with AISC increasing by 9% year-on-year to R861,736/kg (US$1,572/oz).
DRDGOLD surface tonnes milled decreased by 4% year-on-year, however with a 4% increase in grade, gold production of 1,453kg (46,715oz) remained in line with Q3 2021. AISC of R765,603/kg (US$1,397/oz) increased by 18% year-on-year primarily due to industry wide inflationary effects and a 51% increase in sustaining capital, reflecting investment in new pump stations and piping at the ERGO operations. DRDGOLD project capital also increased from R14 million (US$1 million) in Q3 2021 to R53 million (US$3 million) in Q3 2022 with spending on the solar power plant and the Far West Gold Recoveries project at the Driefontein 2 reclamation plant.
Consultations regarding possible restructuring of Beatrix 4 shaft and Kloof 1 plant
On 1 November 2022, organised labour and other potentially affected stakeholders were notified that the company would be entering into consultation in terms of S189A of the Labour Relations Act (S189) regarding the possible restructuring of its SA gold operations pursuant to ongoing losses experienced at the Beatrix 4 shaft and the impact of depleting mineral reserves to the Kloof 1 plant.
The life of the Beatrix 4 shaft was previously prolonged, following S189 consultations in 2017, which, through the successful adoption of productivity enhancement and cost containment measures implemented following consultation with stakeholders, enabled it to remain in operation as long as it made a profit, on average, over any continuous period of three months (after accounting for AISC).
It is anticipated that the consultation process will reduce the number of employees that may potentially be retrenched through the implementation of possible retrenchment avoidance measures, including natural attrition, retirements, voluntary retrenchment and the transfer of suitably skilled employees to vacant positions.
We are committed to minimising the impact of the proposed restructuring and will engage with all relevant stakeholders in an effort to avoid job losses, while attempting to limit the impact on the remainder of the operations and employees at the SA gold operations and the sustainability of the Group.
The Burnstone project
Progress on the project was adversely affected by the industrial action during H1 2022, resulting delays in underground development. In addition due to logistics issues, there have been delays in the delivery of critical spares from Europe. Labour procurement has been slower than expected due to the unavailability of skilled operators from surrounding areas. Project capital guidance remains unchanged at R1.1 billion (US$73 million) with R644 million (US$40 million) spent to date (R329 million (US$21 million) in H1 2022 and R315 million (US$18 million) in Q3 2022).
Sandouville nickel refinery
The integration of the Sandouville nickel refinery into the Group continued during Q3 2022. Sandouville faced various operational and logistics issues during Q3 2022, including solvent supply constraints, and engineering failures in July 2022 which temporarily took 40% of capacity offline. In addition, a four week technical shutdown commenced in September 2022 with operations recommencing in mid October 2022. The Sandouville nickel refinery produced 1,003 tonnes of nickel metal in Q3 2022 (2,251 tonnes in Q2 2022), 650 tonnes of nickel salts (668 tonnes in Q2 2022) and 37 tonnes of cobalt chloride (78 tonnes in Q2 2022) at a nickel equivalent sustaining cost of US$30,185/tNi (R514,654/tNi), 12% higher than Q2 2022.
Integration is focused on: recruitment, implementing rigorous maintenance programs and increasing critical spares. The focus is on continuity and stability of production by de-bottlenecking the plant to increase throughput to nameplate capacity of c.12kt of Ni metal, c.4kt of Ni salts and c.600t of CoCl2 by 2026.
Recent increases in electricity and gas prices have reduced the gross operating margin and pose an ongoing risk to costs especially the future supply and availability of European energy and gas during the upcoming winter season.
In parallel with the current plant production, Sibanye-Stillwater continues to advance pre-feasibility studies on the following three processes, expected to be completed during 2023:
Sibanye-Stillwater Operating update | Quarter ended 30 September 2022 6
•Producing battery grade nickel sulphate with the intention of producing 44,000 tonnes per year in two stages
•PGM autocatalyst recycling using European feedstocks
•Battery metals recycling
Further announcements will be made on these developments when the studies have been concluded.
STRATEGIC DEVELOPMENTS
Increased shareholding in Keliber Oy (Keliber)
On 30 June 2022, the Group announced its intention to exercise its pre-emptive right to increase its shareholding in Keliber to 50% plus one share for a cash consideration of approximately €146 million. A simultaneous voluntary cash offer was made to minority shareholders of Keliber, other than the Finnish Minerals Group, which increased Sibanye-Stillwater's shareholding in Keliber to an effective 84.96% for a further cash consideration of approximately €189.8 million excluding Finnish transfer tax of €2.3 million.
The Finnish Minerals Group, a Finnish State-owned holding and development company which manages the state’s mining industry
shareholdings and is the second largest shareholder in Keliber behind Sibanye-Stillwater has a current effective holding of 13.90% in Keliber with the other remaining minority shareholders holding an effective 1.14%.
With the voluntary offer now concluded, a capital raise by Keliber will be executed to achieve Keliber’s desired debt to equity ratio. The maximum total investment by Sibanye-Stillwater in the proposed capital raise is around €104 million depending on the extent to which minorities and the Finnish Minerals Group participate. Conventional debt facilities are currently under discussion with third party lenders to at least match the €250 million equity contribution to fully fund construction of the project.
Keliber is aiming to be the first fully integrated lithium producer in Europe supplying approximately 15,000 tonnes of lithium hydroxide
monohydrate per annum into the developing European battery industry. A recent definitive feasibility study and a 31% increase in ore
reserves has confirmed the quality and inherent value of the Keliber project with the fundamental outlook for the lithium market improving significantly since Sibanye-Stillwater acquired its initial stake in Q1 2021.
The transactions secure a significant and controlling exposure for the Group in Keliber, which offers significant growth potential and a valuable footprint in a supportive and attractive jurisdiction to supply critical battery metals into the burgeoning European battery industry.
OPERATING GUIDANCE FOR THE 2022 YEAR1
As previously announced on 11 August 2022, forecast mined 2E PGM production from the US PGM operations for 2022 was revised to between 445,000 2Eoz and 460,000 2Eoz, with AISC of between US$1,380/2Eoz and US$1,425/2Eoz due to the impact of the regional flood and the repositioning of the operations following the optimisation planning carried out during H1 2022. Due to disruptions experienced during Q3 2022 and ongoing issues with employee attrition and skills availability, production for 2022 is likely to be at the lower end of the range provided with costs at the upper end of the range. Capital expenditure is forecast to be between US$275 million and US$285 million (including US$70 million of project capital).
As a result of the challenges highlighted with collection and receipt of used autocatalysts, recycling feed rates have declined significantly and are likely to remain constrained until year end. The US Recycling operations are therefore forecast to feed between 610,000 and 625,000 3Eoz for 2022, with minimal capital expenditure.
Forecast 4E PGM production from the SA PGM operations2 for 2022 remains at between 1,750,000 4Eoz and 1,850,000 4Eoz with AISC between R18,500/4Eoz and R19,200/4Eoz (US$1,233/4Eoz and US$1,280/4Eoz). Capital expenditure is forecast at R4.8 billion (US$320 million) including R950 million (US$63 million) for the K4 project during 2022.
Guidance for gold production from the managed SA gold operations (excluding DRDGOLD) is maintained at between 14,000kg (450,000oz) and 14,500kg (466,000oz) with AISC between R1,390,000/kg (US$2,880/oz) and R1,470,000/kg (US$3,060/oz). Capital expenditure is forecast at R3.9 billion (US$260 million), including R1.1 billion (US$73 million) on the Burnstone project and R270 million (US$18 million) on the Kloof 4 deepening project.
1 The dollar cost conversions for 2022 are based on an average exchange rate of R15.00/US$
2 SA PGM guidance includes third party PoC
NEAL FRONEMAN
CHIEF EXECUTIVE OFFICER
Sibanye-Stillwater Operating update | Quarter ended 30 September 2022 7
SALIENT FEATURES AND COST BENCHMARKS - QUARTERS
US and SA PGM operations
| US OPERA-TIONS | SA OPERATIONS | |||||||||||||||||||||||||||||||||||||||||||
Total US and SA PGM1 | Total US PGM | Total SA PGM1 | Rustenburg | Marikana1 | Kroondal | Plat Mile | Mimosa | |||||||||||||||||||||||||||||||||||||
| Attributable | Under- ground2 | Total | Under- ground | Surface | Under- ground | Surface | Under- ground | Surface | Attribu-table | Surface | Attribu-table | |||||||||||||||||||||||||||||||||
| Production | ||||||||||||||||||||||||||||||||||||||||||||
| Tonnes milled/treated | 000't | Sep 2022 | 9,625 | 241 | 9,383 | 4,303 | 5,081 | 1,666 | 1,418 | 1,515 | 927 | 782 | 2,736 | 340 | ||||||||||||||||||||||||||||||
| Jun 2022 | 9,641 | 299 | 9,342 | 4,328 | 5,014 | 1,552 | 1,385 | 1,602 | 952 | 814 | 2,677 | 360 | ||||||||||||||||||||||||||||||||
| Sep 2021 | 10,747 | 384 | 10,363 | 4,964 | 5,399 | 1,778 | 1,442 | 1,889 | 1,044 | 945 | 2,913 | 352 | ||||||||||||||||||||||||||||||||
| Plant head grade | g/t | Sep 2022 | 2.21 | 12.23 | 1.96 | 3.30 | 0.82 | 3.34 | 1.03 | 3.70 | 0.87 | 2.33 | 0.69 | 3.52 | ||||||||||||||||||||||||||||||
| Jun 2022 | 2.25 | 12.41 | 1.92 | 3.23 | 0.79 | 3.26 | 0.95 | 3.57 | 0.87 | 2.39 | 0.68 | 3.49 | ||||||||||||||||||||||||||||||||
| Sep 2021 | 2.46 | 12.92 | 2.08 | 3.40 | 0.86 | 3.37 | 1.17 | 3.89 | 0.87 | 2.40 | 0.71 | 3.58 | ||||||||||||||||||||||||||||||||
| Plant recoveries | % | Sep 2022 | 75.59 | 89.25 | 73.19 | 85.09 | 32.61 | 86.52 | 52.47 | 87.06 | 25.94 | 82.17 | 20.30 | 74.44 | ||||||||||||||||||||||||||||||
| Jun 2022 | 74.79 | 90.93 | 71.59 | 84.87 | 24.75 | 86.28 | 36.61 | 86.90 | 23.91 | 82.81 | 16.50 | 73.06 | ||||||||||||||||||||||||||||||||
| Sep 2021 | 75.69 | 90.62 | 72.27 | 85.07 | 25.78 | 86.38 | 31.72 | 86.92 | 25.85 | 83.77 | 20.64 | 71.01 | ||||||||||||||||||||||||||||||||
| Yield | g/t | Sep 2022 | 1.67 | 10.92 | 1.43 | 2.81 | 0.27 | 2.89 | 0.54 | 3.22 | 0.23 | 1.91 | 0.14 | 2.62 | ||||||||||||||||||||||||||||||
| Jun 2022 | 1.68 | 11.28 | 1.37 | 2.74 | 0.20 | 2.81 | 0.35 | 3.10 | 0.21 | 1.98 | 0.11 | 2.55 | ||||||||||||||||||||||||||||||||
| Sep 2021 | 1.86 | 11.71 | 1.50 | 2.89 | 0.22 | 2.91 | 0.37 | 3.38 | 0.22 | 2.01 | 0.15 | 2.54 | ||||||||||||||||||||||||||||||||
PGM production3 | 4Eoz - 2Eoz | Sep 2022 | 518,032 | 85,889 | 432,143 | 388,460 | 43,683 | 154,797 | 24,641 | 156,873 | 6,723 | 48,120 | 12,319 | 28,670 | ||||||||||||||||||||||||||||||
| Jun 2022 | 520,608 | 107,650 | 412,958 | 381,445 | 31,513 | 140,344 | 15,487 | 159,793 | 6,368 | 51,797 | 9,658 | 29,511 | ||||||||||||||||||||||||||||||||
| Sep 2021 | 644,398 | 144,325 | 500,073 | 461,593 | 38,480 | 166,400 | 17,206 | 205,340 | 7,548 | 61,083 | 13,726 | 28,770 | ||||||||||||||||||||||||||||||||
PGM sold4 | 4Eoz - 2Eoz | Sep 2022 | 471,994 | 69,534 | 402,460 | 137,246 | 16,578 | 160,115 | 48,120 | 12,319 | 28,082 | |||||||||||||||||||||||||||||||||
| Jun 2022 | 521,579 | 127,047 | 394,532 | 111,494 | 17,887 | 176,830 | 51,797 | 9,658 | 26,866 | |||||||||||||||||||||||||||||||||||
| Sep 2021 | 592,631 | 132,637 | 459,994 | 144,461 | 16,088 | 196,251 | 61,083 | 13,726 | 28,385 | |||||||||||||||||||||||||||||||||||
Price and costs5 | ||||||||||||||||||||||||||||||||||||||||||||
Average PGM basket price6 | R/4Eoz - R/2Eoz | Sep 2022 | 40,485 | 30,878 | 42,269 | 43,331 | 34,278 | 42,033 | 44,972 | 33,714 | 33,412 | |||||||||||||||||||||||||||||||||
| Jun 2022 | 38,309 | 28,499 | 41,699 | 42,844 | 28,408 | 42,147 | 44,461 | 30,080 | 32,363 | |||||||||||||||||||||||||||||||||||
| Sep 2021 | 39,662 | 30,924 | 42,347 | 43,089 | 28,266 | 42,247 | 46,357 | 34,642 | 33,392 | |||||||||||||||||||||||||||||||||||
| Average PGM basket price6 | US$/4Eoz - US$/2Eoz | Sep 2022 | 2,374 | 1,811 | 2,479 | 2,541 | 2,010 | 2,465 | 2,638 | 1,977 | 1,960 | |||||||||||||||||||||||||||||||||
| Jun 2022 | 2,457 | 1,828 | 2,675 | 2,748 | 1,822 | 2,703 | 2,852 | 1,929 | 2,076 | |||||||||||||||||||||||||||||||||||
| Sep 2021 | 2,711 | 2,114 | 2,895 | 2,945 | 1,932 | 2,888 | 3,169 | 2,368 | 2,282 | |||||||||||||||||||||||||||||||||||
Operating cost7 | R/t | Sep 2022 | 1,043 | 7,504 | 871 | 1,764 | 279 | 1,459 | 1,049 | 58 | 1,493 | |||||||||||||||||||||||||||||||||
| Jun 2022 | 1,037 | 6,478 | 856 | 1,843 | 229 | 1,374 | 1,053 | 53 | 1,292 | |||||||||||||||||||||||||||||||||||
| Sep 2021 | 928 | 4,932 | 775 | 1,575 | 244 | 1,233 | 894 | 48 | 1,173 | |||||||||||||||||||||||||||||||||||
| Operating cost7 | US$/t | Sep 2022 | 61 | 440 | 51 | 103 | 16 | 86 | 62 | 3 | 88 | |||||||||||||||||||||||||||||||||
| Jun 2022 | 67 | 416 | 55 | 118 | 15 | 88 | 68 | 3 | 83 | |||||||||||||||||||||||||||||||||||
| Sep 2021 | 63 | 337 | 53 | 108 | 17 | 84 | 61 | 3 | 80 | |||||||||||||||||||||||||||||||||||
| Operating cost7 | R/4Eoz - R/2Eoz | Sep 2022 | 19,793 | 21,085 | 19,518 | 18,986 | 16,071 | 21,767 | 17,041 | 12,907 | 17,719 | |||||||||||||||||||||||||||||||||
| Jun 2022 | 19,593 | 17,993 | 20,042 | 20,378 | 20,469 | 21,118 | 16,545 | 14,703 | 15,757 | |||||||||||||||||||||||||||||||||||
| Sep 2021 | 15,673 | 13,123 | 16,454 | 16,833 | 20,458 | 16,990 | 13,834 | 10,200 | 14,355 | |||||||||||||||||||||||||||||||||||
| Operating cost7 | US$/4Eoz - US$/2Eoz | Sep 2022 | 1,161 | 1,237 | 1,145 | 1,114 | 943 | 1,277 | 999 | 757 | 1,039 | |||||||||||||||||||||||||||||||||
| Jun 2022 | 1,257 | 1,154 | 1,286 | 1,307 | 1,313 | 1,355 | 1,061 | 943 | 1,011 | |||||||||||||||||||||||||||||||||||
| Sep 2021 | 1,071 | 897 | 1,125 | 1,151 | 1,398 | 1,161 | 946 | 697 | 981 | |||||||||||||||||||||||||||||||||||
All-in sustaining cost8 | R/4Eoz - R/2Eoz | Sep 2022 | 21,271 | 30,947 | 19,211 | 18,435 | 21,785 | 15,399 | 11,283 | 21,032 | ||||||||||||||||||||||||||||||||||
| Jun 2022 | 19,534 | 23,437 | 18,438 | 18,129 | 20,107 | 14,904 | 13,667 | 16,062 | ||||||||||||||||||||||||||||||||||||
| Sep 2021 | 15,561 | 14,156 | 15,992 | 17,701 | 15,933 | 12,327 | 10,345 | 15,294 | ||||||||||||||||||||||||||||||||||||
| All-in sustaining cost8 | US$/4Eoz - US$/2Eoz | Sep 2022 | 1,248 | 1,815 | 1,127 | 1,081 | 1,278 | 903 | 662 | 1,234 | ||||||||||||||||||||||||||||||||||
| Jun 2022 | 1,253 | 1,503 | 1,183 | 1,163 | 1,290 | 956 | 877 | 1030 | ||||||||||||||||||||||||||||||||||||
| Sep 2021 | 1,064 | 968 | 1,093 | 1,210 | 1,089 | 843 | 707 | 1045 | ||||||||||||||||||||||||||||||||||||
All-in cost8 | R/4Eoz - R/2Eoz | Sep 2022 | 22,582 | 36,000 | 19,726 | 18,441 | 23,051 | 15,399 | 11,283 | 21,032 | ||||||||||||||||||||||||||||||||||
| Jun 2022 | 20,389 | 25,397 | 18,983 | 18,129 | 21,365 | 14,904 | 13,667 | 16,062 | ||||||||||||||||||||||||||||||||||||
| Sep 2021 | 16,609 | 18,195 | 16,123 | 17,701 | 16,224 | 12,327 | 10,345 | 15,294 | ||||||||||||||||||||||||||||||||||||
| All-in cost8 | US$/4Eoz - US$/2Eoz | Sep 2022 | 1,324 | 2,111 | 1,157 | 1,082 | 1,352 | 903 | 662 | 1,234 | ||||||||||||||||||||||||||||||||||
| Jun 2022 | 1,308 | 1,629 | 1,218 | 1,163 | 1,370 | 956 | 877 | 1,030 | ||||||||||||||||||||||||||||||||||||
| Sep 2021 | 1,135 | 1,244 | 1,102 | 1,210 | 1,109 | 843 | 707 | 1,045 | ||||||||||||||||||||||||||||||||||||
Capital expenditure5 | ||||||||||||||||||||||||||||||||||||||||||||
| Ore reserve development | Rm | Sep 2022 | 1,313 | 723 | 590 | 194 | 396 | — | — | — | ||||||||||||||||||||||||||||||||||
| Jun 2022 | 1,196 | 641 | 555 | 173 | 382 | — | — | — | ||||||||||||||||||||||||||||||||||||
| Sep 2021 | 739 | 296 | 443 | 168 | 275 | — | — | — | ||||||||||||||||||||||||||||||||||||
| Sustaining capital | Rm | Sep 2022 | 758 | 293 | 465 | 140 | 242 | 80 | 3 | 258 | ||||||||||||||||||||||||||||||||||
| Jun 2022 | 640 | 211 | 429 | 148 | 208 | 68 | 5 | 181 | ||||||||||||||||||||||||||||||||||||
| Sep 2021 | 592 | 143 | 449 | 115 | 268 | 58 | 8 | 118 | ||||||||||||||||||||||||||||||||||||
| Corporate and projects | Rm | Sep 2022 | 642 | 434 | 208 | 1 | 207 | — | — | — | ||||||||||||||||||||||||||||||||||
| Jun 2022 | 412 | 211 | 201 | — | 201 | — | — | — | ||||||||||||||||||||||||||||||||||||
| Sep 2021 | 639 | 583 | 56 | — | 56 | — | — | — | ||||||||||||||||||||||||||||||||||||
| Total capital expenditure | Rm | Sep 2022 | 2,713 | 1,450 | 1,263 | 335 | 845 | 80 | 3 | 258 | ||||||||||||||||||||||||||||||||||
| Jun 2022 | 2,248 | 1,063 | 1,185 | 321 | 791 | 68 | 5 | 181 | ||||||||||||||||||||||||||||||||||||
| Sep 2021 | 1,970 | 1,022 | 948 | 283 | 599 | 58 | 8 | 118 | ||||||||||||||||||||||||||||||||||||
| Total capital expenditure | US$m | Sep 2022 | 159 | 85 | 74 | 20 | 50 | 5 | — | 15 | ||||||||||||||||||||||||||||||||||
| Jun 2022 | 144 | 68 | 76 | 21 | 51 | 4 | — | 12 | ||||||||||||||||||||||||||||||||||||
| Sep 2021 | 135 | 70 | 65 | 19 | 41 | 4 | 1 | 8 | ||||||||||||||||||||||||||||||||||||
Average exchange rate for the quarters ended 30 September 2022, 30 June 2022 and 30 September 2021 was R17.05/US$, R15.59/US$ and R14.63/US$, respectively
Figures may not add as they are rounded independently
1The Total US and SA PGM, Total SA PGM and Marikana excludes the production and costs associated with the purchase of concentrate (PoC) from third parties. For a reconciliation of the Operating cost, AISC and AIC excluding third party PoC, refer to “Reconciliation of operating cost excluding third party PoC for Total US and SA PGM, Total SA PGM and Marikana - Quarters” and “Reconciliation of AISC and AIC excluding third party PoC for Total US and SA PGM, Total SA PGM and Marikana – Quarters”
Sibanye-Stillwater Operating update | Quarter ended 30 September 2022 8
2The US PGM operations’ underground production is converted to metric tonnes and kilograms, and performance is translated into rand. In addition to the US PGM operations’ underground production, the operation treats recycling material which is excluded from the statistics shown above and is detailed in the PGM recycling table below
3Production per product – see prill split in the table below
4PGM sold includes the third party PoC ounces sold
5The Total US and SA PGM and Total SA PGM operations’ unit cost benchmarks and capital expenditure exclude the financial results of Mimosa, which is equity accounted and excluded from revenue and cost of sales
6The average PGM basket price is the PGM revenue per 4E/2E ounce, prior to a purchase of concentrate adjustment
7Operating cost is the average cost of production and operating cost per tonne is calculated by dividing the cost of sales, before amortisation and depreciation and change in inventory in a period by the tonnes milled/treated in the same period, and operating cost per ounce (and kilogram) is calculated by dividing the cost of sales, before amortisation and depreciation and change in inventory in a period, by the PGM produced in the same period
8All-in cost is calculated in accordance with the World Gold Council guidance. All-in cost excludes income tax, costs associated with merger and acquisition activities, working capital, impairments, financing costs, one-time severance charges and items needed to normalise earnings. All-in cost is made up of All-in sustaining cost, being the cost to sustain current operations, given as a sub-total in the All-in cost calculation, together with corporate and major capital expenditure associated with growth. All-in sustaining cost per ounce (and kilogram) and All-in cost per ounce (and kilogram) are calculated by dividing the All-in sustaining cost and All-in cost, respectively, in a period by the total 4E/2E PGM produced in the same period. For a reconciliation of cost of sales, before amortisation and depreciation to All-in cost, see “All-in costs - Quarters”
Mining - PGM Prill split including third party PoC, excluding recycling operations
| GROUP PGM | SA OPERATIONS | US OPERATIONS | ||||||||||||||||||||||||||||||||||||||||||||||||||||||
| Sep 2022 | Jun 2022 | Sep 2021 | Sep 2022 | Jun 2022 | Sep 2021 | Sep 2022 | Jun 2022 | Sep 2021 | ||||||||||||||||||||||||||||||||||||||||||||||||
| % | % | % | % | % | % | % | % | % | ||||||||||||||||||||||||||||||||||||||||||||||||
| Platinum | 286,103 | 54 | % | 278,511 | 52 | % | 336,620 | 51 | % | 265,975 | 59 | % | 253,999 | 59 | % | 304,116 | 59 | % | 20,128 | 23 | % | 24,512 | 23 | % | 32,504 | 23 | % | |||||||||||||||||||||||||||||
| Palladium | 200,137 | 37 | % | 210,930 | 39 | % | 265,876 | 40 | % | 134,376 | 30 | % | 127,792 | 30 | % | 154,055 | 30 | % | 65,761 | 77 | % | 83,138 | 77 | % | 111,821 | 77 | % | |||||||||||||||||||||||||||||
| Rhodium | 40,296 | 8 | % | 37,880 | 7 | % | 44,433 | 7 | % | 40,296 | 9 | % | 37,880 | 9 | % | 44,433 | 9 | % | ||||||||||||||||||||||||||||||||||||||
| Gold | 8,216 | 2 | % | 7,942 | 2 | % | 11,174 | 2 | % | 8,216 | 2 | % | 7,942 | 2 | % | 11,174 | 2 | % | ||||||||||||||||||||||||||||||||||||||
| PGM production 4E/2E | 534,752 | 100 | % | 535,262 | 100 | % | 658,103 | 100 | % | 448,863 | 100 | % | 427,612 | 100 | % | 513,778 | 100 | % | 85,889 | 100 | % | 107,650 | 100 | % | 144,325 | 100 | % | |||||||||||||||||||||||||||||
| Ruthenium | 64,192 | 59,933 | 80,065 | 64,192 | 59,933 | 80,065 | ||||||||||||||||||||||||||||||||||||||||||||||||||
| Iridium | 16,034 | 15,299 | 18,451 | 16,034 | 15,299 | 18,451 | ||||||||||||||||||||||||||||||||||||||||||||||||||
| Total 6E/2E | 614,978 | 610,494 | 756,619 | 529,089 | 502,844 | 612,294 | 85,889 | 107,650 | 144,325 | |||||||||||||||||||||||||||||||||||||||||||||||
Recycling at US operations
| Unit | Sep 2022 | Jun 2022 | Sep 2021 | |||||||||||
| Average catalyst fed/day | Tonne | 17.7 | 22.0 | 22.7 | ||||||||||
| Total processed | Tonne | 1,630 | 2,004 | 2,087 | ||||||||||
| Tolled | Tonne | — | — | 23 | ||||||||||
| Purchased | Tonne | 1,630 | 2,004 | 2,064 | ||||||||||
| PGM fed | 3Eoz | 141,560 | 170,462 | 179,765 | ||||||||||
| PGM sold | 3Eoz | 162,659 | 213,988 | 183,734 | ||||||||||
| PGM tolled returned | 3Eoz | 4,715 | 1,878 | 99 | ||||||||||
Sibanye-Stillwater Operating update | Quarter ended 30 September 2022 9
SA gold operations
| SA OPERATIONS | |||||||||||||||||||||||||||||||||||||||||
| Total SA gold | Driefontein | Kloof | Beatrix | Cooke | DRDGOLD | ||||||||||||||||||||||||||||||||||||
| Total | Under- ground | Surface | Under- ground | Surface | Under- ground | Surface | Under- ground | Surface | Surface | Surface | |||||||||||||||||||||||||||||||
| Production | |||||||||||||||||||||||||||||||||||||||||
| Tonnes milled/treated | 000't | Sep 2022 | 10,237 | 1,117 | 9,120 | 290 | 123 | 336 | 620 | 490 | 18 | 1,202 | 7,157 | ||||||||||||||||||||||||||||
| Jun 2022 | 8,123 | — | 8,123 | — | 5 | — | 40 | — | — | 1,014 | 7,064 | ||||||||||||||||||||||||||||||
| Sep 2021 | 11,199 | 1,474 | 9,725 | 432 | 164 | 493 | 855 | 549 | 103 | 1,182 | 7,421 | ||||||||||||||||||||||||||||||
| Yield | g/t | Sep 2022 | 0.62 | 3.90 | 0.22 | 5.65 | 0.41 | 4.14 | 0.31 | 2.69 | — | 0.27 | 0.20 | ||||||||||||||||||||||||||||
| Jun 2022 | 0.21 | — | 0.20 | — | — | — | 0.28 | — | — | 0.19 | 0.20 | ||||||||||||||||||||||||||||||
| Sep 2021 | 0.82 | 4.78 | 0.21 | 5.72 | 0.41 | 5.68 | 0.30 | 3.24 | 0.29 | 0.25 | 0.20 | ||||||||||||||||||||||||||||||
| Gold produced | kg | Sep 2022 | 6,366 | 4,354 | 2,012 | 1,640 | 50 | 1,393 | 190 | 1,321 | — | 319 | 1,453 | ||||||||||||||||||||||||||||
| Jun 2022 | 1,698 | 49 | 1,649 | 7 | — | 20 | 11 | 22 | — | 195 | 1,443 | ||||||||||||||||||||||||||||||
| Sep 2021 | 9,137 | 7,048 | 2,089 | 2,470 | 67 | 2,801 | 253 | 1,777 | 30 | 290 | 1,449 | ||||||||||||||||||||||||||||||
| oz | Sep 2022 | 204,672 | 139,984 | 64,687 | 52,727 | 1,608 | 44,786 | 6,109 | 42,471 | — | 10,256 | 46,715 | |||||||||||||||||||||||||||||
| Jun 2022 | 54,592 | 1,575 | 53,017 | 225 | — | 643 | 354 | 707 | — | 6,269 | 46,394 | ||||||||||||||||||||||||||||||
| Sep 2021 | 293,761 | 226,598 | 67,163 | 79,412 | 2,154 | 90,054 | 8,134 | 57,132 | 965 | 9,324 | 46,586 | ||||||||||||||||||||||||||||||
| Gold sold | kg | Sep 2022 | 6,070 | 4,095 | 1,975 | 1,524 | 48 | 1,314 | 174 | 1,257 | — | 311 | 1,442 | ||||||||||||||||||||||||||||
| Jun 2022 | 1,735 | 129 | 1,606 | 9 | — | 14 | 1 | 106 | — | 159 | 1,446 | ||||||||||||||||||||||||||||||
| Sep 2021 | 9,069 | 7,025 | 2,044 | 2,375 | 47 | 2,742 | 247 | 1,908 | 30 | 292 | 1,428 | ||||||||||||||||||||||||||||||
| oz | Sep 2022 | 195,155 | 131,657 | 63,498 | 48,998 | 1,543 | 42,246 | 5,594 | 40,413 | — | 9,999 | 46,361 | |||||||||||||||||||||||||||||
| Jun 2022 | 55,782 | 4,147 | 51,634 | 289 | — | 450 | 32 | 3,408 | — | 5,112 | 46,490 | ||||||||||||||||||||||||||||||
| Sep 2021 | 291,575 | 225,859 | 65,716 | 76,358 | 1,511 | 88,157 | 7,941 | 61,344 | 965 | 9,388 | 45,911 | ||||||||||||||||||||||||||||||
| Price and costs | |||||||||||||||||||||||||||||||||||||||||
| Gold price received | R/kg | Sep 2022 | 944,316 | 944,020 | 944,220 | 942,721 | 945,338 | 945,908 | |||||||||||||||||||||||||||||||||
| Jun 2022 | 940,634 | 1,000,000 | 1,000,000 | 962,264 | 930,818 | 939,142 | |||||||||||||||||||||||||||||||||||
| Sep 2021 | 837,799 | 839,389 | 836,066 | 834,881 | 842,466 | 841,737 | |||||||||||||||||||||||||||||||||||
| Gold price received | US$/oz | Sep 2022 | 1,723 | 1,722 | 1,722 | 1,720 | 1,725 | 1,726 | |||||||||||||||||||||||||||||||||
| Jun 2022 | 1,877 | 1,995 | 1,995 | 1,920 | 1,857 | 1,874 | |||||||||||||||||||||||||||||||||||
| Sep 2021 | 1,781 | 1,785 | 1,777 | 1,775 | 1,791 | 1,790 | |||||||||||||||||||||||||||||||||||
Operating cost1 | R/t | Sep 2022 | 645 | 4,573 | 163 | 5,623 | 359 | 5,388 | 305 | 3,393 | 1,222 | 214 | 137 | ||||||||||||||||||||||||||||
| Jun 2022 | 463 | — | 151 | — | — | — | 1,825 | — | — | 178 | 136 | ||||||||||||||||||||||||||||||
| Sep 2021 | 537 | 3,157 | 139 | 3,438 | 159 | 3,907 | 251 | 2,262 | 204 | 184 | 118 | ||||||||||||||||||||||||||||||
| US$/t | Sep 2022 | 38 | 268 | 10 | 330 | 21 | 316 | 18 | 199 | 72 | 13 | 8 | |||||||||||||||||||||||||||||
| Jun 2022 | 30 | — | 10 | — | — | — | 117 | — | — | 11 | 9 | ||||||||||||||||||||||||||||||
| Sep 2021 | 37 | 216 | 10 | 235 | 11 | 267 | 17 | 155 | 14 | 13 | 8 | ||||||||||||||||||||||||||||||
| R/kg | Sep 2022 | 1,036,601 | 1,173,404 | 740,557 | 995,732 | 880,000 | 1,300,790 | 994,737 | 1,259,652 | — | 805,643 | 673,090 | |||||||||||||||||||||||||||||
| Jun 2022 | 2,214,370 | 51,632,653 | 745,907 | 131,285,714 | — | 50,200,000 | 6,636,364 | 27,590,909 | — | 923,077 | 664,588 | ||||||||||||||||||||||||||||||
| Sep 2021 | 657,656 | 660,187 | 649,114 | 601,215 | 388,060 | 687,612 | 849,802 | 698,931 | 700,000 | 751,724 | 604,555 | ||||||||||||||||||||||||||||||
| US$/oz | Sep 2022 | 1,891 | 2,141 | 1,351 | 1,816 | 1,605 | 2,373 | 1,815 | 2,298 | — | 1,470 | 1,228 | |||||||||||||||||||||||||||||
| Jun 2022 | 4,418 | 103,012 | 1,488 | 261,927 | — | 100,154 | 13,240 | 55,046 | — | 1,842 | 1,326 | ||||||||||||||||||||||||||||||
| Sep 2021 | 1,398 | 1,404 | 1,380 | 1,278 | 825 | 1,462 | 1,807 | 1,486 | 1,488 | 1,598 | 1,285 | ||||||||||||||||||||||||||||||
All-in sustaining cost2 | R/kg | Sep 2022 | 1,210,049 | 1,215,013 | 1,527,554 | 1,424,025 | 861,736 | 765,603 | |||||||||||||||||||||||||||||||||
| Jun 2022 | 2,522,190 | 110,222,222 | 76,266,667 | 7,264,151 | 1,056,604 | 899,723 | |||||||||||||||||||||||||||||||||||
| Sep 2021 | 796,008 | 790,669 | 848,444 | 825,593 | 787,671 | 649,860 | |||||||||||||||||||||||||||||||||||
| All-in sustaining cost2 | US$/oz | Sep 2022 | 2,207 | 2,216 | 2,787 | 2,598 | 1,572 | 1,397 | |||||||||||||||||||||||||||||||||
| Jun 2022 | 5,032 | 219,903 | 152,159 | 14,493 | 2,108 | 1,795 | |||||||||||||||||||||||||||||||||||
| Sep 2021 | 1,692 | 1,681 | 1,804 | 1,755 | 1,675 | 1,382 | |||||||||||||||||||||||||||||||||||
All-in cost2 | R/kg | Sep 2022 | 1,293,245 | 1,215,013 | 1,598,118 | 1,424,025 | 861,736 | 802,358 | |||||||||||||||||||||||||||||||||
| Jun 2022 | 2,663,977 | 110,222,222 | 77,600,000 | 7,264,151 | 1,056,604 | 887,967 | |||||||||||||||||||||||||||||||||||
| Sep 2021 | 809,792 | 790,669 | 862,830 | 826,625 | 787,671 | 659,664 | |||||||||||||||||||||||||||||||||||
| All-in cost2 | US$/oz | Sep 2022 | 2,359 | 2,216 | 2,915 | 2,598 | 1,572 | 1,464 | |||||||||||||||||||||||||||||||||
| Jun 2022 | 5,315 | 219,903 | 154,819 | 14,493 | 2,108 | 1,772 | |||||||||||||||||||||||||||||||||||
| Sep 2021 | 1,722 | 1,681 | 1,834 | 1,757 | 1,675 | 1,402 | |||||||||||||||||||||||||||||||||||
| Capital expenditure | |||||||||||||||||||||||||||||||||||||||||
| Ore reserve development | Rm | Sep 2022 | 472 | 208 | 174 | 90 | — | — | |||||||||||||||||||||||||||||||||
| Jun 2022 | — | — | — | — | — | — | |||||||||||||||||||||||||||||||||||
| Sep 2021 | 729 | 324 | 270 | 135 | — | — | |||||||||||||||||||||||||||||||||||
| Sustaining capital | Rm | Sep 2022 | 409 | 109 | 150 | 37 | — | 113 | |||||||||||||||||||||||||||||||||
| Jun 2022 | 455 | 35 | 58 | 32 | — | 330 | |||||||||||||||||||||||||||||||||||
| Sep 2021 | 342 | 94 | 128 | 45 | — | 75 | |||||||||||||||||||||||||||||||||||
Corporate and projects3 | Rm | Sep 2022 | 488 | — | 105 | — | — | 53 | |||||||||||||||||||||||||||||||||
| Jun 2022 | 220 | — | 20 | — | — | (17) | |||||||||||||||||||||||||||||||||||
| Sep 2021 | 97 | — | 43 | 2 | — | 14 | |||||||||||||||||||||||||||||||||||
| Total capital expenditure | Rm | Sep 2022 | 1,369 | 317 | 429 | 127 | — | 166 | |||||||||||||||||||||||||||||||||
| Jun 2022 | 675 | 35 | 78 | 32 | — | 313 | |||||||||||||||||||||||||||||||||||
| Sep 2021 | 1,168 | 418 | 441 | 182 | — | 89 | |||||||||||||||||||||||||||||||||||
| Total capital expenditure | US$m | Sep 2022 | 80 | 19 | 25 | 7 | — | 10 | |||||||||||||||||||||||||||||||||
| Jun 2022 | 43 | 2 | 5 | 2 | — | 20 | |||||||||||||||||||||||||||||||||||
| Sep 2021 | 80 | 29 | 30 | 12 | — | 6 | |||||||||||||||||||||||||||||||||||
Average exchange rates for the quarters ended 30 September 2022, 30 June 2022 and 30 September 2021 was R17.05/US$, R15.59/US$ and R14.63/US$, respectively
Figures may not add as they are rounded independently
1Operating cost is the average cost of production and operating cost per tonne is calculated by dividing the cost of sales, before amortisation and depreciation and change in inventory in a period by the tonnes milled/treated in the same period, and operating cost per kilogram (and ounce) is calculated by dividing the cost of sales, before amortisation and depreciation and change in inventory in a period by the gold produced in the same period
2All-in cost is calculated in accordance with the World Gold Council guidance. All-in cost excludes income tax, costs associated with merger and acquisition activities, working capital, impairments, financing costs, one time severance charges and items needed to normalise earnings. All-in cost is made up of All-in sustaining cost, being the cost to sustain current operations, given as a sub-total in the All-in cost calculation, together with corporate and major capital expenditure associated with growth. All-in sustaining cost per kilogram (and ounce) and All-in cost per kilogram (and ounce) are calculated by dividing the All-in sustaining cost and All-in cost, respectively, in a period by the total gold sold over the same period. For a reconciliation of cost of sales before amortisation and depreciation to All-in cost, see “All-in costs – Quarters”
3Corporate project expenditure for the quarters ended 30 September 2022, 30 June 2022 and 30 September 2021 was R330 million (US$19 million), R217 million (US$14 million) and R38 million (US$3 million), respectively, the majority of which related to the Burnstone project
Sibanye-Stillwater Operating update | Quarter ended 30 September 2022 10
European operations
| Sibanye-Stillwater Sandouville Refinery | ||||||||||||||
| Battery Metal Split | ||||||||||||||
| Sep 2022 | Jun 2022 | |||||||||||||
| Volumes produced (tons) | % | % | ||||||||||||
Nickel Salts1 | 650 | 39 | % | 668 | 23 | % | ||||||||
| Nickel Metal | 1,003 | 61 | % | 2,251 | 77 | % | ||||||||
| Total Nickel Production tNi | 1,653 | 100 | % | 2,919 | 100 | % | ||||||||
Nickel Cakes2 | 68 | 123 | ||||||||||||
Cobalt Chloride (CoCl2)3 | 37 | 78 | ||||||||||||
Ferric Chloride (FeCl3)3 | 321 | 608 | ||||||||||||
| Volumes sales (tons) | ||||||||||||||
Nickel Salts1 | 529 | 31 | % | 609 | 20 | % | ||||||||
| Nickel Metal | 1,177 | 69 | % | 2,367 | 80 | % | ||||||||
| Total Nickel Sold tNi | 1,706 | 100 | % | 2,976 | 100 | % | ||||||||
Cobalt Chloride (CoCl2)3 | 51 | 95 | ||||||||||||
Ferric Chloride (FeCl3)3 | 321 | 608 | ||||||||||||
| Nickel equivalent basket price | Unit | Sep 2022 | Jun 2022 | ||||||||
| Nickel equivalent average basket price | R/tNi | 384,525 | 471,774 | ||||||||
| US$/tNi | 22,553 | 30,261 | |||||||||
| Nickel equivalent sustaining cost | Unit | Sep 2022 | Jun 2022 | ||||||||
| Cost of sales, before amortisation and depreciation | Rm | 882 | 1,260 | ||||||||
| Carbon tax | Rm | — | — | ||||||||
| Community costs | Rm | — | — | ||||||||
| Share-based payments | Rm | — | — | ||||||||
| Rehabilitation interest and amortisation | Rm | 1 | 1 | ||||||||
| Leases | Rm | 15 | 10 | ||||||||
| Sustaining capital expenditure | Rm | 23 | 19 | ||||||||
| Less: By-product credit | Rm | (43) | (44) | ||||||||
| Nickel equivalent sustaining cost | Rm | 878 | 1,246 | ||||||||
| Nickel Products sold | tNi | 1,706 | 2,976 | ||||||||
| Nickel equivalent sustaining cost | R/tNi | 514,654 | 418,683 | ||||||||
| US$/tNi | 30,185 | 26,856 | |||||||||
Nickel recovery yield4 | % | 95.04 | % | 99.36 | % | ||||||
Average exchange rates for the quarters ended 30 September 2022, 30 June 2022 and 30 September 2021 was R17.05/US$, R15.59/US$ and R14.63/US$, respectively
1 Nickel salts consist of anhydrous nickel, nickel chloride low sodium, nickel chloride standard, nickel carbonate and nickel chloride solution
2 Nickel cakes occur during the processing of nickel matte and are recycled back into the nickel refining process
3 Cobalt chloride and ferric chloride are obtained from nickel matte through a different refining process on an order basis
4 Nickel recovery yield is the percentage of total nickel recovered from the matte relative to the nickel contained in the matte received
Sibanye-Stillwater Operating update | Quarter ended 30 September 2022 11
ALL-IN COSTS - QUARTERS
SA and US PGM operations
Figures are in millions unless otherwise stated
| US OPERATIONS | SA OPERATIONS | ||||||||||||||||||||||||||||||||||
| R' million | Total US and SA PGM1 | Total US PGM2 | Total SA PGM1 | Rustenburg | Marikana1 | Kroondal | Plat Mile | Mimosa | Corporate | ||||||||||||||||||||||||||
Cost of sales, before amortisation and depreciation3 | Sep 2022 | 9,416 | 1,413 | 8,003 | 3,218 | 3,758 | 868 | 159 | 511 | (511) | |||||||||||||||||||||||||
| Jun 2022 | 9,696 | 2,045 | 7,651 | 3,208 | 3,364 | 937 | 142 | 461 | (461) | ||||||||||||||||||||||||||
| Sep 2021 | 9,598 | 1,820 | 7,778 | 2,647 | 4,077 | 914 | 140 | 419 | (419) | ||||||||||||||||||||||||||
| Royalties | Sep 2022 | 374 | — | 374 | 258 | 112 | 4 | — | 26 | (26) | |||||||||||||||||||||||||
| Jun 2022 | 316 | — | 316 | 94 | 219 | 3 | — | 39 | (39) | ||||||||||||||||||||||||||
| Sep 2021 | 573 | — | 573 | 269 | 302 | 2 | — | 42 | (42) | ||||||||||||||||||||||||||
| Carbon tax | Sep 2022 | (1) | — | (1) | — | — | (1) | — | — | — | |||||||||||||||||||||||||
| Jun 2022 | 1 | — | 1 | — | 1 | — | — | — | — | ||||||||||||||||||||||||||
| Sep 2021 | (1) | — | (1) | — | (1) | — | — | — | — | ||||||||||||||||||||||||||
| Community costs | Sep 2022 | 22 | — | 22 | — | 22 | — | — | — | — | |||||||||||||||||||||||||
| Jun 2022 | 54 | — | 54 | — | 54 | — | — | — | — | ||||||||||||||||||||||||||
| Sep 2021 | 92 | — | 92 | 3 | 89 | — | — | — | — | ||||||||||||||||||||||||||
| Inventory change | Sep 2022 | 1,462 | 398 | 1,064 | 375 | 689 | — | — | (3) | 3 | |||||||||||||||||||||||||
| Jun 2022 | 913 | (108) | 1,021 | 232 | 789 | — | — | 4 | (4) | ||||||||||||||||||||||||||
| Sep 2021 | 982 | 74 | 908 | 711 | 197 | — | — | (6) | 6 | ||||||||||||||||||||||||||
Share-based payments4 | Sep 2022 | 54 | 12 | 42 | 16 | 19 | 7 | — | — | — | |||||||||||||||||||||||||
| Jun 2022 | 147 | 68 | 79 | 29 | 35 | 14 | 1 | — | — | ||||||||||||||||||||||||||
| Sep 2021 | 50 | 21 | 29 | 12 | 13 | 4 | — | — | — | ||||||||||||||||||||||||||
Rehabilitation interest and amortisation5 | Sep 2022 | 35 | 13 | 22 | (8) | 10 | 20 | — | 1 | (1) | |||||||||||||||||||||||||
| Jun 2022 | 53 | 13 | 40 | 1 | 20 | 19 | — | 11 | (11) | ||||||||||||||||||||||||||
| Sep 2021 | 64 | 8 | 56 | (1) | 40 | 17 | — | 1 | (1) | ||||||||||||||||||||||||||
| Leases | Sep 2022 | 16 | 2 | 14 | 3 | 10 | 1 | — | — | — | |||||||||||||||||||||||||
| Jun 2022 | 15 | 1 | 14 | 3 | 9 | 2 | — | — | — | ||||||||||||||||||||||||||
| Sep 2021 | 12 | — | 12 | 2 | 9 | 1 | — | — | — | ||||||||||||||||||||||||||
| Ore reserve development | Sep 2022 | 1,313 | 723 | 590 | 194 | 396 | — | — | — | — | |||||||||||||||||||||||||
| Jun 2022 | 1,196 | 641 | 555 | 173 | 382 | — | — | — | — | ||||||||||||||||||||||||||
| Sep 2021 | 739 | 296 | 443 | 168 | 275 | — | — | — | — | ||||||||||||||||||||||||||
| Sustaining capital expenditure | Sep 2022 | 758 | 293 | 465 | 140 | 242 | 80 | 3 | 258 | (258) | |||||||||||||||||||||||||
| Jun 2022 | 640 | 211 | 429 | 148 | 208 | 68 | 5 | 181 | (181) | ||||||||||||||||||||||||||
| Sep 2021 | 592 | 143 | 449 | 115 | 268 | 58 | 8 | 118 | (118) | ||||||||||||||||||||||||||
| Less: By-product credit | Sep 2022 | (2,327) | (196) | (2,131) | (888) | (981) | (238) | (23) | (190) | 189 | |||||||||||||||||||||||||
| Jun 2022 | (2,940) | (348) | (2,592) | (1,063) | (1,242) | (271) | (16) | (222) | 222 | ||||||||||||||||||||||||||
| Sep 2021 | (2,591) | (319) | (2,272) | (676) | (1,347) | (243) | (6) | (134) | 134 | ||||||||||||||||||||||||||
Total All-in-sustaining costs6 | Sep 2022 | 11,122 | 2,658 | 8,464 | 3,308 | 4,277 | 741 | 139 | 603 | (604) | |||||||||||||||||||||||||
| Jun 2022 | 10,091 | 2,523 | 7,568 | 2,825 | 3,839 | 772 | 132 | 474 | (474) | ||||||||||||||||||||||||||
| Sep 2021 | 10,110 | 2,043 | 8,067 | 3,250 | 3,922 | 753 | 142 | 440 | (440) | ||||||||||||||||||||||||||
| Plus: Corporate cost, growth and capital expenditure | Sep 2022 | 642 | 434 | 208 | 1 | 207 | — | — | — | — | |||||||||||||||||||||||||
| Jun 2022 | 420 | 211 | 209 | — | 209 | — | — | — | — | ||||||||||||||||||||||||||
| Sep 2021 | 645 | 583 | 62 | — | 62 | — | — | — | — | ||||||||||||||||||||||||||
Total All-in-costs6 | Sep 2022 | 11,764 | 3,092 | 8,672 | 3,309 | 4,484 | 741 | 139 | 603 | (604) | |||||||||||||||||||||||||
| Jun 2022 | 10,511 | 2,734 | 7,777 | 2,825 | 4,048 | 772 | 132 | 474 | (474) | ||||||||||||||||||||||||||
| Sep 2021 | 10,755 | 2,626 | 8,129 | 3,250 | 3,984 | 753 | 142 | 440 | (440) | ||||||||||||||||||||||||||
| PGM production | 4Eoz - 2Eoz | Sep 2022 | 534,752 | 85,889 | 448,863 | 179,438 | 180,316 | 48,120 | 12,319 | 28,670 | — | ||||||||||||||||||||||||
| Jun 2022 | 535,262 | 107,650 | 427,612 | 155,831 | 180,815 | 51,797 | 9,658 | 29,511 | — | ||||||||||||||||||||||||||
| Sep 2021 | 658,101 | 144,325 | 513,776 | 183,606 | 226,591 | 61,083 | 13,726 | 28,770 | — | ||||||||||||||||||||||||||
| kg | Sep 2022 | 16,633 | 2,671 | 13,961 | 5,581 | 5,608 | 1,497 | 383 | 892 | — | |||||||||||||||||||||||||
| Jun 2022 | 16,649 | 3,348 | 13,300 | 4,847 | 5,624 | 1,611 | 300 | 918 | — | ||||||||||||||||||||||||||
| Sep 2021 | 20,469 | 4,489 | 15,980 | 5,711 | 7,048 | 1,900 | 427 | 895 | — | ||||||||||||||||||||||||||
| All-in-sustaining cost | R/4Eoz - R/2Eoz | Sep 2022 | 21,977 | 30,947 | 20,143 | 18,435 | 23,719 | 15,399 | 11,283 | 21,032 | — | ||||||||||||||||||||||||
| Jun 2022 | 19,953 | 23,437 | 19,010 | 18,129 | 21,232 | 14,904 | 13,667 | 16,062 | — | ||||||||||||||||||||||||||
| Sep 2021 | 16,065 | 14,156 | 16,633 | 17,701 | 17,309 | 12,327 | 10,345 | 15,294 | — | ||||||||||||||||||||||||||
| US$/4Eoz - US$/2Eoz | Sep 2022 | 1,289 | 1,815 | 1,181 | 1,081 | 1,391 | 903 | 662 | 1,234 | — | |||||||||||||||||||||||||
| Jun 2022 | 1,280 | 1,503 | 1,219 | 1,163 | 1,362 | 956 | 877 | 1,030 | — | ||||||||||||||||||||||||||
| Sep 2021 | 1,098 | 968 | 1,137 | 1,210 | 1,183 | 843 | 707 | 1,045 | — | ||||||||||||||||||||||||||
| All-in-cost | R/4Eoz - R/2Eoz | Sep 2022 | 23,245 | 36,000 | 20,638 | 18,441 | 24,867 | 15,399 | 11,283 | 21,032 | — | ||||||||||||||||||||||||
| Jun 2022 | 20,783 | 25,397 | 19,535 | 18,129 | 22,388 | 14,904 | 13,667 | 16,062 | — | ||||||||||||||||||||||||||
| Sep 2021 | 17,090 | 18,195 | 16,761 | 17,701 | 17,582 | 12,327 | 10,345 | 15,294 | — | ||||||||||||||||||||||||||
| US$/4Eoz - US$/2Eoz | Sep 2022 | 1,363 | 2,111 | 1,210 | 1,082 | 1,459 | 903 | 662 | 1,234 | — | |||||||||||||||||||||||||
| Jun 2022 | 1,333 | 1,629 | 1,253 | 1,163 | 1,436 | 956 | 877 | 1,030 | — | ||||||||||||||||||||||||||
| Sep 2021 | 1,168 | 1,244 | 1,146 | 1,210 | 1,202 | 843 | 707 | 1,045 | — | ||||||||||||||||||||||||||
Average exchange rates for the quarters ended 30 September 2022, 30 June 2022 and 30 September 2021 was R17.05/US$, R15.59/US$ and R14.63/US$, respectively
Figures may not add as they are rounded independently
1The Total US and SA PGM, Total SA PGM and Marikana includes the production and costs associated with the purchase of concentrate (PoC) from third parties. For a reconciliation of the Operating cost, AISC and AIC excluding third party PoC, refer to “Reconciliation of operating cost excluding third party PoC for Total US and SA PGM, Total SA PGM and Marikana - Quarters” and “Reconciliation of AISC and AIC excluding third party PoC for Total US and SA PGM, Total SA PGM and Marikana – Quarters”
2The US PGM operations’ underground production is converted to metric tonnes and kilograms, and performance is translated into SA rand. In addition to the US PGM operations’ underground production, the operation processes various recycling material which is excluded from the 2E PGM production, All-in sustaining cost and All-in cost statistics shown
3Cost of sales, before amortisation and depreciation includes all mining and processing costs, third party refining costs, corporate general and administrative costs, and permitting costs
4Share-based payments are calculated based on the fair value at initial recognition and do not include the adjustment of the cash-settled share-based payment obligation to the reporting date fair value
5Rehabilitation includes the interest charge related to the environmental rehabilitation obligation and the amortisation of the related capitalised rehabilitation costs. The interest charge related to the environmental rehabilitation obligation and the amortisation of the capitalised rehabilitation costs reflect the periodic costs of rehabilitation associated with current PGM production
Sibanye-Stillwater Operating update | Quarter ended 30 September 2022 12
6All-in cost is calculated in accordance with the World Gold Council guidance. All-in cost excludes income tax, costs associated with merger and acquisition activities, working capital, impairments, financing costs, one-time severance charges and items needed to normalise earnings. All-in cost is made up of All-in sustaining cost, being the cost to sustain current operations, given as a sub-total in the All-in cost calculation, together with corporate and major capital expenditure associated with growth. All-in sustaining cost per ounce (and kilogram) and All-in cost per ounce (and kilogram) are calculated by dividing the All-in sustaining cost and All-in cost, respectively, in a period by the total 4E/2E PGM produced in the same period
| Reconciliation of operating cost excluding third party PoC for Total US and SA PGM, Total SA PGM and Marikana - Quarters | ||||||||||||||||||||||||||||||||
| Total US and SA PGM | Total SA PGM | Marikana | ||||||||||||||||||||||||||||||
| R' million | Sep 2022 | Jun 2022 | Sep 2021 | Sep 2022 | Jun 2022 | Sep 2021 | Sep 2022 | Jun 2022 | Sep 2021 | |||||||||||||||||||||||
| Cost of sales, before amortisation and depreciation as reported per table above | 9,416 | 9,696 | 9,598 | 8,003 | 7,651 | 7,778 | 3,758 | 3,364 | 4,077 | |||||||||||||||||||||||
| Inventory change as reported per table above | 1,462 | 913 | 982 | 1,064 | 1,021 | 908 | 689 | 789 | 197 | |||||||||||||||||||||||
| Less: Chrome cost of sales | (402) | (422) | (338) | (402) | (422) | (338) | (96) | (79) | (64) | |||||||||||||||||||||||
| Total operating cost including third party PoC | 10,476 | 10,187 | 10,242 | 8,665 | 8,250 | 8,348 | 4,351 | 4,074 | 4,210 | |||||||||||||||||||||||
| Less: Purchase cost of PoC | (790) | (565) | (593) | (790) | (565) | (593) | (790) | (565) | (593) | |||||||||||||||||||||||
| Total operating cost excluding third party PoC | 9,686 | 9,622 | 9,649 | 7,875 | 7,685 | 7,755 | 3,561 | 3,509 | 3,617 | |||||||||||||||||||||||
| PGM production as reported per table above | 4Eoz- 2Eoz | 534,752 | 535,262 | 658,101 | 448,863 | 427,612 | 513,776 | 180,316 | 180,815 | 226,591 | ||||||||||||||||||||||
| Less: Mimosa production | (28,670) | (29,511) | (28,770) | (28,670) | (29,511) | (28,770) | — | — | — | |||||||||||||||||||||||
| PGM production excluding Mimosa | 506,082 | 505,751 | 629,331 | 420,193 | 398,101 | 485,006 | 180,316 | 180,815 | 226,591 | |||||||||||||||||||||||
| Less: PoC production | (16,720) | (14,654) | (13,703) | (16,720) | (14,654) | (13,703) | (16,720) | (14,654) | (13,703) | |||||||||||||||||||||||
| PGM production excluding Mimosa and third party PoC | 489,362 | 491,097 | 615,628 | 403,473 | 383,447 | 471,303 | 163,596 | 166,161 | 212,888 | |||||||||||||||||||||||
| PGM production including Mimosa and excluding third party PoC | 518,032 | 520,608 | 644,398 | 432,143 | 412,958 | 500,073 | 163,596 | 166,161 | 212,888 | |||||||||||||||||||||||
| Tonnes milled/treated | 000't | 9,625 | 9,641 | 10,747 | 9,383 | 9,342 | 10,363 | 2,441 | 2,554 | 2,933 | ||||||||||||||||||||||
| Less: Mimosa tonnes | (340) | (360) | (352) | (340) | (360) | (352) | — | — | — | |||||||||||||||||||||||
| PGM tonnes excluding Mimosa and third party PoC | 9,284 | 9,281 | 10,395 | 9,043 | 8,982 | 10,011 | 2,441 | 2,554 | 2,933 | |||||||||||||||||||||||
| Operating cost including third party PoC | R/4Eoz-R/2Eoz | 20,700 | 20,142 | 16,274 | 20,621 | 20,723 | 17,212 | 24,130 | 22,531 | 18,580 | ||||||||||||||||||||||
| US$/4Eoz-US$/2Eoz | 1,214 | 1,292 | 1,112 | 1,209 | 1,329 | 1,176 | 1,415 | 1,445 | 1,270 | |||||||||||||||||||||||
| R/t | 1,128 | 1,098 | 985 | 958 | 919 | 834 | 1,782 | 1,595 | 1,435 | |||||||||||||||||||||||
| US$/t | 66 | 70 | 67 | 56 | 59 | 57 | 105 | 102 | 98 | |||||||||||||||||||||||
| Operating cost excluding third party PoC | R/4Eoz-R/2Eoz | 19,793 | 19,593 | 15,673 | 19,518 | 20,042 | 16,454 | 21,767 | 21,118 | 16,990 | ||||||||||||||||||||||
| US$/4Eoz-US$/2Eoz | 1,161 | 1,257 | 1,071 | 1,145 | 1,286 | 1,125 | 1,277 | 1,355 | 1,161 | |||||||||||||||||||||||
| R/t | 1,043 | 1,037 | 928 | 871 | 856 | 775 | 1,459 | 1,374 | 1,233 | |||||||||||||||||||||||
| US$/t | 61 | 67 | 63 | 51 | 55 | 53 | 86 | 88 | 84 | |||||||||||||||||||||||
| Reconciliation of AISC and AIC excluding third party PoC for Total US and SA PGM, Total SA PGM and Marikana - Quarters | ||||||||||||||||||||||||||||||||
| Total US and SA PGM | Total SA PGM | Marikana | ||||||||||||||||||||||||||||||
| R' million | Sep 2022 | Jun 2022 | Sep 2021 | Sep 2022 | Jun 2022 | Sep 2021 | Sep 2022 | Jun 2022 | Sep 2021 | |||||||||||||||||||||||
| Total All-in-sustaining cost as reported per table above | 11,122 | 10,091 | 10,110 | 8,464 | 7,568 | 8,067 | 4,277 | 3,839 | 3,922 | |||||||||||||||||||||||
| Less: Purchase cost of PoC | (790) | (565) | (593) | (790) | (565) | (593) | (790) | (565) | (593) | |||||||||||||||||||||||
| Add: By-product credit of PoC | 77 | 67 | 63 | 77 | 67 | 63 | 77 | 67 | 63 | |||||||||||||||||||||||
| Total All-in-sustaining cost excluding third party PoC | 10,409 | 9,593 | 9,580 | 7,751 | 7,070 | 7,537 | 3,564 | 3,341 | 3,392 | |||||||||||||||||||||||
| Plus: Corporate cost, growth and capital expenditure | 642 | 420 | 645 | 208 | 209 | 62 | 207 | 209 | 62 | |||||||||||||||||||||||
| Total All-in-cost excluding third party PoC | 11,051 | 10,013 | 10,225 | 7,959 | 7,279 | 7,599 | 3,771 | 3,550 | 3,454 | |||||||||||||||||||||||
| PGM production excluding Mimosa and third party PoC | 4Eoz- 2Eoz | 489,362 | 491,097 | 615,628 | 403,473 | 383,447 | 471,303 | 163,596 | 166,161 | 212,888 | ||||||||||||||||||||||
| All-in-sustaining cost excluding third party PoC | R/4Eoz-R/2Eoz | 21,271 | 19,534 | 15,561 | 19,211 | 18,438 | 15,992 | 21,785 | 20,107 | 15,933 | ||||||||||||||||||||||
| US$/4Eoz-US$/2Eoz | 1,248 | 1,253 | 1,064 | 1,127 | 1,183 | 1,093 | 1,278 | 1,290 | 1,089 | |||||||||||||||||||||||
| All-in-cost excluding third party PoC | R/4Eoz-R/2Eoz | 22,582 | 20,389 | 16,609 | 19,726 | 18,983 | 16,123 | 23,051 | 21,365 | 16,224 | ||||||||||||||||||||||
| US$/4Eoz-US$/2Eoz | 1,324 | 1,308 | 1,135 | 1,157 | 1,218 | 1,102 | 1,352 | 1,370 | 1,109 | |||||||||||||||||||||||
Sibanye-Stillwater Operating update | Quarter ended 30 September 2022 13
SA gold operations
Figures are in millions unless otherwise stated
| SA OPERATIONS | |||||||||||||||||||||||||||||
| R' million | Total SA gold | Driefontein | Kloof | Beatrix | Cooke | DRDGOLD | Corporate | ||||||||||||||||||||||
Cost of sales, before amortisation and depreciation1 | Sep 2022 | 6,342 | 1,562 | 1,926 | 1,624 | 256 | 974 | — | |||||||||||||||||||||
| Jun 2022 | 3,784 | 915 | 1,059 | 701 | 154 | 955 | — | ||||||||||||||||||||||
| Sep 2021 | 5,978 | 1,450 | 2,102 | 1,371 | 217 | 838 | — | ||||||||||||||||||||||
| Royalties | Sep 2022 | 21 | 7 | 7 | 6 | 1 | — | — | |||||||||||||||||||||
| Jun 2022 | 2 | — | — | 1 | 1 | — | — | ||||||||||||||||||||||
| Sep 2021 | 49 | 19 | 12 | 8 | 1 | — | 9 | ||||||||||||||||||||||
| Carbon tax | Sep 2022 | 1 | — | — | 1 | — | — | — | |||||||||||||||||||||
| Jun 2022 | 1 | — | — | 1 | — | — | — | ||||||||||||||||||||||
| Sep 2021 | — | — | — | — | — | — | — | ||||||||||||||||||||||
| Community costs | Sep 2022 | 24 | 8 | 7 | 6 | — | 3 | — | |||||||||||||||||||||
| Jun 2022 | 33 | 12 | 10 | 8 | — | 3 | — | ||||||||||||||||||||||
| Sep 2021 | 33 | 12 | 10 | 9 | — | 2 | — | ||||||||||||||||||||||
Share-based payments2 | Sep 2022 | 28 | 10 | 9 | 5 | — | 4 | — | |||||||||||||||||||||
| Jun 2022 | 51 | 21 | 15 | 10 | — | 5 | — | ||||||||||||||||||||||
| Sep 2021 | 26 | 6 | 9 | 6 | — | 5 | — | ||||||||||||||||||||||
Rehabilitation interest and amortisation3 | Sep 2022 | 32 | 5 | (3) | 15 | 11 | 4 | — | |||||||||||||||||||||
| Jun 2022 | 31 | 8 | (2) | 10 | 12 | 2 | 1 | ||||||||||||||||||||||
| Sep 2021 | 50 | 10 | 5 | 20 | 9 | 5 | 1 | ||||||||||||||||||||||
| Leases | Sep 2022 | 19 | 2 | 4 | 7 | — | 6 | — | |||||||||||||||||||||
| Jun 2022 | 21 | 1 | 4 | 7 | 1 | 8 | — | ||||||||||||||||||||||
| Sep 2021 | 19 | 2 | 2 | 7 | 3 | 5 | — | ||||||||||||||||||||||
| Ore reserve development | Sep 2022 | 472 | 208 | 174 | 90 | — | — | — | |||||||||||||||||||||
| Jun 2022 | — | — | — | — | — | — | — | ||||||||||||||||||||||
| Sep 2021 | 729 | 324 | 270 | 135 | — | — | — | ||||||||||||||||||||||
| Sustaining capital expenditure | Sep 2022 | 409 | 109 | 150 | 37 | — | 113 | — | |||||||||||||||||||||
| Jun 2022 | 455 | 35 | 58 | 32 | — | 330 | — | ||||||||||||||||||||||
| Sep 2021 | 342 | 94 | 128 | 45 | — | 75 | — | ||||||||||||||||||||||
| Less: By-product credit | Sep 2022 | (3) | (1) | (1) | (1) | — | — | — | |||||||||||||||||||||
| Jun 2022 | (2) | — | — | — | — | (2) | — | ||||||||||||||||||||||
| Sep 2021 | (7) | (2) | (2) | (1) | — | (2) | — | ||||||||||||||||||||||
Total All-in-sustaining costs4 | Sep 2022 | 7,345 | 1,910 | 2,273 | 1,790 | 268 | 1,104 | — | |||||||||||||||||||||
| Jun 2022 | 4,376 | 992 | 1,144 | 770 | 168 | 1,301 | 1 | ||||||||||||||||||||||
| Sep 2021 | 7,219 | 1,915 | 2,536 | 1,600 | 230 | 928 | 10 | ||||||||||||||||||||||
| Plus: Corporate cost, growth and capital expenditure | Sep 2022 | 505 | — | 105 | — | — | 53 | 347 | |||||||||||||||||||||
| Jun 2022 | 246 | — | 20 | — | — | (17) | 243 | ||||||||||||||||||||||
| Sep 2021 | 125 | — | 43 | 2 | — | 14 | 66 | ||||||||||||||||||||||
Total All-in-costs4 | Sep 2022 | 7,850 | 1,910 | 2,378 | 1,790 | 268 | 1,157 | 347 | |||||||||||||||||||||
| Jun 2022 | 4,622 | 992 | 1,164 | 770 | 168 | 1,284 | 244 | ||||||||||||||||||||||
| Sep 2021 | 7,344 | 1,915 | 2,579 | 1,602 | 230 | 942 | 76 | ||||||||||||||||||||||
| Gold sold | kg | Sep 2022 | 6,070 | 1,572 | 1,488 | 1,257 | 311 | 1,442 | — | ||||||||||||||||||||
| Jun 2022 | 1,735 | 9 | 15 | 106 | 159 | 1,446 | — | ||||||||||||||||||||||
| Sep 2021 | 9,069 | 2,422 | 2,989 | 1,938 | 292 | 1,428 | — | ||||||||||||||||||||||
| oz | Sep 2022 | 195,155 | 50,541 | 47,840 | 40,413 | 9,999 | 46,361 | — | |||||||||||||||||||||
| Jun 2022 | 55,782 | 289 | 482 | 3,408 | 5,112 | 46,490 | — | ||||||||||||||||||||||
| Sep 2021 | 291,575 | 77,869 | 96,099 | 62,308 | 9,388 | 45,911 | — | ||||||||||||||||||||||
| All-in-sustaining cost | R/kg | Sep 2022 | 1,210,049 | 1,215,013 | 1,527,554 | 1,424,025 | 861,736 | 765,603 | — | ||||||||||||||||||||
| Jun 2022 | 2,522,190 | 110,222,222 | 76,266,667 | 7,264,151 | 1,056,604 | 899,723 | — | ||||||||||||||||||||||
| Sep 2021 | 796,008 | 790,669 | 848,444 | 825,593 | 787,671 | 649,860 | — | ||||||||||||||||||||||
| All-in-sustaining cost | US$/oz | Sep 2022 | 2,207 | 2,216 | 2,787 | 2,598 | 1,572 | 1,397 | — | ||||||||||||||||||||
| Jun 2022 | 5,032 | 219,903 | 152,159 | 14,493 | 2,108 | 1,795 | — | ||||||||||||||||||||||
| Sep 2021 | 1,692 | 1,681 | 1,804 | 1,755 | 1,675 | 1,382 | — | ||||||||||||||||||||||
| All-in-cost | R/kg | Sep 2022 | 1,293,245 | 1,215,013 | 1,598,118 | 1,424,025 | 861,736 | 802,358 | — | ||||||||||||||||||||
| Jun 2022 | 2,663,977 | 110,222,222 | 77,600,000 | 7,264,151 | 1,056,604 | 887,967 | — | ||||||||||||||||||||||
| Sep 2021 | 809,792 | 790,669 | 862,830 | 826,625 | 787,671 | 659,664 | — | ||||||||||||||||||||||
| All-in-cost | US$/oz | Sep 2022 | 2,359 | 2,216 | 2,915 | 2,598 | 1,572 | 1,464 | — | ||||||||||||||||||||
| Jun 2022 | 5,315 | 219,903 | 154,819 | 14,493 | 2,108 | 1,772 | — | ||||||||||||||||||||||
| Sep 2021 | 1,722 | 1,681 | 1,834 | 1,757 | 1,675 | 1,402 | — | ||||||||||||||||||||||
Average exchange rates for the quarters ended 30 September 2022, 30 June 2022 and 30 September 2021 was R17.05/US$, R15.59/US$ and R14.63/US$, respectively
Figures may not add as they are rounded independently
1 Cost of sales, before amortisation and depreciation includes all mining and processing costs, third party refining costs, corporate general and administrative costs, and permitting costs
2 Share-based payments are calculated based on the fair value at initial recognition and do not include the adjustment of the cash-settled share-based payment obligation to the reporting date fair value
3 Rehabilitation includes the interest charge related to the environmental rehabilitation obligation and the amortisation of the related capitalised rehabilitation costs. The interest charge related to the environmental rehabilitation obligation and the amortisation of the capitalised rehabilitation costs reflect the periodic costs of rehabilitation associated with current gold production
4 All-in cost is calculated in accordance with the World Gold Council guidance. All-in cost excludes income tax, costs associated with merger and acquisition activities, working capital, impairments, financing costs, one time severance charges and items needed to normalise earnings. All-in cost is made up of All-in sustaining cost, being the cost to sustain current operations, given as a sub-total in the All-in cost calculation, together with corporate and major capital expenditure associated with growth. All-in sustaining cost per kilogram (and ounce) and All-in cost per kilogram (and ounce) are calculated by dividing the All-in sustaining cost and All-in cost, respectively, in a period by the total gold sold over the same period
Sibanye-Stillwater Operating update | Quarter ended 30 September 2022 14
ADJUSTED EBITDA RECONCILIATION - QUARTERS
| Quarter ended Sep 2022 | Quarter ended Jun 2022 | Quarter ended Sep 2021 | |||||||||||||||||||||||||||||||||||||||||||||||||||||||||||||||||||||
| Americas region | Southern Africa (SA) region | European region | Group | Americas region | SA region | European region | Group | Americas region | SA region | Group | |||||||||||||||||||||||||||||||||||||||||||||||||||||||||||||
| Figures in million - SA rand | Total US PGM | US Under- ground PGM | US Recy- cling | SA PGM | SA gold | Battery Metals1 | Corpo-rate | Total | Total US PGM | US Under- ground PGM | US Recy- cling | SA PGM | SA gold | Battery Metals1 | Corpo-rate | Total | Total US PGM | US Under- ground PGM | US Recy- cling | SA PGM | SA gold | Corpo-rate | Total | ||||||||||||||||||||||||||||||||||||||||||||||||
Profit/(loss) before royalties and tax2 | 356 | (83) | 439 | 7,374 | (802) | (331) | (142) | 6,455 | 1,520 | 1,090 | 430 | 8,854 | (1,790) | 103 | (227) | 8,460 | 3,021 | 2,502 | 519 | 10,043 | 1,192 | (236) | 14,020 | ||||||||||||||||||||||||||||||||||||||||||||||||
| Adjusted for: | |||||||||||||||||||||||||||||||||||||||||||||||||||||||||||||||||||||||
| Amortisation and depreciation | 580 | 579 | 1 | 625 | 481 | 55 | — | 1,741 | 739 | 738 | 1 | 601 | 183 | 58 | — | 1,581 | 631 | 630 | 1 | 678 | 885 | — | 2,194 | ||||||||||||||||||||||||||||||||||||||||||||||||
| Interest income | (101) | (32) | (69) | (83) | (124) | — | — | (308) | (103) | (7) | (96) | (131) | (116) | — | (1) | (351) | (94) | — | (94) | (45) | (160) | (2) | (301) | ||||||||||||||||||||||||||||||||||||||||||||||||
| Finance expense | 248 | 248 | — | 163 | 177 | 6 | 78 | 672 | 226 | 226 | — | 248 | 183 | 5 | 78 | 740 | 167 | 157 | 10 | 154 | 113 | 80 | 514 | ||||||||||||||||||||||||||||||||||||||||||||||||
| Share-based payments | 10 | 10 | — | 41 | 43 | — | — | 94 | (8) | (8) | — | (25) | (8) | — | — | (41) | 4 | 4 | — | 6 | 34 | — | 44 | ||||||||||||||||||||||||||||||||||||||||||||||||
Loss/(gain) on financial instruments3 | 160 | 160 | — | 125 | 4 | (23) | — | 266 | (124) | (124) | — | 189 | 24 | (23) | — | 66 | (684) | (684) | — | 83 | (2) | — | (603) | ||||||||||||||||||||||||||||||||||||||||||||||||
Loss/(gain) on foreign exchange differences4 | 8 | 8 | — | (135) | (518) | 63 | (39) | (621) | (1) | (1) | — | (350) | (787) | 18 | 2 | (1,118) | — | — | — | (83) | (527) | — | (610) | ||||||||||||||||||||||||||||||||||||||||||||||||
| Share of results of equity-accounted investees after tax | — | — | — | (55) | (37) | — | 3 | (89) | — | — | — | (357) | (67) | — | 4 | (420) | — | — | — | (286) | (71) | — | (357) | ||||||||||||||||||||||||||||||||||||||||||||||||
| Loss/(gain) on disposal of property, plant and equipment | 1 | 1 | — | (15) | (18) | — | — | (32) | (4) | (4) | — | (17) | (11) | — | — | (32) | 8 | 8 | — | (1) | (10) | — | (3) | ||||||||||||||||||||||||||||||||||||||||||||||||
| Reversal of impairments | — | — | — | (7) | — | — | — | (7) | — | — | — | — | — | — | — | — | — | — | — | — | — | — | — | ||||||||||||||||||||||||||||||||||||||||||||||||
| Restructuring cost | — | — | — | 4 | 3 | — | — | 7 | — | — | — | 16 | 11 | — | — | 27 | — | — | — | 6 | 4 | — | 10 | ||||||||||||||||||||||||||||||||||||||||||||||||
IFRS 16 lease payments5 | (2) | (2) | — | (14) | (20) | (16) | — | (52) | (1) | (1) | — | (15) | (23) | (13) | — | (52) | — | — | — | (13) | (21) | — | (34) | ||||||||||||||||||||||||||||||||||||||||||||||||
| Occupational healthcare expense | — | — | — | — | — | — | — | — | — | — | — | — | (25) | — | — | (25) | — | — | — | — | — | — | — | ||||||||||||||||||||||||||||||||||||||||||||||||
| Other non-recurring costs | 6 | 6 | — | 309 | — | — | 14 | 329 | — | — | — | (1) | — | — | 63 | 62 | 5 | 5 | — | — | (16) | 14 | 3 | ||||||||||||||||||||||||||||||||||||||||||||||||
| Adjusted EBITDA | 1,266 | 895 | 371 | 8,332 | (811) | (246) | (86) | 8,455 | 2,244 | 1,909 | 335 | 9,012 | (2,426) | 148 | (81) | 8,897 | 3,058 | 2,622 | 436 | 10,542 | 1,421 | (144) | 14,877 | ||||||||||||||||||||||||||||||||||||||||||||||||
1 The Battery Metals segment includes Sandouville refinery (Sandouville), Keliber Oy (Keliber) and Battery Metals corporate and reconciling items since the effective dates of acquiring Sandouville on 4 February 2022 and Keliber on 14 March 2022 (where appropriate, Keliber project costs are capitalised in terms of the group accounting policies)
2 Battery Metals includes a loss before royalties and tax of R22 million related to Battery Metals corporate and reconciling items for the three months ended 30 September 2022 (R24 million profit before royalties and tax for the three months ended 30 June 2022)
3 Battery Metals includes a gain on financial instruments of R22 million and R23 million related to Battery Metals corporate and reconciling items for the three months ended 30 September 2022 and 30 June 2022, respectively
4 Battery Metals includes a loss on foreign exchange differences of R45 million related to Battery Metals corporate and reconciling items for the three months ended 30 September 2022
5 Battery Metals includes IFRS 16 lease payments of R1 million related to Keliber for both the three months ended 30 September 2022 and 30 June 2022
Sibanye-Stillwater Operating update | Quarter ended 30 September 2022 15
DEVELOPMENT RESULTS
Development values represent the actual results of sampling and no allowance has been made for any adjustments which may be necessary when estimating ore reserves. All figures below exclude shaft sinking metres, which are reported separately where appropriate.
| US PGM operations | |||||||||||||||||||||||||||||||||||||||||||||||||||||||||||
| Quarter ended | Sep 2022 | Jun 2022 | Nine months ended Sep 2022 | ||||||||||||||||||||||||||||||||||||||||||||||||||||||||
| Reef | Stillwater incl Blitz | East Boulder | Stillwater incl Blitz | East Boulder | Stillwater incl Blitz | East Boulder | |||||||||||||||||||||||||||||||||||||||||||||||||||||
| Total US PGM | Unit | ||||||||||||||||||||||||||||||||||||||||||||||||||||||||||
| Primary development (off reef) | (m) | 1,405 | 269 | 1,576 | 206 | 4,833 | 1,141 | ||||||||||||||||||||||||||||||||||||||||||||||||||||
| Secondary development | (m) | 3,508 | 1,196 | 2,755 | 1,495 | 9,161 | 3,777 | ||||||||||||||||||||||||||||||||||||||||||||||||||||
| SA PGM operations | |||||||||||||||||||||||||||||||||||||||||||||||||||||||||||
| Quarter ended | Sep 2022 | Jun 2022 | Nine months ended Sep 2022 | ||||||||||||||||||||||||||||||||||||||||||||||||||||||||
| Reef | Bathopele | Thembe- lani | Khuseleka | Siphume-lele | Bathopele | Thembe- lani | Khuseleka | Siphume-lele | Bathopele | Thembe- lani | Khuseleka | Siphume-lele | |||||||||||||||||||||||||||||||||||||||||||||||
| Rustenburg | Unit | ||||||||||||||||||||||||||||||||||||||||||||||||||||||||||
| Advanced | (m) | 443 | 1,877 | 3,273 | 738 | 404 | 1,695 | 3,015 | 712 | 1,190 | 4,964 | 8,508 | 2,009 | ||||||||||||||||||||||||||||||||||||||||||||||
| Advanced on reef | (m) | 443 | 696 | 1,277 | 403 | 404 | 756 | 1,129 | 339 | 1,190 | 2,055 | 3,298 | 1,058 | ||||||||||||||||||||||||||||||||||||||||||||||
| Height | (cm) | 220 | 295 | 282 | 285 | 212 | 300 | 285 | 275 | 215 | 296 | 283 | 278 | ||||||||||||||||||||||||||||||||||||||||||||||
| Average value | (g/t) | 2.9 | 2.3 | 2.2 | 2.9 | 3.0 | 2.4 | 2.2 | 3.1 | 2.9 | 2.3 | 2.2 | 3.0 | ||||||||||||||||||||||||||||||||||||||||||||||
| (cm.g/t) | 632 | 670 | 630 | 815 | 643 | 717 | 617 | 860 | 626 | 690 | 618 | 827 | |||||||||||||||||||||||||||||||||||||||||||||||
| SA PGM operations | |||||||||||||||||||||||||||||||||||||||||||||||||||||||||||
| Quarter ended | Sep 2022 | Jun 2022 | Nine months ended Sep 2022 | ||||||||||||||||||||||||||||||||||||||||||||||||||||||||
| Reef | K3 | Rowland | Saffy | E3 | 4B | K4 | K3 | Rowland | Saffy | E3 | 4B | K4 | K3 | Rowland | Saffy | E3 | 4B | K4 | |||||||||||||||||||||||||||||||||||||||||
| Marikana | Unit | ||||||||||||||||||||||||||||||||||||||||||||||||||||||||||
| Primary development | (m) | 8,996 | 4,263 | 3,953 | 867 | 914 | 2,317 | 8,535 | 4,928 | 4,049 | 780 | 968 | 908 | 24,209 | 13,832 | 11,124 | 2,296 | 2,671 | 3,253 | ||||||||||||||||||||||||||||||||||||||||
| Primary development - on reef | (m) | 6,687 | 2,532 | 2,390 | 455 | 556 | 759 | 6,322 | 3,168 | 2,378 | 343 | 623 | 169 | 18,147 | 9,066 | 6,817 | 1,180 | 1,745 | 930 | ||||||||||||||||||||||||||||||||||||||||
| Height | (cm) | 217 | 219 | 238 | 230 | 214 | 239 | 216 | 219 | 234 | 217 | 221 | 237 | 216 | 219 | 232 | 221 | 219 | 238 | ||||||||||||||||||||||||||||||||||||||||
| Average value | (g/t) | 2.5 | 2.5 | 2.4 | 2.6 | 3.0 | 2.8 | 2.8 | 2.6 | 2.5 | 2.9 | 2.9 | 2.9 | 2.7 | 2.6 | 2.5 | 2.8 | 2.9 | 2.8 | ||||||||||||||||||||||||||||||||||||||||
| (cm.g/t) | 534 | 557 | 579 | 591 | 638 | 666 | 602 | 570 | 574 | 635 | 635 | 676 | 578 | 567 | 569 | 610 | 632 | 669 | |||||||||||||||||||||||||||||||||||||||||
| SA PGM operations | |||||||||||||||||||||||||||||||||||||||||||||||||||||||||||
| Quarter ended | Sep 2022 | Jun 2022 | Nine months ended Sep 2022 | ||||||||||||||||||||||||||||||||||||||||||||||||||||||||
| Reef | Kopaneng | Bamba-nani | Kwezi | K6 | Kopaneng | Bamba-nani | Kwezi | K6 | Kopaneng | Bamba-nani | Kwezi | K6 | |||||||||||||||||||||||||||||||||||||||||||||||
| Kroondal | Unit | ||||||||||||||||||||||||||||||||||||||||||||||||||||||||||
| Advanced | (m) | 586 | 789 | 531 | 556 | 527 | 843 | 501 | 395 | 1,591 | 2,165 | 1,585 | 1,161 | ||||||||||||||||||||||||||||||||||||||||||||||
| Advanced on reef | (m) | 436 | 271 | 420 | 478 | 376 | 422 | 250 | 331 | 1,073 | 1,083 | 880 | 891 | ||||||||||||||||||||||||||||||||||||||||||||||
| Height | (cm) | 242 | 214 | 223 | 240 | 245 | 215 | 222 | 229 | 239 | 215 | 220 | 242 | ||||||||||||||||||||||||||||||||||||||||||||||
| Average value | (g/t) | 1.6 | 1.0 | 2.2 | 2.0 | 1.5 | 1.5 | 1.3 | 1.9 | 1.5 | 1.4 | 1.5 | 1.6 | ||||||||||||||||||||||||||||||||||||||||||||||
| (cm.g/t) | 381 | 210 | 480 | 480 | 376 | 325 | 278 | 424 | 350 | 307 | 327 | 391 | |||||||||||||||||||||||||||||||||||||||||||||||
Sibanye-Stillwater Operating update | Quarter ended 30 September 2022 16
| SA gold operations | |||||||||||||||||||||||||||||||||||||||||||||||||||||||||||
| Quarter ended | Sep 2022 | Jun 2022 | Nine months ended Sep 2022 | ||||||||||||||||||||||||||||||||||||||||||||||||||||||||
| Reef | Carbon leader | Main | VCR | Carbon leader | Main | VCR | Carbon leader | Main | VCR | ||||||||||||||||||||||||||||||||||||||||||||||||||
| Driefontein | Unit | ||||||||||||||||||||||||||||||||||||||||||||||||||||||||||
| Advanced | (m) | 443 | 223 | 610 | — | — | — | 1,119 | 516 | 1,568 | |||||||||||||||||||||||||||||||||||||||||||||||||
| Advanced on reef | (m) | 40 | 74 | 172 | — | — | — | 158 | 164 | 430 | |||||||||||||||||||||||||||||||||||||||||||||||||
| Channel width | (cm) | 16 | 56 | 48 | — | — | — | 21 | 57 | 63 | |||||||||||||||||||||||||||||||||||||||||||||||||
| Average value | (g/t) | 42.5 | 7.4 | 35.6 | — | — | — | 37.5 | 9.4 | 43.7 | |||||||||||||||||||||||||||||||||||||||||||||||||
| (cm.g/t) | 666 | 414 | 1,707 | — | — | — | 779 | 540 | 2,737 | ||||||||||||||||||||||||||||||||||||||||||||||||||
| SA gold operations | |||||||||||||||||||||||||||||||||||||||||||||||||||||||||||
| Quarter ended | Sep 2022 | Jun 2022 | Nine months ended Sep 2022 | ||||||||||||||||||||||||||||||||||||||||||||||||||||||||
| Reef | Kloof | Main | Libanon | VCR | Kloof | Main | Libanon | VCR | Kloof | Main | Libanon | VCR | |||||||||||||||||||||||||||||||||||||||||||||||
| Kloof | Unit | ||||||||||||||||||||||||||||||||||||||||||||||||||||||||||
| Advanced | (m) | 901 | 362 | 45 | 604 | — | — | — | — | 1,899 | 737 | 64 | 1,443 | ||||||||||||||||||||||||||||||||||||||||||||||
| Advanced on reef | (m) | 259 | 84 | 45 | 103 | — | — | — | — | 525 | 186 | 64 | 225 | ||||||||||||||||||||||||||||||||||||||||||||||
| Channel width | (cm) | 162 | 73 | 88 | 83 | — | — | — | — | 153 | 87 | 94 | 92 | ||||||||||||||||||||||||||||||||||||||||||||||
| Average value | (g/t) | 10.9 | 10.3 | 2.9 | 16.7 | — | — | — | — | 11.9 | 10.6 | 2.8 | 14.8 | ||||||||||||||||||||||||||||||||||||||||||||||
| (cm.g/t) | 1,766 | 755 | 253 | 1,397 | — | — | — | — | 1,814 | 923 | 261 | 1,355 | |||||||||||||||||||||||||||||||||||||||||||||||
| SA gold operations | |||||||||||||||||||||||||||||||||||||||||||||||||||||||||||
| Quarter ended | Sep 2022 | Jun 2022 | Nine months ended Sep 2022 | ||||||||||||||||||||||||||||||||||||||||||||||||||||||||
| Reef | Beatrix | Kalkoen-krans | Beatrix | Kalkoen-krans | Beatrix | Kalkoen-krans | |||||||||||||||||||||||||||||||||||||||||||||||||||||
| Beatrix | Unit | ||||||||||||||||||||||||||||||||||||||||||||||||||||||||||
| Advanced | (m) | 1,640 | 65 | — | — | 2,426 | 117 | ||||||||||||||||||||||||||||||||||||||||||||||||||||
| Advanced on reef | (m) | 500 | — | — | — | 730 | — | ||||||||||||||||||||||||||||||||||||||||||||||||||||
| Channel width | (cm) | 151 | — | — | — | 145 | — | ||||||||||||||||||||||||||||||||||||||||||||||||||||
| Average value | (g/t) | 7.6 | — | — | — | 7.9 | — | ||||||||||||||||||||||||||||||||||||||||||||||||||||
| (cm.g/t) | 1,143 | — | — | — | 1,143 | — | |||||||||||||||||||||||||||||||||||||||||||||||||||||
| SA gold operations | |||||||||||||||||||||||||||||||||||||||||||||||||||||||||||
| Quarter ended | Sep 2022 | Jun 2022 | Nine months ended Sep 2022 | ||||||||||||||||||||||||||||||||||||||||||||||||||||||||
| Reef | Kimberley | Kimberley | Kimberley | ||||||||||||||||||||||||||||||||||||||||||||||||||||||||
| Burnstone | Unit | ||||||||||||||||||||||||||||||||||||||||||||||||||||||||||
| Advanced | (m) | 223 | — | 260 | |||||||||||||||||||||||||||||||||||||||||||||||||||||||
| Advanced on reef | (m) | — | — | — | |||||||||||||||||||||||||||||||||||||||||||||||||||||||
| Channel width | (cm) | — | — | — | |||||||||||||||||||||||||||||||||||||||||||||||||||||||
| Average value | (g/t) | — | — | — | |||||||||||||||||||||||||||||||||||||||||||||||||||||||
| (cm.g/t) | — | — | — | ||||||||||||||||||||||||||||||||||||||||||||||||||||||||
Sibanye-Stillwater Operating update | Quarter ended 30 September 2022 17
ADMINISTRATION AND CORPORATE
SIBANYE STILLWATER LIMITED (SIBANYE-STILLWATER) Incorporated in the Republic of South Africa Registration number 2014/243852/06 Share code: SSW and SBSW Issuer code: SSW ISIN: ZAE000259701 LISTINGS JSE: SSW NYSE: SBSW WEBSITE  www.sibanyestillwater.com www.sibanyestillwater.comREGISTERED AND CORPORATE OFFICE Constantia Office Park Bridgeview House, Building 11, Ground floor, Cnr 14th Avenue & Hendrik Potgieter Road Weltevreden Park 1709 South Africa Private Bag X5 Westonaria 1780 South Africa Tel: +27 11 278 9600 Fax: +27 11 278 9863 COMPANY SECRETARY Lerato Matlosa Email: lerato.matlosa@sibanyestillwater.com DIRECTORS Dr Vincent Maphai* (Chairman) Neal Froneman (CEO) Charl Keyter (CFO) Dr Elaine Dorward-King* Harry Kenyon-Slaney* Jeremiah Vilakazi* Keith Rayner* Nkosemntu Nika* Richard Menell*^ Savannah Danson* Susan van der Merwe* Timothy Cumming* Sindiswa Zilwa* * Independent non-executive ^ Lead independent director INVESTOR ENQUIRIES James Wellsted Executive Vice President: Investor Relations and Corporate Affairs Mobile: +27 83 453 4014 Email: james.wellsted@sibanyestillwater.com or ir@sibanyestillwater.com | JSE SPONSOR JP Morgan Equities South Africa Proprietary Limited Registration number 1995/011815/07 1 Fricker Road Illovo Johannesburg 2196 South Africa Private Bag X9936 Sandton 2146 South Africa AUDITORS Ernst & Young Inc. (EY) 102 Rivonia Road Sandton 2196 South Africa Private Bag X14 Sandton 2146 South Africa Tel: +27 11 772 3000 AMERICAN DEPOSITARY RECEIPTS TRANSFER AGENT BNY Mellon Shareowner Correspondence (ADR) PO Box 505000 Louisville KY 40233-5000 US toll free: +1 866 247 3871 Tel: +1 201 680 6825 Email: shrrelations@cpushareownerservices.com Tatyana Vesselovskaya Relationship Manager BNY Mellon Depositary Receipts Direct line: +1 212 815 2867 Mobile: +1 203 609 5159 Fax: +1 212 571 3050 Email: tatyana.vesselovskaya@bnymellon.com TRANSFER SECRETARIES SOUTH AFRICA Computershare Investor Services Proprietary Limited Rosebank Towers 15 Biermann Avenue Rosebank 2196 PO Box 61051 Marshalltown 2107 South Africa Tel: +27 11 370 5000 Fax: +27 11 688 5248 | ||||
Sibanye-Stillwater Operating update | Quarter ended 30 September 2022 18
DISCLAIMER
FORWARD LOOKING STATEMENTS
The information in this document may contain forward-looking statements within the meaning of the “safe harbour” provisions of the United States Private Securities Litigation Reform Act of 1995. These forward-looking statements, including, among others, those relating to Sibanye Stillwater Limited’s (“Sibanye-Stillwater” or the “Group”) financial positions, business strategies, plans and objectives of management for future operations, are necessarily estimates reflecting the best judgment of the senior management and directors of Sibanye-Stillwater and involve a number of risks and uncertainties that could cause actual results to differ materially from those suggested by the forward-looking statements. As a consequence, these forward-looking statements should be considered in light of various important factors, including those set forth in this document.
All statements other than statements of historical facts included in this document may be forward-looking statements. Forward-looking statements also often use words such as “will”, “would”, “expect”, “forecast”, “potential”, “may”, “could”, “believe”, “aim”, “anticipate”, “target”, “estimate” and words of similar meaning. By their nature, forward-looking statements involve risk and uncertainty because they relate to future events and circumstances and should be considered in light of various important factors, including those set forth in this disclaimer. Readers are cautioned not to place undue reliance on such statements.
The important factors that could cause Sibanye-Stillwater’s actual results, performance or achievements to differ materially from estimates or projections contained in the forward-looking statements include, without limitation, Sibanye-Stillwater’s future financial position, plans, strategies, objectives, capital expenditures, projected costs and anticipated cost savings, financing plans, debt position and ability to reduce debt leverage; economic, business, political and social conditions in South Africa, Zimbabwe, the United States and elsewhere; plans and objectives of management for future operations; Sibanye-Stillwater’s ability to obtain the benefits of any streaming arrangements or pipeline financing; the ability of Sibanye-Stillwater to comply with loan and other covenants and restrictions and difficulties in obtaining additional financing or refinancing; Sibanye-Stillwater’s ability to service its bond instruments; changes in assumptions underlying Sibanye-Stillwater’s estimation of its current mineral reserves; any failure of a tailings storage facility; the ability to achieve anticipated efficiencies and other cost savings in connection with, and the ability to successfully integrate, past, ongoing and future acquisitions, as well as at existing operations; the ability of Sibanye-Stillwater to complete any ongoing or future acquisitions; the success of Sibanye-Stillwater’s business strategy and exploration and development activities, including any proposed, anticipated or planned expansions into the battery metals or adjacent sectors and estimations or expectations of enterprise value; the ability of Sibanye-Stillwater to comply with requirements that it operate in ways that provide progressive benefits to affected communities; changes in the market price of gold, PGMs, battery metals (e.g., nickel, lithium, copper and zinc) and the cost of power, petroleum fuels, and oil, among other commodities and supply requirements; the occurrence of hazards associated with underground and surface mining; any further downgrade of South Africa’s credit rating; a challenge regarding the title to any of Sibanye-Stillwater’s properties by claimants to land under restitution and other legislation; Sibanye-Stillwater’s ability to implement its strategy and any changes thereto; the outcome of legal challenges to the Group's mining or other land use rights; the occurrence of labour disputes, disruptions and industrial actions; the availability, terms and deployment of capital or credit; changes in the imposition of industry standards, regulatory costs and relevant government regulations, particularly environmental, sustainability, tax, health and safety regulations and new legislation affecting water, mining, mineral rights and business ownership, including any interpretation thereof which may be subject to dispute; the outcome and consequence of any potential or pending litigation or regulatory proceedings, including in relation to any environmental, health or safety issues; failure to meet ethical standards, including actual or alleged instances of fraud, bribery or corruption; the effect of climate change or other extreme weather events on Sibanye-Stillwater’s business; the concentration of all final refining activity and a large portion of Sibanye-Stillwater’s PGM sales from mine production in the United States with one entity; the identification of a material weakness in disclosure and internal controls over financial reporting; the effect of US tax reform legislation on Sibanye-Stillwater and its subsidiaries; the effect of South African Exchange Control Regulations on Sibanye-Stillwater’s financial flexibility; operating in new geographies and regulatory environments where Sibanye-Stillwater has no previous experience; power disruptions, constraints and cost increases; supply chain disruptions and shortages and increases in the price of production inputs; the regional concentration of Sibanye-Stillwater’s operations; fluctuations in exchange rates, currency devaluations, inflation and other macro-economic monetary policies; the occurrence of temporary stoppages or precautionary suspension of operations at its mines for safety or environmental incidents (including natural disasters) and unplanned maintenance; Sibanye-Stillwater’s ability to hire and retain senior management and employees with sufficient technical and/or production skills across its global operations necessary to meet its labour recruitment and retention goals, as well as its ability to achieve sufficient representation of historically disadvantaged South Africans in its management positions; failure of Sibanye-Stillwater’s information technology, communications and systems; the adequacy of Sibanye-Stillwater’s insurance coverage; social unrest, sickness or natural or man-made disaster at informal settlements in the vicinity of some of Sibanye-Stillwater’s South African-based operations; and the impact of HIV, tuberculosis and the spread of other contagious diseases, such as the coronavirus disease (COVID-19). Further details of potential risks and uncertainties affecting Sibanye-Stillwater are described in Sibanye-Stillwater’s filings with the Johannesburg Stock Exchange and the United States Securities and Exchange Commission, including the 2021 Integrated Report and the annual report on Form 20-F for the fiscal year ended 31 December 2021.
These forward-looking statements speak only as of the date of the content. Sibanye-Stillwater expressly disclaims any obligation or undertaking to update or revise any forward-looking statement (except to the extent legally required). These forward-looking statements have not been reviewed or reported on by the Group’s external auditors.
NON-IFRS MEASURES
The information in this document contains certain non-IFRS measures, including adjusted EBITDA, AISC and AIC. These measures may not be comparable to similarly-titled measures used by other companies and are not measures of Sibanye-Stillwater’s financial performance under IFRS. These measures should not be considered in isolation or as a substitute for measures of performance prepared in accordance with IFRS. Sibanye-Stillwater is not providing a reconciliation of the forecast non-IFRS financial information presented in this report because it is unable to provide this reconciliation without unreasonable effort.
WEBSITES
References in this document to information on websites (and/or social media sites) are included as an aid to their location and such information is not incorporated in, and does not form part of, this report.
Sibanye-Stillwater Operating update | Quarter ended 30 September 2022 19