Exhibit 99.1
JOHANNESBURG, 28 February 2023: Sibanye Stillwater Limited (Sibanye-Stillwater or the Group) (JSE: SSW and NYSE: SBSW) is pleased to report operating and financial results for the six months ended 31 December 2022, and condensed consolidated provisional financial statements for the year ended 31 December 2022.
SALIENT FEATURES FOR THE SIX MONTHS AND YEAR ENDED 31 DECEMBER 2022
•Significant improvement in safety performance. All indicators improved with the fatal injury frequency rate (FIFR) reducing by 75%
•Strong balance sheet maintained with net cash of R5.9 bn (US$344m) and net cash: adjusted EBITDA at 0.14x (2021:0.17x)
•Profit for the period of R19bn (US$1.2bn) compared to R33.8bn (US$2.3bn) for 2021
•Final dividend of R3.5bn (US$191m) or 122 SA cents per share (26.98 US cents per ADR), full year dividend of R7.37bn (US$421m) equivalent to a 6%* annual yield
•SA PGM operations continue to move down the industry cost curves despite load curtailment impact on production
•Inflation-linked three and five year wage agreements signed at the SA gold operations and SA PGM operations respectively, positioning operations for stability
•US PGM operations recover from one in 200 year flood and repositioned to respond to the changing macro environment
•Progress on Battery metals strategy
–85% holding in Keliber lithium project obtained and construction of the Keliber lithium refinery commenced in Q1 2023
–US Government offered conditional commitment for a loan of up to US$700 million for the Rhyolite Ridge lithium-boron project
* Based on the closing share price of R44.72 using R2.60 dividend per share for interim and final dividends for the year ended 31 December 2022
| US dollar | SA rand | |||||||||||||||||||||||||||||||||||||||||||
| Year ended | Six months ended | Six months ended | Year ended | |||||||||||||||||||||||||||||||||||||||||
| Dec 2021 | Dec 2022 | Dec 2021 | Jun 2022 | Dec 2022 | KEY STATISTICS | Dec 2022 | Jun 2022 | Dec 2021 | Dec 2022 | Dec 2021 | ||||||||||||||||||||||||||||||||||
| GROUP | ||||||||||||||||||||||||||||||||||||||||||||
| 2,234 | 1,126 | 527 | 782 | 344 | US$m | Basic earnings | Rm | 6,380 | 12,016 | 8,218 | 18,396 | 33,054 | ||||||||||||||||||||||||||||||||
| 2,493 | 1,126 | 787 | 775 | 350 | US$m | Headline earnings | Rm | 6,484 | 11,938 | 12,045 | 18,422 | 36,878 | ||||||||||||||||||||||||||||||||
| 4,639 | 2,510 | 1,852 | 1,465 | 1,045 | US$m | Adjusted EBITDA1 | Rm | 18,550 | 22,561 | 28,057 | 41,111 | 68,606 | ||||||||||||||||||||||||||||||||
| 14.79 | 16.37 | 15.03 | 15.40 | 17.33 | R/US$ | Average exchange rate using daily closing rate | ||||||||||||||||||||||||||||||||||||||
| AMERICAS REGION | ||||||||||||||||||||||||||||||||||||||||||||
PGM underground operations2,3 | ||||||||||||||||||||||||||||||||||||||||||||
| 570,400 | 421,133 | 272,099 | 230,039 | 191,094 | oz | 2E PGM production2,3 | kg | 5,944 | 7,155 | 8,463 | 13,099 | 17,741 | ||||||||||||||||||||||||||||||||
| 2,097 | 1,862 | 1,913 | 1,935 | 1,766 | US$/2Eoz | Average basket price | R/2Eoz | 30,609 | 29,799 | 28,755 | 30,482 | 31,021 | ||||||||||||||||||||||||||||||||
| 727 | 386 | 290 | 261 | 125 | US$m | Adjusted EBITDA1 | Rm | 2,309 | 4,021 | 4,408 | 6,330 | 10,766 | ||||||||||||||||||||||||||||||||
| 1,004 | 1,586 | 1,039 | 1,366 | 1,840 | US$/2Eoz | All-in sustaining cost4 | R/2Eoz | 31,880 | 21,036 | 15,619 | 25,951 | 14,851 | ||||||||||||||||||||||||||||||||
US PGM recycling2,3 | ||||||||||||||||||||||||||||||||||||||||||||
| 755,148 | 598,774 | 352,276 | 361,333 | 237,441 | oz | 3E PGM recycling2,3 | kg | 7,385 | 11,239 | 10,957 | 18,624 | 23,488 | ||||||||||||||||||||||||||||||||
| 3,515 | 3,067 | 3,932 | 2,906 | 3,274 | US$/3Eoz | Average basket price | R/3Eoz | 56,747 | 44,752 | 59,098 | 50,202 | 51,987 | ||||||||||||||||||||||||||||||||
| 101 | 78 | 51 | 39 | 39 | US$m | Adjusted EBITDA1 | Rm | 676 | 598 | 757 | 1,274 | 1,490 | ||||||||||||||||||||||||||||||||
| SOUTHERN AFRICA (SA) REGION | ||||||||||||||||||||||||||||||||||||||||||||
PGM operations3 | ||||||||||||||||||||||||||||||||||||||||||||
| 1,836,138 | 1,667,464 | 941,973 | 823,806 | 843,658 | oz | 4E PGM production3,5 | kg | 26,241 | 25,623 | 29,299 | 51,864 | 57,110 | ||||||||||||||||||||||||||||||||
| 3,182 | 2,622 | 2,696 | 2,817 | 2,434 | US$/4Eoz | Average basket price | R/4Eoz | 42,188 | 43,379 | 40,517 | 42,914 | 47,066 | ||||||||||||||||||||||||||||||||
| 3,490 | 2,330 | 1,336 | 1,374 | 956 | US$m | Adjusted EBITDA1 | Rm | 16,983 | 21,152 | 20,270 | 38,135 | 51,608 | ||||||||||||||||||||||||||||||||
| 1,148 | 1,180 | 1,134 | 1,179 | 1,179 | US$/4Eoz | All-in sustaining cost4 | R/4Eoz | 20,431 | 18,160 | 17,037 | 19,313 | 16,982 | ||||||||||||||||||||||||||||||||
| Gold operations | ||||||||||||||||||||||||||||||||||||||||||||
| 1,072,934 | 620,541 | 554,086 | 191,683 | 428,859 | oz | Gold produced | kg | 13,339 | 5,962 | 17,234 | 19,301 | 33,372 | ||||||||||||||||||||||||||||||||
| 1,787 | 1,798 | 1,780 | 1,864 | 1,720 | US$/oz | Average gold price | R/kg | 958,232 | 922,851 | 860,303 | 946,073 | 849,703 | ||||||||||||||||||||||||||||||||
| 346 | (219) | 184 | (202) | (17) | US$m | Adjusted EBITDA1 | Rm | (440) | (3,106) | 2,762 | (3,546) | 5,113 | ||||||||||||||||||||||||||||||||
| 1,689 | 2,410 | 1,685 | 3,115 | 2,019 | US$/oz | All-in sustaining cost4 | R/kg | 1,124,737 | 1,542,355 | 814,347 | 1,268,360 | 803,260 | ||||||||||||||||||||||||||||||||
| EUROPEAN REGION | ||||||||||||||||||||||||||||||||||||||||||||
Battery metals - Sandouville refinery6 | ||||||||||||||||||||||||||||||||||||||||||||
| — | 6,842 | — | 4,565 | 2,277 | tNi | Nickel production7 | tNi | 2,277 | 4,565 | — | 6,842 | — | ||||||||||||||||||||||||||||||||
| — | 28,019 | — | 30,789 | 24,646 | US$/tNi | Nickel equivalent average basket price8 | R/tNi | 427,120 | 474,144 | — | 458,595 | — | ||||||||||||||||||||||||||||||||
| — | (30) | — | 4 | (34) | US$m | Adjusted EBITDA1 | Rm | (553) | 60 | — | (492) | — | ||||||||||||||||||||||||||||||||
| — | 32,239 | — | 29,896 | 38,333 | US$/tNi | Nickel equivalent sustaining cost9 | R/tNi | 664,311 | 460,397 | — | 527,676 | — | ||||||||||||||||||||||||||||||||
Sibanye-Stillwater Operating and financial results | Six months and year ended 31 December 2022 1
1The Group reports adjusted earnings before interest, taxes, depreciation and amortisation (EBITDA) based on the formula included in the facility agreements for compliance with the debt covenant formula. Adjusted EBITDA may not be comparable to similarly titled measures of other companies. Adjusted EBITDA is not a measure of performance under IFRS and should be considered in addition to and not as a substitute for other measures of financial performance and liquidity. For a reconciliation of profit/loss before royalties and tax to adjusted EBITDA, see note 11.1 of the condensed consolidated provisional financial statements
2The US PGM operations’ underground production is converted to metric tonnes and kilograms, and performance is translated to SA rand (rand). In addition to the US PGM operations’ underground production, the operation treats recycling material which is excluded from the 2E PGM production, average basket price and All-in sustaining cost statistics shown. PGM recycling represents palladium, platinum, and rhodium ounces on spent autocatalysts fed to the furnace
3The Platinum Group Metals (PGM) production in the SA operations is principally platinum, palladium, rhodium and gold, referred to as 4E (3PGM+Au), and in the US operations is principally platinum and palladium, referred to as 2E (2PGM) and US PGM recycling is principally platinum, palladium and rhodium referred to as 3E (3PGM)
4See “Salient features and cost benchmarks” sections for the definition of All-in sustaining cost (AISC)
5The SA PGM production excludes the production associated with the purchase of concentrate (PoC) from third parties. For a reconciliation of the production including third party PoC, refer to the "Reconciliation of operating cost excluding third party PoC for Total US and SA PGM, Total SA PGM and Marikana" sections
6The Sandouville refinery processes nickel matte and is included in the Group results since the effective date of the acquisition on 4 February 2022
7The nickel production at the Sandouville refinery operations is principally nickel metal and nickel salts (liquid form), together referred to as nickel equivalent products
8The nickel equivalent average basket price per ton is the total nickel revenue adjusted for other income - non-product sales divided by the total nickel equivalent tons sold
9See "Salient features and cost benchmarks - Six months Sibanye-Stillwater Sandouville Refinery" for a reconciliation of cost of sales before amortisation and depreciation to nickel equivalent sustaining cost
| Stock data for the six months ended 31 December 2022 | JSE Limited - (SSW) | ||||||||||
| Number of shares in issue | Price range per ordinary share (High/Low) | R35.74 to R49.49 | |||||||||
| - at 31 December 2022 | 2,830,370,251 | Average daily volume | 10,552,646 | ||||||||
| - weighted average | 2,830,196,826 | NYSE - (SBSW); one ADR represents four ordinary shares | |||||||||
| Free Float | 99 | % | Price range per ADR (High/Low) | US$8.16 to US$11.34 | |||||||
| Bloomberg/Reuters | SSWSJ/SSWJ.J | Average daily volume | 2,941,763 | ||||||||
| TABLE OF CONTENTS | |||||
| Notes to the condensed consolidated financial statements | |||||
Sibanye-Stillwater Operating and financial results | Six months and year ended 31 December 2022 2
STATEMENT BY NEAL FRONEMAN, CHIEF EXECUTIVE OFFICER OF SIBANYE-STILLWATER
The Group's performance for 2022 reflects significant positive achievements in some respects, and notable challenges in others.
Without doubt, the most significant achievement during 2022, was the ongoing improvement in our safety performance and turnaround in the number of fatal incidents.
The fatal elimination program that we introduced and developed during 2022 was a fundamental change in the approach to safety across our business. This was not a safety campaign but rather an introduction of a safety cultural transformation that impacts over 85,000 employees.
Through this change we experienced some notable disruptions, including turnover of personnel across all levels at the operations, an impact on production, and an increasing acceptance by our staff and organised labour representatives that this is a new way of doing business. These factors have however been surpassed by a sense of belief, a sense of pride and a commitment to being visible leaders in the industry and we now have aligned our senior leadership to deliver this.
Our focus and opportunity as we move into 2023, will be to continue to improve off the foundation that has been built, to ensure a similar level of engaged leadership throughout the organisation.
The significant improvement in all our lagging indicators, most notably fatal incidents, with the Group fatal injury frequency rate (FIFR) declining by 75%, not only retracing the anomalous regression in fatalities we experienced during 2021, but declining to record levels previously not achieved in the history of the Group, is a reflection of the efforts by all our teams and a positive confirmation that the strategy we have adopted is yielding the results we are seeking.
Despite these improvements, our increased focus on leading indicators continues to highlight that we still experience levels of risk at some of our operations that requires continued focus and still have much to do regarding eliminating fatalities on a sustainable basis. We regrettably suffered five fatalities across the Group during 2022, and while this is an improvement on the 21 fatalities in 2021, it is five too many; eliminating fatal incidents is the first step in our continued effort to ensure our goal of zero harm in the workplace is achieved.
The Board and management of Sibanye-Stillwater extend their sincere condolences to the family, friends, and colleagues of our departed employees. We remain committed to continuous improvement in health and safety at our operations. This is a deliberate journey and whilst we have made significant progress, we continue to modify the strategy based on lessons learned and industry best practice to improve our risk approach, eliminate fatalities and improve accident statistics.
The Group operating and financial results for 2022 were impacted by exogenous factors including a more challenging macro-economic and geopolitical environment and the severe weather event in Montana, which impacted our US PGM operations. Global macro influences, including significant inflationary cost pressures globally, ongoing supply chain disruptions and a deteriorating economic outlook, which reflected in lower demand and lower prices for the metals we produce. The severe weather event caused regional flooding across Montana in June 2022 and restricted access to the Stillwater mine resulting in the operations being shut for 7 weeks. These are some of the factors we have previously highlighted as existential threats (the Grey Elephants) which we need to be mindful of and adapt to, to ensure the sustainability of our organisation and the ecosystems within which we operate.
The 2022 results also reflect more specific incidents, which are partly within our control such as the three-month industrial action and lock out at the SA gold operations, which was necessary to ensure the sustainability of the SA operations and protect the rights of other stakeholders. The outcome of this approach was a historic, five-year inflation linked wage agreement at the SA PGM operations which was achieved timeously and without any disruptions during 2022. This agreement secures a period of relative stability for the SA PGM operations until mid-2027, which will more than compensate for the cost incurred from the industrial action at the SA gold operations.
The manner in which these unanticipated operational disruptions and other external challenges we faced were managed gives me confidence that the regional organisational structure we established in late 2021 is appropriate for the diversified nature of the larger, multinational business. Focused regional teams have been appointed to ensure continued operational delivery across the Group, and appropriate responses to the unique environments in the regions we operate.
The industrial action and flooding events resulted in significantly reduced production from the SA gold and US PGM operations during 2022, with a concomitant increase in unit costs. The phased resumption and build-up of safe production after these operational stoppages also negatively impacted production and costs during the second half of the year, resulting in Group revenue declining by 20% to R138.3 billion (US$8.4 billion) for 2022 compared with R172.2 billion (US$11.6 billion) for 2021.
Group adjusted EBITDA of R41.1 billion (US$2.5 billion) for 2022 was 40% lower than the record adjusted EBITDA of R68.6 billion (US$4.6 billion) for 2021, but still the third highest Group adjusted EBITDA recorded since listing. This was despite the SA gold operations recording a R3.5 billion (US$219 million) adjusted EBITDA loss (compared with a positive R5.1 billion (US$346 million) adjusted EBITDA contribution for 2021) and the adjusted EBITDA contribution from the US PGM underground operations declining by 47% to US$386 million (R6.3 billion).
Normalised earnings1 for 2022 of R21 billion (US$1.3 billion) were 46% lower year-on-year, with normalised earnings1 of R9.8 billion (US$558 million) for H2 2022, 32% lower than for H2 2021, primarily due to the impact of lower commodity prices and production at the SA gold and US PGM operations.
The Board approved a final dividend for H2 2022 of R3.5 billion (US$191 million) or 122 SA cents per share (26.98 US cents* per ADR), which is at the upper end of the Group dividend policy range of 25% to 35% of normalised earnings1. Together with the interim dividend of R3.9 billion (US$230 million) (138 SA cents per share/32.4640 US cents per ADR) for H1 2022, this represents a leading annual dividend yield of 6% for 2022 (at the closing JSE share price of R44.72/share on 31 December 2022).
Despite the challenges faced during 2022, the Group still generated positive adjusted free cash flow of R9.5 billion (US$581 million), maintaining the strong financial position at year end, with cash and cash equivalents of R26.1 billion (US$1.5 billion) exceeding borrowings (excluding non-recourse Burnstone debt) of R20.2 billion (US$1.2 billion), resulting in a R5.9 billion (US$344 million) net cash position and a net cash: adjusted EBITDA ratio at 0.14x.
This solid performance is testament to the significant benefits achieved through the Group's growth and diversification strategy over the last decade, which has resulted in a more resilient and sustainable business. 2022 was a year of consolidation and repositioning for the
Sibanye-Stillwater Operating and financial results | Six months and year ended 31 December 2022 3
Group and, while the operating and financial performance for the year may not reflect this on first consideration, I am confident that the Group is well positioned to continue creating superior shared value for all stakeholders for many years to come.
1 Non-IFRS measures such as normalised earnings are the responsibility of the Group’s Board of Directors and are presented for illustration purposes only, and because of its nature, normalised earnings should not be considered as a representation of financial performance under IFRS. Refer note 8 of the condensed consolidated provisional financial statements for the definition and reconciliation of normalised earnings
A DECADE OF SHARED VALUE
On 11 February 2013, just 10 years ago, Sibanye Gold Limited was unbundled by Gold Fields Limited and listed on the JSE and the NYSE as an independent company with three deep level South African gold mines and a market capitalisation of approximately R10 billion.
Today the Group has evolved into multinational diversified mining and metals processing Group with a portfolio of operations, projects and investments across five continents and with a market capitalisation more than 12-fold larger than it was in 2013. Notably, in addition to the significant capital growth in the business, we have returned over R40 billion in additional value to investors in the form of dividends and share buybacks, four times our initial market capitalisation on listing.
This decade long journey represents significant value creation for all stakeholders, and not exclusively for investors. Early on in our existence, we recognised the importance of creating superior value for all stakeholders. This philosophy is captured by our Umdoni tree which symbolises our business ethos, and the early adoption of a stakeholder capitalism and shared value culture approach.
The impact that Sibanye-Stillwater has made, and the value we have created for all stakeholders during this journey, is evident when comparing our shared value on inception in 2013 to 2021 (which are our most recent audited numbers). In 2013, we employed just over 36,000 people including contractors in South Africa which by 2021 had increased to about 85,000 worldwide. We paid R6 billion in salaries and benefits in 2013, which has grown to over R26 billion in 2021, a more than four-fold increase. In addition to these salaries and benefits, approximately R1.4 billion over the last two years has benefited 46,000 employees in the form of dividends and other employee share option scheme payments. Entry level salaries at our SA gold operations have increased by over 105% since 2013, significantly higher than inflation, contributing to a decent living wage and reducing wage disparity.
The value we have shared with our communities through socio-economic development and corporate social investment programs has also increased significantly over the last 10 years, from just over R1 billion in 2013 to over R2.2 billion in 2021, a 110% increase. We have recently gone beyond these investments by committing 1.5% of equivalent value to dividends paid out to shareholders, to infrastructure development projects in our local communities.
Our contribution to local society and economies goes beyond these investments, with taxes and royalties paid to governments in the regions we operate increasing from R554 million in 2013 to almost R18 billion in 2021, a more than 30 times increase.
As an organisation that produces metals and materials necessary for our society to operate sustainably on a daily basis, and with our strategic focus on delivering on our strategic differentiators of “being recognised as a Force for Good”, “building a Unique global portfolio of green metals and energy solutions that reverse climate change”; and doing so in a way which is “Inclusive, diverse and bionic” as well as being instrumental in “building pandemic-resilient ecosystems”, I expect that we will be able to continue to deliver on our vision: “to be a leader in shared value for all stakeholders” for many decades to come.
This will not be easy. The journey so far has not been smooth, and we have had to overcome many challenges along the way, including industrial action, pandemics, extreme weather events and more, but I am confident that the manner in which we have faced and overcome our challenges so far, demonstrates that we have the right people and team to ensure that we deliver more growth and value.
OPERATING REVIEW
Production from the SA PGM operations for 2022 (including attributable ounces from Mimosa and third-party purchase of concentrate (PoC) of 63,344 4Eoz) of 1,730,808 4Eoz, was marginally below the lower end of annual guidance for 2022. This was a solid performance considering the ongoing impact of Eskom load curtailment as well as factors highlighted previously, including copper cable theft and proactive safety related stoppages. In absolute terms, costs at the SA PGM operations continued to be well managed, with AISC (excluding PoC) of R30 billion (US$1.8 billion) only 3% higher year-on-year. As a result of the year-on-year decline in production however, AISC for 2022 was 14% higher than 2021, increasing to R19,313/4Eoz (US$1,180/4Eoz). This was primarily due to the increased load shedding during H2 2022, with AISC of R20,431/4Eoz (US$1,179/4Eoz) for H2 2022, 13% higher than for the first half of 2022 (R18,160/4Eoz (US$1,179/4Eoz)).
This consistent cost management continues to enhance the relative competitiveness of the SA PGM operations, which have continued to move from the upper end of the cost curves prior to integration into the Group, towards the lower half of the global industry cost curves over the last five years. Pleasingly, stockpiled ore containing approximately 33,000 4Eoz which had accumulated by the end of Q3 2022 due to intensified load curtailment impacting concentrator capacity across the SA PGM operations, was largely processed during the year-end holiday period in December 2022. However, due to timing of the processing of this stockpiled ore (during the December holidays, after the close of the financial year and), 4E PGM sales were 68,707 4Eoz lower than produced for the year, with refined metal produced during this period held as refined PGM inventory, which will reflect as sales for Q1 2023.
2022 also marked the end of the term for the payment of the structured Rustenburg acquisition consideration entered into with Anglo American Platinum (AngloPlat) in 2016. In terms of this agreement, Rustenburg has been paying AngloPlat a deferred annual payment calculated as being equal to 35% of the distributable free cash flow generated by the Rustenburg operation over the six year period, subject to a minimum payment of R3 billion. From 2023 onward, 100% of the cash flow from the Rustenburg operations will accrue to Sibanye-Stillwater and minority BEE shareholders of the Rustenburg operations, including employees.
The SA gold operations (excluding DRDGOLD) were suspended for three months during H1 2022 due to the industrial action and lockout resulting in a 50% decline in production for 2022 to 13,736kg (441,623oz). Production of 10,608 kg (341,055oz) for H2 2022, was significantly improved compared to production of 3,128kg (100,568oz) for H1 2022, reflecting the successful ramp up post the industrial action and the completion of the tailings storage facility (TSF) remediation at the Beatrix operation. More normalised rates of production were achieved during November 2022 and have been maintained during Q1 2023 to date. Including DRDGOLD, production for the year was 19,301kg (620,541oz). In the absence of any further disruptions, which are not expected, production for 2023 is forecast to be significantly higher than for 2022, with correspondingly lower unit costs.
Sibanye-Stillwater Operating and financial results | Six months and year ended 31 December 2022 4
The ramp-up of production from the US PGM operations post the regional flood event in early June 2022 progressed well, with production rates normalising during Q4 2022. Mined 2E PGM production for 2022 of 421,133 2Eoz was 5% below the lower end of annual guidance, reflecting the full impact of the flood event as well as ongoing operational constraints which contributed to the repositioning of the US PGM operations as presented to the market in August 2022 (https://thevault.exchange/?get_group_doc=245/1660214769-ssw-repositioning-US-PGM-operations-changing-macro-environment-11August22.pdf). AISC of US$1,586/2Eoz (R25,951/2Eoz) for 2022 were substantially higher than AISC of US$1,004/2Eoz (R14,851/2Eoz) reported for 2021, primarily as a result of lower production, compounded by inflationary cost impacts and increased ore reserve development (ORD) and sustaining capex associated with the repositioned plan, which resulted in a significant increase in unit costs for H2 2022 relative to H1 2022. Implementation of the repositioned plan is in process, with production forecast to build-up to 700,000+ 2Eoz by 2027 and AISC reducing to less than US$1,000/2Eoz, once flexibility has been restored across the complex and the new cemented backfill plant at Stillwater East has been completed.
The global slowdown in used car scrappage rates due to the uncertain global economic environment, higher interest rates and higher new car prices as well as continued supply chain constraints, (including port and road transport) and a firm adherence to our responsible sourcing principles, impacted receipt and feed rates at the US PGM recycling operation during 2022. Spent autocatalysts containing 3E PGM of 598,774 3Eoz were fed during 2022, 21% lower than 2021.
For the 11 months since acquisition on 4 February 2022, the Sandouville nickel refinery produced 4,839 tonnes of nickel metal, 2,003 tonnes of nickel salts and 153 tonnes of cobalt chloride at a nickel equivalent sustaining cost of US$32,239/tNi (R527,676/tNi). While lower production was expected as a result of planned annual plant maintenance, H2 2022 was impacted by technical challenges at the plant and higher input costs, primarily gas and electricity. The focus for 2023 will be to improve plant availability and to reduce the frequency of unplanned maintenance. Progress has been made in reviewing and renegotiating contracts with suppliers and customers which should results in improved commercial terms at Sandouville for 2023. Since year end there has been a change of leadership at Sandouville and several senior appointments have been made in the European region to further support the recovery at the Sandouville operations. The focus is on continuity and stability of production by de-bottlenecking the plant to increase throughput to nameplate capacity of c.12kt of Ni metal, c.4kt of Ni salts and c.600t of CoCl2 by 2026.
Wage negotiations
Despite the industrial action and lockout which impacted our SA gold operations during the year, we believe that we have preserved significant long-term value through the firm position we took during negotiations. Subsequent to the end of the industrial action at the SA gold operations, the SA PGM operations secured a historic five-year agreement with most of the same unions, without disruption or the need for third party intervention. The annual wage and benefit increases that were agreed at both the SA gold and PGM operations, were in line with inflation and importantly, secured a five-year period of labour stability at the Rustenburg and Marikana operations, which will facilitate delivery of significant value for all stakeholders.
These agreements followed a new collective bargaining agreement with the United Steel Workers International Union (USW) for the East Boulder mine for the period 16 February 2022 through to 31 July 2024. This settlement also represented an inflation linked agreement, consistent with our approach in South Africa. Wage negotiations for the Kroondal operation commence in mid-2023, and we are confident that a similarly positive outcome can be achieved with union representatives at the operation.
MARKET OVERVIEW
Green metals
PGM market - 2022
PGM prices were volatile during 2022, impacted by the Russian invasion of Ukraine during H1 2022, causing temporary supply security concerns amongst end users and by ongoing uncertainty about the global macro-economic outlook.
Russia accounts for approximately 40% of global primary palladium supply (2.7 million ounces) and the incursion into Ukraine resulted in the palladium price surging to record levels at well over US$3,000/oz in March 2022, fuelled by expectations of sanctions being imposed on Russia. Despite US and EU sanctions and Russian refineries being removed from the London platinum & palladium market (LPPM) Good Delivery list, Russian metal continued to flow to other regions. Production from Norilsk was slightly ahead of guidance for 2022, due to the repairs of its furnace No.2 at the Nadezhda Metallurgical Plant being postponed until 2023 and sufficient inventory and spares to maintain production. Norilsk has already indicated that the outlook will be more challenging as access to capital equipment, parts and skills become an increasing issue due to sanctions by Western countries and companies. The palladium price ultimately retreated, ending the year 9% lower at US$1,782/oz.
The platinum price began the year at US$961/oz, peaking at US$1,150/oz in March 2022, before contracting below US$850/oz by mid-year. Concerns about the outlook of supply from South Africa due to escalating power disruptions and increased imports into China, resulted in a recovery in the price, which ended the year 9% higher at US$1,048/oz.
The rhodium price rallied sharply early in 2022, exceeding US$20,000/oz after Russia invaded Ukraine, but similarly to palladium, the rhodium price pulled back to US$12,250/oz at the end of the year, a 13% decline year on year.
Automotive production grew 7.8% year-on-year in 2022, to just over 80 million light vehicles (LDV), driven by an easing of the global chip shortage and the relaxation of COVID-19 restrictions in the west. Auto production was still well below pre-COVID-19 levels of 86.6 million units in 2019 as China's zero COVID-19 policy and worsening macro-economic conditions impacted consumer demand. Heavy-duty vehicle production contracted year-on-year, primarily as a result of reduced orders from China, which remained under strict COVID -19 restrictions until late in the year.
Demand for platinum in automotive applications increased by 17% year-on-year to 2.8Moz as a result of the increase in auto production but mainly due to the substitution of palladium with platinum in gasoline autocatalysts.
Net jewellery demand remained flat at 1.2Moz, well below the 2Moz levels last see in 2015, as China remained closed and competition for disposable income abounds. Similarly, industrial demand dropped 7% year-on-year, largely as a result of China.
Gross automotive demand for palladium rose by 1% year-on-year to 8.5Moz due to the recovery in light vehicle production, however also impacted by substitution of platinum for palladium in gasoline autocatalysts along with increased loadings on catalytic converters in commercial vehicles associated with tighter emissions standards in China and India. Substitution of palladium by platinum in gasoline ICEs increased to approximately 490koz during 2022 through increased adoption of tri-metal catalysts, primarily in China and the USA.
Sibanye-Stillwater Operating and financial results | Six months and year ended 31 December 2022 5
Industrial demand rose modestly as continued strong growth in the glass and petroleum industries offset a decline in demand from the chemical industry.
Recycling of autocatalytic converters was constrained by lower scrappage rates of second-hand vehicles due to the ongoing constraints to auto production, higher interest rates, macro-economic uncertainty and supply chain constraints. 3E recycling was down 8% year-on-year.
Overall, 2022 ended with a bigger platinum surplus (~700koz), a bigger palladium deficit (~350koz) and a rhodium market in balance.
PGM market outlook -2023
Despite the stability provided by most companies concluding five year wage agreements, supply from South Africa is at risk due to ongoing load curtailment by Eskom and the worsening operating environment (e.g. cable theft, crime). Russian supply is also expected to scale back, with Norilsk Nickel already indicating lower production for 2023 and delays to its projects as access to capital equipment and spare parts becomes more challenging due to sanctions, resulting in increased unavailability of equipment.
Recycling is expected to increase by 8% year-on-year, with 2023 recycling output forecast to recover to 2021 levels as new car sales increase, allowing for older vehicles to be scrapped.
LDV production is forecast to increase to 82.5 million units (vs 80.6 million in 2022) due to the ongoing reopening of the Chinese economy from COVID-19 restrictions, a more constructive outlook and a softer macro-economic landing. As China re-opened at the end of 2022, it was hit by a wave of COVID-19 infections, shortly followed by the lunar new year holidays which began in January 2023. As a result, a recovery in the Chinese market is expected to materialise from Q2 2023, with some risk to the downside - depending on the economic outlook. We expect PGM prices to remain muted, particularly during Q1 2023.
We expect further positive demand increments for PGMs due to increased loadings on autocatalysts. Euro 6e emissions regulations were published in December 2022 and come into force in September 2023. Under the new regulations, the conformity factors for RDE (real driving emissions) testing tighten to 1.1 for NOx and 1.34 for PN (particle number), which should be positive for loadings.
In contrast, we anticipate further growth in market share of battery electric vehicles (BEV) from 10% in 2022 to approximately 12% in 2023.
We expect substitution to increase in line with further adoption of the tri-metal catalysts and auto sales (~730koz Pd replaced with Pt in gasoline autocatalysts).
For 2023 we forecast a smaller platinum market surplus of 100 koz, a small deficit of 100koz for palladium and rhodium projected to be close to balance.
Battery Metals market update
Lithium
China continues to be the primary driver of global BEV demand and production. BEV production from China almost doubled during 2022 to over 5 million units, meaning that one fifth of LDVs produced in China are now BEVs. The extension of ‘new energy vehicle’ subsidies was the major factor incentivizing increased production of EVs during the year. Globally, production of BEVs in 2022 exceeded expectations, increasing to 8.4 million units or 10% of global LDV production, with strong growth also recorded in Europe and the USA. As a result of this increase in BEV demand, particularly in China, lithium prices reached record highs in 2022 and remained well supported throughout the year, averaging almost $70,000/t LCE for the year, nearly 300% higher than for 2021.
Gross lithium demand is estimated to have increased by 46% last year, mainly driven by increased global demand from the battery sector. BEV sales are estimated to have been responsible for almost three-quarters of this growth in gross demand, with Chinese BEV production and sales in particular exceeding market expectations.
Primary lithium supply is estimated to have increased by 29% in response to the growth in demand, with almost all of the supply growth coming from brownfield mine and brine expansions in Australia and Chile.
There has been a preferential shift in battery-grade lithium precursors towards lithium carbonate due to the resurgence of lithium iron phosphate (LFP) cathodes in China. Lithium hydroxide remains the driver of demand growth in Europe and North America however, as nickel-rich cathodes continued to dominate in those regions.
Lithium demand for 2023 is forecast to increase by 21% from 2022 levels, with the majority of this growth coming from growth in demand from automotive batteries. Sustained higher prices and an improved long-term outlook for lithium demand has prompted a supply response as highlighted, and lithium prices are expected to pull back from the record levels seen in 2022 but remain well above the long-term historic average prices. This is a necessary market dynamic which incentivizes new projects that will be required to meet demand growth. Primary lithium supply growth is still expected to lag demand over the next decade, but new projects are placed to meet market requirements in the next few years, under the right conditions.
The increased focus on environmental and social factors in recent years has added to the complexity of permitting and developing new projects, with timelines significantly extended. Considering current projections for BEV penetration into the global automotive market, significant investment in new lithium supply will be required to meet forecast demand over the next decade. In our view, new supply is unlikely to keep pace with forecast demand, resulting in deficits in lithium supply from 2026/2027, which will maintain higher prices for longer.
Nickel
Nickel demand from the battery sector is estimated to have grown by 40% in 2022 compared with 2021, primarily driven by strong BEV sales.
However, a 7% contraction in stainless steel demand towards the end of 2022 and continuing during 2023, has offset this increased demand. Stainless steel has been affected by the real estate downturn in China and a deterioration in the Europe economy.
Sibanye-Stillwater Operating and financial results | Six months and year ended 31 December 2022 6
The tightness in the class 1 nickel market also eased over the year, despite strong demand from electric vehicle batteries. The bifurcation between class 2 and class 1 nickel markets has somewhat disappeared owing to the ramp up of nickel pig iron (NPI) to matte conversion capacity in Indonesia. While this conversion has a higher carbon intensity than traditional class 1 nickel production routes, this is not thought to be an issue for in the Asian market. Furthermore, new generation HPAL plants in Indonesia are ramping up more smoothly than previously anticipated, further easing the concerns over the availability of suitable feedstock for the battery supply chain.
Nickel prices averaged $26,300/t on the LME in 2022, 42% higher than 2021. A short squeeze in Q1 led to a price rally in early March before receding to around $20,000/t by Q3. Price volatility following Russia’s invasion of Ukraine subsided as the commodity and associated producers remained absent from sanction lists and anticipated supply chain disruptions did not materialise.
Following a small deficit in 2021, the nickel market is estimated to have shifted into a surplus owing to strong supply growth from Indonesia. Total nickel supply is estimated to have risen 13% in 2022 to over 3 million tonnes, while demand is estimated to have contracted by 3% to 2.7 million tonnes (net of recycling).
The nickel market is predicted to remain in surplus in 2023. Primary supply is projected to grow by 17% this year as mines continue to ramp up output in Indonesia, compared to a more modest 6% growth for demand.
STRATEGIC REVIEW
A disciplined focus on capital allocation and value accretive M&A was maintained during 2022. Battery metal prices remained at elevated levels throughout the year and a move by other industry peers toward diversifying into the battery metals space was evident.
Meaningful progress has been achieved in 2022 with the growth in the European region. An 85% interest in Keliber was acquired by exercising our right to take a 50% stake and concurrently making an offer to minority shareholders other than the Finnish Minerals Group, which remains a key shareholder. The required permits to advance the project have been obtained and construction of the refinery has commenced in 2023.
The Sandouville recapitalisation is gathering momentum, and prospects are good for establishing PGM, and in time, battery metals recycling operations on a meaningful scale in Europe. We are also positioning to become more active in global tailings reprocessing through a recent increase in our investment in New Century.
Commitments have also been obtained from the US Department of Energy for loan funding of up to US$700 million for the development of the Rhyolite Ridge project in Nevada. This reflects the strong support for establishing local supply of the critical minerals required for a low carbon economy in both North America and in Europe, where we have purposefully built strategic beachheads.
These opportunities do not exclude selective expansion into Africa as part of our Africa Region strategy. We have identified that Zambia, under President Hichilema’s new leadership, is transforming into an attractive jurisdiction seeking to attract mining capital under a favourable policy environment. While the Zambian mining industry has been devastated through years of poor regulation and neglect, confidence is building that the changes will persist creating meaningful opportunities for renewal of its mining industry. The intended sale of the Mopani mine is of particular interest presenting a unique opportunity to secure meaningful production ounces of copper, a key green metal for the low carbon economy, at a favourable entry point in the commodity cycles.
With such opportunities scarce in other parts of the world and greater competition for resources due to perceptions of the risk context, we see diversification of specific commodities and jurisdictions within Africa as a meaningful contributor to growth in our green metals strategy.
OPERATING GUIDANCE FOR 2023*
Following the normalisation of production rates at the Stillwater mine during Q4 2022, the US PGM operations are expected to deliver in line with the repositioned plan, with 2E PGM production for 2023 forecast at between 500,000 2Eoz and 535,000 2Eoz, with AISC of between US$1,400/2Eoz to US$1,500/2Eoz reflecting higher ORD and sustaining capital for the near term, as per the repositioned plan. Capital expenditure is forecast to be between US$285 million and US$300 million, including approximately US$25 million project capital.
3E PGM production for the US PGM recycling operations is forecast to be between 450,000 and 500,000 3Eoz fed for the 2023 year Capital expenditure is forecast at US$2.6 million (R41.9 million).
4E PGM production from the SA PGM operations for 2023 is forecast to be between 1.7M 4Eoz and 1.8M 4Eoz including approximately 60,000 4Eoz of third party PoC, with AISC between R20,800/4Eoz and R21,800/4Eoz (US$1,300/4Eoz and US$1,363/4Eoz) - excluding cost of third party PoC. Capital expenditure is forecast at R5.4 billion (US$338 million)* for the year, including project capital of R920 million (US$58 million) on the K4 project.
Gold production from the managed SA gold operations (excluding DRDGOLD) for 2023 is forecast at between 23,500kg (756koz) and 24,500kg (788koz). This guidance reflects a return to normalised rates of production following the industrial action in 2022 but excludes production from Beatrix 4 shaft and Kloof plant 1, which are currently subject to Section 189 consultations. AISC is forecast to be between R950,000/kg and R1,020,000/kg (US$1,882/oz and US$1,940/oz). Capital expenditure is forecast at R5.9 billion (US$237 million), including R1.95 billion (US$122 million) of project capital expenditure provided for the Burnstone project and R150 million (US$9 million) on the Kloof 4 deepening project).
Production from the Sandouville nickel refinery is forecast at between 9.5 and 10.1 kilotonnes of nickel product, at a Nickel equivalent sustaining cost of €24,813/t (R409k/t)* and capital expenditure of €15.9million (R262.9million)*. Capital expenditure at the Keliber lithium project for 2023 is forecast to be about €231million (R3.81 billion)*.
*The guidance has been translated where relevant at an average exchange rate of R16.00/US$ and R16.50/€
NEAL FRONEMAN
CHIEF EXECUTIVE OFFICER
CHIEF EXECUTIVE OFFICER
Sibanye-Stillwater Operating and financial results | Six months and year ended 31 December 2022 7
SIBANYE-STILLWATER GROUP SAFETY AND OPERATING REVIEW
Safety
The health and safety of our employees continues to be our first priority and we remain committed to ensuring a safe work environment at all of our operations. The continued improvement in safety statistics throughout the Group during 2022 and particularly, the significant decline in fatalities was pleasing. All Group safety indicators improved year-on-year and the positive safety trends established since mid-2021 were maintained, reinforcing our confidence in the applicability of our Real risk reduction priority focus which was implemented following a concerning deterioration in safety across the Group during 2021.
This commendable improvement in the Group safety performance is reflected in a 29% improvement in the total recordable injury frequency rate (TRIFR) from 7.10 (per million hours worked) for 2021 to 5.07 for 2022, a 23% improvement in the serious injury frequency rate (SIFR) from 3.77 for 2021 to 2.91 for 2022 and a 27% improvement in the lost time injury frequency rate (LTIFR) from 6.03 for 2021 to 4.41 for 2022. Notably, these safety metrics for 2022 were also substantially better than the average Group safety metrics achieved during 2019 and 2020, with the average LTIFR, SIFR and FIFR for 2022 18%, 4% and 40% better respectively- than the comparable metrics for the average of 2019 and 2020, both of which were considered good safety years prior to the regression in safety statistics in 2021.
The focus for 2022 and continuing during 2023, remains on eliminating fatal incidents, with the anchors being the implementation of our Critical controls, Critical life saving behaviours and Critical management routines in order to prevent fatalities. The key message in the Fatal Elimination strategy in 2022 was "Block the path to death, know when to stop unsafe work and to stop without hesitation". As part of making a life saving commitment, over 95% of Sibanye-Stillwater employees have signed a "Life saving commitment booklet" which contains our essential safety and lifesaving protocols and has helped equip teams with a deeper understanding of our safety protocols and their responsibilities, including when to stop unsafe work practices without hesitation, so that they and their team mates can return safely to their families every day.
In terms of operationalising the fatal elimination plan, the teams' focus is to understand ineffective controls and to address identified factors through site-specific fatal elimination plans. With the priority on high-energy incidents, near miss reporting has become an essential tool to eliminate the potential loss of life and we have classified all incidents into two categories, namely:
•Injuries with the Potential loss of life (IPLL)
•Non-injuries (incidents) with the Potential loss of life (NIPLL)
Weekly potential loss of life reviews have been instituted and capture the Learning from Incidents (LFI) process supporting lessons and learnings to be shared throughout the Group.
The Group has implemented minimum group standards, which define minimum requirements for Critical controls, Critical lifesaving behaviours and Critical management routines throughout the Group. Our focus is on proactive operational line management intervention based on the assessment of leading indicators and improvements in these areas.
Consequent to the intensified focus on eliminating fatal incidents, we experienced a significant reduction in fatal incidents during 2022, with the number of fatalities reducing from 21 in 2021 to five in 2022. This represents a significant milestone in deep level mining in South Africa, specifically with the fatal injury frequency rate (FIFR) declining to 0.033 for 2022, a 75% improvement relative to 2021 and the lowest fatality metrics achieved in the 10-year history of the Group. This is however still five fatals too many, and our relentless focus on eliminating risk from our operations will underpin our journey to sustainably eliminate fatalities from our workplaces. On 21 January 2023, the SA gold operations recorded 2 million fatality free shifts and on 14 February 2023 the SA PGM operations recorded 5 million fatality free shifts. These indicators provide an encouraging platform to build on for the future. We are confident that these interventions have meaningfully contributed to the significant reduction in fatal incidents, and we strongly believe that we can achieve our goal of zero harm in the workplace.
Sadly, on 8 October 2022 at the SA gold Kloof operations, a 40-year old locomotive operator, Ms. F Ntlekisana sustained serious injuries and passed away in a tramming related incident. While this single fatality for Q4 2022 statistically represents a commendable improvement when compared with the nine fatalities suffered during Q4 2021, any death is unacceptable.
US PGM operations
The severe weather event which caused regional flooding across Montana in June 2022, restricted access to the Stillwater operation for seven weeks and caused the suspension of all operating activities at the Stillwater mine (which comprises 60% of production from the US PGM operations) until access to the mine was restored. The gradual build-up to normalised production levels by November 2022 further impacted the operational results during H2 2022. In addition, the cumulative impact of various operational constraints since 2018 and persistent skills shortages, severely restricted operational flexibility and productivity, significantly affecting production and costs during the year.
The deteriorating economic and operating environment and less positive palladium price outlook, prompted a review and repositioning of the US PGM operations to address operational constraints and volatility by improving operational flexibility, thereby ensuring more consistent operational and financial results and a sustainable production build up to over 700,000 2Eoz per annum at AISC below US$1,000/2Eoz (in 2022 terms) by 2027. The detail related to the repositioned operational plan is available at https://www.sibanyestillwater.com/features/us-pgm-operations-review/. Achieving the targeted production and costs will require increased investment in ore reserve development and other essential maintenance capital over a two to three year period to improve the developed state of the mines, and construction of a new underground cemented backfill plant at Stillwater East, which will provide an appropriate support solution to the challenging ground conditions. A number of mining stopes in areas that require cemented backfill for safety and quality of mining reasons, have been suspended until the anticipated completion of the plant within the next 3 years, which will then enable mining to resume in the suspended stopes and allow for a relatively quick ramp up in production at Stillwater East once the plant is commissioned.
As a result of the flood event and other operational constraints highlighted in the H1 2022 and Q3 2022 results (East Boulder geological and geotechnical complexity associated with mining West compounded by critical skills shortages/elevated nitrous oxide levels), mined 2E PGM production from the US PGM operations of 421,133 2Eoz declined by 26% compared with 2021.
Sibanye-Stillwater Operating and financial results | Six months and year ended 31 December 2022 8
The implementation of the repositioned operational plan and accelerated development to restore flexibility is underway but productivity continues to be impacted by high employee turnover which is compounded by the low unemployment rate and skills shortage in the region and the country as a whole and more specifically for the US PGM operations - a shortage of mining, geological and artisan skills. A strong focus on sourcing, training and retaining the required skills whilst simultaneously improving the conditions of employment are being prioritised. For example revised shift rosters (seven days on/seven off) are being trialed at East Boulder to reduce travel and extend shift times for employees, which should lead to improved productivity. The high turnover statistics have begun to improve but will take several months to turnaround. Positively, after a severely disrupted 2022, production in January 2023 started well with overall production at US PGM underground operations exceeding budget.
AISC for 2022 increased by 58% to US$1,586/2Eoz (R25,951/2Eoz) primarily due to the decline in production. In addition, general inflationary costs affecting the industry, a 93% increase in ore reserve development (ORD) costs to US$176 million (R2.9 billion) due to the change in classification of Stillwater East development from growth capital to sustaining capital (ORD), greater support and equipment costs, continued reliance on contractor development at East Boulder and the ramp up of ORD across the operations to increase mining flexibility, contributed to the increase in costs. Sustaining capital (underground mining equipment including remote sensing and environmental monitoring equipment), in order to ensure a safer operating environment, increased by 35% year-on-year to US$72 million (R1.2 billion).
The decision to suspend further growth capital at Stillwater East resulted in project capital expenditure declining by 50% in 2022 to US$82 million (R1.3 billion). In line with many other industries in the USA and globally, the US PGM operations continue to experience underlying inflationary pressures, supply chain issues, input cost inflation and higher labour costs due to skills shortages, which increases reliance on contractors at a higher cost.
The decline in production in 2022 combined with an 11% year-on-year lower average 2E PGM basket price of US$1,862/2Eoz (R30,482/2Eoz) were the main drivers of a 47% decline in adjusted EBITDA from the US PGM operations to US$386 million (R6.3 billion).
2E PGM production for H2 2022 of 191,094 2Eoz was 30% lower than for H2 2021 and 17% lower than for H1 2022, reflecting the impact of the regional flooding and subsequent build up of production at the Stillwater mine. Production from the Stillwater mine of 116,786 2Eoz, was 31% lower year-on-year, while production from East Boulder of 74,309 2Eoz was 27% lower year-on-year. AISC for H2 2022 increased by 77% year-on-year to US$1,840/2Eoz (R31,880/2Eoz) with ORD spending increasing by 81% to US$93 million (R1.6 billion) and sustaining capital increasing by 141% year-on-year to US$47 million (R806 million) for the same reasons as highlighted above. In line with the suspension of further growth capital at Stillwater East and the reclassification of ORD, project capital of US$47 million (R814 million) for H2 2022 was 41% lower year-on-year.
US PGM recycling operation
The global slowdown in used car scrappage rates due to the uncertain global economic environment, higher interest rates and higher new car prices as well as continued supply chain logistic constraints, including port and road transport and a firm adherence to responsible sourcing principles, impacted receipt and feed rates at the US PGM recycling operation during 2022. Average spent autocatalyst fed by the US recycling operation declined by 21% to 18.8 tonnes per day in 2022 compared with 23.8 tonnes per day fed in 2021 with total PGM ounces fed of 598,774 3Eoz, 21% lower year-on-year.
Recycling inventory increased to 49 tonnes at the end of 2022 from 25 tonnes at the end of 2021. Customer advances reduced from US$441 million at the end of 2021 to US$258 million at the end of 2022, attributable to lower volumes of autocatalysts received during H2 2022 and lower palladium and rhodium prices, facilitating a release of US$183 million in working capital.
The average 3E PGM basket price for the US PGM recycling operations for 2022 decreased by 13% year-on-year to US$3,067/3Eoz (R50,202/3Eoz) due to lower realized 3Eoz prices with adjusted EBITDA declining by 23% to US$78 million (R1.3 billion). Net profit after net financing income from the US PGM recycling operations of US$92 million (R1.5 billion) for 2022 was 25% lower than for 2021 (US$122 million/R1.8 billion).
In H2 2022, average autocatalyst receipt rates declined by 37% relative to H1 2022. Average autocatalyst feed rates declined by 35% from 22.8 tonnes per day in H2 2021 to 14.9 tonnes per day in H2 2022. The US PGM recycling operation fed 237,441 3Eoz in H2 2022, a 33% decline when compared to H2 2021. With available inventory declining from 124 tonnes at end June 2022 to 49 tonnes at year end, given ongoing production constraints, the operation focused on inventory management during H2 2022.
SA PGM operations
The SA PGM operations delivered solid operating results, with 4E PGM production of 1,730,808 4Eoz for 2022 (including attributable ounces from Mimosa and PoC) marginally below the lower range of guidance. Production was 9% lower than for 2021 primarily due to ongoing load curtailment by Eskom which intensified towards year end and which resulted in an estimated reduction of 22,700 4Eoz during 2022. Pleasingly, stockpiled ore containing approximately 33,000 4Eoz which had accumulated by the end of Q3 2022 (due to intensified load curtailment), was largely processed during the year-end holiday period in December 2022, significantly reducing the possible production impact. Other factors which impacted production were copper cable theft, Group wide safety interventions in line with our safety strategy and temporary productivity constraints in areas where operations were mining through adverse ground conditions. Production of 1,667,464 4Eoz (excluding PoC) was 9% lower year-on-year. 4E PGM PoC processed increased by 5% to 63,344 4Eoz but was below expected levels at the beginning of 2022 due to production issues and high rainfall affecting third party PoC suppliers.
PGM sold (including attributable from Mimosa) decreased by 12% to 1,662,101 4Eoz year-on-year, approximately 69,000 4E oz lower than produced for 2022. This was primarily due to timing differences between the processing of stockpiled ore during the December holidays and the year-end financial close out. The processing facilities at the SA PGM operations continued to operate after the mining operations had stopped production for the December holidays, utilising spare processing capacity to process stockpiled ore (4E PGM output from the precious metals refinery (the PMR) in December 2022 was double the average of the prior 11 months), resulting in an increase in inventory in the processing pipeline at financial year-end, which was subsequently refined during the December holidays and stored as refined metal for sale in the vaults at the PMR. The approximately 69,000 4Eoz of refined 4E PGM metal produced and stored at the PMR during December 2022, will reflect in sales for Q1 2023.
AISC (excluding the purchase cost of associated with PoC) of R19,313/4Eoz (US$1,180/4Eoz) increased by 14% year-on-year, primarily due to lower production and inflationary pressures on imported spares, steel products, ammonia based products and fuel and oil. Considering the impact of external factors on production, this is a commendable cost performance, which contrasts with higher unit cost increases
Sibanye-Stillwater Operating and financial results | Six months and year ended 31 December 2022 9
reported by industry peers, and is likely to result in the SA PGM operations moving further down the industry cost curves. AISC (including PoC) increased by 11% to R20,078/4Eoz (US$1,227/4Eoz) due to an increase in PoC ounces, despite a reduction in the cost of PoC material as a result of lower average PGM prices.
Capital expenditure for 2022 increased by 34% year-on-year to R5.1 billion (US$312 million), exceeding guidance of R4.8 billion (US$320 million) with ore reserve development 35% higher at R2.1billion (US$130 million), sustaining capital 2% higher at R2.1 billion (US$126 million) and project spend increasing from R203 million (US$14 million) in 2021 to R925 million (US$57 million) primarily on the Marikana K4 project. Capital expenditure exceeded guidance by 7% or R328 million (US$8 million below) as a result of bringing forward the planned expenditure incurred on the No. 1 furnace rebuild project at Marikana and trackless mobile equipment (TMM) at Kroondal and Rustenburg operations, which was originally scheduled for 2023.
The average PGM basket price for 2022 of R42,914/4Eoz (US$2,622/4Eoz) was 9% lower than for 2021 and contributed to adjusted EBITDA declining by 26% to R38.1 billion (US$2.3 billion) year-on-year. The adjusted EBITDA margin of 53% remained historically high, with adjusted EBITDA for 2022 the 2nd highest annual adjusted EBITDA recorded by the SA PGM operations.
For H2 2022, the SA PGM operations produced 4E PGM of 881,656 4Eoz (including PoC) and 843,658 4Eoz (excluding PoC) which was 9% and 10% lower year-on-year respectively. This was largely due to load curtailment intensifying from September 2022 and the Simunye shaft at Kroondal reducing output as it reaches the end of its life. In H2 2022, concentrate purchases from 3rd parties increased by 48% to 37,998 4Eoz due to increased contractual deliveries.
AISC for H2 2022 (excluding PoC) increased by 20% year-on-year to R20,431/4Eoz (US$1,179/4Eoz) with AISC (including PoC) 21% higher at R21,295/4Eoz (US$1,229/4Eoz). This was primarily because of lower production, continued inflationary pressures and 42% higher ORD in H2 2022 to R1.2 billion (US$68 million) primarily because of the ramp-up in Marikana K4 development.
H2 2022 Chrome sales of 1,132kt were 1% higher than for H2 2021 (1,116kt). Chrome revenue of R1.7 billion (US$97 million) for H2 2022 was 36% higher year-on-year, mainly due to the chrome price received improving by 38% from US$166/tonne in H2 2021 to US$228/tonne in H2 2022 with increased production from the Rustenburg and Marikana operations and steady production at Kroondal.
4E PGM production from the Rustenburg operation declined by 6% to 628,897 with AISC increasing by 8% to R19,914/4Eoz (US$1,217/4Eoz), which was a solid achievement considering lower production and inflationary pressures. Bathopele production was impacted by mining through the Hex River fault with production from Siphumelele impacted by seismicity. 4E PGM production for H2 2022 of 324,025 4Eoz was 6% lower year-on-year, with surface production 18% higher at 40,877 4Eoz primarily due to improved plant recoveries which increased by 26% to 43.2% (greater amount of high grade slag treated). Underground production was 8% lower at 283,148 4Eoz. AISC increased by 10% year-on-year to R20,714/4Eoz (US$1,195/4Eoz) in H2 2022 as a result of lower production and continued inflationary cost pressures. AISC was also impacted by 10% higher royalties and 18% higher ORD offset by by-product credits which increased by 44% year-on-year primarily due to increased chrome production and price along with a higher average nickel price.
The gradual ramp-down at the Simunye shaft (forecast for shutdown in Q4 2022) and geologically challenging ground at Bambanani and Kwezi shafts, which negatively impacted productivity and head grade, impacted 4E production from the Kroondal operation. 4E PGM attributable production declined by 11% in 2022 to 201,756 4Eoz with a concomitant 20% increase in AISC to R15,514/4Eoz (US$948/4Eoz). A two-shift cycle has been implemented at Bambanani to improve face time for crews and improve output. 4E PGM production in H2 2022 was 11% lower than for the comparable period in 2021. AISC of R16,139/4Eoz (US$931/4Eoz), was 17% higher than for H2 2021 as a result of lower production, inflationary cost pressures and additional support required to mine through adverse ground conditions.
The Marikana operation was impacted by load curtailment, theft of copper cable and safety stoppages. Stockpiled ore from Marikana was processed during the year-end holiday period resulting in higher inventory levels despite being held as refined metal at year end. This is in the process of unwinding through sales during Q1 2023. The Marikana K4 project is on schedule with initial PGM production having been achieved during the year. 4E PGM production for 2022 (excluding PoC) was 12% lower at 672,917 4Eoz with AISC (excluding PoC) 18% higher at R20,500/4Eoz (US$1,253/4Eoz) due primarily to lower production, inflationary effects and 52% higher ORD capital. PoC production increased by 5% year-on-year to 63,344 4Eoz resulting in total 4E PGM production 11% lower at 736,261 4Eoz. AISC (including PoC) increased by 12% to R22,076/4Eoz (US$1,349/4Eoz).
During H2 2022, 4E PGM production (excluding PoC) at the Marikana operation for 2022 declined by 15% compared to the same period in 2021 to 337,654 4Eoz with underground production 15% lower and surface production 13% lower. PGM production (including PoC) declined by 11% year-on-year to 375,652 4Eoz, benefitting from processing of third party PoC which increased by 48% to 37,998 4Eoz.
AISC (excluding PoC) and AISC (including PoC) for the Marikana operation both increased by 29% for H2 2022 to R22,031/4Eoz (US$1,271/4Eoz) and R23,764/4Eoz (US$1,371/4Eoz) respectively. This was primarily because of lower production, continued inflationary pressures and ORD which was 57% higher year-on-year as a result of additional ORD development being done simultaneously with the development of the K4 shaft. K4 project capital is spent on shaft infrastructure and engineering and for mining up to the first development cross cut, while development beyond the first cross cut classifies as ORD. Also contributing to higher AISC for H2 2022 in comparison to H2 2021 were 28% (R700 million/US$62 million) lower by-product credits which added R1,139/4Eoz (US$118/4Eoz) to AISC. By-product credits were impacted by lower sales of PGM and lower sales of copper and nickel, with inventory built up in the base metals refinery at year end. AISC (including PoC) was also higher because of higher PoC purchase costs which increased by 46% year-on-year to R1.6 billion (US$95 million). Capital expenditure increased by 34% in H2 2022 to R2.0 billion (US$116 million) with project capital at the K4 project increasing by 165% to R519 million (US$30 million).
Attributable 4E production from Mimosa in 2022 declined marginally by 3% year-on-year to 115,534 4Eoz with AISC increasing by 17% to US$1,150/4Eoz/(R18,817/4Eoz) due mainly to inflationary pressures couple with a 56% increase in sustaining capital to US$53 million (R864 million) with the construction of a new tailings facility, additional underground infrastructure and metallurgical improvements.
Attributable 4E PGM production from Mimosa for H2 2022 declined by 1% year-on-year to 57,980 4Eoz with improved plant recoveries offsetting slightly lower throughput. In spite of the steady production performance, AISC in H2 2022 increased by 24% year-on-year to US$1,304/4Eoz (R22,594/4Eoz) due to sustaining capital increasing by 65% year-on-year to US$33 million(R570 million) and industry-wide inflationary effects. The sustaining capital increase is due to construction of a new tailings storage facility, underground infrastructure maintenance, and optimising the reagent suite and cell settings across the flotation circuit to improve recoveries.
4E PGM production from Platinum Mile in 2022 was 8% lower resulting in AISC 14% higher at R10,835/4Eoz (US$662/4Eoz). 4E PGM production from Platinum Mile of 23,558 4Eoz in H2 2022 was 23% lower year-on-year due to depletion of the higher grade East Dam
Sibanye-Stillwater Operating and financial results | Six months and year ended 31 December 2022 10
during 2021 with the focus now on the West dam with lower volumes mined and lower run of mine tailings from Rustenburg operations which impacted recoveries. Lower volume and industry-wide inflationary effects resulted in the AISC in H2 2022 increasing by 40% to R11,886/4Eoz (US$686/4Eoz), which remains the lowest in the Group.
The K4 project
The K4 project performed well and remains within schedule at 34% completion with the following milestones achieved:
•First reef tonnes were hoisted in May 2022
•Reef tonnes hoisted for H2 2022 of 48,670 tonnes with production of 3,984 4Eoz
•K4 development build-up in support of the steady state operation is increasing with primary waste metres developed in H2 2022 of 3,475 metres and primary reef development of 1,719 metres. Merensky ore pass rehabilitation is progressing in line with schedule
•Surface infrastructure is well advanced
•Over 1000 employees on site which is set to double in the next year
•Project capital spent in 2022 was R924 million (US$56 million) in line with budget with R1.1 billion (US$69 million) spent to date. K4 has another year of planned high capital expenditure in 2023 (R920 million/US$58 million) which will then taper off
SA gold operations
The SA gold operations (excluding DRDGOLD) were significantly affected by the industrial action and the lockout of employees, which resulted in total closure of the operations between March and June 2023. The suspension of production and processing at the Beatrix operations for safety purposes including reinforcement of the tailings facility during Q1 2022 was a contributing factor to a 77% decline in production (excluding DRDGOLD) for H1 2022 compared to H1 2021. Production for the second half of the year improved relative to H1 2022, but still substantially lower than for H2 2021, due to the phased resumption of safe production. Normalised production rates were achieved during Q4 2022.
Gold production from the SA gold operations (including DRDGOLD) for 2022 declined by 42% tot 19,301kg (620,541oz) year-on-year. Production from the SA gold operations (excluding DRDGOLD) decreased by 50% to 13,736kg (441,623oz). Production from DRDGOLD declined by 1% year-on-year to 5,565kg (178,919oz) with the yield improving 9% to 0.21g/t due to the last stage clean-up for many sites at East Rand gold operations (ERGO) resulting in lower tonnage but higher grade, compensating for a 9% decline in tonnes milled.
AISC for the SA gold operations (including DRDGOLD) for 2022 increased by 58% to R1,268,360/kg (US$2,410/oz) compared with 2021, primarily due to significantly lower production. AISC for the SA gold operations (excluding DRDGOLD) increased 76% year-on-year to R1,461,956kg (US$2,778/oz) for 2022.
Project capital at the SA gold operations (including DRDGOLD) increased by 178% to R1.3 billion (US$80 million) with project capital spent at Kloof on the Kloof 4 deepening project increasing by 6% year-on-year to R210 million (US$13 million) and capital invested at Burnstone project increasing by 402% to R934 million (US$57 million). Capital expenditure at the SA gold operations (excluding DRDGOLD) on ORD and sustaining capital will remain elevated for 2023 in order to restore operational flexibility arising from significant operational disruptions during 2022.
Project capital at DRDGOLD increased by 164% to R124 million (US$8 milion) with spending on the Phase 1 20MW solar project and related infrastructure at ERGO which is expected to be operational in 6-9 months. Phase 2 is an additional 40MW with battery backup (160MW) estimated to be completed 12-18 months after Phase 1.
The average rand gold price received in 2022 was flat in US dollars but the average rand gold price increased by 11% to R946,073/kg (US$1,798/oz), due to depreciation of the rand relative to the US dollar. Despite this, lower production for 2022 resulted in a R8.7 billion swing in adjusted EBITDA from the SA gold operations (including DRDGOLD) with adjusted EBITDA declining from R5.1 billion (US$346 million) for 2021 to a loss of R3.5 billion (US$219 million) or negative 20% adjusted EBITDA margin for 2022. Given the improved outlook for the gold price and recent rand weakness resulting in spot averaging over R1 million/kg year-to-date, together with an expected period of operational stability, the outlook for the SA gold operations for 2023 is very positive.
Production for H2 2022 (including DRDGOLD) decreased by 23% to 13,339kg (428,859oz) with production (excluding DRDGOLD) of 10,608kg (341,055oz) 26% lower as a result of the phased start-up following the industrial action, as well as the impact of load curtailment, the intensity of which increased towards year end. AISC for the SA gold operations (including DRDGOLD) for H2 2022 increased by 38% to R1,124,737/kg (US$2,019/oz), whilst AISC for the SA gold operations (excluding DRDGOLD) increased by 44% to R1,215,786/kg (US$2,182/oz), primarily due to lower gold sold.
Production from Driefontein in 2022 declined by 47% to 4,893kg (157,314oz) due to the industrial action and the subsequent phased ramp-up during H2 2022 with a concomitant 74% increase in AISC to R1,378,868/kg (US$2,620/oz). Underground production from Driefontein for H2 2022 decreased by 31% to 3,163kg (101,693oz) year-on-year due to 21% lower tonnes milled due to the phased production build up. Underground grades declined by 14% due to a lower production contribution from the higher grade 1 and 4 shafts, which should normalise during 2023. Surface tons milled declined by only 6% but grade improved by 8% due to additional sources of material identified as part of the surface clean-up process. Surface material from the Kloof operations was also toll treated at the Driefontein metallurgical plant during 2022. This enabled the surface operations to increase production by 1% year-on-year in H2 2022 to 240kg (7,716oz). AISC for H2 2022 increased by 51% to R1,219,187/kg (US$2,188/oz) due to lower volumes sold and inflationary impacts. Whilst ORD declined by 12% due to less development, sustaining capital increased by 23% due to the several electrical upgrades and lamproom projects being commissioned in the latter part of 2022.
Production from Kloof declined by 55% in 2022 to 4,920kg (158,182oz) with AISC increasing by 85% to R1,592,030/kg (US$3,025/oz). Surface production at Kloof declined by 55% year-on-year to 620kg (19,933oz) due to the steady depletion of available reserves. Underground production from the Kloof operation for H2 2022 decreased by 35% to 3,284kg (105,583oz) due to 22% lower tonnes milled and a 16% lower average yield due to a proportionately lower tonnage contribution from the higher-grade 4 and 8 Shafts. Surface production at Kloof decreased by 24% to 420kg (13,503oz) in H2 2022 due to the industrial action, a steady depletion of available reserves as well as a change to the surface contractor which resulted in lower volumes during the startup. AISC at Kloof in H2 2022 was consequently 49% higher at R1,309,129/kg (US$2,350/oz), for the same reasons as at Driefontein. Both ORD and sustaining capital decreased during H2 2022 (due to lower expenditure on the K8 development project and K1-K3 integration project) by 11% and 14% respectively. Project capital at Kloof increased by 45% to R155 million (US$9 million) with the delivery of major underground cooling equipment. The K4 sub-vertical shaft
Sibanye-Stillwater Operating and financial results | Six months and year ended 31 December 2022 11
was due to be completed in 2024, however the project has been re-evaluated with the 47 level now excluded from the initial scope. Capital expenditure of R260 million (US$16 million) remains to be spent in 2023 and 2024 which will complete the project.
Gold production in 2022 from the Beatrix operation declined by 54% to 2,913kg (93,655oz) as a result of safety stoppages at the end of 2021, remediation of the TSF and the effects of the industrial action and subsequent ramp-up of production. As a result of primarily lower volumes, AISC increased by 83% in 2022 to R1,573,006/kg (US$2,989/oz). Due to ongoing losses at the Beatrix 4 shaft, a Section 189A process is currently ongoing regarding the possible restructuring of this shaft which accounted for approximately 20% of Beatrix's production in 2023.
Gold production from the Beatrix operation decreased by 15% in H2 2022 compared to H2 2021. Production for H2 2022 benefited from approximately 521kg (16,751oz) of ore which was stockpiled during the reinforcing of the TSF before the industrial action began and processed following the end of industrial action on 9 June 2022 in addition to production from underground. Gold production from surface sources decreased by 65% to 42kg (1,350oz) due to the declining payable reserves. AISC for H2 2022 increased by 39% year-on-year to R1,171,844/kg (US$2,103/oz). ORD and sustaining capital were 25% and 23% lower year-on-year respectively due to the production ramp-up with the ORD also reduced at Beatrix 4, which is subject to a Section 189 process.
Surface gold production from the Cooke operation for 2022 declined by 13% in 2022 to 1,010kg (32,472oz) with a concomitant rise of 22% in AISC to R907,407/kg (US$1,724/oz). Surface gold production for H2 2022 increased by 14% year-on-year to 656kg (21,091oz) due to a 1% increase in tonnes milled and yield which was 13% higher due to the milling of higher grade 3rd party material on a toll basis instead of our own reserves. Toll milling has been planned for the next 2-3 years. Despite the higher inflationary input costs including an 18% increase in the purchasing of toll material from third parties, AISC in H2 2022 only rose by 8% to R867,987/kg (US$1,558/oz) due to the higher amount of gold sold. Care and maintenance costs at Cooke operations increased by 25% to R380 million (US$22 million) due to additional security cost to prevent vandalism and preparation cost for the plug installation at Cooke 1 shaft.
DRDGOLD production was only 1% lower for 2022 at 5,565kg (178,919oz) with an 9% increase in yield offsetting a 9% decline in tonnes milled as some of the older ERGO sites were depleted. Load curtailment and higher levels of rainfall also impacted production. AISC for 2022 increased by 21% to R804,297/oz (US$1,528/oz) primarily due to lower sales and sustaining capital which increased by 96% to R647 million (US$40 million) reflecting investment at new infrastructure at both the ERGO and Far West Gold Recovery (FWGR) operations.
DRDGOLD tonnes milled decreased by 11% year-on-year in H2 2022 due to load curtailment effects and high rainfall which impacted operations. However with a 7% increase in yield, gold production of 2,731kg (87,804oz) in H2 2022 was only down 5% year-on-year. AISC of R799,421/kg (US$1,435/oz) increased by 20% year-on-year due to 4% less gold sold, industry wide inflationary effects and a 63% increase in sustaining capital, reflecting investment in new infrastructure at the East Rand Gold Operations (ERGO) and Far West Gold Recovery (FWGR) operations. DRDGOLD project capital also increased sharply from R38 million (US$3 million) in H2 2021 to R118 million (US$7 million) in H2 2022 with spending primarily on the solar power plant.
Update on S189 Consultation process at Beatrix and Kloof 1 plant
On 1 November 2022, organised labour and other potentially affected stakeholders were notified that the company would be entering
into consultation in terms of S189A of the Labour Relations Act (S189) regarding the possible restructuring of its SA gold operations pursuant
to ongoing losses experienced at the Beatrix 4 shaft and the impact of depleting mineral reserves to the Kloof 1 plant.
The life of the Beatrix 4 shaft was previously prolonged, following S189 consultations in 2017, which, through the successful adoption of
productivity enhancement and cost containment measures implemented following consultation with stakeholders, enabled it to remain
in operation as long as it made a profit, on average, over any continuous period of three months (after accounting for AISC).
The CCMA facilitation process concluded with the last meeting on 1 February 2023. A close-out meeting is scheduled for 28 February 2023. All efforts are being placed on reducing the number of retrenchments by redeploying employees from loss making to profitable operations.
The Burnstone project
The Burnstone project is 47% complete against a plan of 55%, having been especially impacted by the three-month industrial action at the SA gold operations and the slower than planned recruitment of skilled personnel. In particular, trackless mobile machinery (TMM) personal shortages contributed to the delayed development build-up, TMM delivery was delayed due to industrial action, and a shortage of critical components, extending delivery times. Capital on Burnstone to date is R1.1bn (US$69 million) and guidance of R1.95 billion (US$122 million) in 2023. The latest optimised project evaluation generates a 20% IRR and an NPV of R1.3 billion at a gold price of R800,000/kg.
Notable milestones to date are
•The establishment of the required surface infrastructure is progressing well
•As of year-end 661 people are on site with appointment and training of critical TMM skills gaining momentum
•The required TMM equipment has been received and is in operation
•The 56E central underground workshop was completed and the 60E underground reservoir advanced for completion in early 2023
•Project capital of R934 million (US$57 million) was spent in 2022
The immediate focus remains on establishing the required infrastructure, commissioning the existing metallurgical plant and achieving the required development run rate.
Sandouville
The acquisition of the Sandouville nickel refinery in Le Havre, France was concluded on 4 February 2022. For the eleven months, Sandouville produced 4,839 tonnes of nickel metal, 2,003 tonnes of nickel salts and 153 tonnes of cobalt chloride at a nickel equivalent sustaining costs of R527,676/tNi (US$32,239/tNi). After a strong start post acquisition, with production volumes increasing 10% for H1 2022 compared to H1 2021 and adjusted EBITDA of US$4 million (R60 million), H2 2022 was more challenging. Technical issues in the metal unit affected the overall plant performance with the start-up, after the annual maintenance shutdown during October 2022, taking longer than expected. Costs were impacted by lower volumes and higher electricity and gas prices during H2 2022. Sandouville produced 1,340
Sibanye-Stillwater Operating and financial results | Six months and year ended 31 December 2022 12
tonnes of nickel metal, 937 tonnes of nickel salts and 43 tonnes of cobalt chloride in H2 2022 at a nickel equivalent sustaining costs of 664,311/tNi (US$38,333/tNi). An adjusted EBITDA loss of US$30million (R492 million) million was incurred for 2022 after H1 2022 produced an adjusted EBITDA of US$4 million(R60 million). In 2022 US$5 million (R90 million) was spent on sustaining capital.
Due to the issues highlighted above Sandouville incurred an adjusted EBITDA loss of US$34million (R553 million) in H2 2022, a notable decline from positive adjusted EBITDA of US$4 million(R60 million) for H1 2022. Spending on sustaining capital in H2 2022 was US$4 million (R61 million).
In parallel with the current plant, Sibanye-Stillwater is conducting feasibility studies on three processes
•Producing battery grade nickel sulphate with the intention of producing 44,000 tonnes per year in two stages
•PGM autocatalysts recycling using European feedstocks
•Battery metals recycling
Further announcements on these developments are expected in due course, when the relevant studies have been concluded.
Sibanye-Stillwater Operating and financial results | Six months and year ended 31 December 2022 13
FINANCIAL REVIEW OF THE SIBANYE-STILLWATER GROUP
For the six months ended 31 December 2022 (H2 2022) compared with the six months ended 31 December 2021 (H2 2021)
The reporting currency for the Group is the SA rand (rand/R) and the functional currency of the US PGM operations is the US dollar (US$). Direct comparability of the Group results between the two periods is distorted as the results of the US PGM operations are translated to rand at the average exchange rate, which for H2 2022 was R/US$17.33 or 15% weaker than for H2 2021 (R/US$15.03). The functional currency of the Battery metals operations, comprising of Sandouville refinery and Keliber, is the Euro (€) and the results of Sandouville refinery were translated to rand at the average exchange rate, which for H2 2022 was R/€17.57. Keliber is a project in development phase and development expenses are capitalised in accordance with the Group’s accounting policies to property, plant and equipment.
Group financial performance
Group revenue for H2 2022 decreased by 17% to R67,909 million (US$3,878 million) due to lower sales volumes at all operations and lower average US dollar basket prices received at both the SA and US PGM operations. Group cost of sales, before amortisation and depreciation decreased by 10% to R47,512 million (US$2,721 million) mainly due to the lower production volumes which was partially offset by above inflation cost increases at both the SA PGM and managed SA gold operations. The decrease in revenue caused Group adjusted EBITDA for H2 2022 to decrease by 34% or R9,507 million (US$807 million) to R18,550 million (US$1,045 million). The 15% weaker rand relative to the US dollar partially offset the effect of the lower average basket price at both the SA and US PGM operations. Group amortisation and depreciation decreased by 14% to R3,863 million (US$224 million) following lower production volumes.
The revenue, cost of sales, before amortisation and depreciation, net other cash costs, adjusted EBITDA and amortisation and depreciation are set out in the tables below:
| Figures in million - SA rand | |||||||||||||||||||||||||||||||||||||||||||||||
| Revenue | Cost of sales, before amortisation and depreciation | Net other cash costs | Adjusted EBITDA | Amortisation and depreciation | |||||||||||||||||||||||||||||||||||||||||||
| H2 2022 | H2 2021 | % Change | H2 2022 | H2 2021 | % Change | H2 2022 | H2 2021 | % Change | H2 2022 | H2 2021 | % Change | H2 2022 | H2 2021 | % Change | |||||||||||||||||||||||||||||||||
| SA PGM operations | 33,406 | 37,412 | (11) | (15,499) | (16,367) | (5) | (924) | (775) | 19 | 16,983 | 20,270 | (16) | (1,256) | (1,353) | (7) | ||||||||||||||||||||||||||||||||
| US PGM underground operations | 6,011 | 8,622 | (30) | (3,619) | (4,216) | (14) | (83) | 2 | (4250) | 2,309 | 4,408 | (48) | (1,377) | (1,427) | (4) | ||||||||||||||||||||||||||||||||
| US PGM Recycling | 15,949 | 21,296 | (25) | (15,273) | (20,539) | (26) | — | — | — | 676 | 757 | (11) | (2) | (2) | — | ||||||||||||||||||||||||||||||||
| Managed SA gold operations | 9,207 | 12,553 | (27) | (9,677) | (9,986) | (3) | (664) | (527) | 26 | (1,134) | 2,040 | (156) | (1,052) | (1,615) | (35) | ||||||||||||||||||||||||||||||||
| DRDGOLD | 2,654 | 2,498 | 6 | (1,938) | (1,752) | 11 | (22) | (24) | (8) | 694 | 722 | (4) | (79) | (98) | (19) | ||||||||||||||||||||||||||||||||
| Battery Metals operations | 967 | — | 100 | (1,506) | — | 100 | (99) | — | 100 | (638) | — | 100 | (97) | — | 100 | ||||||||||||||||||||||||||||||||
Group corporate1 | (285) | (140) | (104) | — | — | — | (55) | — | — | (340) | (140) | (143) | — | — | — | ||||||||||||||||||||||||||||||||
| Total Group | 67,909 | 82,241 | (17) | (47,512) | (52,860) | (10) | (1,847) | (1,324) | 40 | 18,550 | 28,057 | (34) | (3,863) | (4,495) | (14) | ||||||||||||||||||||||||||||||||
Figures in million - US dollars2 | |||||||||||||||||||||||||||||||||||||||||||||||
| Revenue | Cost of sales, before amortisation and depreciation | Net other cash costs | Adjusted EBITDA | Amortisation and depreciation | |||||||||||||||||||||||||||||||||||||||||||
| H2 2022 | H2 2021 | % Change | H2 2022 | H2 2021 | % Change | H2 2022 | H2 2021 | % Change | H2 2022 | H2 2021 | % Change | H2 2022 | H2 2021 | % Change | |||||||||||||||||||||||||||||||||
| SA PGM operations | 1,893 | 2,476 | (24) | (881) | (1,089) | (19) | (56) | (51) | 10 | 956 | 1,336 | (28) | (72) | (88) | (18) | ||||||||||||||||||||||||||||||||
| US PGM underground operations | 337 | 572 | (41) | (207) | (282) | (27) | (5) | — | — | 125 | 290 | (57) | (79) | (96) | (18) | ||||||||||||||||||||||||||||||||
| US PGM Recycling | 911 | 1,419 | (36) | (872) | (1,368) | (36) | — | — | — | 39 | 51 | (24) | — | — | — | ||||||||||||||||||||||||||||||||
| Managed SA gold operations | 550 | 837 | (34) | (566) | (666) | (15) | (40) | (35) | 14 | (56) | 136 | (141) | (63) | (109) | (42) | ||||||||||||||||||||||||||||||||
| DRDGOLD | 152 | 166 | (8) | (111) | (116) | (4) | (2) | (2) | — | 39 | 48 | (19) | (5) | (7) | (29) | ||||||||||||||||||||||||||||||||
| Battery Metals operations | 51 | — | 100 | (84) | — | 100 | (6) | — | 100 | (39) | — | 100 | (5) | — | 100 | ||||||||||||||||||||||||||||||||
Group corporate1 | (16) | (9) | (78) | — | — | — | (3) | — | — | (19) | (9) | (111) | — | — | — | ||||||||||||||||||||||||||||||||
| Total Group | 3,878 | 5,461 | (29) | (2,721) | (3,521) | (23) | (112) | (88) | 27 | 1,045 | 1,852 | (44) | (224) | (300) | (25) | ||||||||||||||||||||||||||||||||
1 The effect of the streaming transaction has been included under Group Corporate. Please refer to note 17 of the condensed consolidated provisional financial statements
2 Convenience translations have been applied to convert the rand Income Statement amounts into US dollars using a foreign exchange rate of R17.33 for H2 2022 and 15.03 for H2 2021
Revenue
Revenue from the SA PGM operations decreased by 11% to R33,406 million (US$1,893 million) due to a 16% or 146,215 4Eoz decrease in PGMs sold partially offset by a 4% higher average 4E basket price of R42,188/4Eoz (US$2,434/4Eoz) and a 48% increase in the sale of third-party purchase of concentrate (PoC) ounces. The decrease in 4Eoz sold was the consequence of lower production volumes.
At the US PGM underground operations revenue decreased by 41% to US$337 million (R6,011 million), mainly due to a 35% decrease in mined ounces sold correlated with the lower production achieved and an 8% decrease in the average 2E basket price to US$1,766, partially offset by the 15% weaker rand. The rand average 2E basket price increased by 6% to R30,609/2Eoz, combined with the lower sales volumes resulted in a 30% decrease in rand revenue to R6,011 million. Revenue from the US PGM recycling operation decreased by 36% from US$1,419 million (R21,296 million) to US$911 million (R15,949 million) due to a 17% lower average realised basket price of US$3,274/3Eoz and a 22% decrease in recycled ounces sold. The 15% weaker rand translated into a 25% decrease in recycling revenue to R15,949 million.
Revenue from the managed SA gold operations decreased by 27% to R9,207 million (US$550 million) mainly due to lower gold sold volumes, while production ramped up post the strike, which decreased by 34% or 4,988kg during H2 2022, partially offset by an 11% higher rand gold price of R957,467/kg (US$1,718/oz). Revenue from DRDGOLD increased by 6% to R2,654 million (US$152 million) due to an 11% higher rand gold price received of R960,898/kg (US$1,725/oz), partially offset by 4% lower sales volumes.
The Sandouville refinery (included in the Group's results since the effective date of the acquisition on 4 February 2022) sold 1,388 tonnes of Nickel metal and 876 tonnes of Nickel salts at a nickel equivalent basket price of R427,120/tNi (US$24,646/tNi), generating revenue of R967 million (US$51 million). The tNi produced and sold during H2 2022 was lower when compared to H1 2022 due to planned and unplanned maintenance outages during H2 2022.
Sibanye-Stillwater Operating and financial results | Six months and year ended 31 December 2022 14
Cost of sales, before amortisation and depreciation
Cost of sales, before amortisation and depreciation at the SA PGM operations decreased by 5% to R15,499 million (US$881 million) mainly attributable to lower mined underground 4E PGM production, which decreased by 12% to 708,107 4Eoz due to lower development and stoping, engineering stoppages, electricity curtailment/load shedding, copper cable theft and reduced productivity while mining through adverse ground conditions (Hex River Fault at Rustenburg and Shear Zone at Kroondal). Surface production volumes excluding third-party PoC were 4% lower at 77,571 4Eoz. Third-party PoC at the Marikana smelting and refining operations increased by 48% to 37,998 4Eoz. PoC material is purchased at a higher cost, than own mined ore, due to the direct correlation to the rand basket price of PGM’s.
Cost of sales, before amortisation and depreciation at the US PGM underground operations decreased by 27% to US$207 million (R3,619 million). Sales volumes decreased by 35% to 180,356 2Eoz with production volumes decreasing by 30% to 191,094 2Eoz, mainly due to various factors at both the Stillwater and the East Boulder mines. Production was impacted at the Stillwater due to the recovery from the June flooding events, labour shortages of miners, lower face availability and an unplanned concentrator outage, while at East Boulder a safety stoppage due to nitrogen dioxide gas exposure, lower grades achieved and cold weather conditions all contributed to lower production. Cost of sales, before amortisation and depreciation at the US PGM recycling operation decreased, in line with revenue, by 36% from US$1,368 million (R20,539 million) to US$872 million (R15,273 million) of which the continued industry wide global slowdown in receipt rates was the significant driver coupled with a lower average US$ basket price resulting in decreased purchasing costs of spent autocatalysts.
Cost of sales, before amortisation and depreciation at the managed SA gold operations decreased by 3% to R9,677 million (US$566 million) due to 26% or 3,740kg lower production mainly attributable to the production build-up process post the strike with the hard stop also causing work areas to degrade, stoping crews not at full complement due to recruitment restrictions in light of the S189 process and seismicity at Kloof, partially offset by above average inflationary increases in costs including labour, diesel and electricity. Cost of sales, before amortisation and depreciation from DRDGOLD increased by 11% to R1,938 million (US$111 million) due to above inflationary cost increases including steel, diesel and electricity.
The Sandouville refinery produced 1,340 tonnes of Nickel metal and 937 tonnes of Nickel salts at a nickel equivalent sustaining cost R664,311/tNi (US$38,333/tNi), contributing R1,506 million (US$84 million) to cost of sales. Production was lower at the Sandouville refinery for H2 2022 as compared to H1 2022 due to both planned and unplanned maintenance outages.
Adjusted EBITDA
Adjusted EBITDA includes other cash costs, care and maintenance costs; lease payments; strike costs and corporate social investment costs (CSI) (refer note 11.1 of the condensed consolidated provisional financial statements for a reconciliation of profit before royalties, carbon tax and tax to adjusted EBITDA). Care and maintenance costs for H2 2022 were R380 million (US$22 million) at Cooke (H2 2021: R304 million or US$20 million); R48 million (US$3 million) at Marikana (H2 2021: R36 million or US$2 million); R6 million (US$0 million) at Kroondal (H2 2021: Rnil or US$nil); R2 million (US$0 million) at Beatrix (H2 2021: Rnil or US$nil) and R1 million (US$nil) at DRDGOLD (H2 2021: Rnil or US$nil). Lease payments of R74 million (US$4 million) (H2 2021: R70 million or US$5 million) are included in line with the debt covenant formula and corporate social investment costs were R77 million (US$4 million) (H2 2021: R206 million or US$14 million).
Adjusted EBITDA at the SA PGM, US PGM (underground), US PGM (recycling) and SA gold operations decreased due to a decrease in sales volumes stemming from lower production, partially offset by higher average rand commodity prices. Adjusted EBITDA at the Sandouville refinery decreased compared to H1 2022, due to lower sales volumes and a lower nickel equivalent average basket price.
Adjusted EBITDA is shown in the graph below: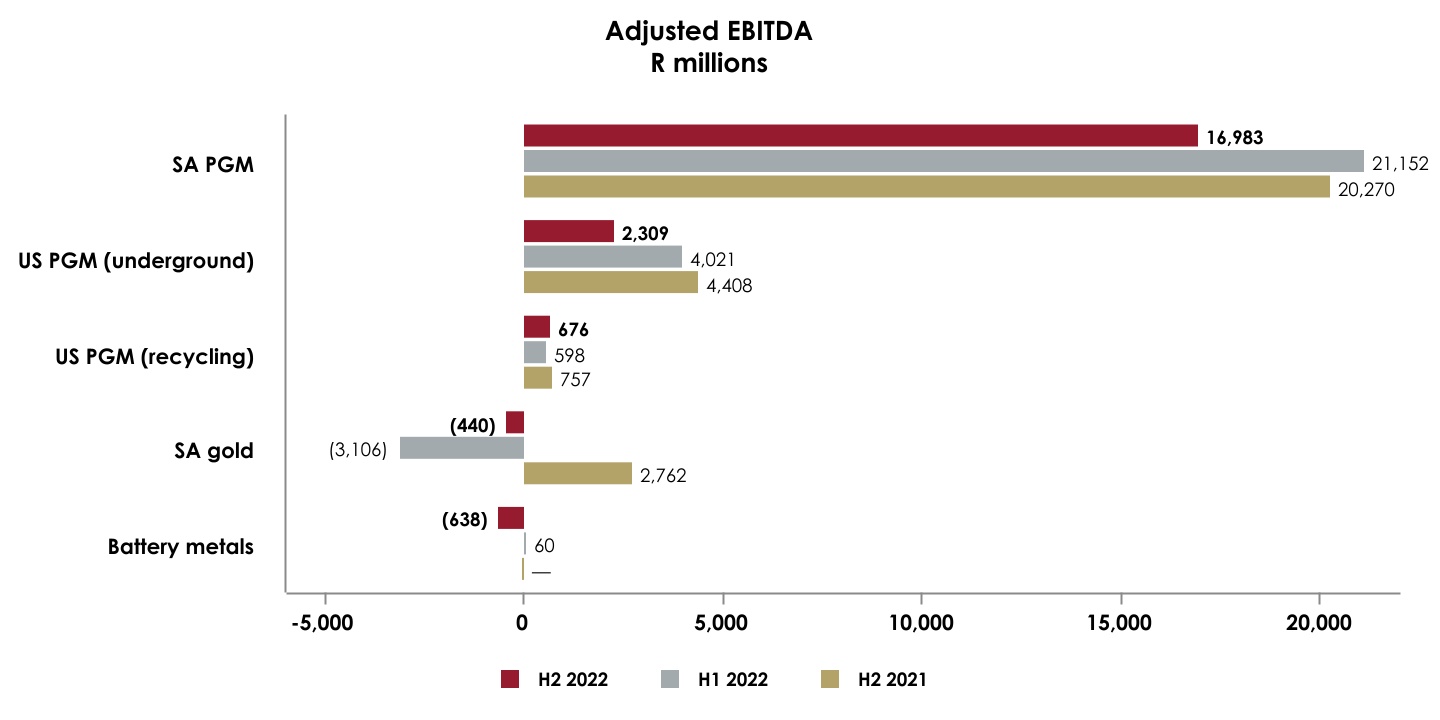
Amortisation and depreciation
Amortisation and depreciation at the SA PGM operations decreased by 7% to R1,256 million (US$72 million), at the US PGM underground operations decreased by 18% to US$79 million (R1,377 million) and at the managed SA gold operations decreased by 35% to R1,052 million (US$63 million), all due to lower production volumes. Amortisation and depreciation at DRDGOLD decreased by 19% to R79 million (US$5 million) due to lower tonnes processed and the sale of DRDGOLD's Driefontein 3 plant during H1 2022.
Interest Income
Interest income increased by R36 million (US$3 million decrease) mainly due to an increase in interest received on higher average cash balances (R109 million or US$4 million), interest received on rehabilitation funds (R28 million or US$1 million) and other interest (R4 million or US$0 million), partially offset by a decrease in interest and investment income on other financial assets.
Sibanye-Stillwater Operating and financial results | Six months and year ended 31 December 2022 15
Finance expense
Finance expense increased by R143 million (US$2 million decrease) to R1,378 million (US$80 million) mainly due to a R178 million (US$8 million) net increase in interest on borrowings, R29 million (US$1 million) increase in interest unwinding on the Anglo deferred payment, R18 million (US$0 million) increase in the unwinding of the Marikana dividend obligation, R21 million (US$0 million) increase in the unwinding of the finance costs on the deferred revenue transactions, R6 million (US$0 million) increase in interest on the occupational healthcare obligation, all partially offset by decreases of R68 million (US$5 million) in the unwinding of amortised cost on borrowings, R1 million (US$3 million) in unwinding of the environmental rehabilitation obligation and other interest of R40 million (US$3 million). Refer to note 3 of the condensed consolidated provisional financial statements for a breakdown of finance expenses.
Loss on financial instruments
The net loss on financial instruments of R3,880 million (US$235 million) for H2 2022 compared with the loss of R5,437 million (US$367 million) for H2 2021, represents a period-on-period decreased net loss of R1,557 million (US$132 million). The net loss for H2 2022 is mainly attributable to fair value losses on the revised cash flows of the Rustenburg deferred payment to Anglo American Platinum Limited (Anglo) of R773 million (US$45 million), Burnstone debt of R776 million (US$45 million), Rustenburg and Marikana operations' BEE cash-settled share-based payment obligations of R985 million (US$57 million) and R875 million (US$50 million) respectively, Marikana dividend obligation of R625 million (US$36 million) and the Palladium hedge contract of R150 million (US$9 million), partially offset by fair value gains on other investments of R129 million (US$7 million). Refer to note 4 of the condensed consolidated provisional financial statements for a breakdown of the loss on financial instruments.
Mining and income tax
The mining and income tax expense decreased by 30% to R3,296 million (US$179 million) which is attributable to the Group’s decreased profitability. The current tax expense decreased by 23% to R4,345 million (US$246 million) and the deferred tax expense increased in H2 2022 by 7% to R1,049 million (US$67 million). The effective tax rate of the Group decreased from 36% to 33% in H2 2022 mainly due to deferred tax assets not recognised relating to the Burnstone project, partially offset by deferred tax assets re-recognised (increased the effective tax rate by 4%).
The Group’s effective tax rate for H2 2022 is 5% higher than the South African statutory company tax rate of 28%. The higher effective tax rate is mainly attributable to the impact of the following: non-deductible loss on fair value of financial instruments of 9% or R906 million (US$52 million), decrease due to a change in the estimated long-term deferred tax rate of 3% or R270 million (US$16 million), non-deductible finance expense of 1% or R104 million (US$6 million) and non-deductible transaction costs of 1% or R76 million (US$4 million); partially offset by unrecognised deferred tax assets re-recognised or utilised of 4% or R372 million (US$21 million), net other non-taxable income and non-deductible expenditure of 1% or R140 million (US$8 million), non-taxable share of results of equity accounted investees of 2% or R145 million (US$8 million) and an increase due to a rate adjustment to the South African gold mining tax formula of 1% or R77 million (US$4 million).
Non-recurring items
Strike costs
During H2 2022 the SA gold operations incurred strike related costs of R34 million (US$2 million).
Flood costs
On 13 June 2022 the US PGM operations experienced a significant flood event which occurred at the Stillwater mining operations in Montana and during H2 2022 incurred costs relating to this incident of R44 million (US$3 million).
Restructuring costs
Restructuring costs of R327 million (US$19 million) for H2 2022 included retrenchment costs of R314 million (US$18 million) and professional fees of R13 million (US$1 million) at the SA gold and SA PGM segments, respectively. The retrenchment costs of R314 million (US$18 million) for H2 2022 mainly included the section 189 costs at SA gold operations relating to Beatrix (R285 million or US$16 million) and Kloof (R27 million or US$2 million).
Transaction costs
Transaction costs of R43 million (US$3 million) for H2 2022 consisted of project and acquisition related legal and advisory fees.
Loss on deconsolidation
During H2 2022 the Group made a loss of R309 million (US$18 million) when it deconsolidated the Bapo Ba Mogale Local Economic Development Trust (Bapo Trust) arising from changes in the Trust Deed registered on 8 August 2022 which resulted in a loss of control.
Gain on disposal of Lonmin Canada
The Group recorded a gain on disposal of R145 million (US$8 million) relating to Lonmin Canada Incorporated.
Borrowings and net debt
Gross debt increased by 9% from R20,887 million (US$1,282 million) at 30 June 2022 to R22,728 million (US$1,334 million) at 31 December 2022. The higher outstanding debt was mainly due to the fair value adjustment on Burnstone debt for R776 million (US$45 million) and a net increase of R952 million (US$55 million) on US dollar denominated debt due to the foreign exchange impact of a 13% weaker rand since 30 June 2022. Net debt, excluding the Burnstone Debt which has no recourse to Sibanye-Stillwater, is in a net cash position of R5,853 million (US$344 million) at 31 December 2022. The Group’s cash balance (excluding cash of Burnstone) decreased by 4% to R26,041 million (US$1,529 million) since 30 June 2022, and includes US$726 million (R12,368 million) held by the US PGM operations mainly due to cash received from the issue of the 2026 and 2029 Notes. Refer to note 11 of the condensed consolidated provisional financial statements for a roll forward of the gross debt for the year ended 31 December 2022.
The Group’s total equity increased to R91,004 million (US$5,342 million) at 31 December 2022 mainly due to total comprehensive income of R21,349 million (US$955 million) for the year, non-controlling interest recognised with the acquisition of Keliber Oy for R1,219 million (US$74 million) and equity settled share based payment reserve of R24 million (US$2 million). These increases were partially offset by dividends paid (R9,453 million or US$578 million), transactions with shareholders (R3,452 million or US$211 million) and the sale of Lonmin Canada Incorporated (R14 million or US$1 million).
Sibanye-Stillwater Operating and financial results | Six months and year ended 31 December 2022 16
The graph below illustrates the Group's Gross debt/Cash/Total equity for H2 2022, H1 2022 and H2 2022:
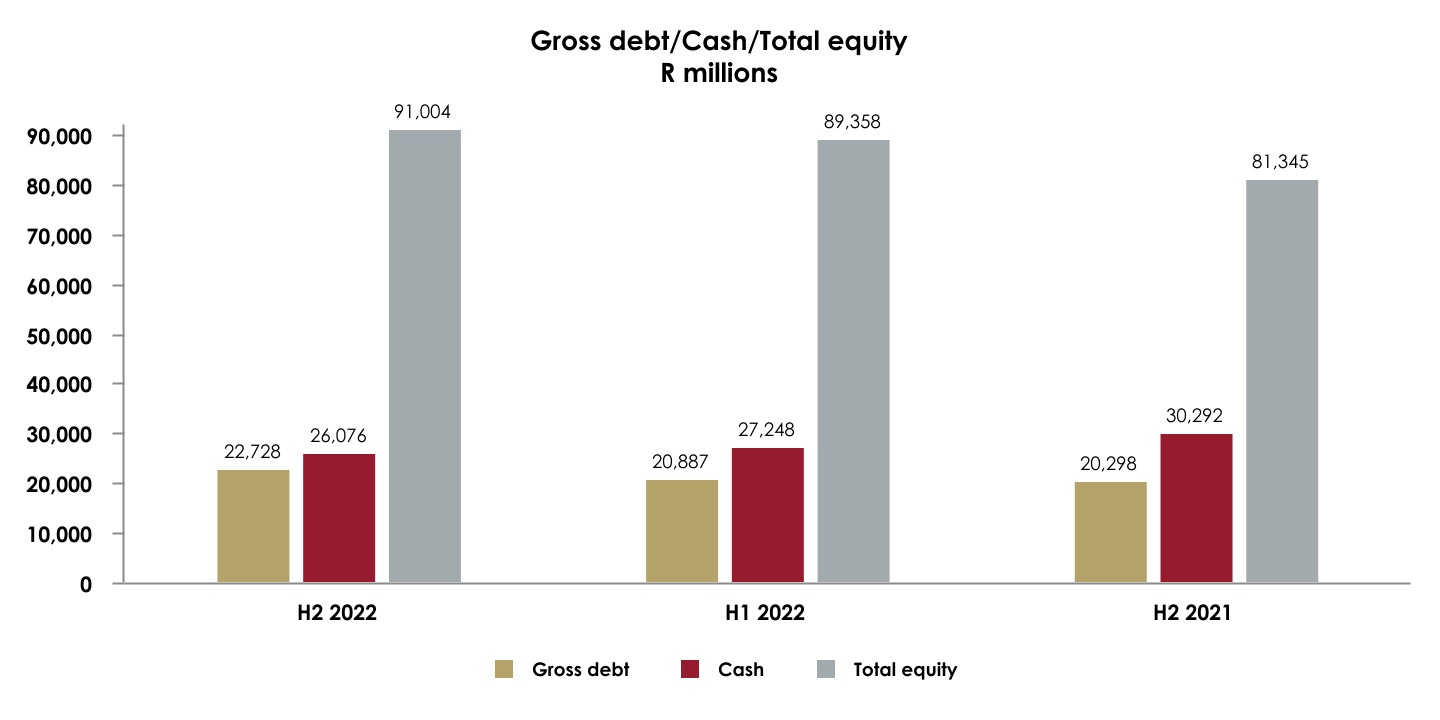
Purchase of concentrate (PoC)
The Marikana operation has agreements in place to purchase PGM concentrates from third parties. The processing of third party material allows better utilisation of smelting and refining capacity. During H2 2022 the Marikana operation purchased 37,998 4Eoz (H2 2021: 25,705 4Eoz) in concentrate from third parties.
US PGM recycling
The US PGM recycling operation delivered a strong financial performance for H2 2022 notwithstanding the operational challenges experienced by the US region and worldwide reduced autocatalyst receipt rates. Delivery rates were impacted by a constrained autocatalyst market throughout H2 2022, which resulted in a decline in receipt rates from customers. As a result, inventory continues to remain below normalised levels while the segment continues to focus on proactive collector engagements to shore up volumes. Working capital for H2 2022 decreased from US$511 million (R8,324 million) at 30 June 2022 to US$258 million (R4,394 million) at 31 December 2022 and the segment continues to remain self-funded with no lines of credit drawn. At 31 December 2022, recycling inventory approximated 49 tonnes (H1 2022: 124 tonnes) containing an estimated 5koz (3E) (H1 2022: 12koz (3E)). The graph below, in relation to the average basket price for purchased 3E PGM content of spent autocatalyst, indicates the quarterly cash advances (on receipt of spent catalysts) and final payment (on final assay) to recycle suppliers, and the cash receipts when the 3E PGM metal is outturned, illustrating the 41% decrease in recycle working capital from 1 January 2022 (US$441 million) to 31 December 2022 (US$258 million).
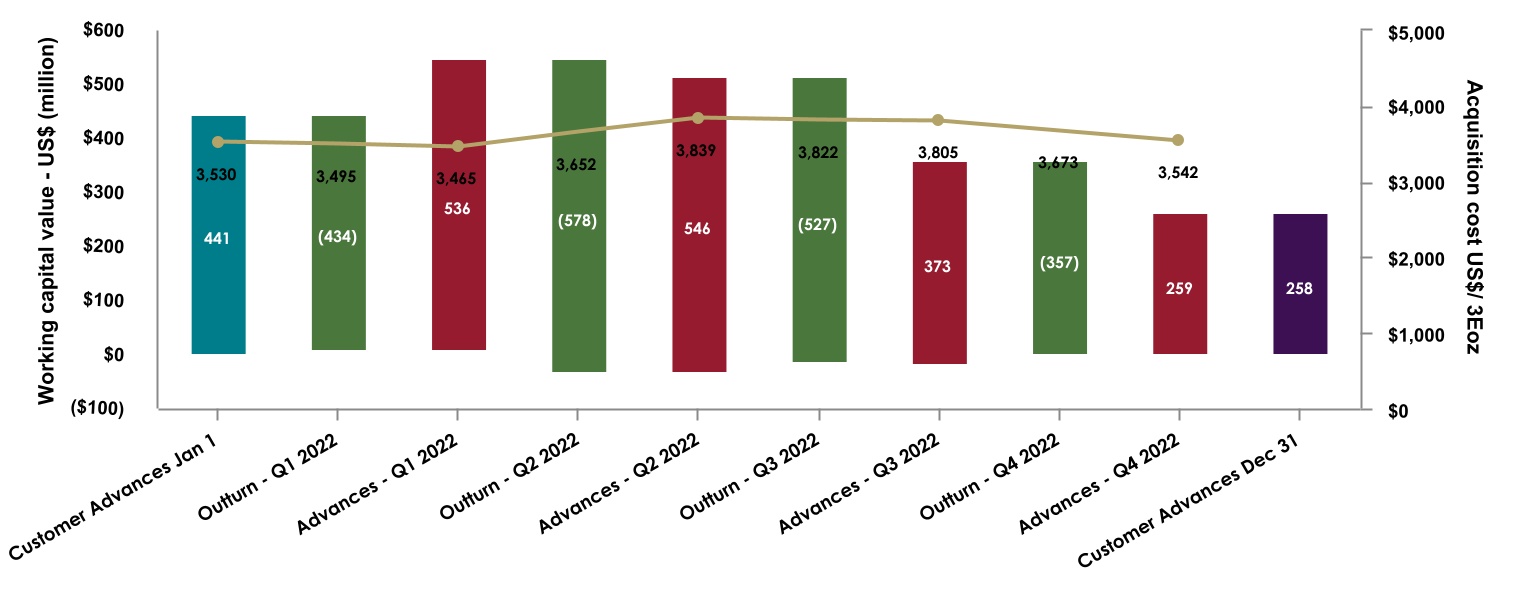
Liquidity and capital resources
Cash flow analysis
Sibanye-Stillwater defines adjusted free cash flow as net cash from operating activities, before dividends paid, net interest paid and deferred revenue advance received, less additions to property, plant and equipment.
Sibanye-Stillwater Operating and financial results | Six months and year ended 31 December 2022 17
The following table shows the adjusted free cash flow per operating segment:
| Figures in million - SA rand | Six months ended | Year ended | ||||||||||||||||||
| H2 2022 | H1 2022 | H2 2021 | FY 2022 | FY 2021 | ||||||||||||||||
| US PGM operations | 3,179 | 1,405 | 8,000 | 4,584 | 8,148 | |||||||||||||||
| SA PGM operations | 2,343 | 11,156 | 8,250 | 13,499 | 22,550 | |||||||||||||||
SA gold operations1 | 1,733 | (7,744) | 4,409 | (6,011) | 7,782 | |||||||||||||||
| Battery Metals | (1,155) | (662) | — | (1,817) | — | |||||||||||||||
| Group corporate | (313) | (433) | (533) | (746) | (1,032) | |||||||||||||||
Adjusted free cash flow2 | 5,787 | 3,722 | 20,126 | 9,509 | 37,448 | |||||||||||||||
1Included in the adjusted free cash flow of the SA gold segment is the Group treasury and shared services function, together referred to as gold corporate. The SA PGM operations, through the intercompany working capital accounts which eliminate on consolidation, contributed R5,920 million (US$342 million) during H2 2022 (H1 2022: received R2,784 million or US$181 million, contributed H2 2021: R4,331 million or US$288 million and FY 2021: R8,049 million or US$544 million) to the working capital increase (inflow) included in the SA gold operations
2 Non-IFRS measures such as adjusted free cash flow as defined above and reconciled below, are the responsibility of the Group’s Board of Directors and are presented for illustration purposes only, and because of its nature, adjusted free cash flow should not be considered as a representation of financial performance under IFRS
The US PGM operations generated adjusted free cash flow of US$183 million (R3,179 million). Net cash inflow from operating activities amounted to US$338 million (R5,856 million) and includes a net decrease (inflow) of US$219 million (R3,792 million) in working capital, which was mainly attributable to the decrease in recycle inventory, a net increase (outflow) in the intercompany working capital accounts of US$1 million (R23 million) and taxes paid of US$12 million (R202 million). The adjusted free cash flow includes additions to property, plant and equipment of US$186 million (R3,231 million).
Adjusted free cash flow from the SA PGM operations was R2,343 million (US$135 million). Net cash inflow from operating activities amounted to R1,574 million (US$91 million) and includes a net increase (outflow) of R1,652 million (US$95 million) in working capital, payments of R4,705 million (US$271 million) towards royalty and income taxes, dividends paid of R4,164 million (US$240 million) and a net increase (outflow) of R5,920 million (US$342 million) in the intercompany working capital accounts. The adjusted free cash flow includes additions to property, plant and equipment of R2,943 million (US$170 million).
The SA gold operations generated adjusted free cash flow of R1,733 million (US$100 million). Net cash inflow from operating activities amounted to R8,521 million (US$492 million) after a net increase (outflow) of R216 million (US$12 million) in working capital, net dividends received of R3,994 million (US$230 million), payments of R149 million (US$9 million) towards royalty and income taxes and a decrease in the intercompany working capital accounts receivable of R5,869 million (US$339 million). The adjusted free cash flow includes additions to property, plant and equipment of R2,963 million (US$171 million).
The Battery metals operations generated negative adjusted free cash flow of R1,155 million (US$67 million). Net cash outflow from operating activities amounted to R596 million (US$34 million) after a net decrease (inflow) of R120 million (US$7 million) in working capital and a net decrease (inflow) of R21 million (US$1 million) in the intercompany working capital accounts. The adjusted free cash flow includes additions to property, plant and equipment of R616 million (US$36 million) of which R555 million (US$32 million) relates to capital expenditure on the Keliber project.
Group corporate’s negative adjusted free cash flow was R313 million (US$18 million). Net cash outflow from operating activities amounted to R4,201 million (US$242 million) and includes a net decrease (inflow) of R53 million (US$3 million) in the intercompany working capital accounts.
The following table shows a reconciliation from net cash from operating activities to adjusted free cash flow:
| Figures in million - SA rand | Six months ended | Year ended | ||||||||||||||||||
| H2 2022 | H1 2022 | H2 2021 | FY 2022 | FY 2021 | ||||||||||||||||
| Net cash from operating activities | 11,154 | 4,389 | 18,960 | 15,543 | 32,256 | |||||||||||||||
| Adjusted for: | ||||||||||||||||||||
| Dividends paid | 4,075 | 5,378 | 8,516 | 9,453 | 18,176 | |||||||||||||||
| Net interest (received)/paid | 313 | 123 | (145) | 436 | (179) | |||||||||||||||
| Deferred revenue advance received | — | (24) | (51) | (24) | (65) | |||||||||||||||
| Less: | ||||||||||||||||||||
| Additions to property, plant and equipment | (9,755) | (6,144) | (7,154) | (15,899) | (12,740) | |||||||||||||||
| Adjusted free cash flow | 5,787 | 3,722 | 20,126 | 9,509 | 37,448 | |||||||||||||||
Non-IFRS measures such as adjusted free cash flow as defined and reconciled above, are the responsibility of the Group’s Board of Directors and are presented for illustration purposes only, and because of its nature, adjusted free cash flow should not be considered as a representation of financial performance under IFRS
Cash and cash equivalents at 31 December 2022 decreased to R26,076 million (US$1,531 million) from R27,248 million (US$1,673 million) at 30 June 2022 (H2 2021: cash at 31 December 2021 increased to R30,292 million or US$1,900 million from R26,097 million or US$1,829 million at 30 June 2021), after net cash from operating activities of R11,154 million (US$664 million) (H2 2021: R18,960 million or US$1,267 million), net cash used in investing activities of R9,850 million (US$574 million) (H2 2021: R8,746 million or US$582 million) and net cash used in financing activities of R3,424 million (US$208 million) (H2 2021: R6,795 million or US$458 million).
DIVIDEND DECLARATION
The Sibanye-Stillwater board of directors has declared and approved a cash dividend of 122 SA cents per ordinary share (US 6.74 cents* per share or US 26.98 cents* per ADR) or approximately R3,453 million (US$191 million*) in respect of the six months ended 31 December 2022 (“Final dividend”). The Board applied the solvency and liquidity test and reasonably concluded that the company will satisfy that test immediately after completing the proposed distribution.
Sibanye-Stillwater dividend policy is to return at least 25% to 35% of normalised earnings to shareholders. Normalised earnings is defined as earnings attributable to the owners of Sibanye-Stillwater excluding gains and losses on financial instruments and foreign exchange differences, impairments, gain/loss on disposal of property, plant and equipment, occupational healthcare expenses, restructuring costs, transactions costs, share-based payment expenses on BEE transactions, gains on acquisitions, net other business development costs, share of results of equity-accounted investees, all after tax and the impact of non-controlling interest, and changes in the estimated deferred tax rate.
The total dividend declared of 260 cents (Final dividend: 122 SA cents and Interim dividend: 138 SA cents) equates to 35% of normalised earnings for the year ended 31 December 2022.
The final dividend will be subject to Dividends Withholding Tax. In accordance with paragraphs 11.17 (a) (i) and 11.17 (c) of the JSE Listings Requirements the following additional information is disclosed:
•The dividend has been declared out of income reserves
•The local Dividends Withholding Tax rate is 20% (twenty per centum)
Sibanye-Stillwater Operating and financial results | Six months and year ended 31 December 2022 18
•The gross local dividend amount is 122.00000 SA cents per ordinary share for shareholders exempt from the Dividends Tax
•The net local dividend amount is 97.60000 SA cents (80% of 122 SA cents) per ordinary share for shareholders liable to pay the Dividends Withholding Tax
•Sibanye-Stillwater currently has 2 830 370 251 ordinary shares in issue
•Sibanye-Stillwater’s income tax reference number is 9723 182 169
Shareholders are advised of the following dates in respect of the final dividend:
Final dividend: 122 SA cents per share
Declaration date: Tuesday, 28 February 2023
Last date to trade cum dividend: Monday, 20 March 2023
Shares commence trading ex-dividend: Wednesday, 22 March 2023
Record date: Friday, 24 March 2023
Payment of dividend: Monday, 27 March 2023
Please note that share certificates may not be dematerialised or rematerialised between Wednesday, 22 March 2023 and Friday, 24 March 2023 both dates inclusive.
To holders of American Depositary Receipts (ADRs):
•Each ADR represents 4 ordinary shares;
•ADRs trade ex-dividend on the New York Stock Exchange (NYSE): Thursday, 23 March 2023;
•Record Friday, 24 March 2023;
•Approximate date of currency conversion: Monday, 27 March 2023; and
•Approximate payment date of dividend: Monday, 10 April 2023
Assuming an exchange rate of R18.0887/US$1*, the dividend payable on an ADR is equivalent to 26.98 United States cents for Shareholders liable to pay dividend withholding tax. However, the actual rate of payment will depend on the exchange rate on the date for currency conversion.
* Based on an exchange rate of R18.0887/US$ at 20 February 2023 from IRESS. However, the actual rate of payment will depend on the exchange rate on the date for currency conversion
MINERAL RESOURCES AND MINERAL RESERVES
On 17 February 2023, Sibanye-Stillwater reported an update of its Mineral Resources and Mineral Reserves as at 31 December 2022, the salient points of which are summarised below.
•A maiden lithium (Li) Mineral Reserve of 193.6kt of Lithium Carbonate Equivalent (LCE), and a 26% increase in Li Mineral Resources to 243.5kt of LCE:
–Continuous execution and delivery on the Group’s green metals strategy with an increased focus on battery metals, has led to an increase in attributable ownership of the Keliber project in Finland from 26.6% to 84.96%
–The declaration of Mineral Reserves follows the completion of a positive Feasibility Study (FS) and the approval for the construction of the Keliber project
–Ongoing, successful exploration at the large and prospective mineral tenement holdings at Keliber also contributed an additional 30.4kt of attributable LCE Mineral Resource
•2E PGM Mineral Reserves of 26.3Moz and Mineral Resources of 56.0Moz following the repositioning of our US PGM operations and consequent update of the life of mine (LoM) plans:
–The Mineral Reserves supports a 42 year LoM, building up to 700koz of annual production by 2026
–The estimates reflects minor year-on-year decreases of 3.6% and 7.1% respectively, due to enhanced estimation methodologies, with considerable Mineral Reserve upside potential remaining, based on the very large Inferred Resource base of 44.8Moz
•31.4Moz 4E PGM Mineral Reserves at our SA PGM operations, and a 1.9% increase in Mineral Resources to 135.6Moz:
–The 2.3% decrease in Mineral Reserves was principally driven by depletion of 2.7Moz during 2022, partly off-set by the conclusion of a positive FS at the 50% owned Mimosa North Hill project (+1.5Moz), which is currently under board consideration for construction
–The large 4E PGM Mineral Resources base at the SA PGM operations provide significant opportunity to increase future Mineral Reserves, extending the life of the operations and unlocking substantial value, subject to the necessary studies being completed and a supportive investment environment
•Stable Mineral Reserves of 12.9Moz (-0.6%), and Mineral Resources of 55.5Moz (-8.2%) at our SA gold operations and projects (including DRDGOLD)
The Group reports its Mineral Resources and Mineral Reserves in accordance with the rules and regulations promulgated by each of the United States Securities and Exchange Commission (SEC) and the JSE at all managed operations, development, and exploration properties. In support of the preliminary disclosure set out in this announcement, the Group expects to file the information required by Subpart 1300 of Regulation S-K under the Securities Act of 1933, including a Technical Report Summary in respect of the Keliber project, with its annual report on Form 20-F on or about 24 April 2023. A JSE-compliant version of this announcement can be located at https://www.sibanyestillwater.com/download/reserves-resources-dec2022-jse.
CHANGE IN BOARD OF DIRECTORS
There was no change to the Board of Sibanye Stillwater Limited during the six month period ended 31 December 2022.
Sibanye-Stillwater Operating and financial results | Six months and year ended 31 December 2022 19
SALIENT FEATURES AND COST BENCHMARKS - SIX MONTHS
SA and US PGM operations
| US OPERA-TIONS | SA OPERATIONS | |||||||||||||||||||||||||||||||||||||||||||
Total US and SA PGM1 | Total US PGM | Total SA PGM1 | Rustenburg | Marikana1 | Kroondal | Plat Mile | Mimosa | |||||||||||||||||||||||||||||||||||||
| Attributable | Under- ground2 | Total | Under- ground | Surface | Under- ground | Surface | Under- ground | Surface | Attribu-table | Surface | Attribu-table | |||||||||||||||||||||||||||||||||
| Production | ||||||||||||||||||||||||||||||||||||||||||||
| Tonnes milled/treated | 000't | Dec 2022 | 18,867 | 527 | 18,339 | 8,532 | 9,807 | 3,065 | 2,803 | 3,175 | 1,818 | 1,604 | 5,186 | 687 | ||||||||||||||||||||||||||||||
| Jun 2022 | 18,932 | 627 | 18,305 | 8,459 | 9,846 | 2,972 | 2,807 | 3,140 | 1,880 | 1,647 | 5,159 | 700 | ||||||||||||||||||||||||||||||||
| Dec 2021 | 20,361 | 710 | 19,651 | 9,183 | 10,468 | 3,220 | 2,920 | 3,499 | 2,043 | 1,756 | 5,505 | 708 | ||||||||||||||||||||||||||||||||
| Plant head grade | g/t | Dec 2022 | 2.26 | 12.43 | 1.97 | 3.29 | 0.82 | 3.33 | 1.05 | 3.66 | 0.87 | 2.36 | 0.67 | 3.52 | ||||||||||||||||||||||||||||||
| Jun 2022 | 2.31 | 12.58 | 1.96 | 3.26 | 0.84 | 3.27 | 1.03 | 3.67 | 0.86 | 2.33 | 0.72 | 3.53 | ||||||||||||||||||||||||||||||||
| Dec 2021 | 2.44 | 13.17 | 2.05 | 3.42 | 0.85 | 3.43 | 1.08 | 3.89 | 0.87 | 2.39 | 0.73 | 3.58 | ||||||||||||||||||||||||||||||||
| Plant recoveries | % | Dec 2022 | 75.43 | 90.31 | 72.67 | 84.89 | 30.00 | 86.29 | 43.20 | 86.86 | 25.83 | 82.51 | 21.09 | 74.52 | ||||||||||||||||||||||||||||||
| Jun 2022 | 74.95 | 90.47 | 71.48 | 84.79 | 27.11 | 86.58 | 36.96 | 87.00 | 24.87 | 82.12 | 20.77 | 72.45 | ||||||||||||||||||||||||||||||||
| Dec 2021 | 76.05 | 89.96 | 72.69 | 85.32 | 28.15 | 87.03 | 34.30 | 87.03 | 26.42 | 83.77 | 23.73 | 71.83 | ||||||||||||||||||||||||||||||||
| Yield | g/t | Dec 2022 | 1.71 | 11.23 | 1.43 | 2.79 | 0.25 | 2.87 | 0.45 | 3.18 | 0.22 | 1.95 | 0.14 | 2.62 | ||||||||||||||||||||||||||||||
| Jun 2022 | 1.73 | 11.38 | 1.40 | 2.76 | 0.23 | 2.83 | 0.38 | 3.19 | 0.21 | 1.91 | 0.15 | 2.56 | ||||||||||||||||||||||||||||||||
| Dec 2021 | 1.85 | 11.85 | 1.49 | 2.92 | 0.24 | 2.99 | 0.37 | 3.39 | 0.23 | 2.00 | 0.17 | 2.57 | ||||||||||||||||||||||||||||||||
PGM production3 | 4Eoz - 2Eoz | Dec 2022 | 1,034,752 | 191,094 | 843,658 | 766,087 | 77,571 | 283,148 | 40,877 | 324,518 | 13,136 | 100,441 | 23,558 | 57,980 | ||||||||||||||||||||||||||||||
| Jun 2022 | 1,053,845 | 230,039 | 823,806 | 751,717 | 72,089 | 270,515 | 34,357 | 322,333 | 12,930 | 101,315 | 24,802 | 57,554 | ||||||||||||||||||||||||||||||||
| Dec 2021 | 1,214,072 | 272,099 | 941,973 | 861,446 | 80,527 | 309,042 | 34,778 | 380,832 | 15,095 | 113,035 | 30,654 | 58,537 | ||||||||||||||||||||||||||||||||
PGM sold4 | 4Eoz - 2Eoz | Dec 2022 | 995,750 | 180,356 | 815,394 | 287,512 | 35,639 | 312,517 | 100,441 | 23,558 | 55,727 | |||||||||||||||||||||||||||||||||
| Jun 2022 | 1,084,907 | 238,200 | 846,707 | 266,589 | 35,054 | 364,441 | 101,315 | 24,802 | 54,506 | |||||||||||||||||||||||||||||||||||
| Dec 2021 | 1,237,050 | 277,562 | 959,488 | 311,967 | 31,680 | 418,546 | 113,035 | 30,654 | 53,606 | |||||||||||||||||||||||||||||||||||
Price and costs5 | ||||||||||||||||||||||||||||||||||||||||||||
Average PGM basket price6 | R/4Eoz - R/2Eoz | Dec 2022 | 39,966 | 30,609 | 42,188 | 43,092 | 32,789 | 42,228 | 44,781 | 33,776 | 33,348 | |||||||||||||||||||||||||||||||||
| Jun 2022 | 40,240 | 29,799 | 43,379 | 44,640 | 29,326 | 43,595 | 46,368 | 34,311 | 33,418 | |||||||||||||||||||||||||||||||||||
| Dec 2021 | 37,758 | 28,755 | 40,517 | 41,323 | 27,581 | 40,477 | 44,108 | 32,984 | 31,756 | |||||||||||||||||||||||||||||||||||
| Average PGM basket price6 | US$/4Eoz - US$/2Eoz | Dec 2022 | 2,306 | 1,766 | 2,434 | 2,487 | 1,892 | 2,437 | 2,584 | 1,949 | 1,924 | |||||||||||||||||||||||||||||||||
| Jun 2022 | 2,613 | 1,935 | 2,817 | 2,899 | 1,904 | 2,831 | 3,011 | 2,228 | 2,170 | |||||||||||||||||||||||||||||||||||
| Dec 2021 | 2,512 | 1,913 | 2,696 | 2,749 | 1,835 | 2,693 | 2,935 | 2,195 | 2,113 | |||||||||||||||||||||||||||||||||||
Operating cost7 | R/t | Dec 2022 | 1,091 | 7,687 | 894 | 1,905 | 290 | 1,411 | 1,103 | 60 | 1,524 | |||||||||||||||||||||||||||||||||
| Jun 2022 | 1,007 | 6,073 | 827 | 1,832 | 191 | 1,326 | 998 | 53 | 1,247 | |||||||||||||||||||||||||||||||||||
| Dec 2021 | 959 | 5,310 | 795 | 1,711 | 204 | 1,267 | 935 | 55 | 1,177 | |||||||||||||||||||||||||||||||||||
| Operating cost7 | US$/t | Dec 2022 | 63 | 444 | 52 | 110 | 17 | 81 | 64 | 3 | 88 | |||||||||||||||||||||||||||||||||
| Jun 2022 | 65 | 394 | 54 | 119 | 12 | 86 | 65 | 3 | 81 | |||||||||||||||||||||||||||||||||||
| Dec 2021 | 64 | 353 | 53 | 114 | 14 | 84 | 62 | 4 | 78 | |||||||||||||||||||||||||||||||||||
| Operating cost7 | R/4Eoz - R/2Eoz | Dec 2022 | 20,304 | 21,220 | 20,081 | 20,618 | 19,889 | 20,873 | 17,612 | 13,117 | 18,075 | |||||||||||||||||||||||||||||||||
| Jun 2022 | 18,430 | 16,554 | 18,994 | 20,128 | 15,601 | 19,850 | 16,217 | 11,088 | 15,168 | |||||||||||||||||||||||||||||||||||
| Dec 2021 | 16,302 | 13,855 | 17,056 | 17,826 | 17,109 | 17,733 | 14,518 | 9,852 | 14,230 | |||||||||||||||||||||||||||||||||||
| Operating cost7 | US$/4Eoz - US$/2Eoz | Dec 2022 | 1,172 | 1,224 | 1,159 | 1,190 | 1,148 | 1,204 | 1,016 | 757 | 1,043 | |||||||||||||||||||||||||||||||||
| Jun 2022 | 1,197 | 1,075 | 1,233 | 1,307 | 1,013 | 1,289 | 1,053 | 720 | 985 | |||||||||||||||||||||||||||||||||||
| Dec 2021 | 1,085 | 922 | 1,135 | 1,186 | 1,138 | 1,180 | 966 | 655 | 947 | |||||||||||||||||||||||||||||||||||
Adjusted EBITDA Margin8 | % | Dec 2022 | 38 | 51 | 52 | 51 | 53 | 28 | 46 | |||||||||||||||||||||||||||||||||||
| Jun 2022 | 51 | 55 | 56 | 55 | 59 | 34 | 61 | |||||||||||||||||||||||||||||||||||||
| Dec 2021 | 51 | 54 | 57 | 54 | 50 | 27 | 50 | |||||||||||||||||||||||||||||||||||||
All-in sustaining cost9 | R/4Eoz - R/2Eoz | Dec 2022 | 22,671 | 31,880 | 20,431 | 20,714 | 22,031 | 16,139 | 11,886 | 22,594 | ||||||||||||||||||||||||||||||||||
| Jun 2022 | 18,824 | 21,036 | 18,160 | 19,054 | 18,949 | 14,874 | 9,878 | 15,029 | ||||||||||||||||||||||||||||||||||||
| Dec 2021 | 16,703 | 15,619 | 17,037 | 18,835 | 17,069 | 13,774 | 8,482 | 15,853 | ||||||||||||||||||||||||||||||||||||
| All-in sustaining cost8 | US$/4Eoz - US$/2Eoz | Dec 2022 | 1,308 | 1,840 | 1,179 | 1,195 | 1,271 | 931 | 686 | 1,304 | ||||||||||||||||||||||||||||||||||
| Jun 2022 | 1,222 | 1,366 | 1,179 | 1,237 | 1,230 | 966 | 641 | 976 | ||||||||||||||||||||||||||||||||||||
| Dec 2021 | 1,111 | 1,039 | 1,134 | 1,253 | 1,136 | 916 | 564 | 1,055 | ||||||||||||||||||||||||||||||||||||
All-in cost9 | R/4Eoz - R/2Eoz | Dec 2022 | 24,039 | 36,139 | 21,096 | 20,714 | 23,580 | 16,139 | 11,886 | 22,594 | ||||||||||||||||||||||||||||||||||
| Jun 2022 | 19,770 | 23,340 | 18,699 | 19,054 | 20,181 | 14,874 | 9,878 | 15,029 | ||||||||||||||||||||||||||||||||||||
| Dec 2021 | 17,915 | 20,007 | 17,270 | 18,835 | 17,589 | 13,774 | 8,482 | 15,853 | ||||||||||||||||||||||||||||||||||||
| All-in cost8 | US$/4Eoz - US$/2Eoz | Dec 2022 | 1,387 | 2,085 | 1,217 | 1,195 | 1,361 | 931 | 686 | 1,304 | ||||||||||||||||||||||||||||||||||
| Jun 2022 | 1,284 | 1,516 | 1,214 | 1,237 | 1,310 | 966 | 641 | 976 | ||||||||||||||||||||||||||||||||||||
| Dec 2021 | 1,192 | 1,331 | 1,149 | 1,253 | 1,170 | 916 | 564 | 1,055 | ||||||||||||||||||||||||||||||||||||
Capital expenditure5 | ||||||||||||||||||||||||||||||||||||||||||||
| Total capital expenditure | Rm | Dec 2022 | 6,172 | 3,230 | 2,942 | 756 | 2,012 | 158 | 16 | 570 | ||||||||||||||||||||||||||||||||||
| Jun 2022 | 4,346 | 2,185 | 2,161 | 620 | 1,420 | 115 | 6 | 294 | ||||||||||||||||||||||||||||||||||||
| Dec 2021 | 4,635 | 2,256 | 2,379 | 701 | 1,499 | 165 | 14 | 299 | ||||||||||||||||||||||||||||||||||||
| Total capital expenditure | US$m | Dec 2022 | 356 | 186 | 170 | 44 | 116 | 9 | 1 | 33 | ||||||||||||||||||||||||||||||||||
| Jun 2022 | 282 | 142 | 140 | 40 | 92 | 7 | — | 19 | ||||||||||||||||||||||||||||||||||||
| Dec 2021 | 308 | 150 | 158 | 47 | 100 | 11 | 1 | 20 | ||||||||||||||||||||||||||||||||||||
Figures may not add as they are rounded independently
Sibanye-Stillwater Operating and financial results | Six months and year ended 31 December 2022 20
1The Total US and SA PGM, Total SA PGM and Marikana excludes the production and costs associated with the purchase of concentrate (PoC) from third parties. For a reconciliation of the Operating cost, AISC and AIC excluding third party PoC, refer to “Reconciliation of operating cost excluding third party PoC for Total US and SA PGM, Total SA PGM and Marikana - Six Months” and “Reconciliation of AISC and AIC excluding third party PoC for Total US and SA PGM, Total SA PGM and Marikana – Six Months”
2The US PGM operations’ underground production is converted to metric tonnes and kilograms, and performance is translated into rand. In addition to the US PGM operations’ underground production, the operation treats recycling material which is excluded from the statistics shown above and is detailed in the PGM recycling table below
3Production per product – see prill split in the table below
4PGM sold includes the third party PoC ounces sold
5The Total US and SA PGM and Total SA PGM operations’ unit cost benchmarks and capital expenditure exclude the financial results of Mimosa, which is equity accounted and excluded from revenue and cost of sales
6The average PGM basket price is the PGM revenue per 4E/2E ounce, prior to a purchase of concentrate adjustment
7Operating cost is the average cost of production and operating cost per tonne is calculated by dividing the cost of sales, before amortisation and depreciation and change in inventory in a period by the tonnes milled/treated in the same period, and operating cost per ounce (and kilogram) is calculated by dividing the cost of sales, before amortisation and depreciation and change in inventory in a period, by the PGM produced in the same period
8Adjusted EBITDA margin is calculated by dividing adjusted EBITDA by revenue
9All-in cost is calculated in accordance with the World Gold Council guidance. All-in cost excludes income tax, costs associated with merger and acquisition activities, working capital, impairments, financing costs, one-time severance charges and items needed to normalise earnings. All-in cost is made up of All-in sustaining cost, being the cost to sustain current operations, given as a sub-total in the All-in cost calculation, together with corporate and major capital expenditure associated with growth. All-in sustaining cost per ounce (and kilogram) and All-in cost per ounce (and kilogram) are calculated by dividing the All-in sustaining cost and All-in cost, respectively, in a period by the total 4E/2E PGM produced in the same period. For a reconciliation of cost of sales, before amortisation and depreciation to All-in cost, see “All-in costs - six months”
| Mining - PGM Prill split including third party PoC, excluding recycling operations | ||||||||||||||||||||||||||||||||||||||||||||||||||||||||
| GROUP PGM | SA OPERATIONS | US OPERATIONS | ||||||||||||||||||||||||||||||||||||||||||||||||||||||
| Dec 2022 | Jun 2022 | Dec 2021 | Dec 2022 | Jun 2022 | Dec 2021 | Dec 2022 | Jun 2022 | Dec 2021 | ||||||||||||||||||||||||||||||||||||||||||||||||
| % | % | % | % | % | % | % | % | % | ||||||||||||||||||||||||||||||||||||||||||||||||
| Platinum | 568,119 | 53 | % | 556,770 | 52 | % | 634,117 | 51 | % | 523,939 | 59 | % | 504,400 | 59 | % | 572,635 | 59 | % | 44,180 | 23 | % | 52,370 | 23 | % | 61,482 | 23 | % | |||||||||||||||||||||||||||||
| Palladium | 409,584 | 38 | % | 431,750 | 40 | % | 500,142 | 40 | % | 262,670 | 30 | % | 254,081 | 30 | % | 289,526 | 30 | % | 146,914 | 77 | % | 177,669 | 77 | % | 210,616�� | 77 | % | |||||||||||||||||||||||||||||
| Rhodium | 78,783 | 7 | % | 74,618 | 7 | % | 84,248 | 7 | % | 78,783 | 9 | % | 74,618 | 9 | % | 84,248 | 9 | % | ||||||||||||||||||||||||||||||||||||||
| Gold | 16,264 | 2 | % | 16,054 | 1 | % | 21,270 | 2 | % | 16,264 | 2 | % | 16,054 | 2 | % | 21,270 | 2 | % | ||||||||||||||||||||||||||||||||||||||
| PGM production 4E/2E | 1,072,750 | 100 | % | 1,079,191 | 100 | % | 1,239,776 | 100 | % | 881,656 | 100 | % | 849,152 | 100 | % | 967,678 | 100 | % | 191,094 | 100 | % | 230,039 | 100 | % | 272,098 | 100 | % | |||||||||||||||||||||||||||||
| Ruthenium | 125,157 | 118,711 | 153,057 | 125,157 | 118,711 | 153,057 | ||||||||||||||||||||||||||||||||||||||||||||||||||
| Iridium | 31,636 | 29,865 | 35,012 | 31,636 | 29,865 | 35,012 | ||||||||||||||||||||||||||||||||||||||||||||||||||
| Total 6E/2E | 1,229,543 | 1,227,767 | 1,427,845 | 1,038,449 | 997,728 | 1,155,747 | 191,094 | 230,039 | 272,098 | |||||||||||||||||||||||||||||||||||||||||||||||
Figures may not add as they are rounded independently
| Recycling at US operations | ||||||||||||||
| Unit | Dec 2022 | Jun 2022 | Dec 2021 | |||||||||||
| Average catalyst fed/day | Tonne | 14.9 | 22.9 | 22.8 | ||||||||||
| Total processed | Tonne | 2,740 | 4,136 | 4,201 | ||||||||||
| Tolled | Tonne | — | — | 23 | ||||||||||
| Purchased | Tonne | 2,740 | 4,136 | 4,177 | ||||||||||
| PGM fed | 3Eoz | 237,441 | 361,333 | 352,276 | ||||||||||
| PGM sold | 3Eoz | 281,641 | 361,560 | 360,167 | ||||||||||
| PGM tolled returned | 3Eoz | 5,458 | 1,878 | 2,050 | ||||||||||
Sibanye-Stillwater Operating and financial results | Six months and year ended 31 December 2022 21
SA gold operations
| SA OPERATIONS | |||||||||||||||||||||||||||||||||||||||||
| Total SA gold | Driefontein | Kloof | Beatrix | Cooke | DRDGOLD | ||||||||||||||||||||||||||||||||||||
| Total | Under- ground | Surface | Under- ground | Surface | Under- ground | Surface | Under- ground | Surface | Surface | Surface | |||||||||||||||||||||||||||||||
| Production | |||||||||||||||||||||||||||||||||||||||||
| Tonnes milled/treated | 000't | Dec 2022 | 19,301 | 2,269 | 17,032 | 604 | 489 | 736 | 1,291 | 929 | 124 | 2,286 | 12,842 | ||||||||||||||||||||||||||||
| Jun 2022 | 16,871 | 492 | 16,379 | 236 | 205 | 256 | 663 | — | — | 1,788 | 13,723 | ||||||||||||||||||||||||||||||
| Dec 2021 | 21,840 | 2,599 | 19,241 | 760 | 522 | 944 | 1,686 | 895 | 307 | 2,260 | 14,466 | ||||||||||||||||||||||||||||||
| Yield | g/t | Dec 2022 | 0.69 | 4.08 | 0.24 | 5.24 | 0.49 | 4.46 | 0.33 | 3.02 | 0.34 | 0.29 | 0.21 | ||||||||||||||||||||||||||||
| Jun 2022 | 0.35 | 5.05 | 0.21 | 5.98 | 0.39 | 3.97 | 0.30 | — | — | 0.20 | 0.21 | ||||||||||||||||||||||||||||||
| Dec 2021 | 0.79 | 4.95 | 0.23 | 6.06 | 0.45 | 5.33 | 0.33 | 3.61 | 0.39 | 0.25 | 0.20 | ||||||||||||||||||||||||||||||
| Gold produced | kg | Dec 2022 | 13,339 | 9,250 | 4,089 | 3,163 | 240 | 3,284 | 420 | 2,803 | 42 | 656 | 2,731 | ||||||||||||||||||||||||||||
| Jun 2022 | 5,962 | 2,486 | 3,476 | 1,411 | 79 | 1,016 | 200 | 59 | 9 | 354 | 2,834 | ||||||||||||||||||||||||||||||
| Dec 2021 | 17,234 | 12,866 | 4,368 | 4,604 | 237 | 5,033 | 550 | 3,229 | 121 | 574 | 2,886 | ||||||||||||||||||||||||||||||
| oz | Dec 2022 | 428,859 | 297,394 | 131,464 | 101,693 | 7,716 | 105,583 | 13,503 | 90,119 | 1,350 | 21,091 | 87,804 | |||||||||||||||||||||||||||||
| Jun 2022 | 191,683 | 79,927 | 111,756 | 45,365 | 2,540 | 32,665 | 6,430 | 1,897 | 289 | 11,381 | 91,115 | ||||||||||||||||||||||||||||||
| Dec 2021 | 554,086 | 413,651 | 140,434 | 148,022 | 7,620 | 161,815 | 17,683 | 103,815 | 3,890 | 18,455 | 92,787 | ||||||||||||||||||||||||||||||
| Gold sold | kg | Dec 2022 | 12,378 | 8,409 | 3,969 | 2,961 | 187 | 2,947 | 372 | 2,501 | 42 | 606 | 2,762 | ||||||||||||||||||||||||||||
| Jun 2022 | 6,481 | 2,958 | 3,523 | 1,503 | 100 | 1,199 | 225 | 256 | 9 | 366 | 2,823 | ||||||||||||||||||||||||||||||
| Dec 2021 | 17,495 | 13,173 | 4,322 | 4,705 | 223 | 5,031 | 529 | 3,437 | 121 | 558 | 2,891 | ||||||||||||||||||||||||||||||
| oz | Dec 2022 | 397,962 | 270,356 | 127,606 | 95,198 | 6,012 | 94,748 | 11,960 | 80,409 | 1,350 | 19,483 | 88,800 | |||||||||||||||||||||||||||||
| Jun 2022 | 208,369 | 95,102 | 113,267 | 48,323 | 3,215 | 38,549 | 7,234 | 8,231 | 289 | 11,767 | 90,762 | ||||||||||||||||||||||||||||||
| Dec 2021 | 562,477 | 423,522 | 138,955 | 151,269 | 7,170 | 161,750 | 17,008 | 110,502 | 3,890 | 17,940 | 92,948 | ||||||||||||||||||||||||||||||
| Price and costs | |||||||||||||||||||||||||||||||||||||||||
| Gold price received | R/kg | Dec 2022 | 958,232 | 958,069 | 958,421 | 956,351 | 953,795 | 960,898 | |||||||||||||||||||||||||||||||||
| Jun 2022 | 922,851 | 917,031 | 916,433 | 939,623 | 920,765 | 928,091 | |||||||||||||||||||||||||||||||||||
| Dec 2021 | 860,303 | 863,028 | 858,273 | 856,661 | 858,423 | 864,407 | |||||||||||||||||||||||||||||||||||
| US$/oz | Dec 2022 | 1,720 | 1,720 | 1,720 | 1,716 | 1,712 | 1,725 | ||||||||||||||||||||||||||||||||||
| Jun 2022 | 1,864 | 1,852 | 1,851 | 1,898 | 1,860 | 1,874 | |||||||||||||||||||||||||||||||||||
| Dec 2021 | 1,780 | 1,786 | 1,776 | 1,773 | 1,776 | 1,789 | |||||||||||||||||||||||||||||||||||
Operating cost1 | R/t | Dec 2022 | 648 | 4,200 | 175 | 5,155 | 280 | 4,820 | 280 | 3,089 | 258 | 233 | 149 | ||||||||||||||||||||||||||||
| Jun 2022 | 488 | 11,624 | 153 | 9,191 | 288 | 9,563 | 347 | — | — | 180 | 135 | ||||||||||||||||||||||||||||||
| Dec 2021 | 528 | 3,390 | 141 | 3,778 | 238 | 3,850 | 200 | 2,577 | 221 | 188 | 122 | ||||||||||||||||||||||||||||||
| US$/t | Dec 2022 | 37 | 242 | 10 | 297 | 16 | 278 | 16 | 178 | 15 | 13 | 9 | |||||||||||||||||||||||||||||
| Jun 2022 | 32 | 755 | 10 | 597 | 19 | 621 | 23 | — | — | 12 | 9 | ||||||||||||||||||||||||||||||
| Dec 2021 | 35 | 226 | 9 | 251 | 16 | 256 | 13 | 171 | 15 | 12 | 8 | ||||||||||||||||||||||||||||||
| R/kg | Dec 2022 | 937,627 | 1,030,270 | 728,051 | 983,876 | 570,833 | 1,080,085 | 859,524 | 1,024,260 | 761,905 | 810,976 | 701,208 | |||||||||||||||||||||||||||||
| Jun 2022 | 1,379,906 | 2,300,483 | 721,519 | 1,537,208 | 746,835 | 2,409,449 | 1,150,000 | 18,677,966 | 4,222,222 | 909,605 | 655,963 | ||||||||||||||||||||||||||||||
| Dec 2021 | 669,084 | 684,828 | 622,711 | 623,588 | 523,207 | 722,035 | 614,545 | 714,153 | 561,983 | 738,676 | 611,920 | ||||||||||||||||||||||||||||||
| US$/oz | Dec 2022 | 1,683 | 1,849 | 1,307 | 1,766 | 1,025 | 1,939 | 1,543 | 1,838 | 1,367 | 1,456 | 1,259 | |||||||||||||||||||||||||||||
| Jun 2022 | 2,787 | 4,646 | 1,457 | 3,105 | 1,508 | 4,866 | 2,323 | 37,724 | 8,528 | 1,837 | 1,325 | ||||||||||||||||||||||||||||||
| Dec 2021 | 1,385 | 1,417 | 1,289 | 1,290 | 1,083 | 1,494 | 1,272 | 1,478 | 1,163 | 1,529 | 1,266 | ||||||||||||||||||||||||||||||
Adjusted EBITDA margin2 | % | Dec 2022 | (4) | (1) | (14) | (9) | (53) | 26 | |||||||||||||||||||||||||||||||||
| Jun 2022 | (52) | (64) | (124) | (451) | (94) | 32 | |||||||||||||||||||||||||||||||||||
| Dec 2021 | 18 | 27 | 16 | 15 | (50) | 29 | |||||||||||||||||||||||||||||||||||
All-in sustaining cost3 | R/kg | Dec 2022 | 1,124,737 | 1,219,187 | 1,309,129 | 1,171,844 | 867,987 | 799,421 | |||||||||||||||||||||||||||||||||
| Jun 2022 | 1,542,355 | 1,692,452 | 2,252,809 | 5,415,094 | 969,945 | 808,360 | |||||||||||||||||||||||||||||||||||
| Dec 2021 | 814,347 | 807,427 | 876,079 | 845,981 | 802,867 | 667,243 | |||||||||||||||||||||||||||||||||||
| All-in sustaining cost2 | US$/oz | Dec 2022 | 2,019 | 2,188 | 2,350 | 2,103 | 1,558 | 1,435 | |||||||||||||||||||||||||||||||||
| Jun 2022 | 3,115 | 3,418 | 4,550 | 10,937 | 1,959 | 1,633 | |||||||||||||||||||||||||||||||||||
| Dec 2021 | 1,685 | 1,671 | 1,813 | 1,751 | 1,661 | 1,381 | |||||||||||||||||||||||||||||||||||
All-in cost3 | R/kg | Dec 2022 | 1,200,679 | 1,219,187 | 1,355,830 | 1,171,844 | 867,987 | 842,143 | |||||||||||||||||||||||||||||||||
| Jun 2022 | 1,610,091 | 1,692,452 | 2,290,730 | 5,430,189 | 969,945 | 810,485 | |||||||||||||||||||||||||||||||||||
| Dec 2021 | 836,639 | 807,427 | 895,324 | 847,948 | 802,867 | 680,387 | |||||||||||||||||||||||||||||||||||
| US$/oz | Dec 2022 | 2,155 | 2,188 | 2,433 | 2,103 | 1,558 | 1,511 | ||||||||||||||||||||||||||||||||||
| Jun 2022 | 3,252 | 3,418 | 4,627 | 10,967 | 1,959 | 1,637 | |||||||||||||||||||||||||||||||||||
| Dec 2021 | 1,731 | 1,671 | 1,853 | 1,755 | 1,661 | 1,408 | |||||||||||||||||||||||||||||||||||
| Capital expenditure | |||||||||||||||||||||||||||||||||||||||||
Total capital expenditure4 | Rm | Dec 2022 | 2,963 | 805 | 894 | 272 | — | 354 | |||||||||||||||||||||||||||||||||
| Jun 2022 | 1,595 | 347 | 391 | 103 | — | 416 | |||||||||||||||||||||||||||||||||||
| Dec 2021 | 2,515 | 828 | 947 | 368 | — | 183 | |||||||||||||||||||||||||||||||||||
| Total capital expenditure | US$m | Dec 2022 | 171 | 46 | 52 | 16 | — | 20 | |||||||||||||||||||||||||||||||||
| Jun 2022 | 104 | 23 | 25 | 7 | — | 27 | |||||||||||||||||||||||||||||||||||
| Dec 2021 | 167 | 55 | 63 | 24 | — | 12 | |||||||||||||||||||||||||||||||||||
Average exchange rate for the six months ended 31 December 2022, 30 June 2022 and 31 December 2021 was R17.33/US$, R15.40/US$ and R15.03/US$, respectively
Figures may not add as they are rounded independently
1Operating cost is the average cost of production and operating cost per tonne is calculated by dividing the cost of sales, before amortisation and depreciation and change in inventory in a period, by the tonnes milled/treated in the same period, and operating cost per kilogram (and ounce) is calculated by dividing the cost of sales, before amortisation and depreciation and change in inventory in a period, by the gold produced in the same period
2Adjusted EBITDA margin is calculated by dividing adjusted EBITDA by revenue
3All-in cost is calculated in accordance with the World Gold Council guidance. All-in cost excludes income tax, costs associated with merger and acquisition activities, working capital, impairments, financing costs, one time severance charges and items needed to normalise earnings. All-in cost is made up of All-in sustaining cost, being the cost to sustain current operations, given as a sub-total in the All-in cost calculation, together with corporate and major capital expenditure associated with growth. All-in sustaining cost per kilogram (and ounce) and All-in cost
Sibanye-Stillwater Operating and financial results | Six months and year ended 31 December 2022 22
per kilogram (and ounce) are calculated by dividing the All-in sustaining cost and All-in cost, respectively, in a period by the total gold sold over the same period. For a reconciliation of cost of sales before amortisation and depreciation to All-in cost, see “All-in costs – Six months”
4Corporate project expenditure, which comprises spend on various Corporate IT projects and the Burnstone project, for the six months ended 31 December 2022, 30 June 2022 and 31 December 2021 was R638 million (US$37 million), R338 million (US$22 million), and R189 million (US$13 million), respectively
Sibanye-Stillwater Operating and financial results | Six months and year ended 31 December 2022 23
European operations
| Sibanye-Stillwater Sandouville refinery | ||||||||||||||||||||||||||
| Battery metals split | ||||||||||||||||||||||||||
| Dec 2022 | Jun 20221 | |||||||||||||||||||||||||
| Volumes produced (tonnes) | % | % | ||||||||||||||||||||||||
Nickel Salts2 | 937 | 41 | % | 1,066 | 23 | % | ||||||||||||||||||||
| Nickel Metal | 1,340 | 59 | % | 3,499 | 77 | % | ||||||||||||||||||||
| Total Nickel production tNi | 2,277 | 100 | % | 4,565 | 100 | % | ||||||||||||||||||||
Nickel Cakes3 | 91 | 193 | ||||||||||||||||||||||||
Cobalt Chloride (CoCl2)4 | 43 | 113 | ||||||||||||||||||||||||
Ferric Chloride (FeCl3)4 | 431 | 968 | ||||||||||||||||||||||||
| Volumes sales (tonnes) | ||||||||||||||||||||||||||
Nickel Salts2 | 876 | 39 | % | 984 | 21 | % | ||||||||||||||||||||
| Nickel Metal | 1,388 | 61 | % | 3,599 | 79 | % | ||||||||||||||||||||
| Total Nickel sold tNi | 2,264 | 100 | % | 4,583 | 100 | % | ||||||||||||||||||||
Cobalt Chloride (CoCl2)4 | 19 | 145 | ||||||||||||||||||||||||
Ferric Chloride (FeCl3)4 | 431 | 968 | ||||||||||||||||||||||||
| Nickel equivalent basket price | Unit | Dec 2022 | Jun 20221 | ||||||||||||||
| Revenue from sale of products | Rm | 967 | 2,173 | ||||||||||||||
| Nickel products sold | tNi | 2,264 | 4,583 | ||||||||||||||
| Nickel equivalent average basket price | R/tNi | 427,120 | 474,144 | ||||||||||||||
| Nickel equivalent average basket price | US$/tNi | 24,646 | 30,789 | ||||||||||||||
| Nickel equivalent sustaining cost | Unit | Dec 2022 | Jun 20221 | ||||||||||||||
| Cost of sales, before amortisation and depreciation | Rm | 1,506 | 2,125 | ||||||||||||||
| Carbon tax | Rm | — | — | ||||||||||||||
| Community costs | Rm | — | — | ||||||||||||||
| Share-based payments | Rm | — | — | ||||||||||||||
| Rehabilitation interest and amortisation | Rm | 3 | 3 | ||||||||||||||
| Leases | Rm | 2 | 12 | ||||||||||||||
| Sustaining capital expenditure | Rm | 61 | 29 | ||||||||||||||
| Less: By-product credit | Rm | (68) | (59) | ||||||||||||||
| Nickel equivalent sustaining cost | Rm | 1,504 | 2,110 | ||||||||||||||
| Nickel products sold | tNi | 2,264 | 4,583 | ||||||||||||||
| Nickel equivalent sustaining cost | R/tNi | 664,311 | 460,397 | ||||||||||||||
| Nickel equivalent sustaining cost | US$/tNi | 38,333 | 29,896 | ||||||||||||||
Nickel recovery yield5 | % | 92.29 | % | 98.79 | % | ||||||||||||
Average exchange rate for the six months ended 31 December 2022 and 30 June 2022 was R17.33/US$ and R15.40/US$, respectively
Figures may not add as they are rounded independently
1Amounts included since effective date of the acquisition on 4 February 2022
2Nickel salts consist of anhydrous nickel, nickel chloride low sodium, nickel chloride standard, nickel carbonate and nickel chloride solution
3Nickel cakes occur during the processing of nickel matte and are recycled back into the nickel refining process
4Cobalt chloride and ferric chloride are obtained from nickel matte through a different refining process on an order basis
5Nickel recovery yield is the percentage of total nickel recovered from the matte relative to the nickel contained in the matte received
Sibanye-Stillwater Operating and financial results | Six months and year ended 31 December 2022 24
CONDENSED CONSOLIDATED PROVISIONAL FINANCIAL STATEMENTS
Condensed consolidated income statement
Figures are in millions unless otherwise stated
| US dollar | SA rand | ||||||||||||||||||||||||||||||||||
| Year ended | Six months ended | Six months ended | Year ended | ||||||||||||||||||||||||||||||||
| Unaudited | Unaudited | Unaudited | Unaudited | Unaudited | Unaudited | Unaudited | Unaudited | Unaudited | Unaudited | ||||||||||||||||||||||||||
| Dec 2021 | Dec 2022 | Dec 2021 | Jun 2022 | Dec 2022 | Notes | Dec 2022 | Jun 2022 | Dec 2021 | Dec 2022 | Dec 2021 | |||||||||||||||||||||||||
| 11,643 | 8,448 | 5,461 | 4,570 | 3,878 | Revenue | 2 | 67,909 | 70,379 | 82,241 | 138,288 | 172,194 | ||||||||||||||||||||||||
| (7,391) | (6,208) | (3,821) | (3,263) | (2,945) | Cost of sales | (51,375) | (50,249) | (57,355) | (101,624) | (109,306) | |||||||||||||||||||||||||
| (6,830) | (5,775) | (3,521) | (3,054) | (2,721) | Cost of sales, before amortisation and depreciation | (47,512) | (47,025) | (52,860) | (94,537) | (101,013) | |||||||||||||||||||||||||
| (561) | (433) | (300) | (209) | (224) | Amortisation and depreciation | (3,863) | (3,224) | (4,495) | (7,087) | (8,293) | |||||||||||||||||||||||||
| 4,252 | 2,240 | 1,640 | 1,307 | 933 | 16,534 | 20,130 | 24,886 | 36,664 | 62,888 | ||||||||||||||||||||||||||
| 81 | 73 | 38 | 38 | 35 | Interest income | 614 | 589 | 578 | 1,203 | 1,202 | |||||||||||||||||||||||||
| (169) | (173) | (82) | (95) | (78) | Finance expense | 3 | (1,378) | (1,462) | (1,235) | (2,840) | (2,496) | ||||||||||||||||||||||||
| (26) | (13) | (6) | (7) | (6) | Share-based payment expenses | (106) | (112) | (85) | (218) | (383) | |||||||||||||||||||||||||
| (425) | (261) | (367) | (26) | (235) | Loss on financial instruments | 4 | (3,880) | (399) | (5,437) | (4,279) | (6,279) | ||||||||||||||||||||||||
| 78 | 38 | 104 | 9 | 29 | Gain on foreign exchange differences | 476 | 140 | 1,527 | 616 | 1,149 | |||||||||||||||||||||||||
| 134 | 79 | 38 | 50 | 29 | Share of results of equity-accounted investees after tax | 517 | 770 | 585 | 1,287 | 1,989 | |||||||||||||||||||||||||
| (205) | (225) | (105) | (92) | (133) | Other costs | 1.2 | (2,249) | (1,430) | (1,543) | (3,679) | (3,018) | ||||||||||||||||||||||||
| 52 | 68 | 32 | 48 | 20 | Other income | 1.2 | 383 | 727 | 466 | 1,110 | 764 | ||||||||||||||||||||||||
| 2 | 10 | 2 | 6 | 4 | Gain on disposal of property, plant and equipment | 68 | 94 | 30 | 162 | 36 | |||||||||||||||||||||||||
| (348) | — | (348) | — | — | Reversal of impairments/(impairments) | 5 | 6 | — | (5,148) | 6 | (5,148) | ||||||||||||||||||||||||
| (13) | — | (13) | — | — | Early redemption premium on the 2025 Notes | — | — | (196) | — | (196) | |||||||||||||||||||||||||
| 1 | 13 | (1) | 2 | 11 | Occupational healthcare gain/(expense) | 186 | 25 | (10) | 211 | 14 | |||||||||||||||||||||||||
| (7) | (22) | (4) | (2) | (20) | Restructuring costs | (327) | (36) | (69) | (363) | (107) | |||||||||||||||||||||||||
| (9) | (9) | (6) | (7) | (2) | Transaction costs | (44) | (108) | (102) | (152) | (140) | |||||||||||||||||||||||||
| 3,398 | 1,818 | 922 | 1,231 | 587 | Profit before royalties, carbon tax and tax | 10,800 | 18,928 | 14,247 | 29,728 | 50,275 | |||||||||||||||||||||||||
| (184) | (112) | (71) | (63) | (49) | Royalties | (864) | (970) | (1,072) | (1,834) | (2,714) | |||||||||||||||||||||||||
| — | 1 | — | 1 | — | Carbon tax | (1) | 11 | (1) | 10 | (4) | |||||||||||||||||||||||||
| 3,214 | 1,707 | 851 | 1,169 | 538 | Profit before tax | 9,935 | 17,969 | 13,174 | 27,904 | 47,557 | |||||||||||||||||||||||||
| (930) | (545) | (307) | (366) | (179) | Mining and income tax | 6 | (3,296) | (5,628) | (4,697) | (8,924) | (13,761) | ||||||||||||||||||||||||
| (913) | (567) | (375) | (321) | (246) | - Current tax | (4,345) | (4,937) | (5,675) | (9,282) | (13,506) | |||||||||||||||||||||||||
| (17) | 22 | 68 | (45) | 67 | - Deferred tax | 1,049 | (691) | 978 | 358 | (255) | |||||||||||||||||||||||||
| 2,284 | 1,162 | 544 | 803 | 359 | Profit for the period | 6,639 | 12,341 | 8,477 | 18,980 | 33,796 | |||||||||||||||||||||||||
| Profit for the period attributable to: | |||||||||||||||||||||||||||||||||||
| 2,234 | 1,126 | 527 | 782 | 344 | - Owners of Sibanye-Stillwater | 6,380 | 12,016 | 8,218 | 18,396 | 33,054 | |||||||||||||||||||||||||
| 50 | 36 | 17 | 21 | 15 | - Non-controlling interests (NCI) | 259 | 325 | 259 | 584 | 742 | |||||||||||||||||||||||||
| Earnings per ordinary share (cents) | |||||||||||||||||||||||||||||||||||
| 77 | 40 | 19 | 28 | 13 | Basic earnings per share | 7.1 | 225 | 426 | 288 | 651 | 1,140 | ||||||||||||||||||||||||
| 76 | 40 | 19 | 28 | 13 | Diluted earnings per share | 7.2 | 225 | 424 | 286 | 650 | 1,129 | ||||||||||||||||||||||||
| 2,898,804 | 2,826,085 | 2,853,495 | 2,821,905 | 2,830,197 | Weighted average number of shares ('000) | 7.1 | 2,830,197 | 2,821,905 | 2,853,495 | 2,826,085 | 2,898,804 | ||||||||||||||||||||||||
| 2,927,246 | 2,830,781 | 2,876,894 | 2,830,908 | 2,830,781 | Diluted weighted average number of shares ('000) | 7.2 | 2,830,781 | 2,830,908 | 2,876,894 | 2,830,781 | 2,927,246 | ||||||||||||||||||||||||
| 14.79 | 16.37 | 15.03 | 15.40 | 17.33 | Average R/US$ rate | ||||||||||||||||||||||||||||||
The condensed consolidated provisional financial statements for the year and six months ended 31 December 2022 have been prepared by Sibanye-Stillwater's Group financial reporting team headed by Jacques le Roux (CA (SA)). This process was supervised by the Group's Chief Financial Officer, Charl Keyter and approved by the Sibanye-Stillwater board of directors. A convenience translation has been applied to the primary statements into US dollar based on the average exchange rate for the period for the condensed consolidated income statement, statements of other comprehensive income and cash flows, and the period-end closing exchange rate for the condensed consolidated statement of financial position and exchange rate differences on translation are accounted for in the condensed consolidated statement of other comprehensive income. This information is provided as supplementary information only and has not been reviewed or reported on by the Company's external auditor. | ||
Sibanye-Stillwater Operating and financial results | Six months and year ended 31 December 2022 25
Condensed consolidated statement of other comprehensive income
Figures are in millions unless otherwise stated
| US dollar | SA rand | ||||||||||||||||||||||||||||||||||
| Year ended | Six months ended | Six months ended | Year ended | ||||||||||||||||||||||||||||||||
| Unaudited | Unaudited | Unaudited | Unaudited | Unaudited | Unaudited | Unaudited | Unaudited | Unaudited | Unaudited | ||||||||||||||||||||||||||
| Dec 2021 | Dec 2022 | Dec 2021 | Jun 2022 | Dec 2022 | Dec 2022 | Jun 2022 | Dec 2021 | Dec 2022 | Dec 2021 | ||||||||||||||||||||||||||
| 2,284 | 1,162 | 544 | 803 | 359 | Profit for the period | 6,639 | 12,341 | 8,477 | 18,980 | 33,796 | |||||||||||||||||||||||||
| (115) | (207) | (209) | (148) | (59) | Other comprehensive income, net of tax | 2,551 | (182) | 5,561 | 2,369 | 4,635 | |||||||||||||||||||||||||
| — | — | — | — | — | Foreign currency translation adjustments1 | 2,673 | 1,167 | 4,846 | 3,840 | 3,807 | |||||||||||||||||||||||||
| 56 | (90) | 48 | (88) | (2) | Fair value adjustment on other investments2 | (118) | (1,349) | 715 | (1,467) | 828 | |||||||||||||||||||||||||
| — | — | — | — | — | Re-measurement of defined benefit plan2 | (4) | — | — | (4) | — | |||||||||||||||||||||||||
| (171) | (117) | (257) | (60) | (57) | Currency translation adjustments3 | — | — | — | — | — | |||||||||||||||||||||||||
| 2,169 | 955 | 335 | 655 | 300 | Total comprehensive income | 9,190 | 12,159 | 14,038 | 21,349 | 38,431 | |||||||||||||||||||||||||
| Total comprehensive income attributable to: | |||||||||||||||||||||||||||||||||||
| 2,119 | 914 | 318 | 633 | 281 | - Owners of Sibanye-Stillwater | 8,850 | 11,821 | 13,790 | 20,671 | 37,698 | |||||||||||||||||||||||||
| 50 | 41 | 17 | 22 | 19 | - Non-controlling interests | 340 | 338 | 248 | 678 | 733 | |||||||||||||||||||||||||
| 14.79 | 16.37 | 15.03 | 15.40 | 17.33 | Average R/US$ rate | ||||||||||||||||||||||||||||||
1 These gains and losses will be reclassified to profit or loss upon disposal of the underlying operations
2 These gains and losses will never be reclassified to profit or loss
3 These gains and losses relate to the convenience translation of the SA rand amounts to US dollar and will never be reclassified to profit or loss
Condensed consolidated statement of financial position
Figures are in millions unless otherwise stated
| US dollar | SA rand | ||||||||||||||||||||||
| Unaudited | Unaudited | Unaudited | Unaudited | Unaudited | Unaudited | ||||||||||||||||||
| Dec 2021 | Jun 2022 | Dec 2022 | Notes | Dec 2022 | Jun 2022 | Dec 2021 | |||||||||||||||||
| 5,531 | 5,857 | 6,216 | Non-current assets | 105,867 | 95,407 | 88,163 | |||||||||||||||||
| 3,921 | 4,246 | 4,516 | Property, plant and equipment | 76,909 | 69,166 | 62,494 | |||||||||||||||||
| 14 | 19 | 16 | Right-of-use assets | 279 | 306 | 222 | |||||||||||||||||
| 485 | 490 | 489 | Goodwill and other intangibles | 8,322 | 7,987 | 7,727 | |||||||||||||||||
| 476 | 481 | 497 | Equity-accounted investments | 8,471 | 7,830 | 7,594 | |||||||||||||||||
| 211 | 171 | 196 | Other investments | 9 | 3,340 | 2,788 | 3,367 | ||||||||||||||||
| 326 | 320 | 312 | Environmental rehabilitation obligation funds | 5,306 | 5,219 | 5,202 | |||||||||||||||||
| 41 | 61 | 47 | Other receivables | 798 | 994 | 651 | |||||||||||||||||
| 57 | 69 | 143 | Deferred tax assets | 2,442 | 1,117 | 906 | |||||||||||||||||
| 4,067 | 3,879 | 3,567 | Current assets | 60,764 | 63,182 | 64,831 | |||||||||||||||||
| 1,573 | 1,658 | 1,549 | Inventories | 26,384 | 27,005 | 25,080 | |||||||||||||||||
| 465 | 437 | 440 | Trade and other receivables | 7,500 | 7,124 | 7,411 | |||||||||||||||||
| 33 | 14 | 5 | Other receivables | 81 | 221 | 523 | |||||||||||||||||
| 78 | 97 | 42 | Tax receivable | 723 | 1,584 | 1,245 | |||||||||||||||||
| 1,900 | 1,673 | 1,531 | Cash and cash equivalents | 26,076 | 27,248 | 30,292 | |||||||||||||||||
| 18 | — | — | Asset held for sale | — | — | 280 | |||||||||||||||||
| 9,598 | 9,736 | 9,783 | Total assets | 166,631 | 158,589 | 152,994 | |||||||||||||||||
| 5,102 | 5,487 | 5,342 | Total equity | 91,004 | 89,358 | 81,345 | |||||||||||||||||
| 3,206 | 3,097 | 3,254 | Non-current liabilities | 55,408 | 50,436 | 51,108 | |||||||||||||||||
| 1,267 | 1,275 | 1,327 | Borrowings | 11 | 22,606 | 20,772 | 20,191 | ||||||||||||||||
| 11 | 15 | 12 | Lease liabilities | 208 | 240 | 177 | |||||||||||||||||
| 518 | 531 | 502 | Environmental rehabilitation obligation and other provisions | 8,552 | 8,655 | 8,263 | |||||||||||||||||
| 64 | 53 | 46 | Occupational healthcare obligation | 781 | 868 | 1,017 | |||||||||||||||||
| 177 | 174 | 293 | Cash-settled share-based payment obligations | 12 | 4,991 | 2,833 | 2,829 | ||||||||||||||||
| 289 | 125 | 147 | Other payables | 13 | 2,500 | 2,029 | 4,599 | ||||||||||||||||
| 389 | 379 | 376 | Deferred revenue | 6,399 | 6,175 | 6,204 | |||||||||||||||||
| 1 | 1 | 1 | Tax and royalties payable | 11 | 10 | 10 | |||||||||||||||||
| 490 | 544 | 550 | Deferred tax liabilities | 9,360 | 8,854 | 7,818 | |||||||||||||||||
| 1,290 | 1,152 | 1,187 | Current Liabilities | 20,219 | 18,795 | 20,541 | |||||||||||||||||
| 7 | 7 | 7 | Borrowings | 11 | 122 | 115 | 107 | ||||||||||||||||
| 7 | 7 | 7 | Lease liabilities | 111 | 119 | 104 | |||||||||||||||||
| — | 9 | 3 | Occupational healthcare obligation | 44 | 140 | — | |||||||||||||||||
| 4 | 15 | 17 | Cash-settled share-based payment obligations | 12 | 284 | 252 | 58 | ||||||||||||||||
| 951 | 883 | 919 | Trade and other payables | 15,653 | 14,392 | 15,162 | |||||||||||||||||
| 299 | 175 | 228 | Other payables | 13 | 3,891 | 2,856 | 4,765 | ||||||||||||||||
| 10 | 6 | 1 | Deferred revenue | 21 | 102 | 156 | |||||||||||||||||
| 12 | 50 | 5 | Tax and royalties payable | 93 | 819 | 189 | |||||||||||||||||
| 9,598 | 9,736 | 9,783 | Total equity and liabilities | 166,631 | 158,589 | 152,994 | |||||||||||||||||
| 15.94 | 16.29 | 17.03 | Closing R/US$ rate | ||||||||||||||||||||
Sibanye-Stillwater Operating and financial results | Six months and year ended 31 December 2022 26
Condensed consolidated statement of changes in equity
Figures are in millions unless otherwise stated
US dollar1 | SA rand1 | ||||||||||||||||||||||||||||||||||||||||
| Stated capital | Re- organisation reserve | Other reserves | Accum- ulated profit/(loss) | Non- controlling interests | Total equity | Notes | Total equity | Non- controlling interests | Accum- ulated profit | Other reserves | Re- organisation reserve | Stated capital | |||||||||||||||||||||||||||||
| 1,936 | 2,599 | 517 | (391) | 153 | 4,814 | Balance at 31 December 2020 (Previously reported) | 70,716 | 2,236 | 12,760 | 2,569 | 23,001 | 30,150 | |||||||||||||||||||||||||||||
| — | — | — | (33) | 33 | — | Correction of transaction with DRDGOLD shareholders | 1.3 | — | 544 | (544) | — | — | — | ||||||||||||||||||||||||||||
| 1,936 | 2,599 | 517 | (424) | 186 | 4,814 | Balance at 31 December 2020 (Restated) | 70,716 | 2,780 | 12,216 | 2,569 | 23,001 | 30,150 | |||||||||||||||||||||||||||||
| — | — | (115) | 2,234 | 50 | 2,169 | Total comprehensive income for the period | 38,431 | 733 | 33,054 | 4,644 | — | — | |||||||||||||||||||||||||||||
| — | — | — | 2,234 | 50 | 2,284 | Profit for the period | 33,796 | 742 | 33,054 | — | — | — | |||||||||||||||||||||||||||||
| — | — | (115) | — | — | (115) | Other comprehensive income, net of tax | 4,635 | (9) | — | 4,644 | — | — | |||||||||||||||||||||||||||||
| — | — | — | (1,206) | (23) | (1,229) | Dividends paid | (18,176) | (344) | (17,832) | — | — | — | |||||||||||||||||||||||||||||
| — | — | 10 | — | 1 | 11 | Equity-settled share-based payments | 151 | 9 | — | 142 | — | — | |||||||||||||||||||||||||||||
| (575) | — | — | — | — | (575) | Share buy-back | (8,503) | — | — | — | — | (8,503) | |||||||||||||||||||||||||||||
| — | — | — | 2 | (81) | (79) | Marikana B-BBEE transaction | (1,146) | (1,180) | 34 | — | — | — | |||||||||||||||||||||||||||||
| — | — | — | (6) | (3) | (9) | Transaction with Platinum Mile shareholders | (128) | (46) | (82) | — | — | — | |||||||||||||||||||||||||||||
| — | — | (2) | 2 | — | — | Adjustment due to sale of St Helena Hospital Proprietary Limited (St Helena Hospital) | — | — | 24 | (24) | — | — | |||||||||||||||||||||||||||||
| 1,361 | 2,599 | 410 | 602 | 130 | 5,102 | Balance at 31 December 2021 (Restated) | 81,345 | 1,952 | 27,414 | 7,331 | 23,001 | 21,647 | |||||||||||||||||||||||||||||
| — | — | (212) | 1,126 | 41 | 955 | Total comprehensive income for the period | 21,349 | 678 | 18,392 | 2,279 | — | — | |||||||||||||||||||||||||||||
| — | — | — | 1,126 | 36 | 1,162 | Profit for the period | 18,980 | 584 | 18,396 | — | — | — | |||||||||||||||||||||||||||||
| — | — | (212) | — | 5 | (207) | Other comprehensive income, net of tax | 2,369 | 94 | (4) | 2,279 | — | — | |||||||||||||||||||||||||||||
| — | — | — | (562) | (16) | (578) | Dividends paid | (9,453) | (256) | (9,197) | — | — | — | |||||||||||||||||||||||||||||
| — | — | 1 | — | 1 | 2 | Equity-settled share-based payments | 24 | 10 | — | 14 | — | — | |||||||||||||||||||||||||||||
| — | — | — | — | 74 | 74 | Keliber Oy (Keliber) asset acquisition | 10.1 | 1,219 | 1,219 | — | — | — | — | ||||||||||||||||||||||||||||
| — | — | 4 | (173) | (42) | (211) | Transaction with shareholders2 | (3,452) | (686) | (2,828) | 62 | — | — | |||||||||||||||||||||||||||||
| — | — | — | — | (1) | (1) | Sale of Lonmin Canada Incorporated (Lonmin Canada)3 | (14) | (14) | — | — | — | — | |||||||||||||||||||||||||||||
| — | — | (1) | — | — | (1) | Foreign exchange movement recycled through profit or loss | (14) | — | — | (14) | — | — | |||||||||||||||||||||||||||||
| 1,361 | 2,599 | 202 | 993 | 187 | 5,342 | Balance at 31 December 2022 | 91,004 | 2,903 | 33,781 | 9,672 | 23,001 | 21,647 | |||||||||||||||||||||||||||||
1 This information is unaudited
2 This relates to transactions entered into by Sibanye-Stillwater with the shareholders of Keliber (refer note 10.1)
3 The Group entered into an arrangement to dispose of its interest in Lonmin Canada to Magna Mining Incorporated for an aggregate purchase consideration of CAD10 million (Canadian dollars)of which CAD2 million is deferred over twelve months. The transaction concluded during Q4 2022 and resulted in a profit of R145 million recognised in profit or loss. Lonmin Canada held the Denison PGM exploration project in Canada and was acquired as part of the Lonmin plc (subsequently renamed to Sibanye UK Limited) acquisition on 7 June 2019
Sibanye-Stillwater Operating and financial results | Six months and year ended 31 December 2022 27
Condensed consolidated statement of cash flows
Figures are in millions unless otherwise stated
| US dollar | SA rand | ||||||||||||||||||||||||||||||||||
| Year ended | Six months ended | Six months ended | Year ended | ||||||||||||||||||||||||||||||||
| Unaudited | Unaudited | Unaudited | Unaudited | Unaudited | Unaudited | Unaudited | Unaudited | Unaudited | Unaudited | ||||||||||||||||||||||||||
| Dec 2021 | Dec 2022 | Dec 2021 | Jun 2022 | Dec 2022 | Note | Dec 2022 | Jun 2022 | Dec 2021 | Dec 2022 | Dec 2021 | |||||||||||||||||||||||||
| Cash flows from operating activities | |||||||||||||||||||||||||||||||||||
| 4,583 | 2,489 | 1,852 | 1,436 | 1,053 | Cash generated by operations | 18,639 | 22,107 | 28,055 | 40,746 | 67,784 | |||||||||||||||||||||||||
| 4 | 1 | 3 | 2 | (1) | Deferred revenue advance received | — | 24 | 51 | 24 | 65 | |||||||||||||||||||||||||
| — | — | — | — | — | Post-retirement health care payments | — | (1) | (1) | (1) | (1) | |||||||||||||||||||||||||
| (16) | (17) | (7) | (13) | (4) | Cash-settled share-based payments paid | (74) | (198) | (113) | (272) | (240) | |||||||||||||||||||||||||
| (11) | (14) | — | (15) | 1 | Payment of Marikana dividend obligation | — | (225) | — | (225) | (162) | |||||||||||||||||||||||||
| (119) | (278) | 2 | (295) | 17 | Additional deferred payments relating to acquisition of a business1 | — | (4,545) | — | (4,545) | (1,754) | |||||||||||||||||||||||||
| 166 | 24 | 473 | (107) | 131 | Change in working capital | 2,034 | (1,648) | 6,924 | 386 | 2,455 | |||||||||||||||||||||||||
| 4,607 | 2,205 | 2,323 | 1,008 | 1,197 | 20,599 | 15,514 | 34,916 | 36,113 | 68,147 | ||||||||||||||||||||||||||
| 65 | 42 | 30 | 30 | 12 | Interest received | 221 | 461 | 448 | 682 | 960 | |||||||||||||||||||||||||
| (53) | (68) | (20) | (38) | (30) | Interest paid | (534) | (584) | (303) | (1,118) | (781) | |||||||||||||||||||||||||
| (207) | (111) | (82) | (64) | (47) | Royalties paid | (836) | (979) | (1,237) | (1,815) | (3,055) | |||||||||||||||||||||||||
| (1,003) | (542) | (419) | (302) | (240) | Tax paid | (4,221) | (4,645) | (6,348) | (8,866) | (14,839) | |||||||||||||||||||||||||
| (1,229) | (577) | (565) | (349) | (228) | Dividends paid | (4,075) | (5,378) | (8,516) | (9,453) | (18,176) | |||||||||||||||||||||||||
| 2,180 | 949 | 1,267 | 285 | 664 | Net cash from operating activities | 11,154 | 4,389 | 18,960 | 15,543 | 32,256 | |||||||||||||||||||||||||
| Cash flow from investing activities | |||||||||||||||||||||||||||||||||||
| (861) | (971) | (477) | (399) | (572) | Additions to property, plant and equipment | (9,755) | (6,144) | (7,154) | (15,899) | (12,740) | |||||||||||||||||||||||||
| 5 | 12 | 3 | 8 | 4 | Proceeds on disposal of property, plant and equipment | 75 | 116 | 46 | 191 | 80 | |||||||||||||||||||||||||
| — | (69) | — | (74) | 5 | Acquisition of subsidiaries, net of cash acquired | 10 | — | (1,132) | — | (1,132) | — | ||||||||||||||||||||||||
| 69 | 34 | 24 | 24 | 10 | Dividends received | 201 | 363 | 371 | 564 | 1,020 | |||||||||||||||||||||||||
| (122) | (47) | (120) | (29) | (18) | Additions to other investments | (322) | (450) | (1,781) | (772) | (1,803) | |||||||||||||||||||||||||
| (30) | (6) | (11) | (6) | — | Acquisition of equity-accounted investment | — | (92) | (168) | (92) | (446) | |||||||||||||||||||||||||
| (5) | (5) | (4) | (1) | (4) | Contributions to environmental rehabilitation funds | (63) | (23) | (61) | (86) | (72) | |||||||||||||||||||||||||
| (39) | (11) | — | (12) | 1 | Payment of deferred/contingent payment1 | — | (185) | (15) | (185) | (577) | |||||||||||||||||||||||||
| (4) | (1) | — | (1) | — | Contributions to enterprise development fund | — | (10) | (14) | (10) | (65) | |||||||||||||||||||||||||
| — | (4) | — | — | (4) | Cash outflow on loss of control of subsidiary | (58) | — | — | (58) | — | |||||||||||||||||||||||||
| — | 4 | — | — | 4 | Proceeds on sale of Lonmin Canada | 72 | — | — | 72 | — | |||||||||||||||||||||||||
| 2 | — | 2 | — | — | Proceeds on sale of St Helena Hospital | — | — | 25 | — | 25 | |||||||||||||||||||||||||
| 1 | 2 | 1 | 2 | — | Proceeds from environmental rehabilitation funds | — | 33 | 5 | 33 | 10 | |||||||||||||||||||||||||
| (984) | (1,062) | (582) | (488) | (574) | Net cash used in investing activities | (9,850) | (7,524) | (8,746) | (17,374) | (14,568) | |||||||||||||||||||||||||
| Cash flow from financing activities | |||||||||||||||||||||||||||||||||||
| 1,396 | 489 | 1,245 | 357 | 132 | Loans raised | 11 | 2,500 | 5,500 | 18,455 | 8,000 | 20,651 | ||||||||||||||||||||||||
| (1,369) | (489) | (1,166) | (357) | (132) | Loans repaid | 11 | (2,502) | (5,501) | (17,305) | (8,003) | (20,252) | ||||||||||||||||||||||||
| (8) | (8) | (4) | (5) | (3) | Lease payments | (59) | (72) | (56) | (131) | (112) | |||||||||||||||||||||||||
| (9) | (205) | (9) | — | (205) | Acquisition of non-controlling interests | 10.1 | (3,363) | — | (128) | (3,363) | (128) | ||||||||||||||||||||||||
| (575) | — | (524) | — | — | Share buy-back | — | — | (7,761) | — | (8,503) | |||||||||||||||||||||||||
| (565) | (213) | (458) | (5) | (208) | Net cash used in financing activities | (3,424) | (73) | (6,795) | (3,497) | (8,344) | |||||||||||||||||||||||||
| 631 | (326) | 227 | (208) | (118) | Net (decrease)/increase in cash and cash equivalents | (2,120) | (3,208) | 3,419 | (5,328) | 9,344 | |||||||||||||||||||||||||
| (109) | (43) | (156) | (19) | (24) | Effect of exchange rate fluctuations on cash held | 948 | 164 | 776 | 1,112 | 708 | |||||||||||||||||||||||||
| 1,378 | 1,900 | 1,829 | 1,900 | 1,673 | Cash and cash equivalents at beginning of the period | 27,248 | 30,292 | 26,097 | 30,292 | 20,240 | |||||||||||||||||||||||||
| 1,900 | 1,531 | 1,900 | 1,673 | 1,531 | Cash and cash equivalents at end of the period | 26,076 | 27,248 | 30,292 | 26,076 | 30,292 | |||||||||||||||||||||||||
| 14.79 | 16.37 | 15.03 | 15.40 | 17.33 | Average R/US$ rate | ||||||||||||||||||||||||||||||
| 15.94 | 17.03 | 15.94 | 16.29 | 17.03 | Closing R/US$ rate | ||||||||||||||||||||||||||||||
1 Included in the payments made is R4,441 million, R179 million and R110 million relating to the Rustenburg operation acquisition (Rustenburg deferred payment), Pandora acquisition and SFA (Oxford) acquisition, respectively. Payments made up to the original fair value of the liability are classified as investing cash flows, with any amount paid above the original fair value of the liability classified as operating cash flows
Sibanye-Stillwater Operating and financial results | Six months and year ended 31 December 2022 28
Notes to the condensed consolidated provisional financial statements
1. Basis of accounting and preparation
The condensed consolidated provisional financial statements are prepared in accordance with the requirements of the JSE Listings Requirements for provisional reports and the requirements of the Companies Act of South Africa. The JSE Listings Requirements require provisional reports to be prepared in accordance with framework concepts, and the measurement and recognition requirements of International Financial Reporting Standards (IFRS), and the South African Institute of Chartered Accountants Financial Reporting Guides as issued by the Accounting Practices Committee and Financial Pronouncements as issued by the Financial Reporting Standards Council and to also, as a minimum, contain information required by IAS 34 Interim Financial Reporting. The accounting policies applied in the preparation of these condensed consolidated provisional financial statements are in terms of IFRS and are consistent with those applied in the previous consolidated annual financial statements, included in the 31 December 2021 annual financial report.
The condensed consolidated income statement, and statements of other comprehensive income and cash flows for the six months ended
31 December 2021 were not reviewed by the Company’s external auditor and were prepared by subtracting the condensed consolidated financial statements for the six months ended 30 June 2021 from the comprehensive consolidated financial statements for the year ended 31 December 2021. The condensed consolidated income statement, and statements of other comprehensive income and cash flows for the six months ended 31 December 2022 have not been reviewed by the Company’s external auditor and were prepared by subtracting the condensed consolidated financial statements for the six months ended 30 June 2022 from the condensed consolidated provisional financial statements for the year ended 31 December 2022.
31 December 2021 were not reviewed by the Company’s external auditor and were prepared by subtracting the condensed consolidated financial statements for the six months ended 30 June 2021 from the comprehensive consolidated financial statements for the year ended 31 December 2021. The condensed consolidated income statement, and statements of other comprehensive income and cash flows for the six months ended 31 December 2022 have not been reviewed by the Company’s external auditor and were prepared by subtracting the condensed consolidated financial statements for the six months ended 30 June 2022 from the condensed consolidated provisional financial statements for the year ended 31 December 2022.
The translation of the primary statements into US dollar is based on the average exchange rate for the period for the condensed consolidated income statement, statements of other comprehensive income and cash flows, and the period-end closing exchange rate for the statement of financial position. Exchange differences on translation are accounted for in the statement of other comprehensive income. This information is provided as supplementary information only and has not been reviewed by the Company's external auditor.
1.1 Standards, interpretations and amendments to published standards effective on 1 January 2022 and those issued but not yet effective
The amendments to published standards effective on 1 January 2022 and adopted by the Sibanye Stillwater Limited (Sibanye-Stillwater) group (the Group) did not have a material effect on the Group’s condensed consolidated provisional financial statements for the year ended 31 December 2022. Standards, interpretations and amendments to published standards not yet effective on 1 January 2022 are not expected to have a material effect on the Group.
1.2 Condensed consolidated income statement re-presentation to align to the presentation included in the Group's Annual Financial Report
Management reclassified the presentation of "Net other costs" on the condensed consolidated income statement for the year and six months ended 31 December 2022, as well as re-presented all comparative information, to align to the presentation in the Group's annual financial statements for the year ended 31 December 2022. The impact of the re-presentation is the disaggregation of "Net other costs" to "Other costs" and "Other income". The presentation changes have no impact on the Group's profit for the current and previous periods presented. The below table details the presentation changes made to previously disclosed line items.
| Figures in million - SA rand | Six months ended | Year ended | ||||||||||||
| Unaudited | Unaudited | Unaudited | ||||||||||||
| June 2022 | Dec 2021 | Dec 2021 | ||||||||||||
| Previously presented line items: | ||||||||||||||
| Net other costs | (703) | (1,077) | (2,254) | |||||||||||
| Care and maintenance | (358) | (352) | (737) | |||||||||||
| Change in estimate of environmental rehabilitation obligation, and right of recovery receivable and payable | — | 162 | 167 | |||||||||||
| Strike related costs | (223) | — | — | |||||||||||
| Service entity (costs)/income | 55 | (85) | (59) | |||||||||||
| Non-recurring COVID-19 costs | — | (2) | (3) | |||||||||||
| Other | (177) | (800) | (1,622) | |||||||||||
| Disaggregated line items presented: | ||||||||||||||
| Other costs | (1,430) | (1,543) | (3,018) | |||||||||||
| Other income | 727 | 466 | 764 | |||||||||||
1.3 Restatement of accumulated profit and non-controlling interest (NCI)
On 10 January 2020, Sibanye-Stillwater announced that it had exercised its option to subscribe for additional ordinary shares of DRDGOLD to attain a 50.1% shareholding in DRDGOLD. The exercise of this option increased Sibanye-Stillwater’s holding in DRDGOLD from 265,000,000 shares to 433,158,944 shares. The exercise price amounted to R1,086 million for the subscription. This transaction was recognised in the Sibanye-Stillwater’s group financial statements for the year ended 31 December 2020.
The subsequent increase in the DRDGOLD shareholding was accounted for as a transaction with shareholders and accounted for in equity. The purchase of the additional shares by the Group was recognised as a dilution of the NCI amounting to R220 million. In determining the attributable NCI adjustment, management identified that they incorrectly classified the consideration paid for the share subscription to the owners of the parent and therefore excluded this consideration paid from the net asset value of DRDGOLD used in determining the NCI. Since the NCI ultimately shares in the proportionate interest of the net assets of DRDGOLD, the NCI’s should also share in the cash arising from the share subscription.
The impact of this error resulted in a classification difference between NCI and equity attributable to the owners of Sibanye-Stillwater of R544 million. Therefore, the transaction with DRDGOLD shareholders disclosed in the financial statements for the year ended 31 December 2020 should have been an increase in NCI of R324 million rather than a decrease of R220 million. Accordingly, as at 31 December 2020 and 31 December 2021, management restated the accumulated profit and NCI by R544 million, respectively.
This error has no impact on any condensed consolidated income statements, condensed consolidated statements of other comprehensive income and cash flows. Although this error has no impact on the condensed consolidated statements of financial position at 31 December 2021 and 30 June 2022, as presented in these condensed consolidated provisional financial statements, it has a restatement impact on the 31 December 2020 and 31 December 2021 comprehensive statements of financial position included in the Group annual financial report.
Sibanye-Stillwater Operating and financial results | Six months and year ended 31 December 2022 29
2. Revenue
The Group’s sources of revenue are:
| Figures in million - SA rand | Six months ended | Year ended | ||||||||||||||||||
| Unaudited | Unaudited | Unaudited | Unaudited | Unaudited | ||||||||||||||||
| Dec 2022 | June 2022 | Dec 2021 | Dec 2022 | Dec 2021 | ||||||||||||||||
| Gold mining activities | 11,861 | 5,981 | 15,051 | 17,842 | 28,358 | |||||||||||||||
PGM mining activities1 | 39,017 | 45,342 | 46,194 | 84,359 | 102,099 | |||||||||||||||
| Battery Metals activities | 967 | 2,173 | — | 3,140 | — | |||||||||||||||
| Recycling activities | 15,949 | 16,318 | 21,296 | 32,267 | 40,710 | |||||||||||||||
Stream1 | 97 | 241 | 366 | 338 | 625 | |||||||||||||||
Toll treatment arrangement2 | — | 105 | 345 | 105 | 521 | |||||||||||||||
| Total revenue from contracts with customers | 67,891 | 70,160 | 83,252 | 138,051 | 172,313 | |||||||||||||||
Adjustments relating to sales of PGM concentrate3 | 18 | 219 | (1,011) | 237 | (119) | |||||||||||||||
| Total revenue | 67,909 | 70,379 | 82,241 | 138,288 | 172,194 | |||||||||||||||
1 The difference between revenue from PGM mining activities above and total revenue from PGM mining activities per the segment report relates to the separate disclosure of revenue from the gold and palladium streaming arrangement with Wheaton Precious Metals International (Wheaton International)(Wheaton Stream) in the above as well as the separate disclosure of revenue related to adjustments on the sales of PGM concentrate and the toll treatment arrangement entered into by Marikana (refer footnote 2 below). Revenue relating to the Wheaton Stream is incorporated in the Group corporate segment as described in the segment report (refer note 17)
2 This relates to revenue recognised in respect of a toll treatment arrangement entered into by Marikana during 2021. This arrangement concluded on 31 December 2021 and toll treatment revenue recognised for the year ended 31 December 2022 represents revenue earned for the processing of material received before 31 December 2021
3 These adjustments relate to provisional pricing arrangements resulting in subsequent changes to the amount of revenue recognised
Revenue per geographical region of the relevant operations:
| Figures in million - SA rand | Six months ended | Year ended | ||||||||||||||||||
| Unaudited | Unaudited | Unaudited | Unaudited | Unaudited | ||||||||||||||||
| Dec 2022 | June 2022 | Dec 2021 | Dec 2022 | Dec 2021 | ||||||||||||||||
| Southern Africa | 45,267 | 44,240 | 52,463 | 89,507 | 113,512 | |||||||||||||||
| United States | 21,675 | 23,966 | 29,778 | 45,641 | 58,682 | |||||||||||||||
| Europe | 967 | 2,173 | — | 3,140 | — | |||||||||||||||
| Total revenue | 67,909 | 70,379 | 82,241 | 138,288 | 172,194 | |||||||||||||||
Percentage of revenue per segment based on the geographical location of customers purchasing from the Group:
| Six months ended | Year ended | ||||||||||||||||
| Unaudited | Unaudited | Unaudited | Unaudited | Unaudited | |||||||||||||
| Dec 2022 | June 2022 | Dec 2021 | Dec 2022 | Dec 2021 | |||||||||||||
| Gold | ||
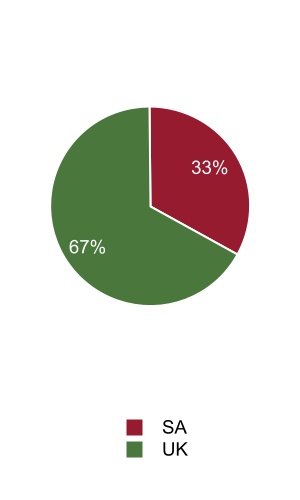
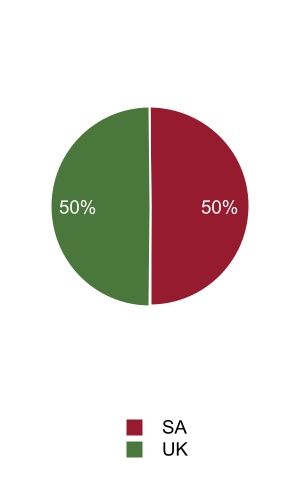
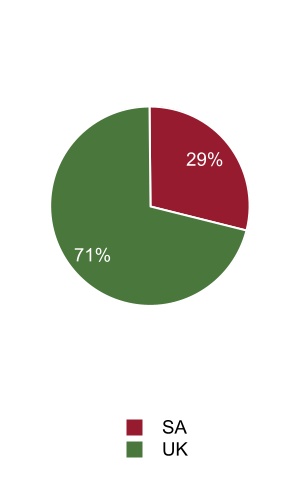

| Dec 2022 | June 2022 | Dec 2021 | Dec 2022 | Dec 2021 | |||||||||||||
| PGM | ||
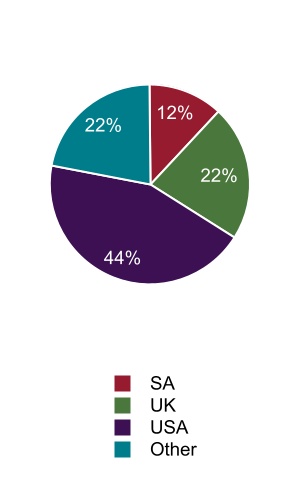
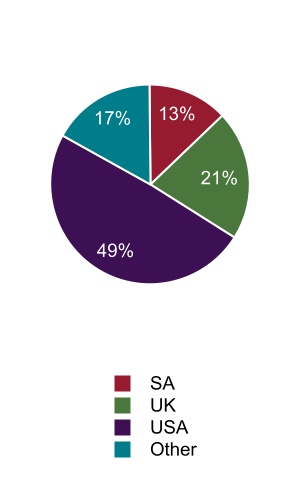
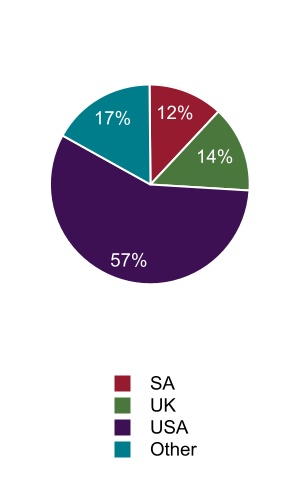
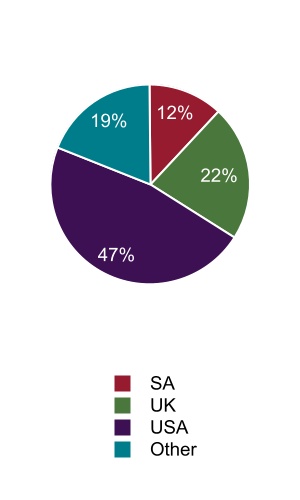
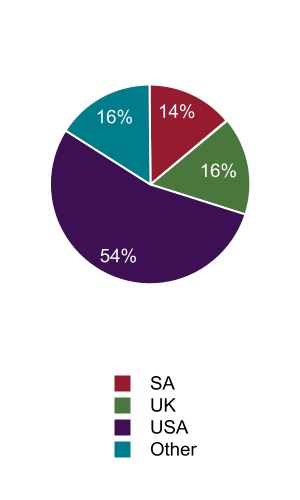
Sibanye-Stillwater Operating and financial results | Six months and year ended 31 December 2022 30
| Six months ended | Year ended | ||||||||||||||||
| Unaudited | Unaudited | Unaudited | Unaudited | Unaudited | |||||||||||||
| Dec 2022 | June 2022 | Dec 2021 | Dec 2022 | Dec 2021 | |||||||||||||
| Battery metals | ||
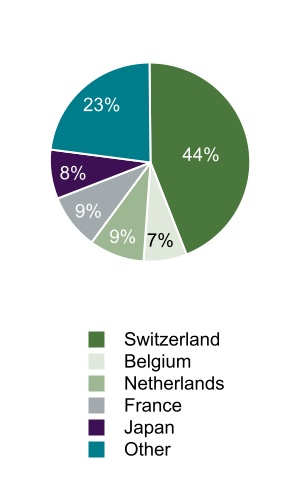
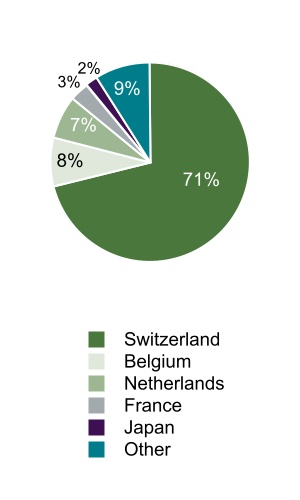
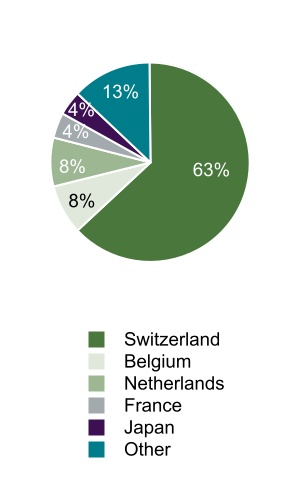
Revenue generated per product:
| Figures in million - SA rand | Six months ended | Year ended | ||||||||||||||||||
| Unaudited | Unaudited | Unaudited | Unaudited | Unaudited | ||||||||||||||||
| Dec 2022 | June 2022 | Dec 2021 | Dec 2022 | Dec 2021 | ||||||||||||||||
| Gold | 12,287 | 6,525 | 15,671 | 18,812 | 29,533 | |||||||||||||||
| PGMs | 52,278 | 58,792 | 63,922 | 111,070 | 137,958 | |||||||||||||||
| Platinum | 8,817 | 9,009 | 10,059 | 17,826 | 21,238 | |||||||||||||||
| Palladium | 19,540 | 22,735 | 25,216 | 42,275 | 52,859 | |||||||||||||||
| Rhodium | 22,124 | 25,042 | 26,685 | 47,166 | 59,828 | |||||||||||||||
| Iridium | 1,152 | 1,328 | 1,233 | 2,480 | 2,694 | |||||||||||||||
| Ruthenium | 645 | 678 | 729 | 1,323 | 1,339 | |||||||||||||||
| Chrome | 1,675 | 1,806 | 1,227 | 3,481 | 2,259 | |||||||||||||||
Nickel1 | 1,540 | 2,765 | 811 | 4,305 | 1,420 | |||||||||||||||
Other2 | 129 | 491 | 610 | 620 | 1,024 | |||||||||||||||
| Total revenue | 67,909 | 70,379 | 82,241 | 138,288 | 172,194 | |||||||||||||||
1 For the year ended 31 December 2022, Nickel includes R870 million Nickel salts (R419 million and R451 million for the six months ended 31 December 2022 and six months ended 30 June 2022, respectively) and R2,020 million Nickel metal (R424 million and R1,596 million for the six months ended 31 December 2022 and six months ended 30 June 2022, respectively) sold from the Battery metals operations. The remaining Nickel is sold from the Group's SA PGM and US PGM operations
2 Other primarily includes revenue from silver, cobalt and copper sales. For the year and six months ended 31 December 2022, revenue from the Marikana toll treatment arrangement of R105 million and Rnil, respectively is included (R105 million and R345 million for the six months ended 30 June 2022 and six months ended 31 December 2021, respectively, and R521 million for the year ended 31 December 2021)
3. Finance expense
| Figures in million - SA rand | Six months ended | Year ended | ||||||||||||||||||
| Unaudited | Unaudited | Unaudited | Unaudited | Unaudited | ||||||||||||||||
| Notes | Dec 2022 | June 2022 | Dec 2021 | Dec 2022 | Dec 2021 | |||||||||||||||
| Interest charge on: | ||||||||||||||||||||
| Borrowings — interest | 11 | (515) | (531) | (337) | (1,046) | (801) | ||||||||||||||
| - US$600 million revolving credit facility (RCF) | (34) | (28) | (15) | (62) | (113) | |||||||||||||||
| - R5.5 billion RCF | (40) | (115) | (36) | (155) | (66) | |||||||||||||||
| - 2022 and 2025 Notes | — | — | (187) | — | (523) | |||||||||||||||
| - 2026 and 2029 Notes | (441) | (388) | (99) | (829) | (99) | |||||||||||||||
| Borrowings — unwinding of amortised cost | 11 | (116) | (100) | (184) | (216) | (302) | ||||||||||||||
| - 2022 and 2025 Notes | — | — | (112) | — | (169) | |||||||||||||||
| - 2026 and 2029 Notes | (36) | (32) | (8) | (68) | (8) | |||||||||||||||
| - Burnstone Debt | (80) | (68) | (64) | (148) | (125) | |||||||||||||||
| Lease liabilities | (14) | (17) | (14) | (31) | (29) | |||||||||||||||
| Environmental rehabilitation obligation | (309) | (302) | (310) | (611) | (615) | |||||||||||||||
| Occupational healthcare obligation | (45) | (40) | (39) | (85) | (77) | |||||||||||||||
| Rustenburg deferred payment | 13.1 | (92) | (174) | (63) | (266) | (158) | ||||||||||||||
| Marikana dividend obligation | (76) | (89) | (58) | (165) | (87) | |||||||||||||||
| Deferred revenue | (172) | (154) | (151) | (326) | (309) | |||||||||||||||
| Other | (39) | (55) | (79) | (94) | (118) | |||||||||||||||
| Total finance expense | (1,378) | (1,462) | (1,235) | (2,840) | (2,496) | |||||||||||||||
Sibanye-Stillwater Operating and financial results | Six months and year ended 31 December 2022 31
4. Loss on financial instruments
| Figures in million - SA rand | Six months ended | Year ended | ||||||||||||||||||
| Unaudited | Unaudited | Unaudited | Unaudited | Unaudited | ||||||||||||||||
| Notes | Dec 2022 | June 2022 | Dec 2021 | Dec 2022 | Dec 2021 | |||||||||||||||
Fair value (loss)/gain on palladium hedge contract1 | (150) | (91) | 550 | (241) | 234 | |||||||||||||||
Fair value loss on share-based payment obligations2 | (1,860) | (295) | (713) | (2,155) | (1,264) | |||||||||||||||
| Loss on the revised cash flow of the Rustenburg deferred payment | 13.1 | (773) | — | (4,658) | (773) | (4,653) | ||||||||||||||
| Loss on the revised cash flow of the Burnstone Debt | 11 | (776) | — | (2) | (776) | (2) | ||||||||||||||
| Loss on the revised cash flow of the Marikana dividend obligation | (625) | (25) | (468) | (650) | (468) | |||||||||||||||
| Fair value gain on other investments | 129 | 23 | — | 152 | — | |||||||||||||||
| Other | 175 | (11) | (146) | 164 | (126) | |||||||||||||||
| Total loss on financial instruments | (3,880) | (399) | (5,437) | (4,279) | (6,279) | |||||||||||||||
1 On 17 January 2020, Stillwater Mining Company (wholly owned subsidiary of Sibanye-Stillwater) concluded a palladium hedge agreement which commenced on 28 February 2020, comprising the delivery of 240,000 ounces of palladium over two years (10,000 ounces per month) with a zero cost collar which establishes a minimum and a maximum cap of US$1,500 and US$3,400 per ounce, respectively. The hedge agreement concluded on 31 January 2022. On 24 March 2021, Stillwater Mining Company concluded an additional palladium hedge agreement commencing on 28 February 2022, comprising the delivery of 140,000 ounces of palladium over a fourteen month period (10,000 ounces per month) with a zero cost collar which establishes a minimum floor and a maximum cap of US$1,800 and US$3,300 per ounce, respectively. As hedge accounting is not applied, resulting gains or losses are accounted for as gains or losses on financial instruments in profit or loss
2 The fair value loss relates to the cash-settled share-based payment obligations in respect of the Rustenburg operation B-BBEE transaction and the Marikana B-BBEE transaction (refer note 12)
5. Reversal of impairments/(impairments)
The Group performed its annual impairment testing for goodwill and cash-generating units (CGUs) where impairment indicators were present at
31 December 2022. The below table is a breakdown of the reversal of impairment/(impairments) recognised for each period ended.
31 December 2022. The below table is a breakdown of the reversal of impairment/(impairments) recognised for each period ended.
| Figures in million - SA rand | Six months ended | Year ended | ||||||||||||||||||
| Unaudited | Unaudited | Unaudited | Unaudited | Unaudited | ||||||||||||||||
| Dec 2022 | June 2022 | Dec 2021 | Dec 2022 | Dec 2021 | ||||||||||||||||
| Impairment of mining assets | (1) | — | (5,148) | (1) | (5,148) | |||||||||||||||
| Other reversal of impairment | 7 | — | — | 7 | — | |||||||||||||||
| Total reversal of impairments/(impairments) | 6 | — | (5,148) | 6 | (5,148) | |||||||||||||||
Group impairment assumptions
The annual life-of-mine plan, used in the annual impairment assessment, takes into account the following:
•Proved and probable ore reserves of the CGUs
•Cash flows based on the life-of-mine plan
•Sustaining capital expenditure estimates over the life-of-mine plan
The Group's estimates and assumptions used in the 31 December 2022 calculations include:
| Gold operations | PGM operations | Battery Metals | ||||||||||||||||||
| Unaudited | Unaudited | Unaudited | Unaudited | Unaudited | ||||||||||||||||
| Dec 2022 | Dec 2021 | Dec 2022 | Dec 2021 | Dec 2022 | ||||||||||||||||
Average gold price1 | R/kg | 869,035 | 773,398 | |||||||||||||||||
Average PGM (4E) basket price1 | R/4Eoz | 27,566 | 24,422 | |||||||||||||||||
Average PGM (2E) basket price1 | US$/2Eoz | 1,334 | 1,180 | |||||||||||||||||
Average nickel price1 | US$/lbs | 8.3 | ||||||||||||||||||
Average cobalt price1 | US$/lbs | 22.1 | ||||||||||||||||||
Nominal discount rate — South Africa2, 3 | % | 13.9 - 15.8 | 11.5 - 13.5 | 22.5 - 22.6 | 20.0 | |||||||||||||||
Nominal discount rate — United States3 | % | 12.9 | 8.3 | |||||||||||||||||
Nominal discount rate — Europe3 | % | 9.8 | ||||||||||||||||||
Inflation rate — South Africa4 | % | 6.5 | 6.0 | 6.5 | 6.0 | |||||||||||||||
Inflation rate — United States4 | % | 4.0 | 2.0 | |||||||||||||||||
Inflation rate — Europe4 | % | 2.5 | ||||||||||||||||||
Life-of-mine5 | years | 4 - 10 | 4 - 9 | 15 - 49 | 17 - 50 | 24 | ||||||||||||||
1 The average prices and the exchange rate were derived by considering various bank and commodity broker consensus forecasts. The average gold price used in the impairment assessment of the Burnstone project was R793,473/kg (2021: R729,270/kg) and on the Mimosa equity-accounted joint venture was R25,420/4Eoz (2021: R21,943/4Eoz)
2 Nominal discount rate for the Burnstone project is 17.4% (2021: 15.3%) and for the equity-accounted joint venture Mimosa, 30.7% (2021: 24.4%)
3 The nominal discount rate is calculated as the weighted average cost of capital of the respective CGUs
4 The inflation rate is based on historical mining inflation, projected electricity and labour cost increases and the forecast inflation rate of each region
5 Periods longer than five years are considered appropriate based on the nature of the operations since a formally approved life-of-mine plan is used to determine cash flows over the life of each mine based on the available reserves
Results of impairment assessments for the Group's gold operations, PGM operations, battery metals operations and goodwill allocated to CGUs
No impairment was identified for the Group's gold, PGM and battery metals CGUs or any CGUs with allocated goodwill. Sufficient headroom exists for all CGUs with allocated goodwill. Management believes that currently there are no reasonably possible changes in the assumptions used to assess impairment, which would lead to an impairment for any CGUs with allocated goodwill.
Sibanye-Stillwater Operating and financial results | Six months and year ended 31 December 2022 32
6. Mining and income tax
| Figures in million - SA rand | Six months ended | Year ended | ||||||||||||||||||
| Unaudited | Unaudited | Unaudited | Unaudited | Unaudited | ||||||||||||||||
| Dec 2022 | June 2022 | Dec 2021 | Dec 2022 | Dec 2021 | ||||||||||||||||
Tax on profit before tax at maximum South African statutory company tax rate (28%)1 | (2,782) | (5,031) | (3,689) | (7,813) | (13,316) | |||||||||||||||
| South African gold mining tax formula rate adjustment | 77 | (58) | 16 | 19 | 63 | |||||||||||||||
| US statutory tax rate adjustment | 32 | 149 | (44) | 181 | 466 | |||||||||||||||
| Deferred tax rate differentials | 16 | — | — | 16 | — | |||||||||||||||
| Non-deductible amortisation and depreciation | 43 | (45) | (6) | (2) | (13) | |||||||||||||||
| Non-taxable dividend received | 4 | — | 7 | 4 | 7 | |||||||||||||||
| Non-deductible finance expense | (104) | (92) | (46) | (196) | (108) | |||||||||||||||
| Non-deductible share-based payments | (3) | (4) | (15) | (7) | (42) | |||||||||||||||
| Non-deductible loss on fair value of financial instruments | (906) | (70) | (868) | (976) | (1,021) | |||||||||||||||
| Non-taxable gain on foreign exchange differences | 15 | 7 | 48 | 22 | 47 | |||||||||||||||
| Non-taxable share of results of equity-accounted investees | 145 | 215 | 164 | 360 | 557 | |||||||||||||||
| Non-taxable reversal of impairments/(non-deductible impairments) | 1 | — | (22) | 1 | (22) | |||||||||||||||
| Non-deductible transaction costs | (76) | — | (39) | (76) | (69) | |||||||||||||||
| Tax adjustment in respect of prior periods | — | (35) | 439 | (35) | 386 | |||||||||||||||
| Net other non-taxable income and non-deductible expenditure | 140 | 16 | 286 | 156 | 351 | |||||||||||||||
| Change in estimated deferred tax rate | (270) | 323 | 141 | 53 | 86 | |||||||||||||||
Unrecognised deferred tax assets recognised or utilised/(deferred tax assets unrecognised or derecognised)2 | 372 | (1,003) | (1,069) | (631) | (1,133) | |||||||||||||||
| Mining and income tax | (3,296) | (5,628) | (4,697) | (8,924) | (13,761) | |||||||||||||||
| Effective tax rate | 33 | % | 31 | % | 36 | % | 32 | % | 29 | % | ||||||||||
1 The corporate income tax rate applicable to Sibanye-Stillwater and its South African subsidiaries will change to 27% from 1 January 2023
2 The amount for the year ended 31 December 2022 mainly includes deferred tax assets not recognised at Sibanye Gold Proprietary Limited (SGL) and the Cooke operations of R962 million during the six months ended 30 June 2022 and R255 million for the six months ended 31 December 2022 related to the Burnstone project, which is offset by previously derecognised deferred tax assets recognised at SGL of R644 million during the six months ended 31 December 2022. The amounts for the six months and year ended 31 December 2021 include the derecognition of deferred tax assets of R837 million relating to deductible temporary differences, that can no longer be recognised due to the impairment of the mining assets in the SA gold operations
7. Earnings per share
7.1 Basic earnings per share
| Six months ended | Year ended | |||||||||||||||||||
| Unaudited | Unaudited | Unaudited | Unaudited | Unaudited | ||||||||||||||||
| Dec 2022 | June 2022 | Dec 2021 | Dec 2022 | Dec 2021 | ||||||||||||||||
| Ordinary shares in issue (’000) | 2,830,370 | 2,830,019 | 2,808,406 | 2,830,370 | 2,808,406 | |||||||||||||||
| Adjustment for weighting of ordinary shares in issue (’000) | (173) | (8,114) | 45,089 | (4,285) | 90,398 | |||||||||||||||
| Adjusted weighted average number of shares (’000) | 2,830,197 | 2,821,905 | 2,853,495 | 2,826,085 | 2,898,804 | |||||||||||||||
| Profit attributable to owners of Sibanye-Stillwater (SA rand million) | 6,380 | 12,016 | 8,218 | 18,396 | 33,054 | |||||||||||||||
| Basic earnings per share (EPS) (cents) | 225 | 426 | 288 | 651 | 1,140 | |||||||||||||||
7.2 Diluted earnings per share
Potential ordinary shares arising from the equity-settled share-based payment scheme resulted in a dilution for the six month periods ended 30 June 2022 and 31 December 2021 as well as the 12 month periods ended 31 December 2022 and 31 December 2021.
| Six months ended | Year ended | |||||||||||||||||||
| Unaudited | Unaudited | Unaudited | Unaudited | Unaudited | ||||||||||||||||
| Dec 2022 | June 2022 | Dec 2021 | Dec 2022 | Dec 2021 | ||||||||||||||||
| Weighted average number of shares | ||||||||||||||||||||
| Adjusted weighted average number of shares (’000) | 2,830,197 | 2,821,905 | 2,853,495 | 2,826,085 | 2,898,804 | |||||||||||||||
| Potential ordinary shares - equity-settled share plan (’000) | 584 | 9,003 | 23,399 | 4,696 | 28,442 | |||||||||||||||
| Diluted weighted average number of shares (’000) | 2,830,781 | 2,830,908 | 2,876,894 | 2,830,781 | 2,927,246 | |||||||||||||||
| Diluted earnings per share (DEPS) (cents) | 225 | 424 | 286 | 650 | 1,129 | |||||||||||||||
Sibanye-Stillwater Operating and financial results | Six months and year ended 31 December 2022 33
7.3 Headline earnings per share
| Figures in million - SA rand unless otherwise stated | Six months ended | Year ended | ||||||||||||||||||
| Unaudited | Unaudited | Unaudited | Unaudited | Unaudited | ||||||||||||||||
| Dec 2022 | June 2022 | Dec 2021 | Dec 2022 | Dec 2021 | ||||||||||||||||
| Profit attributable to owners of Sibanye-Stillwater | 6,380 | 12,016 | 8,218 | 18,396 | 33,054 | |||||||||||||||
| Gain on disposal of property, plant and equipment | (68) | (94) | (30) | (162) | (36) | |||||||||||||||
| (Reversal of impairments)/impairments | (6) | — | 5,148 | (6) | 5,148 | |||||||||||||||
| Derecognition of property, plant and equipment in Marathon project | — | — | — | — | 2 | |||||||||||||||
| Loss/(gain) on deconsolidation of subsidiary | 309 | (1) | — | 308 | — | |||||||||||||||
| Foreign exchange movement recycled through profit or loss | (13) | (1) | — | (14) | — | |||||||||||||||
| Profit on sale of Lonmin Canada | (145) | — | — | (145) | — | |||||||||||||||
| Profit on sale of St Helena Hospital | — | — | (16) | — | (16) | |||||||||||||||
| Taxation effect of remeasurement items | 23 | 13 | (1,275) | 36 | (1,274) | |||||||||||||||
| Re-measurement items, attributable to non-controlling interest | 4 | 5 | — | 9 | — | |||||||||||||||
| Headline earnings | 6,484 | 11,938 | 12,045 | 18,422 | 36,878 | |||||||||||||||
| Adjusted weighted average number of shares (’000) | 2,830,197 | 2,821,905 | 2,853,495 | 2,826,085 | 2,898,804 | |||||||||||||||
| Headline EPS (cents) | 229 | 423 | 422 | 652 | 1,272 | |||||||||||||||
7.4 Diluted headline earnings per share
| Figures in million - SA rand unless otherwise stated | Six months ended | Year ended | ||||||||||||||||||
| Unaudited | Unaudited | Unaudited | Unaudited | Unaudited | ||||||||||||||||
| Dec 2022 | June 2022 | Dec 2021 | Dec 2022 | Dec 2021 | ||||||||||||||||
| Headline earnings | 6,484 | 11,938 | 12,045 | 18,422 | 36,878 | |||||||||||||||
| Diluted weighted average number of shares (’000) | 2,830,781 | 2,830,908 | 2,876,894 | 2,830,781 | 2,927,246 | |||||||||||||||
| Diluted headline EPS (cents) | 229 | 422 | 419 | 651 | 1,260 | |||||||||||||||
8. Dividends
Dividend policy
The Group’s dividend policy is to return between 25% to 35% of normalised earnings to shareholders and after due consideration of future requirements the dividend may be increased beyond these levels. The Board, therefore, considers normalised earnings in determining what value will be distributed to shareholders. The Board believes normalised earnings provides useful information to investors regarding the extent to which results of operations may affect shareholder returns. Normalised earnings is defined as earnings attributable to the owners of Sibanye-Stillwater excluding gains and losses on financial instruments and foreign exchange differences, impairments, gain/loss on disposal of property, plant and equipment, occupational healthcare expenses, restructuring costs, transactions costs, share-based payment expenses on B-BBEE transactions, gains on acquisitions, net other business development costs, share of results of equity-accounted investees, all after tax and the impact of non-controlling interest, and changes in the estimated deferred tax rate.
In line with Sibanye-Stillwater’s Capital Allocation Framework, the Board of Directors resolved to declare a final dividend of 122 (2021: 187) SA cents per share. Together with the interim dividend of 138 (2021: 292) SA cents per share, which was declared and paid, this brings the total dividend for the year ended 31 December 2022 to 260 (2021: 479) SA cents per share and this amounts to a payout of 35% (2021: 35%) of normalised earnings.
| Figures in million - SA rand | Six months ended | Year ended | ||||||||||||||||||
| Unaudited | Unaudited | Unaudited | Unaudited | Unaudited | ||||||||||||||||
| Dec 2022 | June 2022 | Dec 2021 | Dec 2022 | Dec 2021 | ||||||||||||||||
| Profit attributable to the owners of Sibanye-Stillwater | 6,380 | 12,016 | 8,218 | 18,396 | 33,054 | |||||||||||||||
| Adjusted for: | ||||||||||||||||||||
| Loss on financial instruments | 3,880 | 399 | 5,437 | 4,279 | 6,279 | |||||||||||||||
| Gain on foreign exchange differences | (476) | (140) | (1,527) | (616) | (1,149) | |||||||||||||||
| Gain on disposal of property, plant and equipment | (68) | (94) | (30) | (162) | (36) | |||||||||||||||
| (Reversal of impairments)/impairments | (6) | — | 5,148 | (6) | 5,148 | |||||||||||||||
| Restructuring costs | 327 | 36 | 69 | 363 | 107 | |||||||||||||||
| Transaction costs | 44 | 108 | 102 | 152 | 140 | |||||||||||||||
| Occupational healthcare (gain)/expense | (186) | (25) | 10 | (211) | (14) | |||||||||||||||
| Loss due to dilution of interest in joint operation | — | — | 2 | — | 4 | |||||||||||||||
| Early redemption premium on the 2025 Notes | — | — | 196 | — | 196 | |||||||||||||||
| Loss/(gain) on deconsolidation of subsidiary | 309 | (1) | — | 308 | — | |||||||||||||||
| Profit on sale of Lonmin Canada | (145) | — | — | (145) | — | |||||||||||||||
| Profit on sale of St Helena Hospital | — | — | (16) | — | (16) | |||||||||||||||
| Change in estimated deferred tax rate | 270 | (323) | (141) | (53) | (86) | |||||||||||||||
| Share of results of equity-accounted investees after tax | (517) | (770) | (585) | (1,287) | (1,989) | |||||||||||||||
| Tax effect of the items adjusted above | 20 | (53) | (2,413) | (33) | (2,755) | |||||||||||||||
| Non-controlling interest effect of the items listed above | 7 | 29 | 2 | 36 | — | |||||||||||||||
Normalised earnings1 | 9,839 | 11,182 | 14,472 | 21,021 | 38,883 | |||||||||||||||
1 Non-IFRS measures such as normalised earnings as defined and reconciled above, are the responsibility of the Group's Board of Directors and are presented for illustration purposes only, and because of its nature, normalised earnings should not be considered as a representation of financial performance under IFRS
Sibanye-Stillwater Operating and financial results | Six months and year ended 31 December 2022 34
9. Other investments
The movement in the other investments balance for the period includes the below. The remainder of the movement is primarily due to fair value adjustments at period end.
Investment in Verkor S.A. (Verkor)
During February 2022, the Group entered into a term sheet whereby the Group, through its wholly-owned subsidiary, Sibanye Battery Metals Proprietary Limited, invested in Verkor by subscribing for a €25 million convertible bond. Verkor is a French Gigafactory project aiming to enter the European battery materials market as a manufacturer of low-carbon footprint batteries for application in electric vehicles and large-scale stationary storage markets. The Group subscribed for the convertible bond on 22 March 2022 amounting to R409 million, and subject to early repayment events, will be redeemable in full on 30 June 2024. The convertible bond is recognised as an investment and measured at fair value, with net gains and losses recognised in profit or loss. The fair value of the investment at 31 December 2022 amounted to R554 million (30 June 2022: R432 million) with R145 million recognised as a fair value gain for the year ended 31 December 2022 (R122 million and R23 million gain recognised for the six months ended 31 December 2022 and 30 June 2022, respectively).
10. Acquisitions
10.1 Keliber asset acquisition
On 23 February 2021, Keliber Oy (Keliber) and the Group entered into an investment agreement that enables Keliber to significantly advance its lithium project in Central Ostrobothnia, Finland. The Keliber project consists of several advanced stage lithium spodumene deposits, with significant exploration upside potential in close proximity to the existing project. The project includes the development of a chemical plant in Kokkola, at 66 kilometres from the mining area, which will produce battery grade lithium hydroxide.
Under the investment agreement, the Group made an initial phased equity investment of €30 million for an approximate 30% equity shareholding into Keliber. In the first tranche the Group subscribed for shares in Keliber for €15 million and simultaneously, on the same terms as Sibanye-Stillwater’s €30 million phased investment, a further €10 million equity issuance was offered to the existing Keliber shareholders, which was fully subscribed. The investment agreement allows the Group to finance development work of a further €15 million in two tranches over a twelve-month period. The second tranche subscription payment was made on 16 September 2021.
The investment in Keliber resulting from the €15 million subscription in the first tranche and the €10 million in the second tranche was treated as an equity accounted associate from 17 March 2021, being the date on which the closing conditions on the first tranche subscription were met. The first and second tranche subscriptions resulted in an aggregate 26.6% shareholding as at 31 December 2021, which allowed for representation on the board of Keliber as well as significant involvement in the technical committee of the company. The transaction was entered into at fair value, and the difference between the net asset value and the fair value paid by the Group was attributed to the mineral reserve.
On 14 March 2022, the Group made payment for the third tranche of the initial phased equity investment in Keliber. The subscription price amounted to €5 million for an additional 125,000 shares in Keliber, resulting in an aggregate shareholding of approximately 30% at the time of subscription. Upon subscribing for the third tranche of the initial equity investment in Keliber during March 2022, the Group's pre-emptive right to obtain a majority shareholding (50% plus one share) and majority board representation in Keliber became exercisable.
Since the Group obtained substantive ability to acquire a majority shareholding in Keliber upon subscription for the third tranche share investment, management concluded that control was obtained at the time of subscription. At the date of acquisition, Keliber did not meet the definition of a business in terms of IFRS 3 Business Combinations (IFRS 3), and is therefore accounted for as an asset acquisition. Since the Group had already obtained control over Keliber with the third tranche subscription, subsequent share subscriptions are accounted for directly in equity as transactions with non-controlling shareholders on their respective effective dates.
Allocation of purchase consideration
Since the acquisition is outside the scope of IFRS 3, the purchase consideration was allocated to identifiable assets and liabilities based on their relative fair values. Assets and liabilities that are initially measured at an amount other than cost, such as financial instruments recognised at fair value, were recognised at their respective carrying amounts as specified in the applicable accounting standards. The functional currency of Keliber is Euro.
The below table summarises the value of the consideration paid and non-controlling interests recognised at the date of acquisition:
| Figures in million - SA rand | ||||||||
| Unaudited | ||||||||
| Jun 2022 | ||||||||
Consideration (30.3%)1 | 530 | |||||||
| Gross value of allocated purchase consideration | 1,749 | |||||||
| Non-controlling interest recognised (69.7%) | 1,219 | |||||||
1 The consideration is determined as the carrying value of the equity accounted investment at 14 March 2022 (i.e. the effective date) of R446 million and the cost of the €5 million third tranche payment made on the effective date amounting to R84 million. Net cash of R261 million was acquired at the effective date
Sibanye-Stillwater Operating and financial results | Six months and year ended 31 December 2022 35
The following table summarises the allocation of the gross purchase consideration to identifiable assets and liabilities:
| Figures in million - SA rand | ||||||||
| Unaudited | ||||||||
| Jun 2022 | ||||||||
| Property, plant and equipment | 1,481 | |||||||
| Right-of-use assets | 31 | |||||||
| Other receivables — non-current | 2 | |||||||
| Trade and other receivables | 31 | |||||||
| Cash and cash equivalents | 345 | |||||||
| Borrowings | (30) | |||||||
| Cash-settled share-based payment obligations | (14) | |||||||
| Lease liabilities | (32) | |||||||
| Other payables — non-current | (2) | |||||||
| Trade and other payables | (63) | |||||||
| Total purchase consideration allocated on relative fair value basis | 1,749 | |||||||
Subsequent shareholder transactions
On 30 June 2022, Sibanye-Stillwater announced its intention to exercise the pre-emptive right, and subsequently exercised this right on 29 July 2022 for a cash consideration of €146 million (Pre-emptive Offer). On 30 June 2022, the Group also made a voluntary cash offer to minority shareholders of Keliber, other than the Finnish Minerals Group, to increase its shareholding in Keliber to over 80% (Voluntary Offer) if taken up by all shareholders. The Voluntary Offer was subject to certain conditions and only considered to be accepted if the relevant shareholder completes a share transfer form. The Voluntary Offer was completed on 3 October 2022 at a total cost of €192 million (including transfer tax of €2 million). The table below illustrates the impact of the attribution of the NCI on accumulated profit of the Group as a result of the subsequent transactions with shareholders:
| Figures in million - SA rand | ||||||||
| Unaudited | ||||||||
| Dec 2022 | ||||||||
| Pre-emptive Offer | ||||||||
Cash consideration paid to Keliber for share subscription1 | (2,476) | |||||||
Cash attributed to NCI2 | 1,238 | |||||||
Reattribution of equity3 | 349 | |||||||
| Adjustment to accumulated profit | (889) | |||||||
| Voluntary Offer | ||||||||
| Cash consideration paid to NCI shareholders | (3,363) | |||||||
Reattribution of equity3 | 1,530 | |||||||
| Adjustment to accumulated profit | (1,833) | |||||||
| The net effect on equity attributable to the owners of Sibanye-Stillwater is summarised as follows: | ||||||||
| Accumulated profit impact — Pre-emptive Offer | (889) | |||||||
| Accumulated profit impact — Voluntary Offer | (1,833) | |||||||
Net effect due to foreign currency translation, share subscription costs and put options4 | (106) | |||||||
Total effect on accumulated profit as a result of the subsequent NCI transactions5 | (2,828) | |||||||
1 The cash consideration paid for the Pre-emptive Offer is consolidated in the Group. The full reattribution is recognised in equity and is a non-cash transaction for the Group
2 Since the NCI shares in a proportionate interest of the net assets of Keliber, the cash consideration paid for the Pre-emptive Offer is proportionally allocated to the NCI
3 This is the reattribution of the net asset value of Keliber as a result of the change in shareholding
4 The put options relate to rights held by shareholders holding approximately 1% in the share capital of Keliber to sell their shareholding to the Group at fair value less 10%
5 The Group's effective shareholding in Keliber following the Pre-emptive Offer, Voluntary Offer and impact of the put options was 85.90% at 31 December 2022
10.2 Sandouville business combination
On 30 July 2021, Sibanye-Stillwater announced that it had entered into an exclusive put option agreement (Put Option) with French mining group Eramet SA (Eramet) for the acquisition of 100% of the Sandouville nickel hydrometallurgical processing facility (Sandouville), located in Normandy, France. The Sandouville facility is situated in the industrial heart of Europe at Le Havre, France’s second largest industrial port, with strategic access to extensive logistical infrastructure including shipping, rail and key motorways, supporting any future supply into the European end user markets.
The transaction is the second step in the Group's battery metals strategy, building on the investment in the Keliber lithium hydroxide project, in partnership with the State of Finland and the Finnish Minerals Group, announced in February 2021. The Sandouville site is a polyvalent facility which is already zoned for heavy industrial purposes. The site is scaleable for nickel, cobalt and lithium battery grade products, and will enable the Group to further advance its battery metals strategy and recycling activities.
On 4 November 2021, following the signing of the exclusive Put Option, Sibanye-Stillwater announced that the Share Purchase Agreement (SPA) had been signed to acquire 100% of Sandouville. The signature of the SPA followed the successful completion of the information-consultation process with the employee representative bodies of Sandouville and Eramet, who rendered a favourable opinion of the transaction. The transaction also received the key regulatory approvals of the South African Reserve Bank and clearance from the French Foreign Investment Control Office. The remaining conditions in respect of the acquisition were fulfilled on 4 February 2022, the effective acquisition date.
Sandouville’s financial results were consolidated from the effective date. For the eleven months ended 31 December 2022, the Sandouville operations contributed revenue of R3,140 million and a net loss of R635 million to the Group’s results. Sandouville’s pro forma revenue and net loss would have been R3,324 million and R691 million, respectively, had the acquisition been effective from 1 January 2022. In determining these amounts, management has assumed that the fair value adjustments, determined provisionally, that arose on the date of acquisition would have been the same if the acquisition had occurred on 1 January 2022. The functional currency of Sandouville is Euro.
The purchase price allocation (PPA) was prepared on a provisional basis in accordance with IFRS 3 for, amongst others, property, plant and equipment, contingent liabilities, provisions, as well as any deferred tax implications at 30 June 2022. No new information was obtained by 31 December 2022, and the PPA is considered to be final.
Sibanye-Stillwater Operating and financial results | Six months and year ended 31 December 2022 36
Consideration
The fair value of the consideration is as follows:
| Figures in million - SA rand | ||||||||
| Unaudited | ||||||||
| Jun 2022 | ||||||||
Cash1 | 1,501 | |||||||
| Total consideration | 1,501 | |||||||
1 The cash consideration is made up of an initial payment on 4 February 2022 of EUR81 million (R1,390 million) and an additional payment of EUR6 million (R111 million) on 11 May 2022
Acquisition related costs
The Group incurred total acquisition related costs of R27 million for the year ended 31 December 2022 (R2 million for the six months ended 31 December 2022, R25 million for the six months ended 30 June 2022 and R28 million for the six months ended 31 December 2021) on advisory and legal fees. These costs are recognised as transaction costs in profit or loss during the period in which incurred.
Identified assets acquired and liabilities assumed
The following table summarises the recognised amounts of assets acquired and liabilities assumed at the acquisition date:
| Figures in million - SA rand | ||||||||
| Unaudited | ||||||||
| Jun 2022 | ||||||||
| Property, Plant and equipment | 1,257 | |||||||
| Right-of-use assets | 78 | |||||||
| Intangible assets | 83 | |||||||
| Other receivables — non-current | 11 | |||||||
| Inventories | 601 | |||||||
| Trade and other receivables | 104 | |||||||
Cash and cash equivalents1 | 108 | |||||||
| Tax receivable | 3 | |||||||
| Lease liabilities | (88) | |||||||
| Environmental rehabilitation obligation and other provisions | (97) | |||||||
| Other payables — non-current | (164) | |||||||
| Borrowings | (9) | |||||||
| Trade and other payables | (409) | |||||||
Fair value of identifiable net assets acquired2 | 1,478 | |||||||
1 The transaction results in net cash paid of R1,393 million as a result of cash and cash equivalents acquired of R108 million and cash consideration paid of R1,501 million
2 Fair value of assets and liabilities were determined as follows:
•The fair value of property, plant and equipment was based on an income approach consisting of a discounted cash flow model, as well as considering the depreciated replacement cost of the plant
•Lease liabilities and right-of-use assets approximate fair value, based on an assessment of the present value of the remaining lease payments at the effective date of the transaction using a market related discount rate
•Intangible assets includes software, patents, trademarks and customer relationships acquired from Eramet SA. The majority of the asset value is attributable to the customer relationships acquired and trademarks, which were valued based on the discounted future cash flows of commission contracts
•Inventories approximate fair value, based on the short inventory cycle and an assessment of net realisable value
•Trade and other receivables and trade and other payables approximate fair value due to their short-term nature
•The fair value of the decommissioning obligation is calculated on a discounted cash flow model considering the cost of decommissioning of the plant
•Borrowings approximate fair value based on an assessment of the discounted future cash flows at the effective date using a market related discount rate
Goodwill
Goodwill arising from the business combination has been recognised as follows:
| Figures in million - SA rand | ||||||||
| Unaudited | ||||||||
| Jun 2022 | ||||||||
| Consideration | 1,501 | |||||||
| Fair value of identifiable net assets acquired | (1,478) | |||||||
Goodwill1 | 23 | |||||||
1 The goodwill is attributable to the premium paid for the synergies and benefits expected to be derived from implementing the Group's battery metals strategy. None of the goodwill amount is deductible for tax purposes
Sibanye-Stillwater Operating and financial results | Six months and year ended 31 December 2022 37
11. Borrowings
| Figures in million - SA rand | Six months ended | Year ended | ||||||||||||||||||
| Unaudited | Unaudited | Unaudited | Unaudited | Unaudited | ||||||||||||||||
| Notes | Dec 2022 | June 2022 | Dec 2021 | Dec 2022 | Dec 2021 | |||||||||||||||
| Balance at beginning of the period | 20,887 | 20,298 | 17,188 | 20,298 | 18,383 | |||||||||||||||
| Borrowings acquired on acquisition of subsidiaries | 10 | — | 39 | — | 39 | — | ||||||||||||||
| Loans raised | 2,500 | 5,500 | 18,426 | 8,000 | 20,622 | |||||||||||||||
US$600 million RCF1 | — | — | — | — | 703 | |||||||||||||||
R5.5 billion RCF2 | 2,500 | 5,500 | — | 8,000 | — | |||||||||||||||
2026 and 2029 Notes3 | — | — | 18,208 | — | 18,208 | |||||||||||||||
Other borrowings4 | — | — | 218 | — | 1,711 | |||||||||||||||
| Loans repaid | (2,502) | (5,501) | (17,305) | (8,003) | (20,252) | |||||||||||||||
US$600 million RCF1 | — | — | (6,244) | — | (7,728) | |||||||||||||||
R5.5 billion RCF2 | (2,500) | (5,500) | — | (8,000) | — | |||||||||||||||
Other borrowings4 | (2) | (1) | (221) | (3) | (1,684) | |||||||||||||||
| 2022 and 2025 Notes | — | — | (10,840) | — | (10,840) | |||||||||||||||
| Early redemption premium on the 2025 Notes | — | — | 196 | — | 196 | |||||||||||||||
| Unwinding of loans recognised at amortised cost | 3 | 116 | 100 | 184 | 216 | 302 | ||||||||||||||
| Accrued interest | 3 | 515 | 531 | 337 | 1,046 | 801 | ||||||||||||||
| Accrued interest paid | (516) | (545) | (255) | (1,061) | (706) | |||||||||||||||
| 2022 and 2025 Notes | — | — | (204) | — | (527) | |||||||||||||||
| 2026 and 2029 Notes | (442) | (402) | — | (844) | — | |||||||||||||||
| R5.5 billion and US$600 million RCFs | (74) | (143) | (51) | (217) | (179) | |||||||||||||||
| Loss on the revised cash flow of the Burnstone Debt | 4 | 776 | — | 2 | 776 | 2 | ||||||||||||||
| Loss on foreign exchange differences and foreign currency translation | 952 | 465 | 1,525 | 1,417 | 950 | |||||||||||||||
| Balance at end of the period | 22,728 | 20,887 | 20,298 | 22,728 | 20,298 | |||||||||||||||
1 During the six months ended 31 December 2021, Sibanye-Stillwater extended the maturity date for all of its lenders to 5 April 2023
2 During the year ended 31 December 2021, the Group extended the R5.5 billion RCF maturity date, which matures 11 November 2024
3 On 16 November 2021, the Group completed a two-tranche corporate bond offering of 4.0% Notes (US$675 million) due 16 November 2026 (the 2026 Notes) and 4.5% Notes (US$525 million) due 16 November 2029 (the 2029 Notes) (together the 2026 and 2029 Notes). At 31 December 2021, the portion of transaction costs accrued for and not yet settled amounted to R29 million
4 Other borrowings consist mainly of overnight facilities and borrowings acquired on acquisition of Keliber and Sandouville
Borrowings consist of:
| Figures in million - SA rand | ||||||||||||||||||||
| Unaudited | Unaudited | Unaudited | ||||||||||||||||||
| Dec 2022 | June 2022 | Dec 2021 | ||||||||||||||||||
US$600 million RCF1,2 | — | — | — | |||||||||||||||||
R5.5 billion RCF1,2 | — | — | — | |||||||||||||||||
| 2026 and 2029 Notes | 20,140 | 19,229 | 18,785 | |||||||||||||||||
| Burnstone Debt | 2,540 | 1,611 | 1,507 | |||||||||||||||||
| Other borrowings | 48 | 47 | 6 | |||||||||||||||||
| Borrowings | 22,728 | 20,887 | 20,298 | |||||||||||||||||
| Current portion of borrowings | (122) | (115) | (107) | |||||||||||||||||
| Non-current borrowings | 22,606 | 20,772 | 20,191 | |||||||||||||||||
1 These facilities are both undrawn at 31 December 2022 and at the date of this report
2 The US$600 million RCF and the R5.5 billion RCF are affected by the LIBOR reform which came into effect on 1 January 2021. The R5.5 billion RCF is linked to JIBAR and is not drawn down, however the JIBAR is only expected to be impacted by the reform at a later stage and any impact thereof is to be considered when this occurs. The US$600 million RCF is linked to a US LIBOR, however the Group is in process to refinance this facility (refer note 16.2). Therefore, the Group was not impacted when the amendment became effective and no significant impact is expected on the condensed consolidated provisional financial statements for the year ended 31 December 2022
11.1 Capital management
Debt maturity
The following are contractually due, undiscounted cash flows resulting from maturities of borrowings, including interest payments:
| Figures in million - SA rand | ||||||||||||||||||||
| Total | Within one year | Between one and two years | Between two and three years | Between three and five years | After five years | |||||||||||||||
| 31 December 2022 | ||||||||||||||||||||
| - Capital | ||||||||||||||||||||
| 2026 and 2029 Notes | 20,436 | — | — | — | 11,495 | 8,941 | ||||||||||||||
| Burnstone Debt | 132 | — | 25 | 107 | — | — | ||||||||||||||
| Other borrowings | 47 | 15 | 7 | 4 | 8 | 13 | ||||||||||||||
| - Interest | 13,412 | 862 | 865 | 868 | 1,344 | 9,473 | ||||||||||||||
Sibanye-Stillwater Operating and financial results | Six months and year ended 31 December 2022 38
Net cash to adjusted EBITDA
| Figures in million - SA rand | Rolling 12 months | |||||||||||||||||||
| Unaudited | Unaudited | Unaudited | ||||||||||||||||||
| Dec 2022 | June 2022 | Dec 2021 | ||||||||||||||||||
Borrowings1 | 20,188 | 19,276 | 18,791 | |||||||||||||||||
Cash and cash equivalents2 | 26,038 | 27,211 | 30,257 | |||||||||||||||||
Net cash3 | (5,850) | (7,935) | (11,466) | |||||||||||||||||
Adjusted EBITDA4 | 41,111 | 50,618 | 68,606 | |||||||||||||||||
Net cash to adjusted EBITDA (ratio)5 | (0.14) | (0.16) | (0.17) | |||||||||||||||||
1 Borrowings are only those borrowings that have recourse to Sibanye-Stillwater. Borrowings, therefore, exclude the Burnstone Debt
2 Cash and cash equivalents exclude cash of Burnstone
3 Net cash represents borrowings and bank overdraft less cash and cash equivalents. Borrowings are only those borrowings that have recourse to Sibanye-Stillwater and, therefore, exclude the Burnstone Debt. Net cash excludes cash of Burnstone
4 The adjusted earnings before interest, taxes, depreciation and amortisation (EBITDA) calculation is based on the definitions included in the facility agreements for compliance with the debt covenant formula, except for impact of new accounting standards and acquisitions, where the facility agreements allow the results from the acquired operations to be annualised. Adjusted EBITDA may not be comparable to similarly titled measures of other companies. Adjusted EBITDA as defined and reconciled below, is not a measure of performance under IFRS and should be considered in addition to, and not as a substitute for, other measures of financial performance and liquidity
5 Net cash to adjusted EBITDA ratio is defined as net debt as of the end of a reporting period divided by adjusted EBITDA of the 12 months ended on the same reporting date. Non-IFRS measures such as net (cash)/debt to adjusted EBITDA ratio are the responsibility of the Group’s Board of Directors and are presented for illustration purposes only, and because of its nature, net (cash)/ debt to adjusted EBITDA should not be considered as a representation of financial performance under IFRS
Reconciliation of profit before royalties, carbon tax and tax to adjusted EBITDA
| Figures in million - SA rand | Six months ended | Year ended | ||||||||||||||||||
| Unaudited | Unaudited | Unaudited | Unaudited | Unaudited | ||||||||||||||||
| Dec 2022 | June 2022 | Dec 2021 | Dec 2022 | Dec 2021 | ||||||||||||||||
| Profit before royalties, carbon tax and tax | 10,800 | 18,928 | 14,247 | 29,728 | 50,275 | |||||||||||||||
| Adjusted for: | ||||||||||||||||||||
| Amortisation and depreciation | 3,863 | 3,224 | 4,495 | 7,087 | 8,293 | |||||||||||||||
| Interest income | (614) | (589) | (578) | (1,203) | (1,202) | |||||||||||||||
| Finance expense | 1,378 | 1,462 | 1,235 | 2,840 | 2,496 | |||||||||||||||
| Share-based payments | 106 | 112 | 85 | 218 | 383 | |||||||||||||||
| Loss on financial instruments | 3,880 | 399 | 5,437 | 4,279 | 6,279 | |||||||||||||||
| Gain on foreign exchange differences | (476) | (140) | (1,527) | (616) | (1,149) | |||||||||||||||
| Share of results of equity-accounted investees after tax | (517) | (770) | (585) | (1,287) | (1,989) | |||||||||||||||
| Change in estimate of environmental rehabilitation obligation, and right of recovery receivable and payable | (71) | — | (162) | (71) | (167) | |||||||||||||||
| Gain on disposal of property, plant and equipment | (68) | (94) | (30) | (162) | (36) | |||||||||||||||
| (Reversal of impairments)/impairments | (6) | — | 5,148 | (6) | 5,148 | |||||||||||||||
| Restructuring costs | 327 | 36 | 69 | 363 | 107 | |||||||||||||||
| Transaction costs | 44 | 108 | 102 | 152 | 140 | |||||||||||||||
| IFRS 16 lease payments | (74) | (89) | (71) | (163) | (142) | |||||||||||||||
| Occupational healthcare (gain)/expense | (186) | (25) | 10 | (211) | (14) | |||||||||||||||
| Loss/(gain) on deconsolidation of subsidiary | 309 | (1) | — | 308 | — | |||||||||||||||
| Profit on sale of Lonmin Canada | (145) | — | — | (145) | — | |||||||||||||||
| Profit on sale of St Helena Hospital | — | — | (16) | — | (16) | |||||||||||||||
| Early redemption premium on the 2025 Notes | — | — | 196 | — | 196 | |||||||||||||||
| Loss due to dilution of interest in joint operation | — | — | 2 | — | 4 | |||||||||||||||
| Adjusted EBITDA | 18,550 | 22,561 | 28,057 | 41,111 | 68,606 | |||||||||||||||
12. Share-based payment obligations
The following table summarises the share-based payment obligations of the group:
| Figures in million - SA rand | ||||||||||||||
| Unaudited | Unaudited | Unaudited | ||||||||||||
| Dec 2022 | June 2022 | Dec 2021 | ||||||||||||
Cash-settled share-based payment — Rustenburg operation B-BBEE transaction1 | 3,112 | 2,127 | 2,067 | |||||||||||
Cash-settled share-based payment — Marikana B-BBEE transaction2 | 1,732 | 607 | 560 | |||||||||||
| Cash-settled share-based payment — Employee incentive scheme | 431 | 351 | 260 | |||||||||||
| Balance at the end of the period | 5,275 | 3,085 | 2,887 | |||||||||||
| Current portion of cash-settled share-based payment obligations | (284) | (252) | (58) | |||||||||||
| Non-current portion of cash-settled share-based payment obligations | 4,991 | 2,833 | 2,829 | |||||||||||
1 Included in the movement is a fair value loss of R1,189 million recognised for the year ended 31 December 2022 (R985 million and R204 million for the six months ended 31 December 2022 and 30 June 2022, respectively), offset by payments made of R144 million during the six months ended 30 June 2022. The fair value loss is recognised in total loss on financial instruments (refer note 4)
2 The movement is mainly due to a fair value loss of R965 million recognised for the year ended 31 December 2022 (R875 million and R91 million recognised for the six months ended 31 December 2022 and 30 June 2022, respectively), which is partially offset by payments made of R44 million during the six months ended 30 June 2022. The fair value loss is recognised in total loss on financial instruments (refer note 4). Also included in the movement is a cash-settled share-based payment obligation recognised of R251 million due to the deconsolidation of the Bapo Ba Mogale Local Economic Development Trust (Bapo trust). The deconsolidation was as a result of significant changes in the Bapo trust deed, which resulted in joint control over the relevant activities of the Bapo trust for the Group. The deconsolidation resulted in a total loss on deconsolidation of R309 million recognised in Other costs as detailed in profit or loss. The total loss on deconsolidation consists of the loss upon recognition of the R251 million cash-settled share-based payment obligation and the derecognition of cash and cash equivalents of R58 million held by the Bapo trust
Sibanye-Stillwater Operating and financial results | Six months and year ended 31 December 2022 39
13. Other payables
| Figures in million - SA rand | ||||||||||||||
| Unaudited | Unaudited | Unaudited | ||||||||||||
| Note | Dec 2022 | June 2022 | Dec 2021 | |||||||||||
| Rustenburg deferred payment | 13.1 | 3,518 | 2,653 | 6,920 | ||||||||||
| Contingent consideration (related to the SFA (Oxford) Limited acquisition) | — | — | 100 | |||||||||||
| Right of recovery payable | 34 | 34 | 32 | |||||||||||
| Deferred consideration (related to Pandora acquisition) | 128 | 239 | 400 | |||||||||||
Marikana dividend obligation1 | 2,129 | 1,428 | 1,539 | |||||||||||
| Other non-current payables | 582 | 531 | 373 | |||||||||||
| Other payables | 6,391 | 4,885 | 9,364 | |||||||||||
| Current portion of other payables | (3,891) | (2,856) | (4,765) | |||||||||||
| Non-current other payables | 2,500 | 2,029 | 4,599 | |||||||||||
1 Included in the movement is a fair value loss of R650 million for the year ended 31 December 2022 (R625 million and R25 million recognised for the six months ended 31 December 2022 and 30 June 2022, respectively), which is primarily as a result of an increase in the long-term PGM basket price. The movement also includes payments made of R225 million during the six months ended 30 June 2022
13.1 Rustenburg deferred payment
| Figures in million - SA rand | Six months ended | Year ended | ||||||||||||||||||
| Unaudited | Unaudited | Unaudited | Unaudited | Unaudited | ||||||||||||||||
| Notes | Dec 2022 | June 2022 | Dec 2021 | Dec 2022 | Dec 2021 | |||||||||||||||
| Balance at the beginning of the period | 2,653 | 6,920 | 2,199 | 6,920 | 4,355 | |||||||||||||||
| Interest charge | 3 | 92 | 174 | 63 | 266 | 158 | ||||||||||||||
| Payment | — | (4,441) | — | (4,441) | (2,246) | |||||||||||||||
Loss on revised estimated cash flows1 | 4 | 773 | — | 4,658 | 773 | 4,653 | ||||||||||||||
Balance at end of the period2 | 3,518 | 2,653 | 6,920 | 3,518 | 6,920 | |||||||||||||||
| Current portion of liability | (3,518) | (2,653) | (4,315) | (3,518) | (4,315) | |||||||||||||||
| Non-current portion of liability | — | — | 2,605 | — | 2,605 | |||||||||||||||
1 The loss on revised estimated cash flows is primarily as a result of actual profit compared to the 2022 life-of-mine due to the high price environment that existed in FY2022, which will impact the final payment on 30 March 2023
2 The Rustenburg deferred payment is calculated as being equal to 35% of the distributable free cash flow generated by the Rustenburg operation over a six year (1 January 2017 to 31 December 2022) period from inception (latest of transaction closing or 1 January 2017), subject to a minimum payment of R3 billion. The deferred payment liability at 31 December 2022 was calculated based on the actual distributable free cash flow of the Rustenburg operation for the year ended 31 December 2022. For prior periods, the deferred payment liability was calculated using estimated cash flow models that used several key assumptions, including estimates of future sales volumes, PGM prices, operating costs and capital expenditure
14. Fair value of financial assets and financial liabilities, and risk management
14.1 Measurement of fair value
The Group uses the following hierarchy for determining and disclosing the fair value of financial instruments:
•Level 1: unadjusted quoted prices in active markets for identical assets or liabilities
•Level 2: inputs other than quoted prices in level 1 that are observable for the asset or liability, either directly (as prices) or indirectly (derived from prices)
•Level 3: inputs for the asset or liability that are not based on observable market data (unobservable inputs)
The following table sets out the Group’s significant financial instruments measured at fair value by level within the fair value hierarchy:
| Figures in million - SA rand | |||||||||||||||||||||||||||||
| Unaudited | Unaudited | Unaudited | |||||||||||||||||||||||||||
| Dec 2022 | June 2022 | Dec 2021 | |||||||||||||||||||||||||||
| Level 1 | Level 2 | Level 3 | Level 1 | Level 2 | Level 3 | Level 1 | Level 2 | Level 3 | |||||||||||||||||||||
| Financial assets measured at fair value | |||||||||||||||||||||||||||||
Environmental rehabilitation obligation funds1 | 4,528 | 778 | — | 4,469 | 750 | — | 4,477 | 725 | — | ||||||||||||||||||||
Trade receivables — PGM concentrate sales2 | — | 3,564 | — | — | 3,570 | — | — | 3,794 | — | ||||||||||||||||||||
Other investments3 | 2,320 | — | 855 | 2,111 | — | 677 | 3,143 | — | 224 | ||||||||||||||||||||
Asset held for sale4 | — | — | — | — | — | — | — | 280 | — | ||||||||||||||||||||
Palladium hedge contract5 | — | 50 | — | — | 193 | — | — | 286 | — | ||||||||||||||||||||
1 Environmental rehabilitation obligation funds comprise a fixed income portfolio of bonds as well as fixed and notice deposits. The environmental rehabilitation obligation funds are stated at fair value based on the nature of the fund’s investments
2 The fair value for trade receivables measured at fair value through profit or loss are determined based on ruling market prices, volatilities and interest rates
3 The fair values of listed investments are based on the quoted prices available from the relevant stock exchanges. The carrying amounts of other short-term investment products with short maturity dates approximate fair value. The fair values of non-listed investments are determined through valuation techniques that include inputs that are not based on observable market data. These inputs include price/book ratios as well as marketability and minority shareholding discounts which are impacted by the size of the shareholding. The difference between other investments in the statement of financial position and the table above, relates to investments measured at amortised cost, with carrying amounts that approximate fair values
4 The fair value of the asset held for sale was derived from the quoted Generation Mining share price
5 The fair value of the palladium hedge is determined using on a Monte Carlo simulation model based on market forward prices, volatilities and interest rates
Sibanye-Stillwater Operating and financial results | Six months and year ended 31 December 2022 40
Fair value of financial instruments
The table below shows the fair value and carrying amount of financial instruments where the carrying amount does not approximate fair value:
| Figures in million - SA rand | ||||||||||||||
| Carrying value | Fair Value | |||||||||||||
| Level 1 | Level 2 | Level 3 | ||||||||||||
| 31 December 2022 (Unaudited) | ||||||||||||||
2026 and 2029 Notes1 | 20,140 | 17,379 | — | — | ||||||||||
Burnstone Debt2 | 2,540 | — | — | 2,245 | ||||||||||
| Total | 22,680 | 17,379 | — | 2,245 | ||||||||||
| 30 June 2022 (Unaudited) | ||||||||||||||
2026 and 2029 Notes1 | 19,229 | 15,965 | — | — | ||||||||||
Burnstone Debt2 | 1,611 | — | — | 2,614 | ||||||||||
| Total | 20,840 | 15,965 | — | 2,614 | ||||||||||
| 31 December 2021 (Unaudited) | ||||||||||||||
2026 and 2029 Notes1 | 18,785 | 18,664 | — | — | ||||||||||
Burnstone Debt2 | 1,507 | — | — | 2,996 | ||||||||||
| Total | 20,292 | 18,664 | — | 2,996 | ||||||||||
1 The fair value is based on the quoted market prices of the notes
2 The fair value of the Burnstone Debt has been derived from discounted cash flow models. These models use several key assumptions, including estimates of future sales volumes, Gold prices, operating costs, capital expenditure and discount rate. The Burnstone long-term gold price at 31 December 2022 was R793,473/kg (31 December 2021 and 30 June 2022: R729,270/kg) and the discount rate applied was 10.52% (30 June 2022: 5.55% and 31 December 2021: 4.18%). The fair value estimate is sensitive to changes in the key assumptions, for example, increases in the market related discount rate would decrease the fair value if all other inputs remain unchanged. The extent of the fair value changes would depend on how inputs change in relation to each other
14.2 Risk management activities
Liquidity risk: working capital and going concern assessment
For the year ended 31 December 2022, the Group realised a profit of R18,980 million (31 December 2021: R33,796 million). As at 31 December 2022 the Group’s current assets exceeded its current liabilities by R40,545 million (31 December 2021: R44,290 million) and the Group’s total assets exceeded its total liabilities by R91,004 million (31 December 2021: R81,345 million). During the year ended 31 December 2022 the Group generated net cash from operating activities of R15,543 million (31 December 2021: R32,256 million).
The Group currently has committed undrawn debt facilities of R16,403 million at 31 December 2022 (31 December 2021: R15,749 million) and cash balances of R26,076 million (31 December 2021: R30,292 million). The most immediate debt maturities are the US$600 million USD RCF maturing in April 2023 and the R5.5 billion ZAR RCF maturing in November 2024, both which was undrawn at 31 December 2022 and at the date of approval of these condensed consolidated provisional financial statements. The Group is at an advance stage to refinance (and upsize) its US$ RCF. Sibanye-Stillwater’s leverage ratio (net (cash)/debt to adjusted EBITDA) as at 31 December 2022 was (0.1):1 (31 December 2021 was (0.2):1) and its interest coverage ratio (adjusted EBITDA to net finance charges/(income)) was 93:1 (31 December 2021 was (5,281):1). Both considerably better than the maximum permitted leverage ratio of at most 2.5:1 and minimum required interest coverage ratio of 4.0:1, calculated on a quarterly basis, required under the US$600 million RCF and the R5.5 billion RCF. At the date of approving these condensed consolidated provisional financial statements there were no significant event which had a significant negative impact on the Group’s strong liquidity position.
Notwithstanding the exceptionally strong liquidity position and financial outlook, events such as the outbreak of infectious diseases or uncontrolled COVID-19 infection rates in recent history could impose restrictions on all or some of our operations. Events such as these could negatively impact the production outlook and deteriorate the Group’s forecasted liquidity position which may require the Group to further increase operational flexibility by adjusting mine plans and reducing capital expenditure. The Group could also, if necessary, consider options to increase funding flexibility which may include, amongst others, additional loan facilities or debt capital market issuances, streaming facilities, prepayment facilities or, if other options are not deemed preferable or achievable by the Board, an equity capital raise. The Group could also, with lender approval, request covenant amendments or restructure facilities. During past adversity management has successfully implemented similar actions.
Management believes that the cash forecasted to be generated by operations, cash on hand, the committed unutilised debt facilities as well as additional funding opportunities will enable the Group to continue to meet its obligations as they fall due for a period of at least eighteen months after the reporting date. The condensed consolidated provisional financial statements for the year ended 31 December 2022, therefore, have been prepared on a going concern basis.
15. Contingent liabilities
15.1 Notice from Appian Capital to commence legal proceedings
On 26 October 2021, Sibanye-Stillwater entered into share purchase agreements to acquire the Santa Rita nickel mine and Serrote copper mine (the Atlantic Nickel SPA and the MVV SPA, respectively) from affiliates of Appian Capital Advisory LLP (Appian). Subsequent to signing the agreements, Appian informed Sibanye-Stillwater that a geotechnical event occurred at the Santa Rita open pit operation. After becoming aware of the geotechnical event, Sibanye-Stillwater assessed the event and its effect and concluded that the event was and was reasonably expected to be material and adverse to the business, financial condition, results of operations, the properties, assets, liabilities or operations of Santa Rita. Accordingly, pursuant to the terms of the Atlantic Nickel SPA, on 24 January 2022, Sibanye-Stillwater gave notice of termination of the Atlantic Nickel SPA. As the MVV SPA was conditional on the closing of the Atlantic Nickel SPA, which had become impossible to satisfy, on the same date Sibanye-Stillwater also gave notice of termination of the MVV SPA.
On 27 May 2022, Appian initiated legal proceedings before the High Court of England and Wales against Sibanye-Stillwater. On 3 August 2022, the Group filed its defence. Sibanye-Stillwater’s view is that the Atlantic Nickel SPA and the MVV SPA were rightfully terminated and the Group is confident that the claim will be defended successfully. The trial is set to begin in June 2024, with the key pre-trial steps taking place over the remainder of 2023. The proceedings are in early stages and additional information and estimates of potential outcomes are unavailable.
Sibanye-Stillwater Operating and financial results | Six months and year ended 31 December 2022 41
16. Events after the reporting period
There were no events that could have a material impact on the financial results of the Group after 31 December 2022 up to the date on which the condensed consolidated provisional financial statements for the six months and year ended 31 December 2022 were authorised for issue, other than those discussed below:
16.1 Section 189A consultations
On 1 November 2022, Sibanye-Stillwater announced that it had entered into a consultation process in terms of Section 189A of the Labour Relations Act (S189) with organised labour and other affected stakeholders, regarding the possible restructuring of the Group's SA gold operations pursuant to ongoing losses experienced at the Beatrix 4 shaft and the impact of depleting mineral reserves at the Kloof 1 plant. The CCMA facilitation process concluded with the last meeting on 1 February 2023 and a close-out meeting is scheduled to be held on 28 February 2023.
16.2 Refinancing of the US$600 million RCF
Sibanye-Stillwater is in the process of refinancing its US$600 million RCF before it matures in April 2023. The new facility is planned to be a minimum of US$800 million RCF for a term of three years, with two optional 1-year extensions (3 + 1 + 1), from the effective date of the facility. The facility will be used in financing of the Group's ongoing capital expenditure, working capital and general corporate expenditure requirements, which may include the financing of future acquisitions or business combinations. The RCF will be linked to a Secured Overnight Financing Rate which is a recently effective interest rate published as part of the IBOR reform.
16.3 Off-market takeover offer for New Century Resources Limited (New Century)
On 21 February 2023, Sibanye-Stillwater announced the launch of an off-market takeover offer, through its wholly-owned subsidiary Sibanye Resources Australia Proprietary Limited, at A$1.10 cash consideration per share for all the shares in New Century that Sibanye-Stillwater does not own. Prior to the takeover offer, Sibanye-Stillwater was the largest shareholder in New Century with a shareholding of 19.9%. Sibanye-Stillwater will pay up to US$83 million should it acquire the additional shares in New Century under the takeover offer. Based on the most recent information on 27 February 2023, Sibanye-Stillwater successfully obtained a total shareholding in New Century of 52.9% at a cash consideration amounting to approximately A$48 million for the additional shares obtained. The proposed takeover is in line with the Group’s strategy to invest in the circular economy and to be a global leader in tailings retreatment and recycling.
Management is in the process of assessing Sibanye-Stillwater's control over New Century as a result of the takeover and will then start the process of identifying and measuring the assets and liabilities in accordance with IFRS 3 for, amongst others, property, plant and equipment, contingent liabilities, inventory, provisions, as well as any deferred tax implications to the extent applicable.
Sibanye-Stillwater Operating and financial results | Six months and year ended 31 December 2022 42
17. Segment reporting
Figures in million
| For the six months ended 31 Dec 2022 (Unaudited) | |||||||||||||||||||||||||||||||||||||||||||||||||||||||||||||||||||||||
| GROUP | US PGM OPERATIONS | SA OPERATIONS | Europe | GROUP | |||||||||||||||||||||||||||||||||||||||||||||||||||||||||||||||||||
| SA rand | Total | Total US PGM | Underground | Recycling | Total SA Operations | Total SA PGM | Rusten- burg | Marikana | Kroondal | Platinum Mile | Mimosa | Corporate and re- conciling items1 | Total SA gold | Drie- fontein | Kloof | Beatrix | Cooke | DRD- GOLD | Corporate and re- conciling items1 | Total Battery Metals | Sandouville | Corporate and re- conciling items1,2 | Cor- porate1 | ||||||||||||||||||||||||||||||||||||||||||||||||
| Revenue | 67,909 | 21,960 | 6,011 | 15,949 | 45,267 | 33,406 | 14,350 | 14,430 | 3,963 | 663 | 1,928 | (1,928) | 11,861 | 3,016 | 3,181 | 2,432 | 578 | 2,654 | — | 967 | 967 | — | (285) | ||||||||||||||||||||||||||||||||||||||||||||||||
| Underground | 45,437 | 6,011 | 6,011 | — | 39,711 | 31,658 | 13,265 | 14,430 | 3,963 | — | 1,928 | (1,928) | 8,053 | 2,836 | 2,826 | 2,391 | — | — | — | — | — | — | (285) | ||||||||||||||||||||||||||||||||||||||||||||||||
| Surface | 5,556 | — | — | — | 5,556 | 1,748 | 1,085 | — | — | 663 | — | — | 3,808 | 180 | 355 | 41 | 578 | 2,654 | — | — | — | — | — | ||||||||||||||||||||||||||||||||||||||||||||||||
| Recycling/processing | 16,916 | 15,949 | — | 15,949 | — | — | — | — | — | — | — | — | — | — | — | — | — | — | — | 967 | 967 | — | — | ||||||||||||||||||||||||||||||||||||||||||||||||
| Cost of sales, before amortisation and depreciation | (47,512) | (18,892) | (3,619) | (15,273) | (27,114) | (15,499) | (6,887) | (6,530) | (1,774) | (308) | (1,046) | 1,046 | (11,615) | (2,989) | (3,564) | (2,628) | (496) | (1,938) | — | (1,506) | (1,506) | — | — | ||||||||||||||||||||||||||||||||||||||||||||||||
| Underground | (26,897) | (3,619) | (3,619) | — | (23,278) | (14,575) | (6,271) | (6,530) | (1,774) | — | (1,046) | 1,046 | (8,703) | (2,852) | (3,254) | (2,597) | — | — | — | — | — | — | — | ||||||||||||||||||||||||||||||||||||||||||||||||
| Surface | (3,836) | — | — | — | (3,836) | (924) | (616) | — | — | (308) | — | — | (2,912) | (137) | (310) | (31) | (496) | (1,938) | — | — | — | — | — | ||||||||||||||||||||||||||||||||||||||||||||||||
| Recycling/processing | (16,779) | (15,273) | — | (15,273) | — | — | — | — | — | — | — | — | — | — | — | — | — | — | — | (1,506) | (1,506) | — | — | ||||||||||||||||||||||||||||||||||||||||||||||||
Net other cash costs3 | (1,847) | (83) | (83) | — | (1,610) | (924) | (11) | (507) | (82) | (168) | — | (156) | (686) | (55) | (56) | (33) | (390) | (22) | (130) | (99) | (14) | (85) | (55) | ||||||||||||||||||||||||||||||||||||||||||||||||
| Adjusted EBITDA | 18,550 | 2,985 | 2,309 | 676 | 16,543 | 16,983 | 7,452 | 7,393 | 2,107 | 187 | 882 | (1,038) | (440) | (28) | (439) | (229) | (308) | 694 | (130) | (638) | (553) | (85) | (340) | ||||||||||||||||||||||||||||||||||||||||||||||||
| Amortisation and depreciation | (3,863) | (1,379) | (1,377) | (2) | (2,387) | (1,256) | (511) | (628) | (91) | (21) | (190) | 185 | (1,131) | (482) | (311) | (242) | — | (79) | (17) | (97) | (92) | (5) | — | ||||||||||||||||||||||||||||||||||||||||||||||||
| Interest income | 614 | 143 | 74 | 69 | 471 | 207 | 21 | 101 | 60 | 22 | 84 | (81) | 264 | 45 | 36 | 23 | 19 | 155 | (14) | — | — | — | — | ||||||||||||||||||||||||||||||||||||||||||||||||
| Finance expense | (1,378) | (507) | (507) | — | (691) | (329) | (1,953) | (151) | (59) | — | (17) | 1,851 | (362) | (50) | (47) | (51) | (43) | (34) | (137) | (8) | (6) | (2) | (172) | ||||||||||||||||||||||||||||||||||||||||||||||||
| Share-based payments | (106) | (17) | (17) | — | (87) | (34) | (13) | (19) | (2) | — | — | — | (53) | (11) | (11) | (8) | — | (10) | (13) | — | — | — | (2) | ||||||||||||||||||||||||||||||||||||||||||||||||
Net other4 | (2,742) | (156) | (156) | — | (2,742) | (2,525) | (9,454) | (1,487) | 241 | 8 | (175) | 8,342 | (217) | 7 | 13 | 17 | (53) | 13 | (214) | 116 | 44 | 72 | 40 | ||||||||||||||||||||||||||||||||||||||||||||||||
Non-underlying items5 | (275) | (7) | (7) | — | (234) | (140) | 5 | (141) | 12 | — | — | (16) | (94) | 16 | (12) | (281) | (1) | — | 184 | — | — | — | (34) | ||||||||||||||||||||||||||||||||||||||||||||||||
| Royalties and carbon tax | (865) | — | — | — | (865) | (818) | (565) | (245) | (6) | — | (57) | 55 | (47) | (15) | (16) | (13) | (3) | — | — | — | — | — | — | ||||||||||||||||||||||||||||||||||||||||||||||||
| Profit before tax | 9,935 | 1,062 | 319 | 743 | 10,008 | 12,088 | (5,018) | 4,823 | 2,262 | 196 | 527 | 9,298 | (2,080) | (518) | (787) | (784) | (389) | 739 | (341) | (627) | (607) | (20) | (508) | ||||||||||||||||||||||||||||||||||||||||||||||||
| Current taxation | (4,345) | (318) | (4,023) | (3,903) | (1,766) | (1,496) | (586) | (56) | (35) | 36 | (120) | (1) | — | — | — | (106) | (13) | — | — | — | (4) | ||||||||||||||||||||||||||||||||||||||||||||||||||
| Deferred taxation | 1,049 | 202 | 886 | (364) | 37 | (354) | (48) | 1 | (92) | 92 | 1,250 | 76 | (221) | 128 | — | (79) | 1,346 | (39) | — | (39) | — | ||||||||||||||||||||||||||||||||||||||||||||||||||
| Profit/(loss) for the period | 6,639 | 946 | 6,871 | 7,821 | (6,747) | 2,973 | 1,628 | 141 | 400 | 9,426 | (950) | (443) | (1,008) | (656) | (389) | 554 | 992 | (666) | (607) | (59) | (512) | ||||||||||||||||||||||||||||||||||||||||||||||||||
| Attributable to: | |||||||||||||||||||||||||||||||||||||||||||||||||||||||||||||||||||||||
| Owners of the parent | 6,380 | 946 | 6,598 | 7,817 | (6,747) | 2,969 | 1,628 | 141 | 400 | 9,426 | (1,219) | (443) | (1,008) | (656) | (389) | 278 | 999 | (652) | (607) | (45) | (512) | ||||||||||||||||||||||||||||||||||||||||||||||||||
| Non-controlling interest holders | 259 | — | 273 | 4 | — | 4 | — | — | — | — | 269 | — | — | — | — | 276 | (7) | (14) | — | (14) | — | ||||||||||||||||||||||||||||||||||||||||||||||||||
| Sustaining capital expenditure | (2,997) | (807) | (806) | (1) | (2,129) | (1,239) | (385) | (681) | (158) | (15) | (570) | 570 | (890) | (263) | (303) | (87) | — | (237) | — | (61) | (61) | — | — | ||||||||||||||||||||||||||||||||||||||||||||||||
| Ore reserve development | (3,956) | (1,610) | (1,610) | — | (2,346) | (1,184) | (372) | (812) | — | — | — | — | (1,162) | (542) | (435) | (185) | — | — | — | — | — | — | — | ||||||||||||||||||||||||||||||||||||||||||||||||
| Growth projects | (2,802) | (815) | (815) | — | (1,432) | (520) | — | (519) | — | — | — | (1) | (912) | — | (156) | — | — | (118) | (638) | (555) | — | (555) | — | ||||||||||||||||||||||||||||||||||||||||||||||||
| Total capital expenditure | (9,755) | (3,232) | (3,231) | (1) | (5,907) | (2,943) | (757) | (2,012) | (158) | (15) | (570) | 569 | (2,964) | (805) | (894) | (272) | — | (355) | (638) | (616) | (61) | (555) | — | ||||||||||||||||||||||||||||||||||||||||||||||||
Sibanye-Stillwater Operating and financial results | Six months and year ended 31 December 2022 43
| For the six months ended 31 Dec 2022 (Unaudited) | |||||||||||||||||||||||||||||||||||||||||||||||||||||||||||||||||||||||
| GROUP | US PGM OPERATIONS | SA OPERATIONS | Europe | GROUP | |||||||||||||||||||||||||||||||||||||||||||||||||||||||||||||||||||
US dollars6 | Total | Total US PGM | Underground | Recycling | Total SA Operations | Total SA PGM | Rusten- burg | Marikana | Kroondal | Platinum Mile | Mimosa | Corporate and re- conciling items1 | Total SA gold | Drie- fontein | Kloof | Beatrix | Cooke | DRD- GOLD | Corporate and re- conciling items1 | Total Battery Metals | Sandouville | Corporate and re- conciling items1,2 | Cor- porate1 | ||||||||||||||||||||||||||||||||||||||||||||||||
| Revenue | 3,878 | 1,248 | 337 | 911 | 2,595 | 1,893 | 820 | 811 | 225 | 38 | 109 | (110) | 702 | 179 | 190 | 147 | 34 | 152 | — | 51 | 51 | — | (16) | ||||||||||||||||||||||||||||||||||||||||||||||||
| Underground | 2,595 | 337 | 337 | — | 2,274 | 1,792 | 757 | 811 | 225 | — | 109 | (110) | 482 | 168 | 169 | 145 | — | — | — | — | — | — | (16) | ||||||||||||||||||||||||||||||||||||||||||||||||
| Surface | 321 | — | — | — | 321 | 101 | 63 | — | — | 38 | — | — | 220 | 11 | 21 | 2 | 34 | 152 | — | — | — | — | — | ||||||||||||||||||||||||||||||||||||||||||||||||
| Recycling/processing | 962 | 911 | — | 911 | — | — | — | — | — | — | — | — | — | — | — | — | — | — | — | 51 | 51 | — | — | ||||||||||||||||||||||||||||||||||||||||||||||||
| Cost of sales, before amortisation and depreciation | (2,721) | (1,079) | (207) | (872) | (1,558) | (881) | (395) | (368) | (102) | (18) | (60) | 62 | (677) | (174) | (207) | (156) | (29) | (111) | — | (84) | (84) | — | — | ||||||||||||||||||||||||||||||||||||||||||||||||
| Underground | (1,544) | (207) | (207) | — | (1,337) | (828) | (360) | (368) | (102) | — | (60) | 62 | (509) | (166) | (189) | (154) | — | — | — | — | — | — | — | ||||||||||||||||||||||||||||||||||||||||||||||||
| Surface | (221) | — | — | — | (221) | (53) | (35) | — | — | (18) | — | — | (168) | (8) | (18) | (2) | (29) | (111) | — | — | — | — | — | ||||||||||||||||||||||||||||||||||||||||||||||||
| Recycling/processing | (956) | (872) | — | (872) | — | — | — | — | — | — | — | — | — | — | — | — | — | — | — | (84) | (84) | — | — | ||||||||||||||||||||||||||||||||||||||||||||||||
Net other cash costs3 | (112) | (5) | (5) | — | (98) | (56) | (2) | (30) | (5) | (9) | — | (10) | (42) | (3) | (3) | (2) | (23) | (2) | (9) | (6) | (1) | (5) | (3) | ||||||||||||||||||||||||||||||||||||||||||||||||
| Adjusted EBITDA | 1,045 | 164 | 125 | 39 | 939 | 956 | 423 | 413 | 118 | 11 | 49 | (58) | (17) | 2 | (20) | (11) | (18) | 39 | (9) | (39) | (34) | (5) | (19) | ||||||||||||||||||||||||||||||||||||||||||||||||
| Amortisation and depreciation | (224) | (79) | (79) | — | (140) | (72) | (29) | (37) | (5) | (1) | (11) | 11 | (68) | (28) | (19) | (15) | — | (5) | (1) | (5) | (5) | — | — | ||||||||||||||||||||||||||||||||||||||||||||||||
| Interest income | 35 | 9 | 5 | 4 | 26 | 11 | 2 | 6 | 4 | 1 | 5 | (7) | 15 | 3 | 2 | 1 | 1 | 9 | (1) | — | — | — | — | ||||||||||||||||||||||||||||||||||||||||||||||||
| Finance expense | (78) | (29) | (29) | — | (38) | (17) | (109) | (9) | (4) | — | (1) | 106 | (21) | (3) | (3) | (3) | (2) | (2) | (8) | (1) | (1) | — | (10) | ||||||||||||||||||||||||||||||||||||||||||||||||
| Share-based payments | (6) | (1) | (1) | — | (5) | (2) | (1) | (1) | (1) | — | — | 1 | (3) | — | (1) | (1) | — | — | (1) | — | — | — | — | ||||||||||||||||||||||||||||||||||||||||||||||||
Net other4 | (170) | (9) | (9) | — | (170) | (157) | (578) | (91) | 15 | — | (9) | 506 | (13) | 1 | 1 | 1 | (3) | 1 | (14) | 6 | 2 | 4 | 3 | ||||||||||||||||||||||||||||||||||||||||||||||||
Non-underlying items5 | (15) | — | — | — | (13) | (7) | 1 | (8) | 1 | — | — | (1) | (6) | 1 | (1) | (17) | — | — | 11 | — | — | — | (2) | ||||||||||||||||||||||||||||||||||||||||||||||||
| Royalties and carbon tax | (49) | — | — | — | (49) | (46) | (32) | (13) | (1) | — | (3) | 3 | (3) | (1) | (1) | (1) | — | — | — | — | — | — | — | ||||||||||||||||||||||||||||||||||||||||||||||||
| Profit before tax | 538 | 55 | 12 | 43 | 550 | 666 | (323) | 260 | 127 | 11 | 30 | 561 | (116) | (25) | (42) | (46) | (22) | 42 | (23) | (39) | (38) | (1) | (28) | ||||||||||||||||||||||||||||||||||||||||||||||||
| Current taxation | (246) | (18) | (228) | (221) | (103) | (83) | (33) | (3) | (2) | 3 | (7) | — | — | — | — | (6) | (1) | — | — | — | — | ||||||||||||||||||||||||||||||||||||||||||||||||||
| Deferred taxation | 67 | 12 | 57 | (18) | 5 | (20) | (3) | — | (5) | 5 | 75 | 4 | (13) | 7 | — | (5) | 82 | (2) | — | (2) | — | ||||||||||||||||||||||||||||||||||||||||||||||||||
| Profit/(loss) for the period | 359 | 49 | 379 | 427 | (421) | 157 | 91 | 8 | 23 | 569 | (48) | (21) | (55) | (39) | (22) | 31 | 58 | (41) | (38) | (3) | (28) | ||||||||||||||||||||||||||||||||||||||||||||||||||
| Attributable to: | |||||||||||||||||||||||||||||||||||||||||||||||||||||||||||||||||||||||
| Owners of the parent | 344 | 49 | 363 | 427 | (421) | 157 | 91 | 8 | 23 | 569 | (64) | (21) | (55) | (39) | (22) | 15 | 58 | (40) | (38) | (2) | (28) | ||||||||||||||||||||||||||||||||||||||||||||||||||
| Non-controlling interest holders | 15 | — | 16 | — | — | — | — | — | — | — | 16 | — | — | — | — | 16 | — | (1) | — | (1) | — | ||||||||||||||||||||||||||||||||||||||||||||||||||
| Sustaining capital expenditure | (175) | (47) | (47) | — | (125) | (73) | (22) | (40) | (10) | (1) | (34) | 34 | (52) | (16) | (18) | (5) | — | (13) | — | (3) | (3) | — | — | ||||||||||||||||||||||||||||||||||||||||||||||||
| Ore reserve development | (232) | (93) | (93) | — | (139) | (69) | (22) | (47) | — | — | — | — | (70) | (33) | (26) | (11) | — | — | — | — | — | — | — | ||||||||||||||||||||||||||||||||||||||||||||||||
| Growth projects | (167) | (48) | (48) | — | (85) | (30) | — | (30) | — | — | — | — | (55) | — | (9) | — | — | (8) | (38) | (34) | — | (34) | — | ||||||||||||||||||||||||||||||||||||||||||||||||
| Total capital expenditure | (574) | (188) | (188) | — | (349) | (172) | (44) | (117) | (10) | (1) | (34) | 34 | (177) | (49) | (53) | (16) | — | (21) | (38) | (37) | (3) | (34) | — | ||||||||||||||||||||||||||||||||||||||||||||||||
1Corporate and reconciling items represent the items to reconcile segment data to condensed consolidated financial statement totals. This does not represent a separate segment as it does not generate revenue. Group corporate includes the Wheaton Stream transaction and corporate transaction costs
2Corporate and reconciling items for Battery Metals includes a net loss of R143 million for Keliber
3Net other cash costs consist of service entity and sundry income (R167 million) and other costs as detailed in profit or loss, excluding the loss on deconsolidation of the Bapo Trust (R309 million) and include lease payments (R74 million) to conform with the adjusted EBITDA reconciliation disclosed in note 11.1
4Net other consists of loss on financial instruments, loss on foreign exchange differences as detailed in profit or loss, change in estimate of environmental rehabilitation obligation, and right of recovery receivable and payable (income of R71 million) and the add back of the lease payment referred to in footnote 3 above. Corporate and reconciling items net other includes the share of results of equity-accounted investees after tax as detailed in profit or loss
5Non-underlying items consists of gain on disposal of property, plant and equipment, reversal of impairments, restructuring costs, and transaction costs as detailed in profit or loss and also includes profit on sale of Lonmin Canada (R145 million), loss on deconsolidation of the Bapo Trust (R309 million)and occupational healthcare income as detailed in profit or loss
6The average exchange rate for the six months ended 31 December 2022 was R17.33/US$
Sibanye-Stillwater Operating and financial results | Six months and year ended 31 December 2022 44
Figures in millions
| For the six months ended 30 Jun 2022 (Unaudited) | |||||||||||||||||||||||||||||||||||||||||||||||||||||||||||||||||||||||
| GROUP | US PGM OPERATIONS | SA OPERATIONS | Europe | GROUP | |||||||||||||||||||||||||||||||||||||||||||||||||||||||||||||||||||
| SA rand | Total | Total US PGM | Underground | Recycling | Total SA Operations | Total SA PGM | Rusten- burg | Marikana | Kroondal | Platinum Mile | Mimosa | Corporate and re- conciling items1 | Total SA gold | Drie- fontein | Kloof | Beatrix | Cooke | DRD- GOLD | Corporate and re- conciling items1 | Total Battery Metals | Sandouville2 | Corporate and re- conciling items1,3 | Cor- porate1 | ||||||||||||||||||||||||||||||||||||||||||||||||
| Revenue | 70,379 | 24,130 | 7,812 | 16,318 | 44,240 | 38,259 | 14,754 | 18,323 | 4,408 | 774 | 2,339 | (2,339) | 5,981 | 1,470 | 1,305 | 249 | 337 | 2,620 | — | 2,173 | 2,173 | — | (164) | ||||||||||||||||||||||||||||||||||||||||||||||||
| Underground | 46,888 | 7,812 | 7,812 | — | 39,240 | 36,524 | 13,793 | 18,323 | 4,408 | — | 2,339 | (2,339) | 2,716 | 1,377 | 1,098 | 241 | — | — | — | — | — | — | (164) | ||||||||||||||||||||||||||||||||||||||||||||||||
| Surface | 5,000 | — | — | — | 5,000 | 1,735 | 961 | — | — | 774 | — | — | 3,265 | 93 | 207 | 8 | 337 | 2,620 | — | — | — | — | — | ||||||||||||||||||||||||||||||||||||||||||||||||
| Recycling | 18,491 | 16,318 | — | 16,318 | — | — | — | — | — | — | — | — | — | — | — | — | — | — | — | 2,173 | 2,173 | — | — | ||||||||||||||||||||||||||||||||||||||||||||||||
| Cost of sales, before amortisation and depreciation | (47,025) | (19,560) | (3,840) | (15,720) | (25,340) | (16,781) | (6,659) | (8,073) | (1,774) | (275) | (890) | 890 | (8,559) | (2,292) | (2,817) | (1,282) | (326) | (1,842) | — | (2,125) | (2,125) | — | — | ||||||||||||||||||||||||||||||||||||||||||||||||
| Underground | (25,837) | (3,840) | (3,840) | — | (21,997) | (15,953) | (6,106) | (8,073) | (1,774) | — | (890) | 890 | (6,044) | (2,233) | (2,567) | (1,244) | — | — | — | — | — | — | — | ||||||||||||||||||||||||||||||||||||||||||||||||
| Surface | (3,343) | — | — | — | (3,343) | (828) | (553) | — | — | (275) | — | — | (2,515) | (59) | (250) | (38) | (326) | (1,842) | — | — | — | — | — | ||||||||||||||||||||||||||||||||||||||||||||||||
| Recycling | (17,845) | (15,720) | — | (15,720) | — | — | — | — | — | — | — | — | — | — | — | — | — | — | — | (2,125) | (2,125) | — | — | ||||||||||||||||||||||||||||||||||||||||||||||||
Net other cash costs4 | (793) | 49 | 49 | — | (854) | (326) | 162 | (181) | (46) | (239) | (21) | (1) | (528) | (118) | (111) | (90) | (327) | 62 | 56 | 12 | 13 | (1) | — | ||||||||||||||||||||||||||||||||||||||||||||||||
| Adjusted EBITDA | 22,561 | 4,619 | 4,021 | 598 | 18,046 | 21,152 | 8,257 | 10,069 | 2,588 | 260 | 1,428 | (1,450) | (3,106) | (940) | (1,623) | (1,123) | (316) | 840 | 56 | 60 | 61 | (1) | (164) | ||||||||||||||||||||||||||||||||||||||||||||||||
| Amortisation and depreciation | (3,224) | (1,424) | (1,422) | (2) | (1,739) | (1,162) | (470) | (577) | (89) | (19) | (152) | 145 | (577) | (239) | (158) | (63) | (3) | (97) | (17) | (61) | (61) | — | — | ||||||||||||||||||||||||||||||||||||||||||||||||
| Interest income | 589 | 166 | 7 | 159 | 422 | 195 | 22 | 113 | 49 | 8 | 18 | (15) | 227 | 23 | 21 | 12 | 16 | 110 | 45 | — | — | — | 1 | ||||||||||||||||||||||||||||||||||||||||||||||||
| Finance expense | (1,462) | (445) | (445) | — | (856) | (502) | (2,665) | (169) | (52) | — | (19) | 2,403 | (354) | (50) | (48) | (44) | (43) | (44) | (125) | (7) | (7) | — | (154) | ||||||||||||||||||||||||||||||||||||||||||||||||
| Share-based payments | (112) | (30) | (30) | — | (82) | (39) | (14) | (17) | (7) | (1) | — | — | (43) | (9) | (4) | (2) | — | (9) | (19) | — | — | — | — | ||||||||||||||||||||||||||||||||||||||||||||||||
Net other5 | 600 | (87) | (87) | — | 687 | 500 | 101 | (112) | 62 | (3) | (324) | 776 | 187 | 6 | 13 | 17 | 3 | 15 | 133 | (5) | (21) | 16 | 5 | ||||||||||||||||||||||||||||||||||||||||||||||||
Non-underlying items6 | (24) | 2 | 2 | — | 81 | 8 | 5 | 5 | (16) | — | (1) | 15 | 73 | (6) | (2) | — | (1) | 10 | 72 | — | — | — | (107) | ||||||||||||||||||||||||||||||||||||||||||||||||
| Royalties and carbon tax | (959) | — | — | — | (959) | (954) | (458) | (490) | (7) | — | (70) | 71 | (5) | (7) | (6) | 10 | (2) | — | — | — | — | — | — | ||||||||||||||||||||||||||||||||||||||||||||||||
| Profit before tax | 17,969 | 2,801 | 2,046 | 755 | 15,600 | 19,198 | 4,778 | 8,822 | 2,528 | 245 | 880 | 1,945 | (3,598) | (1,222) | (1,807) | (1,193) | (346) | 825 | 145 | (13) | (28) | 15 | (419) | ||||||||||||||||||||||||||||||||||||||||||||||||
| Current taxation | (4,937) | (337) | (4,600) | (4,470) | (1,403) | (2,270) | (702) | (74) | (173) | 152 | (130) | (5) | (3) | — | — | (120) | (2) | — | — | — | — | ||||||||||||||||||||||||||||||||||||||||||||||||||
| Deferred taxation | (691) | 113 | (804) | (968) | (627) | (339) | (12) | 7 | (46) | 49 | 164 | 8 | 37 | 26 | — | (46) | 139 | — | — | — | — | ||||||||||||||||||||||||||||||||||||||||||||||||||
| Profit/(loss) for the period | 12,341 | 2,577 | 10,196 | 13,760 | 2,748 | 6,213 | 1,814 | 178 | 661 | 2,146 | (3,564) | (1,219) | (1,773) | (1,167) | (346) | 659 | 282 | (13) | (28) | 15 | (419) | ||||||||||||||||||||||||||||||||||||||||||||||||||
| Attributable to: | |||||||||||||||||||||||||||||||||||||||||||||||||||||||||||||||||||||||
| Owners of the parent | 12,016 | 2,577 | 9,871 | 13,760 | 2,748 | 6,213 | 1,814 | 178 | 661 | 2,146 | (3,889) | (1,219) | (1,773) | (1,167) | (346) | 334 | 282 | (13) | (28) | 15 | (419) | ||||||||||||||||||||||||||||||||||||||||||||||||||
| Non-controlling interest holders | 325 | — | 325 | — | — | — | — | — | — | — | 325 | — | — | — | — | 325 | — | — | — | — | — | ||||||||||||||||||||||||||||||||||||||||||||||||||
| Sustaining capital expenditure | (1,949) | (378) | (378) | — | (1,542) | (817) | (305) | (391) | (115) | (6) | (294) | 294 | (725) | (95) | (152) | (68) | — | (410) | — | (29) | (29) | — | — | ||||||||||||||||||||||||||||||||||||||||||||||||
| Ore reserve development | (2,684) | (1,277) | (1,277) | — | (1,407) | (939) | (315) | (624) | — | — | — | — | (468) | (252) | (185) | (31) | — | — | — | — | — | — | — | ||||||||||||||||||||||||||||||||||||||||||||||||
| Growth projects | (1,511) | (530) | (530) | — | (807) | (405) | — | (405) | — | — | — | — | (402) | — | (54) | (4) | — | (6) | (338) | (174) | — | (174) | — | ||||||||||||||||||||||||||||||||||||||||||||||||
| Total capital expenditure | (6,144) | (2,185) | (2,185) | — | (3,756) | (2,161) | (620) | (1,420) | (115) | (6) | (294) | 294 | (1,595) | (347) | (391) | (103) | — | (416) | (338) | (203) | (29) | (174) | — | ||||||||||||||||||||||||||||||||||||||||||||||||
Sibanye-Stillwater Operating and financial results | Six months and year ended 31 December 2022 45
| For the six months ended 30 Jun 2022 (Unaudited) | |||||||||||||||||||||||||||||||||||||||||||||||||||||||||||||||||||||||
| GROUP | US PGM OPERATIONS | SA OPERATIONS | Europe | GROUP | |||||||||||||||||||||||||||||||||||||||||||||||||||||||||||||||||||
US dollars7 | Total | Total US PGM | Underground | Recycling | Total SA Operations | Total SA PGM | Rusten- burg | Marikana | Kroondal | Platinum Mile | Mimosa | Corporate and re- conciling items1 | Total SA gold | Drie- fontein | Kloof | Beatrix | Cooke | DRD- GOLD | Corporate and re- conciling items1 | Total Battery Metals | Sandouville2 | Corporate and re- conciling items1,3 | Cor- porate1 | ||||||||||||||||||||||||||||||||||||||||||||||||
| Revenue | 4,570 | 1,567 | 507 | 1,060 | 2,873 | 2,485 | 958 | 1,190 | 286 | 50 | 152 | (151) | 388 | 95 | 84 | 17 | 22 | 170 | — | 141 | 141 | — | (11) | ||||||||||||||||||||||||||||||||||||||||||||||||
| Underground | 3,045 | 507 | 507 | — | 2,549 | 2,373 | 896 | 1,190 | 286 | — | 152 | (151) | 176 | 89 | 71 | 16 | — | — | — | — | — | — | (11) | ||||||||||||||||||||||||||||||||||||||||||||||||
| Surface | 324 | — | — | — | 324 | 112 | 62 | — | — | 50 | — | — | 212 | 6 | 13 | 1 | 22 | 170 | — | — | — | — | — | ||||||||||||||||||||||||||||||||||||||||||||||||
| Recycling | 1,201 | 1,060 | — | 1,060 | — | — | — | — | — | — | — | — | — | — | — | — | — | — | — | 141 | 141 | — | — | ||||||||||||||||||||||||||||||||||||||||||||||||
| Cost of sales, before amortisation and depreciation | (3,054) | (1,270) | (249) | (1,021) | (1,646) | (1,090) | (432) | (524) | (115) | (18) | (58) | 57 | (556) | (149) | (183) | (83) | (21) | (120) | — | (138) | (138) | — | — | ||||||||||||||||||||||||||||||||||||||||||||||||
| Underground | (1,678) | (249) | (249) | — | (1,429) | (1,036) | (396) | (524) | (115) | — | (58) | 57 | (393) | (145) | (167) | (81) | — | — | — | — | — | — | — | ||||||||||||||||||||||||||||||||||||||||||||||||
| Surface | (217) | — | — | — | (217) | (54) | (36) | — | — | (18) | — | — | (163) | (4) | (16) | (2) | (21) | (120) | — | — | — | — | — | ||||||||||||||||||||||||||||||||||||||||||||||||
| Recycling | (1,159) | (1,021) | — | (1,021) | — | — | — | — | — | — | — | — | — | — | — | — | — | — | — | (138) | (138) | — | — | ||||||||||||||||||||||||||||||||||||||||||||||||
Net other cash costs4 | (51) | 3 | 3 | — | (55) | (21) | 11 | (12) | (3) | (16) | (1) | — | (34) | (8) | (7) | (6) | (21) | 4 | 4 | 1 | 1 | — | — | ||||||||||||||||||||||||||||||||||||||||||||||||
| Adjusted EBITDA | 1,465 | 300 | 261 | 39 | 1,172 | 1,374 | 537 | 654 | 168 | 16 | 93 | (94) | (202) | (62) | (106) | (72) | (20) | 54 | 4 | 4 | 4 | — | (11) | ||||||||||||||||||||||||||||||||||||||||||||||||
| Amortisation and depreciation | (209) | (92) | (92) | — | (113) | (76) | (31) | (37) | (6) | (1) | (10) | 9 | (37) | (16) | (10) | (4) | — | (6) | (1) | (4) | (4) | — | — | ||||||||||||||||||||||||||||||||||||||||||||||||
| Interest income | 38 | 10 | — | 10 | 28 | 14 | 1 | 7 | 3 | 1 | 1 | 1 | 14 | 1 | 1 | 1 | 1 | 7 | 3 | — | — | — | — | ||||||||||||||||||||||||||||||||||||||||||||||||
| Finance expense | (95) | (29) | (29) | — | (56) | (33) | (173) | (11) | (3) | — | (1) | 155 | (23) | (3) | (3) | (3) | (3) | (3) | (8) | — | — | — | (10) | ||||||||||||||||||||||||||||||||||||||||||||||||
| Share-based payments | (7) | (2) | (2) | — | (5) | (2) | (1) | (1) | — | — | — | — | (3) | (1) | — | — | — | (1) | (1) | — | — | — | — | ||||||||||||||||||||||||||||||||||||||||||||||||
Net other5 | 40 | (6) | (6) | — | 46 | 34 | 7 | (7) | 4 | — | (21) | 51 | 12 | — | 1 | 1 | — | 1 | 9 | — | (1) | 1 | — | ||||||||||||||||||||||||||||||||||||||||||||||||
Non-underlying items6 | (1) | — | — | — | 6 | — | — | — | (1) | — | — | 1 | 6 | — | — | — | — | 1 | 5 | — | — | — | (7) | ||||||||||||||||||||||||||||||||||||||||||||||||
| Royalties and carbon tax | (62) | — | — | — | (62) | (63) | (30) | (32) | — | — | (5) | 4 | 1 | — | — | 1 | — | — | — | — | — | — | — | ||||||||||||||||||||||||||||||||||||||||||||||||
| Profit before tax | 1,169 | 181 | 132 | 49 | 1,016 | 1,248 | 310 | 573 | 165 | 16 | 57 | 127 | (232) | (81) | (117) | (76) | (22) | 53 | 11 | — | (1) | 1 | (28) | ||||||||||||||||||||||||||||||||||||||||||||||||
| Current taxation | (321) | (22) | (299) | (291) | (91) | (147) | (46) | (5) | (11) | 9 | (8) | — | — | — | — | (8) | — | — | — | — | — | ||||||||||||||||||||||||||||||||||||||||||||||||||
| Deferred taxation | (45) | 7 | (52) | (63) | (41) | (22) | (1) | — | (3) | 4 | 11 | 1 | 2 | 2 | — | (3) | 9 | — | — | — | — | ||||||||||||||||||||||||||||||||||||||||||||||||||
| Profit/(loss) for the period | 803 | 166 | 665 | 894 | 178 | 404 | 118 | 11 | 43 | 140 | (229) | (80) | (115) | (74) | (22) | 42 | 20 | — | (1) | 1 | (28) | ||||||||||||||||||||||||||||||||||||||||||||||||||
| Attributable to: | — | ||||||||||||||||||||||||||||||||||||||||||||||||||||||||||||||||||||||
| Owners of the parent | 782 | 166 | 644 | 894 | 178 | 404 | 118 | 11 | 43 | 140 | (250) | (80) | (115) | (74) | (22) | 21 | 20 | — | (1) | 1 | (28) | ||||||||||||||||||||||||||||||||||||||||||||||||||
| Non-controlling interest holders | 21 | — | 21 | — | — | — | — | — | — | — | 21 | — | — | — | — | 21 | — | — | — | — | — | ||||||||||||||||||||||||||||||||||||||||||||||||||
| Sustaining capital expenditure | (126) | (25) | (25) | — | (99) | (52) | (20) | (25) | (7) | — | (19) | 19 | (47) | (6) | (10) | (4) | — | (27) | — | (2) | (2) | — | — | ||||||||||||||||||||||||||||||||||||||||||||||||
| Ore reserve development | (174) | (83) | (83) | — | (91) | (61) | (20) | (41) | — | — | — | — | (30) | (16) | (12) | (2) | — | — | — | — | — | — | — | ||||||||||||||||||||||||||||||||||||||||||||||||
| Growth projects | (97) | (34) | (34) | — | (52) | (26) | — | (26) | — | — | — | — | (26) | — | (4) | — | — | — | (22) | (11) | — | (11) | — | ||||||||||||||||||||||||||||||||||||||||||||||||
| Total capital expenditure | (397) | (142) | (142) | — | (242) | (139) | (40) | (92) | (7) | — | (19) | 19 | (103) | (22) | (26) | (6) | — | (27) | (22) | (13) | (2) | (11) | — | ||||||||||||||||||||||||||||||||||||||||||||||||
1Corporate and reconciling items represent the items to reconcile segment data to condensed consolidated financial statement totals. This does not represent a separate segment as it does not generate revenue. Group corporate includes the Wheaton Stream transaction and corporate transaction costs
2The Battery Metals results for the six months ended 30 June 2022 includes the results of Sandouville for the five months since acquisition (refer note 10.2)
3Corporate and reconciling items for Battery Metals includes Keliber since the effective date of acquisition (refer note 10.1)
4Net other cash costs consist of service entity and sundry income (R726 million) and other costs as detailed in profit or loss and include lease payments (R89 million) to conform with the adjusted EBITDA reconciliation disclosed in note 11.1
5Net other consists of loss on financial instruments, loss on foreign exchange differences as detailed in profit or loss and the add back of the lease payment referred to in footnote 4 above. Corporate and reconciling items net other includes the share of results of equity-accounted investees after tax as detailed in profit or loss
6Non-underlying items consists of gain on disposal of property, plant and equipment, impairments, restructuring costs and transaction costs as detailed in profit or loss and also includes non-cash gain on deregistration of subsidiary in the Group (R1 million)and occupational healthcare income as detailed in profit or loss
7The average exchange rate for the six months ended 30 June 2022 was R15.40/US$
Sibanye-Stillwater Operating and financial results | Six months and year ended 31 December 2022 46
Figures are in millions
| For the six months ended 31 Dec 2021 (Unaudited) | ||||||||||||||||||||||||||||||||||||||||||||||||||||||||||||||
| GROUP | US PGM OPERATIONS | SA OPERATIONS | GROUP | |||||||||||||||||||||||||||||||||||||||||||||||||||||||||||
| SA rand | Total | Total US PGM | Underground | Recycling | Total SA Operations | Total SA PGM | Rusten- burg | Marikana | Kroondal | Platinum Mile | Mimosa | Corporate and re- conciling items1 | Total SA gold | Drie- fontein | Kloof | Beatrix | Cooke | DRD- GOLD | Corporate and re- conciling items1 | Cor- porate1 | ||||||||||||||||||||||||||||||||||||||||||
| Revenue | 82,241 | 29,918 | 8,622 | 21,296 | 52,463 | 37,412 | 13,740 | 19,251 | 3,679 | 743 | 1,674 | (1,675) | 15,051 | 4,254 | 4,772 | 3,048 | 479 | 2,498 | — | (140) | ||||||||||||||||||||||||||||||||||||||||||
| Underground | 55,248 | 8,622 | 8,622 | — | 46,766 | 35,476 | 12,547 | 19,251 | 3,679 | — | 1,674 | (1,675) | 11,290 | 4,056 | 4,293 | 2,941 | — | — | — | (140) | ||||||||||||||||||||||||||||||||||||||||||
| Surface | 5,697 | — | — | — | 5,697 | 1,936 | 1,193 | — | — | 743 | — | — | 3,761 | 198 | 479 | 107 | 479 | 2,498 | — | — | ||||||||||||||||||||||||||||||||||||||||||
| Recycling | 21,296 | 21,296 | — | 21,296 | — | — | — | — | — | — | — | — | — | — | — | — | — | — | — | — | ||||||||||||||||||||||||||||||||||||||||||
| Cost of sales, before amortisation and depreciation | (52,860) | (24,755) | (4,216) | (20,539) | (28,105) | (16,367) | (5,952) | (8,328) | (1,785) | (303) | (813) | 814 | (11,738) | (3,056) | (3,961) | (2,561) | (408) | (1,752) | — | — | ||||||||||||||||||||||||||||||||||||||||||
| Underground | (28,802) | (4,216) | (4,216) | — | (24,586) | (15,539) | (5,427) | (8,328) | (1,785) | — | (813) | 814 | (9,047) | (2,932) | (3,623) | (2,492) | — | — | — | — | ||||||||||||||||||||||||||||||||||||||||||
| Surface | (3,519) | — | — | — | (3,519) | (828) | (525) | — | — | (303) | — | — | (2,691) | (124) | (338) | (69) | (408) | (1,752) | — | — | ||||||||||||||||||||||||||||||||||||||||||
| Recycling | (20,539) | (20,539) | — | (20,539) | — | — | — | — | — | — | — | — | — | — | — | — | — | — | — | — | ||||||||||||||||||||||||||||||||||||||||||
Net other cash costs2 | (1,324) | 2 | 2 | — | (1,326) | (775) | 108 | (554) | (48) | (243) | (21) | (17) | (551) | (49) | (47) | (38) | (312) | (24) | (81) | — | ||||||||||||||||||||||||||||||||||||||||||
| Adjusted EBITDA | 28,057 | 5,165 | 4,408 | 757 | 23,032 | 20,270 | 7,896 | 10,369 | 1,846 | 197 | 840 | (878) | 2,762 | 1,149 | 764 | 449 | (241) | 722 | (81) | (140) | ||||||||||||||||||||||||||||||||||||||||||
| Amortisation and depreciation | (4,495) | (1,429) | (1,427) | (2) | (3,066) | (1,353) | (462) | (595) | (275) | (18) | (142) | 139 | (1,713) | (672) | (545) | (368) | (6) | (98) | (24) | — | ||||||||||||||||||||||||||||||||||||||||||
| Interest income | 578 | 163 | 9 | 154 | 400 | 112 | 11 | 53 | 45 | 3 | 8 | (8) | 288 | 35 | 25 | 17 | 7 | 109 | 95 | 15 | ||||||||||||||||||||||||||||||||||||||||||
| Finance expense | (1,235) | (463) | (453) | (10) | (621) | (350) | (2,217) | (192) | (62) | — | (3) | 2,124 | (271) | (51) | (44) | (41) | (34) | (30) | (71) | (151) | ||||||||||||||||||||||||||||||||||||||||||
| Share-based payments | (85) | (8) | (8) | — | (77) | (10) | (4) | (5) | (1) | — | — | — | (67) | (4) | (5) | (5) | — | (10) | (43) | — | ||||||||||||||||||||||||||||||||||||||||||
Net other3 | (3,092) | 556 | 556 | — | (3,699) | (4,958) | (12,246) | (618) | 353 | 46 | (41) | 7,548 | 1,259 | 7 | 8 | 16 | 86 | 17 | 1,125 | 51 | ||||||||||||||||||||||||||||||||||||||||||
Non-underlying items4 | (5,481) | (230) | (230) | — | (5,171) | 4 | 1 | 2 | (1) | — | — | 2 | (5,175) | (210) | (3,680) | (1,286) | (1) | — | 2 | (80) | ||||||||||||||||||||||||||||||||||||||||||
| Royalties and carbon tax | (1,073) | — | — | — | (1,073) | (975) | (512) | (458) | (6) | — | (65) | 66 | (98) | (50) | (23) | (17) | (2) | — | (6) | — | ||||||||||||||||||||||||||||||||||||||||||
| Profit before tax | 13,174 | 3,754 | 2,855 | 899 | 9,725 | 12,740 | (7,533) | 8,556 | 1,899 | 228 | 597 | 8,993 | (3,015) | 204 | (3,500) | (1,235) | (191) | 710 | 997 | (305) | ||||||||||||||||||||||||||||||||||||||||||
| Current taxation | (5,675) | (582) | (5,084) | (4,937) | (1,748) | (2,497) | (558) | (124) | (157) | 147 | (147) | (6) | (7) | (3) | — | (141) | 10 | (9) | ||||||||||||||||||||||||||||||||||||||||||||
| Deferred taxation | 978 | (150) | 1,128 | 957 | 989 | (115) | 22 | 59 | (9) | 11 | 171 | 142 | 1,163 | 221 | — | (44) | (1,311) | — | ||||||||||||||||||||||||||||||||||||||||||||
| Profit/(loss) for the period | 8,477 | 3,022 | 5,769 | 8,760 | (8,292) | 5,944 | 1,363 | 163 | 431 | 9,151 | (2,991) | 340 | (2,344) | (1,017) | (191) | 525 | (304) | (314) | ||||||||||||||||||||||||||||||||||||||||||||
| Attributable to: | ||||||||||||||||||||||||||||||||||||||||||||||||||||||||||||||
| Owners of the parent | 8,218 | 3,022 | 5,510 | 8,760 | (8,292) | 5,944 | 1,363 | 163 | 431 | 9,151 | (3,250) | 340 | (2,344) | (1,017) | (191) | 266 | (304) | (314) | ||||||||||||||||||||||||||||||||||||||||||||
| Non-controlling interest holders | 259 | — | 259 | — | — | — | — | — | — | — | 259 | — | — | — | — | 259 | — | — | ||||||||||||||||||||||||||||||||||||||||||||
| Sustaining capital expenditure | (2,469) | (294) | (290) | (4) | (2,175) | (1,352) | (387) | (787) | (164) | (14) | (299) | 299 | (823) | (213) | (352) | (113) | — | (145) | — | — | ||||||||||||||||||||||||||||||||||||||||||
| Ore reserve development | (2,954) | (772) | (772) | — | (2,182) | (832) | (315) | (516) | — | — | — | (1) | (1,350) | (614) | (489) | (247) | — | — | — | — | ||||||||||||||||||||||||||||||||||||||||||
| Growth projects | (1,731) | (1,194) | (1,194) | — | (537) | (197) | — | (197) | — | — | — | — | (340) | — | (107) | (7) | — | (38) | (188) | — | ||||||||||||||||||||||||||||||||||||||||||
| Total capital expenditure | (7,154) | (2,260) | (2,256) | (4) | (4,894) | (2,381) | (702) | (1,500) | (164) | (14) | (299) | 298 | (2,513) | (827) | (948) | (367) | — | (183) | (188) | — | ||||||||||||||||||||||||||||||||||||||||||
Sibanye-Stillwater Operating and financial results | Six months and year ended 31 December 2022 47
| For the six months ended 31 Dec 2021 (Unaudited) | ||||||||||||||||||||||||||||||||||||||||||||||||||||||||||||||
| GROUP | US PGM OPERATIONS | SA OPERATIONS | GROUP | |||||||||||||||||||||||||||||||||||||||||||||||||||||||||||
US dollars5 | Total | Total US PGM | Underground | Recycling | Total SA Operations | Total SA PGM | Rusten- burg | Marikana | Kroondal | Platinum Mile | Mimosa | Corporate and re- conciling items1 | Total SA gold | Drie- fontein | Kloof | Beatrix | Cooke | DRD- GOLD | Corporate and re- conciling items1 | Cor- porate1 | ||||||||||||||||||||||||||||||||||||||||||
| Revenue | 5,461 | 1,991 | 572 | 1,419 | 3,479 | 2,476 | 910 | 1,276 | 241 | 50 | 110 | (111) | 1,003 | 283 | 317 | 205 | 32 | 166 | — | (9) | ||||||||||||||||||||||||||||||||||||||||||
| Underground | 3,662 | 572 | 572 | — | 3,099 | 2,346 | 830 | 1,276 | 241 | — | 110 | (111) | 753 | 270 | 286 | 197 | — | — | — | (9) | ||||||||||||||||||||||||||||||||||||||||||
| Surface | 380 | — | — | — | 380 | 130 | 80 | — | — | 50 | — | — | 250 | 13 | 31 | 8 | 32 | 166 | — | — | ||||||||||||||||||||||||||||||||||||||||||
| Recycling | 1,419 | 1,419 | — | 1,419 | — | — | — | — | — | — | — | — | — | — | — | — | — | — | — | — | ||||||||||||||||||||||||||||||||||||||||||
| Cost of sales, before amortisation and depreciation | (3,521) | (1,650) | (282) | (1,368) | (1,871) | (1,089) | (397) | (553) | (119) | (20) | (54) | 54 | (782) | (203) | (263) | (172) | (28) | (116) | — | — | ||||||||||||||||||||||||||||||||||||||||||
| Underground | (1,919) | (282) | (282) | — | (1,637) | (1,034) | (362) | (553) | (119) | — | (54) | 54 | (603) | (195) | (241) | (167) | — | — | — | — | ||||||||||||||||||||||||||||||||||||||||||
| Surface | (234) | — | — | — | (234) | (55) | (35) | — | — | (20) | — | — | (179) | (8) | (22) | (5) | (28) | (116) | — | — | ||||||||||||||||||||||||||||||||||||||||||
| Recycling | (1,368) | (1,368) | — | (1,368) | — | — | — | — | — | — | — | — | — | — | — | — | — | — | — | — | ||||||||||||||||||||||||||||||||||||||||||
Net other cash costs2 | (88) | — | — | — | (88) | (51) | 7 | (37) | (3) | (16) | (1) | (1) | (37) | (3) | (4) | (3) | (20) | (2) | (5) | — | ||||||||||||||||||||||||||||||||||||||||||
| Adjusted EBITDA | 1,852 | 341 | 290 | 51 | 1,520 | 1,336 | 520 | 686 | 119 | 14 | 55 | (58) | 184 | 77 | 50 | 30 | (16) | 48 | (5) | (9) | ||||||||||||||||||||||||||||||||||||||||||
| Amortisation and depreciation | (300) | (96) | (96) | — | (204) | (88) | (31) | (39) | (18) | (1) | (10) | 11 | (116) | (45) | (36) | (25) | (1) | (7) | (2) | — | ||||||||||||||||||||||||||||||||||||||||||
| Interest income | 38 | 11 | 1 | 10 | 26 | 8 | — | 3 | 3 | — | 1 | 1 | 18 | 2 | 1 | 1 | — | 7 | 7 | 1 | ||||||||||||||||||||||||||||||||||||||||||
| Finance expense | (82) | (31) | (30) | (1) | (41) | (22) | (148) | (13) | (4) | — | — | 143 | (19) | (4) | (3) | (3) | (2) | (2) | (5) | (10) | ||||||||||||||||||||||||||||||||||||||||||
| Share-based payments | (6) | (1) | (1) | — | (5) | (2) | — | — | — | — | — | (2) | (3) | — | — | — | — | — | (3) | — | ||||||||||||||||||||||||||||||||||||||||||
Net other3 | (208) | 38 | 38 | — | (249) | (335) | (828) | (42) | 24 | 3 | (3) | 511 | 86 | — | — | 1 | 6 | 1 | 78 | 3 | ||||||||||||||||||||||||||||||||||||||||||
Non-underlying items4 | (372) | (16) | (16) | — | (350) | — | — | — | — | — | — | — | (350) | (15) | (249) | (87) | — | — | 1 | (6) | ||||||||||||||||||||||||||||||||||||||||||
| Royalties and carbon tax | (71) | — | — | — | (71) | (65) | (34) | (30) | — | — | (4) | 3 | (6) | (3) | (1) | (1) | — | — | (1) | — | ||||||||||||||||||||||||||||||||||||||||||
| Profit before tax | 851 | 246 | 186 | 60 | 626 | 832 | (521) | 565 | 124 | 16 | 39 | 609 | (206) | 12 | (238) | (84) | (13) | 47 | 70 | (21) | ||||||||||||||||||||||||||||||||||||||||||
| Current taxation | (375) | (38) | (336) | (325) | (115) | (166) | (36) | (9) | (10) | 11 | (11) | (1) | (1) | — | — | (10) | 1 | (1) | ||||||||||||||||||||||||||||||||||||||||||||
| Deferred taxation | 68 | (10) | 78 | 68 | 67 | (7) | 2 | 4 | — | 2 | 10 | 9 | 78 | 15 | — | (3) | (89) | — | ||||||||||||||||||||||||||||||||||||||||||||
| Profit/(loss) for the period | 544 | 198 | 368 | 575 | (569) | 392 | 90 | 11 | 29 | 622 | (207) | 20 | (161) | (69) | (13) | 34 | (18) | (22) | ||||||||||||||||||||||||||||||||||||||||||||
| Attributable to: | ||||||||||||||||||||||||||||||||||||||||||||||||||||||||||||||
| Owners of the parent | 527 | 198 | 351 | 576 | (569) | 392 | 90 | 13 | 29 | 621 | (225) | 20 | (161) | (69) | (13) | 16 | (18) | (22) | ||||||||||||||||||||||||||||||||||||||||||||
| Non-controlling interest holders | 17 | — | 17 | (1) | — | — | — | (2) | — | 1 | 18 | — | — | — | — | 18 | — | — | ||||||||||||||||||||||||||||||||||||||||||||
| Sustaining capital expenditure | (165) | (19) | (19) | — | (146) | (91) | (26) | (53) | (11) | (1) | (20) | 20 | (55) | (15) | (24) | (7) | — | (9) | — | — | ||||||||||||||||||||||||||||||||||||||||||
| Ore reserve development | (198) | (52) | (52) | — | (146) | (55) | (21) | (34) | — | — | — | — | (91) | (41) | (33) | (17) | — | — | — | — | ||||||||||||||||||||||||||||||||||||||||||
| Growth projects | (115) | (79) | (79) | — | (36) | (14) | — | (14) | — | — | — | — | (22) | — | (7) | — | — | (2) | (13) | — | ||||||||||||||||||||||||||||||||||||||||||
| Total capital expenditure | (478) | (150) | (150) | — | (328) | (160) | (47) | (101) | (11) | (1) | (20) | 20 | (168) | (56) | (64) | (24) | — | (11) | (13) | — | ||||||||||||||||||||||||||||||||||||||||||
1Corporate and reconciling items represent the items to reconcile segment data to condensed consolidated financial statement totals. This does not represent a separate segment as it does not generate revenue. Group corporate includes the Wheaton Stream transaction, initial recognition of battery metal investment, corporate taxation, interest and corporate transaction costs
2Net other cash costs consist of service entity and sundry income (R288 million), and other costs as detailed in profit or loss, excluding non-cash loss due to dilution of interest in joint operation (R2 million), and include lease payments (R71 million) to conform with the adjusted EBITDA reconciliation disclosed in note 11.1
3Net other consists of gain on financial instruments, loss on foreign exchange differences as detailed in profit or loss, change in estimate of environmental rehabilitation obligation, and right of recovery receivable and payable (income of R162 million) and the add back of the lease payment referred to in footnote 2 above. Corporate and reconciling items net other includes the share of results of equity-accounted investees after tax as detailed in profit or loss
4Non-underlying items consists of gain on disposal of property, plant and equipment, impairments which include impairment to mining assets of Driefontein, Kloof and Beatrix of R212 million, R3,642 million and R1,293 million, respectively, restructuring costs, transaction costs and early redemption premium on the 2022 and 2025 Notes as detailed in profit or loss and also includes non-cash loss with dilution of interest in joint operation (R2 million), profit on sale of St Helena Hospital (R16 million) and occupational healthcare expense as detailed in profit or loss
5The average exchange rate for the six months ended 31 December 2021 was R15.03/US$
Sibanye-Stillwater Operating and financial results | Six months and year ended 31 December 2022 48
Figures are in millions
| For the year ended 31 Dec 2022 (Unaudited) | |||||||||||||||||||||||||||||||||||||||||||||||||||||||||||||||||||||||
| GROUP | US PGM OPERATIONS | SA OPERATIONS | Europe | GROUP | |||||||||||||||||||||||||||||||||||||||||||||||||||||||||||||||||||
| SA rand | Total | Total US PGM | Underground | Recycling | Total SA Operations | Total SA PGM | Rusten- burg | Marikana | Kroondal | Platinum Mile | Mimosa | Corporate and re- conciling items1 | Total SA gold | Drie- fontein | Kloof | Beatrix | Cooke | DRD- GOLD | Corporate and re- conciling items1 | Total Battery Metals | Sandouville2 | Corporate and re- conciling items1,3 | Cor- porate1 | ||||||||||||||||||||||||||||||||||||||||||||||||
| Revenue | 138,288 | 46,090 | 13,823 | 32,267 | 89,507 | 71,665 | 29,104 | 32,753 | 8,371 | 1,437 | 4,267 | (4,267) | 17,842 | 4,486 | 4,486 | 2,681 | 915 | 5,274 | — | 3,140 | 3,140 | — | (449) | ||||||||||||||||||||||||||||||||||||||||||||||||
| Underground | 92,325 | 13,823 | 13,823 | — | 78,951 | 68,182 | 27,058 | 32,753 | 8,371 | — | 4,267 | (4,267) | 10,769 | 4,213 | 3,924 | 2,632 | — | — | — | — | — | — | (449) | ||||||||||||||||||||||||||||||||||||||||||||||||
| Surface | 10,556 | — | — | — | 10,556 | 3,483 | 2,046 | — | — | 1,437 | — | — | 7,073 | 273 | 562 | 49 | 915 | 5,274 | — | — | — | — | — | ||||||||||||||||||||||||||||||||||||||||||||||||
| Recycling/processing | 35,407 | 32,267 | — | 32,267 | — | — | — | — | — | — | — | — | — | — | — | — | — | — | — | 3,140 | 3,140 | — | — | ||||||||||||||||||||||||||||||||||||||||||||||||
| Cost of sales, before amortisation and depreciation | (94,537) | (38,452) | (7,459) | (30,993) | (52,454) | (32,280) | (13,546) | (14,603) | (3,548) | (583) | (1,936) | 1,936 | (20,174) | (5,281) | (6,381) | (3,910) | (822) | (3,780) | — | (3,631) | (3,631) | — | — | ||||||||||||||||||||||||||||||||||||||||||||||||
| Underground | (52,734) | (7,459) | (7,459) | — | (45,275) | (30,528) | (12,377) | (14,603) | (3,548) | — | (1,936) | 1,936 | (14,747) | (5,085) | (5,821) | (3,841) | — | — | — | — | — | — | — | ||||||||||||||||||||||||||||||||||||||||||||||||
| Surface | (7,179) | — | — | — | (7,179) | (1,752) | (1,169) | — | — | (583) | — | — | (5,427) | (196) | (560) | (69) | (822) | (3,780) | — | — | — | — | — | ||||||||||||||||||||||||||||||||||||||||||||||||
| Recycling/processing | (34,624) | (30,993) | — | (30,993) | — | — | — | — | — | — | — | — | — | — | — | — | — | — | — | (3,631) | (3,631) | — | — | ||||||||||||||||||||||||||||||||||||||||||||||||
Net other cash costs4 | (2,640) | (34) | (34) | — | (2,464) | (1,250) | 151 | (688) | (128) | (407) | (21) | (157) | (1,214) | (173) | (167) | (123) | (717) | 40 | (74) | (87) | (1) | (86) | (55) | ||||||||||||||||||||||||||||||||||||||||||||||||
| Adjusted EBITDA | 41,111 | 7,604 | 6,330 | 1,274 | 34,589 | 38,135 | 15,709 | 17,462 | 4,695 | 447 | 2,310 | (2,488) | (3,546) | (968) | (2,062) | (1,352) | (624) | 1,534 | (74) | (578) | (492) | (86) | (504) | ||||||||||||||||||||||||||||||||||||||||||||||||
| Amortisation and depreciation | (7,087) | (2,803) | (2,799) | (4) | (4,126) | (2,418) | (981) | (1,205) | (180) | (40) | (342) | 330 | (1,708) | (721) | (469) | (305) | (3) | (176) | (34) | (158) | (153) | (5) | — | ||||||||||||||||||||||||||||||||||||||||||||||||
| Interest income | 1,203 | 309 | 81 | 228 | 893 | 402 | 43 | 214 | 109 | 30 | 102 | (96) | 491 | 68 | 57 | 35 | 35 | 265 | 31 | — | — | — | 1 | ||||||||||||||||||||||||||||||||||||||||||||||||
| Finance expense | (2,840) | (952) | (952) | — | (1,547) | (831) | (4,618) | (320) | (111) | — | (36) | 4,254 | (716) | (100) | (95) | (95) | (86) | (78) | (262) | (15) | (13) | (2) | (326) | ||||||||||||||||||||||||||||||||||||||||||||||||
| Share-based payments | (218) | (47) | (47) | — | (169) | (73) | (27) | (36) | (9) | (1) | — | — | (96) | (20) | (15) | (10) | — | (19) | (32) | — | — | — | (2) | ||||||||||||||||||||||||||||||||||||||||||||||||
Net other5 | (2,142) | (243) | (243) | — | (2,055) | (2,025) | (9,353) | (1,599) | 303 | 5 | (499) | 9,118 | (30) | 13 | 26 | 34 | (50) | 28 | (81) | 111 | 23 | 88 | 45 | ||||||||||||||||||||||||||||||||||||||||||||||||
Non-underlying items6 | (299) | (5) | (5) | — | (153) | (132) | 10 | (136) | (4) | — | (1) | (1) | (21) | 10 | (14) | (281) | (2) | 10 | 256 | — | — | — | (141) | ||||||||||||||||||||||||||||||||||||||||||||||||
| Royalties and carbon tax | (1,824) | — | — | — | (1,824) | (1,772) | (1,023) | (735) | (13) | — | (127) | 126 | (52) | (22) | (22) | (3) | (5) | — | — | — | — | — | — | ||||||||||||||||||||||||||||||||||||||||||||||||
| Profit before tax | 27,904 | 3,863 | 2,365 | 1,498 | 25,608 | 31,286 | (240) | 13,645 | 4,790 | 441 | 1,407 | 11,243 | (5,678) | (1,740) | (2,594) | (1,977) | (735) | 1,564 | (196) | (640) | (635) | (5) | (927) | ||||||||||||||||||||||||||||||||||||||||||||||||
| Current taxation | (9,282) | (655) | (8,623) | (8,373) | (3,169) | (3,766) | (1,288) | (130) | (208) | 188 | (250) | (6) | (3) | — | — | (226) | (15) | — | — | — | (4) | ||||||||||||||||||||||||||||||||||||||||||||||||||
| Deferred taxation | 358 | 315 | 82 | (1,332) | (590) | (693) | (60) | 8 | (138) | 141 | 1,414 | 84 | (184) | 154 | — | (125) | 1,485 | (39) | — | (39) | — | ||||||||||||||||||||||||||||||||||||||||||||||||||
| Profit/(loss) for the year | 18,980 | 3,523 | 17,067 | 21,581 | (3,999) | 9,186 | 3,442 | 319 | 1,061 | 11,572 | (4,514) | (1,662) | (2,781) | (1,823) | (735) | 1,213 | 1,274 | (679) | (635) | (44) | (931) | ||||||||||||||||||||||||||||||||||||||||||||||||||
| Attributable to: | |||||||||||||||||||||||||||||||||||||||||||||||||||||||||||||||||||||||
| Owners of the parent | 18,396 | 3,523 | 16,469 | 21,577 | (3,999) | 9,182 | 3,442 | 319 | 1,061 | 11,572 | (5,108) | (1,662) | (2,781) | (1,823) | (735) | 612 | 1,281 | (665) | (635) | (30) | (931) | ||||||||||||||||||||||||||||||||||||||||||||||||||
| Non-controlling interest holders | 584 | — | 598 | 4 | — | 4 | — | — | — | — | 594 | — | — | — | — | 601 | (7) | (14) | — | (14) | — | ||||||||||||||||||||||||||||||||||||||||||||||||||
| Sustaining capital expenditure | (4,946) | (1,185) | (1,184) | (1) | (3,671) | (2,056) | (690) | (1,072) | (273) | (21) | (864) | 864 | (1,615) | (358) | (455) | (155) | — | (647) | — | (90) | (90) | — | — | ||||||||||||||||||||||||||||||||||||||||||||||||
| Ore reserve development | (6,640) | (2,887) | (2,887) | — | (3,753) | (2,123) | (687) | (1,436) | — | — | — | — | (1,630) | (794) | (620) | (216) | — | — | — | — | — | — | — | ||||||||||||||||||||||||||||||||||||||||||||||||
| Growth projects | (4,313) | (1,345) | (1,345) | — | (2,239) | (925) | — | (924) | — | — | — | (1) | (1,314) | — | (210) | (4) | — | (124) | (976) | (729) | — | (729) | — | ||||||||||||||||||||||||||||||||||||||||||||||||
| Total capital expenditure | (15,899) | (5,417) | (5,416) | (1) | (9,663) | (5,104) | (1,377) | (3,432) | (273) | (21) | (864) | 863 | (4,559) | (1,152) | (1,285) | (375) | — | (771) | (976) | (819) | (90) | (729) | — | ||||||||||||||||||||||||||||||||||||||||||||||||
Sibanye-Stillwater Operating and financial results | Six months and year ended 31 December 2022 49
| For the year ended 31 Dec 2022 (Unaudited) | |||||||||||||||||||||||||||||||||||||||||||||||||||||||||||||||||||||||
| GROUP | US PGM OPERATIONS | SA OPERATIONS | Europe | GROUP | |||||||||||||||||||||||||||||||||||||||||||||||||||||||||||||||||||
US dollars7 | Total | Total US PGM | Underground | Recycling | Total SA Operations | Total SA PGM | Rusten- burg | Marikana | Kroondal | Platinum Mile | Mimosa | Corporate and re- conciling items1 | Total SA gold | Drie- fontein | Kloof | Beatrix | Cooke | DRD- GOLD | Corporate and re- conciling items1 | Total Battery Metals | Sandouville2 | Corporate and re- conciling items1,3 | Cor- porate1 | ||||||||||||||||||||||||||||||||||||||||||||||||
| Revenue | 8,448 | 2,815 | 844 | 1,971 | 5,468 | 4,378 | 1,778 | 2,001 | 511 | 88 | 261 | (261) | 1,090 | 274 | 274 | 164 | 56 | 322 | — | 192 | 192 | — | (27) | ||||||||||||||||||||||||||||||||||||||||||||||||
| Underground | 5,640 | 844 | 844 | — | 4,823 | 4,165 | 1,653 | 2,001 | 511 | — | 261 | (261) | 658 | 257 | 240 | 161 | — | — | — | — | — | — | (27) | ||||||||||||||||||||||||||||||||||||||||||||||||
| Surface | 645 | — | — | — | 645 | 213 | 125 | — | — | 88 | — | — | 432 | 17 | 34 | 3 | 56 | 322 | — | — | — | — | — | ||||||||||||||||||||||||||||||||||||||||||||||||
| Recycling/processing | 2,163 | 1,971 | — | 1,971 | — | — | — | — | — | — | — | — | — | — | — | — | — | — | — | 192 | 192 | — | — | ||||||||||||||||||||||||||||||||||||||||||||||||
| Cost of sales, before amortisation and depreciation | (5,775) | (2,349) | (456) | (1,893) | (3,204) | (1,971) | (827) | (892) | (217) | (36) | (118) | 119 | (1,233) | (323) | (390) | (239) | (50) | (231) | — | (222) | (222) | — | — | ||||||||||||||||||||||||||||||||||||||||||||||||
| Underground | (3,222) | (456) | (456) | — | (2,766) | (1,864) | (756) | (892) | (217) | — | (118) | 119 | (902) | (311) | (356) | (235) | — | — | — | — | — | — | — | ||||||||||||||||||||||||||||||||||||||||||||||||
| Surface | (438) | — | — | — | (438) | (107) | (71) | — | — | (36) | — | — | (331) | (12) | (34) | (4) | (50) | (231) | — | — | — | — | — | ||||||||||||||||||||||||||||||||||||||||||||||||
| Recycling/processing | (2,115) | (1,893) | — | (1,893) | — | — | — | — | — | — | — | — | — | — | — | — | — | — | — | (222) | (222) | — | — | ||||||||||||||||||||||||||||||||||||||||||||||||
Net other cash costs4 | (163) | (2) | (2) | — | (153) | (77) | 9 | (42) | (8) | (25) | (1) | (10) | (76) | (11) | (10) | (8) | (44) | 2 | (5) | (5) | — | (5) | (3) | ||||||||||||||||||||||||||||||||||||||||||||||||
| Adjusted EBITDA | 2,510 | 464 | 386 | 78 | 2,111 | 2,330 | 960 | 1,067 | 286 | 27 | 142 | (152) | (219) | (60) | (126) | (83) | (38) | 93 | (5) | (35) | (30) | (5) | (30) | ||||||||||||||||||||||||||||||||||||||||||||||||
| Amortisation and depreciation | (433) | (171) | (171) | — | (253) | (148) | (60) | (74) | (11) | (2) | (21) | 20 | (105) | (44) | (29) | (19) | — | (11) | (2) | (9) | (9) | — | — | ||||||||||||||||||||||||||||||||||||||||||||||||
| Interest income | 73 | 19 | 5 | 14 | 54 | 25 | 3 | 13 | 7 | 2 | 6 | (6) | 29 | 4 | 3 | 2 | 2 | 16 | 2 | — | — | — | — | ||||||||||||||||||||||||||||||||||||||||||||||||
| Finance expense | (173) | (58) | (58) | — | (94) | (50) | (282) | (20) | (7) | — | (2) | 261 | (44) | (6) | (6) | (6) | (5) | (5) | (16) | (1) | (1) | — | (20) | ||||||||||||||||||||||||||||||||||||||||||||||||
| Share-based payments | (13) | (3) | (3) | — | (10) | (4) | (2) | (2) | (1) | — | — | 1 | (6) | (1) | (1) | (1) | — | (1) | (2) | — | — | — | — | ||||||||||||||||||||||||||||||||||||||||||||||||
Net other5 | (130) | (15) | (15) | — | (124) | (123) | (571) | (98) | 19 | — | (30) | 557 | (1) | 1 | 2 | 2 | (3) | 2 | (5) | 6 | 1 | 5 | 3 | ||||||||||||||||||||||||||||||||||||||||||||||||
Non-underlying items6 | (16) | — | — | — | (7) | (7) | 1 | (8) | — | — | — | — | — | 1 | (1) | (17) | — | 1 | 16 | — | — | — | (9) | ||||||||||||||||||||||||||||||||||||||||||||||||
| Royalties and carbon tax | (111) | — | — | — | (111) | (109) | (62) | (45) | (1) | — | (8) | 7 | (2) | (1) | (1) | — | — | — | — | — | — | — | — | ||||||||||||||||||||||||||||||||||||||||||||||||
| Profit before tax | 1,707 | 236 | 144 | 92 | 1,566 | 1,914 | (13) | 833 | 292 | 27 | 87 | 688 | (348) | (106) | (159) | (122) | (44) | 95 | (12) | (39) | (39) | — | (56) | ||||||||||||||||||||||||||||||||||||||||||||||||
| Current taxation | (567) | (40) | (527) | (512) | (194) | (230) | (79) | (8) | (13) | 12 | (15) | — | — | — | — | (14) | (1) | — | — | — | — | ||||||||||||||||||||||||||||||||||||||||||||||||||
| Deferred taxation | 22 | 19 | 5 | (81) | (36) | (42) | (4) | — | (8) | 9 | 86 | 5 | (11) | 9 | — | (8) | 91 | (2) | — | (2) | — | ||||||||||||||||||||||||||||||||||||||||||||||||||
| Profit/(loss) for the year | 1,162 | 215 | 1,044 | 1,321 | (243) | 561 | 209 | 19 | 66 | 709 | (277) | (101) | (170) | (113) | (44) | 73 | 78 | (41) | (39) | (2) | (56) | ||||||||||||||||||||||||||||||||||||||||||||||||||
| Attributable to: | |||||||||||||||||||||||||||||||||||||||||||||||||||||||||||||||||||||||
| Owners of the parent | 1,126 | 215 | 1,007 | 1,321 | (243) | 561 | 209 | 19 | 66 | 709 | (314) | (101) | (170) | (113) | (44) | 36 | 78 | (40) | (39) | (1) | (56) | ||||||||||||||||||||||||||||||||||||||||||||||||||
| Non-controlling interest holders | 36 | — | 37 | — | — | — | — | — | — | — | 37 | — | — | — | — | 37 | — | (1) | — | (1) | — | ||||||||||||||||||||||||||||||||||||||||||||||||||
| Sustaining capital expenditure | (301) | (72) | (72) | — | (224) | (125) | (42) | (65) | (17) | (1) | (53) | 53 | (99) | (22) | (28) | (9) | — | (40) | — | (5) | (5) | — | — | ||||||||||||||||||||||||||||||||||||||||||||||||
| Ore reserve development | (406) | (176) | (176) | — | (230) | (130) | (42) | (88) | — | — | — | — | (100) | (49) | (38) | (13) | — | — | — | — | — | — | — | ||||||||||||||||||||||||||||||||||||||||||||||||
| Growth projects | (264) | (82) | (82) | — | (137) | (56) | — | (56) | — | — | — | — | (81) | — | (13) | — | — | (8) | (60) | (45) | — | (45) | — | ||||||||||||||||||||||||||||||||||||||||||||||||
| Total capital expenditure | (971) | (330) | (330) | — | (591) | (311) | (84) | (209) | (17) | (1) | (53) | 53 | (280) | (71) | (79) | (22) | — | (48) | (60) | (50) | (5) | (45) | — | ||||||||||||||||||||||||||||||||||||||||||||||||
1Corporate and reconciling items represent the items to reconcile segment data to condensed consolidated financial statement totals. This does not represent a separate segment as it does not generate revenue. Group corporate includes the Wheaton Stream transaction and corporate transaction costs
2The Battery Metals results for the year ended 31 December 2022 includes the results of Sandouville for the eleven months since acquisition (refer note 10.2)
3Corporate and reconciling items for Battery Metals includes a net loss of R143 million for Keliber since the effective date of acquisition (refer note 10.1)
4Net other cash costs consist of service entity and sundry income (R893 million) and other costs as detailed in profit or loss, excluding the loss on deconsolidation of the Bapo Trust (R309 million) and include lease payments (R163 million) to conform with the adjusted EBITDA reconciliation disclosed in note 11.1
5Net other consists of loss on financial instruments, loss on foreign exchange differences as detailed in profit or loss, change in estimate of environmental rehabilitation obligation, and right of recovery receivable and payable (income of R71 million) and the add back of the lease payment referred to in footnote 4 above. Corporate and reconciling items net other includes the share of results of equity-accounted investees after tax as detailed in profit or loss
6Non-underlying items consists of gain on disposal of property, plant and equipment, reversal of impairments, restructuring costs and transaction costs as detailed in profit or loss and also includes non-cash gain on deregistration of subsidiary in the Group (R1 million), profit on sale of Lonmin Canada (R145 million), loss on deconsolidation of the Bapo Trust (R309 million) and occupational healthcare income as detailed in profit or loss
7The average exchange rate for the year ended 31 December 2022 was R16.37/US$
Sibanye-Stillwater Operating and financial results | Six months and year ended 31 December 2022 50
Figures are in millions
| For the year ended 31 Dec 2021 (Unaudited) | ||||||||||||||||||||||||||||||||||||||||||||||||||||||||||||||
| GROUP | US PGM OPERATIONS | SA OPERATIONS | GROUP | |||||||||||||||||||||||||||||||||||||||||||||||||||||||||||
| SA rand | Total | Total US PGM | Underground | Recycling | Total SA Operations | Total SA PGM | Rusten- burg | Marikana | Kroondal | Platinum Mile | Mimosa | Corporate and re- conciling items1 | Total SA gold | Drie- fontein | Kloof | Beatrix | Cooke | DRD- GOLD | Corporate and re- conciling items1 | Cor- porate1 | ||||||||||||||||||||||||||||||||||||||||||
| Revenue | 172,194 | 59,053 | 18,343 | 40,710 | 113,512 | 85,154 | 31,749 | 41,610 | 10,293 | 1,503 | 4,393 | (4,394) | 28,358 | 7,932 | 9,294 | 5,343 | 999 | 4,790 | — | (371) | ||||||||||||||||||||||||||||||||||||||||||
| Underground | 120,403 | 18,343 | 18,343 | — | 102,431 | 81,477 | 29,575 | 41,610 | 10,293 | — | 4,393 | (4,394) | 20,954 | 7,722 | 8,089 | 5,143 | — | — | — | (371) | ||||||||||||||||||||||||||||||||||||||||||
| Surface | 11,081 | — | — | — | 11,081 | 3,677 | 2,174 | — | — | 1,503 | — | — | 7,404 | 210 | 1,205 | 200 | 999 | 4,790 | — | — | ||||||||||||||||||||||||||||||||||||||||||
| Recycling | 40,710 | 40,710 | — | 40,710 | — | — | — | — | — | — | — | — | — | — | — | — | — | — | — | — | ||||||||||||||||||||||||||||||||||||||||||
| Cost of sales, before amortisation and depreciation | (101,013) | (46,787) | (7,567) | (39,220) | (54,226) | (31,971) | (11,464) | (16,561) | (3,416) | (531) | (1,587) | 1,588 | (22,255) | (5,691) | (7,844) | (4,565) | (808) | (3,347) | — | — | ||||||||||||||||||||||||||||||||||||||||||
| Underground | (54,989) | (7,567) | (7,567) | — | (47,422) | (30,430) | (10,454) | (16,561) | (3,416) | — | (1,587) | 1,588 | (16,992) | (5,559) | (6,986) | (4,447) | — | — | — | — | ||||||||||||||||||||||||||||||||||||||||||
| Surface | (6,804) | — | — | — | (6,804) | (1,541) | (1,010) | — | — | (531) | — | — | (5,263) | (132) | (858) | (118) | (808) | (3,347) | — | — | ||||||||||||||||||||||||||||||||||||||||||
| Recycling | (39,220) | (39,220) | — | (39,220) | — | — | — | — | — | — | — | — | — | — | — | — | — | — | — | — | ||||||||||||||||||||||||||||||||||||||||||
Net other cash costs2 | (2,575) | (10) | (10) | — | (2,565) | (1,575) | 134 | (1,036) | (91) | (492) | (42) | (48) | (990) | (78) | (83) | (73) | (611) | (40) | (105) | — | ||||||||||||||||||||||||||||||||||||||||||
| Adjusted EBITDA | 68,606 | 12,256 | 10,766 | 1,490 | 56,721 | 51,608 | 20,419 | 24,013 | 6,786 | 480 | 2,764 | (2,854) | 5,113 | 2,163 | 1,367 | 705 | (420) | 1,403 | (105) | (371) | ||||||||||||||||||||||||||||||||||||||||||
| Amortisation and depreciation | (8,293) | (2,601) | (2,598) | (3) | (5,692) | (2,515) | (885) | (1,099) | (495) | (31) | (274) | 269 | (3,177) | (1,165) | (1,064) | (691) | (11) | (188) | (58) | — | ||||||||||||||||||||||||||||||||||||||||||
| Interest income | 1,202 | 382 | 10 | 372 | 805 | 219 | 22 | 92 | 97 | 7 | 12 | (11) | 586 | 60 | 47 | 31 | 22 | 222 | 204 | 15 | ||||||||||||||||||||||||||||||||||||||||||
| Finance expense | (2,496) | (954) | (897) | (57) | (1,233) | (666) | (4,201) | (328) | (116) | — | (5) | 3,984 | (567) | (99) | (85) | (82) | (63) | (60) | (178) | (309) | ||||||||||||||||||||||||||||||||||||||||||
| Share-based payments | (383) | (73) | (73) | — | (310) | (89) | (35) | (42) | (12) | — | — | — | (221) | (20) | (32) | (21) | — | (19) | (129) | — | ||||||||||||||||||||||||||||||||||||||||||
Net other3 | (2,832) | 238 | 238 | — | (3,121) | (4,305) | (12,232) | (985) | 248 | 34 | (43) | 8,673 | 1,184 | 16 | 22 | 33 | 92 | 22 | 999 | 51 | ||||||||||||||||||||||||||||||||||||||||||
Non-underlying items4 | (5,529) | (278) | (278) | — | (5,153) | 2 | 4 | (1) | (1) | — | — | — | (5,155) | (202) | (3,686) | (1,290) | (3) | — | 26 | (98) | ||||||||||||||||||||||||||||||||||||||||||
| Royalties and carbon tax | (2,718) | — | — | — | (2,718) | (2,548) | (1,405) | (1,129) | (14) | — | (160) | 160 | (170) | (95) | (46) | (29) | (5) | — | 5 | — | ||||||||||||||||||||||||||||||||||||||||||
| Profit before tax | 47,557 | 8,970 | 7,168 | 1,802 | 39,299 | 41,706 | 1,687 | 20,521 | 6,493 | 490 | 2,294 | 10,221 | (2,407) | 658 | (3,477) | (1,344) | (388) | 1,380 | 764 | (712) | ||||||||||||||||||||||||||||||||||||||||||
| Current taxation | (13,506) | (1,422) | (12,014) | (11,745) | (4,864) | (4,768) | (1,885) | (218) | (574) | 564 | (269) | (13) | (13) | (7) | — | (263) | 27 | (70) | ||||||||||||||||||||||||||||||||||||||||||||
| Deferred taxation | (255) | (89) | (166) | (367) | 956 | (1,460) | 56 | 80 | (18) | 19 | 201 | 49 | 1,158 | 233 | — | (77) | (1,162) | — | ||||||||||||||||||||||||||||||||||||||||||||
| Profit/(loss) for the year | 33,796 | 7,459 | 27,119 | 29,594 | (2,221) | 14,293 | 4,664 | 352 | 1,702 | 10,804 | (2,475) | 694 | (2,332) | (1,118) | (388) | 1,040 | (371) | (782) | ||||||||||||||||||||||||||||||||||||||||||||
| Attributable to: | ||||||||||||||||||||||||||||||||||||||||||||||||||||||||||||||
| Owners of the parent | 33,054 | 7,459 | 26,377 | 29,360 | (2,221) | 14,075 | 4,664 | 336 | 1,702 | 10,804 | (2,983) | 694 | (2,332) | (1,118) | (388) | 527 | (366) | (782) | ||||||||||||||||||||||||||||||||||||||||||||
| Non-controlling interest holders | 742 | — | 742 | 234 | — | 218 | — | 16 | — | — | 508 | — | — | — | — | 513 | (5) | — | ||||||||||||||||||||||||||||||||||||||||||||
| Sustaining capital expenditure | (4,119) | (796) | (791) | (5) | (3,323) | (2,019) | (619) | (1,104) | (268) | (28) | (499) | 499 | (1,304) | (322) | (488) | (164) | — | (330) | — | — | ||||||||||||||||||||||||||||||||||||||||||
| Ore reserve development | (5,535) | (1,354) | (1,354) | — | (4,181) | (1,577) | (629) | (947) | — | — | — | (1) | (2,604) | (1,177) | (930) | (497) | — | — | — | — | ||||||||||||||||||||||||||||||||||||||||||
| Growth projects | (3,086) | (2,411) | (2,411) | — | (675) | (203) | — | (203) | — | — | — | — | (472) | — | (198) | (7) | — | (47) | (220) | — | ||||||||||||||||||||||||||||||||||||||||||
| Total capital expenditure | (12,740) | (4,561) | (4,556) | (5) | (8,179) | (3,799) | (1,248) | (2,254) | (268) | (28) | (499) | 498 | (4,380) | (1,499) | (1,616) | (668) | — | (377) | (220) | — | ||||||||||||||||||||||||||||||||||||||||||
Sibanye-Stillwater Operating and financial results | Six months and year ended 31 December 2022 51
| For the year ended 31 Dec 2021 (Unaudited) | ||||||||||||||||||||||||||||||||||||||||||||||||||||||||||||||
| GROUP | US PGM OPERATIONS | SA OPERATIONS | GROUP | |||||||||||||||||||||||||||||||||||||||||||||||||||||||||||
US dollars5 | Total | Total US PGM | Underground | Recycling | Total SA Operations | Total SA PGM | Rusten- burg | Marikana | Kroondal | Platinum Mile | Mimosa | Corporate and re- conciling items1 | Total SA gold | Drie- fontein | Kloof | Beatrix | Cooke | DRD- GOLD | Corporate and re- conciling items1 | Cor- porate1 | ||||||||||||||||||||||||||||||||||||||||||
| Revenue | 11,643 | 3,993 | 1,240 | 2,753 | 7,675 | 5,757 | 2,147 | 2,813 | 696 | 102 | 297 | (298) | 1,918 | 536 | 628 | 362 | 68 | 324 | — | (25) | ||||||||||||||||||||||||||||||||||||||||||
| Underground | 8,140 | 1,240 | 1,240 | — | 6,925 | 5,508 | 2,000 | 2,813 | 696 | — | 297 | (298) | 1,417 | 522 | 547 | 348 | — | — | — | (25) | ||||||||||||||||||||||||||||||||||||||||||
| Surface | 750 | — | — | — | 750 | 249 | 147 | — | — | 102 | — | — | 501 | 14 | 81 | 14 | 68 | 324 | — | — | ||||||||||||||||||||||||||||||||||||||||||
| Recycling | 2,753 | 2,753 | — | 2,753 | — | — | — | — | — | — | — | — | — | — | — | — | — | — | — | — | ||||||||||||||||||||||||||||||||||||||||||
| Cost of sales, before amortisation and depreciation | (6,830) | (3,164) | (512) | (2,652) | (3,666) | (2,161) | (775) | (1,119) | (231) | (36) | (107) | 107 | (1,505) | (385) | (530) | (309) | (55) | (226) | — | — | ||||||||||||||||||||||||||||||||||||||||||
| Underground | (3,718) | (512) | (512) | — | (3,206) | (2,057) | (707) | (1,119) | (231) | — | (107) | 107 | (1,149) | (376) | (472) | (301) | — | — | — | — | ||||||||||||||||||||||||||||||||||||||||||
| Surface | (460) | — | — | — | (460) | (104) | (68) | — | — | (36) | — | — | (356) | (9) | (58) | (8) | (55) | (226) | — | — | ||||||||||||||||||||||||||||||||||||||||||
| Recycling | (2,652) | (2,652) | — | (2,652) | — | — | — | — | — | — | — | — | — | — | — | — | — | — | — | — | ||||||||||||||||||||||||||||||||||||||||||
Net other cash costs2 | (174) | (1) | (1) | — | (173) | (106) | 9 | (70) | (6) | (33) | (3) | (3) | (67) | (5) | (6) | (5) | (41) | (3) | (7) | — | ||||||||||||||||||||||||||||||||||||||||||
| Adjusted EBITDA | 4,639 | 828 | 727 | 101 | 3,836 | 3,490 | 1,381 | 1,624 | 459 | 33 | 187 | (194) | 346 | 146 | 92 | 48 | (28) | 95 | (7) | (25) | ||||||||||||||||||||||||||||||||||||||||||
| Amortisation and depreciation | (561) | (176) | (176) | — | (385) | (169) | (60) | (74) | (33) | (2) | (19) | 19 | (216) | (79) | (72) | (47) | (1) | (13) | (4) | — | ||||||||||||||||||||||||||||||||||||||||||
| Interest income | 81 | 26 | 1 | 25 | 54 | 15 | 1 | 6 | 7 | — | 1 | — | 39 | 4 | 3 | 2 | 1 | 15 | 14 | 1 | ||||||||||||||||||||||||||||||||||||||||||
| Finance expense | (169) | (65) | (61) | (4) | (83) | (44) | (284) | (22) | (8) | — | — | 270 | (39) | (7) | (6) | (6) | (4) | (4) | (12) | (21) | ||||||||||||||||||||||||||||||||||||||||||
| Share-based payments | (26) | (5) | (5) | — | (21) | (7) | (2) | (3) | (1) | — | — | (1) | (14) | (1) | (2) | (1) | — | (1) | (9) | — | ||||||||||||||||||||||||||||||||||||||||||
Net other3 | (192) | 16 | 16 | — | (211) | (290) | (827) | (67) | 17 | 2 | (3) | 588 | 79 | 1 | 1 | 2 | 6 | 1 | 68 | 3 | ||||||||||||||||||||||||||||||||||||||||||
Non-underlying items4 | (374) | (19) | (19) | — | (348) | — | — | — | — | — | — | — | (348) | (14) | (249) | (87) | — | — | 2 | (7) | ||||||||||||||||||||||||||||||||||||||||||
| Royalties and carbon tax | (184) | — | — | — | (184) | (173) | (95) | (76) | (1) | — | (11) | 10 | (11) | (6) | (3) | (2) | — | — | — | — | ||||||||||||||||||||||||||||||||||||||||||
| Profit before tax | 3,214 | 605 | 483 | 122 | 2,658 | 2,822 | 114 | 1,388 | 440 | 33 | 155 | 692 | (164) | 44 | (236) | (91) | (26) | 93 | 52 | (49) | ||||||||||||||||||||||||||||||||||||||||||
| Current taxation | (913) | (96) | (812) | (794) | (329) | (322) | (127) | (15) | (39) | 38 | (18) | (1) | (1) | — | — | (18) | 2 | (5) | ||||||||||||||||||||||||||||||||||||||||||||
| Deferred taxation | (17) | (6) | (11) | (24) | 65 | (99) | 4 | 5 | (1) | 2 | 13 | 3 | 78 | 16 | — | (5) | (79) | — | ||||||||||||||||||||||||||||||||||||||||||||
| Profit/(loss) for the year | 2,284 | 503 | 1,835 | 2,004 | (150) | 967 | 317 | 23 | 115 | 732 | (169) | 46 | (159) | (75) | (26) | 70 | (25) | (54) | ||||||||||||||||||||||||||||||||||||||||||||
| Attributable to: | ||||||||||||||||||||||||||||||||||||||||||||||||||||||||||||||
| Owners of the parent | 2,234 | 503 | 1,785 | 1,989 | (150) | 952 | 317 | 23 | 115 | 732 | (204) | 46 | (159) | (75) | (26) | 35 | (25) | (54) | ||||||||||||||||||||||||||||||||||||||||||||
| Non-controlling interest holders | 50 | — | 50 | 15 | — | 15 | — | — | — | — | 35 | — | — | — | — | 35 | — | — | ||||||||||||||||||||||||||||||||||||||||||||
Sustaining capital expenditure5 | (278) | (53) | (53) | — | (225) | (137) | (42) | (75) | (18) | (2) | (34) | 34 | (88) | (22) | (33) | (11) | — | (22) | — | — | ||||||||||||||||||||||||||||||||||||||||||
| Ore reserve development | (376) | (92) | (92) | — | (284) | (107) | (43) | (64) | — | — | — | — | (177) | (80) | (63) | (34) | — | — | — | — | ||||||||||||||||||||||||||||||||||||||||||
| Growth projects | (208) | (163) | (163) | — | (45) | (14) | — | (14) | — | — | — | — | (31) | — | (13) | — | — | (3) | (15) | — | ||||||||||||||||||||||||||||||||||||||||||
| Total capital expenditure | (862) | (308) | (308) | — | (554) | (258) | (85) | (153) | (18) | (2) | (34) | 34 | (296) | (102) | (109) | (45) | — | (25) | (15) | — | ||||||||||||||||||||||||||||||||||||||||||
1Corporate and reconciling items represent the items to reconcile segment data to condensed consolidated financial statement totals. This does not represent a separate segment as it does not generate revenue. Group corporate includes the Wheaton Stream transaction, initial recognition of battery metal investment, corporate taxation, interest and corporate transaction costs
2Net other cash costs consist of service entity and sundry income of R581 million and other costs as detailed in profit or loss, excluding non-cash loss due to dilution of interest in joint operation (R4 million), and include lease payments (R142 million) to conform with the adjusted EBITDA reconciliation disclosed in note 11.1
3Net other consists of gain on financial instruments, loss on foreign exchange differences as detailed in profit or loss, change in estimate of environmental rehabilitation obligation, and right of recovery receivable and payable (R167 million) and the add back of the lease payment referred to in footnote 2 above. Corporate and reconciling items net other includes the share of results of equity-accounted investees after tax as detailed in profit or loss
4Non-underlying items consists of gain on disposal of property, plant and equipment, impairments which include impairment to mining assets of Driefontein, Kloof and Beatrix of R212 million, R3,642 million and R1,293 million, respectively), restructuring costs, transaction costs and early redemption premium on the 2022 and 2025 Notes as detailed in profit or loss and also includes non-cash loss with dilution of interest in joint operation (R4 million), profit on sale of St Helena Hospital (R16 million) and occupational healthcare gain as detailed in profit or loss
5The average exchange rate for the year ended 31 December 2021 was R14.79/US$
Sibanye-Stillwater Operating and financial results | Six months and year ended 31 December 2022 52
ALL-IN COSTS - SIX MONTHS
US and SA PGM operations
| US OPERATIONS | SA OPERATIONS | ||||||||||||||||||||||||||||||||||
| R' million | Total US and SA PGM1 | Total US PGM2 | Total SA PGM1 | Rustenburg | Marikana1 | Kroondal | Plat Mile | Mimosa | Corporate | ||||||||||||||||||||||||||
Cost of sales, before amortisation and depreciation3 | Dec 2022 | 19,117 | 3,616 | 15,501 | 6,888 | 6,530 | 1,774 | 309 | 1,046 | (1,046) | |||||||||||||||||||||||||
| Jun 2022 | 20,623 | 3,842 | 16,781 | 6,659 | 8,073 | 1,774 | 275 | 890 | (890) | ||||||||||||||||||||||||||
| Dec 2021 | 20,583 | 4,216 | 16,367 | 5,952 | 8,328 | 1,785 | 302 | 813 | (813) | ||||||||||||||||||||||||||
| Royalties | Dec 2022 | 817 | — | 817 | 565 | 245 | 7 | — | 57 | (57) | |||||||||||||||||||||||||
| Jun 2022 | 953 | — | 953 | 458 | 488 | 7 | — | 70 | (70) | ||||||||||||||||||||||||||
| Dec 2021 | 975 | — | 975 | 512 | 458 | 5 | — | 65 | (65) | ||||||||||||||||||||||||||
| Carbon tax | Dec 2022 | (1) | — | (1) | — | — | (1) | — | — | — | |||||||||||||||||||||||||
| Jun 2022 | — | — | — | (1) | 1 | — | — | — | — | ||||||||||||||||||||||||||
| Dec 2021 | — | — | — | — | — | — | — | — | — | ||||||||||||||||||||||||||
| Community costs | Dec 2022 | 49 | — | 49 | — | 49 | — | — | — | — | |||||||||||||||||||||||||
| Jun 2022 | 95 | — | 95 | — | 95 | — | — | — | — | ||||||||||||||||||||||||||
| Dec 2021 | 87 | — | 87 | 6 | 81 | — | — | — | — | ||||||||||||||||||||||||||
| Inventory change | Dec 2022 | 3,106 | 439 | 2,667 | 347 | 2,320 | — | — | 2 | (2) | |||||||||||||||||||||||||
| Jun 2022 | (385) | (34) | (351) | (245) | (106) | — | — | (17) | 17 | ||||||||||||||||||||||||||
| Dec 2021 | 98 | (446) | 544 | 573 | (29) | — | — | 20 | (20) | ||||||||||||||||||||||||||
Share-based payments4 | Dec 2022 | 133 | 56 | 77 | 30 | 42 | 5 | — | — | — | |||||||||||||||||||||||||
| Jun 2022 | 182 | 81 | 101 | 37 | 45 | 17 | 1 | — | — | ||||||||||||||||||||||||||
| Dec 2021 | 97 | 40 | 57 | 23 | 27 | 7 | — | — | — | ||||||||||||||||||||||||||
Rehabilitation interest and amortisation5 | Dec 2022 | 86 | 28 | 58 | (13) | 26 | 45 | — | 3 | (3) | |||||||||||||||||||||||||
| Jun 2022 | 105 | 24 | 81 | 2 | 40 | 39 | — | 12 | (12) | ||||||||||||||||||||||||||
| Dec 2021 | 143 | 16 | 127 | — | 81 | 46 | — | 2 | (2) | ||||||||||||||||||||||||||
| Leases | Dec 2022 | 31 | 4 | 27 | 6 | 19 | 2 | — | — | — | |||||||||||||||||||||||||
| Jun 2022 | 32 | 3 | 29 | 6 | 19 | 4 | — | — | — | ||||||||||||||||||||||||||
| Dec 2021 | 29 | 1 | 28 | 5 | 19 | 4 | — | — | — | ||||||||||||||||||||||||||
| Ore reserve development | Dec 2022 | 2,793 | 1,610 | 1,183 | 371 | 812 | — | — | — | — | |||||||||||||||||||||||||
| Jun 2022 | 2,216 | 1,277 | 939 | 315 | 624 | — | — | — | — | ||||||||||||||||||||||||||
| Dec 2021 | 1,603 | 772 | 831 | 315 | 516 | — | — | — | — | ||||||||||||||||||||||||||
| Sustaining capital expenditure | Dec 2022 | 2,046 | 806 | 1,240 | 385 | 681 | 158 | 16 | 570 | (570) | |||||||||||||||||||||||||
| Jun 2022 | 1,195 | 378 | 817 | 305 | 391 | 115 | 6 | 294 | (294) | ||||||||||||||||||||||||||
| Dec 2021 | 1,642 | 290 | 1,352 | 386 | 787 | 165 | 14 | 299 | (299) | ||||||||||||||||||||||||||
| Less: By-product credit | Dec 2022 | (4,545) | (467) | (4,078) | (1,867) | (1,797) | (369) | (45) | (368) | 368 | |||||||||||||||||||||||||
| Jun 2022 | (5,292) | (732) | (4,560) | (1,727) | (2,347) | (449) | (37) | (384) | 384 | ||||||||||||||||||||||||||
| Dec 2021 | (4,943) | (639) | (4,304) | (1,296) | (2,497) | (455) | (56) | (271) | 271 | ||||||||||||||||||||||||||
Total All-in-sustaining costs6 | Dec 2022 | 23,632 | 6,092 | 17,540 | 6,712 | 8,927 | 1,621 | 280 | 1,310 | (1,310) | |||||||||||||||||||||||||
| Jun 2022 | 19,724 | 4,839 | 14,885 | 5,809 | 7,323 | 1,507 | 245 | 865 | (865) | ||||||||||||||||||||||||||
| Dec 2021 | 20,314 | 4,250 | 16,064 | 6,476 | 7,771 | 1,557 | 260 | 928 | (928) | ||||||||||||||||||||||||||
| Plus: Corporate cost, growth and capital expenditure | Dec 2022 | 1,337 | 814 | 523 | — | 523 | — | — | — | — | |||||||||||||||||||||||||
| Jun 2022 | 943 | 530 | 413 | — | 413 | — | — | — | — | ||||||||||||||||||||||||||
| Dec 2021 | 1,400 | 1,194 | 206 | — | 206 | — | — | — | — | ||||||||||||||||||||||||||
Total All-in-costs6 | Dec 2022 | 24,969 | 6,906 | 18,063 | 6,712 | 9,450 | 1,621 | 280 | 1,310 | (1,310) | |||||||||||||||||||||||||
| Jun 2022 | 20,667 | 5,369 | 15,298 | 5,809 | 7,736 | 1,507 | 245 | 865 | (865) | ||||||||||||||||||||||||||
| Dec 2021 | 21,714 | 5,444 | 16,270 | 6,476 | 7,977 | 1,557 | 260 | 928 | (928) | ||||||||||||||||||||||||||
| PGM production | 4Eoz - 2Eoz | Dec 2022 | 1,072,750 | 191,094 | 881,656 | 324,025 | 375,652 | 100,441 | 23,558 | 57,980 | — | ||||||||||||||||||||||||
| Jun 2022 | 1,079,191 | 230,039 | 849,152 | 304,872 | 360,609 | 101,315 | 24,802 | 57,554 | — | ||||||||||||||||||||||||||
| Dec 2021 | 1,239,777 | 272,099 | 967,678 | 343,820 | 421,632 | 113,035 | 30,654 | 58,537 | — | ||||||||||||||||||||||||||
| kg | Dec 2022 | 33,366 | 5,944 | 27,423 | 10,078 | 11,684 | 3,124 | 733 | 1,803 | — | |||||||||||||||||||||||||
| Jun 2022 | 33,567 | 7,155 | 26,412 | 9,483 | 11,216 | 3,151 | 771 | 1,790 | — | ||||||||||||||||||||||||||
| Dec 2021 | 38,561 | 8,463 | 30,098 | 10,694 | 13,114 | 3,516 | 953 | 1,821 | — | ||||||||||||||||||||||||||
| All-in-sustaining cost | R/4Eoz - R/2Eoz | Dec 2022 | 23,288 | 31,880 | 21,295 | 20,714 | 23,764 | 16,139 | 11,886 | 22,594 | — | ||||||||||||||||||||||||
| Jun 2022 | 19,306 | 21,036 | 18,804 | 19,054 | 20,307 | 14,874 | 9,878 | 15,029 | — | ||||||||||||||||||||||||||
| Dec 2021 | 17,197 | 15,619 | 17,669 | 18,835 | 18,431 | 13,774 | 8,482 | 15,853 | — | ||||||||||||||||||||||||||
| US$/4Eoz - US$/2Eoz | Dec 2022 | 1,344 | 1,840 | 1,229 | 1,195 | 1,371 | 931 | 686 | 1,304 | — | |||||||||||||||||||||||||
| Jun 2022 | 1,254 | 1,366 | 1,221 | 1,237 | 1,319 | 966 | 641 | 976 | — | ||||||||||||||||||||||||||
| Dec 2021 | 1,144 | 1,039 | 1,176 | 1,253 | 1,226 | 916 | 564 | 1,055 | — | ||||||||||||||||||||||||||
| All-in-cost | R/4Eoz - R/2Eoz | Dec 2022 | 24,606 | 36,139 | 21,930 | 20,714 | 25,156 | 16,139 | 11,886 | 22,594 | — | ||||||||||||||||||||||||
| Jun 2022 | 20,229 | 23,340 | 19,325 | 19,054 | 21,453 | 14,874 | 9,878 | 15,029 | — | ||||||||||||||||||||||||||
| Dec 2021 | 18,382 | 20,007 | 17,896 | 18,835 | 18,919 | 13,774 | 8,482 | 15,853 | — | ||||||||||||||||||||||||||
| US$/4Eoz - US$/2Eoz | Dec 2022 | 1,420 | 2,085 | 1,265 | 1,195 | 1,452 | 931 | 686 | 1,304 | — | |||||||||||||||||||||||||
| Jun 2022 | 1,314 | 1,516 | 1,255 | 1,237 | 1,393 | 966 | 641 | 976 | — | ||||||||||||||||||||||||||
| Dec 2021 | 1,223 | 1,331 | 1,191 | 1,253 | 1,259 | 916 | 564 | 1,055 | — | ||||||||||||||||||||||||||
Average exchange rate for the six months ended 31 December 2022, 30 June 2022 and 31 December 2021 was R17.33/US$, R15.40/US$ and R15.03/US$, respectively
Figures may not add as they are rounded independently
Sibanye-Stillwater Operating and financial results | Six months and year ended 31 December 2022 53
1The Total US and SA PGM, Total SA PGM and Marikana includes the production and costs associated with the purchase of concentrate (PoC) from third parties. For a reconciliation of the Operating cost, AISC and AIC excluding third party PoC, refer to “Reconciliation of operating cost excluding third party PoC for Total US and SA PGM, Total SA PGM and Marikana - Six Months” and “Reconciliation of AISC and AIC excluding third party PoC for Total US and SA PGM, Total SA PGM and Marikana – Six Months”
2The US PGM operations’ underground production is converted to metric tonnes and kilograms, and performance is translated into SA rand. In addition to the US PGM operations’ underground production, the operation processes various recycling material which is excluded from the 2E PGM production, All-in sustaining cost and All-in cost statistics shown
3Cost of sales, before amortisation and depreciation includes all mining and processing costs, third party refining costs, corporate general and administrative costs, and permitting costs
4Share-based payments are calculated based on the fair value at initial recognition and do not include the adjustment of the cash-settled share-based payment obligation to the reporting date fair value
5Rehabilitation includes the interest charge related to the environmental rehabilitation obligation and the amortisation of the related capitalised rehabilitation costs. The interest charge related to the environmental rehabilitation obligation and the amortisation of the capitalised rehabilitation costs reflect the periodic costs of rehabilitation associated with current PGM production
6All-in cost is calculated in accordance with the World Gold Council guidance. All-in cost excludes income tax, costs associated with merger and acquisition activities, working capital, impairments, financing costs, one-time severance charges and items needed to normalise earnings. All-in cost is made up of All-in sustaining cost, being the cost to sustain current operations, given as a sub-total in the All-in cost calculation, together with corporate and major capital expenditure associated with growth. All-in sustaining cost per ounce (and kilogram) and All-in cost per ounce (and kilogram) are calculated by dividing the All-in sustaining cost and All-in cost, respectively, in a period by the total 4E/2E PGM produced in the same period
| Reconciliation of operating cost excluding third party PoC for Total US and SA PGM, Total SA PGM and Marikana - Six Months | ||||||||||||||||||||||||||||||||
| Total US and SA PGM | Total SA PGM | Marikana | ||||||||||||||||||||||||||||||
| R' million | Dec 2022 | Jun 2022 | Dec 2021 | Dec 2022 | Jun 2022 | Dec 2021 | Dec 2022 | Jun 2022 | Dec 2021 | |||||||||||||||||||||||
| Cost of sales, before amortisation and depreciation as reported per table above | 19,117 | 20,623 | 20,583 | 15,501 | 16,781 | 16,367 | 6,530 | 8,073 | 8,328 | |||||||||||||||||||||||
| Inventory change as reported per table above | 3,106 | (385) | 98 | 2,667 | (351) | 544 | 2,320 | (106) | (29) | |||||||||||||||||||||||
| Less: Chrome cost of sales | (753) | (776) | (721) | (753) | (776) | (721) | (164) | (212) | (156) | |||||||||||||||||||||||
| Total operating cost including third party PoC | 21,470 | 19,462 | 19,960 | 17,415 | 15,654 | 16,190 | 8,686 | 7,755 | 8,143 | |||||||||||||||||||||||
| Less: Purchase cost of PoC | (1,638) | (1,100) | (1,122) | (1,638) | (1,100) | (1,122) | (1,638) | (1,100) | (1,122) | |||||||||||||||||||||||
| Total operating cost excluding third party PoC | 19,832 | 18,362 | 18,838 | 15,777 | 14,554 | 15,068 | 7,048 | 6,655 | 7,021 | |||||||||||||||||||||||
| PGM production as reported per table above | 4Eoz- 2Eoz | 1,072,750 | 1,079,191 | 1,239,777 | 881,656 | 849,152 | 967,678 | 375,652 | 360,609 | 421,632 | ||||||||||||||||||||||
| Less: Mimosa production | (57,980) | (57,554) | (58,537) | (57,980) | (57,554) | (58,537) | — | — | — | |||||||||||||||||||||||
| PGM production excluding Mimosa | 1,014,770 | 1,021,637 | 1,181,240 | 823,676 | 791,598 | 909,141 | 375,652 | 360,609 | 421,632 | |||||||||||||||||||||||
| Less: PoC production | (37,998) | (25,346) | (25,705) | (37,998) | (25,346) | (25,705) | (37,998) | (25,346) | (25,705) | |||||||||||||||||||||||
| PGM production excluding Mimosa and third party PoC | 976,772 | 996,291 | 1,155,535 | 785,678 | 766,252 | 883,436 | 337,654 | 335,263 | 395,927 | |||||||||||||||||||||||
| PGM production including Mimosa and excluding third party PoC | 1,034,752 | 1,053,845 | 1,214,072 | 843,658 | 823,806 | 941,973 | 337,654 | 335,263 | 395,927 | |||||||||||||||||||||||
| Tonnes milled/treated | 000't | 18,867 | 18,932 | 20,361 | 18,339 | 18,305 | 19,651 | 4,993 | 5,020 | 5,542 | ||||||||||||||||||||||
| Less: Mimosa tonnes | (687) | (700) | (708) | (687) | (700) | (708) | — | — | — | |||||||||||||||||||||||
| PGM tonnes excluding Mimosa and third party PoC | 18,179 | 18,232 | 19,653 | 17,652 | 17,605 | 18,943 | 4,993 | 5,020 | 5,542 | |||||||||||||||||||||||
| Operating cost including third party PoC | R/4Eoz-R/2Eoz | 21,158 | 19,050 | 16,897 | 21,143 | 19,775 | 17,808 | 23,122 | 21,505 | 19,313 | ||||||||||||||||||||||
| US$/4Eoz-US$/2Eoz | 1,221 | 1,237 | 1,124 | 1,220 | 1,284 | 1,185 | 1,334 | 1,396 | 1,285 | |||||||||||||||||||||||
| R/t | 1,181 | 1,067 | 1,016 | 987 | 889 | 855 | 1,739 | 1,545 | 1,469 | |||||||||||||||||||||||
| US$/t | 68 | 69 | 68 | 57 | 58 | 57 | 100 | 100 | 98 | |||||||||||||||||||||||
| Operating cost excluding third party PoC | R/4Eoz-R/2Eoz | 20,304 | 18,430 | 16,302 | 20,081 | 18,994 | 17,056 | 20,873 | 19,850 | 17,733 | ||||||||||||||||||||||
| US$/4Eoz-US$/2Eoz | 1,172 | 1,197 | 1,085 | 1,159 | 1,233 | 1,135 | 1,204 | 1,289 | 1,180 | |||||||||||||||||||||||
| R/t | 1,091 | 1,007 | 959 | 894 | 827 | 795 | 1,411 | 1,326 | 1,267 | |||||||||||||||||||||||
| US$/t | 63 | 65 | 64 | 52 | 54 | 53 | 81 | 86 | 84 | |||||||||||||||||||||||
| Reconciliation of AISC and AIC excluding third party PoC for Total US and SA PGM, Total SA PGM and Marikana - Six Months | ||||||||||||||||||||||||||||||||
| Total US and SA PGM | Total SA PGM | Marikana | ||||||||||||||||||||||||||||||
| R' million | Dec 2022 | Jun 2022 | Dec 2021 | Dec 2022 | Jun 2022 | Dec 2021 | Dec 2022 | Jun 2022 | Dec 2021 | |||||||||||||||||||||||
| Total All-in-sustaining cost as reported per table above | 23,632 | 19,724 | 20,314 | 17,540 | 14,885 | 16,064 | 8,927 | 7,323 | 7,771 | |||||||||||||||||||||||
| Less: Purchase cost of PoC | (1,638) | (1,100) | (1,122) | (1,638) | (1,100) | (1,122) | (1,638) | (1,100) | (1,122) | |||||||||||||||||||||||
| Add: By-product credit of PoC | 150 | 130 | 109 | 150 | 130 | 109 | 150 | 130 | 109 | |||||||||||||||||||||||
| Total All-in-sustaining cost excluding third party PoC | 22,144 | 18,754 | 19,301 | 16,052 | 13,915 | 15,051 | 7,439 | 6,353 | 6,758 | |||||||||||||||||||||||
| Plus: Corporate cost, growth and capital expenditure | 1,337 | 943 | 1,400 | 523 | 413 | 206 | 523 | 413 | 206 | |||||||||||||||||||||||
| Total All-in-cost excluding third party PoC | 23,481 | 19,697 | 20,701 | 16,575 | 14,328 | 15,257 | 7,962 | 6,766 | 6,964 | |||||||||||||||||||||||
| PGM production excluding Mimosa and third party PoC | 4Eoz- 2Eoz | 976,772 | 996,291 | 1,155,535 | 785,678 | 766,252 | 883,436 | 337,654 | 335,263 | 395,927 | ||||||||||||||||||||||
| All-in-sustaining cost excluding third party PoC | R/4Eoz-R/2Eoz | 22,671 | 18,824 | 16,703 | 20,431 | 18,160 | 17,037 | 22,031 | 18,949 | 17,069 | ||||||||||||||||||||||
| US$/4Eoz-US$/2Eoz | 1,308 | 1,222 | 1,111 | 1,179 | 1,179 | 1,134 | 1,271 | 1,230 | 1,136 | |||||||||||||||||||||||
| All-in-cost excluding third party PoC | R/4Eoz-R/2Eoz | 24,039 | 19,770 | 17,915 | 21,096 | 18,699 | 17,270 | 23,580 | 20,181 | 17,589 | ||||||||||||||||||||||
| US$/4Eoz-US$/2Eoz | 1,387 | 1,284 | 1,192 | 1,217 | 1,214 | 1,149 | 1,361 | 1,310 | 1,170 | |||||||||||||||||||||||
Sibanye-Stillwater Operating and financial results | Six months and year ended 31 December 2022 54
SA gold operations
| SA OPERATIONS | |||||||||||||||||||||||||||||
| R' million | Total SA gold | Driefontein | Kloof | Beatrix | Cooke | DRDGOLD | Corporate | ||||||||||||||||||||||
Cost of sales, before amortisation and depreciation1 | Dec 2022 | 11,616 | 2,989 | 3,565 | 2,629 | 496 | 1,937 | — | |||||||||||||||||||||
| Jun 2022 | 8,557 | 2,292 | 2,816 | 1,281 | 326 | 1,842 | — | ||||||||||||||||||||||
| Dec 2021 | 11,739 | 3,056 | 3,962 | 2,560 | 409 | 1,752 | — | ||||||||||||||||||||||
| Royalties | Dec 2022 | 46 | 15 | 16 | 12 | 3 | — | — | |||||||||||||||||||||
| Jun 2022 | 17 | 7 | 7 | 1 | 2 | — | — | ||||||||||||||||||||||
| Dec 2021 | 96 | 49 | 24 | 15 | 2 | — | 6 | ||||||||||||||||||||||
| Carbon tax | Dec 2022 | 1 | — | — | 1 | — | — | — | |||||||||||||||||||||
| Jun 2022 | (11) | — | — | (11) | — | — | — | ||||||||||||||||||||||
| Dec 2021 | 1 | — | — | 1 | — | — | — | ||||||||||||||||||||||
| Community costs | Dec 2022 | 27 | 8 | 7 | 6 | — | 6 | — | |||||||||||||||||||||
| Jun 2022 | 66 | 24 | 20 | 17 | — | 5 | — | ||||||||||||||||||||||
| Dec 2021 | 65 | 23 | 19 | 17 | 1 | 5 | — | ||||||||||||||||||||||
Share-based payments2 | Dec 2022 | 76 | 24 | 25 | 17 | — | 10 | — | |||||||||||||||||||||
| Jun 2022 | 70 | 25 | 22 | 14 | — | 9 | — | ||||||||||||||||||||||
| Dec 2021 | 51 | 12 | 17 | 12 | — | 10 | — | ||||||||||||||||||||||
Rehabilitation interest and amortisation3 | Dec 2022 | 71 | (4) | (14) | 30 | 26 | 8 | 25 | |||||||||||||||||||||
| Jun 2022 | 69 | 17 | (2) | 20 | 24 | 7 | 3 | ||||||||||||||||||||||
| Dec 2021 | 96 | 11 | 7 | 33 | 31 | 10 | 4 | ||||||||||||||||||||||
| Leases | Dec 2022 | 39 | 3 | 9 | 15 | 1 | 11 | — | |||||||||||||||||||||
| Jun 2022 | 42 | 2 | 9 | 14 | 3 | 14 | — | ||||||||||||||||||||||
| Dec 2021 | 39 | 4 | 5 | 14 | 6 | 10 | — | ||||||||||||||||||||||
| Ore reserve development | Dec 2022 | 1,163 | 542 | 436 | 185 | — | — | — | |||||||||||||||||||||
| Jun 2022 | 468 | 252 | 185 | 31 | — | — | — | ||||||||||||||||||||||
| Dec 2021 | 1,352 | 615 | 489 | 248 | — | — | — | ||||||||||||||||||||||
| Sustaining capital expenditure | Dec 2022 | 889 | 263 | 303 | 87 | — | 236 | — | |||||||||||||||||||||
| Jun 2022 | 725 | 95 | 152 | 68 | — | 410 | — | ||||||||||||||||||||||
| Dec 2021 | 822 | 213 | 351 | 113 | — | 145 | — | ||||||||||||||||||||||
| Less: By-product credit | Dec 2022 | (6) | (2) | (2) | (2) | — | — | — | |||||||||||||||||||||
| Jun 2022 | (7) | (1) | (1) | — | — | (5) | — | ||||||||||||||||||||||
| Dec 2021 | (14) | (4) | (3) | (3) | (1) | (3) | — | ||||||||||||||||||||||
Total All-in-sustaining costs4 | Dec 2022 | 13,922 | 3,838 | 4,345 | 2,980 | 526 | 2,208 | 25 | |||||||||||||||||||||
| Jun 2022 | 9,996 | 2,713 | 3,208 | 1,435 | 355 | 2,282 | 3 | ||||||||||||||||||||||
| Dec 2021 | 14,247 | 3,979 | 4,871 | 3,010 | 448 | 1,929 | 10 | ||||||||||||||||||||||
| Plus: Corporate cost, growth and capital expenditure | Dec 2022 | 940 | — | 155 | — | — | 118 | 667 | |||||||||||||||||||||
| Jun 2022 | 439 | — | 54 | 4 | — | 6 | 375 | ||||||||||||||||||||||
| Dec 2021 | 390 | — | 107 | 7 | — | 38 | 238 | ||||||||||||||||||||||
Total All-in-costs4 | Dec 2022 | 14,862 | 3,838 | 4,500 | 2,980 | 526 | 2,326 | 692 | |||||||||||||||||||||
| Jun 2022 | 10,435 | 2,713 | 3,262 | 1,439 | 355 | 2,288 | 378 | ||||||||||||||||||||||
| Dec 2021 | 14,637 | 3,979 | 4,978 | 3,017 | 448 | 1,967 | 248 | ||||||||||||||||||||||
| Gold sold | kg | Dec 2022 | 12,378 | 3,148 | 3,319 | 2,543 | 606 | 2,762 | — | ||||||||||||||||||||
| Jun 2022 | 6,481 | 1,603 | 1,424 | 265 | 366 | 2,823 | — | ||||||||||||||||||||||
| Dec 2021 | 17,495 | 4,928 | 5,560 | 3,558 | 558 | 2,891 | — | ||||||||||||||||||||||
| oz | Dec 2022 | 397,962 | 101,211 | 106,708 | 81,759 | 19,483 | 88,800 | — | |||||||||||||||||||||
| Jun 2022 | 208,369 | 51,538 | 45,783 | 8,520 | 11,767 | 90,762 | — | ||||||||||||||||||||||
| Dec 2021 | 562,477 | 158,439 | 178,758 | 114,392 | 17,940 | 92,948 | — | ||||||||||||||||||||||
| All-in-sustaining cost | R/kg | Dec 2022 | 1,124,737 | 1,219,187 | 1,309,129 | 1,171,844 | 867,987 | 799,421 | — | ||||||||||||||||||||
| Jun 2022 | 1,542,355 | 1,692,452 | 2,252,809 | 5,415,094 | 969,945 | 808,360 | — | ||||||||||||||||||||||
| Dec 2021 | 814,347 | 807,427 | 876,079 | 845,981 | 802,867 | 667,243 | — | ||||||||||||||||||||||
| All-in-sustaining cost | US$/oz | Dec 2022 | 2,019 | 2,188 | 2,350 | 2,103 | 1,558 | 1,435 | — | ||||||||||||||||||||
| Jun 2022 | 3,115 | 3,418 | 4,550 | 10,937 | 1,959 | 1,633 | — | ||||||||||||||||||||||
| Dec 2021 | 1,685 | 1,671 | 1,813 | 1,751 | 1,661 | 1,381 | — | ||||||||||||||||||||||
| All-in-cost | R/kg | Dec 2022 | 1,200,679 | 1,219,187 | 1,355,830 | 1,171,844 | 867,987 | 842,143 | — | ||||||||||||||||||||
| Jun 2022 | 1,610,091 | 1,692,452 | 2,290,730 | 5,430,189 | 969,945 | 810,485 | — | ||||||||||||||||||||||
| Dec 2021 | 836,639 | 807,427 | 895,324 | 847,948 | 802,867 | 680,387 | — | ||||||||||||||||||||||
| All-in-cost | US$/oz | Dec 2022 | 2,155 | 2,188 | 2,433 | 2,103 | 1,558 | 1,511 | — | ||||||||||||||||||||
| Jun 2022 | 3,252 | 3,418 | 4,627 | 10,967 | 1,959 | 1,637 | — | ||||||||||||||||||||||
| Dec 2021 | 1,731 | 1,671 | 1,853 | 1,755 | 1,661 | 1,408 | — | ||||||||||||||||||||||
Average exchange rate for the six months ended 31 December 2022, 30 June 2022 and 31 December 2021 was R17.33/US$, R15.40/US$ and R15.03/US$, respectively
Figures may not add as they are rounded independently
1Cost of sales, before amortisation and depreciation includes all mining and processing costs, third party refining costs, corporate general and administrative costs, and permitting costs
2Share-based payments are calculated based on the fair value at initial recognition and do not include the adjustment of the cash-settled share-based payment obligation to the reporting date fair value
3Rehabilitation includes the interest charge related to the environmental rehabilitation obligation and the amortisation of the related capitalised rehabilitation costs. The interest charge related to the environmental rehabilitation obligation and the amortisation of the capitalised rehabilitation costs reflect the periodic costs of rehabilitation associated with current gold production
4All-in cost is calculated in accordance with the World Gold Council guidance. All-in cost excludes income tax, costs associated with merger and acquisition activities, working capital, impairments, financing costs, one time severance charges and items needed to normalise earnings. All-in cost is made up of All-in sustaining cost, being the cost to sustain current operations, given as a sub-total in the All-in cost calculation, together with corporate and major capital expenditure associated with growth. All-in sustaining cost per kilogram (and ounce) and All-in cost per kilogram (and ounce) are calculated by dividing the All-in sustaining cost and All-in cost, respectively, in a period by the total gold sold over the same period
Sibanye-Stillwater Operating and financial results | Six months and year ended 31 December 2022 55
SALIENT FEATURES AND COST BENCHMARKS - YEAR
US and SA PGM operations
| US OPERA-TIONS | SA OPERATIONS | |||||||||||||||||||||||||||||||||||||||||||||||||||||||||||||||||||||||||||||||
Total US and SA PGM1 | Total US PGM | Total SA PGM1 | Rustenburg | Marikana1 | Kroondal | Plat Mile | Mimosa | |||||||||||||||||||||||||||||||||||||||||||||||||||||||||||||||||||||||||
| Attributable | Under- ground2 | Total | Under- ground | Surface | Under- ground | Surface | Under- ground | Surface | Attribu-table | Surface | Attribu-table | |||||||||||||||||||||||||||||||||||||||||||||||||||||||||||||||||||||
| Production | ||||||||||||||||||||||||||||||||||||||||||||||||||||||||||||||||||||||||||||||||
| Tonnes milled/treated | 000't | Dec 2022 | 37,799 | 1,154 | 36,644 | 16,991 | 19,653 | 6,037 | 5,610 | 6,315 | 3,698 | 3,251 | 10,345 | 1,387 | ||||||||||||||||||||||||||||||||||||||||||||||||||||||||||||||||||
| Dec 2021 | 39,776 | 1,469 | 38,307 | 18,090 | 20,217 | 6,341 | 5,712 | 6,802 | 3,869 | 3,525 | 10,636 | 1,422 | ||||||||||||||||||||||||||||||||||||||||||||||||||||||||||||||||||||
| Plant head grade | g/t | Dec 2022 | 2.28 | 12.51 | 1.96 | 3.27 | 0.83 | 3.30 | 1.04 | 3.67 | 0.86 | 2.35 | 0.70 | 3.52 | ||||||||||||||||||||||||||||||||||||||||||||||||||||||||||||||||||
| Dec 2021 | 2.45 | 13.33 | 2.03 | 3.39 | 0.82 | 3.38 | 1.07 | 3.87 | 0.87 | 2.40 | 0.67 | 3.58 | ||||||||||||||||||||||||||||||||||||||||||||||||||||||||||||||||||||
| Plant recoveries | % | Dec 2022 | 75.26 | 90.40 | 72.16 | 84.97 | 28.54 | 86.44 | 40.11 | 86.81 | 25.49 | 82.13 | 20.77 | 73.58 | ||||||||||||||||||||||||||||||||||||||||||||||||||||||||||||||||||
| Dec 2021 | 76.78 | 89.71 | 73.31 | 85.59 | 27.90 | 87.72 | 34.57 | 87.11 | 26.11 | 83.28 | 22.91 | 72.86 | ||||||||||||||||||||||||||||||||||||||||||||||||||||||||||||||||||||
| Yield | g/t | Dec 2022 | 1.72 | 11.31 | 1.42 | 2.78 | 0.24 | 2.85 | 0.42 | 3.19 | 0.22 | 1.93 | 0.15 | 2.59 | ||||||||||||||||||||||||||||||||||||||||||||||||||||||||||||||||||
| Dec 2021 | 1.88 | 11.96 | 1.49 | 2.90 | 0.23 | 2.96 | 0.37 | 3.37 | 0.23 | 2.00 | 0.15 | 2.61 | ||||||||||||||||||||||||||||||||||||||||||||||||||||||||||||||||||||
PGM production3 | 4Eoz - 2Eoz | Dec 2022 | 2,088,597 | 421,133 | 1,667,464 | 1,517,804 | 149,660 | 553,663 | 75,234 | 646,851 | 26,066 | 201,756 | 48,360 | 115,534 | ||||||||||||||||||||||||||||||||||||||||||||||||||||||||||||||||||
| Dec 2021 | 2,406,538 | 570,400 | 1,836,138 | 1,687,446 | 148,692 | 604,436 | 67,938 | 737,228 | 28,258 | 226,531 | 52,496 | 119,251 | ||||||||||||||||||||||||||||||||||||||||||||||||||||||||||||||||||||
PGM sold4 | 4Eoz - 2Eoz | Dec 2022 | 2,080,657 | 418,556 | 1,662,101 | 554,101 | 70,693 | 676,958 | 201,756 | 48,360 | 110,233 | |||||||||||||||||||||||||||||||||||||||||||||||||||||||||||||||||||||
| Dec 2021 | 2,433,886 | 548,276 | 1,885,610 | 608,817 | 65,894 | 822,389 | 226,531 | 52,496 | 109,483 | |||||||||||||||||||||||||||||||||||||||||||||||||||||||||||||||||||||||
Price and costs5 | ||||||||||||||||||||||||||||||||||||||||||||||||||||||||||||||||||||||||||||||||
Average PGM basket price6 | R/4Eoz - R/2Eoz | Dec 2022 | 40,276 | 30,482 | 42,914 | 43,998 | 31,055 | 43,035 | 45,795 | 34,237 | 33,494 | |||||||||||||||||||||||||||||||||||||||||||||||||||||||||||||||||||||
| Dec 2021 | 43,281 | 31,021 | 47,066 | 47,841 | 29,774 | 47,251 | 51,938 | 35,852 | 35,628 | |||||||||||||||||||||||||||||||||||||||||||||||||||||||||||||||||||||||
| Average PGM basket price6 | US$/4Eoz - US$/2Eoz | Dec 2022 | 2,461 | 1,862 | 2,622 | 2,688 | 1,897 | 2,629 | 2,798 | 2,092 | 2,046 | |||||||||||||||||||||||||||||||||||||||||||||||||||||||||||||||||||||
| Dec 2021 | 2,926 | 2,097 | 3,182 | 3,235 | 2,013 | 3,195 | 3,512 | 2,424 | 2,409 | |||||||||||||||||||||||||||||||||||||||||||||||||||||||||||||||||||||||
Operating cost7 | R/t | Dec 2022 | 1,049 | 6,811 | 860 | 1,869 | 240 | 1,369 | 1,049 | 56 | 1,385 | |||||||||||||||||||||||||||||||||||||||||||||||||||||||||||||||||||||
| Dec 2021 | 949 | 5,174 | 781 | 1,643 | 195 | 1,273 | 896 | 50 | 1,122 | |||||||||||||||||||||||||||||||||||||||||||||||||||||||||||||||||||||||
| Operating cost7 | US$/t | Dec 2022 | 64 | 416 | 53 | 114 | 15 | 84 | 64 | 3 | 85 | |||||||||||||||||||||||||||||||||||||||||||||||||||||||||||||||||||||
| Dec 2021 | 64 | 350 | 53 | 111 | 13 | 86 | 61 | 3 | 76 | |||||||||||||||||||||||||||||||||||||||||||||||||||||||||||||||||||||||
| Operating cost7 | R/4Eoz - R/2Eoz | Dec 2022 | 19,357 | 18,671 | 19,543 | 20,377 | 17,931 | 20,365 | 16,912 | 12,055 | 16,627 | |||||||||||||||||||||||||||||||||||||||||||||||||||||||||||||||||||||
| Dec 2021 | 15,918 | 13,324 | 16,780 | 17,239 | 16,368 | 17,752 | 13,941 | 10,115 | 13,384 | |||||||||||||||||||||||||||||||||||||||||||||||||||||||||||||||||||||||
| Operating cost7 | US$/4Eoz - US$/2Eoz | Dec 2022 | 1,183 | 1,141 | 1,194 | 1,245 | 1,096 | 1,244 | 1,033 | 737 | 1,016 | |||||||||||||||||||||||||||||||||||||||||||||||||||||||||||||||||||||
| Dec 2021 | 1,076 | 901 | 1,135 | 1,166 | 1,107 | 1,200 | 943 | 684 | 905 | |||||||||||||||||||||||||||||||||||||||||||||||||||||||||||||||||||||||
Adjusted EBITDA margin8 | % | Dec 2022 | 46 | 53 | 54 | 53 | 56 | 31 | 54 | |||||||||||||||||||||||||||||||||||||||||||||||||||||||||||||||||||||||
| Dec 2021 | 59 | 61 | 64 | 58 | 66 | 32 | 63 | |||||||||||||||||||||||||||||||||||||||||||||||||||||||||||||||||||||||||
All-in sustaining cost9 | R/4Eoz - R/2Eoz | Dec 2022 | 20,730 | 25,951 | 19,313 | 19,914 | 20,500 | 15,514 | 10,835 | 18,817 | ||||||||||||||||||||||||||||||||||||||||||||||||||||||||||||||||||||||
| Dec 2021 | 16,451 | 14,851 | 16,982 | 18,460 | 17,394 | 12,943 | 9,486 | 14,549 | ||||||||||||||||||||||||||||||||||||||||||||||||||||||||||||||||||||||||
| All-in sustaining cost9 | US$/4Eoz - US$/2Eoz | Dec 2022 | 1,267 | 1,586 | 1,180 | 1,217 | 1,253 | 948 | 662 | 1,150 | ||||||||||||||||||||||||||||||||||||||||||||||||||||||||||||||||||||||
| Dec 2021 | 1,112 | 1,004 | 1,148 | 1,248 | 1,176 | 875 | 641 | 984 | ||||||||||||||||||||||||||||||||||||||||||||||||||||||||||||||||||||||||
All-in cost9 | R/4Eoz - R/2Eoz | Dec 2022 | 21,886 | 29,145 | 19,916 | 19,914 | 21,891 | 15,514 | 10,835 | 18,817 | ||||||||||||||||||||||||||||||||||||||||||||||||||||||||||||||||||||||
| Dec 2021 | 17,599 | 19,078 | 17,108 | 18,460 | 17,675 | 12,943 | 9,486 | 14,549 | ||||||||||||||||||||||||||||||||||||||||||||||||||||||||||||||||||||||||
| All-in cost9 | US$/4Eoz - US$/2Eoz | Dec 2022 | 1,337 | 1,781 | 1,217 | 1,217 | 1,337 | 948 | 662 | 1,150 | ||||||||||||||||||||||||||||||||||||||||||||||||||||||||||||||||||||||
| Dec 2021 | 1,190 | 1,290 | 1,157 | 1,248 | 1,195 | 875 | 641 | 984 | ||||||||||||||||||||||||||||||||||||||||||||||||||||||||||||||||||||||||
Capital expenditure5 | ||||||||||||||||||||||||||||||||||||||||||||||||||||||||||||||||||||||||||||||||
| Ore reserve development | Rm | Dec 2022 | 5,010 | 2,887 | 2,123 | 687 | 1,436 | — | — | — | ||||||||||||||||||||||||||||||||||||||||||||||||||||||||||||||||||||||
| Dec 2021 | 2,930 | 1,354 | 1,576 | 629 | 947 | — | — | — | ||||||||||||||||||||||||||||||||||||||||||||||||||||||||||||||||||||||||
| Sustaining capital | Rm | Dec 2022 | 3,240 | 1,184 | 2,056 | 690 | 1,072 | 273 | 21 | 864 | ||||||||||||||||||||||||||||||||||||||||||||||||||||||||||||||||||||||
| Dec 2021 | 2,810 | 791 | 2,019 | 619 | 1,104 | 268 | 28 | 499 | ||||||||||||||||||||||||||||||||||||||||||||||||||||||||||||||||||||||||
| Corporate and projects | Rm | Dec 2022 | 2,270 | 1,345 | 925 | — | 924 | — | — | — | ||||||||||||||||||||||||||||||||||||||||||||||||||||||||||||||||||||||
| Dec 2021 | 2,614 | 2,411 | 203 | — | 203 | — | — | — | ||||||||||||||||||||||||||||||||||||||||||||||||||||||||||||||||||||||||
| Total capital expenditure | Rm | Dec 2022 | 10,520 | 5,416 | 5,104 | 1,377 | 3,432 | 273 | 21 | 864 | ||||||||||||||||||||||||||||||||||||||||||||||||||||||||||||||||||||||
| Dec 2021 | 8,354 | 4,556 | 3,798 | 1,248 | 2,254 | 268 | 28 | 499 | ||||||||||||||||||||||||||||||||||||||||||||||||||||||||||||||||||||||||
| Total capital expenditure | US$m | Dec 2022 | 643 | 331 | 312 | 84 | 210 | 17 | 1 | 53 | ||||||||||||||||||||||||||||||||||||||||||||||||||||||||||||||||||||||
| Dec 2021 | 565 | 308 | 257 | 84 | 152 | 18 | 2 | 34 | ||||||||||||||||||||||||||||||||||||||||||||||||||||||||||||||||||||||||
Average exchange rates for the year ended 31 December 2022 and 31 December 2021 were R16.37/US$ and R14.79/US$, respectively
Figures may not add as they are rounded independently
1The Total US and SA PGM, Total SA PGM and Marikana excludes the production and costs associated with the purchase of concentrate (PoC) from third parties. For a reconciliation of the Operating cost, AISC and AIC excluding third party PoC, refer to “Reconciliation of operating cost excluding third party PoC for Total US and SA PGM, Total SA PGM and Marikana - Year” and “Reconciliation of AISC and AIC excluding third party PoC for Total US and SA PGM, Total SA PGM and Marikana – Year”
2The US PGM operations’ underground production is converted to metric tonnes and kilograms, and performance is translated into rand. In addition to the US PGM operations’ underground production, the operation treats various recycling material which is excluded from the statistics shown above and is detailed in the PGM recycling table on the next page
3The Production per product – see prill split table on the next page
4PGM sold includes the third party PoC ounces sold
5The total US and SA PGM and Total SA PGM operations’ unit cost benchmarks and capital expenditure exclude the financial results of Mimosa, which is equity accounted and excluded from revenue and cost of sales
6The average PGM basket price is the PGM revenue per 4E/2E ounce, prior to a purchase of concentrate adjustment
7Operating cost is the average cost of production and operating cost per tonne is calculated by dividing costs of sales, before amortisation and depreciation and change in inventory in a period, by the tonnes milled/treated in the same period, and operating cost per ounce (and kilogram) is calculated by dividing the cost of sales, before amortisation and depreciation and change in inventory in a period, by the PGM produced in the same period
8Adjusted EBITDA margin is calculated by dividing adjusted EBITDA by revenue
9All-in cost is calculated in accordance with the World Gold Council guidance. All-in cost excludes income tax, costs associated with merger and acquisition activities, working capital, impairments, financing costs, one-time severance charges and items needed to normalise earnings. All-in cost is made up of All-in sustaining cost, being the cost to sustain current operations, given as a sub-total in the All-in cost calculation, together with corporate and major capital expenditure associated with growth. All-in sustaining cost per ounce (and kilogram)and All-in cost per ounce (and kilogram) are calculated by dividing the All-in sustaining cost and All-in cost, respectively, in a period by the total 4E/2E PGM produced in the same period. For a reconciliation of cost of sales before amortisation and depreciation to All-in cost, see “All-in costs – Year”
Sibanye-Stillwater Operating and financial results | Six months and year ended 31 December 2022 56
| Mining - PGM Prill split including third party PoC, excluding recycling operations | ||||||||||||||||||||||||||||||||||||||
| GROUP PGM | SA OPERATIONS | US OPERATIONS | ||||||||||||||||||||||||||||||||||||
| Dec 2022 | Dec 2021 | Dec 2022 | Dec 2021 | Dec 2022 | Dec 2021 | |||||||||||||||||||||||||||||||||
| % | % | % | % | % | % | |||||||||||||||||||||||||||||||||
| Platinum | 1,124,891 | 52 | % | 1,251,708 | 51 | % | 1,028,340 | 59 | % | 1,122,568 | 59 | % | 96,551 | 23 | % | 129,140 | 23 | % | ||||||||||||||||||||
| Palladium | 841,330 | 39 | % | 1,007,495 | 41 | % | 516,748 | 30 | % | 566,236 | 30 | % | 324,582 | 77 | % | 441,259 | 77 | % | ||||||||||||||||||||
| Rhodium | 153,401 | 7 | % | 165,454 | 7 | % | 153,401 | 9 | % | 165,454 | 9 | % | ||||||||||||||||||||||||||
| Gold | 32,319 | 2 | % | 42,414 | 2 | % | 32,319 | 2 | % | 42,414 | 2 | % | ||||||||||||||||||||||||||
| PGM production 4E/2E | 2,151,941 | 100 | % | 2,467,070 | 100 | % | 1,730,808 | 100 | % | 1,896,670 | 100 | % | 421,133 | 100 | % | 570,400 | 100 | % | ||||||||||||||||||||
| Ruthenium | 243,869 | 294,484 | 243,869 | 294,484 | ||||||||||||||||||||||||||||||||||
| Iridium | 61,501 | 68,234 | 61,501 | 68,234 | ||||||||||||||||||||||||||||||||||
| Total 6E/2E | 2,457,311 | 2,829,788 | 2,036,178 | 2,259,388 | 421,133 | 570,400 | ||||||||||||||||||||||||||||||||
Figures may not add as they are rounded independently
| Recycling at US operations | |||||||||||
| Unit | Dec 2022 | Dec 2021 | |||||||||
| Average catalyst fed/day | Tonne | 18.8 | 23.8 | ||||||||
| Total processed | Tonne | 6,876 | 8,673 | ||||||||
| Tolled | Tonne | — | 38 | ||||||||
| Purchased | Tonne | 6,876 | 8,636 | ||||||||
| PGM fed | 3Eoz | 598,774 | 755,149 | ||||||||
| PGM sold | 3Eoz | 643,200 | 782,552 | ||||||||
| PGM tolled returned | 3Eoz | 7,336 | 12,630 | ||||||||
Sibanye-Stillwater Operating and financial results | Six months and year ended 31 December 2022 57
SA gold operations
| SA OPERATIONS | |||||||||||||||||||||||||||||||||||||||||
| Total SA gold | Driefontein | Kloof | Beatrix | Cooke | DRDGOLD | ||||||||||||||||||||||||||||||||||||
| Total | Under- ground | Surface | Under- ground | Surface | Under- ground | Surface | Under- ground | Surface | Surface | Surface | |||||||||||||||||||||||||||||||
| Production | |||||||||||||||||||||||||||||||||||||||||
| Tonnes milled/treated | 000't | Dec 2022 | 36,172 | 2,761 | 33,411 | 840 | 694 | 992 | 1,954 | 929 | 124 | 4,074 | 26,565 | ||||||||||||||||||||||||||||
| Dec 2021 | 44,402 | 5,162 | 39,240 | 1,474 | 563 | 1,862 | 4,141 | 1,826 | 650 | 4,642 | 29,244 | ||||||||||||||||||||||||||||||
| Yield | g/t | Dec 2022 | 0.53 | 4.25 | 0.23 | 5.45 | 0.46 | 4.34 | 0.32 | 3.08 | 0.41 | 0.25 | 0.21 | ||||||||||||||||||||||||||||
| Dec 2021 | 0.75 | 4.79 | 0.22 | 6.11 | 0.45 | 5.13 | 0.33 | 3.37 | 0.36 | 0.25 | 0.19 | ||||||||||||||||||||||||||||||
| Gold produced | kg | Dec 2022 | 19,301 | 11,736 | 7,565 | 4,574 | 319 | 4,300 | 620 | 2,862 | 51 | 1,010 | 5,565 | ||||||||||||||||||||||||||||
| Dec 2021 | 33,372 | 24,719 | 8,653 | 9,013 | 252 | 9,558 | 1,378 | 6,148 | 232 | 1,166 | 5,625 | ||||||||||||||||||||||||||||||
| oz | Dec 2022 | 620,541 | 377,321 | 243,220 | 147,057 | 10,256 | 138,248 | 19,933 | 92,015 | 1,640 | 32,472 | 178,919 | |||||||||||||||||||||||||||||
| Dec 2021 | 1,072,934 | 794,734 | 278,200 | 289,775 | 8,102 | 307,297 | 44,304 | 197,663 | 7,459 | 37,488 | 180,848 | ||||||||||||||||||||||||||||||
| Gold sold | kg | Dec 2022 | 18,859 | 11,367 | 7,492 | 4,464 | 287 | 4,146 | 597 | 2,757 | 51 | 972 | 5,585 | ||||||||||||||||||||||||||||
| Dec 2021 | 33,374 | 24,710 | 8,664 | 9,076 | 238 | 9,561 | 1,400 | 6,073 | 232 | 1,175 | 5,619 | ||||||||||||||||||||||||||||||
| oz | Dec 2022 | 606,331 | 365,457 | 240,873 | 143,521 | 9,227 | 133,297 | 19,194 | 88,640 | 1,640 | 31,251 | 179,562 | |||||||||||||||||||||||||||||
| Dec 2021 | 1,072,999 | 794,445 | 278,554 | 291,800 | 7,652 | 307,393 | 45,011 | 195,251 | 7,459 | 37,777 | 180,655 | ||||||||||||||||||||||||||||||
| Price and costs | |||||||||||||||||||||||||||||||||||||||||
| Gold price received | R/kg | Dec 2022 | 946,073 | 944,222 | 945,815 | 954,772 | 941,358 | 944,315 | |||||||||||||||||||||||||||||||||
| Dec 2021 | 849,703 | 851,621 | 847,915 | 847,423 | 850,213 | 852,465 | |||||||||||||||||||||||||||||||||||
| Gold price received | US$/oz | Dec 2022 | 1,798 | 1,794 | 1,797 | 1,814 | 1,789 | 1,795 | |||||||||||||||||||||||||||||||||
| Dec 2021 | 1,787 | 1,791 | 1,783 | 1,782 | 1,788 | 1,793 | |||||||||||||||||||||||||||||||||||
Operating cost1 | R/t | Dec 2022 | 573 | 5,524 | 164 | 6,289 | 282 | 6,045 | 302 | 4,277 | 557 | 210 | 142 | ||||||||||||||||||||||||||||
| Dec 2021 | 503 | 3,310 | 134 | 3,778 | 234 | 3,769 | 206 | 2,464 | 182 | 174 | 115 | ||||||||||||||||||||||||||||||
| US$/t | Dec 2022 | 35 | 338 | 10 | 384 | 17 | 369 | 18 | 261 | 34 | 13 | 9 | |||||||||||||||||||||||||||||
| Dec 2021 | 34 | 224 | 9 | 255 | 16 | 255 | 14 | 167 | 12 | 12 | 8 | ||||||||||||||||||||||||||||||
| R/kg | Dec 2022 | 1,074,400 | 1,299,591 | 725,050 | 1,154,569 | 614,420 | 1,394,419 | 953,226 | 1,388,889 | 1,352,941 | 846,535 | 678,167 | |||||||||||||||||||||||||||||
| Dec 2021 | 669,723 | 691,209 | 608,344 | 617,885 | 523,810 | 734,149 | 619,739 | 731,945 | 508,621 | 692,967 | 595,911 | ||||||||||||||||||||||||||||||
| US$/oz | Dec 2022 | 2,042 | 2,470 | 1,378 | 2,194 | 1,168 | 2,650 | 1,811 | 2,639 | 2,571 | 1,609 | 1,289 | |||||||||||||||||||||||||||||
| Dec 2021 | 1,408 | 1,454 | 1,279 | 1,299 | 1,102 | 1,544 | 1,303 | 1,539 | 1,070 | 1,457 | 1,253 | ||||||||||||||||||||||||||||||
Adjusted EBITDA margin2 | R/kg | Dec 2022 | (20) | (22) | (46) | (50) | (68) | 29 | |||||||||||||||||||||||||||||||||
| Dec 2021 | 18 | 27 | 15 | 13 | (42) | 29 | |||||||||||||||||||||||||||||||||||
All-in sustaining cost3 | R/kg | Dec 2022 | 1,268,360 | 1,378,868 | 1,592,030 | 1,573,006 | 907,407 | 804,297 | |||||||||||||||||||||||||||||||||
| Dec 2021 | 803,260 | 793,000 | 858,316 | 857,256 | 742,979 | 665,065 | |||||||||||||||||||||||||||||||||||
| All-in sustaining cost2 | US$/oz | Dec 2022 | 2,410 | 2,620 | 3,025 | 2,989 | 1,724 | 1,528 | |||||||||||||||||||||||||||||||||
| Dec 2021 | 1,689 | 1,668 | 1,805 | 1,803 | 1,562 | 1,399 | |||||||||||||||||||||||||||||||||||
All-in cost3 | R/kg | Dec 2022 | 1,341,588 | 1,378,868 | 1,636,306 | 1,574,430 | 907,407 | 826,500 | |||||||||||||||||||||||||||||||||
| Dec 2021 | 821,358 | 793,000 | 876,380 | 858,366 | 742,979 | 673,429 | |||||||||||||||||||||||||||||||||||
| All-in cost2 | US$/oz | Dec 2022 | 2,549 | 2,620 | 3,110 | 2,992 | 1,724 | 1,571 | |||||||||||||||||||||||||||||||||
| Dec 2021 | 1,727 | 1,668 | 1,843 | 1,805 | 1,562 | 1,416 | |||||||||||||||||||||||||||||||||||
| Capital expenditure | |||||||||||||||||||||||||||||||||||||||||
| Ore reserve development | Rm | Dec 2022 | 1,630 | 794 | 620 | 216 | — | — | |||||||||||||||||||||||||||||||||
| Dec 2021 | 2,604 | 1,177 | 930 | 497 | — | — | |||||||||||||||||||||||||||||||||||
| Sustaining capital | Rm | Dec 2022 | 1,615 | 358 | 455 | 155 | — | 647 | |||||||||||||||||||||||||||||||||
| Dec 2021 | 1,304 | 322 | 488 | 164 | — | 330 | |||||||||||||||||||||||||||||||||||
Corporate and projects4 | Rm | Dec 2022 | 1,314 | — | 210 | 4 | — | 124 | |||||||||||||||||||||||||||||||||
| Dec 2021 | 472 | — | 198 | 7 | — | 47 | |||||||||||||||||||||||||||||||||||
| Total capital expenditure | Rm | Dec 2022 | 4,559 | 1,152 | 1,285 | 375 | — | 771 | |||||||||||||||||||||||||||||||||
| Dec 2021 | 4,380 | 1,499 | 1,616 | 668 | — | 377 | |||||||||||||||||||||||||||||||||||
| Total capital expenditure | US$m | Dec 2022 | 279 | 70 | 79 | 23 | — | 47 | |||||||||||||||||||||||||||||||||
| Dec 2021 | 296 | 101 | 109 | 45 | — | 25 | |||||||||||||||||||||||||||||||||||
Average exchange rates for the year ended 31 December 2022 and 31 December 2021 were R16.37/US$ and R14.79/US$, respectively
Figures may not add as they are rounded independently
1Operating cost is the average cost of production and operating cost per tonne is calculated by dividing the cost of sales, before amortisation and depreciation and change in inventory in a period, by the tonnes milled/treated in the same period, and operating cost per kilogram (and ounce) is calculated by dividing the cost of sales, before amortisation and depreciation and change in inventory in a period, by the gold produced in the same period
2Adjusted EBITDA margin is calculated by dividing adjusted EBITDA by revenue
3All-in cost is calculated in accordance with the World Gold Council guidance. All-in cost excludes income tax, costs associated with merger and acquisition activities, working capital, impairments, financing costs, one time severance charges and items needed to normalise earnings. All-in cost is made up of All-in sustaining cost, being the cost to sustain current operations, given as a sub-total in the All-in cost calculation, together with corporate and major capital expenditure associated with growth. All-in sustaining cost per kilogram (and ounce) and All-in cost per kilogram (and ounce) are calculated by dividing the All-in sustaining cost and All-in cost, respectively, in a period by the total gold sold over the same period. For a reconciliation of cost of sales before amortisation and depreciation to All-in cost, see “All-in costs – Year”
4Corporate project expenditure, which comprises spend on various Corporate IT projects and the Burnstone project, for the years ended 31 December 2022 and 31 December 2021 was R976 million (US$60 million) and R220 million (US$15 million), respectively
Sibanye-Stillwater Operating and financial results | Six months and year ended 31 December 2022 58
European operations
| Sibanye-Stillwater Sandouville refinery | ||||||||||||||
| Battery metal split | ||||||||||||||
Dec 20221 | ||||||||||||||
| Volumes produced (tonnes) | % | |||||||||||||
Nickel Salts2 | 2,003 | 29 | % | |||||||||||
| Nickel Metal | 4,839 | 71 | % | |||||||||||
| Total Nickel production tNi | 6,842 | 100 | % | |||||||||||
Nickel Cakes3 | 284 | |||||||||||||
Cobalt Chloride (CoCl2)4 | 153 | |||||||||||||
Ferric Chloride (FeCl3)4 | 1,399 | |||||||||||||
| Volumes sales (tonnes) | ||||||||||||||
Nickel Salts2 | 1,860 | 27 | % | |||||||||||
| Nickel Metal | 4,987 | 73 | % | |||||||||||
| Total Nickel sold tNi | 6,847 | 100 | % | |||||||||||
Cobalt Chloride (CoCl2)4 | 164 | |||||||||||||
Ferric Chloride (FeCl3)4 | 1,399 | |||||||||||||
| Nickel equivalent basket price | Unit | Dec 20221 | |||||||||
| Revenue from sale of products | Rm | 3,140 | |||||||||
| Nickel products sold | tNi | 6,847 | |||||||||
| Nickel equivalent average basket price | R/tNi | 458,595 | |||||||||
| Nickel equivalent average basket price | US$/tNi | 28,019 | |||||||||
| Nickel equivalent sustaining cost | Unit | Dec 20221 | |||||||||
| Cost of sales, before amortisation and depreciation | Rm | 3,631 | |||||||||
| Carbon tax | Rm | — | |||||||||
| Community costs | Rm | — | |||||||||
| Share-based payments | Rm | — | |||||||||
| Rehabilitation interest and amortisation | Rm | 5 | |||||||||
| Leases | Rm | 14 | |||||||||
| Sustaining capital expenditure | Rm | 90 | |||||||||
| Less: By-product credit | Rm | (127) | |||||||||
| Nickel equivalent sustaining cost | Rm | 3,613 | |||||||||
| Nickel products sold | tNi | 6,847 | |||||||||
| Nickel equivalent sustaining cost | R/tNi | 527,676 | |||||||||
| Nickel equivalent sustaining cost | US$/tNi | 32,239 | |||||||||
Nickel recovery yield5 | % | 95.54 | % | ||||||||
Average exchange rate for the year ended 31 December 2022 was R16.37/US$
Figures may not add as they are rounded independently
1Amounts included since effective date of the acquisition on 4 February 2022
2Nickel salts consist of anhydrous nickel, nickel chloride low sodium, nickel chloride standard, nickel carbonate and nickel chloride solution
3Nickel cakes occur during the processing of nickel matte and are recycled back into the nickel refining process
4Cobalt chloride and ferric chloride are obtained from nickel matte through a different refining process on an order basis
5Nickel recovery yield is the percentage of total nickel recovered from the matte relative to the nickel contained in the matte received
Non-IFRS measures such as the Nickel equivalent sustaining cost is the responsibility of the Group’s Board of Directors and is presented for illustration purposes only, and because of its nature, Nickel equivalent sustaining cost should not be considered as a representation of financial performance
Sibanye-Stillwater Operating and financial results | Six months and year ended 31 December 2022 59
ALL-IN COSTS - YEAR
SA and US PGM operations
| US OPERATIONS | SA OPERATIONS | ||||||||||||||||||||||||||||||||||
| R' million | Total US and SA PGM1 | Total US PGM2 | Total SA PGM1 | Rustenburg | Marikana1 | Kroondal | Plat Mile | Mimosa | Corporate | ||||||||||||||||||||||||||
Cost of sales, before amortisation and depreciation3 | Dec 2022 | 39,739 | 7,458 | 32,281 | 13,547 | 14,603 | 3,548 | 583 | 1,936 | (1,936) | |||||||||||||||||||||||||
| Dec 2021 | 39,539 | 7,567 | 31,972 | 11,464 | 16,561 | 3,416 | 531 | 1,587 | (1,587) | ||||||||||||||||||||||||||
| Royalties | Dec 2022 | 1,772 | — | 1,772 | 1,024 | 734 | 14 | — | 127 | (127) | |||||||||||||||||||||||||
| Dec 2021 | 2,547 | — | 2,547 | 1,405 | 1,128 | 14 | — | 160 | (160) | ||||||||||||||||||||||||||
| Carbon tax | Dec 2022 | — | — | — | (1) | 2 | (1) | — | — | — | |||||||||||||||||||||||||
| Dec 2021 | 1 | — | 1 | — | 1 | — | — | — | — | ||||||||||||||||||||||||||
| Community costs | Dec 2022 | 144 | — | 144 | — | 144 | — | — | — | — | |||||||||||||||||||||||||
| Dec 2021 | 161 | — | 161 | 12 | 150 | — | — | — | (1) | ||||||||||||||||||||||||||
| Inventory change | Dec 2022 | 2,720 | 405 | 2,315 | 101 | 2,214 | — | — | (15) | 15 | |||||||||||||||||||||||||
| Dec 2021 | 1,327 | 33 | 1,294 | 816 | 478 | — | — | 9 | (9) | ||||||||||||||||||||||||||
Share-based payments4 | Dec 2022 | 315 | 137 | 178 | 68 | 87 | 22 | 2 | — | — | |||||||||||||||||||||||||
| Dec 2021 | 199 | 86 | 113 | 45 | 53 | 15 | — | — | — | ||||||||||||||||||||||||||
Rehabilitation interest and amortisation5 | Dec 2022 | 193 | 52 | 141 | (11) | 66 | 86 | — | 14 | (14) | |||||||||||||||||||||||||
| Dec 2021 | 275 | 31 | 244 | — | 162 | 81 | — | 4 | (3) | ||||||||||||||||||||||||||
| Leases | Dec 2022 | 62 | 6 | 56 | 12 | 38 | 6 | — | — | — | |||||||||||||||||||||||||
| Dec 2021 | 54 | 1 | 53 | 11 | 35 | 7 | — | — | — | ||||||||||||||||||||||||||
| Ore reserve development | Dec 2022 | 5,010 | 2,887 | 2,123 | 687 | 1,436 | — | — | — | — | |||||||||||||||||||||||||
| Dec 2021 | 2,930 | 1,354 | 1,576 | 629 | 947 | — | — | — | — | ||||||||||||||||||||||||||
| Sustaining capital expenditure | Dec 2022 | 3,240 | 1,184 | 2,056 | 690 | 1,072 | 273 | 21 | 864 | (864) | |||||||||||||||||||||||||
| Dec 2021 | 2,810 | 791 | 2,019 | 619 | 1,104 | 268 | 28 | 499 | (499) | ||||||||||||||||||||||||||
| Less: By-product credit | Dec 2022 | (9,835) | (1,200) | (8,635) | (3,593) | (4,142) | (818) | (82) | (752) | 752 | |||||||||||||||||||||||||
| Dec 2021 | (9,287) | (1,392) | (7,895) | (2,589) | (4,376) | (869) | (61) | (524) | 524 | ||||||||||||||||||||||||||
Total All-in-sustaining costs6 | Dec 2022 | 43,360 | 10,929 | 32,431 | 12,524 | 16,254 | 3,130 | 524 | 2,174 | (2,174) | |||||||||||||||||||||||||
| Dec 2021 | 40,556 | 8,471 | 32,085 | 12,412 | 16,243 | 2,932 | 498 | 1,735 | (1,735) | ||||||||||||||||||||||||||
| Plus: Corporate cost, growth and capital expenditure | Dec 2022 | 2,282 | 1,345 | 937 | — | 936 | — | — | — | 1 | |||||||||||||||||||||||||
| Dec 2021 | 2,626 | 2,411 | 215 | — | 215 | — | — | — | — | ||||||||||||||||||||||||||
Total All-in-costs6 | Dec 2022 | 45,642 | 12,274 | 33,368 | 12,524 | 17,190 | 3,130 | 524 | 2,174 | (2,173) | |||||||||||||||||||||||||
| Dec 2021 | 43,182 | 10,882 | 32,300 | 12,412 | 16,458 | 2,932 | 498 | 1,735 | (1,735) | ||||||||||||||||||||||||||
| PGM production | 4Eoz - 2Eoz | Dec 2022 | 2,151,941 | 421,133 | 1,730,808 | 628,897 | 736,261 | 201,756 | 48,360 | 115,534 | — | ||||||||||||||||||||||||
| Dec 2021 | 2,467,070 | 570,400 | 1,896,670 | 672,374 | 826,018 | 226,531 | 52,496 | 119,251 | — | ||||||||||||||||||||||||||
| kg | Dec 2022 | 66,933 | 13,099 | 53,834 | 19,561 | 22,900 | 6,275 | 1,504 | 3,594 | — | |||||||||||||||||||||||||
| Dec 2021 | 76,734 | 17,741 | 58,993 | 20,913 | 25,692 | 7,046 | 1,633 | 3,709 | — | ||||||||||||||||||||||||||
| All-in-sustaining cost | R/4Eoz - R/2Eoz | Dec 2022 | 21,292 | 25,951 | 20,078 | 19,914 | 22,076 | 15,514 | 10,835 | 18,817 | — | ||||||||||||||||||||||||
| Dec 2021 | 17,274 | 14,851 | 18,051 | 18,460 | 19,664 | 12,943 | 9,486 | 14,549 | — | ||||||||||||||||||||||||||
| US$/4Eoz - US$/2Eoz | Dec 2022 | 1,301 | 1,586 | 1,227 | 1,217 | 1,349 | 948 | 662 | 1,150 | — | |||||||||||||||||||||||||
| Dec 2021 | 1,168 | 1,004 | 1,221 | 1,248 | 1,330 | 875 | 641 | 984 | — | ||||||||||||||||||||||||||
| All-in-cost | R/4Eoz - R/2Eoz | Dec 2022 | 22,413 | 29,145 | 20,658 | 19,914 | 23,348 | 15,514 | 10,835 | 18,817 | — | ||||||||||||||||||||||||
| Dec 2021 | 18,392 | 19,078 | 18,172 | 18,460 | 19,925 | 12,943 | 9,486 | 14,549 | — | ||||||||||||||||||||||||||
| US$/4Eoz - US$/2Eoz | Dec 2022 | 1,369 | 1,781 | 1,262 | 1,217 | 1,426 | 948 | 662 | 1,150 | — | |||||||||||||||||||||||||
| Dec 2021 | 1,244 | 1,290 | 1,229 | 1,248 | 1,347 | 875 | 641 | 984 | — | ||||||||||||||||||||||||||
Average exchange rates for the year ended 31 December 2022 and 31 December 2021 were R16.37/US$ and R14.79/US$, respectively
Figures may not add as they are rounded independently
1The Total US and SA PGM, Total SA PGM and Marikana includes the production and costs associated with the purchase of concentrate (PoC) from third parties. For a reconciliation of the Operating cost, AISC and AIC excluding third party PoC, refer to “Reconciliation of operating cost excluding third party PoC for Total US and SA PGM, Total SA PGM and Marikana - Year” and “Reconciliation of AISC and AIC excluding third party PoC for Total US and SA PGM, Total SA PGM and Marikana – Year”
2The US PGM operations’ underground production is converted to metric tonnes and kilograms, and performance is translated into SA rand. In addition to the US PGM operations’ underground production, the operation processes various recycling material which is excluded from the 2E PGM production, All-in sustaining cost and All-in cost statistics shown
3Cost of sales, before amortisation and depreciation includes all mining and processing costs, third party refining costs, corporate general and administrative costs, and permitting costs
4Share-based payments are calculated based on the fair value at initial recognition and do not include the adjustment of the cash-settled share-based payment obligation to the reporting date fair value
5Rehabilitation includes the interest charge related to the environmental rehabilitation obligation and the amortisation of the related capitalised rehabilitation costs. The interest charge related to the environmental rehabilitation obligation and the amortisation of the capitalised rehabilitation costs reflect the periodic costs of rehabilitation associated with current PGM production
6All-in cost is calculated in accordance with the World Gold Council guidance. All-in cost excludes income tax, costs associated with merger and acquisition activities, working capital, impairments, financing costs, one-time severance charges and items needed to normalise earnings. All-in cost is made up of All-in sustaining cost, being the cost to sustain current operations, given as a sub-total in the All-in cost calculation, together with corporate and major capital expenditure associated with growth. All-in sustaining cost per ounce (and kilogram) and All-in cost per ounce (and kilogram) are calculated by dividing the All-in sustaining cost and All-in cost, respectively, in a period by the total 4E/2E PGM produced in the same period
Non-IFRS measures such as All-in sustaining cost and All-in cost is the responsibility of the Group’s Board of Directors and is presented for illustration purposes only, and because of its nature, All-in sustaining cost and All-in cost should not be considered as a representation of financial performance.
Sibanye-Stillwater Operating and financial results | Six months and year ended 31 December 2022 60
| Reconciliation of operating cost excluding third party PoC for Total US and SA PGM, Total SA PGM and Marikana - Year | |||||||||||||||||||||||
| Total US and SA PGM | Total SA PGM | Marikana | |||||||||||||||||||||
| R' million | Dec 2022 | Dec 2021 | Dec 2022 | Dec 2021 | Dec 2022 | Dec 2021 | |||||||||||||||||
| Cost of sales, before amortisation and depreciation as reported per table above | 39,739 | 39,539 | 32,281 | 31,972 | 14,603 | 16,561 | |||||||||||||||||
| Inventory change as reported per table above | 2,720 | 1,327 | 2,315 | 1,294 | 2,214 | 478 | |||||||||||||||||
| Less: Chrome cost of sales | (1,528) | (1,286) | (1,528) | (1,286) | (375) | (280) | |||||||||||||||||
| Total operating cost including third party PoC | 40,931 | 39,580 | 33,068 | 31,980 | 16,442 | 16,759 | |||||||||||||||||
| Less: Purchase cost of PoC | (2,738) | (3,170) | (2,738) | (3,170) | (2,738) | (3,170) | |||||||||||||||||
| Total operating cost excluding third party PoC | 38,193 | 36,410 | 30,330 | 28,810 | 13,704 | 13,589 | |||||||||||||||||
| PGM production as reported per table above | 4Eoz- 2Eoz | 2,151,941 | 2,467,070 | 1,730,808 | 1,896,670 | 736,261 | 826,018 | ||||||||||||||||
| Less: Mimosa production | (115,534) | (119,251) | (115,534) | (119,251) | — | — | |||||||||||||||||
| PGM production excluding Mimosa | 2,036,407 | 2,347,819 | 1,615,274 | 1,777,419 | 736,261 | 826,018 | |||||||||||||||||
| Less: PoC production | (63,344) | (60,532) | (63,344) | (60,532) | (63,344) | (60,532) | |||||||||||||||||
| PGM production excluding Mimosa and third party PoC | 1,973,063 | 2,287,287 | 1,551,930 | 1,716,887 | 672,917 | 765,486 | |||||||||||||||||
| PGM production including Mimosa and excluding third party PoC | 2,088,597 | 2,406,538 | 1,667,464 | 1,836,138 | 672,917 | 765,486 | |||||||||||||||||
| Tonnes milled/treated | 000't | 37,799 | 39,776 | 36,644 | 38,307 | 10,013 | 10,671 | ||||||||||||||||
| Less: Mimosa tonnes | (1,387) | (1,422) | (1,387) | (1,422) | — | — | |||||||||||||||||
| PGM tonnes excluding Mimosa and third party PoC | 36,411 | 38,354 | 35,257 | 36,885 | 10,013 | 10,671 | |||||||||||||||||
| Operating cost including third party PoC | R/4Eoz-R/2Eoz | 20,100 | 16,858 | 20,472 | 17,992 | 22,332 | 20,289 | ||||||||||||||||
| US$/4Eoz-US$/2Eoz | 1,228 | 1,140 | 1,251 | 1,217 | 1,364 | 1,372 | |||||||||||||||||
| R/t | 1,124 | 1,032 | 938 | 867 | 1,642 | 1,571 | |||||||||||||||||
| US$/t | 69 | 70 | 57 | 59 | 100 | 106 | |||||||||||||||||
| Operating cost excluding third party PoC | R/4Eoz-R/2Eoz | 19,357 | 15,918 | 19,543 | 16,780 | 20,365 | 17,752 | ||||||||||||||||
| US$/4Eoz-US$/2Eoz | 1,183 | 1,076 | 1,194 | 1,135 | 1,244 | 1,200 | |||||||||||||||||
| R/t | 1,049 | 949 | 860 | 781 | 1,369 | 1,273 | |||||||||||||||||
| US$/t | 64 | 64 | 53 | 53 | 84 | 86 | |||||||||||||||||
| Reconciliation of AISC and AIC excluding third party PoC for Total US and SA PGM, Total SA PGM and Marikana - Year | |||||||||||||||||||||||
| Total US and SA PGM | Total SA PGM | Marikana | |||||||||||||||||||||
| R' million | Dec 2022 | Dec 2021 | Dec 2022 | Dec 2021 | Dec 2022 | Dec 2021 | |||||||||||||||||
| Total All-in-sustaining cost as reported per table above | 43,360 | 40,556 | 32,431 | 32,085 | 16,254 | 16,243 | |||||||||||||||||
| Less: Purchase cost of PoC | (2,738) | (3,170) | (2,738) | (3,170) | (2,738) | (3,170) | |||||||||||||||||
| Add: By-product credit of PoC | 279 | 242 | 279 | 242 | 279 | 242 | |||||||||||||||||
| Total All-in-sustaining cost excluding third party PoC | 40,901 | 37,628 | 29,972 | 29,157 | 13,795 | 13,315 | |||||||||||||||||
| Plus: Corporate cost, growth and capital expenditure | 2,282 | 2,626 | 937 | 215 | 936 | 215 | |||||||||||||||||
| Total All-in-cost excluding third party PoC | 43,183 | 40,254 | 30,909 | 29,372 | 14,731 | 13,530 | |||||||||||||||||
| PGM production excluding Mimosa and third party PoC | 4Eoz- 2Eoz | 1,973,063 | 2,287,287 | 1,551,930 | 1,716,887 | 672,917 | 765,486 | ||||||||||||||||
| All-in-sustaining cost excluding third party PoC | R/4Eoz-R/2Eoz | 20,730 | 16,451 | 19,313 | 16,982 | 20,500 | 17,394 | ||||||||||||||||
| US$/4Eoz-US$/2Eoz | 1,267 | 1,112 | 1,180 | 1,148 | 1,253 | 1,176 | |||||||||||||||||
| All-in-cost excluding third party PoC | R/4Eoz-R/2Eoz | 21,886 | 17,599 | 19,916 | 17,108 | 21,891 | 17,675 | ||||||||||||||||
| US$/4Eoz-US$/2Eoz | 1,337 | 1,190 | 1,217 | 1,157 | 1,337 | 1,195 | |||||||||||||||||
Sibanye-Stillwater Operating and financial results | Six months and year ended 31 December 2022 61
SA gold operations
| SA OPERATIONS | |||||||||||||||||||||||||||||
| R' million | Total SA gold | Driefontein | Kloof | Beatrix | Cooke | DRDGOLD | Corporate | ||||||||||||||||||||||
Cost of sales, before amortisation and depreciation1 | Dec 2022 | 20,175 | 5,281 | 6,381 | 3,911 | 822 | 3,780 | — | |||||||||||||||||||||
| Dec 2021 | 22,256 | 5,691 | 7,845 | 4,565 | 808 | 3,347 | — | ||||||||||||||||||||||
| Royalties | Dec 2022 | 62 | 22 | 22 | 13 | 5 | — | — | |||||||||||||||||||||
| Dec 2021 | 167 | 95 | 46 | 27 | 5 | — | (6) | ||||||||||||||||||||||
| Carbon tax | Dec 2022 | (10) | — | — | (10) | — | — | — | |||||||||||||||||||||
| Dec 2021 | 2 | — | — | 2 | — | — | — | ||||||||||||||||||||||
| Community costs | Dec 2022 | 94 | 33 | 27 | 23 | — | 11 | — | |||||||||||||||||||||
| Dec 2021 | 127 | 46 | 38 | 34 | 1 | 8 | — | ||||||||||||||||||||||
Share-based payments2 | Dec 2022 | 146 | 49 | 47 | 31 | — | 19 | — | |||||||||||||||||||||
| Dec 2021 | 100 | 23 | 35 | 23 | — | 19 | — | ||||||||||||||||||||||
Rehabilitation interest and amortisation3 | Dec 2022 | 141 | 12 | (17) | 51 | 52 | 16 | 27 | |||||||||||||||||||||
| Dec 2021 | 189 | 32 | 17 | 70 | 47 | 18 | 5 | ||||||||||||||||||||||
| Leases | Dec 2022 | 80 | 5 | 18 | 29 | 4 | 24 | — | |||||||||||||||||||||
| Dec 2021 | 82 | 8 | 14 | 28 | 13 | 19 | — | ||||||||||||||||||||||
| Ore reserve development | Dec 2022 | 1,630 | 794 | 620 | 216 | — | — | — | |||||||||||||||||||||
| Dec 2021 | 2,604 | 1,177 | 930 | 497 | — | — | — | ||||||||||||||||||||||
| Sustaining capital expenditure | Dec 2022 | 1,615 | 358 | 455 | 155 | — | 647 | — | |||||||||||||||||||||
| Dec 2021 | 1,304 | 322 | 488 | 164 | — | 330 | — | ||||||||||||||||||||||
| Less: By-product credit | Dec 2022 | (13) | (3) | (2) | (2) | (1) | (5) | — | |||||||||||||||||||||
| Dec 2021 | (23) | (8) | (5) | (5) | (1) | (4) | — | ||||||||||||||||||||||
Total All-in-sustaining costs4 | Dec 2022 | 23,920 | 6,551 | 7,551 | 4,417 | 882 | 4,492 | 27 | |||||||||||||||||||||
| Dec 2021 | 26,808 | 7,386 | 9,408 | 5,405 | 873 | 3,737 | (1) | ||||||||||||||||||||||
| Plus: Corporate cost, growth and capital expenditure | Dec 2022 | 1,381 | — | 210 | 4 | — | 124 | 1,043 | |||||||||||||||||||||
| Dec 2021 | 604 | — | 198 | 7 | — | 47 | 352 | ||||||||||||||||||||||
Total All-in-costs4 | Dec 2022 | 25,301 | 6,551 | 7,761 | 4,421 | 882 | 4,616 | 1,070 | |||||||||||||||||||||
| Dec 2021 | 27,412 | 7,386 | 9,606 | 5,412 | 873 | 3,784 | 351 | ||||||||||||||||||||||
| Gold sold | kg | Dec 2022 | 18,859 | 4,751 | 4,743 | 2,808 | 972 | 5,585 | — | ||||||||||||||||||||
| Dec 2021 | 33,374 | 9,314 | 10,961 | 6,305 | 1,175 | 5,619 | — | ||||||||||||||||||||||
| oz | Dec 2022 | 606,331 | 152,748 | 152,491 | 90,279 | 31,251 | 179,562 | — | |||||||||||||||||||||
| Dec 2021 | 1,072,999 | 299,452 | 352,404 | 202,710 | 37,777 | 180,655 | — | ||||||||||||||||||||||
| All-in-sustaining cost | R/kg | Dec 2022 | 1,268,360 | 1,378,868 | 1,592,030 | 1,573,006 | 907,407 | 804,297 | — | ||||||||||||||||||||
| Dec 2021 | 803,260 | 793,000 | 858,316 | 857,256 | 742,979 | 665,065 | — | ||||||||||||||||||||||
| All-in-sustaining cost | US$/oz | Dec 2022 | 2,410 | 2,620 | 3,025 | 2,989 | 1,724 | 1,528 | — | ||||||||||||||||||||
| Dec 2021 | 1,689 | 1,668 | 1,805 | 1,803 | 1,562 | 1,399 | — | ||||||||||||||||||||||
| All-in-cost | R/kg | Dec 2022 | 1,341,588 | 1,378,868 | 1,636,306 | 1,574,430 | 907,407 | 826,500 | — | ||||||||||||||||||||
| Dec 2021 | 821,358 | 793,000 | 876,380 | 858,366 | 742,979 | 673,429 | — | ||||||||||||||||||||||
| All-in-cost | US$/oz | Dec 2022 | 2,549 | 2,620 | 3,110 | 2,992 | 1,724 | 1,571 | — | ||||||||||||||||||||
| Dec 2021 | 1,727 | 1,668 | 1,843 | 1,805 | 1,562 | 1,416 | — | ||||||||||||||||||||||
Average exchange rates for the year ended 31 December 2022 and 31 December 2021 were R16.37/US$ and R14.79/US$, respectively
Figures may not add as they are rounded independently
1 Cost of sales, before amortisation and depreciation includes all mining and processing costs, third party refining costs, corporate general and administrative costs, and permitting costs
2 Share-based payments are calculated based on the fair value at initial recognition and do not include the adjustment of the cash-settled share-based payment obligation to the reporting date fair value
3 Rehabilitation includes the interest charge related to the environmental rehabilitation obligation and the amortisation of the related capitalised rehabilitation costs. The interest charge related to the environmental rehabilitation obligation and the amortisation of the capitalised rehabilitation costs reflect the periodic costs of rehabilitation associated with current gold production
4 All-in cost is calculated in accordance with the World Gold Council guidance. All-in cost excludes income tax, costs associated with merger and acquisition activities, working capital, impairments, financing costs, one time severance charges and items needed to normalise earnings. All-in cost is made up of All-in sustaining cost, being the cost to sustain current operations, given as a sub-total in the All-in cost calculation, together with corporate and major capital expenditure associated with growth. All-in sustaining cost per kilogram (and ounce) and All-in cost per kilogram (and ounce) are calculated by dividing the All-in sustaining cost and All-in cost, respectively, in a period by the total gold sold over the same period
Non-IFRS measures such as All-in sustaining cost and All-in cost is the responsibility of the Group’s Board of Directors and is presented for illustration purposes only, and because of its nature, All-in sustaining cost and All-in cost should not be considered as a representation of financial performance.
Sibanye-Stillwater Operating and financial results | Six months and year ended 31 December 2022 62
SALIENT FEATURES AND COST BENCHMARKS - QUARTERS
US and SA PGM operations
| US OPERA-TIONS | SA OPERATIONS | |||||||||||||||||||||||||||||||||||||||||||
Total US and SA PGM1 | Total US PGM | Total SA PGM1 | Rustenburg | Marikana1 | Kroondal | Plat Mile | Mimosa | |||||||||||||||||||||||||||||||||||||
| Attributable | Under- ground2 | Total | Under- ground | Surface | Under- ground | Surface | Under- ground | Surface | Attribu-table | Surface | Attribu-table | |||||||||||||||||||||||||||||||||
| Production | ||||||||||||||||||||||||||||||||||||||||||||
| Tonnes milled/treated | 000't | Dec 2022 | 9,242 | 286 | 8,956 | 4,229 | 4,727 | 1,399 | 1,385 | 1,660 | 892 | 823 | 2,450 | 347 | ||||||||||||||||||||||||||||||
| Sep 2022 | 9,625 | 241 | 9,383 | 4,303 | 5,081 | 1,666 | 1,418 | 1,515 | 927 | 782 | 2,736 | 340 | ||||||||||||||||||||||||||||||||
| Plant head grade | g/t | Dec 2022 | 2.31 | 12.60 | 1.98 | 3.27 | 0.82 | 3.31 | 1.08 | 3.62 | 0.86 | 2.40 | 0.66 | 3.53 | ||||||||||||||||||||||||||||||
| Sep 2022 | 2.21 | 12.23 | 1.96 | 3.30 | 0.82 | 3.34 | 1.03 | 3.70 | 0.87 | 2.33 | 0.69 | 3.52 | ||||||||||||||||||||||||||||||||
| Plant recoveries | % | Dec 2022 | 75.42 | 91.20 | 72.30 | 84.94 | 27.20 | 86.22 | 33.77 | 86.75 | 26.01 | 82.43 | 21.62 | 74.39 | ||||||||||||||||||||||||||||||
| Sep 2022 | 75.59 | 89.25 | 73.19 | 85.09 | 32.61 | 86.52 | 52.47 | 87.06 | 25.94 | 82.17 | 20.30 | 74.44 | ||||||||||||||||||||||||||||||||
| Yield | g/t | Dec 2022 | 1.74 | 11.49 | 1.43 | 2.78 | 0.22 | 2.85 | 0.36 | 3.14 | 0.22 | 1.98 | 0.14 | 2.63 | ||||||||||||||||||||||||||||||
| Sep 2022 | 1.67 | 10.92 | 1.43 | 2.81 | 0.27 | 2.89 | 0.54 | 3.22 | 0.23 | 1.91 | 0.14 | 2.62 | ||||||||||||||||||||||||||||||||
PGM production3 | 4Eoz - 2Eoz | Dec 2022 | 516,720 | 105,205 | 411,515 | 377,627 | 33,888 | 128,351 | 16,236 | 167,645 | 6,413 | 52,321 | 11,239 | 29,310 | ||||||||||||||||||||||||||||||
| Sep 2022 | 518,032 | 85,889 | 432,143 | 388,460 | 43,683 | 154,797 | 24,641 | 156,873 | 6,723 | 48,120 | 12,319 | 28,670 | ||||||||||||||||||||||||||||||||
PGM sold4 | 4Eoz - 2Eoz | Dec 2022 | 523,756 | 110,822 | 412,934 | 150,266 | 19,061 | 152,402 | 52,321 | 11,239 | 27,645 | |||||||||||||||||||||||||||||||||
| Sep 2022 | 471,994 | 69,534 | 402,460 | 137,246 | 16,578 | 160,115 | 48,120 | 12,319 | 28,082 | |||||||||||||||||||||||||||||||||||
Price and costs5 | ||||||||||||||||||||||||||||||||||||||||||||
Average PGM basket price6 | R/4Eoz - R/2Eoz | Dec 2022 | 39,418 | 30,608 | 41,953 | 42,625 | 30,156 | 42,446 | 44,636 | 33,775 | 33,279 | |||||||||||||||||||||||||||||||||
| Sep 2022 | 40,485 | 30,878 | 42,269 | 43,331 | 34,278 | 42,033 | 44,972 | 33,714 | 33,412 | |||||||||||||||||||||||||||||||||||
| Average PGM basket price6 | US$/4Eoz - US$/2Eoz | Dec 2022 | 2,238 | 1,738 | 2,382 | 2,420 | 1,712 | 2,410 | 2,535 | 1,918 | 1,890 | |||||||||||||||||||||||||||||||||
| Sep 2022 | 2,374 | 1,811 | 2,479 | 2,541 | 2,010 | 2,465 | 2,638 | 1,977 | 1,960 | |||||||||||||||||||||||||||||||||||
Operating cost7 | R/t | Dec 2022 | 1,140 | 7,838 | 918 | 2,072 | 300 | 1,366 | 1,154 | 61 | 1,553 | |||||||||||||||||||||||||||||||||
| Sep 2022 | 1,043 | 7,504 | 871 | 1,764 | 279 | 1,459 | 1,049 | 58 | 1,493 | |||||||||||||||||||||||||||||||||||
| Operating cost7 | US$/t | Dec 2022 | 65 | 445 | 52 | 118 | 17 | 78 | 66 | 3 | 88 | |||||||||||||||||||||||||||||||||
| Sep 2022 | 61 | 440 | 51 | 103 | 16 | 86 | 62 | 3 | 88 | |||||||||||||||||||||||||||||||||||
| Operating cost7 | R/4Eoz - R/2Eoz | Dec 2022 | 20,812 | 21,320 | 20,672 | 22,587 | 25,622 | 20,034 | 18,138 | 13,346 | 18,390 | |||||||||||||||||||||||||||||||||
| Sep 2022 | 19,793 | 21,085 | 19,518 | 18,986 | 16,071 | 21,767 | 17,041 | 12,907 | 17,719 | |||||||||||||||||||||||||||||||||||
| Operating cost7 | US$/4Eoz - US$/2Eoz | Dec 2022 | 1,182 | 1,211 | 1,174 | 1,283 | 1,455 | 1,138 | 1,030 | 758 | 1,044 | |||||||||||||||||||||||||||||||||
| Sep 2022 | 1,161 | 1,237 | 1,145 | 1,114 | 943 | 1,277 | 999 | 757 | 1,039 | |||||||||||||||||||||||||||||||||||
All-in sustaining cost8 | R/4Eoz - R/2Eoz | Dec 2022 | 24,066 | 32,613 | 21,713 | 23,543 | 22,257 | 16,819 | 12,457 | 24,053 | ||||||||||||||||||||||||||||||||||
| Sep 2022 | 21,271 | 30,947 | 19,211 | 18,435 | 21,785 | 15,399 | 11,283 | 21,032 | ||||||||||||||||||||||||||||||||||||
| All-in sustaining cost8 | US$/4Eoz - US$/2Eoz | Dec 2022 | 1,367 | 1,852 | 1,233 | 1,337 | 1,264 | 955 | 707 | 1,366 | ||||||||||||||||||||||||||||||||||
| Sep 2022 | 1,248 | 1,815 | 1,127 | 1,081 | 1,278 | 903 | 662 | 1234 | ||||||||||||||||||||||||||||||||||||
All-in cost8 | R/4Eoz - R/2Eoz | Dec 2022 | 25,492 | 36,234 | 22,535 | 23,536 | 24,067 | 16,819 | 12,457 | 24,053 | ||||||||||||||||||||||||||||||||||
| Sep 2022 | 22,582 | 36,000 | 19,726 | 18,441 | 23,051 | 15,399 | 11,283 | 21,032 | ||||||||||||||||||||||||||||||||||||
| All-in cost8 | US$/4Eoz - US$/2Eoz | Dec 2022 | 1,448 | 2,058 | 1,280 | 1,337 | 1,367 | 955 | 707 | 1,366 | ||||||||||||||||||||||||||||||||||
| Sep 2022 | 1,324 | 2,111 | 1,157 | 1,082 | 1,352 | 903 | 662 | 1,234 | ||||||||||||||||||||||||||||||||||||
Capital expenditure5 | ||||||||||||||||||||||||||||||||||||||||||||
| Ore reserve development | Rm | Dec 2022 | 1,481 | 887 | 594 | 178 | 416 | — | — | — | ||||||||||||||||||||||||||||||||||
| Sep 2022 | 1,313 | 723 | 590 | 194 | 396 | — | — | — | ||||||||||||||||||||||||||||||||||||
| Sustaining capital | Rm | Dec 2022 | 1,288 | 513 | 775 | 245 | 439 | 78 | 13 | 313 | ||||||||||||||||||||||||||||||||||
| Sep 2022 | 758 | 293 | 465 | 140 | 242 | 80 | 3 | 258 | ||||||||||||||||||||||||||||||||||||
| Corporate and projects | Rm | Dec 2022 | 692 | 381 | 311 | (1) | 312 | — | — | — | ||||||||||||||||||||||||||||||||||
| Sep 2022 | 642 | 434 | 208 | 1 | 207 | — | — | — | ||||||||||||||||||||||||||||||||||||
| Total capital expenditure | Rm | Dec 2022 | 3,461 | 1,781 | 1,680 | 422 | 1,167 | 78 | 13 | 313 | ||||||||||||||||||||||||||||||||||
| Sep 2022 | 2,713 | 1,450 | 1,263 | 335 | 845 | 80 | 3 | 258 | ||||||||||||||||||||||||||||||||||||
| Total capital expenditure | US$m | Dec 2022 | 197 | 101 | 95 | 24 | 66 | 4 | 1 | 18 | ||||||||||||||||||||||||||||||||||
| Sep 2022 | 159 | 85 | 74 | 20 | 50 | 5 | — | 15 | ||||||||||||||||||||||||||||||||||||
Average exchange rate for the quarters ended 31 December 2022 and 30 September 2022 was R17.61/US$ and R17.05/US$, respectively
Figures may not add as they are rounded independently
1The Total US and SA PGM, Total SA PGM and Marikana excludes the production and costs associated with the purchase of concentrate (PoC) from third parties. For a reconciliation of the Operating cost, AISC and AIC excluding third party PoC, refer to “Reconciliation of operating cost excluding third party PoC for Total US and SA PGM, Total SA PGM and Marikana - Quarters” and “Reconciliation of AISC and AIC excluding third party PoC for Total US and SA PGM, Total SA PGM and Marikana – Quarters”
2The US PGM operations’ underground production is converted to metric tonnes and kilograms, and performance is translated into SA rand. In addition to the US PGM operations’ underground production, the operation treats recycling material which is excluded from the statistics shown above and is detailed in the PGM recycling table on the next page
3Production per product – see prill split in the table on the next page
4PGM sold includes the third party PoC ounces sold
5The Total US and SA PGM and Total SA PGM operations’ unit cost benchmarks and capital expenditure exclude the financial results of Mimosa, which is equity accounted and excluded from revenue and cost of sales
6The average PGM basket price is the PGM revenue per 4E/2E ounce, prior to a purchase of concentrate adjustment
7Operating cost is the average cost of production and operating cost per tonne is calculated by dividing the cost of sales, before amortisation and depreciation and change in inventory in a period by the tonnes milled/treated in the same period, and operating cost per ounce (and kilogram) is calculated by dividing the cost of sales, before amortisation and depreciation and change in inventory in a period by the PGM produced in the same period
8All-in cost is calculated in accordance with the World Gold Council guidance. All-in cost excludes income tax, costs associated with merger and acquisition activities, working capital, impairments, financing costs, one-time severance charges and items needed to normalise earnings. All-in cost is made up of All-in sustaining cost, being the cost to sustain current operations, given as a sub-total in the All-in cost calculation, together with corporate and major capital expenditure associated with growth. All-in sustaining cost per ounce (and kilogram) and All-in cost per ounce (and kilogram) are calculated by dividing the All-in sustaining cost and All-in cost, respectively, in a period by the total 4E/2E PGM produced in the same period. For a reconciliation of cost of sales, before amortisation and depreciation to All-in cost, see “All-in costs - Quarters”
Sibanye-Stillwater Operating and financial results | Six months and year ended 31 December 2022 63
| Mining - PGM Prill split including third party PoC, excluding recycling operations | ||||||||||||||||||||||||||||||||||||||
| GROUP PGM | SA OPERATIONS | US OPERATIONS | ||||||||||||||||||||||||||||||||||||
| Dec 2022 | Sep 2022 | Dec 2022 | Sep 2022 | Dec 2022 | Sep 2022 | |||||||||||||||||||||||||||||||||
| % | % | % | % | % | % | |||||||||||||||||||||||||||||||||
| Platinum | 282,016 | 52 | % | 286,103 | 54 | % | 257,964 | 60 | % | 265,975 | 59 | % | 24,052 | 23 | % | 20,128 | 23 | % | ||||||||||||||||||||
| Palladium | 209,447 | 39 | % | 200,137 | 37 | % | 128,294 | 30 | % | 134,376 | 30 | % | 81,153 | 77 | % | 65,761 | 77 | % | ||||||||||||||||||||
| Rhodium | 38,487 | 7 | % | 40,296 | 8 | % | 38,487 | 9 | % | 40,296 | 9 | % | ||||||||||||||||||||||||||
| Gold | 8,048 | 1 | % | 8,216 | 2 | % | 8,048 | 2 | % | 8,216 | 2 | % | ||||||||||||||||||||||||||
| PGM production 4E/2E | 537,998 | 100 | % | 534,752 | 100 | % | 432,793 | 100 | % | 448,863 | 100 | % | 105,205 | 100 | % | 85,889 | 100 | % | ||||||||||||||||||||
| Ruthenium | 60,965 | 64,192 | 60,965 | 64,192 | ||||||||||||||||||||||||||||||||||
| Iridium | 15,602 | 16,034 | 15,602 | 16,034 | ||||||||||||||||||||||||||||||||||
| Total 6E/2E | 614,565 | 614,978 | 509,360 | 529,089 | 105,205 | 85,889 | ||||||||||||||||||||||||||||||||
Figures may not add as they are rounded independently
| Recycling at US operations | |||||||||||
| Unit | Dec 2022 | Sep 2022 | |||||||||
| Average catalyst fed/day | Tonne | 12.1 | 17.7 | ||||||||
| Total processed | Tonne | 1,110 | 1,630 | ||||||||
| Tolled | Tonne | — | — | ||||||||
| Purchased | Tonne | 1,110 | 1,630 | ||||||||
| PGM fed | 3Eoz | 95,881 | 141,560 | ||||||||
| PGM sold | 3Eoz | 118,982 | 162,659 | ||||||||
| PGM tolled returned | 3Eoz | 743 | 4,715 | ||||||||
Sibanye-Stillwater Operating and financial results | Six months and year ended 31 December 2022 64
SA gold operations
| SA OPERATIONS | |||||||||||||||||||||||||||||||||||||||||
| Total SA gold | Driefontein | Kloof | Beatrix | Cooke | DRDGOLD | ||||||||||||||||||||||||||||||||||||
| Total | Under- ground | Surface | Under- ground | Surface | Under- ground | Surface | Under- ground | Surface | Surface | Surface | |||||||||||||||||||||||||||||||
| Production | |||||||||||||||||||||||||||||||||||||||||
| Tonnes milled/treated | 000't | Dec 2022 | 9,064 | 1,152 | 7,912 | 313 | 366 | 400 | 670 | 439 | 106 | 1,085 | 5,685 | ||||||||||||||||||||||||||||
| Sep 2022 | 10,237 | 1,117 | 9,120 | 290 | 123 | 336 | 620 | 490 | 18 | 1,202 | 7,157 | ||||||||||||||||||||||||||||||
| Yield | g/t | Dec 2022 | 0.77 | 4.25 | 0.26 | 4.86 | 0.52 | 4.73 | 0.34 | 3.38 | 0.40 | 0.31 | 0.22 | ||||||||||||||||||||||||||||
| Sep 2022 | 0.62 | 3.90 | 0.22 | 5.65 | 0.41 | 4.14 | 0.31 | 2.69 | — | 0.27 | 0.20 | ||||||||||||||||||||||||||||||
| Gold produced | kg | Dec 2022 | 6,973 | 4,896 | 2,077 | 1,523 | 190 | 1,891 | 230 | 1,482 | 42 | 337 | 1,278 | ||||||||||||||||||||||||||||
| Sep 2022 | 6,366 | 4,354 | 2,012 | 1,640 | 50 | 1,393 | 190 | 1,321 | — | 319 | 1,453 | ||||||||||||||||||||||||||||||
| oz | Dec 2022 | 224,187 | 157,410 | 66,777 | 48,966 | 6,109 | 60,797 | 7,395 | 47,647 | 1,350 | 10,835 | 41,089 | |||||||||||||||||||||||||||||
| Sep 2022 | 204,672 | 139,984 | 64,687 | 52,727 | 1,608 | 44,786 | 6,109 | 42,471 | — | 10,256 | 46,715 | ||||||||||||||||||||||||||||||
| Gold sold | kg | Dec 2022 | 6,308 | 4,314 | 1,994 | 1,437 | 139 | 1,633 | 198 | 1,244 | 42 | 295 | 1,320 | ||||||||||||||||||||||||||||
| Sep 2022 | 6,070 | 4,095 | 1,975 | 1,524 | 48 | 1,314 | 174 | 1,257 | — | 311 | 1,442 | ||||||||||||||||||||||||||||||
| oz | Dec 2022 | 202,807 | 138,698 | 64,109 | 46,201 | 4,469 | 52,502 | 6,366 | 39,996 | 1,350 | 9,484 | 42,439 | |||||||||||||||||||||||||||||
| Sep 2022 | 195,155 | 131,657 | 63,498 | 48,998 | 1,543 | 42,246 | 5,594 | 40,413 | — | 9,999 | 46,361 | ||||||||||||||||||||||||||||||
| Price and costs | |||||||||||||||||||||||||||||||||||||||||
| Gold price received | R/kg | Dec 2022 | 971,623 | 972,081 | 969,962 | 969,673 | 962,712 | 977,273 | |||||||||||||||||||||||||||||||||
| Sep 2022 | 944,316 | 944,020 | 944,220 | 942,721 | 945,338 | 945,908 | |||||||||||||||||||||||||||||||||||
| Gold price received | US$/oz | Dec 2022 | 1,716 | 1,717 | 1,713 | 1,713 | 1,700 | 1,726 | |||||||||||||||||||||||||||||||||
| Sep 2022 | 1,723 | 1,722 | 1,722 | 1,720 | 1,725 | 1,726 | |||||||||||||||||||||||||||||||||||
Operating cost1 | R/t | Dec 2022 | 652 | 3,838 | 188 | 4,721 | 254 | 4,340 | 257 | 2,749 | 94 | 254 | 165 | ||||||||||||||||||||||||||||
| Sep 2022 | 645 | 4,573 | 163 | 5,623 | 359 | 5,388 | 305 | 3,393 | 1,222 | 214 | 137 | ||||||||||||||||||||||||||||||
| US$/t | Dec 2022 | 37 | 218 | 11 | 268 | 14 | 246 | 15 | 156 | 5 | 14 | 9 | |||||||||||||||||||||||||||||
| Sep 2022 | 38 | 268 | 10 | 330 | 21 | 316 | 18 | 199 | 72 | 13 | 8 | ||||||||||||||||||||||||||||||
| R/kg | Dec 2022 | 847,268 | 902,778 | 716,418 | 971,110 | 489,474 | 916,975 | 747,826 | 814,440 | 238,095 | 818,991 | 733,177 | |||||||||||||||||||||||||||||
| Sep 2022 | 1,036,601 | 1,173,404 | 740,557 | 995,732 | 880,000 | 1,300,790 | 994,737 | 1,259,652 | — | 805,643 | 673,090 | ||||||||||||||||||||||||||||||
| US$/oz | Dec 2022 | 1,496 | 1,595 | 1,265 | 1,715 | 865 | 1,620 | 1,321 | 1,438 | 421 | 1,447 | 1,295 | |||||||||||||||||||||||||||||
| Sep 2022 | 1,891 | 2,141 | 1,351 | 1,816 | 1,605 | 2,373 | 1,815 | 2,298 | — | 1,470 | 1,228 | ||||||||||||||||||||||||||||||
All-in sustaining cost2 | R/kg | Dec 2022 | 1,041,218 | 1,220,812 | 1,130,530 | 924,572 | 871,186 | 837,121 | |||||||||||||||||||||||||||||||||
| Sep 2022 | 1,210,049 | 1,215,013 | 1,527,554 | 1,424,025 | 861,736 | 765,603 | |||||||||||||||||||||||||||||||||||
| All-in sustaining cost2 | US$/oz | Dec 2022 | 1,839 | 2,156 | 1,997 | 1,633 | 1,539 | 1,479 | |||||||||||||||||||||||||||||||||
| Sep 2022 | 2,207 | 2,216 | 2,787 | 2,598 | 1,572 | 1,397 | |||||||||||||||||||||||||||||||||||
All-in cost2 | R/kg | Dec 2022 | 1,110,812 | 1,220,812 | 1,157,837 | 924,572 | 871,186 | 886,364 | |||||||||||||||||||||||||||||||||
| Sep 2022 | 1,293,245 | 1,215,013 | 1,598,118 | 1,424,025 | 861,736 | 802,358 | |||||||||||||||||||||||||||||||||||
| All-in cost2 | US$/oz | Dec 2022 | 1,962 | 2,156 | 2,045 | 1,633 | 1,539 | 1,566 | |||||||||||||||||||||||||||||||||
| Sep 2022 | 2,359 | 2,216 | 2,915 | 2,598 | 1,572 | 1,464 | |||||||||||||||||||||||||||||||||||
| Capital expenditure | |||||||||||||||||||||||||||||||||||||||||
| Ore reserve development | Rm | Dec 2022 | 691 | 334 | 262 | 95 | — | — | |||||||||||||||||||||||||||||||||
| Sep 2022 | 472 | 208 | 174 | 90 | — | — | |||||||||||||||||||||||||||||||||||
| Sustaining capital | Rm | Dec 2022 | 480 | 154 | 153 | 50 | — | 123 | |||||||||||||||||||||||||||||||||
| Sep 2022 | 409 | 109 | 150 | 37 | — | 113 | |||||||||||||||||||||||||||||||||||
Corporate and projects3 | Rm | Dec 2022 | 423 | — | 50 | — | — | 65 | |||||||||||||||||||||||||||||||||
| Sep 2022 | 488 | — | 105 | — | — | 53 | |||||||||||||||||||||||||||||||||||
| Total capital expenditure | Rm | Dec 2022 | 1,594 | 488 | 465 | 145 | — | 188 | |||||||||||||||||||||||||||||||||
| Sep 2022 | 1,369 | 317 | 429 | 127 | — | 166 | |||||||||||||||||||||||||||||||||||
| Total capital expenditure | US$m | Dec 2022 | 91 | 28 | 26 | 8 | — | 11 | |||||||||||||||||||||||||||||||||
| Sep 2022 | 80 | 19 | 25 | 7 | — | 10 | |||||||||||||||||||||||||||||||||||
Average exchange rate for the quarters ended 31 December 2022 and 30 September 2022 was R17.61/US$ and 17.05/US$, respectively
Figures may not add as they are rounded independently
1Operating cost is the average cost of production and operating cost per tonne is calculated by dividing the cost of sales, before amortisation and depreciation and change in inventory in a period by the tonnes milled/treated in the same period, and operating cost per kilogram (and ounce) is calculated by dividing the cost of sales, before amortisation and depreciation and change in inventory in a period by the gold produced in the same period
2All-in cost is calculated in accordance with the World Gold Council guidance. All-in cost excludes income tax, costs associated with merger and acquisition activities, working capital, impairments, financing costs, one time severance charges and items needed to normalise earnings. All-in cost is made up of All-in sustaining cost, being the cost to sustain current operations, given as a sub-total in the All-in cost calculation, together with corporate and major capital expenditure associated with growth. All-in sustaining cost per kilogram (and ounce) and All-in cost per kilogram (and ounce) are calculated by dividing the All-in sustaining cost and All-in cost, respectively, in a period by the total gold sold over the same period. For a reconciliation of cost of sales before amortisation and depreciation to All-in cost, see “All-in costs – Quarters”
3Corporate project expenditure, which comprises spend on various Corporate IT projects and the Burnstone project, for the quarters ended 31 December 2022 and 30 September 2022 was R308 million (US$17 million) and R330 million (US$19 million), respectively
Sibanye-Stillwater Operating and financial results | Six months and year ended 31 December 2022 65
European operations
| Sibanye-Stillwater Sandouville refinery | ||||||||||||||
| Battery metal split | ||||||||||||||
| Dec 2022 | Sep 2022 | |||||||||||||
| Volumes produced (tonnes) | % | % | ||||||||||||
Nickel Salts1 | 287 | 46 | % | 650 | 39 | % | ||||||||
| Nickel Metal | 337 | 54 | % | 1,003 | 61 | % | ||||||||
| Total Nickel production tNi | 624 | 100 | % | 1,653 | 100 | % | ||||||||
Nickel Cakes2 | 23 | 68 | ||||||||||||
Cobalt Chloride (CoCl2)3 | 6 | 37 | ||||||||||||
Ferric Chloride (FeCl3)3 | 110 | 321 | ||||||||||||
| Volumes sales (tonnes) | ||||||||||||||
Nickel Salts1 | 347 | 62 | % | 529 | 31 | % | ||||||||
| Nickel Metal | 211 | 38 | % | 1,177 | 69 | % | ||||||||
| Total Nickel sold tNi | 558 | 100 | % | 1,706 | 100 | % | ||||||||
Cobalt Chloride (CoCl2)3 | (32) | 51 | ||||||||||||
Ferric Chloride (FeCl3)3 | 110 | 321 | ||||||||||||
| Nickel equivalent basket price | Unit | Dec 2022 | Sep 2022 | ||||||||
| Nickel equivalent average basket price | R/tNi | 557,348 | 384,525 | ||||||||
| US$/tNi | 31,649 | 22,553 | |||||||||
| Nickel equivalent sustaining cost | Unit | Dec 2022 | Sep 2022 | ||||||||
| Cost of sales, before amortisation and depreciation | Rm | 624 | 882 | ||||||||
| Carbon tax | Rm | — | — | ||||||||
| Community costs | Rm | — | — | ||||||||
| Share-based payments | Rm | — | — | ||||||||
| Rehabilitation interest and amortisation | Rm | 1 | 1 | ||||||||
| Leases | Rm | (13) | 15 | ||||||||
| Sustaining capital expenditure | Rm | 37 | 23 | ||||||||
| Less: By-product credit | Rm | (25) | (43) | ||||||||
| Nickel equivalent sustaining cost | Rm | 624 | 878 | ||||||||
| Nickel products sold | tNi | 558 | 1,706 | ||||||||
| Nickel equivalent sustaining cost | R/tNi | 1,118,280 | 514,654 | ||||||||
| US$/tNi | 63,503 | 30,185 | |||||||||
Nickel recovery yield4 | % | 89.53 | % | 95.04 | % | ||||||
Average exchange rate for the quarters ended 31 December 2022 and 30 September 2022 was R17.61/US$ and 17.05/US$, respectively
Figures may not add as they are rounded independently
1Nickel salts consist of anhydrous nickel, nickel chloride low sodium, nickel chloride standard, nickel carbonate and nickel chloride solution
2Nickel cakes occur during the processing of nickel matte and are recycled back into the nickel refining process
3Cobalt chloride and ferric chloride are obtained from nickel matte through a different refining process on an order basis
4Nickel recovery yield is the percentage of total nickel recovered from the matte relative to the nickel contained in the matte received
Sibanye-Stillwater Operating and financial results | Six months and year ended 31 December 2022 66
ALL-IN COSTS - QUARTERS
US and SA PGM operations
| US OPERATIONS | SA OPERATIONS | ||||||||||||||||||||||||||||||||||
| R' million | Total US and SA PGM1 | Total US PGM2 | Total SA PGM1 | Rustenburg | Marikana1 | Kroondal | Plat Mile | Mimosa | Corporate | ||||||||||||||||||||||||||
Cost of sales, before amortisation and depreciation3 | Dec 2022 | 9,700 | 2,203 | 7,497 | 3,670 | 2,772 | 905 | 150 | 535 | (535) | |||||||||||||||||||||||||
| Sep 2022 | 9,416 | 1,413 | 8,003 | 3,218 | 3,758 | 868 | 159 | 511 | (511) | ||||||||||||||||||||||||||
| Royalties | Dec 2022 | 444 | — | 444 | 307 | 134 | 3 | — | 31 | (31) | |||||||||||||||||||||||||
| Sep 2022 | 374 | — | 374 | 258 | 112 | 4 | — | 26 | (26) | ||||||||||||||||||||||||||
| Carbon tax | Dec 2022 | — | — | — | — | — | — | — | — | — | |||||||||||||||||||||||||
| Sep 2022 | (1) | — | (1) | — | — | (1) | — | — | — | ||||||||||||||||||||||||||
| Community costs | Dec 2022 | 27 | — | 27 | — | 27 | — | — | — | — | |||||||||||||||||||||||||
| Sep 2022 | 22 | — | 22 | — | 22 | — | — | — | — | ||||||||||||||||||||||||||
| Inventory change | Dec 2022 | 1,642 | 40 | 1,602 | (29) | 1,631 | — | — | 4 | (4) | |||||||||||||||||||||||||
| Sep 2022 | 1,462 | 398 | 1,064 | 375 | 689 | — | — | (3) | 3 | ||||||||||||||||||||||||||
Share-based payments4 | Dec 2022 | 79 | 44 | 35 | 14 | 22 | (2) | — | — | — | |||||||||||||||||||||||||
| Sep 2022 | 54 | 12 | 42 | 16 | 19 | 7 | — | — | — | ||||||||||||||||||||||||||
Rehabilitation interest and amortisation5 | Dec 2022 | 49 | 13 | 36 | (5) | 15 | 26 | — | 1 | (1) | |||||||||||||||||||||||||
| Sep 2022 | 35 | 13 | 22 | (8) | 10 | 20 | — | 1 | (1) | ||||||||||||||||||||||||||
| Leases | Dec 2022 | 15 | 2 | 13 | 3 | 9 | 1 | — | — | — | |||||||||||||||||||||||||
| Sep 2022 | 16 | 2 | 14 | 3 | 10 | 1 | — | — | — | ||||||||||||||||||||||||||
| Ore reserve development | Dec 2022 | 1,481 | 887 | 594 | 178 | 416 | — | — | — | — | |||||||||||||||||||||||||
| Sep 2022 | 1,313 | 723 | 590 | 194 | 396 | — | — | — | — | ||||||||||||||||||||||||||
| Sustaining capital expenditure | Dec 2022 | 1,288 | 513 | 775 | 245 | 439 | 78 | 13 | 313 | (313) | |||||||||||||||||||||||||
| Sep 2022 | 758 | 293 | 465 | 140 | 242 | 80 | 3 | 258 | (258) | ||||||||||||||||||||||||||
| Less: By-product credit | Dec 2022 | (2,218) | (271) | (1,947) | (979) | (814) | (131) | (23) | (179) | 179 | |||||||||||||||||||||||||
| Sep 2022 | (2,327) | (196) | (2,131) | (888) | (981) | (238) | (23) | (190) | 189 | ||||||||||||||||||||||||||
Total All-in-sustaining costs6 | Dec 2022 | 12,507 | 3,431 | 9,076 | 3,404 | 4,651 | 880 | 140 | 705 | (705) | |||||||||||||||||||||||||
| Sep 2022 | 11,122 | 2,658 | 8,464 | 3,308 | 4,277 | 741 | 139 | 603 | (604) | ||||||||||||||||||||||||||
| Plus: Corporate cost, growth and capital expenditure | Dec 2022 | 695 | 381 | 314 | (1) | 315 | — | — | — | — | |||||||||||||||||||||||||
| Sep 2022 | 642 | 434 | 208 | 1 | 207 | — | — | — | — | ||||||||||||||||||||||||||
Total All-in-costs6 | Dec 2022 | 13,202 | 3,812 | 9,390 | 3,403 | 4,966 | 880 | 140 | 705 | (705) | |||||||||||||||||||||||||
| Sep 2022 | 11,764 | 3,092 | 8,672 | 3,309 | 4,484 | 741 | 139 | 603 | (604) | ||||||||||||||||||||||||||
| PGM production | 4Eoz - 2Eoz | Dec 2022 | 537,998 | 105,205 | 432,793 | 144,587 | 195,336 | 52,321 | 11,239 | 29,310 | — | ||||||||||||||||||||||||
| Sep 2022 | 534,752 | 85,889 | 448,863 | 179,438 | 180,316 | 48,120 | 12,319 | 28,670 | — | ||||||||||||||||||||||||||
| kg | Dec 2022 | 16,734 | 3,272 | 13,461 | 4,497 | 6,076 | 1,627 | 350 | 912 | — | |||||||||||||||||||||||||
| Sep 2022 | 16,633 | 2,671 | 13,961 | 5,581 | 5,608 | 1,497 | 383 | 892 | — | ||||||||||||||||||||||||||
| All-in-sustaining cost | R/4Eoz - R/2Eoz | Dec 2022 | 24,587 | 32,613 | 22,494 | 23,543 | 23,810 | 16,819 | 12,457 | 24,053 | — | ||||||||||||||||||||||||
| Sep 2022 | 21,977 | 30,947 | 20,143 | 18,435 | 23,719 | 15,399 | 11,283 | 21,032 | — | ||||||||||||||||||||||||||
| US$/4Eoz - US$/2Eoz | Dec 2022 | 1,396 | 1,852 | 1,277 | 1,337 | 1,352 | 955 | 707 | 1,366 | — | |||||||||||||||||||||||||
| Sep 2022 | 1,289 | 1,815 | 1,181 | 1,081 | 1,391 | 903 | 662 | 1,234 | — | ||||||||||||||||||||||||||
| All-in-cost | R/4Eoz - R/2Eoz | Dec 2022 | 25,953 | 36,234 | 23,272 | 23,536 | 25,423 | 16,819 | 12,457 | 24,053 | — | ||||||||||||||||||||||||
| Sep 2022 | 23,245 | 36,000 | 20,638 | 18,441 | 24,867 | 15,399 | 11,283 | 21,032 | — | ||||||||||||||||||||||||||
| US$/4Eoz - US$/2Eoz | Dec 2022 | 1,474 | 2,058 | 1,322 | 1,337 | 1,444 | 955 | 707 | 1,366 | — | |||||||||||||||||||||||||
| Sep 2022 | 1,363 | 2,111 | 1,210 | 1,082 | 1,459 | 903 | 662 | 1,234 | — | ||||||||||||||||||||||||||
Average exchange rate for the quarters ended 31 December 2022 and 30 September 2022 was R17.61/US$ and R17.05/US$, respectively
Figures may not add as they are rounded independently
1The Total US and SA PGM, Total SA PGM and Marikana includes the production and costs associated with the purchase of concentrate (PoC) from third parties. For a reconciliation of the Operating cost, AISC and AIC excluding third party PoC, refer to “Reconciliation of operating cost excluding third party PoC for Total US and SA PGM, Total SA PGM and Marikana - Quarters” and “Reconciliation of AISC and AIC excluding third party PoC for Total US and SA PGM, Total SA PGM and Marikana – Quarters”
2The US PGM operations’ underground production is converted to metric tonnes and kilograms, and performance is translated into SA rand. In addition to the US PGM operations’ underground production, the operation processes various recycling material which is excluded from the 2E PGM production, All-in sustaining cost and All-in cost statistics shown
3Cost of sales, before amortisation and depreciation includes all mining and processing costs, third party refining costs, corporate general and administrative costs, and permitting costs
4Share-based payments are calculated based on the fair value at initial recognition and do not include the adjustment of the cash-settled share-based payment obligation to the reporting date fair value
5Rehabilitation includes the interest charge related to the environmental rehabilitation obligation and the amortisation of the related capitalised rehabilitation costs. The interest charge related to the environmental rehabilitation obligation and the amortisation of the capitalised rehabilitation costs reflect the periodic costs of rehabilitation associated with current PGM production
6All-in cost is calculated in accordance with the World Gold Council guidance. All-in cost excludes income tax, costs associated with merger and acquisition activities, working capital, impairments, financing costs, one-time severance charges and items needed to normalise earnings. All-in cost is made up of All-in sustaining cost, being the cost to sustain current operations, given as a sub-total in the All-in cost calculation, together with corporate and major capital expenditure associated with growth. All-in sustaining cost per ounce (and kilogram) and All-in cost per ounce (and kilogram) are calculated by dividing the All-in sustaining cost and All-in cost, respectively, in a period by the total 4E/2E PGM produced in the same period
Sibanye-Stillwater Operating and financial results | Six months and year ended 31 December 2022 67
| Reconciliation of operating cost excluding third party PoC for Total US and SA PGM, Total SA PGM and Marikana - Quarters | |||||||||||||||||||||||
| Total US and SA PGM | Total SA PGM | Marikana | |||||||||||||||||||||
| R' million | Dec 2022 | Sep 2022 | Dec 2022 | Sep 2022 | Dec 2022 | Sep 2022 | |||||||||||||||||
| Cost of sales, before amortisation and depreciation as reported per table above | 9,700 | 9,416 | 7,497 | 8,003 | 2,772 | 3,758 | |||||||||||||||||
| Inventory change as reported per table above | 1,642 | 1,462 | 1,602 | 1,064 | 1,631 | 689 | |||||||||||||||||
| Less: Chrome cost of sales | (349) | (402) | (349) | (402) | (67) | (96) | |||||||||||||||||
| Total operating cost including third party PoC | 10,993 | 10,476 | 8,750 | 8,665 | 4,336 | 4,351 | |||||||||||||||||
| Less: Purchase cost of PoC | (849) | (790) | (849) | (790) | (849) | (790) | |||||||||||||||||
| Total operating cost excluding third party PoC | 10,144 | 9,686 | 7,901 | 7,875 | 3,487 | 3,561 | |||||||||||||||||
| PGM production as reported per table above | 4Eoz- 2Eoz | 537,998 | 534,752 | 432,793 | 448,863 | 195,336 | 180,316 | ||||||||||||||||
| Less: Mimosa production | (29,310) | (28,670) | (29,310) | (28,670) | — | — | |||||||||||||||||
| PGM production excluding Mimosa | 508,688 | 506,082 | 403,483 | 420,193 | 195,336 | 180,316 | |||||||||||||||||
| Less: PoC production | (21,278) | (16,720) | (21,278) | (16,720) | (21,278) | (16,720) | |||||||||||||||||
| PGM production excluding Mimosa and third party PoC | 487,410 | 489,362 | 382,205 | 403,473 | 174,058 | 163,596 | |||||||||||||||||
| PGM production including Mimosa and excluding third party PoC | 516,720 | 518,032 | 411,515 | 432,143 | 174,058 | 163,596 | |||||||||||||||||
| Tonnes milled/treated | 000't | 9,242 | 9,625 | 8,956 | 9,383 | 2,552 | 2,441 | ||||||||||||||||
| Less: Mimosa tonnes | (347) | (340) | (347) | (340) | — | — | |||||||||||||||||
| PGM tonnes excluding Mimosa and third party PoC | 8,895 | 9,284 | 8,608 | 9,043 | 2,552 | 2,441 | |||||||||||||||||
| Operating cost including third party PoC | R/4Eoz-R/2Eoz | 21,610 | 20,700 | 21,686 | 20,621 | 22,198 | 24,130 | ||||||||||||||||
| US$/4Eoz-US$/2Eoz | 1,227 | 1,214 | 1,231 | 1,209 | 1,261 | 1,415 | |||||||||||||||||
| R/t | 1,236 | 1,128 | 1,016 | 958 | 1,699 | 1,782 | |||||||||||||||||
| US$/t | 70 | 66 | 58 | 56 | 96 | 105 | |||||||||||||||||
| Operating cost excluding third party PoC | R/4Eoz-R/2Eoz | 20,812 | 19,793 | 20,672 | 19,518 | 20,034 | 21,767 | ||||||||||||||||
| US$/4Eoz-US$/2Eoz | 1,182 | 1,161 | 1,174 | 1,145 | 1,138 | 1,277 | |||||||||||||||||
| R/t | 1,140 | 1,043 | 918 | 871 | 1,366 | 1,459 | |||||||||||||||||
| US$/t | 65 | 61 | 52 | 51 | 78 | 86 | |||||||||||||||||
| Reconciliation of AISC and AIC excluding third party PoC for Total US and SA PGM, Total SA PGM and Marikana - Quarters | |||||||||||||||||||||||
| Total US and SA PGM | Total SA PGM | Marikana | |||||||||||||||||||||
| R' million | Dec 2022 | Sep 2022 | Dec 2022 | Sep 2022 | Dec 2022 | Sep 2022 | |||||||||||||||||
| Total All-in-sustaining cost as reported per table above | 12,507 | 11,122 | 9,076 | 8,464 | 4,651 | 4,277 | |||||||||||||||||
| Less: Purchase cost of PoC | (849) | (790) | (849) | (790) | (849) | (790) | |||||||||||||||||
| Add: By-product credit of PoC | 72 | 77 | 72 | 77 | 72 | 77 | |||||||||||||||||
| Total All-in-sustaining cost excluding third party PoC | 11,730 | 10,409 | 8,299 | 7,751 | 3,874 | 3,564 | |||||||||||||||||
| Plus: Corporate cost, growth and capital expenditure | 695 | 642 | 314 | 208 | 315 | 207 | |||||||||||||||||
| Total All-in-cost excluding third party PoC | 12,425 | 11,051 | 8,613 | 7,959 | 4,189 | 3,771 | |||||||||||||||||
| PGM production excluding Mimosa and third party PoC | 4Eoz- 2Eoz | 487,410 | 489,362 | 382,205 | 403,473 | 174,058 | 163,596 | ||||||||||||||||
| All-in-sustaining cost excluding third party PoC | R/4Eoz-R/2Eoz | 24,066 | 21,271 | 21,713 | 19,211 | 22,257 | 21,785 | ||||||||||||||||
| US$/4Eoz-US$/2Eoz | 1,367 | 1,248 | 1,233 | 1,127 | 1,264 | 1,278 | |||||||||||||||||
| All-in-cost excluding third party PoC | R/4Eoz-R/2Eoz | 25,492 | 22,582 | 22,535 | 19,726 | 24,067 | 23,051 | ||||||||||||||||
| US$/4Eoz-US$/2Eoz | 1,448 | 1,324 | 1,280 | 1,157 | 1,367 | 1,352 | |||||||||||||||||
Sibanye-Stillwater Operating and financial results | Six months and year ended 31 December 2022 68
SA gold operations
| SA OPERATIONS | |||||||||||||||||||||||||||||
| R' million | Total SA gold | Driefontein | Kloof | Beatrix | Cooke | DRDGOLD | Corporate | ||||||||||||||||||||||
Cost of sales, before amortisation and depreciation1 | Dec 2022 | 5,274 | 1,427 | 1,638 | 1,005 | 240 | 964 | — | |||||||||||||||||||||
| Sep 2022 | 6,342 | 1,562 | 1,926 | 1,624 | 256 | 974 | — | ||||||||||||||||||||||
| Royalties | Dec 2022 | 24 | 8 | 9 | 6 | 1 | — | — | |||||||||||||||||||||
| Sep 2022 | 21 | 7 | 7 | 6 | 1 | — | — | ||||||||||||||||||||||
| Carbon tax | Dec 2022 | 1 | — | — | 1 | — | — | — | |||||||||||||||||||||
| Sep 2022 | 1 | — | — | 1 | — | — | — | ||||||||||||||||||||||
| Community costs | Dec 2022 | 3 | — | — | — | — | 3 | — | |||||||||||||||||||||
| Sep 2022 | 24 | 8 | 7 | 6 | — | 3 | — | ||||||||||||||||||||||
Share-based payments2 | Dec 2022 | 45 | 12 | 16 | 11 | — | 6 | — | |||||||||||||||||||||
| Sep 2022 | 28 | 10 | 9 | 5 | — | 4 | — | ||||||||||||||||||||||
Rehabilitation interest and amortisation3 | Dec 2022 | 37 | (10) | (11) | 15 | 16 | 4 | 23 | |||||||||||||||||||||
| Sep 2022 | 32 | 5 | (3) | 15 | 11 | 4 | — | ||||||||||||||||||||||
| Leases | Dec 2022 | 17 | 1 | 4 | 7 | — | 5 | — | |||||||||||||||||||||
| Sep 2022 | 19 | 2 | 4 | 7 | — | 6 | — | ||||||||||||||||||||||
| Ore reserve development | Dec 2022 | 691 | 334 | 262 | 95 | — | — | — | |||||||||||||||||||||
| Sep 2022 | 472 | 208 | 174 | 90 | — | — | — | ||||||||||||||||||||||
| Sustaining capital expenditure | Dec 2022 | 480 | 154 | 153 | 50 | — | 123 | — | |||||||||||||||||||||
| Sep 2022 | 409 | 109 | 150 | 37 | — | 113 | — | ||||||||||||||||||||||
| Less: By-product credit | Dec 2022 | (4) | (2) | (1) | (1) | — | — | — | |||||||||||||||||||||
| Sep 2022 | (3) | (1) | (1) | (1) | — | — | — | ||||||||||||||||||||||
Total All-in-sustaining costs4 | Dec 2022 | 6,568 | 1,924 | 2,070 | 1,189 | 257 | 1,105 | 23 | |||||||||||||||||||||
| Sep 2022 | 7,345 | 1,910 | 2,273 | 1,790 | 268 | 1,104 | — | ||||||||||||||||||||||
| Plus: Corporate cost, growth and capital expenditure | Dec 2022 | 439 | — | 50 | — | — | 65 | 324 | |||||||||||||||||||||
| Sep 2022 | 505 | — | 105 | — | — | 53 | 347 | ||||||||||||||||||||||
Total All-in-costs4 | Dec 2022 | 7,007 | 1,924 | 2,120 | 1,189 | 257 | 1,170 | 347 | |||||||||||||||||||||
| Sep 2022 | 7,850 | 1,910 | 2,378 | 1,790 | 268 | 1,157 | 347 | ||||||||||||||||||||||
| Gold sold | kg | Dec 2022 | 6,308 | 1,576 | 1,831 | 1,286 | 295 | 1,320 | — | ||||||||||||||||||||
| Sep 2022 | 6,070 | 1,572 | 1,488 | 1,257 | 311 | 1,442 | — | ||||||||||||||||||||||
| oz | Dec 2022 | 202,807 | 50,670 | 58,868 | 41,346 | 9,484 | 42,439 | — | |||||||||||||||||||||
| Sep 2022 | 195,155 | 50,541 | 47,840 | 40,413 | 9,999 | 46,361 | — | ||||||||||||||||||||||
| All-in-sustaining cost | R/kg | Dec 2022 | 1,041,218 | 1,220,812 | 1,130,530 | 924,572 | 871,186 | 837,121 | — | ||||||||||||||||||||
| Sep 2022 | 1,210,049 | 1,215,013 | 1,527,554 | 1,424,025 | 861,736 | 765,603 | — | ||||||||||||||||||||||
| All-in-sustaining cost | US$/oz | Dec 2022 | 1,839 | 2,156 | 1,997 | 1,633 | 1,539 | 1,479 | — | ||||||||||||||||||||
| Sep 2022 | 2,207 | 2,216 | 2,787 | 2,598 | 1,572 | 1,397 | — | ||||||||||||||||||||||
| All-in-cost | R/kg | Dec 2022 | 1,110,812 | 1,220,812 | 1,157,837 | 924,572 | 871,186 | 886,364 | — | ||||||||||||||||||||
| Sep 2022 | 1,293,245 | 1,215,013 | 1,598,118 | 1,424,025 | 861,736 | 802,358 | — | ||||||||||||||||||||||
| All-in-cost | US$/oz | Dec 2022 | 1,962 | 2,156 | 2,045 | 1,633 | 1,539 | 1,566 | — | ||||||||||||||||||||
| Sep 2022 | 2,359 | 2,216 | 2,915 | 2,598 | 1,572 | 1,464 | — | ||||||||||||||||||||||
Average exchange rate for the quarters ended 31 December 2022 and 30 September 2022 was R17.61/US$ and R17.05/US$, respectively
Figures may not add as they are rounded independently
1Cost of sales, before amortisation and depreciation includes all mining and processing costs, third party refining costs, corporate general and administrative costs, and permitting costs
2Share-based payments are calculated based on the fair value at initial recognition and do not include the adjustment of the cash-settled share-based payment obligation to the reporting date fair value
3Rehabilitation includes the interest charge related to the environmental rehabilitation obligation and the amortisation of the related capitalised rehabilitation costs. The interest charge related to the environmental rehabilitation obligation and the amortisation of the capitalised rehabilitation costs reflect the periodic costs of rehabilitation associated with current gold production
4All-in cost is calculated in accordance with the World Gold Council guidance. All-in cost excludes income tax, costs associated with merger and acquisition activities, working capital, impairments, financing costs, one time severance charges and items needed to normalise earnings. All-in cost is made up of All-in sustaining cost, being the cost to sustain current operations, given as a sub-total in the All-in cost calculation, together with corporate and major capital expenditure associated with growth. All-in sustaining cost per kilogram (and ounce) and All-in cost per kilogram (and ounce) are calculated by dividing the All-in sustaining cost and All-in cost, respectively, in a period by the total gold sold over the same period
Sibanye-Stillwater Operating and financial results | Six months and year ended 31 December 2022 69
DEVELOPMENT RESULTS
Development values represent the actual results of sampling and no allowance has been made for any adjustments which may be necessary when estimating ore reserves. All figures below exclude shaft sinking metres, which are reported separately where appropriate.
| US PGM operations | |||||||||||||||||||||||||||||||||||||||||||||||||||||||||||
| Quarter ended | Dec 2022 | Sep 2022 | Year ended 31 December 2022 | ||||||||||||||||||||||||||||||||||||||||||||||||||||||||
| Reef | Stillwater incl Blitz | East Boulder | Stillwater incl Blitz | East Boulder | Stillwater incl Blitz | East Boulder | |||||||||||||||||||||||||||||||||||||||||||||||||||||
| Total US PGM | Unit | ||||||||||||||||||||||||||||||||||||||||||||||||||||||||||
| Primary development (off reef) | (m) | 1,297 | 299 | 1,405 | 269 | 6,130 | 1,441 | ||||||||||||||||||||||||||||||||||||||||||||||||||||
| Secondary development | (m) | 3,262 | 1,521 | 3,508 | 1,196 | 12,423 | 5,298 | ||||||||||||||||||||||||||||||||||||||||||||||||||||
| SA PGM operations | |||||||||||||||||||||||||||||||||||||||||||||||||||||||||||
| Quarter ended | Dec 2022 | Sep 2022 | Year ended 31 December 2022 | ||||||||||||||||||||||||||||||||||||||||||||||||||||||||
| Reef | Batho-pele | Thembe-lani | Khuse-leka | Siphume-lele | Batho-pele | Thembe-lani | Khuse-leka | Siphume-lele | Batho-pele | Thembe-lani | Khuse-leka | Siphume-lele | |||||||||||||||||||||||||||||||||||||||||||||||
| Rustenburg | Unit | ||||||||||||||||||||||||||||||||||||||||||||||||||||||||||
| Advanced | (m) | 415 | 1,379 | 2,976 | 726 | 443 | 1,877 | 3,273 | 738 | 1,605 | 6,343 | 11,483 | 2,734 | ||||||||||||||||||||||||||||||||||||||||||||||
| Advanced on reef | (m) | 415 | 588 | 1,056 | 358 | 443 | 696 | 1,277 | 403 | 1,605 | 2,643 | 4,354 | 1,417 | ||||||||||||||||||||||||||||||||||||||||||||||
| Height | (cm) | 217 | 291 | 281 | 265 | 220 | 295 | 282 | 285 | 215 | 294 | 283 | 275 | ||||||||||||||||||||||||||||||||||||||||||||||
| Average value | (g/t) | 3.0 | 2.3 | 2.3 | 2.9 | 2.9 | 2.3 | 2.2 | 2.9 | 2.9 | 2.3 | 2.2 | 2.9 | ||||||||||||||||||||||||||||||||||||||||||||||
| (cm.g/t) | 655 | 674 | 632 | 754 | 632 | 670 | 630 | 815 | 633 | 686 | 621 | 809 | |||||||||||||||||||||||||||||||||||||||||||||||
| SA PGM operations | |||||||||||||||||||||||||||||||||||||||||||||||||||||||||||
| Quarter ended | Dec 2022 | Sep 2022 | Year ended 31 December 2022 | ||||||||||||||||||||||||||||||||||||||||||||||||||||||||
| Reef | K3 | Rowland | Saffy | E3 | 4B | K4 | K3 | Rowland | Saffy | E3 | 4B | K4 | K3 | Rowland | Saffy | E3 | 4B | K4 | |||||||||||||||||||||||||||||||||||||||||
| Marikana | Unit | ||||||||||||||||||||||||||||||||||||||||||||||||||||||||||
| Primary development | (m) | 8,230 | 3,975 | 3,585 | 770 | 926 | 2,876 | 8,996 | 4,263 | 3,953 | 867 | 914 | 2,317 | 32,438 | 17,806 | 14,708 | 3,066 | 3,597 | 6,130 | ||||||||||||||||||||||||||||||||||||||||
| Primary development - on reef | (m) | 6,084 | 2,558 | 1,868 | 401 | 706 | 960 | 6,687 | 2,532 | 2,390 | 455 | 556 | 759 | 24,231 | 11,624 | 8,686 | 1,581 | 2,451 | 1,890 | ||||||||||||||||||||||||||||||||||||||||
| Height | (cm) | 216 | 219 | 237 | 222 | 219 | 240 | 217 | 219 | 238 | 230 | 214 | 239 | 216 | 219 | 233 | 222 | 219 | 239 | ||||||||||||||||||||||||||||||||||||||||
| Average value | (g/t) | 2.7 | 2.5 | 2.4 | 2.9 | 2.8 | 2.5 | 2.5 | 2.5 | 2.4 | 2.6 | 3.0 | 2.8 | 2.7 | 2.6 | 2.4 | 2.8 | 2.9 | 2.6 | ||||||||||||||||||||||||||||||||||||||||
| (cm.g/t) | 585 | 543 | 575 | 632 | 620 | 596 | 534 | 557 | 579 | 591 | 638 | 666 | 580 | 562 | 570 | 616 | 629 | 622 | |||||||||||||||||||||||||||||||||||||||||
| SA PGM operations | |||||||||||||||||||||||||||||||||||||||||||||||||||||||||||
| Quarter ended | Dec 2022 | Sep 2022 | Year ended 31 December 2022 | ||||||||||||||||||||||||||||||||||||||||||||||||||||||||
| Reef | Kopa-neng | Bamba-nani | Kwezi | K6 | Kopa-neng | Bamba-nani | Kwezi | K6 | Kopa-neng | Bamba-nani | Kwezi | K6 | |||||||||||||||||||||||||||||||||||||||||||||||
| Kroondal | Unit | ||||||||||||||||||||||||||||||||||||||||||||||||||||||||||
| Advanced | (m) | 538 | 774 | 576 | 450 | 586 | 789 | 531 | 556 | 2,129 | 2,940 | 2,162 | 1,611 | ||||||||||||||||||||||||||||||||||||||||||||||
| Advanced on reef | (m) | 436 | 452 | 521 | 431 | 436 | 271 | 420 | 478 | 1,509 | 1,535 | 1,401 | 1,322 | ||||||||||||||||||||||||||||||||||||||||||||||
| Height | (cm) | 239 | 224 | 218 | 232 | 242 | 214 | 223 | 240 | 239 | 217 | 219 | 239 | ||||||||||||||||||||||||||||||||||||||||||||||
| Average value | (g/t) | 2.0 | 1.5 | 2.2 | 2.3 | 1.6 | 1.0 | 2.2 | 2.0 | 1.6 | 1.5 | 1.7 | 1.8 | ||||||||||||||||||||||||||||||||||||||||||||||
| (cm.g/t) | 475 | 338 | 470 | 528 | 381 | 210 | 480 | 480 | 381 | 315 | 368 | 429 | |||||||||||||||||||||||||||||||||||||||||||||||
Sibanye-Stillwater Operating and financial results | Six months and year ended 31 December 2022 70
| SA gold operations | |||||||||||||||||||||||||||||||||||||||||||||||||||||||||||
| Quarter ended | Dec 2022 | Sep 2022 | Year ended 31 December 2022 | ||||||||||||||||||||||||||||||||||||||||||||||||||||||||
| Reef | Carbon leader | Main | VCR | Carbon leader | Main | VCR | Carbon leader | Main | VCR | ||||||||||||||||||||||||||||||||||||||||||||||||||
| Driefontein | Unit | ||||||||||||||||||||||||||||||||||||||||||||||||||||||||||
| Advanced | (m) | 823 | 433 | 1,018 | 443 | 223 | 610 | 1,942 | 949 | 2,587 | |||||||||||||||||||||||||||||||||||||||||||||||||
| Advanced on reef | (m) | 28 | 75 | 205 | 40 | 74 | 172 | 186 | 239 | 635 | |||||||||||||||||||||||||||||||||||||||||||||||||
| Channel width | (cm) | 17 | 64 | 49 | 16 | 56 | 48 | 20 | 59 | 58 | |||||||||||||||||||||||||||||||||||||||||||||||||
| Average value | (g/t) | 54.7 | 5.2 | 37.9 | 42.5 | 7.4 | 35.6 | 39.7 | 8.0 | 42.1 | |||||||||||||||||||||||||||||||||||||||||||||||||
| (cm.g/t) | 918 | 329 | 1,841 | 666 | 414 | 1,707 | 800 | 474 | 2,448 | ||||||||||||||||||||||||||||||||||||||||||||||||||
| SA gold operations | |||||||||||||||||||||||||||||||||||||||||||||||||||||||||||
| Quarter ended | Dec 2022 | Sep 2022 | Year ended 31 December 2022 | ||||||||||||||||||||||||||||||||||||||||||||||||||||||||
| Reef | Kloof | Main | Libanon | VCR | Kloof | Main | Libanon | VCR | Kloof | Main | Libanon | VCR | |||||||||||||||||||||||||||||||||||||||||||||||
| Kloof | Unit | ||||||||||||||||||||||||||||||||||||||||||||||||||||||||||
| Advanced | (m) | 1,131 | 601 | 57 | 1,020 | 901 | 362 | 45 | 604 | 3,030 | 1,338 | 121 | 2,464 | ||||||||||||||||||||||||||||||||||||||||||||||
| Advanced on reef | (m) | 345 | 127 | 57 | 155 | 259 | 84 | 45 | 103 | 870 | 313 | 121 | 380 | ||||||||||||||||||||||||||||||||||||||||||||||
| Channel width | (cm) | 131 | 58 | 95 | 95 | 162 | 73 | 88 | 83 | 144 | 75 | 95 | 93 | ||||||||||||||||||||||||||||||||||||||||||||||
| Average value | (g/t) | 9.5 | 11.3 | 2.0 | 16.0 | 10.9 | 10.3 | 2.9 | 16.7 | 11.0 | 10.8 | 2.4 | 15.3 | ||||||||||||||||||||||||||||||||||||||||||||||
| (cm.g/t) | 1,247 | 652 | 194 | 1,510 | 1,766 | 755 | 253 | 1,397 | 1,589 | 813 | 229 | 1,419 | |||||||||||||||||||||||||||||||||||||||||||||||
| SA gold operations | |||||||||||||||||||||||||||||||||||||||||||||||||||||||||||
| Quarter ended | Dec 2022 | Sep 2022 | Year ended 31 December 2022 | ||||||||||||||||||||||||||||||||||||||||||||||||||||||||
| Reef | Beatrix | Kalkoen-krans | Beatrix | Kalkoen-krans | Beatrix | Kalkoen-krans | |||||||||||||||||||||||||||||||||||||||||||||||||||||
| Beatrix | Unit | ||||||||||||||||||||||||||||||||||||||||||||||||||||||||||
| Advanced | (m) | 2,503 | 110 | 1,640 | 65 | 4,929 | 227 | ||||||||||||||||||||||||||||||||||||||||||||||||||||
| Advanced on reef | (m) | 740 | 9 | 500 | — | 1,470 | 9 | ||||||||||||||||||||||||||||||||||||||||||||||||||||
| Channel width | (cm) | 147 | 68 | 151 | — | 146 | 68 | ||||||||||||||||||||||||||||||||||||||||||||||||||||
| Average value | (g/t) | 6.5 | 30.3 | 7.6 | — | 7.2 | 30.3 | ||||||||||||||||||||||||||||||||||||||||||||||||||||
| (cm.g/t) | 964 | 2,060 | 1,143 | — | 1,053 | 2,060 | |||||||||||||||||||||||||||||||||||||||||||||||||||||
| SA gold operations | |||||||||||||||||||||||||||||||||||||||||||||||||||||||||||
| Quarter ended | Dec 2022 | Sep 2022 | Year ended 31 December 2022 | ||||||||||||||||||||||||||||||||||||||||||||||||||||||||
| Reef | Kimberley | Kimberley | Kimberley | ||||||||||||||||||||||||||||||||||||||||||||||||||||||||
| Burnstone | Unit | ||||||||||||||||||||||||||||||||||||||||||||||||||||||||||
| Advanced | (m) | 305 | 223 | 566 | |||||||||||||||||||||||||||||||||||||||||||||||||||||||
| Advanced on reef | (m) | 12 | — | 12 | |||||||||||||||||||||||||||||||||||||||||||||||||||||||
| Channel width | (cm) | 28 | — | 28 | |||||||||||||||||||||||||||||||||||||||||||||||||||||||
| Average value | (g/t) | 10.7 | — | 10.7 | |||||||||||||||||||||||||||||||||||||||||||||||||||||||
| (cm.g/t) | 300 | — | 300 | ||||||||||||||||||||||||||||||||||||||||||||||||||||||||
Sibanye-Stillwater Operating and financial results | Six months and year ended 31 December 2022 71
ADMINISTRATION AND CORPORATE INFORMATION
SIBANYE STILLWATER LIMITED (SIBANYE-STILLWATER) Incorporated in the Republic of South Africa Registration number 2014/243852/06 Share code: SSW and SBSW Issuer code: SSW ISIN: ZAE000259701 LISTINGS JSE: SSW NYSE: SBSW WEBSITE  www.sibanyestillwater.com www.sibanyestillwater.comREGISTERED AND CORPORATE OFFICE Constantia Office Park Bridgeview House, Building 11, Ground floor, Cnr 14th Avenue & Hendrik Potgieter Road Weltevreden Park 1709 South Africa Private Bag X5 Westonaria 1780 South Africa Tel: +27 11 278 9600 Fax: +27 11 278 9863 COMPANY SECRETARY Lerato Matlosa Email: lerato.matlosa@sibanyestillwater.com DIRECTORS Dr Vincent Maphai* (Chairman) Neal Froneman (CEO) Charl Keyter (CFO) Dr Elaine Dorward-King* Harry Kenyon-Slaney* Jeremiah Vilakazi* Keith Rayner* Nkosemntu Nika* Richard Menell*^ Savannah Danson* Susan van der Merwe* Timothy Cumming* Sindiswa Zilwa* * Independent non-executive ^ Lead independent director INVESTOR ENQUIRIES James Wellsted Executive Vice President: Investor Relations and Corporate Affairs Mobile: +27 83 453 4014 Email: james.wellsted@sibanyestillwater.com or ir@sibanyestillwater.com | JSE SPONSOR JP Morgan Equities South Africa Proprietary Limited Registration number 1995/011815/07 1 Fricker Road Illovo Johannesburg 2196 South Africa Private Bag X9936 Sandton 2146 South Africa AUDITORS Ernst & Young Inc. (EY) 102 Rivonia Road Sandton 2196 South Africa Private Bag X14 Sandton 2146 South Africa Tel: +27 11 772 3000 AMERICAN DEPOSITARY RECEIPTS TRANSFER AGENT BNY Mellon Shareowner Correspondence (ADR) Mailing address of agent: Computershare PO Box 43078 Providence, RI 02940-3078 Overnight/certified/registered delivery: Computershare 150 Royall Street, Suite 101 Canton, MA 02021 US toll free: + 1 888 269 2377 Tel: +1 201 680 6825 Email: shrrelations@cpushareownerservices.com Tatyana Vesselovskaya Relationship Manager - BNY Mellon Depositary Receipts Email: tatyana.vesselovskaya@bnymellon.com TRANSFER SECRETARIES SOUTH AFRICA Computershare Investor Services Proprietary Limited Rosebank Towers15 Biermann Avenue Rosebank 2196 PO Box 61051 Marshalltown 2107 South Africa Tel: +27 11 370 5000 Fax: +27 11 688 5248 | ||||
Sibanye-Stillwater Operating and financial results | Six months and year ended 31 December 2022 72
DISCLAIMER
FORWARD LOOKING STATEMENTS
The information in this document may contain forward-looking statements within the meaning of the “safe harbour” provisions of the United States Private Securities Litigation Reform Act of 1995. These forward-looking statements, including, among others, those relating to Sibanye Stillwater Limited’s (Sibanye-Stillwater or the Group) financial positions, business strategies, plans and objectives of management for future operations, are necessarily estimates reflecting the best judgment of the senior management and directors of Sibanye-Stillwater and involve a number of risks and uncertainties that could cause actual results to differ materially from those suggested by the forward-looking statements. As a consequence, these forward-looking statements should be considered in light of various important factors, including those set forth in this announcement.
All statements other than statements of historical facts included in this document may be forward-looking statements. Forward-looking statements also often use words such as “will”, “would”, “expect”, “forecast”, “potential”, “may”, “could”, “believe”, “aim”, “anticipate”, “target”, “estimate” and words of similar meaning. By their nature, forward-looking statements involve risk and uncertainty because they relate to future events and circumstances and should be considered in light of various important factors, including those set forth in this disclaimer. Readers are cautioned not to place undue reliance on such statements.
The important factors that could cause Sibanye-Stillwater’s actual results, performance or achievements to differ materially from estimates or projections contained in the forward-looking statements include, without limitation, Sibanye-Stillwater’s future financial position, plans, strategies, objectives, capital expenditures, projected costs and anticipated cost savings, financing plans, debt position and ability to reduce debt leverage; economic, business, political and social conditions in South Africa, Zimbabwe, the United States and elsewhere; plans and objectives of management for future operations; Sibanye-Stillwater’s ability to obtain the benefits of any streaming arrangements or pipeline financing; the ability of Sibanye-Stillwater to comply with loan and other covenants and restrictions and difficulties in obtaining additional financing or refinancing; Sibanye-Stillwater’s ability to service its bond instruments; changes in assumptions underlying Sibanye-Stillwater’s estimation of its Mineral Resources and Mineral Reserves; any failure of a tailings storage facility; the ability to achieve anticipated efficiencies and other cost savings in connection with, and the ability to successfully integrate, past, ongoing and future acquisitions, as well as at existing operations; the ability of Sibanye-Stillwater to complete any ongoing or future acquisitions; the success of Sibanye-Stillwater’s business strategy and exploration and development activities, including any proposed, anticipated or planned expansions into the battery metals or adjacent sectors and estimations or expectations of enterprise value (including the Rhyolite Ridge project); the ability of Sibanye-Stillwater to comply with requirements that it operate in ways that provide progressive benefits to affected communities; changes in the market price of gold, PGMs, battery metals (e.g., nickel, lithium, copper and zinc) and the cost of power, petroleum fuels, and oil, among other commodities and supply requirements; the occurrence of hazards associated with underground and surface mining; any further downgrade of South Africa’s credit rating; the impact of South Africa's greylisting; a challenge regarding the title to any of Sibanye-Stillwater’s properties by claimants to land under restitution and other legislation; Sibanye-Stillwater’s ability to implement its strategy and any changes thereto; the outcome of legal challenges to the Group’s mining or other land use rights; the occurrence of labour disputes, disruptions and industrial actions; the availability, terms and deployment of capital or credit; changes in the imposition of industry standards, regulatory costs and relevant government regulations, particularly environmental, sustainability, tax, health and safety regulations and new legislation affecting water, mining, mineral rights and business ownership, including any interpretation thereof which may be subject to dispute; the outcome and consequence of any potential or pending litigation or regulatory proceedings, including in relation to any environmental, health or safety issues; failure to meet ethical standards, including actual or alleged instances of fraud, bribery or corruption; the effect of climate change or other extreme weather events on Sibanye-Stillwater’s business; the concentration of all final refining activity and a large portion of Sibanye-Stillwater’s PGM sales from mine production in the United States with one entity; the identification of a material weakness in disclosure and internal controls over financial reporting; the effect of US tax reform legislation on Sibanye-Stillwater and its subsidiaries; the effect of South African Exchange Control Regulations on Sibanye-Stillwater’s financial flexibility; operating in new geographies and regulatory environments where Sibanye-Stillwater has no previous experience; power disruptions, constraints and cost increases; supply chain disruptions and shortages and increases in the price of production inputs; the regional concentration of Sibanye-Stillwater’s operations; fluctuations in exchange rates, currency devaluations, inflation and other macro-economic monetary policies; the occurrence of temporary stoppages or precautionary suspension of operations at its mines for safety or environmental incidents (including natural disasters) and unplanned maintenance; Sibanye-Stillwater’s ability to hire and retain senior management and employees with sufficient technical and/or production skills across its global operations necessary to meet its labour recruitment and retention goals, as well as its ability to achieve sufficient representation of historically disadvantaged South Africans in its management positions; failure of Sibanye-Stillwater’s information technology, communications and systems; the adequacy of Sibanye-Stillwater’s insurance coverage; social unrest, sickness or natural or man-made disaster at informal settlements in the vicinity of some of Sibanye-Stillwater’s South African-based operations; and the impact of HIV, tuberculosis and the spread of other contagious diseases, such as the coronavirus disease (COVID-19).
Further details of potential risks and uncertainties affecting Sibanye-Stillwater are described in Sibanye-Stillwater’s filings with the Johannesburg Stock Exchange and the United States Securities and Exchange Commission, including the 2021 Integrated Report and the annual report on Form 20-F for the fiscal year ended 31 December 2021 (SEC File no. 333-234096).
These forward-looking statements speak only as of the date of the content. Sibanye-Stillwater expressly disclaims any obligation or undertaking to update or revise any forward-looking statement (except to the extent legally required). These forward-looking statements have not been reviewed or reported on by the Group’s external auditors.
NON-IFRS MEASURES
The information contained in this document may contain certain non-IFRS measures, including adjusted EBITDA, AISC, AIC and Nickel equivalent sustaining cost. These measures may not be comparable to similarly-titled measures used by other companies and are not measures of Sibanye-Stillwater’s financial performance under IFRS. These measures should not be considered in isolation or as a substitute for measures of performance prepared in accordance with IFRS. Sibanye-Stillwater is not providing a reconciliation of the forecast non-IFRS financial information presented in this report because it is unable to provide this reconciliation without unreasonable effort. These forecast non-IFRS financial information presented have not been reviewed or reported on by the Group’s external auditors.
Mineral Resources and Mineral Reserves
Sibanye-Stillwater’s Mineral Resources and Mineral Reserves are estimates at a particular date, and are affected by fluctuations in mineral prices, the exchange rates, operating costs, mining permits, changes in legislation and operating factors. Sibanye-Stillwater reports its Mineral Resources and Mineral Reserves in accordance with the rules and regulations promulgated by each of the United States Securities and Exchange Commission (SEC) and the JSE at all managed operations, development, and exploration properties. Sibanye-Stillwater expects to file the information required by Subpart 1300 of Regulation S-K under the Securities Act of 1933, including a Technical Report Summary in respect of the Keliber project, with its annual report on Form 20-F for the year ended 31 December 2022.
WEBSITES
References in this document to information on websites (and/or social media sites) are included as an aid to their location and such information is not incorporated in, and does not form part of, this report.
Sibanye-Stillwater Operating and financial results | Six months and year ended 31 December 2022 73