Exhibit 99.1
JOHANNESBURG, 5 March 2024: Sibanye Stillwater Limited (Sibanye-Stillwater or the Group) (JSE: SSW and NYSE: SBSW) is pleased to report operating and financial results for the six months ended 31 December 2023, and condensed consolidated financial statements for the year ended 31 December 2023.
SALIENT FEATURES FOR THE SIX MONTHS AND YEAR ENDED 31 DECEMBER 2023
•Unfortunate regression in fatalities primarily due to the Burnstone conveyor contractor incident
•Revenue 18% lower than for 2022, primarily due to lower PGM and nickel prices
•Loss for the period of R37.4bn (US$2.0bn) includes non-cash impairments of R47.5bn (US$2.6bn)
•Zero final dividend together with interim dividend of 53 SA cents per share (11.19 US cents* per ADR) equivalent to an annual yield of 2.1%
•Proactive repositioning to rebase high-cost operations expected to deliver R6.6bn in cost savings and capital preservation
•Strong balance sheet at year-end with net debt: adjusted EBITDA at 0.58x
•R7.1bn (US$412 million) adjusted EBITDA turnaround in SA gold
•SA PGM operations continue to move operations down the industry cost curve with 4% unit cost increases
•Construction of the Keliber lithium refinery commenced in Q1 2023 and concentrator earth works started in Q4 2023
* Based on the closing exchange rate of R18.94/US$ at 22 August 2023 from EquityRT and closing share price of R24.90 at 31 December 2023
KEY STATISTICS – GROUP
| US dollar | SA rand | |||||||||||||||||||||||||||||||||||||||||||
| Year ended | Six months ended | Six months ended | Year ended | |||||||||||||||||||||||||||||||||||||||||
| Dec 2022 | Dec 2023 | Dec 2022 | Jun 2023 | Dec 2023 | KEY STATISTICS | Dec 2023 | Jun 2023 | Dec 2022 | Dec 2023 | Dec 2022 | ||||||||||||||||||||||||||||||||||
| GROUP | ||||||||||||||||||||||||||||||||||||||||||||
| 1,126 | (2,051) | 344 | 407 | (2,458) | US$m | Basic earnings | Rm | (45,195) | 7,423 | 6,380 | (37,772) | 18,396 | ||||||||||||||||||||||||||||||||
| 1,126 | 97 | 350 | 324 | (227) | US$m | Headline earnings | Rm | (4,107) | 5,891 | 6,484 | 1,784 | 18,422 | ||||||||||||||||||||||||||||||||
| 2,510 | 1,116 | 1,045 | 776 | 340 | US$m | Adjusted EBITDA1 | Rm | 6,409 | 14,147 | 18,550 | 20,556 | 41,111 | ||||||||||||||||||||||||||||||||
| 1,162 | (2,032) | 359 | 427 | (2,459) | US$m | (Loss)/profit for the period | Rm | (45,216) | 7,786 | 6,639 | (37,430) | 18,980 | ||||||||||||||||||||||||||||||||
| 16.37 | 18.42 | 17.33 | 18.21 | 18.62 | R/US$ | Average exchange rate using daily closing rate | ||||||||||||||||||||||||||||||||||||||
| TABLE OF CONTENTS | Page | Stock data for the six months ended 31 December 2023 | ||||||||||||
| Number of shares in issue | ||||||||||||||
| - at 31 December 2023 | 2,830,567,264 | |||||||||||||
| - weighted average | 2,830,567,264 | |||||||||||||
| Free Float | 99 | % | ||||||||||||
| Bloomberg/Reuters | SSWSJ/SSWJ.J | |||||||||||||
| Notes to the condensed consolidated financial statements | JSE Limited - (SSW) | |||||||||||||
| Price range per ordinary share (High/Low) | R18.70 to R33.82 | |||||||||||||
| Average daily volume | 16,223,948 | |||||||||||||
| NYSE - (SBSW); one ADR represents four ordinary shares | ||||||||||||||
| Price range per ADR (High/Low) | US$4.27 to US$7.73 | |||||||||||||
| Average daily volume | 5,189,016 | |||||||||||||
Sibanye-Stillwater Operating and financial results | Six months and year ended 31 December 2023 1
KEY STATISTICS BY REGION
| US dollar | SA rand | |||||||||||||||||||||||||||||||||||||||||||
| Year ended | Six months ended | Six months ended | Year ended | |||||||||||||||||||||||||||||||||||||||||
| Dec 2022 | Dec 2023 | Dec 2022 | Jun 2023 | Dec 2023 | KEY STATISTICS | Dec 2023 | Jun 2023 | Dec 2022 | Dec 2023 | Dec 2022 | ||||||||||||||||||||||||||||||||||
| AMERICAS REGION | ||||||||||||||||||||||||||||||||||||||||||||
| US PGM underground operations | ||||||||||||||||||||||||||||||||||||||||||||
| 421,133 | 427,272 | 191,094 | 205,513 | 221,759 | oz | 2E PGM production2,3 | kg | 6,897 | 6,392 | 5,944 | 13,290 | 13,099 | ||||||||||||||||||||||||||||||||
| 1,862 | 1,243 | 1,766 | 1,390 | 1,124 | US$/2Eoz | Average basket price | R/2Eoz | 20,928 | 25,312 | 30,609 | 22,890 | 30,482 | ||||||||||||||||||||||||||||||||
| 386 | 35 | 125 | 53 | (18) | US$m | Adjusted EBITDA1 | Rm | (266) | 976 | 2,309 | 710 | 6,330 | ||||||||||||||||||||||||||||||||
| 1,586 | 1,872 | 1,840 | 1,737 | 1,992 | US$/2Eoz | All-in sustaining cost4 | R/2Eoz | 37,090 | 31,633 | 31,880 | 34,465 | 25,951 | ||||||||||||||||||||||||||||||||
| US PGM recycling | ||||||||||||||||||||||||||||||||||||||||||||
| 598,774 | 310,314 | 237,441 | 162,452 | 147,862 | oz | 3E PGM recycling2,3 | kg | 4,599 | 5,053 | 7,385 | 9,652 | 18,624 | ||||||||||||||||||||||||||||||||
| 3,067 | 2,334 | 3,274 | 2,735 | 1,939 | US$/3Eoz | Average basket price | R/3Eoz | 36,105 | 49,804 | 56,747 | 42,981 | 50,202 | ||||||||||||||||||||||||||||||||
| 78 | 33 | 39 | 20 | 13 | US$m | Adjusted EBITDA1 | Rm | 236 | 371 | 676 | 607 | 1,274 | ||||||||||||||||||||||||||||||||
| SOUTHERN AFRICA (SA) REGION | ||||||||||||||||||||||||||||||||||||||||||||
| PGM operations | ||||||||||||||||||||||||||||||||||||||||||||
| 1,667,464 | 1,672,927 | 843,658 | 799,182 | 873,745 | oz | 4E PGM production3,5,13 | kg | 27,177 | 24,857 | 26,241 | 52,034 | 51,864 | ||||||||||||||||||||||||||||||||
| 2,622 | 1,574 | 2,434 | 1,867 | 1,304 | US$/4Eoz | Average basket price | R/4Eoz | 24,276 | 34,006 | 42,188 | 28,979 | 42,914 | ||||||||||||||||||||||||||||||||
| 2,330 | 958 | 956 | 649 | 309 | US$m | Adjusted EBITDA1 | Rm | 5,826 | 11,794 | 16,983 | 17,620 | 38,135 | ||||||||||||||||||||||||||||||||
| 1,180 | 1,089 | 1,179 | 1,083 | 1,094 | US$/4Eoz | All-in sustaining cost4 | R/4Eoz | 20,363 | 19,716 | 20,431 | 20,054 | 19,313 | ||||||||||||||||||||||||||||||||
| Gold operations | ||||||||||||||||||||||||||||||||||||||||||||
| 620,541 | 810,584 | 428,859 | 416,738 | 393,847 | oz | Gold produced | kg | 12,250 | 12,962 | 13,339 | 25,212 | 19,301 | ||||||||||||||||||||||||||||||||
| 1,798 | 1,936 | 1,720 | 1,921 | 1,955 | US$/oz | Average gold price | R/kg | 1,170,362 | 1,124,871 | 958,232 | 1,146,093 | 946,073 | ||||||||||||||||||||||||||||||||
| (219) | 193 | (17) | 130 | 63 | US$m | Adjusted EBITDA1 | Rm | 1,148 | 2,375 | (440) | 3,523 | (3,546) | ||||||||||||||||||||||||||||||||
| 2,410 | 1,904 | 2,019 | 1,813 | 2,008 | US$/oz | All-in sustaining cost4 | R/kg | 1,202,225 | 1,061,477 | 1,124,737 | 1,127,138 | 1,268,360 | ||||||||||||||||||||||||||||||||
| EUROPEAN REGION | ||||||||||||||||||||||||||||||||||||||||||||
Sandouville nickel refinery6 | ||||||||||||||||||||||||||||||||||||||||||||
| 6,842 | 7,125 | 2,277 | 3,493 | 3,632 | tNi | Nickel production7 | tNi | 3,632 | 3,493 | 2,277 | 7,125 | 6,842 | ||||||||||||||||||||||||||||||||
| 28,019 | 23,955 | 24,646 | 26,888 | 21,075 | US$/tNi | Nickel equivalent average basket price8 | R/tNi | 392,420 | 489,635 | 427,120 | 441,138 | 458,595 | ||||||||||||||||||||||||||||||||
| (30) | (72) | (34) | (35) | (37) | US$m | Adjusted EBITDA1 | Rm | (701) | (627) | (553) | (1,328) | (492) | ||||||||||||||||||||||||||||||||
| 32,239 | 35,474 | 38,333 | 37,486 | 33,492 | US$/tNi | Nickel equivalent sustaining cost9 | R/tNi | 623,615 | 682,628 | 664,311 | 653,246 | 527,676 | ||||||||||||||||||||||||||||||||
| AUSTRALIAN REGION | ||||||||||||||||||||||||||||||||||||||||||||
Century zinc retreatment operation10 | ||||||||||||||||||||||||||||||||||||||||||||
| — | 76 | — | 24 | 51 | ktZn | Zinc metal produced (payable)11 | ktZn | 51 | 24 | — | 76 | — | ||||||||||||||||||||||||||||||||
| — | 1,728 | — | 1,640 | 1,766 | US$/tZn | Average equivalent zinc concentrate price12 | R/tZn | 32,878 | 29,871 | — | 31,815 | — | ||||||||||||||||||||||||||||||||
| — | (15) | — | (28) | 13 | US$m | Adjusted EBITDA1 | Rm | 217 | (502) | — | (285) | — | ||||||||||||||||||||||||||||||||
| — | 1,975 | — | 2,418 | 1,759 | US$/tZn | All-in sustaining cost4 | R/tZn | 32,746 | 44,030 | — | 36,361 | — | ||||||||||||||||||||||||||||||||
1The Group reports adjusted earnings before interest, taxes, depreciation and amortisation (EBITDA) based on the formula included in the facility agreements for compliance with the debt covenant formula. Adjusted EBITDA may not be comparable to similarly titled measures of other companies. Adjusted EBITDA is not a measure of performance under IFRS and should be considered in addition to and not as a substitute for other measures of financial performance and liquidity. For a reconciliation of profit/loss before royalties, carbon tax and tax to adjusted EBITDA, see note 11.1 of the condensed consolidated financial statements
2The US PGM operations’ underground production is converted to metric tonnes and kilograms, and performance is translated to SA rand (rand). In addition to the US PGM operations’ underground production, the operation treats recycling material which is excluded from the 2E PGM production, average basket price and All-in sustaining cost statistics shown. PGM recycling represents palladium, platinum, and rhodium ounces fed to the furnace
3The Platinum Group Metals (PGM) production in the SA operations is principally platinum, palladium, rhodium and gold, referred to as 4E (3PGM+Au), and in the US operations is principally platinum and palladium, referred to as 2E (2PGM) and US PGM recycling is principally platinum, palladium and rhodium referred to as 3E (3PGM)
4See “Salient features and cost benchmarks” sections for the definition of All-in sustaining cost (AISC)
5The SA PGM production excludes the production associated with the purchase of concentrate (PoC) from third parties. For a reconciliation of the production including third party PoC, refer to the "Reconciliation of operating cost excluding third party PoC for US and SA PGM operations, Total SA PGM operations and Marikana" sections
6The Sandouville refinery processes nickel matte and is included in the Group results since the effective date of the acquisition on 4 February 2022
7The nickel production at the Sandouville nickel refinery operations is principally nickel metal and nickel salts (liquid form), together referred to as nickel equivalent products
8The nickel equivalent average basket price per tonne is the total nickel revenue adjusted for other income less non-product sales divided by the total nickel equivalent tonnes sold
9See "Salient features and cost benchmarks"" sections Sandouville nickel refinery for a definition of nickel equivalent sustaining cost
10The Century zinc tailings retreatment operation is a leading tailings management and rehabilitation operation in Queensland, Australia. The Century operation was acquired by the Group on 22 February 2023
11Zinc metal produced (payable) is the payable quantity of zinc metal produced after applying smelter content deductions
12Average equivalent zinc concentrate price is the total zinc sales revenue recognised at the price expected to be received excluding the fair value adjustments divided by the payable zinc metal sold
13As previously announced, Sibanye Rustenburg Platinum Mines Limited had entered into a pool and share agreement to acquire Rustenburg Platinum Mines Limited 50% ownership. The acquisition became effective on 1 November 2023 after all conditions precedent had either been met or waived, therefore SA PGM operations for the six months and year ended December 2023 includes Kroondal at 100% for November and December 2023
Sibanye-Stillwater Operating and financial results | Six months and year ended 31 December 2023 2
STATEMENT BY NEAL FRONEMAN, CHIEF EXECUTIVE OFFICER OF SIBANYE-STILLWATER
While the operating environment remains challenging, with macro-economic and geo-political uncertainty persisting, our medium to long term view on the fundamental outlook for the metals we produce with the exception of nickel, remains largely unchanged.
We are confident that the PGM price weakness during 2023 does not signal a structural change in PGM fundamentals like that of the nickel market, but is more temporary in nature and we are beginning to see increasing signs which support a better demand outlook. We believe that the precipitous decline in PGM prices during H1 2023, was due to a confluence of negative factors and exacerbated by unexpected destocking of inventory which caught the market by surprise, causing increased uncertainty and market anxiety. This bearish sentiment was reflected in a significant build-up of speculative short positions in palladium, which also contributed to the price pressure.
We continue to see emerging signals that in fact support our long held, robust view on the PGM demand including:
•Absolute light duty vehicle (LDV) production is forecast to grow over the rest of this decade
•The recent moderation in battery electric vehicle (BEV) growth rates and accompanying increase in hybrid power-train adoption supports our view that the predicted demise of internal combustion engine (ICE) vehicles was premature and that delivery on BEV penetration forecasts would be challenging
•Primary supply is likely to continue declining in an inflationary environment with low PGM prices
•Recycling supply remains subdued and well below forecasts
At the same time, we remain constructive on the outlook for lithium as well, despite current oversupply and the collapse in lithium prices. We see increasing evidence that permitting and financing new mine supply is becoming more challenging and costly. As such we remain confident that we have timed our lithium strategy well and will be suitably positioned to deliver into a growing deficit market in the latter part of this decade.
Despite this relatively sanguine view on future metal prices, we are not ignorant of the risks posed by a potential extended downturn, and have already taken proactive and decisive actions, which tangibly address financial losses and better position the business for sustainability.
Our repositioning for a changing and less supportive environment began in 2021, aligned with our revised strategy, which was informed by the grey elephants (highly probable, high impact and yet ignored threats) we identified at the time.
The initial repositioning commenced in mid-2022 in anticipation of a deteriorating operating environment and palladium price outlook, with the US PGM operations repositioned for the high inflation environment, by suspending capital expenditure on further growth and a refocus on improving operational flexibility and efficiency and reducing costs.
The significant further decline in palladium and rhodium prices during 2023, was larger than we had anticipated, prompting a Group wide review of all operations and a focus on bottom of the cycle austerity and value preservation.
The identification and decisive implementation of cost saving and capital preservation opportunities during 2023 and 2024 to date, is expected to yield approximately R6.6 billion (US$375 million) in cost and capital savings (aiming at resetting the cost base) and capital reduction and/or deferrals, which will benefit near and medium term cash flow. These initiatives since mid-2022 include:
| Repositioning actions/events unlocking expected cost and capital benefits | R | US$ | |||||||||
| February 2022 | Noted the likely prospect of a global economic downturn post the invasion of Ukraine | n/a | n/a | ||||||||
| August 2022 | Repositioning of US PGM operations for anticipated palladium price weakness in 2028 | n/a | n/a | ||||||||
| February 2023 | Closure of Beatrix 4 Shaft and Kloof 2 processing plant | R500m | US$29m | ||||||||
| From May 2023 | Entered into gold ZAR hedges (zero cost collars) to protect price downside* | n/a | n/a | ||||||||
| November 2023 | Raised US$500m convertible note to fund the recycling strategy at a 4.25% interest rate | n/a | n/a | ||||||||
| November 2023 | Closure of Kloof 4 shaft | R1.1bn | US$63m | ||||||||
| November 2023 | Further repositioning of US PGM operations for ongoing decline in 2E basket price | R3bn | US$171m | ||||||||
| November 2023 | Deferral of capital investment in Burnstone project and corporate savings | R1.2bn | US$69m | ||||||||
| February 2024 | Closure of Simunye shaft, rightsizing of Siphumelele and Rowland shafts and | R750m | US$43m | ||||||||
conditional operations at 4 Belt shaft | |||||||||||
| Total estimated benefit expected** | R6.6bn | US$375m | |||||||||
*60% of 2024 production hedged with floor of R1.1million/kg and cap of R1.4 million/kg ** The above financial information and the information on which it is based has not been reviewed or reported on by Sibanye-Stillwater’s auditors | |||||||||||
We recognize however that if low commodity prices persist, earnings are going to remain under pressure and, with ongoing inflationary cost pressure, there may be further restructuring required. We have a strong balance sheet as a buffer, but will clearly continue to manage our financial position in terms of our earnings and cash flow.
This may require further repositioning to address losses at the US PGM operations and the Sandouville refinery. The recent Court ruling on aspects of the Keliber lithium project is likely to result in delays to the commencement of the Rapasaari mine. While further assessment of the implications for the Keliber Lithium project are still being done, rescheduling of some capital investment may be an option. We are also considering alternative capital and financing opportunities including revenue protection and monetisation and in 2023 implemented a hedge at our SA gold operations of over 60% of 2024 production, with a floor of R1.1m/kg and a ceiling of R1.4m/kg, protecting revenue downside without stifling upside.
Safety
A regression in the number of fatal incidents in 2023 compared to 2022 (which represented a record year for most safety measures) was deeply regretful and of concern for management and the board, was the increase in number of fatalities to 11 from five in 2022. Despite this disappointing regression in fatal incidents, our continued focus on eliminating fatalities through the ongoing implementation of the fatal elimination plan Group wide, resulted in many improvements in underlying safety trends during the year.
Sibanye-Stillwater Operating and financial results | Six months and year ended 31 December 2023 3
The safety performance of the Group is covered in more detail on page 9 of this report, but on behalf of management and the Board of Sibanye Stillwater, we wish to express our deep regret and extend our sincere condolences to the families and friends of our late colleagues.
We are committed to continuous improvement in health and safety at our operations. This is a deliberate journey and whilst we have made significant progress, we continue to embed the strategy based on lessons learned and industry best practice to improve our high energy risk mitigation approach thereby eliminating fatalities from our operations. Pleasingly during 2023, we achieved a best ever performance in serious injuries and a significant reduction in incidents and injuries that had a potential for loss of life. Our SA PGM operations achieved over 11 consecutive months fatal free while our gold operations have currently been fatal free for seven months. Our absolute priority remains on eliminating fatal incidents from our operations.
Financial overview
The substantial declines in the prices of most commodities (with the notable exception of gold) and persistent cost inflation, translated into materially lower earnings and cash flows placing the entire global mining industry under severe financial pressure.
The Group’s financial results for the year ended 31 December 2023 (2023) were similarly impacted by the sudden and sharp decline in PGM and nickel prices. The 33% year-on-year decline in the average PGM basket prices in particular, resulted in a dramatic fall in the profitability of the US and SA PGM operations, which in recent years have contributed the bulk of Group earnings and cash flow.
The contrast in profitability of these operations between H1 2023 and H2 2023 is particularly stark, with the average 2E PGM basket price declining by 19% period-on-period to US$1,124/2Eoz (R20,928/2Eoz), resulting in the US PGM operations reporting an adjusted EBITDA loss of US$18 million (R266 million) from adjusted EBITDA of US$53 million (R976 million) for the previous 6 months. While the SA PGM operations remain profitable, a 42% decline in the average 4E PGM basket price resulted in adjusted EBITDA more than halving period-on-period to R5.8 billion (US$309 million) for H2 2023.
Consequently, Group adjusted EBITDA for 2023 fell to R20.6 billion (US$1.1 billion), 50% lower than adjusted EBITDA of R41.1 billion (US$2.5 billion) for 2022, which was in itself a 40% decline from record levels of R68.6 billion (US$4.6 billion) for 2021 (which marked the peak of the commodity price cycle).
The significant decline in metal prices and uncertain outlook, along with specific operational performance factors, also resulted in the Group having to recognise impairments of R47.5 billion (US$2.6 billion) against various assets (detailed in the condensed consolidated financial statements), which was a primary driver of the Group reporting a loss for 2023 of R37.4 billion (US$2.0 billion) compared with a R19.0 billion (US$1.2 billion) profit for 2022.
Pleasingly however, other than the US PGM recycling business, which continued to be impacted by external factors, all of the Group’s operations achieved production guidance for 2023 with our SA gold and SA PGM operations and Australian retreatment operation, Century zinc, all profitable before the end of Q4 2023.
Consistent and disciplined adherence to the Group capital allocation framework, has also maintained a solid financial position at year-end, with our balance sheet leverage still well below our stated mid-cycle comfort ratio of 1x net debt:adjusted EBITDA, with cash on hand of R25.5bn (US$1.4bn) and undrawn debt facilities of R24bn (US$1.29bn) providing ample liquidity headroom and financial flexibility.
ESG and Sustainability - commitment and success
Sustainability/ESG is a strategic imperative for the Group and Sibanye-Stillwater continues to drive ESG improvement throughout the Group. To advance this commitment, Melanie Naidoo-Vermaak was appointed as Chief Sustainability Officer, effective 1 January 2024. Melanie has over 20 years’ experience in sustainable development in both the private mining and public sectors in South Africa and globally. In addition to driving our efficient delivery of our strategic ESG priorities, Melanie will also will further diversify and strengthen our senior leadership team. (https://www.sibanyestillwater.com/about-us/leadership/melanie-naidoo-vermaak/).
In 2023 notable achievements have been made in the following areas:
We have made considerable progress with our SA renewable projects which will further reduce our carbon footprint, energy security risk and improve operating costs, thereby enhancing the sustainability of our SA operations. There are currently 632MW of renewable projects planned in SA for commercial operation by end-2026 with 267MW already contracted through Power Purchase Agreements (PPAs) and in construction. The 89MW Castle wind farm, the 103MW Witberg wind farm and the 75 MW (of 150 MW) SOLA Group solar project.
These projects are expected to reach commercial operation in 2025 and will provide approximately 15% of our SA electricity requirements and will enable scope 2 emissions reduction of approximately 921,000t CO2 per year from a base of 6.7Mt combined Scope 1&2 in 2022.
A further five renewable energy projects with a total capacity of 364MW are well advanced and planned for financial close in 2024. The total project portfolio of 632 MW will supplement approximately 30% of our utility supply, with renewable electricity from 2027 provided at a 20-30% discount to Eskom tariffs, escalating at CPI. The total capital investment of these projects is c.R12-14bn, funded through third-party PPAs. In addition all projects meet or exceed the South African Mining Charter requirements and will contribute towards socioeconomic development of our local communities.
In January 2023: Sibanye-Stillwater was included in the Bloomberg Gender-Equality Index (GEI) for 2023. The Group is one of 484 companies globally (and one of only eight South African companies), across 45 countries and regions representing 11 sectors, which qualified to be included in the index. Sibanye-Stillwater was included in this year’s index for scoring above a global threshold established by Bloomberg for gender equality across five pillars: leadership & talent pipeline, equal pay & gender pay parity, inclusive culture, anti-sexual harassment policies, and external brand.
The Sibanye Foundation NPC performs public benefit activities for the benefit of the beneficiaries, with a particular emphasis on conservation, environment, healthcare, education, skills development, welfare, humanitarian, access to digital media, sports, infrastructure and cultural initiatives. In 2023, R211million (US$11million) funding was provided through allocation equivalent to 1.5% of declared dividends for societal upliftment, with R42 million (US$2 million) allocated mostly to SA where we partnered with organisations such as Gift of the Givers and Breadline Africa to providing infrastructure to disadvantaged schools in SA. One project was supported in
Sibanye-Stillwater Operating and financial results | Six months and year ended 31 December 2023 4
Europe (€30,000) at a community centre. It is intended that the remaining funds will be disbursed on an annual basis to ensure continuity of the social programmes supported, to cover periods of reduced dividends.
In May 2023 Sibanye-Stillwater's Corporate and South African operations achieved ISO 27001 certification. ISO 27001 is a globally recognised standard that sets out the requirements for an Information Security Management System (ISMS). It provides a systematic and risk-based approach to managing and protecting sensitive information, including financial data, intellectual property, customer information, and other critical assets. ISO 27001 certification is essential for protecting our employee and client information, reputation and other sensitive information. The ISO standard includes a process-based approach to initiating, implementing, operating, and maintaining our ISMS.
In July 2023, Sibanye-Stillwater and the University of the Witwatersrand, Johannesburg (Wits) launched the newly refurbished and rebranded Wits Sibanye-Stillwater Innovation bridge (the Innovation bridge), a Wits Centenary Project funded by Sibanye-Stillwater. The launch of the Innovation bridge on 12 July 2023 was accompanied by an additional commitment of R51 million from Sibanye-Stillwater to Wits for study bursaries, learnerships within the Group’s mining operations, graduate internship programmes and staff development within the Wits Faculty of Engineering and the Built Environment (FEBE). Since 2014, Sibanye-Stillwater has enabled over 500 students to study at Wits by providing bursaries and allowances amounting to R19.4 million. In addition, The Group has contributed R68.5 million in funding for the DigiMine, with a further R5.5 million committed for 2023 and has donated R50 million worth of technical equipment to the FEBE.
Good progress has been made at Marikana on the journey of the Marikana Renewal Process. As part of the Marikana renewal, we were able to collaborate with stakeholders as follows:
•Meaningful progress on the issues raised by families to the company (education, housing, livelihoods, health of the elderly and Koppie Memorial)
•Stakeholder Pitso (a gathering or conference) to look at sustainable relationship building and rebasing trust
•Agreed on a socio-economic compact delivering youth development and job creating programmes in partnership with communities, suppliers and development agencies
At the 4th annual Marikana Memorial Lecture on 14 August 2023, Gift of the Givers Founder Dr Imtiaz Sooliman, appealed to government, business, mining companies and the country’s people to work together to rebuild the country and for people to turn away from the widespread negativity which is inhibiting attainment of this goal. He said much of the negativity is due to the fact that people have not recovered from the trauma of the COVID-19 pandemic and that there are other historical factors that also need to be overcome.
Also in August 2023, Sibanye-Stillwater achieved joint first place in both the metals and mining sector category and joint first place “overall” in the 2023 sustainability data transparency index (SDTI) research report compiled by Integrated reporting & assurance services (IRAS). The SDTI is compiled annually by IRAS and the current results are based on the Sibanye-Stillwater Group’s 2022 disclosures published in April 2023 (its Integrated report and the supplements of its suite of reports). The Group scored 90.75% for the 2023 STDI - significantly higher than the mining and metals sector's average rating of 64.5%, resulting in the top rating, further improving last year’s ranking of being third overall and the top-rated in the mining sector.
In December 2023 Sibanye-Stillwater through the Sibanye Rustenburg Mine Community Development Trust (SRMCDT) announced an R84 million investment for development programmes that will empower communities adjacent to Sibanye-Stillwater’s Rustenburg operation in the North West Province. The SRMCDT was established in 2016 by Sibanye Rustenburg Platinum Mines (SRPM) – now Sibanye-Stillwater’s Rustenburg operation - to contribute towards socio-economic development programmes to create sustainable and empowered communities within the Rustenburg Local Municipalities (exclusively SRPM communities) and create a future that will sustain them beyond mining. The Trust, which is part of the broad-based, black economic empowerment consortium owning 26% of the Rustenburg operation, has to date received an accumulative R301.8 million in dividends from the Rustenburg operation to unlock the value that can be created by community upliftment initiatives as outlined in the SRMCDT deed. The Trust supports programmes in education and training, sustainable health and social development, rehabilitation of the natural environment, training for entrepreneurs and upliftment programmes for the vulnerable in the communities, in particular women, youth, and people living with disabilities.
More recently, on 14 February 2024, Sibanye-Stillwater was awarded an ‘A-’ rating for both its water security and its climate change disclosures by CDP, a non-profit organisation which runs the global environmental disclosure system. The Group’s water CDP rating improved from B to A- and is notably higher than the average global submissions which hold a C-rating, the average C-rating for the African region, and the average B- rating for the Metallic mineral mining sector. Furthermore, Sibanye-Stillwater’s Climate change CDP rating of A- exceeded the average C-rating of the global submissions, the average B-rating for the African region, and the Metallic mineral mining sector’s average C-rating .
MARKET OVERVIEW
Green metals
PGM market - 2023
The platinum price was volatile in 2023, decreasing by 8% by year-end. The price began the year at US$1,074/oz but retreated close to US$900/oz in February. Concerns over the impact of South African power disruptions on primary supply saw the price rally to over US$1,100/oz in April. However, the producers were able to mitigate the impact with limited effect on mined volumes. The price retreated over the second half of the year, as load-shedding eased, with prices falling to a low of US$845/oz in November, before rallying to end the year at $992/oz.
The palladium price continued its retreat from the record level seen in 2022 following the Russian invasion of Ukraine, falling 39% from $1,793/oz to $1,104/oz as at 31 December 2023. Some automakers that had built up additional palladium inventory as a precaution in case of supply disruptions reduced excess stock levels during the year. In addition, Nornickel postponed its smelter maintenance resulting in higher palladium output than anticipated.
The rhodium price continued to decline, falling 64% from $12,250/oz to $4,425/oz. Similar to palladium, stock sales also influenced the rhodium price. Chinese glass manufacturers that had thrifted rhodium from their processing, owing to the high price, sold the metal into the domestic market, resulting in significantly reduced imports into China.
Sibanye-Stillwater Operating and financial results | Six months and year ended 31 December 2023 5
Light vehicle production exceeded initial expectations of modest growth and climbed 10% to almost 91 million units with global BEV production rising by 39% to over 11 million units (~12%), as supply chain disruptions were overcome and consumer demand remained robust. Automotive demand for platinum increased by 20% year-on-year to 3.3Moz, partly as a result of the increased production and partly owing to the more widespread use of tri-metal gasoline autocatalysts. Heavy-duty vehicle production increased last year, mostly as a result of higher output in China as the economy normalised following the removal of Covid-19 restrictions.
Cautious consumers in China with a preference for gold over platinum jewellery contributed a 6% decline year-on-year as net global platinum jewellery demand remained flat at 1Moz. Despite strong growth for platinum in the glass and chemical sector, overall demand for industrial uses remained flat.
Gross palladium automotive demand remained largely flat at 8.4Moz. Despite the rise in light vehicle production, palladium demand was impacted by substitution with platinum in gasoline autocatalysts.
Secondary supply of PGMs fell by approximately 14% last year as the availability of spent autocatalysts was constrained by lower scrappage rates of second-hand vehicles and some collectors held onto catalysts waiting for a recovery in prices.
In 2023, the platinum and rhodium markets shifted into deficit (~320koz and ~55koz respectively) from a surplus in the previous year, while the palladium market deficit expanded (~1Moz).
PGM market outlook - 2024
Global PGM production is expected to be slightly lower than last year. Some high-cost production has been closed in South Africa and Eskom remains a risk to refined PGM output. Last year, load curtailment was a contributing factor to the build-up of partially processed material and further high-level load shedding would make it more difficult to process this stock. Russian production is expected to be lower this year as Nornickel undertakes smelter maintenance. The autocatalyst recycling environment remains challenging. Despite a strong year for new light vehicle sales in 2023, there have been fewer end-of-life vehicles than typical as second-hand vehicles have been kept on the road for longer.
Light vehicle production is forecast to increase modestly to 91.6 million units after strong production growth in 2023 (90.8 million) as supply chain problems were overcome amid robust consumer demand. However, global BEV market share is predicted to increase to 15% from 12% resulting in slightly lower automotive demand for PGMs. The next round of European tailpipe emissions standards for light vehicles (Euro 7) has been delayed with permissible emission levels weakened, which may help to sustain PGM demand in autocatalysts. While this does not offer the higher PGM loadings normally seen at each new step in emissions standards, it also does not add significant cost to internal combustion engine vehicles, thus keeping vehicles with PGM-based autocatalysts competitively priced compared to the electric vehicle alternatives.
The market has become progressively more bearish on Battery Electric Vehicle (BEV) growth rates recently. Previously, annual growth in excess of 30% off a small base had been expected. While the premium sector has electrified to a greater extent, adoption lags in the mass market driven by price, which is not likely to converge with ICE prices in the near term. In addition, challenging macro factors (inflation, limited discretionary spend, high borrowing costs) are also constraining new vehicle purchases. In expansive geographies such as North America, range anxiety abounds in areas where infrastructure has lagged and installing larger batteries to counter this exacerbates the cost issue. BEVs are approximately 30% more expensive, have higher insurance costs and lower resale values than an equivalent ICE and it is expected that hybrids (with similar PGM loadings to ICE) will benefit from these factors. Starting in H2 2023, signs of softer demand for BEVs materialised despite more models coming to market and improved government incentives. This has resulted in slower production ramp-up and delayed capital investments by many OEMs as profitability and returns are under pressure. Increased restrictions on the US IRA subsidies from 2024 will negatively impact OEM margins with costs being passed on to consumers. Finally, as many key economies hold elections this year, there is significant uncertainty around environmental and economic policies that could impact the mix of "future power trains". We expect BEV growth rates to slow over the medium term, with ICE hybrids increasing over the same period.
The European Commission announced some €7 billion funding for over 30 hydrogen projects through the Important Projects of Common European Interest (IPCEI) initiative in mid-February. This included additional electrolyser deployment for renewable hydrogen production and construction of further Liquid Organic Hydrogen Carrier (LOHC) terminal capacity for handling hydrogen. Whilst PGM-based technologies are only involved in some of these projects, this is nonetheless positive for demand growth (mainly platinum, iridium, and ruthenium) in the hydrogen economy.
Battery Metals market update
Lithium
Gross lithium demand is estimated to have increased by 42% last year, primarily driven by greater demand from the battery sector. Growing BEV and PHEV production and larger battery pack sizes led to a 55% rise in lithium consumed in automotive lithium-ion batteries, accounting for over 90% of overall growth.
China was the primary driver of global automotive demand growth once again, comprising 40% of growth in 2023, despite a slower growth in BEV sales compared to the year before. China’s BEV production expanded by 29% to nearly 7 million units last year, while domestic BEV sales continued to increase robustly, albeit at a slower pace than in 2022, owing to weaker consumer confidence caused by a worsening macroeconomic outlook and price wars. Lithium consumption also grew robustly in the US and Europe and global BEV production rose by 39% to more than 11 million units.
Primary lithium supply is estimated to have increased by 51% in response to high prices prevailing in recent years, with new supply outpacing demand for the first time since 2018 and pushing the market into a primary surplus. The majority of this additional supply came from Australia, Chile and China, with Brazil, Africa and North America also beginning to emerge as notable sources of supply. As a result of growth in primary supply and destocking of accumulated inventory in China, lithium carbonate prices fell by 82% from close to $70,000/t at the start of 2023 to around $12,000/t at the end the year.
Lithium demand is forecast to increase by a more muted 29% for 2024, largely owing to continued growth in the BEV segment, especially in China. With additional growth in lithium supply expected from expansion of production in Australia, China, Africa and Argentina, prices
Sibanye-Stillwater Operating and financial results | Six months and year ended 31 December 2023 6
are likely to remain subdued for 2024, albeit above historical levels, before rising over the medium term as the market balance begins to tighten once again.
While prices should continue to incentivise projects at quality assets, pauses in investment and other delays may lead to a lag in supply growth further out, and shortfalls are therefore expected to re-emerge from 2026/27 as demand growth outstrips expansion in supply.
Nickel
In 2023, global demand for nickel rose 5%, as demand for mobility batteries continued to increase rapidly. Battery demand is estimated to have increased by more than 25% last year, largely thanks to strong growth in BEV sales in China, which reached 6.68 million units. Despite the rising market share of lithium iron phosphate batteries in the Chinese market, the greater energy density of high-nickel NMC batteries is supporting demand in the European and North American markets. Stainless steel demand was stable year-on-year in 2023, rising marginally to just over 3 million tonnes.
The nickel market was in surplus in 2023 as global nickel supply increased significantly. This was mainly as a result of nickel pig iron and mixed hydroxide precipitate (MHP) production expansion in Indonesia. The sharp increase in supply has depressed benchmark nickel prices and caused the value of nickel in battery-grade nickel sulphate to trade at a discount to LME nickel price for much of the year. Indonesian output is expected to continue to increase during 2024, extending the market surplus.
The LME nickel price averaged $21,505/tonne for 2023, 18% lower than for 2022, and fell to $16,375/tonne by the end of the year. The price volatility caused by the invasion of Ukraine has subsided, and the shift in focus from a tight class 1 market to oversupply due to Indonesian supply growth contributed to the price weakness. Lower-cost nickel production in Indonesia is undercutting the rest of global supply, and has resulted in a number of nickel operations being closed in the last few months, with more production likely to close in 2024.
Zinc
The zinc price (LME Cash Settlement Price) started relatively high at US$3,289/tonne in January 2023 then dropped to US$2,502/tonne in December 2023. Chinese smelters, which comprise approximately 50% of global smelting capacity, reported record production for 2023 .
A decline in zinc prices in 2023 triggered the suspensions and closures of a number of zinc mines. This resulted in tightness in the zinc concentrate market which contributed to a fall in Treatment Charges (TC's) for zinc concentrate below the 2023 annual benchmark of US$274/tonne. By the end of 2023, spot TC's had fallen to below US$100/tonne.
Although inflationary pressures in several of the world’s major economies appear to be easing, global supply chains may not fully normalise due to geopolitical tensions and conflicts in 2024. Globally, zinc miners’ margins remain under pressure. However, an expected bounce back in demand mainly driven by China, India and a moderate recovery in Europe, together with delayed new mine projects and expansions due to financial and technical issues, should be positive for zinc markets in 2024. Zinc concentrate supply is expected to be tight in the first half of 2024, resulting in low spot TC's.
These factors are expected to be supportive of stronger zinc prices across 2024 compared to current levels. In addition, market expectations are that 2024’s annual benchmark TC's will be lower than last year’s US$274/tonne, and a better year for zinc miners should be expected.
STRATEGIC REVIEW
A disciplined focus on capital allocation was maintained during the year. Despite the significant pressure on commodity prices, with the exception of gold, market valuations have been slow to retrace until very recently, and whilst we continue to evaluate opportunities, the primary M&A focus has been on the circular economy where valuations have become more reasonable, and in line with our strategy. Our involvement in the process to extend our copper portfolio into Zambia through our bid to acquire the Mopani operation was unsuccessful. We remain interested in increasing our exposure to copper at an opportune time including through progressing feasibility studies for Mt Lyell.
In January the Rhyolite Ridge lithium/boron project in Nevada was awarded a conditional loan of US$700 million from the US Department of Energy, a strong endorsement of the project. The project is in the final stages of the federal permitting process with a record of decision expected in Q4 2024. While the focus is on getting the South basin into production, the option we have on the North basin offers a vast footprint providing scalability in future. Provided Rhyolite Ridge meets the conditions precedent, it is expected that Sibanye-Stillwater could commence funding of the staged US$490 million (R9.4bn*) JV contribution in H2 2024. With a minimum two year lead time from start of construction, the earliest that Rhyolite Ridge could commence operations would be late 2026.
The integration of New Century Resources, with majority ownership acquired on 22 February 2023 and 100% ownership on 15 May 2023, has progressed well with restructuring carried out to optimise regional and operational efficiencies. With Century zinc tailings retreatment operations operating well, the focus has moved onto exploring regional opportunities. In November the Group exercised the option to acquire 100% of the Mt Lyell Copper Project (a previously operated copper mine) located in Tasmania, Australia. The Mt Lyell feasibility study (AACE Class 3 Estimate) is expected to be finished in H1 2024.
We announced in November that we had brought forward the completion of the transaction entered into between Rustenburg Platinum Mines Limited (RPM) a subsidiary of Anglo American Platinum Limited (AAP), and Sibanye-Stillwater’s subsidiary, Sibanye Rustenburg Platinum Mines Limited (Rustenburg operation) which was originally announced on 31 January 2022, resulting in the Rustenburg operation acquiring RPM’s 50% share in the Kroondal pool and share agreement (Kroondal PSA) and the Group assuming full ownership of the low cost, mechanised Kroondal operation, effective 1 November 2023.
RPM will be paid a deferred consideration (Deferred Consideration) calculated from 1 November 2023 until the full contracted 1,350,000 4Eoz (100% basis) have been delivered, which is expected to be during Q2 2024 (the Deferred Period). Further detail on the transaction is available at: (https://thevault.exchange/?get_group_doc=245/1698843217-ssw-Kroondal-PSA-early-close-01nov2023.pdf). The remaining ounces (approx. 231,009 4E as at end September 2023) will continue to be delivered under the terms of the current Kroondal operation purchase of concentrate (PoC) agreement. Upon delivery of the final remaining ounces, the PoC will fall away and all PGM concentrate from the Kroondal operation, will be subject to the terms of the current Rustenburg operation’s sale and toll treatment agreement with RPM.
Sibanye-Stillwater Operating and financial results | Six months and year ended 31 December 2023 7
This transaction is a smart and value accretive transaction for all stakeholders. By consolidating the mining area with the adjacent Rustenburg operations under a single operator, the operating life of the Kroondal operation will be extended by extracting adjacent Rustenburg resources from the mechanised and low-cost Kroondal operation adding approximated 1.7 million 4Eoz extra production over the life-of-mine. Accelerating the extraction of more remote parts of the Rustenburg operation orebody will also unlock significant value by realising financial benefits many years earlier, sustaining employment for an extended period and enabling the creation of significant shared value for all stakeholders in the region.
During 2023, through our BioniCCube investment vehicle, we made investments in Verkor €15 million (R299 million), Glint £1.3 million (R31 million) and other (including Enhywhere) ~ €1 million (R16 million).
In line with the focus on the circular economy, we are optimistic that the acquisition of Reldan will be concluded for an estimated cash consideration of US$155.4m (R3.0 billion*) in March 2024. It is anticipated that the transaction will be value accretive and positively contribute to Sibanye-Stillwater from day one. The financing will be provided by the opportunistic and well timed US$500 million senior unsecured guaranteed convertible bond due in 2028, which we completed in November 2023, paying a low coupon of 4.25% per annum. This offering was multiple times oversubscribed and was one of various available financing options, which provided financial flexibility at a reasonable cost under market conditions, and will enable further delivery on our strategic growth objectives at an opportune time in the commodity cycle, whilst maintaining balance sheet resilience and liquidity.
While we continue to look at selective M&A which will complement our existing business, our focus for now is on the Group's strategic essentials with a major focus on reducing both operating and capital costs and improving efficiencies whilst managing our operating entities and projects using the existing balance sheet.
* Based on the closing exchange rate of R19.25/US$ at 29 February 2024 from EquityRT
OPERATING GUIDANCE FOR 2024*
The US PGM operations forecast production of between 440,000 2Eoz and 460,000 2Eoz, with AISC of between US$1,365/2Eoz to US$1,425/2Eoz excluding any possible S45X credit (45X Advanced Manufacturing Production Credit (S45X credit)), with a capital reduction. Capital expenditure is forecast to be between US$175 million and US$190 million, including approximately US$13 million project capital.
3E PGM production for the US PGM recycling operations is forecast to be between 300,000 and 350,000 3Eoz fed for 2024. Capital expenditure is forecast at US$700,000 (R12 million).
4E PGM production from the SA PGM operations for 2024 is forecast to be between 1.8 million 4Eoz and 1.9 million 4Eoz including approximately 80,000 4Eoz of third party PoC, with AISC between R21,800/4Eoz and R22,500/4Eoz (US$1,245/4Eoz and US$1,285/4Eoz) - excluding cost of third party PoC. Capital expenditure is forecast at R6.0 billion (US$343 million)* for the year.
Gold production from the managed SA gold operations (excluding DRDGOLD) for 2024 is forecast at between 19,500kg (627koz) and 20,500kg (659koz). AISC is forecast to be between R1,100,000/kg and R1,200,000/kg (US$1,955/oz and US$2,133/oz). Capital expenditure is forecast at R3.9 billion (US$223 million), including R390 million (US$22 million) of project capital expenditure provided for the Burnstone project.
Production from the Sandouville nickel refinery is forecast at between 7.5 and 8.5 kilotonnes of nickel product, at a Nickel equivalent sustaining cost of between €21,000/tNi (R399k/tNi)* and €23,000/tNi (R437k/tNi)* and capital expenditure of €8 million (R152 million)*. Capital expenditure at the Keliber lithium project for 2024 is forecast to be about €361 million (R6.9 billion)*.
Production from the Century zinc tailings retreatment operation is forecast at between 87 and 100 kilotonnes of zinc metal (payable) at an AISC of between A$3,032 and A$3,434/tZn (US$2,032 and US$2,302/tZn or R35,560 and R40,285/tZn) and capital expenditure of A$17 million (US$11 million or R196 million). Project capital on the Mount Lyell copper/gold project for 2024 is forecast to be A$6.6 million (US$4 million or R77 million).
*The guidance has been translated where relevant at an average exchange rate of R17.50/US$, R19.00/€ and R11.73/A$
NEAL FRONEMAN
CHIEF EXECUTIVE OFFICER
CHIEF EXECUTIVE OFFICER
Sibanye-Stillwater Operating and financial results | Six months and year ended 31 December 2023 8
SIBANYE-STILLWATER GROUP SAFETY AND OPERATING REVIEW
Safety
The health and safety of our employees continues to be our first priority and we remain committed to ensuring a safe work environment at all of our operations. With the acquisition of New Century Resources in early 2023, the Group safety statistics now include the Australian region with effect from March 2023.
A regression in the number of fatalities during 2023 was deeply disappointing, with 11 colleagues fatally injured compared to five during 2022. This resulted in the fatal injury frequency rate (FIFR) increasing from 0.033 in 2022 to 0.066 in 2023. The 11 fatalities comprised six fatalities for H1 2023, including the Burnstone incident where four contractors were fatally injured in a single incident, followed by five fatalities for H2 2023 (two occurring during Q4 2023).
On 12 November 2023 at the Marikana operation, Mr Lemogang Sebitoane, an artisan assistant working at K3 shaft, Marikana operation was fatally injured in a rail bound equipment incident. On 13 November 2023 at the US PGM operations, a contractor employee working at the Stillwater mine sustained fatal injuries while operating a roof bolting machine.
We mourn the tragic loss of all 11 employees over the year, and will continue to intensify the focus on the implementation of the Fatal Elimination Strategy. The Board and management of Sibanye-Stillwater extend their sincere condolences to the loved ones, families and friends of our deceased colleagues. All incidents have been or are currently being investigated along with relevant stakeholders and support provided to the families of the deceased.
After several years of consistently improving safety statistics, Group lagging safety indicators marginally regressed in 2023 with the exception of the serious injury frequency rate (SIFR) which improved by 10% year-on-year to 2.61 (per million hours worked), the lowest rate ever recorded by the Group. Moreover, serious injuries for the SA region also reduced to the lowest levels on record.
Year-on-year, the Group lost time injury frequency rate (LTIFR) regressed by 4% from 4.41 to 4.57 and the total recordable injury frequency rate (TRIFR) regressed marginally by 3% from 5.07 to 5.24. Although these indicators regressed compared with 2022, these figures continue to be relatively low, and general declining trends over the last five years remain positive.
While Zero harm remains our ultimate objective, our immediate goal is to eliminate fatal and serious incidents through our Fatal elimination strategy, which is comprised of the key pillars of critical controls, critical lifesaving behaviours and critical management routines. The key messages in the Fatal elimination strategy are to strengthen the culture in "blocking the path to death", to know when to stop unsafe work and to stop without hesitation.
The Group has now embedded 19 minimum standards which define minimum requirements for the key pillars of the Fatal Elimination Strategy and all operational teams are committed to the strategy. The focus on rigorous compliance checklists of these Group minimum standards is ongoing and is continuously instilled by safety officials and line management. Data analysis and reporting have been increased further and the fatal elimination plans made more prominent through visuals and work routines in the workplace. Critical management routine audits are conducted regularly to verify controls and behaviours to ensure that key routines are in place.
In terms of operationalising the Fatal elimination plan, the teams' focus is to understand ineffective controls and to address identified factors through site-specific fatal elimination plans. With the priority on high-energy incidents, near-miss reporting has become an essential tool to eliminate the potential loss of life. We have defined the metrics for focus on High Potential Incidents (HPI) as Injuries with the Potential loss of life (IPLL) and Non-injuries with the Potential loss of life (NIPLL). Despite a significant increase in the reporting of near miss incidents during the year, we have seen a 40% decline in HPI frequency rate, when compared to H2 of 2022 from 3.64 to 2.18 per million hours worked.
Self-stoppages of work in unsafe environments and near-miss incident reporting is strongly encouraged and continues to improve with self stoppages from operational crews now above 50% of total reported stoppages, reflecting the embedded safety culture we are striving for. The key focus, for now, is on ensuring effective management routines and embedding a clear understanding of critical controls at the operator level during 2024.
The US PGM operations safety performance regressed with total reportable injuries increasing from 34 in 2022 to 47 in 2023, resulting in the TRIFR increasing by 40% from 7.61 in 2022 to 10.66 in 2023. The regression in rates is a consequence of a number of capital project builds on surface being concluded, resulting in less surface hours worked by contractors during 2023. The US operations are focused on increased crew engagement to further inculcate the Group safety strategy amid high labour turnover.
The SA PGM operations also reported a slight regression in the safety performance off the strong 2022 base with the TRIFR increasing from 4.90 in 2022 to 5.01 for 2023, although the SIFR improved by 18% from 2.72 in 2022 to 2.23, the lowest level since 2018. The SA PGM operations suffered two fatal incidents in 2023 compared with three in 2022, but achieved over 11 months of fatal free operations, underpinning our commitment and ability to eliminate fatal incidents.
The TRIFR for the SA gold operations safety performance regressed marginally from 5.10 to 5.21 for 2023. Although there was an improvement towards year end, with no fatalities for the past seven months, the regression in fatalities is being addressed.
The European region (EU region) which includes both the Keliber lithium project and Sandouville had five reportable injuries in 2023 compared with six in 2022, with the relative increase in the hours worked resulting in the TRIFR declining by 42% to 6.14.
The Australian region had three recordable injuries, for the period March to December 2023, resulting in a 12 month rolling TRIFR for the year of 6.46.
US PGM operations
Production from the US PGM underground operations steadily improved over the course of 2023, following the shaft incident at the Stillwater West mine during Q1 2023, achieving sustainable levels during Q4 2023. Mined 2E PGM production of 427,272 2Eoz for 2023 was 1% higher than for 2022 and in line with revised guidance of 420k 2Eoz to 430k 2Eoz.
Both the Stillwater and East Boulder mines continued to be constrained by limited operational flexibility due to a reduced developed state and an ongoing shortage of critical skills, with the consequent reliance on contractors elevating costs. Production for 2024 has been
Sibanye-Stillwater Operating and financial results | Six months and year ended 31 December 2023 9
repositioned for a lower PGM price environment, with cost structures being reassessed to maintain recent production levels rather than pursuing growth.
Total operating costs for 2023 increased by 4% to US$500 million (R9.2 billion), however AISC increased by 18% to US$1,872/2Eoz (R34,465/2Eoz), mainly due to a 20% increase in ore reserve development (ORD) expenditure to US$211 million (R3.9 billion) and a 63% increase in sustaining capital expenditure to US$118 million (R2.2 billion) and lower than planned production. ORD expenditure increases were as a result of continued reliance on contractors and increased ORD across the operations to increase mining flexibility. ORD expenditure comprised 26% of and contributed US$494/2Eoz (R9,102/2Eoz) to AISC for 2023, compared to US$419/2Eoz (R6,855/2Eoz) for 2022. Sustaining capital expenditure, which contributed US$277/2Eoz (R5,097/2Eoz) to AISC for 2023 (15% of AISC for 2023 from 11% for 2022) included fleet replacement of underground mining equipment, equipping of critical life of mine ventilation raises at both mines (including fans and a heat exchanger at East Boulder), underground network infrastructure (fibre) and expenditure associated with the smelter rebuild. With many of these capital items completed and some deferred, sustaining capital is forecast to halve in 2024.
The decision to suspend further growth capital at Stillwater East in terms of the August 2022 repositioning plan resulted in project capital expenditure declining by 49% for 2023 to US$42 million (R774 million). Following the completion of the Benbow decline in September 2022, the remaining project capital spent in 2023 was invested to complete the 56 East holing to the Benbow decline, and towards the processing plant upgrade, with the first line of the processing plant successfully commissioned.
Mined 2E PGM sold for 2023 increased by 2% to 425,007 2Eoz, in line with the production increase. The 33% decline in the average 2E PGM basket price for 2023 to US$1,243/2Eoz (R22,890/2Eoz) and higher costs were the main drivers of a 91% decline in adjusted EBITDA from the US PGM mined operations to US$35 million (R710 million).
2E PGM production for H2 2023 of 221,759 2Eoz was 16% higher than for H2 2022 and 8% higher than H1 2023, reflecting the recovery in production from the flooding incident in H2 2022 and the shaft incident at the Stillwater West mine in March 2023. Production from the Stillwater mine (including Stillwater West and Stillwater East) of 139,512 2Eoz for H2 2023, was 19% higher year-on-year, with production of 82,248 2Eoz from East Boulder 11% higher year-on-year. AISC for H2 2023 increased by 8% year-on-year to US$1,992/2Eoz (R37,090/2Eoz) with total operating costs increasing by 20%, reflective of higher production and additional underground support costs, including additional maintenance, which was US$16 million higher, stope mining costs US$7 million higher and surface facilities US$5 million higher, as some of these activities were halted in 2022 due to the flooding event. In addition there was a reversal of US$15 million of the US$25 million 45X IRA credit recognised in H1 2023, (it appears that credit may only be applicable to processing of critical minerals, not mining). ORD expenditure increased by 8% to US$100 million (R1.9 billion) and sustaining capital increased by 61% year-on-year to US$75 million (R1.4 billion) with H2 2022 impacted by the flooding event and for the same reasons as highlighted for the full year.
US PGM recycling operation
The global autocatalyst recycling market remains depressed, mainly as a result of the uncertain global economic outlook, recessionary concerns and higher interest rates, which have inhibited consumer demand for new vehicles resulting in light duty vehicles remaining in service for longer periods before being scrapped. These factors continued to impact receipt and feed rates at the US PGM recycling operation during 2023. Average spent autocatalyst fed by the US recycling operation for 2023 declined by 44% to 10.5 tonnes per day compared with 18.8 tonnes per day for 2022, significantly lower than average rates of around 24 tonnes fed in 2021, with total PGM ounces fed of 310,314 3Eoz, 48% lower year-on-year.
The average 3E PGM basket price for the US PGM recycling operations for 2023 decreased by 24% year-on-year to US$2,334/3Eoz
(R42,981/3Eoz) with adjusted EBITDA declining by 58% to US$33 million (R607 million).
For H2 2023, average autocatalysts feed rates decreased by 32% from 14.9 tonnes per day in H2 2022 to 10.2 tonnes per day in H2 2023 and a further decline from the 10.9 tonnes per day fed in H1 2023. During H2 2023, 1,870 tonnes of recycle material was received and 1,872 tonnes treated. Available inventory declined from 27 tonnes at the end of June 2023 to 25 tonnes at year end.
SA PGM operations
The SA PGM operations delivered another consistent operational performance for 2023 with production of 1,748,430 4Eoz (including attributable production from Mimosa and third-party purchase of concentrate (PoC)) within annual guidance of 1.7 million 4Eoz to 1.8 million 4Eoz. The consolidation of 100% of production from the Kroondal operation from 1 November 2023, following the early closure of the acquisition of Anglo American Platinum’s 50% share in the Kroondal pool-and-share agreement (the Kroondal Transaction), added a further 20,900 4Eoz to total annual production. Third party 4E PGM PoC processed increased by 52% to 96,403 4Eoz as a result of higher contractual deliveries from third parties than assumed for 2023 guidance (60,000 4Eoz).
A 10% increase in surface production to 164,381 4Eoz was primarily due to improved recovery factors coupled with better feed grade which increased year-on-year by 9% and 2% respectively, primarily driven by Rustenburg's recoveries which improved by 16% year-on-year. This assisted in offsetting the decline in underground production from the Kroondal operation, primarily due to the cessation of primary mining from the Simunye shaft during 2022 which reduced attributable production by 16,400 4Eoz year-on-year, the tailing off of production at the Klipfontein opencast operation which is coming to the end of its life and poor ground conditions at the western shafts (Kwezi and K6) and at the Bambanani shaft in the east.
AISC (excluding third party PoC) of R20,054/4Eoz (US$1,089/4Eoz) increased by 4% year-on-year. This is a commendable cost performance given ongoing inflationary pressures and compares favourably against higher unit cost increases reported by industry peers, and is expected to result in the SA PGM operations moving further down the industry cost curve. A significant contributor to the lower AISC in 2023 was by-product credits which increased by 26% to R10.9 billion (US$592 million) and reduced AISC for 2023 by R6,592/4Eoz (US$358/4Eoz). The increase in by-product credits was primarily due to an increased chrome contribution (chrome represented 47% o R10.9 billion (US$592 million) by-product credits for 2023 compared with 40% of R8.6 billion (US$528 million) for 2022), and lower royalties which offset a 20% increase in ORD expenditure. By-product credits have become a significant contributor to industry profitability, particularly due to high chrome prices, and are often overlooked by the market. AISC (including PoC) increased by only 1% to R20,286/4Eoz (US$1,102/4Eoz) primarily due to lower PoC cost as a result of lower PGM prices, despite PoC processed increasing by 52% to 96,403 4Eoz.
Capital expenditure for 2023 increased by 11% year-on-year to R5.6 billion (US$307 million), slightly exceeding guidance of R5.4 billion (US$300 million) with ORD 20% higher at R2.6 billion (US$139 million) primarily due to the ongoing ramp-up of the Marikana K4 project. Sustaining capital was flat year-on-year at R2.1 billion (US$112 million). Project spend increased by 12% from R925 million (US$57 million) for
Sibanye-Stillwater Operating and financial results | Six months and year ended 31 December 2023 10
2022 to R1.0 billion (US$56 million) primarily on the Marikana K4 project and a new chrome extraction plant at Platinum Mile (R125 million (US$7 million).
Chrome sales in 2023 of 2,456kt were marginally lower than for 2022 , due to lower volumes from the Kroondal operation as the Simunye shaft wound down. Chrome revenue of R5.2 billion (US$280 million) for 2023 was 48% higher year-on-year, due to the chrome price received improving by 23% from US$233/tonne in 2022 to US$287/tonne in FY2023 coupled with the exchange rate weakening by 13%.
Despite the commendable cost performance, the 32% lower average 4E PGM basket price of R28,979/4Eoz (US$1,574/4Eoz) for 2023, resulted in adjusted EBITDA declining by 54% to R17.6 billion (US$958 million) year-on-year, with adjusted EBITDA margins declining from 53% to 32%.
For H2 2023, the SA PGM operations produced 920,607 4Eoz (including PoC) and 873,745 4Eoz (excluding PoC) which were both 4% higher year-on-year. This was due to a 23% increase in third party PoC to 46,862 4Eoz and the additional contribution of 20,900 4Eoz from the 100% consolidation of the Kroondal PSA with effect from 1 November 2023. AISC for H2 2023 (excluding PoC) of R20,363/4Eoz (US$20,363/4Eoz), was marginally lower year-on-year, with AISC (including PoC) 4% lower at R20,352/4Eoz (US$1,093/4Eoz). By-product credits increased by 42% to R5.8 billion (US$312 million), primarily driven by higher chrome prices and volumes sold. PoC cost was 29% lower year-on-year at R1.2 billion (US$62 million) due to lower PGM basket prices despite PoC volumes increasing by 23% to 46,862 4Eoz.
Capital expenditure for H2 2023 moderated in response to lower PGM basket prices and tighter control on costs with ORD only 2% higher at R1.2 billion (US$65 million), sustaining capital 3% higher at R1.3 billion (US$68 million) and project capital 15% higher at R597 million (US$32 million) primarily at the Marikana K4 development with R506 million (US$27 million) and R89 million (US$5 million) spent completing the new chrome extraction plant at Platinum Mile.
H2 2023 Chrome sales of 1,371kt were 21% higher than for H2 2022 (1,132kt) due to improved production and an improved product mix. Chrome revenue of R2.9 billion (US$158 million) for H2 2023 was 76% higher year-on-year, mainly due to the chrome price received improving by 26% from US$228/tonne in H2 2022 to US$288/tonne in H2 2023 , coupled with the exchange rate weakening by 7%.
PGM production from the Rustenburg operation for 2023 increased by 5% to 658,417 4Eoz with underground production 4% higher and surface production 12% higher due to a 16% increase in plant recoveries from an improved blend of high and low grade material from the Waterval West Dam and from processing furnace slag. AISC for 2023 declined by 9% to R18,204/4Eoz (US$989/4Eoz) primarily lower due to 38% higher by-product credit, a 65% decline in royalties and marginally lower ORD and sustaining capital expenditure. Bathopele has now re-established production headings beyond the Hex River fault with production improving, whilst Siphumelele which continued to be impacted by seismicity has been repositioned for sustainable levels of production at a lower cost structure.
As highlighted above, the early completion of the Kroondal PSA contributed 20,900 4Eoz to 2023 production from the Kroondal operations. Attributable PGM production declined by 8% in 2023 to 186,252 4Eoz with a concomitant 25% increase in AISC to R19,441/4Eoz (US$1,056/4Eoz), due to the cessation of production from the Simunye shaft within Q4 2022 and Bambanani and Kwezi shafts continuing to encounter geologically challenging ground. In addition the Klipfontein operation is nearing the end of its life. By-product credits from the Kroondal operation were 14% lower due to lower production detailed previously.
PGM production from the Marikana operation for 2023 (excluding PoC) was 2% lower at 660,149 4Eoz with underground production 2% lower and surface production 8% higher, due to higher plant head grade and better recoveries. Marikana surface operation has converted from hydro mining to a hydro/mechanical hybrid method which has led to lower feed densities, better recoveries and improved plant stability. AISC (excluding PoC) of R22,742/4Eoz (US$1,235/4Eoz) was 11% higher primarily due to lower production, and 31% higher ORD expenditure due to the ramp-up of the K4 shaft (K4 shaft ORD costs comprised 49% of ORD expenditure from the Marikana operation (18% in 2022)). In addition sustaining capital at K4 commenced in H1 2023 with R47 million spent in H2 2023. While the K4 shaft project remains in the build-up phase, unit operating costs, ORD and sustaining capital will remain temporarily elevated, but are expected to reduce as production builds up. PoC production increased by 52% year-on-year to 96,403 4Eoz resulting in total PGM production from the Marikana operation (including PoC) increasing by 3% to 756,552 4Eoz. AISC (including PoC) increased by only 4% to R22,907/4Eoz (US$1,244/4Eoz) as a result of the above mentioned factors, moderated by royalties which were 40% lower and by-product credits 25% higher due primarily to higher chrome prices. By-products credits in 2023 reduced AISC by R6,832/4Eoz (US$(371)/4Eoz) for 2023.
Capital expenditure increased by 4% in H2 2023 to R2.1 billion (US$113 million) with project capital at the K4 shaft decreasing by 3% to R506 million (US$27 million) in line with planning parameters.
Two shafts from the Marikana operation, Belt 4 shaft (4B) and the Rowland shaft were subjected to the S189 of the Labour Relations Act restructuring process which concluded on 23 February 2024. In terms of the Section 189 process it has been agreed that the 4B shaft will continue to operate on the condition that there are no net losses on a monthly basis. With the ore reserve nearly depleted and the life of mine scheduled to end in 2024, operations are winding down regardless. The Rowland shaft has been repositioned for sustainable levels of production at a lower cost structure.
Attributable 4E production from Mimosa in 2023 increased by 1% year-on-year to 116,308 4Eoz, with AISC increasing by 15% to US$1,317/4Eoz (R24,255/4Eoz) due mainly to inflationary pressures being experienced in Zimbabwe, in particular electricity costs which rose for exporters by 40% in October 2022 and a further 21% in October 2023, the first two increases experienced since 2014. In addition sustaining capital increased by 9% off an already high base to US$57 million (R1.1 billion) with the ongoing construction of a new tailings storage facility (TSF) which is scheduled to be commissioned in April 2024.
4E PGM production from Platinum Mile in 2023 was 7% higher at 51,801 4Eoz than 2022 due to higher plant recoveries and better feed grade which increased the yield by 7%. At Platinum mile, re-mining of the Waterval West dam has been converted to 100% mechanical from hydro-mining, which has led to not only improved plant stability but also higher recoveries. In 2003, AISC increased by 6% to R11,486/4Eoz (US$624/4Eoz) due to the higher production, despite sustaining capital which increased by 43% to R30 million (US$2 million).
The K4 project
The K4 project remains within schedule and achieved the following milestones:
•Reef tonnes hoisted for H2 2023 of 216,022 tonnes with production of 17,897 4Eoz
Sibanye-Stillwater Operating and financial results | Six months and year ended 31 December 2023 11
•K4 primary development near steady state operational levels with primary waste metres developed in H2 2023 of 4,526 meters and primary reef development of 1,860 meters
•Merensky Ore pass rehabilitation is well advanced and progressing in line with scheduled
•Surface infrastructure for the raise boring of the up cast and down cast ventilation shafts has been established.
•Project capital spent for 2023 of R893 million (US$48million) was consistent with 2022 of R924 million (US$56 million)
* Amounts translated at the average rate of R18.42/US$ for FY2023 and project expenditure to date, R16.37/US$ for FY2022, R17.50/US$ for FY2024 Plan
SA gold operations
The SA gold operations achieved a R7.1 billion (US$412 million) turnaround in adjusted EBITDA year-on-year. This achievement illustrates that relative stability in production and exposure to a higher gold price can drive strong financial results, underlining the important contribution of the SA gold operations. Like-for-like operational comparisons are difficult given the industrial action and lock out and subsequent production build up, which affected 2022 as well as the closure of Beatrix 4 shaft at the end of that year, with the shaft incident at Kloof 4 shaft and fire at Driefontein 5 shaft significantly impacting production for H2 2023.
The build-up of gold production from the SA gold managed operations during H2 2022 following the industrial action and lockout during
H1 2022 impacted 2022 production and unit costs. Normalisation of production was achieved in November 2022 and exposure to a higher gold price drove a significant turnaround from the managed SA gold operations during H1 2023. During Q3 2023 however, the managed SA gold operations suffered two significant incidents which impacted production and led to higher costs than would otherwise have been expected. On 12 July 2023, a fire at Driefontein 5 shaft disrupted operations at both Driefontein 1 and 5 shafts. Driefontein 1 shaft crews resumed production in August and Driefontein 5 shaft at the end of September with normalised production rates achieved during Q4 2023. The Kloof 4 shaft which had been operationally constrained by seismicity and cooling issues, was impacted by a shaft incident on 30 July which led to the closure of the shaft for the remainder of the year and eventual permanent closure. The Kloof section 189 was concluded before the end of the year.
Gold production from the SA gold operations (including DRDGOLD) for 2023 increased by 31% to 25,212kg (810,584oz) year-on-year, with production (excluding DRDGOLD) increasing by 46% to 20,114kg (646,680oz), within revised guidance of 19,500 kg to 20,500 kg (625 koz to 660 koz) following the Kloof 4 shaft incident in mid-2023, with production (including DRDGOLD) increasing by 31% to 25,212kg (810,584oz) year-on-year. Production from DRDGOLD for 2023 declined by 8% year-on-year to 5,098kg (163,904oz) with the yield improving by 14% to 0.24g/t due to last stage clean-up for many sites at East Rand gold operations (ERGO) resulting in lower tonnage but higher grade, compensating for a 19% decline in tonnes milled.
AISC for the SA gold operations (excluding DRDGOLD) decreased by 19% year-on-year to R1,186,846/kg (US$2,005/oz), which was at the lower end of revised guidance of R1,190,000 - R1,290,000/kg (US$2,056 - US$2,230/oz). A 53% increase in gold sold to 20,343kg (654,043oz), offset a 65% increase in ORD expenditure to R2.7 billion (US$146 million) and a 6% increase in sustaining capital expenditure to R1.0 billion (US$56 million). AISC for the SA gold operations (including DRDGOLD) for 2023 decreased by 11% to R1,127,138/kg (US$1,904/oz), primarily due to 35% more gold sold.
Total capital expenditure from the SA gold operations (excluding DRDGOLD) increased by 42% to R5.4 billion (US$293 million) in line with guidance. Capital expenditure on ORD increased by 65% to R2.7 billion (US$146 million) due to a catch up from lower development rates for 2022 to restore operational flexibility with sustaining capital increasing by only 6% reflecting the Kloof 4 shaft incident and the closure of the Beatrix 4 shaft. Project capital at the SA gold operations (including DRDGOLD) increased in 2023 by 94% to R2.6 billion (US$139 million) with project capital invested at the Burnstone project increasing by 62% to R1.5 billion (US$82 million). Project capital at DRDGOLD increased 6 fold to R882 million (US$48 million) with spending on the Phase 1 20MW solar project and related infrastructure at ERGO. Phase 2 is an additional 40MW with battery backup (160MW) estimated to be completed 12 months after Phase 1. Project spending on the Kloof 4 deepening project came to an end due to the Kloof 4 shaft accident, declining by44% to R117 million (US$6 million).
The average rand gold price received in 2023 increased by 21% to R1,146,093/kg (US$1,936/oz), due to depreciation of the rand relative to the US dollar and an 8% higher dollar gold price. With significantly higher production (and gold sold) and lower AISC, this resulted in a significant improvement in profitability of the SA gold operation. Adjusted EBITDA from the SA gold operations (including DRDGOLD) improved from an adjusted EBITDA loss of R3.5 billion (US$219 million) for 2022 to adjusted EBITDA of R3.5 billion (US$193 million), a significant turnaround of R7.1 billion (US$412 million). Given the improved outlook for the gold price and ongoing rand weakness resulting in the spot gold price averaging over R1.2 million/kg year-to-date, together with an expected period of operational stability post the recent restructuring with high costs shafts closed and costs reducing, the outlook for the SA gold operations for 2024 is very positive.
Production for H2 2023 (including DRDGOLD) decreased by 8% to 12,250kg (393,847oz) with production (excluding DRDGOLD) of 9,703kg (311,959oz) 9% lower primarily as a result of the Kloof 4 shaft closure, the Driefontein fire and the closure of the Beatrix 4 shaft in Q4 2022. AISC for H2 2023 increased by 7% to R1,202,225/kg (US$2,008/oz), whilst AISC for the SA gold operations (excluding DRDGOLD) increased by only 5% to R1,273,907/kg (US$2,128/oz), primarily due to lower gold sold.
Production from the Driefontein operation for 2023 increased by 48% to 7,258kg (233,350oz), with AISC declining by 14% to R1,187,292/kg (US$2,005/oz). Underground production for H2 2023 increased by 2% to 3,241kg (104,201oz) year-on-year with 13% lower tonnes milled due to the effects of the fire at 5 Shaft which also impacted 1 shaft, with underground production 17% lower than for H1 2023. The underground yield increased by 17% to 6.15g/tonne due to higher grades at Driefontein 1 shaft where the secondary Ventersdorp contact reef (VCR) is being mined extensively. Surface production of only 59kg (1,897oz) in H2 2023 was 75% lower year-on-year due to the planned depletion of surface resources. AISC in H2 2023 increased by 10% to R1,339,533/kg (US$2,238/oz) year-on-year due to ORD increasing by 29% to R701 million (US$38 million) and sustaining capital increasing by 14% to R300 million (US$16 million).
Production from the Kloof operation for 2023 increased by 51% to 7,433kg (238,976oz), in spite of the loss of around 905kg (29,100 oz) from the Kloof 4 shaft incident. Underground tonnes milled and yield were 41% and 12% higher respectively with yields increasing due to suspension of all Kloof 4 shaft development ore which is low grade. AISC in 2023 decreased by 22% to R1,242,735/kg (US$2,099/oz) due to increased production with gold sold increasing by 63% to 7,708kg (247,818oz). Underground production from the Kloof operation for H2 2023 decreased by 2% to 3,204kg (103,011oz) despite the loss of Kloof 4 production. Surface production at Kloof increased by 5% to 443kg (14,243oz) in H2 2023, despite lower volumes processed, the yield was 51% higher at 0.49g/tonne due to higher grades in the current surface rock dumps. AISC for H2 2023 decreased by 2% to R1,288,535/kg (US$2,152/oz), primarily due to gold sold being 10% higher at 3,646kg (117,222oz). Kloof has continued to fund the high fixed costs of the Kloof 4 shaft until its closure. ORD increased by only 1% in H2 2023 to R441 million (US$24 million) as a result of the curtailment of the Kloof 4 shaft, whilst sustaining capital was 20% lower at R242 million (US$13 million).
Sibanye-Stillwater Operating and financial results | Six months and year ended 31 December 2023 12
Production from the Beatrix operation increased by 45% to 4,237kg (136,223oz) year-on-year, with 2023 more stable than 2022. The increase in production followed the closure of the Beatrix 4 shaft in December 2022 which historically accounted for around 20% of Beatrix's production and recovery from industrial action. Gold sold increased by 49% to 4,192kg (134,776oz). As a result of higher gold sold, AISC declined by 30% in 2023 to R1,100,668/kg (US$1,859/oz), the lowest of the SA managed operations despite ORD increasing by 50% to R324 million (US$18 million). Sustaining capital reduced by 26% to R114 million (US$6 million). AISC for H2 2023 declined by 1% year-on-year to R1,162,644/kg (US$1,942/oz) with total operating costs declining by 26% to R1.9 billion (US$104 million) primarily as a result of the closure of the high cost Beatrix 4 shaft with ORD and sustaining capital declining by 16% and 17% respectively.
Surface gold production from the Cooke operation in 2023 increased by 17% in 2023 to 1,186kg (38,131oz) mainly due to a 12% increase in yield. Despite gold sold increasing by 25% to 1,219kg (39,192oz), AISC increased by 23% to R1,117,309/kg (US$1,887/oz) on the back of above inflation increases in costs and higher aggregate purchase costs of third party gold bearing material, where the purchase price is linked to the gold price. Surface gold production for H2 2023 decreased by 6% year-on-year to 618kg (19,869oz) with AISC increasing by 36% to R1,183,775/kg (US$1,977/oz)
DRDGOLD production declined by 8% for 2023 to 5,098kg (163,904oz) with a 14% increase in yield offsetting a 19% decline in tonnes milled to 21.4Mt as major reclamation sites at ERGO and Far West Gold Recoveries (FWGR) came to the end of their lives. Delays were also experienced in obtaining water usage licences from the Department of Water and Sanitation and community related issues to commission major replacement sites at ERGO. The increase in yield is associated with higher grade remnant material that is typically encountered during the final stage of reclamation and clean up, and the reclamation of high grade sand at ERGO in H1 2023. Lower tonnes milled coupled with inflationary increase in key consumables and higher electricity and diesel costs, increase in key consumables and electricity at FWGR, plus increased security costs and additional contractor and machine hire costs to enable the reclamation of final remnant material resulted in operating costs per tonne increasing by 35% to R192/tonne (US$10/tonne). This increase in operating costs combined with the industry wide inflationary effects and the decrease in gold sold resulted in higher AISC of R888,321/kg (US$1,500/oz), 10% higher year-on- year. Sustaining capital in 2023 was also 33% lower at R432 million (US$23 million) reflecting the tailing off of the investment in new infrastructure for the development of major reclamation sites at both the ERGO and FWGR operations. DRDGOLD project capital also increased by 611% in 2023 to R882 million (US$48 million) mainly as a result of the solar power plant expected to be commissioned by the end of March 2024 and the battery storage system by the end of October 2024. In H2 2023 gold production was 7% lower year-on-year at 2,547kg (81,888oz) with AISC increasing by 17% to R938,856/kg (US$1,568/oz) year-on-year due to 8% less gold sold.
The Burnstone project
The Burnstone project progressed well during H2 2023. Due to the redesign requirements on the waste conveyor, the rock handling system was approached in two phases. Phase 1 which includes the underground ore handling, shaft hoisting and truck loading on surface infrastructure was completed, and the project is now able to hoist by using Tip 1 on 40 level.
•The surface rail yard is nearing completion with 95% of the surface area having been concreted
•The surface change houses and the office building civil works have been completed and the steel structures are being erected
•40-level workshops have shown substantial progress following delays experienced with support work
The Burnstone project is now 65% complete. Project capital spent at Burnstone in 2023 was R1.5 billion (US$82 million) in line with guidance, with R698 million (US$37 million) spent in H2 2023.
Consistent with the requirements of the Group’s capital allocation framework, the Burnstone project (included in the SA gold corporate and reconciling items reportable segment) will be deferred.
European region
Sandouville nickel refinery
The acquisition of the Sandouville nickel refinery in Le Havre, France was concluded on 4 February 2022, so comparing 2022 with 2023 should be seen in this context. Although production at Sandouville for 2023 improved slightly due to better plant utilisation and higher nickel recoveries, excessive downtime due to higher than expected maintenance continues to impact production leading to higher than expected operating costs and elevated sustaining capital costs.
Total nickel production from the Sandouville nickel refinery of 7,125 tonnes for 2023 was within guidance of 7kt to 7.5 kt, with total nickel production increasing relative to H2 2022 and H1 2023, due to improved plant stability achieved during H2 2023, despite being constrained by heavy rainfall which affected the wastewater treatment, resulting in the loss of approximately 44 production days. Total nickel production included 1,411 tonnes of nickel salts and 5,714 tonnes of nickel metal. This was as a result of prioritising nickel metal production over nickel salts due to weaker plating markets. Premiums on spot cathode sales were adversely impacted by an oversupply of nickel cathode. Nickel equivalent AISC for 2023 of US$35,474/tNi (R653,246/tNi) was slightly below guidance of US$36,513-37,469/tNi (€33,715-34,588/tNi). AISC in 2023 was impacted by increased operating costs of US$235 million (R4,329 billion) due to higher costs relating to plant maintenance, and an increase in variable costs (reagents, energy including electricity and gas), and higher sustaining capital which increased by 145% to US$13 million (R248 million). Total nickel sold in 2023 of 6,855 tonnes (including salts and metal) was in line with 2022. As a result of higher costs and unfavourable raw material inventory valuation adjustments caused by constant declines in the nickel price, the adjusted EBITDA loss of US$72 million (R1.3 billion) was significantly higher than the 2022 loss of US$30 (R492 million),
During the study to repurpose the nickel refinery to produce nickel sulphate (NiSO4), the Group identified an alternative option and has assessed the potential of producing precursor cathode active material (pCAM). A scoping study on the viability of producing pCAM at the Sandouville plant was conducted between November 2023 and January 2024 and the results are encouraging, both with regards to the market and the production costs that could be achieved as a brownfield project. A pre-feasibility study will commence during March 2024. Further announcements will be made on this as soon as various stages of the study are completed. To optimize the use of resources, the project that has been referred to as "battery recycling" is now a side stream of the pCAM project, looking into the possibility of using black mass produced by battery recyclers as feedstock.
Sibanye-Stillwater also completed a pre-feasibility study on PGM autocatalysts recycling using European feedstocks. It was concluded that the project was not viable due to unfavourable evolution of market conditions in Europe and it has been stopped.
Keliber lithium project
Sibanye-Stillwater Operating and financial results | Six months and year ended 31 December 2023 13
Construction activities of the Keliber lithium refinery in Kokkola, Finland have continued successfully after the start of construction in March 2023. Similarly, the earthworks and selected infrastructure works commenced at the Päiväneva concentrator site in late 2023.
The mining permit for the Rapasaari mine became legally valid in December 2023 as the Vaasa Administrative Court rejected the appeal lodged against the permit.
On 23 February 2024, the Vaasa Administrative Court (Court) issued a ruling on three appeals, including Sibanye-Stillwater’s appeal of certain emission-related permit conditions in connection with the environmental permit for the Rapasaari mine and the Päiväneva concentrator issued in December 2022 (Environmental Permit).
The Court upheld and partially amended the Environmental Permit as requested by Sibanye-Stillwater, while referring certain permit conditions back to the Permitting Authority (Regional State Administrative Agency for Western and Inland Finland) for further review. These conditions pertain to the placement of Rapasaari mine’s waste rock and certain waste fractions from the concentrator, the aftercare plan for the extractive waste areas and the associated financial guarantees.
As the Environmental Permit was otherwise affirmed, the permit remains in effect despite the Court’s ruling, allowing the construction work at the Päiväneva concentrator to continue in all material respects in accordance with existing plans. Sibanye-Stillwater expects concentrator operations to commence as planned, subject to Permitting Authority review and issuance of enforceable permit decisions.
The full impact of the Court’s ruling on the Rapasaari mine related permit conditions has not yet been determined. Based on preliminary analyses, Sibanye-Stillwater expects the process to obtain the required permit decision from the Permitting Authority will delay commencement of the Rapasaari mine operations. Sibanye-Stillwater is in the process of assessing the overall impact, if any, to timing of the Sibanye-Stillwater’s Keliber Lithium Project.
The Lithium refinery in Kokkola and the Syväjärvi mine are not affected by the ruling of the Court.
Keliber recorded one lost time injury during H2 2023. Full year safety performance was 7.9 (per million working hours).
Key developments in H2 2023
•Decision on 6 October 2023 to commence the second phase of the Keliber lithium project which includes the construction of the concentrator in Päiväneva and the development of the Syväjärvi open pit mine. Delivery of ore from the Syväjärvi open pit mine will be timed to coincide with the commissioning of the concentrator. Subsequently, the earthworks and selected infrastructure works have commenced at the Päiväneva concentrator site in late 2023
•Construction activities of the Keliber lithium refinery in Kokkola, Finland have continued successfully after the start in March 2023. The main plant facility steel structure and cladding are ready, and equipment installations have started
•Recruitments for key managerial and white-collar positions proceeded – end of Q4 2023 employee headcount reached 70 people. Production operators onboarding to start with support from the local educational institutes and key systems suppliers
•Exploration drilling progressed well with a total of 69 holes and 13,894 meters drilled at the key exploration target areas during H2 2023 with continued promising results
•Project capital expenditure estimate for the project updated to €656 million (R13,7 billion) (previously €588 million (R12,3 billion) on the back of amended water treatment technology to ensure compliance with more stringent effluent water quality conditions, and to increase lithium refinery recovery*
•Capital expenditure for 2023 was €124 million (R2.5 billion) versus revised guidance of €130 million (R2.3 billion). Capital expenditure in H2 2023 was €59 million (R1.2 billion). Project to date expenditure is €144 million (R2,871 billion)*
* Amounts are translated at the translated at the average rate of R19.94/€ for FY2023 and project expenditure to date, R20.20/€ for H2 2023 and a spot rate at 28 February 2024 of R20.88/€ for project capital expenditure estimated for the project
Australian region
Century zinc tailings retreatment operation
Sibanye-Stillwater acquired control of New Century Resources Limited from 22 February 2023, enhancing the Group's exposure to tailings
retreatment. The integration of New Century into Sibanye-Stillwater is progressing well.
The Century zinc tailings retreatment operation (Century operation) produced 76 kilotonnes (kt) of payable zinc metal at an AISC of US$1,975/tZn (R36,361/tZn) for 2023. Production was severely impacted by adverse weather conditions in March 2023 which resulted in flooding of the operation and the suspension of hydro mining for approximately three weeks. A return to normalised levels of production was achieved in mid-April 2023. Total capital expenditure from the Century operation of US$9 million (R165 million) included US$6 million (R114 million) of sustaining capital expenditure and US$3 million (R51 million) of growth projects. The Century operation adjusted EBITDA loss for the year was US$15 million (R285 million). However, with the average equivalent zinc concentrate price rising by 8% from H1 2023 to H2 2023, payable zinc metal produced increasing from 24kt to 51kt and AISC 27% lower to US$1,766/tZn (R32,878/tZn), the Century operation delivered a significantly improved financial result in H2 2023, with adjusted EBITDA improving from an adjusted EBITDA loss of US$28 million (R502 million) for H1 2023 to a positive adjusted EBITDA of US$13 million (R217 million) for H2 2023.
Mt Lyell copper project
During H2 2023, the Group acquired 100% of the Mt Lyell Copper Project (a previously operated copper mine) located in Tasmania, Australia. In H2 2023, US$5 million (R85 million) was expensed and an additional US$14 million (R268 million) was capitalised in recognition of the acquisition consideration and transaction costs. The Mt Lyell feasibility study (AACE Class 3 Estimate) is expected to be completed in H1 2024.
* Amounts are translated at the translated at the average rate of R12.17/A$ and R18.62/US$ for H2 2023
Sibanye-Stillwater Operating and financial results | Six months and year ended 31 December 2023 14
FINANCIAL REVIEW OF THE SIBANYE-STILLWATER GROUP
For the six months ended 31 December 2023 (H2 2023) compared with the six months ended 31 December 2022 (H2 2022)
The reporting currency for the Group is the SA rand (rand) and the functional currency of the US PGM operations is the US dollar (US$). Direct comparability of the Group results between the two periods is distorted as the results of the US PGM operations are translated to rand at the average exchange rate, which for H2 2023 was R/US$18.62 or 7% weaker than for H2 2022 (R/US$17.33). The functional currency of the European region, comprising of the Sandouville nickel refinery and the Keliber lithium project, is the euro(€) and the results of Sandouville refinery were translated to rand at the average exchange rate, which for H2 2023 was R/€20.20 or 15% weaker than for H2 2022 (R/€17.57). Keliber is a project in development phase and project development expenses are capitalised in accordance with the Group’s accounting policies to property, plant and equipment. The functional currency of the Australian region comprising the Century zinc retreatment operation and the Mt Lyell copper mine project, is the Australian dollar(A$) and the results of the Century zinc retreatment operation were translated to rand at the average exchange rate, which for H2 2023 was R12.17/A$. Mt Lyell, a previously operated underground copper mine was put on care and maintenance in 2014 and a feasibility study, which considers the re-establishment of this operation, is currently underway.
Group financial performance
Group revenue for H2 2023 decreased by 22% to R53,116 million (US$2,846 million) mainly due to lower average US dollar PGM basket prices received at the SA PGM operations, US PGM operations (underground and recycled) and European region (Sandouville nickel refinery), and lower sales volumes at the SA gold operations, partially offset by higher prices received at the SA gold operations. Group cost of sales, before amortisation and depreciation decreased by 6% to R44,818 million (US$2,405 million) mainly due to the lower delivered spent autocatalyst volumes at the US PGM recycling, partially offset by higher sales volumes at the US PGM operations, SA PGM operations and Sandouville nickel refinery. In addition, the SA gold, SA PGM and US PGM underground operations experienced above inflation cost increases. The decrease in revenue caused Group adjusted EBITDA for H2 2023 to decrease by 65% or R12,141 million (US$705 million) to R6,409 million (US$340 million). The 7% weaker rand relative to the US dollar partially offset the effect of the lower average basket price at both the SA and US PGM operations. Group amortisation and depreciation increased by 37% to R5,281 million (US$284 million) due to increased capital expenditure and higher production at the SA PGM and US PGM underground operations which were also impacted by the 7% weaker rand.
The revenue, cost of sales, before amortisation and depreciation, net other cash costs, adjusted EBITDA and amortisation and depreciation are set out in the tables below:
| Figures in million - SA rand | |||||||||||||||||||||||||||||||||||||||||||||||
| Revenue | Cost of sales, before amortisation and depreciation | (Loss)/profit for the period | Adjusted EBITDA | Amortisation and depreciation | |||||||||||||||||||||||||||||||||||||||||||
| H2 2023 | H2 2022 | % Change | H2 2023 | H2 2022 | % Change | H2 2023 | H2 2022 | % Change | H2 2023 | H2 2022 | % Change | H2 2023 | H2 2022 | % Change | |||||||||||||||||||||||||||||||||
| SA PGM operations | 25,243 | 33,406 | (24) | (18,566) | (15,499) | 20 | 4,119 | 7,821 | (47) | 5,826 | 16,983 | (66) | (1,606) | (1,256) | 28 | ||||||||||||||||||||||||||||||||
| Total US PGM operations | 10,903 | 21,960 | (50) | (10,904) | (18,892) | (42) | (36,771) | 946 | (3987) | (30) | 2,985 | (101) | (1,837) | (1,379) | 33 | ||||||||||||||||||||||||||||||||
| US PGM underground operations | 5,277 | 6,011 | (12) | (5,514) | (3,619) | 52 | — | — | — | (266) | 2,309 | (112) | (1,835) | (1,377) | 33 | ||||||||||||||||||||||||||||||||
| US PGM Recycling | 5,626 | 15,949 | (65) | (5,390) | (15,273) | (65) | — | — | — | 236 | 676 | (65) | (2) | (2) | — | ||||||||||||||||||||||||||||||||
| Managed SA gold operations | 10,908 | 9,207 | 18 | (9,791) | (9,677) | 1 | (3,914) | (1,504) | 160 | 345 | (1,134) | (130) | (1,129) | (1,052) | 7 | ||||||||||||||||||||||||||||||||
| DRDGOLD | 2,974 | 2,654 | 12 | (2,152) | (1,938) | 11 | 615 | 554 | 11 | 803 | 694 | 16 | (110) | (79) | 39 | ||||||||||||||||||||||||||||||||
| European region | 1,347 | 967 | 39 | (2,000) | (1,506) | 33 | (4,612) | (666) | 592 | (796) | (638) | 25 | (109) | (97) | 12 | ||||||||||||||||||||||||||||||||
| Australian region | 1,745 | — | 100 | (1,405) | — | 100 | (4,175) | — | 100 | 216 | — | 100 | (490) | — | 100 | ||||||||||||||||||||||||||||||||
Group corporate1 | (4) | (285) | 99 | — | — | — | (478) | (512) | (7) | 45 | (340) | 113 | — | — | — | ||||||||||||||||||||||||||||||||
| Total Group | 53,116 | 67,909 | (22) | (44,818) | (47,512) | (6) | (45,216) | 6,639 | (781) | 6,409 | 18,550 | (65) | (5,281) | (3,863) | 37 | ||||||||||||||||||||||||||||||||
Figures in million - US dollars2 | |||||||||||||||||||||||||||||||||||||||||||||||
| Revenue | Cost of sales, before amortisation and depreciation | (Loss)/profit for the period | Adjusted EBITDA | Amortisation and depreciation | |||||||||||||||||||||||||||||||||||||||||||
| H2 2023 | H2 2022 | % Change | H2 2023 | H2 2022 | % Change | H2 2023 | H2 2022 | % Change | H2 2023 | H2 2022 | % Change | H2 2023 | H2 2022 | % Change | |||||||||||||||||||||||||||||||||
| SA PGM operations | 1,352 | 1,893 | (29) | (997) | (881) | 13 | 215 | 427 | (50) | 309 | 956 | (68) | (86) | (72) | 19 | ||||||||||||||||||||||||||||||||
| Total US PGM operations | 584 | 1,248 | (53) | (587) | (1,079) | (46) | (1,995) | 49 | (4171) | (5) | 164 | (103) | (99) | (79) | 25 | ||||||||||||||||||||||||||||||||
| US PGM underground operations | 283 | 337 | (16) | (299) | (207) | 44 | — | — | — | (18) | 125 | (114) | (99) | (79) | 25 | ||||||||||||||||||||||||||||||||
| US PGM Recycling | 301 | 911 | (67) | (288) | (872) | (67) | — | — | — | 13 | 39 | (67) | — | — | — | ||||||||||||||||||||||||||||||||
| Managed SA gold operations | 585 | 550 | 6 | (524) | (566) | (7) | (209) | (79) | 165 | 19 | (56) | (134) | (61) | (63) | (3) | ||||||||||||||||||||||||||||||||
| DRDGOLD | 160 | 152 | 5 | (115) | (111) | 4 | 34 | 31 | 10 | 44 | 39 | 13 | (6) | (5) | 20 | ||||||||||||||||||||||||||||||||
| European region | 72 | 51 | 41 | (107) | (84) | 27 | (251) | (41) | 512�� | (42) | (39) | 8 | (6) | (5) | 20 | ||||||||||||||||||||||||||||||||
| Australian region | 94 | — | 100 | (75) | — | 100 | (225) | — | 100 | 13 | — | 100 | (26) | — | 100 | ||||||||||||||||||||||||||||||||
Group corporate1 | (1) | (16) | 94 | — | — | — | (28) | (28) | — | 2 | (19) | 111 | — | — | — | ||||||||||||||||||||||||||||||||
| Total Group | 2,846 | 3,878 | (27) | (2,405) | (2,721) | (12) | (2,459) | 359 | (785) | 340 | 1,045 | (67) | (284) | (224) | 27 | ||||||||||||||||||||||||||||||||
1 The effect of the streaming transaction has been included under Group Corporate. Please refer to note 18.2 of the condensed consolidated financial statements
2 Convenience translations have been applied to convert the rand Income Statement amounts into US dollars using a foreign exchange rate of R18.62 for H2 2023 and 17.33 for H2 2022
Revenue
Revenue from the SA PGM operations decreased by 24% to R25,243 million (US$1,352 million) due to a 22% lower average rand 4E basket price of R24,276/4Eoz (US$1,304/4Eoz), partially offset by a 11% or 85,255 4Eoz increase in PGMs sold and a 23% increase in the sale of third-party purchase of concentrate (PoC) ounces. The increase in 4Eoz sold was a consequence of higher production volumes.
At the US PGM underground operations revenue decreased by 16% to US$283 million (R5,277 million), mainly due to a 36% decrease in the average 2E basket price to US$1,124, partially offset by the 7% weaker rand and a 30% increase in ounces sold, which correlated with the higher production achieved. The rand average 2E basket price decreased by 32% to R20,928/2Eoz, combined with the higher sales volumes resulted in a 12% decrease in rand revenue to R5,277 million. Revenue from the US PGM recycling operation decreased by 67% from US$911 million (R15,949
Sibanye-Stillwater Operating and financial results | Six months and year ended 31 December 2023 15
million) to US$301 million (R5,626 million) due to a 41% lower average realised basket price of US$1,939/3Eoz and a 45% decrease in recycled ounces sold. The 7% weaker rand translated into a 65% decrease in recycling revenue to R5,626 million.
Revenue from the managed SA gold operations increased by 18% to R10,908 million (US$585 million) mainly due to a 23% higher rand gold price of R1,169,597/kg (US$1,954/oz), partially offset by lower volumes. Revenue from DRDGOLD increased by 12% to R2,974 million (US$160 million) due to a 22% higher rand gold price received of R1,173,176/kg (US$1,960/oz), partially offset by 7% lower sales volumes.
At the European region, revenue from the Sandouville nickel refinery increased by 39% to R1,347 million (US$72 million), mainly due to a 52% increase in total nickel sold partially offset by a 8% lower nickel equivalent basket price of R392,420/tNi (US$21,075/tNi).
At the Australian region, for the six months ended 31 December 2023 the Century zinc retreatment operation sold 50 kilotonnes of zinc metal (payable) in concentrate at an average equivalent zinc concentrate price of R32,878/zinc tonne (ztn) (US$1,766/ztn), generating revenue of R1,745 million (US$94 million).
Cost of sales, before amortisation and depreciation
Cost of sales, before amortisation and depreciation at the SA PGM operations increased by 20% to R18,566 million (US$997 million) mainly due to above inflation cost increases on electricity, imported spares, explosives and fuel and an increase in sales volumes. Underground 4E PGM mined production increased by 2% to 724,667 4Eoz and surface production volumes excluding third-party PoC were16% higher at 90,112 4Eoz. Third-party PoC at the Marikana smelting and refining operations increased by 23% to 46,862 4Eoz. PoC material is purchased at a higher cost, than own mined ore, due to the direct correlation to the basket price of PGM’s.
Cost of sales, before amortisation and depreciation at the US PGM underground operations increased by 44% to US$299 million (R5,514 million) due to the increase in sales volumes, above inflation increases in costs, mainly impacting maintenance, propane and diesel, a US$51 million (R950 million) write-down of inventory to net realisable value and higher underground support, stope mining and surface facilities costs. Sales volumes increased by 30% to 234,370 2Eoz due a build-up of inventory at the smelter and refinery during H2 2022, with production volumes increasing by 16% to 221,759 2Eoz, following the regional floods during June 2022 that impacted both production and sales for H2 2022. During H2 2023 production at the Stillwater operation was impacted by lower grades, paste plant delays and production stoppages, where at East Boulder production was mainly impacted by power interruptions, mine face availability and equipment availability. Cost of sales, before amortisation and depreciation at the US PGM recycling operation decreased, in line with revenue, by 67% from US$872 million (R15,273 million) to US$288 million (R5,390 million) due to the industry wide global slowdown of autocatalyst recycling market which started in the second quarter of 2022 and which continued to affect receipt rates of spent autocatalysts at the recycle operations.
Cost of sales, before amortisation and depreciation at the managed SA gold operations increased marginally by 1% to R9,791 million (US$524 million) due to above average inflationary increases in electricity, explosives and support consumables costs and higher fissure water pumping costs, maintenance and safety costs to minimise the impact of production stoppages, partially offset by 9% or 905kg lower production. Cost of sales, before amortisation and depreciation from DRDGOLD increased by 11% to R2,152 million (US$115 million) due to above inflationary cost increases in machine hire, contractor reclamation costs and electricity.
Cost of sales, before amortisation and depreciation at the Sandouville nickel refinery increased by 33% to R2,000 million (US$107 million) mainly due to higher fixed costs, maintenance costs and unfavourable raw material inventory valuation adjustment caused by lower market prices. Production was 60% higher at the Sandouville nickel refinery mainly due to better plant stability achieved during H2 2023 but constrained by heavy rainfall which affected the wastewater treatment, resulting in the loss of approximately 44 production days.
At the Australian region, the Century zinc retreatment operation produced 51 kilotonnes of zinc metal (payable) at an all-in sustaining cost of R32,746/zinc tonne (ztn) (US$1,759/ztn), contributing R1,405 million (US$75 million) to cost of sales.
Loss for the period
Profit for H2 2022 decreased by 781% from R6,639 million (US$359 million) to a net loss of R45,216 million (US$2,459 million) mainly due to a combination of lower revenue and higher cost of sales as discussed above. The loss for H2 2023 was further compounded by total impairments of R47,445 million (US$2,576 million) recognised for the US PGM underground operation, SA Gold's Kloof operation and Burnstone project, Sandouville nickel refinery, Century zinc retreatment operation and Mimosa equity accounted investment, including an equity accounted loss from Mimosa following the impairment of property, plant and equipment at the entity level and higher other costs of R1,865 million (US$89 million), partially offset by lower loss on financial instruments of R3,744 million (US$228 million) and higher other income of R463 million (US$26 million) as discussed in the sections below.
Adjusted EBITDA
Adjusted EBITDA includes other cash costs, care and maintenance costs; lease payments; strike costs and corporate social investment costs (see note 11.1 of the condensed consolidated financial statements for a reconciliation of profit before royalties, carbon tax and tax to adjusted EBITDA). Care and maintenance costs for H2 2023 were R445 million (US$24 million) at Cooke (H2 2022: R380 million or US$22 million), R36 million (US$2 million) at Beatrix (H2 2022: R2 million or US$0 million), R46 million (US$2 million) at Kloof (H2 2022: R0 million or US$0 million), R0 million (US$0 million) at DRDGOLD (H2 2022: R1 million or US$0 million), R59 million (US$3 million) at Marikana (H2 2022: R48 million or US$3 million), R2 million (US$0 million) at Rustenburg (H2 2022: R0 million or US$0 million) and R6 million (US$0 million) at Kroondal (H2 2022: R6 million or US$0 million). Lease payments of R140 million (US$8 million) (H2 2022: R74 million or US$4 million) are included in line with the debt covenant formula and corporate social investment costs were R86 million (US$5 million) (H2 2022: R77 million (US$4 million).
Adjusted EBITDA at the SA PGM, US PGM underground and US PGM recycling operations, decreased due to the lower average PGM basket prices received and a decrease in sales volumes at the US PGM recycling operations. Adjusted EBITDA at the SA gold operations increased due to a higher average gold price, partially offset by lower production and sales volumes during H2 2023. The Sandouville nickel refinery realised a higher adjusted EBITDA loss compared to H2 2022, mainly due to higher net other cash costs and a lower rand nickel equivalent average basket price, partially offset by higher sales and production volumes. The Century zinc retreatment operation generated an adjusted EBITDA of R217 million (US$13 million).
Sibanye-Stillwater Operating and financial results | Six months and year ended 31 December 2023 16
The (Loss)/profit and Adjusted EBITDA are shown in the graphs below:
The (Loss)/profit in the graph above includes the impairments recognised during the H2 2023 period, which are discussed under the Non-recurring items section further below.
Sibanye-Stillwater Operating and financial results | Six months and year ended 31 December 2023 17
The below table illustrates the reconciliation of profit before royalties, carbon tax and tax to adjusted EBITDA:
| Six months ended 31 December 2023 | ||||||||||||||||||||||||||||||||||||||
| Figures in million – SA rand | Group | Total US PGM | Under- ground | Recycling | Total SA PGM | Total SA gold1 | DRD- GOLD | Total EU operations | Sandouville nickel refinery | Total AUS operations | Century zinc retreatment operation | Group corporate | ||||||||||||||||||||||||||
| (Loss)/profit before royalties, carbon tax and tax | (49,977) | (43,565) | (43,799) | 234 | 5,535 | (2,798) | 808 | (4,608) | (4,254) | (4,095) | (4,059) | (446) | ||||||||||||||||||||||||||
| Adjusted for: | ||||||||||||||||||||||||||||||||||||||
| Amortisation and depreciation | 5,281 | 1,837 | 1,835 | 2 | 1,606 | 1,239 | 110 | 109 | 105 | 490 | 490 | — | ||||||||||||||||||||||||||
| Interest income | (651) | (100) | (100) | — | (199) | (295) | (146) | (52) | — | (2) | (1) | (3) | ||||||||||||||||||||||||||
| Finance expense | 1,615 | 603 | 603 | — | 305 | 457 | 35 | 48 | 8 | 64 | 38 | 138 | ||||||||||||||||||||||||||
| Share-based payments | 70 | 27 | 27 | — | 16 | 33 | 13 | (11) | 3 | — | — | 5 | ||||||||||||||||||||||||||
| Loss/(gain) on financial instruments | 136 | 2,136 | 2,136 | — | (2,458) | 97 | (8) | 248 | (34) | 114 | 113 | (1) | ||||||||||||||||||||||||||
| (Gain)/loss on foreign exchange movements | (123) | 3 | 3 | — | (100) | (41) | 2 | 11 | 11 | 20 | 9 | (16) | ||||||||||||||||||||||||||
| Share of results of equity-accounted investees after tax | 1,437 | — | — | — | 1,585 | (154) | — | — | — | — | — | 6 | ||||||||||||||||||||||||||
| Change in estimate of environmental rehabilitation obligation, and right of recovery liability and asset | (45) | — | — | — | (45) | — | — | — | — | — | — | — | ||||||||||||||||||||||||||
| (Gain)/loss on disposal of property, plant and equipment | (31) | 46 | 46 | — | (33) | (44) | — | — | — | — | — | — | ||||||||||||||||||||||||||
| Impairments | 47,445 | 38,919 | 38,919 | — | 505 | 2,731 | — | 1,607 | 1,607 | 3,683 | 3,683 | — | ||||||||||||||||||||||||||
| Gain on acquisition | (898) | — | — | — | (898) | — | — | — | — | — | — | — | ||||||||||||||||||||||||||
| Occupational healthcare gain | (357) | — | — | — | — | (357) | — | — | — | — | — | — | ||||||||||||||||||||||||||
| Restructuring costs | 689 | 41 | 41 | — | 336 | 312 | — | — | — | — | — | — | ||||||||||||||||||||||||||
| Transaction costs | 394 | 29 | 29 | — | — | — | — | — | — | — | — | 365 | ||||||||||||||||||||||||||
| Onerous contract provision | 1,865 | — | — | — | — | — | — | 1,865 | 1,865 | — | — | — | ||||||||||||||||||||||||||
| Gain on increase in equity-accounted investment | (3) | — | — | — | — | — | — | — | — | — | — | (3) | ||||||||||||||||||||||||||
| Gain on remeasurement of previous interest in Kroondal | (298) | — | — | — | (298) | — | — | — | — | — | — | — | ||||||||||||||||||||||||||
| Lease payments | (140) | (6) | (6) | — | (31) | (32) | (11) | (13) | (12) | (58) | (56) | — | ||||||||||||||||||||||||||
| Adjusted EBITDA | 6,409 | (30) | (266) | 236 | 5,826 | 1,148 | 803 | (796) | (701) | 216 | 217 | 45 | ||||||||||||||||||||||||||
| Six months ended 31 December 2022 | ||||||||||||||||||||||||||||||||||||||
| Figures in million – SA rand | Total | Total US PGM | Under- ground | Recycling | Total SA PGM | Total SA gold1 | DRD- GOLD | Total EU operations | Sandouville nickel refinery | Group corporate | ||||||||||||||||||||||||||||
| Profit/(loss) before royalties, carbon tax and tax | 10,800 | 1,062 | 319 | 743 | 12,906 | (2,033) | 739 | (627) | (607) | (508) | ||||||||||||||||||||||||||||
| Adjusted for: | ||||||||||||||||||||||||||||||||||||||
| Amortisation and depreciation | 3,863 | 1,379 | 1,377 | 2 | 1,256 | 1,131 | 79 | 97 | 92 | — | ||||||||||||||||||||||||||||
| Interest income | (614) | (143) | (74) | (69) | (207) | (264) | (155) | — | — | — | ||||||||||||||||||||||||||||
| Finance expense | 1,378 | 507 | 507 | — | 329 | 362 | 34 | 8 | 6 | 172 | ||||||||||||||||||||||||||||
| Share-based payments | 106 | 17 | 17 | — | 34 | 53 | 10 | — | — | 2 | ||||||||||||||||||||||||||||
| Loss/(gain) on financial instruments | 3,880 | 149 | 149 | — | 3,137 | 723 | — | (122) | (1) | (7) | ||||||||||||||||||||||||||||
| (Gain)/loss on foreign exchange movements | (476) | 10 | 10 | — | (58) | (395) | (3) | 8 | (42) | (41) | ||||||||||||||||||||||||||||
| Share of results of equity-accounted investees after tax | (517) | — | — | — | (401) | (123) | — | — | — | 7 | ||||||||||||||||||||||||||||
| Change in estimate of environmental rehabilitation obligation, and right of recovery liability and asset | (71) | — | — | — | (125) | 54 | — | — | — | — | ||||||||||||||||||||||||||||
| (Gain)/loss on disposal of property, plant and equipment | (68) | 1 | 1 | — | (29) | (40) | — | — | — | — | ||||||||||||||||||||||||||||
| Reversal of impairments | (6) | — | — | — | (6) | — | — | — | — | — | ||||||||||||||||||||||||||||
| Occupational healthcare gain | (186) | — | — | — | — | (186) | — | — | — | — | ||||||||||||||||||||||||||||
| Restructuring costs | 327 | — | — | — | 7 | 320 | — | — | — | — | ||||||||||||||||||||||||||||
| Transaction costs | 44 | 7 | 7 | — | 3 | (1) | — | — | — | 35 | ||||||||||||||||||||||||||||
| Loss on deconsolidation of subsidiary | 309 | — | — | — | 309 | — | — | — | — | — | ||||||||||||||||||||||||||||
| Profit on sale of Lonmin Canada | (145) | — | — | — | (145) | — | — | — | — | — | ||||||||||||||||||||||||||||
| Lease payments | (74) | (4) | (4) | — | (27) | (41) | (10) | (2) | (1) | — | ||||||||||||||||||||||||||||
| Adjusted EBITDA | 18,550 | 2,985 | 2,309 | 676 | 16,983 | (440) | 694 | (638) | (553) | (340) | ||||||||||||||||||||||||||||
Sibanye-Stillwater Operating and financial results | Six months and year ended 31 December 2023 18
| Six months ended 31 December 2023 | ||||||||||||||||||||||||||||||||||||||
| Figures in million – US dollar | Group | Total US PGM | Under- ground | Recycling | Total SA PGM | Total SA gold1 | DRD- GOLD | Total EU operations | Sandouville nickel refinery | Total AUS operations | Century zinc retreatment operation | Group corporate | ||||||||||||||||||||||||||
| (Loss)/profit before royalties, carbon tax and tax | (2,720) | (2,365) | (2,378) | 13 | 291 | (148) | 45 | (251) | (232) | (221) | (219) | (26) | ||||||||||||||||||||||||||
| Adjusted for: | ||||||||||||||||||||||||||||||||||||||
| Amortisation and depreciation | 284 | 99 | 99 | — | 86 | 67 | 6 | 6 | 6 | 26 | 26 | — | ||||||||||||||||||||||||||
| Interest income | (35) | (6) | (6) | — | (11) | (15) | (8) | (3) | — | — | — | — | ||||||||||||||||||||||||||
| Finance expense | 87 | 33 | 33 | — | 18 | 23 | 2 | 3 | 1 | 3 | 2 | 7 | ||||||||||||||||||||||||||
| Share-based payments | 4 | 1 | 1 | — | 4 | — | — | (1) | — | — | — | — | ||||||||||||||||||||||||||
| Loss/(gain) on financial instruments | 7 | 116 | 116 | — | (134) | 4 | (1) | 14 | (2) | 6 | 6 | 1 | ||||||||||||||||||||||||||
| (Gain)/loss on foreign exchange movements | (5) | — | — | — | (4) | (2) | — | 1 | 1 | 1 | — | (1) | ||||||||||||||||||||||||||
| Share of results of equity-accounted investees after tax | 78 | — | — | — | 86 | (8) | — | — | — | — | — | — | ||||||||||||||||||||||||||
| Change in estimate of environmental rehabilitation obligation, and right of recovery liability and asset | (2) | — | — | — | (2) | — | — | — | — | — | — | — | ||||||||||||||||||||||||||
| (Gain)/loss on disposal of property, plant and equipment | (2) | 2 | 2 | — | (1) | (3) | — | — | — | — | — | — | ||||||||||||||||||||||||||
| Impairments | 2,576 | 2,113 | 2,113 | — | 27 | 149 | — | 87 | 87 | 200 | 200 | — | ||||||||||||||||||||||||||
| Gain on acquisition | (49) | — | — | — | (49) | — | — | — | — | — | — | — | ||||||||||||||||||||||||||
| Occupational healthcare gain | (20) | — | — | — | — | (20) | — | — | — | — | — | — | ||||||||||||||||||||||||||
| Restructuring costs | 38 | 2 | 2 | — | 18 | 18 | — | — | — | — | — | — | ||||||||||||||||||||||||||
| Transaction costs | 22 | 1 | 1 | — | — | — | — | — | — | — | — | 21 | ||||||||||||||||||||||||||
| Onerous contract provision | 101 | — | — | — | — | — | — | 101 | 101 | — | — | — | ||||||||||||||||||||||||||
| Gain on increase in equity-accounted investment | — | — | — | — | — | — | — | — | — | — | — | — | ||||||||||||||||||||||||||
| Gain on remeasurement of previous interest in Kroondal | (17) | — | — | — | (17) | — | — | — | — | — | — | — | ||||||||||||||||||||||||||
| Lease payments | (7) | (1) | (1) | — | (3) | (2) | — | 1 | 1 | (2) | (2) | — | ||||||||||||||||||||||||||
| Adjusted EBITDA | 340 | (5) | (18) | 13 | 309 | 63 | 44 | (42) | (37) | 13 | 13 | 2 | ||||||||||||||||||||||||||
| Six months ended 31 December 2022 | ||||||||||||||||||||||||||||||||||||||
| Figures in million – US dollar | Total | Total US PGM | Under- ground | Recycling | Total SA PGM | Total SA gold1 | DRD- GOLD | Total EU operations | Sandouville nickel refinery | Group corporate | ||||||||||||||||||||||||||||
| Profit/(loss) before royalties, carbon tax and tax | 587 | 55 | 12 | 43 | 712 | (113) | 42 | (39) | (38) | (28) | ||||||||||||||||||||||||||||
| Adjusted for: | ||||||||||||||||||||||||||||||||||||||
| Amortisation and depreciation | 224 | 79 | 79 | — | 72 | 68 | 5 | 5 | 5 | — | ||||||||||||||||||||||||||||
| Interest income | (35) | (9) | (5) | (4) | (11) | (15) | (9) | — | — | — | ||||||||||||||||||||||||||||
| Finance expense | 78 | 29 | 29 | — | 17 | 21 | 2 | 1 | 1 | 10 | ||||||||||||||||||||||||||||
| Share-based payments | 6 | 1 | 1 | — | 2 | 3 | — | — | — | — | ||||||||||||||||||||||||||||
| Loss/(gain) on financial instruments | 235 | 9 | 9 | — | 189 | 44 | — | (7) | — | — | ||||||||||||||||||||||||||||
| (Gain)/loss on foreign exchange movements | (29) | — | — | — | (2) | (24) | — | 1 | (2) | (4) | ||||||||||||||||||||||||||||
| Share of results of equity-accounted investees after tax | (29) | — | — | — | (22) | (8) | — | — | — | 1 | ||||||||||||||||||||||||||||
| Change in estimate of environmental rehabilitation obligation, and right of recovery liability and asset | (4) | — | — | — | (8) | 4 | — | — | — | — | ||||||||||||||||||||||||||||
| Gain on disposal of property, plant and equipment | (4) | — | — | — | (1) | (3) | — | — | — | — | ||||||||||||||||||||||||||||
| Reversal of impairments | — | — | — | — | — | — | — | — | — | — | ||||||||||||||||||||||||||||
| Occupational healthcare gain | (11) | — | — | — | — | (11) | — | — | — | — | ||||||||||||||||||||||||||||
| Restructuring costs | 20 | — | — | — | — | 20 | — | — | — | — | ||||||||||||||||||||||||||||
| Transaction costs | 2 | — | — | — | — | — | — | — | — | 2 | ||||||||||||||||||||||||||||
| Loss on deconsolidation of subsidiary | 19 | — | — | — | 19 | — | — | — | — | — | ||||||||||||||||||||||||||||
| Profit on sale of Lonmin Canada | (9) | — | — | — | (9) | — | — | — | — | — | ||||||||||||||||||||||||||||
| Lease payments | (5) | — | — | — | (2) | (3) | (1) | — | — | — | ||||||||||||||||||||||||||||
| Adjusted EBITDA | 1,045 | 164 | 125 | 39 | 956 | (17) | 39 | (39) | (34) | (19) | ||||||||||||||||||||||||||||
1.Managed SA gold operations excludes DRDGOLD
Sibanye-Stillwater Operating and financial results | Six months and year ended 31 December 2023 19
| Six months ended 30 June 2023 | ||||||||||||||||||||||||||||||||||||||
| Figures in million – SA rand | Group1 | Total US PGM | Under- ground | Recycling | Total SA PGM | Total SA gold1 | DRD- GOLD | Total EU operations | Sandouville nickel refinery | Total AUS operations | Century zinc retreatment operation | Group corporate | ||||||||||||||||||||||||||
| Profit/(loss) before royalties, carbon tax and tax | 11,183 | (544) | (913) | 369 | 11,768 | 1,571 | 998 | (625) | (646) | (539) | (516) | (448) | ||||||||||||||||||||||||||
| Adjusted for: | ||||||||||||||||||||||||||||||||||||||
| Amortisation and depreciation | 4,731 | 1,553 | 1,551 | 2 | 1,369 | 1,143 | 84 | 97 | 94 | 569 | 569 | — | ||||||||||||||||||||||||||
| Interest income | (718) | (113) | (113) | — | (279) | (316) | (165) | (1) | — | (8) | (5) | (1) | ||||||||||||||||||||||||||
| Finance expense | 1,684 | 531 | 531 | — | 401 | 440 | 37 | 19 | 5 | 120 | 120 | 173 | ||||||||||||||||||||||||||
| Share-based payments | 43 | 12 | 12 | — | 2 | 20 | 12 | 5 | 5 | — | — | 4 | ||||||||||||||||||||||||||
| (Gain)/loss on financial instruments | (371) | (72) | (72) | — | 501 | (78) | (6) | (80) | (10) | (629) | (628) | (13) | ||||||||||||||||||||||||||
| (Gain)/loss on foreign exchange movements | (1,850) | (15) | (15) | — | (1,794) | 15 | (7) | (66) | (66) | 19 | (5) | (9) | ||||||||||||||||||||||||||
| Share of results of equity-accounted investees after tax | (263) | — | — | — | (114) | (161) | — | — | — | — | — | 12 | ||||||||||||||||||||||||||
| Gain on disposal of property, plant and equipment | (74) | (1) | (1) | — | (46) | (27) | (10) | — | — | — | — | — | ||||||||||||||||||||||||||
| Impairments | 9 | — | — | — | 1 | 2 | — | — | — | 6 | 6 | — | ||||||||||||||||||||||||||
| Occupational healthcare gain | (8) | — | — | — | — | (8) | — | — | — | — | — | — | ||||||||||||||||||||||||||
| Restructuring costs | (174) | — | — | — | 15 | (189) | — | — | — | — | — | — | ||||||||||||||||||||||||||
| Transaction costs | 80 | (2) | (2) | — | — | — | — | — | — | 2 | — | 80 | ||||||||||||||||||||||||||
| Gain on increase in equity-accounted investment | (2) | — | — | — | — | — | — | — | — | — | — | (2) | ||||||||||||||||||||||||||
| Lease payments | (123) | (2) | (2) | — | (30) | (37) | (10) | (12) | (9) | (42) | (43) | — | ||||||||||||||||||||||||||
| Adjusted EBITDA | 14,147 | 1,347 | 976 | 371 | 11,794 | 2,375 | 933 | (663) | (627) | (502) | (502) | (204) | ||||||||||||||||||||||||||
1 The SA rand amounts can be translated to US dollar at an average exchange rate of R18.21/US$ which amounts to a profit before royalties, carbon tax and tax of US$614 million (R11,183 million) and adjusted EBITDA of US$776 million (R14,147 million)
Amortisation and depreciation
Amortisation and depreciation at the SA PGM and US PGM operations increased by 28% to R1,606 million (US$86 million) and 25% to US$99 million (R1,835 million), respectively due to higher production volumes and progressive capital expenditure. Amortisation and depreciation at the managed SA gold operations increased by 7% to R1,129 million (US$61 million) mainly due to higher progressive capital expenditure and additions, partially offset by a 9% decrease in production. Amortisation and depreciation of DRDGOLD increased by 39% to R110 million (US$6 million) due to higher progressive capital expenditure over the past two years on the development and commissioning of two major reclamation sites at Ergo and FWGR which were commissioned in July 2023. Amortisation and depreciation at the European region increased by 12% to R109 million (US$6 million) mainly due to higher production at the Sandouville nickel refinery. Amortisation and depreciation at the Australian operation was R490 million (US$26 million).
Interest Income
Interest income increased by R37 million (US$0 million) to R651 million (US$35 million) mainly due to an increase in interest received on higher average cash balances (R80 million or US$3 million), interest received on rehabilitation funds (R29 million or US$1 million) and interest received on rehabilitation guarantees (R20 million or US$1 million), partially offset by a decrease in interest on right of recovery assets (R5 million or US$0 million) and a decrease in interest on other financial assets (R87 million or US$5 million).
Finance expense
Finance expense increased by R237 million (US$10 million) to R1,615 million (US$88 million) mainly due to a R102 million (US$3 million) increase in interest on borrowings, R88 million (US$4 million) increase in the unwinding of amortised cost on borrowings, R38 million (US$2 million) increase in the unwinding of the Marikana dividend obligation, R77 million (US$3 million) increase in unwinding of the environmental rehabilitation obligation, R8 million (US$0 million) increase in unwinding of interest on lease liabilities and R44 million (US$5 million) increase in other interest, all partially offset by decreases of R10 million (US$1 million) in interest on the occupational healthcare obligation, R92 million (US$5 million) in interest unwinding on the Rustenburg deferred payment to Anglo American Platinum Limited (Anglo) and R18 million (US$2 million) in the unwinding of the finance costs on the deferred revenue transactions (see note 3 of the condensed consolidated financial statements for a breakdown of finance expenses).
Loss on financial instruments
The net loss on financial instruments of R136 million (US$7 million) for H2 2023 compared with the loss of R3,880 million (US$235 million) for H2 2022, represents a period-on-period decreased net loss of R3,744 million (US$228 million). The net loss for H2 2023 is mainly attributable to the fair value loss on the US$ convertible bond derivative financial instrument of R2,136 million (US$115 million), fair value losses on hedge contracts for zinc of R132 million (US$7 million) and gold of R184 million (US$10 million), fair value loss on the contingent consideration relating to the Kroondal acquisition of R137 million (US$7 million) and fair value losses on other financial instruments of R205 million (US$11 million), partially offset by fair value gains on the revised cash flows of the Burnstone debt of R32 million (US$2 million), fair value gains on other investments of R14 million (US$1 million), fair value gains on the Rustenburg and Marikana operations BEE cash-settled share-based payment obligations and the Marikana dividend obligation of R2,075 million (US$111 million) and R537 million (US$29 million), respectively (see note 4 of the condensed consolidated financial statements for a breakdown of the loss on financial instruments).
Other costs
Other costs for H2 2023 increased by 83% from R2,249 million to R4,114 million due to the provision of R1,865 million (US$100 million) recognised during the period for an onerous supply contract at the Sandouville nickel refinery. Sustained losses incurred at the Sandouville nickel refinery resulted in the Group's assessment and conclusion that the supply contract is onerous, as the unavoidable costs of meeting the obligations under the contract exceed the expected economic benefits (see note 12 of the condensed consolidated financial statements).
Other income
Other income was 121% or R463 million (US$26 million) higher at R846 million (US$46 million) due to the gain on remeasurement of the of previous interest in Kroondal of R298 million (US$16 million) and higher sundry income of R327 million (US$18 million) (see note 5.2 of the condensed consolidated financial statements for a breakdown of other income).
Sibanye-Stillwater Operating and financial results | Six months and year ended 31 December 2023 20
Mining and income tax
The mining and income tax expense decreased by 258% to a net credit of R5,220 million (US$285 million) which is attributable to the Group’s decreased profitability. The current tax expense decreased by 82% to R788 million (US$42 million) and the deferred tax expense decreased in H2 2023 by 473% to a credit of R6,008 million (US$327 million). The effective tax rate of the Group decreased from 33% to 10% in H2 2023 mainly due to the impairment of property, plant and equipment in entities for which historically the Group did not raise net deferred tax assets, unrecognised deferred tax assets and non-deductible impairment of goodwill.
The Group’s effective tax rate for H2 2023 is 17% lower than the South African statutory company tax rate of 27%. The lower effective tax rate is mainly attributable to the impact of the following: decrease due to a change in the estimated deferred tax rate of 3% or R1,467 million (US$79 million), a lower statutory tax rate applicable to the US PGM operations of 4% or R2,154 million (US$116 million), non-deductible impairments of 5% or R2,392 million (US$128 million), decrease due to unrecognised deferred tax assets unrecognised or derecognised of 7% or R3,287 million (US$177 million) and non-taxable share of results of equity accounted investees of 1% or R388 million (US$21 million), partially offset by US state tax adjustment of 2% or R1,081 million (US$58 million) and net other non-taxable income and non-deductible expenditure of 0% or R30 million (US$2 million).
Non-recurring items
Impairments
At 31 December 2023, the Group raised impairments of R47,445 million (US$2,576 million) mainly related to:
•A 5.3% decrease of Mimosa's expected life of mine average recovered grade due to plant recoveries being affected by a change in the mineralogy of the ore, combined with above inflationary increases in working costs, resulted in a decrease in the expected future net cash flows from Mimosa. The lower value in use led to an after tax equity accounted impairment of property, plant and equipment amounting to R1,384 million (US$75 million) and the further impairment of the investment in the equity-accounted investee of R423 million (US$23 million) (included in the Mimosa reportable segment)
•Various operational constraints, as previously reported, in the ramp-up of the Blitz project, coupled with higher than inflation increases in operating costs and a decrease in medium to long-term forecast palladium prices, resulted in a decrease in the expected future net cash flows from the US PGM operation. The higher weighted average cost of capital, driven by a higher beta, in combination with the aforementioned factors, contributed to the reduced value in use at year end, which led to an impairment of property, plant and equipment and goodwill amounting to R38,900 million (US$2,112 million). In addition, goodwill allocated to the US PGM operation amounting to R60 million (US$3 million) pertaining to the acquisition of SFA (Oxford) was impaired
•An onerous supply contract, higher fixed and variable costs, significantly reduced expected sustainable production volumes and higher than initially expected sustaining capital expenditure, resulted in the decrease in expected future net cash flows from the Sandouville nickel refinery. This, together with lower nickel prices, reduced the value in use at year end and led to an impairment of property, plant and equipment, intangible assets and goodwill amounting to R1,606 million (US$87 million). Further studies are currently ongoing to determine the future optimal usage of infrastructure at the Sandouville nickel refinery
•Lower than expected production volumes, above inflationary increases in operating costs, higher sustaining capital, the relative short life-of- mine and the diminishing window of opportunity to develop and operate the expansion projects concurrent with the ongoing operation, resulted in a decrease in the expected future net cash flows from the Century zinc retreatment operation. The lower value in use led to an impairment of property, plant and equipment amounting to R3,689 million (US$200 million)
•Consistent with the requirements of the Group’s capital allocation framework, the Burnstone project (included in the SA Gold corporate and reconciling items reportable segment) will be delayed and is expected to ramp-up again during 2025. The additional costs during the delay, the deferral of mine ramp-up and higher weighted average cost of capital due to an increase in the beta, risk free rate and cost of debt, has resulted in a decrease in the expected future net cash flows from Burnstone. The lower value in use led to an impairment of property, plant and equipment amounting to R1,115 million (US$61 million)
•Operational constraints, including seismicity and cooling, at the Kloof 4 shaft, compounded by the shaft incident during H2 2023 that damaged the shaft infrastructure, resulted in a severe deterioration in productivity that negatively impacted the financial viability of the Kloof 4 shaft. Consequently, during 2023, following a consultative process, the Group announced the closure of Kloof 4 shaft, which led to the specific impairment of property, plant and equipment amounting to R1,616 million (US$88 million)
Gain on acquisition
Sibanye-Stillwater through its subsidiary Sibanye Rustenburg Platinum Mines Limited (SRPM) entered into an agreement with Rustenburg Platinum Mines Limited (RPM) a subsidiary of Anglo American Platinum Limited, whereby the Group will assume full ownership of the Kroondal operation with SRPM acquiring RPM's 50% ownership in the pool and share agreement (Kroondal PSA) between Kroondal Operations Proprietary Limited (wholly-owned subsidiary of the Group) and RPM. On 1 November 2023, Sibanye-Stillwater announced that the transaction had been brought forward and all conditions precedent had either been met or waived in order for SRPM to acquire RPM's 50% share in the Kroondal PSA effective 1 November 2023 (acquisition date). The consideration at the effective date is based on the remaining Kroondal agreed PSA ounces payable to RPM. Historically, and up to delivering the last agreed PSA ounce to RPM (expected June 2024), the delivered agreed PSA ounces included SRPM ounces mined outside of the Kroondal PSA area, resulting in reduced ounces being mined from the PSA area. The remaining PSA reserves are included in the valuation of the business combination and is the primary reason for the gain on acquisition of R898 million (US$48 million).
Restructuring costs
Restructuring costs of R689 million (US$37 million) includes retrenchment costs of R664 million (US$36 million) mainly due to employees taking voluntary severance packages as part of the S189 processes at the SA gold operations (Beatrix: R35 million or US$2 million, Driefontein: R23 million or US$1 million, Kloof: R247 million or US$13 million, Cooke: R4 million or US$0 million), SA PGM operations (Rustenburg R111 million or US$6 million, Kroondal R23 million or US$1 million and Marikana R201 million or US$11 million), Protection Services (R2 million or US$0 million)) and Academy (R2 million or R0 million) and at the US PGM operations (R16 million or US$1 million). Other restructuring costs of R25 million (US$1 million) consisted of severance pay at the US PGM operations.
Transaction costs
Transaction costs of R394 million (US$21 million) include project related legal and advisory fees. Legal and advisory fees on merger and acquisition activities relating to ioneer (R8 million or US$0 million), New Century Resources (R76 million or US$4 million), Appian (R17 million or US$1 million), Keliber (R2 million or US$0 million), other transaction related general legal and advisory costs (R262 million or US$14million) and convertible bond fees (R29 million or US$2 million).
Borrowings and net debt
Gross debt, including the derivative financial instrument, increased by 60% from R25,312 million (US$1,343 million) at 30 June 2023 to R40,428 million (US$2,177 million) at 31 December 2023. The increase in outstanding debt was due to the issue of the US$500 million convertible bond for R7,455 million (US$406 million) and associated derivative financial instrument of R3,810 (US$205 million), and a drawdown on the ZAR RCF of R4,000 million (US$215 million), partially offset by a net decrease of R352 million (US$19 million) on US dollar denominated debt due to a stronger rand since 30 June 2023. Net debt, excluding the Burnstone Debt which has no recourse to Sibanye-Stillwater, was R11,918 million (US$642 million) at 31
Sibanye-Stillwater Operating and financial results | Six months and year ended 31 December 2023 21
December 2023. The Group’s cash balance (excluding cash of Burnstone) increased by 15% to R25,519 million (US$1,374 million) since 30 June 2023, and includes US$750 million (R13,925 million) held by the US PGM operations (see note 10 of the condensed consolidated financial statements for a roll forward of the gross debt for the year ended 31 December 2023.
The Group’s total equity decreased to R51,607 million (US$2,777 million) at 31 December 2023 due to negative total comprehensive income of R32,782 million (US$2,205 million) for the year, dividends paid of (R5,318 million or US$289 million), recognition of the non-controlling interest on the New Century Resources Limited (Century) business combination (R906 million or US$49 million) and the recognition of the Keliber dividend obligation (R792 million or US$43 million). These decreases were partially offset by the purchase of Century's non-controlling interest (R919 million or US$50 million), transactions with Keliber shareholders (R1,097 million or US$59 million) and equity settled share based payment reserve of R48 million (US$2 million).
The graph below illustrates the Group's Gross debt/Cash/Total equity for H2 2023, H1 2023 and H2 2022:
Liquidity and capital resources
Cash flow analysis
Sibanye-Stillwater defines adjusted free cash flow as net cash from operating activities, before dividends paid, net interest paid and deferred revenue advance received, less additions to property, plant and equipment.
The following table shows the adjusted free cash flow per operating segment:
| Figures in million - SA rand | Six months ended | Year ended | ||||||||||||||||||
| H2 2023 | H1 2023 | H2 2022 | FY 2023 | FY 2022 | ||||||||||||||||
| US PGM operations | (1,373) | (1,324) | 3,179 | (2,697) | 4,584 | |||||||||||||||
| SA PGM operations | 6,103 | 2,297 | 2,343 | 8,400 | 13,499 | |||||||||||||||
SA gold operations1 | (10,077) | 46 | 1,733 | (10,031) | (6,011) | |||||||||||||||
| European operations | (1,156) | (2,511) | (1,155) | (3,667) | (1,817) | |||||||||||||||
| Australian operation | (1,032) | (665) | — | (1,697) | — | |||||||||||||||
| Group corporate | (556) | (379) | (313) | (935) | (746) | |||||||||||||||
Adjusted free cash flow2 | (8,091) | (2,536) | 5,787 | (10,627) | 9,509 | |||||||||||||||
1Included in the adjusted free cash flow of the SA gold segment is the Group treasury and shared services function, together referred to as gold corporate. The SA PGM operations, through the intercompany working capital accounts which eliminate on consolidation, received R6,367 million (US$342 million) during H2 2023 (H1 2023: contributed R1,349 million or US$74 million, contributed H2 2022: R5,920 million or US$342 million and FY 2022: R3,136 million or US$161 million) to the working capital increase (inflow) included in the SA gold operations
2Adjusted free cash flow, defined above and reconciled below, is not a measure of performance under IFRS. As a result, it should not be considered in isolation or as alternatives to any other measure of financial performance presented in accordance with IFRS
The US PGM operations generated negative adjusted free cash flow of US$74 million (R1,373 million). Net cash inflow from operating activities amounted to US$5 million (R98 million) and includes a net decrease (inflow) of US$125 million (R2,324 million) in working capital, which was mainly attributable to the decrease in recycle inventory, a net increase (outflow) in the intercompany working capital accounts of US$1 million (R16 million) and taxes paid of US$1 million (R12 million). The adjusted free cash flow includes additions to property, plant and equipment of US$190 million (R3,544 million).
Adjusted free cash flow from the SA PGM operations was R6,103 million (US$328 million). Net cash inflow from operating activities amounted to R9,222 million (US$495 million) and includes a net increase (outflow) of R1,314 million (US$71 million) in working capital, payments of R1,352 million (US$73 million) towards royalty and income taxes, dividends paid of R311 million (US$17 million) and a net decrease (inflow) of R6,367 million (US$342 million) in the intercompany working capital accounts. The adjusted free cash flow includes additions to property, plant and equipment of R2,980 million (US$160 million).
The SA gold operations generated negative adjusted free cash flow of R10,077 million (US$541 million). Net cash outflow from operating activities amounted to R6,832 million (US$367 million) after a net increase (outflow) of R561 million (US$30 million) in working capital, net dividends received of R279 million (US$15 million), payments of R66 million (US$3 million) towards royalty and income taxes and an increase (outflow) in the intercompany working capital accounts payable of R6,464 million (US$347 million). The adjusted free cash flow includes additions to property, plant and equipment of R3,739 million (US$201 million).
The European operations, which comprise the Sandouville nickel refinery and the Keliber lithium project which is in project development phase, generated negative adjusted free cash flow of R1,156 million (US$62 million). Net cash inflow from operating activities amounted to R64 million (US$4 million) after a net decrease (inflow) of R803 million (US$43 million) in working capital, payments of R64 million (US$3 million) towards royalty and income taxes and after a net decrease (inflow) of R76 million (US$4 million) in the intercompany working capital accounts. The adjusted free
Sibanye-Stillwater Operating and financial results | Six months and year ended 31 December 2023 22
cash flow includes additions to property, plant and equipment of R1,235 million (US$66 million) of which R1,082 million (US$58 million) relates to capital expenditure on the Keliber project.
The Australian operation generated negative adjusted free cash flow of R1,032 million (US$55 million). Net cash outflow from operating activities amounted to R452 million (US$24 million) after a net increase (outflow) of R472 million (US$25 million) in working capital, payments of R141 million (US$8 million) towards royalties and after a net decrease (inflow) of R1 million (US$0 million) in the intercompany working capital accounts. The adjusted free cash flow includes additions to property, plant and equipment of R61 million (US$3 million).
Group corporate’s negative adjusted free cash flow was R556 million (US$30 million). Net cash inflow from operating activities amounted to R52 million (US$3 million) after a net decrease (inflow) of R5 million (US$0 million) in working capital, payments of R25 million (US$1 million) towards royalty and income taxes and after a net decrease (inflow) of R35 million (US$2 million) in the intercompany working capital accounts.
The following table shows a reconciliation from net cash from operating activities to adjusted free cash flow:
| Figures in million - SA rand | Six months ended | Year ended | ||||||||||||||||||
| H2 2023 | H1 2023 | H2 2022 | FY 2023 | FY 2022 | ||||||||||||||||
| Net cash from operating activities | 2,152 | 4,943 | 11,154 | 7,095 | 15,543 | |||||||||||||||
| Adjusted for: | ||||||||||||||||||||
| Dividends paid | 1,779 | 3,539 | 4,075 | 5,318 | 9,453 | |||||||||||||||
| Net interest paid | 171 | 135 | 313 | 306 | 436 | |||||||||||||||
| Deferred revenue advance received | (636) | (299) | — | (935) | (24) | |||||||||||||||
| Less: | ||||||||||||||||||||
| Additions to property, plant and equipment | (11,557) | (10,854) | (9,755) | (22,411) | (15,899) | |||||||||||||||
| Adjusted free cash flow | (8,091) | (2,536) | 5,787 | (10,627) | 9,509 | |||||||||||||||
Adjusted free cash flow, defined and reconciled above, is not a measure of performance under IFRS. As a result, it should not be considered in isolation or as alternatives to any other measure of financial performance presented in accordance with IFRS
Cash and cash equivalents at 31 December 2023 increased to R25,560 million (US$1,376 million) from R22,159 million (US$1,176 million) at 30 June 2023 (H2 2022: cash at 31 December 2022 decreased to R26,076 million or US$1,531 million from R27,248 million or US$1,673 million at 30 June 2022), after net cash from operating activities of R2,152 million (US$113 million) (H2 2022: R11,154 million or US$664 million), net cash used in investing activities of R11,659 million (US$627 million) (H2 2022: R9,850 million or US$574 million) and net cash from in financing activities of R12,999 million (US$705 million) (H2 2022: net cash used in financing activities R3,424 million or US$208 million).
DIVIDENDS
The Group’s dividend policy is to return between 25% to 35% of normalised earnings1 to shareholders and after due consideration of future requirements the dividend may be increased beyond these levels. The Board, therefore, considers normalised earnings1 in determining what value will be distributed to shareholders. The Board believes normalised earnings1 provides useful information to investors regarding the extent to which results of operations may affect shareholder returns. Normalised earnings1 is defined as earnings attributable to the owners of Sibanye-Stillwater excluding gains and losses on financial instruments and foreign exchange differences, impairments, gain/loss on disposal of property, plant and equipment, occupational healthcare expenses, restructuring costs, transactions costs, share-based payment expenses on B-BBEE transactions, gains on acquisitions, net other business development costs, share of results of equity-accounted investees, all after tax and the impact of non-controlling interest, and changes in the estimated deferred tax rate.
In line with Sibanye-Stillwater’s dividend policy and Capital Allocation Framework, the Board of Directors resolved not to declare a final dividend (2022: 122 SA cents per share). With the interim dividend of 53 (2022: 138) SA cents per share, which was declared and paid, this brings the total dividend for the year ended 31 December 2023 to 53 (2022: 260) SA cents per share. The interim dividend amounted to a payout of 35% of normalised earnings1 for the six months ended 30 June 2023 (2022: 35% of normalised earnings1 for the year ended 31 December 2022).
1 Normalised earnings is not a measure of performance under IFRS. As a result, it should not be considered in isolation or as alternatives to any other measure of financial performance presented in accordance with IFRS. See note 9 of the condensed consolidated financial statements for the definition and reconciliation of normalised earnings
MINERAL RESOURCES AND MINERAL RESERVES
On 26 February 2024, Sibanye-Stillwater reported an update of its Mineral Resources and Mineral Reserves as at 31 December 2023, the salient points of which are summarised below.
•Stable 2E PGM Mineral Resources of 57.2Moz (+2.1%) and Mineral Reserves of 26.3Moz (unchanged) at our US PGM operations
•4E PGM Mineral Resources of 144.6Moz (+6.7%) and Mineral Reserves of 28.1Moz (-10.4%) at our SA PGM operations
–The reduction in Reserves is largely driven by depletion (-1.9Moz) and the exclusion of the North Hill Project at Mimosa (-1.5Moz)
•Gold Mineral Resources of 31.5Moz (-25.4%) and Mineral Reserves of 10.9Moz (-15.7%) at our SA gold operations and projects (including DRDGOLD)
–Impacted by the rationalisation at our Kloof and Beatrix operations, which led to the cessation of production at the Kloof 4 and Beatrix West shafts
•An 81% increase in attributable lithium Mineral Resources to 440kt of lithium carbonate equivalent (LCE)
–Driven by successful exploration activities at the Keliber project in Finland and an update Mineral Resource estimate at the Rhyolite Ridge project in Nevada
•Zinc Mineral Resources of 1,252Mlb (+307%) and Mineral Reserves of 1,726Mlb (+287%)
–Driven by the 100% acquisition of New Century Resources Ltd (Century)
•Copper Mineral Resources of 8,163Mlb (-39.4%)
–The exercise of the Mt Lyell option, obtained via the acquisition of Century, has added 1,609Mlb of contained copper
–Unchanged Mineral Resources at the Altar project, but due to a 60% earn-in obtained by Aldebaran Resources Ltd., the manager of the Altar exploration project, 6,752Mlb of attributable copper Mineral Resources have been impacted. Mineral Resources now stands at 6,386Mlb copper (48.61% attributable)
•Uranium (U3O8) Mineral Resources of 59.2Mlb, a decrease of -11.1%
–Due to reasonable prospect for economic extraction (RPEE) considerations, portions of the Cooke Millsite TSF (-7.4Mlb) have been excluded
Sibanye-Stillwater is preparing, and will file with the United States Securities and Exchange Commission (SEC), updated technical report summaries as required by Subpart 1300 of Regulation S-K with its 2023 annual report on Form 20-F.
Akanani Mining Propriety Limited was the holder of a new order (converted) prospecting right MPT No. 249/2006 for platinum group metals, gold, silver, nickel, copper and cobalt on the Farms Moordkopje and Zwartfontein which covered 40.95km². The right was renewed and ultimately
Sibanye-Stillwater Operating and financial results | Six months and year ended 31 December 2023 23
expired on 3 April 2021. An application for conversion to a mining right was submitted by Sibanye-Stillwater in March 2021, prior to expiry of the converted prospecting right. Based on what Sibanye-Stillwater believes is an incorrect interpretation of the prevailing legislation and case law, the Department of Mineral Resources and Energy granted a prospecting right to a third-party applicant. Sibanye-Stillwater has referred the dispute to the High Court for review and is of the view that it has favourable prospects of succeeding in this dispute.
CHANGE IN BOARD OF DIRECTORS
There were no changes to the Board of Sibanye Stillwater Limited during the six month period ended 31 December 2023. The tenure of six non-executive directors on the Board has exceeded nine years and in terms of good corporate governance Sibanye-Stillwater has made some changes to the composition of its board committees with effect from January 2024. In order to manage a smooth transition to a more balanced profile that ensures that independence is maintained, the following changes have been effected:
• Mr Harry Kenyon-Slaney has been appointed as Lead Independent Director and Chair of the Risk Committee
• Mr Jerry Vilakazi is appointed Chair of the Health and Safety Committee
• Dr Elaine Dorward-King has become Chair of the Social, Ethics and Sustainability Committee, and
• Mr Keith Rayner has become the Chair of the Investment Committee
In addition to the above changes, Mr Nkosemntu Nika and Ms Susan van der Merwe will retire at the 2024 AGM.
Sibanye-Stillwater Operating and financial results | Six months and year ended 31 December 2023 24
SALIENT FEATURES AND COST BENCHMARKS - SIX MONTHS
US and SA PGM operations
US and SA PGM operations1 | US PGM operations | Total SA PGM operations1 | Rustenburg | Marikana1 | Kroondal3 | Plat Mile | Mimosa | |||||||||||||||||||||||||||||||||||||
Under- ground2 | Total | Under- ground | Surface | Under- ground | Surface | Under- ground | Surface | Under- ground | Surface | Attribu-table | ||||||||||||||||||||||||||||||||||
| Production | ||||||||||||||||||||||||||||||||||||||||||||
| Tonnes milled/treated | kt | Dec 2023 | 19,012 | 606 | 18,406 | 8,716 | 9,690 | 3,089 | 2,837 | 3,261 | 1,897 | 1,655 | 4,956 | 712 | ||||||||||||||||||||||||||||||
| Jun 2023 | 18,211 | 569 | 17,642 | 8,070 | 9,573 | 2,984 | 2,649 | 2,993 | 1,729 | 1,413 | 5,194 | 680 | ||||||||||||||||||||||||||||||||
| Dec 2022 | 18,867 | 527 | 18,339 | 8,532 | 9,807 | 3,065 | 2,803 | 3,175 | 1,818 | 1,604 | 5,186 | 687 | ||||||||||||||||||||||||||||||||
| Plant head grade | g/t | Dec 2023 | 2.34 | 12.62 | 2.01 | 3.29 | 0.85 | 3.46 | 1.02 | 3.60 | 0.92 | 2.31 | 0.73 | 3.37 | ||||||||||||||||||||||||||||||
| Jun 2023 | 2.29 | 12.37 | 1.96 | 3.29 | 0.84 | 3.36 | 1.04 | 3.66 | 0.92 | 2.25 | 0.72 | 3.49 | ||||||||||||||||||||||||||||||||
| Dec 2022 | 2.26 | 12.43 | 1.97 | 3.29 | 0.82 | 3.33 | 1.05 | 3.66 | 0.87 | 2.36 | 0.67 | 3.52 | ||||||||||||||||||||||||||||||||
| Plant recoveries | % | Dec 2023 | 76.48 | 90.95 | 73.62 | 85.00 | 34.03 | 86.17 | 51.36 | 86.32 | 28.23 | 83.61 | 22.77 | 76.47 | ||||||||||||||||||||||||||||||
| Jun 2023 | 75.07 | 91.00 | 71.86 | 84.93 | 28.73 | 86.20 | 41.34 | 86.95 | 24.10 | 81.71 | 21.06 | 75.12 | ||||||||||||||||||||||||||||||||
| Dec 2022 | 75.43 | 90.31 | 72.67 | 84.89 | 30.00 | 86.29 | 43.20 | 86.86 | 25.83 | 82.51 | 21.09 | 74.52 | ||||||||||||||||||||||||||||||||
| Yield | g/t | Dec 2023 | 1.79 | 11.48 | 1.48 | 2.80 | 0.29 | 2.98 | 0.52 | 3.11 | 0.26 | 1.93 | 0.17 | 2.58 | ||||||||||||||||||||||||||||||
| Jun 2023 | 1.72 | 11.26 | 1.41 | 2.79 | 0.24 | 2.90 | 0.43 | 3.18 | 0.22 | 1.84 | 0.15 | 2.62 | ||||||||||||||||||||||||||||||||
| Dec 2022 | 1.71 | 11.23 | 1.43 | 2.79 | 0.25 | 2.87 | 0.45 | 3.18 | 0.22 | 1.95 | 0.14 | 2.62 | ||||||||||||||||||||||||||||||||
PGM production4 | 4Eoz - 2Eoz | Dec 2023 | 1,095,504 | 221,759 | 873,745 | 783,633 | 90,112 | 296,159 | 47,787 | 325,772 | 15,843 | 102,736 | 26,482 | 58,966 | ||||||||||||||||||||||||||||||
| Jun 2023 | 1,004,695 | 205,513 | 799,182 | 724,913 | 74,269 | 277,846 | 36,625 | 306,209 | 12,325 | 83,516 | 25,319 | 57,342 | ||||||||||||||||||||||||||||||||
| Dec 2022 | 1,034,752 | 191,094 | 843,658 | 766,087 | 77,571 | 283,148 | 40,877 | 324,518 | 13,136 | 100,441 | 23,558 | 57,980 | ||||||||||||||||||||||||||||||||
PGM sold5 | 4Eoz - 2Eoz | Dec 2023 | 1,136,130 | 234,370 | 901,760 | 292,433 | 39,005 | 384,266 | 102,736 | 26,482 | 56,838 | |||||||||||||||||||||||||||||||||
| Jun 2023 | 1,008,686 | 190,637 | 818,049 | 250,340 | 37,027 | 368,923 | 83,516 | 25,319 | 52,924 | |||||||||||||||||||||||||||||||||||
| Dec 2022 | 995,750 | 180,356 | 815,394 | 287,512 | 35,639 | 312,517 | 100,441 | 23,558 | 55,727 | |||||||||||||||||||||||||||||||||||
Price and costs6 | ||||||||||||||||||||||||||||||||||||||||||||
Average PGM basket price7 | R/4Eoz - R/2Eoz | Dec 2023 | 23,561 | 20,928 | 24,276 | 24,523 | 22,780 | 24,242 | 24,759 | 22,848 | 22,819 | |||||||||||||||||||||||||||||||||
| Jun 2023 | 32,245 | 25,312 | 34,006 | 34,487 | 27,476 | 34,290 | 35,394 | 29,077 | 29,083 | |||||||||||||||||||||||||||||||||||
| Dec 2022 | 39,966 | 30,609 | 42,188 | 43,092 | 32,789 | 42,228 | 44,781 | 33,776 | 33,348 | |||||||||||||||||||||||||||||||||||
| US$/4Eoz - US$/2Eoz | Dec 2023 | 1,265 | 1,124 | 1,304 | 1,317 | 1,223 | 1,302 | 1,330 | 1,227 | 1,226 | ||||||||||||||||||||||||||||||||||
| Jun 2023 | 1,771 | 1,390 | 1,867 | 1,894 | 1,509 | 1,883 | 1,944 | 1,597 | 1,597 | |||||||||||||||||||||||||||||||||||
| Dec 2022 | 2,306 | 1,766 | 2,434 | 2,487 | 1,892 | 2,437 | 2,584 | 1,949 | 1,924 | |||||||||||||||||||||||||||||||||||
Operating cost8,11 | R/t | Dec 2023 | 1,278 | 8,631 | 1,026 | 2,111 | 294 | 1,592 | 1,366 | 67 | 1,754 | |||||||||||||||||||||||||||||||||
| Jun 2023 | 1,140 | 6,994 | 944 | 2,038 | 196 | 1,573 | 1,183 | 59 | 1,692 | |||||||||||||||||||||||||||||||||||
| Dec 2022 | 1,091 | 7,687 | 894 | 1,905 | 290 | 1,411 | 1,103 | 60 | 1,524 | |||||||||||||||||||||||||||||||||||
| US$/t | Dec 2023 | 69 | 464 | 55 | 113 | 16 | 86 | 73 | 4 | 94 | ||||||||||||||||||||||||||||||||||
| Jun 2023 | 63 | 384 | 52 | 112 | 11 | 86 | 65 | 3 | 93 | |||||||||||||||||||||||||||||||||||
| Dec 2022 | 63 | 444 | 52 | 110 | 17 | 81 | 64 | 3 | 88 | |||||||||||||||||||||||||||||||||||
| R/4Eoz - R/2Eoz | Dec 2023 | 22,562 | 23,566 | 22,288 | 22,019 | 17,432 | 24,039 | 21,998 | 12,612 | 21,165 | ||||||||||||||||||||||||||||||||||
| Jun 2023 | 21,098 | 19,356 | 21,580 | 21,883 | 14,198 | 23,326 | 20,020 | 12,125 | 20,073 | |||||||||||||||||||||||||||||||||||
| Dec 2022 | 20,304 | 21,220 | 20,081 | 20,618 | 19,889 | 20,873 | 17,612 | 13,117 | 18,075 | |||||||||||||||||||||||||||||||||||
| US$/4Eoz - US$/2Eoz | Dec 2023 | 1,212 | 1,266 | 1,197 | 1,183 | 936 | 1,291 | 1,181 | 677 | 1,137 | ||||||||||||||||||||||||||||||||||
| Jun 2023 | 1,159 | 1,063 | 1,185 | 1,202 | 780 | 1,281 | 1,099 | 666 | 1,102 | |||||||||||||||||||||||||||||||||||
| Dec 2022 | 1,172 | 1,224 | 1,159 | 1,190 | 1,148 | 1,204 | 1,016 | 757 | 1,043 | |||||||||||||||||||||||||||||||||||
Adjusted EBITDA Margin9 | % | Dec 2023 | (5) | 23 | ||||||||||||||||||||||||||||||||||||||||
| Jun 2023 | 19 | 39 | ||||||||||||||||||||||||||||||||||||||||||
| Dec 2022 | 38 | 51 | ||||||||||||||||||||||||||||||||||||||||||
All-in sustaining cost10,11 | R/4Eoz - R/2Eoz | Dec 2023 | 23,941 | 37,090 | 20,363 | 18,093 | 23,169 | 20,704 | 12,235 | 25,218 | ||||||||||||||||||||||||||||||||||
| Jun 2023 | 22,301 | 31,633 | 19,716 | 18,323 | 22,286 | 17,877 | 10,664 | 23,264 | ||||||||||||||||||||||||||||||||||||
| Dec 2022 | 22,671 | 31,880 | 20,431 | 20,714 | 22,031 | 16,139 | 11,886 | 22,594 | ||||||||||||||||||||||||||||||||||||
| US$/4Eoz - US$/2Eoz | Dec 2023 | 1,286 | 1,992 | 1,094 | 972 | 1,244 | 1,112 | 657 | 1,354 | |||||||||||||||||||||||||||||||||||
| Jun 2023 | 1,225 | 1,737 | 1,083 | 1,006 | 1,224 | 982 | 586 | 1,278 | ||||||||||||||||||||||||||||||||||||
| Dec 2022 | 1,308 | 1,840 | 1,179 | 1,195 | 1,271 | 931 | 686 | 1,304 | ||||||||||||||||||||||||||||||||||||
All-in cost10,11 | R/4Eoz - R/2Eoz | Dec 2023 | 24,877 | 38,758 | 21,099 | 18,093 | 24,659 | 20,723 | 15,595 | 25,218 | ||||||||||||||||||||||||||||||||||
| Jun 2023 | 23,196 | 33,594 | 20,316 | 18,323 | 23,514 | 18,092 | 12,086 | 23,264 | ||||||||||||||||||||||||||||||||||||
| Dec 2022 | 24,039 | 36,139 | 21,096 | 20,714 | 23,580 | 16,139 | 11,886 | 22,594 | ||||||||||||||||||||||||||||||||||||
| US$/4Eoz - US$/2Eoz | Dec 2023 | 1,336 | 2,082 | 1,133 | 972 | 1,324 | 1,113 | 838 | 1,354 | |||||||||||||||||||||||||||||||||||
| Jun 2023 | 1,274 | 1,845 | 1,116 | 1,006 | 1,291 | 994 | 664 | 1,278 | ||||||||||||||||||||||||||||||||||||
| Dec 2022 | 1,387 | 2,085 | 1,217 | 1,195 | 1,361 | 931 | 686 | 1,304 | ||||||||||||||||||||||||||||||||||||
Capital expenditure6 | ||||||||||||||||||||||||||||||||||||||||||||
| Total capital expenditure | Rm | Dec 2023 | 6,704 | 3,627 | 3,077 | 683 | 2,102 | 177 | 115 | 547 | ||||||||||||||||||||||||||||||||||
| Jun 2023 | 5,784 | 3,213 | 2,571 | 630 | 1,771 | 130 | 40 | 510 | ||||||||||||||||||||||||||||||||||||
| Dec 2022 | 6,172 | 3,230 | 2,942 | 756 | 2,012 | 158 | 16 | 570 | ||||||||||||||||||||||||||||||||||||
| US$m | Dec 2023 | 360 | 195 | 165 | 37 | 113 | 10 | 6 | 29 | |||||||||||||||||||||||||||||||||||
| Jun 2023 | 318 | 176 | 141 | 35 | 97 | 7 | 2 | 28 | ||||||||||||||||||||||||||||||||||||
| Dec 2022 | 356 | 186 | 170 | 44 | 116 | 9 | 1 | 33 | ||||||||||||||||||||||||||||||||||||
Figures may not add as they are rounded independently
1The US and SA PGM operations, Total SA PGM operation and Marikana excludes the production and costs associated with the purchase of concentrate (PoC) from third parties. For a reconciliation of the Operating cost, AISC and AIC excluding third party PoC, refer to “Reconciliation of operating cost excluding third party PoC for US and SA PGM operations, Total SA PGM operations and Marikana - Six Months” and “Reconciliation of AISC and AIC excluding third party PoC for US and SA PGM operations, Total SA PGM operations and Marikana – Six Months”
2The US PGM operations’ underground production is converted to metric tonnes and kilograms, and performance is translated into rand. In addition to the US PGM operations’ underground production, the operation treats recycling material which is excluded from the statistics shown above and is detailed in the PGM recycling table below
3Kroondal operations for the six months ended December 2023 includes production and costs for two months (November and December 2023) at 100%
4Production per product – see prill split in the table below
5PGM sold includes the third party PoC ounces sold
Sibanye-Stillwater Operating and financial results | Six months and year ended 31 December 2023 25
6The US and SA PGM operations and Total SA PGM operations’ unit cost benchmarks and capital expenditure exclude the financial results of Mimosa, which is equity accounted and excluded from revenue and cost of sales
7The average PGM basket price is the PGM revenue per 4E/2E ounce, prior to purchase of concentrate adjustment
8Operating cost is the average cost of production and operating cost per tonne is calculated by dividing the cost of sales, before amortisation and depreciation and change in inventory in a period by the tonnes milled/treated in the same period, and operating cost per ounce (and kilogram) is calculated by dividing the cost of sales, before amortisation and depreciation and change in inventory in a period, by the PGM produced in the same period. For a reconciliation of unit operating cost, see “Unit operating cost - Six Months"
9Adjusted EBITDA margin is calculated by dividing adjusted EBITDA by revenue
10All-in cost is calculated in accordance with the World Gold Council guidance. All-in cost excludes income tax, costs associated with merger and acquisition activities, working capital, impairments, financing costs, one-time severance charges and items needed to normalise earnings. All-in cost is made up of All-in sustaining cost, being the cost to sustain current operations, given as a sub-total in the All-in cost calculation, together with corporate and major capital expenditure associated with growth. All-in sustaining cost per ounce (and kilogram) and All-in cost per ounce (and kilogram) are calculated by dividing the All-in sustaining cost and All-in cost, respectively, in a period by the total 4E/2E PGM produced in the same period. For a reconciliation of cost of sales, before amortisation and depreciation to All-in cost, see “All-in costs - Six Months”
11Operating cost, adjusted EBITDA margin, all-in sustaining costs and all-in costs, are not measures of performance under IFRS. As a result, such measures should not be considered in isolation or as alternatives to any other measure of financial performance presented in accordance with IFRS
| Mining - PGM Prill split including third party PoC, excluding recycling operations | ||||||||||||||||||||||||||||||||||||||||||||||||||||||||
| US AND SA PGM OPERATIONS | TOTAL SA PGM OPERATIONS | US PGM OPERATIONS | ||||||||||||||||||||||||||||||||||||||||||||||||||||||
| Dec 2023 | Jun 2023 | Dec 2022 | Dec 2023 | Jun 2023 | Dec 2022 | Dec 2023 | Jun 2023 | Dec 2022 | ||||||||||||||||||||||||||||||||||||||||||||||||
| % | % | % | % | % | % | % | % | % | ||||||||||||||||||||||||||||||||||||||||||||||||
| Platinum | 598,701 | 52 | % | 553,324 | 52 | % | 568,119 | 53 | % | 548,270 | 60 | % | 506,071 | 60 | % | 523,939 | 59 | % | 50,431 | 23 | % | 47,253 | 23 | % | 44,180 | 23 | % | |||||||||||||||||||||||||||||
| Palladium | 445,400 | 39 | % | 410,317 | 39 | % | 409,584 | 38 | % | 274,072 | 30 | % | 252,057 | 30 | % | 262,670 | 30 | % | 171,328 | 77 | % | 158,260 | 77 | % | 146,914 | 77 | % | |||||||||||||||||||||||||||||
| Rhodium | 82,449 | 7 | % | 75,298 | 7 | % | 78,783 | 7 | % | 82,449 | 9 | % | 75,298 | 9 | % | 78,783 | 9 | % | ||||||||||||||||||||||||||||||||||||||
| Gold | 15,816 | 1 | % | 15,297 | 1 | % | 16,264 | 2 | % | 15,816 | 2 | % | 15,297 | 2 | % | 16,264 | 2 | % | ||||||||||||||||||||||||||||||||||||||
| PGM production 4E/2E | 1,142,366 | 100 | % | 1,054,236 | 100 | % | 1,072,750 | 100 | % | 920,607 | 100 | % | 848,723 | 100 | % | 881,656 | 100 | % | 221,759 | 100 | % | 205,513 | 100 | % | 191,094 | 100 | % | |||||||||||||||||||||||||||||
| Ruthenium | 131,223 | 119,656 | 125,157 | 131,223 | 119,656 | 125,157 | ||||||||||||||||||||||||||||||||||||||||||||||||||
| Iridium | 32,795 | 30,339 | 31,636 | 32,795 | 30,339 | 31,636 | ||||||||||||||||||||||||||||||||||||||||||||||||||
| Total 6E/2E | 1,306,384 | 1,204,231 | 1,229,543 | 1,084,625 | 998,718 | 1,038,449 | 221,759 | 205,513 | 191,094 | |||||||||||||||||||||||||||||||||||||||||||||||
Figures may not add as they are rounded independently
| US PGM Recycling | ||||||||||||||
| Unit | Dec 2023 | Jun 2023 | Dec 2022 | |||||||||||
| Average catalyst fed/day | Tonne | 10.2 | 10.9 | 14.9 | ||||||||||
| Total processed | Tonne | 1,872 | 1,979 | 2,740 | ||||||||||
| Tolled | Tonne | — | — | — | ||||||||||
| Purchased | Tonne | 1,872 | 1,979 | 2,740 | ||||||||||
| PGM fed | 3Eoz | 147,862 | 162,452 | 237,441 | ||||||||||
| PGM sold | 3Eoz | 155,675 | 153,446 | 281,641 | ||||||||||
| PGM tolled returned | 3Eoz | 2,408 | 5,052 | 5,458 | ||||||||||
Sibanye-Stillwater Operating and financial results | Six months and year ended 31 December 2023 26
SALIENT FEATURES AND COST BENCHMARKS - SIX MONTHS (continued)
SA gold operations
| SA OPERATIONS | |||||||||||||||||||||||||||||||||||||||||
| Total SA gold | Driefontein | Kloof | Beatrix | Cooke | DRDGOLD | ||||||||||||||||||||||||||||||||||||
| Total | Under- ground | Surface | Under- ground | Surface | Under- ground | Surface | Under- ground | Surface | Surface | Surface | |||||||||||||||||||||||||||||||
| Production | |||||||||||||||||||||||||||||||||||||||||
| Tonnes milled/treated | kt | Dec 2023 | 16,190 | 1,870 | 14,320 | 527 | 33 | 649 | 899 | 695 | 35 | 2,187 | 11,165 | ||||||||||||||||||||||||||||
| Jun 2023 | 15,751 | 2,185 | 13,566 | 710 | 224 | 750 | 666 | 725 | 330 | 2,102 | 10,243 | ||||||||||||||||||||||||||||||
| Dec 2022 | 19,301 | 2,269 | 17,032 | 604 | 489 | 736 | 1,291 | 929 | 124 | 2,286 | 12,842 | ||||||||||||||||||||||||||||||
| Yield | g/t | Dec 2023 | 0.76 | 4.58 | 0.26 | 6.15 | 1.77 | 4.94 | 0.49 | 3.07 | 0.26 | 0.28 | 0.23 | ||||||||||||||||||||||||||||
| Jun 2023 | 0.82 | 4.34 | 0.26 | 5.47 | 0.33 | 4.77 | 0.31 | 2.80 | 0.22 | 0.27 | 0.25 | ||||||||||||||||||||||||||||||
| Dec 2022 | 0.69 | 4.08 | 0.24 | 5.24 | 0.49 | 4.46 | 0.33 | 3.02 | 0.34 | 0.29 | 0.21 | ||||||||||||||||||||||||||||||
| Gold produced | kg | Dec 2023 | 12,250 | 8,574 | 3,676 | 3,241 | 59 | 3,204 | 443 | 2,129 | 9 | 618 | 2,547 | ||||||||||||||||||||||||||||
| Jun 2023 | 12,962 | 9,490 | 3,472 | 3,884 | 74 | 3,579 | 207 | 2,027 | 72 | 568 | 2,551 | ||||||||||||||||||||||||||||||
| Dec 2022 | 13,339 | 9,250 | 4,089 | 3,163 | 240 | 3,284 | 420 | 2,803 | 42 | 656 | 2,731 | ||||||||||||||||||||||||||||||
| oz | Dec 2023 | 393,847 | 275,660 | 118,186 | 104,201 | 1,897 | 103,011 | 14,243 | 68,449 | 289 | 19,869 | 81,888 | |||||||||||||||||||||||||||||
| Jun 2023 | 416,738 | 305,111 | 111,627 | 124,873 | 2,379 | 115,067 | 6,655 | 65,170 | 2,315 | 18,262 | 82,017 | ||||||||||||||||||||||||||||||
| Dec 2022 | 428,859 | 297,394 | 131,464 | 101,693 | 7,716 | 105,583 | 13,503 | 90,119 | 1,350 | 21,091 | 87,804 | ||||||||||||||||||||||||||||||
| Gold sold | kg | Dec 2023 | 11,863 | 8,241 | 3,622 | 3,127 | 45 | 3,217 | 429 | 1,897 | 9 | 604 | 2,535 | ||||||||||||||||||||||||||||
| Jun 2023 | 13,566 | 9,937 | 3,629 | 3,929 | 123 | 3,794 | 268 | 2,214 | 72 | 615 | 2,551 | ||||||||||||||||||||||||||||||
| Dec 2022 | 12,378 | 8,409 | 3,969 | 2,961 | 187 | 2,947 | 372 | 2,501 | 42 | 606 | 2,762 | ||||||||||||||||||||||||||||||
| oz | Dec 2023 | 381,404 | 264,954 | 116,450 | 100,535 | 1,447 | 103,429 | 13,793 | 60,990 | 289 | 19,419 | 81,502 | |||||||||||||||||||||||||||||
| Jun 2023 | 436,157 | 319,482 | 116,675 | 126,320 | 3,955 | 121,980 | 8,616 | 71,182 | 2,315 | 19,773 | 82,017 | ||||||||||||||||||||||||||||||
| Dec 2022 | 397,962 | 270,356 | 127,606 | 95,198 | 6,012 | 94,748 | 11,960 | 80,409 | 1,350 | 19,483 | 88,800 | ||||||||||||||||||||||||||||||
| Price and costs | |||||||||||||||||||||||||||||||||||||||||
| Gold price received | R/kg | Dec 2023 | 1,170,362 | 1,171,501 | 1,166,484 | 1,171,563 | 1,172,185 | 1,173,176 | |||||||||||||||||||||||||||||||||
| Jun 2023 | 1,124,871 | 1,129,566 | 1,127,523 | 1,124,672 | 1,121,951 | 1,114,073 | |||||||||||||||||||||||||||||||||||
| Dec 2022 | 958,232 | 958,069 | 958,421 | 956,351 | 953,795 | 960,898 | |||||||||||||||||||||||||||||||||||
| US$/oz | Dec 2023 | 1,955 | 1,957 | 1,949 | 1,957 | 1,958 | 1,960 | ||||||||||||||||||||||||||||||||||
| Jun 2023 | 1,921 | 1,929 | 1,926 | 1,921 | 1,916 | 1,903 | |||||||||||||||||||||||||||||||||||
| Dec 2022 | 1,720 | 1,720 | 1,720 | 1,716 | 1,712 | 1,725 | |||||||||||||||||||||||||||||||||||
Operating cost1,4 | R/t | Dec 2023 | 765 | 4,894 | 226 | 6,394 | 450 | 5,643 | 375 | 3,057 | 397 | 316 | 196 | ||||||||||||||||||||||||||||
| Jun 2023 | 739 | 4,004 | 213 | 4,432 | 370 | 4,957 | 344 | 2,599 | 245 | 272 | 188 | ||||||||||||||||||||||||||||||
| Dec 2022 | 648 | 4,200 | 175 | 5,155 | 280 | 4,820 | 280 | 3,089 | 258 | 233 | 149 | ||||||||||||||||||||||||||||||
| US$/t | Dec 2023 | 41 | 263 | 12 | 343 | 24 | 303 | 20 | 164 | 21 | 17 | 11 | |||||||||||||||||||||||||||||
| Jun 2023 | 41 | 220 | 12 | 243 | 20 | 272 | 19 | 143 | 13 | 15 | 10 | ||||||||||||||||||||||||||||||
| Dec 2022 | 37 | 242 | 10 | 297 | 16 | 278 | 16 | 178 | 15 | 13 | 9 | ||||||||||||||||||||||||||||||
| R/kg | Dec 2023 | 1,011,673 | 1,067,413 | 881,665 | 1,039,185 | 254,237 | 1,142,634 | 760,722 | 997,182 | 1,555,556 | 1,118,123 | 857,479 | |||||||||||||||||||||||||||||
| Jun 2023 | 897,778 | 922,129 | 831,221 | 810,247 | 1,121,622 | 1,039,396 | 1,106,280 | 929,452 | 1,125,000 | 1,007,042 | 753,038 | ||||||||||||||||||||||||||||||
| Dec 2022 | 937,627 | 1,030,270 | 728,051 | 983,876 | 570,833 | 1,080,085 | 859,524 | 1,024,260 | 761,905 | 810,976 | 701,208 | ||||||||||||||||||||||||||||||
| US$/oz | Dec 2023 | 1,690 | 1,783 | 1,473 | 1,736 | 425 | 1,909 | 1,271 | 1,666 | 2,598 | 1,868 | 1,432 | |||||||||||||||||||||||||||||
| Jun 2023 | 1,533 | 1,575 | 1,420 | 1,384 | 1,916 | 1,775 | 1,890 | 1,588 | 1,922 | 1,720 | 1,286 | ||||||||||||||||||||||||||||||
| Dec 2022 | 1,683 | 1,849 | 1,307 | 1,766 | 1,025 | 1,939 | 1,543 | 1,838 | 1,367 | 1,456 | 1,259 | ||||||||||||||||||||||||||||||
Adjusted EBITDA margin2 | % | Dec 2023 | 8 | ||||||||||||||||||||||||||||||||||||||
| Jun 2023 | 16 | ||||||||||||||||||||||||||||||||||||||||
| Dec 2022 | (4) | ||||||||||||||||||||||||||||||||||||||||
All-in sustaining cost3,4 | R/kg | Dec 2023 | 1,202,225 | 1,339,533 | 1,288,535 | 1,162,644 | 1,183,775 | 938,856 | |||||||||||||||||||||||||||||||||
| Jun 2023 | 1,061,477 | 1,068,855 | 1,201,379 | 1,048,556 | 1,053,659 | 837,711 | |||||||||||||||||||||||||||||||||||
| Dec 2022 | 1,124,737 | 1,219,187 | 1,309,129 | 1,171,844 | 867,987 | 799,421 | |||||||||||||||||||||||||||||||||||
| US$/oz | Dec 2023 | 2,008 | 2,238 | 2,152 | 1,942 | 1,977 | 1,568 | ||||||||||||||||||||||||||||||||||
| Jun 2023 | 1,813 | 1,826 | 2,052 | 1,791 | 1,800 | 1,431 | |||||||||||||||||||||||||||||||||||
| Dec 2022 | 2,019 | 2,188 | 2,350 | 2,103 | 1,558 | 1,435 | |||||||||||||||||||||||||||||||||||
All-in cost3,4 | R/kg | Dec 2023 | 1,308,017 | 1,339,533 | 1,302,249 | 1,162,644 | 1,183,775 | 1,117,949 | |||||||||||||||||||||||||||||||||
| Jun 2023 | 1,162,244 | 1,068,855 | 1,217,873 | 1,048,556 | 1,053,659 | 1,005,096 | |||||||||||||||||||||||||||||||||||
| Dec 2022 | 1,200,679 | 1,219,187 | 1,355,830 | 1,171,844 | 867,987 | 842,143 | |||||||||||||||||||||||||||||||||||
| US$/oz | Dec 2023 | 2,185 | 2,238 | 2,175 | 1,942 | 1,977 | 1,867 | ||||||||||||||||||||||||||||||||||
| Jun 2023 | 1,985 | 1,826 | 2,080 | 1,791 | 1,800 | 1,717 | |||||||||||||||||||||||||||||||||||
| Dec 2022 | 2,155 | 2,188 | 2,433 | 2,103 | 1,558 | 1,511 | |||||||||||||||||||||||||||||||||||
| Capital expenditure | |||||||||||||||||||||||||||||||||||||||||
Total capital expenditure5 | Rm | Dec 2023 | 3,336 | 1,001 | 733 | 228 | — | 655 | |||||||||||||||||||||||||||||||||
| Jun 2023 | 3,367 | 950 | 716 | 209 | — | 657 | |||||||||||||||||||||||||||||||||||
| Dec 2022 | 2,963 | 805 | 894 | 272 | — | 354 | |||||||||||||||||||||||||||||||||||
| Total capital expenditure | US$m | Dec 2023 | 179 | 54 | 39 | 12 | — | 35 | |||||||||||||||||||||||||||||||||
| Jun 2023 | 185 | 52 | 39 | 11 | — | 36 | |||||||||||||||||||||||||||||||||||
| Dec 2022 | 171 | 46 | 52 | 16 | — | 20 | |||||||||||||||||||||||||||||||||||
Average exchange rate for the six months ended 31 December 2023, 30 June 2023 and 31 December 2022 was R18.62/US$, R18.21/US$ and R17.33/US$, respectively
Figures may not add as they are rounded independently
1Operating cost is the average cost of production and operating cost per tonne is calculated by dividing the cost of sales, before amortisation and depreciation and change in inventory in a period by the tonnes milled/treated in the same period, and operating cost per kilogram (and ounce) is calculated by dividing the cost of sales, before amortisation and depreciation and change in inventory in a period by the gold produced in the same period
2Adjusted EBITDA margin is calculated by dividing adjusted EBITDA by revenue
Sibanye-Stillwater Operating and financial results | Six months and year ended 31 December 2023 27
3All-in cost is calculated in accordance with the World Gold Council guidance. All-in cost excludes income tax, costs associated with merger and acquisition activities, working capital, impairments, financing costs, one time severance charges and items needed to normalise earnings. All-in cost is made up of All-in sustaining cost, being the cost to sustain current operations, given as a sub-total in the All-in cost calculation, together with corporate and major capital expenditure associated with growth. All-in sustaining cost per kilogram (and ounce) and All-in cost per kilogram (and ounce) are calculated by dividing the All-in sustaining cost and All-in cost, respectively, in a period by the total gold sold over the same period. For a reconciliation of cost of sales before amortisation and depreciation to All-in cost, see “All-in costs – Six Months”
4Operating cost, adjusted EBITDA margin, all-in sustaining costs and all-in costs, are not measures of performance under IFRS. As a result, such measures should not be considered in isolation or as alternatives to any other measure of financial performance presented in accordance with IFRS
5Corporate project expenditure, which comprises spend on various Corporate IT projects and the Burnstone project, for the six months ended 31 December 2023, 30 June 2023 and 31 December 2022 was R719 million (US$39 million), R835 million (US$46 million), and R638 million (US$37 million), respectively
Sibanye-Stillwater Operating and financial results | Six months and year ended 31 December 2023 28
SALIENT FEATURES AND COST BENCHMARKS - SIX MONTHS (continued)
European operations
| Sandouville nickel refinery | ||||||||||||||||||||
| Metals split | ||||||||||||||||||||
| Dec 2023 | Jun 2023 | Dec 2022 | ||||||||||||||||||
| Volumes produced (tonnes) | % | % | % | |||||||||||||||||
Nickel salts1 | 623 | 17 | % | 788 | 23 | % | 937 | 41 | % | |||||||||||
| Nickel metal | 3,009 | 83 | % | 2,705 | 77 | % | 1,340 | 59 | % | |||||||||||
| Total Nickel production tNi | 3,632 | 100 | % | 3,493 | 100 | % | 2,277 | 100 | % | |||||||||||
Nickel cakes2 | 162 | 158 | 91 | |||||||||||||||||
Cobalt chloride (CoCl2)3 | 64 | 63 | 43 | |||||||||||||||||
Ferric chloride (FeCl3)3 | 570 | 644 | 431 | |||||||||||||||||
| Volumes sales (tonnes) | ||||||||||||||||||||
Nickel salts1 | 541 | 16 | % | 593 | 17 | % | 876 | 39 | % | |||||||||||
| Nickel metal | 2,889 | 84 | % | 2,832 | 83 | % | 1,388 | 61 | % | |||||||||||
| Total Nickel sold tNi | 3,430 | 100 | % | 3,425 | 100 | % | 2,264 | 100 | % | |||||||||||
Nickel cakes2 | — | 21 | — | |||||||||||||||||
Cobalt chloride (CoCl2)3 | 66 | 50 | 19 | |||||||||||||||||
Ferric chloride (FeCl3)3 | 570 | 644 | 431 | |||||||||||||||||
| Nickel equivalent basket price | Unit | Dec 2023 | Jun 2023 | Dec 2022 | ||||||||||
| Revenue from sale of products | Rm | 1,346 | 1,677 | 967 | ||||||||||
| Nickel products sold | tNi | 3,430 | 3,425 | 2,264 | ||||||||||
Nickel equivalent average basket price4 | R/tNi | 392,420 | 489,635 | 427,120 | ||||||||||
| Nickel equivalent average basket price | US$/tNi | 21,075 | 26,888 | 24,646 | ||||||||||
| Nickel equivalent sustaining cost | Rm | Dec 2023 | Jun 2023 | Dec 2022 | ||||||||||
| Cost of sales, before amortisation and depreciation | 2,000 | 2,329 | 1,506 | |||||||||||
| Share-based payments | 9 | 11 | — | |||||||||||
| Rehabilitation interest and amortisation | 7 | 3 | 3 | |||||||||||
| Leases | 10 | 10 | 2 | |||||||||||
| Sustaining capital expenditure | 152 | 95 | 61 | |||||||||||
| Less: By-product credit | (39) | (110) | (68) | |||||||||||
Nickel equivalent sustaining cost5 | 2,139 | 2,338 | 1,504 | |||||||||||
| Nickel products sold | tNi | 3,430 | 3,425 | 2,264 | ||||||||||
Nickel equivalent sustaining cost5 | R/tNi | 623,615 | 682,628 | 664,311 | ||||||||||
| Nickel equivalent sustaining cost | US$/tNi | 33,492 | 37,486 | 38,333 | ||||||||||
Nickel recovery yield6 | % | 96.18 | % | 96.80 | % | 92.29 | % | |||||||
Average exchange rate for the six months ended 31 December 2023, 30 June 2023 and 31 December 2022 was R18.62/US$, R18.21/US$ and R17.33/US$, respectively
Figures may not add as they are rounded independently
1Nickel salts consist of anhydrous nickel, nickel chloride low sodium, nickel chloride standard, nickel carbonate and nickel chloride solution
2Nickel cakes occur during the processing of nickel matte and are recycled back into the nickel refining process
3Cobalt chloride and ferric chloride are obtained from nickel matte through a different refining process on an order basis
4The Nickel equivalent average basket price per tonne is the total nickel revenue adjusted for other income less non-product sales divided by the total nickel equivalent tonnes sold
5The Nickel equivalent sustaining cost, is the cost to sustain current operations. Nickel equivalent sustaining cost per tonne nickel is calculated by dividing the Nickel equivalent sustaining cost, in a period by the total nickel products sold over the same period. Nickel equivalent sustaining cost and Nickel equivalent sustaining costs per tonne are intended to provide additional information only, do not have any standardised meaning prescribed by IFRS and should not be considered in isolation or as alternatives to cost of sales, profit before tax, profit for the year, cash from operating activities or any other measure of financial performance presented in accordance with IFRS. Nickel equivalent sustaining cost and Nickel equivalent sustaining costs per tonne as presented in this document may not be comparable to other similarly titled measures of performance of other companies. Other companies may calculate these measures differently as a result of differences in the underlying accounting principles, policies applied and accounting frameworks such as in US GAAP. Differences may also arise related to definitional differences of sustaining versus development capital activities based upon each company’s internal policies. Non-IFRS measures such as Nickel equivalent sustaining cost and Nickel equivalent sustaining costs per tonne because of its nature, should not be considered as a representation of financial performance under IFRS
6Nickel recovery yield is the percentage of total nickel recovered from the matte relative to the nickel contained in the matte received
Sibanye-Stillwater Operating and financial results | Six months and year ended 31 December 2023 29
SALIENT FEATURES AND COST BENCHMARKS - SIX MONTHS (continued)
Australian operations
Century zinc retreatment operation1 | |||||||||||
| Production | |||||||||||
| Ore mined and processed | kt | Dec 2023 | 4,036 | ||||||||
| Jun 2023 | 2,061 | ||||||||||
| Processing feed grade | % | Dec 2023 | 3.12 | ||||||||
| Jun 2023 | 3.09 | ||||||||||
| Plant recoveries | % | Dec 2023 | 49.65 | ||||||||
| Jun 2023 | 46.33 | ||||||||||
Concentrate produced2 | kt | Dec 2023 | 138 | ||||||||
| Jun 2023 | 66 | ||||||||||
Concentrate zinc grade3 | % | Dec 2023 | 45.23 | ||||||||
| Jun 2023 | 45.01 | ||||||||||
Metal produced (zinc in concentrate)4 | kt | Dec 2023 | 63 | ||||||||
| Jun 2023 | 29 | ||||||||||
Zinc metal produced (payable)5 | kt | Dec 2023 | 51 | ||||||||
| Jun 2023 | 24 | ||||||||||
Zinc sold6 | kt | Dec 2023 | 61 | ||||||||
| Jun 2023 | 33 | ||||||||||
Zinc sold (payable)7 | kt | Dec 2023 | 50 | ||||||||
| Jun 2023 | 27 | ||||||||||
| Price and costs | |||||||||||
Average equivalent zinc concentrate price8 | R/tZn | Dec 2023 | 32,878 | ||||||||
| Jun 2023 | 29,871 | ||||||||||
| US$/tZn | Dec 2023 | 1,766 | |||||||||
| Jun 2023 | 1,640 | ||||||||||
All-in sustaining cost9,10 | R/tZn | Dec 2023 | 32,746 | ||||||||
| Jun 2023 | 44,030 | ||||||||||
| US$/tZn | Dec 2023 | 1,759 | |||||||||
| Jun 2023 | 2,418 | ||||||||||
All-in cost9,10 | R/tZn | Dec 2023 | 34,203 | ||||||||
| Jun 2023 | 50,338 | ||||||||||
| US$/tZn | Dec 2023 | 1,837 | |||||||||
| Jun 2023 | 2,764 | ||||||||||
Average exchange rate for the six months ended 31 December 2023 and 30 June 2023 was R18.62/US$ and R18.21/US$, respectively
Figures may not add as they are rounded independently
1Century is a leading tailings management and rehabilitation company that currently owns and operates the Century zinc tailings retreatment operation in Queensland, Australia. Century was acquired by the Group on 22 February 2023
2Concentrate produced is the dry concentrate which has been processed that contains zinc, silver and waste material
3Concentrate zinc grade is the percentage of zinc contained in the concentrate produced
4Metal produced (zinc in concentrate) is the zinc metal contained in the concentrate produced
5Zinc metal produced (payable) is the payable quantity of zinc metal produced after applying smelter content deductions
6Zinc sold is the zinc metal contained in the concentrate sold
7Zinc sold (payable) is the payable quantity of zinc metal sold after applying smelter content deductions
8Average equivalent zinc concentrate price is the total zinc sales revenue recognised at the price expected to be received excluding the fair value adjustments divided by the payable zinc metal sold
9All-in cost is calculated in accordance with the World Gold Council guidance. All-in cost excludes income tax, costs associated with merger and acquisition activities, working capital, impairments, financing costs, one-time severance charges and items needed to normalise earnings. All-in cost is made up of All-in sustaining cost, being the cost to sustain current operations, given as a sub-total in the All-in cost calculation, together with corporate and major capital expenditure associated with growth. All-in sustaining cost per tonne and All-in cost per tonne are calculated by dividing the All-in sustaining cost and All-in cost, respectively, in a period by the total tonnes of zinc metal produced (payable) in the same period. For a reconciliation of cost of sales, before amortisation and depreciation to All-in cost, see “All-in costs - Six Months”
10All-in sustaining costs and all-in costs, are not measures of performance under IFRS. As a result, such measures should not be considered in isolation or as alternatives to any other measure of financial performance presented in accordance with IFRS
Sibanye-Stillwater Operating and financial results | Six months and year ended 31 December 2023 30
CONDENSED CONSOLIDATED FINANCIAL STATEMENTS
Condensed consolidated income statement
Figures are in millions unless otherwise stated
| US dollar | SA rand | ||||||||||||||||||||||||||||||||||
| Year ended | Six months ended | Six months ended | Year ended | ||||||||||||||||||||||||||||||||
| Unaudited | Unaudited | Unaudited | Unaudited | Unaudited | Unaudited | Unaudited | Unaudited | Unaudited | Unaudited | ||||||||||||||||||||||||||
| Dec 2022 | Dec 2023 | Dec 2022 | Jun 2023 | Dec 2023 | Notes | Dec 2023 | Jun 2023 | Dec 2022 | Dec 2023 | Dec 2022 | |||||||||||||||||||||||||
| 8,448 | 6,172 | 3,878 | 3,326 | 2,846 | Revenue | 2 | 53,116 | 60,568 | 67,909 | 113,684 | 138,288 | ||||||||||||||||||||||||
| (6,208) | (5,417) | (2,945) | (2,728) | (2,689) | Cost of sales | (50,099) | (49,669) | (51,375) | (99,768) | (101,624) | |||||||||||||||||||||||||
| (5,775) | (4,873) | (2,721) | (2,468) | (2,405) | Cost of sales, before amortisation and depreciation | (44,818) | (44,938) | (47,512) | (89,756) | (94,537) | |||||||||||||||||||||||||
| (433) | (544) | (224) | (260) | (284) | Amortisation and depreciation | (5,281) | (4,731) | (3,863) | (10,012) | (7,087) | |||||||||||||||||||||||||
| 2,240 | 755 | 933 | 598 | 157 | 3,017 | 10,899 | 16,534 | 13,916 | 36,664 | ||||||||||||||||||||||||||
| 73 | 74 | 35 | 39 | 35 | Interest income | 651 | 718 | 614 | 1,369 | 1,203 | |||||||||||||||||||||||||
| (173) | (179) | (78) | (92) | (87) | Finance expense | 3 | (1,615) | (1,684) | (1,378) | (3,299) | (2,840) | ||||||||||||||||||||||||
| (13) | (6) | (6) | (2) | (4) | Share-based payment expenses | (70) | (43) | (106) | (113) | (218) | |||||||||||||||||||||||||
| (261) | 13 | (235) | 20 | (7) | (Loss)/gain on financial instruments | 4 | (136) | 371 | (3,880) | 235 | (4,279) | ||||||||||||||||||||||||
| 38 | 107 | 29 | 102 | 5 | Gain on foreign exchange differences | 123 | 1,850 | 476 | 1,973 | 616 | |||||||||||||||||||||||||
| 79 | (64) | 29 | 14 | (78) | Share of results of equity-accounted investees after tax | (1,437) | 263 | 517 | (1,174) | 1,287 | |||||||||||||||||||||||||
| (225) | (318) | (133) | (96) | (222) | Other costs | 5.1 | (4,114) | (1,744) | (2,249) | (5,858) | (3,679) | ||||||||||||||||||||||||
| 68 | 67 | 20 | 21 | 46 | Other income | 5.2 | 846 | 386 | 383 | 1,232 | 1,110 | ||||||||||||||||||||||||
| 10 | 6 | 4 | 4 | 2 | Gain on disposal of property, plant and equipment | 31 | 74 | 68 | 105 | 162 | |||||||||||||||||||||||||
| — | (2,576) | — | — | (2,576) | (Impairments)/reversal of impairments | 6 | (47,445) | (9) | 6 | (47,454) | 6 | ||||||||||||||||||||||||
| — | 49 | — | — | 49 | Gain on acquisition | 10.3 | 898 | — | — | 898 | — | ||||||||||||||||||||||||
| 13 | 20 | 11 | — | 20 | Occupational healthcare gain | 357 | 8 | 186 | 365 | 211 | |||||||||||||||||||||||||
| (22) | (28) | (20) | 10 | (38) | Restructuring costs | (689) | 174 | (327) | (515) | (363) | |||||||||||||||||||||||||
| (9) | (26) | (2) | (4) | (22) | Transaction costs | (394) | (80) | (44) | (474) | (152) | |||||||||||||||||||||||||
| 1,818 | (2,106) | 587 | 614 | (2,720) | (Loss)/profit before royalties, carbon tax and tax | (49,977) | 11,183 | 10,800 | (38,794) | 29,728 | |||||||||||||||||||||||||
| (112) | (57) | (49) | (33) | (24) | Royalties | (458) | (592) | (864) | (1,050) | (1,834) | |||||||||||||||||||||||||
| 1 | — | — | — | — | Carbon tax | (1) | (1) | (1) | (2) | 10 | |||||||||||||||||||||||||
| 1,707 | (2,163) | 538 | 581 | (2,744) | (Loss)/profit before tax | (50,436) | 10,590 | 9,935 | (39,846) | 27,904 | |||||||||||||||||||||||||
| (545) | 131 | (179) | (154) | 285 | Mining and income tax | 7 | 5,220 | (2,804) | (3,296) | 2,416 | (8,924) | ||||||||||||||||||||||||
| (567) | (173) | (246) | (131) | (42) | - Current tax | (788) | (2,390) | (4,345) | (3,178) | (9,282) | |||||||||||||||||||||||||
| 22 | 304 | 67 | (23) | 327 | - Deferred tax | 6,008 | (414) | 1,049 | 5,594 | 358 | |||||||||||||||||||||||||
| 1,162 | (2,032) | 359 | 427 | (2,459) | (Loss)/profit for the period | (45,216) | 7,786 | 6,639 | (37,430) | 18,980 | |||||||||||||||||||||||||
| (Loss)/profit for the period attributable to: | |||||||||||||||||||||||||||||||||||
| 1,126 | (2,051) | 344 | 407 | (2,458) | - Owners of Sibanye-Stillwater | (45,195) | 7,423 | 6,380 | (37,772) | 18,396 | |||||||||||||||||||||||||
| 36 | 19 | 15 | 20 | (1) | - Non-controlling interests (NCI) | (21) | 363 | 259 | 342 | 584 | |||||||||||||||||||||||||
| Earnings per ordinary share (cents) | |||||||||||||||||||||||||||||||||||
| 40 | (72) | 13 | 14 | (86) | Basic earnings per share | 8.1 | (1,597) | 262 | 225 | (1,334) | 651 | ||||||||||||||||||||||||
| 40 | (72) | 13 | 14 | (86) | Diluted earnings per share | 8.2 | (1,597) | 262 | 225 | (1,334) | 650 | ||||||||||||||||||||||||
| 2,826,085 | 2,830,528 | 2,830,197 | 2,830,488 | 2,830,567 | Weighted average number of shares ('000) | 8.1 | 2,830,567 | 2,830,488 | 2,830,197 | 2,830,528 | 2,826,085 | ||||||||||||||||||||||||
| 2,830,781 | 2,830,567 | 2,830,781 | 2,830,567 | 2,830,567 | Diluted weighted average number of shares ('000) | 8.2 | 2,830,567 | 2,830,567 | 2,830,781 | 2,830,567 | 2,830,781 | ||||||||||||||||||||||||
| 16.37 | 18.42 | 17.33 | 18.21 | 18.62 | Average R/US$ rate | ||||||||||||||||||||||||||||||
The condensed consolidated financial statements for the year and six months ended 31 December 2023 have been prepared by Sibanye-Stillwater's Group financial reporting team headed by Jacques le Roux (CA (SA)). This process was supervised by the Group's Chief Financial Officer, Charl Keyter and approved by the Sibanye-Stillwater board of directors. A convenience translation has been applied to the primary statements into US dollar based on the average exchange rate for the period for the condensed consolidated income statement, statements of other comprehensive income and cash flows, and the period-end closing exchange rate for the condensed consolidated statement of financial position and exchange rate differences on translation are accounted for in the condensed consolidated statement of other comprehensive income. This information is provided as supplementary information only and has not been reviewed or reported on by the Company's external auditor. | ||
Sibanye-Stillwater Operating and financial results | Six months and year ended 31 December 2023 31
Condensed consolidated statement of other comprehensive income
Figures are in millions unless otherwise stated
| US dollar | SA rand | ||||||||||||||||||||||||||||||||||
| Year ended | Six months ended | Six months ended | Year ended | ||||||||||||||||||||||||||||||||
| Unaudited | Unaudited | Unaudited | Unaudited | Unaudited | Unaudited | Unaudited | Unaudited | Unaudited | Unaudited | ||||||||||||||||||||||||||
| Dec 2022 | Dec 2023 | Dec 2022 | Jun 2023 | Dec 2023 | Dec 2023 | Jun 2023 | Dec 2022 | Dec 2023 | Dec 2022 | ||||||||||||||||||||||||||
| 1,162 | (2,032) | 359 | 427 | (2,459) | (Loss)/profit for the period | (45,216) | 7,786 | 6,639 | (37,430) | 18,980 | |||||||||||||||||||||||||
| (207) | (173) | (64) | (202) | 29 | Other comprehensive income, net of tax | (1,397) | 6,045 | 2,551 | 4,648 | 2,369 | |||||||||||||||||||||||||
| — | — | — | — | — | Foreign currency translation adjustments1 | (826) | 6,058 | 2,673 | 5,232 | 3,840 | |||||||||||||||||||||||||
| (90) | (32) | (2) | (1) | (31) | Fair value adjustment on other investments2 | (569) | (13) | (118) | (582) | (1,467) | |||||||||||||||||||||||||
| — | — | — | — | — | Re-measurement of defined benefit plan2 | (2) | — | (4) | (2) | (4) | |||||||||||||||||||||||||
| (117) | (141) | (62) | (201) | 60 | Currency translation adjustments3 | — | — | — | — | — | |||||||||||||||||||||||||
| 955 | (2,205) | 295 | 225 | (2,430) | Total comprehensive income | (46,613) | 13,831 | 9,190 | (32,782) | 21,349 | |||||||||||||||||||||||||
| Total comprehensive income attributable to: | |||||||||||||||||||||||||||||||||||
| 914 | (2,227) | 276 | 202 | (2,429) | - Owners of Sibanye-Stillwater | (46,591) | 13,407 | 8,850 | (33,184) | 20,671 | |||||||||||||||||||||||||
| 41 | 22 | 19 | 23 | (1) | - Non-controlling interests | (22) | 424 | 340 | 402 | 678 | |||||||||||||||||||||||||
| 16.37 | 18.42 | 17.33 | 18.21 | 18.62 | Average R/US$ rate | ||||||||||||||||||||||||||||||
1 These gains and losses will be reclassified to profit or loss upon disposal of the underlying operations
2 These gains and losses will never be reclassified to profit or loss
3 These gains and losses relate to the convenience translation of the SA rand amounts to US dollar and will never be reclassified to profit or loss
Condensed consolidated statement of financial position
Figures are in millions unless otherwise stated
| US dollar | SA rand | ||||||||||||||||||||||
| Unaudited | Unaudited | Unaudited | Unaudited | Unaudited | Unaudited | ||||||||||||||||||
| Dec 2022 | Jun 2023 | Dec 2023 | Notes | Dec 2023 | Jun 2023 | Dec 2022 | |||||||||||||||||
| 6,216 | 6,564 | 4,368 | Non-current assets | 81,119 | 123,772 | 105,867 | |||||||||||||||||
| 4,516 | 4,924 | 3,303 | Property, plant and equipment | 61,338 | 92,824 | 76,909 | |||||||||||||||||
| 16 | 32 | 30 | Right-of-use assets | 560 | 610 | 279 | |||||||||||||||||
| 489 | 485 | 27 | Goodwill and other intangibles | 502 | 9,151 | 8,322 | |||||||||||||||||
| 497 | 491 | 385 | Equity-accounted investments | 7,148 | 9,264 | 8,471 | |||||||||||||||||
| 196 | 178 | 171 | Other investments | 3,179 | 3,364 | 3,340 | |||||||||||||||||
| 312 | 295 | 319 | Environmental rehabilitation obligation funds | 5,927 | 5,555 | 5,306 | |||||||||||||||||
| 47 | 42 | 28 | Other receivables | 523 | 794 | 798 | |||||||||||||||||
| 143 | 117 | 105 | Deferred tax assets | 1,942 | 2,210 | 2,442 | |||||||||||||||||
| 3,567 | 3,005 | 3,328 | Current assets | 61,822 | 56,652 | 60,764 | |||||||||||||||||
| 1,549 | 1,364 | 1,420 | Inventories | 26,363 | 25,710 | 26,384 | |||||||||||||||||
| 440 | 425 | 479 | Trade and other receivables | 8,900 | 8,016 | 7,500 | |||||||||||||||||
| 5 | 12 | 1 | Other receivables | 26 | 233 | 81 | |||||||||||||||||
| 42 | 28 | 52 | Tax receivable | 973 | 534 | 723 | |||||||||||||||||
| 1,531 | 1,176 | 1,376 | Cash and cash equivalents | 25,560 | 22,159 | 26,076 | |||||||||||||||||
| 9,783 | 9,569 | 7,696 | Total assets | 142,941 | 180,424 | 166,631 | |||||||||||||||||
| 5,342 | 5,309 | 2,777 | Total equity | 51,607 | 100,164 | 91,004 | |||||||||||||||||
| 3,254 | 3,303 | 2,957 | Non-current liabilities | 54,927 | 62,238 | 55,408 | |||||||||||||||||
| 1,327 | 1,336 | 1,343 | Borrowings and derivative financial instrument | 11 | 24,946 | 25,177 | 22,606 | ||||||||||||||||
| 12 | 23 | 21 | Lease liabilities | 384 | 440 | 208 | |||||||||||||||||
| 502 | 603 | 673 | Environmental rehabilitation obligation and other provisions | 12 | 12,505 | 11,369 | 8,552 | ||||||||||||||||
| 46 | 38 | 22 | Occupational healthcare obligation | 400 | 707 | 781 | |||||||||||||||||
| 293 | 236 | 146 | Cash-settled share-based payment obligations | 13 | 2,718 | 4,445 | 4,991 | ||||||||||||||||
| 147 | 178 | 183 | Other payables | 14 | 3,407 | 3,347 | 2,500 | ||||||||||||||||
| 376 | 341 | 341 | Deferred revenue | 6,327 | 6,429 | 6,399 | |||||||||||||||||
| 1 | 1 | 3 | Tax and royalties payable | 64 | 12 | 11 | |||||||||||||||||
| 550 | 547 | 225 | Deferred tax liabilities | 4,176 | 10,312 | 9,360 | |||||||||||||||||
| 1,187 | 957 | 1,962 | Current Liabilities | 36,407 | 18,022 | 20,219 | |||||||||||||||||
| 7 | 7 | 834 | Borrowings and derivative financial instrument | 11 | 15,482 | 135 | 122 | ||||||||||||||||
| — | — | 45 | Environmental rehabilitation obligation and other provisions | 12 | 832 | — | — | ||||||||||||||||
| 7 | 11 | 11 | Lease liabilities | 198 | 200 | 111 | |||||||||||||||||
| 3 | 4 | — | Occupational healthcare obligation | — | 74 | 44 | |||||||||||||||||
| 17 | 41 | 23 | Cash-settled share-based payment obligations | 13 | 432 | 764 | 284 | ||||||||||||||||
| 919 | 816 | 887 | Trade and other payables | 16,464 | 15,377 | 15,653 | |||||||||||||||||
| 228 | 24 | 109 | Other payables | 14 | 2,015 | 451 | 3,891 | ||||||||||||||||
| 1 | 17 | 16 | Deferred revenue | 305 | 324 | 21 | |||||||||||||||||
| 5 | 37 | 37 | Tax and royalties payable | 679 | 697 | 93 | |||||||||||||||||
| 9,783 | 9,569 | 7,696 | Total equity and liabilities | 142,941 | 180,424 | 166,631 | |||||||||||||||||
| 17.03 | 18.85 | 18.57 | Closing R/US$ rate | ||||||||||||||||||||
Sibanye-Stillwater Operating and financial results | Six months and year ended 31 December 2023 32
Condensed consolidated statement of changes in equity
Figures are in millions unless otherwise stated
US dollar1 | SA rand1 | ||||||||||||||||||||||||||||||||||||||||
| Stated capital | Re- organisation reserve | Other reserves | Accum- ulated profit/(loss) | Non- controlling interests | Total equity | Notes | Total equity | Non- controlling interests | Accum- ulated profit/(loss) | Other reserves | Re- organisation reserve | Stated capital | |||||||||||||||||||||||||||||
| 1,361 | 2,599 | 410 | 602 | 130 | 5,102 | Balance at 31 December 2021 | 81,345 | 1,952 | 27,414 | 7,331 | 23,001 | 21,647 | |||||||||||||||||||||||||||||
| — | — | (212) | 1,126 | 41 | 955 | Total comprehensive income for the period | 21,349 | 678 | 18,392 | 2,279 | — | — | |||||||||||||||||||||||||||||
| — | — | — | 1,126 | 36 | 1,162 | Profit for the period | 18,980 | 584 | 18,396 | — | — | — | |||||||||||||||||||||||||||||
| — | — | (212) | — | 5 | (207) | Other comprehensive income, net of tax | 2,369 | 94 | (4) | 2,279 | — | — | |||||||||||||||||||||||||||||
| — | — | — | (562) | (16) | (578) | Dividends paid | (9,453) | (256) | (9,197) | — | — | — | |||||||||||||||||||||||||||||
| — | — | 1 | — | 1 | 2 | Equity-settled share-based payments | 24 | 10 | — | 14 | — | — | |||||||||||||||||||||||||||||
| — | — | — | — | 74 | 74 | Keliber Oy (Keliber) asset acquisition | 1,219 | 1,219 | — | — | — | — | |||||||||||||||||||||||||||||
| — | — | 4 | (173) | (42) | (211) | Transaction with shareholders | (3,452) | (686) | (2,828) | 62 | — | — | |||||||||||||||||||||||||||||
| — | — | — | — | (1) | (1) | Sale of Lonmin Canada Incorporated (Lonmin Canada) | (14) | (14) | — | — | — | — | |||||||||||||||||||||||||||||
| — | — | (1) | — | — | (1) | Foreign exchange movement recycled through profit or loss | (14) | — | — | (14) | — | — | |||||||||||||||||||||||||||||
| 1,361 | 2,599 | 202 | 993 | 187 | 5,342 | Balance at 31 December 2022 | 91,004 | 2,903 | 33,781 | 9,672 | 23,001 | 21,647 | |||||||||||||||||||||||||||||
| — | — | (176) | (2,051) | 22 | (2,205) | Total comprehensive income for the period | (32,782) | 402 | (37,774) | 4,590 | — | — | |||||||||||||||||||||||||||||
| — | — | — | (2,051) | 19 | (2,032) | (Loss)/profit for the period | (37,430) | 342 | (37,772) | — | — | — | |||||||||||||||||||||||||||||
| — | — | (176) | — | 3 | (173) | Other comprehensive income, net of tax | 4,648 | 60 | (2) | 4,590 | — | — | |||||||||||||||||||||||||||||
| — | — | — | (269) | (20) | (289) | Dividends paid | (5,318) | (365) | (4,953) | — | — | — | |||||||||||||||||||||||||||||
| — | — | 1 | — | 1 | 2 | Equity-settled share-based payments | 48 | 24 | — | 24 | — | — | |||||||||||||||||||||||||||||
| — | — | — | — | 50 | 50 | New Century Resources Limited (Century) business combination | 10.1 | 919 | 919 | — | — | — | — | ||||||||||||||||||||||||||||
| — | — | (4) | 25 | 38 | 59 | Transactions with Keliber Oy (Keliber) shareholders | 10.2 | 1,097 | 700 | 463 | (66) | — | — | ||||||||||||||||||||||||||||
| — | — | — | — | (43) | (43) | Keliber dividend obligation | 14 | (792) | (792) | — | — | — | — | ||||||||||||||||||||||||||||
| — | — | — | 1 | (50) | (49) | Transactions with Century shareholders | 10.1 | (906) | (914) | 13 | (5) | — | — | ||||||||||||||||||||||||||||
| — | — | (90) | — | — | (90) | Foreign exchange movement recycled through profit or loss2 | (1,663) | — | — | (1,663) | — | — | |||||||||||||||||||||||||||||
| 1,361 | 2,599 | (67) | (1,301) | 185 | 2,777 | Balance at 31 December 2023 | 51,607 | 2,877 | (8,470) | 12,552 | 23,001 | 21,647 | |||||||||||||||||||||||||||||
1 This information is unaudited
2 This relates to the deregistration of dormant subsidiaries in the Group which resulted in the reclassification of foreign currency translation reserve movements from other comprehensive income to profit or loss. The foreign exchange movement is included in gain on foreign exchange differences in profit or loss
Sibanye-Stillwater Operating and financial results | Six months and year ended 31 December 2023 33
Condensed consolidated statement of cash flows
Figures are in millions unless otherwise stated
| US dollar | SA rand | ||||||||||||||||||||||||||||||||||
| Year ended | Six months ended | Six months ended | Year ended | ||||||||||||||||||||||||||||||||
| Unaudited | Unaudited | Unaudited | Unaudited | Unaudited | Unaudited | Unaudited | Unaudited | Unaudited | Unaudited | ||||||||||||||||||||||||||
| Dec 2022 | Dec 2023 | Dec 2022 | Jun 2023 | Dec 2023 | Notes | Dec 2023 | Jun 2023 | Dec 2022 | Dec 2023 | Dec 2022 | |||||||||||||||||||||||||
| Cash flows from operating activities | |||||||||||||||||||||||||||||||||||
| 2,489 | 1,017 | 1,053 | 786 | 231 | Cash generated by operations | 4,409 | 14,317 | 18,639 | 18,726 | 40,746 | |||||||||||||||||||||||||
| 1 | 51 | (1) | 16 | 35 | Deferred revenue advance received | 636 | 299 | — | 935 | 24 | |||||||||||||||||||||||||
| — | — | — | — | — | Post-retirement health care payments | — | — | — | — | (1) | |||||||||||||||||||||||||
| (17) | (35) | (4) | (31) | (4) | Cash-settled share-based payments paid | (70) | (567) | (74) | (637) | (272) | |||||||||||||||||||||||||
| (14) | (10) | 1 | (10) | — | Payment of Marikana dividend obligation | — | (191) | — | (191) | (225) | |||||||||||||||||||||||||
| (278) | (203) | 17 | (205) | 2 | Additional deferred/contingent payments relating to acquisition of a business1 | — | (3,733) | — | (3,733) | (4,545) | |||||||||||||||||||||||||
| 24 | 95 | 131 | 53 | 42 | Change in working capital | 787 | 963 | 2,034 | 1,750 | 386 | |||||||||||||||||||||||||
| 2,205 | 915 | 1,197 | 609 | 306 | 5,762 | 11,088 | 20,599 | 16,850 | 36,113 | ||||||||||||||||||||||||||
| 42 | 54 | 12 | 30 | 24 | Interest received | 460 | 538 | 221 | 998 | 682 | |||||||||||||||||||||||||
| (68) | (71) | (30) | (37) | (34) | Interest paid | (631) | (673) | (534) | (1,304) | (1,118) | |||||||||||||||||||||||||
| (111) | (50) | (47) | (20) | (30) | Royalties paid | (565) | (357) | (836) | (922) | (1,815) | |||||||||||||||||||||||||
| (542) | (174) | (240) | (116) | (58) | Tax paid | (1,095) | (2,114) | (4,221) | (3,209) | (8,866) | |||||||||||||||||||||||||
| (577) | (289) | (228) | (194) | (95) | Dividends paid | (1,779) | (3,539) | (4,075) | (5,318) | (9,453) | |||||||||||||||||||||||||
| 949 | 385 | 664 | 272 | 113 | Net cash from operating activities | 2,152 | 4,943 | 11,154 | 7,095 | 15,543 | |||||||||||||||||||||||||
| Cash flow from investing activities | |||||||||||||||||||||||||||||||||||
| (971) | (1,217) | (572) | (596) | (621) | Additions to property, plant and equipment | (11,557) | (10,854) | (9,755) | (22,411) | (15,899) | |||||||||||||||||||||||||
| 12 | 9 | 4 | 5 | 4 | Proceeds on disposal of property, plant and equipment | 84 | 84 | 75 | 168 | 191 | |||||||||||||||||||||||||
| (69) | 26 | 5 | 12 | 14 | Acquisition of subsidiaries, net of cash acquired | 10 | 247 | 224 | — | 471 | (1,132) | ||||||||||||||||||||||||
| 34 | 24 | 10 | 18 | 6 | Dividends received | 115 | 334 | 201 | 449 | 564 | |||||||||||||||||||||||||
| (47) | (36) | (18) | (1) | (35) | Additions to other investments | (636) | (22) | (322) | (658) | (772) | |||||||||||||||||||||||||
| — | 11 | — | — | 11 | Disposals of other investments | 202 | — | — | 202 | — | |||||||||||||||||||||||||
| (6) | (21) | — | (22) | 1 | Acquisition of equity-accounted investment2 | — | (396) | — | (396) | (92) | |||||||||||||||||||||||||
| (5) | (10) | (4) | (3) | (7) | Contributions to environmental rehabilitation funds | (128) | (57) | (63) | (185) | (86) | |||||||||||||||||||||||||
| (11) | — | 1 | — | — | Payment of deferred/contingent payment1 | — | — | — | — | (185) | |||||||||||||||||||||||||
| (1) | — | — | — | — | Contributions to enterprise development fund | — | — | — | — | (10) | |||||||||||||||||||||||||
| (4) | — | (4) | — | — | Cash outflow on loss of control of subsidiary | — | — | (58) | — | (58) | |||||||||||||||||||||||||
| 4 | — | 4 | — | — | Proceeds on sale of Lonmin Canada | — | — | 72 | — | 72 | |||||||||||||||||||||||||
| 2 | 17 | — | 17 | — | Proceeds from environmental rehabilitation funds | 14 | 308 | — | 322 | 33 | |||||||||||||||||||||||||
| (1,062) | (1,197) | (574) | (570) | (627) | Net cash used in investing activities | (11,659) | (10,379) | (9,850) | (22,038) | (17,374) | |||||||||||||||||||||||||
| Cash flow from financing activities | |||||||||||||||||||||||||||||||||||
| 489 | 783 | 132 | 55 | 728 | Loans raised3 | 11 | 13,431 | 1,000 | 2,500 | 14,431 | 8,000 | ||||||||||||||||||||||||
| (489) | (72) | (132) | (55) | (17) | Loans repaid | 11 | (315) | (1,008) | (2,502) | (1,323) | (8,003) | ||||||||||||||||||||||||
| (8) | (12) | (3) | (6) | (6) | Lease payments | (117) | (102) | (59) | (219) | (131) | |||||||||||||||||||||||||
| (205) | (55) | (205) | (55) | — | Acquisition of NCI4 | — | (1,009) | (3,363) | (1,009) | (3,363) | |||||||||||||||||||||||||
| — | 60 | — | 60 | — | Proceeds from NCI on rights issue | 10.2 | — | 1,096 | — | 1,096 | — | ||||||||||||||||||||||||
| (213) | 704 | (208) | (1) | 705 | Net cash from/(used) in financing activities | 12,999 | (23) | (3,424) | 12,976 | (3,497) | |||||||||||||||||||||||||
| (326) | (108) | (118) | (299) | 191 | Net increase/(decrease) in cash and cash equivalents | 3,492 | (5,459) | (2,120) | (1,967) | (5,328) | |||||||||||||||||||||||||
| (43) | (47) | (24) | (56) | 9 | Effect of exchange rate fluctuations on cash held | (91) | 1,542 | 948 | 1,451 | 1,112 | |||||||||||||||||||||||||
| 1,900 | 1,531 | 1,673 | 1,531 | 1,176 | Cash and cash equivalents at beginning of the period | 22,159 | 26,076 | 27,248 | 26,076 | 30,292 | |||||||||||||||||||||||||
| 1,531 | 1,376 | 1,531 | 1,176 | 1,376 | Cash and cash equivalents at end of the period | 25,560 | 22,159 | 26,076 | 25,560 | 26,076 | |||||||||||||||||||||||||
| 16.37 | 18.42 | 17.33 | 18.21 | 18.62 | Average R/US$ rate | ||||||||||||||||||||||||||||||
| 17.03 | 18.57 | 17.03 | 18.85 | 18.57 | Closing R/US$ rate | ||||||||||||||||||||||||||||||
1 Included in the payments made for the year ended 31 December 2023 and six months ended 30 June 2023 is R3,606 million (year ended 31 December 2022: R4,441 million) and R127 million (year ended 2022: R179 million) related to the Rustenburg operation acquisition (Rustenburg deferred payment) and Pandora acquisition, respectively. The payments for the year ended 31 December 2022 also include R110 million related to the SFA (Oxford) acquisition. Payments made up to the original fair value of the liability are classified as investing cash flows, with any amount paid above the original fair value of the liability classified as operating cash flows
2 The amount includes cash consideration paid amounting to R373 million (A$30 million) for additional shares acquired in Century on 21 February 2023 (see note 10.1)
3 Loans raised for the year and six months ended 31 December 2023 includes the derivative financial instrument related to the US$ Convertible Bond of R1,673 million
4 This consists of cash consideration paid of R906 million in respect of NCI shareholders of Century (see note 10.1) and R103 million in respect of the voluntary offers to NCI shareholders of Keliber (see note 10.2)
Sibanye-Stillwater Operating and financial results | Six months and year ended 31 December 2023 34
Notes to the condensed consolidated financial statements
1. Basis of accounting and preparation
The condensed consolidated financial statements are prepared in accordance with the requirements of the JSE Listings Requirements for condensed financial statements and the requirements of the Companies Act of South Africa. The JSE Listings Requirements require condensed financial statements to be prepared in accordance with framework concepts, and the measurement and recognition requirements of International Financial Reporting Standards (IFRS), and the South African Institute of Chartered Accountants Financial Reporting Guides as issued by the Accounting Practices Committee and Financial Pronouncements as issued by the Financial Reporting Standards Council and to also, as a minimum, contain information required by IAS 34 Interim Financial Reporting. The accounting policies applied in the preparation of these condensed consolidated financial statements are in terms of IFRS and are consistent with those applied in the previous consolidated annual financial statements, included in the 31 December 2022 annual financial report.
The condensed consolidated income statement, and statements of other comprehensive income and cash flows for the six months ended
31 December 2022 were not reviewed by the Company’s external auditor and were prepared by subtracting the condensed consolidated financial statements for the six months ended 30 June 2022 from the comprehensive consolidated financial statements for the year ended 31 December 2022. The condensed consolidated income statement, and statements of other comprehensive income and cash flows for the six months ended 31 December 2023 have not been reviewed by the Company’s external auditor and were prepared by subtracting the condensed consolidated financial statements for the six months ended 30 June 2023 from the condensed consolidated financial statements for the year ended 31 December 2023.
31 December 2022 were not reviewed by the Company’s external auditor and were prepared by subtracting the condensed consolidated financial statements for the six months ended 30 June 2022 from the comprehensive consolidated financial statements for the year ended 31 December 2022. The condensed consolidated income statement, and statements of other comprehensive income and cash flows for the six months ended 31 December 2023 have not been reviewed by the Company’s external auditor and were prepared by subtracting the condensed consolidated financial statements for the six months ended 30 June 2023 from the condensed consolidated financial statements for the year ended 31 December 2023.
The translation of the primary statements into US dollar is based on the average exchange rate for the period for the condensed consolidated income statement, statements of other comprehensive income and cash flows, and the period-end closing exchange rate for the statement of financial position. Exchange differences on translation are accounted for in the statement of other comprehensive income. This information is provided as supplementary information only and has not been reviewed by the Company's external auditor.
1.1 Standards, interpretations and amendments to published standards effective on 1 January 2023 and those issued but not yet effective
The amendments to published standards effective on 1 January 2023 and adopted by the Sibanye Stillwater Limited (Sibanye-Stillwater) group (the Group) did not have a material effect on the Group’s condensed consolidated financial statements for the year ended 31 December 2023. Standards, interpretations and amendments to published standards not yet effective on 1 January 2023 are not expected to have a material effect on the Group.
2. Revenue
The Group’s sources of revenue are:
| Figures in million - SA rand | Six months ended | Year ended | ||||||||||||||||||
| Unaudited | Unaudited | Unaudited | Unaudited | Unaudited | ||||||||||||||||
| Dec 2023 | June 2023 | Dec 2022 | Dec 2023 | Dec 2022 | ||||||||||||||||
| Gold mining activities | 13,882 | 15,261 | 11,861 | 29,143 | 17,842 | |||||||||||||||
PGM mining activities1 | 30,393 | 35,882 | 39,017 | 66,275 | 84,359 | |||||||||||||||
| Nickel refining activities | 1,347 | 1,677 | 967 | 3,024 | 3,140 | |||||||||||||||
Century zinc retreatment operation2 | 1,742 | 838 | — | 2,580 | — | |||||||||||||||
| Recycling activities (US PGM) | 5,626 | 7,692 | 15,949 | 13,318 | 32,267 | |||||||||||||||
Stream1 | 321 | 188 | 97 | 509 | 338 | |||||||||||||||
| Toll treatment arrangement (SA PGM) | — | — | — | — | 105 | |||||||||||||||
| Total revenue from contracts with customers | 53,311 | 61,538 | 67,891 | 114,849 | 138,051 | |||||||||||||||
Adjustments relating to sales of SA PGM concentrate provisional pricing3 | (198) | (638) | 18 | (836) | 237 | |||||||||||||||
Adjustments relating to zinc operation provisional pricing3 | 3 | (332) | — | (329) | — | |||||||||||||||
| Total revenue | 53,116 | 60,568 | 67,909 | 113,684 | 138,288 | |||||||||||||||
1 The difference between revenue from PGM mining activities above and total revenue from PGM mining activities per the segment report relates to the separate disclosure of revenue from the gold and palladium streaming arrangement with Wheaton Precious Metals International (Wheaton International) (Wheaton Stream) in the above. Revenue relating to the Wheaton Stream is incorporated in the Group corporate segment as described in the segment report (see note 18)
2 The difference between revenue from zinc retreatment operations above and total revenue from zinc retreatment operations per the segment report relates to the separate disclosure of revenue related to adjustments on the provisional pricing on zinc sales
3 These adjustments relate to provisional pricing arrangements resulting in subsequent changes to the amount of revenue recognised
Revenue per geographical region of the relevant operations:
| Figures in million - SA rand | Six months ended | Year ended | ||||||||||||||||||
| Unaudited | Unaudited | Unaudited | Unaudited | Unaudited | ||||||||||||||||
| Dec 2023 | June 2023 | Dec 2022 | Dec 2023 | Dec 2022 | ||||||||||||||||
| Southern Africa (SA) | 39,125 | 45,611 | 45,267 | 84,736 | 89,507 | |||||||||||||||
| United States (US) | 10,899 | 12,774 | 21,675 | 23,673 | 45,641 | |||||||||||||||
| Europe (EU) | 1,347 | 1,677 | 967 | 3,024 | 3,140 | |||||||||||||||
| Australia (AUS) | 1,745 | 506 | — | 2,251 | — | |||||||||||||||
| Total revenue | 53,116 | 60,568 | 67,909 | 113,684 | 138,288 | |||||||||||||||
Sibanye-Stillwater Operating and financial results | Six months and year ended 31 December 2023 35
Percentage of revenue per segment based on the geographical location of customers purchasing from the Group:
| Six months ended | Year ended | ||||||||||||||||
| Unaudited | Unaudited | Unaudited | Unaudited | Unaudited | |||||||||||||
| Dec 2023 | June 2023 | Dec 2022 | Dec 2023 | Dec 2022 | |||||||||||||
| Gold | ||
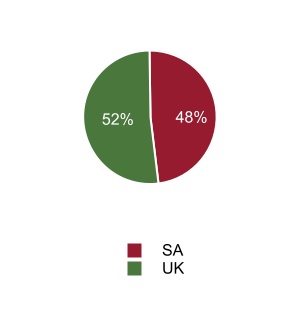
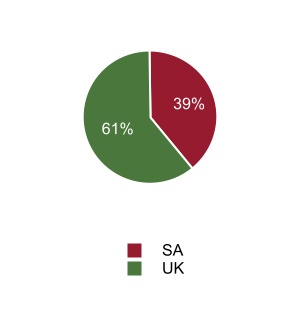
| PGM | ||
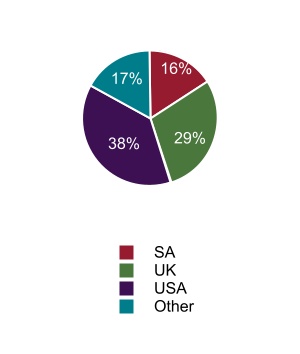
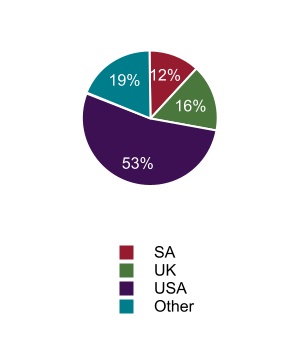
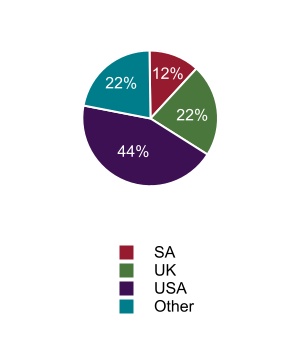
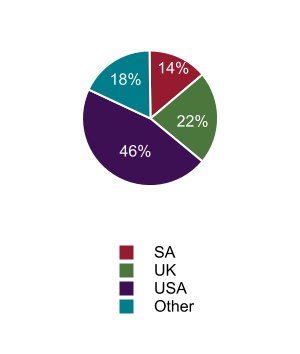
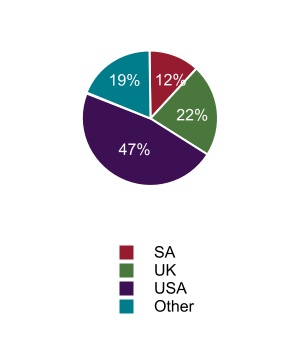
| Sandouville nickel refinery | ||
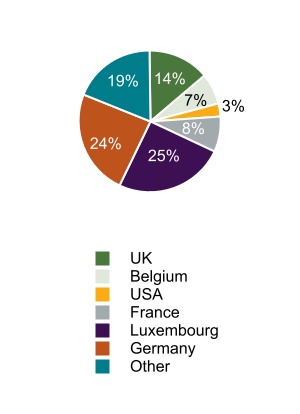

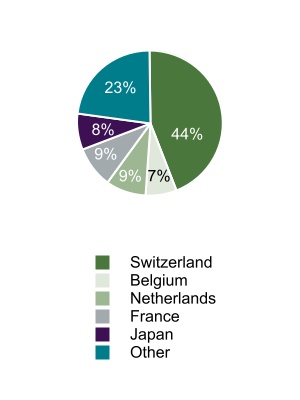
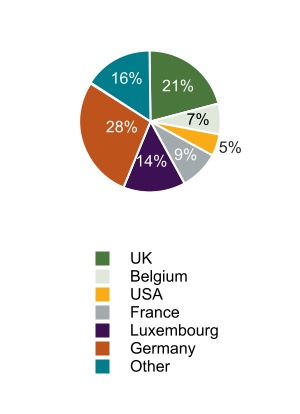
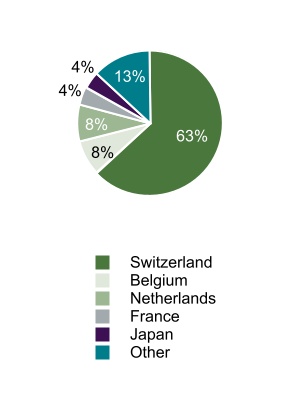
| Century zinc retreatment operation | ||
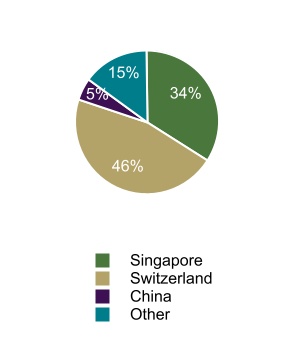
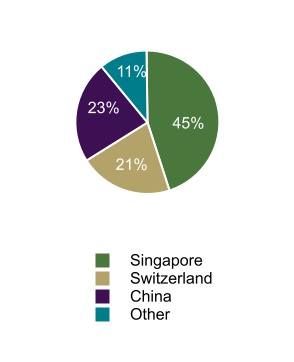
Sibanye-Stillwater Operating and financial results | Six months and year ended 31 December 2023 36
Revenue generated per product:
| Figures in million - SA rand | Six months ended | Year ended | ||||||||||||||||||
| Unaudited | Unaudited | Unaudited | Unaudited | Unaudited | ||||||||||||||||
| Dec 2023 | June 2023 | Dec 2022 | Dec 2023 | Dec 2022 | ||||||||||||||||
| Gold | 14,450 | 15,807 | 12,287 | 30,257 | 18,812 | |||||||||||||||
| PGMs | 31,770 | 39,320 | 52,278 | 71,090 | 111,070 | |||||||||||||||
| Platinum | 10,171 | 9,604 | 8,817 | 19,775 | 17,826 | |||||||||||||||
| Palladium | 11,975 | 13,296 | 19,540 | 25,271 | 42,275 | |||||||||||||||
| Rhodium | 7,528 | 14,463 | 22,124 | 21,991 | 47,166 | |||||||||||||||
| Iridium | 1,530 | 1,353 | 1,152 | 2,883 | 2,480 | |||||||||||||||
| Ruthenium | 566 | 604 | 645 | 1,170 | 1,323 | |||||||||||||||
| Chrome | 2,947 | 2,218 | 1,675 | 5,165 | 3,481 | |||||||||||||||
Nickel1 | 1,902 | 2,432 | 1,540 | 4,334 | 4,305 | |||||||||||||||
Zinc2 | 1,643 | 483 | — | 2,126 | — | |||||||||||||||
Other3 | 404 | 308 | 129 | 712 | 620 | |||||||||||||||
| Total revenue | 53,116 | 60,568 | 67,909 | 113,684 | 138,288 | |||||||||||||||
1 For the year and six months ended 31 December 2023, Nickel includes R560 million and R237 million Nickel salts, respectively (R323 million and R419 million for the six months ended 30 June 2023 and six months ended 31 December 2022, respectively) and R2,343 million and R1,036 million Nickel metal, respectively (R1,307 million and R424 million for the six months ended 30 June 2023 and six months ended 31 December 2022, respectively) sold from the Sandouville nickel refinery. The remaining Nickel is sold from the Group's SA PGM and US PGM operations
2 Zinc sales are from the Century zinc retreatment operation since the effective date of acquisition (see note 10.1)
3 Other primarily includes revenue from silver, cobalt and copper sales
3. Finance expense
| Figures in million - SA rand | Six months ended | Year ended | ||||||||||||||||||
| Unaudited | Unaudited | Unaudited | Unaudited | Unaudited | ||||||||||||||||
| Notes | Dec 2023 | June 2023 | Dec 2022 | Dec 2023 | Dec 2022 | |||||||||||||||
| Interest charge on: | ||||||||||||||||||||
| Borrowings — interest | 11 | (617) | (575) | (515) | (1,192) | (1,046) | ||||||||||||||
| - US$1 billion revolving credit facility (RCF) | (27) | (46) | — | (73) | — | |||||||||||||||
| - US$600 million RCF | — | (20) | (34) | (20) | (62) | |||||||||||||||
| - R5.5 billion RCF | (75) | (50) | (40) | (125) | (155) | |||||||||||||||
| - 2026 and 2029 Notes | (473) | (459) | (441) | (932) | (829) | |||||||||||||||
| - US$ Convertible Bond | (36) | — | — | (36) | — | |||||||||||||||
| - Other borrowings | (6) | — | — | (6) | — | |||||||||||||||
| Borrowings — unwinding of amortised cost | 11 | (204) | (155) | (116) | (359) | (216) | ||||||||||||||
| - 2026 and 2029 Notes | (41) | (39) | (36) | (80) | (68) | |||||||||||||||
| - Burnstone Debt | (136) | (116) | (80) | (252) | (148) | |||||||||||||||
| - US$ Convertible Bond | (27) | — | — | (27) | — | |||||||||||||||
| Lease liabilities | (22) | (21) | (14) | (43) | (31) | |||||||||||||||
| Environmental rehabilitation obligation | (386) | (372) | (309) | (758) | (611) | |||||||||||||||
| Occupational healthcare obligation | (35) | (35) | (45) | (70) | (85) | |||||||||||||||
| Rustenburg deferred payment | — | (85) | (92) | (85) | (266) | |||||||||||||||
| Marikana dividend obligation | (114) | (122) | (76) | (236) | (165) | |||||||||||||||
| Deferred revenue | (154) | (173) | (172) | (327) | (326) | |||||||||||||||
| Other | (83) | (146) | (39) | (229) | (94) | |||||||||||||||
| Total finance expense | (1,615) | (1,684) | (1,378) | (3,299) | (2,840) | |||||||||||||||
4. (Loss)/gain on financial instruments
| Figures in million - SA rand | Six months ended | Year ended | ||||||||||||||||||
| Unaudited | Unaudited | Unaudited | Unaudited | Unaudited | ||||||||||||||||
| Notes | Dec 2023 | June 2023 | Dec 2022 | Dec 2023 | Dec 2022 | |||||||||||||||
Fair value gain/(loss) on palladium hedge contract1 | — | 72 | (150) | 72 | (241) | |||||||||||||||
Fair value (loss)/gain on gold hedge contracts2 | (184) | 44 | — | (140) | — | |||||||||||||||
Fair value (loss)/gain on zinc hedge contracts3 | (132) | 623 | — | 491 | — | |||||||||||||||
| Fair value loss on derivative financial instrument | 11 | (2,136) | — | — | (2,136) | — | ||||||||||||||
Fair value gain/(loss) on share-based payment obligations4 | 2,075 | (486) | (1,860) | 1,589 | (2,155) | |||||||||||||||
| Loss on the revised cash flow of the Rustenburg deferred payment | — | (4) | (773) | (4) | (773) | |||||||||||||||
| Gain/(loss) on the revised cash flow of the Burnstone Debt | 11 | 32 | — | (776) | 32 | (776) | ||||||||||||||
| Gain/(loss) on the revised cash flow of the Marikana dividend obligation | 537 | 11 | (625) | 548 | (650) | |||||||||||||||
| Fair value loss on contingent consideration (related to the Kroondal acquisition) | (137) | — | — | (137) | — | |||||||||||||||
| Fair value gain on other investments | 14 | 102 | 129 | 116 | 152 | |||||||||||||||
| Other | (205) | 9 | 175 | (196) | 164 | |||||||||||||||
| Total (loss)/gain on financial instruments | (136) | 371 | (3,880) | 235 | (4,279) | |||||||||||||||
1 On 17 January 2020, Stillwater Mining Company (wholly owned subsidiary of Sibanye-Stillwater) concluded a palladium hedge agreement which commenced on 28 February 2020, comprising the delivery of 240,000 ounces of palladium over two years (10,000 ounces per month) with a zero cost collar which establishes a minimum and a maximum cap of US$1,500 and US$3,400 per ounce, respectively. The hedge agreement concluded on 31 January 2022. On 24 March 2021, Stillwater Mining Company concluded an additional palladium hedge agreement commencing on 28 February 2022, comprising the delivery of 140,000 ounces of palladium over a fourteen month period (10,000 ounces per month) with a zero cost collar which establishes a minimum floor and a maximum cap of US$1,800 and US$3,300 per ounce, respectively. The hedge agreement concluded in March 2023. As hedge accounting is not applied, resulting gains or losses are accounted for as gains or losses on financial instruments in profit or loss
2 On 3 May 2023, Sibanye Gold Proprietary Limited concluded a gold hedge agreement which commenced on 4 May 2023. The agreement is structured at monthly average prices, comprising the delivery of 154,320 ounces of gold over 12 months (12,860 ounces per month) with a zero cost collar which establishes a floor and cap of R34,214 and R46,050 per ounce, respectively. On 17 November 2023, Sibanye Gold Proprietary Limited concluded two additional gold hedge agreements which commenced on 17 November 2023. The agreements are structured at monthly average prices, comprising the delivery of 120,000 and 240,000 ounces of gold over 12 months, respectively. The agreements have a zero cost collar which establishes a floor of R34,214 per
Sibanye-Stillwater Operating and financial results | Six months and year ended 31 December 2023 37
ounce for both agreements and cap of R43,545 and R43,800 per ounce, respectively. As hedge accounting is not applied, resulting gains or losses are accounted for as gains or losses on financial instruments in profit or loss
3 Century concluded a hedge agreement on 15 June 2021 for 90,000 tonnes of payable zinc over three years which commenced July 2021 to June 2024 in equal monthly deliveries (2,500 tonnes per month) at a fixed monthly price of A$3,717/t net of all fees and costs. In November 2021, Century concluded an additional hedge agreement for 90,000 tonnes of payable zinc for two years (3,750 tonnes per month) which commenced January 2022 to December 2023 at a fixed price of A$3,938/t net of all fees and costs. As hedge accounting is not applied, resulting gains or losses are accounted for as gains or losses on financial instruments in profit or loss
4 The fair value gain relates to the cash-settled share-based payment obligations in respect of the Rustenburg operation B-BBEE transaction and the Marikana B-BBEE transaction (see note 13)
5. Other costs and other income
5.1 Other costs
| Figures in million - SA rand | Six months ended | Year ended | ||||||||||||||||||
| Unaudited | Unaudited | Unaudited | Unaudited | Unaudited | ||||||||||||||||
| Note | Dec 2023 | June 2023 | Dec 2022 | Dec 2023 | Dec 2022 | |||||||||||||||
| Care and maintenance | (594) | (784) | (436) | (1,378) | (794) | |||||||||||||||
| Corporate and social investment costs | (86) | (63) | (76) | (149) | (237) | |||||||||||||||
| Cost incurred on employee and community trusts | (469) | — | (360) | (469) | (429) | |||||||||||||||
| Exploration costs | (74) | (109) | (4) | (183) | (12) | |||||||||||||||
| Non-mining royalties | (30) | (54) | (160) | (84) | (235) | |||||||||||||||
| Strike related costs | — | (3) | (35) | (3) | (258) | |||||||||||||||
| Service entity costs | (92) | (274) | (336) | (366) | (569) | |||||||||||||||
| Onerous contract provision | 12 | (1,865) | — | — | (1,865) | — | ||||||||||||||
| Loss on deconsolidation of a subsidiary | — | — | (309) | — | (309) | |||||||||||||||
| Other | (904) | (457) | (533) | (1,361) | (836) | |||||||||||||||
| Total other costs | (4,114) | (1,744) | (2,249) | (5,858) | (3,679) | |||||||||||||||
5.2 Other income
| Figures in million - SA rand | Six months ended | Year ended | ||||||||||||||||||
| Unaudited | Unaudited | Unaudited | Unaudited | Unaudited | ||||||||||||||||
| Dec 2023 | June 2023 | Dec 2022 | Dec 2023 | Dec 2022 | ||||||||||||||||
| Change in estimate of environmental rehabilitation obligation, and right of recovery receivable and payable | 45 | — | 71 | 45 | 71 | |||||||||||||||
| Service entity income | 240 | 257 | 234 | 497 | 464 | |||||||||||||||
| Sundry income | 260 | 127 | (67) | 387 | 429 | |||||||||||||||
| Profit on sale of Lonmin Canada | — | — | 145 | — | 145 | |||||||||||||||
| Gain on remeasurement of previous interest in Kroondal | 298 | — | — | 298 | — | |||||||||||||||
| Gain on increase in equity-accounted investment | 3 | 2 | — | 5 | — | |||||||||||||||
| Gain on deregistration of a subsidiary | — | — | — | — | 1 | |||||||||||||||
| Total other income | 846 | 386 | 383 | 1,232 | 1,110 | |||||||||||||||
6. (Impairments)/reversal of impairments
The Group performed its annual impairment testing for goodwill and cash-generating units (CGUs) where impairment indicators were present at
31 December 2023. The below table is a breakdown of the (impairments)/reversal of impairments recognised for each period ended.
31 December 2023. The below table is a breakdown of the (impairments)/reversal of impairments recognised for each period ended.
| Figures in million - SA rand | Six months ended | Year ended | ||||||||||||||||||
| Unaudited | Unaudited | Unaudited | Unaudited | Unaudited | ||||||||||||||||
| Dec 2023 | June 2023 | Dec 2022 | Dec 2023 | Dec 2022 | ||||||||||||||||
| Impairment of mining assets and goodwill | (47,004) | (9) | (1) | (47,013) | (1) | |||||||||||||||
Impairment of investment in equity-accounted investee1 | (423) | — | — | (423) | — | |||||||||||||||
| Impairment of loan to equity-accounted investee | (18) | — | — | (18) | — | |||||||||||||||
| Other reversal of impairment | — | — | 7 | — | 7 | |||||||||||||||
| Total (impairments)/reversal of impairments | (47,445) | (9) | 6 | (47,454) | 6 | |||||||||||||||
1 A 5.3% decrease in the expected life of mine average recovered grade due to plant recoveries being affected by a change in the mineralogy of the ore, combined with above inflationary increases in working costs, resulted in a decrease in the expected future net cash flows from Mimosa. The lower value in use led to an after tax equity accounted impairment of property, plant and equipment amounting to R1,384 million (see note 8.3) and the further impairment of the investment in the equity-accounted investee of R423 million (included in SA PGM in the segment report — see note 18). The weighted average PGM (4E) basket price, nominal discount rate and life-of-mine used in the Mimosa impairment assessment was R26,632/4Eoz, 31.2% and 11 years, respectively. The recoverable amount was determined as R2,757 million
The impairment of mining assets and goodwill for the year ended 31 December 2023 relates to the following classes of assets:
| Figures in million - SA rand | Year ended | ||||||||||||||||||||||
| Unaudited | |||||||||||||||||||||||
Stillwater1 | Sandouville nickel refinery2 | Century retreatment operation3 | Burnstone4 | Kloof5 | Other1 | Total | |||||||||||||||||
| Mine development, infrastructure and other | 10,222 | 1,430 | 2,434 | 1,115 | 1,616 | 27 | 16,844 | ||||||||||||||||
| Land, mineral rights and rehabilitation | 20,326 | 67 | 843 | — | — | — | 21,236 | ||||||||||||||||
| Exploration and evaluation assets | — | — | 412 | — | — | — | 412 | ||||||||||||||||
| Intangible assets | — | 86 | — | — | — | — | 86 | ||||||||||||||||
| Goodwill | 8,352 | 23 | — | — | — | 60 | 8,435 | ||||||||||||||||
| Total impairment | 38,900 | 1,606 | 3,689 | 1,115 | 1,616 | 87 | 47,013 | ||||||||||||||||
Sibanye-Stillwater Operating and financial results | Six months and year ended 31 December 2023 38
1 Various operational constraints, as previously reported, in the ramp-up of the Blitz project, coupled with higher than inflation increases in operating costs and a decrease in medium to long-term forecast palladium prices, resulted in a decrease in the expected future net cash flows from the US PGM operation. The higher weighted average cost of capital, driven by a higher beta, in combination with the aforementioned factors, contributed to the reduced value in use at year end, which led to an impairment of property, plant and equipment and goodwill amounting to R38,900 million. In addition, goodwill allocated to the US PGM operation amounting to R60 million pertaining to the acquisition of SFA (Oxford) was impaired
2 An onerous supply contract (see note 12), higher fixed and variable costs, significantly reduced expected sustainable production volumes and higher than initially expected sustaining capital expenditure, resulted in the decrease in expected future net cash flows from the Sandouville nickel refinery. This, together with lower nickel prices, reduced the value in use at year end and led to an impairment of property, plant and equipment, intangible assets and goodwill amounting to R1,606 million. Further studies are currently ongoing to determine the future optimal usage of infrastructure at the Sandouville nickel refinery
3 Lower than expected production volumes, above inflationary increases in operating costs, higher sustaining capital, the approaching end of life-of-mine and the diminishing window of opportunity to develop and operate the expansion projects concurrent with the ongoing operation, resulted in a decrease in the expected future net cash flows from the Century zinc retreatment operation. The lower value in use led to an impairment of property, plant and equipment amounting to R3,689 million
4 Consistent with the requirements of the Group’s capital allocation framework, the Burnstone project (included in the SA Gold corporate and reconciling items reportable segment) will be delayed and is expected to ramp-up again during 2025. The additional costs during the delay, the deferral of mine ramp-up and higher weighted average cost of capital due to an increase in the beta, risk free rate and cost of debt, has resulted in a decrease in the expected future net cash flows from Burnstone. The lower value in use led to an impairment of property, plant and equipment amounting to R1,115 million
5 Operational constraints, including seismicity and cooling, at the Kloof 4 shaft, compounded by the shaft incident during H2 2023 that damaged the shaft infrastructure, resulted in a severe deterioration in productivity that negatively impacted the financial viability of the Kloof 4 shaft. Consequently, during 2023, following a consultative process, the Group announced the closure of Kloof 4 shaft, which led to the specific impairment of property, plant and equipment amounting to R1,616 million
The assumptions applied in the value in use impairment calculation as well as the recoverable amount for each of the CGUs impacted by the impairments are set out below:
| Unaudited | |||||||||||||||||
| Stillwater | Sandouville nickel refinery | Century retreatment operation | Burnstone | ||||||||||||||
Weighted average PGM (2E) basket price1 | US$/2Eoz | 1,281 | |||||||||||||||
Weighted average nickel price1 | US$/lbs | 8.9 | |||||||||||||||
Weighted average cobalt price1 | US$/lbs | 15.8 | |||||||||||||||
Weighted average zinc price1 | A$/t | 3,873 | |||||||||||||||
Weighted average gold price1 | R/kg | 1,012,625 | |||||||||||||||
Inflation rate2 | % | 2.5 | 1.6 | 2.9 | 6.0 | ||||||||||||
Nominal discount rate3 | % | 12.0 | 7.4 | 9.3 | 18.9 | ||||||||||||
Life-of-mine4 (life-of-refinery) | years | 46 | 23 | 4 | 25 | ||||||||||||
| Recoverable amount | R' million | 22,246 | — | — | 3,799 | ||||||||||||
1 The weighted average commodity prices and exchange rate were derived by considering various bank and commodity broker consensus forecasts
2 The inflation rate is based on the expected forecast inflation rate for the geographic region which most affects the CGU's cash flows
3 The nominal discount rate is calculated as the weighted average cost of capital of the respective CGUs
4 Periods longer than five years are considered appropriate based on the nature of the operations since a formally approved life-of-mine plan is used to determine cash flows over the life of each mine based on the available reserves
Group impairment assumptions
The annual life-of-mine plan, used in the annual impairment assessments, takes into account the following:
•Proved and probable ore reserves of the CGUs
•Cash flows based on the life-of-mine plan
•Sustaining capital expenditure estimates over the life-of-mine plan
The Group's estimates and assumptions used in the 31 December 2023 calculations include:
| Gold operations | PGM operations | Europe (Sandouville nickel refinery)1 | Australia | |||||||||||||||||||||||
| Unaudited | Unaudited | Unaudited | Unaudited | Unaudited | Unaudited | Unaudited | ||||||||||||||||||||
| Dec 2023 | Dec 2022 | Dec 2023 | Dec 2022 | Dec 2023 | Dec 2022 | Dec 2023 | ||||||||||||||||||||
Average gold price2 | R/kg | 1,072,364 | 869,035 | |||||||||||||||||||||||
Average PGM (4E) basket price2 | R/4Eoz | 29,124 | 27,566 | |||||||||||||||||||||||
Average PGM (2E) basket price2 | US$/2Eoz | 1,281 | 1,334 | |||||||||||||||||||||||
Average nickel price2 | US$/lbs | 8.9 | 8.3 | |||||||||||||||||||||||
Average cobalt price2 | US$/lbs | 15.8 | 22.1 | |||||||||||||||||||||||
Average zinc price2 | A$/t | 3,873 | ||||||||||||||||||||||||
Nominal discount rate — South Africa3, 4 | % | 13.7 - 15.8 | 13.9 - 15.8 | 22.5 - 22.7 | 22.5 - 22.6 | |||||||||||||||||||||
Nominal discount rate — United States4 | % | 12.0 | 12.9 | |||||||||||||||||||||||
Nominal discount rate — Europe4 | % | 7.4 | 9.8 | |||||||||||||||||||||||
Nominal discount rate — Australia4 | % | 9.3 | ||||||||||||||||||||||||
Inflation rate — South Africa5 | % | 6.0 | 6.5 | 6.0 | 6.5 | |||||||||||||||||||||
Inflation rate — United States5 | % | 2.5 | 4.0 | |||||||||||||||||||||||
Inflation rate — Europe5 | % | 1.6 | 2.5 | |||||||||||||||||||||||
Inflation rate — Australia5 | % | 2.9 | ||||||||||||||||||||||||
Life-of-mine6 | years | 4 - 11 | 4 - 10 | 14 - 47 | 15 - 49 | 23 | 24 | 4 | ||||||||||||||||||
1 The Keliber impairment assessment at 31 December 2023 applied an average lithium hydroxide price of US$22,933/t, nominal discount rate of 10.1%, inflation rate of 2% and a life-of-mine of 24 years
2 The average prices and the exchange rate were derived by considering various bank and commodity broker consensus forecasts. The average gold price used in the impairment assessment of the Burnstone project was R1,012,625/kg (2022: R793,473/kg) and weighted average PGM (4E) basket price used for the Mimosa equity-accounted joint venture was R26,632/4Eoz (2022: R25,420/4Eoz)
3 Nominal discount rate for the Burnstone project is 18.9% (2022: 17.4%) and for the equity-accounted joint venture Mimosa, 31.2% (2022: 30.7%)
4 The nominal discount rate is calculated as the weighted average cost of capital of the respective CGUs
5 The inflation rate is based on the expected forecast inflation rate in the geographical region which most affects the CGU's cash flows
6 Periods longer than five years are considered appropriate based on the nature of the operations since a formally approved life-of-mine plan is used to determine cash flows over the life of each mine based on the available reserves
Results of impairment assessments for the Group's gold operations, SA PGM operations and goodwill allocated to other CGUs
Other than the impairments described above, no further impairment was identified for the Group's gold and SA PGM CGUs or any other CGUs with allocated goodwill. However, holding all other assumptions constant, a decrease in the average gold price used for Kloof (R1,064,988/kg) exceeding 6.3% will result in impairment. Management believes that currently, there are no reasonably possible changes in the assumptions above, which would lead to an impairment of any of the Group's CGUs, other than Kloof.
Sibanye-Stillwater Operating and financial results | Six months and year ended 31 December 2023 39
7. Mining and income tax
| Figures in million - SA rand | Six months ended | Year ended | ||||||||||||||||||
| Unaudited | Unaudited | Unaudited | Unaudited | Unaudited | ||||||||||||||||
| Dec 2023 | June 2023 | Dec 2022 | Dec 2023 | Dec 2022 | ||||||||||||||||
| Tax on profit before tax at maximum South African statutory company tax rate (27%) | 13,617 | (2,859) | (2,782) | 10,758 | (7,813) | |||||||||||||||
| South African gold mining tax formula rate adjustment | 47 | 189 | 77 | 236 | 19 | |||||||||||||||
US statutory tax rate adjustment1 | (2,154) | (22) | 32 | (2,176) | 181 | |||||||||||||||
US state tax adjustment1 | 1,081 | 40 | 11 | 1,121 | (168) | |||||||||||||||
| Deferred tax rate differentials | — | — | 16 | — | 16 | |||||||||||||||
| Non-deductible amortisation and depreciation | (1) | (1) | 43 | (2) | (2) | |||||||||||||||
| Non-taxable dividend received | 1 | — | 4 | 1 | 4 | |||||||||||||||
| Non-deductible finance expense | (95) | (85) | (104) | (180) | (196) | |||||||||||||||
| Non-deductible share-based payments | (4) | (3) | (3) | (7) | (7) | |||||||||||||||
| (Non-deductible loss)/non-taxable gain on fair value of financial instruments | 39 | (140) | (906) | (101) | (976) | |||||||||||||||
Non-taxable gain on foreign exchange differences2 | 52 | 411 | 15 | 463 | 22 | |||||||||||||||
| Non-taxable share of results of equity-accounted investees | (388) | 71 | 145 | (317) | 360 | |||||||||||||||
| Non-taxable gain on acquisition | 243 | — | — | 243 | — | |||||||||||||||
| (Non-deductible impairments)/non-taxable reversal of impairments | (2,392) | — | 1 | (2,392) | 1 | |||||||||||||||
| Non-deductible transaction costs | (114) | (44) | (76) | (158) | (76) | |||||||||||||||
| Tax adjustment in respect of prior periods | 12 | (2) | — | 10 | (35) | |||||||||||||||
| Net other non-taxable income and non-deductible expenditure | 30 | (302) | 129 | (272) | 324 | |||||||||||||||
| Change in estimated deferred tax rate | (1,467) | 741 | (270) | (726) | 53 | |||||||||||||||
(Unrecognised deferred tax assets)/unrecognised deferred tax assets recognised2,3 | (3,287) | (798) | 372 | (4,085) | (631) | |||||||||||||||
| Mining and income tax | 5,220 | (2,804) | (3,296) | 2,416 | (8,924) | |||||||||||||||
| Effective tax rate | 10 | % | 26 | % | 33 | % | 6 | % | 32 | % | ||||||||||
1 The US statutory rate adjustment relates to the difference between the US federal tax rate (21%) and the South African statutory company tax rate (27%). The US is also subject to state taxes for which adjustment has been made
2 A non-taxable gain on foreign exchange differences for the six months ended 30 June 2023 amounting to R402 million was reclassified from unrecognised deferred tax to conform to current period changes in presentation
3 The amount for the year ended 31 December 2023 relates mainly to unrecognised deferred tax assets at Sandouville nickel refinery, Century, Burnstone, Cooke and Sibanye Gold Proprietary Limited (SGL) amounting to R3,775 million. The amount for the year ended 31 December 2022 mainly included deferred tax assets not recognised at SGL, Burnstone and Cooke of R1,217 million, which was offset by previously derecognised deferred tax assets recognised at SGL of R644 million
8. Earnings per share
8.1 Basic earnings per share
| Six months ended | Year ended | |||||||||||||||||||
| Unaudited | Unaudited | Unaudited | Unaudited | Unaudited | ||||||||||||||||
| Dec 2023 | June 2023 | Dec 2022 | Dec 2023 | Dec 2022 | ||||||||||||||||
| Ordinary shares in issue (’000) | 2,830,567 | 2,830,567 | 2,830,370 | 2,830,567 | 2,830,370 | |||||||||||||||
| Adjustment for weighting of ordinary shares in issue (’000) | — | (79) | (173) | (39) | (4,285) | |||||||||||||||
| Adjusted weighted average number of shares (’000) | 2,830,567 | 2,830,488 | 2,830,197 | 2,830,528 | 2,826,085 | |||||||||||||||
| (Loss)/profit attributable to owners of Sibanye-Stillwater (SA rand million) | (45,195) | 7,423 | 6,380 | (37,772) | 18,396 | |||||||||||||||
| Basic earnings per share (EPS) (cents) | (1,597) | 262 | 225 | (1,334) | 651 | |||||||||||||||
8.2 Diluted earnings per share
Potential ordinary shares arising from the equity-settled share-based payment scheme resulted in a dilution for the six month periods ended 30 June 2023 and 31 December 2022 as well as the 12 month periods ended 31 December 2023 and 31 December 2022.
| Six months ended | Year ended | |||||||||||||||||||
| Unaudited | Unaudited | Unaudited | Unaudited | Unaudited | ||||||||||||||||
| Dec 2023 | June 2023 | Dec 2022 | Dec 2023 | Dec 2022 | ||||||||||||||||
| Weighted average number of shares | ||||||||||||||||||||
| Adjusted weighted average number of shares (’000) | 2,830,567 | 2,830,488 | 2,830,197 | 2,830,528 | 2,826,085 | |||||||||||||||
| Potential ordinary shares - equity-settled share plan (’000) | — | 79 | 584 | 39 | 4,696 | |||||||||||||||
| Diluted weighted average number of shares (’000) | 2,830,567 | 2,830,567 | 2,830,781 | 2,830,567 | 2,830,781 | |||||||||||||||
| Diluted earnings per share (DEPS) (cents) | (1,597) | 262 | 225 | (1,334) | 650 | |||||||||||||||
Sibanye-Stillwater Operating and financial results | Six months and year ended 31 December 2023 40
8.3 Headline earnings per share
| Figures in million - SA rand unless otherwise stated | Six months ended | Year ended | ||||||||||||||||||
| Unaudited | Unaudited | Unaudited | Unaudited | Unaudited | ||||||||||||||||
| Dec 2023 | June 2023 | Dec 2022 | Dec 2023 | Dec 2022 | ||||||||||||||||
| (Loss)/profit attributable to owners of Sibanye-Stillwater | (45,195) | 7,423 | 6,380 | (37,772) | 18,396 | |||||||||||||||
| Gain on disposal of property, plant and equipment | (31) | (74) | (68) | (105) | (162) | |||||||||||||||
| Impairments/(reversal of impairments) | 47,445 | 9 | (6) | 47,454 | (6) | |||||||||||||||
| Impairment recognised by equity-accounted investee, net of tax | 1,384 | — | — | 1,384 | — | |||||||||||||||
| Gain on acquisition | (898) | — | — | (898) | — | |||||||||||||||
| Gain on remeasurement of previous interest in Kroondal | (298) | — | — | (298) | — | |||||||||||||||
| Loss on deconsolidation of subsidiary | — | — | 309 | — | 308 | |||||||||||||||
| Foreign exchange movement recycled through profit or loss | (173) | (1,490) | (13) | (1,663) | (14) | |||||||||||||||
| Profit on sale of Lonmin Canada | — | — | (145) | — | (145) | |||||||||||||||
| Taxation effect of remeasurement items | (6,341) | 19 | 23 | (6,322) | 36 | |||||||||||||||
| Re-measurement items, attributable to non-controlling interest | — | 4 | 4 | 4 | 9 | |||||||||||||||
| Headline earnings | (4,107) | 5,891 | 6,484 | 1,784 | 18,422 | |||||||||||||||
| Adjusted weighted average number of shares (’000) | 2,830,567 | 2,830,488 | 2,830,197 | 2,830,528 | 2,826,085 | |||||||||||||||
| Headline EPS (cents) | (145) | 208 | 229 | 63 | 652 | |||||||||||||||
8.4 Diluted headline earnings per share
| Figures in million - SA rand unless otherwise stated | Six months ended | Year ended | ||||||||||||||||||
| Unaudited | Unaudited | Unaudited | Unaudited | Unaudited | ||||||||||||||||
| Dec 2023 | June 2023 | Dec 2022 | Dec 2023 | Dec 2022 | ||||||||||||||||
| Headline earnings | (4,107) | 5,891 | 6,484 | 1,784 | 18,422 | |||||||||||||||
| Diluted weighted average number of shares (’000) | 2,830,567 | 2,830,567 | 2,830,781 | 2,830,567 | 2,830,781 | |||||||||||||||
| Diluted headline EPS (cents) | (145) | 208 | 229 | 63 | 651 | |||||||||||||||
9. Dividends
Dividend policy
The Group’s dividend policy is to return between 25% to 35% of normalised earnings to shareholders and after due consideration of future requirements the dividend may be increased beyond these levels. The Board, consistently considers normalised earnings in determining what value will be distributed to shareholders. The Board believes normalised earnings provides useful information to investors regarding the extent to which results of operations may affect shareholder returns. Normalised earnings is defined as earnings attributable to the owners of Sibanye-Stillwater excluding gains and losses on financial instruments and foreign exchange differences, impairments, gain/loss on disposal of property, plant and equipment, occupational healthcare expenses, restructuring costs, transactions costs, share-based payment expenses on B-BBEE transactions, gains on acquisitions, net other business development costs, share of results of equity-accounted investees, all after tax and the impact of non-controlling interest, and changes in the estimated deferred tax rate.
In line with Sibanye-Stillwater’s dividend policy and its Capital Allocation Framework, the Board of Directors resolved not to declare a final dividend (2022: 122 SA cents per share) for the year ended 31 December 2023. With the interim dividend of 53 (2022: 138) SA cents per share, which was declared and paid, this brings the total dividend for the year ended 31 December 2023 to 53 (2022: 260) SA cents per share. The interim dividend amounted to a payout of 35% of normalised earnings for the six months ended 30 June 2023 (2022: 35% of normalised earnings for the year ended 31 December 2022).
| Figures in million - SA rand | Six months ended | Year ended | ||||||||||||||||||
| Unaudited | Unaudited | Unaudited | Unaudited | Unaudited | ||||||||||||||||
| Dec 2023 | June 2023 | Dec 2022 | Dec 2023 | Dec 2022 | ||||||||||||||||
| (Loss)/profit attributable to the owners of Sibanye-Stillwater | (45,195) | 7,423 | 6,380 | (37,772) | 18,396 | |||||||||||||||
| Adjusted for: | ||||||||||||||||||||
| Loss/(gain) on financial instruments | 136 | (371) | 3,880 | (235) | 4,279 | |||||||||||||||
| Gain on foreign exchange differences | (123) | (1,850) | (476) | (1,973) | (616) | |||||||||||||||
| Gain on disposal of property, plant and equipment | (31) | (74) | (68) | (105) | (162) | |||||||||||||||
| Impairments/(reversal of impairments) | 47,445 | 9 | (6) | 47,454 | (6) | |||||||||||||||
| Restructuring costs | 689 | (174) | 327 | 515 | 363 | |||||||||||||||
| Transaction costs | 394 | 80 | 44 | 474 | 152 | |||||||||||||||
| Occupational healthcare gain | (357) | (8) | (186) | (365) | (211) | |||||||||||||||
| Gain on increase in equity-accounted investment | (3) | (2) | — | (5) | — | |||||||||||||||
| Gain on acquisition | (898) | — | — | (898) | — | |||||||||||||||
| Gain on remeasurement of previous interest in Kroondal | (298) | — | — | (298) | — | |||||||||||||||
| Loss on deconsolidation of subsidiary | — | — | 309 | — | 308 | |||||||||||||||
| Profit on sale of Lonmin Canada | — | — | (145) | — | (145) | |||||||||||||||
| Change in estimated deferred tax rate | 1,467 | (741) | 270 | 726 | (53) | |||||||||||||||
| Share of results of equity-accounted investees after tax | 1,437 | (263) | (517) | 1,174 | (1,287) | |||||||||||||||
| Tax effect of the items adjusted above | (6,913) | 249 | 20 | (6,664) | (33) | |||||||||||||||
| Non-controlling interest effect of the items listed above | (284) | 8 | 7 | (276) | 36 | |||||||||||||||
Normalised earnings1 | (2,534) | 4,286 | 9,839 | 1,752 | 21,021 | |||||||||||||||
1 Normalised earnings, as defined and reconciled above, is not a measure of performance under IFRS. As a result, it should not be considered in isolation or as alternatives to any other measure of financial performance presented in accordance with IFRS
Sibanye-Stillwater Operating and financial results | Six months and year ended 31 December 2023 41
10. Acquisitions and shareholder transactions
10.1 New Century Resources Limited (Century) business combination
On 21 February 2023, Sibanye-Stillwater announced the launch of an off-market takeover offer, through its wholly-owned subsidiary Sibanye Resources Australia Proprietary Limited, at A$1.10 cash consideration per share for all the shares in Century that Sibanye-Stillwater did not own. Century is an Australian base metal producer with zinc assets and a brownfield copper development project, which operates Australia's largest hydraulic mine at the Century Mine in Queensland, extracting, processing and marketing zinc recovered from historical tailings. The takeover is in line with the Group’s strategy to invest in the circular economy and to be a global leader in tailings retreatment and recycling.
Prior to the takeover offer, Sibanye-Stillwater was the largest shareholder in Century with a shareholding of 19.9%. On 22 February 2023, Sibanye-Stillwater obtained a controlling shareholding of 50.15% in Century through the on-market purchase of shares, therefore being the effective acquisition date.
Century's financial results were consolidated from the effective date. For the ten months ended 31 December 2023, Century contributed revenue of R2,251 million (A$184 million) and a net loss of R4,767 million (A$377 million) to the Group's results. Century's pro forma revenue and net loss would have been R3,085 million (A$253 million) and R5,062 million (A$403 million), respectively, had the acquisition been effective from 1 January 2023. In determining these amounts, management assumed that the fair value adjustments that arose on the date of acquisition would have been the same if the acquisition had occurred on 1 January 2023. The functional currency of Century is the Australian dollar.
The purchase price allocation on the effective date was prepared on a provisional basis in accordance with IFRS 3 Business Combinations (IFRS 3) for, amongst others, property, plant and equipment, contingent liabilities, provisions, as well as any deferred tax implications. If new information obtained within one year of the acquisition date, about facts and circumstances that existed at the acquisition date, identifies adjustments to the below amounts or any additional provisions that existed at the date of acquisition, then the accounting for the acquisition will be revised.
Consideration
The fair value of the consideration, including previous interest held is as follows:
| Figures in million - SA rand | ||||||||
| Unaudited | ||||||||
| Jun 2023 | ||||||||
| Total fair value of investment in New Century prior to acquisition | 730 | |||||||
Fair value of original investment in New Century1 | 357 | |||||||
Consideration paid for investment in associate2 | 373 | |||||||
Cash consideration paid to obtain control3 | 194 | |||||||
| Total consideration | 924 | |||||||
1 This represents Sibanye-Stillwater's 19.89% investment in Century acquired in 2021. Sibanye-Stillwater held 26,184,675 shares which were revalued at A$1.1 per share, being the offer price for the take-over, directly before the acquisition of Century. A fair value gain of R99 million was recognised in fair value adjustment on other investments included in other comprehensive income
2 This represents 27,245,481 shares purchased by Sibanye-Stillwater at A$1.1 per share on 21 February 2023 for a cash consideration of A$30 million (R373 million). With this share purchase Sibanye-Stillwater obtained an additional 20.69% interest in Century, resulting in a total shareholding of 40.58% prior to the acquisition date
3 The cash consideration paid to obtain control was for the purchase of 14,257,682 shares at A$1.1 per share on 22 February 2023, amounting to A$15.7 million (R194 million) and an additional 9.57% interest in Century, resulting in a total shareholding of 50.15%
Acquisition related costs
The Group incurred total acquisition related costs of R18 million for the year ended 31 December 2023 on advisory and legal fees. These costs are recognised as transaction costs in profit or loss during the period in which incurred.
Identified assets acquired and liabilities assumed
The following table summarises the recognised amounts of assets acquired and liabilities assumed at the acquisition date:
| Figures in million - SA rand | ||||||||
| Unaudited | ||||||||
| Jun 2023 | ||||||||
Property, plant and equipment2 | 4,610 | |||||||
Right-of-use assets1 | 293 | |||||||
Other receivables1 | 142 | |||||||
Environmental rehabilitation obligation funds1 | 329 | |||||||
Inventories1,2 | 422 | |||||||
Trade and other receivables1 | 262 | |||||||
Cash and cash equivalents1,3 | 418 | |||||||
Lease liabilities1 | (315) | |||||||
Environmental rehabilitation obligation and other provisions2 | (2,363) | |||||||
Other payables1,2 | (863) | |||||||
Borrowings1 | (3) | |||||||
Deferred revenue1 | (198) | |||||||
Trade and other payables1 | (606) | |||||||
Tax and royalties payable1 | (285) | |||||||
Fair value of identifiable net assets acquired2 | 1,843 | |||||||
1 Carrying value approximates fair value, except as detailed in footnote 2 below
2 Fair value of assets and liabilities for which the carrying value does not approximate fair value, excluding those not within the IFRS 3 measurement scope, were determined as follows:
•The fair value of property, plant and equipment was based on an income approach consisting of a discounted cash flow model, and where necessary, fair values were limited to the relevant depreciated replacement cost
•The fair value of inventories in respect of zinc concentrate was based on an assessment of net realisable value
•The fair value of the environmental rehabilitation obligation was calculated using a discounted cash flow model considering the cost of rehabilitating and decommissioning the mine and relevant infrastructure
•The fair value of a financial liability, included in other payables, was based on an income approach consisting of a discounted cash flow model
•The fair value of a zinc hedge liability, included in other payables, was valued through a third party module based on the specifications of the existing hedge agreements and utilising relevant LME price inputs
3 The transaction results in net cash acquired of R224 million based on cash and cash equivalents acquired of R418 million and cash consideration paid of R194 million
Sibanye-Stillwater Operating and financial results | Six months and year ended 31 December 2023 42
The table below summarises the value of the consideration paid and NCI recognised at the date of acquisition:
1 The amount recognised as NCI represents the NCI holders' effective proportionate share (49.85%) in the fair value of the identifiable net assets acquired
| Figures in million - SA rand | ||||||||
| Unaudited | ||||||||
| Jun 2023 | ||||||||
| Consideration | 924 | |||||||
| Fair value of identifiable net assets acquired | (1,843) | |||||||
NCI1 | (919) | |||||||
Subsequent shareholder transactions
Sibanye-Stillwater acquired additional shares in Century through its original take-over offer subsequent to the effective date of the acquisition. On 10 May 2023, Sibanye-Stillwater, through on- and off-market trades, obtained a 100% interest in Century through cash consideration paid of A$74 million (R906 million) for the additional 49.85% interest in Century.
The table below illustrates the effect of the remaining interest acquired in Century on equity attributable to the owners of Sibanye-Stillwater for the six months ended 30 June 2023:
| Figures in million - SA rand | ||||||||
| Unaudited | ||||||||
| Jun 2023 | ||||||||
| Consideration paid for acquiring the remaining 49.85% interest in Century | (906) | |||||||
| Carrying value of NCI | 914 | |||||||
Total impact on equity attributable to owners of Sibanye-Stillwater1 | 8 | |||||||
1 The amount includes R13 million increase on accumulated profit and R5 million decrease on other reserves in respect of foreign currency translation reserve
10.2 Transactions with Keliber shareholders
On 25 April 2023 the Finnish Minerals Group increased its holding in Keliber from 14% to 20% by subscribing for EUR53.9 million (R1,096 million) of a EUR104 million rights issue. The Group's portion of the subscription (through wholly-owned subsidiary, Keliber Lithium Proprietary Limited) amounted to EUR50.2 million (R1,009 million) which is eliminated on a Sibanye-Stillwater Group level. In addition to the rights issue, other minority shareholders in Keliber (which held 0.79% of the total Keliber shareholding) for which the Group previously recognised an accelerated put option liability at 31 December 2022, received and accepted voluntary offers at the same share price (EUR157.28 per share) as the voluntary offer that concluded in 2022. A total payment of EUR5.2 million (R103 million) was made by the Group to all the shareholders who accepted the voluntary offers during June 2023. Following these transactions, the Finnish Minerals Group holds 20% in Keliber, the Group retained approximately 79%, while other minority shareholders hold the balance of the shares in Keliber.
The below table summarises the above transactions and the impact thereof on the equity attributable to the owners of Sibanye-Stillwater:
| Figures in million - SA rand | |||||
| Unaudited | |||||
| Jun 2023 | |||||
| Rights issue and voluntary offers | |||||
| Cash consideration paid on rights issue subscription by the Group | (1,009) | ||||
| Payment eliminated on consolidation | 1,009 | ||||
| Cash consideration received from rights issue subscription by NCI | 1,096 | ||||
| Cash consideration paid by the Group to NCI on voluntary offer | (103) | ||||
| Net cash received by the Group | 993 | ||||
| Net reattribution of equity (accumulated profit and foreign currency translation reserve) | (596) | ||||
| Net increase on equity attributable to the owners of Sibanye-Stillwater as a result of the transactions with Keliber shareholders | 397 | ||||
| Increase in accumulated profit | 463 | ||||
| Decrease in foreign currency translation reserve | (66) | ||||
| Increase in NCI | 700 | ||||
| Net increase on total equity as a result of the transactions with Keliber shareholders | 1,097 | ||||
10.3 Kroondal business combination
On 31 January 2022, Sibanye-Stillwater announced that, through its subsidiary Sibanye Rustenburg Platinum Mines Limited (SRPM), it had entered into an agreement with Rustenburg Platinum Mines Limited (RPM) a subsidiary of Anglo American Platinum Limited, whereby the Group will assume full ownership of the Kroondal operation with SRPM acquiring RPM's 50% ownership in the pool and share agreement (Kroondal PSA) between Kroondal Operations Proprietary Limited (wholly-owned subsidiary of the Group) and RPM. On 1 November 2023, Sibanye-Stillwater announced that the transaction had been brought forward and all conditions precedent had either been met or waived in order for SRPM to acquire RPM's 50% share in the Kroondal PSA effective 1 November 2023 (acquisition date). The implementation of the transaction (as announced on 31 January 2022) was subject to key conditions precedent such as the relevant regulatory approvals and required consent to transfer RPM's mining right to SRPM. Another key condition precedent was the delivery of 1,350,000 4E ounces by the Kroondal operation to RPM's designated smelters through the mining of both the Kroondal PSA orebody and SRPM orebody and the Klipfontein open pit operation. In order to expedite the transaction, this condition was waived in return for SRPM paying a contingent consideration to RPM until the full agreed number of ounces are delivered, which is expected to conclude in Q2 2024. The transaction also includes a contingent payment related to the mining of the Merensky Reef mining area, however since Sibanye-Stillwater currently does not plan to mine this area, no consideration was included as part of the business combination.
The conclusion of this transaction allows for the Group to extend the Kroondal operations' operating life, which was constrained by the existing Kroondal PSA, which has been transferred to SRPM on the effective date of the transaction. The Group will be able to realise the true potential of the adjacent resources by utilising the mechanised and low-cost Kroondal operation to mine across the boundary with SRPM and accelerate the extraction of more remote areas of the SRPM orebody, which is expected to sustain employment in the Group and ensure the creation of significant value.
Kroondal's financial results were fully consolidated from the effective date. For the two months ended 31 December 2023, Kroondal contributed revenue of R1,006 million and a net profit of R609 million to the Group's results. Kroondal's pro forma revenue and net profit would have been R8,120 million and R1,387 million, respectively, had the acquisition been effective from 1 January 2023. In determining these amounts, management assumed that the fair value adjustments that arose on the date of acquisition would have been the same if the acquisition had occurred on 1 January 2023. The functional currency of Kroondal is SA rand.
Sibanye-Stillwater Operating and financial results | Six months and year ended 31 December 2023 43
The purchase price allocation on the effective date was prepared on a provisional basis in accordance with IFRS 3 for, amongst others, property, plant and equipment, contingent liabilities, provisions, as well as any deferred tax implications. If new information obtained within one year of the acquisition date, about facts and circumstances that existed at the acquisition date, identifies adjustments to the below amounts or any additional provisions that existed at the date of acquisition, then the accounting for the acquisition will be revised.
Consideration
The fair value of the consideration, including previous interest held is as follows:
| Figures in million - SA rand | ||||||||
| Unaudited | ||||||||
| Dec 2023 | ||||||||
| Cash consideration | —* | |||||||
Fair value of previously held interest1 | 2,354 | |||||||
| Total contingent consideration | 1,433 | |||||||
Contingent consideration related to delivery of agreed ounces2 | 333 | |||||||
Contingent consideration related to AAP receivable portion3 | 1,100 | |||||||
| Total consideration | 3,787 | |||||||
*Cash consideration of R1
1 The fair value of the previously held proportionally consolidated interest in Kroondal includes cash and cash equivalents of R489 million. The remeasurement of the Group's previous interest in Kroondal resulted in a gain of R298 million which is included in other income (see note 5.2)
2 Sibanye-Stillwater agreed to pay RPM a contingent consideration based on a percentage of the cumulative pre-tax cash flows of the Kroondal PSA (effective 1 November 2023) until the total 1,350,000 4E ounces are delivered to RPM (agreed PSA ounces). The percentage is determined based on a sliding scale/specific ranges of the PGM basket price included in the sale agreement. Sibanye-Stillwater will not make any payment to RPM if the cumulative pre-tax cash flows of the Kroondal PSA is negative. The contingent consideration at the effective date was calculated using an average 4E PGM basket price of R20,703/4Eoz and a discount rate of 10.76%. A 10% change in the average 4E PGM basket price will result in an undiscounted R127 million change to the contingent consideration. The contingent consideration is subsequently measured at fair value with movements recognised in profit or loss. The liability at 31 December 2023 amounted to R300 million with a fair value gain of R33 million recognised in profit or loss
3 Sibanye-Stillwater agreed to pay RPM an amount equal to 50% of the amount receivable from RPM at the end of the final measurement period in respect of the agreed PSA ounces in footnote 2 above (agreed PSA ounces receivable). The amount receivable relates to a Kroondal PSA PGM concentrate sale agreement between Sibanye-Stillwater and RPM. RPM will withhold 50% of each payment of the agreed PSA ounces receivable until the payment is made in full. Sibanye-Stillwater determined the contingent consideration at effective date as 50% of the agreed PSA ounces receivable and was calculated using an average 4E PGM basket price of R22,495/4Eoz and a discount rate of 10.76%. A 10% change in the average 4E PGM basket price will result in an undiscounted R123 million change to the contingent consideration. The contingent consideration is subsequently measured at fair value with movements recognised in profit or loss. The contingent consideration liability at 31 December 2023 amounted to R1,270 million with a fair value loss of R170 million recognised in profit or loss
Acquisition related costs
The Group incurred total acquisition related costs of R3 million for the year ended 31 December 2023 (R2 million and R1 million for the six months 31 December 2023 and 30 June 2023, respectively) on advisory and legal fees. These costs are recognised as transaction costs in profit or loss during the period in which incurred.
Identified assets acquired and liabilities assumed
The following table summarises the recognised amounts of assets acquired and liabilities assumed at the acquisition date:
| Figures in million - SA rand | ||||||||
| Unaudited | ||||||||
| Dec 2023 | ||||||||
Property, plant and equipment2 | 2,093 | |||||||
Right-of-use assets1 | 4 | |||||||
Environmental rehabilitation obligation funds1 | 287 | |||||||
Inventories1 | 194 | |||||||
Trade and other receivables1 | 3,462 | |||||||
Cash and cash equivalents1,3 | 920 | |||||||
Environmental rehabilitation obligation and other provisions2 | (873) | |||||||
Deferred tax liabilities4 | (348) | |||||||
Other payables1 | (5) | |||||||
Cash-settled share-based payment obligations1 | (31) | |||||||
Trade and other payables1 | (1,018) | |||||||
Fair value of identifiable net assets acquired2 | 4,685 | |||||||
1 Carrying value approximates fair value, except as detailed in footnote 2 below
2 Fair value of assets and liabilities for which the carrying value does not approximate fair value, excluding those not within the IFRS 3 measurement scope, were determined as follows:
•The fair value of property, plant and equipment was based on an income approach consisting of a discounted cash flow model, and where relevant, fair values were limited to the relevant depreciated replacement cost
•The fair value of the environmental rehabilitation obligation was calculated using a discounted cash flow model considering the cost of rehabilitating and decommissioning the mine and relevant infrastructure
3 The transaction results in net cash acquired of R431 million based on total fair value of cash and cash equivalents acquired of R920 million, excluding the fair value of cash and cash equivalents included in Sibanye-Stillwater's previously held proportionally consolidated interest in Kroondal amounting to R489 million and cash consideration paid of R1
4 Not within the IFRS 3 measurement scope and therefore measured in accordance with the requirements of IAS 12 Income Taxes
The table below summarises the value of the consideration paid and gain recognised at the date of acquisition:
| Figures in million - SA rand | ||||||||
| Unaudited | ||||||||
| Dec 2023 | ||||||||
| Consideration | 3,787 | |||||||
| Fair value of identifiable net assets acquired | (4,685) | |||||||
| Gain on acquisition | (898) | |||||||
The consideration at the effective date is based on the remaining Kroondal agreed PSA ounces payable to RPM. Historically, and up to delivering the last agreed PSA ounce to RPM (expected June 2024), the delivered agreed PSA ounces included SRPM ounces mined outside of the Kroondal PSA area, resulting in reduced ounces being mined from the PSA area. The remaining PSA reserves are included in the valuation of the business combination and is the primary reason for the gain on acquisition.
Sibanye-Stillwater Operating and financial results | Six months and year ended 31 December 2023 44
10.4 Copper Mines of Tasmania Proprietary Limited (CMT) asset acquisition
On 1 November 2023, Sibanye-Stillwater announced that it had exercised its option to acquire a 100% shareholding, for a consideration of US$10 million (R186 million), in CMT which owns the Mt Lyell copper mine in Tasmania, Australia. Sibanye-Stillwater obtained the option to acquire CMT from Vedanta Limited, as part of the Group's acquisition of Century in 2023 (see note 10.1).
Mt Lyell is a previously operated underground copper mine which commenced production in 1894 and operated until it was put on care and maintenance in 2014. This transaction will potentially provide the Group with low cost exposure to copper, which has been identified as an essential metal necessary to enable the clean energy transition. Mt Lyell will also potentially add primary production of copper to the Group's current lithium and nickel exposure. A feasibility study, which considers the re-establishment of the operation is underway.
At the date of acquisition (17 November 2023), CMT did not meet the definition of a business in terms of IFRS 3, and is therefore accounted for as an asset acquisition.
Allocation of purchase consideration
Since the acquisition is outside the scope of IFRS 3, the purchase consideration was allocated to identifiable assets and liabilities based on their relative fair values. Assets and liabilities that are initially measured at an amount other than cost, such as financial instruments recognised at fair value, were recognised at their respective carrying amounts as specified in the applicable accounting standards. The functional currency of CMT is the Australian dollar.
The below table summarises the value of the consideration paid the date of acquisition:
| Figures in million - SA rand | ||||||||
| Unaudited | ||||||||
| Dec 2023 | ||||||||
Consideration1 | 261 | |||||||
1 The consideration includes transaction costs amounting to A$6 million (R75 million), which was not settled at 31 December 2023
The following table summarises the allocation of the gross purchase consideration to identifiable assets and liabilities:
| Figures in million - SA rand | ||||||||
| Unaudited | ||||||||
| Dec 2023 | ||||||||
| Property, plant and equipment | 556 | |||||||
| Trade and other receivables | 20 | |||||||
Cash and cash equivalents1 | 2 | |||||||
| Inventories | 53 | |||||||
| Borrowings | (3) | |||||||
| Environmental rehabilitation provision | (340) | |||||||
| Trade and other payables | (27) | |||||||
| Total purchase consideration allocated on relative fair value basis | 261 | |||||||
1 The transaction results in net cash paid of R184 million
Sibanye-Stillwater Operating and financial results | Six months and year ended 31 December 2023 45
11. Borrowings and derivative financial instrument
| Figures in million - SA rand | Six months ended | Year ended | ||||||||||||||||||
| Unaudited | Unaudited | Unaudited | Unaudited | Unaudited | ||||||||||||||||
| Dec 2023 | June 2023 | Dec 2022 | Dec 2023 | Dec 2022 | ||||||||||||||||
| Borrowings | 36,618 | 25,312 | 22,728 | 36,618 | 22,728 | |||||||||||||||
| Derivative financial instrument | 3,810 | — | — | 3,810 | — | |||||||||||||||
| Balance at the end of the period | 40,428 | 25,312 | 22,728 | 40,428 | 22,728 | |||||||||||||||
| Current portion of borrowings and derivative financial instrument | (15,482) | (135) | (122) | (15,482) | (122) | |||||||||||||||
| Non-current portion of borrowings and derivative financial instrument | 24,946 | 25,177 | 22,606 | 24,946 | 22,606 | |||||||||||||||
Borrowings
| Figures in million - SA rand | Six months ended | Year ended | ||||||||||||||||||
| Unaudited | Unaudited | Unaudited | Unaudited | Unaudited | ||||||||||||||||
| Notes | Dec 2023 | June 2023 | Dec 2022 | Dec 2023 | Dec 2022 | |||||||||||||||
| Balance at beginning of the period | 25,312 | 22,728 | 20,887 | 22,728 | 20,298 | |||||||||||||||
| Borrowings acquired on acquisition of subsidiaries | 10 | 3 | 3 | — | 6 | 39 | ||||||||||||||
| Loans raised | 11,758 | 1,000 | 2,500 | 12,758 | 8,000 | |||||||||||||||
US$1 billion RCF1 | — | — | — | — | — | |||||||||||||||
| US$ Convertible bond | 7,455 | — | — | 7,455 | — | |||||||||||||||
R5.5 billion RCF2 | 4,000 | 1,000 | 2,500 | 5,000 | 8,000 | |||||||||||||||
| Other borrowings | 303 | — | — | 303 | — | |||||||||||||||
| Loans repaid | (315) | (1,008) | (2,502) | (1,323) | (8,003) | |||||||||||||||
US$1 billion RCF1 | — | — | — | — | — | |||||||||||||||
R5.5 billion RCF2 | — | (1,000) | (2,500) | (1,000) | (8,000) | |||||||||||||||
| Other borrowings | (315) | (8) | (2) | (323) | (3) | |||||||||||||||
| Unwinding of loans recognised at amortised cost | 3 | 204 | 155 | 116 | 359 | 216 | ||||||||||||||
| Accrued interest | 3 | 617 | 575 | 515 | 1,192 | 1,046 | ||||||||||||||
| Accrued interest paid | (577) | (598) | (516) | (1,175) | (1,061) | |||||||||||||||
| 2026 and 2029 Notes | (468) | (483) | (442) | (951) | (844) | |||||||||||||||
| R5.5 billion and US$600 million RCFs | (103) | (115) | (74) | (218) | (217) | |||||||||||||||
| Other borrowings | (6) | — | — | (6) | — | |||||||||||||||
| (Gain)/loss on the revised cash flow of the Burnstone Debt | 4 | (32) | — | 776 | (32) | 776 | ||||||||||||||
| (Gain)/loss on foreign exchange differences and foreign currency translation | (352) | 2,457 | 952 | 2,105 | 1,417 | |||||||||||||||
| Balance at end of the period | 36,618 | 25,312 | 22,728 | 36,618 | 22,728 | |||||||||||||||
1 On 6 April 2023, the Group concluded the refinancing of the US$600 million RCF. The new facility is a minimum of US$1 billion RCF for a period of three years, with two optional 1-year extensions (3+1+1), from the effective date of the facility. The facility is linked to a secured overnight financing rate, which was used as a replacement for the US LIBOR upon refinancing the RCF
2 The R5.5 billion RCF matures 11 November 2024
Borrowings and facilities consist of:
| Figures in million - SA rand | ||||||||||||||||||||
| Unaudited | Unaudited | Unaudited | ||||||||||||||||||
| Dec 2023 | June 2023 | Dec 2022 | ||||||||||||||||||
US$1 billion RCF1 | — | — | — | |||||||||||||||||
R5.5 billion RCF2 | 4,000 | — | — | |||||||||||||||||
| US$ Convertible Bond | 7,538 | — | — | |||||||||||||||||
| 2026 and 2029 Notes | 22,042 | 22,331 | 20,140 | |||||||||||||||||
Burnstone Debt2 | 2,991 | 2,931 | 2,540 | |||||||||||||||||
Other borrowings3 | 47 | 50 | 48 | |||||||||||||||||
| Borrowings | 36,618 | 25,312 | 22,728 | |||||||||||||||||
| Current portion of borrowings | (11,672) | (135) | (122) | |||||||||||||||||
| Non-current borrowings | 24,946 | 25,177 | 22,606 | |||||||||||||||||
1 The facility is undrawn at 31 December 2023 and at the date of this report
2 The R5.5 billion RCF and the Burnstone debt are affected by the IBOR reform amendments to IFRS, which came into effect on 1 January 2021. The R5.5 billion RCF is linked to JIBAR, however the JIBAR is only expected to be impacted by the reform at a later stage and any impact thereof is to be considered when this occurs. The Burnstone debt is linked to a US LIBOR and the Group is in process to transition the debt facility to a new interest rate. The impact on the Burnstone debt due to IBOR reform is unknown at 31 December 2023 and will be assessed when further detail is available in respect of the transition to a new interest rate
3 Other borrowings consist mainly of overnight facilities and borrowings acquired on acquisition of Keliber, Sandouville and New Century
US$500 million Convertible Bond
Sibanye-Stillwater (through its wholly-owned subsidiary Stillwater Mining Company) launched an offering of US$500 million senior, unsecured, guaranteed bonds, due in November 2028 and subject to the receipt of the requisite approval by a general meeting of the shareholders of Sibanye-Stillwater, will be convertible into new and/or existing Sibanye-Stillwater ordinary shares (Convertible Bonds). Prior to, and/or absent of such approval, holders of the Convertible Bonds will, on conversion, receive a cash amount equal to the value of the underlying ordinary shares. The proceeds of the bonds will be applied to the advancement of the Group's growth strategy including the funding of future acquisitions, whilst preserving the current balance sheet for funding existing operations and projects through a lower commodity price environment.
Sibanye-Stillwater Operating and financial results | Six months and year ended 31 December 2023 46
| Terms of US$500 million Convertible Bond | |||||
| Issue size: | US$500 million | ||||
| Coupon: | 4.25% | ||||
| Maturity date: | 28 November 2028 (five years) | ||||
| Conversion premium: | 32.5% | ||||
| Reference share price: | US$1.0088 (R18.55), being the volume weighted average price of Sibanye-Stillwater's shares listed on the JSE Limited between opening of trading and close of trading on 21 November 2023, converted into US$ at R18.388/US$ | ||||
| Initial conversion price: | US$1.3367 | ||||
| Issuer: | Stillwater Mining Company | ||||
| Guarantors: | Sibanye Stillwater Limited, Sibanye Gold Proprietary Limited, Kroondal Operations Proprietary Limited, Sibanye Rustenburg Platinum Mines Proprietary Limited, Eastern Platinum Proprietary Limited, Western Platinum Proprietary Limited | ||||
Derivative financial instrument (related to the US$ Convertible Bond)
| Figures in million - SA rand | Six months ended | Year ended | ||||||||||||||||||
| Unaudited | Unaudited | Unaudited | Unaudited | Unaudited | ||||||||||||||||
| Note | Dec 2023 | June 2023 | Dec 2022 | Dec 2023 | Dec 2022 | |||||||||||||||
| Balance at beginning of the year | — | — | — | — | — | |||||||||||||||
| Initial recognition of derivative financial instrument | 1,673 | — | — | 1,673 | — | |||||||||||||||
Loss on financial instruments1 | 4 | 2,136 | — | — | 2,136 | — | ||||||||||||||
| Loss on foreign exchange differences | 1 | — | — | 1 | — | |||||||||||||||
| Balance at end of the year | 3,810 | — | — | 3,810 | — | |||||||||||||||
| Current portion of derivative financial instrument | (3,810) | — | — | (3,810) | — | |||||||||||||||
| Non-current portion of derivative financial instrument | — | — | — | — | — | |||||||||||||||
1 The fair value loss on the derivative financial instrument is mainly due to an increase in the Sibanye-Stillwater share price since the effective date
11.1 Capital management
Debt maturity
The following are contractually due, undiscounted cash flows resulting from maturities of borrowings, including interest payments:
| Figures in million - SA rand | ||||||||||||||||||||
| Total | Within one year | Between one and two years | Between two and three years | Between three and five years | After five years | |||||||||||||||
| 31 December 2023 | ||||||||||||||||||||
| - Capital | ||||||||||||||||||||
| R5.5 billion RCF | 4,000 | 4,000 | — | — | — | — | ||||||||||||||
| 2026 and 2029 Notes | 22,284 | — | — | 12,535 | — | 9,749 | ||||||||||||||
| US$ Convertible Bond | 9,285 | 9,285 | — | — | — | — | ||||||||||||||
| Burnstone Debt | 145 | — | — | — | 145 | — | ||||||||||||||
| Other borrowings | 47 | 18 | 5 | 5 | 10 | 9 | ||||||||||||||
| - Interest | 17,328 | 1,339 | 941 | 876 | 1,049 | 13,123 | ||||||||||||||
Net debt/(cash) to adjusted EBITDA
| Figures in million - SA rand | Rolling 12 months | |||||||||||||||||||
| Unaudited | Unaudited | Unaudited | ||||||||||||||||||
| Dec 2023 | June 2023 | Dec 2022 | ||||||||||||||||||
Borrowings1 | 37,437 | 22,381 | 20,188 | |||||||||||||||||
Cash and cash equivalents2 | 25,519 | 22,119 | 26,038 | |||||||||||||||||
Net debt/(cash)3 | 11,918 | 262 | (5,850) | |||||||||||||||||
Adjusted EBITDA4 | 20,556 | 32,697 | 41,111 | |||||||||||||||||
Net debt/(cash) to adjusted EBITDA (ratio)5 | 0.58 | 0.01 | (0.14) | |||||||||||||||||
1 Borrowings are only those borrowings that have recourse to Sibanye-Stillwater. Borrowings, therefore, exclude the Burnstone Debt and include the derivative financial instrument
2 Cash and cash equivalents exclude cash of Burnstone
3 Net debt/(cash) represents borrowings and bank overdraft less cash and cash equivalents. Borrowings are only those borrowings that have recourse to Sibanye-Stillwater and, therefore, exclude the Burnstone Debt and include the derivative financial instrument. Net cash excludes cash of Burnstone
4 The adjusted earnings before interest, taxes, depreciation and amortisation (EBITDA) calculation is based on the definitions included in the facility agreements for compliance with the debt covenant formula, except for impact of new accounting standards and acquisitions, project finance subsidiaries (Burnstone) and acquisitions, where the facility agreements allow the results from the acquired operations to be annualised. Adjusted EBITDA may not be comparable to similarly titled measures of other companies. Adjusted EBITDA, as defined and reconciled below, is not a measure of performance under IFRS and should be considered in addition to, and not as a substitute for, other measures of financial performance and liquidity
5 Net debt/(cash) to adjusted EBITDA ratio is a pro forma performance measure and is defined as net cash as of the end of a reporting period divided by adjusted EBITDA of the 12 months ended on the same reporting date. Net debt/(cash) to adjusted EBITDA is not a measure of performance under IFRS. As a result, it should not be considered in isolation or as alternatives to any other measure of financial performance presented in accordance with IFRS
Sibanye-Stillwater Operating and financial results | Six months and year ended 31 December 2023 47
Reconciliation of profit before royalties, carbon tax and tax to adjusted EBITDA
| Figures in million - SA rand | Six months ended | Year ended | ||||||||||||||||||
| Unaudited | Unaudited | Unaudited | Unaudited | Unaudited | ||||||||||||||||
| Dec 2023 | June 2023 | Dec 2022 | Dec 2023 | Dec 2022 | ||||||||||||||||
| (Loss)/profit before royalties, carbon tax and tax | (49,977) | 11,183 | 10,800 | (38,794) | 29,728 | |||||||||||||||
| Adjusted for: | ||||||||||||||||||||
| Amortisation and depreciation | 5,281 | 4,731 | 3,863 | 10,012 | 7,087 | |||||||||||||||
| Interest income | (651) | (718) | (614) | (1,369) | (1,203) | |||||||||||||||
| Finance expense | 1,615 | 1,684 | 1,378 | 3,299 | 2,840 | |||||||||||||||
| Share-based payments | 70 | 43 | 106 | 113 | 218 | |||||||||||||||
| Loss/(gain) on financial instruments | 136 | (371) | 3,880 | (235) | 4,279 | |||||||||||||||
| Gain on foreign exchange differences | (123) | (1,850) | (476) | (1,973) | (616) | |||||||||||||||
| Share of results of equity-accounted investees after tax | 1,437 | (263) | (517) | 1,174 | (1,287) | |||||||||||||||
| Change in estimate of environmental rehabilitation obligation, and right of recovery receivable and payable | (45) | — | (71) | (45) | (71) | |||||||||||||||
| Gain on disposal of property, plant and equipment | (31) | (74) | (68) | (105) | (162) | |||||||||||||||
| Impairments/(reversal of impairments) | 47,445 | 9 | (6) | 47,454 | (6) | |||||||||||||||
| Gain on remeasurement of previous interest in Kroondal | (298) | — | — | (298) | — | |||||||||||||||
| Onerous contract provision | 1,865 | — | — | 1,865 | — | |||||||||||||||
| Gain on acquisition | (898) | — | — | (898) | — | |||||||||||||||
| Restructuring costs | 689 | (174) | 327 | 515 | 363 | |||||||||||||||
| Transaction costs | 394 | 80 | 44 | 474 | 152 | |||||||||||||||
| IFRS 16 lease payments | (140) | (123) | (74) | (263) | (163) | |||||||||||||||
| Occupational healthcare (gain)/expense | (357) | (8) | (186) | (365) | (211) | |||||||||||||||
| Loss on deconsolidation of subsidiary | — | — | 309 | — | 308 | |||||||||||||||
| Gain on increase in equity-accounted investment | (3) | (2) | — | (5) | — | |||||||||||||||
| Profit on sale of Lonmin Canada | — | — | (145) | — | (145) | |||||||||||||||
| Adjusted EBITDA | 6,409 | 14,147 | 18,550 | 20,556 | 41,111 | |||||||||||||||
12. Environmental rehabilitation obligation and other provisions
The following table summarises the environmental rehabilitation obligation and other provisions of the Group:
| Figures in million - SA rand | ||||||||||||||
| Unaudited | Unaudited | Unaudited | ||||||||||||
| Dec 2023 | June 2023 | Dec 2022 | ||||||||||||
| Environmental rehabilitation obligation | 11,355 | 11,252 | 8,435 | |||||||||||
Other provisions1 | 1,982 | 117 | 117 | |||||||||||
| Balance at the end of the period | 13,337 | 11,369 | 8,552 | |||||||||||
Current portion of environmental rehabilitation obligation and other provisions2 | (832) | — | — | |||||||||||
| Non-current portion of environmental rehabilitation obligation and other provisions | 12,505 | 11,369 | 8,552 | |||||||||||
1 Includes onerous contract provision of R1,865 million (see below)
2 The current portion at 31 December 2023 relates to the onerous contract provision
Other provisions
Other provisions include an onerous supply contract provision relating to the raw material used in the Sandouville nickel refinery's production process, which is purchased under a single supply contract maturing on 31 December 2027. Due to sustained losses incurred at the operation, the Group assessed whether the supply contract is onerous at the reporting date. Consequently, the Group determined whether the unavoidable costs of meeting the obligations under the contract exceed the economic benefits expected to be received under it. The unavoidable costs under a contract reflect the least net cost of exiting from the contract, which is the lower of the cost of fulfilling it and any compensation or penalties arising from failure to fulfil it. Based on this assessment, the Group recognised an onerous contract provision amounting to R1,865 million, which represents the present value at 31 December 2023 of the penalty payable on early exiting the supply contract and the unavoidable losses to be incurred in meeting Sandouville's obligations under the contract during the notice period. Before the separate provision for the onerous contract was established, the Group recognised an impairment loss on assets, partially dedicated to the contract (see note 6). The onerous contract provision was calculated based on an expectation of terminating the contract in line with the required notice period and discounted at a pre-tax rate of 5.75%, reflecting the risks specific to the provision.
13. Cash-settled share-based payment obligations
The following table summarises the share-based payment obligations of the Group:
| Figures in million - SA rand | ||||||||||||||
| Unaudited | Unaudited | Unaudited | ||||||||||||
| Dec 2023 | June 2023 | Dec 2022 | ||||||||||||
Cash-settled share-based payment — Rustenburg operation B-BBEE transaction1 | 2,467 | 3,157 | 3,112 | |||||||||||
Cash-settled share-based payment — Marikana B-BBEE transaction2 | 415 | 1,766 | 1,732 | |||||||||||
| Cash-settled share-based payment — Employee incentive scheme | 268 | 286 | 431 | |||||||||||
| Balance at the end of the period | 3,150 | 5,209 | 5,275 | |||||||||||
| Current portion of cash-settled share-based payment obligations | (432) | (764) | (284) | |||||||||||
| Non-current portion of cash-settled share-based payment obligations | 2,718 | 4,445 | 4,991 | |||||||||||
1 Included in the movement is a fair value gain of R346 million recognised for the year ended 31 December 2023 (gain of R692 million and loss of R346 million for the six months ended 31 December 2023 and 30 June 2023, respectively), and payments made of R300 million during the six months ended 30 June 2023. The fair value gain is recognised in total loss on financial instruments (see note 4)
2 The movement is mainly due to a fair value gain of R1,243 million recognised for the year ended 31 December 2023 (gain R1,383 million and loss of R140 million recognised for the six months ended 31 December 2023 and 30 June 2023, respectively), and payments made of R74 million during the six months ended 30 June 2023. The fair value gain is recognised in total loss on financial instruments (see note 4)
Sibanye-Stillwater Operating and financial results | Six months and year ended 31 December 2023 48
14. Other payables
| Figures in million - SA rand | ||||||||||||||
| Unaudited | Unaudited | Unaudited | ||||||||||||
| Note | Dec 2023 | June 2023 | Dec 2022 | |||||||||||
Rustenburg deferred payment1 | — | — | 3,518 | |||||||||||
| Right of recovery payable | — | 26 | 34 | |||||||||||
| Contingent consideration (related to the Kroondal acquisition) | 10.3 | 1,570 | — | — | ||||||||||
| Deferred consideration (related to Pandora acquisition) | 44 | 26 | 128 | |||||||||||
| Marikana dividend obligation | 1,626 | 2,049 | 2,129 | |||||||||||
Keliber dividend obligation2 | 1,147 | 822 | — | |||||||||||
| Gold and zinc hedge derivative liability | 173 | — | — | |||||||||||
| Other non-current payables | 862 | 875 | 582 | |||||||||||
| Other payables | 5,422 | 3,798 | 6,391 | |||||||||||
| Current portion of other payables | (2,015) | (451) | (3,891) | |||||||||||
| Non-current other payables | 3,407 | 3,347 | 2,500 | |||||||||||
1 The Rustenburg deferred payment was settled in cash on 30 March 2023
2 During April 2023, Sibanye-Stillwater (through its wholly-owned subsidiary, Keliber Lithium Proprietary Limited) signed a revised shareholders' agreement with the Finnish Minerals Group, which resulted in a contractual obligation to declare dividends amounting to 40% of the free cash flow of Keliber. A dividend obligation was recognised for the NCI of Keliber on the effective date of the agreement (25 April 2023) at R792 million, with a corresponding reduction in NCI. The Group's attributable portion of the dividend obligation eliminates on consolidation. The dividend obligation is a financial liability and was initially measured at fair value less any directly attributable costs, and subsequently measured at amortised cost. The following assumptions were applied in the fair value measurement of the dividend obligation at 31 December 2023:
•Average lithium hydroxide price: US$22,933/t
•Real discount rate: 9.83%
•Inflation rate: 2.0%
•Life-of-mine: 24 years
15. Fair value of financial assets and financial liabilities, and risk management
15.1 Measurement of fair value
The Group uses the following hierarchy for determining and disclosing the fair value of financial instruments:
•Level 1: unadjusted quoted prices in active markets for identical assets or liabilities
•Level 2: inputs other than quoted prices in level 1 that are observable for the asset or liability, either directly (as prices) or indirectly (derived from prices)
•Level 3: inputs for the asset or liability that are not based on observable market data (unobservable inputs)
The following table sets out the Group’s significant financial instruments measured at fair value by level within the fair value hierarchy:
| Figures in million - SA rand | |||||||||||||||||||||||||||||
| Unaudited | Unaudited | Unaudited | |||||||||||||||||||||||||||
| Dec 2023 | June 2023 | Dec 2022 | |||||||||||||||||||||||||||
| Level 1 | Level 2 | Level 3 | Level 1 | Level 2 | Level 3 | Level 1 | Level 2 | Level 3 | |||||||||||||||||||||
| Financial assets measured at fair value | |||||||||||||||||||||||||||||
Environmental rehabilitation obligation funds1 | 5,080 | 847 | — | 4,746 | 809 | — | 4,528 | 778 | — | ||||||||||||||||||||
Trade receivables — PGM concentrate sales2 | — | 3,407 | — | — | 2,632 | — | — | 3,564 | — | ||||||||||||||||||||
Trade receivables — Zinc provisional price sales2 | — | 108 | — | — | 79 | — | — | — | — | ||||||||||||||||||||
Other investments3 | 1,652 | — | 1,233 | 2,093 | — | 960 | 2,320 | — | 855 | ||||||||||||||||||||
Palladium hedge contract4 | — | — | — | — | — | — | — | 50 | — | ||||||||||||||||||||
Gold hedge contracts4 | — | — | — | — | 44 | — | — | — | — | ||||||||||||||||||||
Zinc hedge contracts4 | — | — | — | — | 149 | — | — | — | — | ||||||||||||||||||||
| Financial liabilities measured at fair value | |||||||||||||||||||||||||||||
Gold hedge contracts4 | — | 140 | — | — | — | — | — | — | — | ||||||||||||||||||||
Zinc hedge contracts4 | — | 33 | — | — | — | — | — | — | — | ||||||||||||||||||||
Contingent consideration5 | — | — | 1,570 | — | — | — | — | — | — | ||||||||||||||||||||
Derivative financial instrument6 | — | 3,810 | — | — | — | — | — | — | — | ||||||||||||||||||||
1 Environmental rehabilitation obligation funds comprise a fixed income portfolio of bonds as well as fixed and notice deposits. The environmental rehabilitation obligation funds are stated at fair value based on the nature of the fund’s investments
2 The fair value for trade receivables measured at fair value through profit or loss are determined based on ruling market prices, volatilities and interest rates
3 The fair values of listed investments are based on the quoted prices available from the relevant stock exchanges. The carrying amounts of other short-term investment products with short maturity dates approximate fair value. The fair values of non-listed investments are determined through valuation techniques that include inputs that are not based on observable market data. These inputs include price/book ratios as well as marketability and minority shareholding discounts which are impacted by the size of the shareholding. The level 3 balance consists primarily of an investment in Verkor, which is valued based on a recent share subscription price recently determined by market participants and since Verkor is a pre-revenue operation still in development, the subscription price is considered a reasonable approximation of fair value. The difference between other investments in the statement of financial position and the table above, relates to investments measured at amortised cost, with carrying amounts that approximate fair values
4 The fair value of the palladium and gold hedge is determined using a Monte Carlo simulation model based on market forward prices, volatilities and interest rates. The fair value of the zinc hedge is determined by calculating the delta of the relevant forward curves relating to the fixed and floating elements of the swaps, and discounting the result using a market-related discount rate
5 The fair value of the contingent consideration relating to the Kroondal acquisition has been derived from discounted cash flow models. These models use several key assumptions, including estimates of future production volumes, PGM basket prices, operating costs, capital expenditure and market related discount rate (see note 14). The fair value estimate is sensitive to changes in the key assumptions (see note 10.3). The extent of the fair value changes would depend on how inputs change in relation to each other
6 The fair value of derivative financial instruments is estimated based on ruling market prices, volatilities, interest rates and option pricing methodologies based on observable quoted inputs
Sibanye-Stillwater Operating and financial results | Six months and year ended 31 December 2023 49
The below table summarises the movement in financial assets and financial liabilities classified as level 3 in the table above:
| Figures in million - SA rand | Six months ended | Year ended | ||||||||||||||||||
| Unaudited | Unaudited | Unaudited | Unaudited | Unaudited | ||||||||||||||||
| Dec 2023 | June 2023 | Dec 2022 | Dec 2023 | Dec 2022 | ||||||||||||||||
| Financial assets measured at fair value | ||||||||||||||||||||
| Balance at the beginning of the period | 960 | 855 | 677 | 855 | 224 | |||||||||||||||
| Fair value movement recognised in profit or loss | 5 | 103 | 152 | 108 | 152 | |||||||||||||||
| Fair value movement recognised in other comprehensive income | (38) | (21) | — | (59) | (8) | |||||||||||||||
| Additions | 308 | 15 | 23 | 323 | 483 | |||||||||||||||
| Foreign currency translation | (2) | 8 | 3 | 6 | 4 | |||||||||||||||
| Balance at the end of the period | 1,233 | 960 | 855 | 1,233 | 855 | |||||||||||||||
| Financial liabilities measured at fair value | ||||||||||||||||||||
| Initial recognition | 1,433 | — | — | 1,433 | — | |||||||||||||||
| Fair value movement recognised in profit or loss | 137 | — | — | 137 | — | |||||||||||||||
| Balance at the end of the period | 1,570 | — | — | 1,570 | — | |||||||||||||||
Fair value of financial instruments
The table below shows the fair value and carrying amount of financial instruments where the carrying amount does not approximate fair value:
| Figures in million - SA rand | ||||||||||||||
| Carrying value | Fair Value | |||||||||||||
| Level 1 | Level 2 | Level 3 | ||||||||||||
| 31 December 2023 (Unaudited) | ||||||||||||||
2026 and 2029 Notes1 | 22,042 | 18,949 | — | — | ||||||||||
Burnstone Debt2 | 2,991 | — | — | 2,509 | ||||||||||
US$ Convertible Bond3 | 7,538 | — | 7,471 | — | ||||||||||
| Total | 32,571 | 18,949 | 7,471 | 2,509 | ||||||||||
| 30 June 2023 (Unaudited) | ||||||||||||||
2026 and 2029 Notes1 | 22,331 | 19,400 | — | — | ||||||||||
Burnstone Debt2 | 2,931 | — | — | 2,568 | ||||||||||
| Total | 25,262 | 19,400 | — | 2,568 | ||||||||||
| 31 December 2022 (Unaudited) | ||||||||||||||
2026 and 2029 Notes1 | 20,140 | 17,379 | — | — | ||||||||||
Burnstone Debt2 | 2,540 | — | — | 2,245 | ||||||||||
| Total | 22,680 | 17,379 | — | 2,245 | ||||||||||
1 The fair value is based on the quoted market prices of the notes
2 The fair value of the Burnstone Debt has been derived from discounted cash flow models. These models use several key assumptions, including estimates of future sales volumes, Gold prices, operating costs, capital expenditure and discount rate. The Burnstone long-term gold price at 31 December 2023 was R1,012,625/kg (30 June 2023 and 31 December 2022 was R793,473/kg) and the discount rate applied was 10.74% (30 June 2023: 10.64% and 31 December 2022: 10.52%). The fair value estimate is sensitive to changes in the key assumptions, for example, increases in the market related discount rate would decrease the fair value if all other inputs remain unchanged. The extent of the fair value changes would depend on how inputs change in relation to each other
3 The fair value of the amortised cost component of the US$ Convertible Bond is based on the quoted price of the instrument after separating the fair value of the derivative component
15.2 Risk management activities
Liquidity risk: working capital and going concern assessment
For the year ended 31 December 2023, the Group realised a loss of R37,430 million (31 December 2022: profit of R18,980 million). As at 31 December 2023 the Group’s current assets exceeded its current liabilities by R25,415 million (31 December 2022: R40,545 million) and the Group’s total assets exceeded its total liabilities by R51,607 million (31 December 2022: R91,004 million). During the year ended 31 December 2023 the Group generated net cash from operating activities of R7,095 million (31 December 2022: R15,543 million).
The Group has committed undrawn debt facilities of R20,755 million at 31 December 2023 (31 December 2022: R16,403 million) and cash balances of R25,560 million (31 December 2022: R26,076 million). The Group concluded the refinancing of its US$600 million RCF to a US$1 billion RCF during 2023, and the most immediate debt maturity is the R5.5 billion RCF maturing in November 2024. During November 2023, the Group launched an offering of US$500 million senior, unsecured, guaranteed convertible bonds, due in November 2028, which will be applied to the advancement of the Group's growth strategy including the funding of future acquisitions, whilst preserving the current balance sheet for funding existing operations and projects through a lower commodity price environment. The bonds, subject to approval by a general meeting of Sibanye-Stillwater shareholders, will be convertible into existing or new ordinary shares. Until such approval is obtained, holders of the bonds will, on conversion, receive a cash amount equal to the value of the underlying ordinary shares, and therefore at 31 December 2023 the Convertible Bond and associated derivative financial instrument are classified as repayable within twelve months. Sibanye-Stillwater’s leverage ratio (net debt/(cash) to adjusted EBITDA) as at 31 December 2023 was 0.58:1 (31 December 2022 was (0.14):1) and its interest coverage ratio (adjusted EBITDA to net finance charges/(income)) was 66:1 (31 December 2022 was 93:1). Both considerably better than the maximum permitted leverage ratio of at most 2.5:1 and minimum required interest coverage ratio of 4.0:1, calculated on a quarterly basis, required under the US$1 billion RCF and the R5.5 billion RCF. At the date of approving these condensed consolidated financial statements there were no significant events which had a significant negative impact on the Group’s strong liquidity position.
Notwithstanding the strong liquidity position and financial outlook, events such as a further decline or prolonged low commodity market, shaft incidents, natural disaster events and other operational related incidents could impose restrictions on all or some of our operations. Events such as these could negatively impact the production outlook and deteriorate the Group’s forecasted liquidity position which may require the Group to further increase operational flexibility by adjusting mine plans and reducing capital expenditure. This is encouraged by a disciplined application of the Group's Capital allocation framework which is essential to operational excellence and long-term value creation. This enables the Group to adhere to sound financial decision-making structures and mechanisms to manage costs and ensure long-term sustainability. The Group could also, if necessary, consider options to increase funding flexibility which may include, amongst others, additional loan facilities or debt capital market issuances, streaming facilities, prepayment facilities or, if other options are not deemed preferable or achievable by the Board, an equity capital raise. The Group could also, with lender approval, request covenant amendments or restructure facilities as appropriate. During past adversity management has successfully implemented similar actions.
Management believes that the cash on hand, the committed unutilised debt facilities, additional funding opportunities and if required, delaying development expenditure will enable the Group to continue to meet its obligations as they fall due for a period of at least eighteen months after
Sibanye-Stillwater Operating and financial results | Six months and year ended 31 December 2023 50
the reporting date. The condensed consolidated financial statements for the year ended 31 December 2023, therefore, have been prepared on a going concern basis.
16. Contingent liabilities/assets
16.1 Notice from Appian Capital to commence legal proceedings
On 26 October 2021, Sibanye-Stillwater entered into share purchase agreements to acquire the Santa Rita nickel mine and Serrote copper mine (the Atlantic Nickel SPA and the MVV SPA, respectively) from affiliates of Appian Capital Advisory LLP (Appian). Subsequent to signing the agreements, Appian informed Sibanye-Stillwater that a geotechnical event occurred at the Santa Rita open pit operation. After becoming aware of the geotechnical event, Sibanye-Stillwater assessed the event and its effect and concluded that the event was and was reasonably expected to be material and adverse to the business, financial condition, results of operations, the properties, assets, liabilities or operations of Santa Rita. Accordingly, pursuant to the terms of the Atlantic Nickel SPA, on 24 January 2022, Sibanye-Stillwater gave notice of termination of the Atlantic Nickel SPA. As the MVV SPA was conditional on the closing of the Atlantic Nickel SPA, which had become impossible to satisfy, on the same date Sibanye-Stillwater also gave notice of termination of the MVV SPA.
On 27 May 2022, Appian initiated legal proceedings before the High Court of England and Wales against Sibanye-Stillwater. On 3 August 2022, the Group filed its defence. Sibanye-Stillwater’s view is that the Atlantic Nickel SPA and the MVV SPA were rightfully terminated and the Group is confident that the claim will be defended successfully. The trial is set to begin in June 2024, with the remaining steps to trial taking place in the lead up to June 2024. The proceedings are in early stages and additional information and estimates of potential outcomes are unavailable.
16.2 US PGM insurance claim
During H1 2022, the US PGM operations was affected by a significant flood event, which caused the suspension of operations and consequently a loss of production. As a result of the losses incurred, a business interruption and property damage claim was lodged with the insurer. Following the assessment process, the Group believes it is probable that a reimbursement of approximately US$44 million for the business interruption and
US$18 million for property damage will be received during 2024. After the reporting date and up to the date of filing this report, the Group received US$6 million relating to the business interruption claim.
US$18 million for property damage will be received during 2024. After the reporting date and up to the date of filing this report, the Group received US$6 million relating to the business interruption claim.
17. Events after the reporting period
There were no events that could have a material impact on the financial results of the Group after 31 December 2023 up to the date on which the condensed consolidated financial statements for the six months and year ended 31 December 2023 were authorised for issue, other than those discussed below:
17.1 Reldan acquisition
On 9 November 2023, Sibanye-Stillwater announced that it had entered into a purchase agreement to acquire 100% of the Reldan group of companies (Reldan). The acquisition is being conducted at an enterprise value of US$211.5 million (R3,928 million), with an estimated cash consideration payable of approximately US$155.4 million (R2,886 million).
Reldan is a Pennsylvania-based recycling group which reprocesses various waste streams, including industrial waste (semiconductor scrap, plating waste, etc.) and electronic waste (mobile phones, tablets, etc.) to recycle green precious metals. In addition to its US operations, Reldan has established a presence in Mexico and India, where it has forged strategic joint ventures with local partners. At 31 December 2023, certain conditions precedent were still outstanding. Consequently, since the Group will only obtain control over Reldan on the closing date of the transaction, management concluded that the transaction was not yet effective at the reporting date. This transaction is expected to become effective shortly after the date of this report.
Sibanye-Stillwater Operating and financial results | Six months and year ended 31 December 2023 51
18. Segment reporting
The presentation of the segment report was updated to remove the adjusted EBITDA non-GAAP measure, “net other cash costs”, “net other”, and “non-underlying items” and retain profit or loss as the primary measure of profitability, being one of the measures of financial information regularly provided to the chief operating decision maker (CODM). The segment reports of prior periods have been aligned with the revised presentation.
Figures are in millions
| For the six months ended 31 Dec 2023 (Unaudited) | For the six months ended 30 Jun 2023 (Unaudited) | For the six months ended 31 Dec 2022 (Unaudited) | ||||||||||||||||||||||||||||||||||||||||||||||||||||||||||||||||||||||||
| Notes | GROUP | AMERICAS | SOUTHERN AFRICA | EUROPE | AUSTRALIA | GROUP | GROUP | AMERICAS | SOUTHERN AFRICA | EUROPE | GROUP | GROUP | AMERICAS | SOUTHERN AFRICA | EUROPE | GROUP | ||||||||||||||||||||||||||||||||||||||||||||||||||||||||||
| SA rand | Total | Total US PGM | Total SA operations | Total SA PGM | Total SA gold | Total EU operations | Total AUS operations | Cor- porate1 | Total | Total US PGM | Total SA operations | Total SA PGM | Total SA gold | Total EU operations | Total AUS operations | Cor- porate1 | Total | Total US PGM | Total SA operations | Total SA PGM | Total SA gold | Total EU operations | Cor- porate1 | |||||||||||||||||||||||||||||||||||||||||||||||||||
| Revenue | 53,116 | 10,903 | 39,125 | 25,243 | 13,882 | 1,347 | 1,745 | (4) | 60,568 | 12,909 | 45,611 | 30,350 | 15,261 | 1,677 | 506 | (135) | 67,909 | 21,960 | 45,267 | 33,406 | 11,861 | 967 | (285) | |||||||||||||||||||||||||||||||||||||||||||||||||||
| Underground | 38,685 | 5,277 | 33,412 | 23,776 | 9,636 | — | — | (4) | 44,927 | 5,217 | 39,845 | 28,599 | 11,246 | — | — | (135) | 45,437 | 6,011 | 39,711 | 31,658 | 8,053 | — | (285) | |||||||||||||||||||||||||||||||||||||||||||||||||||
| Surface | 7,458 | — | 5,713 | 1,467 | 4,246 | — | 1,745 | — | 6,272 | — | 5,766 | 1,751 | 4,015 | — | 506 | — | 5,556 | — | 5,556 | 1,748 | 3,808 | — | — | |||||||||||||||||||||||||||||||||||||||||||||||||||
| Recycling/processing | 6,973 | 5,626 | — | — | — | 1,347 | — | — | 9,369 | 7,692 | — | — | — | 1,677 | — | — | 16,916 | 15,949 | — | — | — | 967 | — | |||||||||||||||||||||||||||||||||||||||||||||||||||
| Cost of sales, before amortisation and depreciation | (44,818) | (10,904) | (30,509) | (18,566) | (11,943) | (2,000) | (1,405) | — | (44,938) | (11,487) | (30,271) | (18,133) | (12,138) | (2,329) | (851) | — | (47,512) | (18,892) | (27,114) | (15,499) | (11,615) | (1,506) | — | |||||||||||||||||||||||||||||||||||||||||||||||||||
| Underground | (31,851) | (5,514) | (26,337) | (17,573) | (8,764) | — | — | — | (30,631) | (4,166) | (26,465) | (17,246) | (9,219) | — | — | — | (26,897) | (3,619) | (23,278) | (14,575) | (8,703) | — | — | |||||||||||||||||||||||||||||||||||||||||||||||||||
| Surface | (5,577) | — | (4,172) | (993) | (3,179) | — | (1,405) | — | (4,657) | — | (3,806) | (887) | (2,919) | — | (851) | — | (3,836) | — | (3,836) | (924) | (2,912) | — | — | |||||||||||||||||||||||||||||||||||||||||||||||||||
| Recycling/processing | (7,390) | (5,390) | — | — | — | (2,000) | — | — | (9,650) | (7,321) | — | — | — | (2,329) | — | — | (16,779) | (15,273) | — | — | — | (1,506) | — | |||||||||||||||||||||||||||||||||||||||||||||||||||
| Amortisation and depreciation | (5,281) | (1,837) | (2,845) | (1,606) | (1,239) | (109) | (490) | — | (4,731) | (1,553) | (2,512) | (1,369) | (1,143) | (97) | (569) | — | (3,863) | (1,379) | (2,387) | (1,256) | (1,131) | (97) | — | |||||||||||||||||||||||||||||||||||||||||||||||||||
| Interest income | 651 | 100 | 494 | 199 | 295 | 52 | 2 | 3 | 718 | 113 | 595 | 279 | 316 | 1 | 8 | 1 | 614 | 143 | 471 | 207 | 264 | — | — | |||||||||||||||||||||||||||||||||||||||||||||||||||
| Finance expense | (1,615) | (603) | (762) | (305) | (457) | (48) | (64) | (138) | (1,684) | (531) | (841) | (401) | (440) | (19) | (120) | (173) | (1,378) | (507) | (691) | (329) | (362) | (8) | (172) | |||||||||||||||||||||||||||||||||||||||||||||||||||
| Share-based payments | (70) | (27) | (49) | (16) | (33) | 11 | — | (5) | (43) | (12) | (22) | (2) | (20) | (5) | — | (4) | (106) | (17) | (87) | (34) | (53) | — | (2) | |||||||||||||||||||||||||||||||||||||||||||||||||||
| (Loss)/gain on financial instruments | 4 | (136) | (2,136) | 2,361 | 2,458 | (97) | (248) | (114) | 1 | 371 | 72 | (423) | (501) | 78 | 80 | 629 | 13 | (3,880) | (149) | (3,860) | (3,137) | (723) | 122 | 7 | ||||||||||||||||||||||||||||||||||||||||||||||||||
| Gain/(loss) on foreign exchange differences | 123 | (3) | 141 | 100 | 41 | (11) | (20) | 16 | 1,850 | 15 | 1,779 | 1,794 | (15) | 66 | (19) | 9 | 476 | (10) | 453 | 58 | 395 | (8) | 41 | |||||||||||||||||||||||||||||||||||||||||||||||||||
| Share of results of equity-accounted investees after tax | (1,437) | — | (1,431) | (1,585) | 154 | — | — | (6) | 263 | — | 275 | 114 | 161 | — | — | (12) | 517 | — | 524 | 401 | 123 | — | (7) | |||||||||||||||||||||||||||||||||||||||||||||||||||
| Other costs | 5.1 | (4,114) | (34) | (1,974) | (974) | (1,000) | (2,047) | (108) | 49 | (1,744) | (74) | (1,437) | (467) | (970) | (49) | (115) | (69) | (2,249) | (83) | (1,995) | (1,079) | (916) | (116) | (55) | ||||||||||||||||||||||||||||||||||||||||||||||||||
| Other income | 5.2 | 846 | 11 | 738 | 497 | 241 | 52 | 42 | 3 | 386 | 1 | 333 | 74 | 259 | 50 | — | 2 | 383 | 4 | 360 | 143 | 217 | 19 | — | ||||||||||||||||||||||||||||||||||||||||||||||||||
| Gain/(loss) on disposal of property, plant and equipment | 31 | (46) | 77 | 33 | 44 | — | — | — | 74 | 1 | 73 | 46 | 27 | — | — | — | 68 | (1) | 69 | 29 | 40 | — | — | |||||||||||||||||||||||||||||||||||||||||||||||||||
| (Impairments)/reversal of impairments | 6 | (47,445) | (38,919) | (3,236) | (505) | (2,731) | (1,607) | (3,683) | — | (9) | — | (3) | (1) | (2) | — | (6) | — | 6 | — | 6 | 6 | — | — | — | ||||||||||||||||||||||||||||||||||||||||||||||||||
| Gain on acquisition | 10.3 | 898 | — | 898 | 898 | — | — | — | — | — | — | — | — | — | — | — | — | — | — | — | — | — | — | — | ||||||||||||||||||||||||||||||||||||||||||||||||||
| Occupational healthcare gain | 357 | — | 357 | — | 357 | — | — | — | 8 | — | 8 | — | 8 | — | — | — | 186 | — | 186 | — | 186 | — | — | |||||||||||||||||||||||||||||||||||||||||||||||||||
| Restructuring costs | (689) | (41) | (648) | (336) | (312) | — | — | — | 174 | — | 174 | (15) | 189 | — | — | — | (327) | — | (327) | (7) | (320) | — | — | |||||||||||||||||||||||||||||||||||||||||||||||||||
| Transaction costs | (394) | (29) | — | — | — | — | — | (365) | (80) | 2 | — | — | — | — | (2) | (80) | (44) | (7) | (2) | (3) | 1 | — | (35) | |||||||||||||||||||||||||||||||||||||||||||||||||||
| Royalties and carbon tax | (459) | — | (380) | (326) | (54) | — | (79) | — | (593) | — | (541) | (479) | (62) | — | (52) | — | (865) | — | (865) | (818) | (47) | — | — | |||||||||||||||||||||||||||||||||||||||||||||||||||
| Mining and income tax | 5,220 | 6,794 | (1,537) | (1,090) | (447) | (4) | (1) | (32) | (2,804) | 818 | (3,579) | (3,062) | (517) | (40) | (1) | (2) | (3,296) | (116) | (3,137) | (4,267) | 1,130 | (39) | (4) | |||||||||||||||||||||||||||||||||||||||||||||||||||
| Current taxation | (788) | 353 | (1,045) | (921) | (124) | (64) | (1) | (31) | (2,390) | (10) | (2,363) | (2,160) | (203) | (16) | (1) | — | (4,345) | (318) | (4,023) | (3,903) | (120) | — | (4) | |||||||||||||||||||||||||||||||||||||||||||||||||||
| Deferred taxation | 6,008 | 6,441 | (492) | (169) | (323) | 60 | — | (1) | (414) | 828 | (1,216) | (902) | (314) | (24) | — | (2) | 1,049 | 202 | 886 | (364) | 1,250 | (39) | — | |||||||||||||||||||||||||||||||||||||||||||||||||||
| (Loss)/profit for the period | (45,216) | (36,771) | 820 | 4,119 | (3,299) | (4,612) | (4,175) | (478) | 7,786 | 274 | 9,219 | 8,227 | 992 | (665) | (592) | (450) | 6,639 | 946 | 6,871 | 7,821 | (950) | (666) | (512) | |||||||||||||||||||||||||||||||||||||||||||||||||||
| Sustaining capital expenditure | (3,708) | (1,395) | (2,088) | (1,271) | (817) | (153) | (72) | — | (2,348) | (785) | (1,426) | (786) | (640) | (95) | (42) | — | (2,997) | (807) | (2,129) | (1,239) | (890) | (61) | — | |||||||||||||||||||||||||||||||||||||||||||||||||||
| Ore reserve development | (4,369) | (1,863) | (2,506) | (1,207) | (1,299) | — | — | — | (4,768) | (2,026) | (2,742) | (1,344) | (1,398) | — | — | — | (3,956) | (1,610) | (2,346) | (1,184) | (1,162) | — | — | |||||||||||||||||||||||||||||||||||||||||||||||||||
| Growth projects | (3,394) | (371) | (1,821) | (597) | (1,224) | (1,199) | (3) | — | (3,492) | (403) | (1,770) | (441) | (1,329) | (1,271) | (48) | — | (2,802) | (815) | (1,432) | (520) | (912) | (555) | — | |||||||||||||||||||||||||||||||||||||||||||||||||||
| Total capital expenditure | (11,471) | (3,629) | (6,415) | (3,075) | (3,340) | (1,352) | (75) | — | (10,608) | (3,214) | (5,938) | (2,571) | (3,367) | (1,366) | (90) | — | (9,755) | (3,232) | (5,907) | (2,943) | (2,964) | (616) | — | |||||||||||||||||||||||||||||||||||||||||||||||||||
| note 18.1 | note 18.2 | note 18.1 | note 18.2 | note 18.1 | note 18.2 | |||||||||||||||||||||||||||||||||||||||||||||||||||||||||||||||||||||
Sibanye-Stillwater Operating and financial results | Six months and year ended 31 December 2023 52
| For the six months ended 31 Dec 2023 (Unaudited) | For the six months ended 30 Jun 2023 (Unaudited) | For the six months ended 31 Dec 2022 (Unaudited) | |||||||||||||||||||||||||||||||||||||||||||||||||||||||||||||||||||||
| GROUP | AMERICAS | SOUTHERN AFRICA | EUROPE | AUSTRALIA | GROUP | GROUP | AMERICAS | SOUTHERN AFRICA | EUROPE | GROUP | GROUP | AMERICAS | SOUTHERN AFRICA | EUROPE | GROUP | ||||||||||||||||||||||||||||||||||||||||||||||||||||||||
US dollars2 | Total | Total US PGM | Total SA operations | Total SA PGM | Total SA gold | Total EU operations | Total AUS operations | Cor- porate1 | Total | Total US PGM | Total SA operations | Total SA PGM | Total SA gold | Total EU operations | Total AUS operations | Cor- porate1 | Total | Total US PGM | Total SA operations | Total SA PGM | Total SA gold | Total EU operations | Cor- porate1 | ||||||||||||||||||||||||||||||||||||||||||||||||
| Revenue | 2,846 | 584 | 2,097 | 1,352 | 745 | 72 | 94 | (1) | 3,326 | 708 | 2,505 | 1,667 | 838 | 92 | 28 | (7) | 3,878 | 1,248 | 2,595 | 1,893 | 702 | 51 | (16) | ||||||||||||||||||||||||||||||||||||||||||||||||
| Underground | 2,071 | 283 | 1,789 | 1,273 | 516 | — | — | (1) | 2,468 | 286 | 2,189 | 1,571 | 618 | — | — | (7) | 2,595 | 337 | 2,274 | 1,792 | 482 | — | (16) | ||||||||||||||||||||||||||||||||||||||||||||||||
| Surface | 402 | — | 308 | 79 | 229 | — | 94 | — | 344 | — | 316 | 96 | 220 | — | 28 | — | 321 | — | 321 | 101 | 220 | — | — | ||||||||||||||||||||||||||||||||||||||||||||||||
| Recycling/processing | 373 | 301 | — | — | — | 72 | — | — | 514 | 422 | — | — | — | 92 | — | — | 962 | 911 | — | — | — | 51 | — | ||||||||||||||||||||||||||||||||||||||||||||||||
| Cost of sales, before amortisation and depreciation | (2,405) | (587) | (1,636) | (997) | (639) | (107) | (75) | — | (2,468) | (631) | (1,662) | (995) | (667) | (128) | (47) | — | (2,721) | (1,079) | (1,558) | (881) | (677) | (84) | — | ||||||||||||||||||||||||||||||||||||||||||||||||
| Underground | (1,713) | (299) | (1,414) | (944) | (470) | — | — | — | (1,681) | (229) | (1,452) | (946) | (506) | — | — | — | (1,544) | (207) | (1,337) | (828) | (509) | — | — | ||||||||||||||||||||||||||||||||||||||||||||||||
| Surface | (297) | — | (222) | (53) | (169) | — | (75) | — | (257) | — | (210) | (49) | (161) | — | (47) | — | (221) | — | (221) | (53) | (168) | — | — | ||||||||||||||||||||||||||||||||||||||||||||||||
| Recycling/processing | (395) | (288) | — | — | — | (107) | — | — | (530) | (402) | — | — | — | (128) | — | — | (956) | (872) | — | — | — | (84) | — | ||||||||||||||||||||||||||||||||||||||||||||||||
| Amortisation and depreciation | (284) | (99) | (153) | (86) | (67) | (6) | (26) | — | (260) | (85) | (139) | (76) | (63) | (5) | (31) | — | (224) | (79) | (140) | (72) | (68) | (5) | — | ||||||||||||||||||||||||||||||||||||||||||||||||
| Interest income | 35 | 6 | 26 | 11 | 15 | 3 | — | — | 39 | 6 | 33 | 15 | 18 | — | — | — | 35 | 9 | 26 | 11 | 15 | — | — | ||||||||||||||||||||||||||||||||||||||||||||||||
| Finance expense | (87) | (33) | (41) | (18) | (23) | (3) | (3) | (7) | (92) | (29) | (45) | (20) | (25) | (1) | (7) | (10) | (78) | (29) | (38) | (17) | (21) | (1) | (10) | ||||||||||||||||||||||||||||||||||||||||||||||||
| Share-based payments | (4) | (1) | (4) | (4) | — | 1 | — | — | (2) | (1) | (1) | 1 | (2) | — | — | — | (6) | (1) | (5) | (2) | (3) | — | — | ||||||||||||||||||||||||||||||||||||||||||||||||
| (Loss)/gain on financial instruments | (7) | (116) | 130 | 134 | (4) | (14) | (6) | (1) | 20 | 4 | (24) | (28) | 4 | 4 | 34 | 2 | (235) | (9) | (233) | (189) | (44) | 7 | — | ||||||||||||||||||||||||||||||||||||||||||||||||
| Gain/(loss) on foreign exchange differences | 5 | — | 6 | 4 | 2 | (1) | (1) | 1 | 102 | 1 | 98 | 99 | (1) | 4 | (1) | — | 29 | — | 26 | 2 | 24 | (1) | 4 | ||||||||||||||||||||||||||||||||||||||||||||||||
| Share of results of equity-accounted investees after tax | (78) | — | (78) | (86) | 8 | — | — | — | 14 | — | 15 | 6 | 9 | — | — | (1) | 29 | — | 30 | 22 | 8 | — | (1) | ||||||||||||||||||||||||||||||||||||||||||||||||
| Other costs | (222) | (2) | (106) | (52) | (54) | (111) | (6) | 3 | (96) | (4) | (79) | (27) | (52) | (3) | (6) | (4) | (133) | (5) | (118) | (64) | (54) | (7) | (3) | ||||||||||||||||||||||||||||||||||||||||||||||||
| Other income | 46 | 1 | 41 | 28 | 13 | 2 | 2 | — | 21 | — | 18 | 4 | 14 | 3 | — | — | 20 | — | 19 | 8 | 11 | 1 | — | ||||||||||||||||||||||||||||||||||||||||||||||||
| Gain on disposal of property, plant and equipment | 2 | (2) | 4 | 1 | 3 | — | — | — | 4 | — | 4 | 3 | 1 | — | — | — | 4 | — | 4 | 1 | 3 | — | — | ||||||||||||||||||||||||||||||||||||||||||||||||
| (Impairments)/reversal of impairments | (2,576) | (2,113) | (176) | (27) | (149) | (87) | (200) | — | — | — | — | — | — | — | — | — | — | — | — | — | — | — | — | ||||||||||||||||||||||||||||||||||||||||||||||||
| Gain on acquisition | 49 | — | 49 | 49 | — | — | — | — | — | — | — | — | — | — | — | — | — | — | — | — | — | — | — | ||||||||||||||||||||||||||||||||||||||||||||||||
| Occupational healthcare gain | 20 | — | 20 | — | 20 | — | — | — | — | — | — | — | — | — | — | — | 11 | — | 11 | — | 11 | — | — | ||||||||||||||||||||||||||||||||||||||||||||||||
| Restructuring costs | (38) | (2) | (36) | (18) | (18) | — | — | — | 10 | — | 10 | (1) | 11 | — | — | — | (20) | — | (20) | — | (20) | — | — | ||||||||||||||||||||||||||||||||||||||||||||||||
| Transaction costs | (22) | (1) | — | — | — | — | — | (21) | (4) | — | — | — | — | — | — | (4) | (2) | — | — | — | — | — | (2) | ||||||||||||||||||||||||||||||||||||||||||||||||
| Royalties and carbon tax | (24) | — | (20) | (18) | (2) | — | (4) | — | (33) | — | (30) | (27) | (3) | — | (3) | — | (49) | — | (49) | (46) | (3) | — | — | ||||||||||||||||||||||||||||||||||||||||||||||||
| Mining and income tax | 285 | 370 | (83) | (58) | (25) | — | — | (2) | (154) | 44 | (196) | (168) | (28) | (2) | — | — | (179) | (6) | (171) | (239) | 68 | (2) | — | ||||||||||||||||||||||||||||||||||||||||||||||||
| Current taxation | (42) | 20 | (57) | (50) | (7) | (3) | — | (2) | (131) | (1) | (129) | (118) | (11) | (1) | — | — | (246) | (18) | (228) | (221) | (7) | — | — | ||||||||||||||||||||||||||||||||||||||||||||||||
| Deferred taxation | 327 | 350 | (26) | (8) | (18) | 3 | — | — | (23) | 45 | (67) | (50) | (17) | (1) | — | — | 67 | 12 | 57 | (18) | 75 | (2) | — | ||||||||||||||||||||||||||||||||||||||||||||||||
| (Loss)/profit for the period | (2,459) | (1,995) | 40 | 215 | (175) | (251) | (225) | (28) | 427 | 13 | 507 | 453 | 54 | (36) | (33) | (24) | 359 | 49 | 379 | 427 | (48) | (41) | (28) | ||||||||||||||||||||||||||||||||||||||||||||||||
| Sustaining capital expenditure | (201) | (75) | (114) | (70) | (44) | (8) | (4) | — | (128) | (43) | (78) | (43) | (35) | (5) | (2) | — | (175) | (47) | (125) | (73) | (52) | (3) | — | ||||||||||||||||||||||||||||||||||||||||||||||||
| Ore reserve development | (234) | (100) | (134) | (64) | (70) | — | — | — | (262) | (111) | (151) | (74) | (77) | — | — | — | (232) | (93) | (139) | (69) | (70) | — | — | ||||||||||||||||||||||||||||||||||||||||||||||||
| Growth projects | (181) | (20) | (97) | (32) | (65) | (64) | — | — | (192) | (22) | (97) | (24) | (73) | (70) | (3) | — | (167) | (48) | (85) | (30) | (55) | (34) | — | ||||||||||||||||||||||||||||||||||||||||||||||||
| Total capital expenditure | (616) | (195) | (345) | (166) | (179) | (72) | (4) | — | (582) | (176) | (326) | (141) | (185) | (75) | (5) | — | (574) | (188) | (349) | (172) | (177) | (37) | — | ||||||||||||||||||||||||||||||||||||||||||||||||
| note 18.1 | note 18.2 | note 18.1 | note 18.2 | note 18.1 | note 18.2 | ||||||||||||||||||||||||||||||||||||||||||||||||||||||||||||||||||
1Group corporate includes the Wheaton Stream transaction and mainly includes corporate transaction and finance costs
2The average exchange rate for the six months ended 31 December 2023 was R18.62/US$, six months ended 30 June 2023 was R18.21/US$ and six months ended 31 December 2022 was R17.33/US$
Sibanye-Stillwater Operating and financial results | Six months and year ended 31 December 2023 53
Figures are in millions
| For the year ended 31 Dec 2023 (Unaudited) | For the year ended 31 Dec 2022 (Unaudited) | |||||||||||||||||||||||||||||||||||||||||||||||||
| Notes | GROUP | AMERICAS | SOUTHERN AFRICA | EUROPE | AUSTRALIA | GROUP | GROUP | AMERICAS | SOUTHERN AFRICA | EUROPE | GROUP | |||||||||||||||||||||||||||||||||||||||
| SA rand | Total | Total US PGM | Total SA operations | Total SA PGM | Total SA gold | Total EU operations | Total AUS operations | Cor- porate1 | Total | Total US PGM | Total SA operations | Total SA PGM | Total SA gold | Total EU operations | Cor- porate1 | |||||||||||||||||||||||||||||||||||
| Revenue | 113,684 | 23,812 | 84,736 | 55,593 | 29,143 | 3,024 | 2,251 | (139) | 138,288 | 46,090 | 89,507 | 71,665 | 17,842 | 3,140 | (449) | |||||||||||||||||||||||||||||||||||
| Underground | 83,612 | 10,494 | 73,257 | 52,375 | 20,882 | — | — | (139) | 92,325 | 13,823 | 78,951 | 68,182 | 10,769 | — | (449) | |||||||||||||||||||||||||||||||||||
| Surface | 13,730 | — | 11,479 | 3,218 | 8,261 | — | 2,251 | — | 10,556 | — | 10,556 | 3,483 | 7,073 | — | — | |||||||||||||||||||||||||||||||||||
| Recycling/processing | 16,342 | 13,318 | — | — | — | 3,024 | — | — | 35,407 | 32,267 | — | — | — | 3,140 | — | |||||||||||||||||||||||||||||||||||
| Cost of sales, before amortisation and depreciation | (89,756) | (22,391) | (60,780) | (36,699) | (24,081) | (4,329) | (2,256) | — | (94,537) | (38,452) | (52,454) | (32,280) | (20,174) | (3,631) | — | |||||||||||||||||||||||||||||||||||
| Underground | (62,482) | (9,680) | (52,802) | (34,819) | (17,983) | — | — | — | (52,734) | (7,459) | (45,275) | (30,528) | (14,747) | — | — | |||||||||||||||||||||||||||||||||||
| Surface | (10,234) | — | (7,978) | (1,880) | (6,098) | — | (2,256) | — | (7,179) | — | (7,179) | (1,752) | (5,427) | — | — | |||||||||||||||||||||||||||||||||||
| Recycling/processing | (17,040) | (12,711) | — | — | — | (4,329) | — | — | (34,624) | (30,993) | — | — | — | (3,631) | — | |||||||||||||||||||||||||||||||||||
| Amortisation and depreciation | (10,012) | (3,390) | (5,357) | (2,975) | (2,382) | (206) | (1,059) | — | (7,087) | (2,803) | (4,126) | (2,418) | (1,708) | (158) | — | |||||||||||||||||||||||||||||||||||
| Interest income | 1,369 | 213 | 1,089 | 478 | 611 | 53 | 10 | 4 | 1,203 | 309 | 893 | 402 | 491 | — | 1 | |||||||||||||||||||||||||||||||||||
| Finance expense | (3,299) | (1,134) | (1,603) | (706) | (897) | (67) | (184) | (311) | (2,840) | (952) | (1,547) | (831) | (716) | (15) | (326) | |||||||||||||||||||||||||||||||||||
| Share-based payments | (113) | (39) | (71) | (18) | (53) | 6 | — | (9) | (218) | (47) | (169) | (73) | (96) | — | (2) | |||||||||||||||||||||||||||||||||||
| Gain/(loss)on financial instruments | 4 | 235 | (2,064) | 1,938 | 1,957 | (19) | (168) | 515 | 14 | (4,279) | (242) | (4,188) | (3,477) | (711) | 144 | 7 | ||||||||||||||||||||||||||||||||||
| Gain/(loss) on foreign exchange differences | 1,973 | 12 | 1,920 | 1,894 | 26 | 55 | (39) | 25 | 616 | (8) | 623 | 208 | 415 | (49) | 50 | |||||||||||||||||||||||||||||||||||
| Share of results of equity-accounted investees after tax | (1,174) | — | (1,156) | (1,471) | 315 | — | — | (18) | 1,287 | — | 1,298 | 1,062 | 236 | — | (11) | |||||||||||||||||||||||||||||||||||
| Other costs | 5 | (5,858) | (108) | (3,411) | (1,441) | (1,970) | (2,096) | (223) | (20) | (3,679) | (129) | (3,379) | (1,616) | (1,763) | (116) | (55) | ||||||||||||||||||||||||||||||||||
| Other income | 5 | 1,232 | 12 | 1,071 | 571 | 500 | 102 | 42 | 5 | 1,110 | 102 | 963 | 385 | 578 | 45 | — | ||||||||||||||||||||||||||||||||||
| Gain/(loss) on disposal of property, plant and equipment | 105 | (45) | 150 | 79 | 71 | — | — | — | 162 | 5 | 157 | 54 | 103 | — | — | |||||||||||||||||||||||||||||||||||
| (Impairments)/reversal of impairments | 6 | (47,454) | (38,919) | (3,239) | (506) | (2,733) | (1,607) | (3,689) | — | 6 | — | 6 | 6 | — | — | — | ||||||||||||||||||||||||||||||||||
| Gain on acquisition | 10.3 | 898 | — | 898 | 898 | — | — | — | — | — | — | — | — | — | — | — | ||||||||||||||||||||||||||||||||||
| Occupational healthcare gain | 365 | — | 365 | — | 365 | — | — | — | 211 | — | 211 | — | 211 | — | — | |||||||||||||||||||||||||||||||||||
| Restructuring costs | (515) | (41) | (474) | (351) | (123) | — | — | — | (363) | (2) | (361) | (26) | (335) | — | — | |||||||||||||||||||||||||||||||||||
| Transaction costs | (474) | (27) | — | — | — | — | (2) | (445) | (152) | (8) | (2) | (3) | 1 | — | (142) | |||||||||||||||||||||||||||||||||||
| Royalties and carbon tax | (1,052) | — | (921) | (805) | (116) | — | (131) | — | (1,824) | — | (1,824) | (1,772) | (52) | — | — | |||||||||||||||||||||||||||||||||||
| Mining and income tax | 2,416 | 7,612 | (5,116) | (4,152) | (964) | (44) | (2) | (34) | (8,924) | (340) | (8,541) | (9,705) | 1,164 | (39) | (4) | |||||||||||||||||||||||||||||||||||
| Current taxation | (3,178) | 343 | (3,408) | (3,081) | (327) | (80) | (2) | (31) | (9,282) | (655) | (8,623) | (8,373) | (250) | — | (4) | |||||||||||||||||||||||||||||||||||
| Deferred taxation | 5,594 | 7,269 | (1,708) | (1,071) | (637) | 36 | — | (3) | 358 | 315 | 82 | (1,332) | 1,414 | (39) | — | |||||||||||||||||||||||||||||||||||
| (Loss)/profit for the year | (37,430) | (36,497) | 10,039 | 12,346 | (2,307) | (5,277) | (4,767) | (928) | 18,980 | 3,523 | 17,067 | 21,581 | (4,514) | (679) | (931) | |||||||||||||||||||||||||||||||||||
| Sustaining capital expenditure | (6,056) | (2,180) | (3,514) | (2,057) | (1,457) | (248) | (114) | — | (4,946) | (1,185) | (3,671) | (2,056) | (1,615) | (90) | — | |||||||||||||||||||||||||||||||||||
| Ore reserve development | (9,137) | (3,889) | (5,248) | (2,551) | (2,697) | — | — | — | (6,640) | (2,887) | (3,753) | (2,123) | (1,630) | — | — | |||||||||||||||||||||||||||||||||||
| Growth projects | (6,886) | (774) | (3,591) | (1,038) | (2,553) | (2,470) | (51) | — | (4,313) | (1,345) | (2,239) | (925) | (1,314) | (729) | — | |||||||||||||||||||||||||||||||||||
| Total capital expenditure | (22,079) | (6,843) | (12,353) | (5,646) | (6,707) | (2,718) | (165) | — | (15,899) | (5,417) | (9,663) | (5,104) | (4,559) | (819) | — | |||||||||||||||||||||||||||||||||||
| note 18.1 | note 18.2 | note 18.1 | note 18.2 | |||||||||||||||||||||||||||||||||||||||||||||||
Sibanye-Stillwater Operating and financial results | Six months and year ended 31 December 2023 54
Figures are in millions
| For the year ended 31 Dec 2023 (Unaudited) | For the year ended 31 Dec 2022 (Unaudited) | ||||||||||||||||||||||||||||||||||||||||||||||
| GROUP | AMERICAS | SOUTHERN AFRICA | EUROPE | AUSTRALIA | GROUP | GROUP | AMERICAS | SOUTHERN AFRICA | EUROPE | GROUP | |||||||||||||||||||||||||||||||||||||
US dollars2 | Total | Total US PGM | Total SA operations | Total SA PGM | Total SA gold | Total EU operations | Total AUS operations | Cor- porate1 | Total | Total US PGM | Total SA operations | Total SA PGM | Total SA gold | Total EU operations | Cor- porate1 | ||||||||||||||||||||||||||||||||
| Revenue | 6,172 | 1,292 | 4,602 | 3,019 | 1,583 | 164 | 122 | (8) | 8,448 | 2,815 | 5,468 | 4,378 | 1,090 | 192 | (27) | ||||||||||||||||||||||||||||||||
| Underground | 4,539 | 569 | 3,978 | 2,844 | 1,134 | — | — | (8) | 5,640 | 844 | 4,823 | 4,165 | 658 | — | (27) | ||||||||||||||||||||||||||||||||
| Surface | 746 | — | 624 | 175 | 449 | — | 122 | — | 645 | — | 645 | 213 | 432 | — | — | ||||||||||||||||||||||||||||||||
| Recycling/processing | 887 | 723 | — | — | — | 164 | — | — | 2,163 | 1,971 | — | — | — | 192 | — | ||||||||||||||||||||||||||||||||
| Cost of sales, before amortisation and depreciation | (4,873) | (1,218) | (3,298) | (1,992) | (1,306) | (235) | (122) | — | (5,775) | (2,349) | (3,204) | (1,971) | (1,233) | (222) | — | ||||||||||||||||||||||||||||||||
| Underground | (3,394) | (528) | (2,866) | (1,890) | (976) | — | — | — | (3,222) | (456) | (2,766) | (1,864) | (902) | — | — | ||||||||||||||||||||||||||||||||
| Surface | (554) | — | (432) | (102) | (330) | — | (122) | — | (438) | — | (438) | (107) | (331) | — | — | ||||||||||||||||||||||||||||||||
| Recycling/processing | (925) | (690) | — | — | — | (235) | — | — | (2,115) | (1,893) | — | — | — | (222) | — | ||||||||||||||||||||||||||||||||
| Amortisation and depreciation | (544) | (184) | (292) | (162) | (130) | (11) | (57) | — | (433) | (171) | (253) | (148) | (105) | (9) | — | ||||||||||||||||||||||||||||||||
| Interest income | 74 | 12 | 59 | 26 | 33 | 3 | — | — | 73 | 19 | 54 | 25 | 29 | — | — | ||||||||||||||||||||||||||||||||
| Finance expense | (179) | (62) | (86) | (38) | (48) | (4) | (10) | (17) | (173) | (58) | (94) | (50) | (44) | (1) | (20) | ||||||||||||||||||||||||||||||||
| Share-based payments | (6) | (2) | (5) | (3) | (2) | 1 | — | — | (13) | (3) | (10) | (4) | (6) | — | — | ||||||||||||||||||||||||||||||||
| Gain/(loss) on financial instruments | 13 | (112) | 106 | 106 | — | (10) | 28 | 1 | (261) | (15) | (255) | (211) | (44) | 9 | — | ||||||||||||||||||||||||||||||||
| Gain/(loss) on foreign exchange differences | 107 | 1 | 104 | 103 | 1 | 3 | (2) | 1 | 38 | — | 38 | 13 | 25 | (4) | 4 | ||||||||||||||||||||||||||||||||
| Share of results of equity-accounted investees after tax | (64) | — | (63) | (80) | 17 | — | — | (1) | 79 | — | 80 | 65 | 15 | — | (1) | ||||||||||||||||||||||||||||||||
| Other costs | (318) | (6) | (185) | (79) | (106) | (114) | (12) | (1) | (225) | (8) | (207) | (99) | (108) | (7) | (3) | ||||||||||||||||||||||||||||||||
| Other income | 67 | 1 | 59 | 32 | 27 | 5 | 2 | — | 68 | 6 | 59 | 24 | 35 | 3 | — | ||||||||||||||||||||||||||||||||
| Gain on disposal of property, plant and equipment | 6 | (2) | 8 | 4 | 4 | — | — | — | 10 | — | 10 | 3 | 7 | — | — | ||||||||||||||||||||||||||||||||
| (Impairments)/reversal of impairments | (2,576) | (2,113) | (176) | (27) | (149) | (87) | (200) | — | — | — | — | — | — | — | — | ||||||||||||||||||||||||||||||||
| Gain on acquisition | 49 | — | 49 | 49 | — | — | — | — | — | — | — | — | — | — | — | ||||||||||||||||||||||||||||||||
| Occupational healthcare gain | 20 | — | 20 | — | 20 | — | — | — | 13 | — | 13 | — | 13 | — | — | ||||||||||||||||||||||||||||||||
| Restructuring costs | (28) | (2) | (26) | (19) | (7) | — | — | — | (22) | — | (22) | (2) | (20) | — | — | ||||||||||||||||||||||||||||||||
| Transaction costs | (26) | (1) | — | — | — | — | — | (25) | (9) | — | — | — | — | — | (9) | ||||||||||||||||||||||||||||||||
| Royalties and carbon tax | (57) | — | (50) | (45) | (5) | — | (7) | — | (111) | — | (111) | (109) | (2) | — | — | ||||||||||||||||||||||||||||||||
| Mining and income tax | 131 | 414 | (279) | (226) | (53) | (2) | — | (2) | (545) | (21) | (522) | (593) | 71 | (2) | — | ||||||||||||||||||||||||||||||||
| Current taxation | (173) | 19 | (186) | (168) | (18) | (4) | — | (2) | (567) | (40) | (527) | (512) | (15) | — | — | ||||||||||||||||||||||||||||||||
| Deferred taxation | 304 | 395 | (93) | (58) | (35) | 2 | — | — | 22 | 19 | 5 | (81) | 86 | (2) | — | ||||||||||||||||||||||||||||||||
| (Loss)/profit for the year | (2,032) | (1,982) | 547 | 668 | (121) | (287) | (258) | (52) | 1,162 | 215 | 1,044 | 1,321 | (277) | (41) | (56) | ||||||||||||||||||||||||||||||||
| Sustaining capital expenditure | (329) | (118) | (192) | (113) | (79) | (13) | (6) | — | (301) | (72) | (224) | (125) | (99) | (5) | — | ||||||||||||||||||||||||||||||||
| Ore reserve development | (496) | (211) | (285) | (138) | (147) | — | — | — | (406) | (176) | (230) | (130) | (100) | — | — | ||||||||||||||||||||||||||||||||
| Growth projects | (373) | (42) | (194) | (56) | (138) | (134) | (3) | — | (264) | (82) | (137) | (56) | (81) | (45) | — | ||||||||||||||||||||||||||||||||
| Total capital expenditure | (1,198) | (371) | (671) | (307) | (364) | (147) | (9) | — | (971) | (330) | (591) | (311) | (280) | (50) | — | ||||||||||||||||||||||||||||||||
| note 18.1 | note 18.2 | note 18.1 | note 18.2 | ||||||||||||||||||||||||||||||||||||||||||||
1Group corporate includes the Wheaton Stream transaction and mainly includes corporate transaction and finance costs
2The average exchange rate for the year ended 31 December 2023 was R18.42/US$ and the year ended 31 December 2022 was R16.37/US$
Sibanye-Stillwater Operating and financial results | Six months and year ended 31 December 2023 55
18.1 US PGM and total SA operations
Figures in million
| For the six months ended 31 Dec 2023 (Unaudited) | ||||||||||||||||||||||||||||||||||||||||||||||||||||||||
| US PGM OPERATIONS | SA OPERATIONS | |||||||||||||||||||||||||||||||||||||||||||||||||||||||
| SA rand | Total US PGM | Underground | Recycling | Total SA Operations | Total SA PGM | Rusten- burg | Marikana | Kroondal | Platinum Mile | Mimosa | Corporate and re- conciling items1 | Total SA gold | Drie- fontein | Kloof | Beatrix | Cooke | DRD- GOLD | Corporate and re- conciling items1 | ||||||||||||||||||||||||||||||||||||||
| Revenue | 10,903 | 5,277 | 5,626 | 39,125 | 25,243 | 10,612 | 11,828 | 2,314 | 489 | 1,396 | (1,396) | 13,882 | 3,715 | 4,253 | 2,232 | 708 | 2,974 | — | ||||||||||||||||||||||||||||||||||||||
| Underground | 5,277 | 5,277 | — | 33,412 | 23,776 | 9,634 | 11,828 | 2,314 | — | 1,396 | (1,396) | 9,636 | 3,664 | 3,750 | 2,222 | — | — | — | ||||||||||||||||||||||||||||||||||||||
| Surface | — | — | — | 5,713 | 1,467 | 978 | — | — | 489 | — | — | 4,246 | 51 | 503 | 10 | 708 | 2,974 | — | ||||||||||||||||||||||||||||||||||||||
| Recycling/processing | 5,626 | — | 5,626 | — | — | — | — | — | — | — | — | — | — | — | — | — | — | — | ||||||||||||||||||||||||||||||||||||||
Cost of sales, before amortisation and depreciation2 | (10,904) | (5,514) | (5,390) | (30,509) | (18,566) | (7,811) | (8,148) | (2,273) | (334) | (1,253) | 1,253 | (11,943) | (3,220) | (3,970) | (1,934) | (667) | (2,152) | — | ||||||||||||||||||||||||||||||||||||||
| Underground | (5,514) | (5,514) | — | (26,337) | (17,573) | (7,152) | (8,148) | (2,273) | — | (1,253) | 1,253 | (8,764) | (3,204) | (3,641) | (1,919) | — | — | — | ||||||||||||||||||||||||||||||||||||||
| Surface | — | — | — | (4,172) | (993) | (659) | — | — | (334) | — | — | (3,179) | (16) | (329) | (15) | (667) | (2,152) | — | ||||||||||||||||||||||||||||||||||||||
| Recycling/processing | (5,390) | — | (5,390) | — | — | — | — | — | — | — | — | — | — | — | — | — | — | — | ||||||||||||||||||||||||||||||||||||||
| Amortisation and depreciation | (1,837) | (1,835) | (2) | (2,845) | (1,606) | (586) | (840) | (140) | (25) | (249) | 234 | (1,239) | (505) | (426) | (182) | (1) | (110) | (15) | ||||||||||||||||||||||||||||||||||||||
| Interest income | 100 | 100 | — | 494 | 199 | 22 | 89 | 62 | 17 | 3 | 6 | 295 | 40 | 39 | 22 | 11 | 146 | 37 | ||||||||||||||||||||||||||||||||||||||
| Finance expense | (603) | (603) | — | (762) | (305) | (1,782) | (210) | (68) | — | (3) | 1,758 | (457) | (68) | (74) | (62) | (55) | (35) | (163) | ||||||||||||||||||||||||||||||||||||||
| Share-based payments | (27) | (27) | — | (49) | (16) | (7) | (10) | 2 | — | — | (1) | (33) | (4) | (4) | (3) | — | (13) | (9) | ||||||||||||||||||||||||||||||||||||||
| (Loss)/gain on financial instruments | (2,136) | (2,136) | — | 2,361 | 2,458 | 5,847 | 1,902 | (145) | — | 1 | (5,147) | (97) | 12 | 10 | 6 | 18 | 8 | (151) | ||||||||||||||||||||||||||||||||||||||
| Gain/(loss) on foreign exchange differences | (3) | (3) | — | 141 | 100 | (20) | 144 | (20) | (2) | (21) | 19 | 41 | — | — | — | — | (2) | 43 | ||||||||||||||||||||||||||||||||||||||
| Share of results of equity-accounted investees after tax | — | — | — | (1,431) | (1,585) | — | — | — | — | — | (1,585) | 154 | — | — | — | — | — | 154 | ||||||||||||||||||||||||||||||||||||||
| Other costs | (34) | (34) | — | (1,974) | (974) | 2 | (612) | (86) | (133) | — | (145) | (1,000) | (67) | (64) | (36) | (448) | (9) | (376) | ||||||||||||||||||||||||||||||||||||||
| Other income | 11 | 11 | — | 738 | 497 | 1 | 126 | 50 | — | 1 | 319 | 241 | 2 | — | 19 | (19) | 1 | 238 | ||||||||||||||||||||||||||||||||||||||
| Gain/(loss) on disposal of property, plant and equipment | (46) | (46) | — | 77 | 33 | 20 | 13 | 1 | — | (1) | — | 44 | 12 | 14 | 11 | — | — | 7 | ||||||||||||||||||||||||||||||||||||||
| (Impairments)/reversal of impairments | (38,919) | (38,919) | — | (3,236) | (505) | (2) | — | (21) | — | (2,287) | 1,805 | (2,731) | — | (1,616) | — | — | — | (1,115) | ||||||||||||||||||||||||||||||||||||||
| Gain on acquisition | — | — | — | 898 | 898 | — | — | 898 | — | — | — | — | — | — | — | — | — | — | ||||||||||||||||||||||||||||||||||||||
| Occupational healthcare gain | — | — | — | 357 | — | — | — | — | — | — | — | 357 | — | — | — | — | — | 357 | ||||||||||||||||||||||||||||||||||||||
| Restructuring costs | (41) | (41) | — | (648) | (336) | (88) | (202) | (45) | — | — | (1) | (312) | (23) | (246) | (34) | (4) | — | (5) | ||||||||||||||||||||||||||||||||||||||
| Transaction costs | (29) | (29) | — | — | — | — | — | — | — | — | — | — | — | — | — | — | — | — | ||||||||||||||||||||||||||||||||||||||
| Royalties and carbon tax | — | — | — | (380) | (326) | (159) | (163) | (4) | — | (58) | 58 | (54) | (18) | (21) | (11) | (3) | (1) | — | ||||||||||||||||||||||||||||||||||||||
| Mining and income tax | 6,794 | — | — | (1,537) | (1,090) | (569) | (509) | 74 | (2) | 466 | (550) | (447) | (320) | 103 | 5 | (1) | (192) | (42) | ||||||||||||||||||||||||||||||||||||||
| Current taxation | 353 | (1,045) | (921) | (541) | (347) | 39 | 16 | (9) | (79) | (124) | (1) | — | 1 | (1) | (125) | 2 | ||||||||||||||||||||||||||||||||||||||||
| Deferred taxation | 6,441 | (492) | (169) | (28) | (162) | 35 | (18) | 475 | (471) | (323) | (319) | 103 | 4 | — | (67) | (44) | ||||||||||||||||||||||||||||||||||||||||
| (Loss)/profit for the period | (36,771) | 820 | 4,119 | 5,480 | 3,408 | 599 | 10 | (2,005) | (3,373) | (3,299) | (444) | (2,002) | 33 | (461) | 615 | (1,040) | ||||||||||||||||||||||||||||||||||||||||
| Sustaining capital expenditure | (1,395) | (1,394) | (1) | (2,088) | (1,271) | (371) | (700) | (174) | (26) | (547) | 547 | (817) | (300) | (242) | (73) | — | (202) | — | ||||||||||||||||||||||||||||||||||||||
| Ore reserve development | (1,863) | (1,863) | — | (2,506) | (1,207) | (312) | (895) | — | — | — | — | (1,299) | (701) | (442) | (156) | — | — | — | ||||||||||||||||||||||||||||||||||||||
| Growth projects | (371) | (371) | — | (1,821) | (597) | — | (506) | (2) | (89) | — | — | (1,224) | — | (50) | — | — | (455) | (719) | ||||||||||||||||||||||||||||||||||||||
| Total capital expenditure | (3,629) | (3,628) | (1) | (6,415) | (3,075) | (683) | (2,101) | (176) | (115) | (547) | 547 | (3,340) | (1,001) | (734) | (229) | — | (657) | (719) | ||||||||||||||||||||||||||||||||||||||
Sibanye-Stillwater Operating and financial results | Six months and year ended 31 December 2023 56
| For the six months ended 31 Dec 2023 (Unaudited) | ||||||||||||||||||||||||||||||||||||||||||||||||||||||||
| US PGM OPERATIONS | SA OPERATIONS | |||||||||||||||||||||||||||||||||||||||||||||||||||||||
US dollars3 | Total US PGM | Underground | Recycling | Total SA Operations | Total SA PGM | Rusten- burg | Marikana | Kroondal | Platinum Mile | Mimosa | Corporate and re- conciling items1 | Total SA gold | Drie- fontein | Kloof | Beatrix | Cooke | DRD- GOLD | Corporate and re- conciling items1 | ||||||||||||||||||||||||||||||||||||||
| Revenue | 584 | 283 | 301 | 2,097 | 1,352 | 569 | 632 | 124 | 27 | 75 | (75) | 745 | 199 | 228 | 120 | 38 | 160 | — | ||||||||||||||||||||||||||||||||||||||
| Underground | 283 | 283 | — | 1,789 | 1,273 | 517 | 632 | 124 | — | 75 | (75) | 516 | 196 | 201 | 119 | — | — | — | ||||||||||||||||||||||||||||||||||||||
| Surface | — | — | — | 308 | 79 | 52 | — | — | 27 | — | — | 229 | 3 | 27 | 1 | 38 | 160 | — | ||||||||||||||||||||||||||||||||||||||
| Recycling/processing | 301 | — | 301 | — | — | — | — | — | — | — | — | — | — | — | — | — | — | — | ||||||||||||||||||||||||||||||||||||||
Cost of sales, before amortisation and depreciation2 | (587) | (299) | (288) | (1,636) | (997) | (419) | (437) | (122) | (18) | (68) | 67 | (639) | (172) | (212) | (104) | (36) | (115) | — | ||||||||||||||||||||||||||||||||||||||
| Underground | (299) | (299) | — | (1,414) | (944) | (384) | (437) | (122) | — | (68) | 67 | (470) | (172) | (195) | (103) | — | — | — | ||||||||||||||||||||||||||||||||||||||
| Surface | — | — | — | (222) | (53) | (35) | — | — | (18) | — | — | (169) | — | (17) | (1) | (36) | (115) | — | ||||||||||||||||||||||||||||||||||||||
| Recycling/processing | (288) | — | (288) | — | — | — | — | — | — | — | — | — | — | — | — | — | — | — | ||||||||||||||||||||||||||||||||||||||
| Amortisation and depreciation | (99) | (99) | — | (153) | (86) | (32) | (45) | (8) | (2) | (14) | 15 | (67) | (27) | (23) | (10) | — | (6) | (1) | ||||||||||||||||||||||||||||||||||||||
| Interest income | 6 | 6 | — | 26 | 11 | 1 | 4 | 3 | 1 | — | 2 | 15 | 2 | 2 | 1 | — | 8 | 2 | ||||||||||||||||||||||||||||||||||||||
| Finance expense | (33) | (33) | — | (41) | (18) | (96) | (11) | (4) | — | (1) | 94 | (23) | (3) | (4) | (3) | (3) | (2) | (8) | ||||||||||||||||||||||||||||||||||||||
| Share-based payments | (1) | (1) | — | (4) | (4) | — | (1) | — | — | — | (3) | — | — | — | — | — | — | — | ||||||||||||||||||||||||||||||||||||||
| (Loss)/gain on financial instruments | (116) | (116) | — | 130 | 134 | 318 | 103 | (8) | — | — | (279) | (4) | — | 1 | 1 | 1 | 1 | (8) | ||||||||||||||||||||||||||||||||||||||
| Gain/(loss) on foreign exchange differences | — | — | — | 6 | 4 | (1) | 6 | (1) | — | (1) | 1 | 2 | — | — | — | — | — | 2 | ||||||||||||||||||||||||||||||||||||||
| Share of results of equity-accounted investees after tax | — | — | — | (78) | (86) | — | — | — | — | — | (86) | 8 | — | — | — | — | — | 8 | ||||||||||||||||||||||||||||||||||||||
| Other costs | (2) | (2) | — | (106) | (52) | 1 | (33) | (5) | (7) | — | (8) | (54) | (3) | (4) | (2) | (24) | (1) | (20) | ||||||||||||||||||||||||||||||||||||||
| Other income | 1 | 1 | — | 41 | 28 | — | 7 | 3 | — | — | 18 | 13 | — | — | 1 | (1) | — | 13 | ||||||||||||||||||||||||||||||||||||||
| Gain on disposal of property, plant and equipment | (2) | (2) | — | 4 | 1 | 1 | — | — | — | — | — | 3 | 1 | 1 | 1 | — | — | — | ||||||||||||||||||||||||||||||||||||||
| (Impairments)/reversal of impairments | (2,113) | (2,113) | — | (176) | (27) | — | — | (1) | — | (124) | 98 | (149) | — | (88) | — | — | — | (61) | ||||||||||||||||||||||||||||||||||||||
| Gain on acquisition | — | — | — | 49 | 49 | — | — | 49 | — | — | — | — | — | — | — | — | — | — | ||||||||||||||||||||||||||||||||||||||
| Occupational healthcare gain | — | — | — | 20 | — | — | — | — | — | — | — | 20 | — | — | — | — | — | 20 | ||||||||||||||||||||||||||||||||||||||
| Restructuring costs | (2) | (2) | — | (36) | (18) | (5) | (10) | (3) | — | — | — | (18) | (1) | (14) | (2) | — | — | (1) | ||||||||||||||||||||||||||||||||||||||
| Transaction costs | (1) | (1) | — | — | — | — | — | — | — | — | — | — | — | — | — | — | — | — | ||||||||||||||||||||||||||||||||||||||
| Royalties and carbon tax | — | — | — | (20) | (18) | (8) | (9) | — | — | (3) | 2 | (2) | (1) | (1) | — | — | — | — | ||||||||||||||||||||||||||||||||||||||
| Mining and income tax | 370 | — | — | (83) | (58) | (30) | (26) | 4 | (1) | 25 | (30) | (25) | (17) | 6 | — | — | (11) | (3) | ||||||||||||||||||||||||||||||||||||||
| Current taxation | 20 | (57) | (50) | (29) | (18) | 2 | — | — | (5) | (7) | — | — | — | — | (7) | — | ||||||||||||||||||||||||||||||||||||||||
| Deferred taxation | 350 | (26) | (8) | (1) | (8) | 2 | (1) | 25 | (25) | (18) | (17) | 6 | — | — | (4) | (3) | ||||||||||||||||||||||||||||||||||||||||
| (Loss)/profit for the period | (1,995) | 40 | 215 | 299 | 180 | 31 | — | (111) | (184) | (175) | (22) | (108) | 3 | (25) | 34 | (57) | ||||||||||||||||||||||||||||||||||||||||
| Sustaining capital expenditure | (75) | (75) | — | (114) | (70) | (20) | (38) | (10) | (2) | (29) | 29 | (44) | (17) | (13) | (4) | — | (10) | — | ||||||||||||||||||||||||||||||||||||||
| Ore reserve development | (100) | (100) | — | (134) | (64) | (16) | (48) | — | — | — | — | (70) | (37) | (24) | (9) | — | — | — | ||||||||||||||||||||||||||||||||||||||
| Growth projects | (20) | (20) | — | (97) | (32) | — | (27) | — | (5) | — | — | (65) | — | (2) | — | — | (25) | (38) | ||||||||||||||||||||||||||||||||||||||
| Total capital expenditure | (195) | (195) | — | (345) | (166) | (36) | (113) | (10) | (7) | (29) | 29 | (179) | (54) | (39) | (13) | — | (35) | (38) | ||||||||||||||||||||||||||||||||||||||
1Corporate and reconciling items represent the items to reconcile segment data to condensed consolidated financial statement totals, such as intercompany eliminations and share of results of equity-accounted investees after tax. This does not represent a separate segment as it does not generate revenue
2Included in cost of sales, before amortisation and depreciation is total write-down of inventory to net realisable value amounting to R1,092 million. This write-down mainly relates to PGM in process and PGM finished goods of R723 million and R283 million, respectively, of which R950 million relates to Stillwater as a result of the lower commodity price environment
3The average exchange rate for the six months ended 31 December 2023 was R18.62/US$
Sibanye-Stillwater Operating and financial results | Six months and year ended 31 December 2023 57
Figures in millions
| For the six months ended 30 Jun 2023 (Unaudited) | ||||||||||||||||||||||||||||||||||||||||||||||||||||||||
| US PGM OPERATIONS | SA OPERATIONS | |||||||||||||||||||||||||||||||||||||||||||||||||||||||
| SA rand | Total US PGM | Underground | Recycling | Total SA Operations | Total SA PGM | Rusten- burg | Marikana | Kroondal | Platinum Mile | Mimosa | Corporate and re- conciling items1 | Total SA gold | Drie- fontein | Kloof | Beatrix | Cooke | DRD- GOLD | Corporate and re- conciling items1 | ||||||||||||||||||||||||||||||||||||||
| Revenue | 12,909 | 5,217 | 7,692 | 45,611 | 30,350 | 12,110 | 15,454 | 2,249 | 537 | 1,821 | (1,821) | 15,261 | 4,577 | 4,580 | 2,572 | 690 | 2,842 | — | ||||||||||||||||||||||||||||||||||||||
| Underground | 5,217 | 5,217 | — | 39,845 | 28,599 | 10,896 | 15,454 | 2,249 | — | 1,821 | (1,821) | 11,246 | 4,442 | 4,312 | 2,492 | — | — | — | ||||||||||||||||||||||||||||||||||||||
| Surface | — | — | — | 5,766 | 1,751 | 1,214 | — | — | 537 | — | — | 4,015 | 135 | 268 | 80 | 690 | 2,842 | — | ||||||||||||||||||||||||||||||||||||||
| Recycling | 7,692 | — | 7,692 | — | — | — | — | — | — | — | — | — | — | — | — | — | — | — | ||||||||||||||||||||||||||||||||||||||
Cost of sales, before amortisation and depreciation2 | (11,487) | (4,166) | (7,321) | (30,271) | (18,133) | (7,336) | (8,813) | (1,677) | (307) | (1,156) | 1,156 | (12,138) | (3,347) | (4,179) | (2,125) | (599) | (1,888) | — | ||||||||||||||||||||||||||||||||||||||
| Underground | (4,166) | (4,166) | — | (26,465) | (17,246) | (6,756) | (8,813) | (1,677) | — | (1,156) | 1,156 | (9,219) | (3,264) | (3,911) | (2,044) | — | — | — | ||||||||||||||||||||||||||||||||||||||
| Surface | — | — | — | (3,806) | (887) | (580) | — | — | (307) | — | — | (2,919) | (83) | (268) | (81) | (599) | (1,888) | — | ||||||||||||||||||||||||||||||||||||||
| Recycling | (7,321) | — | (7,321) | — | — | — | — | — | — | — | — | — | — | — | — | — | — | — | ||||||||||||||||||||||||||||||||||||||
| Amortisation and depreciation | (1,553) | (1,551) | (2) | (2,512) | (1,369) | (549) | (697) | (94) | (22) | (226) | 219 | (1,143) | (510) | (370) | (146) | — | (84) | (33) | ||||||||||||||||||||||||||||||||||||||
| Interest income | 113 | 113 | — | 595 | 279 | 28 | 159 | 64 | 25 | 29 | (26) | 316 | 35 | 34 | 19 | 13 | 165 | 50 | ||||||||||||||||||||||||||||||||||||||
| Finance expense | (531) | (531) | — | (841) | (401) | (2,284) | (203) | (54) | — | (25) | 2,165 | (440) | (48) | (52) | (51) | (58) | (37) | (194) | ||||||||||||||||||||||||||||||||||||||
| Share-based payments | (12) | (12) | — | (22) | (2) | (2) | (3) | 3 | — | — | — | (20) | 1 | 2 | 3 | — | (12) | (14) | ||||||||||||||||||||||||||||||||||||||
| Gain/(loss) on financial instruments | 72 | 72 | — | (423) | (501) | (780) | (149) | (3) | — | (1) | 432 | 78 | 11 | 8 | 6 | 10 | 6 | 37 | ||||||||||||||||||||||||||||||||||||||
| Gain/(loss) on foreign exchange differences | 15 | 15 | — | 1,779 | 1,794 | 15 | 1,559 | 185 | 35 | (212) | 212 | (15) | — | — | — | — | 7 | (22) | ||||||||||||||||||||||||||||||||||||||
| Share of results of equity-accounted investees after tax | — | — | — | 275 | 114 | — | 8 | — | — | — | 106 | 161 | — | — | — | — | — | 161 | ||||||||||||||||||||||||||||||||||||||
| Other costs | (74) | (74) | — | (1,437) | (467) | 81 | (84) | (38) | (149) | (30) | (247) | (970) | (12) | (83) | (231) | (439) | (11) | (194) | ||||||||||||||||||||||||||||||||||||||
| Other income | 1 | 1 | — | 333 | 74 | 1 | 38 | — | — | 36 | (1) | 259 | 1 | — | — | — | — | 258 | ||||||||||||||||||||||||||||||||||||||
| Gain on disposal of property, plant and equipment | 1 | 1 | — | 73 | 46 | 13 | 31 | 2 | — | — | — | 27 | 11 | 1 | 5 | — | 10 | — | ||||||||||||||||||||||||||||||||||||||
| (Impairments)/reversal of impairments | — | — | — | (3) | (1) | — | — | — | — | — | (1) | (2) | (2) | — | — | — | — | — | ||||||||||||||||||||||||||||||||||||||
| Gain on acquisition | — | — | — | — | — | — | — | — | — | — | — | — | — | — | — | — | — | — | ||||||||||||||||||||||||||||||||||||||
| Occupational healthcare gain | — | — | — | 8 | — | — | — | — | — | — | — | 8 | — | — | — | — | — | 8 | ||||||||||||||||||||||||||||||||||||||
| Restructuring costs | — | — | — | 174 | (15) | (6) | (4) | (5) | — | — | — | 189 | (2) | 14 | 181 | — | — | (4) | ||||||||||||||||||||||||||||||||||||||
| Transaction costs | 2 | 2 | — | — | — | — | — | — | — | — | — | — | — | — | — | — | — | — | ||||||||||||||||||||||||||||||||||||||
| Royalties and carbon tax | — | — | — | (541) | (479) | (196) | (279) | (5) | — | (75) | 76 | (62) | (23) | (23) | (13) | (3) | — | — | ||||||||||||||||||||||||||||||||||||||
| Mining and income tax | 818 | — | — | (3,579) | (3,062) | (1,165) | (1,652) | (173) | (33) | (56) | 17 | (517) | (494) | (674) | (474) | — | (240) | 1,365 | ||||||||||||||||||||||||||||||||||||||
| Current taxation | (10) | (2,363) | (2,160) | (654) | (1,274) | (163) | (27) | (29) | (13) | (203) | (1) | — | — | — | (180) | (22) | ||||||||||||||||||||||||||||||||||||||||
| Deferred taxation | 828 | (1,216) | (902) | (511) | (378) | (10) | (6) | (27) | 30 | (314) | (493) | (674) | (474) | — | (60) | 1,387 | ||||||||||||||||||||||||||||||||||||||||
| Profit/(loss) for the period | 274 | 9,219 | 8,227 | (70) | 5,365 | 454 | 86 | 105 | 2,287 | 992 | 198 | (742) | (254) | (386) | 758 | 1,418 | ||||||||||||||||||||||||||||||||||||||||
| Sustaining capital expenditure | (785) | (784) | (1) | (1,426) | (786) | (273) | (397) | (112) | (4) | (510) | 510 | (640) | (190) | (179) | (41) | — | (230) | — | ||||||||||||||||||||||||||||||||||||||
| Ore reserve development | (2,026) | (2,026) | — | (2,742) | (1,344) | (357) | (987) | — | — | — | — | (1,398) | (760) | (470) | (168) | — | — | — | ||||||||||||||||||||||||||||||||||||||
| Growth projects | (403) | (403) | — | (1,770) | (441) | — | (387) | (18) | (36) | — | — | (1,329) | — | (67) | — | — | (427) | (835) | ||||||||||||||||||||||||||||||||||||||
| Total capital expenditure | (3,214) | (3,213) | (1) | (5,938) | (2,571) | (630) | (1,771) | (130) | (40) | (510) | 510 | (3,367) | (950) | (716) | (209) | — | (657) | (835) | ||||||||||||||||||||||||||||||||||||||
Sibanye-Stillwater Operating and financial results | Six months and year ended 31 December 2023 58
| For the six months ended 30 Jun 2023 (Unaudited) | ||||||||||||||||||||||||||||||||||||||||||||||||||||||||
| US PGM OPERATIONS | SA OPERATIONS | |||||||||||||||||||||||||||||||||||||||||||||||||||||||
US dollars3 | Total US PGM | Underground | Recycling | Total SA Operations | Total SA PGM | Rusten- burg | Marikana | Kroondal | Platinum Mile | Mimosa | Corporate and re- conciling items1 | Total SA gold | Drie- fontein | Kloof | Beatrix | Cooke | DRD- GOLD | Corporate and re- conciling items1 | ||||||||||||||||||||||||||||||||||||||
| Revenue | 708 | 286 | 422 | 2,505 | 1,667 | 665 | 849 | 124 | 29 | 100 | (100) | 838 | 251 | 252 | 141 | 38 | 156 | — | ||||||||||||||||||||||||||||||||||||||
| Underground | 286 | 286 | — | 2,189 | 1,571 | 598 | 849 | 124 | — | 100 | (100) | 618 | 244 | 237 | 137 | — | — | — | ||||||||||||||||||||||||||||||||||||||
| Surface | — | — | — | 316 | 96 | 67 | — | — | 29 | — | — | 220 | 7 | 15 | 4 | 38 | 156 | — | ||||||||||||||||||||||||||||||||||||||
| Recycling | 422 | — | 422 | — | — | — | — | — | — | — | — | — | — | — | — | — | — | — | ||||||||||||||||||||||||||||||||||||||
Cost of sales, before amortisation and depreciation2 | (631) | (229) | (402) | (1,662) | (995) | (403) | (484) | (92) | (17) | (63) | 64 | (667) | (184) | (230) | (116) | (33) | (104) | — | ||||||||||||||||||||||||||||||||||||||
| Underground | (229) | (229) | — | (1,452) | (946) | (371) | (484) | (92) | — | (63) | 64 | (506) | (179) | (215) | (112) | — | — | — | ||||||||||||||||||||||||||||||||||||||
| Surface | — | — | — | (210) | (49) | (32) | — | — | (17) | — | — | (161) | (5) | (15) | (4) | (33) | (104) | — | ||||||||||||||||||||||||||||||||||||||
| Recycling | (402) | — | (402) | — | — | — | — | — | — | — | — | — | — | — | — | — | — | — | ||||||||||||||||||||||||||||||||||||||
| Amortisation and depreciation | (85) | (85) | — | (139) | (76) | (30) | (38) | (5) | (1) | (12) | 10 | (63) | (28) | (20) | (8) | — | (5) | (2) | ||||||||||||||||||||||||||||||||||||||
| Interest income | 6 | 6 | — | 33 | 15 | 2 | 9 | 4 | 1 | 2 | (3) | 18 | 2 | 2 | 1 | 1 | 9 | 3 | ||||||||||||||||||||||||||||||||||||||
| Finance expense | (29) | (29) | — | (45) | (20) | (125) | (11) | (3) | — | (1) | 120 | (25) | (3) | (3) | (3) | (3) | (2) | (11) | ||||||||||||||||||||||||||||||||||||||
| Share-based payments | (1) | (1) | — | (1) | 1 | — | — | — | — | — | 1 | (2) | — | — | — | — | (1) | (1) | ||||||||||||||||||||||||||||||||||||||
| Gain/(loss) on financial instruments | 4 | 4 | — | (24) | (28) | (43) | (8) | — | — | — | 23 | 4 | 1 | — | — | 1 | — | 2 | ||||||||||||||||||||||||||||||||||||||
| Gain/(loss) on foreign exchange differences | 1 | 1 | — | 98 | 99 | 1 | 86 | 10 | 2 | (12) | 12 | (1) | — | — | — | — | — | (1) | ||||||||||||||||||||||||||||||||||||||
| Share of results of equity-accounted investees after tax | — | — | — | 15 | 6 | — | — | — | — | — | 6 | 9 | — | — | — | — | — | 9 | ||||||||||||||||||||||||||||||||||||||
| Other costs | (4) | (4) | — | (79) | (27) | 4 | (5) | (2) | (8) | (2) | (14) | (52) | (1) | (4) | (12) | (24) | — | (11) | ||||||||||||||||||||||||||||||||||||||
| Other income | — | — | — | 18 | 4 | — | 2 | — | — | 2 | — | 14 | — | — | — | — | — | 14 | ||||||||||||||||||||||||||||||||||||||
| Gain on disposal of property, plant and equipment | — | — | — | 4 | 3 | 1 | 2 | — | — | — | — | 1 | — | — | — | — | 1 | — | ||||||||||||||||||||||||||||||||||||||
| (Impairments)/reversal of impairments | — | — | — | — | — | — | — | — | — | — | — | — | — | — | — | — | — | — | ||||||||||||||||||||||||||||||||||||||
| Gain on acquisition | — | — | — | — | — | — | — | — | — | — | — | — | — | — | — | — | — | — | ||||||||||||||||||||||||||||||||||||||
| Occupational healthcare gain | — | — | — | — | — | — | — | — | — | — | — | — | — | — | — | — | — | — | ||||||||||||||||||||||||||||||||||||||
| Restructuring costs | — | — | — | 10 | (1) | — | (1) | — | — | — | — | 11 | — | 1 | 10 | — | — | — | ||||||||||||||||||||||||||||||||||||||
| Transaction costs | — | — | — | — | — | — | — | — | — | — | — | — | — | — | — | — | — | — | ||||||||||||||||||||||||||||||||||||||
| Royalties and carbon tax | — | — | — | (30) | (27) | (11) | (15) | — | — | (4) | 3 | (3) | (1) | (1) | (1) | — | — | — | ||||||||||||||||||||||||||||||||||||||
| Mining and income tax | 44 | — | — | (196) | (168) | (64) | (91) | (10) | (1) | (3) | 1 | (28) | (27) | (37) | (26) | — | (13) | 75 | ||||||||||||||||||||||||||||||||||||||
| Current taxation | (1) | (129) | (118) | (36) | (70) | (9) | (1) | (2) | — | (11) | — | — | — | — | (10) | (1) | ||||||||||||||||||||||||||||||||||||||||
| Deferred taxation | 45 | (67) | (50) | (28) | (21) | (1) | — | (1) | 1 | (17) | (27) | (37) | (26) | — | (3) | 76 | ||||||||||||||||||||||||||||||||||||||||
| Profit/(loss) for the period | 13 | 507 | 453 | (3) | 295 | 26 | 5 | 7 | 123 | 54 | 10 | (40) | (14) | (20) | 41 | 77 | ||||||||||||||||||||||||||||||||||||||||
| Sustaining capital expenditure | (43) | (43) | — | (78) | (43) | (15) | (22) | (6) | — | (28) | 28 | (35) | (10) | (10) | (2) | — | (13) | — | ||||||||||||||||||||||||||||||||||||||
| Ore reserve development | (111) | (111) | — | (151) | (74) | (20) | (54) | — | — | — | — | (77) | (42) | (26) | (9) | — | — | — | ||||||||||||||||||||||||||||||||||||||
| Growth projects | (22) | (22) | — | (97) | (24) | — | (21) | (1) | (2) | — | — | (73) | — | (4) | — | — | (23) | (46) | ||||||||||||||||||||||||||||||||||||||
| Total capital expenditure | (176) | (176) | — | (326) | (141) | (35) | (97) | (7) | (2) | (28) | 28 | (185) | (52) | (40) | (11) | — | (36) | (46) | ||||||||||||||||||||||||||||||||||||||
1Corporate and reconciling items represent the items to reconcile segment data to condensed consolidated financial statement totals, such as intercompany eliminations and share of results of equity-accounted investees after tax. This does not represent a separate segment as it does not generate revenue
2Included in cost of sales, before amortisation and depreciation is total write-down of inventory to net realisable value amounting to R602 million. This write-down mainly relates to PGM in process and PGM finished goods of R456 million and R140 million, respectively, of which R424 million relates to Stillwater as a result of the lower commodity price environment
3The average exchange rate for the six months ended 30 June 2023 was R18.21/US$
Sibanye-Stillwater Operating and financial results | Six months and year ended 31 December 2023 59
Figures are in millions
| For the six months ended 31 Dec 2022 (Unaudited) | ||||||||||||||||||||||||||||||||||||||||||||||||||||||||
| US PGM OPERATIONS | SA OPERATIONS | |||||||||||||||||||||||||||||||||||||||||||||||||||||||
| SA rand | Total US PGM | Underground | Recycling | Total SA Operations | Total SA PGM | Rusten- burg | Marikana | Kroondal | Platinum Mile | Mimosa | Corporate and re- conciling items1 | Total SA gold | Drie- fontein | Kloof | Beatrix | Cooke | DRD- GOLD | Corporate and re- conciling items1 | ||||||||||||||||||||||||||||||||||||||
| Revenue | 21,960 | 6,011 | 15,949 | 45,267 | 33,406 | 14,350 | 14,430 | 3,963 | 663 | 1,928 | (1,928) | 11,861 | 3,016 | 3,181 | 2,432 | 578 | 2,654 | — | ||||||||||||||||||||||||||||||||||||||
| Underground | 6,011 | 6,011 | — | 39,711 | 31,658 | 13,265 | 14,430 | 3,963 | — | 1,928 | (1,928) | 8,053 | 2,836 | 2,826 | 2,391 | — | — | — | ||||||||||||||||||||||||||||||||||||||
| Surface | — | — | — | 5,556 | 1,748 | 1,085 | — | — | 663 | — | — | 3,808 | 180 | 355 | 41 | 578 | 2,654 | — | ||||||||||||||||||||||||||||||||||||||
| Recycling | 15,949 | — | 15,949 | — | — | — | — | — | — | — | — | — | — | — | — | — | — | — | ||||||||||||||||||||||||||||||||||||||
| Cost of sales, before amortisation and depreciation | (18,892) | (3,619) | (15,273) | (27,114) | (15,499) | (6,887) | (6,530) | (1,774) | (308) | (1,046) | 1,046 | (11,615) | (2,989) | (3,564) | (2,628) | (496) | (1,938) | — | ||||||||||||||||||||||||||||||||||||||
| Underground | (3,619) | (3,619) | — | (23,278) | (14,575) | (6,271) | (6,530) | (1,774) | — | (1,046) | 1,046 | (8,703) | (2,852) | (3,254) | (2,597) | — | — | — | ||||||||||||||||||||||||||||||||||||||
| Surface | — | — | — | (3,836) | (924) | (616) | — | — | (308) | — | — | (2,912) | (137) | (310) | (31) | (496) | (1,938) | — | ||||||||||||||||||||||||||||||||||||||
| Recycling | (15,273) | — | (15,273) | — | — | — | — | — | — | — | — | — | — | — | — | — | — | — | ||||||||||||||||||||||||||||||||||||||
| Amortisation and depreciation | (1,379) | (1,377) | (2) | (2,387) | (1,256) | (511) | (628) | (91) | (21) | (190) | 185 | (1,131) | (482) | (311) | (242) | — | (79) | (17) | ||||||||||||||||||||||||||||||||||||||
| Interest income | 143 | 74 | 69 | 471 | 207 | 21 | 101 | 60 | 22 | 84 | (81) | 264 | 45 | 36 | 23 | 19 | 155 | (14) | ||||||||||||||||||||||||||||||||||||||
| Finance expense | (507) | (507) | — | (691) | (329) | (1,953) | (151) | (59) | — | (17) | 1,851 | (362) | (50) | (47) | (51) | (43) | (34) | (137) | ||||||||||||||||||||||||||||||||||||||
| Share-based payments | (17) | (17) | — | (87) | (34) | (13) | (19) | (2) | — | — | — | (53) | (11) | (11) | (8) | — | (10) | (13) | ||||||||||||||||||||||||||||||||||||||
| (Loss)/gain on financial instruments | (149) | (149) | — | (3,860) | (3,137) | (9,522) | (1,379) | — | — | (4) | 7,768 | (723) | 3 | 4 | 3 | — | — | (733) | ||||||||||||||||||||||||||||||||||||||
| Gain/(loss) on foreign exchange differences | (10) | (10) | — | 453 | 58 | 62 | (119) | 107 | 8 | (170) | 170 | 395 | — | — | — | — | 3 | 392 | ||||||||||||||||||||||||||||||||||||||
| Share of results of equity-accounted investees after tax | — | — | — | 524 | 401 | — | — | — | — | — | 401 | 123 | — | — | — | — | — | 123 | ||||||||||||||||||||||||||||||||||||||
| Other costs | (83) | (83) | — | (1,995) | (1,079) | (6) | (652) | (81) | (168) | — | (172) | (916) | (53) | (47) | (19) | (389) | (12) | (396) | ||||||||||||||||||||||||||||||||||||||
| Other income | 4 | 4 | — | 360 | 143 | 1 | (7) | 133 | — | — | 16 | 217 | 2 | — | — | (54) | — | 269 | ||||||||||||||||||||||||||||||||||||||
| Gain/(loss) on disposal of property, plant and equipment | (1) | (1) | — | 69 | 29 | 9 | 21 | — | — | (1) | — | 40 | 18 | 17 | 5 | — | — | — | ||||||||||||||||||||||||||||||||||||||
| Reversal of impairments/(impairments) | — | — | — | 6 | 6 | — | 7 | 13 | — | — | (14) | — | — | — | — | — | — | — | ||||||||||||||||||||||||||||||||||||||
| Gain on acquisition | — | — | — | — | — | — | — | — | — | — | — | — | — | — | — | — | — | — | ||||||||||||||||||||||||||||||||||||||
| Occupational healthcare gain | — | — | — | 186 | — | — | — | — | — | — | — | 186 | — | — | — | — | — | 186 | ||||||||||||||||||||||||||||||||||||||
| Restructuring costs | — | — | — | (327) | (7) | (4) | (3) | (1) | — | — | 1 | (320) | (2) | (29) | (286) | (1) | — | (2) | ||||||||||||||||||||||||||||||||||||||
| Transaction costs | (7) | (7) | — | (2) | (3) | — | (3) | — | — | — | — | 1 | — | — | — | — | — | 1 | ||||||||||||||||||||||||||||||||||||||
| Royalties and carbon tax | — | — | — | (865) | (818) | (565) | (245) | (6) | — | (57) | 55 | (47) | (15) | (16) | (13) | (3) | — | — | ||||||||||||||||||||||||||||||||||||||
| Mining and income tax | (116) | — | — | (3,137) | (4,267) | (1,729) | (1,850) | (634) | (55) | (127) | 128 | 1,130 | 75 | (221) | 128 | — | (185) | 1,333 | ||||||||||||||||||||||||||||||||||||||
| Current taxation | (318) | (4,023) | (3,903) | (1,766) | (1,496) | (586) | (56) | (35) | 36 | (120) | (1) | — | — | — | (106) | (13) | ||||||||||||||||||||||||||||||||||||||||
| Deferred taxation | 202 | 886 | (364) | 37 | (354) | (48) | 1 | (92) | 92 | 1,250 | 76 | (221) | 128 | — | (79) | 1,346 | ||||||||||||||||||||||||||||||||||||||||
| Profit/(loss) for the period | 946 | 6,871 | 7,821 | (6,747) | 2,973 | 1,628 | 141 | 400 | 9,426 | (950) | (443) | (1,008) | (656) | (389) | 554 | 992 | ||||||||||||||||||||||||||||||||||||||||
| Sustaining capital expenditure | (807) | (806) | (1) | (2,129) | (1,239) | (385) | (681) | (158) | (15) | (570) | 570 | (890) | (263) | (303) | (87) | — | (237) | — | ||||||||||||||||||||||||||||||||||||||
| Ore reserve development | (1,610) | (1,610) | — | (2,346) | (1,184) | (372) | (812) | — | — | — | — | (1,162) | (542) | (435) | (185) | — | — | — | ||||||||||||||||||||||||||||||||||||||
| Growth projects | (815) | (815) | — | (1,432) | (520) | — | (519) | — | — | — | (1) | (912) | — | (156) | — | — | (118) | (638) | ||||||||||||||||||||||||||||||||||||||
| Total capital expenditure | (3,232) | (3,231) | (1) | (5,907) | (2,943) | (757) | (2,012) | (158) | (15) | (570) | 569 | (2,964) | (805) | (894) | (272) | — | (355) | (638) | ||||||||||||||||||||||||||||||||||||||
Sibanye-Stillwater Operating and financial results | Six months and year ended 31 December 2023 60
| For the six months ended 31 Dec 2022 (Unaudited) | ||||||||||||||||||||||||||||||||||||||||||||||||||||||||
| US PGM OPERATIONS | SA OPERATIONS | |||||||||||||||||||||||||||||||||||||||||||||||||||||||
US dollars2 | Total US PGM | Underground | Recycling | Total SA Operations | Total SA PGM | Rusten- burg | Marikana | Kroondal | Platinum Mile | Mimosa | Corporate and re- conciling items1 | Total SA gold | Drie- fontein | Kloof | Beatrix | Cooke | DRD- GOLD | Corporate and re- conciling items1 | ||||||||||||||||||||||||||||||||||||||
| Revenue | 1,248 | 337 | 911 | 2,595 | 1,893 | 820 | 811 | 225 | 38 | 109 | (110) | 702 | 179 | 190 | 147 | 34 | 152 | — | ||||||||||||||||||||||||||||||||||||||
| Underground | 337 | 337 | — | 2,274 | 1,792 | 757 | 811 | 225 | — | 109 | (110) | 482 | 168 | 169 | 145 | — | — | — | ||||||||||||||||||||||||||||||||||||||
| Surface | — | — | — | 321 | 101 | 63 | — | — | 38 | — | — | 220 | 11 | 21 | 2 | 34 | 152 | — | ||||||||||||||||||||||||||||||||||||||
| Recycling | 911 | — | 911 | — | — | — | — | — | — | — | — | — | — | — | — | — | — | — | ||||||||||||||||||||||||||||||||||||||
| Cost of sales, before amortisation and depreciation | (1,079) | (207) | (872) | (1,558) | (881) | (395) | (368) | (102) | (18) | (60) | 62 | (677) | (174) | (207) | (156) | (29) | (111) | — | ||||||||||||||||||||||||||||||||||||||
| Underground | (207) | (207) | — | (1,337) | (828) | (360) | (368) | (102) | — | (60) | 62 | (509) | (166) | (189) | (154) | — | — | — | ||||||||||||||||||||||||||||||||||||||
| Surface | — | — | — | (221) | (53) | (35) | — | — | (18) | — | — | (168) | (8) | (18) | (2) | (29) | (111) | — | ||||||||||||||||||||||||||||||||||||||
| Recycling | (872) | — | (872) | — | — | — | — | — | — | — | — | — | — | — | — | — | — | — | ||||||||||||||||||||||||||||||||||||||
| Amortisation and depreciation | (79) | (79) | — | (140) | (72) | (29) | (37) | (5) | (1) | (11) | 11 | (68) | (28) | (19) | (15) | — | (5) | (1) | ||||||||||||||||||||||||||||||||||||||
| Interest income | 9 | 5 | 4 | 26 | 11 | 2 | 6 | 4 | 1 | 5 | (7) | 15 | 3 | 2 | 1 | 1 | 9 | (1) | ||||||||||||||||||||||||||||||||||||||
| Finance expense | (29) | (29) | — | (38) | (17) | (109) | (9) | (4) | — | (1) | 106 | (21) | (3) | (3) | (3) | (2) | (2) | (8) | ||||||||||||||||||||||||||||||||||||||
| Share-based payments | (1) | (1) | — | (5) | (2) | (1) | (1) | (1) | — | — | 1 | (3) | — | (1) | (1) | — | — | (1) | ||||||||||||||||||||||||||||||||||||||
| (Loss)/gain on financial instruments | (9) | (9) | — | (233) | (189) | (580) | (83) | — | — | — | 474 | (44) | — | 1 | — | — | — | (45) | ||||||||||||||||||||||||||||||||||||||
| Gain/(loss) on foreign exchange differences | — | — | — | 26 | 2 | 3 | (7) | 6 | — | (9) | 9 | 24 | — | — | — | — | — | 24 | ||||||||||||||||||||||||||||||||||||||
| Share of results of equity-accounted investees after tax | — | — | — | 30 | 22 | — | — | — | — | — | 22 | 8 | — | — | — | — | — | 8 | ||||||||||||||||||||||||||||||||||||||
| Other costs | (5) | (5) | — | (118) | (64) | (1) | (39) | (5) | (9) | — | (10) | (54) | (2) | (3) | (1) | (23) | — | (25) | ||||||||||||||||||||||||||||||||||||||
| Other income | — | — | — | 19 | 8 | — | (2) | 9 | — | — | 1 | 11 | — | — | — | (3) | (1) | 15 | ||||||||||||||||||||||||||||||||||||||
| Gain/(loss) on disposal of property, plant and equipment | — | — | — | 4 | 1 | — | 1 | — | — | — | — | 3 | 1 | 1 | 1 | — | — | — | ||||||||||||||||||||||||||||||||||||||
| (Impairments)/reversal of impairments | — | — | — | — | — | — | — | 1 | — | — | (1) | — | — | — | — | — | — | — | ||||||||||||||||||||||||||||||||||||||
| Gain on acquisition | — | — | — | — | — | — | — | — | — | — | — | — | — | — | — | — | — | — | ||||||||||||||||||||||||||||||||||||||
| Occupational healthcare gain | — | — | — | 11 | — | — | — | — | — | — | — | 11 | — | — | — | — | — | 11 | ||||||||||||||||||||||||||||||||||||||
| Restructuring costs | — | — | — | (20) | — | (1) | 1 | — | — | — | — | (20) | — | (2) | (18) | — | — | — | ||||||||||||||||||||||||||||||||||||||
| Transaction costs | — | — | — | — | — | — | — | — | — | — | — | — | — | — | — | — | — | — | ||||||||||||||||||||||||||||||||||||||
| Royalties and carbon tax | — | — | — | (49) | (46) | (32) | (13) | (1) | — | (3) | 3 | (3) | (1) | (1) | (1) | — | — | — | ||||||||||||||||||||||||||||||||||||||
| Mining and income tax | (6) | — | — | (171) | (239) | (98) | (103) | (36) | (3) | (7) | 8 | 68 | 4 | (13) | 7 | — | (11) | 81 | ||||||||||||||||||||||||||||||||||||||
| Current taxation | (18) | (228) | (221) | (103) | (83) | (33) | (3) | (2) | 3 | (7) | — | — | — | — | (6) | (1) | ||||||||||||||||||||||||||||||||||||||||
| Deferred taxation | 12 | 57 | (18) | 5 | (20) | (3) | — | (5) | 5 | 75 | 4 | (13) | 7 | — | (5) | 82 | ||||||||||||||||||||||||||||||||||||||||
| Profit/(loss) for the period | 49 | 379 | 427 | (421) | 157 | 91 | 8 | 23 | 569 | (48) | (21) | (55) | (39) | (22) | 31 | 58 | ||||||||||||||||||||||||||||||||||||||||
| Sustaining capital expenditure | (47) | (47) | — | (125) | (73) | (22) | (40) | (10) | (1) | (34) | 34 | (52) | (16) | (18) | (5) | — | (13) | — | ||||||||||||||||||||||||||||||||||||||
| Ore reserve development | (93) | (93) | — | (139) | (69) | (22) | (47) | — | — | — | — | (70) | (33) | (26) | (11) | — | — | — | ||||||||||||||||||||||||||||||||||||||
| Growth projects | (48) | (48) | — | (85) | (30) | — | (30) | — | — | — | — | (55) | — | (9) | — | — | (8) | (38) | ||||||||||||||||||||||||||||||||||||||
| Total capital expenditure | (188) | (188) | — | (349) | (172) | (44) | (117) | (10) | (1) | (34) | 34 | (177) | (49) | (53) | (16) | — | (21) | (38) | ||||||||||||||||||||||||||||||||||||||
1Corporate and reconciling items represent the items to reconcile segment data to condensed consolidated financial statement totals, such as intercompany eliminations and share of results of equity-accounted investees after tax. This does not represent a separate segment as it does not generate revenue
2The average exchange rate for the six months ended 31 December 2022 was R17.33/US$
Sibanye-Stillwater Operating and financial results | Six months and year ended 31 December 2023 61
Figures are in millions
| For the year ended 31 Dec 2023 (Unaudited) | ||||||||||||||||||||||||||||||||||||||||||||||||||||||||
| US PGM OPERATIONS | SA OPERATIONS | |||||||||||||||||||||||||||||||||||||||||||||||||||||||
| SA rand | Total US PGM | Underground | Recycling | Total SA Operations | Total SA PGM | Rusten- burg | Marikana | Kroondal | Platinum Mile | Mimosa | Corporate and re- conciling items1 | Total SA gold | Drie- fontein | Kloof | Beatrix | Cooke | DRD- GOLD | Corporate and re- conciling items1 | ||||||||||||||||||||||||||||||||||||||
| Revenue | 23,812 | 10,494 | 13,318 | 84,736 | 55,593 | 22,722 | 27,282 | 4,563 | 1,026 | 3,217 | (3,217) | 29,143 | 8,292 | 8,833 | 4,804 | 1,398 | 5,816 | — | ||||||||||||||||||||||||||||||||||||||
| Underground | 10,494 | 10,494 | — | 73,257 | 52,375 | 20,530 | 27,282 | 4,563 | — | 3,217 | (3,217) | 20,882 | 8,106 | 8,062 | 4,714 | — | — | — | ||||||||||||||||||||||||||||||||||||||
| Surface | — | — | — | 11,479 | 3,218 | 2,192 | — | — | 1,026 | — | — | 8,261 | 186 | 771 | 90 | 1,398 | 5,816 | — | ||||||||||||||||||||||||||||||||||||||
| Recycling/processing | 13,318 | — | 13,318 | — | — | — | — | — | — | — | — | — | — | — | — | — | — | — | ||||||||||||||||||||||||||||||||||||||
Cost of sales, before amortisation and depreciation2 | (22,391) | (9,680) | (12,711) | (60,780) | (36,699) | (15,147) | (16,961) | (3,950) | (641) | (2,409) | 2,409 | (24,081) | (6,567) | (8,149) | (4,059) | (1,266) | (4,040) | — | ||||||||||||||||||||||||||||||||||||||
| Underground | (9,680) | (9,680) | — | (52,802) | (34,819) | (13,908) | (16,961) | (3,950) | — | (2,409) | 2,409 | (17,983) | (6,468) | (7,552) | (3,963) | — | — | — | ||||||||||||||||||||||||||||||||||||||
| Surface | — | — | — | (7,978) | (1,880) | (1,239) | — | — | (641) | — | — | (6,098) | (99) | (597) | (96) | (1,266) | (4,040) | — | ||||||||||||||||||||||||||||||||||||||
| Recycling/processing | (12,711) | — | (12,711) | — | — | — | — | — | — | — | — | — | — | — | — | — | — | — | ||||||||||||||||||||||||||||||||||||||
| Amortisation and depreciation | (3,390) | (3,386) | (4) | (5,357) | (2,975) | (1,135) | (1,537) | (234) | (47) | (475) | 453 | (2,382) | (1,015) | (796) | (328) | (1) | (194) | (48) | ||||||||||||||||||||||||||||||||||||||
| Interest income | 213 | 213 | — | 1,089 | 478 | 50 | 248 | 126 | 42 | 32 | (20) | 611 | 75 | 73 | 41 | 24 | 311 | 87 | ||||||||||||||||||||||||||||||||||||||
| Finance expense | (1,134) | (1,134) | — | (1,603) | (706) | (4,066) | (413) | (122) | — | (28) | 3,923 | (897) | (116) | (126) | (113) | (113) | (72) | (357) | ||||||||||||||||||||||||||||||||||||||
| Share-based payments | (39) | (39) | — | (71) | (18) | (9) | (13) | 5 | — | — | (1) | (53) | (3) | (2) | — | — | (25) | (23) | ||||||||||||||||||||||||||||||||||||||
| Gain/(loss)on financial instruments | (2,064) | (2,064) | — | 1,938 | 1,957 | 5,067 | 1,753 | (148) | — | — | (4,715) | (19) | 23 | 18 | 12 | 28 | 14 | (114) | ||||||||||||||||||||||||||||||||||||||
| Gain/(loss) on foreign exchange differences | 12 | 12 | — | 1,920 | 1,894 | (5) | 1,703 | 165 | 33 | (233) | 231 | 26 | — | — | — | — | 5 | 21 | ||||||||||||||||||||||||||||||||||||||
| Share of results of equity-accounted investees after tax | — | — | — | (1,156) | (1,471) | — | 8 | — | — | — | (1,479) | 315 | — | — | — | — | — | 315 | ||||||||||||||||||||||||||||||||||||||
| Other costs | (108) | (108) | — | (3,411) | (1,441) | 83 | (696) | (124) | (282) | (30) | (392) | (1,970) | (79) | (147) | (267) | (887) | (20) | (570) | ||||||||||||||||||||||||||||||||||||||
| Other income | 12 | 12 | — | 1,071 | 571 | 2 | 164 | 50 | — | 37 | 318 | 500 | 3 | — | 19 | (19) | 1 | 496 | ||||||||||||||||||||||||||||||||||||||
| Gain/(loss) on disposal of property, plant and equipment | (45) | (45) | — | 150 | 79 | 33 | 44 | 3 | — | (1) | — | 71 | 23 | 15 | 16 | — | 10 | 7 | ||||||||||||||||||||||||||||||||||||||
| (Impairments)/reversal of impairments | (38,919) | (38,919) | — | (3,239) | (506) | (2) | — | (21) | — | (2,287) | 1,804 | (2,733) | (2) | (1,616) | — | — | — | (1,115) | ||||||||||||||||||||||||||||||||||||||
| Gain on acquisition | — | — | — | 898 | 898 | — | — | 898 | — | — | — | — | — | — | — | — | — | — | ||||||||||||||||||||||||||||||||||||||
| Occupational healthcare gain | — | — | — | 365 | — | — | — | — | — | — | — | 365 | — | — | — | — | — | 365 | ||||||||||||||||||||||||||||||||||||||
| Restructuring costs | (41) | (41) | — | (474) | (351) | (94) | (206) | (50) | — | — | (1) | (123) | (25) | (232) | 147 | (4) | — | (9) | ||||||||||||||||||||||||||||||||||||||
| Transaction costs | (27) | (27) | — | — | — | — | — | — | — | — | — | — | — | — | — | — | — | — | ||||||||||||||||||||||||||||||||||||||
| Royalties and carbon tax | — | — | — | (921) | (805) | (355) | (442) | (9) | — | (133) | 134 | (116) | (41) | (44) | (24) | (6) | (1) | — | ||||||||||||||||||||||||||||||||||||||
| Mining and income tax | 7,612 | — | — | (5,116) | (4,152) | (1,734) | (2,161) | (99) | (35) | 410 | (533) | (964) | (814) | (571) | (469) | (1) | (432) | 1,323 | ||||||||||||||||||||||||||||||||||||||
| Current taxation | 343 | (3,408) | (3,081) | (1,195) | (1,621) | (124) | (11) | (38) | (92) | (327) | (2) | — | 1 | (1) | (305) | (20) | ||||||||||||||||||||||||||||||||||||||||
| Deferred taxation | 7,269 | (1,708) | (1,071) | (539) | (540) | 25 | (24) | 448 | (441) | (637) | (812) | (571) | (470) | — | (127) | 1,343 | ||||||||||||||||||||||||||||||||||||||||
| (Loss)/profit for the year | (36,497) | 10,039 | 12,346 | 5,410 | 8,773 | 1,053 | 96 | (1,900) | (1,086) | (2,307) | (246) | (2,744) | (221) | (847) | 1,373 | 378 | ||||||||||||||||||||||||||||||||||||||||
| Sustaining capital expenditure | (2,180) | (2,178) | (2) | (3,514) | (2,057) | (644) | (1,097) | (286) | (30) | (1,057) | 1,057 | (1,457) | (490) | (421) | (114) | — | (432) | — | ||||||||||||||||||||||||||||||||||||||
| Ore reserve development | (3,889) | (3,889) | — | (5,248) | (2,551) | (669) | (1,882) | — | — | — | — | (2,697) | (1,461) | (912) | (324) | — | — | — | ||||||||||||||||||||||||||||||||||||||
| Growth projects | (774) | (774) | — | (3,591) | (1,038) | — | (893) | (20) | (125) | — | — | (2,553) | — | (117) | — | — | (882) | (1,554) | ||||||||||||||||||||||||||||||||||||||
| Total capital expenditure | (6,843) | (6,841) | (2) | (12,353) | (5,646) | (1,313) | (3,872) | (306) | (155) | (1,057) | 1,057 | (6,707) | (1,951) | (1,450) | (438) | — | (1,314) | (1,554) | ||||||||||||||||||||||||||||||||||||||
Sibanye-Stillwater Operating and financial results | Six months and year ended 31 December 2023 62
| For the year ended 31 Dec 2023 (Unaudited) | ||||||||||||||||||||||||||||||||||||||||||||||||||||||||
| US PGM OPERATIONS | SA OPERATIONS | |||||||||||||||||||||||||||||||||||||||||||||||||||||||
US dollars3 | Total US PGM | Underground | Recycling | Total SA Operations | Total SA PGM | Rusten- burg | Marikana | Kroondal | Platinum Mile | Mimosa | Corporate and re- conciling items1 | Total SA gold | Drie- fontein | Kloof | Beatrix | Cooke | DRD- GOLD | Corporate and re- conciling items1 | ||||||||||||||||||||||||||||||||||||||
| Revenue | 1,292 | 569 | 723 | 4,602 | 3,019 | 1,234 | 1,481 | 248 | 56 | 175 | (175) | 1,583 | 450 | 480 | 261 | 76 | 316 | — | ||||||||||||||||||||||||||||||||||||||
| Underground | 569 | 569 | — | 3,978 | 2,844 | 1,115 | 1,481 | 248 | — | 175 | (175) | 1,134 | 440 | 438 | 256 | — | — | — | ||||||||||||||||||||||||||||||||||||||
| Surface | — | — | — | 624 | 175 | 119 | — | — | 56 | — | — | 449 | 10 | 42 | 5 | 76 | 316 | — | ||||||||||||||||||||||||||||||||||||||
| Recycling/processing | 723 | — | 723 | — | — | — | — | — | — | — | — | — | — | — | — | — | — | — | ||||||||||||||||||||||||||||||||||||||
Cost of sales, before amortisation and depreciation2 | (1,218) | (528) | (690) | (3,298) | (1,992) | (822) | (921) | (214) | (35) | (131) | 131 | (1,306) | (356) | (442) | (220) | (69) | (219) | — | ||||||||||||||||||||||||||||||||||||||
| Underground | (528) | (528) | — | (2,866) | (1,890) | (755) | (921) | (214) | — | (131) | 131 | (976) | (351) | (410) | (215) | — | — | — | ||||||||||||||||||||||||||||||||||||||
| Surface | — | — | — | (432) | (102) | (67) | — | — | (35) | — | — | (330) | (5) | (32) | (5) | (69) | (219) | — | ||||||||||||||||||||||||||||||||||||||
| Recycling/processing | (690) | — | (690) | — | — | — | — | — | — | — | — | — | — | — | — | — | — | — | ||||||||||||||||||||||||||||||||||||||
| Amortisation and depreciation | (184) | (184) | — | (292) | (162) | (62) | (83) | (13) | (3) | (26) | 25 | (130) | (55) | (43) | (18) | — | (11) | (3) | ||||||||||||||||||||||||||||||||||||||
| Interest income | 12 | 12 | — | 59 | 26 | 3 | 13 | 7 | 2 | 2 | (1) | 33 | 4 | 4 | 2 | 1 | 17 | 5 | ||||||||||||||||||||||||||||||||||||||
| Finance expense | (62) | (62) | — | (86) | (38) | (221) | (22) | (7) | — | (2) | 214 | (48) | (6) | (7) | (6) | (6) | (4) | (19) | ||||||||||||||||||||||||||||||||||||||
| Share-based payments | (2) | (2) | — | (5) | (3) | — | (1) | — | — | — | (2) | (2) | — | — | — | — | (1) | (1) | ||||||||||||||||||||||||||||||||||||||
| Gain/(loss) on financial instruments | (112) | (112) | — | 106 | 106 | 275 | 95 | (8) | — | — | (256) | — | 1 | 1 | 1 | 2 | 1 | (6) | ||||||||||||||||||||||||||||||||||||||
| Gain/(loss) on foreign exchange differences | 1 | 1 | — | 104 | 103 | — | 92 | 9 | 2 | (13) | 13 | 1 | — | — | — | — | — | 1 | ||||||||||||||||||||||||||||||||||||||
| Share of results of equity-accounted investees after tax | — | — | — | (63) | (80) | — | — | — | — | — | (80) | 17 | — | — | — | — | — | 17 | ||||||||||||||||||||||||||||||||||||||
| Other costs | (6) | (6) | — | (185) | (79) | 5 | (38) | (7) | (15) | (2) | (22) | (106) | (4) | (8) | (14) | (48) | (1) | (31) | ||||||||||||||||||||||||||||||||||||||
| Other income | 1 | 1 | — | 59 | 32 | — | 9 | 3 | — | 2 | 18 | 27 | — | — | 1 | (1) | — | 27 | ||||||||||||||||||||||||||||||||||||||
| Gain on disposal of property, plant and equipment | (2) | (2) | — | 8 | 4 | 2 | 2 | — | — | — | — | 4 | 1 | 1 | 1 | — | 1 | — | ||||||||||||||||||||||||||||||||||||||
| (Impairments)/reversal of impairments | (2,113) | (2,113) | — | (176) | (27) | — | — | (1) | — | (124) | 98 | (149) | — | (88) | — | — | — | (61) | ||||||||||||||||||||||||||||||||||||||
| Gain on acquisition | — | — | — | 49 | 49 | — | — | 49 | — | — | — | — | — | — | — | — | — | — | ||||||||||||||||||||||||||||||||||||||
| Occupational healthcare gain | — | — | — | 20 | — | — | — | — | — | — | — | 20 | — | — | — | — | — | 20 | ||||||||||||||||||||||||||||||||||||||
| Restructuring costs | (2) | (2) | — | (26) | (19) | (5) | (11) | (3) | — | — | — | (7) | (1) | (13) | 8 | — | — | (1) | ||||||||||||||||||||||||||||||||||||||
| Transaction costs | (1) | (1) | — | — | — | — | — | — | — | — | — | — | — | — | — | — | — | — | ||||||||||||||||||||||||||||||||||||||
| Royalties and carbon tax | — | — | — | (50) | (45) | (19) | (24) | — | — | (7) | 5 | (5) | (2) | (2) | (1) | — | — | — | ||||||||||||||||||||||||||||||||||||||
| Mining and income tax | 414 | — | — | (279) | (226) | (94) | (117) | (6) | (2) | 22 | (29) | (53) | (44) | (31) | (26) | — | (24) | 72 | ||||||||||||||||||||||||||||||||||||||
| Current taxation | 19 | (186) | (168) | (65) | (88) | (7) | (1) | (2) | (5) | (18) | — | — | — | — | (17) | (1) | ||||||||||||||||||||||||||||||||||||||||
| Deferred taxation | 395 | (93) | (58) | (29) | (29) | 1 | (1) | 24 | (24) | (35) | (44) | (31) | (26) | — | (7) | 73 | ||||||||||||||||||||||||||||||||||||||||
| (Loss)/profit for the year | (1,982) | 547 | 668 | 296 | 475 | 57 | 5 | (104) | (61) | (121) | (12) | (148) | (11) | (45) | 75 | 20 | ||||||||||||||||||||||||||||||||||||||||
| Sustaining capital expenditure | (118) | (118) | — | (192) | (113) | (35) | (60) | (16) | (2) | (57) | 57 | (79) | (27) | (23) | (6) | — | (23) | — | ||||||||||||||||||||||||||||||||||||||
| Ore reserve development | (211) | (211) | — | (285) | (138) | (36) | (102) | — | — | — | — | (147) | (79) | (50) | (18) | — | — | — | ||||||||||||||||||||||||||||||||||||||
| Growth projects | (42) | (42) | — | (194) | (56) | — | (48) | (1) | (7) | — | — | (138) | — | (6) | — | — | (48) | (84) | ||||||||||||||||||||||||||||||||||||||
| Total capital expenditure | (371) | (371) | — | (671) | (307) | (71) | (210) | (17) | (9) | (57) | 57 | (364) | (106) | (79) | (24) | — | (71) | (84) | ||||||||||||||||||||||||||||||||||||||
1Corporate and reconciling items represent the items to reconcile segment data to condensed consolidated financial statement totals, such as intercompany eliminations and share of results of equity-accounted investees after tax. This does not represent a separate segment as it does not generate revenue
2Included in cost of sales, before amortisation and depreciation is total write-down of inventory to net realisable value amounting to R1,694 million. This write-down mainly relates to PGM in process and PGM finished goods of R1,179 million and R423 million, respectively, of which R1,374 million relates to Stillwater as a result of the lower commodity price environment
3The average exchange rate for the year ended 31 December 2023 was R18.42/US$
Sibanye-Stillwater Operating and financial results | Six months and year ended 31 December 2023 63
Figures are in millions
| For the year ended 31 Dec 2022 (Unaudited) | ||||||||||||||||||||||||||||||||||||||||||||||||||||||||
| US PGM OPERATIONS | SA OPERATIONS | |||||||||||||||||||||||||||||||||||||||||||||||||||||||
| SA rand | Total US PGM | Underground | Recycling | Total SA Operations | Total SA PGM | Rusten- burg | Marikana | Kroondal | Platinum Mile | Mimosa | Corporate and re- conciling items1 | Total SA gold | Drie- fontein | Kloof | Beatrix | Cooke | DRD- GOLD | Corporate and re- conciling items1 | ||||||||||||||||||||||||||||||||||||||
| Revenue | 46,090 | 13,823 | 32,267 | 89,507 | 71,665 | 29,104 | 32,753 | 8,371 | 1,437 | 4,267 | (4,267) | 17,842 | 4,486 | 4,486 | 2,681 | 915 | 5,274 | — | ||||||||||||||||||||||||||||||||||||||
| Underground | 13,823 | 13,823 | — | 78,951 | 68,182 | 27,058 | 32,753 | 8,371 | — | 4,267 | (4,267) | 10,769 | 4,213 | 3,924 | 2,632 | — | — | — | ||||||||||||||||||||||||||||||||||||||
| Surface | — | — | — | 10,556 | 3,483 | 2,046 | — | — | 1,437 | — | — | 7,073 | 273 | 562 | 49 | 915 | 5,274 | — | ||||||||||||||||||||||||||||||||||||||
| Recycling | 32,267 | — | 32,267 | — | — | — | — | — | — | — | — | — | — | — | — | — | — | — | ||||||||||||||||||||||||||||||||||||||
| Cost of sales, before amortisation and depreciation | (38,452) | (7,459) | (30,993) | (52,454) | (32,280) | (13,546) | (14,603) | (3,548) | (583) | (1,936) | 1,936 | (20,174) | (5,281) | (6,381) | (3,910) | (822) | (3,780) | — | ||||||||||||||||||||||||||||||||||||||
| Underground | (7,459) | (7,459) | — | (45,275) | (30,528) | (12,377) | (14,603) | (3,548) | — | (1,936) | 1,936 | (14,747) | (5,085) | (5,821) | (3,841) | — | — | — | ||||||||||||||||||||||||||||||||||||||
| Surface | — | — | — | (7,179) | (1,752) | (1,169) | — | — | (583) | — | — | (5,427) | (196) | (560) | (69) | (822) | (3,780) | — | ||||||||||||||||||||||||||||||||||||||
| Recycling | (30,993) | — | (30,993) | — | — | — | — | — | — | — | — | — | — | — | — | — | — | — | ||||||||||||||||||||||||||||||||||||||
| Amortisation and depreciation | (2,803) | (2,799) | (4) | (4,126) | (2,418) | (981) | (1,205) | (180) | (40) | (342) | 330 | (1,708) | (721) | (469) | (305) | (3) | (176) | (34) | ||||||||||||||||||||||||||||||||||||||
| Interest income | 309 | 81 | 228 | 893 | 402 | 43 | 214 | 109 | 30 | 102 | (96) | 491 | 68 | 57 | 35 | 35 | 265 | 31 | ||||||||||||||||||||||||||||||||||||||
| Finance expense | (952) | (952) | — | (1,547) | (831) | (4,618) | (320) | (111) | — | (36) | 4,254 | (716) | (100) | (95) | (95) | (86) | (78) | (262) | ||||||||||||||||||||||||||||||||||||||
| Share-based payments | (47) | (47) | — | (169) | (73) | (27) | (36) | (9) | (1) | — | — | (96) | (20) | (15) | (10) | — | (19) | (32) | ||||||||||||||||||||||||||||||||||||||
| (Loss)/gain on financial instruments | (242) | (242) | — | (4,188) | (3,477) | (9,520) | (1,502) | — | — | (16) | 7,561 | (711) | 7 | 8 | 6 | — | — | (732) | ||||||||||||||||||||||||||||||||||||||
| Gain/(loss) on foreign exchange differences | (8) | (8) | — | 623 | 208 | 155 | (127) | 165 | 5 | (482) | 492 | 415 | — | — | — | — | 4 | 411 | ||||||||||||||||||||||||||||||||||||||
| Share of results of equity-accounted investees after tax | — | — | — | 1,298 | 1,062 | — | — | — | — | — | 1,062 | 236 | — | — | — | — | — | 236 | ||||||||||||||||||||||||||||||||||||||
| Other costs | (129) | (129) | — | (3,379) | (1,616) | 161 | (1,040) | (123) | (407) | (22) | (185) | (1,763) | (169) | (149) | (95) | (713) | (21) | (616) | ||||||||||||||||||||||||||||||||||||||
| Other income | 102 | 102 | — | 963 | 385 | 2 | 220 | 133 | — | 1 | 29 | 578 | 2 | — | — | (54) | 85 | 545 | ||||||||||||||||||||||||||||||||||||||
| Gain on disposal of property, plant and equipment | 5 | 5 | — | 157 | 54 | 20 | 35 | — | — | (2) | 1 | 103 | 16 | 19 | 9 | — | 10 | 49 | ||||||||||||||||||||||||||||||||||||||
| Reversal of impairments/(impairments) | — | — | — | 6 | 6 | — | 7 | (1) | — | — | — | — | — | — | — | — | — | — | ||||||||||||||||||||||||||||||||||||||
| Gain on acquisition | — | — | — | — | — | — | — | — | — | — | — | — | — | — | — | — | — | — | ||||||||||||||||||||||||||||||||||||||
| Occupational healthcare gain | — | — | — | 211 | — | — | — | — | — | — | — | 211 | — | — | — | — | — | 211 | ||||||||||||||||||||||||||||||||||||||
| Restructuring costs | (2) | (2) | — | (361) | (26) | (10) | (13) | (3) | — | — | — | (335) | (6) | (33) | (290) | (2) | — | (4) | ||||||||||||||||||||||||||||||||||||||
| Transaction costs | (8) | (8) | — | (2) | (3) | — | (3) | — | — | — | — | 1 | — | — | — | — | — | 1 | ||||||||||||||||||||||||||||||||||||||
| Royalties and carbon tax | — | — | — | (1,824) | (1,772) | (1,023) | (735) | (13) | — | (127) | 126 | (52) | (22) | (22) | (3) | (5) | — | — | ||||||||||||||||||||||||||||||||||||||
| Mining and income tax | (340) | — | — | (8,541) | (9,705) | (3,759) | (4,459) | (1,348) | (122) | (346) | 329 | 1,164 | 78 | (187) | 154 | — | (351) | 1,470 | ||||||||||||||||||||||||||||||||||||||
| Current taxation | (655) | (8,623) | (8,373) | (3,169) | (3,766) | (1,288) | (130) | (208) | 188 | (250) | (6) | (3) | — | — | (226) | (15) | ||||||||||||||||||||||||||||||||||||||||
| Deferred taxation | 315 | 82 | (1,332) | (590) | (693) | (60) | 8 | (138) | 141 | 1,414 | 84 | (184) | 154 | — | (125) | 1,485 | ||||||||||||||||||||||||||||||||||||||||
| Profit/(loss) for the year | 3,523 | 17,067 | 21,581 | (3,999) | 9,186 | 3,442 | 319 | 1,061 | 11,572 | (4,514) | (1,662) | (2,781) | (1,823) | (735) | 1,213 | 1,274 | ||||||||||||||||||||||||||||||||||||||||
| Sustaining capital expenditure | (1,185) | (1,184) | (1) | (3,671) | (2,056) | (690) | (1,072) | (273) | (21) | (864) | 864 | (1,615) | (358) | (455) | (155) | — | (647) | — | ||||||||||||||||||||||||||||||||||||||
| Ore reserve development | (2,887) | (2,887) | — | (3,753) | (2,123) | (687) | (1,436) | — | — | — | — | (1,630) | (794) | (620) | (216) | — | — | — | ||||||||||||||||||||||||||||||||||||||
| Growth projects | (1,345) | (1,345) | — | (2,239) | (925) | — | (924) | — | — | — | (1) | (1,314) | — | (210) | (4) | — | (124) | (976) | ||||||||||||||||||||||||||||||||||||||
| Total capital expenditure | (5,417) | (5,416) | (1) | (9,663) | (5,104) | (1,377) | (3,432) | (273) | (21) | (864) | 863 | (4,559) | (1,152) | (1,285) | (375) | — | (771) | (976) | ||||||||||||||||||||||||||||||||||||||
Sibanye-Stillwater Operating and financial results | Six months and year ended 31 December 2023 64
| For the year ended 31 Dec 2022 (Unaudited) | ||||||||||||||||||||||||||||||||||||||||||||||||||||||||
| US PGM OPERATIONS | SA OPERATIONS | |||||||||||||||||||||||||||||||||||||||||||||||||||||||
US dollars2 | Total US PGM | Underground | Recycling | Total SA Operations | Total SA PGM | Rusten- burg | Marikana | Kroondal | Platinum Mile | Mimosa | Corporate and re- conciling items1 | Total SA gold | Drie- fontein | Kloof | Beatrix | Cooke | DRD- GOLD | Corporate and re- conciling items1 | ||||||||||||||||||||||||||||||||||||||
| Revenue | 2,815 | 844 | 1,971 | 5,468 | 4,378 | 1,778 | 2,001 | 511 | 88 | 261 | (261) | 1,090 | 274 | 274 | 164 | 56 | 322 | — | ||||||||||||||||||||||||||||||||||||||
| Underground | 844 | 844 | — | 4,823 | 4,165 | 1,653 | 2,001 | 511 | — | 261 | (261) | 658 | 257 | 240 | 161 | — | — | — | ||||||||||||||||||||||||||||||||||||||
| Surface | — | — | — | 645 | 213 | 125 | — | — | 88 | — | — | 432 | 17 | 34 | 3 | 56 | 322 | — | ||||||||||||||||||||||||||||||||||||||
| Recycling | 1,971 | — | 1,971 | — | — | — | — | — | — | — | — | — | — | — | — | — | — | — | ||||||||||||||||||||||||||||||||||||||
| Cost of sales, before amortisation and depreciation | (2,349) | (456) | (1,893) | (3,204) | (1,971) | (827) | (892) | (217) | (36) | (118) | 119 | (1,233) | (323) | (390) | (239) | (50) | (231) | — | ||||||||||||||||||||||||||||||||||||||
| Underground | (456) | (456) | — | (2,766) | (1,864) | (756) | (892) | (217) | — | (118) | 119 | (902) | (311) | (356) | (235) | — | — | — | ||||||||||||||||||||||||||||||||||||||
| Surface | — | — | — | (438) | (107) | (71) | — | — | (36) | — | — | (331) | (12) | (34) | (4) | (50) | (231) | — | ||||||||||||||||||||||||||||||||||||||
| Recycling | (1,893) | — | (1,893) | — | — | — | — | — | — | — | — | — | — | — | — | — | — | — | ||||||||||||||||||||||||||||||||||||||
| Amortisation and depreciation | (171) | (171) | — | (253) | (148) | (60) | (74) | (11) | (2) | (21) | 20 | (105) | (44) | (29) | (19) | — | (11) | (2) | ||||||||||||||||||||||||||||||||||||||
| Interest income | 19 | 5 | 14 | 54 | 25 | 3 | 13 | 7 | 2 | 6 | (6) | 29 | 4 | 3 | 2 | 2 | 16 | 2 | ||||||||||||||||||||||||||||||||||||||
| Finance expense | (58) | (58) | — | (94) | (50) | (282) | (20) | (7) | — | (2) | 261 | (44) | (6) | (6) | (6) | (5) | (5) | (16) | ||||||||||||||||||||||||||||||||||||||
| Share-based payments | (3) | (3) | — | (10) | (4) | (2) | (2) | (1) | — | — | 1 | (6) | (1) | (1) | (1) | — | (1) | (2) | ||||||||||||||||||||||||||||||||||||||
| (Loss)/gain on financial instruments | (15) | (15) | — | (255) | (211) | (580) | (91) | — | — | (1) | 461 | (44) | — | 1 | — | — | — | (45) | ||||||||||||||||||||||||||||||||||||||
| Gain/(loss) on foreign exchange differences | — | — | — | 38 | 13 | 9 | (7) | 10 | — | (29) | 30 | 25 | — | — | — | — | — | 25 | ||||||||||||||||||||||||||||||||||||||
| Share of results of equity-accounted investees after tax | — | — | — | 80 | 65 | — | — | — | — | — | 65 | 15 | — | — | — | — | — | 15 | ||||||||||||||||||||||||||||||||||||||
| Other costs | (8) | (8) | — | (207) | (99) | 10 | (64) | (8) | (25) | (1) | (11) | (108) | (10) | (9) | (6) | (44) | (1) | (38) | ||||||||||||||||||||||||||||||||||||||
| Other income | 6 | 6 | — | 59 | 24 | — | 13 | 9 | — | — | 2 | 35 | — | — | — | (3) | 5 | 33 | ||||||||||||||||||||||||||||||||||||||
| Gain on disposal of property, plant and equipment | — | — | — | 10 | 3 | 1 | 2 | — | — | — | — | 7 | 1 | 1 | 1 | — | 1 | 3 | ||||||||||||||||||||||||||||||||||||||
| Reversal of impairments/(impairments) | — | — | — | — | — | — | — | — | — | — | — | — | — | — | — | — | — | — | ||||||||||||||||||||||||||||||||||||||
| Gain on acquisition | — | — | — | — | — | — | — | — | — | — | — | — | — | — | — | — | — | — | ||||||||||||||||||||||||||||||||||||||
| Occupational healthcare gain | — | — | — | 13 | — | — | — | — | — | — | — | 13 | — | — | — | — | — | 13 | ||||||||||||||||||||||||||||||||||||||
| Restructuring costs | — | — | — | (22) | (2) | (1) | (1) | — | — | — | — | (20) | — | (2) | (18) | — | — | — | ||||||||||||||||||||||||||||||||||||||
| Transaction costs | — | — | — | — | — | — | — | — | — | — | — | — | — | — | — | — | — | — | ||||||||||||||||||||||||||||||||||||||
| Royalties and carbon tax | — | — | — | (111) | (109) | (62) | (45) | (1) | — | (8) | 7 | (2) | (1) | (1) | — | — | — | — | ||||||||||||||||||||||||||||||||||||||
| Mining and income tax | (21) | — | — | (522) | (593) | (230) | (272) | (83) | (8) | (21) | 21 | 71 | 5 | (11) | 9 | — | (22) | 90 | ||||||||||||||||||||||||||||||||||||||
| Current taxation | (40) | (527) | (512) | (194) | (230) | (79) | (8) | (13) | 12 | (15) | — | — | — | — | (14) | (1) | ||||||||||||||||||||||||||||||||||||||||
| Deferred taxation | 19 | 5 | (81) | (36) | (42) | (4) | — | (8) | 9 | 86 | 5 | (11) | 9 | — | (8) | 91 | ||||||||||||||||||||||||||||||||||||||||
| Profit/(loss) for the year | 215 | 1,044 | 1,321 | (243) | 561 | 209 | 19 | 66 | 709 | (277) | (101) | (170) | (113) | (44) | 73 | 78 | ||||||||||||||||||||||||||||||||||||||||
| Sustaining capital expenditure | (72) | (72) | — | (224) | (125) | (42) | (65) | (17) | (1) | (53) | 53 | (99) | (22) | (28) | (9) | — | (40) | — | ||||||||||||||||||||||||||||||||||||||
| Ore reserve development | (176) | (176) | — | (230) | (130) | (42) | (88) | — | — | — | — | (100) | (49) | (38) | (13) | — | — | — | ||||||||||||||||||||||||||||||||||||||
| Growth projects | (82) | (82) | — | (137) | (56) | — | (56) | — | — | — | — | (81) | — | (13) | — | — | (8) | (60) | ||||||||||||||||||||||||||||||||||||||
| Total capital expenditure | (330) | (330) | — | (591) | (311) | (84) | (209) | (17) | (1) | (53) | 53 | (280) | (71) | (79) | (22) | — | (48) | (60) | ||||||||||||||||||||||||||||||||||||||
1Corporate and reconciling items represent the items to reconcile segment data to condensed consolidated financial statement totals, such as intercompany eliminations and share of results of equity-accounted investees after tax. This does not represent a separate segment as it does not generate revenue
2The average exchange rate for the year ended 31 December 2022 was R16.37/US$
Sibanye-Stillwater Operating and financial results | Six months and year ended 31 December 2023 65
18.2 Sandouville nickel refinery and Zinc retreatment operation
Figures are in millions
| For the six months ended 31 Dec 2023 (Unaudited) | For the six months ended 30 Jun 2023 (Unaudited) | For the six months ended 31 Dec 2022 (Unaudited) | |||||||||||||||||||||||||||||||||||||||||||||
| EUROPE | AUSTRALIA | EUROPE | EUROPE | ||||||||||||||||||||||||||||||||||||||||||||
| SA rand | Total EU operations | Sandouville nickel refinery | Corporate and re- conciling items1 | Total AUS operations | Century zinc retreatment operation | Corporate and re- conciling items1 | Total EU operations | Sandouville nickel refinery | Corporate and re- conciling items1 | Total AUS operations | Century zinc retreatment operation2 | Corporate and re- conciling items1 | Total EU operations | Sandouville nickel refinery | Corporate and re- conciling items1 | ||||||||||||||||||||||||||||||||
| Revenue | 1,347 | 1,347 | — | 1,745 | 1,745 | — | 1,677 | 1,677 | — | 506 | 506 | — | 967 | 967 | — | ||||||||||||||||||||||||||||||||
| Underground | — | — | — | — | — | — | — | — | — | — | — | — | — | — | — | ||||||||||||||||||||||||||||||||
| Surface | — | — | — | 1,745 | 1,745 | — | — | — | — | 506 | 506 | — | — | — | — | ||||||||||||||||||||||||||||||||
| Recycling/processing | 1,347 | 1,347 | — | — | — | — | 1,677 | 1,677 | — | — | — | — | 967 | 967 | — | ||||||||||||||||||||||||||||||||
| Cost of sales, before amortisation and depreciation | (2,000) | (2,000) | — | (1,405) | (1,405) | — | (2,329) | (2,329) | — | (851) | (851) | — | (1,506) | (1,506) | — | ||||||||||||||||||||||||||||||||
| Underground | — | — | — | — | — | — | — | — | — | — | — | — | — | — | — | ||||||||||||||||||||||||||||||||
| Surface | — | — | — | (1,405) | (1,405) | — | — | — | — | (851) | (851) | — | — | — | — | ||||||||||||||||||||||||||||||||
| Recycling/processing | (2,000) | (2,000) | — | — | — | — | (2,329) | (2,329) | — | — | — | — | (1,506) | (1,506) | — | ||||||||||||||||||||||||||||||||
| Amortisation and depreciation | (109) | (105) | (4) | (490) | (490) | — | (97) | (94) | (3) | (569) | (569) | — | (97) | (92) | (5) | ||||||||||||||||||||||||||||||||
| Interest income | 52 | — | 52 | 2 | 1 | 1 | 1 | — | 1 | 8 | 5 | 3 | — | — | — | ||||||||||||||||||||||||||||||||
| Finance expense | (48) | (8) | (40) | (64) | (38) | (26) | (19) | (5) | (14) | (120) | (120) | — | (8) | (6) | (2) | ||||||||||||||||||||||||||||||||
| Share-based payments | 11 | (3) | 14 | — | — | — | (5) | (5) | — | — | — | — | — | — | — | ||||||||||||||||||||||||||||||||
| (Loss)/gain on financial instruments | (248) | 34 | (282) | (114) | (113) | (1) | 80 | 10 | 70 | 629 | 628 | 1 | 122 | 1 | 121 | ||||||||||||||||||||||||||||||||
| Gain/(loss) on foreign exchange differences | (11) | (11) | — | (20) | (9) | (11) | 66 | 66 | — | (19) | 5 | (24) | (8) | 42 | (50) | ||||||||||||||||||||||||||||||||
| Share of results of equity-accounted investees after tax | — | — | — | — | — | — | — | — | — | — | — | — | — | — | — | ||||||||||||||||||||||||||||||||
| Other costs | (2,047) | (1,947) | (100) | (108) | (109) | 1 | (49) | (15) | (34) | (115) | (114) | (1) | (116) | (31) | (85) | ||||||||||||||||||||||||||||||||
| Other income | 52 | 46 | 6 | 42 | 42 | — | 50 | 49 | 1 | — | — | — | 19 | 18 | 1 | ||||||||||||||||||||||||||||||||
| Gain/(loss) on disposal of property, plant and equipment | — | — | — | — | — | — | — | — | — | — | — | — | — | — | — | ||||||||||||||||||||||||||||||||
| (Impairments)/reversal of impairments | (1,607) | (1,607) | — | (3,683) | (3,683) | — | — | — | — | (6) | (6) | — | — | — | — | ||||||||||||||||||||||||||||||||
| Gain on acquisition | — | — | — | — | — | — | — | — | — | — | — | — | — | — | — | ||||||||||||||||||||||||||||||||
| Occupational healthcare gain | — | — | — | — | — | — | — | — | — | — | — | — | — | — | — | ||||||||||||||||||||||||||||||||
| Restructuring costs | — | — | — | — | — | — | — | — | — | — | — | — | — | — | — | ||||||||||||||||||||||||||||||||
| Transaction costs | — | — | — | — | — | — | — | — | — | (2) | — | (2) | — | — | — | ||||||||||||||||||||||||||||||||
| Royalties and carbon tax | — | — | — | (79) | (79) | — | — | — | — | (52) | (52) | — | — | — | — | ||||||||||||||||||||||||||||||||
| Mining and income tax | (4) | — | (4) | (1) | — | (1) | (40) | — | (40) | (1) | — | (1) | (39) | — | (39) | ||||||||||||||||||||||||||||||||
| Current taxation | (64) | — | (64) | (1) | — | (1) | (16) | — | (16) | (1) | — | (1) | — | — | — | ||||||||||||||||||||||||||||||||
| Deferred taxation | 60 | — | 60 | — | — | — | (24) | — | (24) | — | — | — | (39) | — | (39) | ||||||||||||||||||||||||||||||||
| (Loss)/profit for the period | (4,612) | (4,254) | (358) | (4,175) | (4,138) | (37) | (665) | (646) | (19) | (592) | (568) | (24) | (666) | (607) | (59) | ||||||||||||||||||||||||||||||||
| Sustaining capital expenditure | (153) | (153) | — | (72) | (72) | — | (95) | (95) | — | (42) | (42) | — | (61) | (61) | — | ||||||||||||||||||||||||||||||||
| Ore reserve development | — | — | — | — | — | — | — | — | — | — | — | — | — | — | — | ||||||||||||||||||||||||||||||||
| Growth projects | (1,199) | — | (1,199) | (3) | (3) | — | (1,271) | — | (1,271) | (48) | (48) | — | (555) | — | (555) | ||||||||||||||||||||||||||||||||
| Total capital expenditure | (1,352) | (153) | (1,199) | (75) | (75) | — | (1,366) | (95) | (1,271) | (90) | (90) | — | (616) | (61) | (555) | ||||||||||||||||||||||||||||||||
Sibanye-Stillwater Operating and financial results | Six months and year ended 31 December 2023 66
Figures are in millions
| For the six months ended 31 Dec 2023 (Unaudited) | For the six months ended 30 Jun 2023 (Unaudited) | For the six months ended 31 Dec 2022 (Unaudited) | |||||||||||||||||||||||||||||||||||||||||||||
| EUROPE | AUSTRALIA | EUROPE | EUROPE | ||||||||||||||||||||||||||||||||||||||||||||
US dollars3 | Total EU operations | Sandouville nickel refinery | Corporate and re- conciling items1 | Total AUS operations | Century zinc retreatment operation | Corporate and re- conciling items1 | Total EU operations | Sandouville nickel refinery | Corporate and re- conciling items1 | Total AUS operations | Century zinc retreatment operation2 | Corporate and re- conciling items1 | Total EU operations | Sandouville nickel refinery | Corporate and re- conciling items1 | ||||||||||||||||||||||||||||||||
| Revenue | 72 | 72 | — | 94 | 94 | — | 92 | 92 | — | 28 | 28 | — | 51 | 51 | — | ||||||||||||||||||||||||||||||||
| Underground | — | — | — | — | — | — | — | — | — | — | — | — | — | — | — | ||||||||||||||||||||||||||||||||
| Surface | — | — | — | 94 | 94 | — | — | — | — | 28 | 28 | — | — | — | — | ||||||||||||||||||||||||||||||||
| Recycling/processing | 72 | 72 | — | — | — | — | 92 | 92 | — | — | — | — | 51 | 51 | — | ||||||||||||||||||||||||||||||||
| Cost of sales, before amortisation and depreciation | (107) | (107) | — | (75) | (75) | — | (128) | (128) | — | (47) | (47) | — | (84) | (84) | — | ||||||||||||||||||||||||||||||||
| Underground | — | — | — | — | — | — | — | — | — | — | — | — | — | — | — | ||||||||||||||||||||||||||||||||
| Surface | — | — | — | (75) | (75) | — | — | — | — | (47) | (47) | — | — | — | — | ||||||||||||||||||||||||||||||||
| Recycling/processing | (107) | (107) | — | — | — | — | (128) | (128) | — | — | — | — | (84) | (84) | — | ||||||||||||||||||||||||||||||||
| Amortisation and depreciation | (6) | (6) | — | (26) | (26) | — | (5) | (5) | — | (31) | (31) | — | (5) | (5) | — | ||||||||||||||||||||||||||||||||
| Interest income | 3 | — | 3 | — | — | — | — | — | — | — | — | — | — | — | — | ||||||||||||||||||||||||||||||||
| Finance expense | (3) | (1) | (2) | (3) | (2) | (1) | (1) | — | (1) | (7) | (7) | — | (1) | (1) | — | ||||||||||||||||||||||||||||||||
| Share-based payments | 1 | — | 1 | — | — | — | — | — | — | — | — | — | — | — | — | ||||||||||||||||||||||||||||||||
| (Loss)/gain on financial instruments | (14) | 2 | (16) | (6) | (6) | — | 4 | — | 4 | 34 | 34 | — | 7 | — | 7 | ||||||||||||||||||||||||||||||||
| Gain/(loss) on foreign exchange differences | (1) | (1) | — | (1) | — | (1) | 4 | 4 | — | (1) | — | (1) | (1) | 2 | (3) | ||||||||||||||||||||||||||||||||
| Share of results of equity-accounted investees after tax | — | — | — | — | — | — | — | — | — | — | — | — | — | — | — | ||||||||||||||||||||||||||||||||
| Other costs | (111) | (106) | (5) | (6) | (6) | — | (3) | (1) | (2) | (6) | (6) | — | (7) | (2) | (5) | ||||||||||||||||||||||||||||||||
| Other income | 2 | 2 | — | 2 | 2 | — | 3 | 3 | — | — | — | — | 1 | 1 | — | ||||||||||||||||||||||||||||||||
| Gain on disposal of property, plant and equipment | — | — | — | — | — | — | — | — | — | — | — | — | — | — | — | ||||||||||||||||||||||||||||||||
| (Impairments)/reversal of impairments | (87) | (87) | — | (200) | (200) | — | — | — | — | — | — | — | — | — | — | ||||||||||||||||||||||||||||||||
| Gain on acquisition | — | — | — | — | — | — | — | — | — | — | — | — | — | — | — | ||||||||||||||||||||||||||||||||
| Occupational healthcare gain | — | — | — | — | — | — | — | — | — | — | — | — | — | — | — | ||||||||||||||||||||||||||||||||
| Restructuring costs | — | — | — | — | — | — | — | — | — | — | — | — | — | — | — | ||||||||||||||||||||||||||||||||
| Transaction costs | — | — | — | — | — | — | — | — | — | — | — | — | — | — | — | ||||||||||||||||||||||||||||||||
| Royalties and carbon tax | — | — | — | (4) | (4) | — | — | — | — | (3) | (3) | — | — | — | — | ||||||||||||||||||||||||||||||||
| Mining and income tax | — | — | — | — | — | — | (2) | — | (2) | — | — | — | (2) | — | (2) | ||||||||||||||||||||||||||||||||
| Current taxation | (3) | — | (3) | — | — | — | (1) | — | (1) | — | — | — | — | — | — | ||||||||||||||||||||||||||||||||
| Deferred taxation | 3 | — | 3 | — | — | — | (1) | — | (1) | — | — | — | (2) | — | (2) | ||||||||||||||||||||||||||||||||
| (Loss)/profit for the period | (251) | (232) | (19) | (225) | (223) | (2) | (36) | (35) | (1) | (33) | (32) | (1) | (41) | (38) | (3) | ||||||||||||||||||||||||||||||||
| Sustaining capital expenditure | (8) | (8) | — | (4) | (4) | — | (5) | (5) | — | (2) | (2) | — | (3) | (3) | — | ||||||||||||||||||||||||||||||||
| Ore reserve development | — | — | — | — | — | — | — | — | — | — | — | — | — | — | — | ||||||||||||||||||||||||||||||||
| Growth projects | (64) | — | (64) | — | — | — | (70) | — | (70) | (3) | (3) | — | (34) | — | (34) | ||||||||||||||||||||||||||||||||
| Total capital expenditure | (72) | (8) | (64) | (4) | (4) | — | (75) | (5) | (70) | (5) | (5) | — | (37) | (3) | (34) | ||||||||||||||||||||||||||||||||
1Corporate and reconciling items represent the items to reconcile segment data to consolidated financial statement totals, such as intercompany eliminations and share of results of equity-accounted investees after tax. This does not represent a separate segment as it does not generate revenue. Corporate and reconciling items for total EU operations includes Keliber
2New Century's results are included for the four months ended 30 June 2023 since the effective date of acquisition (see note 10.1)
3The average exchange rate for the six months ended 31 December 2023 was R18.62/US$, six months ended 30 June 2023 was R18.21/US$ and six months ended 31 December 2022 was R17.33/US$
Sibanye-Stillwater Operating and financial results | Six months and year ended 31 December 2023 67
Figures are in millions
| For the year ended 31 Dec 2023 (Unaudited) | For the year ended 31 Dec 2022 (Unaudited) | ||||||||||||||||||||||||||||
| EUROPE | AUSTRALIA | EUROPE | |||||||||||||||||||||||||||
| SA rand | Total EU operations | Sandouville nickel refinery | Corporate and re- conciling items1 | Total AUS operations | Century zinc retreatment operation3 | Corporate and re- conciling items1 | Total EU operations | Sandouville nickel refinery2 | Corporate and re- conciling items1 | ||||||||||||||||||||
| Revenue | 3,024 | 3,024 | — | 2,251 | 2,251 | — | 3,140 | 3,140 | — | ||||||||||||||||||||
| Underground | — | — | — | — | — | — | — | — | — | ||||||||||||||||||||
| Surface | — | — | — | 2,251 | 2,251 | — | — | — | — | ||||||||||||||||||||
| Recycling/processing | 3,024 | 3,024 | — | — | — | — | 3,140 | 3,140 | — | ||||||||||||||||||||
| Cost of sales, before amortisation and depreciation | (4,329) | (4,329) | — | (2,256) | (2,256) | — | (3,631) | (3,631) | — | ||||||||||||||||||||
| Underground | — | — | — | — | — | — | — | — | — | ||||||||||||||||||||
| Surface | — | — | — | (2,256) | (2,256) | — | — | — | — | ||||||||||||||||||||
| Recycling/processing | (4,329) | (4,329) | — | — | — | — | (3,631) | (3,631) | — | ||||||||||||||||||||
| Amortisation and depreciation | (206) | (199) | (7) | (1,059) | (1,059) | — | (158) | (153) | (5) | ||||||||||||||||||||
| Interest income | 53 | — | 53 | 10 | 6 | 4 | — | — | — | ||||||||||||||||||||
| Finance expense | (67) | (13) | (54) | (184) | (158) | (26) | (15) | (13) | (2) | ||||||||||||||||||||
| Share-based payments | 6 | (8) | 14 | — | — | — | — | — | — | ||||||||||||||||||||
| Gain/(loss)on financial instruments | (168) | 44 | (212) | 515 | 515 | — | 144 | — | 144 | ||||||||||||||||||||
| Gain/(loss) on foreign exchange differences | 55 | 55 | — | (39) | (4) | (35) | (49) | 9 | (58) | ||||||||||||||||||||
| Share of results of equity-accounted investees after tax | — | — | — | — | — | — | — | — | — | ||||||||||||||||||||
| Other costs | (2,096) | (1,962) | (134) | (223) | (223) | — | (116) | (31) | (85) | ||||||||||||||||||||
| Other income | 102 | 95 | 7 | 42 | 42 | — | 45 | 44 | 1 | ||||||||||||||||||||
| Gain/(loss) on disposal of property, plant and equipment | — | — | — | — | — | — | — | — | — | ||||||||||||||||||||
| (Impairments)/reversal of impairments | (1,607) | (1,607) | — | (3,689) | (3,689) | — | — | — | — | ||||||||||||||||||||
| Gain on acquisition | — | — | — | — | — | — | — | — | — | ||||||||||||||||||||
| Occupational healthcare gain | — | — | — | — | — | — | — | — | — | ||||||||||||||||||||
| Restructuring costs | — | — | — | — | — | — | — | — | — | ||||||||||||||||||||
| Transaction costs | — | — | — | (2) | — | (2) | — | — | — | ||||||||||||||||||||
| Royalties and carbon tax | — | — | — | (131) | (131) | — | — | — | — | ||||||||||||||||||||
| Mining and income tax | (44) | — | (44) | (2) | — | (2) | (39) | — | (39) | ||||||||||||||||||||
| Current taxation | (80) | — | (80) | (2) | — | (2) | — | — | — | ||||||||||||||||||||
| Deferred taxation | 36 | — | 36 | — | — | — | (39) | — | (39) | ||||||||||||||||||||
| (Loss)/profit for the year | (5,277) | (4,900) | (377) | (4,767) | (4,706) | (61) | (679) | (635) | (44) | ||||||||||||||||||||
| Sustaining capital expenditure | (248) | (248) | — | (114) | (114) | — | (90) | (90) | — | ||||||||||||||||||||
| Ore reserve development | — | — | — | — | — | — | — | — | — | ||||||||||||||||||||
| Growth projects | (2,470) | — | (2,470) | (51) | (51) | — | (729) | — | (729) | ||||||||||||||||||||
| Total capital expenditure | (2,718) | (248) | (2,470) | (165) | (165) | — | (819) | (90) | (729) | ||||||||||||||||||||
Sibanye-Stillwater Operating and financial results | Six months and year ended 31 December 2023 68
Figures are in millions
| For the year ended 31 Dec 2023 (Unaudited) | For the year ended 31 Dec 2022 (Unaudited) | ||||||||||||||||||||||||||||
| EUROPE | AUSTRALIA | EUROPE | |||||||||||||||||||||||||||
US dollars4 | Total EU operations | Sandouville nickel refinery | Corporate and re- conciling items1 | Total AUS operations | Century zinc retreatment operation3 | Corporate and re- conciling items1 | Total EU operations | Sandouville nickel refinery2 | Corporate and re- conciling items1 | ||||||||||||||||||||
| Revenue | 164 | 164 | — | 122 | 122 | — | 192 | 192 | — | ||||||||||||||||||||
| Underground | — | — | — | — | — | — | — | — | — | ||||||||||||||||||||
| Surface | — | — | — | 122 | 122 | — | — | — | — | ||||||||||||||||||||
| Recycling/processing | 164 | 164 | — | — | — | — | 192 | 192 | — | ||||||||||||||||||||
| Cost of sales, before amortisation and depreciation | (235) | (235) | — | (122) | (122) | — | (222) | (222) | — | ||||||||||||||||||||
| Underground | — | — | — | — | — | — | — | — | — | ||||||||||||||||||||
| Surface | — | — | — | (122) | (122) | — | — | — | — | ||||||||||||||||||||
| Recycling/processing | (235) | (235) | — | — | — | — | (222) | (222) | — | ||||||||||||||||||||
| Amortisation and depreciation | (11) | (11) | — | (57) | (57) | — | (9) | (9) | — | ||||||||||||||||||||
| Interest income | 3 | — | 3 | — | — | — | — | — | — | ||||||||||||||||||||
| Finance expense | (4) | (1) | (3) | (10) | (9) | (1) | (1) | (1) | — | ||||||||||||||||||||
| Share-based payments | 1 | — | 1 | — | — | — | — | — | — | ||||||||||||||||||||
| Gain/(loss) on financial instruments | (10) | 2 | (12) | 28 | 28 | — | 9 | — | 9 | ||||||||||||||||||||
| Gain/(loss) on foreign exchange differences | 3 | 3 | — | (2) | — | (2) | (4) | — | (4) | ||||||||||||||||||||
| Share of results of equity-accounted investees after tax | — | — | — | — | — | — | — | — | — | ||||||||||||||||||||
| Other costs | (114) | (107) | (7) | (12) | (12) | — | (7) | (2) | (5) | ||||||||||||||||||||
| Other income | 5 | 5 | — | 2 | 2 | — | 3 | 3 | — | ||||||||||||||||||||
| Gain on disposal of property, plant and equipment | — | — | — | — | — | — | — | — | — | ||||||||||||||||||||
| (Impairments)/reversal of impairments | (87) | (87) | — | (200) | (200) | — | — | — | — | ||||||||||||||||||||
| Gain on acquisition | — | — | — | — | — | — | — | — | — | ||||||||||||||||||||
| Occupational healthcare gain | — | — | — | — | — | — | — | — | — | ||||||||||||||||||||
| Restructuring costs | — | — | — | — | — | — | — | — | — | ||||||||||||||||||||
| Transaction costs | — | — | — | — | — | — | — | — | — | ||||||||||||||||||||
| Royalties and carbon tax | — | — | — | (7) | (7) | — | — | — | — | ||||||||||||||||||||
| Mining and income tax | (2) | — | (2) | — | — | — | (2) | — | (2) | ||||||||||||||||||||
| Current taxation | (4) | — | (4) | — | — | — | — | — | — | ||||||||||||||||||||
| Deferred taxation | 2 | — | 2 | — | — | — | (2) | — | (2) | ||||||||||||||||||||
| (Loss)/profit for the year | (287) | (267) | (20) | (258) | (255) | (3) | (41) | (39) | (2) | ||||||||||||||||||||
| Sustaining capital expenditure | (13) | (13) | — | (6) | (6) | — | (5) | (5) | — | ||||||||||||||||||||
| Ore reserve development | — | — | — | — | — | — | — | — | — | ||||||||||||||||||||
| Growth projects | (134) | — | (134) | (3) | (3) | — | (45) | — | (45) | ||||||||||||||||||||
| Total capital expenditure | (147) | (13) | (134) | (9) | (9) | — | (50) | (5) | (45) | ||||||||||||||||||||
1Corporate and reconciling items represent the items to reconcile segment data to consolidated financial statement totals, such as intercompany eliminations and share of results of equity-accounted investees after tax. This does not represent a separate segment as it does not generate revenue. Corporate and reconciling items for total EU operations includes Keliber
2Sandouville nickel refinery's results for the year ended 31 December 2022 includes the results of Sandouville for the eleven months since acquisition
3New Century's results for the year ended 31 December 2023 are included for the ten months since the effective date of acquisition (see note 10.1)
4The average exchange rate for the year ended 31 December 2023 was R18.42/US$ and the year ended 31 December 2022 was R16.37/US$
Sibanye-Stillwater Operating and financial results | Six months and year ended 31 December 2023 69
ALL-IN COSTS - SIX MONTHS
US and SA PGM operations
Figures are in rand millions unless otherwise stated
US and SA PGM operations1 | US PGM operations2 | Total SA PGM operations1 | Rustenburg | Marikana1 | Kroondal3 | Plat Mile | Mimosa | Corporate | |||||||||||||||||||||||||||
Cost of sales, before amortisation and depreciation4 | Dec 2023 | 24,082 | 5,516 | 18,566 | 7,811 | 8,148 | 2,273 | 334 | 1,253 | (1,253) | |||||||||||||||||||||||||
| Jun 2023 | 22,298 | 4,165 | 18,133 | 7,336 | 8,813 | 1,677 | 307 | 1,156 | (1,156) | ||||||||||||||||||||||||||
| Dec 2022 | 19,117 | 3,616 | 15,501 | 6,888 | 6,530 | 1,774 | 309 | 1,046 | (1,046) | ||||||||||||||||||||||||||
| Royalties | Dec 2023 | 325 | — | 325 | 159 | 162 | 4 | — | 58 | (58) | |||||||||||||||||||||||||
| Jun 2023 | 479 | — | 479 | 196 | 278 | 5 | — | 75 | (75) | ||||||||||||||||||||||||||
| Dec 2022 | 817 | — | 817 | 565 | 245 | 7 | — | 57 | (57) | ||||||||||||||||||||||||||
| Carbon tax | Dec 2023 | 1 | — | 1 | — | 1 | — | — | — | — | |||||||||||||||||||||||||
| Jun 2023 | 1 | — | 1 | — | 1 | — | — | — | — | ||||||||||||||||||||||||||
| Dec 2022 | (1) | — | (1) | — | — | (1) | — | — | — | ||||||||||||||||||||||||||
| Community costs | Dec 2023 | 55 | — | 55 | 16 | 37 | 2 | — | — | — | |||||||||||||||||||||||||
| Jun 2023 | 43 | — | 43 | — | 43 | — | — | — | — | ||||||||||||||||||||||||||
| Dec 2022 | 49 | — | 49 | — | 49 | — | — | — | — | ||||||||||||||||||||||||||
| Inventory change | Dec 2023 | 1,469 | (290) | 1,759 | 310 | 1,455 | (6) | — | (5) | 5 | |||||||||||||||||||||||||
| Jun 2023 | (8) | (187) | 179 | (256) | 435 | — | — | (5) | 5 | ||||||||||||||||||||||||||
| Dec 2022 | 3,106 | 439 | 2,667 | 347 | 2,320 | — | — | 2 | (2) | ||||||||||||||||||||||||||
Share-based payments5 | Dec 2023 | 124 | 69 | 55 | 20 | 30 | 3 | — | — | — | |||||||||||||||||||||||||
| Jun 2023 | 84 | 52 | 32 | 13 | 19 | (2) | — | — | — | ||||||||||||||||||||||||||
| Dec 2022 | 133 | 56 | 77 | 30 | 42 | 5 | — | — | — | ||||||||||||||||||||||||||
Rehabilitation interest and amortisation6 | Dec 2023 | 106 | 43 | 63 | 1 | 25 | 37 | — | 2 | (2) | |||||||||||||||||||||||||
| Jun 2023 | 106 | 41 | 65 | (6) | 34 | 37 | — | 3 | (3) | ||||||||||||||||||||||||||
| Dec 2022 | 86 | 28 | 58 | (13) | 26 | 45 | — | 3 | (3) | ||||||||||||||||||||||||||
| Leases | Dec 2023 | 42 | 6 | 36 | 13 | 21 | 2 | — | — | — | |||||||||||||||||||||||||
| Jun 2023 | 33 | 2 | 31 | 10 | 19 | 2 | — | — | — | ||||||||||||||||||||||||||
| Dec 2022 | 31 | 4 | 27 | 6 | 19 | 2 | — | — | — | ||||||||||||||||||||||||||
| Ore reserve development | Dec 2023 | 3,070 | 1,863 | 1,207 | 312 | 895 | — | — | — | — | |||||||||||||||||||||||||
| Jun 2023 | 3,370 | 2,026 | 1,344 | 357 | 987 | — | — | — | — | ||||||||||||||||||||||||||
| Dec 2022 | 2,793 | 1,610 | 1,183 | 371 | 812 | — | — | — | — | ||||||||||||||||||||||||||
| Sustaining capital expenditure | Dec 2023 | 2,667 | 1,394 | 1,273 | 371 | 701 | 175 | 26 | 547 | (547) | |||||||||||||||||||||||||
| Jun 2023 | 1,570 | 784 | 786 | 273 | 397 | 112 | 4 | 510 | (510) | ||||||||||||||||||||||||||
| Dec 2022 | 2,046 | 806 | 1,240 | 385 | 681 | 158 | 16 | 570 | (570) | ||||||||||||||||||||||||||
| Less: By-product credit | Dec 2023 | (6,180) | (376) | (5,804) | (2,790) | (2,615) | (363) | (36) | (368) | 368 | |||||||||||||||||||||||||
| Jun 2023 | (5,478) | (382) | (5,096) | (2,161) | (2,556) | (338) | (41) | (405) | 405 | ||||||||||||||||||||||||||
| Dec 2022 | (4,545) | (467) | (4,078) | (1,867) | (1,797) | (369) | (45) | (368) | 368 | ||||||||||||||||||||||||||
Total All-in-sustaining costs7 | Dec 2023 | 25,761 | 8,225 | 17,536 | 6,223 | 8,860 | 2,127 | 324 | 1,487 | (1,487) | |||||||||||||||||||||||||
| Jun 2023 | 22,498 | 6,501 | 15,997 | 5,762 | 8,470 | 1,493 | 270 | 1,334 | (1,334) | ||||||||||||||||||||||||||
| Dec 2022 | 23,632 | 6,092 | 17,540 | 6,712 | 8,927 | 1,621 | 280 | 1,310 | (1,310) | ||||||||||||||||||||||||||
| Plus: Corporate cost, growth and capital expenditure | Dec 2023 | 970 | 370 | 600 | — | 509 | 2 | 89 | — | — | |||||||||||||||||||||||||
| Jun 2023 | 848 | 403 | 445 | — | 391 | 18 | 36 | — | — | ||||||||||||||||||||||||||
| Dec 2022 | 1,337 | 814 | 523 | — | 523 | — | — | — | — | ||||||||||||||||||||||||||
Total All-in-costs7 | Dec 2023 | 26,731 | 8,595 | 18,136 | 6,223 | 9,369 | 2,129 | 413 | 1,487 | (1,487) | |||||||||||||||||||||||||
| Jun 2023 | 23,346 | 6,904 | 16,442 | 5,762 | 8,861 | 1,511 | 306 | 1,334 | (1,334) | ||||||||||||||||||||||||||
| Dec 2022 | 24,969 | 6,906 | 18,063 | 6,712 | 9,450 | 1,621 | 280 | 1,310 | (1,310) | ||||||||||||||||||||||||||
| PGM production | 4Eoz - 2Eoz | Dec 2023 | 1,142,366 | 221,759 | 920,607 | 343,946 | 388,477 | 102,736 | 26,482 | 58,966 | — | ||||||||||||||||||||||||
| Jun 2023 | 1,054,236 | 205,513 | 848,723 | 314,471 | 368,075 | 83,516 | 25,319 | 57,342 | — | ||||||||||||||||||||||||||
| Dec 2022 | 1,072,750 | 191,094 | 881,656 | 324,025 | 375,652 | 100,441 | 23,558 | 57,980 | — | ||||||||||||||||||||||||||
| kg | Dec 2023 | 35,532 | 6,897 | 28,634 | 10,698 | 12,083 | 3,195 | 824 | 1,834 | — | |||||||||||||||||||||||||
| Jun 2023 | 32,790 | 6,392 | 26,398 | 9,781 | 11,448 | 2,598 | 788 | 1,784 | — | ||||||||||||||||||||||||||
| Dec 2022 | 33,366 | 5,944 | 27,423 | 10,078 | 11,684 | 3,124 | 733 | 1,803 | — | ||||||||||||||||||||||||||
| All-in-sustaining cost | R/4Eoz - R/2Eoz | Dec 2023 | 23,778 | 37,090 | 20,352 | 18,093 | 22,807 | 20,704 | 12,235 | 25,218 | — | ||||||||||||||||||||||||
| Jun 2023 | 22,568 | 31,633 | 20,214 | 18,323 | 23,012 | 17,877 | 10,664 | 23,264 | — | ||||||||||||||||||||||||||
| Dec 2022 | 23,288 | 31,880 | 21,295 | 20,714 | 23,764 | 16,139 | 11,886 | 22,594 | — | ||||||||||||||||||||||||||
| US$/4Eoz - US$/2Eoz | Dec 2023 | 1,277 | 1,992 | 1,093 | 972 | 1,225 | 1,112 | 657 | 1,354 | — | |||||||||||||||||||||||||
| Jun 2023 | 1,239 | 1,737 | 1,110 | 1,006 | 1,264 | 982 | 586 | 1,278 | — | ||||||||||||||||||||||||||
| Dec 2022 | 1,344 | 1,840 | 1,229 | 1,195 | 1,371 | 931 | 686 | 1,304 | — | ||||||||||||||||||||||||||
| All-in-cost | R/4Eoz - R/2Eoz | Dec 2023 | 24,673 | 38,758 | 21,048 | 18,093 | 24,117 | 20,723 | 15,595 | 25,218 | — | ||||||||||||||||||||||||
| Jun 2023 | 23,419 | 33,594 | 20,776 | 18,323 | 24,074 | 18,092 | 12,086 | 23,264 | — | ||||||||||||||||||||||||||
| Dec 2022 | 24,606 | 36,139 | 21,930 | 20,714 | 25,156 | 16,139 | 11,886 | 22,594 | — | ||||||||||||||||||||||||||
| US$/4Eoz - US$/2Eoz | Dec 2023 | 1,325 | 2,082 | 1,130 | 972 | 1,295 | 1,113 | 838 | 1,354 | — | |||||||||||||||||||||||||
| Jun 2023 | 1,286 | 1,845 | 1,141 | 1,006 | 1,322 | 994 | 664 | 1,278 | — | ||||||||||||||||||||||||||
| Dec 2022 | 1,420 | 2,085 | 1,265 | 1,195 | 1,452 | 931 | 686 | 1,304 | — | ||||||||||||||||||||||||||
Average exchange rate for the six months ended 31 December 2023, 30 June 2023 and 31 December 2022 was R18.62/US$, R18.21/US$ and R17.33/US$, respectively
Figures may not add as they are rounded independently
Sibanye-Stillwater Operating and financial results | Six months and year ended 31 December 2023 70
1The US and SA PGM operations, Total SA PGM operations and Marikana includes the production and costs associated with the purchase of concentrate (PoC) from third parties. For a reconciliation of the Operating cost, AISC and AIC excluding third party PoC, refer to “Reconciliation of operating cost excluding third party PoC for US and SA PGM operations, Total SA PGM operations and Marikana - Six Months” and “Reconciliation of AISC and AIC excluding third party PoC for US and SA PGM operations, Total SA PGM operations and Marikana – Six Months”
2The US PGM operations’ underground production is converted to metric tonnes and kilograms, and performance is translated into SA rand. In addition to the US PGM operations’ underground production, the operation processes various recycling material which is excluded from the 2E PGM production, All-in sustaining cost and All-in cost statistics shown
3Kroondal operations for the six months ended December 2023 includes production and costs for two months (November and December 2023) at 100%
4Cost of sales, before amortisation and depreciation includes all mining and processing costs, third party refining costs, corporate general and administrative costs, and permitting costs
5Share-based payments are calculated based on the fair value at initial recognition and do not include the adjustment of the cash-settled share-based payment obligation to the reporting date fair value
6Rehabilitation includes the interest charge related to the environmental rehabilitation obligation and the amortisation of the related capitalised rehabilitation costs. The interest charge related to the environmental rehabilitation obligation and the amortisation of the capitalised rehabilitation costs reflect the periodic costs of rehabilitation associated with current PGM production
7All-in cost is calculated in accordance with the World Gold Council guidance. All-in cost excludes income tax, costs associated with merger and acquisition activities, working capital, impairments, financing costs, one-time severance charges and items needed to normalise earnings. All-in cost is made up of All-in sustaining cost, being the cost to sustain current operations, given as a sub-total in the All-in cost calculation, together with corporate and major capital expenditure associated with growth. All-in sustaining cost per ounce (and kilogram) and All-in cost per ounce (and kilogram) are calculated by dividing the All-in sustaining cost and All-in cost, respectively, in a period by the total 4E/2E PGM produced in the same period
| Reconciliation of operating cost excluding third party PoC for US and SA PGM operations, Total SA PGM operations and Marikana - Six months | ||||||||||||||||||||||||||||||||
| US and SA PGM operations | Total SA PGM operations | Marikana | ||||||||||||||||||||||||||||||
| Rm | Dec 2023 | Jun 2023 | Dec 2022 | Dec 2023 | Jun 2023 | Dec 2022 | Dec 2023 | Jun 2023 | Dec 2022 | |||||||||||||||||||||||
| Cost of sales, before amortisation and depreciation as reported per table above | 24,082 | 22,298 | 19,117 | 18,566 | 18,133 | 15,501 | 8,148 | 8,813 | 6,530 | |||||||||||||||||||||||
| Inventory change as reported per table above | 1,469 | (8) | 3,106 | 1,759 | 179 | 2,667 | 1,455 | 435 | 2,320 | |||||||||||||||||||||||
| Less: Chrome cost of sales | (1,007) | (708) | (753) | (1,007) | (708) | (753) | (233) | (223) | (164) | |||||||||||||||||||||||
| Total operating cost including third party PoC | 24,544 | 21,582 | 21,470 | 19,318 | 17,604 | 17,415 | 9,370 | 9,025 | 8,686 | |||||||||||||||||||||||
| Less: Purchase cost of PoC | (1,158) | (1,595) | (1,638) | (1,158) | (1,595) | (1,638) | (1,158) | (1,595) | (1,638) | |||||||||||||||||||||||
| Total operating cost excluding third party PoC | 23,386 | 19,987 | 19,832 | 18,160 | 16,009 | 15,777 | 8,212 | 7,430 | 7,048 | |||||||||||||||||||||||
| PGM production as reported per table above | 4Eoz- 2Eoz | 1,142,366 | 1,054,236 | 1,072,750 | 920,607 | 848,723 | 881,656 | 388,477 | 368,075 | 375,652 | ||||||||||||||||||||||
| Less: Mimosa production | (58,966) | (57,342) | (57,980) | (58,966) | (57,342) | (57,980) | — | — | — | |||||||||||||||||||||||
| PGM production excluding Mimosa | 1,083,400 | 996,894 | 1,014,770 | 861,641 | 791,381 | 823,676 | 388,477 | 368,075 | 375,652 | |||||||||||||||||||||||
| Less: PoC production | (46,862) | (49,541) | (37,998) | (46,862) | (49,541) | (37,998) | (46,862) | (49,541) | (37,998) | |||||||||||||||||||||||
| PGM production excluding Mimosa and third party PoC | 1,036,538 | 947,353 | 976,772 | 814,779 | 741,840 | 785,678 | 341,615 | 318,534 | 337,654 | |||||||||||||||||||||||
| PGM production including Mimosa and excluding third party PoC | 1,095,504 | 1,004,695 | 1,034,752 | 873,745 | 799,182 | 843,658 | 341,615 | 318,534 | 337,654 | |||||||||||||||||||||||
| Tonnes milled/treated | kt | 19,012 | 18,211 | 18,867 | 18,406 | 17,642 | 18,339 | 5,158 | 4,722 | 4,993 | ||||||||||||||||||||||
| Less: Mimosa tonnes | (712) | (680) | (687) | (712) | (680) | (687) | — | — | — | |||||||||||||||||||||||
| PGM tonnes excluding Mimosa and third party PoC | 18,300 | 17,531 | 18,179 | 17,694 | 16,962 | 17,652 | 5,158 | 4,722 | 4,993 | |||||||||||||||||||||||
| Operating cost including third party PoC | R/4Eoz-R/2Eoz | 22,655 | 21,649 | 21,158 | 22,420 | 22,245 | 21,143 | 24,120 | 24,519 | 23,122 | ||||||||||||||||||||||
| US$/4Eoz-US$/2Eoz | 1,217 | 1,189 | 1,221 | 1,204 | 1,222 | 1,220 | 1,295 | 1,346 | 1,334 | |||||||||||||||||||||||
| R/t | 1,341 | 1,231 | 1,181 | 1,092 | 1,038 | 987 | 1,817 | 1,911 | 1,739 | |||||||||||||||||||||||
| US$/t | 72 | 68 | 68 | 59 | 57 | 57 | 98 | 105 | 100 | |||||||||||||||||||||||
| Operating cost excluding third party PoC | R/4Eoz-R/2Eoz | 22,562 | 21,098 | 20,304 | 22,288 | 21,580 | 20,081 | 24,039 | 23,326 | 20,873 | ||||||||||||||||||||||
| US$/4Eoz-US$/2Eoz | 1,212 | 1,159 | 1,172 | 1,197 | 1,185 | 1,159 | 1,291 | 1,281 | 1,204 | |||||||||||||||||||||||
| R/t | 1,278 | 1,140 | 1,091 | 1,026 | 944 | 894 | 1,592 | 1,573 | 1,411 | |||||||||||||||||||||||
| US$/t | 69 | 63 | 63 | 55 | 52 | 52 | 86 | 86 | 81 | |||||||||||||||||||||||
| Reconciliation of AISC and AIC excluding third party PoC for US and SA PGM operations, Total SA PGM operations and Marikana - Six Months | ||||||||||||||||||||||||||||||||
| US and SA PGM operations | Total SA PGM operations | Marikana | ||||||||||||||||||||||||||||||
| Rm | Dec 2023 | Jun 2023 | Dec 2022 | Dec 2023 | Jun 2023 | Dec 2022 | Dec 2023 | Jun 2023 | Dec 2022 | |||||||||||||||||||||||
| Total All-in-sustaining cost as reported per table above | 25,761 | 22,498 | 23,632 | 17,536 | 15,997 | 17,540 | 8,860 | 8,470 | 8,927 | |||||||||||||||||||||||
| Less: Purchase cost of PoC | (1,158) | (1,595) | (1,638) | (1,158) | (1,595) | (1,638) | (1,158) | (1,595) | (1,638) | |||||||||||||||||||||||
| Add: By-product credit of PoC | 213 | 224 | 150 | 213 | 224 | 150 | 213 | 224 | 150 | |||||||||||||||||||||||
| Total All-in-sustaining cost excluding third party PoC | 24,816 | 21,127 | 22,144 | 16,591 | 14,626 | 16,052 | 7,915 | 7,099 | 7,439 | |||||||||||||||||||||||
| Plus: Corporate cost, growth and capital expenditure | 970 | 848 | 1,337 | 600 | 445 | 523 | 509 | 391 | 523 | |||||||||||||||||||||||
| Total All-in-cost excluding third party PoC | 25,786 | 21,975 | 23,481 | 17,191 | 15,071 | 16,575 | 8,424 | 7,490 | 7,962 | |||||||||||||||||||||||
| PGM production excluding Mimosa and third party PoC | 4Eoz- 2Eoz | 1,036,538 | 947,353 | 976,772 | 814,779 | 741,840 | 785,678 | 341,615 | 318,534 | 337,654 | ||||||||||||||||||||||
| All-in-sustaining cost excluding third party PoC | R/4Eoz-R/2Eoz | 23,941 | 22,301 | 22,671 | 20,363 | 19,716 | 20,431 | 23,169 | 22,286 | 22,031 | ||||||||||||||||||||||
| US$/4Eoz-US$/2Eoz | 1,286 | 1,225 | 1,308 | 1,094 | 1,083 | 1,179 | 1,244 | 1,224 | 1,271 | |||||||||||||||||||||||
| All-in-cost excluding third party PoC | R/4Eoz-R/2Eoz | 24,877 | 23,196 | 24,039 | 21,099 | 20,316 | 21,096 | 24,659 | 23,514 | 23,580 | ||||||||||||||||||||||
| US$/4Eoz-US$/2Eoz | 1,336 | 1,274 | 1,387 | 1,133 | 1,116 | 1,217 | 1,324 | 1,291 | 1,361 | |||||||||||||||||||||||
Sibanye-Stillwater Operating and financial results | Six months and year ended 31 December 2023 71
ALL-IN COSTS - SIX MONTHS (continued)
SA gold operations
Figures are in rand millions unless otherwise stated
| SA OPERATIONS | |||||||||||||||||||||||||||||
| Total SA gold | Driefontein | Kloof | Beatrix | Cooke | DRDGOLD | Corporate | |||||||||||||||||||||||
Cost of sales, before amortisation and depreciation1 | Dec 2023 | 11,942 | 3,219 | 3,970 | 1,933 | 668 | 2,152 | — | |||||||||||||||||||||
| Jun 2023 | 12,138 | 3,347 | 4,179 | 2,125 | 599 | 1,888 | — | ||||||||||||||||||||||
| Dec 2022 | 11,616 | 2,989 | 3,565 | 2,629 | 496 | 1,937 | — | ||||||||||||||||||||||
| Royalties | Dec 2023 | 53 | 19 | 21 | 11 | 3 | — | (1) | |||||||||||||||||||||
| Jun 2023 | 61 | 23 | 23 | 13 | 3 | — | (1) | ||||||||||||||||||||||
| Dec 2022 | 46 | 15 | 16 | 12 | 3 | — | — | ||||||||||||||||||||||
| Carbon tax | Dec 2023 | — | — | — | — | — | — | — | |||||||||||||||||||||
| Jun 2023 | — | — | — | — | — | — | — | ||||||||||||||||||||||
| Dec 2022 | 1 | — | — | 1 | — | — | — | ||||||||||||||||||||||
| Community costs | Dec 2023 | (7) | (1) | (2) | (8) | — | 4 | — | |||||||||||||||||||||
| Jun 2023 | 11 | 1 | 2 | 1 | — | 7 | — | ||||||||||||||||||||||
| Dec 2022 | 27 | 8 | 7 | 6 | — | 6 | — | ||||||||||||||||||||||
Share-based payments2 | Dec 2023 | 50 | 15 | 10 | 9 | — | 14 | 2 | |||||||||||||||||||||
| Jun 2023 | 35 | 9 | 8 | 1 | — | 12 | 5 | ||||||||||||||||||||||
| Dec 2022 | 76 | 24 | 25 | 17 | — | 10 | — | ||||||||||||||||||||||
Rehabilitation interest and amortisation3 | Dec 2023 | 88 | (1) | 9 | 36 | 43 | (2) | 3 | |||||||||||||||||||||
| Jun 2023 | 100 | 2 | 15 | 39 | 45 | (3) | 2 | ||||||||||||||||||||||
| Dec 2022 | 71 | (4) | (14) | 30 | 26 | 8 | 25 | ||||||||||||||||||||||
| Leases | Dec 2023 | 31 | — | 10 | 9 | 1 | 11 | — | |||||||||||||||||||||
| Jun 2023 | 29 | 1 | 6 | 11 | 1 | 10 | — | ||||||||||||||||||||||
| Dec 2022 | 39 | 3 | 9 | 15 | 1 | 11 | — | ||||||||||||||||||||||
| Ore reserve development | Dec 2023 | 1,298 | 701 | 441 | 156 | — | — | — | |||||||||||||||||||||
| Jun 2023 | 1,398 | 760 | 470 | 168 | — | — | — | ||||||||||||||||||||||
| Dec 2022 | 1,163 | 542 | 436 | 185 | — | — | — | ||||||||||||||||||||||
| Sustaining capital expenditure | Dec 2023 | 815 | 300 | 242 | 72 | — | 201 | — | |||||||||||||||||||||
| Jun 2023 | 641 | 190 | 179 | 41 | — | 230 | 1 | ||||||||||||||||||||||
| Dec 2022 | 889 | 263 | 303 | 87 | — | 236 | — | ||||||||||||||||||||||
| Less: By-product credit | Dec 2023 | (8) | (3) | (3) | (2) | — | — | — | |||||||||||||||||||||
| Jun 2023 | (13) | (2) | (2) | (2) | — | (7) | — | ||||||||||||||||||||||
| Dec 2022 | (6) | (2) | (2) | (2) | — | — | — | ||||||||||||||||||||||
Total All-in-sustaining costs4 | Dec 2023 | 14,262 | 4,249 | 4,698 | 2,216 | 715 | 2,380 | 4 | |||||||||||||||||||||
| Jun 2023 | 14,400 | 4,331 | 4,880 | 2,397 | 648 | 2,137 | 7 | ||||||||||||||||||||||
| Dec 2022 | 13,922 | 3,838 | 4,345 | 2,980 | 526 | 2,208 | 25 | ||||||||||||||||||||||
| Plus: Corporate cost, growth and capital expenditure | Dec 2023 | 1,255 | — | 50 | — | — | 454 | 751 | |||||||||||||||||||||
| Jun 2023 | 1,367 | — | 67 | — | — | 427 | 873 | ||||||||||||||||||||||
| Dec 2022 | 940 | — | 155 | — | — | 118 | 667 | ||||||||||||||||||||||
Total All-in-costs4 | Dec 2023 | 15,517 | 4,249 | 4,748 | 2,216 | 715 | 2,834 | 755 | |||||||||||||||||||||
| Jun 2023 | 15,767 | 4,331 | 4,947 | 2,397 | 648 | 2,564 | 880 | ||||||||||||||||||||||
| Dec 2022 | 14,862 | 3,838 | 4,500 | 2,980 | 526 | 2,326 | 692 | ||||||||||||||||||||||
| Gold sold | kg | Dec 2023 | 11,863 | 3,172 | 3,646 | 1,906 | 604 | 2,535 | — | ||||||||||||||||||||
| Jun 2023 | 13,566 | 4,052 | 4,062 | 2,286 | 615 | 2,551 | — | ||||||||||||||||||||||
| Dec 2022 | 12,378 | 3,148 | 3,319 | 2,543 | 606 | 2,762 | — | ||||||||||||||||||||||
| oz | Dec 2023 | 381,404 | 101,982 | 117,222 | 61,279 | 19,419 | 81,502 | — | |||||||||||||||||||||
| Jun 2023 | 436,157 | 130,275 | 130,596 | 73,497 | 19,773 | 82,017 | — | ||||||||||||||||||||||
| Dec 2022 | 397,962 | 101,211 | 106,708 | 81,759 | 19,483 | 88,800 | — | ||||||||||||||||||||||
| All-in-sustaining cost | R/kg | Dec 2023 | 1,202,225 | 1,339,533 | 1,288,535 | 1,162,644 | 1,183,775 | 938,856 | — | ||||||||||||||||||||
| Jun 2023 | 1,061,477 | 1,068,855 | 1,201,379 | 1,048,556 | 1,053,659 | 837,711 | — | ||||||||||||||||||||||
| Dec 2022 | 1,124,737 | 1,219,187 | 1,309,129 | 1,171,844 | 867,987 | 799,421 | — | ||||||||||||||||||||||
| All-in-sustaining cost | US$/oz | Dec 2023 | 2,008 | 2,238 | 2,152 | 1,942 | 1,977 | 1,568 | — | ||||||||||||||||||||
| Jun 2023 | 1,813 | 1,826 | 2,052 | 1,791 | 1,800 | 1,431 | — | ||||||||||||||||||||||
| Dec 2022 | 2,019 | 2,188 | 2,350 | 2,103 | 1,558 | 1,435 | — | ||||||||||||||||||||||
| All-in-cost | R/kg | Dec 2023 | 1,308,017 | 1,339,533 | 1,302,249 | 1,162,644 | 1,183,775 | 1,117,949 | — | ||||||||||||||||||||
| Jun 2023 | 1,162,244 | 1,068,855 | 1,217,873 | 1,048,556 | 1,053,659 | 1,005,096 | — | ||||||||||||||||||||||
| Dec 2022 | 1,200,679 | 1,219,187 | 1,355,830 | 1,171,844 | 867,987 | 842,143 | — | ||||||||||||||||||||||
| All-in-cost | US$/oz | Dec 2023 | 2,185 | 2,238 | 2,175 | 1,942 | 1,977 | 1,867 | — | ||||||||||||||||||||
| Jun 2023 | 1,985 | 1,826 | 2,080 | 1,791 | 1,800 | 1,717 | — | ||||||||||||||||||||||
| Dec 2022 | 2,155 | 2,188 | 2,433 | 2,103 | 1,558 | 1,511 | — | ||||||||||||||||||||||
Average exchange rate for the six months ended 31 December 2023, 30 June 2023 and 31 December 2022 was R18.62/US$, R18.21/US$ and R17.33/US$, respectively
Figures may not add as they are rounded independently
1 Cost of sales, before amortisation and depreciation includes all mining and processing costs, third party refining costs, corporate general and administrative costs, and permitting costs
2 Share-based payments are calculated based on the fair value at initial recognition and do not include the adjustment of the cash-settled share-based payment obligation to the reporting date fair value
3 Rehabilitation includes the interest charge related to the environmental rehabilitation obligation and the amortisation of the related capitalised rehabilitation costs. The interest charge related to the environmental rehabilitation obligation and the amortisation of the capitalised rehabilitation costs reflect the periodic costs of rehabilitation associated with current gold production
4 All-in cost is calculated in accordance with the World Gold Council guidance. All-in cost excludes income tax, costs associated with merger and acquisition activities, working capital, impairments, financing costs, one time severance charges and items needed to normalise earnings. All-in cost is made up of All-in sustaining cost, being the cost to sustain current operations,
Sibanye-Stillwater Operating and financial results | Six months and year ended 31 December 2023 72
given as a sub-total in the All-in cost calculation, together with corporate and major capital expenditure associated with growth. All-in sustaining cost per kilogram (and ounce) and All-in cost per kilogram (and ounce) are calculated by dividing the All-in sustaining cost and All-in cost, respectively, in a period by the total gold sold over the same period
ALL-IN-COSTS - SIX MONTHS (continued)
Australian operations
Figures are in rand millions unless otherwise stated
Century zinc retreatment operation1 | |||||||||||
Cost of sales, before amortisation and depreciation2 | Dec 2023 | 1,404 | |||||||||
| Jun 2023 | 851 | ||||||||||
| Royalties | Dec 2023 | 79 | |||||||||
| Jun 2023 | 52 | ||||||||||
| Community costs | Dec 2023 | 37 | |||||||||
| Jun 2023 | 10 | ||||||||||
| Inventory change | Dec 2023 | 125 | |||||||||
| Jun 2023 | 91 | ||||||||||
| Share-based payments | Dec 2023 | — | |||||||||
| Jun 2023 | — | ||||||||||
Rehabilitation interest and amortisation3 | Dec 2023 | 11 | |||||||||
| Jun 2023 | 3 | ||||||||||
| Leases | Dec 2023 | 57 | |||||||||
| Jun 2023 | 43 | ||||||||||
| Sustaining capital expenditure | Dec 2023 | 73 | |||||||||
| Jun 2023 | 42 | ||||||||||
| Less: By-product credit | Dec 2023 | (101) | |||||||||
| Jun 2023 | (24) | ||||||||||
Total All-in-sustaining costs4 | Dec 2023 | 1,685 | |||||||||
| Jun 2023 | 1,068 | ||||||||||
| Plus: Corporate cost, growth and capital expenditure | Dec 2023 | 75 | |||||||||
| Jun 2023 | 153 | ||||||||||
Total All-in-costs4 | Dec 2023 | 1,760 | |||||||||
| Jun 2023 | 1,221 | ||||||||||
| Zinc metal produced (payable) | kt | Dec 2023 | 51 | ||||||||
| Jun 2023 | 24 | ||||||||||
| All-in-sustaining cost | R/tZn | Dec 2023 | 32,746 | ||||||||
| Jun 2023 | 44,030 | ||||||||||
| US$/tZn | Dec 2023 | 1,759 | |||||||||
| Jun 2023 | 2,418 | ||||||||||
| All-in-cost | R/tZn | Dec 2023 | 34,203 | ||||||||
| Jun 2023 | 50,338 | ||||||||||
| US$/tZn | Dec 2023 | 1,837 | |||||||||
| Jun 2023 | 2,764 | ||||||||||
Average exchange rate for the six months ended 31 December 2023 and 30 June 2023 was R18.62/US$ and R18.21/US$, respectively
Figures may not add as they are rounded independently
1Century is a leading tailings management and rehabilitation company that currently owns and operates the Century zinc tailings retreatment operation in Queensland, Australia. Century was acquired by the Group on 22 February 2023
2Cost of sales, before amortisation and depreciation includes all mining and processing costs, corporate general and administrative costs, and permitting costs
3Rehabilitation includes the interest charge related to the environmental rehabilitation obligation and the amortisation of the related capitalised rehabilitation costs. The interest charge related to the environmental rehabilitation obligation and the amortisation of the capitalised rehabilitation costs reflect the periodic costs of rehabilitation associated with current zinc production
4All-in cost is calculated in accordance with the World Gold Council guidance. All-in cost excludes income tax, costs associated with merger and acquisition activities, working capital, impairments, financing costs, one-time severance charges and items needed to normalise earnings. All-in cost is made up of All-in sustaining cost, being the cost to sustain current operations, given as a sub-total in the All-in cost calculation, together with corporate and major capital expenditure associated with growth. All-in sustaining cost per tonne and All-in cost per tonne are calculated by dividing the All-in sustaining cost and All-in cost, respectively, in a period by the total tonnes of zinc metal produced (payable) in the same period
Sibanye-Stillwater Operating and financial results | Six months and year ended 31 December 2023 73
UNIT OPERATING COST - SIX MONTHS
US and SA PGM operations
Figures are in rand millions unless otherwise stated
US and SA PGM operations1 | US PGM operations | Total SA PGM operations1,3 | Rustenburg3 | Marikana3 | Kroondal3,4 | Plat Mile | Mimosa | |||||||||||||||||||||||||||||||
Under- ground2 | Total | Under- ground | Surface | Under- ground | Surface | Attribu-table | Surface | Attribu-table | ||||||||||||||||||||||||||||||
| Cost of sales, before amortisation and depreciation | Dec 2023 | 24,082 | 5,516 | 18,566 | 7,152 | 659 | 8,148 | 2,273 | 334 | 1,253 | ||||||||||||||||||||||||||||
| Jun 2023 | 22,298 | 4,165 | 18,133 | 6,756 | 580 | 8,813 | 1,677 | 307 | 1,156 | |||||||||||||||||||||||||||||
| Dec 2022 | 19,117 | 3,616 | 15,501 | 6,272 | 616 | 6,530 | 1,774 | 309 | 1,046 | |||||||||||||||||||||||||||||
| Inventory change | Dec 2023 | 1,469 | (290) | 1,759 | 136 | 174 | 1,455 | (6) | — | (5) | ||||||||||||||||||||||||||||
| Jun 2023 | (8) | (187) | 179 | (196) | (60) | 435 | — | — | (5) | |||||||||||||||||||||||||||||
| Dec 2022 | 3,106 | 439 | 2,667 | 150 | 197 | 2,320 | — | — | 2 | |||||||||||||||||||||||||||||
| Less: Chrome cost of sales | Dec 2023 | (1,007) | — | (1,007) | (767) | — | (233) | (7) | — | — | ||||||||||||||||||||||||||||
| Jun 2023 | (708) | — | (708) | (480) | — | (223) | (5) | — | — | |||||||||||||||||||||||||||||
| Dec 2022 | (753) | — | (753) | (584) | — | (164) | (5) | — | — | |||||||||||||||||||||||||||||
| Less: Purchase cost of PoC | Dec 2023 | (1,158) | — | (1,158) | — | — | (1,158) | — | — | — | ||||||||||||||||||||||||||||
| Jun 2023 | (1,595) | — | (1,595) | — | — | (1,595) | — | — | — | |||||||||||||||||||||||||||||
| Dec 2022 | (1,638) | — | (1,638) | — | — | (1,638) | — | — | — | |||||||||||||||||||||||||||||
| Total operating cost excluding third party PoC | Dec 2023 | 23,386 | 5,226 | 18,160 | 6,521 | 833 | 8,212 | 2,260 | 334 | 1,248 | ||||||||||||||||||||||||||||
| Jun 2023 | 19,987 | 3,978 | 16,009 | 6,080 | 520 | 7,430 | 1,672 | 307 | 1,151 | |||||||||||||||||||||||||||||
| Dec 2022 | 19,832 | 4,055 | 15,777 | 5,838 | 813 | 7,048 | 1,769 | 309 | 1,048 | |||||||||||||||||||||||||||||
Tonnes milled/treated excluding third party PoC5 | kt | Dec 2023 | 18,300 | 606 | 17,694 | 3,089 | 2,837 | 3,261 | 1,897 | 1,655 | 4,956 | 712 | ||||||||||||||||||||||||||
| Jun 2023 | 17,531 | 569 | 16,962 | 2,984 | 2,649 | 2,993 | 1,729 | 1,413 | 5,194 | 680 | ||||||||||||||||||||||||||||
| Dec 2022 | 18,179 | 527 | 17,652 | 3,065 | 2,803 | 3,175 | 1,818 | 1,604 | 5,186 | 687 | ||||||||||||||||||||||||||||
PGM production excluding third party PoC5 | 4Eoz | Dec 2023 | 1,036,538 | 221,759 | 814,779 | 296,159 | 47,787 | 341,615 | 102,736 | 26,482 | 58,966 | |||||||||||||||||||||||||||
| Jun 2023 | 947,353 | 205,513 | 741,840 | 277,846 | 36,625 | 318,534 | 83,516 | 25,319 | 57,342 | |||||||||||||||||||||||||||||
| Dec 2022 | 976,772 | 191,094 | 785,678 | 283,148 | 40,877 | 337,654 | 100,441 | 23,558 | 57,980 | |||||||||||||||||||||||||||||
Operating cost excluding third party PoC6 | R/t | Dec 2023 | 1,278 | 8,631 | 1,026 | 2,111 | 294 | 1,592 | 1,366 | 67 | 1,754 | |||||||||||||||||||||||||||
| Jun 2023 | 1,140 | 6,994 | 944 | 2,038 | 196 | 1,573 | 1,183 | 59 | 1,692 | |||||||||||||||||||||||||||||
| Dec 2022 | 1,091 | 7,687 | 894 | 1,905 | 290 | 1,411 | 1,103 | 60 | 1,524 | |||||||||||||||||||||||||||||
| US$/t | Dec 2023 | 69 | 464 | 55 | 113 | 16 | 86 | 73 | 4 | 94 | ||||||||||||||||||||||||||||
| Jun 2023 | 63 | 384 | 52 | 112 | 11 | 86 | 65 | 3 | 93 | |||||||||||||||||||||||||||||
| Dec 2022 | 63 | 444 | 52 | 110 | 17 | 81 | 64 | 3 | 88 | |||||||||||||||||||||||||||||
| R/4Eoz - R/2Eoz | Dec 2023 | 22,562 | 23,566 | 22,288 | 22,019 | 17,432 | 24,039 | 21,998 | 12,612 | 21,165 | ||||||||||||||||||||||||||||
| Jun 2023 | 21,098 | 19,356 | 21,580 | 21,883 | 14,198 | 23,326 | 20,020 | 12,125 | 20,073 | |||||||||||||||||||||||||||||
| Dec 2022 | 20,304 | 21,220 | 20,081 | 20,618 | 19,889 | 20,873 | 17,612 | 13,117 | 18,075 | |||||||||||||||||||||||||||||
| US$/4Eoz - US$/2Eoz | Dec 2023 | 1,212 | 1,266 | 1,197 | 1,183 | 936 | 1,291 | 1,181 | 677 | 1,137 | ||||||||||||||||||||||||||||
| Jun 2023 | 1,159 | 1,063 | 1,185 | 1,202 | 780 | 1,281 | 1,099 | 666 | 1,102 | |||||||||||||||||||||||||||||
| Dec 2022 | 1,172 | 1,224 | 1,159 | 1,190 | 1,148 | 1,204 | 1,016 | 757 | 1,043 | |||||||||||||||||||||||||||||
Average exchange rate for the six months ended 31 December 2023, 30 June 2023 and 31 December 2022 was R18.62/US$, R18.21/US$ and R17.33/US$, respectively
Figures may not add as they are rounded independently
1 US and SA PGM operations and Total SA PGM operations exclude the results of Mimosa, which is equity accounted
2 The US PGM operations’ underground production is converted to metric tonnes and kilograms, and performance is translated into rand. In addition to the US PGM operations’
underground production, the operation treats various recycling material which is excluded from the statistics shown above
3 Cost of sales, before amortisation and depreciation for Total SA PGM, Rustenburg, Marikana and Kroondal includes the Chrome cost of sales which is excluded for unit cost calculation purposes as Chrome production is excluded from the 4Eoz production
4 Kroondal operations for the six months ended December 2023 includes production and costs for two months (November and December 2023) at 100%
5 For a reconciliation of the production excluding Mimosa and third party PoC, refer to “Reconciliation of operating cost excluding third party PoC for US and SA PGM operations, Total SA PGM operations and Marikana - Six Months”
6 Operating cost is the average cost of production and operating cost per tonne is calculated by dividing the cost of sales, before amortisation and depreciation and change in inventory in a period by the tonnes milled/treated in the same period, and operating cost per ounce is calculated by dividing the cost of sales, before amortisation and depreciation and change in inventory in a period, by the PGM produced in the same period
Sibanye-Stillwater Operating and financial results | Six months and year ended 31 December 2023 74
UNIT OPERATING COST - SIX MONTHS (continued)
SA gold operations
Figures are in rand millions unless otherwise stated
| Total SA gold operations | Driefontein | Kloof | Beatrix | Cooke | DRDGOLD | ||||||||||||||||||||||||||||||||||||
| Total | Under- ground | Surface | Under- ground | Surface | Under- ground | Surface | Under- ground | Surface | Surface | Surface | |||||||||||||||||||||||||||||||
| Cost of sales, before amortisation and depreciation | Dec 2023 | 11,942 | 8,764 | 3,178 | 3,204 | 15 | 3,641 | 329 | 1,919 | 14 | 668 | 2,152 | |||||||||||||||||||||||||||||
| Jun 2023 | 12,138 | 9,219 | 2,919 | 3,264 | 83 | 3,911 | 268 | 2,044 | 81 | 599 | 1,888 | ||||||||||||||||||||||||||||||
| Dec 2022 | 11,616 | 8,703 | 2,913 | 2,852 | 137 | 3,254 | 311 | 2,597 | 32 | 496 | 1,937 | ||||||||||||||||||||||||||||||
| Inventory change | Dec 2023 | 451 | 388 | 63 | 164 | — | 20 | 8 | 204 | — | 23 | 32 | |||||||||||||||||||||||||||||
| Jun 2023 | (501) | (468) | (33) | (117) | — | (191) | (39) | (160) | — | (27) | 33 | ||||||||||||||||||||||||||||||
| Dec 2022 | 891 | 827 | 64 | 260 | — | 293 | 50 | 274 | — | 36 | (22) | ||||||||||||||||||||||||||||||
| Total operating cost | Dec 2023 | 12,393 | 9,152 | 3,241 | 3,368 | 15 | 3,661 | 337 | 2,123 | 14 | 691 | 2,184 | |||||||||||||||||||||||||||||
| Jun 2023 | 11,637 | 8,751 | 2,886 | 3,147 | 83 | 3,720 | 229 | 1,884 | 81 | 572 | 1,921 | ||||||||||||||||||||||||||||||
| Dec 2022 | 12,507 | 9,530 | 2,977 | 3,112 | 137 | 3,547 | 361 | 2,871 | 32 | 532 | 1,915 | ||||||||||||||||||||||||||||||
| Tonnes milled/treated | kt | Dec 2023 | 16,190 | 1,870 | 14,320 | 527 | 33 | 649 | 899 | 695 | 35 | 2,187 | 11,165 | ||||||||||||||||||||||||||||
| Jun 2023 | 15,751 | 2,185 | 13,566 | 710 | 224 | 750 | 666 | 725 | 330 | 2,102 | 10,243 | ||||||||||||||||||||||||||||||
| Dec 2022 | 19,301 | 2,269 | 17,032 | 604 | 489 | 736 | 1,291 | 929 | 124 | 2,286 | 12,842 | ||||||||||||||||||||||||||||||
| Gold produced | kg | Dec 2023 | 12,250 | 8,574 | 3,676 | 3,241 | 59 | 3,204 | 443 | 2,129 | 9 | 618 | 2,547 | ||||||||||||||||||||||||||||
| Jun 2023 | 12,962 | 9,490 | 3,472 | 3,884 | 74 | 3,579 | 207 | 2,027 | 72 | 568 | 2,551 | ||||||||||||||||||||||||||||||
| Dec 2022 | 13,339 | 9,250 | 4,089 | 3,163 | 240 | 3,284 | 420 | 2,803 | 42 | 656 | 2,731 | ||||||||||||||||||||||||||||||
| oz | Dec 2023 | 393,847 | 275,660 | 118,186 | 104,201 | 1,897 | 103,011 | 14,243 | 68,449 | 289 | 19,869 | 81,888 | |||||||||||||||||||||||||||||
| Jun 2023 | 416,738 | 305,111 | 111,627 | 124,873 | 2,379 | 115,067 | 6,655 | 65,170 | 2,315 | 18,262 | 82,017 | ||||||||||||||||||||||||||||||
| Dec 2022 | 428,859 | 297,394 | 131,464 | 101,693 | 7,716 | 105,583 | 13,503 | 90,119 | 1,350 | 21,091 | 87,804 | ||||||||||||||||||||||||||||||
Operating cost1 | R/t | Dec 2023 | 765 | 4,894 | 226 | 6,394 | 450 | 5,643 | 375 | 3,057 | 397 | 316 | 196 | ||||||||||||||||||||||||||||
| Jun 2023 | 739 | 4,004 | 213 | 4,432 | 370 | 4,957 | 344 | 2,599 | 245 | 272 | 188 | ||||||||||||||||||||||||||||||
| Dec 2022 | 648 | 4,200 | 175 | 5,155 | 280 | 4,820 | 280 | 3,089 | 258 | 233 | 149 | ||||||||||||||||||||||||||||||
| US$/t | Dec 2023 | 41 | 263 | 12 | 343 | 24 | 303 | 20 | 164 | 21 | 17 | 11 | |||||||||||||||||||||||||||||
| Jun 2023 | 41 | 220 | 12 | 243 | 20 | 272 | 19 | 143 | 13 | 15 | 10 | ||||||||||||||||||||||||||||||
| Dec 2022 | 37 | 242 | 10 | 297 | 16 | 278 | 16 | 178 | 15 | 13 | 9 | ||||||||||||||||||||||||||||||
| R/kg | Dec 2023 | 1,011,673 | 1,067,413 | 881,665 | 1,039,185 | 254,237 | 1,142,634 | 760,722 | 997,182 | 1,555,556 | 1,118,123 | 857,479 | |||||||||||||||||||||||||||||
| Jun 2023 | 897,778 | 922,129 | 831,221 | 810,247 | 1,121,622 | 1,039,396 | 1,106,280 | 929,452 | 1,125,000 | 1,007,042 | 753,038 | ||||||||||||||||||||||||||||||
| Dec 2022 | 937,627 | 1,030,270 | 728,051 | 983,876 | 570,833 | 1,080,085 | 859,524 | 1,024,260 | 761,905 | 810,976 | 701,208 | ||||||||||||||||||||||||||||||
| US$/oz | Dec 2023 | 1,690 | 1,783 | 1,473 | 1,736 | 425 | 1,909 | 1,271 | 1,666 | 2,598 | 1,868 | 1,432 | |||||||||||||||||||||||||||||
| Jun 2023 | 1,533 | 1,575 | 1,420 | 1,384 | 1,916 | 1,775 | 1,890 | 1,588 | 1,922 | 1,720 | 1,286 | ||||||||||||||||||||||||||||||
| Dec 2022 | 1,683 | 1,849 | 1,307 | 1,766 | 1,025 | 1,939 | 1,543 | 1,838 | 1,367 | 1,456 | 1,259 | ||||||||||||||||||||||||||||||
Average exchange rate for the six months ended 31 December 2023, 30 June 2023 and 31 December 2022 was R18.62/US$, R18.21/US$ and R17.33/US$, respectively
Figures may not add as they are rounded independently
1 Operating cost is the average cost of production and operating cost per tonne is calculated by dividing the cost of sales, before amortisation and depreciation and change in inventory in a period by the tonnes milled/treated in the same period, and operating cost per kilogram (and ounce) is calculated by dividing the cost of sales, before amortisation and depreciation and change in inventory in a period by the gold produced in the same period
Sibanye-Stillwater Operating and financial results | Six months and year ended 31 December 2023 75
SALIENT FEATURES AND COST BENCHMARKS - YEAR
US and SA PGM operations
US and SA PGM operations1 | US PGM operations | Total SA PGM operations1 | Rustenburg | Marikana1 | Kroondal3 | Plat Mile | Mimosa | |||||||||||||||||||||||||||||||||||||
Under- ground2 | Total | Under- ground | Surface | Under- ground | Surface | Under- ground | Surface | Under- ground | Surface | Attribu-table | ||||||||||||||||||||||||||||||||||
| Production | ||||||||||||||||||||||||||||||||||||||||||||
| Tonnes milled/treated | kt | Dec 2023 | 37,223 | 1,174 | 36,048 | 16,786 | 19,262 | 6,073 | 5,486 | 6,253 | 3,626 | 3,068 | 10,150 | 1,392 | ||||||||||||||||||||||||||||||
| Dec 2022 | 37,799 | 1,154 | 36,644 | 16,991 | 19,653 | 6,037 | 5,610 | 6,315 | 3,698 | 3,251 | 10,345 | 1,387 | ||||||||||||||||||||||||||||||||
| Plant head grade | g/t | Dec 2023 | 2.32 | 12.50 | 1.99 | 3.29 | 0.85 | 3.41 | 1.03 | 3.63 | 0.92 | 2.28 | 0.73 | 3.43 | ||||||||||||||||||||||||||||||
| Dec 2022 | 2.28 | 12.51 | 1.96 | 3.27 | 0.83 | 3.30 | 1.04 | 3.67 | 0.86 | 2.35 | 0.70 | 3.52 | ||||||||||||||||||||||||||||||||
| Plant recoveries | % | Dec 2023 | 75.71 | 90.97 | 72.67 | 84.96 | 31.23 | 86.21 | 46.46 | 86.60 | 26.26 | 82.83 | 21.75 | 75.77 | ||||||||||||||||||||||||||||||
| Dec 2022 | 75.26 | 90.40 | 72.16 | 84.97 | 28.54 | 86.44 | 40.11 | 86.81 | 25.49 | 82.13 | 20.77 | 73.58 | ||||||||||||||||||||||||||||||||
| Yield | g/t | Dec 2023 | 1.75 | 11.37 | 1.44 | 2.80 | 0.27 | 2.94 | 0.48 | 3.14 | 0.24 | 1.89 | 0.16 | 2.60 | ||||||||||||||||||||||||||||||
| Dec 2022 | 1.72 | 11.31 | 1.42 | 2.78 | 0.24 | 2.85 | 0.42 | 3.19 | 0.22 | 1.93 | 0.15 | 2.59 | ||||||||||||||||||||||||||||||||
PGM production4 | 4Eoz - 2Eoz | Dec 2023 | 2,100,199 | 427,272 | 1,672,927 | 1,508,546 | 164,381 | 574,005 | 84,412 | 631,981 | 28,168 | 186,252 | 51,801 | 116,308 | ||||||||||||||||||||||||||||||
| Dec 2022 | 2,088,597 | 421,133 | 1,667,464 | 1,517,804 | 149,660 | 553,663 | 75,234 | 646,851 | 26,066 | 201,756 | 48,360 | 115,534 | ||||||||||||||||||||||||||||||||
PGM sold5 | 4Eoz - 2Eoz | Dec 2023 | 2,144,816 | 425,007 | 1,719,809 | 542,773 | 76,032 | 753,189 | 186,252 | 51,801 | 109,762 | |||||||||||||||||||||||||||||||||
| Dec 2022 | 2,080,657 | 418,556 | 1,662,101 | 554,101 | 70,693 | 676,958 | 201,756 | 48,360 | 110,233 | |||||||||||||||||||||||||||||||||||
Price and costs6 | ||||||||||||||||||||||||||||||||||||||||||||
Average PGM basket price7 | R/4Eoz - R/2Eoz | Dec 2023 | 27,715 | 22,890 | 28,979 | 29,395 | 24,810 | 29,181 | 29,586 | 25,924 | 25,942 | |||||||||||||||||||||||||||||||||
| Dec 2022 | 40,276 | 30,482 | 42,914 | 43,998 | 31,055 | 43,035 | 45,795 | 34,237 | 33,494 | |||||||||||||||||||||||||||||||||||
| US$/4Eoz - US$/2Eoz | Dec 2023 | 1,505 | 1,243 | 1,574 | 1,596 | 1,347 | 1,585 | 1,607 | 1,408 | 1,409 | ||||||||||||||||||||||||||||||||||
| Dec 2022 | 2,461 | 1,862 | 2,622 | 2,688 | 1,897 | 2,629 | 2,798 | 2,092 | 2,046 | |||||||||||||||||||||||||||||||||||
Operating cost8,11 | R/t | Dec 2023 | 1,210 | 7,837 | 986 | 2,075 | 247 | 1,583 | 1,282 | 63 | 1,723 | |||||||||||||||||||||||||||||||||
| Dec 2022 | 1,049 | 6,811 | 860 | 1,869 | 240 | 1,369 | 1,049 | 56 | 1,385 | |||||||||||||||||||||||||||||||||||
| US$/t | Dec 2023 | 66 | 426 | 54 | 113 | 13 | 86 | 70 | 3 | 94 | ||||||||||||||||||||||||||||||||||
| Dec 2022 | 64 | 416 | 53 | 114 | 15 | 84 | 64 | 3 | 85 | |||||||||||||||||||||||||||||||||||
| R/4Eoz - R/2Eoz | Dec 2023 | 21,862 | 21,539 | 21,951 | 21,955 | 16,029 | 23,693 | 21,111 | 12,374 | 20,626 | ||||||||||||||||||||||||||||||||||
| Dec 2022 | 19,357 | 18,671 | 19,543 | 20,377 | 17,931 | 20,365 | 16,912 | 12,055 | 16,627 | |||||||||||||||||||||||||||||||||||
| US$/4Eoz - US$/2Eoz | Dec 2023 | 1,187 | 1,170 | 1,192 | 1,192 | 870 | 1,287 | 1,146 | 672 | 1,120 | ||||||||||||||||||||||||||||||||||
| Dec 2022 | 1,183 | 1,141 | 1,194 | 1,245 | 1,096 | 1,244 | 1,033 | 737 | 1,016 | |||||||||||||||||||||||||||||||||||
Adjusted EBITDA margin9 | % | Dec 2023 | 7 | 32 | ||||||||||||||||||||||||||||||||||||||||
| Dec 2022 | 46 | 53 | ||||||||||||||||||||||||||||||||||||||||||
All-in sustaining cost10,11 | R/4Eoz - R/2Eoz | Dec 2023 | 23,158 | 34,465 | 20,054 | 18,204 | 22,742 | 19,441 | 11,486 | 24,255 | ||||||||||||||||||||||||||||||||||
| Dec 2022 | 20,730 | 25,951 | 19,313 | 19,914 | 20,500 | 15,514 | 10,835 | 18,817 | ||||||||||||||||||||||||||||||||||||
| US$/4Eoz - US$/2Eoz | Dec 2023 | 1,258 | 1,872 | 1,089 | 989 | 1,235 | 1,056 | 624 | 1,317 | |||||||||||||||||||||||||||||||||||
| Dec 2022 | 1,267 | 1,586 | 1,180 | 1,217 | 1,253 | 948 | 662 | 1,150 | ||||||||||||||||||||||||||||||||||||
All-in cost10,11 | R/4Eoz - R/2Eoz | Dec 2023 | 24,075 | 36,277 | 20,726 | 18,204 | 24,105 | 19,549 | 13,899 | 24,255 | ||||||||||||||||||||||||||||||||||
| Dec 2022 | 21,886 | 29,145 | 19,916 | 19,914 | 21,891 | 15,514 | 10,835 | 18,817 | ||||||||||||||||||||||||||||||||||||
| US$/4Eoz - US$/2Eoz | Dec 2023 | 1,307 | 1,970 | 1,125 | 989 | 1,309 | 1,062 | 755 | 1,317 | |||||||||||||||||||||||||||||||||||
| Dec 2022 | 1,337 | 1,781 | 1,217 | 1,217 | 1,337 | 948 | 662 | 1,150 | ||||||||||||||||||||||||||||||||||||
Capital expenditure6 | ||||||||||||||||||||||||||||||||||||||||||||
| Ore reserve development | Rm | Dec 2023 | 6,440 | 3,889 | 2,551 | 669 | 1,882 | — | — | — | ||||||||||||||||||||||||||||||||||
| Dec 2022 | 5,010 | 2,887 | 2,123 | 687 | 1,436 | — | — | — | ||||||||||||||||||||||||||||||||||||
| Sustaining capital | Rm | Dec 2023 | 4,236 | 2,178 | 2,058 | 644 | 1,097 | 287 | 30 | 1,057 | ||||||||||||||||||||||||||||||||||
| Dec 2022 | 3,240 | 1,184 | 2,056 | 690 | 1,072 | 273 | 21 | 864 | ||||||||||||||||||||||||||||||||||||
| Corporate and projects | Rm | Dec 2023 | 1,812 | 774 | 1,038 | — | 893 | 20 | 125 | — | ||||||||||||||||||||||||||||||||||
| Dec 2022 | 2,270 | 1,345 | 925 | — | 924 | — | — | — | ||||||||||||||||||||||||||||||||||||
| Total capital expenditure | Rm | Dec 2023 | 12,488 | 6,841 | 5,647 | 1,313 | 3,872 | 307 | 155 | 1,057 | ||||||||||||||||||||||||||||||||||
| Dec 2022 | 10,520 | 5,416 | 5,104 | 1,377 | 3,432 | 273 | 21 | 864 | ||||||||||||||||||||||||||||||||||||
| Total capital expenditure | US$m | Dec 2023 | 678 | 371 | 307 | 71 | 210 | 17 | 8 | 57 | ||||||||||||||||||||||||||||||||||
| Dec 2022 | 643 | 331 | 312 | 84 | 210 | 17 | 1 | 53 | ||||||||||||||||||||||||||||||||||||
Average exchange rates for the year ended 31 December 2023 and 31 December 2022 were R18.42/US$ and R16.37/US$, respectively
Figures may not add as they are rounded independently
1The US and SA PGM operations, Total SA PGM operation and Marikana excludes the production and costs associated with the purchase of concentrate (PoC) from third parties. For a reconciliation of the Operating cost, AISC and AIC excluding third party PoC, refer to “Reconciliation of operating cost excluding third party PoC for US and SA PGM operations, Total SA PGM operations and Marikana - Year” and “Reconciliation of AISC and AIC excluding third party PoC for US and SA PGM operations, Total SA PGM operations and Marikana – Year”
2The US PGM operations’ underground production is converted to metric tonnes and kilograms, and performance is translated into rand. In addition to the US PGM operations’ underground production, the operation treats recycling material which is excluded from the statistics shown above and is detailed in the PGM recycling table below
3Kroondal operations for the year ended December 2023 includes production and costs for two months (November and December 2023) at 100%
4Production per product – see prill split in the table below
5PGM sold includes the third party PoC ounces sold
6The US and SA PGM operations and Total SA PGM operations’ unit cost benchmarks and capital expenditure exclude the financial results of Mimosa, which is equity accounted and excluded from revenue and cost of sales
7The average PGM basket price is the PGM revenue per 4E/2E ounce, prior to purchase of concentrate adjustment
8Operating cost is the average cost of production and operating cost per tonne is calculated by dividing the cost of sales, before amortisation and depreciation and change in inventory in a period by the tonnes milled/treated in the same period, and operating cost per ounce (and kilogram) is calculated by dividing the cost of sales, before amortisation and depreciation and change in inventory in a period, by the PGM produced in the same period. For a reconciliation of unit operating cost, see “Unit operating cost - Year"
9Adjusted EBITDA margin is calculated by dividing adjusted EBITDA by revenue
10All-in cost is calculated in accordance with the World Gold Council guidance. All-in cost excludes income tax, costs associated with merger and acquisition activities, working capital, impairments, financing costs, one-time severance charges and items needed to normalise earnings. All-in cost is made up of All-in sustaining cost, being the cost to sustain current operations, given as a sub-total in the All-in cost calculation, together with corporate and major capital expenditure associated with growth. All-in sustaining cost per ounce (and kilogram) and All-in cost
Sibanye-Stillwater Operating and financial results | Six months and year ended 31 December 2023 76
per ounce (and kilogram) are calculated by dividing the All-in sustaining cost and All-in cost, respectively, in a period by the total 4E/2E PGM produced in the same period. For a reconciliation of cost of sales, before amortisation and depreciation to All-in cost, see “All-in costs - Year”
11Operating cost, adjusted EBITDA margin, all-in sustaining costs and all-in costs, are not measures of performance under IFRS. As a result, such measures should not be considered in isolation or as alternatives to any other measure of financial performance presented in accordance with IFRS
| Mining - PGM Prill split including third party PoC, excluding recycling operations | ||||||||||||||||||||||||||||||||||||||
| US AND SA PGM OPERATIONS | TOTAL SA PGM OPERATIONS | US PGM OPERATIONS | ||||||||||||||||||||||||||||||||||||
| Dec 2023 | Dec 2022 | Dec 2023 | Dec 2022 | Dec 2023 | Dec 2022 | |||||||||||||||||||||||||||||||||
| % | % | % | % | % | % | |||||||||||||||||||||||||||||||||
| Platinum | 1,152,025 | 52 | % | 1,124,891 | 52 | % | 1,054,341 | 60 | % | 1,028,340 | 59 | % | 97,684 | 23 | % | 96,551 | 23 | % | ||||||||||||||||||||
| Palladium | 855,717 | 39 | % | 841,330 | 39 | % | 526,129 | 30 | % | 516,748 | 30 | % | 329,588 | 77 | % | 324,582 | 77 | % | ||||||||||||||||||||
| Rhodium | 157,747 | 7 | % | 153,401 | 7 | % | 157,747 | 9 | % | 153,401 | 9 | % | ||||||||||||||||||||||||||
| Gold | 31,113 | 1 | % | 32,319 | 2 | % | 31,113 | 2 | % | 32,319 | 2 | % | ||||||||||||||||||||||||||
| PGM production 4E/2E | 2,196,602 | 100 | % | 2,151,941 | 100 | % | 1,769,330 | 100 | % | 1,730,808 | 100 | % | 427,272 | 100 | % | 421,133 | 100 | % | ||||||||||||||||||||
| Ruthenium | 250,879 | 243,869 | 250,879 | 243,869 | ||||||||||||||||||||||||||||||||||
| Iridium | 63,134 | 61,501 | 63,134 | 61,501 | ||||||||||||||||||||||||||||||||||
| Total 6E/2E | 2,510,615 | 2,457,311 | 2,083,343 | 2,036,178 | 427,272 | 421,133 | ||||||||||||||||||||||||||||||||
Figures may not add as they are rounded independently
| US PGM Recycling | |||||||||||
| Unit | Dec 2023 | Dec 2022 | |||||||||
| Average catalyst fed/day | Tonne | 10.5 | 18.8 | ||||||||
| Total processed | Tonne | 3,851 | 6,876 | ||||||||
| Tolled | Tonne | — | — | ||||||||
| Purchased | Tonne | 3,851 | 6,876 | ||||||||
| PGM fed | 3Eoz | 310,314 | 598,774 | ||||||||
| PGM sold | 3Eoz | 309,121 | 643,200 | ||||||||
| PGM tolled returned | 3Eoz | 7,460 | 7,336 | ||||||||
Sibanye-Stillwater Operating and financial results | Six months and year ended 31 December 2023 77
SALIENT FEATURES AND COST BENCHMARKS - YEAR (continued)
SA gold operations
| SA OPERATIONS | |||||||||||||||||||||||||||||||||||||||||
| Total SA gold | Driefontein | Kloof | Beatrix | Cooke | DRDGOLD | ||||||||||||||||||||||||||||||||||||
| Total | Under- ground | Surface | Under- ground | Surface | Under- ground | Surface | Under- ground | Surface | Surface | Surface | |||||||||||||||||||||||||||||||
| Production | |||||||||||||||||||||||||||||||||||||||||
| Tonnes milled/treated | kt | Dec 2023 | 31,941 | 4,055 | 27,886 | 1,237 | 258 | 1,399 | 1,565 | 1,420 | 366 | 4,289 | 21,408 | ||||||||||||||||||||||||||||
| Dec 2022 | 36,172 | 2,761 | 33,411 | 840 | 694 | 992 | 1,954 | 929 | 124 | 4,074 | 26,565 | ||||||||||||||||||||||||||||||
| Yield | g/t | Dec 2023 | 0.79 | 4.45 | 0.26 | 5.76 | 0.52 | 4.85 | 0.42 | 2.93 | 0.22 | 0.28 | 0.24 | ||||||||||||||||||||||||||||
| Dec 2022 | 0.53 | 4.25 | 0.23 | 5.45 | 0.46 | 4.34 | 0.32 | 3.08 | 0.41 | 0.25 | 0.21 | ||||||||||||||||||||||||||||||
| Gold produced | kg | Dec 2023 | 25,212 | 18,064 | 7,148 | 7,125 | 133 | 6,783 | 650 | 4,156 | 81 | 1,186 | 5,098 | ||||||||||||||||||||||||||||
| Dec 2022 | 19,301 | 11,736 | 7,565 | 4,574 | 319 | 4,300 | 620 | 2,862 | 51 | 1,010 | 5,565 | ||||||||||||||||||||||||||||||
| oz | Dec 2023 | 810,584 | 580,771 | 229,813 | 229,074 | 4,276 | 218,078 | 20,898 | 133,618 | 2,604 | 38,131 | 163,904 | |||||||||||||||||||||||||||||
| Dec 2022 | 620,541 | 377,321 | 243,220 | 147,057 | 10,256 | 138,248 | 19,933 | 92,015 | 1,640 | 32,472 | 178,919 | ||||||||||||||||||||||||||||||
| Gold sold | kg | Dec 2023 | 25,429 | 18,178 | 7,251 | 7,056 | 168 | 7,011 | 697 | 4,111 | 81 | 1,219 | 5,086 | ||||||||||||||||||||||||||||
| Dec 2022 | 18,859 | 11,367 | 7,492 | 4,464 | 287 | 4,146 | 597 | 2,757 | 51 | 972 | 5,585 | ||||||||||||||||||||||||||||||
| oz | Dec 2023 | 817,561 | 584,436 | 233,125 | 226,856 | 5,401 | 225,409 | 22,409 | 132,172 | 2,604 | 39,192 | 163,519 | |||||||||||||||||||||||||||||
| Dec 2022 | 606,331 | 365,457 | 240,873 | 143,521 | 9,227 | 133,297 | 19,194 | 88,640 | 1,640 | 31,251 | 179,562 | ||||||||||||||||||||||||||||||
| Price and costs | |||||||||||||||||||||||||||||||||||||||||
| Gold price received | R/kg | Dec 2023 | 1,146,093 | 1,147,979 | 1,145,952 | 1,145,992 | 1,146,842 | 1,143,531 | |||||||||||||||||||||||||||||||||
| Dec 2022 | 946,073 | 944,222 | 945,815 | 954,772 | 941,358 | 944,315 | |||||||||||||||||||||||||||||||||||
| Gold price received | US$/oz | Dec 2023 | 1,936 | 1,939 | 1,936 | 1,936 | 1,937 | 1,931 | |||||||||||||||||||||||||||||||||
| Dec 2022 | 1,798 | 1,794 | 1,797 | 1,814 | 1,789 | 1,795 | |||||||||||||||||||||||||||||||||||
Operating cost1,4 | R/t | Dec 2023 | 752 | 4,414 | 220 | 5,267 | 384 | 5,276 | 362 | 2,822 | 262 | 294 | 192 | ||||||||||||||||||||||||||||
| Dec 2022 | 573 | 5,524 | 164 | 6,289 | 282 | 6,045 | 302 | 4,277 | 557 | 210 | 142 | ||||||||||||||||||||||||||||||
| US$/t | Dec 2023 | 41 | 240 | 12 | 286 | 21 | 287 | 20 | 153 | 14 | 16 | 10 | |||||||||||||||||||||||||||||
| Dec 2022 | 35 | 338 | 10 | 384 | 17 | 369 | 18 | 261 | 34 | 13 | 9 | ||||||||||||||||||||||||||||||
| R/kg | Dec 2023 | 953,118 | 991,032 | 857,303 | 914,246 | 744,361 | 1,088,309 | 870,769 | 963,908 | 1,185,185 | 1,064,081 | 805,218 | |||||||||||||||||||||||||||||
| Dec 2022 | 1,074,400 | 1,299,591 | 725,050 | 1,154,569 | 614,420 | 1,394,419 | 953,226 | 1,388,889 | 1,352,941 | 846,535 | 678,167 | ||||||||||||||||||||||||||||||
| US$/oz | Dec 2023 | 1,610 | 1,674 | 1,448 | 1,544 | 1,257 | 1,838 | 1,471 | 1,628 | 2,002 | 1,797 | 1,360 | |||||||||||||||||||||||||||||
| Dec 2022 | 2,042 | 2,470 | 1,378 | 2,194 | 1,168 | 2,650 | 1,811 | 2,639 | 2,571 | 1,609 | 1,289 | ||||||||||||||||||||||||||||||
Adjusted EBITDA margin2 | R/kg | Dec 2023 | 12 | ||||||||||||||||||||||||||||||||||||||
| Dec 2022 | (20) | ||||||||||||||||||||||||||||||||||||||||
All-in sustaining cost3,4 | R/kg | Dec 2023 | 1,127,138 | 1,187,292 | 1,242,735 | 1,100,668 | 1,117,309 | 888,321 | |||||||||||||||||||||||||||||||||
| Dec 2022 | 1,268,360 | 1,378,868 | 1,592,030 | 1,573,006 | 907,407 | 804,297 | |||||||||||||||||||||||||||||||||||
| All-in sustaining cost2 | US$/oz | Dec 2023 | 1,904 | 2,005 | 2,099 | 1,859 | 1,887 | 1,500 | |||||||||||||||||||||||||||||||||
| Dec 2022 | 2,410 | 2,620 | 3,025 | 2,989 | 1,724 | 1,528 | |||||||||||||||||||||||||||||||||||
All-in cost3,4 | R/kg | Dec 2023 | 1,230,328 | 1,187,292 | 1,257,914 | 1,100,668 | 1,117,309 | 1,061,738 | |||||||||||||||||||||||||||||||||
| Dec 2022 | 1,341,588 | 1,378,868 | 1,636,306 | 1,574,430 | 907,407 | 826,500 | |||||||||||||||||||||||||||||||||||
| All-in cost2 | US$/oz | Dec 2023 | 2,078 | 2,005 | 2,125 | 1,859 | 1,887 | 1,793 | |||||||||||||||||||||||||||||||||
| Dec 2022 | 2,549 | 2,620 | 3,110 | 2,992 | 1,724 | 1,571 | |||||||||||||||||||||||||||||||||||
| Capital expenditure | |||||||||||||||||||||||||||||||||||||||||
| Ore reserve development | Rm | Dec 2023 | 2,697 | 1,461 | 912 | 324 | — | — | |||||||||||||||||||||||||||||||||
| Dec 2022 | 1,630 | 794 | 620 | 216 | — | — | |||||||||||||||||||||||||||||||||||
| Sustaining capital | Rm | Dec 2023 | 1,457 | 490 | 421 | 114 | — | 432 | |||||||||||||||||||||||||||||||||
| Dec 2022 | 1,615 | 358 | 455 | 155 | — | 647 | |||||||||||||||||||||||||||||||||||
Corporate and projects4 | Rm | Dec 2023 | 2,554 | — | 117 | — | — | 882 | |||||||||||||||||||||||||||||||||
| Dec 2022 | 1,314 | — | 210 | 4 | — | 124 | |||||||||||||||||||||||||||||||||||
| Total capital expenditure | Rm | Dec 2023 | 6,708 | 1,951 | 1,450 | 438 | — | 1,314 | |||||||||||||||||||||||||||||||||
| Dec 2022 | 4,559 | 1,152 | 1,285 | 375 | — | 771 | |||||||||||||||||||||||||||||||||||
| Total capital expenditure | US$m | Dec 2023 | 364 | 106 | 79 | 24 | — | 71 | |||||||||||||||||||||||||||||||||
| Dec 2022 | 279 | 70 | 79 | 23 | — | 47 | |||||||||||||||||||||||||||||||||||
Average exchange rates for the year ended 31 December 2023 and 31 December 2022 were R18.42/US$ and R16.37/US$, respectively
Figures may not add as they are rounded independently
1Operating cost is the average cost of production and operating cost per tonne is calculated by dividing the cost of sales, before amortisation and depreciation and change in inventory in a period by the tonnes milled/treated in the same period, and operating cost per kilogram (and ounce) is calculated by dividing the cost of sales, before amortisation and depreciation and change in inventory in a period by the gold produced in the same period
2Adjusted EBITDA margin is calculated by dividing adjusted EBITDA by revenue
3All-in cost is calculated in accordance with the World Gold Council guidance. All-in cost excludes income tax, costs associated with merger and acquisition activities, working capital, impairments, financing costs, one time severance charges and items needed to normalise earnings. All-in cost is made up of All-in sustaining cost, being the cost to sustain current operations, given as a sub-total in the All-in cost calculation, together with corporate and major capital expenditure associated with growth. All-in sustaining cost per kilogram (and ounce) and All-in cost per kilogram (and ounce) are calculated by dividing the All-in sustaining cost and All-in cost, respectively, in a period by the total gold sold over the same period. For a reconciliation of cost of sales before amortisation and depreciation to All-in cost, see “All-in costs – Year”
4Operating cost, adjusted EBITDA margin, all-in sustaining costs and all-in costs, are not measures of performance under IFRS. As a result, such measures should not be considered in isolation or as alternatives to any other measure of financial performance presented in accordance with IFRS
5Corporate project expenditure, which comprises spend on various Corporate IT projects and the Burnstone project, for the years ended 31 December 2023 and 31 December 2022 was R1,555 million (US$84 million) and R976 million (US$60 million), respectively
Sibanye-Stillwater Operating and financial results | Six months and year ended 31 December 2023 78
SALIENT FEATURES AND COST BENCHMARKS - YEAR (continued)
European operations
| Sandouville nickel refinery | ||||||||||||||
| Metals split | ||||||||||||||
| Dec 2023 | Dec 20221 | |||||||||||||
| Volumes produced (tonnes) | % | % | ||||||||||||
Nickel salts2 | 1,411 | 20 | % | 2,003 | 29 | % | ||||||||
| Nickel metal | 5,714 | 80 | % | 4,839 | 71 | % | ||||||||
| Total Nickel production tNi | 7,125 | 100 | % | 6,842 | 100 | % | ||||||||
Nickel cakes3 | 320 | 284 | ||||||||||||
Cobalt chloride (CoCl2)4 | 127 | 153 | ||||||||||||
Ferric chloride (FeCl3)4 | 1,214 | 1399 | ||||||||||||
| Volumes sales (tonnes) | ||||||||||||||
Nickel salts2 | 1,134 | 17 | % | 1,860 | 27 | % | ||||||||
| Nickel metal | 5,721 | 83 | % | 4,987 | 73 | % | ||||||||
| Total Nickel sold tNi | 6,855 | 100 | % | 6,847 | 100 | % | ||||||||
Nickel cakes3 | 21 | — | ||||||||||||
Cobalt chloride (CoCl2)4 | 116 | 164 | ||||||||||||
Ferric chloride (FeCl3)4 | 1,214 | 1399 | ||||||||||||
| Nickel equivalent basket price | Unit | Dec 2023 | Dec 20221 | ||||||||
| Revenue from sale of products | Rm | 3,024 | 3,140 | ||||||||
| Nickel products sold | tNi | 6,855 | 6,847 | ||||||||
Nickel equivalent average basket price5 | R/tNi | 441,138 | 458,595 | ||||||||
| Nickel equivalent average basket price | US$/tNi | 23,955 | 28,019 | ||||||||
| Nickel equivalent sustaining cost | Rm | Dec 2023 | Dec 20221 | ||||||||
| Cost of sales, before amortisation and depreciation | 4,329 | 3,631 | |||||||||
| Share-based payments | 21 | — | |||||||||
| Rehabilitation interest and amortisation | 9 | 5 | |||||||||
| Leases | 20 | 14 | |||||||||
| Sustaining capital expenditure | 248 | 90 | |||||||||
| Less: By-product credit | (149) | (127) | |||||||||
Nickel equivalent sustaining cost6 | 4,478 | 3,613 | |||||||||
| Nickel products sold | tNi | 6,855 | 6,847 | ||||||||
Nickel equivalent sustaining cost6 | R/tNi | 653,246 | 527,676 | ||||||||
| Nickel equivalent sustaining cost | US$/tNi | 35,474 | 32,239 | ||||||||
Nickel recovery yield7 | % | 96.49 | % | 95.54 | % | ||||||
Average exchange rates for the year ended 31 December 2023 and 31 December 2022 were R18.42/US$ and R16.37/US$, respectively
Figures may not add as they are rounded independently
1Amounts included since effective date of the acquisition on 4 February 2022
2Nickel salts consist of anhydrous nickel, nickel chloride low sodium, nickel chloride standard, nickel carbonate and nickel chloride solution
3Nickel cakes occur during the processing of nickel matte and are recycled back into the nickel refining process
4Cobalt chloride and ferric chloride are obtained from nickel matte through a different refining process on an order basis
5The Nickel equivalent average basket price per tonne is the total nickel revenue adjusted for other income less non-product sales divided by the total nickel equivalent tonnes sold
6The Nickel equivalent sustaining cost, is the cost to sustain current operations. Nickel equivalent sustaining cost per tonne nickel is calculated by dividing the Nickel equivalent sustaining cost, in a period by the total nickel products sold over the same period. Nickel equivalent sustaining cost and Nickel equivalent sustaining costs per tonne are intended to provide additional information only, do not have any standardised meaning prescribed by IFRS and should not be considered in isolation or as alternatives to cost of sales, profit before tax, profit for the year, cash from operating activities or any other measure of financial performance presented in accordance with IFRS. Nickel equivalent sustaining cost and Nickel equivalent sustaining costs per tonne as presented in this document may not be comparable to other similarly titled measures of performance of other companies. Other companies may calculate these measures differently as a result of differences in the underlying accounting principles, policies applied and accounting frameworks such as in US GAAP. Differences may also arise related to definitional differences of sustaining versus development capital activities based upon each company’s internal policies. Non-IFRS measures such as Nickel equivalent sustaining cost and Nickel equivalent sustaining costs per tonne because of its nature, should not be considered as a representation of financial performance under IFRS
7Nickel recovery yield is the percentage of total nickel recovered from the matte relative to the nickel contained in the matte received
Sibanye-Stillwater Operating and financial results | Six months and year ended 31 December 2023 79
SALIENT FEATURES AND COST BENCHMARKS - YEAR (continued)
Australian operations
Century zinc retreatment operation1 | |||||||||||
| Production | |||||||||||
| Ore mined and processed | kt | Dec 2023 | 6,097 | ||||||||
| Processing feed grade | % | Dec 2023 | 3.11 | ||||||||
| Plant recoveries | % | Dec 2023 | 48.53 | ||||||||
Concentrate produced2 | kt | Dec 2023 | 204 | ||||||||
Concentrate zinc grade3 | % | Dec 2023 | 45.16 | ||||||||
Metal produced (zinc in concentrate)4 | kt | Dec 2023 | 92 | ||||||||
Zinc metal produced (payable)5 | kt | Dec 2023 | 76 | ||||||||
Zinc sold6 | kt | Dec 2023 | 94 | ||||||||
Zinc sold (payable)7 | kt | Dec 2023 | 77 | ||||||||
| Price and costs | |||||||||||
Average equivalent zinc concentrate price8 | R/tZn | Dec 2023 | 31,815 | ||||||||
| US$/tZn | Dec 2023 | 1,728 | |||||||||
All-in sustaining cost9,10 | R/tZn | Dec 2023 | 36,361 | ||||||||
| US$/tZn | Dec 2023 | 1,975 | |||||||||
All-in cost9,10 | R/tZn | Dec 2023 | 39,359 | ||||||||
| US$/tZn | Dec 2023 | 2,137 | |||||||||
Average exchange rates for the year ended 31 December 2023 was R18.42/US$
Figures may not add as they are rounded independently
1.Century is a leading tailings management and rehabilitation company that currently owns and operates the Century zinc tailings retreatment operation in Queensland, Australia. Century was acquired by the Group on 22 February 2023
2.Concentrate produced is the dry concentrate which has been processed that contains zinc, silver and waste material
3.Concentrate zinc grade is the percentage of zinc contained in the concentrate produced
4.Metal produced (zinc in concentrate) is the zinc metal contained in the concentrate produced
5.Zinc metal produced (payable) is the payable quantity of zinc metal produced after applying smelter content deductions
6.Zinc sold is the zinc metal contained in the concentrate sold
7.Zinc sold (payable) is the payable quantity of zinc metal sold after applying smelter content deductions
8.Average equivalent zinc concentrate price is the total zinc sales revenue recognised at the price expected to be received excluding the fair value adjustments divided by the payable zinc metal sold
9.All-in cost is calculated in accordance with the World Gold Council guidance. All-in cost excludes income tax, costs associated with merger and acquisition activities, working capital, impairments, financing costs, one-time severance charges and items needed to normalise earnings. All-in cost is made up of All-in sustaining cost, being the cost to sustain current operations, given as a sub-total in the All-in cost calculation, together with corporate and major capital expenditure associated with growth. All-in sustaining cost per tonne and All-in cost per tonne are calculated by dividing the All-in sustaining cost and All-in cost, respectively, in a period by the total tonnes of zinc metal produced (payable) in the same period. For a reconciliation of cost of sales, before amortisation and depreciation to All-in cost, see “All-in costs - Year”
10.All-in sustaining costs and all-in costs, are not measures of performance under IFRS. As a result, such measures should not be considered in isolation or as alternatives to any other measure of financial performance presented in accordance with IFRS
Sibanye-Stillwater Operating and financial results | Six months and year ended 31 December 2023 80
ALL-IN COSTS - YEAR
US and SA PGM operations
US and SA PGM operations1 | US PGM operations2 | Total SA PGM operations1 | Rustenburg | Marikana1 | Kroondal3 | Plat Mile | Mimosa | Corporate | |||||||||||||||||||||||||||
Cost of sales, before amortisation and depreciation4 | Dec 2023 | 46,379 | 9,680 | 36,699 | 15,147 | 16,961 | 3,950 | 641 | 2,409 | (2,409) | |||||||||||||||||||||||||
| Dec 2022 | 39,739 | 7,458 | 32,281 | 13,547 | 14,603 | 3,548 | 583 | 1,936 | (1,936) | ||||||||||||||||||||||||||
| Royalties | Dec 2023 | 803 | — | 803 | 355 | 440 | 8 | — | 133 | (133) | |||||||||||||||||||||||||
| Dec 2022 | 1,772 | — | 1,772 | 1,024 | 734 | 14 | — | 127 | (127) | ||||||||||||||||||||||||||
| Carbon tax | Dec 2023 | 2 | — | 2 | — | 2 | — | — | — | — | |||||||||||||||||||||||||
| Dec 2022 | — | — | — | (1) | 2 | (1) | — | — | — | ||||||||||||||||||||||||||
| Community costs | Dec 2023 | 99 | — | 99 | 16 | 80 | 2 | — | — | — | |||||||||||||||||||||||||
| Dec 2022 | 144 | — | 144 | — | 144 | — | — | — | — | ||||||||||||||||||||||||||
| Inventory change | Dec 2023 | 1,461 | (477) | 1,938 | 54 | 1,890 | (6) | — | (10) | 10 | |||||||||||||||||||||||||
| Dec 2022 | 2,720 | 405 | 2,315 | 101 | 2,214 | — | — | (15) | 15 | ||||||||||||||||||||||||||
Share-based payments5 | Dec 2023 | 208 | 122 | 86 | 33 | 49 | 2 | 1 | — | — | |||||||||||||||||||||||||
| Dec 2022 | 315 | 137 | 178 | 68 | 87 | 22 | 2 | — | — | ||||||||||||||||||||||||||
Rehabilitation interest and amortisation6 | Dec 2023 | 212 | 84 | 128 | (5) | 59 | 74 | — | 5 | (5) | |||||||||||||||||||||||||
| Dec 2022 | 193 | 52 | 141 | (11) | 66 | 86 | — | 14 | (14) | ||||||||||||||||||||||||||
| Leases | Dec 2023 | 75 | 8 | 67 | 23 | 39 | 5 | — | — | — | |||||||||||||||||||||||||
| Dec 2022 | 62 | 6 | 56 | 12 | 38 | 6 | — | — | — | ||||||||||||||||||||||||||
| Ore reserve development | Dec 2023 | 6,440 | 3,889 | 2,551 | 669 | 1,882 | — | — | — | — | |||||||||||||||||||||||||
| Dec 2022 | 5,010 | 2,887 | 2,123 | 687 | 1,436 | — | — | — | — | ||||||||||||||||||||||||||
| Sustaining capital expenditure | Dec 2023 | 4,236 | 2,178 | 2,058 | 644 | 1,097 | 287 | 30 | 1,057 | (1,057) | |||||||||||||||||||||||||
| Dec 2022 | 3,240 | 1,184 | 2,056 | 690 | 1,072 | 273 | 21 | 864 | (864) | ||||||||||||||||||||||||||
| Less: By-product credit | Dec 2023 | (11,655) | (758) | (10,897) | (4,950) | (5,169) | (701) | (77) | (773) | 773 | |||||||||||||||||||||||||
| Dec 2022 | (9,835) | (1,200) | (8,635) | (3,593) | (4,142) | (818) | (82) | (752) | 752 | ||||||||||||||||||||||||||
Total All-in-sustaining costs7 | Dec 2023 | 48,260 | 14,726 | 33,534 | 11,986 | 17,330 | 3,621 | 595 | 2,821 | (2,821) | |||||||||||||||||||||||||
| Dec 2022 | 43,360 | 10,929 | 32,431 | 12,524 | 16,254 | 3,130 | 524 | 2,174 | (2,174) | ||||||||||||||||||||||||||
| Plus: Corporate cost, growth and capital expenditure | Dec 2023 | 1,819 | 774 | 1,045 | — | 900 | 20 | 125 | — | — | |||||||||||||||||||||||||
| Dec 2022 | 2,282 | 1,345 | 937 | — | 936 | — | — | — | 1 | ||||||||||||||||||||||||||
Total All-in-costs7 | Dec 2023 | 50,079 | 15,500 | 34,579 | 11,986 | 18,230 | 3,641 | 720 | 2,821 | (2,821) | |||||||||||||||||||||||||
| Dec 2022 | 45,642 | 12,274 | 33,368 | 12,524 | 17,190 | 3,130 | 524 | 2,174 | (2,173) | ||||||||||||||||||||||||||
| PGM production | 4Eoz - 2Eoz | Dec 2023 | 2,196,602 | 427,272 | 1,769,330 | 658,417 | 756,552 | 186,252 | 51,801 | 116,308 | — | ||||||||||||||||||||||||
| Dec 2022 | 2,151,941 | 421,133 | 1,730,808 | 628,897 | 736,261 | 201,756 | 48,360 | 115,534 | — | ||||||||||||||||||||||||||
| kg | Dec 2023 | 68,322 | 13,290 | 55,032 | 20,479 | 23,531 | 5,793 | 1,611 | 3,618 | — | |||||||||||||||||||||||||
| Dec 2022 | 66,933 | 13,099 | 53,834 | 19,561 | 22,900 | 6,275 | 1,504 | 3,594 | — | ||||||||||||||||||||||||||
| All-in-sustaining cost | R/4Eoz - R/2Eoz | Dec 2023 | 23,199 | 34,465 | 20,286 | 18,204 | 22,907 | 19,441 | 11,486 | 24,255 | — | ||||||||||||||||||||||||
| Dec 2022 | 21,292 | 25,951 | 20,078 | 19,914 | 22,076 | 15,514 | 10,835 | 18,817 | — | ||||||||||||||||||||||||||
| US$/4Eoz - US$/2Eoz | Dec 2023 | 1,260 | 1,872 | 1,102 | 989 | 1,244 | 1,056 | 624 | 1,317 | — | |||||||||||||||||||||||||
| Dec 2022 | 1,301 | 1,586 | 1,227 | 1,217 | 1,349 | 948 | 662 | 1,150 | — | ||||||||||||||||||||||||||
| All-in-cost | R/4Eoz - R/2Eoz | Dec 2023 | 24,073 | 36,277 | 20,919 | 18,204 | 24,096 | 19,549 | 13,899 | 24,255 | — | ||||||||||||||||||||||||
| Dec 2022 | 22,413 | 29,145 | 20,658 | 19,914 | 23,348 | 15,514 | 10,835 | 18,817 | — | ||||||||||||||||||||||||||
| US$/4Eoz - US$/2Eoz | Dec 2023 | 1,307 | 1,970 | 1,136 | 989 | 1,309 | 1,062 | 755 | 1,317 | — | |||||||||||||||||||||||||
| Dec 2022 | 1,369 | 1,781 | 1,262 | 1,217 | 1,426 | 948 | 662 | 1,150 | — | ||||||||||||||||||||||||||
Average exchange rates for the year ended 31 December 2023 and 31 December 2022 were R18.42/US$ and R16.37/US$, respectively
Figures may not add as they are rounded independently
1The US and SA PGM operations, Total SA PGM operations and Marikana includes the production and costs associated with the purchase of concentrate (PoC) from third parties. For a reconciliation of the Operating cost, AISC and AIC excluding third party PoC, refer to “Reconciliation of operating cost excluding third party PoC for US and SA PGM operations, Total SA PGM operations and Marikana - Year” and “Reconciliation of AISC and AIC excluding third party PoC for US and SA PGM operations, Total SA PGM operations and Marikana – Year”
2The US PGM operations’ underground production is converted to metric tonnes and kilograms, and performance is translated into SA rand. In addition to the US PGM operations’ underground production, the operation processes various recycling material which is excluded from the 2E PGM production, All-in sustaining cost and All-in cost statistics shown
3Kroondal operations for the year ended December 2023 includes production and costs for two months (November and December 2023) at 100%
4Cost of sales, before amortisation and depreciation includes all mining and processing costs, third party refining costs, corporate general and administrative costs, and permitting costs
5Share-based payments are calculated based on the fair value at initial recognition and do not include the adjustment of the cash-settled share-based payment obligation to the reporting date fair value
6Rehabilitation includes the interest charge related to the environmental rehabilitation obligation and the amortisation of the related capitalised rehabilitation costs. The interest charge related to the environmental rehabilitation obligation and the amortisation of the capitalised rehabilitation costs reflect the periodic costs of rehabilitation associated with current PGM production
7All-in cost is calculated in accordance with the World Gold Council guidance. All-in cost excludes income tax, costs associated with merger and acquisition activities, working capital, impairments, financing costs, one-time severance charges and items needed to normalise earnings. All-in cost is made up of All-in sustaining cost, being the cost to sustain current operations, given as a sub-total in the All-in cost calculation, together with corporate and major capital expenditure associated with growth. All-in sustaining cost per ounce (and kilogram) and All-in cost per ounce (and kilogram) are calculated by dividing the All-in sustaining cost and All-in cost, respectively, in a period by the total 4E/2E PGM produced in the same period
Sibanye-Stillwater Operating and financial results | Six months and year ended 31 December 2023 81
| Reconciliation of operating cost excluding third party PoC for US and SA PGM operations, Total SA PGM operations and Marikana - Year | |||||||||||||||||||||||
| US and SA PGM operations | Total SA PGM operations | Marikana | |||||||||||||||||||||
| Rm | Dec 2023 | Dec 2022 | Dec 2023 | Dec 2022 | Dec 2023 | Dec 2022 | |||||||||||||||||
| Cost of sales, before amortisation and depreciation as reported per table above | 46,379 | 39,739 | 36,699 | 32,281 | 16,961 | 14,603 | |||||||||||||||||
| Inventory change as reported per table above | 1,461 | 2,720 | 1,938 | 2,315 | 1,890 | 2,214 | |||||||||||||||||
| Less: Chrome cost of sales | (1,715) | (1,528) | (1,715) | (1,528) | (457) | (375) | |||||||||||||||||
| Total operating cost including third party PoC | 46,125 | 40,931 | 36,922 | 33,068 | 18,394 | 16,442 | |||||||||||||||||
| Less: Purchase cost of PoC | (2,753) | (2,738) | (2,753) | (2,738) | (2,753) | (2,738) | |||||||||||||||||
| Total operating cost excluding third party PoC | 43,372 | 38,193 | 34,169 | 30,330 | 15,641 | 13,704 | |||||||||||||||||
| PGM production as reported per table above | 4Eoz- 2Eoz | 2,196,602 | 2,151,941 | 1,769,330 | 1,730,808 | 756,552 | 736,261 | ||||||||||||||||
| Less: Mimosa production | (116,308) | (115,534) | (116,308) | (115,534) | — | — | |||||||||||||||||
| PGM production excluding Mimosa | 2,080,294 | 2,036,407 | 1,653,022 | 1,615,274 | 756,552 | 736,261 | |||||||||||||||||
| Less: PoC production | (96,403) | (63,344) | (96,403) | (63,344) | (96,403) | (63,344) | |||||||||||||||||
| PGM production excluding Mimosa and third party PoC | 1,983,891 | 1,973,063 | 1,556,619 | 1,551,930 | 660,149 | 672,917 | |||||||||||||||||
| PGM production including Mimosa and excluding third party PoC | 2,100,199 | 2,088,597 | 1,672,927 | 1,667,464 | 660,149 | 672,917 | |||||||||||||||||
| Tonnes milled/treated | kt | 37,223 | 37,799 | 36,048 | 36,644 | 9,880 | 10,013 | ||||||||||||||||
| Less: Mimosa tonnes | (1,392) | (1,387) | (1,392) | (1,387) | — | — | |||||||||||||||||
| PGM tonnes excluding Mimosa and third party PoC | 35,831 | 36,411 | 34,656 | 35,257 | 9,880 | 10,013 | |||||||||||||||||
| Operating cost including third party PoC | R/4Eoz-R/2Eoz | 22,172 | 20,100 | 22,336 | 20,472 | 24,313 | 22,332 | ||||||||||||||||
| US$/4Eoz-US$/2Eoz | 1,204 | 1,228 | 1,213 | 1,251 | 1,320 | 1,364 | |||||||||||||||||
| R/t | 1,287 | 1,124 | 1,065 | 938 | 1,862 | 1,642 | |||||||||||||||||
| US$/t | 70 | 69 | 58 | 57 | 101 | 100 | |||||||||||||||||
| Operating cost excluding third party PoC | R/4Eoz-R/2Eoz | 21,862 | 19,357 | 21,951 | 19,543 | 23,693 | 20,365 | ||||||||||||||||
| US$/4Eoz-US$/2Eoz | 1,187 | 1,183 | 1,192 | 1,194 | 1,287 | 1,244 | |||||||||||||||||
| R/t | 1,210 | 1,049 | 986 | 860 | 1,583 | 1,369 | |||||||||||||||||
| US$/t | 66 | 64 | 54 | 53 | 86 | 84 | |||||||||||||||||
| Reconciliation of AISC and AIC excluding third party PoC for US and SA PGM operations, Total SA PGM operations and Marikana - Year | |||||||||||||||||||||||
| US and SA PGM operations | Total SA PGM operations | Marikana | |||||||||||||||||||||
| Rm | Dec 2023 | Dec 2022 | Dec 2023 | Dec 2022 | Dec 2023 | Dec 2022 | |||||||||||||||||
| Total All-in-sustaining cost as reported per table above | 48,260 | 43,360 | 33,534 | 32,431 | 17,330 | 16,254 | |||||||||||||||||
| Less: Purchase cost of PoC | (2,753) | (2,738) | (2,753) | (2,738) | (2,753) | (2,738) | |||||||||||||||||
| Add: By-product credit of PoC | 436 | 279 | 436 | 279 | 436 | 279 | |||||||||||||||||
| Total All-in-sustaining cost excluding third party PoC | 45,943 | 40,901 | 31,217 | 29,972 | 15,013 | 13,795 | |||||||||||||||||
| Plus: Corporate cost, growth and capital expenditure | 1,819 | 2,282 | 1,045 | 937 | 900 | 936 | |||||||||||||||||
| Total All-in-cost excluding third party PoC | 47,762 | 43,183 | 32,262 | 30,909 | 15,913 | 14,731 | |||||||||||||||||
| PGM production excluding Mimosa and third party PoC | 4Eoz- 2Eoz | 1,983,891 | 1,973,063 | 1,556,619 | 1,551,930 | 660,149 | 672,917 | ||||||||||||||||
| All-in-sustaining cost excluding third party PoC | R/4Eoz-R/2Eoz | 23,158 | 20,730 | 20,054 | 19,313 | 22,742 | 20,500 | ||||||||||||||||
| US$/4Eoz-US$/2Eoz | 1,258 | 1,267 | 1,089 | 1,180 | 1,235 | 1,253 | |||||||||||||||||
| All-in-cost excluding third party PoC | R/4Eoz-R/2Eoz | 24,075 | 21,886 | 20,726 | 19,916 | 24,105 | 21,891 | ||||||||||||||||
| US$/4Eoz-US$/2Eoz | 1,307 | 1,337 | 1,125 | 1,217 | 1,309 | 1,337 | |||||||||||||||||
Sibanye-Stillwater Operating and financial results | Six months and year ended 31 December 2023 82
ALL-IN COSTS - YEAR (continued)
SA gold operations
Figures are in rand millions unless otherwise stated
| SA OPERATIONS | |||||||||||||||||||||||||||||
| Total SA gold | Driefontein | Kloof | Beatrix | Cooke | DRDGOLD | Corporate | |||||||||||||||||||||||
Cost of sales, before amortisation and depreciation1 | Dec 2023 | 24,080 | 6,566 | 8,150 | 4,058 | 1,266 | 4,040 | — | |||||||||||||||||||||
| Dec 2022 | 20,175 | 5,281 | 6,381 | 3,911 | 822 | 3,780 | — | ||||||||||||||||||||||
| Royalties | Dec 2023 | 115 | 41 | 44 | 24 | 6 | — | — | |||||||||||||||||||||
| Dec 2022 | 62 | 22 | 22 | 13 | 5 | — | — | ||||||||||||||||||||||
| Carbon tax | Dec 2023 | 1 | — | — | — | — | 1 | — | |||||||||||||||||||||
| Dec 2022 | (10) | — | — | (10) | — | — | — | ||||||||||||||||||||||
| Community costs | Dec 2023 | 4 | — | — | (7) | — | 11 | — | |||||||||||||||||||||
| Dec 2022 | 94 | 33 | 27 | 23 | — | 11 | — | ||||||||||||||||||||||
Share-based payments2 | Dec 2023 | 84 | 23 | 19 | 10 | — | 25 | 7 | |||||||||||||||||||||
| Dec 2022 | 146 | 49 | 47 | 31 | — | 19 | — | ||||||||||||||||||||||
Rehabilitation interest and amortisation3 | Dec 2023 | 186 | 1 | 22 | 74 | 89 | (5) | 5 | |||||||||||||||||||||
| Dec 2022 | 141 | 12 | (17) | 51 | 52 | 16 | 27 | ||||||||||||||||||||||
| Leases | Dec 2023 | 59 | 1 | 16 | 20 | 1 | 21 | — | |||||||||||||||||||||
| Dec 2022 | 80 | 5 | 18 | 29 | 4 | 24 | — | ||||||||||||||||||||||
| Ore reserve development | Dec 2023 | 2,697 | 1,461 | 912 | 324 | — | — | — | |||||||||||||||||||||
| Dec 2022 | 1,630 | 794 | 620 | 216 | — | — | — | ||||||||||||||||||||||
| Sustaining capital expenditure | Dec 2023 | 1,457 | 490 | 421 | 114 | — | 432 | — | |||||||||||||||||||||
| Dec 2022 | 1,615 | 358 | 455 | 155 | — | 647 | — | ||||||||||||||||||||||
| Less: By-product credit | Dec 2023 | (21) | (6) | (5) | (3) | — | (7) | — | |||||||||||||||||||||
| Dec 2022 | (13) | (3) | (2) | (2) | (1) | (5) | — | ||||||||||||||||||||||
Total All-in-sustaining costs4 | Dec 2023 | 28,662 | 8,577 | 9,579 | 4,614 | 1,362 | 4,518 | 12 | |||||||||||||||||||||
| Dec 2022 | 23,920 | 6,551 | 7,551 | 4,417 | 882 | 4,492 | 27 | ||||||||||||||||||||||
| Plus: Corporate cost, growth and capital expenditure | Dec 2023 | 2,624 | — | 117 | — | — | 882 | 1,625 | |||||||||||||||||||||
| Dec 2022 | 1,381 | — | 210 | 4 | — | 124 | 1,043 | ||||||||||||||||||||||
Total All-in-costs4 | Dec 2023 | 31,286 | 8,577 | 9,696 | 4,614 | 1,362 | 5,400 | 1,637 | |||||||||||||||||||||
| Dec 2022 | 25,301 | 6,551 | 7,761 | 4,421 | 882 | 4,616 | 1,070 | ||||||||||||||||||||||
| Gold sold | kg | Dec 2023 | 25,429 | 7,224 | 7,708 | 4,192 | 1,219 | 5,086 | — | ||||||||||||||||||||
| Dec 2022 | 18,859 | 4,751 | 4,743 | 2,808 | 972 | 5,585 | — | ||||||||||||||||||||||
| oz | Dec 2023 | 817,561 | 232,257 | 247,818 | 134,776 | 39,192 | 163,519 | — | |||||||||||||||||||||
| Dec 2022 | 606,331 | 152,748 | 152,491 | 90,279 | 31,251 | 179,562 | — | ||||||||||||||||||||||
| All-in-sustaining cost | R/kg | Dec 2023 | 1,127,138 | 1,187,292 | 1,242,735 | 1,100,668 | 1,117,309 | 888,321 | — | ||||||||||||||||||||
| Dec 2022 | 1,268,360 | 1,378,868 | 1,592,030 | 1,573,006 | 907,407 | 804,297 | — | ||||||||||||||||||||||
| All-in-sustaining cost | US$/oz | Dec 2023 | 1,904 | 2,005 | 2,099 | 1,859 | 1,887 | 1,500 | — | ||||||||||||||||||||
| Dec 2022 | 2,410 | 2,620 | 3,025 | 2,989 | 1,724 | 1,528 | — | ||||||||||||||||||||||
| All-in-cost | R/kg | Dec 2023 | 1,230,328 | 1,187,292 | 1,257,914 | 1,100,668 | 1,117,309 | 1,061,738 | — | ||||||||||||||||||||
| Dec 2022 | 1,341,588 | 1,378,868 | 1,636,306 | 1,574,430 | 907,407 | 826,500 | — | ||||||||||||||||||||||
| All-in-cost | US$/oz | Dec 2023 | 2,078 | 2,005 | 2,125 | 1,859 | 1,887 | 1,793 | — | ||||||||||||||||||||
| Dec 2022 | 2,549 | 2,620 | 3,110 | 2,992 | 1,724 | 1,571 | — | ||||||||||||||||||||||
Average exchange rates for the year ended 31 December 2023 and 31 December 2022 were R18.42/US$ and R16.37/US$, respectively
Figures may not add as they are rounded independently
1 Cost of sales, before amortisation and depreciation includes all mining and processing costs, third party refining costs, corporate general and administrative costs, and permitting costs
2 Share-based payments are calculated based on the fair value at initial recognition and do not include the adjustment of the cash-settled share-based payment obligation to the reporting date fair value
3 Rehabilitation includes the interest charge related to the environmental rehabilitation obligation and the amortisation of the related capitalised rehabilitation costs. The interest charge related to the environmental rehabilitation obligation and the amortisation of the capitalised rehabilitation costs reflect the periodic costs of rehabilitation associated with current gold production
4 All-in cost is calculated in accordance with the World Gold Council guidance. All-in cost excludes income tax, costs associated with merger and acquisition activities, working capital, impairments, financing costs, one time severance charges and items needed to normalise earnings. All-in cost is made up of All-in sustaining cost, being the cost to sustain current operations, given as a sub-total in the All-in cost calculation, together with corporate and major capital expenditure associated with growth. All-in sustaining cost per kilogram (and ounce) and All-in cost per kilogram (and ounce) are calculated by dividing the All-in sustaining cost and All-in cost, respectively, in a period by the total gold sold over the same period
Sibanye-Stillwater Operating and financial results | Six months and year ended 31 December 2023 83
ALL-IN-COSTS - YEAR (continued)
Australian operations
Figures are in rand millions unless otherwise stated
Century zinc retreatment operation1 | |||||||||||
Cost of sales, before amortisation and depreciation2 | Dec 2023 | 2,257 | |||||||||
| Royalties | Dec 2023 | 131 | |||||||||
| Community costs | Dec 2023 | 47 | |||||||||
| Inventory change | Dec 2023 | 216 | |||||||||
| Share-based payments | Dec 2023 | — | |||||||||
Rehabilitation interest and amortisation3 | Dec 2023 | 14 | |||||||||
| Leases | Dec 2023 | 99 | |||||||||
| Sustaining capital expenditure | Dec 2023 | 114 | |||||||||
| Less: By-product credit | Dec 2023 | (125) | |||||||||
Total All-in-sustaining costs4 | Dec 2023 | 2,753 | |||||||||
| Plus: Corporate cost, growth and capital expenditure | Dec 2023 | 227 | |||||||||
Total All-in-costs4 | Dec 2023 | 2,980 | |||||||||
| Zinc metal produced (payable) | kt | Dec 2023 | 76 | ||||||||
| All-in-sustaining cost | R/tZn | Dec 2023 | 36,361 | ||||||||
| US$/tZn | Dec 2023 | 1,975 | |||||||||
| All-in-cost | R/tZn | Dec 2023 | 39,359 | ||||||||
| US$/tZn | Dec 2023 | 2,137 | |||||||||
Average exchange rates for the year ended 31 December 2023 was R18.42/US$
Figures may not add as they are rounded independently
1.Century is a leading tailings management and rehabilitation company that currently owns and operates the Century zinc tailings retreatment operation in Queensland, Australia. Century was acquired by the Group on 22 February 2023
2.Cost of sales, before amortisation and depreciation includes all mining and processing costs, corporate general and administrative costs, and permitting costs
3.Rehabilitation includes the interest charge related to the environmental rehabilitation obligation and the amortisation of the related capitalised rehabilitation costs. The interest charge related to the environmental rehabilitation obligation and the amortisation of the capitalised rehabilitation costs reflect the periodic costs of rehabilitation associated with current zinc production
4.All-in cost is calculated in accordance with the World Gold Council guidance. All-in cost excludes income tax, costs associated with merger and acquisition activities, working capital, impairments, financing costs, one-time severance charges and items needed to normalise earnings. All-in cost is made up of All-in sustaining cost, being the cost to sustain current operations, given as a sub-total in the All-in cost calculation, together with corporate and major capital expenditure associated with growth. All-in sustaining cost per tonne and All-in cost per tonne are calculated by dividing the All-in sustaining cost and All-in cost, respectively, in a period by the total tonnes of zinc metal produced (payable) in the same period
Sibanye-Stillwater Operating and financial results | Six months and year ended 31 December 2023 84
UNIT OPERATING COST - YEAR
US and SA PGM operations
Figures are in rand millions unless otherwise stated
US and SA PGM operations1 | US PGM operations | Total SA PGM operations1,3 | Rustenburg3 | Marikana3 | Kroondal3,4 | Plat Mile | Mimosa | |||||||||||||||||||||||||||||||
Under- ground2 | Total | Under- ground | Surface | Under- ground | Surface | Under- ground | Surface | Attribu-table | ||||||||||||||||||||||||||||||
| Cost of sales, before amortisation and depreciation | Dec 2023 | 46,379 | 9,680 | 36,699 | 13,908 | 1,239 | 16,961 | 3,950 | 641 | 2,409 | ||||||||||||||||||||||||||||
| Dec 2022 | 39,739 | 7,458 | 32,281 | 12,378 | 1,169 | 14,603 | 3,548 | 583 | 1,936 | |||||||||||||||||||||||||||||
| Inventory change | Dec 2023 | 1,461 | (477) | 1,938 | (60) | 114 | 1,890 | (6) | — | (10) | ||||||||||||||||||||||||||||
| Dec 2022 | 2,720 | 405 | 2,315 | (79) | 180 | 2,214 | — | — | (15) | |||||||||||||||||||||||||||||
| Less: Chrome cost of sales | Dec 2023 | (1,715) | — | (1,715) | (1,246) | — | (457) | (12) | — | — | ||||||||||||||||||||||||||||
| Dec 2022 | (1,528) | — | (1,528) | (1,017) | — | (375) | (136) | — | — | |||||||||||||||||||||||||||||
| Less: Purchase cost of PoC | Dec 2023 | (2,753) | — | (2,753) | — | — | (2,753) | — | — | — | ||||||||||||||||||||||||||||
| Dec 2022 | (2,738) | — | (2,738) | — | — | (2,738) | — | — | — | |||||||||||||||||||||||||||||
| Total operating cost excluding third party PoC | Dec 2023 | 43,372 | 9,203 | 34,169 | 12,602 | 1,353 | 15,641 | 3,932 | 641 | 2,399 | ||||||||||||||||||||||||||||
| Dec 2022 | 38,193 | 7,863 | 30,330 | 11,282 | 1,349 | 13,704 | 3,412 | 583 | 1,921 | |||||||||||||||||||||||||||||
Tonnes milled/treated excluding third party PoC5 | kt | Dec 2023 | 35,831 | 1,174 | 34,656 | 6,073 | 5,486 | 6,253 | 3,626 | 3,068 | 10,150 | 1,392 | ||||||||||||||||||||||||||
| Dec 2022 | 36,411 | 1,154 | 35,257 | 6,037 | 5,610 | 6,315 | 3,698 | 3,251 | 10,345 | 1,387 | ||||||||||||||||||||||||||||
PGM production excluding third party PoC5 | 4Eoz | Dec 2023 | 1,983,891 | 427,272 | 1,556,619 | 574,005 | 84,412 | 660,149 | 186,252 | 51,801 | 116,308 | |||||||||||||||||||||||||||
| Dec 2022 | 1,973,063 | 421,133 | 1,551,930 | 553,663 | 75,234 | 672,917 | 201,756 | 48,360 | 115,534 | |||||||||||||||||||||||||||||
Operating cost excluding third party PoC6 | R/t | Dec 2023 | 1,210 | 7,837 | 986 | 2,075 | 247 | 1,583 | 1,282 | 63 | 1,723 | |||||||||||||||||||||||||||
| Dec 2022 | 1,049 | 6,811 | 860 | 1,869 | 240 | 1,369 | 1,049 | 56 | 1,385 | |||||||||||||||||||||||||||||
| US$/t | Dec 2023 | 66 | 426 | 54 | 113 | 13 | 86 | 70 | 3 | 94 | ||||||||||||||||||||||||||||
| Dec 2022 | 64 | 416 | 53 | 114 | 15 | 84 | 64 | 3 | 85 | |||||||||||||||||||||||||||||
| R/4Eoz - R/2Eoz | Dec 2023 | 21,862 | 21,539 | 21,951 | 21,955 | 16,029 | 23,693 | 21,111 | 12,374 | 20,626 | ||||||||||||||||||||||||||||
| Dec 2022 | 19,357 | 18,671 | 19,543 | 20,377 | 17,931 | 20,365 | 16,912 | 12,055 | 16,627 | |||||||||||||||||||||||||||||
| US$/4Eoz - US$/2Eoz | Dec 2023 | 1,187 | 1,170 | 1,192 | 1,192 | 870 | 1,287 | 1,146 | 672 | 1,120 | ||||||||||||||||||||||||||||
| Dec 2022 | 1,183 | 1,141 | 1,194 | 1,245 | 1,096 | 1,244 | 1,033 | 737 | 1,016 | |||||||||||||||||||||||||||||
Average exchange rates for the year ended 31 December 2023 and 31 December 2022 were R18.42/US$ and R16.37/US$, respectively
Figures may not add as they are rounded independently
1 US and SA PGM operations and Total SA PGM operations exclude the results of Mimosa, which is equity accounted
2 The US PGM operations’ underground production is converted to metric tonnes and kilograms, and performance is translated into rand. In addition to the US PGM operations’
underground production, the operation treats various recycling material which is excluded from the statistics shown above
3 Cost of sales, before amortisation and depreciation for Total SA PGM, Rustenburg, Marikana and Kroondal includes the Chrome cost of sales which is excluded for unit cost calculation purposes as Chrome production is excluded from the 4Eoz production
4 Kroondal operations for the year ended December 2023 includes production and costs for two months (November and December 2023) at 100%)
5 For a reconciliation of the production excluding Mimosa and third party PoC, refer to “Reconciliation of operating cost excluding third party PoC for US and SA PGM operations, Total SA PGM operations and Marikana - Year”
6 Operating cost is the average cost of production and operating cost per tonne is calculated by dividing the cost of sales, before amortisation and depreciation and change in inventory in a period by the tonnes milled/treated in the same period, and operating cost per ounce is calculated by dividing the cost of sales, before amortisation and depreciation and change in inventory in a period, by the PGM produced in the same period
Sibanye-Stillwater Operating and financial results | Six months and year ended 31 December 2023 85
UNIT OPERATING COST - YEAR (continued)
SA gold operations
Figures are in rand millions unless otherwise stated
| Total SA gold operations | Driefontein | Kloof | Beatrix | Cooke | DRDGOLD | ||||||||||||||||||||||||||||||||||||
| Total | Under- ground | Surface | Under- ground | Surface | Under- ground | Surface | Under- ground | Surface | Surface | Surface | |||||||||||||||||||||||||||||||
| Cost of sales, before amortisation and depreciation | Dec 2023 | 24,080 | 17,982 | 6,098 | 6,467 | 99 | 7,553 | 597 | 3,962 | 96 | 1,266 | 4,040 | |||||||||||||||||||||||||||||
| Dec 2022 | 20,175 | 14,748 | 5,427 | 5,085 | 196 | 5,821 | 560 | 3,842 | 69 | 822 | 3,780 | ||||||||||||||||||||||||||||||
| Inventory change | Dec 2023 | (50) | (80) | 30 | 47 | — | (171) | (31) | 44 | — | (4) | 65 | |||||||||||||||||||||||||||||
| Dec 2022 | 562 | 504 | 58 | 196 | — | 175 | 31 | 133 | — | 33 | (6) | ||||||||||||||||||||||||||||||
| Total operating cost | Dec 2023 | 24,030 | 17,902 | 6,128 | 6,514 | 99 | 7,382 | 566 | 4,006 | 96 | 1,262 | 4,105 | |||||||||||||||||||||||||||||
| Dec 2022 | 20,737 | 15,252 | 5,485 | 5,281 | 196 | 5,996 | 591 | 3,975 | 69 | 855 | 3,774 | ||||||||||||||||||||||||||||||
| Tonnes milled/treated | kt | Dec 2023 | 31,941 | 4,055 | 27,886 | 1,237 | 258 | 1,399 | 1,565 | 1,420 | 366 | 4,289 | 21,408 | ||||||||||||||||||||||||||||
| Dec 2022 | 36,172 | 2,761 | 33,411 | 840 | 694 | 992 | 1,954 | 929 | 124 | 4,074 | 26,565 | ||||||||||||||||||||||||||||||
| Gold produced | kg | Dec 2023 | 25,212 | 18,064 | 7,148 | 7,125 | 133 | 6,783 | 650 | 4,156 | 81 | 1,186 | 5,098 | ||||||||||||||||||||||||||||
| Dec 2022 | 19,301 | 11,736 | 7,565 | 4,574 | 319 | 4,300 | 620 | 2,862 | 51 | 1,010 | 5,565 | ||||||||||||||||||||||||||||||
| oz | Dec 2023 | 810,584 | 580,771 | 229,813 | 229,074 | 4,276 | 218,078 | 20,898 | 133,618 | 2,604 | 38,131 | 163,904 | |||||||||||||||||||||||||||||
| Dec 2022 | 620,541 | 377,321 | 243,220 | 147,057 | 10,256 | 138,248 | 19,933 | 92,015 | 1,640 | 32,472 | 178,919 | ||||||||||||||||||||||||||||||
Operating cost1 | R/t | Dec 2023 | 752 | 4,414 | 220 | 5,267 | 384 | 5,276 | 362 | 2,822 | 262 | 294 | 192 | ||||||||||||||||||||||||||||
| Dec 2022 | 573 | 5,524 | 164 | 6,289 | 282 | 6,045 | 302 | 4,277 | 557 | 210 | 142 | ||||||||||||||||||||||||||||||
| US$/t | Dec 2023 | 41 | 240 | 12 | 286 | 21 | 287 | 20 | 153 | 14 | 16 | 10 | |||||||||||||||||||||||||||||
| Dec 2022 | 35 | 338 | 10 | 384 | 17 | 369 | 18 | 261 | 34 | 13 | 9 | ||||||||||||||||||||||||||||||
| R/kg | Dec 2023 | 953,118 | 991,032 | 857,303 | 914,246 | 744,361 | 1,088,309 | 870,769 | 963,908 | 1,185,185 | 1,064,081 | 805,218 | |||||||||||||||||||||||||||||
| Dec 2022 | 1,074,400 | 1,299,591 | 725,050 | 1,154,569 | 614,420 | 1,394,419 | 953,226 | 1,388,889 | 1,352,941 | 846,535 | 678,167 | ||||||||||||||||||||||||||||||
| US$/oz | Dec 2023 | 1,610 | 1,674 | 1,448 | 1,544 | 1,257 | 1,838 | 1,471 | 1,628 | 2,002 | 1,797 | 1,360 | |||||||||||||||||||||||||||||
| Dec 2022 | 2,042 | 2,470 | 1,378 | 2,194 | 1,168 | 2,650 | 1,811 | 2,639 | 2,571 | 1,609 | 1,289 | ||||||||||||||||||||||||||||||
Average exchange rates for the year ended 31 December 2023 and 31 December 2022 were R18.42/US$ and R16.37/US$, respectively
Figures may not add as they are rounded independently
1 Operating cost is the average cost of production and operating cost per tonne is calculated by dividing the cost of sales, before amortisation and depreciation and change in inventory in a period by the tonnes milled/treated in the same period, and operating cost per kilogram (and ounce) is calculated by dividing the cost of sales, before amortisation and depreciation and change in inventory in a period by the gold produced in the same period
Sibanye-Stillwater Operating and financial results | Six months and year ended 31 December 2023 86
SALIENT FEATURES AND COST BENCHMARKS - QUARTERS
US and SA PGM operations
US and SA PGM operations1 | US PGM operations | Total SA PGM operations1 | Rustenburg | Marikana1 | Kroondal3 | Plat Mile | Mimosa | |||||||||||||||||||||||||||||||||||||
| Attributable | Under- ground2 | Total | Under- ground | Surface | Under- ground | Surface | Under- ground | Surface | Attribu-table | Surface | Attribu-table | |||||||||||||||||||||||||||||||||
| Production | ||||||||||||||||||||||||||||||||||||||||||||
| Tonnes milled/treated | kt | Dec 2023 | 9,301 | 289 | 9,012 | 4,259 | 4,753 | 1,446 | 1,418 | 1,552 | 1,028 | 900 | 2,307 | 361 | ||||||||||||||||||||||||||||||
| Sep 2023 | 9,711 | 316 | 9,394 | 4,457 | 4,937 | 1,643 | 1,420 | 1,709 | 869 | 755 | 2,649 | 351 | ||||||||||||||||||||||||||||||||
| Plant head grade | g/t | Dec 2023 | 2.36 | 13.75 | 1.99 | 3.26 | 0.86 | 3.47 | 1.03 | 3.60 | 0.89 | 2.28 | 0.75 | 3.39 | ||||||||||||||||||||||||||||||
| Sep 2023 | 2.33 | 11.59 | 2.02 | 3.32 | 0.84 | 3.46 | 1.01 | 3.61 | 0.95 | 2.34 | 0.72 | 3.36 | ||||||||||||||||||||||||||||||||
| Plant recoveries | % | Dec 2023 | 76.29 | 91.78 | 72.86 | 84.57 | 34.01 | 85.63 | 50.58 | 85.89 | 28.31 | 83.57 | 22.68 | 76.09 | ||||||||||||||||||||||||||||||
| Sep 2023 | 76.64 | 90.10 | 74.01 | 85.36 | 34.07 | 86.43 | 52.16 | 86.47 | 28.32 | 83.85 | 22.61 | 76.62 | ||||||||||||||||||||||||||||||||
| Yield | g/t | Dec 2023 | 1.80 | 12.62 | 1.45 | 2.76 | 0.29 | 2.97 | 0.52 | 3.09 | 0.25 | 1.91 | 0.17 | 2.58 | ||||||||||||||||||||||||||||||
| Sep 2023 | 1.78 | 10.44 | 1.49 | 2.83 | 0.29 | 2.99 | 0.53 | 3.12 | 0.27 | 1.96 | 0.16 | 2.57 | ||||||||||||||||||||||||||||||||
PGM production4 | 4Eoz - 2Eoz | Dec 2023 | 538,398 | 116,213 | 422,185 | 377,498 | 44,687 | 138,182 | 23,742 | 154,274 | 8,327 | 55,136 | 12,618 | 29,906 | ||||||||||||||||||||||||||||||
| Sep 2023 | 557,106 | 105,546 | 451,560 | 406,135 | 45,425 | 157,977 | 24,045 | 171,498 | 7,516 | 47,600 | 13,864 | 29,060 | ||||||||||||||||||||||||||||||||
PGM sold5 | 4Eoz - 2Eoz | Dec 2023 | 586,434 | 109,488 | 476,946 | 151,111 | 23,945 | 204,455 | 55,136 | 12,618 | 29,681 | |||||||||||||||||||||||||||||||||
| Sep 2023 | 549,696 | 124,882 | 424,814 | 141,322 | 15,060 | 179,811 | 47,600 | 13,864 | 27,157 | |||||||||||||||||||||||||||||||||||
Price and costs6 | ||||||||||||||||||||||||||||||||||||||||||||
Average PGM basket price7 | R/4Eoz - R/2Eoz | Dec 2023 | 23,171�� | 19,545 | 24,052 | 24,350 | 22,506 | 23,976 | 24,570 | 22,629 | 22,311 | |||||||||||||||||||||||||||||||||
| Sep 2023 | 23,933 | 22,122 | 24,479 | 24,670 | 23,050 | 24,481 | 24,968 | 23,044 | 23,343 | |||||||||||||||||||||||||||||||||||
| US$/4Eoz - US$/2Eoz | Dec 2023 | 1,242 | 1,048 | 1,290 | 1,306 | 1,207 | 1,286 | 1,317 | 1,213 | 1,196 | ||||||||||||||||||||||||||||||||||
| Sep 2023 | 1,287 | 1,190 | 1,317 | 1,327 | 1,240 | 1,317 | 1,343 | 1,240 | 1,256 | |||||||||||||||||||||||||||||||||||
Operating cost8,10 | R/t | Dec 2023 | 1,332 | 10,256 | 1,034 | 2,212 | 223 | 1,530 | 1,467 | 69 | 1,697 | |||||||||||||||||||||||||||||||||
| Sep 2023 | 1,226 | 7,140 | 1,019 | 2,021 | 363 | 1,654 | 1,244 | 66 | 1,812 | |||||||||||||||||||||||||||||||||||
| US$/t | Dec 2023 | 71 | 550 | 55 | 119 | 12 | 82 | 79 | 4 | 91 | ||||||||||||||||||||||||||||||||||
| Sep 2023 | 66 | 384 | 55 | 109 | 20 | 89 | 67 | 4 | 97 | |||||||||||||||||||||||||||||||||||
| R/4Eoz - R/2Eoz | Dec 2023 | 23,424 | 25,539 | 22,798 | 23,158 | 13,310 | 24,280 | 23,941 | 12,601 | 20,464 | ||||||||||||||||||||||||||||||||||
| Sep 2023 | 21,723 | 21,384 | 21,808 | 21,022 | 21,460 | 23,814 | 19,727 | 12,623 | 21,886 | |||||||||||||||||||||||||||||||||||
| US$/4Eoz - US$/2Eoz | Dec 2023 | 1,256 | 1,369 | 1,222 | 1,242 | 714 | 1,302 | 1,284 | 676 | 1,097 | ||||||||||||||||||||||||||||||||||
| Sep 2023 | 1,169 | 1,150 | 1,173 | 1,131 | 1,154 | 1,281 | 1,061 | 679 | 1,177 | |||||||||||||||||||||||||||||||||||
All-in sustaining cost9,10 | R/4Eoz - R/2Eoz | Dec 2023 | 24,687 | 38,300 | 20,654 | 17,403 | 23,764 | 22,562 | 13,869 | 25,212 | ||||||||||||||||||||||||||||||||||
| Sep 2023 | 23,210 | 35,738 | 20,080 | 18,701 | 22,607 | 18,550 | 10,747 | 25,258 | ||||||||||||||||||||||||||||||||||||
| US$/4Eoz - US$/2Eoz | Dec 2023 | 1,324 | 2,054 | 1,107 | 933 | 1,274 | 1,210 | 744 | 1,352 | |||||||||||||||||||||||||||||||||||
| Sep 2023 | 1,249 | 1,922 | 1,080 | 1,006 | 1,216 | 998 | 578 | 1359 | ||||||||||||||||||||||||||||||||||||
All-in cost9,10 | R/4Eoz - R/2Eoz | Dec 2023 | 25,542 | 39,763 | 21,329 | 17,403 | 25,234 | 22,599 | 15,771 | 25,212 | ||||||||||||||||||||||||||||||||||
| Sep 2023 | 24,223 | 37,642 | 20,871 | 18,701 | 24,115 | 18,550 | 15,364 | 25,258 | ||||||||||||||||||||||||||||||||||||
| US$/4Eoz - US$/2Eoz | Dec 2023 | 1,370 | 2,132 | 1,144 | 933 | 1,353 | 1,212 | 846 | 1,352 | |||||||||||||||||||||||||||||||||||
| Sep 2023 | 1,303 | 2,025 | 1,123 | 1,006 | 1,297 | 998 | 826 | 1,359 | ||||||||||||||||||||||||||||||||||||
Capital expenditure6 | ||||||||||||||||||||||||||||||||||||||||||||
| Ore reserve development | Rm | Dec 2023 | 1,398 | 813 | 585 | 163 | 422 | — | — | — | ||||||||||||||||||||||||||||||||||
| Sep 2023 | 1,671 | 1,049 | 622 | 149 | 473 | — | — | — | ||||||||||||||||||||||||||||||||||||
| Sustaining capital | Rm | Dec 2023 | 1,579 | 792 | 787 | 217 | 424 | 115 | 31 | 281 | ||||||||||||||||||||||||||||||||||
| Sep 2023 | 1,086 | 602 | 484 | 154 | 276 | 59 | (5) | 266 | ||||||||||||||||||||||||||||||||||||
| Corporate and projects | Rm | Dec 2023 | 432 | 170 | 262 | — | 236 | 2 | 24 | — | ||||||||||||||||||||||||||||||||||
| Sep 2023 | 535 | 201 | 334 | — | 270 | — | 64 | — | ||||||||||||||||||||||||||||||||||||
| Total capital expenditure | Rm | Dec 2023 | 3,409 | 1,775 | 1,634 | 380 | 1,082 | 117 | 55 | 281 | ||||||||||||||||||||||||||||||||||
| Sep 2023 | 3,292 | 1,852 | 1,440 | 303 | 1,019 | 59 | 59 | 266 | ||||||||||||||||||||||||||||||||||||
| Total capital expenditure | US$m | Dec 2023 | 183 | 95 | 88 | 20 | 58 | 6 | 3 | 15 | ||||||||||||||||||||||||||||||||||
| Sep 2023 | 177 | 100 | 77 | 16 | 55 | 3 | 3 | 14 | ||||||||||||||||||||||||||||||||||||
Average exchange rate for the quarters ended 31 December 2023 and 30 September 2023 was R18.65/US$ and R18.59/US$, respectively
Figures may not add as they are rounded independently
1The US and SA PGM operations, Total SA PGM operation and Marikana excludes the production and costs associated with the purchase of concentrate (PoC) from third parties. For a reconciliation of the Operating cost, AISC and AIC excluding third party PoC, refer to “Reconciliation of operating cost excluding third party PoC for US and SA PGM operations, Total SA PGM operations and Marikana - Quarters” and “Reconciliation of AISC and AIC excluding third party PoC for US and SA PGM operations, Total SA PGM operations and Marikana – Quarters”
2The US PGM operations’ underground production is converted to metric tonnes and kilograms, and performance is translated into rand. In addition to the US PGM operations’ underground production, the operation treats recycling material which is excluded from the statistics shown above and is detailed in the PGM recycling table below
3Kroondal operations for the quarter ended December 2023 includes production and costs for two months (November and December 2023) at 100%
4Production per product – see prill split in the table below
5PGM sold includes the third party PoC ounces sold
6The US and SA PGM operations and Total SA PGM operations’ unit cost benchmarks and capital expenditure exclude the financial results of Mimosa, which is equity accounted and excluded from revenue and cost of sales
7The average PGM basket price is the PGM revenue per 4E/2E ounce, prior to purchase of concentrate adjustment
8Operating cost is the average cost of production and operating cost per tonne is calculated by dividing the cost of sales, before amortisation and depreciation and change in inventory in a period by the tonnes milled/treated in the same period, and operating cost per ounce (and kilogram) is calculated by dividing the cost of sales, before amortisation and depreciation and change in inventory in a period, by the PGM produced in the same period. For a reconciliation of unit operating cost, see “Unit operating cost - Quarters"
9All-in cost is calculated in accordance with the World Gold Council guidance. All-in cost excludes income tax, costs associated with merger and acquisition activities, working capital, impairments, financing costs, one-time severance charges and items needed to normalise earnings. All-in cost is made up of All-in sustaining cost, being the cost to sustain current operations, given as a sub-total in the All-in cost calculation, together with corporate and major capital expenditure associated with growth. All-in sustaining cost per ounce (and kilogram) and All-in cost per ounce (and kilogram) are calculated by dividing the All-in sustaining cost and All-in cost, respectively, in a period by the total 4E/2E PGM produced in the same period. For a reconciliation of cost of sales, before amortisation and depreciation to All-in cost, see “All-in costs - Quarters”
Sibanye-Stillwater Operating and financial results | Six months and year ended 31 December 2023 87
10Operating cost, all-in sustaining costs and all-in costs, are not measures of performance under IFRS. As a result, such measures should not be considered in isolation or as alternatives to any other measure of financial performance presented in accordance with IFRS
| Mining - PGM Prill split including third party PoC, excluding recycling operations | ||||||||||||||||||||||||||||||||||||||
| US AND SA PGM OPERATIONS | TOTAL SA PGM OPERATIONS | US PGM OPERATIONS | ||||||||||||||||||||||||||||||||||||
| Dec 2023 | Sep 2023 | Dec 2023 | Sep 2023 | Dec 2023 | Sep 2023 | |||||||||||||||||||||||||||||||||
| % | % | % | % | % | % | |||||||||||||||||||||||||||||||||
| Platinum | 291,742 | 52 | % | 306,959 | 53 | % | 265,507 | 60 | % | 282,763 | 59 | % | 26,235 | 23 | % | 24,196 | 23 | % | ||||||||||||||||||||
| Palladium | 222,145 | 40 | % | 223,255 | 38 | % | 132,167 | 30 | % | 141,905 | 30 | % | 89,978 | 77 | % | 81,350 | 77 | % | ||||||||||||||||||||
| Rhodium | 39,598 | 7 | % | 42,851 | 7 | % | 39,598 | 9 | % | 42,851 | 9 | % | ||||||||||||||||||||||||||
| Gold | 7,780 | 1 | % | 8,036 | 1 | % | 7,780 | 2 | % | 8,036 | 2 | % | ||||||||||||||||||||||||||
| PGM production 4E/2E | 561,265 | 100 | % | 581,101 | 100 | % | 445,052 | 100 | % | 475,555 | 100 | % | 116,213 | 100 | % | 105,546 | 100 | % | ||||||||||||||||||||
| Ruthenium | 63,423 | 67,800 | 63,423 | 67,800 | ||||||||||||||||||||||||||||||||||
| Iridium | 15,959 | 16,836 | 15,959 | 16,836 | ||||||||||||||||||||||||||||||||||
| Total 6E/2E | 640,647 | 665,737 | 524,434 | 560,191 | 116,213 | 105,546 | ||||||||||||||||||||||||||||||||
Figures may not add as they are rounded independently
| US PGM Recycling | |||||||||||
| Unit | Dec 2023 | Sep 2023 | |||||||||
| Average catalyst fed/day | Tonne | 11.0 | 9.5 | ||||||||
| Total processed | Tonne | 999 | 873 | ||||||||
| Tolled | Tonne | — | — | ||||||||
| Purchased | Tonne | 999 | 873 | ||||||||
| PGM fed | 3Eoz | 75,428 | 72,434 | ||||||||
| PGM sold | 3Eoz | 77,996 | 77,679 | ||||||||
| PGM tolled returned | 3Eoz | 317 | 2,091 | ||||||||
Sibanye-Stillwater Operating and financial results | Six months and year ended 31 December 2023 88
SALIENT FEATURES AND COST BENCHMARKS - QUARTERS (continued)
SA gold operations
| SA OPERATIONS | |||||||||||||||||||||||||||||||||||||||||
| Total SA gold | Driefontein | Kloof | Beatrix | Cooke | DRDGOLD | ||||||||||||||||||||||||||||||||||||
| Total | Under- ground | Surface | Under- ground | Surface | Under- ground | Surface | Under- ground | Surface | Surface | Surface | |||||||||||||||||||||||||||||||
| Production | |||||||||||||||||||||||||||||||||||||||||
| Tonnes milled/treated | kt | Dec 2023 | 7,945 | 904 | 7,041 | 275 | 21 | 284 | 419 | 344 | 3 | 1,066 | 5,533 | ||||||||||||||||||||||||||||
| Sep 2023 | 8,245 | 966 | 7,279 | 251 | 13 | 365 | 481 | 350 | 33 | 1,121 | 5,632 | ||||||||||||||||||||||||||||||
| Yield | g/t | Dec 2023 | 0.77 | 4.77 | 0.25 | 6.50 | 0.78 | 4.66 | 0.50 | 3.47 | 0.77 | 0.29 | 0.23 | ||||||||||||||||||||||||||||
| Sep 2023 | 0.75 | 4.42 | 0.26 | 5.77 | 3.37 | 5.16 | 0.49 | 2.66 | 0.21 | 0.28 | 0.23 | ||||||||||||||||||||||||||||||
| Gold produced | kg | Dec 2023 | 6,102 | 4,307 | 1,795 | 1,789 | 16 | 1,322 | 209 | 1,196 | 2 | 305 | 1,263 | ||||||||||||||||||||||||||||
| Sep 2023 | 6,148 | 4,267 | 1,881 | 1,452 | 43 | 1,882 | 234 | 933 | 7 | 313 | 1,284 | ||||||||||||||||||||||||||||||
| oz | Dec 2023 | 196,184 | 138,473 | 57,711 | 57,518 | 514 | 42,503 | 6,720 | 38,452 | 64 | 9,806 | 40,606 | |||||||||||||||||||||||||||||
| Sep 2023 | 197,663 | 137,187 | 60,476 | 46,683 | 1,382 | 60,508 | 7,523 | 29,997 | 225 | 10,063 | 41,282 | ||||||||||||||||||||||||||||||
| Gold sold | kg | Dec 2023 | 5,685 | 3,892 | 1,793 | 1,632 | 2 | 1,286 | 224 | 974 | 2 | 297 | 1,268 | ||||||||||||||||||||||||||||
| Sep 2023 | 6,178 | 4,349 | 1,829 | 1,495 | 43 | 1,931 | 205 | 923 | 7 | 307 | 1,267 | ||||||||||||||||||||||||||||||
| oz | Dec 2023 | 182,777 | 125,131 | 57,646 | 52,470 | 64 | 41,346 | 7,202 | 31,315 | 64 | 9,549 | 40,767 | |||||||||||||||||||||||||||||
| Sep 2023 | 198,627 | 139,824 | 58,804 | 48,065 | 1,382 | 62,083 | 6,591 | 29,675 | 225 | 9,870 | 40,735 | ||||||||||||||||||||||||||||||
| Price and costs | |||||||||||||||||||||||||||||||||||||||||
| Gold price received | R/kg | Dec 2023 | 1,188,566 | 1,188,494 | 1,185,430 | 1,189,549 | 1,188,552 | 1,191,640 | |||||||||||||||||||||||||||||||||
| Sep 2023 | 1,153,448 | 1,153,446 | 1,153,090 | 1,152,688 | 1,153,094 | 1,154,696 | |||||||||||||||||||||||||||||||||||
| US$/oz | Dec 2023 | 1,982 | 1,982 | 1,977 | 1,984 | 1,982 | 1,987 | ||||||||||||||||||||||||||||||||||
| Sep 2023 | 1,930 | 1,930 | 1,929 | 1,929 | 1,929 | 1,932 | |||||||||||||||||||||||||||||||||||
Operating cost1,3 | R/t | Dec 2023 | 747 | 4,832 | 223 | 5,888 | 243 | 6,117 | 349 | 2,927 | 387 | 324 | 193 | ||||||||||||||||||||||||||||
| Sep 2023 | 784 | 4,953 | 230 | 6,948 | 783 | 5,277 | 397 | 3,184 | 429 | 308 | 198 | ||||||||||||||||||||||||||||||
| US$/t | Dec 2023 | 40 | 259 | 12 | 316 | 13 | 328 | 19 | 157 | 21 | 17 | 10 | |||||||||||||||||||||||||||||
| Sep 2023 | 42 | 266 | 12 | 374 | 42 | 284 | 21 | 171 | 23 | 17 | 11 | ||||||||||||||||||||||||||||||
| R/kg | Dec 2023 | 972,304 | 1,013,699 | 872,981 | 906,093 | 312,500 | 1,313,918 | 698,565 | 842,809 | 500,000 | 1,131,148 | 847,189 | |||||||||||||||||||||||||||||
| Sep 2023 | 1,051,074 | 1,121,865 | 890,484 | 1,203,168 | 232,558 | 1,022,848 | 816,239 | 1,195,070 | 2,000,000 | 1,102,236 | 868,380 | ||||||||||||||||||||||||||||||
| US$/oz | Dec 2023 | 1,622 | 1,691 | 1,456 | 1,511 | 521 | 2,191 | 1,165 | 1,406 | 834 | 1,886 | 1,413 | |||||||||||||||||||||||||||||
| Sep 2023 | 1,759 | 1,877 | 1,490 | 2,013 | 389 | 1,711 | 1,366 | 2,000 | 3,346 | 1,844 | 1,453 | ||||||||||||||||||||||||||||||
All-in sustaining cost2,3 | R/kg | Dec 2023 | 1,168,690 | 1,228,886 | 1,423,179 | 993,852 | 1,188,552 | 913,249 | |||||||||||||||||||||||||||||||||
| Sep 2023 | 1,232,600 | 1,455,137 | 1,193,820 | 1,343,011 | 1,169,381 | 963,694 | |||||||||||||||||||||||||||||||||||
| US$/oz | Dec 2023 | 1,949 | 2,049 | 2,374 | 1,657 | 1,982 | 1,523 | ||||||||||||||||||||||||||||||||||
| Sep 2023 | 2,062 | 2,435 | 1,997 | 2,247 | 1,957 | 1,612 | |||||||||||||||||||||||||||||||||||
All-in cost2,3 | R/kg | Dec 2023 | 1,295,339 | 1,228,886 | 1,428,477 | 993,852 | 1,188,552 | 1,151,420 | |||||||||||||||||||||||||||||||||
| Sep 2023 | 1,319,197 | 1,455,137 | 1,213,483 | 1,343,011 | 1,169,381 | 1,083,662 | |||||||||||||||||||||||||||||||||||
| US$/oz | Dec 2023 | 2,160 | 2,049 | 2,382 | 1,657 | 1,982 | 1,920 | ||||||||||||||||||||||||||||||||||
| Sep 2023 | 2,207 | 2,435 | 2,030 | 2,247 | 1,957 | 1,813 | |||||||||||||||||||||||||||||||||||
| Capital expenditure | |||||||||||||||||||||||||||||||||||||||||
| Ore reserve development | Rm | Dec 2023 | 622 | 362 | 196 | 64 | — | — | |||||||||||||||||||||||||||||||||
| Sep 2023 | 677 | 339 | 246 | 92 | — | — | |||||||||||||||||||||||||||||||||||
| Sustaining capital | Rm | Dec 2023 | 449 | 169 | 134 | 57 | — | 89 | |||||||||||||||||||||||||||||||||
| Sep 2023 | 367 | 131 | 108 | 16 | — | 112 | |||||||||||||||||||||||||||||||||||
Corporate and projects4 | Rm | Dec 2023 | 691 | — | 8 | — | — | 302 | |||||||||||||||||||||||||||||||||
| Sep 2023 | 531 | — | 42 | — | — | 152 | |||||||||||||||||||||||||||||||||||
| Total capital expenditure | Rm | Dec 2023 | 1,762 | 531 | 338 | 121 | — | 391 | |||||||||||||||||||||||||||||||||
| Sep 2023 | 1,576 | 470 | 396 | 108 | — | 264 | |||||||||||||||||||||||||||||||||||
| US$m | Dec 2023 | 94 | 28 | 18 | 6 | — | 21 | ||||||||||||||||||||||||||||||||||
| Sep 2023 | 85 | 25 | 21 | 6 | — | 14 | |||||||||||||||||||||||||||||||||||
Average exchange rate for the quarters ended 31 December 2023 and 30 September 2023 was R18.65/US$ and 18.59/US$, respectively
Figures may not add as they are rounded independently
1Operating cost is the average cost of production and operating cost per tonne is calculated by dividing the cost of sales, before amortisation and depreciation and change in inventory in a period by the tonnes milled/treated in the same period, and operating cost per kilogram (and ounce) is calculated by dividing the cost of sales, before amortisation and depreciation and change in inventory in a period by the gold produced in the same period
2All-in cost is calculated in accordance with the World Gold Council guidance. All-in cost excludes income tax, costs associated with merger and acquisition activities, working capital, impairments, financing costs, one time severance charges and items needed to normalise earnings. All-in cost is made up of All-in sustaining cost, being the cost to sustain current operations, given as a sub-total in the All-in cost calculation, together with corporate and major capital expenditure associated with growth. All-in sustaining cost per kilogram (and ounce) and All-in cost per kilogram (and ounce) are calculated by dividing the All-in sustaining cost and All-in cost, respectively, in a period by the total gold sold over the same period. For a reconciliation of cost of sales before amortisation and depreciation to All-in cost, see “All-in costs – Quarters”
3Operating cost, all-in sustaining costs and all-in costs, are not measures of performance under IFRS. As a result, such measures should not be considered in isolation or as alternatives to any other measure of financial performance presented in accordance with IFRS
4Corporate project expenditure, which comprises spend on various Corporate IT projects and the Burnstone project, for the quarters ended 31 December 2023 and 30 September 2023 was R381 million (US$20 million) and R337 million (US$18 million), respectively
Sibanye-Stillwater Operating and financial results | Six months and year ended 31 December 2023 89
SALIENT FEATURES AND COST BENCHMARKS - QUARTERS (continued)
European operations
| Sandouville nickel refinery | ||||||||||||||
| Metals split | ||||||||||||||
| Dec 2023 | Sep 2023 | |||||||||||||
| Volumes produced (tonnes) | % | % | ||||||||||||
Nickel salts1 | 196 | 15 | % | 427 | 18 | % | ||||||||
| Nickel metal | 1,084 | 85 | % | 1,925 | 82 | % | ||||||||
| Total Nickel production tNi | 1,280 | 100 | % | 2,352 | 100 | % | ||||||||
Nickel cakes2 | 59 | 103 | ||||||||||||
Cobalt chloride (CoCl2)3 | 18 | 46 | ||||||||||||
Ferric chloride (FeCl3)3 | 161 | 409 | ||||||||||||
| Volumes sales (tonnes) | ||||||||||||||
Nickel salts1 | 254 | 17 | % | 287 | 15 | % | ||||||||
| Nickel metal | 1,225 | 83 | % | 1,664 | 85 | % | ||||||||
| Total Nickel sold tNi | 1,479 | 100 | % | 1,951 | 100 | % | ||||||||
Nickel cakes2 | — | — | ||||||||||||
Cobalt chloride (CoCl2)3 | 25 | 41 | ||||||||||||
Ferric chloride (FeCl3)3 | 161 | 409 | ||||||||||||
| Nickel equivalent basket price | Unit | Dec 2023 | Sep 2023 | ||||||||
Nickel equivalent average basket price4 | R/tNi | 377,958 | 403,895 | ||||||||
| US$/tNi | 20,266 | 21,726 | |||||||||
| Nickel equivalent sustaining cost | Rm | Dec 2023 | Sep 2023 | ||||||||
| Cost of sales, before amortisation and depreciation | 900 | 1,100 | |||||||||
| Share-based payments | 16 | (7) | |||||||||
| Rehabilitation interest and amortisation | 4 | 2 | |||||||||
| Leases | 5 | 5 | |||||||||
| Sustaining capital expenditure | 70 | 82 | |||||||||
| Less: By-product credit | — | (39) | |||||||||
Nickel equivalent sustaining cost5 | 995 | 1,143 | |||||||||
| Nickel products sold | tNi | 1,479 | 1,951 | ||||||||
Nickel equivalent sustaining cost5 | R/tNi | 672,752 | 585,853 | ||||||||
| US$/tNi | 36,072 | 31,514 | |||||||||
Nickel recovery yield6 | % | 93.53 | % | 98.82 | % | ||||||
Average exchange rate for the quarters ended 31 December 2023 and 30 September 2023 was R18.65/US$ and 18.59/US$, respectively
Figures may not add as they are rounded independently
1Nickel salts consist of anhydrous nickel, nickel chloride low sodium, nickel chloride standard, nickel carbonate and nickel chloride solution
2Nickel cakes occur during the processing of nickel matte and are recycled back into the nickel refining process
3Cobalt chloride and ferric chloride are obtained from nickel matte through a different refining process on an order basis
4The Nickel equivalent average basket price per tonne is the total nickel revenue adjusted for other income less non-product sales divided by the total nickel equivalent tonnes sold
5The Nickel equivalent sustaining cost, is the cost to sustain current operations. Nickel equivalent sustaining cost per tonne nickel is calculated by dividing the Nickel equivalent sustaining cost, in a period by the total nickel products sold over the same period. Nickel equivalent sustaining cost and Nickel equivalent sustaining costs per tonne are intended to provide additional information only, do not have any standardised meaning prescribed by IFRS and should not be considered in isolation or as alternatives to cost of sales, profit before tax, profit for the year, cash from operating activities or any other measure of financial performance presented in accordance with IFRS. Nickel equivalent sustaining cost and Nickel equivalent sustaining costs per tonne as presented in this document may not be comparable to other similarly titled measures of performance of other companies. Other companies may calculate these measures differently as a result of differences in the underlying accounting principles, policies applied and accounting frameworks such as in US GAAP. Differences may also arise related to definitional differences of sustaining versus development capital activities based upon each company’s internal policies. Non-IFRS measures such as Nickel equivalent sustaining cost and Nickel equivalent sustaining costs per tonne because of its nature, should not be considered as a representation of financial performance under IFRS
6Nickel recovery yield is the percentage of total nickel recovered from the matte relative to the nickel contained in the matte received
Sibanye-Stillwater Operating and financial results | Six months and year ended 31 December 2023 90
SALIENT FEATURES AND COST BENCHMARKS - QUARTERS (continued)
Australian operations
| Century zinc retreatment operation | |||||||||||
| Production | |||||||||||
| Ore mined and processed | kt | Dec 2023 | 2,063 | ||||||||
| Sep 2023 | 1,973 | ||||||||||
| Processing feed grade | % | Dec 2023 | 3.07 | ||||||||
| Sep 2023 | 3.16 | ||||||||||
| Plant recoveries | % | Dec 2023 | 50.56 | ||||||||
| Sep 2023 | 48.91 | ||||||||||
Concentrate produced1 | kt | Dec 2023 | 71 | ||||||||
| Sep 2023 | 67 | ||||||||||
Concentrate zinc grade2 | % | Dec 2023 | 45.16 | ||||||||
| Sep 2023 | 45.31 | ||||||||||
Metal produced (zinc in concentrate)3 | kt | Dec 2023 | 32 | ||||||||
| Sep 2023 | 30 | ||||||||||
Zinc metal produced (payable)4 | kt | Dec 2023 | 26 | ||||||||
| Sep 2023 | 25 | ||||||||||
Zinc sold5 | kt | Dec 2023 | 33 | ||||||||
| Sep 2023 | 28 | ||||||||||
Zinc sold (payable)6 | kt | Dec 2023 | 27 | ||||||||
| Sep 2023 | 23 | ||||||||||
| Price and costs | |||||||||||
Average equivalent zinc concentrate price7 | R/tZn | Dec 2023 | 33,852 | ||||||||
| Sep 2023 | 31,747 | ||||||||||
| US$/tZn | Dec 2023 | 1,815 | |||||||||
| Sep 2023 | 1,708 | ||||||||||
All-in sustaining cost8,9 | R/tZn | Dec 2023 | 32,783 | ||||||||
| Sep 2023 | 32,587 | ||||||||||
| US$/tZn | Dec 2023 | 1,758 | |||||||||
| Sep 2023 | 1,753 | ||||||||||
All-in cost8,9 | R/tZn | Dec 2023 | 33,390 | ||||||||
| Sep 2023 | 34,937 | ||||||||||
| US$/tZn | Dec 2023 | 1,790 | |||||||||
| Sep 2023 | 1,879 | ||||||||||
Average exchange rate for the quarters ended 31 December 2023 and 30 September 2023 was R18.65/US$ and 18.59/US$, respectively
Figures may not add as they are rounded independently
1.Concentrate produced is the dry concentrate which has been processed that contains zinc, silver and waste material
2.Concentrate zinc grade is the percentage of zinc contained in the concentrate produced
3.Metal produced (zinc in concentrate) is the zinc metal contained in the concentrate produced
4.Zinc metal produced (payable) is the payable quantity of zinc metal produced after applying smelter content deductions
5.Zinc sold is the zinc metal contained in the concentrate sold
6.Zinc sold (payable) is the payable quantity of zinc metal sold after applying smelter content deductions
7.Average equivalent zinc concentrate price is the total zinc sales revenue recognised at the price expected to be received excluding the fair value adjustments divided by the payable zinc metal sold
8.All-in cost is calculated in accordance with the World Gold Council guidance. All-in cost excludes income tax, costs associated with merger and acquisition activities, working capital, impairments, financing costs, one-time severance charges and items needed to normalise earnings. All-in cost is made up of All-in sustaining cost, being the cost to sustain current operations, given as a sub-total in the All-in cost calculation, together with corporate and major capital expenditure associated with growth. All-in sustaining cost per tonne and All-in cost per tonne are calculated by dividing the All-in sustaining cost and All-in cost, respectively, in a period by the total tonnes of zinc metal produced (payable) in the same period. For a reconciliation of cost of sales, before amortisation and depreciation to All-in cost, see “All-in costs - Quarters”
9.All-in sustaining costs and all-in costs, are not measures of performance under IFRS. As a result, such measures should not be considered in isolation or as alternatives to any other measure of financial performance presented in accordance with IFRS
Sibanye-Stillwater Operating and financial results | Six months and year ended 31 December 2023 91
ALL-IN COSTS - QUARTERS
US and SA PGM operations
US and SA PGM operations1 | US PGM operations2 | Total SA PGM operations1 | Rustenburg | Marikana1 | Kroondal3 | Plat Mile | Mimosa | Corporate | |||||||||||||||||||||||||||
Cost of sales, before amortisation and depreciation4 | Dec 2023 | 12,624 | 3,005 | 9,619 | 4,256 | 3,873 | 1,331 | 159 | 614 | (614) | |||||||||||||||||||||||||
| Sep 2023 | 11,457 | 2,510 | 8,947 | 3,555 | 4,275 | 942 | 175 | 640 | (640) | ||||||||||||||||||||||||||
| Royalties | Dec 2023 | 242 | — | 242 | 89 | 150 | 3 | — | 29 | (29) | |||||||||||||||||||||||||
| Sep 2023 | 84 | — | 84 | 70 | 12 | 2 | — | 29 | (29) | ||||||||||||||||||||||||||
| Carbon tax | Dec 2023 | — | — | — | — | — | — | — | — | — | |||||||||||||||||||||||||
| Sep 2023 | — | — | — | — | — | — | — | — | — | ||||||||||||||||||||||||||
| Community costs | Dec 2023 | 34 | — | 34 | 16 | 15 | 2 | — | — | — | |||||||||||||||||||||||||
| Sep 2023 | 21 | — | 21 | — | 21 | — | — | — | — | ||||||||||||||||||||||||||
| Inventory change | Dec 2023 | 556 | (37) | 593 | (153) | 752 | (6) | — | (2) | 2 | |||||||||||||||||||||||||
| Sep 2023 | 912 | (253) | 1,165 | 462 | 703 | — | — | (4) | 4 | ||||||||||||||||||||||||||
Share-based payments5 | Dec 2023 | 46 | 47 | (1) | — | 7 | (8) | — | — | — | |||||||||||||||||||||||||
| Sep 2023 | 78 | 22 | 56 | 20 | 24 | 11 | — | — | — | ||||||||||||||||||||||||||
Rehabilitation interest and amortisation6 | Dec 2023 | 60 | 21 | 39 | 8 | 10 | 21 | — | 1 | (1) | |||||||||||||||||||||||||
| Sep 2023 | 46 | 21 | 25 | (6) | 14 | 17 | — | 2 | (2) | ||||||||||||||||||||||||||
| Leases | Dec 2023 | 23 | 5 | 18 | 6 | 10 | 2 | — | — | — | |||||||||||||||||||||||||
| Sep 2023 | 18 | 1 | 17 | 6 | 10 | 1 | — | — | — | ||||||||||||||||||||||||||
| Ore reserve development | Dec 2023 | 1,398 | 813 | 585 | 163 | 422 | — | — | — | — | |||||||||||||||||||||||||
| Sep 2023 | 1,671 | 1,049 | 622 | 149 | 473 | — | — | — | — | ||||||||||||||||||||||||||
| Sustaining capital expenditure | Dec 2023 | 1,579 | 792 | 787 | 217 | 424 | 115 | 31 | 281 | (281) | |||||||||||||||||||||||||
| Sep 2023 | 1,086 | 602 | 484 | 154 | 276 | 59 | (5) | 266 | (266) | ||||||||||||||||||||||||||
| Less: By-product credit | Dec 2023 | (3,522) | (195) | (3,327) | (1,784) | (1,312) | (216) | (15) | (169) | 169 | |||||||||||||||||||||||||
| Sep 2023 | (2,658) | (180) | (2,478) | (1,006) | (1,302) | (149) | (21) | (199) | 199 | ||||||||||||||||||||||||||
Total All-in-sustaining costs7 | Dec 2023 | 13,040 | 4,451 | 8,589 | 2,818 | 4,351 | 1,244 | 175 | 754 | (754) | |||||||||||||||||||||||||
| Sep 2023 | 12,715 | 3,772 | 8,943 | 3,404 | 4,506 | 883 | 149 | 734 | (734) | ||||||||||||||||||||||||||
| Plus: Corporate cost, growth and capital expenditure | Dec 2023 | 435 | 170 | 265 | — | 239 | 2 | 24 | — | — | |||||||||||||||||||||||||
| Sep 2023 | 535 | 201 | 334 | — | 270 | — | 64 | — | — | ||||||||||||||||||||||||||
Total All-in-costs7 | Dec 2023 | 13,475 | 4,621 | 8,854 | 2,818 | 4,590 | 1,246 | 199 | 754 | (754) | |||||||||||||||||||||||||
| Sep 2023 | 13,250 | 3,973 | 9,277 | 3,404 | 4,776 | 883 | 213 | 734 | (734) | ||||||||||||||||||||||||||
| PGM production | 4Eoz - 2Eoz | Dec 2023 | 561,265 | 116,213 | 445,052 | 161,924 | 185,468 | 55,136 | 12,618 | 29,906 | — | ||||||||||||||||||||||||
| Sep 2023 | 581,101 | 105,546 | 475,555 | 182,022 | 203,009 | 47,600 | 13,864 | 29,060 | — | ||||||||||||||||||||||||||
| kg | Dec 2023 | 17,457 | 3,615 | 13,843 | 5,036 | 5,769 | 1,715 | 392 | 930 | — | |||||||||||||||||||||||||
| Sep 2023 | 18,074 | 3,283 | 14,791 | 5,662 | 6,314 | 1,481 | 431 | 904 | — | ||||||||||||||||||||||||||
| All-in-sustaining cost | R/4Eoz - R/2Eoz | Dec 2023 | 24,541 | 38,300 | 20,689 | 17,403 | 23,460 | 22,562 | 13,869 | 25,212 | — | ||||||||||||||||||||||||
| Sep 2023 | 23,033 | 35,738 | 20,029 | 18,701 | 22,196 | 18,550 | 10,747 | 25,258 | — | ||||||||||||||||||||||||||
| US$/4Eoz - US$/2Eoz | Dec 2023 | 1,316 | 2,054 | 1,109 | 933 | 1,258 | 1,210 | 744 | 1,352 | — | |||||||||||||||||||||||||
| Sep 2023 | 1,239 | 1,922 | 1,077 | 1,006 | 1,194 | 998 | 578 | 1,359 | — | ||||||||||||||||||||||||||
| All-in-cost | R/4Eoz - R/2Eoz | Dec 2023 | 25,360 | 39,763 | 21,327 | 17,403 | 24,748 | 22,599 | 15,771 | 25,212 | — | ||||||||||||||||||||||||
| Sep 2023 | 24,002 | 37,642 | 20,777 | 18,701 | 23,526 | 18,550 | 15,364 | 25,258 | — | ||||||||||||||||||||||||||
| US$/4Eoz - US$/2Eoz | Dec 2023 | 1,360 | 2,132 | 1,144 | 933 | 1,327 | 1,212 | 846 | 1,352 | — | |||||||||||||||||||||||||
| Sep 2023 | 1,291 | 2,025 | 1,118 | 1,006 | 1,266 | 998 | 826 | 1,359 | — | ||||||||||||||||||||||||||
Average exchange rate for the quarters ended 31 December 2023 and 30 September 2023 was R18.65/US$ and R18.59/US$, respectively
Figures may not add as they are rounded independently
1The US and SA PGM operations, Total SA PGM operations and Marikana includes the production and costs associated with the purchase of concentrate (PoC) from third parties. For a reconciliation of the Operating cost, AISC and AIC excluding third party PoC, refer to “Reconciliation of operating cost excluding third party PoC for US and SA PGM operations, Total SA PGM operations and Marikana - Quarters” and “Reconciliation of AISC and AIC excluding third party PoC for US and SA PGM operations, Total SA PGM operations and Marikana – Quarters”
2The US PGM operations’ underground production is converted to metric tonnes and kilograms, and performance is translated into SA rand. In addition to the US PGM operations’ underground production, the operation processes various recycling material which is excluded from the 2E PGM production, All-in sustaining cost and All-in cost statistics shown
3Kroondal operations for the quarter ended December 2023 includes production and costs for two months (November and December 2023) at 100%
4Cost of sales, before amortisation and depreciation includes all mining and processing costs, third party refining costs, corporate general and administrative costs, and permitting costs
5Share-based payments are calculated based on the fair value at initial recognition and do not include the adjustment of the cash-settled share-based payment obligation to the reporting date fair value
6Rehabilitation includes the interest charge related to the environmental rehabilitation obligation and the amortisation of the related capitalised rehabilitation costs. The interest charge related to the environmental rehabilitation obligation and the amortisation of the capitalised rehabilitation costs reflect the periodic costs of rehabilitation associated with current PGM production
7All-in cost is calculated in accordance with the World Gold Council guidance. All-in cost excludes income tax, costs associated with merger and acquisition activities, working capital, impairments, financing costs, one-time severance charges and items needed to normalise earnings. All-in cost is made up of All-in sustaining cost, being the cost to sustain current operations, given as a sub-total in the All-in cost calculation, together with corporate and major capital expenditure associated with growth. All-in sustaining cost per ounce (and kilogram) and All-in cost per ounce (and kilogram) are calculated by dividing the All-in sustaining cost and All-in cost, respectively, in a period by the total 4E/2E PGM produced in the same period
Sibanye-Stillwater Operating and financial results | Six months and year ended 31 December 2023 92
| Reconciliation of operating cost excluding third party PoC for US and SA PGM operations, Total SA PGM operations and Marikana - Quarters | |||||||||||||||||||||||
| US and SA PGM operations | Total SA PGM operations | Marikana | |||||||||||||||||||||
| Rm | Dec 2023 | Sep 2023 | Dec 2023 | Sep 2023 | Dec 2023 | Sep 2023 | |||||||||||||||||
| Cost of sales, before amortisation and depreciation as reported per table above | 12,624 | 11,457 | 9,619 | 8,947 | 3,873 | 4,275 | |||||||||||||||||
| Inventory change as reported per table above | 556 | 912 | 593 | 1,165 | 752 | 703 | |||||||||||||||||
| Less: Chrome cost of sales | (675) | (333) | (675) | (333) | (83) | (150) | |||||||||||||||||
| Total operating cost including third party PoC | 12,505 | 12,036 | 9,537 | 9,779 | 4,542 | 4,828 | |||||||||||||||||
| Less: Purchase cost of PoC | (594) | (565) | (594) | (565) | (594) | (565) | |||||||||||||||||
| Total operating cost excluding third party PoC | 11,911 | 11,471 | 8,943 | 9,214 | 3,948 | 4,263 | |||||||||||||||||
| PGM production as reported per table above | 4Eoz- 2Eoz | 561,265 | 581,101 | 445,052 | 475,555 | 185,468 | 203,009 | ||||||||||||||||
| Less: Mimosa production | (29,906) | (29,060) | (29,906) | (29,060) | — | — | |||||||||||||||||
| PGM production excluding Mimosa | 531,359 | 552,041 | 415,146 | 446,495 | 185,468 | 203,009 | |||||||||||||||||
| Less: PoC production | (22,867) | (23,995) | (22,867) | (23,995) | (22,867) | (23,995) | |||||||||||||||||
| PGM production excluding Mimosa and third party PoC | 508,492 | 528,046 | 392,279 | 422,500 | 162,601 | 179,014 | |||||||||||||||||
| PGM production including Mimosa and excluding third party PoC | 538,398 | 557,106 | 422,185 | 451,560 | 162,601 | 179,014 | |||||||||||||||||
| Tonnes milled/treated | kt | 9,301 | 9,711 | 9,012 | 9,394 | 2,580 | 2,578 | ||||||||||||||||
| Less: Mimosa tonnes | (361) | (351) | (361) | (351) | — | — | |||||||||||||||||
| PGM tonnes excluding Mimosa and third party PoC | 8,940 | 9,359 | 8,651 | 9,043 | 2,580 | 2,578 | |||||||||||||||||
| Operating cost including third party PoC | R/4Eoz-R/2Eoz | 23,534 | 21,803 | 22,973 | 21,902 | 24,489 | 23,782 | ||||||||||||||||
| US$/4Eoz-US$/2Eoz | 1,262 | 1,173 | 1,232 | 1,178 | 1,313 | 1,279 | |||||||||||||||||
| R/t | 1,399 | 1,286 | 1,102 | 1,081 | 1,761 | 1,873 | |||||||||||||||||
| US$/t | 75 | 69 | 59 | 58 | 94 | 101 | |||||||||||||||||
| Operating cost excluding third party PoC | R/4Eoz-R/2Eoz | 23,424 | 21,723 | 22,798 | 21,808 | 24,280 | 23,814 | ||||||||||||||||
| US$/4Eoz-US$/2Eoz | 1,256 | 1,169 | 1,222 | 1,173 | 1,302 | 1,281 | |||||||||||||||||
| R/t | 1,332 | 1,226 | 1,034 | 1,019 | 1,530 | 1,654 | |||||||||||||||||
| US$/t | 71 | 66 | 55 | 55 | 82 | 89 | |||||||||||||||||
| Reconciliation of AISC and AIC excluding third party PoC for US and SA PGM operations, Total SA PGM operations and Marikana - Quarters | |||||||||||||||||||||||
| US and SA PGM operations | Total SA PGM operations | Marikana | |||||||||||||||||||||
| Rm | Dec 2023 | Sep 2023 | Dec 2023 | Sep 2023 | Dec 2023 | Sep 2023 | |||||||||||||||||
| Total All-in-sustaining cost as reported per table above | 13,040 | 12,715 | 8,589 | 8,943 | 4,351 | 4,506 | |||||||||||||||||
| Less: Purchase cost of PoC | (594) | (565) | (594) | (565) | (594) | (565) | |||||||||||||||||
| Add: By-product credit of PoC | 107 | 106 | 107 | 106 | 107 | 106 | |||||||||||||||||
| Total All-in-sustaining cost excluding third party PoC | 12,553 | 12,256 | 8,102 | 8,484 | 3,864 | 4,047 | |||||||||||||||||
| Plus: Corporate cost, growth and capital expenditure | 435 | 535 | 265 | 334 | 239 | 270 | |||||||||||||||||
| Total All-in-cost excluding third party PoC | 12,988 | 12,791 | 8,367 | 8,818 | 4,103 | 4,317 | |||||||||||||||||
| PGM production excluding Mimosa and third party PoC | 4Eoz- 2Eoz | 508,492 | 528,046 | 392,279 | 422,500 | 162,601 | 179,014 | ||||||||||||||||
| All-in-sustaining cost excluding third party PoC | R/4Eoz-R/2Eoz | 24,687 | 23,210 | 20,654 | 20,080 | 23,764 | 22,607 | ||||||||||||||||
| US$/4Eoz-US$/2Eoz | 1,324 | 1,249 | 1,107 | 1,080 | 1,274 | 1,216 | |||||||||||||||||
| All-in-cost excluding third party PoC | R/4Eoz-R/2Eoz | 25,542 | 24,223 | 21,329 | 20,871 | 25,234 | 24,115 | ||||||||||||||||
| US$/4Eoz-US$/2Eoz | 1,370 | 1,303 | 1,144 | 1,123 | 1,353 | 1,297 | |||||||||||||||||
Sibanye-Stillwater Operating and financial results | Six months and year ended 31 December 2023 93
ALL-IN COSTS - QUARTERS (continued)
SA gold operations
Figures are in rand millions unless otherwise stated
| SA OPERATIONS | |||||||||||||||||||||||||||||
| Total SA gold | Driefontein | Kloof | Beatrix | Cooke | DRDGOLD | Corporate | |||||||||||||||||||||||
Cost of sales, before amortisation and depreciation1 | Dec 2023 | 5,506 | 1,472 | 1,808 | 833 | 331 | 1,062 | — | |||||||||||||||||||||
| Sep 2023 | 6,436 | 1,747 | 2,162 | 1,101 | 336 | 1,090 | — | ||||||||||||||||||||||
| Royalties | Dec 2023 | 26 | 10 | 9 | 6 | 1 | — | — | |||||||||||||||||||||
| Sep 2023 | 27 | 9 | 12 | 5 | 1 | — | — | ||||||||||||||||||||||
| Carbon tax | Dec 2023 | — | — | — | — | — | — | — | |||||||||||||||||||||
| Sep 2023 | — | — | — | — | — | — | — | ||||||||||||||||||||||
| Community costs | Dec 2023 | (11) | (2) | (2) | (8) | — | 1 | — | |||||||||||||||||||||
| Sep 2023 | 4 | — | 1 | — | — | 3 | — | ||||||||||||||||||||||
Share-based payments2 | Dec 2023 | 1 | 1 | (7) | (5) | — | 7 | 5 | |||||||||||||||||||||
| Sep 2023 | 48 | 14 | 17 | 14 | — | 6 | (3) | ||||||||||||||||||||||
Rehabilitation interest and amortisation3 | Dec 2023 | 35 | (2) | 3 | 19 | 21 | (7) | 1 | |||||||||||||||||||||
| Sep 2023 | 50 | — | 5 | 17 | 22 | 5 | 1 | ||||||||||||||||||||||
| Leases | Dec 2023 | 20 | — | 9 | 5 | — | 6 | — | |||||||||||||||||||||
| Sep 2023 | 11 | — | 1 | 5 | — | 5 | — | ||||||||||||||||||||||
| Ore reserve development | Dec 2023 | 622 | 362 | 196 | 64 | — | — | — | |||||||||||||||||||||
| Sep 2023 | 677 | 339 | 246 | 92 | — | — | — | ||||||||||||||||||||||
| Sustaining capital expenditure | Dec 2023 | 449 | 169 | 134 | 57 | — | 89 | — | |||||||||||||||||||||
| Sep 2023 | 367 | 131 | 108 | 16 | — | 112 | — | ||||||||||||||||||||||
| Less: By-product credit | Dec 2023 | (4) | (2) | (1) | (1) | — | — | — | |||||||||||||||||||||
| Sep 2023 | (5) | (2) | (2) | (1) | — | — | — | ||||||||||||||||||||||
Total All-in-sustaining costs4 | Dec 2023 | 6,644 | 2,008 | 2,149 | 970 | 353 | 1,158 | 6 | |||||||||||||||||||||
| Sep 2023 | 7,615 | 2,238 | 2,550 | 1,249 | 359 | 1,221 | (2) | ||||||||||||||||||||||
| Plus: Corporate cost, growth and capital expenditure | Dec 2023 | 720 | — | 8 | — | — | 302 | 410 | |||||||||||||||||||||
| Sep 2023 | 535 | — | 42 | — | — | 152 | 341 | ||||||||||||||||||||||
Total All-in-costs4 | Dec 2023 | 7,364 | 2,008 | 2,157 | 970 | 353 | 1,460 | 416 | |||||||||||||||||||||
| Sep 2023 | 8,150 | 2,238 | 2,592 | 1,249 | 359 | 1,373 | 339 | ||||||||||||||||||||||
| Gold sold | kg | Dec 2023 | 5,685 | 1,634 | 1,510 | 976 | 297 | 1,268 | — | ||||||||||||||||||||
| Sep 2023 | 6,178 | 1,538 | 2,136 | 930 | 307 | 1,267 | — | ||||||||||||||||||||||
| oz | Dec 2023 | 182,777 | 52,534 | 48,548 | 31,379 | 9,549 | 40,767 | — | |||||||||||||||||||||
| Sep 2023 | 198,627 | 49,448 | 68,674 | 29,900 | 9,870 | 40,735 | — | ||||||||||||||||||||||
| All-in-sustaining cost | R/kg | Dec 2023 | 1,168,690 | 1,228,886 | 1,423,179 | 993,852 | 1,188,552 | 913,249 | — | ||||||||||||||||||||
| Sep 2023 | 1,232,600 | 1,455,137 | 1,193,820 | 1,343,011 | 1,169,381 | 963,694 | — | ||||||||||||||||||||||
| All-in-sustaining cost | US$/oz | Dec 2023 | 1,949 | 2,049 | 2,374 | 1,657 | 1,982 | 1,523 | — | ||||||||||||||||||||
| Sep 2023 | 2,062 | 2,435 | 1,997 | 2,247 | 1,957 | 1,612 | — | ||||||||||||||||||||||
| All-in-cost | R/kg | Dec 2023 | 1,295,339 | 1,228,886 | 1,428,477 | 993,852 | 1,188,552 | 1,151,420 | — | ||||||||||||||||||||
| Sep 2023 | 1,319,197 | 1,455,137 | 1,213,483 | 1,343,011 | 1,169,381 | 1,083,662 | — | ||||||||||||||||||||||
| All-in-cost | US$/oz | Dec 2023 | 2,160 | 2,049 | 2,382 | 1,657 | 1,982 | 1,920 | — | ||||||||||||||||||||
| Sep 2023 | 2,207 | 2,435 | 2,030 | 2,247 | 1,957 | 1,813 | — | ||||||||||||||||||||||
Average exchange rate for the quarters ended 31 December 2023 and 30 September 2023 was R18.65/US$ and R18.59/US$, respectively
Figures may not add as they are rounded independently
1Cost of sales, before amortisation and depreciation includes all mining and processing costs, third party refining costs, corporate general and administrative costs, and permitting costs
2 Share-based payments are calculated based on the fair value at initial recognition and do not include the adjustment of the cash-settled share-based payment obligation to the reporting date fair value
3 Rehabilitation includes the interest charge related to the environmental rehabilitation obligation and the amortisation of the related capitalised rehabilitation costs. The interest charge related to the environmental rehabilitation obligation and the amortisation of the capitalised rehabilitation costs reflect the periodic costs of rehabilitation associated with current gold production
4 All-in cost is calculated in accordance with the World Gold Council guidance. All-in cost excludes income tax, costs associated with merger and acquisition activities, working capital, impairments, financing costs, one time severance charges and items needed to normalise earnings. All-in cost is made up of All-in sustaining cost, being the cost to sustain current operations, given as a sub-total in the All-in cost calculation, together with corporate and major capital expenditure associated with growth. All-in sustaining cost per kilogram (and ounce) and All-in cost per kilogram (and ounce) are calculated by dividing the All-in sustaining cost and All-in cost, respectively, in a period by the total gold sold over the same period
Sibanye-Stillwater Operating and financial results | Six months and year ended 31 December 2023 94
ALL-IN-COSTS - QUARTERS (continued)
Australian operations
Figures are in rand millions unless otherwise stated
| Century zinc retreatment operation | |||||||||||
Cost of sales, before amortisation and depreciation1 | Dec 2023 | 691 | |||||||||
| Sep 2023 | 713 | ||||||||||
| Royalties | Dec 2023 | 55 | |||||||||
| Sep 2023 | 24 | ||||||||||
| Community costs | Dec 2023 | 15 | |||||||||
| Sep 2023 | 22 | ||||||||||
| Inventory change | Dec 2023 | 79 | |||||||||
| Sep 2023 | 45 | ||||||||||
| Share-based payments | Dec 2023 | — | |||||||||
| Sep 2023 | — | ||||||||||
Rehabilitation interest and amortisation2 | Dec 2023 | 5 | |||||||||
| Sep 2023 | 5 | ||||||||||
| Leases | Dec 2023 | 27 | |||||||||
| Sep 2023 | 30 | ||||||||||
| Sustaining capital expenditure | Dec 2023 | 42 | |||||||||
| Sep 2023 | 30 | ||||||||||
| Less: By-product credit | Dec 2023 | (50) | |||||||||
| Sep 2023 | (51) | ||||||||||
Total All-in-sustaining costs3 | Dec 2023 | 864 | |||||||||
| Sep 2023 | 818 | ||||||||||
| Plus: Corporate cost, growth and capital expenditure | Dec 2023 | 16 | |||||||||
| Sep 2023 | 59 | ||||||||||
Total All-in-costs3 | Dec 2023 | 880 | |||||||||
| Sep 2023 | 877 | ||||||||||
| Zinc metal produced (payable) | kt | Dec 2023 | 26 | ||||||||
| Sep 2023 | 25 | ||||||||||
| All-in-sustaining cost | R/tZn | Dec 2023 | 32,783 | ||||||||
| Sep 2023 | 32,587 | ||||||||||
| US$/tZn | Dec 2023 | 1,758 | |||||||||
| Sep 2023 | 1,753 | ||||||||||
| All-in-cost | R/tZn | Dec 2023 | 33,390 | ||||||||
| Sep 2023 | 34,937 | ||||||||||
| US$/tZn | Dec 2023 | 1,790 | |||||||||
| Sep 2023 | 1,879 | ||||||||||
Average exchange rate for the quarters ended 31 December 2023 and 30 September 2023 was R18.65/US$ and R18.59/US$, respectively
Figures may not add as they are rounded independently
1Cost of sales, before amortisation and depreciation includes all mining and processing costs, corporate general and administrative costs, and permitting costs
2Rehabilitation includes the interest charge related to the environmental rehabilitation obligation and the amortisation of the related capitalised rehabilitation costs. The interest charge related to the environmental rehabilitation obligation and the amortisation of the capitalised rehabilitation costs reflect the periodic costs of rehabilitation associated with current zinc production
3All-in cost is calculated in accordance with the World Gold Council guidance. All-in cost excludes income tax, costs associated with merger and acquisition activities, working capital, impairments, financing costs, one-time severance charges and items needed to normalise earnings. All-in cost is made up of All-in sustaining cost, being the cost to sustain current operations, given as a sub-total in the All-in cost calculation, together with corporate and major capital expenditure associated with growth. All-in sustaining cost per tonne and All-in cost per tonne are calculated by dividing the All-in sustaining cost and All-in cost, respectively, in a period by the total tonnes of zinc metal produced (payable) in the same period
Sibanye-Stillwater Operating and financial results | Six months and year ended 31 December 2023 95
UNIT OPERATING COST - QUARTERS
US and SA PGM operations
Figures are in rand millions unless otherwise stated
US and SA PGM operations1 | US PGM operations | Total SA PGM operations1,3 | Rustenburg3 | Marikana3 | Kroondal3,4 | Plat Mile | Mimosa | |||||||||||||||||||||||||||||||
Under- ground2 | Total | Under- ground | Surface | Under- ground | Surface | Attribu-table | Surface | Attribu-table | ||||||||||||||||||||||||||||||
| Cost of sales, before amortisation and depreciation | Dec 2023 | 12,624 | 3,005 | 9,619 | 3,942 | 314 | 3,873 | 1,331 | 159 | 614 | ||||||||||||||||||||||||||||
| Sep 2023 | 11,457 | 2,510 | 8,947 | 3,211 | 344 | 4,275 | 942 | 175 | 640 | |||||||||||||||||||||||||||||
| Inventory change | Dec 2023 | 556 | (37) | 593 | (155) | 2 | 752 | (6) | — | (2) | ||||||||||||||||||||||||||||
| Sep 2023 | 912 | (253) | 1,165 | 290 | 172 | 703 | — | — | (4) | |||||||||||||||||||||||||||||
| Less: Chrome cost of sales | Dec 2023 | (675) | — | (675) | (587) | — | (83) | (5) | — | — | ||||||||||||||||||||||||||||
| Sep 2023 | (333) | — | (333) | (180) | — | (150) | (3) | — | — | |||||||||||||||||||||||||||||
| Less: Purchase cost of PoC | Dec 2023 | (594) | — | (594) | — | — | (594) | — | — | — | ||||||||||||||||||||||||||||
| Sep 2023 | (565) | — | (565) | — | — | (565) | — | — | — | |||||||||||||||||||||||||||||
| Total operating cost excluding third party PoC | Dec 2023 | 11,911 | 2,968 | 8,943 | 3,200 | 316 | 3,948 | 1,320 | 159 | 612 | ||||||||||||||||||||||||||||
| Sep 2023 | 11,471 | 2,257 | 9,214 | 3,321 | 516 | 4,263 | 939 | 175 | 636 | |||||||||||||||||||||||||||||
Tonnes milled/treated excluding third party PoC5 | kt | Dec 2023 | 8,940 | 289 | 8,651 | 1,446 | 1,418 | 1,552 | 1,028 | 900 | 2,307 | 361 | ||||||||||||||||||||||||||
| Sep 2023 | 9,359 | 316 | 9,043 | 1,643 | 1,420 | 1,709 | 869 | 755 | 2,649 | 351 | ||||||||||||||||||||||||||||
PGM production excluding third party PoC5 | 4Eoz | Dec 2023 | 508,492 | 116,213 | 392,279 | 138,182 | 23,742 | 162,601 | 55,136 | 12,618 | 29,906 | |||||||||||||||||||||||||||
| Sep 2023 | 528,046 | 105,546 | 422,500 | 157,977 | 24,045 | 179,014 | 47,600 | 13,864 | 29,060 | |||||||||||||||||||||||||||||
Operating cost excluding third party PoC6 | R/t | Dec 2023 | 1,332 | 10,256 | 1,034 | 2,212 | 223 | 1,530 | 1,467 | 69 | 1,697 | |||||||||||||||||||||||||||
| Sep 2023 | 1,226 | 7,140 | 1,019 | 2,021 | 363 | 1,654 | 1,244 | 66 | 1,812 | |||||||||||||||||||||||||||||
| US$/t | Dec 2023 | 71 | 550 | 55 | 119 | 12 | 82 | 79 | 4 | 91 | ||||||||||||||||||||||||||||
| Sep 2023 | 66 | 384 | 55 | 109 | 20 | 89 | 67 | 4 | 97 | |||||||||||||||||||||||||||||
| R/4Eoz - R/2Eoz | Dec 2023 | 23,424 | 25,539 | 22,798 | 23,158 | 13,310 | 24,280 | 23,941 | 12,601 | 20,464 | ||||||||||||||||||||||||||||
| Sep 2023 | 21,723 | 21,384 | 21,808 | 21,022 | 21,460 | 23,814 | 19,727 | 12,623 | 21,886 | |||||||||||||||||||||||||||||
| US$/4Eoz - US$/2Eoz | Dec 2023 | 1,256 | 1,369 | 1,222 | 1,242 | 714 | 1,302 | 1,284 | 676 | 1,097 | ||||||||||||||||||||||||||||
| Sep 2023 | 1,169 | 1,150 | 1,173 | 1,131 | 1,154 | 1,281 | 1,061 | 679 | 1,177 | |||||||||||||||||||||||||||||
Average exchange rate for the quarters ended 31 December 2023 and 30 September 2023 was R18.65/US$ and R18.59/US$, respectively
Figures may not add as they are rounded independently
1 US and SA PGM operations and Total SA PGM operations exclude the results of Mimosa, which is equity accounted
2 The US PGM operations’ underground production is converted to metric tonnes and kilograms, and performance is translated into rand. In addition to the US PGM operations’
underground production, the operation treats various recycling material which is excluded from the statistics shown above
3 Cost of sales, before amortisation and depreciation for Total SA PGM, Rustenburg, Marikana and Kroondal includes the Chrome cost of sales which is excluded for unit cost calculation purposes as Chrome production is excluded from the 4Eoz production
4 Kroondal operations for the year ended December 2023 includes production and costs for two months (November and December 2023) at 100%
5 For a reconciliation of the production excluding Mimosa and third party PoC, refer to “Reconciliation of operating cost excluding third party PoC for US and SA PGM operations, Total SA PGM operations and Marikana - Quarters”
6 Operating cost is the average cost of production and operating cost per tonne is calculated by dividing the cost of sales, before amortisation and depreciation and change in inventory in a period by the tonnes milled/treated in the same period, and operating cost per ounce is calculated by dividing the cost of sales, before amortisation and depreciation and change in inventory in a period, by the PGM produced in the same period
Sibanye-Stillwater Operating and financial results | Six months and year ended 31 December 2023 96
UNIT OPERATING COST - QUARTERS (continued)
SA gold operations
Figures are in rand millions unless otherwise stated
| Total SA gold operations | Driefontein | Kloof | Beatrix | Cooke | DRDGOLD | ||||||||||||||||||||||||||||||||||||
| Total | Under- ground | Surface | Under- ground | Surface | Under- ground | Surface | Under- ground | Surface | Surface | Surface | |||||||||||||||||||||||||||||||
| Cost of sales, before amortisation and depreciation | Dec 2023 | 5,506 | 3,968 | 1,538 | 1,467 | 5 | 1,669 | 139 | 832 | 1 | 331 | 1,062 | |||||||||||||||||||||||||||||
| Sep 2023 | 6,436 | 4,796 | 1,640 | 1,737 | 10 | 1,972 | 190 | 1,087 | 14 | 336 | 1,090 | ||||||||||||||||||||||||||||||
| Inventory change | Dec 2023 | 427 | 398 | 29 | 154 | — | 68 | 7 | 176 | — | 14 | 8 | |||||||||||||||||||||||||||||
| Sep 2023 | 26 | (9) | 35 | 10 | — | (47) | 1 | 28 | — | 9 | 25 | ||||||||||||||||||||||||||||||
| Total operating cost | Dec 2023 | 5,933 | 4,366 | 1,567 | 1,621 | 5 | 1,737 | 146 | 1,008 | 1 | 345 | 1,070 | |||||||||||||||||||||||||||||
| Sep 2023 | 6,462 | 4,787 | 1,675 | 1,747 | 10 | 1,925 | 191 | 1,115 | 14 | 345 | 1,115 | ||||||||||||||||||||||||||||||
| Tonnes milled/treated | kt | Dec 2023 | 7,945 | 904 | 7,041 | 275 | 21 | 284 | 419 | 344 | 3 | 1,066 | 5,533 | ||||||||||||||||||||||||||||
| Sep 2023 | 8,245 | 966 | 7,279 | 251 | 13 | 365 | 481 | 350 | 33 | 1,121 | 5,632 | ||||||||||||||||||||||||||||||
| Gold produced | kg | Dec 2023 | 6,102 | 4,307 | 1,795 | 1,789 | 16 | 1,322 | 209 | 1,196 | 2 | 305 | 1,263 | ||||||||||||||||||||||||||||
| Sep 2023 | 6,148 | 4,267 | 1,881 | 1,452 | 43 | 1,882 | 234 | 933 | 7 | 313 | 1,284 | ||||||||||||||||||||||||||||||
| oz | Dec 2023 | 196,184 | 138,473 | 57,711 | 57,518 | 514 | 42,503 | 6,720 | 38,452 | 64 | 9,806 | 40,606 | |||||||||||||||||||||||||||||
| Sep 2023 | 197,663 | 137,187 | 60,476 | 46,683 | 1,382 | 60,508 | 7,523 | 29,997 | 225 | 10,063 | 41,282 | ||||||||||||||||||||||||||||||
Operating cost1 | R/t | Dec 2023 | 747 | 4,832 | 223 | 5,888 | 243 | 6,117 | 349 | 2,927 | 387 | 324 | 193 | ||||||||||||||||||||||||||||
| Sep 2023 | 784 | 4,953 | 230 | 6,948 | 783 | 5,277 | 397 | 3,184 | 429 | 308 | 198 | ||||||||||||||||||||||||||||||
| US$/t | Dec 2023 | 40 | 259 | 12 | 316 | 13 | 328 | 19 | 157 | 21 | 17 | 10 | |||||||||||||||||||||||||||||
| Sep 2023 | 42 | 266 | 12 | 374 | 42 | 284 | 21 | 171 | 23 | 17 | 11 | ||||||||||||||||||||||||||||||
| R/kg | Dec 2023 | 972,304 | 1,013,699 | 872,981 | 906,093 | 312,500 | 1,313,918 | 698,565 | 842,809 | 500,000 | 1,131,148 | 847,189 | |||||||||||||||||||||||||||||
| Sep 2023 | 1,051,074 | 1,121,865 | 890,484 | 1,203,168 | 232,558 | 1,022,848 | 816,239 | 1,195,070 | 2,000,000 | 1,102,236 | 868,380 | ||||||||||||||||||||||||||||||
| US$/oz | Dec 2023 | 1,622 | 1,691 | 1,456 | 1,511 | 521 | 2,191 | 1,165 | 1,406 | 834 | 1,886 | 1,413 | |||||||||||||||||||||||||||||
| Sep 2023 | 1,759 | 1,877 | 1,490 | 2,013 | 389 | 1,711 | 1,366 | 2,000 | 3,346 | 1,844 | 1,453 | ||||||||||||||||||||||||||||||
Average exchange rate for the quarters ended 31 December 2023 and 30 September 2023 was R18.65/US$ and R18.59/US$, respectively
Figures may not add as they are rounded independently
1 Operating cost is the average cost of production and operating cost per tonne is calculated by dividing the cost of sales, before amortisation and depreciation and change in inventory in a period by the tonnes milled/treated in the same period, and operating cost per kilogram (and ounce) is calculated by dividing the cost of sales, before amortisation and depreciation and change in inventory in a period by the gold produced in the same period
Sibanye-Stillwater Operating and financial results | Six months and year ended 31 December 2023 97
DEVELOPMENT RESULTS
Development values represent the actual results of sampling and no allowance has been made for any adjustments which may be necessary when estimating ore reserves. All figures below exclude shaft sinking metres, which are reported separately where appropriate.
| US PGM operations | Dec 2023 quarter | Sep 2023 quarter | Year ended 31 December 2023 | ||||||||||||||||||||||||||||||||||||||||||||||||||||||||
| Reef | Stillwater incl Blitz | East Boulder | Stillwater incl Blitz | East Boulder | Stillwater incl Blitz | East Boulder | |||||||||||||||||||||||||||||||||||||||||||||||||||||
| Total US PGM | Unit | ||||||||||||||||||||||||||||||||||||||||||||||||||||||||||
| Primary development (off reef) | (m) | 1,262 | 85 | 1,785 | 172 | 6,221 | 1,180 | ||||||||||||||||||||||||||||||||||||||||||||||||||||
| Secondary development | (m) | 3,296 | 1,161 | 3,185 | 1,402 | 11,582 | 5,305 | ||||||||||||||||||||||||||||||||||||||||||||||||||||
| SA PGM operations | Dec 2023 quarter | Sep 2023 quarter | Year ended 31 December 2023 | ||||||||||||||||||||||||||||||||||||||||||||||||||||||||
| Reef | Batho-pele | Thembe-lani | Khuse-leka | Siphume-lele | Batho-pele | Thembe-lani | Khuse-leka | Siphume-lele | Batho-pele | Thembe-lani | Khuse-leka | Siphume-lele | |||||||||||||||||||||||||||||||||||||||||||||||
| Rustenburg | Unit | ||||||||||||||||||||||||||||||||||||||||||||||||||||||||||
| Advanced | (m) | 705 | 1,685 | 2,818 | 661 | 809 | 1,933 | 3,057 | 705 | 2,913 | 6,789 | 10,927 | 2,469 | ||||||||||||||||||||||||||||||||||||||||||||||
| Advanced on reef | (m) | 705 | 651 | 1,099 | 450 | 809 | 835 | 1,171 | 386 | 2,913 | 2,922 | 4,013 | 1,536 | ||||||||||||||||||||||||||||||||||||||||||||||
| Height | (cm) | 218 | 303 | 285 | 258 | 213 | 251 | 285 | 268 | 220 | 283 | 286 | 267 | ||||||||||||||||||||||||||||||||||||||||||||||
| Average value | (g/t) | 2.9 | 2.3 | 2.2 | 3.0 | 2.8 | 2.3 | 2.3 | 3.1 | 2.8 | 2.3 | 2.3 | 3.0 | ||||||||||||||||||||||||||||||||||||||||||||||
| (cm.g/t) | 639 | 705 | 637 | 776 | 594 | 579 | 644 | 825 | 617 | 663 | 650 | 800 | |||||||||||||||||||||||||||||||||||||||||||||||
| SA PGM operations | Dec 2023 quarter | Sep 2023 quarter | Year ended 31 December 2023 | ||||||||||||||||||||||||||||||||||||||||||||||||||||||||
| Reef | K3 | Rowland | Saffy | E3 | 4B | K4 | K3 | Rowland | Saffy | E3 | 4B | K4 | K3 | Rowland | Saffy | E3 | 4B | K4 | |||||||||||||||||||||||||||||||||||||||||
| Marikana | Unit | ||||||||||||||||||||||||||||||||||||||||||||||||||||||||||
| Primary development | (m) | 9,268 | 3,590 | 3,192 | 1,124 | 499 | 2,797 | 9,897 | 4,999 | 3,782 | 1,257 | 594 | 3,589 | 33,999 | 16,806 | 13,191 | 4,246 | 2,832 | 12,182 | ||||||||||||||||||||||||||||||||||||||||
| Primary development - on reef | (m) | 7,627 | 1,941 | 1,801 | 756 | 392 | 729 | 7,835 | 2,795 | 2,036 | 791 | 418 | 1,131 | 26,296 | 9,519 | 7,216 | 2,681 | 1,941 | 3,718 | ||||||||||||||||||||||||||||||||||||||||
| Height | (cm) | 217 | 220 | 234 | 255 | 226 | 240 | 217 | 218 | 235 | 248 | 228 | 241 | 217 | 220 | 235 | 239 | 219 | 240 | ||||||||||||||||||||||||||||||||||||||||
| Average value | (g/t) | 2.8 | 2.6 | 2.4 | 2.3 | 3.0 | 2.4 | 2.8 | 2.6 | 2.5 | 2.6 | 3.0 | 2.4 | 2.8 | 2.5 | 2.5 | 2.5 | 2.9 | 2.5 | ||||||||||||||||||||||||||||||||||||||||
| (cm.g/t) | 611 | 577 | 558 | 577 | 671 | 575 | 608 | 563 | 581 | 642 | 674 | 584 | 613 | 550 | 576 | 600 | 644 | 587 | |||||||||||||||||||||||||||||||||||||||||
| SA PGM operations | Dec 2023 quarter | Sep 2023 quarter | Year ended 31 December 2023 | ||||||||||||||||||||||||||||||||||||||||||||||||||||||||
| Reef | Simunye1 | Kopa-neng | Bamba-nani | Kwezi | K6 | Simunye1 | Kopa-neng | Bamba-nani | Kwezi | K6 | Simunye1 | Kopa-neng | Bamba-nani | Kwezi | K6 | ||||||||||||||||||||||||||||||||||||||||||||
| Kroondal | Unit | ||||||||||||||||||||||||||||||||||||||||||||||||||||||||||
| Advanced | (m) | — | 813 | 973 | 269 | 473 | — | 1,161 | 1,138 | 260 | 440 | 675 | 3,676 | 4,370 | 1,134 | 1,888 | |||||||||||||||||||||||||||||||||||||||||||
| Advanced on reef | (m) | — | 717 | 556 | 200 | 417 | — | 942 | 778 | 234 | 404 | 604 | 3,168 | 2,980 | 962 | 1,758 | |||||||||||||||||||||||||||||||||||||||||||
| Height | (cm) | — | 234 | 216 | 237 | 236 | — | 240 | 232 | 230 | 227 | 230 | 237 | 237 | 235 | 231 | |||||||||||||||||||||||||||||||||||||||||||
| Average value | (g/t) | — | 2.0 | 1.5 | 1.8 | 2.1 | — | 2.1 | 1.8 | 2.0 | 1.8 | 2.2 | 2.1 | 1.8 | 2.0 | 2.0 | |||||||||||||||||||||||||||||||||||||||||||
| (cm.g/t) | — | 474 | 320 | 419 | 495 | — | 500 | 419 | 455 | 401 | 516 | 496 | 419 | 469 | 465 | ||||||||||||||||||||||||||||||||||||||||||||
1 Simunye development was done as part of the Kopaneng extraction strategy. Based on planning and measuring this portion of mining below Simunye will be allocated to Kopaneng with effect from April 2023 onwards
Sibanye-Stillwater Operating and financial results | Six months and year ended 31 December 2023 98
| SA gold operations | Dec 2023 quarter | Sep 2023 quarter | Year ended 31 December 2023 | ||||||||||||||||||||||||||||||||||||||||||||||||||||||||
| Reef | Carbon leader | Main | VCR | Carbon leader | Main | VCR | Carbon leader | Main | VCR | ||||||||||||||||||||||||||||||||||||||||||||||||||
| Driefontein | Unit | ||||||||||||||||||||||||||||||||||||||||||||||||||||||||||
| Advanced | (m) | 425 | 565 | 1,445 | 294 | 381 | 1,004 | 1,755 | 1,995 | 4,898 | |||||||||||||||||||||||||||||||||||||||||||||||||
| Advanced on reef | (m) | 107 | 150 | 170 | 88 | 84 | 156 | 318 | 285 | 646 | |||||||||||||||||||||||||||||||||||||||||||||||||
| Channel width | (cm) | 17 | 103 | 68 | 43 | 100 | 62 | 29 | 97 | 57 | |||||||||||||||||||||||||||||||||||||||||||||||||
| Average value | (g/t) | 60.8 | 4.2 | 64.1 | 19.9 | 5.6 | 52.9 | 32.4 | 5.1 | 48.0 | |||||||||||||||||||||||||||||||||||||||||||||||||
| (cm.g/t) | 1,047 | 429 | 4,354 | 852 | 557 | 3,258 | 926 | 488 | 2,749 | ||||||||||||||||||||||||||||||||||||||||||||||||||
| SA gold operations | Dec 2023 quarter | Sep 2023 quarter | Year ended 31 December 2023 | ||||||||||||||||||||||||||||||||||||||||||||||||||||||||
| Reef | Kloof | Main | Libanon | VCR | Kloof | Main | Libanon | VCR | Kloof | Main | Libanon | VCR | |||||||||||||||||||||||||||||||||||||||||||||||
| Kloof | Unit | ||||||||||||||||||||||||||||||||||||||||||||||||||||||||||
| Advanced | (m) | 1,278 | 521 | — | 178 | 1,082 | 644 | — | 630 | 4,425 | 2,397 | 91 | 2,401 | ||||||||||||||||||||||||||||||||||||||||||||||
| Advanced on reef | (m) | 316 | 109 | — | 12 | 351 | 128 | — | 72 | 1,493 | 517 | 91 | 334 | ||||||||||||||||||||||||||||||||||||||||||||||
| Channel width | (cm) | 158 | 57 | — | 150 | 177 | 77 | — | 85 | 163 | 66 | 97 | 103 | ||||||||||||||||||||||||||||||||||||||||||||||
| Average value | (g/t) | 3.3 | 18.5 | — | 24.5 | 3.2 | 11.5 | — | 18.2 | 4.2 | 13.1 | 2.1 | 13.1 | ||||||||||||||||||||||||||||||||||||||||||||||
| (cm.g/t) | 524 | 1,055 | — | 3,682 | 568 | 887 | — | 1,541 | 690 | 867 | 201 | 1,348 | |||||||||||||||||||||||||||||||||||||||||||||||
| SA gold operations | Dec 2023 quarter | Sep 2023 quarter | Year ended 31 December 2023 | ||||||||||||||||||||||||||||||||||||||||||||||||||||||||
| Reef | Beatrix | Kalkoen-krans | Beatrix | Kalkoen-krans | Beatrix | Kalkoen-krans | |||||||||||||||||||||||||||||||||||||||||||||||||||||
| Beatrix | Unit | ||||||||||||||||||||||||||||||||||||||||||||||||||||||||||
| Advanced | (m) | 1,584 | — | 1,928 | — | 7,489 | 8 | ||||||||||||||||||||||||||||||||||||||||||||||||||||
| Advanced on reef | (m) | 638 | — | 663 | — | 2,480 | — | ||||||||||||||||||||||||||||||||||||||||||||||||||||
| Channel width | (cm) | 132 | — | 163 | — | 157 | — | ||||||||||||||||||||||||||||||||||||||||||||||||||||
| Average value | (g/t) | 4.7 | — | 8.1 | — | 6.7 | — | ||||||||||||||||||||||||||||||||||||||||||||||||||||
| (cm.g/t) | 619 | — | 1,312 | — | 1,045 | — | |||||||||||||||||||||||||||||||||||||||||||||||||||||
| SA gold operations | Dec 2023 quarter | Sep 2023 quarter | Year ended 31 December 2023 | ||||||||||||||||||||||||||||||||||||||||||||||||||||||||
| Reef | Kimberley | Kimberley | Kimberley | ||||||||||||||||||||||||||||||||||||||||||||||||||||||||
| Burnstone | Unit | ||||||||||||||||||||||||||||||||||||||||||||||||||||||||||
| Advanced | (m) | 1,277 | 821 | 3,299 | |||||||||||||||||||||||||||||||||||||||||||||||||||||||
| Advanced on reef | (m) | 89 | 33 | 122 | |||||||||||||||||||||||||||||||||||||||||||||||||||||||
| Channel width | (cm) | 36 | 23 | 33 | |||||||||||||||||||||||||||||||||||||||||||||||||||||||
| Average value | (g/t) | 12.1 | 15.2 | 12.7 | |||||||||||||||||||||||||||||||||||||||||||||||||||||||
| (cm.g/t) | 440 | 350 | 415 | ||||||||||||||||||||||||||||||||||||||||||||||||||||||||
Sibanye-Stillwater Operating and financial results | Six months and year ended 31 December 2023 99
ADJUSTED EBITDA RECONCILIATION - YEARS
| 2023 | ||||||||||||||||||||||||||||||||
| Figures in million – SA rand | Group1 | Total US PGM | Underground | Recycling | Total SA PGM | Total SA gold | Total EU operations | Sandouville nickel refinery | Total AUS operations | Century zinc retreatment operation | ||||||||||||||||||||||
| (Loss)/profit before royalties, carbon tax and tax | (38,794) | (44,109) | (44,712) | 603 | 17,303 | (1,227) | (5,233) | (4,900) | (4,634) | (4,575) | ||||||||||||||||||||||
| Adjusted for: | ||||||||||||||||||||||||||||||||
| Amortisation and depreciation | 10,012 | 3,390 | 3,386 | 4 | 2,975 | 2,382 | 206 | 199 | 1,059 | 1,059 | ||||||||||||||||||||||
| Interest income | (1,369) | (213) | (213) | — | (478) | (611) | (53) | — | (10) | (6) | ||||||||||||||||||||||
| Finance expense | 3,299 | 1,134 | 1,134 | — | 706 | 897 | 67 | 13 | 184 | 158 | ||||||||||||||||||||||
| Share-based payments | 113 | 39 | 39 | — | 18 | 53 | (6) | 8 | — | — | ||||||||||||||||||||||
| Loss/(gain) on financial instruments | (235) | 2,064 | 2,064 | — | (1,957) | 19 | 168 | (44) | (515) | (515) | ||||||||||||||||||||||
| (Gain)/loss on foreign exchange movements | (1,973) | (12) | (12) | — | (1,894) | (26) | (55) | (55) | 39 | 4 | ||||||||||||||||||||||
| Share of results of equity-accounted investees after tax | 1,174 | — | — | — | 1,471 | (315) | — | — | — | — | ||||||||||||||||||||||
| Change in estimate of environmental rehabilitation obligation, and right of recovery liability and asset | (45) | — | — | — | (45) | — | — | — | — | — | ||||||||||||||||||||||
| (Gain)/loss on disposal of property, plant and equipment | (105) | 45 | 45 | — | (79) | (71) | — | — | — | — | ||||||||||||||||||||||
| Impairments | 47,454 | 38,919 | 38,919 | — | 506 | 2,733 | 1,607 | 1,607 | 3,689 | 3,689 | ||||||||||||||||||||||
| Gain on acquisition | (898) | — | — | — | (898) | — | — | — | — | — | ||||||||||||||||||||||
| Occupational healthcare gain | (365) | — | — | — | — | (365) | — | — | — | — | ||||||||||||||||||||||
| Restructuring costs | 515 | 41 | 41 | — | 351 | 123 | — | — | — | — | ||||||||||||||||||||||
| Transaction costs | 474 | 27 | 27 | — | — | — | — | — | 2 | — | ||||||||||||||||||||||
| Lease payments | (263) | (8) | (8) | — | (61) | (69) | (25) | (21) | (100) | (99) | ||||||||||||||||||||||
| Onerous contract provision | 1,865 | — | — | — | — | — | 1,865 | 1,865 | — | — | ||||||||||||||||||||||
| Gain on increase in equity-accounted investment | (5) | — | — | — | — | — | — | — | — | — | ||||||||||||||||||||||
| Gain on remeasurement of previous interest in Kroondal | (298) | — | — | — | (298) | — | — | — | — | — | ||||||||||||||||||||||
Adjusted EBITDA2 | 20,556 | 1,317 | 710 | 607 | 17,620 | 3,523 | (1,459) | (1,328) | (286) | (285) | ||||||||||||||||||||||
1 The SA rand amounts can be translated to US dollar at an average exchange rate of R18.42/US$ which amounts to a loss before royalties, carbon tax and tax of US$2,106 million (R38,794 million) and adjusted EBITDA of US$1,116 million (R20,556 million)
2 Adjusted EBITDA, as defined in note 11.1 of the condensed consolidated financial statements and reconciled above, is not a measure of performance under IFRS and should be considered in addition to, and not as a substitute for, other measures of financial performance and liquidity
Sibanye-Stillwater Operating and financial results | Six months and year ended 31 December 2023 100
| 2022 | ||||||||||||||||||||||||||
| Figures in million – SA rand | Group1 | Total US PGM | Underground | Recycling | Total SA PGM | Total SA gold | Total EU operations | Sandouville nickel refinery | ||||||||||||||||||
| (Loss)/profit before royalties, carbon tax and tax | 29,728 | 3,863 | 2,365 | 1,498 | 33,058 | (5,626) | (640) | (635) | ||||||||||||||||||
| Adjusted for: | ||||||||||||||||||||||||||
| Amortisation and depreciation | 7,087 | 2,803 | 2,799 | 4 | 2,418 | 1,708 | 158 | 153 | ||||||||||||||||||
| Interest income | (1,203) | (309) | (81) | (228) | (402) | (491) | — | — | ||||||||||||||||||
| Finance expense | 2,840 | 952 | 952 | — | 831 | 716 | 15 | 13 | ||||||||||||||||||
| Share-based payments | 218 | 47 | 47 | — | 73 | 96 | — | — | ||||||||||||||||||
| Loss/(gain) on financial instruments | 4,279 | 242 | 242 | — | 3,477 | 711 | (144) | — | ||||||||||||||||||
| (Gain)/loss on foreign exchange movements | (616) | 8 | 8 | — | (208) | (415) | 49 | (9) | ||||||||||||||||||
| Share of results of equity-accounted investees after tax | (1,287) | — | — | — | (1,062) | (236) | — | — | ||||||||||||||||||
| Change in estimate of environmental rehabilitation obligation, and right of recovery liability and asset | (71) | — | — | — | (125) | 54 | — | — | ||||||||||||||||||
| (Gain)/loss on disposal of property, plant and equipment | (162) | (5) | (5) | — | (54) | (103) | — | — | ||||||||||||||||||
| Impairments | (6) | — | — | — | (6) | — | — | — | ||||||||||||||||||
| Occupational healthcare gain | (211) | — | — | — | — | (211) | — | — | ||||||||||||||||||
| Restructuring costs | 363 | 2 | 2 | — | 26 | 335 | — | — | ||||||||||||||||||
| Transaction costs | 152 | 8 | 8 | — | 3 | (1) | — | — | ||||||||||||||||||
| Lease payments | (163) | (7) | (7) | — | (57) | (83) | (16) | (14) | ||||||||||||||||||
| Loss on deconsolidation of subsidiary | 308 | — | — | — | 308 | — | — | — | ||||||||||||||||||
| Profit on sale of Lonmin Canada | (145) | — | — | — | (145) | — | — | — | ||||||||||||||||||
| Adjusted EBITDA | 41,111 | 7,604 | 6,330 | 1,274 | 38,135 | (3,546) | (578) | (492) | ||||||||||||||||||
1 The SA rand amounts can be translated to US dollar at an average exchange rate of R16.37/US$ which amounts to a profit before royalties, carbon tax and tax of US$1,816 million (R29,728 million) and adjusted EBITDA of US$2,510 million (R41,111 million)
Sibanye-Stillwater Operating and financial results | Six months and year ended 31 December 2023 101
ADMINISTRATION AND CORPORATE INFORMATION
SIBANYE STILLWATER LIMITED (SIBANYE-STILLWATER) Incorporated in the Republic of South Africa Registration number 2014/243852/06 Share code: SSW and SBSW Issuer code: SSW ISIN: ZAE000259701 LISTINGS JSE: SSW NYSE: SBSW WEBSITE  www.sibanyestillwater.com www.sibanyestillwater.comREGISTERED AND CORPORATE OFFICE Constantia Office Park Bridgeview House, Building 11, Ground floor, Cnr 14th Avenue & Hendrik Potgieter Road Weltevreden Park 1709 South Africa Private Bag X5 Westonaria 1780 South Africa Tel: +27 11 278 9600 Fax: +27 11 278 9863 COMPANY SECRETARY Lerato Matlosa Email: lerato.matlosa@sibanyestillwater.com DIRECTORS Dr Vincent Maphai* (Chairman) Neal Froneman (CEO) Charl Keyter (CFO) Dr Elaine Dorward-King* Harry Kenyon-Slaney*^ Jeremiah Vilakazi* Keith Rayner* Nkosemntu Nika* Richard Menell* Savannah Danson* Susan van der Merwe* Timothy Cumming* Sindiswa Zilwa* * Independent non-executive ^ Lead independent director, appointed January 2024 INVESTOR ENQUIRIES James Wellsted Executive Vice President: Investor Relations and Corporate Affairs Mobile: +27 83 453 4014 Email: james.wellsted@sibanyestillwater.com or ir@sibanyestillwater.com | JSE SPONSOR JP Morgan Equities South Africa Proprietary Limited Registration number 1995/011815/07 1 Fricker Road Illovo Johannesburg 2196 South Africa Private Bag X9936 Sandton 2146 South Africa AUDITORS Ernst & Young Inc. (EY) 102 Rivonia Road Sandton 2196 South Africa Private Bag X14 Sandton 2146 South Africa Tel: +27 11 772 3000 AMERICAN DEPOSITARY RECEIPTS TRANSFER AGENT BNY Mellon Shareowner Correspondence (ADR) Mailing address of agent: Computershare PO Box 43078 Providence, RI 02940-3078 Overnight/certified/registered delivery: Computershare 150 Royall Street, Suite 101 Canton, MA 02021 US toll free: + 1 888 269 2377 Tel: +1 201 680 6825 Email: shrrelations@cpushareownerservices.com Tatyana Vesselovskaya Relationship Manager - BNY Mellon Depositary Receipts Email: tatyana.vesselovskaya@bnymellon.com TRANSFER SECRETARIES SOUTH AFRICA Computershare Investor Services Proprietary Limited Rosebank Towers15 Biermann Avenue Rosebank 2196 PO Box 61051 Marshalltown 2107 South Africa Tel: +27 11 370 5000 Fax: +27 11 688 5248 | ||||
Sibanye-Stillwater Operating and financial results | Six months and year ended 31 December 2023 102
DISCLAIMER
FORWARD LOOKING STATEMENTS
The information in this document may contain forward-looking statements within the meaning of the “safe harbour” provisions of the United States Private Securities Litigation Reform Act of 1995 with respect to Sibanye Stillwater Limited’s (Sibanye-Stillwater or the Group) financial condition, results of operations, business strategies, operating efficiencies, competitive position, growth opportunities for existing services, plans and objectives of management for future operations, markets for stock and other matters. These forward-looking statements, including, among others, those relating to Sibanye-Stillwater’s future business prospects, revenues and income, expected cost savings and capital reduction/deferral, climate change-related targets and metrics, the potential benefits of past and future acquisitions (including statements regarding growth, cost savings, benefits from and access to international financing and financial re-ratings), gold, PGM, nickel and lithium pricing expectations, levels of output, supply and demand, information relating to Sibanye-Stillwater’s new or ongoing development projects, any proposed, anticipated or planned expansions into the battery metals or adjacent sectors and estimations or expectations of enterprise value, adjusted EBITDA and net asset, are necessarily estimates reflecting the best judgment of the senior management and directors of Sibanye-Stillwater and involve a number of risks and uncertainties that could cause actual results to differ materially from those suggested by the forward-looking statements. As a consequence, these forward-looking statements should be considered in light of various important factors, including those set forth in this document.
All statements other than statements of historical facts included in this document may be forward-looking statements. Forward-looking statements also often use words such as “will”, “would”, “expect”, “forecast”, “goal”, “vision”, “potential”, “may”, “could”, “believe”, “aim”, “anticipate”, “target”, “estimate” and words of similar meaning. By their nature, forward-looking statements involve risk and uncertainty because they relate to future events and circumstances and should be considered in light of various important factors, including those set forth in this disclaimer. Readers are cautioned not to place undue reliance on such statements.
The important factors that could cause Sibanye-Stillwater’s actual results, performance or achievements to differ materially from estimates or projections contained in the forward-looking statements include, without limitation, Sibanye-Stillwater’s future financial position, plans, strategies, objectives, capital expenditures, projected costs and anticipated cost savings, financing plans, debt position and ability to reduce debt leverage; economic, business, political and social conditions in South Africa, Zimbabwe, the United States, Europe, Australia and elsewhere; plans and objectives of management for future operations; Sibanye-Stillwater’s ability to obtain the benefits of any streaming arrangements or pipeline financing; the ability of Sibanye-Stillwater to comply with loan and other covenants and restrictions and difficulties in obtaining additional financing or refinancing; Sibanye-Stillwater’s ability to service its bond instruments; changes in assumptions underlying Sibanye-Stillwater’s estimation of its Mineral Resources and Mineral Reserves; any failure of a tailings storage facility; the ability to achieve anticipated efficiencies and other cost savings in connection with, and the ability to successfully integrate, past, ongoing and future acquisitions, as well as at existing operations; the ability of Sibanye-Stillwater to complete any ongoing or future acquisitions; the success of Sibanye-Stillwater’s business strategy and exploration and development activities, including any proposed, anticipated or planned expansions into the battery metals or adjacent sectors and estimations or expectations of enterprise value (including the Rhyolite Ridge project); the ability of Sibanye-Stillwater to comply with requirements that it operate in ways that provide progressive benefits to affected communities; changes in the market price of gold, PGMs, battery metals (e.g., nickel, lithium, copper and zinc) and the cost of power, petroleum fuels, and oil, among other commodities and supply requirements; the occurrence of hazards associated with underground and surface mining; any further downgrade of South Africa’s credit rating; the impact of South Africa's greylisting; a challenge regarding the title to any of Sibanye-Stillwater’s properties by claimants to land under restitution and other legislation; Sibanye-Stillwater’s ability to implement its strategy and any changes thereto; the outcome of legal challenges to the Group’s mining or other land use rights; the occurrence of labour disputes, disruptions and industrial actions; the availability, terms and deployment of capital or credit; changes in the imposition of industry standards, regulatory costs and relevant government regulations, particularly environmental, sustainability, tax, health and safety regulations and new legislation affecting water, mining, mineral rights and business ownership, including any interpretation thereof which may be subject to dispute; increasing regulation of environmental and sustainability matters such as greenhouse gas emissions and climate change; being subject to, and the outcome and consequence of, any potential or pending litigation or regulatory proceedings, including in relation to any environmental, health or safety issues; the ability of Sibanye-Stillwater to meet its decarbonisation targets, including by diversifying its energy mix with renewable energy projects; failure to meet ethical standards, including actual or alleged instances of fraud, bribery or corruption; the effect of climate change or other extreme weather events on Sibanye-Stillwater’s business; the concentration of all final refining activity and a large portion of Sibanye-Stillwater’s PGM sales from mine production in the United States with one entity; the identification of a material weakness in disclosure and internal controls over financial reporting; the effect of US tax reform legislation on Sibanye-Stillwater and its subsidiaries; the effect of South African Exchange Control Regulations on Sibanye-Stillwater’s financial flexibility; operating in new geographies and regulatory environments where Sibanye-Stillwater has no previous experience; power disruptions, constraints and cost increases; supply chain disruptions and shortages and increases in the price of production inputs; the regional concentration of Sibanye-Stillwater’s operations; fluctuations in exchange rates, currency devaluations, inflation and other macro-economic monetary policies; the occurrence of temporary stoppages or precautionary suspension of operations at its mines for safety or environmental incidents (including natural disasters) and unplanned maintenance; Sibanye-Stillwater’s ability to hire and retain senior management and employees with sufficient technical and/or production skills across its global operations necessary to meet its labour recruitment and retention goals, as well as its ability to achieve sufficient representation of historically disadvantaged South Africans in its management positions; failure of Sibanye-Stillwater’s information technology, communications and systems; the adequacy of Sibanye-Stillwater’s insurance coverage; social unrest, sickness or natural or man-made disaster at informal settlements in the vicinity of some of Sibanye-Stillwater’s South African-based operations; and the impact of HIV, tuberculosis and the spread of other contagious diseases, including global pandemics.
Further details of potential risks and uncertainties affecting Sibanye-Stillwater are described in Sibanye-Stillwater’s filings with the Johannesburg Stock Exchange and the United States Securities and Exchange Commission, including the 2022 Integrated Report and the Annual Financial Report for the fiscal year ended 31 December 2022 on Form 20-F filed with the United States Securities and Exchange Commission on 24 April 2023 (SEC File no. 333-234096).
These forward-looking statements speak only as of the date of the content. Sibanye-Stillwater expressly disclaims any obligation or undertaking to update or revise any forward-looking statement (except to the extent legally required). These forward-looking statements have not been reviewed or reported on by the Group’s external auditors.
Non-IFRS Measures
The information contained in this document may contain certain non-IFRS measures, including, among others, adjusted EBITDA, adjusted EBITDA margin, AISC, AIC, Nickel equivalent sustaining cost and adjusted free cash flow. These measures may not be comparable to similarly-titled measures used by other companies and are not measures of Sibanye-Stillwater’s financial performance under IFRS. These measures should not be considered in isolation or as a substitute for measures of performance prepared in accordance with IFRS. Sibanye-Stillwater is not providing a reconciliation of the forecast non-IFRS financial information presented in this document because it is unable to provide this reconciliation without unreasonable effort. These forecast non-IFRS financial information presented have not been reviewed or reported on by the Group’s external auditors.
Websites
References in this document to information on websites (and/or social media sites) are included as an aid to their location and such information is not incorporated in, and does not form part of, this document.
Sibanye-Stillwater Operating and financial results | Six months and year ended 31 December 2023 103