Exhibit 99.2

2Q20 Earnings Presentation August 2020

2 Important Disclosure IN REVIEWING THE INFORMATION CONTAINED IN THIS PRESENTATION, YOU ARE AGREEING TO ABIDE BY THE TERMS OF THIS DISCLAIMER . THIS INFORMATION IS BEING MADE AVAILABLE TO EACH RECIPIENT SOLELY FOR ITS INFORMATION AND IS SUBJECT TO AMENDMENT . This presentation is prepared by XP Inc . (the “Company,” “we” or “our”), is solely for informational purposes . This presentation does not constitute a prospectus and does not constitute an offer to sell or the solicitation of an offer to buy any securities . In addition, this document and any materials distributed in connection with this presentation are not directed to, or intended for distribution to or use by, any person or entity that is a citizen or resident or located in any locality, state, country or other jurisdiction where such distribution, publication, availability or use would be contrary to law or regulation or which would require any registration or licensing within such jurisdiction . This presentation was prepared by the Company . Neither the Company nor any of its affiliates, officers, employees or agents, make any representation or warranty, express or implied, in relation to the fairness, reasonableness, adequacy, accuracy or completeness of the information, statements or opinions, whichever their source, contained in this presentation or any oral information provided in connection herewith, or any data it generates and accept no responsibility, obligation or liability (whether direct or indirect, in contract, tort or otherwise) in relation to any of such information . The information and opinions contained in this presentation are provided as at the date of this presentation, are subject to change without notice and do not purport to contain all information that may be required to evaluate the Company . The information in this presentation is in draft form and has not been independently verified . The Company and its affiliates, officers, employees and agents expressly disclaim any and all liability which may be based on this presentation and any errors therein or omissions therefrom . Neither the Company nor any of its affiliates, officers, employees or agents makes any representation or warranty, express or implied, as to the achievement or reasonableness of future projections, management targets, estimates, prospects or returns, if any . The information contained in this presentation does not purport to be comprehensive and has not been subject to any independent audit or review . Certain of the financial information as of and for the periods ended December 31 , 2019 , 2018 and 2017 has been derived from audited financial statements and all other financial information has been derived from unaudited interim financial statements . A significant portion of the information contained in this presentation is based on estimates or expectations of the Company, and there can be no assurance that these estimates or expectations are or will prove to be accurate . The Company’s internal estimates have not been verified by an external expert, and the Company cannot guarantee that a third party using different methods to assemble, analyze or compute market information and data would obtain or generate the same results . Statements in the presentation, including those regarding the possible or assumed future or other performance of the Company or its industry or other trend projections, constitute forward - looking statements . These statements are generally identified by the use of words such as “anticipate,” “believe,” “could,” “expect,” “should,” “plan,” “intend,” “estimate” and “potential,” among others . By their nature, forward - looking statements are necessarily subject to a high degree of uncertainty and involve known and unknown risks, uncertainties, assumptions and other factors because they relate to events and depend on circumstances that will occur in the future whether or not outside the control of the Company . Such factors may cause actual results, performance or developments to differ materially from those expressed or implied by such forward - looking statements and there can be no assurance that such forward - looking statements will prove to be correct . These risks and uncertainties include factors relating to : ( 1 ) general economic, financial, political, demographic and business conditions in Brazil, as well as any other countries we may serve in the future and their impact on our business ; ( 2 ) fluctuations in interest, inflation and exchange rates in Brazil and any other countries we may serve in the future ; ( 3 ) competition in the financial services industry ; ( 4 ) our ability to implement our business strategy ; ( 5 ) our ability to adapt to the rapid pace of technological changes in the financial services industry ; ( 6 ) the reliability, performance, functionality and quality of our products and services and the investment performance of investment funds managed by third parties or by our asset managers ; ( 7 ) the availability of government authorizations on terms and conditions and within periods acceptable to us ; ( 8 ) our ability to continue attracting and retaining new appropriately - skilled employees ; ( 9 ) our capitalization and level of indebtedness ; ( 10 ) the interests of our controlling shareholders ; ( 11 ) changes in government regulations applicable to the financial services industry in Brazil and elsewhere ; ( 12 ) our ability to compete and conduct our business in the future ; ( 13 ) the success of operating initiatives, including advertising and promotional efforts and new product, service and concept development by us and our competitors ; ( 14 ) changes in consumer demands regarding financial products, customer experience related to investments and technological advances, and our ability to innovate to respond to such changes ; ( 15 ) changes in labor, distribution and other operating costs ; ( 16 ) our compliance with, and changes to, government laws, regulations and tax matters that currently apply to us ; ( 17 ) the negative impacts of the COVID - 19 pandemic on global, regional and national economies and the related market volatility and protracted economic downturn ; and ( 18 ) other factors that may affect our financial condition, liquidity and results of operations . Accordingly, you should not place undue reliance on forward - looking statements . The forward - looking statements included herein speak only as at the date of this presentation and the Company does not undertake any obligation to update these forward - looking statements . Past performance does not guarantee or predict future performance . Moreover, the Company and its affiliates, officers, employees and agents do not undertake any obligation to review, update or confirm expectations or estimates or to release any revisions to any forward - looking statements to reflect events that occur or circumstances that arise in relation to the content of the presentation . You are cautioned not to unduly rely on such forward - looking statements when evaluating the information presented and we do not intend to update any of these forward - looking statements . Market data and industry information used throughout this presentation are based on management’s knowledge of the industry and the good faith estimates of management . The Company also relied, to the extent available, upon management’s review of industry surveys and publications and other publicly available information prepared by a number of third party sources . All of the market data and industry information used in this presentation involves a number of assumptions and limitations, and you are cautioned not to give undue weight to such estimates . Although the Company believes that these sources are reliable, there can be no assurance as to the accuracy or completeness of this information, and the Company has not independently verified this information . The contents hereof should not be construed as investment, legal, tax or other advice and you should consult your own advisers as to legal, business, tax and other related matters concerning an investment in the Company . The Company is not acting on your behalf and does not regard you as a customer or a client . It will not be responsible to you for providing protections afforded to clients or for advising you on the relevant transaction . This presentation also includes certain non - GAAP financial information . We believe that such information is meaningful and useful in understanding the activities and business metrics of the Company’s operations . We also believe that these non - GAAP financial measures reflect an additional way of viewing aspects of the Company’s business that, when viewed with our International Financial Reporting Standards (“IFRS”) results, as issued by the International Accounting Standards Board, provide a more complete understanding of factors and trends affecting the Company’s business . Further, investors regularly rely on non - GAAP financial measures to assess operating performance and such measures may highlight trends in the Company’s business that may not otherwise be apparent when relying on financial measures calculated in accordance with IFRS . We also believe that certain non - GAAP financial measures are frequently used by securities analysts, investors and other interested parties in the evaluation of public companies in the Company’s industry, many of which present these measures when reporting their results . The non - GAAP financial information is presented for informational purposes and to enhance understanding of the IFRS financial statements . The non - GAAP measures should be considered in addition to results prepared in accordance with IFRS, but not as a substitute for, or superior to, IFRS results . As other companies may determine or calculate this non - GAAP financial information differently, the usefulness of these measures for comparative purposes is limited . A reconciliation of such non - GAAP financial measures to the nearest GAAP measure is included in this presentation . For purposes of this presentation : “Active Clients” means the total number of retail clients served through our XP Investimentos, Rico, Clear, XP Investments and XP Private (Europe) brands, with an AUC above R $ 100 . 00 or that have transacted at least once in the last thirty days . For purposes of calculating this metric, if a client holds an account in more than one of the aforementioned entities, such client will be counted as one “active client” for each such account . For example, if a client holds an account in each of XP Investimentos and Rico, such client will count as two “active clients” for purposes of this metric . “Assets Under Custody (AUC)” means the market value of all client assets invested through XP’s platform, including equities, fixed income securities, mutual funds (including those managed by XP Gestão de Recursos Ltda . , XP Advisory Gestão Recursos Ltda . and XP Vista Asset Management Ltda . , as well as by third - party asset managers), pension funds (including those from XP Vida e Previdência S . A . , as well as by third - party insurance companies), exchange traded funds, COEs (Structured Notes), REITs, and uninvested cash balances (Floating Balances), among others . 2

3 Index 0 1 2Q20 KPIs and Financials 0 2 Recent Developments 0 3 Q&A 0 4 Opening Remarks

1 Opening Remarks
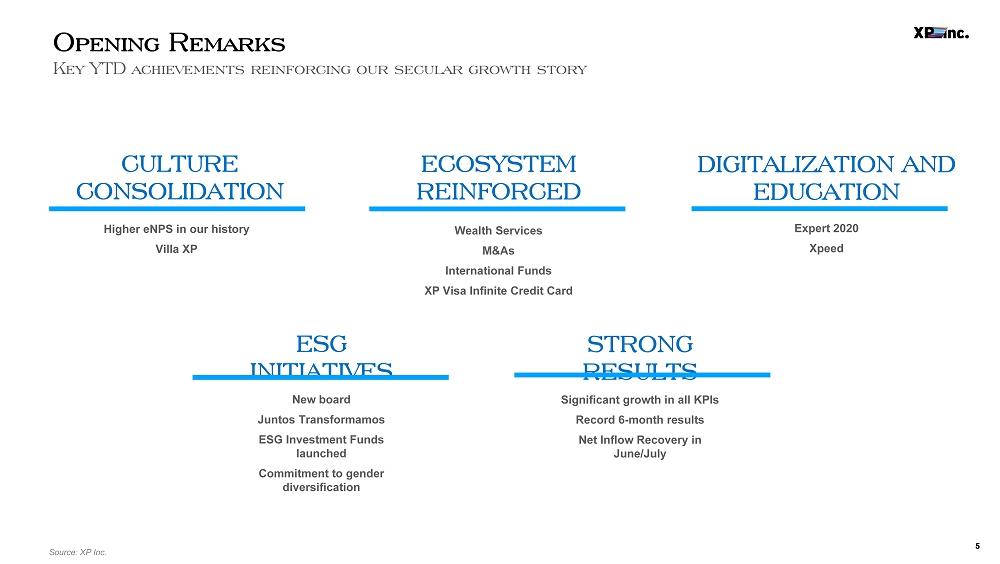
5 CULTURE CONSOLIDATION Opening Remarks ECOSYSTEM REINFORCED Key YTD achievements reinforcing our secular growth story Higher eNPS in our history Villa XP Wealth Services M&As International Funds XP Visa Infinite Credit Card New board Juntos Transformamos ESG Investment Funds launched Commitment to gender diversification ESG INITIATIVES Significant growth in all KPIs Record 6 - month results Net Inflow Recovery in June/July STRONG RESULTS DIGITALIZATION AND EDUCATION Expert 2020 Xpeed Source: XP Inc.

2 2Q20 KPIs and Financials
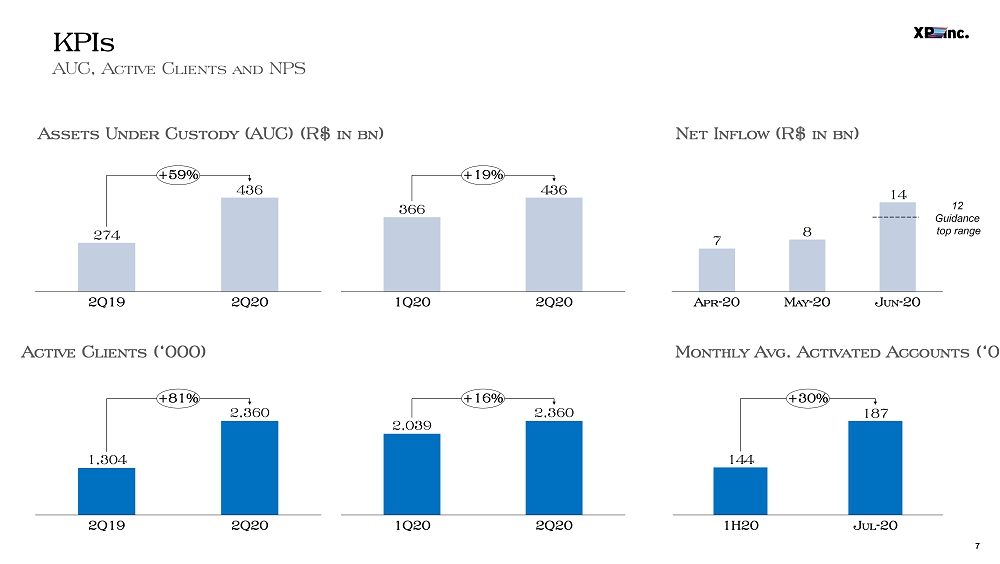
7 KPIs AUC, Active Clients and NPS Assets Under Custody (AUC) (R$ in bn) Active Clients (‘000) 2Q19 2Q20 2,360 1,304 +81% 2,039 2Q20 1Q20 2,360 +16% 274 436 2Q19 2Q20 +59% 366 436 1Q20 2Q20 +19% 144 187 1H20 Jul - 20 +30% 7 8 14 Apr - 20 May - 20 Jun - 20 Monthly Avg. Activated Accounts (‘000) Net Inflow (R$ in bn) 12 Guidance top range
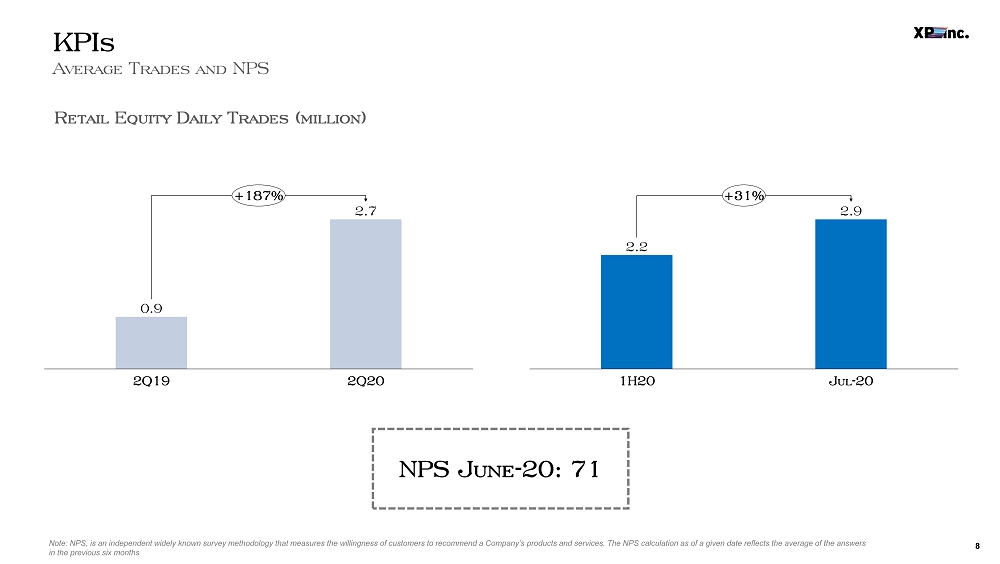
8 KPIs Average Trades and NPS Note: NPS, is an independent widely known survey methodology that measures the willingness of customers to recommend a Compan y’s products and services. The NPS calculation as of a given date reflects the average of the answers in the previous six months Retail Equity Daily Trades (million) 1H20 Jul - 20 2.9 2.2 +31% 2Q19 2Q20 0.9 2.7 +187% NPS June - 20: 71
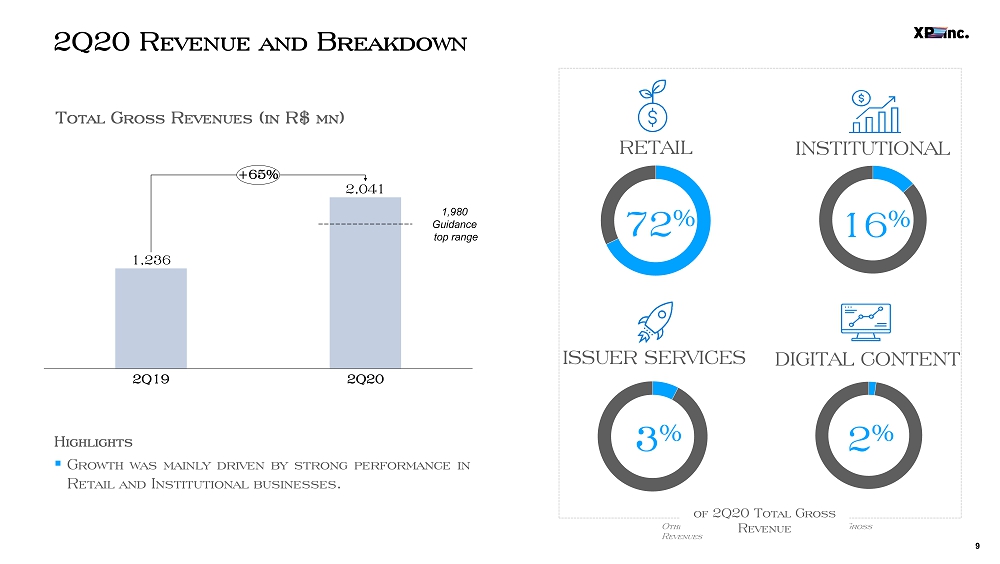
9 2 Q20 Revenue and Breakdown RETAIL INSTITUTIONAL ISSUER SERVICES DIGITAL CONTENT 72 % 16 % 3 % 2 % Other Revenue represented 6% of Total Gross Revenues Total Gross Revenues (in R$ mn) Highlights ▪ Growth was mainly driven by strong performance in Retail and Institutional businesses . of 2Q20 Total Gross Revenue 2,041 2Q19 2Q20 1,236 +65% 1,980 Guidance top range
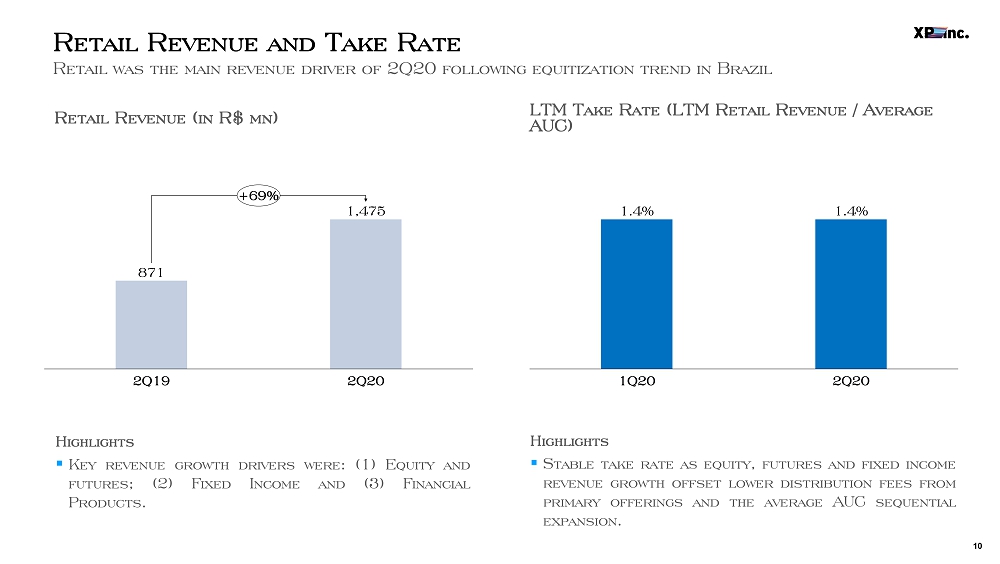
10 Retail Revenue and Take Rate Retail was the main revenue driver of 2Q20 following equitization trend in Brazil LTM Take Rate (LTM Retail Revenue / Average AUC) Retail Revenue (in R$ mn) 1.4% 1Q20 2Q20 1.4% 871 2Q19 1,475 2Q20 +69% Highlights ▪ Stable take rate as equity, futures and fixed income revenue growth offset lower distribution fees from primary offerings and the average AUC sequential expansion . Highlights ▪ Key revenue growth drivers were : ( 1 ) Equity and futures ; ( 2 ) Fixed Income and ( 3 ) Financial Products .
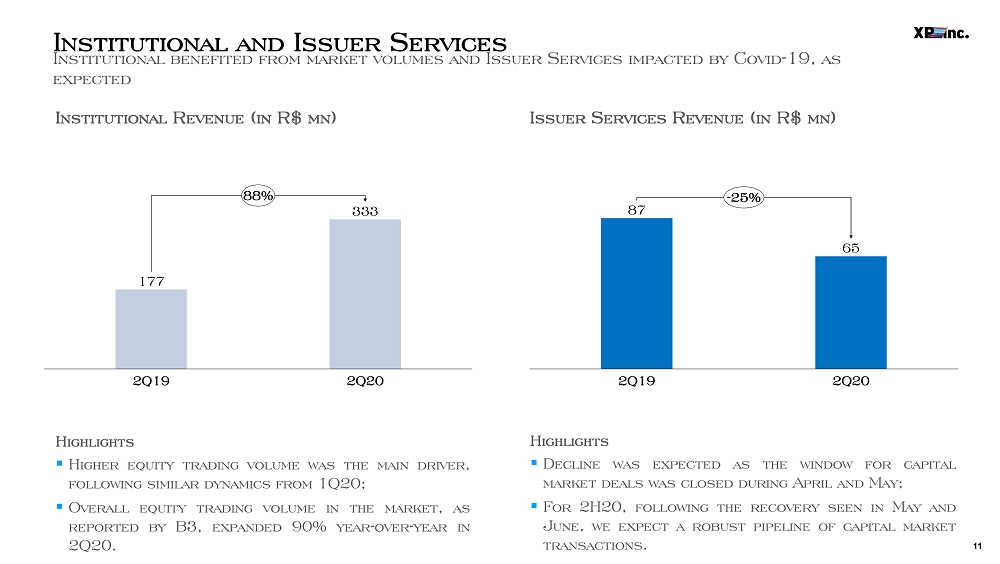
11 Highlights ▪ Decline was expected as the window for capital market deals was closed during April and May ; ▪ For 2 H 20 , following the recovery seen in May and June, we expect a robust pipeline of capital market transactions . 87 65 2Q20 2Q19 - 25% Highlights ▪ Higher equity trading volume was the main driver, following similar dynamics from 1 Q 20 ; ▪ Overall equity trading volume in the market, as reported by B 3 , expanded 90 % year - over - year in 2 Q 20 . 177 333 2Q20 2Q19 88% Institutional and Issuer Services Institutional benefited from market volumes and Issuer Services impacted by Covid - 19, as expected Issuer Services Revenue (in R$ mn) Institutional Revenue (in R$ mn)
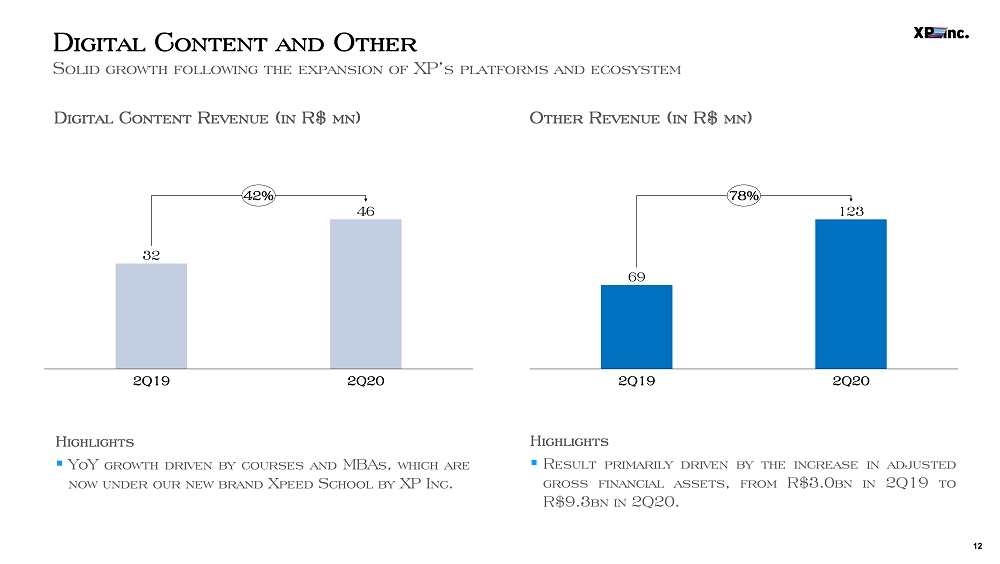
12 Highlights ▪ Result primarily driven by the increase in adjusted gross financial assets, from R $ 3 . 0 bn in 2 Q 19 to R $ 9 . 3 bn in 2 Q 20 . 69 123 2Q20 2Q19 78% Highlights ▪ YoY growth driven by courses and MBAs, which are now under our new brand Xpeed School by XP Inc . 32 46 2Q19 2Q20 42% Digital Content and Other Solid growth following the expansion of XP’s platforms and ecosystem Other Revenue (in R$ mn) Digital Content Revenue (in R$ mn)
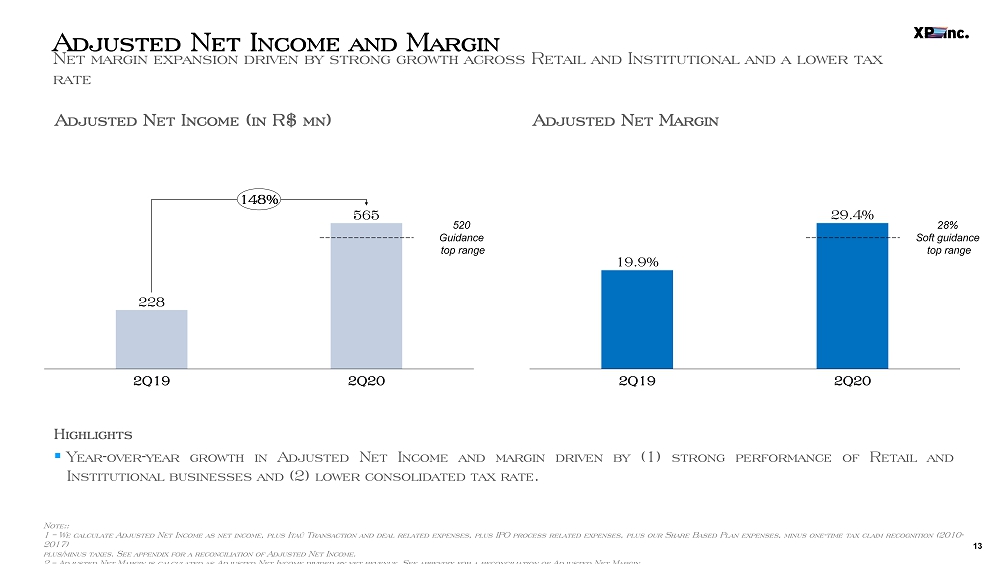
13 Adjusted Net Income and Margin Net margin expansion driven by strong growth across Retail and Institutional and a lower tax rate Highlights ▪ Year - over - year growth in Adjusted Net Income and margin driven by ( 1 ) strong performance of Retail and Institutional businesses and ( 2 ) lower consolidated tax rate . Adjusted Net Income (in R$ mn) Adjusted Net Margin Note :: 1 – We calculate Adjusted Net Income as net income, plus Itaú Transaction and deal related expenses, plus IPO process related expenses, plus our Share Based Plan expenses, minus one - time tax claim recognition ( 2010 - 2017 ) plus/minus taxes . See appendix for a reconciliation of Adjusted Net Income . 2 – Adjusted Net Margin is calculated as Adjusted Net Income divided by net revenue . See appendix for a reconciliation of Adjusted Net Margin .. 2Q19 29.4% 2Q20 19.9% 228 565 2Q19 2Q20 148% 28% Soft guidance top range 520 Guidance top range

3 Recent Developments
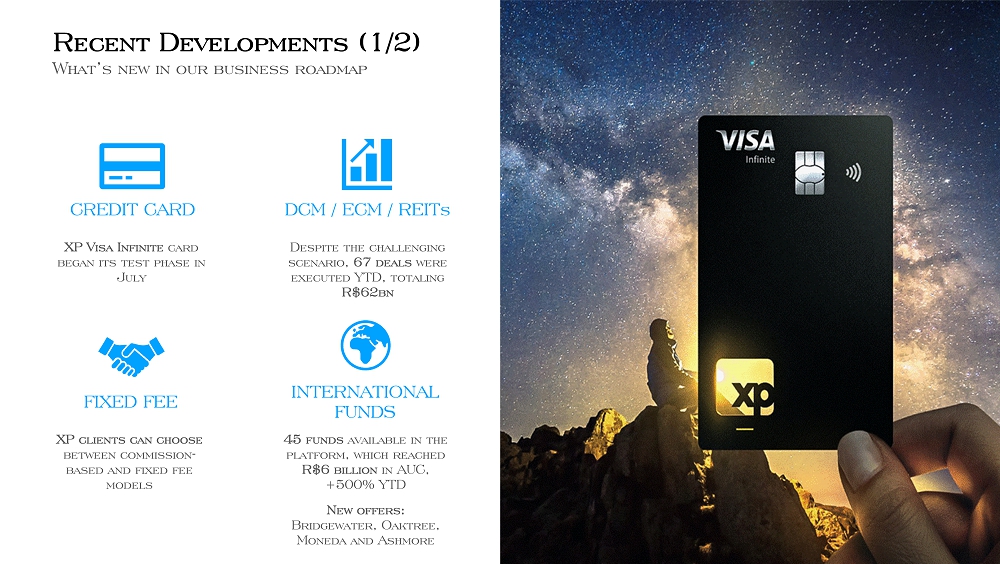
15 Recent Developments (1/2) XP Visa Infinite card began its test phase in July CREDIT CARD DCM / ECM / REITs Despite the challenging scenario, 67 deals were executed YTD, totaling R$62bn What’s new in our business roadmap 45 funds available in the platform, which reached R$6 billion in AUC, +500% YTD New offers: Bridgewater, Oaktree, Moneda and Ashmore INTERNATIONAL FUNDS XP clients can choose between commission - based and fixed fee models FIXED FEE
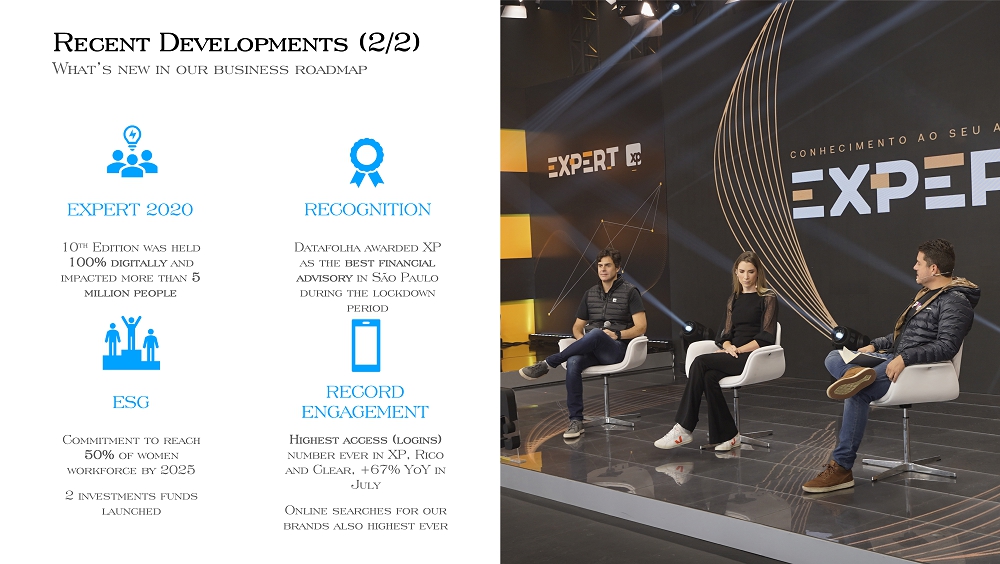
16 Recent Developments (2/2) What’s new in our business roadmap RECOGNITION Datafolha awarded XP as the best financial advisory in São Paulo during the lockdown period Highest access (logins) number ever in XP, Rico and Clear, +67% YoY in July Online searches for our brands also highest ever RECORD ENGAGEMENT 10 th Edition was held 100% digitally and impacted more than 5 million people EXPERT 2020 Commitment to reach 50% of women workforce by 2025 2 investments funds launched ESG
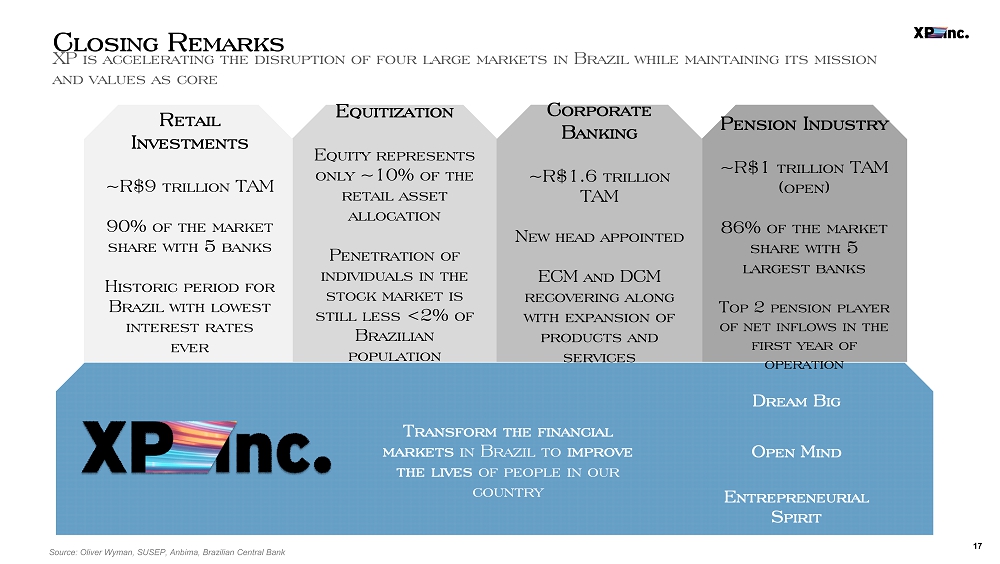
17 Closing Remarks XP is accelerating the disruption of four large markets in Brazil while maintaining its mission and values as core Retail Investments ~R$8 trillion TAM 90% of the market share with 5 largest banks Equitization Equity represents only ~10% of the retail asset allocation Penetration of individuals in the stock market is still less <2% of Brazilian population Pension Industry ~R$1 trillion TAM (open) 86% of the market share with 5 largest banks Top 2 pension player of net inflows in the first year of operation Corporate Banking ~R$1.6 trillion TAM New head appointed ECM and DCM recovering along with expansion of products and services Dream Big Retail Investments ~R$9 trillion TAM 90% of the market share with 5 banks Historic period for Brazil with lowest interest rates ever Transform the financial markets in Brazil to improve the lives of people in our country Open Mind Entrepreneurial Spirit Source: Oliver Wyman, SUSEP, Anbima , Brazilian Central Bank

Q&A

Investor Relations Carlos Lazar André Martins ir@xpi.com.br IR Website: investors.xpinc.com

Appendix

21 COGS and SG&A Gross margin expansion and efficiency gains COGS (in R$ mn) Operating Expenses (in R$ mn) Highlights ▪ Year - over - year gross margin expansion due to product mix and equitization accelerating direct channel growth . 366 579 2Q19 2Q20 58% 69.8% 68.1% Gross Margin 35.3% 36.8% % of Net Revenue 2Q19 0 41 2Q20 422 678 61% Share Based Compensation Highlights ▪ Efficiency gains arising mainly from our business model’s operating leverage .
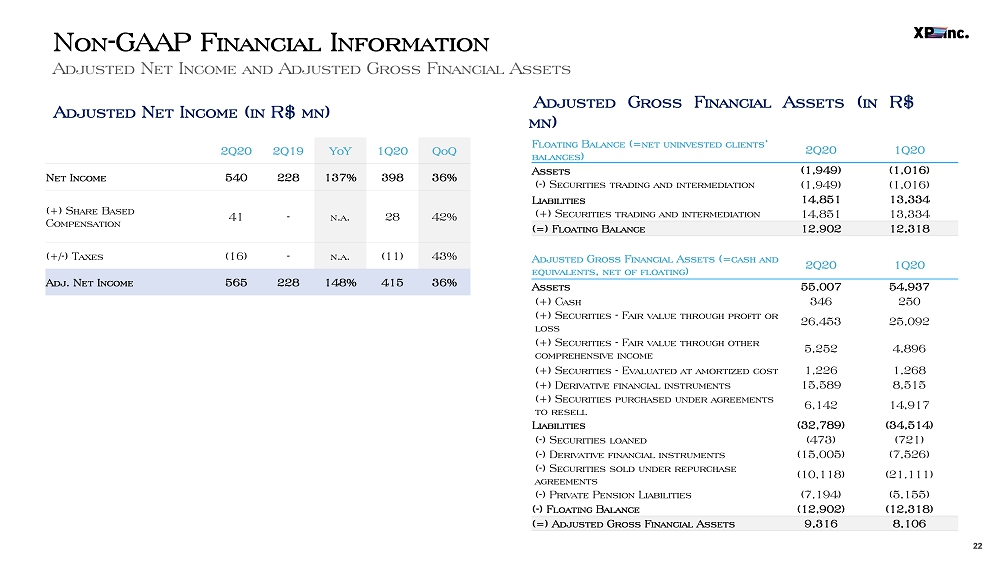
22 Non - GAAP Financial Information Adjusted Net Income and Adjusted Gross Financial Assets 22 Adjusted Gross Financial Assets (in R $ mn ) Adjusted Net Income (in R $ mn ) 2Q20 2Q19 YoY 1Q20 QoQ Net Income 540 228 137% 398 36% (+) Share Based Compensation 41 - n.a. 28 42% (+/ - ) Taxes (16) - n.a. (11) 43% Adj. Net Income 565 228 148% 415 36% Floating Balance (=net uninvested clients’ balances) 2Q20 1Q20 Assets (1,949) (1,016) ( - ) Securities trading and intermediation (1,949) (1,016) Liabilities 14,851 13,334 (+) Securities trading and intermediation 14,851 13,334 (=) Floating Balance 12,902 12,318 Adjusted Gross Financial Assets (=cash and equivalents, net of floating) 2Q20 1Q20 Assets 55,007 54,937 (+) Cash 346 250 (+) Securities - Fair value through profit or loss 26,453 25,092 (+) Securities - Fair value through other comprehensive income 5,252 4,896 (+) Securities - Evaluated at amortized cost 1,226 1,268 (+) Derivative financial instruments 15,589 8,515 (+) Securities purchased under agreements to resell 6,142 14,917 Liabilities (32,789) (34,514) ( - ) Securities loaned (473) (721) ( - ) Derivative financial instruments (15,005) (7,526) ( - ) Securities sold under repurchase agreements (10,118) (21,111) ( - ) Private Pension Liabilities (7,194) (5,155) ( - ) Floating Balance (12,902) (12,318) (=) Adjusted Gross Financial Assets 9,316 8,106