
1 4Q20 Earnings Presentation

2 Important Disclosure IN REVIEWING THE INFORMATION CONTAINED IN THIS PRESENTATION, YOU ARE AGREEING TO ABIDE BY THE TERMS OF THIS DISCLAIMER . THIS INFORMATION IS BEING MADE AVAILABLE TO EACH RECIPIENT SOLELY FOR ITS INFORMATION AND IS SUBJECT TO AMENDMENT . This presentation is prepared by XP Inc . (the “Company,” “we” or “our”), is solely for informational purposes . This presentation does not constitute a prospectus and does not constitute an offer to sell or the solicitation of an offer to buy any securities . In addition, this document and any materials distributed in connection with this presentation are not directed to, or intended for distribution to or use by, any person or entity that is a citizen or resident or located in any locality, state, country or other jurisdiction where such distribution, publication, availability or use would be contrary to law or regulation or which would require any registration or licensing within such jurisdiction . This presentation was prepared by the Company . Neither the Company nor any of its affiliates, officers, employees or agents, make any representation or warranty, express or implied, in relation to the fairness, reasonableness, adequacy, accuracy or completeness of the information, statements or opinions, whichever their source, contained in this presentation or any oral information provided in connection herewith, or any data it generates and accept no responsibility, obligation or liability (whether direct or indirect, in contract, tort or otherwise) in relation to any of such information . The information and opinions contained in this presentation are provided as at the date of this presentation, are subject to change without notice and do not purport to contain all information that may be required to evaluate the Company . The information in this presentation is in draft form and has not been independently verified . The Company and its affiliates, officers, employees and agents expressly disclaim any and all liability which may be based on this presentation and any errors therein or omissions therefrom . Neither the Company nor any of its affiliates, officers, employees or agents makes any representation or warranty, express or implied, as to the achievement or reasonableness of future projections, management targets, estimates, prospects or returns, if any . The information contained in this presentation does not purport to be comprehensive and has not been subject to any independent audit or review . Certain of the financial information as of and for the periods ended December 31 , 2019 , 2018 and 2017 has been derived from audited financial statements and all other financial information has been derived from unaudited interim financial statements . A significant portion of the information contained in this presentation is based on estimates or expectations of the Company, and there can be no assurance that these estimates or expectations are or will prove to be accurate . The Company’s internal estimates have not been verified by an external expert, and the Company cannot guarantee that a third party using different methods to assemble, analyze or compute market information and data would obtain or generate the same results . Statements in the presentation, including those regarding the possible or assumed future or other performance of the Company or its industry or other trend projections, constitute forward - looking statements . These statements are generally identified by the use of words such as “anticipate,” “believe,” “could,” “expect,” “should,” “plan,” “intend,” “estimate” and “potential,” among others . By their nature, forward - looking statements are necessarily subject to a high degree of uncertainty and involve known and unknown risks, uncertainties, assumptions and other factors because they relate to events and depend on circumstances that will occur in the future whether or not outside the control of the Company . Such factors may cause actual results, performance or developments to differ materially from those expressed or implied by such forward - looking statements and there can be no assurance that such forward - looking statements will prove to be correct . These risks and uncertainties include factors relating to : ( 1 ) general economic, financial, political, demographic and business conditions in Brazil, as well as any other countries we may serve in the future and their impact on our business ; ( 2 ) fluctuations in interest, inflation and exchange rates in Brazil and any other countries we may serve in the future ; ( 3 ) competition in the financial services industry ; ( 4 ) our ability to implement our business strategy ; ( 5 ) our ability to adapt to the rapid pace of technological changes in the financial services industry ; ( 6 ) the reliability, performance, functionality and quality of our products and services and the investment performance of investment funds managed by third parties or by our asset managers ; ( 7 ) the availability of government authorizations on terms and conditions and within periods acceptable to us ; ( 8 ) our ability to continue attracting and retaining new appropriately - skilled employees ; ( 9 ) our capitalization and level of indebtedness ; ( 10 ) the interests of our controlling shareholders ; ( 11 ) changes in government regulations applicable to the financial services industry in Brazil and elsewhere ; ( 12 ) our ability to compete and conduct our business in the future ; ( 13 ) the success of operating initiatives, including advertising and promotional efforts and new product, service and concept development by us and our competitors ; ( 14 ) changes in consumer demands regarding financial products, customer experience related to investments and technological advances, and our ability to innovate to respond to such changes ; ( 15 ) changes in labor, distribution and other operating costs ; ( 16 ) our compliance with, and changes to, government laws, regulations and tax matters that currently apply to us ; ( 17 ) the negative impacts of the COVID - 19 pandemic on global, regional and national economies and the related market volatility and protracted economic downturn ; and ( 18 ) other factors that may affect our financial condition, liquidity and results of operations . Accordingly, you should not place undue reliance on forward - looking statements . The forward - looking statements included herein speak only as at the date of this presentation and the Company does not undertake any obligation to update these forward - looking statements . Past performance does not guarantee or predict future performance . Moreover, the Company and its affiliates, officers, employees and agents do not undertake any obligation to review, update or confirm expectations or estimates or to release any revisions to any forward - looking statements to reflect events that occur or circumstances that arise in relation to the content of the presentation . You are cautioned not to unduly rely on such forward - looking statements when evaluating the information presented and we do not intend to update any of these forward - looking statements . Market data and industry information used throughout this presentation are based on management’s knowledge of the industry and the good faith estimates of management . The Company also relied, to the extent available, upon management’s review of industry surveys and publications and other publicly available information prepared by a number of third party sources . All of the market data and industry information used in this presentation involves a number of assumptions and limitations, and you are cautioned not to give undue weight to such estimates . Although the Company believes that these sources are reliable, there can be no assurance as to the accuracy or completeness of this information, and the Company has not independently verified this information . The contents hereof should not be construed as investment, legal, tax or other advice and you should consult your own advisers as to legal, business, tax and other related matters concerning an investment in the Company . The Company is not acting on your behalf and does not regard you as a customer or a client . It will not be responsible to you for providing protections afforded to clients or for advising you on the relevant transaction . This presentation also includes certain non - GAAP financial information . We believe that such information is meaningful and useful in understanding the activities and business metrics of the Company’s operations . We also believe that these non - GAAP financial measures reflect an additional way of viewing aspects of the Company’s business that, when viewed with our International Financial Reporting Standards (“IFRS”) results, as issued by the International Accounting Standards Board, provide a more complete understanding of factors and trends affecting the Company’s business . Further, investors regularly rely on non - GAAP financial measures to assess operating performance and such measures may highlight trends in the Company’s business that may not otherwise be apparent when relying on financial measures calculated in accordance with IFRS . We also believe that certain non - GAAP financial measures are frequently used by securities analysts, investors and other interested parties in the evaluation of public companies in the Company’s industry, many of which present these measures when reporting their results . The non - GAAP financial information is presented for informational purposes and to enhance understanding of the IFRS financial statements . The non - GAAP measures should be considered in addition to results prepared in accordance with IFRS, but not as a substitute for, or superior to, IFRS results . As other companies may determine or calculate this non - GAAP financial information differently, the usefulness of these measures for comparative purposes is limited . A reconciliation of such non - GAAP financial measures to the nearest GAAP measure is included in this presentation . For purposes of this presentation : “Active Clients” means the total number of retail clients served through our XP Investimentos, Rico, Clear, XP Investments and XP Private (Europe) brands, with an AUC above R $ 100 . 00 or that have transacted at least once in the last thirty days . For purposes of calculating this metric, if a client holds an account in more than one of the aforementioned entities, such client will be counted as one “active client” for each such account . For example, if a client holds an account in each of XP Investimentos and Rico, such client will count as two “active clients” for purposes of this metric . “Assets Under Custody (AUC)” means the market value of all client assets invested through XP’s platform, including equities, fixed income securities, mutual funds (including those managed by XP Gestão de Recursos Ltda . , XP Advisory Gestão Recursos Ltda . and XP Vista Asset Management Ltda . , as well as by third - party asset managers), pension funds (including those from XP Vida e Previdência S . A . , as well as by third - party insurance companies), exchange traded funds, COEs (Structured Notes), REITs, and uninvested cash balances (Floating Balances), among others . 2

3 Index Strategy Update 02 4Q20 KPIs and Financials 03 Guidance 04 01 Opening Remarks Q&A 05

1 Opening Remarks
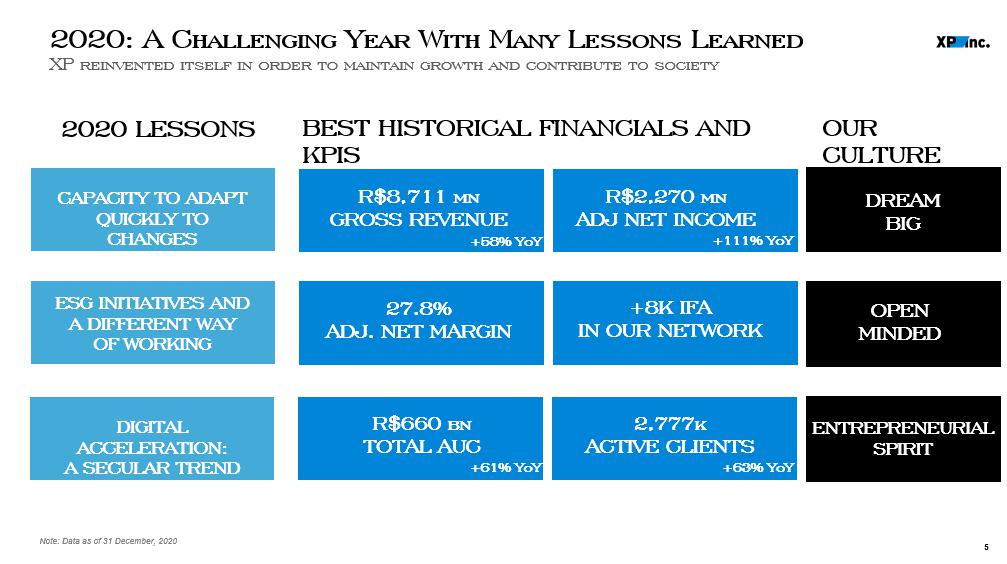
5 2020: A Challenging Year With Many Lessons Learned X P reinvented itself in order to maintain growth and contribute to society 2020 LESSONS DIGITAL ACCELERATION: A SECULAR TREND CAPACITY TO ADAPT QUICKLY TO CHANGES ESG INITIATIVES AND A DIFFERENT WAY OF WORKING BEST HISTORICAL FINANCIALS AND KPIS R$660 bn TOTAL AUC +58% YoY 2,777k ACTIVE CLIENTS +63% YoY +8K IFA IN OUR NETWORK R$8,711 mn GROSS REVENUE Note: Data as of 31 December, 2020 +61% YoY R$2,270 mn ADJ NET INCOME +111% YoY OUR CULTURE DREAM BIG OPEN MINDED ENTREPRENEURIAL SPIRIT 27.8% ADJ. NET MARGIN

2 Strategy Update

7 Addressing the Brazilian Financial Revenue Pool E xpanding our TAM: XP has historically entered in new verticals and there is much more to come… Source: XP Inc. 5.5 2016 1.3 2017 2018 2020 2019 2.0 3.2 8.7 XP Revenue 2020 Total TAM 770.0 8.7 XP INC. GROSS REVENUE (in R$ bn) TOTAL FINANCIAL REVENUE POOL (2021) (in R$ bn) 60% CAGR TOTAL ADDRESSABLE MARKET (TAM) ROADMAP 2001 - 2018 2019 2021 2020 HISTORICAL REVENUE DRIVERS ▪ RETAIL INVESTMENTS ▪ INSTITUTIONAL BROKERAGE ▪ DCM ADDRESSED TAM @IPO R$70BN + PENSION FUNDS + INSURANCE BROKERAGE + ECM + REITS ADDRESSED TAM R$125BN + INSURANCE (LIFE + SURETY) + FX AND DERIVATIVES + M&A (RIZA ACQUISITION) + COLLATERALIZED CREDIT ADDRESSED TAM TODAY R$180BN + CREDIT CARD + DEBIT CARD + DIGITAL BANKING + UPPER MIDDLE MARKET CREDIT + CORPORATE CREDIT 1.2% of TAM 2022+ LONG - TERM TAM R$770BN + SMB & MIDDLE MARKET CREDIT + OTHER CREDIT PRODUCTS + OTHER PRODUCTS
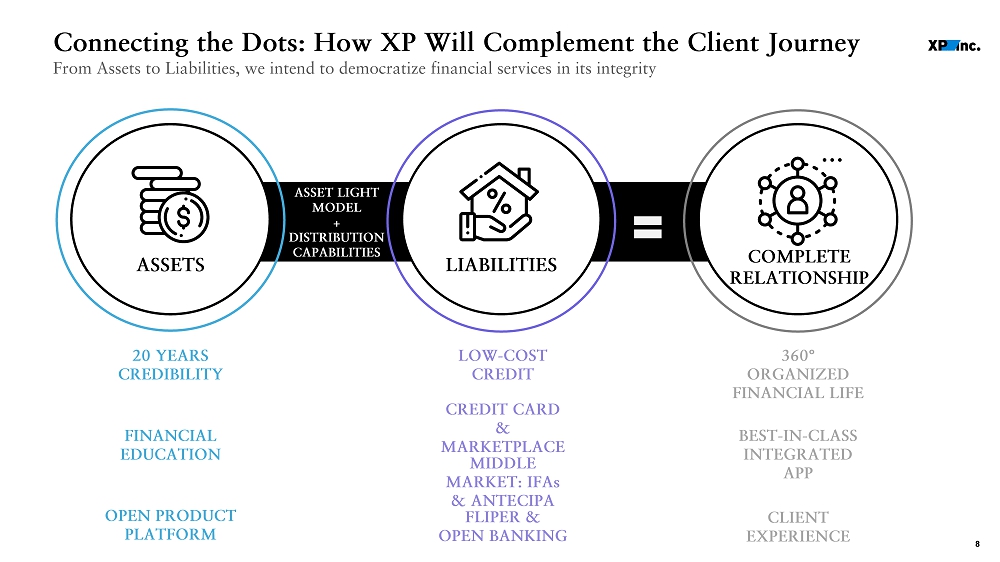
8 Connecting the Dots: How XP Will Complement the Client Journey From Assets to Liabilities , we intend to democratize financial services in its integrity COMPLETE RELATIONSHIP LIABILITIES ASSETS ASSET LIGHT MODEL + DISTRIBUTION CAPABILITIES 20 YEARS CREDIBILITY FINANCIAL EDUCATION OPEN PRODUCT PLATFORM LOW - COST CREDIT CREDIT CARD & MARKETPLACE MIDDLE MARKET: IFAs & ANTECIPA FLIPER & OPEN BANKING 360 ° ORGANIZED FINANCIAL LIFE BEST - IN - CLASS INTEGRATED APP CLIENT EXPERIENCE

9 Collateralized Credit and Credit Card EXPONENTIAL GROWTH Dec - 20 Mar - 20 Jun - 20 Sep - 20 64 3,874 380 1,368 CREDIT CARD NOW AVAILABLE FOR XP INVESTIMENTOS’ CLIENTS WITH THE FOLLOWING BENEFITS : ▪ ASSET LIGHT CREDIT PORTFOLIO, WITH 19 % RWA ▪ OVERCOLLATERAL SUPPORTING 0 % NPL RATIO ▪ COMPETITIVE INTEREST RATES FOR COMPANIES AND INDIVIDUALS ▪ NO FEES ▪ 1% INVESTBACK, FIRST IN THE MARKET ▪ MARKETPLACE ▪ DYNAMIC CREDIT LIMIT ▪ SINGLE XP APP FOR ALL THE SERVICES ▪ DIGITAL WALLET Innovative and integrated solutions made possible by XP’s proprietary technology developments 1. COLLATERALIZED CREDIT 2. XP VISA INFINITE CREDIT CARD CREDIT PORTFOLIO (in R$ mn )

10 Tech Development Example: Innovation from Scratch to Scale Soma is XP’s own Design System AN ECOSYSTEM TO UNITE, CREATE AND EVOLVE SOMA EFFICIENCY IMPACTS 60 MINUTES OF WORK REDUCED PER HEAD 40K HOURS OF PROJECT WORK REDUCED LESS 15% ON OUR TIME TO MARKET 2020 MAIN PROJECTS ALL XP INC. BRANDS BENEFITED FROM SOMA CREDIT CARD 6 MONTHS OF DEVELOPMENT IFA HUB SCALE AND PERFORMANCE FOR OUR IFA NETWORK DESIGN AWARD 2020 FINALIST NEW XP APP 4.8 RATING IN APPLE STORE

3 4Q20 KPIs and Financials
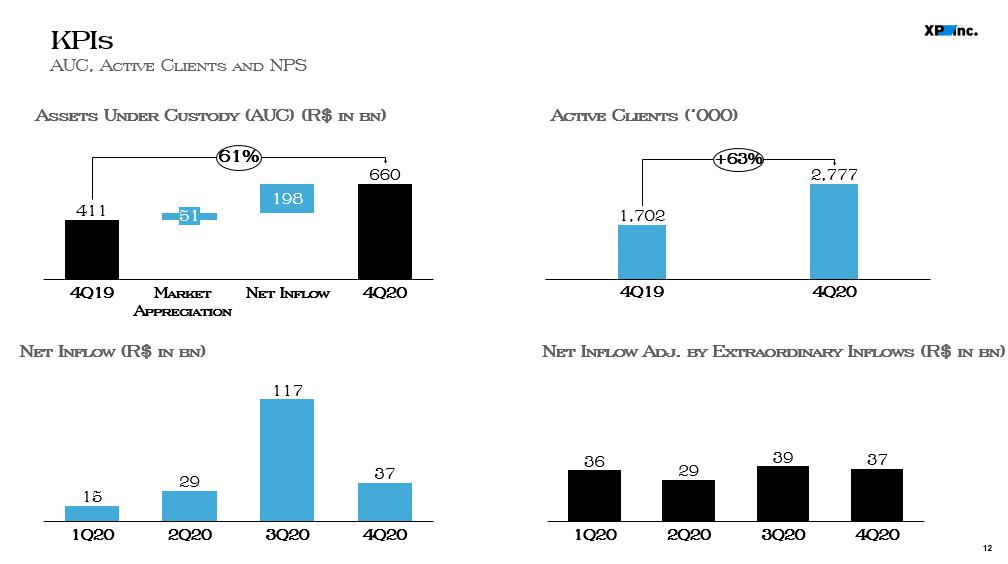
12 KPIs AUC, Active Clients and NPS Assets Under Custody (AUC) (R$ in bn) Net Inflow (R$ in bn) 4Q19 4Q20 1,702 2,777 +63% Active Clients (‘000) Net Inflow Adj. by Extraordinary Inflows (R$ in bn) 411 660 198 Net Inflow 4Q19 51 Market Appreciatio n 4Q20 61% 15 29 117 37 1Q20 3Q20 2Q20 4Q20 36 29 39 37 2Q20 1Q20 3Q20 4Q20
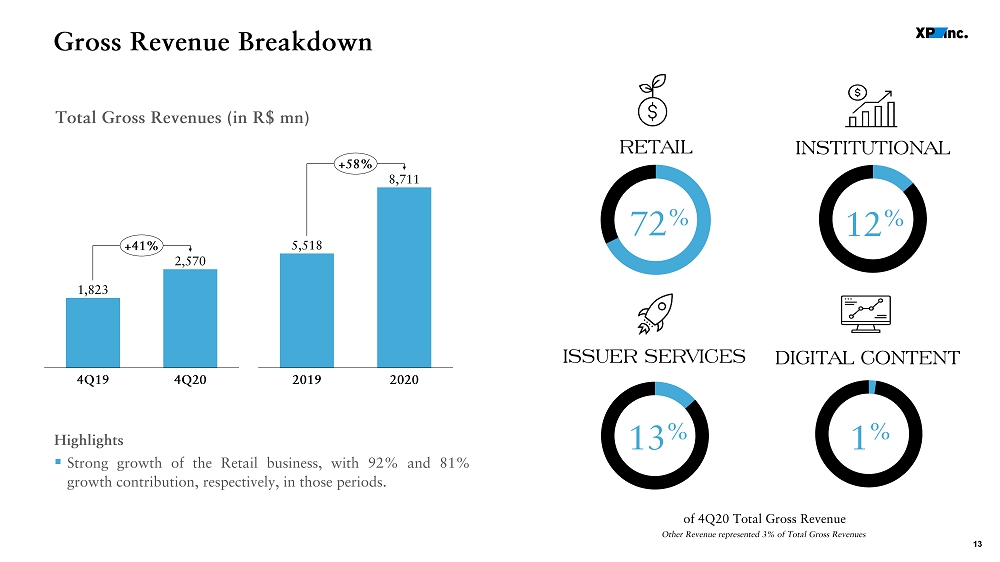
13 Gross Revenue Breakdown RETAIL INSTITUTIONAL ISSUER SERVICES DIGITAL CONTENT 72 % 12 % 13 % 1 % Other Revenue represented 3% of Total Gross Revenues Total Gross Revenues (in R$ mn) Highlights ▪ Strong growth of the Retail business, with 92 % and 81 % growth contribution, respectively, in those periods . of 4Q20 Total Gross Revenue 4Q19 4Q20 2,570 1,823 +41% 2019 2020 5,518 8,711 +58%

14 Retail Revenue and Take Rate Strong expansion following client addition and healthy net inflow LTM Take Rate (LTM Retail Revenue / Average AUC) Retail Revenue (in R$ mn) 1.3% 4Q19 4Q20 1.3% 4Q20 1,844 4Q19 1,155 +60% Highlights ▪ Stable take rate as higher Equities and Futures’ trading volumes and Financial Products distribution offset the impact from the recent extraordinary equity inflow . Highlights ▪ Key revenue growth drivers were : ( 1 ) Equity and futures ; ( 2 ) Financial Products and ( 3 ) Fixed Income ; ▪ On 4 Q 20 , Retail related revenues represented 75 % of consolidated Net Income from Financial Instruments . Note: Average AUC = (Sum of AUC from beginning of period and each quarter end in a given year, being 5 data points in one yea r)/ 5 2019 2020 6,271 3,676 +71%
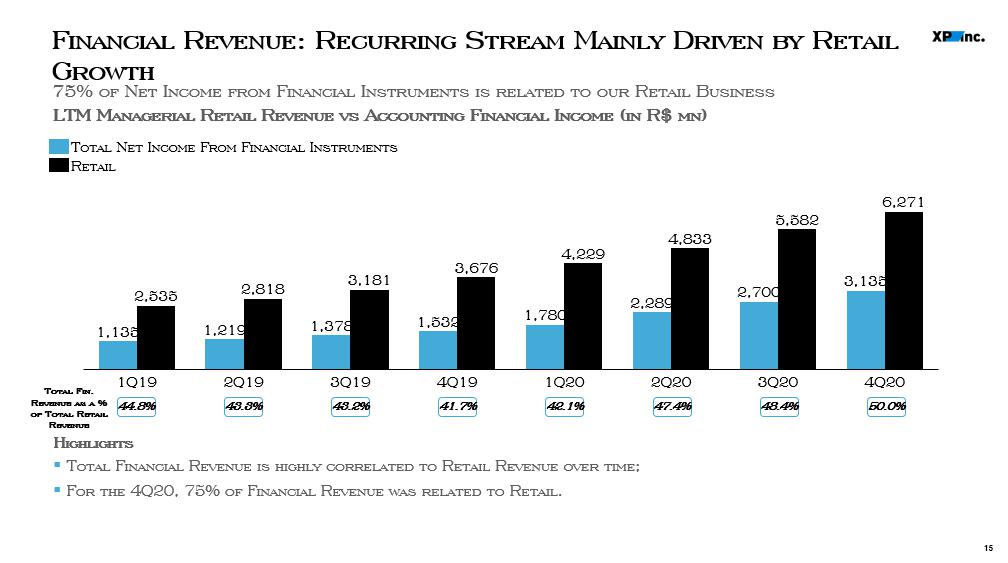
15 Financial Revenue: Recurring Stream Mainly Driven by Retail Growth 75% of Net Income from Financial Instruments is related to our Retail Business LTM Managerial Retail Revenue vs Accounting Financial Income (in R$ mn) 1Q20 1Q19 2Q19 4Q19 3Q19 2Q20 3Q20 4Q20 1,135 2,535 1,219 2,818 1,378 3,181 1,532 3,676 1,780 5,582 4,229 2,289 4,833 2,700 3,135 6,271 Total Net Income From Financial Instruments Retail Highlights ▪ Total Financial Revenue is highly correlated to Retail Revenue over time ; ▪ For the 4 Q 20 , 75 % of Financial Revenue was related to Retail . 43.3% 44.8% 43.2% 41.7% 42.1% 47.4% 48.4% 50.0% Total Fin. Revenue as a % of Total Retail Revenue
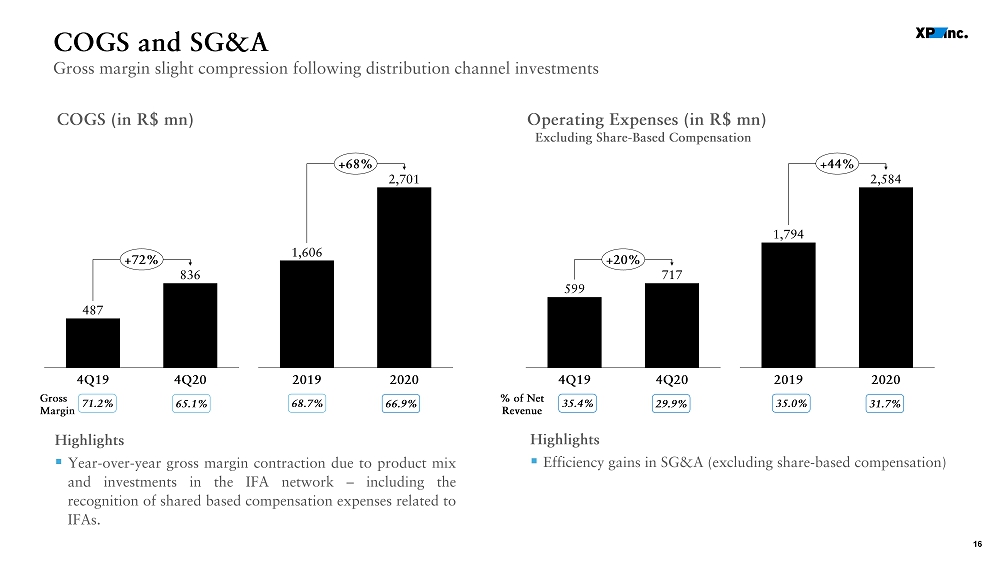
16 29.9% 35.4% % of Net Revenue 599 717 4Q19 4Q20 +20% 2,584 2019 2020 1,794 +44% 31.7% 35.0% COGS and SG&A Gross margin slight compression following distribution channel investments COGS (in R$ mn) Operating Expenses (in R$ mn) Highlights ▪ Year - over - year gross margin contraction due to product mix and investments in the IFA network – including the recognition of shared based compensation expenses related to IFAs . 65.1% 71.2% Gross Margin % of Net Revenue Highlights ▪ Efficiency gains in SG&A (excluding share - based compensation) Excluding Share - Based Compensation 487 836 4Q19 4Q20 +72% 2019 1,606 2020 2,701 +68% 66.9% 68.7%

17 Highlights ▪ 4 Q 20 growth was driven by : ( 1 ) strong performance of Retail and ( 2 ) operating leverage in SG&A, offset by higher COGS ratio ; ▪ Despite ( 1 ) 50 % year - over - year growth in headcount, ( 2 ) investing in new business and ( 3 ) investing in our IFA Network, adjusted EBITDA Margin expanded from 32 . 7 % to 35 . 8 % . The margin expansion reflects the benefits of our operating leverage and technology investments made in the past, which provided scalability for the company . Adjusted EBITDA and Margin Operating Leverage offsetting higher COGS Adjusted EBITDA (in R$ mn) Adjusted EBITDA Margin 627 891 4Q19 4Q20 +42% 2,918 2020 2019 1,679 +74% 4Q19 4Q20 37.1% 37.2% 2019 32.7% 2020 35.8% Note: See appendix for a reconciliation of Adjusted EBITDA.
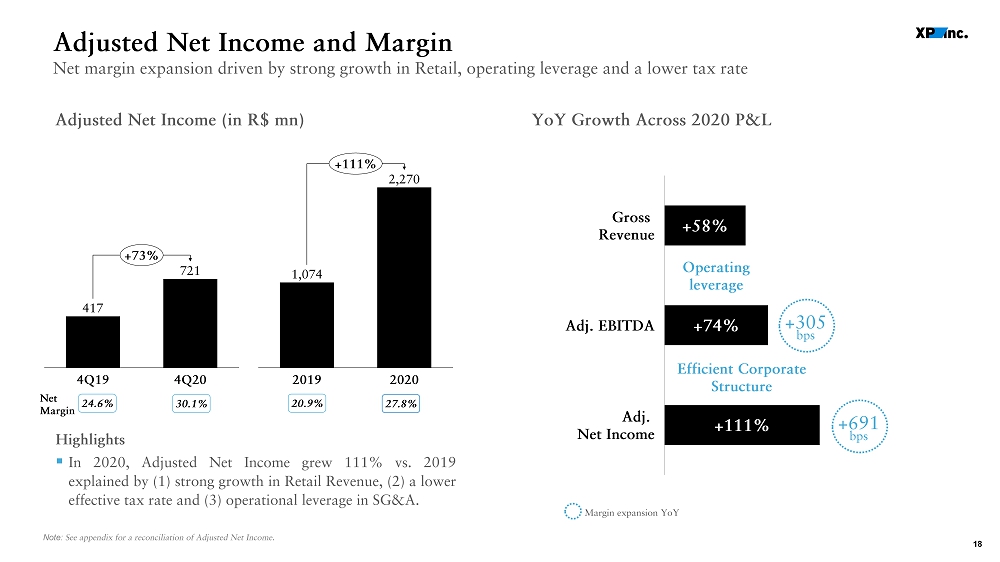
18 Highlights ▪ In 2020 , Adjusted Net Income grew 111 % vs . 2019 explained by ( 1 ) strong growth in Retail Revenue, ( 2 ) a lower effective tax rate and ( 3 ) operational leverage in SG&A . Adjusted Net Income and Margin Net margin expansion driven by strong growth in Retail, operating leverage and a lower tax rate Adjusted Net Income (in R$ mn) 417 721 4Q19 4Q20 +73% 1,074 2019 2020 2,270 +111% Note: See appendix for a reconciliation of Adjusted Net Income. 30.1% 24.6% Net Margin 27.8% 20.9% YoY Growth Across 2020 P&L +58% +74% +111% Gross Revenue Adj. EBITDA Adj. Net Income +305 bps Operating leverage Efficient Corporate Structure +691 bps Margin expansion YoY
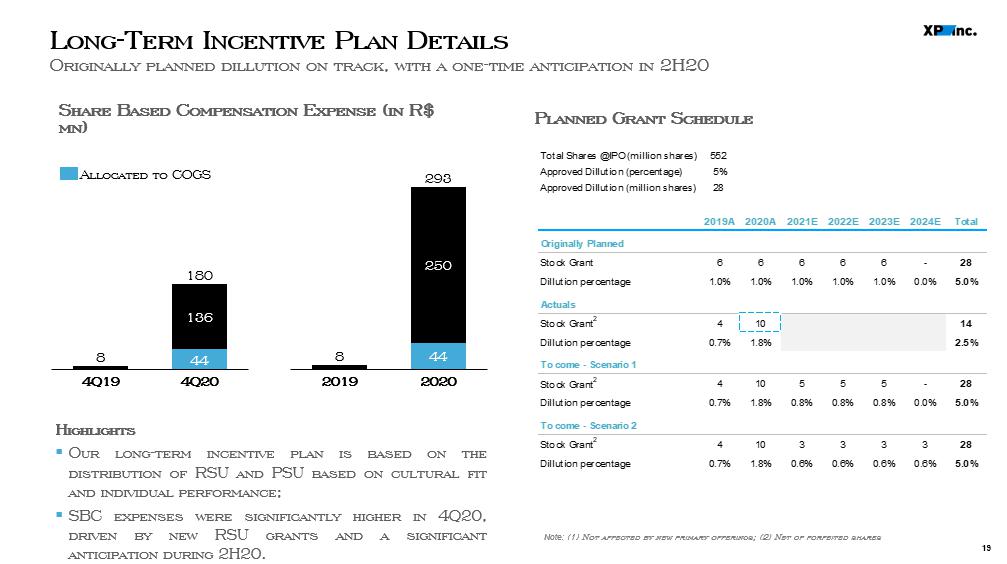
19 Long - Term Incentive Plan Details Originally planned dillution on track, with a one - time anticipation in 2H20 Note: (1) Not affected by new primary offerings; (2) Net of forfeited shares Share Based Compensation Expense (in R$ mn ) Highlights ▪ Our long - term incentive plan is based on the distribution of RSU and PSU based on cultural fit and individual performance ; ▪ SBC expenses were significantly higher in 4 Q 20 , driven by new RSU grants and a significant anticipation during 2 H 20 . 8 44 136 4Q19 4Q20 180 8 44 250 293 2019 2020 Allocated to COGS Planned Grant Schedule

4 Guidance

21 REVISED 3 - 5 YEAR ADJUSTED NET MARGIN GUIDANCE DISCLAIMER – Estimated and subject to change. See “Important Disclosure” on page 2 of this presentation. 18% – 22% OLD 24% – 30% NEW G uidance Revision

Q&A

23 Investors Relations ir@xpi.com.br https://investors.xpinc.com/

Appendix

25 KPIs Average Trades and NPS Note: NPS, is an independent widely known survey methodology that measures the willingness of customers to recommend a Compan y’s products and services. The NPS calculation as of a given date reflects the average of the answers in the previous six months Retail Equity DARTs (million) 4Q19 2.5 1.1 4Q20 126% NPS Dec - 20: 71 XP Inc. Retail Equity Market Share Dec - 20 29% Custody Traded Volume 55%

26 Highlights ▪ ( 1 ) ECM, with 11 executed deals in the quarter and ( 2 ) DCM division, with participation in 55 deals, vs . 8 and 51 , respectively ; ▪ Revenue increase of 36 % for the full year, even with a low performance in the second quarter due to overall market conditions . Highlights ▪ Increase in equity trading volume compared to 4 Q 19 , offset by lower funds performance fees ; ▪ Compared to 2019 , Institutional revenue grew 51 % , from R $ 802 million to R $ 1 . 2 billion, driven by higher equity trading volume . Institutional and Issuer Services Institutional benefited from volumes and Issuer Services from market window Issuer Services Revenue (in R$ mn) Institutional Revenue (in R$ mn) 306 307 4Q19 4Q20 802 2020 2019 1,210 +51% 221 323 4Q19 4Q20 +46% 507 688 2019 2020 +36%

27 Non - GAAP Financial Information Adjusted Net Income and Adjusted Gross Financial Assets 27 Adjusted Net Income (in R $ mn ) Adjusted EBITDA (in R $ mn ) 4Q20 4Q19 YoY 3Q20 QoQ FY20 FY19 YoY EBITDA 705 598 18% 681 4% 2,616 1,720 52% (+) Stock Based Compensation 180 8 n.a. 44 305% 293 8 n.a. (+) Offering expenses 6 22 -73% 2 216% 8 22 -65% (-) Tax claim recognition (2010-2020) - - n.a. - n.a. - (71) -100% Adj. EBITDA 891 627 42% 727 23% 2,918 1,679 74% 4Q20 4Q19 YoY 3Q20 QoQ FY20 FY19 YoY Net Income 602 390 54% 541 11% 2,081 1,089 91% (+) Stock Based Compensation 180 8 n.a. 44 305% 293 8 n.a. (+) Offering expenses 6 22 -73% 2 216% 8 22 -65% (-) Tax claim recognition (2010-2020) - - n.a. - n.a. - (71) -100% (+/-) Taxes (68) (3) n.a. (18) 283% (113) 25 n.a. Adj. Net Income 721 417 73% 570 26% 2,270 1,074 111%

28 Non - GAAP Financial Information Adjusted Net Income and Adjusted Gross Financial Assets 28 Adjusted Gross Financial Assets (in R $ mn ) Floating Balance (in R $ mn ) Floating Balance (=net univested clients' deposits) 4Q20 3Q20 QoQ Assets (1,028) (1,484) -31% (-) Securities trading and intermediation (1,028) (1,484) -31% Liabilities 20,303 15,160 34% (+) Securities trading and intermediation 20,303 15,160 34% (=) Floating Balance 19,275 13,676 41%