Exhibit 99.2

1 2Q24 Earnings Presentation

2 Important Disclosure IN REVIEWING THE INFORMATION CONTAINED IN THIS PRESENTATION, YOU ARE AGREEING TO ABIDE BY THE TERMS OF THIS DISCLAIMER . THIS INFORMATION IS BEING MADE AVAILABLE TO EACH RECIPIENT SOLELY FOR ITS INFORMATION AND IS SUBJECT TO AMENDMENT . This presentation is prepared by XP Inc . (the “Company,” “we” or “our”), is solely for informational purposes . This presentation does not constitute a prospectus and does not constitute an offer to sell or the solicitation of an offer to buy any securities . In addition, this document and any materials distributed in connection with this presentation are not directed to, or intended for distribution to or use by, any person or entity that is a citizen or resident or located in any locality, state, country or other jurisdiction where such distribution, publication, availability or use would be contrary to law or regulation or which would require any registration or licensing within such jurisdiction . This presentation was prepared by the Company . Neither the Company nor any of its affiliates, officers, employees or agents, make any representation or warranty, express or implied, in relation to the fairness, reasonableness, adequacy, accuracy or completeness of the information, statements or opinions, whichever their source, contained in this presentation or any oral information provided in connection herewith, or any data it generates and accept no responsibility, obligation or liability (whether direct or indirect, in contract, tort or otherwise) in relation to any of such information . The information and opinions contained in this presentation are provided as at the date of this presentation, are subject to change without notice and do not purport to contain all information that may be required to evaluate the Company . The information in this presentation is in draft form and has not been independently verified . The Company and its affiliates, officers, employees and agents expressly disclaim any and all liability which may be based on this presentation and any errors therein or omissions therefrom . Neither the Company nor any of its affiliates, officers, employees or agents makes any representation or warranty, express or implied, as to the achievement or reasonableness of future projections, management targets, estimates, prospects or returns, if any . The information contained in this presentation does not purport to be comprehensive and has not been subject to any independent audit or review . Certain of the financial information as of and for the periods ended December 31 , 2019 , 2018 and 2017 has been derived from audited financial statements and all other financial information has been derived from unaudited interim financial statements . A significant portion of the information contained in this presentation is based on estimates or expectations of the Company, and there can be no assurance that these estimates or expectations are or will prove to be accurate . The Company’s internal estimates have not been verified by an external expert, and the Company cannot guarantee that a third party using different methods to assemble, analyze or compute market information and data would obtain or generate the same results . Statements in the presentation, including those regarding the possible or assumed future or other performance of the Company or its industry or other trend projections, constitute forward - looking statements . These statements are generally identified by the use of words such as “anticipate,” “believe,” “could,” “expect,” “should,” “plan,” “intend,” “estimate” and “potential,” among others . By their nature, forward - looking statements are necessarily subject to a high degree of uncertainty and involve known and unknown risks, uncertainties, assumptions and other factors because they relate to events and depend on circumstances that will occur in the future whether or not outside the control of the Company . Such factors may cause actual results, performance or developments to differ materially from those expressed or implied by such forward - looking statements and there can be no assurance that such forward - looking statements will prove to be correct . These risks and uncertainties include factors relating to : ( 1 ) general economic, financial, political, demographic and business conditions in Brazil, as well as any other countries we may serve in the future and their impact on our business ; ( 2 ) fluctuations in interest, inflation and exchange rates in Brazil and any other countries we may serve in the future ; ( 3 ) competition in the financial services industry ; ( 4 ) our ability to implement our business strategy ; ( 5 ) our ability to adapt to the rapid pace of technological changes in the financial services industry ; ( 6 ) the reliability, performance, functionality and quality of our products and services and the investment performance of investment funds managed by third parties or by our asset managers ; ( 7 ) the availability of government authorizations on terms and conditions and within periods acceptable to us ; ( 8 ) our ability to continue attracting and retaining new appropriately - skilled employees ; ( 9 ) our capitalization and level of indebtedness ; ( 10 ) the interests of our controlling shareholders ; ( 11 ) changes in government regulations applicable to the financial services industry in Brazil and elsewhere ; ( 12 ) our ability to compete and conduct our business in the future ; ( 13 ) the success of operating initiatives, including advertising and promotional efforts and new product, service and concept development by us and our competitors ; ( 14 ) changes in consumer demands regarding financial products, customer experience related to investments and technological advances, and our ability to innovate to respond to such changes ; ( 15 ) changes in labor, distribution and other operating costs ; ( 16 ) our compliance with, and changes to, government laws, regulations and tax matters that currently apply to us ; ( 17 ) the negative impacts of the COVID - 19 pandemic on global, regional and national economies and the related market volatility and protracted economic downturn ; and ( 18 ) other factors that may affect our financial condition, liquidity and results of operations . Accordingly, you should not place undue reliance on forward - looking statements . The forward - looking statements included herein speak only as at the date of this presentation and the Company does not undertake any obligation to update these forward - looking statements . Past performance does not guarantee or predict future performance . Moreover, the Company and its affiliates, officers, employees and agents do not undertake any obligation to review, update or confirm expectations or estimates or to release any revisions to any forward - looking statements to reflect events that occur or circumstances that arise in relation to the content of the presentation . You are cautioned not to unduly rely on such forward - looking statements when evaluating the information presented and we do not intend to update any of these forward - looking statements . Market data and industry information used throughout this presentation are based on management’s knowledge of the industry and the good faith estimates of management . The Company also relied, to the extent available, upon management’s review of industry surveys and publications and other publicly available information prepared by a number of third party sources . All of the market data and industry information used in this presentation involves a number of assumptions and limitations, and you are cautioned not to give undue weight to such estimates . Although the Company believes that these sources are reliable, there can be no assurance as to the accuracy or completeness of this information, and the Company has not independently verified this information . The contents hereof should not be construed as investment, legal, tax or other advice and you should consult your own advisers as to legal, business, tax and other related matters concerning an investment in the Company . The Company is not acting on your behalf and does not regard you as a customer or a client . It will not be responsible to you for providing protections afforded to clients or for advising you on the relevant transaction . This presentation also includes certain non - GAAP financial information . We believe that such information is meaningful and useful in understanding the activities and business metrics of the Company’s operations . We also believe that these non - GAAP financial measures reflect an additional way of viewing aspects of the Company’s business that, when viewed with our International Financial Reporting Standards (“IFRS”) results, as issued by the International Accounting Standards Board, provide a more complete understanding of factors and trends affecting the Company’s business . Further, investors regularly rely on non - GAAP financial measures to assess operating performance and such measures may highlight trends in the Company’s business that may not otherwise be apparent when relying on financial measures calculated in accordance with IFRS . We also believe that certain non - GAAP financial measures are frequently used by securities analysts, investors and other interested parties in the evaluation of public companies in the Company’s industry, many of which present these measures when reporting their results . The non - GAAP financial information is presented for informational purposes and to enhance understanding of the IFRS financial statements . The non - GAAP measures should be considered in addition to results prepared in accordance with IFRS, but not as a substitute for, or superior to, IFRS results . As other companies may determine or calculate this non - GAAP financial information differently, the usefulness of these measures for comparative purposes is limited . A reconciliation of such non - GAAP financial measures to the nearest GAAP measure is included in this presentation . For purposes of this presentation : “Active Clients” means the total number of retail clients served through our XP Investimentos, Rico, Clear, XP Investments and XP Private (Europe) brands, with Client Assets above R $ 100 . 00 or that have transacted at least once in the last thirty days . For purposes of calculating this metric, if a client holds an account in more than one of the aforementioned entities, such client will be counted as one “active client” for each such account . For example, if a client holds an account in each of XP Investimentos and Rico, such client will count as two “active clients” for purposes of this metric . “Client Assets” means the market value of all client assets invested through XP’s platform, including equities, fixed income securities, mutual funds (including those managed by XP Gestão de Recursos Ltda . , XP Advisory Gestão Recursos Ltda . and XP Vista Asset Management Ltda . , as well as by third - party asset managers), pension funds (including those from XP Vida e Previdência S . A . , as well as by third - party insurance companies), exchange traded funds, COEs (Structured Notes), REITs, and uninvested cash balances (Floating Balances), among others .

Index 2Q24 Financials and Main KPIs 02 Final Remarks 03 01 Key Highlights Q&A 04 Appendix 05

1 Key Highlights
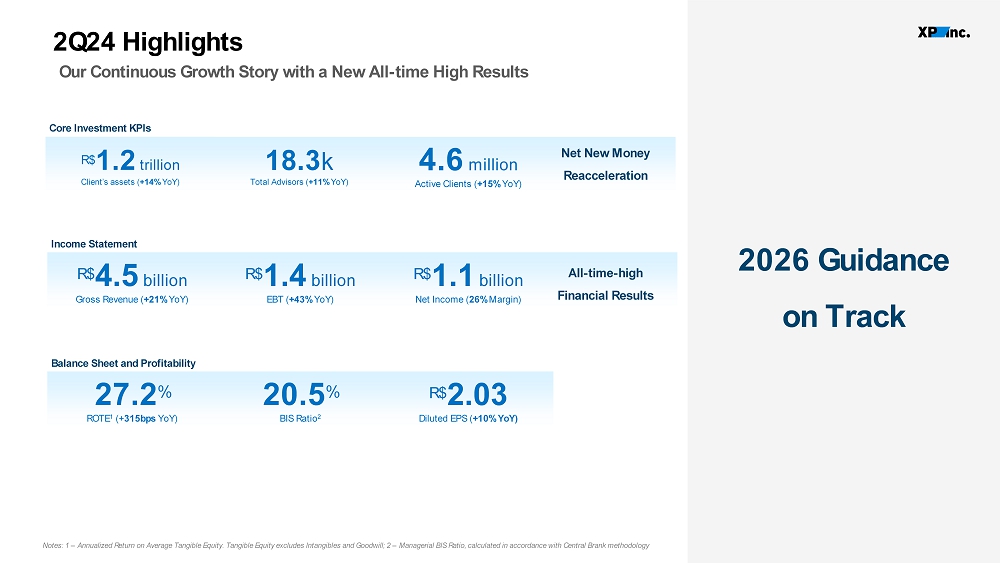
5 R$ 4.5 billion Gross Revenue ( +21% YoY) R$ 1.2 trillion Client’s assets ( +14% YoY) 2Q24 Highlights Core Investment KPIs Income Statement Balance Sheet and Profitability Notes: 1 – Annualized Return on Average Tangible Equity. Tangible Equity excludes Intangibles and Goodwill; 2 – Managerial BIS Ratio, c alculated in accordance with Central Brank methodology 1 8 .3 k Total Advisors ( +11% YoY) 4.6 million Active Clients ( +1 5 % YoY) R$ 1.4 billion EBT ( +43% YoY) R$ 1.1 billion Net Income ( 26% Margin) 27.2 % ROTE 1 (+ 315bps YoY) 20.5 % BIS Ratio 2 R$ 2.03 Diluted EPS ( +10% YoY) Net New Money Reacceleration All - time - high Financial Results 2026 Guidance on Track Our Continuous Growth Story with a New All - time High Results

6 14.8 17.4 3Q23 LTM @ ID 2Q24 LTM 2026 Guidance 26.8 Strategy Tracker 22.8 25% CAGR 11% CAGR 19% CAGR Gross Revenue R$ Billion Retail Investments Leadership in Core Business Our main goal is to achieve leadership in the investment market, our core business. To do this, we need to maintain and expand our differentials and continue to grow in all customer segments . Retail Cross - Sell Grow with Our Clients’ Needs Starting from our clients’ needs, we will expand our offer to serve their complete financial needs , aiming to break the link of investors with the incumbent banks once and for all. Corporate & SMB Premier Service with Unique Value We want to fully explore the synergy of a Wholesale Bank offer with the investment universe, deepening our relationship with the main economic groups in Brazil.' Quality We want to provide a unique level of quality that ensures us the principality of our customers 30% - 34% EBT Margin 28% 26%

7 Strategy Tracker Retail Investments Leadership in Core Business Our main goal is to achieve leadership in the investment market, our core business. To do this, we need to maintain and expand our differentials and continue to grow in all customer segments . Retail Cross - Sell Grow with Our Clients’ Needs Starting from our clients’ needs, we will expand our offer to serve their complete financial needs , aiming to break the link of investors with the incumbent banks once and for all. Corporate & SMB Premier Service with Unique Value We want to fully explore the synergy of a Wholesale Bank offer with the investment universe, deepening our relationship with the main economic groups in Brazil.' Quality We want to provide a unique level of quality that guarantees us the primacy of our customers

8 19 13 24 3 2 8 2Q23 1Q24 2Q24 22 15 32 +44% Retail Corporate Net New Money R$ Million Retail Strategy – Keeping Our Moats Expanding and Protecting our Core Business Multi - Channel Distribution and Expansion Through Internal Advisors and RIAs 2 Product Platform Best Investment Options – from Fixed - Income to Alternative Investments 1 Higher Productivity HUB platform, XP Academy and Digital Empowerment 3 Added - Value Services Mindset Through Large - Scale Financial Planning 4 Ability To Grow In Our Core Business Our Strategy Setting The Stage For Our Future Retail Investments - Net New Money Improvement

9 Strategy Tracker Retail Investments Leadership in Core Business Our main goal is to achieve leadership in the investment market, our core business. To do this, we need to maintain and expand our differentials and continue to grow in all customer segments . Retail Cross - Sell Grow with Our Clients’ Needs Starting from our clients’ needs, we will expand our offer to serve their complete financial needs , aiming to break the link of investors with the incumbent banks once and for all. Corporate & SMB Premier Service with Unique Value We want to fully explore the synergy of a Wholesale Bank offer with the investment universe, deepening our relationship with the main economic groups in Brazil.' Quality We want to provide a unique level of quality that guarantees us the primacy of our customers

10 Investments Credit Card Principality ~ 4 Months XP Card Becomes Primary Credit Card + 7 % More Custody Per year - 13 pp Lower Churn Per Year 202 248 307 2Q23 1Q24 2Q24 +52% Retail Cross - Sell Notes: 1 – Includes FX, Digital Account and Global Investments Highlights Strong Growth… But Still Underpenetrated 10 11 12 2Q23 1Q24 2Q24 +19% Life Insurance Gross Written Premiums R$ Million Card’s TPV R$ Billion 64 73 75 2Q23 1Q24 2Q24 +17% Retirement Plans Client Assets R$ Billion 69 82 104 2Q23 1Q24 2Q24 +51% Other New Products Revenue 1 R$ Million

11 Strategy Tracker Retail Investments Leadership in Core Business Our main goal is to achieve leadership in the investment market, our core business. To do this, we need to maintain and expand our differentials and continue to grow in all customer segments . Retail Cross - Sell Grow with Our Clients’ Needs Starting from our clients’ needs, we will expand our offer to serve their complete financial needs , aiming to break the link of investors with the incumbent banks once and for all. Corporate & SMB Premier Service with Unique Value We want to fully explore the synergy of a Wholesale Bank offer with the investment universe, deepening our relationship with the main economic groups in Brazil.' Quality We want to provide a unique level of quality that guarantees us the primacy of our customers
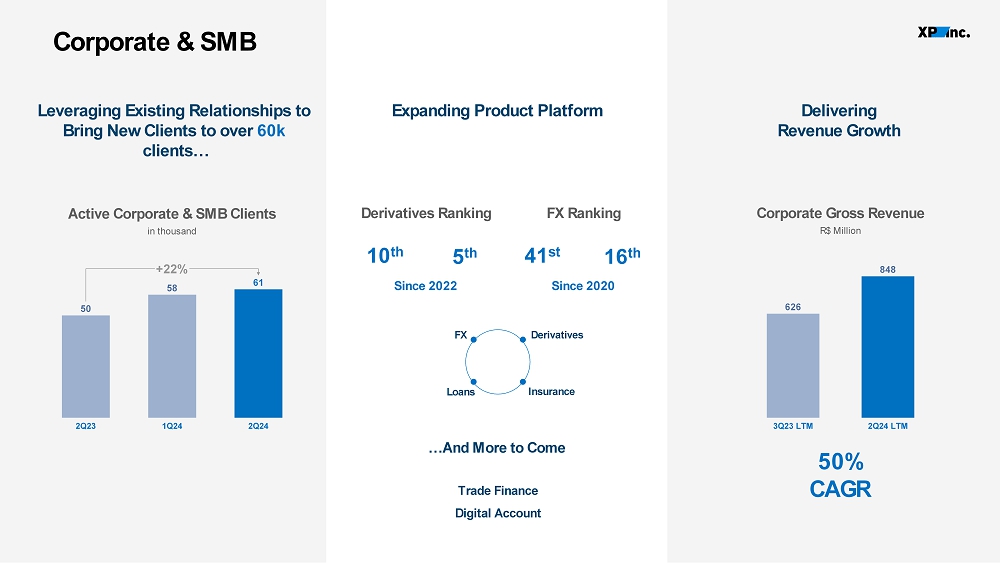
12 Corporate & SMB Derivatives Ranking 10 th Since 2022 5 th Leveraging Existing Relationships to Bring New Clients to over 60k clients… … And More to Come Trade Finance Digital Account FX Ranking Active Corporate & SMB Clients in thousand 50 58 61 2Q23 1Q24 2Q24 +22% 626 848 3Q23 LTM 2Q24 LTM Corporate Gross Revenue R$ Million FX Derivatives Insurance Loans 50% CAGR Expanding Product Platform 41 st Since 2020 16 th Delivering Revenue Growth

2 2Q24 Financials

14 CFO Priorities Corporate Restructuring x Lower Cost of Capital 1 Guidance Delivery x New Products Increasing Profitability and Strict Cost Control, Keeping our Innovation DNA 2 Capital Allocation x Disciplined Capital Allocation and Recurr ing Capital Distribution to Shareholders 3 Higher Returns

15 78% 10% 8% 4% 2Q23 73% 8% 12% 6% 1Q24 73% 8% 14% 5% 2Q24 100% 100% 100% Gross Revenue +21% YoY Growth in Gross Revenue Corporate & Issuer Services as a Highlight Gross Revenue Breakdown % Gross Revenue Breakdown R$ Million Retail Institutional Corporate & Issuer Services Other 2,892 3,131 3,294 385 354 346 283 509 629 276 233 167 2Q23 1Q24 2Q24 3,728 4,270 4,503

16 Fixed Income as the Main Highlight Again Retail Revenue Breakdown % Retail Revenue R$ Million 37% 20% 12% 14% 18% 2Q23 36% 22% 10% 16% 16% 1Q24 34% 25% 11% 16% 15% 2Q24 100% 100% 100% Retail Revenue 2,892 3,131 3,294 2,300 2,400 2,500 2,600 2,700 2,800 2,900 3,000 3,100 3,200 3,300 2Q23 1Q24 2Q24 +14% Equities Fixed Income Funds Platform New Verticals Other 14% Growth YoY Driven by Strong Fixed Income Activity

17 ▪ Strong DCM Activity ▪ Corporate Posting Continuous Growth Corporate & Issuer Services Revenue Note 1: Corporate Securities considered in our Total Loan Portfolio. Corporate & Issuer Services Breakdown R$ Million 126 228 245 157 280 384 2Q23 1Q24 2Q24 283 509 629 +122% Corporate Issuer Services Fostering New Investment Options Corporate Issuer Underwriting & Warehousing Retail Distribution Market Making & Liquidity Provider Corporate Securities 1 R$ Billion 16 16 26 4Q23 1Q24 2Q24 +67%

18 Efficiency and Compensation Ratios 1 LTM % Sales, General & Administrative Expenses (SG&A)¹ and Ratios Notes: 1 – Calculated as SG&A ex - revenue from incentives from Tesouro Direto , B3, and others divided by Net Revenue. 2 – Calculated as People SG&A (Salary and Taxes, Bonuses and Share Based Compensation) divided by Net Revenue;. 899 1,007 978 347 410 442 2Q23 1Q24 2Q24 1,246 1,416 1,420 +14% People Non - people SG&A¹ R$ Million 29.8% 29.8% 25.2% 24.6% 41.5% 41.7% 38.3% 36.5% 36.1% 2Q22 3Q22 4Q22 1Q23 26.8% 2Q23 3Q23 4Q23 1Q24 2Q24 Expenses Under Control Diligent Expenses Management Underpins Best Efficiency Ratio Since IPO

19 Earning Before Taxes (EBT) 2Q23 1Q24 2Q24 27.3% 26.9% 32.8% +552 bps 968 1,088 1,384 2Q23 1Q24 2Q24 +43% EBT Margin % EBT R$ million Positive Business Dynamics based on Rising Ecosystem Revenues and Strict Expenses Control Translates into the Highest EBT in our History
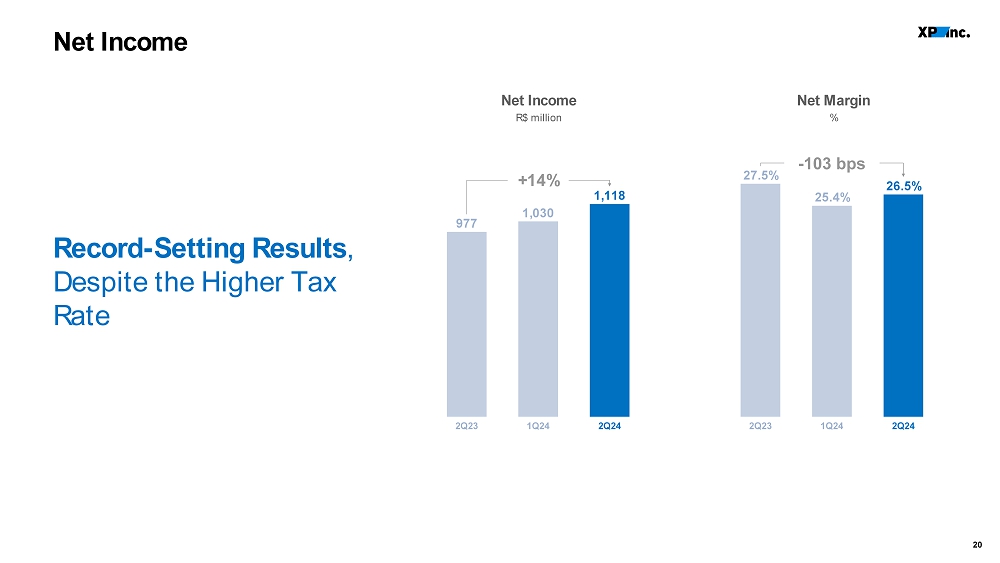
20 977 1,030 1,118 2Q23 1Q24 2Q24 +14% Net Margin % Net Income R$ million 2Q23 1Q24 2Q24 27.5% 25.4% 26.5% - 103 bps Record - Setting Results , Despite the Higher Tax Rate Net Income
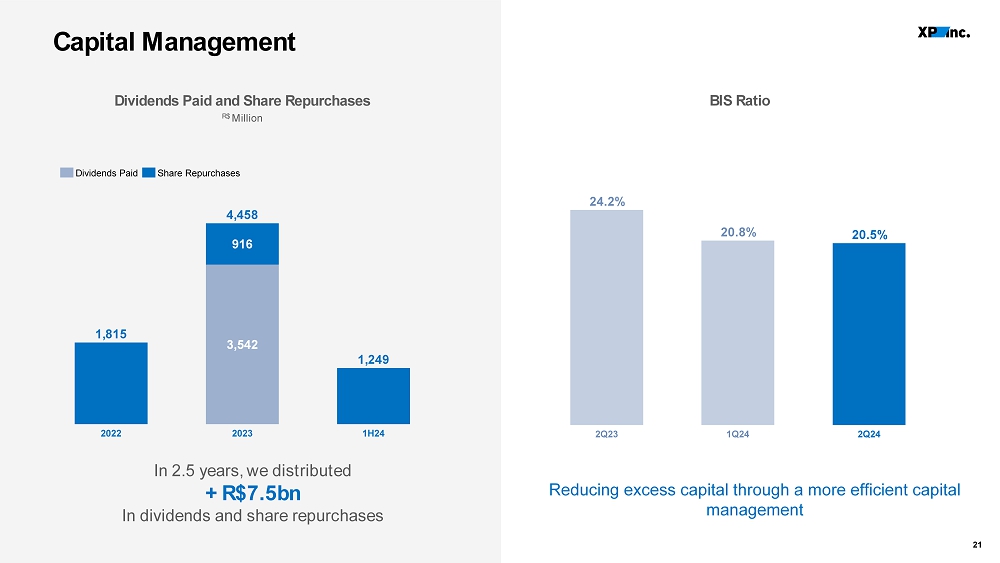
21 Reducing excess capital through a more efficient capital management BIS Ratio 1,815 3,542 1,249 916 2022 2023 1H24 4,458 Capital Management In 2.5 years, we distributed + R$7.5bn In dividends and share repurchases Dividends Paid Share Repurchases Dividends Paid and Share Repurchases R$ Million 2Q23 1Q24 2Q24 24.2% 20.8% 20.5%

22 Annualized ROTE¹ and ROAE² % Notes: 1 – Annualized Return on Average Tangible Equity. Tangible Equity excludes Intangibles and Goodwill; 2 – Annualized Retur n on Average Equity. 24.1% 25.4% 27.2% 22.0% 20.7% 22.1% 2Q23 1Q24 2Q24 ROTE ROAE Return on Tangible Equity 975 1,030 1,117 1.83 1.85 2.03 0.0 0.2 0.4 0.6 0.8 1.0 1.2 1.4 1.6 1.8 2.0 2.2 0 200 400 600 800 1,000 1,200 1,400 1,600 2Q23 1Q24 2Q24 Net Income (R$mm) Diluted EPS (R$) EPS ROTE of 27.2%, driven by 14% YoY growth in Net Income and a R$1.2 billion buyback in the quarter

3 Final Remarks

24 Solid Quarter x Guidance on Track 1 2 x Retail NNM Improvement Net New Money 3 x Keeping and Enhancing our Differentiation Moats Final Remarks

4 Q&A

5 Appendix

27 Total Loan Portfolio¹ Note: 1 – Gross of Expected Credit Losses. Total Unsecured Secured R$ billion 19.3 1.6 17.7 Loans 7.4 2.4 5.0 Credit Card 26.0 20.3 5.7 Corporate Securities 52.7 17.4 24.3 Credit Portfolio Main Activities • Investment Banking • Fixed Income Distribution • Corporate Credit

28 Non - GAAP Financial Information Adjusted Assets (from the factors listed below) reflects our business more realistically [B] Retirement Plans ▪ AUM from XP Vida & Previdência is accounted in both assets and liabilities [C] Float ▪ Uninvested cash from clients allocated in sovereign bonds Key factors inflating our balance sheet Simplified Balance Sheet (in R $ mn ) Assets [A] [B] Retirement Plans [C] Float Adjusted Assets [A-B-C] Total 297.141 60.981 19.034 217.125 Securities - Fair Value through P&L 134.481 60.981 - 73.500 Securities - Repos 21.773 - - 21.773 Securities - Fair Value through OCI 38.386 - 14.594 23.792 Securities - Trading & Intermediation 4.440 - 4.440 - Other Financial Instruments 39.167 - - 39.167 Other Assets 58.895 - - 58.895 Liabilities + Equity [A] [B] Retirement Plans [C] Float Adjusted Assets [A-B-C] Total 297.141 60.981 19.034 217.125 Securities - Repos 53.890 - - 53.890 Other Finan. Liab. 37.332 - - 37.332 Pension Funds 60.981 60.981 - - Securities - Trading & Intermediation 19.034 - 19.034 - Other Liabilities & Equity 125.904 - - 125.904

29 (in R $ mn ) 1Q24 2Q24 261.880 277.536 Financial Assets 189.656 212.034 Securities & Derivatives 29.542 26.321 Loans 30.291 21.773 Repos 12.391 17.410 Other (227.665) (242.890) ( - ) Financial Liabilities (58.654) (60.981) ( - ) Retirement Plans Liabilities (57.107) (67.198) ( - ) Market Funding Operations (49.054) (53.890) ( - ) Repos (51.917) (49.597) ( - ) Securities & Derivatives (10.932) (11.224) ( - ) Other (13.883) (14.594) ( - ) Float 20.332 20.053 (=) Adjusted Gross Financial Assets 1Q24 2Q24 20.332 20.053 (=) Adjusted Gross Financial Assets (10.960) (10.918) ( - ) Gross Debt (3.436) (3.775) ( - ) Bonds (2.280) (1.176) ( - ) Debentures (2.267) (2.528) ( - ) Borrowings (2.976) (3.440) ( - ) Structured financing 9.372 9.134 (=) Net Asset Value Net Asset Value 29 Adj. Gross Financial Assets NAV = Gross Debt -

30 Investor Relations ir@xpi.com.br https://investors.xpinc.com/
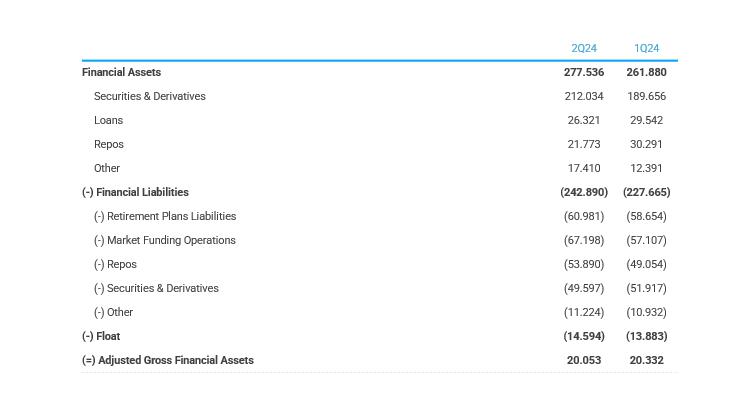
1Q24 2Q24 261.880 277.536 Financial Assets 189.656 212.034 Securities & Derivatives 29.542 26.321 Loans 30.291 21.773 Repos 12.391 17.410 Other (227.665) (242.890) ( - ) Financial Liabilities (58.654) (60.981) ( - ) Retirement Plans Liabilities (57.107) (67.198) ( - ) Market Funding Operations (49.054) (53.890) ( - ) Repos (51.917) (49.597) ( - ) Securities & Derivatives (10.932) (11.224) ( - ) Other (13.883) (14.594) ( - ) Float 20.332 20.053 (=) Adjusted Gross Financial Assets