| FREE WRITING PROSPECTUS | ||
| FILED PURSUANT TO RULE 433 | ||
| REGISTRATION FILE NO.: 333-228375-02 | ||
 |  |  |
BANK 2019-BNK21
Free Writing Prospectus
Structural and Collateral Term Sheet
$1,180,998,012
(Approximate Total Mortgage Pool Balance)
$991,521,000
(Approximate Offered Certificates)
Banc of America Merrill Lynch Commercial Mortgage Inc.
as Depositor
Morgan Stanley Mortgage Capital Holdings LLC
Bank of America, National Association
Wells Fargo Bank, National Association
as Sponsors and Mortgage Loan Sellers
Commercial Mortgage Pass-Through Certificates
Series 2019-BNK21
September 23, 2019
BofA MERRILL LYNCH Co-Lead Bookrunner Manager | WELLS FARGO SECURITIES Co-Lead Bookrunner Manager | MORGAN STANLEY Co-Lead Bookrunner Manager |
Academy Securities, Inc. Co-Manager | Drexel Hamilton Co-Manager |
STATEMENT REGARDING THIS FREE WRITING PROSPECTUS
The depositor has filed a registration statement (including a prospectus) with the SEC (File No. 333-228375) for the offering to which this communication relates. Before you invest, you should read the prospectus in that registration statement and other documents the depositor has filed with the SEC for more complete information about the depositor, the issuing entity and this offering. You may get these documents for free by visiting EDGAR on the SEC web site atwww.sec.gov. Alternatively, the depositor or any underwriter or any dealer participating in the offering will arrange to send you the prospectus if you request it by calling toll free 1-866-294-1322 or by email todg.Prospectus_Requests@baml.com.
This is not a research report and was not prepared by any Underwriters’ research department. Please see additional important information and qualifications at the end of this Term Sheet.
| BANK 2019-BNK21 |
Neither this Term Sheet nor anything contained herein shall form the basis for any contract or commitment whatsoever.The information contained herein is preliminary as of the date hereof.This Term Sheet is subject to change, completion or amendment from time to time.The information contained herein will be superseded by similar information delivered to you as part of the Preliminary Prospectus.The information contained herein supersedes any such information previously delivered.The information contained herein should be reviewed only in conjunction with the entire Preliminary Prospectus.All of the information contained herein is subject to the same limitations and qualifications contained in the Preliminary Prospectus.The information contained herein does not contain all relevant information relating to the underlying mortgage loans or mortgaged properties.Such information is described in the Preliminary Prospectus.The information contained herein will be more fully described in the Preliminary Prospectus.The information contained herein should not be viewed as projections, forecasts, predictions or opinions with respect to value.Prior to making any investment decision, prospective investors are strongly urged to read the Preliminary Prospectus in its entirety.Neither the Securities and Exchange Commission nor any state securities commission has approved or disapproved of these securities or determined if this Term Sheet is truthful or complete.Any representation to the contrary is a criminal offense.
IMPORTANT NOTICE RELATING TO AUTOMATICALLY GENERATED EMAIL DISCLAIMERS
Any legends, disclaimers or other notices that may appear at the bottom of, or attached to, the email communication to which this Term Sheet may have been attached are not applicable to this Term Sheet and should be disregarded. Such legends, disclaimers or other notices have been automatically generated as a result of this Term Sheet having been sent via Bloomberg or another email system.
IMPORTANT NOTICE REGARDING THE CONDITIONS FOR THIS OFFERING OF ASSET-BACKED SECURITIES
THE ASSET-BACKED SECURITIES REFERRED TO IN THIS TERM SHEET ARE BEING OFFERED WHEN, AS AND IF ISSUED. IN PARTICULAR, YOU ARE ADVISED THAT THE ASSET-BACKED SECURITIES, AND THE ASSET POOL BACKING THEM, ARE SUBJECT TO MODIFICATION OR REVISION (INCLUDING, AMONG OTHER THINGS, THE POSSIBILITY THAT ONE OR MORE CLASSES OF SECURITIES MAY BE SPLIT, COMBINED OR ELIMINATED), AT ANY TIME PRIOR TO ISSUANCE OR AVAILABILITY OF A FINAL PROSPECTUS. AS A RESULT, YOU MAY COMMIT TO PURCHASE SECURITIES THAT HAVE CHARACTERISTICS THAT MAY CHANGE, AND YOU ARE ADVISED THAT ALL OR A PORTION OF THE SECURITIES MAY NOT BE ISSUED THAT HAVE THE CHARACTERISTICS DESCRIBED IN THIS TERM SHEET. OUR OBLIGATION TO SELL SECURITIES TO YOU IS CONDITIONED ON THE SECURITIES AND THE UNDERLYING TRANSACTION HAVING THE CHARACTERISTICS DESCRIBED IN THIS TERM SHEET. IF WE DETERMINE THAT THE FOREGOING CONDITION IS NOT SATISFIED IN ANY MATERIAL RESPECT, WE WILL NOTIFY YOU, AND NEITHER THE ISSUING ENTITY NOR ANY UNDERWRITER WILL HAVE ANY OBLIGATION TO YOU TO DELIVER ALL OR ANY PORTION OF THE SECURITIES WHICH YOU HAVE COMMITTED TO PURCHASE, AND THERE WILL BE NO LIABILITY BETWEEN US AS A CONSEQUENCE OF THE NON-DELIVERY.
This is not a research report and was not prepared by the Underwriters’ research department. Please see additional important information and qualifications at the end of this Term Sheet.
T-2
| BANK 2019-BNK21 | Structural Overview |
Offered Certificates
| Class | Expected Ratings (Fitch/S&P/DBRS)(1) | Approximate Initial Certificate Balance or Notional Amount(2) | Approximate Initial Credit Support(3) | Pass-Through Rate Description | Expected Weighted Average Life (Years)(4) | Expected Principal Window (Months)(4) | Certificate Principal UW NOI Debt Yield(5) | Certificate Principal to Value Ratio(6) |
| Class A-1 | AAAsf/AAA(sf)/AAA(sf) | 20,194,000 | 30.000% | (7) | 2.90 | 1-59 | 14.7% | 42.6% |
| Class A-2 | AAAsf/AAA(sf)/AAA(sf) | 9,516,000 | 30.000% | (7) | 4.89 | 59-59 | 14.7% | 42.6% |
| Class A-SB | AAAsf/AAA(sf)/AAA(sf) | 31,582,000 | 30.000% | (7) | 7.39 | 59-117 | 14.7% | 42.6% |
| Class A-3 | AAAsf/AAA(sf)/AAA(sf) | 20,143,000 | 30.000% | (7) | 6.81 | 82-82 | 14.7% | 42.6% |
| Class A-4 | AAAsf/AAA(sf)/AAA(sf) | (8) | 30.000% | (7) | (8) | (8) | 14.7% | 42.6% |
| Class A-5 | AAAsf/AAA(sf)/AAA(sf) | (8) | 30.000% | (7) | (8) | (8) | 14.7% | 42.6% |
| Class X-A | AAAsf/AAA(sf)/AAA(sf) | 785,363,000(9) | N/A | Variable IO(10) | N/A | N/A | N/A | N/A |
| Class X-B | A-sf/NR/AA(low)(sf) | 206,158,000(9) | N/A | Variable IO(10) | N/A | N/A | N/A | N/A |
| Class A-S | AAAsf/AAA(sf)/AAA(sf) | 84,146,000 | 22.500% | (7) | 9.95 | 119-120 | 13.3% | 47.2% |
| Class B | AA-sf/AA-(sf)/AAA(sf) | 63,110,000 | 16.875% | (7) | 9.98 | 120-120 | 12.4% | 50.6% |
| Class C | A-sf/NR/A(high)(sf) | 58,902,000 | 11.625% | (7) | 9.98 | 120-120 | 11.6% | 53.8% |
Privately Offered Certificates(11)
| Class | Expected Ratings (Fitch/S&P/DBRS)(1) | Approximate Initial Certificate Balance or Notional Amount(2) | Approximate Initial Credit Support(3) | Pass-Through Rate Description | Expected Weighted Average Life (Years)(4) | Expected Principal Window (Months)(4) | Certificate Principal UW NOI Debt Yield(5) | Certificate Principal to Value Ratio(6) |
| Class X-D | BBB-sf/NR/A(low)(sf) | 56,098,000(9) | N/A | Variable IO(10) | N/A | N/A | N/A | N/A |
| Class X-F | BB-sf/NR/BBB(low)(sf) | 23,841,000(9) | N/A | Variable IO(10) | N/A | N/A | N/A | N/A |
| Class X-G | B-sf/NR/BB(sf) | 11,219,000(9) | N/A | Variable IO(10) | N/A | N/A | N/A | N/A |
| Class X-H | NR/NR/NR | 39,269,110(9) | N/A | Variable IO(10) | N/A | N/A | N/A | N/A |
| Class D | BBBsf/NR/A(low)(sf) | 32,256,000 | 8.750% | (7) | 9.98 | 120-120 | 11.3% | 55.6% |
| Class E | BBB-sf/NR/BBB(high)(sf) | 23,842,000 | 6.625% | (7) | 9.98 | 120-120 | 11.0% | 56.9% |
| Class F | BB-sf/NR/BB(high)(sf) | 23,841,000 | 4.500% | (7) | 9.98 | 120-120 | 10.8% | 58.1% |
| Class G | B-sf/NR/BB(low)(sf) | 11,219,000 | 3.500% | (7) | 9.98 | 120-120 | 10.7% | 58.8% |
| Class H | NR/NR/NR | 39,269,110 | 0.000% | (7) | 9.98 | 120-120 | 10.3% | 60.9% |
Non-Offered Eligible Vertical Interest(11)
| Class | Expected Ratings (Fitch/S&P/DBRS)(1) | Approximate Initial Certificate Balance or Notional Amount(2) | Approximate Initial Credit Support(3) | Pass-Through Rate Description | Expected Weighted Average Life (Years)(4) | Expected Principal Window (Months)(4) | Certificate Principal UW NOI Debt Yield | Certificate Principal to Value Ratio |
| RR Interest | NR/NR/NR | $59,049,900.58 | N/A | (12) | 9.59 | 1-120 | N/A | N/A |
| (1) | Ratings shown are those of Fitch Ratings, Inc. (“Fitch”), S&P Global Ratings, acting through Standard & Poor’s Financial Services LLC (“S&P”), and DBRS, Inc. (“DBRS”). Certain nationally recognized statistical rating organizations that were not hired by the depositor may use information they receive pursuant to Rule 17g-5 under the Securities Exchange Act of 1934, as amended, or otherwise to rate the certificates. There can be no assurance as to what ratings a non-hired nationally recognized statistical rating organization would assign. See “Risk Factors—Other Risks Relating to the Certificates—Nationally Recognized Statistical Rating Organizations May Assign Different Ratings to the Certificates; Ratings of the Certificates Reflect Only the Views of the Applicable Rating Agencies as of the Dates Such Ratings Were Issued; Ratings May Affect ERISA Eligibility; Ratings May Be Downgraded” and “Ratings” in the Preliminary Prospectus to be dated on or about the date hereof (the “Preliminary Prospectus”). Capitalized terms used but not defined herein have the meanings assigned to such terms in the Preliminary Prospectus. |
| (2) | Approximate, subject to a permitted variance of plus or minus 5% and further subject to the discussion in footnote (8) below. In addition, the notional amounts of the Class X-A, Class X-B, Class X-D, Class X-F, Class X-G and Class X-H certificates may vary depending upon the final pricing of the classes of principal balance certificates whose certificate balances comprise such notional amounts, and, if as a result of such pricing the pass-through rate of any class of the Class X-A, Class X-B, Class X-D, Class X-F, Class X-G or Class X-H certificates, as applicable, would be equal to zero at all times, such class of certificates will not be issued on the closing date of this securitization. |
| (3) | The approximate initial credit support percentages set forth for the certificates are approximate and, for the Class A-1, Class A-2, Class A-SB, Class A-3, Class A-4 and Class A-5 certificates, are represented in the aggregate. The RR Interest provides credit support only to the limited extent that it is allocated a portion of any losses incurred on the underlying mortgage loans, which such losses are allocated between it, on the one hand, and to the Non-Retained Certificates, on the other hand,pro rata in accordance with their respective Percentage Allocation Entitlements (as defined below). See “Credit Risk Retention” in the Preliminary Prospectus. |
| (4) | The Expected Weighted Average Life and Expected Principal Window during which distributions of principal would be received as set forth in the foregoing table with respect to each class of certificates having a certificate balance are based on the assumptions set forth under “Yield and Maturity Considerations— |
This is not a research report and was not prepared by the Underwriters’ research department. Please see additional important information and qualifications at the end of this Term Sheet.
T-3
| BANK 2019-BNK21 | Structural Overview |
Weighted Average Life” in the Preliminary Prospectus and on the assumptions that there are no prepayments, modifications or losses in respect of the mortgage loans and that there are no extensions or forbearances of maturity dates or anticipated repayment dates of the mortgage loans.
| (5) | Certificate Principal UW NOI Debt Yield for any class of principal balance certificates (other than the RR Interest) is calculated as the product of (a) the weighted average UW NOI Debt Yield for the mortgage pool, multiplied by (b) a fraction, the numerator of which is the total initial certificate balance of all the principal balance certificates, and the denominator of which is the sum of (x) the total initial certificate balance of the subject class of principal balance certificates and all other classes of principal balance certificates (other than the RR Interest), if any, that are senior to such class and (y) the outstanding certificate balance of the RR Interest, multiplied by the applicable RR Interest Computation Percentage. The Certificate Principal UW NOI Debt Yields of the Class A-1, Class A-2, Class A-SB, Class A-3, Class A-4 and Class A-5 certificates are calculated in the aggregate for those classes as if they were a single class. With respect to any class of principal balance certificates, the “RR Interest Computation Percentage” is equal to a fraction, expressed as a percentage, the numerator of which is the total initial certificate balance of the subject class of principal balance certificates and all other classes of principal balance certificates (other than the RR Interest), if any, that are senior to such class, and the denominator of which is the sum of the total initial certificate balance of all the principal balance certificates (other than the RR Interest). |
| (6) | Certificate Principal to Value Ratio for any class of principal balance certificates (other than the RR Interest) is calculated as the product of (a) the weighted average Cut-off Date LTV Ratio of the mortgage pool, multiplied by (b) a fraction, the numerator of which is the sum of (x) the total initial certificate balance of the subject class of principal balance certificates and all other classes of principal balance certificates (other than the RR Interest), if any, that are senior to such class and (y) the outstanding certificate balance of the RR Interest, multiplied by the applicable RR Interest Computation Percentage, and the denominator of which is the total initial certificate balance of all the principal balance certificates. The Certificate Principal to Value Ratios of the Class A-1, Class A-2, Class A-SB, Class A-3, Class A-4 and Class A-5 certificates are calculated in the aggregate for those classes as if they were a single class. |
| (7) | The pass-through rate for each class of the Class A-1, Class A-2, Class A-SB, Class A-3, Class A-4, Class A-5, Class A-S, Class B, Class C, Class D, Class E, Class F, Class G and Class H certificates (which, together with the RR Interest, are referred to as the “principal balance certificates”) will be one of the following: (i) a fixed rateper annum, (ii) a variable rateper annum equal to the weighted average of the net mortgage interest rates on the mortgage loans for the related distribution date, (iii) a variable rateper annum equal to the lesser of (a) a fixed rate and (b) the weighted average of the net mortgage interest rates on the mortgage loans for the related distribution date or (iv) a variable rateper annum equal to the weighted average of the net mortgage interest rates on the mortgage loans for the related distribution date minus a specified percentage. For purposes of the calculation of the weighted average of the net mortgage interest rates on the mortgage loans for each distribution date, the net mortgage interest rates will be adjusted as necessary to a 30/360 basis. |
| (8) | The exact initial certificate balances of the Class A-4 and Class A-5 certificates are unknown and will be determined based on the final pricing of those classes of certificates. However, the initial certificate balances, weighted average lives and principal windows of the Class A-4 and Class A-5 certificates are expected to be within the applicable ranges reflected in the following chart. The aggregate initial certificate balance of the Class A-4 and Class A-5 certificates is expected to be approximately $703,928,000, subject to a variance of plus or minus 5%. |
| Class of Certificates | Expected Range of Initial Certificate Balance | Expected Range of Weighted Average Life (Years) | Expected Range of Principal Window (Months) |
| Class A-4 | $200,000,000 - $350,000,000 | 9.78 – 9.79 | 117 – 118 |
| Class A-5 | $353,928,000 - $503,928,000 | 9.86 – 9.89 | 118– 119 |
| (9) | The Class X-A, Class X-B, Class X-D, Class X-F, Class X-G and Class X-H certificates (collectively referred to as the “Class X certificates”) are notional amount certificates and will not be entitled to distributions of principal. The notional amount of the Class X-A certificates will be equal to the aggregate certificate balance of the Class A-1, Class A-2, Class A-SB, Class A-3, Class A-4 and Class A-5 certificates. The notional amount of the Class X-B certificates will be equal to the aggregate certificate balance of the Class A-S, Class B and Class C certificates. The notional amount of the Class X-D certificates will be equal to the aggregate certificate balance of the Class D and Class E certificates. The notional amount of each class of the Class X-F, Class X-G and Class X-H certificates will be equal to the certificate balance of the class of principal balance certificates that, with the addition of “X-”, has the same alphabetical designation as the subject class of Class X certificates. |
| (10) | The pass-through rate for the Class X-A certificates for any distribution date will be aper annum rate equal to the excess, if any, of (a) the weighted average of the net mortgage interest rates on the mortgage loans for the related distribution date, over (b) the weighted average of the pass-through rates on the Class A-1, Class A-2, Class A-SB, Class A-3, Class A-4 and Class A-5 certificates for the related distribution date, weighted on the basis of their respective certificate balances outstanding immediately prior to that distribution date. The pass-through rate for the Class X-B certificates for any distribution date will be aper annum rate equal to the excess, if any, of (a) the weighted average of the net mortgage interest rates on the mortgage loans for the related distribution date, over (b) the weighted average of the pass-through rates on the Class A-S, Class B and Class C certificates for the related distribution date, weighted on the basis of their respective certificate balances outstanding immediately prior to that distribution date. The pass-through rate for the Class X-D certificates for any distribution date will be aper annum rate equal to the excess, if any, of (a) the weighted average of the net mortgage interest rates on the mortgage loans for the related distribution date, over (b) the weighted average of the pass-through rates on the Class D and Class E certificates for the related distribution date, weighted on the basis of their respective certificate balances outstanding immediately prior to that distribution date. The pass-through rate for each class of the Class X-F, Class X-G and Class X-H certificates for any distribution date will be aper annum rate equal to the excess, if any, of (a) the weighted average of the net mortgage interest rates on the mortgage loans for the related distribution date, over (b) the pass-through rate for the related distribution date of the class of principal balance certificates that, with the addition of “X-”, has the same alphabetical designation as the subject class of Class X certificates. For purposes of the calculation of the weighted average of the net mortgage interest rates on the mortgage loans for each distribution date, the net mortgage interest rates will be adjusted as necessary to a 30/360 basis. |
| (11) | Not offered pursuant to the Preliminary Prospectus or this Term Sheet. Information provided in this Term Sheet regarding the characteristics of these certificates is provided only to enhance your understanding of the offered certificates. The privately offered certificates also include the Class V and Class R certificates, which do not have a certificate balance, notional amount, credit support, pass-through rate, rating, assumed final distribution date or rated final distribution date, and which are not shown in the chart. The Class V certificates represent a beneficial ownership interest held through the grantor trust in a specified percentage of certain excess interest in respect of mortgage loans having anticipated repayment dates, if any. The Class R certificates represent the beneficial ownership of the residual interest in each of the real estate mortgage investment conduits, as further described in the Preliminary Prospectus. |
| (12) | Although it does not have a specified pass-through rate (other than for tax reporting purposes), the effective pass-through rate for the RR Interest will be a variable rateper annumequal to the weighted average of the net mortgage interest rates on the mortgage loans for the related distribution date (in each case adjusted, if necessary, to accrue on the basis of a 360-day year consisting of twelve 30-day months). |
This is not a research report and was not prepared by the Underwriters’ research department. Please see additional important information and qualifications at the end of this Term Sheet.
T-4
| BANK 2019-BNK21 | Structural Overview |
Issue Characteristics
| Offered Certificates: | $991,521,000 (approximate) monthly pay, multi-class, commercial mortgage pass-through certificates, consisting of nine principal balance classes (Class A-1, Class A-2, Class A-SB, Class A-3, Class A-4, Class A-5, Class A-S, Class B and Class C) and two interest-only classes (Class X-A and Class X-B) |
| Co-Lead Managers and Joint Bookrunners: |
BofA Securities, Inc., Morgan Stanley & Co. LLC, and Wells Fargo Securities, LLC
|
| Co-Managers: | Academy Securities, Inc. and Drexel Hamilton, LLC |
| Mortgage Loan Sellers: | Morgan Stanley Mortgage Capital Holdings LLC, Bank of America, National Association and Wells Fargo Bank, National Association |
| Rating Agencies: | Fitch, S&P and DBRS |
| Master Servicer: | Wells Fargo Bank, National Association |
| Special Servicer: | Rialto Capital Advisors, LLC |
| Certificate Administrator/ Certificate Registrar/Custodian: | Wells Fargo Bank, National Association |
| Trustee: | Wilmington Trust, National Association |
| Operating Advisor: | Park Bridge Lender Services LLC |
| Asset Representations Reviewer: | Park Bridge Lender Services LLC |
| Initial Directing Certificateholder: | RREF III Debt AIV, LP (or another affiliate of Rialto Capital Advisors, LLC) |
| Risk Retention Consultation Party: | Bank of America, National Association |
| U.S. Credit Risk Retention: | For a discussion on the manner in which the U.S. credit risk retention requirements will be addressed by Bank of America, National Association, as the retaining sponsor, see “Credit Risk Retention” in the Preliminary Prospectus. |
| EU Risk Retention: | None of the sponsors or any other party to this transaction intends to retain a material net economic interest in the securitization constituted by the issue of the Certificates in a manner prescribed by Article 6 of European Union Regulation (EU) 2017/2402. In addition, no such person undertakes to take any action which may be required by any investor for the purposes of its compliance with any applicable requirement under such regulation. |
| Cut-off Date: | The mortgage loans will be considered part of the trust fund as of their respective cut-off dates. The cut-off date with respect to each mortgage loan is the respective due date for the monthly debt service payment that is due in October 2019 (or, in the case of any mortgage loan that has its first due date after October 2019, the date that would have been its due date in October 2019 under the terms of that mortgage loan if a monthly debt service payment were scheduled to be due in that month). |
| Expected Pricing Date: | Week of September 30, 2019 |
| Expected Closing Date: | October 23, 2019 |
| Determination Dates: | The 11th day of each month or, if the 11th day is not a business day, then the business day immediately following such 11th day. |
| Distribution Dates: | The 4th business day following each determination date. The first distribution date will be in November 2019. |
| Rated Final Distribution Date: | The distribution date in October 2052 |
| Interest Accrual Period: | Preceding calendar month |
| Payment Structure: | Sequential pay |
| Tax Treatment: | REMIC |
| Optional Termination: | 1.00% clean-up call (solely for the purposes of this calculation, if such right is being exercised after November 2029 and the Park Tower at Transbay mortgage loan or the U-Haul AREC Portfolio 35 mortgage loan is still an asset of the trust, then such mortgage loan will be excluded from the then-aggregate principal balance of the pool of mortgage loans and from the initial pool balance) |
| Minimum Denominations: | $10,000 for each class of Offered Certificates (other than Class X-A and Class X-B certificates); $1,000,000 for the Class X-A and Class X-B certificates |
| Settlement Terms: | DTC, Euroclear and Clearstream |
| Legal/Regulatory Status: | Each class of Offered Certificates is expected to be eligible for exemptive relief under ERISA. No class of Offered Certificates is SMMEA eligible. |
| Analytics: | The certificate administrator is expected to make available all distribution date statements, CREFC® reports and supplemental notices received by it to certain modeling financial services as described in the Preliminary Prospectus. |
| Bloomberg Ticker: | BANK 2019-BN21<MTGE><GO> |
| Risk Factors: | THE CERTIFICATES INVOLVE CERTAIN RISKS AND MAY NOT BE SUITABLE FOR ALL INVESTORS. SEE THE “RISK FACTORS” SECTION OF THE PRELIMINARY PROSPECTUS. |
This is not a research report and was not prepared by the Underwriters’ research department. Please see additional important information and qualifications at the end of this Term Sheet.
T-5
| BANK 2019-BNK21 | Structural Overview |
Structural Overview
| Allocation Between the RR Interest and the Non-Retained Certificates: |
The aggregate amount available for distributions to the holders of the Certificates (including the RR Interest) on each distribution date (net of specified expenses of the issuing entity, including fees payable to, and costs and expenses reimbursable to, the master servicers, any primary servicers, the special servicers, the certificate administrator, the trustee, the operating advisor, the asset representations reviewer and CREFC®) will be allocated between amounts available for distribution to the holders of the RR Interest, on the one hand, and to all other Certificates (other than the Class R Certificates), referred to herein as the “Non-Retained Certificates”, on the other hand. The portion of such amount allocable to (a) the RR Interest will at all times be the product of such amount multiplied by 5% and (b) the Non-Retained Certificates will at all times be the product of such amount multiplied by the difference between 100% and the percentage set forth in clause (a) (each, the respective “Percentage Allocation Entitlement”). |
| Accrual: | Each class of Offered Certificates will accrue interest on a 30/360 basis. |
| Amount and Order of Distributions: |
On each distribution date, the Non-Retained Certificates’ Percentage Allocation Entitlement of funds available for distribution from the mortgage loans, net of (i) any yield maintenance charges and prepayment premiums and (ii) any excess interest, will be distributed in the following amounts and order of priority:
First, to the Class A-1, Class A-2, Class A-SB, Class A-3, Class A-4, Class A-5, Class X-A, Class X-B, Class X-D, Class X-F, Class X-G and Class X-H certificates, in respect of interest, up to an amount equal to, andpro rata in accordance with, the interest entitlements for those classes;
Second, to the Class A-1, Class A-2, Class A-SB, Class A-3, Class A-4 and Class A-5 certificates as follows, to the extent of applicable available funds allocated to principal: either (i)(a)first, to principal on the Class A-SB certificates, until the certificate balance of the Class A-SB certificates is reduced to the planned principal balance for the related distribution date set forth in Annex E to the Preliminary Prospectus, and (b)second, to principal on each class of the Class A-1, Class A-2, Class A-3, Class A-4, Class A-5 and Class A-SB certificates, in that order, in each case until the certificate balance of such class of certificates has been reduced to zero, or (ii) if the certificate balance of each class of principal balance certificates other than the Class A-1, Class A-2, Class A-SB, Class A-3, Class A-4 and Class A-5 certificates and the RR Interest has been reduced to zero as a result of the allocation of losses on the mortgage loans to those certificates, to principal on the Class A-1, Class A-2, Class A-SB, Class A-3, Class A-4 and Class A-5 certificates,pro rata, without regard to the distribution priorities described above or the planned principal balance of the Class A-SB certificates;
Third, to the Class A-1, Class A-2, Class A-SB, Class A-3, Class A-4 and Class A-5 certificates, first, up to an amount equal to, andpro rata based on, any previously unreimbursed losses on the mortgage loans allocable to principal that were previously borne by each such class and then in the amount of interest thereon;
Fourth, to each class of the Class A-S, Class B and Class C certificates, in that order, in each case as follows: (a) to interest on such class of certificates in the amount of its interest entitlement; (b) to the extent of applicable available funds allocable to principal remaining after distributions in respect of principal to each class with a higher priority (as set forth in this clause or prior enumerated clauses set forth above), to principal on such class of certificates until its certificate balance has been reduced to zero; and (c) to reimburse such class of certificates, first, in the amount of any previously unreimbursed losses on the mortgage loans that were previously allocated to those certificates, then in the amount of interest thereon;
Fifth, to the principal balance certificates (other than the Class A-1, Class A-2, Class A-SB, Class A-3, Class A-4, Class A-5, Class A-S, Class B and Class C certificates and the RR Interest) in the amounts and order of priority described in “Description of the Certificates—Distributions” in the Preliminary Prospectus; and
Sixth, to the Class R certificates, any remaining amounts. |
| Interest and Principal Entitlements: |
The interest entitlement of each class of Offered Certificates on each distribution date generally will be the interest accrued during the related interest accrual period on the related certificate balance or notional amount at the related pass-through rate, net of any prepayment interest shortfalls allocated to that class for such distribution date as described below. If prepayment interest shortfalls arise from voluntary prepayments on serviced mortgage loans during any collection period, the master servicer is required to make a limited compensating interest payment to offset those shortfalls. See “Description of the Certificates—Prepayment Interest Shortfalls” in the Preliminary Prospectus. The remaining amount of prepayment interest shortfalls will be allocated between the RR Interest, on one hand, and the Non-Retained Certificates, on the other hand, in accordance with their respective Percentage Allocation Entitlements. The prepayment interest shortfalls allocated to the Non-Retained Certificates (other than the Class V Certificates) will be allocated among such classes of certificates entitled to interest, on apro rata basis, based on their respective amounts of accrued interest for the related distribution date, to reduce the interest entitlement on each such class of certificates. If a class receives less than the entirety of its interest entitlement on any distribution date, then the shortfall (excluding any shortfall due to prepayment interest shortfalls), together with interest thereon, will be added to its interest entitlement for the next succeeding distribution date.
The aggregate principal distribution amount for each distribution date generally will be the aggregate amount of principal received or advanced in respect of the mortgage loans, net of any non-recoverable advances and interest thereon and any workout-delayed reimbursement amounts that are reimbursed to the master servicer or the trustee during the related collection period. Non-recoverable advances and interest thereon are reimbursable from principal collections before reimbursement from other amounts. Workout-delayed reimbursement amounts will be reimbursable from principal collections. The Non-Retained Certificates and the |
This is not a research report and was not prepared by the Underwriters’ research department. Please see additional important information and qualifications at the end of this Term Sheet.
T-6
| BANK 2019-BNK21 | Structural Overview |
| RR Interest will be entitled to their respective Percentage Allocation Entitlements of the aggregate principal distribution amount. | |
| Special Servicer Compensation: | The principal compensation to be paid to the special servicer in respect of its special servicing activities will be the special servicing fee, the workout fee and the liquidation fee.
The special servicing fee for each distribution date is calculated based on the outstanding principal balance of each serviced mortgage loan that is a specially serviced mortgage loan (and any related serviced companion loan) or as to which the related mortgaged property has become an REO property at the special servicing fee rate, which will be a rate equal to the greater of (i) 0.25000%per annum and (ii) theper annumrate that would result in a special servicing fee for the related month of (x) $3,500 or (y) with respect to any mortgage loan with respect to which the risk retention consultation party is entitled to consult with such special servicer, for so long as the related mortgage loan is a specially serviced loan during the occurrence and continuance of a consultation termination event, $5,000. The special servicing fee will be payable monthly,first, from liquidation proceeds, insurance and condemnation proceeds, and other collections in respect of the related specially serviced mortgage loan or REO property and,then, from general collections on all the mortgage loans and any REO properties.
The special servicer will also be entitled to (i) liquidation fees generally equal to 1.0% (or, if such rate would result in an aggregate liquidation fee less than $25,000, then the liquidation fee rate will be equal to the lesser of (i) 3.0% and (ii) such lower rate as would result in an aggregate liquidation fee equal to $25,000) of liquidation proceeds and certain other collections in respect of a specially serviced mortgage loan (and any related serviced companion loan) or related REO property and of amounts received in respect of mortgage loan repurchases by the related mortgage loan sellers and (ii) workout fees generally equal to 1.0% of interest (other than post-ARD excess interest on mortgage loans with anticipated repayment dates and other than default interest) and principal payments made in respect of a rehabilitated mortgage loan (and any related serviced companion loan), subject to a floor of $25,000 with respect to any mortgage loan, whole loan or related REO property, and in the case of each of clause (i) and (ii), subject to certain adjustments and exceptions as described in the Preliminary Prospectus under “Pooling and Servicing Agreement—Servicing and Other Compensation and Payment of Expenses—Special Servicing Compensation”.
With respect to any non-serviced mortgage loan, the related special servicer under the related other pooling and servicing agreement pursuant to which such mortgage loan is being serviced will be entitled to similar compensation as that described above with respect to such non-serviced mortgage loan under such other pooling and servicing agreement as further described in the Preliminary Prospectus, although any related fees may accrue at a different rate and there may be a higher (or no) cap on liquidation and workout fees. |
| Prepayment Premiums/Yield Maintenance Charges: |
If any yield maintenance charge or prepayment premium is collected during any collection period with respect to any mortgage loan, then on the immediately succeeding distribution date, the certificate administrator will pay: (i)(a) to the holders of each class of the Class A-1, Class A-2, Class A-SB, Class A-3, Class A-4, Class A-5, Class A-S, Class B, Class C, Class D and Class E certificates, the product of (x) the Non-Retained Certificates’ Percentage Allocation Entitlement of such yield maintenance charge or prepayment premium, (y) the related Base Interest Fraction for such class and the applicable principal prepayment, and (z) a fraction, the numerator of which is equal to the amount of principal distributed to such class for that distribution date, and the denominator of which is the total amount of principal distributed to the Class A-1, Class A-2, Class A-SB, Class A-3, Class A-4, Class A-5, Class A-S, Class B, Class C, Class D and Class E certificates for that distribution date, (b) to the holders of the Class X-A certificates, the excess, if any, of (x) the product of (1) the Non-Retained Certificates’ Percentage Allocation Entitlement of such yield maintenance charge or prepayment premium and (2) a fraction, the numerator of which is equal to the amount of principal distributed to the Class A-1, Class A-2, Class A-SB, Class A-3, Class A-4 and Class A-5 certificates for that distribution date, and the denominator of which is the total amount of principal distributed to the Class A-1, Class A-2, Class A-SB, Class A-3, Class A-4, Class A-5, Class A-S, Class B, Class C, Class D and Class E certificates for that distribution date, over (y) the amount of such yield maintenance charge or prepayment premium distributed to the Class A-1, Class A-2, Class A-SB, Class A-3, Class A-4 and Class A-5 certificates as described above, (c) to the holders of the Class X-B certificates, the excess, if any, of (x) the product of (1) the Non-Retained Certificates’ Percentage Allocation Entitlement of such yield maintenance charge or prepayment premium and (2) a fraction, the numerator of which is equal to the amount of principal distributed to the Class A-S, Class B and Class C certificates for that distribution date, and the denominator of which is the total amount of principal distributed to the Class A-1, Class A-2, Class A-SB, Class A-3, Class A-4, Class A-5, Class A-S, Class B, Class C, Class D and Class E certificates for that distribution date, over (y) the amount of such yield maintenance charge or prepayment premium distributed to the Class A-S, Class B and Class C certificates as described above, and (d) to the holders of the Class X-D certificates, any remaining portion of the Non-Retained Certificates’ Percentage Allocation Entitlement of such yield maintenance charge or prepayment premium not distributed as described above, and (ii) to the RR Interest, its Percentage Allocation Entitlement of such yield maintenance charge or prepayment premium. All yield maintenance charges and prepayment premiums referred to above will be net of any liquidation fees payable therefrom.
No prepayment premiums or yield maintenance charges will be distributed to the holders of the Class X-F, Class X-G, Class X-H, Class F, Class G, Class H, Class V or Class R Certificates.
“Base Interest Fraction” means, with respect to any principal prepayment of any mortgage loan that provides for the payment of a yield maintenance charge or prepayment premium, and with respect to any class of principal balance certificates (other than the RR Interest), a fraction (A) the numerator of which is the greater of (x) zero and (y) the difference between (i) the pass-through rate on that class, and (ii) the applicable discount rate and |
This is not a research report and was not prepared by the Underwriters’ research department. Please see additional important information and qualifications at the end of this Term Sheet.
T-7
| BANK 2019-BNK21 | Structural Overview |
(B) the denominator of which is the difference between (i) the mortgage interest rate on the related mortgage loan and (ii) the applicable discount rate; provided, that: under no circumstances will the Base Interest Fraction be greater than one; if the discount rate referred to above is greater than or equal to both the mortgage interest rate on the related mortgage loan and the pass-through rate on that class, then the Base Interest Fraction will equal zero; and if the discount rate referred to above is greater than or equal to the mortgage interest rate on the related mortgage loan and is less than the pass-through rate on that class, then the Base Interest Fraction will be equal to 1.0.
Consistent with the foregoing, the Base Interest Fraction is equal to:
(Pass-Through Rate – Discount Rate) (Mortgage Rate – Discount Rate) | |
| Realized Losses: | On each distribution date, immediately following the distributions to be made to the certificateholders on that date, the certificate administrator is required to calculate the amount, if any, by which (i) the aggregate stated principal balance of the mortgage loans, including any successor REO loans, expected to be outstanding immediately following that distribution date is less than (ii) the then aggregate certificate balance of the principal balance certificates after giving effect to distributions of principal on that distribution date. The Non-Retained Certificates’ Percentage Allocation Entitlement of such amount will be applied to the Class H, Class G, Class F, Class E, Class D, Class C, Class B and Class A-S certificates, in that order, in each case until the related certificate balance has been reduced to zero, and then to the Class A-1, Class A-2, Class A-SB, Class A-3, Class A-4 and Class A-5 certificates,pro rata based upon their respective certificate balances, until their respective certificate balances have been reduced to zero. The RR Interest’s Percentage Allocation Entitlement of such amount will be applied to the RR Interest until the related RR Interest balance has been reduced to zero. |
| Serviced Whole Loans: | Each of the following mortgaged properties or portfolio of mortgaged properties secures a mortgage loan and one or morepari passu promissory notes and, in some cases, one or more generally subordinate promissory notes (each, a “serviced companion loan”) that will be serviced pursuant to the related intercreditor agreement and the pooling and servicing agreement for this transaction: Park Tower at Transbay, 230 Park Avenue South, Storage Post Portfolio, 105 East 17thStreet, Tysons Tower, National Anchored Retail Portfolio and Landing at Fancher Creek. With respect to each such mortgaged property or portfolio of mortgaged properties, the related mortgage loan, together with the related serviced companion loan(s), is referred to herein (for so long as it is serviced under the pooling and servicing agreement for this transaction) as a “serviced whole loan.” Each serviced companion loan is not part of the mortgage pool and may be contributed to one or more future securitization transactions (if not already securitized) or may be otherwise transferred at any time, subject to compliance with the related intercreditor agreement. See the table below entitled “Mortgage Loans with Pari Passu Companion Loans,” as well as “Description of the Mortgage Pool—The Whole Loans” in the Preliminary Prospectus, for additional information regarding each such whole loan. |
| Non-Serviced Whole Loans: | Each of the following mortgaged properties or portfolio of mortgaged properties secures a mortgage loan (each, a “non-serviced mortgage loan”), one or morepari passu promissory notes and, in some cases, one or more generally subordinate promissory notes (each such promissory note, a “non-serviced companion loan”) that will be serviced pursuant to the related intercreditor agreement and the pooling and servicing agreement or trust and servicing agreement (referred to herein as a related “pooling and servicing agreement”) for another securitization transaction: The Tower at Burbank, Grand Canal Shoppes, NKX Multifamily Portfolio and Global Data Center. With respect to each such mortgaged property or portfolio of mortgaged properties, the related mortgage loan, together with the related non-serviced companion loan(s), is referred to herein (for so long as it is serviced under the pooling and servicing agreement for another securitization transaction) as a “non-serviced whole loan.” Each non-serviced companion loan is not part of the mortgage pool and may be contributed to one or more future securitization transactions (if not already securitized) or may be otherwise transferred at any time, subject to compliance with the related intercreditor agreement. Servicing of each non-serviced whole loan will generally be directed by the holder of the related control note (or, if such control note is included in a securitization, the directing certificateholder thereunder (or other party designated thereunder to exercise the rights of such control note)), and such holder will have the right to replace the special servicer with respect to the related whole loan with or without cause. See the tables below entitled “Mortgage Loans with Pari Passu Companion Loans” and“Mortgage Loans with Subordinate Debt,” as well as “Description of the Mortgage Pool—The Whole Loans” in the Preliminary Prospectus, for additional information regarding each such whole loan. |
| Directing Certificateholder/ Controlling Class: |
The “Directing Certificateholder” will be the Controlling Class Certificateholder (or its representative) selected by more than 50% (by certificate balance) of the Controlling Class Certificateholders;provided, that (1) absent that selection, (2) until a Directing Certificateholder is so selected or (3) upon receipt of a notice from a majority of the Controlling Class Certificateholders (by certificate balance) that a Directing Certificateholder is no longer designated, the Controlling Class Certificateholder that owns the largest aggregate certificate balance of the Controlling Class (or its representative) will be the Directing Certificateholder;provided, that (a) in the case of clause (3), if no one holder owns the largest aggregate certificate balance of the Controlling Class, then there will be no Directing Certificateholder until appointed in accordance with the terms of the pooling and servicing agreement, and (b) the certificate administrator and the other parties to the pooling and servicing agreement will be entitled to assume that the identity of the Directing Certificateholder has not changed until such parties receive written notice of a replacement of the Directing Certificateholder from a party holding the requisite interest in the Controlling Class (as confirmed by the certificate registrar), or the resignation of the then current Directing Certificateholder.
|
This is not a research report and was not prepared by the Underwriters’ research department. Please see additional important information and qualifications at the end of this Term Sheet.
T-8
| BANK 2019-BNK21 | Structural Overview |
The “Controlling Class” will be, as of any time of determination, the most subordinate class of Control Eligible Certificates then outstanding that has an aggregate certificate balance (as notionally reduced by any Cumulative Appraisal Reduction Amounts (as defined below) allocable to such class) at least equal to 25% of the initial certificate balance of that class; provided, that if at any time the certificate balances of the certificates other than the Control Eligible Certificates and the RR Interest have been reduced to zero as a result of principal payments on the mortgage loans, then the Controlling Class will be the most subordinate class of Control Eligible Certificates that has a certificate balance greater than zero without regard to any Cumulative Appraisal Reduction Amounts. The Controlling Class as of the closing date will be the Class H certificates.
The “Control Eligible Certificates” will be any of the Class G or Class H certificates. | |
| Control Rights: | Prior to a Control Termination Event, the Directing Certificateholder will have certain consent and consultation rights under the pooling and servicing agreement with respect to certain major decisions and other matters. A “Control Termination Event” will occur when (i) the Class G certificates have a certificate balance (taking into account the application of the allocable portion of any Cumulative Appraisal Reduction Amounts to notionally reduce the certificate balance thereof) of less than 25% of the initial certificate balance of that class; or (ii) a holder of the Class G certificates is the majority controlling class certificateholder and has irrevocably waived its right, in writing, to exercise any of the rights of the controlling class certificateholder and such rights have not been reinstated to a successor controlling class certificateholder; provided that a Control Termination Event will be deemed not continuing in the event that the certificate balances of the principal balance certificates other than the Control Eligible Certificates and the RR Interest have been reduced to zero as a result of principal payments on the mortgage loans.
After the occurrence of a Control Termination Event but prior to the occurrence of a Consultation Termination Event, the Directing Certificateholder will not have any consent rights, but the Directing Certificateholder will have certain non-binding consultation rights under the pooling and servicing agreement with respect to certain major decisions and other matters. A “Consultation Termination Event” will occur when (i) no class of Control Eligible Certificates has a certificate balance (without regard to the application of the allocable portion of any Cumulative Appraisal Reduction Amounts) at least equal to 25% of the initial certificate balance of that class; or (ii) a holder of a majority of the Class G certificates is the majority controlling class certificateholder and has irrevocably waived its right, in writing, to exercise any of the rights of the controlling class certificateholder and such rights have not been reinstated to a successor controlling class certificateholder (provided that no Consultation Termination Event resulting solely from the operation of clause (ii) will be deemed to have existed or be in continuance with respect to a successor majority holder of the Class G certificates that has not irrevocably waived its right to exercise any of the rights of the controlling class certificateholder); provided that a Consultation Termination Event will be deemed not continuing in the event that the certificate balances of the principal balance certificates other than the Control Eligible Certificates and the RR Interest have been reduced to zero as a result of principal payments on the mortgage loans.
After the occurrence of a Consultation Termination Event, the Directing Certificateholder will not have any consent or consultation rights, except with respect to any rights expressly set forth in the pooling and servicing agreement, and the operating advisor will retain certain non-binding consultation rights under the pooling and servicing agreement with respect to certain major decisions and other matters.
Notwithstanding the proviso to the definitions of “Control Termination Event” and “Consultation Termination Event”, a Control Termination Event and a Consultation Termination Event will each be deemed to have occurred with respect to any Excluded Loan with respect to the Directing Certificateholder or the holder of the majority of the Controlling Class, and neither the Directing Certificateholder nor any Controlling Class Certificateholder will have any consent or consultation rights with respect to the servicing of such Excluded Loan.
An “Excluded Loan” means (a) with respect to the Directing Certificateholder or the holder of the majority of the Controlling Class, a mortgage loan or whole loan with respect to which, as of any date of determination, the Directing Certificateholder or the holder of the majority of the Controlling Class is a Borrower Party or (b) with respect to the Risk Retention Consultation Party or the holder of the majority of the RR Interest, a mortgage loan or whole loan with respect to which, as of any date of determination, the Risk Retention Consultation Party or the holder of the majority of the RR Interest is a Borrower Party. It is expected that there will be no Excluded Loans with respect to this securitization on the Closing Date.
“Borrower Party” means a borrower, a mortgagor, a manager of a mortgaged property, the holder of a mezzanine loan that has been accelerated or as to which foreclosure or enforcement proceedings have been commenced against the equity collateral pledged to secure the related mezzanine loan, or any Borrower Party Affiliate.
“Borrower Party Affiliate” means, with respect to a borrower, a mortgagor, a manager of a mortgaged property or the holder of a mezzanine loan that has been accelerated or as to which foreclosure or enforcement proceedings have been commenced against the equity collateral pledged to secure the related mezzanine loan, (a) any other person controlling or controlled by or under common control with such borrower, mortgagor, manager or mezzanine lender, as applicable, or (b) any other person owning, directly or indirectly, 25% or more of the beneficial interests in such borrower, mortgagor, manager or mezzanine lender, as applicable. For the purposes of this definition, “control” when used with respect to any specified person means the power to direct the management and policies of such person, directly or indirectly, whether through the ownership of voting securities, by contract or otherwise and the terms “controlling” and “controlled” have meanings correlative to the foregoing.
Notwithstanding any of the foregoing to the contrary, if any mortgage loan is part of a whole loan, the Directing Certificateholder’s consent and/or consultation rights with respect thereto may be limited as described in the Preliminary Prospectus. In particular, with respect to each non-serviced whole loan, the Directing Certificateholder will only have certain consultation rights with respect to certain major decisions and other |
This is not a research report and was not prepared by the Underwriters’ research department. Please see additional important information and qualifications at the end of this Term Sheet.
T-9
| BANK 2019-BNK21 | Structural Overview |
| matters related to such whole loan, in each case only prior to a Control Termination Event or Consultation Termination Event, as applicable. In addition, with respect to any serviced A/B whole loan, for so long as the holder of the related subordinate companion loan is the controlling note holder, the holder of such subordinate companion loan (rather than the Directing Certificateholder) will be entitled to exercise such consent and consultation rights with respect to such whole loan. | |
| Appraisal Reduction Amounts and Collateral Deficiency Amounts: |
An “Appraisal Reduction Amount” generally will be created in the amount, if any, by which the principal balance of a required appraisal loan (which is a mortgage loan with respect to which certain defaults, modifications or insolvency events have occurred as further described in the Preliminary Prospectus) plus other amounts overdue or advanced in connection with such mortgage loan exceeds 90% of the appraised value of the related mortgaged property plus certain escrows and reserves (including letters of credit) held with respect to the mortgage loan.
A mortgage loan will cease to be subject to an Appraisal Reduction Amount when it has been brought current for at least three consecutive months, no additional event of default is foreseeable in the reasonable judgment of the special servicer and no other circumstances exist that would cause such mortgage loan or any related companion loan to be a specially serviced loan; however, a “Collateral Deficiency Amount” may exist with respect to any mortgage loan that is modified into an AB loan structure (an “AB Modified Loan”) and remains a corrected mortgage loan and, if so, will generally equal the excess of (i) the stated principal balance of such AB Modified Loan (taking into account the related junior note(s) and anypari passu notes included therein), over (ii) the sum of (in the case of a whole loan, solely to the extent allocable to the subject mortgage loan) (x) the most recent appraised value for the related mortgaged property or mortgaged properties, plus (y) solely to the extent not reflected or taken into account in such appraised value (or in the calculation of any related Appraisal Reduction Amount) and to the extent on deposit with, or otherwise under the control of, the lender as of the date of such determination, any capital or additional collateral contributed by the related borrower at the time the mortgage loan became (and as part of the modification related thereto) such AB Modified Loan for the benefit of the related mortgaged property or mortgaged properties (provided that in the case of an non-serviced mortgage loan, the amounts set forth in this clause (y) will be taken into account solely to the extent relevant information is received by the special servicer), plus (z) any other escrows or reserves (in addition to any amounts set forth in the immediately preceding clause (y) and solely to the extent not reflected or taken into account in the calculation of any related Appraisal Reduction Amount) held by the lender in respect of such AB Modified Loan as of the date of such determination, which such excess, for the avoidance of doubt, will be determined separately from and exclude any related Appraisal Reduction Amounts.
As used herein, a “Cumulative Appraisal Reduction Amount” will be the sum of any Appraisal Reduction Amounts and any Collateral Deficiency Amounts.
Any Appraisal Reduction Amount in respect of any non-serviced mortgage loan generally will be calculated in accordance with the other servicing agreement pursuant to which such mortgage loan is being serviced, which calculations are expected to be generally similar to those provided for in the pooling and servicing agreement for this transaction.
If any mortgage loan is part of a whole loan, any Appraisal Reduction Amount or Collateral Deficiency Amount will (or effectively will) be calculated in respect of such whole loan taken as a whole and allocated, to the extent provided in the related intercreditor agreement and the related pooling and servicing agreement,first, to any related subordinate companion loan, andsecond, to the related mortgage loan and anypari passu companion loan on apro rata basis by unpaid principal balance.
Appraisal Reduction Amounts will proportionately reduce the interest portion of debt service advances required to be made in respect of the related mortgage loan. Appraisal Reduction Amounts and Collateral Deficiency Amounts (in each case, to the extent of the Non-Retained Certificates’ Percentage Allocation Entitlement thereof) will be taken into account in determining the identity of the controlling class entitled to appoint the Directing Certificateholder, the existence of a Control Termination Event and the allocation and/or exercise of voting rights for certain purposes (see“Directing Certificateholder/Controlling Class” above).
|
| Appraised-Out Class: | An “Appraised-Out Class” is any class of Control Eligible Certificates, the certificate balance of which (taking into account the application of the Non-Retained Certificates’ Percentage Allocation Entitlement of any Appraisal Reduction Amounts or Collateral Deficiency Amounts to notionally reduce the certificate balance of such class) has been reduced to less than 25% of its initial certificate balance. Any Appraised-Out Class may not exercise any direction, control, consent and/or similar rights of the Controlling Class until such time, if any, as such class is reinstated as the Controlling Class, and the rights of the Controlling Class will be exercised by the next most senior class of Control Eligible Certificates that is not an Appraised-Out Class, if any, during such period. |
| Appraisal Remedy: | The holders of the majority (by certificate balance) of an Appraised-Out Class (such holders, the “Requesting Holders”) will have the right, at their sole expense, to require the special servicer to order (or, with respect to a non-serviced mortgage loan, require the special servicer to request from the applicable non-serviced special servicer) a second appraisal of any mortgage loan (or serviced whole loan) for which an appraisal reduction event has occurred or as to which there exists a Collateral Deficiency Amount. With respect to any serviced mortgage loan, the special servicer will be required to use its reasonable efforts to ensure that such appraisal is delivered within 30 days from receipt of the Requesting Holders’ written request and will be required to cause such appraisal to be prepared on an “as-is” basis by an MAI appraiser. With respect to any non-serviced mortgage loan, the special servicer will be required to use commercially reasonable efforts to obtain such second appraisal from the applicable non-serviced special servicer. Upon receipt of such supplemental appraisal, the special servicer will be required to determine, in accordance with the Servicing Standard, whether, based on its assessment of such supplemental appraisal, any recalculation of the applicable Appraisal |
This is not a research report and was not prepared by the Underwriters’ research department. Please see additional important information and qualifications at the end of this Term Sheet.
T-10
| BANK 2019-BNK21 | Structural Overview |
Reduction Amount or Collateral Deficiency Amount is warranted and, if so warranted, such person will be required to recalculate such Appraisal Reduction Amount or Collateral Deficiency Amount, as applicable, based upon such supplemental appraisal and information from the applicable non-serviced special servicer as described above. If required by any such recalculation, the applicable Appraised-Out Class will be reinstated as the Controlling Class and each Appraised-Out Class will, if applicable, have its related certificate balance notionally restored to the extent required by such recalculation of the Appraisal Reduction Amount or Collateral Deficiency Amount, if applicable.
In addition, the Requesting Holders of any Appraised-Out Class will have the right to challenge the Appraisal Reduction Amount and to require the special servicer to order an additional appraisal of any serviced mortgage loan as to which there exists a Collateral Deficiency Amount if an event has occurred at, or with respect to, the related mortgaged property or mortgaged properties that would have a material effect on its or their appraised value, and the special servicer is required to use reasonable efforts to obtain an appraisal from an MAI appraiser reasonably acceptable to the special servicer within 30 days from receipt of the Requesting Holders’ written request.
| |
| Sale of Defaulted Loans: | Under certain circumstances the special servicer may be required to use reasonable efforts to solicit offers for a defaulted serviced mortgage loan (and any related companion loan (to the extent provided under the related intercreditor agreement) and/or related REO properties).
The Directing Certificateholder will not have a right of first refusal to purchase a defaulted loan.
If the special servicer does not receive an offer at least equal to the outstanding principal balance plus all accrued and unpaid interest and outstanding costs and expenses and certain other amounts specified in the pooling and servicing agreement (the “Par Purchase Price”), the special servicer may purchase the defaulted loan or REO property at the Par Purchase Price or may accept the first cash offer received from any person that is determined to be a fair price for such defaulted loan or REO property. If multiple offers are received during the period designated by the special servicer for receipt of offers, such special servicer is generally required to select the highest offer. The special servicer will be required to determine whether any cash offer constitutes a fair price for any defaulted loan or REO property if the highest offeror is a person other than a party to the pooling and servicing agreement for this transaction (the “PSA”), the Directing Certificateholder, the Risk Retention Consultation Party, any sponsor, any Borrower Party, any independent contractor engaged by the special servicer, the trustee for the securitization of a related companion loan (with respect to a whole loan if it is a defaulted loan), any related companion loan holder or its representative, any holder of a related mezzanine loan or any known affiliate of any of the preceding entities (each, an “Interested Person”). If an offer is made by an Interested Person, the trustee will be required to determine (based upon the most recent appraisal conducted in accordance with the terms of the PSA) whether the offer constitutes a fair price for the defaulted loan or REO property unless (i) the offer is equal to or greater than the applicable Par Purchase Price and (ii) the offer is the highest offer received. Absent an offer at least equal to the Par Purchase Price, no offer from an Interested Person will constitute a fair price unless (x) it is the highest offer received and (y) at least two other offers are received from independent third parties. Neither the trustee nor any of its affiliates may make an offer for or purchase any specially serviced loan or REO property.
Notwithstanding any of the foregoing to the contrary, the special servicer is not required to accept the highest offer and may accept a lower offer for a defaulted loan or REO property if such special servicer determines, in accordance with the Servicing Standard (and subject to the requirements of any related intercreditor agreement), that a rejection of such offer would be in the best interests of the certificateholders and any related companion loan holders as a collective whole as if they constituted a single lender (and with respect to a serviced A/B whole loan, taking into account the subordinate nature of any related subordinate companion loan), so long as such lower offer was not made by such special servicer or any of its affiliates.
If title to any mortgaged property is acquired by the trust fund, the special servicer will generally be required to sell such mortgaged property prior to the close of the third calendar year beginning after the year of acquisition.
The foregoing applies to mortgage loans serviced under the PSA. With respect to any non-serviced whole loan, if the special servicer under the applicable pooling and servicing agreement determines to sell the related controlling companion loan if it becomes a defaulted loan, then the special servicer will be required to sell the related whole loan, including the related mortgage loan included in the BANK 2019-BNK21 securitization trust and the relatedpari passu companion loan(s) and, under certain circumstances, any subordinate companion loan(s), as a single loan. In connection with any such sale, the special servicer under the applicable pooling and servicing agreement will be required to follow procedures substantially similar to those set forth above.
|
| Risk Retention Consultation Party: | A risk retention consultation party may be appointed by the holder or holders of more than 50% of the RR Interest, by certificate balance. The majority RR Interest holder will have a continuing right to appoint, remove or replace the risk retention consultation party in its sole discretion. This right may be exercised at any time and from time to time. Except with respect to an Excluded Loan as to such party or the holder of the majority of the RR Interest, the risk retention consultation party will be entitled to consult with the special servicer, upon request of the risk retention consultation party, with respect to certain material servicing actions proposed by such special servicer; provided, that prior to the occurrence and continuance of a Consultation Termination Event, such mortgage loan must also be a specially serviced mortgage loan. |
| Appointment and Replacement of Special Servicers: |
The Directing Certificateholder will appoint the initial special servicers as of the closing date. Prior to the occurrence and continuance of a Control Termination Event, any special servicer may generally be replaced by the Directing Certificateholder with or without cause at any time.
After the occurrence and during the continuance of a Control Termination Event and upon (a) the written direction of holders of principal balance certificates evidencing not less than 25% of the voting rights of all classes of
|
This is not a research report and was not prepared by the Underwriters’ research department. Please see additional important information and qualifications at the end of this Term Sheet.
T-11
| BANK 2019-BNK21 | Structural Overview |
certificates (other than the RR Interest) entitled to principal (taking into account the application of Cumulative Appraisal Reduction Amounts to notionally reduce the certificate balances of classes to which such Cumulative Appraisal Reduction Amounts are allocable) requesting a vote to replace the special servicer with a replacement special servicer, (b) payment by such requesting holders to the certificate administrator of all reasonable fees and expenses to be incurred by the certificate administrator in connection with administering such vote and (c) delivery by such holders of a rating agency confirmation from each applicable rating agency, the certificate administrator will be required to promptly post such notice on its internet website and by mail and conduct the solicitation of votes of all certificates in such regard, which requisite affirmative votes must be received within 180 days of the posting of such notice. Upon the written direction of holders of at least 66 2/3% of a Certificateholder Quorum, the trustee will be required to immediately replace the special servicer with a qualified replacement special servicer designated by such holders of certificates.
After the occurrence and during the continuance of a Consultation Termination Event, if the operating advisor determines that the special servicer is not performing its duties as required under the pooling and servicing agreement or is otherwise not acting in accordance with the Servicing Standard, the operating advisor may also recommend the replacement of such special servicer. The operating advisor’s recommendation to replace such special servicer must be confirmed by an affirmative vote of holders of principal balance certificates evidencing at least a majority of the aggregate voting rights (taking into account the application of any Cumulative Appraisal Reduction Amounts to notionally reduce the respective certificate balances) of all principal balance certificates on an aggregate basis (which requisite affirmative vote must be received within 180 days of posting of the notice of the operating advisor’s recommendation to the certificate administrator’s website).
A “Certificateholder Quorum” means, in connection with any solicitation of votes in connection with the replacement of the special servicer or the asset representations reviewer, the holders of certificates evidencing at least 50% of the aggregate voting rights (taking into account the application of realized losses and, other than with respect to the termination of the asset representations reviewer, any Cumulative Appraisal Reduction Amounts to notionally reduce the certificate balance of the certificates) of all classes of certificates entitled to principal (other than the RR Interest) on an aggregate basis.
With respect to each serviced whole loan, any holder of a relatedpari passu companion loan, following a servicer termination event with respect to the special servicer that affects such holder, will be entitled to direct the trustee (and the trustee will be required) to terminate such special servicer solely with respect to such serviced whole loan. A replacement special servicer will be selected by the trustee or, prior to a Control Termination Event, by the Directing Certificateholder;provided, that any successor special servicer appointed to replace the special servicer with respect to such whole loan cannot be the entity (or its affiliate) that was terminated at the direction of the holder of the relatedpari passucompanion loan.
Notwithstanding any of the foregoing to the contrary, with respect to any serviced A/B whole loans as to which a subordinate companion loan holder is the related controlling note holder, the holder of the related control note will be entitled to replace the special servicer with respect to such whole loan at any time, with or without cause, and while it is a serviced whole loan, no other party may replace the special servicer for such whole loan unless there is a servicer termination event with respect thereto.
With respect to any non-serviced whole loan, the BANK 2019-BNK21 trust, as holder of the related mortgage loan, has the right to terminate the special servicer under the related pooling and servicing agreement if a servicer termination event occurs, with respect to such special servicer that affects the trust in its capacity as such holder. Such rights may be exercised by the Directing Certificateholder prior to a Control Termination Event (or the special servicer, following the occurrence and during the continuance of a Control Termination Event). The successor special servicer will be selected pursuant to the applicable pooling and servicing agreement by the related directing holder prior to a control termination event under such pooling and servicing agreement. | |
| Servicing Standard: | The master servicer and the special servicer are each obligated to service and administer the mortgage loans (and, if applicable, the serviced companion loans) in accordance with the definition of the “Servicing Standard” described in the Preliminary Prospectus and the terms of the pooling and servicing agreement, provided that each non-serviced mortgage loan, if any, will be serviced by another master servicer or special servicer under the pooling and servicing agreement with respect to the securitization of a related companion loan, which entities will be obligated to service and administer such non-serviced mortgage loan pursuant to a similar standard set forth in the related pooling and servicing agreement. |
| Excluded Special Servicer: | If the special servicer obtains knowledge that it has become a Borrower Party with respect to any mortgage loan (an “Excluded Special Servicer Loan”), such special servicer will be required to resign as special servicer of that Excluded Special Servicer Loan. Prior to the occurrence of a Control Termination Event, the Directing Certificateholder will be required to appoint (and may remove and replace with or without cause) a separate special servicer that is not a Borrower Party (an “Excluded Special Servicer”) with respect to any Excluded Special Servicer Loan, unless such Excluded Special Servicer Loan is also an Excluded Loan with respect to the Directing Certificateholder or the holder of the majority of the Controlling Class. After the occurrence and during the continuance of a Control Termination Event, if at any time the applicable Excluded Special Servicer Loan is also an Excluded Loan with respect to the Directing Certificateholder or the holder of the majority of the Controlling Class or if the Directing Certificateholder is entitled to appoint the Excluded Special Servicer but does not so appoint within 30 days of notice of such resignation, the resigning special servicer will be required to use reasonable efforts to select the related Excluded Special Servicer. Any Excluded Special Servicer will be required to perform all of the obligations of the special servicer and will be entitled to all special servicing compensation with respect to such Excluded Special Servicer Loan earned while the related mortgage loan is an Excluded Special Servicer Loan. |
This is not a research report and was not prepared by the Underwriters’ research department. Please see additional important information and qualifications at the end of this Term Sheet.
T-12
| BANK 2019-BNK21 | Structural Overview |
| Liquidated Loan Waterfall: | On liquidation of any mortgage loan, all net liquidation proceeds related to the mortgage loan (but not any related companion loan) will be applied so that amounts allocated as a recovery of accrued and unpaid interest will not, in the first instance, include any delinquent interest that was not advanced as a result of Appraisal Reduction Amounts (or, if a non-recoverability determination was made, delinquent interest that would not have been advanced as a result of Appraisal Reduction Amounts in the absence of such non-recoverability determination) or accrued on the portion of the stated principal balance thereof equal to any related Collateral Deficiency Amount in effect from time to time and as to which no advance was made (collectively, the “Subordinated Interest Amount”). After the adjusted interest amount is so allocated, any remaining liquidation proceeds will be allocated to pay principal on the mortgage loan until the unpaid principal amount of the mortgage loan has been reduced to zero. Any remaining liquidation proceeds will then be allocated to pay the Subordinated Interest Amount. |
| Operating Advisor: | The operating advisor will be required to perform certain review duties if a Control Termination Event has occurred and is continuing, which will generally include a limited annual review of, and the preparation of a report regarding, certain actions of the special servicer with respect to the resolution and/or liquidation of specially serviced loans. The review and report generally will be based on any asset status reports and additional information delivered to the operating advisor by such special servicer. In addition, if a Control Termination Event has occurred and is continuing, the special servicer must consult with the operating advisor (in addition to the Directing Certificateholder if no Consultation Termination Event has occurred and is continuing) in connection with major decisions with respect to mortgage loans. Furthermore, under certain circumstances, but only if a Consultation Termination Event has occurred and is continuing, the operating advisor may recommend the replacement of the special servicer as described above under “—Appointment and Replacement of Special Servicers”; however, the operating advisor will not have any rights or obligations with respect to a non-serviced whole loan.
If a Consultation Termination Event has occurred and is continuing, the operating advisor may be removed and replaced without cause upon the affirmative direction of certificates owners holding not less than 75% of the voting rights of all certificates (taking into account the application of Cumulative Appraisal Reduction Amounts), following a proposal from certificate owners holding not less than 25% of the voting rights of all certificates (taking into account the application of Cumulative Appraisal Reduction Amounts). The certificateholders who initiate a vote on a termination and replacement of the operating advisor without cause must cause the payment of the fees and expenses incurred in the replacement. In addition, in the event there are no classes of certificates outstanding other than the Control Eligible Certificates, the RR Interest and the Class X-F, Class X-G, Class X-H, Class V and Class R certificates, then all of the rights and obligations of the operating advisor under the PSA will terminate without payment of any penalty or termination fee (other than any rights or obligations that accrued prior to the date of such termination (including accrued and unpaid compensation) and other than indemnification rights arising out of events occurring prior to such termination). See “Pooling and Servicing Agreement—The Operating Advisor—Termination of the Operating Advisor Without Cause” in the Preliminary Prospectus. |
| Asset Representations Reviewer: |
The asset representations reviewer will be required to review certain delinquent mortgage loans after a specified delinquency threshold has been met and the required percentage of certificateholders vote to direct a review as described below. The asset representations reviewer will be entitled to the Asset Representations Reviewer Fee with respect to such review. See “Pooling and Servicing Agreement—The Asset Representations Reviewer” in the Preliminary Prospectus.
The certificate administrator will be required to notify certificateholders if the specified delinquency threshold has been met as described in the Preliminary Prospectus under “—The Asset Representations Reviewer”.
If certificateholders evidencing not less than 5.0% of the voting rights request a vote to commence an asset review, and if subsequently (i) a majority of those certificateholders who cast votes and (ii) a majority of an Asset Review Quorum authorizes an asset review within 150 days of the request for a vote, the asset representations reviewer will be required to conduct an asset review of delinquent loans.
The asset representations reviewer may be terminated and replaced without cause. Upon (i) the written direction of certificateholders evidencing not less than 25% of the voting rights (without regard to the application of any Cumulative Appraisal Reduction Amounts) requesting a vote to terminate and replace the asset representations reviewer with a proposed successor asset representations reviewer that is an eligible asset representations reviewer, and (ii) payment by such holders to the certificate administrator of the reasonable fees and expenses to be incurred by the certificate administrator in connection with administering such vote, the certificate administrator will be required to promptly provide notice to all certificateholders and the asset representations reviewer of such request by posting such notice on its internet website, and by mailing such notice to all certificateholders and the asset representations reviewer. Upon the written direction of certificateholders evidencing at least 75% of a Certificateholder Quorum (without regard to the application of any Cumulative Appraisal Reduction Amounts), the trustee will be required to terminate all of the rights and obligations of the asset representations reviewer under the pooling and servicing agreement (other than any rights or obligations that accrued prior to the date of such termination and other than indemnification rights arising out of events occurring prior to such termination) by written notice to the asset representations reviewer, and the proposed successor asset representations reviewer will be appointed. See “Pooling and Servicing Agreement—The Asset Representations Reviewer” in the Preliminary Prospectus.
An “Asset Review Quorum” means, in connection with any solicitation of votes to authorize an Asset Review as described above, the holders of certificates evidencing at least 5.0% of the aggregate voting rights represented by all certificates that have voting rights.
|
This is not a research report and was not prepared by the Underwriters’ research department. Please see additional important information and qualifications at the end of this Term Sheet.
T-13
| BANK 2019-BNK21 | Structural Overview |
| Dispute Resolution Provisions: | The mortgage loan sellers will be subject to the dispute resolution provisions set forth in the PSA to the extent those provisions are triggered with respect to any mortgage loan sold to the depositor by a mortgage loan seller, and such mortgage loan seller will be obligated under the related mortgage loan purchase agreement to comply with all applicable provisions and to take part in any mediation or arbitration proceedings that may result. Generally, in the event that a Repurchase Request is not “Resolved” within 180 days after the related mortgage loan seller receives such Repurchase Request, then the enforcing servicer will be required to send a notice to the first certificateholder (or beneficial owner) to deliver a certificateholder repurchase request with respect to the mortgage loan (the “Initial Requesting Certificateholder”) (if any) and to the certificate administrator (which will be required to make such notice available to certificateholders via the certificate administrator’s website) indicating the enforcing servicer’s intended course of action with respect to the Repurchase Request. If (a) the enforcing servicer’s intended course of action with respect to the Repurchase Request does not involve pursuing further action to exercise rights against the related mortgage loan seller with respect to the Repurchase Request and the Initial Requesting Certificateholder, if any, or any other certificateholder or certificate owner wishes to exercise its right to refer the matter to mediation (including nonbinding arbitration) or arbitration, or (b) the enforcing servicer’s intended course of action is to pursue further action to exercise rights against the related mortgage loan seller with respect to the Repurchase Request but the Initial Requesting Certificateholder, if any, or any other certificateholder or certificate owner does not agree with the dispute resolution method selected by the enforcing servicer, then the Initial Requesting Certificateholder, if any, or such other certificateholder or certificate owner may deliver a written notice to the enforcing servicer indicating its intent to exercise its right to refer the matter to either mediation or arbitration.
“Resolved” means, with respect to a Repurchase Request, (i) that the related material defect or breach has been cured, (ii) the related mortgage loan has been repurchased in accordance with the related mortgage loan purchase agreement, (iii) a mortgage loan has been substituted for the related mortgage loan in accordance with the related mortgage loan purchase agreement, (iv) the applicable mortgage loan seller has made a loss of value payment, (v) a contractually binding agreement has been entered into between the enforcing servicer, on behalf of the issuing entity, and the related mortgage loan seller that settles the related mortgage loan seller’s obligations under the related mortgage loan purchase agreement, or (vi) the related mortgage loan is no longer property of the issuing entity as a result of a sale or other disposition in accordance with the pooling and servicing agreement. See “Pooling and Servicing Agreement—Dispute Resolution Provisions” in the Preliminary Prospectus. |
| Investor Communications: | The certificate administrator is required to include on any Form 10-D any request received from a certificateholder to communicate with other certificateholders related to certificateholders exercising their rights under the terms of the PSA. Any certificateholder wishing to communicate with other certificateholders regarding the exercise of its rights under the terms of the PSA will be able to deliver a written request signed by an authorized representative of the requesting investor to the certificate administrator. |
| Deal Website: | The certificate administrator will be required to maintain a deal website which will include, among other items: (a) summaries of asset status reports prepared by the special servicer, (b) inspection reports, (c) appraisals, (d) various “special notices” described in the Preliminary Prospectus, (e) the “Investor Q&A Forum” and (f) a voluntary “Investor Registry”. Investors may access the deal website following execution of a certification and confidentiality agreement. |
This is not a research report and was not prepared by the Underwriters’ research department. Please see additional important information and qualifications at the end of this Term Sheet.
T-14
| BANK 2019-BNK21 | Collateral Overview |
| Mortgage Loan Sellers | No. of Mortgage Loans | No. of Mortgaged Properties | Aggregate Cut-off Date Balance | % of Pool(1) |
| Morgan Stanley Mortgage Capital Holdings LLC | 21 | 40 | $447,664,158 | 37.9% |
| Bank of America, National Association | 12 | 29 | $359,425,703 | 30.4% |
| Wells Fargo Bank, National Association | 15 | 17 | $263,908,150 | 22.3% |
| Wells Fargo Bank, National Association / Bank of America, National Association(2) | 1 | 1 | $110,000,000 | 9.3% |
| Total: | 49 | 87 | $1,180,998,012 | 100.0% |
Pool Statistics
| Aggregate Cut-off Date Balance: | $1,180,998,012 |
| Number of Mortgage Loans: | 49 |
| Average Cut-off Date Balance per Mortgage Loan: | $24,102,000 |
| Number of Mortgaged Properties: | 87 |
| Average Cut-off Date Balance per Mortgaged Property: | $13,574,690 |
| Weighted Average Mortgage Rate: | 3.6298% |
| % of Pool Secured by 5 Largest Mortgage Loans: | 39.9% |
| % of Pool Secured by 10 Largest Mortgage Loans: | 60.3% |
| % of Pool Secured by ARD Loans(3): | 12.1% |
| Weighted Average Original Term to Maturity (months)(3): | 119 |
| Weighted Average Remaining Term to Maturity (months)(3): | 118 |
| Weighted Average Seasoning (months): | 1 |
| % of Pool Secured by Single Tenant Mortgaged Properties: | 23.8% |
| % of Pool Secured by Refinance Loans: | 57.7% |
| % of Pool Secured by Acquisition Loans: | 31.1% |
| % of Pool Secured by Recapitalization Loans: | 11.2% |
Additional Debt
| % of Pool withPari Passu Mortgage Debt: | 54.5% |
| % of Pool with Subordinate Mortgage Debt: | 3.4% |
| % of Pool with Mezzanine Debt: | 1.4% |
Credit Statistics(4)
| Weighted Average UW NOI DSCR: | 2.53x |
| Weighted Average UW NOI Debt Yield: | 10.3% |
| Weighted Average UW NCF DSCR: | 2.42x |
| Weighted Average UW NCF Debt Yield: | 9.8% |
| Weighted Average Cut-off Date LTV Ratio(5): | 60.9% |
| Weighted Average Maturity Date LTV Ratio(3)(5): | 57.8% |
Footnotes are set forth on the following page.
This is not a research report and was not prepared by the Underwriters’ research department. Please see additional important information and qualifications at the end of this Term Sheet.
T-15
| BANK 2019-BNK21 | Collateral Overview |
Amortization
| Weighted Average Original Amortization Term (months)(6): | 354 |
| Weighted Average Remaining Amortization Term (months)(6): | 354 |
| % of Pool Interest Only through Maturity: | 62.0% |
| % of Pool Interest Only followed by Amortizing Balloon: | 16.2% |
| % of Pool Amortizing Balloon: | 9.8% |
| % of Pool Full IO ARD(3): | 9.7% |
| % of Pool Amortizing ARD(3): | 2.3% |
Lockboxes
| % of Pool with Hard Lockboxes: | 56.5% |
| % of Pool with Springing Lockboxes: | 37.5% |
| % of Pool with Soft Lockboxes: | 5.6% |
| % of Pool with No Lockboxes: | 0.4% |
Reserves
| % of Pool Requiring Tax Reserves: | 51.7% |
| % of Pool Requiring Insurance Reserves: | 19.0% |
| % of Pool Requiring Replacement Reserves: | 41.4% |
| % of Pool Requiring TI/LC Reserves(7): | 50.4% |
Call Protection
| % of Pool with lockout period, followed by defeasance until open period: | 60.2% |
| % of Pool with lockout period, followed by defeasance or the greater of a prepayment premium and yield maintenance until open period: | 14.4% |
| % of Pool with lockout period, followed by yield maintenance until open period: | 9.7% |
| % of Pool with no lockout period. The greater of a prepayment premium and yield maintenance, followed by defeasance or the greater of a prepayment premium and yield maintenance until open period: | 7.9% |
| % of Pool with lockout period, followed by the greater of a prepayment premium and yield maintenance until open period: | 7.7% |
| (1) | Unless otherwise indicated, all references to “% of Pool” in this Term Sheet reflect a percentage of the aggregate principal balance of the mortgage pool as of the Cut-off Date, after application of all payments of principal due during or prior to October 2019. |
| (2) | The 230 Park Avenue South mortgage loan is part of a whole loan that was co-originated by Wells Fargo Bank, National Association, Bank of America, N.A. and JPMorgan Chase Bank, National Association. Such mortgage loan is evidenced by seven promissory notes, two of which are being contributed to the transaction: (i) note A-1, with an outstanding principal balance of $55,000,000 as of the Cut-off Date, as to which Wells Fargo Bank, National Association is acting as mortgage loan seller; and (ii) note A-4, with an outstanding principal balance of $55,000,000 as of the Cut-off Date, as to which Bank of America, N.A. is acting as mortgage loan seller. |
| (3) | With respect to any ARD Loan, unless otherwise indicated, references in this Term Sheet to the applicable “maturity date” or “maturity” refer to the applicable anticipated repayment date with respect to such ARD Loan, and such applicable anticipated repayment date is treated as its maturity date for all purposes hereof. |
| (4) | With respect to any mortgage loan that is part of a whole loan, unless otherwise indicated, all LTV, DSCR and Debt Yield calculations in this Term Sheet include any relatedpari passu companion loans and exclude any subordinate companion loans, as applicable. Additionally, LTV, DSCR and Debt Yield figures in this Term Sheet are calculated for mortgage loans without regard to any additional indebtedness that may be incurred at a future date. For mortgaged properties securing residential cooperative mortgage loans all LTV, DSCR and Debt Yield calculations do not take into account any subordinate debt (whether or not secured by the related mortgaged property), that currently exists or is allowed under the terms of any mortgage loan. With respect to any leased fee loans, the SF/Units and Balance per SF/Unit figures in this Term Sheet are based on the size of the non-collateral improvements. |
| (5) | The LTV ratios set forth in this Term Sheet are generally based on the “as-is” values of the related mortgaged properties; provided that the “as-is” value for a portfolio of mortgaged properties may include a premium relating to the valuation of the mortgaged properties as a whole rather than as the sum of individually valued mortgaged properties; provided, further, that such LTV ratios may be based on “as-stabilized”, “as complete” or other contingent values in certain cases in which reserves have been established at origination for the applicable condition or circumstance that is expected to result in stabilization. See the definition of “Appraised Value” under“Description of the Mortgage Pool—Certain Calculations and Definitions”in the Preliminary Prospectus. |
| (6) | Excludes mortgage loans that provide for payments of interest only through the related maturity date or anticipated repayment date, as applicable. |
| (7) | Excludes hospitality, multifamily, manufactured housing, other data center/leased fee and self storage properties. |
This is not a research report and was not prepared by the Underwriters’ research department. Please see additional important information and qualifications at the end of this Term Sheet.
T-16
| BANK 2019-BNK21 | Characteristics of the Mortgage Loans |
| Top 10 Mortgage Loans or Groups of Cross-Collateralized Mortgage Loans(1) | |||||||||||||
| Loan No. | Mortgage Loan Seller | Property Name | City | State | Property Type | Cut-off Date Balance | % of Pool | SF/Rooms | Cut-off Date Balance per SF/Room | UW NCF DSCR | UW NOI Debt Yield | Cut-off Date LTV | Maturity Date LTV |
| 1 | BANA | Park Tower at Transbay | San Francisco | CA | Office | $115,000,000 | 9.7% | 764,659 | $719 | 2.93x | 10.2% | 49.1% | 49.1% |
| 2 | WFB/BANA | 230 Park Avenue South | New York | NY | Office | $110,000,000 | 9.3% | 373,693 | $669 | 2.64x | 8.9% | 51.0% | 51.0% |
| 3 | BANA | Domain Tower | Austin | TX | Office | $91,000,000 | 7.7% | 309,883 | $294 | 2.53x | 9.0% | 66.2% | 66.2% |
| 4 | MSMCH | Storage Post Portfolio | Various | Various | Self Storage | $85,000,000 | 7.2% | 1,173,842 | $128 | 1.97x | 7.9% | 65.2% | 65.2% |
| 5 | WFB | The Tower at Burbank | Burbank | CA | Office | $70,000,000 | 5.9% | 490,807 | $397 | 3.06x | 10.0% | 62.1% | 62.1% |
| 6 | MSMCH | 105 East 17th Street | New York | NY | Office | $60,500,000 | 5.1% | 125,000 | $880 | 2.02x | 6.5% | 73.3% | 73.3% |
| 7 | WFB | Tysons Tower | McLean | VA | Office | $50,000,000 | 4.2% | 528,730 | $359 | 3.06x | 11.0% | 52.1% | 52.1% |
| 8 | MSMCH | National Anchored Retail Portfolio | Various | Various | Retail | $50,000,000 | 4.2% | 1292762 | $91 | 2.96x | 11.6% | 62.8% | 62.8% |
| 9 | BANA | Embassy Suites Riverfront | Wilmington | NC | Hospitality | $40,400,000 | 3.4% | 186 | $217,204 | 2.13x | 13.1% | 62.2% | 54.8% |
| 10 | MSMCH | Grand Canal Shoppes | Las Vegas | NV | Retail | $40,000,000 | 3.4% | 759,891 | $1,000 | 2.46x | 9.6% | 46.3% | 46.3% |
| Total/Wtd. Avg. | $711,900,000 | 60.3% | 2.59x | 9.5% | 58.6% | 58.2% | |||||||
| (1) | With respect to any mortgage loan that is part of a whole loan, unless otherwise indicated, all LTV, DSCR, Debt Yield and Balance per SF/Room calculations in this Term Sheet include any relatedpari passu companion loans and exclude any subordinate companion loans, as applicable. Additionally, LTV, DSCR, Debt Yield and Balance per SF/Room figures in this Term Sheet are calculated for mortgage loans without regard to any additional indebtedness that may be incurred at a future date. With respect to any leased fee loans, the SF/Rooms and Balance per SF/Room figures in this Term Sheet are based on the size of the non-collateral improvements. |
This is not a research report and was not prepared by the Underwriters’ research department. Please see additional important information and qualifications at the end of this Term Sheet.
T-17
| BANK 2019-BNK21 | Characteristics of the Mortgage Loans |
| Mortgage Loans with Pari Passu Companion Loans | ||||||||||||
| Loan No. | Mortgage Loan Seller | Property Name | Mortgage Loan Cut-off Date Balance | Aggregate Pari Passu Companion Loan Cut-off Date Balance | Combined Cut-off Date Balance | Lead Servicing Agreement | Master Servicer | Special Servicer | Control Rights | Combined UW NCF DSCR(1) | Combined UW NOI Debt Yield(1) | Combined Cut-off Date LTV(1) |
| 1 | BANA | Park Tower at Transbay | $115,000,000 | $435,000,000 | $550,000,000 | BANK 2019-BNK21 | Wells Fargo | Rialto | BANK 2019-BNK21 | 2.93x | 10.2% | 49.1% |
| 2 | WFB/BANA | 230 Park Avenue South | $110,000,000 | $140,000,000 | $250,000,000 | BANK 2019-BNK21 | Wells Fargo | Rialto | BANK 2019-BNK21 | 2.64x | 8.9% | 51.0% |
| 4 | MSMCH | Storage Post Portfolio | $85,000,000 | $65,000,000 | $150,000,000 | BANK 2019-BNK21 | Wells Fargo | Rialto | BANK 2019-BNK21 | 1.97x | 7.9% | 65.2% |
| 5 | WFB | The Tower at Burbank | $70,000,000 | $125,000,000 | $195,000,000 | BANK 2019-BNK20 | Wells Fargo | Midland | BANK 2019-BNK20 | 3.06x | 10.0% | 62.1% |
| 6 | MSMCH | 105 East 17th Street | $60,500,000 | $49,500,000 | $110,000,000 | BANK 2019-BNK21 | Wells Fargo | Rialto | BANK 2019-BNK21 | 2.02x | 6.5% | 73.3% |
| 7 | WFB | Tysons Tower | $50,000,000 | $140,000,000 | $190,000,000 | BANK 2019-BNK21 | Wells Fargo | Rialto | BANK 2019-BNK21 | 3.06x | 11.0% | 52.1% |
| 8 | MSMCH | National Anchored Retail Portfolio | $50,000,000 | $67,000,000 | $117,000,000 | BANK 2019-BNK21 | Wells Fargo | Rialto | BANK 2019-BNK21 | 2.96x | 11.6% | 62.8% |
| 10 | MSMCH | Grand Canal Shoppes | $40,000,000 | $720,000,000 | $760,000,000 | MSC 2019-H7 | Midland | LNR | (2) | 2.46x | 9.6% | 46.3% |
| 11 | MSMCH | NKX Multifamily Portfolio | $31,000,000 | $70,000,000 | $101,000,000 | BANK 2019-BNK20 | Wells Fargo | Midland | BANK 2019-BNK20 | 2.25x | 8.6% | 69.1% |
| 17 | WFB | Landing at Fancher Creek | $20,000,000 | $11,500,000 | $31,500,000 | BANK 2019-BNK21 | Wells Fargo | Rialto | BANK 2019-BNK21 | 1.34x | 8.3% | 67.0% |
| 27 | WFB | Global Data Center | $12,000,000 | $25,000,000 | $37,000,000 | UBS 2019-C17 | Wells Fargo | Rialto | UBS 2019-C17 | 2.29x | 10.6% | 61.7% |
| (1) | DSCR, Debt Yield and LTV calculations include any relatedpari passu companion loans and exclude any subordinate companion loans, as applicable. |
| (2) | The initial directing holder is the holder of the related Note B until the occurrence of a control appraisal event under the related intercreditor agreement, at which time the directing holder will be the directing certificateholder (or other designated party) under the related lead servicing agreement. See “Description of the Mortgage Pool—The Whole Loans” in the Preliminary Prospectus. |
| Mortgage Loans with Subordinate Debt | |||||||||||
| Loan No. | Mortgage Loan Seller | Property Name | Mortgage Loan Cut-off Date Balance | Cut-off Date Balance per SF | Subordinate Debt Cut- off Date Balance | UW NCF DSCR | UW NOI Debt Yield | Cut-off Date LTV | Whole Loan UW NCF DSCR(1) | Whole Loan UW NOI Debt Yield(1) | Whole Loan Cut-off Date LTV(1) |
| 10 | MSMCH | Grand Canal Shoppes | $40,000,000 | $1,000 | $215,000,000 | 2.46x | 9.6% | 46.3% | 1.67x | 7.5% | 59.5% |
| (1) | Whole Loan UW NCF DSCR, Whole Loan UW NOI Debt Yield and Whole Loan Cut-off Date LTV figures shown above are calculated based on any relatedpari passunotes and any related subordinate note(s). |
| Mortgage Loans with Mezzanine Debt | |||||||||||
| Loan No. | Mortgage Loan Seller | Property Name | Mortgage Loan Cut-off Date Balance | Cut-off Date Balance per SF | Mezzanine Debt Cut-off Date Balance | UW NCF DSCR | UW NOI Debt Yield | Cut-off Date LTV | Total Debt UW NCF DSCR(1) | Total Debt UW NOI Debt Yield(1) | Total Debt Cut- off Date LTV(1) |
| 22 | MSMCH | Executive Centre I II III | $16,200,000 | $72 | $3,300,000 | 1.95x | 12.6% | 67.2% | 1.42x | 10.5% | 80.9% |
| (1) | Total Debt UW NCF DSCR, Total Debt UW NOI Debt Yield and Total Debt Cut-off Date LTV figures shown above are calculated based on any relatedpari passu notes, any related subordinate note(s) and the mezzanine debt. |
This is not a research report and was not prepared by the Underwriters’ research department. Please see additional important information and qualifications at the end of this Term Sheet.
T-18
| BANK 2019-BNK21 | Characteristics of the Mortgage Loans |
| Prior Securitization History(1) | ||||||||||||||
| Loan No. | Mortgage Loan Seller | Property Name | City | State | Property Type | Cut-off Date Balance | % of Pool | SF | Cut-off Date Balance per SF(2) | UW NCF DSCR(2) | UW NOI Debt Yield(2) | Cut-off Date LTV(2) | Maturity Date LTV(2) | Prior Securitization |
| 6 | MSMCH | 105 East 17th Street | New York | NY | Office | $60,500,000 | 5.1% | 125,000 | $880 | 2.02x | 6.5% | 73.3% | 73.3% | MSC 2011-C3 |
| 10 | MSMCH | Grand Canal Shoppes | Las Vegas | NV | Retail | $40,000,000 | 3.4% | 759,891 | $1,000 | 2.46x | 9.6% | 46.3% | 46.3% | GSMS 2012-SHOP |
| 16 | MSMCH | Greenway Park Plaza | Phoenix | AZ | Retail | $20,500,000 | 1.7% | 202,399 | $101 | 1.73x | 10.5% | 71.9% | 62.1% | BSCMS 2005-PW10 |
| 26 | MSMCH | Mesquite Crossing Shopping Center | Mesquite | TX | Retail | $12,250,000 | 1.0% | 62,535 | $196 | 2.92x | 11.0% | 57.6% | 57.6% | JPMCC 2005-LDP2 |
| Total | $133,250,000 | 11.3% | ||||||||||||
| (1) | Includes mortgage loans for which all or a portion of the previously existing debt was most recently securitized in conduit securitizations, based on information provided by the related borrower or obtained through searches of a third-party database. The information has not otherwise been confirmed by the mortgage loan sellers. With respect to any mortgage loan that is part of a whole loan, unless otherwise indicated, all LTV, DSCR, Debt Yield and Cut-off Date Balance per SF calculations include any relatedpari passu companion loans and exclude any related subordinate companion loans, as applicable. |
| (2) | For properties that are part of a portfolio, the Cut-off Date Balance per SF, UW NCF DSCR, UW NOI Debt Yield, Cut-off Date LTV and Maturity Date LTV calculations reflect the values of the portfolio as a whole. |
This is not a research report and was not prepared by the Underwriters’ research department. Please see additional important information and qualifications at the end of this Term Sheet.
T-19
| BANK 2019-BNK21 | Characteristics of the Mortgage Loans |
Mortgage Loans with Scheduled Balloon Payment and Related Class(1)
| Class A-2 ($9,516,000) | ||||||||||||||||
| Loan No. | Mortgage Loan Seller | Property Name | State | Property Type | Cut-off Date Balance | % of Pool | Maturity Date Balance | % of Class A-2 Certificate Principal Balance | Rooms | Cut-off Date Balance per Room | UW NCF DSCR | UW NOI Debt Yield | Cut-off Date LTV | Maturity Date LTV | Rem. IO Period (mos.) | Rem. Term to Maturity (mos.) |
| 30 | BANA | Residence Inn - Cumberland Galleria | GA | Hospitality | $10,984,708 | 0.9% | $10,035,243 | 105.5% | 130 | $84,498 | 2.18x | 14.5% | 70.4% | 64.3% | 0 | 59 |
| Total/Wtd. Avg. | $10,984,708 | 0.9% | $10,035,243 | 105.5% | 2.18x | 14.5% | 70.4% | 64.3% | 0 | 59 | ||||||
| Class A-3 ($20,143,000) | ||||||||||||||||
| Loan No. | Mortgage Loan Seller | Property Name | State | Property Type | Cut-off Date Balance | % of Pool | Maturity Date Balance | % of Class A-3 Certificate Principal Balance | SF | Cut-off Date Balance per SF | UW NCF DSCR | UW NOI Debt Yield | Cut-off Date LTV | Maturity Date LTV | Rem. IO Period (mos.) | Rem. Term to Maturity (mos.) |
| 15 | WFB | Westport Village | KY | Retail | $22,850,000 | 1.9% | $21,239,621 | 105.4% | 169,515 | $135 | 1.92x | 11.7% | 72.5% | 67.4% | 34 | 82 |
| Total/Wtd. Avg. | $22,850,000 | 1.9% | $21,239,621 | 105.4% | 1.92x | 11.7% | 72.5% | 67.4% | 34 | 82 | ||||||
| (1) | The tables above reflects the mortgage loan whose balloon payment will be applied to pay down the Class A-2 and Class A-3 certificates, assuming (i) that the mortgage loan does not experience prepayments, defaults or losses; (ii) there are no extensions of the maturity date; and (iii) the mortgage loan is paid in full on its stated maturity date. The tables above are otherwise based on the Structuring Assumptions set forth under “Yield and Maturity Considerations—Weighted Average Life” in the Preliminary Prospectus. |
This is not a research report and was not prepared by the Underwriters’ research department. Please see additional important information and qualifications at the end of this Term Sheet.
T-20
(THIS PAGE INTENTIONALLY LEFT BLANK)
T-21
| BANK 2019-BNK21 | Characteristics of the Mortgage Loans |
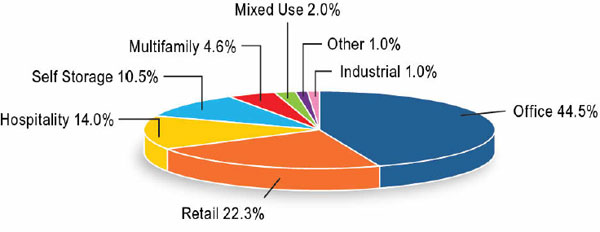
| Property Type Distribution(1) | ||||||||
| Property Type | Number of Mortgaged Properties | Aggregate Cut-off Date Balance | % of Pool | Wtd. Avg. Mortgage Rate | Wtd. Avg. UW NCF DSCR | Wtd. Avg. UW NOI Debt Yield | Wtd. Avg. Cut-off Date LTV | Wtd. Avg. Maturity Date LTV |
| Office | 9 | $526,093,660 | 44.5% | 3.3495% | 2.67x | 9.4% | 58.2% | 57.9% |
| CBD | 4 | $355,500,000 | 30.1% | 3.2819% | 2.71x | 9.1% | 56.4% | 56.4% |
| Suburban | 4 | $161,593,660 | 13.7% | 3.4747% | 2.61x | 10.0% | 62.0% | 61.0% |
| Medical | 1 | $9,000,000 | 0.8% | 3.7700% | 2.03x | 7.9% | 60.8% | 60.8% |
| Retail | 24 | $263,682,007 | 22.3% | 3.7761% | 2.37x | 10.6% | 62.5% | 59.1% |
| Anchored | 14 | $176,822,007 | 15.0% | 3.7135% | 2.38x | 10.7% | 66.3% | 62.5% |
| Specialty Retail | 1 | $40,000,000 | 3.4% | 3.7408% | 2.46x | 9.6% | 46.3% | 46.3% |
| Unanchored | 5 | $22,835,000 | 1.9% | 4.3337% | 1.95x | 10.9% | 65.0% | 56.8% |
| Shadow Anchored | 3 | $21,245,000 | 1.8% | 3.7416% | 2.64x | 11.1% | 61.2% | 58.7% |
| Single Tenant | 1 | $2,780,000 | 0.2% | 3.9500% | 2.48x | 9.9% | 50.5% | 50.5% |
| Hospitality | 13 | $165,514,717 | 14.0% | 3.9457% | 2.35x | 14.3% | 60.7% | 51.8% |
| Full Service | 3 | $76,400,000 | 6.5% | 3.7732% | 2.56x | 14.4% | 60.0% | 53.0% |
| Limited Service | 6 | $51,272,885 | 4.3% | 4.0048% | 2.27x | 14.8% | 59.2% | 48.5% |
| Extended Stay | 3 | $28,684,708 | 2.4% | 4.1386% | 2.02x | 13.3% | 66.3% | 56.4% |
| Select Service | 1 | $9,157,123 | 0.8% | 4.4500% | 2.04x | 13.8% | 58.0% | 47.0% |
| Self Storage | 31 | $123,700,000 | 10.5% | 3.7519% | 1.97x | 8.6% | 62.7% | 58.9% |
| Self Storage | 31 | $123,700,000 | 10.5% | 3.7519% | 1.97x | 8.6% | 62.7% | 58.9% |
| Multifamily | 7 | $54,191,383 | 4.6% | 3.8832% | 1.92x | 8.9% | 68.3% | 63.8% |
| Garden | 6 | $51,000,000 | 4.3% | 3.8371% | 1.89x | 8.5% | 68.3% | 64.3% |
| Independent Living | 1 | $3,191,383 | 0.3% | 4.6200% | 2.39x | 15.6% | 68.6% | 55.9% |
| Mixed Use | 1 | $23,816,245 | 2.0% | 4.1000% | 1.60x | 10.5% | 74.9% | 59.9% |
| Industrial/Office | 1 | $23,816,245 | 2.0% | 4.1000% | 1.60x | 10.5% | 74.9% | 59.9% |
| Other | 1 | $12,000,000 | 1.0% | 4.3200% | 2.29x | 10.6% | 61.7% | 61.7% |
| Data Center | 1 | $12,000,000 | 1.0% | 4.3200% | 2.29x | 10.6% | 61.7% | 61.7% |
| Industrial | 1 | $12,000,000 | 1.0% | 4.3200% | 2.03x | 9.6% | 65.4% | 65.4% |
| Warehouse | 1 | $12,000,000 | 1.0% | 4.3200% | 2.03x | 9.6% | 65.4% | 65.4% |
| Total/Wtd. Avg. | 87 | $1,180,998,012 | 100.0% | 3.6298% | 2.42x | 10.3% | 60.9% | 57.8% |
| (1) | All numerical information concerning the mortgage loans is approximate and, in the case of mortgage loans secured by multiple properties, is based on allocated loan amounts with respect to such properties. All weighted average information regarding the mortgage loans reflects the weighting of the mortgage loans based on their outstanding principal balances as of the Cut-off Date or, in the case of mortgage loans secured by multiple properties, allocated loan amounts. The sum of numbers and percentages in columns may not match the “Total” due to rounding. With respect to any mortgage loan that is part of a whole loan, unless otherwise indicated, all LTV, DSCR and Debt Yield calculations include any relatedpari passu companion loans and exclude any related subordinate companion loans, as applicable. |
This is not a research report and was not prepared by the Underwriters’ research department. Please see additional important information and qualifications at the end of this Term Sheet.
T-22
| BANK 2019-BNK21 | Characteristics of the Mortgage Loans |
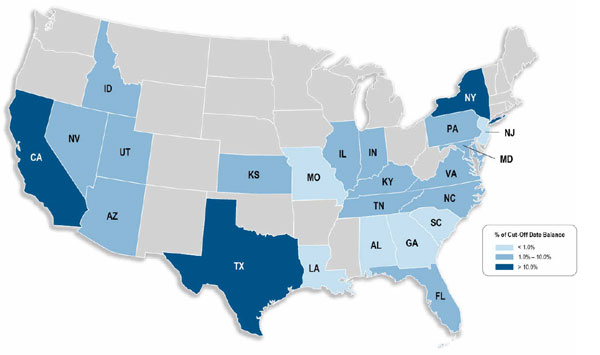
| Geographic Distribution(1) | ||||||||
| State or Other Jurisdiction | Number of Mortgaged Properties | Aggregate Cut-off Date Balance | % of Pool | Wtd. Avg. Mortgage Rate | Wtd. Avg. UW NCF DSCR | Wtd. Avg. UW NOI Debt Yield | Wtd. Avg. Cut- off Date LTV | Wtd. Avg. Maturity Date LTV |
| California | 12 | $269,953,316 | 22.9% | 3.4354% | 2.73x | 9.7% | 56.5% | 55.6% |
| California – Northern(2) | 5 | $140,000,000 | 11.9% | 3.5707% | 2.68x | 9.9% | 52.2% | 50.7% |
| California – Southern(2) | 7 | $129,953,316 | 11.0% | 3.2897% | 2.78x | 9.6% | 61.1% | 60.8% |
| New York | 8 | $212,571,850 | 18.0% | 3.3487% | 2.33x | 8.1% | 60.0% | 59.6% |
| Texas | 19 | $211,743,818 | 17.9% | 3.6488% | 2.54x | 10.8% | 64.3% | 61.9% |
| Florida | 12 | $76,288,626 | 6.5% | 3.8674% | 2.41x | 10.7% | 60.6% | 58.9% |
| Nevada | 4 | $58,118,660 | 4.9% | 3.7915% | 2.35x | 9.8% | 52.4% | 50.4% |
| North Carolina | 2 | $51,800,000 | 4.4% | 3.6720% | 2.05x | 12.7% | 64.8% | 56.0% |
| Virginia | 1 | $50,000,000 | 4.2% | 3.3300% | 3.06x | 11.0% | 52.1% | 52.1% |
| Pennsylvania | 4 | $37,899,509 | 3.2% | 4.1287% | 1.83x | 10.5% | 69.7% | 59.4% |
| Illinois | 4 | $32,427,863 | 2.7% | 3.7806% | 2.69x | 11.3% | 63.2% | 60.8% |
| Kentucky | 2 | $30,650,000 | 2.6% | 4.1394% | 1.82x | 11.2% | 72.0% | 65.6% |
| Arizona | 2 | $22,930,000 | 1.9% | 3.8053% | 1.81x | 10.5% | 71.0% | 62.2% |
| Maryland | 2 | $18,951,767 | 1.6% | 4.4500% | 2.04x | 13.8% | 58.0% | 47.0% |
| Kansas | 1 | $16,200,000 | 1.4% | 3.7102% | 1.95x | 12.6% | 67.2% | 60.6% |
| Utah | 1 | $15,500,000 | 1.3% | 3.7200% | 2.41x | 14.7% | 61.3% | 51.3% |
| Idaho | 2 | $15,191,383 | 1.3% | 4.3830% | 2.11x | 10.9% | 66.1% | 63.4% |
| Indiana | 2 | $15,008,547 | 1.3% | 3.8659% | 2.27x | 12.1% | 63.6% | 54.5% |
| Tennessee | 2 | $14,655,000 | 1.2% | 4.3912% | 1.69x | 11.2% | 67.0% | 56.5% |
| Georgia | 1 | $10,984,708 | 0.9% | 4.2000% | 2.18x | 14.5% | 70.4% | 64.3% |
| Missouri | 2 | $10,883,203 | 0.9% | 3.8054% | 1.68x | 10.5% | 69.5% | 54.1% |
| Alabama | 1 | $3,242,777 | 0.3% | 3.3550% | 1.73x | 10.5% | 56.8% | 40.0% |
| New Jersey | 1 | $2,706,872 | 0.2% | 3.3550% | 1.73x | 10.5% | 56.8% | 40.0% |
| Louisiana | 1 | $2,142,791 | 0.2% | 3.3550% | 1.73x | 10.5% | 56.8% | 40.0% |
| South Carolina | 1 | $1,147,321 | 0.1% | 3.3550% | 1.73x | 10.5% | 56.8% | 40.0% |
| Total/Wtd. Avg. | 87 | $1,180,998,012 | 100.0% | 3.6298% | 2.42x | 10.3% | 60.9% | 57.8% |
| (1) | All numerical information concerning the mortgage loans is approximate and, in the case of mortgage loans secured by multiple properties, is based on allocated loan amounts with respect to such properties. All weighted average information regarding the mortgage loans reflects the weighting of the mortgage loans based on their outstanding principal balances as of the Cut-off Date or, in the case of mortgage loans secured by multiple properties, allocated loan amounts. The sum of numbers and percentages in columns may not match the “Total” due to rounding. With respect to any mortgage loan that is part of a whole loan, unless otherwise indicated, all LTV, DSCR and Debt Yield calculations include any relatedpari passu companion loans and exclude any related subordinate companion loans, as applicable. |
| (2) | “California – Northern” includes zip codes above 93600, and “California – Southern” includes zip codes at or below 93600. |
This is not a research report and was not prepared by the Underwriters’ research department. Please see additional important information and qualifications at the end of this Term Sheet.
T-23
| BANK 2019-BNK21 | Collateral Statistics |
Collateral Statistics(1)
Cut-off Date Balance ($)
| No. of Mortgage Loans | Aggregate Cut-off Date Balance ($) | % of Pool | |
| 1,650,000 - 15,000,000 | 25 | 179,225,000 | 15.2 |
| 15,000,001 - 25,000,000 | 12 | 231,373,012 | 19.6 |
| 25,000,001 - 45,000,000 | 4 | 138,900,000 | 11.8 |
| 45,000,001 - 65,000,000 | 3 | 160,500,000 | 13.6 |
| 65,000,001 - 95,000,000 | 3 | 246,000,000 | 20.8 |
| 95,000,001 - 115,000,000 | 2 | 225,000,000 | 19.1 |
| Total: | 49 | $1,180,998,012 | 100.0% |
Min: $1,650,000 | Max: $115,000,000 Avg: $24,102,000 | ||
State or Other Jurisdiction(2)
| No. of Mortgaged Properties | Aggregate Cut-off Date Balance ($) | % of Pool | |
| California | 12 | 269,953,316 | 22.9 |
| California – Northern(3) | 5 | 140,000,000 | 11.9 |
| California – Southern(3) | 7 | 129,953,316 | 11.0 |
| New York | 8 | 212,571,850 | 18.0 |
| Texas | 19 | 211,743,818 | 17.9 |
| Florida | 12 | 76,288,626 | 6.5 |
| Nevada | 4 | 58,118,660 | 4.9 |
| North Carolina | 2 | 51,800,000 | 4.4 |
| Virginia | 1 | 50,000,000 | 4.2 |
| Pennsylvania | 4 | 37,899,509 | 3.2 |
| Illinois | 4 | 32,427,863 | 2.7 |
| Kentucky | 2 | 30,650,000 | 2.6 |
| Arizona | 2 | 22,930,000 | 1.9 |
| Maryland | 2 | 18,951,767 | 1.6 |
| Kansas | 1 | 16,200,000 | 1.4 |
| Utah | 1 | 15,500,000 | 1.3 |
| Idaho | 2 | 15,191,383 | 1.3 |
| Indiana | 2 | 15,008,547 | 1.3 |
| Tennessee | 2 | 14,655,000 | 1.2 |
| Georgia | 1 | 10,984,708 | 0.9 |
| Missouri | 2 | 10,883,203 | 0.9 |
| Alabama | 1 | 3,242,777 | 0.3 |
| New Jersey | 1 | 2,706,872 | 0.2 |
| Louisiana | 1 | 2,142,791 | 0.2 |
| South Carolina | 1 | 1,147,321 | 0.1 |
| Total | 87 | $1,180,998,012 | 100.0% |
Property Type(2)
| No. of Mortgaged Properties | Aggregate Cut-off Date Balance ($) | % of Pool | |
| Office | 9 | 526,093,660 | 44.5 |
| CBD | 4 | 355,500,000 | 30.1 |
| Suburban | 4 | 161,593,660 | 13.7 |
| Medical | 1 | 9,000,000 | 0.8 |
| Retail | 24 | 263,682,007 | 22.3 |
| Anchored | 14 | 176,822,007 | 15.0 |
| Specialty Retail | 1 | 40,000,000 | 3.4 |
| Unanchored | 5 | 22,835,000 | 1.9 |
| Shadow Anchored | 3 | 21,245,000 | 1.8 |
| Single Tenant | 1 | 2,780,000 | 0.2 |
| Hospitality | 13 | 165,514,717 | 14.0 |
| Full Service | 3 | 76,400,000 | 6.5 |
| Limited Service | 6 | 51,272,885 | 4.3 |
| Extended Stay | 3 | 28,684,708 | 2.4 |
| Select Service | 1 | 9,157,123 | 0.8 |
| Self Storage | 31 | 123,700,000 | 10.5 |
| Self Storage | 31 | 123,700,000 | 10.5 |
| Multifamily | 7 | 54,191,383 | 4.6 |
| Garden | 6 | 51,000,000 | 4.3 |
| Independent Living | 1 | 3,191,383 | 0.3 |
| Mixed Use | 1 | 23,816,245 | 2.0 |
| Industrial/Office | 1 | 23,816,245 | 2.0 |
| Other | 1 | 12,000,000 | 1.0 |
| Data Center | 1 | 12,000,000 | 1.0 |
| Industrial | 1 | 12,000,000 | 1.0 |
| Warehouse | 1 | 12,000,000 | 1.0 |
| Total | 87 | $1,180,998,012 | 100.0% |
Mortgage Rate (%)
| No. of Mortgage Loans | Aggregate Cut-off Date Balance ($) | % of Pool | |
| 3.1300 - 3.4999 | 8 | 547,600,000 | 46.4 |
| 3.5000 - 3.9999 | 25 | 455,852,007 | 38.6 |
| 4.0000 - 4.6200 | 16 | 177,546,005 | 15.0 |
| Total: | 49 | $1,180,998,012 | 100.0% |
| Min: 3.1300% | Max: 4.6200% Wtd Avg: 3.6298% | ||
Original Term to Maturity or ARD (mos.)
| No. of Mortgage Loans | Aggregate Cut-off Date Balance ($) | % of Pool | |
| 60 | 1 | 10,984,708 | 0.9 |
| 84 | 1 | 22,850,000 | 1.9 |
| 120 | 47 | 1,147,163,303 | 97.1 |
| Total: | 49 | $1,180,998,012 | 100.0% |
| Min: 60 mos. | Max: 120 mos. Wtd Avg: 119 mos. | ||
Remaining Term to Maturity or ARD (mos.)
| No. of Mortgage Loans | Aggregate Cut-off Date Balance ($) | % of Pool | |
| 59 - 60 | 1 | 10,984,708 | 0.9 |
| 61 - 84 | 1 | 22,850,000 | 1.9 |
| 85 - 120 | 47 | 1,147,163,303 | 97.1 |
| Total: | 49 | $1,180,998,012 | 100.0% |
| Min: 59 mos. | Max: 120 mos. Wtd Avg: 118 mos. | ||
Original Amortization Term (mos.)
| No. of Mortgage Loans | Aggregate Cut-off Date Balance ($) | % of Pool | |
| Interest Only | 25 | 847,214,000 | 71.7 |
| 300 | 2 | 34,237,246 | 2.9 |
| 360 | 22 | 299,546,765 | 25.4 |
| Total: | 49 | $1,180,998,012 | 100.0% |
| Min: 300 mos. | Max: 360 mos. Wtd Avg: 354 mos. | ||
Remaining Amortization Term (mos.)
| No. of Mortgage Loans | Aggregate Cut-off Date Balance ($) | % of Pool | |
| Interest Only | 25 | 847,214,000 | 71.7 |
| 299 - 300 | 2 | 34,237,246 | 2.9 |
| 301 - 360 | 22 | 299,546,765 | 25.4 |
| Total: | 49 | $1,180,998,012 | 100.0% |
| Min: 299 mos. | Max: 360 mos. Wtd Avg: 354 mos. | ||
Mortgage Loan Sellers
| No. of Mortgage Loans | Aggregate Cut-off Date Balance ($) | % of Pool | |
| MSMCH | 21 | 447,664,158 | 37.9 |
| BANA | 12 | 359,425,703 | 30.4 |
| WFB | 15 | 263,908,150 | 22.3 |
| WFB/BANA | 1 | 110,000,000 | 9.3 |
| Total: | 49 | $1,180,998,012 | 100.0% |
Amortization Type
| No. of Mortgage Loans | Aggregate Cut-off Date Balance ($) | % of Pool | |
| Interest Only | 24 | 732,214,000 | 62.0 |
| Partial Interest Only | 12 | 190,830,000 | 16.2 |
| Amortizing Balloon | 11 | 115,454,012 | 9.8 |
| Full IO, ARD | 1 | 115,000,000 | 9.7 |
| Amortizing, ARD | 1 | 27,500,000 | 2.3 |
| Total: | 49 | $1,180,998,012 | 100.0% |
Cut-off Date LTV Ratio (%)
| No. of Mortgage Loans | Aggregate Cut-off Date Balance ($) | % of Pool | |
| 32.7 - 50.0 | 4 | 175,650,000 | 14.9 |
| 50.1 - 60.0 | 10 | 250,919,014 | 21.2 |
| 60.1 - 65.0 | 14 | 277,000,000 | 23.5 |
| 65.1 - 70.0 | 12 | 298,485,038 | 25.3 |
| 70.1 - 74.9 | 9 | 178,943,960 | 15.2 |
| Total: | 49 | $1,180,998,012 | 100.0% |
| Min: 32.7% | Max: 74.9% | Wtd Avg: 60.9% |
Maturity Date or ARD LTV Ratio (%)
| No. of Mortgage Loans | Aggregate Cut-off Date Balance ($) | % of Pool | |
| 32.7 - 50.0 | 9 | 245,339,014 | 20.8 |
| 50.1 - 60.0 | 18 | 348,135,290 | 29.5 |
| 60.1 - 65.0 | 15 | 277,739,708 | 23.5 |
| 65.1 - 70.0 | 6 | 249,284,000 | 21.1 |
| 70.1 - 73.3 | 1 | 60,500,000 | 5.1 |
| Total: | 49 | $1,180,998,012 | 100.0% |
| Min: 32.7% | Max: 73.3% | Wtd Avg: 57.8% |
UW NCF DSCR (x)
| No. of Mortgage Loans | Aggregate Cut-off Date Balance ($) | % of Pool | |
| 1.34 - 1.60 | 4 | 64,471,245 | 5.5 |
| 1.61 - 1.80 | 6 | 77,056,667 | 6.5 |
| 1.81 - 2.00 | 7 | 154,728,241 | 13.1 |
| 2.01 - 2.20 | 7 | 155,336,475 | 13.2 |
| 2.21 - 2.40 | 6 | 86,891,383 | 7.4 |
| 2.41 - 2.60 | 7 | 173,410,000 | 14.7 |
| 2.61 - 3.00 | 7 | 324,484,000 | 27.5 |
| 3.01 - 4.59 | 5 | 144,620,000 | 12.2 |
| Total: | 49 | $1,180,998,012 | 100.0% |
| Min: 1.34x | Max: 4.59x | Wtd Avg: 2.42x |
UW NOI Debt Yield (%)
| No. of Mortgage Loans | Aggregate Cut-off Date Balance ($) | % of Pool | |
| 6.5 - 9.0 | 9 | 430,200,000 | 36.4 |
| 9.1 - 10.0 | 7 | 168,660,000 | 14.3 |
| 10.1 - 11.0 | 13 | 296,427,912 | 25.1 |
| 11.1 - 13.0 | 9 | 135,794,995 | 11.5 |
| 13.1 - 16.0 | 8 | 116,265,105 | 9.8 |
| 16.1 - 19.0 | 3 | 33,650,000 | 2.8 |
| Total: | 49 | $1,180,998,012 | 100.0% |
| Min: 6.5% | Max: 19.0% | Wtd Avg: 10.3% |
| (1) | All numerical information concerning the mortgage loans is approximate. All weighted average information regarding the mortgage loans reflects the weighting of the mortgage loans based on their outstanding principal balances as of the Cut-off Date. The sum of numbers and percentages in columns may not match the “Total” due to rounding. With respect to any mortgage loan that is part of a whole loan, unless otherwise indicated, all LTV, DSCR and Debt Yield calculations include any relatedpari passu companion loans and exclude any related subordinate companion loans, as applicable. |
| (2) | In the case of mortgage loans secured by multiple properties, cut-off date balance information is based on allocated loan amounts with respect to such properties. |
| (3) | “California – Northern” includes zip codes above 93600, and “California – Southern” includes zip codes at or below 93600. |
This is not a research report and was not prepared by the Underwriters’ research department. Please see additional important information and qualifications at the end of this Term Sheet.
T-24
(THIS PAGE INTENTIONALLY LEFT BLANK)
T-25
| Office – CBD | Loan #1 | Cut-off Date Balance: | $115,000,000 | |
| 250 Howard Street | Park Tower at Transbay | Cut-off Date LTV: | 49.1% | |
| San Francisco, CA 94105 | UW NCF DSCR: | 2.93x | ||
| UW NOI Debt Yield: | 10.2% |
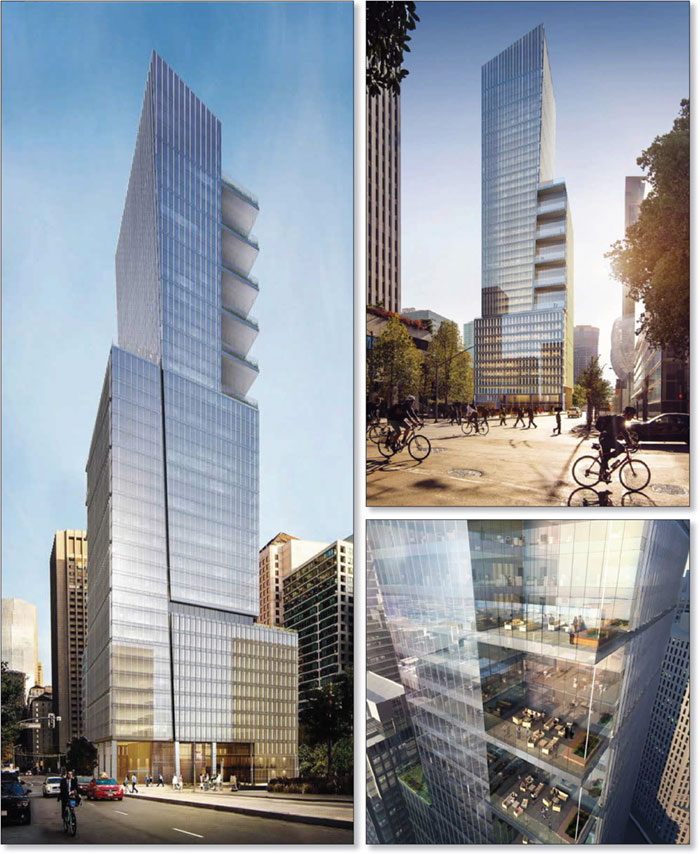
This is not a research report and was not prepared by the Underwriters’ research department. Please see additional important information and qualifications at the end of this Term Sheet.
T-26
| Office – CBD | Loan #1 | Cut-off Date Balance: | $115,000,000 | |
| 250 Howard Street | Park Tower at Transbay | Cut-off Date LTV: | 49.1% | |
| San Francisco, CA 94105 | UW NCF DSCR: | 2.93x | ||
| UW NOI Debt Yield: | 10.2% |

This is not a research report and was not prepared by the Underwriters’ research department. Please see additional important information and qualifications at the end of this Term Sheet.
T-27
| Mortgage Loan No. 1 – Park Tower at Transbay |
| Mortgage Loan Information | Property Information | ||||||
| Mortgage Loan Seller: | BANA | Single Asset/Portfolio: | Single Asset | ||||
| Credit Assessment (DBRS/Fitch/S&P): | AAA/BBB-(sf)/NR | Location: | San Francisco, CA 94105 | ||||
| Original Balance: | $115,000,000 | General Property Type: | Office | ||||
| Cut-off Date Balance(1): | $115,000,000 | Detailed Property Type: | CBD | ||||
| % of Initial Pool Balance(1): | 9.7% | Title Vesting: | Fee | ||||
| Loan Purpose: | Refinance | Year Built/Renovated: | 2018-2019/N/A | ||||
| Borrower Sponsor: | MetLife, Inc. | Size: | 764,659 SF | ||||
| Guarantor: | Park Tower Owner LLC | Cut-off Date Balance per SF(1): | $719 | ||||
| Mortgage Rate: | 3.4500% | Maturity Date/ARD Balance per SF(1): | $719 | ||||
| Note Date: | 7/23/2019 | Property Manager: | MA West Management LLC | ||||
| First Payment Date: | 9/1/2019 | (borrower-related) | |||||
| Anticipated Repayment Date (ARD)(2): | 8/1/2029 | ||||||
| Maturity Date(2): | 8/1/2034 | ||||||
| Original Term to ARD: | 120 months | ||||||
| Original Amortization Term: | 0 months | Underwriting and Financial Information | |||||
| IO Period: | 120 months | UW NOI: | $56,350,668 | ||||
| Seasoning: | 2 months | UW NOI Debt Yield(1): | 10.2% | ||||
| Prepayment Provisions: | LO(23); YM(90); O(7) | UW NOI Debt Yield at Maturity/ARD(1): | 10.2% | ||||
| Lockbox/Cash Mgmt Status: | Hard / Springing | UW NCF DSCR(1): | 2.93x | ||||
| Additional Debt Type: | Pari Passu | Most Recent NOI(4): | N/A | ||||
| Additional Debt Balance(1): | $435,000,000 | 2nd Most Recent NOI(4): | N/A | ||||
| Future Debt Permitted (Type)(1): | No (N/A) | 3rd Most Recent NOI(4): | N/A | ||||
| Reserves(3) | Most Recent Occupancy(5): | 98.9% (10/1/2019) | |||||
| Type | Initial | Monthly | Cap | 2nd Most Recent Occupancy(4): | N/A | ||
| RE Tax: | $0 | Springing | N/A | 3rd Most Recent Occupancy(4): | N/A | ||
| Insurance: | $0 | Springing | N/A | Appraised Value (as of)(6): | $1,120,000,000 (10/1/2019) | ||
| Deferred Maintenance: | $4,412,926 | $0 | N/A | Appraised Value per SF(6): | $1,465 | ||
| TI/LC: | $80,198,366 | $0 | N/A | Cut-off Date LTV Ratio(1)(6): | 49.1% | ||
| Regulatory Fees Reserve: | $5,528,653 | $0 | N/A | Maturity Date/ARD LTV Ratio(1)(6): | 49.1% | ||
| Sources and Uses | ||||||
| Sources | Proceeds | % of Total | Uses | Proceeds | % of Total | |
| Whole Loan Amount(1): | $550,000,000 | 100.0% | Loan Payoff: | $294,460,472 | 53.5% | |
| Reserves(7): | $145,173,206 | 26.4% | ||||
| Return of Equity: | $108,543,869 | 19.7% | ||||
| Closing Costs: | $1,822,453 | 0.3% | ||||
| Total Sources: | $550,000,000 | 100.0% | Total Uses: | $550,000,000 | 100.0% | |
| (1) | The Park Tower at Transbay Mortgage Loan (as defined below) is a part of the Park Tower at Transbay Whole Loan (as defined below) with an original aggregate principal balance of $550,000,000. The Cut-off Date Balance per SF, Maturity Date/ARD Balance per SF, UW NOI Debt Yield, UW NOI Debt Yield at Maturity/ARD, UW NCF DSCR, Cut-off Date LTV Ratio and Maturity Date/ARD LTV Ratio numbers presented above are based on the Park Tower at Transbay Whole Loan. |
| (2) | The Park Tower at Transbay Whole Loan is structured with an Anticipated Repayment Date (“ARD”) and will be interest-only prior to the ARD. From and after the ARD, the Park Tower at Transbay Whole Loan will accrue additional interest at a fixed rate of 2.5000% which will be deferred and due and payable on the Maturity Date (or earlier repayment in full of the Park Tower at Transbay Whole Loan.) The ARD automatically triggers a Cash Sweep Period (see “Lockbox and Cash Management”) whereby all excess cash flow is required to be used to pay down the principal balance of the Park Tower at Transbay Whole Loan and repay the additional accrued interest. |
| (3) | See “Escrows and Reserves” below for further discussion of reserve requirements. |
| (4) | Prior historical operating statements and occupancy are not applicable, as the Park Tower at Transbay Property (as defined below) was constructed in 2018-2019. |
| (5) | The sole office tenant, Facebook, Inc. (98.9% of NRA), is currently in the process of building out its space and, according to the borrower sponsor, is expected to move into the building in phases between September 2019 and September 2020. |
| (6) | The Appraised Value shown reflects a “Prospective Market Value At Stabilization” value as of October 1, 2019, which assumes that Facebook, Inc. has commenced rent payments (which began in August 2019) and that all remaining construction project costs due by September 30, 2019 have been incurred (110% of the cost of which has been reserved by the lender). The “as-is” value as of May 30, 2019 of $959,000,000 results in both a Cut-off Date LTV Ratio and Maturity Date/ARD LTV Ratio of 57.4% for the Park Tower at Transbay Whole Loan. The appraiser also provided an “as dark” value as of May 30, 2019 of $1,004,000,000, which results in both a Cut-off Date LTV Ratio and Maturity Date/ARD LTV Ratio of 54.8% for the Park Tower at Transbay Whole Loan. The “as dark” value is greater than the “as-is” value due to the market rent being higher than the current contract rent at the Park Tower at Transbay Property. |
| (7) | Reserves include $55,033,261 paid by the Park Tower at Transbay Borrower (as defined below) at loan origination, which amount was subsequently disbursed to Facebook, Inc. by the escrow agent to buy out Facebook Inc.’s rent abatement period. |
This is not a research report and was not prepared by the Underwriters’ research department. Please see additional important information and qualifications at the end of this Term Sheet.
T-28
| Office – CBD | Loan #1 | Cut-off Date Balance: | $115,000,000 | |
| 250 Howard Street | Park Tower at Transbay | Cut-off Date LTV: | 49.1% | |
| San Francisco, CA 94105 | UW NCF DSCR: | 2.93x | ||
| UW NOI Debt Yield: | 10.2% |
The Mortgage Loan. The largest mortgage loan (the “Park Tower at Transbay Mortgage Loan”) is a part of a whole loan (the “Park Tower at Transbay Whole Loan”) evidenced by tenpari passu promissory notes in the aggregate original principal amount of $550,000,000. The Park Tower at Transbay Whole Loan is secured by a first priority fee mortgage on a 764,659 SF newly constructed, Class A office tower located in San Francisco, California (the “Park Tower at Transbay Property”).
The Park Tower at Transbay Mortgage Loan is evidenced by the controlling promissory Note A-3 and non-controlling promissory Note A-9 in the original aggregate principal amount of $115,000,000. The non-controlling promissory Notes A-1, A-2, A-4, A-5, A-6, A-7, A-8 and A-10 (together, the “Park Tower at TransbayPari Passu Companion Loans”) are in the aggregate original principal amount of $435,000,000. Notes A-1 and A-8 are expected to be contributed to the BANK 2019-BNK20 securitization trust. Notes A-2, A-4, A-5, A-6, A-7 and A-10 are currently held by Bank of America, N.A. and are expected to be contributed to future securitization trusts or may be otherwise transferred at any time. The Park Tower at Transbay Whole Loan will be serviced pursuant to the pooling and servicing agreement for the BANK 2019-BNK21 securitization trust. See “Description of the Mortgage Pool—The Whole Loans—The Serviced Pari Passu Whole Loans” and “Pooling and Servicing Agreement” in the Preliminary Prospectus.
| Park Tower at Transbay Whole Loan Summary | ||||
| Note | Original Balance | Cut-off Date Balance | Note Holder | Controlling Piece |
| A-1 | $100,000,000 | $100,000,000 | BANK 2019-BNK20 | No |
| A-2 | $100,000,000 | $100,000,000 | Bank of America, N.A. | No |
| A-3 | $100,000,000 | $100,000,000 | BANK 2019-BNK21 | Yes |
| A-4 | $80,000,000 | $80,000,000 | Bank of America, N.A. | No |
| A-5 | $50,000,000 | $50,000,000 | Bank of America, N.A. | No |
| A-6 | $50,000,000 | $50,000,000 | Bank of America, N.A. | No |
| A-7 | $25,000,000 | $25,000,000 | Bank of America, N.A. | No |
| A-8 | $20,000,000 | $20,000,000 | BANK 2019-BNK20 | No |
| A-9 | $15,000,000 | $15,000,000 | BANK 2019-BNK21 | No |
| A-10 | $10,000,000 | $10,000,000 | Bank of America, N.A. | No |
| Total | $550,000,000 | $550,000,000 | ||
The Borrower and the Borrower Sponsor. The borrower is Park Tower Owner LLC, a Delaware limited liability company, structured to be bankruptcy-remote with at least two independent directors (the “Park Tower at Transbay Borrower”).
The borrower sponsor is MetLife, Inc. (NYSE: MET), a Fortune 500 financial services company, providing insurance, annuities, employee benefits and asset management. The borrower sponsor was the original developer of the Park Tower at Transbay Property. There is no non-recourse carveout guarantor and no separate environmental indemnitor for the Park Tower at Transbay Whole Loan.
The Property. The Park Tower at Transbay Property is comprised of a newly constructed, Class A, pre-certified LEED Gold, 43-story high-rise office building located on the northeast corner of Beale Street and Howard Street in the Transbay Transit District in the South Financial District of downtown San Francisco, California. The Park Tower at Transbay Property contains a total of 764,659 SF. All of the office space (755,914 SF) and the two-level subterranean parking are leased to Facebook, Inc. (“Facebook”). Facebook’s space includes a mix of open and private offices, various common areas, a cafeteria, fitness/wellness center and a child care center. There is 50,000 SF of outdoor space including fourteen sky decks: large rooftop terraces on floors 12 and 28, and outside terraces on every third floor starting on floor 13 and ending on the top floor, 43. 70% of the floors have San Francisco Bay views.
The remaining rentable area is comprised of three retail spaces (8,745 SF) on the ground floor. One of the retail spaces was leased to Blue Bottle after loan origination and the other spaces are presently in lease negotiations with prospective tenants, according to the borrower sponsor. Building amenities include bike parking, an open plaza on the ground level, and two non-collateral adjacent public park spaces which are required to be maintained by the Park Tower at Transbay borrower sponsor.
The Park Tower at Transbay Property is located adjacent to the recently completed multi-billion-dollar Salesforce (f/k/a Transbay) Transit Center and City Park, providing immediate proximity to all forms of public transportation. The Park Tower at Transbay Property is within walking distance to the Ferry Building, waterfront AT&T Park, Moscone Center, Westfield Shopping Centre, SF MoMA, Union Square and South Park.
Major Tenant.
Facebook leases all of the office space (755,914 SF) on a long term, triple-net lease which commenced on March 1, 2019. Facebook’s lease is divided into three phases: Phase I includes floors 2-12, Phase II includes floors 13-25 and Phase III includes floors 26-43. The initial rent for Phase I, Phase II and Phase III is $60.00 PSF, $66.00 PSF and $72.00 PSF, respectively, resulting in a current weighted average rent of $65.82 PSF. The Facebook office lease requires annual rental increases of 3.0%. Facebook also leases the subterranean parking (110 spaces with capacity for 140 spaces with valet operations) based on an annual rent of $594,000 ($450/space per month), with increases to market rent every five years.
Facebook is currently in the process of building out its space and, according to the borrower sponsor, is expected to move into the building in phases between September 2019 and September 2020. The Park Tower at Transbay Borrower provided Facebook with a tenant improvement allowance of $110 PSF (of which $80,198,366 ($106 PSF) was outstanding as of the loan origination date and has been fully reserved by the lender) and estimates that Facebook will be spending an additional $300-$350 PSF on its build-out. Pursuant to its lease, Facebook was entitled to rent abatements, which have been bought out by the Park Tower at Transbay Borrower as of July 25, 2019. Facebook is now paying full unabated rent.
Facebook’s lease expiration for Phase I is February 28, 2033 and for Phases II and III are February 28, 2034. Each phase has two eight-year renewal options at fair market rent. In order to exercise the renewal option for Phase II, Facebook must exercise its option for Phase I. In order to exercise the renewal option for Phase III, Facebook must exercise both options for Phase I and II.
This is not a research report and was not prepared by the Underwriters’ research department. Please see additional important information and qualifications at the end of this Term Sheet.
T-29
| Office – CBD | Loan #1 | Cut-off Date Balance: | $115,000,000 | |
| 250 Howard Street | Park Tower at Transbay | Cut-off Date LTV: | 49.1% | |
| San Francisco, CA 94105 | UW NCF DSCR: | 2.93x | ||
| UW NOI Debt Yield: | 10.2% |
Facebook has a right of first offer to purchase the Park Tower at Transbay Property, as discussed in “Right of First Offer” below.
Facebook (NYSE: FB) provides various products to connect and share “online”. The company’s products include Facebook, which enables people to connect, share and discover through mobile devices and personal computers; Instagram, a community for sharing photos, videos, and messages; and Messenger and WhatsApp, both messaging applications. Facebook also provides Oculus, a hardware, software and developer platform, which allows people to connect through its virtual reality products. As of December 31, 2018, Facebook had approximately 1.52 billion daily active users. The company was founded in 2004 and is headquartered in Menlo Park, California. Facebook also has large block leases at 181 Fremont and 215 Fremont, in downtown San Francisco, both within one block of the Park Tower at Transbay Property. For the fiscal year ending December 31, 2018, Facebook reported total revenue of $55.8 billion, up from $40.7 billion in the prior year and $27.6 billion in 2016. Facebook has a current market capitalization of $478 billion.
The following table presents certain information relating to the tenant at the Park Tower at Transbay Property:
| Tenant Summary | ||||||||||||||||||||||
| Tenant Name | Credit Rating (Fitch/Moody’s/S&P) | Tenant SF | Approx. % of Total SF | Annual UW Rent | % of Total Annual UW Rent | Annual UW Rent PSF | Lease Expiration | Renewal Options | Termination Options | |||||||||||||
| Facebook, Inc. – Phase I(1) | NR/NR/NR | 269,814 | 35.3 | % | $16,188,822 | 32.5 | % | $60.00 | 2/28/2033 | 2 x 8 Yrs | N | |||||||||||
| Facebook, Inc. – Phase II(1) | NR/NR/NR | 238,962 | 31.3 | % | $15,771,464 | 31.7 | % | $66.00 | 2/28/2034 | 2 x 8 Yrs | N | |||||||||||
| Facebook, Inc. – Phase III(1) | NR/NR/NR | 247,138 | 32.3 | % | $17,793,967 | 35.8 | % | $72.00 | 2/28/2034 | 2 x 8 Yrs | N | |||||||||||
| Office Total/Wtd. Avg. | 755,914 | 98.9 | % | $49,754,253 | 100.0 | % | $65.82 | |||||||||||||||
| Vacant Space (Retail) | 8,745 | 1.1 | % | $0 | 0.0 | % | ||||||||||||||||
| Total/Wtd. Avg. | 764,659 | 100.0 | % | $49,754,253 | 100.0 | % | ||||||||||||||||
Information is based on the underwritten rent roll.
| (1) | Facebook is currently in the process of building out its space and expected to move into the building in phases between September 2019 and September 2020. |
The following table presents certain information relating to the lease rollover schedule at the Park Tower at Transbay Property:
| Lease Rollover Schedule | ||||||||
| Year | # of Leases Rolling | SF Rolling | UW Rent PSF Rolling | Approx. % of Total SF Rolling | Approx. Cumulative % of SF Rolling | Total UW Rent Rolling | Approx. % of Total Rent Rolling | Approx. Cumulative % of Total Rent Rolling |
| 2019 | 0 | 0 | $0.00 | 0.0% | 0.0% | $0 | 0.0% | 0.0% |
| 2020 | 0 | 0 | $0.00 | 0.0% | 0.0% | $0 | 0.0% | 0.0% |
| 2021 | 0 | 0 | $0.00 | 0.0% | 0.0% | $0 | 0.0% | 0.0% |
| 2022 | 0 | 0 | $0.00 | 0.0% | 0.0% | $0 | 0.0% | 0.0% |
| 2023 | 0 | 0 | $0.00 | 0.0% | 0.0% | $0 | 0.0% | 0.0% |
| 2024 | 0 | 0 | $0.00 | 0.0% | 0.0% | $0 | 0.0% | 0.0% |
| 2025 | 0 | 0 | $0.00 | 0.0% | 0.0% | $0 | 0.0% | 0.0% |
| 2026 | 0 | 0 | $0.00 | 0.0% | 0.0% | $0 | 0.0% | 0.0% |
| 2027 | 0 | 0 | $0.00 | 0.0% | 0.0% | $0 | 0.0% | 0.0% |
| 2028 | 0 | 0 | $0.00 | 0.0% | 0.0% | $0 | 0.0% | 0.0% |
| 2029 | 0 | 0 | $0.00 | 0.0% | 0.0% | $0 | 0.0% | 0.0% |
| 2030 & Beyond | 1 | 755,914 | $65.82 | 98.9% | 98.9% | $49,754,253 | 100.0% | 100.0% |
| Vacant | 0 | 8,745 | $0.00 | 1.1% | 100.0% | $0 | 0.0% | 100.0% |
| Total/Wtd. Avg.(1) | 1 | 764,659 | $65.82 | 100.0% | $49,754,253 | 100.0% | ||
Information is based on the underwritten rent roll.
| (1) | Wtd. Avg. UW Rent PSF Rolling excludes vacant space. |
This is not a research report and was not prepared by the Underwriters’ research department. Please see additional important information and qualifications at the end of this Term Sheet.
T-30
| Office – CBD | Loan #1 | Cut-off Date Balance: | $115,000,000 | |
| 250 Howard Street | Park Tower at Transbay | Cut-off Date LTV: | 49.1% | |
| San Francisco, CA 94105 | UW NCF DSCR: | 2.93x | ||
| UW NOI Debt Yield: | 10.2% |
The Market. The Park Tower at Transbay Property is located in the South Financial District of San Francisco, California, just north of the Rincon Hill/South Beach/SOMA District, which has seen a resurgence in leasing activity particularly with respect to the technology sector, and east of the Yerba Buena District, home to several major redevelopment projects including the Yerba Buena complex, Moscone convention center and Westfield Shopping Center.
A significant development in the San Francisco central business district is the redevelopment of the approximately 40-acre area surrounding the Transbay Terminal, the primary transit hub in the downtown area. Redevelopment plans include replacing the outdated Transbay Terminal (which was completed in August 2018), extending Caltrain 1.3 miles (which construction began in 2012) and developing the surrounding neighborhood by widening Folsom Street and promoting sidewalk cafes and markets, and developing approximately 2,600 new homes, 3 million SF of office and commercial space, and 100,000 SF of retail space. Recent developments of the office space include the 61-story Salesforce Tower.
Salesforce has also leased approximately 325,000 SF at Transbay Parcel F (550 Howard) and approximately 335,000 SF at 350 Mission. Other technology firms leasing large blocks of space in the area include Facebook at 181 Fremont (432,000 SF) and at 215 Fremont (300,000 SF), Adobe at 100 Hooper (280,000 SF), Stripe at 510 Townsend (269,063 SF), Blend Labs at 500 Pine Street (72,000 SF), Twitch at 350 Bush Street (185,000 SF), LinkedIn at 222 Second Street (430,650 SF) and Pinterest at 88 Bluxome Street (490,000 SF). As of the first quarter of 2019, large block demand greater than 50,000 SF has climbed 41% year over year, outpacing supply. According to the appraisal, there are currently 20 tenant requirements of 100,000 SF or more but only five contiguous space options that can offer occupancy through 2023.
According to a third party market report, the Park Tower at Transbay Property is located in the South Financial District office submarket of the San Francisco office market. For the first quarter of 2019, the submarket had total inventory of approximately 28.2 million SF with a vacancy rate of 6.7% and average asking rents of $83.02 PSF.
According to the appraisal, the estimated 2019 population within a one-half-, one- and three-mile radius of the Park Tower at Transbay Property was 16,122, 59,433 and 378,299, respectively. The 2019 median household income within the same radii was $204,917, $105,624 and $113,407, respectively.
The following table presents recent leasing data at comparable office properties with respect to the Park Tower at Transbay Property:
| Comparable Lease Summary | |||||||||
| Property | Year Built/ Renovated | Distance from Subject | Property Size (SF) | Tenant | Lease Area (SF) | Lease Date | Initial Rent PSF NNN | Lease Term (Yrs.) | TI PSF |
| Park Tower at Transbay | 2018-2019 | N/A | 764,659 | 755,914 | March-19 | $65.82 | 15 | $110 | |
| Parcel F 546-550 Howard Street | 2023 (projected) | 0.2 miles | 1,100,000 | Salesforce | 325,000 | 4Q18 | $80.00 | 15 | $100 |
| 88 Bluxome Street | TBD | 1.4 miles | 1,000,000 | 490,000 | 1Q19 | $78.00 | 10-15 | N/A | |
| 181 Fremont Street | 2018 | 0.1 miles | 432,000 | 432,000 | Sep-17 | $65.00 | 10 | $100 | |
| 45 Fremont | 1978 | 0.3 miles | 602,780 | Slack Technologies | 208,459 | Aug-19 | $69.00 | 11.3 | $100-$130 |
| One Tehama | 1929 | 0.2 miles | 98,566 | Social Finance | 98,566 | Sep-18 | $70.00 | 11 | $105 |
Source: Appraisal and Facebook lease.
The following table presents the appraiser’s market rent conclusions:
| Market Rent Summary | ||||
| Office – Low | Office – Mid | Office - High | Retail | |
| Market Rent | $75.00 | $80.00 | $85.00 | $65.00 |
| Lease Term (Yrs.) | 12 | 12 | 12 | 10 |
| Rental Increase Projection | 3.0%per annum | 3.0%per annum | 3.0%per annum | 3.0%per annum |
This is not a research report and was not prepared by the Underwriters’ research department. Please see additional important information and qualifications at the end of this Term Sheet.
T-31
| Office – CBD | Loan #1 | Cut-off Date Balance: | $115,000,000 | |
| 250 Howard Street | Park Tower at Transbay | Cut-off Date LTV: | 49.1% | |
| San Francisco, CA 94105 | UW NCF DSCR: | 2.93x | ||
| UW NOI Debt Yield: | 10.2% |
Underwritten Net Cash Flow.The following table presents certain information relating to the Underwritten Net Cash Flow at the Park Tower at Transbay Property:
| Cash Flow Analysis(1) | |||||
| UW | UW PSF | ||||
| Base Rent(2) | $50,322,681 | $65.81 | |||
| Straight Line Rent | $7,996,394 | $10.46 | |||
| Reimbursements | $29,328,101 | $38.35 | |||
| Parking Income | $594,000 | $0.78 | |||
| Vacancy(3) | ($2,908,912) | ($3.80) | |||
| Effective Gross Income | $85,332,264 | $111.60 | |||
| Real Estate Taxes | $16,161,609 | $21.14 | |||
| Insurance | $1,561,863 | $2.04 | |||
| Other Operating Expenses | $11,258,124 | $14.72 | |||
| Total Operating Expenses | $28,981,596 | $37.90 | |||
| Net Operating Income | $56,350,668 | $73.69 | |||
| TI/LC | $0 | $0.00 | |||
| Capital Expenditures | $72,995 | $0.10 | |||
| Net Cash Flow | $56,277,673 | $73.60 | |||
| Occupancy %(3) | 96.7% | ||||
| NOI DSCR(4) | 2.93x | ||||
| NCF DSCR(4) | 2.93x | ||||
| NOI Debt Yield(4) | 10.2% | ||||
| NCF Debt Yield(4) | 10.2% | ||||
| (1) | Prior historical operating statements and occupancy are not applicable, as the Park Tower at Transbay Property was constructed in 2018-2019. |
| (2) | UW Base Rent includes the ground floor retail space (8,745 SF) grossed up to an estimated NNN rent of $65.00 PSF. |
| (3) | The Park Tower at Transbay Property is 98.9% leased to Facebook. UW Vacancy is 2.5% for the office floors and 100.0% for the retail space. |
| (4) | The debt service coverage ratios and debt yields shown are based on the Park Tower at Transbay Whole Loan. |
Escrows and Reserves.
Taxes and Insurance Reserves -So long as (x) no Cash Sweep Period (as defined below) exists and (y) the Park Tower at Transbay Borrower provides evidence to the lender that all property taxes and insurance premiums have been paid in full, monthly escrows for taxes and insurance will be waived.
Deferred Maintenance -The Park Tower at Transbay Borrower deposited at loan origination $4,412,926, which is equal to 110% of the estimated cost for the completion of the outstanding project costs for the construction of the Park Tower at Transbay Property.
TI/LC Reserve -The Park Tower at Transbay Borrower deposited at loan origination $80,198,366 for outstanding tenant improvement allowances owed to Facebook.
Regulatory Fees Reserve -The Park Tower at Transbay Borrower deposited at loan origination $5,528,653 which is equal to 100% of the estimated cost for the regulatory fees in connection with the development of the Park Tower at Transbay Property as required pursuant to an owner participation/disposition and development agreement between the Successor Agency to the Redevelopment Agency of the City of San Francisco and the Park Tower at Transbay Borrower and as required for Municipal Transportation Agency additional street use fees.
Lockbox and Cash Management. The Park Tower at Transbay Whole Loan documents require a hard lockbox with springing cash management upon the occurrence of a Cash Sweep Period. During the continuance of a Cash Sweep Period, all funds in the lockbox account are required to be swept each business day to a lender-controlled cash management account and disbursed in accordance with the Park Tower at Transbay Whole Loan documents. Additionally, during a Cash Sweep Period, all excess cash flow is required to be held as additional security for the Park Tower at Transbay Whole Loan until the discontinuance of the Cash Sweep Period.
A “Cash Sweep Period” will commence upon:
| (i) | an event of default under the Park Tower at Transbay Whole Loan documents beyond notice and cure periods (a “Default Trigger”), |
| (ii) | the Park Tower at Transbay Borrower seeking bankruptcy protection (a “Borrower Bankruptcy Trigger”), |
| (iii) | Facebook seeking bankruptcy protection (a “Facebook Bankruptcy Trigger”), |
| (iv) | Facebook (A) being in monetary or material non-monetary default beyond notice and cure periods or (B) terminating or giving notice to terminate its lease (each, a “Tenant Trigger”), |
This is not a research report and was not prepared by the Underwriters’ research department. Please see additional important information and qualifications at the end of this Term Sheet.
T-32
| Office – CBD | Loan #1 | Cut-off Date Balance: | $115,000,000 | |
| 250 Howard Street | Park Tower at Transbay | Cut-off Date LTV: | 49.1% | |
| San Francisco, CA 94105 | UW NCF DSCR: | 2.93x | ||
| UW NOI Debt Yield: | 10.2% |
| (v) | the Park Tower at Transbay Borrower failing to repay the Park Tower at Transbay Whole Loan in full on or before the ARD (an “ARD Trigger”), |
| (vi) | if a Facebook Bankruptcy Trigger or a Tenant Trigger previously occurred and was cured pursuant to clause (c) below and thereafter, the debt yield is less than 7.000% (not including any straight line rent) for two consecutive calendar quarters (a “Debt Yield Trigger”), or |
| (vii) | any replacement tenant (should the Facebook lease be terminated) subsequently going dark in more than 50% the office SF at the Park Tower at Transbay Property (a “Replacement Tenant Trigger”), unless the replacement tenant has a credit rating of at least “BBB-” by S&P or Fitch or “Baa3” by Moody’s. |
A Cash Sweep Period will end when (provided no other Cash Sweep Period is continuing):
| (a) | if triggered by a Default Trigger, the cure of the event of default under the Park Tower at Transbay Whole Loan documents, |
| (b) | if triggered by a Facebook Bankruptcy Trigger, the replacement or assumption of the Facebook lease by the bankruptcy court and the dismissal of such bankruptcy proceedings, |
| (c) | if triggered by a Tenant Trigger or a Debt Yield Trigger, the debt yield being equal to or greater than 7.00% (not including any straight line rent) for the trailing two quarters, and |
| (d) | if triggered by a Replacement Tenant Trigger (x) delivery of a replacement lease(s) for at least 50% of the office SF at the Park Tower at Transbay Property, or (y) the dark replacement tenant re-opens business in at least 50% of the office SF at the Park Tower at Transbay Property. |
A Cash Sweep Period triggered by a Borrower Bankruptcy Trigger or an ARD Trigger may not be cured and will continue until the full repayment of the Park Tower at Transbay Whole Loan. All excess cash collected after an ARD Triggerwill be applied to the reduction of principal, then to pay off additional accrued interest.
Additional Secured Indebtedness (not including trade debts). The Park Tower at Transbay Property also secures the Park Tower at TransbayPari PassuCompanion Loans which have an aggregate Cut-off Date principal balance of $435,000,000. The Park Tower at TransbayPari Passu Companion Loans accrue interest at the same rate as the Park Tower at Transbay Mortgage Loan. The Park Tower at Transbay Mortgage Loan is entitled to payments of interest on apro rata andpari passubasis with the Park Tower at TransbayPari PassuCompanion Loans. The holders of the Park Tower at Transbay Mortgage Loan and the Park Tower at TransbayPari PassuCompanion Loans have entered into a co-lender agreement which sets forth the allocation of collections on the Park Tower at Transbay Whole Loan. See “Description of the Mortgage Pool—The Whole Loans—The Serviced Pari Passu Whole Loans” in the Preliminary Prospectus.
Mezzanine Loan and Preferred Equity.Not permitted.
Release of Property. Not permitted.
Right of First Offer.Facebook has a right of first offer to purchase the Park Tower at Transbay Property at the same terms as any purchase offer received by the Park Tower at Transbay Borrower. If Facebook fails to exercise its right of first offer, the Park Tower at Transbay Borrower will be free to sell the Park Tower at Transbay Property to another party other than a Facebook competitor, namely Alphabet Inc., Amazon.com, Inc., Apple Inc., Microsoft Corporation, salesforce.com, inc., Snap Inc. and Samsung Electronics, which list of competitors is subject to change by Facebook in accordance with its lease.
Letter of Credit.None.
Terrorism Insurance.The Park Tower at Transbay Borrower is required to obtain and maintain property insurance that covers perils of terrorism and acts of terrorism in an amount equal to the full replacement cost of the Park Tower at Transbay Property and business interruption insurance for 36 months with a twelve month extended period of indemnity, provided, if the Terrorism Risk Insurance Act of 2002, as extended and modified by the Terrorism Risk Insurance Program Reauthorization Act of 2015 (as the same may be further modified, amended, or extended) is not in effect, the Park Tower at Transbay Borrower will not be required to pay annual premiums in excess of two times the premium then payable for the property and business interruption/loss of rents insurance in order to obtain the terrorism coverage. See “Risk Factors—Risks Relating to the Mortgage Loans—Terrorism Insurance May Not Be Available for All Mortgaged Properties” in the Preliminary Prospectus.
This is not a research report and was not prepared by the Underwriters’ research department. Please see additional important information and qualifications at the end of this Term Sheet.
T-33
| Office – CBD | Loan #2 | Cut-off Date Balance: | $110,000,000 | |
| 230 Park Avenue South | 230 Park Avenue South | Cut-off Date LTV: | 51.0% | |
| New York, NY 10003 | UW NCF DSCR: | 2.64x | ||
| UW NOI Debt Yield: | 8.9% |
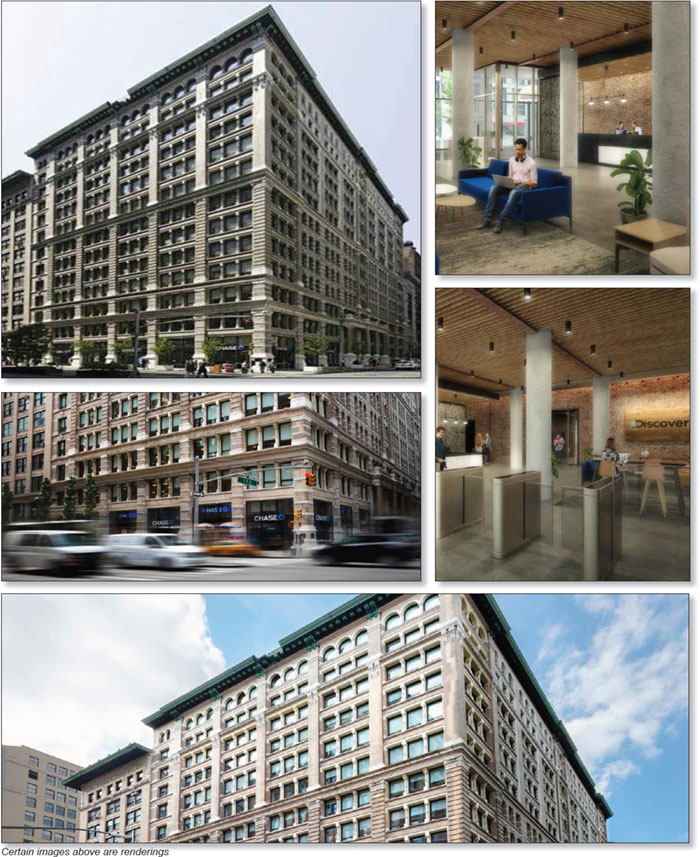
This is not a research report and was not prepared by the Underwriters’ research department. Please see additional important information and qualifications at the end of this Term Sheet.
T-34
| Office – CBD | Loan #2 | Cut-off Date Balance: | $110,000,000 | |
| 230 Park Avenue South | 230 Park Avenue South | Cut-off Date LTV: | 51.0% | |
| New York, NY 10003 | UW NCF DSCR: | 2.64x | ||
| UW NOI Debt Yield: | 8.9% |

This is not a research report and was not prepared by the Underwriters’ research department. Please see additional important information and qualifications at the end of this Term Sheet.
T-35
| Mortgage Loan No. 2 – 230 Park Avenue South |
| Mortgage Loan Information | Property Information | |||||
| Mortgage Loan Seller: | WFB/BANA | Single Asset/Portfolio: | Single Asset | |||
| Credit Assessment (DBRS/Fitch/S&P): | BBB(low)/NR/NR | Location: | New York, NY 10003 | |||
| Original Balance(1): | $110,000,000 | General Property Type: | Office | |||
| Cut-off Date Balance(1): | $110,000,000 | Detailed Property Type: | CBD | |||
| % of Initial Pool Balance: | 9.3% | Title Vesting: | Fee | |||
| Loan Purpose: | Refinance | Year Built/Renovated: | 1895/2019 | |||
| Borrower Sponsor: | TF Cornerstone Properties, LLC | Size: | 373,693 SF | |||
| Guarantor: | TF Cornerstone Properties, LLC | Cut-off Date Balance per SF(1): | $669 | |||
| Mortgage Rate: | 3.2700% | Maturity Balance per SF(1): | $669 | |||
| Note Date: | 9/11/2019 | Property Manager: | TF Cornerstone, Inc. | |||
| First Payment Date: | 10/11/2019 | (borrower-related) | ||||
| Maturity Date: | 9/11/2029 | |||||
| Original Term to Maturity: | 120 months | Underwriting and Financial Information | ||||
| Original Amortization Term: | 0 months | UW NOI: | $22,147,556 | |||
| IO Period: | 120 months | UW NOI Debt Yield(1): | 8.9% | |||
| Seasoning: | 1 month | UW NOI Debt Yield at Maturity(1): | 8.9% | |||
| Prepayment Provisions(2): | LO (25); DEF/YM1 (88); O (7) | UW NCF DSCR(1): | 2.64x | |||
| Lockbox/Cash Mgmt Status: | Hard/Springing | Most Recent NOI(4): | N/A | |||
| Additional Debt Type(1): | Pari Passu | 2nd Most Recent NOI(4): | N/A | |||
| Additional Debt Balance(1): | $140,000,000 | 3rd Most Recent NOI(4): | N/A | |||
| Future Debt Permitted (Type): | No (N/A) | Most Recent Occupancy: | 100.0% (9/1/2019) | |||
| Reserves(3) | 2nd Most Recent Occupancy: | 100.0% (12/31/2018) | ||||
| Type | Initial | Monthly | Cap | 3rd Most Recent Occupancy: | 100.0% (12/31/2017) | |
| RE Taxes: | $0 | Springing | N/A | Appraised Value (as of)(5): | $490,000,000 (7/24/2019) | |
| Insurance: | $0 | Springing | N/A | Appraised Value per SF(5): | $1,311 | |
| Rent Concession Reserve: | $24,763,070 | $0 | N/A | Cut-off Date LTV Ratio(1)(5): | 51.0% | |
| Existing Landlord Obligations Reserve: | (3) | $0 | N/A | Maturity Date LTV Ratio(1)(5): | 51.0% | |
| Sources and Uses | ||||||
| Sources | Proceeds | % of Total | Uses | Proceeds | % of Total | |
| Whole Loan Amount(1): | $250,000,000 | 100.0% | Loan Payoff Amount: | $146,203,186 | 58.5% | |
| Upfront Reserves: | $59,026,648 | 23.6% | ||||
| Return of Equity: | $30,340,319 | 12.1% | ||||
| Closing Costs: | $14,429,847 | 5.8% | ||||
| Total Sources: | $250,000,000 | 100.0% | Total Uses: | $250,000,000 | 100.0% | |
| (1) | The Cut-off Date Balance per SF, Maturity Date Balance per SF, UW NOI Debt Yield, UW NOI Debt Yield at Maturity, UW NCF DSCR, Cut-off Date LTV Ratio and Maturity Date LTV Ratio numbers presented above are based on the 230 Park Avenue South Whole Loan (as defined below). |
| (2) | Defeasance or prepayment of the 230 Park Avenue South Whole Loan is permitted at any time after the earlier to occur of (a) the end of the two-year period commencing on the closing date of the securitization of the last promissory note representing a portion of the 230 Park Avenue South Whole Loan to be securitized and (b) September 11, 2022 (“Defeasance Lockout Date”). No prepayment premium will apply on or after March 11, 2029. The assumed defeasance lockout period of 25 payments is based on the closing date of this transaction in October 2019. Partial defeasance or partial prepayment (with the applicable yield maintenance premium) of the 230 Park Avenue Whole Loan is permitted, after the Defeasance Lockout Date, solely to satisfy the debt yield threshold to prevent a Cash Trap Event Period (see the “Lockbox and Cash Management” below for further discussion). |
| (3) | See“Escrows and Reserves” below for further discussion of reserve requirements. |
| (4) | The 230 Park Avenue South Property (as defined below) has been approximately 100.0% leased since 2008, however, it is currently undergoing an extensive repositioning program to serve as Discovery, Inc.’s global corporate headquarters. Accordingly, operating history was not considered relevant to underwriting. |
| (5) | The Appraised Value shown reflects a “Hypothetical Market Value as Stabilized Today” which assumes that all free rent has burned off and all of the tenant improvements and landlord work have been completed. At loan closing, the 230 Park Avenue South Borrower escrowed $24,763,070 for all free rent and gap rent pertaining to the Discovery space and $34,263,578 representing 75% of the tenant allowances, tenant improvements and capital improvements pertaining to the Discovery lease and space (the remaining 25% was guaranteed by the Guarantor) (see “Escrows and Reserves” below for further information). The appraiser also concluded to an “As-Is” appraised value of $415,000,000 as of July 24, 2019, which results in a Cut-off Date LTV Ratio of 60.2% and Maturity Date LTV Ratio of 60.2% for the 230 Park Avenue South Whole Loan. Additionally, the appraiser concluded to a hypothetical “Go Dark” value of $350,000,000 as of July 24, 2019. Further, the appraisal notes that, since the 230 Park Avenue South Property is the subject of and expected to be eligible for New York City’s Industrial and Commercial Abatement Program (ICAP), the 10-year benefit has been assumed in its analysis of both the “As-Is” appraised value and the “Hypothetical Market Value as Stabilized Today” (see “The Property” section below for further information about the ICAP). |
This is not a research report and was not prepared by the Underwriters’ research department. Please see additional important information and qualifications at the end of this Term Sheet.
T-36
| Office – CBD | Loan #2 | Cut-off Date Balance: | $110,000,000 | |
| 230 Park Avenue South | 230 Park Avenue South | Cut-off Date LTV: | 51.0% | |
| New York, NY 10003 | UW NCF DSCR: | 2.64x | ||
| UW NOI Debt Yield: | 8.9% |
The Mortgage Loan. The second largest mortgage loan (the “230 Park Avenue South Mortgage Loan”) is part of a whole loan (the “230 Park Avenue South Whole Loan”) that is evidenced by sevenpari passupromissory notes in the aggregate original principal amount of $250,000,000. The 230 Park Avenue South Whole Loan was co-originated on September 11, 2019 by Wells Fargo Bank, National Association (“Wells Fargo”), Bank of America, N.A. (“Bank of America”) and JPMorgan Chase Bank, National Association (“JPMorgan”). The 230 Park Avenue South Whole Loan is secured by a first priority fee mortgage encumbering an office building located in New York, New York (the “230 Park Avenue South Property”). The 230 Park Avenue South Mortgage Loan is evidenced by the controlling promissory Note A-1 (being contributed by Wells Fargo) and the non-controlling promissory Note A-4 (being contributed by Bank of America) in the aggregate original principal amount of $110,000,000. The non-controlling promissory notes A-2, A-3, A-5, A-6 and A-7 in the aggregate original principal amount of $140,000,000 (collectively, the “230 Park Avenue South ServicedPari Passu Companion Loans”) are currently held by Wells Fargo, Bank of America and JPMorgan and are expected to be contributed to future securitization trusts or may be otherwise transferred at any time. The 230 Park Avenue South Whole Loan will be serviced pursuant to the pooling and servicing agreement for the BANK 2019-BNK21 securitization trust. See “Description of the Mortgage Pool—The Whole Loans—The Serviced Pari Passu Whole Loans” and “Pooling and Servicing Agreement” in the Preliminary Prospectus.
| 230 Park Avenue South Whole Loan Summary | ||||
| Note | Original Balance | Cut-off Date Balance | Note Holder | Controlling Piece |
| A-1 | $55,000,000 | $55,000,000 | BANK 2019-BNK21 | Yes |
| A-2 | $30,000,000 | $30,000,000 | Wells Fargo Bank, National Association | No |
| A-3 | $25,000,000 | $25,000,000 | Wells Fargo Bank, National Association | No |
| A-4 | $55,000,000 | $55,000,000 | BANK 2019-BNK21 | No |
| A-5 | $30,000,000 | $30,000,000 | Bank of America, N.A. | No |
| A-6 | $25,000,000 | $25,000,000 | Bank of America, N.A. | No |
| A-7 | $30,000,000 | $30,000,000 | JPMorgan Chase Bank, National Association | No |
| Total | $250,000,000 | $250,000,000 | ||
The Borrower and the Borrower Sponsor. The borrower is 230 PAS SPE LLC (the “230 Park Avenue South Borrower”), a Delaware limited liability company and single purpose entity with two independent directors.
The borrower sponsor and non-recourse carveout guarantor is TF Cornerstone Properties, LLC (“Guarantor”), an affiliate of TF Cornerstone Inc., which, together with Guarantor and other affiliates (collectively, “TF Cornerstone”), comprise a family-owned real estate enterprise focused on acquisition, development, construction and management of residential and commercial properties. Founded in the 1970s and led by K. Thomas and Frederick Elghanayan, TF Cornerstone’s current portfolio includes approximately 12,625 apartment units in New York City and over 2.5 million square feet of commercial space in New York and Washington, D.C. (including 12 office properties). TF Cornerstone’s portfolio includes 387 Park Avenue South and Carnegie Hall Tower, approximately 0.4 and 2.1 miles northeast of the 230 Park Avenue South Property, respectively.
The Property. The 230 Park Avenue South Property is a 373,693 SF, 14-story office building located within the Midtown South area of Manhattan in New York, New York. The 230 Park Avenue South Property was constructed in 1895 and is currently undergoing an extensive repositioning program that, per the appraisal, is expected to position the 230 Park Avenue South Property as a Class A building following completion. As part of a lease recently executed with Discovery for 96.7% of the NRA, the building is currently undergoing a $14.6 million modernization that includes the expansion and renovation of the entry and lobby areas (approximately $6.6 million), updated destination dispatch elevators and a newly-built service elevator that will operate on the cellar, ground and second floors (approximately $3.2 million). The 230 Park Avenue South Property will also undergo upgrades to the HVAC systems and cooling tower (approximately $2.0 million), improvements to the electrical service that will increase capacity to 8,000 Amps (approximately $2.0 million) and other miscellaneous renovations (approximately $0.8 million). Additionally, an indoor/outdoor studio is expected to be created in the newly-designed courtyard area; and the existing office spaces are expected to be renovated to consist of open, loft-style space with exposed ceilings.
According to the appraisal, as part of the proposed redevelopment, the 230 Park Avenue South Borrower is anticipated to benefit from a 10-year Industrial Commercial Abatement Program (“ICAP”) Tax Abatement. The ICAP provides abatements for property taxes for industrial or commercial properties that have been built, modernized, expanded or physically improved throughout Manhattan and the outer boroughs of New York. To qualify for the ICAP abatement, (a) properties must spend 30% of the taxable assessed value in capital expenses in four years from the date the building permit was issued, and (b) construction must be completed within five years of the issuance of a building permit, among other conditions. The borrower sponsor has filed for an ICAP tax abatement on the 230 Park Avenue South Property and is expected to be a candidate for approval of the ICAP tax abatement based on the repositioning of the existing improvements. As of the date of origination of the 230 Park Avenue South Whole Loan, the 230 Park Avenue South Property had not received the abatement; however, an ICAP application was filed in May 2018. The ICAP was not given credit in the lender’s underwriting; however, the ICAP was assumed in the appraiser’s analysis. The appraisal notes that the 230 Park Avenue South Property is expected to be eligible for the ICAP.
The 230 Park Avenue South Property was 100.0% leased to three tenants as of September 1, 2019; however, Discovery is not yet in occupancy or paying rent. Approximately 3.3% of the net rentable area and 5.9% of the underwritten base rent at the 230 Park Avenue South Property is attributed to two ground floor retail tenants (JPMorgan Chase and Earth Mail) with frontage along Park Avenue South and East 19th Street.
Major Tenant.
Discovery (361,214 SF, 96.7% of NRA; 94.1% of underwritten base rent, January 31, 2037 expiration). Discovery Communications, LLC, a wholly owned subsidiary of Discovery, Inc. (“Discovery”; S&P: BBB-; NASDAQ: DISCA), is an American mass media company with numerous television networks including the Discovery Channel, Animal Planet, TLC, HTGV, Travel Channel, and the Food Network. As of September 6, 2019, Discover had a market capitalization of approximately $15.9 billion. In March 2018, Discovery purchased Scripps Networks Interactive for approximately $14.6 billion, which was
This is not a research report and was not prepared by the Underwriters’ research department. Please see additional important information and qualifications at the end of this Term Sheet.
T-37
| Office – CBD | Loan #2 | Cut-off Date Balance: | $110,000,000 | |
| 230 Park Avenue South | 230 Park Avenue South | Cut-off Date LTV: | 51.0% | |
| New York, NY 10003 | UW NCF DSCR: | 2.64x | ||
| UW NOI Debt Yield: | 8.9% |
the owner of HGTV, Food Network, and the Travel Channel. Discovery is planning to move Scripps’ headquarters into the 230 Park Avenue South Property along with the rest of Discovery.
Discovery is expected to utilize its space at the 230 Park Avenue South Property as its corporate headquarters. Discovery is expected to occupy a portion of the ground floor, floors 2-13, the courtyard and the penthouse (floor 14), as well as eastern & western cellars. The company is expected to utilize all space from the fourth floor through the penthouse as space for general and executive offices, as well as certain ancillary purposes. The ground, second, and third floor are expected to be used by one of the channels in Discovery’s portfolio, the Food Network, as production kitchens and studio space.
Discovery has a signed lease but is not yet in occupancy or paying rent. Discovery has taken possession of the eastern & western cellars, its ground floor space and floors 2-11; floors 12-14 were recently delivered on September 1, 2019; and the courtyard space is expected to be delivered in February 2021. Discovery is expected to commence occupying the premises in January 2020 with a full occupancy date expected by December 2020. Discovery’s lease is guaranteed by Discovery, Inc., the rated parent company, and has either one, 10-year or two, five-year renewal options at the fair market rental rate following its lease expiration in January 2037.
Discovery’s rent commencement is expected in June 2020 for floors 2-3 and 7-10 (46.6% of Discovery’s space; 46.2% of Discovery’s underwritten base rent); in July 2020 for the ground floor and eastern cellar space (3.6% of Discovery’s space; 3.0% of Discovery’s underwritten base rent); in September 2020 for floors 4-6 and 11 (31.0% of Discovery’s space; 29.8% of Discovery’s underwritten base rent); in October 2020 for the western cellar space (1.7% of Discovery’s space; 1.0% of Discovery’s underwritten base rent); in November 2020 for floors 12-14 (16.6% of Discovery’s space; 19.4% of Discovery’s underwritten base rent); and in April 2022 for the courtyard premises (0.5% of Discovery’s space; 0.6% of Discovery’s underwritten base rent). All outstanding free rent and gap rent were reserved for at the time of origination of the 230 Park Avenue Whole Loan, along with 75% of the landlord lease obligations for Discovery (with the additional 25% guaranteed by the Guarantor; see the “Escrows and Reserves” section below). There is no assurance that Discovery will take occupancy or begin paying rent by the estimated dates noted herein.
The following table presents certain information relating to the tenancy at the 230 Park Avenue South Property:
| Tenant Summary | ||||||||
| Tenant Name | Credit Rating (Fitch/Moody’s/ S&P)(1) | Tenant SF | Approx. % of SF | Annual UW Rent | % of Total Annual UW Rent | Annual UW Rent PSF | Termination Option (Y/N) | Lease Expiration |
| Discovery Communications, LLC(2) | NR/NR/BBB- | 361,214 | 96.7% | $30,363,766(3) | 94.1% | $84.06(3) | N | 1/31/2037(4) |
| Other Tenants(5) | 12,479 | 3.3% | $1,911,210 | 5.9% | $153.15 | |||
| Vacant Space | 0 | 0.0% | $0 | 0.0% | $0.00 | |||
| Total/Wtd. Avg. | 373,693 | 100.0% | $32,274,976 | 100.0% | $86.37 |
| ||
| (1) | The Discovery lease is guaranteed by Discovery, Inc., the rated entity. |
| (2) | Discovery has an executed lease but has not yet taken occupancy or commenced paying rent (see tenant description in“Major Tenants” above for further information). |
| (3) | The Annual UW Rent and Annual UW Rent PSF shown above include straight-line rent averaging over the remaining loan term for Discovery totaling $1,218,633. Discovery’s current rental rate is $80.69 PSF. |
| (4) | Discovery has either one, 10-year option or two, 5-year options to renew, each with 24 months’ notice at the fair market rental rate. |
| (5) | Other Tenants comprise two ground level retail tenants. |
The following table presents certain information relating to the lease rollover schedule at the 230 Park Avenue South Property:
| Lease Rollover Schedule(1)(2) | ||||||||
| Year | # of Leases Rolling | SF Rolling | Annual UW Rent PSF Rolling | Approx. % of Total SF Rolling | Approx. Cumulative % of SF Rolling | Total UW Rent Rolling | Approx. % of Total Rent Rolling | Approx. Cumulative % of Total Rent Rolling |
| 2019 | 0 | 0 | $0.00 | 0.0% | 0.0% | $0 | 0.0% | 0.0% |
| 2020 | 0 | 0 | $0.00 | 0.0% | 0.0% | $0 | 0.0% | 0.0% |
| 2021 | 2 | 12,479 | $153.15 | 3.3% | 3.3% | $1,911,210 | 5.9% | 5.9% |
| 2022 | 0 | 0 | $0.00 | 0.0% | 3.3% | $0 | 0.0% | 5.9% |
| 2023 | 0 | 0 | $0.00 | 0.0% | 3.3% | $0 | 0.0% | 5.9% |
| 2024 | 0 | 0 | $0.00 | 0.0% | 3.3% | $0 | 0.0% | 5.9% |
| 2025 | 0 | 0 | $0.00 | 0.0% | 3.3% | $0 | 0.0% | 5.9% |
| 2026 | 0 | 0 | $0.00 | 0.0% | 3.3% | $0 | 0.0% | 5.9% |
| 2027 | 0 | 0 | $0.00 | 0.0% | 3.3% | $0 | 0.0% | 5.9% |
| 2028 | 0 | 0 | $0.00 | 0.0% | 3.3% | $0 | 0.0% | 5.9% |
| 2029 | 0 | 0 | $0.00 | 0.0% | 3.3% | $0 | 0.0% | 5.9% |
| 2030 & Beyond | 1 | 361,214 | $84.06 | 96.7% | 100.0% | $30,363,766 | 94.1% | 100.0% |
| Vacant | 0 | 0 | $0.00 | 0.0% | 100.0% | $0 | 0.0% | 100.0% |
| Total/Wtd. Avg. | 3 | 373,693 | $86.37 | 100.0% | $32,274,976 | 100.0% | ||
| (1) | Information is based on the underwritten rent roll. |
| (2) | Certain tenants may have lease termination options that are exercisable prior to the originally stated expiration date of the subject lease and that are not considered in the Lease Rollover Schedule. |
This is not a research report and was not prepared by the Underwriters’ research department. Please see additional important information and qualifications at the end of this Term Sheet.
T-38
| Office – CBD | Loan #2 | Cut-off Date Balance: | $110,000,000 | |
| 230 Park Avenue South | 230 Park Avenue South | Cut-off Date LTV: | 51.0% | |
| New York, NY 10003 | UW NCF DSCR: | 2.64x | ||
| UW NOI Debt Yield: | 8.9% |
The Market. The 230 Park Avenue South Property is situated on the southwest corner of the intersection of Park Avenue South and East 19th Street within the Midtown South area of Manhattan, New York, New York. The 230 Park Avenue South Property is situated approximately four blocks southeast of the 23rd Street Subway station (which services the 4 and 6 lines) and four blocks northeast of the 14th Street/Union Square subway station (which services the L, N, Q, R, W, 4, 5 and 6 lines and is the fourth busiest Subway station according to the most recently published data by the Metropolitan Transportation Authority (MTA) in 2016). Madison Square Park, a 6.2-acre public park that opened in 1847, is located approximately four blocks northwest of the 230 Park Avenue South Property. Notable landmarks and historical buildings that surround Madison Square Park include the Flatiron Building, the Toy Center, the New York Life Building, 11 Madison Avenue, the Met Life Tower, and One Madison Park. According to a third party market research provider, the estimated 2019 population within a three- and five-mile radius of the 230 Park Avenue South Property was approximately 1,275,932 and 2,911,772, respectively; and the estimated 2019 average household income within the same radii was approximately $136,389 and $116,789, respectively.
According to a third-party market research report, the 230 Park Avenue South Property is situated within the Gramercy Park Office submarket of the New York Office Market. As of September 4, 2019, the Gramercy Park Office submarket reported a total inventory of approximately 28.2 million SF with a 6.6% vacancy rate and average asking rent of $72.13 per SF, triple net.
The appraiser identified a competitive set of 26 office properties totaling approximately 8.7 million SF, with an average occupancy rate of 95.6%. In addition, the appraiser identified nine comparable leases ranging from $82.00 PSF to $130.00 PSF, modified gross (with a weighted average of $91.75 PSF; see table below).
The following table presents certain information relating to the appraisal’s market rent conclusion for the 230 Park Avenue South Property:
| Market Rent Summary | |||
| Office – Floor 2-6 | Office Floor 7-11 | Office Floor 12-14 | |
| Market Rent (PSF) | $85.00 | $90.00 | $100.00 |
| Lease Term (Years) | 15 | 15 | 15 |
| Concessions | 12 months | 12 months | 12 months |
| Lease Type (Reimbursements) | MG | MG | MG |
| Rent Increase Projection | 8.0% every 5 years | 8.0% every 5 years | 8.0% every 5 years |
The following table presents information relating to comparable office property sales for the 230 Park Avenue South Property:
| Comparable Property Sale Summary | ||||||
| Property Name/Location | Sale Date | Year Built/ Renovated | Total NRA (SF) | Occupancy | Sale Price | Sale Price PSF |
230 Park Avenue South Property New York, NY | N/A | 1895/2019 | 373,693 | 100.0% | ||
450 West 15th Street New York, NY | May 2019 | 1928/2012 | 320,789 | 94% | $600,000,000 | $1,870 |
875 Washington Street New York, NY | Apr. 2019 | 1900/N/A(1) | 70,263 | 100% | $133,000,000 | $1,893 |
670 Broadway New York, NY | Feb. 2019 | 1900/2016 | 71,929 | 98% | $130,500,000 | $1,814 |
400 Madison Avenue New York, NY | Oct. 2018 | 1929/2013-2015 | 180,181 | 80% | $194,500,000 | $1,079 |
160 Fifth Avenue New York, NY | Dec. 2018 | 1892/2009 | 122,328 | 100% | $180,750,000 | $1,478 |
540 West 26th Street New York, NY | Aug. 2018 | 2018/NAV | 166,966 | 95% | $257,000,000 | $1,539 |
330 Hudson Street New York, NY | Feb. 2018 | 1910/2013 | 466,738 | 76% | $385,000,000 | $825 |
245-249 West 17th Street New York, NY | Oct. 2017 | 1909/NAV | 281,294 | 100% | $324,020,945 | $1,152 |
| Source:Appraisal | ||||||
| (1) Renovations at 875 Washington Street are ongoing and expected to be completed in 2020. | ||||||
This is not a research report and was not prepared by the Underwriters’ research department. Please see additional important information and qualifications at the end of this Term Sheet.
T-39
| Office – CBD | Loan #2 | Cut-off Date Balance: | $110,000,000 | |
| 230 Park Avenue South | 230 Park Avenue South | Cut-off Date LTV: | 51.0% | |
| New York, NY 10003 | UW NCF DSCR: | 2.64x | ||
| UW NOI Debt Yield: | 8.9% |
The following table presents certain information relating to comparable office leases for the 230 Park Avenue South Property:
| Comparable Leases Summary | |||||||||
| Property Name/Location | Year Built/ Renovated | Total GLA (SF) | Occupancy(1) | Distance from Subject | Tenant Name | Lease Date/Term | Lease Area (SF) | Annual Base Rent PSF | Lease Type |
230 Park Avenue South Property(2) New York, NY | 1895/2019 | 373,693 | 100.0% | - | Discovery Communications | Apr. 2019 / 17.8 Yrs | 361,214 | $80.69(2) | MG |
114 Fifth Avenue New York, NY | 1972/1995 | 2,522,000 | 100.0% | 0.3 Miles | Unqork | Jun. 2019 / 10.0 Yrs | 38,652 | $88.00 | MG |
100-104 Fifth Avenue New York, NY | 1905/N/A | 305,000 | 100.0% | 0.3 Miles | Bankrate | Feb. 2019 / 10.7 Yrs | 22,800 | $99.00 | MG |
315 Park Avenue South New York, NY | 1910/2007 | 356,330 | 90.1% | 0.3 Miles | PitchBook Data, Inc. | Jan. 2019 / 11.4 Yrs | 17,050 | $95.00 | MG |
155 Avenue of the Americas New York, NY | 1928/N/A | 226,376 | 100.0% | 1.4 Miles | Downtown Music Publishing | Jan. 2019 / 11.0 Yrs | 26,399 | $88.00 | MG |
110 Fifth Avenue New York, NY | 1890/2002 | 174,900 | 100.0% | 0.3 Miles | Compass | Nov. 2018 / 10.9 Yrs | 80,000 | $88.00 | MG |
57-59 East 11th Street New York, NY | 1903/N/A | 68,133 | 100.0% | 0.5 Miles | WeWork | Nov. 2018 / 16.0 Yrs | 57,022 | $90.00 | MG |
888 Broadway New York, NY | 1900/N/A | 175,000 | 100.0% | 0.1 Miles | Netflix | Oct. 2018 / 13.1 Yrs | 37,378 | $130.00 | MG |
315 Park Avenue South New York, NY | 1910/2007 | 356,330 | 90.1% | 0.3 Miles | Fullscreen Media | Jul. 2018 / 3.0-10.8 Yrs | 34,000 | $82.00 | MG |
287 Park Avenue South New York, NY | 1893/N/A | 117,852 | 94.4% | 0.2 Miles | Spaces by Regus | Jun. 2018 / 15.0 Yrs | 103,321 | $85.21 | MG |
Source:Appraisal, unless otherwise noted
| (1) | Information obtained from a third party market research provider. |
| (2) | Information obtained from the borrower sponsor. The rent shown for Discovery represents the tenant’s current contractual rental rate, while the tenant was underwritten to the straight-line average over the remaining loan term of $84.06 PSF due to its investment grade nature. |
This is not a research report and was not prepared by the Underwriters’ research department. Please see additional important information and qualifications at the end of this Term Sheet.
T-40
| Office – CBD | Loan #2 | Cut-off Date Balance: | $110,000,000 | |
| 230 Park Avenue South | 230 Park Avenue South | Cut-off Date LTV: | 51.0% | |
| New York, NY 10003 | UW NCF DSCR: | 2.64x | ||
| UW NOI Debt Yield: | 8.9% |
Underwritten Net Cash Flow.The following table presents certain information relating to the Underwritten Net Cash Flow at the 230 Park Avenue South Property:
| Cash Flow Analysis(1) | ||
| UW | UW PSF | |
| Gross Potential Base Rent | $31,056,343 | $83.11 |
| Rent Average Benefit | $1,218,633(2) | $3.26 |
| Grossed Up Vacant Space | $0 | $0.00 |
| Total Recoveries | $2,251,148 | $6.02 |
| Other Income | $0 | $0.00 |
| Less Vacancy & Credit Loss | ($929,486)(3) | ($2.49) |
| Effective Gross Income | $33,596,638 | $89.90 |
| Real Estate Taxes | $6,627,000 | $17.73 |
| Insurance | $226,312 | $0.61 |
| Other Operating Expenses | $4,595,770 | $12.30 |
| Total Expenses | $11,449,082 | $30.64 |
|
| |
| Net Operating Income | $22,147,556 | $59.27 |
| Capital Expenditures | $119,582 | $0.32 |
| TI/LC | $66,408 | $0.18 |
| Net Cash Flow | $21,961,566 | $58.77 |
| ||
| Occupancy% | 100.0%(3) | |
| NOI DSCR(4) | 2.66x | |
| NCF DSCR(4) | 2.64x | |
| NOI Debt Yield(4) | 8.9% | |
| NCF Debt Yield(4) | 8.8% | |
| (1) | The 230 Park Avenue South Property has been approximately 100.0% leased since 2008, however, it is currently undergoing an extensive repositioning program to serve as Discovery’s global corporate headquarters. Accordingly, operating history was not considered relevant to underwriting. |
| (2) | Represents straight-line rent averaging over the remaining loan term for Discovery Communications. |
| (3) | The underwritten economic vacancy is 2.9%. The 230 Park Avenue South Property was 100.0% leased as of September 1, 2019. |
| (4) | The debt service coverage ratios and debt yields are based on the 230 Park Avenue South Whole Loan. |
Escrows and Reserves.
Real Estate Taxes – Upon the occurrence and continuance of a Cash Trap Event Period (see “Lockbox and Cash Management” section), the 230 Park Avenue South Whole Loan documents require ongoing monthly real estate tax reserves in an amount equal to 1/12 of the real estate taxes that the lender estimates will be payable during the next 12 months.
Insurance – Upon the occurrence and continuance of a Cash Trap Event Period, the 230 Park Avenue South Whole Loan documents require ongoing monthly insurance reserves in an amount equal to 1/12 of the insurance premiums that the lender estimates will be payable for the renewal of the coverage during the next 12 months, provided, that so long as no event of default is continuing, to the extent insurance is maintained by the 230 Park Avenue South Borrower under a blanket policy reasonably acceptable to the lender (along with evidence of renewal not less than five business days prior to expiration), the 230 Park Avenue South Borrower is not required to make ongoing monthly insurance reserve deposits applicable to such blanket policy.
Rent Concession Reserve – The 230 Park Avenue South Borrower was required to deposit an upfront reserve of $24,763,070 for future rent credits or abatements under the Discovery lease.
Existing Landlord Obligations Reserve – The 230 Park Avenue South Borrower is required to deposit an upfront reserve of $34,263,578 representing 75% of the landlord lease obligations for Discovery ($8,924,975 landlord work and $36,759,796 tenant allowances, collectively the “Landlord Lease Obligations”) which are payable by the 230 Park Avenue South Borrower but not yet due. The remaining 25% of the landlord lease obligations is required to be paid for by the 230 Park Avenue South Borrower or from capital contributions from the constituent owners of the 230 Park Avenue South Borrower and is fully guaranteed by the Guarantor (along with any potential future cost increases) (“Guaranteed Portion”). Pursuant to the 230 Park Avenue South Whole Loan documents, (1) the cost of the final 25% of the Landlord Lease Obligations must be funded from and paid for from the Existing Landlord Obligations Reserve (the “Final Portion”) and (2) the 230 Park Avenue South Borrower or its constituent owners are required to have fully funded and paid for the Guaranteed Portion on or before the date when 75% of the Landlord Lease Obligations have been paid for and satisfied. The 230 Park Avenue South Borrower is required to deliver evidence reasonably satisfactory to the lender that the 230 Park Avenue South Borrower has paid for the Guaranteed Portion before the 230 Park Avenue South Borrower may make a request for and receive the Final Portion.
This is not a research report and was not prepared by the Underwriters’ research department. Please see additional important information and qualifications at the end of this Term Sheet.
T-41
| Office – CBD | Loan #2 | Cut-off Date Balance: | $110,000,000 | |
| 230 Park Avenue South | 230 Park Avenue South | Cut-off Date LTV: | 51.0% | |
| New York, NY 10003 | UW NCF DSCR: | 2.64x | ||
| UW NOI Debt Yield: | 8.9% |
Lockbox and Cash Management. The 230 Park Avenue South Whole Loan documents require that the 230 Park Avenue South Borrower establish and maintain a lender-controlled lockbox account, which is already in place, and that the 230 Park Avenue South Borrower direct all tenants to pay rent directly into such lockbox account. The loan documents also require that all rents received by the 230 Park Avenue South Borrower or the property manager be deposited into the lockbox account within two business days of receipt. Upon the occurrence of a Cash Trap Event Period (as defined below), all funds in the lockbox account are required to be swept each business day into the cash management account controlled by the lender and, on each payment date, all funds in the cash management account are required to be applied in accordance with the 230 Park Avenue South Whole Loan documents. Prior to the occurrence of a Cash Trap Event Period, all funds in the lockbox account will be disbursed to the 230 Park Avenue South Borrower. During a Cash Trap Event Period, any excess cash flow remaining after satisfaction of the waterfall items (subject to the Applicable Sweep Cap described below) are required to be swept into an excess cash flow subaccount to be held by the lender as additional security for the 230 Park Avenue South Whole Loan.
A “Cash Trap Event Period” will commence upon the earlier of the following:
| (i) | the occurrence of an event of default under the 230 Park Avenue South Whole Loan documents; or |
| (ii) | the occurrence of a Material Tenant Sweep Period (as defined below). |
A Cash Trap Event Period will end upon the occurrence of the following:
| ● | with regard to clause (i), the cure of such event of default; or |
| ● | with regard to clause (ii), a Material Tenant Sweep Period Cure (as defined below). |
A “Material Tenant Sweep Period” will commence upon the earlier of the following:
| (i) | the date that the Significant Portion Condition (as defined below) is met; |
| (ii) | the date that the Material Portion Condition (as defined below) is met and the Material Tenant (as defined below) having not met a long-term unsecured debt rating of at least ‘BBB-’ from S&P or an equivalent rating from each of the other rating agencies which rate such entity (“Investment Grade Condition”); |
| (iii) | the Material Tenant giving notice of termination of its lease; |
| (iv) | any termination or cancellation of the Material Tenant lease (including, without limitation, rejection in any bankruptcy or similar insolvency proceeding) and/or the Material Tenant lease failing to otherwise be in full force and effect; |
| (v) | the Material Tenant being subject to a bankruptcy or similar insolvency proceeding; |
| (vi) | the Material Tenant being in (x) monetary default for more than 30 days of (1) its base rent obligations or (2) additional rent obligations, where such unpaid additional rent exceeds $1,000,000, which will be increased by CPI on each anniversary of the loan origination date (except to the extent such nonpayment of additional rent is the result of a good faith dispute on the part of the Material Tenant subject to conditions in the 230 Park Avenue Whole Loan documents) or (y) material non-monetary default beyond all applicable notice and grace periods under such lease; or |
| (vii) | the Material Tenant meeting the Minimum Required Tenant Rating (as defined below) (but not exceeding such rating) or failing to meet the Minimum Required Tenant Rating. |
A “Material Tenant Sweep Period Cure” will occur upon the following:
| ● | with regard to clause (i), (ii), (v), (vi) and (vii) of the definition of Material Tenant Sweep Period: |
| ○ | the Applicable Sweep Cap being achieved. |
| ● | with regard to clause (iii) of the definition of Material Tenant Sweep Period: |
| ○ | the Material Tenant having rescinded such notice of termination; or |
| ○ | a Material Tenant Re-Tenanting Event (as defined below). |
| ● | with regard to clause (vi) of the definition of Material Tenant Sweep Period: |
| ○ | the Material Tenant no longer being in the respective monetary or material non-monetary default. |
| ● | with regard to clause (i) through (vii) of the definition of Material Tenant Sweep Period: |
| ○ | the premises demised under the Material Tenant lease (or such portion thereof) being re-leased to a replacement tenant or tenants pursuant to a lease approved or deemed approved by the lender, such that the 230 Park Avenue South Property will achieve an adjusted net cash flow debt yield (“NCF DY”) of at least 7.75% for two consecutive quarters (the “Minimum DY Threshold”) (a “Material Tenant Re-Tenanting Event”); |
| ○ | in the case where the Material Tenant is subject to a proceeding under creditor’s rights laws, the applicable Material Tenant’s lease having been affirmed, assigned and assumed in a manner reasonably satisfactory to the lender (other than in the case of an assignment of the Material Tenant lease in accordance with its terms) (“Tenant Bankruptcy Cures”); provided, however, notwithstanding the occurrence of any Tenant Bankruptcy Cure, if a Material Tenant Sweep Period exists as a result of the existence of an event described in clauses (i) through (iv) or (vi) through (vii) of the definition of Material Tenant Sweep Period, then the Material Tenant Sweep Period will not cease but the Applicable Sweep Cap will be recalculated, as appropriate, to reflect the cause of the Material Tenant Sweep Period. |
Additionally, the 230 Park Avenue South Borrower will have the right to partially defease or partially prepay (with the applicable yield maintenance premium) the 230 Park Avenue Whole Loan, provided in each case, such partial defeasance or partial prepayment, as applicable, will not be permitted prior to the defeasance lockout date, so as to satisfy such Minimum DY Threshold (as defined above) or, at its option, by otherwise delivering to the lender cash collateral or a letter of credit in an amount that would, if applied to the repayment of the 230 Park Avenue Whole Loan, satisfy such Minimum DY Threshold. Such cash collateral or letter of credit will be held by the lender as additional collateral for the 230 Park Avenue South Whole Loan.
This is not a research report and was not prepared by the Underwriters’ research department. Please see additional important information and qualifications at the end of this Term Sheet.
T-42
| Office – CBD | Loan #2 | Cut-off Date Balance: | $110,000,000 | |
| 230 Park Avenue South | 230 Park Avenue South | Cut-off Date LTV: | 51.0% | |
| New York, NY 10003 | UW NCF DSCR: | 2.64x | ||
| UW NOI Debt Yield: | 8.9% |
For purposes of determining a Material Tenant Sweep Period Cure, (1) the entirety of the premises demised under the Material Tenant lease need not be re-leased so long as the 230 Park Avenue South Property satisfies the Minimum DY Threshold, (2) if such Material Tenant is the subject of a proceeding under creditor’s rights laws and assigns such Material Lease to an assignee tenant in accordance with the terms of the Material Lease and such assignee tenant does not satisfy the Base Rating Condition (as defined below) then a Material Tenant Sweep Period will remain in effect, and/or (3) if the 230 Park Avenue South Borrower cures a Material Tenant Sweep Period by entering into two replacement Material Tenant leases approved by the lender and the 230 Park Avenue South Property achieves the Minimum DY Threshold for two consecutive quarters, then there will no longer be a Material Tenant Sweep Period in place, but because 100% of the demised premises is not leased to one successor tenant, the definition of “Cash Trap Event Period” will be revised on and after such cure to remove a Material Tenant Sweep Period as a trigger in clause (ii) of such definitions and replace such clause (ii) of such definition with the DY Trigger (as defined below) (i.e. 6.50%) as more particularly set forth in the definition of “Material Tenant”.
“Material Tenant” means Discovery (together with any lease guarantor, and any successor guarantor, that guarantees the obligations of the Material Tenant under the applicable Material Tenant lease, any successor tenant (each, a “Successor Tenant”)). If there is a Successor Tenant or Successor Tenants under a lease(s) in accordance with the 230 Park Avenue South Whole Loan documents, the “Material Tenant Sweep Periods,” the cures of such “Material Tenant Sweep Periods”, and the “Applicable Sweep Cap” relating to such applicable Successor Tenant and/or Successor Tenants will be restructured and/or modified as follows: If the Material Tenant vacates and the Discovery lease is terminated and the premises demised thereunder are released to a replacement Successor Tenant or Successor Tenants in accordance with the 230 Park Avenue Whole Loan documents and (1)(A) such replacement Successor Tenant leases and occupies 100% of the demised premises which are leased to Discovery under its lease (i.e., 14 floors in the improvements or 361,214 square feet in the aggregate), (B) such replacement Material Tenant lease is on the same or better economic terms as the Discovery lease as determined by the lender, and (C) such replacement Successor Tenant meets the Investment Grade Condition, then the “Material Tenant Sweep Periods,” the cures of such “Material Tenant Sweep Periods” and the “Applicable Sweep Cap” will be the same as are in place currently with the Discovery tenant as the initial Material Tenant hereunder or (2) in the event that any one or more of the clauses above are not met, then there will not be a Material Tenant Sweep Period in the definition of “Cash Trap Event Period” hereunder but such respective clauses of the definition will be replaced with the following trigger event and cure: the date upon which the NCF DY for the 230 Park Avenue South Property fails to be at least 6.50% (the “DY Trigger”) and such DY Trigger will be cured if the NCF DY equals or exceeds 6.50% for two consecutive calendar quarters.
“Significant Portion Condition” means, with respect to any premises demised under a Material Tenant lease, that the applicable Material Tenant ceases operating its business (“goes dark”), or otherwise fails to be in actual, physical occupancy of, in a Significant Portion (as defined below) of the applicable Material Tenant premises; provided that, for purposes of this definition and the definitions of Material Portion Condition and Substantial Occupancy Condition, (i) after the Material Tenant has taken initial occupancy of the demised premises and commenced the operation of its business in the demised premises, Material Tenant will be deemed in actual physical occupancy of space that is the subject of alterations or repairs by Material Tenant or the 230 Park Avenue South Borrower, including as a result of casualty, (ii) with respect to the Discovery lease only, occupancy by Material Tenant’s affiliates, related parties and permitted users, each as permitted under the Discovery lease, will be deemed operation of Discovery Tenant’s business and actual physical occupancy by Discovery Tenant in the Material Tenant premises demised under the Discovery lease and (iii) with respect to the Discovery lease only, there will be an initial period following loan origination, subject to force majeure, to allow the Material Tenant the opportunity to take initial occupancy of the Material Tenant premises and Material Tenant will be deemed in operation of the premises, subject to conditions outlined in the 230 Park Avenue South Whole Loan documents, including (1) the Material Tenant lease being in full force and effect, (2) the 230 Park Avenue South Borrower is required to commence certain landlord fit-out or base building work as described in the Discovery lease and complete such landlord work on or before the applicable milestone date set forth in the Discovery lease, but no later than May 1, 2020 with respect to the last component of landlord work, such date is subject to extension as set forth in the 230 Park Avenue South Whole Loan documents, (3) Material Tenant is required to perform tenant’s initial alterations and certain HVAC work on the 14th floor of the 230 Park Avenue South Property as described in the Discovery lease and complete such work on or before June 30, 2021, subject to extension as set forth in the 230 Park Avenue South Whole Loan documents, (4) no contingency termination rights being set forth in the Material Tenant lease except for customary termination rights for landlord’s failure to perform the work prior to tenant taking occupancy provided (A) at the time of determination, no event of default exists under the 230 Park Avenue South Whole Loan documents and (B) the lender has reserved for the cost of such work and (5) Material Tenant is paying full unabated rent (or such abated rent has been fully reserved for by the lender).
“Substantial Occupancy Condition” means that the applicable Material Tenant is in actual, physical occupancy and operating its business (“not dark”) in 75% of its rentable SF; “Material Portion Condition” means that the applicable Material Tenant ceases to operate its business (“goes dark”) or otherwise fails to be in actual physical occupancy of a Material Portion of the demised premises; “Material Portion” means 25% or more of rentable SF of a particular space, but less than 50% of the rentable SF such space; “Significant Portion” means 50% or more of the rentable SF of the tenant’s premises (provided that the courtyard premises will only be included when the premises is delivered to the tenant (expected to be February 2021)).
“Applicable Sweep Cap” means:
| ● | with respect to any Material Tenant Sweep Period that is the result of the applicable Material Tenant failing to maintain a long-term unsecured debt rating of at least ‘BB’ from S&P or an equivalent rating from each of the other rating agency which rate such entity (“Minimum Required Tenant Rating”): |
| ○ | provided the Substantial Occupancy Condition is met, $25 per square foot of the applicable Material Tenant premises; or |
| ○ | provided the Substantial Occupancy Condition is not met (i.e., either the Significant Portion Condition or the Material Portion Condition are met), $75 per square foot of the applicable Material Tenant Premises. |
| ● | if the Minimum Required Rating is met (but is not exceeded): |
| ○ | provided the Substantial Occupancy Condition is met, $15 per square foot of the applicable Material Tenant premises; |
| ○ | provided the Material Portion Condition is met, $50 per square foot of the applicable Material Tenant premises; or |
| ○ | provided the Significant Portion Condition is met, $75 per square foot of the applicable Material Tenant Premises. |
| ● | with respect to any Material Tenant Sweep Period occurring at such time as the long term unsecured debt rating of at least ‘BB+’ (but less than ‘BBB-’) from S&P or an equivalent rating from each of the other rating agencies which rate such entity (“Base Rating Condition”) and: |
| ○ | provided the Material Portion Condition is met, $25 per square foot of the applicable Material Tenant Premises; or |
| ○ | provided the Significant Portion Condition is met, $75 per square foot of the applicable Material Tenant Premises |
This is not a research report and was not prepared by the Underwriters’ research department. Please see additional important information and qualifications at the end of this Term Sheet.
T-43
| Office – CBD | Loan #2 | Cut-off Date Balance: | $110,000,000 | |
| 230 Park Avenue South | 230 Park Avenue South | Cut-off Date LTV: | 51.0% | |
| New York, NY 10003 | UW NCF DSCR: | 2.64x | ||
| UW NOI Debt Yield: | 8.9% |
| ● | with respect to any Material Tenant Sweep Period occurring at such time as the Investment Grade Condition and the Significant Portion Condition are met, $25 per square foot of the applicable Material Tenant Premises. |
| ● | with respect to any Material Tenant Sweep Period occurring as the result of clauses (v) and/or (vi) of the definition thereof, $75 per square foot of the applicable Material Tenant Premises. |
Additional Secured Indebtedness (not including trade debts).The 230 Park Avenue South Property also secures the 230 Park Avenue South ServicedPari Passu Companion Loans, which have an aggregate Cut-off Date principal balance of $140,000,000. The 230 Park Avenue South ServicedPari Passu Companion Loans accrue interest at the same rate as the 230 Park Avenue South Mortgage Loan. The 230 Park Avenue South Mortgage Loan is entitled to payments of principal and interest on apro rata andpari passu basis with the 230 Park Avenue South ServicedPari Passu Companion Loans. The holders of the 230 Park Avenue South Mortgage Loan and the 230 Park Avenue South ServicedPari Passu Companion Loans have entered into a co-lender agreement which sets forth the allocation of collections on the 230 Park Avenue South Whole Loan. See “Description of the Mortgage Pool—The Whole Loans—The Serviced Pari Passu Whole Loans” in the Preliminary Prospectus.
Mezzanine Loan and Preferred Equity. Not permitted.
Release of Property.Not permitted.
Ground Lease. None.
Right of First Offer.Discovery has a right of first offer to purchase (i) the 230 Park Avenue South Property or (ii) all of the direct equity interests in the 230 Park Avenue South Borrower, if the 230 Park Avenue South Borrower markets the 230 Park Avenue South Property or such equity interests, as applicable, for sale up to and including April 1, 2023 (the “ROFO”) provided that, among other things, no event of default has occurred or is continuing under the Discovery lease. The ROFO is not extinguished by foreclosure, provided the conditions relating to non-disturbance are satisfied as set forth in the subordination, non-disturbance and attornment agreement obtained by Discover at closing, however, the ROFO does not apply to foreclosure or deed-in-lieu thereof or the first subsequent transfer following either one of the foregoing occurrences.
Terrorism Insurance.The 230 Park Avenue South Whole Loan documents require that the “all risk” insurance policy required to be maintained by the 230 Park Avenue South Borrower provide coverage for terrorism in an amount equal to the full replacement cost of the 230 Park Avenue South Property, as well as business interruption insurance covering no less than the 24-month period following the occurrence of a casualty event, together with a 6-month extended period of indemnity (provided that if TRIPRA or a similar statute is not in effect, the 230 Park Avenue South Borrower will not be obligated to pay terrorism insurance premiums in excess of two times the premium for the casualty and business interruption coverage on a stand-alone basis at the time any terrorism coverage was excluded from the applicable policy).
This is not a research report and was not prepared by the Underwriters’ research department. Please see additional important information and qualifications at the end of this Term Sheet.
T-44
(THIS PAGE INTENTIONALLY LEFT BLANK)
T-45
| Office - Suburban | Loan #3 | Cut-off Date Balance: | $91,000,000 | |
| 10721 Domain Drive | Domain Tower | Cut-off Date LTV: | 66.2% | |
| Austin, TX 78758 | U/W NCF DSCR: | 2.53x | ||
| U/W NOI Debt Yield: | 9.0% |
This is not a research report and was not prepared by the Underwriters’ research department. Please see additional important information and qualifications at the end of this Term Sheet.
T-46
| Office - Suburban | Loan #3 | Cut-off Date Balance: | $91,000,000 | |
| 10721 Domain Drive | Domain Tower | Cut-off Date LTV: | 66.2% | |
| Austin, TX 78758 | U/W NCF DSCR: | 2.53x | ||
| U/W NOI Debt Yield: | 9.0% |

This is not a research report and was not prepared by the Underwriters’ research department. Please see additional important information and qualifications at the end of this Term Sheet.
T-47
| Mortgage Loan No. 3 – Domain Tower |
| Mortgage Loan Information | Property Information | |||||
| Mortgage Loan Seller: | BANA | Single Asset/Portfolio: | Single Asset | |||
| Credit Assessment (DBRS/Fitch/S&P): | NR/NR/NR | Location: | Austin, TX 78758 | |||
| Original Balance: | $91,000,000 | General Property Type: | Office | |||
| Cut-off Date Balance: | $91,000,000 | Detailed Property Type: | Suburban | |||
| % of Initial Pool Balance: | 7.7% | Title Vesting: | Leasehold | |||
| Loan Purpose: | Acquisition | Year Built/Renovated: | 2018/N/A | |||
| Borrower Sponsor: | iStar Inc. | Size: | 309,883 SF | |||
| Guarantor: | iStar Inc. | Cut-off Date Balance per SF: | $294 | |||
| Mortgage Rate: | 3.4870% | Maturity Date Balance per SF: | $294 | |||
| Note Date: | 8/1/2019 | Property Manager: | HPI Real Estate Management, Inc. | |||
| First Payment Date: | 9/1/2019 | (borrower-related) | ||||
| Maturity Date: | 8/1/2029 | |||||
| Original Term to Maturity: | 120 months | |||||
| Original Amortization Term: | 0 months | |||||
| IO Period: | 120 months | |||||
| Seasoning: | 2 months | |||||
| Prepayment Provisions: | LO (26); DEF (90); O (4) | Underwriting and Financial Information | ||||
| Lockbox/Cash Mgmt Status: | Hard/In Place | UW NOI: | $8,187,504 | |||
| Additional Debt Type: | N/A | UW NOI Debt Yield: | 9.0% | |||
| Additional Debt Balance: | N/A | UW NOI Debt Yield at Maturity: | 9.0% | |||
| Future Debt Permitted (Type): | No (N/A) | UW NCF DSCR: | 2.53x | |||
| Reserves(1) | Most Recent NOI(2): | N/A | ||||
| Type | Initial | Monthly | Cap | 2nd Most Recent NOI(2): | N/A | |
| RE Tax: | $2,395,200 | Springing | N/A | 3rd Most Recent NOI(2): | N/A | |
| Insurance: | $0 | Springing | N/A | Most Recent Occupancy(3): | 100.0% (10/1/2019) | |
| Recurring Replacements: | $0 | Springing | N/A | 2nd Most Recent Occupancy(2): | N/A | |
| TI/LC: | $0 | Springing | N/A | 3rd Most Recent Occupancy(2): | N/A | |
| Indeed TI Reserve: | $17,435,884 | $0 | N/A | Appraised Value (as of)(4): | $137,500,000 (1/1/2020) | |
| Ground Rent Reserve: | $227,500 | $227,500 | N/A | Appraised Value per SF(4): | $444 | |
| Free Rent Reserve: | $677,708 | $0 | N/A | Cut-off Date LTV Ratio(4): | 66.2% | |
| Condominium Reserve: | $0 | Springing | N/A | Maturity Date LTV Ratio(4): | 66.2% | |
| Sources and Uses | ||||||
| Sources | Proceeds | % of Total | Uses | Proceeds | % of Total | |
| Loan Amount: | $91,000,000 | 60.6% | Purchase Price(5): | $128,939,860 | 85.8% | |
| Borrower Equity: | $59,288,439 | 39.4% | Reserves: | $20,736,292 | 13.8% | |
| Closing Costs: | $612,287 | 0.4% | ||||
| Total Sources: | $150,288,439 | 100.0% | Total Uses: | $150,288,439 | 100.0% | |
| (1) | SeeEscrows and Reserves” below for further discussion of reserve requirements. |
| (2) | Historical financial statements and occupancy are not available, as the Domain Tower Property (as defined below) was constructed in 2018. |
| (3) | The sole tenant, Indeed, Inc., has an executed lease, will commence rental payments on November 1, 2019, is completing its build-out and is expected to be in full occupancy of its space by February 2020. |
| (4) | The Appraised Value shown reflects a “Prospective As Complete/Stabilized” value as of January 1, 2020, which assumes the sole tenant, Indeed, Inc., has taken occupancy of its entire leased space, which is expected by February 2020. The “As-Is” value as of July 15, 2019 of $119,400,000 results in both a Cut-off Date LTV Ratio and a Maturity Date LTV Ratio of 76.2%. The appraiser also provided a “Hypothetical Go Dark” value as of July 15, 2019 of $85,800,000. |
| (5) | The borrower sponsor purchased the leasehold interest in the Domain Tower Property, simultaneously with the non-collateral fee interest, for an allocated purchase price of $128,939,860. |
The Mortgage Loan. The third largest mortgage loan (the “Domain Tower Mortgage Loan”) is evidenced by a promissory note in the original principal amount of $91,000,000 and secured by a first priority leasehold mortgage on a 309,883 SF, eleven-story office building located in Austin, Texas (the “Domain Tower Property”).
The Borrower and the Borrower Sponsor. The borrower is Star 10721 Domain DR LH Owner LLC, a Delaware limited liability company structured to be bankruptcy-remote, with at least two independent directors (the “Domain Tower Borrower”). The borrower sponsor and non-recourse carveout guarantor is iStar Inc., a Maryland corporation (“iStar”).
iStar (NYSE: STAR) is a real estate investment company that finances, invests in and develops real estate and related projects. iStar is rated Ba3, BB-and BB- by Moody’s, S&P and Fitch, respectively. iStar is also the founder, investment manager and largest shareholder of Safehold Inc. (NYSE: SAFE), the first publicly-traded company to focus on modern ground leases. iStar invested over $59.2 million to purchase the Domain Tower Property.
This is not a research report and was not prepared by the Underwriters’ research department. Please see additional important information and qualifications at the end of this Term Sheet.
T-48
| Office - Suburban | Loan #3 | Cut-off Date Balance: | $91,000,000 | |
| 10721 Domain Drive | Domain Tower | Cut-off Date LTV: | 66.2% | |
| Austin, TX 78758 | U/W NCF DSCR: | 2.53x | ||
| U/W NOI Debt Yield: | 9.0% |
The Property. The Domain Tower Property is comprised of an eleven-story, Class A office building and an attached (via sky bridge) eight-level parking garage. The parking garage is shared with an adjacent non-collateral office building (see “Condominium” below) with 1,240 spaces (of the total 2,366 spaces) allocated to the Domain Tower Property. The office improvements were constructed in 2018 and contain 309,883 SF of rentable area with 15-foot floor heights. The Domain Tower Property features a two-story lobby, interior staircases connecting floors 1 through 7, a third floor cafeteria and outdoor terrace, an eleventh floor rooftop terrace, auditorium and training center, fitness center and yoga studio.
Sole Tenant. Indeed, Inc. (“Indeed”) is the sole tenant at the Domain Tower Property. Indeed has a fifteen year lease that commenced in January 1, 2019 and expires December 31, 2033, with a renewal option for a minimum of 154,942 SF in full contiguous floor increments starting on the first floor for either (at Indeed’s option) two periods of five years at 100% of fair market rent or one ten-year period at 95% of fair market rent. Indeed’s lease is guaranteed by its parent company, Recruit Holdings Co., Ltd., a publicly-traded company headquartered in Tokyo, Japan (TYO: 6098) (Moody’s/S&P: A3/A).
According to the borrower sponsor, Indeed is investing over $15.0 million ($48 PSF) towards the build-out of its space, and was provided with a tenant improvement allowance of up to $55.00 PSF. As of the loan origination date, $17,435,884 of the tenant improvement allowance remained outstanding, which amount has been fully reserved by the lender. Additionally, during 2025, Indeed is entitled to an additional refurbishment allowance of $5.00 PSF, which unless requested by December 31, 2025 will not be disbursed to the tenant.
Indeed currently occupies floors 1 through 5 and floors 9 through 11 at the Domain Tower Property and is expected to complete its tenant improvements on its remaining floors and be in full occupancy by February 2020. Indeed was entitled to an initial ten-month rent abatement, with initial rent of $32.50 PSF commencing November 1, 2019. For the period from the loan origination date until the rent commencement date, the lender reserved $677,708 of free rent. Rent for the second year of the lease term, commencing January 2020, is $33.39 PSF, and the lease provides for annual rental increases of approximately 2.7% until the expiration of the lease in 2033.
Indeed operates a worldwide jobsite, with over 200 million unique visitors per month and is available in more than 60 countries and 28 languages. Indeed has over 2,500 employees between five locations in its headquarter city of Austin, Texas, and has additional offices in New York, San Francisco, San Mateo, Seattle and Stamford and international offices in Amsterdam, Dublin, Düsseldorf, Hyderabad, London, Paris, Sydney, Tokyo and Toronto.
The following table presents certain information relating to the tenant at the Domain Tower Property.
| Tenant Summary(1) | |||||||||
| Tenant Name | Credit Rating | Tenant SF | Approx. % of Total SF | Annual UW Rent | % of Total Annual UW Rent | Annual UW Rent PSF | Lease Expiration | Renewal Options | Termination Options |
| Indeed, Inc.(3) | NR/A3/A | 309,883 | 100.0% | $11,606,487 | 100.0% | $37.45 | 12/31/2033 | (4) | N |
| Vacant Space | 0 | 0.0% | $0 | 0.0% | |||||
| Total/Wtd. Avg. | 309,883 | 100.0% | $11,606,487 | 100.0% | |||||
| (1) | Information is based on the underwritten rent roll. |
| (2) | Ratings are those of the parent company. |
| (3) | Indeed, Inc. is completing its build-out and is expected to be in full occupancy of its space by February 2020. |
| (4) | Indeed, Inc. has a renewal option for a minimum of 154,942 SF in full contiguous floor increments starting on the first floor for either two periods of five years at 100% of fair market rent or one ten-year period at 95% of fair market rent. |
The following table presents certain information relating to the lease rollover schedule at the Domain Tower Property:
| Lease Rollover Schedule(1) | ||||||||
| Year | # of Leases Rolling | SF Rolling | UW Rent PSF Rolling | Approx. % of Total SF Rolling | Approx. Cumulative % of SF Rolling | Total UW Rent Rolling | Approx. % of Total Rent Rolling | Approx. Cumulative % of Total Rent Rolling |
| 2019 | 0 | 0 | $0.00 | 0.0% | 0.0% | $0 | 0.0% | 0.0% |
| 2020 | 0 | 0 | $0.00 | 0.0% | 0.0% | $0 | 0.0% | 0.0% |
| 2021 | 0 | 0 | $0.00 | 0.0% | 0.0% | $0 | 0.0% | 0.0% |
| 2022 | 0 | 0 | $0.00 | 0.0% | 0.0% | $0 | 0.0% | 0.0% |
| 2023 | 0 | 0 | $0.00 | 0.0% | 0.0% | $0 | 0.0% | 0.0% |
| 2024 | 0 | 0 | $0.00 | 0.0% | 0.0% | $0 | 0.0% | 0.0% |
| 2025 | 0 | 0 | $0.00 | 0.0% | 0.0% | $0 | 0.0% | 0.0% |
| 2026 | 0 | 0 | $0.00 | 0.0% | 0.0% | $0 | 0.0% | 0.0% |
| 2027 | 0 | 0 | $0.00 | 0.0% | 0.0% | $0 | 0.0% | 0.0% |
| 2028 | 0 | 0 | $0.00 | 0.0% | 0.0% | $0 | 0.0% | 0.0% |
| 2029 | 0 | 0 | $0.00 | 0.0% | 0.0% | $0 | 0.0% | 0.0% |
| 2030 & Beyond | 1 | 309,883 | $37.45 | 100.0% | 100.0% | $11,606,487 | 100.0% | 100.0% |
| Vacant | 0 | 0 | $0.00 | 0.0% | 100.0% | $0 | 0.0% | 100.0% |
| Total/Wtd. Avg. | 1 | 309,883 | $37.45 | 100.0% | $11,606,487 | 100.0% | ||
| (1) | Information is based on the underwritten rent roll. |
This is not a research report and was not prepared by the Underwriters’ research department. Please see additional important information and qualifications at the end of this Term Sheet.
T-49
| Office - Suburban | Loan #3 | Cut-off Date Balance: | $91,000,000 | |
| 10721 Domain Drive | Domain Tower | Cut-off Date LTV: | 66.2% | |
| Austin, TX 78758 | U/W NCF DSCR: | 2.53x | ||
| U/W NOI Debt Yield: | 9.0% |
The Market. The Domain Tower Property is located in the north central section of Austin, Texas. According to the appraisal, over the last five years, there has been significant residential development in the neighborhood, driven by an expansion of corporate employment centers including Dell Computer, Samsung Semiconductors, Motorola and other computer related organizations. According to the appraisal, the Austin area is projected to experience a 2.3% growth in office employment over the next five years.
The Domain Tower Property is located within the mixed-use development known as The Domain. The Domain encompasses 304 acres and is located along the east side of MoPac Expressway, the west side of Burnet Road, and north of Braker Lane. Phase I of the development includes approximately 700,000 SF of luxury retail and restaurant space, eight restaurants, 75,000 SF of office space, luxury apartments and a full-service hotel. Phase II of the development is set in a streetscape environment, marketed as a night-life destination alternative to downtown and South Congress, and features an additional 600,000 SF of specialty retail, dining and several locally-based bars, entertainment venues and apartments. Notable current office tenants include Indeed, Amazon, Facebook, Expedia, IBM, WeWork and Charles Schwab. Facebook has also pre-leased the entire Domain 12 office building (316,336 SF) and Homeaway, Inc. and Expedia have pre-leased the entire Domain 11 office building (315,862 SF), both currently under construction with expected completion dates in late 2020. Notable retail tenants in the development include Whole Foods Market, Dillard’s, Neiman Marcus and Macy’s. When fully developed, The Domain will offer a total of nearly 2 million SF of retail, dining and entertainment space, 3.5 million SF of office space, 4,500 residential units, and three hotels.
Primary access to the neighborhood is provided by the six-lane MoPac Expressway (Loop 1), which travels north to the center of Austin and continues to the northern Austin suburbs, the recently extended six-lane Research Boulevard (State US Highway 183), which travels north to Lakeline Mall and the suburban developments of Cedar Park and Leander and southeast to US 290, and four-lane Capital of Texas Highway 360, which serves as the westernmost outer loop for the metropolitan area.
The Domain Tower Property is located in the North/Domain submarket of the Austin office market. The North/Domain submarket for the first quarter of 2019 had inventory of approximately 9.46 million SF that was 90.6% occupied with asking rents of $36.64 PSF.
According to the appraisal, the estimated 2019 population within a one-, three- and five-mile radius of the Domain Tower Property was 10,040, 127,820 and 316,731, respectively. The 2019 average household income within the same radii was $96,011, $92,202 and $96,425, respectively.
The following table presents recent leasing data at comparable office properties with respect to the Domain Tower Property:
| Comparable Lease Summary | |||||||||
| Property, Address | Year Built | Total SF/ Occupancy | Quoted Rental Rate PSF (NNN) | Distance from Subject | Tenant | Lease Area (SF) | Lease Date | Initial Rent PSF | Lease Term (Yrs.) |
Domain Tower Property(1) 10721 Domain Drive | 2018 | 309,883 / 100% | N/A | NA | Indeed, Inc. | 309,883 | Jan-19 | $37.45 | 15.0 |
Domain 8 11601 Alterra Parkway | 2016 | 291,058 / 100% | $33.00 | 1.0 mile | Amazon | 102,389 170,707 | Aug-17 Jun-17 | $29.50 $29.50 | 8.3 10.0 |
Domain 7 11501 Alterra Parkway | 2015 | 221,954 / 100% | $30.00 | 1.3 miles | Express Scripts | 13,945 | Aug-16 | $28.00 | 5.0 |
Domain 1 11801 Domain Drive | 2015 | 124,578 / 100% | $30.00 | 1.1 miles | Aristocrat Gaming Atkins WeWork | 24,412 36,000 61,969 | Feb-17 Feb-17 Jan-17 | $30.75 $29.00 $30.18 | 8.3 8.3 12.0 |
Flatiron Domain 10727 Domain Drive | 2019 | 38,291 / 20% | $39.50 | 0.0 miles | Quoted | ||||
Domain Gateway 2900 Esperanza | 2009 | 183,910 / 100% | $35.00 | 1.0 mile | Indeed | 183,980 | Sept-19 | $35.00 | 13.0 |
Source: Appraisal.
(1) Information is based on the underwritten rent roll.
The following table presents the appraiser’s market rent conclusions:
| Market Rent Summary | |
| Office | |
| Market Rent | $34.50 |
| Lease Term | 10 year |
| Rental Increase Projection | 2.75%per annum |
This is not a research report and was not prepared by the Underwriters’ research department. Please see additional important information and qualifications at the end of this Term Sheet.
T-50
| Office - Suburban | Loan #3 | Cut-off Date Balance: | $91,000,000 | |
| 10721 Domain Drive | Domain Tower | Cut-off Date LTV: | 66.2% | |
| Austin, TX 78758 | U/W NCF DSCR: | 2.53x | ||
| U/W NOI Debt Yield: | 9.0% |
Underwritten Net Cash Flow.The following table presents certain information relating to the Underwritten Net Cash Flow at the Domain Tower Property:
| Cash Flow Analysis(1) | ||
| UW | UW PSF | |
| Gross Potential Rent(2) | $11,606,487 | $37.45 |
| Reimbursements | $5,530,999 | $17.85 |
| Net Rental Income | $17,137,486 | $55.30 |
| Vacancy(3) | ($428,437) | ($1.38) |
| Effective Gross Income | $16,709,049 | $53.92 |
| Taxes | $3,292,499 | $10.62 |
| Insurance | $58,057 | $0.19 |
| Ground Lease Expense(4) | $2,989,274 | $9.65 |
| Other Operating Expenses | $2,181,715 | $7.04 |
| Total Operating Expenses | $8,521,545 | $27.50 |
| Net Operating Income | $8,187,504 | $26.42 |
| Capital Expenditures | $61,977 | $0.20 |
| Net Cash Flow | $8,125,527 | $26.22 |
| NOI DSCR | 2.54x | |
| NCF DSCR | 2.53x | |
| NOI Debt Yield | 9.0% | |
| NCF Debt Yield | 8.9% | |
| (1) | Historical financial statements are not available as the Domain Tower Property was constructed in 2018. |
| (2) | UW Gross Potential Rent is based on the 10-year average contractual rent for Indeed. |
| (3) | UW Vacancy is 2.5%. As of the Cut-off Date, the Domain Tower Property is 100.0% leased. |
| (4) | UW Ground Lease Expense is based on the 10-year average ground lease payment. The current annual ground rent is $2,730,000, with annual increases of 2.0% (or beginning with year 11 of the lease, on every tenth year, the greater of 2.0% and a consumer price index adjustment). |
Escrows and Reserves.
Taxes and Insurance Reserves.The Domain Tower Borrower deposited at loan origination $2,395,200 for real estate taxes and is required to reserve monthly 1/12th of the estimated annual property taxes and 1/12th of the estimated annual insurance premiums (unless waived due to a blanket policy in place). The monthly tax and insurance reserve requirements will be reduced by the percentage of taxes and insurance that Indeed (or any replacement tenant) is obligated to directly pay during the next twelve months provided (i) no event of default is continuing, (ii) the tenant is expressly obligated to directly pay taxes or insurance premiums, does so prior to the date taxes would become delinquent or insurance would expire, and provides evidence of payment to the lender, (iii) the tenant’s lease is in full force and effect and (iv) no Cash Sweep Period (as defined below) is continuing as a result of an Indeed Trigger Event (as defined below). Currently, Indeed is obligated to directly pay 100.0% of taxes and insurance.
Replacement Reserve.During the continuance of any of (i) an event of a default under the Domain Tower Mortgage Loan documents, (ii) Indeed’s (or any replacement tenant’s) lease failing to be in full force and effect, (iii) Indeed’s (or any replacement tenant’s) failure to pay for the replacements directly, or (iv) a Cash Sweep Period due to an Indeed Trigger Event, the Domain Tower Borrower is required to reserve monthly $5,165 for replacement reserves.
Tenant Improvements and Leasing Commissions Reserve.Upon Indeed’s lease no longer being in full force and effect, the Domain Tower Borrower is required to deposit monthly an amount reasonably estimated by the lender to be necessary for leasing commissions and tenant improvement costs anticipated during the remaining term of the Domain Tower Mortgage Loan based on an occupancy rate at the Domain Tower Property of 90%.
Indeed TI/LC Reserve.Provided no Indeed TI Trigger Event (as defined below) is continuing, during an Indeed Trigger Event, the Domain Tower Borrower is required to deposit all excess cash to the Indeed TI/LC Reserve, which funds are required to be disbursed solely for tenant improvement and leasing commissions costs incurred in connection with a related lease extension or Indeed Re-Tenanting Event (as defined below). When the Indeed Trigger Event is cured, any excess cash collected in the Indeed TI/LC Reserve will be disbursed to the Domain Tower Borrower, provided no Cash Sweep Period is continuing, in which case the excess cash will be held by the lender as additional security for the Domain Tower Mortgage Loan.
Indeed TI Reserve.The Domain Tower Borrower deposited at loan origination $17,435,884 and upon an Indeed TI Trigger Event until cured, is required to deposit all excess cash to the Indeed TI Reserve. The Indeed TI Reserve funds are required to be disbursed to Indeed to pay the construction allowance due to the tenant after satisfaction of the requirements under its lease, and the remaining funds disbursed for tenant improvement costs incurred in accordance with the Indeed lease. Notwithstanding the foregoing, in the event the Indeed lease is terminated (other than by reason of a landlord default under the lease), the Indeed TI Reserve funds are required to be transferred to the Indeed TI/LC Reserve.
Ground Rent Reserve.The Domain Tower Borrower deposited at loan origination $227,500 and is required to deposit monthly the ground rent due for the immediately following month to replenish the reserve such that there are sufficient funds to pay the ground rent when due.
This is not a research report and was not prepared by the Underwriters’ research department. Please see additional important information and qualifications at the end of this Term Sheet.
T-51
| Office - Suburban | Loan #3 | Cut-off Date Balance: | $91,000,000 | |
| 10721 Domain Drive | Domain Tower | Cut-off Date LTV: | 66.2% | |
| Austin, TX 78758 | U/W NCF DSCR: | 2.53x | ||
| U/W NOI Debt Yield: | 9.0% |
Free Rent Reserve.The Domain Tower Borrower deposited at loan origination $677,708 for free rent owed under the Indeed lease from September 2019 through December 2019.
Condominium Reserve.During the continuance of any of (i) an event of a default under the Domain Tower Mortgage Loan documents, (ii) Indeed’s (or any replacement tenant’s) lease failing to be in full force and effect, (iii) Indeed’s (or any replacement tenant’s) failure to pay for any condominium common charges directly, or (iv) a Cash Sweep Period due to an Indeed Trigger Event, the Domain Tower Borrower is required to reserve monthly the estimated amounts due for condominium common charges for the succeeding month.
A “Cash Sweep Period” will occur during (i) an Indeed Trigger Event until cured, (ii) the period when the debt service coverage ratio is less than 1.15x for two calendar quarters, until the debt service coverage ratio is at least 1.20x for two calendar quarters, (iii) an Indeed TI Trigger Event until cured or (iv) the occurrence of any event of default under the ground lease until cured.
An “Indeed Trigger Event” will commence upon any of:
| (i) | on or after January 1, 2020, Indeed (or its replacement tenant) vacating or going dark, or giving notice to vacate or go dark, in at least 50% of its leased space (or 25% if the tenant is rated below “BBB-” or is not rated by any NRSRO), |
| (ii) | Indeed (or its replacement tenant) having its lease terminated, |
| (iii) | if the Indeed lease is no longer in effect, the date that the replacement tenant is required under its lease to exercise an available extension or renewal option, or the date that is twelve months prior to the expiration date of the replacement tenant’s lease (beyond all available renewal options), |
| (iv) | Indeed (or its replacement tenant) defaulting in payment of rent (beyond 30 days’ notice), |
| (v) | Indeed (or its replacement tenant), any guarantor of its lease, or the assets of either the tenant or guarantor becoming the subject of any bankruptcy proceeding, and |
| (vi) | Indeed or its lease guarantor being downgraded below “BBB-” or not being rated by any NRSRO. |
An Indeed Trigger Event will end upon an Indeed Re-Tenanting Event (as defined below), or:
| (a) | if triggered by (i) above, the earlier of (x) the amount swept into the Indeed TI/LC Reserve being equal to the product of $20 times the rentable square footage of the dark space and (y) Indeed (or its replacement tenant) conducting its normal business in at least 75% of its leased space and, if applicable, revoking any notice to vacate or go dark, |
| (b) | if triggered by (ii) or (iii) above, Indeed (or its replacement tenant) having renewed its lease on its entire leased space and all related tenant improvements and leasing commissions being satisfied or reserved, |
| (c) | if triggered by (iv) above, the cure of the event of default, |
| (d) | if triggered by (v) above, the lease or guaranty being assumed without material alteration, or the tenant, guarantor and their assets no longer being subject to any bankruptcy proceedings, and the tenant’s and guarantor’s obligations remaining unaltered, or |
| (e) | if triggered by (vi) above, the earlier of (x) the amount swept to the Indeed TI/LC Reserve being equal to $10,845,905 and (y) the credit rating being raised or reinstated to at least “BBB-”. |
An “Indeed TI Trigger Event” will commence on September 1, 2024, unless the Indeed lease has been terminated or Indeed is no longer entitled to receive the entire tenant improvement allowance ($5.00 PSF payable during 2025), and will end when the lender has swept $1,549,415 to the Indeed TI Reserve or has received such amount as a letter of credit.
An “Indeed Re-Tenanting Event” will occur when all of (i) at least 90% of the Indeed space is directly leased to one or more replacement tenants acceptable to the lender, (ii) all tenant improvement costs and leasing commissions related to the Indeed space are satisfied or reserved, and (iii) the replacement tenant(s) are conducting normal business operations in the Indeed space.
Lockbox and Cash Management. The Domain Tower Mortgage Loan documents require a hard lockbox with in-place cash management. Upon the occurrence and continuance of a Cash Sweep Period, all excess cash is required to be held by the lender as additional security for the Domain Tower Mortgage Loan, unless the Cash Sweep Period is triggered by an Indeed Trigger Event, in which case all excess cash is required to be held in the Indeed TI/LC Reserve to be disbursed solely for tenant improvement and leasing commission costs incurred in connection with a related lease extension or Indeed Re-Tenanting Event.
Additional Secured Indebtedness (not including trade debts). Not permitted.
Mezzanine Loan and Preferred Equity.Not permitted.
Release of Property. Not permitted.
Right of First Refusal.None.
Letter of Credit.None.
Ground Lease.The Domain Tower Property is comprised of a ground leasehold interest under a 99-year ground lease with 10721 Domain Dr Ground Owner LLC (the “Ground Lessor”), dated August 1, 2019 and expiring July 31, 2118. The Ground Lessor is an affiliate of Safehold Inc. (NYSE: SAFE), which is an affiliate of the borrower sponsor. A voluntary termination of the ground lease is an event of default and a recourse event to the Domain Tower Mortgage Loan guarantor. The ground lease requires current annual payments of $2,730,000, increasing by 2% annually (or beginning in year 11 and on every tenth year through the lease, by the greater of 2% or a consumer price index adjustment).
Condominium.The parking garage is situated on 1.4-acres and is encumbered by a condominium comprised of Unit A and Unit B. The Domain Tower Borrower’s leasehold interest in Unit A is a part of the collateral for the Domain Tower Property. Unit A represents 52.27% interest in the condominium and the condominium documents require an 80% majority to implement major decisions.
This is not a research report and was not prepared by the Underwriters’ research department. Please see additional important information and qualifications at the end of this Term Sheet.
T-52
| Office - Suburban | Loan #3 | Cut-off Date Balance: | $91,000,000 | |
| 10721 Domain Drive | Domain Tower | Cut-off Date LTV: | 66.2% | |
| Austin, TX 78758 | U/W NCF DSCR: | 2.53x | ||
| U/W NOI Debt Yield: | 9.0% |
Terrorism Insurance.The Domain Tower Borrower is required to obtain and maintain property insurance that covers perils of terrorism and acts of terrorism in an amount equal to the full replacement cost of the Domain Tower Property and business interruption insurance for eighteen months with a twelve month extended period of indemnity. See “Risk Factors—Risks Relating to the Mortgage Loans—Terrorism Insurance May Not Be Available for All Mortgaged Properties” in the Preliminary Prospectus.
This is not a research report and was not prepared by the Underwriters’ research department. Please see additional important information and qualifications at the end of this Term Sheet.
T-53
| Self Storage | Loan #4 | Cut-off Date Balance: | $85,000,000 | |
| Various | Storage Post Portfolio | Cut-off Date LTV: | 65.2% | |
| Various, Various | U/W NCF DSCR: | 1.97x | ||
| U/W NOI Debt Yield: | 7.9% |
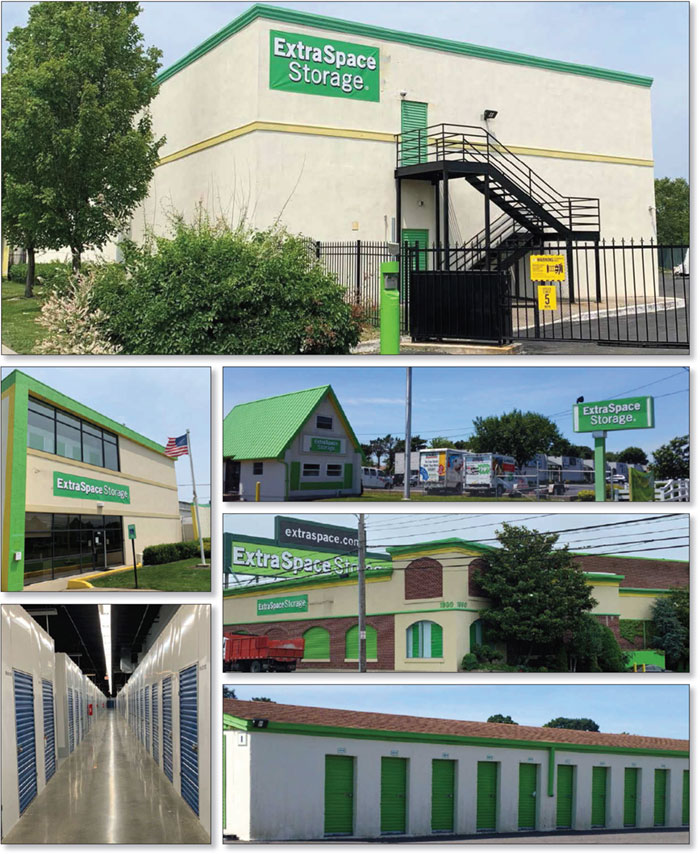
This is not a research report and was not prepared by the Underwriters’ research department. Please see additional important information and qualifications at the end of this Term Sheet.
T-54
| Self Storage | Loan #4 | Cut-off Date Balance: | $85,000,000 | |
| Various | Storage Post Portfolio | Cut-off Date LTV: | 65.2% | |
| Various, Various | U/W NCF DSCR: | 1.97x | ||
| U/W NOI Debt Yield: | 7.9% |
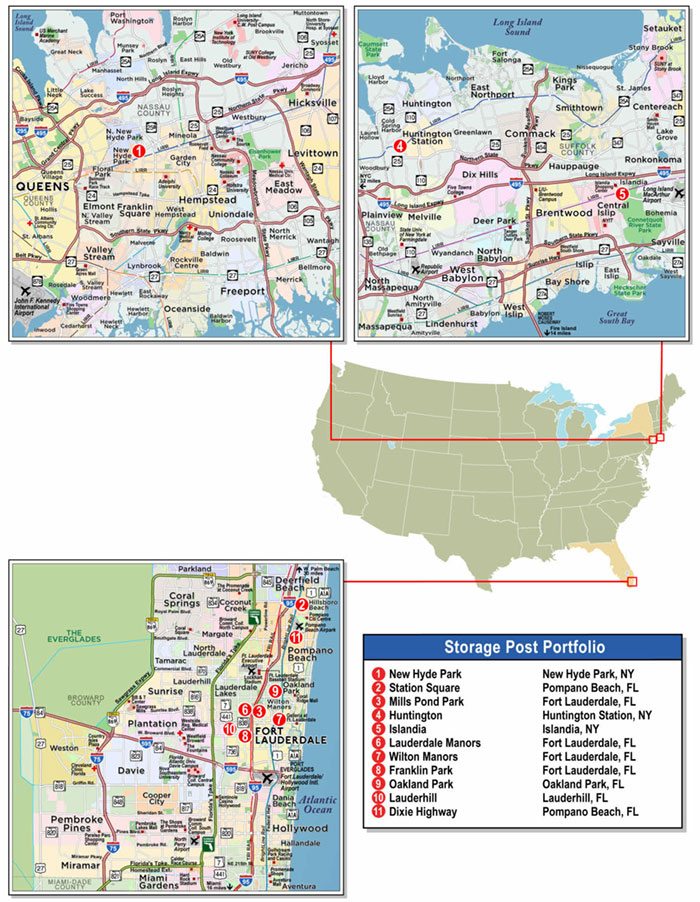
This is not a research report and was not prepared by the Underwriters’ research department. Please see additional important information and qualifications at the end of this Term Sheet.
T-55
| Mortgage Loan No. 4 – Storage Post Portfolio |
| Mortgage Loan Information | Property Information | ||||||
| Mortgage Loan Seller: | MSMCH | Single Asset/Portfolio: | Portfolio | ||||
| Credit Assessment (DBRS/Fitch/S&P): | NR/NR/NR | Location: | Various | ||||
| Original Balance(1): | $85,000,000 | General Property Type: | Self Storage | ||||
| Cut-off Date Balance(1): | $85,000,000 | Detailed Property Type: | Self Storage | ||||
| % of Initial Pool Balance: | 7.2% | Title Vesting: | Fee | ||||
| Loan Purpose: | Acquisition | Year Built/Renovated: | Various/Various | ||||
| Borrower Sponsor: | Extra Space Storage Inc. | Size: | 1,173,842 SF | ||||
| Guarantor: | Extra Space Storage Inc. | Cut-off Date Balance per SF(1): | $128 | ||||
| Mortgage Rate: | 3.8900% | Maturity Date Balance per SF(1): | $128 | ||||
| Note Date: | 9/13/2019 | Property Manager: | Extra Space Management, Inc. | ||||
| First Payment Date: | 11/1/2019 | (borrower-related) | |||||
| Maturity Date: | 10/1/2029 | Underwriting and Financial Information | |||||
| Original Term to Maturity: | 120 months | UW NOI: | $11,891,642 | ||||
| Original Amortization Term: | 0 months | UW NOI Debt Yield(1): | 7.9% | ||||
| IO Period: | 120 months | UW NOI Debt Yield at Maturity(1): | 7.9% | ||||
| Seasoning: | 0 months | UW NCF DSCR(1): | 1.97x | ||||
| Prepayment Provisions(2): | LO (24); DEF (89); O (7) | Most Recent NOI: | $11,554,063 (7/31/2019 TTM) | ||||
| Lockbox/Cash Mgmt Status: | Springing/Springing | 2nd Most Recent NOI: | $11,665,446 (12/31/2018) | ||||
| Additional Debt Type(1)(3): | Pari Passu | 3rd Most Recent NOI: | $11,908,645 (12/31/2017) | ||||
| Additional Debt Balance(1)(3): | $65,000,000 | Most Recent Occupancy: | 92.4% (5/31/2019) | ||||
| Future Debt Permitted (Type)(4): | Yes (Mezzanine) | 2nd Most Recent Occupancy: | 93.7% (12/31/2018) | ||||
| 3rd Most Recent Occupancy: | 93.8% (12/31/2017) | ||||||
| Reserves(5) | Appraised Value (as of)(6): | $230,000,000 (8/1/2019) | |||||
| Type | Initial | Monthly | Cap | Appraised Value per SF: | $196 | ||
| RE Tax: | $0 | Springing | N/A | Cut-off Date LTV Ratio(1)(6): | 65.2% | ||
| Insurance: | $0 | Springing | N/A | Maturity Date LTV Ratio(1)(6): | 65.2% | ||
| Sources and Uses | ||||||
| Sources | Proceeds | % of Total | Uses | Proceeds | % of Total | |
| Whole Loan Amount(1) | $150,000,000 | 65.1% | Purchase Price(7): | $228,500,000 | 99.2% | |
| Borrower Equity: | $80,339,324 | 34.9% | Closing Costs: | $1,839,324 | 0.8% | |
| Total Sources: | $230,339,324 | 100.0% | Total Uses: | $230,339,324 | 100.0% | |
| (1) | The Storage Post Portfolio Mortgage Loan (as defined below) is a part of the Storage Post Portfolio Whole Loan (as defined below) with an original aggregate principal balance of $150,000,000. The Cut-off Date Balance per SF, Maturity Date Balance per SF, UW NOI Debt Yield, UW NOI Debt Yield at Maturity, UW NCF DSCR, Cut-off Date LTV Ratio and Maturity Date LTV Ratio numbers presented above are based on the Storage Post Portfolio Whole Loan. |
| (2) | The Storage Post Portfolio Borrowers (as defined below) have the right to defease the Storage Post Portfolio Whole Loan, in whole or in part, on any date after the earlier to occur of (i) two years after the closing date of the securitization that includes the lastpari passu note to be securitized and (ii) November 1, 2022. The assumed defeasance lockout period of 24 payments is based on the closing date of this transaction in October 2019. |
| (3) | See “The Mortgage Loan” and “Additional Secured Indebtedness (not including trade debts)” below for a discussion of additional indebtedness. |
| (4) | See “Mezzanine Loan and Preferred Equity” below for information regarding the future permitted debt. |
| (5) | See “Escrows and Reserves” below for further discussion of reserve requirements. |
| (6) | The Appraised Value is the “as is portfolio” appraised value of the Storage Post Portfolio Properties (as defined below) as a whole, which reflects an 8.7% premium to the aggregate appraised value of the individual properties. The aggregate appraised value for the individual properties as of July 18, 2019 or July 19, 2019, as applicable, is $211,600,000, which results in a Cut-off Date LTV Ratio and a Maturity Date LTV Ratio of 70.9%. |
| (7) | The Storage Post Properties were acquired in May 2019 and at loan closing a bridge loan of $150,204,500 and a bridge loan fee of $1,050,000 were paid off. |
The Mortgage Loan. The fourth largest mortgage loan (the “Storage Post Portfolio Mortgage Loan”) is a part of a whole loan (the “Storage Post Portfolio Whole Loan”) that is evidenced by threepari passu promissory notes in the original aggregate principal amount of $150,000,000. The Storage Post Portfolio Whole Loan is secured by a first priority fee mortgage encumbering 11 self storage properties located throughout New York and Florida (the “Storage Post Portfolio Properties”). The Storage Post Portfolio Mortgage Loan is evidenced by the controlling promissory Note A-1 in the original principal amount of $85,000,000. The two promissory Notes A-2 and A-3 (together, the “Storage Post Portfolio ServicedPari Passu Companion Loans”), in the aggregate original principal amount of $65,000,000, are expected to be contributed to future securitization trusts or may be otherwise transferred at any time. The Storage Post Portfolio Whole Loan will be serviced pursuant to the pooling and servicing agreement for the BANK 2019-BNK21 securitization trust. See “Description of the Mortgage Pool—The Whole Loans—The Serviced Pari Passu Whole Loans” and “Pooling and Servicing Agreement” in the Preliminary Prospectus.
| Storage Post Portfolio Whole Loan Summary | ||||
| Note | Original Balance | Cut-off Date Balance | Note Holder | Controlling Piece |
| A-1 | $85,000,000 | $85,000,000 | BANK 2019-BNK21 | Yes |
| A-2 | $45,000,000 | $45,000,000 | MSBNA | No |
| A-3 | $20,000,000 | $20,000,000 | MSBNA | No |
| Total | $150,000,000 | $150,000,000 | ||
This is not a research report and was not prepared by the Underwriters’ research department. Please see additional important information and qualifications at the end of this Term Sheet.
T-56
| Self Storage | Loan #4 | Cut-off Date Balance: | $85,000,000 | |
| Various | Storage Post Portfolio | Cut-off Date LTV: | 65.2% | |
| Various, Various | U/W NCF DSCR: | 1.97x | ||
| U/W NOI Debt Yield: | 7.9% |
The Borrowers and the Borrower Sponsor. The borrowers are ESS-NYFL JV Florida Sub II LLC and ESS-NYFL JV New York Sub LLC (collectively, the “Storage Post Portfolio Borrowers”), each a Delaware limited liability company structured to be bankruptcy-remote with two independent directors. Extra Space Storage Inc. (“Extra Space Storage”) is the borrower sponsor and non-recourse carveout guarantor with respect to the Storage Post Portfolio Whole Loan. Extra Space Storage is headquartered in Salt Lake City, Utah and owned or operated over 1,700 self-storage locations across 40 states, Washington, D.C. and Puerto Rico as of June 30, 2019. The Storage Post Portfolio Borrowers are owned by a limited partnership of which the general partner is an affiliate of Extra Space Storage and the limited partners consist of an affiliate of Extra Space Storage (16%) and two unaffiliated entities owned or managed by GIC Real Estate, Inc. (45%) or Rosewood Investment Corporation (39%). GIC Real Estate, Inc. is an affiliate of an investment firm established in 1981 to manage Singapore’s foreign reserves. Rosewood Investment Corporation is a privately-held company. In some circumstances, the unaffiliated limited partners are entitled to purchase the entirety of the general and limited partnership interests of such affiliates of Extra Space Storage, provided that the unaffiliated limited partners provide a replacement non-recourse carveout guarantor that meets certain net worth and liquidity requirements and is reasonably approved by the lender.
The Properties. The Storage Post Portfolio Properties are comprised of 11 self storage properties containing a total of 10,680 units, comprised of approximately 36.7% non-climate controlled units, approximately 57.5% climate controlled units and approximately 5.9% recreational vehicle (“RV”) storage units. The Storage Post Portfolio Properties range in size from approximately 44,000 SF to 194,000 SF, and average unit size is 95 SF. The Storage Post Portfolio Properties are located in Florida (8 properties representing 75.6% of total SF and 60.6% of TTM NOI) and New York (3 properties representing 24.4% of total SF and 39.4% of TTM NOI). Excluding New Hyde Park and Station Square, no single property accounts for more than 9.1% of TTM NOI or 12.0% of total SF. The Storage Post Portfolio Properties have exhibited stable occupancy, having averaged 93.3% occupancy since 2016, with no property dropping below 90% occupancy during that time. As of May 31, 2019, the Storage Post Portfolio Properties were 92.4% occupied. The Storage Post Portfolio Properties were built between 1946 and 2003 and one property was renovated in 1999. According to the Storage Post Portfolio Borrowers, approximately $1.5 million has been spent in capital expenditures across the portfolio since 2017 and the borrower sponsor currently plans to spend approximately $5.9 million in capital improvements predominantly on asphalt and roofing renovations. However, such capital improvements are not required or reserved for under the Storage Post Portfolio Whole Loan documents.
The following table presents certain information relating to the Storage Post Portfolio Properties:
| Storage Post Portfolio Summary(1) | |||||||||
Property Name | City | State | Year Built | Total | Units | Cut-off Date | % of ALA | Appraised | % of Appraised |
| New Hyde Park | New Hyde Park | NY | 2003 | 151,284 | 1,948 | $41,363,000 | 27.6% | $65,000,000 | 30.7% |
| Station Square | Pompano Beach | FL | 1967-1986 | 193,735 | 1,198 | $22,403,000 | 14.9% | $30,100,000 | 14.2% |
| Mills Pond Park | Fort Lauderdale | FL | 1989-1994 | 117,230 | 1,093 | $12,988,000 | 8.7% | $17,400,000 | 8.2% |
| Huntington | Huntington Station | NY | 1946 | 44,059 | 603 | $12,004,000 | 8.0% | $18,000,000 | 8.5% |
| Islandia | Islandia | NY | 1985 | 90,753 | 874 | $12,003,000 | 8.0% | $18,000,000 | 8.5% |
| Lauderdale Manors | Fort Lauderdale | FL | 1973 | 124,501 | 1,082 | $11,248,000 | 7.5% | $14,000,000 | 6.6% |
| Wilton Manors | Fort Lauderdale | FL | 1968 | 56,842 | 759 | $9,870,000 | 6.6% | $12,500,000 | 5.9% |
| Franklin Park | Fort Lauderdale | FL | 1972-1987 | 140,735 | 1,192 | $9,441,000 | 6.3% | $12,700,000 | 6.0% |
| Oakland Park | Oakland Park | FL | 1959-1970 | 90,540 | 518 | $7,820,000 | 5.2% | $9,900,000 | 4.7% |
| Lauderhill | Lauderhill | FL | 1984 | 91,372 | 1,039 | $6,310,000 | 4.2% | $8,500,000 | 4.0% |
| Dixie Highway | Pompano Beach | FL | 1966-1970 | 72,792 | 374 | $4,550,000 | 3.0% | $5,500,000 | 2.6% |
| Total/Wtd. Avg.: | 1,173,842 | 10,680 | $150,000,000 | 100.0% | $230,000,000 | 100.0% | |||
| (1) | Based on the underwritten rent roll. |
| (2) | The Appraised Value is the “as is portfolio” appraised value of the Storage Post Portfolio Properties as a whole, which reflects an 8.7% premium to the aggregate appraised value of the individual properties. The aggregate appraised value for the individual properties as of July 18, 2019 or July 19, 2019, as applicable, is $211,600,000, which results in a Cut-off Date LTV Ratio and a Maturity Date LTV Ratio of 70.9%. The % of Appraised Value is based on the aggregate appraised value for the individual properties. |
This is not a research report and was not prepared by the Underwriters’ research department. Please see additional important information and qualifications at the end of this Term Sheet.
T-57
| Self Storage | Loan #4 | Cut-off Date Balance: | $85,000,000 | |
| Various | Storage Post Portfolio | Cut-off Date LTV: | 65.2% | |
| Various, Various | U/W NCF DSCR: | 1.97x | ||
| U/W NOI Debt Yield: | 7.9% |
The following table presents certain information relating to the unit mix and net operating income of the Storage Post Portfolio Properties:
| Storage Post Portfolio Summary(1) | |||||||||
Property Name | City / State | Non- | Climate | RV | Non- | Climate | RV SF | 7/31/2019 | % of Total 7/31/2019 TTM NOI |
| New Hyde Park | New Hyde Park, NY | 11 | 1,876 | 61 | 1,162 | 137,922 | 12,200 | $2,822,926 | 24.4% |
| Station Square | Pompano Beach, FL | 87 | 953 | 158 | 13,870 | 78,831 | 101,034 | $1,807,703 | 15.6% |
| Mills Pond Park | Fort Lauderdale, FL | 290 | 794 | 9 | 43,291 | 61,534 | 12,405 | $1,050,689 | 9.1% |
| Huntington | Huntington Station, NY | 314 | 276 | 13 | 24,931 | 17,895 | 1,233 | $866,420 | 7.5% |
| Islandia | Islandia, NY | 846 | 0 | 28 | 86,401 | 0 | 4,352 | $866,214 | 7.5% |
| Lauderdale Manors | Fort Lauderdale, FL | 417 | 632 | 33 | 66,266 | 49,035 | 9,200 | $968,297 | 8.4% |
| Wilton Manors | Fort Lauderdale, FL | 0 | 755 | 4 | 0 | 56,202 | 640 | $837,917 | 7.3% |
| Franklin Park | Fort Lauderdale, FL | 539 | 445 | 208 | 78,900 | 20,571 | 41,264 | $761,212 | 6.6% |
| Oakland Park | Oakland Park, FL | 472 | 31 | 15 | 74,284 | 1,846 | 14,410 | $664,196 | 5.7% |
| Lauderhill | Lauderhill, FL | 714 | 298 | 27 | 72,007 | 15,045 | 4,320 | $507,898 | 4.4% |
| Dixie Highway | Pompano Beach, FL | 225 | 79 | 70 | 48,602 | 3,660 | 20,530 | $400,592 | 3.5% |
| Total/Wtd. Avg.: | 3,915 | 6,139 | 626 | 509,713 | 442,541 | 221,588 | $11,554,063 | 100.0% | |
| (1) | Based on the underwritten rent roll. |
The Market. The Storage Post Portfolio Properties are located across New York and Florida. Eight properties are located in Florida (75.6% of total SF and 60.6% of TTM NOI) and three properties are located in New York (24.4% of total SF and 39.4% of TTM NOI).
The following table presents the geographical distribution of the Storage Post Portfolio Properties:
| Storage Post Portfolio Summary(1) | |||||||||
State | Total | Units | Cut-off Date Allocated Loan Amount | % of ALA | 5/31/2019 Occupancy | Non-Climate Controlled Units | Climate Controlled Units | RV Units | 7/31/2019 TTM NOI |
| Florida | 887,745 | 7,255 | $84,630,000 | 56.4% | 92.7% | 2,744 | 3,987 | 524 | $6,998,503 |
| New York | 286,096 | 3,425 | $65,370,000 | 43.6% | 91.6% | 1,171 | 2,152 | 102 | $4,555,560 |
| Total/Wtd. Avg.: | 1,173,842 | 10,680 | $150,000,000 | 100.0% | 92.4% | 3,915 | 6,139 | 626 | $11,554,063 |
| (1) | Based on the underwritten rent roll. |
The following table presents the local demographics data at the Storage Post Portfolio Properties:
| Local Demographics Summary | ||||
Property Name | City | State | 2018 Population (within 1-mi. / 3-mi. / 5-mi. Radius) | 2018 Average Household Income (within 1-mi. / 3-mi. / 5-mi. Radius) |
| New Hyde Park | New Hyde Park | NY | 26,252 / 234,615 / 662,557 | NAV / $139,757 / NAV |
| Station Square | Pompano Beach | FL | 21,465 / 117,140 / 273,488 | $53,558 / $69,931 / $76,808 |
| Mills Pond Park | Fort Lauderdale | FL | 17,330 / 186,745 / 418,337 | $49,630 / $61,815 / $71,432 |
| Huntington | Huntington Station | NY | 13,201 / 77,193 / 167,554 | $116,382 / $148,257 / $172,807 |
| Islandia | Islandia | NY | 8,299 / 90,070 / 254,301 | NAV / $116,413 / NAV |
| Lauderdale Manors | Fort Lauderdale | FL | 17,049 / 190,826 / 435,608 | $46,590 / $56,621 / $70,549 |
| Wilton Manors | Fort Lauderdale | FL | 24,075 / 143,718 / 301,366 | $76,314 / $84,602 / $78,142 |
| Franklin Park | Fort Lauderdale | FL | 18,386 / 181,533 / 386,514 | $43,549 / $62,827 / $70,938 |
| Oakland Park | Oakland Park | FL | 20,708 / 145,430 / 362,521 | $61,073 / $79,732 / $73,825 |
| Lauderhill | Lauderhill | FL | 17,947 / 194,008 / 434,170 | $51,339 / $54,786 / $65,140 |
| Dixie Highway | Pompano Beach | FL | 16,874 / 118,465 / 272,879 | $59,993 / $73,906 / $74,475 |
Source: Appraisals
This is not a research report and was not prepared by the Underwriters’ research department. Please see additional important information and qualifications at the end of this Term Sheet.
T-58
| Self Storage | Loan #4 | Cut-off Date Balance: | $85,000,000 | |
| Various | Storage Post Portfolio | Cut-off Date LTV: | 65.2% | |
| Various, Various | U/W NCF DSCR: | 1.97x | ||
| U/W NOI Debt Yield: | 7.9% |
The following table presents certain information relating to certain self-storage lease comparables provided in the appraisals for the Storage Post Portfolio Properties:
| Competitive Set Summary | ||||||
Property Name | City | State | Occupancy Rates | Competitive Set | Asking Rent | Market Rent |
| New Hyde Park | New Hyde Park | NY | 90.1% | 88.5% | $220 | $203 |
| Station Square | Pompano Beach | FL | 93.3% | 82.4% | $124 | $136 |
| Mills Pond Park | Fort Lauderdale | FL | 91.2% | 89.8% | $129 | $135 |
| Huntington | Huntington Station | NY | 92.2% | 89.0% | $249 | $221 |
| Islandia | Islandia | NY | 93.6% | 91.0% | $169 | $164 |
| Lauderdale Manors | Fort Lauderdale | FL | 91.7% | 90.2% | $131 | $134 |
| Wilton Manors | Fort Lauderdale | FL | 94.3% | 91.2% | $157 | $155 |
| Franklin Park | Fort Lauderdale | FL | 92.4% | 91.2% | $102 | $113 |
| Oakland Park | Oakland Park | FL | 92.8% | 90.0% | $183 | $183 |
| Lauderhill | Lauderhill | FL | 90.8% | 91.2% | $109 | $109 |
| Dixie Highway | Pompano Beach | FL | 96.6% | 83.0% | $224 | $214 |
Source: Appraisals and underwritten rent roll.
Operating History and Underwritten Net Cash Flow.The following table presents certain information relating to the historical operating performance and the Underwritten Net Cash Flow of the Storage Post Portfolio Properties:
| Cash Flow Analysis | ||||||
| 2016 | 2017 | 2018 | 7/31/2019 TTM | UW | UW PSF | |
| Base Rent | $19,746,811 | $20,403,182 | $20,571,192 | $20,292,015 | $20,292,015 | $17.29 |
| Unit Rent Discounts/Bad Rent | ($1,640,000) | ($1,733,778) | ($1,761,561) | ($1,642,932) | ($1,642,932) | ($1.40) |
| Total Other Income | $1,113,534 | $1,102,803 | $1,089,766 | $1,220,708 | $1,220,708 | $1.04 |
| Effective Gross Income | $19,220,345 | $19,772,208 | $19,899,398 | $19,869,791 | $19,869,791 | $16.93 |
| Real Estate Taxes | $2,192,374 | $2,378,144 | $2,568,249 | $2,687,202 | $2,687,202 | $2.29 |
| Insurance | $338,048 | $336,791 | $348,950 | $373,959 | $373,959 | $0.32 |
| Other Expenses | $5,230,743 | $5,148,628 | $5,316,753 | $5,254,567 | $4,916,988 | $4.19 |
| Total Expenses | $7,761,165 | $7,863,563 | $8,233,952 | $8,315,728 | $7,978,149 | $6.80 |
| Net Operating Income(1) | $11,459,179 | $11,908,645 | $11,665,446 | $11,554,063 | $11,891,642 | $10.13 |
| Capital Expenditures | $0 | $0 | $0 | $0 | $234,768 | $0.20 |
| Net Cash Flow | $11,459,179 | $11,908,645 | $11,665,446 | $11,554,063 | $11,656,874 | $9.93 |
| Occupancy %(1) | 93.0% | 93.8% | 93.7% | 92.4% | 93.1% | |
| NOI DSCR(2) | 1.94x | 2.01x | 1.97x | 1.95x | 2.01x | |
| NCF DSCR(2) | 1.94x | 2.01x | 1.97x | 1.95x | 1.97x | |
| NOI Debt Yield(2) | 7.6% | 7.9% | 7.8% | 7.7% | 7.9% | |
| NCF Debt Yield(2) | 7.6% | 7.9% | 7.8% | 7.7% | 7.8% | |
| (1) | As of May 31, 2019, the Storage Post Portfolio Properties were 92.4% occupied. |
| (2) | Debt service coverage ratios and debt yields are based on the Storage Post Portfolio Whole Loan. |
Escrows and Reserves.
Taxes– Monthly reserves for real estate taxes are not required so long as (i) Extra Space Storage Inc. is the non-recourse carveout guarantor of the Storage Post Portfolio Whole Loan, (ii) no Cash Sweep Event Period (as defined below) has occurred and is continuing, and (iii) the Storage Post Portfolio Borrowers provide the lender with paid receipts for real estate taxes upon lender’s written request and by no later than three business days prior to the date on which such real estate taxes would be delinquent. If such conditions are not satisfied, the Storage Post Portfolio Borrowers will be required to deposit monthly reserves for real estate taxes in an amount equal to 1/12 of the real estate taxes that the lender estimates will be payable during the next twelve months.
Insurance – Monthly reserves for insurance premiums are not required so long as (i) Extra Space Storage Inc. is the non-recourse carveout guarantor of the Storage Post Portfolio Whole Loan, (ii) no event of default is continuing, (iii) the insurance coverage for each Storage Post Portfolio Property is included in a blanket or umbrella policy approved by the lender in its reasonable discretion, and (iv) the Storage Post Portfolio Borrowers provide the lender with evidence of payment of the insurance premiums and renewals of the insurance policies, no later than ten days prior to the expiration of the current policy. If such conditions are not satisfied, the Storage Post Portfolio Borrowers will be required to deposit monthly reserves for insurance premiums in an amount equal to 1/12 of the insurance premiums that the lender estimates will be payable for the renewal of coverage upon the expiration of the insurance policies.
This is not a research report and was not prepared by the Underwriters’ research department. Please see additional important information and qualifications at the end of this Term Sheet.
T-59
| Self Storage | Loan #4 | Cut-off Date Balance: | $85,000,000 | |
| Various | Storage Post Portfolio | Cut-off Date LTV: | 65.2% | |
| Various, Various | U/W NCF DSCR: | 1.97x | ||
| U/W NOI Debt Yield: | 7.9% |
Lockbox and Cash Management. The Storage Post Portfolio Whole Loan is structured with a springing soft lockbox and springing cash management. Upon the first occurrence of a Cash Sweep Event Period, the Storage Post Portfolio Borrowers are required to establish (i) a lockbox account into which, during a Cash Sweep Event Period, the Storage Post Portfolio Borrowers are required to directly deposit, or cause to be deposited, all rents, and all De Minimis Revenue (as defined below) (less anticipated costs for debits for credit and chargebacks, fees and refunded items) from the Storage Post Portfolio Properties, and (ii) a lender-controlled cash management account, into which the Storage Post Portfolio Borrowers are required to cause all sums in the lockbox account to be transferred on each business day during a Cash Sweep Event Period. During the continuance of a Cash Sweep Event Period, provided no event of default is continuing, all funds in the cash management account are required to be applied on each monthly payment date: (i) to make deposits into an account for payment of tenant insurance premiums, sales tax, and packing supply cash receipts (“De Minimis Revenue”), which are to be disbursed to the Storage Post Portfolio Borrowers within five business days of delivery to the lender of a budget for such expenses, (ii) to make the monthly deposits into the real estate tax and insurance reserves, if any, as described above under “Escrows and Reserves,” (iii) to pay debt service on the Storage Post Portfolio Whole Loan, (iv) to pay operating expenses set forth in the annual budget (which is required to be approved by the lender during a Cash Sweep Event Period) and lender-approved extraordinary expenses, and (v) to deposit any remainder into an excess cash flow subaccount to be held as additional security for the Storage Post Portfolio Whole Loan during such Cash Sweep Event Period. If no Cash Sweep Event Period exists, funds in the lockbox account are required to be disbursed to the Storage Post Portfolio Borrowers.
A “Cash Sweep Event Period” means a period:
| (i) | commencing upon the occurrence of an event of default under the Storage Post Portfolio Whole Loan documents and ending upon the cure of such event of default; or |
| (ii) | commencing upon the debt service coverage ratio on the Storage Post Portfolio Whole Loan falling below 1.10x based upon the trailing-twelve months (calculated at the end of each calendar quarter assuming a 30 year amortization schedule), and ending on the date the debt service coverage ratio equals or exceeds 1.25x for two consecutive calendar quarters (calculated assuming a 30 year amortization schedule). |
Additional Secured Indebtedness (not including trade debts). In addition to the Storage Post Portfolio Mortgage Loan, the Storage Post Portfolio Properties also secure the Storage Post Portfolio ServicedPari Passu Companion Loans, which have an aggregate Cut-off Date principal balance of $65,000,000. The Storage Post Portfolio ServicedPari Passu Companion Loans accrue interest at the same rate as the Storage Post Portfolio Mortgage Loan. The Storage Post Portfolio Mortgage Loan is entitled to payments of interest and principal on a pro rata andpari passu basis with the Storage Post Portfolio ServicedPari Passu Companion Loans. The holders of the Storage Post Portfolio Mortgage Loan and the Storage Post Portfolio ServicedPari Passu Companion Loans have entered into a co-lender agreement which sets forth the allocation of collections on the Storage Post Portfolio Whole Loan. See“Description of the Mortgage Pool—The Whole Loans—The Serviced Pari Passu Whole Loans”in the Preliminary Prospectus.
Mezzanine Loan and Preferred Equity. A constituent party or parties (direct or indirect) of the Storage Post Portfolio Borrowers (the “Mezzanine Borrower”) has a one-time right to obtain a mezzanine loan (the “Mezzanine Debt”) from a third-party lender secured by a pledge of up to 49% of such Mezzanine Borrower’s direct or indirect equity interests in the Storage Post Portfolio Borrowers, provided certain conditions are satisfied, including (a) no event of default is continuing, (b) the aggregate loan-to-value ratio of the Storage Post Portfolio Whole Loan and the Mezzanine Debt is equal to or less than 65% (based on an updated appraisal acceptable to the lender), (c) the aggregate debt yield of the Storage Post Portfolio Whole Loan and the Mezzanine Debt is not less than 8.0%, (d) the maturity date of the Mezzanine Debt is coterminous with or longer than the maturity date of the Storage Post Portfolio Whole Loan, (e) the lender and the mezzanine lender enter into an intercreditor agreement in form and substance reasonably acceptable to the lender, and (f) the lender has received a rating agency confirmation as to the implementation of the Mezzanine Debt.
Release of Property. After the expiration of the defeasance lockout period for the Storage Post Portfolio Whole Loan, the Storage Post Portfolio Borrowers have the right to obtain a release of any of the individual Storage Post Portfolio Properties, provided certain conditions are satisfied, including: (i) no event of default is continuing, (ii) the Storage Post Portfolio Borrowers partially defease the Storage Post Portfolio Whole Loan in a principal amount equal to 125% of the allocated loan amount of the related individual property, (iii) the debt yield for all remaining Storage Post Portfolio Properties is not less than the debt yield immediately preceding the release, and (iv) customary REMIC requirements are satisfied.
In addition, the Storage Post Portfolio Borrowers are permitted to obtain the release of an approximately 0.45 acre release parcel included in the Station Square property (the “Release Parcel”), in connection with an arm’s length third party sale of the Release Parcel, provided that certain conditions are satisfied, including, (i) if applicable, the Release Parcel Release Price (as defined below) is defeased, (ii) customary REMIC requirements are satisfied and (iii) following the release, the remaining portion of the Station Square property (the “Remaining Station Square Property”) complies with legal requirements, including zoning and parking requirements, and constitutes a separate tax lot.
“Release Parcel Release Price” means 125% of the amount required such that the Release Parcel Loan-To-Value-Ratio does not exceed 73.9%.
“Release Parcel Loan-To-Value Ratio” means a percentage calculated by multiplying (i) a fraction, the (x) numerator of which is the outstanding principal balance of the allocated loan amount for the Station Square property, and (y) denominator of which is the value of the Remaining Station Square Property based on a current appraisal thereof, in the case of each of (x) and (y), as determined immediately prior to the release of the Release Parcel, by (ii) 100%.
Right of First Offer/Right of First Refusal. None.
Ground Lease. None.
Letter of Credit. None.
Terrorism Insurance. The Storage Post Portfolio Borrowers are required to obtain and maintain an “all risk” property insurance policy that covers perils of terrorism and acts of terrorism in an amount equal to the “full replacement cost” of the Storage Post Portfolio Properties, together with business income insurance covering not less than the 18-month period commencing at the time of loss, together with an extended period of indemnity endorsement of not less than 12 months. Notwithstanding the foregoing, for so long as the Terrorism Risk Insurance Act of 2002, as extended and modified by the Terrorism Risk Insurance Program Reauthorization Act of 2015 (“TRIPRA”) is in effect (including any extensions thereof or if another federal governmental program is in effect relating to “acts of terrorism” which provides substantially similar protections as TRIPRA), and covers both domestic and foreign acts of terrorism, the lender is required to accept terrorism insurance which insures against “covered acts” as defined by TRIPRA (or such other program). See“Risk Factors—Risks Relating to the Mortgage Loans—Terrorism Insurance May Not Be Available for All Mortgaged Properties”in the Preliminary Prospectus.
This is not a research report and was not prepared by the Underwriters’ research department. Please see additional important information and qualifications at the end of this Term Sheet.
T-60
(THIS PAGE INTENTIONALLY LEFT BLANK)
T-61
| Office – CBD | Loan #5 | Cut-off Date Balance: | $70,000,000 | |
| 3900 West Alameda Avenue | The Tower at Burbank | Cut-off Date LTV: | 62.1% | |
| Burbank, CA 91505 | UW NCF DSCR: | 3.06x | ||
| UW NOI Debt Yield: | 10.0% |
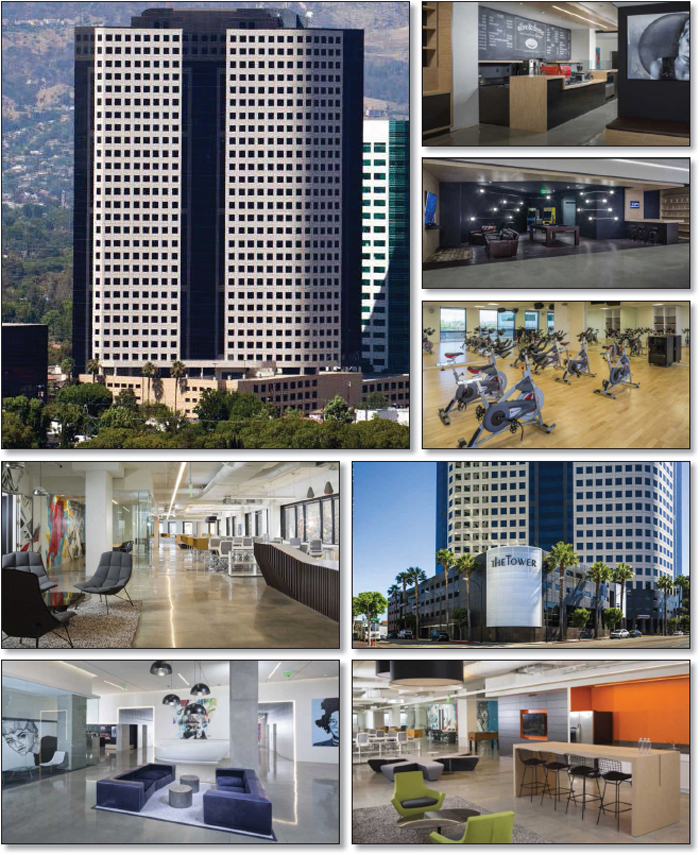
This is not a research report and was not prepared by the Underwriters’ research department. Please see additional important information and qualifications at the end of this Term Sheet.
T-62
| Office – CBD | Loan #5 | Cut-off Date Balance: | $70,000,000 | |
| 3900 West Alameda Avenue | The Tower at Burbank | Cut-off Date LTV: | 62.1% | |
| Burbank, CA 91505 | UW NCF DSCR: | 3.06x | ||
| UW NOI Debt Yield: | 10.0% |
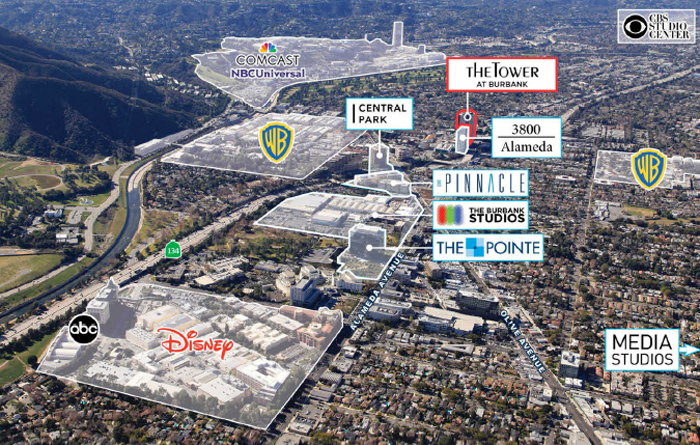
This is not a research report and was not prepared by the Underwriters’ research department. Please see additional important information and qualifications at the end of this Term Sheet.
T-63
| Office – CBD | Loan #5 | Cut-off Date Balance: | $70,000,000 | |
| 3900 West Alameda Avenue | The Tower at Burbank | Cut-off Date LTV: | 62.1% | |
| Burbank, CA 91505 | UW NCF DSCR: | 3.06x | ||
| UW NOI Debt Yield: | 10.0% |

This is not a research report and was not prepared by the Underwriters’ research department. Please see additional important information and qualifications at the end of this Term Sheet.
T-64
| Office – CBD | Loan #5 | Cut-off Date Balance: | $70,000,000 | |
| 3900 West Alameda Avenue | The Tower at Burbank | Cut-off Date LTV: | 62.1% | |
| Burbank, CA 91505 | UW NCF DSCR: | 3.06x | ||
| UW NOI Debt Yield: | 10.0% |
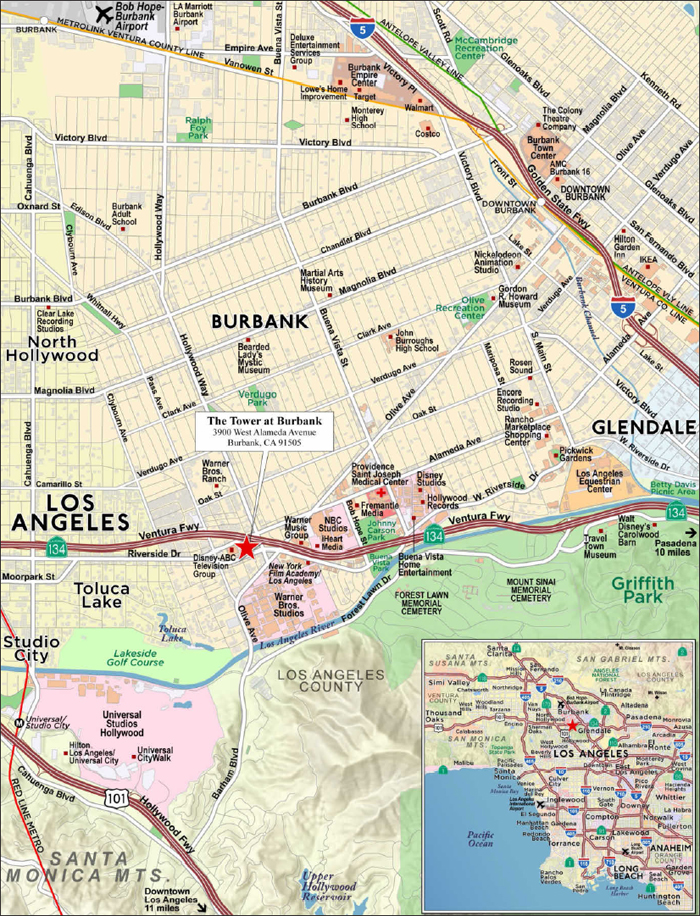
This is not a research report and was not prepared by the Underwriters’ research department. Please see additional important information and qualifications at the end of this Term Sheet.
T-65
| Mortgage Loan No. 5 – The Tower at Burbank |
| Mortgage Loan Information | Property Information | |||||
| Mortgage Loan Seller: | WFB | Single Asset/Portfolio: | Single Asset | |||
| Credit Assessment (DBRS/Fitch/S&P): | NR/NR/NR | Location: | Burbank, CA 91505 | |||
| Original Balance(1): | $70,000,000 | General Property Type: | Office | |||
| Cut-off Date Balance(1): | $70,000,000 | Detailed Property Type: | CBD | |||
| % of Initial Pool Balance: | 5.9% | Title Vesting: | Fee | |||
| Loan Purpose: | Refinance | Year Built/Renovated: | 1989/2015-2019 | |||
| Borrower Sponsor: | BPP Burbank Holdings LLC | Size: | 490,807 SF | |||
| Guarantor: | BPP Burbank Holdings LLC | Cut-off Date Balance per SF(1): | $397 | |||
| Mortgage Rate: | 3.1300% | Maturity Balance per SF(1): | $397 | |||
| Note Date: | 8/8/2019 | Property Manager: | The Worthe Real Estate Group, | |||
| First Payment Date: | 9/11/2019 | Inc. (borrower-related) | ||||
| Maturity Date: | 8/11/2029 | |||||
| Original Term to Maturity: | 120 months | |||||
| Original Amortization Term: | 0 months | |||||
| IO Period: | 120 months | Underwriting and Financial Information | ||||
| Seasoning: | 2 months | UW NOI(4): | $19,595,795 | |||
| Prepayment Provisions(2): | YM0.5 (26); DEF/YM0.5 (87); O (7) | UW NOI Debt Yield(1): | 10.0% | |||
| Lockbox/Cash Mgmt Status: | Hard/Springing | UW NOI Debt Yield at Maturity(1): | 10.0% | |||
| Additional Debt Type(1): | Pari Passu | UW NCF DSCR(1): | 3.06x | |||
| Additional Debt Balance(1): | $125,000,000 | Most Recent NOI(4): | $10,881,903 (12/31/2018) | |||
| Future Debt Permitted (Type): | No (N/A) | 2nd Most Recent NOI(4): | $5,444,777 (12/31/2017) | |||
| Reserves(3) | 3rd Most Recent NOI(5): | N/A | ||||
| Type | Initial | Monthly | Cap | Most Recent Occupancy(6): | 97.3% (7/1/2019) | |
| Real Estate Taxes: | $0 | Springing | N/A | 2nd Most Recent Occupancy(6): | 64.2% (12/31/2018) | |
| Insurance: | $0 | Springing | N/A | 3rd Most Recent Occupancy: | 56.7% (12/31/2017) | |
| Recurring Replacements: | $0 | Springing | $122,702 | Appraised Value (as of): | $314,000,000 (6/24/2019) | |
| TI/LC: | $0 | Springing | $490,807 | Appraised Value per SF: | $640 | |
| Existing TI/LC Obligations Reserve: | $15,934,738 | $0 | N/A | Cut-off Date LTV Ratio(1): | 62.1% | |
| Free Rent Obligations Guaranty: | (3) | $0 | N/A | Maturity Date LTV Ratio(1): | 62.1% | |
| Sources and Uses | ||||||
| Sources | Proceeds | % of Total | Uses | Proceeds | % of Total | |
| Whole Loan Amount(1): | $195,000,000 | 100.0% | Loan Payoff Amount: | $143,131,029 | 73.4% | |
| Return of Equity: | $34,532,989 | 17.7% | ||||
| Upfront Reserves: | $15,934,738 | 8.2% | ||||
| Closing Costs: | $1,401,244 | 0.7% | ||||
| Total Sources: | $195,000,000 | 100.0% | Total Uses: | $195,000,000 | 100.0% | |
| (1) | The Tower at Burbank Mortgage Loan (as defined below) is a part of The Tower at Burbank Whole Loan (as defined below) with an original aggregate principal balance of $195,000,000. The Cut-off Date Balance per SF, Maturity Date Balance per SF, UW NOI Debt Yield, UW NOI Debt Yield at Maturity, UW NCF DSCR, Cut-off Date LTV Ratio and Maturity Date LTV Ratio numbers presented above are based on The Tower at Burbank Whole Loan. |
| (2) | Defeasance of The Tower at Burbank Whole Loan is permitted at any time after the earlier to occur of (a) the end of the two-year period commencing on the closing date of the securitization of the last promissory note representing a portion of The Tower at Burbank Whole Loan to be securitized and (b) August 8, 2022. The Tower at Burbank Borrower may prepay The Tower at Burbank Whole Loan in whole or in part at any time, provided that such prepayment is accompanied by the greater of a yield maintenance premium or a prepayment premium equal to 0.5% of the principal amount being prepaid. No prepayment premium will apply on or after February 11, 2029. |
| (3) | See“Escrows and Reserves” below for further discussion of reserve requirements. |
| (4) | See “Operating History and Underwritten Net Cash Flow” below for a discussion of the increases in historical NOI and from historical to UW NOI. |
| (5) | Occupancy in 2016 ranged from 12.8% to 39.2% and accordingly the net operating income for such period was not considered relevant to underwriting and was not obtained from the borrower sponsor. |
| (6) | The increase from the 2nd Most Recent Occupancy to the Most Recent Occupancy is attributed to leases signed with 4 new tenants totaling approximately 35.3% of net rentable area. |
This is not a research report and was not prepared by the Underwriters’ research department. Please see additional important information and qualifications at the end of this Term Sheet.
T-66
| Office – CBD | Loan #5 | Cut-off Date Balance: | $70,000,000 | |
| 3900 West Alameda Avenue | The Tower at Burbank | Cut-off Date LTV: | 62.1% | |
| Burbank, CA 91505 | UW NCF DSCR: | 3.06x | ||
| UW NOI Debt Yield: | 10.0% |
The Mortgage Loan. The fifth largest mortgage loan (“The Tower at Burbank Mortgage Loan”) is part of a whole loan (“The Tower at Burbank Whole Loan”) that is evidenced by threepari passupromissory notes in the aggregate original principal amount of $195,000,000. The Tower at Burbank Whole Loan is secured by a first priority fee mortgage encumbering a Class A office building located in Burbank, California (“The Tower at Burbank Property”). The Tower at Burbank Mortgage Loan is evidenced by the non-controlling promissory note A-2 in the original principal amount of $70,000,000. The controlling promissory note A-1 is expected to be securitized in the BANK 2019-BNK20 securitization trust and the non-controlling note A-3 (collectively, “The Tower at Burbank Non-ServicedPari Passu Companion Loans”) is currently held by Wells Fargo Bank, N.A. and is expected to be contributed to a future securitization trust or may be otherwise transferred at any time. The Tower at Burbank Whole Loan is expected to be serviced pursuant to the pooling and servicing agreement for the BANK 2019-BNK20 securitization trust. See “Description of the Mortgage Pool—The Whole Loans—The Non-Serviced Pari Passu Whole Loans” and “Pooling and Servicing Agreement—Servicing of the Non-Serviced Mortgage Loans” in the Preliminary Prospectus.
| The Tower at Burbank Whole Loan Summary | ||||
| Note | Original Balance | Cut-off Date Balance | Note Holder | Controlling Piece |
| A-1 | $100,000,000 | $100,000,000 | BANK 2019-BNK20 | Yes |
| A-2 | $70,000,000 | $70,000,000 | BANK 2019-BNK21 | No |
| A-3 | $25,000,000 | $25,000,000 | Wells Fargo Bank, N.A. | No |
| Total | $195,000,000 | $195,000,000 | ||
The Borrower and the Borrower Sponsor. The borrower is Tower Burbank Owner, LLC (“The Tower at Burbank Borrower”), a Delaware limited liability company and single purpose entity with two independent directors. Tower Fitness Center/Café TRS, LLC (“TRS Entity”), the operating lessee solely managing the fitness center and café at The Tower at Burbank Property, is a party to certain of The Tower at Burbank Whole Loan documents.
The borrower sponsor and non-recourse carveout guarantor is BPP Burbank Holdings LLC (the “Guarantor”), a Delaware limited liability company and an affiliate of both The Blackstone Group L.P. (“Blackstone”) and The Worthe Real Estate Group, Inc. (“Worthe”). Blackstone is a global investment firm that has approximately $545 billion in assets under management as of June 30, 2019. Founded in 1985, Blackstone currently employs approximately 2,500 people in 24 offices around the world, while its portfolio companies employ over 400,000 people globally. Worthe’s current commercial real estate portfolio includes 37 assets and 11 development sites in California totaling approximately 5.6 million SF and 3.2 million SF of future development. Worthe acquired The Tower at Burbank Property from BlackRock in 2014. According to a third party news provider, Blackstone and Worthe together control approximately 70% of the office supply within the Burbank media district.
The Tower at Burbank Whole Loan documents provide that the Guarantor’s aggregate liability for various bankruptcy-related springing recourse events is subject to a cap equal to 20% of the then-outstanding principal balance of The Tower at Burbank Whole Loan at the time of such event, plus specified costs of enforcement. The Tower at Burbank Whole Loan documents also provide for, among other losses carveouts, a losses carveout (instead of springing recourse) for voluntary transfers of The Tower at Burbank Property or controlling equity interest in The Tower at Burbank Borrower made in violation of The Tower at Burbank Whole Loan documents. In connection with a cap on the Guarantor’s limits of liability for environmental losses, The Tower at Burbank Borrower provided a pollution legal liability-type environmental insurance policy (“PLL Policy”) issued by Great American E & S Insurance Company in the amount of $5,000,000 with an initial term of 6 years. The Tower at Burbank Whole Loan documents provide that the Guarantor has no liability for environmental matters if the policy has a term through the “required policy period” (at least two years past The Tower at Burbank Whole Loan maturity date). If the PLL Policy does not run through the required policy period, the Guarantor’s liability for environmental matters is capped at the amount of the related PLL policy limits. A Phase I environmental site assessment was required at loan origination and indicated no recognized environmental conditions at The Tower at Burbank Property. See “Description of the Mortgage Pool—Non-recourse Carveout Limitations” in the Preliminary Prospectus.
The Property. The Tower at Burbank Property is a 490,807 SF, 32-story Class A, LEED Gold certified office building located in Burbank, California. Constructed in 1989 and situated on a 1.5-acre site, The Tower at Burbank Property includes a nine-story parking garage with 1,346 spaces (resulting in a parking ratio of approximately 2.7 spaces per 1,000 SF of net rentable area). The Tower at Burbank Property was renovated from 2015 to 2018 at an approximate cost of $11.1 million, which included roof, HVAC, parking garage, fitness center, lobby, individual floor lobby/corridor and restroom upgrades, along with exterior improvements. Additional repairs were completed in 2019, totaling approximately $3.0 million, including lobby/corridor improvements, wall/window seal repairs, installation of electric vehicle charging stations and additional restroom upgrades. Amenities at The Tower at Burbank Property include a recently renovated fitness center with locker rooms, valet service, ground floor cafe, and a tenant lounge inclusive of an arcade, pool table, and bar. According to the borrower sponsor, additional renovations and capital improvements estimated at $7.6 million are currently planned from 2020 to 2023; however, such renovations are not required by The Tower at Burbank Whole Loan documents and were not reserved for at origination.
Worthe acquired The Tower at Burbank Property in March 2014 when it was 3.9% occupied, and Blackstone subsequently acquired an ownership interest in September 2017 (at which point the building was approximately 55.1% occupied; at an allocated purchase price of $230.0 million), as part of Worthe’s 14-property Burbank portfolio recapitalization.
As of July 1, 2019, The Tower at Burbank Property was 97.3% leased to 15 media, entertainment, technology, real estate, finance and co-working tenants with approximately 36.2% of the net rentable area and 37.2% of underwritten base rent attributed to investment grade tenants. As of September 2019, three tenants totaling 33.6% of NRA and 35.7% of underwritten base rent have executed leases but have not yet taken occupancy or commenced paying rent, including Disney (23.6% of NRA; 25.3% of underwritten base rent; see details in “Major Tenants” section below), ZestFinance (3.8% of NRA; 4.0% of underwritten base rent; expected occupancy and rent commencement by year-end 2019) and Prime Focus (6.2% of NRA; 6.3% of underwritten base rent; expected occupancy and rent commencement by year-end 2019). The Tower at Burbank Whole Loan was not structured with a reserve or guaranty related to gap rent for the period from loan origination through the commencement of rent for such tenants not yet paying rent. There is no assurance that Disney, ZestFinance and Prime Focus will take occupancy and begin paying rent by the estimated dates noted herein.
This is not a research report and was not prepared by the Underwriters’ research department. Please see additional important information and qualifications at the end of this Term Sheet.
T-67
| Office – CBD | Loan #5 | Cut-off Date Balance: | $70,000,000 | |
| 3900 West Alameda Avenue | The Tower at Burbank | Cut-off Date LTV: | 62.1% | |
| Burbank, CA 91505 | UW NCF DSCR: | 3.06x | ||
| UW NOI Debt Yield: | 10.0% |
Major Tenants.
Disney (115,673 SF, 23.6% of NRA; 25.3% of underwritten base rent). The Walt Disney Company (“Disney”; rated A/A2/A by Fitch/Moody’s/S&P), together with its subsidiaries and affiliates, is a diversified international family entertainment and media enterprise with multiple business segments, including, media networks; theme parks, experiences and products; studio entertainment and direct-to-consumer. Disney reported annual net income of approximately $13.1 billion for fiscal year (“FY”) 2018, a 39.5% increase over FY 2017. As of August 22, 2019, Disney had a total market capitalization of approximately $245.3 billion. Walt Disney Animation is expected to operate at The Tower at Burbank Property. From the first fully-animated feature film, 1937’sSnow White and the Seven Dwarfs, to 2013’s Academy Award-winning Frozen, the studio has produced films includingCinderella,Sleeping Beauty,The Jungle Book,Beauty and the Beast, andThe Lion King. Disney’s lease is guaranteed by ABC Cable Networks Group and has two, five-year renewal options, each with 12 months’ notice, at the fair market rental rate following lease expiration in December 2029.
Disney has an executed lease but has not yet taken occupancy or commenced paying rent. Disney is expected to take occupancy of its space in two phases: “Phase I” (floors 25, 26, 27 and 29, totaling 77,126 SF) and “Phase II” (floors 28 and 30, totaling 38,547 SF). As of September 2019, with respect to the Phase I space, Disney is (i) expected to commence a 10-month free rent period in February 2020, (ii) expected to take occupancy in April 2020, and (iii) required to commence paying full unabated rent following the 10-month free period (expected in December 2020). With respect to the Phase II space, Disney is (i) expected to take occupancy and commence a 10-month free rent period in July 2020, and (ii) required to commence paying full unabated rent following the 10-month free rent period (expected in May 2021). Approximately $4.7 million was guaranteed by the Guarantor pursuant to the Free Rent Obligations Guaranty with respect to Disney’s 10-month free rent period (for both the Phase I and Phase II space; see“Escrows and Reserves” below). Disney is not required to commence paying rent until the expiration of its free rent periods, and the Tower at Burbank Whole Loan was not structured with a reserve or guaranty related to gap rent for the period from loan origination through the commencement of Disney’s free rent periods. There is no assurance that Disney will take occupancy or begin paying rent by the estimated dates noted herein.
WeWork (74,742 SF, 15.2% of NRA; 15.7% of underwritten base rent). WeWork Companies Inc. (rated B/B by Fitch/S&P) provides furnished and fully-serviced shared workspaces, primarily to small and midmarket enterprises. According to the appraisal, WeWork currently leases approximately 10 million square feet of space across 280 locations in 86 cities, including cities in the United States, Israel, Mexico, China, France, South Korea, Australia, the United Kingdom, Hong Kong, Germany, and the Netherlands. The entity on the WeWork lease is 3900 W Alameda Ave Tenant LLC, and the lease is guaranteed by WeWork Companies Inc. The initial maximum aggregate liability of the lease guarantor was limited to $5,300,000; and beginning May 2019, was reduced to $2,650,000. As long as the tenant is not then in default under its lease beyond any applicable notice and cure periods, the lease guarantor’s cap on liability will be reduced to $2,000,000 beginning in April 2022. WeWork’s lease at The Tower at Burbank Property commenced in April 2017 for its 11th-12th floor space and May 2017 for its 14th-15th floor space and has two, 5-year renewal options remaining, each with 12 months’ notice, at the fair market rental rate following its April 2032 lease expiration.
Vubiquity, Inc. (56,055 SF, 11.4% of NRA; 11.1% of underwritten base rent). Vubiquity, Inc. (“Vubiquity”), part of the Amdocs Media division of Amdocs (NASDAQ: DOX; Baa2/BBB by Moody’s/S&P), connects content owners and video distributors to deliver media to viewers on any screen. Headquartered at The Tower at Burbank Property with additional offices in Toronto and London, Vubiquity works with film studios, television networks, independent producers and digital first networks and brings content to over 1,000 global video distributors. Vubiquity has the one-time right to terminate its lease effective August 1, 2022, with nine months’ prior notice, subject to a termination fee equal to (i) three times the then current monthly base rent, plus (ii) the then unamortized amount (based on the monthly straight line amortization over the initial lease term using a 7.0% interest rate) of tenant improvements and leasing commissions, as of the effective date of termination. Vubiquity’s lease is guaranteed by Vubiquity Holdings, Inc. and has two, five-year renewal options, each with 12 months’ notice, at the fair market rental rate following its lease expiration in June 2026. Vubiquity has a total of five months of free rent, which will occur each July from 2020 to 2024. $1.1 million in outstanding free rent was guaranteed by the Guarantor pursuant to the Free Rent Obligations Guaranty.
This is not a research report and was not prepared by the Underwriters’ research department. Please see additional important information and qualifications at the end of this Term Sheet.
T-68
| Office – CBD | Loan #5 | Cut-off Date Balance: | $70,000,000 | |
| 3900 West Alameda Avenue | The Tower at Burbank | Cut-off Date LTV: | 62.1% | |
| Burbank, CA 91505 | UW NCF DSCR: | 3.06x | ||
| UW NOI Debt Yield: | 10.0% |
The following table presents certain information relating to the tenancy at The Tower at Burbank Property:
| Tenant Summary | ||||||||||
| Tenant Name | Credit Rating (Fitch/Moody’s/S&P)(1) | Tenant SF | Approx. % of Total SF | Annual UW Rent(2) | % of Total Annual UW Rent | Annual UW Rent PSF(2) | Lease Expiration | Termination Option (Y/N) | ||
| Disney(3) | A/A2/A | 115,673 | 23.6% | $5,621,708(3) | 25.3% | $48.60 | (3) | 12/31/2029 | (4) | N |
| WeWork(5) | B/NR/B | 74,742 | 15.2% | $3,479,253 | 15.7% | $46.55 | 4/30/2032 | (6) | N | |
| Vubiquity, Inc. | NR/Baa2/BBB | 56,055 | 11.4% | $2,460,525(7) | 11.1% | $43.89 | (7) | 6/30/2026 | (8) | Y(9) |
| STX Filmworks, LLC | NR/NR/NR | 38,077 | 7.8% | $1,853,951(10) | 8.4% | $48.69 | (10) | 11/30/2025 | (11) | N |
| PictureHead | NR/NR/NR | 37,370 | 7.6% | $1,640,350(12) | 7.4% | $43.89 | (12) | 6/30/2026 | (13) | N |
| Subtotal/Wtd. Avg. | 321,917 | 65.6% | $15,055,787 | 67.8% | $46.77 | |||||
| Other Tenants | 155,705 | 31.7% | $7,135,180 | 32.2% | $45.82 | |||||
| Vacant Space | 13,185 | 2.7% | $0 | 0.0% | $0.00 | |||||
| Total/Wtd. Avg. | 490,807 | 100.0% | $22,190,967 | 100.0% | $46.46 | (14) | ||||
| (1) | Certain ratings are those of the parent company whether or not the parent guarantees the lease. |
| (2) | Annual UW Rent and Annual UW Rent PSF include contractual rent steps through September 2020 totaling $415,805. The lender’s underwriting gives separate credit for straight-line rent averaging for investment grade tenants through the lesser of the lease terms or the loan term totaling $974,059 ($794,074 for Disney, $160,716 for Vubiquity, Inc. and $19,268 for Union Bank of California; see “Operating History and Underwritten Net Cash Flow” below). The Annual UW Rent and Annual UW Rent PSF shown in the table above do not include credit given for straight-line rent averaging for such investment grade tenants. |
| (3) | Disney has an executed lease but has not yet taken occupancy or commenced paying rent (see tenant description in“Major Tenants” above for further information). |
| (4) | Disney has two, five-year renewal options remaining, each with 12 months’ notice, at the fair market rental rate. |
| (5) | The entity on the WeWork lease is 3900 W Alameda Ave Tenant LLC, and the lease is guaranteed by WeWork Companies Inc. (which is the rated entity). The initial maximum aggregate liability of the lease guarantor was limited to $5,300,000; and beginning May 2019, was reduced to $2,650,000. As long as the tenant is not then in default under its lease beyond any applicable notice and cure periods, the lease guarantor’s cap on liability will be reduced to $2,000,000 beginning in April 2022. |
| (6) | WeWork has two, five-year renewal options remaining, each with 12 months’ notice, at the fair market rental rate. |
| (7) | Vubiquity has a total of five months of free rent, which will occur each July from 2020 to 2024. $1.1 million in outstanding free rent was guaranteed by the Guarantor pursuant to Free Rent Obligations Guaranty. |
| (8) | Vubiquity has two, 5-year renewal options remaining, each with 12 months’ written notice, at the fair market rental rate. |
| (9) | Vubiquity has the one-time right to terminate its lease effective August 1, 2022, with nine months’ prior notice, subject to a termination fee equal to (i) three times the then current monthly base rent plus (ii) the then unamortized amount (based on the monthly straight line amortization over the initial lease term using a 7.0% interest rate) of tenant improvements and leasing commissions, as of the effective date of termination |
| (10) | STX Filmworks, LLC has will receive one month of free rent in March 2023. $84,152 in outstanding free rent was guaranteed by the Guarantor pursuant to the Free Rent Obligations Guaranty. |
| (11) | STX Filmworks, LLC has one, 5-year renewal option remaining, with 12 months’ written notice, at the fair market rental rate. |
| (12) | PictureHead has a total of four months of free rent, which will occur each July from 2020 to 2023. $571,885 in outstanding free rent was guaranteed by the Guarantor pursuant to the Free Rent Obligations Guaranty. |
| (13) | PictureHead has two, 5-year renewal options remaining, each with 12 months’ written notice and at the fair market rental rate. |
| (14) | Total/Wtd. Avg. Annual UW Rent PSF excludes vacant space. |
This is not a research report and was not prepared by the Underwriters’ research department. Please see additional important information and qualifications at the end of this Term Sheet.
T-69
| Office – CBD | Loan #5 | Cut-off Date Balance: | $70,000,000 | |
| 3900 West Alameda Avenue | The Tower at Burbank | Cut-off Date LTV: | 62.1% | |
| Burbank, CA 91505 | UW NCF DSCR: | 3.06x | ||
| UW NOI Debt Yield: | 10.0% |
The following table presents certain information relating to the lease rollover schedule at The Tower at Burbank Property:
| Lease Rollover Schedule(1)(2) | ||||||||
| Year | # of Leases Rolling | SF Rolling | Annual UW Rent PSF Rolling | Approx. % of Total SF Rolling | Approx. Cumulative % of SF Rolling | Total UW Rent Rolling | Approx. % of Total Rent Rolling | Approx. Cumulative % of Total Rent Rolling |
| 2019 | 0 | 0 | $0.00 | 0.0% | 0.0% | $0 | 0.0% | 0.0% |
| 2020 | 2 | 27,529 | $43.89 | 5.6% | 5.6% | $1,208,381 | 5.4% | 5.4% |
| 2021 | 2 | 19,074 | $45.78 | 3.9% | 9.5% | $873,177 | 3.9% | 9.4% |
| 2022 | 1 | 7,866 | $43.93 | 1.6% | 11.1% | $345,535 | 1.6% | 10.9% |
| 2023 | 2 | 33,371 | $46.08 | 6.8% | 17.9% | $1,537,838 | 6.9% | 17.9% |
| 2024 | 1 | 4,624 | $45.89 | 0.9% | 18.8% | $212,216 | 1.0% | 18.8% |
| 2025 | 2 | 38,077 | $48.69 | 7.8% | 26.6% | $1,853,951 | 8.4% | 27.2% |
| 2026 | 3 | 99,164 | $44.09 | 20.2% | 46.8% | $4,372,158 | 19.7% | 46.9% |
| 2027 | 0 | 0 | $0.00 | 0.0% | 46.8% | $0 | 0.0% | 46.9% |
| 2028 | 2 | 27,203 | $47.31 | 5.5% | 52.3% | $1,286,936 | 5.8% | 52.7% |
| 2029 | 7 | 115,673 | $48.60 | 23.6% | 75.9% | $5,621,708 | 25.3% | 78.0% |
| 2030 & Beyond | 4 | 105,041 | $46.45 | 21.4% | 97.3% | $4,879,067 | 22.0% | 100.0% |
| Vacant | 0 | 13,185 | $0.00 | 2.7% | 100.0% | $0 | 0.0% | 100.0% |
| Total/Wtd. Avg.(3) | 26 | 490,807 | $46.46 | 100.0% | $22,190,967 | 100.0% | ||
| (1) | Information is based on the underwritten rent roll. |
| (2) | Certain tenants may have lease termination options that are exercisable prior to the originally stated expiration date of the subject lease and that are not considered in the Lease Rollover Schedule. |
| (3) | Wtd. Avg. Annual UW Rent PSF Rolling excludes vacant space. |
The Market. The Tower at Burbank Property is located within the central business district of Burbank, Los Angeles County, California, approximately 0.4 miles west of Route 134/Ventura freeway (provides access east to Glendale and Pasadena and west (via Route 101) to Thousand Oaks and Ventura), 3.6 miles southwest of Interstate 5 (provides access south to Los Angeles), 10.5 miles northwest of the Los Angeles central business district, 3.2 miles southeast of Bob Hope (Hollywood/Burbank) Airport and 24.3 miles northeast of Los Angeles International Airport. The Tower at Burbank Property is situated approximately 0.5 miles southeast of the intersection of Ventura Freeway and Clybourn Avenue, which, according to a third party market research provider, had an average daily traffic count of225,581 vehicles as of 2018.
The City of Burbank serves as the headquarters for Walt Disney and Warner Brothers. Walt Disney’s corporate headquarters is situated approximately 1.2 miles northeast of The Tower at Burbank Property and Warner Brothers Studios’ world headquarters is located approximately 0.7 miles southeast of The Tower at Burbank Property. According to the appraisal, Los Angeles County has an estimated 2,116 employers within the Motion Picture and Video Production industry and also includes the corporate headquarters for Paramount Pictures (approximately 6.0 miles southeast of The Tower at Burbank Property), 21st Century Fox (11.2 miles southwest), Sony (17.3 miles southwest), and Universal Pictures (2.0 miles southwest).
According to a third party market research provider, the estimated 2019 population within a three- and five-mile radius of The Tower at Burbank Property was approximately 176,822 and 643,279, respectively; and the estimated 2019 average household income within the same radii was approximately $100,083 and $90,277, respectively.
According to a third-party market research report, The Tower at Burbank Property is situated within the Burbank Office submarket of the Los Angeles Office Market. As of August 23, 2019, the Burbank Office submarket reported a total inventory of approximately 14.5 million SF with a 6.2% vacancy rate and average asking rent of $39.06 per SF, gross. The submarket vacancy rate has decreased from 12.5% in 2013 and averaged 9.3% from 2013 through 2018. The appraiser identified a competitive set of 28 Burbank office properties totaling approximately 5.4 million SF, with an average occupancy rate of 91.8% and quoted rents ranging from $39.60 to $48.60 per SF, full-service gross.
The following table presents certain information relating to the appraisal’s market rent conclusion for The Tower at Burbank Property:
| Market Rent Summary | |||
| Office – Floor 1 | Office – Floors 6-19 | Office – Floors 20-32 | |
| Market Rent (PSF) | $46.80 | $47.40 | $48.60 |
| Lease Term (Years) | 7 | 7 | 7 |
| Lease Type (Reimbursements) | Full-Service | Full-Service | Full-Service |
| Rent Increase Projection | 3.0%per annum | 3.0%per annum | 3.0%per annum |
This is not a research report and was not prepared by the Underwriters’ research department. Please see additional important information and qualifications at the end of this Term Sheet.
T-70
| Office – CBD | Loan #5 | Cut-off Date Balance: | $70,000,000 | |
| 3900 West Alameda Avenue | The Tower at Burbank | Cut-off Date LTV: | 62.1% | |
| Burbank, CA 91505 | UW NCF DSCR: | 3.06x | ||
| UW NOI Debt Yield: | 10.0% |
The following table presents information relating to comparable office property sales for The Tower at Burbank Property:
| Comparable Property Sale Summary | ||||||
| Property Name/Location | Sale Date | Year Built/ Renovated | Total NRA (SF) | Occupancy | Sale Price | Sale Price PSF |
The Tower at Burbank Property 3900 W. Alameda Avenue Burbank, CA | N/A | 1989/2015-2019 | 490,807 | 97.3% | N/A | N/A |
1055 E. Colorado Boulevard Pasadena, CA | Jun. 2019 | 2000/N/A | 173,327 | 89% | $85,000,000 | $490.40 |
Wilshire Courtyard 5700 & 5750 Wilshire Boulevard Los Angeles, CA | Jan. 2019 | 1987/N/A | 1,006,645 | 60% | $628,000,000 | $623.85 |
C3 5800 Bristol Parkway Culver City, CA | May 2019 | 2017/N/A | 283,207 | 100% | $260,000,000 | $918.06 |
5161 Lankershim Boulevard North Hollywood, CA | Jun. 2019 | 1990/N/A | 201,652 | 100% | $102,700,000 | $509.29 |
Campus at Playa Vista 12015, 12025, 12035, and 12045 Waterfront Drive Los Angeles, CA | Nov. 2018 | 2009/N/A | 325,269 | 99% | $335,000,000 | $1,029.92 |
The Wedbush Center 1000 Wilshire Boulevard Los Angeles, CA | Mar. 2018 | 1987/N/A | 476,491 | 86% | $196,000,000 | $411.34 |
5670 Wilshire Boulevard Los Angeles, CA | Oct. 2017 | 1964/N/A | 407,059 | 96% | $215,000,000 | $528.18 |
177 E. Colorado Boulevard Pasadena, CA | Sep. 2017 | 1973/N/A | 321,062 | 88% | $161,500,000 | $503.02 |
One California Plaza 300 S. Grand Avenue Los Angeles, CA | Jun. 2017 | 1985/N/A | 1,031,183 | 88% | $459,000,000 | $445.12 |
Buena Vista Plaza 2411 W. Olive Avenue Burbank, CA
| Jan.2017 | 1991/2004 | 117,858 | 100% | $52,500,000 | $445.45 |
Source:Appraisal.
This is not a research report and was not prepared by the Underwriters’ research department. Please see additional important information and qualifications at the end of this Term Sheet.
T-71
| Office – CBD | Loan #5 | Cut-off Date Balance: | $70,000,000 | |
| 3900 West Alameda Avenue | The Tower at Burbank | Cut-off Date LTV: | 62.1% | |
| Burbank, CA 91505 | UW NCF DSCR: | 3.06x | ||
| UW NOI Debt Yield: | 10.0% |
The following table presents certain information relating to comparable office leases for The Tower at Burbank Property:
Comparable Leases Summary | ||||||||
| Property Name/Location | Year Built/ Renovated | Total GLA (SF) | Occupancy | Distance from Subject | Lease Date/Term | Lease Area (SF) | Annual Base Rent PSF | Lease Type |
The Tower at Burbank Property 3900 W. Alameda Avenue Burbank, CA | 1989/2015-2019 | 490,807 | 97.3% | - | ||||
Buena Vista Plaza 2411 W. Olive Burbank, CA | 1991/2004 | 117,858 | 100.0% | 1.0 Miles | Q1 2018 / 7.2 Yrs. | 4,306 | $46.00 | Full Service |
4000 W. Alameda Building 4000 W. Alameda Avenue Burbank, CA | 1983/1998 | 118,818 | 100.0% | 0.1 Miles | Q3 2018 / 7.0 Yrs. | 8,462 | $40.20 | Full Service |
| Legacy Media Tower | 1986/N/A | 150,755 | 82.9% | 0.9 Miles | Q1 2019 / 5.4 Yrs. | 4,835 | $43.80 | Full Service |
2600 West Olive Avenue Burbank, CA | Q3 2018 / 5.5 Yrs. | 9,187 | $43.80 | Full Service | ||||
| Business Arts Plaza | 1985/N/A | 152,469 | 93.6% | 0.3 Miles | Q2 2019 / 1.8 Yrs. | 27,305 | $48.60 | Full Service |
3601 West Olive Avenue Burbank, CA | Q2 2018 / 6.0 Yrs. | 7,523 | $46.20 | Full Service | ||||
| Burbank Empire Center | 2009/N/A | 351,748 | 66.3% | 3.5 Miles | Q4 2018 / 7.1 Yrs. | 11,855 | $41.40 | Full Service |
2300 Empire Avenue Burbank, CA | Q3 2018 / 10.0 Yrs. | 27,000 | $40.20 | Full Service | ||||
| Media Studios N. Phase II | 1998/N/A | 217,230 | 71.0% | 3.4 Miles | Q1 2019 / 5.4 Yrs. | 41,647 | $45.00 | Full Service |
2255 N. Ontario Street Burbank, CA | Q2 2018 / 2.0 Yrs. | 8,716 | $42.00 | Full Service | ||||
Allianz Building 2350 Empire Avenue Burbank, CA | 2002/N/A | 229,946 | 100.0% | 3.3 Miles | Q3 2018 / 5.4 Yrs. | 27,000 | $39.00 | Full Service |
Burbank Executive Plaza 300 E. Magnolia Boulevard Burbank, CA | 1983/N/A(1) | 65,179(1) | 79.8%(1) | 3.1 Miles | Q1 2019 / 11.0 Yrs. | 17,123 | $40.80 | Full Service |
Citibank Building 333 N. Glenoaks Boulevard Burbank, CA | 1978/N/A(1) | 87,908(1) | 87.3%(1) | 3.1 Miles | Q4 2018 / 5.5 Yrs. | 5,759 | $39.00 | Full Service |
Source:Appraisal, unless otherwise noted.
| (1) | Information obtained from a third party market research provider. |
This is not a research report and was not prepared by the Underwriters’ research department. Please see additional important information and qualifications at the end of this Term Sheet.
T-72
| Office – CBD | Loan #5 | Cut-off Date Balance: | $70,000,000 | |
| 3900 West Alameda Avenue | The Tower at Burbank | Cut-off Date LTV: | 62.1% | |
| Burbank, CA 91505 | UW NCF DSCR: | 3.06x | ||
| UW NOI Debt Yield: | 10.0% |
Operating History and Underwritten Net Cash Flow.The following table presents certain information relating to the historical operating performance and Underwritten Net Cash Flow at The Tower at Burbank Property:
| Cash Flow Analysis(1) | ||||
| 2017(2) | 2018(2)(3) | UW(3) | UW PSF | |
| Gross Potential Base Rent | $10,944,511 | $15,671,096 | $22,190,967(4) | $45.21(4) |
| Rent Average Benefit | $0 | $0 | $974,059(5) | $1.98 |
| Free Rent Adjustment | ($2,612,837) | ($1,914,832) | $0 | $0.00 |
| Grossed Up Vacant Space | $0 | $0 | $640,791 | $1.31 |
| Total Recoveries | $269,605 | $358,552 | $658,692 | $1.34 |
| Parking Income | $1,186,002 | $1,934,782 | $2,793,563 | $5.69 |
| Other Income | $280,236 | $418,148 | $357,979 | $0.73 |
| Less Vacancy & Credit Loss | $0 | $0 | ($1,369,905)(6) | ($2.79) |
| Effective Gross Income | $10,067,516 | $16,467,745 | $26,246,146 | $53.48 |
| Real Estate Taxes | $1,235,056 | $1,394,963 | $1,382,528 | $2.82 |
| Insurance | $147,780 | $396,405 | $423,541 | $0.86 |
| Other Operating Expenses | $3,239,903 | $3,794,474 | $4,844,283 | $9.87 |
| Total Expenses | $4,622,739 | $5,585,842 | $6,650,351 | $13.55 |
| Net Operating Income | $5,444,777 | $10,881,903 | $19,595,795 | $39.93 |
| Capital Expenditures | $0 | $0 | $98,161 | $0.20 |
| TI/LC | $0 | $0 | $490,807 | $1.00 |
| Net Cash Flow | $5,444,777 | $10,881,903 | $19,006,826 | $38.73 |
| Occupancy % | 56.7% | 64.2% | 97.3%(6) | |
| NOI DSCR(7) | 0.88x | 1.75x | 3.16x | |
| NCF DSCR(7) | 0.88x | 1.75x | 3.06x | |
| NOI Debt Yield(7) | 2.8% | 5.6% | 10.0% | |
| NCF Debt Yield(7) | 2.8% | 5.6% | 9.7% | |
| (1) | Occupancy in 2016 ranged from 12.8% to 39.2% and accordingly the operating history for the period prior to 2017 was not considered relevant to underwriting and was not obtained from the borrower sponsor. |
| (2) | The increase in Gross Potential Base Rent and Net Operating Income from 2017 to 2018 was driven by 5 new leases totaling 23.2% of underwritten base rent commencing between April 2017 and June 2018. |
| (3) | The increase in Gross Potential Base Rent and Net Operating Income from 2018 to UW was driven by leases with 4 new tenants totaling 37.5% of underwritten base rent. UW includes credit for three tenants totaling 35.7% of underwritten base rent that have executed leases but have not yet taken occupancy or commenced paying rent (see “The Property” section above for further details). |
| (4) | UW Gross Potential Base Rent PSF and UW Gross Potential Base Rent include contractual rent steps through September 2020 totaling $415,805. |
| (5) | Represents straight-line rent averaging over the lesser of the remaining lease terms or the loan term for investment grade tenants Disney ($794,074), Vubiquity, Inc. ($160,716) and Union Bank of California ($19,268). |
| (6) | The underwritten economic vacancy is 6.0%. The Tower at Burbank Property was 97.3% leased as of July 1, 2019. |
| (7) | The debt service coverage ratios and debt yields are based on The Tower at Burbank Whole Loan. |
Escrows and Reserves.
Real Estate Taxes – Upon the occurrence and continuance of a Cash Trap Event Period (see “Lockbox and Cash Management” section), The Tower at Burbank Whole Loan documents require ongoing monthly real estate tax reserves in an amount equal to 1/12 of the real estate taxes that the lender estimates will be payable during the next 12 months.
Insurance – Upon the occurrence and continuance of a Cash Trap Event Period, The Tower at Burbank Whole Loan documents require ongoing monthly insurance reserves in an amount equal to 1/12 of the insurance premiums that the lender estimates will be payable for the renewal of the coverage during the next 12 months, provided, that so long as no event of default is continuing, to the extent insurance is maintained by The Tower at Burbank Borrower under one or more blanket policies reasonably acceptable to the lender, The Tower at Burbank Borrower is not required to make ongoing monthly insurance reserve deposits applicable to such blanket policy.
Replacement Reserve – Upon the occurrence and continuance of a Cash Trap Event Period, The Tower at Burbank Whole Loan documents require ongoing monthly replacement reserves (or letter of credit in lieu thereof) equal to one-twelfth of the aggregate square footage of The Tower at Burbank Property multiplied by $0.25 (currently $10,225), subject to a cap of the aggregate square footage of The Tower at Burbank Property multiplied by $0.25 (currently $122,702).
Rollover Reserve – Upon the occurrence and continuance of a Cash Trap Event Period, The Tower at Burbank Whole Loan documents require ongoing monthly rollover reserves (or letter of credit in lieu thereof) equal to one-twelfth of the aggregate square footage of The Tower at Burbank Property multiplied by $1.00 (currently $40,901), subject to a cap of the aggregate square footage of The Tower at Burbank Property multiplied by $1.00 (currently $490,807).
Existing TI/LC Obligations Reserve – The Tower at Burbank Borrower deposited an upfront reserve of $15,934,738 for outstanding tenant improvement and leasing commission obligations attributable to the 12-month period following loan origination related to certain tenants at The Tower at Burbank Property.
This is not a research report and was not prepared by the Underwriters’ research department. Please see additional important information and qualifications at the end of this Term Sheet.
T-73
| Office – CBD | Loan #5 | Cut-off Date Balance: | $70,000,000 | |
| 3900 West Alameda Avenue | The Tower at Burbank | Cut-off Date LTV: | 62.1% | |
| Burbank, CA 91505 | UW NCF DSCR: | 3.06x | ||
| UW NOI Debt Yield: | 10.0% |
Free Rent Obligations Guaranty – In lieu of an upfront deposit of outstanding free rent under certain leases at The Tower at Burbank Property, the Guarantor delivered to the lender a free rent guaranty in the amount of outstanding free rent obligations related to 9 leases (totaling $8,917,465 at the time of loan origination, which includes $4,684,757 related to the Disney free rent period). Upon the occurrence and during the continuance of an event of default, the Guarantor is required to deposit the amount due on the outstanding free rent obligations into the cash management subaccount, and such funds are required to be applied by the lender in accordance with The Tower at Burbank Whole Loan documents. The amount of the unfunded free rent obligations covered by the Free Rent Obligations Guaranty are required to be reduced, on a monthly basis, pursuant to the free rent disbursement schedule in The Tower at Burbank Whole Loan documents.
Lockbox and Cash Management. The Tower at Burbank Whole Loan is structured with a hard lockbox, which is already in place, and springing cash management. The Tower at Burbank Borrower is required to direct tenants to pay rent directly into such lockbox account and all rents received directly by The Tower at Burbank Borrower or the property manager are required to be deposited into the lockbox account within two business days of receipt. Prior to the occurrence of a Cash Trap Event Period, all funds in the lockbox account are required to be distributed to The Tower at Burbank Borrower. During a Cash Trap Event Period, funds in the lockbox account are required to be swept on each business day to a lender-controlled cash management account. Any excess cash flow remaining after satisfaction of the waterfall items outlined in the loan documents is required to be swept to an excess cash flow subaccount controlled by the lender as additional security for The Tower at Burbank Whole Loan during the continuance of the Cash Trap Event Period.
In lieu of The Tower at Burbank Borrower depositing any excess cash flow into the lender-controlled excess cash flow subaccount, so long as no event of default has occurred and is continuing, The Tower at Burbank Borrower has the right to cause the Guarantor to deliver to the lender an excess cash flow guaranty with a guaranteed liability amount equal to (x) the aggregate amount of excess cash flow disbursed to The Tower at Burbank Borrower in lieu of being deposited into the excess cash flow subaccount less (y) the aggregate amount of excess cash flow The Tower at Burbank Borrower actually spends for items permitted under The Tower at Burbank Whole Loan documents, provided that, among other requirements outlined in The Tower at Burbank Whole Loan documents, (i) such excess cash flow guaranty is required to be accompanied by a legal opinion concerning the validity, authority, execution and enforceability of such excess cash flow guaranty which may be relied upon by the lender and the rating agencies and (ii) to the extent that the amounts guaranteed under the excess cash flow guaranty equal or exceed 15% of the outstanding principal balance of The Tower at Burbank Whole Loan, such excess cash flow guaranty is required to be accompanied by an additional insolvency opinion reasonably acceptable to the lender and the rating agencies.
A “Cash Trap Event Period” will commence upon the earlier of the following:
| (i) | the occurrence of an event of default under The Tower at Burbank Whole Loan documents; |
| (ii) | The Tower at Burbank Borrower or the TRS Entity (see“The Borrower and the Borrower Sponsor” section) filing, as a debtor, a bankruptcy or similar insolvency proceeding, or otherwise becoming involved, as a debtor, in a bankruptcy or any similar insolvency proceeding (collectively, a “Bankruptcy Action”); or |
| (iii) | the net operating income debt service coverage ratio (“NOI DSCR”) falling below 1.20x for two consecutive calendar quarters. |
A Cash Trap Event Period will end upon the occurrence of the following:
| ● | with regard to clause (i), the cure of such event of default; |
| ● | with regard to clause (ii), in the event of the respective Bankruptcy Action not being consented to by The Tower at Burbank Borrower, TRS Entity or any SPE constituent entity, the respective Bankruptcy Action being discharged, stayed or dismissed within 90 days of its filing; or |
| ● | with regard to clause (iii), (x) the NOI DSCR being greater than or equal to 1.20x for two consecutive calendar quarters or (y) The Tower at Burbank Borrower prepaying The Tower at Burbank Whole Loan (with any applicable yield maintenance premium) in an amount sufficient such that the NOI DSCR is greater than or equal to 1.20x. |
Additional Secured Indebtedness (not including trade debts).The Tower at Burbank Property also secures The Tower at Burbank Non-ServicedPari Passu Companion Loans, which have an aggregate Cut-off Date principal balance of $125,000,000. The Tower at Burbank Non-ServicedPari Passu Companion Loans accrue interest at the same rate as The Tower at Burbank Mortgage Loan. The Tower at Burbank Mortgage Loan is entitled to payments of principal and interest on apro rata andpari passu basis with The Tower at Burbank Non-ServicedPari Passu Companion Loans. The holders of The Tower at Burbank Mortgage Loan and The Tower at Burbank Non-ServicedPari Passu Companion Loans have entered into a co-lender agreement which sets forth the allocation of collections on The Tower at Burbank Whole Loan. See “Description of the Mortgage Pool—The Whole Loans—The Non-Serviced Pari Passu Whole Loans” in the Preliminary Prospectus.
Mezzanine Loan and Preferred Equity. Not permitted.
Release of Property.The Tower at Burbank Borrower may obtain the release of one or more parcels of unimproved non-income producing land located at The Tower at Burbank Property for which no value was attributed in the appraisal obtained as of loan origination, provided that, among other things, and in accordance with The Tower at Burbank Whole Loan documents, including REMIC related conditions, (i) no event of default has occurred and is continuing and (ii) The Tower at Burbank Borrower is required to pay all costs and expenses incurred by the lender in connection with the release.
Ground Lease. None.
Letter of Credit. None.
Terrorism Insurance.The Tower at Burbank Whole Loan documents require that the “all risk” insurance policy required to be maintained by The Tower at Burbank Borrower provide coverage for terrorism in an amount equal to the full replacement cost of The Tower at Burbank Property, as well as business interruption insurance covering no less than the 18-month period following the occurrence of a casualty event, together with a 12-month extended period of indemnity (provided that if TRIPRA or a similar statute is not in effect, The Tower at Burbank Borrower will not be obligated to pay terrorism insurance premiums in excess of two times the premium for the casualty and business interruption coverage on a stand-alone basis).
This is not a research report and was not prepared by the Underwriters’ research department. Please see additional important information and qualifications at the end of this Term Sheet.
T-74
(THIS PAGE INTENTIONALLY LEFT BLANK)
T-75
| Office – CBD | Loan #6 | Cut-off Date Balance: | $60,500,000 | |
| 105 East 17thStreet | 105 East 17th Street | Cut-off Date LTV: | 73.3% | |
| New York, NY 10003 | U/W NCF DSCR: | 2.02x | ||
| U/W NOI Debt Yield: | 6.5% |
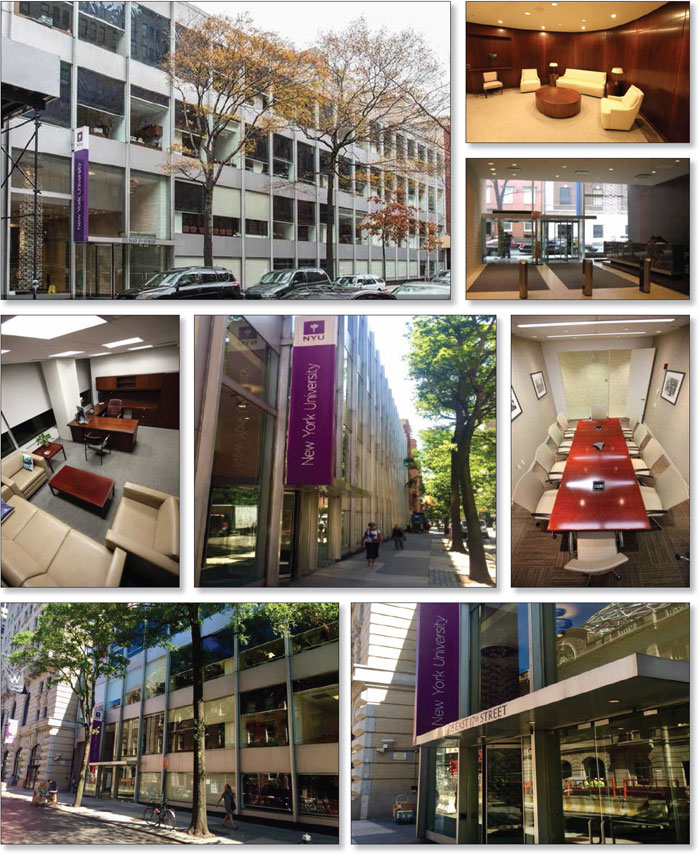
This is not a research report and was not prepared by the Underwriters’ research department. Please see additional important information and qualifications at the end of this Term Sheet.
T-76
| Office – CBD | Loan #6 | Cut-off Date Balance: | $60,500,000 | |
| 105 East 17thStreet | 105 East 17th Street | Cut-off Date LTV: | 73.3% | |
| New York, NY 10003 | U/W NCF DSCR: | 2.02x | ||
| U/W NOI Debt Yield: | 6.5% |
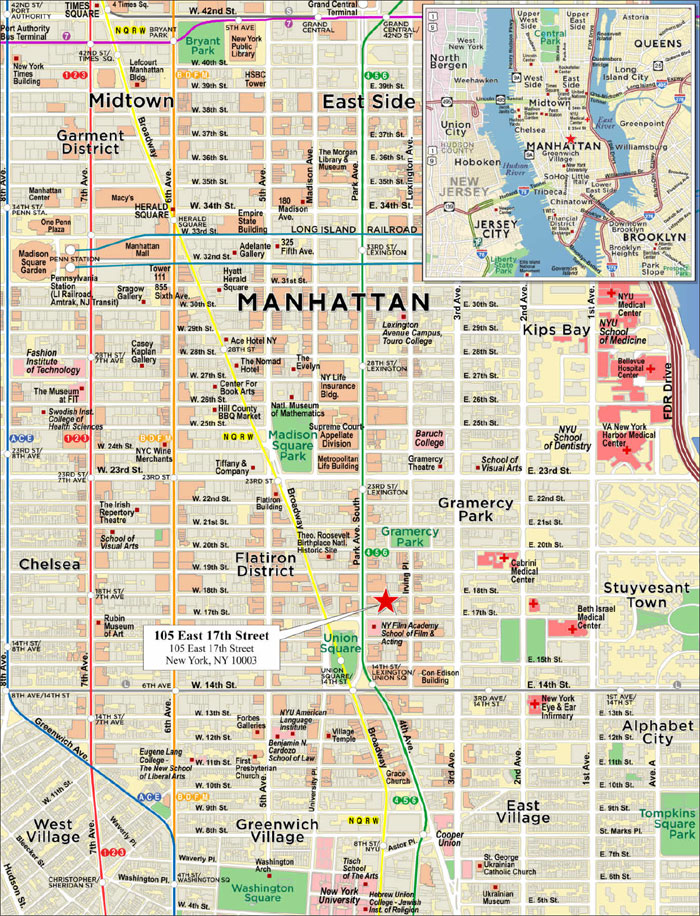
This is not a research report and was not prepared by the Underwriters’ research department. Please see additional important information and qualifications at the end of this Term Sheet.
T-77
| Mortgage Loan No. 6 – 105 East 17th Street |
| Mortgage Loan Information | Property Information | ||||||
| Mortgage Loan Seller: | MSMCH | Single Asset/Portfolio: | Single Asset | ||||
| Credit Assessment (DBRS/Fitch/S&P): | NR/NR/NR | Location: | New York, NY 10003 | ||||
| Original Balance(1): | $60,500,000 | General Property Type: | Office | ||||
| Cut-off Date Balance(1): | $60,500,000 | Detailed Property Type: | CBD | ||||
| % of Initial Pool Balance: | 5.1% | Title Vesting: | Fee | ||||
| Loan Purpose: | Refinance | Year Built/Renovated: | 1960/2008 | ||||
| Borrower Sponsor: | The Related Companies, L.P. | Size: | 125,000 SF | ||||
| Guarantor: | The Related Companies, L.P. | Cut-off Date Balance Per SF(1): | $880 | ||||
| Mortgage Rate: | 3.1600% | Maturity Date Balance Per SF(1): | $880 | ||||
| Note Date: | 8/22/2019 | Property Manager: | Related Management | ||||
| First Payment Date: | 10/5/2019 | Company, L.P. | |||||
| Maturity Date: | 9/5/2029 | (borrower-related) | |||||
| Original Term to Maturity: | 120 months | Underwriting and Financial Information | |||||
| Original Amortization Term: | 0 months | UW NOI: | $7,139,429 | ||||
| IO Period: | 120 months | UW NOI Debt Yield(1): | 6.5% | ||||
| Seasoning: | 1 month | UW NOI Debt Yield at Maturity(1): | 6.5% | ||||
| Prepayment Provisions: | LO (25); DEF/YM1 (90); O (5) | UW NCF DSCR(1): | 2.02x | ||||
| Lockbox/Cash Mgmt Status: | Hard/Springing | Most Recent NOI(4): | N/A | ||||
| Additional Debt Type(1)(2): | Pari Passu | 2nd Most Recent NOI(4): | N/A | ||||
| Additional Debt Balance(1)(2): | $49,500,000 | 3rd Most Recent NOI(4): | N/A | ||||
| Future Debt Permitted (Type): | No (N/A) | Most Recent Occupancy(4): | 100.0% (10/1/2019) | ||||
| 2nd Most Recent Occupancy(4): | 100.0% (12/31/2018) | ||||||
| 3rd Most Recent Occupancy(4): | 100.0% (12/31/2017) | ||||||
| Reserves(3) | Appraised Value (as of): | $150,000,000 (7/25/2019) | |||||
| Type | Initial | Monthly | Cap | Appraised Value per SF: | $1,200 | ||
| RE Tax: | $0 | Springing | N/A | Cut-off Date LTV Ratio(1): | 73.3% | ||
| Insurance: | $0 | Springing | N/A | Maturity Date LTV Ratio(1): | 73.3% | ||
| Sources and Uses | ||||||
| Sources | Proceeds | % of Total | Uses | Proceeds | % of Total | |
| Whole Loan Amount(1): | $110,000,000 | 100.0% | Loan Payoff: | $36,142,395 | 32.9% | |
| Return of Equity: | $71,210,296 | 64.7% | ||||
| Closing Costs: | $2,647,309 | 2.4% | ||||
| Total Sources: | $110,000,000 | 100.0% | Total Uses: | $110,000,000 | 100.0% | |
| (1) | The Cut-off Date Balance per SF, Maturity Date Balance per SF, UW NOI Debt Yield, UW NOI Debt Yield at Maturity, UW NCF DSCR, Cut-off Date LTV Ratio and Maturity Date LTV Ratio numbers presented above are based on the aggregate principal balance of the promissory notes comprising the 105 East 17th Street Whole Loan (as defined below). The 105 East 17th Street Whole Loan was co-originated by Morgan Stanley Bank, N.A. (“MSBNA”), an affiliate of MSMCH, and DBR Investments Co. Limited (“DBRI”) on August 22, 2019. |
| (2) | See “The Mortgage Loan” and “Additional Secured Indebtedness (not including trade debts)” below for a discussion of additional indebtedness. |
| (3) | See “Escrows and Reserves” below for further discussion of reserve requirements. |
| (4) | New York University (“NYU”) took occupancy of the 105 East 17th Street Property in 2012 under a sublease from Zurich Capital Markets, Inc., which has a lease expiring in October 2019. NYU has executed a direct lease commencing in November 2019. Accordingly, historical NOI is not available and historical occupancy percentages are based on NYU’s physical occupancy during its sublease. |
The Mortgage Loan. The sixth largest mortgage loan (the “105 East 17th Street Mortgage Loan”) is part of a whole loan (the “105 East 17th Street Whole Loan”) evidenced by twopari passu promissory notes in the aggregate original principal balance of $110,000,000, both of which are secured by a first priority mortgage encumbering an office building located in New York, New York (the “105 East 17th Street Property”). The 105 East 17th Street Whole Loan was co-originated by MSBNA and DBRI on August 22, 2019. Promissory Note A-1, in the original principal balance of $60,500,000, represents the controlling interest in the 105 East 17th Street Whole Loan and will be included in the BANK 2019-BNK21 securitization trust. Promissory Note A-2, in the original principal balance of $49,500,000, represents the non-controlling interest in the 105 East 17th Street Whole Loan (the “105 East 17th Street ServicedPari Passu Companion Loan”), and is expected to be contributed to the GSMS 2019-GC42 securitization trust. The 105 East 17th Street Mortgage Loan will be serviced pursuant to the pooling and servicing agreement for the BANK 2019-BNK21 securitization trust. See “Description of the Mortgage Pool—The Whole Loans—The Serviced Pari Passu Whole Loans” and “Pooling and Servicing Agreement” in the Preliminary Prospectus.
This is not a research report and was not prepared by the Underwriters’ research department. Please see additional important information and qualifications at the end of this Term Sheet.
T-78
| Office – CBD | Loan #6 | Cut-off Date Balance: | $60,500,000 | |
| 105 East 17thStreet | 105 East 17th Street | Cut-off Date LTV: | 73.3% | |
| New York, NY 10003 | U/W NCF DSCR: | 2.02x | ||
| U/W NOI Debt Yield: | 6.5% |
| 105 East 17th Street Whole Loan Summary | ||||
| Note | Original Balance | Cut-off Date Balance | Anticipated Note Holder | Controlling Piece |
| A-1 | $60,500,000 | $60,500,000 | BANK 2019-BNK21 | Yes |
| A-2 | $49,500,000 | $49,500,000 | GSMS 2019-GC42 | No |
| Total | $110,000,000 | $110,000,000 | ||
The Borrower and the Borrower Sponsor.The borrower is 105 East 17th Street Associates, L.L.C. (the “105 East 17th Street Borrower”), a single-purpose Delaware limited liability company that is approximately 72.0% owned by The Related Companies, L.P. (“Related”). Related is the borrower sponsor and non-recourse carveout guarantor.Founded more than 40 years ago, Related is a real estate company with experience in development, acquisitions, management, finance, fund management, marketing, and sales. Related owns and manages a portfolio of assets, which consist of a diversified mix of properties including 32 luxury rental buildings with over 13,000 apartments, over 30 million square feet of commercial space, 5,500 luxury condominium residences and approximately 60,000 affordable and workforce housing units located throughout the United States.
The Property.The 105 East 17th Street Property is a three-story office property, totaling 125,000 SF, situated on a 0.65-acre site in New York, New York. NYU has occupied 100.0% of the 105 East 17th Street Property since 2012 through a sublease from Zurich Capital Markets, Inc. expiring in October 2019 and has entered into a direct lease commencing in November 2019 and ending in October 2051, with one, five-year renewal option. NYU has no termination or contraction options available. Since its founding in 1831, NYU has become one of the largest private universities in the United States. NYU has a faculty of more than 3,600 full-time members and enrollment of over 50,000 students. The 105 East 17th Street Property houses NYU’s office of the comptroller and the administrative offices for the human resources and scholarship departments.
The following table presents a summary regarding the major tenants at the 105 East 17th Street Property:
| Tenant Summary(1) | |||||||||
| Tenant Name | Credit Rating (Fitch/Moody’s/S&P)(2) | Tenant SF | Approx. % of SF | Annual UW Rent | Annual UW Rent PSF(3) | Approx. % of Total Annual UW Rent | Lease Expiration | Term. Option | |
| NYU(3) | NR/Aa2/AA- | 125,000 | 100.0% | $6,457,500 | $51.66 | 100.0% | 10/31/2051 | N | |
| Subtotal/Wtd. Avg. | 125,000 | 100.0% | $6,457,500 | $51.66 | 100.0% | ||||
| Vacant Space | 0 | 0.0% | $0 | $0.00 | 0.0% | ||||
| Total/Wtd. Avg. | 125,000 | 100.0% | $6,457,500 | $51.66 | 100.0% | ||||
| (1) | Information is based on the underwritten rent roll. |
| (2) | Certain ratings are those of the parent company whether or not the parent guarantees the lease. |
| (3) | NYU took occupancy of the 105 East 17th Street Property in 2012 under a sublease from Zurich Capital Markets, Inc., which has a lease expiring in October 2019. NYU has executed a direct lease commencing in November 2019. |
The following table presents certain information relating to the lease rollover at the 105 East 17th Street Property:
| Lease Rollover Schedule(1) | ||||||||
| Year | # of Leases Rolling | SF Rolling | Approx. % of Total SF Rolling | Approx. Cumulative % of SF Rolling | Total UW Rent Rolling | Annual UW Rent PSF Rolling(3) | Approx. % of Total Rent Rolling | Approx. Cumulative % of Total Rent Rolling |
| 2019 | 0 | 0 | 0.0% | 0.0% | $0 | $0.00 | 0.0% | 0.0% |
| 2020 | 0 | 0 | 0.0% | 0.0% | $0 | $0.00 | 0.0% | 0.0% |
| 2021 | 0 | 0 | 0.0% | 0.0% | $0 | $0.00 | 0.0% | 0.0% |
| 2022 | 0 | 0 | 0.0% | 0.0% | $0 | $0.00 | 0.0% | 0.0% |
| 2023 | 0 | 0 | 0.0% | 0.0% | $0 | $0.00 | 0.0% | 0.0% |
| 2024 | 0 | 0 | 0.0% | 0.0% | $0 | $0.00 | 0.0% | 0.0% |
| 2025 | 0 | 0 | 0.0% | 0.0% | $0 | $0.00 | 0.0% | 0.0% |
| 2026 | 0 | 0 | 0.0% | 0.0% | $0 | $0.00 | 0.0% | 0.0% |
| 2027 | 0 | 0 | 0.0% | 0.0% | $0 | $0.00 | 0.0% | 0.0% |
| 2028 | 0 | 0 | 0.0% | 0.0% | $0 | $0.00 | 0.0% | 0.0% |
| 2029 | 0 | 0 | 0.0% | 0.0% | $0 | $0.00 | 0.0% | 0.0% |
| 2030 & Beyond | 1 | 125,000 | 100.0% | 100.0% | $6,457,500 | $51.66 | 100.0% | 100.0% |
| Vacant Space | 0 | 0 | 0.0% | 100.0% | $0 | $0.00 | 0.0% | 100.0% |
| Total/Wtd. Avg. | 1 | 125,000 | 100.0% | $6,457,500 | $51.66 | 100.0% | ||
| (1) | Information is based on the underwritten rent roll. |
This is not a research report and was not prepared by the Underwriters’ research department. Please see additional important information and qualifications at the end of this Term Sheet.
T-79
| Office – CBD | Loan #6 | Cut-off Date Balance: | $60,500,000 | |
| 105 East 17thStreet | 105 East 17th Street | Cut-off Date LTV: | 73.3% | |
| New York, NY 10003 | U/W NCF DSCR: | 2.02x | ||
| U/W NOI Debt Yield: | 6.5% |
The Market. The 105 East 17th Street Property is located in New York, New York with frontage along East 17th Street and East 18th Street. The 105 East 17th Street Property is in the Madison/Union Square submarket of the Midtown South office market of Manhattan. According to the appraisal, as of the second quarter of 2019, the vacancy rate in the Madison/Union Square submarket was approximately 7.5%, with average gross market asking rents of $81.02 PSF and inventory of approximately 32.1 million SF. According to the appraisal, as of the second quarter of 2019, the vacancy rate in the Midtown South office market was approximately 7.0%, with average gross market asking rents of $82.32 PSF and inventory of approximately 69.2 million SF. The appraisal concluded to a gross market rental rate of $90.00 PSF for floors two to four at the 105 East 17th Street Property and $80.00 PSF for the concourse level at the 105 East 17th Street Property. Additionally, based on NYU’s triple net lease, the appraisal concluded to an adjusted net market rent at the 105 East 17th Street Property of $56.80 PSF.
The following table presents recent leasing data at comparable office properties to the 105 East 17th Street Property:
| Comparable Lease Summary | |||||||
| Property/Location | Year Built | SF | Tenant Name | Lease Size (SF) | Lease Date | Lease Term (Yrs.) | Rent PSF(2) |
105 East 17th Street Property New York, NY | 1960 | 125,000 | NYU(1) | 125,000 | Nov. 2019 | 32.0 | $51.66 |
817 Broadway New York, NY | 1895 | 77,000 | SDC Capital | 9,942 | May 2019
| 7.0
| $105.00
|
200 Park Avenue South New York, NY | 1908 | 225,000 | Ultimate Software | 17,853
| Mar. 2019
| 10.0
| $85.00
|
104 Fifth Avenue New York, NY | 1906 | 250,671 | Red Ventures | 22,802
| Feb. 2019
| 10.0
| $99.00
|
315 Park Avenue South New York, NY | 1928 | 276,000 | Pitchbook | 17,050
| Jan. 2019
| 10.0
| $95.00
|
412 West 15th Street New York, NY | 2018 | 144,272 | Live Nation | 20,756
| June 2018
| 15.0
| $96.00
|
540 West 26th Street New York, NY | 2018 | 166,525 | RocNation | 67,100 | Apr. 2018
| 19.2 | $105.00
|
148 Lafayette Street New York, NY | 1930 | 129,200 | Charlotte Tilbury | 12,315
| Mar. 2018
| 10.0 | $80.00 |
315 Park Avenue South New York, NY | 1910 | 293,100 | Pitchbook Data Inc. | 34,100 | Jan. 2018 | 10.5 | $89.00
|
Source: Appraisal and underwritten rent roll.
| (1) | NYU took occupancy of the 105 East 17th Street Property in 2012 under a sublease from Zurich Capital Markets, Inc. which has a lease expiring in October 2019. NYU has executed a direct lease commencing in November 2019. |
| (2) | Rent PSF for the comparable properties is based on gross lease types. |
This is not a research report and was not prepared by the Underwriters’ research department. Please see additional important information and qualifications at the end of this Term Sheet.
T-80
| Office – CBD | Loan #6 | Cut-off Date Balance: | $60,500,000 | |
| 105 East 17thStreet | 105 East 17th Street | Cut-off Date LTV: | 73.3% | |
| New York, NY 10003 | U/W NCF DSCR: | 2.02x | ||
| U/W NOI Debt Yield: | 6.5% |
Underwritten Net Cash Flow. The following table presents certain information relating to the Underwritten Net Cash Flow at the 105 East 17th Street Property:
| Cash Flow Analysis(1) | ||
| UW | UW PSF | |
| Gross Potential Rent(2) | $7,070,782 | $56.57 |
| Total Recoveries | $1,012,115 | $8.10 |
| Other Income | $100,000 | $0.80 |
| Less Vacancy & Credit Loss | ($0) | ($0.00) |
| Effective Gross Income | $8,182,897 | $65.46 |
| Real Estate Taxes | $0 | $0.00 |
| Insurance | $0 | $0.00 |
| Other Expenses | $1,043,468 | $8.35 |
| Total Expenses | $1,043,468 | $8.35 |
| Net Operating Income | $7,139,429 | $57.12 |
| Capital Expenditures | $31,250 | $0.25 |
| Net Cash Flow | $7,108,179 | $56.87 |
| Occupancy % | 100.0% | |
| NOI DSCR(3) | 2.03x | |
| NCF DSCR(3) | 2.02x | |
| NOI Debt Yield(3) | 6.5% | |
| NCF Debt Yield(3) | 6.5% | |
| (1) | NYU took occupancy of the 105 East 17th Street Property in 2012 under a sublease from Zurich Capital Markets, Inc., which has a lease expiring in October 2019. NYU has executed a direct lease commencing in November 2019. Accordingly, historical operating information is not available. |
| (2) | UW Gross Potential Rent is based on the underwritten rent roll and includes straight line rent steps for NYU through the term of the 105 East 17th Street Whole Loan totaling $613,282. |
| (3) | Debt service coverage ratios and debt yields are based on the 105 East 17th Street Whole Loan. |
Escrows and Reserves.
Tax Funds – The 105 East 17th Street Whole Loan documents provide for monthly deposits into a real estate tax reserve in an amount equal to 1/12 of the annual real estate taxes that the lender estimates will be payable during the next twelve months;provided that such deposits will be reduced to account for the amounts paid by NYU, so long as the NYU Escrow Waiver Conditions (as defined below) are met and NYU is required to pay real estate taxes pursuant to the terms of its lease.
Insurance – The 105 East 17th Street Whole Loan documents provide for monthly deposits into an insurance reserve in an amount equal to 1/12 of the annual estimated insurance premiums; provided that such deposits (a) will be reduced to account for the amounts paid by NYU, so long as the NYU Escrow Waiver Conditions are met and NYU is required to pay the insurance premiums; and (b) will be suspended so long as (i) the 105 East 17th Street Property is not located in a “special flood hazard area”, (ii) the insurance premiums are maintained pursuant to blanket insurance policies meeting the requirements of the 105 East 17th Street Whole Loan documents (and at lender’s request, the 105 East 17th Street Borrower provides satisfactory evidence of payment of such insurance premiums), (iii) the insurance premiums are prepaid one year in advance (or such shorter period for which insurance certificates were delivered at origination), and (iv) no event of default is continuing.
“NYU Escrow Waiver Conditions” means (a) NYU is not in monetary default or material non-monetary default under the NYU lease or, prior to November 1, 2019, the NYU sublease, beyond all applicable notice and cure periods and (b) the NYU lease is in full force and effect.
Lockbox and Cash Management.The 105 East 17th Street Whole Loan is structured with a hard lockbox and springing cash management. The 105 East 17th Street Borrower is required to direct each tenant of the 105 East 17th Street Property to deposit funds directly into the lockbox account, and to deposit any funds received by the 105 East 17th Street Borrower and property manager, notwithstanding such direction, into the lockbox account within two business days of receipt.
Upon the first occurrence of a Cash Sweep Period (as defined below), the lender is required to establish, and the 105 East 17th Street Borrower is required to cooperate with the cash management bank to establish, a lender-controlled cash management account, into which all funds in the lockbox account will be required to be deposited within two business days, so long as a Cash Sweep Period is continuing. During the continuance of a Cash Sweep Period, provided no event of default is continuing, all funds in the cash management account are required to be applied on each monthly payment date: (i) to make the monthly deposits into the real estate tax and insurance reserves as described above under “Escrows and Reserves,” (ii) to pay debt service on the 105 East 17th Street Whole Loan, (iii) to pay operating expenses set forth in the annual budget (which is required to be approved by the lender) and lender-approved extraordinary expenses, and (iv) to deposit any remainder into an excess cash flow subaccount to be held as additional security for the 105 East 17th Street Whole Loan during such Cash Sweep Period. If no Cash Sweep Period exists, funds in the lockbox account are required to be disbursed to the 105 East 17th Street Borrower.
This is not a research report and was not prepared by the Underwriters’ research department. Please see additional important information and qualifications at the end of this Term Sheet.
T-81
| Office – CBD | Loan #6 | Cut-off Date Balance: | $60,500,000 | |
| 105 East 17thStreet | 105 East 17th Street | Cut-off Date LTV: | 73.3% | |
| New York, NY 10003 | U/W NCF DSCR: | 2.02x | ||
| U/W NOI Debt Yield: | 6.5% |
A “Cash Sweep Period” means a period:
| (i) | commencing upon an event of default under the 105 East 17th Street Whole Loan documents and ending if the lender accepts a cure of the event of default; or |
| (ii) | commencing upon the debt service coverage ratio on the 105 East 17th Street Whole Loan falling below 1.45x for two consecutive calendar quarters and ending on the date the debt service coverage ratio equals or exceeds 1.45x for one full calendar quarter; or |
| (iii) | commencing upon the occurrence of a Lease Sweep Period and ending upon such Lease Sweep Period being cured. |
A “Lease Sweep Period” means a period:
| (i) | commencing on the first monthly payment date following the occurrence of any of the following: (a) the occurrence of a bankruptcy, insolvency or similar event of the Lease Sweep Tenant (as defined below) or lease guarantor, (b) upon the occurrence of a monetary default by a Lease Sweep Tenant beyond any applicable notice and cure period, (c) the date that any Lease Sweep Tenant surrenders its space at the 105 East 17th Street Property, or (d) the date the 105 East 17th Street Borrower or property manager receives notice that the Lease Sweep Tenant is electing to terminate the Lease Sweep Lease (as defined below), or the date that the Lease Sweep Tenant actually terminates the Lease Sweep Lease, in each case prior to the then current expiration date, and |
| (ii) | ending upon the first to occur of the following: (a) in case of clause (i)(a) above, (x) with regard to a bankruptcy, insolvency or similar event of Lease Sweep Tenant, (1) the Lease Sweep Lease has been assumed by the Lease Sweep Tenant without any negative material change in the economics, scope or duration of such Lease Sweep Lease and a plan of reorganization has been confirmed as to the Lease Sweep Tenant and the effective date of such plan has occurred, or (2) the applicable Lease Sweep Lease has been assigned to and assumed by an unaffiliated third party assignee pursuant to an assignment approved in the applicable bankruptcy or insolvency proceeding by a non-appealable court order and a guaranty of the Lease Sweep Lease has been executed by a replacement guarantor, (y) with regard to a bankruptcy, insolvency or similar event of the guarantor, (1) the Lease Sweep Lease remains and has remained in full force and effect, and no material monetary or material non-monetary defaults are continuing beyond any applicable notice and cure period (other than the bankruptcy, insolvency or similar event of the Lease Sweep Tenant, provided that in such case the foregoing clause (x) must be satisfied), and a plan of reorganization has been confirmed as to the guarantor of the Lease Sweep Lease and the effective date of such plan has occurred, or (2) the applicable Lease Sweep Lease has been assigned to and assumed by an unaffiliated third party assignee pursuant to an assignment approved in the applicable bankruptcy or insolvency proceeding by a non-appealable court order and a replacement guaranty of the Lease Sweep Lease has been executed by a replacement guarantor, and (z) the related bankruptcy proceeding has been dismissed or discharged within 90 days of the filing; (b) in the case of clause (i)(b) above, a cure by the Lease Sweep Tenant of the applicable default under its Lease Sweep Lease; and (c) in the case of clauses (i)(c) and (i)(d) above, (x) the debt service coverage ratio equals at least 1.45x and (y) 75% or more of the Lease Sweep Lease space is leased pursuant to one or more replacement leases with a replacement tenant reasonably acceptable to the lender and on terms and conditions acceptable to the lender, which are in full force and effect and in the lender’s reasonable judgment, all leasing expenses incurred by the 105 East 17th Street Borrower in leasing the Lease Sweep Lease space pursuant to such replacement leases, free rent periods and/or rent abatement periods set forth in all such replacement leases and all other landlord obligations of an inducement nature required to be performed by the 105 East 17th Street Borrower with respect to such replacement leases have been completed or paid in full. |
A “Lease Sweep Lease” means the NYU lease (and any guaranties thereof) and any replacement lease covering all or substantially all the space currently demised under the NYU lease (and any guaranties thereof).
A “Lease Sweep Tenant” means a tenant under a Lease Sweep Lease.
Additional Secured Indebtedness (not including trade debts).In addition to the 105 East 17th Street Mortgage Loan, the 105 East 17th Street Property also secures the 105 East 17th Street ServicedPari Passu Companion Loan, which has a Cut-off Date principal balance of $49,500,000. The 105 East 17th Street ServicedPari Passu Companion Loan accrues interest at the same rate as the 105 East 17th Street Mortgage Loan. The 105 East 17th Street Mortgage Loan is entitled to payments of interest and principal on apro rata andpari passu basis with the 105 East 17th Street ServicedPari Passu Companion Loan. The holders of the 105 East 17th Street Mortgage Loan and the 105 East 17th Street ServicedPari Passu Companion Loan have entered into a co-lender agreement which sets forth the allocation of collections on the 105 East 17th Street Whole Loan. See “Description of the Mortgage Pool—The Whole Loans—The Serviced Pari Passu Whole Loans” in the Preliminary Prospectus.
Mezzanine Loan and Preferred Equity.Not permitted.
Release of Property.Not permitted.
Letter of Credit.None.
Right of First Offer/Right of First Refusal.None.
Terrorism Insurance.The 105 East 17th Street Borrower is required to obtain and maintain an “all risk” property insurance policy that covers perils of terrorism and acts of terrorism in an amount equal to the “full replacement cost” of the 105 East 17th Street Property together with business income insurance covering no less than the 18-month period commencing at the time of loss, together with an extended period of indemnity endorsement of not less than six months. Notwithstanding the foregoing, for so long as the Terrorism Risk Insurance Act of 2002, as extended and modified by the Terrorism Risk Insurance Program Reauthorization Act of 2015 (“TRIPRA”) is in effect (including any extensions thereof or if another federal governmental program is in effect relating to “acts of terrorism” which provides substantially similar protections as TRIPRA), and covers both domestic and foreign acts of terrorism, the lender is required to accept terrorism insurance which insures against “covered acts” as defined by TRIPRA (or such other program). See “Risk Factors—Risks Relating to the Mortgage Loans—Terrorism Insurance May Not Be Available for All Mortgaged Properties” in the Preliminary Prospectus.
This is not a research report and was not prepared by the Underwriters’ research department. Please see additional important information and qualifications at the end of this Term Sheet.
T-82
(THIS PAGE INTENTIONALLY LEFT BLANK)
T-83
Office – Suburban | Loan #7 | Cut-off Date Balance: |
| $50,000,000 |
7900 Tysons One Place | Tysons Tower | Cut-off Date LTV: |
| 52.1% |
McLean, VA 22102 |
| UW NCF DSCR: |
| 3.06x |
|
| UW NOI Debt Yield: |
| 11.0% |

This is not a research report and was not prepared by the Underwriters’ research department. Please see additional important information and qualifications at the end of this Term Sheet.
T-84
Office – Suburban | Loan #7 | Cut-off Date Balance: |
| $50,000,000 |
7900 Tysons One Place | Tysons Tower | Cut-off Date LTV: |
| 52.1% |
McLean, VA 22102 |
| UW NCF DSCR: |
| 3.06x |
|
| UW NOI Debt Yield: |
| 11.0% |
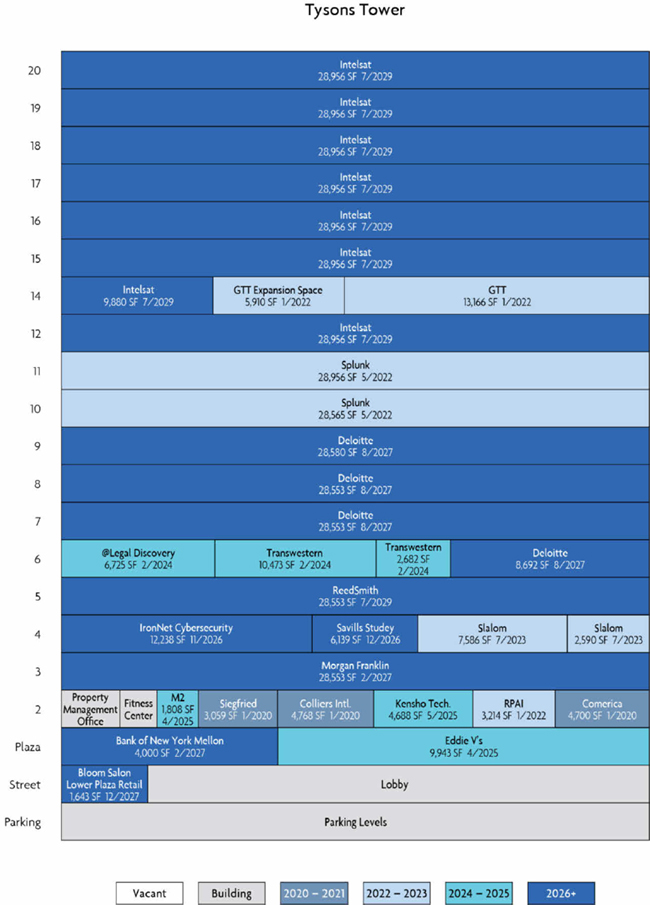
This is not a research report and was not prepared by the Underwriters’ research department. Please see additional important information and qualifications at the end of this Term Sheet.
T-85
Office – Suburban | Loan #7 | Cut-off Date Balance: |
| $50,000,000 |
7900 Tysons One Place | Tysons Tower | Cut-off Date LTV: |
| 52.1% |
McLean, VA 22102 |
| UW NCF DSCR: |
| 3.06x |
|
| UW NOI Debt Yield: |
| 11.0% |

This is not a research report and was not prepared by the Underwriters’ research department. Please see additional important information and qualifications at the end of this Term Sheet.
T-86
Mortgage Loan No. 7 – Tysons Tower |
|
|
|
|
|
|
|
Mortgage Loan Information |
| Property Information | ||||
Mortgage Loan Seller: | WFB |
| Single Asset/Portfolio: | Single Asset | ||
Credit Assessment (DBRS/Fitch/S&P): | NR/NR/NR |
| Location: | McLean, VA 22102 | ||
Original Balance(1): | $50,000,000 |
| General Property Type: | Office | ||
Cut-off Date Balance(1): | $50,000,000 |
| Detailed Property Type: | Suburban | ||
% of Initial Pool Balance: | 4.2% |
| Title Vesting: | Fee | ||
Loan Purpose: | Recapitalization |
| Year Built/Renovated: | 2014/N/A | ||
Borrower Sponsors: | The Macerich Partnership, L.P.; Alaska Permanent Fund Corporation |
| Size: | 528,730 SF | ||
Guarantor: | N/A |
| Cut-off Date Balance per SF(1): | $359 | ||
Mortgage Rate: | 3.3300% |
| Maturity Balance per SF(1): | $359 | ||
Note Date: | 9/12/2019 |
| Property Manager: | Hines Interests Limited Partnership | ||
First Payment Date: | 11/11/2019 |
|
|
| ||
Maturity Date: | 10/11/2029 |
|
|
| ||
Original Term to Maturity: | 120 months |
| Underwriting and Financial Information | |||
Original Amortization Term: | 0 months |
| UW NOI: | $20,829,804 | ||
IO Period: | 120 months |
| UW NOI Debt Yield(1): | 11.0% | ||
Seasoning: | 0 months |
| UW NOI Debt Yield at Maturity(1): | 11.0% | ||
Prepayment Provisions(2): | LO (24); YM1 (91); O (5) |
| UW NCF DSCR(1): | 3.06x | ||
Lockbox/Cash Mgmt Status: | Hard/Springing |
| Most Recent NOI: | $21,702,519 (6/30/2019 TTM) | ||
Additional Debt Type(1): | Pari Passu |
| 2nd Most Recent NOI: | $20,965,668 (12/31/2018) | ||
Additional Debt Balance(1): | $140,000,000 |
| 3rd Most Recent NOI: | $17,880,418 (12/31/2017) | ||
Future Debt Permitted (Type): | No (N/A) |
| Most Recent Occupancy: | 100.0% (8/30/2019) | ||
Reserves(3) |
| 2nd Most Recent Occupancy: | 100.0% (12/31/2018) | |||
Type | Initial | Monthly | Cap |
| 3rd Most Recent Occupancy: | 98.4% (12/31/2017) |
RE Taxes: | $0 | Springing | N/A |
| Appraised Value (as of): | $365,000,000 (8/12/2019) |
Insurance: | $0 | Springing | N/A |
| Appraised Value per SF: | $690 |
Recurring Replacements: | $0 | Springing | $1,000,000 |
| Cut-off Date LTV Ratio(1): | 52.1% |
TI/LC: | $0 | Springing | $1,321,825 |
| Maturity Date LTV Ratio(1): | 52.1% |
|
|
|
|
|
|
|
Sources and Uses | ||||||
Sources | Proceeds | % of Total |
| Uses | Proceeds | % of Total |
Whole Loan Amount(1): | $190,000,000 | 100.0% |
| Return of Equity(4): | $188,546,123 | 99.2% |
|
|
|
| Closing Costs: | $1,453,877 | 0.8% |
Total Sources: | $190,000,000 | 100.0% |
| Total Uses: | $190,000,000 | 100.0% |
(1) | The Cut-off Date Balance per SF, Maturity Date Balance per SF, UW NOI Debt Yield, UW NOI Debt Yield at Maturity, UW NCF DSCR, Cut-off Date LTV Ratio and Maturity Date LTV Ratio numbers presented above are based on the Tysons Tower Whole Loan (as defined below). |
(2) | Prepayment of the Tysons Tower Whole Loan is permitted at any time after the earlier to occur of (a) the end of the two-year period commencing on the closing date of the securitization of the last promissory note representing a portion of the Tysons Tower Whole Loan to be securitized and (b) November 11, 2022 upon payment of the yield maintenance premium. The assumed prepayment lockout period of 24 payments is based on the closing date of this transaction in October 2019. |
(3) | See “Escrows and Reserves” below for further discussion of reserve requirements. |
(4) | The Tysons Tower Property (as defined below) was previously unencumbered. The borrower sponsors constructed the Tysons Tower Property (as defined below) in 2014 at a total cost of approximately $218.2 million ($413 per square foot). |
The Mortgage Loan. The seventh largest mortgage loan (the “Tysons Tower Mortgage Loan”) is part of a whole loan (the “Tysons Tower Whole Loan”) that is evidenced by seven pari passu promissory notes in the aggregate original principal amount of $190,000,000. The Tysons Tower Whole Loan is secured by a first priority fee mortgage encumbering a suburban office building located in McLean, Virginia (the “Tysons Tower Property”). The Tysons Tower Mortgage Loan is evidenced by the controlling promissory Note A-1 in the original principal amount of $50,000,000. The non-controlling promissory notes A-2, A-3, A-4, A-5, A-6 and A-7, in the aggregate original principal amount of $140,000,000 (collectively, the “Tysons Tower Serviced Pari Passu Companion Loans”), are currently held by Wells Fargo Bank, National Association (“WFB”) and JPMorgan Chase Bank, N.A. (“JPMCB”) and are expected to be contributed to future securitization trusts or may be otherwise transferred at any time. The Tysons Tower Whole Loan will be serviced pursuant to the pooling and servicing agreement for the BANK 2019-BNK21 securitization trust. See “Description of the Mortgage Pool—The Whole Loans—The Serviced Pari Passu Whole Loans” and “Pooling and Servicing Agreement” in the Preliminary Prospectus.
This is not a research report and was not prepared by the Underwriters’ research department. Please see additional important information and qualifications at the end of this Term Sheet.
T-87
Office – Suburban | Loan #7 | Cut-off Date Balance: |
| $50,000,000 |
7900 Tysons One Place | Tysons Tower | Cut-off Date LTV: |
| 52.1% |
McLean, VA 22102 |
| UW NCF DSCR: |
| 3.06x |
|
| UW NOI Debt Yield: |
| 11.0% |
|
|
|
|
|
Tysons Tower Whole Loan Summary | ||||
Note | Original Balance | Cut-off Date Balance | Note Holder | Controlling Piece |
A-1 | $50,000,000 | $50,000,000 | BANK 2019-BNK21 | Yes |
A-2 | $25,000,000 | $25,000,000 | WFB | No |
A-3 | $20,000,000 | $20,000,000 | WFB | No |
A-4 | $40,000,000 | $40,000,000 | JPMCB | No |
A-5 | $10,000,000 | $10,000,000 | JPMCB | No |
A-6 | $15,000,000 | $15,000,000 | JPMCB | No |
A-7 | $30,000,000 | $30,000,000 | JPMCB | No |
Total | $190,000,000 | $190,000,000 |
|
|
The Borrower and the Borrower Sponsors. The borrower is Tysons Corner Office I LLC (the “Tysons Tower Borrower”), a Delaware limited liability company and single purpose entity with two independent directors. The borrower sponsors are The Macerich Partnership, L.P. (“MPLP”) and Alaska Permanent Fund Corporation (“APFC”), which each have a 50.0% joint venture ownership interest in the Tysons Tower Borrower.
MPLP is an affiliate of The Macerich Company (“Macerich”) (NYSE: MAC) which maintained an equity market capitalization of approximately $4.7 billion as of June 30, 2019. Macerich is a self-administered and self-managed real estate investment trust involved in the acquisition, ownership, development, redevelopment, management, and leasing of regional and community shopping centers located throughout the United States. Macerich specializes in retail properties in many of the country’s most densely populated markets, with a significant presence on the West Coast, Arizona, Chicago and in the corridor from the greater New York metropolitan area to Washington D.C. As of June 30, 2019, Macerich had ownership interest in commercial real estate assets totaling approximately 51 million SF consisting primarily of 47 regional shopping centers, including the Tysons Corner Center super-regional mall located adjacent to the Tysons Tower Property (see “The Property” section).
APFC is a sovereign wealth fund created in 1980 by the Alaska Legislature and is the largest state-level fund of its kind in the United States. APFC’s investment strategy employs a combination of internally managed direct investments alongside externally-managed fund investments. Major asset classes include public equities, fixed-income, private equity, real estate, infrastructure, and absolute return strategies. As of June 30, 2019, APFC’s real estate portfolio included partial or complete ownership in 54 properties valued at approximately $4.1 billion. As of June 30, 2019, APFC had a total fund value of approximately $66.3 billion.
The Property. The Tysons Tower Property is a 20-story, 528,730 SF, Class A, LEED Gold certified suburban office building located in McLean, Virginia, approximately 11.4 miles west of Washington, D.C. The borrower sponsors constructed the Tysons Tower Property in 2014 at a total cost of approximately $218.2 million ($413 per square foot). Amenities at the Tysons Tower Property include a fitness center with locker rooms, a full service restaurant, covered bike storage, a rooftop garden with panoramic views of Washington, D.C. and the Blue Ridge Mountains, and 1,204 surface and garage parking spaces, resulting in a parking ratio of 2.3 spaces per 1,000 SF of net rentable area. As of August 30, 2019, the Tysons Tower Property was 100.0% occupied by 20 tenants.
The Tysons Tower Property is part of a three-building complex known as the Tysons Corner Campus, which also includes the 28-story Vita Apartments and the 300-room Hyatt Regency Tysons Corner hotel (each owned by affiliates of Macerich, but not part of the collateral for the Tysons Tower Whole Loan). The Tysons Corner Campus is connected via an elevated, 1.5-acre pedestrian plaza that features games, a children’s play area, outdoor common areas, as well as space to host concerts and events. The Tysons Corner Campus is also connected via an elevated walkway to the Macerich-owned, approximately 2.0 million SF Tysons Corner Center super-regional mall, which is located across the street from the Tysons Tower Property. With more than 300 shops, dining and entertainment options, Tysons Corner Center is one of the largest shopping centers in the United States. Major retailers at Tysons Corner Center include Nordstrom, Bloomingdale’s, Macy’s, Apple, Dyson, Uniqlo, American Girl, Louis Vuitton, Gucci, Michael Kors, Lacoste, and The Disney Store, among others.
Major Tenants.
Intelsat Global Service Corporation (212,572 SF, 40.2% of NRA; 41.5% of underwritten base rent, July 31, 2029 expiration). Intelsat Global Service Corporation (“Intelsat”) is a provider of global satellite services serving billions of people worldwide. Intelsat executed its lease at the Tysons Tower Property in July 2014 and was one of the first tenants to take occupancy in the building. Intelsat occupies floors 12 through 20 at the Tysons Tower Property, which serves as the company’s administrative headquarters. Intelsat has two renewal options with 18 months’ notice at the fair market rental rate at the maximum extension of 15 years (in the aggregate, at tenant’s discretion).
Deloitte, LLP (94,378 SF, 17.8% of NRA; 17.2% of underwritten base rent, August 31, 2027 expiration). Deloitte, LLP (“Deloitte”) provides clients with a broad range of audit and assurance, consulting, financial advisory, risk, and tax services. Deloitte executed its lease at the Tysons Tower Property in August 2014 and was one of the first tenants to take occupancy in the building. Deloitte originally occupied floors seven through nine, and exercised an expansion right for a portion of the sixth floor in 2019. Deloitte has the option to elect either (i) one, 10-year renewal option, or (ii) two, 5-year renewal options, each with 18 months’ notice at the fair market rental rate.
Splunk Inc. (57,521 SF, 10.9% of NRA; 11.9% of underwritten base rent, May 31, 2022 expiration). Splunk Inc. (“Splunk”) provides software solutions that enable organizations to gain real-time operational intelligence in the United States and internationally. Splunk serves cloud and online services, education, financial services, government, healthcare/pharmaceuticals, industrials/manufacturing, media/entertainment, retail/e-commerce, technology, and telecommunications industries. Splunk initially took occupancy in the eleventh floor in phases in November 2014 and May 2015, and expanded to occupy the tenth floor in December 2017. Splunk has one, 5-year option to renew with 10 months’ notice at the fair market rental rate.
This is not a research report and was not prepared by the Underwriters’ research department. Please see additional important information and qualifications at the end of this Term Sheet.
T-88
Office – Suburban | Loan #7 | Cut-off Date Balance: |
| $50,000,000 |
7900 Tysons One Place | Tysons Tower | Cut-off Date LTV: |
| 52.1% |
McLean, VA 22102 |
| UW NCF DSCR: |
| 3.06x |
|
| UW NOI Debt Yield: |
| 11.0% |
The following table presents certain information relating to the tenancy at the Tysons Tower Property:
|
|
|
|
|
|
|
|
|
Tenant Summary | ||||||||
Tenant Name | Credit Rating (Fitch/Moody’s/ S&P)(1) | Tenant SF | Approximate % of SF | Annual UW Rent(2) | % of Total Annual UW Rent | Annual UW Rent PSF(2) | Lease Expiration | Termination Option (Y/N) |
Intelsat | NR/NR/CCC+ | 212,572 | 40.2% | $12,430,903 | 41.5% | $58.48 | 7/31/2029(3) | N |
Deloitte | NR/NR/NR | 94,378 | 17.8% | $5,144,545 | 17.2% | $54.51 | 8/31/2027(4) | N |
Splunk | NR/NR/NR | 57,521 | 10.9% | $3,558,249 | 11.9% | $61.86 | 5/31/2022(5) | N |
Morgan Franklin(6) | NR/NR/NR | 28,553 | 5.4% | $1,591,259 | 5.3% | $55.73 | 2/28/2027(7) | Y(8) |
Reed Smith LLP | NR/NR/NR | 28,553 | 5.4% | $1,494,324 | 5.0% | $52.34 | 7/31/2029(9) | Y(10) |
Subtotal/Wtd. Avg. |
| 421,577 | 79.7% | $24,219,280 | 80.8% | $57.45 |
|
|
|
|
|
|
|
|
|
|
|
Other Tenants |
| 107,153 | 20.3% | $5,738,760 | 19.2% | $53.56 |
|
|
Vacant Space |
| 0 | 0.0% | $0 | 0.0% | $0.00 |
|
|
Total/Wtd. Avg. |
| 528,730 | 100.0% | $29,958,040 | 100.0% | $56.66 |
|
|
(1) | Certain ratings are those of the parent company whether or not the parent guarantees the lease. |
(2) | The Annual UW Rent and Annual UW Rent PSF shown above include rent steps through September 2020 totaling $751,235. The lender’s underwriting gives separate credit for straight-line rent averaging for Bank of NY Mellon, an investment grade tenant, over its remaining lease term totaling $18,013. The Annual UW Rent and Annual UW Rent PSF shown in the Tenant Summary table above do not include credit given for straight-line rent averaging for such investment grade tenant. |
(3) | Intelsat has two options to renew with 18 months’ notice at the fair market rental rate that, combined, permit a maximum of 15 years’ extension. |
(4) | Deloitte has the option to elect either (i) one, 10-year renewal option, or (ii) two, 5-year renewal options, each with 18 months’ notice at the fair market rental rate. |
(5) | Splunk has one, 5-year option to renew with 10 months’ notice at the fair market rental rate. |
(6) | Morgan Franklin subleases approximately 3,990 SF to BackOffice Associates, LLC at a base rental rate of $49.92 PSF through January 30, 2020. |
(7) | Morgan Franklin has one, 5-year option to renew with 12 months’ notice at the fair market rental rate. |
(8) | Morgan Franklin has the one-time right to terminate its lease effective February 28, 2024, with 12 months’ prior notice, subject to a termination fee equal to the then-unamortized amount of tenant improvements and leasing commissions, as of the effective date of termination. |
(9) | Reed Smith LLP has two, 5-year options to renew, each with 15 months’ notice at the fair market rental rate. |
(10) | Reed Smith LLP has the one-time right to terminate its lease effective August 1, 2027, with 15 months’ prior notice, subject to a termination fee equal to (i) three months of base rent and (ii) the then-unamortized amount of tenant improvements and leasing commissions, as of the effective date of termination. |
The following table presents certain information relating to the lease rollover schedule at the Tysons Tower Property:
|
|
|
|
|
|
|
|
|
Lease Rollover Schedule(1)(2) | ||||||||
Year | # of Leases Rolling | SF Rolling | Annual UW Rent PSF Rolling | Approx. % of Total SF Rolling | Approx. Cumulative % of SF Rolling | Total UW Rent Rolling | Approx. % of Total Rent Rolling | Approx. Cumulative % of Total Rent Rolling |
MTM | 1 | 1,821 | $0.00 | 0.3% | 0.3% | $0 | 0.0% | 0.0% |
2019 | 0 | 0 | $0.00 | 0.0% | 0.3% | $0 | 0.0% | 0.0% |
2020 | 0 | 0 | $0.00 | 0.0% | 0.3% | $0 | 0.0% | 0.0% |
2021 | 0 | 0 | $0.00 | 0.0% | 0.3% | $0 | 0.0% | 0.0% |
2022 | 6 | 79,811 | $59.35 | 15.1% | 15.4% | $4,736,831 | 15.8% | 15.8% |
2023 | 2 | 10,176 | $53.90 | 1.9% | 17.4% | $548,523 | 1.8% | 17.6% |
2024 | 3 | 19,880 | $55.09 | 3.8% | 21.1% | $1,095,158 | 3.7% | 21.3% |
2025 | 6 | 28,966 | $52.60 | 5.5% | 26.6% | $1,523,660 | 5.1% | 26.4% |
2026 | 3 | 18,377 | $56.78 | 3.5% | 30.1% | $1,043,433 | 3.5% | 29.9% |
2027 | 7 | 128,574 | $55.11 | 24.3% | 54.4% | $7,085,208 | 23.7% | 53.5% |
2028 | 0 | 0 | $0.00 | 0.0% | 54.4% | $0 | 0.0% | 53.5% |
2029 | 12 | 241,125 | $57.75 | 45.6% | 100.0% | $13,925,227 | 46.5% | 100.0% |
2030 & Beyond | 0 | 0 | $0.00 | 0.0% | 100.0% | $0 | 0.0% | 100.0% |
Vacant | 0 | 0 | $0.00 | 0.0% | 100.0% | $0 | 0.0% | 100.0% |
Total/Wtd. Avg. | 40 | 528,730 | $56.66 | 100.0% |
| $29,958,040 | 100.0% |
|
(1) | Information is based on the underwritten rent roll. |
(2) | Certain tenants may have lease termination options that are exercisable prior to the originally stated expiration date of the subject lease and that are not considered in the Lease Rollover Schedule. |
This is not a research report and was not prepared by the Underwriters’ research department. Please see additional important information and qualifications at the end of this Term Sheet.
T-89
Office – Suburban | Loan #7 | Cut-off Date Balance: |
| $50,000,000 |
7900 Tysons One Place | Tysons Tower | Cut-off Date LTV: |
| 52.1% |
McLean, VA 22102 |
| UW NCF DSCR: |
| 3.06x |
|
| UW NOI Debt Yield: |
| 11.0% |
The Market. The Tysons Tower Property is situated on the northwest corner of the intersection of Tysons One Place and Westpark Drive within the Tysons Corner submarket of McLean, Virginia. The Tysons Tower Property is situated approximately two blocks southeast of the Tysons Corner Metrorail station, which operates on the Silver Metro rail line that travels east-west through Washington D.C. The Tysons Corner Metrorail station was built as part of Phase I of the Dulles Corridor Metrorail project, an extension of the Metrorail system through Tysons Corner to Dulles International Airport and Loudoun County, which began operation in 2014. Additionally, the Tysons Tower Property is located adjacent to the Capital Beltway (Interstate-495) and Route 123 interchange, approximately 15.0 miles east of the Dulles International Airport, and approximately 13.1 miles west of the Ronald Reagan Washington Airport.
Tysons Corner is the largest office submarket in Northern Virginia, consisting of approximately 29.0 million square feet of office space. Several Fortune 500 companies have headquarters within the Tysons Corner submarket, including Freddie Mac, Capital One Financial, SAIC, Hilton Worldwide and Gannett. Tysons Corner also features over 5.7 million square feet of retail space including the aforementioned Tysons Corner Center super-regional mall as well as Tysons Galleria, which features Saks Fifth Avenue and Neiman Marcus. Residential uses in Tysons Corner feature numerous garden-style, mid-rise and high-rise apartment and condominium projects. Additionally, during the last 20 years, a significant number of luxury townhouse and single-family detached communities have been developed on in-fill parcels within and surrounding Tysons Corner. According to a third party market research provider, the estimated 2019 population within a three- and five-mile radius of the Tysons Tower Property was approximately 105,483 and 268,473, respectively; and the estimated 2019 average household income within the same radii was approximately $156,464 and $163,643, respectively.
According to a third-party market research report, the Tysons Tower Property is situated within the Tysons Corner submarket of the Washington D.C. office market. As of the second quarter of 2019, the Tysons Corner Class A submarket reported a total inventory of approximately 19.2 million SF with a 13.3% vacancy rate and average asking rent of $40.76 PSF, gross.
The following table presents certain information relating to the appraisal’s market rent conclusion for the Tysons Tower Property:
|
|
|
|
|
Market Rent Summary | ||||
| Upper Office (Floors 10-20) | Office (Floors 2-10) | Restaurant | Bank |
Market Rent (PSF) | $58.00 | $56.00 | $50.00 | $65.00 |
Lease Term (Years) | 10 | 8 | 10 | 10 |
Lease Type (Reimbursements) | Full Service(1) | Full Service(1) | Full Service(1) | NNN |
Rent Increase Projection | 2.75% per annum | 2.75% per annum | 3.00% per annum | 3.00% per annum |
|
|
|
(1) | The appraiser’s ‘Full Service’ designation assumes tenants reimburse the landlord for future increases over the base year. | |
The following table presents information relating to comparable office property sales for the Tysons Tower Property:
|
|
|
|
|
|
|
Comparable Property Sale Summary | ||||||
Property Name/ Location | Sale Date | Year Built/ Renovated | Total NRA (SF) | Occupancy | Sale Price | Sale Price PSF |
Tysons Tower Property 7900 Tysons One Place McLean, VA | N/A | 2014/N/A | 528,730 | 100.0% |
|
|
One Liberty Center 4075 North Randolph Street Arlington, VA | June 2019 | 2005/N/A | 319,327 | 100.0% | $151,200,000 | $473 |
2000 Duke 2000 Duke Street Alexandria, VA | Feb. 2019 | 1997/N/A | 156,746 | 100.0% | $75,000,000 | $478 |
Carlyle Overlook 2318 Mill Road Alexandria, VA | Sept. 2018 | 2008/N/A | 121,908 | 99.0% | $59,000,000 | $484 |
1300 North 17th 1300 North 17th Street Arlington, VA | Jan. 2018 | 1980/N/A | 397,724 | 95.0% | $250,000,000 | $629 |
Waterview 1919 North Lynn Street Rosslyn, VA | May 2017 | 2006/N/A | 633,908 | 99.0% | $460,000,000 | $726 |
Source:Appraisal |
This is not a research report and was not prepared by the Underwriters’ research department. Please see additional important information and qualifications at the end of this Term Sheet.
T-90
Office – Suburban | Loan #7 | Cut-off Date Balance: |
| $50,000,000 |
7900 Tysons One Place | Tysons Tower | Cut-off Date LTV: |
| 52.1% |
McLean, VA 22102 |
| UW NCF DSCR: |
| 3.06x |
|
| UW NOI Debt Yield: |
| 11.0% |
The following table presents certain information relating to comparable office leases for the Tysons Tower Property:
|
|
|
|
|
|
|
|
|
|
Comparable Leases Summary | |||||||||
Property Name/ Location | Year Built/ Renovated | Total GLA | Occupancy(1) | Distance | Tenant Name | Lease Date/ Term | Lease Area | Annual | Lease |
Tysons Tower Property(3) 7900 Tysons One Place McLean, VA | 2014/N/A | 528,730 | 100.0% | - |
|
|
|
|
|
The Loft 1640 Boro Place McLean, VA | 2019/N/A | 143,606 | 82.1% | 0.8 Miles | Spaces | May 2019 / 12.0 Yrs | 51,422 | $54.00 | Full Service |
Boro Tower 8350 Broad Street McLean, VA | 2019/N/A | 438,169 | 76.7% | 0.9 Miles | Alion Science & Technology | Jan. 2019 / 11.1 Yrs | 13,800 | $57.00 | Full Service |
Boro Tower 8350 Broad Street McLean, VA |
|
|
|
| Womble Bond Dickinson | Oct. 2018 / 10.0 Yrs | 24,239 | $59.00 | Full Service |
Boro Tower 8350 Broad Street McLean, VA |
|
|
|
| KPMG | Sept. 2018 / 15.0 Yrs | 168,399 | $52.50 | Full Service |
Boro Tower 8350 Broad Street McLean, VA |
|
|
|
| Hogan Lovells US LLP | July 2017 / 11.5 Yrs | 44,500 | $55.00 | Full Service |
Towers Crescent 1850 Towers Crescent Plaza McLean, VA | 2009/N/A | 295,031 | 99.1% | 0.4 Miles | MicroStrategy | Jan. 2018 / 13.0 Yrs | 213,060 | $47.50 | Full Service |
Reston Station 1900 Reston Metro Plaza Reston, VA | 2017/N/A | 368,413 | 46.4% | 8.0 Miles | Dec. 2018 / 12.0 Yrs | 90,000 | $47.00 | Full Service | |
Reston Town Center – 17Fifty(4) 1750 Presidents Street Reston, VA | 2020/N/A | 276,000 | 99.3% | 9.1 Miles | Leidos | Feb. 2018 / 10.3 Yrs | 276,000 | $55.00 | Full Service |
1812 North Moore 1812 North Moore Street Arlington, VA | 2013/N/A | 539,552 | 62.2% | 9.3 Miles | Ablevets | Oct. 2018 / 11.0 Yrs | 8,261 | $55.00 | Full Service |
1812 North Moore 1812 North Moore Street Arlington, VA |
|
|
|
| Nestle USA | Feb. 2017 / 15.0 Yrs | 205,251 | $60.00 | Full Service |
Central Place Tower 1201 Wilson Boulevard Arlington, VA | 2018/N/A | 552,540 | 92.9% | 9.3 Miles | WeWork | Dec. 2018 / 16.0 Yrs | 83,294 | $63.00 | Full Service |
Central Place Tower 1201 Wilson Boulevard Arlington, VA |
|
|
|
| Accenture LLP | Oct. 2017 / 10.0 Yrs | 29,000 | $60.00 | Full Service |
Source: Appraisal
(1) | Information obtained from a third party market research provider. |
(2) | The appraiser’s ‘Full Service’ designation assumes tenants reimburse the landlord for future increases over the base year. |
(3) | Information obtained from the underwriting file. |
(4) | Reston Town Center – 17Fifty is currently under construction, 99.3% preleased, and expected to open in 2020. |
This is not a research report and was not prepared by the Underwriters’ research department. Please see additional important information and qualifications at the end of this Term Sheet.
T-91
Office – Suburban | Loan #7 | Cut-off Date Balance: |
| $50,000,000 |
7900 Tysons One Place | Tysons Tower | Cut-off Date LTV: |
| 52.1% |
McLean, VA 22102 |
| UW NCF DSCR: |
| 3.06x |
|
| UW NOI Debt Yield: |
| 11.0% |
Operating History and Underwritten Net Cash Flow. The following table presents certain information relating to the historical operating performance and Underwritten Net Cash Flow at the Tysons Tower Property:
|
|
|
|
|
|
|
|
|
|
|
|
|
Cash Flow Analysis | ||||||||||||
| 12/31/2016 |
| 12/31/2017 |
| 12/31/2018 |
| 6/30/2019 |
| UW |
| UW PSF |
|
Gross Potential Base Rent | $19,206,816 |
| $25,076,626 |
| $27,814,508 |
| $28,183,964 |
| $29,958,040(1) |
| $56.66 |
|
Rent Average Benefit | $0 |
| $0 |
| $0 |
| $0 |
| $18,013(2) |
| $0.03 |
|
Percentage Rent | $0 |
| $38,688 |
| $34,469 |
| $59,577 |
| $59,577 |
| $0.11 |
|
Total Recoveries | $208,561 |
| $367,411 |
| $896,729 |
| $1,296,894 |
| $1,732,303 |
| $3.28 |
|
Parking/Garage Income | $1,766,280 |
| $1,931,794 |
| $1,944,613 |
| $1,955,224 |
| $1,955,224 |
| $3.70 |
|
Other Income | $463,258 |
| $478,417 |
| $657,906 |
| $707,054 |
| $707,054 |
| $1.34 |
|
Less Vacancy & Credit Loss | $0 |
| $0 |
| $0 |
| $0 |
| ($2,995,804)(3) |
| ($5.67) |
|
Effective Gross Income | $21,644,915 |
| $27,892,936 |
| $31,348,225 |
| $32,202,713 |
| $31,434,407 |
| $59.45 |
|
|
|
|
|
|
|
|
|
|
|
|
|
|
Real Estate Taxes | $3,219,674 |
| $3,570,905 |
| $3,927,437 |
| $4,057,334 |
| $4,048,719 |
| $7.66 |
|
Insurance | $55,262 |
| $77,406 |
| $72,857 |
| $74,750 |
| $74,936 |
| $0.14 |
|
Other Operating Expenses | $5,807,114 |
| $6,364,207 |
| $6,382,263 |
| $6,368,110 |
| $6,480,948 |
| $12.26 |
|
Total Expenses | $9,082,050 |
| $10,012,518 |
| $10,382,557 |
| $10,500,194 |
| $10,604,603 |
| $20.06 |
|
|
|
|
|
|
|
|
|
|
|
|
|
|
Net Operating Income | $12,562,865 |
| $17,880,418 |
| $20,965,668 |
| $21,702,519 |
| $20,829,804 |
| $39.40 |
|
Capital Expenditures | $0 |
| $0 |
| $0 |
| $0 |
| $105,746 |
| $0.20 |
|
TI/LC | $0 |
| $0 |
| $0 |
| $0 |
| $1,057,460 |
| $2.00 |
|
Net Cash Flow | $12,562,865 |
| $17,880,418 |
| $20,965,668 |
| $21,702,519 |
| $19,666,598 |
| $37.20 |
|
|
|
|
|
|
|
|
|
|
|
|
|
|
Occupancy% | 96.1% |
| 98.4% |
| 100.0% |
| 100.0% |
| 100.0%(3) |
|
|
|
NOI DSCR(4) | 1.95x |
| 2.78x |
| 3.26x |
| 3.37x |
| 3.24x |
|
|
|
NCF DSCR(4) | 1.95x |
| 2.78x |
| 3.26x |
| 3.37x |
| 3.06x |
|
|
|
NOI Debt Yield(4) | 6.6% |
| 9.4% |
| 11.0% |
| 11.4% |
| 11.0% |
|
|
|
NCF Debt Yield(4) | 6.6% |
| 9.4% |
| 11.0% |
| 11.4% |
| 10.4% |
|
|
|
(1) | Based on the underwritten rent roll dated August 30, 2019 and includes rent steps through September 2020 totaling $751,235. |
(2) | Represents straight-line rent averaging over the remaining loan term for Bank of NY Mellon. |
(3) | The underwritten economic vacancy is 9.5%. The Tysons Tower Property was 100.0% occupied as of August 30, 2019. |
(4) | The debt service coverage ratios and debt yields are based on the Tysons Tower Whole Loan. |
Escrows and Reserves.
Real Estate Taxes – Upon the occurrence and continuance of a Cash Trap Event Period (see “Lockbox and Cash Management” section), the Tysons Tower Whole Loan documents require ongoing monthly real estate tax reserves in an amount equal to 1/12 of the real estate taxes that the lender estimates will be payable during the next 12 months.
Insurance – Upon (i) the occurrence and continuance of a Cash Trap Event Period, the Tysons Tower Whole Loan documents require ongoing monthly insurance reserves in an amount equal to 1/12 of the insurance premiums that the lender estimates will be payable for the renewal of the coverage during the next 12 months, (ii) the occurrence and continuance of an event of default or (iii) the failure of the Tysons Tower Borrower to provide evidence of timely payment of insurance premiums, the Tysons Tower Borrower is required to make ongoing monthly insurance reserve deposits applicable to insurance policies for the Tysons Tower Property.
Replacement Reserve – Upon the occurrence and continuance of a Cash Trap Event Period, the Tysons Tower Whole Loan documents require ongoing monthly replacement reserves of $50,000, subject to a cap of $1,000,000.
TI/LC Reserve – Upon the occurrence and continuance of a Cash Trap Event Period, the Tysons Tower Whole Loan documents require ongoing monthly TI/LC reserves of $110,152, subject to a cap of $1,321,825.
Lockbox and Cash Management. The Tysons Tower Whole Loan is structured with a hard lockbox, which is already in place, and springing cash management. The Tysons Tower Borrower is required to direct tenants to pay rent directly into such lockbox account and all rents received directly by the Tysons Tower Borrower or the property manager are required to be deposited into the lockbox account within three business days of receipt. Prior to the occurrence of a Cash Trap Event Period, all funds in the lockbox account are required to be distributed to The Tysons Tower Borrower. During a Cash Trap Event Period, funds in the lockbox account are required to be swept on each business day to a lender-controlled cash management account. Any excess cash flow remaining after satisfaction of the waterfall items outlined in the loan documents is required to be swept to an excess cash flow subaccount controlled by the lender as additional security for the Tysons Tower Whole Loan during the continuance of the Cash Trap Event Period.
This is not a research report and was not prepared by the Underwriters’ research department. Please see additional important information and qualifications at the end of this Term Sheet.
T-92
Office – Suburban | Loan #7 | Cut-off Date Balance: |
| $50,000,000 |
7900 Tysons One Place | Tysons Tower | Cut-off Date LTV: |
| 52.1% |
McLean, VA 22102 |
| UW NCF DSCR: |
| 3.06x |
|
| UW NOI Debt Yield: |
| 11.0% |
A “Cash Trap Event Period” will commence upon the earlier of the following:
| (i) | the occurrence of an event of default under the Tysons Tower Whole Loan documents; or |
| (ii) | the net cash flow debt service coverage ratio (“NCF DSCR”), calculated on a hypothetical fully amortizing 30-year schedule, being less than 1.15x at the end of any calendar quarter. |
A Cash Trap Event Period will end upon the occurrence of the following:
| ● | with regard to clause (i), the cure of such event of default; or |
| ● | with regard to clause (ii), the NCF DSCR, calculated on a hypothetical fully amortizing 30-year schedule, being greater than or equal to 1.20x for two consecutive calendar quarters. |
Additional Secured Indebtedness (not including trade debts). The Tysons Tower Property also secures the Tysons Tower Pari Passu Companion Loans, which have an aggregate Cut-off Date principal balance of $140,000,000. The Tysons Tower Pari Passu Companion Loans accrue interest at the same rate as the Tysons Tower Mortgage Loan. The Tysons Tower Mortgage Loan is entitled to payments of principal and interest on a pro rata and pari passu basis with the Tysons Tower Pari Passu Companion Loans. The holders of the Tysons Tower Mortgage Loan and the Tysons Tower Pari Passu Companion Loans have entered into a co-lender agreement which sets forth the allocation of collections on the Tysons Tower Whole Loan. See “Description of the Mortgage Pool—The Whole Loans—The Serviced Pari Passu Whole Loans” in the Preliminary Prospectus.
Mezzanine Loan and Preferred Equity. Not permitted.
Release of Property. Not permitted.
Ground Lease. None.
Terrorism Insurance. The Tysons Tower Whole Loan documents require that the “all risk” insurance policy required to be maintained by the Tysons Tower Borrower provide coverage for terrorism in an amount equal to the full replacement cost of the Tysons Tower Property, as well as business interruption insurance covering no less than the 24-month period following the occurrence of a casualty event, together with a 6-month extended period of indemnity (provided that if TRIPRA or a similar statute is not in effect, the Tysons Tower Borrower will not be obligated to pay terrorism insurance premiums in excess of two times the premium for the casualty and business interruption coverage on a stand-alone basis).
This is not a research report and was not prepared by the Underwriters’ research department. Please see additional important information and qualifications at the end of this Term Sheet.
T-93
| Retail - Anchored | Loan #8 | Cut-off Date Balance: | $50,000,000 | |
| Various | National Anchored Retail Portfolio | Cut-off Date LTV: | 62.8% | |
| Various, Various | U/W NCF DSCR: | 2.96x | ||
| U/W NOI Debt Yield: | 11.6% |
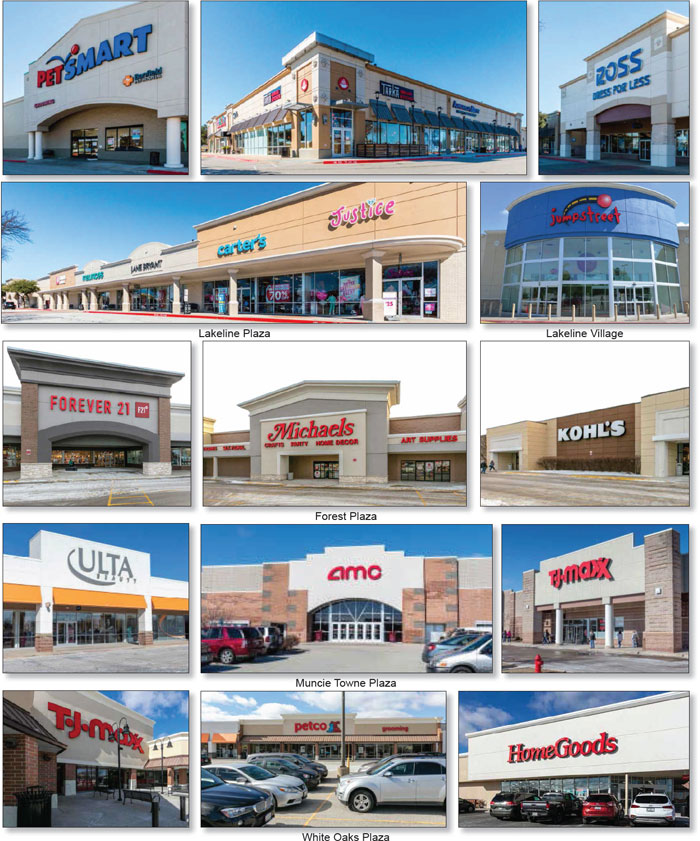
This is not a research report and was not prepared by the Underwriters’ research department. Please see additional important information and qualifications at the end of this Term Sheet.
T-94
| Retail - Anchored | Loan #8 | Cut-off Date Balance: | $50,000,000 | |
| Various | National Anchored Retail Portfolio | Cut-off Date LTV: | 62.8% | |
| Various, Various | U/W NCF DSCR: | 2.96x | ||
| U/W NOI Debt Yield: | 11.6% |
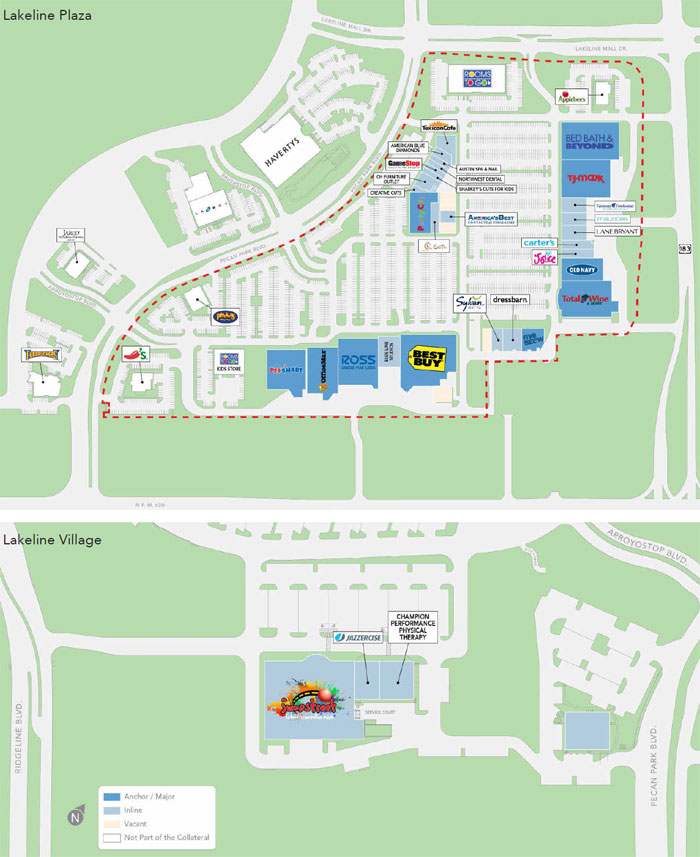
This is not a research report and was not prepared by the Underwriters’ research department. Please see additional important information and qualifications at the end of this Term Sheet.
T-95
| Retail - Anchored | Loan #8 | Cut-off Date Balance: | $50,000,000 | |
| Various | National Anchored Retail Portfolio | Cut-off Date LTV: | 62.8% | |
| Various, Various | U/W NCF DSCR: | 2.96x | ||
| U/W NOI Debt Yield: | 11.6% |
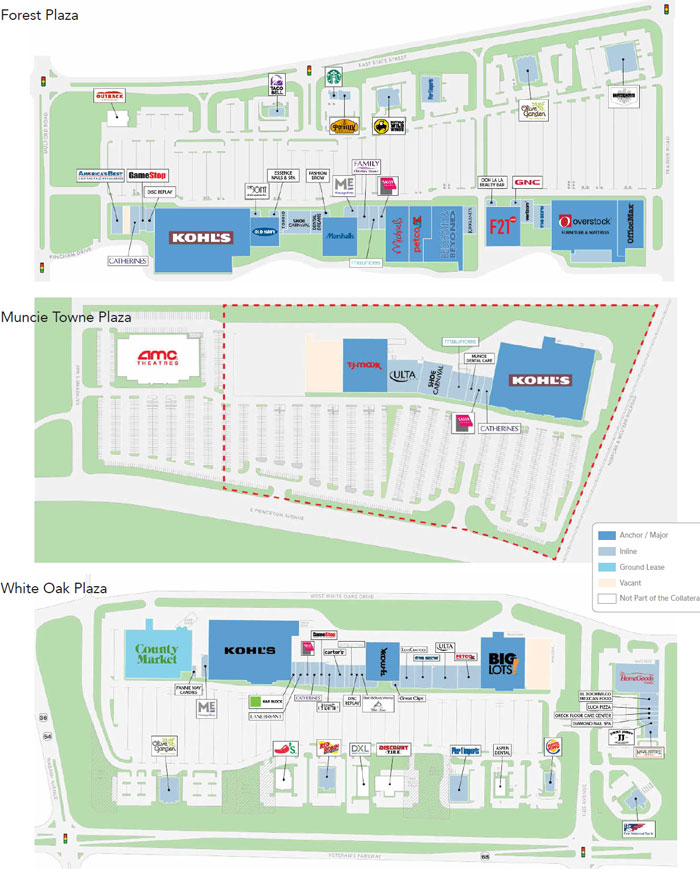
This is not a research report and was not prepared by the Underwriters’ research department. Please see additional important information and qualifications at the end of this Term Sheet.
T-96
| Retail - Anchored | Loan #8 | Cut-off Date Balance: | $50,000,000 | |
| Various | National Anchored Retail Portfolio | Cut-off Date LTV: | 62.8% | |
| Various, Various | U/W NCF DSCR: | 2.96x | ||
| U/W NOI Debt Yield: | 11.6% |
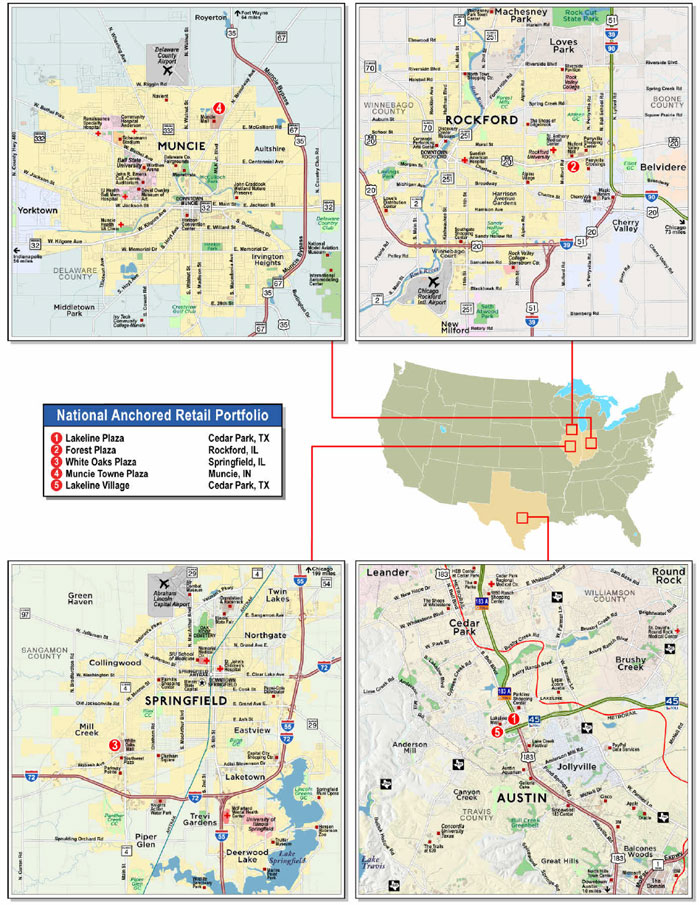
This is not a research report and was not prepared by the Underwriters’ research department. Please see additional important information and qualifications at the end of this Term Sheet.
T-97
| Mortgage Loan No. 8 – National Anchored Retail Portfolio |
| Mortgage Loan Information | Property Information | ||||||
| Mortgage Loan Seller: | MSMCH | Single Asset/Portfolio: | Portfolio | ||||
| Credit Assessment (DBRS/Fitch/S&P): | NR/NR/NR | Location: | Various | ||||
| Original Balance(1): | $50,000,000 | General Property Type: | Retail | ||||
| Cut-off Date Balance(1): | $50,000,000 | Detailed Property Type: | Anchored | ||||
| % of Initial Pool Balance: | 4.2% | Title Vesting: | Fee | ||||
| Loan Purpose: | Refinance | Year Built/Renovated: | Various/Various | ||||
| Borrower Sponsor: | Washington Prime Group, L.P. | Size: | 1,292,762 SF | ||||
| Guarantor: | Washington Prime Group, L.P. | Cut-off Date Balance per SF(1): | $91 | ||||
| Mortgage Rate: | 3.6700% | Maturity Date Balance per SF(1): | $91 | ||||
| Note Date: | 9/16/2019 | Property Manager: | Washington Prime Management | ||||
| First Payment Date: | 11/1/2019 | Associates, LLC | |||||
| Maturity Date: | 10/1/2029 | (borrower-related) | |||||
| Original Term to Maturity: | 120 months | ||||||
| Original Amortization Term: | 0 months | Underwriting and Financial Information | |||||
| IO Period: | 120 months | UW NOI: | $13,530,789 | ||||
| Seasoning: | 0 months | UW NOI Debt Yield(1): | 11.6% | ||||
| Prepayment Provisions(2): | LO (24); DEF (91); O (5) | UW NOI Debt Yield at Maturity(1): | 11.6% | ||||
| Lockbox/Cash Mgmt Status: | Hard/Springing | UW NCF DSCR(1): | 2.96x | ||||
| Additional Debt Type(1)(3): | Pari Passu | Most Recent NOI: | $15,326,804 (6/30/2019 TTM) | ||||
| Additional Debt Balance(1)(3): | $67,000,000 | 2nd Most Recent NOI: | $15,816,812 (12/31/2018) | ||||
| Future Debt Permitted (Type): | No (N/A) | 3rd Most Recent NOI: | $16,210,670 (12/31/2017) | ||||
| Reserves(4) | Most Recent Occupancy: | 93.6% (7/12/2019) | |||||
| Type | Initial | Monthly | Cap | 2nd Most Recent Occupancy: | 95.9% (12/31/2018) | ||
| RE Tax: | $1,111,745 | $275,628 | N/A | 3rd Most Recent Occupancy: | 95.6% (12/31/2017) | ||
| Insurance: | $0 | Springing | N/A | Appraised Value (as of): | $186,400,000 (Various) | ||
| Recurring Replacements: | $0 | $16,160 | N/A | Appraised Value per SF: | $144 | ||
| TI/LC: | $6,000,000 | $64,638 | $10,000,000(5) | Cut-off Date LTV Ratio(1): | 62.8% | ||
| Other: | $954,138 | $0 | N/A | Maturity Date LTV Ratio(1): | 62.8% | ||
| Sources and Uses | ||||||
| Sources | Proceeds | % of Total | Uses | Proceeds | % of Total | |
| Whole Loan Amount(1): | $117,000,000 | 100.0% | Loan Payoff: | $47,253,084 | 40.4% | |
| Return of Equity: | $59,953,425 | 51.2% | ||||
| Reserves: | $8,065,883 | 6.9% | ||||
| Closing Costs: | $1,727,608 | 1.5% | ||||
| Total Sources: | $117,000,000 | 100.0% | Total Uses: | $117,000,000 | 100.0% | |
| (1) | The National Anchored Retail Portfolio Mortgage Loan (as defined below) is a part of the National Anchored Retail Portfolio Whole Loan (as defined below) with an original aggregate principal balance of $117,000,000. The Cut-off Date Balance per SF, Maturity Date Balance per SF, UW NOI Debt Yield, UW NOI Debt Yield at Maturity, UW NCF DSCR, Cut-off Date LTV Ratio and Maturity Date LTV Ratio numbers presented above are based on the National Anchored Retail Portfolio Whole Loan. |
| (2) | The National Anchored Retail Portfolio Borrowers (as defined below) have the right to defease the National Anchored Retail Portfolio Whole Loan, in whole or in part, on any date after the earlier to occur of (i) two years after the closing date of the securitization that includes the lastpari passu note to be securitized and (ii) May 1, 2023. The assumed defeasance lockout period of 24 payments is based on the closing date of this transaction in October 2019. |
| (3) | See “The Mortgage Loan” and “Additional Secured Indebtedness (not including trade debts)” below for a discussion of additional indebtedness. |
| (4) | See “Escrows and Reserves” below for further discussion of reserve requirements. |
| (5) | Springing suspension of the TI/LC cap applies in some circumstances. See“Escrows and Reserves” and“Lockbox and Cash Management” below. |
The Mortgage Loan. The eighth largest mortgage loan (the “National Anchored Retail Portfolio Mortgage Loan”) is a part of a whole loan (the “National Anchored Retail Portfolio Whole Loan”) that is evidenced by threepari passu promissory notes in the original aggregate principal amount of $117,000,000. The National Anchored Retail Portfolio Whole Loan is secured by a first priority fee mortgage encumbering five retail properties located throughout Texas, Illinois and Indiana (the “National Anchored Retail Portfolio Properties” or the “National Anchored Retail Portfolio”). The National Anchored Retail Portfolio Mortgage Loan is evidenced by the controlling promissory Note A-1 in the original principal amount of $50,000,000. The non-controlling promissory Note A-2 and Note A-3 (together, the “National Anchored Retail Portfolio ServicedPari Passu Companion Loans”), in the aggregate original principal amount of $67,000,000, are expected to be contributed to future securitization trusts or may be otherwise transferred at any time. The National Anchored Retail Portfolio Whole Loan will be serviced pursuant to the pooling and servicing agreement for the BANK 2019-BNK21 securitization trust. See “Description of the Mortgage Pool—The Whole Loans—The Serviced Pari Passu Whole Loans” and “Pooling and Servicing Agreement” in the Preliminary Prospectus.
This is not a research report and was not prepared by the Underwriters’ research department. Please see additional important information and qualifications at the end of this Term Sheet.
T-98
| Retail - Anchored | Loan #8 | Cut-off Date Balance: | $50,000,000 | |
| Various | National Anchored Retail Portfolio | Cut-off Date LTV: | 62.8% | |
| Various, Various | U/W NCF DSCR: | 2.96x | ||
| U/W NOI Debt Yield: | 11.6% |
| National Anchored Retail Portfolio Whole Loan Summary | ||||
| Note | Original Balance | Cut-off Date Balance | Note Holder | Controlling Piece |
| A-1 | $50,000,000 | $50,000,000 | BANK 2019-BNK21 | Yes |
| A-2 | $37,000,000 | $37,000,000 | MSBNA | No |
| A-3 | $30,000,000 | $30,000,000 | MSBNA | No |
| Total | $117,000,000 | $117,000,000 | ||
The Borrowers and the Borrower Sponsor. The borrowers are Lakeline Plaza, LLC, Forest Plaza, LLC, White Oaks Plaza, LLC, Muncie Plaza, LLC, and Lakeline Village LLC (collectively, the “National Anchored Retail Portfolio Borrowers”), each a Delaware limited liability company structured to be bankruptcy-remote with two independent directors. Each of the National Anchored Retail Portfolio Borrowers owns one of the National Anchored Retail Portfolio Properties. Washington Prime Group, L.P. is the non-recourse carveout guarantor and the borrower sponsor with respect to the National Anchored Retail Portfolio Whole Loan. Washington Prime Group, L.P. is a subsidiary of Washington Prime Group Inc., and owns, develops and manages all of Washington Prime Group Inc.’s real estate properties and assets. Founded in 2014, Washington Prime Group Inc. is a retail real estate investment trust, headquartered in Columbus, Ohio, that owns, manages, acquires and develops retail properties throughout the United States. As of December, 31 2018, Washington Prime Group Inc.’s portfolio consists of approximately 108 shopping centers, comprised of approximately 58,204,711 SF.
The Properties. The National Anchored Retail Portfolio Properties are comprised of five retail properties containing a total of 1,292,762 SF. The National Anchored Retail Portfolio Properties are located across Texas, Illinois and Indiana. Two properties are located in Illinois (59.2% of total SF), two properties are located in Texas (27.5% of total SF) and one property is located in Indiana (13.3% of total SF). Excluding Kohl’s, no single tenant accounts for more than 5.0% of underwritten rent or 6.7% of total SF. The National Anchored Retail Portfolio Properties have averaged 96.9% occupancy since 2015, with no property experiencing less than 86% occupancy during that time. As of July 12, 2019, the National Anchored Retail Portfolio Properties were 93.6% occupied by 80 tenants. The National Anchored Retail Portfolio Properties were built between 1985 and 1998 and two properties were renovated in 2003. According to the National Anchored Retail Portfolio Borrowers, approximately $14.8 million has been spent in capital expenditures, tenant improvements and leasing commissions across the portfolio since 2016.
Lakeline Village and Lakeline Plaza
The Lakeline Village Property is an anchored retail center comprised of two, one-story buildings totaling 42,212 SF and is situated adjacent to the Lakeline Plaza Property, an anchored retail center comprised of two, one-story buildings totaling 313,580 SF located in Cedar Park, Texas. The Lakeline Village Property and the Lakeline Plaza Property are situated on an approximately 47.99-acre site and feature 1,792 parking spaces (5.0 spaces per 1,000 SF). The Lakeline Village Property and the Lakeline Plaza Property were both built in 1998 and renovated in 2003. As of July 12, 2019, the Lakeline Village Property was 100.0% occupied by three tenants, with Jumpstreet as the anchor tenant (2.5% of the NRA and accounts for 2.2% of underwritten rent for the National Anchored Retail Portfolio) and the Lakeline Plaza Property was 96.2% occupied by 28 tenants, six of which are anchor tenants and ten of which are junior anchor tenants. The anchor tenants include Best Buy, Bed Bath & Beyond, Ross Dress for Less, TJ Maxx, PetSmart and Office Max and collectively comprise 14.7% of the NRA and account for 17.1% of underwritten rent for the National Anchored Retail Portfolio. According to the National Anchored Retail Portfolio Borrowers, approximately $6.3 million in capital expenditures, tenant improvements and leasing commissions has been spent on the Lakeline Plaza Property since 2016.
Forest Plaza
The Forest Plaza Property is an anchored retail center comprised of eight, one-story buildings totaling 433,816 SF located in Rockford, Illinois. The Forest Plaza Property is situated on an approximately 50.58-acre site and features 2,348 parking spaces (5.4 spaces per 1,000 SF). The Forest Plaza Property was built in 1985 and, as of July 12, 2019, the Forest Plaza Property was 93.4% occupied by 31 tenants, two of which are anchor tenants and seven of which are junior anchor tenants. The anchor tenants are Kohl’s and Overstock Furniture & Mattress, who collectively comprise 13.3% of NRA and account for 4.2% of underwritten rent for the National Anchored Retail Portfolio. According to the National Anchored Retail Portfolio Borrowers, approximately $2.7 million has been spent on capital expenditures, tenant improvements and leasing commissions with respect to the Forest Plaza Property since 2016.
White Oaks Plaza
The White Oaks Plaza Property is an anchored retail center comprised of four, one-story buildings totaling 331,533 SF located in Springfield, Illinois. The White Oaks Plaza Property is situated on an approximately 37.55-acre site and features 1,688 parking spaces (5.1 spaces per 1,000 SF). The White Oaks Plaza Property was built in 1986 and as of July 12, 2019, the White Oaks Plaza Property was 94.2% occupied by 29 tenants, three of which are anchor tenants and four of which are junior anchor tenants. The anchor tenants include Kohl’s, Big Lots and Overstock Furniture & Mattress and collectively comprise 12.7% of NRA and account for 9.2% of underwritten rent for the National Anchored Retail Portfolio. According to the National Anchored Retail Portfolio Borrowers, approximately $5.0 million has been spent in capital expenditures, tenant improvements and leasing commissions with respect to the White Oaks Plaza Property since 2016.
Muncie Towne Plaza
The Muncie Towne Plaza Property is an anchored retail center comprised of two, one-story buildings totaling 171,621 SF located in Muncie, Indiana. The Muncie Towne Plaza Property is situated on an approximately 22.92-acre site and features 1,184 parking spaces (6.9 spaces per 1,000 SF). The Muncie Towne Plaza Property was built in 1998 and as of July 12, 2019, the Muncie Towne Plaza Property was 86.3% occupied by eight tenants, one of which is a junior anchor. Such junior anchor tenant is TJ Maxx, which comprises 2.3% of NRA and accounts for 1.9% of underwritten rent for the National Anchored Retail Portfolio. According to the National Anchored Retail Portfolio Borrowers, $803,547 has been spent on capital expenditures and leasing commissions with respect to the Muncie Towne Plaza Property since 2016.
This is not a research report and was not prepared by the Underwriters’ research department. Please see additional important information and qualifications at the end of this Term Sheet.
T-99
| Retail - Anchored | Loan #8 | Cut-off Date Balance: | $50,000,000 | |
| Various | National Anchored Retail Portfolio | Cut-off Date LTV: | 62.8% | |
| Various, Various | U/W NCF DSCR: | 2.90x | ||
| U/W NOI Debt Yield: | 11.6% |
The following table presents a summary of certain information relating to the properties in the National Anchored Retail Portfolio.
| National Anchored Retail Portfolio Properties Summary(1) | |||||||||||
Property Name | City | State | Year Built | Total | % of Total GLA | Occ. % | Cut-off Date Allocated Loan Amount | % of ALA | Appraised Value | 6/30/2019 | |
| Lakeline Plaza Property | Cedar Park | TX | 1998 | 313,580 | 24.3% | 96.2% | 44,940,000 | 38.4% | $71,600,000 | $4,587,093 | |
| Forest Plaza Property | Rockford | IL | 1985 | 433,816 | 33.6% | 93.4% | 30,250,000 | 25.9% | $48,200,000 | $4,274,224 | |
| White Oaks Plaza Property | Springfield | IL | 1986 | 331,533 | 25.6% | 94.2% | 26,490,000 | 22.6% | $42,200,000 | $4,684,190 | |
| Muncie Towne Plaza Property | Muncie | IN | 1998 | 171,621 | 13.3% | 86.3% | 10,550,000 | 9.0% | $16,800,000 | $1,493,307 | |
| Lakeline Village Property | Cedar Park | TX | 1998 | 42,212 | 3.3% | 100.0% | 4,770,000 | 4.1% | $7,600,000 | $287,990 | |
| Total/Wtd. Avg.: | 1,292,762 | 100.0% | 93.6% | $117,000,000 | 100.0% | $186,400,000 | $15,326,804 | ||||
| (1) | Based on the underwritten rent roll dated July 12, 2019. |
The following table presents certain information relating to the major tenants at the National Anchored Retail Portfolio:
| Tenant Summary(1) | ||||||||||||
| Tenant Name | Credit Rating (Fitch/Moody’s/ S&P)(2) | Tenant SF | Approx % of SF | Annual UW Rent | % of Annual UW Rent | Annual UW Rent PSF(3) | Most Recent Sales | Term. Option | Renewal Options | Lease Expiration | ||
| $ | PSF | Occ. Cost % | ||||||||||
| Kohl’s(4) | BBB/Baa2/BBB | 283,990 | 22.0% | $2,154,684 | 15.7% | $7.59 | $60,353,559 | $213 | 3.6% | N | Various | Various |
| Overstock Furniture & Mattress(5) | NR/NR/NR | 86,762 | 6.7% | $210,000 | 1.5% | $2.42 | NAV | NAV | NAV | Y | None | Various |
| TJ Maxx(6) | NR/A2/A+ | 83,878 | 6.5% | $596,336 | 4.3% | $7.11 | $20,401,846 | $243 | 2.9% | N | 2, 5-year | Various |
| Bed Bath & Beyond(7) | NR/Baa3/BB+ | 70,161 | 5.4% | $682,206 | 5.0% | $9.72 | NAV | NAV | NAV | N | Various | Various |
| Office Max(8) | NR/NR/B | 48,107 | 3.7% | $591,466 | 4.3% | $12.29 | NAV | NAV | NAV | N | 1, 5-year | Various |
| Subtotal/Wtd. Avg. | 572,898 | 44.3% | $4,234,691 | 30.9% | $7.39 | |||||||
| Other Tenants | 636,650 | 49.2% | $9,480,151 | 69.1% | $14.89 | |||||||
| Vacant Space | 83,214 | 6.4% | $0 | 0.0% | $0.00 | |||||||
| Total/Wtd. Avg. | 1,292,762 | 100.0% | $13,714,842 | 100.0% | $11.34 | |||||||
| (1) | Information is based on the underwritten rent roll as of July 12, 2019. |
| (2) | Certain ratings are those of the parent company whether or not the parent guarantees the lease. |
| (3) | Total/Wtd. Avg. Annual UW Rent PSF excludes vacant space. |
| (4) | Kohl’s is the largest tenant at the Forest Plaza Property (106,091 SF; expiring January 30, 2021; six, five-year renewal options), the White Oaks Plaza Property (97,245 SF; expiring January 31, 2023; three, five-year renewal options) and the Muncie Towne Plaza Property (80,654 SF; expiring February 3, 2024; two, five-year renewal options). |
| (5) | Overstock Furniture & Mattress is a tenant at the Forest Plaza Property (65,262 SF; expiring November 30, 2020; no renewal options) and the White Oaks Plaza Property (21,500 SF; expiring February 29, 2020; no renewal options). Overstock Furniture & Mattress is entitled to terminate its lease at the Forest Plaza Property upon 60 days’ notice if its gross sales there are not at least $100,000 per month at any time and to terminate its lease at the White Oaks Plaza Property upon 60 days’ notice if its gross sales there are not at least $75,000 per month at any time. |
| (6) | TJ Maxx is a tenant at the Lakeline Plaza Property (29,526 SF; expiring April 30, 2026; two, five-year renewal options), the Muncie Towne Plaza Property (29,352 SF; expiring January 31, 2023; two, five-year renewal options) and White Oaks Plaza Property (25,000 SF; expiring January 31, 2022; two, five-year renewal options). |
| (7) | Bed Bath & Beyond is a tenant at the Forest Plaza Property (35,800 SF; expiring September 30, 2021; no renewal options) and the Lakeline Plaza Property (34,361 SF; expiring January 31, 2023; one, five-year renewal option). |
| (8) | Office Max is a tenant at the Forest Plaza Property (24,470 SF; expiring October 31, 2021; one, five-year renewal option) and the Lakeline Plaza Property (23,637 SF; expiring March 31, 2023; one, five-year renewal option). |
The following table presents certain information relating to the largest tenant at each property in the National Anchored Retail Portfolio:
| National Anchored Retail Portfolio Largest Tenant by Properties Summary(1) | ||||||
| Building | SF | Building Occ. % | Building Largest Tenant | Largest Tenant SF | Largest Tenant % Building SF | Lease Expiration Date |
| Lakeline Plaza Property | 313,580 | 96.2% | Best Buy | 45,416 | 14.5% | 1/31/2025 |
| Forest Plaza Property | 433,816 | 93.4% | Kohl’s | 106,091 | 24.5% | 1/30/2021 |
| White Oaks Plaza Property | 331,533 | 94.2% | Kohl’s | 97,245 | 29.3% | 1/31/2023 |
| Muncie Towne Plaza Property | 171,621 | 86.3% | Kohl’s | 80,654 | 47.0% | 2/3/2024 |
| Lakeline Village Property | 42,212 | 100.0% | Jumpstreet | 32,212 | 76.3% | 6/30/2021 |
| Total / Wtd. Avg. | 1,292,762 | 93.6% | 361,618 | 28.0% | ||
| (1) | Information is based on the underwritten rent roll dated July 12, 2019. |
This is not a research report and was not prepared by the Underwriters’ research department. Please see additional important information and qualifications at the end of this Term Sheet.
T-100
| Retail - Anchored | Loan #8 | Cut-off Date Balance: | $50,000,000 | |
| Various | National Anchored Retail Portfolio | Cut-off Date LTV: | 62.8% | |
| Various, Various | U/W NCF DSCR: | 2.90x | ||
| U/W NOI Debt Yield: | 11.6% |
The following table presents certain information relating to the lease rollover schedule at the National Anchored Retail Portfolio:
| Lease Rollover Schedule(1)(2) | ||||||||
| Year | # of Leases Rolling | SF Rolling | UW Rent PSF Rolling(3) | Approx. % of Total SF Rolling | Approx. Cumulative % of SF Rolling | Total UW Rent Rolling | Approx. % of Total Rent Rolling | Approx. Cumulative % of Total Rent Rolling |
| 2019 | 1 | 1,119 | $29.99 | 0.1% | 0.1% | $33,559 | 0.2% | 0.2% |
| 2020 | 14 | 146,734 | $8.81 | 11.4% | 11.4% | $1,292,635 | 9.4% | 9.7% |
| 2021 | 24 | 314,046 | $10.16 | 24.3% | 35.7% | $3,190,175 | 23.3% | 32.9% |
| 2022 | 12 | 123,574 | $8.37 | 9.6% | 45.3% | $1,034,699 | 7.5% | 40.5% |
| 2023 | 18 | 274,200 | $12.52 | 21.2% | 66.5% | $3,431,826 | 25.0% | 65.5% |
| 2024 | 6 | 136,200 | $10.63 | 10.5% | 77.0% | $1,447,219 | 10.6% | 76.0% |
| 2025 | 5 | 69,476 | $12.65 | 5.4% | 82.4% | $879,108 | 6.4% | 82.5% |
| 2026 | 4 | 37,979 | $12.75 | 2.9% | 85.3% | $484,257 | 3.5% | 86.0% |
| 2027 | 5 | 26,151 | $21.36 | 2.0% | 87.4% | $558,456 | 4.1% | 90.1% |
| 2028 | 5 | 48,636 | $14.76 | 3.8% | 91.1% | $717,946 | 5.2% | 95.3% |
| 2029 | 4 | 22,333 | $24.37 | 1.7% | 92.9% | $544,263 | 4.0% | 99.3% |
| 2030 & Beyond | 1 | 9,100 | $11.07 | 0.7% | 93.6% | $100,700 | 0.7% | 100.0% |
| Vacant Space | 0 | 83,214 | $0.00 | 6.4% | 100.0% | $0 | 0.0% | 100.0% |
| Total/Wtd. Avg. | 99 | 1,292,762 | $11.34 | 100.0% | $13,714,842 | 100.0% | ||
| (1) | Information is based on the underwritten rent roll as of July 12, 2019. |
| (2) | Certain tenants may have lease termination options that are exercisable prior to the stated expiration date of the subject lease or leases which are not considered in the lease rollover schedule. |
| (3) | Total/Wtd. Avg. UW Rent PSF Rolling excludes vacant space. |
The Market. The National Anchored Retail Portfolio Properties are geographically diverse, located in four different markets across three states. The greatest concentration of National Anchored Retail Portfolio Properties is located in Illinois (two properties, 59.2% of total SF), with the other concentrations in Texas (two properties, 27.5% of total SF) and Indiana (one property, 13.3% of total SF).
The Lakeline Plaza Property and the Lakeline Village Property are located adjacent to each other in Cedar Park, Texas, within the Cedar Park retail submarket of the Austin retail market. According to the appraisal, as of the second quarter of 2019, the vacancy rate in the Austin retail market was approximately 4.1%, with average asking rents of $22.31 PSF and inventory of approximately 111.9 million SF. According to the appraisal, as of the second quarter of 2019, the vacancy rate in the Cedar Park retail submarket was approximately 4.0%, with average asking rents of $22.05 PSF and inventory of approximately 9.1 million SF. According to the appraisal, the 2018 population within a one-, three- and five-mile radius of the Lakeline Plaza Property and the Lakeline Village Property was 10,687, 109,121 and 214,731, respectively. The 2018 average household income within the same one-, three- and five-mile radius was $81,754, $109,335 and $118,212, respectively.
The Forest Plaza Property is located in Rockford, Illinois, within the I-39 Corridor/Winnebago County retail submarket of the Rockford retail market. According to the appraisal, as of the second quarter of 2019, the vacancy rate in the Rockford retail market was approximately 6.6%, with average asking rents of $8.47 PSF and inventory of approximately 21.5 million SF. According to the appraisal, as of the second quarter of 2019, the vacancy rate in the I-39 Corridor/Winnebago County retail submarket was approximately 6.8%, with average asking rents of $8.42 PSF and inventory of approximately 19.9 million SF. According to the appraisal, the 2018 population within a one-, three- and five-mile radius of the Forest Plaza Property is 6,464, 55,032 and 139,860, respectively. The 2018 average household income within the same one-, three- and five-mile radius was $72,973, $79,782 and $69,463, respectively.
The White Oaks Plaza Property is located in Springfield, Illinois, within the Springfield retail market. According to the appraisal, as of the second quarter of 2019, the vacancy rate in the Springfield retail market was approximately 5.4%, with average asking rents of $12.68 PSF and inventory of approximately 12.8 million SF. According to the appraisal, the 2018 population within a one-, three- and five-mile radius of the White Oaks Property is 7,125, 50,390 and 100,928, respectively. The 2018 average household income within the same one-, three- and five-mile radius was $103,176, $92,535 and $78,519, respectively.
The Muncie Towne Plaza Property is located in Muncie, Indiana, within the Muncie retail market. According to the appraisal, as of the second quarter of 2019, the vacancy rate in the Muncie retail market was approximately 4.1%, with average asking rents of $9.96 PSF and inventory of approximately 7.4 million SF. According to the appraisal, the 2018 population within a one-, three- and five-mile radius of the Muncie Towne Plaza Property was 4,236, 44,351 and 81,241, respectively. The 2018 average household income within the same one-, three- and five-mile radius was $41,630, $46,555 and $51,379, respectively.
This is not a research report and was not prepared by the Underwriters’ research department. Please see additional important information and qualifications at the end of this Term Sheet.
T-101
| Retail - Anchored | Loan #8 | Cut-off Date Balance: | $50,000,000 | |
| Various | National Anchored Retail Portfolio | Cut-off Date LTV: | 62.8% | |
| Various, Various | U/W NCF DSCR: | 2.90x | ||
| U/W NOI Debt Yield: | 11.6% |
The following table presents certain information relating to the appraiser’s market rent conclusion for anchor tenants at the National Anchored Retail Portfolio Properties:
| Market Rent Summary (Anchor Tenants) | |||
| Building | Market Rent (PSF) | Lease Term (Years) | Rent Increase Projection |
| Lakeline Plaza Property | $12.50 | 10.0 | 1.0% increases |
| Forest Plaza Property | $8.00 | 10.0 | Varies |
| White Oaks Plaza Property | $8.00 | 10.0 | None |
| Muncie Towne Plaza Property | $8.00 | 10.0 | 2.0% increases |
| Lakeline Village Property | $12.50 | 10.0 | 1.0% increases |
The following table presents comparable anchor leases with respect to the National Anchored Retail Portfolio Properties:
| Comparable Lease Summary (Anchor Tenants) | |||||||||
| Property/Location | Comparable Portfolio Property | Year Built | SF | Tenant Name | Lease Date | Lease Term (Yrs.) | Rent PSF | Lease Type | |
| Size (SF) | |||||||||
Beach Wood Centre Avon, IN | Muncie Towne Plaza | 1999 | 99,005 | Listing | 65,705 | -
| -
| $7.50
| NNN |
Muncie Shopping Center Muncie, IN | Muncie Towne Plaza | 1987 | 39,332 | Ollie’s Bargain Outlet, Inc. | 31,500
| July 2018
| 10.0
| $6.00
| NNN |
Scottsdale Shopping Center Chicago, IL | Forest Plaza | 1989 | 202,112 | The Room Place | 42,000 | May 2018 | 10.0 | $9.35 | NNN
|
Waukegan Plaza Chicago, IL | Forest Plaza | 1956 | 211,312 | Dd’s Discounts | 30,000
| Mar. 2018
| 10.0 | $12.50 | NNN |
Franklin Commons Franklin, IN | White Oaks Plaza | 2017 | 86,019 | Ross Dress for Less | 22,000 | Jan. 2018 | 10.0
| $10.25 | NNN
|
Fairview City Shopping Center Fairview Heights, IL | White Oaks Plaza | 1976 | 180,698 | Dick’s Sporting Goods, Inc | 45,085 | Oct. 2017 | 10.0 | $14.00 | NNN |
Oak Meadows Georgetown, TX | Lakeline Plaza | 2017 | 77,050 | Randall’s | 57,655 | Nov. 2017 | 20.0 | $15.75 | NNN |
The Crescent Austin, TX | Lakeline Plaza | 1985 | 117,982 | 99 Ranch Market | 37,239 | Jan. 2017 | 16.0 | $11.73 | NNN |
Source:Appraisal.
This is not a research report and was not prepared by the Underwriters’ research department. Please see additional important information and qualifications at the end of this Term Sheet.
T-102
| Retail - Anchored | Loan #8 | Cut-off Date Balance: | $50,000,000 | |
| Various | National Anchored Retail Portfolio | Cut-off Date LTV: | 62.8% | |
| Various, Various | U/W NCF DSCR: | 2.90x | ||
| U/W NOI Debt Yield: | 11.6% |
Operating History and Underwritten Net Cash Flow.The following table presents certain information relating to the historical operating performance and the Underwritten Net Cash Flow of the National Anchored Retail Portfolio:
| Cash Flow Analysis | ||||||
| 2016 | 2017 | 2018 | 6/30/2019 TTM | UW | UW PSF | |
| Gross Potential Rent | $15,008,510 | $15,269,134 | $14,707,762 | $14,197,940 | $14,741,445 | $11.40 |
| Total Recoveries | $5,479,357 | $5,232,040 | $5,413,913 | $5,231,101 | $5,244,180 | $4.06 |
| Other Income | $100,695 | $142,196 | $310,234 | $426,901 | $181,081 | $0.14 |
| Discounts Concessions | $5,424 | $10,333 | ($42,000) | $35,000 | $0 | $0.00 |
| Vacancy | $0 | $0 | $0 | $0 | ($1,391,633) | ($1.08) |
| Effective Gross Income | $20,593,986 | $20,653,704 | $20,389,908 | $19,890,941 | $18,775,073 | $14.52 |
| Real Estate Taxes | $3,170,583 | $3,156,906 | $3,158,553 | $3,065,380 | $3,201,402 | $2.48 |
| Insurance | $63,399 | $57,509 | $52,803 | $98,315 | $74,287 | $0.06 |
| Other Expenses | $1,296,898 | $1,228,619 | $1,361,740 | $1,400,442 | $1,968,595 | $1.52 |
| Total Expenses | $4,530,881 | $4,443,034 | $4,573,096 | $4,564,137 | $5,244,284 | $4.06 |
| Net Operating Income(1) | $16,063,106 | $16,210,670 | $15,816,812 | $15,326,804 | $13,530,789 | $10.47 |
| Capital Expenditures | $0 | $0 | $0 | $0 | $195,616 | $0.15 |
| TI/LC | $0 | $0 | $0 | $0 | $440,402 | $0.34 |
| Net Cash Flow | $16,063,106 | $16,210,670 | $15,816,812 | $15,326,804 | $12,894,771 | $9.97 |
| Occupancy % | 97.8% | 95.6% | 95.9% | 93.6%(2) | 93.0% | |
| NOI DSCR(3) | 3.69x | 3.72x | 3.63x | 3.52x | 3.11x | |
| NCF DSCR(3) | 3.69x | 3.72x | 3.63x | 3.52x | 2.96x | |
| NOI Debt Yield(3) | 13.7% | 13.9% | 13.5% | 13.1% | 11.6% | |
| NCF Debt Yield(3) | 13.7% | 13.9% | 13.5% | 13.1% | 11.0% | |
| (1) | The decline in Net Operating Income from 2017 to UW is due in part to (i) Toys R Us/Babies R US vacating its space at the Forest Plaza Property in 2018, following which the National Anchored Retail Portfolio Borrowers signed a short term lease with Overstock Furniture & Mattress (which was later extended to provide for a lease expiration date in November 2020) at such property for approximately $1.2 million less in annual rent than the prior lease for the space, (ii) the historical operating statements did not include management fees, while $563,252 of management fees were deducted as an expense in calculating UW Net Operating Income and (iii) a number of tenants were underwritten as vacant for either being dark or anticipated to file for bankruptcy, which tenants were reflected in the historical information. |
| (2) | As of the underwritten rent roll dated July 12, 2019, the National Anchored Retail Portfolio is 93.6% occupied. |
| (3) | Debt service coverage ratios and debt yields are based on the National Anchored Retail Portfolio Whole Loan. |
Escrows and Reserves.
Tax Funds – The National Anchored Retail Portfolio Whole Loan documents provide for an upfront reserve of $1,111,745 for real estate taxes and ongoing monthly reserves for real estate taxes in an amount equal to 1/12 of the real estate taxes that the lender estimates will be payable during the next twelve months (initially, $275,628).
Insurance – The National Anchored Retail Portfolio Whole Loan documents provide for monthly reserves for insurance premiums in an amount equal to 1/12 of the insurance premiums that the lender estimates will be payable for the renewal of coverage upon the expiration of the insurance policies; provided that such monthly reserves are not required so long as (i) no event of default has occurred and is continuing, (ii) the insurance coverage for each National Anchored Retail Portfolio Property is included in a blanket policy approved by the lender in its reasonable discretion, and (iii) the National Anchored Retail Portfolio Borrowers provide the lender with evidence of payment of the insurance premiums and renewals of the insurance policies, no later than ten days prior to the expiration of the current policy.
Recurring Replacements Reserves – The National Anchored Retail Portfolio Whole Loan documents provide for monthly deposits of $16,160 into a capital expenditure reserve.
Rollover Funds – The National Anchored Retail Portfolio Whole Loan documents provide for an upfront rollover reserve of $6,000,000 and ongoing monthly rollover reserves in an amount equal to $64,638;provided that, subject to the provisions described in the next succeeding paragraph, the National Anchored Retail Portfolio Borrowers are not required to deposit more than $10,000,000 (the “Rollover Reserve Cap”) into the rollover reserve. In the event that (i) the rollover reserve funds are subject to the Rollover Reserve Cap, (ii) the lender has released any amounts from the rollover reserve such that there is less than the amount of the Rollover Reserve Cap in the rollover reserve, and (iii) the National Anchored Retail Portfolio Borrowers have ceased making monthly deposits into the rollover reserve, the National Anchored Retail Portfolio Borrowers are required to re-commence the payment of monthly deposit until such time as the amount of the rollover reserve equals the Rollover Reserve Cap. Notwithstanding any provision of the National Anchored Retail Portfolio Whole Loan documents to the contrary, any excess cash flow deposited into the rollover reserve that is to be allocated to the Kohl’s Downgrade Event Cap (as defined below) pursuant to the terms of the cash management agreement (see clause (v) under “Lockbox and Cash Management”) will not be allocated to the Rollover Reserve Cap and any such excess cash flow deposited into the rollover reserve that is to be allocated to the Rollover Reserve Cap (see clause (v) under “Lockbox and Cash Management”) will not be allocated to the Kohl’s Downgrade Event Cap. Furthermore, any amounts being disbursed in connection with the retenanting of any Specified Tenant (as defined below) space currently occupied by any affiliate or subsidiary of Kohl’s Corporation must first be disbursed from the rollover reserve funds allocated to the Kohl’s Downgrade Event Cap and then from any remaining rollover reserve funds.
This is not a research report and was not prepared by the Underwriters’ research department. Please see additional important information and qualifications at the end of this Term Sheet.
T-103
| Retail - Anchored | Loan #8 | Cut-off Date Balance: | $50,000,000 | |
| Various | National Anchored Retail Portfolio | Cut-off Date LTV: | 62.8% | |
| Various, Various | U/W NCF DSCR: | 2.90x | ||
| U/W NOI Debt Yield: | 11.6% |
Notwithstanding the foregoing, if during the first 24 months of any Specified Tenant Lease Expiration Event Period (as defined below), (A) the debt service coverage ratio is less than 1.50x (a “Rollover Debt Service Event”) or (B) three or more Specified Tenants (i) give notice to the National Anchored Retail Portfolio Borrowers of intent to vacate the Specified Tenant space, (ii) “go dark,” vacate, or cease to occupy a substantial portion of the leased premises or discontinue their operations at their leased premises (excluding temporary vacancies), and/or (iii) it is six months prior to any such Specified Tenant’s lease expiration date pursuant to the Specified Tenant lease and such Specified Tenant has failed to extend or renew such Specified Tenant lease (each, a “Rollover Tenant Event”), then the National Anchored Retail Portfolio Borrowers must make monthly rollover reserve deposits and the $10,000,000 cap will not apply until such time as (1) with respect to a Rollover Debt Service Event, the debt service coverage ratio is equal to or greater than 1.50x for two consecutive calendar quarters (a “Rollover Debt Service Cure”) (and no Rollover Tenant Event has occurred and remains uncured) and (2) with respect to a Rollover Tenant Event, (x) the Rollover Tenant Event is cured with respect to two of the three applicable Specified Tenants in accordance with the definition of “Specified Tenant Cure Conditions” (as described below), and (y) the debt service coverage ratio is equal to or greater than 2.00x (a “Rollover Tenant Event Cure”) (and no Rollover Debt Service Event has occurred and remains uncured). However, even if a Rollover Debt Service Event or Rollover Tenant Event is not cured as described above, the $10,000,000 cap will be reinstated when the 24 month period expires. Furthermore, notwithstanding any provision of the National Anchored Retail Portfolio Whole Loan documents to the contrary, at the expiration of any Rollover Excess Cash Sweep Period (as defined below), any amounts remaining in the rollover reserve that exceed the Rollover Cap and do not represent any lease termination fees or amounts allocated to any Kohl’s Downgrade Event Cap must be disbursed to the National Anchored Retail Portfolio Borrowers. See “Lockbox and Cash Management” below.
“Rollover Excess Cash Sweep Period” means a period (during and not longer than the 24-month period described above) (A) commencing upon the first to occur of (i) a Rollover Debt Service Event and (ii) a Rollover Tenant Event; and (B) expiring upon (i) with regard to any Rollover Excess Cash Sweep Period commenced in connection with clause (i) above, a Rollover Debt Service Cure has occurred and (ii) with regard to any Rollover Excess Cash Sweep Period commenced in connection with clause (ii) above, a Rollover Tenant Event Cure has occurred and, in each case, no other Rollover Excess Cash Sweep Period has occurred and is continuing.
“Specified Tenant” means, as applicable, (i) Kohl’s Illinois, Inc. at the Forest Plaza Property, (ii) Best Buy Stores, LP at the Lakeline Plaza Property, (iii) Kohl’s Indiana, LP at the Muncie Towne Plaza Property, and (iv) Kohl’s Illinois, Inc. at the White Oaks Plaza Property.
“Specified Tenant Lease Expiration Event Period” means a Specified Tenant Event Period (as defined below) that commences six months prior to the second of any two Specified Tenants’ stated lease expiration dates pursuant to the Specified Tenant lease (see the definition of “Specified Tenant Event Period” under “Lockbox and Cash Management”).
Rent Concession Reserve Funds – The National Anchored Retail Portfolio Whole Loan documents provide for an upfront rent concession reserve of $57,648, representing the amount of future rent credits or abatements under the existing lease with the tenant known as Diamond Nail Spa at the White Oaks Property. So long as no event of default has occurred and is continuing, the lender must make monthly disbursements of $1,601 from the rent concession reserve funds into the cash management account commencing November 1, 2019 to and including October 2021 or until such time when no rent concession reserve funds remain on deposit with the lender.
Existing TI/LC Obligations Reserve – The National Anchored Retail Portfolio Whole Loan documents provide for an upfront existing tenant improvements and leasing commission reserve of $896,489, representing the tenant improvements and leasing commissions payable by the National Anchored Retail Portfolio Borrowers under certain existing leases at the National Anchored Retail Portfolio Properties.
Lockbox and Cash Management.The National Anchored Retail Portfolio Whole Loan is structured with a hard lockbox (established as a collection of accounts each relating to one National Anchored Retail Portfolio Property) and springing cash management. The National Anchored Retail Portfolio Borrowers and the property manager are required to cause all rents to be deposited directly into the lockbox account and notify and advise each tenant under each lease to send all payments of rent directly to the lockbox account.
All funds on deposit in the lockbox account are required to be transferred periodically (in general, weekly) to an account designated by the National Anchored Retail Portfolio Borrowers unless the lender otherwise instructs. Upon the occurrence of a Cash Sweep Event Period (as defined below), the cash management agreement requires the lender to establish a cash management account and entitles the lender to deliver written notice to the lockbox banks directing them to disburse all available funds then and thereafter on deposit in the lockbox account during a Cash Sweep Event Period to the cash management account in accordance with the terms of the lockbox agreements. The lender is required to terminate the direction upon the cessation of a Cash Sweep Event Period.
During a Cash Sweep Event Period, provided that no event of default is continuing, all funds in the cash management account are required to be applied on each monthly payment date: (i) to make the monthly deposits into the real estate tax and insurance reserves as described above under “Escrows and Reserves,” (ii) to pay debt service on the National Anchored Retail Portfolio Whole Loan, (iii) to make deposits into the capital expenditure reserve and rollover reserve, as described above under “Escrows and Reserves,” (iv) to pay operating expenses set forth in the annual budget (which is required to be approved by the lender during a Cash Sweep Event Period) and lender-approved extraordinary expenses, and (v) to deposit any remainder (“excess cash flow”) (A) if there is both a Specified Tenant Event Period (but not a Rollover Excess Cash Sweep Period) and a Kohl’s Downgrade Event Period, into the rollover reserve (1) first, until an amount equal to the Rollover Reserve Cap has been deposited therein and (2) thereafter, until the expiration of such Kohl’s Downgrade Event Period (provided that, if such Kohl’s Downgrade Event Period is caused by a Kohl’s Downgrade Event (Level 2), such excess cash flow will only be deposited until an amount equal to the Kohl’s Downgrade Event Cap (in addition to an amount equal to the Rollover Reserve Cap) has been deposited into the rollover reserve), (B) if there is a Specified Tenant Event Period, a Rollover Excess Cash Sweep Period and a Kohl’s Downgrade Event Period, (1) first into the rollover reserve until the expiration of such Kohl’s Downgrade Event Period (provided that, if such Kohl’s Downgrade Event Period is caused by a Kohl’s Downgrade Event (Level 2), such excess cash flow will only be deposited until an amount equal to the Kohl’s Downgrade Event Cap has been deposited into the rollover reserve) and (2) thereafter, into the rollover reserve until the expiration of the Rollover Excess Cash Sweep Period (provided that, if any other Specified Tenant Event Period is still continuing after such expiration (in addition to a Kohl’s Downgrade Event Period continuing), then the provision described in clause (A) above will apply to any remaining excess cash flow thereafter), (C) in connection with a Cash Sweep Event caused by a Kohl’s Downgrade Event Period (if no Specified Tenant Event Period and no Rollover Excess Cash Sweep Period has occurred and is continuing), into the rollover reserve (provided that, if such Kohl’s Downgrade Event Period is caused by a Kohl’s Downgrade Event (Level 2), such excess cash flow will only be deposited until an amount equal to the Kohl’s Downgrade Event Cap has been deposited into the rollover reserve), and (D) in connection with any Cash Sweep Event other than a Cash Sweep Event caused by a Kohl’s Downgrade Event Period or a Specified Tenant Event Period, into an excess cash flow subaccount, to be held as additional security for the National Anchored Retail Portfolio Whole
This is not a research report and was not prepared by the Underwriters’ research department. Please see additional important information and qualifications at the end of this Term Sheet.
T-104
| Retail - Anchored | Loan #8 | Cut-off Date Balance: | $50,000,000 | |
| Various | National Anchored Retail Portfolio | Cut-off Date LTV: | 62.8% | |
| Various, Various | U/W NCF DSCR: | 2.90x | ||
| U/W NOI Debt Yield: | 11.6% |
Loan during the continuance of such Cash Sweep Event, subject to disbursement as described below. Notwithstanding the foregoing or any provision of the National Anchored Retail Portfolio Whole Loan documents to the contrary, any excess cash flow deposited into the rollover reserve that is to be allocated to the Kohl’s Downgrade Event Cap will not be allocated to the Rollover Reserve Cap and any excess cash flow deposited into the rollover reserve that is to be allocated to the Rollover Reserve Cap will not be allocated to the Kohl’s Downgrade Event Cap. Funds in the excess cash flow subaccount may be applied to operating expenses reasonably approved by the lender and to leasing expenses, if no funds remain in the rollover reserve and the same conditions to disbursement as apply to the rollover reserve are satisfied.
A “Cash Sweep Event Period” means a period:
| (i) | commencing upon an event of default under the National Anchored Retail Portfolio Whole Loan documents and ending if no event of default exists; |
| (ii) | commencing upon the debt service coverage ratio on the National Anchored Retail Portfolio Whole Loan falling below 1.25x as of the end of any calendar quarter (based on the trailing six months of operating statements and rent rolls), and ending on the date the debt service coverage ratio equals or exceeds 1.25x for six consecutive calendar months; |
| (iii) | commencing upon the occurrence of a Specified Tenant Event Period (as defined below) and ending upon such Specified Tenant Event Period ceasing to exist; |
| (iv) | commencing upon the occurrence of a Kohl’s Downgrade Event Period (as defined below) and ending upon a Kohl’s Downgrade Event Period ceasing to exist; or |
| (v) | after the occurrence of a Kohl’s Go-Private Event (as defined in “Kohl’s Downgrade Event Cure” below), any bankruptcy or similar insolvency of any affiliate or subsidiary of Kohl’s Corporation that is a Specified Tenant and ending upon the earlier of (x) the applicable Specified Tenant no longer being insolvent or subject to any bankruptcy or insolvency proceedings and having affirmed the applicable Specified Tenant Lease pursuant to a final, non-appealable order of a court of competent jurisdiction, (y) the bankruptcy or insolvency proceeding has terminated and the applicable Specified Tenant lease has been affirmed, assumed or assigned by the applicable Specified Tenant in a manner reasonably satisfactory to the lender or the applicable Specified Tenant lease has been assumed and assigned to a third party acceptable to the lender in a manner reasonably satisfactory to the lender, or (z) the National Anchored Retail Portfolio Borrowers have leased at least 85% of the Specified Tenant space to an investment grade tenant or other tenant approved by the lender on terms and conditions approved by the lender and caused to be delivered a tenant estoppel certificate evidencing that the tenant is in actual, physical occupancy, open to the public for business and paying the full, unabated rent due under its lease. |
Notwithstanding the foregoing, a Cash Sweep Event Period will not be deemed to expire in the event that a Cash Sweep Event Period then exists for any other reason.
A “Specified Tenant Event Period” means a period:
| (i) | commencing upon the first to occur of (i) the date when the second of any two Specified Tenants gives notice to vacate its space to the National Anchored Retail Portfolio Borrowers or such Specified Tenant “goes dark”, vacates, or ceases to occupy a substantial portion of the leased premises or discontinues its operations at its leased premises (excluding temporary vacancies), and (ii) six months prior to the second of any two Specified Tenant’s stated lease expiration date; and |
| (ii) | ending upon the satisfaction of the Specified Tenant Cure Conditions (with respect to at least one of the two Specified Tenants). |
Notwithstanding the foregoing, a Specified Tenant Event Period will not commence if the Specified Tenant has renewed or extended the Specified Tenant lease (or otherwise entered into an extension agreement with the National Anchored Retail Portfolio Borrowers) on market terms and conditions acceptable to the lender prior to the Specified Tenant Event Period.
“Specified Tenant Cure Conditions” means each of the following, as applicable (i) the National Anchored Retail Portfolio Borrowers have leased at least 85% of the Specified Tenant space to a tenant on market terms and conditions approved by the lender and caused the delivery to the lender of a tenant estoppel certificate evidencing that the tenant is in actual, physical occupancy, open to the public for business and paying the full, unabated rent due under its lease, or (ii) the Specified Tenant has renewed or extended the Specified Tenant lease on market terms and conditions approved by the lender.
“Kohl’s Downgrade Event Period” means a period commencing upon the first to occur of a Kohl’s Downgrade Event (Level 1) and a Kohl’s Downgrade Event (Level 2) and ending upon the lender’s receipt of evidence, reasonably satisfactory to the lender, of the satisfaction of the applicable Kohl’s Downgrade Event Cure.
“Kohl’s Downgrade Event (Level 1)” means that Kohl’s Corporation’s long-term unsecured debt rating is BB+ or lower from S&P and an equivalent rating or lower from each of the other rating agencies that rate such entity and have been designated in connection with a securitization involving a portion of the National Anchored Retail Portfolio Whole Loan.
“Kohl’s Downgrade Event (Level 2)” means that Kohl’s Corporation’s long-term unsecured debt rating is BB or lower from S&P and an equivalent rating or lower from each of the other rating agencies that rate such entity and have been designated in connection with a securitization involving a portion of the National Anchored Retail Portfolio Whole Loan.
“Kohl’s Downgrade Event Cure” means each of the following: (A)(i) with respect to a Kohl’s Downgrade Event (Level 1), Kohl’s Corporation maintains (and has maintained for at least two consecutive calendar quarters) a long-term unsecured debt rating of at least BBB- or better from S&P and an equivalent rating from each of the other rating agencies that rate such entity and have been designated in connection with a securitization involving a portion of the National Anchored Retail Portfolio Whole Loan and (ii) with respect to a Kohl’s Downgrade Event (Level 2), Kohl’s Corporation maintains (and has maintained for at least two consecutive calendar quarters) a long-term unsecured debt rating of at least BB+ or better from S&P and an equivalent rating from each of the other rating agencies that rate such entity and have been designated in connection with a securitization involving a portion of the National Anchored Retail Portfolio Whole Loan (provided, however, if such rating is not BBB- or better, then a Kohl’s Downgrade Event (Level 1) will still be deemed to have occurred and be continuing until the same has been cured in accordance with the terms described herein), (B)(i) with respect to a Kohl’s Downgrade Event (Level 1), the date immediately subsequent to the eighteenth monthly payment date after the occurrence of such Kohl’s Downgrade Event (Level 1) has occurred, and (ii) with respect to a Kohl’s Downgrade Event (Level 2), the date that excess cash flow in the amount of the Kohl’s Downgrade Event
This is not a research report and was not prepared by the Underwriters’ research department. Please see additional important information and qualifications at the end of this Term Sheet.
T-105
| Retail - Anchored | Loan #8 | Cut-off Date Balance: | $50,000,000 | |
| Various | National Anchored Retail Portfolio | Cut-off Date LTV: | 62.8% | |
| Various, Various | U/W NCF DSCR: | 2.90x | ||
| U/W NOI Debt Yield: | 11.6% |
Cap has been deposited into the rollover reserve, or (C) the National Anchored Retail Portfolio Borrowers have leased at least 85% of the Specified Tenant space occupied by Specified Tenants that are subsidiaries or affiliates of Kohl’s Corporation to an investment grade tenant or other tenant on terms and conditions approved by the lender and caused the delivery of a tenant estoppel certificate evidencing that the tenant is in actual, physical occupancy, open to the public for business and paying the full, unabated rent due under its lease. Notwithstanding any provision of the National Anchored Retail Portfolio Whole Loan documents to the contrary, a Kohl’s Downgrade Event (Level 1) or a Kohl’s Downgrade Event (Level 2) will not be deemed to have occurred if Kohl’s Corporation is no longer a publicly traded entity whose shares are listed on a nationally recognized stock exchange (a “De-Listed Entity”) so long as (i) there has been no material change to Kohl’s Corporation’s (or each such successor entity’s) financial credit worthiness at any time after the de-listing and (ii) Kohl’s Corporation (or such successor entity(ies)) has publicly rated investment grade debt (a “Kohl’s Go-Private Event”). If clauses (i) and (ii) in the foregoing sentence cease to be met at any time after a Kohl’s Go-Private Event, the provisions described herein applicable to a Kohl’s Downgrade Event (Level 1) and a Kohl’s Downgrade Event (Level 2) will apply mutatis mutandis to any successor entity(ies) to Kohl’s Corporation.
“Kohl’s Downgrade Event Cap” means $20,000,000.
Additional Secured Indebtedness (not including trade debts).In addition to the National Anchored Retail Portfolio Mortgage Loan, the National Anchored Retail Portfolio Properties also secure the National Anchored Retail Portfolio ServicedPari Passu Companion Loans, which have an aggregate Cut-off Date principal balance of $67,000,000. The National Anchored Retail Portfolio ServicedPari Passu Companion Loans accrue interest at the same rate as the National Anchored Retail Portfolio Mortgage Loan. The National Anchored Retail Portfolio Mortgage Loan is entitled to payments of interest and principal on apro rata andpari passu basis with the National Anchored Retail Portfolio ServicedPari PassuCompanion Loans. The holders of the National Anchored Retail Portfolio Mortgage Loan and the National Anchored Retail Portfolio ServicedPari Passu Companion Loans have entered into a co-lender agreement which sets forth the allocation of collections on the National Anchored Retail Portfolio Whole Loan. See“Description of the Mortgage Pool—The Whole Loans—The Serviced Pari Passu Whole Loans”in the Preliminary Prospectus.
Mezzanine Loan and Preferred Equity.Not permitted.
Release of Property.After the expiration of the defeasance lockout period, the National Anchored Retail Portfolio Borrowers have the right to obtain a release of the Forest Plaza Property and/or the Muncie Towne Plaza Property, provided that among other conditions: (i) no event of default is continuing, (ii) the National Anchored Retail Portfolio Borrowers partially defease the National Anchored Retail Portfolio Whole Loan in a principal amount equal to 115% of the allocated loan amount for the Forest Plaza Property or the Muncie Towne Plaza Property, as the case may be, (iii) the debt yield for all remaining National Anchored Retail Portfolio Properties is not less than the greater of (a) the debt yield immediately preceding the release and (b) 11.60%, and (iv) customary REMIC requirements are satisfied.
In addition, the National Anchored Retail Portfolio Borrowers are entitled from time to time to obtain the release of each of two Release Parcels (as defined below), in each case without prepayment or defeasance of any portion of the National Anchored Retail Portfolio Whole Loan, in connection with a legal subdivision of such Release Parcel. In each case, the release is subject to the satisfaction of various conditions, including the conditions that (a) no event of default is continuing that would not be cured by the release, (b) the Release Parcel is legally subdivided from the remaining National Anchored Retail Portfolio Properties and constitutes a separate lot for zoning, tax and assessment purposes and (c) the lender is satisfied that the release is permitted pursuant to REMIC requirements. The “Release Parcels” are (i) certain unimproved land at the Lakeline Village Property, and (ii) a pad site at the White Oaks Plaza Property that is occupied by Olive Garden and ground leased by the applicable National Anchored Retail Portfolio Borrower to a third party on terms that grant to the third party an option to purchase the pad site for a nominal sum upon the subdivision of the pad site from the remainder of the White Oaks Plaza Property.
Furthermore, provided that no event of default has occurred and is continuing, the National Anchored Retail Portfolio Borrowers may (i) make transfers of non-income producing portions of any individual National Anchored Retail Portfolio Property to third parties or affiliates and (ii) grant easements, restrictions, covenants, and rights of way in the ordinary course of business for traffic circulation, ingress, egress, parking, access, utilities lines or for other similar purposes. No such transfer, conveyance or other encumbrance may result in a material adverse effect on the use, operation or value of any National Anchored Retail Portfolio Property.
Letter of Credit.None.
Right of First Refusal/Right of First Offer. The ground lessee of the Release Parcel consisting of the pad site at the White Oaks Plaza Property that is occupied by Olive Garden has an option to purchase the pad site for a nominal sum upon the subdivision of the pad site from the remainder of the White Oaks Plaza Property.
Ground Lease.None.
Terrorism Insurance. The National Anchored Retail Portfolio Borrowers are required to obtain and maintain an “all risk” property insurance policy that covers perils of terrorism and acts of terrorism in an amount equal to the “full replacement cost” of the National Anchored Retail Portfolio Properties together with business income insurance covering not less than the 18-month period commencing at the time of loss, together with an extended period of indemnity endorsement of not less than twelve months. Notwithstanding the foregoing, for so long as the Terrorism Risk Insurance Act of 2002, as extended and modified by the Terrorism Risk Insurance Program Reauthorization Act of 2015 (“TRIPRA”) is in effect (including any extensions thereof or if another federal governmental program is in effect relating to “acts of terrorism” which provides substantially similar protections as TRIPRA), and covers both domestic and foreign acts of terrorism, the lender is required to accept terrorism insurance which insures against “covered acts” as defined by TRIPRA (or such other program). Notwithstanding any provision of the National Anchored Retail Portfolio Whole Loan documents to the contrary, if TRIPRA (or a similar or subsequent statute, extension or reauthorization) is not in effect, or a material increase in terrorism insurance premiums results from a modification of TRIPRA (or a similar or subsequent statute, extension or reauthorization) or a terrorism event occurring on U.S. soil, the National Anchored Retail Portfolio Borrowers are not required to maintain terrorism insurance coverage in excess of what is commercially available for annual premiums equal to two times the then-current property insurance premium then payable in respect of the property and business interruption/rental loss insurance required under the National Anchored Retail Portfolio Whole Loan documents (without giving effect to terrorism and earthquake components when terrorism insurance coverage is excluded from any required insurance policies). See“Risk Factors—Risks Relating to the Mortgage Loans—Terrorism Insurance May Not Be Available for All Mortgaged Properties”in the Preliminary Prospectus.
This is not a research report and was not prepared by the Underwriters’ research department. Please see additional important information and qualifications at the end of this Term Sheet.
T-106
(THIS PAGE INTENTIONALLY LEFT BLANK)
T-107
| Hospitality – Full Service | Loan #9 | Cut-off Date Balance: | $40,400,000 | |
| 9 Estell Lee Place | Embassy Suites Riverfront | Cut-off Date LTV: | 62.2% | |
| Wilmington, NC 28401 | U/W NCF DSCR: | 2.13x | ||
| U/W NOI Debt Yield: | 13.1% |

This is not a research report and was not prepared by the Underwriters’ research department. Please see additional important information and qualifications at the end of this Term Sheet.
T-108
| Hospitality – Full Service | Loan #9 | Cut-off Date Balance: | $40,400,000 | |
| 9 Estell Lee Place | Embassy Suites Riverfront | Cut-off Date LTV: | 62.2% | |
| Wilmington, NC 28401 | U/W NCF DSCR: | 2.13x | ||
| U/W NOI Debt Yield: | 13.1% |
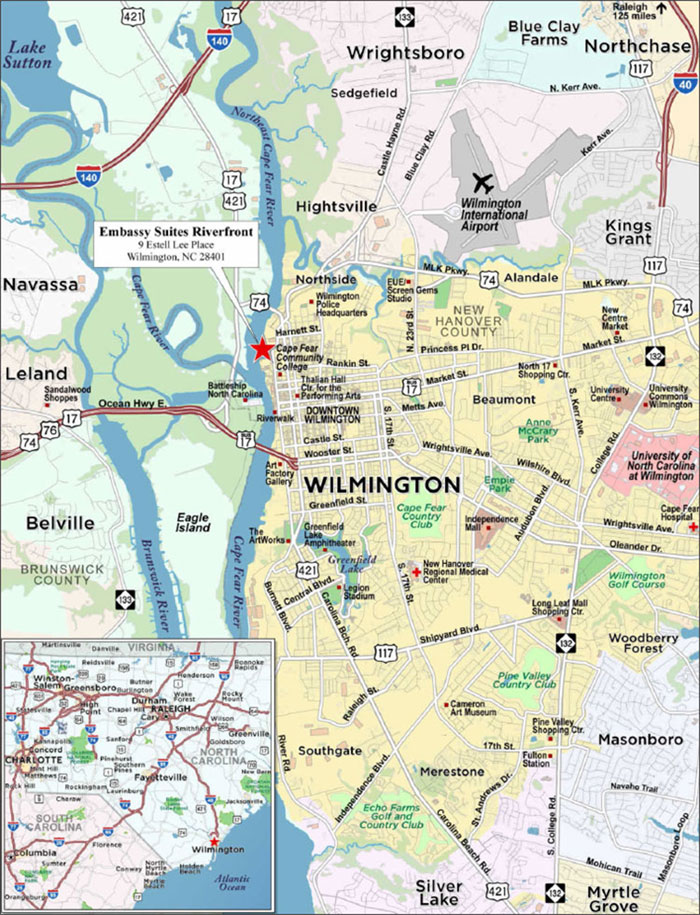
This is not a research report and was not prepared by the Underwriters’ research department. Please see additional important information and qualifications at the end of this Term Sheet.
T-109
| Mortgage Loan No. 9 – Embassy Suites Riverfront |
| Mortgage Loan Information | Property Information | |||||
| Mortgage Loan Seller: | BANA | Single Asset/Portfolio: | Single Asset | |||
| Credit Assessment (DBRS/Fitch/S&P): | NR/NR/NR | Location: | Wilmington, NC 28401 | |||
| Original Balance: | $40,400,000 | General Property Type: | Hospitality | |||
| Cut-off Date Balance: | $40,400,000 | Detailed Property Type: | Full Service | |||
| % of Initial Pool Balance: | 3.4% | Title Vesting: | Fee | |||
| Loan Purpose: | Refinance | Year Built/Renovated: | 2017 / N/A | |||
| Borrower Sponsors: | Mark F. Garcea; Page S. Johnson, II | Size: | 186 Rooms | |||
| Guarantors: | Mark F. Garcea; Page S. Johnson, II | Cut-off Date Balance per Room(1): | $217,204 | |||
| Mortgage Rate: | 3.6500% | Maturity Date Balance per Room(1): | $191,605 | |||
| Note Date: | 9/11/2019 | Property Manager: | Harmony Hospitality, Inc. | |||
| First Payment Date: | 11/1/2019 | (borrower-related) | ||||
| Maturity Date: | 10/1/2029 | |||||
| Original Term to Maturity: | 120 months | |||||
| Original Amortization Term: | 360 months | Underwriting and Financial Information | ||||
| IO Period: | 48 months | UW NOI: | $5,292,544 | |||
| Seasoning: | 0 months | UW NOI Debt Yield: | 13.1% | |||
| Prepayment Provisions: | LO (24); DEF (92); O (4) | UW NOI Debt Yield at Maturity: | 14.9% | |||
| Lockbox/Cash Mgmt Status: | Springing/Springing | UW NCF DSCR: | 3.16x (IO) 2.13x (P&I) | |||
| Additional Debt Type: | N/A | Most Recent NOI: | $5,466,666 (7/31/2019 TTM) | |||
| Additional Debt Balance: | N/A | 2nd Most Recent NOI: | $4,015,985 (12/31/2018) | |||
| Future Debt Permitted (Type): | No (N/A) | 3rd Most Recent NOI(2): | N/A | |||
| Reserves(1) | Most Recent Occupancy: | 82.5% (7/31/2019) | ||||
| Type | Initial | Monthly | Cap | 2nd Most Recent Occupancy: | 71.6% (12/31/2018) | |
| RE Tax: | $260,138 | $26,014 | N/A | 3rd Most Recent Occupancy(2): | N/A | |
| Insurance: | $255,770 | $25,596 | N/A | Appraised Value (as of): | $65,000,000 (8/1/2019) | |
| Immediate Repairs: | $50,000 | N/A | N/A | Appraised Value per Room: | $349,462 | |
| FF&E: | $0 | Springing | N/A | Cut-off Date LTV Ratio: | 62.2% | |
| Parking Agreement: | $25,000 | Springing | N/A | Maturity Date LTV Ratio: | 54.8% | |
| Sources and Uses | ||||||
| Sources | Proceeds | % of Total | Uses | Proceeds | % of Total | |
| Loan Amount: | $40,400,000 | 100.0% | Loan Payoff: | $30,118,564 | 74.6% | |
| Return of Equity: | $8,292,318 | 20.5% | ||||
| Closing Costs: | $1,398,211 | 3.5% | ||||
| Reserves: | $590,907 | 1.5% | ||||
| Total Sources: | $40,400,000 | 100.0% | Total Uses: | $40,400,000 | 100.0% | |
| (1) | See “Escrows and Reserves” below for further discussion of reserve requirements. |
| (2) | Historical NOI and Occupancy information is not available as the Embassy Suites Riverfront Property (as defined below) is newly constructed and opened in December 2017. |
The Mortgage Loan. The ninth largest mortgage loan (the “Embassy Suites Riverfront Mortgage Loan”) is evidenced by a promissory note in the original principal amount of $40,400,000 and secured by a first priority fee mortgage on a 186 all-suite full service hotel located in Wilmington, North Carolina (the “Embassy Suites Riverfront Property”).
The Borrower and the Borrower Sponsors.The borrower is Wilmington Convention Hotel, LLC (the “Embassy Suites Riverfront Borrower”), a single-purpose Virginia limited liability company with at least one independent director.
The borrower sponsors and non-recourse carveout guarantors are Mark F. Garcea and Page S. Johnson, II, the founders of Harmony Investments, Inc., a commercial real estate owner, developer and manager with additional investments in in sports franchises. Harmony Investments, Inc. has a current real estate portfolio across Virginia and North Carolina, including one retail center, one office building, four multifamily properties and twelve hotels, including the Embassy Suites Riverfront Property. Harmony Investments, Inc. developed the Embassy Suites Riverfront Property at a cost of approximately $42,300,000 ($227,388 per room).
The Property. The Embassy Suites Riverfront Property is an eight-story, full service hotel located in downtown Wilmington, North Carolina. The Embassy Suites Riverfront Property opened in December 2017 and contains 186 studio and one-bedroom suites. Each room averages 340 SF and features either one king bed or two queen beds, a living room area with work desk and chair, 49-inch flat screen TV and sofa, and a wet bar area with mini-refrigerator, microwave and coffee/tea maker. Amenities include a restaurant, rooftop lounge, indoor pool, fitness center, complimentary made-to-order breakfast, complimentary daily evening beverage and snack reception, guest laundry facilities, business center, sundry shop, and approximately 3,862 SF of dedicated meeting space. Parking is available pursuant to a long-term lease agreement for exclusive use of 250 garage spaces in the adjacent parking garage owned by the City of Wilmington, North Carolina and used by the adjacent Wilmington Convention Center. The parking lease commenced in December 2014 and expires in December 2047, with two ten-year renewal options, and requires payments of $100 per space per month for the first five lease years followed by annual increases of up to 5% during years 6 through 10 of the lease, and increases every five years thereafter based on inflation and operating costs.
This is not a research report and was not prepared by the Underwriters’ research department. Please see additional important information and qualifications at the end of this Term Sheet.
T-110
| Hospitality – Full Service | Loan #9 | Cut-off Date Balance: | $40,400,000 | |
| 9 Estell Lee Place | Embassy Suites Riverfront | Cut-off Date LTV: | 62.2% | |
| Wilmington, NC 28401 | U/W NCF DSCR: | 2.13x | ||
| U/W NOI Debt Yield: | 13.1% |
The Embassy Suites Riverfront Property operates under a franchise agreement with Hilton Franchise Holding LLC through February 28, 2036.
More specific information about the Embassy Suites Riverfront Property and the related competitive set is set forth in the following table:
| Historical Occupancy, ADR, RevPAR(1)(2) | |||||||||
| Competitive Set | Embassy Suites Riverfront Property | Penetration Factor | |||||||
| Year | Occupancy | ADR | RevPAR | Occupancy | ADR | RevPAR | Occupancy | ADR | RevPAR |
| 12/31/2018 | 74.7% | $129.49 | $96.69 | 69.0% | $168.75 | $116.49 | 92.5% | 130.3% | 120.5% |
| 6/30/2019 T-12 | 80.2% | $134.29 | $107.74 | 79.4% | $173.67 | $137.82 | 98.9% | 129.3% | 127.9% |
| 6/30/2019 T-6 | 81.5% | $133.45 | $108.73 | 82.1% | $172.37 | $141.58 | 100.8% | 129.2% | 130.2% |
Source: Industry Report.
| (1) | The competitive set includesHoliday Inn Wilmington Market Street, Hotel Ballast Wilmington Tapestry Collection by Hilton, Courtyard Wilmington, Staybridge Suites Wilmington – Wrightsville Beach, Homewood Suites by Hilton Wilmington Mayfaire, Courtyard Wilmington Downtown Historic District, Springhill Suites Wilmington Mayfaire and Hampton Inn Wilmington Downtown. |
| (2) | Variances between the underwriting, the appraisal and the industry report data with respect to Occupancy, ADR and RevPAR at the Embassy Suites Riverfront Property are attributable to variances in reporting methodologies and/or timing differences. |
The Market.The Embassy Suites Riverfront Property is located in downtown Wilmington, North Carolina. Downtown Wilmington is located along the Cape Fear River and is the economic and social hub for the region. Downtown Wilmington features a 1.75-mile long riverwalk that features the World War II Battleship NORTH CAROLINA, various stores, restaurants and entertainment venues, hotels, convention and meeting space, museums and cultural facilities. The Historic District of downtown is a part of the National Register of Historic Places.
Economic demand drivers for Wilmington include year-round leisure demand from three barrier island beaches: Carolina Beach, Kure Beach and Wrightsville Beach; film and television production largely driven by EUE Screen Gems Studios, the largest domestic television and movie production facility outside of California; the healthcare industry with the New Hanover Regional Medical Center, Cape Fear Hospital, American Cancer Society, Wilmington VA Health Care Center and NHRMC Orthopedic Hospital; and higher education, with the University of North Carolina at Wilmington, Cape Fear Community College, Shaw University (satellite campus), University of Mount Olive (satellite campus), Miller Motte College and the Center for Marine Science. Major employers in the Wilmington metropolitan statistical area include Pharmaceutical Product Development, GE Aircraft Division, GE Nuclear, CP&L Brunswick Nuclear Plant, Verizon Wireless, Corning, International Paper, AAIPharma Services Corporation, North Carolina State Ports, LL Building Products and Duke Energy.
Wilmington is served by the Wilmington International Airport (ILM), located five miles north of downtown Wilmington. ILM had an estimated passenger count of 934,000 in 2018, an 11.7% increase from the prior year. Delta Air Lines, American Airlines and United operate non-stop service out of ILM.
According to the appraisal, the estimated 2019 population within a one-, three- and five-mile radius of the Embassy Suites Riverfront Property was 5,424, 35,200 and 94,989, respectively. The 2019 average household income within the same radii was $53,434, $51,377 and $53,974, respectively. According to the appraisal, from 2013 to 2018, in the Wilmington metropolitan statistical area, population grew by a compound annual rate of 1.8% and employment grew by a compound annual rate of 2.7%
The following table presents certain information relating to the primary competitive properties to the Embassy Suites Riverfront Property:
| Property Competitive Summary(1) | ||||||||
| Property Name | No. of Rooms | Year Built | Commercial | Meeting & Group | Leisure | Estimated 2018 Occupancy | Estimated 2018 ADR | Estimated 2018 |
| Embassy Suites Riverfront | 186 | 2017 | 50% | 25% | 25% | 72.4% | $166.98 | $120.83 |
| Hotel Ballast Wilmington, Tapestry Collection by Hilton | 272 | 1972 | 40% | 30% | 30% | 70%-75% | $150-$155 | $105-$110 |
| Courtyard Wilmington Downtown/Historic District | 124 | 2014 | 55% | 20% | 25% | 75%-80% | $140-$145 | $105-$110 |
| Hampton Inn Wilmington Downtown | 92 | 2017 | 55% | 15% | 30% | 75%-80% | $145-$150 | $110-$115 |
| Holiday Inn Wilmington-Market Street | 127 | 1987 | 50% | 20% | 30% | 70%-75% | $105-$110 | $75-$80 |
| Staybridge Suites Wilmington – Wrightsville Beach | 93 | 2011 | 65% | 5% | 30% | 75%-80% | $115-$120 | $85-$90 |
| Courtyard Wilmington/Wrightsville Beach | 128 | 1996 | 55% | 20% | 25% | 70%-75% | $110-$115 | $75-$80 |
| Homewood Suites Wilmington/Mayfair | 118 | 2010 | 65% | 10% | 25% | 75%-80% | $125-$130 | $95-$100 |
| Springhill Suites Wilmington Mayfair | 120 | 2015 | 55% | 15% | 30% | 75%-80% | $120-$125 | $90-$95 |
Source:Appraisal.
| (1) | Variances between the underwriting, the appraisal and the Historical Occupancy, ADR, RevPAR table above with respect to Occupancy, ADR and RevPAR at the Embassy Suites Riverfront Property are attributable to variances in reporting methodologies and/or timing differences. |
According to the appraisal, there is one hotel under construction that is expected to directly compete with the Embassy Suites Riverfront Property, a 125-room Aloft Wilmington Downtown that is expected to open in July 2020, adjacent to the Embassy Suites Riverfront Property.
This is not a research report and was not prepared by the Underwriters’ research department. Please see additional important information and qualifications at the end of this Term Sheet.
T-111
| Hospitality – Full Service | Loan #9 | Cut-off Date Balance: | $40,400,000 | |
| 9 Estell Lee Place | Embassy Suites Riverfront | Cut-off Date LTV: | 62.2% | |
| Wilmington, NC 28401 | U/W NCF DSCR: | 2.13x | ||
| U/W NOI Debt Yield: | 13.1% |
Operating History and Underwritten Net Cash Flow. The following table presents certain information relating to the operating history and Underwritten Net Cash Flow at the Embassy Suites Riverfront Property:
| Cash Flow Analysis(1) | ||||
| 2018 | 7/31/2019 TTM | UW | UW per Room | |
| Occupancy | 71.6% | 82.5% | 82.5% | |
| ADR | $168.85 | $ 175.07 | $175.07 | |
| RevPAR | $120.83 | $ 144.50 | $144.50 | |
| Room Revenue | $8,203,289 | $9,810,640 | $9,810,640 | $52,745 |
| Food & Beverage Revenue | $3,457,275 | $3,690,111 | $3,690,111 | $19,839 |
| Other Income | $673,029 | $755,512 | $755,512 | $4,062 |
| Total Revenue | $12,333,593 | $14,256,263 | $14,256,263 | $76,647 |
| Real Estate Taxes | $305,861 | $316,297 | $316,297 | $1,701 |
| Insurance | $272,800 | $278,827 | $279,233 | $1,501 |
| Other Expenses | $7,738,947 | $8,194,473 | $8,368,189 | $44,990 |
| Total Expenses | $8,317,608 | $8,789,597 | $8,963,719 | $48,192 |
| Net Operating Income | $4,015,985 | $5,466,666 | $5,292,544 | $28,455 |
| FF&E | $246,679 | $451,005 | $570,251 | $3,066 |
| Net Cash Flow | $3,769,306 | $5,015,661 | $4,722,294 | $25,389 |
| NOI DSCR (IO) | 2.69x | 3.66x | 3.54x | |
| NOI DSCR (P&I) | 1.81x | 2.46x | 2.39x | |
| NCF DSCR (IO) | 2.52x | 3.35x | 3.16x | |
| NCF DSCR (P&I) | 1.70x | 2.26x | 2.13x | |
| NOI Debt Yield | 9.9% | 13.5% | 13.1% | |
| NCF Debt Yield | 9.3% | 12.4% | 11.7% | |
| (1) | Further historical information is not available as the Embassy Suites Riverfront Property is newly constructed and opened in December 2017. |
Escrows and Reserves.
Real Estate Taxes- The Embassy Suites Riverfront Borrower deposited at loan origination $260,138 for real estate taxes and is required to deposit monthly 1/12 of the estimated real estate taxes that the lender estimates will be payable during the next twelve months (initially $26,014).
Insurance- The Embassy Suites Riverfront Borrower deposited at loan origination $255,770 for insurance premiums and is required to deposit monthly 1/12 of the estimated insurance premiums that the lender estimates will be payable during the next twelve months (initially $25,596), unless waived due to a blanket policy being in place.
Immediate Repairs - The Embassy Suites Riverfront Borrower deposited at loan origination $50,000 for required repairs, which amount represents 125% of the estimated cost of the repairs.
FF&E Reserve -Beginning October 1, 2021, the Embassy Suites Riverfront Borrower will be required to deposit monthly 1/12 of 4% of the gross revenue for the Embassy Suites Riverfront Property for the preceding fiscal year for FF&E reserves.
Parking Agreement Reserve- The Embassy Suites Riverfront Borrower deposited at loan origination $25,000 to the parking agreement reserve and, after an event of default under the Embassy Suites Riverfront Mortgage Loan, is required to deposit monthly $25,000 plus any additional charges so that the lender has sufficient funds to pay the amount due under the parking agreement with the City of Wilmington, North Carolina thirty days prior to when due.
Lockbox and Cash Management. The Embassy Suites Riverfront Mortgage Loan documents require a springing hard lockbox with springing cash management. Upon the occurrence of a Cash Sweep Period (as defined below), the Embassy Suites Riverfront Borrower is required to establish a lockbox account and cash management account. During a Cash Sweep Period, funds from the Embassy Suites Riverfront Property are required to be directly deposited to the lockbox account, then transferred on each business day to the lender controlled cash management account to be applied according to the Embassy Suites Riverfront Mortgage Loan documents. Also during a Cash Sweep Period, all excess cash is required to be held by the lender as additional security for the Embassy Suites Riverfront Mortgage Loan until the discontinuance of the Cash Sweep Period.
A “Cash Sweep Period” will occur either (i) during an event of default under the Embassy Suites Riverfront Mortgage Loan or (ii) commencing when the debt service coverage ratio is less than 1.30x on a trailing twelve month basis (tested quarterly), and ending when the debt service coverage ratio is at least 1.35x on a trailing twelve month basis (tested quarterly) for two consecutive quarters,provided that a Cash Sweep Period can be cured once during the Embassy Suites Riverfront Mortgage Loan term (if it occurs a second time, the Cash Sweep Period will continue until full repayment of the Embassy Suites Riverfront Mortgage Loan).
Additional Secured Indebtedness (not including trade debts). Not permitted.
This is not a research report and was not prepared by the Underwriters’ research department. Please see additional important information and qualifications at the end of this Term Sheet.
T-112
| Hospitality – Full Service | Loan #9 | Cut-off Date Balance: | $40,400,000 | |
| 9 Estell Lee Place | Embassy Suites Riverfront | Cut-off Date LTV: | 62.2% | |
| Wilmington, NC 28401 | U/W NCF DSCR: | 2.13x | ||
| U/W NOI Debt Yield: | 13.1% |
Mezzanine Loan and Preferred Equity.Not permitted.
Release of Property. Not permitted.
Ground Lease. None.
Right of First Refusal.None.
Letter of Credit.None.
Terrorism Insurance. The Embassy Suites Riverfront Borrower is required to obtain and maintain property insurance that covers perils of terrorism and acts of terrorism in an amount equal to the lesser of (i) full replacement cost of the Embassy Suites Riverfront Property and (ii) the original principal balance of the Embassy Suites Riverfront Mortgage Loan, and business interruption insurance for eighteen months with a six month extended period of indemnity. See “Risk Factors—Risks Relating to the Mortgage Loans—Terrorism Insurance May Not Be Available for All Mortgaged Properties” in the Preliminary Prospectus.
This is not a research report and was not prepared by the Underwriters’ research department. Please see additional important information and qualifications at the end of this Term Sheet.
T-113
| Retail – Specialty Retail | Loan #10 | Cut-off Date Balance: | $40,000,000 | |
| 3327 & 3377 Las Vegas Boulevard South | Grand Canal Shoppes | Cut-off Date LTV: | 46.3% | |
| Las Vegas, NV 89109 | U/W NCF DSCR: | 2.46x | ||
| U/W NOI Debt Yield: | 9.6% |

This is not a research report and was not prepared by the Underwriters’ research department. Please see additional important information and qualifications at the end of this Term Sheet.
T-114
| Retail – Specialty Retail | Loan #10 | Cut-off Date Balance: | $40,000,000 | |
| 3327 & 3377 Las Vegas Boulevard South | Grand Canal Shoppes | Cut-off Date LTV: | 46.3% | |
| Las Vegas, NV 89109 | U/W NCF DSCR: | 2.46x | ||
| U/W NOI Debt Yield: | 9.6% |
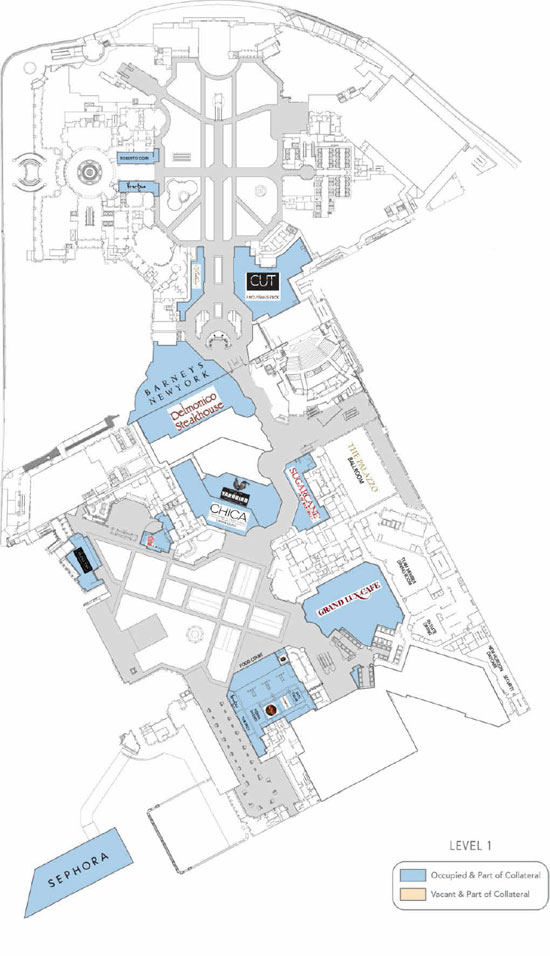
This is not a research report and was not prepared by the Underwriters’ research department. Please see additional important information and qualifications at the end of this Term Sheet.
T-115
| Retail – Specialty Retail | Loan #10 | Cut-off Date Balance: | $40,000,000 | |
| 3327 & 3377 Las Vegas Boulevard South | Grand Canal Shoppes | Cut-off Date LTV: | 46.3% | |
| Las Vegas, NV 89109 | U/W NCF DSCR: | 2.46x | ||
| U/W NOI Debt Yield: | 9.6% |

This is not a research report and was not prepared by the Underwriters’ research department. Please see additional important information and qualifications at the end of this Term Sheet.
T-116
| Retail – Specialty Retail | Loan #10 | Cut-off Date Balance: | $40,000,000 | |
| 3327 & 3377 Las Vegas Boulevard South | Grand Canal Shoppes | Cut-off Date LTV: | 46.3% | |
| Las Vegas, NV 89109 | U/W NCF DSCR: | 2.46x | ||
| U/W NOI Debt Yield: | 9.6% |

This is not a research report and was not prepared by the Underwriters’ research department. Please see additional important information and qualifications at the end of this Term Sheet.
T-117
| Retail – Specialty Retail | Loan #10 | Cut-off Date Balance: | $40,000,000 | |
| 3327 & 3377 Las Vegas Boulevard South | Grand Canal Shoppes | Cut-off Date LTV: | 46.3% | |
| Las Vegas, NV 89109 | U/W NCF DSCR: | 2.46x | ||
| U/W NOI Debt Yield: | 9.6% |

This is not a research report and was not prepared by the Underwriters’ research department. Please see additional important information and qualifications at the end of this Term Sheet.
T-118
| Mortgage Loan No. 10 – Grand Canal Shoppes |
| Mortgage Loan Information | Property Information |
| Mortgage Loan Seller(1): | MSMCH | Single Asset/Portfolio: | Single Asset | ||||
| Credit Assessment (DBRS/Fitch/S&P): | BBB(high)/BBB-(sf)/NR | Location: | Las Vegas, NV 89109 | ||||
| Original Balance(1): | $40,000,000 | General Property Type: | Retail | ||||
| Cut-off Date Balance(1): | $40,000,000 | Detailed Property Type: | Specialty Retail | ||||
| % of Initial Pool Balance: | 3.4% | Title Vesting: | Fee/Leasehold | ||||
| Loan Purpose: | Refinance | Year Built/Renovated: | 1999/2007 | ||||
| Borrower Sponsors: | Brookfield Properties REIT Inc.; Nuveen | Size(6): | 759,891 SF | ||||
| Real Estate | Cut-off Date Balance per SF(1)(6): | $1,000 | |||||
| Guarantor: | BPR Nimbus LLC | Maturity Date Balance per SF(1)(6): | $1,000 | ||||
| Mortgage Rate(2): | 3.7408% | Property Manager: | Brookfield Properties Retail Inc. | ||||
| Note Date: | 6/3/2019 | (borrower-related) | |||||
| First Payment Date: | 8/1/2019 | ||||||
| Maturity Date: | 7/1/2029 | ||||||
| Original Term to Maturity: | 120 months | ||||||
| Original Amortization Term: | 0 months | ||||||
| IO Period: | 120 months | Underwriting and Financial Information | |||||
| Seasoning: | 3 months | UW NOI: | $73,021,709 | ||||
| Prepayment Provisions(3): | LO (27); DEF (88); O (5) | UW NOI Debt Yield(1): | 9.6% | ||||
| Lockbox/Cash Mgmt Status: | Hard/Springing | UW NOI Debt Yield at Maturity(1): | 9.6% | ||||
| Additional Debt Type(1)(4): | Pari Passu/ Subordinate | UW NCF DSCR(1): | 2.46x | ||||
| Additional Debt Balance(1)(4): | $720,000,000 / $215,000,000 | Most Recent NOI: | $71,465,811 (3/31/2019 TTM) | ||||
| Future Debt Permitted (Type): | No (N/A) | 2nd Most Recent NOI: | $71,326,473 (12/31/2018) | ||||
| Reserves(5) | 3rd Most Recent NOI: | $74,425,947 (12/31/2017) | |||||
| Type | Initial | Monthly | Cap | Most Recent Occupancy: | 94.0% (5/31/2019) | ||
| RE Tax: | $0 | Springing | N/A | 2nd Most Recent Occupancy: | 93.3% (12/31/2018) | ||
| Insurance: | $0 | Springing | N/A | 3rd Most Recent Occupancy: | 93.0% (12/31/2017) | ||
| Recurring Replacements: | $0 | Springing | $386,928 | Appraised Value (as of): | $1,640,000,000 (4/3/2019) | ||
| TI/LC: | $12,309,694 | Springing | $2,321,544 | Appraised Value per SF(6): | $2,158 | ||
| Ground Rent Funds: | $0 | Springing | N/A | Cut-off Date LTV Ratio(1): | 46.3% | ||
| Gap Rent Reserve Funds: | $1,218,246 | $0 | N/A | Maturity Date LTV Ratio(1): | 46.3% | ||
| Sources and Uses | ||||||
| Sources | Proceeds | % of Total | Uses | Proceeds | % of Total | |
| Senior Loan Amount(1): | $760,000,000 | 77.9% | Loan Payoff: | $627,284,452 | 64.3% | |
| Subordinate Companion Loan: | $215,000,000 | 22.1% | Return of Equity: | $333,044,567 | 34.2% | |
| Upfront Reserves: | $13,527,940 | 1.4% | ||||
| Closing Costs: | $1,143,041 | 0.1% | ||||
| Total Sources: | $975,000,000 | 100.0% | Total Uses: | $975,000,000 | 100.0% | |
| (1) | The Grand Canal Shoppes Mortgage Loan (as defined below) is part of the Grand Canal Shoppes Whole Loan (as defined below), which is comprised of 24pari passu senior promissory notes with an aggregate original principal balance of $760,000,000 (the “Senior Notes” and, collectively, the “Grand Canal Shoppes Senior Loan”) and one promissory note that is subordinate to the Senior Notes with an original principal balance of $215,000,000 (the “Grand Canal Shoppes Subordinate Companion Loan” and, together with the Grand Canal Shoppes Senior Loan, the “Grand Canal Shoppes Whole Loan”). The Cut-off Date Balance per SF, Maturity Date Balance per SF, UW NOI Debt Yield, UW NOI Debt Yield at Maturity, UW NCF DSCR, Cut-off Date LTV Ratio and Maturity Date LTV Ratio numbers presented above are based on the aggregate principal balance of the promissory notes comprising the Grand Canal Shoppes Senior Loan, without regard to the Grand Canal Shoppes Subordinate Companion Loan. The Cut-off Date Balance per SF, Maturity Date Balance per SF, UW NOI Debt Yield, UW NOI Debt Yield at Maturity, UW NCF DSCR, Cut-off Date LTV Ratio and Maturity Date LTV Ratio numbers based on the combined balance of the entire Grand Canal Shoppes Whole Loan are $1,283, $1,283, 7.5%, 7.5%, 1.67x, 59.5% and 59.5%, respectively. The Grand Canal Shoppes Whole Loan was co-originated by Morgan Stanley Bank, N.A. (“MSBNA”), JPMorgan Chase Bank, National Association (“JPMCB”), Goldman Sachs Bank USA (“GSB”) and Wells Fargo Bank, N.A. (“WFB”) on June 3, 2019. Note A-3-4 was subsequently transferred to Cantor Commercial Real Estate Lending, L.P. (“CCRE”). |
| (2) | Reflects the Senior Notes only. The Grand Canal Shoppes Subordinate Companion Loan accrues interest at the rate of 6.25%per annum. |
| (3) | Defeasance of the Grand Canal Shoppes Whole Loan is permitted at any time after the earlier to occur of (a) the end of the two-year period commencing on the closing date of the securitization of the last Grand Canal Shoppes Whole Loan promissory note to be securitized and (b) June 3, 2022. The assumed defeasance lockout period of 27 payments is based on the closing date of this transaction in October 2019. |
| (4) | See “The Mortgage Loan” and “Additional Secured Indebtedness (not including trade debts)” below for further discussion of additional debt. |
| (5) | See “Escrows and Reserves” below for further discussion of reserve requirements. |
| (6) | Size excludes the 84,743 SF space currently leased to Barneys New York. This space is included in the collateral; however, the Grand Canal Shoppes Whole Loan documents permit a free release with respect to such space. As such, no value or rental income has been attributed to this space. |
This is not a research report and was not prepared by the Underwriters’ research department. Please see additional important information and qualifications at the end of this Term Sheet.
T-119
| Retail – Specialty Retail | Loan #10 | Cut-off Date Balance: | $40,000,000 | |
| 3327 & 3377 Las Vegas Boulevard South | Grand Canal Shoppes | Cut-off Date LTV: | 46.3% | |
| Las Vegas, NV 89109 | U/W NCF DSCR: | 2.46x | ||
| U/W NOI Debt Yield: | 9.6% |
The Mortgage Loan. The tenth largest mortgage loan (the “Grand Canal Shoppes Mortgage Loan”) is part of the Grand Canal Shoppes Whole Loan in the original principal balance of $975,000,000. The Grand Canal Shoppes Whole Loan is secured by a first priority fee and leasehold mortgage encumbering a 759,891 SF retail center located in Las Vegas, Nevada (the “Grand Canal Shoppes Property”). The Grand Canal Shoppes Whole Loan was co-originated by MSBNA, JPMCB, GSB and WFB on June 3, 2019. The Grand Canal Shoppes Whole Loan is comprised of 24 promissory notes, which arepari passu with each other, with an aggregate original principal balance of $760,000,000 and one subordinate promissory note in the original principal balance of $215,000,000. The non-controlling Note A-1-4, in the original principal balance of $40,000,000, represents the Grand Canal Shoppes Mortgage Loan and will be included in the BANK 2019-BNK21 securitization trust. The remaining Senior Notes (collectively, the “Grand Canal Shoppes Non-ServicedPari PassuCompanion Loans”), which had an aggregate original principal balance of $720,000,000, have been or are expected to be contributed to one or more future securitization transactions or may be otherwise transferred at any time. The Grand Canal Shoppes Whole Loan will be serviced pursuant to the pooling and servicing agreement for the MSC 2019-H7 securitization trust. See “Description of the Mortgage Pool—The Whole Loans—The Non-Serviced Pari Passu-A/B Whole Loan”and “Pooling and Servicing Agreement—Servicing of the Non-Serviced Mortgage Loans” in the Preliminary Prospectus.
| Grand Canal Shoppes Whole Loan Summary | ||||
| Notes | Original Balance | Cut-off Date Balance | Anticipated Note Holder | Controlling Piece |
| Grand Canal Shoppes Mortgage Loan | ||||
| A-1-4 | $40,000,000 | $40,000,000 | BANK 2019-BNK21 | No |
| Grand Canal Shoppes Non-ServicedPari Passu Companion Loans | ||||
| A-1-1 | $60,000,000 | $60,000,000 | MSC 2019-H7 | No(1) |
| A-1-2 | $50,000,000 | $50,000,000 | BANK 2019-BNK19 | No |
| A-1-3 | $40,000,000 | $40,000,000 | MSBNA | No |
| A-1-5 | $13,846,154 | $13,846,154 | MSBNA | No |
| A-1-6 | $10,000,000 | $10,000,000 | MSC 2019-H7 | No |
| A-1-7 | $10,000,000 | $10,000,000 | BANK 2019-BNK20 | No |
| A-1-8 | $10,000,000 | $10,000,000 | BANK 2019-BNK20 | No |
| A-2-1 | $50,000,000 | $50,000,000 | BANK 2019-BNK19 | No |
| A-2-2-1 | $20,000,000 | $20,000,000 | BANK 2019-BNK20 | No |
| A-2-2-2 | $30,000,000 | $30,000,000 | CSAIL 2019-C17 | No |
| A-2-3 | $40,000,000 | $40,000,000 | UBS 2019-C17 | No |
| A-2-4 | $25,000,000 | $25,000,000 | UBS AG | No |
| A-2-5 | $10,384,615 | $10,384,615 | UBS 2019-C17 | No |
| A-3-1 | $50,000,000 | $50,000,000 | Benchmark 2019-B12 | No |
| A-3-2 | $50,000,000 | $50,000,000 | JPMCB | No |
| A-3-3 | $40,000,000 | $40,000,000 | JPMCB | No |
| A-3-4 | $25,000,000 | $25,000,000 | CCRE | No |
| A-3-5 | $10,384,615 | $10,384,615 | JPMCB | No |
| A-4-1 | $60,000,000 | $60,000,000 | CGCMT 2019-GC41 | No |
| A-4-2 | $60,000,000 | $60,000,000 | GSB | No |
| A-4-3 | $20,000,000 | $20,000,000 | GSB | No |
| A-4-4 | $25,000,000 | $25,000,000 | GSB | No |
| A-4-5 | $10,384,615 | $10,384,615 | GSB | No |
| Grand Canal Shoppes Subordinate Companion Loan | ||||
| B | $215,000,000 | $215,000,000 | CPPIB Credit Investments II Inc. | Yes(1) |
| Total | $975,000,000 | $975,000,000 | ||
| (1) | The holder of the Grand Canal Shoppes Subordinate Companion Loan will have the right to appoint the special servicer of the Grand Canal Shoppes Whole Loan and to direct certain decisions with respect to the Grand Canal Shoppes Whole Loan, unless a control appraisal event exists under the related co-lender agreement. The Grand Canal Shoppes Whole Loan will be serviced pursuant to the pooling and servicing agreement for the MSC 2019-H7 securitization. |
The Borrower and the Borrower Sponsors. The borrowers are Grand Canal Shops II, LLC and The Shoppes at the Palazzo, LLC, each organized as a Delaware limited liability company and each structured to be bankruptcy remote with two independent directors (the “Grand Canal Shoppes Borrowers”).
The borrower sponsors are Brookfield Properties REIT Inc. and Nuveen Real Estate, and the non-recourse carveout guarantor is BPR Nimbus LLC (the “Grand Canal Shoppes Guarantor”), an affiliate of Brookfield Properties REIT Inc.
Brookfield Properties REIT Inc. ranks among the largest retail real estate companies in the United States. Its portfolio of mall properties spans the nation, encompassing 170 locations across 42 states and representing over 146 million SF of retail space. The company is focused on managing, leasing and redeveloping retail properties.
Nuveen Real Estate is the investment management arm of Teachers Insurance and Annuity Association. Nuveen Real Estate manages various funds and mandates, across both public and private investments and spanning both debt and equity, and has over 80 years of real estate investing experience and more than 500 employees located across over 20 cities throughout the United States, Europe and Asia Pacific.
This is not a research report and was not prepared by the Underwriters’ research department. Please see additional important information and qualifications at the end of this Term Sheet.
T-120
| Retail – Specialty Retail | Loan #10 | Cut-off Date Balance: | $40,000,000 | |
| 3327 & 3377 Las Vegas Boulevard South | Grand Canal Shoppes | Cut-off Date LTV: | 46.3% | |
| Las Vegas, NV 89109 | U/W NCF DSCR: | 2.46x | ||
| U/W NOI Debt Yield: | 9.6% |
The Property. The Grand Canal Shoppes Property is a 759,891 SF specialty retail center that predominantly comprises the first-, second- and third-levels of the Venetian Hotel and Casino and Palazzo Resort and Casino. The Grand Canal Shoppes Property opened in 1999, with an expansion in conjunction with the completion of The Palazzo in 2007, and is anchored by an 84,743 SF, three level Barneys New York. Barneys New York was part of the collateral for the Grand Canal Shoppes Whole Loan at loan origination, but the Grand Canal Shoppes Borrowers have the right to obtain a free release of the Barneys Parcel (as defined below). At origination, no value or rental income was attributed to the Barneys Parcel.
The Venetian Hotel and Casino and Palazzo Resort and Casino are luxury hotels and casino resorts situated within the southeast quadrant of Las Vegas Boulevard and Sands Avenue. The Venetian Hotel and Casino and the Palazzo Resort and Casino are owned and operated by Las Vegas Sands. The overall resort complex is the largest on The Strip (as defined below), and includes 4,049 rooms within The Venetian, 3,068 rooms/suites within The Palazzo, and 225,000 SF of gaming space (combined), none of which are collateral for the Grand Canal Shoppes Whole Loan. The Grand Canal Shoppes Property is physically connected to the Venetian Hotel and Casino and the Palazzo Resort and Casino, which combine to create a large hotel and resort complex with over 7,000 hotel rooms, 2.3 million SF of meeting space,one million SF of retail space and more than 30 restaurants. In addition, the Grand Canal Shoppes Property is within walking distance to over 140,000 hotel rooms.
The Grand Canal Shoppes Property is situated across 21.1 acres of land along the central portion of Las Vegas Boulevard (“The Strip”). The Grand Canal Shoppes Property is a premier shopping, entertainment, and dining venue in Las Vegas featuring a unique Venetian-inspired setting with luxury retailers and restaurant concepts. Attractions include a gondola ride through the canals of the Grand Canal Shoppes Property as well as showroom/theater space for live performances.
The Grand Canal Shoppes Property is currently 94.0% leased as of May 31, 2019. According to the appraisal, the Grand Canal Shoppes Property generates average mall shop sales of over $1,000 PSF. The Grand Canal Shoppes Property generated $427.6 million in gross sales with comparable in-line sales of $1,182 PSF as of the trailing twelve months ended February 28, 2019. The Grand Canal Shoppes Property generates over 60% of its top-line revenue from food and entertainment offerings, including restaurants such as Tao Asian Bistro, which features a night and beach club, Grand Lux Café, Sushi Samba, Delmonico Steakhouse, Cut by Wolfgang Puck, Smith & Wollensky, Verdugo West Brewery, Xiang Tian Xia Chinese Hot Pot and Recital Karaoke, among others. Noteworthy luxury retailers at the Grand Canal Shoppes Property include Louis Vuitton, Salvatore Ferragamo, Fendi and Jimmy Choo.
From 2015 through January 2019, capital expenditures, inclusive of development capital and landlord work, of approximately $20.3 million ($26.70 PSF) were invested in the Grand Canal Shoppes Property. In addition, there is a planned renovation and redevelopment of the common areas within the shopping areas above The Palazzo. Ownership is budgeting approximately $12.0 million to improve lighting and finishes, in an attempt to maintain existing and attract new tenants to this portion of the Grand Canal Shoppes Property. According to management, renovations are expected to begin in September 2019. In addition, renovation, new finishes and lighting are expected to be completed in conjunction with a proposed, 27,422 SF international food hall proposed to be completed in 2020. Such renovation and redevelopment, as well as development of the new food hall, are not required by or reserved for under the Grand Canal Shoppes Whole Loan documents, and we cannot assure you that any such renovation, redevelopment or food hall development will be effected.
The following table presents a summary of historical tenant sales at the Grand Canal Shoppes Property:
| Historical Tenant Sales Summary(1) | ||||||
| 2015 | 2016 | 2017 | 2018 | TTM February 2019 Sales | TTM February 2019 Sales PSF | |
| Anchor/Major Sales | $129,599,970 | $129,282,829 | $130,862,228 | $138,705,093 | $140,317,346 | $1,046 |
| Comparable In-Line Sales | $200,973,916 | $207,912,708 | $223,524,143 | $244,916,086 | $244,795,176 | $1,154 |
| Comparable Food Court Sales | $17,055,210 | $19,744,070 | $21,275,466 | $23,538,795 | $23,688,945 | $1,580 |
| (1) | Information as provided by the borrower sponsor and only includes tenants reporting sales. |
The Grand Canal Shoppes Property is anchored by 18 major tenants, which combined generate approximately $140.3 million in annual sales as of TTM February 2019. Since 2015, the Grand Canal Shoppes Property’s sales performance has steadily increased year-over-year, growing 21.4% over this period. Furthermore, comparable sales have consistently exceeded $1,100 PSF reaching $1,182 PSF as of TTM February 2019.
The first floor of Barneys New York and the casino level (ground floor) space are leased by the Grand Canal Shoppes Borrowers, pursuant to air rights ground leases, which do not include the underlying land. The casino level space consists of restaurants and retail shops contained on the casino levels (ground floor) of the Venetian Hotel and Casino and the Palazzo Resort and Casino. The ground lease for the casino level of the Venetian Hotel and Casino portion of the Grand Canal Shoppes Property expires in 2093, and the ground lease for the casino level of the Palazzo Resort and Casino portion of the Grand Canal Shoppes Property expires in 2097. Each of the annual rents for these leases is $1 and the Grand Canal Shoppes Borrowers have the option to purchase the premises for $1 on the respective expiration dates. The remaining collateral, except for the Walgreens air rights lease space, is owned in fee. A portion of the fee is located at the ground level (the retail annex), with the majority fee located on levels 2 and 3. The collateral is part of a vertical subdivision;i.e. the fee ownership is solely of the designated space on the ground level and levels 2 and 3, and doesn’t include the land. A reciprocal easement agreement governs the relationship among the owner of the Grand Canal Shoppes Property and the owners of other interests in the complex that includes the Venetian Hotel and Casino and the Palazzo Resort and Casino. The Walgreens air rights lease space refers to the air rights above the Walgreens space (the Walgreens space itself is owned by a third party), for which the air rights lease expires in 2064 with one, 40 year extension option. The Walgreens air rights space is currently occupied by Buddy V’s Ristorante and Carlo’s Bakery (12,839 SF, 1.5% of underwritten base rent). The Venetian Hotel and Casino subleases a portion of the air rights parcel from the Grand Canal Shoppes Borrowers pursuant to a separate sublease. The Venetian Hotel and Casino is responsible under its sublease for an amount equal to 80.68% of the ground rent under the Walgreens lease.
Pursuant to the reciprocal easement and ground lease documents, transfers (other than to a lender in connection with foreclosure or delivery of a deed-in-lieu of foreclosure of a mortgage secured by the Grand Canal Shoppes Property or the first subsequent transferee from the lender) of the Grand Canal Shoppes Property are subject to certain transfer restrictions. Additionally, under such documents, Venetian Casino Resort, LLC has the right to cure certain defaults of the Grand Canal Shoppes Borrowers under the Grand Canal Shoppes Whole Loan. See also “Right of First Offer/Right of First Refusal” below.
This is not a research report and was not prepared by the Underwriters’ research department. Please see additional important information and qualifications at the end of this Term Sheet.
T-121
| Retail – Specialty Retail | Loan #10 | Cut-off Date Balance: | $40,000,000 | |
| 3327 & 3377 Las Vegas Boulevard South | Grand Canal Shoppes | Cut-off Date LTV: | 46.3% | |
| Las Vegas, NV 89109 | U/W NCF DSCR: | 2.46x | ||
| U/W NOI Debt Yield: | 9.6% |
| Historical and Current Occupancy(1) | ||||||
| 2014 | 2015 | 2016 | 2017 | 2018 | Current(2) | |
| The Venetian Hotel and Casino | 95.1% | 92.6% | 98.3% | 95.7% | 99.1% | 97.1% |
| Palazzo Resort and Casino | 88.2% | 89.5% | 86.2% | 88.4% | 83.0% | 86.2% |
| Total/Wtd. Avg. | 92.6% | 91.5% | 93.9% | 93.0% | 93.3% | 94.0% |
| (1) | Historical occupancy provided by the borrower sponsor. |
| (2) | Current occupancy is based on the May 31, 2019 underwritten rent roll. |
The following table presents certain information relating to the major tenants at the Grand Canal Shoppes Property:
| Tenant Summary(1) | |||||||||||
| Tenant Name | Credit Rating (Fitch/Moody’s/ S&P)(2) | Tenant SF | Approx. % of SF | Annual UW Rent(3) | % of Annual UW Rent | Annual UW Rent PSF(4) | TTM February 2019 Sales | Term. Options | Lease Expiration | ||
| $ | PSF | Occ. Cost %(5) | |||||||||
| Major Tenants | |||||||||||
| Emporio D’Gondola(6) | NR/NR/NR | 922 | 0.1% | $4,051,692 | 6.0% | $4,394.46 | NAV | NAV | NAV | N | 5/31/2029 |
| The Venetian Resort (Showroom/Theater) | BBB-/NR/BBB- | 38,920 | 5.1% | $4,051,619 | 6.0% | $104.10 | NAV | NAV | NAV | N | 5/31/2029 |
| Regis Galerie(7) | NR/NR/NR | 28,099 | 3.7% | $2,367,955 | 3.5% | $84.27 | $7,010,021 | $249 | 33.8% | N | Various |
| Sephora | NR/NR/A+ | 10,074 | 1.3% | $2,299,995 | 3.4% | $228.31 | NAV | NAV | NAV | N | 7/31/2021 |
| Welcome to Las Vegas(8) | NR/NR/NR | 14,234 | 1.9% | $2,000,502 | 3.0% | $140.54 | $6,612,970 | $465 | 30.3% | N | Various |
| Grand Lux Cafe | NR/NR/NR | 19,100 | 2.5% | $1,463,633 | 2.2% | $76.63 | $21,992,535 | $1,151 | 6.7% | N | 12/31/2029 |
| CUT By Wolfgang Puck | NR/NR/NR | 12,247 | 1.6% | $1,261,441 | 1.9% | $103.00 | $14,171,737 | $1,157 | 8.9% | N | 5/31/2028 |
| Mercato Della Pescheria | NR/NR/NR | 16,479 | 2.2% | $1,131,448 | 1.7% | $68.66 | $9,158,574 | $556 | 12.4% | N | 11/30/2025 |
| Bellusso Jewelry | NR/NR/NR | 2,999 | 0.4% | $1,068,964 | 1.6% | $356.44 | $8,173,547 | $2,725 | 13.1% | N | 11/30/2022 |
| Golden Gai | NR/NR/NR | 12,820 | 1.7% | $1,034,959 | 1.5% | $80.73 | NAV | NAV | NAV | N | 12/31/2029 |
| TAO Asian Bistro | NR/NR/NR | 15,175 | 2.0% | $980,002 | 1.5% | $64.58 | $35,724,404 | $2,354 | 2.7% | N | 1/31/2025 |
| Peter Lik Gallery | NR/NR/NR | 4,394 | 0.6% | $979,686 | 1.5% | $222.96 | $3,859,320 | $878 | 25.4% | N | 8/31/2021 |
| Smith & Wollensky | NR/NR/NR | 14,751 | 1.9% | $942,502 | 1.4% | $63.89 | NAV | NAV | NAV | N | 6/30/2028 |
| Michael Kors(9) | BBB-/NR/BBB- | 4,066 | 0.5% | $917,907 | 1.4% | $225.75 | $3,264,594 | $803 | 28.1% | N | Various |
| Recital Karaoke | NR/NR/NR | 14,062 | 1.9% | $897,999 | 1.3% | $63.86 | NAV | NAV | NAV | N | 2/28/2029 |
| Subtotal/Wtd. Avg. | 208,342 | 27.4% | $25,450,304 | 38.0% | $122.16 | ||||||
| Other Tenants | 506,286 | 66.6% | $41,584,578 | 62.0% | $82.14 | ||||||
| Vacant Space | 45,263 | 6.0% | $0 | 0.0% | $0.00 | ||||||
| Total/Wtd. Avg. | 759,891 | 100.0% | $67,034,881 | 100.0% | $93.80 | ||||||
| (1) | Information is based on the underwritten rent roll. Tenants are listed in order of underwritten rent. |
| (2) | Certain ratings are those of the parent company whether or not the parent guarantees the lease. |
| (3) | Total/Wtd. Avg. Annual UW Rent reflects the following: (a) in-place leases based on the May 2019 rent roll and (b) contractual rent steps of $2,184,628 through May 31, 2020. |
| (4) | Total/Wtd. Avg. Annual UW Rent PSF excludes vacant space. |
| (5) | Occ. Cost % is based on the underwritten rent as of the May 31, 2019 rent roll divided by the most recently reported sales. |
| (6) | This tenant operates as the gondola attraction at the Grand Canal Shoppes Property. |
| (7) | Regis Galerie has 8,406 SF expiring on December 31, 2020, 4,654 SF expiring on February 29, 2020 and 15,039 SF expiring on May 31, 2025. |
| (8) | The Welcome to Las Vegas lease commencement is expected to be February 1, 2020. Gap rent was reserved by the lender at origination. 10,239 SF is expiring on December 31, 2020 and the remaining 3,995 SF is expiring on January 31, 2030. |
| (9) | Michael Kors has 3,733 SF expiring on January 31, 2026 and 333 SF expiring on March 31, 2020. |
This is not a research report and was not prepared by the Underwriters’ research department. Please see additional important information and qualifications at the end of this Term Sheet.
T-122
| Retail – Specialty Retail | Loan #10 | Cut-off Date Balance: | $40,000,000 | |
| 3327 & 3377 Las Vegas Boulevard South | Grand Canal Shoppes | Cut-off Date LTV: | 46.3% | |
| Las Vegas, NV 89109 | U/W NCF DSCR: | 2.46x | ||
| U/W NOI Debt Yield: | 9.6% |
The following table presents certain information relating to the lease rollover at the Grand Canal Shoppes Property:
| Lease Rollover Schedule(1)(2) | ||||||||
| Year | # of Leases Rolling | SF Rolling | Annual UW Rent PSF Rolling(3) | Approx. % of Total SF Rolling | Approx. Cumulative % of SF Rolling | Total UW Rent Rolling(4) | Approx. % of Total Rent Rolling | Approx. Cumulative % of Total Rent Rolling |
| MTM | 3 | 2,080 | $0.00 | 0.3% | 0.3% | $0 | 0.0% | 0.0% |
| 2019 | 17 | 39,567 | $61.58 | 5.2% | 5.5% | $2,436,560 | 3.6% | 3.6% |
| 2020 | 26 | 80,052 | $55.90 | 10.5% | 16.0% | $4,475,224 | 6.7% | 10.3% |
| 2021 | 16 | 28,634 | $200.74 | 3.8% | 19.8% | $5,748,002 | 8.6% | 18.9% |
| 2022 | 13 | 35,084 | $133.50 | 4.6% | 24.4% | $4,683,674 | 7.0% | 25.9% |
| 2023 | 20 | 41,038 | $133.79 | 5.4% | 29.8% | $5,490,655 | 8.2% | 34.1% |
| 2024 | 23 | 60,412 | $105.63 | 8.0% | 37.8% | $6,381,261 | 9.5% | 43.6% |
| 2025 | 22 | 146,378 | $71.87 | 19.3% | 57.0% | $10,519,793 | 15.7% | 59.3% |
| 2026 | 9 | 29,721 | $92.59 | 3.9% | 60.9% | $2,751,933 | 4.1% | 63.4% |
| 2027 | 3 | 6,142 | $139.93 | 0.8% | 61.7% | $859,431 | 1.3% | 64.7% |
| 2028 | 9 | 48,011 | $102.91 | 6.3% | 68.1% | $4,940,574 | 7.4% | 72.0% |
| 2029 | 27 | 185,418 | $97.34 | 24.4% | 92.5% | $18,048,649 | 26.9% | 99.0% |
| 2030 & Beyond | 2 | 12,091 | $57.82 | 1.6% | 94.0% | $699,125 | 1.0% | 100.0% |
| Vacant | 0 | 45,263 | $0.00 | 6.0% | 100.0% | $0 | 0.0% | 100.0% |
| Total/Wtd. Avg. | 190 | 759,891 | $93.80 | 100.0% | $67,034,881 | 100.0% | ||
| (1) | Information is based on the underwritten rent roll. |
| (2) | Certain tenants may have lease termination options that are exercisable prior to the originally stated expiration date of the subject lease and that are not considered in the lease rollover schedule. |
| (3) | Total/Wtd. Avg. Annual UW Rent PSF Rolling excludes vacant space. |
| (4) | Total UW Rent Rolling reflects the following: (a) in-place leases based on the May 2019 rent roll and (b) contractual rent steps of $2,184,628 through May 31, 2020. |
The Market. The Grand Canal Shoppes Property is located in Las Vegas, Nevada along The Strip. The Grand Canal Shoppes Property’s tenant mix of retail, restaurants and entertainment offerings benefits from Las Vegas’s significant number of tourists, convention center attendees and residents. The Grand Canal Shoppes Property is adjacent to the Sands Expo Convention Center, a 1.8 million SF meeting and convention center. Additionally, Las Vegas has various developments in process that are expected to be completed in 2020 and beyond and that are expected to enhance the appeal of the market to visitors. The most notable of these developments is the MSG Sphere, an 18,000 seat performance venue being developed by Madison Square Garden and Las Vegas Sands just east of the Grand Canal Shoppes Property, the construction of the 65,000 seat Las Vegas Stadium, the new home of the NFL’s Oakland Raiders, which is expected to also double as a live entertainment and convention venue, and the Las Vegas Convention Center District is under redevelopment, with a 1.4 million SF expansion. We cannot assure you as to whether or when such developments will be completed.
Primary access to the Grand Canal Shoppes Property is provided by Interstate 15, the region’s primary north-south route, which is situated approximately one mile west of the Grand Canal Shoppes Property, with access gained via Spring Mountain Road/Sands Avenue. The Grand Canal Shoppes Property is located approximately 3 miles north of the McCarran International Airport and has direct access to Citizen Area Transit, which has over 41 routes running throughout the region. According to the appraisal, in 2018, there were over 42.1 million visitors traveling to Las Vegas and over 6.5 million convention visitors. According to the appraisal, the estimated 2018 population within a five-, seven- and ten-mile radius of the Grand Canal Shoppes Property was 410,151, 911,414 and 1,661,641, respectively. The estimated 2018 average household income within a five-, seven- and ten-mile radius was $54,257, $60,146 and $70,983, respectively.
The Grand Canal Shoppes Property is located in the Southeast submarket of the Las Vegas retail market. According to the appraisal, as of the fourth quarter of 2018, the vacancy rate in the Southeast submarket was approximately 14.5%, with average asking rents of $19.41 PSF and inventory of approximately 5.1 million SF. According to the appraisal, as of the fourth quarter of 2018, the vacancy rate in the Las Vegas retail market was approximately 13.4%, with average asking rents of $22.34 PSF and inventory of approximately 29.9 million SF. The appraiser concluded to a market rent of $98.23 PSF for the space at the Grand Canal Shoppes Property.
This is not a research report and was not prepared by the Underwriters’ research department. Please see additional important information and qualifications at the end of this Term Sheet.
T-123
| Retail – Specialty Retail | Loan #10 | Cut-off Date Balance: | $40,000,000 | |
| 3327 & 3377 Las Vegas Boulevard South | Grand Canal Shoppes | Cut-off Date LTV: | 46.3% | |
| Las Vegas, NV 89109 | U/W NCF DSCR: | 2.46x | ||
| U/W NOI Debt Yield: | 9.6% |
The following table presents certain competitive properties to the Grand Canal Shoppes Property:
| Competitive Property Summary | |||||||
| Property, Location | Type | Year Built/ Renovated | Size (SF) | Occ. | Sales PSF | Anchor Tenants | Distance to Subject (mi.) |
Grand Canal Shoppes Property Las Vegas, NV | Fashion/Specialty | 1999/2007 | 759,891 | 94.0%(1) | $1,182(2) | TAO Nightclub, Theater, Grand Lux Café, Mercato Della Pescheria, TAO Asian Bistro, Recital Karaoke, Madame Tussaud Las Vegas, Verdugo West Brewery, Golden Gai | N/A |
| Primary Competition | |||||||
| Forum Shops at Caesars Las Vegas, NV | Fashion/Specialty | 1992/1997, 2004 | 650,000 | 99% | $1,400 - $1,700 | Upscale/themed retail project at Caesars with 1-2 levels | 0.5 |
Wynn Las Vegas Retail Las Vegas, NV | Fashion/Specialty | 2005/2008 | 150,000 | 95% | $2,000 - $3,000 | Upscale retail areas located within The Wynn Las Vegas and Wynn Encore | 0.3 |
The Shops at Crystals Las Vegas, NV | Fashion/Specialty | 2009/NAP | 360,000 | 94% | $1,200 - $1,400 | Upscale specialty retail center with 3-levels on Las Vegas Strip part of City Center | 1.1 |
Miracle Mile Shops Las Vegas, NV | Fashion/Specialty | 2000/2008, 2016 | 494,000 | 93% | $825 - $875 | Mid-Tier specialty retail center with 1 and 2 stories at Planet Hollywood | 1.0 |
Fashion Show Mall Las Vegas, NV(3) | Super-Regional Center | 1981/Various | 1,875,400 | 95% | $825 - $875 | Neiman Marcus, Dillard’s, Macy’s, Saks, Forever 21, Nordstrom, Dick’s Sporting Goods | 0.3 |
| Secondary Competition | |||||||
| The Linq Promenade Las Vegas, NV | Fashion/Specialty | 2014/NAP | 268,000 | 93% | - - - | Retail and entertainment specialty center including a number of restaurants and performance venues | 0.4 |
| Bellagio Shops Las Vegas, NV | Fashion/Specialty | 1998/NAP | - | 100% | - - - | Upscale shopping area located within Bellagio Resort and Casino | 0.8 |
The Showcase Las Vegas, NV | Specialty Retail | 1997/2003, 2009 | 347,281 | 97% | - - - | Coca-Cola, Ross, Hard Rock, M&M’s, Adidas | 1.6 |
| Las Vegas Premium Outlets Las Vegas, NV | Outlet Center | 2003/NAP | 676,113 | 100% | $1,400 - $1,600 | Last Call Neiman Marcus, Off 5th Saks 5th Avenue, Nike | 3.5 |
Source:Appraisal
| (1) | Occupancy as of May 31, 2019. |
| (2) | Comparable inline sales shown as of February 28, 2019. |
| (3) | Owned by an affiliate of the Grand Canal Shoppes Borrowers. |
Operating History and Underwritten Net Cash Flow.The following table presents certain information relating to the historical operating performance and the Underwritten Net Cash Flow at the Grand Canal Shoppes Property:
| Cash Flow Analysis | ||||||
| 2016 | 2017 | 2018 | 3/31/2019 TTM | UW | UW PSF | |
| Base Rent(1) | $68,255,204 | $67,507,328 | $66,471,558 | $66,941,590 | $67,034,881 | $88.22 |
| Total Recoveries | $31,633,869 | $27,875,777 | $25,766,223 | $25,166,107 | $26,539,087 | $34.92 |
| Other Income(2) | $12,765,993 | $12,203,223 | $10,872,872 | $10,365,738 | $10,455,366 | $13.76 |
| Less Vacancy & Credit Loss | $0 | $0 | $0 | $0 | $0 | $0.00 |
| Effective Gross Income | $112,655,066 | $107,586,327 | $103,110,653 | $102,473,435 | $104,029,334 | $136.90 |
| Real Estate Taxes | $1,952,631 | $1,995,183 | $2,076,447 | $2,102,023 | $2,102,023 | $2.77 |
| Insurance | $268,881 | $248,826 | $253,530 | $260,040 | $260,040 | $0.34 |
| Other Operating Expenses(3) | $31,074,924 | $30,916,371 | $29,454,203 | $28,645,562 | $28,645,562 | $37.70 |
| Total Expenses | $33,296,436 | $33,160,381 | $31,784,180 | $31,007,624 | $31,007,624 | $40.81 |
| Net Operating Income(1) | $79,358,630 | $74,425,947 | $71,326,473 | $71,465,811 | $73,021,709 | $96.09 |
| Capital Expenditures | $0 | $0 | $0 | $0 | $0 | $0.00 |
| TI/LC | $0 | $0 | $0 | $0 | $2,023,806 | $2.66 |
| Net Cash Flow | $79,358,630 | $74,425,947 | $71,326,473 | $71,465,811 | $70,997,903 | $93.43 |
| Occupancy %(4) | 93.9% | 93.0% | 93.3% | 93.9% | 94.0% | |
| NOI DSCR(5) | 2.75x | 2.58x | 2.47x | 2.48x | 2.53x | |
| NCF DSCR(5) | 2.75x | 2.58x | 2.47x | 2.48x | 2.46x | |
| NOI Debt Yield(5) | 10.4% | 9.8% | 9.4% | 9.4% | 9.6% | |
| NCF Debt Yield(5) | 10.4% | 9.8% | 9.4% | 9.4% | 9.3% | |
| (1) | UW Base Rent reflects the following: (a) in-place leases based on the March 2019 rent roll and (b) contractual rent steps of $2,184,628 through May 31, 2020. UW Base Rent excludes any rent associated with the Barneys New York space. The increase from 3/31/2019 TTM to UW Base Rent and Net Operating Income is due to recent leasing activity. |
| (2) | Other Income includes vending income, enterprise income, advertising revenue sponsorship income, specialty leasing income, overage rent and percent in lieu. |
| (3) | Other Operating Expenses includes the Walgreens air rights lease rent, of which $133,475 (19.32% of the annual ground lease payment) was underwritten. The Venetian Hotel and Casino is responsible under its sublease for the remaining 80.68% of the ground rent under the Walgreens air rights lease. |
| (4) | UW Occupancy % is as of May 31, 2019. |
| (5) | Debt service coverage ratios and debt yields are based on the Grand Canal Shoppes Senior Loan and exclude the Grand Canal Shoppes Subordinate Companion Loan. |
This is not a research report and was not prepared by the Underwriters’ research department. Please see additional important information and qualifications at the end of this Term Sheet.
T-124
| Retail – Specialty Retail | Loan #10 | Cut-off Date Balance: | $40,000,000 | |
| 3327 & 3377 Las Vegas Boulevard South | Grand Canal Shoppes | Cut-off Date LTV: | 46.3% | |
| Las Vegas, NV 89109 | U/W NCF DSCR: | 2.46x | ||
| U/W NOI Debt Yield: | 9.6% |
Escrows and Reserves.
Real Estate Taxes and Insurance Reserves– During the continuance of a Cash Management Period (as defined below), the Grand Canal Shoppes Borrowers are required to reserve monthly 1/12 of the estimated property taxes and 1/12th of the estimated insurance premiums, provided that the monthly insurance reserve requirement is waived if the Grand Canal Shoppes Borrowers provide the lender with evidence that (a) the insurance policies required to be maintained by the Grand Canal Shoppes Borrowers are maintained pursuant to blanket policies that comply with the requirements of the Grand Canal Shoppes Whole Loan documents and (b) the insurance premiums payable in connection with such policies have been prepaid for not less than one year in advance (or, for the period of coverage under the policies as to which certificates are delivered at origination, such period, if less than one year).
Recurring Replacements Reserve– During the continuance of a Cash Management Period, the Grand Canal Shoppes Borrowers are required to deposit monthly $16,122 for recurring replacements reserves. However, the Grand Canal Shoppes Borrowers will not be required to make any portion of the monthly recurring replacements deposit if the amount then on deposit in the recurring replacements reserve is equal to or exceeds $386,928.
TI/LC Reserve– The Grand Canal Shoppes Whole Loan documents provide for the following deposits into the reserve for tenant improvements and leasing commissions (“TI/LCs”) (i) an upfront deposit of $12,309,694 for unfunded TI/LCs, including for the following tenants: $1,177,693 for Recital Karaoke, $1,472,330 for Verdugo West Brewery, $967,269 for Golden Gai, $63,000 for CUT By Wolfgang Puck, $882,000 for Smith & Wollensky and $20,000 for Once and (ii) during the continuance of a Cash Management Period, monthly deposits in an amount equal to $96,731. However, the Grand Canal Shoppes Borrowers will not be required to make any portion of the monthly TI/LC reserve deposit if the amount then on deposit in the TI/LC reserve is equal to or exceeds $2,321,544.
Ground Rent Reserve– During the continuance of a Cash Management Period, the Grand Canal Shoppes Borrowers are required to deposit monthly 1/12th of the annual amounts due by each of the Grand Canal Shoppes Borrowers, as applicable, under the Ground Leases (as defined below).
Gap Rent Reserve– The Grand Canal Shoppes Whole Loan documents provide for an upfront reserve of $1,218,246 for outstanding gap rents.
Notwithstanding the foregoing, the Grand Canal Shoppes Borrowers’ obligations to make any monthly deposits into the real estate taxes and insurance reserves, recurring replacements reserve, TI/LC reserve and/or ground rent reserve, as applicable, is deemed to be satisfied to the extent there are sufficient funds to make such deposits in the cash management account, in which case no actual payment from the Grand Canal Shoppes Borrowers is required.
Lockbox and Cash Management. The Grand Canal Shoppes Whole Loan is structured with a hard lockbox and springing cash management. The Grand Canal Shoppes Borrowers are required to direct each tenant of the Grand Canal Shoppes Property to deposit all funds (other than Non-Core Income (as defined below)) directly into the lockbox account, and to deposit any funds received by the Grand Canal Shoppes Borrowers and property manager, notwithstanding such direction, into the lockbox account within two business days of receipt. Within two business days of written notification of the commencement of a Cash Management Period, the Grand Canal Shoppes Borrowers are required to establish a lender-controlled cash management account with a cash management bank, into which all funds in the lockbox account will be required to be deposited periodically so long as a Cash Management Period is continuing. So long as a Cash Management Period is continuing, funds in the cash management account are required to be applied (i) to make deposits into the real estate taxes and insurance reserves (if then required), as described above under “Escrows and Reserves”, (ii) to make deposits into the ground rent reserve, as described above under “Escrows and Reserves”, (iii) to pay debt service on the Grand Canal Shoppes Whole Loan, (iv) provided no event of default under the Grand Canal Shoppes Whole Loan is continuing as to which the lender has initiated an enforcement action, to pay operating expenses set forth in the annual budget (which is required to be approved by the lender) and extraordinary operating or capital expenses reasonably approved by the lender, (v) to make deposits into the recurring replacements reserve and the TI/LC reserve, as described above under “Escrows and Reserves,” (vi) in the event a Cash Sweep Period is continuing, to deposit any excess amount remaining in the lockbox account into an excess cash flow account to be held by the lender as additional security for the Grand Canal Shoppes Whole Loan during the continuance of the Cash Sweep Period (provided that so long as no event of default exists as to which the lender has initiated an enforcement action, funds in such reserve may be applied to operating expenses) and (vii) if no Cash Sweep Period and no event of default under the Grand Canal Shoppes Whole Loan are continuing, all funds in the lockbox account are required to be disbursed to the Grand Canal Shoppes Borrowers.
A “Cash Sweep Period” means a period:
| (a) | commencing upon an event of default under the Grand Canal Shoppes Whole Loan and ending if such event of default is cured or waived; or |
| (b) | commencing upon the determination that the debt yield of the Grand Canal Shoppes Whole Loan is less than 6.0% as of the end of any calendar year and ending upon the date that such debt yield is equal to or in excess of 6.0% for two consecutive calendar quarters. |
A “Cash Management Period” means a period:
| (a) | commencing upon an event of default under the Grand Canal Shoppes Whole Loan and ending if such event of default is cured or waived; or |
| (b) | commencing upon the determination that the debt yield of the Grand Canal Shoppes Whole Loan is less than 6.5% as of the end of any calendar year and ending upon the date that such debt yield is equal to or in excess 6.5% for two consecutive calendar quarters. |
“Non-Core Income” means (i) certainde minimis amounts of rents received directly by the Grand Canal Shoppes Borrowers from miscellaneous revenue items such as holiday photos and change retrieved from fountains (but excluding rent from Seasonal Leases) and (ii) certain rents generated pursuant to multi-property sponsorship and advertising programs which are directly attributable to the Grand Canal Shoppes Property. “Seasonal Leases” means leases and/or license agreements having a maximum term of one year or less.
This is not a research report and was not prepared by the Underwriters’ research department. Please see additional important information and qualifications at the end of this Term Sheet.
T-125
| Retail – Specialty Retail | Loan #10 | Cut-off Date Balance: | $40,000,000 | |
| 3327 & 3377 Las Vegas Boulevard South | Grand Canal Shoppes | Cut-off Date LTV: | 46.3% | |
| Las Vegas, NV 89109 | U/W NCF DSCR: | 2.46x | ||
| U/W NOI Debt Yield: | 9.6% |
Additional Secured Indebtedness (not including trade debts). In addition to the Grand Canal Shoppes Mortgage Loan, the Grand Canal Shoppes Property also secures the Grand Canal Shoppes Non-ServicedPari Passu Companion Loans, which have an aggregate Cut-off Date principal balance of $720,000,000, and the Grand Canal Shoppes Subordinate Companion Loan, which has a Cut-off Date principal balance of $215,000,000. The Grand Canal Shoppes Non-ServicedPari Passu Companion Loans accrue interest at the same rate as the Grand Canal Shoppes Mortgage Loan. The Grand Canal Shoppes Subordinate Companion Loan accrues interest at a rate of 6.2500%per annum. The Grand Canal Shoppes Senior Loan is generally senior in right of payment to the Grand Canal Shoppes Subordinate Companion Loan. The holders of the Grand Canal Shoppes Mortgage Loan, the Grand Canal Shoppes Non-ServicedPari Passu Companion Loans and the Grand Canal Shoppes Subordinate Companion Loan have entered into a co-lender agreement which sets forth the allocation of collections on the Grand Canal Shoppes Whole Loan. See “Description of the Mortgage Pool—The Whole Loans—The Non-Serviced Pari Passu-A/B Whole Loan” in the Preliminary Prospectus.
Mezzanine Loan and Preferred Equity.Not permitted.
Release of Barneys Parcel. The Grand Canal Shoppes Borrowers may obtain the release of a portion of the Grand Canal Shoppes Property comprised of the approximately 84,743 SF, three level space currently demised to Barneys New York (the “Barneys Parcel”) pursuant to a lease that is expected to expire on January 31, 2020, upon abona fide sale to a third party not affiliated with the Grand Canal Shoppes Borrowers or the Grand Canal Shoppes Guarantor;provided that, among other things, and in accordance with the Grand Canal Shoppes Whole Loan documents: (i) no event of default has occurred and is continuing, (ii) the lender has received reasonably satisfactory evidence that all portions of the Barneys Parcel owned by the Grand Canal Shoppes Borrowers in fee simple have been legally subdivided from all portions of the Grand Canal Shoppes Property remaining after the release, (iii) upon request by the lender, the Grand Canal Shoppes Borrowers deliver a legal opinion stating that the release does not constitute a “significant modification” of the Grand Canal Shoppes Whole Loan under Section 1001 of the Internal Revenue Code of 1986 or otherwise cause a tax to be imposed on a “prohibited transaction” by any REMIC trust, (iv) following such release, the loan-to-value ratio (as determined by the lender in its sole discretion using only the portion of the remaining Grand Canal Shoppes Property which constitutes acceptable real estate collateral under the Code for a REMIC Trust) is equal to or less than 125% (provided that the Grand Canal Shoppes Borrowers may prepay the “qualified amount” as that term is defined in the Internal Revenue Service Revenue Procedure 2010-30, as the same may be amended, modified or supplemented from time to time, in order to meet the foregoing loan-to-value ratio). From and after the release of the Barneys Parcel, without the prior consent of the lender, neither the Grand Canal Shoppes Borrowers nor any of their affiliates may solicit, cause or facilitate the relocation of any existing tenant at the Grand Canal Shoppes Property to the Barneys Parcel.
Right of First Offer/Right of First Refusal.A transfer of either the Grand Canal Shoppes or the Palazzo Shoppes portion of the Grand Canal Shoppes Property (other than to a lender in connection with foreclosure or delivery of a deed-in-lieu of foreclosure of a mortgage secured by the Grand Canal Shoppes Property or the first subsequent transferee from the lender) is subject to a right of first offer in favor of Venetian Casino Resort, LLC.
Additionally, in the case of acceleration of the Grand Canal Shoppes Whole Loan, Venetian Casino Resort, LLC has the right, subject to the satisfaction of certain financial covenants, to purchase the Grand Canal Shoppes Whole Loan at a price equal to (a) the outstanding principal balance of the Grand Canal Shoppes Whole Loan (b) accrued and unpaid interest up to (but excluding) the date of purchase, (c) all other amounts owed under the Grand Canal Shoppes Whole Loan documents, including, without limitation (but only to the extent so owed) (1) any unreimbursed advances made by the servicer, with interest at the applicable rate, (2) any servicing and special servicing fees, (3) any exit fees, (4) any prepayment, yield maintenance or similar premiums and (5) if the date of purchase is not a scheduled payment date, accrued and unpaid interest from the date of purchase up to (but excluding) the scheduled payment date next succeeding the date of purchase and (d) all reasonable fees and expenses incurred by the lender in connection with the purchase.
Ground/Air Rights Leases. The Grand Canal Shoppes Borrowers have air rights ground leases (which do not include the underlying land) with Venetian Casino Resort, LLC, as lessor, for portions of the retail and restaurant space on the casino level of each of the Venetian Hotel and the Palazzo Resort and Casino portions of the Grand Canal Shoppes Property. The ground lease for the retail and restaurant space on the casino level of the Venetian Hotel is for an 89-year term commencing on May 14, 2004 and expiring on May 13, 2093, with no extension options. The ground lease for the retail and restaurant space on the casino level of the Palazzo Resort and Casino is for an 89-year term commencing on February 29, 2008 and expiring on February 28, 2097, with no extension options. Each of the annual rents for these ground leases is $1 and the Grand Canal Shoppes Borrowers have the option to purchase the premises for $1 on the respective expiration dates.
The air rights above the space leased to Walgreens Co. and used as a Walgreen’s store are leased by a third party to the Grand Canal Shoppes Borrowers, as tenants for a 60-year term commencing on March 1, 2004 and expiring on February 28, 2064, with one 40-year extension option (such lease, together with the ground leases of the casino level restaurant/retail of the Venetian Hotel and Casino and the Palazzo Resort and Casino level restaurant/retail, the “Ground Leases”). The ground rent under the Walgreens air rights lease was initially $600,000; however it escalates annually each year after the seventh lease year (which commenced March 1, 2011) by the same percentage that the consumer price index has increased from the prior year, not to exceed a 2.00% increase in any year. The Venetian Casino Resort, LLC subleases a portion of the Walgreens air rights from the Grand Canal Shoppes Borrowers and is responsible under the sublease to pay an amount equal to 80.68% of the rent under the prime lease. The sublease is coterminous with the Walgreens air rights lease.
Letter of Credit. None.
Terrorism Insurance. The Grand Canal Shoppes Whole Loan documents require that the comprehensive “special perils” insurance policy required to be maintained by the Grand Canal Shoppes Borrowers provide coverage in an amount equal to the “full replacement cost” of the Grand Canal Shoppes Property. The Grand Canal Shoppes Whole Loan documents also require business income insurance covering no less than the 24-month period commencing at the time of casualty, together with a 12-month extended period of indemnity. Notwithstanding the foregoing, for so long as the Terrorism Risk Insurance Act of 2002, as extended and modified by the Terrorism Risk Insurance Program Reauthorization Act of 2007 and by the Terrorism Risk Insurance Program Reauthorization Act of 2015 (“TRIPRA”) is in effect (including any extensions thereof or if another federal governmental program is in effect relating to “acts of terrorism” which provides substantially similar protections as TRIPRA), and covers both domestic and foreign acts of terrorism, the lender is required to accept terrorism insurance which insures against “covered acts” as defined by TRIPRA (or such other program);provided, however, that the Grand Canal Shoppes Borrowers will not be obligated to pay terrorism insurance premiums in excess of two times the premium for the “special perils” and business income coverage on a stand-alone basis (excluding any earthquake insurance or terrorism insurance components of such policies) in any policy year.See “Risk Factors—Risks Relating to the Mortgage Loans—Terrorism Insurance May Not Be Available for All Mortgaged Properties”in the Preliminary Prospectus.
This is not a research report and was not prepared by the Underwriters’ research department. Please see additional important information and qualifications at the end of this Term Sheet.
T-126
(THIS PAGE INTENTIONALLY LEFT BLANK)
T-127
| Mortgage Loan No. 11 – NKX Multifamily Portfolio |
| Mortgage Loan Information | Property Information | ||||||
| Mortgage Loan Seller: | MSMCH | Single Asset/Portfolio: | Portfolio | ||||
| Credit Assessment (DBRS/Fitch/S&P): | NR/NR/NR | Location: | Houston, TX Various | ||||
| Original Balance(1): | $31,000,000 | General Property Type: | Multifamily | ||||
| Cut-off Date Balance(1): | $31,000,000 | Detailed Property Type: | Garden | ||||
| % of Initial Pool Balance: | 2.6% | Title Vesting: | Fee | ||||
| Loan Purpose: | Recapitalization | Year Built/Renovated: | Various/Various | ||||
| Borrower Sponsor: | Nitya Capital | Size: | 1,558 Units | ||||
| Guarantor: | Swapnil Agarwal | Cut-off Date Balance per Unit(1): | $64,827 | ||||
| Mortgage Rate: | 3.5900% | Maturity Date Balance per Unit(1): | $64,827 | ||||
| Note Date: | 8/28/2019 | Property Manager: | Karya Property Management, | ||||
| First Payment Date: | 10/1/2019 | LLC (borrower-related) | |||||
| Maturity Date: | 9/1/2029 | ||||||
| Original Term to Maturity: | 120 months | ||||||
| Original Amortization Term: | 0 months | Underwriting and Financial Information | |||||
| IO Period: | 120 months | UW NOI: | $8,668,819 | ||||
| Seasoning: | 1 month | UW NOI Debt Yield(1): | 8.6% | ||||
| Prepayment Provisions(2): | LO (23); YM1 (92); O (5) | UW NOI Debt Yield at Maturity(1): | 8.6% | ||||
| Lockbox/Cash Mgmt Status: | Springing/Springing | UW NCF DSCR(1): | 2.25x | ||||
| Additional Debt Type(1): | Pari Passu | Most Recent NOI: | $9,135,923 (6/30/2019 TTM) | ||||
| Additional Debt Balance(1): | $70,000,000 | 2nd Most Recent NOI: | $8,485,765 (12/31/2018) | ||||
| Future Debt Permitted (Type): | Yes (Mezzanine) | 3rd Most Recent NOI: | $8,050,235 (12/31/2017) | ||||
| Reserves | Most Recent Occupancy(3): | 88.3% (6/11/2019) | |||||
| Type | Initial | Monthly | Cap | 2nd Most Recent Occupancy: | 90.2% (12/31/2018) | ||
| RE Tax: | $1,562,416 | $173,602 | N/A | 3rd Most Recent Occupancy: | 87.8% (12/31/2017) | ||
| Insurance: | $286,580 | $71,645 | N/A | Appraised Value (as of): | $146,070,000 (7/9/2019) | ||
| Deferred Maintenance: | $78,063 | $0 | N/A | Appraised Value per Unit: | $93,755 | ||
| Recurring Replacements: | $0 | $32,458 | N/A | Cut-off Date LTV Ratio(1): | 69.1% | ||
| Capital Improvements: | $5,762,758 | $0 | N/A | Maturity Date LTV Ratio(1): | 69.1% | ||
| Sources and Uses | ||||||
| Sources | Proceeds | % of Total | Uses | Proceeds | % of Total | |
| Whole Loan Amount: | $101,000,000 | 66.8% | Purchase Price: | $139,800,000 | 92.5% | |
| Borrower Equity: | $50,118,848 | 33.2% | Reserves: | $7,689,817 | 5.1% | |
| Closing Costs: | $3,629,031 | 2.4% | ||||
| Total Sources: | $151,118,848 | 100.0% | Total Uses: | $151,118,848 | 100.0% | |
| (1) | The NKX Multifamily Portfolio Mortgage Loan (as defined below) is part of the NKX Multifamily Portfolio Whole Loan (as defined below), which is comprised of twopari passu promissory notes with an aggregate original principal balance of $101,000,000. The Cut-off Date Balance per Unit, Maturity Date Balance per Unit, UW NOI Debt Yield, UW NOI Debt Yield at Maturity, UW NCF DSCR, Cut-off Date LTV Ratio and Maturity Date LTV Ratio numbers presented above are based on the aggregate principal balance of the promissory notes comprising the NKX Multifamily Portfolio Whole Loan. |
| (2) | Prepayment of the NKX Multifamily Portfolio Whole Loan is permitted at any time on and after September 1, 2021. |
| (3) | Most Recent Occupancy includes 16 fire damaged units at the Sedona Pointe Property, which were destroyed in a fire in April 2019. The damage to these units has been covered by insurance proceeds and the units are expected to be brought back online in the next four months. |
The Mortgage Loan. The eleventh largest mortgage loan (the “NKX Multifamily Portfolio Mortgage Loan”) is part of a whole loan (the “NKX Multifamily Portfolio Whole Loan”) in the original principal balance of $101,000,000. The NKX Multifamily Portfolio Whole Loan is secured by a first priority fee mortgage encumbering five multifamily properties located in Houston, Texas (the “NKX Multifamily Portfolio” or “Properties”). The NKX Multifamily Portfolio Whole Loan is comprised of twopari passu promissory notes in the aggregate original principal balance of $101,000,000. The NKX Multifamily Portfolio Mortgage Loan is evidenced by the non-controlling promissory note A-2 in the original principal amount of $31,000,000. The controlling promissory note A-1 is expected to be securitized in the BANK 2019-BNK20 securitization trust. The NKX Multifamily Portfolio Whole Loan is expected to be serviced pursuant to the pooling and servicing agreement for the BANK 2019-BNK20 securitization transaction. See “Description of the Mortgage Pool—The Whole Loans—The Non-Serviced Pari Passu Whole Loans” and “Pooling and Servicing Agreement—Servicing of the Non-Serviced Mortgage Loans” in the Preliminary Prospectus.
| NKX Multifamily Portfolio Whole Loan Summary | ||||
| Notes | Original Balance | Cut-off Date Balance | Anticipated Note Holder | Controlling Piece |
| A-1 | $70,000,000 | $70,000,000 | BANK 2019-BNK20 | Yes |
| A-2 | $31,000,000 | $31,000,000 | BANK 2019-BNK21 | No |
| Total | $101,000,000 | $101,000,000 | ||
This is not a research report and was not prepared by the Underwriters’ research department. Please see additional important information and qualifications at the end of this Term Sheet.
T-128
| Multifamily – Garden | Loan #11 | Cut-off Date Balance: | $31,000,000 | |
| Various | NKX Multifamily Portfolio | Cut-off Date LTV: | 69.1% | |
| Houston, TX Various | U/W NCF DSCR: | 2.25x | ||
| U/W NOI Debt Yield: | 8.6% |
The Borrowers and the Borrower Sponsor.The borrowers are BCH Brisas del Mar, LLC, BCH Gallery at Champions, LLC, Diamond Hill at Westheimer, LLC, Providence at Memorial, LLC and BCH Sedona Pointe, LLC (the “NKX Multifamily Portfolio Borrowers”). Providence at Memorial, LLC and Diamondhill at Westheimer, LLC are each a single-purpose Delaware limited liability company with one independent director, and the remaining NKX Multifamily Portfolio Borrowers are Texas limited liability companies, each with a Delaware limited liability company, which has one independent director, as its managing member. The borrower sponsor is Nitya Capital and the non-recourse carve-out guarantor is Swapnil Agarwal, the founder and managing principal of Nitya Capital. The NKX Multifamily Portfolio Borrowers are 86.6% indirectly owned by an affiliate of The Olayan Group as a non-voting member, 6.8% indirectly owned by Nitya NKV, LLC as a voting member and 6.6% indirectly owned by SP Houston 5 LLC (an affiliate of Silverpeak Real Estate Partners (“Silverpeak”)) as a voting member. Nitya Capital is a privately held real estate investment firm that focuses on the acquisition and management of multifamily properties. Since inception, Nitya Capital has acquired over 16,300 units and over 400,000 SF of commercial office throughout Texas. In connection with the origination of the NKX Multifamily Portfolio Whole Loan, the NKX Multifamily Portfolio Borrowers were recapitalized by investments by Nitya Capital (the borrower sponsor), The Olayan Group and Silverpeak.
The Portfolio.The NKX Multifamily Portfolio is comprised of five Class B/C, multifamily garden properties totaling 1,558 units located in Houston, Texas. The Properties were constructed between 1968 and 1980, and have each been recently renovated between 2015 and 2019. As of June 11, 2019, the NKX Multifamily Portfolio was 88.3% leased. Since acquiring the NKX Multifamily Portfolio, according to the borrower sponsor, they have invested approximately $12.5 million ($8,027 per unit) in capital improvements across the Properties on general interior and exterior improvements, general renovation costs, flooring, appliance upgrades, bathroom renovations and other renovations. According to the borrower sponsor, the NKX Multifamily Portfolio Borrowers plan to invest an additional $5.76 million ($3,699 per unit) in interior and exterior capital improvements, including new appliances, kitchen upgrades, bathroom upgrades, painting, and other renovations, which amount was escrowed at loan origination (such reserve has allocated amounts for each individual property, but is not required to be used for specific items, other than $700,000 allocated to repair of the fire damaged units at the Sedona Pointe Property).
The following table presents detailed information with respect to each of the Properties included in the NKX Multifamily Portfolio:
NKX Multifamily Portfolio Properties Summary
| ||||||||
| Building | Occupancy(1) | Units(1) | % of Total Units | Appraised Value | Allocated Loan Amount (“ALA”) | % of ALA | UW NOI | % of UW NOI |
| Providence at Memorial | 87.2% | 321 | 20.6% | $41,190,000 | $8,149,010 | 26.3% | $2,104,286 | 24.3% |
| Casa Del Mar | 89.8% | 354 | 22.7% | $31,600,000 | $7,028,713 | 22.7% | $2,123,893 | 24.5% |
| Diamond Hill | 89.8% | 305 | 19.6% | $27,880,000 | $6,200,000 | 20.0% | $1,647,743 | 19.0% |
| Sedona Pointe | 84.7% | 352 | 22.6% | $27,100,000 | $5,693,564 | 18.4% | $1,709,741 | 19.7% |
| Buena Vista | 90.7% | 226 | 14.5% | $18,300,000 | $3,928,713 | 12.7% | $1,083,157 | 12.5% |
| Total/Wtd. Avg. | 88.3% | 1,558 | 100.0% | $146,070,000 | $31,000,000 | 100.0% | $8,668,819 | 100.0% |
| (1) | Based on the borrower rent roll dated June 11, 2019. |
The Properties.
Providence at Memorial
The Providence at Memorial Property is a two story, 321-unit garden-style apartment complex located in the Spring Branch area of Houston. The Providence at Memorial Property was built in 1971 and is situated on 12.07 acres with 427 parking spaces. The unit mix comprises one-, two-, three- and four-bedroom floorplans, an NRA of 352,479 SF and average unit size of 1,098 SF. As of June 11, 2019, the property was 87.2% occupied, with average in place rent of $1,092/unit ($0.98 PSF). Common amenities at the Providence at Memorial Property include two swimming pools, a large clubhouse with business center and billiards table, courtyard with fountain and seating area, pergola with picnic tables, children’s playground, fitness center, two laundry facilities, reading club for children and gated access. Unit amenities include all-electric kitchen, ceiling fans, mini-blinds, and patios or balconies. Select upgraded units include granite countertops, stainless steel or black appliances, ceramic tile backsplashes, wood flooring, brushed nickel hardware, crown molding, walk-in closets, microwaves, and washer/dryer connections.
Casa Del Mar
The Casa Del Mar Property is a two story, 354-unit garden-style apartment complex located in northwest Houston. The Casa Del Mar Property was built in 1979 and is situated on 12.33 acres with 441 parking spaces. The Casa Del Mar Property’s unit mix is comprised of one- and two-bedroom floor plans, an NRA of 266,626 SF and average unit size of 753 SF. As of June 11, 2019, the Casa Del Mar Property was 89.8% occupied, with average in place rent of $845 per unit ($1.13 PSF). Common amenities at the Casa Del Mar Property include two swimming pools and spa, fitness center, playground, 24 hour maintenance surveillance cameras and three laundry centers. Unit amenities include stainless steel appliances, garbage disposals, granite kitchen counter tops, high speed internet, washer/dryer, cable access and fireplaces.
Diamond Hill
The Diamond Hill Property is a three story, 305-unit garden-style apartment complex located in the Woodlake-Briar Meadow area of Houston. The Diamond Hill Property was built in 1968 and is situated on 6.78 acres with 389 parking spaces. The Diamond Hill Property’s unit mix comprises one- and two-bedroom floorplans, an NRA of 248,346 SF and average unit size of 814 SF. As of June 11, 2019, the Diamond Hill Property was 89.8% occupied, with average in place rent of $952 per unit ($1.17 PSF). Common amenities at the Diamond Hill Property include three swimming pools and laundry facilities, night patrol, fitness center, and on-site maintenance. Unit amenities include private balconies, vinyl wood flooring, stainless steel appliances, ceiling fans, crown molding, and kitchen backsplashes.
Sedona Pointe
The Sedona Pointe Property is a two story, 352-unit garden-style apartment complex located in the Cypress Station area of Houston. The Sedona Pointe Property was built in 1979 and is situated on 10.1 acres with 428 parking spaces. The Sedona Pointe Property’s unit mix is comprised of studios, one- and two-bedroom floorplans, an NRA of 240,656 SF and average unit size of 684 SF. As of June 11, 2019, the Sedona Pointe Property was 84.7% occupied,
This is not a research report and was not prepared by the Underwriters’ research department. Please see additional important information and qualifications at the end of this Term Sheet.
T-129
| Multifamily – Garden | Loan #11 | Cut-off Date Balance: | $31,000,000 | |
| Various | NKX Multifamily Portfolio | Cut-off Date LTV: | 69.1% | |
| Houston, TX Various | U/W NCF DSCR: | 2.25x | ||
| U/W NOI Debt Yield: | 8.6% |
with average in place rent of $735 per unit ($1.13 PSF). There are 16 units that are currently offline due to damage from a fire that occurred in April 2019. When adjusting for the 16 fire-damaged units, the Sedona Pointe Property is 87.6% occupied. Common amenities at the Sedona Pointe Property include two swimming pools, resident clubhouse and business center, children’s playground, three laundry facilities, gated access and on-site maintenance. Unit amenities include a private patio/balcony, all-electric kitchens, some with stainless steel appliances, granite or ceramic tile countertops, ceramic or faux wood flooring, and custom cabinetry.
Buena Vista
The Buena Vista Property is a two story, 226-unit garden-style apartment complex located in northwest Houston. The Buena Vista Property was built in 1980 and is situated on 11.1 acres with 361 parking spaces. The unit mix includes one-, two- and three-bedroom floorplans, an NRA of 200,583 SF and an average unit size of 888 SF. As of June 11, 2019, the property was 90.7% occupied, with average in place rent of $825/unit ($0.95 PSF). Common amenities include a swimming pool, resident clubhouse, children’s playground, laundry facilities, covered parking, gated access, fitness center, and on-site maintenance. Unit amenities include all electric kitchens with black appliances, ceramic tile countertops, ceramic or faux wood flooring, full-size washer and dryer connections and ceiling fans.
The Market. The NKX Multifamily Portfolio is located in Houston, Texas, within the Houston multifamily market. According to the appraisal, as of the first quarter of 2019, the vacancy rate in the Houston multifamily market was approximately 5.8%, with average asking rents of $1,089 per unit and inventory of approximately 574,135 units.
The Buena Vista Property, the Casa Del Mar Property and the Sedona Pointe Property are all located within the Champions/FM 1960 submarket of the Houston multifamily market, with the Buena Vista Property and the Casa Del Mar Property located adjacent to each other. According to the appraisal, as of the first quarter of 2019, the vacancy rate in the Champions/FM 1960 submarket was approximately 7.3%, with average asking rents of $954 per unit and inventory of approximately 26,511 units. According to the appraisal, the 2018 population within a one-, three- and five-mile radius of the Buena Vista Property, the Casa Del Mar Property and the Sedona Pointe Property was 11,369, 131,181 and 306,633, respectively. The 2018 average household income within the same one-, three- and five-mile radius was $62,744, $72,260 and $85,303, respectively. According to the appraisal, there are three planned developments expected in the Champions/FM 1960 submarket, which are not expected to compete with any of the Properties.
The Diamond Hill Property is located within the Briar Grove submarket of the Houston multifamily market. According to the appraisal, as of the first quarter of 2019, the vacancy rate in the Briar Grove submarket was approximately 5.8%, with average asking rents of $1,166 per unit and inventory of approximately 38,423 units. According to the appraisal, the 2018 population within a one-, three- and five-mile radius of the Diamond Hill Property was 31,010, 225,312 and 566,378, respectively. The 2018 average household income within the same one-, three- and five-mile radius was $74,405, $85,249 and $94,385, respectively. According to the appraisal, there are two planned and one under construction apartment projects within the Briar Grove submarket, which are not expected to compete with the Diamond Hill Property.
The Providence at Memorial Property is located within the Spring Branch submarket of the Houston multifamily market. According to the appraisal, as of the first quarter of 2019, the vacancy rate in the Spring Branch submarket was approximately 3.9%, with average asking rents of $991 per unit and inventory of approximately 23,458 units. According to the appraisal, the 2018 population within a one-, three- and five-mile radius of the Providence at Memorial Property was 18,599, 128,681 and 443,723, respectively. The 2018 average household income within the same one-, three- and five-mile radius was $107,247, $114,347 and $113,639, respectively. According to the appraisal, there are two planned and one under construction apartment projects within the Briar Grove submarket, which are not expected to compete with the Providence at Memorial Property.
The following table presents certain information relating to the appraiser’s market rent conclusion for the NKX Multifamily Portfolio:
Market Rent Summary
| |||||
| Building | Units | Average Size | Avg. Monthly Contract Rent per Unit | Avg. Monthly Asking Rent per Unit | Avg. Monthly Market Rent per Unit |
| Providence at Memorial | 321 | 1,098 | $1,092 | $1,120 | $1,115 |
| Casa Del Mar | 354 | 753 | $845 | $853 | $853 |
| Diamond Hill | 305 | 814 | $952 | $999 | $1,000 |
| Sedona Pointe | 352 | 684 | $735 | $767 | $774 |
| Buena Vista | 226 | 888 | $825 | $846 | $846 |
This is not a research report and was not prepared by the Underwriters’ research department. Please see additional important information and qualifications at the end of this Term Sheet.
T-130
| Multifamily – Garden | Loan #11 | Cut-off Date Balance: | $31,000,000 | |
| Various | NKX Multifamily Portfolio | Cut-off Date LTV: | 69.1% | |
| Houston, TX Various | U/W NCF DSCR: | 2.25x | ||
| U/W NOI Debt Yield: | 8.6% |
The following table presents certain information relating to comparable rental properties to the Providence at Memorial Property:
| Comparable Rental Properties (Providence at Memorial) | |||||||
| Property | Year Built | # of Stories | # Units | Unit Mix | Average SF per Unit | Average Rent per Unit | Average Annual Rent PSF |
| Providence at Memorial | 1971 | 2 | 321 | 1BR 2BR 3BR 4BR | 700 1,061 1,463 1,500 | $876 $1,103 $1,317 $1,501 | $1.21 $1.02 $0.90 $0.97 |
| Banyan Palms at Spring Branch | 1970 | 2 | 323 | 1BR 2BR 3BR | 723 964 1,300 | $721 $821 $1,095 | $0.99 $0.85 $0.84 |
| Castlewood Apartments | 1972 | 3 | 332 | 1BR 2BR 3BR | 700 1,000 1,375 | $818 $1,078 $1,301 | $1.17 $1.07 $0.95 |
| Hilton Town | 1973 | 2 | 238 | 1BR 2BR 3BR | 778 950 1,190 | $635 $744 $950 | $0.81 $0.78 $0.80 |
| Ravenwood | 1969 | 2 | 236 | 1BR 2BR 3BR | 740 1,200 1,215 | $775 $964 $1,070 | $1.05 $0.80 $0.88 |
| Woods of Spring Grove | 1969 | 2 | 144 | 1BR 2BR 3BR | 790 1,177 1,310 | $788 $975 $1,118 | $1.00 $0.83 $0.85 |
Source:Appraisal
The following table presents certain information relating to comparable rental properties to the Buena Vista Property and the Casa Del Mar Property:
| Comparable Rental Properties (Buena Vista and Casa Del Mar) | |||||||
| Property | Year Built | # of Stories | # Units | Unit Mix | Average SF per Unit | Average Rent per Unit | Average Annual Rent PSF |
| Buena Vista | 1980 | 2 | 226 | 1BR 2BR 3BR | 671 930 1,287 | $694 $860 $1,181 | $1.04 $0.95 $0.92 |
| Casa Del Mar | 1979 | 2 | 354 | 1BR 2BR | 614 897 | $753 $957 | $1.24 $1.04 |
| The Abbey at Champions | 1982 | 2 | 152 | 1BR 2BR | 714 959 | $837 $1,017 | $1.16 $1.05 |
| Champions at Ponderosa | 1978 | 2 | 177 | 1BR 2BR 3BR | 711 876 1,198 | $732 $877 $1,259 | $1.03 $0.99 $1.05 |
| Cypress Ridge | 1980 | 2 | 260 | 1BR 2BR 3BR | 664 867 1,250 | $705 $860 $1,365 | $1.05 $0.99 $1.09 |
| North Bend | 1984 | 3 | 307 | 1BR 2BR | 649 1,009 | $762 $1,033 | $1.17 $1.02 |
| London Park | 1983 | 2 | 257 | 1BR 2BR | 711 991 | $870 $1,105 | $1.22 $1.11 |
Source:Appraisal
This is not a research report and was not prepared by the Underwriters’ research department. Please see additional important information and qualifications at the end of this Term Sheet.
T-131
| Multifamily – Garden | Loan #11 | Cut-off Date Balance: | $31,000,000 | |
| Various | NKX Multifamily Portfolio | Cut-off Date LTV: | 69.1% | |
| Houston, TX Various | U/W NCF DSCR: | 2.25x | ||
| U/W NOI Debt Yield: | 8.6% |
The following table presents certain information relating to comparable rental properties to the Diamond Hill Property:
| Comparable Rental Properties (Diamond Hill) | |||||||
| Property | Year Built | # of Stories | # Units | Unit Mix | Average SF per Unit | Average Rent per Unit | Average Annual Rent PSF |
| Diamond Hill | 1968 | 3 | 305 | 1BR 2BR | 714 1,050 | $922 $1,181 | $1.28 $1.11 |
| Crossview Court | 1971 | 2 | 167 | Studio 1BR 2BR | 400 756 1,204 | $550 $747 $1,115 | $1.38 $0.99 $0.92 |
| The Landing at Westchase | 1976 | 2 | 304 | 1BR 2BR | 560 922 | $752 $1,037 | $1.32 $1.12 |
| The Park at Woodlake | 1973 | 2 | 564 | Studio 1BR 2BR | 515 900 1,075 | $678 $884 $1,080 | $1.32 $0.97 $1.01 |
| SunBlossom at Woodlake | 1970 | 3 | 221 | 1BR 2BR 3BR | 913 1,183 1,430 | $885 $1,062 $1,381 | $0.96 $0.89 $0.97 |
| Woodlake Oaks | 1976 | 2 | 396 | 1BR 2BR | 834 1,250 | $795 $1,080 | $0.94 $0.86 |
Source:Appraisal
The following table presents certain information relating to comparable rental properties to the Sedona Pointe Property:
| Comparable Rental Properties (Sedona Pointe) | |||||||
| Property | Year Built | # of Stories | # Units | Unit Mix | Average SF per Unit | Average Rent per Unit | Average Annual Rent PSF |
| Sedona Pointe | 1979 | 2 | 352 | Studio 1BR 2BR | 520 625 842 | $585 $719 $908 | $1.25 $1.13 $1.10 |
| Copper Lodge | 1978 | 2 | 294 | 1BR 2BR | 753 1,020 | $743 $974 | $0.98 $0.95 |
| The Forest | 1979 | 2 | 192 | 1BR 2BR 3BR | 657 913 1,180 | $723 $865 $1,090 | $1.08 $0.95 $0.92 |
| Highland Cross | 1979 | 2 | 236 | 1BR 2BR | 726 1,037 | $698 $993 | $0.96 $0.96 |
| Kendell Manor | 1981 | 2 | 272 | 1BR 2BR | 704 1,072 | $717 $984 | $1.01 $0.91 |
| The Preakness | 1983 | 2 | 224 | 1BR 2BR | 634 926 | $798 $930 | $1.25 $1.00 |
Source:Appraisal
This is not a research report and was not prepared by the Underwriters’ research department. Please see additional important information and qualifications at the end of this Term Sheet.
T-132
| Multifamily – Garden | Loan #11 | Cut-off Date Balance: | $31,000,000 | |
| Various | NKX Multifamily Portfolio | Cut-off Date LTV: | 69.1% | |
| Houston, TX Various | U/W NCF DSCR: | 2.25x | ||
| U/W NOI Debt Yield: | 8.6% |
Operating History and Underwritten Net Cash Flow. The following table presents certain information relating to the operating history and Underwritten Net Cash Flow at the NKX Multifamily Portfolio:
| Cash Flow Analysis | |||||||||||||
| 2016 | 2017 | 2018 | 6/30/2019 TTM | UW | UW Unit | ||||||||
| Gross Potential Rent(1) | $16,500,437 | $16,206,542 | $16,249,832 | $16,497,130 | $16,584,324 | $10,644.62 | |||||||
| Discounts Concessions | ($451,775) | ($435,801) | ($375,921) | ($438,469) | ($438,469) | ($281.43) | |||||||
| Other Income | $1,321,493 | $1,954,004 | $2,078,843 | $2,493,915 | $2,493,915 | $1,600.72 | |||||||
| Less Vacancy & Credit Loss | ($2,546,769) | ($2,573,325) | ($1,889,858) | ($1,920,382) | ($1,778,671) | ($1,141.64) | |||||||
| Effective Gross Income | $14,823,385 | $15,151,420 | $16,062,896 | $16,632,194 | $16,861,099 | $10,822.27 | |||||||
| Real Estate Taxes | $1,488,694 | $1,447,776 | $1,448,916 | $1,450,197 | $2,083,214 | $1,337.11 | |||||||
| Insurance | $646,558 | $504,627 | $503,652 | $552,517 | $552,517 | $354.63 | |||||||
| Other Expenses | $5,316,372 | $5,148,782 | $5,624,563 | $5,493,557 | $5,556,549 | $3,566.46 | |||||||
| Total Expenses | $7,451,624 | $7,101,185 | $7,577,131 | $7,496,271 | $8,192,280 | $5,258.20 | |||||||
| Net Operating Income | $7,371,761 | $8,050,235 | $8,485,765 | $9,135,923 | $8,668,819 | $5,564.07 | |||||||
| Capital Expenditures | $0 | $0 | $0 | $0 | $389,500 | $250.00 | |||||||
| Net Cash Flow | $7,371,761 | $8,050,235 | $8,485,765 | $9,135,923 | $8,279,319 | $5,314.07 | |||||||
| Occupancy %(2) | 86.0% | 87.8% | 90.2% | 88.3% | 89.3% | ||||||||
| NOI DSCR(3) | 2.01x | 2.19x | 2.31x | 2.49x | 2.36x | ||||||||
| NCF DSCR(3) | 2.01x | 2.19x | 2.31x | 2.49x | 2.25x | ||||||||
| NOI Debt Yield(3) | 7.3% | 8.0% | 8.4% | 9.0% | 8.6% | ||||||||
| NCF Debt Yield(3) | 7.3% | 8.0% | 8.4% | 9.0% | 8.2% | ||||||||
| (1) | UW Gross Potential Rent is based on the borrower rent roll dated June 11, 2019. |
| (2) | 6/30/2019 TTM Occupancy % is as of the borrower rent roll dated June 11, 2019 and includes 16 fire damaged units at the Sedona Pointe Property, which were destroyed in a fire in April 2019. The damage to these units has been covered by insurance proceeds and, according to the borrower sponsor, they are expected to be brought back online in the next four months. |
| (3) | Debt service coverage ratios and debt yields are based on the NKX Multifamily Portfolio Whole Loan. |
This is not a research report and was not prepared by the Underwriters’ research department. Please see additional important information and qualifications at the end of this Term Sheet.
T-133
| Mortgage Loan No. 12 – U-Haul AREC Portfolio 35 |
| Mortgage Loan Information | Property Information | ||||||
| Mortgage Loan Seller: | BANA | Single Asset/Portfolio: | Portfolio | ||||
| Credit Assessment (DBRS/Fitch/S&P): | NR/NR/NR | Location: | Various | ||||
| Original Balance: | $27,500,000 | General Property Type: | Self Storage | ||||
| Cut-off Date Balance: | $27,500,000 | Detailed Property Type: | Self Storage | ||||
| % of Initial Pool Balance: | 2.3% | Title Vesting: | Fee | ||||
| Loan Purpose: | Recapitalization | Year Built/Renovated: | Various / Various | ||||
| Borrower Sponsor: | AMERCO | Size: | 420,282 SF | ||||
| Guarantor: | AMERCO | Cut-off Date Balance per SF: | $65 | ||||
| Mortgage Rate(1): | 3.3550% | Maturity/ARD Date Balance per SF(1): | $46 | ||||
| Note Date: | 9/6/2019 | Property Manager(5): | Various | ||||
| First Payment Date: | 11/1/2019 | (borrower-related) | |||||
| Maturity/ARD Date(1): | 10/1/2029 | ||||||
| Original Term to Maturity/ARD(1): | 120 months | Underwriting and Financial Information | |||||
| Original Amortization Term: | 300 months | UW NOI: | $2,885,800 | ||||
| IO Period: | 0 months | UW NOI Debt Yield: | 10.5% | ||||
| Seasoning: | 0 months | UW NOI Debt Yield at Maturity/ARD(1): | 14.9% | ||||
| Prepayment Provisions: | LO (24); DEF (92); O (4) | UW NCF DSCR: | 1.73x | ||||
| Lockbox/Cash Mgmt Status: | Soft/Springing | Most Recent NOI(6): | $2,819,506 (7/31/2019 TTM) | ||||
| Additional Debt Type: | N/A | 2nd Most Recent NOI(6): | $1,598,621 (12/31/2018) | ||||
| Additional Debt Balance: | N/A | 3rd Most Recent NOI(6): | $1,449,478 (12/31/2017) | ||||
| Future Debt Permitted (Type): | No (N/A) | Most Recent Occupancy(6): | 91.8% (Various) | ||||
| Reserves | 2nd Most Recent Occupancy(6): | 79.8% (12/31/2018) | |||||
| Type | Initial | Monthly | Cap | 3rd Most Recent Occupancy(6): | 74.0% (12/31/2017) | ||
| RE Tax(2): | $290,000 | Springing | N/A | Appraised Value (as of)(7): | $48,410,000 (Various) | ||
| Insurance(3): | $0 | Springing | N/A | Appraised Value per SF: | $115 | ||
| Immediate Repairs: | $528,092 | $0 | N/A | Cut-off Date LTV Ratio(7): | 56.8% | ||
| Recurring Replacements(4): | $37,421 | Springing | $37,421 | Maturity/ARD Date LTV Ratio(1)(7): | 40.0% | ||
| Sources and Uses | ||||||
| Sources | Proceeds | % of Total | Uses | Proceeds | % of Total | |
| Loan Amount: | $27,500,000 | 100.0% | Principal Equity Distribution(8): | $25,488,067 | 92.7% | |
| Closing Costs: | $1,156,420 | 4.2% | ||||
| Upfront Reserves: | $855,513 | 3.1% | ||||
| Total Sources: | $27,500,000 | 100.0% | Total Uses: | $27,500,000 | 100.0% | |
| (1) | The U-Haul AREC Portfolio 35 Mortgage Loan (as defined below) has an initial term of 120 months to the anticipated maturity date (“ARD”) of October 1, 2029, with a final maturity date of October 1, 2044. From and after the ARD until the outstanding principal balance of the U-Haul AREC Portfolio 35 Mortgage Loan and all accrued interest has been paid in full, or until the final maturity date on October 1, 2044, the U-Haul AREC Portfolio 35 Mortgage Loan will accrue interest at a rate (the “Extension Rate”) equal to 3.0000% plus the greater of (a) 3.3550% (the “Initial Interest Rate”) or (b) the 10-year swap yield as of the ARD plus 1.8800%, and all excess cash flow from the U-Haul AREC Portfolio 35 Properties (as defined below) is required to be collected by the lender and applied as follows: first, to pay interest at the Initial Interest Rate, second, to reduce the principal balance of the U-Haul AREC Portfolio 35 Mortgage Loan until the entire outstanding principal balance of the U-Haul AREC Portfolio 35 Mortgage Loan is paid in full, and third, to pay accrued interest on the U-Haul AREC Portfolio 35 Mortgage Loan which has accrued at the Extension Rate and been deferred until repayment of the U-Haul AREC Portfolio 35 Mortgage Loan. |
| (2) | Monthly deposits for real estate taxes are suspended so long as (i) no event of default has occurred, (ii) the U-Haul AREC Portfolio 35 Borrowers (as defined below) have deposited in reserve an amount sufficient to pay taxes for six months and (iii) the lender has received evidence that the taxes have been paid directly by the U-Haul AREC Portfolio 35 Borrowers. |
| (3) | Monthly deposits for insurance are suspended so long as (i) no event of default has occurred, (ii) the lender has received evidence that the insurance premiums have been paid directly by the U-Haul AREC Portfolio 35 Borrowers and (iii) either (a) U-Haul AREC Portfolio 35 Properties are covered by a blanket insurance policy or (b) the U-Haul AREC Portfolio 35 Borrowers have deposited in reserve an amount sufficient to pay insurance premiums for six months. |
| (4) | The U-Haul AREC Portfolio 35 Borrowers are required to deposit $6,237 monthly for replacement reserves subject to a cap of $37,421. |
| (5) | The property managers for the U-Haul AREC Portfolio 35 Properties are U-Haul Co. of Alabama, Inc., U-Haul Co. of California, U-Haul Co. of Florida, U-Haul Co. of Louisiana, U-Haul Company of Missouri, U-Haul Co. of New Jersey, Inc., U-Haul Co. of New York and Vermont, Inc., U-Haul Co. of Pennsylvania, U-Haul Co. of South Carolina, Inc., and U-Haul Co. of Texas, each an affiliate of the U-Haul AREC Portfolio 35 Borrower. |
| (6) | There is a significant increase in occupancy and net operating income due to the increase in unit and property counts. From August 2016 to October 2018, the borrower sponsor added 1,499 units and 6 properties to the portfolio. |
| (7) | The Appraised Value shown reflects a “Bulk Portfolio Value” of $48,410,000. The Cut-off Date LTV and Maturity/ARD Date LTV assuming the aggregate as-is values of the individual properties of $44,750,000 are 61.5% and 43.3% respectively. |
| (8) | The borrower sponsor acquired the U-Haul AREC Portfolio 35 Properties (as defined below) from September 1977 through October 2018. The average acquisition date is February 2005. The five most recent acquisitions occurred in September 2017 (U-Haul Storage of Orchard Park), June 2018 (U-Haul Moving & Storage of Penn Hills and U-Haul 24/7 Storage of Penn Hills), June 2018 (U-Haul 24/7 Storage at University of Florida) and October 2018 (U-Haul Storage at Page Ave). |
This is not a research report and was not prepared by the Underwriters’ research department. Please see additional important information and qualifications at the end of this Term Sheet.
T-134
| Self Storage | Loan #12 | Cut-off Date Balance: | $27,500,000 | |
| Various | U-Haul AREC Portfolio 35 | Cut-off Date LTV: | 56.8% | |
| Various, Various | U/W NCF DSCR: | 1.73x | ||
| U/W NOI Debt Yield: | 10.5% |
The Mortgage Loan. The twelfth largest mortgage loan (the “U-Haul AREC Portfolio 35 Mortgage Loan”) is evidenced by a promissory note in the original principal amount of $27,500,000, and secured by the fee interests in a portfolio of 16 self storage properties located across ten states and totaling 420,282 SF (the “U-Haul AREC Portfolio 35 Properties”).
The Borrowers and the Borrower Sponsor. The borrowers are U-Haul Co. of Florida 35, LLC, UHIL 35, LLC and AREC 35, LLC (the “U-Haul AREC Portfolio 35 Borrowers”), each a Delaware limited liability company structured to be bankruptcy-remote with at least two independent directors.
The sponsor and nonrecourse carve-out guarantor is AMERCO, the parent company of U-Haul International, Inc. (“U-Haul”), Oxford Life Insurance Company, Repwest Insurance Company and Amerco Real Estate Company. AMERCO was founded in 1945 by Sam and Anna Mary Shoen, whose sons, Edward Shoen and Mark Shoen have run the company since the late 1980s.
As of March 31, 2019, U-Haul is one North America’s largest operators of self-storage facilities, reported a network of approximately 1,981 company-operated retail moving stores and 20,000 independent U-Haul dealers throughout North America. U-Haul employs 30,000 people and operates more than 697,000 self-storage units, comprising approximately 60.7 million SF of storage space across approximately 1,631 locations in 50 U.S. states and 10 Canadian provinces.
The Properties. The U-Haul AREC Portfolio 35 Properties are comprised of 16 U-Haul branded properties containing a total of 3,699 traditional storage units, 209 RV storage units and 131 portable U-Box units. The U-Haul AREC Portfolio 35 Properties range in size from approximately 5,050 SF to 52,218 SF and are managed by affiliates of U-Haul. The U-Haul AREC Portfolio 35 Properties are located in 12 different cities across ten states. The greatest concentration of U-Haul AREC Portfolio 35 Properties is located in Texas (two properties, 21.8% of total SF), Louisiana (one property, 11.4% of total SF) and Alabama (one property, 10.4% of total SF), with the remaining twelve properties (56.4% of total SF) located across seven different states. The U-Haul AREC Portfolio 35 Properties were built between 1950 and 2012. The weighted average occupancy for the U-Haul AREC Portfolio 35 Properties was 91.8% by total SF and 90.9% by units, as of July 19, 2019. A release of any of the U-Haul AREC Portfolio 35 Properties is not permitted. The U-Haul AREC Portfolio 35 Borrowers are permitted to acquire certain vacant, contiguous land to expand any mortgaged property (or non-contiguous land to be operated as a remote storage facility, U-Box storage facility or vehicle or RV storage facility), which acquired property would become collateral. See “Description of the Mortgage Pool—Partial Releases; Substitutions; Additions” in the Preliminary Prospectus.
The following table presents detailed information with respect to each of the U-Haul AREC Portfolio 35 Properties.
| U-Haul AREC Portfolio 35 | ||||||||
| Property Name | City, State | Year Built/ Renovated | SF(1) | Total Units Storage / RV(1) | Allocated Loan Amount (“ALA”) | % of ALA | Appraised Value | % of Appraised Value |
| U-Haul Moving & Storage of Woodmere | Montgomery, AL | 1976 / 2012 | 43,883 | 526 / 54 | $3,242,777 | 11.8% | $6,000,000 | 13.4% |
| U-Haul of White Plains | White Plains, NY | 1988-1999 / N/A | 13,960 | 220 / 2 | $3,202,305 | 11.6% | $5,560,000 | 12.4% |
| U-Haul 24/7 Storage at University of Florida | Gainesville, FL | 1954 / N/A | 43,640 | 438 / 0 | $2,741,136 | 10.0% | $4,000,000 | 8.9% |
| U-Haul Moving & Storage of Cedar Brook | Berlin, NJ | 1950; 1970; 2006 / N/A | 37,035 | 257 / 33 | $2,706,872 | 9.8% | $3,860,000 | 8.6% |
| U-Haul Storage at Page Ave | Saint Louis, MO | 2002 / N/A | 36,464 | 258 / 51 | $2,645,196 | 9.6% | $3,860,000 | 8.6% |
| U-Haul Storage of Copperas Cove | Copperas Cove, TX | 2004 / N/A | 52,218 | 345 / 22 | $2,261,437 | 8.2% | $3,300,000 | 7.4% |
| U-Haul Moving & Storage of Southern Hills | Shreveport, LA | 2012 / N/A | 48,055 | 286 / 13 | $2,142,791 | 7.8% | $3,150,000 | 7.0% |
| U-Haul Storage of Southside | Bakersfield, CA | 1989 / N/A | 30,800 | 288 / 0 | $1,583,006 | 5.8% | $2,310,000 | 5.2% |
| U-Haul 24/7 Storage of Penn Hills(2) | Penn Hills, PA | 1983-1988 / N/A | N/A | N/A | $1,507,625 | 5.5% | $2,200,000 | 4.9% |
| U-Haul Storage of Orchard Park | West Seneca, NY | 1965 / N/A | 19,542 | 151 / 34 | $1,463,344 | 5.3% | $2,790,000 | 6.2% |
| U-Haul Moving & Storage of W Greenville | Greenville, SC | 1971 / 2008 | 15,226 | 161 / 0 | $1,147,321 | 4.2% | $2,320,000 | 5.2% |
| U-Haul of Southside(2) | Bakersfield, CA | 1970 / N/A | N/A | N/A | $870,310 | 3.2% | $1,270,000 | 2.8% |
| U-Haul Moving & Storage of West Copperas Cove | Copperas Cove, TX | 2004 / N/A | 39,251 | 431 / 0 | $697,545 | 2.5% | $2,500,000 | 5.6% |
| U-Haul Moving & Storage of Penn Hills | Penn Hills, PA | 1956 / 2008 | 35,158 | 279 / 0 | $575,639 | 2.1% | $840,000 | 1.9% |
| U-Haul Moving & Storage of Orchard Park Rd | West Seneca, NY | 1965 / N/A | 5,050 | 59 / 0 | $363,201 | 1.3% | $530,000 | 1.2% |
| U-Haul at University of Florida(2) | Gainesville, FL | 1969 / N/A | N/A | N/A | $349,495 | 1.3% | $260,000 | 0.6% |
| Total | 420,282 | 3,699 / 209 | $27,500,000 | 100.0% | $44,750,000 | 100.0% | ||
| (1) | Based on the rent roll as of July 19, 2019. |
| (2) | U-Haul 24/7 Storage of Penn Hills, U-Haul of Southside and U-Haul at University of Florida do not have associated SF or unit count as these are remote properties and have their SF and unit counts rolled together with their parent properties of U-Haul Moving & Storage of Penn Hills, U-Haul Storage of Southside and U-Haul 24/7 Storage at University of Florida, respectively. |
This is not a research report and was not prepared by the Underwriters’ research department. Please see additional important information and qualifications at the end of this Term Sheet.
T-135
| Self Storage | Loan #12 | Cut-off Date Balance: | $27,500,000 | |
| Various | U-Haul AREC Portfolio 35 | Cut-off Date LTV: | 56.8% | |
| Various, Various | U/W NCF DSCR: | 1.73x | ||
| U/W NOI Debt Yield: | 10.5% |
The following table presents detailed information with respect to the property types of the U-Haul AREC Portfolio 35 Properties.
| U-Haul AREC Portfolio 35 Performance Summary(1) | |||||
| Property Type | Unit Description | Total Units(2) | Unit Size (SF) | Monthly Asking Rent | Annual GPR |
| Self-Storage | Drive-Up | 1,728 | 136 | $109 | $2,257,243 |
| Self-Storage | Interior (Climate Controlled) | 1,089 | 89 | $106 | $1,390,147 |
| Self-Storage | Interior | 285 | 98 | $118 | $401,866 |
| Self-Storage | Split Level (Climate Controlled) | 89 | 90 | $117 | $124,867 |
| Self-Storage | Split Level | 428 | 73 | $122 | $624,763 |
| Self-Storage | Split Level (Heated) | 50 | 92 | $111 | $66,330 |
| Self-Storage | Storage Lockers | 26 | 35 | $121 | $37,904 |
| Office | Office | 4 | 405 | $435 | $20,878 |
| Parking | RV / Boat / Vehicle Storage | 209 | 67 | $82 | $205,975 |
| Ubox-Storage | Ubox | 131 | 40 | $97 | $152,381 |
| Total / Wtd. Avg. | 4,039 | 105 | $109 | $1,454,525 | |
| (1) | Based on the rent roll as of July 19, 2019. |
| (2) | Total Units include 131 portable U-Box units. |
The Markets. The following table presents detailed information for the U-Haul AREC Portfolio 35 Properties by market.
| U-Haul AREC Portfolio 35 Market Summary | ||||||||||
| Property State | Property Count | Total SF | % SF | Total Units Storage / RV | % Climate Control(1) | Occupancy | Wtd. Avg. Year Built | Wtd. Avg. NOI PSF | TTM July NOI | % NOI |
| Texas | 2 | 91,469 | 21.8% | 776 / 22 | 28.6% | 88.6% | 2004 | $4.59 | $419,550 | 15.1% |
| Louisiana | 1 | 48,055 | 11.4% | 286 / 13 | 27.6% | 91.6% | 2012 | $4.59 | $220,648 | 7.9% |
| Alabama | 1 | 43,883 | 10.4% | 526 / 54 | 53.6% | 92.3% | 1976 | $9.28 | $407,313 | 14.7% |
| Florida | 2 | 43,640 | 10.4% | 438 / 0 | 40.4% | 95.1% | 1962 | $6.49 | $283,063 | 10.2% |
| New York | 3 | 38,552 | 9.2% | 430 / 36 | 30.0% | 97.2% | 1973 | $14.37 | $554,090 | 19.9% |
| New Jersey | 1 | 37,035 | 8.8% | 257 / 33 | 23.7% | 93.1% | 1950 | $5.33 | $197,477 | 7.1% |
| Missouri | 1 | 36,464 | 8.7% | 258 / 51 | 48.8% | 93.7% | 2002 | $5.37 | $195,946 | 7.1% |
| Pennsylvania | 2 | 35,158 | 8.4% | 279 / 0 | 24.0% | 90.3% | 1970 | $4.98 | $174,975 | 6.3% |
| California | 2 | 30,800 | 7.3% | 288 / 0 | 0.0% | 89.8% | 1980 | $5.04 | $155,127 | 5.6% |
| South Carolina | 1 | 15,226 | 3.6% | 161 / 0 | 55.3% | 87.5% | 1971 | $11.12 | $169,331 | 6.1% |
| Total / Wtd. Avg. | 16 | 420,282 | 100.0% | 3,699 / 209 | 33.3% | 91.8% | 1984 | $6.61 | $2,777,521 | 100.0% |
| (1) | % Climate Control is based on total storage units. |
This is not a research report and was not prepared by the Underwriters’ research department. Please see additional important information and qualifications at the end of this Term Sheet.
T-136
| Self Storage | Loan #12 | Cut-off Date Balance: | $27,500,000 | |
| Various | U-Haul AREC Portfolio 35 | Cut-off Date LTV: | 56.8% | |
| Various, Various | U/W NCF DSCR: | 1.73x | ||
| U/W NOI Debt Yield: | 10.5% |
| U-Haul AREC Portfolio 35 – 2018 Demographic Summary | |||||||
| Property Name | City, State | 1-mile Population | 3-mile Population | 5-mile Population | 1-mile Average Household Income | 3-mile Average Household Income | 5-mile Average Household Income |
| U-Haul Moving & Storage of Woodmere | Montgomery, AL | 9,232 | 67,060 | 147,351 | $55,826 | $72,051 | $74,190 |
| U-Haul of White Plains | White Plains, NY | 14,050 | 98,037 | 178,017 | $131,365 | $126,970 | $155,186 |
| U-Haul 24/7 Storage at University of Florida | Gainesville, FL | 4,510 | 57,509 | 119,546 | $53,600 | $36,986 | $48,498 |
| U-Haul Moving & Storage of Cedar Brook | Berlin, NJ | 5,666 | 37,496 | 116,035 | $97,983 | $108,036 | $101,973 |
| U-Haul Storage at Page Ave | Saint Louis, MO | 7,244 | 38,641 | 191,107 | $52,033 | $73,220 | $94,422 |
| U-Haul Storage of Copperas Cove | Copperas Cove, TX | 2,652 | 25,017 | 62,009 | $58,213 | $59,067 | $65,010 |
| U-Haul Moving & Storage of Southern Hills | Shreveport, LA | 7,691 | 33,405 | 79,093 | $54,528 | $58,461 | $52,987 |
| U-Haul Storage of Southside | Bakersfield, CA | 19,114 | 139,345 | 305,207 | $33,369 | $44,446 | $54,012 |
| U-Haul 24/7 Storage of Penn Hills | Penn Hills, PA | 7,892 | 77,805 | 199,933 | $69,422 | $66,076 | $70,459 |
| U-Haul Storage of Orchard Park | West Seneca, NY | 5,739 | 48,120 | 137,802 | $94,159 | $91,025 | $80,263 |
| U-Haul Moving & Storage of W Greenville | Greenville, SC | 3,831 | 47,339 | 108,579 | $81,220 | $63,473 | $65,167 |
| U-Haul of Southside | Bakersfield, CA | 19,114 | 139,345 | 305,207 | $33,369 | $44,446 | $54,012 |
| U-Haul Moving & Storage of West Copperas Cove | Copperas Cove, TX | 2,652 | 25,017 | 62,009 | $58,213 | $59,067 | $65,010 |
| U-Haul Moving & Storage of Penn Hills | Penn Hills, PA | 7,892 | 77,805 | 199,933 | $69,422 | $66,076 | $70,459 |
| U-Haul Moving & Storage of Orchard Park Rd | West Seneca, NY | 5,739 | 48,120 | 137,802 | $94,159 | $91,025 | $80,263 |
| U-Haul at University of Florida | Gainesville, FL | 4,510 | 57,509 | 119,546 | $53,600 | $36,986 | $48,498 |
| Total / Wtd. Avg.(1) | 8,215 | 61,986 | 150,236 | $70,945 | $73,691 | $80,719 | |
Source: Appraisals.
| (1) | The Wtd. Avg. figures are based on allocated loan amounts for the individual properties. |
Operating History and Underwritten Net Cash Flow.The following table presents certain information relating to the historical operating performance and Underwritten Net Cash Flow at the U-Haul AREC Portfolio 35 Properties:
| Cash Flow Analysis | |||||||||||||||
| 2016 | 2017 | 2018 | 3/31/2019 T3 | 7/31/2019 TTM | UW | UW PSF(1) | |||||||||
| Base Rent | $998,363 | $2,165,221 | $2,436,794 | $3,430,051 | $3,841,188 | $5,129,972 | $12.21 | ||||||||
| Other Income(2) | $162,817 | $509,339 | $503,277 | $590,015 | $580,519 | $580,519 | $1.38 | ||||||||
| Less Vacancy & Credit Loss | $0 | $0 | $0 | $0 | $0 | ($1,067,420) | ($2.54) | ||||||||
| Effective Gross Income | $1,161,180 | $2,674,560 | $2,940,071 | $4,020,066 | $4,421,707 | $4,643,071 | $11.05 | ||||||||
| Total Operating Expenses | $657,525 | $1,225,082 | $1,341,450 | $1,534,070 | $1,602,201 | $1,757,271 | $4.18 | ||||||||
| Net Operating Income(3) | $503,655 | $1,449,478 | $1,598,621 | $2,485,996 | $2,819,506 | $2,885,800 | $6.87 | ||||||||
| Capital Expenditures | $0 | $0 | $0 | $0 | $0 | $74,842 | $0.18 | ||||||||
| Net Cash Flow | $503,655 | $1,449,478 | $1,598,621 | $2,485,996 | $2,819,506 | $2,810,958 | $6.69 | ||||||||
| Occupancy %(3) | 69.4% | 74.0% | 79.8% | 85.3% | 86.7% | 79.2% | |||||||||
| NOI DSCR | 0.31x | 0.89x | 0.98x | 1.53x | 1.73x | 1.77x | |||||||||
| NCF DSCR | 0.31x | 0.89x | 0.98x | 1.53x | 1.73x | 1.73x | |||||||||
| NOI Debt Yield | 1.8% | 5.3% | 5.8% | 9.0% | 10.3% | 10.5% | |||||||||
| NCF Debt Yield | 1.8% | 5.3% | 5.8% | 9.0% | 10.3% | 10.2% | |||||||||
| (1) | UW PSF is based on 420,282 SF. |
| (2) | Other Income includes net sales, U-Box net income, U-Move net commissions, inter-company leases, third party lease income and other miscellaneous income. |
| (3) | There is a significant increase in occupancy and net operating income due to the increase in unit and property counts. From August 2016 to October 2018, the borrower sponsor added 1,499 units and 6 properties to the portfolio. |
This is not a research report and was not prepared by the Underwriters’ research department. Please see additional important information and qualifications at the end of this Term Sheet.
T-137
| Mortgage Loan No. 13 – 2621 Van Buren |
Mortgage Loan Information |
| Property Information | |||||
Mortgage Loan Seller: | MSMCH |
| Single Asset/Portfolio: | Single Asset | |||
Credit Assessment (DBRS/Fitch/S&P): | NR/NR/NR |
| Location: | Norristown, PA 19403 | |||
Original Balance: | $23,850,000 |
| General Property Type: | Mixed Use | |||
Cut-off Date Balance: | $23,816,245 |
| Detailed Property Type: | Industrial/Office | |||
% of Initial Pool Balance: | 2.0% |
| Title Vesting: | Fee | |||
Loan Purpose: | Acquisition |
| Year Built/Renovated: | Various/2018 | |||
Borrower Sponsor: | Robert Feinberg |
| Size: | 249,405 SF | |||
Guarantor: | Robert Feinberg |
| Cut-off Date Balance per SF: | $95 | |||
Mortgage Rate: | 4.1000% |
| Maturity Date Balance per SF: | $76 | |||
Note Date: | 8/15/2019 |
| Property Manager: | Sandkris Properties, Inc. | |||
First Payment Date: | 10/1/2019 |
|
| (borrower-related) | |||
Maturity Date: | 9/1/2029 |
|
|
| |||
Original Term to Maturity: | 120 months |
|
|
| |||
Original Amortization Term: | 360 months |
|
|
| |||
IO Period: | 0 months |
| Underwriting and Financial Information | ||||
Seasoning: | 1 month |
| UW NOI: | $2,489,108 | |||
Prepayment Provisions: | LO (25); DEF (90); O (5) |
| UW NOI Debt Yield: | 10.5% | |||
Lockbox/Cash Mgmt Status: | Springing/Springing |
| UW NOI Debt Yield at Maturity: | 13.1% | |||
Additional Debt Type: | N/A |
| UW NCF DSCR: | 1.60x | |||
Additional Debt Balance: | N/A |
| Most Recent NOI: | $1,464,205 (4/30/2019 TTM) | |||
Future Debt Permitted (Type): | No (N/A) |
| 2nd Most Recent NOI: | $1,405,553 (12/31/2018) | |||
Reserves |
| 3rd Most Recent NOI: | $2,031,487 (12/31/2017) | ||||
Type | Initial | Monthly | Cap |
| Most Recent Occupancy: | 92.7% (6/30/2019) | |
RE Tax: | $15,099 | $15,099 | N/A |
| 2nd Most Recent Occupancy(2): | N/A | |
Insurance(1): | $0 | Springing | N/A |
| 3rd Most Recent Occupancy(2): | N/A | |
Deferred Maintenance: | $31,500 | $0 | N/A |
| Appraised Value (as of): | $31,800,000 (6/20/2019) | |
Recurring Replacements: | $0 | $4,157 | N/A |
| Appraised Value per SF: | $128 | |
TI/LC: | $125,000 | $25,980 | $500,000 |
| Cut-off Date LTV Ratio: | 74.9% | |
Outstanding Free Rent: | $139,427 | $0 | N/A |
| Maturity Date LTV Ratio: | 59.9% | |
|
|
|
|
|
|
|
|
Sources and Uses | ||||||
Sources | Proceeds | % of Total |
| Uses | Proceeds | % of Total |
Loan Amount: | $23,850,000 | 72.0% |
| Purchase Price: | $32,000,000 | 96.7% |
Borrower Equity: | $9,257,580 | 28.0% |
| Closing Costs: | $796,553 | 2.4% |
|
|
|
| Reserves: | $311,027 | 0.9% |
Total Sources: | $33,107,580 | 100.0% |
| Total Uses: | $33,107,580 | 100.0% |
(1) | Monthly deposits for insurance are springing upon (i) an event of default occurring, (ii) the 2621 Van Buren Borrowers (as defined below) failing to maintain an approved blanket policy and (iii) the 2621 Van Buren Borrowers failing to provide evidence of renewal and paid receipts for insurance premiums. |
(2) | Historical occupancy information was not provided by the borrower sponsor. |
The Mortgage Loan. The thirteenth largest mortgage loan (the “2621 Van Buren Mortgage Loan”) is evidenced by a promissory note in the original principal amount of $23,850,000 and is secured by a first priority fee mortgage encumbering a mixed use industrial/office center located in Norristown, Pennsylvania (the “2621 Van Buren Property”). Proceeds from the 2621 Van Buren Mortgage Loan were used to acquire the 2621 Van Buren Property, fund upfront reserves and pay closing costs.
The Borrowers and the Borrower Sponsor. The borrowers are LL 2621 Van Buren, LLC and RF 2621 Van Buren, LLC (collectively, the “2621 Van Buren Borrowers”), each a Delaware limited liability company with no independent directors. The 2621 Van Buren Borrowers own the 2621 Van Buren Property as tenants-in-common. The borrower sponsor and the non-recourse carveout guarantor is Robert Feinberg. The 2621 Van Buren Borrowers are wholly owned by Robert Feinberg. Robert Feinberg is the Chief Executive Officer and President of Sandkris Properties, a Pennsylvania-based family-owned real estate investment company, and has decades of commercial real estate experience. Most recently, Sandkris Properties purchased a 303,000 SF office/flex/industrial property in Warminster, Pennsylvania, an 82,000 SF office property in Washington, Pennsylvania, and a 42,000 SF office property in Malvern, Pennsylvania.
The Property. The 2621 Van Buren Property is a mixed use industrial/office property comprised of a one and two-story building totaling 249,405 SF located in Norristown, Pennsylvania. The 2621 Van Buren Property is situated on an approximately 15.29-acre site and features 602 parking spaces (2.4 spaces per 1,000 SF).
The 2621 Van Buren Property was built in phases in 1969, 1972 and 1986, and was renovated in 2018. The renovations included a new west façade, west lobby, patio window replacement, tenant work and additional miscellaneous restorations. The total cost associated with these improvements was approximately $8.9 million. As of June 30, 2019, the 2621 Van Buren Property was 92.7% occupied by seven tenants. The building is approximately 36.7% comprised of office space (51.9% of underwritten rent), 36.5% comprised of warehouse/distribution space (21.9% of underwritten rent), and 26.8%
This is not a research report and was not prepared by the Underwriters’ research department. Please see additional important information and qualifications at the end of this Term Sheet.
T-138
Mixed Use –Industrial/Office | Loan #13 | Cut-off Date Balance: |
| $23,816,245 |
2621 Van Buren Avenue | 2621 Van Buren | Cut-off Date LTV: |
| 74.9% |
Norristown, MA 19403 |
| U/W NCF DSCR: |
| 1.60x |
|
| U/W NOI Debt Yield: |
| 10.5% |
comprised of flex space (26.2% of underwritten rent). As part of the recent capital improvements, new amenities include an internet café, grab ‘n’ go food service, a multi-purpose meeting room, and an outdoor collaboration deck and patio.
Major Tenants.
Comcast (67,054 SF, 26.9% of NRA, 16.8% of underwritten rent). Comcast is a global media and technology company that includes Comcast Cable, NBCUniversal, and Sky. Comcast Cable is one of the nation’s largest providers of high-speed internet, video, voice and security services to residential customers via the Xfinity brand. Comcast has been a warehouse tenant at the 2621 Van Buren Property since 2006, has a lease expiration of September 30, 2020 and has one, 2-year renewal option remaining.
Megger(57,638 SF, 23.1% of NRA, 22.6% of underwritten rent). Megger is an electrical test equipment manufacturing company based in the United Kingdom. Megger products help their customers install, improve efficiency, reduce costs, and extend the life of electrical assets. Megger has been a flex space tenant at the 2621 Van Buren Property since 1999, has a lease expiration of February 29, 2024 with 3% rent increases annually and has one, 5-year renewal option remaining. Megger has a one-time right to terminate its lease after March 1, 2022 upon 12 months written notice and payment of a $175,000 termination fee.
CertaPro Painters (30,994 SF, 12.4% of NRA, 18.9% of underwritten rent). CertaPro Painters is a large franchised residential and commercial painting company in North America. Founded in 1992, CertaPro Painters has more than 350 locally owned and operated franchises in the United States and Canada. CertaPro Painters has been an office space tenant at the 2621 Van Buren Property since 2019, has a lease expiration of June 30, 2029 and has one, 5-year renewal option remaining. CertaPro Painters has five months of free rent, commencing September 1, 2019, which has been fully reserved for.
PJM Interconnection (24,000 SF, 9.6% of NRA, 5.1% of underwritten rent). PJM Interconnection is a regional transmission organization that coordinates the movement of wholesale electricity in all or parts of Delaware, Illinois, Indiana, Kentucky, Maryland, Michigan, New Jersey, North Carolina, Ohio, Pennsylvania, Tennessee, Virginia, West Virginia and the District of Columbia. PJM Interconnection has been a warehouse tenant at the 2621 Van Buren Property since 1999, has a lease expiration of April 30, 2027 and has two, 5-year renewal options remaining.
Paychex North America (18,931 SF, 7.6% of NRA, 12.2% of underwritten rent). Paychex North America is an American provider of payroll, human resource, and benefits outsourcing services for small to medium sized business. The company, founded in 1971, is headquartered in Rochester, New York and has approximately 100 offices servicing nearly 670,000 payroll clients. Paychex North America has been an office space tenant at the 2621 Van Buren Property since 2007, has a lease expiration of June 30, 2021 and has one, 5-year renewal option remaining.
The following table presents a summary regarding the largest tenants at the 2621 Van Buren Property:
Tenant Summary(1) | ||||||||
Tenant Name | Credit Rating (Fitch/Moody’s/S&P)(2) | Tenant SF | Approx.% of Total SF | Annual UW Rent | Annual UW Rent PSF | App. % of Total Annual UW Rent | Term. Option (Y/N) | Lease Expiration |
Comcast | A-/A3/A- | 67,054 | 26.9% | $469,378 | $7.00 | 16.8% | N | 9/30/2020 |
Megger(3) | NR/NR/NR | 57,638 | 23.1% | $631,572 | $10.96 | 22.6% | Y | 2/29/2024 |
CertaPro Painters(4) | NR/NR/NR | 30,994 | 12.4% | $529,288 | $17.08 | 18.9% | N | 6/30/2029 |
PJM Interconnection | NR/Aa2/NR | 24,000 | 9.6% | $142,200 | $5.93 | 5.1% | N | 4/30/2027 |
Paychex North America | NR/NR/NR | 18,931 | 7.6% | $340,758 | $18.00 | 12.2% | N | 6/30/2021 |
Subtotal/Wtd. Avg. |
| 198,617 | 79.6% | $2,113,196 | $10.64 | 75.6% |
|
|
|
|
|
|
|
|
|
|
|
Other Tenants |
| 32,676 | 13.1% | $680,906 | $20.84 | 24.4% |
|
|
Vacant Space |
| 18,112 | 7.3% | $0 | $0.00 | 0.0% |
|
|
Total/Wtd. Avg.(5) |
| 249,405 | 100.0% | $2,794,102 | $12.08 | 100.0% |
|
|
(1) | Information is based on the underwritten rent roll dated as of June 30, 2019. |
(2) | Certain ratings are those of the parent company whether or not the parent guarantees the lease. |
(3) | Megger has a one-time right to terminate the lease after March 1, 2022 upon 12 months written notice and payment of a $175,000 termination fee. |
(4) | Certa Pro Painters has five months of free rent, commencing September 1, 2019, which has been fully reserved for. |
(5) | Total/Wtd. Avg. Annual UW Rent PSF excludes vacant space. |
This is not a research report and was not prepared by the Underwriters’ research department. Please see additional important information and qualifications at the end of this Term Sheet.
T-139
Mixed Use –Industrial/Office | Loan #13 | Cut-off Date Balance: |
| $23,816,245 |
2621 Van Buren Avenue | 2621 Van Buren | Cut-off Date LTV: |
| 74.9% |
Norristown, MA 19403 |
| U/W NCF DSCR: |
| 1.60x |
|
| U/W NOI Debt Yield: |
| 10.5% |
The following table presents certain information with respect to the lease rollover at the 2621 Van Buren Property:
Lease Rollover Schedule(1)(2) | ||||||||
Year | # of Leases Rolling | SF Rolling | Annual UW Rent PSF Rolling(3) | % of Total SF Rolling | Cumulative % of SF Rolling | Annual UW Rent Rolling | % of Annual UW Rent Rolling | Cumulative % of Annual UW Rent Rolling |
2019 | 0 | 0 | $0.00 | 0.0% | 0.0% | $0 | 0.0% | 0.0% |
2020 | 1 | 67,054 | $7.00 | 26.9% | 26.9% | $469,378 | 16.8% | 16.8% |
2021 | 1 | 18,931 | $18.00 | 7.6% | 34.5% | $340,758 | 12.2% | 29.0% |
2022 | 0 | 0 | $0.00 | 0.0% | 34.5% | $0 | 0.0% | 29.0% |
2023 | 0 | 0 | $0.00 | 0.0% | 34.5% | $0 | 0.0% | 29.0% |
2024 | 1 | 57,638 | $10.96 | 23.1% | 57.6% | $631,572 | 22.6% | 51.6% |
2025 | 1 | 15,091 | $22.98 | 6.1% | 63.6% | $346,791 | 12.4% | 64.0% |
2026 | 1 | 17,585 | $19.00 | 7.1% | 70.7% | $334,115 | 12.0% | 76.0% |
2027 | 1 | 24,000 | $5.93 | 9.6% | 80.3% | $142,200 | 5.1% | 81.1% |
2028 | 0 | 0 | $0.00 | 0.0% | 80.3% | $0 | 0.0% | 81.1% |
2029 | 1 | 30,994 | $17.08 | 12.4% | 92.7% | $529,288 | 18.9% | 100.0% |
2030 & Beyond | 0 | 0 | $0.00 | 0.0% | 92.7% | $0 | 0.0% | 100.0% |
Vacant | 0 | 18,112 | $0.00 | 7.3% | 100.0% | $0 | 0.0% | 100.0% |
Total/Wtd. Avg. | 7 | 249,405 | $12.08 | 100.0% |
| $2,794,102 | 100.0% |
|
(1) | Information is based on the underwritten rent roll dated as of June 30, 2019. |
(2) | Certain tenants may have lease termination options that are exercisable prior to the originally stated expiration date of the subject lease and that are not considered in the Lease Rollover Schedule. |
(3) | Total/Wtd. Avg. Annual UW Rent PSF Rolling excludes vacant space. |
The Market. The 2621 Van Buren Property is located in Norristown, Pennsylvania on the northern end of the greater King of Prussia area. The 2621 Van Buren Property is located within Park Pointe at Lower Providence, a business park comprised of a mix of office, industrial, and flex properties. Residential areas are located in the surrounding areas, as is the Club at Shannondell, a township owned golf course. Valley Forge National Historic Park is located to the southeast of Park Pointe. The main portion of King of Prussia, including the King of Prussia Mall itself, is located to the south of the 2621 Van Buren Property. Regional access to the 2621 Van Buren Property is provided by Route 422.
The 2621 Van Buren Property is located in the Philadelphia office market and the King of Prussia/Valley Forge office submarket. According to the appraisal, as of the first quarter of 2019, the Philadelphia office market had approximately 134.1 million SF of office space inventory, overall vacancy in the market was approximately 13.0% and asking rent was $29.17 PSF. According to the appraisal, as of the first quarter of 2019, the King of Prussia/Valley Forge office submarket had approximately 18.0 million SF of office space inventory, overall vacancy in the submarket was approximately 11.6% and asking rent was $29.80 PSF.
The following table presents certain information relating to the appraiser’s market rent conclusion for the 2621 Van Buren Property:
Market Rent Summary | |||||
| Office 5 Yr. Lease | Flex | Warehouse | Office 7 Yr. Lease | Comcast 100% AC |
Market Rent (PSF) | $22.50 | $11.00 | $7.00 | $22.50 | $8.50 |
Lease Term (Years) | 5 | 5 | 5 | 7 | 5 |
Lease Type (Reimbursements) | Full service + electric | Net | Net | Full service + electric | Net |
Rent Increase Projection | 2.5% per annum | 3.0% per annum | 3.0% per annum | 2.5% per annum | 3.0% per annum |
This is not a research report and was not prepared by the Underwriters’ research department. Please see additional important information and qualifications at the end of this Term Sheet.
T-140
Mixed Use –Industrial/Office | Loan #13 | Cut-off Date Balance: |
| $23,816,245 |
2621 Van Buren Avenue | 2621 Van Buren | Cut-off Date LTV: |
| 74.9% |
Norristown, MA 19403 |
| U/W NCF DSCR: |
| 1.60x |
|
| U/W NOI Debt Yield: |
| 10.5% |
The following table presents recent leasing data at comparable properties with respect to the 2621 Van Buren Property:
Comparable Property Summary | |||||||
Property Name / City, State | Built | GLA(1) | Tenant Name | Lease Area (SF) (1) | Lease | Lease Term (Yrs.)(1) | Rent PSF(1) |
2621 Van Buren 2621 Van Buren Avenue Norristown, PA | 1969/1972/1986 | 249,405 | Comcast (Warehouse) Megger (Flex) CertaPro Painters (Office) | 67,054 57,638 21,717 | Oct. 2017 Jan. 2012 April 2019 | 3.0 12.2 10.3 | $7.00 $10.96 $19.75 |
Rittenhouse II (Office) 800 Adams Avenue Norristown, PA | 2008 | 65,716 | Assurance Software Luitpold Pharma | 17,000 23,000 | Jan. 2019 Sept. 2018 | 7.0 7.0 | $25.00 $20.00 |
630 Allendale Road (Office) King of Prussia, PA | 1999 | 160,613 | Quench | 40,000 | March 2018 | 15.0 | $23.75 |
Flex Building (Flex) 1640 East Circle Drive Oaks, PA | 1975 | 20,000 | Steel City
| 10,000 | May 2019 | 5.0 | $6.25 |
Flex Building (Flex) 2525 Monroe Blvd Norristown, PA | 1970 | 352,446 | Confidential | 54,000 | April 2019 | 7.0 | $6.85 |
Valley Forge Business Camp 4 (Flex) 2460 General Armistead Blvd Norristown, PA | 1986 | 38,564 | Confidential | 11,540 | July 2018 | 5.0 | $9.00 |
Great Valley Corporate Center (Flex) 3222 Phoenixville Pike Malvern, PA | 1990 | 200,292 | Accutome | 24,977 | May 2017 | 8.0 | $15.00 |
2564 Boulevard of the Generals (Industrial) Norristown, PA | 1970 | 67,897 | Turn 5, Inc. | 40,000 | March 2017 | 5.4 | $6.25 |
Source: Appraisal
(1) | For the 2621 Van Buren Property, based on the underwritten rent roll dated as of June 30, 2019. |
The following table presents information relating to comparable office property sales for the 2621 Van Buren Property:
Comparable Property Sales | ||||||
Property Name/Location | Sale Date | Year Built | Total SF | Total Occupancy | Sale Price | Sale Price PSF |
2621 Van Buren Norristown, PA | June 2019 | 1969/1972/1986 | 249,405(1) | 92.7%(1) | $32,000,000 | $128.31 |
Valley Forge Park Place King of Prussia, PA | Feb. 2019 | 1981 | 160,043 | 96.0% | $27,650,000 | $172.77 |
Trooper Building Norristown, PA | Jan. 2019 | 1989 | 102,894 | 100.0% | $17,500,000 | $170.08 |
Office/Flex Building Norristown, PA | Oct. 2018 | 1979 | 62,668 | 100.0% | $7,700,000 | $122.87 |
Liberty Portfolio Malvern, PA | Mar. 2018 | Various | 592,942 | 82.0% | $92,000,000 | $155.16 |
Office/Flex Building Malvern, PA | Feb. 2018 | 1996 | 58,594 | 100.0% | $6,600,000 |
$112.64 |
Source: Appraisal
(1) | Information is based on the underwritten rent roll. |
This is not a research report and was not prepared by the Underwriters’ research department. Please see additional important information and qualifications at the end of this Term Sheet.
T-141
Mixed Use –Industrial/Office | Loan #13 | Cut-off Date Balance: |
| $23,816,245 |
2621 Van Buren Avenue | 2621 Van Buren | Cut-off Date LTV: |
| 74.9% |
Norristown, MA 19403 |
| U/W NCF DSCR: |
| 1.60x |
|
| U/W NOI Debt Yield: |
| 10.5% |
Operating History and Underwritten Net Cash Flow. The following table presents certain information relating to the historical operating performance and Underwritten Net Cash Flow at the 2621 Van Buren Property:
Cash Flow Analysis | |||||
| 2017 | 2018 | 4/30/2019 TTM | UW | UW PSF |
Gross Potential Rent(1) | $2,441,914 | $1,798,132 | $1,810,592 | $3,201,622 | $12.84 |
Total Recoveries | $705,091 | $697,534 | $656,484 | $738,924 | $2.96 |
Other Income | $923 | $0 | $0 | $0 | $0.00 |
Less Vacancy & Credit Loss | $0 | $0 | $0 | ($407,520) | ($1.63) |
Effective Gross Income | $3,147,928 | $2,495,666 | $2,467,076 | $3,533,026 | $14.17 |
|
|
|
|
|
|
Real Estate Taxes | $310,250 | $252,212 | $221,548 | $216,597 | $0.87 |
Insurance | $33,529 | $31,791 | $33,112 | $33,112 | $0.13 |
Other Expenses | $772,662 | $806,110 | $748,211 | $794,209 | $3.18 |
Total Expenses | $1,116,441 | $1,090,113 | $1,002,871 | $1,043,918 | $4.19 |
|
|
|
|
|
|
Net Operating Income(1) | $2,031,487 | $1,405,553 | $1,464,205 | $2,489,108 | $9.98 |
Capital Expenditures | $0 | $0 | $0 | $49,881 | $0.20 |
TI/LC | $0 | $0 | $0 | $225,707 | $0.90 |
Net Cash Flow | $2,031,487 | $1,405,553 | $1,464,205 | $2,213,521 | $8.88 |
|
|
|
|
|
|
Occupancy %(2) | N/A | N/A | 92.7% | 87.3% |
|
NOI DSCR | 1.47x | 1.02x | 1.06x | 1.80x |
|
NCF DSCR | 1.47x | 1.02x | 1.06x | 1.60x |
|
NOI Debt Yield | 8.5% | 5.9% | 6.1% | 10.5% |
|
NCF Debt Yield | 8.5% | 5.9% | 6.1% | 9.3% |
|
(1) | UW Gross Potential Rent is based on the underwritten rent roll dated June 30, 2019. The increase in Gross Potential Rent and Net Operating Income from 4/30/2019 TTM to UW is due to (i) the addition of two new leases in 2019, including CertaPro Painters (30,994 SF and $529,288 of underwritten rent) and Merkle (17,585 SF and $334,115 of underwritten rent) and (ii) rent steps take through July 2020 totaling $29,098. |
(2) | UW Occupancy % represents economic occupancy. The 2621 Van Buren Property was 92.7% leased as of June 30, 2019. |
This is not a research report and was not prepared by the Underwriters’ research department. Please see additional important information and qualifications at the end of this Term Sheet.
T-142
(THIS PAGE INTENTIONALLY LEFT BLANK)
T-143
| Mortgage Loan No. 14 – El Paseo Simi |
| Mortgage Loan Information | Property Information | ||||||
| Mortgage Loan Seller: | WFB | Single Asset/Portfolio: | Single Asset | ||||
| Credit Assessment (DBRS/Fitch/S&P): | NR/NR/NR | Location: | Simi Valley, CA 93063 | ||||
| Original Balance: | $23,600,000 | General Property Type: | Retail | ||||
| Cut-off Date Balance: | $23,600,000 | Detailed Property Type: | Anchored | ||||
| % of Initial Pool Balance: | 2.0% | Title Vesting: | Fee | ||||
| Loan Purpose: | Recapitalization | Year Built/Renovated: | 2004 / N/A | ||||
| Borrower Sponsor: | BREIT Operating Partnership L.P. | Size: | 97,085 SF | ||||
| Guarantor: | BREIT Operating Partnership L.P. | Cut-off Date Balance per SF: | $243 | ||||
| Mortgage Rate: | 3.3200% | Maturity Date Balance per SF: | $243 | ||||
| Note Date: | 8/1/2019 | Property Manager: | Shopcore Properties TRS Management LLC | ||||
| First Payment Date: | 9/1/2019 | ||||||
| Maturity Date: | 8/1/2029 | ||||||
| Original Term to Maturity: | 120 months | ||||||
| Original Amortization Term: | 0 months | Underwriting and Financial Information | |||||
| IO Period: | 120 months | UW NOI(5): | $2,167,502 | ||||
| Seasoning: | 2 months | UW NOI Debt Yield: | 9.2% | ||||
| Prepayment Provisions: | YM0.5 (26); YM0.5/DEF (87); O (7) | UW NOI Debt Yield at Maturity: | 9.2% | ||||
| Lockbox/Cash Mgmt Status: | Hard/Springing | UW NCF DSCR: | 2.62x | ||||
| Additional Debt Type: | N/A | Most Recent NOI(5): | $1,886,969 (6/30/2019 TTM) | ||||
| Additional Debt Balance: | N/A | 2nd Most Recent NOI: | $1,888,490 (12/31/2018) | ||||
| Future Debt Permitted (Type): | No (N/A) | 3rd Most Recent NOI: | $1,734,264 (12/31/2017) | ||||
| Reserves | Most Recent Occupancy: | 96.3% (9/1/2019) | |||||
| Type | Initial | Monthly | Cap | 2nd Most Recent Occupancy: | 96.7% (12/31/2018) | ||
| RE Tax: | $0 | Springing(1) | N/A | 3rd Most Recent Occupancy: | 89.6% (12/31/2017) | ||
| Insurance: | $0 | Springing(2) | N/A | Appraised Value (as of): | $38,900,000 (7/6/2019) | ||
| Recurring Replacements: | $0 | Springing(3) | $43,494 | Appraised Value per SF: | $401 | ||
| TI/LC: | $0 | Springing(4) | $217,470 | Cut-off Date LTV Ratio: | 60.7% | ||
| Lease Termination Reserve: | $0 | Springing(5) | N/A | Maturity Date LTV Ratio: | 60.7% | ||
| Sources and Uses | ||||||
| Sources | Proceeds | % of Total | Uses | Proceeds | % of Total | |
| Loan Amount: | $23,600,000 | 100.0% | Return of Equity(6) | $23,322,550 | 98.8% | |
| Closing Costs | $277,450 | 1.2% | ||||
| Total Sources: | $23,600,000 | 100.0% | Total Uses: | $23,600,000 | 100.0% | |
| (1) | The El Paseo Simi Mortgage Loan (as defined below) documents do not require monthly escrows for taxes as long as (i) no event of default has occurred and is continuing, (ii) there has been no bankruptcy action by or against the borrower; and (iii) the net operating income debt service coverage ratio is greater than or equal to 1.20x for two consecutive calendar quarters based on the trailing four-calendar-quarter period. |
| (2) | The El Paseo Simi Mortgage Loan documents do not require ongoing monthly escrows for insurance premiums as long as (i) no event of default has occurred and is continuing, (ii) the El Paseo Simi Property is covered under a blanket policy acceptable to lender, (iii) there has been no bankruptcy action by or against the borrower, and (iv) the net operating income debt service coverage ratio is greater than or equal to 1.20x for two consecutive calendar quarters based on the trailing four-calendar-quarter period |
| (3) | The El Paseo Simi Mortgage Loan documents require a monthly escrow of $1,812 for recurring replacements upon the occurrence of (i) an event of default has occurred and is continuing, (ii) a bankruptcy action by or against the borrower, or (iii) the net operating income debt service coverage ratio being less than 1.20x for two consecutive calendar quarters, based on the trailing four calendar quarter period. |
| (4) | The El Paseo Simi Mortgage Loan documents require a monthly escrow of $9,061 for TI/LCs upon the earlier of the following: (i) an event of default has occurred and is continuing, (ii) a bankruptcy action by or against the borrower, or (iii) the net operating income debt service coverage ratio being less than 1.20x for two consecutive calendar quarters, based on the trailing-four-calendar quarter period. |
| (5) | The El Paseo Simi Mortgage Loan documents require an additional deposit equal to (i) all termination fees received by the borrower from the tenant under a terminated lease and (ii) if a lease terminated is for 20,000 or more square feet and the tenant is relocated to a property owned or controlled by the Guarantor that is not collateral for the El Paseo Simi Mortgage Loan, the lesser of (a) the product of $30 and the square footage of the terminated lease, less any termination fees and (b) to the extent a replacement lease with a new or existing tenant is entered into for substantially the same space or more space that was terminated, the actual leasing costs required under such replacement lease, less any termination fees. |
| (6) | The El Paseo Simi Mortgage Property was purchased on June 18, 2019 for $38,900,000 and was previously unencumbered. |
The Mortgage Loan. The fourteenth largest mortgage loan (the “El Paseo Simi Mortgage Loan”) is evidenced by a single promissory note in the original principal amount of $23,600,000 and secured by a first priority fee mortgage encumbering a 97,085 SF anchored retail center (the “El Paseo Simi Property”) located in Simi Valley, California.
The Borrower and the Borrower Sponsor. The borrower is Bcore Retail El Paseo Owner LLC, a single purpose Delaware limited liability company with no independent director. The borrower sponsor and non-recourse carve-out guarantor is BREIT Operating Partnership L.P. (the “Guarantor”), a limited partnership that is 100% owned by Blackstone Real Estate Income Trust, Inc. (“BREIT”), Blackstone’s non-traded REIT focused on investing in primarily stabilized commercial real estate properties diversified by sector and on providing current income to investors. With approximately $154 billion of investor capital under management, BREIT’s portfolio comprises approximately 103,000 multifamily units, 200 million SF of industrial space, 115,000 hotel rooms and 33 million SF of retail space. The loan documents provide that the Guarantor’s aggregate liability for various losses carve-outs (including fraud, misappropriation of rents or proceeds, environmental liability or waste) and springing recourse events (namely, voluntary or collusive involuntary bankruptcy filings involving the borrower, guarantor or any guarantor affiliate, or such parties’ consenting to the appointment of a receiver or examiner for such entity or the mortgaged property) is subject to a cap equal to 20% of the loan amount.
This is not a research report and was not prepared by the Underwriters’ research department. Please see additional important information and qualifications at the end of this Term Sheet.
T-144
| Retail – Anchored | Loan #14 | Cut-off Date Balance: | $23,600,000 | |
| 2902, 2906, 2910, 2916, 2920, 2930, | El Paseo Simi | Cut-off Date LTV: | 60.7% | |
| 2938 and 2944 Tapo Canyon Road | U/W NCF DSCR: | 2.62x | ||
| Simi Valley, CA 93063 | U/W NOI Debt Yield: | 9.2% |
The Property.The El Paseo Simi Property is a 97,085 SF, anchored retail community center located in Simi Valley, California. Built in 2004 and situated on a 10.4-acre site, the El Paseo Simi Property is anchored by Vons and Cost Plus World Market and is shadow-anchored by Kohl’s (shadow anchor is not part of the collateral). The El Paseo Simi Property comprises 459 surface parking spaces resulting in a parking ratio of 4.2 spaces per 1,000 SF of rentable area.
As of September 1, 2019, the El Paseo Simi Property was 96.3% occupied by 15 tenants, including national retailers such as Jamba Juice, GameStop, Jersey Mike’s Subs and Cold Stone Creamery, and has averaged approximately 96.0% occupancy since 2006. Nine tenants representing approximately 56.4% of NRA and 56.2% of underwritten base rent have been in place at the El Paseo Simi Property since 2005; and seven tenants representing approximately 11.0% of NRA and 31.3% of underwritten base rent have renewed their lease at least once. Three tenants at the El Paseo Simi Property representing approximately 33.6% of underwritten base rent are subject to ground leases and own their improvements – Vons, Macaroni Grill and Union Bank.
Major Tenants.
Vons (44,104 SF, 45.4% of NRA, 22.4% of underwritten rent, lease expires 10/31/2028).Vons is a banner under Albertson’s Companies, the second-largest supermarket chain in North America (after Kroger), with more than 2,200 stores and more than 250,000 employees. Albertson’s ranked 53rd in the 2018 Fortune 500 list of the largest United States corporations by total revenue. Vons 25-year lease at the El Paseo Simi Property commenced in December 2003, and has six 5-year options remaining, each with 180 days’ notice at rental rates as specified in the lease. Vons is subject to a ground lease and owns its improvements.
Cost Plus (20,027 SF, 20.6% of NRA, 13.1% of underwritten rent, lease expires 1/31/2023). Cost Plus is a home goods store that sells furniture, rugs, baskets, ceramics, and other home décor, as well as food and beverages, across 276 stores nationwide. Cost Plus originally signed a 10-year lease at the El Paseo Simi Property in 2012, and has three 5-year renewal options remaining, each with 270 days’ notice at rental rates as specified in the lease.
Other than Vons and Cost Plus, no tenant accounts for more than 6.0% of the net rentable area or 7.7% of underwritten base rent at the El Paseo Simi Property. The following table presents certain information relating to the leases at the El Paseo Simi Property:
| Tenant Summary(1) | |||||||||||
| Tenant Name | Credit Rating (Fitch/ Moody’s/ S&P)(2) | Tenant SF | Approx % of SF | Annual UW Rent(3) | % of Total Annual UW Rent | Annual UW Rent PSF(3) | Lease Expiration | 2018 Sales PSF(4) | Occ. Cost %(4) | Term. Option (Y/N) | Remaining Extension Options |
| Major Tenants | |||||||||||
| Vons (Ground Lease)(5) | NR/NR/NR | 44,104 | 45.4% | $507,111 | 22.4% | $11.50 | 10/31/2028 | N/A | N/A | N | 6, 5-year |
| Cost Plus | NR/Baa3/BB+ | 20,027 | 20.6% | $297,401 | 13.1% | $14.85 | 1/31/2023 | N/A | N/A | N | 3, 5-year |
| VIP Urgent Care | NR/NR/NR | 5,850 | 6.0% | $175,017 | 7.7% | $29.92 | 12/31/2027 | N/A | N/A | N | 2, 5-year |
| Logix Federal Credit Union | NR/NR/NR | 5,772 | 5.9% | $175,483 | 7.7% | $30.40 | 9/30/2022 | N/A | N/A | N | 2, 5-year |
| Luxe Salon Studio & Spa | NR/NR/NR | 3,822 | 3.9% | $120,188 | 5.3% | $31.45 | 12/31/2021 | N/A | N/A | N | 1, 5-year |
| Subtotal/Wtd. Avg. | 79,575 | 82.0% | $1,275,200 | 56.2% | $16.03 | ||||||
| Other Tenants | 13,891 | 14.3% | $992,718 | 43.8% | $53.07(6) | ||||||
| Vacant Space | 3,619 | 3.7% | $0 | 0.0% | $0.00 | ||||||
| Total/Wtd. Avg. | 97,085 | 100.0% | $2,267,918 | 100.0% | $21.53(6) | ||||||
| (1) | Information is based on the underwritten rent roll. |
| (2) | Certain ratings are those of the parent company whether or not the parent company guarantees the lease. |
| (3) | Annual UW Rent and Annual UW Rent PSF include contractual rent steps through October 2020 for eight tenants totaling $36,654. |
| (4) | No tenants at the El Paseo Simi Property are required to report sales. |
| (5) | Vons is subject to a ground lease and owns its improvements. |
| (6) | Annual UW Rent PSF shown for Other Tenants and Total/Wtd. Avg. excludes Annual UW Rent totaling $255,518 for two ground lease tenants, which own their improvements (Macaroni Grill and Union Bank). |
This is not a research report and was not prepared by the Underwriters’ research department. Please see additional important information and qualifications at the end of this Term Sheet.
T-145
| Retail – Anchored | Loan #14 | Cut-off Date Balance: | $23,600,000 | |
| 2902, 2906, 2910, 2916, 2920, 2930, | El Paseo Simi | Cut-off Date LTV: | 60.7% | |
| 2938 and 2944 Tapo Canyon Road | U/W NCF DSCR: | 2.62x | ||
| Simi Valley, CA 93063 | U/W NOI Debt Yield: | 9.2% |
The following table presents certain information relating to the lease rollover schedule at the El Paseo Simi Property:
| Lease Rollover Schedule(1)(2) | ||||||||
| Year | # of Leases Rolling | SF Rolling | UW Rent PSF Rolling | % of Total SF Rolling | Cumulative % of SF Rolling | Total UW Rent Rolling | Approx. % of Total Rent Rolling | Approx. Cumulative % of Total Rent Rolling |
| 2019 | 0 | 0 | $0.00 | 0.0% | 0.0% | $0 | 0.0% | 0.0% |
| 2020 | 2 | 4,119 | $51.41 | 4.2% | 4.2% | $211,776 | 9.3% | 9.3% |
| 2021 | 1 | 3,822 | $31.45 | 3.9% | 8.2% | $120,188 | 5.3% | 14.6% |
| 2022 | 1 | 5,772 | $30.40 | 5.9% | 14.1% | $175,483 | 7.7% | 22.4% |
| 2023 | 2 | 21,617 | $16.94 | 22.3% | 36.4% | $366,184 | 16.1% | 38.5% |
| 2024 | 4 | 4,134 | $58.61(3) | 4.3% | 40.6% | $355,437 | 15.7% | 54.2% |
| 2025 | 0 | 0 | $0.00 | 0.0% | 40.6% | $0 | 0.0% | 54.2% |
| 2026 | 0 | 0 | $0.00 | 0.0% | 40.6% | $0 | 0.0% | 54.2% |
| 2027 | 1 | 5,850 | $29.92 | 6.0% | 46.7% | $175,017 | 7.7% | 61.9% |
| 2028 | 3 | 45,764 | $12.65(3) | 47.1% | 93.8% | $721,306 | 31.8% | 93.7% |
| 2029 | 1 | 2,388 | $59.68 | 2.5% | 96.3% | $142,527 | 6.3% | 100.0% |
| 2030 & Beyond | 0 | 0 | $0.00 | 0.0% | 96.3% | $0 | 0.0% | 100.0% |
| Vacant | 0 | 3,619 | $0.00 | 3.7% | 100.0% | $0 | 0.0% | 100.0% |
| Total/Weighted Average | 15 | 97,085 | $21.53(3) | 100.0% | $2,267,918 | 100.0% | ||
| (1) | Information is based on the underwritten rent roll. |
| (2) | Certain tenants may have lease termination options that are exercisable prior to the originally stated expiration date of the subject lease and that are not considered in the lease rollover schedule. |
| (3) | Excludes Annual UW Rent totaling $255,518 for two ground lease tenants, which own their improvements (Macaroni Grill and Union Bank). |
The Market. The El Paseo Simi Property is located adjacent to Interstate 118 (which provides access eastbound to Los Angeles), approximately 37.5 miles northwest of the Los Angeles central business district and 40.4 miles northwest of the Los Angeles International Airport. The El Paseo Simi Property is located in the city of Simi Valley, a city within the southeastern portion of Ventura County. The City of Simi Valley is largely a commuter bedroom community feeding Ventura County to the west and the Los Angeles area and San Fernando Valley to the east. The El Paseo Simi Property is situated at the intersection of Tapo Canyon Road (the major north/south arterial connecting to the Ronald Reagan Freeway) and Alamo Street (a major east/west arterial), adjacent to City Hall, Ventura County Superior Courthouse, Simi Valley Police Department, Rancho Tapo Community Park, and Simi Valley Library.
According to a third-party market research report, the estimated 2019 population within a one- three- and five-mile radius of the El Paseo Simi Property was approximately 16,374, 82,833, and 116,018, respectively; while the 2019 estimated average household income within the same radii was $108,503, $113,455, and $114,521, respectively.
According to a third-party market research report, the El Paseo Simi Property is situated within the Simi Valley/Moorpark submarket of the Ventura County retail market. As of April 12, 2019, the Simi Valley/Moorpark submarket reported a total inventory of approximately 8.0 million SF of retail space with a 7.4% vacancy rate and average asking rent of $22.88 PSF, triple net. The appraiser identified 10 competitive properties totaling approximately 1.6 million SF with an average vacancy rate of 13.0%.
The following table presents certain information relating to the appraisal’s market rent conclusions for the El Paseo Simi Property:
| Market Rent Summary | ||||||
| Vons Anchor | Cost Plus Anchor | Large Inline | Small Inline | Fronting Shops | Pad | |
| Market Rent (PSF) | $18.00 | $15.00 | $30.00 | $52.00 | $42.00 | $31.50 |
| Lease Term (Years) | 10 | 10 | 5 | 5 | 5 | 10 |
| Lease Type (Reimbursements) | NNN | NNN | NNN | NNN | NNN | NNN |
| Rent Increase Projection | 10% Mid-Term | 10% Mid-Term | 3% Annual | 3% Annual | 3% Annual | 10% Mid-Term |
This is not a research report and was not prepared by the Underwriters’ research department. Please see additional important information and qualifications at the end of this Term Sheet.
T-146
| Retail – Anchored | Loan #14 | Cut-off Date Balance: | $23,600,000 | |
| 2902, 2906, 2910, 2916, 2920, 2930, | El Paseo Simi | Cut-off Date LTV: | 60.7% | |
| 2938 and 2944 Tapo Canyon Road | U/W NCF DSCR: | 2.62x | ||
| Simi Valley, CA 93063 | U/W NOI Debt Yield: | 9.2% |
The following table presents recent leasing data related to anchor spaces at comparable retail properties with respect to the El Paseo Simi Property:
| Comparable Lease Summary | ||||||||||
| Property Name/Address | Year Built/ Renovated | Size (SF) | Occupancy | Distance from Subject | Tenant Name | Lease Size (SF) | Lease Date | Lease Term (Yrs.) | Initial Rent/SF | Lease Type |
El Paseo Simi Property Tapo Canyon Road Simi Valley, CA 93063 | 2004/N/A | 97,085 | 96.3% | N/A | ||||||
Sprouts 16964 Highland Ave Fontana, CA | 2018/N/A | 30,000 | 100.0% | 80.6 miles | Sprouts | 30,000 | Jan 2019 | 15.0 | $18.00 | NNN |
Sycamore Village 2860 Cochran St Simi Valley, CA | 1981/N/A | 2,362,694 | 100.0% | 2.0 miles | Grocery Outlet | 16,770 | July 2018 | 15.0 | $15.12 | NNN |
La Canada Flintridge Town Center 895 to 985 Foothill Boulevard La Canada Flintridge, CA | 2008/N/A | 315,466 | 100.0% | 33.6 miles | Target | 45,865 | Jan 2018 | 10.0 | $19.50 | NNN |
Smart & Final 27550 Base Line St Highland, CA | 2017/N/A | 129,896 | 100.0% | 95.8 miles | Smart & Final | 27,524 | Dec 2017 | 20.0 | $18.48 | NNN |
Smart & Final 303 E Foothill Blvd Azusa, CA | 2017/N/A | 65,340 | 100.0% | 54.2 miles | Smart & Final | 29,438 | Nov 2017 | 15.0 | $17.98 | NNN |
Smart & Final 1023 N Mount Vernon Ave Colton, CA | 2017/N/A | 119,289 | 100.0% | 91.8 miles | Smart & Final | 27,870 | May 2017 | 15.0 | $17.61 | NNN |
Simi Valley Town Center 1555 Simi Valley Center Way Simi Valley, CA | 2005/N/A | 36,789 | 100.0% | 3.1 miles | Studio Movie Grill | 36,789 | July 2015 | 10.0 | $22.00 | Modified Gross |
Source:Appraisal
Operating History and Underwritten Net Cash Flow.The following table presents certain information relating to the operating history and underwritten net cash flow at the El Paseo Simi Property:
| Cash Flow Analysis | ||||||
| 2016(2) | 2017(2) | 2018 | 6/30/2019 TTM(3) | UW(3) | UW PSF | |
| Gross Potential Base Rent(1)1) | $2,210,208 | $1,956,605 | $2,071,977 | $2,052,664 | $2,419,917 | $24.93 |
| Total Recoveries | $734,786 | $670,176 | $736,153 | $751,179 | $796,134 | $8.20 |
| Other Income | $48,114 | $3,480 | $30,235 | $4,121 | $32,566 | $0.34 |
| Less Vacancy & Credit Loss | $0 | $0 | $0 | $0 | ($151,998)(4) | ($1.57) |
| Effective Gross Income | $2,993,109 | $2,630,261 | $2,838,366 | $2,807,964 | $3,096,619 | $31.90 |
| Real Estate Taxes | $283,858 | $292,259 | $301,615 | $276,594 | $255,247 | $2.63 |
| Insurance | $12,218 | $12,176 | $13,688 | $13,688 | $17,809 | $0.18 |
| Other Operating Expenses | $500,679 | $591,561 | $634,573 | $630,713 | $656,061 | $6.76 |
| Total Operating Expenses | $796,755 | $895,996 | $949,876 | $920,995 | $929,116 | $9.57 |
| Net Operating Income | $2,196,353 | $1,734,264 | $1,888,490 | $1,886,969 | $2,167,502 | $22.33 |
| Capital Expenditures | $0 | $0 | $0 | $0 | $29,126 | $0.30 |
| TI/LC | $0 | $0 | $0 | $0 | $47,777 | $0.49 |
| Net Cash Flow | $2,196,353 | $1,734,264 | $1,888,490 | $1,886,969 | $2,090,599 | $21.53 |
| Occupancy % | 100.0% | 89.6% | 96.7% | 96.3% | 96.3%(4) | |
| NOI DSCR | 2.76x | 2.18x | 2.37x | 2.37x | 2.72x | |
| NCF DSCR | 2.76x | 2.18x | 2.37x | 2.37x | 2.62x | |
| NOI Debt Yield | 9.3% | 7.3% | 8.0% | 8.0% | 9.2% | |
| NCF Debt Yield | 9.3% | 7.3% | 8.0% | 8.0% | 8.9% | |
| (1) | UW Gross Potential Base Rent PSF and UW Gross Potential Base Rent include contractual rent steps through October 2020 for eight tenants totaling $36,654. |
| (2) | The decrease in Gross Potential Base Rent and Net Operating Income from 12/31/2016 to 12/31/2017 was driven partly by decline in occupancy from 100.0% to 89.6%. |
| (3) | The increase in Gross Potential Base Rent and Net Operating Income from 6/30/2019 to UW was driven partly by contractual rent steps through October 2020 for eight tenants totaling $36,654 in addition to four renewal leases signed from February through August 2019. |
| (4) | The underwritten economic vacancy is 6.3%. As of September 1, 2019, the El Paseo Simi Property was 96.3% physically occupied. |
This is not a research report and was not prepared by the Underwriters’ research department. Please see additional important information and qualifications at the end of this Term Sheet.
T-147
| Mortgage Loan No. 15 – Westport Village |
| Mortgage Loan Information | Property Information | ||||||
| Mortgage Loan Seller: | WFB | Single Asset/Portfolio: | Single Asset | ||||
| Credit Assessment (DBRS/Fitch/S&P): | NR/NR/NR | Location: | Louisville, KY 40222 | ||||
| Original Balance: | $22,850,000 | General Property Type: | Retail | ||||
| Cut-off Date Balance: | $22,850,000 | Detailed Property Type: | Anchored | ||||
| % of Initial Pool Balance: | 1.9% | Title Vesting: | Fee | ||||
| Loan Purpose: | Acquisition | Year Built/Renovated: | 1969 / 2007 | ||||
| Borrower Sponsors: | Blake R. Berg; Mark C. Ibanez; Samuel H. Heide | Size: | 169,515 SF | ||||
| Guarantor: | WPCM Relative Value Fund I, LLC | Cut-off Date Balance per SF: | $135 | ||||
| Mortgage Rate: | 4.0300% | Maturity Date Balance per SF: | $125 | ||||
| Note Date: | 7/12/2019 | Property Manager: | Crawford Square Real Estate Advisors LLC | ||||
| First Payment Date: | 9/11/2019 | ||||||
| Maturity Date: | 8/11/2026 | ||||||
| Original Term to Maturity: | 84 months | Underwriting and Financial Information | |||||
| Original Amortization Term: | 360 months | UW NOI: | $2,675,805 | ||||
| IO Period: | 36 months | UW NOI Debt Yield: | 11.7% | ||||
| Seasoning: | 2 months | UW NOI Debt Yield at Maturity: | 12.6% | ||||
| Prepayment Provisions: | LO (26); DEF (51); O (7) | UW NCF DSCR: | 2.69x (IO) 1.92x (P&I) | ||||
| Lockbox/Cash Mgmt Status: | Springing/Springing | Most Recent NOI: | $2,537,563 (6/30/2019 TTM) | ||||
| Additional Debt Type: | N/A | 2nd Most Recent NOI: | $2,514,605 (12/31/2018) | ||||
| Additional Debt Balance: | N/A | 3rd Most Recent NOI: | $2,273,242 (12/31/2017) | ||||
| Future Debt Permitted (Type): | No (N/A) | Most Recent Occupancy: | 93.9% (7/10/2019) | ||||
| Reserves | 2nd Most Recent Occupancy: | 92.5% (12/31/2018) | |||||
| Type | Initial | Monthly | Cap | 3rd Most Recent Occupancy: | 95.4% (12/31/2017) | ||
| RE Tax: | $231,132 | $28,891 | N/A | Appraised Value (as of): | $31,500,000 (6/18/2019) | ||
| Insurance: | $4,729 | $4,726 | N/A | Appraised Value per SF: | $186 | ||
| Recurring Replacements: | $0 | $4,097 | N/A | Cut-off Date LTV Ratio: | 72.5% | ||
| TI/LC: | $200,000 | $10,595 | $500,000(1) | Maturity Date LTV Ratio: | 67.4% | ||
| Sources and Uses | ||||||
| Sources | Proceeds | % of Total | Uses | Proceeds | % of Total | |
| Loan Amount: | $22,850,000 | 72.7% | Purchase Price: | $30,300,000 | 96.4% | |
| Cash Equity Contribution: | $8,035,652 | 25.6% | Upfront Reserves: | $435,861 | 1.4% | |
| Seller Credit: | $554,772 | 1.8% | Closing Costs: | $704,563 | 2.2% | |
| Total Sources: | $31,440,424 | 100.0% | Total Uses: | $31,440,424 | 100.0% | |
| (1) | The Westport Village Mortgage Loan (as defined below) documents require monthly escrows for tenant improvements and leasing commissions (“TI/LC”) beyond the cap upon (i) an event of default or (ii) the net cash flow debt yield falling below 8.5%. |
The Mortgage Loan. The fifteenth largest mortgage loan (the “Westport Village Mortgage Loan”) is evidenced by a single promissory note in the original principal amount of $22,850,000 and secured by a first priority fee mortgage encumbering a 169,515 SF anchored retail center (the “Westport Village Property”) located in Louisville, Kentucky.
The Borrower and the Borrower Sponsors. The borrower is Westport Village Property, LLC (the “Westport Village Borrower”), a Delaware limited liability company and single purpose entity with one independent director. The non-recourse carve-out guarantor is WPCM Relative Value Fund I, LLC, a Delaware limited liability company; and the borrower sponsors are Blake R. Berg, Mark C. Ibanez and Samuel H. Heide.
Mr. Berg and Mr. Ibanez are co-founders and principals of Wicker Park Capital Management, L.L.C. (“WPCM”), which manages real estate investments with a goal of offering risk-adjusted returns for its partners. WPCM targets multifamily and retail investments in the southeastern United States. WPCM’s principals (which also include Mr. Heide) have a combined 40 years of institutional experience and have acquired over $7.0 billion in real estate transactions. Since its formation in 2013, WPCM has made 20 investments, including nine retail properties (totaling approximately 1.7 million SF) and 14 apartment communities (totaling approximately 2,496 units).
The Property.The Westport Village Property is a 169,515 SF, six-building, anchored retail center located in Louisville, Kentucky. Situated on a 13.7-acre site, the Westport Village Property was built in 1969, renovated in 2007 and is anchored by Bliss Home and junior anchored by Summer Classics. Two of the six buildings at the Westport Village Property contain two floors with a total of 26,055 SF of office space (15.4% of the net rentable area; 13.3% of underwritten base rent), which is fully occupied by seven tenants. The Westport Village Property contains 702 surface parking spaces resulting in a parking ratio of approximately 4.1 spaces per 1,000 SF of rentable area. As of July 10, 2019, the Westport Village Property was 93.9% occupied by 49 tenants, including a mix of restaurants, boutique fitness studios, salons and clothing outfitters. Twenty-one tenants representing approximately 42.6% of NRA and 50.7% of underwritten rent have been in place at the Westport Village Property since 2010.
This is not a research report and was not prepared by the Underwriters’ research department. Please see additional important information and qualifications at the end of this Term Sheet.
T-148
| Retail – Anchored | Loan #15 | Cut-off Date Balance: | $22,850,000 | |
| 1321 Herr Lane AKA 1315 Herr Lane | Westport Village | Cut-off Date LTV: | 72.5% | |
| Louisville, KY 40222 | U/W NCF DSCR: | 1.92x | ||
| U/W NOI Debt Yield: | 11.7% |
Major Tenants.
Bliss Home (24,534 SF, 14.5% of NRA, 10.1% of underwritten rent, lease expires 7/31/2027).Bliss Home is a full-service furniture store featuring casual contemporary home furnishings, rugs, art and accessories. Bliss Home opened its first location in 2003 in Knoxville, Tennessee and took occupancy at its location at the Westport Village Property in 2017. Bliss Home’s lease has two, 5-year renewal options remaining, each with 180 days’ notice at rental rates as specified in the lease.
Summer Classics (11,055 SF, 6.5% of NRA, 5.9% of underwritten rent, lease expires 12/31/2025). Summer Classics is a manufacturer and retailer of luxury classic, modern and traditional outdoor furniture. Summer Classics creates its products using exclusive materials, including resin wicker, cast aluminum, teak and iron. Summer Classics offers hundreds of custom fabrics, cushions and pillows, along with fire pits and dining sets. Summer Classics has been at the Westport Village Property since July 2008 and has no remaining renewal options following its lease expiration in December 2025.
Other than Bliss Home and Summer Classics, no tenant accounts for more than 3.7% of the net rentable area or 4.4% of underwritten base rent at the Westport Village Property.
The following table presents certain information relating to the leases at the Westport Village Property:
| Tenant Summary(1) | |||||||||||
| Tenant Name | Credit Rating (Fitch/ Moody’s/ S&P) | Tenant SF | Approx. % of SF | Annual UW Rent(2) | % of Total Annual UW Rent | Annual UW Rent PSF(2) | Lease Expiration | 2018 Sales PSF | Occ. Cost %(3) | Term. Option (Y/N) | Remaining Extension |
| Major Tenants | |||||||||||
| Bliss Home | NR/NR/NR | 24,534 | 14.5% | $303,731 | 10.1% | $12.38 | 7/31/2027 | $60.84 | 29.3% | N | 2, 5-year |
| Summer Classics | NR/NR/NR | 11,055 | 6.5% | $179,091 | 5.9% | $16.20 | 12/31/2025 | N/A | N/A | N | N |
| Fulton & Devlin | NR/NR/NR | 6,241 | 3.7% | $121,700 | 4.0% | $19.50 | 8/31/2021 | N/A | N/A | N | N |
| Pediatric Solutions | NR/NR/NR | 6,233 | 3.7% | $45,069 | 1.5% | $7.23 | 11/30/2022 | N/A | N/A | N | N |
| Napa River Grill | NR/NR/NR | 6,217 | 3.7% | $134,412 | 4.4% | $21.62 | 5/31/2023 | $356.81 | 7.6% | N | N |
| Subtotal/Wtd. Avg. | 54,280 | 32.0% | $784,002 | 26.0% | $14.44 | ||||||
| Other Tenants | 104,938 | 61.9% | $2,236,498 | 74.0% | $21.31 | ||||||
| Vacant Space | 10,297 | 6.1% | $0 | 0.0% | $0.00 | ||||||
| Total/Wtd. Avg.(4) | 169,515 | 100.0% | $3,020,501 | 100.0% | $18.97 | ||||||
| (1) | Information is based on the underwritten rent roll. |
| (2) | Annual UW Rent and Annual UW Rent PSF include contractual rent steps through October 2020 for 20 tenants totaling $45,739. |
| (3) | Occ. Cost is based on Annual UW Rent and underwritten tenant reimbursements. |
| (4) | Total/Wtd. Avg. Annual UW Rent PSF excludes vacant space. |
This is not a research report and was not prepared by the Underwriters’ research department. Please see additional important information and qualifications at the end of this Term Sheet.
T-149
| Retail – Anchored | Loan #15 | Cut-off Date Balance: | $22,850,000 | |
| 1321 Herr Lane AKA 1315 Herr Lane | Westport Village | Cut-off Date LTV: | 72.5% | |
| Louisville, KY 40222 | U/W NCF DSCR: | 1.92x | ||
| U/W NOI Debt Yield: | 11.7% |
The following table presents certain information relating to the lease rollover schedule at the Westport Village Property:
| Lease Rollover Schedule(1)(2) | ||||||||
| Year | # of Leases Rolling | SF Rolling | Annual UW Rent PSF Rolling | Approx. % of Total SF Rolling | Approx. Cumulative % of SF Rolling | Total UW Rent Rolling | Approx. % of Total Rent Rolling | Approx. Cumulative % of Total Rent Rolling |
| 2019 | 0 | 0 | $0.00 | 0.0% | 0.0% | $0 | 0.0% | 0.0% |
| 2020 | 5 | 10,844 | $19.11 | 6.4% | 6.4% | $207,198 | 6.9% | 6.9% |
| 2021 | 6 | 13,033 | $21.58 | 7.7% | 14.1% | $281,244 | 9.3% | 16.2% |
| 2022 | 5 | 12,843 | $15.11 | 7.6% | 21.7% | $194,082 | 6.4% | 22.6% |
| 2023 | 15 | 45,440 | $20.56 | 26.8% | 48.5% | $934,126 | 30.9% | 53.5% |
| 2024 | 7 | 22,430 | $21.83 | 13.2% | 61.7% | $489,725 | 16.2% | 69.7% |
| 2025 | 2 | 16,138 | $18.97 | 9.5% | 71.2% | $306,171 | 10.1% | 79.9% |
| 2026 | 1 | 1,220 | $18.00 | 0.7% | 71.9% | $21,960 | 0.7% | 80.6% |
| 2027 | 2 | 27,184 | $13.37 | 16.0% | 88.0% | $363,356 | 12.0% | 92.6% |
| 2028 | 2 | 3,348 | $24.95 | 2.0% | 90.0% | $83,529 | 2.8% | 95.4% |
| 2029 | 2 | 6,738 | $20.65 | 4.0% | 93.9% | $139,110 | 4.6% | 100.0% |
| 2030 & Beyond | 2 | 0 | $0.00 | 0.0% | 93.9% | $0 | 0.0% | 100.0% |
| Vacant | 0 | 10,297 | $0.00 | 6.1% | 100.0% | $0 | 0.0% | 100.0% |
| Total/Wtd. Avg.(3) | 49 | 169,515 | $18.97 | 100.0% | $3,020,501 | 100.0% | ||
| (1) | Information is based on the underwritten rent roll. |
| (2) | Certain tenants may have lease termination options that are exercisable prior to the originally stated expiration date of the subject lease and that are not considered in the lease rollover schedule. |
| (3) | Wtd. Avg. Annual UW Rent PSF Rolling excludes vacant space. |
The Market. The Westport Village Property is located in Louisville, Kentucky, approximately 1.1 miles east of the on-off ramp for Interstate 284 (provides east/west access through Louisville), 2.5 miles north of Interstate 64 (provides access eastbound to Lexington, Kentucky and westbound into Indiana), 10.6 miles northeast of the Louisville central business district and 10.8 miles northeast of the Louisville International Airport. The Westport Village Property is situated approximately 0.2 miles northeast of the intersection of Westport Road and Herr Lane, which, according to a third party market research provider, had a daily traffic count of approximately 35,842 vehicles as of 2018. Approximately 2.2 miles southwest of the Westport Village Property is Mall St. Matthews, an approximately 1.1 million SF Brookfield-owned super-regional mall anchored by Dillard’s, JCPenney and Dave & Buster’s, featuring various boutique shops, dining and entertainment options including a 10-screen Cinemark Theatre.
According to a third-party market research report, the estimated 2019 population within a three- and five-mile radius of the Westport Village Property was approximately 80,509, and 190,274, respectively; while the 2019 estimated average household income within the same radii was $100,732, and $97,223, respectively.
According to a third-party market research report, the Westport Village Property is situated within the Hurstbourne/Lyndon retail submarket of the Louisville Market. As of September 12, 2019, the Hurstbourne/Lyndon submarket reported a total inventory of approximately 5.1 million SF of retail space with a 2.2% vacancy rate and average asking rent of $18.83 PSF, triple net. The submarket vacancy rate has decreased from 9.4% in 2015 and has averaged 4.5% from 2015 through 2018.
The appraiser identified a competitive set of eight retail properties totaling approximately 402,309 SF, with an average occupancy rate of 94.2% and average asking rents ranging from $22.50 to $23.00 per SF, triple net.
The following table presents certain information relating to the appraisal’s market rent conclusions for the Westport Village Property:
| Market Rent Summary | ||||
| Anchor | Jr. Anchor | Inline Retail | 2nd Floor Office | |
| Market Rent (PSF) | $12.00 | $16.00 | $23.00 | $18.50 |
| Lease Term (Years) | 10 | 10 | 5 | 5 |
| Lease Type (Reimbursements) | NNN | NNN | NNN | NNN |
| Rent Increase Projection | Varies | Varies | 2.0% | 2.0% |
This is not a research report and was not prepared by the Underwriters’ research department. Please see additional important information and qualifications at the end of this Term Sheet.
T-150
| Retail – Anchored | Loan #15 | Cut-off Date Balance: | $22,850,000 | |
| 1321 Herr Lane AKA 1315 Herr Lane | Westport Village | Cut-off Date LTV: | 72.5% | |
| Louisville, KY 40222 | U/W NCF DSCR: | 1.92x | ||
| U/W NOI Debt Yield: | 11.7% |
Operating History and Underwritten Net Cash Flow.The following table presents certain information relating to the operating history and underwritten net cash flow at the Westport Village Property:
| Cash Flow Analysis | |||||
| 2017 | 2018 | 6/30/2019 TTM | UW | UW PSF | |
| Gross Potential Base Rent(1) | $2,610,614 | $2,862,191 | $2,870,774 | $3,257,332 | $19.22 |
| Total Recoveries | $685,886 | $810,492 | $789,849 | $814,772 | $4.81 |
| Collection Loss | $0 | ($42,934) | $0 | $0 | $0.00 |
| Other Income | $66,109 | $6,604 | $37,875 | $2,223 | $0.01 |
| Less Vacancy & Credit Loss | $0 | $0 | $0 | ($236,831)(2) | ($1.40) |
| Effective Gross Income | $3,362,608 | $3,636,353 | $3,698,499 | $3,837,495 | $22.64 |
| Real Estate Taxes | $291,005 | $313,951 | $317,105 | $317,105 | $1.87 |
| Insurance | $25,098 | $37,494 | $40,993 | $56,712 | $0.33 |
| Other Operating Expenses | $773,263 | $770,303 | $802,837 | $787,874 | $4.65 |
| Total Operating Expenses | $1,089,366 | $1,121,749 | $1,160,935 | $1,161,690 | $6.85 |
| Net Operating Income | $2,273,242 | $2,514,605 | $2,537,563 | $2,675,805 | $15.79 |
| Capital Expenditures | $0 | $0 | $0 | $49,159 | $0.29 |
| TI/LC | $0 | $0 | $0 | $108,950 | $0.64 |
| Net Cash Flow | $2,273,242 | $2,514,605 | $2,537,563 | $2,517,696 | $14.85 |
| Occupancy % | 95.4% | 92.5% | 93.9% | 93.9%(2) | |
| NOI DSCR (IO) | 2.43x | 2.69x | 2.71x | 2.86x | |
| NOI DSCR (P&I) | 1.73x | 1.91x | 1.93x | 2.04x | |
| NCF DSCR (IO) | 2.43x | 2.69x | 2.71x | 2.69x | |
| NCF DSCR (P&I) | 1.73x | 1.91x | 1.93x | 1.92x | |
| NOI Debt Yield | 9.9% | 11.0% | 11.1% | 11.7% | |
| NCF Debt Yield | 9.9% | 11.0% | 11.1% | 11.0% | |
| (1) | UW Gross Potential Base Rent PSF and UW Gross Potential Base Rent include contractual rent steps through October 2020 for 20 tenants totaling $45,739. |
| (2) | The underwritten economic vacancy is 7.3%. As of July 10, 2019, the Westport Village Property was 93.9% physically occupied. |
This is not a research report and was not prepared by the Underwriters’ research department. Please see additional important information and qualifications at the end of this Term Sheet.
T-151
| BANK 2019-BNK21 |
This material was prepared by sales, trading, banking or other non-research personnel of one of the following (or an affiliate thereof): BofA Securities, Inc. (together with its affiliates, “BofA Securities”), Morgan Stanley & Co. LLC, Morgan Stanley & Co. International Limited, Morgan Stanley Japan Limited and/or Morgan Stanley Dean Witter Asia Limited (together with their affiliates, hereinafter “Morgan Stanley”), Wells Fargo Securities, LLC (together with its affiliates, “Wells Fargo”), Academy Securities, Inc. (together with its affiliates, “Academy”) or Drexel Hamilton, LLC (together with its affiliates, “Drexel”, and collectively with BofA Securities, Morgan Stanley, Wells Fargo and Academy, the “Underwriters”). This material was not produced by an Underwriter’s research analyst, although it may refer to an Underwriter’s research analyst or research report. Unless otherwise indicated, these views (if any) are the author’s and may differ from those of the fixed income or equity research departments of the Underwriters or others in those firms.
This material may have been prepared by or in conjunction with the respective trading desks of the Underwriters that may deal as principal in or own or act as market maker or liquidity provider for the securities/instruments (or related derivatives) mentioned herein. The trading desk of any Underwriter may have accumulated a position in the subject securities/instruments based on the information contained herein. Trading desk materials are not independent of the proprietary interests of the Underwriters, which may conflict with your interests. Each of the Underwriters may also perform or seek to perform investment banking services for the issuers of the securities and instruments mentioned herein.
The information contained in this material is subject to change, completion or amendment from time to time, and the information in this material supersedes information in any other communication relating to the securities referred to in this material. This material is not a solicitation to participate in any trading strategy, and is not an offer to sell any security or instrument or a solicitation of an offer to buy or sell any security or instrument in any jurisdiction where an offer, solicitation or sale is not permitted. Unless otherwise set forth in this material, any securities referred to in this material may not have been registered under the U.S. Securities Act of 1933, as amended, and, if not, may not be offered or sold absent an exemption therefrom. Recipients are required to comply with any legal or contractual restrictions on their purchase, holding, sale, exercise of rights or performance of obligations under any securities/instruments transaction.
The securities/instruments discussed in this material may not be suitable for all investors. This material has been prepared and issued by the Underwriters for intended distribution to market professionals and institutional investor clients. Other recipients should seek independent investment advice prior to making any investment decision based on this material. This material does not provide individually tailored investment advice or offer tax, regulatory, accounting or legal advice. Prior to entering into any proposed transaction, recipients should determine, in consultation with their own investment, legal, tax, regulatory and accounting advisors, the economic risks and merits, as well as the legal, tax, regulatory and accounting characteristics and consequences, of the transaction. You should consider this material as only a single factor in making an investment decision. The value of and income from investments may vary because of changes in interest rates, foreign exchange rates, default rates, prepayment rates, securities/instruments prices, market indexes, operational or financial conditions of companies or other factors. There may be time limitations on the exercise of options or other rights in securities/instruments transactions. Past performance is not necessarily a guide to future performance. Estimates of future performance are based on assumptions that may not be realized. Actual events may differ from those assumed and changes to any assumptions may have a material impact on any projections or estimates. Other events not taken into account may occur and may significantly affect the projections or estimates. Certain assumptions may have been made for modeling purposes only to simplify the presentation and/or calculation of any projections or estimates, and the Underwriters do not represent that any such assumptions will reflect actual future events. Accordingly, there can be no assurance that estimated returns or projections will be realized or that actual returns or performance results will not materially differ from those estimated herein. Some of the information contained in this document may be aggregated data of transactions in securities or other financial instruments executed by an Underwriter that has been compiled so as not to identify the underlying transactions of any particular customer.
Notwithstanding anything herein to the contrary, the Underwriters and each recipient hereof agree that they (and their employees, representatives, and other agents) may disclose to any and all persons, without limitation of any kind from the commencement of discussions, the U.S. federal and state income tax treatment and tax structure of the transaction and all materials of any kind (including opinions or other tax analyses) that are provided to it relating to the tax treatment and tax structure (as such terms are defined in Treasury Regulation 1.6011-4). For this purpose, “tax structure” is limited to facts relevant to the U.S. federal and state income tax treatment of the transaction and does not include information relating to the identity of the parties, their affiliates, agents or advisors. This authorization of tax disclosure is retroactively effective to the commencement of discussions with prospective investors regarding the transactions contemplated herein.
THE DISTRIBUTION OF THIS MATERIAL (A) IF MADE BY A PERSON WHO IS NOT AN AUTHORIZED PERSON UNDER THE FINANCIAL SERVICES AND MARKETS ACT 2000 (“FSMA”), IS BEING MADE ONLY TO, OR DIRECTED ONLY AT, PERSONS WHO (I) ARE OUTSIDE THE UNITED KINGDOM, OR (II) HAVE PROFESSIONAL EXPERIENCE IN MATTERS RELATING TO INVESTMENTS AND QUALIFY AS INVESTMENT PROFESSIONALS IN ACCORDANCE WITH ARTICLE 19(5) OF THE FINANCIAL SERVICES AND MARKETS ACT 2000 (FINANCIAL PROMOTION) ORDER 2005 (THE “FINANCIAL PROMOTION ORDER”), OR (III) ARE PERSONS FALLING WITHIN ARTICLE 49(2)(A) THROUGH (D) (HIGH NET WORTH COMPANIES, UNINCORPORATED ASSOCIATIONS, ETC.) OF THE FINANCIAL PROMOTION ORDER; AND (B) IF MADE BY A PERSON WHO IS AN AUTHORIZED PERSON UNDER THE FSMA, IS BEING MADE ONLY TO, OR DIRECTED ONLY AT, PERSONS WHO (I) ARE OUTSIDE THE UNITED KINGDOM, OR (II) HAVE PROFESSIONAL EXPERIENCE IN MATTERS RELATING TO INVESTMENTS AND QUALIFY AS INVESTMENT PROFESSIONALS IN ACCORDANCE WITH ARTICLE 14(5) OF THE FINANCIAL SERVICES AND MARKETS ACT 2000 (PROMOTION OF COLLECTIVE INVESTMENT SCHEMES) (EXEMPTIONS) ORDER 2001 (THE “PROMOTION OF COLLECTIVE INVESTMENT SCHEMES EXEMPTIONS ORDER”), OR (III) ARE PERSONS FALLING WITHIN ARTICLE 22(2)(A) THROUGH (D) (“HIGH NET WORTH COMPANIES, UNINCORPORATED ASSOCIATIONS, ETC.”) OF THE PROMOTION OF COLLECTIVE INVESTMENT SCHEMES EXEMPTIONS ORDER, OR (IV) ARE PERSONS TO WHOM THE ISSUING ENTITY MAY LAWFULLY BE PROMOTED IN ACCORDANCE WITH CHAPTER 4.12 OF THE UK FINANCIAL CONDUCT AUTHORITY’S CONDUCT OF BUSINESS SOURCEBOOK.
THE OFFERED CERTIFICATES HAVE NOT BEEN AND WILL NOT BE REGISTERED UNDER THE FINANCIAL INSTRUMENTS EXCHANGE ACT OF JAPAN (LAW NO. 25 OF 1948, AS AMENDED (THE “FIEL”)), AND EACH OF MERRILL LYNCH, PIERCE, FENNER & SMITH INCORPORATED, MORGAN STANLEY & CO. LLC, WELLS FARGO SECURITIES, LLC, ACADEMY SECURITIES, INC. AND DREXEL HAMILTON, LLC HAS AGREED THAT IT WILL NOT OFFER OR SELL ANY OFFERED CERTIFICATES, DIRECTLY OR INDIRECTLY, IN JAPAN OR TO, OR FOR THE BENEFIT OF, ANY JAPANESE PERSON, OR TO OTHERS FOR RE-OFFERING OR RESALE, DIRECTLY OR INDIRECTLY, IN JAPAN OR TO ANY JAPANESE PERSON, EXCEPT PURSUANT TO AN EXEMPTION FROM THE REGISTRATION REQUIREMENTS OF, AND OTHERWISE IN COMPLIANCE WITH, THE FIEL AND ANY OTHER APPLICABLE LAWS AND REGULATIONS. FOR THE PURPOSES OF THIS PARAGRAPH, “JAPANESE PERSON” SHALL MEAN ANY PERSON RESIDENT IN JAPAN, INCLUDING ANY CORPORATION OR OTHER ENTITY ORGANIZED UNDER THE LAWS AND REGULATIONS OF JAPAN.