Exhibit (c)(2)

-- Confidential -- May 13, 2022 Confidential Discussion Materials
1 -- Confidential -- -- Confidential -- Disclaimer This presentation has been prepared by Centerview Partners LLC (“Centerview”) for use solely by the Special Committee of the Board of Directors of Convey Health Solutions Holdings, Inc . (“the Company”) in connection with its evaluation of a proposed transaction involving the Company and for no other purpose . The information contained herein is based upon publicly available information . Centerview has relied upon the accuracy and completeness of the foregoing information, and has not assumed any responsibility for any independent verification of such information or for any independent evaluation or appraisal of any of the assets or liabilities (contingent or otherwise) of the Company or any other entity, or concerning the solvency or fair value of the Company or any other entity . The information set forth herein is based upon economic, monetary, market and other conditions as in effect on, and the publicly available information as of, the date hereof, unless indicated otherwise and Centerview assumes no obligation to update or otherwise revise these materials . These materials and the information contained herein are confidential, were not prepared with a view toward public disclosure, and may not be disclosed publicly or made available to third parties without the prior written consent of Centerview . These materials and any other advice, written or oral, rendered by Centerview are intended solely for the benefit and use of the Special Committee Board of Directors of the Company (in its capacity as such) in its consideration of the proposed transaction, and are not for the benefit of, and do not convey any rights or remedies for any holder of securities of or any other person . Centerview will not be responsible for and has not provided any tax, accounting, actuarial, legal or other specialist advice . These materials are not intended to provide the sole basis for evaluating the proposed transaction, and this presentation does not represent a fairness opinion, recommendation, valuation or opinion of any kind, and is necessarily incomplete and should be viewed solely in conjunction with the oral presentation provided by Centerview .

2 -- Confidential -- -- Confidential -- Today’s Agenda Overview of Centerview Partners 1 Outside - In Perspectives on Convey 2
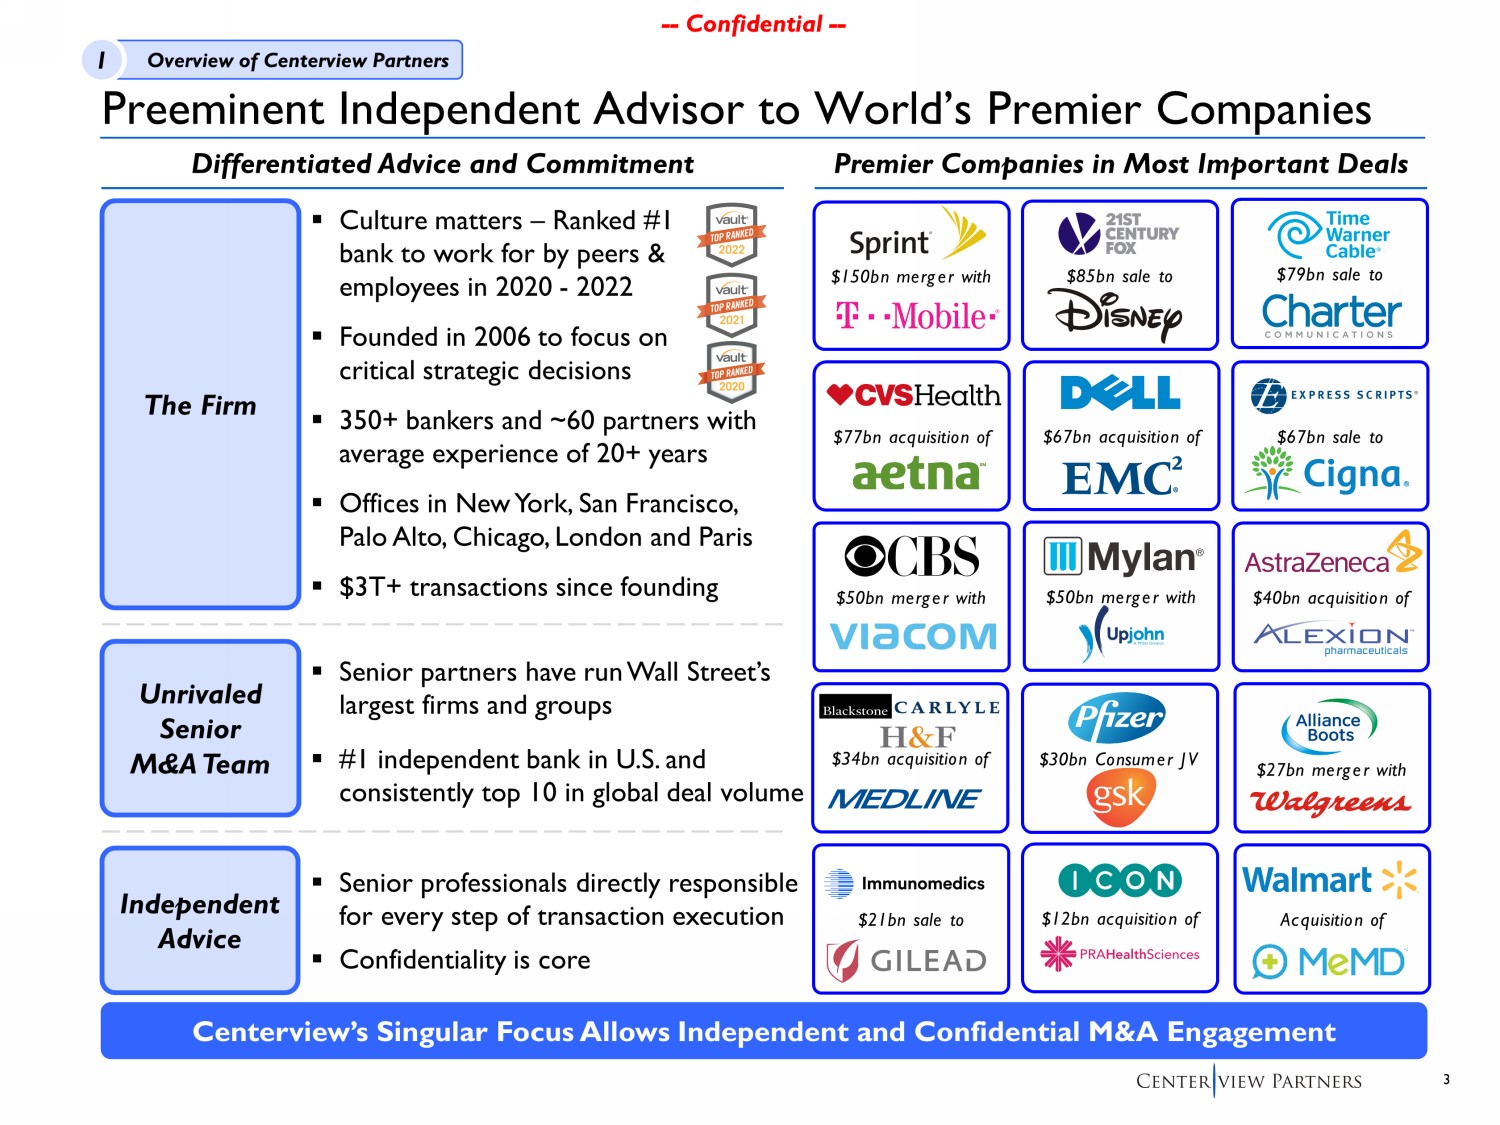
3 -- Confidential -- -- Confidential -- ▪ Culture matters – Ranked #1 bank to work for by peers & employees in 2020 - 2022 ▪ Founded in 2006 to focus on critical strategic decisions ▪ 350+ bankers and ~60 partners with average experience of 20+ years ▪ Offices in New York, San Francisco, Palo Alto, Chicago, London and Paris ▪ $3T+ transactions since founding Preeminent Independent Advisor to World’s Premier Companies The Firm Unrivaled Senior M&A Team ▪ Senior partners have run Wall Street’s largest firms and groups ▪ # 1 independent bank in U.S. and consistently top 10 in global deal volume Independent Advice ▪ Senior professionals directly responsible for every step of transaction execution ▪ Confidentiality is core Differentiated Advice and Commitment Centerview’s Singular Focus Allows Independent and Confidential M&A Engagement Premier Companies in Most Important Deals $150bn merger with $85bn sale to $79bn sale to $67bn sale to $50bn merger with $77bn acquisition of $67bn acquisition of $50bn merger with $30bn Consumer JV $40bn acquisition of Acquisition of $27bn merger with $21bn sale to $34bn acquisition of $ 12bn acquisition of 1 Overview of Centerview Partners
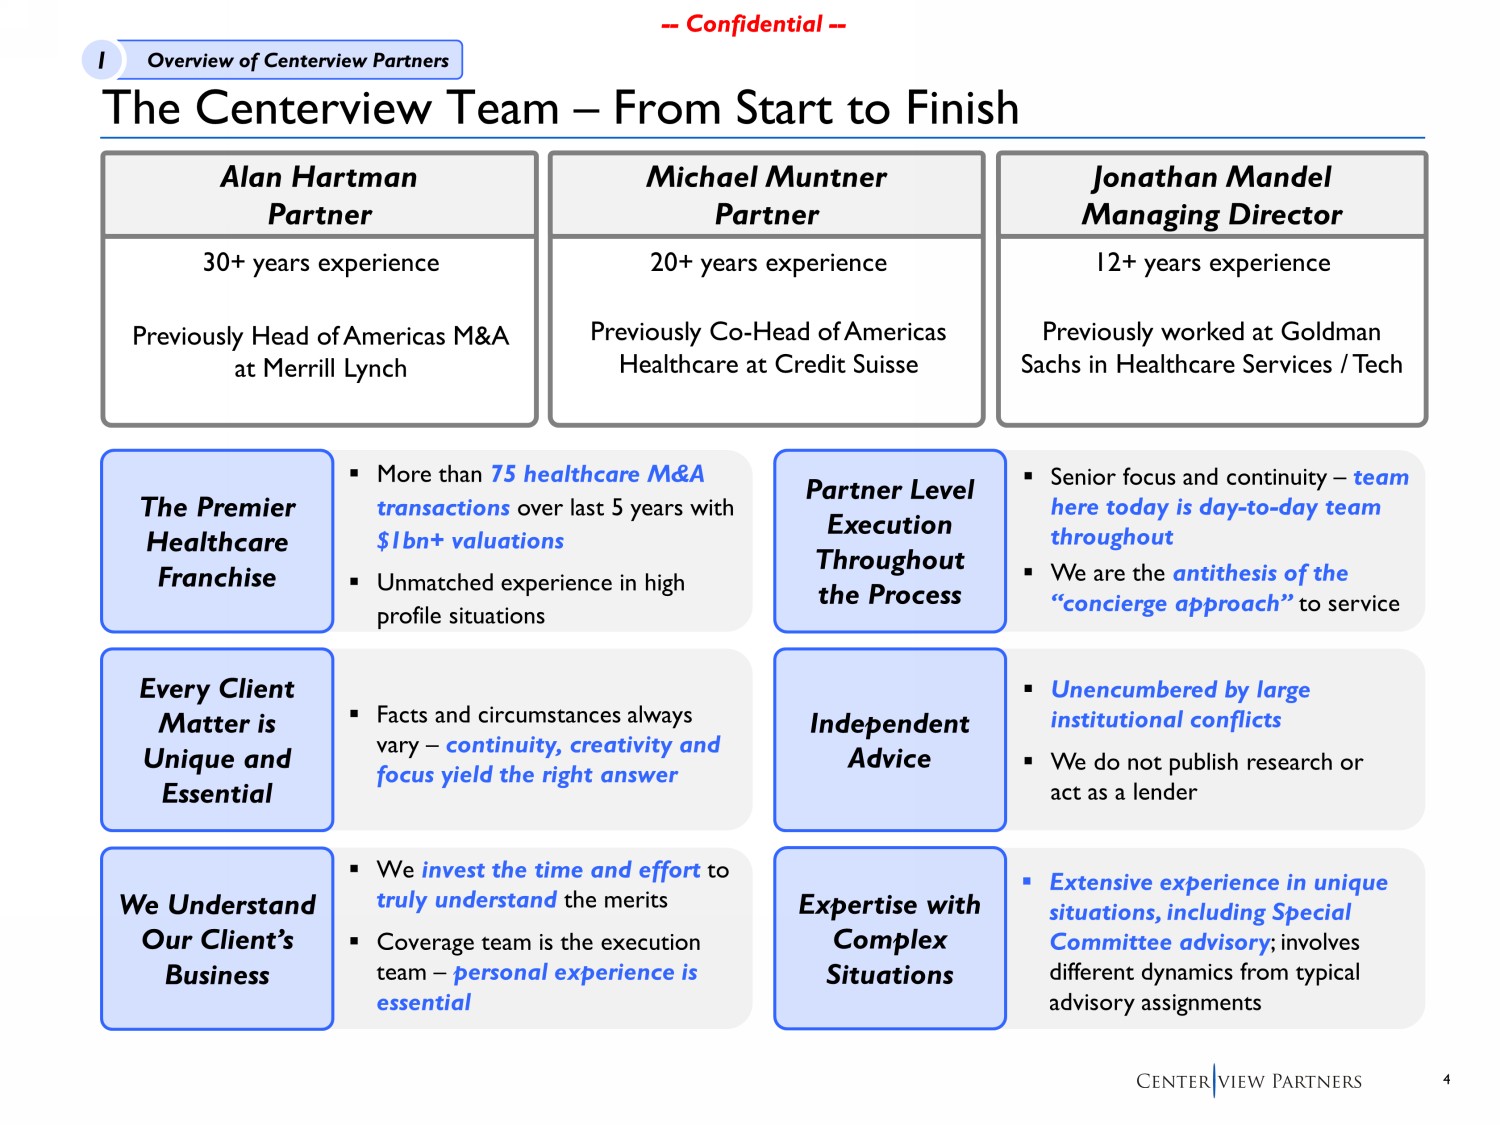
4 -- Confidential -- -- Confidential -- The Centerview Team – From Start to Finish The Premier Healthcare Franchise Every Client Matter is Unique and Essential ▪ Facts and circumstances always vary – continuity, creativity and focus yield the right answer We Understand Our Client’s Business ▪ We invest the time and effort to truly understand the merits ▪ Coverage team is the execution team – personal experience is essential Partner Level Execution Throughout the Process ▪ Senior focus and continuity – team here today is day - to - day team throughout ▪ We are the antithesis of the “concierge approach” to service Independent Advice ▪ U nencumbered by large institutional conflicts ▪ We do not publish research or act as a lender ▪ Extensive experience in unique situations, including Special Committee advisory ; involves different dynamics from typical advisory assignments Expertise with Complex Situations ▪ More than 75 healthcare M&A transactions over last 5 years with $1bn+ valuations ▪ Unmatched experience in high profile situations Alan Hartman Partner 30+ years experience Previously Head of Americas M&A at Merrill Lynch Michael Muntner Partner 20+ years experience Previously Co - Head of Americas Healthcare at Credit Suisse Jonathan Mandel Managing Director 12+ years experience Previously worked at Goldman Sachs in Healthcare Services / Tech 1 Overview of Centerview Partners
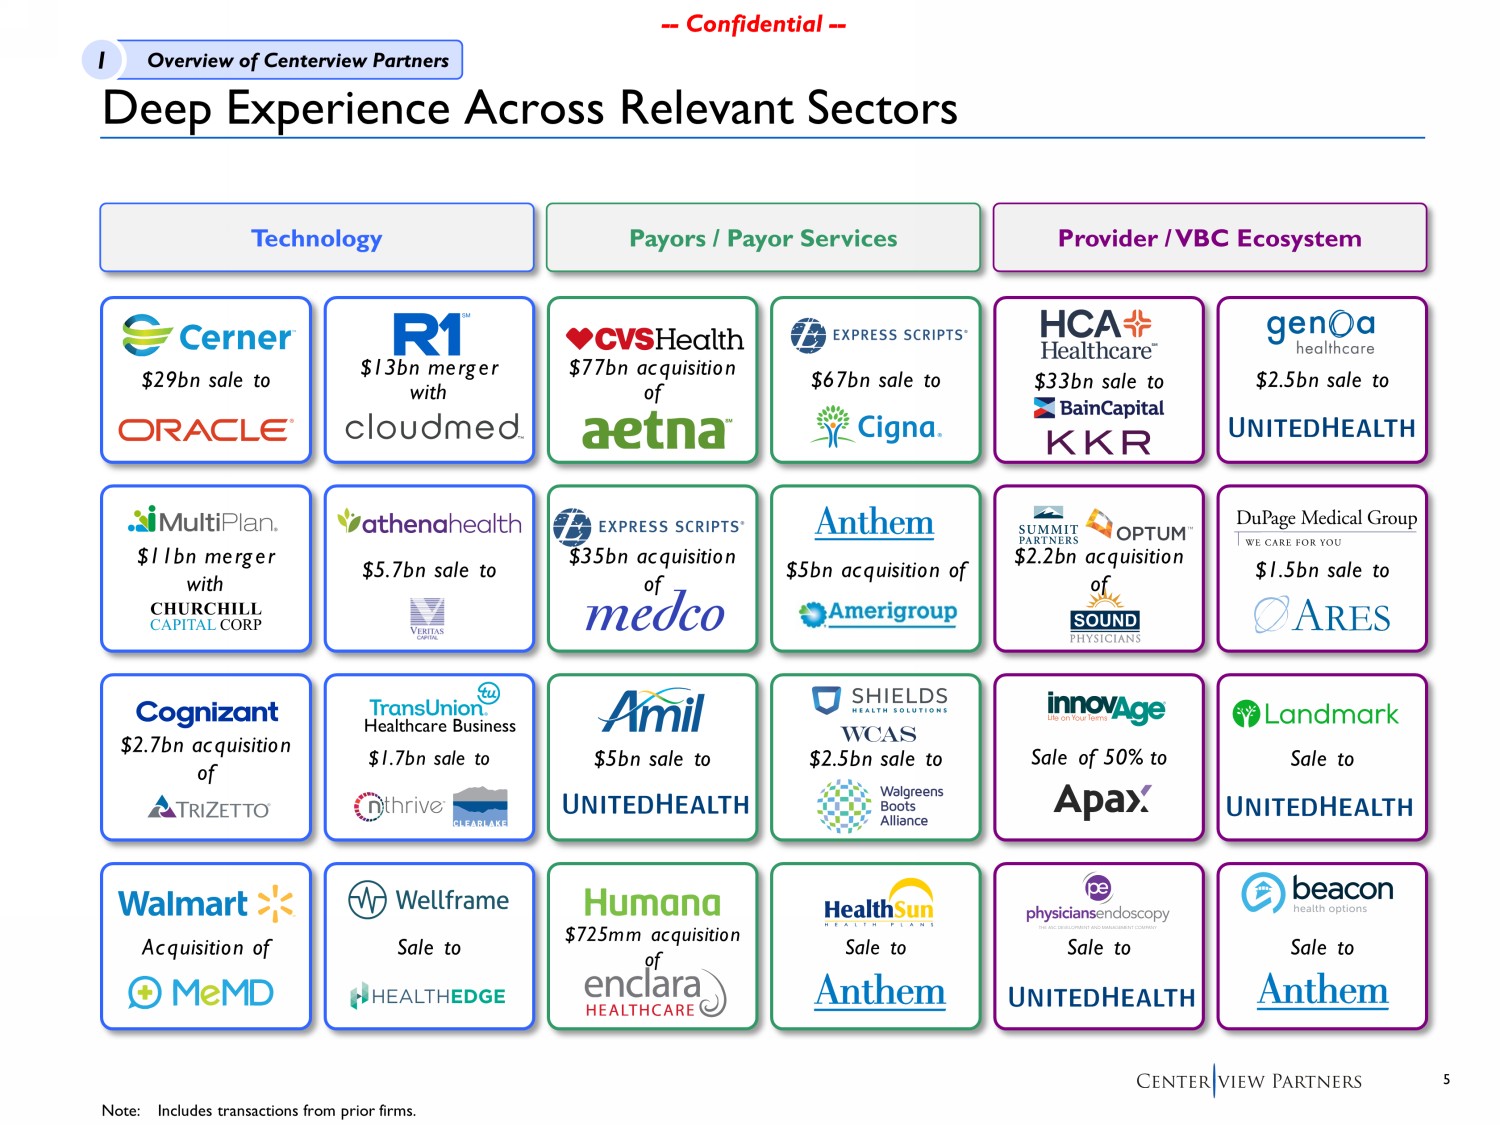
5 -- Confidential -- -- Confidential -- Technology Deep Experience Across Relevant Sectors Payors / Payor Services Provider / VBC Ecosystem $29bn sale to $11bn merger with Acquisition of $2.7bn acquisition of $13bn merger with Sale to $1.7bn sale to $5.7bn sale to $77bn acquisition of $35bn acquisition of $725mm acquisition of $5bn sale to $67bn sale to $5bn acquisition of $2.5bn sale to Sale to Sale of 50% to Sale to $33bn sale to $2.5bn sale to $1.5bn sale to Sale to Sale to Healthcare Business $2.2bn acquisition of 1 Overview of Centerview Partners Note: Includes transactions from prior firms.
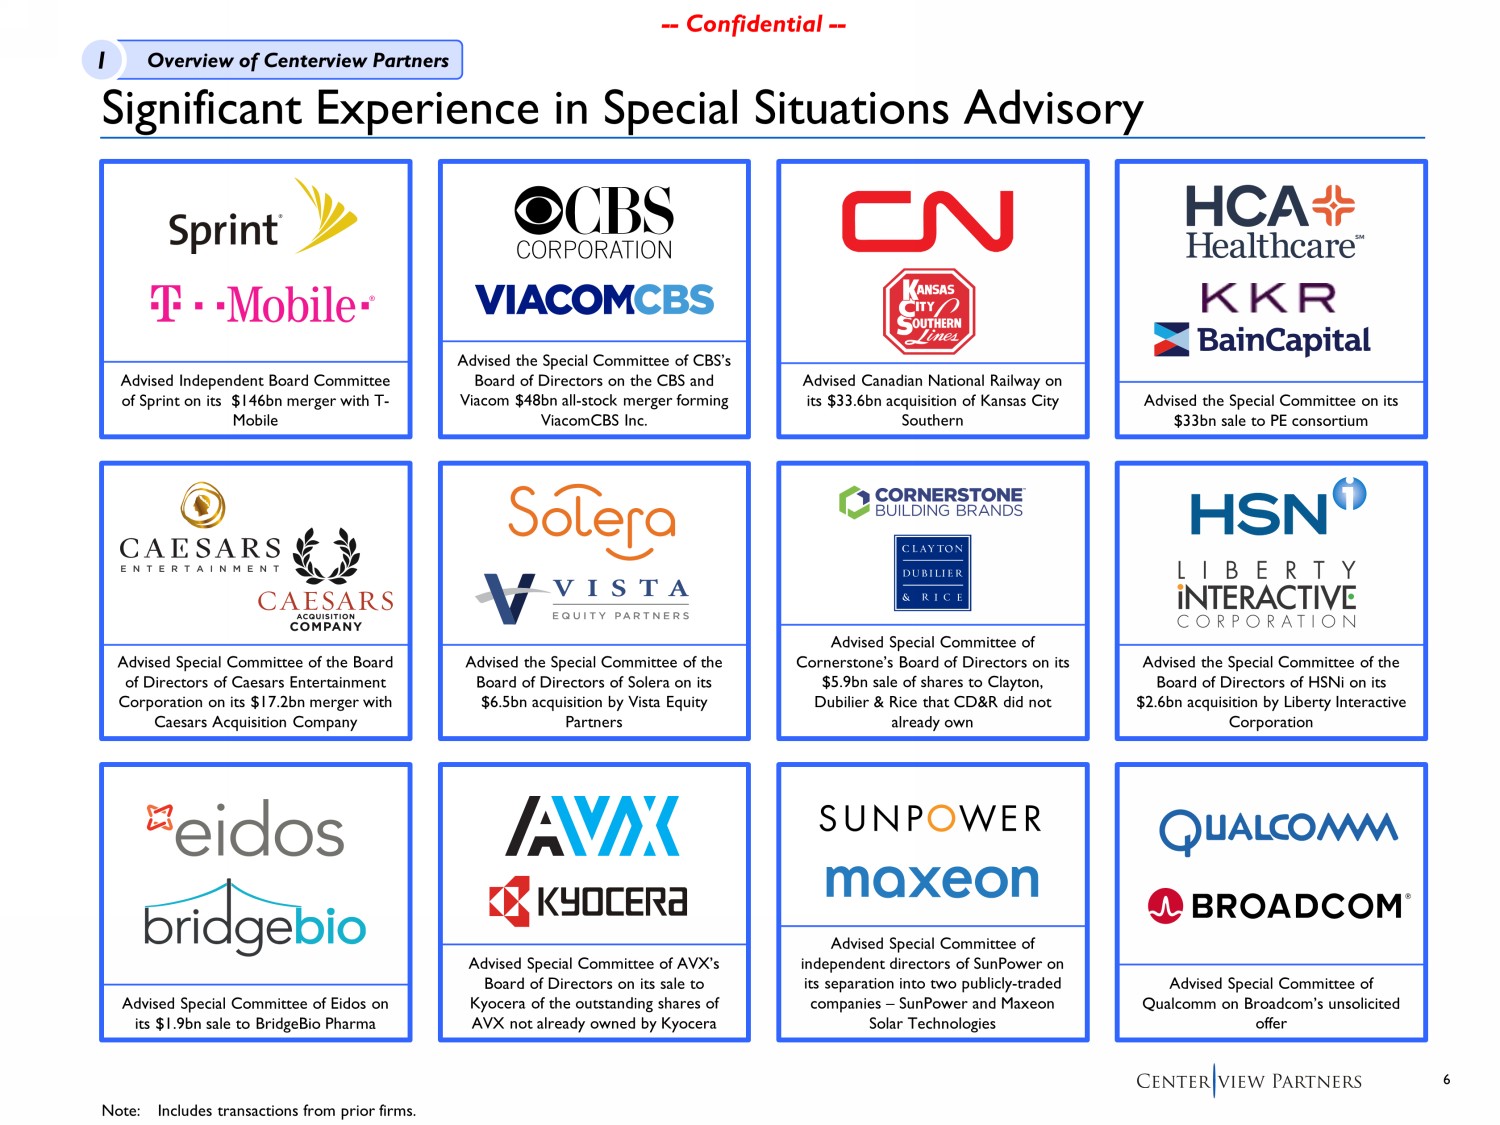
6 -- Confidential -- Significant Experience in Special Situations Advisory Note: Includes transactions from prior firms. Advised the Special Committee on its $33bn sale to PE consortium Advised Special Committee of Qualcomm on Broadcom’s unsolicited offer Advised Independent Board Committee of Sprint on its $146bn merger with T - Mobile Advised the Special Committee of CBS’s Board of Directors on the CBS and Viacom $48bn all - stock merger forming ViacomCBS Inc . Advised Canadian National Railway on its $33.6bn acquisition of Kansas City Southern Advised the Special Committee of the Board of Directors of Solera on its $6.5bn acquisition by Vista Equity Partners Advised the Special Committee of the Board of Directors of HSNi on its $2.6bn acquisition by Liberty Interactive Corporation Advised Special Committee of AVX’s Board of Directors on its sale to Kyocera of the outstanding shares of AVX not already owned by Kyocera Advised Special Committee of independent directors of SunPower on its separation into two publicly - traded companies – SunPower and Maxeon Solar Technologies Advised Special Committee of the Board of Directors of Caesars Entertainment Corporation on its $17.2bn merger with Caesars Acquisition Company Advised Special Committee of Eidos on its $1.9bn sale to BridgeBio Pharma Advised Special Committee of Cornerstone’s Board of Directors on its $5.9bn sale of shares to Clayton, Dubilier & Rice that CD&R did not already own 1 Overview of Centerview Partners
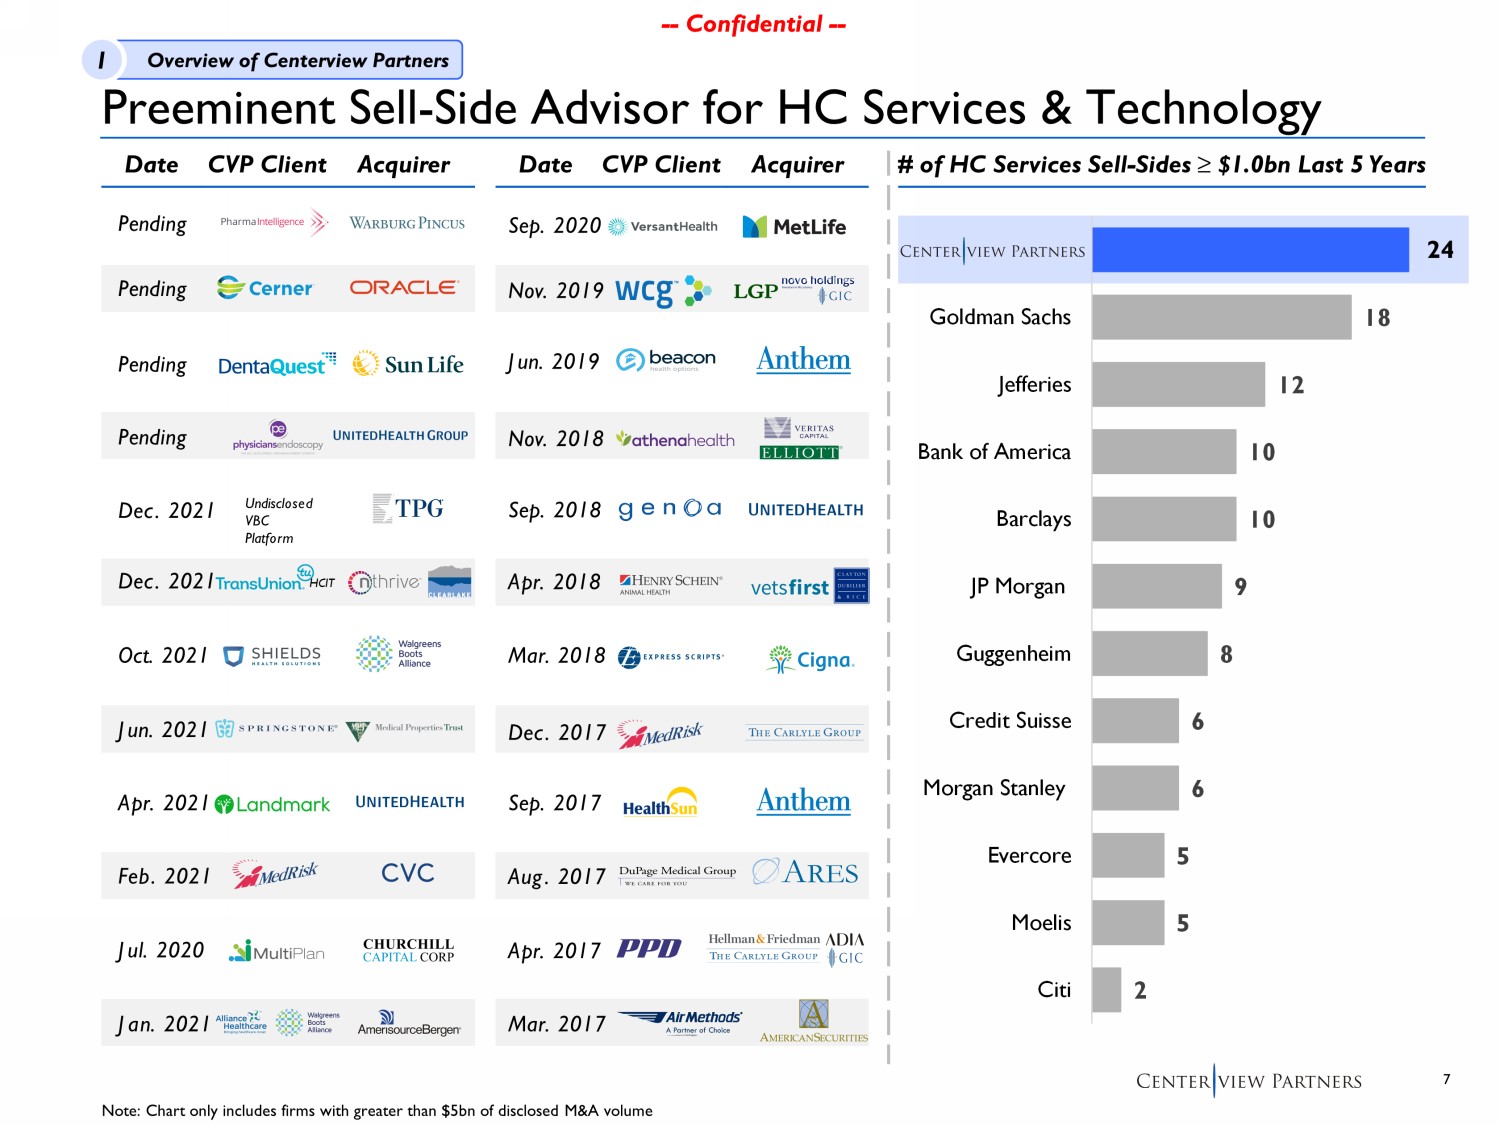
7 -- Confidential -- -- Confidential -- Preeminent Sell - Side Advisor for HC Services & Technology # of HC Services Sell - Sides ≥ $ 1.0bn Last 5 Years Date CVP Client Note: Chart only includes firms with greater than $5bn of disclosed M&A volume Apr. 2021 Feb. 2021 Jan. 2021 Sep. 2020 Jul. 2020 Nov. 2019 Jun. 2019 Nov. 2018 Sep. 2018 Apr. 2018 Mar. 2018 Dec. 2017 Sep. 2017 Aug. 2017 Mar. 2017 Oct. 2021 Dec. 2021 Pending HCIT Acquirer Dec. 2021 Pending Date CVP Client Acquirer Undisclosed VBC Platform Pending 22 18 12 10 10 9 8 6 6 5 5 2 Goldman Sachs Jefferies Bank of America Barclays JP Morgan Guggenheim Credit Suisse Morgan Stanley Evercore Moelis Citi Apr. 2017 Jun. 2021 Pending 24 1 Overview of Centerview Partners
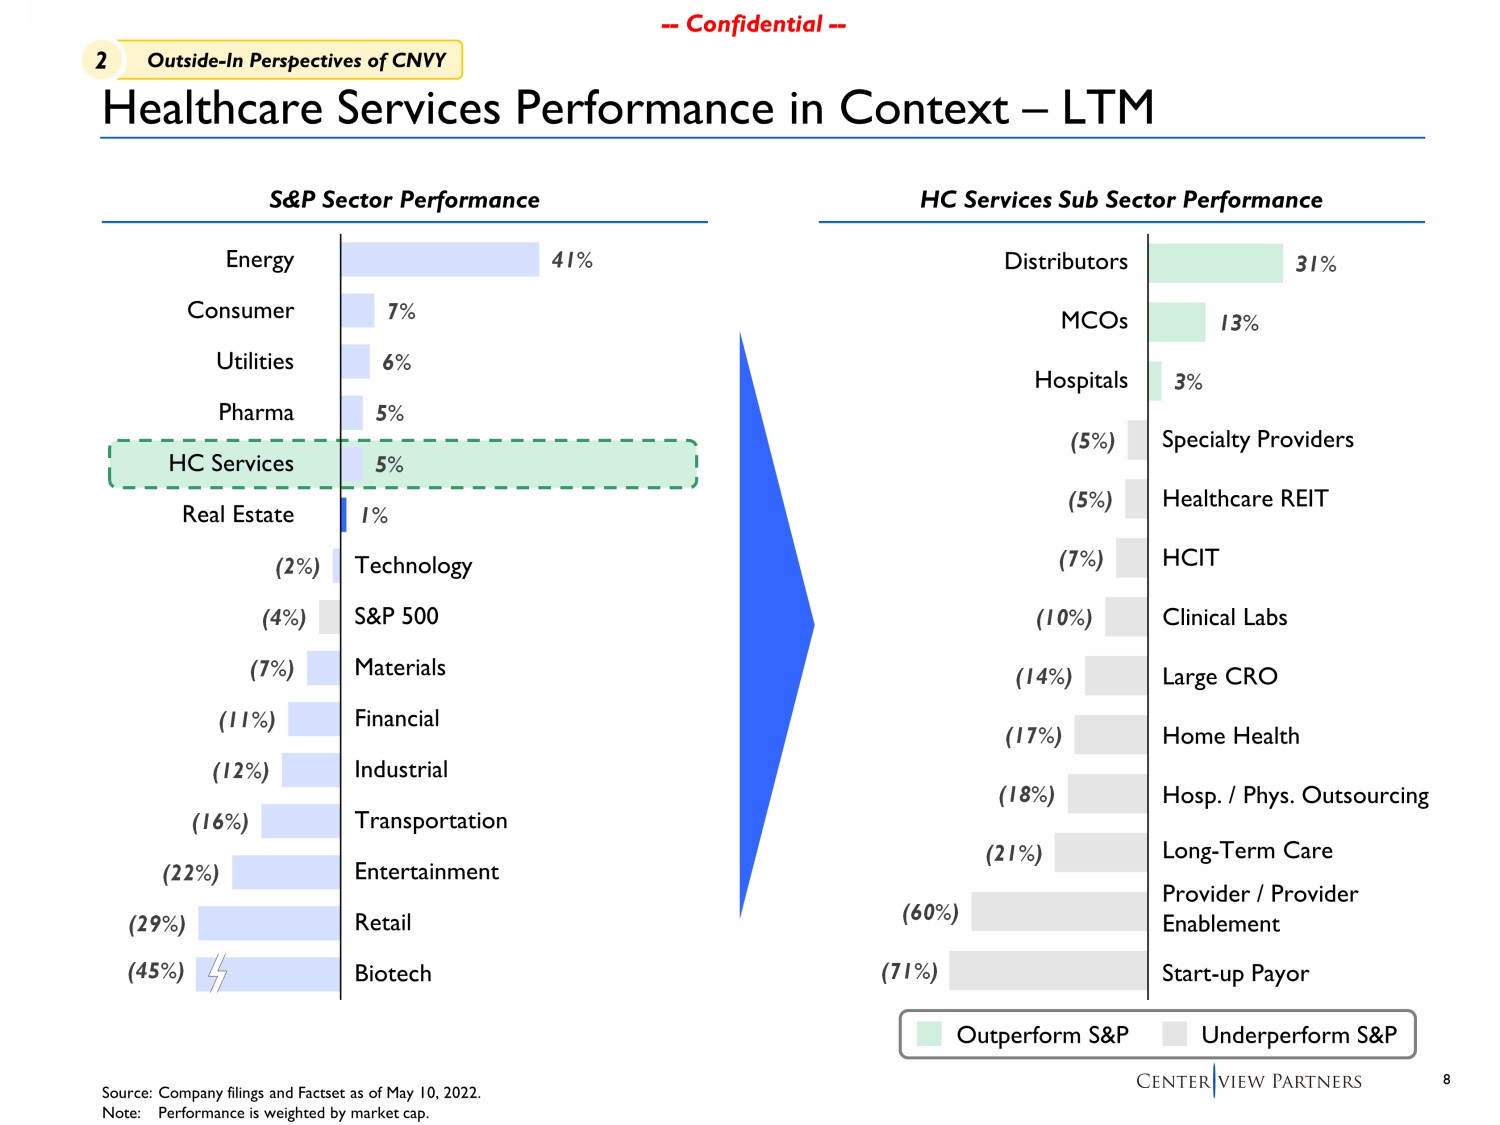
8 -- Confidential -- -- Confidential -- 31% 13% 3% (5%) (5%) (7%) (10%) (14%) (17%) (18%) (21%) (60%) (71%) 41% 7% 6% 5% 5% 1% (2%) (4%) (7%) (11%) (12%) (16%) (22%) (29%) (45%) Healthcare Services Performance in Context – LTM Energy Pharma Retail Consumer Utilities Transportation HC Services Entertainment Real Estate Technology Industrial Materials S&P 500 Financial Biotech S&P Sector Performance HC Services Sub Sector Performance Distributors Specialty Providers Healthcare REIT Hospitals Large CRO MCOs Home Health Clinical Labs HCIT Hosp. / Phys. Outsourcing Long - Term Care Provider / Provider Enablement Start - up Payor Outperform S&P Underperform S&P Source: Company filings and Factset as of May 10, 2022. Note: Performance is weighted by market cap. 2 Outside - In Perspectives of CNVY
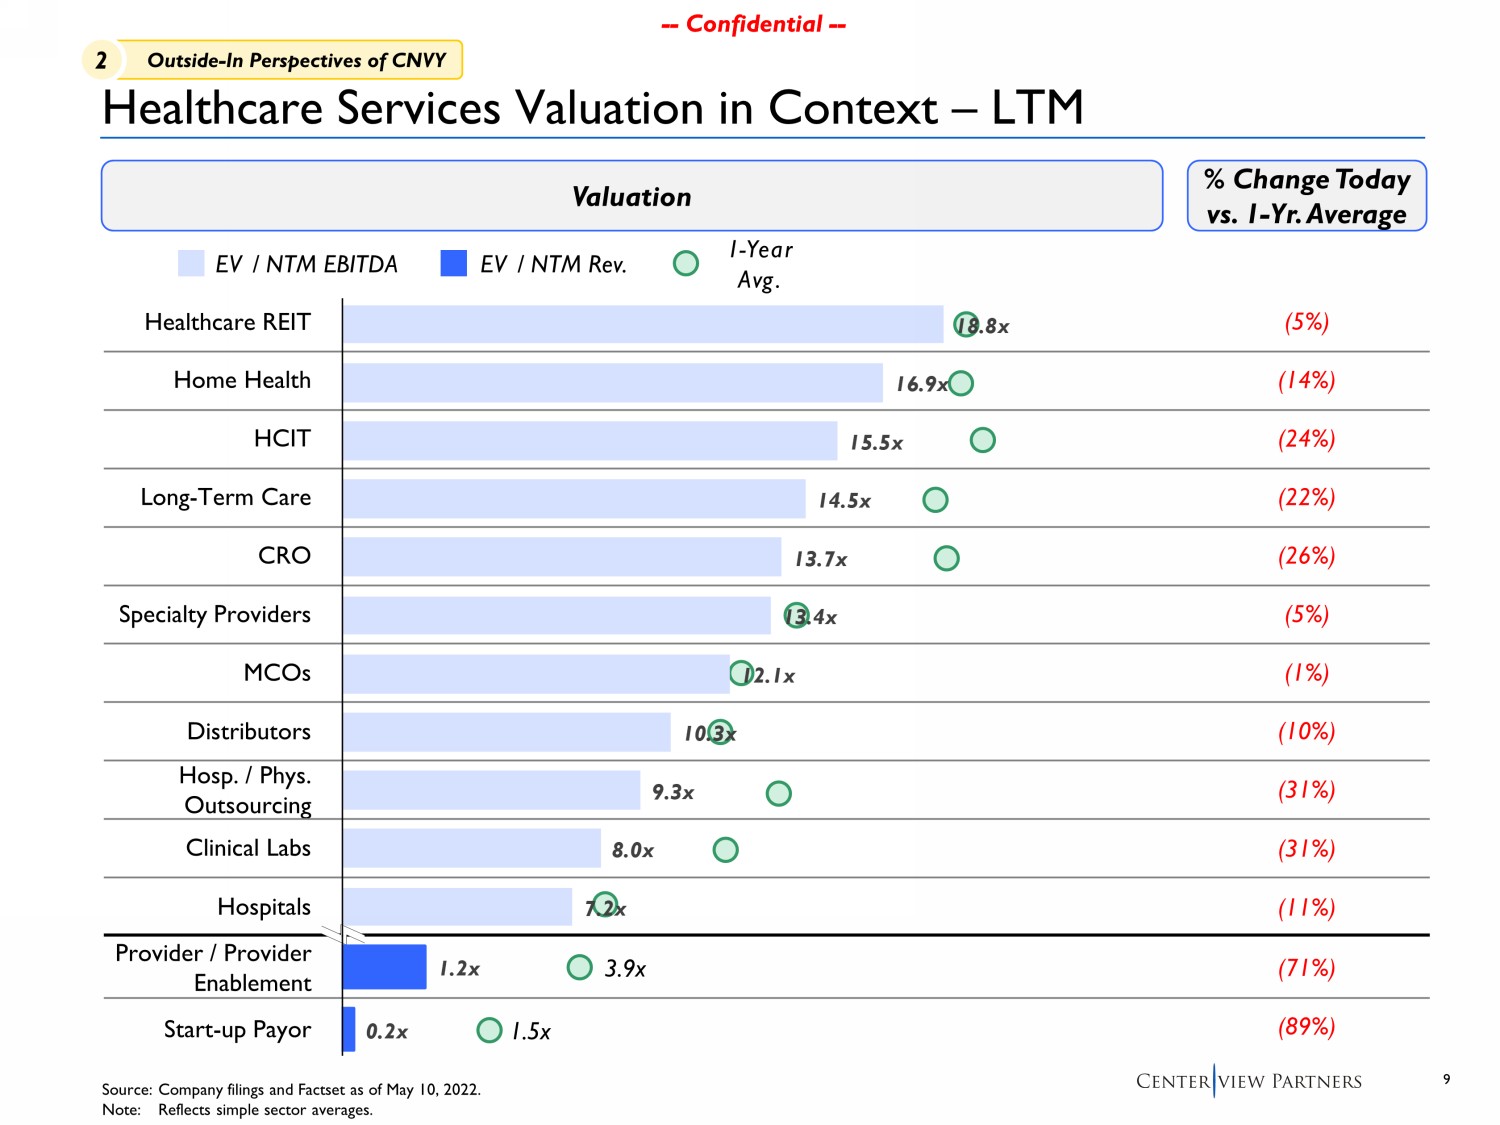
9 -- Confidential -- -- Confidential -- Provider / Provider Enablement Start - up Payor Home Health Long - Term Care Healthcare REIT CRO HCIT Clinical Labs MCOs Specialty Providers Distributors Hosp. / Phys. Outsourcing Hospitals Valuation % Change Today vs. 1 - Yr. Average (71%) (89%) (5%) (14%) (24%) (22%) (26%) (5%) (1%) (10%) (31%) (31%) (11%) Source: Company filings and Factset as of May 10, 2022. Note: Reflects simple sector averages. 1 - Year Avg. EV / NTM Rev. EV / NTM EBITDA 3.9x Healthcare Services Valuation in Context – LTM 1.5x 18.8x 16.9x 15.5x 14.5x 13.7x 13.4x 12.1x 10.3x 9.3x 8.0x 7.2x 1.2x 0.2x 2 Outside - In Perspectives of CNVY

10 -- Confidential -- -- Confidential -- Jun-21 May-19 May-20 May-21 May-22 Share Price Performance YTD 1 Year 3 Years (33.8%) NA NA Peers (21.3%) (20.4%) +7.1% S&P 500 (16.6%) (4.5%) +38.9% Share Price Performance vs. Broader HCIT Sector Source: Factset as of May 10, 2022. (1) Peers include Allscripts , NextGen , CPSI, Evolent , R1 RCM, HealthStream , Premier, Phreesia , MultiPlan , Health Catalyst and Signify Health. Share Price Performance since CNVY IPO +30% +11% +6% +4% (6%) (11%) (27%) (48%) (58%) (59%) (73%) (77%) +39% +7% $5.82 (58%) $14 $5.82 (58%) (5%) (21%) Past 3 Years Since Convey’s IPO S&P 500 Peers (1) May - 22 2 Outside - In Perspectives of CNVY
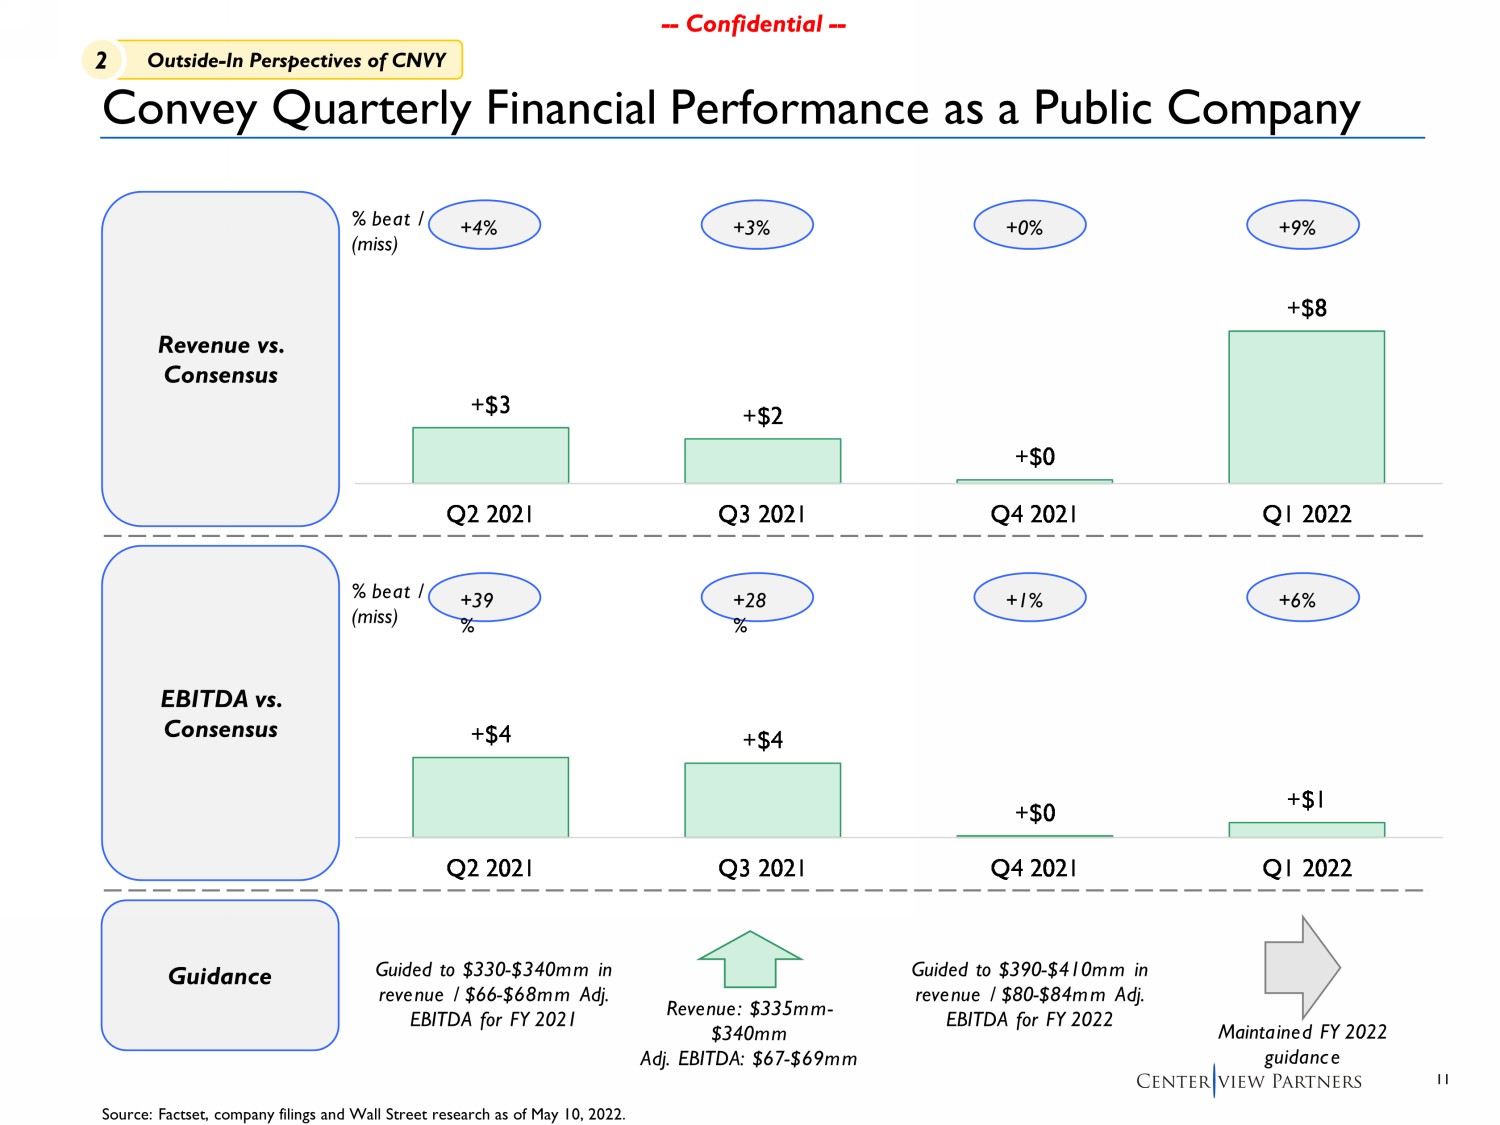
11 -- Confidential -- -- Confidential -- +$8 +$0 +$2 +$3 Q1 2022 Q4 2021 Q3 2021 Q2 2021 +$1 +$0 +$4 +$4 Q1 2022 Q4 2021 Q3 2021 Q2 2021 Convey Quarterly Financial Performance as a Public Company Revenue vs. Consensus EBITDA vs. Consensus Source: Factset , company filings and Wall Street research as of May 10, 2022 . +39 % % beat / (miss) +28 % +1% +6% +4% % beat / (miss) + 3% +0% +9% Guidance Guided to $330 - $340mm in revenue / $66 - $68mm Adj. EBITDA for FY 2021 Revenue: $335mm - $340mm Adj. EBITDA: $67 - $69mm Guided to $390 - $410mm in revenue / $80 - $84mm Adj. EBITDA for FY 2022 Maintained FY 2022 guidance 2 Outside - In Perspectives of CNVY
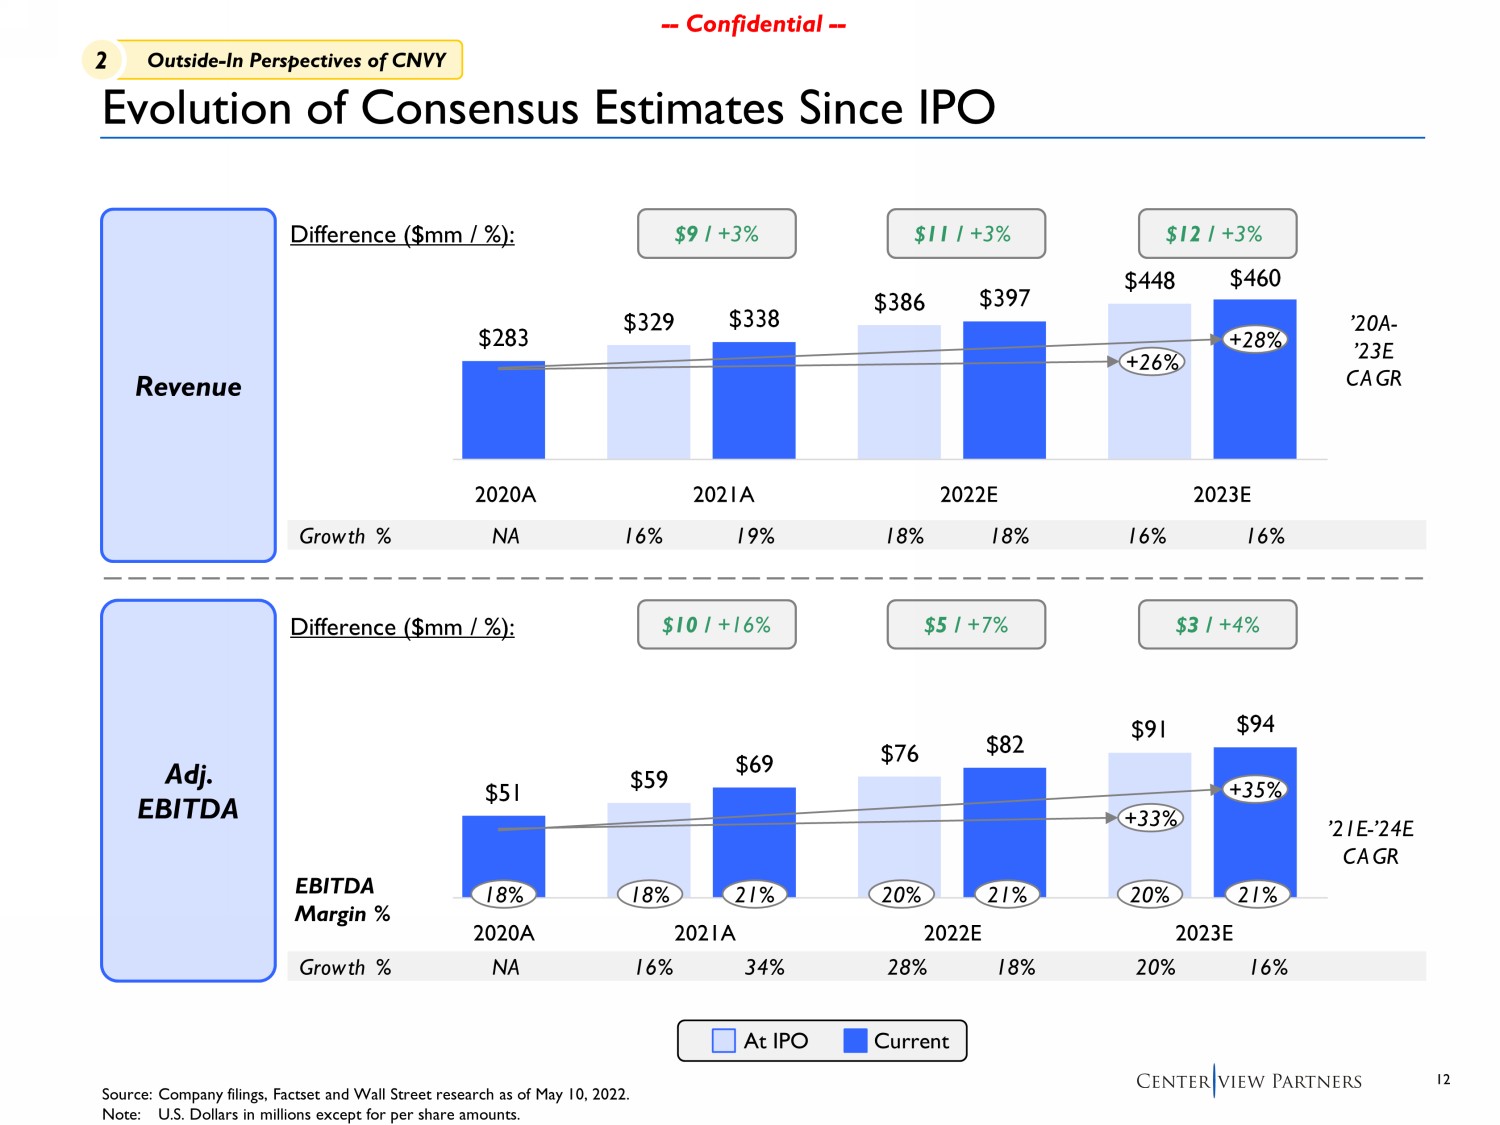
12 -- Confidential -- -- Confidential -- $59 $76 $91 $51 $69 $82 $94 2020A 2021A 2022E 2023E $329 $386 $448 $283 $338 $397 $460 2020A 2021A 2022E 2023E 2021A 2022E 2023E 2020A 2021A 2022E 2023E Evolution of Consensus Estimates Since IPO Source: Company filings, Factset and Wall Street research as of May 10, 2022. Note: U.S. Dollars in millions except for per share amounts . At IPO Current Revenue Adj. EBITDA EBITDA Margin % +35% +33% +28% +26% ’20A - ’23E CAGR ’21E - ’24E CAGR 2020A Difference ($mm / %): Difference ($mm / %): $9 / +3% $11 / +3% $12 / +3% $10 / +16% $5 / +7% $3 / +4% 18% 18% 21% 20% 21% 20% 21% Growth % 16% 18% 19% 18% 16% 16% NA Growth % 16% 28% 34% 18% 20% 16% NA 2 Outside - In Perspectives of CNVY
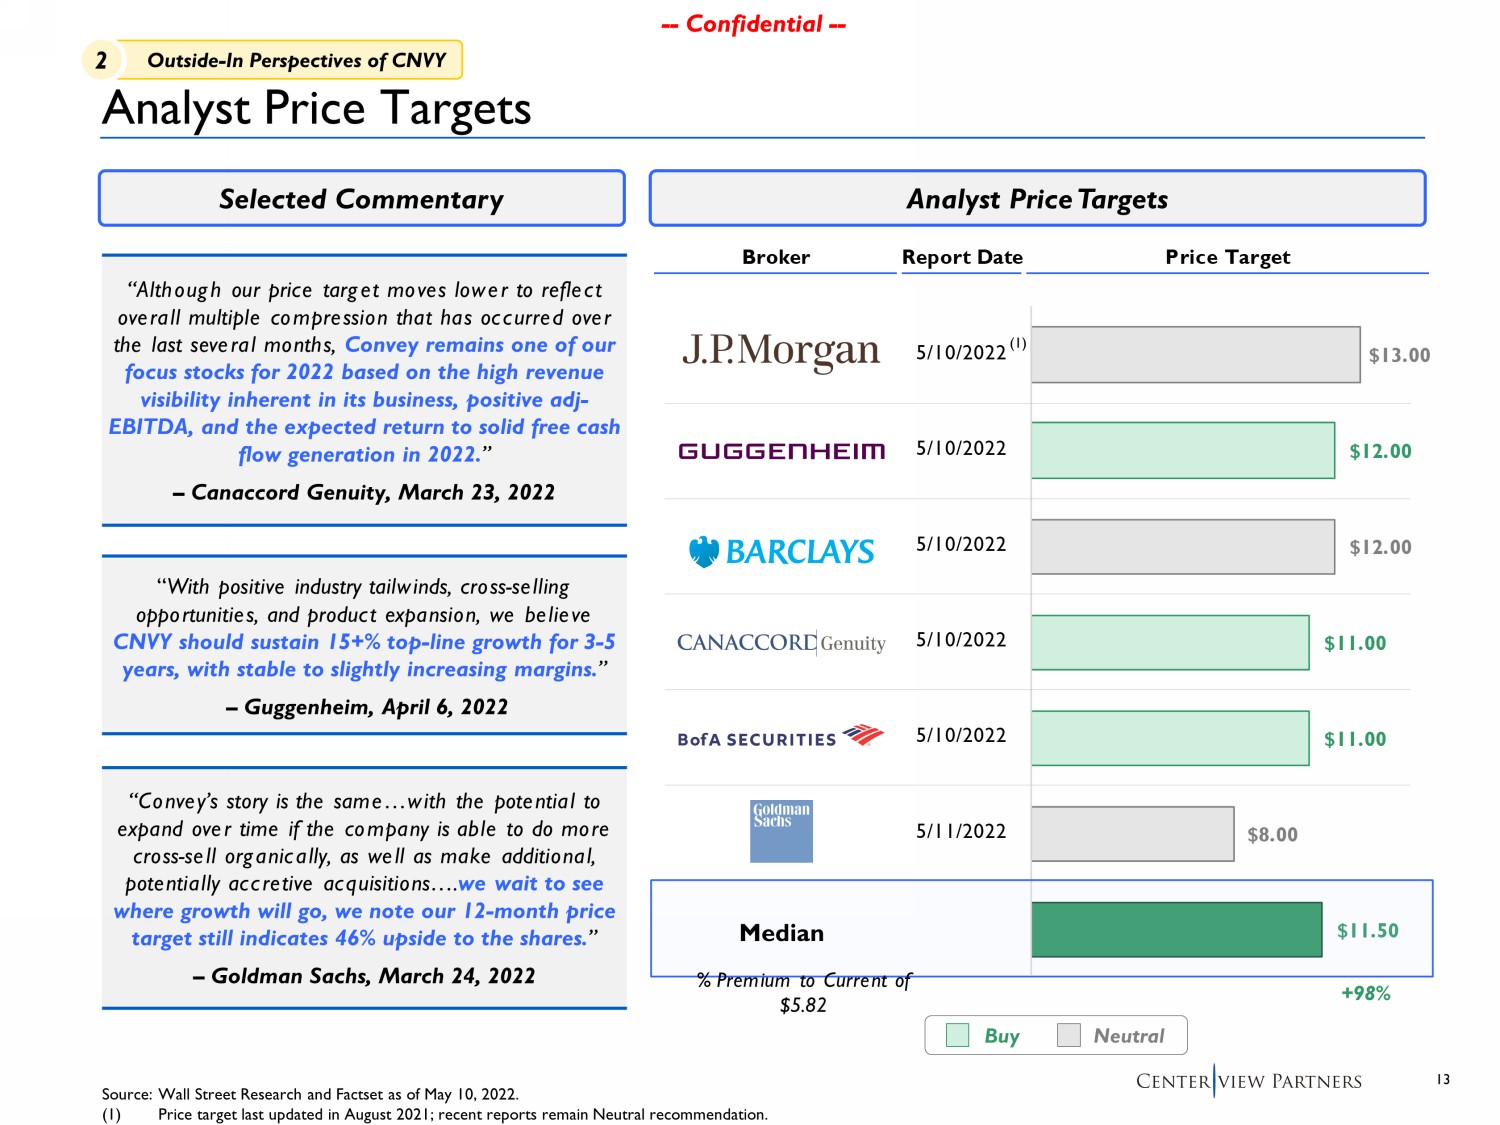
13 -- Confidential -- -- Confidential -- Broker Report Date Price Target 5/10/2022 5/10/2022 5/10/2022 5/10/2022 5/10/2022 5/11/2022 $11.50 $8.00 $11.00 $11.00 $12.00 $12.00 $13.00 Analyst Price Targets Source: Wall Street Research and Factset as of May 10, 2022. (1) Price target last updated in August 2021; recent reports remain Neutral recommendation. Buy “ Convey’s story is the same…with the potential to expand over time if the company is able to do more cross - sell organically, as well as make additional, potentially accretive acquisitions…. we wait to see where growth will go, we note our 12 - month price target still indicates 46% upside to the shares . ” – Goldman Sachs, March 24, 2022 “Although our price target moves lower to reflect overall multiple compression that has occurred over the last several months , Convey remains one of our focus stocks for 2022 based on the high revenue visibility inherent in its business, positive adj - EBITDA, and the expected return to solid free cash flow generation in 2022. ” – Canaccord Genuity , March 23, 2022 “ With positive industry tailwinds, cross - selling opportunities, and product expansion, we believe CNVY should sustain 15+% top - line growth for 3 - 5 years, with stable to slightly increasing margins . ” – Guggenheim, April 6, 2022 Selected Commentary Analyst Price Targets Neutral +98% % Premium to Current of $5.82 Median (1) 2 Outside - In Perspectives of CNVY
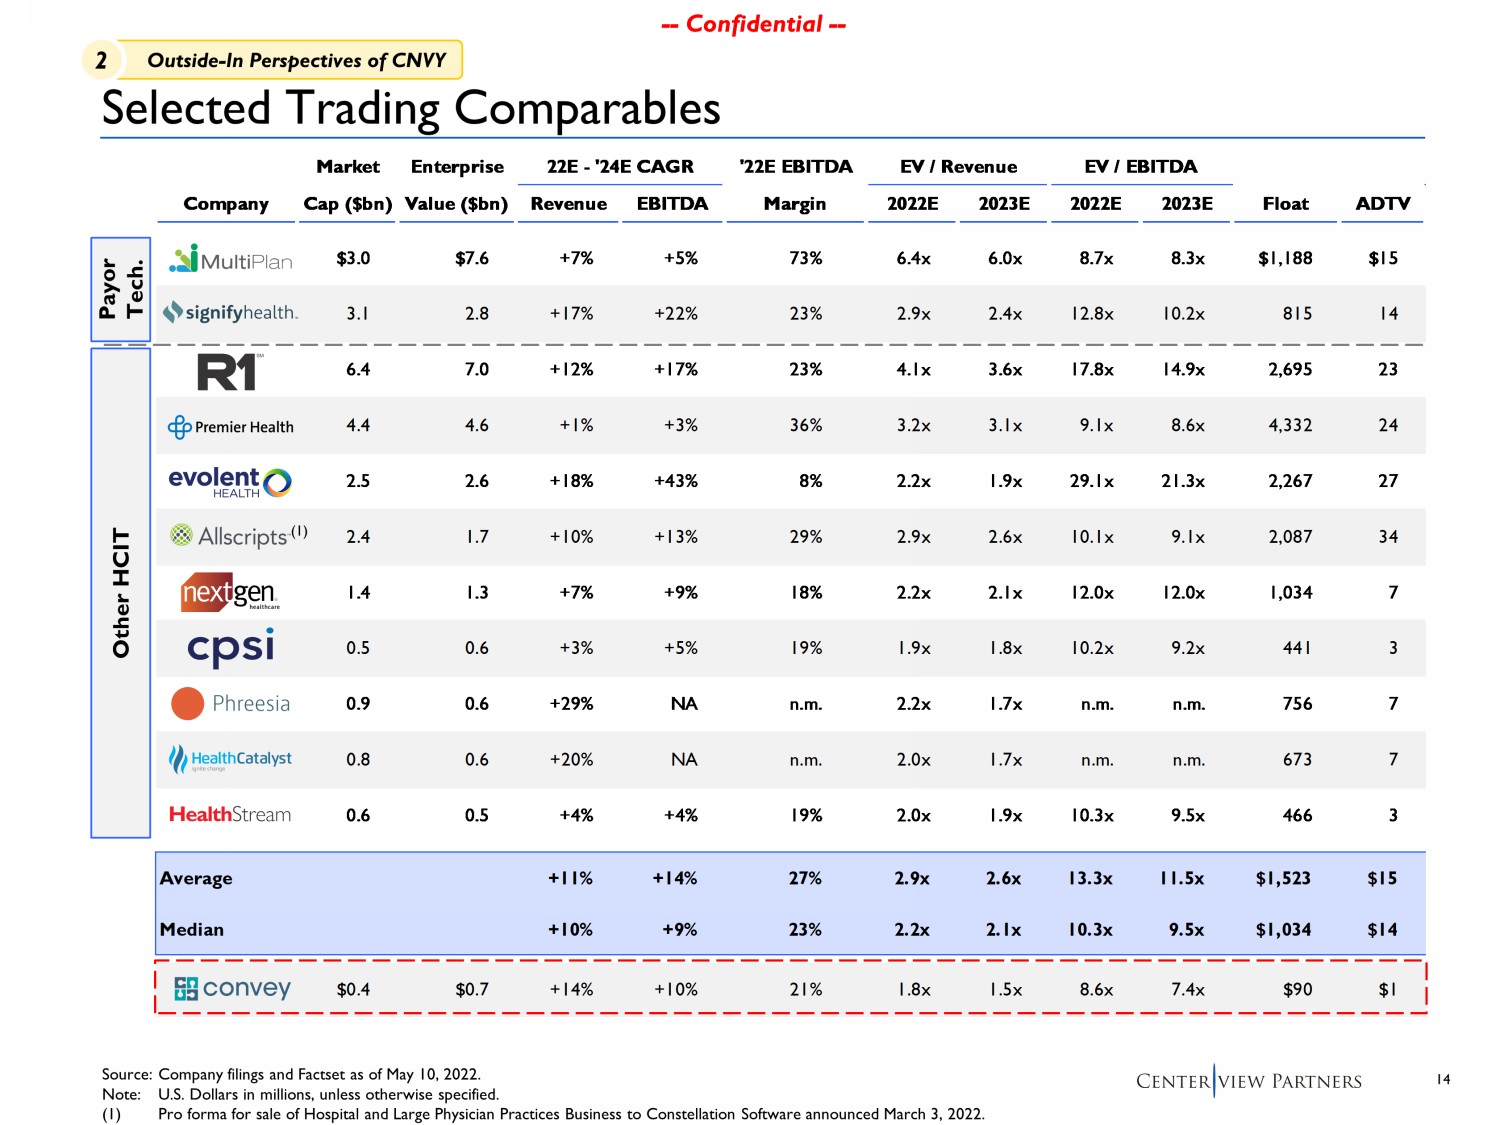
14 -- Confidential -- -- Confidential -- Market Enterprise 22E - '24E CAGR '22E EBITDA EV / Revenue EV / EBITDA LTM Leverage Company Cap ($bn) Value ($bn) Revenue EBITDA Margin 2022E 2023E 2022E 2023E Float ADTV $3.0 $7.6 +7% +5% 73% 6.4x 6.0x 8.7x 8.3x $1,188 $15 3.1 2.8 +17% +22% 23% 2.9x 2.4x 12.8x 10.2x 815 14 6.4 7.0 +12% +17% 23% 4.1x 3.6x 17.8x 14.9x 2,695 23 4.4 4.6 +1% +3% 36% 3.2x 3.1x 9.1x 8.6x 4,332 24 2.5 2.6 +18% +43% 8% 2.2x 1.9x 29.1x 21.3x 2,267 27 2.4 1.7 +10% +13% 29% 2.9x 2.6x 10.1x 9.1x 2,087 34 1.4 1.3 +7% +9% 18% 2.2x 2.1x 12.0x 12.0x 1,034 7 0.5 0.6 +3% +5% 19% 1.9x 1.8x 10.2x 9.2x 441 3 0.9 0.6 +29% NA n.m. 2.2x 1.7x n.m. n.m. 756 7 0.8 0.6 +20% NA n.m. 2.0x 1.7x n.m. n.m. 673 7 0.6 0.5 +4% +4% 19% 2.0x 1.9x 10.3x 9.5x 466 3 Average +11% +14% 27% 2.9x 2.6x 13.3x 11.5x $1,523 $15 Median +10% +9% 23% 2.2x 2.1x 10.3x 9.5x $1,034 $14 $0.4 $0.7 +14% +10% 21% 1.8x 1.5x 8.6x 7.4x $90 $1 Selected Trading Comparables Source: Company filings and Factset as of May 10, 2022 . Note: U.S. Dollars in millions, unless otherwise specified. (1) Pro forma for sale of Hospital and Large Physician Practices Business to Constellation Software announced March 3, 2022. (1) Payor Tech. Other HCIT 2 Outside - In Perspectives of CNVY
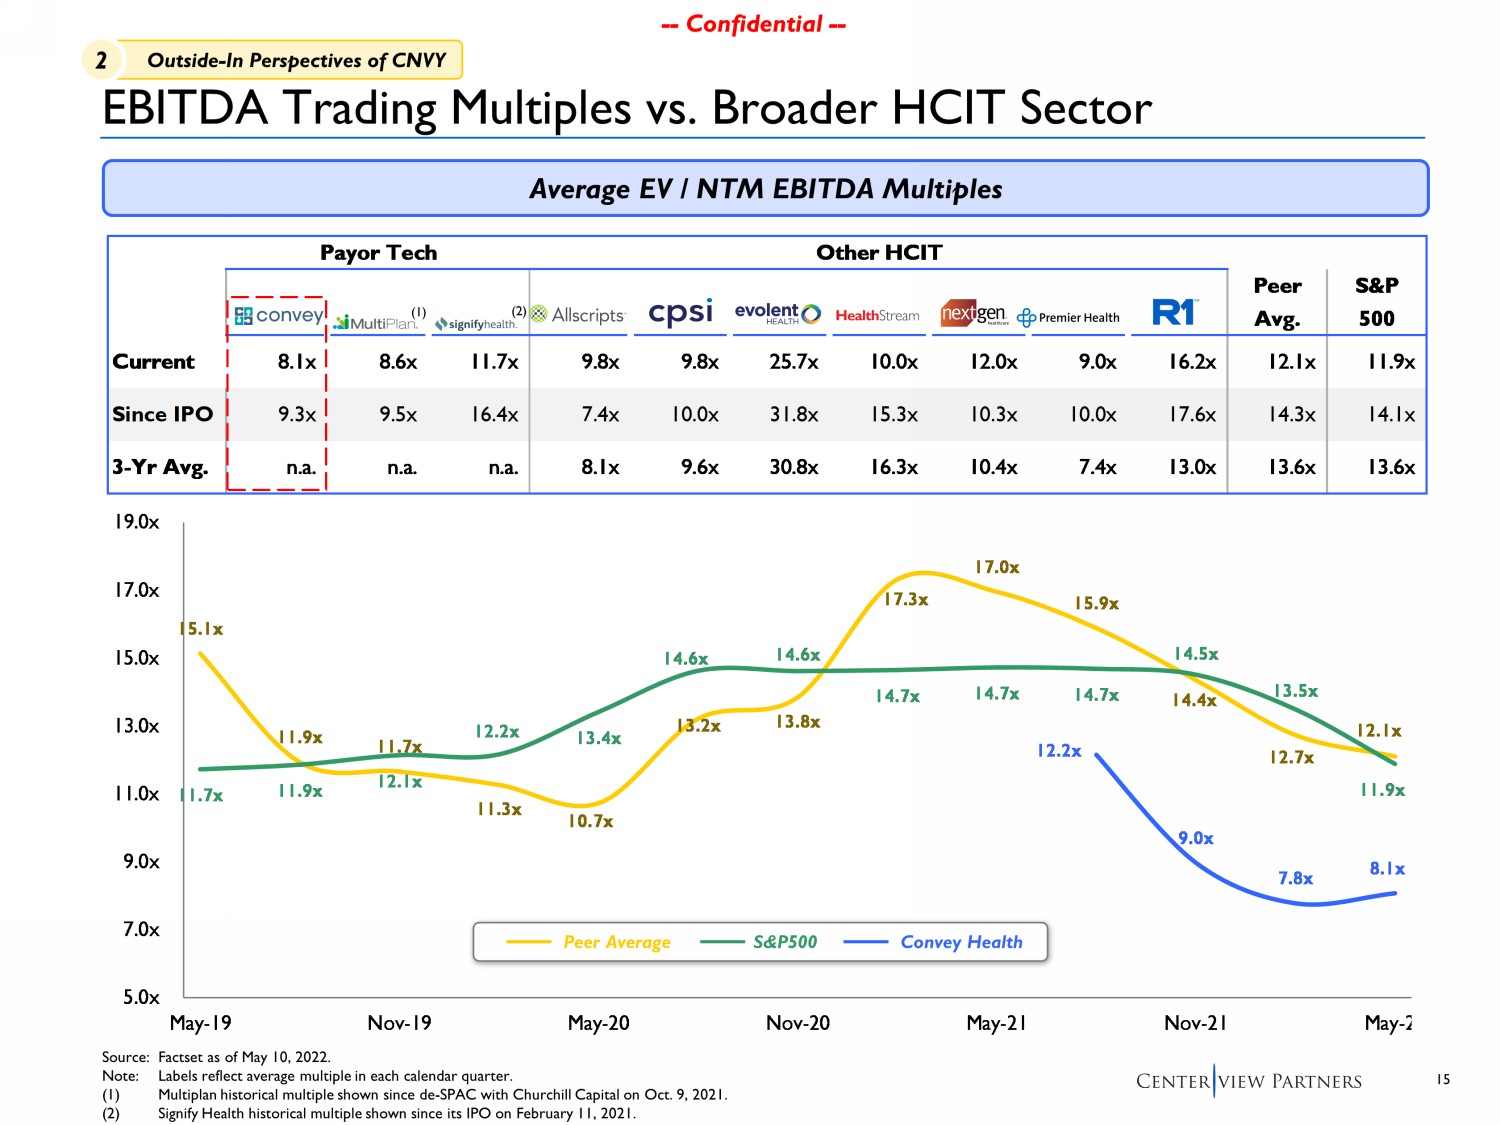
15 -- Confidential -- -- Confidential -- Payor Tech Other HCIT CNVY MPLN SGFY MDRX CPSI EVH HSTM NXGN PINC RCM Peer Avg. S&P 500 Current 8.1x 8.6x 11.7x 9.8x 9.8x 25.7x 10.0x 12.0x 9.0x 16.2x 12.1x 11.9x Since IPO 9.3x 9.5x 16.4x 7.4x 10.0x 31.8x 15.3x 10.3x 10.0x 17.6x 14.3x 14.1x 3-Yr Avg. n.a. n.a. n.a. 8.1x 9.6x 30.8x 16.3x 10.4x 7.4x 13.0x 13.6x 13.6x 12.2x 9.0x 7.8x 8.1x 15.1x 11.9x 11.7x 11.3x 10.7x 13.2x 13.8x 17.3x 17.0x 15.9x 14.4x 12.7x 12.1x 11.7x 11.9x 12.1x 12.2x 13.4x 14.6x 14.6x 14.7x 14.7x 14.7x 14.5x 13.5x 11.9x 5.0x 7.0x 9.0x 11.0x 13.0x 15.0x 17.0x 19.0x May-19 Nov-19 May-20 Nov-20 May-21 Nov-21 May-22 EBITDA Trading Multiples vs. Broader HCIT Sector Average EV / NTM EBITDA Multiples Source: Factset as of May 10, 2022. Note: Labels reflect average multiple in each calendar quarter. (1) Multiplan historical multiple shown since de - SPAC with Churchill Capital on Oct. 9, 2021. (2) Signify Health historical multiple shown since its IPO on February 11, 2021. Peer Average S&P500 Convey Health (1) (2) 2 Outside - In Perspectives of CNVY
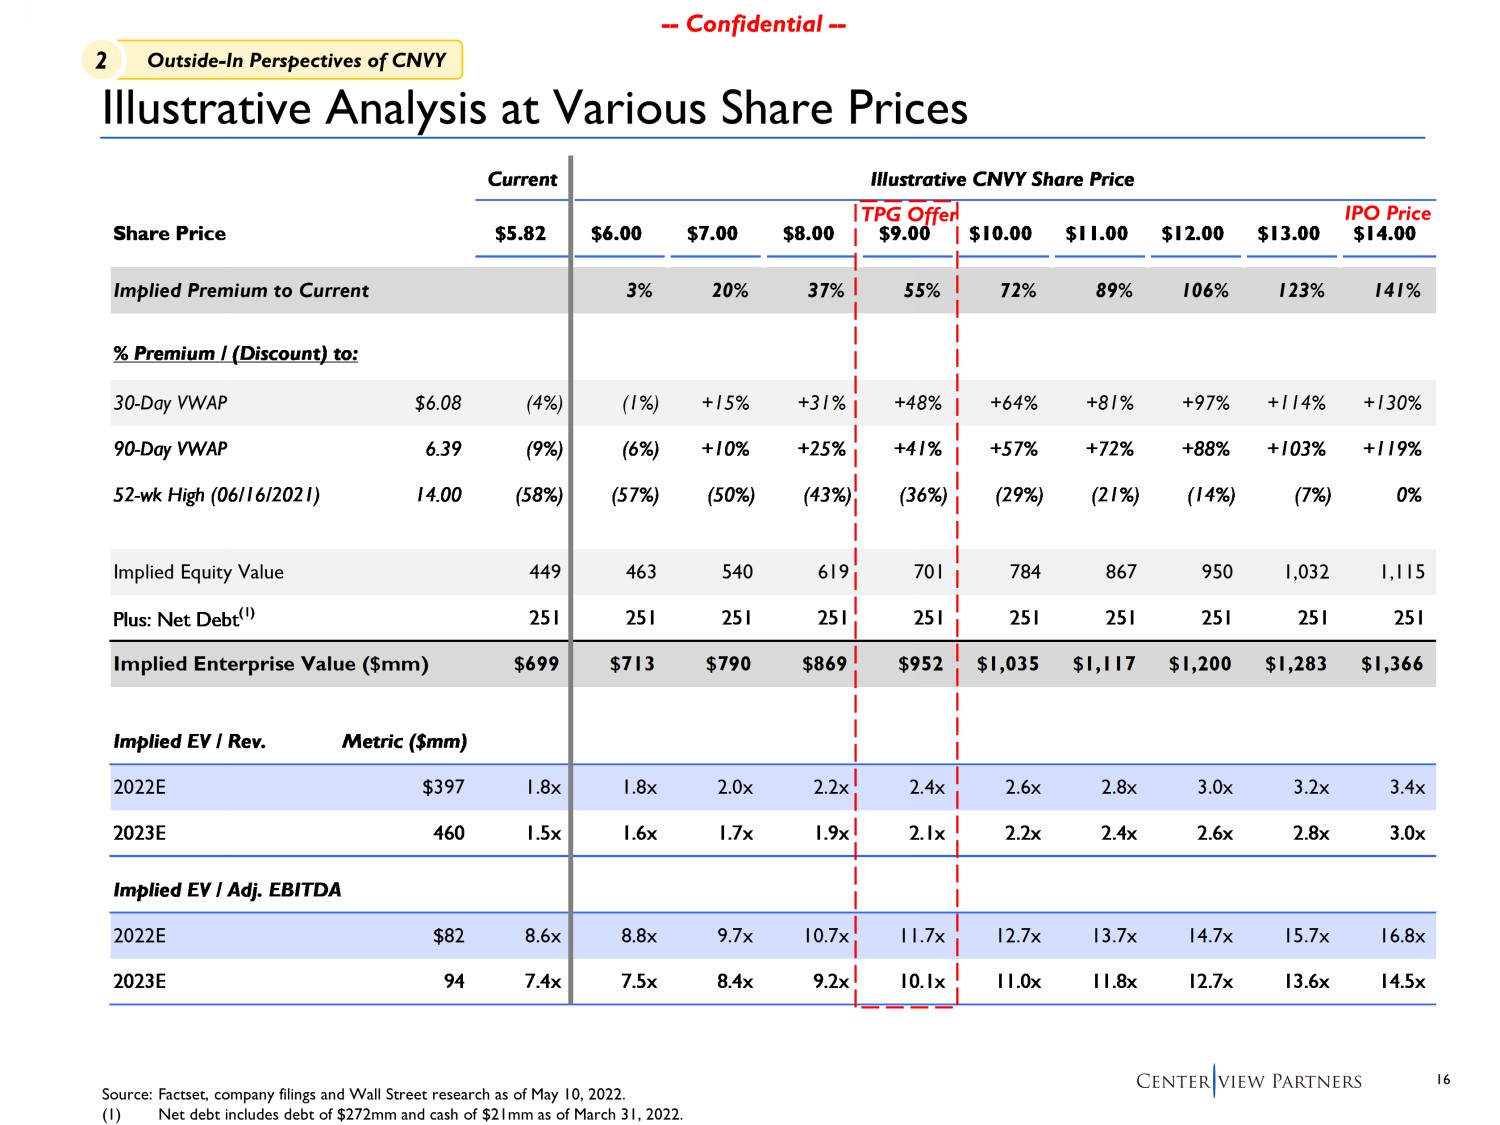
16 -- Confidential -- -- Confidential -- Current Illustrative CNVY Share Price Share Price $5.82 $6.00 $7.00 $8.00 $9.00 $10.00 $11.00 $12.00 $13.00 $14.00 Implied Premium to Current 3% 20% 37% 55% 72% 89% 106% 123% 141% % Premium / (Discount) to: 30-Day VWAP $6.08 (4%) (1%) +15% +31% +48% +64% +81% +97% +114% +130% 90-Day VWAP 6.39 (9%) (6%) +10% +25% +41% +57% +72% +88% +103% +119% 52-wk High (06/16/2021) 14.00 (58%) (57%) (50%) (43%) (36%) (29%) (21%) (14%) (7%) 0% Implied Equity Value 449 463 540 619 701 784 867 950 1,032 1,115 Plus: Net Debt (1) 251 251 251 251 251 251 251 251 251 251 Implied Enterprise Value ($mm) $699 $713 $790 $869 $952 $1,035 $1,117 $1,200 $1,283 $1,366 Implied EV / Rev. Metric ($mm) 2022E $397 1.8x 1.8x 2.0x 2.2x 2.4x 2.6x 2.8x 3.0x 3.2x 3.4x 2023E 460 1.5x 1.6x 1.7x 1.9x 2.1x 2.2x 2.4x 2.6x 2.8x 3.0x Implied EV / Adj. EBITDA 2022E $82 8.6x 8.8x 9.7x 10.7x 11.7x 12.7x 13.7x 14.7x 15.7x 16.8x 2023E 94 7.4x 7.5x 8.4x 9.2x 10.1x 11.0x 11.8x 12.7x 13.6x 14.5x Illustrative Analysis at Various Share Prices Source: Factset , company filings and Wall Street research as of May 10, 2022 . (1) Net debt includes debt of $272mm and cash of $21mm as of March 31, 2022. TPG Offer IPO Price 2 Outside - In Perspectives of CNVY
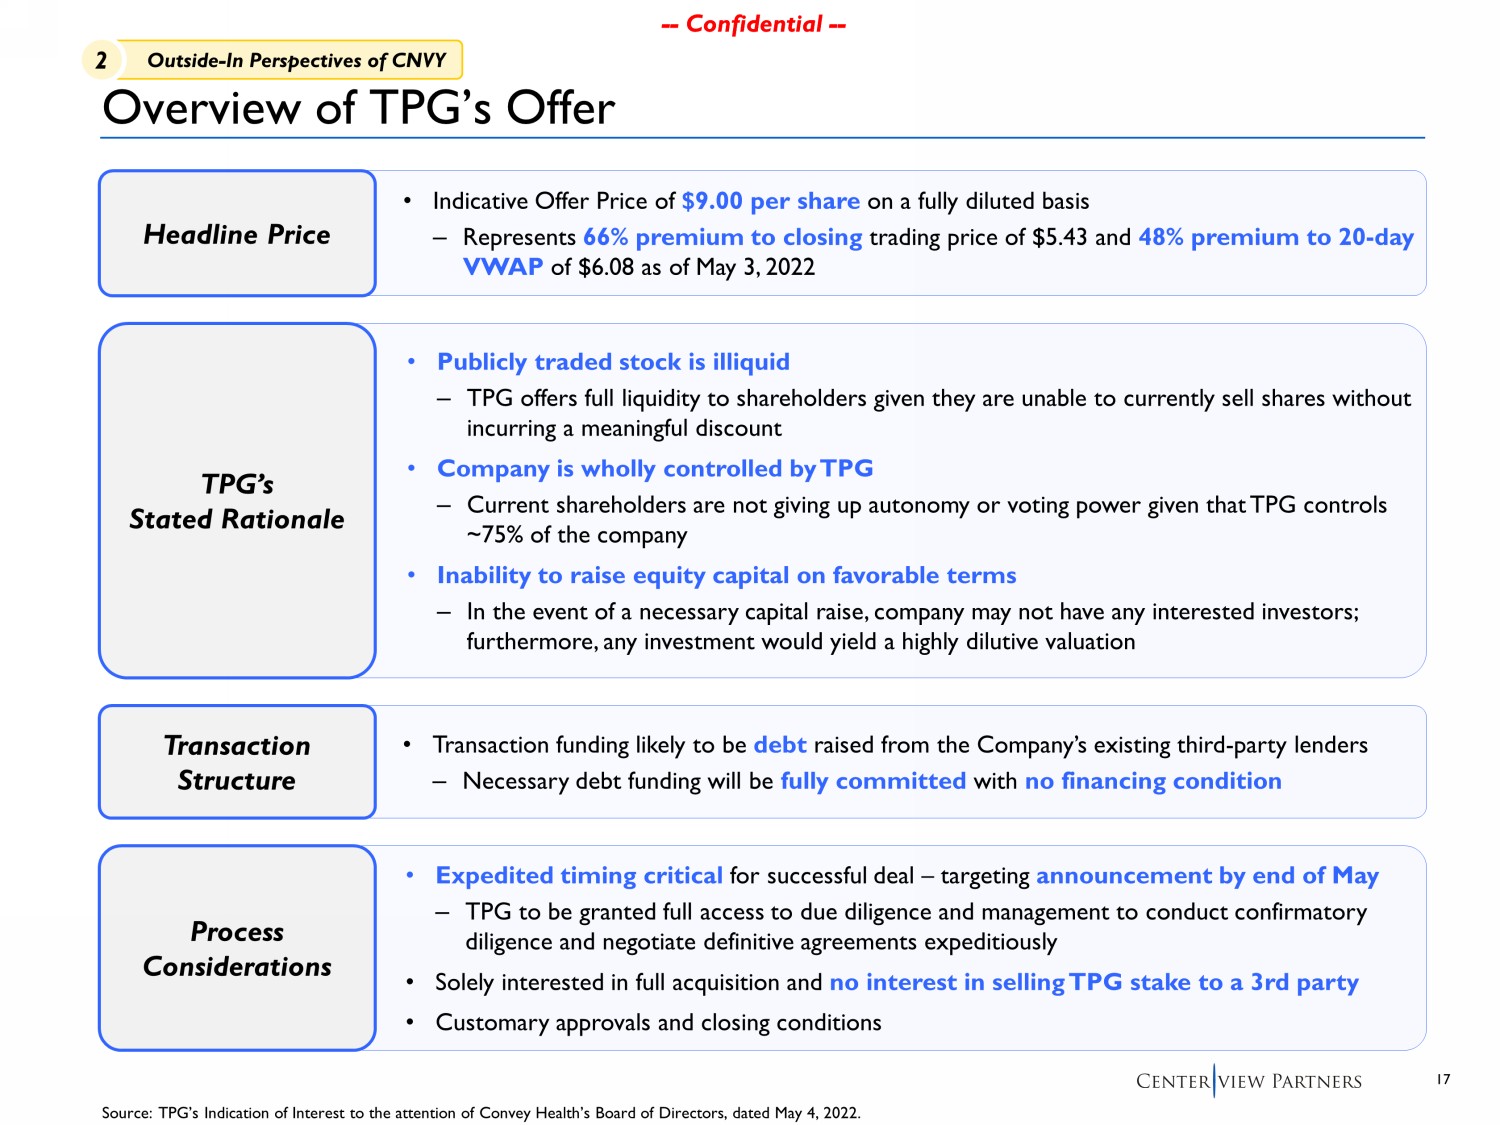
17 -- Confidential -- -- Confidential -- • Indicative Offer Price of $9.00 per share on a fully diluted basis ‒ Represents 66% premium to closing trading price of $5.43 and 48% premium to 20 - day VWAP of $6.08 as of May 3, 2022 • Publicly traded stock is illiquid ‒ TPG offers full liquidity to shareholders given they are unable to currently sell shares without incurring a meaningful discount • Company is wholly controlled by TPG ‒ Current shareholders are not giving up autonomy or voting power given that TPG controls ~75% of the company • Inability to raise equity capital on favorable terms ‒ In the event of a necessary capital raise, company may not have any interested investors; furthermore, any investment would yield a highly dilutive valuation • Transaction funding likely to be debt raised from the Company’s existing third - party lenders ‒ Necessary debt funding will be fully committed with no financing condition • Expedited timing critical for successful deal – targeting announcement by end of May ‒ TPG to be granted full access to due diligence and management to conduct confirmatory diligence and negotiate definitive agreements expeditiously • Solely interested in full acquisition and no interest in selling TPG stake to a 3rd party • Customary approvals and closing conditions Overview of TPG’s Offer Headline Price TPG’s Stated Rationale Transaction Structure Process Considerations 2 Outside - In Perspectives of CNVY Source: TPG’s Indication of Interest to the attention of Convey Health’s Board of Directors, dated May 4, 2022.
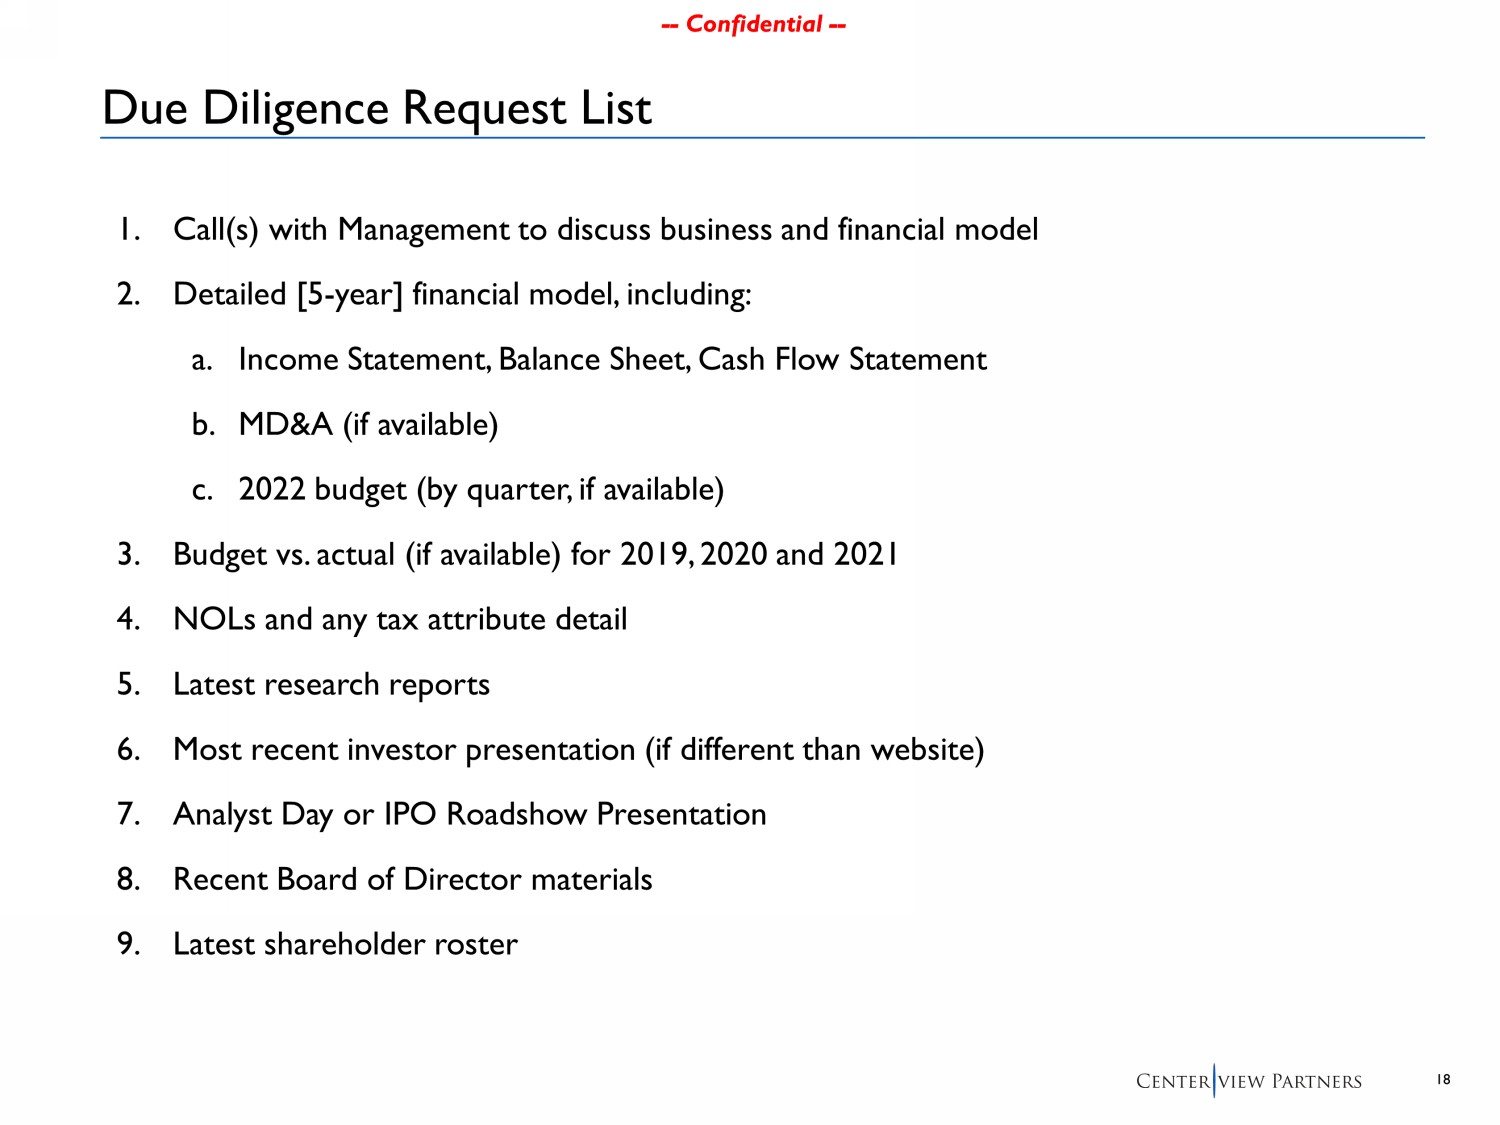
18 -- Confidential -- -- Confidential -- Due Diligence Request List 1. Call(s) with Management to discuss business and financial model 2. Detailed [5 - year] financial model, including: a. Income Statement, Balance Sheet, Cash Flow Statement b. MD&A (if available) c. 2022 budget (by quarter, if available) 3. Budget vs. actual (if available) for 2019, 2020 and 2021 4. NOLs and any tax attribute detail 5. Latest research reports 6. Most recent investor presentation (if different than website) 7. Analyst Day or IPO Roadshow P resentation 8. Recent Board of Director materials 9. Latest shareholder roster
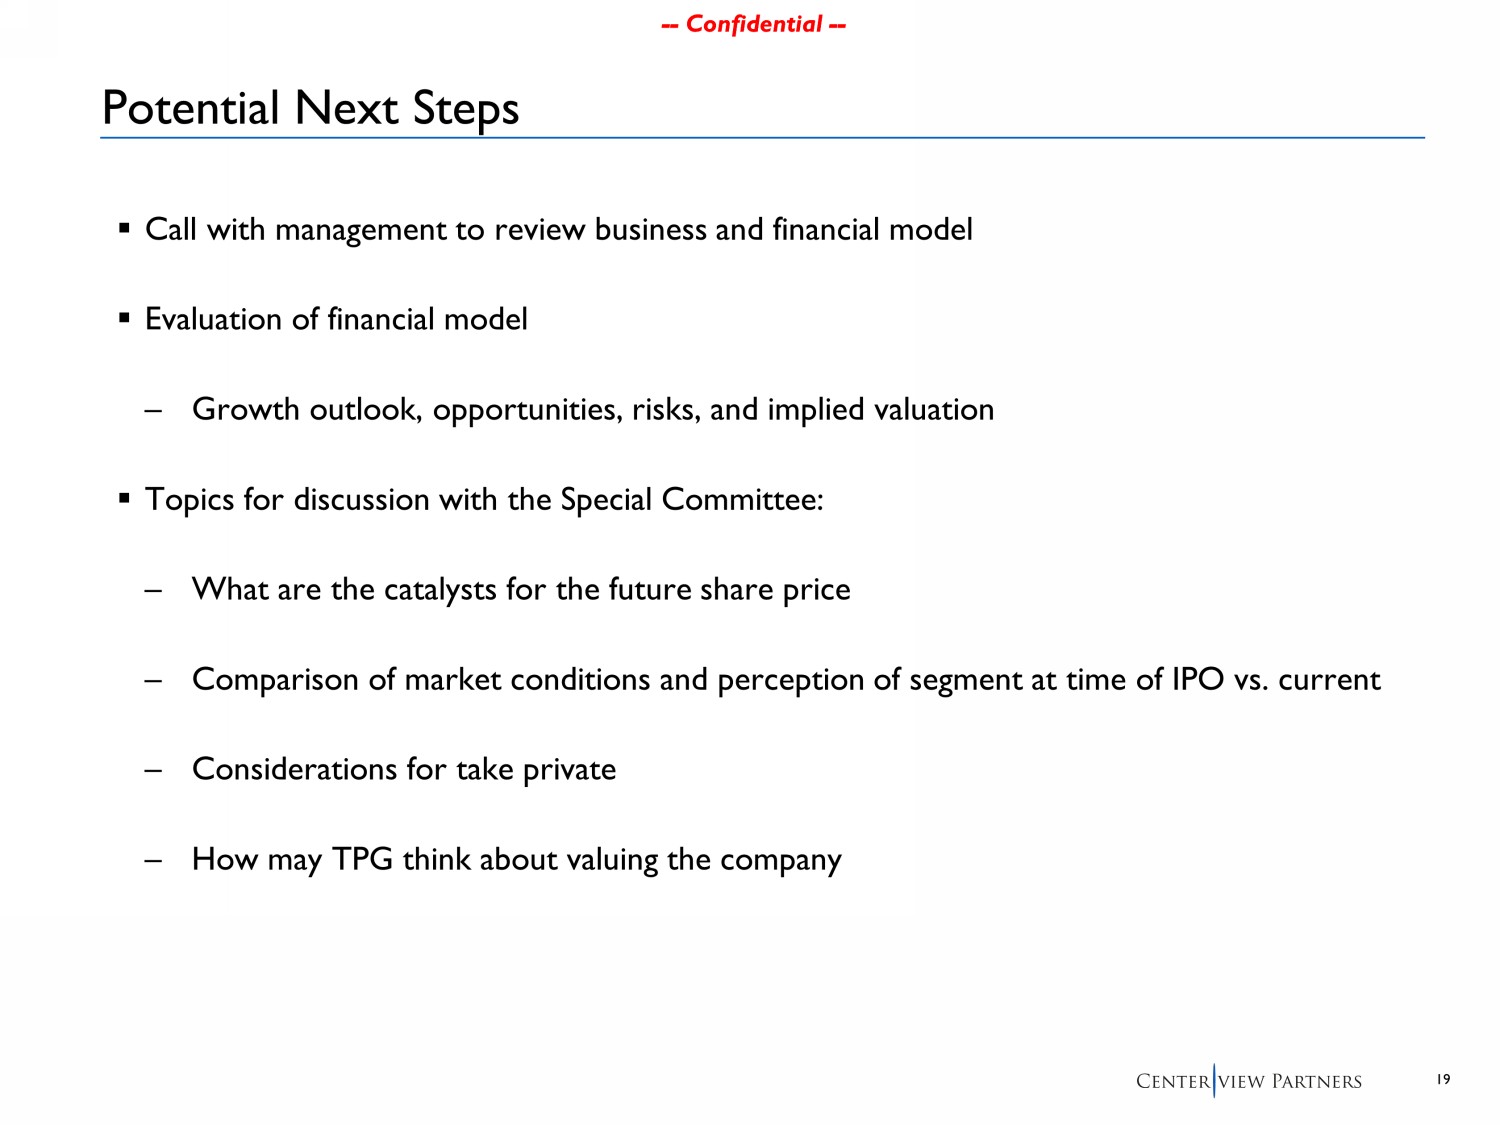
19 -- Confidential -- -- Confidential -- Potential Next Steps ▪ Call with management to review business and financial model ▪ Evaluation of financial model – G rowth outlook, opportunities, risks, and implied valuation ▪ Topics for discussion with the Special Committee: – What are the catalysts for the future share price – Comparison of market conditions and perception of segment at time of IPO vs. current – Considerations for take private – How may TPG think about valuing the company
-- Confidential -- Appendix
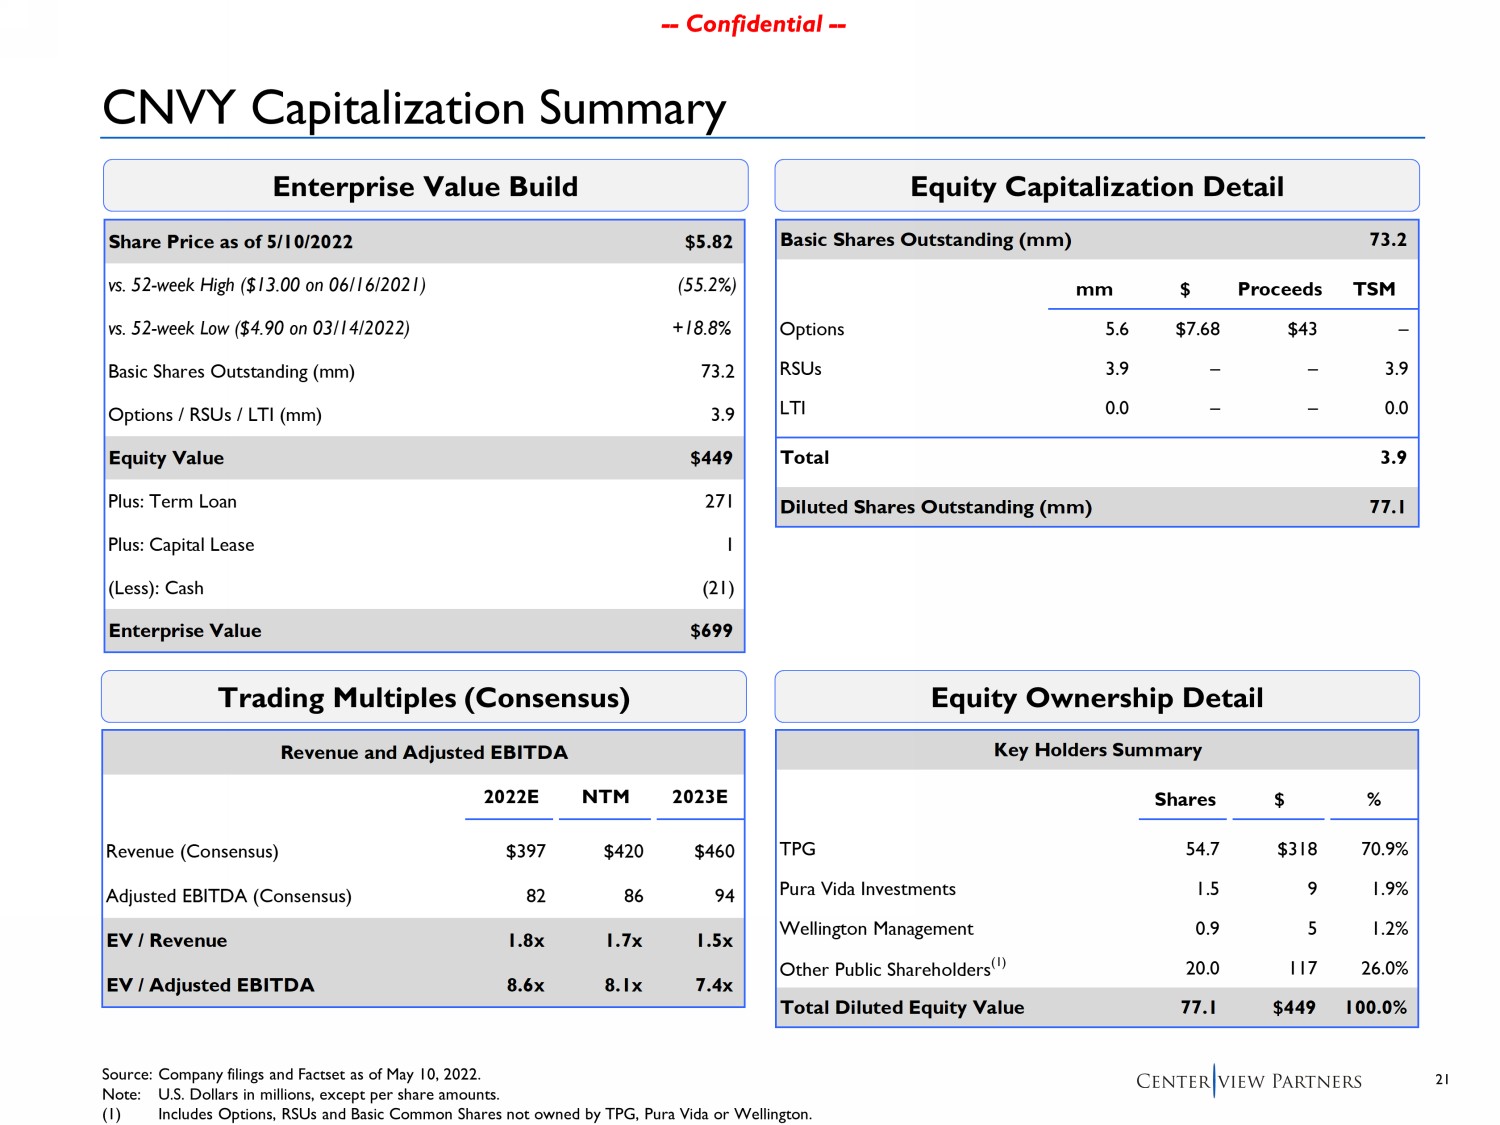
21 -- Confidential -- -- Confidential -- Share Price as of 5/10/2022 $5.82 vs. 52-week High ($13.00 on 06/16/2021) (55.2%) vs. 52-week Low ($4.90 on 03/14/2022) +18.8% Basic Shares Outstanding (mm) 73.2 Options / RSUs / LTI (mm) 3.9 Equity Value $449 Plus: Term Loan 271 Plus: Capital Lease 1 (Less): Cash (21) Enterprise Value $699 Key Holders Summary Shares $ % TPG 54.7 $318 70.9% Pura Vida Investments 1.5 9 1.9% Wellington Management 0.9 5 1.2% Other Public Shareholders (1) 20.0 117 26.0% Total Diluted Equity Value 77.1 $449 100.0% CNVY Capitalization Summary Equity Ownership Detail Trading Multiples (Consensus) Enterprise Value Build Equity Capitalization Detail Revenue and Adjusted EBITDA 2022E NTM 2023E Revenue (Consensus) $397 $420 $460 Adjusted EBITDA (Consensus) 82 86 94 EV / Revenue 1.8x 1.7x 1.5x EV / Adjusted EBITDA 8.6x 8.1x 7.4x Basic Shares Outstanding (mm) 73.2 mm $ Proceeds TSM Options 5.6 $7.68 $43 – RSUs 3.9 – – 3.9 LTI 0.0 – – 0.0 Total 3.9 Diluted Shares Outstanding (mm) 77.1 Source: Company filings and Factset as of May 10, 2022 . Note: U.S. Dollars in millions, except per share amounts . (1) Includes Options, RSUs and Basic Common Shares not owned by TPG, Pura Vida or Wellington.
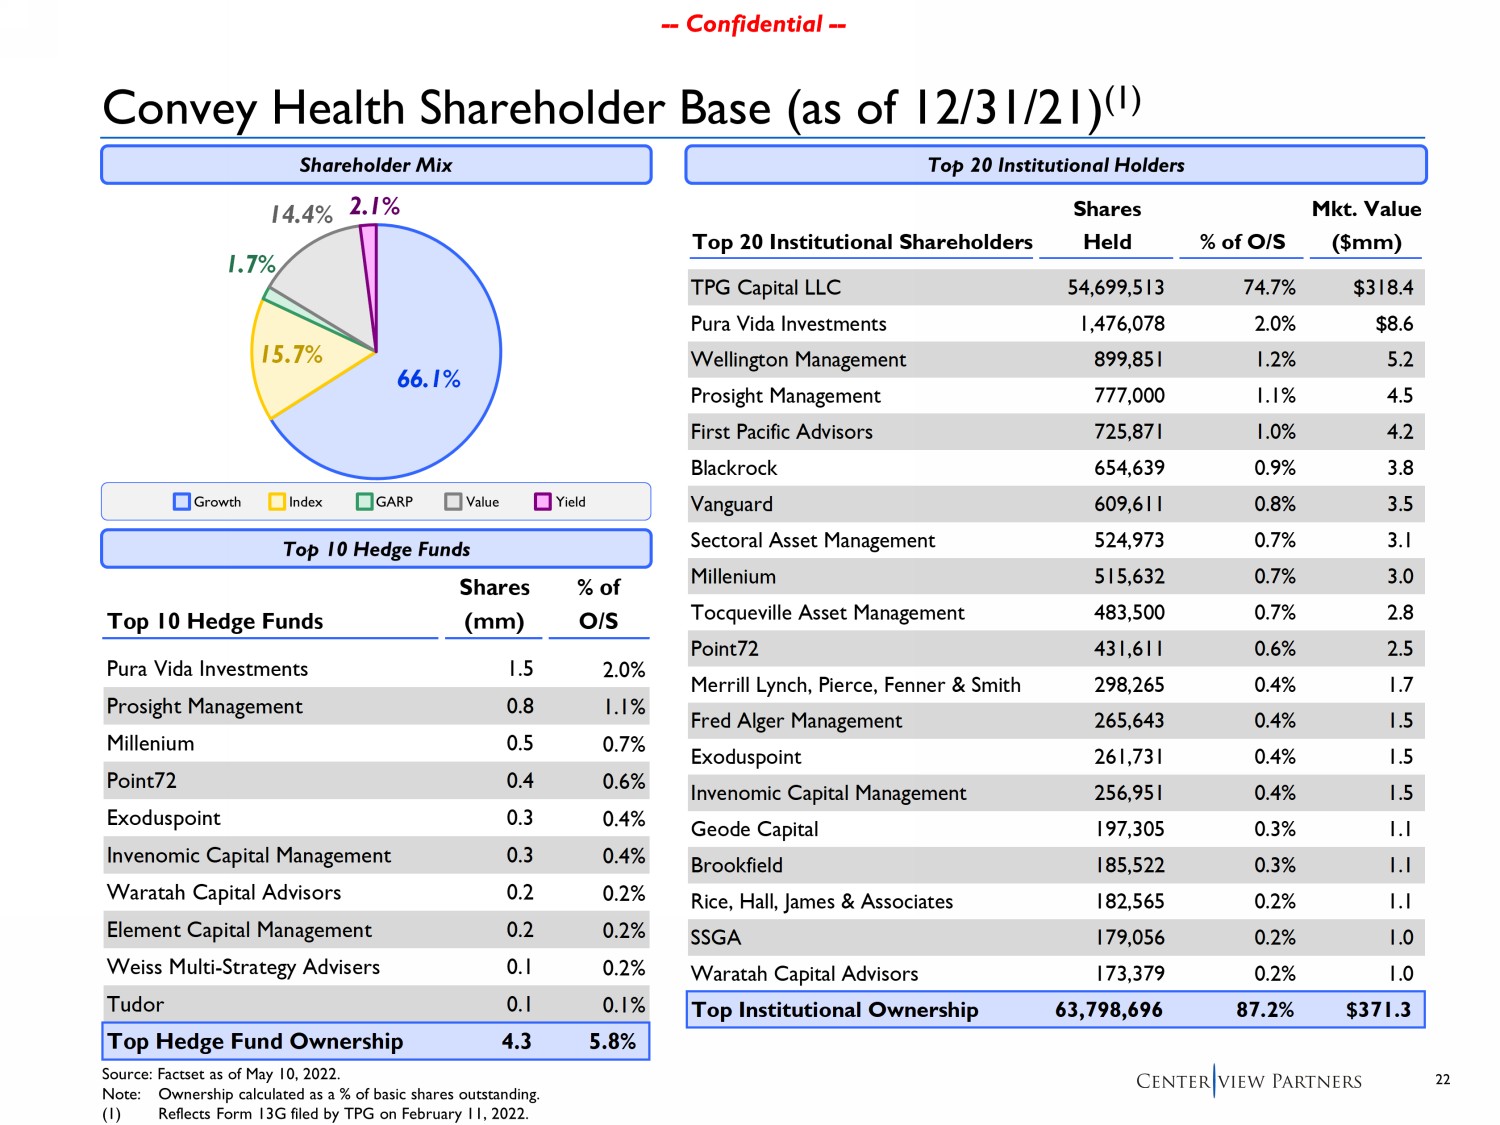
22 -- Confidential -- -- Confidential -- 66.1% 15.7% 1.7% 14.4% 2.1% Convey Health Shareholder Base (as of 12/31/21 ) ( 1) Shares Mkt. Value Top 20 Institutional Shareholders Held % of O/S ($mm) TPG Capital LLC 54,699,513 74.7% $318.4 Pura Vida Investments 1,476,078 2.0% $8.6 Wellington Management 899,851 1.2% 5.2 Prosight Management 777,000 1.1% 4.5 First Pacific Advisors 725,871 1.0% 4.2 Blackrock 654,639 0.9% 3.8 Vanguard 609,611 0.8% 3.5 Sectoral Asset Management 524,973 0.7% 3.1 Millenium 515,632 0.7% 3.0 Tocqueville Asset Management 483,500 0.7% 2.8 Point72 431,611 0.6% 2.5 Merrill Lynch, Pierce, Fenner & Smith 298,265 0.4% 1.7 Fred Alger Management 265,643 0.4% 1.5 Exoduspoint 261,731 0.4% 1.5 Invenomic Capital Management 256,951 0.4% 1.5 Geode Capital 197,305 0.3% 1.1 Brookfield 185,522 0.3% 1.1 Rice, Hall, James & Associates 182,565 0.2% 1.1 SSGA 179,056 0.2% 1.0 Waratah Capital Advisors 173,379 0.2% 1.0 Top Institutional Ownership 63,798,696 87.2% $371.3 Shares % of Top 10 Hedge Funds (mm) O/S Pura Vida Investments 1.5 2.0% Prosight Management 0.8 1.1% Millenium 0.5 0.7% Point72 0.4 0.6% Exoduspoint 0.3 0.4% Invenomic Capital Management 0.3 0.4% Waratah Capital Advisors 0.2 0.2% Element Capital Management 0.2 0.2% Weiss Multi-Strategy Advisers 0.1 0.2% Tudor 0.1 0.1% Top Hedge Fund Ownership 4.3 5.8% Top 20 Institutional Holders Top 10 Hedge Funds Shareholder Mix Source: Factset as of May 10, 2022. Note: Ownership calculated as a % of basic shares outstanding. (1) Reflects Form 13G filed by TPG on February 11, 2022. Growth Index GARP Value Yield