U.S. SECURITIES AND EXCHANGE COMMISSION
Washington, D.C. 20549
----------------------------------------------------------------
FORM N-CSR
CERTIFIED SHAREHOLDER REPORT
OF REGISTERED MANAGEMENT
INVESTMENT COMPANY
Investment Company Act File Number 811-23482
----------------------------------------------------------------
KEYSTONE PRIVATE INCOME FUND
(Exact name of registrant as specified in charter)
----------------------------------------------------------------
c/o UMB Fund Services, Inc.
235 West Galena Street
Milwaukee, WI 53212
(Address of Principal Executive Offices)
Ann Maurer
235 West Galena Street
Milwaukee, WI 53212
(Name and address of agent for service)
----------------------------------------------------------------
Registrant’s Telephone Number, including Area Code: (414) 299-2217
Date of fiscal year end: September 30
Date of reporting period: September 30, 2024
Form N-CSR is to be used by management investment companies to file reports with the Commission not later than 10 days after the transmission to stockholders of any report that is required to be transmitted to stockholders under Rule 30e-1 under the Investment Company Act of 1940 (17 CFR 270.30e-1). The Commission may use the information provided on Form N-CSR in its regulatory, disclosure review, inspection, and policymaking roles.
A registrant is required to disclose the information specified by Form N-CSR, and the Commission will make this information public. A registrant is not required to respond to the collection of information contained in Form N-CSR unless the Form displays a currently valid Office of Management and Budget (“OMB”) control number. Please direct comments concerning the accuracy of the information collection burden estimate and any suggestions for reducing the burden to Secretary, Securities and Exchange Commission, 100 F Street, NE, Washington, DC 20549-1090. The OMB has reviewed this collection of information under the clearance requirements of 44 U.S.C. § 3507.
Item 1. Report to Shareholders
(a)
KEYSTONE PRIVATE INCOME FUND |

Annual Report
For the Year Ended September 30, 2024
Keystone Private Income Fund |
Table of Contents For the Year Ended September 30, 2024 |
1
Keystone Private Income Fund |
Shareholder Letter September 30, 2024 (Unaudited) |
Dear Shareholders,
We are pleased to provide you with our annual report of Keystone Private Income Fund (the “Fund”) for the fiscal year ended September 30, 2024. We are pleased with the continued success of the Fund and are working diligently to expand our investment capabilities and improve the overall investor experience in the Fund.
Despite the continued uncertainty about economic stability, interest rates, and inflation in the broader economy at large, we believe the following components of our investment strategy have contributed to positive returns for our investors over the last year:
• Structuring. Many of our investments amortize, which reduces our exposure over time.
• Seniority. A significant percentage of the Fund’s investments are first lien, senior secured, which we believe is another unique attribute in private credit.
• Collateral. When sourcing new private credit investment opportunities, our bias is toward investments secured by asset-backed collateral, as opposed to positions secured by revenue, business potential, or other intangible assets.
• Low Leverage. Although unusual in the private credit world, we believe that our decision to manage the Fund with low levels of leverage is an uncommon attribute that reduces the overall risk of an investment in the Fund.
We believe these characteristics lower the risk profile of the Fund when compared to other private credit funds that may instead focus on cash-flow based credit investments (as opposed to asset-backed), use meaningful leverage to enhance returns, or focus on subordinated debt or equity positions.
While all investors must always assume some measure of risk when deploying capital, we believe that a methodical, disciplined approach can go a long way toward mitigating that risk. It may not be possible to mitigate all risks, especially in private transactions where there always exists the potential for fraud, collusion, changes in asset prices or simply poor performance.
We remain focused on the same investment tenets that have served us well over the past decade and expect to continue to experience a steady flow of new equipment leasing, financial assets, specialty real estate lending and corporate lending opportunities in the coming months. We will seek to capitalize on what we believe are the best opportunities within our broad investment verticals and expect our allocation to each of these verticals to undulate from time to time depending upon market conditions and our opportunity set. We are optimistic and comfortable with our investment approach in the current turbulent environment.
Shareholders should consult the Private Placement Memorandum for a complete listing of risks associated with the Fund.
We expect to stay the course in the management of the Fund over the coming months. We appreciate your continued support and interest.
2
Keystone Private Income Fund |
Report of Independent Registered Public Accounting Firm September 30, 2024 |

|
| |
Board of Trustees and Shareholders
Keystone Private Income Fund Opinion on the financial statements We have audited the accompanying statement of assets and liabilities of Keystone Private Income Fund, (the “Fund”), including the schedule of investments, as of September 30, 2024, the related statements of operations and cash flows for the year then ended, the statements of changes in net assets for each of the two years in the period then ended, and the related notes (collectively referred to as the “financial statements”) and the financial highlights for each of the two years in the period then ended. In our opinion, the financial statements and financial highlights present fairly, in all material respects, the financial position of the Fund as of September 30, 2024 and the results of its operations and its cash flows for the year then ended, the changes in net assets for each of the two years in the period then ended, and the financial highlights for each of the two years in the period then ended, in conformity with accounting principles generally accepted in the United States of America. The accompanying financial highlights for the year ended September 30, 2022, and prior, were audited by another independent registered public accounting firm whose report dated December 9, 2022 expressed an unqualified opinion on the financial highlights. Basis for opinion These financial statements and financial highlights are the responsibility of the Fund’s management. Our responsibility is to express an opinion on the Fund’s financial statements and financial highlights based on our audits. We are a public accounting firm registered with the Public Company Accounting Oversight Board (United States) (“PCAOB”) and are required to be independent with respect to the Fund in accordance with the U.S. federal securities laws and the applicable rules and regulations of the Securities and Exchange Commission and the PCAOB. We conducted our audits in accordance with the standards of the PCAOB. Those standards require that we plan and perform the audits to obtain reasonable assurance about whether the financial statements and financial highlights are free of material misstatement, whether due to error or fraud. The Fund is not required to have, nor were we engaged to perform, an audit of its internal control over financial reporting. As part of our audits we are required to obtain an understanding of internal control over financial reporting but not for the purpose of expressing an opinion on the effectiveness of the Fund’s internal control over financial reporting. Accordingly, we express no such opinion. |
3
Keystone Private Income Fund |
Report of Independent Registered Public Accounting Firm September 30, 2024 (continued) |
| | Our audits included performing procedures to assess the risks of material misstatement of the financial statements and financial highlights, whether due to error or fraud, and performing procedures that respond to those risks. Such procedures included examining, on a test basis, evidence regarding the amounts and disclosures in the financial statements and financial highlights. Our procedures included confirmation of investments owned as of September 30, 2024, by correspondence with the custodians, brokers and others; when replies were not received, we performed other auditing procedures. Our audits also included evaluating the accounting principles used and significant estimates made by management, as well as evaluating the overall presentation of the financial statements and financial highlights. We believe that our audits provide a reasonable basis for our opinion. 
We have served as the Fund’s auditor since 2023. Dallas, Texas
November 27, 2024 |
4
Keystone Private Income Fund |
Fund Performance September 30, 2024 (Unaudited) |
Performance of a $50,000 Investment
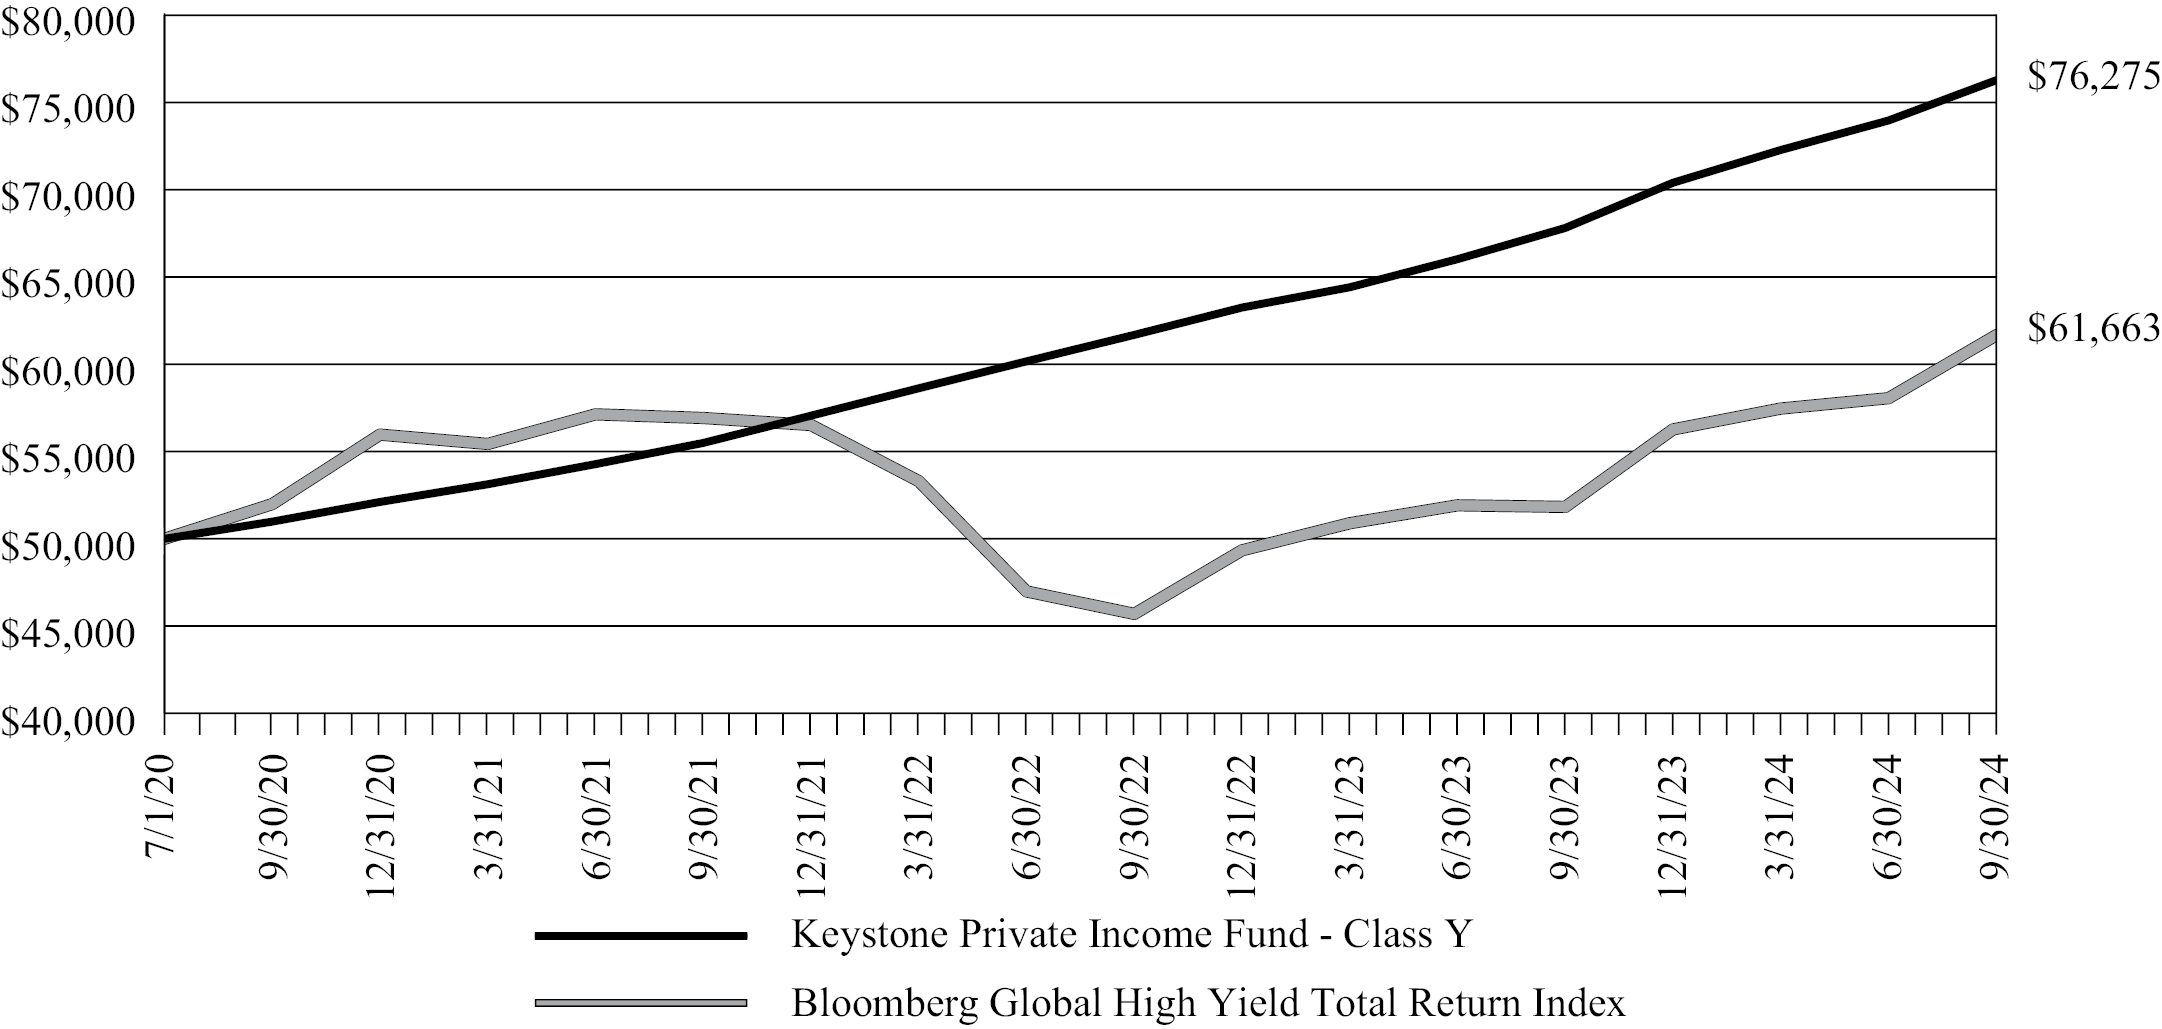
This graph compares a hypothetical $50,000 investment in the Fund’s Y shares, made at its inception, with a similar investment in the Bloomberg Global High Yield Total Return Index. Results include the reinvestment of all dividends and capital gains.
Bloomberg Global High Yield Total Return Index is a multi-currency flagship measure of the global high yield debt market. The index does not reflect expenses, fees or sales charge, which would lower performance. The index is unmanaged and it is not possible to invest in an index.
Average Annual Total Returns as September 30, 2024* | 1 Year | 3 Year | Since
Inception |
Keystone Private Income Fund – Class D (Inception Date 9/30/2020) | 11.76% | 10.47% | 9.90% |
Keystone Private Income Fund – Class Y (Inception Date 7/1/2020) | 12.48% | 11.19% | 10.45% |
Keystone Private Income Fund – Class I (Inception Date 8/1/2020) | 12.60% | 11.29% | 10.63% |
Keystone Private Income Fund – Class Z (Inception Date 8/1/2020) | 12.76% | 11.46% | 10.78% |
Bloomberg Global High Yield Total Return Index | 18.98% | 2.70% | 5.14% |
The performance data quoted here represents past performance and past performance is not a guarantee of future results. Investment return and principal value will fluctuate so that an investor’s shares, when redeemed, may be worth more or less than their original cost. Current performance may be lower or higher than the performance information quoted. The most recent quarter end performance may be obtained by calling 1.888.442.4420.
The Keystone National Group, LLC (the “Investment Manager”) has entered into an expense limitation and reimbursement agreement (the “Expense Limitation and Reimbursement Agreement”) with the Fund, whereby the Investment Manager has agreed to waive fees that it would otherwise have been paid, and/or to assume expenses of the Fund (a “Waiver”), if required to ensure the Total Annual Expenses (including the Investment Management Fee, but excluding any taxes,
5
Keystone Private Income Fund |
Fund Performance September 30, 2024 (Unaudited) (continued) |
interest expense, sales charges and other brokerage commissions, other transaction related expenses, acquired fund fees and expenses, Incentive Fees, expenses incurred in connection with any merger or reorganization, Distribution and Servicing Fees and extraordinary expenses) does not exceed 3.00% of the average daily net assets of any Class of Shares (the “Expense Limit”). Because taxes, interest expense, sales charges and other brokerage commissions, other transaction related expenses, Incentive Fees, Distribution and Servicing Fees, expenses incurred in connection with any merger or reorganization and extraordinary expenses are excluded from the Expense Limit, Total Annual Expenses (after fee waivers and expense reimbursements) may exceed 3.00% of the average daily net assets of each Class of Shares. The performance quoted above reflects the Waiver in effect and would have been lower in its absence. For the year ended September 30, 2024, the Investment Manager did not waive any fees or reimburse any expenses.
Returns reflect the reinvestment of distributions made by the Fund, if any. The graph and the performance table above do not reflect the deduction of taxes that a shareholder would pay on Fund distributions or the redemption of Fund shares.
For the Fund’s current expense ratio, please refer to the Financial Highlights Section of this report.
6
Keystone Private Income Fund |
Schedule of Investments September 30, 2024 |
Principal
Amount | | | | Coupon
Rate | | Maturity
Date | | Original
Acquisition
Date | | Cost | | Fair Value |
| | | Private Credit — 106.5% | | | | | | | | | | | | |
| | | Corporate Finance — 16.8% | | | | | | | | | | | | |
$ | 19,500,000 | | BluRoc Intermediate, LLC1,2 | | 18.00% | | 7/25/2025 | | 7/25/2024 | | $ | 19,500,000 | | $ | 19,500,000 |
| 2,500,000 | | Car Wash Holdco, LLC1,2 | | 15.00% | | 9/16/2025 | | 9/16/2024 | | | 2,500,000 | | | 2,500,000 |
| 83,926,022 | | FilmRise Acquisitions, LLC1,2 | | 15.00% | | 9/17/2025 | | 2/14/2020 | | | 83,926,022 | | | 84,553,413 |
| 13,874,439 | | FVP Funding I, LLC1,2,4 | | 10.00 + 2.00% PIK | | 2/6/2027 | | 2/7/2022 | | | 13,874,439 | | | 13,665,521 |
| 24,780,027 | | FVP Funding II, LLC1,2,4 | | 10.00 + 2.00% PIK | | 10/12/2027 | | 10/12/2022 | | | 24,780,027 | | | 26,441,803 |
| 13,800,000 | | Hall Labs, LLC1,2,8 | | 14.50% | | 6/30/2024 | | 8/11/2021 | | | 13,800,000 | | | 11,761,158 |
| 9,530,177 | | iApartments, Inc.1,2,4 | | 10.75% (Prime + 2.25%) + 6.00% PIK | | 5/18/2030 | | 5/18/2023 | | | 9,530,177 | | | 9,713,805 |
| 14,034,985 | | Loop Inc.1,2 | | 8.00% | | 6/14/2025 | | 5/17/2022 | | | 14,034,985 | | | 10,150,490 |
| 12,629,174 | | LRC Westbridge II Investco, LLC1,2,3 | | 12.00% | | 11/23/2024 | | 8/23/2023 | | | 12,629,174 | | | 12,629,174 |
| 5,764,186 | | Metropolitan Partners Fund VII, LP1,2,3,4 | | 13.00% PIK | | 11/1/2024 | | 3/3/2023 | | | 5,764,186 | | | 5,764,186 |
| 19,000,000 | | MV Cruise Offshore Holdings Ltd.1,2 | | 12.00% | | 6/30/2027 | | 7/3/2024 | | | 19,000,000 | | | 19,000,000 |
| 12,354,762 | | Onward Partners, LLC1,2 | | 15.00% | | 6/17/2026 | | 6/18/2021 | | | 12,354,762 | | | 9,935,306 |
| 10,000,000 | | Vantage Borrower SPV, LLC1,2,8 | | 11.00% | | 5/31/2024 | | 3/7/2022 | | | 10,000,000 | | | 6,363,357 |
| 3,800,000 | | Way.com, Inc.1,2 | | 12.00% | | 3/1/2025 | | 3/1/2023 | | | 3,800,000 | | | 3,800,000 |
| | | | | | | | | | | | 245,493,772 | | | 235,778,213 |
| | | Equipment Leasing — 17.8% | | | | | | | | | | | | |
| 800,770 | | Agility Auto Parts Inc.1,2 | | 12.50% | | 7/1/2026 | | 6/12/2024 | | | 800,770 | | | 800,770 |
| 928,834 | | Airport Van Rental, Inc.1,2 | | 12.50% | | 10/1/2026 | | 7/23/2024 | | | 928,834 | | | 928,834 |
| 491,913 | | Arcade Silverado JV LLC1,2 | | 12.50% | | 12/1/2026 | | 4/25/2024 | | | 491,913 | | | 491,913 |
| 570,372 | | Avensis Energy Services, LLC1,2 | | 12.50% | | 9/1/2026 | | 12/4/2023 | | | 570,372 | | | 570,372 |
| 617,553 | | Blew Bayou Services LLC1,2 | | 14.50% | | 5/1/2025 | | 10/28/2022 | | | 617,553 | | | 617,553 |
| 864,282 | | Bohme, LLC1,2 | | 14.50% | | 11/1/2025 | | 9/28/2022 | | | 864,282 | | | 864,282 |
| 994,783 | | Bohme, LLC1,2 | | 14.50% | | 3/1/2025 | | 2/17/2023 | | | 994,783 | | | 994,783 |
| 1,906,664 | | Broadband Infrastructure,
Inc.1,2 | | 14.50% | | 10/1/2025 | | 3/30/2023 | | | 1,906,664 | | | 1,906,664 |
| 4,851,269 | | Carnaby FA, LLC1,2 | | 42.50%9 | | 11/1/2024 | | 11/6/2023 | | | 4,851,269 | | | 4,851,269 |
| 24,664,195 | | Carnaby FA, LLC1,2 | | 21.94%9 | | 6/1/2027 | | 4/26/2024 | | | 24,664,195 | | | 24,664,195 |
| 3,977,753 | | Carnaby Inventory IV, LLC1,2 | | 12.00% | | 12/31/2024 | | 6/30/2022 | | | 3,977,753 | | | 3,977,753 |
| 77,981 | | Cashman Photo Enterprises of Nevada, Inc.1,2 | | 12.50% | | 4/1/2026 | | 9/5/2023 | | | 77,981 | | | 77,981 |
| 265,284 | | Diesel Displays & Interiors, LLCs1,2 | | 12.50% | | 1/1/2026 | | 11/30/2023 | | | 265,284 | | | 265,284 |
| 3,830,151 | | Eagle Highwall Mining Systems, LLC1,2 | | 14.00% | | 4/1/2027 | | 9/29/2023 | | | 3,830,151 | | | 3,830,151 |
| 295,300 | | EOS Fitness Opco Holdings, LLC1,2 | | 13.00% | | 3/1/2027 | | 9/30/2024 | | | 295,300 | | | 295,300 |
| 1,437,687 | | EOS Fitness Opco Holdings, LLC1,2 | | 13.00% | | 4/1/2029 | | 9/30/2024 | | | 1,437,687 | | | 1,437,687 |
| 615,824 | | EOS Fitness Opco Holdings, LLC1,2 | | 13.00% | | 4/1/2027 | | 9/30/2024 | | | 615,824 | | | 615,824 |
See accompanying notes to financial statements.
7
Keystone Private Income Fund |
Schedule of Investments September 30, 2024 (continued) |
Principal
Amount | | | | Coupon
Rate | | Maturity
Date | | Original
Acquisition
Date | | Cost | | Fair Value |
| | | Private Credit — 106.5% (continued) | | | | | | | | | | |
| | | Equipment Leasing — 17.8% (continued) | | | | | | | | | | |
$ | 891,020 | | EOS Fitness Opco Holdings, LLC1,2 | | 13.00% | | 7/1/2028 | | 9/30/2024 | | $ | 891,020 | | $ | 891,020 |
| 1,508,089 | | EOS Fitness Opco Holdings, LLC1,2 | | 13.00% | | 7/1/2027 | | 9/30/2024 | | | 1,508,089 | | | 1,508,089 |
| 131,369 | | Falls Stamping & Welding Company1,2 | | 12.50% | | 10/1/2026 | | 2/5/2024 | | | 131,369 | | | 131,369 |
| 10,808,541 | | Findlay Machine & Tool, LLC1,2 | | 11.95% | | 3/1/2028 | | 9/24/2024 | | | 10,808,541 | | | 10,808,541 |
| 8,322,357 | | Fisher & Company, Inc.1,2 | | 14.50% | | 5/1/2027 | | 4/9/2024 | | | 8,322,357 | | | 8,322,357 |
| 939,765 | | FPL Food LLC1,2 | | 12.50% | | 4/1/2027 | | 2/28/2024 | | | 939,765 | | | 939,765 |
| 3,706,025 | | Future Legends, LLC1,2 | | 14.50% | | 9/1/2025 | | 2/27/2023 | | | 3,706,025 | | | 3,706,025 |
| 2,552,828 | | Gregory Pharmaceutical Holdings, Inc.1,2 | | 14.50% | | 2/1/2026 | | 7/14/2023 | | | 2,552,828 | | | 2,552,828 |
| 3,937,221 | | Information Technology Partners, Inc.1,2 | | 14.50% | | 1/1/2026 | | 12/15/2023 | | | 3,937,221 | | | 3,937,221 |
| 416,501 | | Innotec, Corp.1,2 | | 12.50% | | 7/1/2025 | | 12/30/2022 | | | 416,501 | | | 416,501 |
| 676,923 | | Island Magic Catamaran Inc.1,2 | | 12.50% | | 10/1/2026 | | 7/22/2024 | | | 676,923 | | | 676,923 |
| 9,790,528 | | JRL Energy, Inc.1,2 | | 14.50% | | 10/1/2026 | | 4/19/2024 | | | 9,790,528 | | | 9,790,528 |
| 4,265,001 | | Kent Distributors, Inc.1,2 | | 14.50% | | 7/1/2027 | | 3/14/2024 | | | 4,265,001 | | | 4,265,001 |
| 195,417 | | Kinikini, LLC1,2 | | 12.50% | | 4/1/2026 | | 2/27/2024 | | | 195,417 | | | 195,417 |
| 1,705,155 | | KVJ Properties, Inc.1,2 | | 12.50% | | 8/31/2025 | | 2/25/2022 | | | 1,705,155 | | | 1,705,155 |
| 377,340 | | Lawson Construction
Company1,2 | | 12.50% | | 1/1/2026 | | 11/2/2023 | | | 377,340 | | | 377,340 |
| 506,457 | | LBF Enterprises dba Powermatic Associates, Inc.1,2 | | 12.50% | | 7/1/2026 | | 12/4/2023 | | | 506,457 | | | 506,457 |
| 6,633,849 | | MC Test Service, Inc.1,2 | | 12.00% | | 7/1/2027 | | 1/25/2022 | | | 6,633,849 | | | 6,633,849 |
| 1,636,539 | | MC Test Service, Inc.1,2 | | 12.50% | | 10/1/2026 | | 12/8/2023 | | | 1,636,539 | | | 1,636,539 |
| 7,563,685 | | Medshift, LLC1,2 | | 14.50% | | 12/1/2027 | | 4/4/2024 | | | 7,563,685 | | | 7,563,685 |
| 6,820,413 | | Medshift, LLC1,2 | | 14.50% | | 12/1/2027 | | 5/3/2024 | | | 6,820,413 | | | 6,820,413 |
| 3,210,822 | | Navajo Health Foundation-Sage Memorial Hospital, Inc.1,2 | | 12.50% | | 1/1/2027 | | 8/8/2024 | | | 3,210,822 | | | 3,210,822 |
| 1,860,761 | | Navajo Transitional Energy Company, LLC1,2 | | 9.50% | | 1/1/2026 | | 12/9/2022 | | | 1,860,761 | | | 1,860,761 |
| 1,067,264 | | Next Century Rebar LLC and Century Steel Fabricators, LLC1,2 | | 12.50% | | 2/1/2027 | | 6/7/2024 | | | 1,067,264 | | | 1,067,264 |
| 126,578 | | Nutritional Resources, Inc.1,2 | | 14.50% | | 1/1/2027 | | 3/1/2024 | | | 126,578 | | | 126,578 |
| 485,975 | | NWC Services LLC1,2 | | 14.50% | | 11/1/2025 | | 10/20/2022 | | | 485,975 | | | 485,975 |
| 1,274,408 | | Onset Financial, Inc.1,2 | | 14.50% | | 5/31/2026 | | 12/11/2020 | | | 1,274,408 | | | 1,274,408 |
| 10,000,000 | | Onset Financial, Inc.1,2,7 | | 12.56% (SOFR + 7.75%) | | 3/31/2031 | | 9/26/2022 | | | 10,000,000 | | | 10,000,000 |
| 2,189,281 | | Phygital Digital Global FX LLC1,2 | | 15.00% | | 2/1/2027 | | 7/15/2024 | | | 2,189,281 | | | 2,189,281 |
| 1,307,663 | | Pierce Powerline Co., LLC1,2 | | 12.50% | | 1/1/2026 | | 8/3/2023 | | | 1,307,663 | | | 1,307,663 |
| 334,742 | | RK Pharma Inc.1,2 | | 14.50% | | 3/1/2025 | | 3/9/2022 | | | 334,742 | | | 334,742 |
| 197,688 | | RK Pharma Inc.1,2 | | 14.50% | | 5/1/2025 | | 9/1/2022 | | | 197,688 | | | 197,688 |
| 84,141 | | Sajawi Corporation1,2 | | 12.50% | | 10/1/2025 | | 8/30/2023 | | | 84,141 | | | 84,141 |
| 968,022 | | Savant Consultants, LLC1,2 | | 12.50% | | 5/1/2026 | | 10/23/2023 | | | 968,022 | | | 968,022 |
See accompanying notes to financial statements.
8
Keystone Private Income Fund |
Schedule of Investments September 30, 2024 (continued) |
Principal
Amount | | | | Coupon
Rate | | Maturity
Date | | Original
Acquisition
Date | | Cost | | Fair Value |
| | | Private Credit — 106.5% (continued) | | | | | | | | | | |
| | | Equipment Leasing — 17.8% (continued) | | | | | | | | | | |
$ | 738,514 | | Southern Fabrication Works, LLC1,2 | | 14.50% | | 3/1/2026 | | 8/16/2023 | | $ | 738,514 | | $ | 738,514 |
| 1,117,479 | | Steelman Aviation, Inc.1,2 | | 12.00% | | 11/1/2025 | | 10/13/2022 | | | 1,117,479 | | | 1,117,479 |
| 6,499,241 | | Sustainable Green Team1,2 | | 14.50% | | 5/1/2025 | | 8/19/2022 | | | 6,499,241 | | | 6,499,241 |
| 814,030 | | Transcontinental Energy Services LLC1,2 | | 12.50% | | 1/1/2026 | | 11/27/2023 | | | 814,030 | | | 814,030 |
| 11,635,306 | | Transportation Financial, LLC1,2 | | 12.50% | | 10/11/2027 | | 8/20/2024 | | | 11,635,306 | | | 11,635,306 |
| 816,762 | | TrialAssure Inc.1,2 | | 12.00% | | 9/1/2025 | | 3/22/2022 | | | 816,762 | | | 816,762 |
| 21,555,829 | | Trico Products Corporation1,2 | | 12.50% | | 12/31/2025 | | 6/30/2022 | | | 21,555,829 | | | 21,555,829 |
| 3,424,472 | | Trico Products Corporation1,2 | | 14.50% | | 12/1/2025 | | 5/5/2023 | | | 3,424,472 | | | 3,424,472 |
| 1,963,645 | | Trico Products Corporation1,2 | | 12.50% | | 10/1/2025 | | 7/3/2023 | | | 1,963,645 | | | 1,963,645 |
| 5,179,332 | | Trico Products Corporation1,2 | | 14.50% | | 9/1/2026 | | 2/29/2024 | | | 5,179,332 | | | 5,179,332 |
| 9,850,901 | | United Auto Supply of Syracuse, West, Inc.1,2 | | 12.00% | | 8/1/2026 | | 6/30/2022 | | | 9,850,901 | | | 9,850,901 |
| 7,167,390 | | United Auto Supply of Syracuse, West, Inc.1,2 | | 12.00% | | 8/1/2026 | | 6/30/2022 | | | 7,167,390 | | | 7,167,390 |
| 527,858 | | Vensure Employer Services, Inc.1,2 | | 14.50% | | 1/31/2025 | | 1/14/2022 | | | 527,858 | | | 527,858 |
| 1,081,638 | | Vensure Employer Services, Inc.1,2 | | 14.50% | | 5/31/2025 | | 5/13/2022 | | | 1,081,638 | | | 1,081,638 |
| 5,165,511 | | Vensure Employer Services, Inc.1,2 | | 14.50% | | 12/31/2024 | | 6/1/2022 | | | 5,165,511 | | | 5,165,511 |
| 2,107,128 | | Vensure Employer Services, Inc.1,2 | | 14.50% | | 5/1/2025 | | 8/2/2022 | | | 2,107,128 | | | 2,107,128 |
| 2,604,655 | | Vensure Employer Services, Inc.1,2 | | 14.50% | | 8/1/2025 | | 11/3/2022 | | | 2,604,655 | | | 2,604,655 |
| 155,818 | | Vensure Employer Services, Inc.1,2 | | 14.50% | | 7/1/2025 | | 12/22/2022 | | | 155,818 | | | 155,818 |
| 2,939,903 | | Vensure Employer Services, Inc.1,2 | | 14.50% | | 9/1/2025 | | 1/24/2023 | | | 2,939,903 | | | 2,939,903 |
| 3,417,141 | | Vensure Employer Services, Inc.1,2 | | 14.50% | | 2/1/2026 | | 5/5/2023 | | | 3,417,141 | | | 3,417,141 |
| 4,062,603 | | Vensure Employer Services, Inc.1,2 | | 14.50% | | 4/1/2026 | | 9/19/2023 | | | 4,062,603 | | | 4,062,603 |
| 2,153,916 | | Vensure Employer Services, Inc.1,2 | | 14.50% | | 2/1/2026 | | 1/18/2024 | | | 2,153,916 | | | 2,153,916 |
| 2,761,705 | | Vensure Employer Services, Inc.1,2 | | 12.50% | | 8/1/2026 | | 5/8/2024 | | | 2,761,705 | | | 2,761,705 |
| 2,869,338 | | Vensure Employer Services, Inc.1,2 | | 12.50% | | 4/1/2026 | | 5/8/2024 | | | 2,869,338 | | | 2,869,338 |
| 1,434,010 | | Vensure Employer Services, Inc.1,2 | | 14.50% | | 5/1/2026 | | 9/17/2024 | | | 1,434,010 | | | 1,434,010 |
| 4,595,103 | | West Liberty Foods1,2 | | 14.50% | | 2/1/2027 | | 8/1/2024 | | | 4,595,103 | | | 4,595,103 |
| | | | | | | | | | | | 250,322,211 | | | 250,322,211 |
See accompanying notes to financial statements.
9
Keystone Private Income Fund |
Schedule of Investments September 30, 2024 (continued) |
Principal
Amount | | | | Coupon
Rate | | Maturity
Date | | Original
Acquisition
Date | | Cost | | Fair Value |
| | | Private Credit — 106.5% (continued) | | | | | | | | | | |
| | | Financial Assets — 21.3% | | | | | | | | | | | | |
$ | 47,320,000 | | Bondit LLC1,2 | | 13.00% | | 5/31/2026 | | 6/3/2024 | | $ | 47,320,000 | | $ | 47,320,000 |
| 9,311,890 | | CapitalPlus Construction Services, LLC1,2,8 | | 12.00% | | 10/1/2023 | | 9/2/2020 | | | 9,311,890 | | | 1,392,386 |
| 2,469,892 | | CapitalPlus Supply Chain Partners, LLC1,2,8 | | 12.00% | | 7/31/2024 | | 8/31/2021 | | | 2,469,892 | | | 874,354 |
| 43,913,486 | | Cocolalla, LLC1,2,4 | | 14.00% PIK | | 3/27/2026 | | 3/16/2023 | | | 43,913,486 | | | 44,970,224 |
| 2,889,928 | | ERC Advance Funding, LLC1,2,7,8 | | 15.30% (SOFR + 10.00%) | | 4/15/2026 | | 6/21/2023 | | | 2,889,928 | | | 2,309,200 |
| 31,406,080 | | Healthcare Funding Partners, LLC1,2 | | 16.22% (Prime + 9.00%) | | 12/31/2026 | | 4/12/2024 | | | 31,406,080 | | | 32,888,262 |
| 16,000,000 | | Kensington Private Equity Fund1,2,3,7 | | 12.23% (SOFR + 7.00%) | | 3/28/2026 | | 3/28/2023 | | | 16,000,000 | | | 15,814,769 |
| 20,000,000 | | Leyline Renewable Capital, LLC1,2 | | 14.00% | | 11/26/2024 | | 5/26/2023 | | | 20,000,000 | | | 20,000,000 |
| 43,089,653 | | Lienstar LLC1,2,4,7 | | 11.40% (Prime + 3.00%) + 3.00% PIK | | 3/13/2025 | | 3/13/2023 | | | 43,089,653 | | | 42,623,328 |
| 25,476,881 | | Metropolitan Partners Fund VII, LP-Oliphant1,2,3 | | 12.50% | | 8/1/2025 | | 7/6/2023 | | | 25,476,881 | | | 25,476,881 |
| 3,793,630 | | Propel Holdings, Inc.1,2 | | 13.60% | | 6/8/2026 | | 6/8/2023 | | | 3,793,630 | | | 3,793,630 |
| 11,748,811 | | Simply Funding SPV, LLC1,2 | | 13.00% | | 10/7/2027 | | 6/23/2021 | | | 11,748,811 | | | 11,763,690 |
| 329,371 | | Sprout Funding SPV II, LLC1,2,8 | | 13.00% | | 2/23/2024 | | 2/24/2021 | | | 329,371 | | | 329,371 |
| 48,450,209 | | Viva Funding SPV, LLC1,2 | | 13.00% | | 6/30/2025 | | 12/23/2020 | | | 48,450,209 | | | 49,612,577 |
| | | | | | | | | | | | 306,199,831 | | | 299,168,672 |
| | | Specialty Real Estate Finance — 50.6% | | | | | | | | | | |
| 9,403,818 | | 517 Grand Canyon, LLC1,2,4 | | 10.50% PIK | | 1/17/2025 | | 4/17/2023 | | | 9,403,818 | | | 9,500,256 |
| 5,973,379 | | 750 Main Street LP1,2,4 | | 9.69% PIK | | 12/15/2024 | | 5/9/2022 | | | 5,973,379 | | | 5,973,379 |
| 3,236,190 | | 8th Avenue Property Owners, LLC1,2,4 | | 12.00% PIK | | 11/14/2025 | | 8/14/2023 | | | 3,236,190 | | | 3,236,190 |
| 19,995,536 | | AE Green Mountain, LLC1,2,4 | | 10.45% PIK | | 8/30/2025 | | 8/30/2023 | | | 19,995,536 | | | 20,381,916 |
| 4,160,484 | | Ashton Oak Homes (Black Locust), LLC1,2,4,7 | | 11.41% PIK (Prime + 3.00%) | | 3/23/2025 | | 3/23/2023 | | | 4,160,484 | | | 4,160,484 |
| 7,555,931 | | Atomic Orchard Experiment, LLC1,2,4 | | 9.75% PIK | | 4/10/2025 | | 11/10/2022 | | | 7,555,931 | | | 7,631,960 |
| 5,384,521 | | BD RC Defuniak Springs, LP1,2,4 | | 11.50% PIK | | 3/18/2025 | | 9/28/2023 | | | 5,384,521 | | | 5,384,521 |
| 3,140,832 | | BD RC Greenwood, LP1,2,4 | | 11.50% PIK | | 3/18/2025 | | 9/28/2023 | | | 3,140,832 | | | 3,140,832 |
| 5,457,131 | | BD RC Jacksonville AL, LP1,2,4 | | 11.50% PIK | | 3/18/2025 | | 9/28/2023 | | | 5,457,131 | | | 5,457,131 |
| 236 | | BD RC Jacksonville Normandy, LP1,2,4 | | 11.50% PIK | | 3/18/2025 | | 9/28/2023 | | | 236 | | | 236 |
| 5,044,049 | | BD RC Montgomery AL, LP1,2,4 | | 11.50% PIK | | 3/18/2025 | | 9/28/2023 | | | 5,044,049 | | | 5,044,049 |
| 557,918 | | BD RC North Myrtle Beach, LP1,2,4 | | 11.50% PIK | | 3/18/2025 | | 9/28/2023 | | | 557,918 | | | 557,918 |
| 4,110,238 | | BD RC Spartanburg, LP1,2,4 | | 11.50% PIK | | 3/18/2025 | | 10/24/2023 | | | 4,110,238 | | | 4,110,238 |
See accompanying notes to financial statements.
10
Keystone Private Income Fund |
Schedule of Investments September 30, 2024 (continued) |
Principal
Amount | | | | Coupon
Rate | | Maturity
Date | | Original
Acquisition
Date | | Cost | | Fair Value |
| | | Private Credit — 106.5% (continued) | | | | | | | | | | |
| | | Specialty Real Estate Finance — 50.6% (continued) | | | | | | | | |
$ | 5,062,567 | | BEP CO Springs Hospitality LLC1,2,4 | | 11.95% PIK | | 11/24/2025 | | 8/24/2023 | | $ | 5,062,567 | | $ | 5,062,567 |
| 5,384,472 | | Bonneyview Redding, LLC1,2,4 | | 8.00% PIK | | 1/28/2025 | | 7/28/2023 | | | 5,384,472 | | | 5,384,472 |
| 13,275,358 | | Capital Miller Pref NewCo, LLC,1,2,4 | | 14.00% PIK | | 12/5/2027 | | 12/5/2022 | | | 13,275,358 | | | 13,507,948 |
| 10,422,173 | | Cartier Industrial Center
LLC1,2,4 | | 9.95% PIK | | 10/24/2024 | | 5/25/2022 | | | 10,422,173 | | | 10,427,743 |
| 11,221,864 | | CC Development LP Series I, LLC1,2,4 | | 9.95% PIK | | 11/18/2024 | | 11/18/2021 | | | 11,221,864 | | | 11,254,516 |
| 8,302,123 | | CC Development LP Series III, LLC1,2,4 | | 10.45% PIK | | 2/3/2025 | | 2/2/2023 | | | 8,302,123 | | | 8,406,601 |
| 5,184,699 | | CCWO8, LLC1,2,4 | | 10.99% PIK | | 4/30/2025 | | 10/23/2023 | | | 5,184,699 | | | 5,184,699 |
| 12,478,747 | | Cedar Falls Partners, LLC1,2,4 | | 11.00% PIK | | 3/21/2025 | | 12/21/2023 | | | 12,478,747 | | | 12,531,348 |
| 5,404,366 | | Chesapeake Pines VA, LLC1,2,4 | | 12.50% PIK | | 1/19/2025 | | 1/19/2022 | | | 5,404,366 | | | 5,369,659 |
| 5,387,741 | | Condev Storage Minneola, LLC1,2,4 | | 10.50% PIK | | 5/2/2025 | | 5/2/2024 | | | 5,387,741 | | | 5,396,158 |
| 10,840,484 | | Corta Stevens Point, LLC1,2,4 | | 9.00% PIK | | 1/12/2025 | | 4/13/2023 | | | 10,840,484 | | | 10,809,523 |
| 8,478,338 | | Dabney Road Industrial LLC1,2,4 | | 10.50% PIK | | 3/20/2025 | | 12/20/2023 | | | 8,478,338 | | | 8,510,600 |
| 8,141,530 | | DZ Tech Community LLC1,2,4 | | 10.50% PIK | | 10/25/2025 | | 8/31/2023 | | | 8,141,530 | | | 8,432,975 |
| 6,075,000 | | Endeavor Investments IX, LLC1,2,4 | | 10.50% PIK | | 11/12/2025 | | 9/15/2022 | | | 6,075,000 | | | 6,244,475 |
| 4,299,999 | | Endeavor Investments VIII, LLC1,2,4 | | 10.50% PIK | | 8/4/2025 | | 2/4/2022 | | | 4,299,999 | | | 4,299,999 |
| 2,688,302 | | Frito Lay-Pomfret1,2,4 | | 9.50% PIK | | 1/30/2025 | | 11/1/2023 | | | 2,688,302 | | | 2,688,302 |
| 25,378,042 | | Frito Lay-Portfolio1,2,4 | | 9.50% PIK | | 10/3/2025 | | 10/4/2023 | | | 25,378,042 | | | 25,856,739 |
| 7,359,393 | | Frontera West-Sonoma Dev, LLC1,2,4 | | 11.29% PIK | | 4/19/2026 | | 10/19/2023 | | | 7,359,393 | | | 7,610,426 |
| 1,763,529 | | Galaxy Management Company, LLC1,2,3,8 | | 14.00% | | 11/10/2023 | | 11/18/2020 | | | 1,763,529 | | | 1,763,529 |
| 2,329,275 | | HD Post Buffalo, LLC1,2,4 | | 9.95% PIK | | 12/6/2024 | | 12/7/2022 | | | 2,329,275 | | | 2,329,275 |
| 15,229,642 | | Holmes Lane Development, LLC1,2,4 | | 10.75% PIK | | 5/4/2025 | | 8/4/2023 | | | 15,229,642 | | | 15,354,788 |
| 630,534 | | HSM Hawley, LLC1,2,4 | | 10.50% PIK | | 4/5/2026 | | 1/10/2024 | | | 630,534 | | | 630,534 |
| 142,276 | | JDI Pasadena Logistics Center SPE, LLC1,2 | | 11.15% | | 8/28/2026 | | 8/30/2024 | | | 142,276 | | | 142,276 |
| 10,809 | | JF Wonderblock Phase 2, LLC1,2,4 | | 10.99% PIK | | 2/20/2028 | | 12/20/2023 | | | 10,809 | | | 10,809 |
| 27,080,979 | | Justus at Promenade Senior, LLC1,2,4 | | 10.30% PIK | | 6/16/2025 | | 3/15/2023 | | | 27,080,979 | | | 27,312,969 |
| 9,566,370 | | Lex Apartments 102B, LLC1,2,4 | | 9.95% PIK | | 3/31/2025 | | 9/9/2022 | | | 9,566,370 | | | 9,566,370 |
| 26,949,211 | | Lex Apartments, LLC1,2,4 | | 10.50% PIK | | 3/31/2025 | | 8/31/2022 | | | 26,949,211 | | | 26,949,211 |
| 5,140,952 | | MAP Logistics Center Lot 33, LLC1,2 | | 10.95% | | 6/17/2025 | | 6/13/2022 | | | 5,140,952 | | | 5,140,952 |
| 19,465,805 | | MC Oslo Aurora, LLC1,2,4,8 | | 13.25% PIK | | 7/11/2025 | | 7/11/2022 | | | 19,465,805 | | | 19,528,328 |
| 16,206,884 | | MC Oslo Hermitage, LLC1,2,4 | | 13.00% PIK | | 6/1/2025 | | 5/19/2022 | | | 16,206,884 | | | 19,476,480 |
| 12,909,290 | | MC Oslo SFM Two, LLC1,2,4,8 | | 13.00% PIK | | 6/1/2025 | | 5/19/2022 | | | 12,909,290 | | | 11,624,349 |
| 8,641,712 | | MC Oslo SFQ, LLC1,2,4,8 | | 13.25% PIK | | 7/11/2025 | | 7/11/2022 | | | 8,641,712 | | | 6,010,854 |
See accompanying notes to financial statements.
11
Keystone Private Income Fund |
Schedule of Investments September 30, 2024 (continued) |
Principal
Amount | | | | Coupon
Rate | | Maturity
Date | | Original
Acquisition
Date | | Cost | | Fair Value |
| | | Private Credit — 106.5% (continued) | | | | | | | | | | |
| | | Specialty Real Estate Finance — 50.6% (continued) | | | | | | | | |
$ | 12,949,346 | | MC Rye Katy, LLC1,2,4,8 | | 13.25% PIK | | 8/9/2025 | | 8/10/2022 | | $ | 12,949,346 | | $ | 14,084,226 |
| 10,910,761 | | MC Rye Northwest, LLC1,2,4,8 | | 13.25% PIK | | 8/9/2025 | | 8/9/2022 | | | 10,910,761 | | | 12,827,179 |
| 12,973,413 | | MC Rye Westchase, LLC1,2,4,8 | | 13.25% PIK | | 8/9/2025 | | 8/9/2022 | | | 12,973,413 | | | 12,745,071 |
| 177,781 | | Merced Security Storage, LLC1,2,4 | | 10.50% PIK | | 5/6/2026 | | 5/6/2024 | | | 177,781 | | | 177,781 |
| 6,391,048 | | Missoula Hotel Holdings,
LLC1,2,4 | | 12.00% PIK | | 8/31/2025 | | 8/24/2023 | | | 6,391,048 | | | 6,377,691 |
| 17,273,118 | | MLab International, LLC1,2,4 | | 9.25% PIK | | 10/30/2024 | | 7/22/2022 | | | 17,273,118 | | | 17,273,118 |
| 6,966,037 | | MSP Retail II, LLC1,2 | | 10.50% | | 8/1/2025 | | 2/1/2024 | | | 6,966,037 | | | 7,015,528 |
| 19,962,145 | | Nancy Jay Industrial Center, LLC1,2,4 | | 12.95% PIK | | 5/31/2027 | | 6/3/2022 | | | 19,962,145 | | | 21,719,878 |
| 11,888,870 | | Odyssey Vortex LLC1,2,4 | | 10.50% PIK | | 11/22/2024 | | 8/22/2023 | | | 11,888,870 | | | 12,116,185 |
| 6,600,000 | | Olympus Bluffs 4, LLC1,2,4 | | 11.95% PIK | | 9/9/2025 | | 9/9/2022 | | | 6,600,000 | | | 6,728,406 |
| 6,015,981 | | Olympus Oaks 1, LLC1,2,4 | | 12.50% PIK | | 7/14/2026 | | 7/13/2023 | | | 6,015,981 | | | 6,047,437 |
| 5,932,327 | | Olympus Oaks 2, LLC1,2,4 | | 12.50% PIK | | 7/14/2026 | | 7/13/2023 | | | 5,932,327 | | | 5,938,003 |
| 6,247,656 | | Olympus Oaks 4, LLC1,2,4 | | 12.50% PIK | | 7/13/2026 | | 7/13/2023 | | | 6,247,656 | | | 6,277,622 |
| 5,926,627 | | Olympus Oaks 5, LLC1,2,4 | | 12.50% PIK | | 7/14/2026 | | 7/13/2023 | | | 5,926,627 | | | 5,934,256 |
| 4,438,965 | | Olympus Oaks 6, LLC1,2,4 | | 12.50% PIK | | 2/16/2027 | | 2/16/2024 | | | 4,438,965 | | | 4,332,985 |
| 814,495 | | Olympus Oaks 7, LLC1,2,4 | | 12.50% PIK | | 2/16/2027 | | 2/16/2024 | | | 814,495 | | | 814,495 |
| 1,524,868 | | Olympus Oaks 8, LLC1,2,4 | | 12.50% PIK | | 2/16/2027 | | 2/16/2024 | | | 1,524,868 | | | 1,524,868 |
| 126,225 | | Olympus Oaks 9, LLC1,2,4 | | 12.50% PIK | | 2/16/2027 | | 2/16/2024 | | | 126,225 | | | 126,225 |
| 5,235,134 | | Olympus Palms 1, LLC1,2,4 | | 12.50% PIK | | 6/30/2025 | | 7/1/2022 | | | 5,235,134 | | | 5,354,109 |
| 3,413,054 | | Olympus Palms 2, LLC1,2 | | 12.50% | | 7/2/2027 | | 7/2/2024 | | | 3,413,054 | | | 3,413,054 |
| 3,792,498 | | Olympus Palms 3, LLC1,2,4 | | 11.95% PIK | | 8/3/2025 | | 8/3/2022 | | | 3,792,498 | | | 3,792,498 |
| 7,916,886 | | Olympus Palms 4, LLC1,2 | | 12.50% | | 10/4/2024 | | 10/4/2022 | | | 7,916,886 | | | 7,947,018 |
| 6,964,130 | | Olympus Palms 5, LLC1,2 | | 12.50% | | 10/4/2024 | | 10/4/2022 | | | 6,964,130 | | | 6,964,130 |
| 6,672,381 | | Olympus Palms 6, LLC1,2 | | 12.50% | | 10/4/2024 | | 10/4/2022 | | | 6,672,381 | | | 6,672,381 |
| 4,454,359 | | Olympus Palms 7, LLC1,2 | | 12.50% | | 7/2/2027 | | 10/4/2022 | | | 4,454,359 | | | 4,454,359 |
| 5,818,470 | | Olympus Pines FF Wash,
LLC1,2 | | 12.50% | | 10/31/2025 | | 7/15/2021 | | | 5,818,470 | | | 5,818,470 |
| 5,349,364 | | Pierce Street Holdings LLC1,2,4 | | 9.75% PIK | | 2/1/2025 | | 3/15/2022 | | | 5,349,364 | | | 5,416,153 |
| 10,337 | | Renton Hotel Holdings, LLC1,2,4 | | 12.00% PIK | | 8/31/2026 | | 5/24/2024 | | | 10,337 | | | 10,337 |
| 7,313,568 | | Richland LA Hotel Holdings, LLC1,2,4 | | 12.00% PIK | | 8/31/2025 | | 8/31/2023 | | | 7,313,568 | | | 7,451,894 |
| 93,551 | | Romeria Pointe, LLC1,2,4 | | 11.09% PIK | | 3/4/2026 | | 3/4/2024 | | | 93,551 | | | 93,551 |
| 4,952,811 | | Salinas Rossi Partners, LLC1,2,4 | | 9.00% PIK | | 12/15/2024 | | 12/15/2022 | | | 4,952,811 | | | 4,992,331 |
| 9,112,322 | | San Antonio Partners, LLC1,2,4 | | 9.00% PIK | | 12/15/2024 | | 12/15/2022 | | | 9,112,322 | | | 9,174,486 |
| 10,232 | | Scarborough Hotel Holdings, LLC1,2,4 | | 12.00% PIK | | 9/30/2026 | | 6/24/2024 | | | 10,232 | | | 10,232 |
| 7,029,864 | | Smyrna Hotel Holdings, LLC1,2,4 | | 12.00% PIK | | 7/20/2025 | | 7/21/2023 | | | 7,029,864 | | | 7,052,984 |
| 107,284 | | Syracuse Hotel Holdings, LLC1,2 | | 12.00% | | 5/31/2026 | | 2/2/2024 | | | 107,284 | | | 107,284 |
| 5,123,250 | | VG Huntsville Storage, LLC1,2,4 | | 11.50% PIK | | 2/7/2025 | | 8/7/2023 | | | 5,123,250 | | | 5,191,829 |
| 605,249 | | VG Pines Residential, LLC1,2,4 | | 11.15% PIK | | 9/1/2026 | | 3/1/2024 | | | 605,249 | | | 605,249 |
| 17,382,618 | | Vivo Living Durham LLC1,2,4,8 | | 9.50% PIK | | 10/14/2024 | | 10/14/2022 | | | 17,382,618 | | | 16,932,306 |
See accompanying notes to financial statements.
12
Keystone Private Income Fund |
Schedule of Investments September 30, 2024 (continued) |
Principal
Amount | | | | Coupon
Rate | | Maturity
Date | | Original
Acquisition
Date | | Cost | | Fair Value |
| | | Private Credit — 106.5% (continued) | | | | | | | | | | | |
| | | Specialty Real Estate Finance — 50.6% (continued) | | | | | | | | | |
$ | 15,036,310 | | Vivo Living Raleigh 1 LLC1,2,4,8 | | 9.50% PIK | | 11/18/2024 | | 11/18/2022 | | $ | 15,036,310 | | $ | 14,646,780 | |
| 39,484,629 | | Vivo Portfolio1,2 | | 11.49% | | 12/15/2025 | | 12/15/2023 | | | 39,484,629 | | | 40,023,787 | |
| 8,257,598 | | West Jordan Hotel Holdings, LLC1,2,4 | | 12.00% PIK | | 6/20/2025 | | 6/20/2023 | | | 8,257,598 | | | 8,253,343 | |
| 25,826,055 | | Zoe Lakeview, LLC1,2,4 | | 10.45% PIK | | 11/21/2024 | | 11/22/2022 | | | 25,826,055 | | | 26,537,306 | |
| | | | | | | | | | | | 702,554,346 | | | 710,375,409 | |
| | | Total Private Credit | | | | | | | | | 1,504,570,160 | | | 1,495,644,505 | |
| | | Private Investment Funds — 0.8% | | | | | | | | | | | |
| N/A | | Structural Keystone VL LLC-Series KS Manscaped1,2,5 | | | | 12/24/2024 | | 12/17/2021 | | $ | 11,377,749 | | $ | 11,377,749 | |
| | | Total Private Investment Funds | | | | | | | | | 11,377,749 | | | 11,377,749 | |
| | | | | | | | | | | | | | | | |
| Shares | | | | | | | | | | | | | | | |
| | | Warrants — 0.0% | | | | | | | | | | | | | |
| 73,274 | | Sovrn Holdings, Inc1,2,5 | | | | | | | | | — | | | — | |
| | | Total Investments —
107.3%⁶ | | | | | | | | $ | 1,515,947,909 | | $ | 1,507,022,254 | |
| | | Liabilities in excess of other assets — (7.3%) | | | | | | | | | | | | (102,817,351 | ) |
| | | Net Assets — 100% | | | | | | | | | | | $ | 1,404,204,903 | |
See accompanying notes to financial statements.
13
Keystone Private Income Fund |
Summary of Investments September 30, 2024 |
Security Type/Sector | | Percent of
Total
Net Assets |
Private Credit | | | |
Specialty Real Estate Finance | | 50.6 | % |
Finance Assets | | 21.3 | % |
Equipment Leasing | | 17.8 | % |
Corporate Finance | | 16.8 | % |
Total Private Credit | | 106.5 | % |
Private Investment Funds | | 0.8 | % |
Warrants | | 0.0 | % |
Total Investments | | 107.3 | % |
Liabilities in excess of other assets | | (7.3 | )% |
Net Assets | | 100.0 | % |
See accompanying notes to financial statements.
14
Keystone Private Income Fund |
Statement of Assets and Liabilities September 30, 2024 |
Assets: | | | | |
Investments, at value (cost $1,515,947,909) | | $ | 1,507,022,254 | |
Unearned upfront investment income | | | (13,509,381 | ) |
Total Investments, at value, less unearned upfront investment income | | $ | 1,493,512,873 | |
Cash | | | 1,314,031 | |
Cash equivalents held in escrow for subscriptions received in advance | | | 19,493,272 | |
Restricted cash held for BlueRoc Intermediate, LLC | | | 4,392,873 | |
Restricted cash held for Propel Holdings, Inc. | | | 104,753 | |
Interest receivable | | | 18,706,075 | |
Purchase premium | | | 309,097 | |
Investments receivable | | | 86,057 | |
Total Assets | | | 1,537,919,031 | |
Liabilities: | | | | |
Payables | | | | |
Line of credit | | | 61,963,548 | |
Distributions payable | | | 25,821,747 | |
Proceeds from subscriptions received in advance | | | 19,493,272 | |
Payable for shares repurchased | | | 15,978,928 | |
Restricted cash payable | | | 4,392,873 | |
Investment expense payable | | | 198,658 | |
Unearned interest reserve | | | 38,439 | |
Investments payable | | | 2,420 | |
Incentive fees payable (Note 4) | | | 3,278,707 | |
Management fee payable (Note 4) | | | 1,783,190 | |
Professional fees payable | | | 223,590 | |
Interest expense payable on line of credit | | | 173,478 | |
Distribution and Servicing fee payable (Note 4) | | | 97,622 | |
Accounting and administration fees payable (Note 4) | | | 77,937 | |
Transfer agent fees payable | | | 46,064 | |
Other accrued expenses | | | 143,655 | |
Total Liabilities | | | 133,714,128 | |
| | | | | |
Net Assets | | $ | 1,404,204,903 | |
| | | | | |
Composition of Net Assets: | | | | |
Paid-in capital | | $ | 1,413,661,344 | |
Total accumulated loss | | | (9,456,441 | ) |
Net Assets | | $ | 1,404,204,903 | |
See accompanying notes to financial statements.
15
Keystone Private Income Fund |
Statement of Assets and Liabilities September 30, 2024 (continued) |
Net Assets Attributable to: | | | |
Class D Shares | | $ | 34,293,794 |
Class Y Shares | | | 174,520,726 |
Class I Shares | | | 101,095,313 |
Class Z Shares | | | 1,094,295,070 |
| | | $ | 1,404,204,903 |
| | | | |
Shares of Beneficial Interest Outstanding (Unlimited Number of Shares Authorized, par value of $0.001): |
Class D Shares | | | 342,308 |
Class Y Shares | | | 1,739,418 |
Class I Shares | | | 1,010,788 |
Class Z Shares | | | 10,906,646 |
| | | | 13,999,160 |
| | | | |
Net Asset Value per Share: | | | |
Class D Shares1 | | $ | 100.18 |
Class Y Shares | | $ | 100.33 |
Class I Shares | | $ | 100.02 |
Class Z Shares | | $ | 100.33 |
See accompanying notes to financial statements.
16
Keystone Private Income Fund |
Statement of Operations For the Year Ended September 30, 2024 |
Investment Income: | | | | |
Investment income | | $ | 151,716,579 | |
Other income1 | | | 49,286,053 | |
Total Investment Income | | | 201,002,632 | |
| | | | | |
Expenses: | | | | |
Incentive fees (Note 4) | | | 25,021,973 | |
Management fees (Note 4) | | | 18,956,795 | |
Interest expense on line of credit | | | 3,089,678 | |
Accounting and administration fees (Note 4) | | | 865,077 | |
Transfer agent fees | | | 489,164 | |
Distribution and Servicing fee (Class Y) (Note 4) | | | 415,554 | |
Distribution and Servicing fee (Class D) (Note 4) | | | 293,770 | |
Distribution and Servicing fee (Class I) (Note 4) | | | 128,775 | |
Professional fees | | | 358,959 | |
Investment expense | | | 309,920 | |
Other fees | | | 248,343 | |
Trustee and officer fees | | | 62,500 | |
Custody fees | | | 30,506 | |
CCO fees (Note 4) | | | 45,363 | |
Total Expenses | | | 50,316,377 | |
Net Investment Income | | | 150,686,255 | |
| | | | | |
Net Change in Unrealized Depreciation on Investments | | | | |
Net change in unrealized depreciation on investments | | | (2,062,588 | ) |
Net Change in Unrealized Depreciation on Investments | | | (2,062,588 | ) |
| | | | | |
Net Increase in Net Assets from Operations | | $ | 148,623,667 | |
See accompanying notes to financial statements.
17
Keystone Private Income Fund |
Statements of Changes in Net Assets |
| | For the
Year Ended
September 30,
2024 | | For the
Year Ended
September 30,
2023 |
Net Increase in Net Assets from:
Operations: | | | | | | | | |
Net investment income | | $ | 150,686,255 | | | $ | 92,511,414 | |
Net change in unrealized depreciation on investments | | | (2,062,588 | ) | | | (6,863,068 | ) |
Net Increase in Net Assets Resulting from Operations | | | 148,623,667 | | | | 85,648,346 | |
| | | | | | | | | |
Distributions to Shareholders: | | | | | | | | |
Distributions: | | | | | | | | |
Class A1 | | | — | | | | (40,029 | ) |
Class D | | | (3,688,799 | ) | | | (2,599,878 | ) |
Class Y | | | (19,897,352 | ) | | | (14,004,749 | ) |
Class I | | | (10,269,830 | ) | | | (6,088,385 | ) |
Class Z | | | (116,830,275 | ) | | | (69,778,373 | ) |
Net Decrease in Net Assets from Distributions to
Shareholders | | | (150,686,256 | ) | | | (92,511,414 | ) |
| | | | | | | | | |
Capital Transactions: | | | | | | | | |
Proceeds from shares sold: | | | | | | | | |
Class A1 | | | — | | | | 5,450,000 | |
Class D | | | 4,528,400 | | | | 4,723,000 | |
Class Y | | | 78,723,432 | | | | 95,128,369 | |
Class I | | | 29,362,400 | | | | 35,012,000 | |
Class Z | | | 301,537,794 | | | | 221,805,449 | |
Reinvestment of distributions: | | | | | | | | |
Class A1 | | | — | | | | 1,480 | |
Class D | | | 895,154 | | | | 547,734 | |
Class Y | | | 6,734,114 | | | | 4,314,453 | |
Class I | | | 3,604,099 | | | | 3,418,780 | |
Class Z | | | 29,098,234 | | | | 12,967,070 | |
Cost of shares repurchased: | | | | | | | | |
Class A1 | | | — | | | | — | |
Class D | | | (985,365 | ) | | | (148,522 | ) |
Class Y | | | (11,805,480 | ) | | | (6,743,187 | ) |
Class I | | | (17,971,712 | ) | | | (3,904,995 | ) |
Class Z | | | (55,077,365 | ) | | | (23,463,234 | ) |
Exchanges | | | | | | | | |
Class A1 | | | — | | | | (12,896,334 | ) |
Class D | | | — | | | | 12,896,334 | |
Class Y | | | (54,842,523 | ) | | | (53,300,812 | ) |
Class I | | | 7,152,892 | | | | 21,964,410 | |
Class Z | | | 47,689,631 | | | | 31,336,402 | |
| | | | | | | | | |
Net Increase (Decrease) in Net Assets from Capital Transaction: | | | | | | | | |
Class A1 | | | — | | | | (7,444,854 | ) |
Class D | | | 4,438,189 | | | | 18,018,546 | |
Class Y | | | 18,809,543 | | | | 39,398,823 | |
See accompanying notes to financial statements.
18
Keystone Private Income Fund |
Statements of Changes in Net Assets (continued) |
| | For the
Year Ended
September 30,
2024 | | For the
Year Ended
September 30,
2023 |
Class I | | | 22,147,679 | | | | 56,490,195 | |
Class Z | | | 323,248,294 | | | | 242,645,687 | |
| | | | | | | | | |
Total Net Increase in Net Assets | | | 366,581,116 | | | | 342,245,329 | |
| | | | | | | | | |
Net Assets | | | | | | | | |
Beginning of year | | | 1,037,623,787 | | | | 695,378,458 | |
End of year | | $ | 1,404,204,903 | | | $ | 1,037,623,787 | |
| | | | | | | | | |
Capital Share Transactions: | | | | | | | | |
Shares sold: | | | | | | | | |
Class A1 | | | — | | | | 53,949 | |
Class D | | | 45,142 | | | | 46,761 | |
Class Y | | | 784,557 | | | | 940,974 | |
Class I | | | 293,906 | | | | 347,509 | |
Class Z | | | 3,005,799 | | | | 2,196,673 | |
Shares issued in reinvestment of distributions: | | | | | | | | |
Class A1 | | | — | | | | 15 | |
Class D | | | 8,939 | | | | 5,444 | |
Class Y | | | 67,144 | | | | 42,804 | |
Class I | | | 36,022 | | | | 34,055 | |
Class Z | | | 290,137 | | | | 128,719 | |
Shares redeemed: | | | | | | | | |
Class A1 | | | — | | | | — | |
Class D | | | (9,888 | ) | | | (1,478 | ) |
Class Y | | | (117,862 | ) | | | (66,847 | ) |
Class I | | | (179,469 | ) | | | (38,966 | ) |
Class Z | | | (549,783 | ) | | | (232,864.00 | ) |
Exchanges | | | | | | | | |
Class A1 | | | — | | | | (127,661 | ) |
Class D | | | — | | | | 127,522 | |
Class Y | | | (546,129 | ) | | | (527,336 | ) |
Class I | | | 71,561 | | | | 218,322 | |
Class Z | | | 474,789 | | | | 309,707 | |
| | | | | | | | | |
Net Increase (Decrease) in Capital Transaction Outstanding: | | | | | | | | |
Class A1 | | | — | | | | (73,697 | ) |
Class D | | | 44,193 | | | | 178,249 | |
Class Y | | | 187,710 | | | | 389,595 | |
Class I | | | 222,020 | | | | 560,920 | |
Class Z | | | 3,220,942 | | | | 2,402,235 | |
See accompanying notes to financial statements.
19
Keystone Private Income Fund |
Statement of Cash Flows For the Year Ended September 30, 2024 |
Cash Flows from Operating Activities | | | | |
Net increase in net assets from operations | | $ | 148,623,667 | |
Adjustments to reconcile net increase in net assets from operations to net cash used in operating activities: | | | | |
Net change in unrealized depreciation | | | 2,062,588 | |
Purchases of investments | | | (1,066,912,820 | ) |
PIK interest income added to principal amount of investment | | | (49,286,053 | ) |
Principal reductions received | | | 720,647,612 | |
(Increase)/Decrease in Assets: | | | | |
Unearned upfront investment income | | | 13,509,381 | |
Interest receivable | | | (1,704,194 | ) |
Investments receivable | | | (86,057 | ) |
Purchase premium | | | (309,097 | ) |
Increase/(Decrease) in Liabilities: | | | | |
Restricted cash payable | | | 4,392,873 | |
Unearned interest reserve | | | 38,439 | |
Investments payable | | | (33,566 | ) |
Investment expense payable | | | 198,658 | |
Management fee payable | | | 459,180 | |
Incentive fees payable | | | 1,632,450 | |
Interest expense payable on line of credit | | | (133,161 | ) |
Professional fees payable | | | 14,487 | |
Transfer agent fees payable | | | 24,990 | |
Accounting and administration fees payable | | | 16,414 | |
Distribution and Servicing fee payable | | | 13,801 | |
Trustee fees payable | | | (21,500 | ) |
Other accrued expenses | | | 23,711 | |
Net Cash Used in Operating Activities | | | (226,828,197 | ) |
| | | | | |
Cash Flows from Financing Activities | | | | |
Proceeds from subscriptions | | | 414,152,026 | |
Increase in payable for proceeds from subscriptions received in advance | | | (22,867,644 | ) |
Proceeds from line of credit | | | 727,145,683 | |
Payments made on line of credit | | | (725,841,328 | ) |
Distributions paid to shareholders, net of reinvestments and increase in distributions
payable | | | (105,986,646 | ) |
Payments for shares repurchased | | | (84,353,141 | ) |
Net Cash Provided by Financing Activities | | | 202,248,950 | |
| | | | | |
Net decrease in cash and cash equivalents | | | (24,579,247 | ) |
| | | | | |
Cash and cash equivalents at beginning of year1 | | | 49,884,176 | |
Cash and cash equivalents at end of year2 | | $ | 25,304,929 | |
See accompanying notes to financial statements.
20
Keystone Private Income Fund |
Financial Highlights Class D Shares |
Per share operating performance.
For a capital share outstanding throughout the year/period.
| | For the
Year Ended
September 30,
2024 | | For the
Year Ended
September 30,
2023 | | For the
Year Ended
September 30,
2022 | | For the
Year Ended
September 30,
2021 | | For the Period
September 30,
2020*
through
September 30,
2020 |
Net Asset Value, beginning of year/period | | $ | 100.38 | | | $ | 101.13 | | | $ | 101.13 | | | $ | 100.00 | | | $ | 100.00 | |
Income from Investment Operations: | | | | | | | | | | | | | | | | | | | | |
Net investment
income1 | | | 11.33 | | | | 9.68 | | | | 9.96 | | | | 9.08 | | | | — | |
Net realized and unrealized gain (loss) on investments2 | | | (0.14 | ) | | | (0.76 | ) | | | 0.13 | | | | (0.75 | ) | | | — | |
Total from investment operations | | | 11.19 | | | | 8.92 | | | | 10.09 | | | | 8.33 | | | | — | |
| | | | | | | | | | | | | | | | | | | | | |
Distributions to investors: | | | | | | | | | | | | | | | | | | | | |
From net investment income | | | (11.39 | ) | | | (9.67 | ) | | | (10.09 | ) | | | (7.20 | ) | | | — | |
Total distributions to investors | | | (11.39 | ) | | | (9.67 | ) | | | (10.09 | ) | | | (7.20 | ) | | | — | |
| | | | | | | | | | | | | | | | | | | | | |
Net Asset Value, end of year/period | | $ | 100.18 | | | $ | 100.38 | | | $ | 101.13 | | | $ | 101.13 | | | $ | 100.00 | |
| | | | | | | | | | | | | | | | | | | | | |
Total Return3 | | | 11.76 | % | | | 9.22 | % | | | 10.44 | % | | | 8.57 | % | | | 0.00 | %4 |
| | | | | | | | | | | | | | | | | | | | | |
Ratios and Supplemental Data: | | | | | | | | | | | | | | | | | | | | |
Net Assets, end of year/period (in thousands) | | $ | 34,294 | | | $ | 29,926 | | | $ | 12,122 | | | $ | 2,391 | | | $ | 62 | |
| | | | | | | | | | | | | | | | | | | | | |
Net expenses | | | 4.87 | %5 | | | 4.53 | %6 | | | 4.82 | %7 | | | 4.36 | %8 | | | 0.00 | %4,10 |
| | | | | | | | | | | | | | | | | | | | | |
Net investment income | | | 11.32 | %5 | | | 9.61 | %6 | | | 9.85 | %7 | | | 8.98 | %8 | | | 0.00 | %4,10 |
| | | | | | | | | | | | | | | | | | | | | |
Senior Securities | | | | | | | | | | | | | | | | | | | | |
Total Amount Outstanding exclusive of Treasury Securities | | | | | | | | | | | | | | | | | | | | |
Borrowings-Revolving Loan Agreement (in thousands) | | | 61,964 | | | | 60,659 | | | | 64,926 | | | | 29,433 | | | | 5,000 | |
Asset Coverage Per $1,000 of Borrowings | | | | | | | | | | | | | | | | | | | | |
Borrowings-Revolving Loan Agreement | | | 23,662 | | | | 18,106 | | | | 11,710 | | | | 12,037 | | | | 14,265 | |
| | | | | | | | | | | | | | | | | | | | | |
Portfolio Turnover
Rate9 | | | 56 | % | | | 49 | % | | | 63 | % | | | 53 | % | | | 1 | %4 |
See accompanying notes to financial statements.
21
Keystone Private Income Fund |
Financial Highlights Class D Shares (continued) |
See accompanying notes to financial statements.
22
Keystone Private Income Fund |
Financial Highlights Class Y Shares |
Per share operating performance.
For a capital share outstanding throughout the year/period.
| | For the
Year Ended
September 30,
2024 | |
For the
Year Ended
September 30,
2023
| |
For the
Year Ended
September 30,
2022
| |
For the
Year Ended
September 30,
2021
| | For the Period
July 1,
2020*
through
September 30,
2020 |
Net Asset Value, beginning of year/period | | $ | 100.53 | | | $ | 101.28 | | | $ | 101.28 | | | $ | 100.58 | | | $ | 100.00 | |
Income from Investment Operations: | | | | | | | | | | | | | | | | | | | | |
Net investment
income1 | | | 12.00 | | | | 10.40 | | | | 10.71 | | | | 9.12 | | | | 1.37 | |
Net realized and unrealized gain (loss) on investments2 | | | (0.14 | ) | | | (0.81 | ) | | | 0.05 | | | | (0.16 | ) | | | 0.60 | |
Total from investment operations | | | 11.86 | | | | 9.59 | | | | 10.76 | | | | 8.96 | | | | 1.97 | |
| | | | | | | | | | | | | | | | | | | | | |
Distributions to investors: | | | | | | | | | | | | | | | | | | | | |
From net investment income | | | (12.06 | ) | | | (10.34 | ) | | | (10.76 | ) | | | (8.26 | ) | | | (1.39 | ) |
Total distributions to investors | | | (12.06 | ) | | | (10.34 | ) | | | (10.76 | ) | | | (8.26 | ) | | | (1.39 | ) |
| | | | | | | | | | | | | | | | | | | | | |
Net Asset Value, end of year/period | | $ | 100.33 | | | $ | 100.53 | | | $ | 101.28 | | | $ | 101.28 | | | $ | 100.58 | |
| | | | | | | | | | | | | | | | | | | | | |
Total Return3 | | | 12.48 | % | | | 9.93 | % | | | 11.16 | % | | | 9.21 | % | | | 1.97 | %4 |
| | | | | | | | | | | | | | | | | | | | | |
Ratios and Supplemental Data: | | | | | | | | | | | | | | | | | | | | |
Net Assets, end of year/period (in thousands) | | $ | 174,521 | | | $ | 155,996 | | | $ | 117,699 | | | $ | 70,988 | | | $ | 20,726 | |
| | | | | | | | | | | | | | | | | | | | | |
Net expenses | | | 4.23 | %6 | | | 3.90 | %7 | | | 4.18 | %8 | | | 4.12 | %9 | | | 3.43 | %5,10 |
| | | | | | | | | | | | | | | | | | | | | |
Net investment income | | | 11.97 | %6 | | | 10.31 | %7 | | | 10.58 | %8 | | | 9.00 | %9 | | | 6.12 | %5,10 |
| | | | | | | | | | | | | | | | | | | | | |
Senior Securities | | | | | | | | | | | | | | | | | | | | |
Total Amount Outstanding exclusive of Treasury Securities | | | | | | | | | | | | | | | | | | | | |
Borrowings-Revolving Loan Agreement (in thousands) | | | 61,964 | | | | 60,659 | | | | 64,926 | | | | 29,433 | | | | 5,000 | |
Asset Coverage Per $1,000 of Borrowings | | | | | | | | | | | | | | | | | | | | |
Borrowings-Revolving Loan Agreement | | | 23,662 | | | | 18,106 | | | | 11,710 | | | | 12,037 | | | | 14,265 | |
| | | | | | | | | | | | | | | | | | | | | |
Portfolio Turnover
Rate11 | | | 56 | % | | | 49 | % | | | 63 | % | | | 53 | % | | | 1 | %4 |
See accompanying notes to financial statements.
23
Keystone Private Income Fund |
Financial Highlights Class Y Shares (continued) |
See accompanying notes to financial statements.
24
Keystone Private Income Fund |
Financial Highlights Class I Shares |
Per share operating performance.
For a capital share outstanding throughout the year/period.
| |
For the
Year Ended
September 30,
2024
| |
For the
Year Ended
September 30,
2023
| |
For the
Year Ended
September 30,
2022
| |
For the
Year Ended
September 30,
2021
| | For the Period
August 1,
2020*
through
September 30,
2020 |
Net Asset Value, beginning of year/period | | $ | 100.21 | | | $ | 100.96 | | | $ | 100.96 | | | $ | 100.76 | | | $ | 100.53 | |
Income from Investment Operations: | | | | | | | | | | | | | | | | | | | | |
Net investment income1 | | | 12.12 | | | | 10.52 | | | | 10.90 | | | | 9.52 | | | | 1.67 | |
Net realized and
unrealized gain (loss)
on investments2 | | | (0.19 | ) | | | (0.86 | ) | | | (0.07 | ) | | | (0.55 | ) | | | (0.19 | ) |
Total from investment operations | | | 11.93 | | | | 9.66 | | | | 10.83 | | | | 8.97 | | | | 1.48 | |
| | | | | | | | | | | | | | | | | | | | | |
Distributions to investors: | | | | | | | | | | | | | | | | | | | | |
From net investment income | | | (12.12 | ) | | | (10.41 | ) | | | (10.83 | ) | | | (8.77 | ) | | | (1.25 | ) |
Total distributions to investors | | | (12.12 | ) | | | (10.41 | ) | | | (10.83 | ) | | | (8.77 | ) | | | (1.25 | ) |
| | | | | | | | | | | | | | | | | | | | | |
Net Asset Value, end of year/period | | $ | 100.02 | | | $ | 100.21 | | | $ | 100.96 | | | $ | 100.96 | | | $ | 100.76 | |
| | | | | | | | | | | | | | | | | | | | | |
Total Return3 | | | 12.60 | % | | | 10.03 | % | | | 11.27 | % | | | 9.24 | % | | | 1.47 | %4 |
| | | | | | | | | | | | | | | | | | | | | |
Ratios and Supplemental Data: | | | | | | | | | | | | | | | | | | | | |
Net Assets, end of year/period
(in thousands) | | $ | 101,095 | | | $ | 79,045 | | | $ | 23,003 | | | $ | 64,570 | | | $ | 11,755 | |
| | | | | | | | | | | | | | | | | | | | | |
Net expenses | | | 4.18 | %6 | | | 3.83 | %7 | | | 4.08 | %8 | | | 3.84 | %9 | | | 3.43 | %5,10 |
| | | | | | | | | | | | | | | | | | | | | |
Net investment income | | | 12.13 | %6 | | | 10.47 | %7 | | | 10.80 | %8 | | | 9.42 | %9 | | | 11.35 | %5,10 |
| | | | | | | | | | | | | | | | | | | | | |
Senior Securities | | | | | | | | | | | | | | | | | | | | |
Total Amount Outstanding exclusive of Treasury Securities | | | | | | | | | | | | | | | | | | | | |
Borrowings-Revolving Loan Agreement (in thousands) | | | 61,964 | | | | 60,659 | | | | 64,926 | | | | 29,433 | | | | 5,000 | |
Asset Coverage Per $1,000
of Borrowings | | | | | | | | | | | | | | | | | | | | |
Borrowings-Revolving
Loan Agreement | | | 23,662 | | | | 18,106 | | | | 11,710 | | | | 12,037 | | | | 14,265 | |
| | | | | | | | | | | | | | | | | | | | | |
Portfolio Turnover Rate11 | | | 56 | % | | | 49 | % | | | 63 | % | | | 53 | % | | | 1 | %4 |
See accompanying notes to financial statements.
25
Keystone Private Income Fund |
Financial Highlights Class I Shares (continued) |
See accompanying notes to financial statements.
26
Keystone Private Income Fund |
Financial Highlights Class Z Shares |
Per share operating performance.
For a capital share outstanding throughout the year/period.
| |
For the
Year Ended
September 30,
2024
| |
For the
Year Ended
September 30,
2023
| |
For the
Year Ended
September 30,
2022
| |
For the
Year Ended
September 30,
2021
| | For the Period
August 1,
2020*
through
September 30,
2020 |
Net Asset Value, beginning of
year/period | | $ | 100.53 | | | $ | 101.28 | | | $ | 101.28 | | | $ | 100.56 | | | $ | 100.53 | |
Income from Investment Operations: | | | | | | | | | | | | | | | | | | | | |
Net investment income1 | | | 12.20 | | | | 10.66 | | | | 10.94 | | | | 9.49 | | | | 1.68 | |
Net realized and
unrealized gain (loss)
on investments2 | | | (0.09 | ) | | | (0.81 | ) | | | 0.07 | | | | (0.27 | ) | | | (0.21 | ) |
Total from investment operations | | | 12.11 | | | | 9.85 | | | | 11.01 | | | | 9.22 | | | | 1.47 | |
| | | | | | | | | | | | | | | | | | | | | |
Distributions to investors: | | | | | | | | | | | | | | | | | | | | |
From net investment income | | | (12.31 | ) | | | (10.60 | ) | | | (11.01 | ) | | | (8.50 | ) | | | (1.44 | ) |
Total distributions to investors | | | (12.31 | ) | | | (10.60 | ) | | | (11.01 | ) | | | (8.50 | ) | | | (1.44 | ) |
| | | | | | | | | | | | | | | | | | | | | |
Net Asset Value, end of year/period | | $ | 100.33 | | | $ | 100.53 | | | $ | 101.28 | | | | 101.28 | | | $ | 100.56 | |
| | | | | | | | | | | | | | | | | | | | | |
Total Return3 | | | 12.76 | % | | | 10.20 | % | | | 11.43 | % | | | 9.49 | % | | | 1.46 | %4 |
| | | | | | | | | | | | | | | | | | | | | |
Ratios and Supplemental Data: | | | | | | | | | | | | | | | | | | | | |
Net Assets, end of year/period
(in thousands) | | $ | 1,094,295 | | | $ | 772,657 | | | $ | 535,110 | | | $ | 185,090 | | | $ | 32,680 | |
| | | | | | | | | | | | | | | | | | | | | |
Net expenses | | | 3.97 | %6 | | | 3.66 | %7 | | | 3.93 | %8 | | | 3.82 | %9 | | | 3.25 | %5,10 |
| | | | | | | | | | | | | | | | | | | | | |
Net investment income | | | 12.17 | %6 | | | 10.57 | %7 | | | 10.81 | %8 | | | 9.37 | %9 | | | 11.41 | %5,10 |
| | | | | | | | | | | | | | | | | | | | | |
Senior Securities | | | | | | | | | | | | | | | | | | | | |
Total Amount Outstanding exclusive of Treasury Securities | | | | | | | | | | | | | | | | | | | | |
Borrowings-Revolving Loan Agreement (in thousands) | | | 61,964 | | | | 60,659 | | | | 64,926 | | | | 29,433 | | | | 5,000 | |
Asset Coverage Per $1,000
of Borrowings | | | | | | | | | | | | | | | | | | | | |
Borrowings-Revolving Loan Agreement | | | 23,662 | | | | 18,106 | | | | 11,710 | | | | 12,037 | | | | 14,265 | |
| | | | | | | | | | | | | | | | | | | | | |
Portfolio Turnover Rate11 | | | 56 | % | | | 49 | % | | | 63 | % | | | 53 | % | | | 1 | %4 |
See accompanying notes to financial statements.
27
Keystone Private Income Fund |
Financial Highlights Class Z Shares (continued) |
See accompanying notes to financial statements.
28
Keystone Private Income Fund |
Notes to Financial Statements September 30, 2024 |
1. Organization
The Keystone Private Income Fund (the “Fund”) is a Delaware statutory trust registered under the Investment Company Act of 1940, as amended (the “Investment Company Act”), as a non-diversified, closed-end management investment company. The Fund operates under an Agreement and Declaration of Trust dated August 26, 2019 (the “Declaration of Trust”). Keystone National Group, LLC serves as the investment adviser (the “Investment Manager”) of the Fund. The Investment Manager is an investment adviser registered with the Securities and Exchange Commission (the “SEC”) under the Investment Advisers Act of 1940, as amended. The Fund intends to continue to qualify and has elected to be treated as a regulated investment company (“RIC”) under the Internal Revenue Code of 1986, as amended (the “Code”). The Fund commenced operations on July 1, 2020.
The Fund offers five separate classes (each a “Class”) of shares of beneficial interest (“Shares”) designated as Class A, Class D, Class Y Class I, and Class Z Shares. As used herein, “Shareholders” refers to the holders of Shares of the Fund. Each class of Shares is subject to different fees and expenses. As of September 30, 2024, there were no Class A Shares of the Fund outstanding. The Fund may offer additional classes of Shares in the future.
The Fund’s primary investment objective is to produce current income. The Investment Manager manages the Fund’s portfolio with a view toward producing current income, managing liquidity and protecting against downside scenarios. Under normal market conditions, the Fund will seek to achieve its investment objective by opportunistically investing, directly or indirectly, a majority of its net assets (plus any borrowings for investment purposes) in a wide range of private credit-oriented or other cash flow producing investments. For purposes of the Fund’s strategy, such investments may include corporate loans and credit facilities, equipment leasing transactions, real estate backed loans, corporate and consumer receivables, and other specialty finance opportunities or income-producing assets. The Fund may allocate its assets through a wide range of investment vehicles and structures, including among others as senior debt and also as subordinated debt, preferred equity and common equity investments. There can be no assurance that the Fund will achieve its investment objective.
2. Significant Accounting Policies
Basis of Preparation and Use of Estimates
The Fund is an investment company and follows the accounting and reporting guidance under Financial Accounting Standards Board (“FASB”) Accounting Standards Codification (“ASC”) Topic 946, Financial Services — Investment Companies. The accompanying financial statements have been prepared in conformity with accounting principles generally accepted in the United States of America (“U.S. GAAP”). The preparation of the financial statements in accordance with U.S. GAAP requires management to make estimates and assumptions that affect the reported amounts of assets and liabilities and disclosure of contingent assets and liabilities at the date of the financial statements, as well as reported amounts of increases and decreases in net assets from operations during the reporting period. Actual results could differ from these estimates.
Allocation of Shareholders Capital
The shares of each class represent an interest in the same portfolio of investments of the Fund and have equal rights as to voting, redemptions, dividends and liquidation, subject to the approval of the Trustees. Income, expenses (other than expenses attributable to a specific class), and realized and unrealized gains and losses on investments are allocated to each class of shares in proportion to their relative shares outstanding. Shareholders of a class that bears distribution and service expenses under the terms of a distribution plan have exclusive voting rights with respect to that distribution plan.
Investment Transactions and Related Investment Income
The Fund’s investment transactions are accounted for on a trade-date basis. Realized gains and losses from investment transactions and unrealized appreciation and depreciation of investments are determined using the specific identification method for financial reporting. Interest income is recognized on the accrual basis and prepayment fees are recognized as interest income when received. Interest receivables are written off when deemed uncollectible. Dividend income is recognized on the ex-dividend date. Some or all of the interest payments of a loan or preferred equity may be
29
Keystone Private Income Fund |
Notes to Financial Statements September 30, 2024 (continued) |
2. Significant Accounting Policies (continued) |
structured in the form of payment in kind (“PIK”), which accrues on a current basis but is generally not paid in cash until maturity or some other determined payment date. PIK interest is included in the Fund’s net asset value and also in determining net investment income for purposes of calculating the Incentive Fee (defined below). PIK interest may be combined with cash current paid interest or otherwise tailored to address both the specific circumstances of the borrower and the return requirements of the investor. Interest payments structured in the form of PIK are subject to the risk that a borrower could default when actual cash interest or principal payments are due.
Upfront investment income or other payments are sometimes charged to borrowers at the closing of a loan investment transaction. This income is received at the time of closing and then deferred to be recognized as investment income over the term of the loan utilizing the straight-line method, which does not differ materially from the effective interest method under US GAAP. For the year ended September 30, 2024, the Fund recognized upfront investment income of $13,080,209, which is included in investment income in the Statement of Operations. As of September 30, 2024, the Fund has $13,509,381 of unearned upfront investment income included in the Statement of Assets and Liabilities.
Cash Escrow
Subscriptions are generally subject to the receipt of cleared funds on or prior to the acceptance date set by the Fund and notified to prospective investors. Pending any closing, funds received from prospective investors will be placed in an interest-bearing escrow account with UMB Bank, n.a., the Fund’s escrow agent, and are restricted for use otherwise. On the date of any closing, the balance in the escrow account with respect to each investor whose investment is accepted will be invested in the Fund on behalf of such investor. Any interest earned on escrowed amounts will be credited to the Fund for the benefit of all Shareholders.
Federal Income Taxes
The Fund has qualified and intends to continue to qualify as a “RIC” under Subchapter M of the Code. As so qualified, the Fund will not be subject to federal income tax to the extent it distributes substantially all of its net investment income and capital gains to Shareholders. Therefore, no federal income tax provision is required. Management of the Fund is required to determine whether a tax position taken by the Fund is more likely than not to be sustained upon examination by the applicable taxing authority, based on the technical merits of the position. Based on its analysis, there were no tax positions identified by management of the Fund that did not meet the “more likely than not” standard as of September 30, 2024.
Distributions to Shareholders
The Fund accrues distributions monthly and pays distributions quarterly to its Shareholders of the net investment income of the Fund after payment of Fund operating expenses. The dividend rate may be modified by the Fund’s Board of Trustees (the “Board”) from time to time. To the extent that any portion of the Fund’s quarterly distributions are considered a return of capital to Shareholders, such portion would not be considered dividends for U.S. federal income tax purposes and would represent a return of the amounts that such Shareholders invested. Although such return of capital distributions are not currently taxable to Shareholders, such distributions will have the effect of lowering a Shareholder’s tax basis in such Shares, and could result in a higher tax liability when the Shares are sold, even if they have not increased in value, or in fact, have lost value. The Fund’s final distribution for each tax year is expected to include any remaining investment company taxable income and net tax-exempt income undistributed during the tax year, as well as any undistributed net capital gain realized during the tax year. If the total distributions made in any tax year exceed investment company taxable income, net tax-exempt income and net capital gain, such excess distributed amount would be treated as ordinary dividend income to the extent of the Fund’s current and accumulated earnings and profits. This distribution policy, may, under certain circumstances, have adverse consequences to the Fund and its Shareholders because it may result in a return of capital resulting in less of a Shareholder’s assets being invested in the Fund and, over time, increase the Fund’s expense ratio. The distribution policy also may cause the Fund to sell securities at a time it would not otherwise do so to manage the distribution of income and gain.
30
Keystone Private Income Fund |
Notes to Financial Statements September 30, 2024 (continued) |
2. Significant Accounting Policies (continued) |
Valuation of Investments
The Board has approved valuation procedures for the Fund (the “Valuation Procedures”). Under the Valuation Procedures adopted by the Board, the Board has delegated day-to-day responsibility for fair value determinations and pricing to the Investment Manager (the “Valuation Designee”) subject to the oversight of the Board. The Valuation Designee oversees the valuation of the Fund’s investments on behalf of the Fund in accordance with the Valuation Procedures, which provide that investments will be valued at fair value. Furthermore, the valuation of the Fund’s assets will be done in accordance with the FASB ASC Topic 820, Fair Value Measurements and Disclosures.
In general, fair value represents a good faith approximation of the current value of an asset and is used when there is no public market or possibly no market at all for the asset. As a result, the fair values of one or more assets may not be the prices at which those assets are ultimately sold. Prospective investors should be aware that situations involving uncertainties as to the value of investments could have an adverse effect on the Fund’s net asset value (“NAV”) if the judgments of the Valuation Designee regarding appropriate valuations should prove incorrect.
The Fund holds a high proportion of illiquid investments relative to its total investments, which is directly related to the Fund’s investment objectives and strategy. The valuation approach will likely vary by investment, but may include comparable public market valuations, comparable transaction valuations and discounted cash flow analyses. All factors that might materially impact the value of an investment (i.e., underlying collateral, operating results, financial condition, achievement of milestones, and economic and/or market events) may be considered. In certain circumstances the Valuation Designee may determine that cost best approximates the fair value of the particular investment.
Repurchase Offers
The Fund provides some liquidity to Shareholders by making quarterly offers to repurchase a certain percentage of its outstanding Shares at NAV. The decision to offer to repurchase Shares is in the complete and absolute discretion of the Board and the Board may, under certain circumstances, elect not to offer to repurchase Shares. The Fund believes that these repurchase offers are generally beneficial to the Fund’s Shareholders and generally are funded from available cash. However, the repurchase of Shares by the Fund decreases the assets of the Fund and, therefore, may have the effect of increasing the Fund’s expense ratio. Repurchase offers and the need to fund repurchase obligations may also affect the ability of the Fund to be fully invested or force the Fund to maintain a higher percentage of its assets in liquid investments, which may harm the Fund’s investment performance.
Borrowing, Use of Leverage
The Fund may employ leverage through a secured Revolving Loan Agreement, as amended (the “Revolving Loan Agreement”) to achieve its investment objective. The Fund’s willingness to use leverage, and the extent to which leverage is used at any time, will depend on many factors, including the Investment Manager’s assessment of the yield curve environment, interest rate trends, market conditions and other factors. Borrowings by the Fund will further diminish returns (or increase losses on capital) to the extent overall returns are less than the Fund’s cost of funds. Such debt exposes the Fund to refinancing, recourse and other risks. As a general matter, the presence of leverage can accelerate losses. Subject to prevailing market conditions, the Fund may add financial leverage if, immediately after such borrowing, it would have asset coverage (as defined in the Investment Company Act) of 300% or more (in the event leverage is obtained solely through debt) or 200% or more (in the event leverage is obtained solely though preferred stock). The Fund may use leverage opportunistically and may choose to increase or decrease its leverage, or use different types or combinations of leveraging instruments, at any time based on the Fund’s assessment of market conditions and the investment environment. The Investment Manager expects that the Fund’s borrowings may ultimately be secured with a security interest in Fund investments. In times of adverse market conditions, the Fund may be required to post additional collateral which could affect the Fund’s liquidity.
As of September 30, 2024, the Revolving Loan Agreement has maximum credit available of $275,000,000 with a maturity date of August 2, 2027. Previously the maximum credit available was $110,000,000. For the year ended September 30, 2024, the average balance outstanding and weighted average interest rate were $33,740,139 and
31
Keystone Private Income Fund |
Notes to Financial Statements September 30, 2024 (continued) |
2. Significant Accounting Policies (continued) |
8.33%, respectively. For the year ended September 30, 2024, the Fund incurred and paid interest expense of $3,089,678, and $3,222,839, respectively. As of September 30, 2024, the Fund has an outstanding line of credit balance of $61,963,548 at a 8.05% interest rate. The maximum the Fund borrowed during the fiscal year ended September 30, 2024 was $94,120,000 on December 27, 2023.
Participations
The Fund may invest a portion of its assets in participation interests or special purpose vehicles holding various credit investments. The special risks associated with these obligations include adverse consequences resulting from participating in such instruments with other institutions with lower credit quality and limitations on the ability of the Fund to directly enforce its rights with respect to participations. The Fund may acquire interests in such credit investments either directly (by way of sale or assignment) or indirectly (by way of participation). The purchaser of an assignment typically succeeds to all the rights and obligations of the assigning institution and becomes a contracting party under the credit arrangement with respect to the obligation; however, its rights can be more restricted than those of the assigning institution. Participation interests in a portion of a credit arrangement typically results in a contractual relationship only with the institution participating out the interest and not directly with the counterparty. In purchasing participations, the Fund may have no right to enforce compliance by the counterparty with the terms of the credit agreement, and the Fund may not directly benefit from the collateral supporting the credit obligation in which it has purchased the participation. As a result, if the Fund were to hold a participation, it would assume the credit risk of both the borrower and the institution selling the participation to the Fund.
Restricted Cash
The Fund holds restricted cash due to BlueRoc Intermediate, LLC subject to the loan agreement. The restricted cash is offset as Restricted cash payable on the Statement of Assets and Liabilities. The Fund pays the restricted cash to BlueRoc Intermediate, LLC weekly. Restricted cash held for Propel Holdings, Inc. is used to purchase loans on behalf of the Fund. Loans purchased at premium are amortized over the life of loan as Purchase premium on the Statement of Assets and Liabilities.
3. Principal Risks
Non-Diversified Status
The Fund is a “non-diversified” management investment company. Thus, there are no percentage limitations imposed by the Investment Company Act on the Fund’s assets that may be invested, directly or indirectly, in the securities of any one issuer. Consequently, if one or more securities are allocated a relatively large percentage of the Fund’s assets, losses suffered by such securities could result in a higher reduction in the Fund’s capital than if such capital had been more proportionately allocated among a larger number of securities. The Fund may also be more susceptible to any single economic or regulatory occurrence than a diversified investment company.
Limited Liquidity
Shares in the Fund provide limited liquidity since Shareholders will not be able to redeem Shares on a daily basis. A Shareholder may not be able to tender its Shares in the Fund promptly after it has made a decision to do so. In addition, with very limited exceptions, Shares are not transferable, and liquidity will be provided only through repurchase offers made quarterly by the Fund. Shares in the Fund are therefore suitable only for investors who can bear the risks associated with the limited liquidity of Shares and should be viewed as a long-term investment.
Investment Manager Incentive Fee Risk
Any Incentive Fee (defined below) payable by the Fund that relates to its net investment income may be computed and paid on income that may include interest or gains that have been accrued or are unrealized, but not yet received or realized. The Investment Manager is not under any obligation to reimburse the Fund for any part of the Incentive Fee it received that was based on accrued income or unrealized gains that the Fund never received or realized, and
32
Keystone Private Income Fund |
Notes to Financial Statements September 30, 2024 (continued) |
3. Principal Risks (continued) |
such circumstances would result in the Fund’s paying an Incentive Fee on income it never received or gains it never realized. The Incentive Fee payable by the Fund to the Investment Manager may create an incentive for it to make investments on the Fund’s behalf that are risky or more speculative than would be the case in the absence of such compensation arrangement. The way in which the Incentive Fee payable to the Investment Manager is determined may encourage it to use leverage to increase the return on the Fund’s investments. Under certain circumstances, the use of leverage may increase the likelihood of default, which would disfavor Shareholders. Such a practice could result in the Fund’s investing in more speculative securities than would otherwise be in its best interests, which could result in higher investment losses, particularly during cyclical economic downturns.
Private Credit
Private credit is a common term for unregistered debt investments made through privately negotiated transactions. Private credit investments may be structured using a range of financial instruments, including without limitation first and second lien senior secured loans, subordinated or unsecured debt and preferred equity arrangements. From time to time these investments might include equity features such as warrants, options, or common stock depending on the strategy of the investor and the financing requirements of the company or asset.
Loans to private companies, businesses and operators can range in credit quality depending on security-specific factors, including total leverage, amount of leverage senior to the collateral that secures the investment, variability in the issuer’s cash flows, the size of the issuer, the quality of collateral securing debt and the degree to which such collateral covers the accompanying debt obligations. The businesses in which the Fund invests may be levered, and the investments made by the Fund will generally not be rated by national credit rating agencies. The loans in which the Fund will invest may be rated below investment grade if they were rated. Below investment grade securities, which are often referred to as “junk,” have predominantly speculative characteristics and may carry a greater risk with respect to a borrower’s capacity to pay interest and repay principal.
Market Disruption and Geopolitical Risks
Certain local, regional or global events such as war (including Russia’s invasion of Ukraine and the Israel-Hamas war), acts of terrorism, the spread of infectious illnesses and/or other public health issues, or other events may have a significant impact on a security or instrument. These types of events and others like them are collectively referred to as “Market Disruptions and Geopolitical Risks” and they may have adverse impacts on the worldwide economy, as well as the economies of individual countries, the financial health of individual companies and the market in general in significant and unforeseen ways. Some of the impacts noted in recent times include but are not limited to embargos, political actions, supply chain disruptions, restrictions to investment and/or monetary movement including the forced selling of securities or the inability to participate in impacted markets. The duration of these events could adversely affect the Fund’s performance, the performance of the securities in which the Fund invests and may lead to losses on your investment. The ultimate impact of Market Disruption and Geopolitical Risks on the financial performance of the Fund’s investments is not reasonably estimable at this time. Management is actively monitoring these events.
Banking Risk
The impairment or failure of one or more banks with whom the Fund transacts may inhibit the Fund’s ability to access depository accounts. In the event of such a failure of a banking institution where the Fund holds depository accounts, access to such accounts could be restricted and U.S. Federal Deposit Insurance Corporation (“FDIC”) protection may not be available for balances in excess of amounts insured by the FDIC. In such instances, the Fund may not recover such excess, uninsured amounts.
4. Investment Advisory and Other Agreements
The Fund has entered into an investment management agreement (the “Investment Management Agreement”) with the Investment Manager. Pursuant to the Investment Management Agreement, the Investment Manager is entitled to a fee consisting of two components — a base management fee (the “Investment Management Fee”) and an incentive fee (the “Incentive Fee”). The Investment Management Fee is calculated and payable monthly in arrears at the annual
33
Keystone Private Income Fund |
Notes to Financial Statements September 30, 2024 (continued) |
4. Investment Advisory and Other Agreements (continued) |
rate of 1.50% of the month-end value of the Fund’s net assets before management fees for the current month. The Investment Management Fee is paid out of the Fund’s assets. Such fees are paid to the Investment Manager before giving effect to any repurchase of Shares effective as of that date and decrease the net profits or increase the net losses of the Fund that are credited to its Shareholders.
Effective January 1, 2021, the Incentive Fee is calculated and payable monthly in arrears based upon the Fund’s net profits for the immediately preceding month, and is subject to a hurdle rate, expressed as a rate of return on the Fund’s net assets equal to 0.58333333% per month (or an annualized hurdle rate of 7.00%), subject to a “catch-up” feature. Prior to January 1, 2021, the Incentive Fee was calculated quarterly. The Incentive Fee is equal to 15.0% of the excess, if any, of (i) the net profits of the Fund for the relevant period over (ii) the then balance, if any, of the Loss Recovery Account. For the purposes of the Incentive Fee, the term “net profits” means the amount by which the NAV of the Fund on the last day of the relevant period exceeds the NAV of the Fund as of the commencement of the same period, including any net change in unrealized appreciation or depreciation of investments and realized income and gains or losses and expenses (which, for this purpose shall not include any distribution and/or shareholder servicing fees, litigation, any extraordinary expenses or Incentive Fee). The Fund will maintain a memorandum account (the “Loss Recovery Account”), which will have an initial balance of zero and will be (i) increased upon the close of each calendar month end of the Fund by the amount of the net losses of the Fund for the month, and (ii) decreased (but not below zero) upon the close of each calendar month end by the amount of the net profits of the Fund for the month. Shareholders will benefit from the Loss Recovery Account in proportion to their holdings of Shares. The “catch-up” provision is intended to provide the Investment Manager with an incentive fee of 15.0% on all of the Fund’s net profits when the Fund’s net profits reach 0.68627451% of net assets in any calendar month (8.24% annualized). For the year ended September 30, 2024, the Fund incurred $25,021,973 in incentive fees.
The Investment Manager has entered into an expense limitation and reimbursement agreement (the “Expense Limitation and Reimbursement Agreement”) with the Fund, whereby the Investment Manager has agreed to waive fees that it would otherwise have been paid, and/or to assume expenses of the Fund (a “Waiver”), if required to ensure the Total Annual Expenses (including the Investment Management Fee, but excluding any taxes, interest expense, sales charges and other brokerage commissions, other transaction related expenses, acquired fund fees and expenses, Incentive Fees, expenses incurred in connection with any merger or reorganization, Distribution and Servicing Fees and extraordinary expenses) does not exceed 3.00% of the average daily net assets of any Class of Shares (the “Expense Limit”). Because taxes, interest expense, sales charges and other brokerage commissions, other transaction related expenses, Incentive Fees, Distribution and Servicing Fees, expenses incurred in connection with any merger or reorganization and extraordinary expenses are excluded from the Expense Limit, Total Annual Expenses (after fee waivers and expense reimbursements) may exceed 3.00% of the average daily net assets of each Class of Shares.
For a period not to exceed three years from the date on which a Waiver is made, the Investment Manager may recoup amounts waived or assumed, provided they are able to effect such recoupment without causing the Fund’s expense ratio (after recoupment) to exceed the lesser of (i) the expense limit in effect at the time of the waiver and (ii) the expense limit in effect at the time of the recoupment. The Expense Limitation and Reimbursement Agreement had an initial one-year term, which ended on February 2, 2021, and will automatically renew for consecutive one-year terms thereafter. Either the Fund or the Investment Manager may terminate the Expense Limitation and Reimbursement Agreement upon 30 days’ written notice. For the year ended September 30, 2024, the Investment Manager did not waive any fees or reimburse any expenses. As of September 30, 2024, there were no recoverable reimbursed expenses to the Investment Manager.
UMB Distribution Services, LLC serves as the Fund’s placement agent (the “Placement Agent”); UMB Fund Services, Inc. (“UMBFS”) serves as the Fund’s fund accountant, transfer agent and administrator. For the year ended September 30, 2024, the Fund’s allocated UMBFS fees are reported as Distribution and Servicing fees on the Statement of Operations.
A trustee and certain officers of the Fund are employees of UMBFS or the Investment Manager. The Fund does not compensate trustees and officers affiliated with the Fund’s administrator or Investment Manager. For the year ended September 30, 2024, the Fund’s allocated fees incurred for trustees who are not affiliated with the Fund’s administrator or Investment Manager are reported on the Statement of Operations.
34
Keystone Private Income Fund |
Notes to Financial Statements September 30, 2024 (continued) |
4. Investment Advisory and Other Agreements (continued) |
Vigilant Compliance, LLC provides Chief Compliance Officer (“CCO”) services to the Fund. The Fund’s allocated fees incurred for CCO services for the year ended September 30, 2024 are reported on the Statement of Operations.
The Fund has adopted a Distribution and Service Plan with respect to Class A Shares, Class D Shares, Class Y Shares and Class I Shares in compliance with Rule 12b-1 under the Investment Company Act. Under the Distribution and Service Plan, the Fund may pay as compensation up to 1.00% on an annualized basis of the aggregate net assets of the Fund attributable to Class A Shares, up to 0.90% on an annualized basis of the aggregate net assets of the Fund attributable to Class D Shares, up to 0.25% on an annualized basis of the aggregate net assets of the Fund attributable to Class Y Shares, and up to 0.15% on an annualized basis of the aggregate net assets of the Fund attributable to Class I Shares (the “Distribution and Servicing Fee”) to the Fund’s Placement Agent or other qualified recipients under the Distribution and Service Plan. For purposes of determining the Distribution and Servicing Fee, NAV will be calculated prior to any reduction for any fees and expenses, including, without limitation, the Distribution and Servicing Fee payable. Therefore, it is possible the Distribution and Servicing Fee rate on the Financial Highlights may show a rate above the contractual limit. Class Z Shares are not subject to the Distribution and Service Plan.
5. Fair Value of Investments
Fair value — Definition
The Fund uses a fair value hierarchy that prioritizes the inputs to valuation techniques used to measure fair value. The objective of a fair value measurement is to determine the price that would be received to sell an asset or paid to transfer a liability in an orderly transaction between market participants at the measurement date (an exit price). Accordingly, the fair value hierarchy gives the highest priority to unadjusted quoted prices in active markets for identical assets or liabilities (Level 1 measurements) and the lowest priority to unobservable inputs (Level 3 measurements). The three levels of the fair value hierarchy are as follows:
• Level 1 – Valuations based on unadjusted quoted prices in active markets that are accessible at the measurement date for identical, unrestricted assets or liabilities.
• Level 2 – Valuations based on inputs, other than quoted prices included in Level 1, that are observable either directly or indirectly.
• Level 3 – Valuations based on inputs that are both significant and unobservable to the overall fair value measurement.
The availability of valuation techniques and observable inputs can vary from investment to investment and are affected by a wide variety of factors, including type of investment, whether the investment is new and not yet established in the marketplace, the liquidity of markets, and other characteristics particular to the transaction. To the extent that valuation is based on models or inputs that are less observable or unobservable in the market, determining fair value requires more judgment. Because of the inherent uncertainty of valuation, estimated values may be materially higher or lower than the values that would have been used had a ready market for the investments existed. Accordingly, the degree of judgment exercised by the Investment Manager in determining fair value is greatest for investments categorized in Level 3.
The Fund’s assets recorded at fair value have been categorized based on a fair value hierarchy as described in the Fund’s significant accounting policies. The following table presents information about the Fund’s assets and liabilities measured at fair value as of September 30, 2024:
Investments | | Level 1 | | Level 2 | | Level 3 | | Total |
Private Credit | | $ | — | | $ | — | | $ | 1,495,644,505 | | $ | 1,495,644,505 |
Private Investment Funds | | | — | | | — | | | 11,377,749 | | | 11,377,749 |
Warrants* | | | — | | | — | | | — | | | — |
Total Investments, at fair value | | $ | — | | $ | — | | $ | 1,507,022,254 | | $ | 1,507,022,254 |
35
Keystone Private Income Fund |
Notes to Financial Statements September 30, 2024 (continued) |
5. Fair Value of Investments (continued) |
The following table presents the changes in assets and transfers in and out which are classified in Level 3 of the fair value hierarchy for the year ended September 30, 2024:
| | Private Credit | | Private
Investment
Funds | | Warrants* |
Balance as of October 1, 2023 | | $ | 1,101,936,262 | | | $ | 11,597,318 | | | $ | — |
Transfers In | | | — | | | | — | | | | — |
Transfers Out | | | — | | | | — | | | | — |
Purchases | | | 1,066,912,820 | | | | — | | | | — |
PIK interest income added to principal amount of investment | | | 49,286,053 | | | | — | | | | — |
Sales | | | — | | | | — | | | | — |
Principal reductions received | | | (720,428,042 | ) | | | (219,569 | ) | | | — |
Realized gains (losses) | | | — | | | | — | | | | — |
Change in unrealized appreciation (depreciation) | | | (2,062,588 | ) | | | — | | | | — |
Balance as of September 30, 2024 | | $ | 1,495,644,505 | | | $ | 11,377,749 | | | $ | — |
The following table summarizes the valuation techniques and significant unobservable inputs used for the Fund’s investments that are categorized in Level 3 of the fair value hierarchy as of September 30, 2024.
Investments | | Fair Value | | Valuation
Technique | | Unobservable
Inputs | | Range of
Inputs |
Private Credit | | $ | 1,495,644,505 | | Discounted Cash Flow | | Discount Rate | | 9.0% – 25.1% |
Private Investment Funds | | | 11,377,749 | | Discounted Cash Flow | | Discount Rate | | 11.0% |
Warrants* | | | — | | Recent transactions | | Price | | N/A |
6. Capital Stock
The minimum initial investment in Class A Shares and Class Y Shares by any investor is $50,000, the minimum initial investment in Class D Shares and Class I Shares by any investor is $5,000,000, and the minimum initial investment by any investor in Class Z Shares is $10,000,000. However, the Fund, in its sole discretion, may accept investments in any Class of Shares below these minimums. Shares may be purchased by principals and employees of the Investment Manager or its affiliates and their immediate family members without being subject to the minimum investment requirements. Class Y and Class D Shares were issued at $100.00 per share and Class A, Class I, and Class Z Shares were issued at $100.53 per share.
Class A Shares and Class D Shares are subject to a sales charge of up to 3.50%. No sales charge is expected to be charged with respect to investments by the Investment Manager or its affiliates, and their respective directors, principals, officers and employees and others in the Investment Manager’s sole discretion. The full amount of the sales charge may be reallowed to brokers or dealers participating in the offering. Your financial intermediary may impose additional charges when you purchase Shares of the Fund. Neither Class I, Class Y nor Class Z Shares are subject to any sales charge.
Because the Fund is a closed-end fund, and Shareholders do not have the right to require the Fund to redeem Shares, the Fund may from time to time offer to repurchase Shares pursuant to written tenders by Shareholders, in order to provide a limited degree of liquidity to Shareholders. Repurchases will be made at such times, in such amounts and on such terms as may be determined by the Board, in its sole discretion. In determining whether the Fund should offer to repurchase Shares, the Board will consider a variety of operational, business and economic factors. The Investment Manager expects to ordinarily recommend that the Board authorize the Fund to offer to repurchase Shares from
36
Keystone Private Income Fund |
Notes to Financial Statements September 30, 2024 (continued) |
6. Capital Stock (continued) |
Shareholders quarterly with March 31, June 30, September 30 and December 31 valuation dates (or, if any such date is not a Business Day, on the last Business Day of such calendar quarter).
If the interval between the date of purchase of Shares and the valuation date with respect to the repurchase of such Shares is less than 365 calendar days, then such repurchase will be subject to a 2.00% early repurchase fee payable to the Fund. In determining whether the repurchase of Shares is subject to an early repurchase fee, the Fund will repurchase that portion of the Shares held the longest first. Early repurchase fees, if any, are disclosed in the Statement of Changes in Net Assets. For the year ended September 30, 2024 there were no early repurchase fees.
For the year ended September 30, 2024, the Fund’s capital stock transactions are reported on the Statements of Changes in Net Assets.
7. Federal Income Taxes
At September 30, 2024, gross unrealized appreciation and depreciation on investments, based on cost for federal income tax purposes, were as follows:
Cost of investments | | $ | 1,515,858,946 | |
Gross unrealized appreciation | | $ | 19,272,231 | |
Gross unrealized depreciation | | | (28,108,923 | ) |
Net unrealized appreciation/depreciation on investments | | $ | (8,836,692 | ) |
The difference between cost amounts for financial statement and federal income tax purposes is due primarily to timing differences in recognizing certain partnership investments income.
GAAP requires that certain components of net assets to be reclassified between financial and tax reporting. These reclassifications have no effect on net assets or net asset value per share. For the year ended September 30, 2024, permanent differences in book and tax accounting have been reclassified to paid-in capital and total distributable earnings as follows:
Increase (Decrease) |
Paid in
Capital | Total
Distributable
Earnings |
$ 530,784 | $ (530,784) |
As of September 30, 2024, the components of distributable earnings on a tax basis were as follows:
Undistributed ordinary income | | $ | 25,189,792 | |
Undistributed long-term capital gains | | | 12,207 | |
Distributions payable | | | (25,821,747 | ) |
Accumulated capital and other losses | | | — | |
Unrealized depreciation on investments | | | (8,836,693 | ) |
Total accumulated loss | | $ | (9,456,441 | ) |
The tax character of distributions paid during the years ended September 30, 2024 and September 30, 2023 was as follows:
| | 2024 | | 2023 |
Distributions paid from: | | | | | | |
Ordinary income | | $ | 124,864,509 | | $ | 71,057,676 |
Net long-term capital gains | | | — | | | — |
Total distributions paid | | $ | 124,864,509 | | $ | 71,057,676 |
37
Keystone Private Income Fund |
Notes to Financial Statements September 30, 2024 (continued) |
7. Federal Income Taxes (continued) |
The difference in the amount of distributions against the Statements of Changes in Net Assets relates to the timing of certain distributions being reported on a cash basis for tax purposes. At September 30, 2024, there were $25,821,747 of distributions payable that will be considered paid in the tax year ending September 30, 2025 for tax purposes.
8. Investment Transactions
For the year ended September 30, 2024, purchases and sales of investments, including principal reductions received, excluding short-term investments, were $1,066,912,820 and $720,647,612, respectively.
9. Indemnifications
In the normal course of business, the Fund enters into contracts that contain a variety of representations which provide general indemnifications. The Fund’s maximum exposure under these arrangements is unknown, as this would involve future claims that may be made against the Fund that have not yet occurred. However, the Fund expects the risk of loss to be remote.
10. Subsequent Events
In preparing these financial statements, management has evaluated subsequent events through the date of issuance of the financial statements included herein.
At a meeting held on September 10-11, 2024 the Fund’s Board of Trustee’s approved continuing to use UMB Distribution Services, LLC, as the Fund’s placement agent following a change in control transaction expected to close in December 2024. Following the closing of this transaction, UMB Distribution Services, LLC will change its name to Distribution Services, LLC.
There have been no other subsequent events that occurred during such period that would require disclosure or would be required to be recognized in the financial statements.
38
Keystone Private Income Fund |
Other Information September 30, 2024 (Unaudited) |
Proxy Voting
The Fund is required to file Form N-PX, with its complete proxy voting record for twelve-month period ending on June 30, no later than August 31. The Fund’s Form N-PX filing and a description of the Fund’s proxy voting policies and procedures are available: (i) without charge, upon request, by calling the Fund at 1-888-442-4420 or (ii) by visiting the SEC’s website at www.sec.gov.
Availability of Quarterly Portfolio Schedules
The Fund files its complete schedule of portfolio holdings with the SEC for the first and third quarters of each fiscal year as an exhibit to its report on Form N-PORT. The Fund’s Forms N-PORT are or will be available on the SEC’s website at www.sec.gov or by calling the Fund at 1-888-442-4420.
Tax Information (Unaudited)
For Federal income tax purposes, the Fund designates long-term capital gain dividends of $12,207 for the year ended September 30, 2024.
39
Keystone Private Income Fund |
Other Information September 30, 2024 (Unaudited) (continued) |
PRIVACY NOTICE
FACTS | WHAT DOES THE FUND DO WITH YOUR PERSONAL INFORMATION? |
Why? | Financial companies choose how they share your personal information. Federal law gives consumers the right to limit some but not all sharing. Federal law also requires us to tell you how we collect, share, and protect your personal information. Please read this notice carefully to understand what we do. |
What? | The types of personal information we collect and share depend on the product or service you have with us. This information can include: • Social Security number • Account balances • Account transactions • Transaction history • Wire transfer instructions • Checking account information When you are no longer our customer, we continue to share your information as described in this notice. |
How? | All financial companies need to share customers’ personal information to run their everyday business. In the section below, we list the reasons financial companies can share their customers’ personal information; the reasons funds choose to share; and whether you can limit this sharing. |
Reasons we can share your personal information | Does the
Fund share? | Can you limit
this sharing? |
For our everyday business purposes – such as to process your transactions, maintain your account(s), respond to court orders and legal investigations, or report to credit bureaus | Yes | No |
For our marketing purposes – to offer our products and services to you | No | We don’t share |
For joint marketing with other financial companies | No | We don’t share |
For our affiliates’ everyday business purposes – information about your transactions and experiences | Yes | No |
For our affiliates’ everyday business purposes – information about your creditworthiness | No | We don’t share |
For our affiliates to market to you | No | We don’t share |
For nonaffiliates to market to you | No | We don’t share |
Questions? | | Call 1-877-779-1999 |
40
Keystone Private Income Fund |
Other Information September 30, 2024 (Unaudited) (continued) |
What we do | |
How does the Fund protect my personal information? | To protect your personal information from unauthorized access and use, we use security measures that comply with federal law. These measures include computer safeguards and secured files and buildings. |
How does the Fund collect my personal information? | We collect your personal information, for example, when you • Open an account • Provide account information • Give us your contact information • Make a wire transfer • Tell us where to send the money We also collect your information from others, such as credit bureaus, affiliates, or other companies. |
Why can’t I limit all sharing? | Federal law gives you the right to limit only • Sharing for affiliates’ everyday business purposes – information about your creditworthiness • Affiliates from using your information to market to you • Sharing for nonaffiliates to market to you State laws and individual companies may give you additional rights to limit sharing. |
Definitions | |
Affiliates | Companies related by common ownership or control. They can be financial and nonfinancial companies. Our affiliates include companies such as Keystone National Group, LLC. |
Nonaffiliates | Companies not related by common ownership or control. They can be financial and nonfinancial companies. • The Fund doesn’t share with nonaffiliates so they can market to you. |
Joint marketing | A formal agreement between nonaffiliated financial companies that together market financial products or services to you. • The Fund doesn’t jointly market. |
41
Keystone Private Income Fund |
Fund Management September 30, 2024 (Unaudited) |
The identity of the members of the Board and the Fund’s officers and brief biographical information is set forth below. The Fund’s Statement of Additional Information includes additional information about the membership of the Board, and is available without charge, upon request, by calling the Fund at 1 (888) 442-4420.
INDEPENDENT TRUSTEES |
NAME, ADDRESS
AND YEAR
OF BIRTH | POSITION(S)
HELD
WITH THE
FUND | TERM OF
OFFICE
AND
LENGTH
OF TIME
SERVED* | PRINCIPAL
OCCUPATION(S)
DURING PAST
5 YEARS | NUMBER OF
PORTFOLIOS
IN FUND
COMPLEX**
OVERSEEN
BY TRUSTEE | OTHER
DIRECTORSHIPS
HELD BY
TRUSTEES |
David G. Lee Year of Birth: 1952 c/o UMB Fund Services, Inc.
235 W. Galena St.
Milwaukee, WI 53212 | Chairman and Trustee | Since Inception (2020) | Retired (Since 2012); President and Director, Client Opinions, Inc. (2003 – 2012); Chief Operating Officer, Brandywine Global Investment Management (1998 – 2002). | 20 | None |
Robert Seyferth Year of Birth: 1952 c/o UMB Fund Services, Inc.
235 W. Galena St.
Milwaukee, WI 53212 | Trustee | Since Inception (2020) | Retired (Since 2009); Chief Procurement Officer/Senior Managing Director, Bear Stearns/JP Morgan Chase (1993 – 2009). | 20 | None |
Gary E. Shugrue Year of Birth: 1954 c/o UMB Fund Services, Inc.
235 W. Galena St.
Milwaukee, WI 53212 | Trustee | Since Inception (2020) | Retired (Since 2023); Managing Director, Veritable LP (investment advisory firm) (2016 – 2023); Founder/President, Ascendant Capital Partners, LP (private equity firm) (2001 – 2015). | 20 | Trustee, Quaker Investment Trust (3 portfolios) (registered investment company). |
42
Keystone Private Income Fund |
Fund Management September 30, 2024 (Unaudited) (continued) |
INTERESTED TRUSTEES AND OFFICERS |
NAME, ADDRESS
AND YEAR
OF BIRTH | POSITION(S)
HELD
WITH THE
FUND | TERM OF
OFFICE
AND
LENGTH
OF TIME
SERVED* | PRINCIPAL
OCCUPATION(S)
DURING PAST
5 YEARS | NUMBER OF
PORTFOLIOS
IN FUND
COMPLEX**
OVERSEEN
BY TRUSTEE | OTHER
DIRECTORSHIPS
HELD BY
TRUSTEES |
Terrance P. Gallagher***
Year of Birth: 1958 c/o UMB Fund Services, Inc.
235 W. Galena St.
Milwaukee, WI 53212 | Trustee | Since Inception (2020) | Executive Vice President and Trust Platform Director, UMB Fund Services, Inc. (2024 – Present); President and Trustee, Investment Managers Series Trust II (registered investment company) (2013 – Present); Executive Vice President and Director of Fund Accounting, Administration and Tax, UMB Fund Services, Inc. (2007 – 2023). | 20 | President and Trustee, Investment Managers Series Trust II (42 portfolios) (registered investment company). |
John Earl Year of Birth: 1966 60 East South Temple, Suite 2100
Salt Lake City,
UT 8411 | President | Since Inception (2020) | Managing Partner, Keystone National Group (2006 – present) | N/A | N/A |
Brad Allen Year of Birth: 1980 60 East South Temple, Suite 2100
Salt Lake City, UT 8411 | Treasurer | Since Inception (2020) | Chief Financial Officer & General Counsel, Keystone National Group (2010 – present) | N/A | N/A |
Bernadette Murphy Year of Birth: 1964 c/o UMB Fund Services, Inc.
235 W. Galena St.
Milwaukee, WI 53212 | Chief Compliance Officer | Since
2021 | Director, Vigilant Compliance, LLC (investment management solutions firm) (2018 – Present). | N/A | N/A |
43
Keystone Private Income Fund |
Fund Management September 30, 2024 (Unaudited) (continued) |
INTERESTED TRUSTEES AND OFFICERS |
NAME, ADDRESS
AND YEAR
OF BIRTH | POSITION(S)
HELD
WITH THE
FUND | TERM OF
OFFICE
AND
LENGTH
OF TIME
SERVED* | PRINCIPAL
OCCUPATION(S)
DURING PAST
5 YEARS | NUMBER OF
PORTFOLIOS
IN FUND
COMPLEX**
OVERSEEN
BY TRUSTEE | OTHER
DIRECTORSHIPS
HELD BY
TRUSTEES |
Ann Maurer Year of Birth: 1972 c/o UMB Fund Services, Inc.
235 W. Galena St.
Milwaukee, WI 53212 | Secretary | Since Inception (2020) | Senior Vice President, Client Services (2017 – Present), Vice President, Senior Client Service Manager
(2013 – 2017), Assistant Vice President, Client Relations Manager (2002 – 2013),
UMB Fund Services, Inc. | N/A | N/A |
44
Investment Manager
Keystone National Group, LLC
60 East South Temple, Suite 2100
Salt Lake City, UT 8411
www.keystonenational.com
Custodian Bank
UMB Bank, n.a.
928 Grand Blvd
Kansas City, MO 64106
Fund Administrator, Transfer Agent, and Fund Accountant
UMB Fund Services
235 W. Galena Street
Milwaukee, Wisconsin 53212
Placement Agent
UMB Distribution Services, LLC
235 West Galena Street
Milwaukee, WI 53212
Independent Registered Public Accounting Firm
Grant Thornton LLP
171 N. Clark Street, Suite 200
Chicago, IL 60601
(b) Not applicable
Item 2. Code of Ethics.
(a) The registrant, as of the end of the period covered by this report, has adopted a code of ethics that applies to the registrant’s principal executive officer, principal financial officer, principal accounting officer or controller, or persons performing similar functions, regardless of whether these individuals are employed by the registrant or a third party.
(b) The registrant’s code of ethics are written standards that are reasonably designed to deter wrongdoing and to promote: (1) Honest and ethical conduct, including the ethical handling of actual or apparent conflicts of interest between personal and professional relationships; (2) Full, fair, accurate, timely, and understandable disclosure in reports and documents that a registrant files with, or submits to, the Commission and in other public communications made by the registrant; (3) Compliance with applicable governmental laws, rules, and regulations; (4) The prompt internal reporting of violations of the code to an appropriate person or persons identified in the code; and (5) Accountability for adherence to the code.
(c) There have been no amendments, during the period covered by this report, to a provision of the code of ethics that applies to the registrant’s principal executive officer, principal financial officer, principal accounting officer or controller, or persons performing similar functions, regardless of whether these individuals are employed by the registrant or a third party, and that relates to any element of the code of ethics description.
(d) The registrant has not granted any waivers, during the period covered by this report, including an implicit waiver, from a provision of the code of ethics that applies to the registrant’s principal executive officer, principal financial officer, principal accounting officer or controller, or persons performing similar functions, regardless of whether these individuals are employed by the registrant or a third party, that relates to one or more of the items set forth in paragraph (b) of this Item’s instructions.
(e) Not applicable.
(f) The registrant has included with this filing, pursuant to Item 13(a)(1), a copy of its code of ethics that applies to the registrant’s principal executive officer, principal financial officer, principal accounting officer or controller, or persons performing similar functions, as an exhibit to its annual report on this Form N-CSR.
Item 3. Audit Committee Financial Expert.
As of the end of the period covered by the report, the registrant’s Board of Trustees has determined that Mr. David G. Lee and Mr. Robert Seyferth are qualified to serve as the audit committee financial experts serving on its Audit Committee and that they are “independent,” as defined by Item 3 of Form N-CSR.
Item 4. Principal Accountant Fees and Services.
Audit Fees
(a) The aggregate fees billed for the fiscal year ended September 30, 2024 and the fiscal year ended September 30, 2023 for professional services rendered by the principal accountant for the audit of the registrant’s annual financial statements or services that are normally provided by the accountant in connection with statutory and regulatory filings or engagements for that fiscal year or fiscal period, as applicable, are $225,750 and $205,500, respectively.
Audit-Related Fees
(b) The aggregate fees billed for the fiscal year ended September 30, 2024 and the fiscal year ended September 30, 2023 for assurance and related services by the principal accountant that are reasonably related to the performance of the audit of the registrant’s financial statements and are not reported under paragraph (a) of this Item are $0 and $0, respectively.
Tax Fees
(c) The aggregate fees billed for the fiscal year ended September 30, 2024 and the fiscal year ended September 30, 2023 for professional services rendered by the principal accountant for tax compliance, tax advice, and tax planning are $0 and $0, respectively.
All Other Fees
(d) The aggregate fees billed for the fiscal year ended September 30, 2024 and the fiscal year ended September 30, 2023 for products and services provided by the principal accountant, other than the services reported in paragraphs (a) through (c) of this Item are $0 and $0, respectively.
(e)(1) Disclose the audit committee’s pre-approval policies and procedures described in paragraph (c)(7) of Rule 2-01 of Regulation S-X.
The registrant’s Audit Committee must pre-approve the audit and non-audit services of the Auditors prior to the Auditor’s engagement for those services.
(e)(2) The percentage of services described in each of paragraphs (b) through (d) of this Item that were approved by the audit committee pursuant to paragraph (c)(7)(i)(C) of Rule 2-01 of Regulation S-X is as follows:
(b) 0%
(c) 0%
(d) 0%
(f) The percentage of hours expended on the principal accountant’s engagement to audit the registrant’s financial statements for the most recent fiscal year that were attributed to work performed by persons other than the principal accountant’s full-time, permanent employees was less than fifty percent.
(g) The aggregate non-audit fees billed by the registrant’s accountant for services rendered to the registrant, and rendered to the registrant’s investment adviser (not including any sub-adviser whose role is primarily portfolio management and is subcontracted with or overseen by another investment adviser), and any entity controlling, controlled by, or under common control with the adviser that provides ongoing services to the registrant for the fiscal year ended September 30, 2024 and the fiscal year ended September 30, 2023 of the registrant was $0 and $0, respectively.
(h) The registrant’s Audit Committee of the Board of Trustees has considered whether the provision of non-audit services that were rendered to the registrant’s investment adviser (not including any sub-adviser whose role is primarily portfolio management and is subcontracted with or overseen by another investment adviser), and any entity controlling, controlled by, or under common control with the investment adviser that provides ongoing services to the registrant that were not pre-approved pursuant to paragraph (c)(7)(ii) of Rule 2-01 of Regulation S-X is compatible with maintaining the principal accountant’s independence.
(i) Not applicable.
(j) Not applicable.
Item 5. Audit Committee of Listed Registrants.
Not applicable.
Item 6. Investments.
(a) Schedule of Investments in securities of unaffiliated issuers as of the close of the reporting period is included as part of the report to shareholders filed under Item 1(a) of this form.
(b) Not applicable
Item 7. Financial Statements and Financial Highlights for Open-End Management Investment Companies.
Not applicable.
Item 8. Changes in and Disagreements with Accountants for Open-End Management Investment Companies.
Not applicable.
Item 9. Proxy Disclosures for Open-End Management Investment Companies.
Not applicable.
Item 10. Remuneration Paid to Directors, Officers, and Others of Open-End Management Investment Companies.
Not applicable.
Item 11. Statement Regarding Basis for Approval of Investment Advisory Contract.
Not applicable.
Item 12. Disclosure of Proxy Voting Policies and Procedures for Closed-End Management Investment Companies.
PROXY POLICY
INTRODUCTION
Keystone National Group, LLC (“Keystone”) acts as the advisor to the Keystone Private Income Fund (“the Fund”). Rule 206(4)-6 under the Advisers Act requires a registered investment adviser with voting authority over client proxies to adopt proxy voting policies and procedures, including procedures to address material conflicts of interest, and to disclose such procedures and its specific voting history to clients.1 The Rule does not apply to advisers whose clients retain voting authority, smaller investment advisers who are registered with state securities authorities, or investment advisers who are not required to register under the Advisers Act.
An adviser subject to the Rule is required to:
• adopt and implement written policies and procedures that are reasonably designed to ensure that the adviser votes proxies in the best interests of its clients; describe such procedures to clients and, upon request, provide a summary of the procedures to clients;
• disclose to clients how they may obtain information on how the adviser voted their proxies; and
• retain certain written records about its proxy voting. (See Section XIX. – “Recordkeeping Requirements” below for a more complete description.)
The Rule applies to all advisers that have explicit or implicit proxy voting authority over client securities. The SEC has clarified that an overall delegation of discretionary authority to an adviser constitutes implicit proxy voting authority, even though an advisory contract may be silent on this point. The Rule does not apply to advisers who do not have authority to vote the proxies themselves but provide advice to clients about voting proxies.
The SEC did not mandate specific proxy voting policies and procedures. However, the SEC encouraged the design of policies and procedures that address:
• how an adviser votes its proxies on behalf of its clients; and
• the particular factors that an adviser takes into consideration when voting on particular matters.
The Rule also specifically requires that the procedures address material conflicts that may arise between an adviser or its affiliates and its clients (such as when the adviser has business or personal relationships with participants in proxy contests, corporate directors or candidates for directorship). The SEC noted that a policy of disclosing conflicts to a client and obtaining direction from the client on how to vote would satisfy the requirement of the Rule (although certain additional consideration should be given to this alternative in the case of employee benefit plan clients). Otherwise, the adviser must be able to demonstrate that its vote was based on the client’s best interest and not on the interests of the adviser.
The SEC staff has also issued guidance on an investment adviser’s responsibilities in retaining proxy advisory firms.2 The guidance suggests that advisers have an ongoing duty to monitor proxy advisory firms to ensure that the firms have the capacity and competency to adequately analyze proxy issues. The SEC staff has indicated that an adviser should take reasonable steps to verify that a proxy advisory firm is independent and can make proxy voting recommendations in an impartial manner and in the best interests of the adviser’s clients.
Effective September 16, 2019
Item 13. Portfolio Managers of Closed-End Management Investment Companies.
(a)(1) Identification of Portfolio Manager(s) or Management Team Members and Description of Role of Portfolio Manager(s) or Management Team Members
The following is biographical information about the members of Keystone National Group, LLC (the “Investment Manager”), who are primarily responsible for the day-to-day portfolio management of the Keystone Private Income Fund as of the date of the filing of this report:
John Earl
Mr. Earl is a Managing Partner of the Investment Manager and is active in investment selection, due diligence and the general management of the Investment Manager. Mr. Earl was previously a Senior Vice President in the investment banking department of Lehman Brothers. While at Lehman Brothers, Mr. Earl was active in evaluating and executing a broad variety of direct investment opportunities and monetization strategies, including acquisitions, mergers, buyouts, initial public offerings, secondary equity offerings, recapitalizations and company sale transactions. Prior to joining Lehman Brothers, Mr. Earl was a Vice President of investment banking at Shattuck Hammond Partners. In addition, Mr. Earl held previous positions at Dillon, Read & Co., Inc. and Credit Suisse. Mr. Earl holds a Juris Doctor degree from the J. Reuben Clark School of Law and an M.B.A. from the Marriott School of Management at Brigham Young University. Mr. Earl joined the Investment Manager in 2006.
Brandon Nielson
Mr. Nielson is a Managing Partner of the Investment Manager and is active in investment selection, due diligence and the general management of the Investment Manager. Mr. Nielson served as a Vice President at Partners Group, a global alternative investments firm. Based in the firm’s New York office, Mr. Nielson played a key role in building Partners Group’s U.S. presence and in identifying and performing due diligence on U.S. investment opportunities, including buyout fund investments, secondaries and co-investments. He later worked at Partners Group’s headquarters in Switzerland where he helped launch the firm’s Transaction Services business and was active in private equity structuring and fund formation. Prior to his time at Partners Group, Mr. Nielson worked for the accounting firm KPMG. He earned his Certified Public Accountant license (no longer active) and holds a B.S. degree in Accounting and M.B.A. from the Marriott School of Management at Brigham Young University. Mr. Nielson joined the Investment Manager in 2006.
Brad Allen
Mr. Allen is responsible for Keystone’s accounting, investor reporting, operations and legal affairs. He oversees the firm’s financial reporting, capital markets and legal initiatives. Prior to joining Keystone, Mr. Allen was a corporate securities attorney at Wilson Sonsini Goodrich & Rosati in Palo Alto, California, where he represented public and private companies on corporate governance initiatives and in a broad range of corporate transactions, including venture capital and private equity investments, secured lending, mergers, acquisitions and public offerings. Mr. Allen previously managed the financial reporting and accounting affairs of an elite language technology and localization service provider. He earned his Certified Public Accountant license (no longer active) and was a member of the State Bar of California (no longer active) and the American Institute of Certified Public Accountants (no longer active). Mr. Allen and holds a B.S. degree in Accounting from the Marriott School of Management and graduated Magna Cum Laude with a Juris Doctor degree from the J. Reuben Clark School of Law. Mr. Allen joined the Investment Manager in 2010.
Taylor Jackson
Mr. Jackson is focused on creating value for investors within Keystone’s real estate focused transactions. Mr. Jackson previously served as Vice President with Nearon Enterprises, a private real estate investment firm located in the San Francisco Bay Area, where he was responsible for all aspects of real estate investment including acquisition and debt sourcing, investment due diligence, leasing, asset management and asset disposition. Mr. Jackson was directly responsible for the investment and development of over 1.5 million square feet of Industrial, Office, Retail and Multifamily assets in the San Francisco Bay Area and Salt Lake City markets. Mr. Jackson holds a B.S. degree in Accounting and Information Systems from Brigham Young University and an M.B.A. from the Haas School of Business at the University of California, Berkeley. Mr. Jackson joined the Investment Manager in 2017.
(a)(2) Other Accounts Managed by Portfolio Manager(s) or Management Team Member and Potential Conflicts of Interest
The following table provides information about portfolios and accounts, other than the Fund, of the personnel of Keystone National Group, LLC (the “Investment Manager”), who are primarily responsible for the day-to-day portfolio management (the “Portfolio Managers”) as of September 30, 2024:
| | Type of Accounts | | Total # of
Accounts
Managed | | Total
Assets
($mm) | | # of Accounts
managed that
Advisory Fee
Based on
Performance | | Total Assets
that Advisory
Fee Based on
Performance
($mm) |
John Earl | | Registered Investment Companies: | | - | | $ | | | - | | - | | $ | | | - |
| | | Other Pooled Investment Vehicles: | | 11 | | $ | | | 578 | | 10 | | $ | | | 203 |
| | | Other Accounts: | | - | | $ | | | - | | - | | $ | | | - |
Brandon Nielson | | Registered Investment Companies: | | - | | $ | | | - | | - | | $ | | | - |
| | | Other Pooled Investment Vehicles: | | 11 | | $ | | | 578 | | 10 | | $ | | | 203 |
| | | Other Accounts: | | - | | $ | | | - | | - | | $ | | | - |
Brad Allen | | Registered Investment Companies: | | - | | $ | | | - | | - | | $ | | | - |
| | | Other Pooled Investment Vehicles: | | 11 | | $ | | | 578 | | 10 | | $ | | | 203 |
| | | Other Accounts: | | - | | $ | | | - | | - | | $ | | | - |
Taylor Jackson | | Registered Investment Companies: | | - | | $ | | | - | | - | | $ | | | - |
| | | Other Pooled Investment Vehicles: | | 11 | | $ | | | 578 | | 10 | | $ | | | 203 |
| | | Other Accounts: | | - | | $ | | | - | | - | | $ | | | - |
Conflicts of Interest as of September 30, 2024
Actual or apparent conflicts of interest may arise when a portfolio manager has day-to-day management responsibilities with respect to more than one fund or other account. More specifically, portfolio managers who manage multiple funds and/or other accounts may be presented with one or more of the following potential conflicts:
The management of multiple funds and/or other accounts may result in a Portfolio Manager devoting unequal time and attention to the management of each fund and/or other account. The Investment Manager seeks to manage such competing interests for the time and attention of the Portfolio Managers by having the Portfolio Managers focus on a particular investment discipline. Most other accounts managed by the Portfolio Managers are managed using the same investment models that are used in connection with the management of the Fund.
If a Portfolio Manager identifies a limited investment opportunity which may be suitable for more than one fund or other account, a fund may not be able to take full advantage of that opportunity due to an allocation of filled purchase or sale orders across all eligible funds and other accounts. To deal with these situations, the Investment Manager has adopted procedures for allocating portfolio transactions across multiple accounts.
The Investment Manager has adopted certain compliance procedures which are designed to address these types of conflicts. However, there is no guarantee that such procedures will detect each and every situation in which a conflict arises.
(a)(3) Compensation Structure of Portfolio Manager
Compensation of the Portfolio Managers as of September 30, 2024
Total compensation paid to each Portfolio Manager includes a base salary fixed from year to year, a discretionary performance bonus and eligibility for a share of carried interest/performance fees in closed-end funds managed by the Investment Manager. The amounts paid to the Portfolio Managers are based on a percentage of the fees earned by the Investment Manager from managing the Fund and other investment accounts. The performance bonus reflects individual performance and the performance of the Investment Manager’s business as a whole. The discretionary performance bonus is determined by senior management of the Investment Manager and is based on a wide variety of factors, including without limitation investment performance, quality of work, contributions to non-investment related efforts and organizational development.
The compensation structure of key investment professionals is structured to incent long-term client retention and client service, to attract and retain highly qualified investment management professionals and to reward individual and team contributions toward creating shareholder value.
(a)(4) Disclosure of Securities Ownership
Portfolio Management Team’s Ownership of Shares
Name of Portfolio Management Team Member: | Dollar Range of Shares
Beneficially Owned by Portfolio
Management Team Member*: |
John Earl | Over $1,000,000 |
Brandon Nielson | Over $1,000,000 |
Brad Allen | Over $1,000,000 |
Taylor Jackson | None |
(b) Not Applicable.
Item 14. Purchases of Equity Securities by Closed-End Management Investment Company and Affiliated Purchasers.
Not applicable.
Item 15. Submission of Matters to a Vote of Security Holders.
There have been no material changes to the procedures by which the shareholders may recommend nominees to the registrant’s board of trustees, where those changes were implemented after the registrant last provided disclosure in response to the requirements of Item 407(c)(2)(iv) of Regulation S-K (17CFR 229.407), or this Item.
Item 16. Controls and Procedures.
(a) The registrant’s principal executive and principal financial officers, or persons performing similar functions, have concluded that the registrant’s disclosure controls and procedures (as defined in Rule 30a-3(c) under the Investment Company Act of 1940, as amended (the “1940 Act”) (17 CFR 270.30a-3(c))) are effective, as of a date within 90 days of the filing date of the report that includes the disclosure required by this paragraph, based on their evaluation of these controls and procedures required by Rule 30a-3(b) under the 1940 Act (17 CFR 270.30a-3(b)) and Rules 13a-15(b) or 15d-15(b) under the Securities Exchange Act of 1934, as amended (17 CFR 240.13a-15(b) or 240.15d-15(b)).
(b) There were no changes in the registrant’s internal control over financial reporting (as defined in Rule 30a-3(d) under the 1940 Act (17 CFR 270.30a-3(d)) that occurred during the period covered by this report that has materially affected, or is reasonably likely to materially affect, the registrant’s internal control over financial reporting.
Item 17. Disclosure of Securities Lending Activities for Closed-End Management Investment Companies.
None.
Item 18. Recovery of Erroneously Awarded Compensation.
(a) Not applicable.
(b) Not applicable.
Item 19. Exhibits.
(a)(1) Code of ethics or any amendments thereto, that is subject to disclosure required by Item 2 is attached hereto.
(a)(2) Not applicable.
(a)(3) Certifications pursuant to Rule 30a-2(a) under the 1940 Act and Section 302 of the Sarbanes-Oxley Act of 2002 are attached hereto.
(a)(4) Not applicable.
(a)(5) Not applicable.
(b) Not applicable.
SIGNATURES
Pursuant to the requirements of the Securities Exchange Act of 1934 and the Investment Company Act of 1940, the registrant has duly caused this report to be signed on its behalf by the undersigned, thereunto duly authorized.
(registrant) | | Keystone Private Income Fund |
By (Signature and Title) | | |
| | | /s/ John Earl |
| | | John Earl, President |
| | | (Principal Executive Officer) |
Date | | December 6, 2024 |
Pursuant to the requirements of the Securities Exchange Act of 1934 and the Investment Company Act of 1940, this report has been signed below by the following persons on behalf of the registrant and in the capacities and on the date indicated.
By (Signature and Title) | | /s/ John Earl |
| | | John Earl, President |
| | | (Principal Executive Officer) |
Date | | December 6, 2024 |
By (Signature and Title) | | /s/ Brad Allen |
| | | Brad Allen, Treasurer |
| | | (Principal Financial Officer) |
Date | | December 6, 2024 |