Exhibit 99.2
Technology - Enabled Population Health Management August 2020
Disclaimer This investor presentation (“Investor Presentation”) is for informational purposes only and does not constitute an offer to sell, solicitation of an offer to buy, or a recommendation to purchase any equity, debt or other financial instruments of GreenVision Acquisition Corp.(“GRNV”) or Accountable Healthcare of America (“AHA” or the Company) or any of GRNV’s or AHA’s affiliate securities (as such term is defined under the U.S. federal securities laws). The information contained herein does not purport to be all - inclusive and is qualified in its entirety by the definitive merger agreement entered into August 25, 2020, filed by GRNV on a Current Report on Form 8 - K on August 25, 2020. The data contained herein is derived from various internal and external sources. No representation is made as to the reasonableness of the assumptions made within or the accuracy or completeness of any other information contained herein. All levels, prices and spreads are historical and do not represent current market levels, prices or spreads, some or all of which may have changed since the issuance of this document. Any data on past performance, modeling contained herein is not an indication as to future performance. GRNV and AHA assume no obligation to update the information in this Investor Presentation. Neither GRNV or AHA accepts any liability whatsoever for any losses arising from the use of this Investor Presentation or reliance on the information contained herein. Nothing herein shall be deemed to constitute investment, legal, tax, financial, accounting or other advice. This Investor Presentation is being provided for use only by the intended recipient. No representation or warranty (whether expressed or implied) has been made by GRNV, AHA or any of their respective affiliates with respect to the matters set forth in this Investor Presentation, and the recipient disclaims any such representation or warranty. Only those particular representations and warranties of GRNV, AHA or any of their respective affiliates made in a definite written subscription agreement, if any, regarding the matters set forth in this Investor Presentation (which will not contain any representation or warranty relating to this Investor Presentation or information contained in or omitted from this Investor Presentation) when and if executed, and subject to such limitations and restrictions as specified therein, shall have any legal effect. At any time upon the request of GRNV for any reason, recipient shall promptly deliver to GRNV or securely destroy this Investor Presentation and any other documents furnished to recipient by or on behalf of GRNV or AHA without keeping any copies, in whole or in part. 2
Forward Looking Statements This Investor Presentation includes “forward - looking statements” within the meaning of the “safe harbor” provisions of the US Private Securities Litigation Reform Act of 1995. Forward - looking statements can be identified by the use of words such as “forecast,” “intend,” “target,” “believe,” will,” “expect,” “estimate,” “plan,” and “project” and other similar expressions t hat predict or indicate future events or trends or that are not statements of historical matters. Such forward - looking statements include statements about our beliefs and expectations and the estimated financial information and other projections contained herein. Examples of forward - looking statements include, among others, statements made in this Investor Presentation regarding the revenues, earnings, performance, strategies, prospects and other aspects of the business of AHA, GRNV or the combined company after completion of the proposed transaction (“the Business Combination”). Forward - looking statements are neither historical fac ts nor assurances of future performance. Instead, they are based only on management’s current beliefs, expectations and assumpti ons . Because forward - looking statements relate to the future, they are subject to inherent uncertainties, risks and changes in circumstances that are difficult to predict and many of which are outside of our control. Actual results and outcomes may dif fer materially from those indicated in the forward - looking statements. Therefore, you should not rely on any of these forward - lookin g statements. Important factors that could cause actual results and outcomes to differ materially from those indicated in the forward - looking statements include, among others, the following: (1) the occurrence of any event that could give rise to the termination of the merger agreement between GRNV and AHA (the “Merger Agreement”) with respect to the Business Combination; (2) the outcome of any legal proceedings that may be instituted against GRNV, the combined company, or others following the announcement of the Business Combination and the Merger Agreement; (3) the inability to complete the Business Combination due to the failure to obtain approval of GRNV’s stockholders or to satisfy other conditions to closing in the Mer ger Agreement; (4) changes to the proposed structure of the Business Combination that may be required or appropriate as a result of applicable laws or regulations; (5) the ability to meet NASDAQ listing standards following the consummation of the Business Combination; 3 Disclaimer
(6) the risk that the Business Combination disrupts current plans and operations of AHA as a result of the announcement and c ons ummation of the Business Combination; (7) the ability to recognize the anticipated benefits of the Business Combination, which may be aff ect ed by, among other things, competition, the ability of the combined company to grow and manage growth profitably, maintain relationships w ith third parties and partners, obtain adequate supply of raw materials and retain its management and key employees; (8) costs related to the B usi ness Combination; (9) changes in applicable laws or regulations; (10) the possibility that AHA or the combined company may be adve rse ly affected by other economic, business, regulatory, and/or competitive factors; (11) AHA estimates of expenses; (12) the impact of forei gn currency exchange rates and interest rates fluctuations on the results of AHA or the combined company; and (13) other risks and uncert ain ties indicated in this Investor Presentation under “Risks Related to Projections and Pro Forma Presentation,” the proxy statement of GRNV (t he “Proxy Statement”) to be filed by GRNV with the Securities and Exchange Commission (the “SEC”) in connection with the Business Combi nat ion, including those under “Risk Factors” therein, and other documents filed or to be filed from time to time with the SEC by GRNV . Y ou are cautioned not to place undue reliance upon any forward - looking statements, which speak only as of the date made. GRNV and AHA un dertake no obligation to publicly update any forward - looking statement, whether written or oral, that may be made from time to time, whe ther as a result of new information, future developments or otherwise, except as required by law. Industry and Market Data In this Investor Presentation, AHA relies on and refers to information and statistics in the sectors in which it intends to c omp ete. AHA obtained this information and statistics from third - party sources believed to be reliable, including reports by market research firms. AH A has supplemented this information where necessary with its own internal estimates, taking into account publicly available informa tio n about other industry participants and its management’s best view as to information that is not publicly available. Neither AHA nor GRNV h as independently verified the accuracy or completeness of any such third - party information. 4 Disclaimer

Today’s Presenters 5 Board Member Jonathan Intrater NASDAQ: GRNV Warren Hosseinion, M.D. Chief Executive Officer Accountable Healthcare America Former CEO and Co - Founder ApolloMed NASDAQ: AMEH Mark Fawcett President Accountable Healthcare America Former Sr. VP. & Treasurer Fresenius Medical Care Board Member, ApolloMed NASDAQ: AMEH
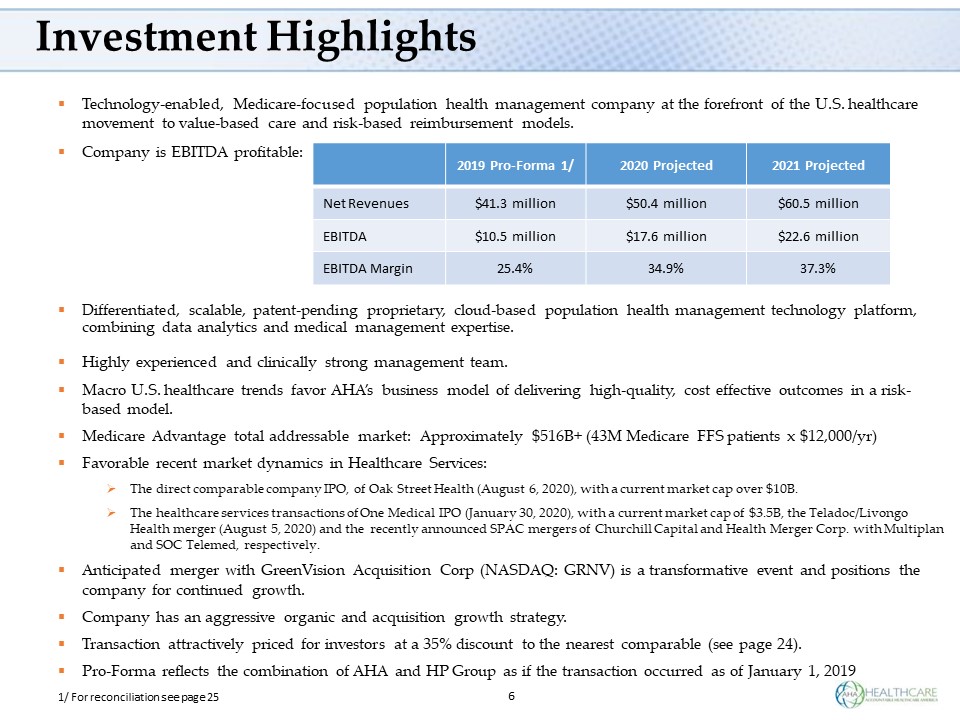
Investment Highlights ▪ Technology - enabled, Medicare - focused population health management company at the forefront of the U.S. healthcare movement to value - based care and risk - based reimbursement models. ▪ Company is EBITDA profitable: ▪ Differentiated, scalable, patent - pending proprietary, cloud - based population health management technology platform, combining data analytics and medical management expertise. ▪ Highly experienced and clinically strong management team. ▪ Macro U.S. healthcare trends favor AHA’s business model of delivering high - quality, cost effective outcomes in a risk - based model. ▪ Medicare Advantage total addressable market: Approximately $516B+ (43M Medicare FFS patients x $12,000/yr) ▪ Favorable recent market dynamics in Healthcare Services: » The direct comparable company IPO, of Oak Street Health (August 6, 2020), with a current market cap over $10B. » The healthcare services transactions of One Medical IPO (January 30, 2020), with a current market cap of $3.5B, the Teladoc/L ivo ngo Health merger (August 5, 2020) and the recently announced SPAC mergers of Churchill Capital and Health Merger Corp. with Multiplan and SOC Telemed, respectively. ▪ Anticipated merger with GreenVision Acquisition Corp (NASDAQ: GRNV) is a transformative event and positions the company for continued growth. ▪ Company has an aggressive organic and acquisition growth strategy. ▪ Transaction attractively priced for investors at a 35% discount to the nearest comparable (see page 24). ▪ Pro - Forma reflects the combination of AHA and HP Group as if the transaction occurred as of January 1, 2019 1/ For reconciliation see page 25 6 2019 Pro - Forma 1/ 2020 Projected 2021 Projected Net Revenues $41.3 million $50.4 million $60.5 million EBITDA $10.5 million $17.6 million $22.6 million EBITDA Margin 25.4% 34.9% 37.3%

7 ▪ Founded in 2014 by seasoned healthcare executives with the foresight to build solutions for risk - based reimbursements. ▪ Post - Merger, the Company will own and manage Medicare - focused, risk - bearing provider networks using a combination of a patent - pending proprietary cloud - based data analytics platform and advanced medical management processes. ▪ Company specializes in caring for Medicare patients with multiple chronic conditions. ▪ Our integrated platform improves the quality of care, reduces healthcare costs and drives optimized financial outcomes and clinical outcomes for patients and providers. AHA Company Overview
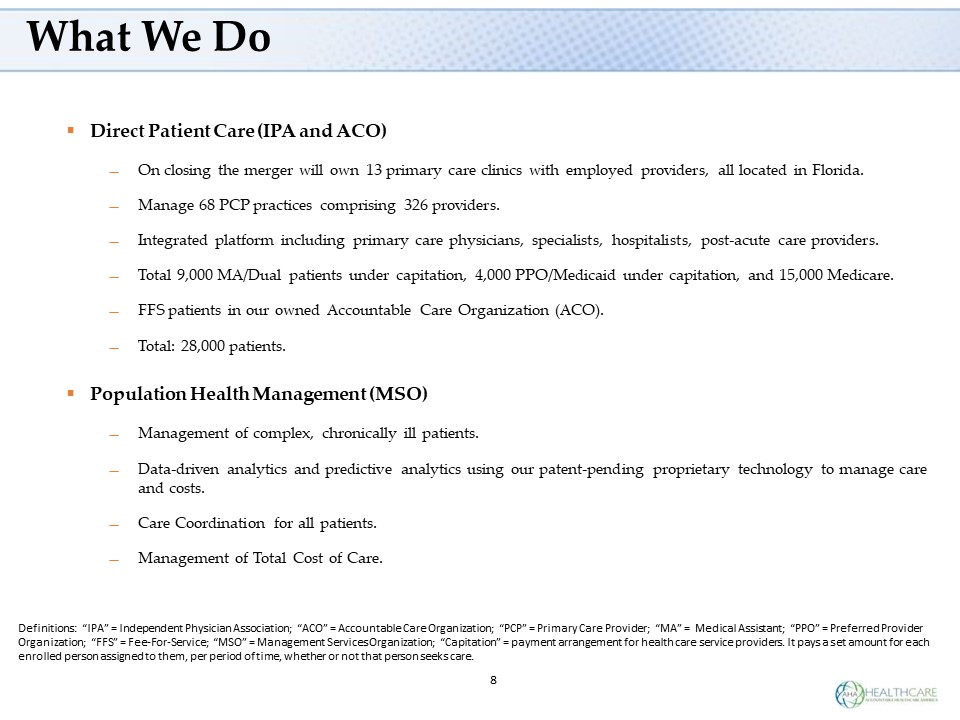
8 ▪ Direct Patient Care (IPA and ACO) ̶ On closing the merger will own 13 primary care clinics with employed providers, all located in Florida. ̶ Manage 68 PCP practices comprising 326 providers. ̶ Integrated platform including primary care physicians, specialists, hospitalists, post - acute care providers. ̶ Total 9,000 MA/Dual patients under capitation, 4,000 PPO/Medicaid under capitation, and 15,000 Medicare. ̶ FFS patients in our owned Accountable Care Organization (ACO). ̶ Total: 28,000 patients. ▪ Population Health Management (MSO) ̶ Management of complex, chronically ill patients. ̶ Data - driven analytics and predictive analytics using our patent - pending proprietary technology to manage care and costs. ̶ Care Coordination for all patients. ̶ Management of Total Cost of Care. Definitions: “IPA” = Independent Physician Association; “ACO” = Accountable Care Organization; “PCP” = Primary Care Provid er; “MA” = Medical Assistant; “PPO” = Preferred Provider Organization; “FFS” = Fee - For - Service; “MSO” = Management Services Organization; “Capitation” = pa yment arrangement for health care service providers. It pays a set amount for each enrolled person assigned to them, per period of time, whether or not th at person seeks care. What We Do

9 Transformative merger with GreenVision SPAC to produce a highly profitable publicly - traded population health management company • Creates an innovative, profitable publicly - traded population health management company, capable of swift growth. • Anticipated close in November 2020 • Platform for geographic expansion • Transaction size: $150M • Approx. shares outstanding at closing: 12.75M Pro forma Merger Overview Pro forma FY 2020 revenues Patient - lives managed Healthcare professionals within our network 220 $50MM 28,000 326 Employees
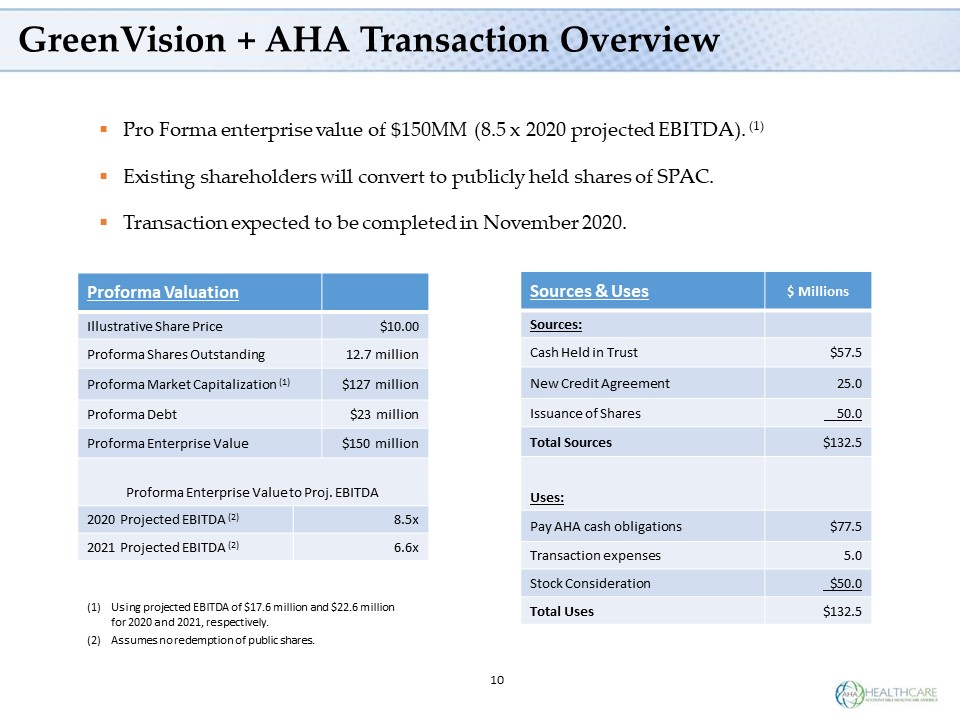
10 GreenVision + AHA Transaction Overview ▪ Pro Forma enterprise value of $150MM (8.5 x 2020 projected EBITDA). (1) ▪ Existing shareholders will convert to publicly held shares of SPAC. ▪ Transaction expected to be completed in November 2020. Proforma Valuation Illustrative Share Price $10.00 Proforma Shares Outstanding 12.7 million Proforma Market Capitalization (1) $127 million Proforma Debt $23 million Proforma Enterprise Value $150 million Proforma Enterprise Value to Proj. EBITDA 2020 Projected EBITDA (2) 8.5x 2021 Projected EBITDA (2) 6.6x (1) Using projected EBITDA of $17.6 million and $22.6 million for 2020 and 2021, respectively. (2) Assumes no redemption of public shares. Sources & Uses $ Millions Sources: Cash Held in Trust $57.5 New Credit Agreement 25.0 Issuance of Shares 50.0 Total Sources $132.5 Uses: Pay AHA cash obligations $77.5 Transaction expenses 5.0 Stock Consideration $50.0 Total Uses $132.5
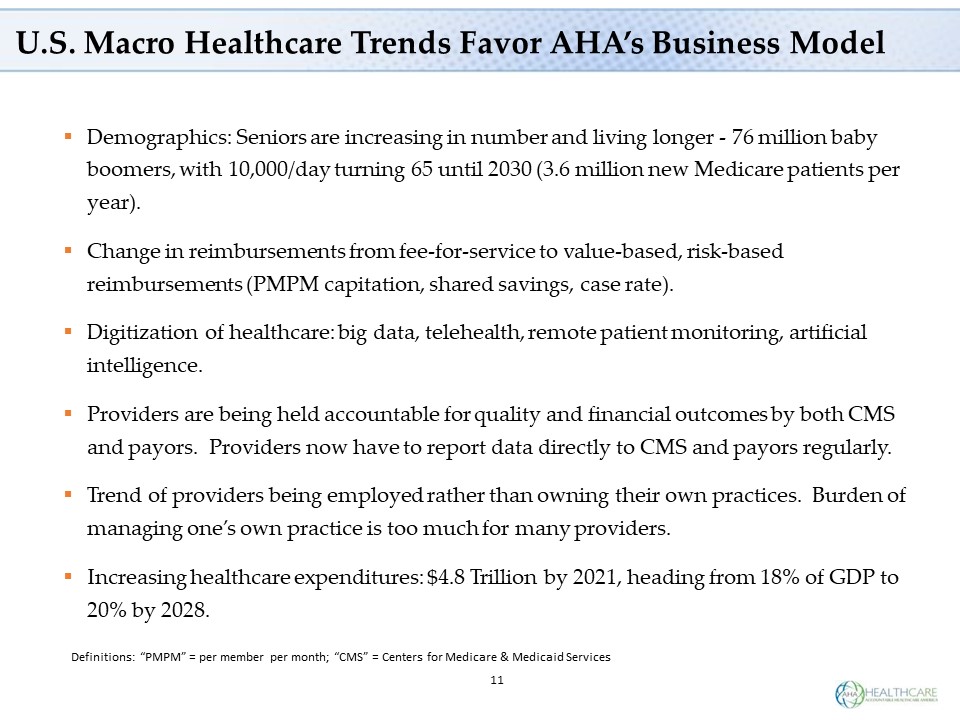
U.S. Macro Healthcare Trends Favor AHA’s Business Model ▪ Demographics: Seniors are increasing in number and living longer - 76 million baby boomers, with 10,000/day turning 65 until 2030 (3.6 million new Medicare patients per year). ▪ Change in reimbursements from fee - for - service to value - based, risk - based reimbursements (PMPM capitation, shared savings, case rate). ▪ Digitization of healthcare: big data, telehealth, remote patient monitoring, artificial intelligence. ▪ Providers are being held accountable for quality and financial outcomes by both CMS and payors. Providers now have to report data directly to CMS and payors regularly. ▪ Trend of providers being employed rather than owning their own practices. Burden of managing one’s own practice is too much for many providers. ▪ Increasing healthcare expenditures: $4.8 Trillion by 2021, heading from 18% of GDP to 20% by 2028. Definitions: “PMPM” = per member per month; “CMS” = Centers for Medicare & Medicaid Services 11
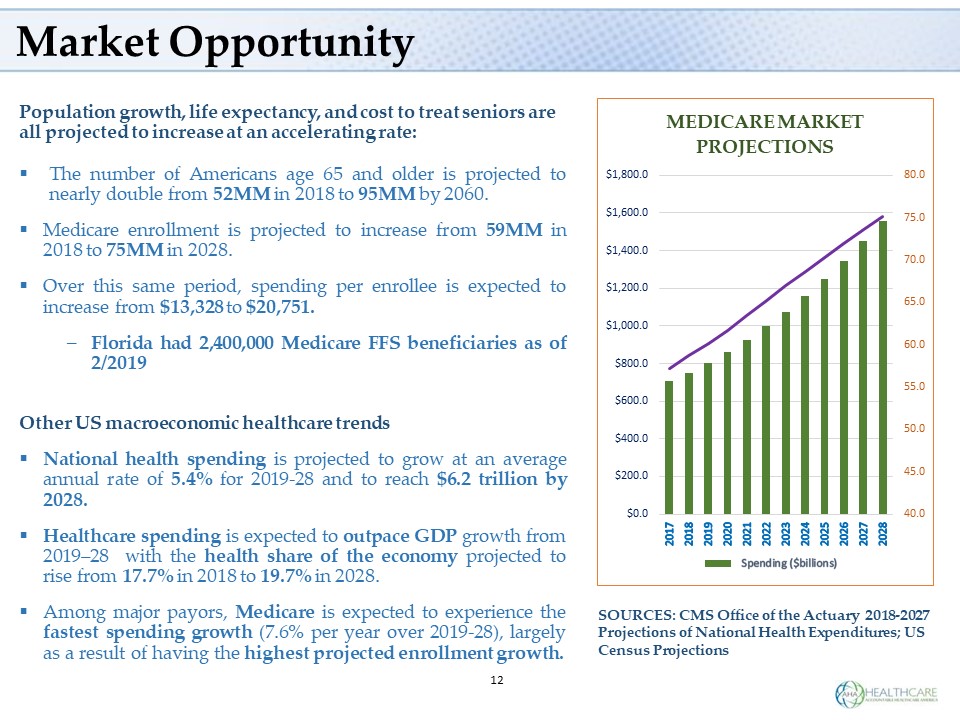
12 Market Opportunity Population growth, life expectancy, and cost to treat seniors are all projected to increase at an accelerating rate: ▪ The number of Americans age 65 and older is projected to nearly double from 52 MM in 2018 to 95 MM by 2060 . ▪ Medicare enrollment is projected to increase from 59 MM in 2018 to 75 MM in 2028 . ▪ Over this same period, spending per enrollee is expected to increase from $ 13 , 328 to $ 20 , 751 . – Florida had 2 , 400 , 000 Medicare FFS beneficiaries as of 2 / 2019 Other US macroeconomic healthcare trends ▪ National health spending is projected to grow at an average annual rate of 5 . 4 % for 2019 - 28 and to reach $ 6 . 2 trillion by 2028 . ▪ Healthcare spending is expected to outpace GDP growth from 2019 – 28 with the health share of the economy projected to rise from 17 . 7 % in 2018 to 19 . 7 % in 2028 . ▪ Among major payors, Medicare is expected to experience the fastest spending growth ( 7 . 6 % per year over 2019 - 28 ), largely as a result of having the highest projected enrollment growth . 40.0 45.0 50.0 55.0 60.0 65.0 70.0 75.0 80.0 $0.0 $200.0 $400.0 $600.0 $800.0 $1,000.0 $1,200.0 $1,400.0 $1,600.0 $1,800.0 MEDICARE MARKET PROJECTIONS SOURCES: CMS Office of the Actuary 2018 - 2027 Projections of National Health Expenditures; US Census Projections
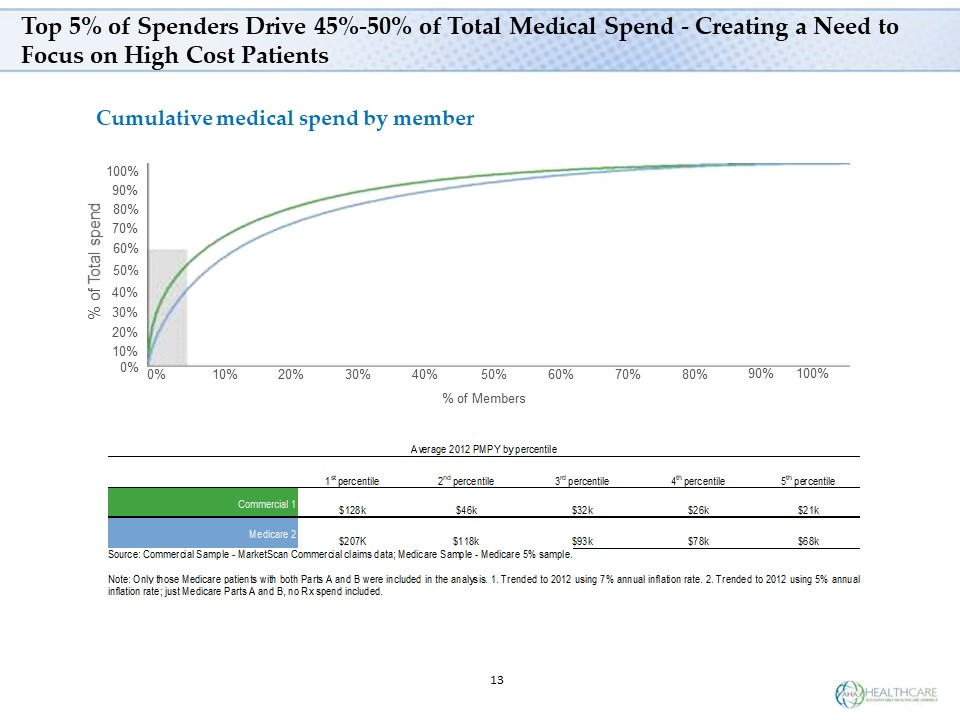
13 Cumulative medical spend by member 0% 10% 20% 30% 40% 50% 60% 70% 80% 90% 100% % of Members Average 2012 PMPY by percentile 1 st percentile 2 nd percentile 3 rd percentile 4 th percentile 5 th percentile Commercial 1 $128k $46k $32k $26k $21k Medicare 2 $207K $118k $93k $78k $68k Source: Commercial Sample - MarketScan Commercial claims data; Medicare Sample - Medicare 5% sample. Note: Only those Medicare patients with both Parts A and B were included in the analysis. 1. Trended to 2012 using 7% annual inflation rate. 2. Trended to 2012 using 5% annual inflation rate; just Medicare Parts A and B, no Rx spend inc luded. % of Total spend 10% 100% 60% 50% 40% 20% 30% 0% 70% 80% 90% Top 5% of Spenders Drive 45% - 50% of Total Medical Spend - Creating a Need to Focus on High Cost Patients
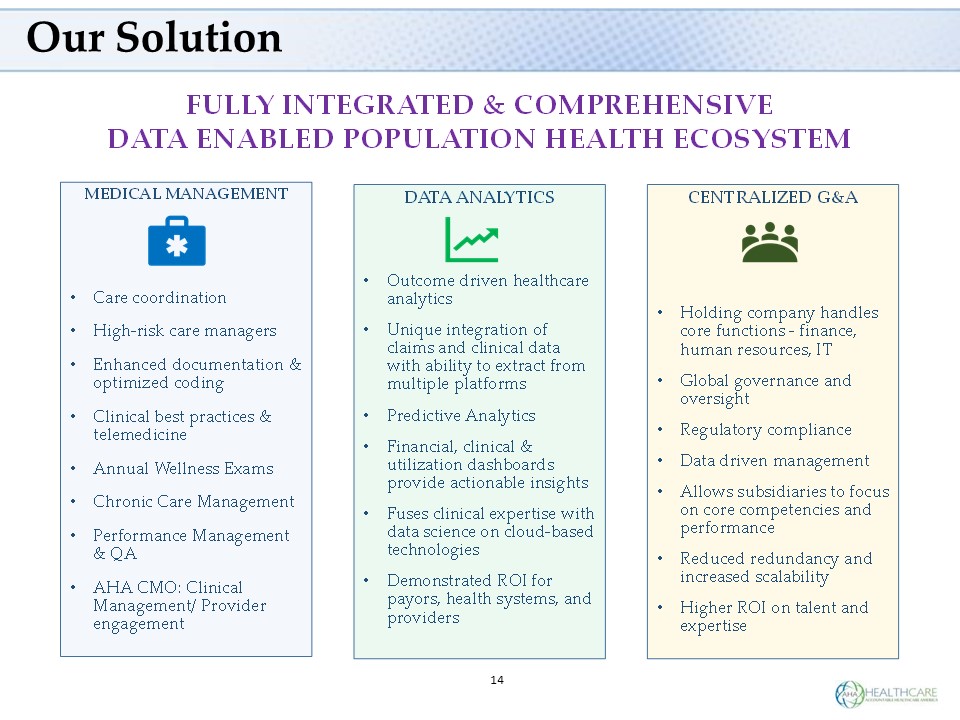
14 Our Solution FULLY INTEGRATED & COMPREHENSIVE DATA ENABLED POPULATION HEALTH ECOSYSTEM MEDICAL MANAGEMENT • Care coordination • High - risk care managers • Enhanced documentation & optimized coding • Clinical best practices & telemedicine • Annual Wellness Exams • Chronic Care Management • Performance Management & QA • AHA CMO: Clinical Management/ Provider engagement DATA ANALYTICS • Outcome driven healthcare analytics • Unique integration of claims and clinical data with ability to extract from multiple platforms • Predictive Analytics • Financial, clinical & utilization dashboards provide actionable insights • Fuses clinical expertise with data science on cloud - based technologies • Demonstrated ROI for payors, health systems, and providers CENTRALIZED G&A • Holding company handles core functions - finance, human resources, IT • Global governance and oversight • Regulatory compliance • Data driven management • Allows subsidiaries to focus on core competencies and performance • Reduced redundancy and increased scalability • Higher ROI on talent and expertise
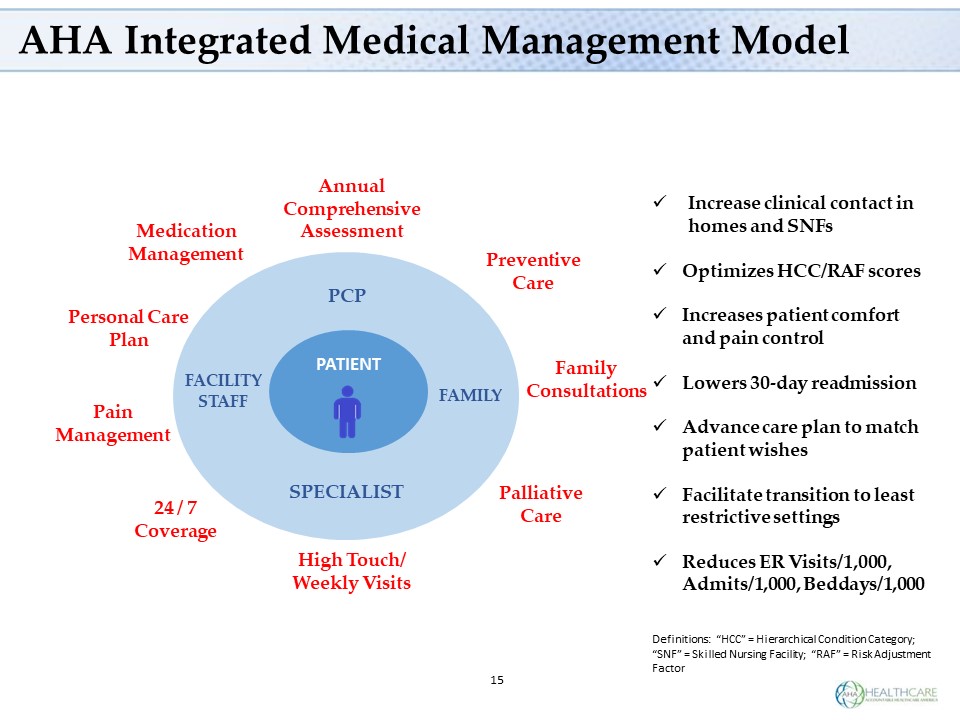
15 AHA Integrated Medical Management Model PATIENT PCP FACILITY STAFF FAMILY SPECIALIST Family Consultations Medication Management Annual Comprehensive Assessment Palliative Care Pain Management Preventive Care 24 / 7 Coverage High Touch/ Weekly Visits Personal Care Plan x Increase clinical contact in homes and SNFs x Optimizes HCC/RAF scores x Increases patient comfort and pain control x Lowers 30 - day readmission x Advance care plan to match patient wishes x Facilitate transition to least restrictive settings x Reduces ER Visits/1,000, Admits/1,000, Beddays/1,000 Definitions: “HCC” = Hierarchical Condition Category; “SNF” = Skilled Nursing Facility; “RAF” = Risk Adjustment Factor MB1
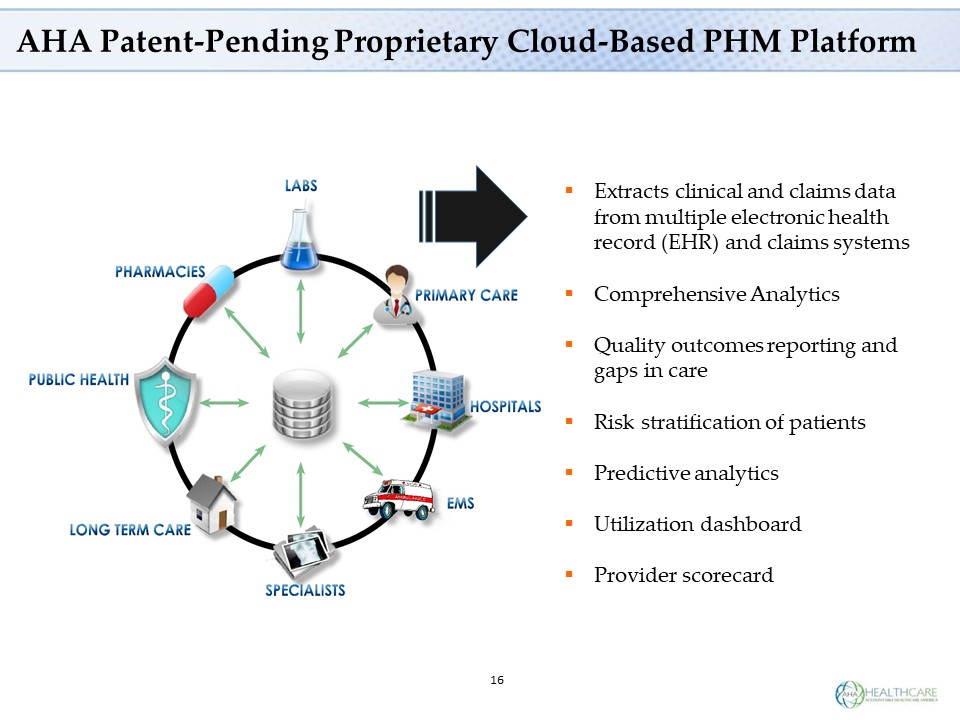
AHA Patent - Pending Proprietary Cloud - Based PHM Platform ▪ Extracts clinical and claims data from multiple electronic health record (EHR) and claims systems ▪ Comprehensive Analytics ▪ Quality outcomes reporting and gaps in care ▪ Risk stratification of patients ▪ Predictive analytics ▪ Utilization dashboard ▪ Provider scorecard 16
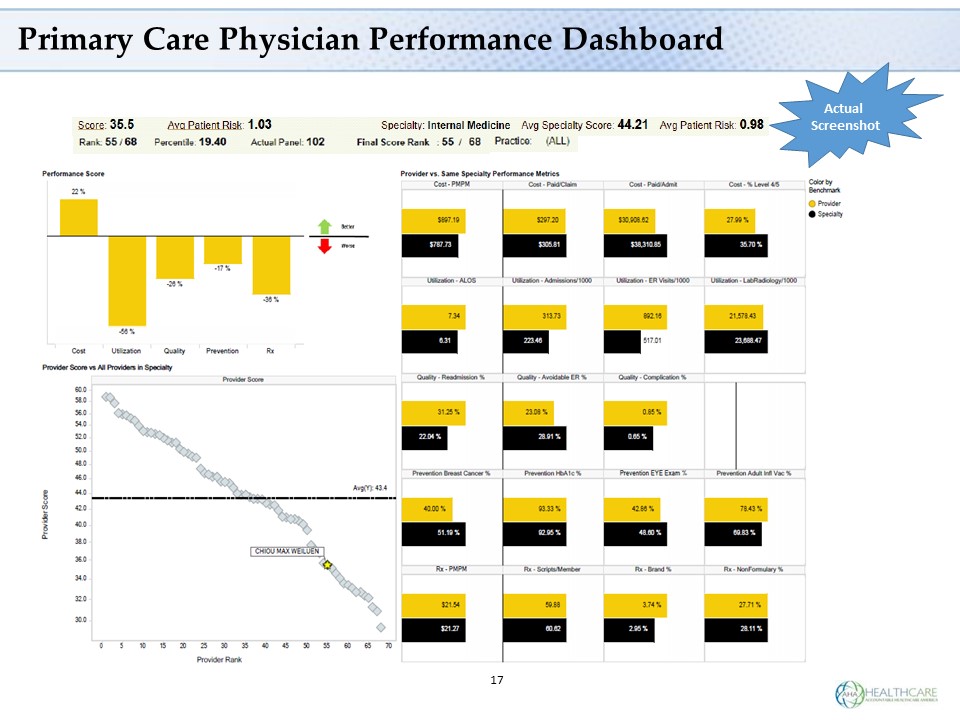
17 Primary Care Physician Performance Dashboard Actual Screenshot
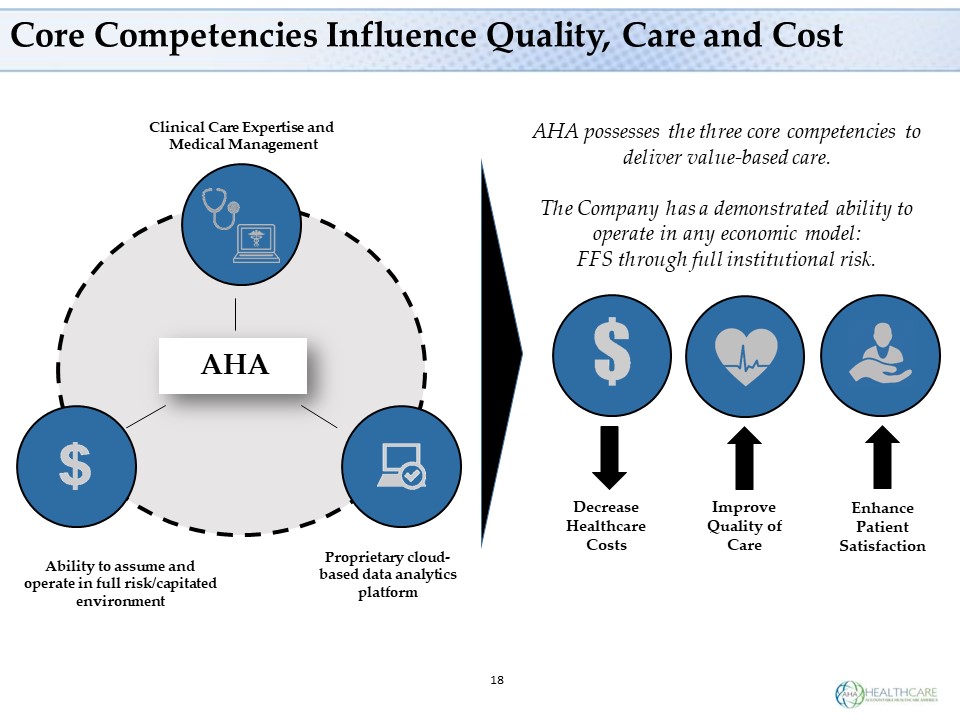
Core Competencies Influence Quality, Care and Cost 18 Clinical Care Expertise and Medical Management Ability to assume and operate in full risk/capitated environment Proprietary cloud - based data analytics platform Decrease Healthcare Costs Improve Quality of Care Enhance Patient Satisfaction AHA possesses the three core competencies to deliver value - based care. The Company has a demonstrated ability to operate in any economic model: FFS through full institutional risk. A AHA
AHA Differentiators ▪ Expertise in providing high quality, cost - efficient care. ▪ Expertise in managing complex, chronically ill patients. ▪ Leverage data - driven integrated platform to actively manage patients. ▪ AHA platform is built on emerging trend of value - based care. ▪ Data analytics: past, current and predictive using patent - pending proprietary technology. ▪ Physicians prefer to be part of physician - run groups. ▪ Population health management and care coordination capabilities. ▪ Ability to assume financial risk profitably. ▪ Sustainable, responsible profitable growth. 19
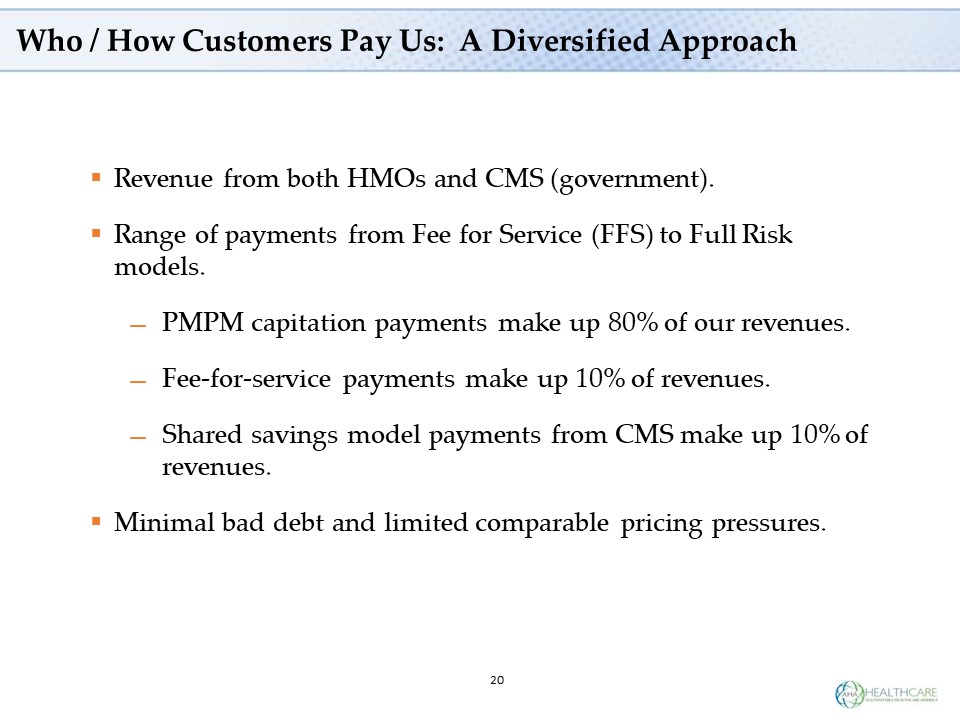
20 Who / How Customers Pay Us: A Diversified Approach ▪ Revenue from both HMOs and CMS (government). ▪ Range of payments from Fee for Service (FFS) to Full Risk models. ̶ PMPM capitation payments make up 80% of our revenues. ̶ Fee - for - service payments make up 10% of revenues. ̶ Shared savings model payments from CMS make up 10% of revenues. ▪ Minimal bad debt and limited comparable pricing pressures.
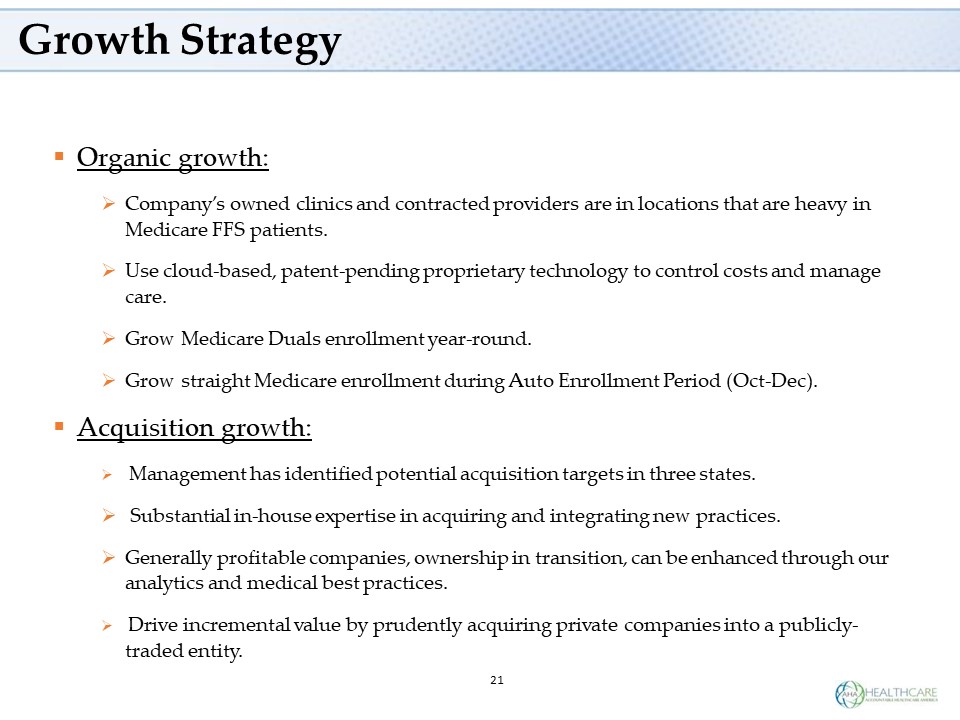
Growth Strategy ▪ Organic growth: » Company’s owned clinics and contracted providers are in locations that are heavy in Medicare FFS patients. » Use cloud - based, patent - pending proprietary technology to control costs and manage care. » Grow Medicare Duals enrollment year - round. » Grow straight Medicare enrollment during Auto Enrollment Period (Oct - Dec). ▪ Acquisition growth: » Management has identified potential acquisition targets in three states. » Substantial in - house expertise in acquiring and integrating new practices. » Generally profitable companies, ownership in transition, can be enhanced through our analytics and medical best practices. » Drive incremental value by prudently acquiring private companies into a publicly - traded entity. 21
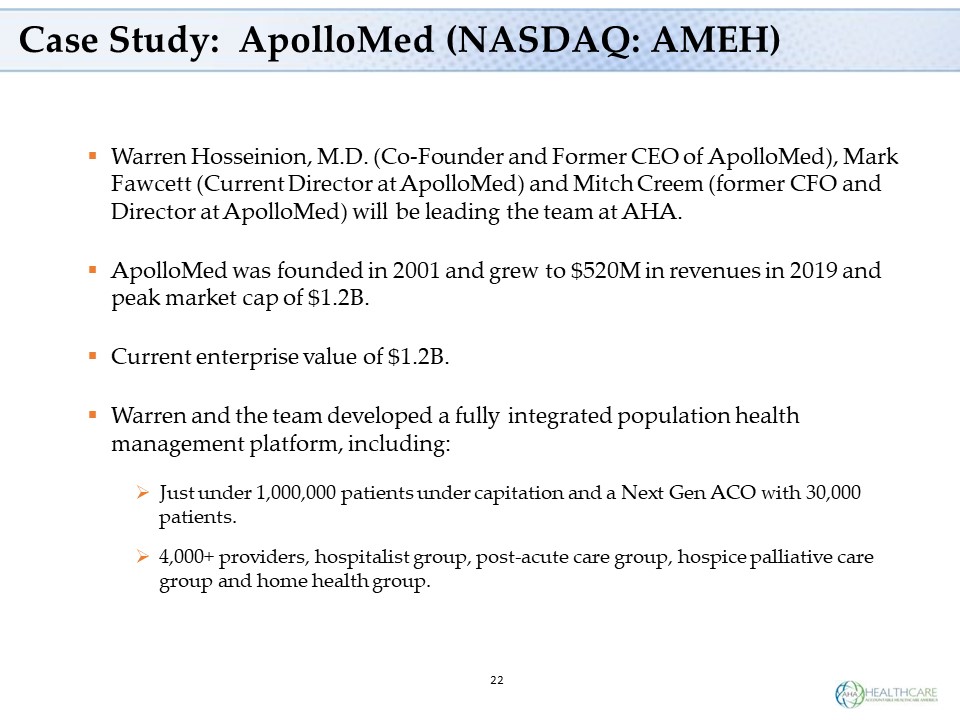
Case Study: ApolloMed (NASDAQ: AMEH) ▪ Warren Hosseinion, M.D. (Co - Founder and Former CEO of ApolloMed), Mark Fawcett (Current Director at ApolloMed) and Mitch Creem (former CFO and Director at ApolloMed) will be leading the team at AHA. ▪ ApolloMed was founded in 2001 and grew to $520M in revenues in 2019 and peak market cap of $1.2B. ▪ Current enterprise value of $1.2B. ▪ Warren and the team developed a fully integrated population health management platform, including: » Just under 1,000,000 patients under capitation and a Next Gen ACO with 30,000 patients. » 4,000+ providers, hospitalist group, post - acute care group, hospice palliative care group and home health group. 22
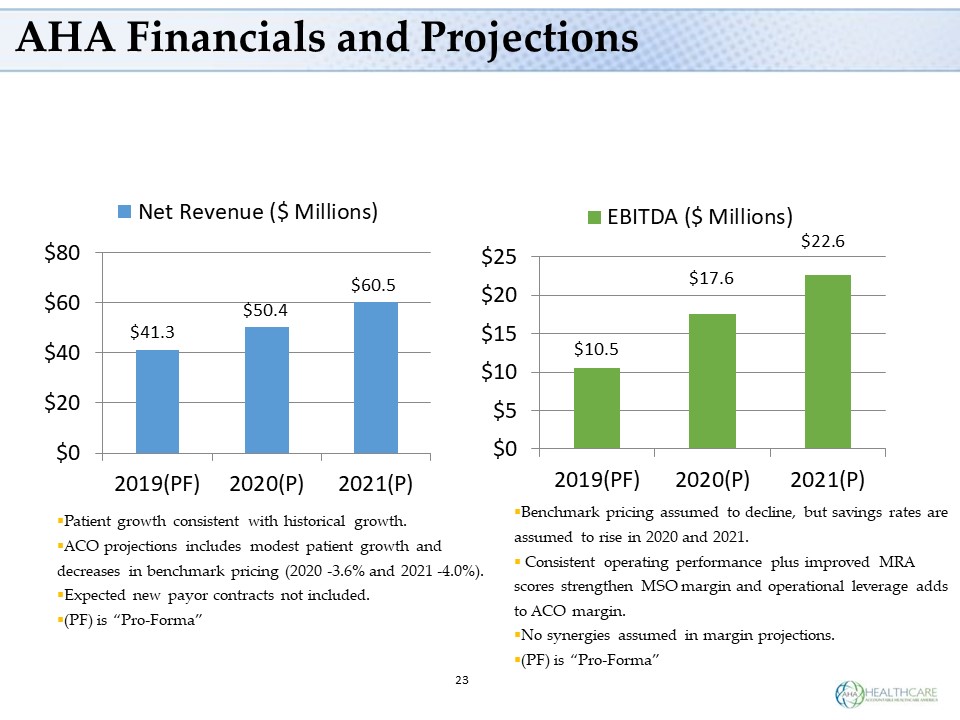
AHA Financials and Projections 23 $41.3 $50.4 $60.5 $0 $20 $40 $60 $80 2019(PF) 2020(P) 2021(P) Net Revenue ($… $10.5 $17.6 … $0 $5 $10 $15 $20 $25 2019(PF) 2020(P) 2021(P) EBITDA ($ Millions) ▪ Patient growth consistent with historical growth. ▪ ACO projections includes modest patient growth and decreases in benchmark pricing (2020 - 3.6% and 2021 - 4.0%). ▪ Expected new payor contracts not included. ▪ (PF) is “Pro - Forma” ▪ Benchmark pricing assumed to decline, but savings rates are assumed to rise in 2020 and 2021. ▪ Consistent operating performance plus improved MRA scores strengthen MSO margin and operational leverage adds to ACO margin. ▪ No synergies assumed in margin projections. ▪ (PF) is “Pro - Forma”
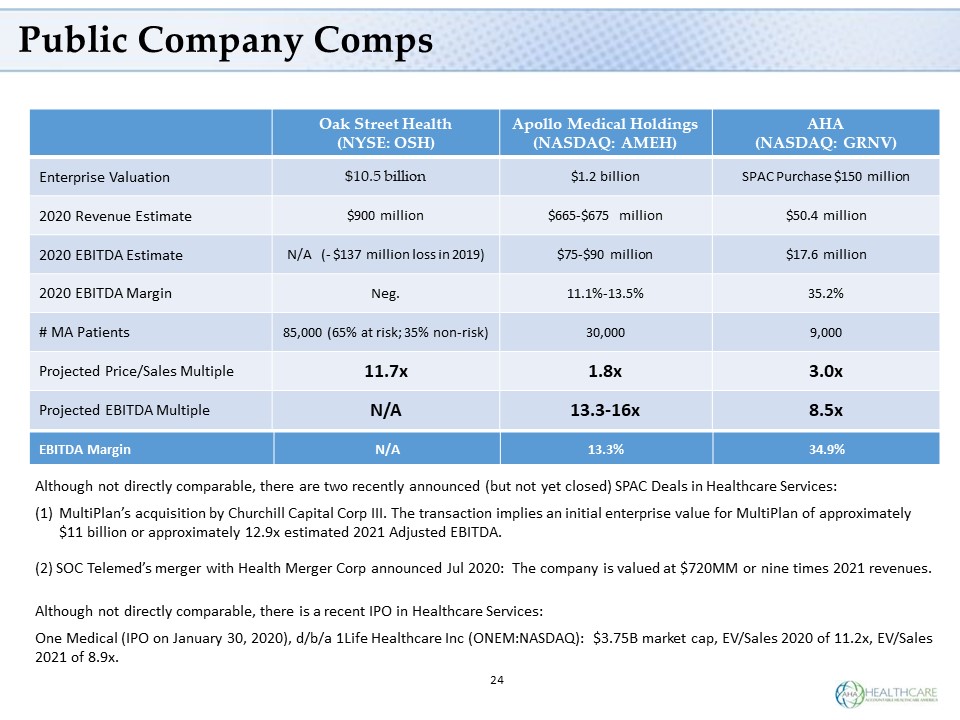
24 Public Company Comps Oak Street Health (NYSE: OSH) Apollo Medical Holdings (NASDAQ: AMEH) AHA (NASDAQ: GRNV) Enterprise Valuation $10.5 billion $1.2 billion SPAC Purchase $150 million 2020 Revenue Estimate $900 million $665 - $675 million $50.4 million 2020 EBITDA Estimate N/A ( - $137 million loss in 2019) $75 - $90 million $17.6 million 2020 EBITDA Margin Neg. 11.1% - 13.5% 35.2% # MA Patients 85,000 (65% at risk; 35% non - risk) 30,000 9,000 Projected Price/Sales Multiple 11.7x 1.8x 3.0x Projected EBITDA Multiple N/A 13.3 - 16x 8.5x Although not directly comparable, there are two recently announced (but not yet closed) SPAC Deals in Healthcare Services: (1) MultiPlan’s acquisition by Churchill Capital Corp III. The transaction implies an initial enterprise value for MultiPlan of approximately $11 billion or approximately 12.9x estimated 2021 Adjusted EBITDA. (2) SOC Telemed’s merger with Health Merger Corp announced Jul 2020: The company is valued at $720MM or nine times 2021 revenues. Although not directly comparable, there is a recent IPO in Healthcare Services: One Medical (IPO on January 30, 2020), d/b/a 1Life Healthcare Inc (ONEM:NASDAQ): $3.75B market cap, EV/Sales 2020 of 11.2x, EV/Sales 2021 of 8.9x. EBITDA Margin N/A 13.3% 34.9% MB2 MB3
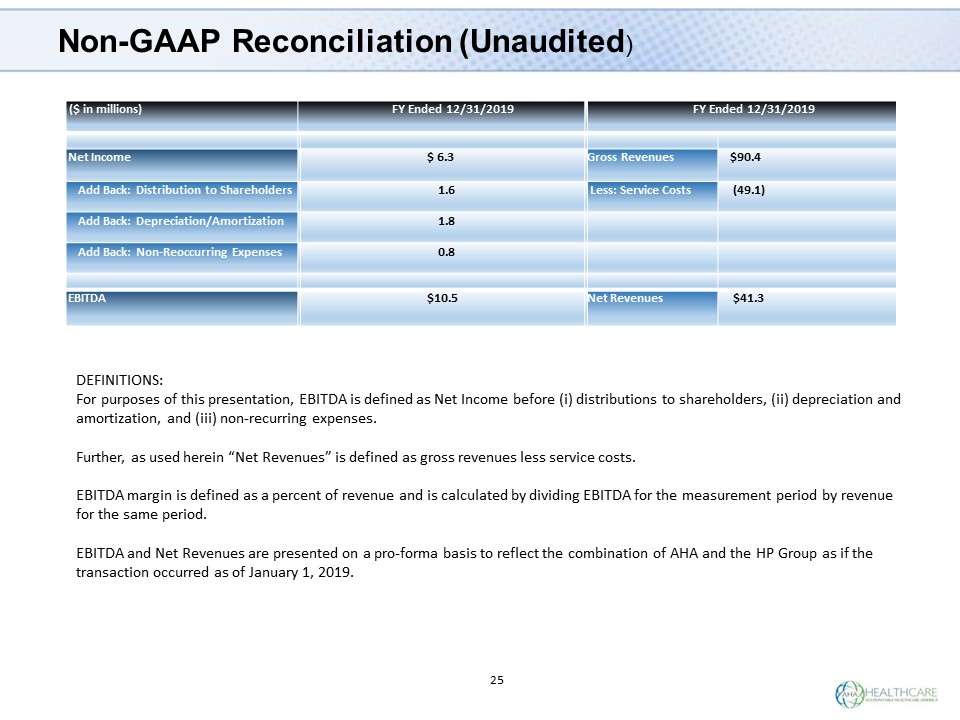
25 Non - GAAP Reconciliation (Unaudited ) ($ in millions) FY Ended 12/31/2019 FY Ended 12/31/2019 Net Income $ 6.3 Gross Revenues $90.4 Add Back: Distribution to Shareholders 1.6 Less: Service Costs (49.1) Add Back: Depreciation/Amortization 1.8 Add Back: Non - Reoccurring Expenses 0.8 EBITDA $10.5 Net Revenues $41.3 DEFINITIONS: For purposes of this presentation, EBITDA is defined as Net Income before ( i ) distributions to shareholders, (ii) depreciation and amortization, and (iii) non - recurring expenses. Further, as used herein “Net Revenues” is defined as gross revenues less service costs. EBITDA margin is defined as a percent of revenue and is calculated by dividing EBITDA for the measurement period by revenue for the same period. EBITDA and Net Revenues are presented on a pro - forma basis to reflect the combination of AHA and the HP Group as if the transaction occurred as of January 1, 2019.
No Offer or Solicitation. This presentation shall not constitute a solicitation of a proxy, consent or authorization with respect to any securities or in respect of the business combination. This presentation shall also not constitute an offer to sell or the solicitation of an offer to buy any securities of Greenvision , AHA or their affiliates. Use of Projections. This presentation contains financial forecasts. Neither GreenVision’s nor AHA’s auditors have audited, reviewed, compiled or performed any procedures with respect to the projections for the purpose of their inclusion in this presentation, and accordi ngl y, neither of them expressed an opinion or provided any other form of assurance with respect thereto for the purpose of this presentation. These projections are for illustrative purposes only and should not be relied upon as being necessarily indicat ive of future results. In this presentation, certain of the above - mentioned projected information has been provided for purposes of providing comparisons with historical data. The assumptions and estimates underlying the prospective financial information ar e inherently uncertain and are subject to a wide variety of significant business, economic and competitive risks and uncertaint ies that could cause actual results to differ materially from those contained in the prospective financial information. Projectio ns are inherently uncertain due to a number of factors outside of GreenVision’s or AHA’s control. Accordingly, there can be no assurance that the prospective results are indicative of future performance of GreenVision , AHA or the combined company after the business combination or that actual results will not differ materially from those presented in the prospective financial information. Inclusion of the prospective financial information in this presentation should not be regarded as a representati on by any person that the results contained in the prospective financial information will be achieved. Non - GAAP Measures. This presentation includes certain non - GAAP financial measures, including EBITDA and EBITDA Margin. The Company's management believes that these non - GAAP, unaudited measures of financial results provides useful information to management and investors regarding certain financial and business trends relating to the Company's financial condition and results of operations and you should not rely on any single financial measure to evaluate the Company's business. These non - GAAP financial measures are not calculated in accordance with generally accepted accounting principles in the United States (“GAAP ”) and should not be considered as alternatives to GAAP. These non - GAAP financial measures are included herein because GreenVision and AHA believe that the use of these non - GAAP financial measures provides an additional tool for investors to use in evaluating ongoing operating results and trends. Other companies may calculate their non - GAAP financial measures differently, and therefore the Company’s non - GAAP financial measures may not be directly comparable to similarly titled measures of other companies. For additional information and a reconciliation of these non - GAAP financial measures differently, and therefore the Company’s non - GAAP financial measures may not be directly comparable to similarly titled measures of other companies. 26 Disclaimer
• For additional information and a reconciliation of these non - GAAP financial measures to the nearest comparable GAAP financial measures, see the section on Page 25 titled “Non - GAAP Reconciliation” in the Appendix at the end of this presentation. Additionally, to the extent that forward - looking non - GAAP financial measures are provided, they are presented on a non - GAAP basis without reconciliations of such forward - looking non - GAAP financial measures due to the inherent difficulty in forecasting and quantifying certain amounts that are necessary for such reconciliation. Additional Information GreenVision Acquisition Corp. is a blank check company formed for the purpose of entering into a merger, share exchange, asset acquisition, stock purchase, recapitalization, reorganization or other similar business combination with one or more businesses or entities. In connection with the proposed business combination with Accountable Healthcare America, GreenVision intends to file relevant materials with the Securities and Exchange Commission (the “SEC”), including a preliminary proxy statement on Schedule 14A. Promptly after filing its definitive proxy statement with the SEC, GreenVision will mail the definitive proxy statement and a proxy card to each stockholder entitled to vote at the special meeting relatin g to the transaction. INVESTORS AND SECURITY HOLDERS OF GREENVISION ARE URGED TO READ THESE MATERIALS (INCLUDING ANY AMENDMENTS OR SUPPLEMENTS THERETO) AND ANY OTHER RELEVANT DOCUMENTS IN CONNECTION WITH THE TRANSACTION THAT GREENVISION WILL FILE WITH THE SEC WHEN THEY BECOME AVAILABLE BECAUSE THEY WILL CONTAIN IMPORTANT INFORMATION ABOUT GREENVISION, ACCOUNTABLE HEALTHCARE AMERICA AND THE TRANSACTION. The definitive proxy statement, the preliminary proxy statement and other relevant materials in connection with the transaction (when they become available), and any other documents filed by GreenVision with the SEC, may be obtained free of charge at the SEC’s website ( www.sec.gov ) or by writing to GreenVision Acquisition Corp., One Penn Plaza, New York, NY 10019, Attn: David Fu, Chief Executive Officer. Participants in the Solicitation GreenVision and its directors and executive officers may be deemed participants in the solicitation of proxies from Forum’s stockholders with respect to the Business Combination. A list of names of such directors and executive officers and a description of their interests in Forum is contained in GreenVision’s annual report on Form 10 - K for the fiscal year ended December 31, 2019, which was filed with the SEC and is available free of charge at the SEC’s website at www.sec.gov or by directing a request to GreenVision Acquisition Corp., One Penn Plaza, 36 th Floor, New York, New York 10019. Additional information regarding the interests of such directors and executive officers will be contained in the proxy statement for the Business Combination when available. AHA and its directors and executive officers may also be deemed to be participants in the solicitation of proxies from stockholders of GreenVision in connection with the Business Combination. A list of the names of such directors and executive officers and a description of their interests in the Business Combination will be included in the proxy statement for the Business Combination when available. 27 Disclaimer