UNITED STATES
SECURITIES AND EXCHANGE COMMISSION
Washington, D.C. 20549
________________________________________
FORM N-CSR
________________________________________
CERTIFIED SHAREHOLDER REPORT OF REGISTERED MANAGEMENT
INVESTMENT COMPANIES
Investment Company Act File Number 811-23480
StepStone Private Markets
(Exact name of registrant as specified in charter)
_________________________________________
128 S Tryon St., Suite 1600
Charlotte, NC 28202
(Address of principal executive offices) (Zip code)
_________________________________________
Robert W. Long
Chief Executive Officer
StepStone Group Private Wealth LLC
128 S Tryon St., Suite 1600
Charlotte, NC 28202
(Name and address of agent for service)
_________________________________________
Registrant’s telephone number, including area code: (704) 215-4300
Date of fiscal year end: March 31
Date of reporting period: March 31, 2023
Item 1. Reports to Stockholders.
(a) The Report to Shareholders is attached herewith.
StepStone Private Markets
Consolidated Financial Statements
March 31, 2023
Annual Report
Beginning on March 1, 2021, as permitted by regulations adopted by the Securities and Exchange Commission, paper copies of the Fund’s shareholder reports like this one will no longer be sent by mail, unless you specifically request paper copies of the reports from the Fund or from your financial intermediary, such as a broker-dealer or bank. Instead, the reports will be made available on a website, and you will be notified by mail each time a report is posted and provided with a website link to access the report.
If you already elected to receive shareholder reports electronically, you will not be affected by this change and you need not take any action. You may elect to receive shareholder reports and other communications from the Fund electronically by contacting the Fund or your financial intermediary. You may elect to receive all future reports, including your shareholder reports, in paper free of charge by contacting the Fund at 704-215-4300. Your election to receive reports in paper will apply to all funds held with your financial intermediary or all StepStone Funds.
StepStone Private Markets
Annual Report
March 31, 2023
Table of Contents
StepStone Private Markets | Page |
Manager’s Discussion and Analysis of Fund Performance (unaudited) | 1 |
Report of Independent Registered Public Accounting Firm | 5 |
Consolidated Schedule of Investments | 6 |
Consolidated Statement of Assets and Liabilities | 11 |
Consolidated Statement of Operations | 12 |
Consolidated Statements of Changes in Net Assets | 13 |
Consolidated Statement of Cash Flows | 14 |
Consolidated Financial Highlights | 15 |
Notes to Consolidated Financial Statements | 19 |
Trustees and Officers (unaudited) | 31 |
Approval of Investment Advisory and Sub-Advisory Agreements (unaudited) | 34 |
The Fund files its complete schedule of investments with the Securities and Exchange Commission (the “Commission”) for the first and third quarters of each fiscal year as an exhibit to its reports on Form N-PORT. The Fund’s Form N-PORT reports are available on the Commission’s website at http://www.sec.gov.
A description of the policies and procedures that the Fund uses to determine how to vote proxies relating to portfolio securities, as well as information relating to how the Fund voted proxies relating to portfolio securities during the most recent 12-month period ended June 30, is available (i) without charge, upon request, by calling (704) 215-4300; or through the Fund’s website at https://www.stepstonepw.com/sprim-documents; or both; and (ii) on the Commission’s website at http://www.sec.gov.
StepStone Private Markets
Manager’s Discussion and Analysis of Fund Performance
March 31, 2023 (unaudited)
Introduction
StepStone Private Markets (“SPRIM” or the “Fund”) offers accredited investors global exposure to the major private market asset classes in an open architecture solution that targets attractive risk-adjusted returns. SPRIM’s portfolio seeks to be well-diversified across underlying managers and by sector, strategy, geography and vintage year.
Designed specifically for individual investors and small institutions, SPRIM’s investor-centric structure emphasizes convenience, efficiency and transparency. An evergreen fund, SPRIM raises capital monthly while providing liquidity through quarterly redemptions. There are no ongoing capital calls. Investors will receive regular distributions, and tax reporting is provided via Form 1099.
Performance
We are pleased to report that SPRIM generated a net return of 8.2% for the fiscal year ending March 31, 2023. Since its inception on October 1, 2020, SPRIM has delivered a 28.9% annualized return and a 88.6% total return.1 SPRIM posted positive returns in 23 of its 30 months of operations and reached $1.1B of assets under management as of March 31, 2023.
Portfolio Construction Drives Returns
We believe that the Fund’s strong returns since inception benefited from:
| | ● | Strategic portfolio construction that emphasizes secondary purchases of mature assets closer to expected realization; |
| | ● | Robust capital inflows that allowed us to continuously invest into an environment that we deem attractive; and |
| | ● | Modest allocations to real assets and private debt that helped dampen volatility, provide consistent income and reduce the impact of inflation. |
Return Components and Benchmark
Despite the challenging market environment due to geopolitical uncertainty, inflationary pressures and rising interest rates, SPRIM achieved a 8.2% gain in fiscal year 2023, substantially outpacing the MSCI World Index,2 SPRIM’s primary benchmark, which reported an 8.7% decline during the same period. We attribute our performance to the following factors.
| | ● | Market dislocation presented opportunities for us to purchase assets, managed by historically top tier managers, at discounted prices compared to their NAV. Unrealized gains from secondary discounts totaled approximately $56M for the fiscal year. |
| | ● | Although merger and acquisition activity declined materially in fiscal year 2023, our portfolio continued to experience liquidity events. Realized gains and income distributions totaled approximately $25M. We believe this resilience in realizations demonstrates the benefits of a mature, diversified portfolio during weak capital market conditions. |
Liquidity and Redemptions
We believe SPRIM has ample liquidity to meet its obligations and is well-positioned to execute on investment opportunities in fiscal 2024 that may arise from continued market uncertainty. As of March 31, 2023, SPRIM held $162M of cash and cash equivalents and had $150M available to be drawn under its credit facility.
1
StepStone Private Markets
Manager’s Discussion and Analysis of Fund Performance
March 31, 2023 (unaudited) (continued)
During fiscal year 2023, SPRIM conducted four quarterly redemptions, each providing for up to 5% of outstanding shares to be repurchased. Redemptions are completed on a quarterly basis, and the proceeds are disbursed shortly after quarter-end once the NAV per share is determined.3 None of the quarterly redemptions were fully subscribed, and an average of 0.8% of outstanding shares were redeemed in each quarter.4
Investing Through the Cycle, Focused on Secondaries
SPRIM executed on its strategy of consistently investing through market cycles while leveraging StepStone’s global scale and depth to deploy $521M in 35 separate private market transactions during the fiscal year ending March 31, 2023. In a market that we believe has been favorably repriced, SPRIM focused on secondaries by investing $354M in 22 secondary purchases and selectively added $164M in 11 co-investments and $3M in two seasoned primaries. Private equity represented the majority of this deployment at $392M, complemented by $79M in real assets and $50M in private debt.
SPRIM has assembled a portfolio of 131 funds and 25 co-investments managed by 100 fund sponsors at year-end. The portfolio includes over 2,000 underlying companies, broadly diversified in all key private market metrics, such as industry, size, vintage year and geography in a manner designed to mitigate volatility and risk. Within the context of a diversification strategy, SPRIM focused on more durable industries that may benefit from long-term growth trends such as Information Technology, Industrials and Healthcare.
This commentary reflects the viewpoints of StepStone Group Private Wealth LLC as of March 31, 2023 and is not intended as a forecast or guarantee of future results.
2
StepStone Private Markets
Manager’s Discussion and Analysis of Fund Performance
March 31, 2023 (unaudited) (continued)
Average Annual Total Returns
| | Average Annual Total Returns as of March 31, 2023 |
| | 1 Year | Since Inception |
StepStone Private Markets, Class I | 8.2% | 28.9% |
StepStone Private Markets, Class D | 8.0% | 28.8% |
StepStone Private Markets, Class S | 7.5% | 28.6% |
StepStone Private Markets, Class T | 7.4% | 28.5% |
MSCI World Index(2) | (8.7)% | 6.6% |
Comparison of Change in the Value of a $1,000,000 Investment (10/1/20 – 3/31/23)(1)
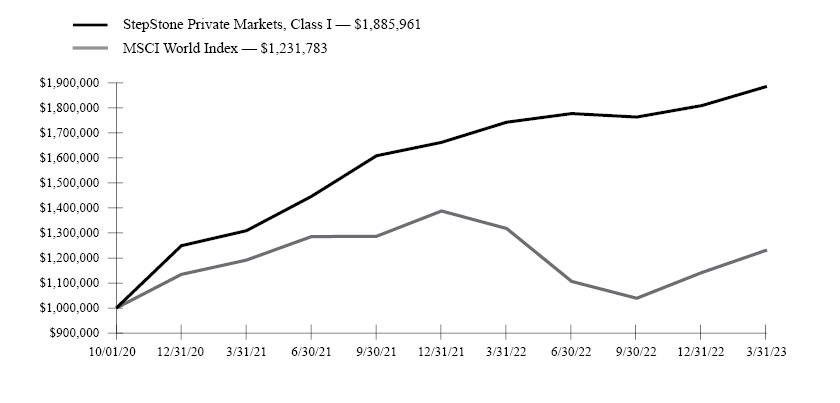
The chart above represents the hypothetical growth of a $1,000,000 investment in Class I shares. Returns for the Fund’s other classes will vary from what is seen above due to differences in fee structures, specifically the distribution and shareholder servicing fees associated with brokers, dealers and certain RIAs and other financial intermediaries.
The performance data quoted herein represents past performance, and the return and value of an investment in the Fund will fluctuate so that, when redeemed, it may be worth less than its original cost. Past performance does not predict future performance.
The Fund’s performance assumes the reinvestment of dividends. Index returns assume reinvestment of dividends and, unlike a portfolio’s returns, do not reflect any fees or expenses. If such fees and expenses were included in the index returns, the performance would have been lower. Please note that one cannot invest directly in an unmanaged index.
3
StepStone Private Markets
Manager’s Discussion and Analysis of Fund Performance
March 31, 2023 (unaudited) (concluded)
There are no assurances that the Fund will meet its stated objectives. The Fund’s holdings and allocations are subject to change because it is actively managed and should not be considered recommendations to buy individual securities.
Returns shown do not reflect the deduction of taxes that a shareholder would pay on Fund distributions or the redemption of Fund shares.
(1) | The date of inception for all share classes is October 1, 2020. Performance is cumulative and represents the percent change in net asset value (NAV) for the Class I shares and assumes reinvestment of all distributions pursuant to SPRIM’s distribution reinvestment plan. |
(2) | The MSCI World Index is a free float-adjusted market capitalization weighted index that is designed to measure the equity market performance of developed markets. The MSCI World Index consists of the following 23 developed market country indices: Australia, Austria, Belgium, Canada, Denmark, Finland, France, Germany, Hong Kong, Ireland, Israel, Italy, Japan, Netherlands, New Zealand, Norway, Portugal, Singapore, Spain, Sweden, Switzerland, the United Kingdom and the United States. The MSCI World Index is a total return index and SPRIM’s primary benchmark. |
(3) | Please review the Fund’s prospectus for the repurchase policy. |
(4) | Figure is the average of each quarter’s percentage of outstanding shares redeemed, including the March 31, 2023 redemption, the proceeds of which were disbursed on or around April 20, 2023. |
4
Report of Independent Registered Public Accounting Firm
To the Shareholders and Board of Trustees of
StepStone Private Markets
Opinion on the Financial Statements
We have audited the accompanying consolidated statement of assets and liabilities of StepStone Private Markets (the “Fund”), including the consolidated schedule of investments, as of March 31, 2023, and the related consolidated statements of operations and cash flows for the year then ended, the consolidated statements of changes in net assets for each of the two years in the period then ended, and the consolidated financial highlights for each of the two years in the period then ended and the period from October 1, 2020 (commencement of operations) to March 31, 2023, and the related notes (collectively referred to as the “financial statements”). In our opinion, the financial statements present fairly, in all material respects, the consolidated financial position of the Fund at March 31, 2023, and the consolidated results of its operations and its cash flows for the year then ended, the consolidated changes in its net assets for each of the two years in the period then ended, and the consolidated financial highlights for each of the two years in the period then ended and the period from October 1, 2020 (commencement of operations) to March 31, 2023, in conformity with U.S. generally accepted accounting principles.
Basis for Opinion
These financial statements are the responsibility of the Fund’s management. Our responsibility is to express an opinion on the Fund’s financial statements based on our audits. We are a public accounting firm registered with the Public Company Accounting Oversight Board (United States) (“PCAOB”) and are required to be independent with respect to the Fund in accordance with the U.S. federal securities laws and the applicable rules and regulations of the Securities and Exchange Commission and the PCAOB.
We conducted our audits in accordance with the standards of the PCAOB. Those standards require that we plan and perform the audit to obtain reasonable assurance about whether the financial statements are free of material misstatement, whether due to error or fraud. The Fund is not required to have, nor were we engaged to perform, an audit of the Fund’s internal control over financial reporting. As part of our audits, we are required to obtain an understanding of internal control over financial reporting but not for the purpose of expressing an opinion on the effectiveness of the Fund’s internal control over financial reporting. Accordingly, we express no such opinion.
Our audits included performing procedures to assess the risks of material misstatement of the financial statements, whether due to error or fraud, and performing procedures that respond to those risks. Such procedures included examining, on a test basis, evidence regarding the amounts and disclosures in the financial statements. Our procedures included confirmation of investments owned as of March 31, 2023, by correspondence with the custodians, investment funds or portfolio company investees; when replies were not received from investment funds or portfolio company investees, we performed other auditing procedures. Our audits also included evaluating the accounting principles used and significant estimates made by management, as well as evaluating the overall presentation of the financial statements. We believe that our audits provide a reasonable basis for our opinion.

We have served as the auditor of one or more of the StepStone Group LP investment companies since 2020.
New York, New York
May 30, 2023
5
StepStone Private Markets
Consolidated Schedule of Investments
March 31, 2023
Investment Funds(a)(b)(c) — 74.2% | | | | | | | | | | | |
Name | Acquisition
Date | Asset Class | Geographic
Region(d) | | Shares | | | Fair Value | |
TPG Partners VIII, L.P. (o) | 06/30/2022 | Private Equity | North America | | | | | | $ | 52,527,000 | |
Octagon StepStone CLO Fund, Ltd. (f) | 02/07/2023 | Private Debt | North America | | | 50,000 | | | | 50,116,753 | |
Franklin BSP Lending Corporation | 03/31/2022 | Private Debt | North America | | | 4,899,195 | | | | 35,666,143 | |
Cortland Growth and Income, L.P. | 04/01/2022 | Real Assets | North America | | | 18,010 | | | | 26,064,032 | |
Encore Consumer Capital Fund III, L.P. (g) | 06/30/2022 | Private Equity | North America | | | | | | | 24,952,115 | |
TPG Partners VII, L.P. | 01/05/2023 | Private Equity | North America | | | | | | | 22,735,050 | |
Roark Capital Partners CF LP | 08/26/2022 | Private Equity | North America | | | | | | | 22,323,853 | |
Trinity Hunt Partners CF, L.P. (f) | 10/14/2022 | Private Equity | North America | | | | | | | 21,801,236 | |
Harvest Partners VII, L.P. (f) | 11/01/2022 | Private Equity | North America | | | | | | | 20,400,291 | |
Clearlake Capital Partners VI (Offshore), L.P. (f) | 09/29/2022 | Private Equity | North America | | | | | | | 16,635,220 | |
WestCap Strategic Operator US Feeder Fund, L.P. (e) | 04/13/2022 | Private Equity | North America | | | | | | | 16,008,925 | |
Pegasus WSJLL Fund, L.P. (f) | 12/14/2021 | Private Equity | North America | | | | | | | 14,644,496 | |
Hellman & Friedman Capital Partners IX, L.P. (e) | 06/30/2022 | Private Equity | North America | | | | | | | 12,688,020 | |
XPV Water Extended Value Fund LP (f) | 10/03/2022 | Private Equity | North America | | | | | | | 12,591,500 | |
Blue Point Capital Partners IV, L.P. (e)(f) | 06/30/2022 | Private Equity | North America | | | | | | | 11,787,258 | |
Harvest Partners VII (Parallel), L.P. (f) | 11/01/2022 | Private Equity | North America | | | | | | | 10,793,956 | |
OceanSound Partners Fund, LP (e)(f)(h) | 02/28/2022 | Private Equity | North America | | | | | | | 10,652,636 | |
Riverside Micro-Cap Fund IV-A, L.P. (f) | 12/31/2021 | Private Equity | North America | | | | | | | 10,339,932 | |
Green Equity Investors VII, L.P. (f)(g) | 06/30/2022 | Private Equity | North America | | | | | | | 9,892,798 | |
Kelso Breathe Investor (DE), L.P. (f) | 02/11/2021 | Private Equity | North America | | | | | | | 9,356,867 | |
CD&R Value Building Partners I, L.P. | 12/17/2021 | Private Equity | North America | | | | | | | 9,067,334 | |
Clearlake Capital Partners VI, L.P. (f) | 12/30/2022 | Private Equity | North America | | | | | | | 9,042,003 | |
Insight Partners Continuation Fund II, L.P. (f) | 03/31/2023 | Private Equity | North America | | | | | | | 8,437,500 | |
Trive Capital Fund III LP (i) | 12/31/2021 | Private Equity | North America | | | | | | | 7,914,510 | |
Trident VIII, L.P. (f) | 12/30/2022 | Private Equity | North America | | | | | | | 7,678,267 | |
Global Infrastructure Partners II-C, L.P. | 06/30/2021 | Real Assets | North America | | | | | | | 7,169,012 | |
Vector Capital V, L.P. (f) | 12/31/2021 | Private Equity | North America | | | | | | | 7,068,726 | |
H.I.G. Realty Credit SRE Non-REIT Feeder Fund, L.P. | 10/01/2021 | Real Assets | North America | | | | | | | 7,023,534 | |
Tiger Global Private Investment Partners XV Feeder, L.P. (f)(h) | 03/23/2022 | Private Equity | North America | | | | | | | 6,931,625 | |
HPH II International FF, LP (f) | 07/12/2021 | Private Equity | North America | | | | | | | 6,532,721 | |
WestCap Strategic Operator Offshore Feeder, L.P. | 04/13/2022 | Private Equity | North America | | | | | | | 6,521,489 | |
Webster Equity Partners III-A, L.P. (f) | 04/29/2021 | Private Equity | North America | | | | | | | 6,511,309 | |
Clayton, Dubilier & Rice Fund X, L.P. (g) | 12/31/2021 | Private Equity | North America | | | | | | | 6,375,219 | |
West Street Real Estate Secondary Partners B, L.P. (j) | 12/10/2021 | Real Assets | North America | | | | | | | 6,015,615 | |
Audax Private Equity Fund IV CF, L.P. (f) | 12/24/2020 | Private Equity | North America | | | | | | | 5,499,052 | |
Green Equity Investors Offshore Fund VII, L.P. (f) | 09/30/2022 | Private Equity | North America | | | | | | | 5,313,500 | |
Accordion DC Holdings, LP (f) | 12/08/2022 | Private Equity | North America | | | | | | | 5,150,000 | |
Westview Capital Partners III, L.P. (f)(g) | 12/31/2021 | Private Equity | North America | | | | | | | 4,441,965 | |
JFL-NG Continuation Fund, L.P. (f) | 10/27/2021 | Private Equity | North America | | | | | | | 4,400,375 | |
Valar Co-Invest 1 LP (f)(k)(l) | 12/29/2020 | Private Equity | North America | | | | | | | 4,363,965 | |
Excellere Capital Fund II, L.P. (f) | 04/01/2021 | Private Equity | North America | | | | | | | 4,127,764 | |
AHP Fund II PV Feeder L.P. | 12/28/2020 | Private Equity | North America | | | | | | | 3,989,069 | |
Green Equity Investors VIII, L.P. (f)(g) | 06/30/2022 | Private Equity | North America | | | | | | | 3,937,463 | |
Album Ventures MSL-C, LP (f) | 04/21/2022 | Private Equity | North America | | | | | | | 3,914,438 | |
THL HT Parallel SPV, L.P. | 11/30/2020 | Private Equity | North America | | | | | | | 3,806,734 | |
Patriot SPV, L.P. (f) | 03/18/2021 | Private Equity | North America | | | | | | | 3,795,322 | |
Thoma Bravo Fund XI-A, L.P. | 01/01/2022 | Private Equity | North America | | | | | | | 3,396,599 | |
The accompanying notes are an integral part of these consolidated financial statements.
6
StepStone Private Markets
Consolidated Schedule of Investments
March 31, 2023 (continued)
Investment Funds(a)(b)(c) — 74.2% | | | | | | | | | | | |
Name | Acquisition
Date | Asset Class | Geographic
Region(d) | | Shares | | | Fair Value | |
OHCP V GA COI, L.P. (f) | 12/16/2020 | Private Equity | North America | | | | | | $ | 3,388,721 | |
Imaginary I Opportunity, L.P. (f)(h) | 04/21/2022 | Private Equity | North America | | | | | | | 3,387,254 | |
Green Equity Investors Offshore Fund VIII, L.P. (f) | 09/30/2022 | Private Equity | North America | | | | | | | 3,384,193 | |
Catterton Partners VII, L.P. (f) | 12/31/2021 | Private Equity | North America | | | | | | | 3,305,987 | |
Berkshire Fund IX, L.P. (j) | 09/04/2021 | Private Equity | North America | | | | | | | 3,183,926 | |
Apollo Overseas Partners IX, L.P. (g) | 01/01/2022 | Private Equity | North America | | | | | | | 3,108,996 | |
Riverside Micro-Cap Fund IV B A, L.P. (f) | 12/31/2021 | Private Equity | North America | | | | | | | 2,964,463 | |
Blue Point Capital Partners III, L.P. (e)(f) | 06/30/2022 | Private Equity | North America | | | | | | | 2,878,736 | |
Oak Hill Capital Partners V, L.P. | 01/29/2021 | Private Equity | North America | | | | | | | 2,872,838 | |
Berkshire Fund VIII, L.P. (j) | 09/04/2021 | Private Equity | North America | | | | | | | 2,294,328 | |
Gryphon Partners IV, L.P. (f) | 12/31/2021 | Private Equity | North America | | | | | | | 2,253,812 | |
Stripes Continuation Feeder Fund, LP (f) | 10/29/2021 | Private Equity | North America | | | | | | | 2,253,035 | |
Pine Brook Capital Partners II, L.P. (g) | 12/31/2020 | Private Equity | North America | | | | | | | 2,202,221 | |
Trive Capital Fund III-A LP | 12/31/2021 | Private Equity | North America | | | | | | | 2,184,778 | |
Fulcrum Capital Partners V, LP | 12/31/2021 | Private Equity | North America | | | | | | | 2,141,608 | |
TA Atlantic and Pacific VII-B L.P. (g) | 12/31/2020 | Private Equity | North America | | | | | | | 2,119,996 | |
AHP Fund I PV Feeder L.P. | 12/28/2020 | Private Equity | North America | | | | | | | 2,093,908 | |
Riverside Capital Appreciation Fund VI, L.P. (f) | 12/31/2021 | Private Equity | North America | | | | | | | 2,073,944 | |
Harvest Partners VI, L.P. (f)(i) | 03/31/2021 | Private Equity | North America | | | | | | | 1,866,416 | |
Encore Consumer Capital Fund (PV) IV, LP (f) | 06/30/2022 | Private Equity | North America | | | | | | | 1,767,756 | |
Thoma Bravo Special Opportunities Fund II-A, L.P. | 01/01/2022 | Private Equity | North America | | | | | | | 1,746,362 | |
Harvest Partners IX (Parallel), L.P. (f) | 11/01/2022 | Private Equity | North America | | | | | | | 1,707,083 | |
Vista Equity Endeavor Fund I-A, L.P. (f) | 01/01/2022 | Private Equity | North America | | | | | | | 1,543,611 | |
Apollo Overseas Partners (Delaware 892) VIII, L.P. (g) | 04/01/2021 | Private Equity | North America | | | | | | | 1,531,995 | |
Jade Equity Investors Offshore Fund, L.P. (f) | 09/30/2022 | Private Equity | North America | | | | | | | 1,416,685 | |
Sterling Investment Partners III, L.P. (g) | 01/01/2021 | Private Equity | North America | | | | | | | 1,415,641 | |
PTEV, L.P. (f)(j) | 12/30/2021 | Private Equity | North America | | | | | | | 1,414,928 | |
Trive Capital Fund II (Offshore) LP | 12/31/2021 | Private Equity | North America | | | | | | | 1,299,120 | |
Tailwind Capital Partners II (Cayman) L.P. (f) | 12/31/2020 | Private Equity | North America | | | | | | | 1,280,495 | |
Trive Structured Capital Fund I-A L.P. | 06/21/2022 | Private Equity | North America | | | | | | | 1,268,389 | |
Ampersand CF Limited Partnership (f) | 11/13/2020 | Private Equity | North America | | | | | | | 1,215,517 | |
Blue Point Capital Partners V (A), L.P. (f) | 06/30/2022 | Private Equity | North America | | | | | | | 1,132,131 | |
FFL Parallel Fund IV, L.P. (g) | 01/01/2021 | Private Equity | North America | | | | | | | 1,081,896 | |
SPC Partners IV, L.P. (e)(f) | 03/31/2021 | Private Equity | North America | | | | | | | 984,083 | |
Berkshire Fund X, L.P. (f)(j) | 09/04/2021 | Private Equity | North America | | | | | | | 981,422 | |
L Catterton VIII Offshore, L.P. (f) | 12/31/2021 | Private Equity | North America | | | | | | | 951,613 | |
Blackstone Capital Partners VI L.P. (g) | 01/01/2021 | Private Equity | North America | | | | | | | 855,434 | |
Apollo Natural Resources Partners II, L.P. (g) | 04/01/2021 | Private Equity | North America | | | | | | | 617,581 | |
Gridiron Capital Fund II, L.P. (e)(f) | 04/01/2021 | Private Equity | North America | | | | | | | 614,539 | |
Madison Dearborn Capital Partners VIII-C, L.P. | 03/12/2021 | Private Equity | North America | | | | | | | 492,832 | |
Littlejohn Fund IV-A, L.P. (f)(g) | 12/31/2020 | Private Equity | North America | | | | | | | 392,734 | |
Trive Capital Fund IV-A LP (f) | 05/16/2022 | Private Equity | North America | | | | | | | 371,722 | |
AEA Investors Fund V LP (f)(g) | 12/31/2020 | Private Equity | North America | | | | | | | 354,173 | |
Water Street Healthcare Partners II, L.P. (f) | 04/01/2021 | Private Equity | North America | | | | | | | 323,839 | |
Saw Mill Capital Investors, L.P. (f)(i) | 04/09/2021 | Private Equity | North America | | | | | | | 206,133 | |
Trive Capital Fund I (Offshore) LP (f) | 12/31/2021 | Private Equity | North America | | | | | | | 203,231 | |
SPC Partners V, L.P. (g) | 12/31/2020 | Private Equity | North America | | | | | | | 194,551 | |
LLR Equity Partners III, L.P. (e)(f) | 04/02/2021 | Private Equity | North America | | | | | | | 169,104 | |
TPG Growth II, L.P. (e)(f) | 04/09/2021 | Private Equity | North America | | | | | | | 129,205 | |
ABRY Partners VI, L.P. (e)(f) | 03/31/2021 | Private Equity | North America | | | | | | | 126,340 | |
The accompanying notes are an integral part of these consolidated financial statements.
7
StepStone Private Markets
Consolidated Schedule of Investments
March 31, 2023 (continued)
Investment Funds(a)(b)(c) — 74.2% | | | | | | | | | | | |
Name | Acquisition
Date | Asset Class | Geographic
Region(d) | | Shares | | | Fair Value | |
Odyssey Investment Partners Fund IV, LP (f) | 04/01/2021 | Private Equity | North America | | | | | | $ | 112,809 | |
Gores Capital Partners III, L.P. (g) | 01/01/2021 | Private Equity | North America | | | | | | | 67,021 | |
Apollo Overseas Partners (Delaware 892) VII, L.P. (g) | 04/01/2021 | Private Equity | North America | | | | | | | 62,778 | |
Apollo Natural Resources Partners, L.P. (g) | 04/01/2021 | Private Equity | North America | | | | | | | 34,372 | |
TowerBrook Investors III (Parallel), L.P. (f) | 12/31/2020 | Private Equity | North America | | | | | | | 30,826 | |
Gridiron Strategic Advisors Fund, L.P. (e)(f) | 04/01/2021 | Private Equity | North America | | | | | | | 21,212 | |
ABRY Senior Equity III, L.P. (e)(f) | 03/31/2021 | Private Equity | North America | | | | | | | 14,293 | |
Clearview Capital Fund II, L.P. (e)(f) | 03/31/2021 | Private Equity | North America | | | | | | | 5,202 | |
Riverside Fund IV, L.P. (f)(i) | 04/09/2021 | Private Equity | North America | | | | | | | 1,598 | |
Green Equity Investors IX, L.P. (f)(p) | 04/09/2021 | Private Equity | North America | | | | | | | — | |
Total North America — 61.6% | | | | | | | | | | 648,502,607 | |
| | | | | | | | | | | | |
Ufenau Continuation 3, SLP (f) | 04/14/2022 | Private Equity | Europe | | | | | | | 17,615,246 | |
Altor Fund V (No. 1) AB (f) | 12/30/2022 | Private Equity | Europe | | | | | | | 15,730,412 | |
EQT IX (NO.2) EUR SCSp (f)(g) | 07/06/2022 | Private Equity | Europe | | | | | | | 13,857,105 | |
VIP SIV I LP (f) | 05/06/2022 | Private Equity | Europe | | | | | | | 11,981,956 | |
Altor Fund IV (No. 1) AB (f) | 12/30/2022 | Private Equity | Europe | | | | | | | 10,547,015 | |
InfraRed Infrastructure V (1) LP | 06/29/2022 | Real Assets | Europe | | | | | | | 7,242,206 | |
Sixth Cinven Fund (No. 3) Limited Partnership (e) | 10/30/2020 | Private Equity | Europe | | | | | | | 6,815,764 | |
Growth Capital Partners Fund V LP (e)(h) | 04/14/2022 | Private Equity | Europe | | | | | | | 6,395,551 | |
EQT VIII (NO.2) SCSp (f)(g) | 07/06/2022 | Private Equity | Europe | | | | | | | 6,074,658 | |
Advent International GPE VIII-H Limited Partnership (f)(g) | 12/31/2021 | Private Equity | Europe | | | | | | | 4,591,615 | |
Fifth Cinven Fund (No. 1) Limited Partnership (e) | 10/30/2020 | Private Equity | Europe | | | | | | | 1,422,452 | |
DFI European Value-Add Fund II (e) | 07/12/2021 | Real Assets | Europe | | | | | | | 1,063,285 | |
Astorg IQ-EQ Fund (f) | 12/31/2021 | Private Equity | Europe | | | | | | | 888,341 | |
LQG JV Landmark Portfolio GmbH & Co. KG (e)(f) | 07/12/2021 | Real Assets | Europe | | | | | | | 566,040 | |
Kitty Hawk Capital Partners IV L.P. (e)(f) | 07/12/2021 | Real Assets | Europe | | | | | | | 563,013 | |
Advent International GPE VII-E Limited Partnership (f)(g) | 12/31/2021 | Private Equity | Europe | | | | | | | 555,506 | |
WREP#2 Luxco S.à r.l. (e)(f) | 07/12/2021 | Real Assets | Europe | | | | | | | 490,103 | |
Equistone Partners Europe Fund IV (f) | 12/31/2020 | Private Equity | Europe | | | | | | | 358,482 | |
Eurostone SRIO II S.C.A (e)(f) | 07/12/2021 | Real Assets | Europe | | | | | | | 178,974 | |
Total Europe — 10.2% | | | | | | | | | | 106,937,724 | |
| | | | | | | | | | | | |
NewQuest Asia Fund IV HH, L.P. (f) | 04/25/2022 | Private Equity | Asia | | | | | | | 10,546,710 | |
Eve One Fund II L.P. (f)(h) | 03/11/2022 | Private Equity | Asia | | | | | | | 7,206,386 | |
Vertex IV CF L.P. (f) | 01/04/2022 | Private Equity | Middle East | | | | | | | 5,953,912 | |
Carlyle MENA Partners, L.P. and Parallel Vehicles (g) | 01/01/2021 | Private Equity | Middle East | | | | | | | 647,488 | |
Carlyle South America Buyout Fund, L.P. and Parallel Vehicles (g) | 01/01/2021 | Private Equity | Latin America | | | | | | | 490,741 | |
Total Rest of World — 2.4% | | | | | | | | | | 24,845,237 | |
| | | | | | | | | | | | |
Total Investment Funds — 74.2% | | | | | | | | | | | |
(Cost $678,877,993) | | | | | | | | | $ | 780,285,568 | |
The accompanying notes are an integral part of these consolidated financial statements.
8
StepStone Private Markets
Consolidated Schedule of Investments
March 31, 2023 (continued)
Co-Investments(a)(b)(c) — 14.4% | | | | | | | | | | | |
Name | Acquisition
Date | Asset Class | Geographic
Region(d) | | Shares | | | Fair Value | |
Ares CARS Co-Invest, L.P. | 05/26/2022 | Real Assets | North America | | | | | | $ | 20,060,416 | |
JFL-Rand Co-Invest US Partners, L.P. (f) | 03/10/2023 | Private Equity | North America | | | | | | | 9,117,418 | |
MH Fund II Co-Invest, LP (j) | 03/23/2021 | Real Assets | North America | | | | | | | 6,522,496 | |
KKR Apple Co-Invest L.P. (f) | 09/20/2021 | Real Assets | North America | | | | | | | 5,691,147 | |
Decisions, LLC (f)(i)(k) | 12/28/2020 | Private Equity | North America | | | 1,718,769 | | | | 5,633,961 | |
RPIII FB Co-Invest LLC (f)(i)(k) | 03/02/2023 | Private Equity | North America | | | | | | | 5,000,000 | |
LJ Perimeter Co-Invest, L.P. (f) | 10/28/2022 | Private Equity | North America | | | | | | | 4,822,410 | |
Palms Co-Investment Partners, L.P. (f) | 06/03/2022 | Private Equity | North America | | | | | | | 4,674,082 | |
THL Fund IX Investors (Beacon), L.P. (f)(k) | 05/05/2021 | Private Equity | North America | | | | | | | 4,354,417 | |
Pegasus Coinvestors, L.P. (i) | 10/05/2021 | Real Assets | North America | | | | | | | 3,803,072 | |
TPG VIII Merlin CI II, L.P. | 07/30/2021 | Private Equity | North America | | | | | | | 3,801,238 | |
MPP KKC Holdings, LLC (f)(j)(k) | 11/10/2021 | Private Equity | North America | | | 3,000,000 | | | | 3,087,000 | |
BPCP Speedstar Acquisition, LLC (j)(k) | 01/20/2021 | Private Equity | North America | | | 1,900 | | | | 2,815,982 | |
Providence VIII Tetris Co-Investment-A L.P. (f) | 11/18/2022 | Private Equity | North America | | | | | | | 2,739,447 | |
WP Irving Co-Invest, L.P. (f) | 04/11/2022 | Private Equity | North America | | | | | | | 2,346,521 | |
Mosyle Corporation – Series B-2 (f)(k) | 04/21/2022 | Private Equity | North America | | | 45,010 | | | | 1,083,980 | |
Total North America — 8.1% | | | | | | | | | | 85,553,587 | |
| | | | | | | | | | | | |
Kindred Capital Co-Invest I LP (f)(k) | 04/26/2022 | Private Equity | Europe | | | | | | | 15,125,016 | |
KKR Cretaceous Co-Invest L.P. (f) | 12/08/2022 | Real Assets | Europe | | | | | | | 14,300,000 | |
Blackstone Infrastructure Miro Co-Invest (CYM) L.P. | 04/25/2022 | Real Assets | Europe | | | | | | | 13,221,626 | |
Palace Co-Invest, SLP (f)(k) | 08/07/2021 | Real Assets | Europe | | | | | | | 9,343,829 | |
Triton C Investment A L.P. (f) | 03/29/2022 | Private Equity | Europe | | | | | | | 4,873,362 | |
BC Partners Defender Co-Investment L.P. (f) | 09/10/2021 | Private Equity | Europe | | | | | | | 3,509,435 | |
Enak Aggregator Limited Partnership (f) | 01/18/2022 | Private Equity | Europe | | | | | | | 3,235,769 | |
Cinven Discovery Limited Partnership (f) | 09/22/2022 | Private Equity | Europe | | | | | | | 2,397,571 | |
Total Europe — 6.3% | | | | | | | | | | 66,006,608 | |
| | | | | | | | | | | | |
Total Co-Investments — 14.4% | | | | | | | | | | | |
(Cost $141,334,519) | | | | | | | | | $ | 151,560,195 | |
Co-Investment(c) — Direct Debt — 0.2% | | | | | | | | | | | | |
Name | Rate | Acquisition
Date | Maturity
Date | Investment
Type | | Principal | | | Fair Value | |
Hao Tian Asia Investment Co Ltd. Facility A (k) | 10.65% | 06/04/2021 | 10/11/2024 | Mezzanine | | | 2,583,874 | | | $ | 2,583,874 | |
Total Co-Investment — Direct Debt — 0.2% | | | | | | | | | | | | |
(Cost $2,910,194) | | | | | | | | | | $ | 2,583,874 | |
The accompanying notes are an integral part of these consolidated financial statements.
9
StepStone Private Markets
Consolidated Schedule of Investments
March 31, 2023 (concluded)
Cash Equivalents — 15.4% | | | | | | | | | | | | | | | | |
Name | | Asset Class | | | Geographic
Region(d) | | | Shares | | | Fair Value | |
First American Government Obligations Fund, Class X 4.65%(m)(n) | | | Cash Equivalent | | | | North America | | | | 161,736,387 | | | $ | 161,736,387 | |
Total Cash Equivalents — 15.4% | | | | | | | | | | | | | | | | |
(Cost $161,736,387) | | | | | | | | | | | | | | $ | 161,736,387 | |
| | | | | | | | | | | | | | | | | |
Total Investments — 104.2% (Cost $984,859,093) | | | | | | | | | | | | | | $ | 1,096,166,024 | |
Other Assets and Liabilities, Net — (4.2)% | | | | | | | | | | | | | | | (43,780,657 | ) |
Net Assets — 100.0% | | | | | | | | | | | | | | $ | 1,052,385,367 | |
(a) | Investment does not issue shares, unless shares are listed. |
(b) | Investment funds and co-investments are not redeemable and the final distribution date is not known at this time. |
(c) | Private Assets are generally issued in private placement transactions and as such are generally restricted as to resale. Each investment may have been purchased on various dates and for different amounts. The date of the first purchase is reflected under Acquisition Date. Total fair value of restricted investments as of March 31, 2023, was $934,429,637 or 88.8% of net assets. As of March 31, 2023, the aggregate cost of each investment restricted to sale was $37,704,050, $50,000,000, $31,000,000, $31,268,656, $16,355,082, $16,981,339, $18,155,284, $18,770,222, $17,372,473, $14,752,870, $16,624,504, $12,853,588, $11,529,893, $9,548,075, $9,900,549, $9,109,565, $7,944,661, $11,407,653, $10,620,164, $4,694,825, $8,474,822, $7,728,400, $8,437,500, $5,241,826, $6,079,987, $10,056,220, $5,404,123, $7,027,208, $8,833,794, $4,310,349, $7,354,370, $3,840,334, $5,198,462, $4,783,136, $4,884,805, $5,512,200, $5,002,335, $3,583,047, $2,369,905, $2,700,000, $4,097,159, $4,564,793, $3,502,412, $3,916,008, $2,172,659, $2,441,907, $4,285,170, $2,458,440, $3,000,000, $3,060,531, $4,909,764, $3,082,888, $2,256,020, $1,924,556, $2,263,845, $2,286,200, $2,396,201, $1,678,313, $2,882,792, $1,223,659, $1,536,130, $1,875,213, $465,100, $2,582,225, $1,652,261, $1,667,265, $1,935,027, $1,848,759, $2,121,816, $844,789, $1,566,487, $1,297,763, $770,349, $1,559,649, $1,110,323, $942,654, $1,417,145, $919,287, $1,179,390, $798,313, $1,227,436, $932,290, $939,168, $740,243, $464,406, $540,707, $519,747, $75,461, $409,498, $1, $540,828, $171,758, $139,258, $174,527, $301,587, $168,370, $152,768, $1, $1, $0, $0, $107,310, $258,960, $55,651, $782,874, $8,800, $0, $17,820,697, $13,333,048, $12,450,951, $8,606,086, $8,599,627, $6,462,728, $3,852,096, $5,079,853, $6,020,970, $3,933,011, $1,042,766, $1,115,538, $517,283, $932,694, $357,599, $839,317, $363,874, $267,149, $65,596, $6,124,376, $7,000,000, $4,706,047, $39,531, $725,967, $21,134,383, $9,114,964, $6,152,186, $5,173,770, $2,700,000, $5,000,000, $4,832,342, $4,674,082, $2,486,950, $3,455,422, $0, $3,000,000, $1,900,000, $2,745,001, $2,310,953, $1,083,980, $15,125,016, $14,300,000, $13,524,717, $9,370,425, $4,912,115, $3,061,767, $2,875,802, $2,400,645, $2,910,194, respectively, totaling $823,122,706. |
(d) | Geographic region generally reflects the location of the Investment Manager. |
(e) | Security is held by SPRIM Cayman LLC. |
(g) | Security is held by SPRIM Cayman II LLC. |
(h) | Seasoned primary investment. |
(i) | Security is held by SPRIM LLC — Series B. |
(j) | Security is held by SPRIM LLC — Series A. |
(k) | Level 3 security in accordance with fair value hierarchy. |
(l) | Partnership is invested solely in Wise plc listed on the London Stock Exchange effective July 7, 2021. |
(m) | The rate reported is the 7-day effective yield at the period end. |
(n) | The audited statements of the fund can be found at sec.gov. |
(o) | A portion of the security is held by SPRIM Cayman LLC. |
(p) | Investment has been committed to but has not been funded by the Fund. |
Summary of Investments by Strategy (as a percentage of total investments) |
Secondary Investment Funds | | | 68.0 | % |
Co-Investments | | | 13.8 | |
Primary Investment Funds | | | 3.2 | |
Co-Investments - Direct Debt | | | 0.2 | |
Cash Equivalents | | | 14.8 | |
Total Investments | | | 100.0 | % |
The accompanying notes are an integral part of these consolidated financial statements.
10
StepStone Private Markets
Consolidated Statement of Assets and Liabilities
March 31, 2023
Assets: | | | | |
Investments, at fair value (Cost $823,122,706) | | $ | 934,429,637 | |
Cash and cash equivalents | | | 161,736,387 | |
Cash denominated in foreign currency (Cost $87,686) | | | 86,698 | |
Cash held in escrow | | | 44,113,425 | |
Investments paid in advance | | | 9,840,335 | |
Dividend and interest receivable | | | 1,531,026 | |
Due from Feeder Fund | | | 300,867 | |
Distributions receivable from investments | | | 61,956 | |
Other assets | | | 96,044 | |
Total Assets | | | 1,152,196,375 | |
| | | | | |
Liabilities: | | | | |
Revolving credit facility | | | — | |
Less deferred debt issuance costs | | | (911,335 | ) |
Revolving credit facility less deferred debt issuance costs | | | (911,335 | ) |
Subscriptions received in advance | | | 44,113,425 | |
Payable for investments purchased | | | 38,395,763 | |
Payable for share repurchases | | | 12,646,671 | |
Deferred tax liability | | | 3,016,152 | |
Management fees payable | | | 1,281,196 | |
Professional fees payable | | | 562,611 | |
Commitment fees payable | | | 168,750 | |
Interest payable | | | 153,060 | |
Trustees’ fees payable | | | 41,452 | |
Other accrued expenses | | | 343,263 | |
Total Liabilities | | | 99,811,008 | |
| | | | | |
Commitments and Contingencies (see Note 8) | | | | |
| | | | | |
Net Assets | | $ | 1,052,385,367 | |
| | | | | |
Net Assets Consist of: | | | | |
Paid-in capital | | $ | 930,903,451 | |
Total distributable earnings | | | 121,481,916 | |
Net Assets | | $ | 1,052,385,367 | |
| | | | | |
Class I: | | | | |
Net Assets | | $ | 963,316,460 | |
Outstanding Shares | | | 21,121,302 | |
Net Asset Value Per Share* | | $ | 45.61 | |
| | | | | |
Class D: | | | | |
Net Assets | | $ | 31,668,021 | |
Outstanding Shares | | | 695,522 | |
Net Asset Value Per Share* | | $ | 45.53 | |
| | | | | |
Class S: | | | | |
Net Assets | | $ | 51,018,654 | |
Outstanding Shares | | | 1,124,367 | |
Net Asset Value Per Share* | | $ | 45.38 | |
| | | | | |
Class T: | | | | |
Net Assets | | $ | 6,382,232 | |
Outstanding Shares | | | 140,910 | |
Net Asset Value Per Share* | | $ | 45.29 | |
* | Net Asset Value Per Share is calculated utilizing non-rounded Outstanding Shares. |
The accompanying notes are an integral part of these consolidated financial statements.
11
StepStone Private Markets
Consolidated Statement of Operations
For the Year Ended March 31, 2023
Investment Income: | | | | |
Dividend income (net of taxes withheld of $336,498) | | $ | 12,579,593 | |
Interest income | | | 5,000,988 | |
Total Investment Income | | | 17,580,581 | |
| | | | | |
Expenses: | | | | |
Management fees | | | 11,066,638 | |
Revolving credit facility fees and expenses (1) | | | 1,901,468 | |
Amortization of deferred investment costs | | | 1,747,358 | |
Professional fees | | | 955,034 | |
Administration fees | | | 849,487 | |
Transfer agent fees | | | 307,318 | |
Distribution and shareholder servicing fees (Class S) | | | 184,671 | |
Distribution and shareholder servicing fees (Class D) | | | 40,581 | |
Distribution and shareholder servicing fees (Class T) | | | 24,565 | |
Tax expense | | | 169,955 | |
Trustees’ fees | | | 162,992 | |
Amortization of offering costs | | | 157,476 | |
Other expenses | | | 444,237 | |
Total Expenses | | | 18,011,780 | |
Adviser expense recoupment | | | 950,626 | |
| | | | | |
Net Expenses | | | 18,962,406 | |
| | | | | |
Net Investment Loss | | | (1,381,825 | ) |
| | | | | |
Net Realized Gain (Loss) and Change in Unrealized Appreciation (Depreciation) on Investments and Foreign Currency: | | | | |
Net realized gain distributions from investments and foreign currency transactions | | | 12,341,841 | |
Net change in unrealized appreciation (depreciation) on investments and foreign currency translation | | | 55,842,095 | |
| | | | | |
Net Realized Gain (Loss) and Change in Unrealized Appreciation (Depreciation) on Investments and Foreign Currency | | | 68,183,936 | |
| | | | | |
Net Increase in Net Assets Resulting from Operations | | $ | 66,802,111 | |
(1) | Includes amortization of debt issuance costs, commitment fees and interest expense. |
The accompanying notes are an integral part of these consolidated financial statements.
12
StepStone Private Markets
Consolidated Statements of Changes in Net Assets
| | | For the
Year Ended
March 31, 2023 | | | For the
Year Ended
March 31, 2022 | |
Net Increase in Net Assets Resulting from Operations: | | | | | | | | |
Net investment loss | | $ | (1,381,825 | ) | | $ | (3,100,812 | ) |
Net realized gain distributions from investments and foreign currency transactions | | | 12,341,841 | | | | 21,405,045 | |
Net change in unrealized appreciation (depreciation) on investments and foreign currency translation | | | 55,842,095 | | | | 38,388,446 | |
Net Increase in Net Assets Resulting from Operations | | | 66,802,111 | | | | 56,692,679 | |
| | | | | | | | | |
Distributions from Distributable Earnings: | | | | | | | | |
Class I | | | (16,394,012 | ) | | | (3,738,377 | ) |
Class D | | | (487,065 | ) | | | (122,959 | ) |
Class S | | | (447,726 | ) | | | (967 | ) |
Class T | | | (74,170 | ) | | | (2,817 | ) |
Total Distributions from Distributable Earnings | | | (17,402,973 | ) | | | (3,865,120 | ) |
| | | | | | | | | |
Capital Transactions (see Note 9): | | | | | | | | |
Class I: | | | | | | | | |
Proceeds from shares issued | | | 490,075,040 | | | | 311,689,416 | |
Reinvestment of distributions | | | 10,189,628 | | | | 1,842,496 | |
Repurchase of shares | | | (28,124,884 | ) | | | — | |
Class D: | | | | | | | | |
Proceeds from shares issued | | | 15,334,320 | | | | 8,030,407 | |
Reinvestment of distributions | | | 261,258 | | | | 79,598 | |
Repurchase of shares | | | (293,037 | ) | | | — | |
Class S: | | | | | | | | |
Proceeds from shares issued | | | 49,609,100 | | | | — | |
Reinvestment of distributions | | | 382,623 | | | | 777 | |
Repurchase of shares | | | (803,871 | ) | | | — | |
Class T: | | | | | | | | |
Proceeds from shares issued | | | 5,594,829 | | | | 386,000 | |
Reinvestment of distributions | | | 24,401 | | | | 1,260 | |
Repurchase of shares | | | — | | | | — | |
Net Increase in Net Assets Resulting from Capital Transactions | | | 542,249,407 | | | | 322,029,954 | |
| | | | | | | | | |
Total Increase in Net Assets | | | 591,648,545 | | | | 374,857,513 | |
| | | | | | | | | |
Net Assets: | | | | | | | | |
Beginning of year | | | 460,736,822 | | | | 85,879,309 | |
End of year | | $ | 1,052,385,367 | | | $ | 460,736,822 | |
Amounts designated as “—” are $0.
The accompanying notes are an integral part of these consolidated financial statements.
13
StepStone Private Markets
Consolidated Statement of Cash Flows
For the Year Ended March 31, 2023
Cash Flows from Operating Activities: | | | | |
Net increase in net assets resulting from operations | | $ | 66,802,111 | |
Adjustments to Reconcile Net Increase in Net Assets Resulting from Operations to Net Cash used in Operating Activities: | | | | |
Purchases of investments | | | (575,628,869 | ) |
Distributions received from investments | | | 28,626,137 | |
Redemption fees on repurchase of shares | | | (16,375 | ) |
Net realized gain distributions from investments and foreign currency transactions | | | (12,341,841 | ) |
Net change in unrealized (appreciation) depreciation on investments and foreign currency translation | | | (55,842,095 | ) |
Decrease in distributions receivable from investments | | | 1,044,711 | |
Increase in investments paid in advance | | | (9,840,335 | ) |
Increase in dividend and interest receivable | | | (1,373,014 | ) |
Decrease in due from Feeder Fund | | | 120,536 | |
Increase in other assets | | | (27,224 | ) |
Increase in payable for investments purchased | | | 38,395,763 | |
Increase in subscriptions received in advance | | | 13,032,082 | |
Increase in deferred tax liability | | | 142,287 | |
Increase in management fees payable | | | 734,159 | |
Increase in professional fees payable | | | 233,444 | |
Increase in commitment fees payable | | | 102,482 | |
Increase in interest payable | | | 153,060 | |
Increase in trustees’ fees payable | | | 444 | |
Decrease in due to Adviser | | | (106,858 | ) |
Increase in other accrued expenses | | | 184,744 | |
Net Cash used in Operating Activities | | | (505,604,651 | ) |
| | | | | |
Cash Flows from Financing Activities: | | | | |
Distributions paid in cash | | | (7,188,016 | ) |
Proceeds from shares issued | | | 560,613,289 | |
Repurchase of shares | | | (16,558,746 | ) |
Proceeds from revolving credit facility | | | 37,500,000 | |
Repayments of revolving credit facility | | | (37,500,000 | ) |
Amortization of debt issuance costs | | | (544,130 | ) |
Net Cash provided by Financing Activities | | | 536,322,397 | |
| | | | | |
Effect of exchange rate changes on cash | | | (645,903 | ) |
| | | | | |
Net Increase in Cash and Cash Equivalents, Cash Denominated in Foreign Currency and Cash Held in Escrow | | | 30,071,843 | |
| | | | | |
Cash and Cash Equivalents, Cash Denominated in Foreign Currency and Cash Held in Escrow: | | | | |
Beginning of year | | | 175,864,667 | |
End of year | | $ | 205,936,510 | |
| | | | | |
End of year balances | | | | |
Cash and cash equivalents | | | 161,736,387 | |
Cash denominated in foreign currency | | | 86,698 | |
Cash held in escrow | | | 44,113,425 | |
End of year balance | | $ | 205,936,510 | |
| | | | | |
Supplemental Disclosure of Cash Flow Information: | | | | |
Reinvestment of distributions | | $ | 10,857,910 | |
Cash paid during the year for interest expense and commitment fees | | $ | 1,215,108 | |
Cash paid during the year for taxes | | $ | 27,668 | |
Stock distributions received in-kind from investments | | $ | 922,855 | |
The accompanying notes are an integral part of these consolidated financial statements.
14
StepStone Private Markets
Consolidated Financial Highlights
Class I | | For the
Year Ended
March 31, 2023 | | | For the
Year Ended
March 31, 2022 | | | For the
Period Ended
March 31, 2021 (1) | |
Net asset value per share, beginning of period | | $ | 43.07 | | | $ | 33.65 | | | $ | 25.00 | |
Net increase in net assets resulting from operations: | | | | | | | | | | | | |
Net investment loss(2) | | | (0.07 | ) | | | (0.54 | ) | | | (0.89 | ) |
Net realized gains and change in unrealized appreciation on investments and foreign currency translation(2) | | | 3.57 | | | | 10.44 | | | | 9.54 | |
Net increase in net assets resulting from operations | | | 3.50 | | | | 9.90 | | | | 8.65 | |
Distributions from net investment income | | | (0.40 | ) | | | (0.23 | ) | | | — | |
Distribution from capital gains | | | (0.56 | ) | | | (0.25 | ) | | | — | |
Total distributions | | | (0.96 | ) | | | (0.48 | ) | | | — | |
Net asset value per share, end of period | | $ | 45.61 | | | $ | 43.07 | | | $ | 33.65 | |
| | | | | | | | | | | | | |
Total Return† | | | 8.23 | % | | | 29.43 | % | | | 34.60 | %†† |
| | | | | | | | | | | | | |
Ratios and Supplemental Data | | | | | | | | | | | | |
Net assets, end of period (thousands) | | $ | 963,316 | | | $ | 445,249 | | | $ | 81,122 | |
Ratio of net expenses to average net assets | | | 2.45 | %‡ | | | 3.56 | %‡ | | | 6.05 | %* |
Ratio of gross expenses to average net assets | | | 2.32 | %^‡ | | | 3.38 | %^‡ | | | 11.57 | %^* |
Ratio of net investment loss to average net assets | | | (0.16 | )% | | | (1.36 | )% | | | (5.85 | )%* |
Portfolio turnover rate** | | | 4.35 | % | | | 25.31 | % | | | 5.95 | % |
Asset coverage ratio | | | N/A | | | | N/A | | | | 4.29 | |
(1) | The Class commenced operations on October 1, 2020. |
(2) | Per share data calculated using average shares outstanding during the period. |
† | Total return based on per share net asset value reflects the change in net asset value based on the effects of the performance of the Fund during the period and assumes distributions, if any, were reinvested. Total returns shown exclude the effect of applicable sales charges. |
†† | Total return would have been lower had certain expenses not been waived and assumed by the Adviser during the period. |
‡ | Ratio includes the deferred income tax expense related to SPRIM LLC. For the fiscal years ended March 31, 2023 and March 31, 2022, this expense amounted to 0.02% and 0.94% of average net assets, respectively. |
^ | Represents the ratio of expenses to average net assets absent the adviser expense reimbursement and/or recoupment of operating expenses. |
** | Represents lesser of purchases of or distributions received from investments for the period divided by the average of the monthly fair value of investments during the period. Result is not annualized. |
The accompanying notes are an integral part of these consolidated financial statements.
15
StepStone Private Markets
Consolidated Financial Highlights (continued)
Class D | | For the
Year Ended
March 31, 2023 | | | For the
Year Ended
March 31, 2022 | | | For the
Period Ended
March 31, 2021 (1) | |
Net asset value per share, beginning of period | | $ | 43.03 | | | $ | 33.62 | | | $ | 25.00 | |
Net increase in net assets resulting from operations: | | | | | | | | | | | | |
Net investment loss(2) | | | (0.15 | ) | | | (0.46 | ) | | | (1.17 | ) |
Net realized gains and change in unrealized appreciation on investments and foreign currency translation(2) | | | 3.57 | | | | 10.31 | | | | 9.79 | |
Net increase in net assets resulting from operations | | | 3.42 | | | | 9.85 | | | | 8.62 | |
Distributions from net investment income | | | (0.36 | ) | | | (0.19 | ) | | | — | |
Distribution from capital gains | | | (0.56 | ) | | | (0.25 | ) | | | — | |
Total distributions | | | (0.92 | ) | | | (0.44 | ) | | | — | |
Net asset value per share, end of period | | $ | 45.53 | | | $ | 43.03 | | | $ | 33.62 | |
| | | | | | | | | | | | | |
Total Return† | | | 8.04 | % | | | 29.32 | % | | | 34.48 | %†† |
| | | | | | | | | | | | | |
Ratios and Supplemental Data | | | | | | | | | | | | |
Net assets, end of period (thousands) | | $ | 31,668 | | | $ | 14,908 | | | $ | 4,623 | |
Ratio of net expenses to average net assets | | | 2.62 | %‡ | | | 3.52 | %‡ | | | 7.72 | %* |
Ratio of gross expenses to average net assets | | | 2.49 | %^‡ | | | 3.44 | %^‡ | | | 11.54 | %^* |
Ratio of net investment loss to average net assets | | | (0.34 | )% | | | (1.17 | )% | | | (7.47 | )%* |
Portfolio turnover rate** | | | 4.35 | % | | | 25.31 | % | | | 5.95 | % |
Asset coverage ratio | | | N/A | | | | N/A | | | | 4.29 | |
(1) | The Class commenced operations on October 1, 2020. |
(2) | Per share data calculated using average shares outstanding during the period. |
† | Total return based on per share net asset value reflects the change in net asset value based on the effects of the performance of the Fund during the period and assumes distributions, if any, were reinvested. Total returns shown exclude the effect of applicable sales charges. |
†† | Total return would have been lower had certain expenses not been waived and assumed by the Adviser during the period. |
‡ | Ratio includes the deferred income tax expense related to SPRIM LLC. For the fiscal years ended March 31, 2023 and March 31, 2022, this expense amounted to 0.02% and 0.85% of average net assets, respectively. |
^ | Represents the ratio of expenses to average net assets absent the adviser expense reimbursement and/or recoupment of operating expenses. |
** | Represents lesser of purchases of or distributions received from investments for the period divided by the average of the monthly fair value of investments during the period. Result is not annualized. |
The accompanying notes are an integral part of these consolidated financial statements.
16
StepStone Private Markets
Consolidated Financial Highlights (continued)
Class S | | For the
Year Ended
March 31, 2023 | | | For the
Year Ended
March 31, 2022 | | | For the
Period Ended
March 31, 2021 (1) | |
Net asset value per share, beginning of period | | $ | 43.07 | | | $ | 33.65 | | | $ | 25.00 | |
Net increase in net assets resulting from operations: | | | | | | | | | | | | |
Net investment loss(2) | | | (0.30 | ) | | | (0.31 | ) | | | (0.79 | ) |
Net realized gains and change in unrealized appreciation on investments and foreign currency translation(2) | | | 3.48 | | | | 10.21 | | | | 9.44 | |
Net increase in net assets resulting from operations | | | 3.18 | | | | 9.90 | | | | 8.65 | |
Distributions from net investment income | | | (0.31 | ) | | | (0.23 | ) | | | — | |
Distribution from capital gains | | | (0.56 | ) | | | (0.25 | ) | | | — | |
Total distributions | | | (0.87 | ) | | | (0.48 | ) | | | — | |
Net asset value per share, end of period | | $ | 45.38 | | | $ | 43.07 | | | $ | 33.65 | |
| | | | | | | | | | | | | |
Total Return† | | | 7.48 | % | | | 29.43 | % | | | 34.60 | %†† |
| | | | | | | | | | | | | |
Ratios and Supplemental Data | | | | | | | | | | | | |
Net assets, end of period (thousands) | | $ | 51,019 | | | $ | 87 | | | $ | 67 | |
Ratio of net expenses to average net assets | | | 3.41 | %‡ | | | 3.43 | %‡ | | | 5.44 | %* |
Ratio of gross expenses to average net assets | | | 3.40 | %^‡ | | | 3.45 | %^‡ | | | 11.67 | %^* |
Ratio of net investment loss to average net assets | | | (0.67 | )% | | | (0.81 | )% | | | (5.27 | )%* |
Portfolio turnover rate** | | | 4.35 | % | | | 25.31 | % | | | 5.95 | % |
Asset coverage ratio | | | N/A | | | | N/A | | | | 4.29 | |
(1) | The Class commenced operations on October 1, 2020. |
(2) | Per share data calculated using average shares outstanding during the period. |
† | Total return based on per share net asset value reflects the change in net asset value based on the effects of the performance of the Fund during the period and assumes distributions, if any, were reinvested. Total returns shown exclude the effect of applicable sales charges. |
†† | Total return would have been lower had certain expenses not been waived and assumed by the Adviser during the period. |
‡ | Ratio includes the deferred income tax expense related to SPRIM LLC. For the fiscal years ended March 31, 2023 and March 31, 2022, this expense amounted to (0.02)% and 0.72% of average net assets, respectively. |
^ | Represents the ratio of expenses to average net assets absent the adviser expense reimbursement and/or recoupment of operating expenses. |
** | Represents lesser of purchases of or distributions received from investments for the period divided by the average of the monthly fair value of investments during the period. Result is not annualized. |
The accompanying notes are an integral part of these consolidated financial statements.
17
StepStone Private Markets
Consolidated Financial Highlights (concluded)
Class T | | For the
Year Ended
March 31, 2023 | | | For the
Year Ended
March 31, 2022 | | | For the
Period Ended
March 31, 2021 (1) | |
Net asset value per share, beginning of period | | $ | 43.05 | | | $ | 33.65 | | | $ | 25.00 | |
Net increase in net assets resulting from operations: | | | | | | | | | | | | |
Net investment loss(2) | | | (0.31 | ) | | | (0.88 | ) | | | (0.79 | ) |
Net realized gains and change in unrealized appreciation on investments and foreign currency translation(2) | | | 3.44 | | | | 10.76 | | | | 9.44 | |
Net increase in net assets resulting from operations | | | 3.13 | | | | 9.88 | | | | 8.65 | |
Distributions from net investment income | | | (0.33 | ) | | | (0.23 | ) | | | — | |
Distribution from capital gains | | | (0.56 | ) | | | (0.25 | ) | | | — | |
Total distributions | | | (0.89 | ) | | | (0.48 | ) | | | — | |
Net asset value per share, end of period | | $ | 45.29 | | | $ | 43.05 | | | $ | 33.65 | |
| | | | | | | | | | | | | |
Total Return† | | | 7.37 | % | | | 29.37 | % | | | 34.60 | %†† |
| | | | | | | | | | | | | |
Ratios and Supplemental Data | | | | | | | | | | | | |
Net assets, end of period (thousands) | | $ | 6,382 | | | $ | 493 | | | $ | 67 | |
Ratio of net expenses to average net assets | | | 3.37 | %‡ | | | 3.95 | %‡ | | | 5.44 | %* |
Ratio of gross expenses to average net assets | | | 3.32 | %^‡ | | | 3.69 | %^‡ | | | 11.67 | %^* |
Ratio of net investment loss to average net assets | | | (0.70 | )% | | | (2.18 | )% | | | (5.27 | )%* |
Portfolio turnover rate** | | | 4.35 | % | | | 25.31 | % | | | 5.95 | % |
Asset coverage ratio | | | N/A | | | | N/A | | | | 4.29 | |
(1) | The Class commenced operations on October 1, 2020. |
(2) | Per share data calculated using average shares outstanding during the period. |
† | Total return based on per share net asset value reflects the change in net asset value based on the effects of the performance of the Fund during the period and assumes distributions, if any, were reinvested. Total returns shown exclude the effect of applicable sales charges. |
†† | Total return would have been lower had certain expenses not been waived and assumed by the Adviser during the period. |
‡ | Ratio includes the deferred income tax expense related to SPRIM LLC. For the fiscal years ended March 31, 2023 and March 31, 2022, this expense amounted to 0.02% and 1.15% of average net assets, respectively. |
^ | Represents the ratio of expenses to average net assets absent the adviser expense reimbursement and/or recoupment of operating expenses. |
** | Represents lesser of purchases of or distributions received from investments for the period divided by the average of the monthly fair value of investments during the period. Result is not annualized. |
The accompanying notes are an integral part of these consolidated financial statements.
18
StepStone Private Markets
Notes to Consolidated Financial Statements
March 31, 2023
1. Organization
StepStone Private Markets (“Fund”) (formerly known as Conversus StepStone Private Markets) was organized as a Delaware statutory trust under the Delaware Statutory Trust Act on September 6, 2019 and is registered under the Investment Company Act of 1940, as amended, as a non-diversified, closed-end management investment company. The Fund is offered to accredited investors as defined in Rule 501(a) of Regulation D promulgated under the Securities Act of 1933. The Fund commenced operations on October 1, 2020. Effective November 10, 2022, the Fund was renamed StepStone Private Markets.
The Fund offers Class I shares, Class D shares, Class S shares and Class T shares (together, “Shares”) to accredited investors (“Shareholders”) under the Securities Act of 1933, as amended. The Shares are continuously offered with subscriptions accepted on a monthly basis at the then-current-month net asset value (“NAV”) per share, adjusted for sales load, if applicable. The Fund may, from time to time, offer to repurchase Shares pursuant to written tender offers by Shareholders. Repurchases will be made at such times, in such amounts and on such terms as determined by the Fund’s Board of Trustees (“Board”).
The Board provides broad oversight over the Fund’s investment program, management and operations and has the right to delegate management responsibilities. StepStone Group Private Wealth LLC (formerly known as StepStone Conversus LLC) serves as the Fund’s investment adviser (“Adviser”). The Adviser oversees the management of the Fund’s day-to-day activities including structuring, governance, distribution, reporting and oversight. StepStone Group LP (“StepStone”) serves as the Fund’s investment sub-adviser (“Sub-Adviser”) and is responsible for the day-to-day management of the Fund’s assets. StepStone Group Private Wealth LLC is a wholly owned subsidiary of StepStone.
The Fund’s investment objective is to achieve long-term capital appreciation and provide current income by investing in private market assets (“Private Assets”). To achieve its investment objective, the Fund will allocate its assets across private equity, private debt and real assets by making primary and secondary investments in private funds (“Investment Funds”) as well as making direct investments in the equity and/or debt of operating companies, projects or properties (“Co-Investments”).
Master-Feeder Structure
The Fund and StepStone Private Markets Feeder Ltd. (“Feeder Fund”) (formerly known as Conversus StepStone Private Markets Feeder Ltd.) are part of a “master-feeder” structure. The Feeder Fund invests substantially all of its assets in the Fund. At March 31, 2023, the Feeder Fund invests in Class I shares and owned 18.5% of the Fund’s net assets.
2. Summary of Significant Accounting Policies
The accompanying consolidated financial statements have been prepared in conformity with accounting principles generally accepted in the United States of America (“U.S. GAAP”) and are presented in U.S. dollars which is the functional currency of the Fund. The Fund is an investment company and therefore applies the accounting and reporting guidance issued by the U.S. Financial Accounting Standards Board (“FASB”) in Accounting Standards Codification (“ASC”) Topic 946, Financial Services — Investment Companies. The following are significant accounting policies which are consistently followed in the preparation of the consolidated financial statements.
Basis of Consolidation
The consolidated financial statements include the accounts of subsidiaries wholly-owned by the Fund: SPRIM LLC (Series A and Series B) (formerly known as CPRIM LLC (Series A and Series B)), a Delaware limited liability company, as well as SPRIM Cayman LLC (formerly CPRIM Cayman LLC), SPRIM Cayman II LLC (formerly CPRIM Cayman II LLC) and SPRIM Cayman III LLC (formerly CPRIM Cayman III LLC) (together, “SPRIM Cayman”), which are limited liability companies registered in the Cayman Islands. All intercompany accounts and transactions have been eliminated in consolidation.
19
StepStone Private Markets
Notes to Consolidated Financial Statements
March 31, 2023 (continued)
2. Summary of Significant Accounting Policies (continued)
Use of Estimates
The preparation of consolidated financial statements in conformity with U.S. GAAP requires management to make estimates and assumptions that affect the reported amounts of assets and liabilities and disclosures of contingent assets and liabilities at the date of the consolidated financial statements and the reported amounts of income and expenses during the reporting period. Changes in the economic environment, financial markets, and any other factors or parameters used in determining these estimates could cause actual results to differ materially.
Net Asset Value Determination
The NAV of the Fund is determined as of the close of business on the last business day of each calendar month, each date the Shares are offered or repurchased, as of the date of any distribution and at such other times as the Board determines (each, a “Determination Date”). In determining NAV, the Fund’s investments are valued as of the relevant Determination Date. The NAV of the Fund will equal, unless otherwise noted, the value of the total assets of the Fund, less all of its liabilities, including accrued fees and expenses allocated to Shares based on the relative net assets of each class to the total net assets of the Fund, each determined as of the relevant Determination Date.
Valuation of Investments
The Fund’s investments are valued as of each Determination Date at fair value consistent with the principles of ASC Topic 820, Fair Value Measurements. The Board has chosen to designate the Fund’s Adviser to perform fair value determination relating to any or all Fund investments and has adopted valuation policies and procedures (“Valuation Procedures”). The Adviser has appointed a pricing committee (“Pricing Committee”) to manage the valuation process of the Fund. The Pricing Committee is responsible for determining, in good faith, the fair value of all investments held by the Fund and utilizes the resources and personnel of the Adviser, the Sub-Adviser and the Fund’s administrator in carrying out its responsibilities. The Board receives reports from the Adviser on at least a quarterly basis summarizing material fair value matters that occurred during the quarter, including any changes in valuation risks, deviations from established Valuation Procedures and pricing service changes.
Investments held by the Fund in Private Assets include investments in Investment Funds and Co-Investments. These types of investments normally do not have readily available market prices and therefore will be fair valued according to the Valuation Procedures. The Valuation Procedures require evaluation of all relevant factors reasonably available to the Adviser at the time the Fund’s investments are valued. The fair value of the Fund’s investments in Private Assets are estimates.
Ordinarily, the fair value of an Investment Fund is based on the net asset value of the Investment Fund reported by its investment manager. In determining fair value, the Fund also incorporates public benchmark returns that are relevant to the Investment Funds under consideration to adjust fair values for the relevant Determination Date. The public benchmark returns are adjusted for long-term, historical correlations between public and private investment returns and other relevant factors. If the Pricing Committee determines that the most recent net asset value reported by the investment manager of the Investment Fund does not represent fair value or if the investment manager of the Investment Fund does not report a net asset value to the Fund, a fair value determination is made by the Pricing Committee in accordance with the Valuation Procedures. In making that determination, the Pricing Committee will consider whether it is appropriate, in light of all relevant circumstances, to value such Investment Fund at the net asset value last reported by its investment manager, or whether to adjust such net asset value to reflect a premium or discount (adjusted net asset value). The net asset values or adjusted net asset values are net of management fees and performance/incentive fees or allocations (carried interest) payable pursuant to the respective organizational documents of the Investment Funds.
20
StepStone Private Markets
Notes to Consolidated Financial Statements
March 31, 2023 (continued)
2. Summary of Significant Accounting Policies (continued)
In assessing the fair value of the Fund’s Co-Investments in accordance with the Valuation Procedures, the Pricing Committee uses a variety of methods such as earnings and multiple analysis, discounted cash flow analysis and market data from third party pricing services. The Pricing Committee makes assumptions that are based on market conditions existing at the Determination Date. Key inputs and assumptions include, but are not limited to, reported net asset values, capital calls, distributions and revenue and EBITDA multiples. Other techniques, such as option pricing models and estimated discounted value of future cash flows, may be used to determine fair value.
In certain circumstances, the Pricing Committee may determine that cost best approximates the fair value of a particular Private Asset. For investments held by the Fund that are publicly traded and for which market quotations are available, valuations are generally based on the closing sales prices, or an average of the closing bid and ask prices, as of the Determination Date.
The Sub-Adviser and one or more of its affiliates acts as investment adviser to clients other than the Fund. However, the value attributed to a Private Asset held by the Fund and the value attributed to the same Private Asset held by another client of the Sub-Adviser or one of its affiliates might differ as a result of differences in accounting, regulatory, timing and other factors applicable to the Fund when compared to such other client.
Foreign Currency Translation
The books and records of the Fund are maintained in U.S. dollars. The value of investments, assets and liabilities denominated in currencies other than U.S. dollars are translated into U.S. dollars based upon current foreign exchange rates on the Determination Date. Purchases and sales of foreign investments, income and expenses are converted into U.S. dollars based on currency exchange rates prevailing on the date of the relevant transaction. The Fund does not isolate the net realized and unrealized gain or loss resulting from changes in exchange rates from fluctuations in the fair value of investments. Such fluctuations are included within the net realized gain distributions from investments and foreign currency transactions and the net change in unrealized appreciation (depreciation) on investments and foreign currency translation in the Consolidated Statement of Operations. As of March 31, 2023, the Fund held investments in sixteen Investment Funds and five Co-Investments denominated in foreign currencies.
Realized Gain (Loss) on Investments, Interest Income and Dividend Income
Distributions received from Investment Funds and Co-Investments occur at irregular intervals and the exact timing of the distributions cannot be determined. The classification of distributions received, including return of capital, realized gains, dividend income, net of withholding tax, and interest income, is based on information received from the investment manager of the Investment Fund or Co-Investment. Dividend income and interest income are recorded on an accrual basis.
Fund Expenses
The Fund bears all expenses incurred in the course of its operations, including, but not limited to, the following: all fees and expenses of the Private Assets in which the Fund invests (“Acquired Fund Fees”), management fees, fees and expenses associated with a credit facility, legal fees, administrator fees, audit and tax preparation fees, custodial fees, transfer agency fees, registration expenses, expenses of the Board and other administrative expenses. Certain of these operating expenses are subject to an expense limitation agreement which expired on September 30, 2022 (the “Expense Limitation and Reimbursement Agreement” as further discussed in Note 4). Expenses are recorded on an accrual basis and allocated to Shares based upon ownership percentage. Closing costs associated with the purchase of Investment Funds and Co-Investments are included in the cost of the investment.
21
StepStone Private Markets
Notes to Consolidated Financial Statements
March 31, 2023 (continued)
2. Summary of Significant Accounting Policies (continued)
Offering Costs
Offering costs are treated as deferred charges and amortized over the subsequent 12-month period using the straight-line method. During the year ended March 31, 2023, $0.2 million of offering costs were amortized into expense and are included in the Consolidated Statement of Operations. Prior to September 30, 2022, these costs were subject to the Expense Limitation and Reimbursement Agreement. Offering costs consist primarily of legal fees, filing fees and printing costs in connection with the preparation of the registration statement and related filings. The Fund will continue to incur offering costs due to its continuously offered status.
Federal Income Taxes
For U.S. federal income tax purposes, the Fund has elected to be treated, and intends to qualify annually, as a Regulated Investment Company (“RIC”) under Subchapter M of the Internal Revenue Code by distributing substantially all of its taxable net investment income and net realized capital gains to Shareholders each year and by meeting certain diversification and income requirements with respect to investments. If the Fund were to fail to meet the requirements to qualify as a RIC, and if the Fund were ineligible to or otherwise unable to cure such failure, the Fund would be subject to tax on its taxable income at corporate rates, whether or not distributed to Shareholders, and all distributions of earnings and profits would be taxable to Shareholders as ordinary income.
The Fund’s tax year is the 12-month period ending September 30. The Fund files tax returns as prescribed by the tax laws of the jurisdictions in which it operates. In the normal course of business, the Fund is subject to examination by federal, state, local and foreign jurisdictions, where applicable. As of September 30, 2022, the tax years from the year 2021 forward remain subject to examination by the major tax jurisdictions under the statute of limitations (generally, the three prior taxable years).
Distributions are determined in accordance with federal income tax regulations, which may differ from net investment income and net realized capital gains for financial statement purposes (U.S. GAAP). Differences may be permanent or temporary. Permanent differences, including book/tax differences relating to Shareholder distributions, are reclassified among capital accounts in the consolidated financial statements to reflect the applicable tax characterization. Temporary differences arise when certain items of income, expense, gain or loss are recognized in different periods for financial statement and tax purposes; these differences will reverse in the future. The tax basis components of distributable earnings differ from the amounts reflected in the Consolidated Statement of Assets and Liabilities due to temporary book/tax differences. These amounts will be finalized before filing the Fund’s federal tax return.
SPRIM LLC, a wholly-owned subsidiary of the Fund, is a domestic limited liability company that has elected to be treated as a C-corporation for federal and state income tax purposes and is required to account for its estimate of income taxes through the establishment of a deferred tax asset or liability. The Fund recognizes deferred income taxes for temporary differences in the basis of assets and liabilities for financial and income tax purposes. Deferred tax assets are recognized for deductible temporary differences, tax credit carryforwards or net operating loss carryforwards and deferred tax liabilities are recognized for taxable temporary differences. To the extent SPRIM LLC has a deferred tax asset, consideration is given to whether or not a valuation allowance is required.
The SPRIM Cayman subsidiaries, wholly-owned by the Fund, will continue to be treated as separate entities from their sole owner, the Fund, and thus are disregarded for U.S. federal income tax purposes.
Cash and Cash Equivalents and Cash Denominated in Foreign Currency
Cash and cash equivalents and cash denominated in a foreign currency include monies on deposit with U.S. Bank National Association (“U.S. Bank”), the Fund’s custodian, and investments in the First American Government Obligations Fund Class X money market mutual fund. The money market mutual fund invests primarily in government securities and other
22
StepStone Private Markets
Notes to Consolidated Financial Statements
March 31, 2023 (continued)
2. Summary of Significant Accounting Policies (continued)
short-term, highly liquid instruments with low risk of loss, and is recorded at NAV per share which approximates fair value. Deposits, at times, may exceed the insurance limit guaranteed by the Federal Deposit Insurance Corporation. The Fund has not experienced any losses on deposits and does not believe it is exposed to significant credit risk on such deposits. There are no restrictions on cash and cash equivalents and cash denominated in foreign currency held by U.S. Bank on the Fund’s behalf.
Cash Held in Escrow
Cash held in escrow represents restricted monies received in advance of the effective date of a Shareholder’s subscription. The monies are on deposit with UMB Bank, N.A. under the authorization of UMB Fund Services, Inc. (the Fund’s transfer agent, as described in Note 5) and are released from escrow upon the determination of NAV as of the effective date of the subscription. The liability for subscriptions received in advance is included in the Consolidated Statement of Assets and Liabilities.
Deferred Costs Relating to Purchases of Investment Funds
Deferred costs relating to purchases of Investment Funds are amortized monthly over the term of the deferral until the due date of the deferred payment. At the due date, the value of the payment equals the notional amount due to the respective counterparty.
Recently Adopted Regulatory Matters
On October 28, 2020, the Securities and Exchange Commission (the “SEC”) adopted regulations governing the use of derivatives by registered investment companies (“Rule 18f-4”). Rule 18f-4 imposes limits on the amount of derivatives a fund can enter into, eliminates the asset segregation framework currently used by funds to comply with Section 18 of the 1940 Act, treats derivatives as senior securities and requires funds whose use of derivatives is more than a limited specified exposure amount to establish and maintain a comprehensive derivatives risk management program and appoint a derivatives risk manager. The Fund is a limited user of derivatives as specified in the rule. The Fund implemented Rule 18f-4 on August 19, 2022.
In December 2020, the SEC adopted a new rule providing a framework for fund valuation practices (“Rule 2a-5”). Rule 2a-5 establishes requirements for determining fair value in good faith for purposes of the 1940 Act. Rule 2a-5 permits fund boards to designate certain parties to perform fair value determinations, subject to board oversight and certain other conditions. Rule 2a-5 also defines when market quotations are “readily available” for purposes of the 1940 Act and the threshold for determining whether a fund must fair value a security. In connection with Rule 2a-5, the SEC also adopted related recordkeeping requirements and is rescinding previously issued guidance, including with respect to the role of a board in determining fair value and the accounting and auditing of fund investments. The Fund implemented Rule 2a-5 on August 31, 2022. The Board designated the Adviser to perform fair value determinations relating to any or all Fund investments.
3. Fair Value Measurements
In accordance with U.S. GAAP, ASC Topic 820, Fair Value Measurements, the fair value of the Fund’s investments is disclosed in a hierarchy that prioritizes the inputs to valuation techniques used to measure the fair value. A three-tier hierarchy is used to distinguish between (1) inputs that reflect the assumptions market participants would use in pricing an asset or liability developed based on market data obtained from sources independent of the reporting entity (observable inputs) and (2) inputs that reflect the reporting entity’s own assumptions about the assumptions market participants would
23
StepStone Private Markets
Notes to Consolidated Financial Statements
March 31, 2023 (continued)
3. Fair Value Measurements (continued)
use in pricing an asset or liability developed based on the best information available in the circumstances (unobservable inputs) and to establish classification of fair value measurements for disclosure purposes. Various inputs are used in determining the value of the Fund’s investments. The inputs are summarized in the three broad levels:
| | - | Level 1 – Inputs that reflect unadjusted quoted prices in active markets for identical assets and liabilities that the Fund has the ability to access at the measurement date. The types of investments included in Level 1 include marketable securities that are primarily traded on a securities exchange or over the counter and registered money market funds; |
| | - | Level 2 – Inputs other than quoted prices that are observable for the asset or liability, either directly or indirectly, including inputs in markets that are not considered to be active. The types of investments included in Level 2 can include corporate notes, convertible notes, warrants and restricted equity securities; and |
| | - | Level 3 – Inputs that are unobservable. The inputs into determination of fair value require significant management judgement and/or estimation. The types of investments generally included in Level 3 are equity and debt investments that are privately owned. |
An investment’s categorization within the valuation hierarchy described above is based upon the lowest level of input that is significant to the fair value measurement. Investments valued using the practical expedient at NAV or adjusted NAV as reported by the investment managers are excluded from the hierarchy.
The following table summarizes the Fund’s investments classified in the fair value hierarchy as of March 31, 2023:
| | Level 1 | | | Level 2 | | | Level 3 | | | Investments
Valued at NAV
or Adjusted
NAV | | | Total | |
Investment Funds | | $ | — | | | $ | — | | | $ | 4,363,965 | | | $ | 775,921,603 | | | $ | 780,285,568 | |
Co-Investments | | | — | | | | — | | | | 49,028,059 | | | | 105,116,010 | | | | 154,144,069 | |
Cash Equivalents | | | 161,736,387 | | | | — | | | | — | | | | — | | | | 161,736,387 | |
Total Investments | | $ | 161,736,387 | | | $ | — | | | $ | 53,392,024 | | | $ | 881,037,613 | | | $ | 1,096,166,024 | |
The following table shows a reconciliation of the investments for which significant unobservable inputs (Level 3) were used in determining fair value:
| | Investment Funds | | | Co-Investments | | | Total Investments | |
Balance as of March 31, 2022 | | $ | 161,689,638 | | | $ | 52,485,761 | | | $ | 214,175,399 | |
Transfers into Level 3 | | | — | | | | — | | | | — | |
Purchases | | | — | | | | 21,467,215 | | | | 21,467,215 | |
Distributions from investments | | | — | | | | (1,518,879 | ) | | | (1,518,879 | ) |
Net Realized Gain (Loss) | | | — | | | | (268,808 | ) | | | (268,808 | ) |
Net Change in Unrealized Appreciation (Depreciation) | | | (238,624 | ) | | | 2,527,469 | | | | 2,288,845 | |
Transfers out of Level 3 | | | (157,087,049 | ) | | | (25,664,699 | ) | | | (182,751,748 | ) |
Balance as of March 31, 2023 | | $ | 4,363,965 | | | $ | 49,028,059 | | | $ | 53,392,024 | |
Net Change in Unrealized Appreciation (Depreciation) on investments held as
of March 31, 2023 | | | (238,624 | ) | | | 2,527,469 | | | | 2,288,845 | |
24
StepStone Private Markets
Notes to Consolidated Financial Statements
March 31, 2023 (continued)
3. Fair Value Measurements (continued)
Changes in inputs or methodologies used for valuing investments, including timing of reported net asset values of Investment Funds and Co-Investments reported by their investment managers, may result in transfers in or out of levels within the fair value hierarchy. The inputs or methodologies used for valuing investments may not necessarily be an indication of the risk associated with investing in those investments. Transfers between levels of the fair value hierarchy are reported at the beginning of the reporting period in which they occur. All transfers out during the year ended March 31, 2023 were the result of reported net asset values by their investment managers.
The following table summarizes quantitative information related to significant unobservable inputs (Level 3) used in determining fair value for investments held as of March 31, 2023:
Security Type | | Fair Value as
of March 31,
2023 | | Valuation Technique | Unobservable Input | Single Input or
Range of Inputs
(weighted average) | Impact to Valuation from
an Increase in Input (1) |
Investment Funds | | $ | 4,363,965 | | Adjusted net asset value | Reported net asset/fair value adjustments | N/A | N/A |
Co-Investments | | $ | 20,125,016 | | Recent transactions | Recent transaction | N/A | N/A |
Co-Investments | | $ | 19,601,228 | | Market comparable companies | Enterprise value to EBITDA multiple | 8.7x-22.0x (13.5x) | Increase |
Co-Investments | | $ | 6,717,941 | | Market comparable companies | Enterprise value to revenue multiple | 6.1x-21.0x (8.5x) | Increase |
Co-Investments | | $ | 2,583,874 | | Adjusted net asset value | Reported net asset/fair value adjustments | N/A | N/A |
(1) | This column represents the directional change in the fair value of the Level 3 investments that would result from an increase/decrease to the corresponding unobservable input. Significant increases or decreases in these inputs in isolation would result in a significantly lower or higher fair value measurements. |
4. Investment Adviser and Transactions with Affiliates
For its services to the Fund, the Adviser is entitled to a management fee (“Management Fee”), which is paid monthly in arrears, at an annual rate of 1.4%, based on the Fund’s month-end net assets. The Adviser pays the Sub-Adviser 50% of the Management Fee monthly in arrears. For the year ended March 31, 2023, the Adviser earned $11.1 million in Management Fees of which $1.3 million was payable to the Adviser as of March 31, 2023.
The Fund entered into the Expense Limitation and Reimbursement Agreement with the Adviser through September 30, 2022 (“Limitation Period”). The Expense Limitation and Reimbursement Agreement limits the amount of the Fund’s aggregate monthly ordinary operating expenses, excluding certain specified expenses (“Specified Expenses”), borne by the Fund in respect of each class of shares during the Limitation Period to an amount not to exceed 1.0%, on an annualized basis, of the Fund’s month-end net assets (“Expense Cap”).
Specified Expenses that are not covered by the Expense Limitation and Reimbursement Agreement include: (i) the Management Fee; (ii) Acquired Fund Fees; (iii) transactional costs, including legal costs and brokerage commissions associated with the acquisition and disposition of Private Assets and other investments; (iv) interest payments incurred on borrowing by the Fund; (v) fees and expenses incurred in connection with a credit facility; (vi) distribution and shareholder servicing fees; (vii) taxes; and (viii) extraordinary expenses resulting from events and transactions that are distinguished by their unusual nature and by the infrequency of their occurrence.
25
StepStone Private Markets
Notes to Consolidated Financial Statements
March 31, 2023 (continued)
4. Investment Adviser and Transactions with Affiliates (continued)
To the extent the Fund’s aggregate annual ordinary operating expenses, exclusive of the Specified Expenses, exceed the Expense Cap, the Adviser will waive its management fee and/or reimburse the Fund for expenses to the extent necessary to eliminate such excess. The Adviser may also directly pay expenses on behalf of the Fund and waive reimbursement under the Expense Limitation and Reimbursement Agreement. To the extent that the Adviser waives fees or reimburses expenses, it is permitted to recoup any amounts waived and expense amounts previously paid or borne by the Adviser, for a period not to exceed three years from the year in which such fees were waived or expenses were borne by the Adviser, provided that the Fund’s total annual operating expenses are below the Expense Cap that was in place at the time of such fee reductions or expense reimbursements.
For the year ended March 31, 2023, $1.0 million of expenses in excess of the Expense Cap were recouped. As of March 31, 2023, no expenses are subject to recoupment. The Adviser did not pay any expenses on behalf of the Fund during the year ended March 31, 2023.
As of March 31, 2023, the Fund had a due from Feeder Fund balance of $0.3 million for operating expenses paid by the Fund on behalf of the Feeder Fund.
5. Administrator, Custodian and Transfer Agent
SEI Investments Global Funds Services (“SEI”) serves as the Fund’s administrator. In this role, SEI provides administrative and accounting services to the Fund and charges the Fund fees that are based on the Fund’s assets under management, subject to a minimum annual fee. For the year ended March 31, 2023, SEI earned $0.8 million in administration fees of which $0.1 million was payable as of March 31, 2023.
U.S. Bank serves as the Fund’s custodian and charges the Fund fees based on average assets under management and also charges various transaction related fees. For the year ended March 31, 2023, U.S. Bank earned $0.1 million in custody fees of which $0.0 million was payable as of March 31, 2023.
Atlantic Shareholder Services, LLC (“Atlantic”) served as the Fund’s transfer agent through March 11, 2023. Effective March 11, 2023, UMB Fund Services, Inc. (“UMB”) replaced Atlantic as the Fund’s transfer agent. Atlantic and UMB receive and process purchase orders, effect issuance of shares, prepare and transmit payments for distributions, receive and process tender offers and maintain records of account on behalf of the Shareholders. Atlantic and UMB charge the Fund an asset-based fee and various transaction or account level fees. For the year ended March 31, 2023, transfer agent fees were $0.3 million of which $0.1 million was payable as of March 31, 2023.
6. Distribution and Shareholder Servicing Plan
Foreside Financial Services, LLC serves as the Fund’s distributor (the “Distributor”) pursuant to a distribution agreement. The Distributor distributes the Shares of the Fund, in compliance with Rule 12b-1 under the Investment Company Act. The Distributor is authorized to enter into Sub-Distribution Agreements with brokers, dealers and certain RIAs and other financial intermediaries to effect the distribution of Shares of the Fund. The Fund pays a monthly distribution and shareholder services fee out of the net assets of Class S Shares and Class T Shares at the annual rate of 0.85% of the aggregate NAV of Class S Shares and Class T Shares, determined and accrued as of the last day of each calendar month (before any repurchases of Shares). The Fund pays a monthly shareholder services fee out of the net assets of Class D Shares at the annual rate of 0.25% of the aggregate NAV of Class D Shares. Class I Shares are not subject to a distribution and shareholder servicing fee. For the year ended March 31, 2023, distribution and shareholder servicing fees incurred are disclosed on the Consolidated Statement of Operations.
26
StepStone Private Markets
Notes to Consolidated Financial Statements
March 31, 2023 (continued)
7. Revolving Credit Facility
The Fund has a revolving credit agreement, as amended from time to time (“Credit Facility”), with a syndicate of third-party bank lenders, led by Cadence Bank, N.A. The purpose of the Credit Facility is to provide short-term working capital, primarily to bridge the timing of the Fund’s acquisition of Private Assets in advance of the receipt of monthly subscriptions. The Credit Facility had an interest rate of the Daily Simple SOFR rate plus 2.8% per annum, with a minimum rate of 3.3%, and an unused fee of 0.5% per annum. On August 5, 2022, the Credit Facility was amended with an interest rate of the Daily Simple SOFR rate plus 3.0% per annum, with a minimum rate of 3.5%, and an unused fee of 0.6% per annum. The average interest rate on short-term borrowings during the year was 7.5%. In conjunction with the Credit Facility, the Fund paid a closing fee of 0.5% which is being amortized in the Consolidated Statement of Operations over the term of the Credit Facility. For the year ended March 31, 2023, expenses charged to the Fund related to the Credit Facility were $1.9 million. The average daily short-term borrowings outstanding during the year ended March 31, 2023 was $11.2 million. The Fund is required to maintain outstanding borrowings of at least 25% of the aggregate revolving credit commitment for no less than six months during the period from August 5, 2022 through August 4, 2023.
The following table provides a summary of the key characteristics of the Credit Facility as of March 31, 2023:
Current Balance (in millions) | $0.0 |
Aggregate Revolving Credit Commitment Available (in millions) | $150.0 |
Inception Date | November 23, 2021 |
Maturity Date | February 5, 2025 |
Unused Fee(1) | 0.6% per annum |
(1) | The Fund is charged a fee on the unused portion of the Credit Facility. |
8. Commitments and Contingencies
As of March 31, 2023, the Fund has contractual unfunded commitments to provide additional funding of $230.5 million to certain investments. The aforementioned commitments to investments are subject to certain terms and conditions prior to closing of the relevant transactions. There can be no assurance that such transactions will close as expected.
ASC 460-10, Guarantees - Overall, requires entities to provide disclosure and, in certain circumstances, recognition of guarantees and indemnifications. In the normal course of business, the Fund enters into contracts that contain a variety of indemnification arrangements. The Fund’s exposure under these arrangements, if any, cannot be quantified. However, the Fund has not had claims or losses pursuant to these indemnification arrangements and expects the potential for a material loss to be remote.
The Fund may, from time to time, be party to various legal matters arising in the ordinary course of business, including claims and litigation proceedings. Although the ultimate outcome of the foregoing matters, if any, cannot be ascertained at this time, it is the opinion of the Adviser, after consultation with counsel, that the resolution of such matters would not have a material adverse effect on the Fund’s consolidated financial statements.
9. Capital Share Transactions
The Fund offers Class I, Class D, Class S and Class T shares. Of the Fund’s Shares, the minimum initial investment for Class T, Class S and Class D shares from each investor is $50,000 and the minimum initial investment from each investor for Class I shares is $1.0 million. Investors purchasing Class S and Class T shares may be charged a sales load up to a maximum of 3.5%, and investors purchasing Class D shares may be charged a sales load up to a maximum of 1.5%. Investors purchasing Class I shares are not charged a sales load. The Fund accepts initial and additional purchases of shares as of the first business day of each calendar month at the Fund’s then-current NAV per share (determined as of the close of business on the last business day of the immediately preceding month).
27
StepStone Private Markets
Notes to Consolidated Financial Statements
March 31, 2023 (continued)
9. Capital Share Transactions (continued)
The following table summarizes the capital share transactions:
| | | For the Year Ended
March 31, 2023 | | | For the Year Ended
March 31, 2022 | |
| | | Shares | | | Amounts | | | Shares | | | Amounts | |
Class I | | | | | | | | | | | | | | | | |
Proceeds from shares issued | | | 11,179,593 | | | $ | 490,075,040 | | | | 7,882,538 | | | $ | 311,689,417 | |
Reinvestment of distributions | | | 233,474 | | | | 10,189,628 | | | | 44,753 | | | | 1,842,496 | |
Repurchase of shares | | | (629,543 | ) | | | (28,124,884 | ) | | | — | | | | — | |
Net increase | | | 10,783,524 | | | $ | 472,139,784 | | | | 7,927,291 | | | $ | 313,531,913 | |
Class D | | | | | | | | | | | | | | | | |
Proceeds from shares issued | | | 349,850 | | | $ | 15,334,320 | | | | 207,024 | | | $ | 8,030,407 | |
Reinvestment of distributions | | | 5,998 | | | | 261,258 | | | | 1,935 | | | | 79,598 | |
Repurchase of shares | | | (6,775 | ) | | | (293,037 | ) | | | — | | | | — | |
Net increase | | | 349,073 | | | $ | 15,302,541 | | | | 208,959 | | | $ | 8,110,005 | |
Class S | | | | | | | | | | | | | | | | |
Proceeds from shares issued | | | 1,131,084 | | | $ | 49,609,100 | | | | — | | | $ | — | |
Reinvestment of distributions | | | 8,774 | | | | 382,623 | | | | 19 | | | | 777 | |
Repurchase of shares | | | (17,510 | ) | | | (803,871 | ) | | | — | | | | — | |
Net increase | | | 1,122,348 | | | $ | 49,187,852 | | | | 19 | | | $ | 777 | |
Class T | | | | | | | | | | | | | | | | |
Proceeds from shares issued | | | 128,897 | | | $ | 5,594,829 | | | | 9,421 | | | $ | 386,000 | |
Reinvestment of distributions | | | 561 | | | | 24,401 | | | | 31 | | | | 1,260 | |
Repurchase of shares | | | — | | | | — | | | | — | | | | — | |
Net increase | | | 129,458 | | | $ | 5,619,230 | | | | 9,452 | | | $ | 387,260 | |
The Board may, from time to time and in its sole discretion, commence a tender offer to repurchase Shares. The Adviser anticipates recommending to the Board that, under normal circumstances, the Fund conduct quarterly tender offers to repurchase up to 5.0% of the Fund’s outstanding Shares. Any repurchase of Shares which have been held for less than one year by a Shareholder, as measured through the date of redemption, will be subject to an early repurchase fee equal to 2.0% of the NAV of the Shares repurchased by the Fund. The Fund has no obligation to repurchase Shares at any time; any such repurchases will only be made at such times, in such amounts and on such terms as may be determined by the Board of Trustees, in its sole discretion.
10. Investment Transactions
Purchases of Investment Funds and Co-Investments for the year ended March 31, 2023 totaled $480.7 million and $94.0 million, respectively. Total proceeds received from investments that represented return of capital distributions were $14.3 million for the year ended March 31, 2023.
28
StepStone Private Markets
Notes to Consolidated Financial Statements
March 31, 2023 (continued)
11. Tax Information
The Fund has temporary differences primarily due to timing of the amortization of organizational and offering costs and differences between book and tax treatment of partnership and passive foreign investment company investments.
As of September 30, 2022, the Fund had a permanent book to tax difference of $1.1 million resulting from distributions in excess of total tax basis net investment income and net realized capital gains. This permanent book to tax difference has been reclassified to paid-in capital and has no effect on the net assets or net asset value per share of the Fund.
The tax character of Subchapter M distributions for the tax years ended 2022 and 2021 were as follows:
| | Ordinary
Income | | | Long-Term
Capital Gains | |
2022 | | $ | 3,918,329 | | | $ | 4,346,296 | |
2021 | | | — | | | | — | |
For the tax year ended September 30, 2022, the Fund’s tax components of distributable earnings on a tax basis are as follows:
Undistributed ordinary income | | $ | — | |
Net tax appreciation (depreciation) | | | 57,222,089 | |
Other differences | | | (972,491 | ) |
Total distributable earnings | | $ | 56,249,598 | |
As of March 31, 2023, the federal tax cost of investments and unrealized appreciation (depreciation) are as follows:
Gross unrealized appreciation | | $ | 134,890,326 | |
Gross unrealized depreciation | | | (22,729,472 | ) |
Net unrealized appreciation | | $ | 112,160,854 | |
Tax cost of investments | | $ | 984,005,170 | |
SPRIM LLC recorded a deferred provision for income tax expense of $0.2 million for the year ended March 31, 2023. The deferred income tax is computed by applying the federal statutory income tax rate of 21.0% and estimated applicable state tax statutory rate of 2.5% to net investment income and realized and unrealized gains (losses) on investments before taxes. As of March 31, 2023, SPRIM LLC has a deferred tax liability of $3.0 million.
In accounting for income taxes, the Fund follows the guidance in ASC Topic 740, Accounting for Uncertainty in Income Taxes (“ASC 740”). ASC 740 prescribes the minimum recognition threshold a tax position must meet in connection with accounting for uncertainties in income tax positions taken or expected to be taken by an entity before being measured and recognized in the consolidated financial statements. A position that meets this standard is measured at the maximum benefit that will more likely than not be realized upon settlement. Management has concluded there were no uncertain tax positions as of March 31, 2023 for federal income tax purposes or in the Fund’s state and local tax jurisdictions. The Fund will recognize interest and penalties, if any, related to unrecognized tax benefits as tax expense in the Consolidated Statement of Operations. For the year ended March 31, 2023, the Fund did not incur any interest or penalties. The Fund did not have any unrecognized tax benefits as of March 31, 2023.
12. Risk Factors
An investment in the Fund involves material risks, including performance risk, liquidity risk, business and financial risk, risks associated with the use of leverage, valuation risk, tax risk and other risks that should be carefully considered prior to investing and investing should only be considered by persons financially able to maintain their investment and who can afford a loss of a substantial part or all of such investment.
29
StepStone Private Markets
Notes to Consolidated Financial Statements
March 31, 2023 (concluded)
13. Counterparty Insolvency or Failure
There is a risk that any of the Fund’s counterparties could become insolvent or fail. For example, in March 2023, Silicon Valley Bank and Signature Bank were closed by their chartering state regulators and the United States Federal Deposit Insurance Corporation appointed as receiver. If one or more of the Fund’s counterparties were to become insolvent or the subject of liquidation or other insolvency proceedings, there is a risk that the recovery of the Fund’s securities and other assets from such counterparty would be delayed or be of a value less than the value of the securities or assets originally entrusted to such counterparty.
In addition, the Fund may use counterparties located in various jurisdictions around the world. Such local counterparties are subject to various laws and regulations in various jurisdictions that are designed to protect their customers in the event of their insolvency. However, the practical effect of these laws and their application to the Fund’s assets will be subject to substantial limitations and uncertainties. As a result of the large number of entities and jurisdictions involved and the range of possible factual scenarios involving the insolvency of a counterparty, it is very difficult to generalize about the effect of their insolvency on the Fund and their respective assets. Investors should assume that the insolvency of any counterparty would result in a loss to the Fund which could be material.
14. Subsequent Events
Effective April 3, 2023 and May 1, 2023, there were additional subscriptions into the Fund in amounts of $44.1 million and $41.5 million, respectively, including $3.6 million and $4.7 million, respectively, subscribed by the Feeder Fund.
On April 19, 2023, the Fund paid $12.6 million for shares repurchased as of March 31, 2023.
The Fund has evaluated subsequent events through the date the consolidated financial statements were issued and has determined there have not been any additional events that have occurred that would require adjustments or disclosures in the consolidated financial statements or the accompanying notes.
30
StepStone Private Markets
Trustees and Officers
March 31, 2023 (unaudited)
The Fund seeks as Trustees individuals of distinction and experience in business and finance, government service or academia. In determining that a particular Trustee was and continues to be qualified to serve as Trustee, the Board has considered a variety of criteria, none of which, in isolation, was controlling. Based on a review of the experience, qualifications, attributes or skills of each Trustee, including those enumerated in the table below, the Board has determined that each of the Trustees is qualified to serve as a Trustee of the Fund. In addition, the Board believes that, collectively, the Trustees have balanced and diverse experience, qualifications, attributes and skills that allow the Board to operate effectively in governing the Fund and protecting the interests of Shareholders. Information about the Fund’s committees is provided below under “Independent Trustees and the Committees.”
The Trustees of the Fund, their birth years, addresses, positions held, lengths of time served, their principal business occupations during the past five years, the number of portfolios in the “Fund Complex” (defined below) currently overseen by each Independent Trustee and other directorships, if any, held by the Trustees, are shown below. The Fund Complex includes all open-end and closed-end funds (including all of their portfolios) advised by the Advisers and any registered funds that have an adviser that is an affiliate of the Advisers. The Fund’s Statement of Additional Information (“SAI”) includes additional information about the Trustees and Officers. The SAI may be obtained without charge by calling 704-215-4300.
Name Address,
and Birth Year | Position(s)
Held with
Registrant | Term of Office
and Length of
Time Served 1 | Principal Occupation(s)
During Past Five Years | Number of
Portfolios
Overseen in
Fund Complex | Other Trusteeships/
Directorships
Held Outside the
Fund Complex 2 |
INDEPENDENT TRUSTEES |
Harold Mills
c/o StepStone Group Private Wealth LLC
128 S Tryon St.,
Suite 1600
Charlotte, NC 28202
Birth Year: 1970 | Trustee | Indefinite Length — Since Inception | CEO, VMD Ventures (since 2016); CEO, ZeroChaos (2000 – 2017) | 2 | None |
Tracy Schmidt
c/o StepStone Group Private Wealth LLC
128 S Tryon St.,
Suite 1600
Charlotte, NC 28202
Birth Year: 1957 | Trustee | Indefinite Length — Since Inception | Founder, Morning Star Advisory, LLC (consulting and advisory services) (since 2018), Enterprise Chief Financial Officer, Group President of Alternative Investments and Chief Operating Officer, CNL Financial Group (2004 – 2018) | 2 | None |
Ron Sturzenegger
c/o StepStone Group Private Wealth LLC
128 S Tryon St.,
Suite 1600
Charlotte, NC 28202
Birth Year: 1960 | Trustee | Indefinite Length — Since Inception | Enterprise Business & Community Engagement Executive, Bank of America (2014 – 2018) | 2 | Director of KBS Real Estate Investment Trust II, Inc. (since 2019), and KBS Real Estate Investment Trust III, Inc. (since 2019) |
31
StepStone Private Markets
Trustees and Officers
March 31, 2023 (unaudited) (continued)
The Trustee who is affiliated with the Advisers or affiliates of the Advisers (as set forth below) and his age, address, positions held, length of time served, his principal business occupations during the past five years, the number of portfolios in the Fund Complex overseen by the Interested Trustee and the other directorships, if any, held by the Interested Trustee, are shown below.
Name Address,
and Birth Year | Position(s)
Held with
Registrant | Term of Office
and Length of
Time Served 1 | Principal Occupation(s)
During Past Five Years | Number of
Portfolios
Overseen in
Fund Complex | Other Trusteeships/
Directorships
Held Outside the
Fund Complex 2 |
TRUSTEES | | | | | |
Tom Sittema
c/o StepStone Group Private Wealth LLC
128 S Tryon St.,
Suite 1600
Charlotte, NC 28202
Birth Year: 1958 | Chairperson of the Board of Trustees | Indefinite Length — Since Inception | Executive Chairman, StepStone (Since 2020); Managing Director, RiverBridge Capital (Since 2018); CEO, CNL Financial Group (2009-2017) | 2 | Director of CNL Healthcare Properties (2012-2017); Director of CNL Healthcare Properties II (2015-2017); Director of Corporate Capital Trust (2010-2017); Director of Corporate Capital Trust II (2014-2017); Director of CNL Lifestyles Property Trust (2012-2017); Director of CNL Growth Properties, Inc. (2016-2017) |
Bob Long
c/o StepStone Group Private Wealth LLC
128 S Tryon St.,
Suite 1600
Charlotte, NC 28202
Birth Year: 1962 | Trustee | Indefinite Length — Since Inception | CEO, StepStone (Since 2019); Vice Chairman/ President, Star Mountain Capital (2016-2018) | 2 | None |
1 | Each Trustee serves an indefinite term, until his or her successor is elected. |
2 | This includes any directorships at public companies and registered investment companies held by the Trustee over the past five years. |
32
StepStone Private Markets
Trustees and Officers
March 31, 2023 (unaudited) (concluded)
The executive officers of the Fund, their birth years, addresses, positions held, lengths of time served and their principal business occupations during the past five years are shown below.
Name Address,
and Birth Year | Position(s)
Held with
Registrant | Length of
Time Served 1 | Principal Occupation(s) During Past 5 Years |
EXECUTIVE OFFICERS | | |
Bob Long
c/o StepStone Group Private Wealth LLC
128 S Tryon St.,
Suite 1600
Charlotte, NC 28202
Birth Year: 1962 | President and Principal Executive Officer | Indefinite Length — Since Inception | See above |
Kimberly Zeitvogel
c/o StepStone Group Private Wealth LLC
128 S Tryon St.,
Suite 1600
Charlotte, NC 28202
Birth Year: 1971 | Treasurer and Principal Financial Officer | Indefinite Length — Since January 2023 | Managing Director of Finance, StepStone Group Private Wealth LLC (since 2020); Vice President of Finance, Millennium Advisors, LLC (2018-2020) |
Chris Ancona
c/o StepStone Group Private Wealth LLC
128 S Tryon St.,
Suite 1600
Charlotte, NC 28202
Birth Year: 1976 | Chief Compliance Officer | Indefinite Length — Since July 2022 | Deputy CCO, StepStone (Since 2021); CCO and Counsel, Greenspring Associates (2019-2021); CCO, Man Numeric (2017-2019) |
1 | Each Officer serves an indefinite term, until his or her successor is elected. |
33
StepStone Private Markets
Approval of Investment Advisory and Sub-Advisory Agreements
March 31, 2023 (unaudited)
Approval of Investment Advisory and Sub-Advisory Agreements
At an in-person meeting of the Board of Trustees (the “Board”) of StepStone Private Markets (the “Fund”) held on March 1, 2023 (the “Meeting”), the Board, including a majority of the Trustees who are not considered to be “interested persons” of the Fund (the “Independent Trustees”) under the Investment Company Act of 1940, as amended (the “1940 Act”), unanimously voted to approve the continuation of each of the following: (i) an investment advisory agreement by and between StepStone Group Private Wealth LLC (the “Adviser”) and the Fund (the “Advisory Agreement”); and (ii) a separate sub-advisory agreement by and among StepStone Group LP (the “Sub-Adviser” and collectively with the Adviser, the “Advisers”), the Adviser and the Fund (the “Sub-Advisory Agreement” and together with the Advisory Agreement, the “Agreements”).
In connection with their consideration of whether to approve the continuation of the Agreements, the Board received and reviewed information provided by the Advisers relating to the Fund, the Agreements and the Advisers, including comparative fee and expense information and other information regarding the respective nature, extent and quality of services to be provided by each Adviser under the Agreements. The materials provided to the Board generally included, among other items: (i) information on the Fund’s management fees and other expenses, including information comparing the management fees to be paid by the Fund to those of a peer group of funds; (ii) information about each Adviser’s profitability with respect to the Agreements; and (iii) a memorandum prepared by each Adviser in response to a request submitted by legal counsel to the Funds (each, a “Response Memorandum”), including a description of each Adviser’s business, a copy of each Adviser’s Form ADV, and certain other information about each Adviser to be considered in connection with the review by the members of the Board. The Board, including the Fund’s Independent Trustees, also considered other matters such as: (i) the Fund’s investment objective and strategies; (ii) the Fund’s investment performance over relevant time periods; (iii) the Advisers’ investment personnel and operations, including the personnel and other resources devoted to the Fund; (iv) the Advisers’ financial results and financial condition; (v) the resources to be devoted to the Fund’s investment policies and restrictions, policies on personal securities transactions and other compliance policies and procedures; (vi) the Advisers’ policies with respect to allocation of investments and seeking best execution; and (vii) possible conflicts of interest. Throughout the process, the Board had the opportunity to ask questions of and request additional materials from the Advisers.
In determining whether to approve the continuation of the Agreements for the Fund, the members of the Board reviewed and evaluated information and factors they believed to be relevant and appropriate through the exercise of their reasonable business judgment. The Board, including the Independent Trustees, did not identify any single factor as determinative. Individual members of the Board may have evaluated the information presented differently from one another, giving different weights to various factors in considering whether to approve the continuation of the Agreements. Throughout the evaluation process, the Board was assisted by counsel for the Fund. A more detailed summary of the important, but not necessarily all, factors the Board considered with respect to its approval of the continuation of the Agreements is provided below.
Advisory Agreement
Matters considered by the Board, including the Independent Trustees, in connection with its approval of the continuation of the Advisory Agreement included the factors listed below.
The nature, extent and quality of the services to be provided to the Fund under the Advisory Agreement. The Board considered the responsibilities of the Adviser under the Advisory Agreement, and the services provided by the Adviser to the Fund, including, without limitation, the management, oversight, operational, and governance services that the Adviser and its employees provide to the Fund, the Adviser’s coordination of services for the Fund by its service providers, its compliance procedures and practices, and its efforts to promote the Fund. The Board also considered the background and experience of the Adviser’s senior management personnel. The Board noted that certain of the Fund’s officers are employees of the Adviser or its affiliates and serve the Fund without additional compensation from the Fund. The Board further considered
34
StepStone Private Markets
Approval of Investment Advisory and Sub-Advisory Agreements
March 31, 2023 (unaudited) (continued)
information regarding the Adviser’s program designed to ensure compliance with federal securities and other applicable laws and the Adviser’s risk management processes. After reviewing the foregoing information and further information in the Adviser’s Response Memorandum (which included, among other information, descriptions of the Adviser’s business and the Adviser’s Form ADV) and discussing the Adviser’s proposed services to the Fund, the Board concluded that the quality, extent, and nature of the services provided by the Adviser are satisfactory and appropriate for the Fund.
Investment management capabilities and experiences of the Adviser. The Board considered the quality of the services provided and the quality of the Adviser’s resources that are available to the Fund. The Board evaluated the Adviser’s advisory, operational, governance, distribution, legal, compliance, and risk management services, among other services, and information the Board received regarding the experience and professional qualifications of the Adviser’s key personnel and the size and functions of its staff. The Board noted that the Adviser is a wholly owned subsidiary of the Sub-Adviser and leverages the infrastructure of the Sub-Adviser to support its operations, which includes working closely with key personnel of the Sub-Adviser. After consideration of these factors, the Board determined that the Adviser is an appropriate investment adviser for the Fund.
Performance. The Board considered the investment performance of the Fund, which is provided to the Board on a regular basis and other information and materials provided to the Board by the Advisers concerning Fund performance. Based on these considerations, the Board concluded that it had continued confidence in the Adviser’s and the Sub-Adviser’s overall capabilities to manage the Fund.
Cost of the services to be provided and profits realized by the Adviser from the relationship with the Fund. The Board examined and evaluated the fee arrangement between the Adviser and the Fund under the Advisory Agreement, including as compared with the fees and expenses of certain unaffiliated closed-end funds operated as tender funds considered by the Adviser to have similar investment objectives and strategies to the Fund (the “Peer Group”). The Board considered information about the Adviser’s profitability with respect to the Fund, as well as the costs of services provided by the Adviser to the Fund. The Board received and reviewed information relating to the financial condition of the Adviser and its affiliates. The Board also considered potential benefits for the Adviser in managing the Fund, including promotion of the Adviser’s name and enhancement of its reputation in the industry. Upon further consideration and discussion of the foregoing, the Board concluded that the fees paid to the Adviser by the Fund are appropriate and representative of arm’s-length negotiations.
Economies of Scale. The Board considered the size and growth prospects of the Fund and how it relates to the structure of the Fund’s management fee schedule, which does not include breakpoints. After considering all of the information available to it, the Board concluded that it was satisfied with the extent to which economies of scale would be shared for the benefit of the Fund’s shareholders based on currently available information. The Board noted, however, that it would continue to monitor any future growth in the Fund’s assets and the appropriateness of management fee breakpoints or other methods to share benefits from economies of scale as part of its future review of the Advisory Agreement.
Comparison of fees paid to those under other investment advisory contracts. In evaluating the management fees and expenses, the Board considered the Fund’s management fees in absolute terms and as compared with the fees and expenses of the Peer Group. Based upon the comparative fee information provided, the Board noted that the Fund’s management fees were below the Peer Group’s average.
Benefits derived or to be derived by the Adviser from its relationship with the Fund. The Board considered “fall-out” or ancillary benefits that would accrue to the Adviser as a result of its relationship with the Fund (other than the advisory fee), including non-quantifiable reputational benefits. The Board noted in this regard that the Adviser continues to evaluate and pursue opportunities to provide advisory services to additional funds or other vehicles with overlapping investment strategies, and that the track record of the Fund may enhance the Adviser’s ability to market its services and win such mandates.
35
StepStone Private Markets
Approval of Investment Advisory and Sub-Advisory Agreements
March 31, 2023 (unaudited) (continued)
Sub-Advisory Agreement
Matters considered by the Board, including the Independent Trustees, in connection with its approval of the continuation of the Sub-Advisory Agreement included the factors listed below.
The nature, extent, and quality of the services to be provided to the Fund under the Sub-Advisory Agreement. The Board considered the responsibilities the Sub-Adviser under the Sub-Advisory Agreement and the services provided by the Sub-Adviser including, without limitation, the investment advisory services and the Sub-Adviser’s compliance procedures and practices. The Board also considered the background, and experience of the Sub-Adviser’s senior management personnel and the qualifications, background, and responsibilities of the portfolio managers primarily responsible for the day-to-day portfolio management services for the Fund. After reviewing the foregoing information and further information in the materials, including the Sub-Adviser’s Response Memorandum (which included, among other information, descriptions of the Sub-Adviser’s business and the Sub-Adviser’s Form ADV), the Board concluded that the quality, extent, and nature of the services provided by the Sub-Adviser are satisfactory and appropriate for the Fund.
The investment management capabilities and experience of the Sub-Adviser. The Board evaluated the investment management experience of the Sub-Adviser, noting that the Sub-Adviser currently manages accounts that use an investment strategy similar to that proposed for the Fund (although none of the accounts are registered investment companies). The Board also considered that the Fund will benefit from the scale and resources of the Sub-Adviser and its affiliates. It was noted that the Sub-Adviser was a global private markets specialist overseeing (together with its related advisers) approximately $602 billion of private capital allocations, including approximately $134 billion of assets under management as of September 30, 2022. The Board discussed with the Sub-Adviser the investment objective and strategies of the Fund and the Sub-Adviser’s plans for implementing the Fund’s strategies. After considering these factors, the Board determined that the Sub-Adviser is an appropriate Sub-Adviser to the Fund.
Performance. The Board considered the investment performance of the Fund, which is provided to the Board on a regular basis and other information and materials provided to the Board by the Advisers concerning Fund performance. Based on these considerations, the Board concluded that it had continued confidence in the Adviser’s and the Sub-Adviser’s overall capabilities to manage the Fund.
The costs of the services to be provided and profits realized by the Sub-Adviser from its relationship with the Fund. The Board reviewed the fees paid under the Sub-Advisory Agreement, which the Board noted are paid by the Adviser not the Fund. The Board considered information about the Sub-Adviser’s profitability with respect to the Fund, as well as the costs of services provided by the Sub-Adviser to the Fund. The Board received and reviewed information relating to the financial condition of the Sub-Adviser and its affiliates. Upon further consideration and discussion of the foregoing, the Board concluded that the fees paid to the Sub-Adviser by the Adviser under the Sub-Advisory Agreement are appropriate and representative of arm’s-length negotiations.
Economies of Scale. The Board considered the size and growth prospects of the Fund and how it relates to the structure of the Fund’s management fee schedule. After considering all of the information available to it, the Board concluded that it was satisfied with the extent to which economies of scale would be shared for the benefit of the Fund’s shareholders based on currently available information, noting that the Adviser is responsible for the payment of sub-advisory fees to the Sub-Adviser.
Other benefits to be derived by the Sub-Adviser from its relationship with the Fund. The Board considered “fall-out” or ancillary benefits that would accrue to the Sub-Adviser as a result of its relationship with the Fund (other than the sub-advisory fee), including non-quantifiable reputational benefits. The Board noted in this regard that the Sub-Adviser continues to evaluate and pursue opportunities to provide advisory services to additional funds or other vehicles with overlapping investment strategies, and that the track record of the Fund may enhance the Sub-Adviser’s ability to market its services and win such mandates.
***
36
StepStone Private Markets
Approval of Investment Advisory and Sub-Advisory Agreements
March 31, 2023 (unaudited) (concluded)
At the conclusion of these discussions, the Board agreed that it had been furnished with sufficient information to make an informed business decision on the approval of the continuation of the Agreements. In reaching this conclusion, the Board did not assign relative weights to the factors discussed above or deem any one or group of them to be controlling in and of themselves. Based on the discussions and considerations at the Meeting, the Board, including the Independent Trustees, voted to approve the continuation of the Agreements.
37
CON-AR-001-0300
(b) Not applicable.
Item 2. Code of Ethics.
(a) The registrant (or the “Fund”), as of the end of the period covered by this report, has adopted a code of ethics that applies to the registrant’s principal executive officer, principal financial officer or persons performing similar functions, regardless of whether these individuals are employed by the registrant or a third party. A copy of the code of ethics is filed herewith.
(c) There have been no amendments, during the period covered by this report, to a provision of the code of ethics that applies to the registrant’s principal executive officer, principal financial officer or persons performing similar functions, regardless of whether these individuals are employed by the registrant or a third party, and that relates to any element of the code of ethics description.
(d) The registrant has not granted any waivers, during the period covered by this report, including an implicit waiver, from a provision of the code of ethics that applies to the registrant’s principal executive officer, principal financial officer or persons performing similar functions, regardless of whether these individuals are employed by the registrant or a third party, that relates to one or more of the items set forth in paragraph (b) of this item’s instructions.
(e) Not applicable.
(f) The registrant’s Code of Ethics is attached as Exhibit (a)(1) to this Form N-CSR.
Item 3. Audit Committee Financial Expert.
(a)(1) The registrant’s board of trustees has determined that the registrant has at least one audit committee financial expert serving on the audit committee.
(a)(2) The audit committee financial expert is Mr. Tracy Schmidt who is independent as defined in Form N-CSR Item 3 (a)(2).
Item 4. Principal Accountant Fees and Services.
Audit Fees
(a) The aggregate fees billed for the year ended March 31, 2023 and period ended March 31, 2022 for professional services rendered by the principal accountant for the audit of the registrant’s annual financial statements or services that are normally provided by the accountant in connection with statutory and regulatory filings or engagements for each year or period are $0.24 million and $0.20 million, respectively.
Audit-Related Fees
(b) The aggregate fees billed for the year ended March 31, 2023 and period ended March 31, 2022 for assurance and related services by the principal accountant that are reasonably related to the performance of the audit of the registrant’s financial statements and are not reported under paragraph (a) of this Item are $0.03 million and $0, respectively. Audited-related fees principally includes fees associated with reviewing and providing comments on semi-annual reports and issuing consents.
Tax Fees
(c) The aggregate fees billed for the year ended March 31, 2023 and period ended March 31, 2022 for professional services rendered by the principal accountant for tax compliance, tax advice and tax planning are $0.14 million and $0.08 million, respectively.
All Other Fees
(d) The aggregate fees billed for the year ended March 31, 2023 and period ended March 31, 2022 for products and services provided by the principal accountant other than the services reported in paragraphs (a) through (c) of this Item are $0 and $0, respectively.
(e)(1) During its regularly scheduled periodic meetings, the registrant’s audit committee will pre-approve all audit, audit-related, tax and other services to be provided by the principal accountants of the registrant.
The audit committee may, from time to time, delegate to one or more of its members who are “independent trustees” (as defined in Section 2(a)(19) of the Investment Company Act of 1940 (the “1940 Act”)) pre-approval authority for any subsequent new engagements that arise between regularly scheduled meeting dates provided that any fees that are pre-approved are presented to the audit committee at its next regularly scheduled meeting.
Under applicable laws, pre-approval of non-audit services may be waived provided that: (i) the aggregate amount of all such services provided constitutes no more than five percent of the total amount of fees paid by the registrant to its principal accountant during the fiscal year in which services are provided; (ii) such services were not recognized by the registrant at the time of engagement as non-audit services; and (iii) such services are promptly brought to the attention of the audit committee of the registrant, approved prior to the completion of the audit, and approved based upon a determination that the service is eligible for waiver.
(e)(2) The percentage of services described in each of paragraphs (b) through (d) of this Item that were approved by the audit committee pursuant to paragraph (c)(7)(i)(C) of Rule 2-01 of Regulation S-X are as follows:
(b) Not applicable.
(c) 0%
(d) Not applicable.
(f) Not applicable.
(g) The aggregate non-audit fees billed by the registrant’s accountant for services rendered to the registrant, and rendered to the registrant’s investment adviser (not including any sub-adviser whose role is primarily portfolio management and is subcontracted with or overseen by another investment adviser), and any entity controlling, controlled by, or under common control with the adviser that provides ongoing services to the registrant for the year ended March 31, 2023 and period ended March 31, 2022 were $1.71 million and $2.71 million, respectively.
(h) The registrant’s audit committee has considered whether the provision of non-audit services that were rendered to either the registrant’s investment adviser (not including any sub-adviser whose role is primarily portfolio management and is subcontracted with or overseen by another investment adviser) or any entity controlling, controlled by, or under common control with the registrant’s investment adviser that provides ongoing services to the registrant that were not pre-approved pursuant to paragraph (c)(7)(ii) of Rule 2-01 of Regulation S-X is compatible with maintaining the principal accountant’s independence. No such services were rendered.
(i) Not applicable.
(j) Not applicable.
Item 5. Audit Committee of Listed Registrants.
Not applicable.
Item 6. Investments.
(a) The Schedule of Investments in unaffiliated issuers as of the close of the reporting period is included as part of the Report to Stockholders filed under Item 1 of this form.
(b) Not applicable.
Item 7. Disclosure of Proxy Voting Policies and Procedures for Closed-End Management Investment Companies.
The Fund’s investment adviser, StepStone Group Private Wealth LLC (the “Adviser”), has delegated proxy voting responsibility to StepStone Group LP (the “Sub-Adviser”). The Sub-Adviser’s exercise of this delegated proxy voting authority on behalf of the Fund is subject to the oversight of the Adviser.
The policies and procedures used by the Sub-Adviser to determine how to vote proxies relating to portfolio securities is set forth below:
PROXY VOTING POLICY
Pursuant to Rule 206(4)-6 and Rule 204-2 under the Investment Advisers Act of 1940 (the “Advisers Act”), it is a fraudulent, deceptive, or manipulative act, practice or course of business, within the meaning of Section 206(4) of the Advisers Act, for an investment adviser to exercise voting authority with respect to client securities, unless (A) the adviser has adopted and implemented written policies and procedures that are reasonably designed to ensure that the adviser votes proxies in the best interests of its clients, (B) the adviser describes its proxy voting procedures to its clients and provides copies on request, and (C) the adviser discloses to clients how they may obtain information on how the adviser voted their proxies.
Voting Proxies
The Sub-Adviser is responsible for voting proxies on behalf of the Fund. The Sub-Adviser must vote proxies in a way that is consistent with the Sub-Adviser’s fiduciary duty to the Fund, and any investment policy of the Fund and maintain records of proxies voted, together with a brief explanation why votes were cast in a particular way.
The Sub-Adviser, as a matter of policy and as a fiduciary to the Fund, has responsibility for voting proxies for portfolio securities consistent with the best economic interest of the Fund. The Sub-Adviser’s policy and practice includes the responsibility to monitor corporate actions, receive and vote client proxies and disclose any potential conflicts of interest as well as make information available to clients about the voting of proxies for their portfolio securities and maintaining relevant and required records.
The Sub-Adviser has adopted the following procedures to implement the Sub-Adviser’s firm policy in regard to the Fund.
Voting Procedures
All investment professionals will forward any proxy materials received on behalf of the Fund to the Sub-Adviser’s Chief Compliance Officer, as applicable.
The Sub-Adviser’s Chief Compliance Officer, as applicable, will verify the Fund holds the security to which the proxy relates.
Absent material conflicts, the investment professionals responsible for the investment to which the proxy materials relate, in consultation with Sub-Adviser’s Chief Compliance Officer will determine how the Sub-Adviser should vote the proxy in accordance with applicable voting guidelines, complete the proxy, and vote the proxy in a timely and appropriate manner.
Voting Guidelines
The Sub-Adviser will vote proxies in the best interests of the Fund. The Sub-Adviser’s policy is to vote all proxies from a specific issuer the same way for each client absent qualifying restrictions from a client or as documented in the file by Sub-Adviser’s Chief Compliance Officer, as applicable. Clients of the Sub-Adviser, outside of the Fund, are permitted to place reasonable restrictions on the Sub-Adviser’s voting authority in the same manner that they may place such restrictions on the actual selection of account securities.
The Sub-Adviser will generally vote in favor of routine corporate housekeeping proposals such as to change capitalization (e.g., increase the authorized number of common or preferred shares of stock (to the extent there are not disproportionate voting rights per preferred share)), the election of directors, setting the time and place of the annual meeting, change of fiscal year, change of name, and selection of auditors absent conflicts of interest raised by an auditor’s non-audit services.
In the case of non-routine matters, voting decisions will generally be made in support of management, unless it is believed that such recommendation is not in the best interests of the Fund. On a case by case basis, the Sub-Adviser will decide non-routine matters, taking into account the opinion of management and the effect on management, and the effect on shareholder value and the issuer’s business practices. These matters include, but are not limited to, change of domicile, change in preemptive rights or cumulative voting rights, compensation plans, investment restrictions for social policy goals, precatory proposals, classification of the board of directors, poison pill proposals or amendments, recapitalizations, and super-majority voting.
The Sub-Adviser will abstain from voting if it is determined to be in the best interests of the Fund. In making such a determination, various factors will be considered, including, but not limited to, the costs associated with exercising the proxy (e.g., travel or translation costs) and any legal restrictions on trading resulting from the exercise of the proxy. In consultation with the Sub-Adviser’s Chief Compliance Officer, as applicable, the Sub-Adviser may also consider any special regulatory implications applicable to the client or the Sub-Adviser resulting from the exercise of the proxy.
Conflicts of Interest
The Sub-Adviser will identify any conflicts that exist between the interests of the Sub-Adviser and the client by reviewing the relationship of the Sub-Adviser with the issuer of each security to determine if the Sub-Adviser or any of its employees has any financial, business or personal relationship with the issuer.
If a material conflict of interest exists, the Sub-Adviser’s Chief Compliance Officer, as applicable, will determine whether it is appropriate to disclose the conflict to the affected clients, to give the clients an opportunity to vote the proxies themselves, or to address the voting issue through other objective means such as voting in a manner consistent with a predetermined voting policy or receiving an independent third party voting recommendation.
The Sub-Adviser will maintain a record of the resolution of any conflict of interest.
Recordkeeping
The Sub-Adviser’s Chief Compliance Officer, as applicable, shall retain the following proxy records in accordance with the U.S. Securities and Exchange Commission’s (“SEC”) five-year retention requirement.
| · | These policies and procedures and any amendments. |
| · | Each proxy statement that the Sub-Adviser receives. |
| · | A record of each vote that the Sub-Adviser casts. |
| · | Any document the Sub-Adviser created that was material to making a decision how to vote proxies, or that memorializes that decision including periodic reports to the Sub-Adviser’s Chief Compliance Officer or proxy committee, if applicable. |
| · | A copy of each written request from the Board for information on how the Sub-Adviser voted the Fund’s proxies, and a copy of any written response. |
Private Markets Investments
Investments in private markets are often subject to contractual agreements among the investors in the fund or company. If the Sub-Adviser has the authority to vote with respect to the interests, it will exercise its rights in accord with its contractual obligations and, if its vote is not constrained by contract, the Sub-Adviser will determine how to vote based on the principles described above. Records relating to the vote will be kept for the five-year retention period.
The registrant will file a Form N-PX, with the Fund’s complete proxy voting record for the 12 months ended June 30, no later than August 31st of each year.
Item 8. Portfolio Managers of Closed-End Management Investment Companies.
(a)(1) Fund Management
The following provides biographical information about the individuals who are primarily responsible for the day-to-day management of the registrant’s portfolio (“Portfolio Managers”) as of the date of this filing:
Thomas Keck
Thomas Keck leads the Sub-Adviser’s global research activities and the development of SPITM, the Sub-Adviser’s proprietary research database. He is also involved in the Firm’s environmental, social and governance (ESG) and risk management initiatives.
Prior to co-founding the Sub-Adviser, Mr. Keck was a managing director at Pacific Corporate Group, a private equity investment firm that oversaw over $15 billion of private equity commitments for institutional investors. Before that he was a principal with Blue Capital, a middle market buyout firm.
Mr. Keck graduated cum laude with a BA from the George Washington University and received his MBA with high honors from the University of Chicago Booth School of Business. He served in the US Navy as a Naval Flight Officer, receiving numerous decorations flying EA-6Bs off the USS Nimitz (CVN-68).
Michael Elio
Michael Elio is a member of the Sub-Adviser’s private equity team, focusing on middle-market buyouts and secondary funds. He is also involved in advisory and portfolio management activities.
Prior to joining the Sub-Adviser in 2014, Mr. Elio was a managing director at ILPA, where he led programs around research, standards and industry strategic priorities. Before that he was a partner and managing director at LP Capital Advisors where he led the firm’s Boston office and served as the lead consultant to North American and European institutional investors. Mr. Elio was the primary consultant for many of the firm’s largest clients including public and private pension plans committing more than $5 billion annually.
(a)(2) Other Accounts Managed by Fund Management and Potential Conflicts of Interest
In addition to the Fund, Thomas Keck and Michael Elio are responsible for the day-to-day advisement of certain other accounts, as listed below (“Other Accounts”). The information below is provided as of March 31, 2023.
Name | | | | | Registered Investment Companies | | | | | | | | | Other Pooled Investment Vehicles | | | | | | | | | Other Accounts | |
| | | Number of Accounts | | | Total Assets ($ billions) | | | Number of Accounts Subject to Performance Fee | | | Assets Subject to Performance Fee ($ billions) | | | Number of Accounts | | | Total Assets ($ billions) | | | Number of Accounts Subject to Performance Fee | | | Assets Subject to Performance Fee ($ billions) | | | Number of Accounts | | | Total Assets ($ billions) | | | Number of Accounts Subject to Performance Fee | | | Assets Subject to Performance Fee ($ billions) | |
| Thomas Keck | | | 0 | | | $ | 0 | | | | 0 | | | $ | 0 | | | | 17 | | | $ | 52.3 | | | | 17 | | | $ | 52.3 | | | | 0 | | | $ | 0 | | | | 0 | | | $ | 0 | |
| Michael Elio | | | 0 | | | $ | 0 | | | | 0 | | | $ | 0 | | | | 8 | | | $ | 1.9 | | | | 8 | | | $ | 1.9 | | | | 14 | | | $ | 39.4 | | | | 0 | | | $ | 0 | |
Conflicts of Interests. A potential conflict of interest may arise as a result of a Portfolio Manager’s provision of advisory services to Other Accounts. Other Accounts may pay higher management fees and/or performance fees than the Fund, and this could create an incentive for a Portfolio Manager to favor such funds in the allocation of investment opportunities.
The Sub-Adviser has implemented procedures that are designed to ensure that investment opportunities are allocated in a manner that: (i) treats all of its clients fairly and equitably; (ii) prevents conflicts regarding allocation of investment opportunities among its clients; and (iii) complies with applicable regulatory requirements. For example, the Sub-Adviser uses an allocation methodology designed to allocate all investments ratably based on a defined allocation procedure. Notwithstanding the foregoing, an aggregated investment may be allocated on a different basis under certain circumstances depending on factors which include, but are not limited to, available cash, liquidity requirements, risk parameters and legal and/or regulatory requirements.
The Sub-Adviser and its investment personnel, including a Portfolio Manager, may hold investments in Other Accounts. This may create an incentive for the Sub-Adviser and its investment personnel to take investment actions based on those investment interests which might diverge, in some cases, from the interests of other clients or favor or disfavor certain funds over other funds. Any potential conflict that arises from these circumstances is mitigated by several factors, including: (i) the fact that the Sub-Adviser’s investment process is designed to achieve long-term capital appreciation as opposed to short-term profits and (ii) the fact that the allocation process is controlled by finance and compliance personnel for the Sub-Adviser.
(a)(3) Compensation Structure of Fund Management Team
The Sub-Adviser’s philosophy on compensation is to provide senior professionals incentives that are tied to both short-term and long-term performance of the firm. All investment professionals are salaried. Further, all investment professionals are eligible for a short-term incentive bonus each year that is discretionary and based upon the professional’s performance, as well as the performance of the business.
Compensation for the Portfolio Managers includes, a salary, a discretionary bonus and certain retirement benefits from the Sub-Adviser. Additionally, each of the Portfolio Managers have equity interests in the Sub-Adviser and indirectly benefit from the success of the Fund based on their ownership interest.
(a)(4) Disclosure of Securities Ownership
The Fund is required to show the dollar amount range of each of Mr. Keck’s and Mr. Elio’s “beneficial ownership” of shares of the Fund as of the end of the most recently completed fiscal year. Dollar amount ranges to be disclosed are established by the SEC. “Beneficial ownership” is determined in accordance with Rule 16a-1(a)(2) under the Securities Exchange Act of 1934, as amended (the “Exchange Act”). As of March 31, 2023, Mr. Keck and Mr. Elio did not beneficially own shares of the Fund.
(b) Not applicable.
Item 9. Purchases of Equity Securities by Closed-End Management Investment Company and Affiliated Purchasers.
No purchases were made during the reporting period by or on behalf of the Fund or any “affiliated purchaser,” as defined in Rule 10b-18(a)(3) under the Exchange Act (17 CFR 240.10b-18(a)(3)), of shares or other units of any class of the Fund’s equity securities that is registered by the registrant pursuant to Section 12 of the Exchange Act (15 U.S.C. 781).
Item 10. Submission of Matters to a Vote of Security Holders.
There have been no material changes to the procedures by which shareholders may recommend nominees to the registrant’s board of trustees during the period covered by this report.
Item 11. Controls and Procedures.
(a) The registrant’s principal executive and principal financial officers, or persons performing similar functions, have concluded that the registrant’s disclosure controls and procedures, as defined in Rule 30a-3(c) under the 1940 Act (17 CFR 270.30a-3(c)) as of a date within 90 days of the filing date of the report, are effective based on the evaluation of these controls and procedures required by Rule 30a-3(b) under the 1940 Act (17 CFR 270.30a-3(b)) and Rules 13a-15(b) or 15d-15(b) under the Exchange Act (17 CFR 270.30a-15(b) or 240.15d-15(b)).
��
(b) There were no changes in the registrant’s internal control over financial reporting (as defined in Rule 30a-3(d) under the 1940 Act (17CFR 270.3a-3(d)) that occurred during the period covered by this report that has materially affected, or were reasonably likely to materially affect, the registrant’s internal control over financial reporting.
Items 12. Disclosure of Securities Lending Activities for Closed-End Management Investment Companies.
Item 13. Exhibits.
(a)(1) Code of Ethics attached hereto.
(a)(2) A separate certification for the principal executive officer and the principal financial officer of the registrant as required by Rule 30a-2(a) under the 1940 Act (17 CFR 270.30a-2(a)), is filed herewith.
(a)(3) Not applicable.
(a)(4) Not applicable.
(b) Officer certifications as required by Rule 30a-2(b) under the 1940 Act (17 CFR 270.30a-2(b)) also accompany this filing as an exhibit.
SIGNATURES
Pursuant to the requirements of the Securities Exchange Act of 1934 and the Investment Company Act of 1940, the registrant has duly caused this report to be signed on its behalf by the undersigned, thereunto duly authorized.
| (Registrant) | StepStone Private Markets |
| By (Signature and Title)* | /s/ Robert W. Long Robert W. Long President and Principal Executive Officer |
| Date: June 8, 2023 | |
Pursuant to the requirements of the Securities Exchange Act of 1934 and the Investment Company Act of 1940, this report has been signed below by the following persons on behalf of the registrant and in the capacities and on the dates indicated.
| By (Signature and Title)* | /s/ Robert W. Long Robert W. Long President and Principal Executive Officer |
| Date: June 8, 2023 | |
| By (Signature and Title)* | /s/ Kimberly S. Zeitvogel Kimberly S. Zeitvogel Treasurer and Principal Financial Officer |
| Date: June 8, 2023 | |
* Print the name and title of each signing officer under his or her signature.