Exhibit 99.2

Third Quarter 2022 Earnings Call Tim Myers – Chief Executive Officer Erick Asmussen – Chief Financial Officer November 1, 2022

Important Information 2 Forward-Looking Statements This presentation contains statements that relate to future events and expectations and, as such, constitute forward-looking statements within the meaning of the Private Securities Litigation Reform Act of 1995. Forward-looking statements include those containing such words as "anticipates," "believes," "could," "estimates," "expects," "forecasts," "goal," "guidance," "intends," "may," "outlook," "plans," "projects," "seeks," "sees," "should," "targets," "will," "would," or other words of similar meaning. All statements that reflect Arconic’s expectations, assumptions, projections, beliefs or opinions about the future, other than statements of historical fact, are forward-looking statements, including, without limitation, statements, relating to the condition of, or trends or developments in, the ground transportation, aerospace, building and construction, industrial, packaging and other end markets; Arconic’s future financial results, operating performance, working capital, cash flows, liquidity and financial position; cost savings and restructuring programs; Arconic's strategies, outlook, business and financial prospects; share repurchases; costs associated with pension and other postretirement benefit plans; projected sources of cash flow; and potential legal liability. These statements reflect beliefs and assumptions that are based on Arconic’s perception of historical trends, current conditions and expected future developments, as well as other factors Arconic believes are appropriate in the circumstances. Forward-looking statements are not guarantees of future performance, and actual results may differ materially from those indicated by these forward-looking statements due to a variety of risks, uncertainties and changes in circumstances, many of which are beyond Arconic’s control. Such risks and uncertainties include, but are not limited to: (a) continuing uncertainty regarding the duration and impact of the COVID-19 pandemic on our business and the businesses of our customers and suppliers including labor shortages and increased quarantine rates; (b) deterioration in global economic and financial market conditions generally; (c) unfavorable changes in the end markets we serve; (d) the inability to achieve the level of revenue growth, cash generation, cost savings, benefits of our management of legacy liabilities, improvement in profitability and margins, fiscal discipline, or strengthening of competitiveness and operations anticipated or targeted; (e) adverse changes in discount rates or investment returns on pension assets; (f) competition from new product offerings, disruptive technologies, industry consolidation or other developments; (g) the loss of significant customers or adverse changes in customers’ business or financial condition; (h) manufacturing difficulties or other issues that impact product performance, quality or safety; (i) the impact of pricing volatility in raw materials and inflationary pressures on our costs of production, including energy; (j) a significant downturn in the business or financial condition of a key supplier or other supply chain disruptions; (k) challenges to or infringements on our intellectual property rights; (l) the inability to successfully implement our re-entry into the U.S. packaging market or to realize the expected benefits of other strategic initiatives or projects; (m) the inability to identify or successfully respond to changing trends in our end markets; (n) the impact of potential cyber attacks and information technology or data security breaches; (o) geopolitical, economic, and regulatory risks relating to our global operations, including compliance with U.S. and foreign trade and tax laws, potential expropriation of properties located outside the U.S., sanctions, tariffs, embargoes and other regulations; (p) the outcome of contingencies, including legal proceedings, government or regulatory investigations, and environmental remediation and compliance matters; (q) restrictions imposed by authorities on our Russian operations; (r) our ability to complete the announced divestiture of our Russian operations and the impact of such divestiture on our business and operations; (s) reactions to or consequences of our announcement regarding the sale of our Russian operations, including the potential for our Russian operations to be nationalized or otherwise expropriated by the Russian government; (t) the impact of the ongoing conflict between Russia and Ukraine on economic conditions in general and on our business and operations, including sanctions, tariffs, and increased energy prices; and (u) the other risk factors summarized in Arconic’s Form 10-K for the year ended December 31, 2021 and other reports filed with the U.S. Securities and Exchange Commission. The above list of factors is not exhaustive or necessarily in order of importance. Market projections are subject to the risks discussed above and in this presentation, and other risks in the market. The statements in this presentation are made as of the date of this presentation, even if subsequently made available by Arconic on its website or otherwise. Arconic disclaims any intention or obligation to update publicly any forward-looking statements, whether in response to new information, future events, or otherwise, except as required by applicable law.

Important Information (cont’d) 3 Non-GAAP Financial Measures Some of the information included in this presentation is derived from Arconic’s consolidated financial information but is not presented in Arconic’s financial statements prepared in accordance with accounting principles generally accepted in the United States of America (GAAP). Certain of these financial measures are considered “non-GAAP financial measures” under SEC rules. These non-GAAP financial measures supplement our GAAP disclosures and should not be considered an alternative to any measure of performance or financial condition as determined in accordance with GAAP, and investors should consider Arconic’s performance and financial condition as reported under GAAP and all other relevant information when assessing the performance or financial condition of Arconic. Non-GAAP financial measures have limitations as analytical tools, and investors should not consider them in isolation or as a substitute for analysis of the results or financial condition as reported under GAAP. Non-GAAP financial measures presented by Arconic may not be comparable to non-GAAP financial measures presented by other companies. Reconciliations to the most directly comparable GAAP financial measures and management’s rationale for the use of the non-GAAP financial measures can be found in the appendix to this presentation. Arconic has not provided reconciliations of any forward-looking non-GAAP financial measures, such as adjusted EBITDA, free cash flow, and adjusted free cash flow, to the most directly comparable GAAP financial measures because such reconciliations are not available without unreasonable efforts due to the variability and complexity with respect to the charges and other components excluded from the non-GAAP measures, such as the effects of metal price lag, foreign currency movements, gains or losses on sales of assets, taxes, and any future restructuring or impairment charges. These reconciling items are in addition to the inherent variability already included in the GAAP measures, which includes, but is not limited to, price/mix and volume. Arconic believes such reconciliations would imply a degree of precision that would be confusing or misleading to investors.

3Q 2022 Results Impacted by Temporary Operational Challenges Key Financial Data Sales of $2.3 billion, up 21% year over year (up 13% organically), down 11% from prior quarter Net loss of $65 million, or $0.64 per share, compared with net income of $16 million, or $0.15 per share, in 3Q 2021. Third quarter 2022 includes an after-tax, non-cash asset impairment charge of $70 million related to the Extrusions segment business review Adjusted EBITDA of $143 million, down 16% year over year Cash provided from operations of $91 million Planned Repairs Completed By the end of 3Q 2022, all planned major repairs at Tennessee and Davenport were completed Demand across North American end markets remains strong European energy crisis impacting demand and profitability Share Repurchases and Strategy Execution Completed existing $300 million share repurchase program Expanded Board with addition of director with substantial ESG expertise Phase 2 Davenport casting pit complete and Lancaster hot mill stand project underway and expected to begin ramp up in 1H 2023. Phase 3 and 4 capital project planning continues with refocused priorities 4 See appendix for non-GAAP financial measure reconciliations.

Operational Challenges and European Energy Price Impact on 2022 Outlook 5 OPERATIONAL CHALLENGES IMPACTING 2Q 2022 + 3Q 2022 PRODUCTION AS ANNOUNCED 9/14/2022 ESTIMATED IMPACT TO CURRENT ADJUSTED EBITDA OUTLOOK VS. OUTLOOK AS OF 1Q 2022 END ($M) Tennessee Delacquering Furnace Furnace condenser repaired Came online 9/26/2022 Tennessee Hot Mill Electrical Issues Electrical cable repaired Repaired on 9/6/2022 Tennessee Casting Pit Lining Casting pit relined Came online 9/26/2022 Davenport Casting Pit Lining Casting pit relined Came online 9/6/2022 2Q22 ~$15 3Q22 ~$40 4Q22 ~$15 FY22 ~$70 Running at expected rates – No recurring impact expected in 2023 EUROPEAN ENERGY IMPACT AS ANNOUNCED 9/14/2022 DEMAND LOSS Hyperinflationary energy costs driving reduction in demand primarily in 4Q 2022 Uncertainty expected to continue into 2023 ENERGY COSTS Energy input costs to European facilities higher than expected as of 1Q 2022 end, but showing modest improvement into November and December 2022 Revised European total impact to FY 2022 to ~$30M from ~$35M due to better spot energy prices - ~$10 ~$20 ~$30 NEW CHALLENGES DRIVING REVISIONS TO GUIDANCE AS ANNOUNCED 11/1/2022 LANCASTER OUTAGE DELAY Lancaster hot mill returned to service from an outage supporting Phase 2 growth initiative in late-September. It is operating at lower rates due to upgraded equipment not functioning properly. Operations are expected to return to normal rates by the end of 4Q 2022 Ingot and work-in-process inventory - ~$5 ~$25 ~$30

3Q 2022 Sales Growth Impacted by Production Challenges 6 Ground Transportation Automotive continues to improve year over year offset partially by weakness in commercial transportation due to Company production challenges Packaging North American volumes ramped to expected run rate levels while international packaging sales impacted by European sanctions on Russian sales Building and Construction Pricing in North America continues to drive growth Industrial Products and Other Production outages and other operational challenges reduced industrial output at Tennessee facility and demand in Europe saw steep declines Aerospace Continued market recovery supported by production rate increases at aerospace OEMs Organic revenue is a non-GAAP financial measure. Management believes this measure is meaningful to investors as it presents revenue on a comparable basis for all periods presented due to the impact of changes in aluminum prices, divestitures, and foreign currency fluctuations relative to the prior year period. See appendix for non-GAAP financial measure reconciliations. End Market Revenue year- over-year change Organic revenue year-over-year change Revenue sequential change Ground Transportation 11% 11% (10%) Packaging 25% 28% (22%) Building and Construction 17% 17% (9%) Industrial Products and Other 24% (19%) (6%) Aerospace 53% 49% 0% 3Q 2022 Organic Revenue1 by End Market

3Q 2022 Financial Highlights Sales of $2.3 billion, up 21% year over year (13% organically) Net loss of $65 million, or $0.64 per share, compared with a net income of $16 million, or $0.15 per share, in 3Q 2021. Third quarter 2022 includes an after-tax, non-cash asset impairment charge of $70 million related to the Extrusions segment business review Adjusted EBITDA of $143 million, down 16% year over year Cash provided from operations was $91 million and capital expenditures were $47 million Quarter-end cash balance was $312 million with total cash and liquidity of approximately $1.4 billion Repurchased 3.0 million shares for ~$86 million in 3Q, completing the $300 million authorization. Since program inception in May 2021, repurchased ~9.8 million shares or ~9% of shares outstanding Adjusted EBITDA 2Q 2020 – 3Q 2022 ($M) 7 See appendix for non-GAAP financial measure reconciliations.
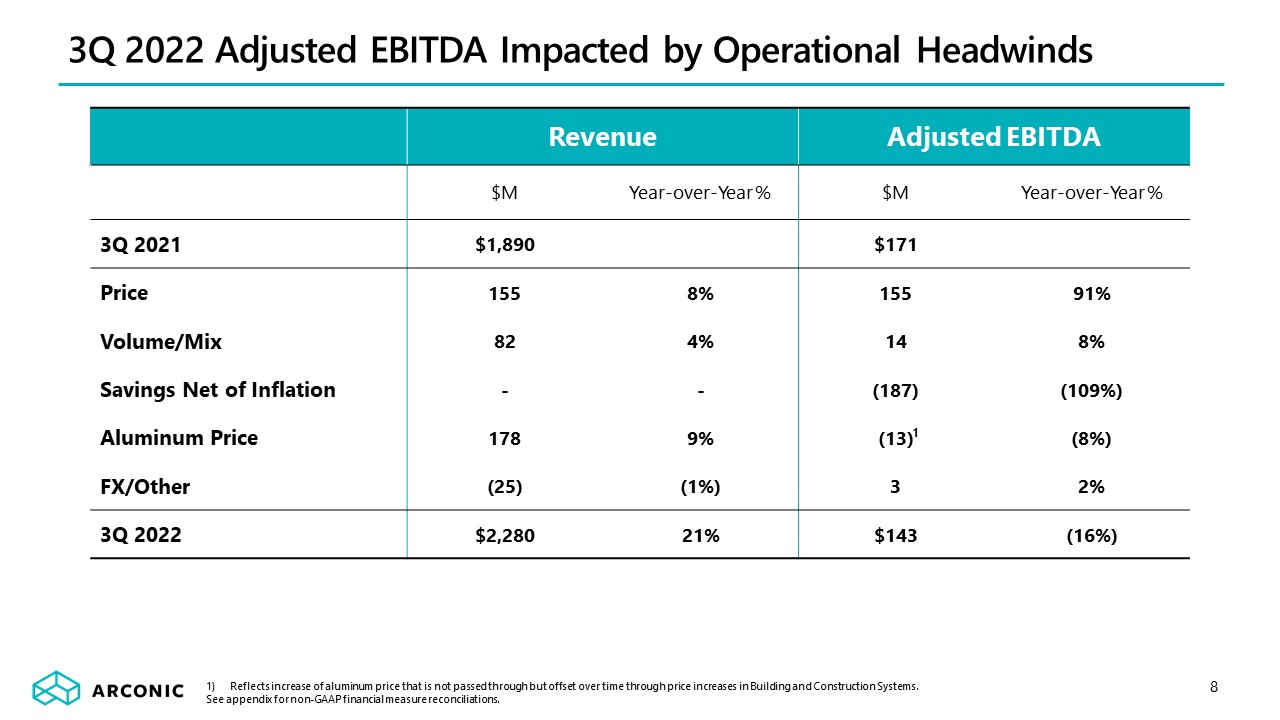
3Q 2022 Adjusted EBITDA Impacted by Operational Headwinds Revenue Adjusted EBITDA $M Year-over-Year % $M Year-over-Year % 3Q 2021 $1,890 $171 Price 155 8% 155 91% Volume/Mix 82 4% 14 8% Savings Net of Inflation - - (187) (109%) Aluminum Price 178 9% (13) (8%) FX/Other (25) (1%) 3 2% 3Q 2022 $2,280 21% $143 (16%) 8 Reflects increase of aluminum price that is not passed through but offset over time through price increases in Building and Construction Systems. See appendix for non-GAAP financial measure reconciliations. 1
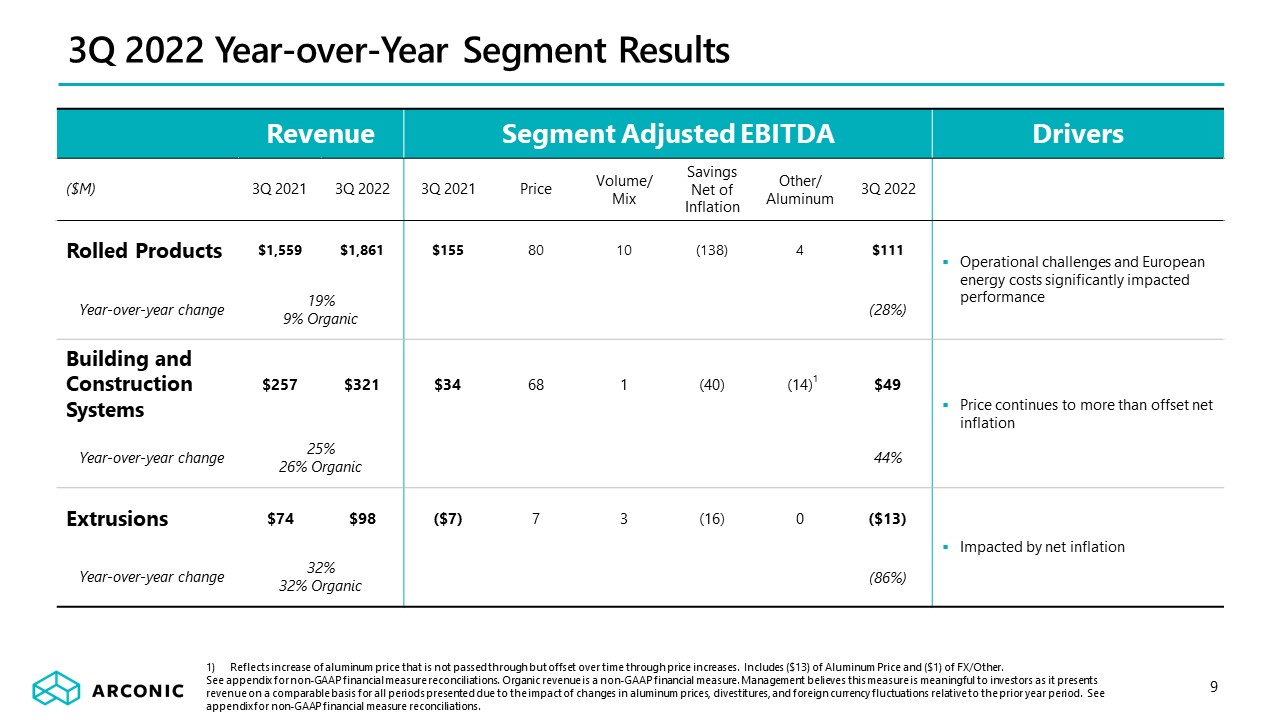
3Q 2022 Year-over-Year Segment Results Revenue Segment Adjusted EBITDA Drivers ($M) 3Q 2021 3Q 2022 3Q 2021 Price Volume/ Mix Savings Net of Inflation Other/ Aluminum 3Q 2022 Rolled Products $1,559 $1,861 $155 80 10 (138) 4 $111 Operational challenges and European energy costs significantly impacted performance Year-over-year change 19% 9% Organic (28%) Building and Construction Systems $257 $321 $34 68 1 (40) (14) $49 Price continues to more than offset net inflation Year-over-year change 25% 26% Organic 44% Extrusions $74 $98 ($7) 7 3 (16) 0 ($13) Impacted by net inflation Year-over-year change 32% 32% Organic (86%) 9 1 Reflects increase of aluminum price that is not passed through but offset over time through price increases. Includes ($13) of Aluminum Price and ($1) of FX/Other. See appendix for non-GAAP financial measure reconciliations. Organic revenue is a non-GAAP financial measure. Management believes this measure is meaningful to investors as it presents revenue on a comparable basis for all periods presented due to the impact of changes in aluminum prices, divestitures, and foreign currency fluctuations relative to the prior year period. See appendix for non-GAAP financial measure reconciliations.

Ground Transportation Outlook reduced due to softer commercial transportation sales that have been impacted by operational challenges in North America and weaker demand in Europe Automotive continues to grow year over year as supply chain issues ease Industrial Products and Other Reduction driven by operational issues in Tennessee and Lancaster and weaker demand in Europe Building and Construction Outlook unchanged as weakness in Europe being offset by strong pricing in North America Packaging Outlook reduced due to volatility in Russia and China exports Aerospace Demand remains strong as aerospace OEMs continue to ramp up production 2022 Organic Revenue Outlook 2022 Organic Revenue Year-over-Year Trajectory 10 Prior Current Prior Current Prior Current Prior Current Prior Current 2022 Compared to Prior Outlook

Russia (Samara) Operations Update 11 Arconic announced on May 19, 2022 that it is pursuing a sale of the Russian operations, with several parties expressing interest during the process Working towards the completion of a sale to a third party pursuant to a framework agreement, with closing subject to certain conditions and contingencies Timing and likelihood are difficult to predict given geopolitical factors, legal proceedings involving Russian operations, governmental approval processes and other complexities Samara operations continue to run normally 3Q 2022 sales of $240 million compared with $259 million in 3Q 2021 3Q 2022 Adjusted EBITDA of $20 million compared with $22 million in 3Q 2021 Adjusted EBITDA is expected to be approximately $75-$85 million in 2022, compared with $87 million in 2021 Quarter end cash of $174 million up from $79 million at year-end 2021 due to earnings, foreign currency impact, and lower aluminum prices Samara Facility 2021 Revenue by End Market

Revised 2022 Outlook and Key Themes 12 Resolved operational challenges at Tennessee and Davenport End markets in North America remain resilient while energy crisis causing demand weakness and higher costs in Europe Phase 2 growth investments complete in Davenport and underway in Lancaster to reach run rate impact in 2023 Reviewing Phase 3 and Phase 4 growth investment timing and sequencing Full-year 2022 Adjusted EBITDA reduced due to challenges at Lancaster related to equipment upgrades Completed existing $300 million share repurchase program Assumes average LME aluminum price of $2,300/mt and Midwest Premium of $550/mt. Assumes no factored receivables. Arconic has not provided reconciliations of any forward-looking non-GAAP financial measures, such as adjusted EBITDA and free cash flow, to the most directly comparable GAAP financial measures because such reconciliations are not available without unreasonable efforts due to the variability and complexity with respect to the charges and other components excluded from the non-GAAP measures, such as the effects of metal price lag, foreign currency movements, gains or losses on sales of assets, taxes, and any future restructuring or impairment charges. These reconciling items are in addition to the inherent variability already included in the GAAP measures, which includes, but is not limited to, price/mix and volume. Arconic believes such reconciliations would imply a degree of precision that would be confusing or misleading to investors. Prior Updated Revenue1 $9,200 - $9,500 $9,000- $9,300 Adjusted EBITDA2 $715 - $765 $700 - $730 Free cash flow1,2 ~$200 ~$150 Updated 2022 Outlook ($M)

Appendix
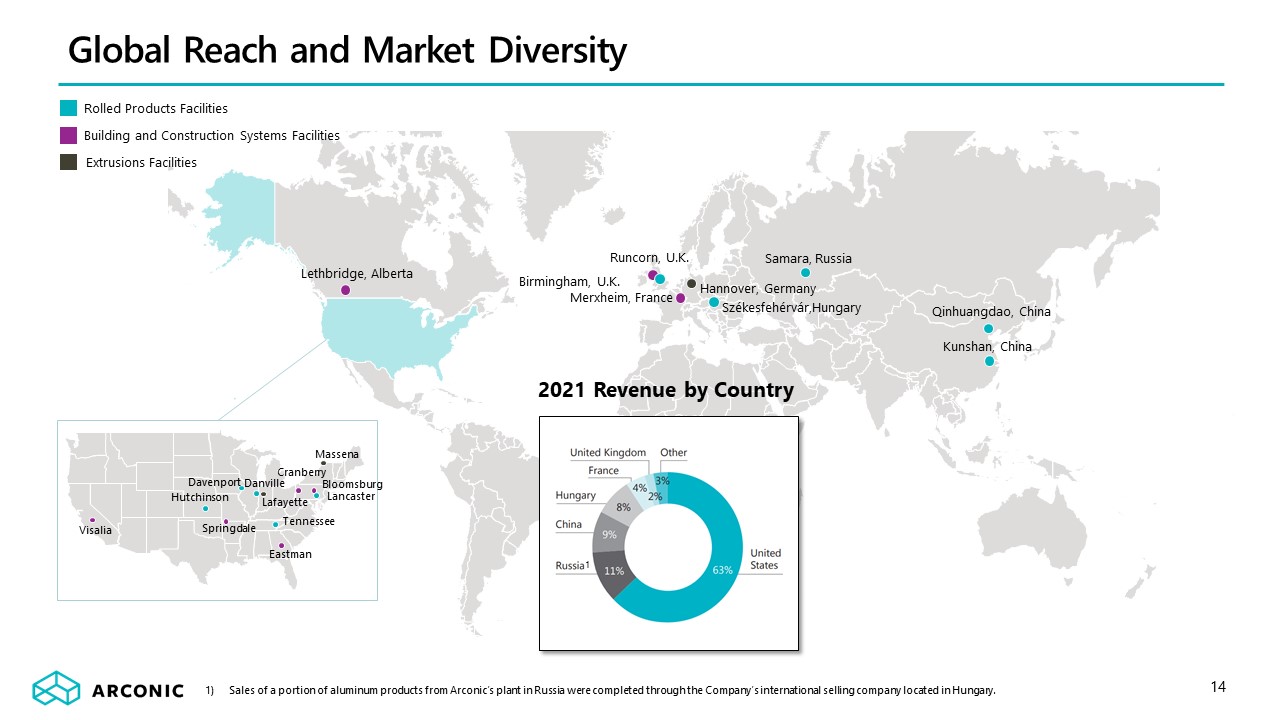
14 Rolled Products Facilities Building and Construction Systems Facilities Extrusions Facilities Samara, Russia Kunshan, China Székesfehérvár,Hungary Qinhuangdao, China Merxheim, France Runcorn, U.K. Hannover, Germany Davenport Danville Hutchinson Lancaster Tennessee Springdale Visalia Eastman Bloomsburg Cranberry Lafayette Lethbridge, Alberta Birmingham, U.K. Massena Global Reach and Market Diversity 2021 Revenue by Country 1 Sales of a portion of aluminum products from Arconic’s plant in Russia were completed through the Company’s international selling company located in Hungary.

15 ($M) Quarter ended September 30, June 30, September 30, 2022 2022 2021 Total Segment Adjusted EBITDA(1) $ 147 $ 215 $ 182 Unallocated amounts: Corporate expenses(2) (4) (10) (7) Stock-based compensation expense (6) (8) (8) Metal price lag(3) 15 30 (21) Unrealized (losses) gains on mark-to-market hedging instruments and derivatives (7) 21 – Provision for depreciation and amortization (59) (62) (61) Restructuring and other charges(4) (112) (2) (14) Other(5) (10) (40) (3) Operating (loss) income (36) 144 68 Interest expense (27) (26) (26) Other (expenses) income, net(6) (27) 35 (15) Benefit (Provision) for income taxes 25 (38) (11) Net income attributable to noncontrolling interest – (1) – Consolidated net (loss) income attributable to Arconic Corporation $ (65) $ 114 $ 16 Reconciliation of Segment Adjusted EBITDA Arconic’s profit or loss measure for its reportable segments is Segment Adjusted EBITDA (Earnings before interest, taxes, depreciation, and amortization). The Company calculates Segment Adjusted EBITDA as Total sales (third-party and intersegment) minus each of (i) Cost of goods sold, (ii) Selling, general administrative, and other expenses, and (iii) Research and development expenses, plus each of (i) Stock-based compensation expense, (ii) Metal price lag (see footnote 3), and (iii) Unrealized (gains) losses on mark-to-market hedging instruments and derivatives (see below). Arconic’s Segment Adjusted EBITDA may not be comparable to similarly titled measures of other companies’ reportable segments. Effective in the first quarter of 2022, management modified the Company’s definition of Segment Adjusted EBITDA to exclude the impact of unrealized gains and losses on mark-to-market hedging instruments and derivatives. This modification was deemed appropriate as Arconic is considering entering into additional hedging instruments in future reporting periods if favorable conditions exist to mitigate cost inflation. Certain of these instruments may not qualify for hedge accounting resulting in unrealized gains and losses being recorded directly to Sales or Cost of goods sold, as appropriate (i.e., mark-to-market). Additionally, this change was also applied to derivatives that do not qualify for hedge accounting for consistency purposes. The Company does not have a regular practice of entering into contracts that are treated as derivatives for accounting purposes. Ultimately, this change was made to maintain the transparency and visibility of the underlying operating performance of Arconic’s reportable segments. Prior to this change, the Company had a limited number of hedging instruments and derivatives that did not qualify for hedge accounting, the unrealized impact of which was not material to Arconic’s Segment Adjusted EBITDA performance measure. Accordingly, periods prior to the effective date of this change were not recast to reflect this change. Total Segment Adjusted EBITDA is the sum of the respective Segment Adjusted EBITDA for each of the Company’s three reportable segments: Rolled Products, Building and Construction Systems, and Extrusions. This amount is being presented for the sole purpose of reconciling Segment Adjusted EBITDA to the Company’s Consolidated net (loss) income. Corporate expenses are composed of general administrative and other expenses of operating the corporate headquarters and other global administrative facilities. Metal price lag represents the financial impact of the timing difference between when aluminum prices included in Sales are recognized and when aluminum purchase prices included in Cost of goods sold are realized. This adjustment aims to remove the effect of the volatility in metal prices and the calculation of this impact considers applicable metal hedging transactions. In the quarter ended September 30, 2022, the Company updated its five-year strategic plan, the results of which indicated that there was a decline in the forecasted financial performance for the Extrusions segment (and asset group). As such, management evaluated the recoverability of the long-lived assets of the Extrusions asset group and, ultimately, determined that such assets were impaired. Accordingly, in the quarter ended September 30, 2022, the Company recorded an impairment charge of $92, composed of $90 for Properties, plants, and equipment and $2 for intangible assets. In the quarters ended September 30, 2022 and 2021, Restructuring and other charges includes $15 and $5, respectively, related to the settlement of a portion of the Company’s U.S. defined benefit pension plan obligations as a result of elections by certain plan participants to receive lump-sum benefit payments. Other includes certain items that impact Cost of goods sold and Selling, general administrative, and other expenses on the Company’s Statement of Consolidated Operations that are not included in Segment Adjusted EBITDA, including those described as “Other special items” (see footnote 5 to the Reconciliation of Total Company Adjusted EBITDA presented elsewhere in this Appendix). In the quarters ended September 30, 2022 and June 30, 2022, Other (expenses) income, net includes an $11 loss and a $54 gain, respectively, for the remeasurement of monetary balances, primarily cash, related to the Company’s operations in Russia from rubles to the U.S. dollar. This loss and gain were the result of a significant weakening and strengthening, respectively, of the ruble against the U.S. dollar in the respective periods.

16 ($M) Quarter ended Quarter ended Quarter ended September 30, 2022 June 30, 2022 March 31, 2022 December 31, 2021 September 30, 2021 June 30, 2021 March 31, 2021 December 31, 2020 September 30, 2020 June 30, 2020 Net (loss) income attributable to Arconic Corporation $ (65) $ 114 $ 42 $ (38) $ 16 $ (427) $ 52 $ (64) $ 5 $ (96) Add: Net income attributable to noncontrolling interest – 1 – – – – – – – – (Benefit) Provision for income taxes (25) 38 12 19 11 (108) 16 (4) 10 (32) Other expenses (income), net(1) 27 (35) 17 15 15 15 22 1 27 16 Interest expense 27 26 25 26 26 25 23 21 22 40 Restructuring and other charges(2) 112 2 5 12 14 597 1 127 3 77 Impairment of goodwill(3) – – – 65 – – – – – – Provision for depreciation and amortization 59 62 60 67 61 62 63 60 63 68 Stock-based compensation 6 8 5 7 8 5 2 5 6 5 Metal price lag(4) (15) (30) 36 (11) 21 11 (5) (3) 16 10 Unrealized losses (gains) on mark-to-market hedging instruments and derivatives 7 (21) (2) – – – – – – – Other special items(5) 10 39 5 13 (1) 7 5 8 13 11 Adjusted EBITDA $ 143 $ 204 $ 205 $ 175 $ 171 $ 187 $ 179 $ 151 $ 165 $ 99 Sales $ 2,280 $ 2,548 $ 2,191 $ 2,138 $ 1,890 $ 1,801 $ 1,675 $ 1,462 $ 1,415 $ 1,187 Adjusted EBITDA Margin 6.3% 8.0% 9.4% 8.2% 9.0% 10.4% 10.7% 10.3% 11.7% 8.3% Arconic’s definition of Adjusted EBITDA (Earnings before interest, taxes, depreciation, and amortization) is net margin plus an add-back for the following items: Provision for depreciation and amortization; Stock-based compensation; Metal price lag (see footnote 4); Unrealized (gains) losses on mark-to-market hedging instruments and derivatives (see below); and Other special items. Net margin is equivalent to Sales minus the following items: Cost of goods sold; Selling, general administrative, and other expenses; Research and development expenses; and Provision for depreciation and amortization. Special items are composed of restructuring and other charges, discrete income tax items, and other items as deemed appropriate by management. There can be no assurances that additional special items will not occur in future periods. Adjusted EBITDA is a non-GAAP financial measure. Management believes that this measure is meaningful to investors because Adjusted EBITDA provides additional information with respect to Arconic’s operating performance and the Company’s ability to meet its financial obligations. The Adjusted EBITDA presented may not be comparable to similarly titled measures of other companies. Effective in the first quarter of 2022, management modified the Company’s definition of Adjusted EBITDA to exclude the impact of unrealized gains and losses on mark-to-market hedging instruments and derivatives. This modification was deemed appropriate as Arconic is considering entering into additional hedging instruments in future reporting periods if favorable conditions exist to mitigate cost inflation. Certain of these instruments may not qualify for hedge accounting resulting in unrealized gains and losses being recorded directly to Sales or Cost of goods sold, as appropriate (i.e., mark-to-market). Additionally, this change was also applied to derivatives that do not qualify for hedge accounting for consistency purposes. The Company does not have a regular practice of entering into contracts that are treated as derivatives for accounting purposes. Ultimately, this change was made to maintain the transparency and visibility of the underlying operating performance of Arconic. Prior to this change, the Company had a limited number of hedging instruments and derivatives that did not qualify for hedge accounting, the unrealized impact of which was not material to Arconic’s Adjusted EBITDA. Accordingly, periods prior to the effective date of this change were not recast to reflect this change. Reconciliation of Total Company Adjusted EBITDA

In the quarters ended September 30, 2022 and June 30, 2022, Other expenses (income), net includes an $11 loss and a $54 gain, respectively, for the remeasurement of monetary balances, primarily cash, related to the Company’s operations in Russia from rubles to the U.S. dollar. This loss and gain were the result of a significant weakening and strengthening, respectively, of the ruble against the U.S. dollar in the respective periods. In the quarter ended September 30, 2022, the Company updated its five-year strategic plan, the results of which indicated that there was a decline in the forecasted financial performance for the Extrusions segment (and asset group). As such, management evaluated the recoverability of the long-lived assets of the Extrusions asset group and, ultimately, determined that such assets were impaired. Accordingly, in the quarter ended September 30, 2022, the Company recorded an impairment charge of $92, composed of $90 for Properties, plants, and equipment and $2 for intangible assets. In the quarter ended September 30, 2022, Restructuring and other charges includes $15 related to the settlement of a portion of the Company’s U.S. defined benefit pension plan obligations as a result of elections by certain plan participants to receive lump-sum benefit payments. In the year ended December 31, 2021, Restructuring and other charges includes $584 related to the settlement of a portion of the Company’s U.S. defined benefit pension plan obligations as a result of the purchase of a group annuity contract ($549-2Q21) and elections by certain plan participants to receive lump-sum benefit payments ($11-4Q21, $5-3Q21, $19-2Q21). In the year ended December 31, 2020, Restructuring and other charges includes a $198 settlement charge related to the annuitizations of a portion of the Company’s U.S. ($140-4Q20) and U.K. ($3-3Q20, $55-2Q20) defined benefit pension plan obligations and a $25 benefit (4Q20) for contingent consideration received related to the October 2018 sale of the Texarkana (Texas) rolling mill. In the quarter ended December 31, 2021, Arconic completed its annual review of goodwill for impairment for each of its three reporting units: Rolled Products, Building and Construction Systems, and Extrusions. The results of this review indicated that the carrying value of the Extrusions reporting unit’s goodwill was fully impaired. Accordingly, in the quarter ended December 31, 2021, the Company recognized an impairment charge of $65. This impairment was primarily driven by a combination of market-based factors, including delays in aerospace market improvement and significant cost inflation, resulting in increasingly limited margin expansion. The Company had not previously identified any triggering events during 2021 prior to the annual review. Metal price lag represents the financial impact of the timing difference between when aluminum prices included in Sales are recognized and when aluminum purchase prices included in Cost of goods sold are realized. This adjustment aims to remove the effect of the volatility in metal prices and the calculation of this impact considers applicable metal hedging transactions. Other special items include the following: • for the quarter ended September 30, 2022, a charge related to the Grasse River environmental remediation matter ($9), costs related to the Grenfell Tower legal matter ($3), and other items ($(2)); • for the quarter ended June 30, 2022, costs related to a new labor agreement with the United Steelworkers ($19), a charge for two environmental remediation matters ($9), costs related to several legal matters, including Grenfell Tower ($3) and other ($4), and other items ($4); • for the quarter ended March 31, 2022, costs related to several legal matters ($2), costs related to the packaging restart at the Tennessee rolling mill ($2), and other items ($1); • for the quarter ended December 31, 2021, costs related to several legal matters, including Grenfell Tower ($4) and other ($2), costs related to both an equipment fire and packaging restart at the Tennessee rolling mill ($5), and other items ($2); • for the quarter ended September 30, 2021, a partial reversal of a previously established reserve related to the Grasse River environmental remediation matter ($11), costs related to several legal matters ($7), and other items ($3); • for the quarter ended June 30, 2021, a write-down of inventory related to the idling of both the remaining operations at the Chandler (Arizona) extrusions facility and the casthouse operations at the Lafayette (Indiana) extrusions facility ($4) and costs related to several legal matters ($3); • for the quarter ended March 31, 2021, costs related to several legal matters, including Grenfell Tower ($4) and other ($1); • for the quarter ended December 31, 2020, costs related to several legal matters ($5) and other items ($3); • for the quarter ended September 30, 2020, costs related to several legal matters, including Grenfell Tower ($4) and other ($2), a write-down of inventory related to the idling of the casthouse operations at the Chandler (Arizona) extrusions facility ($5), and other items ($2); and • for the quarter ended June 30, 2020, costs related to several legal matters, including a customer settlement ($5), Grenfell Tower ($3), and other ($3). 17 Reconciliation of Total Company Adjusted EBITDA (cont’d)

18 Adjusted EBITDA to Free Cash Flow Bridge ($M) Quarter ended Quarter ended Quarter ended September 30, 2022 June 30, 2022 March 31, 2022 December 31, 2021 September 30, 2021 June 30, 2021 March 31, 2021 Adjusted EBITDA(1) $143 $204 $205 $175 $171 $187 $179 Change in working capital(2) (2) (49) (200) 11 (126) (51) (230) Cash payments for: Environmental remediation (1) (2) (4) (40) (23) (4) (17) Pension contributions(3) (9) (9) (4) (2) (3) (252) (201) Other postretirement benefits (7) (8) (8) (10) (9) (10) (10) Restructuring actions (2) (1) (2) (4) (2) (4) (5) Interest (30) (23) (29) (22) (28) (22) (18) Income taxes (3) (23) (4) (10) (4) (6) (6) Capital expenditures (47) (33) (95) (61) (51) (44) (28) Other(4) 2 73 (57) (2) (18) (5) 14 Free Cash Flow(5) $44 $129 $(198) $35 $(93) $(211) $(322) Adjusted EBITDA is a non-GAAP financial measure. See Reconciliation of Total Company Adjusted EBITDA presented elsewhere in this Appendix for (i) Arconic’s definition of Adjusted EBITDA, (ii) management’s rationale for the presentation of this non-GAAP measure, and (iii) a reconciliation of this non-GAAP measure to the most directly comparable GAAP measure. Arconic’s definition of working capital is Receivables plus Inventories less Accounts payable, trade. In January 2021, the Company contributed a total of $200 to its two funded U.S. defined benefit pension plans, comprised of the estimated minimum required funding for 2021 of $183 and an additional $17. In April 2021, the Company contributed a total of $250 to its two funded U.S. defined benefit pension plans to maintain the funding level of the remaining plan obligations not transferred under a group annuity contract. Other includes the impact of metal price lag as follows: 3Q22-$15; 2Q22-$30; 1Q22-$(36); 4Q21-$11; 3Q21-$(21); 2Q21-$(11); and 1Q21-$5. See footnote 4 in Reconciliation of Total Company Adjusted EBITDA presented elsewhere in this Appendix for additional information on metal price lag. Arconic’s definition of Free Cash Flow is Cash from operations less capital expenditures. Free Cash Flow is a non-GAAP financial measure. Management believes that this measure is meaningful to investors because management reviews cash flows generated from operations after taking into consideration capital expenditures, which are both necessary to maintain and expand the Company’s asset base and expected to generate future cash flows from operations. It is important to note that Free Cash Flow does not represent the residual cash flow available for discretionary expenditures since other non-discretionary expenditures, such as mandatory debt service requirements, are not deducted from the measure. 3Q22: Cash provided from operations of $91 less capital expenditures of $47 = free cash flow of $44 2Q22: Cash provided from operations of $162 less capital expenditures of $33 = free cash flow of $129 1Q22: Cash used for operations of $(103) less capital expenditures of $95 = free cash flow of $(198) 4Q21: Cash provided from operations of $96 less capital expenditures of $61 = free cash flow of $35 3Q21: Cash used for operations of $(42) less capital expenditures of $51 = free cash flow of $(93) 2Q21: Cash used for operations of $(167) less capital expenditures of $44 = free cash flow of $(211) 1Q21: Cash used for operations of $(294) less capital expenditures of $28 = free cash flow of $(322)

Reconciliation of Organic Revenue by End Market Organic revenue is a non-GAAP financial measure. Management believes this measure is meaningful to investors as it presents revenue on a comparable basis for all periods presented due to the impact of changes in aluminum prices and foreign currency fluctuations relative to the prior year period. 19 ($M) Ground Building and Industrial and 3Q21 Transportation Construction Aerospace Packaging Other Total Revenue $706 $327 $162 $325 $370 $1,890 3Q22 Revenue $785 $384 $248 $405 $458 $2,280 Less: Aluminum price impact 11 14 3 (13) 163 178 Foreign currency impact (11) (14) 3 2 (5) (25) Organic Revenue $785 $384 $242 $416 $300 $2,127
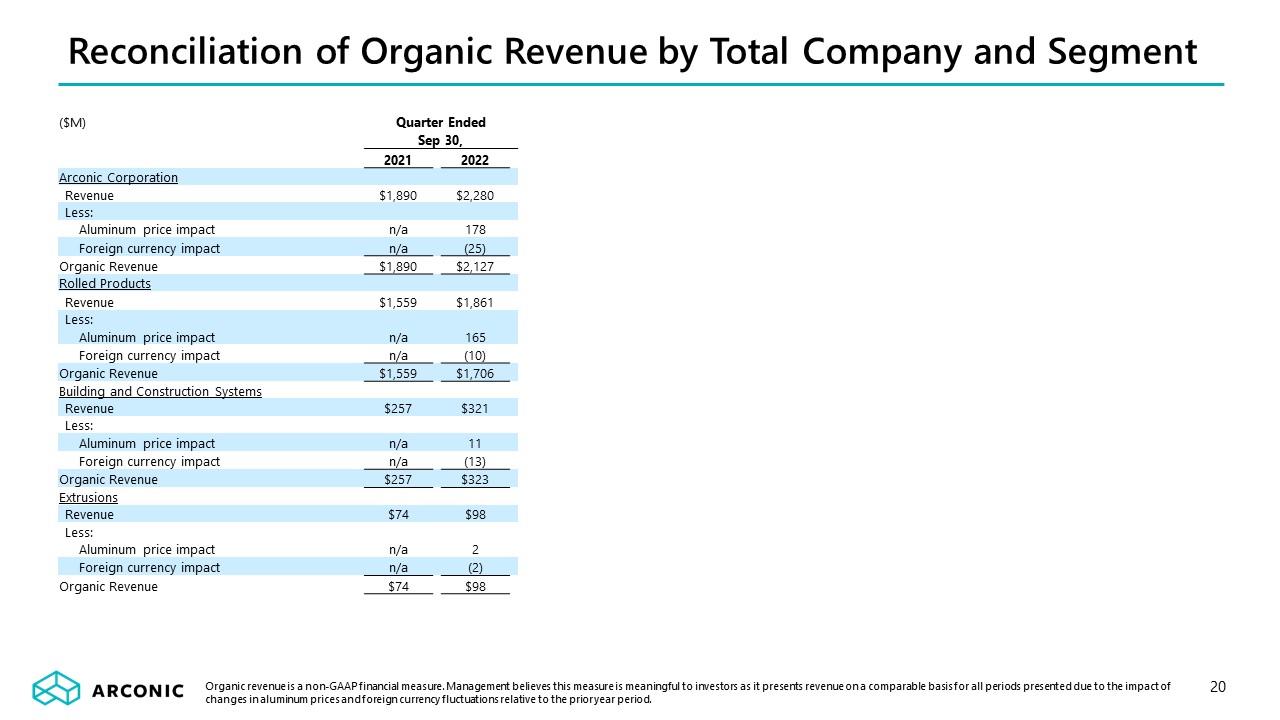
Reconciliation of Organic Revenue by Total Company and Segment Organic revenue is a non-GAAP financial measure. Management believes this measure is meaningful to investors as it presents revenue on a comparable basis for all periods presented due to the impact of changes in aluminum prices and foreign currency fluctuations relative to the prior year period. 20 ($M) Quarter Ended Sep 30, 2021 2022 Arconic Corporation Revenue $1,890 $2,280 Less: �� Aluminum price impact n/a 178 Foreign currency impact n/a (25) Organic Revenue $1,890 $2,127 Rolled Products Revenue $1,559 $1,861 Less: Aluminum price impact n/a 165 Foreign currency impact n/a (10) Organic Revenue $1,559 $1,706 Building and Construction Systems Revenue $257 $321 Less: Aluminum price impact n/a 11 Foreign currency impact n/a (13) Organic Revenue $257 $323 Extrusions Revenue $74 $98 Less: Aluminum price impact n/a 2 Foreign currency impact n/a (2) Organic Revenue $74 $98
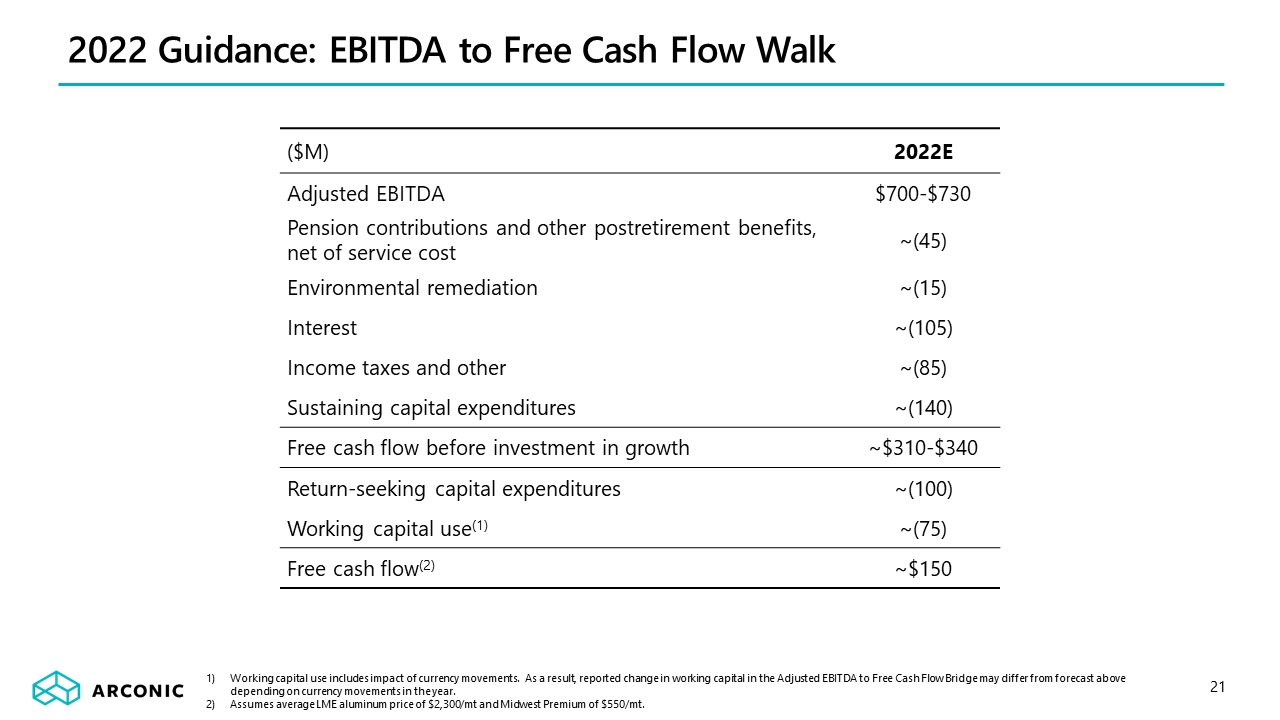
2022 Guidance: EBITDA to Free Cash Flow Walk ($M) 2022E Adjusted EBITDA $700-$730 Pension contributions and other postretirement benefits, net of service cost ~(45) Environmental remediation ~(15) Interest ~(105) Income taxes and other ~(85) Sustaining capital expenditures ~(140) Free cash flow before investment in growth ~$310-$340 Return-seeking capital expenditures ~(100) Working capital use(1) ~(75) Free cash flow(2) ~$150 Working capital use includes impact of currency movements. As a result, reported change in working capital in the Adjusted EBITDA to Free Cash Flow Bridge may differ from forecast above depending on currency movements in the year. Assumes average LME aluminum price of $2,300/mt and Midwest Premium of $550/mt. 21