Exhibit 99.2

Fourth Quarter 2022 Earnings Call Tim Myers – Chief Executive Officer Erick Asmussen – Chief Financial Officer February 21, 2023

Important Information 2 Forward-Looking Statements This presentation contains statements that relate to future events and expectations and, as such, constitute forward-looking statements within the meaning of the Private Securities Litigation Reform Act of 1995. Forward-looking statements include those containing such words as "anticipates," "believes," "could," "estimates," "expects," "forecasts," "goal," "guidance," "intends," "may," "outlook," "plans," "projects," "seeks," "sees," "should," "targets," "will," "would," or other words of similar meaning. All statements that reflect Arconic’s expectations, assumptions, projections, beliefs or opinions about the future, other than statements of historical fact, are forward-looking statements, including, without limitation, statements, relating to the condition of, or trends or developments in, the ground transportation, aerospace, building and construction, industrial, packaging and other end markets; Arconic’s future financial results, operating performance, working capital, cash flows, liquidity and financial position; cost savings and restructuring programs; Arconic's strategies, outlook, business and financial prospects; share repurchases; costs associated with pension and other postretirement benefit plans; projected sources of cash flow; potential legal liability; the impact of inflationary price pressures; and the potential impact of public health epidemics or pandemics, including the COVID-19 pandemic. These statements reflect beliefs and assumptions that are based on Arconic’s perception of historical trends, current conditions and expected future developments, as well as other factors Arconic believes are appropriate in the circumstances. Forward-looking statements are not guarantees of future performance, and actual results may differ materially from those indicated by these forward-looking statements due to a variety of risks, uncertainties and changes in circumstances, many of which are beyond Arconic’s control. Such risks and uncertainties include, but are not limited to: (a) continuing uncertainty regarding the impact of the COVID-19 pandemic on our business and the businesses of our customers and suppliers; (b) deterioration in global economic and financial market conditions generally; (c) unfavorable changes in the end markets we serve; (d) the inability to achieve the level of revenue growth, cash generation, cost savings, benefits of our management of legacy liabilities, improvement in profitability and margins, fiscal discipline, or strengthening of competitiveness and operations anticipated or targeted; (e) adverse changes in discount rates or investment returns on pension assets; (f) competition from new product offerings, disruptive technologies, industry consolidation or other developments; (g) the loss of significant customers or adverse changes in customers’ business or financial condition; (h) manufacturing difficulties or other issues that impact product performance, quality or safety; (i) the impact of pricing volatility in raw materials and inflationary pressures on our costs of production, including energy; (j) a significant downturn in the business or financial condition of a key supplier or other supply chain disruptions; (k) challenges to or infringements on our intellectual property rights; (l) the inability to realize the expected benefits of our re-entry in the U.S. packaging market or other strategic initiatives or projects; (m) the inability to identify or successfully respond to changing trends in our end markets; (n) the impact of potential cyber attacks and information technology or data security breaches; (o) geopolitical, economic, and regulatory risks relating to our global operations, including compliance with U.S. and foreign trade and tax laws and other regulations, potential expropriation of properties located outside the U.S., sanctions, tariffs, embargoes, and renegotiation or nullification of existing agreements; (p) the outcome of contingencies, including legal proceedings, government or regulatory investigations, and environmental remediation and compliance matters; (q) the impact of the ongoing conflict between Russia and Ukraine on economic conditions in general and on our business and operations, including sanctions, tariffs, and increased energy prices; and (r) the other risk factors summarized in Arconic’s Form 10-K for the year ended December 31, 2022 and other reports filed with the U.S. Securities and Exchange Commission. The above list of factors is not exhaustive or necessarily in order of importance. Market projections are subject to the risks discussed above and in this presentation, and other risks in the market. The statements in this presentation are made as of the date of this presentation, even if subsequently made available by Arconic on its website or otherwise. Arconic disclaims any intention or obligation to update publicly any forward-looking statements, whether in response to new information, future events, or otherwise, except as required by applicable law.

Important Information (cont’d) 3 Non-GAAP Financial Measures Some of the information included in this presentation is derived from Arconic’s consolidated financial information but is not presented in Arconic’s financial statements prepared in accordance with accounting principles generally accepted in the United States of America (GAAP). Certain of these financial measures are considered “non-GAAP financial measures” under SEC rules. These non-GAAP financial measures supplement our GAAP disclosures and should not be considered an alternative to any measure of performance or financial condition as determined in accordance with GAAP, and investors should consider Arconic’s performance and financial condition as reported under GAAP and all other relevant information when assessing the performance or financial condition of Arconic. Non-GAAP financial measures have limitations as analytical tools, and investors should not consider them in isolation or as a substitute for analysis of the results or financial condition as reported under GAAP. Non-GAAP financial measures presented by Arconic may not be comparable to non-GAAP financial measures presented by other companies. Reconciliations to the most directly comparable GAAP financial measures and management’s rationale for the use of the non-GAAP financial measures can be found in the appendix to this presentation. Arconic has not provided reconciliations of any forward-looking non-GAAP financial measures, such as adjusted EBITDA, and free cash flow, to the most directly comparable GAAP financial measures because such reconciliations are not available without unreasonable efforts due to the variability and complexity with respect to the charges and other components excluded from the non-GAAP measures, such as the effects of metal price lag, foreign currency movements, gains or losses on sales of assets, taxes, and any future restructuring or impairment charges. These reconciling items are in addition to the inherent variability already included in the GAAP measures, which includes, but is not limited to, price/mix and volume. Arconic believes such reconciliations would imply a degree of precision that would be confusing or misleading to investors.

2023 to Benefit from Return to Stability and Ongoing Capital Discipline Sustainability and Growth Operational challenges impacting 2H 2022 have been addressed Market outlook is stable in North America and uncertain in Europe North American packaging sales growing as re-entry was completed in 2022 Announcing 2030 greenhouse gas emission intensity reduction targets Sold Russian operations and closed transaction in mid-November FY2023 Adjusted EBITDA expected to grow on comparable basis Disciplined Capital Allocation Initiated a new $200 million share repurchase program Repurchased ~10% of shares outstanding at separation date Reviewing growth investments timing and sequencing FY2023 free cash flow expected to step up significantly 4

4Q 2022 Sales Growth Led by Aerospace and Packaging 5 Ground Transportation North American automotive and commercial transportation growth driven by normalizing OEM production and supply chains Building and Construction Pricing and improved regional mix driving growth as demand weakness is impacting European businesses Packaging Continued year over year growth as North American can sheet production achieved expected run rates Industrial Products and Other Production outages at the Lancaster facility and weak European demand impacted total industrial sales Aerospace Ongoing recovery at aerospace OEMs driving growth Organic revenue is a non-GAAP financial measure. Management believes this measure is meaningful to investors as it presents revenue on a comparable basis for all periods presented due to the impact of changes in aluminum prices, divestitures, and foreign currency fluctuations relative to the prior year period. See appendix for non-GAAP financial measure reconciliations. 4Q 2022 Organic Revenue1 by End Market End Market Revenue year- over-year change Organic revenue year-over-year change1 Ground Transportation (11%) 1% Building and Construction 2% 12% Packaging (29%) 16% Industrial Products and Other (15%) (33%) Aerospace 40% 56% Total (9%) 2%

4Q 2022 Financial Highlights Adjusted EBITDA1 1Q 2021 – 4Q 2022 ($M) 6 Adjusted EBITDA: Net Income (Loss) (GAAP) as follows: 1Q 2021 = $52M; 2Q 2021 = $(427M); 3Q 2021 = $16M; 4Q 2021 = $(38M); 1Q 2022 = $42M; 2Q 2022 = $114M; 3Q 2022 = $(65M); 4Q 2022 = $(273M); See appendix for non-GAAP financial measure reconciliations. Cash provided from operations was $188 million and capital expenditures were $70 million; working capital was a source of cash of $76 million, but was lower than expected due to recovery from operational challenges in 4Q 2022 Repurchased ~2.1 million shares for $46 million in 4Q. In total under all repurchase authorizations, the Company has repurchased ~11.8 million shares for $346 million, or ~10% of shares outstanding at separation in April 2020 Key Financial Metrics ($M) 4Q 2022 3Q 2022 Q/Q 4Q 2021 4Q Y/Y 2022 2021 2022 Y/Y Sales $1,942 $2,280 (15%) $2,138 (9%) $8,961 $7,504 19% Organic Revenue $1,898 - $1,858 2% $7,965 $7,224 10% Net Loss (273) (65) (38) (182) (397) Adjusted EBITDA 154 143 8% 175 (12%) 706 712 (1%) Adjusted EBITDA excluding Russian Operations 145 123 18% 153 (5%) 635 625 2%

4Q 2022 Revenue and Adjusted EBITDA Bridges Revenue Adjusted EBITDA $M Year-over-Year % $M Year-over-Year % 4Q 2021 $2,138 $1751 Price 133 6% 133 76% Inflation - - (93) (53%) Volume/Mix (81) (4%) (8) (5%) Net Productivity - - (33) (19%) Aluminum Price (62) (3%) (10) (6%) Divestitures (164) (8%) (13) (7%) FX/Other (22) (1%) 3 2% 4Q 2022 $1,942 (9%) $1541 (12%) 7 Adjusted EBITDA: Net Loss (GAAP) as follows: 4Q 2021 = $(38M); 4Q 2022 = $(273M). Reflects increase of aluminum price that is not passed through but offset over time through price increases in Building and Construction Systems. See appendix for non-GAAP financial measure reconciliations. 2

4Q 2022 Year-over-Year Segment Results Revenue Segment Adjusted EBITDA Drivers ($M) 4Q 2021 4Q 2022 4Q 2021 Price Inflation Volume/ Mix Net Productivity Divestitures Other/ Aluminum 4Q 2022 Rolled Products $1,790 $1,535 $162 66 (50) (15) (33) (13) 3 $120 Carryover impact of operational issues in 3Q 2022 and Lancaster challenges in 4Q 2022 caused negative productivity Economic weakness in Europe affecting demand Year-over-year change (14%) (2%) Organic (26%) Building and Construction Systems $261 $304 $33 59 (31) 2 (4) - (10) $49 Favorable regional mix, price, and demand drove very strong year over year performance�� Year-over-year change 16% 18% Organic 48% Extrusions $87 $109 ($9) 8 (11) 5 (10) - - ($17) Inflation partially offset by price Continued operational challenges causing underperformance Year-over-year change 25% 31% Organic (89%) 8 1 Reflects increase of aluminum price that is not passed through but offset over time through price increases. See appendix for non-GAAP financial measure reconciliations. Organic revenue is a non-GAAP financial measure. Management believes this measure is meaningful to investors as it presents revenue on a comparable basis for all periods presented due to the impact of changes in aluminum prices, divestitures, and foreign currency fluctuations relative to the prior year period.
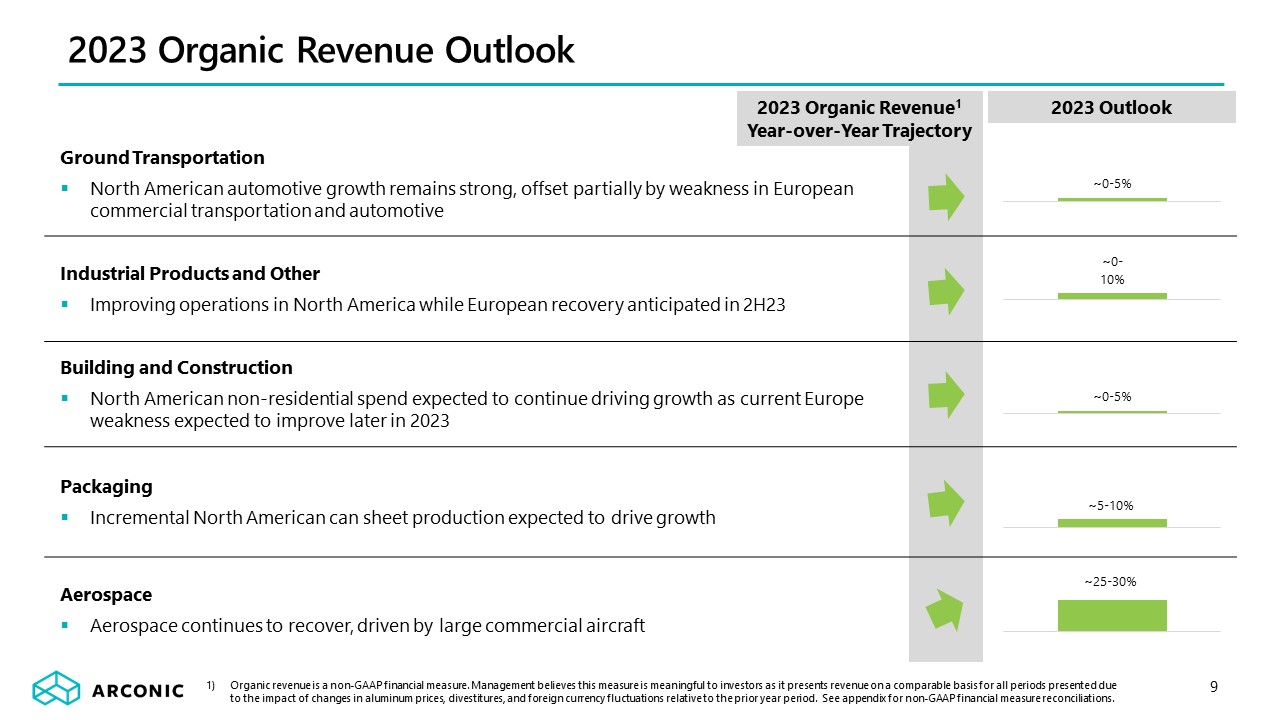
Ground Transportation North American automotive growth remains strong, offset partially by weakness in European commercial transportation and automotive Industrial Products and Other Improving operations in North America while European recovery anticipated in 2H23 Building and Construction North American non-residential spend expected to continue driving growth as current Europe weakness expected to improve later in 2023 Packaging Incremental North American can sheet production expected to drive growth Aerospace Aerospace continues to recover, driven by large commercial aircraft 2023 Organic Revenue Outlook 2023 Organic Revenue1 Year-over-Year Trajectory 9 2023 Outlook Organic revenue is a non-GAAP financial measure. Management believes this measure is meaningful to investors as it presents revenue on a comparable basis for all periods presented due to the impact of changes in aluminum prices, divestitures, and foreign currency fluctuations relative to the prior year period. See appendix for non-GAAP financial measure reconciliations.

30% Announcing New 2030 ESG Targets Reduction in GHG emission intensity by 20301,2 Compared to 2021 base year. Includes Scopes 1, 2, and 3 emissions. In conjunction with Arconic’s commitment to the United Nations Sustainable Development Goals 10% Reduction in energy intensity by 20301 35% Salaried women in workforce by 20301 80% High-risk suppliers meet Supply Chain Management Program criteria by 20301 10
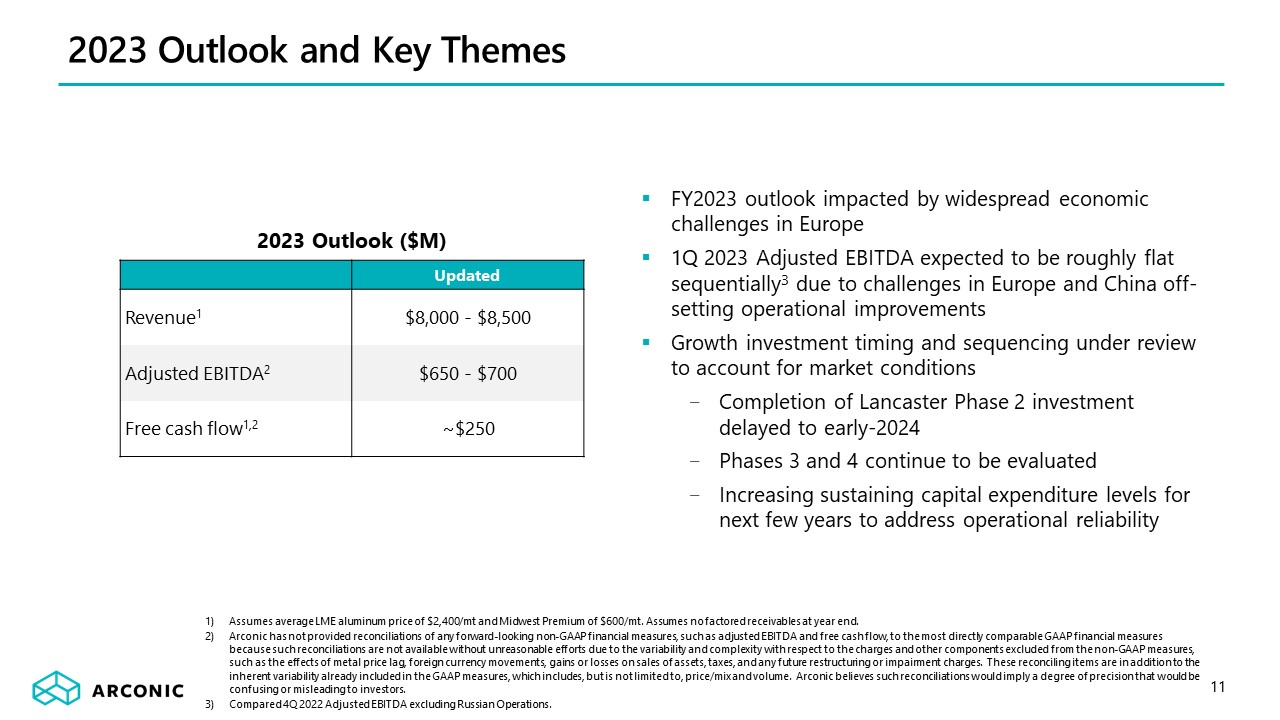
2023 Outlook and Key Themes 11 FY2023 outlook impacted by widespread economic challenges in Europe 1Q 2023 Adjusted EBITDA expected to be roughly flat sequentially3 due to challenges in Europe and China off-setting operational improvements Growth investment timing and sequencing under review to account for market conditions Completion of Lancaster Phase 2 investment delayed to early-2024 Phases 3 and 4 continue to be evaluated Increasing sustaining capital expenditure levels for next few years to address operational reliability Assumes average LME aluminum price of $2,400/mt and Midwest Premium of $600/mt. Assumes no factored receivables at year end. Arconic has not provided reconciliations of any forward-looking non-GAAP financial measures, such as adjusted EBITDA and free cash flow, to the most directly comparable GAAP financial measures because such reconciliations are not available without unreasonable efforts due to the variability and complexity with respect to the charges and other components excluded from the non-GAAP measures, such as the effects of metal price lag, foreign currency movements, gains or losses on sales of assets, taxes, and any future restructuring or impairment charges. These reconciling items are in addition to the inherent variability already included in the GAAP measures, which includes, but is not limited to, price/mix and volume. Arconic believes such reconciliations would imply a degree of precision that would be confusing or misleading to investors. Compared 4Q 2022 Adjusted EBITDA excluding Russian Operations. Updated Revenue1 $8,000 - $8,500 Adjusted EBITDA2 $650 - $700 Free cash flow1,2 ~$250 2023 Outlook ($M)
Appendix

13 ($M) Quarter ended December 31, September 30, December 31, 2022 2022 2021 Total Segment Adjusted EBITDA(1) $ 152 $ 147 $ 186 Unallocated amounts: Corporate expenses(2) (6) (4) (7) Stock-based compensation expense 4 (6) (7) Metal price lag(3) 8 15 11 Unrealized losses on mark-to-market hedging instruments and derivatives (10) (7) – Provision for depreciation and amortization (56) (59) (67) Impairment of goodwill(4) – – (65) Restructuring and other charges(5) (337) (112) (12) Other(6) (6) (10) (17) Operating (loss) income (251) (36) 22 Interest expense (26) (27) (26) Other expenses, net(7) (32) (27) (15) Benefit (Provision) for income taxes 36 25 (19) Net income attributable to noncontrolling interest – – – Consolidated net loss attributable to Arconic Corporation $ (273) $ (65) $ (38) Reconciliation of Segment Adjusted EBITDA Arconic’s profit or loss measure for its reportable segments is Segment Adjusted EBITDA (Earnings before interest, taxes, depreciation, and amortization). The Company calculates Segment Adjusted EBITDA as Total sales (third-party and intersegment) minus each of (i) Cost of goods sold, (ii) Selling, general administrative, and other expenses, and (iii) Research and development expenses, plus each of (i) Stock-based compensation expense, (ii) Metal price lag (see footnote 3), and (iii) Unrealized (gains) losses on mark-to-market hedging instruments and derivatives (see below). Arconic’s Segment Adjusted EBITDA may not be comparable to similarly titled measures of other companies’ reportable segments. Effective in the first quarter of 2022, management modified the Company’s definition of Segment Adjusted EBITDA to exclude the impact of unrealized gains and losses on mark-to-market hedging instruments and derivatives. This modification was deemed appropriate as Arconic is considering entering into additional hedging instruments in future reporting periods if favorable conditions exist to mitigate cost inflation. Certain of these instruments may not qualify for hedge accounting resulting in unrealized gains and losses being recorded directly to Sales or Cost of goods sold, as appropriate (i.e., mark-to-market). Additionally, this change was also applied to derivatives that do not qualify for hedge accounting for consistency purposes. The Company does not have a regular practice of entering into contracts that are treated as derivatives for accounting purposes. Ultimately, this change was made to maintain the transparency and visibility of the underlying operating performance of Arconic’s reportable segments. Prior to this change, the Company had a limited number of hedging instruments and derivatives that did not qualify for hedge accounting, the unrealized impact of which was not material to Arconic’s Segment Adjusted EBITDA performance measure. Accordingly, periods prior to the effective date of this change were not recast to reflect this change. Total Segment Adjusted EBITDA is the sum of the respective Segment Adjusted EBITDA for each of the Company’s three reportable segments: Rolled Products, Building and Construction Systems, and Extrusions. This amount is being presented for the sole purpose of reconciling Segment Adjusted EBITDA to the Company’s Consolidated net loss. Corporate expenses are composed of general administrative and other expenses of operating the corporate headquarters and other global administrative facilities. Metal price lag represents the financial impact of the timing difference between when aluminum prices included in Sales are recognized and when aluminum purchase prices included in Cost of goods sold are realized. This adjustment aims to remove the effect of the volatility in metal prices and the calculation of this impact considers applicable metal hedging transactions. In the quarter ended December 31, 2021, Arconic completed its annual review of goodwill for impairment for each of its three reporting units: Rolled Products, Building and Construction Systems, and Extrusions. The results of this review indicated that the carrying value of the Extrusions reporting unit’s goodwill was fully impaired. Accordingly, in the quarter ended December 31, 2021, the Company recognized an impairment charge of $65. This impairment was primarily driven by a combination of market-based factors, including delays in aerospace market improvement and significant cost inflation, resulting in increasingly limited margin expansion. The Company had not previously identified any triggering events during 2021 prior to the annual review.

14 Reconciliation of Segment Adjusted EBITDA (cont’d) On November 15, 2022, Arconic completed the sale of 100% of its operations in Russia to Promishlennie Investitsii LLC, the majority owner of VSMPO-AVISMA Corporation, for cash proceeds of $230. The transaction closed after the Company received all required approvals, resulting in the receipt of the cash consideration in exchange for all of Arconic’s net assets in Russia. These net assets included $203 of cash held in Russia that was not available for distribution to the parent company because of injunctions imposed as a result of litigation initiated in March 2020 by the Federal Antimonopoly Service of The Russian Federation (“FAS”). The Company recorded a loss of $306 ($304 after-tax) in connection with this transaction. At a hearing on December 22, 2022, the Samara Court dismissed the litigation. In the quarter ended September 30, 2022, the Company updated its five-year strategic plan, the results of which indicated that there was a decline in the forecasted financial performance for the Extrusions segment (and asset group). As such, management evaluated the recoverability of the long-lived assets of the Extrusions asset group and, ultimately, determined that such assets were impaired. Accordingly, in the quarter ended September 30, 2022, the Company recorded an impairment charge of $92, composed of $90 for Properties, plants, and equipment and $2 for intangible assets. Also, in the quarters ended December 31, 2022, September 30, 2022, and December 31, 2021, Restructuring and other charges includes $31, $15, and $11, respectively, related to the settlement of a portion of the Company’s U.S. defined benefit pension plan obligations as a result of elections by certain plan participants to receive lump-sum benefit payments. Other includes certain items that impact Cost of goods sold and Selling, general administrative, and other expenses on the Company’s Statement of Consolidated Operations that are not included in Segment Adjusted EBITDA, including those described as “Other special items” (see footnote 5 to the Reconciliation of Total Company Adjusted EBITDA presented elsewhere in this Appendix). In the quarter ended September 30, 2022, Other expenses, net includes an $11 loss for the remeasurement of monetary balances, primarily cash, related to the Company’s former operations in Russia (see Note 5) from rubles to the U.S. dollar. This loss was the result of a significant weakening of the Russian ruble against the U.S. dollar in the period.

15 ($M) Quarter ended Quarter ended Quarter ended Year ended December 31, 2022 September 30, 2022 June 30, 2022 March 31, 2022 December 31, 2021 September 30, 2021 June 30, 2021 March 31, 2021 December 31, 2022 December 31, 2021 Net (loss) income attributable to Arconic Corporation $ (273) $ (65) $ 114 $ 42 $ (38) $ 16 $ (427) $ 52 $ (182) $ (397) Add: Net income attributable to noncontrolling interest – – 1 – – – – – 1 – (Benefit) Provision for income taxes (36) (25) 38 12 19 11 (108) 16 (11) (62) Other expenses (income), net(1) 32 27 (35) 17 15 15 15 22 41 67 Interest expense 26 27 26 25 26 26 25 23 104 100 Restructuring and other charges(2) 337 112 2 5 12 14 597 1 456 624 Impairment of goodwill(3) – – – – 65 – – – – 65 Provision for depreciation and amortization 56 59 62 60 67 61 62 63 237 253 Stock-based compensation (4) 6 8 5 7 8 5 2 15 22 Metal price lag(4) (8) (15) (30) 36 (11) 21 11 (5) (17) 16 Unrealized losses (gains) on mark-to-market hedging instruments and derivatives 10 7 (21) (2) – – – – (6) – Other special items(5) 14 10 39 5 13 (1) 7 5 68 24 Adjusted EBITDA $ 154 $ 143 $ 204 $ 205 $ 175 $ 171 $ 187 $ 179 $ 706 $ 712 Sales $ 1,942 $ 2,280 $ 2,548 $ 2,191 $ 2,138 $ 1,890 $ 1,801 $ 1,675 $ 8,961 $ 7,504 Adjusted EBITDA Margin 7.9% 6.3% 8.0% 9.4% 8.2% 9.0% 10.4% 10.7% 7.9% 9.5% Arconic’s definition of Adjusted EBITDA (Earnings before interest, taxes, depreciation, and amortization) is net margin plus an add-back for the following items: Provision for depreciation and amortization; Stock-based compensation; Metal price lag (see footnote 4); Unrealized (gains) losses on mark-to-market hedging instruments and derivatives (see below); and Other special items. Net margin is equivalent to Sales minus the following items: Cost of goods sold; Selling, general administrative, and other expenses; Research and development expenses; and Provision for depreciation and amortization. Special items are composed of restructuring and other charges, discrete income tax items, and other items as deemed appropriate by management. There can be no assurances that additional special items will not occur in future periods. Adjusted EBITDA is a non-GAAP financial measure. Management believes that this measure is meaningful to investors because Adjusted EBITDA provides additional information with respect to Arconic’s operating performance and the Company’s ability to meet its financial obligations. The Adjusted EBITDA presented may not be comparable to similarly titled measures of other companies. Effective in the first quarter of 2022, management modified the Company’s definition of Adjusted EBITDA to exclude the impact of unrealized gains and losses on mark-to-market hedging instruments and derivatives. This modification was deemed appropriate as Arconic is considering entering into additional hedging instruments in future reporting periods if favorable conditions exist to mitigate cost inflation. Certain of these instruments may not qualify for hedge accounting resulting in unrealized gains and losses being recorded directly to Sales or Cost of goods sold, as appropriate (i.e., mark-to-market). Additionally, this change was also applied to derivatives that do not qualify for hedge accounting for consistency purposes. The Company does not have a regular practice of entering into contracts that are treated as derivatives for accounting purposes. Ultimately, this change was made to maintain the transparency and visibility of the underlying operating performance of Arconic. Prior to this change, the Company had a limited number of hedging instruments and derivatives that did not qualify for hedge accounting, the unrealized impact of which was not material to Arconic’s Adjusted EBITDA. Accordingly, periods prior to the effective date of this change were not recast to reflect this change. Reconciliation of Total Company Adjusted EBITDA

In the quarters ended September 30, 2022 and June 30, 2022, Other expenses (income), net includes an $11 loss and a $54 gain, respectively, for the remeasurement of monetary balances, primarily cash, related to the Company’s operations in Russia from rubles to the U.S. dollar. This loss and gain were the result of a significant weakening and strengthening, respectively, of the ruble against the U.S. dollar in the respective periods. In the year ended December 31, 2022, Restructuring and other charges includes a loss of $306 ($304 after-tax) (4Q22) related to the sale of the Company’s operations in Russia and an impairment charge of $92 (3Q22) related to a business review of Arconic’s Extrusions segment (see footnote 5 to the Reconciliation of Segment Adjusted EBITDA presented elsewhere in this Appendix), as well as a charge of $46 ($31-4Q22, $15-3Q22) related to the settlement of a portion of the Company’s U.S. defined benefit pension plan obligations as a result of elections by certain plan participants to receive lump-sum benefit payments. In the year ended December 31, 2021, Restructuring and other charges includes $584 related to the settlement of a portion of the Company’s U.S. defined benefit pension plan obligations as a result of the purchase of a group annuity contract ($549-2Q21) and elections by certain plan participants to receive lump-sum benefit payments ($11-4Q21, $5-3Q21, $19-2Q21). See footnote 4 to the Reconciliation of Segment Adjusted EBITDA presented elsewhere in this Appendix. Metal price lag represents the financial impact of the timing difference between when aluminum prices included in Sales are recognized and when aluminum purchase prices included in Cost of goods sold are realized. This adjustment aims to remove the effect of the volatility in metal prices and the calculation of this impact considers applicable metal hedging transactions. Other special items include the following: • for the quarter ended December 31, 2022, a charge related to environmental remediation matters ($9), costs related to several legal matters ($1), and other items ($4); • for the quarter ended September 30, 2022, a charge related to the Grasse River environmental remediation matter ($9), costs related to the Grenfell Tower legal matter ($3), and other items ($(2)); • for the quarter ended June 30, 2022, costs related to a new labor agreement with the United Steelworkers ($19), a charge for two environmental remediation matters ($9), costs related to several legal matters, including Grenfell Tower ($3) and other ($4), and other items ($4); • for the quarter ended March 31, 2022, costs related to several legal matters ($2), costs related to the packaging restart at the Tennessee rolling mill ($2), and other items ($1); • for the quarter ended December 31, 2021, costs related to several legal matters, including Grenfell Tower ($4) and other ($2), costs related to both an equipment fire and packaging restart at the Tennessee rolling mill ($5), and other items ($2); • for the quarter ended September 30, 2021, a partial reversal of a previously established reserve related to the Grasse River environmental remediation matter ($11), costs related to several legal matters ($7), and other items ($3); • for the quarter ended June 30, 2021, a write-down of inventory related to the idling of both the remaining operations at the Chandler (Arizona) extrusions facility and the casthouse operations at the Lafayette (Indiana) extrusions facility ($4) and costs related to several legal matters ($3); and • for the quarter ended March 31, 2021, costs related to several legal matters, including Grenfell Tower ($4) and other ($1). 16 Reconciliation of Total Company Adjusted EBITDA (cont’d)

Reconciliation of Total Company Adjusted EBITDA excluding Russian Operations 17 ($M) Quarter ended December 31, 2022 Quarter ended September 30, 2022 As reported Russia(1) As recast(1) As reported Russia(1) As recast(1) Net (loss) income attributable to Arconic Corporation $ (273) $ 7 $ (280) $ (65) $ 5 $ (70) Add: Net income attributable to noncontrolling interest – – – – – – Benefit for income taxes (36) – (36) (25) (2) (23) Other expenses (income), net(2) 32 (1) 33 27 11 16 Interest expense 26 – 26 27 – 27 Restructuring and other charges(3) 337 – 337 112 – 112 Provision for depreciation and amortization 56 3 53 59 6 53 Stock-based compensation (4) – (4) 6 – 6 Metal price lag(4) (8) – (8) (15) – (15) Unrealized losses on mark-to-market hedging instruments and derivatives 10 – 10 7 – 7 Other special items(5) 14 – 14 10 – 10 Adjusted EBITDA $ 154 $ 9 $ 145 $ 143 $ 20 $ 123 Sales $ 1,942 $ 116 $ 1,826 $ 2,280 $ 240 $ 2,040 Adjusted EBITDA Margin 7.9% 7.8% 7.9% 6.3% 8.3% 6.0% Quarter ended June 30, 2022 Quarter ended March 31, 2022 As reported Russia(1) As recast(1) As reported Russia(1) As recast(1) Net income attributable to Arconic Corporation $ 114 $ 57 $ 57 $ 42 $ 6 $ 36 Add: Net income attributable to noncontrolling interest 1 1 – – – – Provision for income taxes 38 17 21 12 2 10 Other (income) expenses, net(2) (35) (58) 23 17 4 13 Interest expense 26 – 26 25 – 25 Restructuring and other charges(3) 2 – 2 5 – 5 Provision for depreciation and amortization 62 7 55 60 6 54 Stock-based compensation 8 – 8 5 – 5 Metal price lag(4) (30) – (30) 36 – 36 Unrealized gains on mark-to-market hedging instruments and derivatives (21) – (21) (2) – (2) Other special items(5) 39 – 39 5 – 5 Adjusted EBITDA $ 204 $ 24 $ 180 $ 205 $ 18 $ 187 Sales $ 2,548 $ 314 $ 2,234 $ 2,191 $ 233 $ 1,958 Adjusted EBITDA Margin 8.0% 7.6% 8.1% 9.4% 7.7% 9.6%
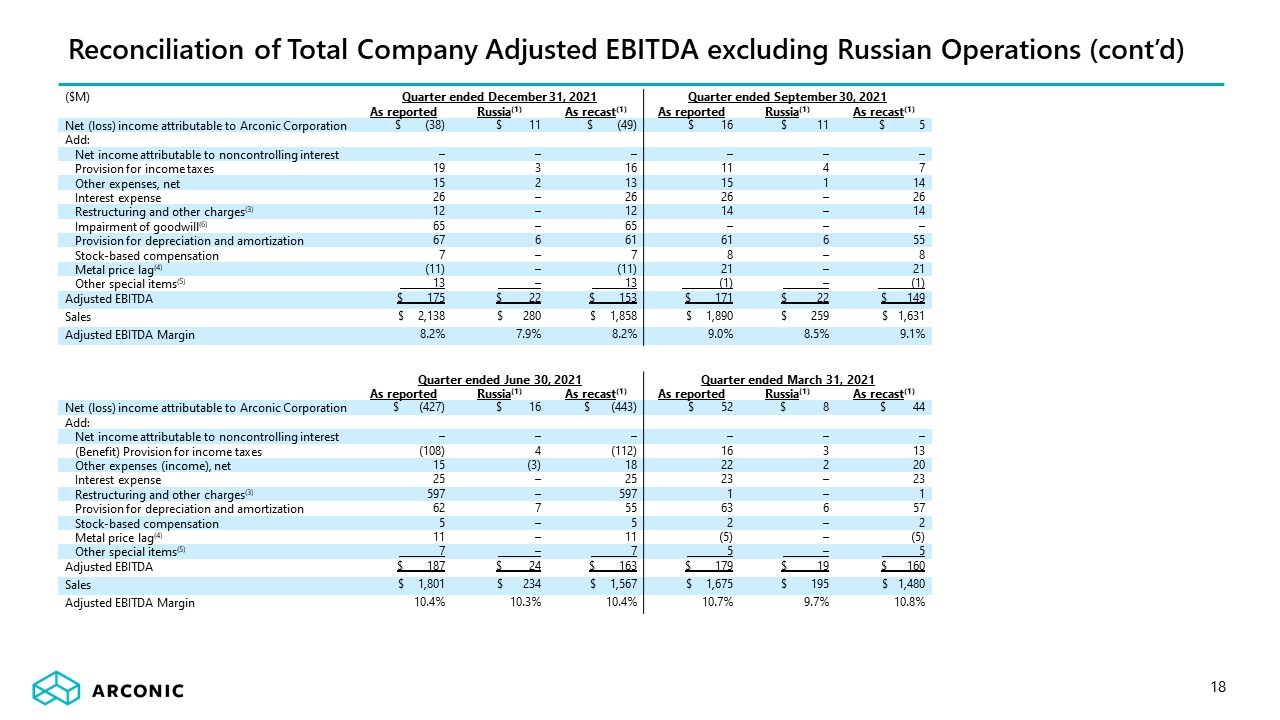
Reconciliation of Total Company Adjusted EBITDA excluding Russian Operations (cont’d) 18 ($M) Quarter ended December 31, 2021 Quarter ended September 30, 2021 As reported Russia(1) As recast(1) As reported Russia(1) As recast(1) Net (loss) income attributable to Arconic Corporation $ (38) $ 11 $ (49) $ 16 $ 11 $ 5 Add: Net income attributable to noncontrolling interest – – – – – – Provision for income taxes 19 3 16 11 4 7 Other expenses, net 15 2 13 15 1 14 Interest expense 26 – 26 26 – 26 Restructuring and other charges(3) 12 – 12 14 – 14 Impairment of goodwill(6) 65 – 65 – – – Provision for depreciation and amortization 67 6 61 61 6 55 Stock-based compensation 7 – 7 8 – 8 Metal price lag(4) (11) – (11) 21 – 21 Other special items(5) 13 – 13 (1) – (1) Adjusted EBITDA $ 175 $ 22 $ 153 $ 171 $ 22 $ 149 Sales $ 2,138 $ 280 $ 1,858 $ 1,890 $ 259 $ 1,631 Adjusted EBITDA Margin 8.2% 7.9% 8.2% 9.0% 8.5% 9.1% Quarter ended June 30, 2021 Quarter ended March 31, 2021 As reported Russia(1) As recast(1) As reported Russia(1) As recast(1) Net (loss) income attributable to Arconic Corporation $ (427) $ 16 $ (443) $ 52 $ 8 $ 44 Add: Net income attributable to noncontrolling interest – – – – – – (Benefit) Provision for income taxes (108) 4 (112) 16 3 13 Other expenses (income), net 15 (3) 18 22 2 20 Interest expense 25 – 25 23 – 23 Restructuring and other charges(3) 597 – 597 1 – 1 Provision for depreciation and amortization 62 7 55 63 6 57 Stock-based compensation 5 – 5 2 – 2 Metal price lag(4) 11 – 11 (5) – (5) Other special items(5) 7 – 7 5 – 5 Adjusted EBITDA $ 187 $ 24 $ 163 $ 179 $ 19 $ 160 Sales $ 1,801 $ 234 $ 1,567 $ 1,675 $ 195 $ 1,480 Adjusted EBITDA Margin 10.4% 10.3% 10.4% 10.7% 9.7% 10.8%

Reconciliation of Total Company Adjusted EBITDA excluding Russian Operations (cont’d) 19 ($M) Year ended December 31, 2022 Year ended December 31, 2021 As reported Russia(1) As recast(1) As reported Russia(1) As recast(1) Net (loss) income attributable to Arconic Corporation $ (182) $ 75 $ (257) $ (397) $ 46 $ (443) Add: Net income attributable to noncontrolling interest 1 1 – – – – (Benefit) Provision for income taxes (11) 17 (28) (62) 14 (76) Other expenses (income), net(2) 41 (44) 85 67 2 65 Interest expense 104 – 104 100 – 100 Restructuring and other charges(3) 456 – 456 624 – 624 Impairment of goodwill(6) – – – 65 – 65 Provision for depreciation and amortization 237 22 215 253 25 228 Stock-based compensation 15 – 15 22 – 22 Metal price lag(4) (17) – (17) 16 – 16 Unrealized gains on mark-to-market hedging instruments and derivatives (6) – (6) – – – Other special items(5) 68 – 68 24 – 24 Adjusted EBITDA $ 706 $ 71 $ 635 $ 712 $ 87 $ 625 Sales $ 8,961 $ 903 $ 8,058 $ 7,504 $ 968 $ 6,536 Adjusted EBITDA Margin 7.9% 7.9% 7.9% 9.5% 9.0% 9.6% Adjusted EBITDA is a non-GAAP financial measure. See Reconciliation of Total Company Adjusted EBITDA presented elsewhere in this Appendix for (i) the Company’s definition of Adjusted EBITDA and (ii) management’s rationale for the presentation of this non-GAAP measure. The “As reported” column presents a reconciliation of this non-GAAP measure to the most directly comparable GAAP measure. Adjusted EBITDA excluding Russia is also a non-GAAP financial measure. On November 15, 2022, Arconic completed the sale of 100% of its operations in Russia (see footnote 5 to the Reconciliation of Segment Adjusted EBITDA presented elsewhere in this Appendix). Accordingly, management believes the presentation of Adjusted EBITDA excluding Russia is meaningful to investors because such measure provides context as to the contribution made by the Company’s former operations in Russia relative to Arconic’s total financial performance. Additionally, this measure provides a historical basis with which to compare the Company’s financial performance in future periods. The “Russia” column presents the unaudited combined financial information of Arconic’s subsidiaries that held the Company’s former operations in Russia prepared from the historical accounting records of these legal entities. This information is not equivalent to that which would be presented as consolidated financial information prepared in accordance with accounting principles generally accepted in the United States of America if these subsidiaries were to be presented as a standalone consolidated reporting entity. Other amounts related to Arconic’s former operations in Russia recorded in the historical accounting records of other legal entities included in the Company’s consolidated group, such as the loss on the sale of the previously mentioned former subsidiaries recorded by the direct parent company of these legal entities, were presented in the “As recast” column. However, the amount presented as Adjusted EBITDA excluding Russia is the same whether these other amounts related to Arconic’s former operations in Russia are presented in the “Russia” column or the “As recast” column. The amounts in the “As recast” column are equal to the amounts in the “As reported” column less the amounts in the “Russia” column. Consequently, there are limitations in the usefulness of the amounts presented in the “As recast” column for Net (loss) income attributable to Arconic Corporation and (Benefit) Provision for income taxes. For example, the (Benefit) Provision for income taxes would need to be recalculated on a “without” approach to consider the consolidated company excluding the former operations in Russia, the impact of which may extend beyond subtracting the amount for (Benefit) Provision for income taxes presented in the “Russia” column from the consolidated amount in the “As reported” column. Conversely, the amount presented for Adjusted EBITDA excluding Russia does not contain any such limitations. See footnote 1 to the Reconciliation of Total Company Adjusted EBITDA presented elsewhere in this Appendix. See footnote 2 to the Reconciliation of Total Company Adjusted EBITDA presented elsewhere in this Appendix. See footnote 4 to the Reconciliation of Total Company Adjusted EBITDA presented elsewhere in this Appendix. See footnote 5 to the Reconciliation of Total Company Adjusted EBITDA presented elsewhere in this Appendix. See footnote 4 to the Reconciliation of Segment Adjusted EBITDA presented elsewhere in this Appendix.

20 Adjusted EBITDA to Free Cash Flow Bridge ($M) Quarter ended Quarter ended Quarter ended December 31, 2022 September 30, 2022 June 30, 2022 March 31, 2022 December 31, 2021 September 30, 2021 June 30, 2021 March 31, 2021 Adjusted EBITDA(1) $154 $143 $204 $205 $175 $171 $187 $179 Change in working capital(2) 65 2 (49) (200) 11 (126) (51) (230) Cash payments for: Environmental remediation (4) (1) (2) (4) (40) (23) (4) (17) Pension contributions(3) (9) (9) (9) (4) (2) (3) (252) (201) Other postretirement benefits (7) (7) (8) (8) (10) (9) (10) (10) Restructuring actions – (2) (1) (2) (4) (2) (4) (5) Interest (24) (30) (23) (29) (22) (28) (22) (18) Income taxes 1 (3) (23) (4) (10) (4) (6) (6) Capital expenditures (70) (47) (33) (95) (61) (51) (44) (28) Other(4) 12 (2) 73 (57) (2) (18) (5) 14 Free Cash Flow(5) $118 $44 $129 $(198) $35 $(93) $(211) $(322) Adjusted EBITDA is a non-GAAP financial measure. See Reconciliation of Total Company Adjusted EBITDA presented elsewhere in this Appendix for (i) Arconic’s definition of Adjusted EBITDA, (ii) management’s rationale for the presentation of this non-GAAP measure, and (iii) a reconciliation of this non-GAAP measure to the most directly comparable GAAP measure. Arconic’s definition of working capital is Receivables plus Inventories less Accounts payable, trade. In January 2021, the Company contributed a total of $200 to its two funded U.S. defined benefit pension plans, comprised of the estimated minimum required funding for 2021 of $183 and an additional $17. In April 2021, the Company contributed a total of $250 to its two funded U.S. defined benefit pension plans to maintain the funding level of the remaining plan obligations not transferred under a group annuity contract. Other includes the impact of metal price lag as follows: 4Q22-$8; 3Q22-$15; 2Q22-$30; 1Q22-$(36); 4Q21-$11; 3Q21-$(21); 2Q21-$(11); and 1Q21-$5. See footnote 4 in Reconciliation of Total Company Adjusted EBITDA presented elsewhere in this Appendix for additional information on metal price lag. Arconic’s definition of Free Cash Flow is Cash from operations less capital expenditures. Free Cash Flow is a non-GAAP financial measure. Management believes that this measure is meaningful to investors because management reviews cash flows generated from operations after taking into consideration capital expenditures, which are both necessary to maintain and expand the Company’s asset base and expected to generate future cash flows from operations. It is important to note that Free Cash Flow does not represent the residual cash flow available for discretionary expenditures since other non-discretionary expenditures, such as mandatory debt service requirements, are not deducted from the measure. 4Q22: Cash provided from operations of $188 less capital expenditures of $70 = free cash flow of $118 3Q22: Cash provided from operations of $91 less capital expenditures of $47 = free cash flow of $44 2Q22: Cash provided from operations of $162 less capital expenditures of $33 = free cash flow of $129 1Q22: Cash used for operations of $(103) less capital expenditures of $95 = free cash flow of $(198) 4Q21: Cash provided from operations of $96 less capital expenditures of $61 = free cash flow of $35 3Q21: Cash used for operations of $(42) less capital expenditures of $51 = free cash flow of $(93) 2Q21: Cash used for operations of $(167) less capital expenditures of $44 = free cash flow of $(211) 1Q21: Cash used for operations of $(294) less capital expenditures of $28 = free cash flow of $(322)

Reconciliation of Organic Revenue by End Market Organic revenue is a non-GAAP financial measure. Management believes this measure is meaningful to investors as it presents revenue on a comparable basis for all periods presented due to the impact of divestitures, changes in aluminum prices and foreign currency fluctuations relative to the prior year period. 21 ($M) Ground Building and Industrial and 4Q21 Transportation Construction Aerospace Packaging Other Total Revenue $797 $333 $180 $397 $431 $2,138 Less: Sales - Samara 2 17 15 207 39 280 Organic Revenue $795 $316 $165 $190 $392 $1,858 4Q22 Revenue $707 $340 $252 $283 $366 $1,948 Less: Sales - Samara 0 6 11 75 24 116 Aluminum price impact (86) (10) (15) (12) 88 (35) Foreign currency impact (10) (9) (2) (1) (9) (31) Organic Revenue $803 $353 $258 $221 $263 $1,898 ($M) Ground Building and Industrial and FY21 Transportation Construction Aerospace Packaging Other Total Revenue $2,799 $1,255 $631 $1,217 $1,602 $7,504 Less: Sales - Samara 2 17 15 207 39 280 Organic Revenue $2,797 $1,238 $616 $1,010 $1,563 $7,224 FY22 Revenue $3,119 $1,522 $959 $1,603 $1,764 $8,967 Less: Sales - Samara 0 6 11 75 24 116 Aluminum price impact 266 73 39 187 404 969 Foreign currency impact (26) (41) 1 (2) (15) (83) Organic Revenue $2,879 $1,484 $908 $1,343 $1,351 $7,965
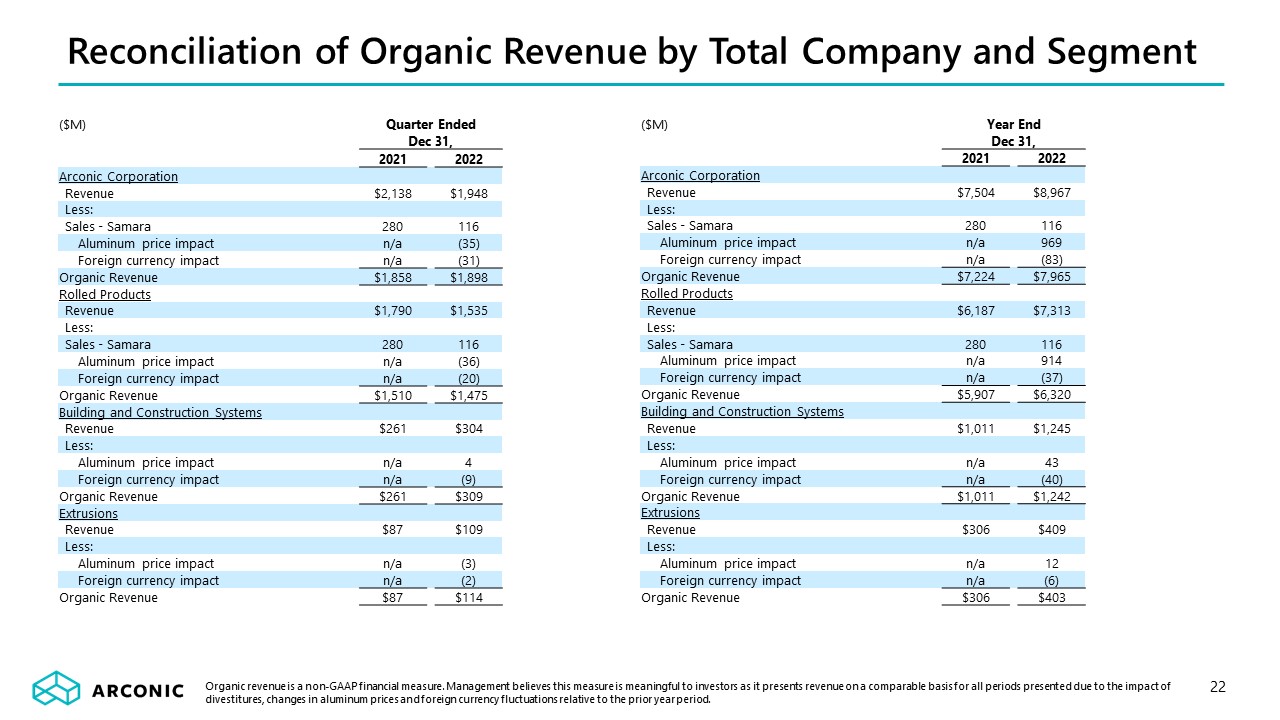
Organic revenue is a non-GAAP financial measure. Management believes this measure is meaningful to investors as it presents revenue on a comparable basis for all periods presented due to the impact of divestitures, changes in aluminum prices and foreign currency fluctuations relative to the prior year period. 22 ($M) Quarter Ended Dec 31, 2021 2022 Arconic Corporation Revenue $2,138 $1,948 Less: Sales - Samara 280 116 Aluminum price impact n/a (35) Foreign currency impact n/a (31) Organic Revenue $1,858 $1,898 Rolled Products Revenue $1,790 $1,535 Less: Sales - Samara 280 116 Aluminum price impact n/a (36) Foreign currency impact n/a (20) Organic Revenue $1,510 $1,475 Building and Construction Systems Revenue $261 $304 Less: Aluminum price impact n/a 4 Foreign currency impact n/a (9) Organic Revenue $261 $309 Extrusions Revenue $87 $109 Less: Aluminum price impact n/a (3) Foreign currency impact n/a (2) Organic Revenue $87 $114 ($M) Year End Dec 31, 2021 2022 Arconic Corporation Revenue $7,504 $8,967 Less: Sales - Samara 280 116 Aluminum price impact n/a 969 Foreign currency impact n/a (83) Organic Revenue $7,224 $7,965 Rolled Products Revenue $6,187 $7,313 Less: Sales - Samara 280 116 Aluminum price impact n/a 914 Foreign currency impact n/a (37) Organic Revenue $5,907 $6,320 Building and Construction Systems Revenue $1,011 $1,245 Less: Aluminum price impact n/a 43 Foreign currency impact n/a (40) Organic Revenue $1,011 $1,242 Extrusions Revenue $306 $409 Less: Aluminum price impact n/a 12 Foreign currency impact n/a (6) Organic Revenue $306 $403 Reconciliation of Organic Revenue by Total Company and Segment

2023 Guidance: EBITDA to Free Cash Flow Walk ($M) 2023E Adjusted EBITDA $650-$700 Pension contributions and other postretirement benefits, net of service cost ~(55) Environmental remediation ~(25) Interest ~(105) Income taxes and other ~(65) Sustaining capital expenditures ~(175) Free cash flow before investment in growth ~225-$275 Return-seeking capital expenditures ~(100) Working capital source(1) ~100 Free cash flow(2) ~$250 Working capital use includes impact of currency movements. As a result, reported change in working capital in the Adjusted EBITDA to Free Cash Flow Bridge may differ from forecast above depending on currency movements in the year. Assumes average LME aluminum price of $2,400/mt and Midwest Premium of $600/mt. 23
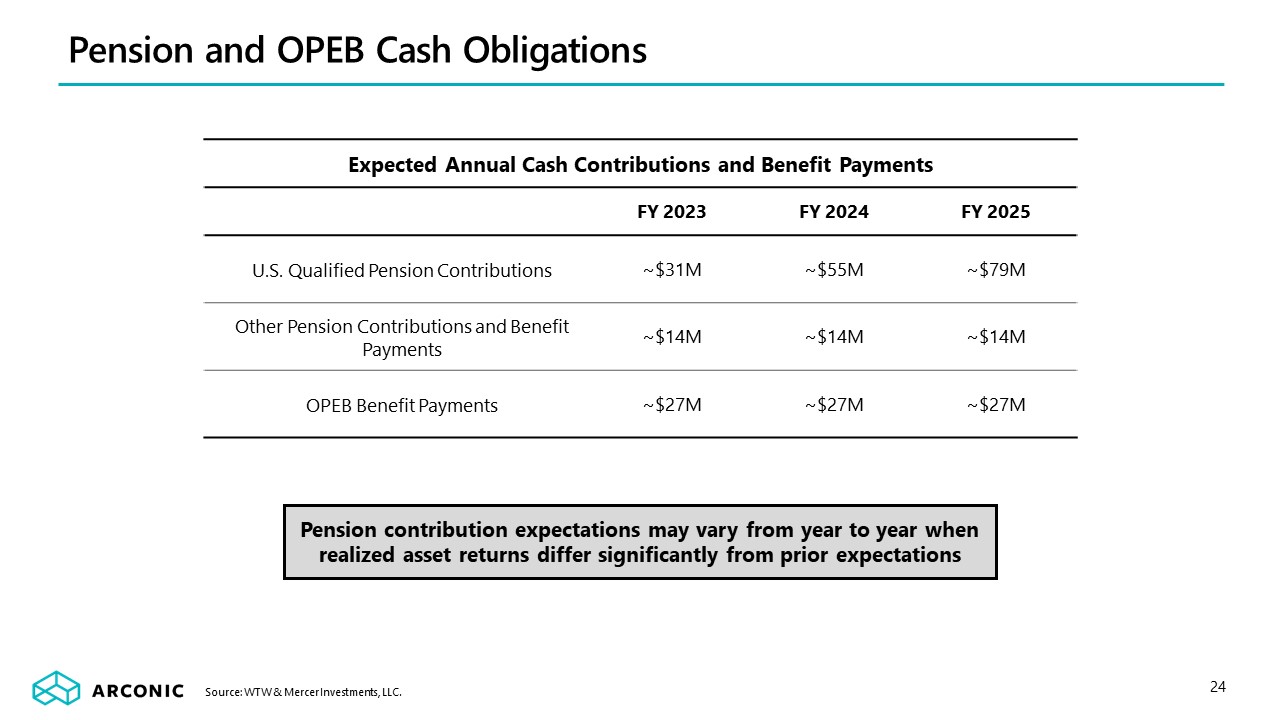
Pension and OPEB Cash Obligations FY 2023 FY 2024 FY 2025 U.S. Qualified Pension Contributions ~$31M ~$55M ~$79M Other Pension Contributions and Benefit Payments ~$14M ~$14M ~$14M OPEB Benefit Payments ~$27M ~$27M ~$27M Source: WTW & Mercer Investments, LLC. Expected Annual Cash Contributions and Benefit Payments 24 Pension contribution expectations may vary from year to year when realized asset returns differ significantly from prior expectations