Exhibit 99.2

SOC Telemed / HCMC Investor Presentation JULY 2020
2 Disclaimer This presentation (together with oral statements made in connection herewith, this “Presentation”) contains selected confidential information about Specialists On Call, Inc . (“SOC”) and Healthcare Merger Corp . (“HCMC”) . By participating in this Presentation, you expressly agree to keep confidential all otherwise non - public information disclosed by us, whether orally or in writing, during this Presentation or in these Presentation materials . You also agree not to distribute, disclose or use such information for any purpose, other than for the purpose of your firm’s participation in the potential financing and to return to SOC and HCMC, delete or destroy this Presentation upon request . You are also being advised that the United States securities laws restrict persons with material non - public information about a company from purchasing or selling securities of such company, or from communicating such information to any other person under circumstances in which it is reasonably foreseeable that such person is likely to purchase or sell such company’s securities on the basis of such information . This Presentation has been prepared to assist interested parties in making their own evaluation with respect to the contemplated business combination and for no other purpose . This Presentation relates to the potential financing of a portion of the contemplated transaction through a private placement of HCMC’s Class A common stock . This Presentation shall not constitute a “solicitation” as defined in Regulation 14 A under the Securities Exchange Act of 1934 , as amended (the “Exchange Act”) . Nothing herein should be construed as legal, financial, tax or other advice . You should consult your own advisers concerning any legal, financial, tax or other considerations concerning the opportunity described herein . The general explanations included in this Presentation cannot address, and are not intended to address, your specific investment objectives, financial situations or financial needs . This Presentation is not an offer, or a solicitation of an offer, to buy or sell any investment or other specific product . Any offering of securities (the “Securities”) will not be registered under the Securities Act of 1933 , as amended (the “Act”), and will be offered as a private placement to a limited number of institutional “accredited investors” as defined in Rule 501 (a)( 1 ), ( 2 ), ( 3 ) or ( 7 ) under the Act and “Institutional Accounts” as defined in FINRA Rule 4512 (c) . Accordingly, the Securities must continue to be held unless a subsequent disposition is exempt from the registration requirements of the Act . Investors should consult with their legal counsel as to the applicable requirements for a purchaser to avail itself of any exemption under the Act . The transfer of the Securities may also be subject to conditions set forth in an agreement under which they are to be issued . Investors should be aware that they might be required to bear the final risk of their investment for an indefinite period of time . Neither SOC nor HCMC is making an offer of the Securities in any state or territory where the offer is not permitted . NEITHER THE SECURITIES AND EXCHANGE COMMISSION NOR ANY STATE OR TERRITORIAL SECURITIES COMMISSION HAS APPROVED OR DISAPPROVED OF THE SECURITIES OR DETERMINED IF THIS PRESENTATION IS TRUTHFUL OR COMPLETE . Industry and Market Data . Information contained in this Presentation concerning SOC’s industry and the markets in which it operates, including SOC’s general expectations and market position, market opportunity and market size, is based on information from SOC management’s estimates and research, as well as from industry and general publications and research, surveys and studies conducted by third parties . In some cases, we may not expressly refer to the sources from which this information is derived . Management estimates are derived from industry and general publications and research, surveys and studies conducted by third parties and SOC’s knowledge of its industry and assumptions based on such information and knowledge, which we believe to be reasonable . In addition, assumptions and estimates of SOC’s and its industry’s future performance are necessarily subject to a high degree of uncertainty and risk due to a variety of factors . These and other factors could cause SOC’s future performance and actual market growth, opportunity and size and the like to differ materially from our assumptions and estimates . No representation or warranty, express or implied, is or will be given by SOC, HCMC or any of their affiliates, directors, officers, employees or advisers or any other person as to the accuracy or completeness of the information in this Presentation (including as to the accuracy or reasonableness of statements, estimates, targets, projections, assumptions or judgments) or any other written, oral or other communications transmitted or otherwise made available to any party in the course of its evaluation of a possible transaction . Accordingly, none of SOC, HCMC or any of their respective affiliates, directors, officers, employees or advisers or any other person shall be liable for any direct, indirect or consequential loss or damages suffered by any person as a result of relying on any statement in or omission from this Presentation and any such liability is expressly disclaimed . Trademarks . HCMC and SOC own or have rights to various trademarks, service marks and trade names that they use in connection with the operation of their respective businesses . This Presentation may also contain trademarks, service marks, trade names and copyrights of third parties, which are the property of their respective owners . The use or display of third parties’ trademarks, service marks, trade names or products in this Presentation is not intended to, and does not imply, a relationship with HCMC or SOC, or an endorsement or sponsorship by or of HCMC or SOC . Solely for convenience, the trademarks, service marks, trade names and copyrights referred to in this Presentation may appear without the TM, SM, ® or © symbols, but such references are not intended to indicate, in any way, that HCMC or SOC will not assert, to the fullest extent under applicable law, their rights or the right of the applicable licensor to these trademarks, service marks, trade names and copyrights . Use of Projections . This Presentation contains projected financial information with respect to SOC, including revenue, net income, bookings, gross margin, operating expenses, Adjusted EBITDA, Adjusted EBITDA Margin and Telemed IQ growth for 2020 - 2022 . Such projected financial information constitutes forward - looking information and is for illustrative purposes only and should not be relied upon as necessarily being indicative of future results . The assumptions and estimates underlying such projected financial information are inherently uncertain and are subject to a wide variety of significant business, economic, competitive and other risks and uncertainties that could cause actual results to differ materially from those contained in the prospective financial information . See “Forward - Looking Statements” below . Actual results may differ materially from the results contemplated by the projected financial information contained in this Presentation, and the inclusion of such information in this Presentation should not be regarded as a representation by any person that the results reflected in such projections will be achieved . Neither of HCMC’s or SOC’s independent auditors have audited, reviewed, compiled, or performed any procedures with respect to the projections for the purpose of their inclusion in this Presentation, and accordingly, neither of them expressed an opinion or provided any other form of assurance with respect thereto for the purpose of this Presentation .
3 Disclaimer (Cont’d) Use of Non - GAAP Financial Measures . The financial information and data contained in this Presentation is unaudited and does not conform to Regulation S - X promulgated under the Act . Accordingly, such information and data may not be included in, may be adjusted in or may be presented differently in, any proxy statement to be filed by HCMC with the Securities and Exchange Commission (the “SEC”) . Some of the financial information and data contained in this Presentation, such as Adjusted EBITDA and Adjusted EBITDA Margin, have not been prepared in accordance with United States generally accepted accounting principles (“GAAP”) . HCMC and SOC believe these non - GAAP measures of financial results provide useful information to management and investors regarding certain financial and business trends relating to SOC’s financial condition and results of operations . HCMC and SOC believe that the use of these non - GAAP financial measures provides an additional tool for investors to use in evaluating projected operating results and trends . Other companies may calculate these non - GAAP financial measures differently, and therefore such financial measures may not be directly comparable to similarly titled measures of other companies . Management does not consider these non - GAAP measures in isolation or as an alternative to financial measures determined in accordance with GAAP . The principal limitation of these non - GAAP financial measures is that they exclude significant expenses and income that are required by GAAP to be recorded in SOC’s financial statements . In addition, they are subject to inherent limitations as they reflect the exercise of judgments by management about which expense and income are excluded or included in determining these non - GAAP financial measures . In order to compensate for these limitations, management presents non - GAAP financial measures in connection with GAAP results which are included in the Appendix of this Presentation . Additional Information ; Participants in the Solicitation . If the contemplated business combination is pursued, HCMC will be required to file a preliminary and definitive proxy statement, which may include a registration statement, and other relevant documents with the SEC . Stockholders and other interested persons are urged to read the proxy statement and any other relevant documents filed with the SEC when they become available because they will contain important information about HCMC, SOC and the contemplated business combination . Stockholders will be able to obtain a free copy of the proxy statement (when filed), as well as other filings containing information about HCMC, SOC and the contemplated business combination, without charge, at the SEC’s website located at www . sec . gov . HCMC and its directors and executive officers and other persons may be deemed to be participants in the solicitations of proxies from HCMC’s stockholders in respect of the contemplated business combination and the other matters set forth in the definitive proxy statement . Information regarding HCMC’s directors and executive officers is available under the heading “Directors, Executive Officers and Corporate Governance” in its Annual Report on Form 10 - K for the year ended December 31 , 2019 , filed with the SEC on March 25 , 2020 . Additional information regarding the participants in the proxy solicitation and a description of their direct and indirect interests, by security holdings or otherwise, will be contained in the proxy statement relating to the contemplated business combination when it becomes available . This Presentation does not contain all the information that should be considered in the contemplated business combination . It is not intended to form any basis of any investment decision or any decision in respect to the contemplated business combination . The definitive proxy statement will be mailed to stockholders as of a record date to be established for voting on the contemplated business combination when it becomes available . Forward Looking Statements . This Presentation includes “forward - looking statements” within the meaning of the “safe harbor” provisions of the United States Private Securities Litigation Reform Act of 1995 . Forward - looking statements may be identified by the use of words such as “estimate,” “plan,” “potential,” “predict,” “project,” “forecast,” “intend,” “may,” “should,” “would,” “will,” “expect,” “continue,” “anticipate,” “believe,” “seek,” “target” or other similar expressions that predict or indicate future events or trends or that are not statements of historical matters . These forward - looking statements include, but are not limited to, statements regarding estimates and forecasts of other financial and performance metrics and projections of market opportunity and market share . These statements are based on various assumptions, whether or not identified in this Presentation, and on the current expectations of SOC’s and HCMC’s management and are not predictions of actual performance . These forward - looking statements are provided for illustrative purposes only and are not intended to serve as, and must not be relied on by any investor as, a guarantee, an assurance, a prediction or a definitive statement of fact or probability . Actual events and circumstances are difficult or impossible to predict and will differ from assumptions . Many actual events and circumstances are beyond the control of SOC and HCMC . These forward - looking statements are subject to a number of risks and uncertainties, including changes in business, market, financial, political and legal conditions ; the inability of the parties to successfully or timely consummate the proposed business combination, including the risk that any required regulatory approvals are not obtained, are delayed or are subject to unanticipated conditions that could adversely affect the combined company or the expected benefits of the proposed business combination or that the approval of the stockholders of HCMC or SOC is not obtained ; failure to realize the anticipated benefits of the proposed business combination ; risks relating to the uncertainty of the projected financial information with respect to SOC ; risks related to SOC’s business, adoption of its software platform and other matters ; the effects of competition on SOC’s future business ; the amount of redemption requests made by HCMC’s public stockholders ; the ability of HCMC or the combined company to issue equity or equity - linked securities in connection with the proposed business combination or in the future, and those factors discussed in HCMC’s Annual Report on Form 10 - K for the year ended December 31 , 2019 , and Quarterly Report on Form 10 - Q for the quarter ended March 31 , 2020 , in each case, under the heading “Risk Factors,” and other documents of HCMC filed, or to be filed, with the SEC, as well as in any materials made available to you in connection with this presentation . If any of these risks materialize or our assumptions prove incorrect, actual results could differ materially from the results implied by these forward - looking statements . There may be additional risks that neither HCMC nor SOC presently know or that HCMC and SOC currently believe are immaterial that could also cause actual results to differ from those contained in the forward - looking statements . In addition, forward - looking statements reflect HCMC’s and SOC’s expectations, plans or forecasts of future events and views as of the date of this Presentation . HCMC and SOC anticipate that subsequent events and developments will cause HCMC’s and SOC’s assessments to change . However, while HCMC and SOC may elect to update these forward - looking statements at some point in the future, HCMC and SOC specifically disclaim any obligation to do so . These forward - looking statements should not be relied upon as representing HCMC’s and SOC’s assessments as of any date subsequent to the date of this Presentation . Accordingly, undue reliance should not be placed upon the forward - looking statements . Neither SOC, HCMC, nor any of their respective affiliates have any obligation to update this Presentation unless required by applicable law . Although all information and opinions expressed in this Presentation were obtained from sources believed to be reliable and in good faith, no representation or warranty, express or implied, is made as to its accuracy or completeness . This Presentation contains preliminary information only, is subject to change at any time and is not, and should not be assumed to be, complete or to constitute all the information necessary to adequately make an informed decision regarding SOC and HCMC . Recipients of this Presentation should each make their own evaluation of SOC and of the relevance and adequacy of the information and should make such other investigations as they deem necessary .
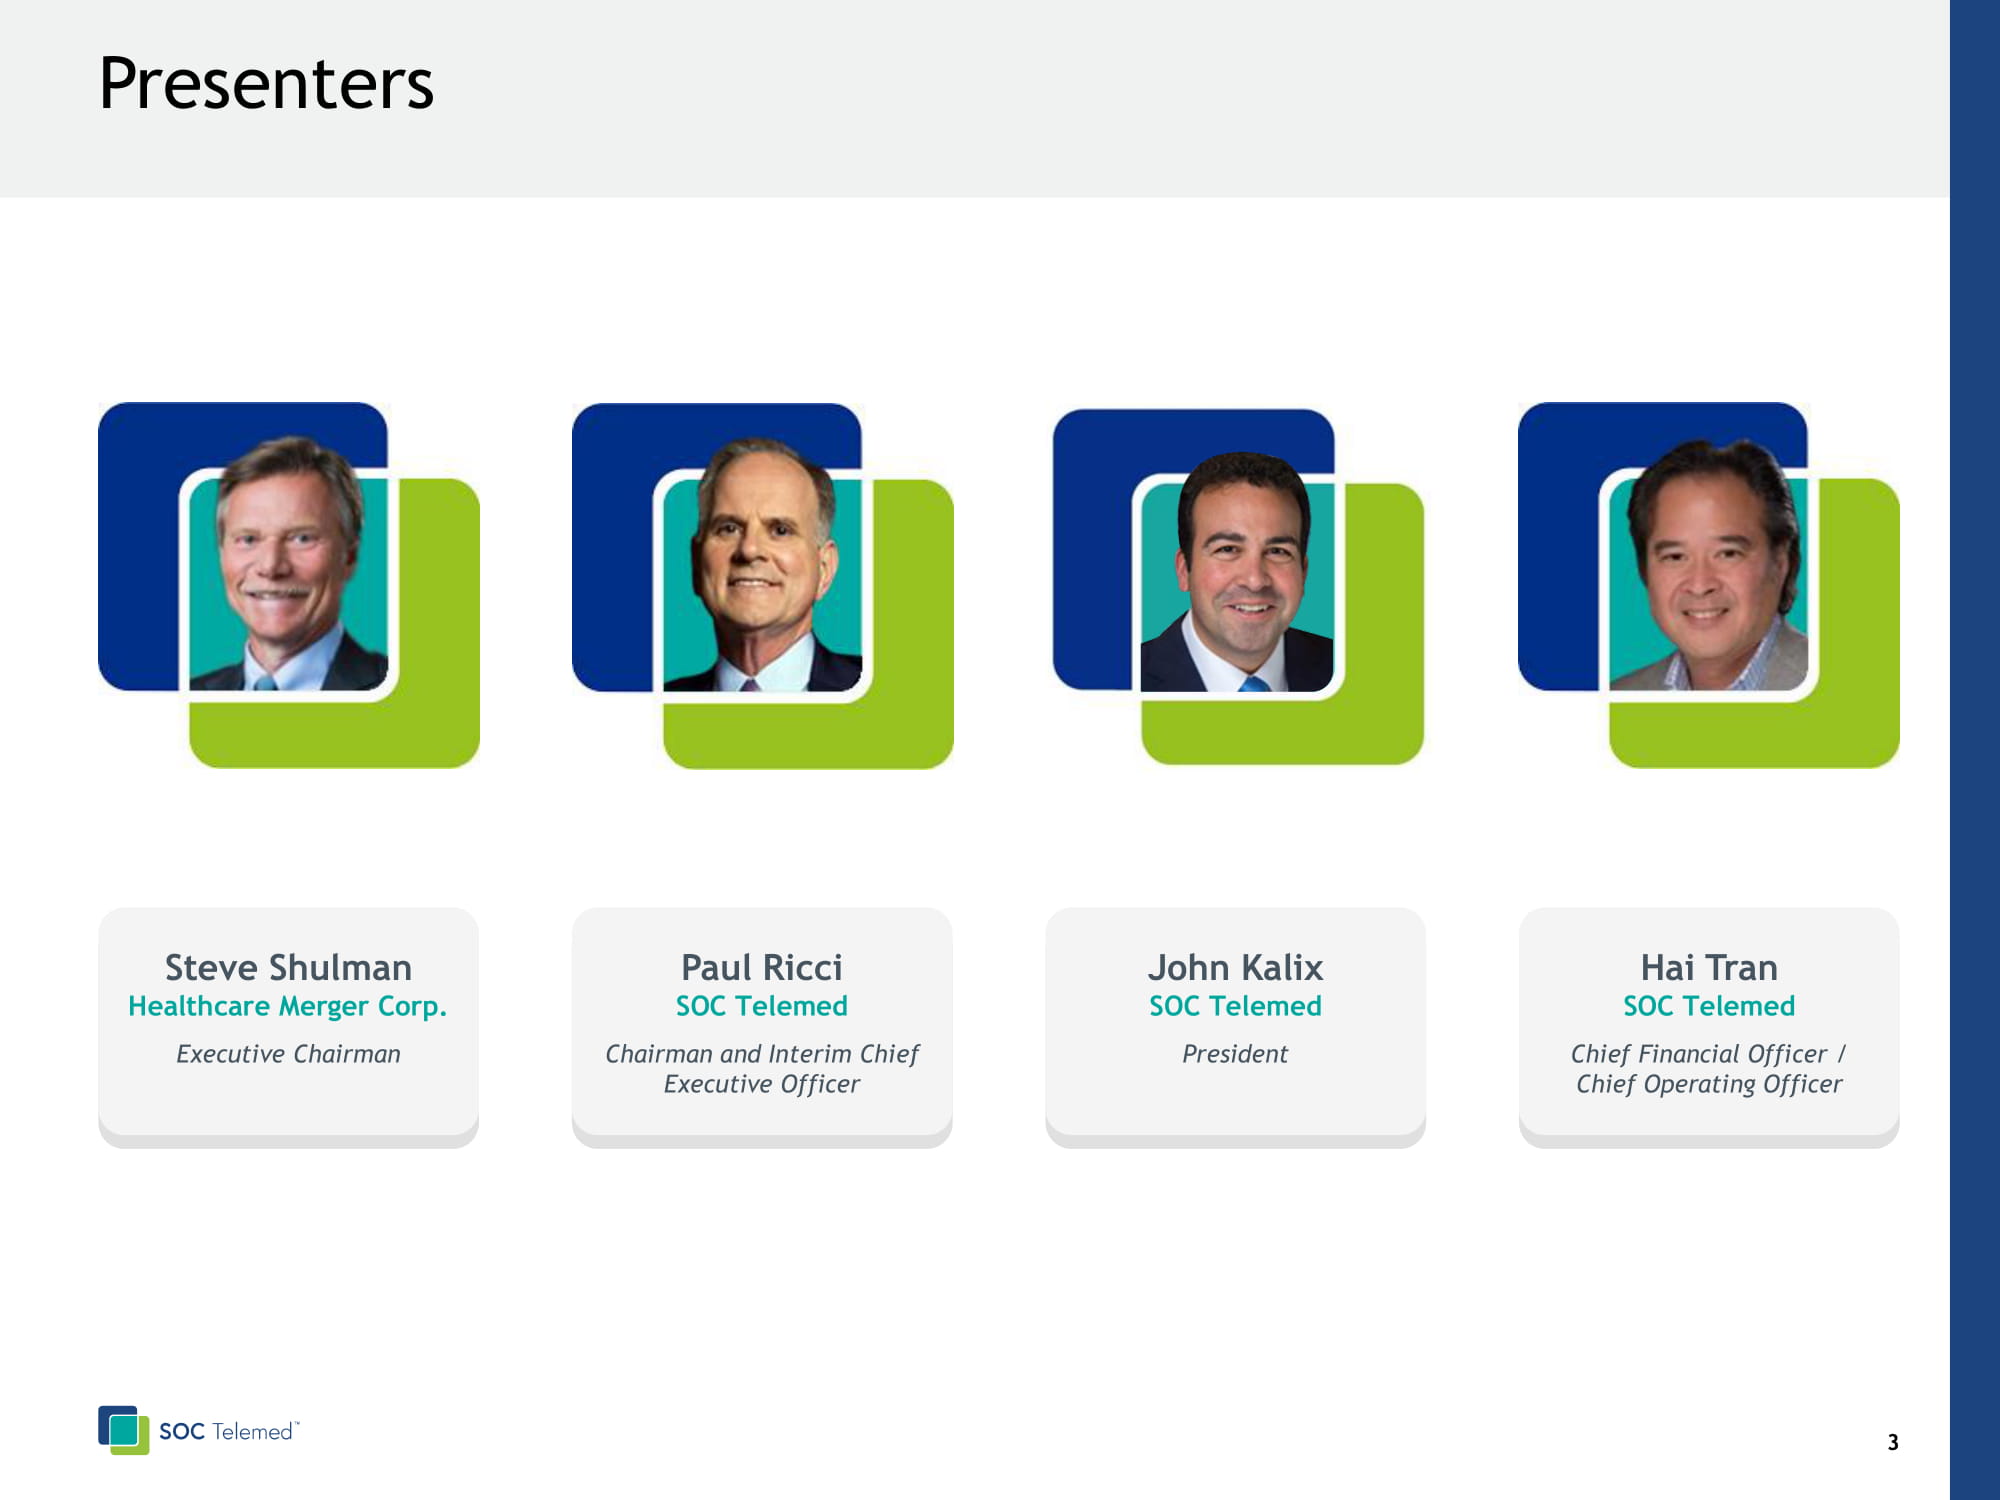
4 Presenters John Kalix SOC Telemed President Hai Tran SOC Telemed Chief Financial Officer / Chief Operating Officer Steve Shulman Healthcare Merger Corp. Executive Chairman Paul Ricci SOC Telemed Chairman and Interim Chief Executive Officer
5 HCMC Investment Highlights Compelling Market Opportunity Scaled , Differentiated Acute Care Telemedicine Platform Substantial Opportunities T o Expand And Grow Attractive Financial Profile Powerful Partnership B etween SOC And HCMC

6 Agenda I. Company Overview II. Investment Highlights III. Financial Overview Appendix

Company Overview
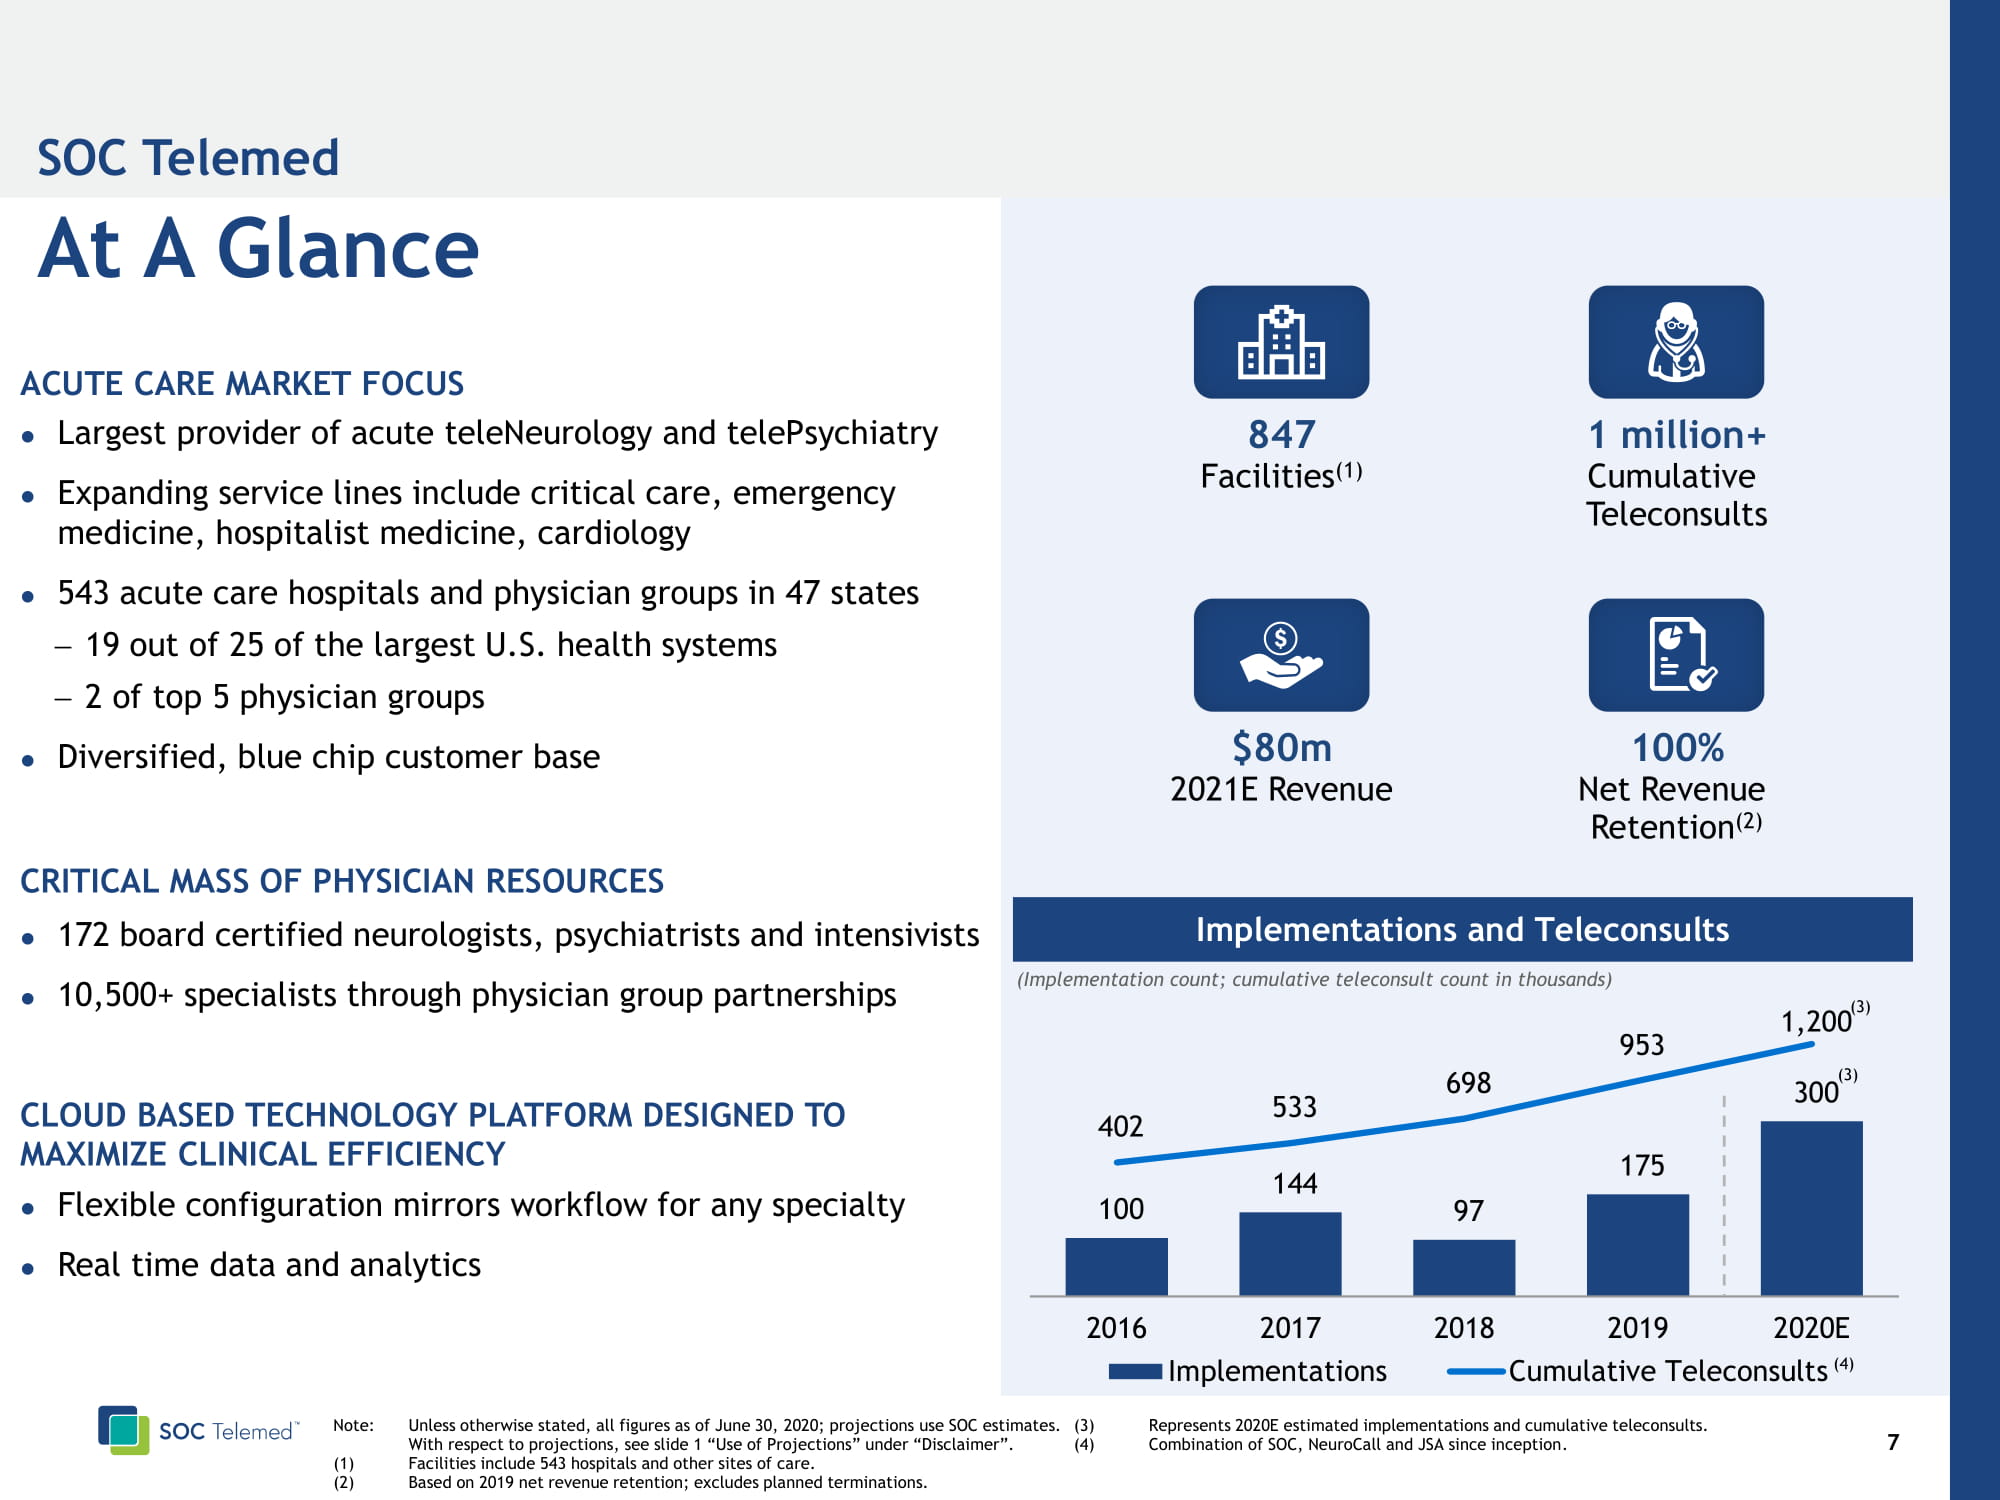
8 ACUTE CARE MARKET FOCUS Largest provider of acute teleNeurology and telePsychiatry Expanding service lines include critical care, emergency medicine, hospitalist medicine, cardiology 543 acute care hospitals and physician groups in 47 states − 19 out of 25 of the largest U.S. health systems − 2 of top 5 physician groups Diversified , blue chip customer base CRITICAL MASS OF PHYSICIAN RESOURCES 172 board certified neurologists , psychiatrists and intensivists 10,500+ specialists through physician group partnerships CLOUD BASED TECHNOLOGY PLATFORM DESIGNED TO MAXIMIZE CLINICAL EFFICIENCY Flexible configuration mirrors workflow for any specialty Real time data and analytics At A Glance SOC Telemed 100 144 97 175 300 402 533 698 953 1,200 2016 2017 2018 2019 2020E Implementations Cumulative Teleconsults Implementations and Teleconsults Note: Unless otherwise stated, all figures as of June 30, 2020; projections use SOC estimates . With respect to projections, see slide 1 “Use of Projections” under “Disclaimer”. (1) Facilities include 543 hospitals and other sites of care. (2) Based on 2019 net revenue retention; excludes planned terminations. (3) Represents 2020E estimated implementations and cumulative teleconsults. (4) Combination of SOC, NeuroCall and JSA since inception . (3) (4) 847 Facilities (1) $80m 2021E Revenue 100% Net Revenue Retention (2) 1 million+ Cumulative Teleconsults (Implementation count; cumulative teleconsult count in thousands) (3)
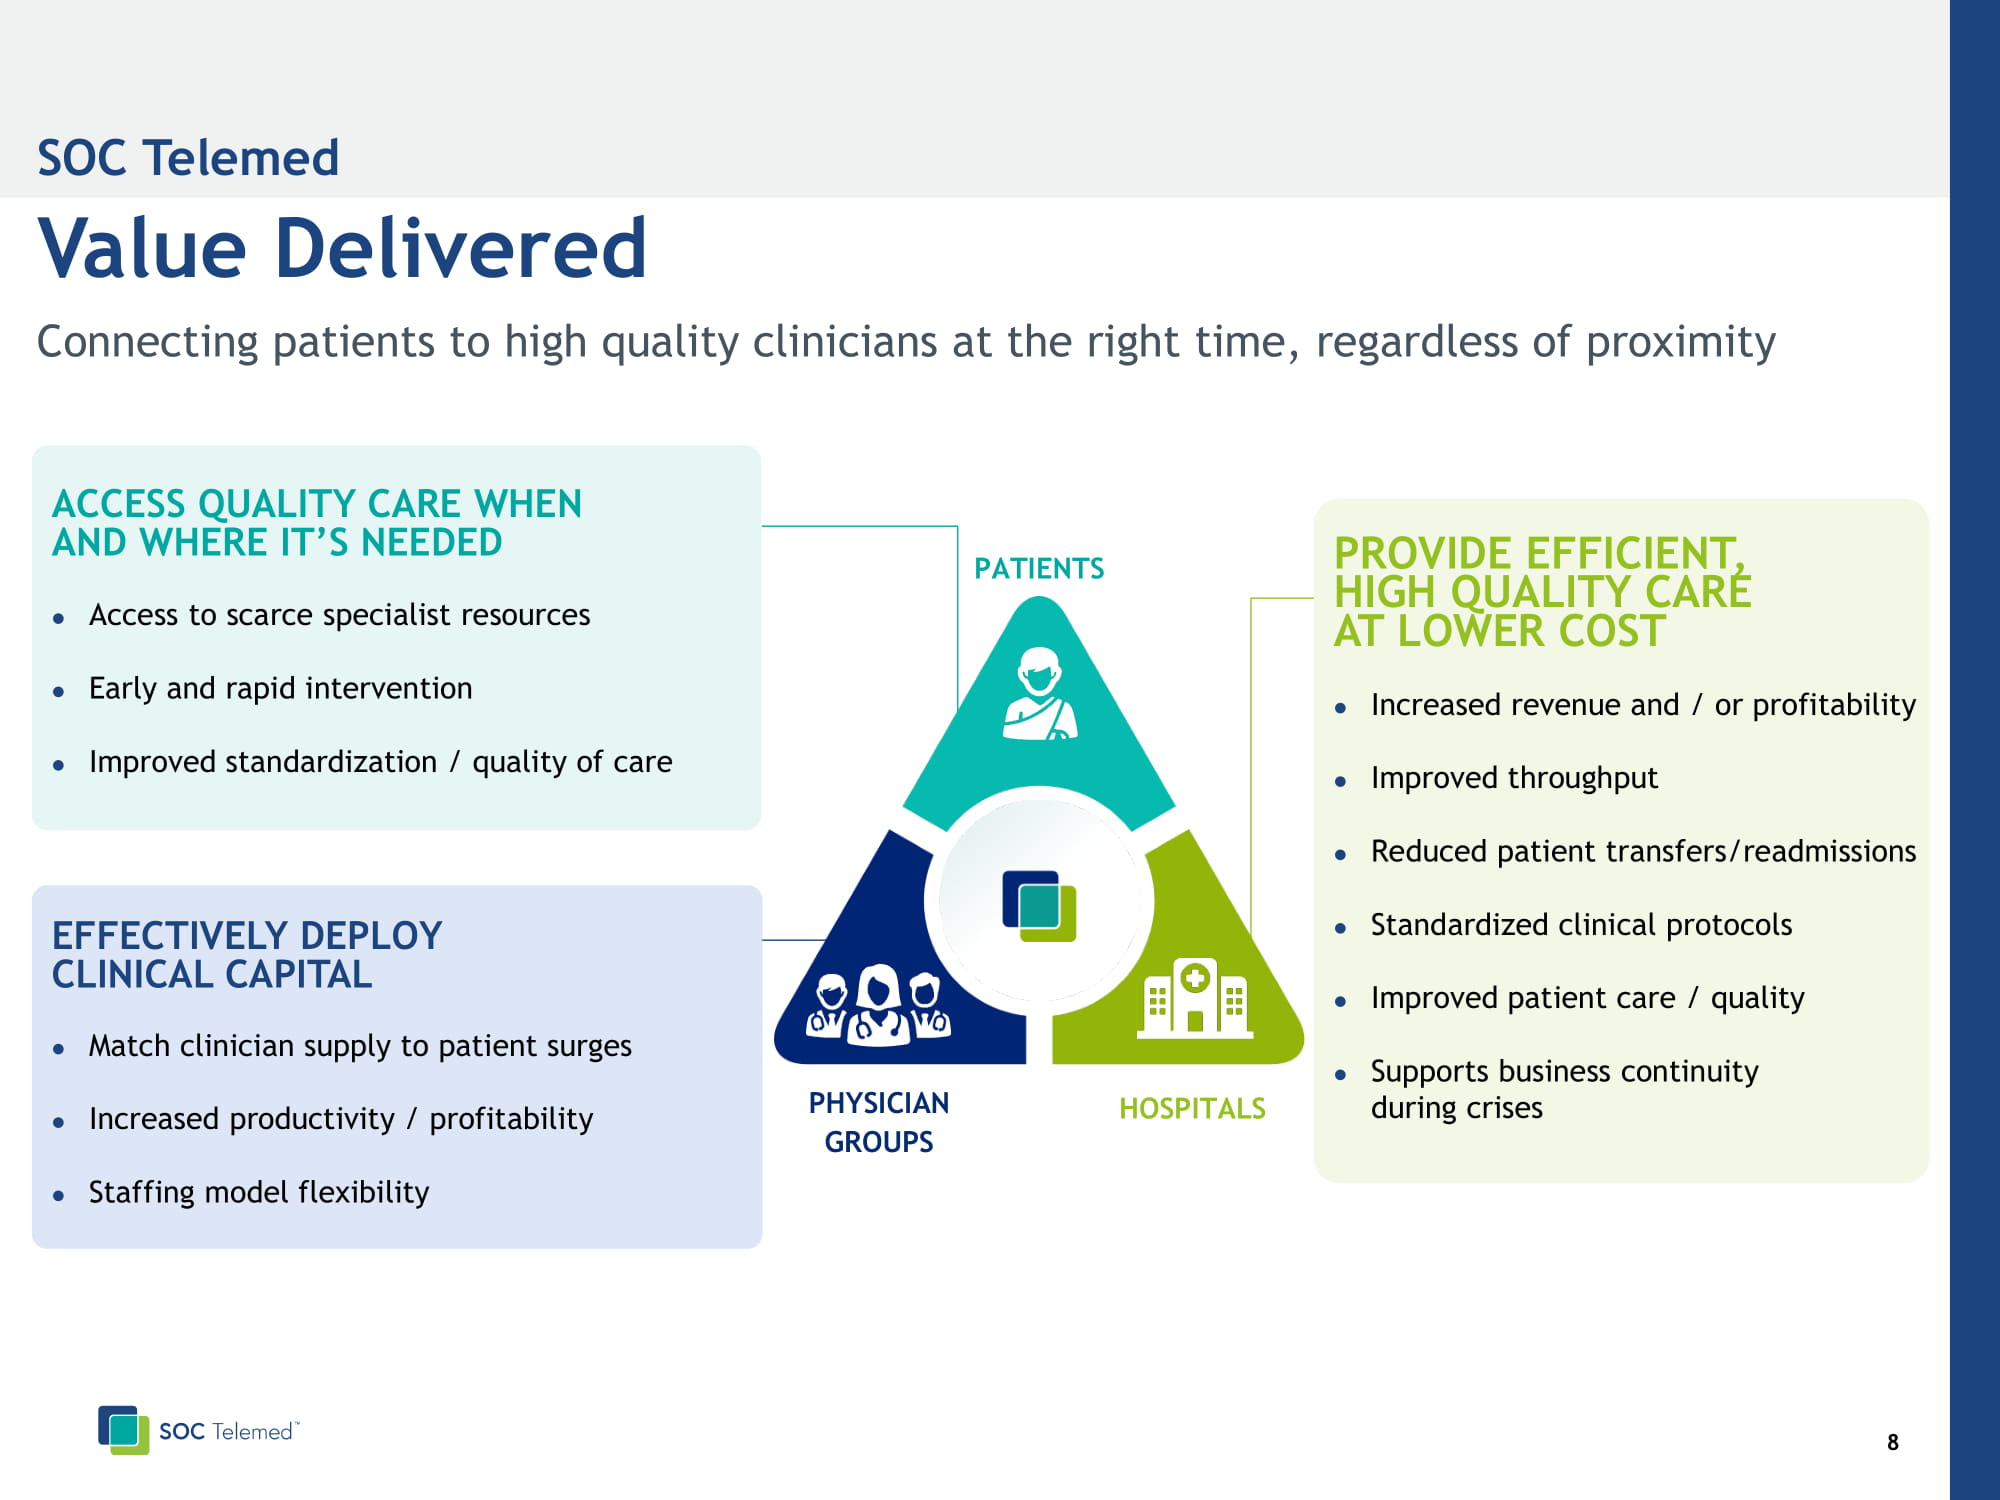
9 Connecting patients to high quality clinicians at the right time, regardless of proximity Increased revenue and / or profitability Improved throughput Reduced patient transfers/readmissions Standardized clinical protocols Improved patient care / quality Supports business continuity during crises PROVIDE EFFICIENT, HIGH QUALITY CARE AT LOWER COST Access to scarce specialist resources Early and rapid intervention Improved standardization / quality of care Match clinician supply to patient surges Increased productivity / profitability Staffing model flexibility EFFECTIVELY DEPLOY CLINICAL CAPITAL ACCESS QUALITY CARE WHEN AND WHERE IT’S NEEDED Value Delivered SOC Telemed PHYSICIAN GROUPS HOSPITALS PATIENTS

PATIENT / HOSPITAL HOSPITAL SOC COORDINATION CENTER TELECLINICAN Patient arrives at hospital Hospital requests consult Client - configurable d ecision engine matches patient and clinician. SOC queues, assigns, & dispatches request teleClinician engages with patient and / or care team and documents consult Telemed IQ sends consult note seamlessly into patient medical record in hospital EMR Robust reporting package provides actionable insights across every step Supports Complex Hospital Workflows Telemed IQ 10
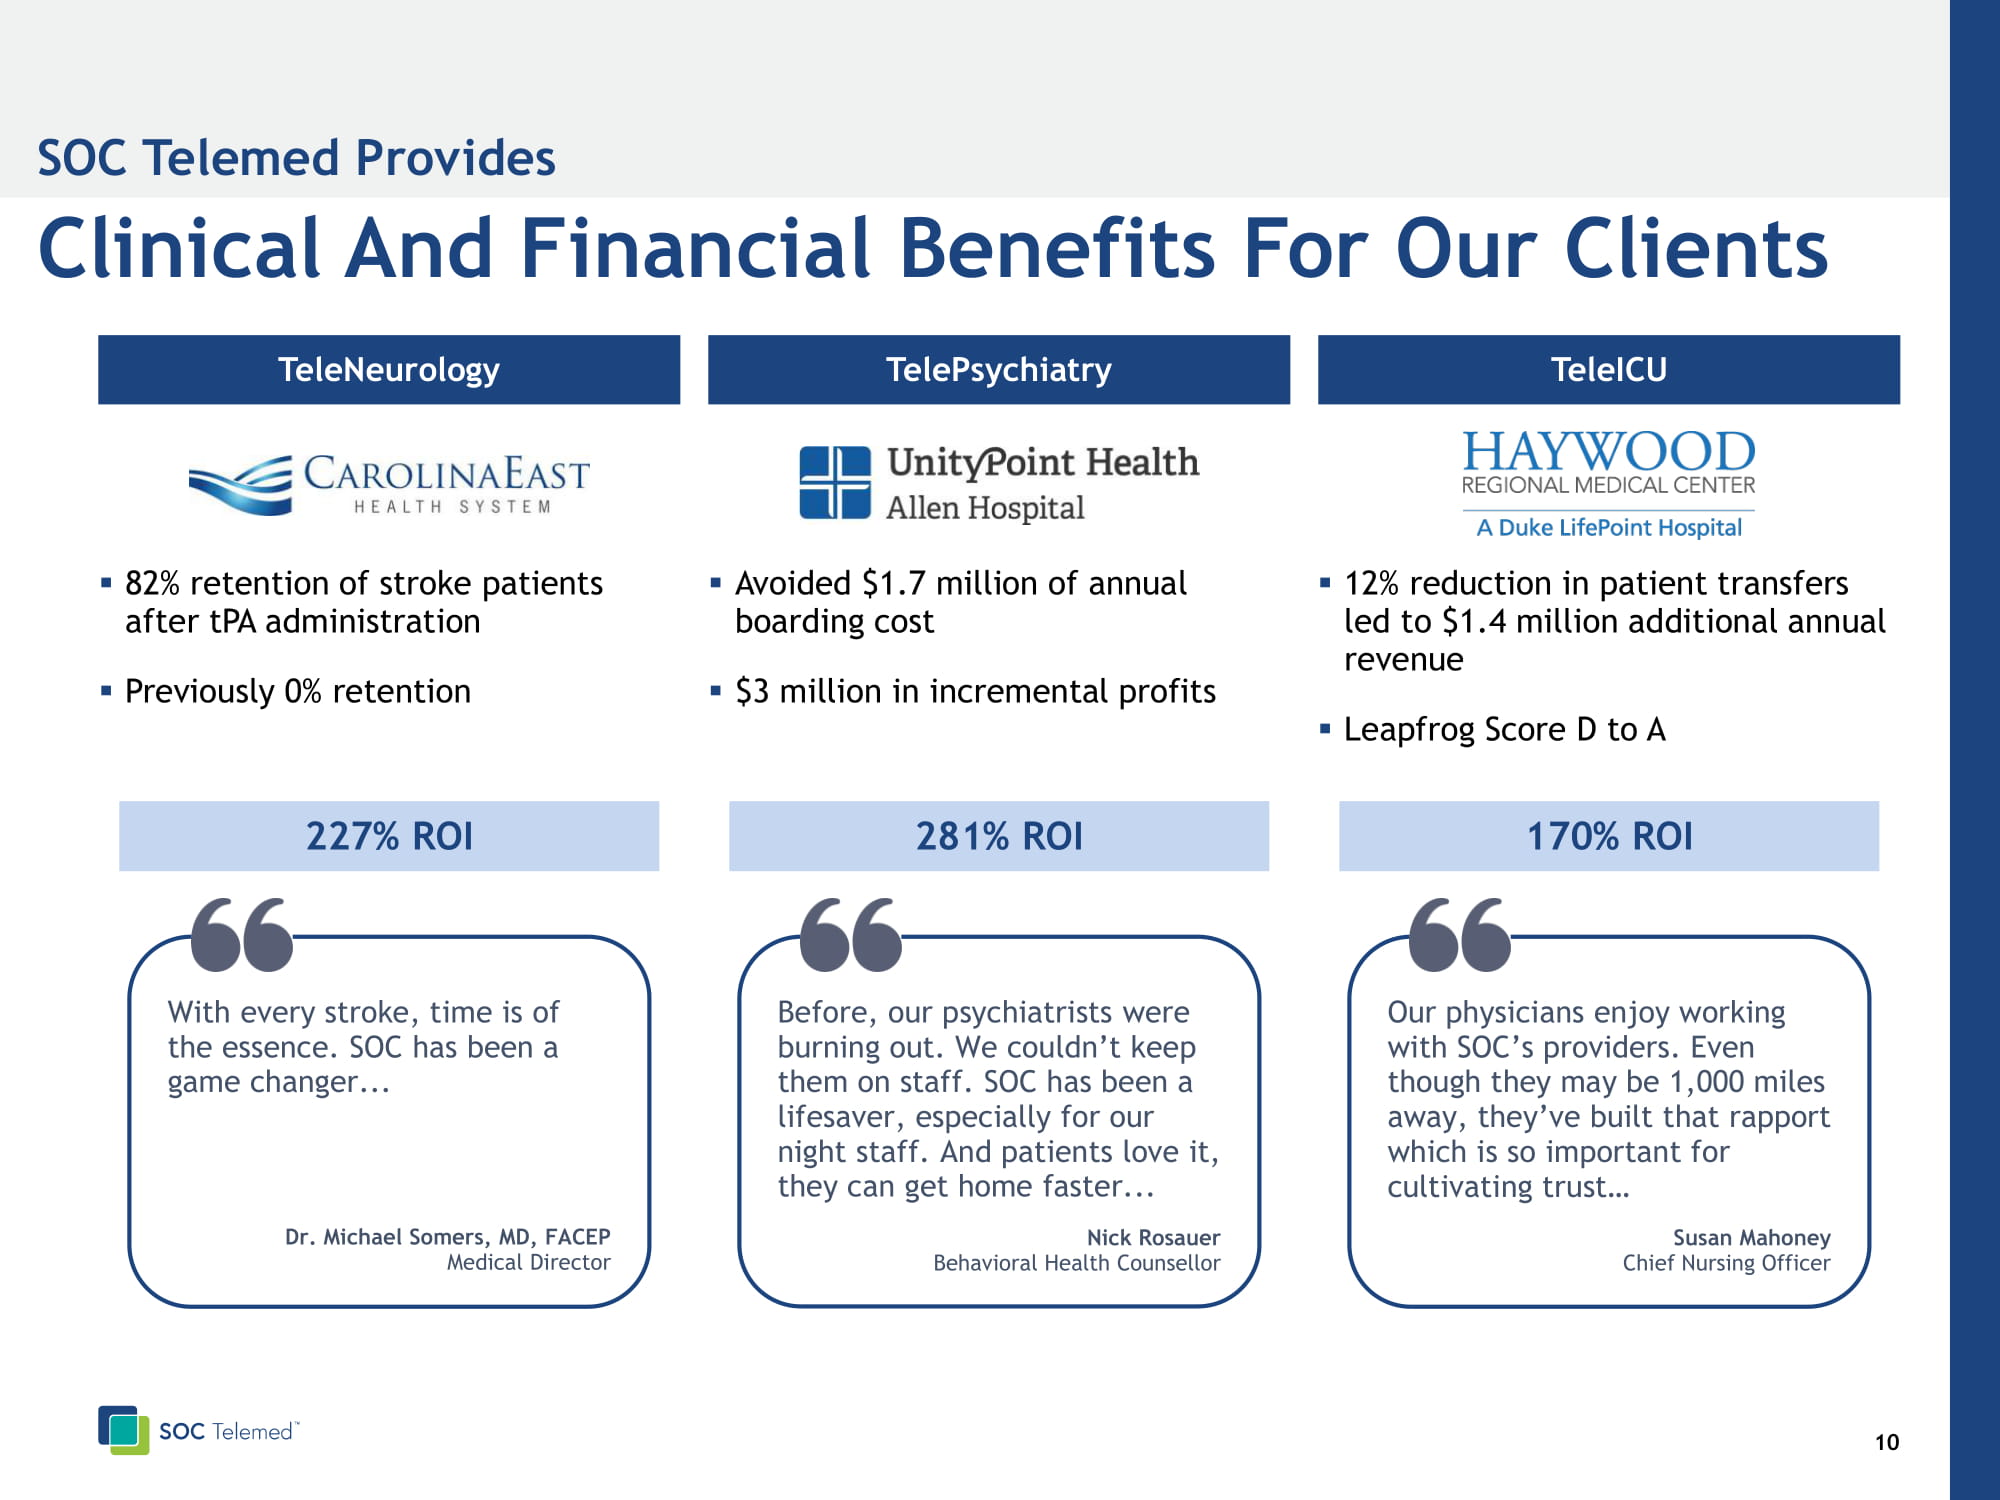
11 Clinical And Financial Benefits For Our Clients SOC Telemed Provides TeleNeurology TelePsychiatry TeleICU ▪ 12% reduction in patient transfers led to $1.4 million additional annual revenue ▪ Leapfrog Score D to A ▪ Avoided $1.7 million of annual boarding cost ▪ $3 million in incremental profits ▪ 82% retention of stroke patients after tPA administration ▪ Previously 0% retention Our physicians enjoy working with SOC’s providers. Even though they may be 1,000 miles away, they’ve built that rapport which is so important for cultivating trust… Susan Mahoney Chief Nursing Officer Before, our psychiatrists were burning out. We couldn’t keep them on staff. SOC has been a lifesaver, especially for our night staff. And patients love it, they can get home faster... Nick Rosauer Behavioral Health Counsellor With every stroke, time is of the essence. SOC has been a game changer... Dr. Michael Somers, MD, FACEP Medical Director 227% ROI 281% ROI 170% ROI

Investment Highlights

13 Investment Highlights Compelling Market Opportunity 1 Substantial Opportunities to Expand and Grow 3 Scaled, Differentiated Acute Care Telemedicine Platform 2 Strong Financial Profile 4

14 Differentiated Position In The Telemedicine Landscape One - to - One Scheduled Many - to - Many On - Demand Clinician Supply Not An Issue Clinician Supply Is Limited Increasing workflow complexity Increasing need for resource optimization Primarily in support of scheduled virtual office visits for existing patients Focus on video session establishment technology On - demand capability limited to waiting rooms Popular with small physician practices for outpatient cases App - based direct - to - consumer : digital patient intake, eligibility & copay verification , online payment Addresses simple acute care hospital workflows with InTouch and Avizia Non - supervised self - service consult management Large payer contracts Optimization model for financial, clinical, operational sustainability Turnkey 24x7 command center for workflow assurance Active management of physician’s time , the costliest resource Low code p latform : configurable decision engines and UI screens Real - time visibility to clinical supply for supply - side elasticity, on - shift or off - shift Complex workflows for care continuity in acute care Revenue c ycle management 1
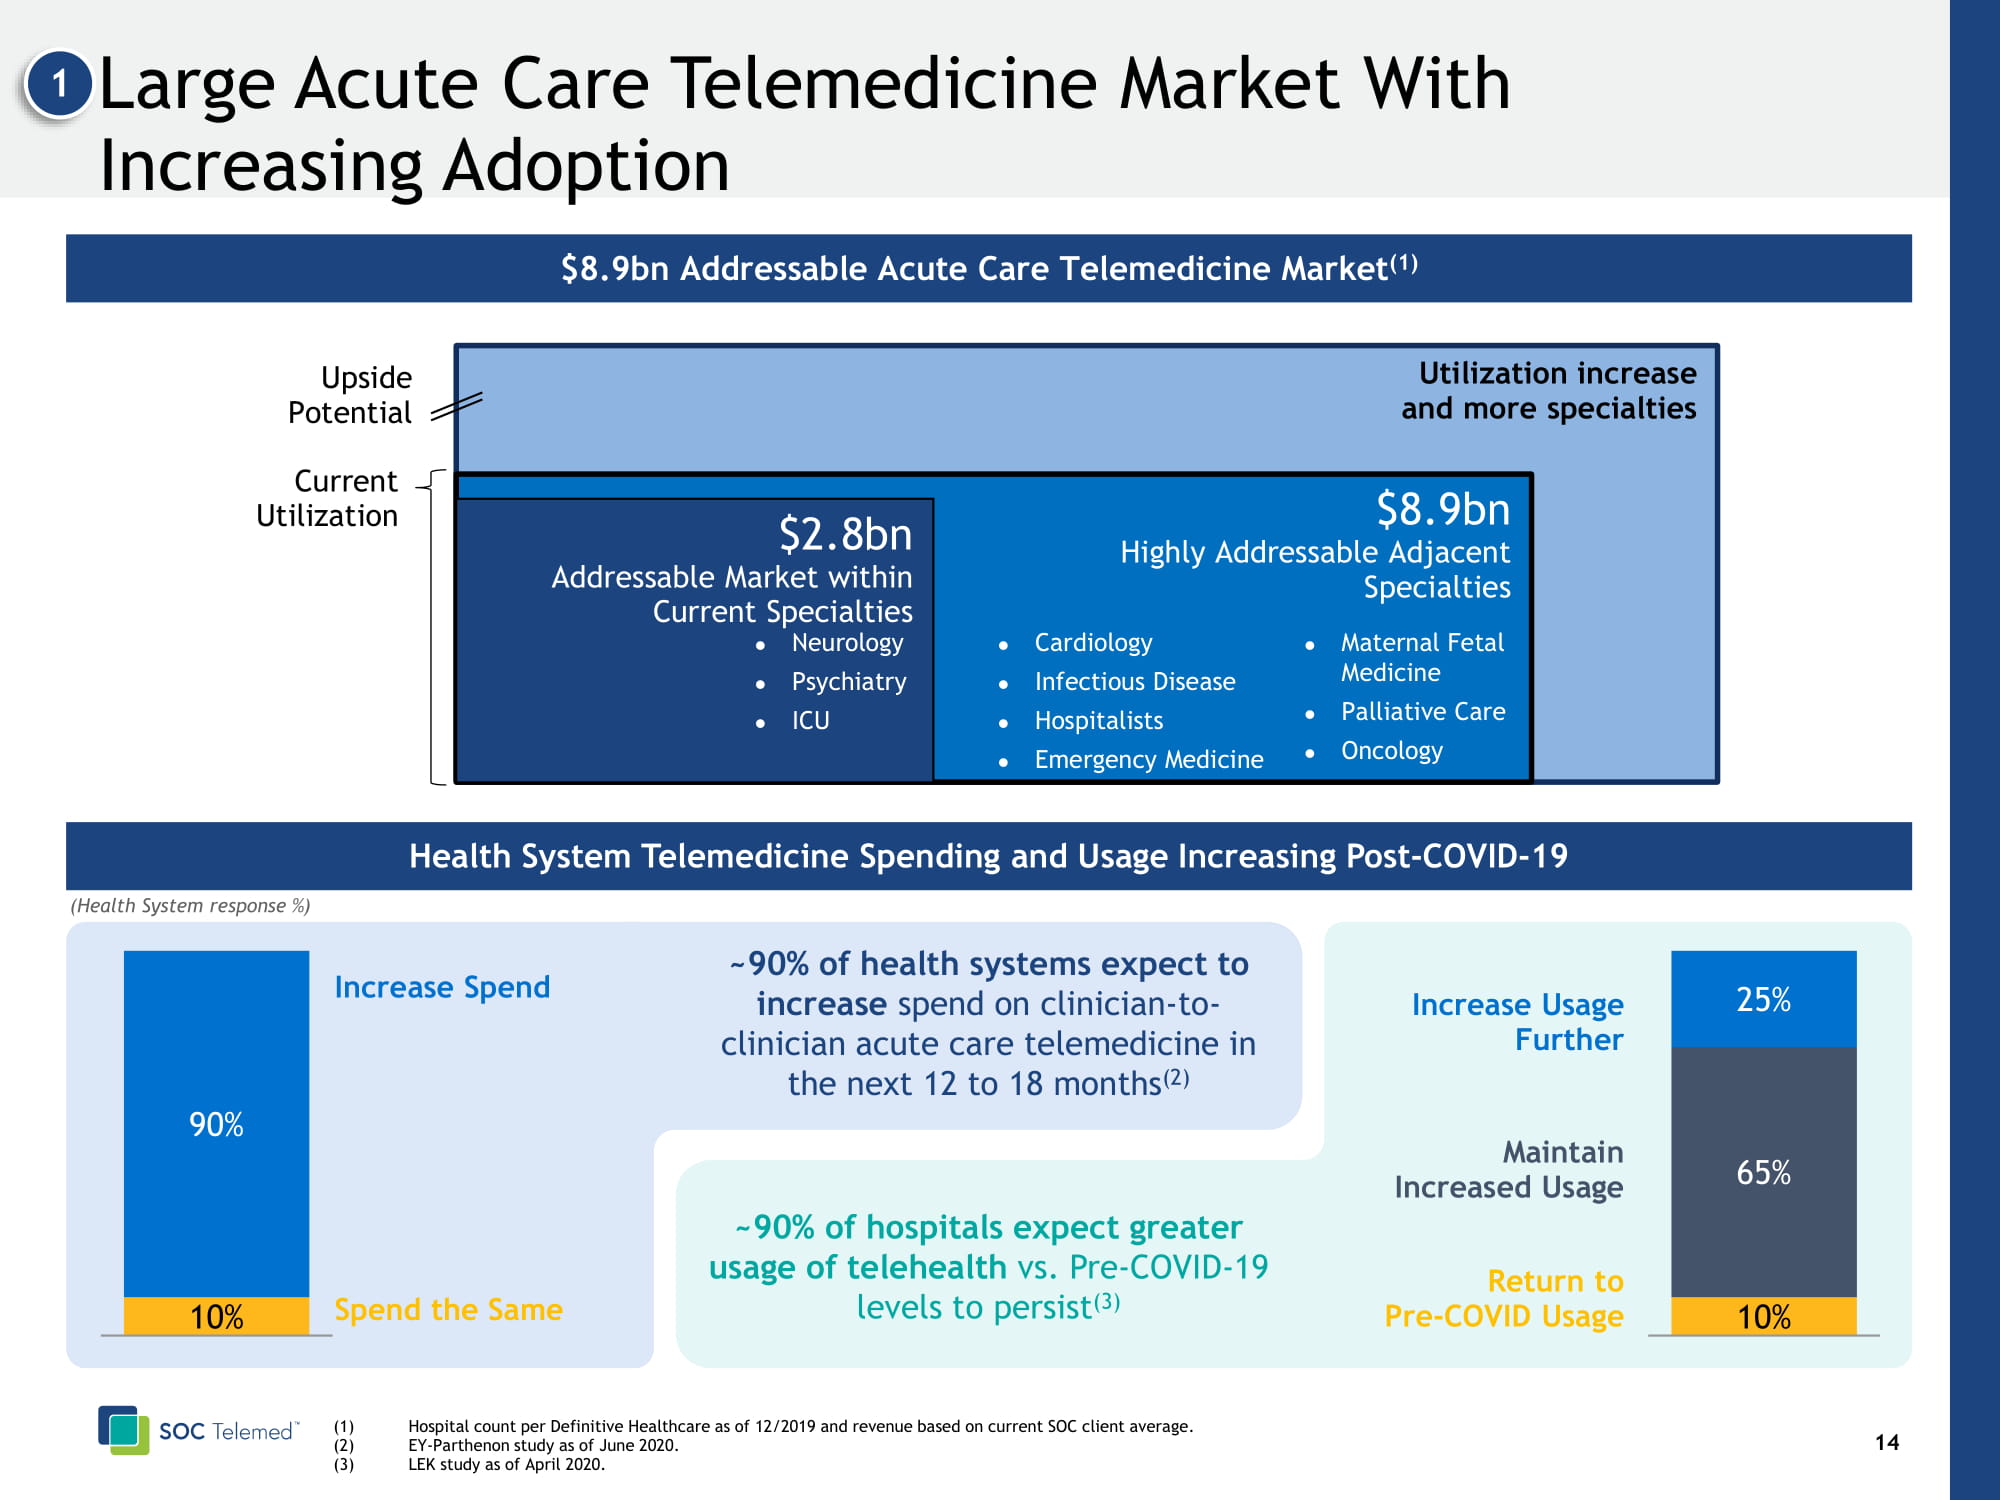
15 Large Acute Care Telemedicine Market With Increasing Adoption 1 (1) Hospital count per Definitive Healthcare as of 12/2019 and revenue based on current SOC client average. (2) EY - Parthenon study as of June 2020. (3) LEK study as of April 2020. Upside Potential Current Utilization Utilization increase and more specialties $8.9bn Highly Addressable Adjacent Specialties $ 2.8bn Addressable Market within Current Specialties Increase Usage Further $8.9bn Addressable Acute Care Telemedicine Market (1) Cardiology Infectious Disease Hospitalists Emergency Medicine Maternal Fetal Medicine Palliative Care Oncology (Health System response %) Health System Telemedicine Spending and Usage Increasing Post - COVID - 19 10% 65% 25% 1 10% 90% 1 Return to Pre - COVID Usage Spend the Same Maintain Increased Usage Increase Spend ~ 90% of hospitals expect greater usage of telehealth vs. Pre - COVID - 19 levels to persist (3) ~ 90% of health systems expect to increase spend on clinician - to - clinician acute care telemedicine in the next 12 to 18 months (2) Neurology Psychiatry ICU
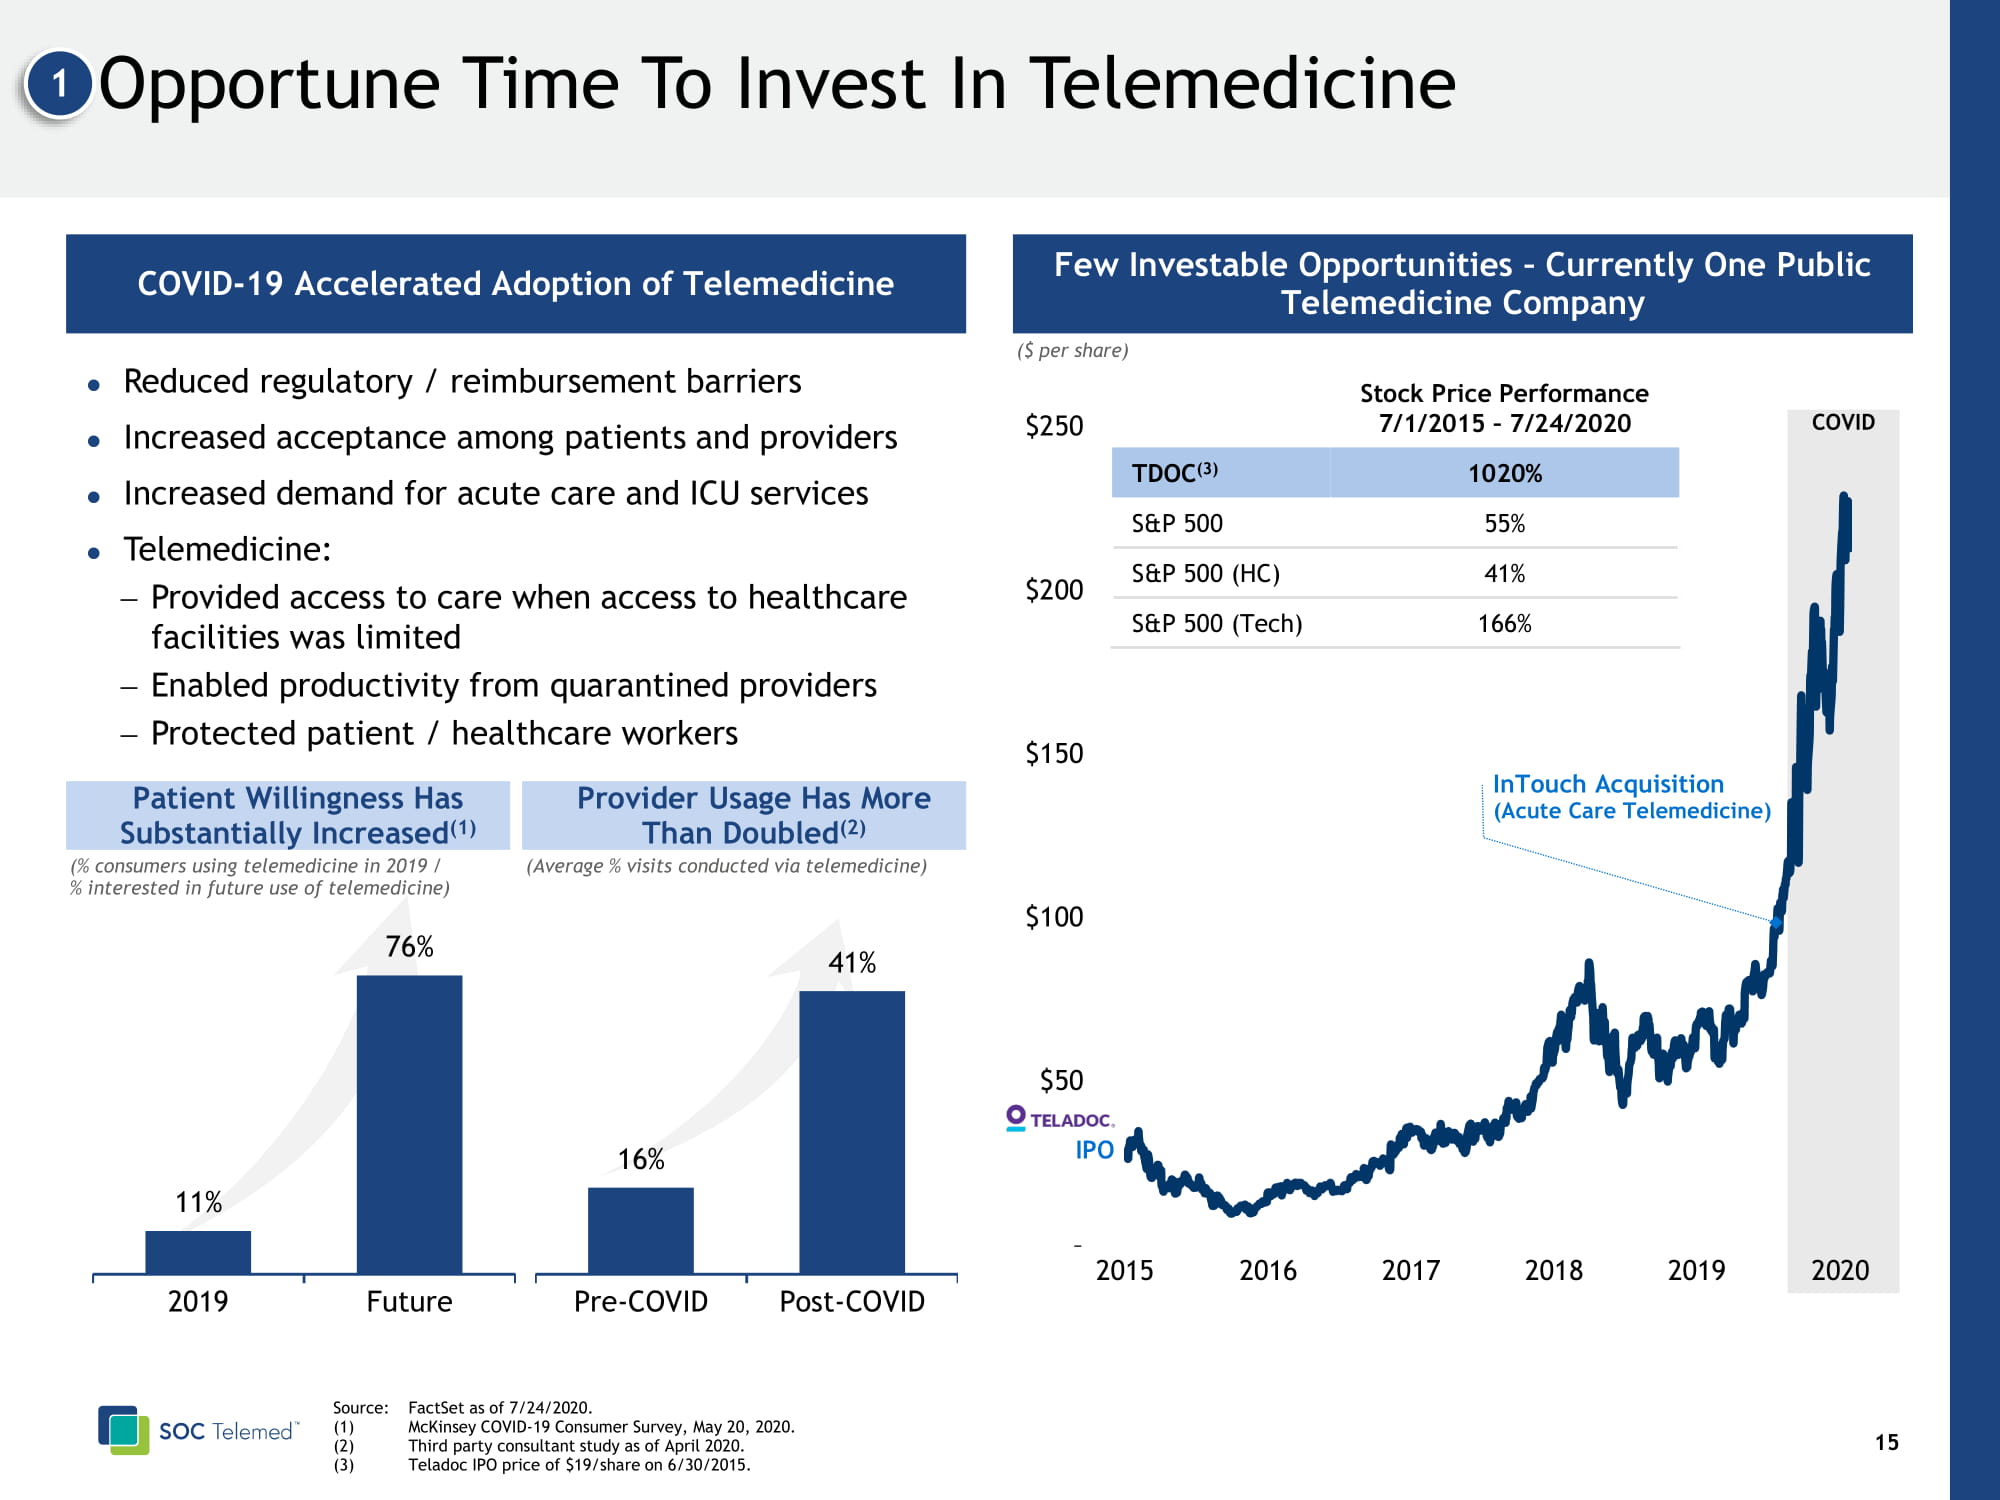
16 Opportune Time To Invest In Telemedicine 1 COVID – $50 $100 $150 $200 $250 2015 2016 2017 2018 2019 2020 InTouch Acquisition (Acute Care Telemedicine ) IPO Stock Price Performance 7/1/2015 – 7/24/2020 TDOC (3) 1020% S&P 500 55% S&P 500 (HC) 41% S&P 500 (Tech) 166% 11% 76% 2019 Future (% consumers using telemedicine in 2019 / % interested in future use of telemedicine) 16% 41% Pre-COVID Post-COVID (Average % visits conducted via telemedicine) ($ per share) Source : FactSet as of 7/24/2020 . (1) McKinsey COVID - 19 Consumer Survey, May 20, 2020. (2) Third party consultant study as of April 2020. (3) Teladoc IPO price of $19/share on 6/30/2015 . Few Investable Opportunities – Currently One Public Telemedicine Company COVID - 19 Accelerated Adoption of Telemedicine Reduced regulatory / reimbursement barriers Increased acceptance among patients and providers Increased demand for acute care and ICU services Telemedicine: − Provided access to care when access to healthcare facilities was limited − Enabled productivity from quarantined providers − Protected patient / healthcare workers Patient Willingness Has Substantially Increased (1 ) Provider Usage Has More Than Doubled (2)
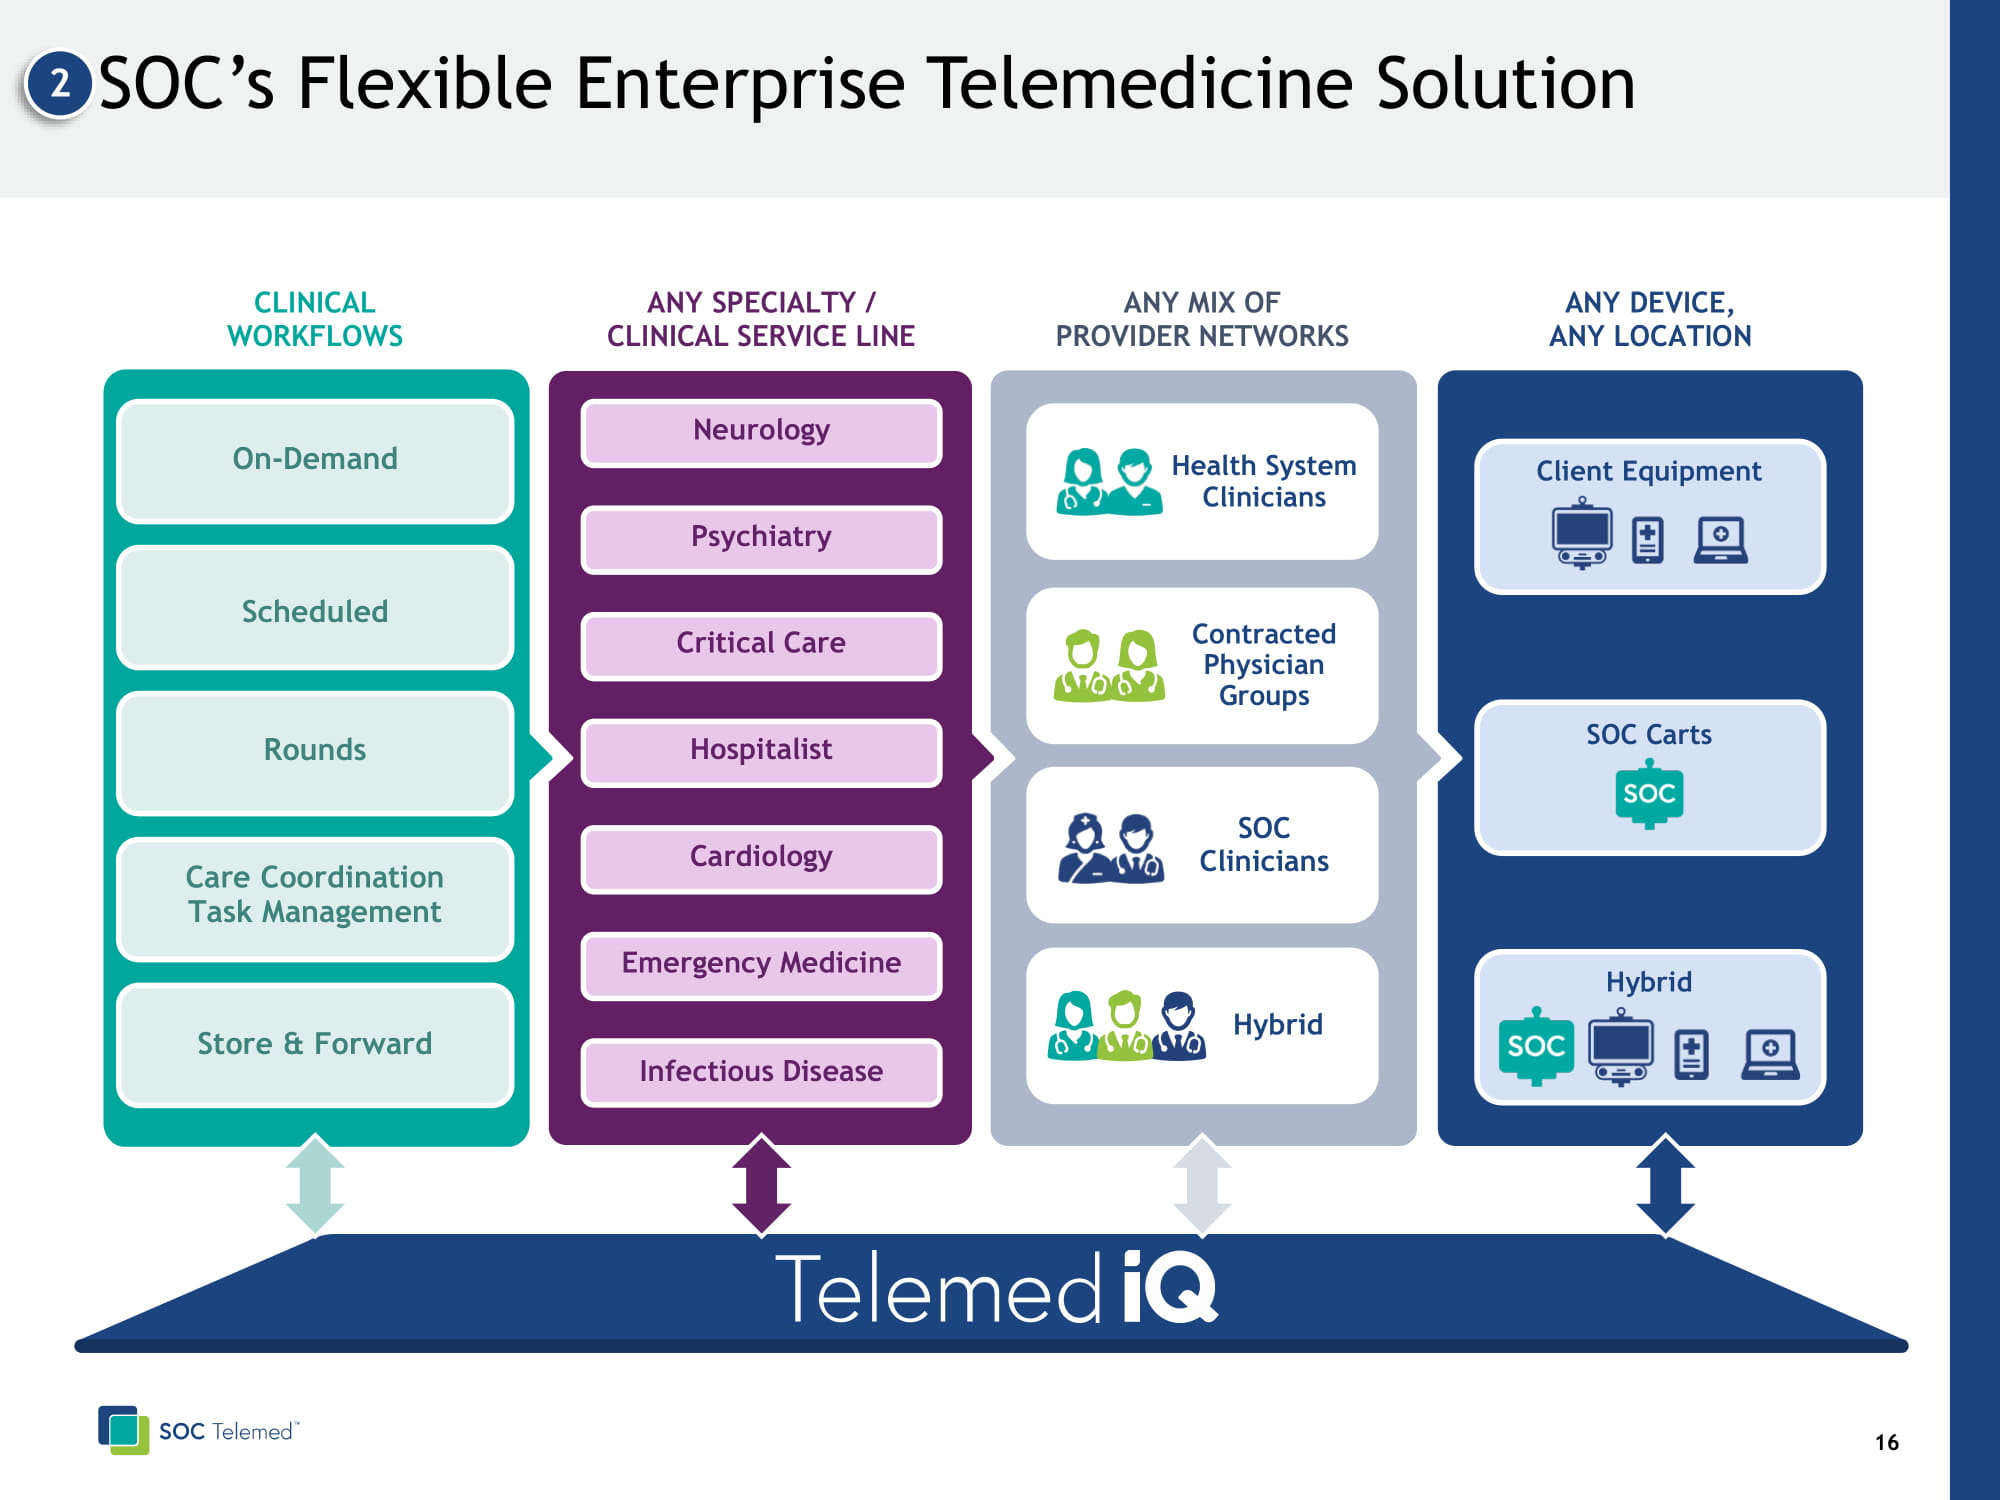
17 SOC’s Flexible Enterprise Telemedicine Solution 2 ANY SPECIALTY / CLINICAL SERVICE LINE CLINICAL WORKFLOWS ANY MIX OF PROVIDER NETWORKS ANY DEVICE, ANY LOCATION Neurology Psychiatry Critical Care Hospitalist Cardiology Emergency Medicine Infectious Disease SOC Carts Client Equipment Hybrid Health System Clinicians Hybrid SOC Clinicians Contracted Physician Groups On - Demand Scheduled Rounds Care Coordination Task Management Store & Forward
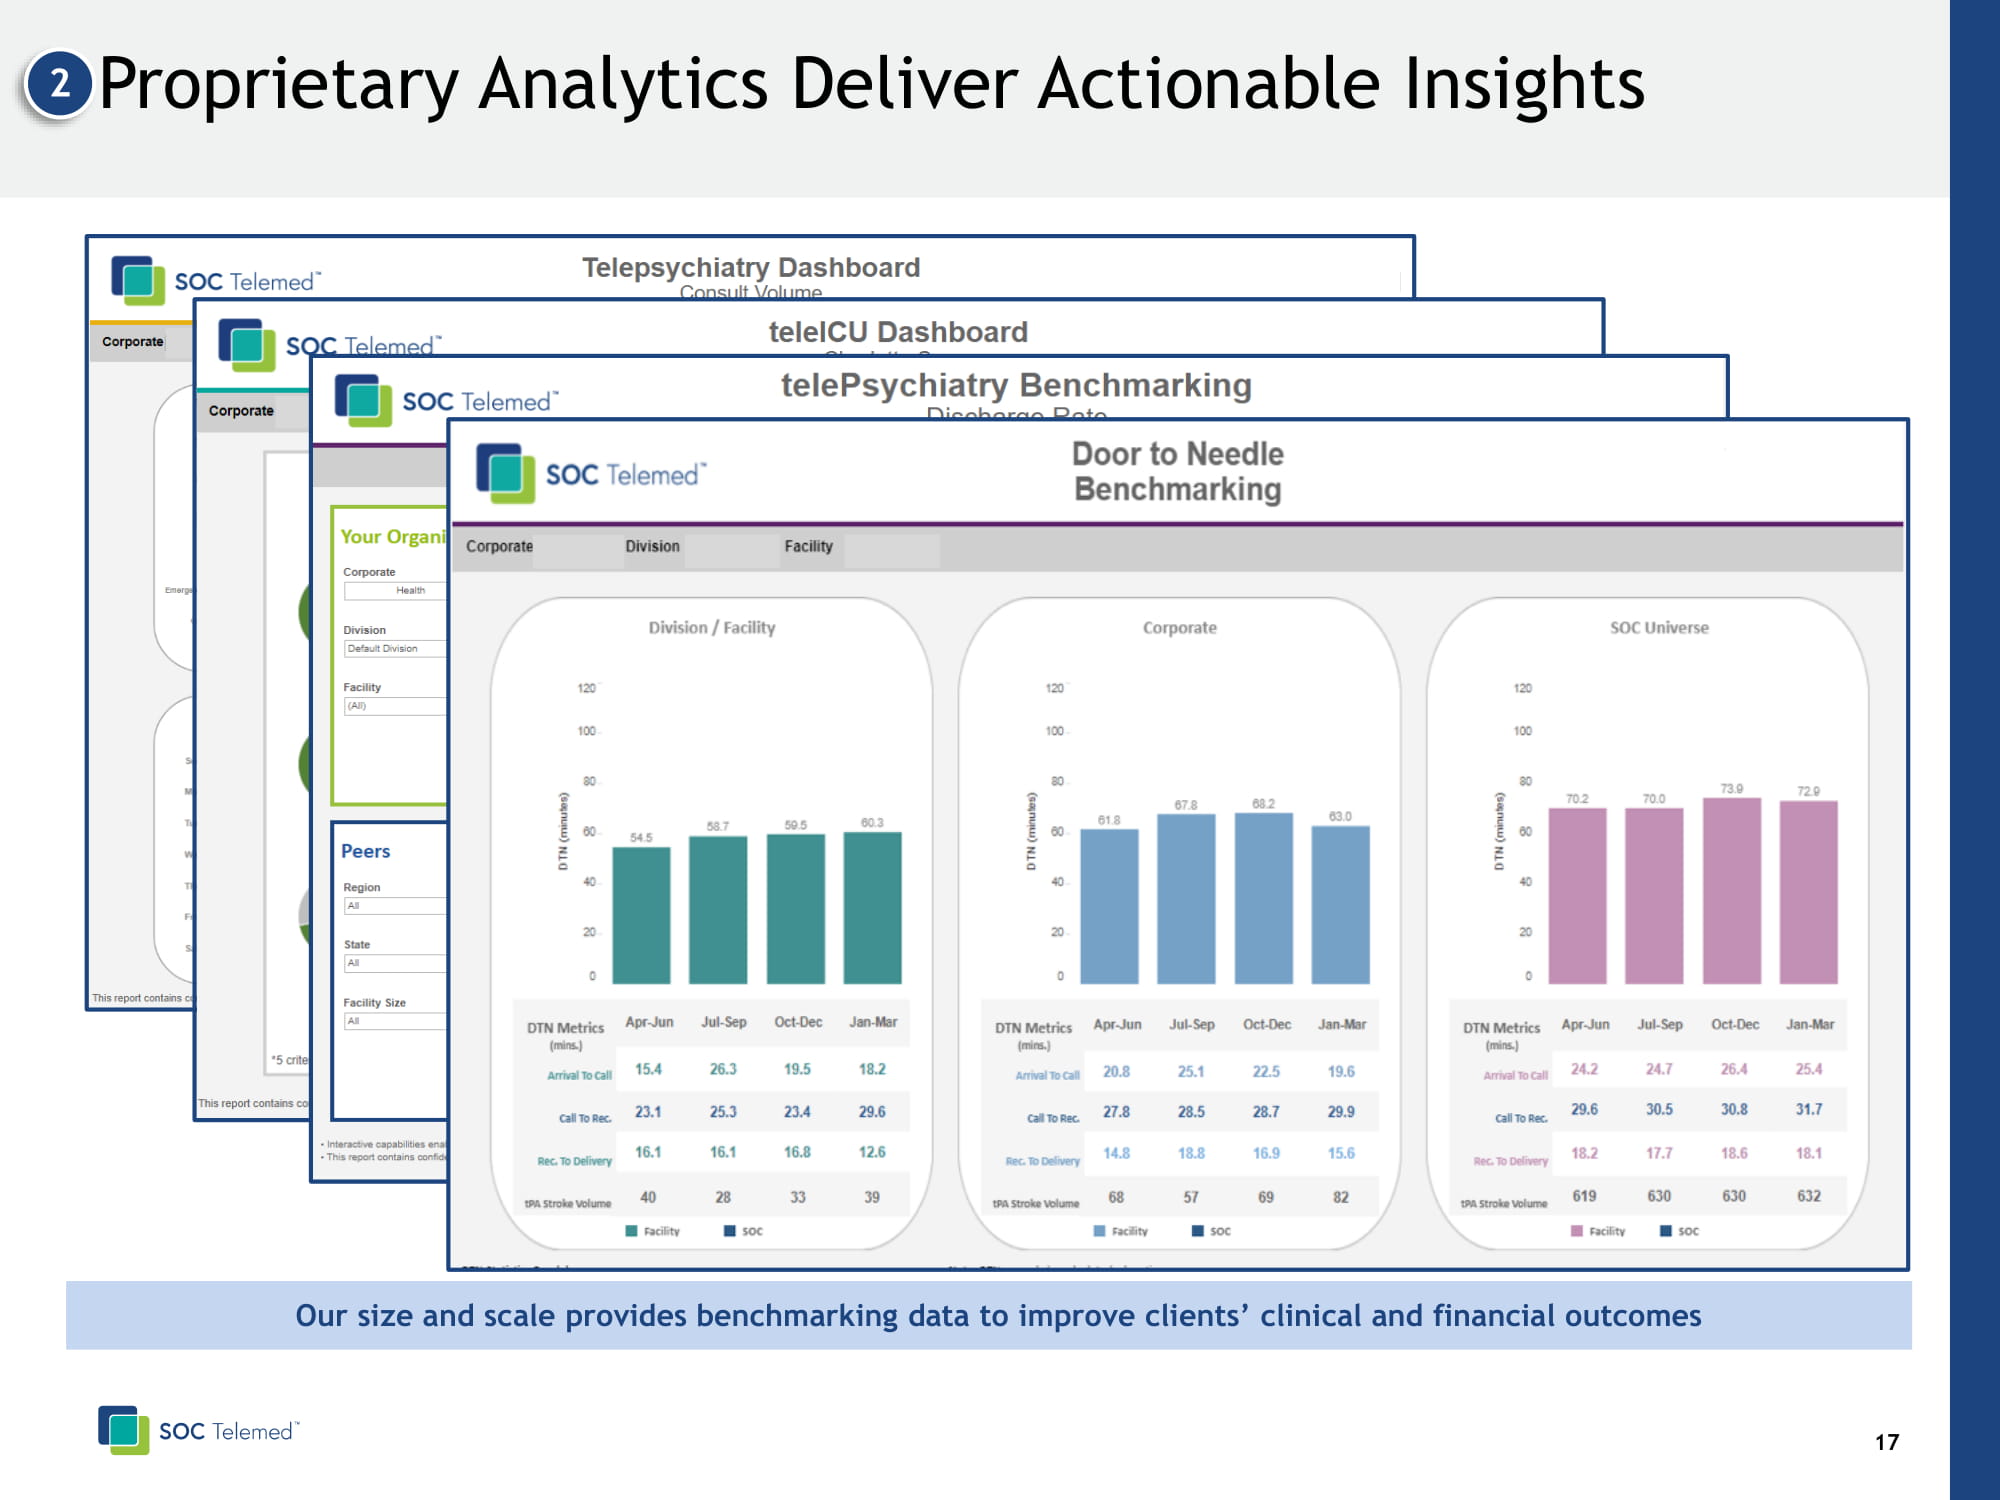
18 Proprietary Analytics Deliver Actionable Insights 2 Our size and scale provides benchmarking data to improve clients’ clinical and financial outcomes

19 Strong Momentum Signing New Clients Balanced mix of historical bookings; 47% new clients as percentage of 1H 2020 total bookings 3
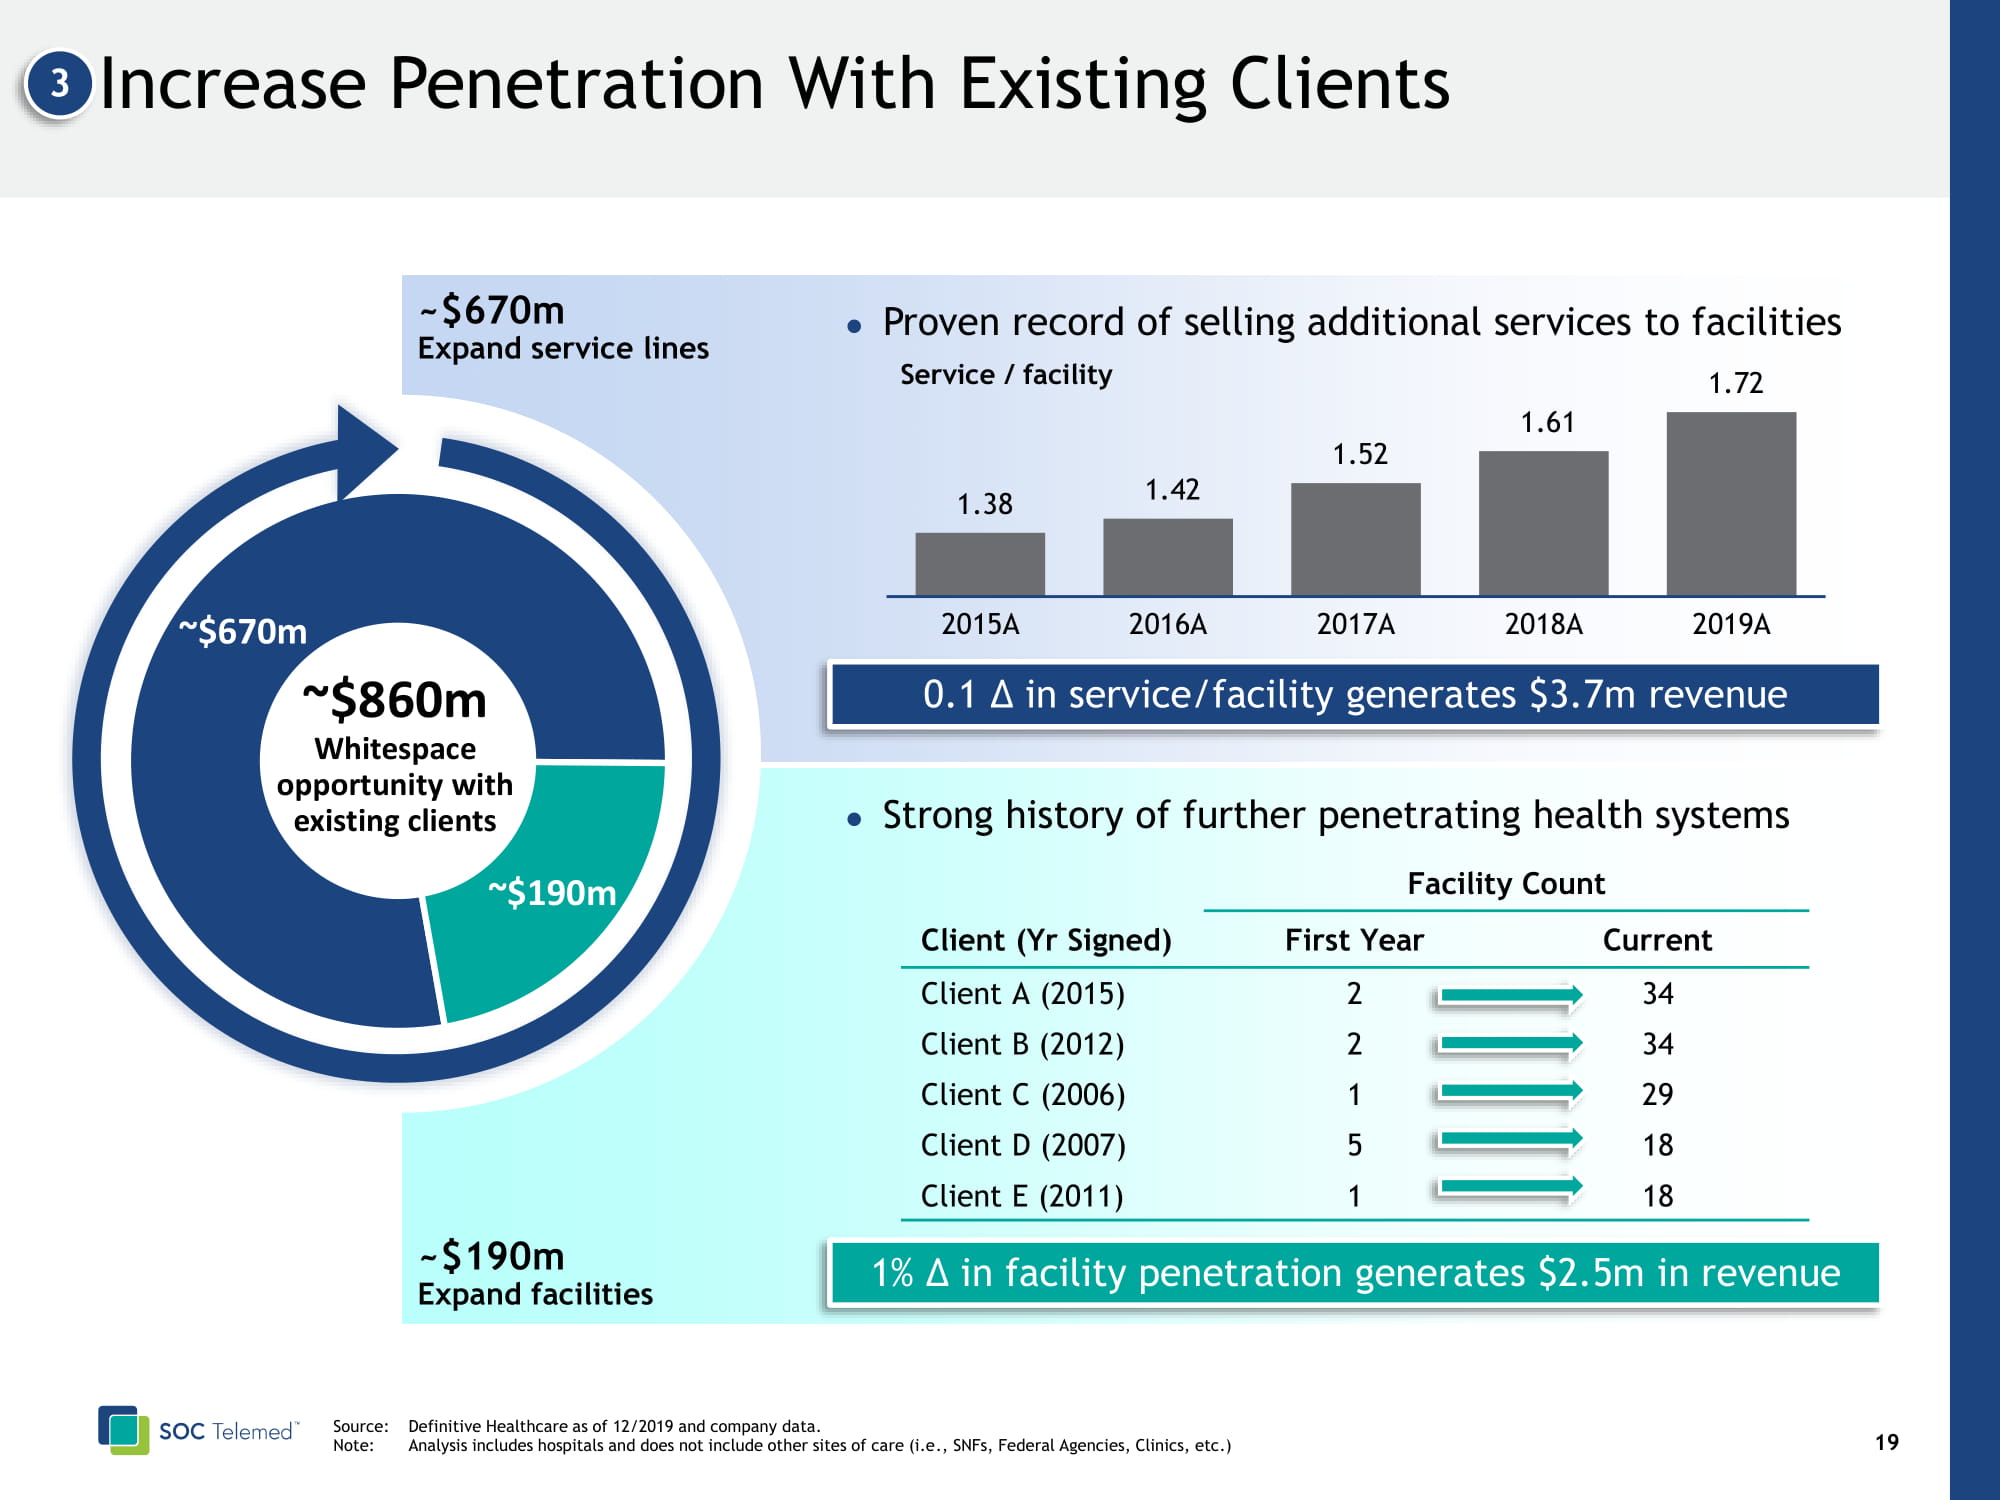
20 Increase Penetration With Existing Clients 3 Strong history of further penetrating health systems Facility Count Client (Yr Signed) First Year Current Client A (2015) 2 34 Client B (2012) 2 34 Client C (2006) 1 29 Client D (2007) 5 18 Client E (2011) 1 18 Proven record of selling additional services to facilities 1.38 1.42 1.52 1.61 1.72 2015A 2016A 2017A 2018A 2019A Service / facility 0.1 Δ in service/facility generates $3.7m revenue 1% Δ in facility penetration generates $2.5m in revenue ~$670m ~$190m ~$860m Whitespace opportunity with existing clients ~$670m Expand service lines ~$190m Expand facilities Source: Definitive Healthcare as of 12/2019 and company data. Note: Analysis includes hospitals and does not include other sites of care (i.e ., SNFs, Federal Agencies, Clinics, etc .)
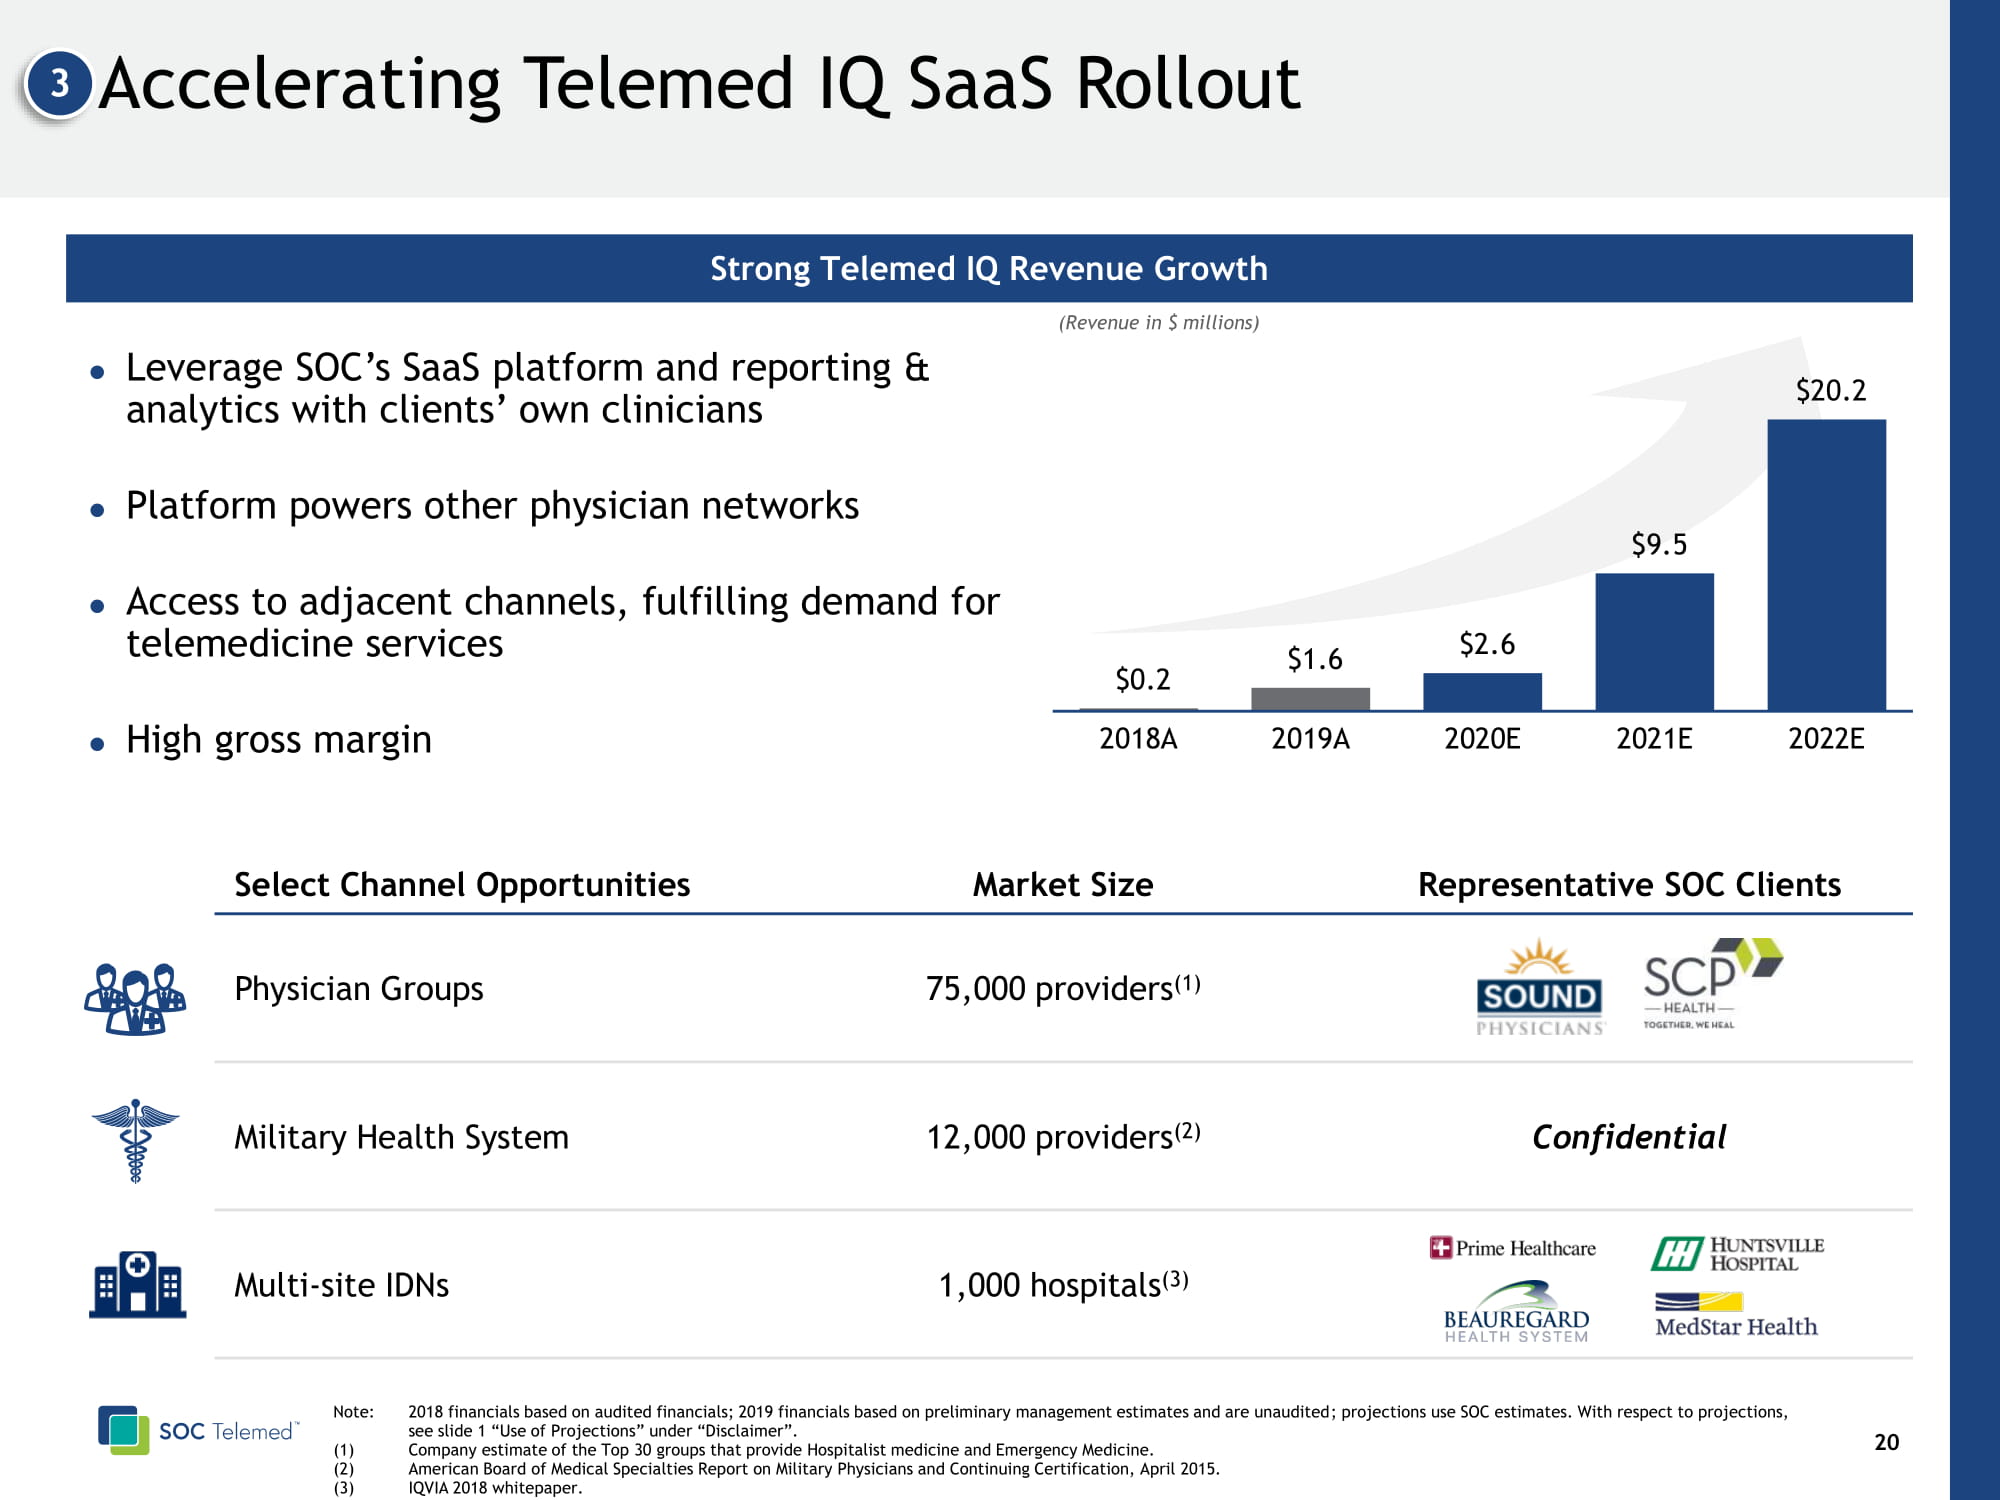
Select Channel Opportunities Market Size Representative SOC Clients Physician Groups 75,000 providers (1) Military Health System 12,000 providers (2) Confidential Multi - site IDNs 1,000 hospitals (3) 21 Accelerating Telemed IQ SaaS Rollout Strong Telemed IQ Revenue Growth Note: 2018 financials based on audited financials; 2019 financials based on preliminary management estimates and are unaudited ; projections use SOC estimates . With respect to projections, see slide 1 “Use of Projections” under “Disclaimer”. ( 1) Company estimate of the Top 30 groups that provide Hospitalist medicine and Emergency Medicine. (2) American Board of Medical Specialties Report on Military Physicians and Continuing Certification, April 2015. (3) IQVIA 2018 whitepaper. $0.2 $1.6 $2.6 $9.5 $20.2 2018A 2019A 2020A 2021A 2022A 3 Leverage SOC’s SaaS platform and reporting & analytics with clients’ own clinicians Platform powers other physician networks Access to adjacent channels, fulfilling demand for telemedicine services High gross margin (Revenue in $ millions )

Substantial Opportunity To Grow And Expand 3 22 New Products and Assets Settings of Care • Hospitals • Health Systems • SNF • Freestanding EDs Clinical Solutions • Neurology • Psychiatry • Intensive Care Channels • Physician Staffing Companies • Government Products and Assets • Telemed IQ Platform • SOC Specialists • Revenue Cycle • Hardware Markets • Employers • Payors • Retail • Hospitality • Schools/Universities Settings of Care • Urgent Care • Post - acute • Pediatric Hospitals • Assisted Living • Dialysis and Infusion Products and Services • Asynchronous telemedicine • Patient engagement/navigation • Remote patient monitoring • Digital triage • Intake, eligibility, payment Clinical Solutions • Oncology • Infectious Disease • Nephrology • Maternal Fetal Medicine • Dermatology/Wound Care • Palliative Care • Geriatrics International TRANSFORMATIONAL • Retail specialist care • Self testing / diagnostics • Virtual referral management • AI – triage, diagnosis, support • Hospital at home • Medication adherence • Virtual care health plan • Virtual clinical trials • Precision medicine Create New Markets, Target New Customer Needs Enter Adjacent Markets Existing Markets and Customers Existing Products and Assets Incremental Products and Assets

Financial Overview
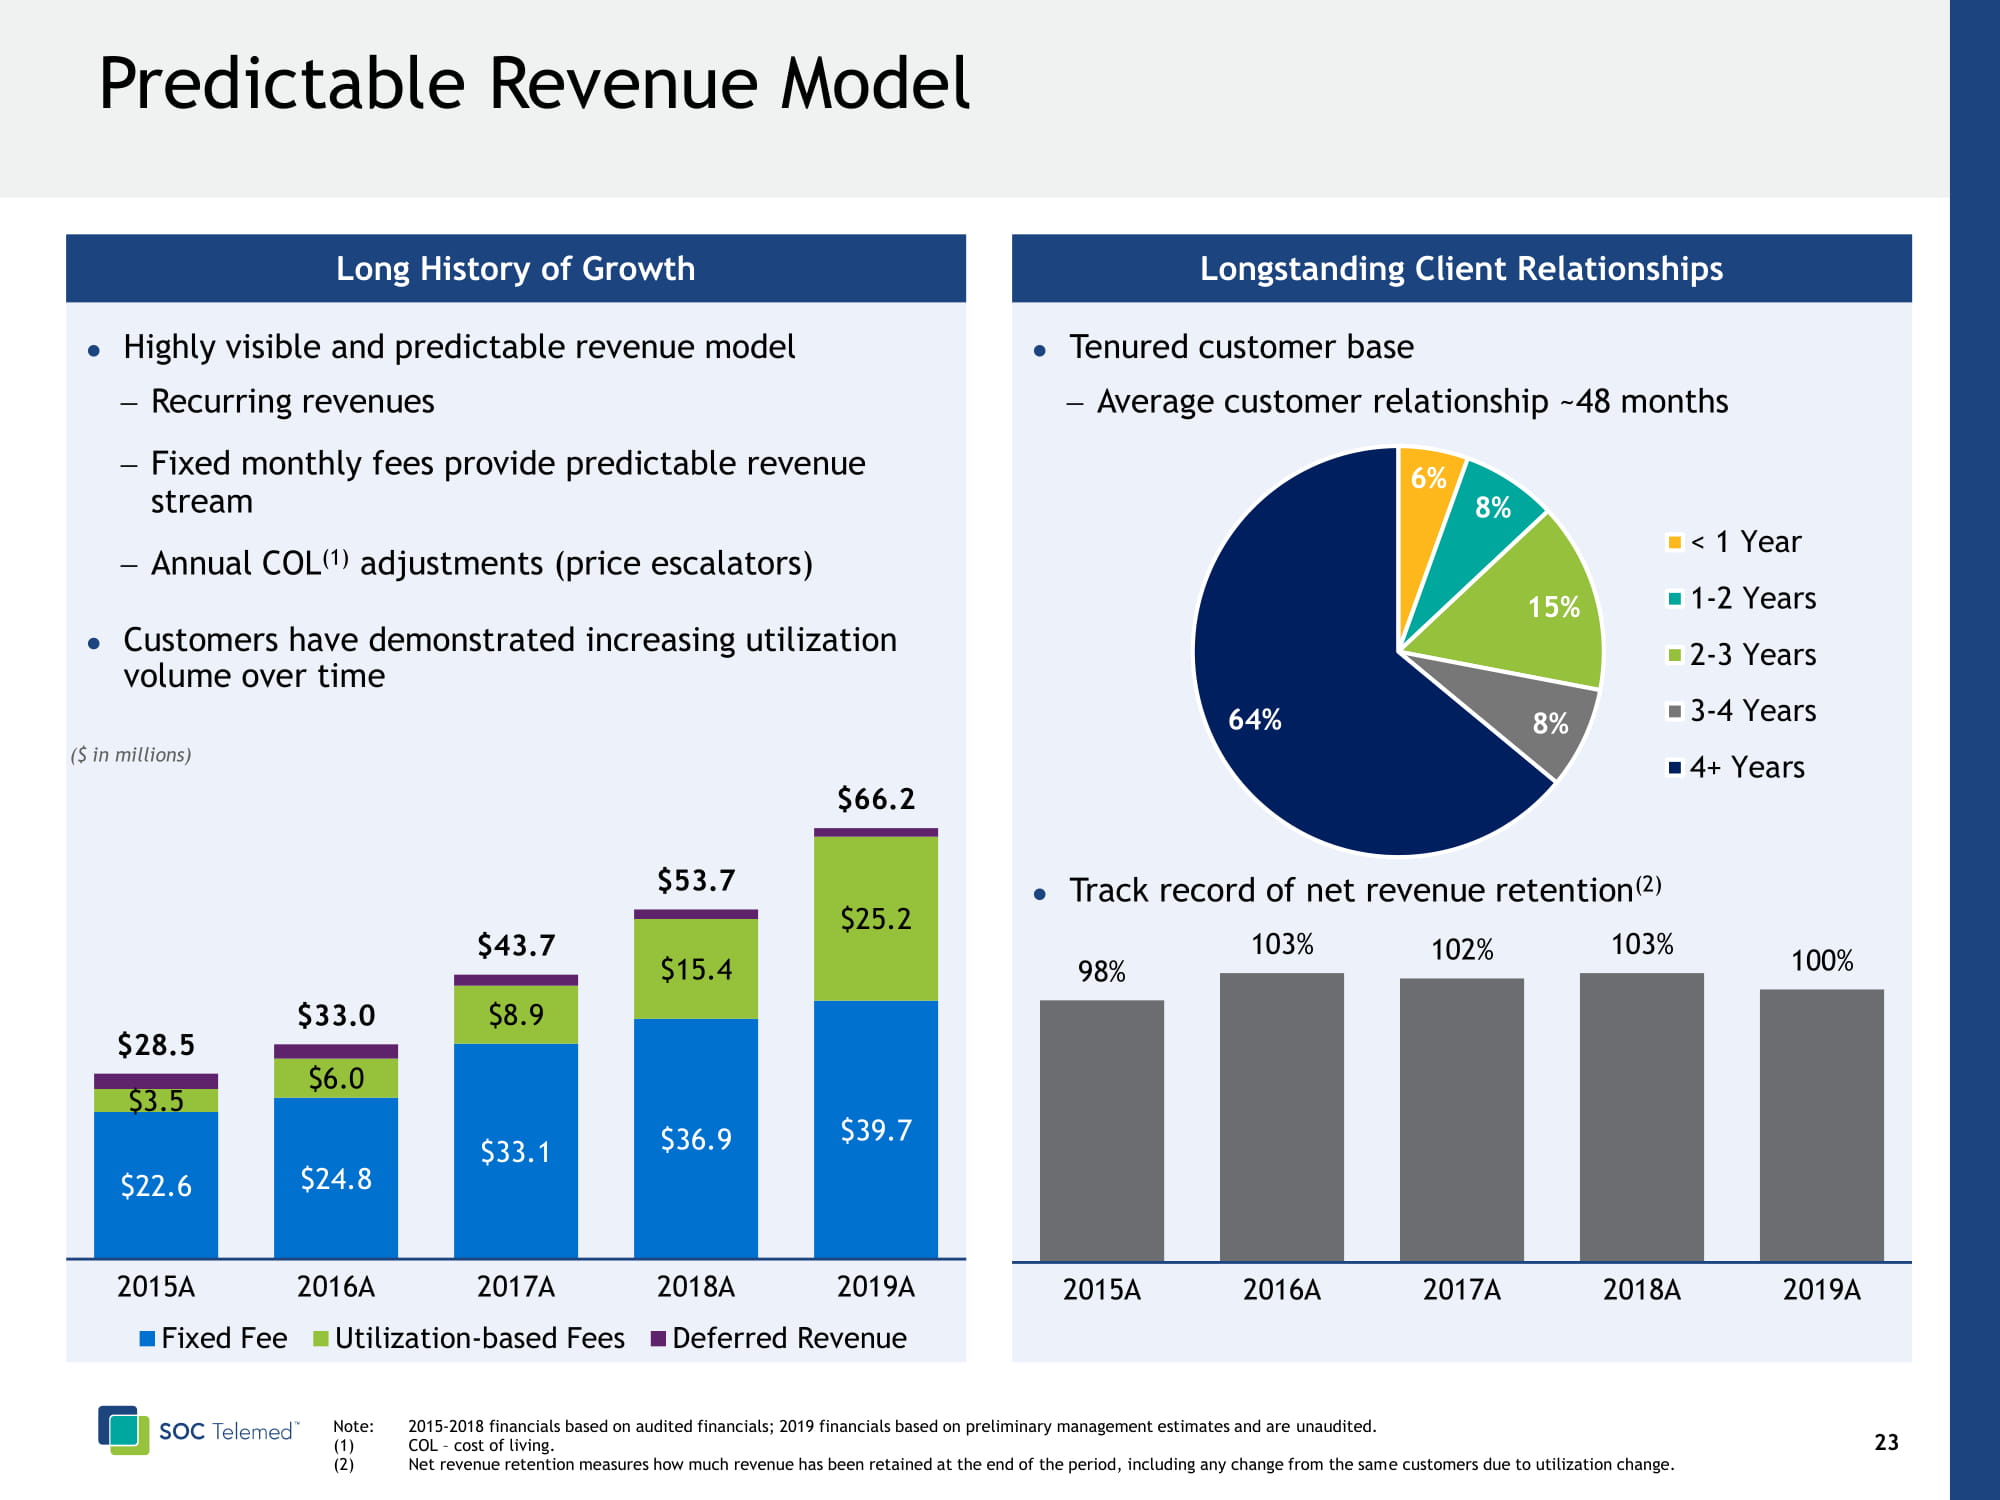
24 Predictable Revenue Model Long History of Growth Highly visible and predictable revenue model − Recurring revenues − Fixed monthly fees provide predictable revenue stream − Annual COL (1) adjustments (price escalators) Customers have demonstrated increasing utilization volume over time Note: 2015 - 2018 financials based on audited financials; 2019 financials based on preliminary management estimates and are unaudited . (1) COL – cost of living. (2) Net revenue retention measures how much revenue has been retained at the end of the period, including any change from the sam e customers due to utilization change. $22.6 $24.8 $33.1 $36.9 $39.7 $3.5 $6.0 $8.9 $15.4 $25.2 $28.5 $33.0 $43.7 $53.7 $66.2 2015A 2016A 2017A 2018A 2019A Fixed Fee Utilization-based Fees Deferred Revenue ($ in millions) Longstanding Client Relationships Tenured customer base − Average customer relationship ~48 months Track record of net revenue retention (2) 6% 8% 15% 8% 64% < 1 Year 1-2 Years 2-3 Years 3-4 Years 4+ Years 98% 103% 102% 103% 100% 2015A 2016A 2017A 2018A 2019A
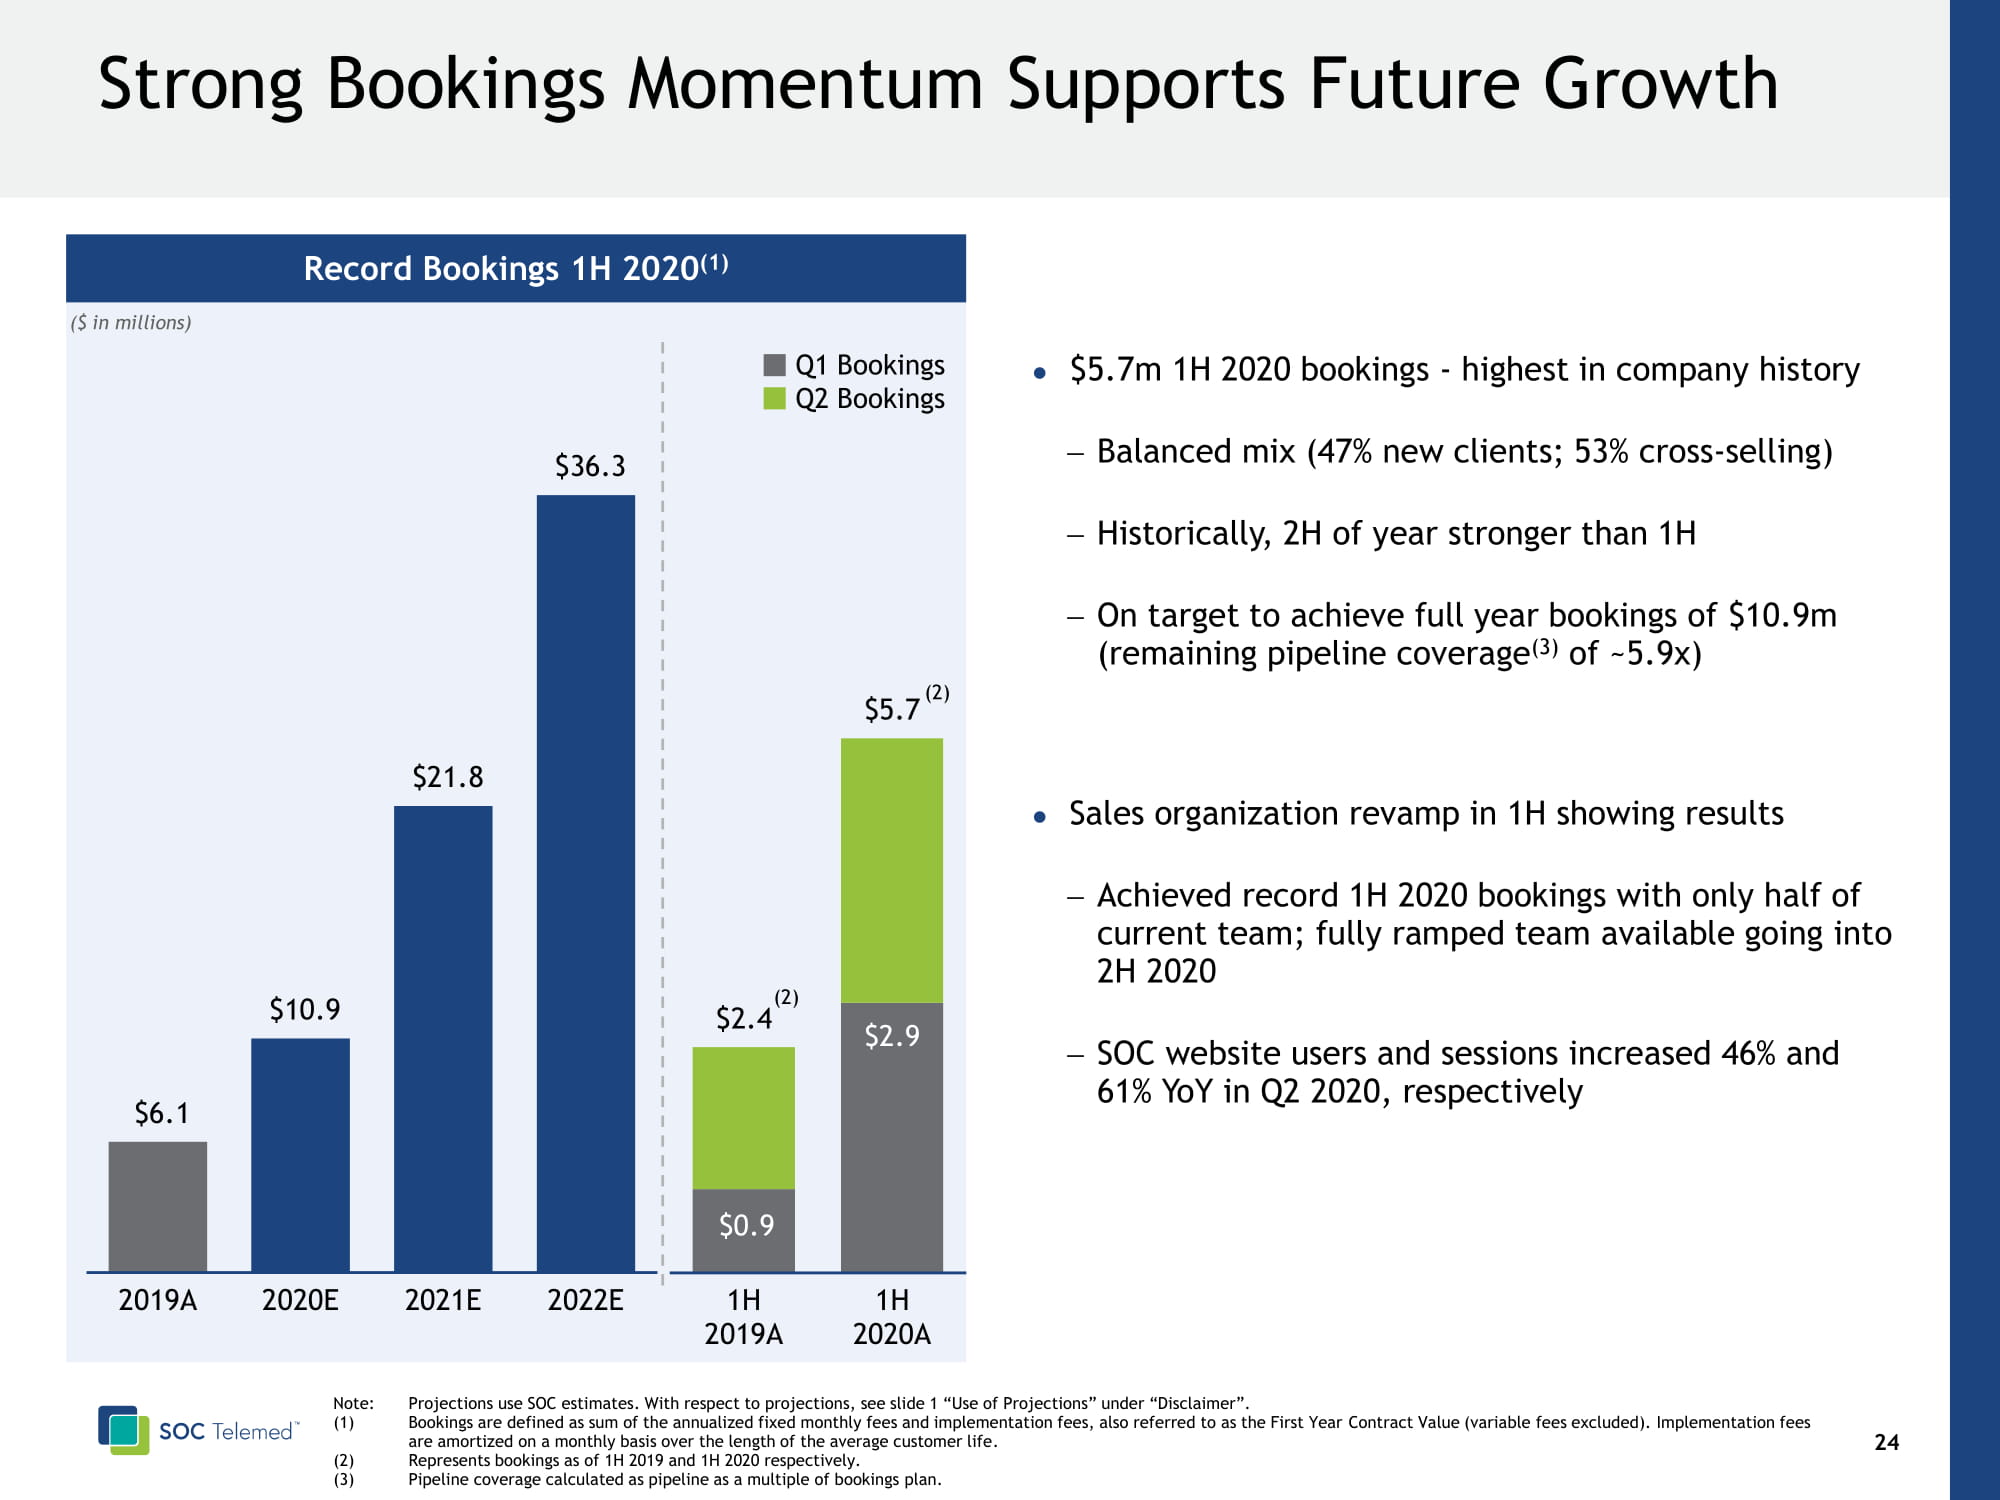
25 Strong Bookings Momentum Supports Future Growth Record Bookings 1H 2020 (1) $5.7m 1H 2020 bookings - highest in company history − Balanced mix ( 47% new clients; 53% cross - selling) − Historically, 2H of year stronger than 1H − On target to achieve full year bookings of $10.9m (remaining pipeline coverage (3) of ~5.9x ) Sales organization revamp in 1H showing results − Achieved record 1H 2020 bookings with only half of current team; fully ramped team available going into 2H 2020 − SOC website users and sessions increased 46% and 61% YoY in Q2 2020, respectively ($ in millions) $6.1 $10.9 $21.8 $36.3 2019E 2020E 2021E 2022E $0.9 $2.9 $2.4 $5.7 1H 2019A 1H 2020A Note: Projections use SOC estimates . With respect to projections, see slide 1 “Use of Projections” under “Disclaimer”. ( 1) Bookings are defined as sum of the annualized fixed monthly fees and implementation fees, also referred to as the First Year Contract Value (variable fees excluded). Implementation fees are amortized on a monthly basis over the length of the average customer life . (2) Represents bookings as of 1H 2019 and 1H 2020 respectively. (3) Pipeline coverage calculated as pipeline as a multiple of bookings plan. Q1 Bookings Q2 Bookings (2) (2)
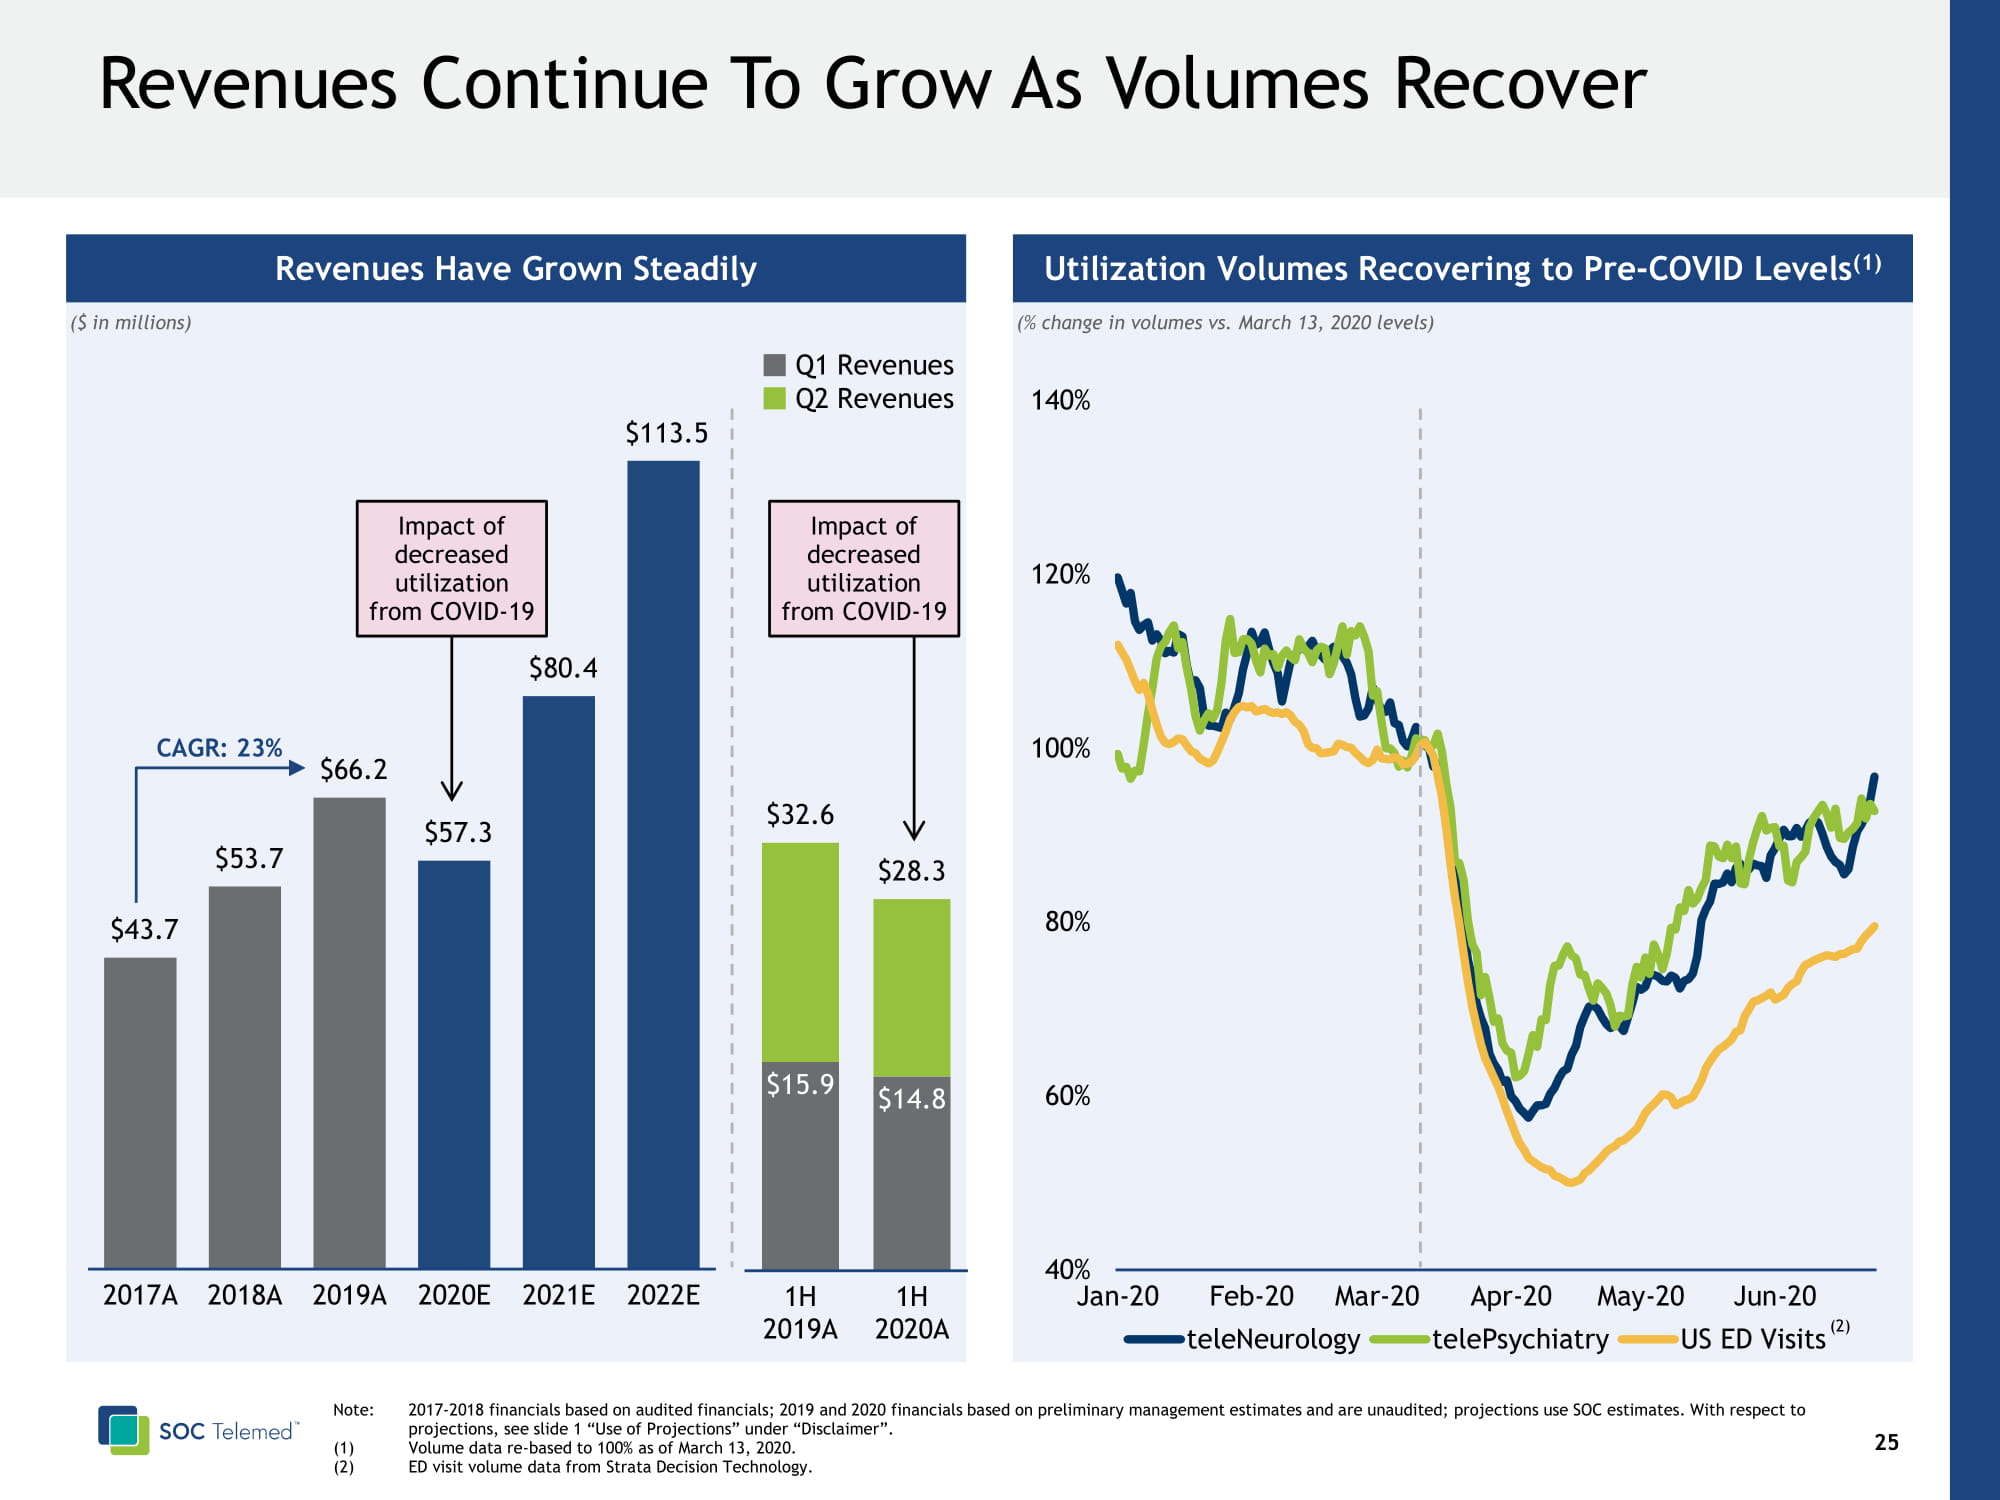
Utilization Volumes Recovering to Pre - COVID Levels (1) 26 Revenues Continue To Grow As Volumes Recover Revenues Have Grown Steadily ($ in millions) 40% 60% 80% 100% 120% 140% Jan-20 Feb-20 Mar-20 Apr-20 May-20 Jun-20 teleNeurology telePsychiatry US ED Visits (% change in volumes vs. March 13, 2020 levels) Note: 2017 - 2018 financials based on audited financials; 2019 and 2020 financials based on preliminary management estimates and are unaudited; projections use SOC estimates . With respect to projections, see slide 1 “Use of Projections” under “Disclaimer”. (1) Volume data re - based to 100% as of March 13, 2020. (2) ED visit volume data from Strata Decision Technology. (2) CAGR: 23% $15.9 $14.8 $32.6 $28.3 1H 2019A 1H 2020A Q1 Revenues Q2 Revenues Impact of decreased utilization from COVID - 19 Impact of decreased utilization from COVID - 19 $43.7 $53.7 $66.2 $57.3 $80.4 $113.5 2017A 2018A 2019A 2020A 2021A 2022A
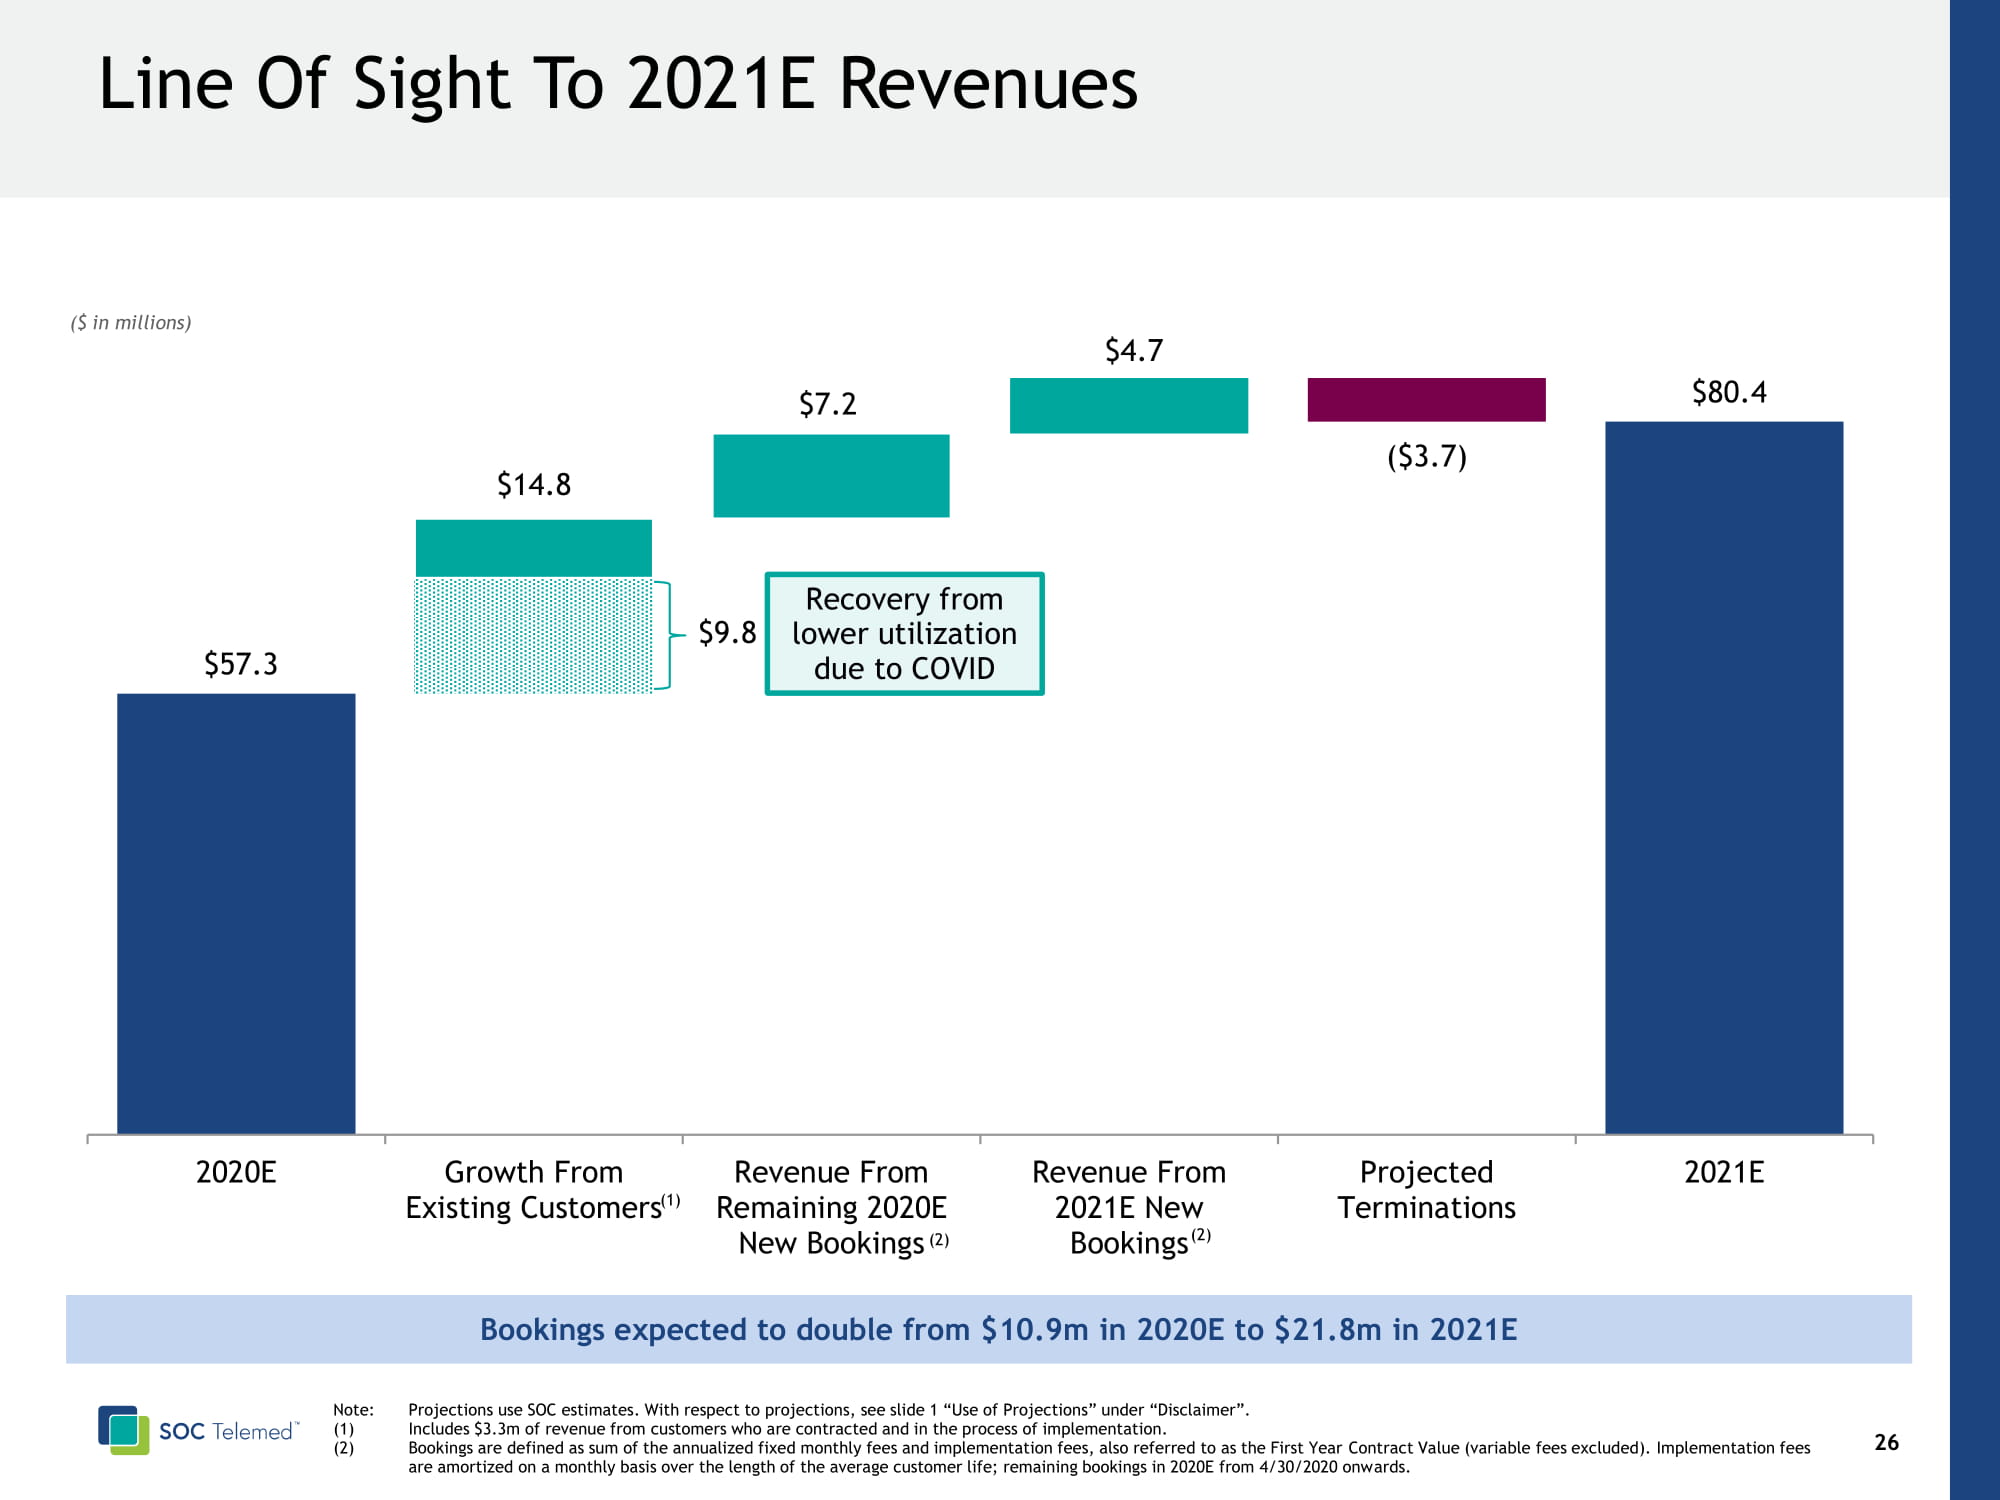
27 Line Of Sight To 2021E Revenues ($ in millions) $9.8 $7.2 $4.7 $14.8 ($3.7) $57.3 $80.4 2020E Growth From Existing Customers Revenue From Remaining 2020E New Bookings Revenue From 2021E New Bookings Projected Terminations 2021E Recovery from lower utilization due to COVID Note: Projections use SOC estimates . With respect to projections, see slide 1 “Use of Projections” under “Disclaimer”. (1) Includes $ 3.3m of revenue from customers who are contracted and in the process of implementation. (2) Bookings are defined as sum of the annualized fixed monthly fees and implementation fees, also referred to as the First Year Co ntract Value (variable fees excluded). Implementation fees are amortized on a monthly basis over the length of the average customer life; remaining bookings in 2020E from 4/30/2020 onw ard s. (2) (2) (1) Bookings expected to double from $10.9m in 2020E to $21.8m in 2021E
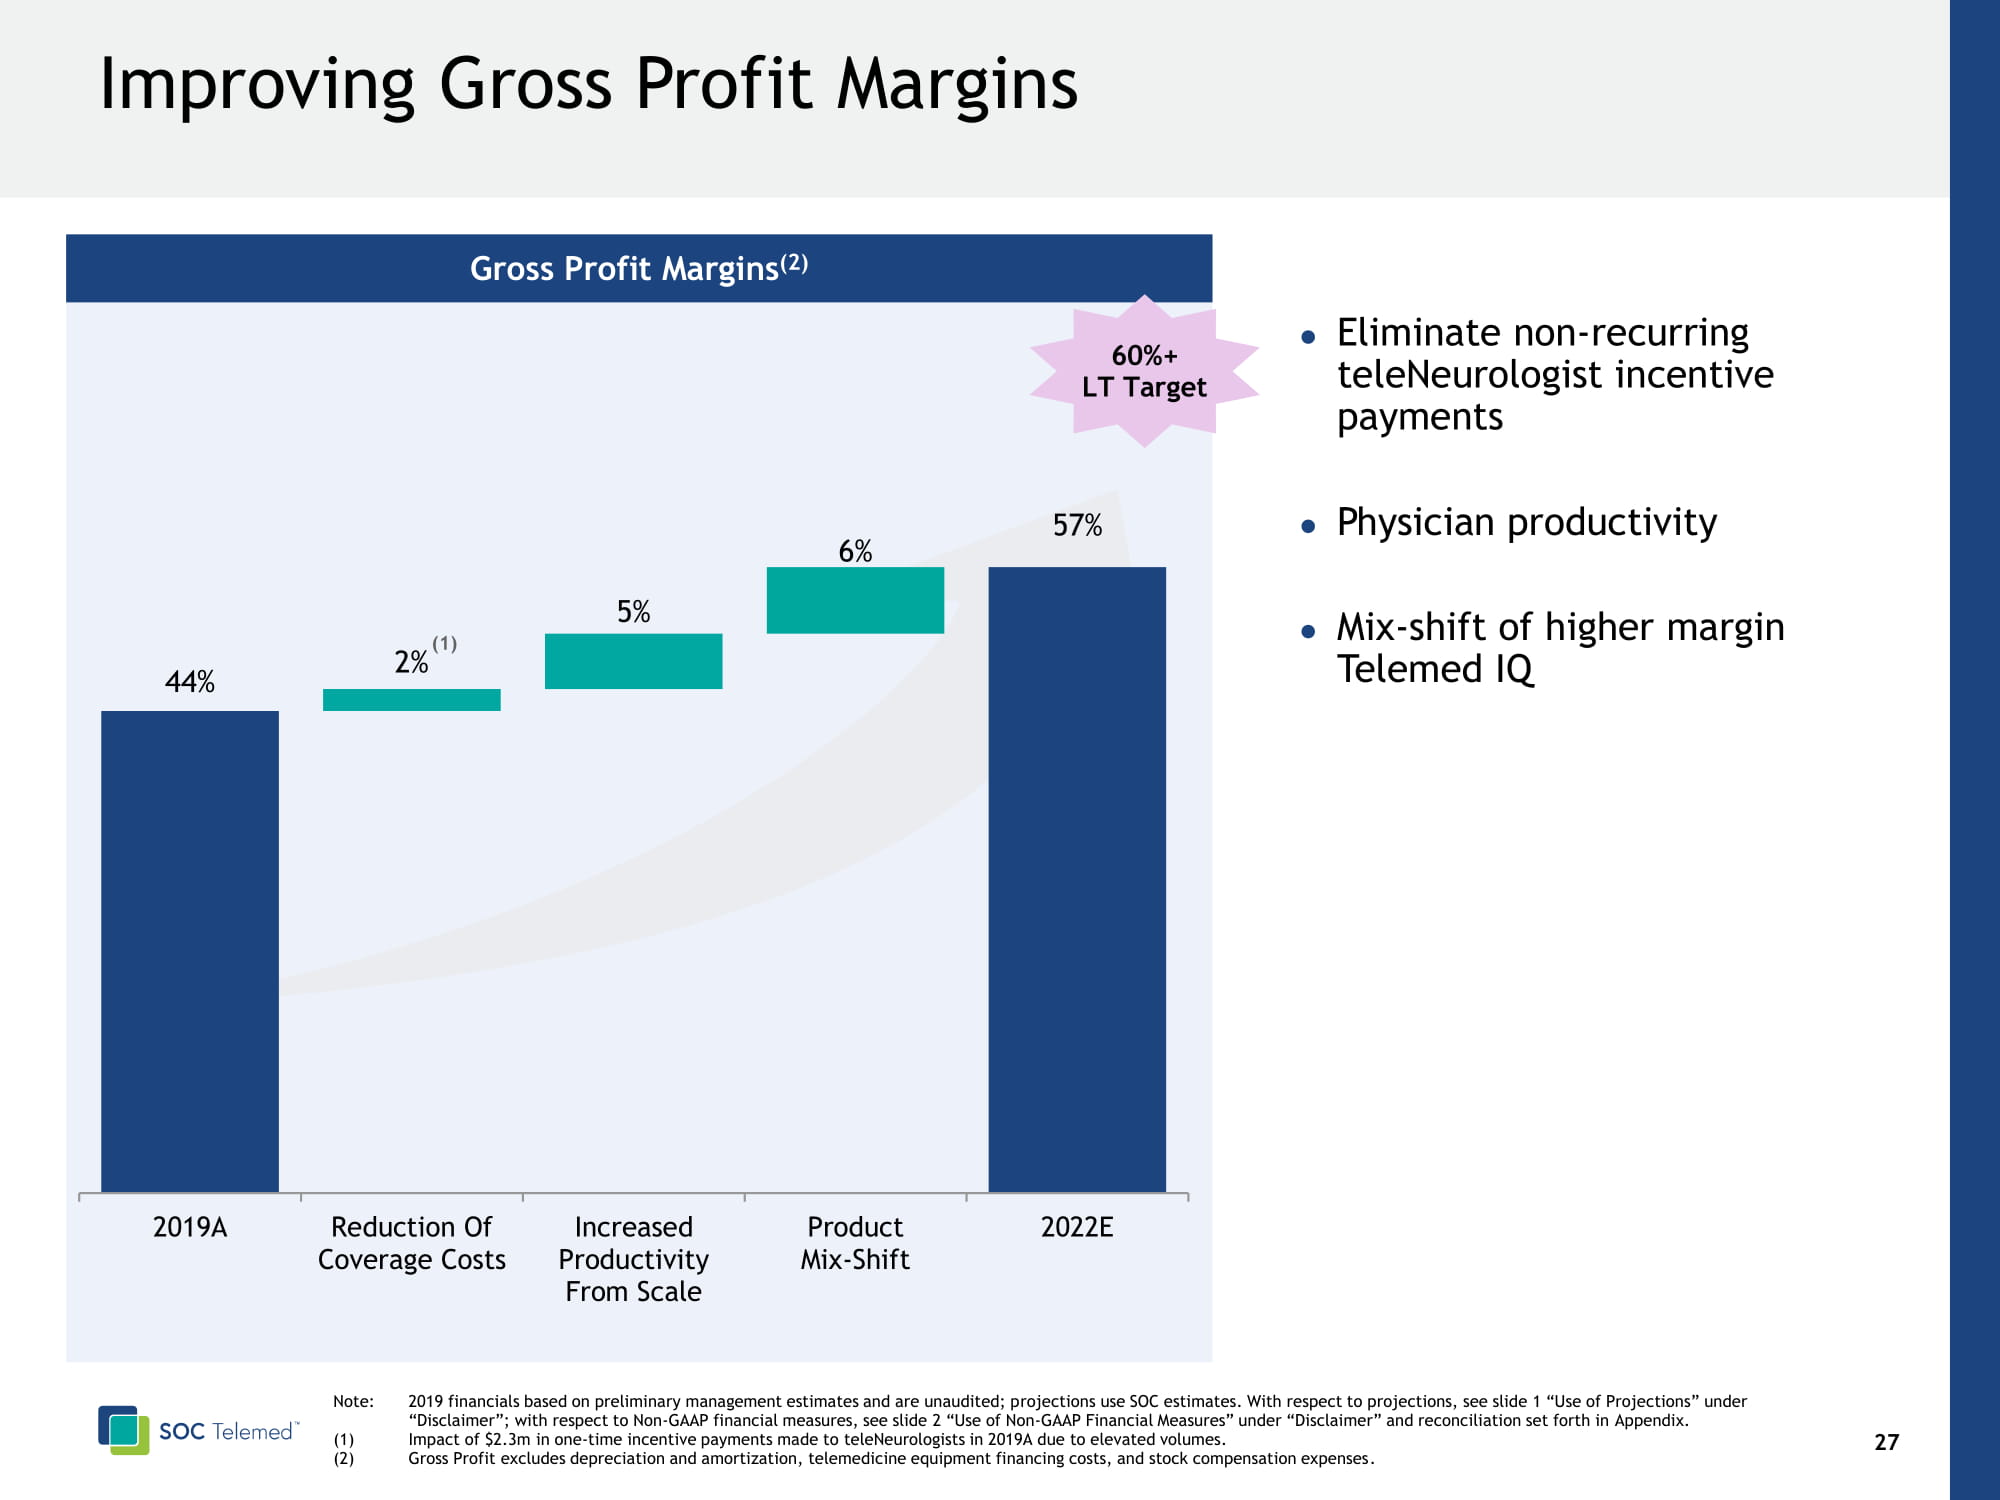
Gross Profit Margins (2) (1) 6 0%+ LT Target 28 Improving Gross Profit Margins 57% 2% 5% 6% 44% 2019A Reduction Of Coverage Costs Increased Productivity From Scale Product Mix-Shift 2022E Note: 2019 financials based on preliminary management estimates and are unaudited; p rojections use SOC estimates . With respect to projections, see slide 1 “Use of Projections” under “Disclaimer”; with respect to Non - GAAP financial measures, see slide 2 “Use of Non - GAAP Financial Measures” under “Disclaimer” and reconciliation set forth in Appendix. ( 1) Impact of $2.3m in one - time incentive payments made to teleNeurologists in 2019A due to elevated volumes . (2) Gross Profit excludes depreciation and amortization, telemedicine equipment financing costs, and stock compensation expenses . Eliminate non - recurring teleNeurologist incentive payments Physician productivity Mix - shift of higher margin Telemed IQ

29 Financial Summary 1H 2020 Bookings (1) Highest in History $ 5.7m 2019 Net Revenue Retention 100% 2016 – 2019 Revenue CAGR 26% LT Gross Profit Margin (2) Target 60%+ LT Adjusted EBITDA Margin Target ~20% (1) Bookings are defined as sum of the annualized fixed monthly fees and implementation fees, also referred to as the First Year Contract Value (variable fees excluded). Implementation fees are amortized on a monthly basis over the length of the average customer life . (2) Gross Profit excludes depreciation and amortization, telemedicine equipment financing costs, and stock compensation expenses .
30 Conclusion Compelling Market Opportunity Scaled , Differentiated Acute Care Telemedicine Platform Substantial Opportunities T o Expand And Grow Attractive Financial Profile Powerful Partnership B etween SOC And HCMC

Appendix

32 SOC Telemed (“SOC ”), a leading provider of acute care telemedicine, expects to enter into a definitive agreement to merge with Healthcare Merger Corp. (“HCMC”) Implied enterprise value of $721 million (9.0x 2021E revenue ) (1) Transaction to be funded through a combination of HCMC’s $250 million of cash in trust and $ 165 million of committed PIPE financing, led by a number of institutional investors Proceeds used to pay cash consideration to selling shareholders, pay down existing debt, general corporate purposes and transaction expenses Current shareholders of SOC to maintain 40% pro forma ownership (1) Closing expected in Q4 2020 Transaction Overview Note: Projections use SOC estimates . With respect to projections, see slide 1 “Use of Projections” under “Disclaimer ”. (1) Assumes no redemptions. Excludes 1.9 million founder shares subject to earnout at $12.50 and $ 15.00.

Sources HCMC Cash in Trust $250 Anticipated PIPE Proceeds $165 Seller Rollover Equity $305 Total Sources $720 Uses Cash Consideration to SOC Shareholders $267 Cash to Balance Sheet $45 Debt Repayment (1) $83 Seller Rollover Equity $305 Assumed Transaction Expenses (2) $20 Total Uses $720 33 Pro Forma Capitalization And Ownership ($ in millions) ($ in millions, except for share price) Note: Projections use SOC estimates . With respect to projections, see slide 1 “Use of Projections” under “Disclaimer ”; assumes no redemptions; share count includes 30.5 million roll - over shares (assumes $10.00 redemption price for illustrative purposes), 25.0 million HCMC shares, 16.5 million PIPE shares and 5.1 million sponsor shares; share count excludes 1.9 million sponsor earnout shares ( 50% vesting at $12.50 and 50% at $15.00) ; as well as the impact of 12.5 million public warrants and 0.4 million private placement warrants (struck at $11.50). (1) Debt repayment as of 6/30/2020 including back - end facility fees; debt subject to 4% PIK interest if repaid at later date. (2) Includes deferred HCMC IPO fees and other fees and expenses . (3) Undrawn $20m revolver contemplated to be put in place at time of transaction close. Estimated Transaction Sources & Uses Illustrative Post - Transaction Ownership Breakdown Pro Forma Enterprise Valuation at Close PF Transaction SOC Telemed Illustrative Share Price $10.00 Pro Forma Shares Outstanding 77.1m Total Equity Value $771 (+) Debt as of 6/30/20 (3) – ( – ) Cash as of 6/30/20 ($50) Pro Forma Enterprise Value $721 Pro Forma 2021E EV/Revenue 9.0x 7% 32% 40% 21% SPAC Sponsor Shares Public Stockholder Shares Seller Rollover Shares PIPE Investor(s)

34 Operational Benchmarking 40% 19% 54% 40% 32% 24% 17% 38% 24% 55% 63% 74% 36% 78% 77% 64% 58% 73% ~60% ~65% ~75% ~45% ~80% ~70% ~62% ~75% 0% 12% 6% - 7% 25% 13% 18% 3% 19% ~20% ~20% ~20% ~20% ~20% ~30% ~20% ~25% NA Revenue Growth ( 2020E – 2021E ) Gross Margin (2021E & LT Target) Adj. EBITDA Margin (2021E & LT Target) NA Digital Health Communications Teleconference Peer Averages Source: Company filings and FactSet as of 7/24/2020 . Note: Data calendarised to December year end; Teladoc based on broker forecasts, pro forma for full - year impact of InTouch acquisition in 2020E and 2021E; projections use SOC estimat es . With respect to projections, see slide 1 “Use of Projections” under “Disclaimer”.

35 Valuation Benchmarking EV / Revenue (2021E) 9.0x 17.8x 24.6x 11.7x 32.7x 17.8x 17.0x 18.0x 22.5x Digital Health Communications Teleconference Peer Averages Source: Company filings and FactSet as of 7/24/2020 . Note: Data calendarised to December year end; Teladoc based on broker forecasts, pro forma for full - year impact of InTouch acquisition in 2020E and 2021E; projections use SOC estimat es . With respect to projections, see slide 1 “Use of Projections” under “Disclaimer”.
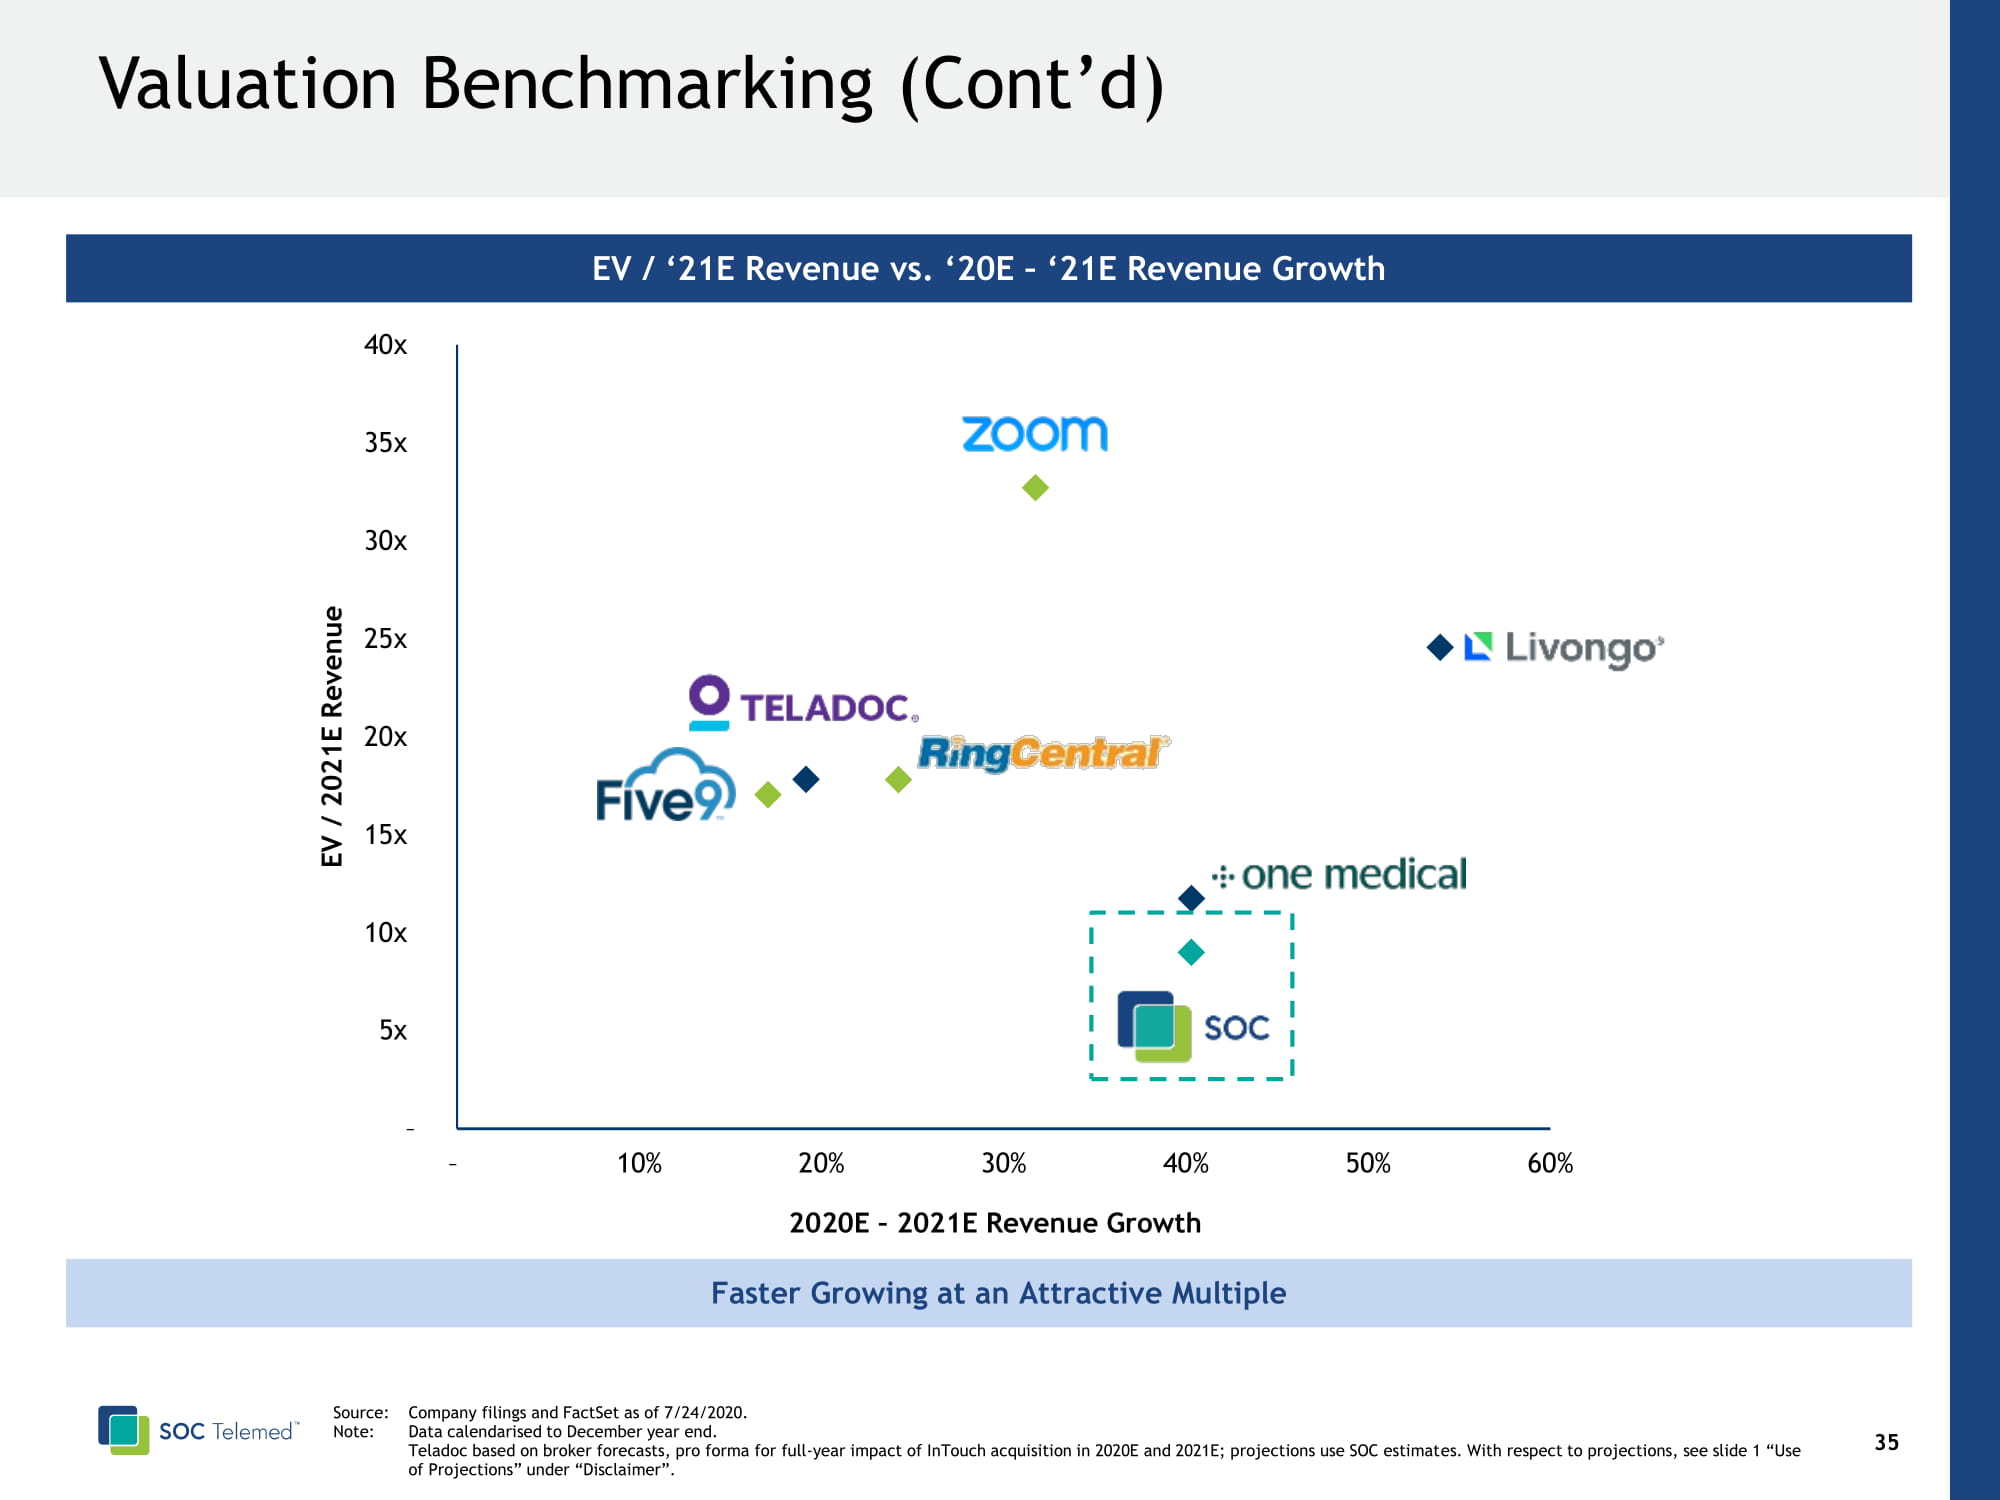
– 5x 10x 15x 20x 25x 30x 35x 40x – 200% 400% 600% 800% 1000% 1200% 1400% 1600% 1800% EV / 2021E Revenue 2020E – 2021E Revenue Growth 36 Valuation Benchmarking (Cont’d ) EV / ‘21E Revenue vs. ‘20E – ‘21E Revenue Growth Faster Growing at an Attractive Multiple Source: Company filings and FactSet as of 7/24/2020 . Note: Data calendarised to December year end. Teladoc based on broker forecasts, pro forma for full - year impact of InTouch acquisition in 2020E and 2021E; projections use SOC estimat es . With respect to projections, see slide 1 “Use of Projections” under “Disclaimer”.
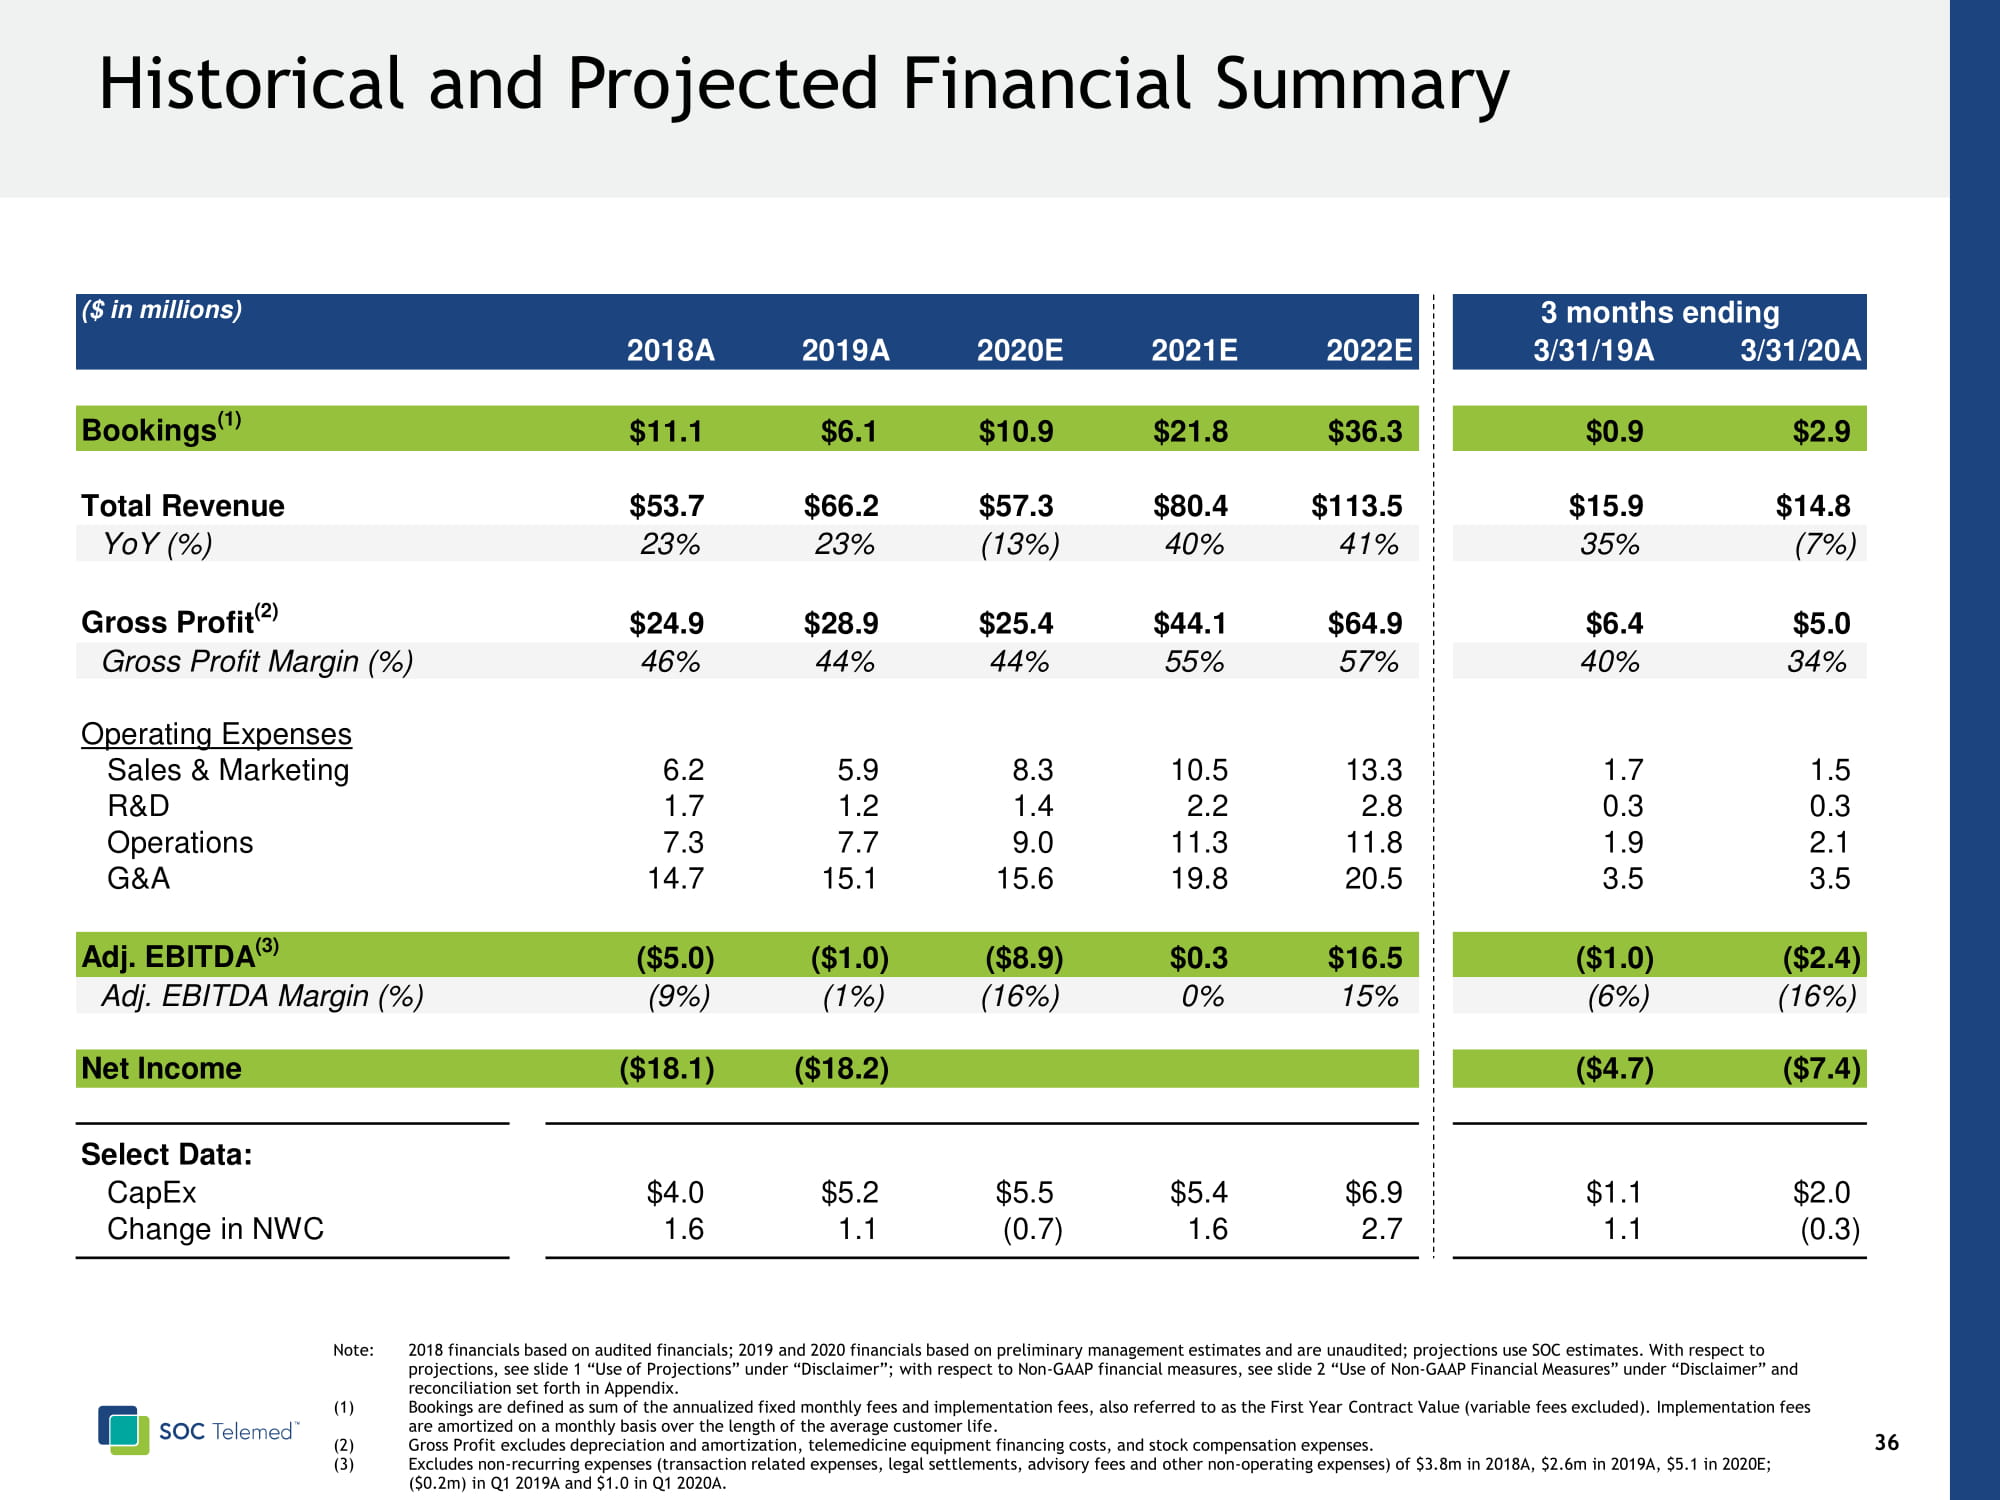
37 Historical and Projected Financial Summary ($ in millions) 3 months ending 2018A 2019A 2020E 2021E 2022E 3/31/19A 3/31/20A Bookings (1) $11.1 $6.1 $10.9 $21.8 $36.3 $0.9 $2.9 Total Revenue $53.7 $66.2 $57.3 $80.4 $113.5 $15.9 $14.8 YoY (%) 23% 23% (13%) 40% 41% 35% (7%) Gross Profit (2) $24.9 $28.9 $25.4 $44.1 $64.9 $6.4 $5.0 Gross Profit Margin (%) 46% 44% 44% 55% 57% 40% 34% Operating Expenses Sales & Marketing 6.2 5.9 8.3 10.5 13.3 1.7 1.5 R&D 1.7 1.2 1.4 2.2 2.8 0.3 0.3 Operations 7.3 7.7 9.0 11.3 11.8 1.9 2.1 G&A 14.7 15.1 15.6 19.8 20.5 3.5 3.5 Adj. EBITDA (3) ($5.0) ($1.0) ($8.9) $0.3 $16.5 ($1.0) ($2.4) Adj. EBITDA Margin (%) (9%) (1%) (16%) 0% 15% (6%) (16%) Net Income ($18.1) ($18.2) ($4.7) ($7.4) Select Data: CapEx $4.0 $5.2 $5.5 $5.4 $6.9 $1.1 $2.0 Change in NWC 1.6 1.1 (0.7) 1.6 2.7 1.1 (0.3) Note: 2018 financials based on audited financials; 2019 and 2020 financials based on preliminary management estimates and are unaudited; projections use SOC estimates . With respect to projections, see slide 1 “Use of Projections” under “Disclaimer”; with respect to Non - GAAP financial measures, see slide 2 “Use of Non - GAAP Financial Measures” under “Disclaimer” and reconciliation set forth in Appendix. (1) Bookings are defined as sum of the annualized fixed monthly fees and implementation fees, also referred to as the First Year Contract Value (variable fees excluded). Implementation fees are amortized on a monthly basis over the length of the average customer life . (2) Gross Profit excludes depreciation and amortization, telemedicine equipment financing costs, and stock compensation expenses. (3) Excludes non - recurring expenses (transaction related expenses, legal settlements, advisory fees and other non - operating expenses) of $ 3.8m in 2018A, $2.6m in 2019A, $5.1 in 2020E; ($ 0.2m) in Q1 2019A and $1.0 in Q1 2020A.
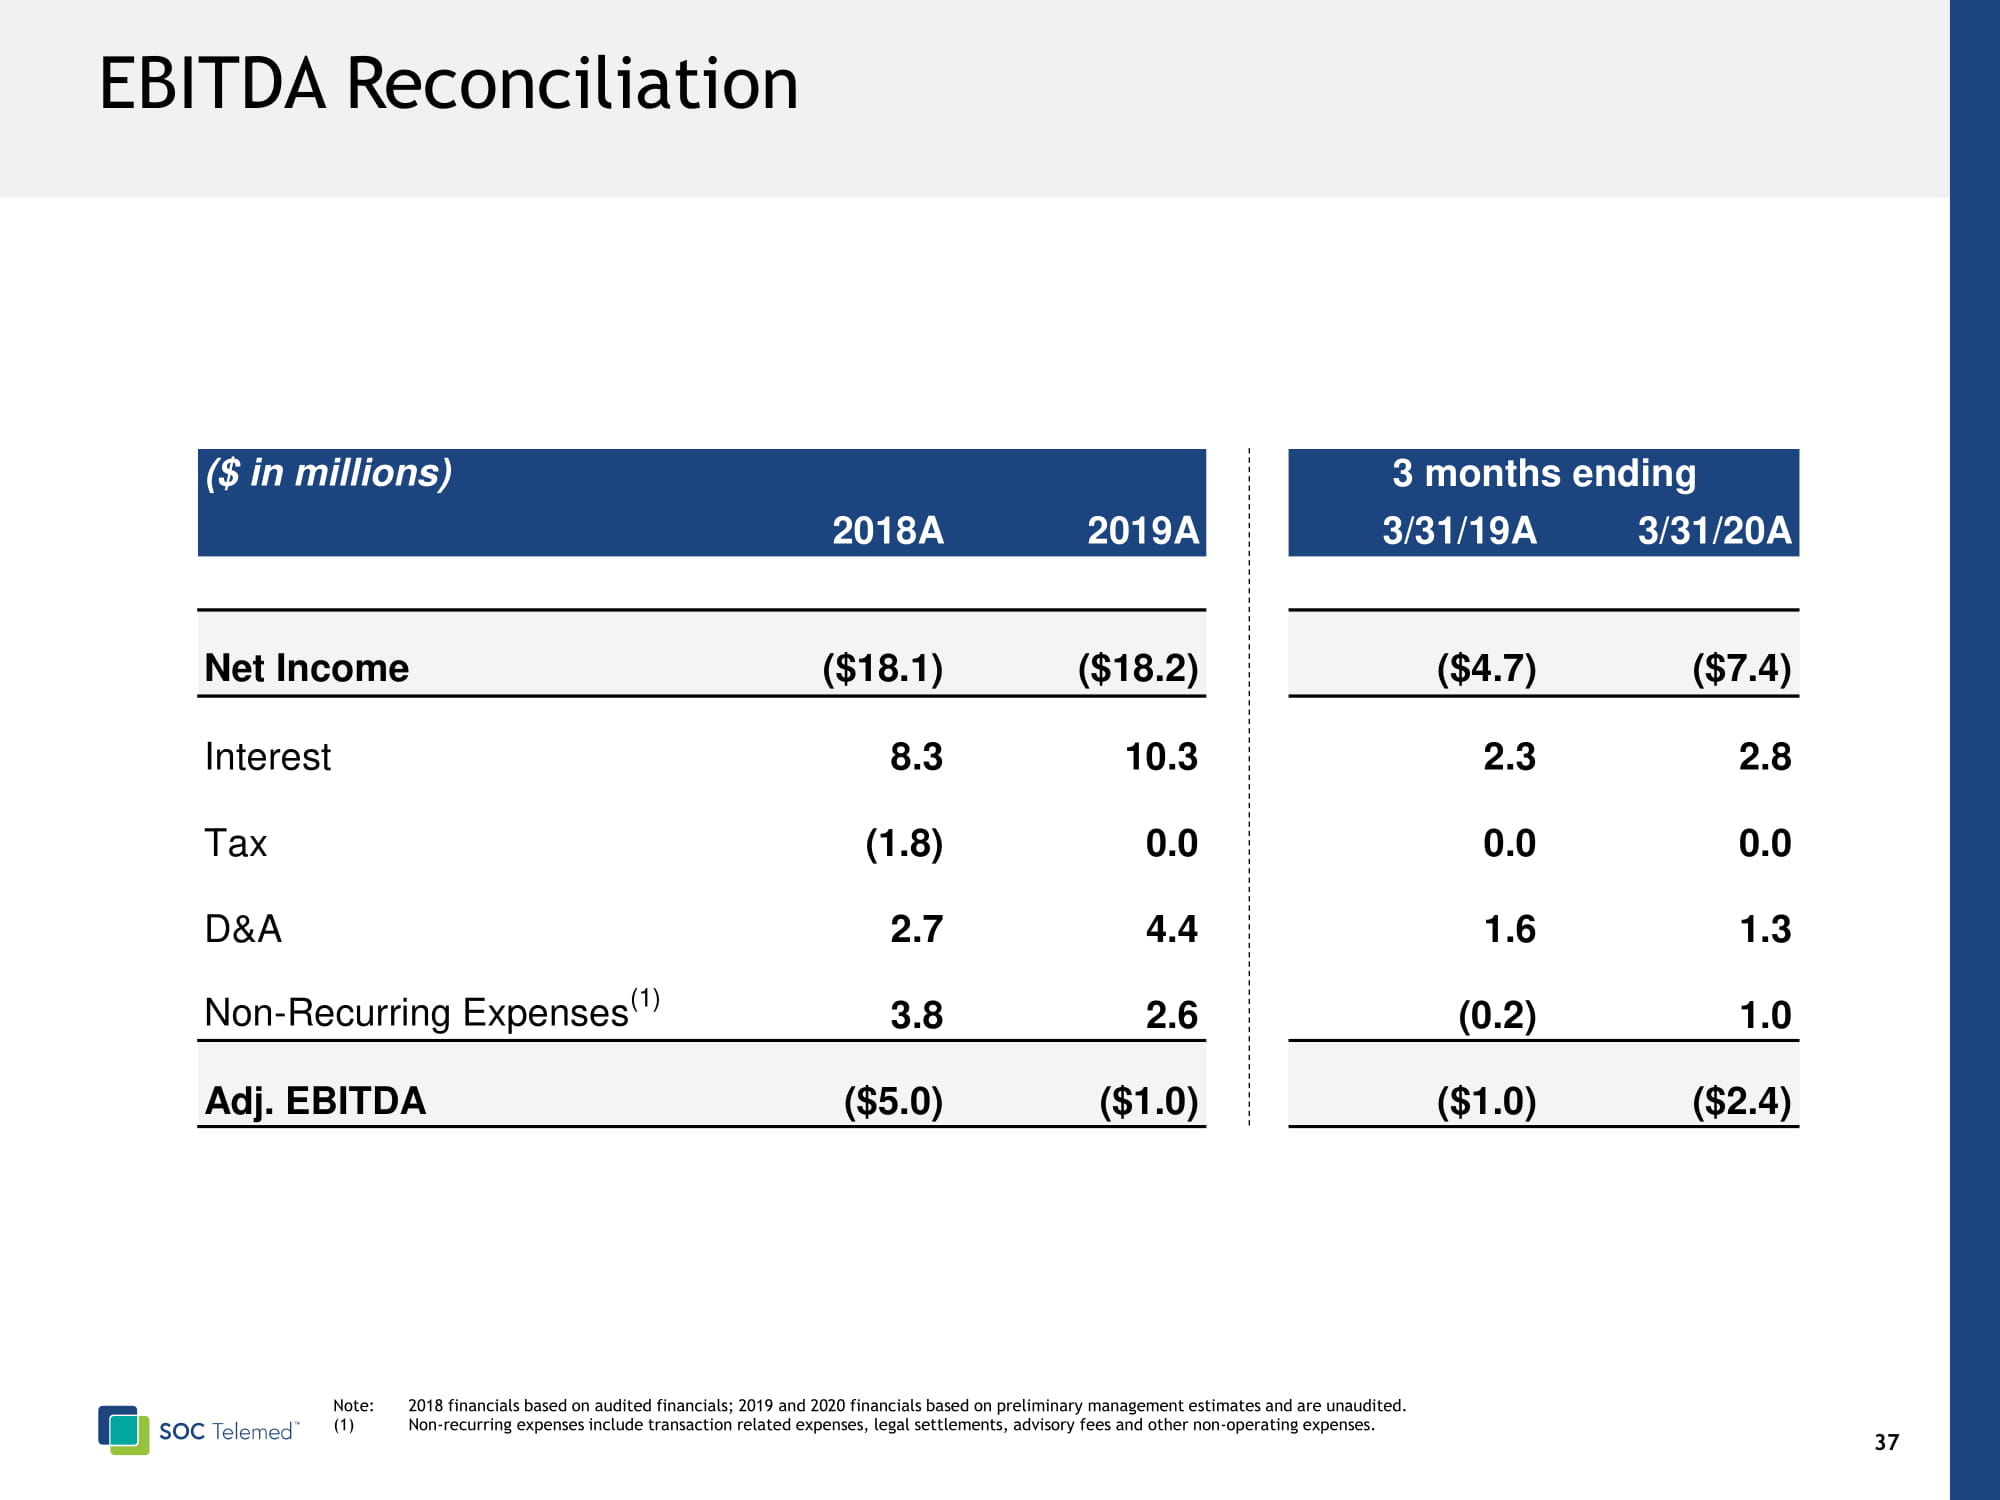
38 EBITDA Reconciliation ($ in millions) 3 months ending 2018A 2019A 3/31/19A 3/31/20A Net Income ($18.1) ($18.2) ($4.7) ($7.4) Interest 8.3 10.3 2.3 2.8 Tax (1.8) 0.0 0.0 0.0 D&A 2.7 4.4 1.6 1.3 Non-Recurring Expenses (1) 3.8 2.6 (0.2) 1.0 Adj. EBITDA ($5.0) ($1.0) ($1.0) ($2.4) Note: 2018 financials based on audited financials; 2019 and 2020 financials based on preliminary management estimates and are unaudited. (1) Non - recurring expenses include transaction related expenses, legal settlements, advisory fees and other non - operating expenses.

39 Top Tier Sponsors F ounded in 1966, Warburg Pincus is a global growth equity firm that has invested more than $79 billion in over 880 companies across more than 40 countries worldwide Warburg Pincus has deep domain knowledge and been active in healthcare and technology, with $12 billion invested in over 160 healthcare companies and over $15 billion invested in over 270 technology companies CEO Steve Shulman has 45+ years of experience leading and acquiring healthcare businesses Chairman of Magellan Health; previously served as Chairman and CEO Chairman of Quartet Health and CareCentrix Director of VillageMD, Pager and Facet Technologies Previously Chairman of R1 RCM and HMA HCMC

40 Uniquely Focused In Tech Enabled Acute Care Telemedicine Marketplace Acute Care Specialist Services Depth Of Software Offering In Acute Care Air Traffic Control Turnkey, h igh touch approach with accountability Do More With Less Demand - Supply Optimization Plug & Play Multiple Physician Groups Configurable Decision Engine Data Driven Platform Actionable Analytics / Benchmarking Advanced Workflows Proactive care - continuity clinical protocols Revenue Cycle Management Compliant billing for acute telemedicine