Wells Fargo Commercial Mortgage Trust 2019-C54
Filed: 4 Nov 19, 3:50pm
| FREE WRITING PROSPECTUS | ||
| FILED PURSUANT TO RULE 433 | ||
| REGISTRATION FILE NO.: 333-226486-11 | ||
 |  |
Free Writing Prospectus
Structural and Collateral Term Sheet
$669,827,472
(Approximate Initial Pool Balance)
$579,400,000
(Approximate Aggregate Certificate Balance of Offered Certificates)
Wells Fargo Commercial Mortgage Trust 2019-C54
as Issuing Entity
Wells Fargo Commercial Mortgage Securities, Inc.
as Depositor
Argentic Real Estate Finance LLC
Wells Fargo Bank, National Association
Rialto Mortgage Finance, LLC
BSPRT CMBS Finance, LLC
UBS AG
as Sponsors and Mortgage Loan Sellers
Commercial Mortgage Pass-Through Certificates
Series 2019-C54
November 4, 2019
WELLS FARGO SECURITIES Co-Lead Manager and Joint Bookrunner | UBS SECURITIES LLC Co-Lead Manager and Joint Bookrunner | |
Academy Securities Co-Manager | Drexel Hamilton Co-Manager |
STATEMENT REGARDING THIS FREE WRITING PROSPECTUS
The depositor has filed a registration statement (including a prospectus) with the Securities and Exchange Commission (‘‘SEC’’) (SEC File No. 333-226486) for the offering to which this communication relates. Before you invest, you should read the prospectus in the registration statement and other documents the depositor has filed with the SEC for more complete information about the depositor, the issuing entity and this offering. You may get these documents for free by visiting EDGAR on the SEC Web site at www.sec.gov. Alternatively, the depositor, any underwriter, or any dealer participating in the offering will arrange to send you the prospectus after filing if you request it by calling toll free 1-800-745-2063 (8 a.m. – 5 p.m. EST) or by emailing wfs.cmbs@wellsfargo.com.
Nothing in this document constitutes an offer of securities for sale in any jurisdiction where the offer or sale is not permitted. The information contained herein is preliminary as of the date hereof, supersedes any such information previously delivered to you and will be superseded by any such information subsequently delivered and ultimately by the final prospectus relating to the securities. These materials are subject to change, completion, supplement or amendment from time to time.
This free writing prospectus has been prepared by the underwriters for information purposes only and does not constitute, in whole or in part, a prospectus for the purposes of Directive 2003/71/EC (as amended) and/or Part VI of the Financial Services and Markets Act 2000, as amended, or other offering document.
STATEMENT REGARDING ASSUMPTIONS AS TO SECURITIES, PRICING ESTIMATES AND OTHER INFORMATION
The attached information contains certain tables and other statistical analyses (the “Computational Materials”) which have been prepared in reliance upon information furnished by the Mortgage Loan Sellers. Numerous assumptions were used in preparing the Computational Materials, which may or may not be reflected herein. As such, no assurance can be given as to the Computational Materials’ accuracy, appropriateness or completeness in any particular context; or as to whether the Computational Materials and/or the assumptions upon which they are based reflect present market conditions or future market performance. The Computational Materials should not be construed as either projections or predictions or as legal, tax, financial or accounting advice. You should consult your own counsel, accountant and other advisors as to the legal, tax, business, financial and related aspects of a purchase of these securities. Any weighted average lives, yields and principal payment periods shown in the Computational Materials are based on prepayment and/or loss assumptions, and changes in such prepayment and/or loss assumptions may dramatically affect such weighted average lives, yields and principal payment periods. In addition, it is possible that prepayments or losses on the underlying assets will occur at rates higher or lower than the rates shown in the attached Computational Materials. The specific characteristics of the securities may differ from those shown in the Computational Materials due to differences between the final underlying assets and the preliminary underlying assets used in preparing the Computational Materials. The principal amount and designation of any security described in the Computational Materials are subject to change prior to issuance. None of Wells Fargo Securities, LLC, UBS Securities LLC, Academy Securities, Inc., Drexel Hamilton, LLC, or any of their respective affiliates, make any representation or warranty as to the actual rate or timing of payments or losses on any of the underlying assets or the payments or yield on the securities. The information in this presentation is based upon management forecasts and reflects prevailing conditions and management’s views as of this date, all of which are subject to change. In preparing this presentation, we have relied upon and assumed, without independent verification, the accuracy and completeness of all information available from public sources or which was provided to us by or on behalf of the Mortgage Loan Sellers or which was otherwise reviewed by us.
This free writing prospectus contains certain forward-looking statements. If and when included in this free writing prospectus, the words “expects”, “intends”, “anticipates”, “estimates” and analogous expressions and all statements that are not historical facts, including statements about our beliefs or expectations, are intended to identify forward-looking statements. Any forward-looking statements are made subject to risks and uncertainties which could cause actual results to differ materially from those stated. Those risks and uncertainties include, among other things, declines in general economic and business conditions, increased competition, changes in demographics, changes in political and social conditions, regulatory initiatives and changes in customer preferences, many of which are beyond our control and the control of any other person or entity related to this offering. The forward-looking statements made in this free writing prospectus are made as of the date stated on the cover. We have no obligation to update or revise any forward-looking statement.
Wells Fargo Securities is the trade name for the capital markets and investment banking services of Wells Fargo & Company and its subsidiaries, including but not limited to Wells Fargo Securities, LLC, a member of NYSE, FINRA, NFA and SIPC, Wells Fargo Prime Services, LLC, a member of FINRA, NFA and SIPC, and Wells Fargo Bank, N.A. Wells Fargo Securities, LLC and Wells Fargo Prime Services, LLC are distinct entities from affiliated banks and thrifts.
IMPORTANT NOTICE REGARDING THE OFFERED CERTIFICATES
The information herein is preliminary and may be supplemented or amended prior to the time of sale. In addition, the Offered Certificates referred to in these materials and the asset pool backing them are subject to modification or revision (including the possibility that one or more classes of certificates may be split, combined or eliminated at any time prior to issuance or availability of a final prospectus) and are offered on a “when, as and if issued” basis.
The underwriters described in these materials may from time to time perform investment banking services for, or solicit investment banking business from, any company named in these materials. The underwriters and/or their affiliates or respective employees may from time to time have a long or short position in any security or contract discussed in these materials.
The information contained herein supersedes any previous such information delivered to any prospective investor and will be superseded by information delivered to such prospective investor prior to the time of sale.
IMPORTANT NOTICE RELATING TO AUTOMATICALLY-GENERATED EMAIL DISCLAIMERS
Any legends, disclaimers or other notices that may appear at the bottom of any email communication to which this free writing prospectus is attached relating to (1) these materials not constituting an offer (or a solicitation of an offer), (2) any representation that these materials are accurate or complete and may not be updated or (3) these materials possibly being confidential, are not applicable to these materials and should be disregarded. Such legends, disclaimers or other notices have been automatically generated as a result of these materials having been sent via Bloomberg or another system.
| THE INFORMATION IN THIS STRUCTURAL AND COLLATERAL TERM SHEET IS NOT COMPLETE AND MAY BE AMENDED PRIOR TO THE TIME OF SALE. THIS TERM SHEET IS NOT AN OFFER TO SELL THESE SECURITIES AND IT IS NOT A SOLICITATION OF AN OFFER TO BUY THESE SECURITIES IN ANY JURISDICTION WHERE THE OFFER OR SALE IS NOT PERMITTED. |
| 2 |
| Wells Fargo Commercial Mortgage Trust 2019-C54 | Certificate Structure |
I. Certificate Structure
| Class | Expected Ratings (Fitch/KBRA/S&P)(1) | Approximate Initial Certificate Balance or Notional Amount(2) | Approx. Initial | Pass-Through Rate Description | Weighted Average Life (Years)(4) | Expected Principal Window(4) | Certificate Principal to Value Ratio(5) | Certificate Principal U/W NOI Debt Yield(6) | ||
| Offered Certificates | ||||||||||
| A-1 | AAAsf/AAA(sf)/AAA(sf) | $13,445,000 | 30.000% | (7) | 2.98 | 01/20 – 10/24 | 44.4% | 14.3% | ||
| A-2 | AAAsf/AAA(sf)/AAA(sf) | $25,365,000 | 30.000% | (7) | 4.87 | 10/24 – 10/24 | 44.4% | 14.3% | ||
| A-SB | AAAsf/AAA(sf)/AAA(sf) | $21,614,000 | 30.000% | (7) | 7.27 | 10/24 – 06/29 | 44.4% | 14.3% | ||
| A-3 | AAAsf/AAA(sf)/AAA(sf) | (8) | 30.000% | (7) | (8) | (8) | 44.4% | 14.3% | ||
| A-4 | AAAsf/AAA(sf)/AAA(sf) | (8) | 30.000% | (7) | (8) | (8) | 44.4% | 14.3% | ||
| X-A | AAAsf/AAA(sf)/AAA(sf) | $468,879,000(9) | N/A | Variable(10) | N/A | N/A | N/A | N/A | ||
| X-B | A-sf/AAA(sf)/A-(sf) | $110,521,000(11) | N/A | Variable(12) | N/A | N/A | N/A | N/A | ||
| A-S | AAAsf/AAA(sf)/AAA(sf) | $46,050,000 | 23.125% | (7) | 9.95 | 11/29 – 11/29 | 48.7% | 13.0% | ||
| B | AA-sf/AA(sf)/AA(sf) | $31,817,000 | 18.375% | (7) | 9.95 | 11/29 – 11/29 | 51.7% | 12.3% | ||
| C | A-sf/A-(sf)/A-(sf) | $32,654,000 | 13.500% | (7) | 9.95 | 11/29 – 11/29 | 54.8% | 11.6% | ||
| Non-Offered Certificates | ||||||||||
| X-D(13) | BBBsf/BBB+(sf)/NR | $17,818,000(14) | N/A | Variable(15) | N/A | N/A | N/A | N/A | ||
| D(13) | BBBsf/BBB+(sf)/NR | $17,818,000 | 10.840% | (7) | 9.95 | 11/29 – 11/29 | 56.5% | 11.2% | ||
| Risk Retention Certificates | ||||||||||
| E-RR(13) | BBB-sf/BBB-(sf)/NR | $19,023,000 | 8.000% | (7) | 9.95 | 11/29 – 11/29 | 58.3% | 10.9% | ||
| F-RR | BB-sf/BB-(sf)/NR | $18,420,000 | 5.250% | (7) | 9.95 | 11/29 – 11/29 | 60.0% | 10.6% | ||
| G-RR | B-sf/B(sf)/NR | $6,698,000 | 4.250% | (7) | 9.95 | 11/29 – 11/29 | 60.7% | 10.5% | ||
| H-RR | NR/NR/NR | $28,468,471 | 0.000% | (7) | 9.95 | 11/29 – 11/29 | 63.4% | 10.0% | ||
| Notes: | ||||||||||
| (1) | The expected ratings presented are those of Fitch Ratings, Inc. (“Fitch”), Kroll Bond Rating Agency, Inc. (“KBRA”) and S&P Global Ratings (“S&P”), which the depositor hired to rate the Offered Certificates. One or more other nationally recognized statistical rating organizations that were not hired by the depositor may use information they receive pursuant to Rule 17g-5 under the Securities Exchange Act of 1934, as amended (the “Exchange Act”) or otherwise, to rate or provide market reports and/or published commentary related to the Offered Certificates. We cannot assure you as to what ratings a non-hired nationally recognized statistical rating organization would assign or that its reports will not express differing, possibly negative, views of the mortgage loans and/or the Offered Certificates. The ratings of each Class of Offered Certificates address the likelihood of the timely distribution of interest and, except in the case of the Class X-A, X-B and X-D Certificates, the ultimate distribution of principal due on those Classes on or before the Rated Final Distribution Date. See “Risk Factors—Other Risks Relating to the Certificates—Nationally Recognized Statistical Rating Organizations May Assign Different Ratings to the Certificates; Ratings of the Certificates Reflect Only the Views of the Applicable Rating Agencies as of the Dates Such Ratings Were Issued; Ratings May Affect ERISA Eligibility; Ratings May Be Downgraded” and “Ratings” in the Preliminary Prospectus, expected to be dated November 4, 2019 (the “Preliminary Prospectus”). Fitch, KBRA and S&P have informed us that the “sf” designation in their ratings represents an identifier for structured finance product ratings. | |||||||||
| (2) | The Certificate Balances and Notional Amounts set forth in the table are approximate. The actual initial Certificate Balances and Notional Amounts may be larger or smaller depending on the initial pool balance of the mortgage loans definitively included in the pool of mortgage loans, which aggregate cut-off date balance may be as much as 5% larger or smaller than the amount presented in the Preliminary Prospectus. In addition, the Notional Amounts of the Class X-A, X-B and X-D Certificates may vary depending upon the final pricing of the Classes of Principal Balance Certificates (as defined in the Preliminary Prospectus) whose Certificate Balances comprise such Notional Amounts, and, if, as a result of such pricing, the pass-through rate of the Class X-A, X-B or X-D Certificates, as applicable, would be equal to zero at all times, such Class of Certificates may not be issued on the closing date of this securitization. | |||||||||
| (3) | The approximate initial credit support with respect to the Class A-1, A-2, A-SB, A-3 and A-4 Certificates represents the approximate credit enhancement for the Class A-1, A-2, A-SB, A-3 and A-4 Certificates in the aggregate. | |||||||||
| (4) | Weighted Average Lives and Expected Principal Windows are calculated based on an assumed prepayment rate of 0% CPR and the “Structuring Assumptions” described under “Yield and Maturity Considerations—Weighted Average Life” in the Preliminary Prospectus. | |||||||||
| (5) | The Certificate Principal to Value Ratio for each Class of Certificates (other than the Class A-1, A-2, A-SB, A-3 and A-4 Certificates) is calculated as the product of (a) the weighted average Cut-off Date LTV Ratio for the mortgage loans and (b) a fraction, the numerator of which is the total initial Certificate Balance of such Class of Certificates and all Classes of Principal Balance Certificates senior to such Class of Certificates and the denominator of which is the total initial Certificate Balance of all of the Principal Balance Certificates. The Certificate Principal to Value Ratio for each of the Class A-1, A-2, A-SB, A-3 and A-4 Certificates is calculated in the aggregate for those Classes as if they were a single Class and is calculated as the product of (a) the weighted average Cut-off Date LTV Ratio for the mortgage loans and (b) a fraction, the numerator of which is the total initial aggregate Certificate Balances of such Classes of Certificates and the denominator of which is the total initial Certificate Balance of all of the Principal Balance Certificates. In any event, however, excess mortgaged property value associated with a mortgage loan will not be available to offset losses on any other mortgage loan. | |||||||||
| (6) | The Certificate Principal U/W NOI Debt Yield for each Class of Certificates (other than the Class A-1, A-2, A-SB, A-3 and A-4 Certificates) is calculated as the product of (a) the weighted average U/W NOI Debt Yield for the mortgage loans and (b) a fraction, the numerator of which is the total initial Certificate Balance of all of the Classes of Principal Balance Certificates and the denominator of which is the total initial Certificate Balance for such Class of Certificates and all Classes of Principal Balance Certificates senior to such Class of Certificates. The Certificate Principal U/W NOI Debt Yield for each of the Class A-1, A-2, A-SB, A-3 and A-4 Certificates is calculated in the aggregate for those Classes as if they were a single Class and is calculated as the product of (a) the weighted average U/W NOI Debt Yield for the mortgage loans and (b) a fraction, the numerator of which is the total initial Certificate Balance of all of the Classes of Principal Balance Certificates and the denominator of which is the total aggregate initial Certificate Balances for the Class A-1, A-2, A-SB, A-3 and A-4 Certificates. In any event, however, cash flow from each mortgaged property supports only the related mortgage loan and will not be available to support any other mortgage loan. | |||||||||
| (7) | The pass-through rates for the Class A-1, A-2, A-SB, A-3, A-4, A-S, B, C, D, E-RR, F-RR, G-RR and H-RR Certificates in each case will be one of the following: (i) a fixed rateper annum, (ii) a variable rate per annum equal to the weighted average of the net mortgage interest rates on the mortgage loans for the related distribution date, (iii) a variable rateper annumequal to the lesser of (a) a fixed rate and (b) the weighted average of the net mortgage interest rates on the mortgage loans for the related distribution date or (iv) a variable rateper annum equal to the weighted average of the net mortgage interest rates on the mortgage loans for the related distribution date | |||||||||
| THE INFORMATION IN THIS STRUCTURAL AND COLLATERAL TERM SHEET IS NOT COMPLETE AND MAY BE AMENDED PRIOR TO THE TIME OF SALE. THIS TERM SHEET IS NOT AN OFFER TO SELL THESE SECURITIES AND IT IS NOT A SOLICITATION OF AN OFFER TO BUY THESE SECURITIES IN ANY JURISDICTION WHERE THE OFFER OR SALE IS NOT PERMITTED. |
| 3 |
| Wells Fargo Commercial Mortgage Trust 2019-C54 | Certificate Structure |
| minus a specified percentage. For purposes of the calculation of the weighted average of the net mortgage interest rates on the mortgage loans for each distribution date, the mortgage interest rates will be adjusted as necessary to a 30/360 basis. |
| (8) | The exact initial Certificate Balances of the Class A-3 and A-4 Certificates are unknown and will be determined based on the final pricing of those Classes of certificates. However, the respective initial Certificate Balances, weighted average lives and principal windows of the Class A-3 and A-4 Certificates are expected to be within the applicable ranges reflected in the following chart. The aggregate initial Certificate Balance of the Class A-3 and A-4 Certificates is expected to be approximately $408,455,000, subject to a variance of plus or minus 5%. In the event that the Class A-3 Certificates are issued at $408,455,000, the Class A-4 Certificates will not be issued. |
Class of | Expected Range of | Expected Range of | Expected Range of Principal Window | |||||
| Class A-3 | $50,000,000 - $408,455,000 | 9.71 – 9.87 | 06/29 – 09/29 / 06/29 – 11/29 | |||||
| Class A-4 | $208,455,000 - $358,455,000 | 9.89 – 9.92 | 09/29 – 11/29 / 10/29 – 11/29 |
| (9) | The Class X-A Certificates are notional amount certificates. The Notional Amount of the Class X-A Certificates will be equal to the aggregate Certificate Balance of the Class A-1, A-2, A-SB, A-3 and A-4 Certificates outstanding from time to time. The Class X-A Certificates will not be entitled to distributions of principal. |
| (10) | The pass-through rate for the Class X-A Certificates for any distribution date will be aper annum rate equal to the excess, if any, of (a) the weighted average of the net mortgage interest rates on the mortgage loans for the related distribution date, over (b) the weighted average of the pass-through rates on the Class A-1, A-2, A-SB, A-3 and A-4 Certificates for the related distribution date, weighted on the basis of their respective Certificate Balances outstanding immediately prior to that distribution date. For purposes of the calculation of the weighted average of the net mortgage interest rates on the mortgage loans for each distribution date, the mortgage interest rates will be adjusted as necessary to a 30/360 basis. |
| (11) | The Class X-B Certificates are notional amount certificates. The Notional Amount of the Class X-B Certificates will be equal to the aggregate Certificate Balance of the Class A-S, B and C Certificates outstanding from time to time. The Class X-B Certificates will not be entitled to distributions of principal. |
| (12) | The pass-through rate for the Class X-B Certificates for any distribution date will be aper annum rate equal to the excess, if any, of (a) the weighted average of the net mortgage interest rates on the mortgage loans for the related distribution date, over (b) the weighted average of the pass-through rates on the Class A-S, B and C Certificates for the related distribution date, weighted on the basis of their respective Certificate Balances outstanding immediately prior to that distribution date. For purposes of the calculation of the weighted average of the net mortgage interest rates on the mortgage loans for each distribution date, the mortgage interest rates will be adjusted as necessary to a 30/360 basis. |
| (13) | The initial Notional Amount of the X-D Certificates and the initial Certificate Balance of each of the Class D and E-RR Certificates are subject to change based on final pricing of all certificates and the final determination of the Class E-RR, F-RR, G-RR and H-RR Certificates (collectively, the “horizontal risk retention certificates”) that will be retained by the retaining sponsor through a third party purchaser as part of the U.S. risk retention requirements. For more information regarding the methodology and key inputs and assumptions used to determine the sizing of the horizontal risk retention certificates, see “Credit Risk Retention” in the Preliminary Prospectus. The initial Notional Amount of the Class X-D Certificates is expected to fall within a range of $14,978,000 and $20,329,000, the initial Certificate Balance of the Class D Certificates is expected to fall within a range of $14,978,000 and $20,329,000 and the initial Certificate Balance of the Class E-RR Certificates is expected to fall within a range of $16,512,000 and $21,863,000, with the ultimate initial Certificate Balance determined such that the aggregate fair value of the Class E-RR, Class F-RR, Class G-RR and Class H-RR Certificates will equal at least 5% of the estimated fair value as of the Closing Date of all of the classes of Certificates (other than the Class R Certificates) issued by the issuing entity. |
| (14) | The Class X-D Certificates are notional amount certificates. The Notional Amount of the Class X-D Certificates will be equal to the Certificate Balance of the Class D Certificates outstanding from time to time. The Class X-D Certificates will not be entitled to distributions of principal. |
| (15) | The pass-through rate for the Class X-D Certificates for any distribution date will be aper annum rate equal to the excess, if any, of (a) the weighted average of the net mortgage interest rates on the mortgage loans for the related distribution date, over (b) the pass-through rate on the Class D Certificates for the related distribution date. For purposes of the calculation of the weighted average of the net mortgage interest rates on the mortgage loans for each distribution date, the mortgage interest rates will be adjusted as necessary to a 30/360 basis. |
| THE INFORMATION IN THIS STRUCTURAL AND COLLATERAL TERM SHEET IS NOT COMPLETE AND MAY BE AMENDED PRIOR TO THE TIME OF SALE. THIS TERM SHEET IS NOT AN OFFER TO SELL THESE SECURITIES AND IT IS NOT A SOLICITATION OF AN OFFER TO BUY THESE SECURITIES IN ANY JURISDICTION WHERE THE OFFER OR SALE IS NOT PERMITTED. |
| 4 |
| Wells Fargo Commercial Mortgage Trust 2019-C54 | Transaction Highlights |
II. Transaction Highlights
Mortgage Loan Sellers:
Mortgage Loan Seller | Number of | Number of | Aggregate Cut-off Date Balance | % of Initial Pool | ||||||
| Argentic Real Estate Finance LLC | 11 | 16 | $177,079,177 | 26.4 | % | |||||
| Wells Fargo Bank, National Association | 11 | 12 | 173,893,603 | 26.0 | ||||||
| Rialto Mortgage Finance, LLC | 9 | 20 | 158,376,246 | 23.6 | ||||||
| BSPRT CMBS Finance, LLC | 7 | 19 | 105,722,940 | 15.8 | ||||||
| UBS AG | 6 | 21 | 54,755,506 | 8.2 | ||||||
Total | 44 | 88 | $669,827,472 | 100.0 | % | |||||
Loan Pool:
| Initial Pool Balance: | $669,827,472 |
| Number of Mortgage Loans: | 44 |
| Average Cut-off Date Balance per Mortgage Loan: | $15,223,352 |
| Number of Mortgaged Properties: | 88 |
| Average Cut-off Date Balance per Mortgaged Property(1): | $7,611,676 |
| Weighted Average Mortgage Interest Rate: | 3.887% |
| Ten Largest Mortgage Loans as % of Initial Pool Balance: | 45.9% |
| Weighted Average Original Term to Maturity or ARD (months): | 118 |
| Weighted Average Remaining Term to Maturity or ARD (months): | 116 |
| Weighted Average Original Amortization Term (months)(2): | 358 |
| Weighted Average Remaining Amortization Term (months)(2): | 357 |
| Weighted Average Seasoning (months): | 2 |
| (1) | Information regarding mortgage loans secured by multiple properties is based on an allocation according to relative appraised values or the allocated loan amounts or property-specific release prices set forth in the related loan documents or such other allocation as the related mortgage loan seller deemed appropriate. |
| (2) | Excludes any mortgage loan that does not amortize. |
Credit Statistics:
| Weighted Average U/W Net Cash Flow DSCR(1): | 2.21x |
| Weighted Average U/W Net Operating Income Debt Yield(1): | 10.0% |
| Weighted Average Cut-off Date Loan-to-Value Ratio(1): | 63.4% |
| Weighted Average Balloon or ARD Loan-to-Value Ratio(1): | 59.7% |
| % of Mortgage Loans with Additional Subordinate Debt(2): | 7.4% |
| % of Mortgage Loans with Single Tenants(3): | 10.8% |
| (1) | With respect to any mortgage loan that is part of a whole loan, loan-to-value ratio, debt service coverage ratio and debt yield calculations include the relatedpari passucompanion loan(s). The debt service coverage ratio, debt yield and loan-to-value ratio information do not take into account any subordinate debt (whether or not secured by the related mortgaged property), that currently exists or is allowed under the terms of any mortgage loan. See “Description of the Mortgage Pool—Mortgage Pool Characteristics” in the Preliminary Prospectus and Annex A-1 to the Preliminary Prospectus. |
| (2) | The percentage figure expressed as “% of Mortgage Loans with Additional Subordinate Debt” is determined as a percentage of the initial pool balance and does not take into account any future subordinate debt (whether or not secured by the mortgaged property), if any, that may be permitted under the terms of any mortgage loan or the pooling and servicing agreement. See “Description of the Mortgage Pool—Additional Indebtedness—Other Unsecured Indebtedness” in the Preliminary Prospectus. |
| (3) | Excludes mortgage loans that are secured by multiple single tenant properties. |
| THE INFORMATION IN THIS STRUCTURAL AND COLLATERAL TERM SHEET IS NOT COMPLETE AND MAY BE AMENDED PRIOR TO THE TIME OF SALE. THIS TERM SHEET IS NOT AN OFFER TO SELL THESE SECURITIES AND IT IS NOT A SOLICITATION OF AN OFFER TO BUY THESE SECURITIES IN ANY JURISDICTION WHERE THE OFFER OR SALE IS NOT PERMITTED. |
| 5 |
| Wells Fargo Commercial Mortgage Trust 2019-C54 | Transaction Highlights |
Loan Structural Features:
Amortization:Based on the Initial Pool Balance, 33.4% of the mortgage pool (21 mortgage loans) has scheduled amortization, as follows:
22.6% (13 mortgage loans) provides for an interest-only period followed by an amortization period; and
10.8% (8 mortgage loans) requires amortization during the entire loan term.
Interest-Only:Based on the Initial Pool Balance, 66.6% of the mortgage pool (23 mortgage loans) provides for interest-only payments during the entire loan term through maturity or ARD. The Weighted Average Cut-off Date Loan-to-Value Ratio and Weighted Average U/W Net Cash Flow DSCR for those mortgage loans are 62.0% and 2.43x, respectively.
Hard Lockboxes: Based on the Initial Pool Balance, 37.4% of the mortgage pool (15 mortgage loans) have hard lockboxes in place.
Reserves:The mortgage loans require amounts to be escrowed monthly as follows (excluding any mortgage loans with springing provisions):
| Real Estate Taxes: | 86.4% of the pool |
| Insurance: | 69.8% of the pool |
| Capital Replacements: | 89.9% of the pool |
| TI/LC: | 75.5% of the pool(1) |
| (1) | The percentage of Initial Pool Balance for mortgage loans with TI/LC reserves is based on the aggregate principal balance allocable to loans that include retail, office, mixed use and industrial properties. |
Call Protection/Defeasance: Based on the Initial Pool Balance, the mortgage pool has the following call protection and defeasance features:
78.0% of the mortgage pool (35 mortgage loans) features a lockout period, then defeasance only until an open period;
10.9% of the mortgage pool (4 mortgage loans) features a lockout period, then the greater of a prepayment premium (1%) or yield maintenance until an open period;
4.5% of the mortgage pool (3 mortgage loans) features a lockout period, then the greater of a prepayment premium (1%) or yield maintenance or defeasance until an open period;
3.7% of the mortgage pool (1 mortgage loan) features the greater of a prepayment premium (0.5%) or yield maintenance, then the greater of a prepayment premium (0.5%) or yield maintenance or defeasance until an open period; and
2.9% of the mortgage pool (1 mortgage loan) features yield maintenance, then yield maintenance or defeasance until an open period.
Prepayment restrictions for each mortgage loan reflect the entire life of the mortgage loan. Please refer to Annex A-1 to the Preliminary Prospectus and the footnotes related thereto for further information regarding individual loan call protection.
| THE INFORMATION IN THIS STRUCTURAL AND COLLATERAL TERM SHEET IS NOT COMPLETE AND MAY BE AMENDED PRIOR TO THE TIME OF SALE. THIS TERM SHEET IS NOT AN OFFER TO SELL THESE SECURITIES AND IT IS NOT A SOLICITATION OF AN OFFER TO BUY THESE SECURITIES IN ANY JURISDICTION WHERE THE OFFER OR SALE IS NOT PERMITTED. |
| 6 |
| Wells Fargo Commercial Mortgage Trust 2019-C54 | Issue Characteristics |
III. Issue Characteristics
| Securities Offered: | $579,400,000 approximate monthly pay, multi-class, commercial mortgage REMIC pass-through certificates consisting of ten classes (Classes A-1, A-2, A-SB, A-3, A-4, A-S, B, C, X-A and X-B), which are offered pursuant to a registration statement filed with the SEC (such classes of certificates, the “Offered Certificates”). | |
| Mortgage Loan Sellers: | Argentic Real Estate Finance LLC (“AREF”), Wells Fargo Bank, National Association (“WFB”), Rialto Mortgage Finance, LLC (“RMF”), BSPRT CMBS Finance, LLC (“BSPRT”) and UBS AG, by and through its branch office at 1285 Avenue of the Americas, New York, New York (“UBS AG”). | |
| Joint Bookrunners and Co-Lead Managers: | Wells Fargo Securities, LLC and UBS Securities LLC | |
| Co-Manager: | Academy Securities, Inc. and Drexel Hamilton, LLC | |
| Rating Agencies: | Fitch Ratings, Inc., Kroll Bond Rating Agency, Inc. and S&P Global Ratings, acting through Standard & Poor’s Financial Services LLC | |
| Master Servicer: | Wells Fargo Bank, National Association | |
| Special Servicer: | LNR Partners, LLC | |
| Certificate Administrator: | Wells Fargo Bank, National Association | |
| Trustee: | Wilmington Trust, National Association | |
| Operating Advisor: | Park Bridge Lender Services LLC | |
| Asset Representations Reviewer: | Park Bridge Lender Services LLC | |
| Initial Majority Controlling Class Certificateholder: | Argentic Securities Holdings Cayman Limited or an affiliate | |
| U.S. Credit Risk Retention: | For a discussion on the manner in which the U.S. credit risk retention requirements will be satisfied by Argentic Real Estate Finance LLC, as the retaining sponsor, see “Credit Risk Retention” in the Preliminary Prospectus.
A majority-owned affiliate of Argentic Real Estate Finance LLC, as retaining sponsor, will acquire an “eligible horizontal residual interest” comprised of the Class E-RR, F-RR, G-RR and H-RR certificates (the “horizontal risk retention certificates”). Under the credit risk retention rules, AREF or such majority-owned affiliate will be permitted to transfer the horizontal risk retention certificates to a subsequent third-party purchaser. For additional information, see “Credit Risk Retention” in the Preliminary Prospectus.
| |
| EU Credit Risk Retention | None of the sponsors, the depositor or any other party to the transaction intends or is required to retain a material net economic interest in the securitization constituted by the issue of the certificates in a manner that would satisfy the requirements of the European Union Regulation (EU) 2017/2402. In addition, no such person undertakes to take any other action which may be required by any investor for the purposes of its compliance with any applicable requirement under such Regulation. Furthermore, the arrangements described under “Credit Risk Retention” in the Preliminary Prospectus have not been structured with the objective of ensuring compliance by any person with any requirements of such Regulation. | |
| Cut-off Date: | The Cut-off Date with respect to each mortgage loan is the due date for the monthly debt service payment that is due in December 2019 (or, in the case of any mortgage loan that has its first due date in January 2020, the date that would have been its due date in December 2019 under the terms of that mortgage loan if a monthly debt service payment were scheduled to be due in that month). | |
| Expected Closing Date: | On or about December 3, 2019. | |
| Determination Dates: | The 11th day of each month (or if that day is not a business day, the next succeeding business day), commencing in January 2020. | |
| Distribution Dates: | The fourth business day following the Determination Date in each month, commencing in January 2020. | |
| Rated Final Distribution Date: | The Distribution Date in December 2052. | |
| Interest Accrual Period: | With respect to any Distribution Date, the calendar month immediately preceding the month in which such Distribution Date occurs. |
| THE INFORMATION IN THIS STRUCTURAL AND COLLATERAL TERM SHEET IS NOT COMPLETE AND MAY BE AMENDED PRIOR TO THE TIME OF SALE. THIS TERM SHEET IS NOT AN OFFER TO SELL THESE SECURITIES AND IT IS NOT A SOLICITATION OF AN OFFER TO BUY THESE SECURITIES IN ANY JURISDICTION WHERE THE OFFER OR SALE IS NOT PERMITTED. |
| 7 |
| Wells Fargo Commercial Mortgage Trust 2019-C54 | Issue Characteristics |
| Day Count: | The Offered Certificates will accrue interest on a 30/360 basis. | |
| Minimum Denominations: | $10,000 for each Class of Offered Certificates (other than the Class X-A and X-B Certificates) and $1,000,000 for the Class X-A and X-B Certificates. Investments may also be made in any whole dollar denomination in excess of the applicable minimum denomination. | |
| Clean-up Call: | 1.0% | |
| Delivery: | DTC, Euroclear and Clearstream Banking | |
| ERISA/SMMEA Status: | Each Class of Offered Certificates is expected to be eligible for exemptive relief under ERISA. No Class of Offered Certificates will be SMMEA eligible. | |
| Risk Factors: | THE CERTIFICATES INVOLVE CERTAIN RISKS AND MAY NOT BE SUITABLE FOR ALL INVESTORS. SEE THE “RISK FACTORS” SECTION OF THE PRELIMINARY PROSPECTUS. | |
| Bond Analytics Information: | The Certificate Administrator will be authorized to make distribution date statements, CREFC® reports and certain supplemental reports (other than confidential information) available to certain financial modeling and data provision services, including Bloomberg, L.P., Trepp, LLC, Intex Solutions, Inc., Interactive Data Corp., Markit Group Limited, BlackRock Financial Management, Inc., CMBS.com, Inc., Moody’s Analytics, MBS Data, LLC and Thomson Reuters Corporation and RealINSIGHT. | |
| Tax Treatment | For U.S. federal income tax purposes, the issuing entity will consist of one or more REMICs and the Offered Certificates will represent REMIC regular interests. |
| THE INFORMATION IN THIS STRUCTURAL AND COLLATERAL TERM SHEET IS NOT COMPLETE AND MAY BE AMENDED PRIOR TO THE TIME OF SALE. THIS TERM SHEET IS NOT AN OFFER TO SELL THESE SECURITIES AND IT IS NOT A SOLICITATION OF AN OFFER TO BUY THESE SECURITIES IN ANY JURISDICTION WHERE THE OFFER OR SALE IS NOT PERMITTED. |
| 8 |
| Wells Fargo Commercial Mortgage Trust 2019-C54 | Characteristics of the Mortgage Pool |
IV. Characteristics of the Mortgage Pool(1)
A. Ten Largest Mortgage Loans
| Mortgage Loan Seller | Mortgage Loan Name | City | State | Number of Mortgage Loans / Mortgaged Properties | Mortgage Loan Cut-off Date Balance ($) | % of Initial Pool Balance (%) | Property Type | Number of SF/Units | Cut-off Date Balance Per SF/Unit | Cut-off Date LTV Ratio (%) | Balloon or ARD LTV Ratio (%) | U/W NCF DSCR (x) | U/W NOI Debt Yield (%) | |||||
| RMF | Continental Park - Rosecrans Douglas | El Segundo | CA | 1 / 1 | $55,000,000 | 8.2 | % | Office | 206,012 | $267 | 52.9 | % | 52.9 | % | 3.06 | x | 10.8 | % |
| RMF | West Bountiful Commons | West Bountiful | UT | 1 / 1 | 34,750,000 | 5.2 | Retail | 324,349 | 107 | 64.7 | 64.7 | 2.40 | 9.8 | |||||
| WFB | Torrey Ridge Apartments | Fresno | CA | 1 / 1 | 32,500,000 | 4.9 | Multifamily | 418 | 77,751 | 68.4 | 57.8 | 1.54 | 9.2 | |||||
| AREF | 74 Kent Street & 11-20 46th Road | Various | NY | 1 / 2 | 30,500,000 | 4.6 | Office | 66,470 | 459 | 62.2 | 62.2 | 1.94 | 8.7 | |||||
| AREF | 77 Clinton Avenue | Brooklyn | NY | 1 / 1 | 30,400,000 | 4.5 | Office | 127,000 | 239 | 54.3 | 54.3 | 2.19 | 8.9 | |||||
| BSPRT | Takoma Metro Center | Washington | DC | 1 / 1 | 27,600,000 | 4.1 | Mixed Use | 198,107 | 139 | 69.7 | 69.7 | 2.33 | 9.7 | |||||
| WFB | The Tower at Burbank | Burbank | CA | 1 / 1 | 25,000,000 | 3.7 | Office | 490,807 | 397 | 62.1 | 62.1 | 3.06 | 10.0 | |||||
| RMF | Planet Self Storage Portfolio | Various | Various | 1 /11 | 25,000,000 | 3.7 | Self Storage | 563,807 | 124 | 67.1 | 67.1 | 2.42 | 7.9 | |||||
| BSPRT | The District at Tuttle | Columbus | OH | 1 / 1 | 24,000,000 | 3.6 | Multifamily | 228 | 105,263 | 64.7 | 64.7 | 1.78 | 7.9 | |||||
| WFB | 730 Arizona Avenue | Santa Monica | CA | 1 / 1 | 22,750,000 | 3.4 | Office | 28,822 | 789 | 59.9 | 59.9 | 2.13 | 8.9 | |||||
| Top Three Total/Weighted Average | 3 / 3 | $122,250,000 | 18.3 | % | 60.4 | % | 57.6 | % | 2.47 | x | 10.1 | % | ||||||
| Top Five Total/Weighted Average | 5 /6 | $183,150,000 | 27.3 | % | 59.7 | % | 57.8 | % | 2.33 | x | 9.7 | % | ||||||
| Top Ten Total/Weighted Average | 10 / 21 | $307,500,000 | 45.9 | % | 61.8 | % | 60.7 | % | 2.34 | x | 9.4 | % | ||||||
| Non-Top Ten Total/Weighted Average | 34 / 67 | $362,327,472 | 54.1 | % | 64.7 | % | 58.8 | % | 2.09 | x | 10.6 | % | ||||||
| (1) | With respect to any mortgage loan that is part of a whole loan, the Cut-off Date Balance Per SF/Unit, loan-to-value ratio, debt service coverage ratio and debt yield calculations include the relatedpari passu companion loan(s). With respect to each mortgage loan, debt service coverage ratio, debt yield and loan-to-value ratio information do not take into account any subordinate debt (whether or not secured by the related mortgaged property) that currently exists or is allowed under the terms of such mortgage loan. |
| THE INFORMATION IN THIS STRUCTURAL AND COLLATERAL TERM SHEET IS NOT COMPLETE AND MAY BE AMENDED PRIOR TO THE TIME OF SALE. THIS TERM SHEET IS NOT AN OFFER TO SELL THESE SECURITIES AND IT IS NOT A SOLICITATION OF AN OFFER TO BUY THESE SECURITIES IN ANY JURISDICTION WHERE THE OFFER OR SALE IS NOT PERMITTED. |
| 9 |
| Wells Fargo Commercial Mortgage Trust 2019-C54 | Characteristics of the Mortgage Pool |
B. Summary of the Whole Loans
| Property Name | Mortgage Loan Seller in WFCM 2019-C54 | Note(s)(1) | Original Balance | Holder of Note(1) | Lead Servicer for Whole Loan | Master Servicer Under Lead Securitization Servicing Agreement | Special Servicer Under Lead Securitization Servicing Agreement | |
| The Tower at Burbank | WFB | A-1 | $100,000,000 | BANK 2019-BNK20 | Yes | Wells Fargo Bank, National Association | Midland Loan Services | |
| A-2 | $70,000,000 | BANK 2019-BNK21 | No | |||||
| A-3 | $25,000,000 | WFCM 2019-C54 | No | |||||
| Planet Self Storage Portfolio | RMF | A-1, A-3 | $45,000,000 | WFCM 2019-C53(2) | Yes | Wells Fargo Bank, National Association | Midland Loan Services | |
| A-2, A-4 | $25,000,000 | WFCM 2019-C54 | No | |||||
| Phoenix Industrial Portfolio II | UBS AG | A-1, A-2, A-5 | $40,000,000 | UBS 2019-C17 | Yes | Wells Fargo Bank, National Association | Rialto Capital Advisors, LLC | |
| A-3, A-4 | $20,000,000 | WFCM 2019-C54 | No | |||||
| A-6 | $8,000,000 | UBS AG | No | |||||
| Global Payments, Inc. | BSPRT | A-1 | $19,167,000 | WFCM 2019-C54 | Yes | Wells Fargo Bank, National Association | LNR Partners, LLC | |
| A-2 | $10,000,000 | BSPRT CMBS Finance, LLC | No | |||||
| NMR Pharmacy Portfolio | BSPRT | A-1 | $17,500,000 | WFCM 2019-C54 | Yes | Wells Fargo Bank, National Association | LNR Partners, LLC | |
| A-2 | $14,300,000 | BBCMS 2019-C5(3) | No | |||||
| Washington Avenue Portfolio | AREF | A-1 | $26,000,000 | GSMS 2019-GSA1(4) | Yes | Midland Loan Services | LNR Partners, LLC | |
| A-2 | $13,000,000 | WFCM 2019-C54 | No | |||||
| CIRE Equity Retail & Industrial Portfolio | UBS AG | A-1, A-2-1 | $50,000,000 | BMARK 2019-B12 | Yes | Midland Loan Services | Midland Loan Services | |
| A-2-2, A-3 | $27,160,000 | CGCMT 2019-GC41 | No | |||||
| A-4 | $22,000,000 | WFCM 2019-C51 | No | |||||
| A-5-1 | $15,000,000 | UBS 2019-C17 | No | |||||
| A-5-2 | $5,000,000 | WFCM 2019-C54 | No | |||||
| A-6 | $9,440,000 | BBCMS 2019-C4 | No | |||||
| (1) | Unless otherwise indicated, each note not currently held by a securitization trust is expected to be contributed to a future securitization. No assurance can be provided that any such note will not be split further. |
| (2) | The WFCM 2019-C53 transaction is expected to close on or about November 7, 2019. |
| (3) | The BBCMS 2019-C5 transaction is expected to close on or about November 26, 2019. |
| (4) | The GSMS 2019-GSA1 transaction is expected to close on or about November 8, 2019. |
| THE INFORMATION IN THIS STRUCTURAL AND COLLATERAL TERM SHEET IS NOT COMPLETE AND MAY BE AMENDED PRIOR TO THE TIME OF SALE. THIS TERM SHEET IS NOT AN OFFER TO SELL THESE SECURITIES AND IT IS NOT A SOLICITATION OF AN OFFER TO BUY THESE SECURITIES IN ANY JURISDICTION WHERE THE OFFER OR SALE IS NOT PERMITTED. |
| 10 |
| Wells Fargo Commercial Mortgage Trust 2019-C54 | Characteristics of the Mortgage Pool |
C. Mortgage Loans with Additional Secured and Mezzanine Financing
| Loan No. | Mortgage Loan Seller | Mortgage Loan Name | Mortgage Loan Cut-off Date Balance ($) | % of Initial Pool Balance (%) | Sub Debt Cut-off Date Balance ($) | Mezzanine Debt Cut-off Date Balance ($) | Total Debt Interest Rate (%)(1) | Mortgage Loan U/W NCF DSCR (x)(2) | Total Debt U/W NCF DSCR (x) | Mortgage Loan Cut-off Date U/W NOI Debt Yield (%)(2) | Total Debt Cut-off Date U/W NOI Debt Yield (%) | Mortgage Loan Cut-off Date LTV Ratio (%)(2) | Total Debt Cut-off Date LTV Ratio (%) | ||||||||
| 9 | BSPRT | The District at Tuttle | $24,000,000 | 3.6 | % | NAP | $4,000,000 | 5.1000 | % | 1.78 | x | 1.28 | x | 7.9 | % | 6.8 | % | 64.7 | % | 75.5 | % |
| 15 | BSPRT | NMR Pharmacy Portfolio | 17,500,000 | 2.6 | NAP | 8,500,000 | 5.7258 | 1.96 | 1.16 | 8.9 | 7.0 | 62.7 | 79.5 | ||||||||
| 31 | AREF | Number 10 Main Apartments(3) | 8,000,000 | 1.2 | $3,000,000 | NAP | 4.9100 | 2.11 | 2.11 | 10.9 | 7.9 | 61.5 | 84.6 | ||||||||
| Total/Weighted Average | $49,500,000 | 7.4 | % | $3,000,000 | $12,500,000 | 5.2905 | % | 1.90 | x | 1.37 | x | 8.7 | % | 7.0 | % | 63.5 | % | 78.4 | % | ||
| (1) | Total Debt Interest Rate for any specified mortgage loan reflects the weighted average of the interest rates on the respective components of the total debt. |
| (2) | With respect to any mortgage loan that is part of a whole loan, the loan-to-value ratio, debt service coverage ratio and debt yield calculations include the related pari passu companion loan(s). |
| (3) | Total Debt Interest Rate and related metrics are based on the senior debt rate only. |
| THE INFORMATION IN THIS STRUCTURAL AND COLLATERAL TERM SHEET IS NOT COMPLETE AND MAY BE AMENDED PRIOR TO THE TIME OF SALE. THIS TERM SHEET IS NOT AN OFFER TO SELL THESE SECURITIES AND IT IS NOT A SOLICITATION OF AN OFFER TO BUY THESE SECURITIES IN ANY JURISDICTION WHERE THE OFFER OR SALE IS NOT PERMITTED. |
| 11 |
| Wells Fargo Commercial Mortgage Trust 2019-C54 | Characteristics of the Mortgage Pool |
D. Previous Securitization History(1)
| Loan No. | Mortgage Loan Seller | Mortgage Loan or Mortgaged Property Name | City | State | Property Type | Mortgage Loan or Mortgaged Property Cut-off Date Balance ($) | % of Initial Pool Balance (%) | Previous Securitization | |
| 6 | BSPRT | Takoma Metro Center | Washington | DC | Mixed Use | $27,600,000 | 4.1 | % | BSPRT 2018-FL3 |
| 9 | BSPRT | The District at Tuttle | Columbus | OH | Multifamily | 24,000,000 | 3.6 | FREMF 2017-KF32 | |
| 11 | UBS AG | Phoenix Industrial Portfolio II | Various | Various | Industrial | 20,000,000 | 3.0 | SGCP 2018-FL1 | |
| 15.01 | BSPRT | WAG – Knoxville, TN | Knoxville | TN | Retail | 2,880,896 | 0.4 | COMM 2012-CR2 | |
| 15.04 | BSPRT | CVS - Dublin, OH | Dublin | OH | Retail | 1,392,296 | 0.2 | BSPRT 2018-FL3 | |
| 15.05 | BSPRT | CVS - Ashland, KY | Ashland | KY | Retail | 1,318,003 | 0.2 | BSPRT 2018-FL3 | |
| 15.08 | BSPRT | CVS - Bristol, VA | Bristol | VA | Retail | 1,078,616 | 0.2 | BSPRT 2018-FL3 | |
| 15.09 | BSPRT | CVS - Bristol, TN | Bristol | TN | Retail | 1,051,101 | 0.2 | BSPRT 2018-FL3 | |
| 15.10 | BSPRT | CVS - Evans, GA | Evans | GA | Retail | 1,034,591 | 0.2 | BSPRT 2018-FL3 | |
| 15.12 | BSPRT | CVS - Summerfield, NC | Summerfield | NC | Retail | 899,764 | 0.1 | BSPRT 2018-FL3 | |
| 17 | AREF | Platte Airpark Tech Campus | Colorado Springs | CO | Office | 16,500,000 | 2.5 | COMM 2014 -CR16 | |
| 19 | AREF | The Hamptons Apartments | Virginia Beach | VA | Multifamily | 15,850,000 | 2.4 | MSBAM 2015-C23 | |
| 31 | AREF | Number 10 Main Apartments | Memphis | TN | Multifamily | 8,000,000 | 1.2 | JPMBB 2015-C30 | |
| 42 | UBS AG | Comfort Suites at The University | Conway | SC | Hospitality | 4,487,561 | 0.7 | COMM 2015-CR23 | |
| Total | $126,092,829 | 18.8 | % | ||||||
| (1) | The table above represents the most recent securitization with respect to the mortgaged property securing the related mortgage loan, based on information provided by the related borrower or obtained through searches of a third-party database. While loans secured by the above mortgaged properties may have been securitized multiple times in prior transactions, mortgage loans in this securitization are only listed in the above chart if the mortgage loan paid off a loan in another securitization. The information has not otherwise been confirmed by the mortgage loan sellers. |
| THE INFORMATION IN THIS STRUCTURAL AND COLLATERAL TERM SHEET IS NOT COMPLETE AND MAY BE AMENDED PRIOR TO THE TIME OF SALE. THIS TERM SHEET IS NOT AN OFFER TO SELL THESE SECURITIES AND IT IS NOT A SOLICITATION OF AN OFFER TO BUY THESE SECURITIES IN ANY JURISDICTION WHERE THE OFFER OR SALE IS NOT PERMITTED. |
| 12 |
| Wells Fargo Commercial Mortgage Trust 2019-C54 | Characteristics of the Mortgage Pool |
E. Mortgage Loans with Scheduled Balloon Payments and Related Classes
| Class A-2(1) | ||||||||||||||||
| Loan No. | Mortgage Loan Seller | Mortgage Loan Name | State | Property Type | Mortgage Loan Cut-off Date Balance ($) | % of Initial Pool Balance (%) | Mortgage Loan Balance at Maturity or ARD ($) | % of Class A-2 Certificate Principal Balance (%)(2) | SF | Loan per SF ($) | U/W NCF DSCR (x) | U/W NOI Debt Yield (%) | Cut-off Date LTV Ratio (%) | Balloon or ARD LTV Ratio (%) | Rem. IO Period (mos.) | Rem. Term to Maturity or ARD (mos.) |
| 8 | RMF | Planet Self Storage Portfolio | Various | Self Storage | $25,000,000 | 3.7% | $25,000,000 | 98.6% | 563,807 | $124 | 2.42x | 7.9% | 67.1% | 67.1% | 58 | 58 |
| Total/Weighted Average | $25,000,000 | 3.7% | $25,000,000 | 98.6% | 2.42x | 7.9% | 67.1% | 67.1% | 58 | 58 | ||||||
| (1) | The table above presents the mortgage loan(s) whose balloon payments would be applied to pay down the principal balance of the Class A-2 Certificates, assuming a 0% CPR and applying the “Structuring Assumptions” described in the Preliminary Prospectus, including the assumptions that (i) none of the mortgage loans in the pool experience prepayments prior to maturity (or, in the case of an ARD loan, its anticipated repayment date), defaults or losses; (ii) there are no extensions of maturity dates of any mortgage loans in the pool; and (iii) each mortgage loan in the pool is paid in full on its stated maturity date (or, in the case of an ARD loan, its anticipated repayment date). Each Class of Certificates evidences undivided ownership interests in the entire pool of mortgage loans. Debt service coverage ratio, debt yield and loan-to-value ratio information do not take into account any subordinate debt (whether or not secured by the related mortgaged property) that currently exists or is allowed under the terms of any mortgage loan. See Annex A-1 to the Preliminary Prospectus. |
| (2) | Reflects the percentage equal to the Balloon Balance divided by the initial Class A-2 Certificate Balance. |
| THE INFORMATION IN THIS STRUCTURAL AND COLLATERAL TERM SHEET IS NOT COMPLETE AND MAY BE AMENDED PRIOR TO THE TIME OF SALE. THIS TERM SHEET IS NOT AN OFFER TO SELL THESE SECURITIES AND IT IS NOT A SOLICITATION OF AN OFFER TO BUY THESE SECURITIES IN ANY JURISDICTION WHERE THE OFFER OR SALE IS NOT PERMITTED. |
| 13 |
| Wells Fargo Commercial Mortgage Trust 2019-C54 | Characteristics of the Mortgage Pool |
F. Property Type Distribution(1)
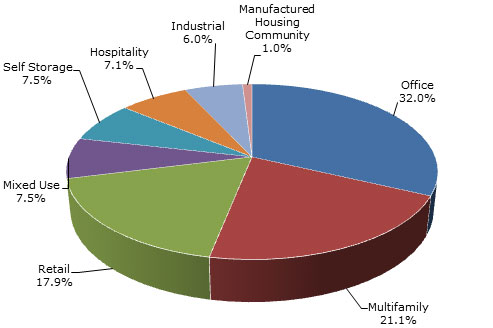
| Property Type | Number of Mortgaged Properties | Aggregate Cut-off Date Balance ($) | % of Initial Pool Balance (%) | Weighted Average Cut-off Date LTV Ratio (%) | Weighted Average Balloon or ARD LTV Ratio (%) | Weighted Average U/W NCF DSCR (x) | Weighted Average U/W NOI Debt Yield (%) | Weighted Average U/W NCF Debt Yield (%) | Weighted Average Mortgage Rate (%) | |||||||||||||||||
| Office | 10 | $214,372,940 | 32.0 | % | 60.0 | % | 58.2 | % | 2.45 | x | 10.0 | % | 9.6 | % | 3.726 | % | ||||||||||
| Suburban | 6 | 128,472,940 | 19.2 | 60.4 | 57.4 | 2.52 | 10.6 | 10.1 | 3.673 | |||||||||||||||||
| CBD | 4 | 85,900,000 | 12.8 | 59.4 | 59.4 | 2.35 | 9.1 | 8.9 | 3.804 | |||||||||||||||||
| Multifamily | 11 | 141,383,488 | 21.1 | 65.3 | 61.9 | 2.05 | 9.3 | 8.9 | 3.983 | |||||||||||||||||
| Garden | 7 | 114,083,488 | 17.0 | 67.4 | 63.3 | 1.93 | 9.0 | 8.7 | 3.997 | |||||||||||||||||
| Mid Rise | 2 | 11,000,000 | 1.6 | 59.5 | 59.5 | 2.37 | 8.5 | 8.3 | 3.440 | |||||||||||||||||
| Student Housing | 1 | 8,300,000 | 1.2 | 46.6 | 46.6 | 3.20 | 12.2 | 11.8 | 3.625 | |||||||||||||||||
| High Rise | 1 | 8,000,000 | 1.2 | 61.5 | 61.5 | 2.11 | 10.9 | 10.5 | 4.910 | |||||||||||||||||
| Retail | 28 | 120,218,271 | 17.9 | 62.2 | 59.5 | 2.29 | 10.4 | 9.9 | 3.908 | |||||||||||||||||
| Anchored | 12 | 73,493,271 | 11.0 | 61.7 | 58.7 | 2.48 | 11.4 | 10.7 | 3.856 | |||||||||||||||||
| Unanchored | 2 | 26,450,000 | 3.9 | 62.5 | 59.5 | 2.03 | 8.7 | 8.3 | 3.745 | |||||||||||||||||
| Single Tenant | 13 | 17,500,000 | 2.6 | 62.7 | 62.7 | 1.96 | 8.9 | 8.6 | 4.316 | |||||||||||||||||
| Shadow Anchored | 1 | 2,775,000 | 0.4 | 71.8 | 59.3 | 1.61 | 10.3 | 9.5 | 4.250 | |||||||||||||||||
| Mixed Use | 4 | 50,240,032 | 7.5 | 66.6 | 66.6 | 2.41 | 10.0 | 9.4 | 3.866 | |||||||||||||||||
| Flex/Office/Retail | 1 | 27,600,000 | 4.1 | 69.7 | 69.7 | 2.33 | 9.7 | 9.0 | 3.790 | |||||||||||||||||
| Retail/Office | 3 | 22,640,032 | 3.4 | 62.7 | 62.7 | 2.52 | 10.3 | 9.9 | 3.960 | |||||||||||||||||
| Self Storage | 15 | 49,993,267 | 7.5 | 67.2 | 61.7 | 2.01 | 8.7 | 8.5 | 3.588 | |||||||||||||||||
| Self Storage | 15 | 49,993,267 | 7.5 | 67.2 | 61.7 | 2.01 | 8.7 | 8.5 | 3.588 | |||||||||||||||||
| Hospitality | 6 | 47,262,070 | 7.1 | 61.4 | 49.5 | 1.98 | 13.3 | 11.8 | 4.366 | |||||||||||||||||
| Select Service | 2 | 26,395,332 | 3.9 | 63.5 | 50.9 | 2.03 | 13.3 | 11.9 | 4.218 | |||||||||||||||||
| Limited Service | 3 | 15,407,012 | 2.3 | 58.9 | 47.7 | 1.96 | 13.4 | 11.9 | 4.502 | |||||||||||||||||
| Extended Stay | 1 | 5,459,726 | 0.8 | 57.9 | 47.2 | 1.79 | 12.6 | 11.2 | 4.700 | |||||||||||||||||
| Industrial | 12 | 39,857,403 | 6.0 | 73.2 | 63.2 | 1.58 | 9.6 | 8.7 | 4.029 | |||||||||||||||||
| Flex | 2 | 17,390,144 | 2.6 | 73.3 | 61.2 | 1.60 | 9.2 | 8.7 | 3.618 | |||||||||||||||||
| Warehouse | 8 | 15,511,939 | 2.3 | 74.0 | 64.8 | 1.43 | 9.8 | 8.5 | 4.442 | |||||||||||||||||
| Manufacturing | 1 | 4,885,496 | 0.7 | 74.2 | 64.8 | 1.41 | 9.8 | 8.5 | 4.450 | |||||||||||||||||
| Warehouse Distribution | 1 | 2,069,823 | 0.3 | 64.7 | 64.7 | 2.94 | 10.5 | 10.2 | 3.400 | |||||||||||||||||
| Manufactured Housing Community | 2 | 6,500,000 | 1.0 | 54.1 | 46.5 | 1.41 | 9.0 | 8.8 | 4.800 | |||||||||||||||||
| Manufactured Housing Community | 2 | 6,500,000 | 1.0 | 54.1 | 46.5 | 1.41 | 9.0 | 8.8 | 4.800 | |||||||||||||||||
| Total/Weighted Average: | 88 | $669,827,472 | 100.0 | % | 63.4 | % | 59.7 | % | 2.21 | x | 10.0 | % | 9.5 | % | 3.887 | % | ||||||||||
| (1) | Because this table presents information relating to the mortgaged properties and not the mortgage loans, the information for mortgage loans secured by more than one mortgaged property is based on allocated amounts (allocating the principal balance of the mortgage loan to each of those properties according to the relative appraised values of the mortgaged properties or the allocated loan amounts or property-specific release prices set forth in the related mortgage loan documents or such other allocation as the related mortgage loan seller deemed appropriate). With respect to any mortgage loan that is part of a whole loan, the loan-to-value ratio, debt service coverage ratio and debt yield calculations include the related pari passu companion loan(s). With respect to each mortgage loan, debt service coverage ratio, debt yield and loan-to-value ratio information do not take into account any subordinate debt (whether or not secured by the related mortgaged property) that currently exists or is allowed under the terms of such mortgage loan. See Annex A-1 to the Preliminary Prospectus. |
| THE INFORMATION IN THIS STRUCTURAL AND COLLATERAL TERM SHEET IS NOT COMPLETE AND MAY BE AMENDED PRIOR TO THE TIME OF SALE. THIS TERM SHEET IS NOT AN OFFER TO SELL THESE SECURITIES AND IT IS NOT A SOLICITATION OF AN OFFER TO BUY THESE SECURITIES IN ANY JURISDICTION WHERE THE OFFER OR SALE IS NOT PERMITTED. |
| 14 |
| Wells Fargo Commercial Mortgage Trust 2019-C54 | Characteristics of the Mortgage Pool |
G. Geographic Distribution(1)
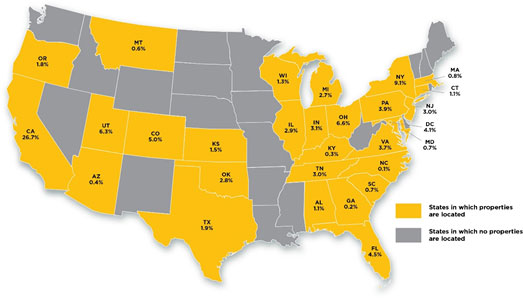
| Location | Number of Mortgaged Properties | Aggregate Cut-off Date Balance ($) | % of Initial Pool Balance (%) | Weighted Average Cut-off Date LTV Ratio (%) | Weighted Average Balloon or ARD LTV Ratio (%) | Weighted Average U/W NCF DSCR (x) | Weighted Average U/W NOI Debt Yield (%) | Weighted Average U/W NCF Debt Yield (%) | Weighted Average Mortgage Rate (%) | |||||||||||||||||
| California | 11 | $178,942,360 | 26.7 | % | 61.8 | % | 58.2 | % | 2.44 | x | 10.0 | % | 9.6 | % | 3.615 | % | ||||||||||
| Southern California | 7 | 126,611,965 | 18.9 | 59.3 | 57.7 | 2.64 | 10.0 | 9.6 | 3.505 | |||||||||||||||||
| Northern California | 4 | 52,330,394 | 7.8 | 67.7 | 59.3 | 1.95 | 9.8 | 9.5 | 3.881 | |||||||||||||||||
| New York | 3 | 60,900,000 | 9.1 | 58.3 | 58.3 | 2.06 | 8.8 | 8.5 | 4.080 | |||||||||||||||||
| Ohio | 8 | 44,367,823 | 6.6 | 65.0 | 61.2 | 1.77 | 9.1 | 8.6 | 4.332 | |||||||||||||||||
| Utah | 2 | 42,150,000 | 6.3 | 65.6 | 64.1 | 2.23 | 9.8 | 9.3 | 3.963 | |||||||||||||||||
| Colorado | 5 | 33,543,515 | 5.0 | 56.3 | 46.1 | 2.24 | 13.3 | 12.5 | 3.911 | |||||||||||||||||
| Florida | 5 | 30,439,191 | 4.5 | 65.3 | 55.6 | 1.84 | 11.3 | 10.3 | 4.255 | |||||||||||||||||
| District of Columbia | 1 | 27,600,000 | 4.1 | 69.7 | 69.7 | 2.33 | 9.7 | 9.0 | 3.790 | |||||||||||||||||
| Pennsylvania | 7 | 26,285,072 | 3.9 | 65.2 | 55.9 | 1.81 | 10.7 | 9.8 | 4.299 | |||||||||||||||||
| Virginia | 3 | 24,928,616 | 3.7 | 72.6 | 69.6 | 1.95 | 9.2 | 8.9 | 4.049 | |||||||||||||||||
| Indiana | 3 | 21,011,874 | 3.1 | 68.8 | 68.8 | 2.21 | 8.7 | 8.7 | 3.890 | |||||||||||||||||
| New Jersey | 5 | 20,254,407 | 3.0 | 64.2 | 56.7 | 2.22 | 11.3 | 10.4 | 3.780 | |||||||||||||||||
| Tennessee | 4 | 20,231,997 | 3.0 | 55.6 | 55.6 | 2.53 | 11.0 | 10.7 | 4.267 | |||||||||||||||||
| Illinois | 1 | 19,500,000 | 2.9 | 58.7 | 58.7 | 2.22 | 8.5 | 8.1 | 3.600 | |||||||||||||||||
| Oklahoma | 1 | 18,750,000 | 2.8 | 63.9 | 63.9 | 2.16 | 9.0 | 8.4 | 3.810 | |||||||||||||||||
| Michigan | 2 | 17,885,496 | 2.7 | 67.9 | 65.3 | 2.48 | 10.1 | 9.5 | 3.672 | |||||||||||||||||
| Texas | 3 | 13,000,000 | 1.9 | 64.7 | 64.7 | 2.94 | 10.5 | 10.2 | 3.400 | |||||||||||||||||
| Oregon | 3 | 11,824,016 | 1.8 | 59.9 | 59.9 | 2.36 | 8.6 | 8.4 | 3.489 | |||||||||||||||||
| Kansas | 1 | 10,000,000 | 1.5 | 65.4 | 58.1 | 1.91 | 12.1 | 11.1 | 4.160 | |||||||||||||||||
| Wisconsin | 2 | 8,418,757 | 1.3 | 74.2 | 64.8 | 1.41 | 9.8 | 8.5 | 4.450 | |||||||||||||||||
| Alabama | 2 | 7,564,119 | 1.1 | 70.9 | 55.0 | 1.89 | 14.0 | 11.9 | 4.183 | |||||||||||||||||
| Connecticut | 3 | 7,292,857 | 1.1 | 67.1 | 67.1 | 2.42 | 7.9 | 7.8 | 3.175 | |||||||||||||||||
| Massachusetts | 2 | 5,428,571 | 0.8 | 67.1 | 67.1 | 2.42 | 7.9 | 7.8 | 3.175 | |||||||||||||||||
| Maryland | 1 | 4,500,000 | 0.7 | 61.2 | 52.6 | 1.93 | 10.9 | 10.8 | 3.757 | |||||||||||||||||
| South Carolina | 1 | 4,487,561 | 0.7 | 61.5 | 49.0 | 2.36 | 15.5 | 13.6 | 4.020 | |||||||||||||||||
| Montana | 1 | 3,793,267 | 0.6 | 63.2 | 46.7 | 1.35 | 9.5 | 9.1 | 4.638 | |||||||||||||||||
| Arizona | 4 | 2,570,346 | 0.4 | 64.9 | 64.9 | 2.27 | 10.2 | 9.6 | 4.139 | |||||||||||||||||
| Kentucky | 2 | 2,223,270 | 0.3 | 62.7 | 62.7 | 1.96 | 8.9 | 8.6 | 4.316 | |||||||||||||||||
| Georgia | 1 | 1,034,591 | 0.2 | 62.7 | 62.7 | 1.96 | 8.9 | 8.6 | 4.316 | |||||||||||||||||
| North Carolina | 1 | 899,764 | 0.1 | 62.7 | 62.7 | 1.96 | 8.9 | 8.6 | 4.316 | |||||||||||||||||
| Total/Weighted Average | 88 | $669,827,472 | 100.0 | % | 63.4 | % | 59.7 | % | 2.21 | x | 10.0 | % | 9.5 | % | 3.887 | % | ||||||||||
| (1) | Because this table presents information relating to the mortgaged properties and not the mortgage loans, the information for mortgage loans secured by more than one mortgaged property is based on allocated amounts (allocating the principal balance of the mortgage loan to each of those properties according to the relative appraised values of the mortgaged properties or the allocated loan amounts or property-specific release prices set forth in the related mortgage loan documents or such other allocation as the related mortgage loan seller deemed appropriate). With respect to any mortgage loan that is part of a whole loan, the loan-to-value ratio, debt service coverage ratio and debt yield calculations include the relatedpari passu companion loan(s). With respect to each mortgage loan, debt service coverage ratio, debt yield and loan-to-value ratio information do not take into account any subordinate debt (whether or not secured by the related mortgaged property) that currently exists or is allowed under the terms of such mortgage loan. See Annex A-1 to the Preliminary Prospectus. |
| THE INFORMATION IN THIS STRUCTURAL AND COLLATERAL TERM SHEET IS NOT COMPLETE AND MAY BE AMENDED PRIOR TO THE TIME OF SALE. THIS TERM SHEET IS NOT AN OFFER TO SELL THESE SECURITIES AND IT IS NOT A SOLICITATION OF AN OFFER TO BUY THESE SECURITIES IN ANY JURISDICTION WHERE THE OFFER OR SALE IS NOT PERMITTED. |
| 15 |
| Wells Fargo Commercial Mortgage Trust 2019-C54 | Characteristics of the Mortgage Pool |
H. Characteristics of the Mortgage Pool(1)
| CUT-OFF DATE BALANCE | ||||||||
| Range of Cut-off Date Balances ($) | Number of Mortgage Loans | Aggregate Cut- off Date Balance | Percent by Aggregate Cut-off Date Pool Balance (%) | |||||
| 3,750,000- 4,000,000 | 2 | $7,543,267 | 1.1 | % | ||||
| 4,000,001 - 5,000,000 | 3 | 13,987,561 | 2.1 | |||||
| 5,000,001 - 6,000,000 | 2 | 10,505,940 | 1.6 | |||||
| 6,000,001 - 7,000,000 | 4 | 26,083,488 | 3.9 | |||||
| 7,000,001 - 8,000,000 | 3 | 23,400,000 | 3.5 | |||||
| 8,000,001 - 9,000,000 | 2 | 17,000,000 | 2.5 | |||||
| 9,000,001 - 10,000,000 | 3 | 29,034,457 | 4.3 | |||||
| 10,000,001 - 15,000,000 | 6 | 73,876,582 | 11.0 | |||||
| 15,000,001 - 20,000,000 | 9 | 160,896,177 | 24.0 | |||||
| 20,000,001 - 30,000,000 | 5 | 124,350,000 | 18.6 | |||||
| 30,000,001 - 50,000,000 | 4 | 128,150,000 | 19.1 | |||||
| 50,000,001 - 55,000,000 | 1 | 55,000,000 | 8.2 | |||||
| Total: | 44 | $669,827,472 | 100.0 | % | ||||
| Average | $15,223,352 | |||||||
| UNDERWRITTEN NOI DEBT SERVICE COVERAGE RATIO | ||||||||
| Range of U/W NOI DSCRs (x) | Number of Mortgage Loans | Aggregate Cut- off Date Balance | Percent by Aggregate Cut-off Date Pool Balance (%) | |||||
| 1.40 | 1 | $3,793,267 | 0.6 | % | ||||
| 1.41 - 1.50 | 2 | 10,250,000 | 1.5 | |||||
| 1.51 - 1.60 | 3 | 48,150,000 | 7.2 | |||||
| 1.61 - 1.70 | 5 | 58,883,488 | 8.8 | |||||
| 1.71 - 1.80 | 1 | 9,050,000 | 1.4 | |||||
| 1.81 - 1.90 | 1 | 24,000,000 | 3.6 | |||||
| 1.91 - 2.00 | 2 | 35,000,000 | 5.2 | |||||
| 2.01 - 2.50 | 18 | 274,041,509 | 40.9 | |||||
| 2.51 - 3.00 | 5 | 84,893,501 | 12.7 | |||||
| 3.01 - 3.50 | 5 | 111,284,457 | 16.6 | |||||
| 3.51 - 3.72 | 1 | 10,481,250 | 1.6 | |||||
| Total: | 44 | $669,827,472 | 100.0 | % | ||||
| Weighted Average | 2.32x | |||||||
| UNDERWRITTEN NCF DEBT SERVICE COVERAGE RATIO | ||||||||
| Range of U/W NCF DSCRs (x) | Number of Mortgage Loans | Aggregate Cut- off Date Balance | Percent by Aggregate Cut-off Date Pool Balance (%) | |||||
| 1.35 | 1 | $3,793,267 | 0.6 | % | ||||
| 1.36 - 1.50 | 5 | 44,600,000 | 6.7 | |||||
| 1.51 - 1.60 | 4 | 66,450,000 | 9.9 | |||||
| 1.61 - 1.70 | 2 | 15,283,488 | 2.3 | |||||
| 1.71 - 1.90 | 2 | 40,379,177 | 6.0 | |||||
| 1.91 - 2.00 | 5 | 76,712,353 | 11.5 | |||||
| 2.01 - 2.50 | 18 | 287,843,480 | 43.0 | |||||
| 2.51 - 3.00 | 2 | 26,000,000 | 3.9 | |||||
| 3.01 - 3.50 | 4 | 98,284,457 | 14.7 | |||||
| 3.51 - 3.52 | 1 | 10,481,250 | 1.6 | |||||
| Total: | 44 | $669,827,472 | 100.0 | % | ||||
| Weighted Average | 2.21x | |||||||
| LOAN PURPOSE | ||||||||
| Loan Purpose | Number of Mortgage Loans | Aggregate Cut- off Date Balance | Percent by Aggregate Cut-off Date Pool Balance (%) | |||||
| Refinance | 29 | $477,710,928 | 71.3 | % | ||||
| Acquisition | 12 | 151,616,543 | 22.6 | |||||
| Refinance/Acquisition | 2 | 24,000,000 | 3.6 | |||||
| Acquisition/Recapitalization | 1 | 16,500,000 | 2.5 | |||||
| Total: | 44 | $669,827,472 | 100.0 | % | ||||
| MORTGAGE RATE | ||||||||
Range of Mortgage Rates (%) | Number of Mortgage Loans | Aggregate Cut- off Date Balance | Percent by Aggregate Cut-off Date Pool Balance (%) | |||||
| 3.130 - 3.500 | 7 | $152,481,250 | 22.8 | % | ||||
| 3.501 - 3.750 | 4 | 55,034,457 | 8.2 | |||||
| 3.751 - 4.000 | 9 | 183,117,000 | 27.3 | |||||
| 4.001 - 4.250 | 13 | 133,272,322 | 19.9 | |||||
| 4.251 - 4.500 | 5 | 98,400,000 | 14.7 | |||||
| 4.501 - 4.750 | 4 | 33,022,443 | 4.9 | |||||
| 4.751 - 4.910 | 2 | 14,500,000 | 2.2 | |||||
| Total: | 44 | $669,827,472 | 100.0 | % | ||||
| Weighted Average | 3.887% | |||||||
| UNDERWRITTEN NOI DEBT YIELD | ||||||||
Range of U/W NOI Debt Yields (%) | Number of Mortgage Loans | Aggregate Cut- off Date Balance | Percent by Aggregate Cut-off Date Pool Balance (%) | |||||
| 7.9 - 8.0 | 2 | $49,000,000 | 7.3 | % | ||||
| 8.1 - 9.0 | 11 | 188,517,000 | 28.1 | |||||
| 9.1 - 10.0 | 12 | 205,493,267 | 30.7 | |||||
| 10.1 - 11.0 | 9 | 119,233,488 | 17.8 | |||||
| 11.1 - 12.0 | 1 | 16,500,000 | 2.5 | |||||
| 12.1 - 13.0 | 4 | 45,160,427 | 6.7 | |||||
| 13.1 - 15.0 | 2 | 26,395,332 | 3.9 | |||||
| 15.1 - 16.0 | 1 | 4,487,561 | 0.7 | |||||
| 16.1 - 18.0 | 1 | 5,055,940 | 0.8 | |||||
| 18.1 - 18.3 | 1 | 9,984,457 | 1.5 | |||||
| Total: | 44 | $669,827,472 | 100.0 | % | ||||
| Weighted Average | 10.0% | |||||||
| UNDERWRITTEN NCF DEBT YIELD | ||||||||
| Range of U/W NCF Debt Yields (%) | Number of Mortgage Loans | Aggregate Cut- off Date Balance | Percent by Aggregate Cut-off Date Pool Balance (%) | |||||
| 7.7 - 8.0 | 2 | $49,000,000 | 7.3 | % | ||||
| 8.1 - 9.0 | 18 | 316,067,000 | 47.2 | |||||
| 9.1 - 10.0 | 9 | 111,226,755 | 16.6 | |||||
| 10.1 - 11.0 | 5 | 85,950,000 | 12.8 | |||||
| 11.1 - 12.0 | 6 | 75,872,780 | 11.3 | |||||
| 12.1 - 13.0 | 1 | 12,182,979 | 1.8 | |||||
| 13.1 - 16.0 | 2 | 9,543,501 | 1.4 | |||||
| 16.1 - 16.8 | 1 | 9,984,457 | 1.5 | |||||
| Total: | 44 | $669,827,472 | 100.0 | % | ||||
| Weighted Average | 9.5% | |||||||
| ORIGINAL TERM TO MATURITY or ARD | ||||||||
| Original Terms to Maturity or ARD (months) | Number of Mortgage Loans | Aggregate Cut- off Date Balance | Percent by Aggregate Cut-off Date Pool Balance (%) | |||||
| 60 | 1 | $25,000,000 | 3.7 | % | ||||
| 120 | 43 | 644,827,472 | 96.3 | |||||
| Total: | 44 | $669,827,472 | 100.0 | % | ||||
| Weighted Average | 118 months | |||||||
| (1) | With respect to any mortgage loan that is part of a whole loan, the loan-to-value ratio, debt service coverage ratio and debt yield calculations include the relatedpari passucompanion loan(s) but exclude any related subordinate debt (unless otherwise stated). With respect to each mortgage loan, debt service coverage ratio, debt yield and loan-to-value ratio information do not take into account any subordinate debt (whether or not secured by the related mortgaged property) that currently exists or is allowed under the terms of such mortgage loan. See Annex A-1 to the Preliminary Prospectus. Prepayment provisions for each mortgage loan reflects the entire life of the loan (from origination to maturity or ARD). |
| THE INFORMATION IN THIS STRUCTURAL AND COLLATERAL TERM SHEET IS NOT COMPLETE AND MAY BE AMENDED PRIOR TO THE TIME OF SALE. THIS TERM SHEET IS NOT AN OFFER TO SELL THESE SECURITIES AND IT IS NOT A SOLICITATION OF AN OFFER TO BUY THESE SECURITIES IN ANY JURISDICTION WHERE THE OFFER OR SALE IS NOT PERMITTED. |
| 16 |
| Wells Fargo Commercial Mortgage Trust 2019-C54 | Characteristics of the Mortgage Pool |
| REMAINING TERM TO MATURITY or ARD | ||||||||
| Range of Remaining Terms to Maturity or ARD (months) | Number of Mortgage Loans | Aggregate Cut- off Date Balance | Percent by Aggregate Cut-off Date Pool Balance (%) | |||||
| 58 | 1 | $25,000,000 | 3.7 | % | ||||
| 114 - 119 | 43 | 644,827,472 | 96.3 | |||||
| Total: | 44 | $669,827,472 | 100.0 | % | ||||
| Weighted Average | 116 months | |||||||
| ORIGINAL AMORTIZATION TERM(2) | ||||||||
| Original Amortization Terms (months) | Number of Mortgage Loans | Aggregate Cut- off Date Balance | Percent by Aggregate Cut-off Date Pool Balance (%) | |||||
| Non-Amortizing | 23 | $446,398,250 | 66.6 | % | ||||
| 300 | 2 | 8,849,207 | 1.3 | |||||
| 360 | 19 | 214,580,015 | 32.0 | |||||
| Total: | 44 | $669,827,472 | 100.0 | % | ||||
| Weighted Average(3) | 358 months | |||||||
| (2) | The original amortization term shown for any mortgage loan that is interest-only for part of its term does not include the number of months in its interest-only period and reflects only the number of months as of the commencement of amortization remaining from the end of such interest-only period. |
| (3) | Excludes the non-amortizing mortgage loans. |
| REMAINING AMORTIZATION TERM(4) | ||||||||
Range of Remaining Amortization Terms | Number of Mortgage Loans | Aggregate Cut- off Date Balance | Percent by Aggregate Cut-off Date Pool Balance (%) | |||||
| Non-Amortizing | 23 | $446,398,250 | 66.6 | % | ||||
| 298 - 299 | 2 | 8,849,207 | 1.3 | |||||
| 300 - 360 | 19 | 214,580,015 | 32.0 | |||||
| Total: | 44 | $669,827,472 | 100.0 | % | ||||
| Weighted Average(5) | 357 months | |||||||
| (4) | The remaining amortization term shown for any mortgage loan that is interest-only for part of its term does not include the number of months in its interest-only period and reflects only the number of months as of the commencement of amortization remaining from the end of such interest-only period. |
| (5) | Excludes the non-amortizing mortgage loans. |
| LOCKBOXES | ||||||||
| Type of Lockbox | Number of Mortgage Loans | Aggregate Cut- off Date Balance | Percent by Aggregate Cut-off Date Pool Balance (%) | |||||
| Springing | 21 | $298,427,557 | 44.6 | % | ||||
| Hard/Springing Cash Management | 14 | 227,599,915 | 34.0 | |||||
| Soft/Springing Cash Management | 4 | 91,850,000 | 13.7 | |||||
| Hard/Upfront Cash Management | 1 | 22,750,000 | 3.4 | |||||
| None | 3 | 21,200,000 | 3.2 | |||||
| Soft/Upfront Cash Management | 1 | 8,000,000 | 1.2 | |||||
| Total: | 44 | $669,827,472 | 100.0 | % | ||||
| PREPAYMENT PROVISION SUMMARY(6) | ||||||||
| Prepayment Provision | Number of Mortgage Loans | Aggregate Cut- off Date Balance | Percent by Aggregate Cut-off Date Pool Balance (%) | |||||
| Lockout / Defeasance / Open | 35 | $522,360,472 | 78.0 | % | ||||
| Lockout / GRTR 1% or YM / Open | 4 | 72,850,000 | 10.9 | |||||
| Lockout / GRTR 1% or YM or Defeasance / Open | 3 | 30,450,000 | 4.5 | |||||
| GRTR 0.5% or YM / GRTR 0.5% or YM or Defeasance / Open | 1 | 25,000,000 | 3.7 | |||||
| YM / YM or Defeasance / Open | 1 | 19,167,000 | 2.9 | |||||
| Total: | 44 | $669,827,472 | 100.0 | % | ||||
| (6) | As a result of property releases or the application of funds in a performance reserve, partial principal prepayments could occur during a period that voluntary principal prepayments are otherwise prohibited. |
| CUT-OFF DATE LOAN-TO-VALUE RATIO | ||||||||
| Range of Cut-off Date LTV Ratios (%) | Number of Mortgage Loans | Aggregate Cut- off Date Balance | Percent by Aggregate Cut-off Date Pool Balance (%) | |||||
| 34.5 | 1 | $9,984,457 | 1.5 | % | ||||
| 34.6 - 50.0 | 1 | 8,300,000 | 1.2 | |||||
| 50.1 - 55.0 | 3 | 91,900,000 | 13.7 | |||||
| 55.1 - 60.0 | 5 | 75,079,177 | 11.2 | |||||
| 60.1 - 65.0 | 16 | 232,557,410 | 34.7 | |||||
| 65.1 - 70.0 | 11 | 168,672,940 | 25.2 | |||||
| 70.1 - 74.5 | 7 | 83,333,488 | 12.4 | |||||
| Total: | 44 | $669,827,472 | 100.0 | % | ||||
| Weighted Average | 63.4% | |||||||
| BALLOON or ARD LOAN-TO-VALUE RATIO | ||||||||
| Range of Balloon or ARD LTV Ratios (%) | Number of Mortgage Loans | Aggregate Cut- off Date Balance | Percent by Aggregate Cut-off Date Pool Balance (%) | |||||
| 27.1 | 1 | $9,984,457 | 1.5 | % | ||||
| 27.2 - 50.0 | 6 | 51,642,984 | 7.7 | |||||
| 50.1 - 55.0 | 6 | 112,918,293 | 16.9 | |||||
| 55.1 - 60.0 | 10 | 141,683,488 | 21.2 | |||||
| 60.1 - 65.0 | 16 | 252,981,250 | 37.8 | |||||
| 65.1 - 70.0 | 4 | 84,767,000 | 12.7 | |||||
| 70.1 - 74.5 | 1 | 15,850,000 | 2.4 | |||||
| Total: | 44 | $669,827,472 | 100.0 | % | ||||
| Weighted Average | 59.7% | |||||||
| AMORTIZATION TYPE | ||||||||
| Amortization Type | Number of Mortgage Loans | Aggregate Cut- off Date Balance | Percent by Aggregate Cut-off Date Pool Balance (%) | |||||
| Interest-only, Balloon | 22 | $427,231,250 | 63.8 | % | ||||
| Interest-only, Amortizing Balloon | 13 | 151,100,000 | 22.6 | |||||
| Amortizing Balloon | 8 | 72,329,222 | 10.8 | |||||
| Interest-only, ARD | 1 | 19,167,000 | 2.9 | |||||
| Total: | 44 | $669,827,472 | 100.0 | % | ||||
| ORIGINAL TERM OF INTEREST-ONLY PERIOD FOR PARTIAL IO LOANS | ||||||||
| IO Terms (months) | Number of Mortgage Loans | Aggregate Cut- off Date Balance | Percent by Aggregate Cut-off Date Pool Balance (%) | |||||
| 12 | 2 | $25,550,000 | 3.8 | % | ||||
| 24 | 6 | 75,650,000 | 11.3 | |||||
| 36 | 4 | 39,900,000 | 6.0 | |||||
| 48 | 1 | 10,000,000 | 1.5 | |||||
| Total: | 13 | $151,100,000 | 22.6 | % | ||||
| Weighted Average | 27 months | |||||||
| SEASONING | ||||||||
| Seasoning (months) | Number of Mortgage Loans | Aggregate Cut- off Date Balance | Percent by Aggregate Cut-off Date Pool Balance (%) | |||||
| 1 | 22 | $339,006,879 | 50.6 | % | ||||
| 2 | 18 | 267,589,343 | 39.9 | |||||
| 3 | 2 | 33,231,250 | 5.0 | |||||
| 4 | 1 | 25,000,000 | 3.7 | |||||
| 6 | 1 | 5,000,000 | 0.7 | |||||
| Total: | 44 | $669,827,472 | 100.0 | % | ||||
| Weighted Average | 2 months | |||||||
| THE INFORMATION IN THIS STRUCTURAL AND COLLATERAL TERM SHEET IS NOT COMPLETE AND MAY BE AMENDED PRIOR TO THE TIME OF SALE. THIS TERM SHEET IS NOT AN OFFER TO SELL THESE SECURITIES AND IT IS NOT A SOLICITATION OF AN OFFER TO BUY THESE SECURITIES IN ANY JURISDICTION WHERE THE OFFER OR SALE IS NOT PERMITTED. |
| 17 |
| Wells Fargo Commercial Mortgage Trust 2019-C54 | Certain Terms and Conditions |
V. Certain Terms and Conditions
| Interest Entitlements: | The interest entitlement of each Class of Certificates on each Distribution Date generally will be the interest accrued during the related Interest Accrual Period on the related Certificate Balance or Notional Amount at the related pass-through rate, net of any prepayment interest shortfalls allocated to that Class for such Distribution Date as described below. If prepayment interest shortfalls arise from voluntary prepayments (without Master Servicer consent) on particular non-specially serviced loans during any collection period, the Master Servicer is required to make a compensating interest payment to offset those shortfalls, generally up to an amount equal to the portion of its master servicing fees that accrue at 0.25 basis pointsper annum. The remaining amount of prepayment interest shortfalls will be allocated to reduce the interest entitlement on all Classes of Certificates entitled to interest, on apro rata basis, based on their respective amounts of accrued interest for the related Distribution Date. If a Class receives less than the entirety of its interest entitlement on any Distribution Date, then the shortfall (excluding any shortfall due to prepayment interest shortfalls), together with interest thereon, will be added to its interest entitlement for the next succeeding Distribution Date. |
| Principal Distribution Amount: | The Principal Distribution Amount for each Distribution Date generally will be the aggregate amount of principal received or advanced in respect of the mortgage loans, net of any non-recoverable advances and interest thereon and workout-delayed reimbursement amounts that are reimbursed to the Master Servicer, the Special Servicer or the Trustee during the related collection period. Non-recoverable advances and interest thereon are reimbursable from principal collections and advances before reimbursement from other amounts. Workout-delayed reimbursement amounts are reimbursable from principal collections. |
| Subordination, Allocation of Losses and Certain Expenses | The chart below describes the manner in which the payment rights of certain Classes of Certificates will be senior or subordinate, as the case may be, to the payment rights of other Classes of Certificates. The chart also shows the corresponding entitlement to receive principal and/or interest of certain Classes of Certificates (other than excess interest that accrues on each mortgage loan that has an anticipated repayment date) on any distribution date in descending order. It also shows the manner in which losses are allocated to certain Classes of Certificates in ascending order (beginning with the Non-Offered Certificates, and other than the Class V and Class R certificates) to reduce the balance of each such Class to zero;provided that no principal payments or mortgage loan losses will be allocated to the Class X-A, X-B, X-D, V or R Certificates, although principal payments and losses may reduce the Notional Amounts of the Class X-A, X-B and X-D certificates and, therefore, the amount of interest they accrue. |
(1) The Class X-A, X-B and X-D Certificates are interest-only certificates. (2) Non-Offered Certificates.
|
| THE INFORMATION IN THIS STRUCTURAL AND COLLATERAL TERM SHEET IS NOT COMPLETE AND MAY BE AMENDED PRIOR TO THE TIME OF SALE. THIS TERM SHEET IS NOT AN OFFER TO SELL THESE SECURITIES AND IT IS NOT A SOLICITATION OF AN OFFER TO BUY THESE SECURITIES IN ANY JURISDICTION WHERE THE OFFER OR SALE IS NOT PERMITTED. |
| 18 |
| Wells Fargo Commercial Mortgage Trust 2019-C54 | Certain Terms and Conditions |
| Distributions: | On each Distribution Date, funds available for distribution from the mortgage loans, net of specified trust fees, expenses and reimbursements will generally be distributed in the following amounts and order of priority (in each case to the extent of remaining available funds): |
| 1. Class A-1, A-2, A-SB, A-3, A-4, X-A, X-B and X-D Certificates: To interest on the Class A-1, A-2, A-SB, A-3, A-4, X-A, X-B and X-D Certificates,pro rata, according to their respective interest entitlements. | |
| 2. Class A-1, A-2, A-SB, A-3 and A-4 Certificates: To principal on the Class A-1, A-2, A-SB, A-3 and A-4 Certificates in the following amounts and order of priority: (i) first, to principal on the Class A-SB Certificates, in an amount up to the Principal Distribution Amount for such Distribution Date until their Certificate Balance is reduced to the Class A-SB Planned Principal Balance for such Distribution Date; (ii) second, to principal on the Class A-1 Certificates until their Certificate Balance is reduced to zero, up to the remainder of the Principal Distribution Amount for such Distribution Date; (iii) third, to principal on the Class A-2 Certificates until their Certificate Balance is reduced to zero, up to the remainder of the Principal Distribution Amount for such Distribution Date; (iv) fourth, to principal on the Class A-3 Certificates until their Certificate Balance is reduced to zero, up to the remainder of the Principal Distribution Amount for such Distribution Date; (v) fifth, to principal on the Class A-4 Certificates until their Certificate Balance is reduced to zero, up to the remainder of the Principal Distribution Amount for such Distribution Date; and (vi) sixth, to principal on the Class A-SB Certificates until their Certificate Balance is reduced to zero, up to the remainder of the Principal Distribution Amount for such Distribution Date. However, if the Certificate Balance of each Class of Principal Balance Certificates, other than the Class A-1, A-2, A-SB, A-3 and A-4 Certificates, has been reduced to zero as a result of the allocation of Mortgage Loan losses and expenses and any of the Class A-1, A-2, A-SB, A-3 and A-4 Certificates remains outstanding, then the Principal Distribution Amount will be distributed to the Class A-1, A-2, A-SB, A-3 and A-4 Certificates,pro rata, based on their respective outstanding Certificate Balances, until their Certificate Balances have been reduced to zero. | |
| 3. Class A-1, A-2, A-SB, A-3 and A-4 Certificates: To reimburse the holders of the Class A-1, A-2, A-SB, A-3 and A-4 Certificates,pro rata, on the basis of previously allocated unreimbursed losses, for any previously unreimbursed losses (plus interest thereon) on the mortgage loans that were previously allocated in reduction of the Certificate Balances of such Classes. | |
4. Class A-S Certificates: To make distributions on the Class A-S Certificates as follows: (a) first, to interest on the Class A-S Certificates in the amount of the interest entitlement for that Class; (b) next, to the extent of the portion of the Principal Distribution Amount remaining after distributions in respect of principal to each Class with a higher distribution priority (in this case, the Class A-1, A-2, A-SB, A-3 and A-4 Certificates), to principal on the Class A-S Certificates until their Certificate Balance is reduced to zero; and (c) next, to reimburse the holders of the Class A-S Certificates for any previously unreimbursed losses (plus interest thereon) on the mortgage loans that were previously allocated to that Class in reduction of their Certificate Balance.
5. Class B Certificates: To make distributions on the Class B Certificates as follows: (a) first, to interest on the Class B Certificates in the amount of the interest entitlement for that Class; (b) next, to the extent of the portion of the Principal Distribution Amount remaining after distributions in respect of principal to each Class with a higher distribution priority (in this case, the Class A-1, A-2, A-SB, A-3, A-4 and A-S Certificates), to principal on the Class B Certificates until their Certificate Balance is reduced to zero; and (c) next, to reimburse the holders of the Class B Certificates for any previously unreimbursed losses (plus interest thereon) on the mortgage loans that were previously allocated to that Class in reduction of their Certificate Balance.
6. Class C Certificates: To make distributions on the Class C Certificates as follows: (a) first, to interest on the Class C Certificates in the amount of the interest entitlement for that Class; (b) next, to the extent of the portion of the Principal Distribution Amount remaining after distributions in respect of principal to each Class with a higher distribution priority (in this case, the Class A-1, A-2, A-SB, A-3, A-4, A-S and B Certificates), to principal on the Class C Certificates until their Certificate Balance is reduced to zero; and (c) next, to reimburse the holders of the Class C Certificates for any previously unreimbursed losses (plus interest thereon) on the mortgage loans that were previously allocated to that Class in reduction of their Certificate Balance.
7. After the Class A-1, A-2, A-SB, A-3, A-4, X-A, X-B, X-D, A-S, B and C Certificates are paid all amounts to which they are entitled, the remaining funds available for distribution will be used to pay interest, principal and loss reimbursement amounts on the Class D, E-RR,
|
| THE INFORMATION IN THIS STRUCTURAL AND COLLATERAL TERM SHEET IS NOT COMPLETE AND MAY BE AMENDED PRIOR TO THE TIME OF SALE. THIS TERM SHEET IS NOT AN OFFER TO SELL THESE SECURITIES AND IT IS NOT A SOLICITATION OF AN OFFER TO BUY THESE SECURITIES IN ANY JURISDICTION WHERE THE OFFER OR SALE IS NOT PERMITTED. |
| 19 |
| Wells Fargo Commercial Mortgage Trust 2019-C54 | Certain Terms and Conditions |
F-RR, G-RR and H-RR Certificates sequentially in that order in a manner analogous to the Class C Certificates. | |
| Allocation of Yield Maintenance Charges and Prepayment Premiums: | If any yield maintenance charge or prepayment premium is collected during any particular collection period with respect to any mortgage loan, then on the Distribution Date corresponding to that collection period, the certificate administrator will pay that yield maintenance charge or prepayment premium (net of liquidation fees payable therefrom) in the following manner: (1) to each of the Class A-1, A-2, A-SB, A-3, A-4, A-S, B, C and D Certificates, the product of (a) the yield maintenance charge or prepayment premium, (b) the related Base Interest Fraction (as defined in the Preliminary Prospectus) for such Class, and (c) a fraction, the numerator of which is equal to the amount of principal distributed to such Class for that Distribution Date, and the denominator of which is the total amount of principal distributed to all Principal Balance Certificates for that Distribution Date, (2) to the Class X-A Certificates, the excess, if any, of (a) the product of (i) such yield maintenance charge or prepayment premium and (ii) a fraction, the numerator of which is equal to the amount of principal distributed to the Class A-1, A-2, A-SB, A-3 and A-4 Certificates for that Distribution Date, and the denominator of which is the total amount of principal distributed to all Principal Balance Certificates for that Distribution Date, over (b) the amount of such yield maintenance charge or prepayment premium distributed to the Class A-1, A-2, A-SB, A-3 and A-4 Certificates as described above, and (3) to the Class X-B Certificates, any remaining portion of such yield maintenance charge or prepayment premium not distributed as described above.
No prepayment premiums or yield maintenance charges will be distributed to the holders of the Class X-D, E-RR, F-RR, G-RR, H-RR, V or R certificates. For a description of when prepayment premiums and yield maintenance charges are generally required on the mortgage loans, see Annex A-1 to the Preliminary Prospectus. See also “Risk Factors—Risks Relating to the Mortgage Loans—Risks Relating to Enforceability of Yield Maintenance Charges, Prepayment Premiums or Defeasance Provisions” and “Risk Factors—Other Risks Relating to the Certificates—Your Yield May Be Affected by Defaults, Prepayments and Other Factors” in the Preliminary Prospectus. Prepayment premiums and yield maintenance charges will be distributed on each Distribution Date only to the extent they are actually received on the mortgage loans as of the related Determination Date. |
| Realized Losses: | The Certificate Balances of the Class A-1, A-2, A-SB, A-3, A-4, A-S, B, C, D, E-RR, F-RR, G-RR and H-RR Certificates will be reduced without distribution on any Distribution Date as a write-off to the extent of any losses realized on the mortgage loans allocated to such Class on such Distribution Date. Such losses will be applied in the following order, in each case until the related Certificate Balance is reduced to zero: first, to the Class H-RR Certificates; second, to the Class G-RR Certificates; third, to the Class F-RR Certificates; fourth, to the Class E-RR Certificates; fifth, to the Class D Certificates; sixth, to the Class C Certificates; seventh, to the Class B Certificates; eighth, to the Class A-S Certificates; and, finally, pro rata, to the Class A-1, A-2, A-SB, A-3 and A-4 Certificates based on their outstanding Certificate Balances.
The Notional Amount of the Class X-A Certificates will be reduced by the amount of all losses that are allocated to the Class A-1, A-2, A-SB, A-3 or A-4 Certificates as write-offs in reduction of their Certificate Balances. The Notional Amount of the Class X-B Certificates will be reduced by the amount of all losses that are allocated to the Class A-S, B or C Certificates as write-offs in reduction of their Certificate Balances. The Notional Amount of the Class X-D Certificates will be reduced by the amount of all losses that are allocated to the Class D Certificates as write-offs in reduction of its Certificate Balance.
|
| P&I Advances: | The Master Servicer or, if the Master Servicer fails to do so, the Trustee, will be obligated to advance delinquent debt service payments (other than balloon payments, excess interest and default interest) and assumed debt service payments on mortgage loans with delinquent balloon payments (excluding any related companion loan), except to the extent any such advance is deemed non-recoverable from collections on the related mortgage loan. In addition, if an Appraisal Reduction Amount exists for a given mortgage loan, the interest portion of any P&I advance for such mortgage loan will be reduced, which will have the effect of reducing the amount of interest available for distribution to the Certificates in reverse alphabetical order of their Class designations (except that interest payments on the Class A-1, A-2, A-SB, A-3, A-4, X-A, X-B and X-D Certificates would be affected on apari passu basis). |
| Servicing Advances: | The Master Servicer or, if the Master Servicer fails to do so, the Trustee, will be obligated to make servicing advances, including the payment of delinquent property taxes, insurance premiums and ground rent, except to the extent that those advances are deemed non-recoverable from collections on the related mortgage loan. The Master Servicer or the Trustee, as applicable, will have the primary obligation to make any required servicing advances with respect to any serviced whole loan. With respect to any non-serviced whole loan, the master servicer or trustee, as applicable, under the related lead securitization servicing agreement will have the primary obligation to make any required servicing advances with respect to such non-serviced whole loan. |
| THE INFORMATION IN THIS STRUCTURAL AND COLLATERAL TERM SHEET IS NOT COMPLETE AND MAY BE AMENDED PRIOR TO THE TIME OF SALE. THIS TERM SHEET IS NOT AN OFFER TO SELL THESE SECURITIES AND IT IS NOT A SOLICITATION OF AN OFFER TO BUY THESE SECURITIES IN ANY JURISDICTION WHERE THE OFFER OR SALE IS NOT PERMITTED. |
| 20 |
| Wells Fargo Commercial Mortgage Trust 2019-C54 | Certain Terms and Conditions |
Appraisal Reduction Amounts and Collateral Deficiency Amounts:
| An “Appraisal Reduction Amount” generally will be created in the amount, if any, by which the principal balance of a required appraisal loan (which is a mortgage loan (other than a non-serviced mortgage loan) with respect to which certain defaults, modifications or insolvency events have occurred as further described in the Preliminary Prospectus) plus other amounts overdue or advanced in connection with such mortgage loan exceeds 90% of the appraised value of the related mortgaged property plus certain escrows and reserves (including letters of credit) held with respect to the mortgage loan. With respect to any serviced whole loan, any Appraisal Reduction Amount will be allocated,pro rata, to the related mortgage loan and the relatedpari passu companion loan(s). With respect to any non-serviced mortgage loan, appraisal reduction amounts are expected to be calculated in a similar manner under the related non-serviced pooling and servicing agreement.
A mortgage loan will cease to be a required appraisal loan when the same has ceased to be a specially serviced loan (if applicable), has been brought current for at least three consecutive months and no other circumstances exist that would cause such mortgage loan to be a required appraisal loan.
A “Collateral Deficiency Amount” will exist with respect to any mortgage loan that is modified into an AB loan structure and remains a corrected mortgage loan and will generally equal the excess of (i) the stated principal balance of such AB modified loan (taking into account the related junior note(s) and anypari passu notes included therein), over (ii) the sum of (in the case of a whole loan, solely to the extent allocable to the subject mortgage loan) (x) the most recent appraised value of the related mortgaged property plus (y) solely to the extent not reflected or taken into account in such appraised value and to the extent on deposit with, or otherwise under the control of, the lender as of the date of such determination, any capital or additional collateral contributed by the related borrower at the time the mortgage loan (and as part of the modification thereto) became an AB modified loan plus (z) any other escrows or reserves (in addition to any amounts set forth in the immediately preceding clause (y)) held with respect to the mortgage loan as of the date of such determination.
A “Cumulative Appraisal Reduction Amount” with respect to any mortgage loan will be the sum of any Appraisal Reduction Amount and any Collateral Deficiency Amount.
Appraisal Reduction Amounts will affect the amount of debt service advances in respect of the related mortgage loan. Additionally, Cumulative Appraisal Reduction Amounts will be taken into account in the determination of the identity of the Class whose majority constitutes the “majority controlling class certificateholder” and is entitled to appoint the directing certificateholder. |
Clean-Up Call and Exchange Termination:
| On each Distribution Date occurring after the aggregate unpaid principal balance of the pool of mortgage loans is less than 1.0% of the principal balance of the mortgage loans as of the cut-off date (solely for the purposes of this calculation, if such right is being exercised after the distribution date in December 2029 and the Global Payments, Inc. mortgage loan is still an asset of the issuing entity, then such mortgage loan will be excluded from the then-aggregate stated principal balance of the pool of mortgage loans and from the initial pool balance), certain specified persons will have the option to purchase all of the remaining mortgage loans (and the trust’s interest in all property acquired through exercise of remedies in respect of any mortgage loan) at the price specified in the Preliminary Prospectus. Exercise of the option will terminate the trust and retire the then-outstanding certificates.
If the aggregate Certificate Balances of each of the Class A-1, A-2, A-SB, A-3, A-4, A-S, B, C and D Certificates have been reduced to zero, the trust may also be terminated in connection with an exchange of all the then-outstanding certificates (other than the Class V and Class R Certificates) for the mortgage loans and REO properties then remaining in the issuing entity, subject to payment of a price specified in the Preliminary Prospectus, but all of the holders of those outstanding Classes (other than the Class V and Class R Certificates) of certificates would have to voluntarily participate in the exchange. |
| Liquidation Loan Waterfall: | Following the liquidation of any loan or property, the net liquidation proceeds generally will be applied (after reimbursement of advances and certain trust fund expenses), first, as a recovery of accrued interest, other than delinquent interest that was not advanced as a result of Appraisal Reduction Amounts, second, as a recovery of principal until all principal has been recovered, and then as a recovery of delinquent interest that was not advanced as a result of Appraisal Reduction Amounts. Please see “Description of the Certificates—Distributions—Application Priority of Mortgage Loan Collections or Whole Loan Collections” in the Preliminary Prospectus. |
| Control Eligible Certificates: | The Class E-RR, F-RR, G-RR and H-RR Certificates. |
| Directing Certificateholder/ Controlling Class: | A directing certificateholder may be appointed by the “majority controlling class certificateholder”, which will be the holder(s) of a majority of the Controlling Class. |
| THE INFORMATION IN THIS STRUCTURAL AND COLLATERAL TERM SHEET IS NOT COMPLETE AND MAY BE AMENDED PRIOR TO THE TIME OF SALE. THIS TERM SHEET IS NOT AN OFFER TO SELL THESE SECURITIES AND IT IS NOT A SOLICITATION OF AN OFFER TO BUY THESE SECURITIES IN ANY JURISDICTION WHERE THE OFFER OR SALE IS NOT PERMITTED. |
| 21 |
| Wells Fargo Commercial Mortgage Trust 2019-C54 | Certain Terms and Conditions |
| The “Controlling Class” will be, as of any time of determination, the most subordinate Class of Control Eligible Certificates then outstanding that has an aggregate Certificate Balance (as notionally reduced by any Cumulative Appraisal Reduction Amounts allocable to such Class(es)) at least equal to 25% of the initial Certificate Balance of that Class;provided,however, that if at any time the Certificate Balances of the certificates other than the Control Eligible Certificates have been reduced to zero as a result of principal payments on the Mortgage Loans, then the Controlling Class will be the most subordinate Class of Control Eligible Certificates that has a Certificate Balance greater than zero without regard to any Cumulative Appraisal Reduction Amounts. The Controlling Class as of the Closing Date will be the Class H-RR Certificates. | |
| Control and Consultation: | The rights of various parties to replace the Special Servicer and approve or consult with respect to major actions of the Special Servicer will vary according to defined periods.
A “Control Termination Event” will occur when the Class E-RR Certificates have a Certificate Balance (taking into account the application of any Cumulative Appraisal Reduction Amounts to notionally reduce the Certificate Balance of such Class) of less than 25% of the initial Certificate Balance of that Class;provided,however, that a Control Termination Event will not be deemed continuing in the event that the Certificate Balances of the certificates other than the Control Eligible Certificates have been reduced to zero as a result of principal payments on the Mortgage Loans.
A “Consultation Termination Event” will occur when there is no Class of Control Eligible Certificates that has a then-outstanding Certificate Balance at least equal to 25% of the initial Certificate Balance of that Class, in each case, without regard to the application of any Cumulative Appraisal Reduction Amounts;provided,however, that a Consultation Termination Event will not be deemed continuing in the event that the Certificate Balances of the certificates other than the Control Eligible Certificates have been reduced to zero as a result of principal payments on the Mortgage Loans.
If no Control Termination Event has occurred and is continuing, except with respect to the Excluded Loans (as defined below) (i) the directing certificateholder will be entitled to grant or withhold approval of asset status reports prepared, and material servicing actions proposed, by the Special Servicer, and (ii) the directing certificateholder will be entitled to terminate and replace the Special Servicer with or without cause, and appoint itself or another person as the successor special servicer. It will be a condition to such appointment that KBRA, Fitch and S&P (and any rating agency rating any securities backed by anypari passu companion loan(s) serviced under this transaction) confirm that the appointment would not result in a qualification, downgrade or withdrawal of any of their then-current ratings of certificates (and any certificates backed by anypari passu companion loan(s) serviced under this transaction).
If a Control Termination Event has occurred and is continuing but no Consultation Termination Event has occurred and is continuing, the Special Servicer will be required to consult with the directing certificateholder (other than with respect to Excluded Loans) in connection with asset status reports and material special servicing actions.
If a Consultation Termination Event has occurred and is continuing, no directing certificateholder will be recognized or have any right to terminate the Special Servicer or approve, direct or consult with respect to servicing matters.
With respect to each serviced whole loan the rights of the directing certificateholder described above will be subject to the consultation rights of the holders of the related pari passu companion loans. Those consultation rights will generally extend to asset status reports and material special servicing actions involving the related whole loan, will be as set forth in the related intercreditor agreement, and will be in addition to the rights of the directing certificateholder in this transaction described above.
With respect to each non-serviced whole loan, the applicable servicing agreement for the related controllingpari passu companion loan(s) generally grants (or will grant) the directing certificateholder under the related securitization control rights that may include the right to approve or disapprove various material servicing actions involving the related whole loan. The directing certificateholder for this securitization (so long as no Consultation Termination Event has occurred and is occurring) generally will nonetheless have the right to be consulted on a non-binding basis with respect to such actions. For purposes of the servicing of any such whole loan contemplated by this paragraph, the occurrence and continuance of a Control Termination Event or Consultation Termination Event under this securitization will not limit the control or other rights of the directing certificateholder (or equivalent) under the securitization of the related controllingpari passu companion loan(s). |
| THE INFORMATION IN THIS STRUCTURAL AND COLLATERAL TERM SHEET IS NOT COMPLETE AND MAY BE AMENDED PRIOR TO THE TIME OF SALE. THIS TERM SHEET IS NOT AN OFFER TO SELL THESE SECURITIES AND IT IS NOT A SOLICITATION OF AN OFFER TO BUY THESE SECURITIES IN ANY JURISDICTION WHERE THE OFFER OR SALE IS NOT PERMITTED. |
| 22 |
| Wells Fargo Commercial Mortgage Trust 2019-C54 | Certain Terms and Conditions |
The control rights and consent and consultation rights described in the preceding paragraphs are subject to various limitations, conditions and exceptions as described in the Preliminary Prospectus.
Notwithstanding any contrary description set forth above, in the event that, with respect to any mortgage loan, the majority controlling class certificateholder or the directing certificateholder is a Borrower Party, the majority controlling class certificateholder and the directing certificateholder will have no right to receive asset status reports or such other information as may be specified in the WFCM 2019-C54 pooling and servicing agreement, or to grant or withhold approval of, or consult with respect to, asset status reports prepared, and material servicing actions proposed, by the Special Servicer, with respect to such mortgage loan, and such mortgage loan will be referred to as an “Excluded Loan” as to such party.
In addition, notwithstanding any contrary description set forth above, in the event that, with respect to any mortgage loan, a controlling class certificateholder is a Borrower Party, such controlling class certificateholder will have no right to receive asset status reports or such other information as may be specified in the WFCM 2019-C54 pooling and servicing agreement with respect to such mortgage loan.
“Borrower Party” means a borrower, a mortgagor or a manager of a mortgaged property, an Accelerated Mezzanine Loan Lender, or any Borrower Party Affiliate. “Accelerated Mezzanine Loan Lender” means a mezzanine lender under a mezzanine loan that has been accelerated or as to which foreclosure or enforcement proceedings have been commenced against the equity collateral pledged to secure such mezzanine loan. “Borrower Party Affiliate” means, with respect to a borrower, a mortgagor, a manager of a Mortgaged Property or an Accelerated Mezzanine Loan Lender, (x) any other person controlling or controlled by or under common control with such borrower, mortgagor, manager or Accelerated Mezzanine Loan Lender, as applicable, or (y) any other person owning, directly or indirectly, 25% or more of the beneficial interests in such borrower, mortgagor, manager or Accelerated Mezzanine Loan Lender. | |
| Replacement of Special Servicer: | If a Control Termination Event has occurred and is continuing, the Special Servicer may be removed and replaced without cause upon the affirmative direction of certificate owners holding not less than 66-2/3% of a certificateholder quorum, following a proposal from certificate owners holding not less than 25% of the appraisal-reduced voting rights of all Certificates. The certificateholders who initiate a vote on a termination and replacement of the Special Servicer without cause must cause KBRA, Fitch and S&P to confirm the then-current ratings of the certificates (or decline to review the matter) and cause the payment of the fees and expenses incurred in the replacement. If no Control Termination Event has occurred and is continuing, the Special Servicer may be replaced by the directing certificateholder, subject to KBRA, Fitch and S&P (and any Rating Agency rating any securities backed by anypari passu companion loan(s) serviced under this transaction) confirming the then-current ratings of the Certificates (and any certificates backed by anyparipassu companion loans serviced under this transaction) or declining to review the matter.
In addition, if at any time the Operating Advisor determines, in its sole discretion exercised in good faith, that (i) the Special Servicer is not performing its duties as required under the pooling and servicing agreement in accordance with the Servicing Standard and (ii) the replacement of the Special Servicer would be in the best interest of the certificateholders as a collective whole, then, the Operating Advisor will have the right to recommend the replacement of the Special Servicer and will submit its formal recommendation to the Trustee and the Certificate Administrator (along with its rationale, its proposed replacement special servicer and other relevant information justifying its recommendation).
The Operating Advisor’s recommendation to replace the Special Servicer must be confirmed by an affirmative vote of holders of Principal Balance Certificates evidencing at least a majority of a quorum of certificateholders (which, for this purpose, is the holders of Principal Balance Certificates that (i) evidence at least 20% of the Voting Rights (taking into account the application of any cumulative appraisal reduction amounts to notionally reduce the respective Certificate Balances) of all Principal Balance Certificates on an aggregate basis, and (ii) consist of at least three certificateholders or certificate owners that are not risk retention affiliated with each other). In the event the holders of Principal Balance Certificates evidencing at least a majority of a quorum of certificateholders elect to remove and replace the Special Servicer (which requisite affirmative votes must be received within 180 days of the posting of the notice of the Operating Advisor’s recommendation to replace the Special Servicer to the Certificate Administrator's website), the Certificate Administrator will be required to receive a Rating Agency Confirmation from each of the Rating Agencies at that time. |
| THE INFORMATION IN THIS STRUCTURAL AND COLLATERAL TERM SHEET IS NOT COMPLETE AND MAY BE AMENDED PRIOR TO THE TIME OF SALE. THIS TERM SHEET IS NOT AN OFFER TO SELL THESE SECURITIES AND IT IS NOT A SOLICITATION OF AN OFFER TO BUY THESE SECURITIES IN ANY JURISDICTION WHERE THE OFFER OR SALE IS NOT PERMITTED. |
| 23 |
| Wells Fargo Commercial Mortgage Trust 2019-C54 | Certain Terms and Conditions |
| Excluded Special Servicer: | In the event that, with respect to any mortgage loan, the Special Servicer is a Borrower Party, the Special Servicer will be required to resign as special servicer of such mortgage loan (referred to as an “excluded special servicer loan”). If no Control Termination Event has occurred and is continuing, the directing certificateholder will be entitled to appoint (and may replace with or without cause) a separate special servicer that is not a Borrower Party (referred to as an “excluded special servicer”) with respect to such excluded special servicer loan unless such excluded special servicer loan is also an excluded loan. Otherwise, upon resignation of the Special Servicer with respect to an excluded special servicer loan, the resigning Special Servicer will be required to appoint the excluded special servicer. |
| Appraisal Remedy: | If the Class of Certificates comprising the Controlling Class loses its status as Controlling Class because of the application of an Appraisal Reduction Amount or Collateral Deficiency Amount, the holders of a majority of the voting rights of such Class may require the Special Servicer to order a second appraisal for any mortgage loan in respect of which an Appraisal Reduction Amount or Collateral Deficiency Amount has been applied. The Special Servicer must thereafter determine whether, based on its assessment of such second appraisal, any recalculation of the Appraisal Reduction Amount or Collateral Deficiency Amount is warranted. Such Class will not be able to exercise any direction, control, consent and/or similar rights of the Controlling Class unless and until reinstated as the Controlling Class through such determination; and pending such determination, the rights of the Controlling Class will be exercised by the Control Eligible Certificates, if any, that would be the Controlling Class taking into account the subject appraisal reduction amount. |
| Sale of Defaulted Assets: | There will be no “fair value” purchase option. Instead, the WFCM 2019-C54 pooling and servicing agreement will authorize the Special Servicer to sell defaulted mortgage loans serviced by such Special Servicer to the highest bidder in a manner generally similar to sales of REO properties.
The sale of a defaulted loan (other than a non-serviced whole loan) for less than par plus accrued interest and certain other fees and expenses owed on the loan will be subject to consent or consultation rights of the directing certificateholder and/or Operating Advisor, as described in the Preliminary Prospectus. Generally speaking, the holder of apari passu companion loan will have consent and/or consultation rights, as described in the Preliminary Prospectus.
With respect to any serviced whole loan and, if such whole loan becomes a defaulted loan under the WFCM 2019-C54 pooling and servicing agreement, the Special Servicer will generally be required to sell both the mortgage loan and the related pari passu companion loan(s) as a single whole loan.
With respect to each non-serviced whole loan, the applicable servicing agreement governing the servicing of such whole loan generally provides (or is expected to provide) that, if the relatedpari passu companion loan(s) serviced under such agreement become a defaulted loan under such servicing agreement, then the related special servicer may offer to sell to any person (or may offer to purchase) for cash such whole loan during such time as such applicablepari passucompanion loan(s) constitutes a defaulted loan under such servicing agreement. Generally speaking, in connection with any such sale, the related special servicer is required to sell both the mortgage loan and the related pari passu companion loan(s) as a whole loan. The directing certificateholder for this securitization generally will have consent and/or consultation rights as the holder of an interest in the related mortgage loan, as described in the Preliminary Prospectus.
The procedures for the sale of any whole loan that becomes a defaulted whole loan, and any associated consultation rights, are subject to various limitations, conditions and exceptions as described in the Preliminary Prospectus.
|
| “As-Is” Appraisals: | Appraisals must be conducted on an “as-is” basis, and must be no more than 12 months old, for purposes of determining Appraisal Reduction Amounts and market value in connection with REO sales. Required appraisals may consist of updates of prior appraisals. Internal valuations by the Special Servicer are permitted if the principal balance of a mortgage loan is less than $2,000,000. |
| THE INFORMATION IN THIS STRUCTURAL AND COLLATERAL TERM SHEET IS NOT COMPLETE AND MAY BE AMENDED PRIOR TO THE TIME OF SALE. THIS TERM SHEET IS NOT AN OFFER TO SELL THESE SECURITIES AND IT IS NOT A SOLICITATION OF AN OFFER TO BUY THESE SECURITIES IN ANY JURISDICTION WHERE THE OFFER OR SALE IS NOT PERMITTED. |
| 24 |
| Wells Fargo Commercial Mortgage Trust 2019-C54 | Certain Terms and Conditions |
| Operating Advisor: | The Operating Advisor will have certain review and consultation rights relating to the performance of the Special Servicer and with respect to its actions taken in connection with the resolution and/or liquidation of Specially Serviced Loans. With respect to each mortgage loan (other than a Non-Serviced Mortgage Loan) or serviced whole loan, the Operating Advisor will be responsible for:
● reviewing the actions of the Special Servicer with respect to any Specially Serviced Loan;
● reviewing (i) all reports by the Special Servicer made available to Privileged Persons on the Certificate Administrator’s website and (ii) each Asset Status Report (as defined in the Preliminary Prospectus) (after the occurrence and during the continuance of an Operating Advisor Consultation Event (as defined below)) and Final Asset Status Report (as defined in the Preliminary Prospectus);
● recalculating and reviewing for accuracy and consistency with the WFCM 2019-C54 pooling and servicing agreement the mathematical calculations by the special servicer and the corresponding application of the non-discretionary portion of the applicable formulas required to be utilized in connection with Appraisal Reduction Amounts, Collateral Deficiency Amounts and net present value calculations used in the Special Servicer’s determination of what course of action to take in connection with the workout or liquidation of a Specially Serviced Loan; and
● preparing an annual report (if any mortgage loan (other than any Non-Serviced Mortgage Loan) or serviced whole loan was a Specially Serviced Loan at any time during the prior calendar year or an Operating Advisor Consultation Event (as defined below) occurred during the prior calendar year) that sets forth whether the Operating Advisor believes, in its sole discretion exercised in good faith, that the Special Servicer is operating in compliance with the Servicing Standard with respect to its performance of its duties under the pooling and servicing agreement with respect to Specially Serviced Loans (and, after the occurrence and continuance of an Operating Advisor Consultation Event (as defined below), with respect to major decisions on non-Specially Serviced Loans) during the prior calendar year on an “asset-level basis”. The Operating Advisor will identify (1) which, if any, standards the Operating Advisor believes, in its sole discretion exercised in good faith, the Special Servicer has failed to comply with and (2) any material deviations from the Special Servicer’s obligations under the pooling and servicing agreement with respect to the resolution or liquidation of any Specially Serviced Loan or REO Property (other than with respect to any REO Property related to any Non-Serviced Mortgage Loan). In preparing any Operating Advisor Annual Report (as defined in the Preliminary Prospectus), the Operating Advisor will not be required to report on instances of non-compliance with, or deviations from, the Servicing Standard or the Special Servicer’s obligations under the pooling and servicing agreement that the Operating Advisor determines, in its sole discretion exercised in good faith, to be immaterial.
With respect to each mortgage loan (other than any Non-Serviced Mortgage Loan) or serviced whole loan, after the Operating Advisor has received notice that an Operating Advisor Consultation Event (as defined below) has occurred and is continuing, in addition to the duties described above, the Operating Advisor will be required to perform the following additional duties:
● to consult (on a non-binding basis) with the Special Servicer in respect of asset status reports and
● to consult (on a non-binding basis) with the Special Servicer with respect to “major decisions” processed by the Special Servicer.
An “Operating Advisor Consultation Event” will occur when the Certificate Balances of the Class E-RR, F-RR, G-RR and H-RR Certificates in the aggregate (taking into account the application of any Cumulative Appraisal Reduction Amounts to notionally reduce the Certificate Balances of such Classes) is 25% or less of the initial Certificate Balances of such Classes in the aggregate.
|
| Asset Representations Reviewer: | The Asset Representations Reviewer will be required to review certain delinquent mortgage loans after a specified delinquency threshold has been exceeded (an “Asset Review Trigger”) and the required percentage of certificateholders vote to direct a review of such delinquent loans. An Asset Review Trigger will occur when either (1) mortgage loans with an aggregate outstanding principal balance of 25.0% or more of the aggregate outstanding principal balance of all of the mortgage loans (including any REO loans (or a portion of any REO loan in the case of a whole loan)) held by the issuing entity as of the end of the applicable collection period are delinquent loans or (2) at least 15 mortgage loans are delinquent loans as of the end of the applicable collection period and the outstanding principal balance of such delinquent loans in the aggregate |
| THE INFORMATION IN THIS STRUCTURAL AND COLLATERAL TERM SHEET IS NOT COMPLETE AND MAY BE AMENDED PRIOR TO THE TIME OF SALE. THIS TERM SHEET IS NOT AN OFFER TO SELL THESE SECURITIES AND IT IS NOT A SOLICITATION OF AN OFFER TO BUY THESE SECURITIES IN ANY JURISDICTION WHERE THE OFFER OR SALE IS NOT PERMITTED. |
| 25 |
| Wells Fargo Commercial Mortgage Trust 2019-C54 | Certain Terms and Conditions |
constitutes at least 20.0% of the aggregate outstanding principal balance of all of the mortgage loans (including any REO loans (or a portion of any REO loan in the case of a whole loan)) held by the issuing entity as of the end of the applicable collection period. See “Pooling and Servicing Agreement—The Asset Representations Reviewer—Asset Review” in the Preliminary Prospectus.
The Asset Representations Reviewer may be terminated and replaced without cause. Upon (i) the written direction of certificateholders evidencing not less than 25% of the voting rights (without regard to the application of any Cumulative Appraisal Reduction Amounts) requesting a vote to terminate and replace the Asset Representations Reviewer with a proposed successor Asset Representations Reviewer that is an eligible asset representations reviewer, and (ii) payment by such holders to the certificate administrator of the reasonable fees and expenses to be incurred by the certificate administrator in connection with administering such vote, the certificate administrator will promptly provide notice to all certificateholders and the Asset Representations Reviewer of such request by posting such notice on its internet website, and by mailing such notice to all certificateholders and the Asset Representations Reviewer. Upon the written direction of certificateholders evidencing at least 75% of a certificateholder quorum (without regard to the application of any Cumulative Appraisal Reduction Amounts), the Trustee will terminate all of the rights and obligations of the Asset Representations Reviewer under the WFCM 2019-C54 pooling and servicing agreement by written notice to the Asset Representations Reviewer, and the proposed successor Asset Representations Reviewer will be appointed. See “Pooling and Servicing Agreement—The Asset Representations Reviewer” in the Preliminary Prospectus.
| |
| Dispute Resolution Provisions: | The mortgage loan sellers will be subject to the dispute resolution provisions set forth in the WFCM 2019-C54 pooling and servicing agreement to the extent those provisions are triggered with respect to any mortgage loan sold to the depositor by a mortgage loan seller and such mortgage loan seller will be obligated under the related mortgage loan purchase agreement to comply with all applicable provisions and to take part in any mediation or arbitration proceedings that may result.
Generally, in the event that a Repurchase Request (as defined in the Preliminary Prospectus) is not “Resolved” (as defined below) within 180 days after the related mortgage loan seller receives such Repurchase Request, then the enforcing servicer will be required to send a notice to the “Initial Requesting Certificateholder” (if any) and the Certificate Administrator indicating the enforcing servicer’s intended course of action with respect to the Repurchase Request. If (a) the enforcing servicer’s intended course of action with respect to the Repurchase Request does not involve pursuing further action to exercise rights against the related mortgage loan seller with respect to the Repurchase Request and the Initial Requesting Certificateholder, if any, or any other certificateholder or certificate owner wishes to exercise its right to refer the matter to mediation (including non-binding arbitration) or arbitration, or (b) the enforcing servicer’s intended course of action is to pursue further action to exercise rights against the related mortgage loan seller with respect to the Repurchase Request but the Initial Requesting Certificateholder, if any, or any other certificateholder or certificate owner does not agree with the dispute resolution method selected by the enforcing servicer, then the Initial Requesting Certificateholder, if any, or such other certificateholder or certificate owner may deliver a written notice to the Special Servicer indicating its intent to exercise its right to refer the matter to either mediation or arbitration.
“Resolved” means, with respect to a Repurchase Request, (i) that the related Material Defect has been cured, (ii) the related mortgage loan has been repurchased in accordance with the related mortgage loan purchase agreement, (iii) a mortgage loan has been substituted for the related mortgage loan in accordance with the related mortgage loan purchase agreement, (iv) the applicable mortgage loan seller has made a Loss of Value Payment (as defined in the Preliminary Prospectus), (v) a contractually binding agreement is entered into between the enforcing servicer, on behalf of the issuing entity, and the related mortgage loan seller that settles the related mortgage loan seller’s obligations under the related mortgage loan purchase agreement or (vi) the related mortgage loan is no longer property of the issuing entity as a result of a sale or other disposition in accordance with the WFCM 2019-C54 pooling and servicing agreement. See “Pooling and Servicing Agreement—Dispute Resolution Provisions” in the Preliminary Prospectus.
|
| Investor Communications: | The certificate administrator is required to include on any Form 10–D any request received from a certificateholder to communicate with other certificateholders related to certificateholders exercising their rights under the terms of the WFCM 2019-C54 pooling and servicing agreement. Any certificateholder wishing to communicate with other certificateholders regarding the exercise of its rights under the terms of the WFCM 2019-C54 pooling and servicing agreement will be able to deliver a written request signed by an authorized representative of the requesting investor to the certificate administrator. |
| THE INFORMATION IN THIS STRUCTURAL AND COLLATERAL TERM SHEET IS NOT COMPLETE AND MAY BE AMENDED PRIOR TO THE TIME OF SALE. THIS TERM SHEET IS NOT AN OFFER TO SELL THESE SECURITIES AND IT IS NOT A SOLICITATION OF AN OFFER TO BUY THESE SECURITIES IN ANY JURISDICTION WHERE THE OFFER OR SALE IS NOT PERMITTED. |
| 26 |
| Wells Fargo Commercial Mortgage Trust 2019-C54 | Certain Terms and Conditions |
| Certain Fee Offsets: | If a workout fee is earned by the Special Servicer following a loan default with respect to any mortgage loan that it services, then certain limitations will apply based on modification fees paid by the borrower. The modification fee generally must not exceed 1% of the principal balance of the loan as modified in any 12-month period. In addition, if the loan re-defaults, any subsequent workout fee on that loan must be reduced by a portion of the modification fees paid by the borrower in the previous 12-months. Likewise, liquidation fees collected in connection with a liquidation or partial liquidation of a mortgage loan must be reduced by a portion of the modification fees paid by the borrower in the previous 12 months. |
| Deal Website: | The Certificate Administrator will be required to maintain a deal website, which will include, among other items: (a) summaries of asset status reports prepared by the Special Servicer, (b) inspection reports, (c) appraisals, (d) various “special notices” described in the Preliminary Prospectus, (e) the “Investor Q&A Forum”, (f) a voluntary “Investor Registry” and (g) the “Risk Retention Special Notices” tab. Investors may access the deal website following execution of a certification and confidentiality agreement. |
| Initial Majority Controlling Class Certificateholder: | It is expected that Argentic Securities Holdings Cayman Limited or an affiliate will be the initial majority controlling class certificateholder. |
| Whole Loans: | Each of the mortgaged properties identified above under “IV. Characteristics of the Mortgage Pool—B. Summary of the Whole Loans” secures both a mortgage loan to be included in the trust fund and one or more other mortgage loans that will not be included in the trust fund, each of which will bepari passu with the mortgage loan included in the trust fund. We refer to each such group of mortgage loans as a “whole loan”. Such “—Summary of the Whole Loans” section includes further information regarding the various notes in each whole loan, the holders of such notes, the lead servicing agreement for each such whole loan, and the master servicer and special servicer under such lead servicing agreement. |
| THE INFORMATION IN THIS STRUCTURAL AND COLLATERAL TERM SHEET IS NOT COMPLETE AND MAY BE AMENDED PRIOR TO THE TIME OF SALE. THIS TERM SHEET IS NOT AN OFFER TO SELL THESE SECURITIES AND IT IS NOT A SOLICITATION OF AN OFFER TO BUY THESE SECURITIES IN ANY JURISDICTION WHERE THE OFFER OR SALE IS NOT PERMITTED. |
| 27 |
| Office - Suburban | Loan #1 | Cut-off Date Balance: | $55,000,000 | |
| 831 Douglas Street & 2201, | Continental Park – Rosecrans Douglas | Cut-off Date LTV: | 52.9% | |
| 2221 & 2231 Rosecrans Avenue | U/W NCF DSCR: | 3.06x | ||
| El Segundo, CA 90245 | U/W NOI Debt Yield: | 10.8% |
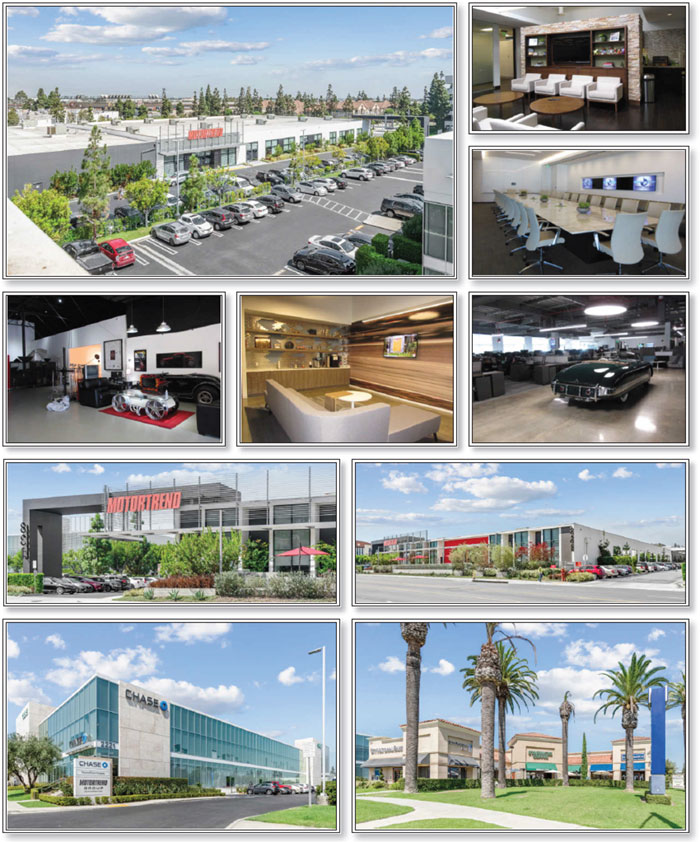
| THE INFORMATION IN THIS STRUCTURAL AND COLLATERAL TERM SHEET IS NOT COMPLETE AND MAY BE AMENDED PRIOR TO THE TIME OF SALE. THIS TERM SHEET IS NOT AN OFFER TO SELL THESE SECURITIES AND IT IS NOT A SOLICITATION OF AN OFFER TO BUY THESE SECURITIES IN ANY JURISDICTION WHERE THE OFFER OR SALE IS NOT PERMITTED. |
| 28 |
| Office - Suburban | Loan #1 | Cut-off Date Balance: | $55,000,000 | |
| 831 Douglas Street & 2201, | Continental Park – Rosecrans Douglas | Cut-off Date LTV: | 52.9% | |
| 2221 & 2231 Rosecrans Avenue | U/W NCF DSCR: | 3.06x | ||
| El Segundo, CA 90245 | U/W NOI Debt Yield: | 10.8% |
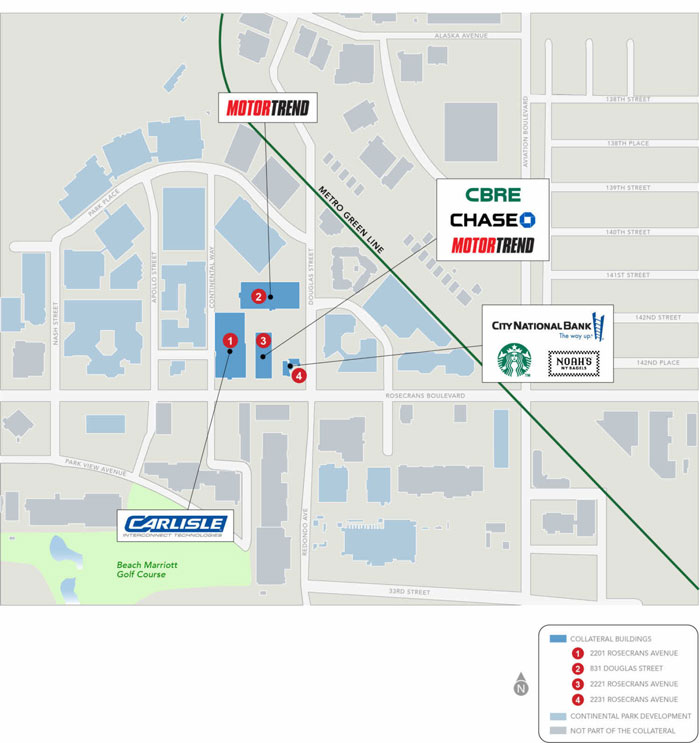
| THE INFORMATION IN THIS STRUCTURAL AND COLLATERAL TERM SHEET IS NOT COMPLETE AND MAY BE AMENDED PRIOR TO THE TIME OF SALE. THIS TERM SHEET IS NOT AN OFFER TO SELL THESE SECURITIES AND IT IS NOT A SOLICITATION OF AN OFFER TO BUY THESE SECURITIES IN ANY JURISDICTION WHERE THE OFFER OR SALE IS NOT PERMITTED. |
| 29 |
| Office - Suburban | Loan #1 | Cut-off Date Balance: | $55,000,000 | |
| 831 Douglas Street & 2201, | Continental Park – Rosecrans Douglas | Cut-off Date LTV: | 52.9% | |
| 2221 & 2231 Rosecrans Avenue | U/W NCF DSCR: | 3.06x | ||
| El Segundo, CA 90245 | U/W NOI Debt Yield: | 10.8% |
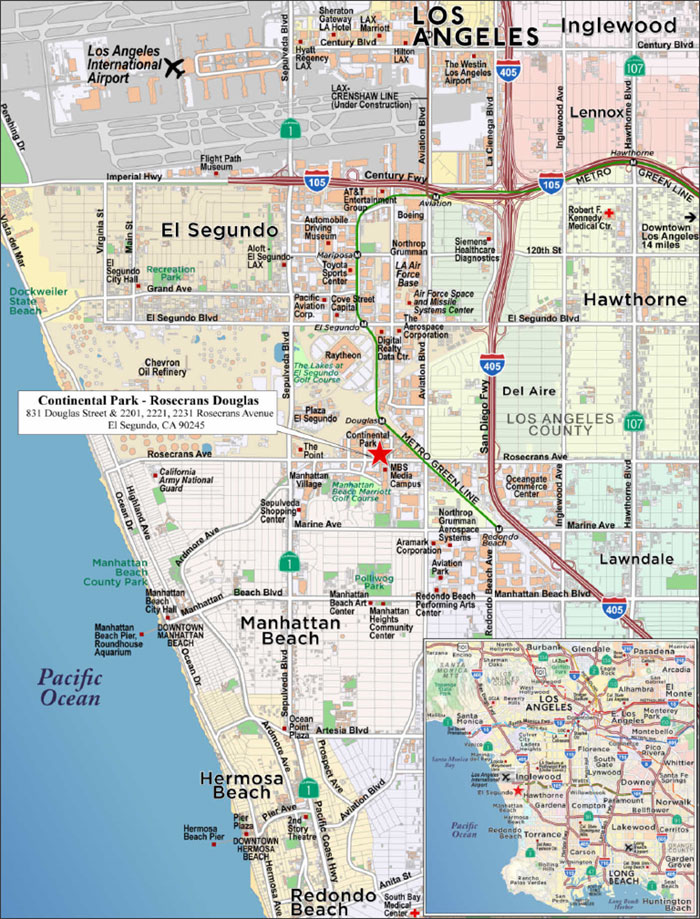
| THE INFORMATION IN THIS STRUCTURAL AND COLLATERAL TERM SHEET IS NOT COMPLETE AND MAY BE AMENDED PRIOR TO THE TIME OF SALE. THIS TERM SHEET IS NOT AN OFFER TO SELL THESE SECURITIES AND IT IS NOT A SOLICITATION OF AN OFFER TO BUY THESE SECURITIES IN ANY JURISDICTION WHERE THE OFFER OR SALE IS NOT PERMITTED. |
| 30 |
| No. 1 – Continental Park – Rosecrans Douglas | |||||||
| Mortgage Loan Information | Mortgaged Property Information | ||||||
| Mortgage Loan Seller: | Rialto Mortgage Finance, LLC | Single Asset/Portfolio: | Single Asset | ||||
Credit Assessment (Fitch/KBRA/S&P): | NR/NR/NR | Property Type – Subtype: | Office – Suburban | ||||
| Original Principal Balance: | $55,000,000 | Location: | El Segundo, CA | ||||
| Cut-off Date Balance: | $55,000,000 | Size: | 206,012 SF | ||||
| % of Initial Pool Balance: | 8.2% | Cut-off Date Balance Per SF: | $266.97 | ||||
| Loan Purpose: | Refinance | Maturity Date Balance Per SF: | $266.97 | ||||
| Borrower Sponsor: | Continental Development Corporation | Year Built/Renovated: | 1965/2017 | ||||
| Guarantor: | Continental Development Corporation | Title Vesting: | Fee | ||||
| Mortgage Rate: | 3.3400% | Property Manager: | Self-managed | ||||
| Note Date: | October 18, 2019 | Current Occupancy (As of): | 100.0% (9/9/2019) | ||||
| Seasoning: | 1 month | YE 2018 Occupancy: | 100.0% | ||||
| Maturity Date: | November 6, 2029 | YE 2017 Occupancy: | 100.0% | ||||
| IO Period: | 120 months | YE 2016 Occupancy: | 100.0% | ||||
| Loan Term (Original): | 120 months | As-Is Appraised Value(3): | $104,000,000 | ||||
| Amortization Term (Original): | NAP | As-Is Appraised Value Per SF: | $504.82 | ||||
| Loan Amortization Type: | Interest-only, Balloon | As-Is Appraisal Valuation Date: | September 15, 2019 | ||||
| Call Protection: | L(23),GRTR 1% or YM(90),O(7) | ||||||
| Lockbox Type: | Springing | Underwriting and Financial Information(4) | |||||
| Additional Debt: | None | TTM NOI (8/31/2019): | $6,138,874 | ||||
| Additional Debt Type (Balance): | NAP | YE 2018 NOI: | $5,967,074 | ||||
| YE 2017 NOI: | $5,639,026 | ||||||
| YE 2016 NOI: | NAV | ||||||
| U/W Revenues: | $7,523,684 | ||||||
| U/W Expenses: | $1,563,060 | ||||||
| Escrows and Reserves(1) | U/W NOI: | $5,960,625 | |||||
| Initial | Monthly | Cap | U/W NCF: | $5,713,410 | |||
| Taxes | $48,798 | $23,237 | NAP | U/W DSCR based on NOI/NCF: | 3.19x / 3.06x | ||
| Insurance | $8,218 | Springing | NAP | U/W Debt Yield based on NOI/NCF: | 10.8% / 10.4% | ||
| Replacement Reserve | $0 | $3,434 | $206,102 | U/W Debt Yield at Maturity based on NOI/NCF: | 10.8% / 10.4% | ||
| TI/LC Reserve(2) | $6,500,000 | $17,168 | $500,000 | Cut-off Date LTV Ratio: | 52.9% | ||
| LTV Ratio at Maturity: | 52.9% | ||||||
| Sources and Uses | |||||||
| Sources | Uses | ||||||
| Original loan amount | $55,000,000 | 100.0% | Loan payoff | $31,634,989 | 57.5 | % | |
| Upfront reserves | 6,557,016 | 11.9 | |||||
| Closing costs | 764,744 | 1.4 | |||||
| Return of equity | 16,043,251 | 29.2 | |||||
| Total Sources | $55,000,000 | 100.0% | Total Uses | $55,000,000 | 100.0 | % | |
| (1) | See “Escrows” section for a full description of Escrows and Reserves. |
| (2) | The initial TI/LC Reserve is for general TI/LC, including re-leasing the Carlisle space. The TI/LC Reserve Cap does not take into account the initial TI/LC amount collected. |
| (3) | Carlisle Interconnect Technologies ("Carlisle"), the 2nd largest tenant, will be vacating its premises upon lease expiration in February 2020. The appraiser concluded a market rent of approximately $41.40 per square foot for this space. |
| (4) | Underwriting based on tenants in place. With respect to the Carlisle space, the lender underwrote in place rent ($20.35 per square foot). The Continental Park – Rosecrans Douglas Borrower (as defined below) has a letter of intent from a confidential tenant to lease the Carlisle space for ten-years at a rent of $41.40 per square foot with 2.5% annual escalations. |
The Mortgage Loan. The mortgage loan (the “Continental Park - Rosecrans Douglas Mortgage Loan”) is evidenced by a single promissory note secured by a first mortgage encumbering the fee interest in a 206,012 square foot office property located in El Segundo, California (the “Continental Park - Rosecrans Douglas Property”).
The Borrower and Borrower Sponsor.The borrower is Continental Rose-Doug LLC (the “Continental Park - Rosecrans Douglas Borrower”), a Delaware limited liability company and single purpose entity with one independent director. Legal counsel to the Continental Park - Rosecrans Douglas Borrower delivered a non-consolidation opinion in connection with the origination of the Continental Park - Rosecrans Douglas Mortgage Loan. The borrower sponsor and nonrecourse carve-out guarantor of the Continental Park - Rosecrans Douglas Mortgage Loan is Continental Development Corporation (“CDC”).
| THE INFORMATION IN THIS STRUCTURAL AND COLLATERAL TERM SHEET IS NOT COMPLETE AND MAY BE AMENDED PRIOR TO THE TIME OF SALE. THIS TERM SHEET IS NOT AN OFFER TO SELL THESE SECURITIES AND IT IS NOT A SOLICITATION OF AN OFFER TO BUY THESE SECURITIES IN ANY JURISDICTION WHERE THE OFFER OR SALE IS NOT PERMITTED. |
| 31 |
| Office - Suburban | Loan #1 | Cut-off Date Balance: | $55,000,000 | |
| 831 Douglas Street & 2201, | Continental Park – Rosecrans Douglas | Cut-off Date LTV: | 52.9% | |
| 2221 & 2231 Rosecrans Avenue | U/W NCF DSCR: | 3.06x | ||
| El Segundo, CA 90245 | U/W NOI Debt Yield: | 10.8% |
CDC is wholly owned by Richard C. Lundquist and Melanie F. Lundquist, as Trustees of the Richard and Melanie Lundquist Family Trust, established August 20, 2001. Mr. Lundquist serves as the President of CDC, which is privately held and has had the same Lundquist family ownership since its inception. CDC is one of California’s largest commercial real estate developers and owners, and the company is primarily involved in the development of prime income-producing commercial properties designed for long-term investment. CDC has owned or developed more than 6.0 million square feet of office and commercial space in Southern and Northern California, comprised of Class-A office, medical/dental, research and development, commercial, retail, restaurant, entertainment, hospitality and mixed-use properties.
The Property.The Continental Park - Rosecrans Douglas Property is a 206,012 square foot office property, that includes 6,287 square feet of retail space, located on the northwest corner of the intersection of South Douglas Street and Rosecrans Avenue in El Segundo, California. The Continental Park - Rosecrans Douglas Property is situated on 8.6 acres of land and is comprised of two, two-story office buildings, a one-story office building and a one-story retail building. The Continental Park - Rosecrans Douglas Borrower developed the Continental Park - Rosecrans Douglas Property in phases in 1965, 1967, 1974 & 1996, and was most recently renovated in 2011 and 2017. The Continental Park - Rosecrans Douglas Property is 100.0% occupied by six national tenants and one regional tenant as of the September 9, 2019 rent roll. Investment-grade rated tenants occupy 59.7% of the Continental Park - Rosecrans Douglas Property’s net rentable area and contribute 71.1% of the UW base rent. There is on-site parking for 870 vehicles (4.2 spaces per 1,000 square feet) at the Continental Park - Rosecrans Douglas Property, which includes 379 covered spaces located within an above-ground four-story parking structure and 491 surface spaces located throughout the Continental Park - Rosecrans Douglas Property.
Major Tenants.
Largest Tenant: Motor Trend (41.6% of underwritten base rent; 59,908 SF on 3/31/2029 and 22,438 SF on 11/30/2025 lease expiration) –Motor Trend is a subsidiary of Discovery Inc., a global leader in real life entertainment and delivers over 8,000 hours of original programming each year. Discovery’s portfolio of premium brands includes Discover Channel, HGTV, Food Network, TLC, Travel Channel, Turbo/Velocity, Animal Planet, Science Channel, OWN: Oprah Winfrey Network, Discovery Kids in Latin America, Eurosport and Motor Trend OnDemand. Motor Trend is an American automobile magazine that first appeared in September 1949, issued by Petersen Publishing Company in Los Angeles. It has a monthly circulation of over one million readers. The magazines feature road tests, vehicle comparisons and car of the year sectionals. Motor Trend has been a tenant at the Continental Park – Rosecrans Douglas Property since 2009, occupying 4 suites: Suite 150, Suite 175, Suite 195, and Suite 195A. Motor Trend has one, three-year renewal option for its 831 Douglas Street space (suite 150), and two, 5-year renewal options remaining for other suites at the 2221 Rosecrans Avenue location.
2ndLargest Tenant: Carlisle Interconnect Technologies (26.5% of underwritten base rent; 2/29/2020 lease expiration) –Carlisle Interconnect Technologies (“Carlisle”) is a diversified global company with a portfolio of businesses focused on the manufacture and distribution of highly engineered products for both original equipment and aftermarket channels. Carlisle is a division of Carlisle Companies Inc., which operates through its four segments, Carlisle Construction Materials, Carlisle Interconnect Technologies, Carlisle Fluid Technologies and Carlisle Brake & Friction. Carlisle has been a tenant at the Continental Park – Rosecrans Douglas Property since 1991 and has given notice of its intention to vacate upon the conclusion of its lease. The borrower sponsor has provided a letter of intent from a confidential tenant to backfill Carlisle’s space. The letter of intent outlines a ten-year lease with a rental rate starting at $41.40 per square foot with 2.5% annual escalations. This proposed lease will have Proposition 13 protection for the first five years of the lease term, six months of free rent and an improvement allowance of $85 per square foot. Proposition 13 caps real estate taxes at 1% of full cash value and provides that real estate taxes cannot increase by more than 2% per year, unless the property is reassessed due to a change in ownership or upon completion of new construction. Typical “Proposition 13 protections” limit a tenant’s obligation to pay for increases in real estate taxes. The lease commencement date is projected to occur in December 2020. The Continental Park - Rosecrans Douglas Mortgage Loan is structured with a $6.5 million ($85 per square foot) general leasing reserve, which will be available to lease the Carlisle space, as well as other general leasing expenses.
3rdLargest Tenant: CBRE (19.0% of underwritten base rent; 11/30/2021 lease expiration) –CBRE was incorporated in February 2001 and had $105.5 billion of asset under management, more than 480 offices and more than 90,000 employees as of December 31, 2018. CBRE has been included on the Fortune 500 since 2008, ranking #146 in 2019, has been voted the most recognized commercial real estate brand in the Lipsey Company survey for 18 consecutive years (including 2019), has also been rated a World’s Most Ethical Company by the Ethisphere Institute for six consecutive years, and has been named one of Fortune’s “Most Admired Companies” for seven years in a row, including being ranked number one in the real estate sector in 2019. Revenue and adjusted EBITDA for 2018 reached new all-time highs of $21.3 billion and $1.9 billion, respectively. CBRE has been a tenant at the Continental Park – Rosecrans Douglas Property since 2011 and has two, 5-year renewal options remaining.
| THE INFORMATION IN THIS STRUCTURAL AND COLLATERAL TERM SHEET IS NOT COMPLETE AND MAY BE AMENDED PRIOR TO THE TIME OF SALE. THIS TERM SHEET IS NOT AN OFFER TO SELL THESE SECURITIES AND IT IS NOT A SOLICITATION OF AN OFFER TO BUY THESE SECURITIES IN ANY JURISDICTION WHERE THE OFFER OR SALE IS NOT PERMITTED. |
| 32 |
| Office - Suburban | Loan #1 | Cut-off Date Balance: | $55,000,000 | |
| 831 Douglas Street & 2201, | Continental Park – Rosecrans Douglas | Cut-off Date LTV: | 52.9% | |
| 2221 & 2231 Rosecrans Avenue | U/W NCF DSCR: | 3.06x | ||
| El Segundo, CA 90245 | U/W NOI Debt Yield: | 10.8% |
The following table presents certain information relating to the tenancy at the Continental Park – Rosecrans Douglas Property:
Major Tenants
| Tenant Name | Credit Rating (Fitch/Moody’s/ S&P)(1) | Tenant NRSF | % of NRSF | Annual U/W Base Rent PSF(2) | Annual U/W Base Rent(2) | % of Total Annual U/W Base Rent | Lease Expiration Date | Extension Options | Termination Option (Y/N) |
| Major Tenants | |||||||||
| Motor Trend(3) | NR/NR/BBB- | 82,346 | 40.0% | $31.53 | $2,596,533 | 41.6% | Various(4) | Various(5) | Y(6) |
| Carlisle Interconnect Technologies(7) | NR/NR/NR | 81,300 | 39.5% | $20.35 | $1,654,818 | 26.5% | 2/29/2020 | None | N |
| CBRE | NR/Baa1/BBB+ | 30,794 | 14.9% | $38.53 | $1,186,524 | 19.0% | 11/30/2021 | 2, 5-year | N |
| Total Major Tenants | 194,440 | 94.4% | $27.97 | $5,437,874 | 87.0% | ||||
| Non-Major Tenant | 11,572 | 5.6% | $69.96 | $809,619 | 13.0% | ||||
| Occupied Collateral Total | 206,012 | 100.0% | $30.33 | $6,247,494 | 100.0% | ||||
| Vacant Space | 0 | 0.0% | |||||||
| Collateral Total | 206,012 | 100.0% | $30.33 | ||||||
| (1) | Certain ratings are those of the parent company or affiliates whether or not the parent company guarantees the lease. |
| (2) | Annual U/W Base Rent PSF and Annual U/W Base Rent include (i) contractual rent steps through April 1, 2020 totaling $105,409, and (ii) straight-line rent of $307,004, of which $281,137 belongs to Motor Trend and $25,867 belongs to CBRE. |
| (3) | Motor Trend has rent abatement for Suite 175 (10,579 square feet) for a total of $34,952 per month from December 2020 through April 2021. |
| (4) | Motor Trend has 59,908 square feet expiring on 3/31/2029 (Suite 150) and 22,438 square feet expiring on 11/30/2025 (Suite 175, 195, and 195A). |
| (5) | Motor Trend has one, three-year option for its 831 Douglas Street space (Suite 150), and two, five-year option terms for other suites at 2221 Rosecrans Avenue. |
| (6) | Motor Trend has a one-time right to terminate its lease for its 831 Douglas Street space (Suite 175) on April 30, 2027 with ten months’ prior notice and payment of a termination fee equal to 22.49% of the tenant improvement allowance ($47.50 per SF.; $2,845,630) and commissions ($300,000), which equates to $707,452. |
| (7) | Carlisle Interconnect Technologies has given notice it intends to leave its space at the end of its lease term. |
The following table presents certain information relating to the lease rollover schedule at the Continental Park – Rosecrans Douglas Property:
Lease Expiration Schedule(1)(2)
| Year Ending December 31, | No. of Leases Expiring | Expiring NRSF | % of Total NRSF | Cumulative Expiring NRSF | Cumulative % of Total NRSF | Annual U/W Base Rent | % of Total Annual U/W Base Rent | Annual U/W Base Rent PSF |
| MTM | 0 | 0 | 0.0% | 0 | 0.0% | $0 | 0.0% | $0.00 |
| 2019 | 0 | 0 | 0.0% | 0 | 0.0% | $0 | 0.0% | $0.00 |
| 2020 | 1 | 81,300 | 39.5% | 81,300 | 39.5% | $1,654,818 | 26.5% | $20.35 |
| 2021 | 2 | 30,794 | 14.9% | 112,094 | 54.4% | $1,186,524 | 19.0% | $38.53 |
| 2022 | 3 | 8,474 | 4.1% | 120,568 | 58.5% | $567,975 | 9.1% | $67.03 |
| 2023 | 1 | 3,098 | 1.5% | 123,666 | 60.0% | $241,644 | 3.9% | $78.00 |
| 2024 | 0 | 0 | 0.0% | 123,666 | 60.0% | $0 | 0.0% | $0.00 |
| 2025 | 3 | 22,438 | 10.9% | 146,104 | 70.9% | $815,937 | 13.1% | $36.36 |
| 2026 | 0 | 0 | 0.0% | 146,104 | 70.9% | $0 | 0.0% | $0.00 |
| 2027 | 0 | 0 | 0.0% | 146,104 | 70.9% | $0 | 0.0% | $0.00 |
| 2028 | 0 | 0 | 0.0% | 146,104 | 70.9% | $0 | 0.0% | $0.00 |
| 2029 | 1 | 59,908 | 29.1% | 206,012 | 100.0% | $1,780,596 | 28.5% | $29.72 |
| Thereafter | 0 | 0 | 0.0% | 206,012 | 100.0% | $0 | 0.0% | $0.00 |
| Vacant | 0 | 0 | 0.0% | 206,012 | 100.0% | $0 | 0.0% | $0.00 |
| Total/Weighted Average | 11 | 206,012 | 100.0% | $6,247,494 | 100.0% | $30.33 |
| (1) | Information obtained from the underwritten rent roll. |
| (2) | Certain tenants may have lease termination options that are exercisable prior to the originally stated expiration date of the subject lease and that are not considered in the Lease Expiration Schedule. |
| THE INFORMATION IN THIS STRUCTURAL AND COLLATERAL TERM SHEET IS NOT COMPLETE AND MAY BE AMENDED PRIOR TO THE TIME OF SALE. THIS TERM SHEET IS NOT AN OFFER TO SELL THESE SECURITIES AND IT IS NOT A SOLICITATION OF AN OFFER TO BUY THESE SECURITIES IN ANY JURISDICTION WHERE THE OFFER OR SALE IS NOT PERMITTED. |
| 33 |
| Office - Suburban | Loan #1 | Cut-off Date Balance: | $55,000,000 | |
| 831 Douglas Street & 2201, | Continental Park – Rosecrans Douglas | Cut-off Date LTV: | 52.9% | |
| 2221 & 2231 Rosecrans Avenue | U/W NCF DSCR: | 3.06x | ||
| El Segundo, CA 90245 | U/W NOI Debt Yield: | 10.8% |
The following table presents historical occupancy percentages at the Continental Park – Rosecrans Douglas Property:
Historical Occupancy
12/31/2016(1) | 12/31/2017(1) | 12/31/2018(1) | 9/9/2019(2) |
| 100.0% | 100.0% | 100.0% | 100.0% |
| (1) | Information provided by the borrower. |
| (2) | Information obtained from the underwritten rent roll. |
Operating History and Underwritten Net Cash Flow. The following table presents certain information relating to the underwritten net cash flow at the Continental Park – Rosecrans Douglas Property:
Cash Flow Analysis
| 2017 | 2018 | TTM 8/31/2019 | U/W | %(1) | U/W $ per SF | |
| Rents in Place | $5,706,683 | $5,984,020 | $6,072,932 | $6,142,084 | 77.8% | $29.81 |
| Contractual Rent Steps | 0 | 0 | 0 | 412,413(2) | 5.2 | 2.00 |
| Grossed Up Vacant Space | 0 | 0 | 0 | 0 | 0.0 | 0.00 |
| Gross Potential Rent | $5,706,683 | $5,984,020 | $6,072,932 | $6,554,498 | 83.0% | $31.82 |
| Other Income | 329,580 | 350,301 | 374,707 | 402,672 | 5.1 | 1.95 |
| Total Recoveries | 477,703 | 486,692 | 549,346 | 941,305 | 11.9 | 4.57 |
| Net Rental Income | $6,513,966 | $6,821,013 | $6,996,985 | $7,898,475 | 100.0% | $38.34 |
| (Vacancy & Credit Loss) | 0 | 0 | 0 | (374,790)(3) | (5.7) | (1.82) |
| Effective Gross Income | $6,513,966 | $6,821,013 | $6,996,985 | $7,523,684 | 95.3% | $36.52 |
| Real Estate Taxes | $132,136 | $139,398 | $146,781 | $735,441 | 9.8 | 3.57 |
| Insurance | 36,234 | 38,506 | 40,448 | 46,959 | 0.6 | 0.23 |
| Management Fee | 30,746 | 36,266 | 40,696 | 150,474 | 2.0 | 0.73 |
| Other Operating Expenses | 675,824 | 639,769 | 630,186 | 630,186 | 8.4 | 3.06 |
| Total Operating Expenses | $874,940 | $853,939 | $858,111 | $1,563,060 | 20.8% | $7.59 |
| Net Operating Income | $5,639,026 | $5,967,074 | $6,138,874 | $5,960,625 | 79.2% | $28.93 |
| Replacement Reserves | 0 | 0 | 0 | 41,202 | 0.5 | 0.20 |
| TI/LC | 0 | 0 | 0 | 206,012 | 2.7 | 1.00 |
| Net Cash Flow | $5,639,026 | $5,967,074 | $6,138,874 | $5,713,410 | 75.9% | $27.73 |
| NOI DSCR | 3.02x | 3.20x | 3.29x | 3.19x | ||
| NCF DSCR | 3.02x | 3.20x | 3.29x | 3.06x | ||
| NOI Debt Yield | 10.3% | 10.8% | 11.2% | 10.8% | ||
| NCF Debt Yield | 10.3% | 10.8% | 11.2% | 10.4% |
| (1) | Represents (i) percent of Net Rental Income for all revenue fields, (ii) percent of Gross Potential Rent for Vacancy & Credit Loss and (iii) percent of Effective Gross Income for all other fields. |
| (2) | Represents contractual rent steps through April 1, 2020 for Motor Trend, CBRE and Noah’s Bagels, and straight line rent for Motor Trend and CBRE. |
| (3) | The underwritten economic vacancy is 5.0%. The Continental Park – Rosecrans Douglas Property was 100.0% leased as of September 9, 2019. |
Appraisal.The appraiser concluded to an “As-Is” appraised value for the Continental Park – Rosecrans Douglas Property of $104,000,000 as of September 15, 2019. The appraisal acknowledged that tenant Carlisle, currently paying $20.35 per square foot annually, will not be re-leasing its space upon lease expiration in February 2020 and that the Continental Park – Rosecrans Douglas Borrower provided a letter of intent to lease the Carlisle space to a confidential tenant at a rent of $41.40 per square foot. The appraisal concluded that market rent for office space at the Continental Park – Rosecrans Douglas Property is approximately $41.40 per square foot.
Environmental Matters. According to a Phase I environmental site assessment dated September 23, 2019, there was no evidence of any recognized environmental conditions at the Continental Park – Rosecrans Douglas Property.
Market Overview and Competition.The Continental Park – Rosecrans Douglas Property is located in El Segundo, California within the South Bay area of Los Angeles County. Significant industries in the South Bay include defense, aerospace, technology, automotive, international trade, oil & gas, entertainment, media and telecommunication. The largest concentrations of office space are located in the cities of Long Beach, El Segundo, the Los Angeles International Airport area and the 190th Street Corridor in Torrance. Companies headquartered in the South Bay include Mattel, Honda USA, Cetera, Epson, and DIRECTV. Office development in El Segundo is primarily
| THE INFORMATION IN THIS STRUCTURAL AND COLLATERAL TERM SHEET IS NOT COMPLETE AND MAY BE AMENDED PRIOR TO THE TIME OF SALE. THIS TERM SHEET IS NOT AN OFFER TO SELL THESE SECURITIES AND IT IS NOT A SOLICITATION OF AN OFFER TO BUY THESE SECURITIES IN ANY JURISDICTION WHERE THE OFFER OR SALE IS NOT PERMITTED. |
| 34 |
| Office - Suburban | Loan #1 | Cut-off Date Balance: | $55,000,000 | |
| 831 Douglas Street & 2201, | Continental Park – Rosecrans Douglas | Cut-off Date LTV: | 52.9% | |
| 2221 & 2231 Rosecrans Avenue | U/W NCF DSCR: | 3.06x | ||
| El Segundo, CA 90245 | U/W NOI Debt Yield: | 10.8% |
located along Sepulveda Boulevard, Imperial Highway, El Segundo Boulevard, and Rosecrans Avenue. The Continental Park – Rosecrans Douglas Property is located 1.5 miles east of San Diego (405) Freeway, and 6.4 miles south of the Century (105) Freeway which provide regional access for El Segundo.
Submarket Information – According to a third-party market research report, the Continental Park – Rosecrans Douglas Property is situated within the El Segundo office submarket and the South Bay retail submarket. As of second quarter 2019, the El Segundo office submarket reported a total inventory of 17.9 million square feet with an 11.7% vacancy rate, representing a year-over-year increase of 2.98%. As of second quarter 2019, the South Bay retail submarket reported a total inventory of 70.1 million square feet with a 4.97% vacancy rate, representing a year-over-year decrease of 0.11%.
Appraiser’s Comp Set – The appraiser identified eight primary competitive office properties for the Continental Park – Rosecrans Douglas Property totaling approximately 1.5 million square feet, which reported an average occupancy rate of approximately 72.3%. The appraiser also identified four competitive retail properties for Continental Park – Rosecrans Douglas Property totaling approximately 625,232 square feet, which reported an average occupancy rate of approximately 99%. The appraiser concluded to net market rents for the Continental Park – Rosecrans Douglas Property of $41.40 per square foot, for office tenants and $72.00 per square foot gross for the retail tenants.
The following table presents certain information relating to the appraiser’s market rent conclusion for the Continental Park – Rosecrans Douglas Property:
Market Rent Summary(1)
| Large Office | Small/Mid Office | Retail | |
| Market Rent (PSF) | $41.40 | $41.40 | $72.00 |
| Lease Term (Years) | 10 | 5 | 5 |
| Lease Type (Reimbursements) | MG (Net Utilities) | MG (Net Utilities) | NNN |
| Rent Increase Projection | 10.0% after Yr. 5 | 3.0% per annum | 3.0% per annum |
(1) Information obtained from the appraisal.
The table below presents certain information relating to comparable sales for the Continental Park – Rosecrans Douglas Property identified by the appraiser:
Comparable Sales(1)
| Property Name | Location | Rentable Area (SF) | Sale Date | Sale Price | Sale Price (PSF) |
| 777 Aviation Boulevard | El Segundo, CA | 318,182 | Jun-19 | $170,000,000 | $534 |
| Westwood Terrace | Los Angeles, CA | 164,682 | Aug-18 | $92,500,000 | $562 |
| Campus 2100 | El Segundo, CA | 203,946 | Dec-17 | $117,100,000 | $574 |
| 800 Corporate Pointe | Culver City, CA | 245,786 | Sep-17 | $148,000,000 | $602 |
| Ocean Park Plaza | Santa Monica, CA | 100,983 | Sep-17 | $63,500,000 | $629 |
| Apollo at Rosecrans | El Segundo, CA | 546,833 | May-16 | $317,300,000 | $580 |
| (1) | Information obtained from the appraisal. |
| THE INFORMATION IN THIS STRUCTURAL AND COLLATERAL TERM SHEET IS NOT COMPLETE AND MAY BE AMENDED PRIOR TO THE TIME OF SALE. THIS TERM SHEET IS NOT AN OFFER TO SELL THESE SECURITIES AND IT IS NOT A SOLICITATION OF AN OFFER TO BUY THESE SECURITIES IN ANY JURISDICTION WHERE THE OFFER OR SALE IS NOT PERMITTED. |
| 35 |
| Office - Suburban | Loan #1 | Cut-off Date Balance: | $55,000,000 | |
| 831 Douglas Street & 2201, | Continental Park – Rosecrans Douglas | Cut-off Date LTV: | 52.9% | |
| 2221 & 2231 Rosecrans Avenue | U/W NCF DSCR: | 3.06x | ||
| El Segundo, CA 90245 | U/W NOI Debt Yield: | 10.8% |
The table below presents certain information relating to comparable office properties to the Continental Park – Rosecrans Douglas Property identified by the appraiser:
Competitive Set(1)
| Property Name | Location | Distance from Subject | Property Type | Year Built | Anchors | Total GLA | Total Occupancy |
| 840 Apollo | El Segundo, CA | 0.1 miles | Office | 1980 | Marcus & Millichap | 75,337 | 100.0% |
| 2221 Park Place | El Segundo, CA | 0.2 miles | Office | 1966 | WeWork | 90,000 | 100.0% |
| 777 Aviation Boulevard | El Segundo, CA | 0.8 miles | Office | 1968 | FAA | 318,182 | 70.0% |
| 555 Aviation Boulevard | El Segundo, CA | 0.6 miles | Office | 1966 | Publicis | 259,106 | 33.0% |
Ascend at Utah Avenue Campus | El Segundo, CA | 0.5 miles | Office | 2018 | Radiology Partners | 80,000 | 85.0% |
| Campus 2100 | El Segundo, CA | 1.8 miles | Office | 1977 | Chicken of the Sea | 203,946 | 95.0% |
| Gateway El Segundo | El Segundo, CA | 2.3 miles | Office/Retail | 1980 | Spaces | 336,527 | 65.0% |
| INSITE | El Segundo, CA | 2.2 miles | Office | 1953 | Go Guardian | 101,874 | 30.0% |
| (1) | Information obtained from the appraisal. |
The following table presents certain information relating to comparable leases to those at the Continental Park-Rosecrans Douglas Property:
Comparable Office Leases(1)
| Property Name/Location | Year Built/ Renovated | Total GLA (SF) | Distance from Subject | Occupancy | Lease Term | Tenant Size | Annual Base Rent PSF | Reimbursement Amount PSF | Lease Type |
840 Apollo 840 Apollo Street El Segundo, CA | 1980/2004 | 75,337 | 0.1 miles | 100.0% | 7.3 Yrs | 12,500 SF | $43.20 | $38.40 | MG |
2221 Park Place 2221 Park Place El Segundo, CA | 1966/2019 | 90,000 | 0.2 miles | 100.0% | 10.0 Yrs | 90,000 SF | $54.00 | $49.20 | MG |
777 Aviation Boulevard 777 Aviation Boulevard El Segundo, CA | 1968/N/A | 318,182 | 0.8 miles | 70.0% | 6.0 Yrs 6.0 Yrs 10.9 Yrs 15.0 Yrs | 7,174 SF 20,000 SF 43,728 SF 155,000 SF | $46.20 $44.40 $43.20 $48.00 | $41.40 $39.60 $38.40 $37.80 | MG MG MG FS |
555 Aviation Boulevard 555 Aviation Boulevard El Segundo, CA | 1966/2017 | 259,106 | 0.6 miles | 33.0% | 10.0 Yrs | 85,000 SF | $42.60 | $37.80 | MG |
Ascend at Utah Avenue Campus 2330 Utah Avenue El Segundo, CA | 2018/N/A | 80,000 | 0.5 miles | 85.0% | 11.0 Yrs | 63,820 SF | $37.20 | $37.20 | NNN |
Campus 2100 2100, 2120 & 2150 E. Grand Avenue El Segundo, CA | 1977/2005 | 203,946 | 1.8 miles | 95.0% | 5.3 Yrs 5.3 Yrs 7.3 Yrs | 4,180 SF 3,014 SF 33,085 SF | $50.40 $49.80 $33.00 | $40.20 $39.60 $33.00 | FS FS NNN |
Gateway El Segundo 300, 360 & 390 N. Sepulveda Boulevard El Segundo, CA | 1980/2008 | 336,527 | 2.3 miles | 65.0% | 11.0 Yrs | 37,373 SF | $39.60 | $29.40 | FS |
INSITE 2030 E. Maple Avenue El Segundo, CA | 1953/2016 | 101,874 | 2.2 miles | 30.0% | 8.5 Yrs | 30,000 SF | $45.60 | $40.80 | MG |
| (1) | Information obtained from the appraisal. |
| THE INFORMATION IN THIS STRUCTURAL AND COLLATERAL TERM SHEET IS NOT COMPLETE AND MAY BE AMENDED PRIOR TO THE TIME OF SALE. THIS TERM SHEET IS NOT AN OFFER TO SELL THESE SECURITIES AND IT IS NOT A SOLICITATION OF AN OFFER TO BUY THESE SECURITIES IN ANY JURISDICTION WHERE THE OFFER OR SALE IS NOT PERMITTED. |
| 36 |
| Office - Suburban | Loan #1 | Cut-off Date Balance: | $55,000,000 | |
| 831 Douglas Street & 2201, | Continental Park – Rosecrans Douglas | Cut-off Date LTV: | 52.9% | |
| 2221 & 2231 Rosecrans Avenue | U/W NCF DSCR: | 3.06x | ||
| El Segundo, CA 90245 | U/W NOI Debt Yield: | 10.8% |
Comparable Retail Leases(1)
| Property Name/Location | Year Built/ Renovated | Total GLA (SF) | Distance from Subject | Occupancy | Lease Term | Tenant Size | Annual Base Rent PSF | Reimbursement Amount PSF | Lease Type |
Apollo Landing 2171 Rosecrans Ave El Segundo, CA | 2017 / N/A | 13,500 | 0.2 miles | 100.0% | 10.0 Yrs 10.0 Yrs 10.0 Yrs 10.0 Yrs | 2,000 SF 1,200 SF 2,084 SF 4,058 SF | $75.00 $84.00 $84.00 $69.96 | $15.00 | NNN |
Manhattan Marketplace 1570 Rosecrans Ave Manhattan Beach, CA | 1990 / N/A | 113,175 | 0.4 miles | 97.0% | 5.0 Yrs 5.0 Yrs | 1,000 SF 1,500 SF | $64.80 $63.00 | $0.65 | NNN |
The Point 850 S. Sepulveda Blvd El Segundo, CA | 2015 / N/A | 118,000 | 1.3 miles | 100.0% | 5.0 Yrs 10.0 Yrs 5.0 Yrs 5.0 Yrs | 6,919 SF 3,057 SF 6,501 SF 3,000 SF | $47.40 $60.00 $54.96 $60.00 | N/A | NNN |
Plaza El Segundo NEC Rosecrans Ave & Sepulveda Blvd El Segundo, CA | 2007 / N/A | 380,557 | 1.6 miles | 100.0% | 5.0 Yrs 5.0 Yrs | 5,409 SF 902 SF | $58.56 $88.68 | $11.40 | NNN |
| (1) | Information obtained from the appraisal. |
Escrows.
Real Estate Taxes – The Continental Park – Rosecrans Douglas Mortgage Loan documents require an upfront real estate tax reserve of $48,798 and ongoing monthly real estate tax reserves in an amount equal to one-twelfth of the real estate taxes that the lender estimates will be payable during the next twelve months (initially $23,237).
Insurance – The Continental Park – Rosecrans Douglas Mortgage Loan documents require an upfront insurance reserve of $8,218 and ongoing monthly insurance reserves in an amount equal to one-twelfth of the insurance premiums that the lender estimates will be payable during the next twelve months. However, if insurance coverage required per the Continental Park – Rosecrans Douglas Mortgage Loan documents is provided through an approved blanket insurance policy, the Continental Park – Rosecrans Douglas Borrower will not be obligated to make the ongoing monthly insurance deposit so long as Continental Park – Rosecrans Douglas Borrower maintains the insurance coverage required by the Continental Park – Rosecrans Douglas Mortgage Loan documents and delivers to the lender, not less than fifteen (15) days prior to the expiration date of any such blanket insurance policy, certificates of insurance evidencing such policy.
Replacement Reserves – The Continental Park – Rosecrans Douglas Mortgage Loan documents require ongoing monthly replacement reserves of $3,434. However, ongoing monthly replacement reserve deposits will not be required so long as the balance in the replacement reserve exceeds $206,012.
TI/LC Reserve – The Continental Park – Rosecrans Douglas Mortgage Loan documents require an upfront reserve of $6,500,000 and ongoing monthly TI/LC reserves of $17,168 into the rollover account. However, ongoing monthly TI/LC reserves will not be required so long as the TI/LC reserve balance exceeds $500,000 (the “Rollover Cap”), the calculation of which does not include any portion of the $6,500,000 upfront reserve amount. In addition to the required deposits, the Continental Park – Rosecrans Douglas Borrower is required to deposit all Extraordinary Lease Payments (as defined below), net of reasonable, out-of-pocket costs and expenses, if any, incurred by the Continental Park – Rosecrans Douglas Borrower into the rollover account. Extraordinary Lease Payments deposited into the rollover account will not be counted towards the balance in the rollover account that is subject to the Rollover Cap. Notwithstanding the foregoing, in the event the Continental Park – Rosecrans Douglas Borrower receives an Extraordinary Lease Payment from a future tenant occupying all of the 2201 Rosecrans Space, the Extraordinary Lease Payment required to be deposited will be equal to $85.00 per rentable square foot of the 2201 Rosecrans Space, and the Continental Park – Rosecrans Douglas Borrower will be entitled to retain any amount of the Extraordinary Lease Payment in excess of such amount.
“Extraordinary Lease Payment” means any amounts paid to Continental Park – Rosecrans Douglas Borrower in connection with a termination, cancellation, surrender, modification, sale or other disposition of any lease or any portion thereof, other than amounts paid for rent and other charges in respect of periods prior to the date of such termination, cancellation, surrender, modification, sale or other disposition.
Lockbox and Cash Management.The Continental Park – Rosecrans Douglas Mortgage Loan requires a springing lockbox and a springing cash management. Upon the occurrence and continuance of a Cash Management Trigger Event (as defined below), the borrower is required to establish a lender-controlled lockbox account and instruct tenants to deposit rents into such lockbox account. The Continental Park – Rosecrans Douglas Mortgage Loan documents also require that all rents received by the Continental Park – Rosecrans Douglas Borrower or the property manager be deposited into the lockbox account within one business day of receipt. Pursuant to the Continental Park – Rosecrans Douglas Mortgage Loan documents, all excess funds on deposit are required to be applied as follows (a) if a Cash Sweep Event (as defined below) is not in effect, to the Continental Park – Rosecrans Douglas Borrower; and (b) if a Cash Sweep Event is in effect due to the existence of a Critical Tenant Trigger Event (as defined below), to the Critical Tenant
| THE INFORMATION IN THIS STRUCTURAL AND COLLATERAL TERM SHEET IS NOT COMPLETE AND MAY BE AMENDED PRIOR TO THE TIME OF SALE. THIS TERM SHEET IS NOT AN OFFER TO SELL THESE SECURITIES AND IT IS NOT A SOLICITATION OF AN OFFER TO BUY THESE SECURITIES IN ANY JURISDICTION WHERE THE OFFER OR SALE IS NOT PERMITTED. |
| 37 |
| Office - Suburban | Loan #1 | Cut-off Date Balance: | $55,000,000 | |
| 831 Douglas Street & 2201, | Continental Park – Rosecrans Douglas | Cut-off Date LTV: | 52.9% | |
| 2221 & 2231 Rosecrans Avenue | U/W NCF DSCR: | 3.06x | ||
| El Segundo, CA 90245 | U/W NOI Debt Yield: | 10.8% |
TI/LC account until the applicable Critical Tenant Trigger Event cure has occurred. If a Cash Sweep Event is in effect but a Critical Tenant Trigger Event is not in effect, then funds will be applied to the excess cash flow account.
A “Cash Management Trigger Event” will commence upon the earliest to occur of the following:
| (i) | an event of default; |
| (ii) | the Continental Park – Rosecrans Douglas Borrower’s second late debt service payment within a 12-month period; |
| (iii) | a bankruptcy action of the Continental Park – Rosecrans Douglas Borrower, the guarantor or the manager; |
| (iv) | a Cash Management DSCR Trigger Event; or |
| (v) | a Critical Tenant Trigger Event (as defined below). |
A “Cash Management Trigger Event” will end upon the occurrence of:
| ● | with regard to clause (i) above, the cure of such event of default being accepted or waived by the lender; |
| ● | with regard to clause (ii) above, the timely payment of monthly debt service on six consecutive payment dates; |
| ● | with regard to clause (iii) above, such bankruptcy action petition being discharged, stayed, or dismissed within 60 days of such filing among other conditions for the Continental Park – Rosecrans Douglas Borrower or guarantor (or, with respect to the guarantor, if Continental Park – Rosecrans Douglas Borrower replaces such guarantor with an approved replacement guarantor) and within 120 days for the property manager, or, with respect to the property manager, the Continental Park – Rosecrans Douglas Borrower replacing the property manager with a qualified property manager acceptable to the lender; |
| ● | with regard to clause (iv) above, the date the amortizing debt service coverage ratio based on the trailing 12-month period immediately preceding the date of such determination is greater than 1.20x for two consecutive quarters; and |
| ● | with regard to clause (v) above, the date on which the Critical Tenant Trigger Event Cure (as defined below) has occurred. |
A “Cash Management DSCR Trigger Event” will occur on any day the debt service coverage ratio, based on the trailing 12-month period immediately preceding the date of determination, is less than 1.20x for the Continental Park – Rosecrans Douglas Mortgage Loan.
A “Cash Sweep Event” will commence upon the occurrence of the following:
| (i) | an event of default; |
| (ii) | a bankruptcy action of the Continental Park – Rosecrans Douglas Borrower, the guarantor or the property manager; |
| (iii) | a Cash Sweep DSCR Trigger Event (as defined below); or |
| (iv) | a Critical Tenant Trigger Event (as defined below). |
A Cash Sweep Event will end upon the occurrence of:
| ● | with regard to clause (i) above, the cure of such event of default being accepted or waived by the lender; |
| ● | with regard to clause (ii) above, such bankruptcy action petition being discharged, stayed, or dismissed within 90 days of such filing, among other conditions, for the Continental Park – Rosecrans Douglas Borrower or guarantor and within 120 days for the property manager, or, with respect to the property manager, the Continental Park – Rosecrans Douglas Borrower replacing the property manager with a qualified property manager acceptable to the lender; |
| ● | with regard to clause (iii) above, the date the amortizing debt service coverage ratio based on the trailing 12-month period immediately preceding the date of such determination is greater than 1.20x for two consecutive quarters; and |
| ● | with regard to clause (iv) above, the date on which the Critical Tenant Trigger Event Cure (as defined below) has occurred. |
A “Cash Sweep DSCR Trigger Event” will occur on any day the debt service coverage ratio, based on the trailing 12-month period immediately preceding the date of determination, is less than 1.15x for the Continental Park – Rosecrans Douglas Mortgage Loan.
A “Critical Tenant Trigger Event” will commence, with respect to Motor Trend, CBRE and any other tenant occupying 30,000 or more square feet of a critical tenant space (“Critical Tenant”), upon the earlier to occur of the following:
| (i) |
| a. | the date that the related Critical Tenant gives notice of its intention to not extend or renew its lease or to terminate its lease or lease is otherwise terminated; |
| b. | the date that is nine months prior to the related lease expiration date if the Critical Tenant has failed to give notice of its election to renew its lease; or |
| c. | the date on which the Critical Tenant is required under its lease to notify the Continental Park – Rosecrans Douglas Borrower of its election to renew its lease, if the Critical Tenant fails to give such notice; provided, however, that no Critical Tenant Trigger Event will be deemed to have occurred pursuant to this clause (i) in the event that Borrower immediately, upon each occurrence of clauses (a), (b) and/or (c) above with respect to any Critical Tenant, deposits with the lender an amount equal to $50.00 per rentable square foot of the applicable Critical Tenant space or commences making monthly deposits of $300,000 into the Critical Tenant TI/LC account until such time as the Critical Tenant TI/LC funds on deposit equals or exceeds an amount equal to $50.00 per rentable square foot of the applicable Critical Tenant space; |
| (ii) | an event of default under the Critical Tenant lease occurs or is continuing; and |
| (iii) | if a bankruptcy action with respect to the Critical Tenant or any Critical Tenant guarantor occurs. |
| THE INFORMATION IN THIS STRUCTURAL AND COLLATERAL TERM SHEET IS NOT COMPLETE AND MAY BE AMENDED PRIOR TO THE TIME OF SALE. THIS TERM SHEET IS NOT AN OFFER TO SELL THESE SECURITIES AND IT IS NOT A SOLICITATION OF AN OFFER TO BUY THESE SECURITIES IN ANY JURISDICTION WHERE THE OFFER OR SALE IS NOT PERMITTED. |
| 38 |
| Office - Suburban | Loan #1 | Cut-off Date Balance: | $55,000,000 | |
| 831 Douglas Street & 2201, | Continental Park – Rosecrans Douglas | Cut-off Date LTV: | 52.9% | |
| 2221 & 2231 Rosecrans Avenue | U/W NCF DSCR: | 3.06x | ||
| El Segundo, CA 90245 | U/W NOI Debt Yield: | 10.8% |
A “Critical Tenant Trigger Event Cure” will occur upon:
| ● | with regard to clause (i), above, the date that (1) (x) the Critical Tenant lease extension is executed and delivered by the Continental Park – Rosecrans Douglas Borrower and the related Critical Tenant; (B) the amount of Critical Tenant TI/LC funds on deposit in the Critical Tenant TI/LC account as a result of the related Cash Sweep Event Period equals or exceeds an amount equal to $50.00 per rentable square foot of the applicable Critical Tenant space or (C) Continental Park – Rosecrans Douglas Borrower delivers an acceptable letter of credit to the lender in an amount equal to $50.00 per rentable square foot of the applicable Critical Tenant space, or (2) a Critical Tenant Space Re-Tenanting Event (as defined below) has occurred; |
| ● | with regard to clause (ii) above, a cure of the applicable default; and |
| ● | with regard to clause (iii) above, an affirmation that the Critical Tenant is actually paying all rents and other amounts under the lease. |
A “Critical Tenant Space Re-Tenanting Event” will occur on the date each of the following conditions has been satisfied: (i) the Critical Tenant space is leased to one or more replacement tenants for a term of at least five years and on terms that are acceptable to the lender; (ii) all tenant improvement costs, leasing commissions and other material costs and expenses relating to the re-letting of the space have been paid in full; (iii) the replacement tenant(s) has accepted possession and is in actual, physical occupancy of, and is conducting normal business operations at the related Critical Tenant space and is paying full, unabated rent without offset in accordance with its lease (or, alternatively, the Continental Park – Rosecrans Douglas Borrower has deposited with the lender cash or an acceptable letter of credit in an amount equal to all free rents, rent credits, and/or rent abatements provided for under each such replacement tenant’s lease), and (iv) the lender has received a fully-executed copy of each replacement lease, an officer’s certificate and a duly-executed estoppel certificate from each replacement tenant.
Property Management. The Continental Park-Rosecrans Douglas Property is managed by Continental Development Corporation, an affiliate of the Continental Park-Rosecrans Douglas Borrower.
Partial Release. The Continental Park-Rosecrans Douglas Borrower has the right to release a strip of vacant land at any time prior to May 6, 2029 for the purpose of road widening so long as, among other conditions, (i) no event of default has occurred or is continuing, and (ii) such partial release will occur with the transfer of fee title to the land to the City of El Segundo, California.
Terrorism Insurance. The Continental Park-Rosecrans Douglas Mortgage Loan documents require that the “all risk” insurance policy required to be maintained by the Continental Park-Rosecrans Douglas Borrower provides coverage for terrorism in an amount equal to the full replacement cost of the Continental Park-Rosecrans Douglas Property, as well as business interruption insurance covering no less than the 18-month period following the occurrence of a casualty event, together with a 12-month extended period of indemnity.
Earthquake Insurance. The Continental Park-Rosecrans Douglas Property is located in seismic zone 4. There was no requirement for seismic insurance.
| THE INFORMATION IN THIS STRUCTURAL AND COLLATERAL TERM SHEET IS NOT COMPLETE AND MAY BE AMENDED PRIOR TO THE TIME OF SALE. THIS TERM SHEET IS NOT AN OFFER TO SELL THESE SECURITIES AND IT IS NOT A SOLICITATION OF AN OFFER TO BUY THESE SECURITIES IN ANY JURISDICTION WHERE THE OFFER OR SALE IS NOT PERMITTED. |
| 39 |
| Retail - Anchored | Loan #2 | Cut-off Date Balance: | $34,750,000 | |
| 100 North 500 West | West Bountiful Commons | Cut-off Date LTV: | 64.7% | |
| West Bountiful, UT 84010 | U/W NCF DSCR: | 2.40x | ||
| U/W NOI Debt Yield: | 9.8% |
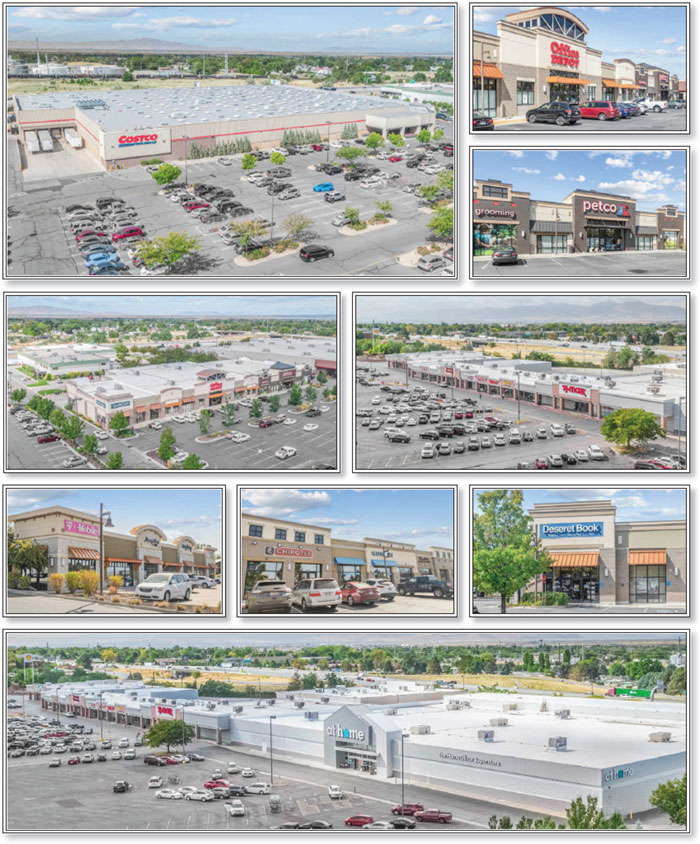
| THE INFORMATION IN THIS STRUCTURAL AND COLLATERAL TERM SHEET IS NOT COMPLETE AND MAY BE AMENDED PRIOR TO THE TIME OF SALE. THIS TERM SHEET IS NOT AN OFFER TO SELL THESE SECURITIES AND IT IS NOT A SOLICITATION OF AN OFFER TO BUY THESE SECURITIES IN ANY JURISDICTION WHERE THE OFFER OR SALE IS NOT PERMITTED. |
| 40 |
| Retail - Anchored | Loan #2 | Cut-off Date Balance: | $34,750,000 | |
| 100 North 500 West | West Bountiful Commons | Cut-off Date LTV: | 64.7% | |
| West Bountiful, UT 84010 | U/W NCF DSCR: | 2.40x | ||
| U/W NOI Debt Yield: | 9.8% |
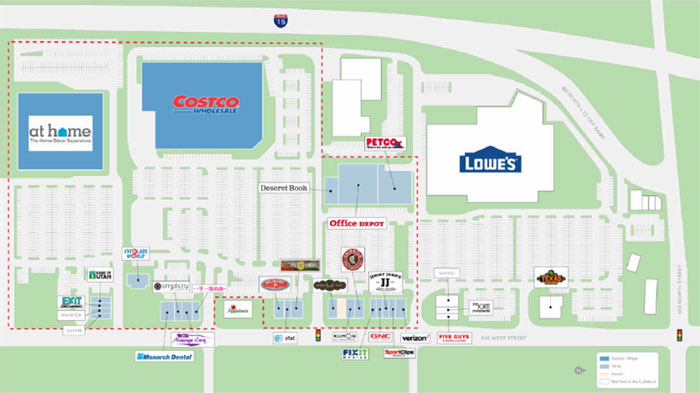
| THE INFORMATION IN THIS STRUCTURAL AND COLLATERAL TERM SHEET IS NOT COMPLETE AND MAY BE AMENDED PRIOR TO THE TIME OF SALE. THIS TERM SHEET IS NOT AN OFFER TO SELL THESE SECURITIES AND IT IS NOT A SOLICITATION OF AN OFFER TO BUY THESE SECURITIES IN ANY JURISDICTION WHERE THE OFFER OR SALE IS NOT PERMITTED. |
| 41 |
| Retail - Anchored | Loan #2 | Cut-off Date Balance: | $34,750,000 | |
| 100 North 500 West | West Bountiful Commons | Cut-off Date LTV: | 64.7% | |
| West Bountiful, UT 84010 | U/W NCF DSCR: | 2.40x | ||
| U/W NOI Debt Yield: | 9.8% |
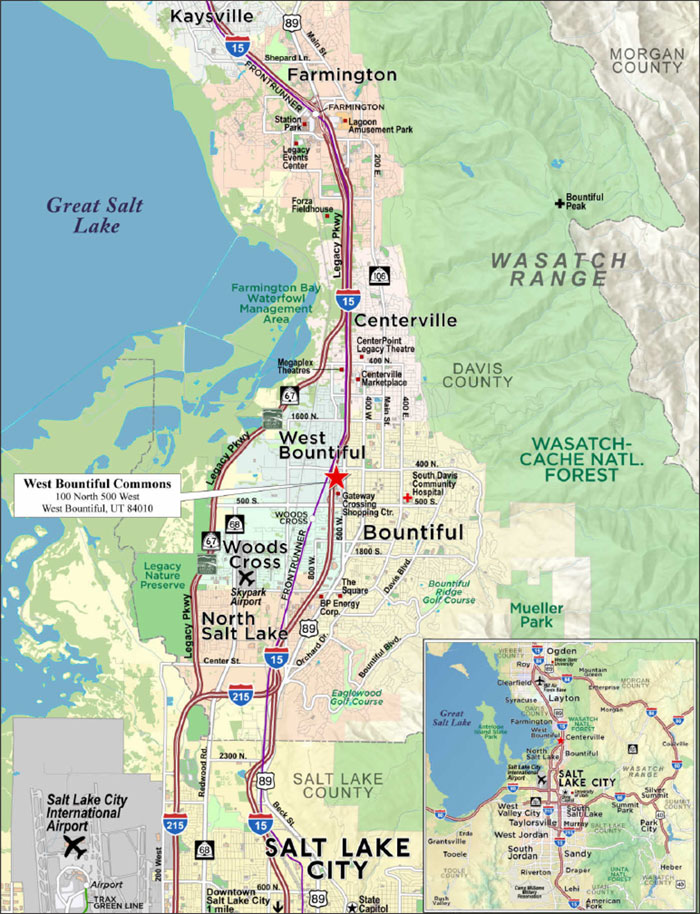
| THE INFORMATION IN THIS STRUCTURAL AND COLLATERAL TERM SHEET IS NOT COMPLETE AND MAY BE AMENDED PRIOR TO THE TIME OF SALE. THIS TERM SHEET IS NOT AN OFFER TO SELL THESE SECURITIES AND IT IS NOT A SOLICITATION OF AN OFFER TO BUY THESE SECURITIES IN ANY JURISDICTION WHERE THE OFFER OR SALE IS NOT PERMITTED. |
| 42 |
| No. 2 – West Bountiful Commons | |||||||
| Mortgage Loan Information | Mortgaged Property Information | ||||||
| Mortgage Loan Seller: | Rialto Mortgage Finance, LLC | Single Asset/Portfolio: | Single Asset | ||||
Credit Assessment (Fitch/KBRA/S&P): | NR/NR/NR | Property Type – Subtype: | Retail – Anchored | ||||
| Original Principal Balance: | $34,750,000 | Location: | West Bountiful, UT | ||||
| Cut-off Date Balance: | $34,750,000 | Size: | 324,349 SF | ||||
| % of Initial Pool Balance: | 5.2% | Cut-off Date Balance Per SF: | $107.14 | ||||
| Loan Purpose: | Refinance | Maturity Date Balance Per SF: | $107.14 | ||||
| Borrower Sponsors: | John R. Thackeray; Armand D. Johansen | Year Built/Renovated: | 1993/2017 | ||||
| Guarantors: | John R. Thackeray; Armand D. Johansen | Title Vesting: | Fee | ||||
| Mortgage Rate: | 3.8400% | Property Manager: | Self-managed | ||||
| Note Date: | October 18, 2019 | Current Occupancy (As of): | 99.2% (9/12/2019) | ||||
| Seasoning: | 1 month | YE 2018 Occupancy: | 97.3% | ||||
| Maturity Date: | November 6, 2029 | YE 2017 Occupancy: | 97.4% | ||||
| IO Period: | 120 months | YE 2016 Occupancy: | 98.8% | ||||
| Loan Term (Original): | 120 months | YE 2015 Occupancy: | NAV | ||||
| Amortization Term (Original): | NAP | As-Is Appraised Value: | $53,700,000 | ||||
| Loan Amortization Type: | Interest-only, Balloon | As-Is Appraised Value Per SF: | $165.56 | ||||
| Call Protection | L(25),D(91),O(4) | As-Is Appraisal Valuation Date: | September 20, 2019 | ||||
| Lockbox Type: | Springing | Underwriting and Financial Information | |||||
| Additional Debt: | None | TTM NOI (8/31/2019): | $3,227,658 | ||||
| Additional Debt Type (Balance): | NAP | YE 2018 NOI: | $3,267,825 | ||||
| YE 2017 NOI: | $3,339,093 | ||||||
| YE 2016 NOI: | $3,046,193 | ||||||
| U/W Revenues: | $3,968,218 | ||||||
| U/W Expenses: | $549,945 | ||||||
| Escrows and Reserves(1) | U/W NOI: | $3,418,273 | |||||
| Initial | Monthly | Cap | U/W NCF: | $3,261,882 | |||
| Taxes | $18,302 | $17,431 | NAP | U/W DSCR based on NOI/NCF: | 2.52x / 2.40x | ||
| Insurance | $19,214 | $1,664 | NAP | U/W Debt Yield based on NOI/NCF: | 9.8% / 9.4% | ||
| Replacement Reserve | $0 | $2,367 | NAP | U/W Debt Yield at Maturity based on NOI/NCF: | 9.8% / 9.4% | ||
| TI/LC Reserve | $0 | $13,244 | NAP | Cut-off Date LTV Ratio: | 64.7% | ||
| Unfunded TI/LC Reserve | $77,025(2) | $99,250(3) | NAP | LTV Ratio at Maturity: | 64.7% | ||
| Sources and Uses | ||||||||
| Sources | Uses | |||||||
| Original loan amount | $34,750,000 | 99.3 | % | Loan Payoff | $34,098,177 | 97.4 | % | |
| Equity Contribution | 241,437 | 0.7 | Closing Costs | 778,718 | 2.2 | |||
| Upfront Reserves | 114,541 | 0.3 | ||||||
| Total Sources | $34,991,437 | 100.0 | % | Total Uses | $34,991,437 | 100.0 | % | |
| (1) | See “Escrows” section for a full description of Escrows and Reserves. |
| (2) | The initial Unfunded TI/LC Reserve represents the tenant improvement amount for the 17thlargest tenant, Nothing Bundt Cakes. |
| (3) | The monthly Unfunded TI/LC Reserve is for the 2nd largest tenant, At Home; the West Bountiful Commons Borrower (as defined below) is required to collect $99,250 on each payment date from December 2019 through March 2020. |
The Mortgage Loan. The mortgage loan (the “West Bountiful Commons Mortgage Loan”) is evidenced by a single promissory note secured by a first mortgage encumbering the fee interest in a 324,349 square foot anchored retail center located in West Bountiful, Utah (the “West Bountiful Commons Property”).
The Borrower and Borrower Sponsors.The borrower is WBC Partners Delaware, LLC (the “West Bountiful Commons Borrower”), a Delaware limited liability company and single purpose entity with two independent directors. Legal counsel to the West Bountiful Commons Borrower delivered a non-consolidation opinion in connection with the origination of the West Bountiful Commons Mortgage Loan. The borrower sponsors and nonrecourse carve-out guarantors of the West Bountiful Commons Mortgage Loan are John R. Thackeray and Armand D. Johansen, on a joint and several basis.
John R. Thackeray is a broker and principal of The Thackeray Company, a Salt Lake City based commercial real estate firm that develops, leases and manages commercial real estate. Mr. Thackeray has over 40 years of experience developing retail shopping centers, multifamily housing, single family subdivisions, and office projects and has historically overseen construction and management
| THE INFORMATION IN THIS STRUCTURAL AND COLLATERAL TERM SHEET IS NOT COMPLETE AND MAY BE AMENDED PRIOR TO THE TIME OF SALE. THIS TERM SHEET IS NOT AN OFFER TO SELL THESE SECURITIES AND IT IS NOT A SOLICITATION OF AN OFFER TO BUY THESE SECURITIES IN ANY JURISDICTION WHERE THE OFFER OR SALE IS NOT PERMITTED. |
| 43 |
| Retail - Anchored | Loan #2 | Cut-off Date Balance: | $34,750,000 | |
| 100 North 500 West | West Bountiful Commons | Cut-off Date LTV: | 64.7% | |
| West Bountiful, UT 84010 | U/W NCF DSCR: | 2.40x | ||
| U/W NOI Debt Yield: | 9.8% |
of the projects. Prior to founding The Thackeray Company, Mr. Thackeray worked as a lawyer with an emphasis in real estate development, consulting, leasing and zoning. Mr. Thackeray is a current member of the Utah State Bar, the Salt Lake Board of Realtors, and ICSC. Mr. Thackeray reported ownership interests in a portfolio of properties, which include 15 retail properties with over 1.5 million square feet, four multifamily properties, 13 hotel properties, two industrial properties, one mixed use property and 143 acres of land.
Armand Johansen is a manager and co-founder of The Thackeray Company. Mr. Johansen has 35 years of experience in real estate development, construction, and management with an emphasis in financing, lease negotiations, option and purchase agreements. Prior to his time at The Thackeray Company, Mr. Johansen worked as a lawyer focusing on real estate development, consulting, leasing, and zoning. Mr. Johansen is a current member of the Utah State Bar. Mr. Johansen reported ownership interests in a portfolio of properties, which include 15 retail properties with over 1.3 million square feet and 143 acres of land.
The Property.The West Bountiful Commons Property is a 324,349 square foot, anchored retail center located in West Bountiful, Utah, approximately 11.4 miles north of Salt Lake City, Utah. The improvements consist of one, single-story, 135,000 square foot Costco wholesale center, one, single-story 101,581 square foot At Home store, and seven single-story retail outparcel buildings, including five multi-tenant strip buildings, one single-tenant commercial building and a bank branch. The improvements were developed in phases between 1980 and 2006 and are situated on a 29.33 acre site with 965 parking spaces (2.98 spaces per 1,000 square feet of NRA). The At Home store (collateral) is attached to a portion of another retail center, Gateway Crossing, which is not included in the West Bountiful Commons Property. The West Bountiful Commons Property is anchored by Costco and At Home and is junior anchored by Office Depot and Petco. As of September 12, 2019, the West Bountiful Commons Property was 99.2% occupied by 25 national and regional tenants.
Major Tenants.
Largest Tenant: Costco Wholesale Corporation (22.1% of underwritten base rent; 11/21/2035 lease expiration) –Costco Wholesale Corporation (“Costco”) operates an international chain of membership warehouses, that carry quality, brand-name merchandise at substantially lower prices than are typically offered by conventional wholesale or retail sources. Costco’s merchandise includes groceries, candy, appliances, television and media, automotive supplies, tires, toys, hardware, sporting goods, jewelry, watches, cameras, books, housewares, apparel, health and beauty aids, furniture, office supplies and office equipment. Costco is open only to members and offers three types of membership: Executive, Business and Gold Star, with the membership cost ranging between $60 and $120 annually. As of September 5, 2019, Costco reported $149.4 billion in annual revenues, 98.5 million membership cardholders served by 783 locations worldwide, 544 of which are in the United States and Puerto Rico, 163,000 employees in the United States and 243,000 employees worldwide. Costco owns its own building and improvements and is operating on a 30-year ground lease with nine, 5-year renewal options.
2ndLargest Tenant: At Home (21.8% of underwritten base rent; 12/31/2025 lease expiration) –At Home is a home décor superstore providing customers with more than 50,000 unique items across broad product categories including furniture, garden, home textiles, housewares, patio, rugs, seasonal décor, tabletop décor and wall décor. As of July 27, 2019, At Home reported 204 stores across 39 states, averaging 105,000 square feet per store. The company benefits from a fully integrated supply chain driven by distribution centers in Plano, Texas and Carlisle, Pennsylvania, respectively, that are able to support more than 350 total stores. At Home was founded in 1979 and maintains its headquarters in Plano, Texas. Per its annual statement dated January 26, 2019, At Home recorded $1.16 billion in net sales, a year-over-year growth of 23%, marking five consecutive years and 19 straight quarters of at least 20% sales growth. Comparable store sales increased 2.7% and culminated in the company’s 20th consecutive quarter of growth. At Home has been a tenant at the West Bountiful Commons Property since 2016 and has three, 5-year renewal options remaining.
3rdLargest Tenant: Office Depot, Inc. (9.3% of underwritten base rent; 3/31/2027 lease expiration) –Office Depot, Inc. ("Office Depot") is a leading provider of business services and supplies, products and technology solutions through its fully integrated omni-channel platform of supply stores, online presence, and dedicated sales professionals and technicians to small, medium and enterprise businesses. Office Depot offers its products under various banners, including Office Depot, OfficeMax, CompuCom, and Grand & Toy. Headquartered in Boca Raton, Florida, the company reported having approximately 44,000 employees as of January 2019. For the fiscal year ending December 29, 2018, Office Depot operated 1,361 retail supply stores. Net sales were approximately $11.0 billion, up 7.6% from the previous fiscal year of approximately $10.2 billion. The current average retail store footprint is 20,000 square feet Office Depot has been a tenant at the West Bountiful Commons Property since 2007 and has two, 5-year renewal options remaining.
| THE INFORMATION IN THIS STRUCTURAL AND COLLATERAL TERM SHEET IS NOT COMPLETE AND MAY BE AMENDED PRIOR TO THE TIME OF SALE. THIS TERM SHEET IS NOT AN OFFER TO SELL THESE SECURITIES AND IT IS NOT A SOLICITATION OF AN OFFER TO BUY THESE SECURITIES IN ANY JURISDICTION WHERE THE OFFER OR SALE IS NOT PERMITTED. |
| 44 |
| Retail - Anchored | Loan #2 | Cut-off Date Balance: | $34,750,000 | |
| 100 North 500 West | West Bountiful Commons | Cut-off Date LTV: | 64.7% | |
| West Bountiful, UT 84010 | U/W NCF DSCR: | 2.40x | ||
| U/W NOI Debt Yield: | 9.8% |
The following table presents certain information relating to the tenancy at the West Bountiful Commons Property:
Major Tenants
| Tenant Name | Credit Rating (Fitch/Moody’s/ S&P)(1) | Tenant NRSF | % of NRSF | Annual U/W Base Rent PSF(2) | Annual U/W Base Rent(2) | % of Total Annual U/W Base Rent | Lease Expiration Date | Extension Options | Termination Option (Y/N) |
| Anchor Tenants | |||||||||
| Costco(3) | NR/Aa3/A+ | 135,000 | 41.6% | $5.91 | $797,500 | 22.1% | 11/21/2035 | 9, 5-year | N |
| At Home | NR/NR/B+ | 101,581 | 31.3% | $7.74 | $786,237 | 21.8% | 12/31/2025 | 3, 5-year | N |
| Total Anchor Tenants | 236,581 | 72.9% | $6.69 | $1,583,737 | 43.9% | ||||
| Major Tenants | |||||||||
| Office Depot | NR/Ba3/B | 21,008 | 6.5% | $15.90 | $334,027 | 9.3% | 3/31/2027 | 2, 5-year | N |
| Petco | NR/NR/NR | 15,000 | 4.6% | $19.80 | $297,000 | 8.2% | 1/31/2027 | 1, 5-year | N |
| Total Anchor Tenants | 36,008 | 11.1% | $17.52 | $631,027 | 17.5% | ||||
| Non-Major Tenants | 49,263 | 15.2% | $28.23 | $1,390,607 | 38.6% | ||||
| Occupied Collateral Total | 321,852 | 99,2% | $11.20 | $3,605,372 | 100.0% | ||||
| Vacant Space | 2,497 | 0.8% | |||||||
| Collateral Total | 324,349 | 100.0% | |||||||
| (1) | Certain ratings are those of the parent company whether or not the parent company guarantees the lease. |
| (2) | Annual U/W Base Rent PSF and Annual U/W Base Rent include contractual rent steps through January 2021 totaling $35,462. |
| (3) | Costco has a right of first refusal to purchase the Costco parcel from the West Bountiful Commons Borrower. Straight-line rent was underwritten for Costco from 2020 to 2030. |
The following table presents certain information relating to tenant sales at the West Bountiful Commons Property:
Tenant Sales (PSF)
| Major Tenant Name | % of Total Annual U/W Base Rent | 2016 | 2017 | 2018 | Anchor Tenant Occupancy Cost |
| In-Line Sales PSF(1) | $264 | $271 | $251 | ||
| In-Line Occupancy Cost | 13.0% | 12.7% | 14.1% |
| (1) | Above in-line sales represent sales reported for Go Wireless Verizon, GNC and Sports Clips. |
| THE INFORMATION IN THIS STRUCTURAL AND COLLATERAL TERM SHEET IS NOT COMPLETE AND MAY BE AMENDED PRIOR TO THE TIME OF SALE. THIS TERM SHEET IS NOT AN OFFER TO SELL THESE SECURITIES AND IT IS NOT A SOLICITATION OF AN OFFER TO BUY THESE SECURITIES IN ANY JURISDICTION WHERE THE OFFER OR SALE IS NOT PERMITTED. |
| 45 |
| Retail - Anchored | Loan #2 | Cut-off Date Balance: | $34,750,000 | |
| 100 North 500 West | West Bountiful Commons | Cut-off Date LTV: | 64.7% | |
| West Bountiful, UT 84010 | U/W NCF DSCR: | 2.40x | ||
| U/W NOI Debt Yield: | 9.8% |
The following table presents certain information relating to the lease rollover schedule at the West Bountiful Commons Property:
Lease Expiration Schedule(1)(2)
| Year Ending December 31, | No. of Leases Expiring | Expiring NRSF | % of Total NRSF | Cumulative Expiring NRSF | Cumulative % of Total NRSF | Annual U/W Base Rent(3) | % of Total Annual U/W Base Rent | Annual U/W Base Rent PSF(3) |
| MTM | 0 | 0 | 0.0% | 0 | 0.0% | $0 | 0.0% | $0.00 |
| 2020 | 0 | 0 | 0.0% | 0 | 0.0% | $0 | 0.0% | $0.00 |
| 2021 | 8 | 15,771 | 4.9% | 15,771 | 4.9% | $446,236 | 12.4% | $28.29 |
| 2022 | 3 | 9,444 | 2.9% | 25,215 | 7.8% | $241,506 | 6.7% | $25.57 |
| 2023 | 3 | 4,599 | 1.4% | 29,814 | 9.2% | $110,740 | 3.1% | $24.08 |
| 2024 | 1 | 1,385 | 0.4% | 31,199 | 9.6% | $38,088 | 1.1% | $27.50 |
| 2025 | 1 | 101,581 | 31.3% | 132,780 | 40.9% | $786,237 | 21.8% | $7.74 |
| 2026 | 1 | 2,800 | 0.9% | 135,580 | 41.8% | $87,318 | 2.4% | $31.19 |
| 2027 | 3 | 38,508 | 11.9% | 174,088 | 53.7% | $713,527 | 19.8% | $18.53 |
| 2028 | 1 | 3,760 | 1.2% | 177,848 | 54.8% | $105,280 | 2.9% | $28.00 |
| 2029 | 2 | 5,004 | 1.5% | 182,852 | 56.4% | $163,140 | 4.5% | $32.60 |
| 2030 | 0 | 0 | 0.0% | 182,852 | 56.4% | $0 | 0.0% | $0.00 |
| Thereafter | 2 | 139,000 | 42.9% | 321,852 | 99.2% | $913,300 | 25.3% | $6.57 |
| Vacant | 0 | 2,497 | 0.8% | 324,349 | 100.0% | 0 | 0.0% | $0.00 |
| Total/Weighted Average | 25 | 324,349 | 100.0% | $3,605,372 | 100.0% | $11.20 |
| (1) | Information obtained from the underwritten rent roll. |
| (2) | Certain tenants may have lease termination options that are exercisable prior to the originally stated expiration date of the subject lease and that are not considered in the Lease Expiration Schedule. |
| (3) | Total/Weighted Average Annual U/W Base Rent and Annual U/W Base Rent PSF exclude vacant space. |
The following table presents historical occupancy percentages at the West Bountiful Commons Property:
Historical Occupancy
12/31/2015 | 12/31/2016(1) | 12/31/2017(1) | 12/31/2018(1) | 9/12/2019(2) |
| NAV | 98.8% | 97.4% | 97.3% | 99.2% |
| (1) | Information obtained from the West Bountiful Commons Borrower. |
| (2) | Information obtained from the underwritten rent roll. |
| THE INFORMATION IN THIS STRUCTURAL AND COLLATERAL TERM SHEET IS NOT COMPLETE AND MAY BE AMENDED PRIOR TO THE TIME OF SALE. THIS TERM SHEET IS NOT AN OFFER TO SELL THESE SECURITIES AND IT IS NOT A SOLICITATION OF AN OFFER TO BUY THESE SECURITIES IN ANY JURISDICTION WHERE THE OFFER OR SALE IS NOT PERMITTED. |
| 46 |
| Retail - Anchored | Loan #2 | Cut-off Date Balance: | $34,750,000 | |
| 100 North 500 West | West Bountiful Commons | Cut-off Date LTV: | 64.7% | |
| West Bountiful, UT 84010 | U/W NCF DSCR: | 2.40x | ||
| U/W NOI Debt Yield: | 9.8% |
Operating History and Underwritten Net Cash Flow. The following table presents certain information relating to the underwritten net cash flow at the West Bountiful Commons Property:
Cash Flow Analysis
| 2016 | 2017 | 2018 | TTM 8/31/2019 | U/W | %(1) | U/W $ per SF | ||
| Rents in Place | $3,132,314 | $3,448,633 | $3,393,645 | $3,337,604 | $3,573,846 | 86.5 | % | $11.02 |
| Contractual Rent Steps(2) | 0 | 0 | 0 | 0 | 67,462 | 1.6 | 0.21 | |
| Grossed Up Vacant Space | 0 | 0 | 0 | 0 | 62,425 | 1.5 |
| 0.19 |
| Gross Potential Rent | $3,132,314 | $3,448,633 | $3,393,645 | $3,337,604 | $3,703,733 | 89.6 | % | $11.42 |
| Other Income | 1,492 | 2,605 | 275 | 441 | 0 | 0.0 | 0.00 | |
| Total Recoveries | 401,578 | 441,588 | 417,919 | 425,547 | 430,260 | 10.4 |
| 1.33 |
| Net Rental Income | $3,535,384 | $3,892,825 | $3,811,839 | $3,763,592 | $4,133,993 | 100.0 | % | $12.75 |
| (Vacancy & Credit Loss) | 0 | 0 | 0 | 0 | (165,775)(3) | (4.5 | ) | (0.51) |
| Effective Gross Income | $3,535,384 | $3,892,825 | $3,811,839 | $3,763,592 | $3,968,218 | 96.0 | % | $12.23 |
| Real Estate Taxes | 175,541 | 216,943 | 203,536 | 198,568 | 205,511 | 5.2 | 0.63 | |
| Insurance | 17,416 | 15,843 | 16,509 | 17,850 | 19,963 | 0.5 | 0.06 | |
| Management Fee | 106,062 | 116,785 | 114,355 | 112,908 | 119,047 | 3.0 | 0.37 | |
| Other Operating Expenses | 190,173 | 204,162 | 209,614 | 206,608 | 205,425 | 5.2 |
| 0.63 |
| Total Operating Expenses | $489,191 | $553,732 | $544,014 | $535,934 | $549,945 | 13.9 | % | $1.70 |
| Net Operating Income | $3,046,193 | $3,339,093 | $3,267,825 | $3,227,658 | $3,418,273 | 86.1 | % | $10.54 |
| Replacement Reserves | 0 | 0 | 0 | 0 | 28,402 | 0.7 | 0.09 | |
| TI/LC | 0 | 0 | 0 | 0 | 127,988 | 3.2 |
| 0.39 |
| Net Cash Flow | $3,046,193 | $3,339,093 | $3,267,825 | $3,227,658 | $3,261,882 | 82.2 | % | $10.06 |
| NOI DSCR | 2.25x | 2.46x | 2.41x | 2.38x | 2.52x | |||
| NCF DSCR | 2.25x | 2.46x | 2.41x | 2.38x | 2.40x | |||
| NOI Debt Yield | 8.8% | 9.6% | 9.4% | 9.3% | 9.8% | |||
| NCF Debt Yield | 8.8% | 9.6% | 9.4% | 9.3% | 9.4% | |||
| (1) | Represents (i) percent of Net Rental Income for all revenue fields, (ii) percent of Gross Potential Rent for Vacancy & Credit Loss and (iii) percent of Effective Gross Income for all other fields. |
| (2) | Represents contractual rent steps through January 2021 and includes $32,000 of underwritten straight line rent for Costco. |
| (3) | The underwritten economic vacancy is 4.0%. The West Bountiful Commons Property was 99.2% leased as of September 12, 2019. |
Appraisal.As of the appraisal valuation date of September 20, 2019, the West Bountiful Commons Property had an “as-is” appraised value of $53,700,000.
Environmental Matters. According to a Phase I environmental site assessment dated September 25, 2019, there was no evidence of any recognized environmental conditions at the West Bountiful Commons Property.
Market Overview and Competition.The West Bountiful Commons Property is located in West Bountiful, Davis County, Utah, within the Salt Lake City metropolitan statistical area (the “Salt Lake City MSA”). Downtown Bountiful is situated along Main Street between W. 400 North and W. 500 South, which includes historic storefront retail featuring local businesses with office and/or residential space above. A number of large companies maintain a large presence in Salt Lake City including Goldman Sachs, who has their second largest national office in Salt Lake, and Delta, which maintains a hub at Salt Lake City International Airport. Salt Lake City is home to the Huntsman Corporation a fortune 500 company. Other companies that maintain a large presence in Salt Lake City include AlphaGraphics, Adobe, eBay, Micron, L-3 Communications, 3M, Myriad Genetics, Overstock.com, and the Sinclair Oil Corporation, among others.
The West Bountiful Commons Property is located approximately 0.8 miles north of downtown Bountiful and approximately 11.4 miles north of Salt Lake City, Utah. Access to the West Bountiful Commons Property neighborhood is provided by Interstate Highway 15 which is an eight lane highway and is the major north-south arterial throughout the metro Salt Lake area. The neighborhood surrounding the West Bountiful Commons Property is a corridor serving the surrounding residential neighborhoods. The N. 500 West arterial between W. 400 North and W. 500 South is densely developed with retail and includes two community centers known as Gateway Crossing and Commons at West Bountiful (of which the West Bountiful Commons Property is a part), which comprise approximately 750,000 square feet of gross leasable area. According to a third party market research report, the estimated 2019 population in a one-, three-, and five-mile radius of the West Bountiful Commons Property is 10,812, 76,664 and 105,937. The average household income within the same radii is $74,293, $96,388 and $103,300, respectively.
| THE INFORMATION IN THIS STRUCTURAL AND COLLATERAL TERM SHEET IS NOT COMPLETE AND MAY BE AMENDED PRIOR TO THE TIME OF SALE. THIS TERM SHEET IS NOT AN OFFER TO SELL THESE SECURITIES AND IT IS NOT A SOLICITATION OF AN OFFER TO BUY THESE SECURITIES IN ANY JURISDICTION WHERE THE OFFER OR SALE IS NOT PERMITTED. |
| 47 |
| Retail - Anchored | Loan #2 | Cut-off Date Balance: | $34,750,000 | |
| 100 North 500 West | West Bountiful Commons | Cut-off Date LTV: | 64.7% | |
| West Bountiful, UT 84010 | U/W NCF DSCR: | 2.40x | ||
| U/W NOI Debt Yield: | 9.8% |
Submarket Information – According to a third-party market research report, the West Bountiful Commons Property is situated within the Davis/Weber Counties submarket. As of third quarter 2019, the submarket reported a total inventory of 30.9 million square feet with a 4.7% vacancy rate and an average quoted rental rate of $16.03 per square feet. As of second quarter 2019, the Davis/Weber Counties submarket reported negative absorption of (81,685) square feet, with 13,773 square feet of construction or 2,200 square feet of deliveries.
Appraiser’s Comp Set – The appraiser identified seven competitive properties for the West Bountiful Commons Property totaling approximately 1,319,201 square feet, which reported a weighted average occupancy rate of approximately 96.9%. The appraiser concluded to net market rents for the West Bountiful Commons Property of $7.50 per square foot anchor tenants, $17.50 per square foot for Jr. Anchor tenants, $30.00 per square foot for shop space and $15.00 per square foot for office tenants.
The following table presents certain information relating to the appraiser’s market rent conclusion for the West Bountiful Commons Property:
Market Rent Summary(1)
| Anchor | Jr. Anchor | Shop | |
| Market Rent (PSF) | $7.50 | $17.50 | $30.00 |
| Lease Term (Years) | 10 | 10 | 5 |
| Lease Type (Reimbursements) | Net (no admin) | Net (no admin) | Net (15% admin) |
| Rent Increase Projection | None | None | 3.0% per annum |
| (1) | Information obtained from the appraisal. |
The table below presents certain information relating to comparable sales for the West Bountiful Commons Property identified by the appraiser:
Comparable Sales(1)
| Property Name | Location | Rentable Area (SF) | Sale Date | Adjusted Sale Price | Sale Price (PSF) |
| Van Winkle Shopping Center | Murray, UT | 168,494 | Aug-17 | $19,085,000 | $113.27 |
| Little Cottonwood Center | Sandy, UT | 151,395 | Mar-18 | $23,400,000 | $154.56 |
| Family Center at Riverdale | Riverdale, UT | 427,828 | Mar-19 | $48,200,000 | $112.66 |
| Parkway Village | Provo, UT | 102,298 | Aug-19 | $18,400,000 | $179.87 |
| Tooele Towne Center | Tooele, UT | 101,143 | Jun-19 | $16,400,000 | $162.15 |
| Marketplace at South Town | Sandy, UT | 316,274 | Sep-19 | $23,050,000 | $72.88 |
| (1) | Information obtained from the appraisal. |
| THE INFORMATION IN THIS STRUCTURAL AND COLLATERAL TERM SHEET IS NOT COMPLETE AND MAY BE AMENDED PRIOR TO THE TIME OF SALE. THIS TERM SHEET IS NOT AN OFFER TO SELL THESE SECURITIES AND IT IS NOT A SOLICITATION OF AN OFFER TO BUY THESE SECURITIES IN ANY JURISDICTION WHERE THE OFFER OR SALE IS NOT PERMITTED. |
| 48 |
| Retail - Anchored | Loan #2 | Cut-off Date Balance: | $34,750,000 | |
| 100 North 500 West | West Bountiful Commons | Cut-off Date LTV: | 64.7% | |
| West Bountiful, UT 84010 | U/W NCF DSCR: | 2.40x | ||
| U/W NOI Debt Yield: | 9.8% |
The following table presents certain information relating to comparable leases to those at the West Bountiful Commons Property:
Comparable Leases(1)
| Property Name/Location | Year Built/ Renovated | Total GLA (SF) | Distance from Subject | Occupancy | Lease Term | Tenant Size (SF) | Annual Base Rent PSF | Reimbursement Amount PSF | Lease Type |
5thSouth Bountiful 245 West 500 South Bountiful, UT | 2004/NAP | 5,101 | 0.8 miles | 54.0% | Quoted | 2,800 SF | $30.00 | NAV | NNN |
5thSouth Plaza 500 South 200 West Bountiful, UT | 1978/1997 | 39,156 | 0.9 miles | 100.0% | 10.0 Yrs Quoted | 2,400 SF NAP | $14.00 $16.00 | $3.75 | NNN |
Gateway Crossing 190-500 South 500 West Bountiful, UT | 1966/NAP | 292,003 | 0.3 miles | 100.0% | Quoted | 1,000-45,000 SF | $15.00 | NAV | NNN |
400 North Plaza 390 North 500 West Bountiful, UT | 2002/NAP | 15,320 | 2.6 miles | 40.0% | 5.3 Yrs 5.0 Yrs | 1,100 SF 1,092 SF | $17.00 $18.00 $15.00 | $3.80 | NNN |
Bountiful Plaza 155 West 500 South Bountiful, UT | 1990/2014 | 68,373 | 1.1 miles | 93.0% | 10.0 Yrs 6.2 Yrs | 3,100 SF 2,000 SF | $24.00 $20.25 | $3.92 | NNN |
The Shops at Fort Union (Former Family Center) 924 East Fort Union Midvale, UT | 1980/2006 | 694,099 | 22.1 miles | 98.0% | 10.0 Yrs 10.7 Yrs 10.0 Yrs 10.4 Yrs | 2,700 SF 2,423 SF 4,739 SF 2,924 SF | $39.00 $30.00 $38.00 $44.00 | $3.75 | NNN |
Crossroads at North Ogden 2434 North 400 East North Ogden, UT | 2014/NAP | 205,149 | 36.0 miles | 95.0% | 10.0 Yrs 7.0 Yrs 5.0 Yrs | 1,700 SF 1,100 SF 1,536 SF | $35.00 $29.00 $23.00 | NAV | NNN |
| (1) | Information obtained from the appraisal. |
Escrows.
Real Estate Taxes – The West Bountiful Commons Mortgage Loan documents require an upfront real estate tax reserve of $18,302 and ongoing monthly tax reserves in an amount equal to one-twelfth of the real estate taxes that the lender estimates will be necessary to pay taxes over the then succeeding twelve months (initially $17,431). The real estate tax reserve does not cover taxes due by Costco and At Home, which tenants pay taxes directly to applicable governmental authorities.
Insurance – The West Bountiful Commons Mortgage Loan documents require an upfront insurance reserve of $19,214 and ongoing monthly insurance reserves in an amount equal to one-twelfth of the insurance premiums that the lender estimates will be payable during the next twelve months (initially $1,664).
Replacement Reserves – The West Bountiful Commons Mortgage Loan documents did not require an upfront replacement reserve. Ongoing monthly replacement reserves of $2,367 are required. The lender may reassess its estimate of the amount necessary for capital expenditure and may require the West Bountiful Commons Borrower to increase the ongoing monthly replacement reserves.
TI/LC Reserve – The West Bountiful Commons Mortgage Loan documents did not require an upfront tenant improvement and leasing commission reserve. Ongoing monthly tenant improvement and leasing commission reserves of $13,244 are required.
Unfunded TI/LC Funds Reserve – The West Bountiful Commons Mortgage Loan documents require an upfront unfunded TI/LC funds reserve of $77,025 and ongoing monthly unfunded TI/LC funds reserve of $99,250 commencing on each payment date occurring in December 2019 through March 2020. The unfunded TI/LC funds reserve represents the amount of tenant improvement and related costs and expenses and leasing commissions payable and/or reimbursable by the West Bountiful Commons Borrower to the following tenants in the following amounts: (i) with respect to Nothing Bundt Cakes, $77,025, and (ii), with respect to At Home, a total of $397,000.
Lockbox and Cash Management.The West Bountiful Commons Mortgage Loan requires a springing lockbox and springing cash management. Upon the occurrence and continuance of a Cash Management Trigger Event (as defined below), the West Bountiful Commons Borrower is required to establish a lender-controlled lockbox account and instruct tenants to deposit rents into such lockbox account. The West Bountiful Commons Mortgage Loan documents also require that all revenues received by the West Bountiful Commons Borrower or property manager be deposited into the lockbox account within one business day of receipt. Pursuant to the West Bountiful Commons Mortgage Loan documents, all excess funds on deposit are required to be applied as follows: (a) if a Cash Sweep Event (as defined below) is not in effect, to the West Bountiful Commons Borrower; and (b) if a Cash Sweep Event is in effect due to the existence of a Critical Tenant Trigger Event (as defined below), to the Critical Tenant TI/LC account until the applicable Critical Tenant Trigger Event cure has occurred. If a Cash Sweep Event is in effect but a Critical Tenant Trigger Event is not in effect, then funds will be applied to the excess cash flow account.
| THE INFORMATION IN THIS STRUCTURAL AND COLLATERAL TERM SHEET IS NOT COMPLETE AND MAY BE AMENDED PRIOR TO THE TIME OF SALE. THIS TERM SHEET IS NOT AN OFFER TO SELL THESE SECURITIES AND IT IS NOT A SOLICITATION OF AN OFFER TO BUY THESE SECURITIES IN ANY JURISDICTION WHERE THE OFFER OR SALE IS NOT PERMITTED. |
| 49 |
| Retail - Anchored | Loan #2 | Cut-off Date Balance: | $34,750,000 | |
| 100 North 500 West | West Bountiful Commons | Cut-off Date LTV: | 64.7% | |
| West Bountiful, UT 84010 | U/W NCF DSCR: | 2.40x | ||
| U/W NOI Debt Yield: | 9.8% |
A “Cash Management Trigger Event” will commence upon the occurrence of the following:
| (i) | an event of default; |
| (ii) | the West Bountiful Commons Borrower’s second late debt service payment within a 12-month period; |
| (iii) | a bankruptcy action of the West Bountiful Commons Borrower, the guarantor or property manager; |
| (iv) | a Cash Management DSCR Trigger Event (as defined below); or |
| (v) | a Critical Tenant Trigger Event (as defined below). |
A Cash Management Trigger Event will end upon the occurrence of:
| ● | with regard to clause (i) above, the cure of such event of default being accepted or waived by the lender; |
| ● | with regard to clause (ii) above, the debt service payments being paid on time for 12 consecutive months; |
| ● | with regard to clause (iii) above, such bankruptcy action petition having been discharged, stayed, or dismissed within 30 days of such filing, among other conditions, for the West Bountiful Commons Borrower or the guarantor and within 120 days for the property manager, or, with respect to the property manager, the West Bountiful Commons Borrower replacing the property manager with a qualified manager acceptable to the lender; |
| ● | with regard to clause (iv) above, the date the amortizing debt service coverage ratio based on the trailing 12-month period immediately preceding the date of such determination is greater than 1.20x for two consecutive quarters; and |
| ● | with regard to clause (v) above, a Critical Tenant Trigger Event Cure (as defined below). |
A “Cash Management DSCR Trigger Event” will occur on any day the debt service coverage ratio, based on the trailing 12-month period immediately preceding the date of determination, is less than 1.20x for the West Bountiful Commons Mortgage Loan.
A “Cash Sweep Event” will commence upon the occurrence of the following:
| (i) | an event of default; |
| (ii) | a bankruptcy action of the West Bountiful Commons Borrower, the guarantor or the property manager; |
| (iii) | a Cash Sweep DSCR Trigger Event (as defined below); or |
| (iv) | a Critical Tenant Trigger Event (as defined below). |
A Cash Sweep Event will end upon the occurrence of:
| ● | with regard to clause (i) above, the cure of such event of default being accepted or waived by the lender; |
| ● | with regard to clause (ii) above, such bankruptcy action petition being discharged, stayed, or dismissed within 30 days of such filing, among other conditions, for the West Bountiful Commons Borrower or guarantor and within 120 days for the property manager, or, with respect to the property manager, the West Bountiful Commons Borrower replacing the property manager with a qualified property manager acceptable to the lender; |
| ● | with regard to clause (iii) above, the date the amortizing debt service coverage ratio based on the trailing 12-month period immediately preceding the date of such determination is greater than 1.10x for two consecutive quarters; and |
| ● | with regard to clause (iv) above, a Critical Tenant Trigger Event Cure (as defined below). |
A “Cash Sweep DSCR Trigger Event” will occur on any day the debt service coverage ratio, based on the trailing 12-month period immediately preceding the date of determination, is less than 1.10x for the West Bountiful Commons Mortgage Loan.
A “Critical Tenant Trigger Event” will commence, with respect to At Home or Costco (“Critical Tenant”), upon the earlier to occur of
the following:
| (i) | the date that the related Critical Tenant gives notice of its intention to not extend or renew its lease or to terminate its lease or lease is otherwise terminated; |
| (ii) | the date that is twelve months prior to the related lease expiration date if the Critical Tenant has failed to give notice of its election to renew its lease; |
| (iii) | the date on which the Critical Tenant is required under its lease to notify the West Bountiful Commons Borrower of its election to renew its lease, if the Critical Tenant fails to give such notice; |
| (iv) | an event of default under the Critical Tenant lease occurs or is continuing; |
| (v) | a bankruptcy action with respect to the Critical Tenant or any Critical Tenant guarantor; |
| (vi) | the Critical Tenant electing to pay reduced rent (including, without limitation, percentage rent in lieu of fixed rent); |
| (vii) | the Critical Tenant discontinuing its normal business operations or otherwise “goes dark”; provided however, that no Critical Tenant Trigger Event will be deemed to have occurred pursuant to clause (i), (ii) or (iii) above in the event that the West Bountiful Commons Borrower immediately, upon each occurrence of clauses (i), (ii) and/or (iii) above with respect to any Critical Tenant, deposits with the lender an amount equal to $1,900,000 with respect to the applicable Critical Tenant space. |
| THE INFORMATION IN THIS STRUCTURAL AND COLLATERAL TERM SHEET IS NOT COMPLETE AND MAY BE AMENDED PRIOR TO THE TIME OF SALE. THIS TERM SHEET IS NOT AN OFFER TO SELL THESE SECURITIES AND IT IS NOT A SOLICITATION OF AN OFFER TO BUY THESE SECURITIES IN ANY JURISDICTION WHERE THE OFFER OR SALE IS NOT PERMITTED. |
| 50 |
| Retail - Anchored | Loan #2 | Cut-off Date Balance: | $34,750,000 | |
| 100 North 500 West | West Bountiful Commons | Cut-off Date LTV: | 64.7% | |
| West Bountiful, UT 84010 | U/W NCF DSCR: | 2.40x | ||
| U/W NOI Debt Yield: | 9.8% |
A “Critical Tenant Trigger Event Cure” will occur upon:
| ● | with regard to clause (i), (ii) or (iii) above, the date that (1) the Critical Tenant lease extension is executed and delivered to the lender by the West Bountiful Commons Borrower and the related tenant improvement costs, leasing commissions and other material costs and expenses have been deposited into the Critical Tenant TI/LC account; or (2) a Critical Tenant Space Re-Tenanting Event (as defined below) has occurred; |
| ● | with regard to clause (iv) above, a cure of the applicable default; |
| ● | with regard to clause (v) above, an affirmation that the Critical Tenant is actually paying all rents and other amounts under the lease; |
| ● | with regard to clause (vi) above, the Critical Tenant re-commencing the payment of full unabated rent; or |
| ● | with regard to clause (vii) above, (1) the Critical Tenant re-commencing its normal business operations for at least ninety 90 consecutive days or (2) a Critical Tenant Space Re-Tenanting Event (as defined below). |
A “Critical Tenant Space Re-tenanting Event” will occur on the date each of the following conditions has been satisfied: (i) the Critical Tenant space is leased to one or more replacement tenants for a term of at least five years and on terms that are acceptable to the lender; (ii) all tenant improvement costs, leasing commissions and other material costs and expenses relating to the re-letting of the space have been paid in full; (iii) the replacement tenant(s) has accepted possession and is in actual, physical occupancy of, and is conducting normal business operations at the related Critical Tenant space and is paying full, unabated rent without offset in accordance with its lease; and (iv) the lender has received a fully-executed copy of each replacement lease, an officer’s certificate and a duly-executed estoppel certificate from each replacement tenant.
Property Management. The West Bountiful Commons Property is managed by The Thackeray Company, L.C., an affiliate of the West Bountiful Commons Borrower.
Partial Release. Not permitted.
Subordinate and Mezzanine Indebtedness.Not permitted.
Ground Lease. None.
Terrorism Insurance.The West Bountiful Commons Mortgage Loan documents require that the “all risk” insurance policy required to be maintained by the West Bountiful Commons Borrower provides coverage for terrorism in an amount equal to the full replacement cost of the West Bountiful Commons Property, as well as business interruption insurance covering no less than the 18-month period following the occurrence of a casualty event, together with a 12-month extended period of indemnity.
Earthquake Insurance. The West Bountiful Commons Property is located in seismic zone 3. There was no requirement for seismic insurance.
| THE INFORMATION IN THIS STRUCTURAL AND COLLATERAL TERM SHEET IS NOT COMPLETE AND MAY BE AMENDED PRIOR TO THE TIME OF SALE. THIS TERM SHEET IS NOT AN OFFER TO SELL THESE SECURITIES AND IT IS NOT A SOLICITATION OF AN OFFER TO BUY THESE SECURITIES IN ANY JURISDICTION WHERE THE OFFER OR SALE IS NOT PERMITTED. |
| 51 |
| Multifamily – Garden | Loan #3 | Cut-off Date Balance: | $32,500,000 | |
| 210 South Clovis Avenue | Torrey Ridge Apartments | Cut-off Date LTV: | 68.4% | |
| Fresno, CA 93727 | U/W NCF DSCR: | 1.54x | ||
| U/W NOI Debt Yield: | 9.2% |
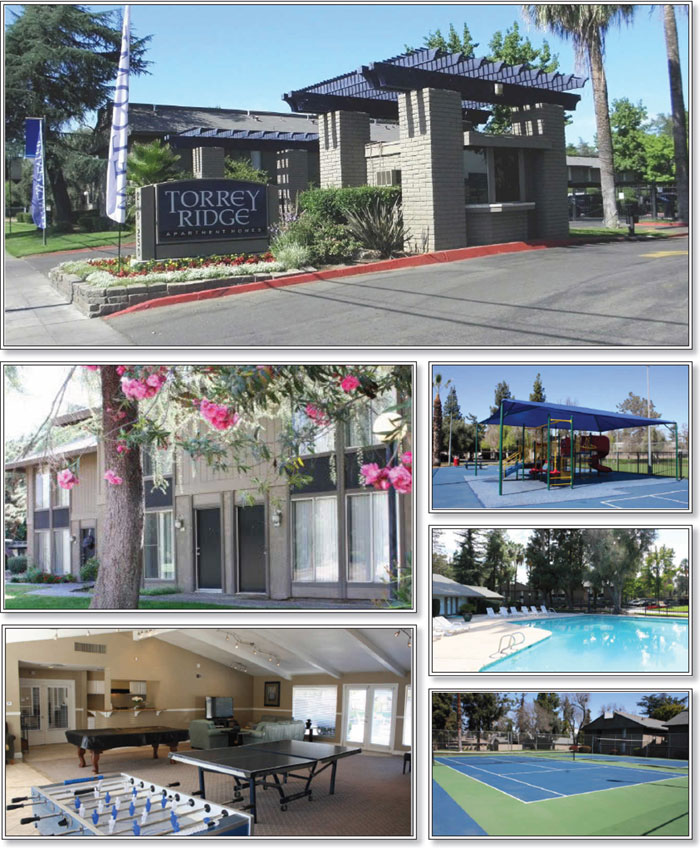
| THE INFORMATION IN THIS STRUCTURAL AND COLLATERAL TERM SHEET IS NOT COMPLETE AND MAY BE AMENDED PRIOR TO THE TIME OF SALE. THIS TERM SHEET IS NOT AN OFFER TO SELL THESE SECURITIES AND IT IS NOT A SOLICITATION OF AN OFFER TO BUY THESE SECURITIES IN ANY JURISDICTION WHERE THE OFFER OR SALE IS NOT PERMITTED. |
| 52 |
| Multifamily – Garden | Loan #3 | Cut-off Date Balance: | $32,500,000 | |
| 210 South Clovis Avenue | Torrey Ridge Apartments | Cut-off Date LTV: | 68.4% | |
| Fresno, CA 93727 | U/W NCF DSCR: | 1.54x | ||
| U/W NOI Debt Yield: | 9.2% |
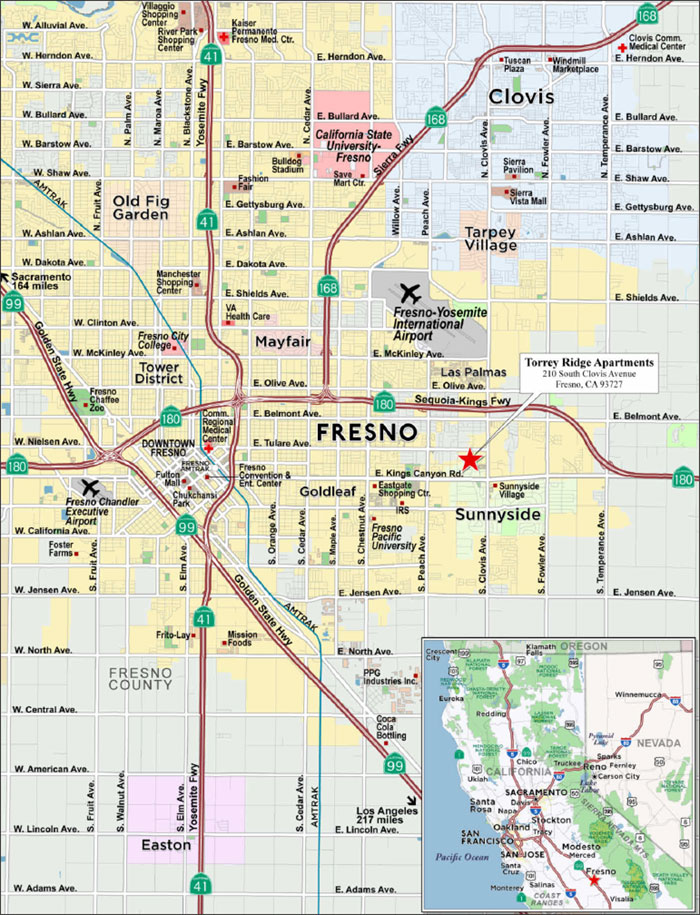
| THE INFORMATION IN THIS STRUCTURAL AND COLLATERAL TERM SHEET IS NOT COMPLETE AND MAY BE AMENDED PRIOR TO THE TIME OF SALE. THIS TERM SHEET IS NOT AN OFFER TO SELL THESE SECURITIES AND IT IS NOT A SOLICITATION OF AN OFFER TO BUY THESE SECURITIES IN ANY JURISDICTION WHERE THE OFFER OR SALE IS NOT PERMITTED. |
| 53 |
| No. 3 – Torrey Ridge Apartments | |||||||
| Mortgage Loan Information | Mortgaged Property Information | ||||||
| Mortgage Loan Seller: | Wells Fargo Bank, National Association | Single Asset/Portfolio: | Single Asset | ||||
Credit Assessment (Fitch/KBRA/S&P): | NR/NR/NR | Property Type – Subtype: | Multifamily – Garden | ||||
| Original Principal Balance: | $32,500,000 | Location: | Fresno, CA | ||||
| Cut-off Date Balance: | $32,500,000 | Size: | 418 Units | ||||
| % of Initial Pool Balance: | 4.9% | Cut-off Date Balance Per Unit: | $77,751 | ||||
| Loan Purpose: | Refinance | Maturity Date Balance Per Unit: | $65,627 | ||||
| Borrower Sponsor: | Patrick De La Torre | Year Built/Renovated: | 1976/2019 | ||||
| Guarantor: | Patrick De La Torre | Title Vesting: | Fee | ||||
| Mortgage Rate: | 4.0700% | Property Manager: | WA Funding, Inc. | ||||
| Note Date: | October 4, 2019 | Current Occupancy (As of): | 93.8% (9/27/2019) | ||||
| Seasoning: | 2 months | YE 2018 Occupancy: | 95.0% | ||||
| Maturity Date: | October 11, 2029 | YE 2017 Occupancy: | 95.5% | ||||
| IO Period: | 24 months | YE 2016 Occupancy: | 96.7% | ||||
| Loan Term (Original): | 120 months | YE 2015 Occupancy: | 96.7% | ||||
| Amortization Term (Original): | 360 months | Appraised Value: | $47,500,000 | ||||
| Loan Amortization Type: | Interest-only, Amortizing Balloon | Appraised Value Per Unit: | $113,636 | ||||
| Call Protection: | L(26),D(90),O(4) | Appraisal Valuation Date: | August 20, 2019 | ||||
| Lockbox Type: | Soft/Springing Cash Management | Underwriting and Financial Information | |||||
| Additional Debt: | None | TTM NOI (8/31/2019): | $3,111,731 | ||||
| Additional Debt Type (Balance): | NAP | YE 2018 NOI(2): | $2,842,376 | ||||
| YE 2017 NOI(2): | $2,367,714 | ||||||
| YE 2016 NOI: | $2,231,123 | ||||||
| U/W Revenues: | $5,046,608 | ||||||
| U/W Expenses: | $2,042,395 | ||||||
| Escrows and Reserves(1) | U/W NOI: | $3,004,213 | |||||
| Initial | Monthly | Cap | U/W NCF: | $2,896,885 | |||
| Taxes | $279,782 | $34,973 | NAP | U/W DSCR based on NOI/NCF: | 1.60x / 1.54x | ||
| Insurance | $153,439 | $13,949 | NAP | U/W Debt Yield based on NOI/NCF: | 9.2% / 8.9% | ||
| Immediate Repairs | $69,969 | $0 | NAP | U/W Debt Yield at Maturity based on NOI/NCF: | 11.0% / 10.6% | ||
| Replacement Reserve | $1,000,000 | $17,277 | NAP | Cut-off Date LTV Ratio: | 68.4% | ||
| Tax Lien Reserve | $9,147 | $0 | NAP | LTV Ratio at Maturity: | 57.8% | ||
| Sources and Uses | |||||||
| Sources | Uses | ||||||
| Original loan amount | $32,500,000 | 100.0% | Loan payoff | $20,683,637 | 63.6 | % | |
| Upfront reserves | 1,512,337 | 4.7 | |||||
| Closing costs | 263,084 | 0.8 | |||||
| Return of equity | 10,040,942 | 30.9 | |||||
| Total Sources | $32,500,000 | 100.0% | Total Uses | $32,500,000 | 100.0 | % | |
| (1) | See “Escrows” section for a full description of Escrows and Reserves. |
| (2) | See “Cash Flow Analysis” table below for an explanation on the increase in NOI from 2017 to 2018. |
The Mortgage Loan. The mortgage loan (the “Torrey Ridge Apartments Mortgage Loan”) is evidenced by a single promissory note secured by a first priority mortgage encumbering the fee interest in a multifamily property located in Fresno, California (the “Torrey Ridge Apartments Property”).
The Borrower and Borrower Sponsor.The borrower is Torrey Ridge, L.P. (the “Torrey Ridge Apartments Borrower”), a California limited partnership and single purpose entity with one independent director. Legal counsel to the Torrey Ridge Apartments Borrower delivered a non-consolidation opinion in connection with the origination of the Torrey Ridge Apartments Mortgage Loan. The borrower sponsor and non-recourse carveout guarantor is Patrick De La Torre.
Mr. De La Torre has been investing in multifamily real estate since 1982 and currently owns four multifamily properties totaling approximately 1,336 apartment units, including the Torrey Ridge Apartments Property. Mr. De La Torre was previously subject to misdemeanor cases filed in 2010 involving housing-related code violations at apartment buildings he previously owned. The cases have been settled, and the last of the related properties was sold in 2015. Mr. De La Torre was also a named defendant in an action alleging
| THE INFORMATION IN THIS STRUCTURAL AND COLLATERAL TERM SHEET IS NOT COMPLETE AND MAY BE AMENDED PRIOR TO THE TIME OF SALE. THIS TERM SHEET IS NOT AN OFFER TO SELL THESE SECURITIES AND IT IS NOT A SOLICITATION OF AN OFFER TO BUY THESE SECURITIES IN ANY JURISDICTION WHERE THE OFFER OR SALE IS NOT PERMITTED. |
| 54 |
| Multifamily – Garden | Loan #3 | Cut-off Date Balance: | $32,500,000 | |
| 210 South Clovis Avenue | Torrey Ridge Apartments | Cut-off Date LTV: | 68.4% | |
| Fresno, CA 93727 | U/W NCF DSCR: | 1.54x | ||
| U/W NOI Debt Yield: | 9.2% |
racial discrimination in residential rental practices in 2014. The case was settled in 2014. See “Description of the Mortgage Pool—Litigation and Other Considerations” in the Preliminary Prospectus.
The Property.The Torrey Ridge Apartments Property is a 418-unit garden style multifamily property located in Fresno, California. Constructed in 1976, renovated in 2018 and 2019 and situated on a 45.2-acre site, the Torrey Ridge Apartments Property contains 90 buildings comprising 96 one-bedroom units, 274 two-bedroom units, and 48 three-bedroom units. The Torrey Ridge Apartments Property contains 723 surface parking spaces, resulting in a parking ratio of approximately 1.7 spaces per unit. As of September 27, 2019, the Torrey Ridge Apartments Property was 93.8% occupied and has averaged 95.6% occupancy since 2015.
Common area amenities at the Torrey Ridge Apartments Property include four outdoor swimming pools, a tennis court, volleyball court, soccer field, fitness center, playground, clubhouse with business center, central courtyards with barbeque areas, and an outdoor fitness trail. Unit amenities include walk-in closets, dishwashers and garbage disposals, plus washer and dryer hookups in the three-bedroom units.
The Torrey Ridge Apartments Borrower has spent approximately $2.1 million in capital expenditures since acquiring the Torrey Ridge Apartments Property in late 2014. Additionally, the Torrey Ridge Apartments Borrower renovated 77 units in 2018 and 2019. Renovations included upgraded appliances, new flooring, upgraded light fixtures, faucets, doorknobs, and outlets.
Prior to borrower sponsor’s acquisition, the Torrey Ridge Apartments Property was the site of criminal activity including a shooting in 2014. See “Description of the Mortgage Pool—Property Types—Multifamily Properties” in the Preliminary Prospectus.
The following table presents certain information relating to the unit mix of the Torrey Ridge Apartments Property:
Unit Mix Summary(1)
| Unit Type | Total No. of Units | % of Total Units | Average Unit Size (SF) | Total No. of Renovated Units | Average Underwritten Monthly Rent per Unit (Non-Renovated) | Average Underwritten Monthly Rent per Unit (Renovated) |
| 1 Bedroom / 1 Bathroom – A | 64 | 15.3% | 703 | 8 | $845 | $870 |
| 1 Bedroom / 1 Bathroom – B | 32 | 7.7% | 769 | 6 | $849 | $872 |
| 2 Bedroom / 1 Bathroom – A | 64 | 15.3% | 904 | 10 | $922 | $961 |
| 2 Bedroom / 1 Bathroom – B | 4 | 1.0% | 1,200 | 0 | $1,060 | NAP |
| 2 Bedroom / 1.5 Bathroom | 206 | 49.3% | 1,040 | 44 | $1,026 | $1,059 |
| 3 Bedroom / 2 Bathroom | 32 | 7.7% | 1,330 | 5 | $1,286 | $1,345 |
| 3 Bedroom / 2.5 Bathroom | 16 | 3.8% | 1,470 | 4 | $1,330 | $1,283 |
| Total/Weighted Average | 418 | 100.0% | 987 | 77 | $996 | $1,042 |
| (1) | Information obtained from the appraisal. |
The following table presents historical occupancy percentages at the Torrey Ridge Apartments Property:
Historical Occupancy
12/31/2015(1) | 12/31/2016(1) | 12/31/2017(1) | 12/31/2018(1) | 9/27/2019(2) |
| 96.7% | 96.7% | 95.5% | 95.0% | 93.8% |
| (1) | Information obtained from a third party market research provider. |
| (2) | Information obtained from the underwritten rent roll. |
| THE INFORMATION IN THIS STRUCTURAL AND COLLATERAL TERM SHEET IS NOT COMPLETE AND MAY BE AMENDED PRIOR TO THE TIME OF SALE. THIS TERM SHEET IS NOT AN OFFER TO SELL THESE SECURITIES AND IT IS NOT A SOLICITATION OF AN OFFER TO BUY THESE SECURITIES IN ANY JURISDICTION WHERE THE OFFER OR SALE IS NOT PERMITTED. |
| 55 |
| Multifamily – Garden | Loan #3 | Cut-off Date Balance: | $32,500,000 | |
| 210 South Clovis Avenue | Torrey Ridge Apartments | Cut-off Date LTV: | 68.4% | |
| Fresno, CA 93727 | U/W NCF DSCR: | 1.54x | ||
| U/W NOI Debt Yield: | 9.2% |
Operating History and Underwritten Net Cash Flow. The following table presents certain information relating to the historical operating performance and underwritten net cash flow at the Torrey Ridge Apartments Property:
Cash Flow Analysis
| 2016 | 2017(1) | 2018(1) | TTM 8/31/2019 | U/W | %(2) | U/W $ per Unit | |
| Base Rent | $3,902,697 | $4,068,180 | $4,292,591 | $4,582,955 | $4,726,320 | 86.8% | $11,307 |
| Grossed Up Vacant Space | 0 | 0 | 0 | 0 | 320,100 | 5.9 | 766 |
| Gross Potential Rent | $3,902,697 | $4,068,180 | $4,292,591 | $4,582,955 | $5,046,420 | 92.7% | $12,073 |
| Laundry Income | 42,015 | 44,645 | 24,553 | 16,670 | 16,670 | 0.3 | 40 |
| Other Income(3) | 324,124 | 316,643 | 427,214 | 382,746 | 382,746 | 7.0 | 916 |
| Net Rental Income | $4,268,836 | $4,429,468 | $4,744,358 | $4,982,372 | $5,445,836 | 100.0% | $13,028 |
| (Vacancy) | 0 | 0 | 0 | 0 | (320,100)(4) | (6.3) | (766) |
| (Concessions & Credit Loss) | (6,472) | (68,113) | (171,246) | (64,197) | (79,128) | (1.6) | (189) |
| Effective Gross Income | $4,262,364 | $4,361,355 | $4,573,111 | $4,918,175 | $5,046,608 | 92.7% | $12,073 |
| Real Estate Taxes(1) | 381,309 | 483,039 | 197,163 | 266,459 | 414,080 | 8.2 | 991 |
| Insurance | 69,189 | 134,092 | 84,536 | 99,380 | 159,411 | 3.2 | 381 |
| Management Fee | 125,637 | 91,476 | 110,215 | 123,099 | 151,398 | 3.0 | 362 |
| Other Operating Expenses | 1,455,106 | 1,285,034 | 1,338,821 | 1,317,506 | 1,317,506 | 26.1 | 3,152 |
| Total Operating Expenses | $2,031,241 | $1,993,641 | $1,730,736 | $1,806,444 | $2,042,395 | 40.5% | $4,886 |
| Net Operating Income | $2,231,123 | $2,367,714 | $2,842,376 | $3,111,731 | $3,004,213 | 59.5% | $7,187 |
| Capital Expenditures | 0 | 0 | 0 | 0 | 107,328 | 2.1 | 257 |
| Net Cash Flow | $2,231,123 | $2,367,714 | $2,842,376 | $3,111,731 | $2,896,885 | 57.4% | $6,930 |
| NOI DSCR | 1.19x | 1.26x | 1.51x | 1.66x | 1.60x | ||
| NCF DSCR | 1.19x | 1.26x | 1.51x | 1.66x | 1.54x | ||
| NOI Debt Yield | 6.9% | 7.3% | 8.7% | 9.6% | 9.2% | ||
| NCF Debt Yield | 6.9% | 7.3% | 8.7% | 9.6% | 8.9% |
| (1) | The increase in Net Operating Income from 2017 to 2018 was driven by an increase in rental rates and timing of real estate tax payments. The U/W real estate taxes are based on the Torrey Ridge Apartments Mortgage Loan multiplied by the current tax rate plus special assessments. |
| (2) | Represents (i) percent of Net Rental Income for all revenue fields, (ii) percent of Gross Potential Rent for Vacancy and Concessions & Credit Loss and (iii) percent of Effective Gross Income for all other fields. |
| (3) | Other Income primarily includes utility charges and other miscellaneous income generated from late fees, keys, security deposits, vending machine income, credit checks, and application fees. |
| (4) | The underwritten economic vacancy is 6.3%. The Torrey Ridge Apartments Property was 93.8% physically occupied as of September 27, 2019. |
Appraisal.The appraiser concluded to an “as-is” appraised value for the Torrey Ridge Apartments Property of $47,500,000 as of August 20, 2019.
Environmental Matters. According to the Phase I environmental site assessment dated August 26, 2019, there was no evidence of any recognized environmental conditions at the Torrey Ridge Apartments Property.
Market Overview and Competition.The Torrey Ridge Apartments Property is located in Fresno, California, approximately 4.9 miles east of the Fresno central business district and 2.6 miles south of the Fresno Yosemite International Airport. Access to the Torrey Ridge Apartments Property is provided by Highway 180 (0.9 miles north) and Highway 41 (4.5 miles west), as well as major thoroughfares East Kings Canyon Road (east/west) and South Clovis Avenue (north/south). According to the appraisal, Fresno is the economic center of California’s Central Valley region. The agriculture industry is the largest contributor to Fresno’s economy, comprising approximately 25.0% of the region’s jobs. Additional major employment sectors include healthcare and manufacturing/processing.
According to a third party market report, the estimated 2019 population within a three- and five-mile radius of the Torrey Ridge Apartments Property was 101,788 and 252,693, respectively; and the estimated 2019 average household income within the same radii was $64,453 and $61,358, respectively.
Submarket Information – According to a third party market research report, the Torrey Ridge Apartments Property is situated within the South Fresno submarket. As of the second quarter of 2019, the submarket reported a total inventory of 6,721 units with a 5.3% vacancy rate and an average asking rental rate of $879 per month.
| THE INFORMATION IN THIS STRUCTURAL AND COLLATERAL TERM SHEET IS NOT COMPLETE AND MAY BE AMENDED PRIOR TO THE TIME OF SALE. THIS TERM SHEET IS NOT AN OFFER TO SELL THESE SECURITIES AND IT IS NOT A SOLICITATION OF AN OFFER TO BUY THESE SECURITIES IN ANY JURISDICTION WHERE THE OFFER OR SALE IS NOT PERMITTED. |
| 56 |
| Multifamily – Garden | Loan #3 | Cut-off Date Balance: | $32,500,000 | |
| 210 South Clovis Avenue | Torrey Ridge Apartments | Cut-off Date LTV: | 68.4% | |
| Fresno, CA 93727 | U/W NCF DSCR: | 1.54x | ||
| U/W NOI Debt Yield: | 9.2% |
Appraiser’s Comp Set – The appraiser identified six primary competitive properties for the Torrey Ridge Apartments Property totaling 1,043 units, which reported an average occupancy rate of approximately 97.3%. The appraiser concluded to monthly market rents per unit ranging from $850 to $1,400 (see “Market Rent Summary” table below).
Market Rent Summary(1)
| Unit Type | Total No. of Units | Total No. of Renovated Units | Market Monthly Rent per Unit (Non-Renovated) | Market Monthly Rent per Unit (Renovated) |
| 1 Bedroom / 1 Bathroom – A | 64 | 8 | $850 | $900 |
| 1 Bedroom / 1 Bathroom – B | 32 | 6 | $875 | $925 |
| 2 Bedroom / 1 Bathroom – A | 64 | 10 | $925 | $975 |
| 2 Bedroom / 1 Bathroom – A | 4 | 0 | $1,050 | $1,100 |
| 2 Bedroom / 1.5 Bathroom | 206 | 44 | $1,025 | $1,075 |
| 3 Bedroom / 2 Bathroom | 32 | 5 | $1,300 | $1,350 |
| 3 Bedroom / 2.5 Bathroom | 16 | 4 | $1,350 | $1,400 |
| Total/Weighted Average | 418 | 77 | $1,002 | $1,067 |
| (1) | Information obtained from the appraisal. |
The following table presents certain information relating to comparable multifamily properties for the Torrey Ridge Apartments Property:
Competitive Set(1)
| Torrey Ridge Apartments (Subject) | Silver Lake Apartments | Riverside Townhomes | Village Oak | Oak Brook Apartments | Landing at Fancher Creek | Maple Grove Apartments | |
| Location | Fresno, CA | Fresno, CA | Fresno, CA | Fresno, CA | Fresno, CA | Fresno, CA | Fresno, CA |
| Distance to Subject | -- | 0.9 miles | 0.4 miles | 0.4 miles | 0.8 miles | 2.1 miles | 4.2 miles |
| Property Type | Garden | Garden | Garden | Garden | Garden | Garden | Garden |
| Year Built/Renovated | 1976/2019 | 1985/NAP | 1976/NAP | 1987/NAP | 1975/NAP | 1986/NAP | 1990/NAP |
| Number of Units | 418 | 252 | 73 | 66 | 56 | 476 | 120 |
| Average Monthly Rent (per unit) | |||||||
| 1 Bedroom | $845-$872 | NAP | NAP | NAP | $750 | $949 | $880 |
| 2 Bedroom | $922-$1,060 | $860-$880 | $1,345 | $910-$1,006 | $850 | $1,009-$1,049 | $1,010 |
| 3 Bedroom | $1,283-$1,345 | NAP | $1,445 | NAP | $1,100 | $1,439 | $1,230 |
| Occupancy | 93.8% | 100.0% | 97.0% | 96.0% | 96.0% | 97.0% | 98.0% |
| (1) | Information obtained from the appraisal and underwritten rent roll. |
Escrows.
Real Estate Taxes – The Torrey Ridge Apartments Mortgage Loan documents require an upfront real estate tax reserve of $279,782 and ongoing monthly real estate tax reserves in an amount equal to one-twelfth of the real estate taxes that the lender estimates will be payable during the next twelve months (initially $34,973).
Insurance– The Torrey Ridge Apartments Mortgage Loan documents require an upfront insurance reserve of $153,439 and ongoing monthly insurance reserves in an amount equal to one-twelfth of the insurance premiums that the lender estimates will be payable for the renewal of the coverage during the next twelve months (initially $13,949).
Immediate Repairs Reserve – The Torrey Ridge Apartments Borrower deposited an upfront reserve of $69,969 for certain immediate repairs of the Torrey Ridge Apartments Property.
Replacement Reserve – The Torrey Ridge Apartments Mortgage Loan documents require an upfront replacement reserve of $1,000,000 and ongoing monthly replacement reserves of $17,277.
Tax Lien Reserve – The Torrey Ridge Apartments Mortgage Loan documents require an upfront tax lien reserve of $9,147 for amounts that may be owed by Mr. De La Torre in connection with certain personal tax liens.
Lockbox and Cash Management. The Torrey Ridge Apartments Mortgage Loan is structured with a soft lockbox, which is already in place, and springing cash management. Prior to the occurrence of a Cash Trap Event Period (as defined below), the Torrey Ridge Apartments Mortgage Loan documents require that the Torrey Ridge Apartments Borrower or the property manager deposit all rents into the lockbox account within one business day of receipt and all funds in the lockbox account are required to be distributed to the Torrey Ridge Apartments Borrower. During a Cash Trap Event Period, funds in the lockbox account are required to be swept to a lender-controlled cash management account and all excess funds are required to be swept to an excess cash flow subaccount controlled by the lender.
| THE INFORMATION IN THIS STRUCTURAL AND COLLATERAL TERM SHEET IS NOT COMPLETE AND MAY BE AMENDED PRIOR TO THE TIME OF SALE. THIS TERM SHEET IS NOT AN OFFER TO SELL THESE SECURITIES AND IT IS NOT A SOLICITATION OF AN OFFER TO BUY THESE SECURITIES IN ANY JURISDICTION WHERE THE OFFER OR SALE IS NOT PERMITTED. |
| 57 |
| Multifamily – Garden | Loan #3 | Cut-off Date Balance: | $32,500,000 | |
| 210 South Clovis Avenue | Torrey Ridge Apartments | Cut-off Date LTV: | 68.4% | |
| Fresno, CA 93727 | U/W NCF DSCR: | 1.54x | ||
| U/W NOI Debt Yield: | 9.2% |
A “Cash Trap Event Period” will commence upon the earlier of the following:
| (i) | the occurrence and continuance of an event of default; |
| (ii) | the net cash flow debt service coverage ratio falling below 1.15x at the end of any calendar quarter; or |
| (iii) | the physical and/or economic occupancy at the Torrey Ridge Apartments Property falling below 80.0%. |
A Cash Trap Event Period will end upon the occurrence of the following:
| ● | with regard to clause (i), the cure of such event of default; |
| ● | with regard to clause (ii), the net cash flow debt service coverage ratio being equal to or greater than 1.15x for two consecutive calendar months; or |
| ● | with regard to clause (iii), the physical and economic occupancy at the Torrey Ridge Apartments Property being equal to or greater than 80.0% for two consecutive calendar months. |
Property Management. Torrey Ridge Apartments Property is managed by WA Funding, Inc., doing business as Regency Property Management (“Regency”). Regency has more than 30 years of experience in real estate management, with a focus in Fresno County, California. Regency currently manages more than 4,000 residential units.
Partial Release.Not permitted.
Real Estate Substitution.Not permitted.
Subordinate and Mezzanine Indebtedness.Not permitted.
Ground Lease. None.
Terrorism Insurance. The Torrey Ridge Apartments Mortgage Loan documents require that the “all risk” insurance policy required to be maintained by Torrey Ridge Apartments Borrower provide coverage for terrorism in an amount equal to the full replacement cost of Torrey Ridge Apartments Property, as well as business interruption insurance covering no less than the 18-month period following the occurrence of a casualty event, together with a six-month extended period of indemnity.
Earthquake Insurance. The Torrey Ridge Apartments Mortgage Loan documents do not require earthquake insurance. The seismic report indicated a scenario expected loss of 5.0% for the Torrey Ridge Apartments Property.
| THE INFORMATION IN THIS STRUCTURAL AND COLLATERAL TERM SHEET IS NOT COMPLETE AND MAY BE AMENDED PRIOR TO THE TIME OF SALE. THIS TERM SHEET IS NOT AN OFFER TO SELL THESE SECURITIES AND IT IS NOT A SOLICITATION OF AN OFFER TO BUY THESE SECURITIES IN ANY JURISDICTION WHERE THE OFFER OR SALE IS NOT PERMITTED. |
| 58 |
(THIS PAGE INTENTIONALLY LEFT BLANK)
| THE INFORMATION IN THIS STRUCTURAL AND COLLATERAL TERM SHEET IS NOT COMPLETE AND MAY BE AMENDED PRIOR TO THE TIME OF SALE. THIS TERM SHEET IS NOT AN OFFER TO SELL THESE SECURITIES AND IT IS NOT A SOLICITATION OF AN OFFER TO BUY THESE SECURITIES IN ANY JURISDICTION WHERE THE OFFER OR SALE IS NOT PERMITTED. |
| 59 |
| Office – CBD | Loan #4 | Cut-off Date Balance: | $30,500,000 | |
| Property Addresses - Various | 74 Kent Street & 11-20 46th Road | Cut-off Date LTV: | 62.2% | |
| U/W NCF DSCR: | 1.94x | |||
| U/W NOI Debt Yield: | 8.7% |
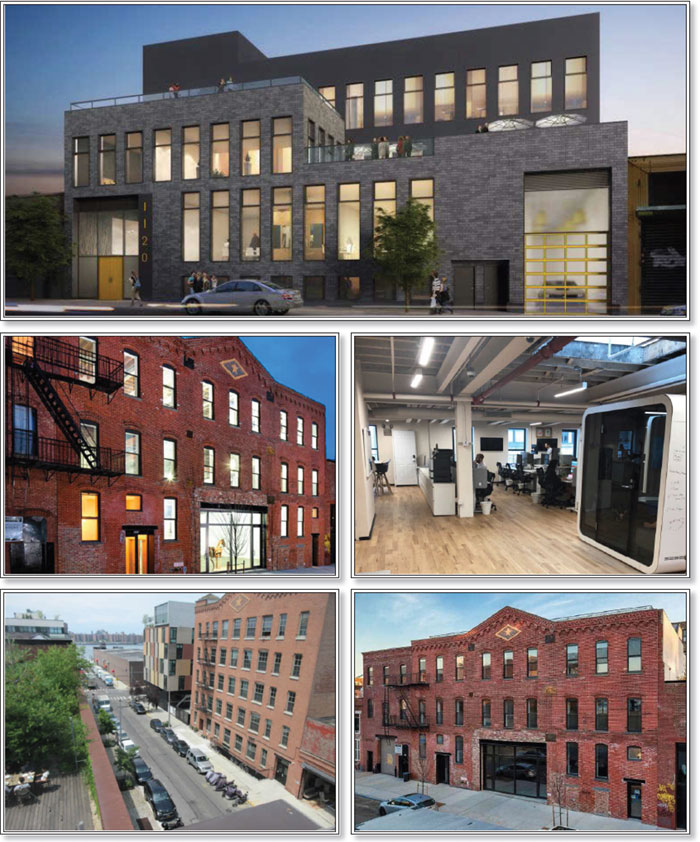
| THE INFORMATION IN THIS STRUCTURAL AND COLLATERAL TERM SHEET IS NOT COMPLETE AND MAY BE AMENDED PRIOR TO THE TIME OF SALE. THIS TERM SHEET IS NOT AN OFFER TO SELL THESE SECURITIES AND IT IS NOT A SOLICITATION OF AN OFFER TO BUY THESE SECURITIES IN ANY JURISDICTION WHERE THE OFFER OR SALE IS NOT PERMITTED. |
| 60 |
| Office – CBD | Loan #4 | Cut-off Date Balance: | $30,500,000 | |
| Property Addresses - Various | 74 Kent Street & 11-20 46th Road | Cut-off Date LTV: | 62.2% | |
| U/W NCF DSCR: | 1.94x | |||
| U/W NOI Debt Yield: | 8.7% |
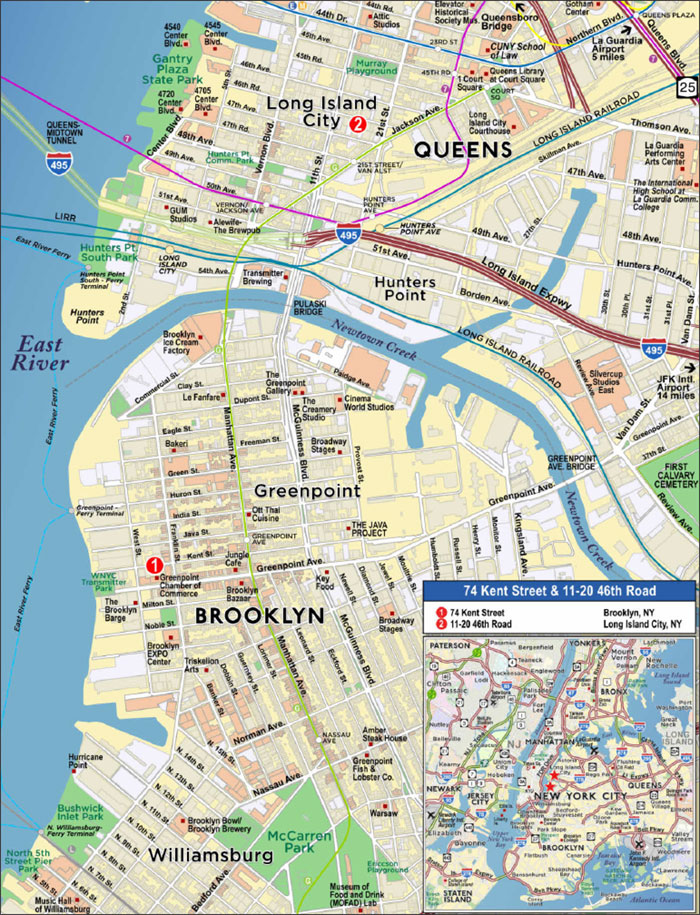
| THE INFORMATION IN THIS STRUCTURAL AND COLLATERAL TERM SHEET IS NOT COMPLETE AND MAY BE AMENDED PRIOR TO THE TIME OF SALE. THIS TERM SHEET IS NOT AN OFFER TO SELL THESE SECURITIES AND IT IS NOT A SOLICITATION OF AN OFFER TO BUY THESE SECURITIES IN ANY JURISDICTION WHERE THE OFFER OR SALE IS NOT PERMITTED. |
| 61 |
| No. 4 – 74 Kent Street & 11-20 46th Road | ||||||||
| Mortgage Loan Information | Mortgaged Property Information | |||||||
| Mortgage Loan Seller: | Argentic Real Estate Finance LLC | Single Asset/Portfolio: | Portfolio | |||||
Credit Assessment (Fitch/KBRA/S&P): | NR/NR/NR | Property Type – Subtype: | Office – CBD | |||||
| Original Principal Balance: | $30,500,000 | Location: | Various, NY | |||||
| Cut-off Date Balance: | $30,500,000 | Size: | 66,470 SF | |||||
| % of Initial Pool Balance: | 4.6% | Cut-off Date Balance Per SF: | $458.85 | |||||
| Loan Purpose: | Refinance | Maturity Date Balance Per SF: | $458.85 | |||||
| Borrower Sponsors: | Simeon Derenshteyn; Elena Gilman | Year Built/Renovated: | Various / Various | |||||
| Guarantors: | Simeon Derenshteyn; Elena Gilman | Title Vesting: | Fee | |||||
| Mortgage Rate: | 4.3100% | Property Manager: | SD Asset Management, LLC | |||||
| Note Date: | October 24, 2019 | Current Occupancy (As of)(2): | 100.0% (10/1/2019) | |||||
| Seasoning: | 1 month | YE 2018 Occupancy(3): | NAV | |||||
| Maturity Date: | November 6, 2029 | YE 2017 Occupancy(3): | NAV | |||||
| IO Period: | 120 months | YE 2016 Occupancy(3): | NAV | |||||
| Loan Term (Original): | 120 months | YE 2015 Occupancy(3): | NAV | |||||
| Amortization Term (Original): | NAP | Appraised Value(4): | $49,000,000 | |||||
| Loan Amortization Type: | Interest-only, Balloon | Appraised Value Per SF(4): | $737.17 | |||||
| Call Protection(2)(3): | L(25),D(91),O(4) | Appraisal Valuation Date(4): | Various | |||||
| Lockbox Type: | Hard/Springing Cash Management | Underwriting and Financial Information | ||||||
| Additional Debt: | None | YE 2018 NOI(3): | NAV | |||||
| Additional Debt Type (Balance): | NAP | YE 2017 NOI(3): | NAV | |||||
| YE 2016 NOI(3): | NAV | |||||||
| YE 2015 NOI(3): | NAV | |||||||
| U/W Revenues: | $3,134,675 | |||||||
| U/W Expenses: | $467,984 | |||||||
| Escrows and Reserves(1) | U/W NOI: | $2,666,691 | ||||||
| Initial | Monthly | Cap | U/W NCF: | $2,586,927 | ||||
| Taxes | $80,123 | $13,354 | NAP | U/W DSCR based on NOI/NCF: | 2.00x / 1.94x | |||
| Insurance | $18,167 | $6,056 | NAP | U/W Debt Yield based on NOI/NCF: | 8.7% / 8.5% | |||
| Replacement Reserve | $0 | $1,108 | NAP | U/W Debt Yield at Maturity based on NOI/NCF: | 8.7% / 8.5% | |||
| TheraCare Earn-Out Reserve | $2,000,000 | $0 | NAP | Cut-off Date LTV Ratio(4): | 62.2% | |||
| TheraCare Free Rent Reserve | $1,302,188 | $0 | NAP | LTV Ratio at Maturity(4): | 62.2% | |||
| Outstanding TI/LC Reserve | $2,290,826 | $0 | NAP | |||||
| TCO Reserve | $3,000,000 | $0 | NAP | |||||
| Vapor Mitigation Reserve | $69,000 | $0 | NAP | |||||
| Sources and Uses | |||||||
| Sources | Uses | ||||||
| Original loan amount | $30,500,000 | 100.0% | Return of equity | 19,117,632 | 62.7 | % | |
| Reserves | 8,760,300 | 28.7 | |||||
| Closing Cost | 2,622,068 | 8.6 | |||||
| Total Sources | $30,500,000 | 100.0% | Total Uses | $30,500,000 | 100.0 | % | |
| (1) | See “Escrows” section for a full description of Escrows and Reserves. |
| (2) | As of the origination date, TheraCare and NYU School of Medicine are not yet in occupancy. NYU School of Medicine has taken possession of its space and is paying unabated rent. TheraCare has posted a security deposit with the borrower in the form of a letter of credit in an amount of $1,562,625 or $45 per square foot, which reduces to $1,171,968 after three years and to $911,531 after seven years. The loan is structured with a $2.0 million TheraCare Earnout Reserve to be released upon, among other things, the earlier of (i) TheraCare fully opening for business and (ii) paying unabated rent as well as an upfront free rent reserve which represents 10 months of rent under the TheraCare lease. See “Escrows” below. |
| (3) | Historical occupancy and cash flow details are not available as the 74 Kent Street Property (as defined below) and 11-20 46th Road Property (as defined below) were re-purposed in 2018 and 2019, respectively. |
| (4) | The Appraised Value presented is the sum of the appraised values for the 74 Kent Street Property and the 11-20 46th Road Property. The “as-is” appraised value of $24.7 million as of July 16, 2019 for the 74 Kent Street Property includes the extraordinary assumption that $1.1 million of outstanding tenant improvements has been funded. At origination, an approximately $1.1 million leasing cost reserve was escrowed. The “as complete” appraised value of $24.3 million as of December 1, 2019 for the 11-20 46th Road Property assumes, amongst other things, the premise will be completed on time and within budget. See “Appraisal” section. |
| THE INFORMATION IN THIS STRUCTURAL AND COLLATERAL TERM SHEET IS NOT COMPLETE AND MAY BE AMENDED PRIOR TO THE TIME OF SALE. THIS TERM SHEET IS NOT AN OFFER TO SELL THESE SECURITIES AND IT IS NOT A SOLICITATION OF AN OFFER TO BUY THESE SECURITIES IN ANY JURISDICTION WHERE THE OFFER OR SALE IS NOT PERMITTED. |
| 62 |
| Office – CBD | Loan #4 | Cut-off Date Balance: | $30,500,000 | |
| Property Addresses - Various | 74 Kent Street & 11-20 46th Road | Cut-off Date LTV: | 62.2% | |
| U/W NCF DSCR: | 1.94x | |||
| U/W NOI Debt Yield: | 8.7% |
The Mortgage Loan. The mortgage loan (the “74 Kent Street & 11-20 46th Road Mortgage Loan”) is evidenced by a single promissory note secured by a first mortgage encumbering the fee interest in two office properties in Brooklyn (the “74 Kent Street Property”) and Long Island City (the “11-20 46th Road Property”), New York (together, the “74 Kent Street & 11-20 46th Road Properties”).
The Borrowers and Borrower Sponsors.The borrowers for the 74 Kent Street & 11-20 46th Road Mortgage Loan are 74 Kent Owner LLC and 11-20 46th Road Owner LLC, each a Delaware limited liability company and single-purpose bankruptcy remote entity with one independent director. Legal counsel to the borrowers delivered a non-consolidation opinion in connection with the origination of the 74 Kent Street & 11-20 46th Road Mortgage Loan. The borrower sponsors are Simeon Derenshteyn and Elena Gilman, each of whom owns 50% of the borrowing entities. The borrower sponsors engaged The Caerus Group, a real estate investment, development, and management firm that provides expertise to investors seeking direct ownership of real assets to assist them with the management of the 74 Kent Street & 11-20 46th Road Properties. The Caerus Group will continue to manage the 74 Kent Street & 11-20 46th Road Properties through its affiliate SD Asset Management, LLC.
The Property.The 74 Kent Street & 11-20 46th Road Properties are comprised of the 74 Kent Street Property and the 11-20 46th Road Property located in Brooklyn and Long Island City, respectively in New York.
The 74 Kent Street Property is a 31,745 square foot, office building situated on a 0.2-acre site in the Greenpoint neighborhood of Brooklyn, New York. The improvements consist of a single, three-story plus basement building constructed in 1931 and renovated in 2018 at a cost of $4.5 million. Renovations included structural work, new mechanicals, adding windows to the basement and creating usable terrace spaces and rooftop space. In addition, the basement yard was opened to provide the lower floor with natural light and air. The building is fully leased to two tenants: NYU School of Medicine and Project Franklin, LLC (Walmart) (“Project Franklin”). NYU School of Medicine leases the basement and first floor for use as medical office, physical therapy and a planned imaging center, and Project Franklin leases the second and third floor for use as creative office space. The 74 Kent Street Property received an ICAP abatement with a 25-year abatement period. See “Description of the Mortgage Pool— Real Estate and Other Tax Considerations” in the Preliminary Prospectus.
The 11-20 46th Road Property is a 34,725 square foot, single-tenant office building situated on a 0.2-acre site in Long Island City, New York. The improvements consist of a single, three-story plus lower level building constructed in 1947. The building is currently under renovation to convert its use from a warehouse to an office property. The borrower sponsor anticipates the renovation to be complete by year-end 2019. The building is fully pre-leased to TheraCare for a base term of 15 years. The lease is scheduled to commence shortly after completion of the renovations. TheraCare will be utilizing the top two floors of the property as their new headquarters office space, which they are relocating from the Penn Station submarket, and will be utilizing the basement and first floor space for educational and treatment services. The 11-20 46th Road Property will benefit from an ICAP abatement with a 15-year abatement period. See “Description of the Mortgage Pool— Real Estate and Other Tax Considerations” in the Preliminary Prospectus.
The 11-20 46th Road Property is expected to receive a temporary certificate of occupancy (“TheraCare TCO”) in November 2019. Based on the Department of Buildings’ (“DOB”) site inspection report, there are a limited number of punch list items remaining. Completion of the remaining items can be self-certified by borrowers’ architect and no additional DOB site inspection is required. At origination, the lender escrowed $3.0 million which will be released to the borrowers upon, among other things, the receipt of the TheraCare TCO. Pursuant to the 74 Kent Street & 11-20 46th Road Mortgage Loan documents, failure to obtain the TheraCare TCO within 55 days of the origination date will trigger a Cash Management Period (as defined below), and any losses related to the borrowers’ failure to obtain the TheraCare TCO would be recourse to the guarantor.
As of October 1, 2019 the 74 Kent Street & 11-20 46th Road Properties were 100% leased by three tenants.
Major Tenants.
Largest Tenant: TheraCare (NR/NR/NR by Fitch/Moody’s/S&P; 34,725 square feet; 52.2% of net rentable area; 48.0% of underwritten base rent; 1/31/2035 lease expiration) – Founded in 1991 and headquartered in NYC, TheraCare is a multi-service healthcare, rehabilitation, developmental and educational organization that focuses on autism services, early intervention services, pre-school and school district staffing. TheraCare is qualified for NYC’s Relocation & Employment Assistance Program, which will provide a tax credit of $3,000 per employee per year, offering additional savings. TheraCare’s lease expires in January 2035 and the lease also contains one, five-year renewal option with no termination options. As of the origination date, TheraCare is not yet open and operating in its space.
Under the lease, TheraCare received 12 months of free rent. On the origination date, the lender reserved $1,302,188, which equates to 10 months of TheraCare rent. The borrowers estimated only 8.5 months of free rent is owed under the TheraCare lease, but acknowledge and agree that, as of the origination date, the TheraCare rent commencement date has not been finally determined in accordance with the TheraCare lease. Because the amount of free rent owed under the TheraCare lease was not finally determined at origination, the lender required the borrowers and guarantor to deposit additional money into the free rent reserve if the amount of free rent owed under the TheraCare lease is greater than the amount reserved at origination.
TheraCare has posted a security deposit with the borrowers in the form of a letter of credit in an amount of $1.56 million, which reduces to $1.17 million after three years and $911,531 after seven years, providing further credit support. During a Cash Management Period, the borrowers are required to, upon the lender’s request, turn over to the lender the security deposits (and any interest theretofore earned thereon) under leases, to be held by the lender in a subaccount, subject to the terms of the leases. The 74 Kent Street & 11-20 46th Road Mortgage Loan is also structured with a $2.0 million earnout reserve to be released upon, among other
| THE INFORMATION IN THIS STRUCTURAL AND COLLATERAL TERM SHEET IS NOT COMPLETE AND MAY BE AMENDED PRIOR TO THE TIME OF SALE. THIS TERM SHEET IS NOT AN OFFER TO SELL THESE SECURITIES AND IT IS NOT A SOLICITATION OF AN OFFER TO BUY THESE SECURITIES IN ANY JURISDICTION WHERE THE OFFER OR SALE IS NOT PERMITTED. |
| 63 |
| Office – CBD | Loan #4 | Cut-off Date Balance: | $30,500,000 | |
| Property Addresses - Various | 74 Kent Street & 11-20 46th Road | Cut-off Date LTV: | 62.2% | |
| U/W NCF DSCR: | 1.94x | |||
| U/W NOI Debt Yield: | 8.7% |
things, the earlier of (a) TheraCare being open for business and (b) TheraCare paying full, unabated rent pursuant to the lease documents. See “Escrows” below.
2ndLargest Tenant: NYU School of Medicine (NR/A3/A- by Fitch/Moody’s/S&P; 16,679 square feet; 25.1% of net rentable area; 28.1% of underwritten base rent; 9/30/2033 lease expiration) – NYU School of Medicine is New York University’s academic medical center. NYU School of Medicine offers various patient care, research, and education services in more than 150 inpatient and outpatient locations throughout New York City’s five boroughs, Long Island, New Jersey, Westchester County, Putnam County, Dutchess County, and Florida. NYU School of Medicine leases the space at the 74 Kent Street Property for medical office usage, including as a physical therapy office and MRI (magnetic resonance imaging) center. NYU School of Medicine executed a 15-year lease that includes two, five-year renewal options. NYU School of Medicine has the right to terminate at any time following the tenth anniversary of the rent commencement date subject to 12-month notice and a termination fee.
NYU School of Medicine has taken possession of its space and is paying unabated rent but is not yet in occupancy. NYU School of Medicine is reportedly investing approximately $8-9 million ($480-540 per square feet) to build out its premise in addition to borrower funded TIs, and approximately $5 million ($300 per square feet) on equipment.
3rdLargest Tenant: Project Franklin (AA/Aa2/AA by Fitch/Moody’s/S&P; 15,066 square feet; 22.7% of net rentable area; 23.8% of underwritten base rent; 4/30/2022 lease expiration) – Project Franklin is an advertising division operating within Walmart’s tech incubator, Store No8. Project Franklin commenced a three-year lease in March 2019. Project Franklin uses its space at the 74 Kent Street Property as creative office space. The lease is fully guaranteed by Walmart, Inc. Walmart, Inc. is a multinational retail corporation that operates a chain of hypermarkets, department stores, and grocery stores. Founded in 1962, the company is publicly traded on the NYSE (WMT). Walmart’s credit rating is Aa2 by Moody’s.
The following table presents certain information relating to the tenancy at the 74 Kent Street & 11-20 46th Road Properties:
Major Tenants
| Tenant Name | Credit Rating (Fitch/ Moody’s/ S&P)(1) | Tenant NRSF | % of NRSF | Annual U/W Base Rent PSF(2) | Annual U/W Base Rent(2) | % of Total Annual U/W Base Rent | Lease Expiration Date | Extension Options | Termination Option (Y/N) |
| Major Tenants | |||||||||
| TheraCare(3)(4) | NR/NR/NR | 34,725 | 52.2% | $45.00 | $1,562,625 | 48.0% | 1/31/2035 | 1, 5-year | N |
| NYU School of Medicine | NR/A3/A- | 16,679 | 25.1% | $54.90 | $915,626 | 28.1% | 9/30/2033 | 2, 5-year | Y(5) |
| Project Franklin(6) | AA/Aa2/AA | 15,066 | 22.7% | $51.52 | $776,125 | 23.8% | 4/30/2022 | N/A | N |
| Total Major Tenants | 66,470 | 100.0% | $48.96 | $3,254,376 | 100.0% | ||||
| Vacant Space | 0 | 0.0% | |||||||
| Collateral Total | 66,470 | 100.0% | |||||||
| (1) | Certain ratings are those of the parent company whether or not the parent company guarantees the lease. |
| (2) | Annual U/W Base Rent PSF and Annual U/W Base Rent include straight-line rent for the NYU School of Medicine and Project Franklin through the earlier of their respective lease expiration dates and the 74 Kent Street & 11-20 46th Road Mortgage Loan maturity date. |
| (3) | TheraCare is comprised of two separate leases for the upper and lower floors respectively with different TheraCare affiliates leasing each portion. |
| (4) | TheraCare received 12 months of free rent under its lease and has not commenced paying rent. |
| (5) | NYU School of Medicine has the right to terminate at any time following the tenth anniversary of rent commencement subject to a 12-month notice and termination fee. |
| (6) | Project Franklin is an advertising division of Walmart and the lease is fully guaranteed by Walmart, Inc. |
| THE INFORMATION IN THIS STRUCTURAL AND COLLATERAL TERM SHEET IS NOT COMPLETE AND MAY BE AMENDED PRIOR TO THE TIME OF SALE. THIS TERM SHEET IS NOT AN OFFER TO SELL THESE SECURITIES AND IT IS NOT A SOLICITATION OF AN OFFER TO BUY THESE SECURITIES IN ANY JURISDICTION WHERE THE OFFER OR SALE IS NOT PERMITTED. |
| 64 |
| Office – CBD | Loan #4 | Cut-off Date Balance: | $30,500,000 | |
| Property Addresses - Various | 74 Kent Street & 11-20 46th Road | Cut-off Date LTV: | 62.2% | |
| U/W NCF DSCR: | 1.94x | |||
| U/W NOI Debt Yield: | 8.7% |
The following table presents certain information relating to the lease rollover schedule at the 74 Kent Street & 11-20 46th Road Properties:
Lease Expiration Schedule(1)(2)
| Year Ending December 31, | No. of Leases Expiring | Expiring NRSF | % of Total NRSF | Cumulative Expiring NRSF | Cumulative % of Total NRSF | Annual U/W Base Rent(3) | % of Total Annual U/W Base Rent | Annual U/W Base Rent PSF(3) | |
| MTM | 0 | 0 | 0.0% | 0 | 0.0% | $0 | 0.0% | $0.00 | |
| 2019 | 0 | 0 | 0.0% | 0 | 0.0% | $0 | 0.0% | $0.00 | |
| 2020 | 0 | 0 | 0.0% | 0 | 0.0% | $0 | 0.0% | $0.00 | |
| 2021 | 0 | 0 | 0.0% | 0 | 0.0% | $0 | 0.0% | $0.00 | |
| 2022 | 1 | 15,066 | 22.7% | 15,066 | 22.7% | $776,125 | 23.8% | $51.52 | |
| 2023 | 0 | 0 | 0.0% | 15,066 | 22.7% | $0 | 0.0% | $0.00 | |
| 2024 | 0 | 0 | 0.0% | 15,066 | 22.7% | $0 | 0.0% | $0.00 | |
| 2025 | 0 | 0 | 0.0% | 15,066 | 22.7% | $0 | 0.0% | $0.00 | |
| 2026 | 0 | 0 | 0.0% | 15,066 | 22.7% | $0 | 0.0% | $0.00 | |
| 2027 | 0 | 0 | 0.0% | 15,066 | 22.7% | $0 | 0.0% | $0.00 | |
| 2028 | 0 | 0 | 0.0% | 15,066 | 22.7% | $0 | 0.0% | $0.00 | |
| 2029 | 0 | 0 | 0.0% | 15,066 | 22.7% | $0 | 0.0% | $0.00 | |
| Thereafter | 2 | 51,404 | 77.3% | 66,470 | 100.0% | $2,478,251 | 76.2% | $48.21 | |
| Vacant | 0 | 0 | 0.0% | 66,470 | 100.0% | $0 | 0.0% | $0.00 | |
| Total/Weighted Average | 3 | 66,470 | 100.0% | $3,254,376 | 100.0% | $48.96 |
| (1) | Information obtained from the underwritten rent roll. |
| (2) | Certain tenants may have lease termination options that are exercisable prior to the originally stated expiration date of the subject lease and that are not considered in the Lease Expiration Schedule. |
| (3) | Total/Weighted Average Annual U/W Base Rent and Annual U/W Base Rent PSF exclude vacant space. |
The following table presents historical occupancy percentages at the 74 Kent Street & 11-20 46th Road Properties:
Historical Occupancy
2016(1) | 2017(1) | 2018(1) | 10/1/2019(2) |
| NAV | NAV | NAV | 100.0% |
| (1) | Historical occupancy information is not available as the 74 Kent Street Property and the 11-20 46th Road Property were re-purposed in 2018 and 2019, respectively. |
| (2) | Information obtained for underwritten rent roll. |
| THE INFORMATION IN THIS STRUCTURAL AND COLLATERAL TERM SHEET IS NOT COMPLETE AND MAY BE AMENDED PRIOR TO THE TIME OF SALE. THIS TERM SHEET IS NOT AN OFFER TO SELL THESE SECURITIES AND IT IS NOT A SOLICITATION OF AN OFFER TO BUY THESE SECURITIES IN ANY JURISDICTION WHERE THE OFFER OR SALE IS NOT PERMITTED. |
| 65 |
| Office – CBD | Loan #4 | Cut-off Date Balance: | $30,500,000 | |
| Property Addresses - Various | 74 Kent Street & 11-20 46th Road | Cut-off Date LTV: | 62.2% | |
| U/W NCF DSCR: | 1.94x | |||
| U/W NOI Debt Yield: | 8.7% |
Operating History and Underwritten Net Cash Flow. The following table presents certain information relating to the historical operating performance and underwritten net cash flow at the 74 Kent Street & 11-20 46th Road Properties:
Cash Flow Analysis(1)
| U/W | %(5) | U/W $ per SF | |||
| Base Rent | $3,117,476 | 94.5% | $46.90 | ||
| Contractual Rent Steps(2) | 136,900 | 4.1 | 2.06 | ||
| Recovery Income | 45,282 | 1.4 | 0.68 | ||
| Gross Potential Rent | $3,299,658 | 100.0% | $49.64 | ||
| Vacancy - Market(3) | (164,983) | (5.0) | (2.48) | ||
| Credit Loss | 0 | 0.0 | 0.00 | ||
| EGI Before Other Income | $3,134,675 | 95.0% | $47.16 | ||
| Parking | 0 | 0.0 | 0.00 | ||
| Effective Gross Income | $3,134,675 | 95.0% | $47.16 | ||
| Real Estate Taxes(4) | 208,289 | 6.6 | 3.13 | ||
| Insurance | 72,666 | 2.3 | 1.09 | ||
| Management Fee | 94,040 | 3.0 | 1.41 | ||
| Other Operating Expenses | 92,989 | 3.0 | 1.40 | ||
| Total Operating Expenses | $467,984 | 14.9% | $7.04 | ||
| Net Operating Income | $2,666,691 | 85.1% | $40.12 | ||
| Replacement Reserves | 13,294 | 0.4 | 0.20 | ||
| TI/LC | 66,470 | 2.1 | 1.00 | ||
| Net Cash Flow | $2,586,927 | 82.5% | $38.92 | ||
| NOI DSCR | 2.00x | ||||
| NCF DSCR | 1.94x | ||||
| NOI Debt Yield | 8.7% | ||||
| NCF Debt Yield | 8.5% |
| (1) | Historical cashflows are not available as the 74 Kent Street Property and the 11-20 46th Road Property were re-purposed in 2018 and 2019, respectively. |
| (2) | UW contractual Rent Steps reflect straight-line rent for the NYU School of Medicine and Project Franklin through the earlier of their respective lease expiration dates and the 74 Kent Street & 11-20 46th Road Mortgage Loan maturity date |
| (3) | The underwritten economic vacancy is 5.0%. The 74 Kent Street & 11-20 46th Road Properties are 100.0% leased as of October 1, 2019. |
| (4) | UW based on the 74 Kent Street Property and the 11-20 46th Road Property benefitting from 25- and 15-year ICAP abatements, respectively. Each property expense is UW to the average of estimated amounts due over years 1-10. |
| (5) | Represents (i) percent of Net Rental Income for all revenue fields, (ii) percent of Gross Potential Rent for Vacancy & Credit Loss and (iii) percent of Effective Gross Income for all other fields. |
Appraisal.The 74 Kent Street & 11-20 46th Road Properties have an aggregate appraised value of $49,000,000. The 74 Kent Street Property had an “as-is” appraised value of $24,700,000 as of July 16, 2019 and the 11-20 46th Road Property had an “as-is” appraised value of $21,000,000 as of July 8, 2019. The 11-20 46th Road Property has an “as-complete” appraised value of $24,300,000 as of December 1, 2019, an “as-stabilized” appraised value of $24,600,000 as of February 1, 2020, as well as a “hypothetical go-dark” value of $18,100,000 as of July 8, 2019.
Environmental Matters. According to the Phase I environmental site assessment dated July 18, 2019, there were no evidence of any recognized environmental conditions at the 74 Kent Street Property. According to the Phase I environmental site assessment dated July 18, 2019, a recognized environmental condition was identified in connection with the 11-20 46th Road Property. The environmental consultant reported that based on review of historical resources, multiple printing facilities historically operated within the limits of the 11-20 46th Road Property from at least 1973 through 2007, and no subsurface investigation information was available for the 11-20 46th Road Property. The environmental consultant reported that given the absence of soil sampling beneath the TheraCare tenant space or the collection of indoor air samples, and future use of the 11-20 46th Road Property by TheraCare as an educational facility for children with special needs, the former printing facility operations within the limits of the 11-20 46th Road Property represent a recognized environmental condition in connection with the 11-20 46th Road Property, as well as a suspect vapor migration condition. The 74 Kent Street & 11-20 46th Road Mortgage Loan documents require, upon approval from the related regulatory agency, the installation of a passive sub-slab depressurization system by April 24, 2020.
Market Overview and Competition.
The 74 Kent Street Property is located in the Greenpoint neighborhood of Brooklyn which is bounded by Newtown Creek to the north, McCarren Park to the south, I-278 to the east and East River to the west. The 74 Kent Street Property has access to the G train at the Greenpoint Avenue Station, which offers access to south and west Brooklyn as well as Long Island City to the north. The area is accessible by automobile via nearby expressways and parkways including the Brooklyn Queens Expressway and the Long Island Expressway. Access to Manhattan is provided via the Williamsburg Bridge, which is south of the 74 Kent Street Property; as well as
| THE INFORMATION IN THIS STRUCTURAL AND COLLATERAL TERM SHEET IS NOT COMPLETE AND MAY BE AMENDED PRIOR TO THE TIME OF SALE. THIS TERM SHEET IS NOT AN OFFER TO SELL THESE SECURITIES AND IT IS NOT A SOLICITATION OF AN OFFER TO BUY THESE SECURITIES IN ANY JURISDICTION WHERE THE OFFER OR SALE IS NOT PERMITTED. |
| 66 |
| Office – CBD | Loan #4 | Cut-off Date Balance: | $30,500,000 | |
| Property Addresses - Various | 74 Kent Street & 11-20 46th Road | Cut-off Date LTV: | 62.2% | |
| U/W NCF DSCR: | 1.94x | |||
| U/W NOI Debt Yield: | 8.7% |
from the Midtown Tunnel which is a few blocks north of the 74 Kent Street Property and is accessible via the Long Island Expressway. The Pulaski Bridge is north of the 74 Kent Street Property and provides access over Newton Creek into Long Island City and Queens. The area is also serviced by two major airports. John F. Kennedy (JFK) International airport is located east of Brooklyn off the Belt Parkway in Queens, and LaGuardia Airport is located north of Brooklyn in northern Queens off the Grand Central Parkway.
According to a third party report, the 74 Kent Street Property is situated within the North Brooklyn submarket of the Brooklyn Office Market. As of the first quarter of 2019, the North Brooklyn submarket reported a total inventory of approximately 12.9 million square feet of office space within 751 buildings with a 9.3% vacancy rate and average asking rent of $36.70 per square foot. A total of 92,000 square feet of space was completed and delivered in the submarket which experienced a positive net absorption of 11,193 square feet during the same period.
11-20 46th Road Property– The 11-20 46th Road Property is located on the south side of 46th Road between 11th and 21st Streets approximately 1.75 miles from Midtown Manhattan in Long Island City, Queens County, NY. Long Island City is located in the western portion of Queens, one of the five boroughs of New York City. The neighborhood is bounded by Astoria/Steinway to the north, Newton Creek to the south, Sunnyside/Woodside to the east and East River to the west. The subject’s immediate neighborhood primarily consists of low- to high-rise multi-family buildings as well as mixed use office and retail properties. There have been numerous new developments of rental and condominium residential structures in Long Island City given the area’s close proximity and ease of transportation to Midtown Manhattan, which is a 3-5 minute subway ride.
The Long Island Express (I-495) travels along the neighborhood’s southern boundary between Long Island to the west and into the Queens Midtown Tunnel to East 34th Street in Manhattan, and the Brooklyn Queens Expressway (I-278) which runs near the neighborhood’s southwestern boundary, and connects with the Long Island Expressway. The Queensboro Bridge is located within close proximity of the 11-20 46th Road Property. Major east-west thoroughfares locally include Northern Boulevard, a major four-lane roadway which extends from the Queensboro Bridge to Manhattan to the west to the eastern end of Long Island and Roosevelt Avenue, another highly populated roadway in the area. Queens is easily accessible via subway, railroad and buses. Twelve NYC subway lines travel into Queens including the E, G, V, F, N, R, W and 7 trains. Two of the region’s three major international airports are located in Queens; LaGuardia Airport and JFK International Airport.
According to the appraisal, the estimated 2019 population in the zip code of 11101 (Long Island City) is 38,832. The median and average household income for the zip code is $75,413 and $119,529, respectively.
Submarket Information – According to a third party report, the 11-20 46th Road Property is situated within the Northwest Queens office submarket of the Queens Office Market. As of the second quarter of 2019, the Northwest Queens submarket reported a total inventory of approximately 17.1 million square feet of office space within 453 buildings with a 14.1% vacancy rate and average asking rent of $33.94 per square foot. A total of 56,000 square feet of space was completed and delivered from the submarket during the current quarter. The submarket experienced a negative net absorption of 20,014 square feet.
The following table presents certain information relating to the appraiser’s market rent conclusions for the 74 Kent & 11-20 46th Road Property:
Market Rent Summary(1)
Office (74 Kent Street) | All Floors (11-20 46th Road) | |
| Market Rent (PSF) | $49.00 | $45.00 |
| Lease Term (Years) | 10 | 10 |
| Lease Type (Reimbursements) | Mod. Gross | Mod. Gross |
| Rent Increase Projection | 3.0%per annum | 3.0%per annum |
| (1) | Information obtained from the appraisal. |
| THE INFORMATION IN THIS STRUCTURAL AND COLLATERAL TERM SHEET IS NOT COMPLETE AND MAY BE AMENDED PRIOR TO THE TIME OF SALE. THIS TERM SHEET IS NOT AN OFFER TO SELL THESE SECURITIES AND IT IS NOT A SOLICITATION OF AN OFFER TO BUY THESE SECURITIES IN ANY JURISDICTION WHERE THE OFFER OR SALE IS NOT PERMITTED. |
| 67 |
| Office – CBD | Loan #4 | Cut-off Date Balance: | $30,500,000 | |
| Property Addresses - Various | 74 Kent Street & 11-20 46th Road | Cut-off Date LTV: | 62.2% | |
| U/W NCF DSCR: | 1.94x | |||
| U/W NOI Debt Yield: | 8.7% |
The following table presents certain information relating to comparable office leases to the 74 Kent Street Property:
Comparable Office Leases(1)
| Property Name/Location | Year Built/ Renovated | Total GLA (SF) | Distance from Subject | Occupancy | Tenant | Tenant Size (SF) | Lease Term (Yrs) | Annual Base Rent PSF | Lease Type |
71-75 North 7th Street 71-75 North 7th Street Brooklyn, NY | 2018/NAP | 26,750 | 0.9 miles | 35.0% | The Wing | 9,336 | 10.5 | $68.00 | MG |
470 Vanderbilt Avenue 470 Vanderbilt Avenue Brooklyn, NY | 1931/2012 | 670,000 | 3.9 miles | 97.8% | ResCare | 59,114 | 10.0 | $37.00 | MG |
DUMBO Heights 175 Pearl Street Brooklyn, NY | 1918/2017 | 211,045 | 4.0 miles | 51.9% | The Lab | 44,000 | 15.0 | $62.00 | MG |
DUMBO Heights 175 Pearl Street Brooklyn, NY | 1918/2017 | 211,045 | 4.0 miles | 51.9% | Spaces | 61,539 | 16.0 | $54.00 | MG |
DUMBO Heights 77 Sands Street Brooklyn, NY | 1962/2017 | 225,684 | 4.0 miles | 100.0% | Brooklyn LAB | 81,648 | 16.0 | $51.00 | MG |
DUMBO Heights 55 Prospect Street Brooklyn, NY | 1967/2017 | 265,846 | 4.0 miles | 93.3% | 2U Inc. | 79,500 | 12.0 | $63.00 | MG |
Industry City 882 Third Avenue Brooklyn, NY | 1906/NAP | 634,550 | 3.1 miles | 100.0% | What If! Innovation | 14,290 | 16.0 | $39.00 | MG |
Industry City 882 Third Avenue Brooklyn, NY | 1906/NAP | 634,550 | 3.1 miles | 100.0% | Buck | 30,000 | 10.0 | $36.00 | MG |
Industry City 241 37th Street Brooklyn, NY | 1907/2009 | 647,700 | 6.8 miles | 98.8% | Essence Communication, Inc. | 23,506 | 11.0 | $41.50 | MG |
10 Jay Street 10 Jay Street Brooklyn, NY | 1897/2018 | 230,000 | 4.2 miles | 86.3% | Translation LLC | 12,209 | 17.0 | $65.00 | MG |
10 Jay Street 10 Jay Street Brooklyn, NY | 1897/2018 | 230,000 | 4.2 miles | 86.3% | Nuxeo | 12,567 | 7.0 | $70.00 | MG |
20 Jay Street 20 Jay Street Brooklyn, NY | 1915/NAP | 443,000 | 4.2 miles | 98.0% | Red Antler, Inc | 22,527 | 6.7 | $40.00 | MG |
20 Jay Street 20 Jay Street Brooklyn, NY | 1915/NAP | 443,000 | 4.2 miles | 98.0% | We Are Walker | 2,800 | 5.0 | $43.00 | MG |
45 Main Street 45 Main Street Brooklyn, NY | 1912/2000 | 475,000 | 3.7 miles | 99.0% | Mission Media NY | 9,900 | 10.0 | $41.50 | MG |
| (1) | Information obtained from appraisal. |
| THE INFORMATION IN THIS STRUCTURAL AND COLLATERAL TERM SHEET IS NOT COMPLETE AND MAY BE AMENDED PRIOR TO THE TIME OF SALE. THIS TERM SHEET IS NOT AN OFFER TO SELL THESE SECURITIES AND IT IS NOT A SOLICITATION OF AN OFFER TO BUY THESE SECURITIES IN ANY JURISDICTION WHERE THE OFFER OR SALE IS NOT PERMITTED. |
| 68 |
| Office – CBD | Loan #4 | Cut-off Date Balance: | $30,500,000 | |
| Property Addresses - Various | 74 Kent Street & 11-20 46th Road | Cut-off Date LTV: | 62.2% | |
| U/W NCF DSCR: | 1.94x | |||
| U/W NOI Debt Yield: | 8.7% |
The following table presents certain information relating to comparable office leases to the 11-20 46th Road Property.
Comparable Office/Community Facility Leases(1)
| Property Name/Location | Year Built | NRA (SF) | Tenant Name | Lease Area (SF) | Lease Date | Lease Term | Base Rent PSF | Reimbursement |
| 85-15 Queens Boulevard | 2017 | 171,954 | Forte Preparatory | 30,806 | Jul-19 | 10.0 | $42.95 | Modified Gross |
| 85-15 Queens Boulevard, | Academy Charter school | |||||||
| Elmhurst, NY | ||||||||
| 955 Flatbush Avenue | 1931 | 46,759 | Davita Inc | 11,400 | Mar-19 | 15.0 | $48.08 | Modified Gross |
| 955 Flatbush Avenue, | ||||||||
| Brooklyn, NY | ||||||||
| 185 Marcy Avenue | 1905 | 70,000 | NYC ACS | 37,680 | Jun-18 | 6.0 | $46.59 | Modified Gross |
| 185 Marcy Avenue, | ||||||||
| Brooklyn, NY | ||||||||
| 59-17 Junction Boulevard | 1971 | 475,000 | Fidelis | 50,000 | Apr-18 | 10.0 | $36.00 | Modified Gross |
| 59-17 Junction Boulevard, | ||||||||
| Queens, NY | ||||||||
| 74 Kent Street | 1931 | 33,435 | NYU Medical | 16,679 | Feb-18 | 15.0 | $50.83 | Modified Gross |
| 74 Kent Street, | ||||||||
| Brooklyn, NY | ||||||||
| 813-815 Broadway and 317 Ellery Street | 1926 | 52,359 | NYC Health & Hospitals Corp. | 52,359 | Feb-18 | 32.7 | $52.48 | Modified Gross |
| 813-815 Broadway and 317 Ellery Street | ||||||||
| Brooklyn, NY | ||||||||
| Evergreen Avenue Office | 1950 | 185,150 | NYC Department of | 185,150 | Sep-17 | 20.0 | $52.59 | Modified Gross |
| 95 Evergreen Avenue, | Citywide Administration | |||||||
| Brooklyn, NY | ||||||||
| 902 Quentin Road | 2013 | 72,269 | NYU - Prem B | 8,836 | Jul-17 | 8.0 | $52.59 | Modified Gross |
| 902 Quentin Road, | ||||||||
| Brooklyn, NY |
| (1) | Information obtained from the appraisal. |
Escrows.
Real Estate Taxes – The 74 Kent Street & 11-20 46th Road Mortgage Loan documents require an upfront real estate tax reserve of $80,123 and ongoing monthly real estate tax reserves in an amount equal to one-twelfth of the real estate taxes that the lender estimates will be payable during the next twelve months (initially $13,354).
Insurance – The 74 Kent Street & 11-20 46th Road Mortgage Loan documents require an upfront insurance reserve of $18,167 and ongoing monthly insurance reserves in an amount equal to one-twelfth of the insurance premiums that the lender estimates will be payable for the renewal of the coverage during the next twelve months (initially $6,056).
Replacement Reserve – The 74 Kent Street & 11-20 46th Road Mortgage Loan documents require an ongoing monthly replacement reserve deposit in an amount equal to one-twelfth of the product obtained by multiplying $0.20 by the aggregate number of rentable square feet of space at the 74 Kent Street & 11-20 46th Road Properties (initially $1,108 per month).
TheraCare Earn-Out Reserve –The 74 Kent Street & 11-20 46th Road Mortgage Loan documents require an upfront earn-out reserve deposit of $2,000,000. Provided that no Cash Management Period (as defined below) is continuing, the borrowers may request that the lender disburse all funds in the earn-out reserve upon the borrowers delivering (A) evidence satisfactory to the lender on the earlier of (i) TheraCare (or an acceptable replacement tenant) opening for business and (ii) TheraCare (or an acceptable replacement tenant) paying full, unabated rent to the borrowers and (B) a notice of title continuation showing that since the origination date there has been no adverse change in the state of title to any of the 74 Kent Street & 11-20 46th Road Properties. Any funds in the earn-out reserve not released by April 24, 2022 will, at the lender’s option either (x) be used by the lender to partially defease the 74 Kent Street & 11-20 46th Road Mortgage Loan, in accordance with the 74 Kent Street & 11-20 46th Road Mortgage Loan documents or (y) be reallocated to the TI/LC Reserve to be used for payment of approved tenant improvements and leasing commissions in accordance with the 74 Kent Street & 11-20 46th Road Mortgage Loan documents.
TCO Reserve - The 74 Kent Street & 11-20 46th Road Mortgage Loan documents require an upfront TCO Reserve deposit of $3,000,000. Provided that no event of default is then in effect, the borrowers may request that the lender disburse all funds in the TCO Reserve upon the borrowers delivering (1) evidence reasonably satisfactory to the lender of a valid and unexpired certificate of occupancy (temporary or final) from the New York City Department of Buildings relating to the demised premises that will be occupied by TheraCare pursuant to the TheraCare lease and (2) a notice of title continuation showing that since the origination date there has been no adverse change in the state of title to any of the 74 Kent Street & 11-20 46th Road Properties.
| THE INFORMATION IN THIS STRUCTURAL AND COLLATERAL TERM SHEET IS NOT COMPLETE AND MAY BE AMENDED PRIOR TO THE TIME OF SALE. THIS TERM SHEET IS NOT AN OFFER TO SELL THESE SECURITIES AND IT IS NOT A SOLICITATION OF AN OFFER TO BUY THESE SECURITIES IN ANY JURISDICTION WHERE THE OFFER OR SALE IS NOT PERMITTED. |
| 69 |
| Office – CBD | Loan #4 | Cut-off Date Balance: | $30,500,000 | |
| Property Addresses - Various | 74 Kent Street & 11-20 46th Road | Cut-off Date LTV: | 62.2% | |
| U/W NCF DSCR: | 1.94x | |||
| U/W NOI Debt Yield: | 8.7% |
Vapor Mitigation Reserve -The 74 Kent Street & 11-20 46th Road Mortgage Loan documents require an upfront Vapor Mitigation reserve of $69,000.
Outstanding TI/LC Reserve –The 74 Kent Street & 11-20 46th Road Mortgage Loan documents require an upfront TI/LC reserve of $2,290,826 ($1,173,479 and $1,117,345 for the TheraCare and NYU School of Medicine leases, respectively).
TheraCare Free Rent Reserve: The 74 Kent Street & 11-20 46th Road Mortgage Loan documents require an upfront Free Rent reserve of $1,302,188.
Lockbox and Cash Management. The 74 Kent Street & 11-20 46th Road Mortgage Loan requires a hard lockbox with springing cash management. The borrower was required at origination of the 74 Kent Street & 11-20 46th Road Mortgage Loan to deliver written instructions to tenants directing them to deposit all rents payable under such leases directly into a lender-controlled lockbox account. The 74 Kent Street & 11-20 46th Road Mortgage Loan documents require that all rents received by the borrower or the property manager be deposited into the lockbox account within one business day of receipt. Prior to the occurrence of a Cash Management Period (as defined below), all funds on deposit in the lockbox account will be disbursed to the 74 Kent Street & 11-20 46th Road Mortgage Loan borrowers. During a Cash Management Period, all funds in the lockbox account are required to be swept each business day into the cash management account, and all excess cash flow is required to be swept to an excess cash flow subaccount held by the lender.
A “Cash Management Period” will commence upon the earlier of the following:
| (i) | the occurrence and continuance of an event of default; |
| (ii) | the net operating income debt service coverage ratio (“NOI DSCR”) falling below 1.30x; |
| (iii) | the commencement of a Lease Sweep Period (as defined below); or |
| (iv) | 55 days after the origination date of the 74 Kent Street & 11-20 46th Road Mortgage Loan if the borrowers have not obtained the TheraCare TCO. |
A Cash Management Period will end upon the occurrence of the following:
| ● | with regard to clauses (i), (ii) and (iii) above, payment in full or defeasance in full of the 74 Kent Street & 11-20 46th Road Mortgage Loan; |
| ● | with regard to clause (i), the cure or waiver of such event of default; |
| ● | with regard to clause (ii), the NOI DSCR being equal to or greater than 1.35x for two consecutive calculation dates; |
| ● | with regard to clause (iii), the end of a Lease Sweep Period; and |
| ● | with regard to clause (iv), the borrowers having delivered to the lender evidence that the borrowers have obtained the TheraCare TCO. |
A “Lease Sweep Period” will commence upon the earliest to occur of the following:
| (i) | any Major Lease (as defined below) being surrendered, cancelled or terminated prior to its then current expiration date or any Major Tenant (as defined below) giving irrevocable notice (whether actual or constructive) to a borrower of its intention to terminate, surrender or cancel the Major Lease to which such Major Tenant is a party; or |
| (ii) | (a) any Major Tenant (other than NYU School of Medicine and Project Franklin) discontinuing its business at its premises (i.e., “goes dark”) in more than 25% of its space at the premises and giving notice (whether actual or constructive) that it intends to discontinue its business (provided, however temporary cessation of business for repairs, upgrades, maintenance and/or subletting or assignment purposes are not considered “going-dark”) or (b) NYU School of Medicine discontinuing its business at its premises in more than 25% of its space at the premises and giving notice (whether actual or constructive) that it intends to discontinue its business (provided, however temporary cessation of business for repairs, upgrades, maintenance and/or subletting or assignment purposes are not considered “going-dark”) (an “NYU Dark Event”); or |
| (iii) | the occurrence and continuance (beyond any applicable notice and cure periods) of a default under any Major Lease by the applicable Major Tenant thereunder; or |
| (iv) | the occurrence of a Major Tenant insolvency proceeding. |
A “Lease Sweep Period” will end upon the earliest of the following:
| (i) | with respect to a Lease Sweep Period caused by a matter described in clauses (i) or (ii) above, the date on which all of the space demised under the subject Major Lease (or portion thereof) that gave rise to the subject Lease Sweep Period has been (a) fully leased pursuant to a replacement lease(s) approved by the lender, (b) partially re-leased pursuant to a replacement lease(s) approved by the lender, and entered into in accordance with the 74 Kent Street & 11-20 46th Road Mortgage Loan documents, if (i) the replacement lease provides for rent equal to at least 80% of the rent for the Major Lease that gave rise to the subject Lease Sweep Period and (ii) the debt yield after giving effect to the replacement lease is equal to or greater than 7.65%, and, in each instance, all approved Major Lease leasing expenses (x) have been paid in full if due and payable or (y) if not yet due and payable, the lender has determined (in its sole but good faith discretion) that sufficient funds have |
| THE INFORMATION IN THIS STRUCTURAL AND COLLATERAL TERM SHEET IS NOT COMPLETE AND MAY BE AMENDED PRIOR TO THE TIME OF SALE. THIS TERM SHEET IS NOT AN OFFER TO SELL THESE SECURITIES AND IT IS NOT A SOLICITATION OF AN OFFER TO BUY THESE SECURITIES IN ANY JURISDICTION WHERE THE OFFER OR SALE IS NOT PERMITTED. |
| 70 |
| Office – CBD | Loan #4 | Cut-off Date Balance: | $30,500,000 | |
| Property Addresses - Various | 74 Kent Street & 11-20 46th Road | Cut-off Date LTV: | 62.2% | |
| U/W NCF DSCR: | 1.94x | |||
| U/W NOI Debt Yield: | 8.7% |
| been accumulated or deposited in the special rollover reserve subaccount to pay for all anticipated expenses in connection with the re-leasing of the space under the applicable lease(s) that gave rise to the subject Lease Sweep Period, including brokerage commissions and tenant improvements, and any anticipated shortfalls of payments required under the 74 Kent Street & 11-20 46th Road Mortgage Loan documents during any period of time that rents are insufficient as a result of down time or free rent periods or (c) with respect to a Lease Sweep Period caused solely by an NYU Dark Event, the date on which an amount at least equal to $60.00 per rentable square foot of demised space under the NYU School of Medicine lease has accumulated in the special rollover reserve subaccount attributable to the NYU School of Medicine lease; |
| (ii) | with respect to a Lease Sweep Period caused by a matter described in clause (iii) above, the subject Major Tenant default being cured, and no other monetary or material non-monetary Major Tenant default having occurred (following all applicable notice and/or cure periods) for a period of three consecutive months following such cure; |
| (iii) | with respect to a Lease Sweep Period caused by a matter described in clause (iv) above, the applicable Major Tenant insolvency proceeding being terminated without termination of the lease or the applicable Major Lease being affirmed, assumed or assigned in a manner reasonably satisfactory to the lender; or |
| (iv) | with respect to a Lease Sweep Period solely in connection with the Project Franklin lease, the date that $500,000 has accumulated in the special rollover reserve subaccount attributable to the Project Franklin lease; provided, further, the borrowers may, at their option, prevent or stop a Lease Sweep Period relating to the Project Franklin lease by either (a) depositing cash in the amount such that the aggregate amount then on deposit in the special rollover reserve subaccount with respect to the Project Franklin lease equals or exceeds $500,000, or (b) delivering to the lender a letter of credit in the face amount such that the sum of the face amount of such letter of credit plus the aggregate amount then on deposit in the special rollover reserve subaccount with respect to the Project Franklin lease equals or exceeds $500,000. |
“Major Lease” means the TheraCare lease, the NYU School of Medicine lease, the Project Franklin lease, and any other lease (or leases with the same tenant and/or its affiliates) that covers 12,500 or more rentable square feet of the improvements at any 74 Kent Street & 11-20 46th Road Properties.
“Major Tenant” means any tenant under a Major Lease.
Property Management. The 74 Kent Street & 11-20 46th Road Properties are managed by SD Asset Management LLC.
Partial Release. Not permitted.
Real Estate Substitution.Not permitted.
Subordinate and Mezzanine Indebtedness.Not permitted.
Ground Lease. None.
Terrorism Insurance.The 74 Kent Street & 11-20 46th Road Mortgage Loan documents require that the “all risk” insurance policy required to be maintained by the borrowers provides coverage for terrorism in an amount equal to the full replacement cost of the 74 Kent Street & 11-20 46th Road Properties, as well as business interruption insurance following the occurrence of a casualty event.
| THE INFORMATION IN THIS STRUCTURAL AND COLLATERAL TERM SHEET IS NOT COMPLETE AND MAY BE AMENDED PRIOR TO THE TIME OF SALE. THIS TERM SHEET IS NOT AN OFFER TO SELL THESE SECURITIES AND IT IS NOT A SOLICITATION OF AN OFFER TO BUY THESE SECURITIES IN ANY JURISDICTION WHERE THE OFFER OR SALE IS NOT PERMITTED. |
| 71 |
| Office – CBD | Loan #5 | Cut-off Date Balance: | $30,400,000 | |
| 77 Clinton Avenue | 77 Clinton Avenue | Cut-off Date LTV: | 54.3% | |
| Brooklyn, NY 11205 | U/W NCF DSCR: | 2.19x | ||
| U/W NOI Debt Yield: | 8.9% |
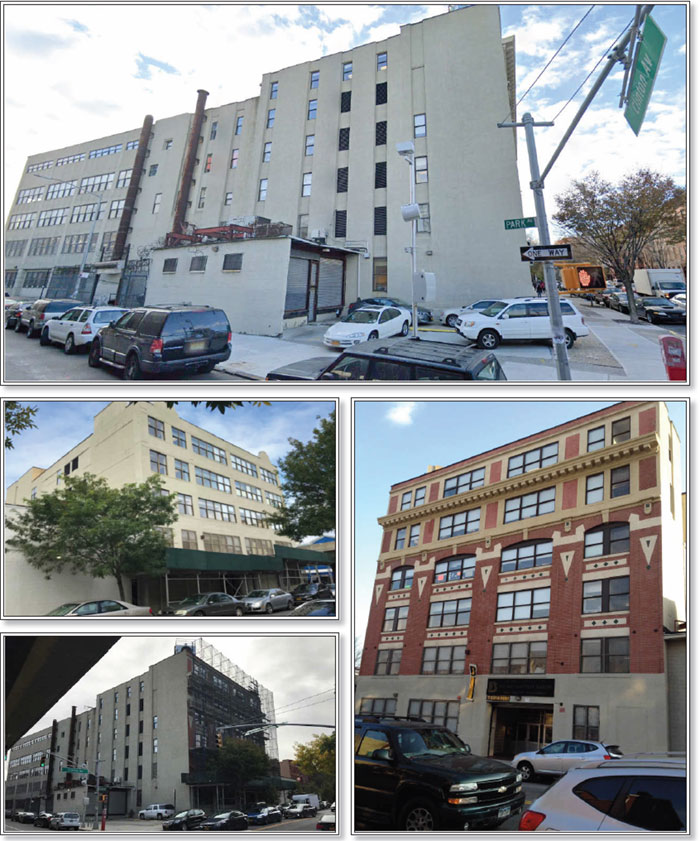
| THE INFORMATION IN THIS STRUCTURAL AND COLLATERAL TERM SHEET IS NOT COMPLETE AND MAY BE AMENDED PRIOR TO THE TIME OF SALE. THIS TERM SHEET IS NOT AN OFFER TO SELL THESE SECURITIES AND IT IS NOT A SOLICITATION OF AN OFFER TO BUY THESE SECURITIES IN ANY JURISDICTION WHERE THE OFFER OR SALE IS NOT PERMITTED. |
| 72 |
| Office – CBD | Loan #5 | Cut-off Date Balance: | $30,400,000 | |
| 77 Clinton Avenue | 77 Clinton Avenue | Cut-off Date LTV: | 54.3% | |
| Brooklyn, NY 11205 | U/W NCF DSCR: | 2.19x | ||
| U/W NOI Debt Yield: | 8.9% |
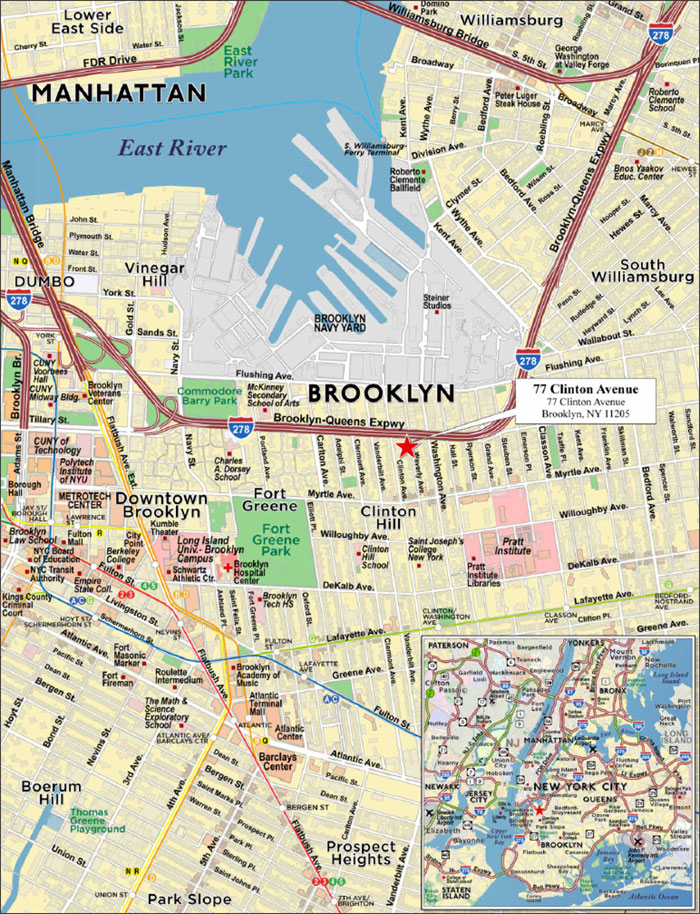
| THE INFORMATION IN THIS STRUCTURAL AND COLLATERAL TERM SHEET IS NOT COMPLETE AND MAY BE AMENDED PRIOR TO THE TIME OF SALE. THIS TERM SHEET IS NOT AN OFFER TO SELL THESE SECURITIES AND IT IS NOT A SOLICITATION OF AN OFFER TO BUY THESE SECURITIES IN ANY JURISDICTION WHERE THE OFFER OR SALE IS NOT PERMITTED. |
| 73 |
| No. 5 – 77 Clinton Avenue | |||||||
| Mortgage Loan Information | Mortgaged Property Information | ||||||
| Mortgage Loan Seller: | Argentic Real Estate Finance LLC | Single Asset/Portfolio: | Single Asset | ||||
Credit Assessment (Fitch/KBRA/S&P): | NR/NR/NR | Property Type – Subtype: | Office – CBD | ||||
| Original Principal Balance: | $30,400,000 | Location: | Brooklyn, NY | ||||
| Cut-off Date Balance: | $30,400,000 | Size: | 127,000 SF | ||||
| % of Initial Pool Balance: | 4.5% | Cut-off Date Balance Per SF: | $239.37 | ||||
| Loan Purpose: | Refinance | Maturity Date Balance Per SF: | $239.37 | ||||
| Borrower Sponsors: | Abraham Leser; Edith Leser | Year Built/Renovated: | 1914/1968 | ||||
| Guarantors(1): | Abraham Leser; Edith Leser | Title Vesting: | Fee | ||||
| Mortgage Rate: | 3.8500% | Property Manager: | Commercial Space Management LLC (borrower-related) | ||||
| Note Date: | October 25, 2019 | Current Occupancy (As of): | 100.0% (12/1/2019) | ||||
| Seasoning: | 1 month | YE 2018 Occupancy: | 100.0% | ||||
| Maturity Date: | November 6, 2029 | YE 2017 Occupancy: | 100.0% | ||||
| IO Period: | 120 months | YE 2016 Occupancy: | 100.0% | ||||
| Loan Term (Original): | 120 months | Appraised Value(2): | $56,000,000 | ||||
| Amortization Term (Original): | NAP | Appraised Value Per SF(2): | $440.94 | ||||
| Loan Amortization Type: | Interest-only, Balloon | Appraisal Valuation Date(2): | October 1, 2020 | ||||
| Call Protection: | L(25),D(91),O(4) | ||||||
| Lockbox Type: | Hard/Springing Cash Management | Underwriting and Financial Information | |||||
| Additional Debt: | None | TTM NOI (9/30/2019): | $2,179,504 | ||||
| Additional Debt Type (Balance): | NAP | YE 2018 NOI: | $2,146,127 | ||||
| YE 2017 NOI: | $2,135,263 | ||||||
| YE 2016 NOI: | $2,160,655 | ||||||
| U/W Revenues: | $3,251,375 | ||||||
| U/W Expenses: | $538,386 | ||||||
| Escrows and Reserves(3) | U/W NOI(4): | $2,712,989 | |||||
| Initial | Monthly | Cap | U/W NCF: | $2,600,589 | |||
| Taxes | $173,681 | $28,947 | NAP | U/W DSCR based on NOI/NCF: | 2.28x / 2.19x | ||
| Insurance | $25,370 | $6,342 | NAP | U/W Debt Yield based on NOI/NCF: | 8.9% / 8.6% | ||
| Replacement Reserve | $0 | $2,117 | NAP | U/W Debt Yield at Maturity based on NOI/NCF: | 8.9% / 8.6% | ||
| Rent Reserve | $771,667 | $0 | NAP | Cut-off Date LTV Ratio(2): | 54.3% | ||
| TI/LC Reserve | $400,000 | $25,000 | $4,000,000 | LTV Ratio at Maturity: | 54.3% | ||
| Sources and Uses | |||||||
| Sources | Uses | ||||||
| Original loan amount | $30,400,000 | 100.0% | Loan payoff | $14,369,299 | 47.3 | % | |
| Return of equity | 13,738,102 | 45.2 | |||||
| Upfront reserves | 1,370,718 | 4.5 | |||||
| Closing costs | 921,881 | 3.0 | |||||
| Total Sources | $30,400,000 | 100.0% | Total Uses | $30,400,000 | 100.0 | % | |
| (1) | In the event the NYC School (as defined below) terminates, cancels or surrenders its lease, the guarantor will be fully and personally liable for the payment of an amount equal to 20% of the then unpaid principal, all interest accrued and unpaid thereon, any yield maintenance premium and all other sums due to the lender in respect of the 77 Clinton Avenue Mortgage Loan (as defined below). Please also refer to information concerning the “Leser Lease” under “Major Tenant” below. |
| (2) | The appraisal value shown represents the “as-stabilized” value which assumes New York City Department of Education is paying the increased rental rate under its renewal lease effective in September 2020. At origination, the 77 Clinton Avenue Borrowers (as defined below) deposited $771,667 into a rent reserve, which represents the difference between the in-place rental rate and the renewal lease rental rate from the origination date through September 2020. The “As-Is” appraised value is $54.5 million which equates to Cut-off Date LTV Ratio and LTV Ratio at Maturity of 55.8% and 55.8%, respectively. The appraiser also concluded a “Go Dark” value of $42.6 million as of October 3, 2019 for the 77 Clinton Avenue Property which assumes the 77 Clinton Avenue Property is a vacant office building. |
| (3) | See “Escrows” section for a full description of Escrows and Reserves. |
| (4) | See “Cash Flow Analysis” chart for an explanation of the increase in U/W NOI. |
| THE INFORMATION IN THIS STRUCTURAL AND COLLATERAL TERM SHEET IS NOT COMPLETE AND MAY BE AMENDED PRIOR TO THE TIME OF SALE. THIS TERM SHEET IS NOT AN OFFER TO SELL THESE SECURITIES AND IT IS NOT A SOLICITATION OF AN OFFER TO BUY THESE SECURITIES IN ANY JURISDICTION WHERE THE OFFER OR SALE IS NOT PERMITTED. |
| 74 |
| Office – CBD | Loan #5 | Cut-off Date Balance: | $30,400,000 | |
| 77 Clinton Avenue | 77 Clinton Avenue | Cut-off Date LTV: | 54.3% | |
| Brooklyn, NY 11205 | U/W NCF DSCR: | 2.19x | ||
| U/W NOI Debt Yield: | 8.9% |
The Mortgage Loan. The mortgage loan (the “77 Clinton Avenue Mortgage Loan”) is evidenced by a single promissory note secured by a first mortgage encumbering the borrower’s fee interest in a 127,000 square foot office building currently operated as a school and located in Brooklyn, New York (the “77 Clinton Avenue Property”).
The Borrowers and Borrower Sponsors.Each borrower, Clinton Associates of Kings Inc. and Clinton Associates of Kings 2 LLC (the “77 Clinton Avenue Borrowers”), is a single purpose entity with one independent director. Legal counsel to the 77 Clinton Avenue Borrowers delivered a non-consolidation opinion in connection with the origination of the 77 Clinton Avenue Mortgage Loan. Abraham Leser and Edith Leser are the borrower sponsors and non-recourse carve-out guarantors of the 77 Clinton Avenue Mortgage Loan.
Abraham Leser is the founder and Chief Executive Officer of The Leser Group Ltd. The Leser Group Ltd., a real estate investment firm focused on the development, acquisition, ownership and management of commercial real estate assets. Based in Brooklyn, New York, The Leser Group Ltd. owns and operates a portfolio of over 40 properties totaling over 2.0 million square feet located throughout New York, New Jersey, Connecticut and Pennsylvania. One of the borrower sponsors previously owned three properties that secured loans which were subject to foreclosure and one property that secured a loan which was subject to a deed-in-lieu of foreclosure, each unrelated to the 77 Clinton Avenue Property. See “Description of the Mortgage Pool—Loan Purpose; Default History, Bankruptcy Issues and Other Proceedings” in the Preliminary Prospectus.
The Property.The 77 Clinton Avenue Property is comprised of one, six-story building totaling 127,000 square feet, situated on a 1.0-acre site in the Clinton Hill neighborhood of Brooklyn, New York. The 77 Clinton Avenue Property is 100.0% leased by the New York City Department of Education (the “NYC School”) and houses the New York City public high school known as Benjamin Banneker Academy. The 77 Clinton Avenue Property was initially leased by the New York City School Construction Authority in February 1995, and the NYC School Lease (as defined below) was subsequently assigned to the NYC School in August 2019. The building was originally constructed as a Drake’s Bakery factory. The building was subsequently redeveloped into the Benjamin Banneker Academy, a charter school, named after the 18th century African American astronomer, surveyor, mathematician and almanac writer, who helped lay out the city of Washington, D.C. The Benjamin Banneker Academy was ranked #35 in the New York Post’s list of “The top 40 public high schools in NYC” in September 2016. The building covers the northern portion of the site with approximately 12,000 square feet of paved exterior space utilized for parking and a playground. The exterior space contains brick and steel gates with access from both Waverly Avenue and Clinton Avenue. The majority of the building is six-stories plus a basement with a single-story basketball court/gymnasium located along the southern portion of the building. The main building entrance is along Clinton Avenue with a secondary entrance along Waverly Avenue and additional emergency exits from the single-story portion of the building. The above grade area is built out as classrooms, kitchen/cafeteria, administrative offices, and other school uses. The basement contains mechanical rooms, janitorial rooms and storage. The 77 Clinton Avenue Property is currently zoned as “R6B” which includes residences of all kinds, schools, health related facilities and office, amongst others, as permitted uses.
Major Tenant.
NYC School (127,000 square feet; 100.0% of net rentable area; 100.0% of underwritten base rent; 09/04/2030 lease expiration) – According to the appraisal, the New York City Department of Education is the largest system of public schools in the United States. Currently, the system operates over 1,800 schools, over 650 of which have opened since 2002. The public-school system, which includes charter schools, has an annual operating budget of approximately $25.2 billion and has an enrollment of over 1.125 million students as of the 2018/2019 school year.
In the event the NYC School Lease is terminated, canceled or surrendered, the guarantor will be fully and personally liable for the payment of an amount equal to 20% of the then unpaid principal, all interest accrued and unpaid thereon, any yield maintenance premium and all other sums due to the lender in respect of the 77 Clinton Avenue Mortgage Loan. In addition, the guarantor executed a lease with the 77 Clinton Avenue Borrowers as landlord and the guarantor as tenant on the origination date (the “Leser Lease”) for a 15-year term. If the NYC School fails or is not obligated to pay all base rent, additional rent and other amounts due pursuant to the terms of its lease, then the guarantor under the Leser Lease covenants and agrees to pay all of the rent and other sums due and to cause the performance of any such other material obligations of NYC School on account of such obligations under the NYC School Lease.
| THE INFORMATION IN THIS STRUCTURAL AND COLLATERAL TERM SHEET IS NOT COMPLETE AND MAY BE AMENDED PRIOR TO THE TIME OF SALE. THIS TERM SHEET IS NOT AN OFFER TO SELL THESE SECURITIES AND IT IS NOT A SOLICITATION OF AN OFFER TO BUY THESE SECURITIES IN ANY JURISDICTION WHERE THE OFFER OR SALE IS NOT PERMITTED. |
| 75 |
| Office – CBD | Loan #5 | Cut-off Date Balance: | $30,400,000 | |
| 77 Clinton Avenue | 77 Clinton Avenue | Cut-off Date LTV: | 54.3% | |
| Brooklyn, NY 11205 | U/W NCF DSCR: | 2.19x | ||
| U/W NOI Debt Yield: | 8.9% |
The following table presents certain information relating to the tenancy at the 77 Clinton Avenue Property:
Major Tenants(1)
| Tenant Name | Credit Rating (Fitch/ Moody’s/ S&P)(2) | Tenant NRSF | % of NRSF | Annual U/W Base Rent PSF | Annual U/W Base Rent | % of Total Annual U/W Base Rent | Lease Expiration Date | Extension Options | Termination Option (Y/N) |
| Major Tenants | |||||||||
| NYC School(3) | AA/Aa1/AA | 115,000 | 90.6% | $29.50 | $3,392,500 | 99.1% | 09/04/2030 | N | Y(4) |
| NYC School(5) | AA/Aa1/AA | 12,000 | 9.4% | $2.50 | $30,000 | 0.9% | 09/04/2030 | N | Y(4) |
| Total Major Tenants | 127,000 | 100.0% | $26.95 | $3,422,500 | 100.0% | ||||
| Vacant Space | 0 | 0.0% | |||||||
| Collateral Total | 127,000 | 100.0% | |||||||
| (1) | Information obtained from the underwritten rent roll. |
| (2) | Certain ratings are those of the parent company whether or not the parent guarantees the lease. |
| (3) | Annual U/W Base Rent PSF and Annual U/W Base Rent is based on the NYC School Lease extension rental rate of $29.50, which goes into effect September 2020. The current base rent under the NYC School Lease is $21.50 per square foot. At origination, the 77 Clinton Avenue Borrowers deposited $771,667 into a rent reserve, which represents the difference in rent between the in-place rental rate and the renewal lease rental rate from the origination date to September 2020. |
| (4) | NYC School has the option to terminate the lease at its sole and absolute discretion after September 5, 2022 or at any time thereafter with 90 days’ notice. |
| (5) | Represents 12,000 square feet of leasable outdoor space. |
The following table presents certain information relating to the lease rollover schedule at the 77 Clinton Avenue Property:
Lease Expiration Schedule(1)(2)
| Year Ending December 31, | No. of Leases Expiring | Expiring NRSF | % of Total NRSF | Cumulative Expiring NRSF | Cumulative % of Total NRSF | Annual U/W Base Rent(3) | % of Total Annual U/W Base Rent | Annual U/W Base Rent PSF(3) |
| MTM | 0 | 0 | 0.0% | 0 | 0.0% | $0 | 0.0% | $0.00 |
| 2019 | 0 | 0 | 0.0% | 0 | 0.0% | $0 | 0.0% | $0.00 |
| 2020 | 0 | 0 | 0.0% | 0 | 0.0% | $0 | 0.0% | $0.00 |
| 2021 | 0 | 0 | 0.0% | 0 | 0.0% | $0 | 0.0% | $0.00 |
| 2022 | 0 | 0 | 0.0% | 0 | 0.0% | $0 | 0.0% | $0.00 |
| 2023 | 0 | 0 | 0.0% | 0 | 0.0% | $0 | 0.0% | $0.00 |
| 2024 | 0 | 0 | 0.0% | 0 | 0.0% | $0 | 0.0% | $0.00 |
| 2025 | 0 | 0 | 0.0% | 0 | 0.0% | $0 | 0.0% | $0.00 |
| 2026 | 0 | 0 | 0.0% | 0 | 0.0% | $0 | 0.0% | $0.00 |
| 2027 | 0 | 0 | 0.0% | 0 | 0.0% | $0 | 0.0% | $0.00 |
| 2028 | 0 | 0 | 0.0% | 0 | 0.0% | $0 | 0.0% | $0.00 |
| 2029 | 0 | 0 | 0.0% | 0 | 0.0% | $0 | 0.0% | $0.00 |
| Thereafter | 2 | 127,000 | 100.0% | 127,000 | 100.0% | $3,422,500 | 100.0% | $26.95 |
| Vacant | 0 | 0 | 0.0% | 127,000 | 100.0% | $0 | 0.0% | $0.00 |
| Total/Weighted Average | 2 | 127,000 | 100.0% | 127,000 | 100.0% | $3,422,500 | 100.0% | $26.95 |
| (1) | Information obtained from the underwritten rent roll. |
| (2) | The tenant has a lease termination option that is exercisable prior to the originally stated expiration date of the subject lease and that is not considered in the Lease Expiration Schedule. |
| (3) | Annual U/W Base Rent PSF and Annual U/W Base Rent are based on the NYC School Lease extension rental rate of $29.50 which goes into effect September 2020. The current base rent under the NYC School Lease is $26.95 per square foot. The 77 Clinton Avenue Borrowers deposited $771,667 into a rent reserve on the origination date which represents the difference in the rent between in-place rental rate and the renewal lease rental rate from the origination date to September 2020. |
| THE INFORMATION IN THIS STRUCTURAL AND COLLATERAL TERM SHEET IS NOT COMPLETE AND MAY BE AMENDED PRIOR TO THE TIME OF SALE. THIS TERM SHEET IS NOT AN OFFER TO SELL THESE SECURITIES AND IT IS NOT A SOLICITATION OF AN OFFER TO BUY THESE SECURITIES IN ANY JURISDICTION WHERE THE OFFER OR SALE IS NOT PERMITTED. |
| 76 |
| Office – CBD | Loan #5 | Cut-off Date Balance: | $30,400,000 | |
| 77 Clinton Avenue | 77 Clinton Avenue | Cut-off Date LTV: | 54.3% | |
| Brooklyn, NY 11205 | U/W NCF DSCR: | 2.19x | ||
| U/W NOI Debt Yield: | 8.9% |
The following table presents historical occupancy percentages at the 77 Clinton Avenue Property:
Historical Occupancy
12/31/2016(1) | 12/31/2017(1) | 12/31/2018(1) | 12/1/2019(2) |
| 100.0% | 100.0% | 100.0% | 100.0% |
| (1) | As provided by the 77 Clinton Avenue Borrowers. |
| (2) | Information obtained from the underwritten rent roll. |
Operating History and Underwritten Net Cash Flow. The following table presents certain information relating to the historical operating performance and underwritten net cash flow at the 77 Clinton Avenue Property:
Cash Flow Analysis
| 2016 | 2017 | 2018 | TTM 9/30/2019 | U/W | %(2) | U/W $ per SF | |
| Base Rent | $2,496,500 | $2,496,500 | $2,496,500 | $2,496,500 | $2,496,500 | 72.9% | $19.66 |
| Contractual Rent Steps | 0 | 0 | 0 | 0 | 926,000 | 27.1 | 7.29 |
| Grossed Up Vacant Space | 0 | 0 | 0 | 0 | 0 | 0.0 | 0.00 |
| Gross Potential Rent | $2,496,500 | $2,496,500 | $2,496,500 | $2,496,500 | $3,422,500(1) | 100.0% | $26.95 |
| Other Income | 470 | 0 | 0 | 0 | 0 | 0.0 | 0.00 |
| Total Recoveries | 58,421 | 67,223 | 80,124 | 118,365 | 0 | 0.0 | 0.00 |
| Net Rental Income | $2,555,390 | $2,563,723 | $2,576,624 | $2,614,865 | $3,422,500 | 100.0% | $26.95 |
| (Vacancy & Credit Loss) | 0 | 0 | 0 | 0 | (171,125)(3) | (5.0) | (1.35) |
| Effective Gross Income | $2,555,390 | $2,563,723 | $2,576,624 | $2,614,865 | $3,251,375 | 95.0% | $25.60 |
| Real Estate Taxes | 293,212 | 310,586 | 323,171 | 248,514 | 347,363 | 10.7 | 2.74 |
| Insurance | 34,407 | 43,687 | 38,090 | 118,579 | 76,109 | 2.3 | 0.60 |
| Management Fee | 63,902 | 64,120 | 64,437 | 65,384 | 97,541 | 3.0 | 0.77 |
| Other Operating Expenses | 3,214 | 10,068 | 4,800 | 2,885 | 17,374 | 0.5 | 0.14 |
| Total Operating Expenses | $394,735 | $428,461 | $430,498 | $435,361 | $538,386 | 16.6% | $4.24 |
| Net Operating Income | $2,160,655 | $ 2,135,263 | $2,146,127 | $2,179,504 | $2,712,989(4) | 83.4% | $21.36 |
| Replacement Reserves | 0 | 0 | 0 | 0 | 25,400 | 0.8 | 0.20 |
| TI/LC(x) | 0 | 0 | 0 | 0 | 87,000 | 2.7 | 0.69 |
| Net Cash Flow | $2,160,655 | $2,135,263 | $2,146,127 | $2,179,504 | $2,600,589 | 80.0% | $20.48 |
| NOI DSCR | 1.82x | 1.79x | 1.80x | 1.83x | 2.28x | ||
| NCF DSCR | 1.82x | 1.79x | 1.80x | 1.83x | 2.19x | ||
| NOI Debt Yield | 7.1% | 7.0% | 7.1% | 7.2% | 8.9% | ||
| NCF Debt Yield | 7.1% | 7.0% | 7.1% | 7.2% | 8.6% |
| (1) | Underwritten based on the NYC School Lease extension rental rate of $29.50 which goes into effect September 2020. The current base rent under the NYC School Lease is $21.50 per square foot. At origination, the 77 Clinton Avenue Borrowers deposited $771,667 into a renewal rent reserve, which represents the difference in rent between the in-place rental rate and the renewal lease rental rate from the origination date to September 2020. |
| (2) | Represents (i) percent of Net Rental Income for all revenue fields, (ii) percent of Gross Potential Rent for Vacancy & Credit Loss and (iii) percent of Effective Gross Income for all other fields. |
| (3) | The underwritten economic vacancy is 5.0%. The 77 Clinton Avenue Property was 100.0% physically occupied as of December 1, 2019. |
| (4) | The UW net operating income increased from TTM 9/30/2019 due to the increase in rental rate under the NYC School Lease extension referenced in footnote (1) above. |
Appraisal.The appraiser concluded to “as-is” and “as-stabilized” appraised values of $54,500,000 and $56,000,000, respectively, for the 77 Clinton Avenue Property. The “as-stabilized” value assumes New York City Department of Education is paying the increased rental rate under its renewal lease effective in September 2020. At origination, the 77 Clinton Avenue Borrowers deposited $771,667 into a renewal rent reserve, which represents the difference between the in-place rental rate and the renewal lease rental rate from the origination date through September 2020. The “As-Is” appraised value is $54.5 million which equates to Cut-off Date LTV Ratio and LTV Ratio at Maturity of 55.8% and 55.8%, respectively. The appraiser also concluded a “Go Dark” value of $42.6 million as of October 3, 2019 for the 77 Clinton Avenue Property which assumes the 77 Clinton Avenue Property is a vacant office building.
| THE INFORMATION IN THIS STRUCTURAL AND COLLATERAL TERM SHEET IS NOT COMPLETE AND MAY BE AMENDED PRIOR TO THE TIME OF SALE. THIS TERM SHEET IS NOT AN OFFER TO SELL THESE SECURITIES AND IT IS NOT A SOLICITATION OF AN OFFER TO BUY THESE SECURITIES IN ANY JURISDICTION WHERE THE OFFER OR SALE IS NOT PERMITTED. |
| 77 |
| Office – CBD | Loan #5 | Cut-off Date Balance: | $30,400,000 | |
| 77 Clinton Avenue | 77 Clinton Avenue | Cut-off Date LTV: | 54.3% | |
| Brooklyn, NY 11205 | U/W NCF DSCR: | 2.19x | ||
| U/W NOI Debt Yield: | 8.9% |
Environmental Matters. According to the Phase I environmental site assessment dated October 8, 2019, there was no evidence of any recognized environmental conditions at the 77 Clinton Avenue Property. The implementation of an asbestos O&M plan was recommended.
Market Overview and Competition.The 77 Clinton Avenue Property is located in the Clinton Hill section of the Borough of Brooklyn, City and State of New York. The neighborhood of Clinton Hill is located to the east of Downtown Brooklyn, which is the business and governmental center of the borough. Clinton Hill is bordered by Fort Greene to the west, Bedford Stuyvesant to the east, Williamsburg and the Brooklyn Navy Yard to the north and Prospect Heights to the south. The 77 Clinton Avenue Property’s immediate area is improved primarily with walk-up apartment buildings and two-family homes. Industrial development predominates to the north of the Brooklyn Queens Expressway due to the Brooklyn Navy Yard. The Brooklyn Navy Yard is a 300-acre waterfront industrial park with over 40 buildings, three dry docks and four active piers. It is home to more than 250 tenants, from art and graphic design firms to trucking and industrial shipping concerns. The nearest subway station is the G train at the corner of Washington Avenue and Lafayette Avenue.
The 77 Clinton Avenue Property is located in the District 13 school district which encompasses areas of Brooklyn Heights, Fort Greene, Clinton Hill and Bedford-Stuyvesant. According to the appraisal, Brooklyn is home to cultural and academic institutions, which are integral parts of the local economy and the quality of life. Brooklyn's primary institutions of higher learning include Brooklyn College, Pratt Institute, and Brooklyn Law School. Brooklyn is also home to Kingsborough Community College. According to the appraisal, Brooklyn's premier public school is Brooklyn Technical, considered along with Stuyvesant and Bronx Science to be in the top three public high schools. Brooklyn is also home to many notable private schools including Packer Collegiate Institute and St. Ann's in Brooklyn Heights, The Friends School in Boerum Hill, Berkeley Carroll in Park Slope, and Poly Prep Country Day School in Dyker Heights.
According to the appraisal, the estimated 2019 population within a one-, three-, and five-mile radius of the 77 Clinton Avenue Property was 153,377, 1,279,894, and 2,858,159, respectively. Currently 18.48% of the population within one mile of the 77 Clinton Avenue Property and 14.22% of the population within five miles are school age (5 to 17).
According to a third-party report, the 77 Clinton Avenue Property is situated within the North Brooklyn submarket of the New York Office Market. As of the second quarter of 2019, the North Brooklyn submarket reported a total inventory of approximately 14.2 million square feet of office space with a 10.8% vacancy rate and average asking rent of $41.11 per square foot.
The following table presents certain information relating to the appraiser’s market rent conclusions for the 77 Clinton Avenue Property:
Market Rent Summary(1)
| Market Rent for Interior Space | Market Rent for Exterior Space | |
| Market Rent (PSF) | $29.50 | $2.50 |
| Lease Term (Years) | 10 | 10 |
| Lease Type (Reimbursements) | RET over Base | RET over Base |
| Rent Increase Projection | 10% increase Year 6 | 10% increase Year 6 |
| (1) | Information obtained from the appraisal. |
| THE INFORMATION IN THIS STRUCTURAL AND COLLATERAL TERM SHEET IS NOT COMPLETE AND MAY BE AMENDED PRIOR TO THE TIME OF SALE. THIS TERM SHEET IS NOT AN OFFER TO SELL THESE SECURITIES AND IT IS NOT A SOLICITATION OF AN OFFER TO BUY THESE SECURITIES IN ANY JURISDICTION WHERE THE OFFER OR SALE IS NOT PERMITTED. |
| 78 |
| Office – CBD | Loan #5 | Cut-off Date Balance: | $30,400,000 | |
| 77 Clinton Avenue | 77 Clinton Avenue | Cut-off Date LTV: | 54.3% | |
| Brooklyn, NY 11205 | U/W NCF DSCR: | 2.19x | ||
| U/W NOI Debt Yield: | 8.9% |
The following table presents certain information relating to comparable school leases to the 77 Clinton Avenue Property:
Comparable School Leases(1)
| Property Name/Location | Distance from Subject | Tenant | Tenant Size (SF) | Lease Date | Lease Term (Yrs.) | Annual Base Rent PSF | Lease Type |
5811 Ditmas Avenue Brooklyn, NY | 5.3 miles | Anex to Primary School 135 and 235 | 66,000 | Dec-18 | 10.0 | $26.00 | NNN |
63 Flushing Avenue Brooklyn, NY | 0.8 miles | S.T.E.A.M. Center High School | 39,742 | Jan-19 | 20.0 | $22.00 | MG |
584 Driggs Avenue Brooklyn, NY | 1.9 miles | Unity Preparatory Charter High School | 20,400 | Sep-18 | 35.0 | $44.12 | NNN |
5613 Flatlands Avenue Brooklyn, NY | 6.2 miles | Public School | 27,576 | Mar-18 | 15.0 | $28.50 | MG |
77 Sands Street Brooklyn, NY | 1.2 miles | Brooklyn Lab Charter School | 75,228 | Jan-18 | 16.5 | $51.00 | MG |
1217 Bedford Avenue Brooklyn, NY | 1.6 miles | Christ the Rock | 22,000 | Sep-17 | 15.0 | $45.00 | MG |
139 Menahan Street Brooklyn, NY | 2.8 miles | Success Academy Charter School, Inc. | 41,510 | May-16 | 20.0 | $26.00 | NNN |
| (1) | Information obtained from the appraisal. |
Escrows.
Real Estate Taxes – The 77 Clinton Avenue Mortgage Loan documents require an upfront real estate tax reserve in the amount of $173,681 and ongoing monthly real estate tax reserves in an amount equal to one-twelfth of the real estate taxes that the lender estimates will be payable during the next twelve months (initially $28,947).
Insurance – The 77 Clinton Avenue Mortgage Loan documents require an upfront insurance reserve in the amount of $25,370 and an ongoing monthly insurance reserve in an amount equal to one-twelfth of the insurance premiums that the lender estimates will be payable during the next twelve months (initially $6,342).
Replacement Reserve – The 77 Clinton Avenue Mortgage Loan documents require ongoing monthly replacement reserves in an amount equal to one-twelfth of $0.20 per square foot (currently $2,117).
TI/LC Reserve –The 77 Clinton Avenue Mortgage Loan documents require an upfront reserve totaling $400,000 and beginning on the payment date in December 2021 through the payment date in November 2025, an ongoing monthly general TI/LC reserve in an amount of $25,000 and from the payment date in December 2025 through the end of the loan term, $43,750, which altogether is anticipated to equal approximately $3.3 million. Monthly deposits are not required to be made on any payment date to the extent that the amount of funds on deposit in the TI/LC Reserve equals or exceeds $4,000,000. Throughout the loan term, the 77 Clinton Avenue Borrowers may elect to replace the TI/LC reserve with a letter of credit equal to the amount in the TI/LC reserve at the time plus the following 12 months expected collection. The 77 Clinton Avenue Borrowers are required to continue to increase the amount of the letter of credit on an annual basis by the annual required amount until such time the letter of credit equals $4.0 million.
Renewal Rent Reserve -The 77 Clinton Avenue Mortgage Loan documents require an upfront renewal rent reserve of $771,667 which represents the difference between the total annual rent currently due under the NYC School Lease and the rent expected to be due in September 2020.
Lockbox and Cash Management. The 77 Clinton Avenue Mortgage Loan documents require that the 77 Clinton Avenue Borrowers establish and maintain a lender-controlled lockbox account and that the 77 Clinton Avenue Borrowers direct all tenants to pay rent directly into such lockbox account. The 77 Clinton Avenue Mortgage Loan documents also require that all rents received by the 77 Clinton Avenue Borrowers or the property manager be deposited into the lockbox account within two business days of receipt. Prior to the occurrence of a Cash Management Period (as defined below), all funds on deposit in the lockbox account will be disbursed to the 77 Clinton Avenue Borrowers. During a Cash Management Period, all funds in the lockbox account are required to be swept each business day into the cash management account, and all excess cash flow is required to be swept to an excess cash flow subaccount held by the lender.
A “Cash Management Period” will commence upon the earlier of the following:
| (i) | the occurrence and continuance of an event of default; |
| (ii) | the net operating income debt service coverage ratio (“NOI DSCR”) falling below 1.20x at the end of any calendar quarter; or |
| (iii) | the commencement of a Lease Sweep Period (as defined below). |
| THE INFORMATION IN THIS STRUCTURAL AND COLLATERAL TERM SHEET IS NOT COMPLETE AND MAY BE AMENDED PRIOR TO THE TIME OF SALE. THIS TERM SHEET IS NOT AN OFFER TO SELL THESE SECURITIES AND IT IS NOT A SOLICITATION OF AN OFFER TO BUY THESE SECURITIES IN ANY JURISDICTION WHERE THE OFFER OR SALE IS NOT PERMITTED. |
| 79 |
| Office – CBD | Loan #5 | Cut-off Date Balance: | $30,400,000 | |
| 77 Clinton Avenue | 77 Clinton Avenue | Cut-off Date LTV: | 54.3% | |
| Brooklyn, NY 11205 | U/W NCF DSCR: | 2.19x | ||
| U/W NOI Debt Yield: | 8.9% |
A “Cash Management Period” will end upon the occurrence of the following:
| (i) | with regard to clause (i) above, the cure of such event of default; |
| (ii) | with regard to clause (ii) above, the NOI DSCR being equal to or greater than 1.25x for two consecutive calendar quarters; and |
| (iii) | with regard to clause (iii) above, the end of the Lease Sweep Period. |
A “Lease Sweep Period” will commence upon the earliest to occur of the following:
| (i) | the date that is twelve months prior to (a) the end of the term of any Major Lease (as defined below) (including any renewal terms) or (b) the maturity date; or |
| (ii) | the earlier of (a) the date required under a Major Lease by which the applicable Major Tenant (as defined below) is required to give notice of its exercise of a renewal option thereunder (and such renewal has not been so exercised) or (b) the date the applicable Major Tenant gives notice of its intention not to renew or extend; or |
| (iii) | (a) a NYC School Lease Sweep Period (as defined below) or (b) any other Major Lease (or any material portion thereof) being surrendered, cancelled or terminated prior to its then current expiration date; or |
| (iv) | from and after September 5, 2022, any Major Tenant discontinuing its business at its premises in any material portion of its premises or giving notice that it intends to discontinue its business in any material portion of its premises; or |
| (v) | a monetary default or a material non-monetary default (beyond any applicable notice and cure periods) under any Major Lease by the applicable Major Tenant thereunder; or |
| (vi) | a Major Tenant insolvency proceeding. |
A “Lease Sweep Period” will end upon the occurrence of the following:
| (i) | with respect to clauses (i), (ii), (iii)(b) or (iv) above, upon the earlier to occur of (a) the date on which the subject Major Tenant irrevocably exercises its renewal or extension option (or otherwise enters into an extension agreement with the 77 Clinton Avenue Borrowers and acceptable to the lender) with respect to all of the space demised under its Major Lease, as applicable, and in the lender’s judgment, sufficient funds have been accumulated in the special rollover reserve (during the continuance of the subject Lease Sweep Period) to pay for all anticipated approved Major Lease leasing expenses for such Major Lease and any other anticipated expenses in connection with such renewal or extension, or (b) the date on which all of the space demised under the subject Major Lease (or portion thereof), as applicable, that gave rise to the subject Lease Sweep Period has been fully leased pursuant to a replacement lease or replacement leases approved by the lender, and entered into in accordance with the 77 Clinton Avenue Mortgage Loan documents, and all approved Major Lease leasing expenses have been paid in full; |
| (ii) | with respect to clause (iii)(a) above, the expiration of the NYC School Lease Sweep Period; |
| (iii) | with respect to clause (v) above, the Major Tenant default being cured, and no other Major Tenant default having occurred for a period of three consecutive months following such cure; and |
| (iv) | with respect to clause (vi) above, the applicable Major Tenant insolvency proceeding having terminated and the applicable Major Lease having been affirmed, assumed or assigned in a manner satisfactory to the lender. |
Notwithstanding anything to the contrary, to the extent that the aggregate amount of rollover reserve funds and special rollover reserve funds then on deposit with the lender as of such payment date (taking into account any letter of credit deposited into the special rollover reserve in accordance with the 77 Clinton Avenue Mortgage Loan documents) equals or exceeds the Special Rollover Reserve Funds Cap, then (provided that no Cash Management Period is then continuing (other than a Cash Management Period triggered solely as a result of a Lease Sweep Period)), the Lease Sweep Period and associated Cash Management Period will end, the lender will give notice to the clearing bank that the sweeping of funds into the cash management account may cease and all funds in the excess cash flow subaccount will be released to the 77 Clinton Avenue Borrowers. The “Special Rollover Reserve Funds Cap” is an amount equal to $5,000,000.
A “Major Lease” means each of the following: (i) the NYC School Lease and (ii) any other lease which covers in the aggregate 20% or more rentable square feet or accounts for 20% or more of the gross revenue at the 77 Clinton Avenue Property.
A “Major Tenant” means any tenant under either a Major Lease, or under one or more leases (leased by such tenant and/or its affiliates), which when taken together cover in the aggregate 20% or more rentable square feet of the 77 Clinton Avenue Property.
A “NYC School Lease Sweep Period” means a period (A) commencing upon the termination, cancellation or surrender of the NYC School Lease, or notification by NYC School of its intent to do any of the foregoing and (B) expiring as of the first to occur of (1) NYC School revoking in writing any notification of such termination, cancellation or surrender of such NYC School Lease, reaffirming such NYC School Lease in writing and resuming ordinary course business operations during customary hours at all of the space leased under such NYC School Lease or (2) the date on which (x) substantially all of the space demised under the NYC School Lease (or portion thereof) that gave rise to the NYC School Lease Sweep Period has been fully re-leased or (y) space within the 77 Clinton Avenue Property has been leased to at least the same economic occupancy as had existed immediately prior to the commencement of the NYC School Lease Sweep Period, in either case pursuant to a replacement lease or replacement leases approved by the lender and entered into in accordance with the 77 Clinton Avenue Mortgage Loan documents, all approved Major Lease leasing expenses (and any other expenses in connection with the re-tenanting of such space) have been paid in full and the applicable replacement tenant is in occupancy of the demised space and paying full, unabated rent under the applicable replacement lease.
“NYC School” means the New York City Department of Education, a/k/a/ the Board of Education of the City School District of the City of New York, a body corporate existing under the Education Law of the State of New York.
| THE INFORMATION IN THIS STRUCTURAL AND COLLATERAL TERM SHEET IS NOT COMPLETE AND MAY BE AMENDED PRIOR TO THE TIME OF SALE. THIS TERM SHEET IS NOT AN OFFER TO SELL THESE SECURITIES AND IT IS NOT A SOLICITATION OF AN OFFER TO BUY THESE SECURITIES IN ANY JURISDICTION WHERE THE OFFER OR SALE IS NOT PERMITTED. |
| 80 |
| Office – CBD | Loan #5 | Cut-off Date Balance: | $30,400,000 | |
| 77 Clinton Avenue | 77 Clinton Avenue | Cut-off Date LTV: | 54.3% | |
| Brooklyn, NY 11205 | U/W NCF DSCR: | 2.19x | ||
| U/W NOI Debt Yield: | 8.9% |
“NYC School Lease” means that certain Lease dated October 27, 2009, together with that certain lease extension and modification dated August 8, 2019 and that certain amended lease extension and modification dated October 16, 2019, by and between NYC School, as tenant (as successor by assignment to The New York City School Construction Authority), and Clinton Associates of Kings 2 LLC, as landlord (as successor by assignment to Clinton Associates of Kings Inc.), affecting the 77 Clinton Avenue Property, together with any amendments, supplements, extensions, renewals and/or other modifications thereto.
Property Management. The 77 Clinton Avenue Property is managed by Commercial Space Management LLC, an affiliate of the 77 Clinton Avenue Borrowers.
Partial Defeasance and Partial Release. Not permitted.
Right of First Refusal. None.
Real Estate Substitution.Not permitted.
Subordinate and Mezzanine Indebtedness.Not permitted.
Ground Lease. None.
Terrorism Insurance.The 77 Clinton Avenue Mortgage Loan documents require that the “all risk” insurance policy required to be maintained by the 77 Clinton Avenue Borrowers provides coverage for terrorism in an amount equal to the full replacement cost of the 77 Clinton Avenue Property, as well as business interruption insurance covering no less than the 18-month period following the occurrence of a casualty event, together with a 6-month extended period of indemnity (provided that if TRIPRA or a similar statute is not in effect, the 77 Clinton Avenue Borrowers will not be obligated to pay terrorism insurance premiums in excess of two times the premium for the casualty and business interruption coverage on a stand-alone basis).
| THE INFORMATION IN THIS STRUCTURAL AND COLLATERAL TERM SHEET IS NOT COMPLETE AND MAY BE AMENDED PRIOR TO THE TIME OF SALE. THIS TERM SHEET IS NOT AN OFFER TO SELL THESE SECURITIES AND IT IS NOT A SOLICITATION OF AN OFFER TO BUY THESE SECURITIES IN ANY JURISDICTION WHERE THE OFFER OR SALE IS NOT PERMITTED. |
| 81 |
| Mixed Use – Flex/Office/Retail | Loan #6 | Cut-off Date Balance: | $27,600,000 | |
| 6856 Eastern Avenue Northwest | Takoma Metro Center | Cut-off Date LTV: | 69.7% | |
| Washington, DC 20012 | U/W NCF DSCR: | 2.33x | ||
| U/W NOI Debt Yield: | 9.7% |

| THE INFORMATION IN THIS STRUCTURAL AND COLLATERAL TERM SHEET IS NOT COMPLETE AND MAY BE AMENDED PRIOR TO THE TIME OF SALE. THIS TERM SHEET IS NOT AN OFFER TO SELL THESE SECURITIES AND IT IS NOT A SOLICITATION OF AN OFFER TO BUY THESE SECURITIES IN ANY JURISDICTION WHERE THE OFFER OR SALE IS NOT PERMITTED. |
| 82 |
| Mixed Use – Flex/Office/Retail | Loan #6 | Cut-off Date Balance: | $27,600,000 | |
| 6856 Eastern Avenue Northwest | Takoma Metro Center | Cut-off Date LTV: | 69.7% | |
| Washington, DC 20012 | U/W NCF DSCR: | 2.33x | ||
| U/W NOI Debt Yield: | 9.7% |

| THE INFORMATION IN THIS STRUCTURAL AND COLLATERAL TERM SHEET IS NOT COMPLETE AND MAY BE AMENDED PRIOR TO THE TIME OF SALE. THIS TERM SHEET IS NOT AN OFFER TO SELL THESE SECURITIES AND IT IS NOT A SOLICITATION OF AN OFFER TO BUY THESE SECURITIES IN ANY JURISDICTION WHERE THE OFFER OR SALE IS NOT PERMITTED. |
| 83 |
| No. 6 – Takoma Metro Center | ||||||
| Mortgage Loan Information | Mortgaged Property Information | |||||
| Mortgage Loan Seller: | BSPRT CMBS Finance, LLC | Single Asset/Portfolio: | Single Asset | |||
Credit Assessment (Fitch/KBRA/S&P): | NR/NR/NR | Property Type – Subtype: | Mixed Use – Flex /Office/Retail | |||
| Original Principal Balance: | $27,600,000 | Location: | Washington, DC | |||
| Cut-off Date Balance: | $27,600,000 | Size: | 198,107 SF | |||
| % of Initial Pool Balance: | 4.1% | Cut-off Date Balance Per SF: | $139.32 | |||
| Loan Purpose: | Refinance | Maturity Date Balance Per SF: | $139.32 | |||
| Borrower Sponsor: | Norman Jemal | Year Built/Renovated: | 1908/2017 | |||
| Guarantor: | Norman Jemal | Title Vesting: | Fee | |||
| Mortgage Rate: | 3.7900% | Property Manager: | Self-managed | |||
| Note Date: | September 27, 2019 | Current Occupancy (As of): | 91.3% (8/23/2019) | |||
| Seasoning: | 2 months | YE 2018 Occupancy: | 89.9% | |||
| Maturity Date: | October 6, 2029 | YE 2017 Occupancy: | 79.8% | |||
| IO Period: | 120 months | YE 2016 Occupancy: | 79.7% | |||
| Loan Term (Original): | 120 months | YE 2015 Occupancy: | 81.8% | |||
| Amortization Term (Original): | NAP | Appraised Value(2): | $39,600,000 | |||
| Loan Amortization Type: | Interest-only, Balloon | Appraised Value Per SF(2): | $199.89 | |||
| Call Protection: | L(26),D(89),O(5) | Appraisal Valuation Date(2): | August 27, 2019 | |||
| Lockbox Type: | Hard/Springing Cash Management | |||||
| Additional Debt: | None | Underwriting and Financial Information | ||||
| Additional Debt Type (Balance): | NAP | TTM NOI (6/30/2019)(3): | $2,382,050 | |||
| YE 2018 NOI(3): | $1,991,136 | |||||
| YE 2017 NOI(3): | $1,782,632 | |||||
| YE 2016 NOI(3): | $1,600,962 | |||||
| Escrows and Reserves(1) | U/W Revenues: | $3,998,690 | ||||
| Initial | Monthly | Cap | U/W Expenses: | $1,325,867 | ||
| Taxes | $81,405 | $40,702 | NAP | U/W NOI(3): | $2,672,824 | |
| Insurance | $26,417 | $3,774 | NAP | U/W NCF: | $2,474,717 | |
| Deferred Maintenance | $28,704 | $0 | NAP | U/W DSCR based on NOI/NCF: | 2.51x / 2.33x | |
| Replacement Reserve | $0 | $3,302 | NAP | U/W Debt Yield based on NOI/NCF: | 9.7% / 9.0% | |
| TI/LC Reserve | $0 | $13,207 | NAP | U/W Debt Yield at Maturity based on NOI/NCF: | 9.7% / 9.0% | |
| Montessori Expansion Reserve | $600,000 | $0 | NAP | Cut-off Date LTV Ratio(2): | 69.7% | |
| Free Rent Reserve | $71,794 | $0 | NAP | LTV Ratio at Maturity(2): | 69.7% | |
| Sources and Uses | |||||
| Sources | Uses | ||||
| Original loan amount | $27,600,000 | 100.0% | Loan payoff(4) | $22,836,836 | 82.7% |
| Upfront reserves | 808,319 | 3.0 | |||
| Closing costs | 243,673 | 0.9 | |||
| Return of equity | 3,711,171 | 13.4 | |||
| Total Sources | $27,600,000 | 100.0% | Total Uses | $27,600,000 | 100.0% |
| (1) | See “Escrows” below for a full description of the Escrows and Reserves. |
| (2) | The Appraised Value represents the “As-Is (No Free Rent)” value of $39,600,000, which assumes no free rent for the Breakthrough Montessori PCS expansion of 25,559 square feet. At origination, $600,000 was reserved for concessions and TI/LC costs related to the Breakthrough Montessori PCS expansion space, a portion of which is currently occupied by A. Salon LTD. The “As-Is” appraised value for the Takoma Metro Center Property (as defined below) is $39,000,000. The Cut-off Date LTV Ratio and LTV Ratio at Maturity based on the $39,000,000 “As-Is” appraised value are 70.8% and 70.8%, respectively. |
| (3) | See “Operating History and Underwritten Net Cash Flow” below for a discussion of the increases in historical NOI and from historical to UW NOI. |
| (4) | Previous debt was originated by Benefit Street Partners Operating Partnership, L.P., which included a $23,000,000 whole loan securitized in the BSPRT 2018-FL3 Mortgage Trust. |
The Mortgage Loan. The mortgage loan (the “Takoma Metro Center Mortgage Loan”) is evidenced by a single promissory note secured by a first mortgage encumbering the borrower’s fee interest in a 198,107 mixed use property located in Washington, District of Columbia (the “Takoma Metro Center Property”).
The Borrower and Borrower Sponsor.The borrower, Jemal's Takoma Park L.L.C. (the “Takoma Metro Center Borrower”) is a District of Columbia limited liability company and single-purpose entity with one independent director. Legal counsel to the Takoma Metro Center Borrower delivered a non-consolidation opinion in connection with the origination of the Takoma Metro Center Mortgage Loan. The borrower sponsor and non-recourse carveout guarantor of the Takoma Metro Center Mortgage Loan is Norman Jemal.
| THE INFORMATION IN THIS STRUCTURAL AND COLLATERAL TERM SHEET IS NOT COMPLETE AND MAY BE AMENDED PRIOR TO THE TIME OF SALE. THIS TERM SHEET IS NOT AN OFFER TO SELL THESE SECURITIES AND IT IS NOT A SOLICITATION OF AN OFFER TO BUY THESE SECURITIES IN ANY JURISDICTION WHERE THE OFFER OR SALE IS NOT PERMITTED. |
| 84 |
| Mixed Use – Flex/Office/Retail | Loan #6 | Cut-off Date Balance: | $27,600,000 | |
| 6856 Eastern Avenue Northwest | Takoma Metro Center | Cut-off Date LTV: | 69.7% | |
| Washington, DC 20012 | U/W NCF DSCR: | 2.33x | ||
| U/W NOI Debt Yield: | 9.7% |
Norman Jemal serves as the principal and Senior Vice President for Douglas Development Corporation (“Douglas”), a real estate development corporation in the Washington area. Douglas’ current portfolio consists of over 10.0 million square feet with more than 5.0 million square feet in the development pipeline. As a principal with Douglas, Norman Jemal is involved in all aspects of the business including acquisitions and dispositions, development, finance and corporate strategic planning. Norman Jemal owns a total of 243 properties consisting of 12.7 million square feet with a total value of approximately $4.3 billion. The sponsor was involved in litigation. See“Description of the Mortgage Pool—Litigation and Other Considerations” in the Preliminary Prospectus.”
The Property.The Takoma Metro Center Property is a 198,107 square foot, four-story Class B mixed use building located in Washington, DC. Constructed in 1908 and situated on a 2.3 acre site, the Takoma Metro Center Property is comprised of 105,124 square feet of flex space, 75,912 square feet of office space and 17,071 square feet of retail space. The Takoma Metro Center Property was partially renovated from 2013-2017, undergoing approximately $2.3 million in capital improvements which included a façade refurbishment, construction of speculative suites for prospective tenants, and the conversion of warehouse/industrial space into ground floor retail. The Takoma Metro Center Property contains 42 parking spaces, resulting in a parking ratio of 0.21 per 1,000 square feet of net rentable area. As of August 23, 2019, the Takoma Metro Center Property was 91.3% leased to 30 tenants.
Major Tenants.
Largest Tenant: The Kennedy Center (Moody’s: Aaa; 58,439 square feet; 16.9% of underwritten base rent; 2/28/2031 lease expiration) –The Kennedy Center is a performing arts center established by Congress as a bureau of the Smithsonian Institution to promote and maintain the John F. Kennedy for the Performing Arts as the national center for the performing arts by developing and producing a wide array of performances encompassing the genres of theater, dance, ballet, orchestra, and other multi-media for adults and children. The Kennedy Center utilizes its space at the Takoma Metro Center Property primarily for rehearsals of the Washington National Opera. The Kennedy Center serves as the official home for the National Symphony Orchestra and the Washington National Opera. The space consists of three large practice spaces, high ceiling storage spaces for props, offices, and several smaller practice rooms. The Kennedy Center has been a tenant at the Takoma Metro Center Property since 2001 and exercised a fifteen-year renewal in 2016. The Kennedy Center has one, five-year renewal option.
2nd Largest Tenant: A. Salon LTD (d/b/a DC Arts Studios) (31,120 square feet; 13.7% of underwritten base rent; 2/28/2021 lease expiration) – Founded in 1979, A. Salon LTD is a member-run arts organization that provides studio space for member artists of all disciplines, creative agencies, and arts organizations. A. Salon LTD also provides exhibition opportunities and professional support, and fosters connections between its member artists so that they may collaborate and grow in their craft, in the true spirit of an artist co-op. A. Salon LTD has been a tenant at the Takoma Metro Center Property since 2004 and has no renewal options remaining.
3rd Largest Tenant: Breakthrough Montessori PCS (15,565 square feet; 6.3% of underwritten base rent; 8/31/2043 lease expiration) – Breakthrough Montessori PCS is an all-day Montessori charter school funded in part by grants from Washington DC’s Citybridge Foundation as part of the Next Generation Learning Challenges (NGLC) Regional Breakthrough Initiative. NGLC is a network of educators, innovators, technologists, and philanthropic foundations funded primarily by the Bill and Melinda Gates Foundation, with additional support from the William and Flora Hewlett Foundation, the Broad Foundation, and the Michael & Susan Dell Foundation. Breakthrough Montessori PCS has been a tenant at the Takoma Metro Center Property since 2018 and has no renewal options. Breakthrough Montessori PCS’s lease includes a 25,559 square foot contractual expansion obligation into a portion of A. Salon LTD’s existing space with an anticipated lease commencement and rent commencement date of April 2021 and August 2022, respectively and a lease expiration date of August 2043.
| THE INFORMATION IN THIS STRUCTURAL AND COLLATERAL TERM SHEET IS NOT COMPLETE AND MAY BE AMENDED PRIOR TO THE TIME OF SALE. THIS TERM SHEET IS NOT AN OFFER TO SELL THESE SECURITIES AND IT IS NOT A SOLICITATION OF AN OFFER TO BUY THESE SECURITIES IN ANY JURISDICTION WHERE THE OFFER OR SALE IS NOT PERMITTED. |
| 85 |
| Mixed Use – Flex/Office/Retail | Loan #6 | Cut-off Date Balance: | $27,600,000 | |
| 6856 Eastern Avenue Northwest | Takoma Metro Center | Cut-off Date LTV: | 69.7% | |
| Washington, DC 20012 | U/W NCF DSCR: | 2.33x | ||
| U/W NOI Debt Yield: | 9.7% |
The following table presents certain information relating to the tenancy at the Takoma Metro Center Property:
Major Tenants
| Tenant Name | Credit Rating (Fitch/ Moody’s/ S&P)(1) | Tenant NRSF | % of NRSF | Annual U/W Base Rent PSF(2) | Annual U/W Base Rent(2) | % of Total Annual U/W Base Rent | Lease Expiration Date | Extension Options | Termination Option (Y/N) |
| Major Tenants | |||||||||
| The Kennedy Center | NR/Aaa/NR | 58,439 | 29.5% | $10.21 | $596,678 | 16.9% | 2/28/2031 | 1, 5-year | N |
| A. Salon LTD | NR/NR/NR | 31,120 | 15.7% | $15.49 | $481,953 | 13.7% | 2/28/2021 | None | N |
| Breakthrough Montessori PCS | NR/NR/NR | 15,565 | 7.9% | $14.18 | $220,765 | 6.3% | 8/31/2043 | None | N |
| Youth For Understanding USA | NR/NR/NR | 9,405 | 4.7% | $35.15 | $330,605 | 9.4% | 8/31/2028 | None | N |
| Manna, Inc. | NR/NR/NR | 6,279 | 3.2% | $26.96 | $169,295 | 4.8% | 7/31/2023 | 1, 5-year | Y(3) |
| Total Major Tenants | 120,808 | 61.0% | $14.89 | $1,799,296 | 51.1% | ||||
| Non-Major Tenant | 60,085 | 30.3% | $28.68 | $1,723,292 | 48.9% | ||||
| Occupied Collateral Total | 180,893 | 91.3% | $19.47 | $3,522,588 | 100.0% | ||||
| Vacant Space | 17,214 | 8.7% | |||||||
| Collateral Total | 198,107 | 100.0% | |||||||
| (1) | Certain ratings are those of the parent company whether the parent company guarantees the lease. |
| (2) | Annual U/W Base Rent PSF and Annual U/W Base Rent include contractual rent steps through October 2020 totaling $140,330 and straight line rent for The Kennedy Center over the term of the Takoma Metro Center Mortgage Loan. |
| (3) | Manna, Inc. has the right to terminate its lease effective October 31, 2021 by providing 9 months’ notice to the lessor. |
The following table presents certain information relating to the lease rollover schedule at the Takoma Metro Center Property:
Lease Expiration Schedule(1)(2)
| Year Ending December 31, | No. of Leases Expiring | Expiring NRSF | % of Total NRSF | Cumulative Expiring NRSF | Cumulative % of Total NRSF | Annual U/W Base Rent(3) | % of Total Annual U/W Base Rent | Annual U/W Base Rent PSF |
| MTM | 0 | 0 | 0.0% | 0 | 0.0% | $0 | 0.0% | $0.00 |
| 2019 | 3 | 4,542 | 2.3% | 4,542 | 2.3% | $76,140 | 2.2% | $16.76 |
| 2020 | 4 | 5,024 | 2.5% | 9,566 | 4.8% | $122,276 | 3.5% | $24.34 |
| 2021 | 12 | 51,938 | 26.2% | 61,504 | 31.0% | $1,146,971 | 32.6% | $22.08 |
| 2022 | 2 | 4,767 | 2.4% | 66,271 | 33.5% | $97,400 | 2.8% | $20.43 |
| 2023 | 3 | 13,193 | 6.7% | 79,464 | 40.1% | $364,256 | 10.3% | $27.61 |
| 2024 | 0 | 0 | 0.0% | 79,464 | 40.1% | $0 | 0.0% | $0.00 |
| 2025 | 4 | 7,792 | 3.9% | 87,256 | 44.0% | $211,660 | 6.0% | $27.16 |
| 2026 | 2 | 6,967 | 3.5% | 94,223 | 47.6% | $218,127 | 6.2% | $31.31 |
| 2027 | 0 | 0 | 0.0% | 94,223 | 47.6% | $0 | 0.0% | $0.00 |
| 2028 | 1 | 9,405 | 4.7% | 103,628 | 52.3% | $330,605 | 9.4% | $35.15 |
| 2029 | 0 | 0 | 0.0% | 103,628 | 52.3% | $0 | 0.0% | $0.00 |
| Thereafter | 3 | 77,265 | 39.0% | 180,893 | 91.3% | $955,155 | 27.1% | $12.36 |
| Vacant | 0 | 17,214 | 8.7% | 198,107 | 100.0% | $0 | 0.0% | $0.00 |
| Total/Weighted Average | 34 | 198,107 | 100.0% | $3,522,588 | 100.0% | $19.47 |
| (1) | Information obtained from the underwritten rent roll. |
| (2) | Certain tenants may have lease termination options that are exercisable prior to the originally stated expiration date of the subject lease and that are not considered in the Lease Expiration Schedule. |
| (3) | Total/Weighted Average Annual U/W Base Rent and Annual U/W Base Rent PSF excludes vacant space. |
| THE INFORMATION IN THIS STRUCTURAL AND COLLATERAL TERM SHEET IS NOT COMPLETE AND MAY BE AMENDED PRIOR TO THE TIME OF SALE. THIS TERM SHEET IS NOT AN OFFER TO SELL THESE SECURITIES AND IT IS NOT A SOLICITATION OF AN OFFER TO BUY THESE SECURITIES IN ANY JURISDICTION WHERE THE OFFER OR SALE IS NOT PERMITTED. |
| 86 |
| Mixed Use – Flex/Office/Retail | Loan #6 | Cut-off Date Balance: | $27,600,000 | |
| 6856 Eastern Avenue Northwest | Takoma Metro Center | Cut-off Date LTV: | 69.7% | |
| Washington, DC 20012 | U/W NCF DSCR: | 2.33x | ||
| U/W NOI Debt Yield: | 9.7% |
The following table presents historical occupancy percentages at the Takoma Metro Center Property:
Historical Occupancy(1)
12/31/2016(2) | 12/31/2017(2)(3) | 12/31/2018(2)(3) | 8/23/2019(4) |
| 79.7% | 79.8% | 89.9% | 91.3% |
| (1) | The difference between historical occupancy figures and current occupancy is due to renovations that occurred at the Takoma Metro Center Property from 2013-2017, which included construction of speculative suites for prospective tenants and conversion of warehouse/industrial space into ground floor retail. |
| (2) | Information obtained from the borrower sponsor. |
| (3) | The increase in occupancy from 2017 to 2018 is a result of Breakthrough Montessori PCS signing a new lease in 2018 for 15,565 square feet. |
| (4) | Information obtained from the underwritten rent roll. |
Operating History and Underwritten Net Cash Flow. The following table presents certain information relating to the underwritten net cash flow at the Takoma Metro Center Property:
Cash Flow Analysis
| 2016(1) | 2017(1) | 2018 | TTM 6/30/2019 | U/W | %(2) | U/W $ per SF | |
| Rents in Place | $2,627,390(3) | $2,640,005(3) | $2,993,142(3) | $3,398,628(3) | $3,382,258 | 76.9% | $17.07 |
| Contractual Rent Steps(4) | 0 | 0 | 0 | 0 | 140,330 | 3.2 | 0.71 |
| Straight Line Rent | 0 | 0 | 0 | 0 | 63,282 | 1.4 | 0.32 |
| Grossed Up Vacant Space | 0 | 0 | 0 | 0 | 399,578 | 9.1 | 2.02 |
| Gross Potential Rent | $2,627,390 | $2,640,005 | $2,993,142 | $3,398,628 | $3,985,448 | 90.6% | $20.12 |
| Other Income(5) | 29,717 | 68,604 | 88,095 | 75,156 | 75,156 | 1.7 | 0.38 |
| Total Recoveries | 261,708 | 328,301 | 346,506 | 395,925 | 337,664 | 7.7 | 1.70 |
| Net Rental Income | $2,918,815 | $3,036,910 | $3,427,743 | $3,869,709 | $4,398,268 | 100.0% | $22.20 |
| (Vacancy & Credit Loss) | (29,985)(6) | (1,900)(6) | (161,532)(6) | (191,558)(6) | (399,578)(7) | (10.0) | (2.02) |
| Effective Gross Income | $2,888,830 | $3,035,010 | $3,266,211 | $3,678,151 | $3,998,690 | 90.9% | $20.18 |
| Real Estate Taxes | 426,525 | 428,339 | 408,851 | 430,378 | 474,203 | 11.9 | 2.39 |
| Insurance | 11,399 | 13,870 | 22,383 | 13,191 | 43,967 | 1.1 | 0.22 |
| Management Fee | 139,456 | 148,819 | 148,879 | 164,795 | 119,961 | 3.0 | 0.61 |
| Other Operating Expenses | 710,488 | 661,350 | 694,962 | 687,736 | 687,736 | 17.2 | 3.47 |
| Total Operating Expenses | $1,287,868 | $1,252,378 | $1,275,076 | $1,296,100 | $1,325,867 | 33.2% | $6.69 |
| Net Operating Income | $1,600,962 | $1,782,632 | $1,991,136 | $2,382,050 | $2,672,824 | 66.8% | $13.49 |
| Replacement Reserves | 39,621 | 39,621 | 39,621 | 39,621 | 39,621 | 1.0 | 0.20 |
| TI/LC | 158,486 | 158,486 | 158,486 | 158,486 | 158,486 | 4.0 | 0.80 |
| Net Cash Flow | $1,402,855 | $1,584,525 | $1,793,029 | $2,183,943 | $2,474,717 | 61.9% | $12.49 |
| NOI DSCR | 1.51x | 1.68x | 1.87x | 2.24x | 2.51x | ||
| NCF DSCR | 1.32x | 1.49x | 1.69x | 2.05x | 2.33x | ||
| NOI Debt Yield | 5.8% | 6.5% | 7.2% | 8.6% | 9.7% | ||
| NCF Debt Yield | 5.1% | 5.7% | 6.5% | 7.9% | 9.0% |
| (1) | The Takoma Metro Center Property underwent renovation from 2013-2017, which included construction of speculative suites for prospective tenants and conversion of warehouse/industrial space into ground floor retail. |
| (2) | Represents (i) percent of Net Rental Income for all revenue fields, (ii) percent of Gross Potential Rent for Vacancy & Credit Loss and (iii) percent of Effective Gross Income for all other fields. |
| (3) | Represents the net rental collections, including Vacancy & Credit Loss for the flex and office spaces at the Takoma Metro Center Property. |
| (4) | Represents contractual rent steps through October 2020. |
| (5) | Other income consists of parking income and miscellaneous income. |
| (6) | Represents Vacancy & Credit loss for the retail space of the Takoma Metro Center Property. |
| (7) | The underwritten economic vacancy is 10.2%. The Takoma Metro Center Property was 91.3% physically occupied as of August 23, 2019. |
Appraisal. The appraiser concluded to an “as-is” (No Free Rent) appraised value of $39,600,000 as of August 27, 2019, which assumes no free rent for the Breakthrough Montessori PCS expansion of 25,559 square feet. At origination, $600,000 was reserved for concessions and TI/LC costs related to the Breakthrough Montessori PCS expansion space, a portion of which is currently occupied by A. Salon LTD. The appraiser concluded to an “as-is” appraised value of $39,000,000 as of August 27, 2019. The appraiser concluded
| THE INFORMATION IN THIS STRUCTURAL AND COLLATERAL TERM SHEET IS NOT COMPLETE AND MAY BE AMENDED PRIOR TO THE TIME OF SALE. THIS TERM SHEET IS NOT AN OFFER TO SELL THESE SECURITIES AND IT IS NOT A SOLICITATION OF AN OFFER TO BUY THESE SECURITIES IN ANY JURISDICTION WHERE THE OFFER OR SALE IS NOT PERMITTED. |
| 87 |
| Mixed Use – Flex/Office/Retail | Loan #6 | Cut-off Date Balance: | $27,600,000 | |
| 6856 Eastern Avenue Northwest | Takoma Metro Center | Cut-off Date LTV: | 69.7% | |
| Washington, DC 20012 | U/W NCF DSCR: | 2.33x | ||
| U/W NOI Debt Yield: | 9.7% |
to a “Prospective Market Value Upon Stabilization” for the Takoma Metro Center Property of $43,000,000 as of August 27, 2022, which assumes that the Breakthrough Montessori PCS expansion space rent will commence by August 2022. The Cut-off Date LTV Ratio and LTV Ratio at Maturity based on the $39,000,000 “As-Is” appraised value are 70.8% and 70.8%, respectively.
Environmental Matters. According to a Phase I environmental site assessment dated September 13, 2019, there was no evidence of any recognized environmental conditions at the Takoma Metro Center Property.
Market Overview and Competition.The Takoma Metro Center Property is located in Washington, DC, in the Washington-Arlington-Alexandria metropolitan statistical area (the “Washington DC MSA”). The Washington DC MSA is one of the largest metropolitan statistical areas in the United States with a population of over 6.1 million. Major industries in the Washington DC MSA include professional/scientific/technology services, public administration and health care/social assistance. Major employers within the Washington DC MSA include Naval Support Activity Washington, Joint Base-Andrews-Naval Air Facility, MedStar Health, Inova Health System and SAIC Inc.
Primary access to the Takoma Metro Center Property’s neighborhood is provided by the Capital Beltway (I-495), an interstate highway that encircles Washington DC, and extends into Northern Virginia and Suburban Maryland. The Takoma Metro Center Property is approximately 0.3 miles from the Takoma Metro Station, which allows convenience for commuters. The nearest cluster of retail centers is located east of the Takoma Metro Center Property on Carroll Avenue in Old Town Takoma Park, also known as Main Street Takoma. The Takoma Metro Center Property is also situated near Takoma Park’s main street business district, which is home to several local retailers and restaurants. According to the appraisal, the estimated 2019 population in a one-, three-, and five-mile radius of the Takoma Metro Center Property is 29,426, 275,517 and 743,386, respectively. The average household income within the same radii is $117,639, $109,362 and $131,345, respectively.
Submarket Information – According to a third-party market research report, the Takoma Metro Center Property is situated within the Uptown District of Columbia office submarket. As of the second quarter of 2019, the submarket reported a total inventory of 12.1 million square feet with a 10.9% vacancy rate and an average quoted rental rate of $41.77.
Appraiser’s Competitive Set – The appraiser identified seven competitive properties for the Takoma Metro Center Property totaling approximately 579,717 square feet, which reported an average occupancy rate of approximately 93.0% The appraiser concluded to net market rents for the Takoma Metro Center Property of $25.00 per square foot for office tenants, $17.50 per square foot for flex tenants, and $30.00 per square foot for retail tenants.
The following table presents certain information relating to the appraiser’s market rent conclusion for the Takoma Metro Center Property:
Market Rent Summary(1)
| Flex | Office | Retail | |
| Market Rent (PSF) | $17.50 | $25.00 | $30.00 |
| Lease Term (Years) | 10 | 5 | 10 |
| Lease Type (Reimbursements) | Base Year Tax | Base Year Tax | Net |
| Rent Increase Projection | 2.5% every year | 3.0% every year | 3.0% every year |
| (1) | Information obtained from the appraisal. |
The table below presents certain information relating to comparable sales pertaining to the Takoma Metro Center Property identified by the appraiser:
Comparable Sales(1)
| Property Name | Location | Rentable Area (SF) | Sale Date | Sale Price | Sale Price (PSF) | Adjusted Sale Price | Adjusted Sale Price (PSF) |
| Station Square | Silver Spring, MD | 500,348 | Jan-19 | $107,000,000 | $214 | $120,960,000 | $242 |
| 8701 Georgia Avenue | Silver Spring, MD | 98,478 | Jan-19 | $19,855,000 | $202 | $19,855,000 | $202 |
| MacArthur Professional Center | Washington, DC | 44,175 | Apr-18 | $14,925,000 | $338 | $14,925,000 | $338 |
| Braddock Metro Center | Alexandria, VA | 362,334 | Jan-18 | $79,077,350 | $218 | $93,000,000 | $257 |
| Computer Sciences Building | Lanham, MD | 309,303 | Oct-17 | $82,000,000 | $265 | $82,000,000 | $265 |
| (1) | Information obtained from the appraisal. |
| THE INFORMATION IN THIS STRUCTURAL AND COLLATERAL TERM SHEET IS NOT COMPLETE AND MAY BE AMENDED PRIOR TO THE TIME OF SALE. THIS TERM SHEET IS NOT AN OFFER TO SELL THESE SECURITIES AND IT IS NOT A SOLICITATION OF AN OFFER TO BUY THESE SECURITIES IN ANY JURISDICTION WHERE THE OFFER OR SALE IS NOT PERMITTED. |
| 88 |
| Mixed Use – Flex/Office/Retail | Loan #6 | Cut-off Date Balance: | $27,600,000 | |
| 6856 Eastern Avenue Northwest | Takoma Metro Center | Cut-off Date LTV: | 69.7% | |
| Washington, DC 20012 | U/W NCF DSCR: | 2.33x | ||
| U/W NOI Debt Yield: | 9.7% |
The following table presents certain information relating to comparable leases to those at the Takoma Metro Center Property:
Comparable Leases(1)
| Property Name/Location | Year Built/ Renovated | Total GLA (SF) | Distance from Subject | Occupancy | Tenant | Tenant Size | Lease Term | Annual Base Rent PSF | Lease Type |
Children’s National Medical Center 6833 4th Street, NW Washington, DC | 1988/2018 | 23,140 | 0.4 miles | 100.0% | Children’s National Medical | 23,140 SF | 15.0 Yrs | $34.25 | Absolute Net |
Atlantic Plumbing 2112 8th St, NW Washington, DC | 2015/NAV | 221,011 | 4.6 miles | 96.0% | Wash Project for Arts | 1,487 SF | 7.0 Yrs | $25.00 | Full Service |
1221 Taylor Street, NW Washington, DC | 1960/NAV | 22,000 | 2.9 miles | 100.0% | MBI Health | 21,769 SF | 4.0 Yrs | $30.60 | Base Year Stop |
1400 Spring Street Silver Spring, MD | 1961/NAV | 73,903 | 2.4 miles | 94.0% | Easter Seals | 18,000 SF | 10.0 Yrs | $20.50 | Full Service |
The Eleven Ten Bonifant Building 1110 Bonifant Street Silver Spring, MD | 1986/1999 | 40,503 | 1.9 miles | 96.0.% | MJ Wells Associates | 2,659 SF | 3.0 Yrs | $26.50 | Full Service |
Zalco Building 8701 Georgia Avenue, Silver Spring, MD | 1961/NAV | 100,203 | 2.1 miles | 92.0% | Jacob's Promise | 3,000 SF | 5.0 Yrs | $25.50 | Base Year Stop |
Wayne Plaza 962 Eastern Avenue NW Silver Spring, MD | 1970/2008 | 98,957 | 1.4 miles | 73.0% | Sports & Fitness Industry Assoc. | 2,979 SF | 5.4 Yrs | $26.75 | Base Year Stop |
| (1) | Information obtained from the appraisal. |
Escrows.
Real Estate Taxes – The Takoma Metro Center Mortgage Loan documents require an upfront real estate tax reserve of $81,405 and ongoing monthly real estate tax reserves in an amount equal to one-twelfth of the real estate taxes that the lender estimates will be payable during the next twelve months (initially $40,702).
Insurance – The Takoma Metro Center Mortgage Loan documents require an upfront insurance reserve of $26,417 and ongoing monthly insurance reserves in an amount equal to one-twelfth of the insurance premiums that the lender estimates will be payable during the next twelve months (initially $3,774).
Replacement Reserves – The Takoma Metro Center Mortgage Loan documents require ongoing monthly replacement reserves of $3,302.
Deferred Maintenance– The Takoma Metro Center Mortgage Loan documents require an upfront reserve of $28,704 for immediate repairs.
TI/LC Reserve– The Takoma Metro Center Mortgage Loan documents require ongoing monthly tenant improvement and leasing commissions reserves of $13,207.
Montessori Expansion Reserve – The Takoma Metro Center Mortgage Loan documents require an upfront reserve of $600,000 associated with Breakthrough Montessori PCS’s 25,559 square foot contractual expansion obligation that has an anticipated lease commencement and rent commencement date of April 2021 and August 2022, respectively.
Free Rent Reserve – The Takoma Metro Center Mortgage Loan documents require an upfront reserve of $71,794 for existing tenant obligations related to Breakthrough Montessori PCS.
Lockbox and Cash Management.The Takoma Metro Center Mortgage Loan documents require a hard lockbox and springing cash management. The Takoma Metro Center Borrower was required at origination to deliver letters to the tenants at the Takoma Metro Center Property directing them to pay all rent and other sums due under their respective leases directly into a lender-controlled lockbox account. Additionally, all revenues and other monies received by the Takoma Metro Center Borrower or related property manager are required to be deposited into the lockbox account within one business day upon receipt. After the occurrence and during the continuance of a Cash Sweep Period (as defined below), all funds are required to be swept each business day into the cash management account controlled by the lender and all funds on deposit in the cash management account after payment of debt service, required reserves and budgeted operating expenses are required to be reserved as additional security for the Takoma Metro Center Mortgage Loan.
| THE INFORMATION IN THIS STRUCTURAL AND COLLATERAL TERM SHEET IS NOT COMPLETE AND MAY BE AMENDED PRIOR TO THE TIME OF SALE. THIS TERM SHEET IS NOT AN OFFER TO SELL THESE SECURITIES AND IT IS NOT A SOLICITATION OF AN OFFER TO BUY THESE SECURITIES IN ANY JURISDICTION WHERE THE OFFER OR SALE IS NOT PERMITTED. |
| 89 |
| Mixed Use – Flex/Office/Retail | Loan #6 | Cut-off Date Balance: | $27,600,000 | |
| 6856 Eastern Avenue Northwest | Takoma Metro Center | Cut-off Date LTV: | 69.7% | |
| Washington, DC 20012 | U/W NCF DSCR: | 2.33x | ||
| U/W NOI Debt Yield: | 9.7% |
A “Cash Sweep Period” will commence upon the occurrence of the following:
| (i) | an event of default; |
| (ii) | the debt yield being less than 6.25%; |
| (iii) | a Specified Tenant Sweep Event (as defined below); or |
| (iv) | a Montessori Expansion Sweep Event (as defined below). |
A Cash Sweep Period will end upon the occurrence of:
| ● | with regard to clause (i) above, the cure of such event of default; |
| ● | with regard to clause (ii) above, the debt yield being greater than or equal to 6.50% for two consecutive calendar quarters; |
| ● | with regard to clause (iii) above, the cure of such Specified Tenant Sweep Event; and |
| ● | with regard to clause (iv) above, the cure of such Montessori Expansion Sweep Event. |
A “Specified Tenant” means, individually and collectively, The Kennedy Center, Breakthrough Montessori PCS, and any other tenant under a lease that demises 40,000 or more of the Takoma Metro Center Property’s square footage.
A “Specified Tenant Sweep Event” will commence upon the occurrence of the following:
| (i) | a default by such Specified Tenant under its lease beyond all applicable notice and/or periods; |
| (ii) | a Specified Tenant going dark, vacating or otherwise failing to occupy 50% or more of its space or giving notice of its intent to do any of the foregoing; |
| (iii) | any bankruptcy or insolvency of a Specified Tenant (or its parent company, or any guarantor of such Specified Tenant’s lease); |
| (iv) | a Specified Tenant terminating, cancelling or surrendering its lease, or giving notice of its intent to do any of the foregoing; |
| (v) | the earlier of (a) the date that is 12 months prior to the scheduled expiration date of such Specified Tenant’s Lease or (b) the date under such Specified Tenant’s Lease by which such Specified Tenant is required to give notice of its exercise of a renewal option; or |
| (vi) | a Specified Tenant having long term senior unsecured debt that is rated and such Specified Tenant’s rating being downgraded three or more “notches” by any applicable rating agency. |
A Specified Tenant Sweep Event will end upon the occurrence of:
| ● | with regard to clause (i) above, (x) a Specified Tenant Re-Tenanting Event (as defined below) or (y) the cure of such event of default has been accepted by the borrower; |
| ● | with regard to clause (ii) above, (x) a Specified Tenant Re-Tenanting Event or (y) the Specified Tenant resuming occupancy and normal business operations and (b) the Specified Tenant delivering to the lender an acceptable tenant estoppel certificate; |
| ● | with regard to clause (iii) above, (x) a Specified Tenant Re-Tenanting Event or (y) the bankruptcy proceedings having been terminated in a manner reasonably satisfactory to the lender, the Specified Tenant’s lease being affirmed and the terms of such lease being reasonably satisfactory to the lender; |
| ● | with regard to clause (iv) above, (x) a Specified Tenant Re-Tenanting Event or (y) (a) the Specified Tenant revoking any termination notification and (b) the Specified Tenant delivering to the lender an acceptable tenant estoppel certificate; |
| ● | with regard to clause (v) above, (x) a Specified Tenant Re-Tenanting Event or (y) the lender receiving (a) acceptable evidence that such Specified Tenant has given notice of renewal under terms of its lease, and all landlord obligations (including the payment of any leasing commissions) have been satisfied in full (or sufficient funds have been reserved for such purposes and to cover any operating shortfalls relating to the delay in the commencement of full rent payments) and (b) an acceptable tenant estoppel certificate; and |
| ● | with regard to clause (vi) above, (x) a Specified Tenant Re-Tenanting Event or (y) the lender receiving acceptable evidence that the applicable Specified Tenant’s credit rating is equivalent to or better than the credit rating such Specified Tenant had as of the origination date. |
A “Specified Tenant Re-Tenanting Event” will occur when the borrower has delivered to the lender: (i) evidence reasonably satisfactory to the lender that either (a) at least 90% or more of the Specified Tenant space has been re-tenanted under lease(s) that are/is acceptable to the lender or (b) at least 90% or more of the Specified Tenant rent has been replaced under lease(s) that are/is acceptable to the lender, and (ii) tenant estoppel(s) reasonable satisfactory to the lender.
A “Montessori Expansion Sweep Event” will commence upon the occurrence of the following:
| (i) | Twelve months prior to the scheduled expiration date of the lease with A. Salon LTD, provided that any applicable cure has not already occurred; |
| (ii) | Six months prior to the scheduled expiration date of the lease with A. Salon LTD, provided that any applicable cure has not already occurred; or |
| (iii) | the date of any termination, cancellation or surrender of the A. Salon LTD lease, or the giving of notice by A. Salon LTD of its intent to terminate, cancel or surrender its lease, provided that any applicable cure has not already occurred. |
| THE INFORMATION IN THIS STRUCTURAL AND COLLATERAL TERM SHEET IS NOT COMPLETE AND MAY BE AMENDED PRIOR TO THE TIME OF SALE. THIS TERM SHEET IS NOT AN OFFER TO SELL THESE SECURITIES AND IT IS NOT A SOLICITATION OF AN OFFER TO BUY THESE SECURITIES IN ANY JURISDICTION WHERE THE OFFER OR SALE IS NOT PERMITTED. |
| 90 |
| Mixed Use – Flex/Office/Retail | Loan #6 | Cut-off Date Balance: | $27,600,000 | |
| 6856 Eastern Avenue Northwest | Takoma Metro Center | Cut-off Date LTV: | 69.7% | |
| Washington, DC 20012 | U/W NCF DSCR: | 2.33x | ||
| U/W NOI Debt Yield: | 9.7% |
A Montessori Expansion Sweep Event will end upon the occurrence of:
| ● | with regard to clause (i) above, the borrower depositing (in cash or letter of credit) an amount that when added to the amounts on deposit in the Montessori Expansion Reserve is equal to 50% of the amount estimated by the lender that would be needed to pay for any landlord work, TI/LC and abated rent required under the expansion lease for Breakthrough Montessori PCS; |
| ● | with regard to clauses (ii) and (iii) above, the borrower depositing (in cash or letter of credit) an amount that when added to the amounts on deposit in the Montessori Expansion Reserve is equal to 100% of the amount estimated by the lender that would be needed to pay for any landlord work, TI/LC and abated rent required under the expansion lease for Breakthrough Montessori PCS; or |
| ● | with regard to clauses (i), (ii) and (iii) above, the lender’s determination that the aggregate sum of the Montessori Expansion Reserve Funds on deposit equals to or exceeds 110% of the amount estimated by the lender that would be needed to pay for any landlord work, TI/LC and abated rent required under the expansion lease for Breakthrough Montessori PCS. |
Property Management. The Takoma Metro Center Property is managed by an affiliate of the Takoma Metro Center Borrower.
Partial Release. Not permitted.
Real Estate Substitution.Not permitted.
Subordinate and Mezzanine Indebtedness.None.
Ground Lease. None.
Terrorism Insurance.The Takoma Metro Center Mortgage Loan documents require that the “all risk” insurance policy required to be maintained by the Takoma Metro Center Borrower provides coverage for terrorism in an amount equal to the full replacement cost of the Takoma Metro Center Property, as well as business interruption insurance covering no less than the 18-month period following the occurrence of a casualty event, together with a 12-month extended period of indemnity.
| THE INFORMATION IN THIS STRUCTURAL AND COLLATERAL TERM SHEET IS NOT COMPLETE AND MAY BE AMENDED PRIOR TO THE TIME OF SALE. THIS TERM SHEET IS NOT AN OFFER TO SELL THESE SECURITIES AND IT IS NOT A SOLICITATION OF AN OFFER TO BUY THESE SECURITIES IN ANY JURISDICTION WHERE THE OFFER OR SALE IS NOT PERMITTED. |
| 91 |
| Office – CBD | Loan #7 | Cut-off Date Balance: | $25,000,000 | |
| 3900 West Alameda Avenue | The Tower at Burbank | Cut-off Date LTV: | 62.1% | |
| Burbank, CA 91505 | U/W NCF DSCR: | 3.06x | ||
| U/W NOI Debt Yield: | 10.0% |
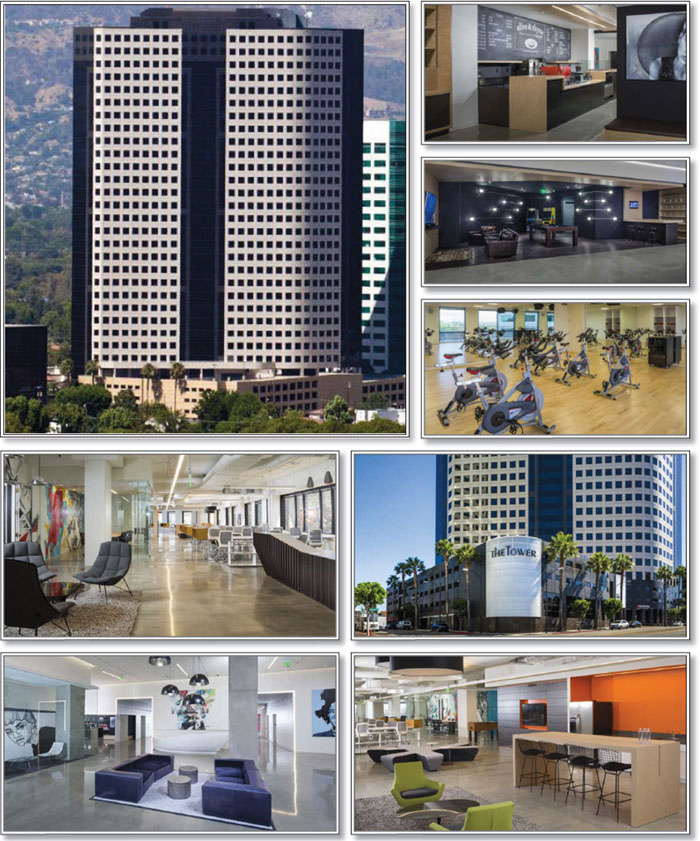
| THE INFORMATION IN THIS STRUCTURAL AND COLLATERAL TERM SHEET IS NOT COMPLETE AND MAY BE AMENDED PRIOR TO THE TIME OF SALE. THIS TERM SHEET IS NOT AN OFFER TO SELL THESE SECURITIES AND IT IS NOT A SOLICITATION OF AN OFFER TO BUY THESE SECURITIES IN ANY JURISDICTION WHERE THE OFFER OR SALE IS NOT PERMITTED. |
| 92 |
| Office – CBD | Loan #7 | Cut-off Date Balance: | $25,000,000 | |
| 3900 West Alameda Avenue | The Tower at Burbank | Cut-off Date LTV: | 62.1% | |
| Burbank, CA 91505 | U/W NCF DSCR: | 3.06x | ||
| U/W NOI Debt Yield: | 10.0% |
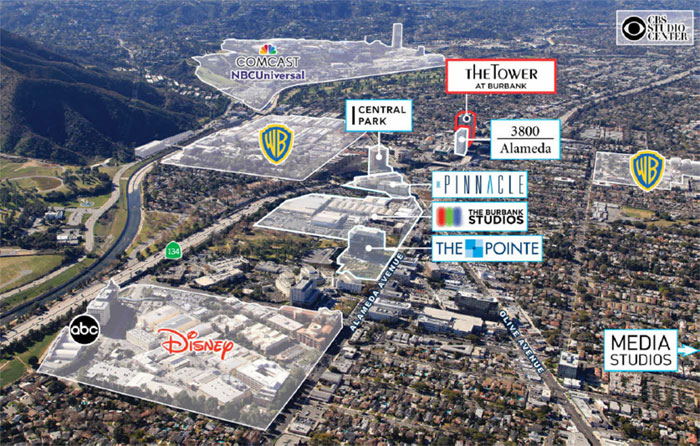
| THE INFORMATION IN THIS STRUCTURAL AND COLLATERAL TERM SHEET IS NOT COMPLETE AND MAY BE AMENDED PRIOR TO THE TIME OF SALE. THIS TERM SHEET IS NOT AN OFFER TO SELL THESE SECURITIES AND IT IS NOT A SOLICITATION OF AN OFFER TO BUY THESE SECURITIES IN ANY JURISDICTION WHERE THE OFFER OR SALE IS NOT PERMITTED. |
| 93 |
| Office – CBD | Loan #7 | Cut-off Date Balance: | $25,000,000 | |
| 3900 West Alameda Avenue | The Tower at Burbank | Cut-off Date LTV: | 62.1% | |
| Burbank, CA 91505 | U/W NCF DSCR: | 3.06x | ||
| U/W NOI Debt Yield: | 10.0% |
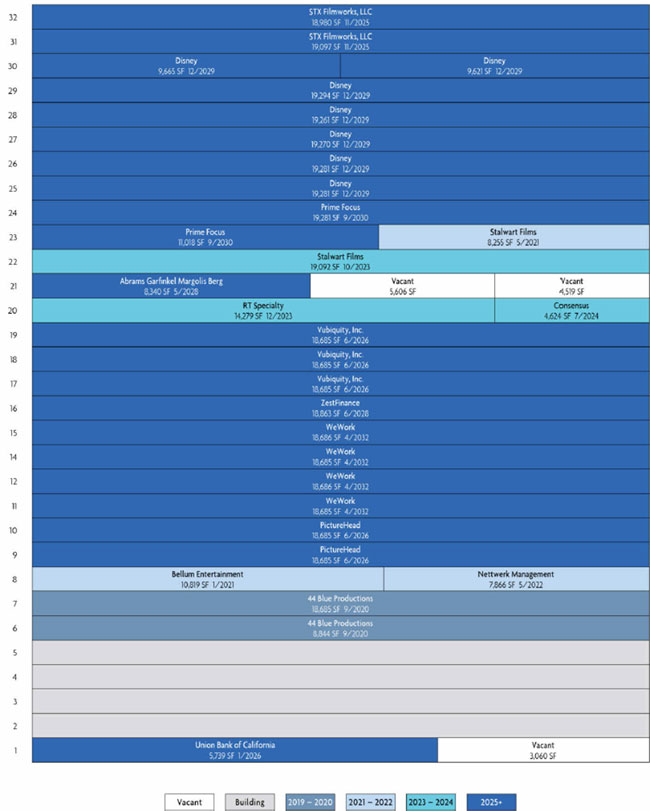
| THE INFORMATION IN THIS STRUCTURAL AND COLLATERAL TERM SHEET IS NOT COMPLETE AND MAY BE AMENDED PRIOR TO THE TIME OF SALE. THIS TERM SHEET IS NOT AN OFFER TO SELL THESE SECURITIES AND IT IS NOT A SOLICITATION OF AN OFFER TO BUY THESE SECURITIES IN ANY JURISDICTION WHERE THE OFFER OR SALE IS NOT PERMITTED. |
| 94 |
| Office – CBD | Loan #7 | Cut-off Date Balance: | $25,000,000 | |
| 3900 West Alameda Avenue | The Tower at Burbank | Cut-off Date LTV: | 62.1% | |
| Burbank, CA 91505 | U/W NCF DSCR: | 3.06x | ||
| U/W NOI Debt Yield: | 10.0% |
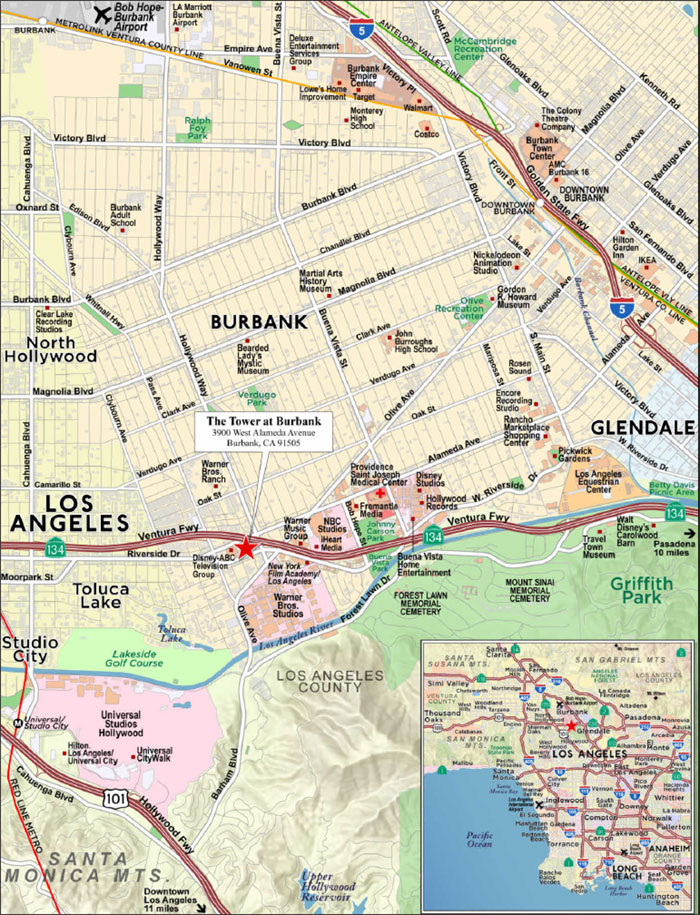
| THE INFORMATION IN THIS STRUCTURAL AND COLLATERAL TERM SHEET IS NOT COMPLETE AND MAY BE AMENDED PRIOR TO THE TIME OF SALE. THIS TERM SHEET IS NOT AN OFFER TO SELL THESE SECURITIES AND IT IS NOT A SOLICITATION OF AN OFFER TO BUY THESE SECURITIES IN ANY JURISDICTION WHERE THE OFFER OR SALE IS NOT PERMITTED. |
| 95 |
| No. 7 – The Tower at Burbank | |||||||
| Mortgage Loan Information | Mortgaged Property Information | ||||||
| Mortgage Loan Seller: | Wells Fargo Bank, National Association | Single Asset/Portfolio: | Single Asset | ||||
Credit Assessment (Fitch/KBRA/S&P): | NR/NR/NR | Property Type – Subtype: | Office – CBD | ||||
| Original Principal Balance(1): | $25,000,000 | Location: | Burbank, CA | ||||
| Cut-off Date Balance(1): | $25,000,000 | Size: | 490,807 SF | ||||
| % of Initial Pool Balance: | 3.7% | Cut-off Date Balance Per SF(1): | $397.30 | ||||
| Loan Purpose: | Refinance | Maturity Date Balance Per SF(1): | $397.30 | ||||
| Borrower Sponsor: | BPP Burbank Holdings LLC | Year Built/Renovated: | 1989/2019 | ||||
| Guarantor: | BPP Burbank Holdings LLC | Title Vesting: | Fee | ||||
| Mortgage Rate: | 3.1300% | Property Manager: | The Worthe Real Estate Group, Inc. | ||||
| Note Date: | August 8, 2019 | Current Occupancy (As of)(4): | 97.3% (7/1/2019) | ||||
| Seasoning: | 4 months | YE 2018 Occupancy(4): | 64.2% | ||||
| Maturity Date: | August 11, 2029 | YE 2017 Occupancy: | 56.7% | ||||
| IO Period: | 120 months | YE 2016 Occupancy: | NAV | ||||
| Loan Term (Original): | 120 months | YE 2015 Occupancy: | NAV | ||||
| Amortization Term (Original): | NAP | Appraised Value: | $314,000,000 | ||||
| Loan Amortization Type: | Interest-only, Balloon | Appraised Value Per SF: | $639.76 | ||||
| Call Protection(2): | GRTR 0.5% or YM(28),GRTR 0.5% or YM or D(85),O(7) | Appraisal Valuation Date: | June 24, 2019 | ||||
| Lockbox Type: | Hard/Springing Cash Management | Underwriting and Financial Information | |||||
| Additional Debt(1): | Yes | YE 2018 NOI(5): | $10,881,903 | ||||
| Additional Debt Type (Balance)(1): | Pari Passu($170,000,000) | YE 2017 NOI(5): | $5,444,777 | ||||
| YE 2016 NOI(6): | NAV | ||||||
| YE 2015 NOI(6): | NAV | ||||||
| U/W Revenues: | $26,246,146 | ||||||
| U/W Expenses: | $6,650,351 | ||||||
| Escrows and Reserves(3) | U/W NOI(5): | $19,595,795 | |||||
| Initial | Monthly | Cap | U/W NCF: | $19,006,826 | |||
| Taxes | $0 | Springing | NAP | U/W DSCR based on NOI/NCF(1): | 3.16x / 3.06x | ||
| Insurance | $0 | Springing | NAP | U/W Debt Yield based on NOI/NCF(1): | 10.0% / 9.7% | ||
| Replacement Reserve | $0 | Springing | $122,702 | U/W Debt Yield at Maturity based on NOI/NCF(1): | 10.0% / 9.7% | ||
| TI/LC Reserve | $0 | Springing | $490,807 | Cut-off Date LTV Ratio(1): | 62.1% | ||
| Existing TI/LC Obligations Reserve | $15,934,738 | $0 | NAP | LTV Ratio at Maturity(1): | 62.1% | ||
| Free Rent Obligations Guaranty | (3) | $0 | NAP | ||||
| Sources and Uses | |||||||
| Sources | Uses | ||||||
| Original whole loan amount(1) | $195,000,000 | 100.0% | Loan payoff | $143,131,029 | 73.4 | % | |
| Return of equity | 34,532,989 | 17.7 | |||||
| Upfront reserves | 15,934,738 | 8.2 | |||||
| Closing costs | 1,401,244 | 0.7 | |||||
| Total Sources | $195,000,000 | 100.0% | Total Uses | $195,000,000 | 100.0 | % | |
| (1) | All statistical information related to the Cut-off Date Balance Per SF, Maturity Date Balance Per SF, U/W DSCR based on NOI/NCF, U/W Debt Yield based on NOI/NCF, U/W Debt Yield at Maturity based on NOI/NCF, Cut-off Date LTV Ratio and LTV Ratio at Maturity numbers presented above are based on The Tower at Burbank Whole Loan (as defined below). |
| (2) | The Tower at Burbank Borrower (as defined below) may prepay The Tower at Burbank Whole Loan in whole or in part at any time, provided that such prepayment is accompanied by the greater of a yield maintenance premium or a prepayment premium equal to 0.5% of the principal amount being prepaid. No prepayment premium will apply on or after February 11, 2029. |
| (3) | See “Escrows” section for a full description of Escrows and Reserves. |
| (4) | The increase from the YE 2018 Occupancy to the Current Occupancy is attributed to leases signed with 4 new tenants totaling approximately 35.3% of net rentable area. |
| (5) | See “Operating History and Underwritten Net Cash Flow” below for a discussion of the increases in historical NOI and from historical to UW NOI. |
| (6) | Occupancy in 2016 ranged from 12.8% to 39.2% and accordingly the net operating income for such period was not considered relevant to underwriting and was not obtained from the borrower sponsor. |
| THE INFORMATION IN THIS STRUCTURAL AND COLLATERAL TERM SHEET IS NOT COMPLETE AND MAY BE AMENDED PRIOR TO THE TIME OF SALE. THIS TERM SHEET IS NOT AN OFFER TO SELL THESE SECURITIES AND IT IS NOT A SOLICITATION OF AN OFFER TO BUY THESE SECURITIES IN ANY JURISDICTION WHERE THE OFFER OR SALE IS NOT PERMITTED. |
| 96 |
| Office – CBD | Loan #7 | Cut-off Date Balance: | $25,000,000 | |
| 3900 West Alameda Avenue | The Tower at Burbank | Cut-off Date LTV: | 62.1% | |
| Burbank, CA 91505 | U/W NCF DSCR: | 3.06x | ||
| U/W NOI Debt Yield: | 10.0% |
The Mortgage Loan. The mortgage loan (“The Tower at Burbank Mortgage Loan”) is part of a whole loan (“The Tower at Burbank Whole Loan”) in the original principal balance of $195,000,000. The Tower at Burbank Whole Loan is secured by a first priority mortgage encumbering the fee interest in an office property located in Burbank, California (“The Tower at Burbank Property”). The Tower at Burbank Whole Loan consists of three notes totaling $195,000,000, which arepari passu with each other. The Tower at Burbank Mortgage Loan represents the non-controlling Note A-3, which has an original principal balance of $25,000,000. The Tower at Burbank Whole Loan is serviced pursuant to the pooling and servicing agreement for the BANK 2019-BNK20 securitization. See “Description of the Mortgage Pool—The Whole Loans—The Non-Serviced Pari Passu Whole Loans” in the Preliminary Prospectus.
The Tower at Burbank Whole Loan Summary
| Notes | Original Balance | Cut-off Date Balance | Note Holder | Controlling Piece |
| A-1 | $100,000,000 | $100,000,000 | BANK 2019-BNK20 | Yes |
| A-2 | $70,000,000 | $70,000,000 | BANK 2019-BNK21 | No |
| A-3 | $25,000,000 | $25,000,000 | WFCM 2019-C54 | No |
| Total | $195,000,000 | $195,000,000 |
The Borrower and Borrower Sponsor.The borrower is Tower Burbank Owner, LLC (“The Tower at Burbank Borrower”), a Delaware limited liability company and single purpose entity with two independent directors. Legal counsel to The Tower at Burbank Borrower delivered a non-consolidation opinion in connection with the origination of The Tower at Burbank Whole Loan. Tower Fitness Center/Café TRS, LLC (“TRS Entity”), the operating lessee solely managing the fitness center and café at The Tower at Burbank Property, is a party to certain of The Tower at Burbank Whole Loan documents.
The borrower sponsor and non-recourse carveout guarantor is BPP Burbank Holdings LLC (the “Guarantor”), a Delaware limited liability company and an affiliate of both The Blackstone Group L.P. (“Blackstone”) and The Worthe Real Estate Group, Inc. (“Worthe”). Blackstone is a global investment firm that has approximately $545 billion in assets under management as of June 30, 2019. Founded in 1985, Blackstone currently employs approximately 2,500 people in 24 offices around the world, while its portfolio companies employ over 400,000 people globally. Worthe’s current commercial real estate portfolio includes 37 assets and 11 development sites in California totaling approximately 5.6 million square feet and 3.2 million square feet of future development. Worthe acquired The Tower at Burbank Property from BlackRock in 2014. According to a third party news provider, Blackstone and Worthe together control approximately 70% of the office supply within the Burbank media district.
The Tower at Burbank Whole Loan documents provide that the Guarantor’s aggregate liability for various bankruptcy-related springing recourse events is subject to a cap equal to 20% of the then-outstanding principal balance of The Tower at Burbank Whole Loan at the time of such event, plus specified costs of enforcement. The Tower at Burbank Whole Loan documents also provide for, among other losses carveouts, a losses carveout (instead of springing recourse) for voluntary transfers of The Tower at Burbank Property or controlling equity interest in The Tower at Burbank Borrower made in violation of The Tower at Burbank Whole Loan documents. In connection with a cap on the Guarantor’s limits of liability for environmental losses, The Tower at Burbank Borrower provided a pollution legal liability-type environmental insurance policy (“PLL Policy”) issued by Great American E & S Insurance Company in the amount of $5,000,000 with an initial term of 6 years. The Tower at Burbank Whole Loan documents provide that the Guarantor has no liability for environmental matters if the policy has a term through the “required policy period” (at least two years past The Tower at Burbank Whole Loan maturity date). If the PLL Policy does not run through the required policy period, the Guarantor’s liability for environmental matters is capped at the amount of the related PLL policy limits. A Phase I environmental site assessment was required at loan origination and indicated no recognized environmental conditions at The Tower at Burbank Property. See “Description of the Mortgage Pool—Non-recourse Carveout Limitations” in the Preliminary Prospectus.
The Property.The Tower at Burbank Property is a 490,807 square foot, 32-story Class A, LEED Gold certified office building located in Burbank, California. Constructed in 1989 and situated on a 1.5-acre site, The Tower at Burbank Property includes a nine-story parking garage with 1,346 spaces (resulting in a parking ratio of approximately 2.7 spaces per 1,000 square feet of net rentable area). The Tower at Burbank Property was renovated from 2015 to 2018 at an approximate cost of $11.1 million, which included roof, HVAC, parking garage, fitness center, lobby, individual floor lobby/corridor and restroom upgrades, along with exterior improvements. Additional repairs were completed in 2019, totaling approximately $3.0 million, including lobby/corridor improvements, wall/window seal repairs, installation of electric vehicle charging stations and additional restroom upgrades. Amenities at The Tower at Burbank Property include a recently renovated fitness center with locker rooms, valet service, ground floor cafe, and a tenant lounge inclusive of an arcade, pool table, and bar. According to the borrower sponsor, additional renovations and capital improvements estimated at $7.6 million are currently planned from 2020 to 2023; however, such renovations are not required by The Tower at Burbank Whole Loan documents and were not reserved for at origination.
Worthe acquired The Tower at Burbank Property in March 2014 when it was 3.9% occupied, and Blackstone subsequently acquired an ownership interest in September 2017 (at which point the building was approximately 55.1% occupied; at an allocated purchase price of $230.0 million), as part of Worthe’s 14-property Burbank portfolio recapitalization.
As of July 1, 2019, The Tower at Burbank Property was 97.3% leased to 15 media, entertainment, technology, real estate, finance and co-working tenants with approximately 36.2% of the net rentable area and 37.2% of underwritten base rent attributed to investment grade tenants. As of September 2019, three tenants totaling 33.6% of NRA and 35.7% of underwritten base rent have executed leases but have not yet taken occupancy or commenced paying rent, including Disney (23.6% of NRA; 25.3% of underwritten base
| THE INFORMATION IN THIS STRUCTURAL AND COLLATERAL TERM SHEET IS NOT COMPLETE AND MAY BE AMENDED PRIOR TO THE TIME OF SALE. THIS TERM SHEET IS NOT AN OFFER TO SELL THESE SECURITIES AND IT IS NOT A SOLICITATION OF AN OFFER TO BUY THESE SECURITIES IN ANY JURISDICTION WHERE THE OFFER OR SALE IS NOT PERMITTED. |
| 97 |
| Office – CBD | Loan #7 | Cut-off Date Balance: | $25,000,000 | |
| 3900 West Alameda Avenue | The Tower at Burbank | Cut-off Date LTV: | 62.1% | |
| Burbank, CA 91505 | U/W NCF DSCR: | 3.06x | ||
| U/W NOI Debt Yield: | 10.0% |
rent; see details in “Major Tenants” section below), ZestFinance (3.8% of NRA; 4.0% of underwritten base rent; expected occupancy and rent commencement by year-end 2019) and Prime Focus (6.2% of NRA; 6.3% of underwritten base rent; expected occupancy and rent commencement by year-end 2019). The Tower at Burbank Whole Loan was not structured with a reserve or guaranty related to gap rent for the period from loan origination through the commencement of rent for such tenants not yet paying rent. There is no assurance that Disney, ZestFinance and Prime Focus will take occupancy and begin paying rent by the estimated dates noted herein.
Major Tenants.
Largest Tenant by UW Base Rent: Disney (115,673 square feet, 23.6% of NRA; 25.3% of underwritten base rent). The Walt Disney Company (“Disney”; rated A/A2/A by Fitch/Moody’s/S&P), together with its subsidiaries and affiliates, is a diversified international family entertainment and media enterprise with multiple business segments, including, media networks; theme parks, experiences and products; studio entertainment and direct-to-consumer. Disney reported annual net income of approximately $13.1 billion for fiscal year (“FY”) 2018, a 39.5% increase over FY 2017. As of August 22, 2019, Disney had a total market capitalization of approximately $245.3 billion. Walt Disney Animation is expected to operate at The Tower at Burbank Property. The studio has produced films including 1937’sSnow White and the Seven Dwarfs, 2013's Academy Award-winning Frozen,Cinderella,Sleeping Beauty,The Jungle Book,Beauty and the Beast, andThe Lion King. Disney’s lease is guaranteed by ABC Cable Networks Group and has two, five-year renewal options, each with 12 months’ notice, at the fair market rental rate following lease expiration in December 2029.
Disney has an executed lease but has not yet taken occupancy or commenced paying rent. Disney is expected to take occupancy of its space in two phases: “Phase I” (floors 25, 26, 27 and 29, totaling 77,126 square feet) and “Phase II” (floors 28 and 30, totaling 38,547 square feet). As of September 2019, with respect to the Phase I space, Disney is (i) expected to commence a 10-month free rent period in February 2020, (ii) expected to take occupancy in April 2020, and (iii) required to commence paying full unabated rent following the 10-month free period (expected in December 2020). With respect to the Phase II space, Disney is (i) expected to take occupancy and commence a 10-month free rent period in July 2020, and (ii) required to commence paying full unabated rent following the 10-month free rent period (expected in May 2021). Approximately $4.7 million was guaranteed by the Guarantor pursuant to the Free Rent Obligations Guaranty (as defined below) with respect to Disney’s 10-month free rent period (for both the Phase I and Phase II space; see“Escrows and Reserves” below). Disney is not required to commence paying rent until the expiration of its free rent periods, and The Tower at Burbank Whole Loan was not structured with a reserve or guaranty related to gap rent for the period from loan origination through the commencement of Disney’s free rent periods. There is no assurance that Disney will take occupancy or begin paying rent by the estimated dates noted herein.
2ndLargest Tenant by UW Base Rent: WeWork (74,742 square feet, 15.2% of NRA; 15.7% of underwritten base rent). WeWork Companies Inc. (rated B/B by Fitch/S&P) provides furnished and fully-serviced shared workspaces, primarily to small and midmarket enterprises. According to the appraisal, WeWork currently leases approximately 10 million square feet of space across 280 locations in 86 cities, including cities in the United States, Israel, Mexico, China, France, South Korea, Australia, the United Kingdom, Hong Kong, Germany, and the Netherlands. The entity on the WeWork lease is 3900 W Alameda Ave Tenant LLC, and the lease is guaranteed by WeWork Companies Inc. The initial maximum aggregate liability of the lease guarantor was limited to $5,300,000; and beginning May 2019, was reduced to $2,650,000. As long as the tenant is not then in default under its lease beyond any applicable notice and cure periods, the lease guarantor’s cap on liability will be reduced to $2,000,000 beginning in April 2022. WeWork’s lease at The Tower at Burbank Property commenced in April 2017 for its 11th-12th floor space and May 2017 for its 14th-15thfloor space and has two, 5-year renewal options remaining, each with 12 months’ notice, at the fair market rental rate following its April 2032 lease expiration. Recently The We Company, the parent company of WeWork withdrew its Form S-1 filing with the Securities and Exchange Commission, indefinitely postponing its proposed initial public offering. See“Description of the Mortgage Pool—Mortgage Pool Characteristics—Property Types—Office Properties”in the Preliminary Prospectus.
3rdLargest Tenant by UW Base Rent: Vubiquity, Inc. (56,055 square feet, 11.4% of NRA; 11.1% of underwritten base rent). Vubiquity, Inc. (“Vubiquity”), part of the Amdocs Media division of Amdocs (NASDAQ: DOX; Baa2/BBB by Moody’s/S&P), connects content owners and video distributors to deliver media to viewers on any screen. Headquartered at The Tower at Burbank Property with additional offices in Toronto and London, Vubiquity works with film studios, television networks, independent producers and digital first networks and brings content to over 1,000 global video distributors. Vubiquity has the one-time right to terminate its lease effective August 1, 2022, with nine months’ prior notice, subject to a termination fee equal to (i) three times the then current monthly base rent, plus (ii) the then unamortized amount (based on the monthly straight line amortization over the initial lease term using a 7.0% interest rate) of tenant improvements and leasing commissions, as of the effective date of termination. Vubiquity’s lease is guaranteed by Vubiquity Holdings, Inc. and has two, five-year renewal options, each with 12 months’ notice, at the fair market rental rate following its lease expiration in June 2026. Vubiquity has a total of five months of free rent, which will occur each July from 2020 to 2024. $1.1 million in outstanding free rent was guaranteed by the Guarantor pursuant to the Free Rent Obligations Guaranty.
| THE INFORMATION IN THIS STRUCTURAL AND COLLATERAL TERM SHEET IS NOT COMPLETE AND MAY BE AMENDED PRIOR TO THE TIME OF SALE. THIS TERM SHEET IS NOT AN OFFER TO SELL THESE SECURITIES AND IT IS NOT A SOLICITATION OF AN OFFER TO BUY THESE SECURITIES IN ANY JURISDICTION WHERE THE OFFER OR SALE IS NOT PERMITTED. |
| 98 |
| Office – CBD | Loan #7 | Cut-off Date Balance: | $25,000,000 | |
| 3900 West Alameda Avenue | The Tower at Burbank | Cut-off Date LTV: | 62.1% | |
| Burbank, CA 91505 | U/W NCF DSCR: | 3.06x | ||
| U/W NOI Debt Yield: | 10.0% |
The following table presents certain information relating to the tenancy at The Tower at Burbank Property:
Major Tenants
| Tenant Name | Credit Rating (Fitch/ Moody’s/ S&P)(1) | Tenant NRSF | % of NRSF | Annual U/W Base Rent PSF(2) | Annual U/W Base Rent(2) | % of Total Annual U/W Base Rent | Lease Expiration Date | Extension Options | Termination Option (Y/N) |
| Major Tenants | |||||||||
| Disney(3) | A/A2/A | 115,673 | 23.6% | $48.60(3) | $5,621,708(3) | 25.3% | 12/31/2029 | 2, 5-year | N |
| WeWork(4) | B/NR/B | 74,742 | 15.2% | $46.55 | $3,479,253 | 15.7% | 4/30/2032 | 2, 5-year | N |
| Vubiquity, Inc. | NR/Baa2/BBB | 56,055 | 11.4% | $43.89(5) | $2,460,525(5) | 11.1% | 6/30/2026 | 2, 5-year | Y(6) |
| STX Filmworks, LLC | NR/NR/NR | 38,077 | 7.8% | $48.69(7) | $1,853,951(7) | 8.4% | 11/30/2025 | 1, 5-year | N |
| PictureHead | NR/NR/NR | 37,370 | 7.6% | $43.89(8) | $1,640,350(8) | 7.4% | 6/30/2026 | 2, 5-year | N |
| Total Major Tenants | 321,917 | 65.6% | $46.77 | $15,055,787 | 67.8% | ||||
| Non-Major Tenant | 155,705 | 31.7% | $45.82 | $7,135,180 | 32.2% | ||||
| Occupied Collateral Total | 477,622 | 97.3% | $46.46 | $22,190,967 | 100.0% | ||||
| Vacant Space | 13,185 | 2.7% | |||||||
| Collateral Total | 490,807 | 100.0% | |||||||
| (1) | Certain ratings are those of the parent company whether or not the parent company guarantees the lease. |
| (2) | Annual U/W Base Rent PSF and Annual U/W Base Rent include contractual rent steps through September 2020 totaling $415,805. The lender’s underwriting gives separate credit for straight-line rent averaging for investment grade tenants through the lesser of the lease terms or the loan term totaling $974,059 ($794,074 for Disney, $160,716 for Vubiquity, Inc. and $19,268 for Union Bank of California; see “Operating History and Underwritten Net Cash Flow” below). The Annual U/W Base Rent PSF and Annual U/W Base Rent shown in the table above do not include credit given for straight-line rent averaging for such investment grade tenants. |
| (3) | Disney has an executed lease but has not yet taken occupancy or commenced paying rent (see tenant description in“Major Tenants” above for further information). |
| (4) | The entity on the WeWork lease is 3900 W Alameda Ave Tenant LLC, and the lease is guaranteed by WeWork Companies Inc. (which is the rated entity). The initial maximum aggregate liability of the lease guarantor was limited to $5,300,000; and beginning May 2019, was reduced to $2,650,000. As long as the tenant is not then in default under its lease beyond any applicable notice and cure periods, the lease guarantor’s cap on liability will be reduced to $2,000,000 beginning in April 2022. |
| (5) | Vubiquity has a total of five months of free rent, which will occur each July from 2020 to 2024. $1.1 million in outstanding free rent was guaranteed by the Guarantor pursuant to Free Rent Obligations Guaranty. |
| (6) | Vubiquity has the one-time right to terminate its lease effective August 1, 2022, with nine months’ prior notice, subject to a termination fee equal to (i) three times the then current monthly base rent plus (ii) the then unamortized amount (based on the monthly straight line amortization over the initial lease term using a 7.0% interest rate) of tenant improvements and leasing commissions, as of the effective date of termination. |
| (7) | STX Filmworks, LLC will receive one month of free rent in March 2023. $84,152 in outstanding free rent was guaranteed by the Guarantor pursuant to the Free Rent Obligations Guaranty. |
| (8) | PictureHead has a total of four months of free rent, which will occur each July from 2020 to 2023. $571,885 in outstanding free rent was guaranteed by the Guarantor pursuant to the Free Rent Obligations Guaranty. |
| THE INFORMATION IN THIS STRUCTURAL AND COLLATERAL TERM SHEET IS NOT COMPLETE AND MAY BE AMENDED PRIOR TO THE TIME OF SALE. THIS TERM SHEET IS NOT AN OFFER TO SELL THESE SECURITIES AND IT IS NOT A SOLICITATION OF AN OFFER TO BUY THESE SECURITIES IN ANY JURISDICTION WHERE THE OFFER OR SALE IS NOT PERMITTED. |
| 99 |
| Office – CBD | Loan #7 | Cut-off Date Balance: | $25,000,000 | |
| 3900 West Alameda Avenue | The Tower at Burbank | Cut-off Date LTV: | 62.1% | |
| Burbank, CA 91505 | U/W NCF DSCR: | 3.06x | ||
| U/W NOI Debt Yield: | 10.0% |
The following table presents certain information relating to the lease rollover schedule at The Tower at Burbank Property:
Lease Expiration Schedule(1)(2)
| Year Ending December 31, | No. of Leases Expiring | Expiring NRSF | % of Total NRSF | Cumulative Expiring NRSF | Cumulative % of Total NRSF | Annual U/W Base Rent(3) | % of Total Annual U/W Base Rent | Annual U/W Base Rent PSF(3) |
| MTM | 0 | 0 | 0.0% | 0 | 0.0% | $0 | 0.0% | $0.00 |
| 2019 | 0 | 0 | 0.0% | 0 | 0.0% | $0 | 0.0% | $0.00 |
| 2020 | 2 | 27,529 | 5.6% | 27,529 | 5.6% | $1,208,381 | 5.4% | $43.89 |
| 2021 | 2 | 19,074 | 3.9% | 46,603 | 9.5% | $873,177 | 3.9% | $45.78 |
| 2022 | 1 | 7,866 | 1.6% | 54,469 | 11.1% | $345,535 | 1.6% | $43.93 |
| 2023 | 2 | 33,371 | 6.8% | 87,840 | 17.9% | $1,537,838 | 6.9% | $46.08 |
| 2024 | 1 | 4,624 | 0.9% | 92,464 | 18.8% | $212,216 | 1.0% | $45.89 |
| 2025 | 2 | 38,077 | 7.8% | 130,541 | 26.6% | $1,853,951 | 8.4% | $48.69 |
| 2026 | 3 | 99,164 | 20.2% | 229,705 | 46.8% | $4,372,158 | 19.7% | $44.09 |
| 2027 | 0 | 0 | 0.0% | 229,705 | 46.8% | $0 | 0.0% | $0.00 |
| 2028 | 2 | 27,203 | 5.5% | 256,908 | 52.3% | $1,286,936 | 5.8% | $47.31 |
| 2029 | 7 | 115,673 | 23.6% | 372,581 | 75.9% | $5,621,708 | 25.3% | $48.60 |
| Thereafter | 4 | 105,041 | 21.4% | 477,622 | 97.3% | $4,879,067 | 22.0% | $46.45 |
| Vacant | 0 | 13,185 | 2.7% | 490,807 | 100.0% | $0 | 0.0% | $0.00 |
| Total/Weighted Average | 26 | 490,807 | 100.0% | $22,190,967 | 100.0% | $46.46 |
| (1) | Information obtained from the underwritten rent roll. |
| (2) | Certain tenants may have lease termination options that are exercisable prior to the originally stated expiration date of the subject lease and that are not considered in the Lease Expiration Schedule. |
| (3) | Total/Weighted Average Annual U/W Base Rent and Annual U/W Base Rent PSF exclude vacant space. |
The following table presents historical occupancy percentages at The Tower at Burbank Property:
Historical Occupancy
12/31/2017(1) | 12/31/2018(1)(2) | 7/1/2019(2)(3) |
| 56.7% | 64.2% | 97.3% |
| (1) | Information obtained from The Tower at Burbank Borrower. |
| (2) | The increase from the 12/31/2018 occupancy to the 7/1/2019 occupancy is attributed to leases signed with 4 new tenants totaling approximately 35.3% of net rentable area. |
| (3) | Information obtained from the underwritten rent roll. |
| THE INFORMATION IN THIS STRUCTURAL AND COLLATERAL TERM SHEET IS NOT COMPLETE AND MAY BE AMENDED PRIOR TO THE TIME OF SALE. THIS TERM SHEET IS NOT AN OFFER TO SELL THESE SECURITIES AND IT IS NOT A SOLICITATION OF AN OFFER TO BUY THESE SECURITIES IN ANY JURISDICTION WHERE THE OFFER OR SALE IS NOT PERMITTED. |
| 100 |
| Office – CBD | Loan #7 | Cut-off Date Balance: | $25,000,000 | |
| 3900 West Alameda Avenue | The Tower at Burbank | Cut-off Date LTV: | 62.1% | |
| Burbank, CA 91505 | U/W NCF DSCR: | 3.06x | ||
| U/W NOI Debt Yield: | 10.0% |
Operating History and Underwritten Net Cash Flow. The following table presents certain information relating to the historical operating performance and underwritten net cash flow at The Tower at Burbank Property:
Cash Flow Analysis(1)
| 2017(2) | 2018(2)(3) | U/W(3) | %(4) | U/W $ per SF | |
| Base Rent | $10,944,511 | $15,671,096 | $21,775,162 | 78.8% | $44.37 |
| Contractual Rent Steps | 0 | 0 | 415,805(5) | 1.5 | 0.85 |
| Credit Tenant Rent Average | 0 | 0 | 974,059(6) | 3.5 | 1.98 |
| Free Rent Adjustment | (2,612,837) | (1,914,832) | 0 | 0.0 | 0.00 |
| Grossed Up Vacant Space | 0 | 0 | 640,791 | 2.3 | 1.31 |
| Gross Potential Rent | $8,331,674 | $13,756,264 | $23,805,817 | 86.2% | $48.50 |
| Parking Income | 1,186,002 | 1,934,782 | 2,793,563 | 10.1 | 5.69 |
| Other Income(3) | 280,236 | 418,148 | 357,979 | 1.3 | 0.73 |
| Total Recoveries | 269,605 | 358,552 | 658,692 | 2.4 | 1.34 |
| Net Rental Income | $10,067,516 | $16,467,745 | $27,616,051 | 100.0% | $56.27 |
| (Vacancy & Credit Loss) | 0 | 0 | (1,369,905)(7) | (5.8) | (2.79) |
| Effective Gross Income | $10,067,516 | $16,467,745 | $26,246,146 | 95.0% | $53.48 |
| Real Estate Taxes | 1,235,056 | 1,394,963 | 1,382,528 | 5.3 | 2.82 |
| Insurance | 147,780 | 396,405 | 423,541 | 1.6 | 0.86 |
| Management Fee | 646,951 | 747,626 | 787,384 | 3.0 | 1.60 |
| Other Operating Expenses | 2,592,952 | 3,046,848 | 4,056,898 | 15.5 | 8.27 |
| Total Operating Expenses | $4,622,739 | $5,585,842 | $6,650,351 | 25.3% | $13.55 |
| Net Operating Income | $5,444,777 | $10,881,903 | $19,595,795 | 74.7% | $39.93 |
| Replacement Reserves | 0 | 0 | 98,161 | 0.4 | 0.20 |
| TI/LC | 0 | 0 | 490,807 | 1.9 | 1.00 |
| Net Cash Flow | $5,444,777 | $10,881,903 | $19,006,826 | 72.4% | $38.73 |
| NOI DSCR(8) | 0.88x | 1.75x | 3.16x | ||
| NCF DSCR(8) | 0.88x | 1.75x | 3.06x | ||
| NOI Debt Yield(8) | 2.8% | 5.6% | 10.0% | ||
| NCF Debt Yield(8) | 2.8% | 5.6% | 9.7% |
| (1) | Occupancy in 2016 ranged from 12.8% to 39.2% and accordingly the operating history for the period prior to 2017 was not considered relevant to underwriting and was not obtained from the borrower sponsor. |
| (2) | The increase in Gross Potential Base Rent and Net Operating Income from 2017 to 2018 was driven by 5 new leases totaling 23.2% of underwritten base rent commencing between April 2017 and June 2018. |
| (3) | The increase in Gross Potential Base Rent and Net Operating Income from 2018 to UW was driven by leases with 4 new tenants totaling 37.5% of underwritten base rent. UW includes credit for three tenants totaling 35.7% of underwritten base rent that have executed leases but have not yet taken occupancy or commenced paying rent (see “The Property” section above for further details). |
| (4) | Represents (i) percent of Net Rental Income for all revenue fields, (ii) percent of Gross Potential Rent for Vacancy & Credit Loss and (iii) percent of Effective Gross Income for all other fields. |
| (5) | Includes contractual rent steps through September 2020 totaling $415,805. |
| (6) | Represents straight-line rent averaging over the lesser of the remaining lease terms or the loan term for investment grade tenants Disney ($794,074), Vubiquity, Inc. ($160,716) and Union Bank of California ($19,268). |
| (7) | The underwritten economic vacancy is 6.0%. The Tower at Burbank Property was 97.3% leased as of July 1, 2019. |
| (8) | The debt service coverage ratios and debt yields are based on The Tower at Burbank Whole Loan |
Appraisal.The appraiser concluded to an “as-is” Appraised Value for The Tower at Burbank Property of $314,000,000 as of June 24, 2019.
Environmental Matters. According to the Phase I environmental site assessment dated May 29, 2019, there was no evidence of any recognized environmental conditions at The Tower at Burbank Property.
Market Overview and Competition.The Tower at Burbank Property is located within the central business district of Burbank, Los Angeles County, California, approximately 0.4 miles west of Route 134/Ventura freeway (provides access east to Glendale and Pasadena and west (via Route 101) to Thousand Oaks and Ventura), 3.6 miles southwest of Interstate 5 (provides access south to Los Angeles), 10.5 miles northwest of the Los Angeles central business district, 3.2 miles southeast of Bob Hope (Hollywood/Burbank)
| THE INFORMATION IN THIS STRUCTURAL AND COLLATERAL TERM SHEET IS NOT COMPLETE AND MAY BE AMENDED PRIOR TO THE TIME OF SALE. THIS TERM SHEET IS NOT AN OFFER TO SELL THESE SECURITIES AND IT IS NOT A SOLICITATION OF AN OFFER TO BUY THESE SECURITIES IN ANY JURISDICTION WHERE THE OFFER OR SALE IS NOT PERMITTED. |
| 101 |
| Office – CBD | Loan #7 | Cut-off Date Balance: | $25,000,000 | |
| 3900 West Alameda Avenue | The Tower at Burbank | Cut-off Date LTV: | 62.1% | |
| Burbank, CA 91505 | U/W NCF DSCR: | 3.06x | ||
| U/W NOI Debt Yield: | 10.0% |
Airport and 24.3 miles northeast of Los Angeles International Airport. The Tower at Burbank Property is situated approximately 0.5 miles southeast of the intersection of Ventura Freeway and Clybourn Avenue, which, according to a third party market research provider, had an average daily traffic count of225,581 vehicles as of 2018.
The City of Burbank serves as the headquarters for Walt Disney and Warner Brothers. Walt Disney’s corporate headquarters is situated approximately 1.2 miles northeast of The Tower at Burbank Property and Warner Brothers Studios’ world headquarters is located approximately 0.7 miles southeast of The Tower at Burbank Property. According to the appraisal, Los Angeles County has an estimated 2,116 employers within the Motion Picture and Video Production industry and also includes the corporate headquarters for Paramount Pictures (approximately 6.0 miles southeast of The Tower at Burbank Property), 21st Century Fox (11.2 miles southwest), Sony (17.3 miles southwest), and Universal Pictures (2.0 miles southwest).
According to a third party market research provider, the estimated 2019 population within a three- and five-mile radius of The Tower at Burbank Property was approximately 176,822 and 643,279, respectively; and the estimated 2019 average household income within the same radii was approximately $100,083 and $90,277, respectively.
According to a third-party market research report, The Tower at Burbank Property is situated within the Burbank Office submarket of the Los Angeles office market. As of August 23, 2019, the Burbank Office submarket reported a total inventory of approximately 14.5 million square feet with a 6.2% vacancy rate and average asking rent of $39.06 per square foot, gross. The submarket vacancy rate has decreased from 12.5% in 2013 and averaged 9.3% from 2013 through 2018. The appraiser identified a competitive set of 28 Burbank office properties totaling approximately 5.4 million square feet, with an average occupancy rate of 91.8% and quoted rents ranging from $39.60 to $48.60 per square foot, full-service gross.
The following table presents certain information relating to the appraisal’s market rent conclusion for The Tower at Burbank Property:
Market Rent Summary(1)
| Office – Floor 1 | Office – Floors 6-19 | Office – Floors 20-32 | |
| Market Rent (PSF) | $46.80 | $47.40 | $48.60 |
| Lease Term (Years) | 7 | 7 | 7 |
| Lease Type (Reimbursements) | Full-Service | Full-Service | Full-Service |
| Rent Increase Projection | 3.0%per annum | 3.0%per annum | 3.0%per annum |
| (1) | Information obtained from the appraisal. |
| THE INFORMATION IN THIS STRUCTURAL AND COLLATERAL TERM SHEET IS NOT COMPLETE AND MAY BE AMENDED PRIOR TO THE TIME OF SALE. THIS TERM SHEET IS NOT AN OFFER TO SELL THESE SECURITIES AND IT IS NOT A SOLICITATION OF AN OFFER TO BUY THESE SECURITIES IN ANY JURISDICTION WHERE THE OFFER OR SALE IS NOT PERMITTED. |
| 102 |
| Office – CBD | Loan #7 | Cut-off Date Balance: | $25,000,000 | |
| 3900 West Alameda Avenue | The Tower at Burbank | Cut-off Date LTV: | 62.1% | |
| Burbank, CA 91505 | U/W NCF DSCR: | 3.06x | ||
| U/W NOI Debt Yield: | 10.0% |
The following table presents information relating to comparable office property sales for The Tower at Burbank Property:
Comparable Sales(1)
| Property Name/Location | Sale Date | Year Built/ Renovated | Total NRA (SF) | Occupancy | Sale Price | Sale Price PSF |
The Tower at Burbank Property 3900 W. Alameda Avenue Burbank, CA | N/A | 1989/2015-2019 | 490,807(2) | 97.3%(2) | N/A | N/A |
1055 E. Colorado Boulevard Pasadena, CA | Jun. 2019 | 2000/N/A | 173,327 | 89% | $85,000,000 | $490.40 |
Wilshire Courtyard 5700 & 5750 Wilshire Boulevard Los Angeles, CA | Jan. 2019 | 1987/N/A | 1,006,645 | 60% | $628,000,000 | $623.85 |
C3 5800 Bristol Parkway Culver City, CA | May 2019 | 2017/N/A | 283,207 | 100% | $260,000,000 | $918.06 |
5161 Lankershim Boulevard North Hollywood, CA | Jun. 2019 | 1990/N/A | 201,652 | 100% | $102,700,000 | $509.29 |
Campus at Playa Vista 12015, 12025, 12035, and 12045 Waterfront Drive Los Angeles, CA | Nov. 2018 | 2009/N/A | 325,269 | 99% | $335,000,000 | $1,029.92 |
The Wedbush Center 1000 Wilshire Boulevard Los Angeles, CA | Mar. 2018 | 1987/N/A | 476,491 | 86% | $196,000,000 | $411.34 |
5670 Wilshire Boulevard Los Angeles, CA | Oct. 2017 | 1964/N/A | 407,059 | 96% | $215,000,000 | $528.18 |
177 E. Colorado Boulevard Pasadena, CA | Sep. 2017 | 1973/N/A | 321,062 | 88% | $161,500,000 | $503.02 |
One California Plaza 300 S. Grand Avenue Los Angeles, CA | Jun. 2017 | 1985/N/A | 1,031,183 | 88% | $459,000,000 | $445.12 |
Buena Vista Plaza 2411 W. Olive Avenue Burbank, CA | Jan.2017 | 1991/2004 | 117,858 | 100% | $52,500,000 | $445.45 |
| (1) | Information obtained from the appraisal. |
| (2) | Information obtained from the underwritten rent roll. |
| THE INFORMATION IN THIS STRUCTURAL AND COLLATERAL TERM SHEET IS NOT COMPLETE AND MAY BE AMENDED PRIOR TO THE TIME OF SALE. THIS TERM SHEET IS NOT AN OFFER TO SELL THESE SECURITIES AND IT IS NOT A SOLICITATION OF AN OFFER TO BUY THESE SECURITIES IN ANY JURISDICTION WHERE THE OFFER OR SALE IS NOT PERMITTED. |
| 103 |
| Office – CBD | Loan #7 | Cut-off Date Balance: | $25,000,000 | |
| 3900 West Alameda Avenue | The Tower at Burbank | Cut-off Date LTV: | 62.1% | |
| Burbank, CA 91505 | U/W NCF DSCR: | 3.06x | ||
| U/W NOI Debt Yield: | 10.0% |
The following table presents certain information relating to comparable office leases for The Tower at Burbank Property:
Comparable Leases(1)
| Property Name/Location | Year Built/ Renovated | Total GLA (SF) | Occupancy | Distance from Subject | Lease Date/Term | Lease Area (SF) | Annual Base Rent PSF | Lease Type |
The Tower at Burbank Property 3900 W. Alameda Avenue Burbank, CA | 1989/2015-2019 | 490,807(2) | 97.3%(2) | - | ||||
Buena Vista Plaza 2411 W. Olive Burbank, CA | 1991/2004 | 117,858 | 100.0% | 1.0 Miles | Q1 2018 / 7.2 Yrs | 4,306 | $46.00 | Full Service |
4000 W. Alameda Building 4000 W. Alameda Avenue Burbank, CA | 1983/1998 | 118,818 | 100.0% | 0.1 Miles | Q3 2018 / 7.0 Yrs | 8,462 | $40.20 | Full Service |
| Legacy Media Tower | 1986/N/A | 150,755 | 82.9% | 0.9 Miles | Q1 2019 / 5.4 Yrs | 4,835 | $43.80 | Full Service |
2600 West Olive Avenue Burbank, CA | Q3 2018 / 5.5 Yrs. | 9,187 | $43.80 | Full Service | ||||
| Business Arts Plaza | 1985/N/A | 152,469 | 93.6% | 0.3 Miles | Q2 2019 / 1.8 Yrs. | 27,305 | $48.60 | Full Service |
3601 West Olive Avenue Burbank, CA | Q2 2018 / 6.0 Yrs. | 7,523 | $46.20 | Full Service | ||||
| Burbank Empire Center | 2009/N/A | 351,748 | 66.3% | 3.5 Miles | Q4 2018 / 7.1 Yrs | 11,855 | $41.40 | Full Service |
2300 Empire Avenue Burbank, CA | Q3 2018 / 10.0 Yrs | 27,000 | $40.20 | Full Service | ||||
| Media Studios N. Phase II | 1998/N/A | 217,230 | 71.0% | 3.4 Miles | Q1 2019 / 5.4 Yrs | 41,647 | $45.00 | Full Service |
2255 N. Ontario Street Burbank, CA | Q2 2018 / 2.0 Yrs. | 8,716 | $42.00 | Full Service | ||||
Allianz Building 2350 Empire Avenue Burbank, CA | 2002/N/A | 229,946 | 100.0% | 3.3 Miles | Q3 2018 / 5.4 Yrs. | 27,000 | $39.00 | Full Service |
Burbank Executive Plaza 300 E. Magnolia Boulevard Burbank, CA | 1983/N/A(3) | 65,179(3) | 79.8%(3) | 3.1 Miles | Q1 2019 / 11.0 Yrs | 17,123 | $40.80 | Full Service |
Citibank Building 333 N. Glenoaks Boulevard Burbank, CA | 1978/N/A(3) | 87,908(3) | 87.3%(3) | 3.1 Miles | Q4 2018 / 5.5Yrs | 5,759 | $39.00 | Full Service |
| (1) | Information obtained from the appraisal unless otherwise noted. |
| (2) | Information obtained from the underwritten rent roll. |
| (3) | Information obtained from a third party market research provider. |
Escrows.
Real Estate Taxes – Upon the occurrence and continuance of a Cash Trap Event Period (see “Lockbox and Cash Management” section), The Tower at Burbank Whole Loan documents require ongoing monthly real estate tax reserves in an amount equal to 1/12 of the real estate taxes that the lender estimates will be payable during the next 12 months.
Insurance– Upon the occurrence and continuance of a Cash Trap Event Period, The Tower at Burbank Whole Loan documents require ongoing monthly insurance reserves in an amount equal to 1/12 of the insurance premiums that the lender estimates will be payable for the renewal of the coverage during the next 12 months, provided, that so long as no event of default is continuing, to the extent insurance is maintained by The Tower at Burbank Borrower under one or more blanket policies reasonably acceptable to the lender, The Tower at Burbank Borrower is not required to make ongoing monthly insurance reserve deposits applicable to such blanket policy.
Replacement Reserve – Upon the occurrence and continuance of a Cash Trap Event Period, The Tower at Burbank Whole Loan documents require ongoing monthly replacement reserves (or letter of credit in lieu thereof) equal to one-twelfth of the aggregate square footage of The Tower at Burbank Property multiplied by $0.25 (currently $10,225), subject to a cap of the aggregate square footage of The Tower at Burbank Property multiplied by $0.25 (currently $122,702).
TI/LC Reserve – Upon the occurrence and continuance of a Cash Trap Event Period, The Tower at Burbank Whole Loan documents require ongoing monthly rollover reserves (or letter of credit in lieu thereof) equal to one-twelfth of the aggregate square footage of
| THE INFORMATION IN THIS STRUCTURAL AND COLLATERAL TERM SHEET IS NOT COMPLETE AND MAY BE AMENDED PRIOR TO THE TIME OF SALE. THIS TERM SHEET IS NOT AN OFFER TO SELL THESE SECURITIES AND IT IS NOT A SOLICITATION OF AN OFFER TO BUY THESE SECURITIES IN ANY JURISDICTION WHERE THE OFFER OR SALE IS NOT PERMITTED. |
| 104 |
| Office – CBD | Loan #7 | Cut-off Date Balance: | $25,000,000 | |
| 3900 West Alameda Avenue | The Tower at Burbank | Cut-off Date LTV: | 62.1% | |
| Burbank, CA 91505 | U/W NCF DSCR: | 3.06x | ||
| U/W NOI Debt Yield: | 10.0% |
The Tower at Burbank Property multiplied by $1.00 (currently $40,901), subject to a cap of the aggregate square footage of The Tower at Burbank Property multiplied by $1.00 (currently $490,807).
Existing TI/LC Obligations Reserve – The Tower at Burbank Borrower deposited an upfront reserve of $15,934,738 for outstanding tenant improvement and leasing commission obligations attributable to the 12-month period following loan origination related to certain tenants at The Tower at Burbank Property.
Free Rent Obligations Guaranty – In lieu of an upfront deposit of outstanding free rent under certain leases at The Tower at Burbank Property, the Guarantor delivered to the lender a free rent guaranty in the amount of outstanding free rent obligations related to 9 leases (totaling $8,917,465 at the time of loan origination, which includes $4,684,757 related to the Disney free rent period) (the “Free Rent Obligations Guaranty”). Upon the occurrence and during the continuance of an event of default, the Guarantor is required to deposit the amount due on the outstanding free rent obligations into the cash management subaccount, and such funds are required to be applied by the lender in accordance with The Tower at Burbank Whole Loan documents. The amount of the unfunded free rent obligations covered by the Free Rent Obligations Guaranty are required to be reduced, on a monthly basis, pursuant to the free rent disbursement schedule in The Tower at Burbank Whole Loan documents.
Lockbox and Cash Management. The Tower at Burbank Whole Loan is structured with a hard lockbox, which is already in place, and springing cash management. The Tower at Burbank Borrower is required to direct tenants to pay rent directly into such lockbox account and all rents received directly by The Tower at Burbank Borrower or the property manager are required to be deposited into the lockbox account within two business days of receipt. Prior to the occurrence of a Cash Trap Event Period, all funds in the lockbox account are required to be distributed to The Tower at Burbank Borrower. During a Cash Trap Event Period, funds in the lockbox account are required to be swept on each business day to a lender-controlled cash management account. Any excess cash flow remaining after satisfaction of the waterfall items outlined in The Tower at Burbank Whole Loan documents is required to be swept to an excess cash flow subaccount controlled by the lender as additional security for The Tower at Burbank Whole Loan during the continuance of the Cash Trap Event Period.
In lieu of The Tower at Burbank Borrower depositing any excess cash flow into the lender-controlled excess cash flow subaccount, so long as no event of default has occurred and is continuing, The Tower at Burbank Borrower has the right to cause the Guarantor to deliver to the lender an excess cash flow guaranty with a guaranteed liability amount equal to (x) the aggregate amount of excess cash flow disbursed to The Tower at Burbank Borrower in lieu of being deposited into the excess cash flow subaccount less (y) the aggregate amount of excess cash flow The Tower at Burbank Borrower actually spends for items permitted under The Tower at Burbank Whole Loan documents, provided that, among other requirements outlined in The Tower at Burbank Whole Loan documents, (i) such excess cash flow guaranty is required to be accompanied by a legal opinion concerning the validity, authority, execution and enforceability of such excess cash flow guaranty which may be relied upon by the lender and the rating agencies and (ii) to the extent that the amounts guaranteed under the excess cash flow guaranty equal or exceed 15% of the outstanding principal balance of The Tower at Burbank Whole Loan, such excess cash flow guaranty is required to be accompanied by an additional insolvency opinion reasonably acceptable to the lender and the rating agencies.
A “Cash Trap Event Period” will commence upon the earlier of the following:
| (i) | the occurrence of an event of default under The Tower at Burbank Whole Loan documents; |
| (ii) | The Tower at Burbank Borrower or the TRS Entity (see“The Borrower and the Borrower Sponsor” section) filing, as a debtor, a bankruptcy or similar insolvency proceeding, or otherwise becoming involved, as a debtor, in a bankruptcy or any similar insolvency proceeding (collectively, a “Bankruptcy Action”); or |
| (iii) | the net operating income debt service coverage ratio (“NOI DSCR”) falling below 1.20x for two consecutive calendar quarters. |
A Cash Trap Event Period will end upon the occurrence of the following:
| ● | with regard to clause (i), the cure of such event of default; |
| ● | with regard to clause (ii), in the event of the respective Bankruptcy Action not being consented to by The Tower at Burbank Borrower, TRS Entity or any special purpose entity constituent entity, the respective Bankruptcy Action being discharged, stayed or dismissed within 90 days of its filing; or |
| ● | with regard to clause (iii), (x) the NOI DSCR being greater than or equal to 1.20x for two consecutive calendar quarters or (y) The Tower at Burbank Borrower prepaying The Tower at Burbank Whole Loan (with any applicable yield maintenance premium) in an amount sufficient such that the NOI DSCR is greater than or equal to 1.20x. |
Property Management. The Tower at Burbank Property is managed by an affiliate of The Tower at Burbank Borrower.
Release of Property.The Tower at Burbank Borrower may obtain the release of one or more parcels of unimproved non-income producing land located at The Tower at Burbank Property for which no value was attributed in the appraisal obtained as of loan origination, provided that, among other things, and in accordance with The Tower at Burbank Whole Loan documents, including REMIC related conditions, (i) no event of default has occurred and is continuing and (ii) The Tower at Burbank Borrower is required to pay all costs and expenses incurred by the lender in connection with the release.
Real Estate Substitution.Not permitted.
Subordinate and Mezzanine Indebtedness.Not permitted.
| THE INFORMATION IN THIS STRUCTURAL AND COLLATERAL TERM SHEET IS NOT COMPLETE AND MAY BE AMENDED PRIOR TO THE TIME OF SALE. THIS TERM SHEET IS NOT AN OFFER TO SELL THESE SECURITIES AND IT IS NOT A SOLICITATION OF AN OFFER TO BUY THESE SECURITIES IN ANY JURISDICTION WHERE THE OFFER OR SALE IS NOT PERMITTED. |
| 105 |
| Office – CBD | Loan #7 | Cut-off Date Balance: | $25,000,000 | |
| 3900 West Alameda Avenue | The Tower at Burbank | Cut-off Date LTV: | 62.1% | |
| Burbank, CA 91505 | U/W NCF DSCR: | 3.06x | ||
| U/W NOI Debt Yield: | 10.0% |
Ground Lease. None.
Terrorism Insurance.The Tower at Burbank Whole Loan documents require that the “all risk” insurance policy required to be maintained by The Tower at Burbank Borrower provide coverage for terrorism in an amount equal to the full replacement cost of The Tower at Burbank Property, as well as business interruption insurance covering no less than the 18-month period following the occurrence of a casualty event, together with a 12-month extended period of indemnity (provided that if TRIPRA or a similar statute is not in effect, The Tower at Burbank Borrower will not be obligated to pay terrorism insurance premiums in excess of two times the premium for the casualty and business interruption coverage on a stand-alone basis).
| THE INFORMATION IN THIS STRUCTURAL AND COLLATERAL TERM SHEET IS NOT COMPLETE AND MAY BE AMENDED PRIOR TO THE TIME OF SALE. THIS TERM SHEET IS NOT AN OFFER TO SELL THESE SECURITIES AND IT IS NOT A SOLICITATION OF AN OFFER TO BUY THESE SECURITIES IN ANY JURISDICTION WHERE THE OFFER OR SALE IS NOT PERMITTED. |
| 106 |
(THIS PAGE INTENTIONALLY LEFT BLANK)
| THE INFORMATION IN THIS STRUCTURAL AND COLLATERAL TERM SHEET IS NOT COMPLETE AND MAY BE AMENDED PRIOR TO THE TIME OF SALE. THIS TERM SHEET IS NOT AN OFFER TO SELL THESE SECURITIES AND IT IS NOT A SOLICITATION OF AN OFFER TO BUY THESE SECURITIES IN ANY JURISDICTION WHERE THE OFFER OR SALE IS NOT PERMITTED. |
| 107 |
| Loan #8 | Cut-off Date Balance: | $25,000,000 | ||
| Self Storage – Self Storage | Planet Self Storage Portfolio | Cut-off Date LTV: | 67.1% | |
| Property Addresses - Various | U/W NCF DSCR: | 2.42x | ||
| U/W NOI Debt Yield: | 7.9% |

| THE INFORMATION IN THIS STRUCTURAL AND COLLATERAL TERM SHEET IS NOT COMPLETE AND MAY BE AMENDED PRIOR TO THE TIME OF SALE. THIS TERM SHEET IS NOT AN OFFER TO SELL THESE SECURITIES AND IT IS NOT A SOLICITATION OF AN OFFER TO BUY THESE SECURITIES IN ANY JURISDICTION WHERE THE OFFER OR SALE IS NOT PERMITTED. |
| 108 |
| Loan #8 | Cut-off Date Balance: | $25,000,000 | ||
| Self Storage – Self Storage | Planet Self Storage Portfolio | Cut-off Date LTV: | 67.1% | |
| Property Addresses - Various | U/W NCF DSCR: | 2.42x | ||
| U/W NOI Debt Yield: | 7.9% |

| THE INFORMATION IN THIS STRUCTURAL AND COLLATERAL TERM SHEET IS NOT COMPLETE AND MAY BE AMENDED PRIOR TO THE TIME OF SALE. THIS TERM SHEET IS NOT AN OFFER TO SELL THESE SECURITIES AND IT IS NOT A SOLICITATION OF AN OFFER TO BUY THESE SECURITIES IN ANY JURISDICTION WHERE THE OFFER OR SALE IS NOT PERMITTED. |
| 109 |
| No. 8 – Planet Self Storage Portfolio | ||||||
| Mortgage Loan Information | Mortgaged Property Information | |||||
| Mortgage Loan Seller: | Rialto Mortgage Finance, LLC | Single Asset/Portfolio: | Portfolio | |||
Credit Assessment (Fitch/KBRA/S&P): | NR/NR/NR | Property Type – Subtype: | Self Storage – Self Storage | |||
| Original Principal Balance(1): | $25,000,000 | Location: | Various | |||
| Cut-off Date Balance(1): | $25,000,000 | Size: | 563,807 SF | |||
| % of Initial Pool Balance: | 3.7% | Cut-off Date Balance Per SF(1): | $124.16 | |||
| Loan Purpose: | Refinance | Maturity Date Balance Per SF(1): | $124.16 | |||
| Borrower Sponsor: | Robert Moser | Year Built/Renovated: | Various/Various | |||
| Guarantor: | Robert Moser | Title Vesting: | Fee | |||
| Mortgage Rate: | 3.1750% | Property Manager: | Self-managed | |||
| Note Date: | September 26, 2019 | Current Occupancy (As of): | 85.2% (8/31/2019) | |||
| Seasoning: | 2 months | YE 2018 Occupancy: | 84.8% | |||
| Maturity Date: | October 6, 2024 | YE 2017 Occupancy: | 82.9% | |||
| IO Period: | 60 months | YE 2016 Occupancy(3): | NAV | |||
| Loan Term (Original): | 60 months | YE 2015 Occupancy(3): | NAV | |||
| Amortization Term (Original): | NAP | Appraised Value(4): | $104,250,000 | |||
| Loan Amortization Type: | Interest-only, Balloon | Appraised Value Per SF(4): | $184.90 | |||
| Call Protection: | L(26),D(30),O(4) | Appraisal Valuation Date: | Various | |||
| Lockbox Type: | Springing | Underwriting and Financial Information | ||||
| Additional Debt(1): | Yes | TTM NOI (8/31/2019): | $5,340,664 | |||
| Additional Debt Type (Balance)(1): | Pari Passu($45,000,000); Future | YE 2018 NOI: | $5,092,614 | |||
| Mezzanine | YE 2017 NOI(5): | $4,808,378 | ||||
| YE 2016 NOI: | NAV | |||||
| U/W Revenues: | $8,246,557 | |||||
| U/W Expenses: | $2,709,614 | |||||
| U/W NOI: | $5,536,943 | |||||
| U/W NCF: | $5,472,942 | |||||
| Escrows and Reserves(2) | U/W DSCR based on NOI/NCF(1): | 2.45x / 2.42x | ||||
| Initial | Monthly | Cap | U/W Debt Yield based on NOI/NCF(1): | 7.9% / 7.8% | ||
| Taxes | $370,554 | $58,818 | NAP | U/W Debt Yield at Maturity based on NOI/NCF(1): | 7.9% / 7.8% | |
| Insurance | $7,162 | $3,410 | NAP | Cut-off Date LTV Ratio(1)(4): | 67.1% | |
| Replacement Reserve | $0 | $5,333 | NAP | LTV Ratio at Maturity(1)(4): | 67.1% | |
| Deferred Maintenance | $73,438 | $0 | NAP | |||
| Sources and Uses | ||||||||
| Sources | Uses | |||||||
| Original whole amount | $70,000,000 | 93.4% | Loan Payoff | $71,483,636 | 95.4% | |||
| Sponsor equity | 4,910,107 | 6.6 | Upfront reserves | 451,153 | 0.6 | |||
| Closing costs | 2,975,318 | 4.0 | ||||||
| Total Sources | $74,910,107 | 100.0% | Total Uses | $74,910,107 | 100.0% | |||
| (1) | The Planet Self Storage Portfolio Mortgage Loan (as defined below) is part of the Planet Self Storage Portfolio Whole Loan (as defined below), which comprises four pari passu notes with an aggregate original balance of $70,000,000. All statistical information related to the Cut-off Date Balance per SF, Maturity Date Balance per SF, U/W DSCR based on NOI/NCF, U/W Debt Yield based on NOI/NCF, U/W Debt Yield at Maturity based on NOI/NCF, Cut-off Date LTV Ratio and LTV Ratio at Maturity are based on the Planet Self Storage Portfolio Whole Loan. |
| (2) | See “Escrows” section for a full description of Escrows and Reserves. |
| (3) | The Planet Self Storage Portfolio Borrowers (as defined below) acquired the Planet Self Storage Portfolio Properties (as defined below) in 2017; therefore, YE 2016 Occupancy and YE 2015 Occupancy are not available. |
| (4) | The Appraised Value, Appraised Value Per SF, Cut-Off Date LTV Ratio and LTV Ratio at Maturity are based on the as-is bulk portfolio value of $104,250,000. The combined “as-is” individual appraised value is $96,350,000, which results in a combined “as-is” appraised value per square foot of $170.89. The Cut-off Date LTV Ratio and LTV Ratio at Maturity based on the combined “as-is” individual appraised value is 72.7% and 72.7%, respectively. |
| (5) | See “Cash Flow Analysis” section for a description of cash flows. |
The Mortgage Loan.The mortgage loan (the “Planet Self Storage Portfolio Mortgage Loan”) is part of a whole loan (the “Planet Self Storage Portfolio Whole Loan”) evidenced by fourpari passu notes with an original principal balance of $70,000,000 and an outstanding principal balance as of the Cut-off Date of $70,000,000 secured by a first mortgage encumbering the fee interest in 11 self-storage properties located in Massachusetts, Connecticut, New Jersey and Pennsylvania (the “Planet Self Storage Portfolio Properties” or the “Planet Self Storage Portfolio”). The Planet Self Storage Portfolio Mortgage Loan is evidenced by the non-controlling Note A-2 and the
| THE INFORMATION IN THIS STRUCTURAL AND COLLATERAL TERM SHEET IS NOT COMPLETE AND MAY BE AMENDED PRIOR TO THE TIME OF SALE. THIS TERM SHEET IS NOT AN OFFER TO SELL THESE SECURITIES AND IT IS NOT A SOLICITATION OF AN OFFER TO BUY THESE SECURITIES IN ANY JURISDICTION WHERE THE OFFER OR SALE IS NOT PERMITTED. |
| 110 |
| Loan #8 | Cut-off Date Balance: | $25,000,000 | ||
| Self Storage – Self Storage | Planet Self Storage Portfolio | Cut-off Date LTV: | 67.1% | |
| Property Addresses - Various | U/W NCF DSCR: | 2.42x | ||
| U/W NOI Debt Yield: | 7.9% |
non-controlling Note A-4. The Planet Self Storage Whole Loan will be serviced pursuant to the pooling and servicing agreement for the WFCM 2019-C53 Trust. See “Description of the Mortgage Pool—The Whole Loans—The Non-Serviced Pari Passu Whole Loans” and “Pooling and Servicing Agreement—Servicing of the Non-Serviced Mortgage Loans” in the Preliminary Prospectus.
Note Summary
| Notes | Original Principal Balance | Cut-off Date Balance | Note Holder | Controlling Interest |
| A-1 | $30,000,000 | $30,000,000 | WFCM 2019-C53 | Yes |
| A-2 | $20,000,000 | $20,000,000 | WFCM 2019-C54 | No |
| A-3 | $15,000,000 | $15,000,000 | WFCM 2019-C53 | No |
| A-4 | $5,000,000 | $5,000,000 | WFCM 2019-C54 | No |
| Total | $70,000,000 | $70,000,000 |
The Borrowers and Borrower Sponsor.The borrowers are Prime Storage Brookfield, LLC, Prime Storage Clinton, LLC, Prime Storage Fairless Hills, LLC, Prime Storage Lindenwold, LLC, Prime Storage Newington, LLC, Prime Storage New Milford, LLC, Prime Storage Phillipsburg, LLC, Prime Storage Quakertown, LLC, Prime Storage Washington, LLC, Prime Storage Hyde Park, LLC and Prime Storage Somerville, LLC (collectively, the “Planet Self Storage Portfolio Borrowers”), each a Delaware limited liability company and single purpose entity, together with two independent directors. Legal counsel to the Planet Self Storage Portfolio Borrowers delivered a non-consolidation opinion in connection with the origination of the Planet Self Storage Portfolio Whole Loan. The borrower sponsor and non-recourse carveout guarantor of the Planet Self Storage Portfolio Whole Loan is Robert Moser.
Robert Moser has over 20 years of experience as an owner, operator and developer of commercial real estate. Robert Moser is the owner and principal of Prime Group Holdings, overseeing all operations, strategic initiatives and investment activities of the company, and is a member of the firm’s investment committee. Over the past few years, Prime Group Holdings has grown to become the largest private owner-operator of self-storage in the United States. Mr. Moser was a party to prior foreclosure litigation. See “Description of the Mortgage Pool–Loan Purpose; Default History, Bankruptcy Issues and Other Proceedings” in the Preliminary Prospectus.
The Properties. The Planet Self Storage Portfolio is a 11-property, 563,807 square-foot and 4,844 unit self storage portfolio located in New Jersey (four properties, 35.5% of the square footage, 34.4% of units), Connecticut (three properties, 33.8% of the square footage, 32.2% of units), Pennsylvania (two properties, 19.5% of the square footage, 18.5% of units) and Massachusetts (two properties, 11.3% of the square footage, 15.0% of units). The Planet Self Storage Portfolio Properties were constructed from 1930 to 2000 and range in size from 27,504 square feet to 87,925 square feet and 311 units to 724 units, with no Planet Self Storage Portfolio Property comprising more than 15.6% of the total net rentable area based on square footage and 14.9% of the total storage units, respectively. Of the 4,844 units at the Planet Self Storage Portfolio Properties, 981 units are climate controlled. The Planet Self Storage Portfolio Properties also generate income from 171 parking spaces, three office units of 1,475 square feet, two apartment units, two billboards, two cell towers, and income from one easement agreement. Based on self storage units, the Planet Self Storage Portfolio Properties were 85.2% occupied as of August 31, 2019.
| THE INFORMATION IN THIS STRUCTURAL AND COLLATERAL TERM SHEET IS NOT COMPLETE AND MAY BE AMENDED PRIOR TO THE TIME OF SALE. THIS TERM SHEET IS NOT AN OFFER TO SELL THESE SECURITIES AND IT IS NOT A SOLICITATION OF AN OFFER TO BUY THESE SECURITIES IN ANY JURISDICTION WHERE THE OFFER OR SALE IS NOT PERMITTED. |
| 111 |
| Loan #8 | Cut-off Date Balance: | $25,000,000 | ||
| Self Storage – Self Storage | Planet Self Storage Portfolio | Cut-off Date LTV: | 67.1% | |
| Property Addresses - Various | U/W NCF DSCR: | 2.42x | ||
| U/W NOI Debt Yield: | 7.9% |
The following table presents certain information regarding the Planet Self Storage Portfolio Properties:
| Property Name – Location | Allocated Cut-off Date Balance | % of Portfolio Cut-off Date Balance | Occupancy(1)(2) | Year Built/ Renovated | Net Rentable Area (SF)(2) | Appraised Value | UW NOI(2) | % of UW NOI | Storage Units(2) |
Prime Storage - Somerville Somerville, MA | $9,100,000 | 13.0% | 91.3% | 1930/1995 | 36,095 | $12,170,000 | $686,906(3)(4) | 12.4% | 414 |
Prime Storage - Newington Newington, CT | 8,370,000 | 12.0 | 83.6 | 2000/2018 | 87,925 | 12,440,000 | 615,271(4) | 11.1 | 724 |
Prime Storage - Washington Washington, NJ | 8,050,000 | 11.5 | 96.9 | 1987/2018 | 63,450 | 10,790,000 | 709,533 | 12.8 | 523 |
Prime Storage - Brookfield Brookfield, CT | 6,800,000 | 9.7 | 83.0 | 1984/2018 | 61,350 | 9,090,000 | 517,582(4)(5)(7) | 9.3 | 505 |
Prime Storage - Quakertown Quakertown, PA | 6,750,000 | 9.6 | 80.5 | 1987/NAP | 67,450 | 9,190,000 | 536,678(4)(6) | 9.7 | 513 |
Prime Storage – Hyde Park Boston, MA | 6,100,000 | 8.7 | 77.8 | 1960/1997 | 27,504 | 9,250,000 | 459,556(4) | 8.3 | 311 |
Prime Storage – New Milford New Milford, CT | 5,250,000 | 7.5 | 84.8 | 1989/NAP | 41,050 | 7,040,000 | 424,320(4)(7) | 7.7 | 329 |
Prime Storage – Philipsburg Greenwich and Lopatcong, NJ | 5,250,000 | 7.5 | 86.3 | 1982/2018 | 48,691 | 7,040,000 | 426,205(4)(6) | 7.7 | 408 |
Prime Storage – Fairless Hills Fairless Hills, PA | 5,030,000 | 7.2 | 90.3 | 1979/NAP | 42,211 | 6,790,000 | 422,942(4) | 7.6 | 382 |
Prime Storage – Clinton Clinton, NJ | 4,800,000 | 6.9 | 90.4 | 1980/2018 | 35,538 | 6,490,000 | 377,115 | 6.8 | 313 |
Prime Storage – Lindenwold Lindenwold, NJ | 4,500,000 | 6.4 | 83.9 | 1979/NAP | 52,543 | 6,060,000 | 360,834(4) | 6.5 | 422 |
| Total/Weighted Average | $70,000,000 | 100.0% | 86.2% | 563,807 | $104,250,000(8) | $5,536,943 | 100.0% | 4,844 |
| (1) | Occupancy is based on storage units. |
| (2) | Based on the underwritten rent roll. |
| (3) | Includes revenue from cell tower. |
| (4) | Includes revenue from parking. |
| (5) | Includes revenue from office. |
| (6) | Includes revenue from billboard. |
| (7) | Includes revenue from apartment. |
| (8) | The total Appraised Value is based on the “as-is” bulk portfolio value. The sum of the appraised values of the individual properties is $96,350,000, resulting in a Cut-off Date LTV Ratio and LTV Ratio at Maturity of 72.7% and 72.7%, respectively. |
The following table presents historical occupancy percentages at the Planet Self Storage Portfolio:
Historical Occupancy(1)
12/31/2015(2) | 12/31/2016(2) | 12/31/2017(3) | 12/31/2018(3) | 8/31/2019(4) |
| NAV | NAV | 82.9% | 84.8% | 85.2% |
| (1) | Occupancy is based on a per square foot basis. |
| (2) | The Planet Self Storage Portfolio Borrowers acquired the Planet Self Storage Portfolio Properties in 2017; therefore, historical occupancy for 12/31/2015 and 12/31/2016 are not available. |
| (3) | Information provided by the Planet Self Storage Portfolio Borrowers. |
| (4) | Based on underwritten rent roll. |
| THE INFORMATION IN THIS STRUCTURAL AND COLLATERAL TERM SHEET IS NOT COMPLETE AND MAY BE AMENDED PRIOR TO THE TIME OF SALE. THIS TERM SHEET IS NOT AN OFFER TO SELL THESE SECURITIES AND IT IS NOT A SOLICITATION OF AN OFFER TO BUY THESE SECURITIES IN ANY JURISDICTION WHERE THE OFFER OR SALE IS NOT PERMITTED. |
| 112 |
| Loan #8 | Cut-off Date Balance: | $25,000,000 | ||
| Self Storage – Self Storage | Planet Self Storage Portfolio | Cut-off Date LTV: | 67.1% | |
| Property Addresses - Various | U/W NCF DSCR: | 2.42x | ||
| U/W NOI Debt Yield: | 7.9% |
Operating History and Underwritten Net Cash Flow. The following table presents certain information relating to the historical operating performance and underwritten net cash flow at the Planet Self Storage Portfolio Properties:
Cash Flow Analysis
| 2017(1) | 2018 | TTM 8/31/2019 | U/W | %(2) | U/W $ per SF | |
| Base Rent(3) | $6,520,760 | $7,721,713 | $7,800,243 | $7,526,647 | 78.8% | $13.35 |
| Grossed Up Vacant Space | 0 | 0 | 0 | 1,244,160 | 13.0 | 2.21 |
| Gross Potential Rent | $6,520,760 | $7,721,713 | $7,800,243 | $8,770,806 | 91.8% | $15.56 |
| Other Income(4) | 571,776 | 640,267 | 738,870 | 783,741 | 8.2 | 1.39 |
| Net Rental Income | $7,092,536 | $8,361,980 | $8,539,113 | $9,554,547 | 100.0% | $16.95 |
| (Vacancy & Credit Loss) | (98,412) | (598,662) | (495,632) | (1,307,991)(5) | (14.9) | (2.32) |
| Effective Gross Income | $6,994,124 | $7,763,318 | $8,043,481 | $8,246,557 | 86.3% | $14.63 |
| Real Estate Taxes | 556,835 | 669,927 | 689,956 | 705,816 | 8.6 | 1.25 |
| Insurance | 89,397 | 50,450 | 50,202 | 40,923 | 0.5 | 0.07 |
| Management Fee | 357,250 | 399,045 | 412,112 | 412,328 | 5.0 | 0.73 |
| Other Operating Expenses | 1,182,264 | 1,551,282 | 1,550,547 | 1,550,547 | 18.8 | 2.75 |
| Total Operating Expenses | $2,185,746 | $2,670,704 | $2,702,817 | $2,709,614 | 32.9% | $4.81 |
| Net Operating Income | $4,808,378 | $5,092,614 | $5,340,664 | $5,536,943 | 67.1% | $9.82 |
| Replacement Reserves | 0 | 0 | 0 | 64,001 | 0.8 | 0.11 |
| TI/LC | 0 | 0 | 0 | 0 | 0.0 | 0.00 |
| Net Cash Flow | $4,808,378 | $5,092,614 | $5,340,664 | $5,472,942 | 66.4% | $9.71 |
| NOI DSCR(6) | 2.13x | 2.25x | 2.36x | 2.45x | ||
| NCF DSCR(6) | 2.13x | 2.25x | 2.36x | 2.42x | ||
| NOI Debt Yield(6) | 6.9% | 7.3% | 7.6% | 7.9% | ||
| NCF Debt Yield(6) | 6.9% | 7.3% | 7.6% | 7.8% |
| (1) | The Planet Self Storage Portfolio Borrowers acquired the Planet Self Storage Portfolio Properties in 2017 and did not receive financial statements for the months of July 2017 – August 2017 for the Prime Storage – Newington, Prime Storage – Washington, Prime Storage – Brookfield, Prime Storage – Quakertown, Prime Storage – New Milford, Prime Storage – Philipsburg, Prime Storage – Fairless Hills, Prime Storage – Clinton and Prime Storage – Lindenwold properties and July 2017 for the Prime Storage – Somerville and Prime Storage – Hyde Park properties. |
| (2) | Represents (i) percent of Net Rental Income for all revenue fields, (ii) percent of Gross Potential Rent for Vacancy & Credit Loss and (iii) percent of Effective Gross Income for all other fields. |
| (3) | Base Rent includes rents from cell tower, parking, billboards, office, and apartment. |
| (4) | Other Income includes insurance income, late fees, application fees, point of sale and other miscellaneous income. |
| (5) | The underwritten economic vacancy is 14.9%. The Planet Self Storage Portfolio Properties were 86.2% occupied as of August 31, 2019 based on self storage units. |
| (6) | The debt service coverage ratios and debt yields are based on the Planet Self Storage Portfolio Whole Loan. |
Appraisal.As of the appraisal valuation dates from August 24, 2019 to August 30, 2019, the Planet Self Storage Portfolio Properties had an “as-is” bulk value of $104,250,000. The sum of the appraised values of the individual properties is $96,350,000, resulting in a Cut-off Date LTV Ratio and LTV Ratio at Maturity of 72.7% and 72.7%, respectively.
Environmental Matters.According to Phase I environmental site assessments dated from September 5, 2019 to September 9, 2019, there was no evidence of any recognized environmental conditions at the Planet Self Storage Portfolio Properties.
Market Overview.The Planet Self Storage Portfolio is an 11-property, 563,807 square-foot and 4,844-unit self-storage portfolio located in New Jersey (four properties, 35.5% of the square footage, 34.4% of units), Connecticut (three properties, 33.8% of the square footage, 32.2% of units), Pennsylvania (two properties, 19.5% of the square footage, 18.5% of units) and Massachusetts (two properties, 11.3% of the square footage, 15.0% of units).
According to the appraisals, the New Jersey properties are located in the Mid-Atlantic sub-region with average monthly rents of $144.67 and $174.27 per unit for 10x10 foot non-climate controlled and climate controlled units, respectively as of the end of the second quarter of 2018. As of the end of the second quarter of 2018, the Mid-Atlantic sub-region reported a vacancy rate of 8.0% for self storage properties.
According to the appraisals, the Connecticut properties are located in the New England sub-region with reported monthly rents of $125.22 and $149.27 per unit for 10x10 foot non-climate controlled and climate controlled units, respectively as of the end of the second quarter of 2018. As of the end of the second quarter of 2019, the New England sub-region reported vacancy rate of 9.5% for self-storage properties.
| THE INFORMATION IN THIS STRUCTURAL AND COLLATERAL TERM SHEET IS NOT COMPLETE AND MAY BE AMENDED PRIOR TO THE TIME OF SALE. THIS TERM SHEET IS NOT AN OFFER TO SELL THESE SECURITIES AND IT IS NOT A SOLICITATION OF AN OFFER TO BUY THESE SECURITIES IN ANY JURISDICTION WHERE THE OFFER OR SALE IS NOT PERMITTED. |
| 113 |
| Loan #8 | Cut-off Date Balance: | $25,000,000 | ||
| Self Storage – Self Storage | Planet Self Storage Portfolio | Cut-off Date LTV: | 67.1% | |
| Property Addresses - Various | U/W NCF DSCR: | 2.42x | ||
| U/W NOI Debt Yield: | 7.9% |
According to the appraisals, the Pennsylvania properties are located in the Bucks County self storage submarket with reported monthly asking rents of $126.97 and $152.39 per unit for 10x10 foot non-climate controlled and climate controlled units, respectively as of end of the second quarter of 2018. As of the end of the second quarter of 2019, the Bucks County self storage submarket reported a vacancy rate of 11.3% for self storage properties.
According to the appraisals, the Massachusetts properties are located in the Boston Core and Cambridge/Near West submarket. The Boston Core submarket reported monthly asking rents of $214.52 and $197.26 per unit for 10x10 foot non-climate controlled and climate controlled units, respectively as of the end of the second quarter of 2018. The Cambridge/Near West submarket reported monthly asking rents of $203.49 and $256.75 per unit for 10x10 foot non-climate controlled and climate controlled units, respectively as of the end of the second quarter of 2018. As of the end of the second quarter of 2019, the Boston Core submarket reported a vacancy rate of 16.3% and the Cambridge/Near West submarket reported a vacancy rate of 10.1% for self storage properties.
Escrows.
Real Estate Taxes –The Planet Self Storage Portfolio Whole Loan documents require an upfront real estate tax reserve of $370,554 and an ongoing monthly real estate tax reserve in an amount equal to one-twelfth of the real estate taxes that the lender estimates will be necessary to pay taxes over the then succeeding twelve months (initially $58,818).
Insurance –The Planet Self Storage Portfolio Whole Loan documents require an upfront insurance reserve of $7,162 and an ongoing monthly insurance premium reserve in an amount equal to one-twelfth of the insurance premiums that the lender estimates will be necessary to pay insurance premiums over the then succeeding twelve months (initially $3,410).
Replacement Reserves –The Planet Self Storage Portfolio Whole Loan documents require ongoing monthly replacement reserves of $5,333.
Deferred Maintenance –The Planet Self Storage Portfolio Whole Loan documents require an upfront reserve of $73,438.
Lockbox and Cash Management. The Planet Self Storage Portfolio Whole Loan documents require a springing lockbox and springing cash management. Upon the occurrence and continuance of a Cash Management Trigger Event (as defined below), (i) the Planet Self Storage Portfolio Borrowers are required to establish a lender-controlled lockbox account and instruct tenants to deposit rents into such lockbox account, and (ii) the Planet Self Storage Portfolio Borrowers and the property manager are required to deposit into such lockbox all rents received within two business day of receipt. Pursuant to the Planet Self Storage Portfolio Whole Loan documents, all excess funds on deposit are required to be applied as follows: (a) if a Cash Sweep Event (as defined below) is not in effect, to the Planet Self Storage Borrowers; and (b) if a Cash Sweep Event is in effect, to an excess cash flow account controlled by the lender, to be held by the lender as additional security for the Planet Self Storage Portfolio Whole Loan.
A “Cash Management Trigger Event” will commence upon the occurrence of the following:
| (i) | an event of default; |
| (ii) | the Planet Self Storage Portfolio Borrower’s second late debt service payment within a 12-month period; |
| (iii) | a bankruptcy action of the Planet Self Storage Portfolio Borrowers, the guarantor or the property managers; |
| (iv) | a Cash Management DSCR Trigger Event (as defined below); or |
| (v) | a mezzanine borrower entering into a subordinate mezzanine loan. |
A Cash Management Trigger Event will end upon the occurrence of:
| (i) | with regard to clause (i) above, the cure of such event of default having been accepted or waived by the lender; |
| (ii) | with regard to clause (ii) above, the debt service payments having been paid on time for 12 consecutive months; |
| (iii) | with regard to clause (iii) above, such bankruptcy action petition having been discharged, stayed, or dismissed within 30 days of such filing, among other conditions, for the Planet Self Storage Portfolio Borrowers or the guarantor and within 120 days for the property manager, or with respect to the property manager, the Planet Self Storage Portfolio Borrowers replacing the property manager with a qualified property manager acceptable to the lender; and |
| (iv) | with regard to clause (iv) above, the date the amortizing debt service coverage ratio based on the trailing 12-month period immediately preceding the date of such determination is greater than 1.25x for two consecutive quarters. |
A “Cash Management DSCR Trigger Event” will occur on any day the debt service coverage ratio, based on the trailing 12-month period immediately preceding the date of determination, is less than 1.20x for the Planet Self Storage Portfolio Whole Loan.
A “Cash Sweep Event” will commence upon the occurrence of the following:
| (i) | an event of default; |
| (ii) | a bankruptcy action of the Planet Self Storage Portfolio Borrowers, the guarantor or the property manager; or |
| (iii) | a Cash Sweep DSCR Trigger Event (as defined below). |
| THE INFORMATION IN THIS STRUCTURAL AND COLLATERAL TERM SHEET IS NOT COMPLETE AND MAY BE AMENDED PRIOR TO THE TIME OF SALE. THIS TERM SHEET IS NOT AN OFFER TO SELL THESE SECURITIES AND IT IS NOT A SOLICITATION OF AN OFFER TO BUY THESE SECURITIES IN ANY JURISDICTION WHERE THE OFFER OR SALE IS NOT PERMITTED. |
| 114 |
| Loan #8 | Cut-off Date Balance: | $25,000,000 | ||
| Self Storage – Self Storage | Planet Self Storage Portfolio | Cut-off Date LTV: | 67.1% | |
| Property Addresses - Various | U/W NCF DSCR: | 2.42x | ||
| U/W NOI Debt Yield: | 7.9% |
A Cash Sweep Event will end upon the occurrence of:
| (i) | with regard to clause (i) above, the cure of such event of default having been accepted or waived by the lender; |
| (ii) | with regard to clause (ii) above, such bankruptcy action petition having been discharged, stayed, or dismissed within 30 days of such filing, among other conditions, for the Planet Self Storage Portfolio Borrowers or the guarantor and within 120 days for the property manager, or with respect to the property manager, the Planet Self Storage Portfolio Borrowers replacing the property manager with a qualified property manager acceptable to the lender; and |
| (iii) | with regard to clause (iii) above, the date the amortizing debt service coverage ratio based on the trailing 12-month period immediately preceding the date of such determination is greater than 1.20x for two consecutive quarters. |
A “Cash Sweep DSCR Trigger Event” will occur on any day the debt service coverage ratio, based on the trailing 12-month period immediately preceding the date of determination, is less than 1.15x for the Planet Self Storage Portfolio Whole Loan.
Property Management.The Planet Self Storage Portfolio Properties are managed by Prime Group Holdings LLC, an affiliate of the Planet Self Storage Portfolio Borrowers.
Partial Release.After expiration of the defeasance lockout period, the Planet Self Storage Portfolio Borrowers may obtain the release of any individual property, provided that, among other conditions, (i) no event of default has occurred and is continuing; (ii) the amount of the Planet Self Storage Portfolio Whole Loan defeased will be 115% of the allocated loan amount for the related Planet Self Storage Portfolio property being released; (iii) the debt service coverage ratio for the remaining properties after such release is not less than the greater of (a) 2.43x and (b) the debt service coverage ratio for the remaining properties and the property to be released for the preceding 12 months; and (iv) the loan-to-value ratio after such release is less than or equal to the lesser of (a) 67.1% and (b) the loan-to-value ratio for the remaining properties and the property to be released immediately preceding the release of the property.
Subordinate and Mezzanine Indebtedness.Provided no event of default has occurred and is continuing, the Planet Self Storage Portfolio Whole Loan documents permit an affiliate of the Planet Self Storage Portfolio Borrowers to incur future mezzanine debt subject to certain conditions, including (i) the execution of an intercreditor agreement in form and substance reasonably acceptable to the lender; (ii) based on the Planet Self Storage Portfolio Whole Loan and the mezzanine loan, (a) the combined loan-to-value ratio is not greater than 67.1% and (b) the debt service coverage ratio is not less than 2.43x; and (iii) receipt of rating agency confirmation from each rating agency, including Fitch, KBRA and S&P, that the mezzanine financing will not result in a downgrade, withdrawal or qualification of the respective ratings assigned to the WFCM 2019-C54 Certificates.
Ground Lease. None.
Terrorism Insurance.The Planet Self Storage Portfolio Whole Loan documents require that the “all risk” insurance policy required to be maintained by the Planet Self Storage Portfolio Borrowers provides coverage for terrorism in an amount equal to the full replacement cost of the Planet Self Storage Portfolio Properties, as well as business interruption insurance covering no less than the 18-month period following the occurrence of a casualty event, together with a 12-month extended period of indemnity.
| THE INFORMATION IN THIS STRUCTURAL AND COLLATERAL TERM SHEET IS NOT COMPLETE AND MAY BE AMENDED PRIOR TO THE TIME OF SALE. THIS TERM SHEET IS NOT AN OFFER TO SELL THESE SECURITIES AND IT IS NOT A SOLICITATION OF AN OFFER TO BUY THESE SECURITIES IN ANY JURISDICTION WHERE THE OFFER OR SALE IS NOT PERMITTED. |
| 115 |
| Multifamily – Garden | Loan #9 | Cut-off Date Balance: | $24,000,000 | |
| 4020 Cyber Avenue | The District at Tuttle | Cut-off Date LTV: | 64.7% | |
| Columbus, OH 43221 | U/W NCF DSCR: | 1.78x | ||
| U/W NOI Debt Yield: | 7.9% |

| THE INFORMATION IN THIS STRUCTURAL AND COLLATERAL TERM SHEET IS NOT COMPLETE AND MAY BE AMENDED PRIOR TO THE TIME OF SALE. THIS TERM SHEET IS NOT AN OFFER TO SELL THESE SECURITIES AND IT IS NOT A SOLICITATION OF AN OFFER TO BUY THESE SECURITIES IN ANY JURISDICTION WHERE THE OFFER OR SALE IS NOT PERMITTED. |
| 116 |
| Multifamily – Garden | Loan #9 | Cut-off Date Balance: | $24,000,000 | |
| 4020 Cyber Avenue | The District at Tuttle | Cut-off Date LTV: | 64.7% | |
| Columbus, OH 43221 | U/W NCF DSCR: | 1.78x | ||
| U/W NOI Debt Yield: | 7.9% |

| THE INFORMATION IN THIS STRUCTURAL AND COLLATERAL TERM SHEET IS NOT COMPLETE AND MAY BE AMENDED PRIOR TO THE TIME OF SALE. THIS TERM SHEET IS NOT AN OFFER TO SELL THESE SECURITIES AND IT IS NOT A SOLICITATION OF AN OFFER TO BUY THESE SECURITIES IN ANY JURISDICTION WHERE THE OFFER OR SALE IS NOT PERMITTED. |
| 117 |
| No. 9 – The District at Tuttle | ||||||
| Mortgage Loan Information | Mortgaged Property Information | |||||
| Mortgage Loan Seller: | BSPRT CMBS Finance, LLC | Single Asset/Portfolio: | Single Asset | |||
Credit Assessment (Fitch/KBRA/S&P): | NR/NR/NR | Property Type – Subtype: | Multifamily – Garden | |||
| Original Principal Balance: | $24,000,000 | Location: | Columbus, OH | |||
| Cut-off Date Balance: | $24,000,000 | Size: | 228 Units | |||
| % of Initial Pool Balance: | 3.6% | Cut-off Date Balance Per Unit(1): | $105,263 | |||
| Loan Purpose: | Refinance | Maturity Date Balance Per Unit(1): | $105,263 | |||
| Borrower Sponsors: | Scott W. Coy; Brian G. Uffelman | Year Built/Renovated: | 2014/NAP | |||
| Guarantors: | Scott W. Coy; Brian G. Uffelman; Lisa M. Boyd | Title Vesting: | Fee | |||
| Mortgage Rate: | 4.28333% | Property Manager: | Self-managed | |||
| Note Date: | September 30, 2019 | Current Occupancy (As of): | 95.2% (9/9/2019) | |||
| Seasoning: | 2 months | YE 2018 Occupancy: | 94.3% | |||
| Maturity Date: | October 6, 2029 | YE 2017 Occupancy: | 88.2% | |||
| IO Period: | 120 months | YE 2016 Occupancy(4): | NAV | |||
| Loan Term (Original): | 120 months | YE 2015 Occupancy(4): | NAV | |||
| Amortization Term (Original): | NAP | As-Is Appraised Value: | $37,100,000 | |||
| Loan Amortization Type: | Interest-only, Balloon | As-Is Appraised Value Per Unit: | $162,719 | |||
| Call Protection: | L(26),D(90),O(4) | As-Is Appraisal Valuation Date: | August 5, 2019 | |||
| Lockbox Type: | Soft/Springing Cash Management | |||||
| Additional Debt: | Yes | Underwriting and Financial Information | ||||
| Additional Debt Type (Balance)(1)(2): | Mezzanine ($4,000,000) | TTM NOI (8/31/2019): | $1,790,546 | |||
| YE 2018 NOI: | $1,770,688 | |||||
| YE 2017 NOI(4): | NAV | |||||
| YE 2016 NOI(4): | NAV | |||||
| U/W Revenues: | $3,184,800 | |||||
| U/W Expenses: | $1,281,433 | |||||
| Escrows and Reserves(3) | U/W NOI: | $1,903,367 | ||||
| Initial | Monthly | Cap | U/W NCF: | $1,857,767 | ||
| Taxes | $314,210 | $62,842 | NAP | U/W DSCR based on NOI/NCF(1): | 1.82x / 1.78x | |
| Insurance | $33,640 | $4,205 | NAP | U/W Debt Yield based on NOI/NCF(1): | 7.9% / 7.7% | |
| Replacement Reserve | $0 | $3,800 | NAP | U/W Debt Yield at Maturity based on NOI/NCF(1): | 7.9% / 7.7% | |
| Cut-off Date LTV Ratio(1): | 64.7% | |||||
| LTV Ratio at Maturity(1): | 64.7% | |||||
| Sources and Uses | ||||||||
| Sources | Uses | |||||||
| Original loan amount | $24,000,000 | 85.7% | Loan payoff | $26,329,385 | 94.0% | |||
| Mezzanine loan amount | 4,000,000 | 14.3 | Closing costs | 376,177 | 1.3 | |||
| Upfront reserves | 347,850 | 1.2 | ||||||
| Return of equity | 946,588 | 3.4 | ||||||
| Total Sources | $28,000,000 | 100.0% | Total Uses | $28,000,000 | 100.0% | |||
| (1) | The equity interest in The District at Tuttle Borrower (as defined below) has been pledged to secure mezzanine indebtedness with an original principal balance of $4,000,000 (“The District at Tuttle Mezzanine Loan”). All statistical information related to the balance per square foot, loan-to-value ratios, debt service coverage ratios and debt yields are based solely on The District at Tuttle Mortgage Loan (as defined below). As of the Cut-off Date, the combined U/W NOI DSCR, U/W NCF DSCR, U/W NOI Debt Yield, U/W NCF Debt Yield, Cut-off Date LTV Ratio and LTV Ratio at Maturity were 1.31x, 1.28x, 6.8%, 6.6%, 75.5% and 75.5%, respectively. |
| (2) | See “Subordinate and Mezzanine Indebtedness” section below. |
| (3) | See “Escrows” section below for a full description of Escrows and Reserves. |
| (4) | Historical operating statements prior to 2018 are not available, as The District at Tuttle Property (as defined below) was acquired in 2017 and such information was not made available by the prior owner. |
The Mortgage Loan.The mortgage loan (“The District at Tuttle Mortgage Loan”) is evidenced by a single promissory note secured by a first mortgage encumbering The District at Tuttle Borrower’s fee interest in a 228-unit garden multifamily property located in Columbus, Ohio (“The District at Tuttle Property”).
| THE INFORMATION IN THIS STRUCTURAL AND COLLATERAL TERM SHEET IS NOT COMPLETE AND MAY BE AMENDED PRIOR TO THE TIME OF SALE. THIS TERM SHEET IS NOT AN OFFER TO SELL THESE SECURITIES AND IT IS NOT A SOLICITATION OF AN OFFER TO BUY THESE SECURITIES IN ANY JURISDICTION WHERE THE OFFER OR SALE IS NOT PERMITTED. |
| 118 |
| Multifamily – Garden | Loan #9 | Cut-off Date Balance: | $24,000,000 | |
| 4020 Cyber Avenue | The District at Tuttle | Cut-off Date LTV: | 64.7% | |
| Columbus, OH 43221 | U/W NCF DSCR: | 1.78x | ||
| U/W NOI Debt Yield: | 7.9% |
The Borrower and Borrower Sponsors.The borrower is District One II, LLC (“The District at Tuttle Borrower”), a Delaware limited liability company and single purpose entity with one independent director. Legal counsel to The District at Tuttle Borrower delivered a non-consolidation opinion in connection with the origination of The District at Tuttle Mortgage Loan. The borrower sponsors are Scott W. Coy and Brian G. Uffelman. The nonrecourse carve-out guarantors of The District at Tuttle Mortgage Loan are Scott W. Coy, Brian G. Uffelman and Lisa M. Boyd.
Mr. Coy is the founder and CEO of Coy Capital Management, Inc., an investment advisory firm based in Pittsburgh, PA, founded in 2011. As of September 2019, Mr. Coy owns a total of 11 multifamily properties consisting of 1,932 units with a total value of approximately $188.6 million. Mr. Uffelman is a founding partner and investor of Single Source Property Solutions, an asset management company based in Canonsburg, PA, founded in 2000. As of March 2019, Mr. Uffelman owns a total of eight multifamily properties consisting of 1,661 units with a total value of approximately of $166.4 million.
The Property. The District at Tuttle Property is a Class A, 228-unit, 14.3-acre garden multifamily complex located in Columbus, Ohio. The unit mix at The District at Tuttle Property consists of 64 one-bedroom, one-bathroom units (ranging in size from 707 to 876 square feet), 154 two-bedroom, two-bathroom units (ranging in size from 1,214 to 1,433 square feet), and 10 three-bedroom, two bathroom units (2,094 square feet).
The District at Tuttle Property was built in 2014 and is comprised of 26, two-to-three story apartment buildings totaling 262,258 square feet of net rentable area, three, one-story garage buildings and one, one-story clubhouse building which also houses the management and leasing office. Unit amenities at The District at Tuttle Property include air conditioning, walk-in closets, patio or balcony, fireplaces, high-speed internet, and a washer and dryer. The District at Tuttle Property’s amenities include a clubhouse with a fitness center, a big-screen media room, an on-site car wash, bocce and horseshoe courts, a community garden and a swimming pool. The District at Tuttle Property has 402 total parking spaces (1.8 spaces per unit), which includes 336 surface parking spaces and 66 garage parking spaces. As of September 9, 2019, The District at Tuttle Property was 95.2% occupied and has averaged 94.4% occupancy since 2017.
The following table presents certain information relating to unit mix at The District at Tuttle Property:
Unit Mix Summary(1)
| Unit Type | No. of Units | % of Total Units | Average Unit Size | Occupancy | Average Actual Rent per Unit(2) | Average Market Rent per Unit(2) | Average Actual Rent PSF(2) | Average Market Rent PSF(2) |
| 1 BR / 1 Bath | 64 | 28.1% | 776 | 87.5% | $1,068 | $1,087 | $1.38 | $1.40 |
| 2 BR / 2 Bath | 154 | 67.5% | 1,244 | 98.1% | $1,256 | $1,299 | $1.01 | $1.04 |
| 3 BR / 2 Bath | 10 | 4.4% | 2,094 | 100.0% | $1,741 | $2,000 | $0.83 | $0.96 |
| Total / Wtd. Avg. | 228 | 100.0% | 1,150 | 95.2% | $1,225 | $1,270 | $1.06 | $1.10 |
| (1) | Information obtained from the underwritten rent roll dated September 9, 2019. |
| (2) | Excludes vacant units. |
The following table presents historical occupancy percentages at The District at Tuttle Property:
Historical Occupancy
12/31/2015 | 12/31/2016 | 12/31/2017(1) | 12/31/2018(1) | 9/9/2019(2) |
| NAV | NAV | 88.2% | 94.3% | 95.2% |
| (1) | Information obtained from The District at Tuttle Borrower. |
| (2) | Information obtained from the underwritten rent roll dated September 9, 2019. |
| THE INFORMATION IN THIS STRUCTURAL AND COLLATERAL TERM SHEET IS NOT COMPLETE AND MAY BE AMENDED PRIOR TO THE TIME OF SALE. THIS TERM SHEET IS NOT AN OFFER TO SELL THESE SECURITIES AND IT IS NOT A SOLICITATION OF AN OFFER TO BUY THESE SECURITIES IN ANY JURISDICTION WHERE THE OFFER OR SALE IS NOT PERMITTED. |
| 119 |
| Multifamily – Garden | Loan #9 | Cut-off Date Balance: | $24,000,000 | |
| 4020 Cyber Avenue | The District at Tuttle | Cut-off Date LTV: | 64.7% | |
| Columbus, OH 43221 | U/W NCF DSCR: | 1.78x | ||
| U/W NOI Debt Yield: | 7.9% |
Operating History and Underwritten Net Cash Flow. The following table presents certain information relating to the underwritten net cash flow at The District at Tuttle Property:
Cash Flow Analysis(1)
| 2018 | TTM 8/31/19 | U/W | %(2) | U/W $ per Unit | |
| Base Rent | $2,947,644 | $2,977,937 | $3,401,699 | 100.4% | $14,919.73 |
| Concessions | 0 | 0 | (148,869) | (4.4) | (652.94) |
| Bad Debt | 0 | 0 | (17,008) | (0.5) | (74.60) |
| Gross Potential Rent | $2,947,644 | $2,977,937 | $3,235,821 | 95.5% | $14,192.20 |
| Other Income(3) | 134,318 | 139,112 | 139,112 | 4.1 | 610.14 |
| Total Recoveries | 12,731 | 11,609 | 11,609 | 0.3 | 50.92 |
| Net Rental Income | $3,094,693 | $3,128,657 | $3,386,541 | 100.0% | $14,853.25 |
| (Vacancy & Credit Loss) | 0 | 0 | (201,741) | (6.2) | (884.83) |
| Effective Gross Income | $3,094,693 | $3,128,657 | $3,184,800 | 94.0% | $13,968.42 |
| Real Estate Taxes | 638,932 | 743,944 | 680,994 | 21.4 | 2,986.82 |
| Insurance | 41,519 | 45,873 | 50,460 | 1.6 | 221.32 |
| Management Fee | 92,841 | 93,860 | 95,544 | 3.0 | 419.05 |
| Other Operating Expenses | 550,713 | 454,435 | 454,435 | 14.3 | 1,993.14 |
| Total Operating Expenses | $1,324,005 | $1,338,111 | $1,281,433 | 40.2% | $5,620.32 |
| Net Operating Income | $1,770,688 | $1,790,546 | $1,903,367 | 59.8% | $8,348.10 |
| Replacement Reserves | 45,600 | 45,600 | 45,600 | 1.4 | 200.00 |
| Net Cash Flow | $1,725,088 | $1,744,946 | $1,857,767 | 58.3% | $8,148.10 |
| NOI DSCR | 1.69x | 1.71x | 1.82x | ||
| NCF DSCR | 1.65x | 1.67x | 1.78x | ||
| NOI Debt Yield | 7.4% | 7.5% | 7.9% | ||
| NCF Debt Yield | 7.2% | 7.3% | 7.7% |
| (1) | Historical operating statements prior to 2018 are not available, as The District at Tuttle Property was acquired in 2017 and such information was not made available by the prior owner. |
| (2) | Represents (i) percent of Net Rental Income for all revenue fields, (ii) percent of Gross Potential Rent for Vacancy & Credit Loss and (iii) percent of Effective Gross Income for all other fields. |
| (3) | Other Income includes pet fees, garage rental income, cable commissions, late fees, clubhouse fees other miscellaneous income. |
Appraisal.The appraiser concluded to an “as-is” appraised value of $37,100,000 as of August 5, 2019.
Environmental Matters. According to a Phase I environmental assessment dated September 18, 2019, there was no evidence of any recognized environmental conditions at The District at Tuttle Property.
Market Overview.The District at Tuttle Property is located in Columbus Ohio, within Franklin County, and within the Columbus Metropolitan Statistical Area (the “Columbus MSA”). According to the appraisal, the Columbus MSA ranks #32 in population out of the nation’s 382 metropolitan areas. The Columbus MSA has added an average of 23,025 residents per year over the 2010-2019 period, and its annual growth rate is greater than that of the State of Ohio. As of June 2019, the unemployment rate in the Columbus MSA was 3.7%, lower than Ohio’s unemployment rate of 4.2%, demonstrating the area’s strong economic health. Since 2009, employment grew by approximately 177,000 jobs, equivalent to a 19.1% gain over the entire period. The major employers in the Columbus MSA include Ohio State University (31,000 employees), OhioHealth (19,900), JP Morgan (19,200), Nationwide (13,000) and Honda (10,700).
The District at Tuttle is located approximately 13.1 miles northwest of Downtown Columbus. Public transportation is provided by the Central Ohio Transit Authority which provides access throughout Columbus. The nearest bus stop is located approximately 0.4 miles from The District at Tuttle Property. The District at Tuttle Property is situated in a residential area with proximate access to Interstate-270, Columbus’ primary beltway. The District at Tuttle Property is proximate to The Mall at Tuttle Crossing (approximately 1.5 miles), a 1,125,000 square foot mall, which features over 120 stores, is anchored by Macy’s and JC Penney and securitized in the MSBAM 2013-C10 transaction. Tuttle Crossing Boulevard and Fishinger Boulevard, approximately 2.0 miles from The District at Tuttle Property serve as a corridor for restaurants around the area. The District at Tuttle Property is also located approximately 17.7 miles northwest of the John Glenn Columbus International Airport.
| THE INFORMATION IN THIS STRUCTURAL AND COLLATERAL TERM SHEET IS NOT COMPLETE AND MAY BE AMENDED PRIOR TO THE TIME OF SALE. THIS TERM SHEET IS NOT AN OFFER TO SELL THESE SECURITIES AND IT IS NOT A SOLICITATION OF AN OFFER TO BUY THESE SECURITIES IN ANY JURISDICTION WHERE THE OFFER OR SALE IS NOT PERMITTED. |
| 120 |
| Multifamily – Garden | Loan #9 | Cut-off Date Balance: | $24,000,000 | |
| 4020 Cyber Avenue | The District at Tuttle | Cut-off Date LTV: | 64.7% | |
| Columbus, OH 43221 | U/W NCF DSCR: | 1.78x | ||
| U/W NOI Debt Yield: | 7.9% |
According to a third party research report, the estimated 2019 population within a one-, three- and five-mile radius is 11,700, 90,884 and 212,322, respectively. According to a third party research report, the estimated 2019 median household income within a one-, three- and five-mile radius is $88,664, $82,653 and $59,718, respectively.
Submarket Information– According to a third-party market research report, The District at Tuttle Property is situated within the Hilliard submarket. As of the second quarter of 2019, the submarket reported a total inventory of 14,880 units with a 4.1% vacancy rate.
Appraiser’s Competitive Set –The appraiser identified five primary competitive properties for The District at Tuttle Property totaling 1,557 units, which reported an average occupancy rate of approximately 94.4%. The appraiser concluded to monthly market rents per unit ranging from $1,087 to $2,000 (see “Unit Mix Summary” table in “The Property” section above).
The following table presents certain information relating to comparable multifamily properties for The District at Tuttle Property:
Competitive Property Summary
Property Name Address | No. Units | NRA (SF) | Avg. Unit Size (SF) | Year Built/ Renov. | Occ. (%)(2) | Dist from Subject | Beds/Bath | Unit Size (SF) | Appraisal Quoted Rent Per Month | Appraisal Quoted Rent Per Month PSF |
The District at Tuttle(1) 4020 Cyber Avenue Columbus, OH | 228 | 262,258 | 1,150 | 2014/ NAP | 95.2% | N/A | 1 BR / 1 Bath 2 BR / 2 Bath 3 BR / 2 Bath | 776 1,244 2,094 | $1,087 $1,299 $2,000 | $1.40 $1.04 $0.96 |
The Pointe(2) 4890 Edwards Farm Road Hilliard, OH | 114 | 119,560 | 1,049 | 2017/ NAP | 98.3% | 0.2 mi | 1 BR / 1 Bath 2 BR / 2 Bath 3 BR / 2 Bath | 664 1,151 1,680 | $1,084 $1,361 $1,996 | $1.63 $1.18 $1.19 |
Times Square(2) 4130 Times Square Boulevard Dublin, OH | 356 | 291,414 | 819 | 2003/ NAP | 91.9% | 0.8 mi | 1 BR / 1 Bath 2 BR / 2 Bath 3 BR / 2 Bath | 639 1,163 1,600 | $879 $1,253 $1,844 | $1.38 $1.08 $1.15 |
The Charleston Apartments(2) 5407 Edward Plantation Drive Columbus, OH | 287 | 264,281 | 921 | 2006/ NAP | 86.8% | 0.4 mi | 1 BR / 1 Bath 2 BR / 2 Bath 3 BR / 2 Bath | 686 1,177 1,567 | $958 $1,262 $1,827 | $1.40 $1.07 $1.17 |
The Farms Apartments(2) 5412 Edwards Farms Road Columbus, OH | 308 | 321,064 | 1,042 | 1999/ NAP | 100.0% | 0.3 mi | 1 BR / 1 Bath 2 BR / 2 Bath 3 BR / 2 Bath | 693 1,187 1,570 | $950 $1,309 $1,824 | $1.37 $1.10 $1.16 |
Greyson at Hickory Chase(2) 4460 Mountain Laurel Road Hilliard, OH | 492 | 466,212 | 948 | 2017/ NAP | 94.9% | 1.0 mi | 1 BR / 1 Bath 2 BR / 2 Bath 3 BR / 2 Bath | 720 962 1,139 | $972 $1,161 $1,579 | $1.35 $1.21 $1.39 |
| (1) | Information obtained from the rent roll dated September 9, 2019. |
| (2) | Information obtained from the appraisal dated September 30,2019. |
Escrows.
Real Estate Taxes –The District at Tuttle Mortgage Loan documents require an upfront real estate tax reserve of $314,210 and ongoing monthly real estate tax reserves in an amount equal to one-twelfth of the real estate taxes that the lender estimates will be payable during the next twelve months (initially $62,842).
Insurance –The District at Tuttle Mortgage Loan documents require an upfront insurance reserve of $33,640 and ongoing monthly insurance reserves in an amount equal to one-twelfth of the insurance premiums that the lender estimates will be payable during the next twelve months (initially $4,205).
Replacement Reserve –The District at Tuttle Mortgage Loan documents require ongoing monthly replacement reserves of $3,800, which the lender may require The District at Tuttle Borrower to increase if the lender reasonably determines such increase is necessary to maintain the proper operation of The District at Tuttle Property.
Lockbox and Cash Management.The District at Tuttle Mortgage Loan is structured with a soft lockbox, which is already in place, and springing cash management. Prior to the occurrence of a Cash Sweep Period (as defined below), The District at Tuttle Mortgage Loan documents require that The District at Tuttle Borrower or the property manager deposit all rents into a lockbox account within one business day of receipt and all funds in such lockbox account are required to be distributed to the borrower. After the occurrence and during the continuance of a Cash Sweep Period (as defined below), all funds are required to be swept each business day into the cash management account controlled by the lender and all funds on deposit in the cash management account after payment of debt service, required reserves and budgeted operating expenses are required to be reserved as additional security for The District at Tuttle Property.
| THE INFORMATION IN THIS STRUCTURAL AND COLLATERAL TERM SHEET IS NOT COMPLETE AND MAY BE AMENDED PRIOR TO THE TIME OF SALE. THIS TERM SHEET IS NOT AN OFFER TO SELL THESE SECURITIES AND IT IS NOT A SOLICITATION OF AN OFFER TO BUY THESE SECURITIES IN ANY JURISDICTION WHERE THE OFFER OR SALE IS NOT PERMITTED. |
| 121 |
| Multifamily – Garden | Loan #9 | Cut-off Date Balance: | $24,000,000 | |
| 4020 Cyber Avenue | The District at Tuttle | Cut-off Date LTV: | 64.7% | |
| Columbus, OH 43221 | U/W NCF DSCR: | 1.78x | ||
| U/W NOI Debt Yield: | 7.9% |
A “Cash Sweep Period” will commence upon the earlier of the following:
| (i) | the occurrence and continuance of an event of default under The District at Tuttle Mortgage Loan documents; |
| (ii) | the net cash flow debt service coverage ratio (combined with The District at Tuttle Mezzanine Loan) falling below 1.10x; or |
| (iii) | the occurrence and continuance of an event of default under The District at Tuttle Mezzanine Loan documents. |
A Cash Sweep Period will end upon the occurrence of the following:
| ● | with regard to clause (i), the cure of such event of default; |
| ● | with regard to clause (ii), the net cash flow debt service coverage ratio (combined with The District at Tuttle Mezzanine Loan) being equal to or greater than 1.15x for two consecutive calendar months; or |
| ● | with regard to clause (iii), the lender’s receipt of written notice from the mezzanine lender of The District at Tuttle Mezzanine Loan that such event of default has been cured. |
Property Management.The District at Tuttle Property is managed by an affiliate of The District at Tuttle Borrower.
Partial Release.Not permitted.
Real Estate Substitution.Not permitted.
Subordinate and Mezzanine Indebtedness. The District at Tuttle Mezzanine Loan is comprised of an interest-only mezzanine loan in the original principal amount of $4.0 million, which is secured by the direct equity ownership in The District at Tuttle Borrower. The District at Tuttle Mezzanine Loan accrues interest at a rate of 10.0000% per annum and is coterminous with The District at Tuttle Mortgage Loan.
Ground Lease.None.
Terrorism Insurance.The District at Tuttle Mortgage Loan documents require that the “all risk” insurance policy required to be maintained by The District at Tuttle Borrower provide coverage for terrorism in an amount equal to the full replacement cost of The District at Tuttle Property, as well as business interruption insurance covering no less than the 12-month period following the occurrence of a casualty event, together with a six-month extended period of indemnity.
| THE INFORMATION IN THIS STRUCTURAL AND COLLATERAL TERM SHEET IS NOT COMPLETE AND MAY BE AMENDED PRIOR TO THE TIME OF SALE. THIS TERM SHEET IS NOT AN OFFER TO SELL THESE SECURITIES AND IT IS NOT A SOLICITATION OF AN OFFER TO BUY THESE SECURITIES IN ANY JURISDICTION WHERE THE OFFER OR SALE IS NOT PERMITTED. |
| 122 |
(THIS PAGE INTENTIONALLY LEFT BLANK)
| THE INFORMATION IN THIS STRUCTURAL AND COLLATERAL TERM SHEET IS NOT COMPLETE AND MAY BE AMENDED PRIOR TO THE TIME OF SALE. THIS TERM SHEET IS NOT AN OFFER TO SELL THESE SECURITIES AND IT IS NOT A SOLICITATION OF AN OFFER TO BUY THESE SECURITIES IN ANY JURISDICTION WHERE THE OFFER OR SALE IS NOT PERMITTED. |
| 123 |
| Office – Suburban | Loan #10 | Cut-off Date Balance: | $22,750,000 | |
| 730 Arizona Avenue (aka 1310 | 730 Arizona Avenue | Cut-off Date LTV: | 59.9% | |
| Lincoln Boulevard) | U/W NCF DSCR: | 2.13x | ||
| Santa Monica, California 90401 | U/W NOI Debt Yield: | 8.9% |

| THE INFORMATION IN THIS STRUCTURAL AND COLLATERAL TERM SHEET IS NOT COMPLETE AND MAY BE AMENDED PRIOR TO THE TIME OF SALE. THIS TERM SHEET IS NOT AN OFFER TO SELL THESE SECURITIES AND IT IS NOT A SOLICITATION OF AN OFFER TO BUY THESE SECURITIES IN ANY JURISDICTION WHERE THE OFFER OR SALE IS NOT PERMITTED. |
| 124 |
| Office – Suburban | Loan #10 | Cut-off Date Balance: | $22,750,000 | |
| 730 Arizona Avenue (aka 1310 | 730 Arizona Avenue | Cut-off Date LTV: | 59.9% | |
| Lincoln Boulevard) | U/W NCF DSCR: | 2.13x | ||
| Santa Monica, California 90401 | U/W NOI Debt Yield: | 8.9% |

| THE INFORMATION IN THIS STRUCTURAL AND COLLATERAL TERM SHEET IS NOT COMPLETE AND MAY BE AMENDED PRIOR TO THE TIME OF SALE. THIS TERM SHEET IS NOT AN OFFER TO SELL THESE SECURITIES AND IT IS NOT A SOLICITATION OF AN OFFER TO BUY THESE SECURITIES IN ANY JURISDICTION WHERE THE OFFER OR SALE IS NOT PERMITTED. |
| 125 |
| No. 10 – 730 Arizona Avenue | |||||||
| Mortgage Loan Information | Mortgaged Property Information | ||||||
| Mortgage Loan Seller: | Wells Fargo Bank, National Association | Single Asset/Portfolio: | Single Asset | ||||
| Credit Assessment (Fitch/KBRA/S&P): | NR/NR/NR | Property Type – Subtype: | Office – Suburban | ||||
| Original Principal Balance: | $22,750,000 | Location: | Santa Monica, CA | ||||
| Cut-off Date Balance: | $22,750,000 | Size: | 28,822 | ||||
| % of Initial Pool Balance: | 3.4% | Cut-off Date Balance Per SF: | $789.33 | ||||
| Loan Purpose: | Refinance | Maturity Date Balance Per SF: | $789.33 | ||||
| Borrower Sponsor: | David Orenstein | Year Built/Renovated: | 1988/2016 | ||||
| Guarantors: | David Orenstein; Palisades Capital Partners LLC | Title Vesting: | Fee | ||||
| Mortgage Rate: | 3.9700% | Property Manager: | Self-managed | ||||
| Note Date: | August 23, 2019 | Current Occupancy (As of): | 100.0% (12/1/2019) | ||||
| Seasoning: | 3 months | YE 2018 Occupancy: | 100.0% | ||||
| Maturity Date: | September 11, 2029 | YE 2017 Occupancy: | 100.0% | ||||
| IO Period: | 120 months | YE 2016 Occupancy: | 100.0% | ||||
| Loan Term (Original): | 120 months | YE 2015 Occupancy(2): | 0.0% | ||||
| Amortization Term (Original): | NAP | As-Is Appraised Value: | $38,000,000 | ||||
| Loan Amortization Type: | Interest-only, Balloon | As-Is Appraised Value Per SF: | $1,318.44 | ||||
| Call Protection: | L(27),D(89),O(4) | As-Is Appraisal Valuation Date: | July 9, 2019 | ||||
| Lockbox Type: | Hard/Upfront Cash Management | ||||||
| Additional Debt: | None | Underwriting and Financial Information | |||||
| Additional Debt Type (Balance): | NAP | TTM NOI (6/30/2019): | $2,144,695 | ||||
| YE 2018 NOI: | $2,095,682 | ||||||
| YE 2017 NOI: | $2,006,326 | ||||||
| YE 2016 NOI(2): | NAV | ||||||
| U/W Revenues: | $2,653,534 | ||||||
| U/W Expenses: | $623,222 | ||||||
| Escrows and Reserves(1) | U/W NOI: | $2,030,312 | |||||
| Initial | Monthly | Cap | U/W NCF: | $1,955,375 | |||
| Taxes | $155,478 | $25,913 | NAP | U/W DSCR based on NOI/NCF: | 2.21x / 2.13x | ||
| Insurance | $44,143 | $4,233 | NAP | U/W Debt Yield based on NOI/NCF: | 8.9% / 8.6% | ||
| Replacement Reserve | $0 | $480 | $16,933 | U/W Debt Yield at Maturity based on NOI/NCF: | 8.9% / 8.6% | ||
| Leasing Reserve | $0 | $6,005 | $216,165(1) | Cut-off Date LTV Ratio: | 59.9% | ||
| LTV Ratio at Maturity: | 59.9% | ||||||
| Sources and Uses | ||||||||
| Sources | Uses | |||||||
| Original loan amount | $22,750,000 | 100.0% | Loan payoff | $20,382,043 | 89.6% | |||
| Return of equity | 2,051,346 | 9.0 | ||||||
| Upfront reserves | 199,621 | 0.9 | ||||||
| Closing costs | 116,990 | 0.5 | ||||||
| Total Sources | $22,750,000 | 100.0% | Total Uses | $22,750,000 | 100.0% | |||
| (1) | See “Escrows” section for a full description of Escrows and Reserves. |
| (2) | According to a third party market research provider, the 730 Arizona Avenue Property (as defined below) was 100.0% occupied from the second quarter of 1996 through the first quarter of 2015 and completely vacant from the second quarter of 2015 through the third quarter of 2016. The 730 Arizona Avenue Borrower (as defined below) acquired the 730 Arizona Avenue Property in September 2015 and subsequently signed a lease with Regus in February 2016 (with a lease commencement date in October 2016) for 100.0% of the net rentable area. |
The Mortgage Loan. The mortgage loan (the “730 Arizona Avenue Mortgage Loan”) is evidenced by a single promissory note secured by a first mortgage encumbering the fee interest in a class B office property in Santa Monica, California (the “730 Arizona Avenue Property”).
The Borrower and Borrower Sponsor.The borrower is 730 Arizona Avenue Holdings, LLC, a Delaware limited liability company and single purpose entity (the “730 Arizona Avenue Borrower”). The borrower sponsor of the 730 Arizona Avenue Mortgage Loan is David Orenstein, and the non-recourse carve-out guarantors are David Orenstein and Palisades Capital Partners LLC.Palisades Capital Partners LLC is a real estate firm based in Los Angeles, California that has a broad range of real estate experience comprising acquisitions, entitlements, design & development, construction, repositioning & redevelopment and asset management. David Orenstein is a manager of Palisades Capital Partners LLC.
| THE INFORMATION IN THIS STRUCTURAL AND COLLATERAL TERM SHEET IS NOT COMPLETE AND MAY BE AMENDED PRIOR TO THE TIME OF SALE. THIS TERM SHEET IS NOT AN OFFER TO SELL THESE SECURITIES AND IT IS NOT A SOLICITATION OF AN OFFER TO BUY THESE SECURITIES IN ANY JURISDICTION WHERE THE OFFER OR SALE IS NOT PERMITTED. |
| 126 |
| Office – Suburban | Loan #10 | Cut-off Date Balance: | $22,750,000 | |
| 730 Arizona Avenue (aka 1310 | 730 Arizona Avenue | Cut-off Date LTV: | 59.9% | |
| Lincoln Boulevard) | U/W NCF DSCR: | 2.13x | ||
| Santa Monica, California 90401 | U/W NOI Debt Yield: | 8.9% |
The Property.The 730 Arizona Avenue Property is a four-story, class B office building containing 28,822 square feet and situated on a 0.3-acre site in Santa Monica, California. Built in 1988 and most recently renovated in 2016, the 730 Arizona Avenue Property reflects an open concept creative office layout with a three-story atrium, finished concrete floors, exposed ceilings, LED lighting and glass partitioning. The ground floor of the 730 Arizona Avenue Property contains a reception area, café and lounge, while the upper floors are built out as creative office space, including private offices with glass partitioning and kitchenettes. The 730 Arizona Avenue Property comprises a 68-space, two-level underground parking garage, resulting in a parking ratio of approximately 2.4 spaces per 1,000 square feet of rentable area. As of December 1, 2019, the 730 Arizona Avenue Property was 100.0% leased to Regus.
Major Tenant.
Regus (28,822 square feet; 100.0% of net rentable area; 100.0% of underwritten base rent; exp. 10/30/2026) The 730 Arizona Avenue Property is fully leased to Regus, which provides serviced offices, virtual offices, meeting rooms and videoconferencing to clients on a contract basis. Regus’s parent company, International Workplace Group (“IWG”), operates under five brands (Regus, Signature by Regus, Spaces, HQ, and No. 18) with more than 3,300 business centers in over 110 countries, adding 299 locations in 2018. For 2018, IWG reported revenue of approximately £2.5 billion (up approximately 9.7% over 2017) and EBITDA of approximately £389.9 million (up approximately 3.6% over 2017).
Regus operates its “Spaces” co-working concept at the 730 Arizona Avenue Property, which, according to the company’s website, targets creating dynamic workspaces with a unique and entrepreneurial spirit. In 2018, IWG added 103 Spaces locations, which represented approximately 56% of total space added. Regus has been in occupancy at the 730 Arizona Avenue Property since November 2016 and has two, five-year renewal options following its lease expiration in October 2026. Regus’s current base rental rate is $65.56 per square foot and its lease is structured with 3.0% annual contractual rental rate increases.
The Regus lease is guaranteed by RGN-National Business Centers, LLC, a Delaware limited liability company (the “Lease Guarantor”). The Lease Guarantor’s liability amount with respect to the Regus lease at the 730 Arizona Property was initially $2,161,650, and as of October 31, 2019, was $1,441,100. As long as the tenant is not in default under its lease, the Lease Guarantor’s liability amount will be further reduced to $1,152,880 in October 2020; $864,660 in October 2021; $423,330 in October 2022; and $0 in October 2023.
The following table presents certain information relating to the tenancy at the 730 Arizona Avenue Property:
Major Tenant(1)
| Tenant Name | Credit Rating Moody’s/ | Tenant NRSF | % of NRSF | Annual U/W Base Rent PSF | Annual U/W Base Rent | % of Total Annual U/W Base Rent | Lease Expiration Date | Extension Options | Termination Option (Y/N) |
| Major Tenants | |||||||||
| Regus | NR/NR/NR | 28,822 | 100.0% | $67.53(2) | $1,946,365(2) | 100.0% | 10/30/2026 | 2, 5-year(3) | N |
| Occupied Collateral Total | 28,822 | 100.0% | $67.53 | $1,946,365 | 100.0% | ||||
| Vacant Space | 0 | 0.0% | |||||||
| Collateral Total | 28,822 | 100.0% | |||||||
| (1) | Information obtained from the Underwritten Rent Roll |
| (2) | Regus’s current contractual rental rate is $65.56 per square foot. The Annual U/W Base Rent PSF and Annual U/W Base Rent include credit for the tenant’s 3.0% contractual rental rate increase in November 2020. Regus’s lease is structured with 3.0% annual contractual rental rate increases. |
| (3) | Regus has 2, 5-year extension options at fair market rent with 12 months’ notice. |
| THE INFORMATION IN THIS STRUCTURAL AND COLLATERAL TERM SHEET IS NOT COMPLETE AND MAY BE AMENDED PRIOR TO THE TIME OF SALE. THIS TERM SHEET IS NOT AN OFFER TO SELL THESE SECURITIES AND IT IS NOT A SOLICITATION OF AN OFFER TO BUY THESE SECURITIES IN ANY JURISDICTION WHERE THE OFFER OR SALE IS NOT PERMITTED. |
| 127 |
| Office – Suburban | Loan #10 | Cut-off Date Balance: | $22,750,000 | |
| 730 Arizona Avenue (aka 1310 | 730 Arizona Avenue | Cut-off Date LTV: | 59.9% | |
| Lincoln Boulevard) | U/W NCF DSCR: | 2.13x | ||
| Santa Monica, California 90401 | U/W NOI Debt Yield: | 8.9% |
The following table presents certain information relating to the lease rollover schedule at the 730 Arizona Avenue Property:
Lease Expiration Schedule(1)
| Year Ending December 31, | No. of Leases Expiring | Expiring NRSF | % of Total NRSF | Cumulative Expiring NRSF | Cumulative % of Total | Annual U/W Base Rent | % of Total Annual U/W Base Rent | Annual U/W Base Rent PSF |
| MTM | 0 | 0 | 0.0% | 0 | 0.0% | $0 | 0.0% | $0.00 |
| 2019 | 0 | 0 | 0.0% | 0 | 0.0% | $0 | 0.0% | $0.00 |
| 2020 | 0 | 0 | 0.0% | 0 | 0.0% | $0 | 0.0% | $0.00 |
| 2021 | 0 | 0 | 0.0% | 0 | 0.0% | $0 | 0.0% | $0.00 |
| 2022 | 0 | 0 | 0.0% | 0 | 0.0% | $0 | 0.0% | $0.00 |
| 2023 | 0 | 0 | 0.0% | 0 | 0.0% | $0 | 0.0% | $0.00 |
| 2024 | 0 | 0 | 0.0% | 0 | 0.0% | $0 | 0.0% | $0.00 |
| 2025 | 0 | 0 | 0.0% | 0 | 0.0% | $0 | 0.0% | $0.00 |
| 2026 | 1 | 28,822 | 100.0% | 28,822 | 100.0% | $1,946,365 | 100.0% | $67.53 |
| 2027 | 0 | 0 | 0.0% | 28,822 | 100.0% | $0 | 0.0% | $0.00 |
| 2028 | 0 | 0 | 0.0% | 28,822 | 100.0% | $0 | 0.0% | $0.00 |
| 2029 | 0 | 0 | 0.0% | 28,822 | 100.0% | $0 | 0.0% | $0.00 |
| Thereafter | 0 | 0 | 0.0% | 28,822 | 100.0% | $0 | 0.0% | $0.00 |
| Vacant | 0 | 0 | 0.0% | 28,822 | 100.0% | $0 | 0.0% | $0.00 |
| Total/Weighted Average | 1 | 28,822 | 100.0% | $1,946,365 | 100.0% | $67.53 |
| (1) | Information obtained from the underwritten rent roll. |
The following table presents historical occupancy percentages at the 730 Arizona Avenue Property:
Historical Occupancy
12/31/2015(1)(2) | 12/31/2016(1) | 12/31/2017(1) | 12/31/2018(1) | 12/1/2019(3) |
| 0.0% | 100.0% | 100.0% | 100.0% | 100.0% |
| (1) | Information obtained from the 730 Arizona Avenue Borrower. |
| (2) | According to a third party market research provider, the 730 Arizona Avenue Property was 100.0% occupied from the second quarter of 1996 through the first quarter of 2015 and completely vacant from the second quarter of 2015 through the third quarter of 2016. The 730 Arizona Avenue Borrower acquired the 730 Arizona Avenue Property in September 2015 and subsequently signed a lease with Regus in February 2016 (with a lease commencement date in October 2016) for 100.0% of the net rentable area. |
| (3) | Information obtained from the underwritten rent roll. |
| THE INFORMATION IN THIS STRUCTURAL AND COLLATERAL TERM SHEET IS NOT COMPLETE AND MAY BE AMENDED PRIOR TO THE TIME OF SALE. THIS TERM SHEET IS NOT AN OFFER TO SELL THESE SECURITIES AND IT IS NOT A SOLICITATION OF AN OFFER TO BUY THESE SECURITIES IN ANY JURISDICTION WHERE THE OFFER OR SALE IS NOT PERMITTED. |
| 128 |
| Office – Suburban | Loan #10 | Cut-off Date Balance: | $22,750,000 | |
| 730 Arizona Avenue (aka 1310 | 730 Arizona Avenue | Cut-off Date LTV: | 59.9% | |
| Lincoln Boulevard) | U/W NCF DSCR: | 2.13x | ||
| Santa Monica, California 90401 | U/W NOI Debt Yield: | 8.9% |
Operating History and Underwritten Net Cash Flow. The following table presents certain information relating to the historical operating performance and underwritten net cash flow at the 730 Arizona Avenue Property:
Cash Flow Analysis
| 2017 | 2018 | TTM 6/30/2019 | U/W | %(1) | U/W $ per SF | ||||||||
| Base Rent | $1,896,005 | $1,896,008 | $1,931,632 | $1,889,675 | 68.7% | $65.56 | |||||||
| Contractual Rent Steps(2) | 0 | 0 | 0 | 56,690 | 2.1 | 1.97 | |||||||
| Grossed Up Vacant Space | 0 | 0 | 0 | 0 | 0.0 | 0.0 | |||||||
| Gross Potential Rent | $1,896,005 | $1,896,008 | $1,931,632 | $1,946,365 | 70.8% | $67.53 | |||||||
| Parking/Garage Income | 248,661 | 213,137 | 217,142 | 212,426 | 7.7 | 7.37 | |||||||
| Total Recoveries | 325,229 | 597,433 | 599,181 | 592,061 | 21.5 | 20.54 | |||||||
| Net Rental Income | $2,469,895 | $2,706,578 | $2,747,955 | $2,750,852 | 100.0% | $95.44 | |||||||
| (Vacancy & Credit Loss) | 0 | 0 | 0 | (97,318)(3) | (5.0) | (3.38) | |||||||
| Effective Gross Income | $2,469,895 | $2,706,578 | $2,747,955 | $2,653,534 | 96.5% | $92.07 | |||||||
| Real Estate Taxes | 289,911 | 295,422 | 296,144 | 296,144 | 11.2 | 10.27 | |||||||
| Insurance | 43,486 | 26,638 | 19,930 | 48,376 | 1.8 | 1.68 | |||||||
| Management Fee | 47,189 | 108,263 | 109,918 | 106,141 | 4.0 | 3.68 | |||||||
| Other Operating Expenses | 82,983 | 180,573 | 177,268 | 172,561 | 6.5 | 5.99 | |||||||
| Total Operating Expenses | $463,569 | $610,896 | $603,260 | $623,222 | 23.5% | $21.62 | |||||||
| Net Operating Income | $2,006,326 | $2,095,682 | $2,144,695 | $2,030,312 | 76.5% | $70.44 | |||||||
| Replacement Reserves | 0 | 0 | 0 | 2,882 | 0.1 | 0.10 | |||||||
| TI/LC | 0 | 0 | 0 | 72,056 | 2.7 | 2.50 | |||||||
| Net Cash Flow | $2,006,326 | $2,095,682 | $2,144,695 | $1,955,375 | 73.7% | $67.84 | |||||||
| NOI DSCR | 2.18x | 2.28x | 2.34x | 2.21x | |||||||||
| NCF DSCR | 2.18x | 2.28x | 2.34x | 2.13x | |||||||||
| NOI Debt Yield | 8.8% | 9.2% | 9.4% | 8.9% | |||||||||
| NCF Debt Yield | 8.8% | 9.2% | 9.4% | 8.6% |
| (1) | Represents (i) percent of Net Rental Income for all revenue fields, (ii) percent of Gross Potential Rent for Vacancy & Credit Loss and (iii) percent of Effective Gross Income for all other fields. |
| (2) | Represents contractual rent steps through November 2020. |
| (3) | The underwritten economic vacancy is 5.0%. The 730 Arizona Avenue Property was 100.0% leased as of December 1, 2019. |
Appraisal.The appraiser concluded to an “as-is” Appraised Value of $38,000,000 as of July 9, 2019. The appraiser also concluded to a hypothetical go dark value of $31,500,000 as of July 9, 2019.
Environmental Matters. According to the Phase I environmental site assessment dated July 11, 2019, there was no evidence of any recognized environmental conditions at the 730 Arizona Avenue Property.
Market Overview and Competition.The 730 Arizona Avenue Property is situated at the southwest corner of the intersection of Arizona Avenue and Lincoln Boulevard in Santa Monica, Los Angeles County, California. Downtown Santa Monica lies approximately 15.6 miles west of the Los Angeles central business district and encompasses approximately 8.1 square miles. Santa Monica is bounded by Pacific Palisades to the north, Brentwood to the east, Santa Monica Bay and the Pacific Ocean to the west and Venice to the south.
The City of Santa Monica is served by the Santa Monica Freeway (Interstate 10), which bisects the city in an east-west direction and extends easterly to downtown Los Angeles and then across the San Gabriel Valley into the Pomona Valley and San Bernardino County. Approximately one mile east of the city’s eastern border, the Santa Monica Freeway intersects with the San Diego Freeway, which is a major north/south traffic route that connects the San Fernando Valley to the north to San Diego County to the south.
According to a third party market research provider, the estimated 2018 population within a three- and five-mile radius of the 730 Arizona Avenue Property was approximately 187,012 and 421,182, respectively; and the estimated 2018 average household income within the same radii was approximately $138,368 and $138,036, respectively.
Submarket Information – According to a third-party market research report, the 730 Arizona Avenue Property is situated within the Santa Monica submarket of the Los Angeles Office Market. As of October 2019, the submarket reported a total inventory of approximately 16.0 million square feet with a 7.9% vacancy rate and average asking rent of $63.59 per square foot, gross. The appraiser concluded to a market rent for the 730 Arizona Avenue Property of $64.00 per square foot, net, with 3.0% annual escalations.
| THE INFORMATION IN THIS STRUCTURAL AND COLLATERAL TERM SHEET IS NOT COMPLETE AND MAY BE AMENDED PRIOR TO THE TIME OF SALE. THIS TERM SHEET IS NOT AN OFFER TO SELL THESE SECURITIES AND IT IS NOT A SOLICITATION OF AN OFFER TO BUY THESE SECURITIES IN ANY JURISDICTION WHERE THE OFFER OR SALE IS NOT PERMITTED. |
| 129 |
| Office – Suburban | Loan #10 | Cut-off Date Balance: | $22,750,000 | |
| 730 Arizona Avenue (aka 1310 | 730 Arizona Avenue | Cut-off Date LTV: | 59.9% | |
| Lincoln Boulevard) | U/W NCF DSCR: | 2.13x | ||
| Santa Monica, California 90401 | U/W NOI Debt Yield: | 8.9% |
The following table presents certain information relating to the appraiser’s market rent conclusions for the 730 Arizona Avenue Property:
Market Rent Summary(1)
| Office | |
| Market Rent (PSF) | $64.00 |
| Lease Term (Years) | 10 |
| Lease Type (Reimbursements) | Net |
| Rent Increase Projection | 3% per annum |
| (1) | Information obtained from the appraisal. |
The table below presents certain information relating to comparable sales pertaining to the 730 Arizona Avenue Property identified by the appraiser:
Comparable Sales(1)
| Property Name | Location | Rentable Area (SF) | Sale Date | Sale Price | Sale Price (PSF) | |||||
| Broadway Plaza | Santa Monica, CA | 112,987 | Jun-2019 | $119,225,000 | $1,055 | |||||
| Lantana East & West | Santa Monica, CA | 278,687 | March-2019 | $321,000,000 | $1,152 | |||||
| UTA and Ice House | Beverly Hills, CA | 234,361 | Dec-2018 | $244,000,000 | $1,041 | |||||
| 1205 Colorado | Santa Monica, CA | 23,166 | Sep-2018 | $33,000,000 | $1,425 | |||||
| 9312-9330 Civic Center | Beverly Hills, CA | 34,245 | Aug-2018 | $35,500,000 | $1,037 | |||||
| Union Bank Building | Beverly Hills, CA | 97,000 | Jan-2018 | $132,000,000 | $1,361 |
| (1) | Information obtained from the appraisal. |
The following table presents certain information relating to comparable leases to 730 Arizona Avenue Property:
Comparable Leases(1)
| Property Name/Location | Year Built/ Renovated | Total GLA (SF) | Distance from Subject | Lease Date | Tenant | Tenant Size | Lease Term | Annual Base Rent PSF | Lease Type |
Subject Property 730 Arizona Avenue Santa Monica, CA | 1988/2016 | 28,822 | NAP | Feb-2016 | Regus | 28,822 SF | 10.0 yrs | $65.56 | NNN |
Wilshire Beverly Center 9465 Wilshire Boulevard Beverly Hills, CA | 1961/1996 | 186,269 | 8.5 miles | Jun-2019 | The Gersh
Agency
| 44,996 SF | 6.0 Yrs | $58.00 | FSG |
One Culver 10000 West Washington Boulevard Culver City, CA | 1986/2017 | 363,548 | 6.8 miles | Mar-2019 | Carbon 38 | 20,500 SF | 11.0 Yrs | $50.20 | FSG |
Lantana 3000 West Olympic Boulevard Santa Monica, CA | 1959/2000 | 131,450 | 3.0 miles | Feb-2019 | WeWork | 112,000 SF | 16.0 Yrs | $49.50 | MG |
Water Garden 2450 Colorado Avenue Santa Monica, CA | 2000/NAP | 278,713 | 1.7 miles | Jan-2019 | NAV | 69,208 SF | 10.0 Yrs | $50.80 | FSG |
Sea Rise 233 Wilshire Boulevard Santa Monica, CA | 1975/2009 | 130,242 | 0.5 miles | Dec-2018 | NAV | 6,152 SF | 5.0 Yrs | $65.92 | FSG |
Clock Tower 225 Santa Monica Boulevard Santa Monica, CA | 1929/2004 | 54,470 | 0.5 miles | Nov-2018 | NAV | 4,390 SF | 5.7 Yrs | $70.50 | MG |
| (1) | Information obtained from the appraisal |
| THE INFORMATION IN THIS STRUCTURAL AND COLLATERAL TERM SHEET IS NOT COMPLETE AND MAY BE AMENDED PRIOR TO THE TIME OF SALE. THIS TERM SHEET IS NOT AN OFFER TO SELL THESE SECURITIES AND IT IS NOT A SOLICITATION OF AN OFFER TO BUY THESE SECURITIES IN ANY JURISDICTION WHERE THE OFFER OR SALE IS NOT PERMITTED. |
| 130 |
| Office – Suburban | Loan #10 | Cut-off Date Balance: | $22,750,000 | |
| 730 Arizona Avenue (aka 1310 | 730 Arizona Avenue | Cut-off Date LTV: | 59.9% | |
| Lincoln Boulevard) | U/W NCF DSCR: | 2.13x | ||
| Santa Monica, California 90401 | U/W NOI Debt Yield: | 8.9% |
Escrows.
Real Estate Taxes – The 730 Arizona Avenue Mortgage Loan documents require an upfront real estate tax reserve of $155,478 and ongoing monthly real estate tax reserves in an amount equal to one-twelfth of the real estate taxes that the lender estimates will be payable during the next twelve months (initially $25,913).
Insurance – The 730 Arizona Avenue Mortgage Loan documents require an upfront insurance reserve of $44,143 and ongoing monthly insurance reserves in an amount equal to one-twelfth of the insurance premiums that the lender estimates will be payable during the next twelve months (initially $4,233).
Replacement Reserve – The 730 Arizona Avenue Mortgage Loan documents require ongoing monthly replacement reserves of $480 (subject to a cap of $16,933, as long as no event of default occurs and the 730 Arizona Avenue Borrower is adequately maintaining the 730 Arizona Avenue Property), which the lender may require the 730 Arizona Avenue Borrower to increase (not more than once per year) if the lender reasonably determines such increase is necessary to maintain the proper operation of the 730 Arizona Avenue Property.
Leasing Reserve –The 730 Arizona Avenue Mortgage Loan documents require ongoing general TI/LC reserves of $6,005; provided, however, that following the occurrence of a Regus Renewal Event (as defined below), (i) as long as no event of default is then continuing, the Leasing Reserve account will be subject to a cap of $216,165 (the “Leasing Reserve Funds Cap”), and (ii) as long as no event of default or other Cash Trap Event Period (see “Lockbox and Cash Management” section) is then continuing, any Leasing Reserve funds then held by the lender in excess of the Leasing Reserve Funds Cap are required to be returned to the 730 Arizona Avenue Borrower promptly following the 730 Arizona Avenue Borrower’s written request thereof.
A “Regus Renewal Event” will occur upon the lender receiving satisfactory evidence that Regus has renewed or extended the term of its lease at the 730 Arizona Avenue Property for a term that extends at least three years beyond the maturity date of the 730 Arizona Avenue Mortgage Loan, at rent equal to or greater than the then-current in-place rent and otherwise on terms and conditions reasonably acceptable to the lender.
Lockbox and Cash Management. The 730 Arizona Avenue Mortgage Loan documents require that the 730 Arizona Avenue Borrower establish and maintain a lender-controlled lockbox account, which is already in place, and that the 730 Arizona Avenue Borrower direct all tenants to pay rent directly into such lockbox account. The 730 Arizona Avenue Mortgage Loan documents also require that all rents received by the 730 Arizona Avenue Borrower or the property manager be deposited into the lockbox account within one business day of receipt. All funds in the lockbox account are required to be swept each business day into the cash management account controlled by the lender and, on each payment date, all funds in the cash management account are required to be applied in accordance with the 730 Arizona Avenue Mortgage Loan documents. Prior to the occurrence of a Cash Trap Event Period, any excess cash flow will be disbursed to the 730 Arizona Avenue Borrower. During a Cash Trap Event Period, any excess cash flow remaining after satisfaction of the waterfall items are required to be swept to an excess cash flow subaccount to be held by the lender as additional security for the 730 Arizona Avenue Mortgage Loan during the continuance of the Cash Trap Event Period; provided, however, that, with respect to a Cash Trap Event Period related solely to a Major Tenant Event Period (as defined below), such excess funds (and/or letter of credit) of up to $2,161,650 will be held in a Regus tenant reserve subaccount (“Major Tenant Reserve Funds”), and further deposits into the excess cash flow subaccount are not required following the occurrence of a Major Tenant Event Deposit Cure (as defined below).
A “Cash Trap Event Period” will commence upon the earlier of the following:
| (i) | the occurrence and continuance of an event of default; |
| (ii) | the amortizing net cash flow debt service coverage ratio based upon a hypothetical 30-year amortization period (the “Amortizing NCF DSCR”) falling below 1.20x; and |
| (iii) | the occurrence and continuation of a Major Tenant Event Period (as defined below). |
A Cash Trap Event Period will end upon the occurrence of the following:
| ● | with regard to clause (i), the cure of such event of default; |
| ● | with regard to clause (ii), the Amortizing NCF DSCR being greater than or equal to 1.25x for two consecutive calendar quarters; or |
| ● | with regard to clause (iii), a Major Tenant Event Period Cure (as defined below). |
A “Major Tenant Event Period” will commence upon the earliest to occur of the following (provided that any reference to ‘Regus’ above, in the conditions below, or within the definition of Major Tenant Event Period Cure below will also apply to such tenant’s successors and assigns, and any replacement tenant that enters into a lease in accordance with the terms of the 730 Arizona Avenue Mortgage Loan documents):
| (i) | the earlier of (x) April 30, 2025 and (y) Regus’s renewal notice period set forth in its lease (currently 12 months prior to lease expiration in October 2026); |
| (ii) | Regus “goes dark”, vacates or otherwise fails to occupy all of its space, or gives notice of its intent to commence any of the foregoing; |
| (iii) | Regus’s parent fails to satisfy the Regus Financial Requirements (as defined below); |
| THE INFORMATION IN THIS STRUCTURAL AND COLLATERAL TERM SHEET IS NOT COMPLETE AND MAY BE AMENDED PRIOR TO THE TIME OF SALE. THIS TERM SHEET IS NOT AN OFFER TO SELL THESE SECURITIES AND IT IS NOT A SOLICITATION OF AN OFFER TO BUY THESE SECURITIES IN ANY JURISDICTION WHERE THE OFFER OR SALE IS NOT PERMITTED. |
| 131 |
| Office – Suburban | Loan #10 | Cut-off Date Balance: | $22,750,000 | |
| 730 Arizona Avenue (aka 1310 | 730 Arizona Avenue | Cut-off Date LTV: | 59.9% | |
| Lincoln Boulevard) | U/W NCF DSCR: | 2.13x | ||
| Santa Monica, California 90401 | U/W NOI Debt Yield: | 8.9% |
| (iv) | a monetary or material non-monetary default (beyond any applicable notice and cure period) under the Regus lease; |
| (v) | Regus, the Lease Guarantor, or any successor guarantor of the Regus lease files, as a debtor, a bankruptcy or similar insolvency proceeding, or otherwise becomes involved, as a debtor, in a bankruptcy or any similar insolvency proceeding; or |
| (vi) | Regus terminates or cancels its lease (or Regus’s lease fails or ceases to be in full force and effect), or gives notice of, or commences a legal proceeding asserting any of the foregoing. |
A “Major Tenant Event Period Cure” will occur upon:
| ● | with regard to clauses (i) through (vi) above, (x) a Major Tenant Re-Tenanting Event (as defined below), or (y) a Major Tenant Event Deposit Cure (as defined below); |
| ● | with regard to clause (i) above, Regus renewing or extending the term of its lease pursuant to the terms set forth in such lease or otherwise on terms and conditions reasonably acceptable to the lender; |
| ● | with regard to clause (ii) above, the lender receiving reasonably satisfactory evidence that Regus has resumed occupancy of and resumed its normal business operations in its space for two consecutive calendar quarters; |
| ● | with regard to clause (iii) above, the Regus Parent (as defined below) satisfying the Regus Financial Requirements; |
| ● | with regard to clause (iv) above, the subject default being cured, and no other default under the related lease having occurred (in each case beyond any applicable notice and cure period) for two consecutive calendar quarters following such cure; and |
| ● | with regard to clause (v) above, the termination of the bankruptcy or insolvency proceeding in a manner satisfactory to the lender and the affirmation of the related lease with terms satisfactory to the lender. |
“Regus Financial Requirements” include the following, as set forth in the annual report of IWG plc (the “Regus Parent”), or any successor parent company of Regus, with respect to a given calendar year (or fiscal year, if such annual report is issued for such period):
| (i) | the Americas division’s “contribution” (as term is used and described on page 26 of the Regus Parent 2018 Annual Report) is no less than £145 million (per the Regus Parent 2018 Annual Report, the Americas division’s contribution for 2018 was approximately £207.6); or |
| (ii) | the Americas division’s “mature gross margin” (as term is used and described on page 26 of the Regus Parent 2018 Annual Report) is at least 15% (per the Regus Parent 2018 Annual Report, the Americas division’s mature gross margin for 2018 was approximately 21.6%); |
A “Major Tenant Re-Tenanting Event” will occur upon the lender having received satisfactory evidence that all of the applicable space has been leased to one or more reasonably satisfactory replacement tenants, each pursuant to a reasonably satisfactory replacement lease (or, solely with respect to a Major Tenant Event Period caused solely by a matter that is personal to a given tenant (e.g., such tenant “goes dark”), pursuant to an assignment of an existing lease on terms and conditions reasonably satisfactory to the lender), with such replacement tenant(s) being in occupancy, open for business and paying full, unabated rent, with all applicable tenant improvement costs and leasing commissions having been paid, along with a satisfactory estoppel certificate from each replacement tenant affirming the foregoing.
A “Major Tenant Event Deposit Cure” will occur upon the amount of Major Tenant Reserve Funds on deposit with the lender (whether by cash or a combination of cash and a letter of credit) being equal to or greater than $2,161,650.
Property Management. The 730 Arizona Avenue Property is managed by an affiliate of the 730 Arizona Avenue Borrower.
Partial Release. Not permitted.
Real Estate Substitution.Not permitted.
Subordinate and Mezzanine Indebtedness.Not permitted.
Ground Lease. None.
Terrorism Insurance.The 730 Arizona Avenue Mortgage Loan documents require that the “all risk” insurance policy required to be maintained by the 730 Arizona Avenue Borrower provides coverage for terrorism in an amount equal to the full replacement cost of the 730 Arizona Avenue Property, as well as business interruption insurance covering no less than the 12-month period following the occurrence of a casualty event, together with a 6-month extended period of indemnity.
| THE INFORMATION IN THIS STRUCTURAL AND COLLATERAL TERM SHEET IS NOT COMPLETE AND MAY BE AMENDED PRIOR TO THE TIME OF SALE. THIS TERM SHEET IS NOT AN OFFER TO SELL THESE SECURITIES AND IT IS NOT A SOLICITATION OF AN OFFER TO BUY THESE SECURITIES IN ANY JURISDICTION WHERE THE OFFER OR SALE IS NOT PERMITTED. |
| 132 |
(THIS PAGE INTENTONALLY LEFT BLANK)
| THE INFORMATION IN THIS STRUCTURAL AND COLLATERAL TERM SHEET IS NOT COMPLETE AND MAY BE AMENDED PRIOR TO THE TIME OF SALE. THIS TERM SHEET IS NOT AN OFFER TO SELL THESE SECURITIES AND IT IS NOT A SOLICITATION OF AN OFFER TO BUY THESE SECURITIES IN ANY JURISDICTION WHERE THE OFFER OR SALE IS NOT PERMITTED. |
| 133 |
| No. 11 – Phoenix Industrial Portfolio II | |||||||
| Mortgage Loan Information | Mortgaged Property Information | ||||||
| Mortgage Loan Seller: | UBS AG | Single Asset/Portfolio: | Portfolio | ||||
Credit Assessment (Fitch/KBRA/S&P): | NR/NR/NR | Property Type – Subtype: | Industrial – Various | ||||
| Original Principal Balance(1): | $20,000,000 | Location: | Various | ||||
| Cut-off Date Balance(1): | $20,000,000 | Size: | 2,390,648 SF | ||||
| % of Initial Pool Balance: | 3.0% | Cut-off Date Balance Per SF(1): | $28.44 | ||||
| Loan Purpose: | Refinance | Maturity Date Balance Per SF(1): | $24.87 | ||||
| Borrower Sponsor: | Phoenix Investors | Year Built/Renovated: | Various/Various | ||||
| Guarantors: | Irrevocable Children's Trust dated 7/22/91; Irrevocable Children's Trust No. 2 dated 7/22/91 | Title Vesting: | Fee | ||||
| Mortgage Rate: | 4.4500% | Property Manager: | Self-managed | ||||
| Note Date: | September 10, 2019 | Current Occupancy (As of)(5): | 93.8% (Various) | ||||
| Seasoning: | 2 months | YE 2018 Occupancy: | 97.4% | ||||
| Maturity Date: | October 6, 2029 | YE 2017 Occupancy(6): | NAV | ||||
| IO Period: | 36 months | YE 2016 Occupancy(6): | NAV | ||||
| Loan Term (Original): | 120 months | YE 2015 Occupancy(6): | NAV | ||||
| Amortization Term (Original): | 360 months | Appraised Value: | $91,700,000 | ||||
| Loan Amortization Type: | Interest-only, Amortizing Balloon | Appraised Value Per SF: | $38.36 | ||||
| Call Protection(2): | L(26),D(88),O(6) | Appraisal Valuation Date: | Various | ||||
| Lockbox Type: | Hard/Springing Cash Management | ||||||
| Additional Debt(1): | Yes | Underwriting and Financial Information | |||||
| Additional Debt Type (Balance): | Pari Passu($48,000,000) | TTM NOI (6/30/2019): | $7,027,527 | ||||
| YE 2018 NOI: | $6,960,523 | ||||||
| YE 2017 NOI(6): | NAV | ||||||
| YE 2016 NOI(6): | NAV | ||||||
| U/W Revenues: | $9,131,734 | ||||||
| U/W Expenses: | $2,447,004 | ||||||
| Escrows and Reserves | U/W NOI(5): | $6,684,731 | |||||
| Initial | Monthly | Cap | U/W NCF: | $5,811,511 | |||
| Taxes | $261,385 | $62,502(3) | NAP | U/W DSCR based on NOI/NCF(1): | 1.63x / 1.41x | ||
| Insurance | $159,062 | $13,255 | NAP | U/W Debt Yield based on NOI/NCF(1): | 9.8% / 8.5% | ||
| Replacement Reserve | $0 | $19,922 | $481,308 | U/W Debt Yield at Maturity based on NOI/NCF(1) | 11.2% / 9.8% | ||
| TI/LC Reserve(4) | $0 | $199,221 | $1,500,000 | Cut-off Date LTV Ratio(1): | 74.2% | ||
| Immediate Repairs Reserve | $283,040 | $0 | NAP | LTV Ratio at Maturity(1): | 64.8% | ||
| Sources and Uses | ||||||||
| Sources | Uses | |||||||
| Original whole loan amount | $68,000,000 | 97.1% | Loan payoff | $44,943,190 | 64.2% | |||
| Borrower equity | 2,041,860 | 2.9 | Upfront reserves | 703,487 | 1.0 | |||
| Closing costs | 563,718 | 0.8 | ||||||
| Partnership Buyout | 23,831,465 | 34.0 | ||||||
| Total Sources | $70,041,860 | 100.0% | Total Uses | $70,041,860 | 100.0% | |||
| (1) | The Phoenix Industrial Portfolio II Mortgage Loan (as defined below) is part of the Phoenix Industrial Portfolio II Whole Loan (as defined below), which is comprised of sixpari passu promissory notes with an aggregate original principal balance of $68,000,000. All statistical information relating to the Cut-off Date Balance per SF, Maturity Date Balance per SF, U/W DSCR based on NOI/NCF, U/W Debt Yield based on NOI/NCF, U/W Debt Yield at Maturity based on NOI/NCF, Cut-off Date LTV Ratio and LTV Ratio at Maturity presented above are based on the Phoenix Industrial Portfolio II Whole Loan. |
| (2) | Defeasance of the Phoenix Industrial Portfolio II Whole Loan is permitted at any time after the earlier to occur of (a) the end of the two-year period commencing on the closing date of the securitization of the last Phoenix Industrial Portfolio II Whole Loan promissory note to be securitized and (b) November 6, 2022. The assumed defeasance lockout period of 26 payments is based on the expected closing date of this transaction in December 2019. Partial release of excess land is permitted. See “Release of Property” section. |
| (3) | The borrowers are required to escrow monthly 1/12 of the annual estimated tax payments,provided, however, that such monthly tax payments related to the Flint property and DuBois property are waived if (a) no event of default has occurred and is continuing, (b) the Android Industries lease and the DuBois Logistics, LLC lease each demises the entirety of each of the Flint property and DuBois property, respectively, (c) the Android Industries lease and the DuBois Logistics, LLC lease are in full force and effect, (d) the then-current term under each of the Android Industries lease and the DuBois Logistics, LLC lease is scheduled to expire no earlier than 12 months, six months, or three months after the date on which the next installment of taxes are due if such taxes are due and payable annually, semi-annually, or quarterly, respectively, (e) no material tenant trigger event with respect to Android Industries and DuBois Logistics, LLC has occurred and is continuing and (f) each of Android Industries and DuBois Logistics, LLC pays taxes in a timely manner directly to government authorities, among other requirements. Notwithstanding the above, monthly tax escrows currently equal to $62,502, which exclude the Flint property and DuBois property. |
| (4) | The borrowers are required to escrow monthly for tenant improvement and leasing commissions in the amount of (a) $199,221 on each monthly payment date through and including October 6, 2020 or (b) $49,805 on each monthly payment date thereafter, subject to a cap of $1,500,000. |
| (5) | The Phoenix Industrial Portfolio II Properties (as defined below) had a physical occupancy of 99.5% as of September 6, 2019 and December 1, 2019. Staples Contract & Commercial (“Staples”) (5.7% of portfolio NRA, 6.9% of gross potential rent) has exercised its termination option effective April 30, 2020 and is currently negotiating with the borrower sponsor on a lease extension. The Staples lease has been underwritten as vacant. |
| (6) | The borrower sponsor acquired the Phoenix Industrial Portfolio II Properties in 2017. As such, prior operating performance and occupancy information is not available. |
| THE INFORMATION IN THIS STRUCTURAL AND COLLATERAL TERM SHEET IS NOT COMPLETE AND MAY BE AMENDED PRIOR TO THE TIME OF SALE. THIS TERM SHEET IS NOT AN OFFER TO SELL THESE SECURITIES AND IT IS NOT A SOLICITATION OF AN OFFER TO BUY THESE SECURITIES IN ANY JURISDICTION WHERE THE OFFER OR SALE IS NOT PERMITTED. |
| 134 |
Property Type – Various Property Addresses – Various | Loan #11 Phoenix Industrial Portfolio II | Cut-off Date Balance: Cut-off Date LTV: U/W NCF DSCR: U/W NOI Debt Yield: | $20,000,000 74.2% 1.41x 9.8% |
The Mortgage Loan. The eleventh largest mortgage loan (the “Phoenix Industrial Portfolio II Mortgage Loan”) is part of a whole loan (the “Phoenix Industrial Portfolio II Whole Loan”) evidenced by six promissory notes with an aggregate original principal balance of $68,000,000. The Phoenix Industrial Portfolio II Whole Loan is secured by first priority fee mortgages encumbering a 2,390,648 square foot portfolio of five industrial warehouse properties located in Wisconsin, Pennsylvania, Michigan and Alabama (each, a “Phoenix Industrial Portfolio II Property”, and collectively, the “Phoenix Industrial Portfolio II Properties”). Promissory Notes A-3 and A-4, with an aggregate original balance of $20,000,000, represent the Phoenix Industrial Portfolio II Mortgage Loan, and will be contributed to the WFCM 2019-C54 Trust. The Phoenix Industrial Portfolio II Whole Loan is serviced pursuant to the pooling and servicing agreement for the UBS 2019-C17 Trust. See “Description of the Mortgage Pool—The Whole Loans—The Non-Serviced Pari Passu Whole Loans” and “Pooling and Servicing Agreement” in the Preliminary Prospectus.
Note Summary
| Notes | Original Principal Balance | Cut-off Date Balance | Note Holder | Controlling Interest |
| A-1 | $20,000,000 | $20,000,000 | UBS 2019-C17 | Yes |
| A-2 | $15,000,000 | $15,000,000 | UBS 2019-C17 | No |
| A-3 | $15,000,000 | $15,000,000 | WFCM 2019-C54 | No |
| A-4 | $5,000,000 | $5,000,000 | WFCM 2019-C54 | No |
| A-5 | $5,000,000 | $5,000,000 | UBS 2019-C17 | No |
| A-6 | $8,000,000 | $8,000,000 | UBS AG | No |
| Total | $68,000,000 | $68,000,000 |
The Properties.The Phoenix Industrial Portfolio II Whole Loan is secured by five industrial properties totaling 2,390,648 square feet located in Wisconsin (42.1% of NRA), Pennsylvania (25.6% of NRA), Michigan (19.2% of NRA) and Alabama (13.1% of NRA). The Phoenix Industrial Portfolio II Properties are 93.8% occupied as of September 6, 2019 and December 1, 2019 by 10 tenants. The borrower sponsor acquired the Phoenix Industrial Portfolio II Properties in 2017 for a purchase price of approximately $60.4 million. Since acquisition, the borrower sponsor has invested approximately $14.4 million in capital improvements and other/soft costs on the Phoenix Industrial Portfolio II Properties.
The following table presents certain information regarding the Phoenix Industrial Portfolio II Properties:
Portfolio Summary(1)
| Property Name | Location | Net Area (SF) | Year Built/ Renovated | Allocated Cut-off Date | % of Portfolio Cut-off Date Balance | UW NCF | Appraised Value | Allocated Cut-off Date LTV | Ceiling Heights (ft.) | Loading Bays | ||||||||||
| Flint | Flint, MI | 460,000 | 2006/NAP | $16,610,687 | 24.4% | $1,866,615 | $22,400,000 | 74.2% | 29 - 32 | 55 | ||||||||||
| DuBois | DuBois, PA | 612,800 | 1961/1988 | $14,237,732 | 20.9% | $1,280,560 | $19,200,000 | 74.2% | 16 - 32 | 82 | ||||||||||
| Jefferson | Jefferson, WI | 591,840 | 1995/NAP | $14,237,732 | 20.9% | $1,147,440 | $19,200,000 | 74.2% | 24 - 25 | 37 | ||||||||||
| Huntsville | Huntsville, AL | 312,105 | 1976/2017 | $8,527,808 | 12.5% | $863,543 | $11,500,000 | 74.2% | 24 - 29 | 18 | ||||||||||
| Beloit | Beloit, WI | 413,903 | 1974/2011 | $14,386,041 | 21.2% | $653,354 | $19,400,000 | 74.2% | 21 - 41 | 41 | ||||||||||
| Total/Weighted Average | 2,390,648 | $68,000,000 | 100.0% | $5,811,511 | $91,700,000 | 74.2% | 233 | |||||||||||||
| (1) | Information is based on the appraisal. |
Flint (19.2% of NRA; 24.4% of ALA): The Flint property is a 460,000 square foot industrial building located in Flint, Michigan. Situated on 57.3 acres, the Flint property has 51 loading docks, four drive-in doors, column spacing of 50 feet by 50 feet, ceiling heights of 29 to 32 feet and 300 parking spaces (0.7 per 1,000 square feet). The Flint property was constructed in 2006 as a build-to-suit for Android Industries and approximately 2% of the space is finished office space. The Android Industries lease has a current expiration date of June 30, 2025 and requires the payment of underwritten base rent of $4.76 per square foot with annual rent escalations of 2% on July 1st of each year. Android Industries is an automotive manufacturer and supplier and utilizes its space at the Flint property to manufacture parts as a supplier and partner to General Motors. Android Industries has one, five-year renewal option remaining and has no termination options. Since acquisition, the borrower sponsor has invested $590,000 at the Flint property for heating/HVAC and generators. According to the borrower sponsor, Android Industries has invested over $30.0 million at the facility on equipment and infrastructure.
Beloit (17.3% of NRA; 21.2% of ALA): The Beloit property is a 413,903 square foot industrial warehouse building located in Beloit, Wisconsin. The improvements were constructed in 1974 and renovated in 2011 and include approximately 1% of finished office space. The Beloit property is situated on 24.8 acres with 143 parking spaces (0.3 per 1,000 square feet). The Beloit property has 33 loading docks, eight drive-in doors and ceiling heights of 21 to 41 feet. The Beloit property is 67.0% leased by four tenants, all of which utilize their space for warehousing and logistics, and has physical occupancy of 100.0%. The largest tenants at the Beloit property are Bay Valley Foods (34.1% of property NRA, 48.0% of property underwritten base rent) and Axium Foods, Inc. (24.1% of property NRA, 33.3% of property underwritten base rent). Staples (33.0% of property NRA, 31.7% of property gross potential rent) has exercised its termination option effective April 30, 2020 and is currently negotiating with the borrower sponsor on a lease extension. As such,
| THE INFORMATION IN THIS STRUCTURAL AND COLLATERAL TERM SHEET IS NOT COMPLETE AND MAY BE AMENDED PRIOR TO THE TIME OF SALE. THIS TERM SHEET IS NOT AN OFFER TO SELL THESE SECURITIES AND IT IS NOT A SOLICITATION OF AN OFFER TO BUY THESE SECURITIES IN ANY JURISDICTION WHERE THE OFFER OR SALE IS NOT PERMITTED. |
| 135 |
Property Type – Various Property Addresses – Various | Loan #11 Phoenix Industrial Portfolio II | Cut-off Date Balance: Cut-off Date LTV: U/W NCF DSCR: U/W NOI Debt Yield: | $20,000,000 74.2% 1.41x 9.8% |
the Staples lease has been underwritten as vacant. Since acquisition, the borrower sponsor has replaced the roof at the Beloit property at a cost of $465,300.
DuBois (25.6% of NRA; 20.9% of ALA): The DuBois property consists of two adjacent parcels located in DuBois, Pennsylvania. Built in 1961 and renovated in 1988 on a 24.7-acre site, the improvements of the 891 Beaver Drive building include a 410,000 square foot industrial warehouse building, of which approximately 8% is office space. Built in 1988 on a 30.4-acre site, the improvements of the 851 Beaver Drive building include a 202,800 square foot industrial warehouse building, of which approximately 69% of the space is refrigerated or freezer space and 4% is office space. The two buildings on the DuBois property have a total of 80 loading docks, two drive-in doors, and ceiling heights ranging from 16 feet to 32 feet, and is served by 426 parking spaces (0.7 per 1,000 square feet). DuBois Logistics, LLC has leased 100.0% of both buildings at the DuBois property since February 2010 and utilizes the space to distribute both dry goods and refrigerated/frozen goods. The DuBois Logistics, LLC lease is guaranteed by its parent company, C&S Wholesale Grocers, Inc., and provides for a lease expiration in February 2025. DuBois Logistics, LLC pays underwritten base rent of $2.14 per square foot at the 891 Beaver Drive building and $3.06 per square foot at the 851 Beaver Drive building, with annual rent escalations on March 1st of each year at both buildings. DuBois Logistics, LLC has one, five-year renewal option remaining and no termination options.
Jefferson (24.8% of NRA; 20.9% of ALA): The Jefferson property consists of two contiguous parcels located in Jefferson, Wisconsin. Built between 1995 and 2014 on a total of 32.3 acres, the improvements include two industrial warehouse buildings totaling 591,840 square feet, of which approximately 1% is finished office space. The Jefferson property has 24 loading docks, 13 drive-in doors and ceiling heights of 24 to 25 feet, and is served by 123 parking spaces (0.2 per 1,000 square feet). Generac Power Systems, Inc. has leased 100.0% of the Jefferson property since December 2013. Its parent company, Generac Holdings (“Generac”), is a manufacturer of backup power generation products based in southeastern Wisconsin. With seven corporate and manufacturing facilities in the Wisconsin region, Generac utilizes its space at the Jefferson property for the logistics management and warehousing of product components and finished products. The Generac lease provides for a lease expiration in November 2023 and requires underwritten base rent of $2.43 per square foot with annual rent escalations of 2% on December 1st of each year. Generac has invested in customized racking and equipment at the Jefferson property and is currently negotiating to extend its lease through November 2031. Generac Power Systems, Inc. has one, five-year renewal option remaining and no termination options. Since acquisition, the borrower sponsor has replaced the roof at the Jefferson property at a cost of $37,810.
Huntsville (13.1% of NRA; 12.5% of ALA): The Huntsville property is a 312,105 square foot industrial warehouse building located in Huntsville, Alabama. The improvements were constructed in 1976 and renovated in 2017 and includes approximately 8% of finished office space. The Huntsville property is situated on 40.3 acres with 350 parking spaces (1.1 per 1,000 square feet). The Huntsville property has 16 loading docks, two drive-in doors, and ceiling heights of 24 to 29 feet. The Huntsville property is 95.9% occupied by Boneal Aerospace, Inc. (39.9% of property NRA, 45.8% of property underwritten base rent), Intercept Industries, Ltd. (33.6% of property NRA, 38.6% of property underwritten base rent) and Custom Assembly, Inc. (22.4% of property NRA, 15.6% of property underwritten base rent). Since acquisition, the borrower sponsor has repainted the Huntsville property at a cost of $130,900.
Market Overview.The Phoenix Industrial Portfolio II Properties are located in Wisconsin (42.1% of ALA), Michigan (24.4% of ALA), Pennsylvania (20.9% of ALA) and Alabama (12.5% of ALA).
Flint, Michigan (24.4% of ALA): The Flint property is located in Flint, Genesee county, Michigan, approximately 69.5 miles northwest of Detroit. Major employers in the area include General Motors, University of Michigan Flint and other regional and local healthcare and medical centers. The Flint property is located near the intersection of Interstate 75 (6.2 miles east) and Interstate 69 (4.1 miles west), providing close proximity to serve the manufacturing and automobile industry in the greater Michigan area. The sole tenant at the Flint property, Android Industries, is an automotive manufacturer and supplier and utilizes its space at the Flint property to manufacture parts as a supplier to and partner of General Motors, specifically its truck plant located 7.2 miles east of the Flint property. In 2018 and 2019, Android Industries was presented with the General Motors Supplier of the Year award, which recognizes outstanding suppliers across General Motors’ global supply chain.
Beloit, Wisconsin (21.2% of ALA): The Beloit property is located in Beloit, Rock county, Wisconsin, approximately 97.6 miles northwest of Chicago and 72.8 miles southwest of Milwaukee. The Beloit property’s geographical location on the Illinois-Wisconsin border, midway between Lake Michigan and the Mississippi River, puts Beloit in the center of the United States Midwest, offering access to markets and suppliers. Additionally, the Beloit property is located immediately southwest of the intersection of Interstate 90 (1.2 miles), which extends to Boston, MA in the east and Seattle, WA in the west, and Interstate 43 (0.5 miles). Regional access to Wisconsin and Illinois communities are provided by numerous regional routes nearby.
DuBois, Pennsylvania (20.9% of ALA): The DuBois property is located in DuBois, Pennsylvania county, Pennsylvania, approximately 102 miles northeast of Pittsburgh and 181 miles east of Cleveland. Interstate 80 extends to San Francisco, CA in the west and Teaneck, New Jersey in the east, making it the second longest highway in the United States, as well as one of the busiest, and is located immediately north of the DuBois property (2.3 miles). According to the appraisal, the central business district in which the DuBois property is located in, has seen redevelopment and re-use of building improvements for commercial purposes. A portion of the neighborhood near the Interstate 80 interchange has seen the most concentrated growth in recent years, and has included some new industrial buildings, a new hotel, a Walmart and other retail properties, and some new office development. The parent company of the sole tenant at the DuBois property, C&S Wholesale Grocers, Inc. is a privately held wholesale grocers with an extensive supply chain and logistics operations, supplying independent supermarkets, chain stores, and institutions with over 140,000 different products.
Jefferson, Wisconsin (20.9% of ALA): The Jefferson property is located in Jefferson, Jefferson county, Wisconsin, approximately 33.3 miles east of Madison and 52.5 miles west of Milwaukee. Major employers in the area include Trek Bicycle, Nasco International, and
| THE INFORMATION IN THIS STRUCTURAL AND COLLATERAL TERM SHEET IS NOT COMPLETE AND MAY BE AMENDED PRIOR TO THE TIME OF SALE. THIS TERM SHEET IS NOT AN OFFER TO SELL THESE SECURITIES AND IT IS NOT A SOLICITATION OF AN OFFER TO BUY THESE SECURITIES IN ANY JURISDICTION WHERE THE OFFER OR SALE IS NOT PERMITTED. |
| 136 |
Property Type – Various Property Addresses – Various | Loan #11 Phoenix Industrial Portfolio II | Cut-off Date Balance: Cut-off Date LTV: U/W NCF DSCR: U/W NOI Debt Yield: | $20,000,000 74.2% 1.41x 9.8% |
Generac Power Systems, Inc. The Jefferson property provides close proximity to Interstate 90 (25.8 miles east), and Interstate 94 (7.8 miles north), which connects the Great Lakes and northern Great Plains regions. The sole tenant at the Jefferson property, Generac Power Systems, Inc., is a manufacturer of backup power generation products based in southeastern Wisconsin and utilizes its space at the Jefferson property to coordinate with Generac’s six corporate and manufacturing facilities in the Wisconsin region, In 2017, Generac and the Wisconsin Economic Development Corporation announced tax credits through 2021 to support Generac’s expansion as well as investments of more than $73 million to renovate its facilities across Wisconsin.
Huntsville, Alabama (12.5% of ALA): The Huntsville property is located in Huntsville, Madison county, Alabama, approximately 90.1 miles north of Birmingham and 120 miles south of Nashville. The largest employers in the Huntsville metropolitan statistical area include US Army/Redstone Arsenal, Huntsville Hospital System, NASA/Marshall Space Flight Center, Huntsville City Schools, and the Boeing Company. The Huntsville property is located 10.5 miles northeast of Cummings Research Park, the second and fourth largest technology and research park in the United States and world, respectively. Additionally, the Huntsville property is located immediately south of Interstate 565 (2.7 miles), which connects Huntsville with Decatur, and approximately 10.5 miles east of Interstate 65, which provides access to Nashville and Birmingham.
The following table presents market information with respect to the Phoenix Industrial Portfolio II Properties:
Market Summary(1)
| Property | Year Built/ Renovated | Size (SF)(2) | Market | In-Place Vacancy(2) | Market Vacancy | Appraisal Concluded Vacancy | Market Inventory(3) | UW Base | Appraisal Market Rent PSF | % Below Market Rent | ||||||||||
| Flint | 2006/NAP | 460,000 | Flint | 0.0% | 3.5% | 4.0% | 29,712,481 | $4.76 | $4.70 | 1.4% | ||||||||||
| DuBois | 1961/1988 | 612,800 | Clearfield County | 0.0% | 1.9% | 0.0% | 5,357,791 | $2.44 | $2.75 | (11.1%) | ||||||||||
| Jefferson | 1995/NAP | 591,840 | Jefferson | 0.0% | 3.0% | 1.0% | 12,541,913 | $2.43 | $2.75 | (11.8%) | ||||||||||
| Huntsville | 1976/2017 | 312,105 | Huntsville | 4.1% | 8.3% | 8.4% | 34,392,147 | $3.37 | $3.75 | (10.1%) | ||||||||||
| Beloit(4) | 1974/2011 | 413,903 | Rock County | 33.0% | 1.6% | 5.0% | 22,885,991 | $4.24 | $4.00 | 5.9% | ||||||||||
| Total/Weighted Average | 2,390,648 | 6.2% | 3.3% | 3.0% | 104,890,323 | $3.26 | $3.47 | (5.8%) | ||||||||||||
| (1) | Information obtained from appraisals. |
| (2) | Information obtained from the underwritten rent rolls. |
| (3) | Information obtained from third party research reports. |
| (4) | Physical occupancy at the Beloit property is 100.0%. Staples (33.0% of property NRA, 31.7% of property gross potential rent) has exercised its termination option effective April 30, 2020 and is currently negotiating with the borrower sponsor on a lease extension. As such, the Staples lease has been underwritten as vacant. Including the Staples lease, the Phoenix Industrial Portfolio II Properties have Weighted Average UW Base Rent PSF of $3.30, which is 6.1% below market. |
The following table presents demographic information with respect to the Phoenix Industrial Portfolio II Properties:
Demographics Summary(1)
| Property | City, State | Allocated Cut-off Date | % of Portfolio Cut-off Date Balance | U/W NCF | % of U/W NCF | Estimated 2019 Population 5-mile Radius | Estimated 2019 Median Household Income 5-mile Radius | |||||||
| Flint | Flint, MI | $16,610,687 | 24.4% | $1,866,615 | 32.1% | 77,658 | $44,754 | |||||||
| DuBois | DuBois, PA | $14,237,732 | 20.9% | $1,280,560 | 22.0% | 20,409 | $52,337 | |||||||
| Jefferson | Jefferson, WI | $14,237,732 | 20.9% | $1,147,440 | 19.7% | 15,408 | $56,713 | |||||||
| Huntsville | Huntsville, AL | $8,527,808 | 12.5% | $863,543 | 14.9% | 44,782 | $85,915 | |||||||
| Beloit | Beloit, WI | $14,386,041 | 21.2% | $653,354 | 11.2% | 58,164 | $47,526 | |||||||
Total/Weighted Average | $68,000,000 | 100.0% | $5,811,511 | 100.0% | 44,391 | $54,594 | ||||||||
| (1) | Information obtained from third party market research reports. |
| THE INFORMATION IN THIS STRUCTURAL AND COLLATERAL TERM SHEET IS NOT COMPLETE AND MAY BE AMENDED PRIOR TO THE TIME OF SALE. THIS TERM SHEET IS NOT AN OFFER TO SELL THESE SECURITIES AND IT IS NOT A SOLICITATION OF AN OFFER TO BUY THESE SECURITIES IN ANY JURISDICTION WHERE THE OFFER OR SALE IS NOT PERMITTED. |
| 137 |
Property Type – Various Property Addresses – Various | Loan #11 Phoenix Industrial Portfolio II | Cut-off Date Balance: Cut-off Date LTV: U/W NCF DSCR: U/W NOI Debt Yield: | $20,000,000 74.2% 1.41x 9.8% |
The following table presents certain information relating to the leases at the Phoenix Industrial Portfolio II Properties:
Major Tenants(1)
| Tenant Name | Credit Rating (Fitch/ Moody’s/ S&P)(2) | Property | Tenant NRSF | % of NRSF | Annual U/W Base Rent PSF | Annual U/W Base Rent | % of Total Annual U/W Base Rent | Lease Expiration Date | Extension Options | Termination Option (Y/N) | ||||||||||
| DuBois Logistics, LLC(3) | NR/NR/NR | DuBois | 612,800 | 25.6% | $2.44 | $1,497,968 | 20.5% | 2/28/2025 | 1, 5-year | N | ||||||||||
| Generac Power Systems, Inc.(4) | NR/NR/NR | Jefferson | 591,840 | 24.8% | $2.43 | $1,435,584 | 19.6% | 11/30/2023 | 1, 5-year | N | ||||||||||
| Android Industries | NR/NR/NR | Flint | 460,000 | 19.2% | $4.76 | $2,191,819 | 30.0% | 6/30/2025 | 1, 5-year | N | ||||||||||
| Bay Valley Foods | NR/Ba3/BB- | Beloit | 140,947 | 5.9% | $4.00 | $563,788 | 7.7% | 5/31/2020 | NAP | N | ||||||||||
| Boneal Aerospace, Inc.(5) | NR/NR/NR | Huntsville | 124,630 | 5.2% | $3.71 | $462,377 | 6.3% | 3/31/2022 | 2, 5-year | Y | ||||||||||
| Intercept Industries, Ltd.(6) | NR/NR/NR | Huntsville | 104,825 | 4.4% | $3.71 | $389,344 | 5.3% | 1/31/2021 | NAP | N | ||||||||||
| Axium Foods, Inc.(7) | NR/NR/NR | Beloit | 99,670 | 4.2% | $3.92 | $390,838 | 5.3% | 8/31/2020 | 1, 1-year | N | ||||||||||
| Custom Assembly, Inc(8) | NR/NR/NR | Huntsville | 70,000 | 2.9% | $2.25 | $157,500 | 2.2% | 11/30/2019 | NAP | Y | ||||||||||
| Foal, LLC | NR/NR/NR | Beloit | 18,511 | 0.8% | $4.25 | $78,672 | 1.1% | 1/31/2020 | NAP | N | ||||||||||
| SSB Manufacturing Company | NR/NR/NR | Beloit | 18,175 | 0.8% | $7.79 | $141,631 | 1.9% | 11/30/2021 | NAP | N | ||||||||||
| Occupied Collateral Total | 2,241,398 | 93.8% | $3.26 | $7,309,521 | 100.0% | |||||||||||||||
| �� | ||||||||||||||||||||
| Vacant Space(9) | 149,250 | 6.2% | ||||||||||||||||||
| Collateral Total | 2,390,648 | 100.0% | ||||||||||||||||||
| (1) | Information is based on the underwritten rent roll. |
| (2) | Certain ratings are those of the parent company or government entity whether or not the parent guarantees the lease. |
| (3) | Ryder Truck Rental, Inc. subleases an immaterial amount of space at the DuBois property for $1 per year. |
| (4) | Generac Power Systems, Inc. is currently negotiating with the borrower sponsor on a lease extension through November 2031. |
| (5) | Boneal Aerospace, Inc. may terminate its lease on February 29, 2020 by providing notice on or before November 11, 2019 and paying a termination fee of $111,462. |
| (6) | Intercept Industries, Ltd. is currently negotiating with the borrower sponsor on a lease extension through January 2026. |
| (7) | Axium Foods, Inc. is currently negotiating with the borrower sponsor to extend its lease and downsize its footprint. The reduced space is in negotiations to be leased to Lyons, a subsidiary of Tru Aseptics. |
| (8) | Custom Assembly, Inc and the borrower sponsor have the mutual right to terminate the current lease with 30 days’ notice. The tenant is currently negotiating with the borrower sponsor on a lease extension through November 2024, as well as an expansion to take over the vacant 12,650 square feet at the Huntsville property. |
| (9) | Includes Staples (5.7% of portfolio NRA, 6.9% of gross potential rent), which has exercised its termination option effective April 30, 2020 and is currently negotiating with the borrower sponsor on a lease extension. |
The following table presents certain information relating to the lease rollover schedule at the Phoenix Industrial Portfolio II Properties:
Lease Expiration Schedule(1)(2)
| Year Ending December 31, | No. of Leases Expiring | Expiring NRSF | % of Total NRSF | Cumulative NRSF | Cumulative % of Total | Annual U/W Base Rent(3) | % of Total U/W Base | Annual U/W Base Rent PSF(3) | ||||||||
| MTM | 0 | 0 | 0.0% | 0 | 0.0% | $0 | 0.0% | $0.00 | ||||||||
| 2019 | 1 | 70,000 | 2.9% | 70,000 | 2.9% | $157,500 | 2.2% | $2.25 | ||||||||
| 2020 | 4 | 259,128 | 10.8% | 329,128 | 13.8% | $1,033,298 | 14.1% | $3.99 | ||||||||
| 2021 | 2 | 123,000 | 5.1% | 452,128 | 18.9% | $530,975 | 7.3% | $4.32 | ||||||||
| 2022 | 1 | 124,630 | 5.2% | 576,758 | 24.1% | $462,377 | 6.3% | $3.71 | ||||||||
| 2023 | 1 | 591,840 | 24.8% | 1,168,598 | 48.9% | $1,435,584 | 19.6% | $2.43 | ||||||||
| 2024 | 0 | 0 | 0.0% | 1,168,598 | 48.9% | $0 | 0.0% | $0.00 | ||||||||
| 2025 | 3 | 1,072,800 | 44.9% | 2,241,398 | 93.8% | $3,689,787 | 50.5% | $3.44 | ||||||||
| 2026 | 0 | 0 | 0.0% | 2,241,398 | 93.8% | $0 | 0.0% | $0.00 | ||||||||
| 2027 | 0 | 0 | 0.0% | 2,241,398 | 93.8% | $0 | 0.0% | $0.00 | ||||||||
| 2028 | 0 | 0 | 0.0% | 2,241,398 | 93.8% | $0 | 0.0% | $0.00 | ||||||||
| 2029 | 0 | 0 | 0.0% | 2,241,398 | 93.8% | $0 | 0.0% | $0.00 | ||||||||
| Thereafter | 0 | 0 | 0.0% | 2,241,398 | 93.8% | $0 | 0.0% | $0.00 | ||||||||
| Vacant | 0 | 149,250 | 6.2% | 2,390,648 | 100.0% | $0 | 0.0% | $0.00 | ||||||||
| Total/Weighted Average 12 | 2,390,648 | 100.0% | $7,309,521 | 100.0% | $3.26 | |||||||||||
| (1) | Information obtained from the underwritten rent roll. |
| (2) | Certain tenants may have termination options that are exercisable prior to the originally stated expiration date of the subject lease and that are not considered in the Lease Expiration Schedule. |
| (3) | Total/Weighted Average Annual U/W Base Rent and Annual U/W Base Rent PSF exclude vacant space. |
| THE INFORMATION IN THIS STRUCTURAL AND COLLATERAL TERM SHEET IS NOT COMPLETE AND MAY BE AMENDED PRIOR TO THE TIME OF SALE. THIS TERM SHEET IS NOT AN OFFER TO SELL THESE SECURITIES AND IT IS NOT A SOLICITATION OF AN OFFER TO BUY THESE SECURITIES IN ANY JURISDICTION WHERE THE OFFER OR SALE IS NOT PERMITTED. |
| 138 |
Property Type – Various Property Addresses – Various | Loan #11 Phoenix Industrial Portfolio II | Cut-off Date Balance: Cut-off Date LTV: U/W NCF DSCR: U/W NOI Debt Yield: | $20,000,000 74.2% 1.41x 9.8% |
The following table presents historical occupancy percentages at the Phoenix Industrial Portfolio II Properties:
Historical Occupancy(1)
12/31/2016(2) | 12/31/2017(2) | 12/31/2018 | Various(3) | |||
| NAV | NAV | 97.4% | 93.8% |
| (1) | Information obtained from the borrowers. |
| (2) | The borrower sponsor acquired the Phoenix Industrial Portfolio II Properties in 2017. As such, prior operating performance and occupancy information is not available. |
| (3) | The Phoenix Industrial Portfolio II Properties had a physical occupancy of 99.5% as of September 6, 2019 and December 1, 2019. Staples (5.7% of portfolio NRA, 6.9% of gross potential rent) has exercised its termination option effective April 30, 2020 and is currently negotiating with the borrower sponsor on a lease extension. The Staples lease has been underwritten as vacant. |
Operating History and Underwritten Net Cash Flow. The following table presents certain information relating to the historical operating performance and underwritten net cash flow at the Phoenix Industrial Portfolio II Properties:
Cash Flow Analysis(1)
| 2018 | TTM 6/30/2019 | U/W | %(2) | U/W $ per SF | |||||||
| Rents in Place | $7,567,781 | $7,718,146 | $7,182,324 | 71.7% | $3.00 | ||||||
| Contractual Rent Steps(3) | 0 | 0 | 127,197 | 1.3 | 0.05 | ||||||
| Grossed Up Vacant Space | 0 | 0 | 593,838 | 5.9 | 0.25 | ||||||
| Gross Potential Rent | $7,567,781 | $7,718,146 | $7,903,358 | 78.9% | $3.31 | ||||||
| Other Income | 0 | 0 | 0 | 0.0 | 0.00 | ||||||
| Total Recoveries | 1,356,217 | 1,557,669 | 2,109,698 | 21.1 | 0.88 | ||||||
| Net Rental Income | $8,923,998 | $9,275,816 | $10,013,057 | 100.0% | $4.19 | ||||||
| (Vacancy & Credit Loss)(4) | 0 | 0 | (881,322) | (11.2) | (0.37) | ||||||
| Effective Gross Income | $8,923,998 | $9,275,816 | $9,131,734 | 91.2% | $3.82 | ||||||
| Real Estate Taxes | 896,131 | 1,050,155 | 1,546,668 | 16.9 | 0.65 | ||||||
| Insurance | 149,420 | 230,784 | 159,062 | 1.7 | 0.07 | ||||||
| Management Fee | 435,091 | 476,239 | 273,952 | 3.0 | 0.11 | ||||||
| Other Operating Expenses | 482,833 | 491,110 | 467,321 | 5.1 | 0.20 | ||||||
| Total Operating Expenses | $1,963,475 | $2,248,289 | $2,447,004 | 26.8% | $1.02 | ||||||
| Net Operating Income | $6,960,523 | $7,027,527 | $6,684,731 | 73.2% | $2.80 | ||||||
| Replacement Reserves | 0 | 0 | 359,446 | 3.9 | 0.15 | ||||||
| TI/LC | 0 | 0 | 513,774 | 5.6 | 0.21 | ||||||
| Net Cash Flow | $6,960,523 | $7,027,527 | $5,811,511 | 63.6% | $2.43 | ||||||
| NOI DSCR(5) | 1.69x | 1.71x | 1.63x | ||||||||
| NCF DSCR(5) | 1.69x | 1.71x | 1.41x | ||||||||
| NOI Debt Yield(5) | 10.2% | 10.3% | 9.8% | ||||||||
| NCF Debt Yield(5) | 10.2% | 10.3% | 8.5% |
| (1) | The borrower sponsor acquired the Phoenix Industrial Portfolio II Properties in 2017. As such, prior operating performance information is not available. |
| (2) | Represents (i) percent of Net Rental Income for all revenue fields, (ii) percent of Gross Potential Rent for Vacancy & Credit Loss and (iii) percent of Effective Gross Income for all other fields. |
| (3) | Represents contractual rent steps through October 2020. |
| (4) | The underwritten economic vacancy is 8.8%. The Phoenix Industrial Portfolio II Properties has leased and physical occupancy of 93.8% and 99.5%, as of September 6, 2019 and December 1, 2019, respectively. |
| (5) | The debt service coverage ratios and debt yields are based on the Phoenix Industrial Portfolio II Whole Loan. |
Release of Property. The Huntsville property includes approximately 17.7 acres of excess land that is currently unimproved (the “Huntsville Outparcel”). As of August 19, 2019, the appraisal concluded an “as is” value of $600,000 for the Huntsville Outparcel and $1,820,000 for Huntsville property (excluding the Huntsville Outparcel). The borrowers may obtain the release of the Huntsville Outparcel, provided that, among other conditions, (i) no event of default under the Phoenix Industrial Portfolio II Whole Loan documents is continuing and (ii) the borrowers provide written evidence reasonably acceptable to the lender in all respects that (a) the Huntsville
| THE INFORMATION IN THIS STRUCTURAL AND COLLATERAL TERM SHEET IS NOT COMPLETE AND MAY BE AMENDED PRIOR TO THE TIME OF SALE. THIS TERM SHEET IS NOT AN OFFER TO SELL THESE SECURITIES AND IT IS NOT A SOLICITATION OF AN OFFER TO BUY THESE SECURITIES IN ANY JURISDICTION WHERE THE OFFER OR SALE IS NOT PERMITTED. |
| 139 |
Property Type – Various Property Addresses – Various | Loan #11 Phoenix Industrial Portfolio II | Cut-off Date Balance: Cut-off Date LTV: U/W NCF DSCR: U/W NOI Debt Yield: | $20,000,000 74.2% 1.41x 9.8% |
Outparcel is not necessary for the operation of the Huntsville property, (b) the Huntsville Outparcel is vacant, non-income producing and unimproved, (c) the intended use of the Huntsville Outparcel will not have a material adverse effect on the applicable borrower or the remaining Huntsville property, and (d) any construction and/or development contemplated to be performed in, over or under the Huntsville Outparcel will not materially disrupt the remaining Huntsville property, among other requirements as listed in the Phoenix Industrial Portfolio II Whole Loan documents. See “Description of the Mortgage Pool—Certain Terms of the Mortgage Loans—Releases; Partial Releases” in the Preliminary Prospectus.
| THE INFORMATION IN THIS STRUCTURAL AND COLLATERAL TERM SHEET IS NOT COMPLETE AND MAY BE AMENDED PRIOR TO THE TIME OF SALE. THIS TERM SHEET IS NOT AN OFFER TO SELL THESE SECURITIES AND IT IS NOT A SOLICITATION OF AN OFFER TO BUY THESE SECURITIES IN ANY JURISDICTION WHERE THE OFFER OR SALE IS NOT PERMITTED. |
| 140 |
(THIS PAGE INTENTONALLY LEFT BLANK)
| THE INFORMATION IN THIS STRUCTURAL AND COLLATERAL TERM SHEET IS NOT COMPLETE AND MAY BE AMENDED PRIOR TO THE TIME OF SALE. THIS TERM SHEET IS NOT AN OFFER TO SELL THESE SECURITIES AND IT IS NOT A SOLICITATION OF AN OFFER TO BUY THESE SECURITIES IN ANY JURISDICTION WHERE THE OFFER OR SALE IS NOT PERMITTED. |
| 141 |
| No. 12 – North & Sheffield | ||||||
| Mortgage Loan Information | Mortgaged Property Information | |||||
| Mortgage Loan Seller: | Wells Fargo Bank, National Association | Single Asset/Portfolio: | Single Asset | |||
Credit Assessment (Fitch/KBRA/S&P): | NR/NR/NR | Property Type – Subtype: | Retail – Unanchored | |||
| Original Principal Balance: | $19,500,000 | Location: | Chicago, IL | |||
| Cut-off Date Balance: | $19,500,000 | Size: | 31,762 SF | |||
| % of Initial Pool Balance: | 2.9% | Cut-off Date Balance Per SF: | $613.94 | |||
| Loan Purpose: | Acquisition | Maturity Date Balance Per SF: | $613.94 | |||
| Borrower Sponsor(1): | Jeffrey J. Feil | Year Built/Renovated: | 1999/2018 | |||
| Guarantor: | Jeffrey J. Feil | Title Vesting: | Fee | |||
| Mortgage Rate: | 3.6000% | Property Manager: | Self-managed | |||
| Note Date: | September 27, 2019 | Current Occupancy (As of): | 100.0% (9/24/2019) | |||
| Seasoning: | 2 months | YE 2018 Occupancy(3): | 100.0% | |||
| Maturity Date: | October 11, 2029 | YE 2017 Occupancy(3): | 19.1% | |||
| IO Period: | 120 months | YE 2016 Occupancy: | 16.8% | |||
| Loan Term (Original): | 120 months | YE 2015 Occupancy: | 16.8% | |||
| Amortization Term (Original): | NAP | As-Is Appraised Value(4): | $33,200,000 | |||
| Loan Amortization Type: | Interest-only, Balloon | As-Is Appraised Value Per SF: | $1,045.27 | |||
| Call Protection: | L(26),D(90),O(4) | As-Is Appraisal Valuation Date: | August 15, 2019 | |||
| Lockbox Type: | Soft/Springing Cash Management | Underwriting and Financial Information | ||||
| Additional Debt: | None | TTM 6/30/2019 NOI(5): | $1,126,690 | |||
| Additional Debt Type (Balance): | N/A | YE 2018 NOI(5): | $262,963 | |||
| YE 2017 NOI(5): | $1,484,663 | |||||
| YE 2016 NOI: | NAV | |||||
| U/W Revenues: | $2,447,912 | |||||
| U/W Expenses: | $794,113 | |||||
| Escrows and Reserves | U/W NOI(5): | $1,653,798 | ||||
| Initial | Monthly | Cap | U/W NCF: | $1,583,922 | ||
| Taxes | $13,306 | $4,434 | NAP | U/W DSCR based on NOI/NCF: | 2.32x / 2.22x | |
| Insurance | $0 | Springing(2) | NAP | U/W Debt Yield based on NOI/NCF: | 8.5% / 8.1% | |
| Replacement Reserve | $0 | $530 | NAP | U/W Debt Yield at Maturity based on NOI/NCF: | 8.5% / 8.1% | |
| Existing TI/LC Obligations Reserve | $24,017 | $0 | NAP | Cut-off Date LTV Ratio: | 58.7% | |
| LTV Ratio at Maturity: | 58.7% | |||||
| Sources and Uses | ||||||||
| Sources | Uses | |||||||
| Original loan amount | $19,500,000 | 60.0% | Purchase price | $32,000,000 | 98.5% | |||
| Borrower sponsor cash equity | 12,990,944 | 40.0 | Closing costs | 453,621 | 1.4 | |||
| Upfront reserves | 37,323 | 0.1 | ||||||
| Total Sources | $32,490,944 | 100.0% | Total Uses | $32,490,944 | 100.0% | |||
| (1) | The borrower sponsor reported a foreclosure in 2017. See “Description of the Mortgage Pool— Loan Purpose; Default History, Bankruptcy Issues and Other Proceedings” in the Preliminary Prospectus. |
| (2) | The mortgage loan documents do not require ongoing monthly escrows for insurance premiums as long as (i) no event of default has occurred and is continuing, (ii) the borrower provides the lender with evidence that the North & Sheffield Property’s (as defined below) insurance coverage is included in a blanket policy and such policy is in full force and effect and (iii) the borrower pays all applicable insurance premiums and provides the lender with evidence of renewals. |
| (3) | Please see “Historical Occupancy” below for a discussion of the increase in occupancy from 2017 to 2018. |
| (4) | The appraiser concluded to a “Go Dark Value” of $22,800,000 as of August 15, 2019. |
| (5) | Please see “Operating History and Underwritten Net Cash Flow” for a discussion of the deviations between historical NOI and U/W NOI. |
The Mortgage Loan.The mortgage loan (the “North & Sheffield Mortgage Loan”) is evidenced by a single promissory note secured by a first mortgage encumbering the borrower’s fee interest in a 31,762 square foot, three-story, unanchored retail property located in Chicago, Illinois (the “North & Sheffield Property”).
The Property. The North & Sheffield Property is 100.0% leased to Lululemon and Sephora on a triple-net basis as of September 24, 2019. The North & Sheffield Property was constructed in 1999, was renovated in 2018 and is situated on a 0.4-acre site with 43 underground garage parking spaces resulting in a parking ratio of 1.4 spaces per 1,000 square feet of rentable area.
| THE INFORMATION IN THIS STRUCTURAL AND COLLATERAL TERM SHEET IS NOT COMPLETE AND MAY BE AMENDED PRIOR TO THE TIME OF SALE. THIS TERM SHEET IS NOT AN OFFER TO SELL THESE SECURITIES AND IT IS NOT A SOLICITATION OF AN OFFER TO BUY THESE SECURITIES IN ANY JURISDICTION WHERE THE OFFER OR SALE IS NOT PERMITTED. |
| 142 |
| Retail – Unanchored | Loan #12 | Cut-off Date Balance: | $19,500,000 | |
| 938 West North Avenue | North & Sheffield | Cut-off Date LTV: | 58.7% | |
| Chicago, IL 60642 | U/W NCF DSCR: | 2.22x | ||
| U/W NOI Debt Yield: | 8.5% |
The borrower acquired the North & Sheffield Property from Acadia Realty Trust, who had owned the North & Sheffield Property since 2013. The North & Sheffield Property was formerly occupied by Restoration Hardware, which vacated in 2015. Lululemon’s lease for approximately 83.2% of the net rentable area at the North & Sheffield Property commenced in December 2018.
Recent renovations included a new façade, windows and doors, a new parking lot control system, new HVAC systems and a new garage door at a total cost of approximately $2.1 million.
Major Tenant.
Largest Tenant: Lululemon (26,412 square feet; 83.2% of net rentable area; 79.9% of underwritten base rent; 1/31/2026 lease expiration)– Founded in Vancouver, Canada in 1998, Lululemon is a yoga-inspired, technical athletic company for men and women. Lululemon reported net revenue of $3.3 billion for its fiscal year 2018, an increase of approximately 24% over the preceding fiscal year. As of October 23, 2019, Lululemon’s market capitalization was approximately $26.9 billion. Lululemon has been a tenant at the North & Sheffield Property since December 2018 and its space includes a café, meditation studio, yoga studio, office space and a conference room. Lululemon has two, 5-year renewal options remaining after its January 2026 lease expiration, each with six months’ prior notice.
Market Overview.The North & Sheffield Property is situated in Chicago’s Lincoln Park neighborhood, approximately 0.2 miles west of the North / Clybourn CTA Station (which services the red line of the ‘L’ train, providing north/south access through Chicago), 0.6 miles east of Interstate 90/94 (which provides access northbound into Wisconsin and to Milwaukee, southbound into Indiana and eastbound to Detroit), 0.2 miles west of the Lincoln Park Apple store, 3.4 miles northwest of the Chicago central business district and 11.2 miles northeast of Chicago Midway International Airport and 13.8 miles southeast of O’Hare International Airport.
The North & Sheffield Property is located 0.1 miles east of the North & Sheffield Commons shopping center which includes Pottery Barn, west elm, Ulta Beauty and Best Buy
According to a third-party market research report, the estimated 2019 population within a three- and five-mile radius of the North & Sheffield Property was approximately 523,579, and 990,787, respectively; while the 2019 estimated average household income within the same radii was $122,182, and $103,453, respectively.
According to a third-party market research report, the North & Sheffield Property is situated within the North Branch/Goose Island retail submarket of the Chicago Market. As of October 23, 2019, the North Branch/Goose Island retail submarket reported a total inventory of approximately 4.9 million square feet with a 5.0% vacancy rate. The appraiser concluded to a market rent of $54.00 per square foot on a triple net basis for the Lululemon space and $67.00 per square foot on a triple net basis for the Sephora space at the North & Sheffield Property.
The following table presents certain information relating to the tenancy at the North & Sheffield Property:
Major Tenants
| Tenant Name | Credit Rating (Fitch/Moody’s/ S&P)(1) | Tenant NRSF | % of NRSF | Annual U/W Base Rent PSF | Annual U/W Base Rent | % of Total Annual U/W Base Rent | Lease Expiration Date | Extension Options | Termination Option (Y/N) |
| Lululemon | NR/NR/NR | 26,412 | 83.2% | $54.07(2) | $1,428,000(2) | 79.9% | 1/31/2026 | 2, 5-year | N |
| Sephora | NR/A1/A+ | 5,350 | 16.8% | $67.00 | $358,450 | 20.1% | 1/31/2024 | 1, 5-year | N |
| Occupied Collateral Total | 31,762 | 100.0% | $56.24 | $1,786,450 | 100.0% | ||||
Vacant Space |
0 |
0.0% | |||||||
| Collateral Total | 31,762 | 100.0% | $56.24 | $1,786,450 | 100.0% | ||||
| (1) | Certain ratings are those of the parent company whether or not the parent company guarantees the lease. |
| (2) | Annual U/W Base Rent PSF and Annual U/W Base Rent include Lululemon’s December 2019 contractual rent increase totaling $28,000. Lululemon’s current rent is $53.01 per square foot. |
| THE INFORMATION IN THIS STRUCTURAL AND COLLATERAL TERM SHEET IS NOT COMPLETE AND MAY BE AMENDED PRIOR TO THE TIME OF SALE. THIS TERM SHEET IS NOT AN OFFER TO SELL THESE SECURITIES AND IT IS NOT A SOLICITATION OF AN OFFER TO BUY THESE SECURITIES IN ANY JURISDICTION WHERE THE OFFER OR SALE IS NOT PERMITTED. |
| 143 |
| Retail – Unanchored | Loan #12 | Cut-off Date Balance: | $19,500,000 | |
| 938 West North Avenue | North & Sheffield | Cut-off Date LTV: | 58.7% | |
| Chicago, IL 60642 | U/W NCF DSCR: | 2.22x | ||
| U/W NOI Debt Yield: | 8.5% |
The following table presents certain information relating to tenant sales at the North & Sheffield Property:
Tenant Sales (PSF)
| Major Tenant Name | % of Total Annual U/W Base Rent | TTM April 2019 Sales PSF(1) | Occupancy Cost(1)(2) |
| Sephora | 20.1% | $1,185 | 7.6% |
| (1) | TTM Sales PSF and Occupancy Cost are for the trailing 12-month period ending April 30, 2019. |
| (2) | Occupancy Cost is based on TTM April 2019 Sales, underwritten base rent and underwritten reimbursements. |
The following table presents certain information relating to the lease rollover schedule at the North & Sheffield Property:
Lease Expiration Schedule(1)
| Year Ending December 31, | No. of Leases Expiring | Expiring NRSF | % of Total NRSF | Cumulative Expiring NRSF | Cumulative % of Total NRSF | Annual U/W Base Rent | % of Total Annual U/W Base Rent | Annual U/W Base Rent PSF |
| MTM | 0 | 0 | 0.0% | 0 | 0.0% | $0 | 0.0% | $0.00 |
| 2019 | 0 | 0 | 0.0% | 0 | 0.0% | $0 | 0.0% | $0.00 |
| 2020 | 0 | 0 | 0.0% | 0 | 0.0% | $0 | 0.0% | $0.00 |
| 2021 | 0 | 0 | 0.0% | 0 | 0.0% | $0 | 0.0% | $0.00 |
| 2022 | 0 | 0 | 0.0% | 0 | 0.0% | $0 | 0.0% | $0.00 |
| 2023 | 0 | 0 | 0.0% | 0 | 0.0% | $0 | 0.0% | $0.00 |
| 2024 | 1 | 5,350 | 16.8% | 5,350 | 16.8% | $358,450 | 20.1% | $67.00 |
| 2025 | 0 | 0 | 0.0% | 5,350 | 16.8% | $0 | 0.0% | $0.00 |
| 2026 | 3 | 26,412 | 83.2% | 31,762 | 100.0% | $1,428,000 | 79.9% | $54.07 |
| 2027 | 0 | 0 | 0.0% | 31,762 | 100.0% | $0 | 0.0% | $0.00 |
| 2028 | 0 | 0 | 0.0% | 31,762 | 100.0% | $0 | 0.0% | $0.00 |
| 2029 | 0 | 0 | 0.0% | 31,762 | 100.0% | $0 | 0.0% | $0.00 |
| Thereafter | 0 | 0 | 0.0% | 31,762 | 100.0% | $0 | 0.0% | $0.00 |
| Vacant | 0 | 0 | 0.0% | 31,762 | 100.0% | $0 | 0.0% | $0.00 |
| Total/Weighted Average | 4 | 31,762 | 100.0% | $1,786,450 | 100.0% | $56.24 |
| (1) | Information obtained from the underwritten rent roll. |
The following table presents historical occupancy percentages at the North & Sheffield Property:
Historical Occupancy
12/31/2015(1) | 12/31/2016(1) | 12/31/2017(1)(2) | 12/31/2018(1)(2) | 9/24/2019(3) |
| 16.8% | 16.8% | 19.1% | 100.0% | 100.0% |
| (1) | Information obtained from a third-party market research provider. |
| (2) | The increase in occupancy from 2017 to 2018 is due to Lululemon’s lease for approximately 83.2% of the net rentable square footage of the North & Sheffield Property. |
| (3) | Information obtained from the underwritten rent roll. |
| THE INFORMATION IN THIS STRUCTURAL AND COLLATERAL TERM SHEET IS NOT COMPLETE AND MAY BE AMENDED PRIOR TO THE TIME OF SALE. THIS TERM SHEET IS NOT AN OFFER TO SELL THESE SECURITIES AND IT IS NOT A SOLICITATION OF AN OFFER TO BUY THESE SECURITIES IN ANY JURISDICTION WHERE THE OFFER OR SALE IS NOT PERMITTED. |
| 144 |
| Retail – Unanchored | Loan #12 | Cut-off Date Balance: | $19,500,000 | |
| 938 West North Avenue | North & Sheffield | Cut-off Date LTV: | 58.7% | |
| Chicago, IL 60642 | U/W NCF DSCR: | 2.22x | ||
| U/W NOI Debt Yield: | 8.5% |
Operating History and Underwritten Net Cash Flow. The following table presents certain information relating to the historical operating performance and underwritten net cash flow at the North & Sheffield Property:
Cash Flow Analysis
| 2017 | 2018(1) | TTM 6/30/2019(1)(2) | U/W(2) | %(3) | U/W $ per SF | |
| Base Rent | $1,571,650 | $477,100 | $1,172,700 | $1,758,450 | 69.3% | $55.36 |
| Contractual Rent Steps | 0 | 0 | 0 | 28,000 | 1.1 | 0.88 |
| Percentage Rent | 8,199 | 1,887 | 1,569 | 0 | 0.0 | 0.00 |
| Grossed Up Vacant Space | 0 | 0 | 0 | 0 | 0.0 | 0.00 |
| Gross Potential Rent | $1,579,849 | $478,987 | $1,174,269 | $1,786,450 | 70.4% | $56.24 |
| Parking Income | 0 | 8,333 | 40,370 | 66,142 | 2.6 | 2.08 |
| Total Recoveries | 11,276 | 191,295 | 603,032 | 684,642 | 27.0 | 21.56 |
| Net Rental Income | $1,591,124 | $678,615 | $1,817,671 | $2,537,234 | 100.0% | $79.88 |
| (Vacancy & Credit Loss) | 0 | 0 | 0 | (89,323)(4) | (5.0) | (2.81) |
| Effective Gross Income | $1,591,124 | $678,615 | $1,817,671 | $2,447,912 | 96.5% | $77.07 |
| Real Estate Taxes | (28,731) | 279,733 | 513,404 | 602,179 | 24.6 | 18.96 |
| Insurance | 12,397 | 12,444 | 12,280 | 13,415 | 0.5 | 0.42 |
| Management Fee | 6,017 | 23,783 | 65,907 | 73,437 | 3.0 | 2.31 |
| Other Operating Expenses | 116,779 | 99,691 | 99,389 | 105,082 | 4.3 | 3.31 |
| Total Operating Expenses | $106,461 | $415,652 | $690,981 | $794,113 | 32.4% | $25.00 |
| Net Operating Income | $1,484,663 | $262,963 | $1,126,690 | $1,653,798 | 67.6% | $52.07 |
| Replacement Reserves | 0 | 0 | 0 | 6,352 | 0.3 | 0.20 |
| TI/LC | 0 | 0 | 0 | 63,524 | 2.6 | 2.00 |
| Net Cash Flow | $1,484,663 | $262,963 | $1,126,690 | $1,583,922 | 64.7% | $49.87 |
| NOI DSCR | 2.08x | 0.37x | 1.58x | 2.32x | ||
| NCF DSCR | 2.08x | 0.37x | 1.58x | 2.22x | ||
| NOI Debt Yield | 7.6% | 1.3% | 5.8% | 8.5% | ||
| NCF Debt Yield | 7.6% | 1.3% | 5.8% | 8.1% |
| (1) | The increase in Net Operating Income from 2018 to TTM 6/30/2019 was driven by Lululemon’s lease commencing in December 2018 (representing approximately 79.9% of underwritten base rent). |
| (2) | The increase in Net Operating Income from TTM 6/30/2019 to U/W was driven by (i) Lululemon’s lease commencing in December 2018 (representing approximately 79.9% of underwritten base rent) and (ii) the inclusion of Lululemon’s December 2019 contractual rent increase totaling $28,000. |
| (3) | Represents (i) percent of Net Rental Income for all revenue fields, (ii) percent of Gross Potential Rent for Vacancy & Credit Loss and (iii) percent of Effective Gross Income for all other fields. |
| (4) | The underwritten economic vacancy is 5.0%. The North & Sheffield Property was 100.0% occupied as of September 24, 2019. |
| THE INFORMATION IN THIS STRUCTURAL AND COLLATERAL TERM SHEET IS NOT COMPLETE AND MAY BE AMENDED PRIOR TO THE TIME OF SALE. THIS TERM SHEET IS NOT AN OFFER TO SELL THESE SECURITIES AND IT IS NOT A SOLICITATION OF AN OFFER TO BUY THESE SECURITIES IN ANY JURISDICTION WHERE THE OFFER OR SALE IS NOT PERMITTED. |
| 145 |
| No. 13 – Global Payments, Inc. | ||||||
| Mortgage Loan Information | Mortgaged Property Information | |||||
| Mortgage Loan Seller: | BSPRT CMBS Finance, LLC | Single Asset/Portfolio: | Single Asset | |||
Credit Assessment (Fitch/KBRA/S&P): | NR/NR/NR | Property Type – Subtype: | Office – Suburban | |||
| Original Principal Balance(1): | $19,167,000 | Location: | Jeffersonville, IN | |||
| Cut-off Date Balance(1): | $19,167,000 | Size: | 226,304 SF | |||
| % of Initial Pool Balance: | 2.9% | Cut-off Date Balance Per SF(1): | $128.88 | |||
| Loan Purpose: | Acquisition | Maturity Date Balance Per SF(1): | $128.88 | |||
| Borrower Sponsor: | BSPRT CRE Equity, LLC | Year Built/Renovated: | 2006/2011 | |||
| Guarantor: | BSPRT CRE Equity, LLC | Title Vesting: | Fee | |||
| Mortgage Rate: | 3.8500% | Property Manager: | Self-managed | |||
| Note Date: | October 15, 2019 | Current Occupancy (As of): | 100.0% (12/1/2019) | |||
| Seasoning: | 1 month | YE 2018 Occupancy: | 100.0% | |||
| Anticipated Repayment Date(2): | November 6, 2029 | YE 2017 Occupancy: | 100.0% | |||
| Final Maturity Date(2): | November 6, 2034 | YE 2016 Occupancy: | 100.0% | |||
| IO Period: | 120 months | YE 2015 Occupancy: | 100.0% | |||
| Loan Term (Original): | 120 months | Appraised Value: | $42,000,000 | |||
| Amortization Term (Original): | NAP | Appraised Value Per SF: | $185.59 | |||
| Loan Amortization Type: | Interest-only, ARD | Appraisal Valuation Date: | August 29, 2019 | |||
| Call Protection(3): | YM(25),YM or D(91),O(4) | |||||
| Lockbox Type: | Springing | Underwriting and Financial Information | ||||
| Additional Debt(1): | Yes | TTM NOI(7): | NAV | |||
| Additional Debt Type (Balance)(1)(4): | Pari Passu ($10,000,000); Future Mezzanine | YE 2018 NOI(7): | NAV | |||
| YE 2017 NOI(7): | NAV | |||||
| YE 2016 NOI(7): | NAV | |||||
| U/W Revenues: | $2,619,544 | |||||
| U/W Expenses: | $78,586 | |||||
| Escrows and Reserves | U/W NOI: | $2,540,957 | ||||
| Initial | Monthly | Cap | U/W NCF: | $2,540,957 | ||
| Taxes | $0 | Springing(5) | NAP | U/W DSCR based on NOI/NCF(1): | 2.23x / 2.23x | |
| Insurance | $0 | Springing(5) | NAP | U/W Debt Yield based on NOI/NCF(1): | 8.7% / 8.7% | |
| Lease Sweep Reserve | $0 | Springing(6) | $2,704,764 | U/W Debt Yield at Maturity based on NOI/NCF(1): | 8.7% / 8.7% | |
| Cut-off Date LTV Ratio(1): | 69.4% | |||||
| LTV Ratio at Maturity or ARD(1)(2): | 69.4% | |||||
| Sources and Uses | ||||||||
| Sources | Uses | |||||||
| Original whole loan amount | $29,167,000 | 69.8% | Purchase Price | $41,667,818 | 99.7% | |||
| Sponsors Contribution | 12,643,278 | 30.2 | Closing Costs | 142,460 | 0.3 | |||
| Upfront Reserves | 0 | 0.0 | ||||||
| Total Sources | $41,810,278 | 100.0% | Total Uses | $41,810,278 | 100.0% | |||
| (1) | The Global Payments, Inc. Mortgage Loan (as defined below) is part of the Global Payments, Inc. Whole Loan (as defined below), which is comprised of twopari passu notes with an aggregate original balance of $29,167,000. All statistical information related to the Cut-off Date Balance per SF, Maturity Date Balance per SF, U/W Debt Yield based on NOI/NCF, U/W Debt Yield at Maturity based on NOI/NCF, U/W DSCR based on NOI/NCF, Cut-off Date LTV Ratio and LTV Ratio at Maturity or ARD are based on the Global Payments, Inc. Whole Loan. |
| (2) | The Global Payments, Inc. Mortgage Loan is structured with an anticipated repayment date of November 6, 2029 (the “ARD”). If the Global Payments, Inc. Mortgage Loan is not paid off before the ARD, then the Global Payments, Inc. Mortgage Loan will accrue interest at the Adjusted Interest Rate (as defined below). |
| (3) | Defeasance of the Global Payments, Inc. Whole Loan is permitted at any time after the earlier of (i) two years after the closing date that includes the last note to be securitized or (ii) three years from the note date. The assumed initial defeasement period lockout period of 25 payments is based on the WFCM 2019-C54 securitization trust closing date of December 2019. |
| (4) | The Global Payments, Inc. Mortgage Loan permits a future mezzanine loan, subject to conditions including the following (i) no event of default has occurred and is continuing, (ii) the combined LTV ratio will not exceed 85.0%, (iii) the combined DSCR will not be less than 1.15x, and (iv) the mezzanine lender will be subject to the approval of the lender. |
| (5) | The Global Payments, Inc. Mortgage Loan documents do not require ongoing monthly escrows for insurance and taxes so long as (i) no trigger period exists with respect to the sole tenant; (ii) the sole tenant is permitted to pay and is actually paying taxes directly to the appropriate public office, (iii) the sole tenant is permitted to maintain and is actually maintaining the insurance in respect of the Global Payments, Inc. Property (as defined below) in accordance with the terms of the lease to the sole tenant and is required to be paying insurance premiums directly to the respective insurer or agent. |
| (6) | On each payment date occurring after the occurrence and during the continuance of a cash sweep period that exists solely due to the continuance of a sweep period relating to the sole tenant, the borrower is required to deposit an amount equal to the excess cash flow generated by the Global Payments, Inc. Property up to a cap of $2,704,764. |
| (7) | Historical financials are unavailable as the Global Payments, Inc. Property was acquired in 2019 and is 100% leased to a single tenant on a triple net lease. |
| THE INFORMATION IN THIS STRUCTURAL AND COLLATERAL TERM SHEET IS NOT COMPLETE AND MAY BE AMENDED PRIOR TO THE TIME OF SALE. THIS TERM SHEET IS NOT AN OFFER TO SELL THESE SECURITIES AND IT IS NOT A SOLICITATION OF AN OFFER TO BUY THESE SECURITIES IN ANY JURISDICTION WHERE THE OFFER OR SALE IS NOT PERMITTED. |
| 146 |
Office – Suburban 1 Heartland Way Jeffersonville, IN 47130 | Loan #13 Global Payments, Inc. | Cut-off Date Balance: Cut-off Date LTV: U/W NCF DSCR: U/W NOI Debt Yield: | $19,167,000 69.4% 2.23x 8.7% |
The Mortgage Loan. The mortgage loan (the “Global Payments, Inc. Mortgage Loan”) is part of a whole loan (the “Global Payments, Inc. Whole Loan”) evidenced by twopari passupromissory notes with an aggregate original principal balance of $29,167,000 secured by a first mortgage encumbering the fee interest in a class B office property in Jeffersonville, Indiana (the “Global Payments, Inc. Property”). The Global Payments, Inc. Mortgage Loan consists of the controlling Note A-1, which had an original principal balance of $19,167,000, has a Cut-off Date Balance of $19,167,000 and is being contributed to the WFCM 2019-C54 trust. The non-controlling Note A-2 had an original principal balance of $10,000,000, has a Cut-off Date Balance of $10,000,000 and is expected to be contributed to a future transaction. See“Description of the Mortgage Pool—The Whole Loans—The Serviced Pari Passu Whole Loans”and“Pooling and Servicing Agreement—Servicing of the Mortgage Loans”in the Preliminary Prospectus.
The Global Payments, Inc. Mortgage Loan requires interest-only payments through the ARD and accrues at a rate of 3.8500%per annum(the “Initial Interest Rate”) through the ARD. Following the ARD, to the extent that the Global Payments, Inc. Mortgage Loan is outstanding, the Global Payments, Inc. Mortgage Loan will accrue interest at a rate of 6.3500% (the “Adjusted Interest Rate”). In addition, to the extent that there is excess cash flow after the payment of reserves, the excess cash flow will be applied to fund tax and insurance reserves, pay down the principal and pay any interest accrued. See loan agreement for more detail.
Note Summary
| Notes | Original Balance | Cut-off Date Balance | Note Holder | Controlling Piece |
| A-1 | $19,167,000 | $19,167,000 | WFCM 2019-C54 | Yes |
| A-2 | $10,000,000 | $10,000,000 | BSPRT CMBS Finance, LLC | No |
| Total | $29,167,000 | $29,167,000 |
The Property.The Global Payments, Inc. Property is comprised of a three-story class B office building totaling 226,304 square feet located in Jeffersonville, Indiana. Constructed in 2006 and subsequently expanded and renovated in 2011, the Global Payments, Inc. Property is 100.0% leased Global Payments, Inc. as of December 1, 2019. The Global Payments, Inc. Property is home to 850 employees including a call center for 600 employees, offices for 150 senior employees, a data center on two floors for 50 employees, and warehousing for 50 employees. The Global Payments, Inc. Property is situated on a 26.4-acre site with 973 surface level parking spaces resulting in a parking ratio of 4.3 spaces per 1,000 square feet of rentable area. The Global Payments, Inc. Property offers a variety of amenities that include a dining room, cafeteria, 11,200 square foot fitness center, outdoor recreation area, a 10,000 square foot child care facility, coffee bars and meeting areas.
Sole Tenant.
Global Payments, Inc. (226,304 square feet; 100.0% of net rentable area; 100.0% of underwritten base rent; 5/31/2037 lease expiration) – Global Payments, Inc. is a leading pure play payments technology company delivering innovative software and services to customers globally. Headquartered in Georgia with over 24,000 employees worldwide, Global Payments, Inc. is a member of the S&P 500 with worldwide reach spanning over 100 countries throughout North America, Europe, Asia Pacific and Latin America.
In May 2019, Global Payments, Inc. announced the acquisition of Total System Services, Inc. (“TSS”) in an all-stock deal for $21.5 billion. TSS was rated BBB- by S&P. For year ended 2018, TSS reported approximately $4.0 billion in revenues and $577 million in net income. Per S&P, the combined entity carries an investment grade credit profile of BBB-. The merger was completed in September 2019 and the combined company, Global Payments, Inc. now provides innovative payments and software solutions to approximately 3.5 million predominantly small to mid-sized merchant locations, services over 1,300 financial institutions and enables digital interactions with over 600 million cardholders globally. As of September 31, 2019, Global Payments, Inc. had a market capitalization of $51.9 billion.
The following table presents certain information relating to the tenancy at the Global Payments, Inc. Property:
Major Tenant
| Tenant Name | Credit Rating (Fitch/Moody’s/S&P)(1) | Tenant NRSF | % of NRSF | Annual U/W Base Rent PSF | Annual U/W Base Rent(2) | % of Total Annual U/W Base Rent(2) | Lease Expiration Date | Extension Options | Termination Option (Y/N) |
| Global Payments, Inc. | NR/Baa3/BBB- | 226,304 | 100.0% | $11.93 | $2,700,560 | 100.0% | 5/31/2037 | 4, 5-year | N |
| Occupied Collateral Total | 226,304 | 100.0% | $11.93 | $2,700,560 | 100.0% | ||||
| Vacant Space | 0 | 0.0% | |||||||
| Collateral Total | 226,304 | 100.0% | |||||||
| (1) | Certain ratings are those of the parent company whether or not the parent company guarantees the lease. |
| (2) | Annual U/W Base Rent PSF and Annual U/W Base Rent includes straightline rent averaging totaling $154,574. |
| THE INFORMATION IN THIS STRUCTURAL AND COLLATERAL TERM SHEET IS NOT COMPLETE AND MAY BE AMENDED PRIOR TO THE TIME OF SALE. THIS TERM SHEET IS NOT AN OFFER TO SELL THESE SECURITIES AND IT IS NOT A SOLICITATION OF AN OFFER TO BUY THESE SECURITIES IN ANY JURISDICTION WHERE THE OFFER OR SALE IS NOT PERMITTED. |
| 147 |
Office – Suburban 1 Heartland Way Jeffersonville, IN 47130 | Loan #13 Global Payments, Inc. | Cut-off Date Balance: Cut-off Date LTV: U/W NCF DSCR: U/W NOI Debt Yield: | $19,167,000 69.4% 2.23x 8.7% |
The following table presents certain information relating to the lease rollover schedule at the Global Payments, Inc. Property:
Lease Expiration Schedule(1)
| Year Ending December 31, | No. of Leases Expiring | Expiring NRSF | % of Total NRSF | Cumulative Expiring NRSF | Cumulative % of Total NRSF | Annual U/W Base Rent(2) | % of Total Annual U/W Base Rent | Annual U/W Base Rent PSF(2) |
| MTM | 0 | 0 | 0.0% | 0 | 0.0% | $0 | 0.0% | $0.00 |
| 2019 | 0 | 0 | 0.0% | 0 | 0.0% | $0 | 0.0% | $0.00 |
| 2020 | 0 | 0 | 0.0% | 0 | 0.0% | $0 | 0.0% | $0.00 |
| 2021 | 0 | 0 | 0.0% | 0 | 0.0% | $0 | 0.0% | $0.00 |
| 2022 | 0 | 0 | 0.0% | 0 | 0.0% | $0 | 0.0% | $0.00 |
| 2023 | 0 | 0 | 0.0% | 0 | 0.0% | $0 | 0.0% | $0.00 |
| 2024 | 0 | 0 | 0.0% | 0 | 0.0% | $0 | 0.0% | $0.00 |
| 2025 | 0 | 0 | 0.0% | 0 | 0.0% | $0 | 0.0% | $0.00 |
| 2026 | 0 | 0 | 0.0% | 0 | 0.0% | $0 | 0.0% | $0.00 |
| 2027 | 0 | 0 | 0.0% | 0 | 0.0% | $0 | 0.0% | $0.00 |
| 2028 | 0 | 0 | 0.0% | 0 | 0.0% | $0 | 0.0% | $0.00 |
| 2029 | 0 | 0 | 0.0% | 0 | 0.0% | $0 | 0.0% | $0.00 |
| Thereafter | 1 | 226,304 | 100.0% | 226,304 | 100.0% | $2,700,560 | 100.0% | $11.93 |
| Vacant | 0 | 0 | 0.0% | 226,304 | 100.0% | $0 | 0.0% | $0.00 |
| Total/Weighted Average | 1 | 226,304 | 100.0% | $2,700,560 | 100.0% | $11.93 |
| (1) | Information obtained from the underwritten rent roll. |
| (2) | Annual U/W Base Rent PSF and Annual U/W Base Rent includes straightline rent averaging totaling $154,574. |
The following table presents historical occupancy percentages at the Global Payments, Inc. Property:
Historical Occupancy
12/31/2015(1) | 12/31/2016(1) | 12/31/2017(1) | 12/31/2018(1) | 12/1/2019(2) |
| 100.0% | 100.0% | 100.0% | 100.0% | 100.0% |
| (1) | Information obtained from the borrower. |
| (2) | Information obtained from the underwritten rent roll. |
| THE INFORMATION IN THIS STRUCTURAL AND COLLATERAL TERM SHEET IS NOT COMPLETE AND MAY BE AMENDED PRIOR TO THE TIME OF SALE. THIS TERM SHEET IS NOT AN OFFER TO SELL THESE SECURITIES AND IT IS NOT A SOLICITATION OF AN OFFER TO BUY THESE SECURITIES IN ANY JURISDICTION WHERE THE OFFER OR SALE IS NOT PERMITTED. |
| 148 |
Office – Suburban 1 Heartland Way Jeffersonville, IN 47130 | Loan #13 Global Payments, Inc. | Cut-off Date Balance: Cut-off Date LTV: U/W NCF DSCR: U/W NOI Debt Yield: | $19,167,000 69.4% 2.23x 8.7% |
Operating History and Underwritten Net Cash Flow. The following table presents certain information relating to underwritten net cash flow at the Global Payments, Inc. Property:
Cash Flow Analysis(1)
| U/W | %(2) | U/W $ per SF | |
| Base Rent | $2,545,986 | 94.3% | $11.25 |
| Contractual Rent Steps(3) | 154,574 | 5.7 | 0.68 |
| Grossed Up Vacant Space | 0 | 0.0 | 0.00 |
| Gross Potential Rent | $2,700,560 | 100.0% | $11.93 |
| Other Income | 0 | 0.0 | 0.00 |
| Total Recoveries | 0 | 0.0 | 0.00 |
| Net Rental Income | $2,700,560 | 100.0% | $11.93 |
| Concessions | 0 | 0.0 | 0.00 |
| (Vacancy & Credit Loss) | ($81,017)(4) | (3.0) | (0.36) |
| Effective Gross Income | $2,619,544 | 97.0% | $11.58 |
| Real Estate Taxes | 0 | 0.0 | 0.00 |
| Insurance | 0 | 0.0 | 0.00 |
| Management Fee | 78,586 | 3.0 | 0.35 |
| Other Operating Expenses | 0 | 0.0 | 0.00 |
| Total Operating Expenses | $78,586 | 3.0% | $0.35 |
| Net Operating Income | $2,540,957 | 97.0% | $11.23 |
| Replacement Reserves | 0 | 0.0 | 0.00 |
| TI/LC | 0 | 0.0 | 0.00 |
| Net Cash Flow | $2,540,957 | 97.0% | $11.23 |
| NOI DSCR | 2.23x | ||
| NCF DSCR | 2.23x | ||
| NOI Debt Yield | 8.7% | ||
| NCF Debt Yield | 8.7% |
| (1) | Historical financials are unavailable as the Global Payments, Inc. Property was acquired in 2019 and is 100% leased to a single tenant on a triple net lease. |
| (2) | Represents (i) percent of Net Rental Income for all revenue fields, (ii) percent of Gross Potential Rent for Vacancy & Credit Loss and (iii) percent of Effective Gross Income for all other fields. |
| (3) | Represents straight-line rent averaging for the sole tenant over its remaining lease term totaling $154,574. |
| (4) | The underwritten economic vacancy is 3.0%. The Global Payments, Inc. Property was 100.0% physically occupied as of December 1, 2019. |
Market Overview and Competition.The Global Payments, Inc. Property is located in the city limits of Jeffersonville, in the west portion of Clark County. Jeffersonville is located north of the Ohio River in the northern tier of the Louisville MSA and adjacent to Clarksville. It is approximately three miles north of the Louisville central business district. According to the appraisal, the Jeffersonville-Clarksville has been expanding its economy alongside neighboring communities such as the Metro Louisville area and other Southern Indiana cities such as New Albany, Sellersburg and the Floyds Knobs area. The Global Payments, Inc. Property sits within Bridgeport Business Centre, an office and industrial park that features tenancy from national corporations including FedEx Ground, Mytex Polymers, Steel Dynamics, Metals USA and Kinder Morgan. In addition, Amazon opened a 1.2 million square foot fulfillment center 3 miles north of the Property in 2015.
The Bridgeport Business Centre has access to primary transportation thoroughfares in the area with state highway 265 approximately 1.4 miles north of the property and Interstate 65 approximately 4.7 miles west of the Global Payments, Inc. Property. The Interstate 65 bridge was recently expanded over the Ohio River, which has improved the traffic flow to and from southern Indiana to downtown Louisville. The East End Bridge over the Ohio River was recently completed, which now allows travelers the opportunity to travel to and from the area by bypassing downtown Louisville and Interstate 65.
According to the appraisal, the estimated 2019 population within a one-, three- and five-mile radius of the Global Payments, Inc. Property was approximately 4,150, 32,753 and 100,613, respectively; and the estimated 2019 average household income within the same radii was approximately $76,782, $77,500 and $94,298, respectively.
| THE INFORMATION IN THIS STRUCTURAL AND COLLATERAL TERM SHEET IS NOT COMPLETE AND MAY BE AMENDED PRIOR TO THE TIME OF SALE. THIS TERM SHEET IS NOT AN OFFER TO SELL THESE SECURITIES AND IT IS NOT A SOLICITATION OF AN OFFER TO BUY THESE SECURITIES IN ANY JURISDICTION WHERE THE OFFER OR SALE IS NOT PERMITTED. |
| 149 |
Office – Suburban 1 Heartland Way Jeffersonville, IN 47130 | Loan #13 Global Payments, Inc. | Cut-off Date Balance: Cut-off Date LTV: U/W NCF DSCR: U/W NOI Debt Yield: | $19,167,000 69.4% 2.23x 8.7% |
Submarket Information – According to a third party market research report, the Global Payments, Inc. Property is located in the South Clark County Office submarket. As of second quarter 2019, there is approximately 3.3 million square feet of office space in South Clark County that operates at a 2.5% vacancy rate and has had no new completions since 2017. The overall asking rental rate for office space is $13.95.
The following table presents certain information relating to the appraiser’s market rent conclusion for the Global Payments, Inc. Property:
Market Rent Summary(1)
| Office | |
| Market Rent (PSF) | $11.00 |
| Average Lease Term (Years) | 10 |
| Lease Type (Reimbursements) | Absolute Net |
| Rent Increase Projection | 1.5%per annum |
| (1) | Information obtained from the appraisal. |
The table below presents certain information relating to comparable sales pertaining to the Global Payments, Inc. Property identified by the appraiser:
Comparable Sales(1)
| Property Name | Location | Rentable Area (SF) | Sale Date | Sale Price | Sale Price (PSF) |
| Spectrum Brands World Headquarters | Middleton, WI | 252,122 | 19-Sep | $52,000,000 | $206.25 |
| Alliance Data Systems | Columbus, OH | 241,493 | 18-Jul | $46,950,000 | $194.42 |
| ABB Building | Highland Hills, OH | 135,430 | 18-Feb | $29,469,568 | $217.60 |
| Manpower Group Headquarters | Milwaukee, WI | 280,000 | 17-Jun | $66,500,000 | $237.50 |
| Miso Headquarters | Carmel, IN | 133,409 | 17-Feb | $28,600,000 | $214.38 |
| Magna Seating of America | Novi, MI | 180,000 | 17-Jun | $53,381,000 | $296.56 |
| Thorton's Headquarters | Louisville, KY | 90,000 | 16-Dec | $27,982,500 | $310.92 |
| Burns & McDonnell Headquarters | Kansas City, MO | 298,795 | 16-Nov | $95,000,000 | $317.94 |
| (1) | Information obtained from the appraisal. |
| THE INFORMATION IN THIS STRUCTURAL AND COLLATERAL TERM SHEET IS NOT COMPLETE AND MAY BE AMENDED PRIOR TO THE TIME OF SALE. THIS TERM SHEET IS NOT AN OFFER TO SELL THESE SECURITIES AND IT IS NOT A SOLICITATION OF AN OFFER TO BUY THESE SECURITIES IN ANY JURISDICTION WHERE THE OFFER OR SALE IS NOT PERMITTED. |
| 150 |
Office – Suburban 1 Heartland Way Jeffersonville, IN 47130 | Loan #13 Global Payments, Inc. | Cut-off Date Balance: Cut-off Date LTV: U/W NCF DSCR: U/W NOI Debt Yield: | $19,167,000 69.4% 2.23x 8.7% |
The following table presents certain information relating to comparable office properties to the Global Payments, Inc. Property identified by the appraiser:
Comparable Leases(1)
| Property Name/Location | Year Built/ Renovated | Property Subtype | Tenant Size (SF) | Distance from Subject | Occupancy | Asking Base Rent PSF | Lease Type |
Autoliv ASP, Inc. Headquarters 26545 American Drive Southfield, MI 48034 | 2018/NAP | Single Tenant | 179,300 | 371.3 miles | 100.0% | $16.15 | NNN |
ABB Building 23000 Harvard Road Highland Hills, OH 44122 | 2017/NAP | Single Tenant | 135,430 | 346.7 miles | 100.0% | $13.60 | NNN |
Express Scripts Headquarters 8555 University Place Drive St. Louis, MO 63121 | 2007/NAP | Single Tenant | 316,541 | 273.1 miles | 100.0% | $14.53 | NNN |
Lane Bryant Building 3344 Morse Crossing Columbus, OH 43219 | 2005/NAP | Single Tenant | 135,485 | 213.3 miles | 100.0% | $12.48 | NNN |
Valvoline World Headquarters 100 Valvoline Way Lexington, KY 40509 | 2017/NAP | Single Tenant | 162,358 | 85.4 miles | 100.0% | $16.41 | NNN |
Siemens - Milford 2000 Eastman Drive Milford, OH 45150 | 1991/2011 | Single Tenant | 221,215 | 115.0 miles | 100.0% | $11.55 | NNN |
Miso Headquarters 720 City Center Drive Carmel, IN 46032 | 2007/NAP | Single Tenant | 133,409 | 130.7 miles | 100.0% | $14.00 | NNN |
Drake International Center 27360 Drake Road Farmington Hills, MI 48331 | 1999/2016 | Single Tenant | 116,824 | 368.3 Miles | 100.0% | $8.55 | NNN |
| (1) | Information obtained from the appraisal. |
| THE INFORMATION IN THIS STRUCTURAL AND COLLATERAL TERM SHEET IS NOT COMPLETE AND MAY BE AMENDED PRIOR TO THE TIME OF SALE. THIS TERM SHEET IS NOT AN OFFER TO SELL THESE SECURITIES AND IT IS NOT A SOLICITATION OF AN OFFER TO BUY THESE SECURITIES IN ANY JURISDICTION WHERE THE OFFER OR SALE IS NOT PERMITTED. |
| 151 |
| No. 14 – Somerset Park at Union | ||||||||
| Mortgage Loan Information | Mortgaged Property Information | |||||||
| Mortgage Loan Seller: | Argentic Real Estate Finance LLC | Single Asset/Portfolio: | Single Asset | |||||
Credit Assessment (Fitch/KBRA/S&P): | NR/NR/NR | Property Type – Subtype: | Multifamily – Garden | |||||
| Original Principal Balance: | $18,750,000 | Location: | Tulsa, OK | |||||
| Cut-off Date Balance: | $18,750,000 | Size: | 424 Units | |||||
| % of Initial Pool Balance: | 2.8% | Cut-off Date Balance Per Unit(1): | $44,221.70 | |||||
| Loan Purpose: | Acquisition | Maturity Date Balance Per Unit(1): | $44,221.70 | |||||
| Borrower Sponsors: | Gerald Lee Nudo; Laurence H. Weiner; Marc Kulick | Year Built/Renovated: | 1984/NAP | |||||
| Guarantors: | Gerald Lee Nudo; Laurence H. Weiner; Marc Kulick | Title Vesting: | Fee | |||||
| Mortgage Rate: | 3.8100% | Property Manager: | Vesta Realty, LLC | |||||
| Note Date: | October 22, 2019 | Current Occupancy (As of): | 95.8% (10/18/2019) | |||||
| Seasoning: | 1 month | TTM 9/30/2019 Occupancy: | 85.9% | |||||
| Maturity Date: | November 6, 2029 | YE 2018 Occupancy: | 87.0% | |||||
| IO Period: | 120 months | YE 2017 Occupancy: | 91.5% | |||||
| Loan Term (Original): | 120 months | As-Is Appraised Value: | $27,000,000 | |||||
| Amortization Term (Original): | NAP | As-Is Appraised Value Per Unit: | $63,679.25 | |||||
| Loan Amortization Type: | Interest-only, Balloon | As-Is Appraisal Valuation Date: | 8/29/2019 | |||||
| Call Protection: | L(25),D(91),O(4) | |||||||
| Lockbox Type(2): | Springing | Underwriting and Financial Information | ||||||
| Additional Debt: | None | TTM NOI (9/30/2019): | $1,454,624 | |||||
| Additional Debt Type (Balance): | NAP | YE 2018 NOI: | $1,507,398 | |||||
| YE 2017 NOI: | $1,830,905 | |||||||
| YE 2016 NOI(3): | NAV | |||||||
| U/W Revenues: | $3,398,105 | |||||||
| U/W Expenses: | $1,845,705 | |||||||
| Escrows and Reserves | U/W NOI: | $1,552,400 | ||||||
| Initial | Monthly | Cap | U/W NCF: | $1,446,400 | ||||
| Taxes | $346,715 | $28,893 | NAP | U/W DSCR based on NOI/NCF(1): | 2.32x / 2.16x | |||
| Insurance | $40,288 | $13,429 | NAP | U/W Debt Yield based on NOI/NCF(1): | 9.0% / 8.4% | |||
| Replacement Reserve | $0 | $8,833 | NAP | U/W Debt Yield at Maturity based on NOI/NCF(1): | 9.0% / 8.4% | |||
| Required Upgrade Reserve(1) | $1,500,000 | $0 | NAP | Cut-off Date LTV Ratio(1): | 63.9% | |||
| LTV Ratio at Maturity(1): | 63.9% | |||||||
| Sources and Uses | ||||||||
| Sources | Uses | |||||||
| Original loan amount | $18,750,000 | 61.3% | Purchase Price | $27,000,000 | 88.3% | |||
| Borrower equity | 11,826,935 | 38.7 | Closing Costs | 1,689,933 | 5.5 | |||
| Reserves | 1,887,003 | 6.2 | ||||||
| Total Sources | $30,576,935 | 100.0% | Total Uses: | $30,576,935 | 100.0% | |||
| (1) | U/W DSCR based on NOI/NCF, U/W Debt Yield based on NOI/NCF, U/W Debt Yield at Maturity based on NOI/NCF, Cut-off Date LTV Ratio, and LTV Ratio at Maturity are calculated net of the $1,500,000 holdback. The holdback can be disbursed in whole or in part provided that, among other things, the following conditions are satisfied: (i) a minimum net operating income debt yield of 8.5%; (ii) a minimum property occupancy of 90.0%, and (iii) no event of default has occurred or is continuing. If the holdback has not been released by October 22, 2022, the lender will apply the unreleased proceeds to pay down the mortgage loan, accompanied by the applicable yield maintenance premium to be paid by the borrower. Assuming the full holdback balance is not applied to the loan amount of $18,750,000, Cut-off Date LTV Ratio, LTV Ratio at Maturity, U/W NOI DSCR, U/W NCF DSCR, U/W NOI Debt Yield and U/W NCF Debt Yield are 69.4%, 69.4%, 2.14x, 1.99x, 8.3% and 7.7%, respectively. |
| (2) | The Somerset Park at Union Mortgage Loan (as defined below) is structured with springing cash management which would be triggered upon (i) the stated maturity date, (ii) an event of default, (iii) if the debt service coverage ratio is less than 1.50x, (iv) if, (I) as of any calendar quarter, the occupancy of the Somerset Park at Union Property (as defined below) is less than 82.5%, or (II) as of two consecutive calendar quarters, the occupancy is less than 85%, (v) if, (I) as of any calendar quarter prior to the 61st month of the Somerset Park at Union Mortgage Loan term, the debt yield is less than 8.0%, or (II) as of any calendar quarter on or following the 61st month but prior to the 73rd month of the Somerset Park at Union Mortgage Loan term, the debt yield is less than 8.25%, or (III) as of any calendar quarter on or following the 73rd month but prior to the 97th month of the Somerset Park at Union Mortgage Loan term, the debt yield is less than 8.50%, or (IV) as of any calendar quarter on or following the 97th month of the Somerset Park at Union Mortgage Loan term, the debt yield is less than 8.75%, or (vi) the failure of the borrower (i) to have fully performed the required upgrades pursuant to Somerset Park at Union Mortgage Loan documents and (ii) to have fully invested upgrades in the amount of $2,250,000 prior to the expiration of the third year of the Somerset Park at Union Mortgage Loan. |
| (3) | YE 2016 NOI was not available as the Somerset Park at Union Property was an acquisition and the historical financial statements were not provided. |
| THE INFORMATION IN THIS STRUCTURAL AND COLLATERAL TERM SHEET IS NOT COMPLETE AND MAY BE AMENDED PRIOR TO THE TIME OF SALE. THIS TERM SHEET IS NOT AN OFFER TO SELL THESE SECURITIES AND IT IS NOT A SOLICITATION OF AN OFFER TO BUY THESE SECURITIES IN ANY JURISDICTION WHERE THE OFFER OR SALE IS NOT PERMITTED. |
| 152 |
| Multifamily – Garden | Loan #14 | Cut-off Date Balance: | $18,750,000 | |
| 9416 East 65th Street | Somerset Park at Union | Cut-off Date LTV: | 63.9% | |
| Tulsa, OK | U/W NCF DSCR: | 2.16x | ||
| U/W NOI Debt Yield: | 9.0% |
The Mortgage Loan. The fourteenth largest mortgage loan (the “Somerset Park at Union Mortgage Loan”) is evidenced by one promissory note in the original principal balance of $18,750,000. The Somerset Park at Union Mortgage Loan is secured by a first priority fee mortgage encumbering a multifamily property located in Tulsa, Oklahoma (the “Somerset Park at Union Property”).
The Property.The Somerset Park at Union Property is comprised of 38, two-story apartment buildings totaling 424 units located in Tulsa, Oklahoma. The Somerset Park at Union Property was built in 1984 and is situated on a 21.2 acre site. The Somerset Park at Union Property features amenities such as a barbeque area, two community pools and a combination leasing office/clubhouse that includes a business center and full kitchen. The unit mix features 240, one bedroom units and 184, two bedroom units, comprising 360,400 square feet and an average unit size of 850 square feet. As of October 18, 2019, the Somerset Park at Union Property was 95.8% occupied, with average in place rent of $675 per unit. The Somerset Park at Union Property is served by 708 surface parking spaces at 1.7 spaces per unit. Prior to borrower sponsor’s acquisition, the Somerset Park at Union Property had been the site of criminal activity in two separate incidents in 2016 and 2019. See “Description of the Mortgage Pool—Property Types—Multifamily Properties” in the Preliminary Prospectus.
The borrower sponsor expects to perform upgrades to the Somerset Park at Union Property. Budgeted capital improvements include interior unit renovations, painting, landscaping, roofs, and HVAC upgrades. In addition, the borrower sponsor expects to implement several upgrades to increase security measures at the Somerset Park at Union Property including adding fencing and a remote security gate, and hiring security services who will be conducting periodic armed patrols and implementing improved video surveillance. The Somerset Park at Union Mortgage Loan is structured with a minimum capital expenditure requirement in the amount of $2.25 million over the first 36 months of the Somerset Park at Union Mortgage Loan term (“Capital Expenditure Requirement”). The failure to fulfill the Capital Expenditure Requirement would trigger a cash management period under the Somerset Park at Union Mortgage Loan documents. The Somerset Park at Union Mortgage Loan is also structured with a $1.5 million holdback which is subject to a minimum net operating income debt yield test of 8.5%.
The Somerset Park at Union Property is managed by Vesta Realty, LLC, a privately held real estate investment firm that focuses on the acquisition and management of multifamily properties in Oklahoma and Arkansas. Since its formation in 2017, Vesta Capital has purchased and managed over 2,300 units with a combined value of over $150 million in the Tulsa and Little Rock markets.
The following table presents detailed information with respect to each of the units included at the Somerset Park at Union Property:
Somerset Park at Union Unit Mix(1)
| Unit Type | Total Units | Occupied Units | % Occupied | Average SF per Unit | Total SF | Monthly Average Rent per Unit | Concluded Average Market Rent per Unit(2) |
| 1A | 128 | 126 | 98.4% | 700 | 89,600 | $595 | $595 |
| 1B | 112 | 99 | 88.4% | 750 | 84,000 | $607 | $600 |
| 2A | 128 | 126 | 98.4% | 1,000 | 128,000 | $742 | $750 |
| 2B | 56 | 55 | 98.2% | 1,050 | 58,800 | $826 | $840 |
| Total/Wtd. Avg. | 424 | 406 | 95.8% | 850 | 360,400 | $675 | $675 |
| (1) | Based on the underwritten rent roll dated October 18, 2019. |
| (2) | Sourced from appraisal. |
The following table presents historical occupancy percentages at the Somerset Park at Union Property:
Historical Occupancy
2017(1) | 2018(1) | 9/30/2019(1) | 10/18/2019(2) | |||
| 91.5% | 87.0% | 85.9% | 95.8% |
| (1) | Information obtained from borrower. |
| (2) | Information obtained from the underwritten rent roll. |
| THE INFORMATION IN THIS STRUCTURAL AND COLLATERAL TERM SHEET IS NOT COMPLETE AND MAY BE AMENDED PRIOR TO THE TIME OF SALE. THIS TERM SHEET IS NOT AN OFFER TO SELL THESE SECURITIES AND IT IS NOT A SOLICITATION OF AN OFFER TO BUY THESE SECURITIES IN ANY JURISDICTION WHERE THE OFFER OR SALE IS NOT PERMITTED. |
| 153 |
| Multifamily – Garden | Loan #14 | Cut-off Date Balance: | $18,750,000 | |
| 9416 East 65th Street | Somerset Park at Union | Cut-off Date LTV: | 63.9% | |
| Tulsa, OK 74133 | U/W NCF DSCR: | 2.16x | ||
| U/W NOI Debt Yield: | 9.0% |
Operating History and Underwritten Net Cash Flow. The following table presents certain information relating to the operating history and underwritten net cash flow at the Somerset Park at Union Property:
Cash Flow Analysis
| 2017 | 2018 | 9/30/2019 TTM | U/W | %(1) | U/W $ per Unit | ||||||
| Gross Potential Rent | $3,525,577 | $3,474,296 | $3,388,897 | $3,445,312 | 84.8 | % | $8,125.74 | ||||
| Other Income(2) | 426,262 | 419,221 | 330,227 | 330,227 | 8.1 | 778.84 | |||||
| Recoveries | 276,452 | 290,423 | 288,210 | 288,210 | 7.1 | 679.74 | |||||
| Net Rental Income | $4,228,291 | $4,183,940 | $4,007,334 | $4,063,749 | 100.0 | % | $9,584.31 | ||||
| Concessions | (138,957) | (118,129) | (78,804) | (82,020) | (2.0) | (193.44) | |||||
| (Vacancy & Credit Loss) | (517,828) | (640,972) | (603,798) | (583,624) | (16.9) | (1,376.47) | |||||
| Effective Gross Income | $3,571,506 | $3,424,839 | $3,324,732 | $3,398,105 | 83.6 | % | $8,014.40 | ||||
| Real Estate Taxes | 219,502 | 230,802 | 235,780 | 347,470 | 10.2 | 819.50 | |||||
| Insurance | 67,392 | 73,552 | 75,672 | 160,000 | 4.7 | 377.36 | |||||
| Management Fee | 97,333 | 93,886 | 90,867 | 101,943 | 3.0 | 240.43 | |||||
| Other Operating Expenses | 1,356,374 | 1,519,201 | 1,467,789 | 1,236,292 | 36.4 | 2,915.78 | |||||
| Total Operating Expenses | $1,740,601 | $1,917,441 | $1,870,108 | $1,845,705 | 54.3 | % | $4,353.08 | ||||
| Net Operating Income | $1,830,905 | $1,507,398 | $1,454,624 | $1,552,400 | 45.7 | % | $3,661.32 | ||||
| Replacement Reserves | 0 | 0 | 0 | 106,000 | 3.1 | 250.00 | |||||
| TI/LC | 0 | 0 | 0 | 0 | 0.0 | 0.00 | |||||
| Net Cash Flow | $1,830,905 | $1,507,398 | $1,454,624 | $1,446,400 | 42.6 | % | $3,411.32 | ||||
| NOI DSCR(3) | 2.74x | 2.26x | 2.18x | 2.32x | |||||||
| NCF DSCR(3) | 2.74x | 2.26x | 2.18x | 2.16x | |||||||
| NOI Debt Yield(3) | 10.6% | 8.7% | 8.4% | 9.0% | |||||||
| NCF Debt Yield(3) | 10.6% | 8.7% | 8.4% | 8.4% |
| (1) | Represents (i) percent of Net Rental Income for all revenue fields, (ii) percent of Gross Potential Rent for Vacancy & Credit Loss and (iii) percent of Effective Gross Income for all other fields. |
| (2) | Other Income includes the deposits, laundry income, and miscellaneous revenues |
| (3) | Assuming the full holdback balance is applied to the loan amount of $18,750,000, U/W NOI DSCR, U/W NCF DSCR, U/W NOI Debt Yield and U/W NCF Debt Yield are 2.14x, 1.99x, 8.3% and 7.7%, respectively. |
Environmental Matters. According to a Phase I environmental site assessment dated September 5, 2019, there was no evidence of any recognized environmental conditions at the Somerset Park at Union Property.
Market Overview and Competition.The Somerset Park at Union Property is located in Tulsa, Oklahoma within the South Tulsa and Broken Arrow submarket of the Tulsa multifamily market. Primary access to the Somerset Park at Union Property is provided by a number of major thoroughfares, including ingress and egress via East 65th Street and S Mingo Road. The Somerset Park at Union Property neighborhood is located in a mixed-use area that supports residential, office commercial, and retail uses.
According to the appraisal, as of the second quarter of 2019, the vacancy rate in the South Tulsa and Broken Arrow submarket was approximately 7.7%, with average asking rents of $732 per unit and inventory of approximately 23,631 units.
According to the appraisal, the Tulsa MSA has a population of 1,015,095 which has increased by 77,617 since 2010, reflecting an annual increase of 0.9%. Population is projected to increase by an additional 39,534 by 2024, reflecting 0.8% annual population growth. The area features an average household income of $73,713 and a median household income of $53,092. Over the next five years, median household income is expected to increase by 10.4%, or $1,101 per annum.
| THE INFORMATION IN THIS STRUCTURAL AND COLLATERAL TERM SHEET IS NOT COMPLETE AND MAY BE AMENDED PRIOR TO THE TIME OF SALE. THIS TERM SHEET IS NOT AN OFFER TO SELL THESE SECURITIES AND IT IS NOT A SOLICITATION OF AN OFFER TO BUY THESE SECURITIES IN ANY JURISDICTION WHERE THE OFFER OR SALE IS NOT PERMITTED. |
| 154 |
| Multifamily – Garden | Loan #14 | Cut-off Date Balance: | $18,750,000 | |
| 9416 East 65th Street | Somerset Park at Union | Cut-off Date LTV: | 63.9% | |
| Tulsa, OK 74133 | U/W NCF DSCR: | 2.16x | ||
| U/W NOI Debt Yield: | 9.0% |
The following table presents certain information relating to comparable rental properties to the Somerset Park at Union Property:
Comparable Rental Properties
| Property | Year Built | Distance to Subject (miles) | Occupancy % | Number of Units | Average Rent per Unit | Average Rent per SF | Average (One | Average (Two | |
| Somerset Park at Union(1) | 1984 | NAP | 95.8% | 424 | $675 | $0.79 | $601 | $784 | |
| Windsail(2) | 1984 | 0.4 miles | 91.0% | 297 | $635 | $0.80 | $571 | $811 | |
| Cedar Glade(2) | 1980 | 0.5 miles | 96.0% | 275 | $773 | $0.80 | $644 | $799 | |
| Chardonnay(2) | 1983 | 0.7 miles | 95.0% | 200 | $709 | $1.02 | $689 | $819 | |
| Woodland Oaks(2) | 1984 | 0.8 miles | 95.0% | 428 | $691 | $0.89 | $689 | $826 | |
| Woodland Park(2) | 1999 | 0.4 miles | 96.0% | 232 | $865 | $0.93 | $775 | $960 | |
| (1) | Based on the underwritten rent roll dated October 18, 2019. |
| (2) | Sourced from appraisal. |
| THE INFORMATION IN THIS STRUCTURAL AND COLLATERAL TERM SHEET IS NOT COMPLETE AND MAY BE AMENDED PRIOR TO THE TIME OF SALE. THIS TERM SHEET IS NOT AN OFFER TO SELL THESE SECURITIES AND IT IS NOT A SOLICITATION OF AN OFFER TO BUY THESE SECURITIES IN ANY JURISDICTION WHERE THE OFFER OR SALE IS NOT PERMITTED. |
| 155 |
| No. 15 – NMR Pharmacy Portfolio | |||||||
| Mortgage Loan Information | Mortgaged Property Information | ||||||
| Mortgage Loan Seller: | BSPRT CMBS Finance, LLC | Single Asset/Portfolio(5): | Portfolio | ||||
Credit Assessment (Fitch/KBRA/S&P): | NR/NR/NR | Property Type – Subtype: | Retail – Single Tenant | ||||
| Original Principal Balance(1): | $17,500,000 | Location: | Various | ||||
| Cut-off Date Balance(1): | $17,500,000 | Size: | 153,806 SF | ||||
| % of Initial Pool Balance: | 2.6% | Cut-off Date Balance Per SF: | $206.75 | ||||
| Loan Purpose: | Refinance/Acquisition | Maturity Date Balance Per SF: | $206.75 | ||||
| Borrower Sponsor: | Moshe Shovtiel Rudich | Year Built/Renovated: | Various/Various | ||||
| Guarantor: | Moshe Shovtiel Rudich | Title Vesting: | Fee | ||||
| Mortgage Rate: | 4.3160% | Property Manager: | Self-managed | ||||
| Note Date: | September 27, 2019 | Current Occupancy (As of): | 100.0% (12/1/2019) | ||||
| Seasoning: | 2 months | YE 2018 Occupancy: | 100.0% | ||||
| Maturity Date: | October 6, 2029 | YE 2017 Occupancy: | 100.0% | ||||
| IO Period: | 120 months | YE 2016 Occupancy: | 100.0% | ||||
| Loan Term (Original): | 120 months | YE 2015 Occupancy: | 100.0% | ||||
| Amortization Term (Original): | NAP | Appraised Value(6): | $50,700,000 | ||||
| Loan Amortization Type: | Interest-only, Balloon | Appraised Value Per SF(6): | $329.64 | ||||
| Call Protection(2): | L(26),D(90),O(4) | Appraisal Valuation Date: | August 29, 2019 | ||||
| Lockbox Type: | Hard/Springing Cash Management | ||||||
| Additional Debt(1)(3): | Yes | Underwriting and Financial Information | |||||
| Additional Debt Type (Balance)(1)(3): | Pari Passu($14,300,000); | TTM NOI(7): | NAV | ||||
| Mezzanine Debt ($8,500,000) | YE 2018 NOI(7): | NAV | |||||
| YE 2017 NOI(7): | NAV | ||||||
| YE 2016 NOI(7): | NAV | ||||||
| U/W Revenues: | $2,931,161 | ||||||
| Escrows and Reserves | U/W Expenses: | $113,838 | |||||
| Initial | Monthly | Cap | U/W NOI: | $2,817,323 | |||
| Taxes | $0 | Springing(4) | NAP | U/W NCF: | $2,731,790 | ||
| Insurance | $37,914 | $4,739 | NAP | U/W DSCR based on NOI/NCF(1): | 2.02x / 1.96x | ||
| Replacement Reserve | $0 | $2,077 | NAP | U/W Debt Yield based on NOI/NCF(1): | 8.9% / 8.6% | ||
| TI/LC Reserve | $0 | $5,525 | NAP | U/W Debt Yield at Maturity based on NOI/NCF(1): | 8.9% / 8.6% | ||
| Immediate Repairs Reserve | $100,740 | $0 | NAP | Cut-off Date LTV Ratio(1): | 62.7% | ||
| Hermitage HVAC Reserve | $30,172 | $0 | NAP | LTV Ratio at Maturity(1): | 62.7% | ||
| Sources and Uses | ||||||||
| Sources | Uses | |||||||
| Original whole loan amount | $31,800,000 | 78.7% | Purchase price (eight properties)(8) | $17,474,056 | 43.2% | |||
| Mezzanine loan amount | 8,500,000 | 21.0 | Loan payoff (five properties)(8) | 20,166,231 | 49.9 | |||
| Sponsor equity | 125,570 | 0.3 | Closing costs | 2,616,456 | 6.5 | |||
| Upfront reserves | 168,827 | 0.4 | ||||||
| Total Sources | $40,425,570 | 100.0% | Total Uses | $40,425,570 | 100.0% | |||
| (1) | The NMR Pharmacy Portfolio Mortgage Loan (as defined below) is part of the NMR Pharmacy Portfolio Whole Loan (as defined below), which comprises twopari passu notes with an aggregate original balance of $31,800,000. All statistical information related to the Cut-off Date Balance per SF, Maturity Date Balance per SF, U/W Debt Yield based on NOI/NCF, U/W Debt Yield at Maturity based on NOI/NCF, U/W DSCR based on NOI/NCF, Cut-off Date LTV Ratio and LTV Ratio at Maturity are based on the NMR Pharmacy Portfolio Whole Loan. |
| (2) | Defeasance of the NMR Pharmacy Portfolio Whole Loan is permitted at any time after the earlier of (i) two years after the closing date that includes the last note to be securitized or (ii) September 27, 2022. The assumed defeasance lockout period of 26 payments is based on the anticipated closing date of the WFCM 2019-C54 securitization trust in December 2019. |
| (3) | The equity interest in the borrower has been pledged to secure mezzanine indebtedness with an original principal balance of $8,500,000 (the “NMR Pharmacy Portfolio Mezzanine Loan”). The NMR Pharmacy Portfolio Mezzanine Loan has an initial term of 120 months and has a remaining term as of the Cut-off Date of 118 months. The NMR Pharmacy Portfolio Mezzanine Loan accrues interest at a rate of 11.0% per annum and requires interest only payments through maturity. All statistical information related to the balance per square foot, loan-to-value ratios, debt service coverage ratios and debt yields are based solely on the NMR Pharmacy Portfolio Whole Loan (as defined below). As of the Cut-off Date, the combined U/W NOI DSCR, U/W NCF DSCR, U/W NOI Debt Yield, U/W NCF Debt Yield, Cut-off Date LTV Ratio and LTV Ratio at Maturity were 1.20x, 1.16x, 7.0%, 6.8%, 79.5% and 79.5%, respectively. |
| (4) | Springing upon the failure to satisfy certain reserve waiver conditions in accordance with the NMR Pharmacy Portfolio Whole Loan documents. |
| (5) | From and after the earlier to occur of September 27, 2022 and the date that is two years from the closing date, the borrowers may obtain the release of the WAG – Huntington, IN mortgaged property and/or the Rite Aid/PNC ATM – Dayton, OH mortgaged property, either together or individually, upon a bona fide sale to a third party, provided, among other conditions, (i) the borrowers have (a) if the release date is after the lockout period, |
| THE INFORMATION IN THIS STRUCTURAL AND COLLATERAL TERM SHEET IS NOT COMPLETE AND MAY BE AMENDED PRIOR TO THE TIME OF SALE. THIS TERM SHEET IS NOT AN OFFER TO SELL THESE SECURITIES AND IT IS NOT A SOLICITATION OF AN OFFER TO BUY THESE SECURITIES IN ANY JURISDICTION WHERE THE OFFER OR SALE IS NOT PERMITTED. |
| 156 |
| Retail – Single Tenant | Loan #15 | Cut-off Date Balance: | $17,500,000 | |
| Property Addresses - Various | NMR Pharmacy Portfolio | Cut-off Date LTV: | 62.7% | |
| U/W NCF DSCR: | 1.96x | |||
| U/W NOI Debt Yield: | 8.9% |
| defeased an amount of principal equal to the greater of (I) 100% of net sales proceeds of the sale of the mortgaged property being released, assuming that the costs of such sale do not exceed 3% of the gross sales price or (II) 125% of the allocated loan amount for the mortgaged property being released (collectively, the “Property Release Price”) or (b) if the release date is prior to the yield maintenance expiration date, the borrowers have paid the lender the sum of the Property Release Price for each Mortgaged Property being released, together with (1) the yield maintenance premium on the portion of the principal balance being prepaid, (2) all interest which would have accrued on the principal amount prepaid through, but not including, the next monthly due date and (3) all other sums then due and payable under the mortgage loan documents, (ii) the mezzanine borrower makes a prepayment to the mezzanine lender of the outstanding principal balance of the mezzanine loan equal to (A) (1) in the case of the release of the Rite Aid/PNC ATM - Dayton, OH mortgaged property, $668,750 and (2) in the case of the release of the WAG – Huntington , IN mortgaged property, $1,031,250 and (B) any yield maintenance premium due under the mezzanine loan with respect to such partial prepayment, (iii) after giving effect to such release, (a) the debt service coverage ratio for the remaining Mortgaged Properties is no less than 1.96x and (b) the LTV ratio (inclusive of mezzanine debt) for the remaining mortgaged properties is no greater than 79.5% and (iv) satisfaction of customary REMIC conditions. |
| (6) | On a portfolio basis, the NMR Pharmacy Portfolio Properties (as defined below) have an “as-is” appraised value of $50,700,000, which includes a portfolio premium. On a stand-alone basis, the thirteen NMR Pharmacy Portfolio Properties have an aggregate “as-is” appraised value of $47,645,000. The Cut-off Date LTV Ratio and the LTV Ratio at Maturity based on the aggregate stand-alone “as-is” appraised value of $47,645,000 are 66.7% and 66.7%, respectively. |
| (7) | Historical operating statements are not available as the NMR Pharmacy Portfolio Properties were recently acquired and such information was not made available by the prior owner. |
| (8) | The proceeds of the NMR Pharmacy Portfolio Whole Loan were used to acquire eight NMR Pharmacy Portfolio Properties and refinance five NMR Pharmacy Portfolio Properties. |
The Mortgage Loan. The mortgage loan (the “NMR Pharmacy Portfolio Mortgage Loan”) is part of a whole loan (the “NMR Pharmacy Portfolio Whole Loan”) evidenced by twopari passu promissory notes with an aggregate original principal balance of $31,800,000 and is secured by a first mortgage encumbering the borrower’s fee interest in a portfolio of six CVS properties, five Walgreens properties and two Rite Aid properties located in eight states (the “NMR Pharmacy Portfolio Properties”). The NMR Pharmacy Portfolio Mortgage Loan consists of the controlling Note A-1, which had an original principal balance of $17,500,000, has a Cut-off Date Balance of $17,500,000 and is being contributed to the WFCM 2019-C54 trust. The non- controlling Note A-2 had an original principal balance of $14,300,000, has a Cut-off Date Balance of $14,300,000 and is expected to be contributed to a future securitization. See “Description of the Mortgage Pool—The Whole Loans—The Serviced Pari Passu Whole Loans” and “Pooling and Servicing Agreement—Servicing of the Mortgage Loans” in the Preliminary Prospectus.
Note Summary
Notes | Original Balance | Cut-off Date Balance | Note Holder | Controlling Piece |
A-1 | $17,500,000 | $17,500,000 | WFCM 2019-C54 | Yes |
| A-2 | $14,300,000 | $14,300,000 | BBCMS 2019-C5(1) | No |
| Total | $31,800,000 | $31,800,000 |
| (1) | The BBCMS 2019-C5 transaction is expected to close on or about November 26, 2019. |
The Properties.The NMR Pharmacy Portfolio Properties consist of six CVS properties, five Walgreens properties and two Rite Aid properties totaling 153,806 rentable square feet located in eight states: Ohio, Tennessee, Kentucky, Indiana, Pennsylvania, Virginia, Georgia and North Carolina. Built between 1951 and 2000, the NMR Pharmacy Portfolio Properties range in size from 10,086 square feet to 15,125 square feet and were 100.0% occupied as of December 1, 2019.
Walgreens is the largest pharmacy store chain in the U.S., with approximately 9,600 stores in all 50 states, the District of Columbia, Puerto Rico and the U.S. Virgin Islands, as of August 31, 2018. In December 2014, Walgreens completed its strategic merger with Alliance Boots to establish Walgreens Boots Alliance, Inc. (“WBA”) and is now part of the Retail Pharmacy USA division of WBA. In March 2018, WBA acquired 1,900 Rite Aid stores for approximately $4.2 billion. All the Walgreen leases at the NMR Pharmacy Portfolio Properties are guaranteed by WBA.
CVS Pharmacy (“CVS”) is one of the largest pharmacy healthcare providers in the U.S., operating more than 9,900 stores across 49 states, the District of Columbia, Puerto Rico. CVS’ loyalty card program, ExtraCare, is one of the largest retail savings and rewards programs in the U.S. with more than 90 million active member households. In December 2015, CVS completed a $1.9 billion agreement to acquire Target’s pharmacy and clinic businesses, bringing 1,672 new pharmacies into CVS, which expanded its retail footprint by more than 20%.
Rite Aid is the largest drugstore chain on the East Coast and the third largest in the U.S., with more than 2,500 stores across 19 states. Rite Aid also has approximately 13 million wellness+ members and employs more than 51,000 employees. Rite Aid was ranked number 94 in the 2018 Fortune 500 lists of the largest U.S. corporations by total revenue. For the twelve month period ended March 2, 2019, Rite Aid reported a total revenue of $21.639 billion.
| THE INFORMATION IN THIS STRUCTURAL AND COLLATERAL TERM SHEET IS NOT COMPLETE AND MAY BE AMENDED PRIOR TO THE TIME OF SALE. THIS TERM SHEET IS NOT AN OFFER TO SELL THESE SECURITIES AND IT IS NOT A SOLICITATION OF AN OFFER TO BUY THESE SECURITIES IN ANY JURISDICTION WHERE THE OFFER OR SALE IS NOT PERMITTED. |
| 157 |
| Retail – Single Tenant | Loan #15 | Cut-off Date Balance: | $17,500,000 | |
| Property Addresses - Various | NMR Pharmacy Portfolio | Cut-off Date LTV: | 62.7% | |
| U/W NCF DSCR: | 1.96x | |||
| U/W NOI Debt Yield: | 8.9% |
The following table presents certain information relating to the NMR Pharmacy Portfolio Properties:
| Property Name - Location | Allocated Cut-off Date Whole Loan Balance | % of Portfolio Cut-off Date Balance | Occupancy | Year Built/ Renovated | Net Rentable Area (SF) | Appraised Value(1) | Portfolio Cut-off Date LTV(1) | % of UW NOI |
WAG - Knoxville, TN 5320 Clinton Highway Knoxville, TN
| $5,235,000 | 16.5% | 100.0% | 2000/NAP | 14,112 | $7,825,000 | 66.7% | 17.7% |
WAG - Cincinnati, OH 9 West Mitchell Avenue Cincinnati, OH
| $3,755,000 | 11.8% | 100.0% | 2000/NAP | 14,490 | $5,600,000 | 66.7% | 11.8% |
WAG - Huntington, IN 1804 North Jefferson Street Huntington, IN | $3,155,000 | 9.9% | 100.0% | 2000/NAP | 15,125 | $4,560,000 | 66.7% | 10.4% |
CVS - Dublin, OH 7470 Sawmill Road Dublin, OH | $2,530,000 | 8.0% | 100.0% | 1999/NAP | 10,086 | $3,910,000 | 66.7% | 6.9% |
CVS - Ashland, KY 1221 Lexington Avenue Ashland, KY | $2,395,000 | 7.5% | 100.0% | 1999/NAP | 11,240 | $3,700,000 | 66.7% | 6.7% |
WAG - Akron, OH 1130 South Arlington Street Akron, OH | $2,280,000 | 7.2% | 100.0% | 1994/NAP | 13,500 | $3,400,000 | 66.7% | 7.3% |
Rite Aid/PNC ATM - Dayton, OH 1158 Wilmington Avenue Dayton, OH | $2,080,000 | 6.5% | 100.0% | 1998/NAP | 11,180 | $2,950,000 | 66.7% | 8.4% |
CVS - Bristol, VA 31 East Valley Drive Bristol, VA | $1,960,000 | 6.2% | 100.0% | 1999/NAP | 10,251 | $2,875,000 | 66.7% | 5.3% |
CVS - Bristol, TN 3030 West State Street Bristol, TN | $1,910,000 | 6.0% | 100.0% | 1999/NAP | 10,200 | $2,950,000 | 66.7% | 5.4% |
CVS - Evans, GA 4385 Hereford Farm Road Evans, GA | $1,880,000 | 5.9% | 100.0% | 1999/NAP | 10,125 | $2,900,000 | 66.7% | 5.3% |
WAG - Henderson, KY 517 North Green Street Henderson, KY | $1,645,000 | 5.2% | 100.0% | 1996/2013 | 11,385 | $2,450,000 | 66.7% | 5.4% |
CVS - Summerfield, NC 4601 US Highway 220 Summerfield, NC | $1,635,000 | 5.1% | 100.0% | 1999/NAP | 10,112 | $2,525,000 | 66.7% | 4.4% |
Rite Aid - Hermitage, PA 1851 East State Street Hermitage, PA | $1,340,000 | 4.2% | 100.0% | 1951/NAP | 12,000 | $2,000,000 | 66.7% | 5.0% |
| Total/Weighted Average | $31,800,000 | 100.0% | 100.0% | 153,806 | $50,700,000(1) | 62.7%(1) | 100.0% |
| (1) | On a portfolio basis, the NMR Pharmacy Portfolio has an “as-is” appraised value of $50,700,000, which includes a portfolio premium resulting in a Portfolio Cut-off Date LTV Ratio of 62.7%. On a stand-alone basis, the thirteen NMR Pharmacy Portfolio Properties have an aggregate “as-is” appraised value of $47,645,000. The Cut-off Date LTV Ratio and the LTV Ratio at Maturity based on the NMR Pharmacy Portfolio Whole Loan and the aggregate stand-alone “as-is” appraised value of $47,645,000 are 66.7% and 66.7%, respectively. |
| THE INFORMATION IN THIS STRUCTURAL AND COLLATERAL TERM SHEET IS NOT COMPLETE AND MAY BE AMENDED PRIOR TO THE TIME OF SALE. THIS TERM SHEET IS NOT AN OFFER TO SELL THESE SECURITIES AND IT IS NOT A SOLICITATION OF AN OFFER TO BUY THESE SECURITIES IN ANY JURISDICTION WHERE THE OFFER OR SALE IS NOT PERMITTED. |
| 158 |
| Retail – Single Tenant | Loan #15 | Cut-off Date Balance: | $17,500,000 | |
| Property Addresses - Various | NMR Pharmacy Portfolio | Cut-off Date LTV: | 62.7% | |
| U/W NCF DSCR: | 1.96x | |||
| U/W NOI Debt Yield: | 8.9% |
The following table presents certain information relating to the tenancy at the NMR Pharmacy Portfolio Properties:
Major Tenants
| Property Name | Locations | Credit Rating (Fitch/Moody’s/S&P)(1) | Tenant NRSF | % of NRSF | Annual U/W Base Rent PSF | Annual U/W Base Rent(2) | % of Total Annual U/W Base Rent(2) | Lease Expiration Date |
| Walgreens | 5 | BBB/Baa2/BBB | 68,612 | 44.6% | $23.30 | $1,598,953 | 52.8% | Various(2) |
| CVS | 6 | NR/Baa2/BBB | 62,014 | 40.3% | $16.43 | $1,019,190 | 33.7% | 7/31/2039 |
| Rite Aid | 2 | B/Caa1/CCC+ | 23,180 | 15.1% | $17.59 | $407,663 | 13.5% | Various(2) |
| Occupied Collateral Total | 153,806 | 100.0% | $19.67 | $3,025,805 | 100.0% | |||
| Vacant Space | 0 | 0.0% | ||||||
| Collateral Total | 153,806 | 100.0% | ||||||
| (1) | Certain ratings are those of the parent company whether or not the parent company guarantees the lease. |
| (2) | See “Lease Detail” table for more information |
The following table presents certain information relating to the leases at the NMR Pharmacy Portfolio Properties:
Lease Detail
| Property Name | Tenant NRSF | % of Portfolio NRSF | Annual U/W Base Rent PSF | Annual U/W Base Rent | % of Portfolio U/W Base Rent | Lease Start Date | Termination Option Date | Lease Expiration Date |
| WAG - Knoxville, TN | 14,112 | 9.2% | $37.49 | $529,000 | 17.5% | 12/30/2000 | 12/31/2026(1) | 12/31/2066 |
| WAG - Cincinnati, OH | 14,490 | 9.4% | $25.19 | $365,000 | 12.1% | 3/22/2001 | 8/31/2028(2) | 8/31/2068 |
| WAG - Huntington, IN | 15,125 | 9.8% | $21.12 | $319,500 | 10.6% | 1/13/2001 | 1/31/2026(3) | 1/31/2081 |
| CVS - Dublin, OH | 10,086 | 6.6% | $20.38 | $205,520 | 6.8% | 8/1/2019 | NAP | 7/31/2039 |
| CVS - Ashland, KY | 11,240 | 7.3% | $17.95 | $201,812 | 6.7% | 8/1/2019 | NAP | 7/31/2039 |
| WAG - Akron, OH | 13,500 | 8.8% | $16.70 | $225,453 | 7.5% | 10/29/1994 | 2/29/2028(4) | 2/28/2053 |
| Rite Aid/PNC ATM - Dayton, OH | 11,180 | 7.3% | $22.59 | $252,503 | 8.3% | 4/1/2018 | NAP | 3/31/2023 |
| CVS - Bristol, VA | 10,251 | 6.7% | $15.49 | $158,757 | 5.2% | 8/1/2019 | NAP | 7/31/2039 |
| CVS - Bristol, TN | 10,200 | 6.6% | $15.94 | $162,582 | 5.4% | 8/1/2019 | NAP | 7/31/2039 |
| CVS - Evans, GA | 10,125 | 6.6% | $15.62 | $158,124 | 5.2% | 8/1/2019 | NAP | 7/31/2039 |
| WAG - Henderson, KY | 11,385 | 7.4% | $14.05 | $160,000 | 5.3% | 5/30/1997 | NAP | 5/31/2034 |
| CVS - Summerfield, NC | 10,112 | 6.6% | $13.09 | $132,395 | 4.4% | 8/1/2019 | NAP | 7/31/2039 |
| Rite Aid - Hermitage, PA | 12,000 | 7.8% | $12.93 | $155,160 | 5.1% | 8/1/2018 | NAP | 1/31/2029 |
| Total/Weighted Average | 153,806 | 100.0% | $19.67 | $3,025,805 | 100.0% |
| (1) | Tenant has the option to terminate the lease (with at least six months’ prior notice) as of December 31, 2026, December 31, 2031, December 31, 2036, December 31, 2041, December 31, 2046, December 31, 2051, December 31, 2056, and December 31, 2061. |
| (2) | Tenant has the option to terminate the lease (with at least six months’ prior notice) as of August 31, 2028, August 31, 2033, August 31, 2038, August 31, 2043, August 31, 2048, August 31, 2053, August 31, 2058, and August 31, 2063. |
| (3) | Tenant has the option to terminate the lease (with at least six months’ prior notice) as of January 31, 2026, January 31, 2031, January 31, 2036, January 31, 2041, January 31, 2046, January 31, 2051, January 31, 2056, January 31, 2061, January 31, 2066, January 31, 2071 and January 31, 2076. |
| (4) | Tenant has the option to terminate the lease (with at least six months’ prior notice) as of February 29, 2028, February 28, 2033, February 28, 2038, February 28, 2043 and February 29, 2048. |
| THE INFORMATION IN THIS STRUCTURAL AND COLLATERAL TERM SHEET IS NOT COMPLETE AND MAY BE AMENDED PRIOR TO THE TIME OF SALE. THIS TERM SHEET IS NOT AN OFFER TO SELL THESE SECURITIES AND IT IS NOT A SOLICITATION OF AN OFFER TO BUY THESE SECURITIES IN ANY JURISDICTION WHERE THE OFFER OR SALE IS NOT PERMITTED. |
| 159 |
| Retail – Single Tenant | Loan #15 | Cut-off Date Balance: | $17,500,000 | |
| Property Addresses - Various | NMR Pharmacy Portfolio | Cut-off Date LTV: | 62.7% | |
| U/W NCF DSCR: | 1.96x | |||
| U/W NOI Debt Yield: | 8.9% |
The following table presents certain information relating to the lease rollover schedule at the NMR Pharmacy Portfolio Properties:
Lease Expiration Schedule(1)
| Year Ending December 31, | No. of Leases Expiring | Expiring NRSF | % of Total NRSF | Cumulative Expiring NRSF | Cumulative % of Total NRSF | Annual U/W Base Rent | % of Total Annual U/W Base Rent | Annual U/W Base Rent PSF |
| MTM | 0 | 0 | 0.0% | 0 | 0.0% | $0 | 0.0% | $0.00 |
| 2019 | 0 | 0 | 0.0% | 0 | 0.0% | $0 | 0.0% | $0.00 |
| 2020 | 0 | 0 | 0.0% | 0 | 0.0% | $0 | 0.0% | $0.00 |
| 2021 | 0 | 0 | 0.0% | 0 | 0.0% | $0 | 0.0% | $0.00 |
| 2022 | 0 | 0 | 0.0% | 0 | 0.0% | $0 | 0.0% | $0.00 |
| 2023 | 1 | 11180 | 7.3% | 11,180 | 7.3% | $252,503 | 8.3% | $22.59 |
| 2024 | 0 | 0 | 0.0% | 11,180 | 7.3% | $0 | 0.0% | $0.00 |
| 2025 | 0 | 0 | 0.0% | 11,180 | 7.3% | $0 | 0.0% | $0.00 |
| 2026 | 1 | 15125 | 9.8% | 26,305 | 17.1% | $319,500 | 10.6% | $21.12 |
| 2027 | 0 | 0 | 0.0% | 26,305 | 17.1% | $0 | 0.0% | $0.00 |
| 2028 | 2 | 27990 | 18.2% | 54,295 | 35.3% | $590,453 | 19.5% | $21.10 |
| 2029 | 1 | 12000 | 7.8% | 66,295 | 43.1% | $155,160 | 5.1% | $12.93 |
| Thereafter | 8 | 87,511 | 56.9% | 153,806 | 100.0% | $1,708,190 | 56.5% | $19.52 |
| Vacant | 0 | 0 | 0.0% | 153,806 | 100.0% | $0 | 0.0% | $0.00 |
| Total/Weighted Average | 13 | 153,806 | 100.0% | $3,025,805 | 100.0% | $19.67 |
| (1) | Information obtained from the underwritten rent roll. |
The following table presents historical occupancy percentages at the NMR Pharmacy Portfolio:
Historical Occupancy
12/31/2015(1) | 12/31/2016(1) | 12/31/2017(1) | 12/31/2018(1) | 12/1/2019(2) | ||||
| 100.0% | 100.0% | 100.0% | 100.0% | 100.0% |
| (1) | Information obtained from the borrowers. |
| (2) | Information obtained from the underwritten rent roll. |
| THE INFORMATION IN THIS STRUCTURAL AND COLLATERAL TERM SHEET IS NOT COMPLETE AND MAY BE AMENDED PRIOR TO THE TIME OF SALE. THIS TERM SHEET IS NOT AN OFFER TO SELL THESE SECURITIES AND IT IS NOT A SOLICITATION OF AN OFFER TO BUY THESE SECURITIES IN ANY JURISDICTION WHERE THE OFFER OR SALE IS NOT PERMITTED. |
| 160 |
| Retail – Single Tenant | Loan #15 | Cut-off Date Balance: | $17,500,000 | |
| Property Addresses - Various | NMR Pharmacy Portfolio | Cut-off Date LTV: | 62.7% | |
| U/W NCF DSCR: | 1.96x | |||
| U/W NOI Debt Yield: | 8.9% |
Market Overview.The NMR Pharmacy Portfolio Properties are located in 13 cities across eight states. See below for demographic information pertaining to the NMR Pharmacy Portfolio Properties.
Estimated Population(1)
| Properties | Estimated Population | ||
| One-mile radius | Three-mile radius | Five-mile radius | |
| WAG - Knoxville, TN(2) | 7,468 | 57,868 | 157,019 |
| WAG - Cincinnati, OH(2) | 11,016 | 128,444 | 325,295 |
| WAG - Huntington, IN(2) | 8,174 | 20,142 | 23,159 |
| CVS - Dublin, OH(3) | 13,689 | 81,457 | 212,336 |
| CVS - Ashland, KY(3) | 5,896 | 33,564 | 60,523 |
| WAG - Akron, OH(2) | 14,372 | 85,728 | 200,358 |
| Rite Aid/PNC ATM - Dayton, OH(3) | 16,427 | 110,264 | 212,573 |
| CVS - Bristol, VA(3) | 5,038 | 31,968 | 50,411 |
| CVS - Bristol, TN(3) | 3,144 | 26,402 | 49,697 |
| CVS - Evans, GA(3) | 5,294 | 55,467 | 123,995 |
| WAG - Henderson, KY(2) | 5,036 | 25,639 | 31,286 |
| CVS - Summerfield, NC(3) | 2,064 | 10,779 | 49,295 |
| Rite Aid - Hermitage, PA(3) | 7,594 | 40,256 | 51,728 |
| (1) | Information obtained from the appraisals. |
| (2) | Property information based on 2019. |
| (3) | Property information based on 2018. |
Average Household Income(1)
| Properties | Average Household Income | ||
| One-mile radius | Three-mile radius | Five-mile radius | |
| WAG - Knoxville, TN(2) | $54,975 | $52,838 | $57,954 |
| WAG - Cincinnati, OH(2) | $63,648 | $54,623 | $66,631 |
| WAG - Huntington, IN(2) | $55,497 | $56,881 | $59,586 |
| CVS - Dublin, OH(3) | $94,212 | $121,504 | $117,241 |
| CVS - Ashland, KY(3) | $54,857 | $60,797 | $60,573 |
| WAG - Akron, OH(2) | $41,622 | $46,779 | $51,566 |
| Rite Aid/PNC ATM - Dayton, OH(3) | $57,373 | $60,559 | $64,173 |
| CVS - Bristol, VA(3) | $53,045 | $49,984 | $56,727 |
| CVS - Bristol, TN(3) | $44,025 | $49,008 | $52,909 |
| CVS - Evans, GA(3) | $93,105 | $94,457 | $99,759 |
| WAG - Henderson, KY(2) | $44,823 | $53,496 | $57,690 |
| CVS - Summerfield, NC(3) | $126,773 | $130,190 | $108,132 |
| Rite Aid - Hermitage, PA(3) | $68,299 | $57,028 | $60,138 |
| (1) | Information obtained from the appraisals. |
| (2) | Property information based on 2019. |
| (3) | Property information based on 2018. |
| THE INFORMATION IN THIS STRUCTURAL AND COLLATERAL TERM SHEET IS NOT COMPLETE AND MAY BE AMENDED PRIOR TO THE TIME OF SALE. THIS TERM SHEET IS NOT AN OFFER TO SELL THESE SECURITIES AND IT IS NOT A SOLICITATION OF AN OFFER TO BUY THESE SECURITIES IN ANY JURISDICTION WHERE THE OFFER OR SALE IS NOT PERMITTED. |
| 161 |
| Retail – Single Tenant | Loan #15 | Cut-off Date Balance: | $17,500,000 | |
| Property Addresses - Various | NMR Pharmacy Portfolio | Cut-off Date LTV: | 62.7% | |
| U/W NCF DSCR: | 1.96x | |||
| U/W NOI Debt Yield: | 8.9% |
Operating History and Underwritten Net Cash Flow. The following table presents certain information relating to the underwritten net cash flow at the NMR Pharmacy Portfolio Properties:
Cash Flow Analysis(1)
| U/W | %(2) | U/W $ per SF | |||
| Base Rent(3) | $3,025,805 | 99.8 | % | $19.67 | |
| Contractual Rent Steps | 0 | 0.0 | 0.00 | ||
| Grossed Up Vacant Space | 0 | 0.0 | 0.00 | ||
| Gross Potential Rent | $3,025,805 | 99.8 | % | $19.67 | |
| Other Income | 5,400 | 0.2 | 0.04 | ||
| Net Rental Income | $3,031,205 | 100.0 | % | $19.71 | |
| (Vacancy & Credit Loss) | (100,045) | -3.3 | (0.65) | ||
| Effective Gross Income | $2,931,161 | 96.7 | % | $19.06 | |
| Real Estate Taxes | 0 | 0.0 | 0.00 | ||
| Insurance | 55,215 | 1.9 | 0.36 | ||
| Management Fee | 58,623 | 2.0 | 0.38 | ||
| Other Operating Expenses | 0 | 0.0 | 0.00 | ||
| Total Operating Expenses | $113,838 | 3.9 | % | $0.74 | |
| Net Operating Income | $2,817,323 | 96.1 | % | $18.32 | |
| Replacement Reserves | 19,238 | 0.7 | 0.13 | ||
| TI/LC | 66,295 | 2.3 | 0.43 | ||
| Net Cash Flow | $2,731,790 | 93.2 | % | $17.76 | |
| NOI DSCR | 2.02x | ||||
| NCF DSCR | 1.96x | ||||
| NOI Debt Yield | 8.9% | ||||
| NCF Debt Yield | 8.6% |
| (1) | Historical operating statements are not available as the NMR Pharmacy Portfolio. Properties are leased to thirteen tenants on triple net leases. |
| (2) | Represents (i) percent of Net Rental Income for all revenue fields, (ii) percent of Gross Potential Rent for Vacancy & Credit Loss and (iii) percent of Effective Gross Income for all other fields. |
| (3) | The underwritten economic vacancy is 3.3%. The NMR Pharmacy Portfolio Properties were 100.0% physically occupied as of December 1, 2019. |
| THE INFORMATION IN THIS STRUCTURAL AND COLLATERAL TERM SHEET IS NOT COMPLETE AND MAY BE AMENDED PRIOR TO THE TIME OF SALE. THIS TERM SHEET IS NOT AN OFFER TO SELL THESE SECURITIES AND IT IS NOT A SOLICITATION OF AN OFFER TO BUY THESE SECURITIES IN ANY JURISDICTION WHERE THE OFFER OR SALE IS NOT PERMITTED. |
| 162 |
| Wells Fargo Commercial Mortgage Trust 2019-C54 | Transaction Contact Information |
VI. Transaction Contact Information
Questions regarding this Structural and Collateral Term Sheet may be directed to any of the following individuals:
| Wells Fargo Securities, LLC | |
| Brigid Mattingly | Tel. (312) 269-3062 |
| A.J. Sfarra | Tel. (212) 214-5613 |
| Alex Wong | Tel. (212) 214-5615 |
| UBS Securities LLC | |
| David Schell | Tel. (212) 713-3375 |
| Nicholas Galeone | Tel. (212) 713-8832 |
| Siho Ham | Tel. (212) 713-1278 |
| THE INFORMATION IN THIS STRUCTURAL AND COLLATERAL TERM SHEET IS NOT COMPLETE AND MAY BE AMENDED PRIOR TO THE TIME OF SALE. THIS TERM SHEET IS NOT AN OFFER TO SELL THESE SECURITIES AND IT IS NOT A SOLICITATION OF AN OFFER TO BUY THESE SECURITIES IN ANY JURISDICTION WHERE THE OFFER OR SALE IS NOT PERMITTED. |
| 163 |
