| FREE WRITING PROSPECTUS | ||
| FILED PURSUANT TO RULE 433 | ||
| REGISTRATION FILE NO.: 333-226943-05 | ||
|
November 12, 2019
FREE WRITING PROSPECTUS
STRUCTURAL AND COLLATERAL TERM SHEET
$1,024,298,346
(Approximate Total Mortgage Pool Balance)
$885,202,000
(Approximate Offered Certificates)
COMM 2019-GC44 |
Deutsche Mortgage & Asset Receiving Corporation
Depositor
German American Capital Corporation
Goldman Sachs Mortgage Company
Citi Real Estate Funding Inc.
Sponsors and Mortgage Loan Sellers
Deutsche Bank Securities | Citigroup | Goldman Sachs & Co. LLC |
Co-Lead Managers and Joint Bookrunners
Academy Securities | Drexel Hamilton |
Co-Managers
The depositor has filed a registration statement (including the prospectus) with the Securities and Exchange Commission (File No. 333-226943) for the offering to which this communication relates. Before you invest, you should read the prospectus in the registration statement and other documents the depositor has filed with the Securities and Exchange Commission for more complete information about the depositor, the issuing entity and this offering. You may get these documents for free by visiting EDGAR on the Securities and Exchange Commission website at www.sec.gov. Alternatively, the depositor or Deutsche Bank Securities Inc., any other underwriter, or any dealer participating in this offering will arrange to send you the prospectus if you request it by calling toll-free 1-800-503-4611 or by emailing: prospectus.cpdg@db.com. The offered certificates referred to in these materials, and the asset pool backing them, are subject to modification or revision (including the possibility that one or more classes of certificates may be split, combined or eliminated at any time prior to issuance or availability of a final prospectus) and are offered on a “when, as and if issued” basis. You understand that, when you are considering the purchase of these certificates, a contract of sale will come into being no sooner than the date on which the relevant class has been priced and we have verified the allocation of certificates to be made to you; any “indications of interest” expressed by you, and any “soft circles” generated by us, will not create binding contractual obligations for you or us. This free writing prospectus does not contain all information that is required to be included in the prospectus.
Capitalized terms used but not defined herein have the meanings assigned to them in the Preliminary Prospectus expected to be dated November 12, 2019 relating to the offered certificates (hereinafter referred to as the “Preliminary Prospectus”).
KEY FEATURES OF SECURITIZATION |
Offering Terms: |
|
Co-Lead Managers and Joint Bookrunners: | Deutsche Bank Securities Inc., Goldman Sachs & Co. LLC and Citigroup Global Markets Inc. |
Co-Managers: | Academy Securities, Inc. and Drexel Hamilton, LLC |
Sponsors and Mortgage Loan Sellers: | German American Capital Corporation* (“GACC”) (26.9%), Goldman Sachs Mortgage Company (“GSMC”) (49.1%) and Citi Real Estate Funding Inc. (“CREFI”) (24.0%) *An indirect wholly owned subsidiary of Deutsche Bank AG |
Master Servicer: | Midland Loan Services, a Division of PNC Bank, National Association |
Operating Advisor: | Park Bridge Lender Services LLC |
Asset Representations Reviewer: | Park Bridge Lender Services LLC |
Special Servicer: | Rialto Capital Advisors, LLC |
Certificate Administrator: | Wells Fargo Bank, National Association |
Trustee: | Wells Fargo Bank, National Association |
Rating Agencies: | Moody’s Investors Service, Inc. (“Moody’s”), S&P Global Ratings, a Standard & Poor’s Financial Services LLC business (“S&P”) and Kroll Bond Rating Agency, Inc. (“KBRA”). |
Credit Risk Retention: | For a discussion on the manner in which the U.S. credit risk retention requirements are being satisfied by GACC, as retaining sponsor, see “Credit Risk Retention” in the Preliminary Prospectus. Note that this securitization transaction is not being structured to satisfy EU risk retention and due diligence requirements. |
Determination Date: | 11th day of each month, or if such 11th day is not a business day, the immediately following business day, commencing in January 2020. |
Distribution Date: | 4th business day following the Determination Date in each month, commencing in January 2020. |
Cut-off Date: | With respect to each mortgage loan, the later of the related payment date of such mortgage loan in December 2019 (or, in the case of any mortgage loan that has its first due date subsequent to December 2019, the date that would have been its due date in December 2019 under the terms of that mortgage loan if a monthly payment were scheduled to be due in that month) and the date of origination of such mortgage loan. Unless otherwise noted, all mortgage loan statistics are based on balances as of the Cut-off Date. |
Closing Date: | On or about December 12, 2019 |
Settlement Terms: | DTC, Euroclear and Clearstream, same day funds, with accrued interest. |
ERISA Eligible: | All of the Offered Certificates are expected to be ERISA eligible. |
SMMEA Eligible: | None of the Offered Certificates will be SMMEA eligible. |
Day Count: | 30/360 |
Tax Treatment: | REMIC |
Rated Final Distribution Date: | August 2057 |
Minimum Denominations: | $10,000 (for each class of offered principal balance certificates) and $100,000 (for each class of offered interest-only certificates) and in each case in multiples of $1 thereafter. |
Clean-up Call: | 1% (with certain exceptions described under “Pooling and Servicing Agreement—Termination; Retirement of Certificates” in the Preliminary Prospectus) |
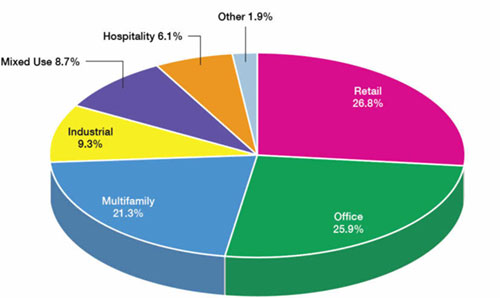
Distribution of Collateral by Property Type |
THE INFORMATION IN THIS STRUCTURAL AND COLLATERAL TERM SHEET IS NOT COMPLETE AND MAY BE AMENDED PRIOR TO THE TIME OF SALE. THIS TERM SHEET IS NOT AN OFFER TO SELL THESE SECURITIES AND IT IS NOT A SOLICITATION OF AN OFFER TO BUY THESE SECURITIES IN ANY JURISDICTION WHERE THE OFFER OR SALE IS NOT PERMITTED.
2
COMM 2019-GC44 Mortgage Trust
|
TRANSACTION HIGHLIGHTS |
Mortgage Loan Sellers | Number of Mortgage Loans | Number of Mortgaged Properties | Aggregate Cut-off Date Balance | % of Initial Pool Balance |
German American Capital Corporation | 9 | 10 | $275,840,769 | 26.9% |
Goldman Sachs Mortgage Company | 20 | 29 | $502,864,115 | 49.1% |
Citi Real Estate Funding Inc. | 14 | 16 | $245,593,462 | 24.0% |
Total: | 43 | 55 | $1,024,298,346 | 100.0% |
Collateral Facts |
|
Initial Outstanding Pool Balance: | $1,024,298,346 |
Number of Mortgage Loans: | 43 |
Number of Mortgaged Properties: | 55 |
Average Mortgage Loan Cut-off Date Balance: | $23,820,892 |
Weighted Average Mortgage Rate: | 3.5463% |
Weighted Average Mortgage Loan Original Term to Maturity Date or ARD (months): | 109 |
Weighted Average Mortgage Loan Remaining Term to Maturity Date or ARD (months): | 108 |
Weighted Average Mortgage Loan Seasoning (months): | 1 |
% of Mortgaged Properties Leased to a Single Tenant: | 13.0% |
Credit Statistics(1) |
|
Weighted Average Mortgage Loan U/W NCF DSCR: | 2.58x |
Weighted Average Mortgage Loan Cut-off Date LTV(2)(3): | 56.9% |
Weighted Average Mortgage Loan Maturity Date or ARD LTV(2): | 53.4% |
Weighted Average U/W NOI Debt Yield(3): | 10.5% |
Amortization Overview |
|
% Mortgage Loans with Amortization through Maturity Date or ARD: | 17.0% |
% Mortgage Loans which pay Interest Only through Maturity or ARD Date: | 66.3% |
% Mortgage Loans which pay Interest Only followed by Amortization through Maturity Date or ARD: | 16.7% |
Weighted Average Remaining Amortization Term (months)(4): | 350 |
Loan Structural Features |
|
% Mortgage Loans with Upfront or Ongoing Tax Reserves: | 62.3% |
% Mortgage Loans with Upfront or Ongoing Replacement Reserves(5): | 78.2% |
% Mortgage Loans with Upfront or Ongoing Insurance Reserves: | 33.7% |
% Mortgage Loans with Upfront or Ongoing TI/LC Reserves(6): | 59.9% |
% Mortgage Loans with In Place Hard Lockboxes(7): | 70.4% |
% Mortgage Loans with Cash Traps Triggered at DSCR Levels ≥ 1.05x: | 49.0% |
% Mortgage Loans with Cash Traps Triggered at Debt Yield Levels ≥ 5.0%: | 38.2% |
|
|
Prepayment Provisions |
|
% Mortgage Loans with Defeasance Only After a Lockout Period and Prior to an Open Period: | 72.9% |
% Mortgage Loans with Prepayment Only After a Lockout Period and Prior to an Open Period with a Yield Maintenance Charge: | 14.8% |
% Mortgage Loans with Prepayment with Yield Maintenance Charge or with Defeasance or Yield Maintenance Charge Prior to an Open Period(8): | 7.3% |
% Mortgage Loans with Prepayment Only After a Lockout Period and Prior to an Open Period with a Yield Maintenance Charge or After a Lockout Period with Defeasance or a Yield Maintenance Charge: | 5.0% |
(1) | The LTV, DSCR and Debt Yield calculations include any related pari passu companion loan(s) and exclude any related subordinate companion loan(s) and/or mezzanine loan(s). |
(2) | With respect to 5 mortgage loans (15.2%) (including Weston Kentucky Portfolio, 55 Green Street, Legends at Village West, Embassy Suites Laredo and Hampton Inn Summerlin), the Cut-off Date LTV and Maturity Date or ARD LTV have been calculated using a value other than the “As Is” appraised values. For additional information please see the footnotes to Annex A-1 in the Preliminary Prospectus. |
(3) | With respect to the Weston Kentucky Portfolio mortgage loan (5.1%) the Cut-off Date LTV and U/W NOI Debt Yield are calculated based on the Cut-off Date Balance net of a related earnout reserve. |
(4) | Excludes mortgage loans which are interest only for the full loan term. |
(5) | Includes FF&E reserves. |
(6) | Represents the percent of the allocated Initial Outstanding Pool Balance of office, retail, industrial and mixed use properties only structured with TI/LC reserves. |
(7) | With respect to the Millennium Park Plaza mortgage loan (1.5%) there is an in place hard lockbox for the retail and office units and an in place soft lockbox for the multifamily units. |
(8) | With respect to the Century Plaza Towers whole loan, prepayment in whole, but not in part, is permitted at any time prior to July 9, 2029 with the payment of a yield maintenance fee. Defeasance of the full $1.2 billion Century Plaza Towers whole loan is permitted after the date that is the earlier of (i) two years from the closing date of the securitization that includes the last pari passu note to be securitized and (ii) October 21, 2022. |
THE INFORMATION IN THIS STRUCTURAL AND COLLATERAL TERM SHEET IS NOT COMPLETE AND MAY BE AMENDED PRIOR TO THE TIME OF SALE. THIS TERM SHEET IS NOT AN OFFER TO SELL THESE SECURITIES AND IT IS NOT A SOLICITATION OF AN OFFER TO BUY THESE SECURITIES IN ANY JURISDICTION WHERE THE OFFER OR SALE IS NOT PERMITTED.
3
COMM 2019-GC44 Mortgage Trust
|
STRUCTURE SUMMARY |
OFFERED CERTIFICATES
Class(1) | Ratings | Initial Certificate | Initial Subordination | Weighted Average Life | Principal (months)(4) | Certificate | Certificate NOI Debt Yield(6) |
|
|
|
|
|
|
|
|
Class A-1 | Aaa(sf)/AAAsf/AAA(sf) | $23,338,000 | 30.000% | 2.82 | 1 – 59 | 39.8% | 15.0% |
Class A-2 | Aaa(sf)/AAAsf/AAA(sf) | $138,840,000 | 30.000% | 4.93 | 59 – 59 | 39.8% | 15.0% |
Class A-3 | Aaa(sf)/AAAsf/AAA(sf) | $55,469,000 | 30.000% | 6.93 | 83 – 83 | 39.8% | 15.0% |
Class A-SB | Aaa(sf)/AAAsf/AAA(sf) | $29,564,000 | 30.000% | 7.24 | 59 – 113 | 39.8% | 15.0% |
Class A-4 | Aaa(sf)/AAAsf/AAA(sf) | (7) | 30.000% | (7) | (7) | 39.8% | 15.0% |
Class A-5 | Aaa(sf)/AAAsf/AAA(sf) | (7) | 30.000% | (7) | (7) | 39.8% | 15.0% |
Class X-A(8) | NR/AAAsf/AAA(sf) | $808,764,000(9) | N/A | N/A | N/A | N/A | N/A |
Class A-M | Aa3(sf)/AAAsf/AAA(sf) | $118,356,000 | 18.000% | 9.93 | 119 – 119 | 46.7% | 12.8% |
Class B | NR/AA-sf/AA-(sf) | $40,685,000 | 13.875% | 9.93 | 119 – 119 | 49.0% | 12.2% |
Class C | NR/A-sf/A-(sf) | $35,753,000 | 10.250% | 9.93 | 119 – 119 | 51.1% | 11.7% |
NON-OFFERED CERTIFICATES
Class(1) | Ratings | Initial Certificate | Initial Subordination | Weighted Average Life | Principal (months)(4) | Certificate | Certificate NOI Debt Yield(6) |
|
|
|
|
|
|
|
|
Class X-B(8) | NR/A-sf/AAA(sf) | $76,438,000(9) | N/A | N/A | N/A | N/A | N/A |
Class X-D(8) | NR/BBB-sf/BBB-(sf) | $41,918,000(9) | N/A | N/A | N/A | N/A | N/A |
Class X-F(8)(10) | NR/BB-sf/BB-(sf) | $18,493,000(9) | N/A | N/A | N/A | N/A | N/A |
Class D | NR/BBBsf/BBB+(sf) | $23,425,000 | 7.875% | 9.93 | 119 – 119 | 52.4% | 11.4% |
Class E | NR/BBB-sf/BBB-(sf) | $18,493,000 | 6.000% | 9.93 | 119 – 119 | 53.5% | 11.2% |
Class F(10) | NR/BB-sf/BB-(sf) | $18,493,000 | 4.125% | 9.93 | 119 – 119 | 54.6% | 11.0% |
Class G-RR(10)(11) | NR/B-sf/B-(sf) | $9,863,000 | 3.125% | 9.93 | 119 – 119 | 55.1% | 10.8% |
Class H-RR(10)(11) | NR/NR/NR | $30,822,346 | 0.000% | 9.93 | 119 – 119 | 56.9% | 10.5% |
NON-OFFERED LOAN-SPECIFIC CERTIFICATES
Class(1) | Ratings | Initial Certificate | Initial Subordination | Weighted Average Life | Principal (months)(4) | Certificate | Certificate NOI Debt Yield(13) |
|
|
|
|
|
|
|
|
Class 180W-A(14) | Baa3(sf)/NR/NR | $33,155,000 | 34.943% | 4.93 | 59 – 59 | 38.2% | 8.8% |
Class 180W-B(14) | Ba3(sf)/NR/NR | $35,530,000 | 20.830% | 4.93 | 59 – 59 | 46.5% | 7.2% |
Class 180W-C(14) | B3(sf)/NR/NR | $42,940,000 | 3.774% | 4.93 | 59 – 59 | 56.5% | 5.9% |
Class 180W-D(14) | NR/NR/NR | $9,500,000 | 0.000% | 4.93 | 59 – 59 | 58.7% | 5.7% |
NON-OFFERED VERTICAL RISK RETENTION INTEREST
Non-Offered Vertical Risk | Ratings | Initial Certificate | Initial Subordination | Weighted Average Life | Principal (months)(15) | Certificate | Certificate NOI Debt Yield |
|
|
|
|
|
|
|
|
Class RR Certificates(16)(17) | NR/NR/NR | $25,800,000(18) | N/A | 8.77 | 1 – 119 | N/A | N/A |
RR Interest(16)(17) | NR/NR/NR | $12,200,000(18) | N/A | 8.77 | 1 – 119 | N/A | N/A |
180W-VRR Interest(14)(17)(19) | NR/NR/NR | $6,375,000 | N/A | 4.93 | 59 – 59 | N/A | N/A |
(1) | The pass-through rates applicable to the Class A-1, Class A-2, Class A-3, Class A-SB, Class A-4, Class A-5, Class A-M, Class B, Class C, Class D, Class E, Class F, Class G-RR and Class H-RR certificates (the “Pooled Principal Balance Certificates”) will equal one of: (i) a fixed per annum rate, (ii) the weighted average of the net mortgage rates on the mortgage loans (in each case, adjusted, if necessary, to accrue on the basis of a 360-day year consisting of twelve 30-day months) as of their respective due dates in the month preceding the month in which the related Distribution Date occurs (the “WAC Rate”), (iii) a rate equal to the lesser of a specified pass-through rate and the WAC Rate or (iv) the WAC Rate less a specified rate. The pass-through rates applicable to the Class 180W-A, Class 180W-B, Class 180W-C and Class 180W-D certificates, in each case, will equal one of the following per annum rates: (i) a fixed rate, (ii) the net mortgage rate on the Trust Subordinate Companion Loan, (iii) the lesser of a specified rate and the net mortgage rate on the Trust Subordinate Companion Loan, or (iv) the net mortgage rate on the Trust Subordinate Companion Loan less a specified rate. |
(2) | Approximate; subject to a permitted variance of plus or minus 5%. Neither the VRR Interest Balance of the VRR Interest nor the Certificate Balance of the 180W-VRR Interest is included in the Certificate Balance or Notional Amount of any Class of Certificates set forth under “Offered Certificates”, “Non-Offered Certificates” or “Non-Offered Loan-Specific Certificates” in the table above. In addition, the Certificate Balance of each Class of Pooled Principal Balance Certificates (and correspondingly, the initial Notional Amount of each Class of Class X Certificates) is subject to change as described in footnote (18) below. |
(3) | The initial subordination levels for the Class A-1, Class A-2, Class A-3, Class A-SB, Class A-4 and Class A-5 certificates are represented in the aggregate. The approximate initial credit support percentage for each class of Pooled Principal Balance Certificates does not include the subordination provided by the trust subordinate companion loan related to the 180 Water mortgage loan. None of the Class 180W-A, Class 180W-B, Class 180W-C, Class 180W-D certificates or the 180W-VRR Interest (the “Loan-Specific Certificates”) will provide credit support to any other class of certificates, except to the extent of the subordination of the trust subordinate companion loan (in which the Loan-Specific Certificates each represent an interest) to the 180 Water mortgage loan. The initial credit support percentages of the Loan-Specific Certificates are based on the 180 Water whole loan. The approximate initial credit support percentages shown in the table above do not take into account the VRR Interest or the 180W-VRR Interest. However, losses incurred on the mortgage loans will be allocated between the VRR Interest, on the one hand, and the Pooled Principal Balance Certificates, on the other hand, pro rata in accordance with their respective outstanding balances, and losses incurred on the trust subordinate companion loan will be allocated between the 180W-VRR Interest, on the one hand, and the Class 180W-A, Class 180W-B, Class 180W-C and Class 180W-D Certificates, on the other hand, pro rata in accordance with their respective outstanding Certificate Balances. |
(4) | The weighted average life and principal window during which distributions of principal would be received as set forth in the table with respect to each class of Pooled Principal Balance Certificates (and the Loan-Specific Certificates) are based on (i) modeling assumptions described in the Preliminary Prospectus and (ii) assumptions that there are no prepayments, delinquencies or losses on the mortgage loans (or, in the case of the Loan-Specific Certificates, the Trust Subordinate Companion Loan). The weighted average life and principal window of the Class A-4 and Class A-5 certificates are expected to be within the applicable ranges reflected in the chart set forth in footnote (7) below. |
(5) | “Certificate Principal to Value Ratio” for any class of Pooled Principal Balance Certificates is calculated as the product of (a) the weighted average mortgage loan Cut-off Date LTV of the mortgage loans, multiplied by (b) a fraction, the numerator of which is the total initial Certificate Balance of the related class of Pooled Principal Balance Certificates and all other classes of Pooled Principal Balance Certificates (and the VRR Interest Balance of any portion of the VRR Interest that is considered to be pari passu or senior to such class), if any, that are senior to such class, and the |
THE INFORMATION IN THIS STRUCTURAL AND COLLATERAL TERM SHEET IS NOT COMPLETE AND MAY BE AMENDED PRIOR TO THE TIME OF SALE. THIS TERM SHEET IS NOT AN OFFER TO SELL THESE SECURITIES AND IT IS NOT A SOLICITATION OF AN OFFER TO BUY THESE SECURITIES IN ANY JURISDICTION WHERE THE OFFER OR SALE IS NOT PERMITTED.
4
COMM 2019-GC44 Mortgage Trust
|
STRUCTURE SUMMARY |
denominator of which is the total initial Certificate Balance of all classes of Pooled Principal Balance Certificates and the initial VRR Interest Balance of the VRR Interest. The Certificate Principal to Value Ratios of the Class A-1, Class A-2, Class A-3, Class A-SB, Class A-4 and Class A-5 certificates are calculated in the aggregate for those classes as if they were a single class.
(6) | “Certificate Underwritten NOI Debt Yield” for any class of Pooled Principal Balance Certificates is calculated as the product of (a) the weighted average Underwritten NOI Debt Yield for the mortgage loans, multiplied by (b) a fraction, the numerator of which is the total initial Certificate Balance of all classes of Pooled Principal Balance Certificates and the initial VRR Interest Balance of the VRR Interest and the denominator of which is the total initial Certificate Balance of such class of Pooled Principal Balance Certificates and all other classes of Pooled Principal Balance Certificates, if any, that are senior to such class (and the VRR Interest Balance of any portion of the VRR Interest that is considered to be pari passu or senior to such class). The Underwritten NOI Debt Yields of the Class A-1, Class A-2, Class A-3, Class A-SB, Class A-4 and Class A-5 certificates are calculated in the aggregate for those classes as if they were a single class. |
(7) | The exact initial Certificate Balances of the Class A-4 and Class A-5 certificates are unknown and will be determined based on the final pricing of those classes of certificates. However, the respective initial Certificate Balances, weighted average lives and principal windows of the Class A-4 and Class A-5 certificates are expected to be within the applicable ranges reflected in the following chart. The aggregate initial Certificate Balance of the Class A-4 and Class A-5 certificates is expected to be approximately $443,197,000, subject to a variance of plus or minus 5.0%. |
Class of Certificates | Expected Range of Initial Certificate Balance | Expected Range of Weighted Avg. Life (years) | Expected Range of Principal Window (months) |
Class A-4 | $75,000,000 - $176,000,000 | 9.63 – 9.76 | 113-116 / 113-119 |
Class A-5 | $267,197,000 - $368,197,000 | 9.93 – 9.90 | 119-119 / 116-119 |
(8) | As further described in the Preliminary Prospectus, the pass-through rate applicable to the Class X-A, Class X-B, Class X-D and Class X-F certificates (collectively, the “Class X Certificates” and, together with the Pooled Principal Balance Certificates and the Class S Certificates, the “Pooled Certificates”) for each Distribution Date will generally be equal to the excess of (i) the WAC Rate over (ii)(A) with respect to the Class X-A certificates, the weighted average of the pass-through rates of the Class A-1, Class A-2, Class A-3, Class A-SB, Class A-4, Class A-5 and Class A-M certificates (based on their respective Certificate Balances immediately prior to such Distribution Date), (B) with respect to the Class X-B certificates, the weighted average of the pass-through rates of the Class B and Class C certificates (based on their respective Certificate Balances immediately prior to such Distribution Date), (C) with respect to the Class X-D certificates, the weighted average of the pass-through rates of the Class D and Class E certificates (based on their respective Certificate Balances immediately prior to such Distribution Date) and (D) with respect to the Class X-F certificates, the pass-through rate of the Class F certificates. |
(9) | The Class X Certificates will not have Certificate Balances. None of the Class X Certificates will be entitled to distributions of principal. The interest accrual amounts on the Class X-A certificates will be calculated by reference to a notional amount equal to the aggregate Certificate Balances of the Class A-1, Class A-2, Class A-3, Class A-SB, Class A-4, Class A-5 and Class A-M certificates. The interest accrual amounts on the Class X-B certificates will be calculated by reference to a notional amount equal to the aggregate Certificate Balances of the Class B and Class C certificates. The interest accrual amounts on the Class X-D certificates will be calculated by reference to a notional amount equal to the aggregate Certificate Balances of the Class D and Class E certificates. The interest accrual amounts on the Class X-F certificates will be calculated by reference to a notional amount equal to the Certificate Balance of the Class F certificates. The notional amount of each class of the Class X Certificates is subject to change depending upon the final pricing of the Pooled Principal Balance Certificates, as follows: (1) if as a result of such pricing the pass-through rate of any class of Pooled Principal Balance Certificates whose Certificate Balance comprises such notional amount is equal to the WAC Rate, the Certificate Balance of such class of Pooled Principal Balance Certificates may not be part of, and will reduce accordingly, such notional amount of the related Class X Certificates (or, if as a result of such pricing the pass-through rate of the related Class X Certificates is equal to zero, such Class X Certificates may not be issued on the Closing Date), and/or (2) if as a result of such pricing the pass-through rate of any class of Pooled Principal Balance Certificates that does not comprise such notional amount of the related Class X Certificates is equal to less than the WAC Rate, such class of Pooled Principal Balance Certificates may become a part of, and will increase accordingly, such notional amount of the related Class X Certificates. |
(10) | The initial Certificate Balance of each of the Class F, Class G-RR and Class H-RR certificates, and the notional amount of the Class X-F certificates, is subject to change based on final pricing of all Pooled Certificates, the final determination of the Class G-RR and Class H-RR certificates (collectively, the “HRR Certificates”) that will be retained by the retaining third-party purchaser and the final determination of the VRR Interest that will be retained as described under “Credit Risk Retention” in the Preliminary Prospectus to satisfy the U.S. risk retention requirements of German American Capital Corporation, as retaining sponsor. For more information regarding the methodology and key inputs and assumptions used to determine the sizing of the HRR Certificates, see “Credit Risk Retention” in the Preliminary Prospectus. |
(11) | The HRR Certificates are expected to be retained by RREF III-D AIV, LLC or its affiliate, in partial satisfaction of the retention obligations of German American Capital Corporation in its capacity as the retaining sponsor in accordance with the credit risk retention rules applicable to the pooled securitization transaction. For more information regarding the methodology and key inputs and assumptions used to determine the sizing of the HRR Certificates, see “Credit Risk Retention” in the Preliminary Prospectus. |
(12) | The “Certificate Principal to Value Ratio” for any class of Loan-Specific Certificates (other than the 180W-VRR Interest) is calculated as the product of (a) the Cut-off Date LTV of the180 Water Whole Loan, multiplied by (b) a fraction, the numerator of which is the sum of (i) the initial Certificate Balance of such class of Loan-Specific Certificates and all other classes of Loan-Specific Certificates, if any, that are senior to such class (including any portions of the 180W-VRR Interest that is considered to be pari passu or senior to such class) and (ii) the principal balance as of the Cut-off Date of the 180 Water Senior Loan, and the denominator of which is the total initial Certificate Balance of all classes of Loan-Specific Certificates (including the 180W-VRR Interest) and the principal balance as of the Cut-off Date of 180 Water Senior Loan. |
(13) | The “Certificate Underwritten NOI Debt Yield” for any class of Loan-Specific Certificates (other than the 180W-VRR Interest) is calculated as the product of (a) the Underwritten NOI Debt Yield for the 180 Water Whole Loan, multiplied by (b) a fraction, the numerator of which is the total initial Certificate Balance of all classes of Loan-Specific Certificates (including the 180W-VRR Interest) and the principal balance as of the Cut-off Date of 180 Water Senior Loan and the denominator of which is the total initial Certificate Balance of such class of Loan-Specific Certificates and all other classes of Loan-Specific Certificates (including any portions of the 180W-VRR Interest that is considered to be pari passu or senior to such class), if any, that are senior to such class and the principal balance as of the Cut-off Date of 180 Water Senior Loan. |
(14) | The Loan-Specific Certificates will only be entitled to receive distributions from, and will only incur losses with respect to, the Trust Subordinate Companion Loan. The Trust Subordinate Companion Loan will be included as an asset of the issuing entity but will not be part of the mortgage pool backing the Pooled Certificates. No class of Pooled Certificates will have any interest in the Trust Subordinate Companion Loan. See “Description of the Mortgage Pool—The Whole Loans—180 Water Whole Loan” in the Preliminary Prospectus. |
(15) | The weighted average life and principal window during which distributions of principal would be received as set forth in the foregoing table with respect to the VRR Interest (as defined below) and the 180W-VRR Interest are based on the assumptions set forth under “Yield and Maturity Considerations—Weighted Average Life” in the Preliminary Prospectus and on the assumptions that there are no prepayments, modifications or losses in respect of the mortgage loans or the Trust Subordinate Companion Loan, as applicable, and that there are no extensions or forbearances of maturity dates. |
(16) | German American Capital Corporation, as the retaining sponsor, is expected to acquire from the depositor, on the Closing Date, an “eligible vertical interest” (as defined in Regulation RR) in the form of a single vertical security comprised of the Class RR certificates and the RR interest (collectively, the “VRR Interest”), representing a specified percentage (to be determined as described in footnote (18) below) of all classes of Pooled Principal Balance Certificates and the VRR Interest. A portion of the VRR Interest will be retained by each of German American Capital Corporation or its “majority-owned affiliate” and GSMC and CREFI in accordance with the credit risk retention rules applicable to the pooled securitization transaction. See “Credit Risk Retention” in the Preliminary Prospectus. |
(17) | Although it does not have a specified pass-through rate (other than for tax reporting purposes), the effective interest rate for the VRR Interest will be the WAC rate. The effective interest rate for the 180W-VRR Interest will be the net mortgage rate of the Trust Subordinate Companion Loan. |
(18) | The initial VRR Interest Balance of the VRR Interest is subject to change depending on the final pricing of all classes of Pooled Certificates with the final VRR Interest Balance of the VRR Interest determined such that, upon initial issuance, the percentage of the fair value of the HRR Certificates and the percentage of the VRR Interest (in the aggregate) will equal at least 5. If the initial VRR Interest balance is reduced, the initial Certificate Balance of each class of Pooled Principal Balance Certificates (and correspondingly, the initial notional amount of each class of Class X Certificates) will be increased on a pro rata basis (based on the initial Certificate Balance set forth in the table above) in an aggregate amount equal to such reduction in the initial VRR Interest Balance of the VRR Interest. If the initial VRR Interest Balance of the VRR Interest is increased, the initial Certificate Balance of each class of Pooled Principal Balance Certificates (and correspondingly, the initial notional amount of each class of Class X Certificates) will be decreased on a pro rata basis (based on the initial Certificate Balance set forth in the table above) in an aggregate amount equal to such increase in the initial VRR Interest Balance of the VRR Interest. For a further description, see “Credit Risk Retention” in the Preliminary Prospectus. |
(19) | German American Capital Corporation, as the retaining sponsor, is expected to acquire from the depositor, on the Closing Date, an “eligible vertical interest” (as defined in Regulation RR) in the form of a single vertical security with an expected aggregate initial Certificate Balance of $6,375,000 (the “180W-VRR Interest”), which is expected to represent approximately 5.00% of all Classes of Loan-Specific Certificates. The 180W-VRR Interest will be retained by German American Capital Corporation or its “majority-owned affiliate” in accordance with the credit risk retention rules applicable to the securitization transaction relating to the Loan-Specific Certificates. |
THE INFORMATION IN THIS STRUCTURAL AND COLLATERAL TERM SHEET IS NOT COMPLETE AND MAY BE AMENDED PRIOR TO THE TIME OF SALE. THIS TERM SHEET IS NOT AN OFFER TO SELL THESE SECURITIES AND IT IS NOT A SOLICITATION OF AN OFFER TO BUY THESE SECURITIES IN ANY JURISDICTION WHERE THE OFFER OR SALE IS NOT PERMITTED.
5
COMM 2019-GC44 Mortgage Trust
|
STRUCTURE SUMMARY |
Class A-2 Principal Paydown(1) |
Class |
Mortgage Loan Seller | Mortgage Loan | Property Type | Cut-off Date | Remaining | Cut-off Date | U/W NCF DSCR | U/W NOI Debt Yield |
A-2 | GACC | 180 Water | Multifamily | $62,500,000 | 59 | 30.5% | 3.15x | 11.0% |
A-2 | GACC | 225 Bush | Office | $50,000,000 | 59 | 34.6% | 3.85x | 13.4% |
A-2 | CREFI | Legends at Village West | Retail | $34,948,301 | 59 | 53.3% | 1.67x | 9.5% |
(1) | This table reflects the mortgage loans whose balloon payments will be applied to pay down the Class A-2 certificates, assuming (i) that none of the mortgage loans experience prepayments, defaults or losses, (ii) there are no extensions of maturity dates and (iii) each mortgage loan is paid in full on its stated maturity date. See “Yield and Maturity Considerations—Yield Considerations” in the Preliminary Prospectus. |
(2) | With respect to the Legends at Village West mortgage loan, the Cut-off Date LTV has been calculated using a value other than the “As Is” appraised values. For additional information please see the footnotes to Annex A-1 in the Preliminary Prospectus. |
Class A-3 Principal Paydown(1) |
Class | Mortgage Loan Seller | Mortgage Loan | Property Type | Cut-off Date | Remaining | Cut-off Date | U/W NCF DSCR | U/W NOI Debt Yield |
A-3 | GSMC | The Essex Site 2 | Mixed Use | $35,100,000 | 83 | 39.9% | 3.66x | 10.3% |
A-3 | GSMC | Cobb Place | Retail | $25,000,000 | 83 | 73.4% | 1.90x | 10.8% |
(1) | This table reflects the mortgage loans whose balloon payments will be applied to pay down the Class A-3 certificates, assuming (i) that none of the mortgage loans experience prepayments, defaults or losses, (ii) there are no extensions of maturity dates and (iii) each mortgage loan is paid in full on its stated maturity date. See “Yield and Maturity Considerations—Yield Considerations” in the Preliminary Prospectus. |
THE INFORMATION IN THIS STRUCTURAL AND COLLATERAL TERM SHEET IS NOT COMPLETE AND MAY BE AMENDED PRIOR TO THE TIME OF SALE. THIS TERM SHEET IS NOT AN OFFER TO SELL THESE SECURITIES AND IT IS NOT A SOLICITATION OF AN OFFER TO BUY THESE SECURITIES IN ANY JURISDICTION WHERE THE OFFER OR SALE IS NOT PERMITTED.
6
COMM 2019-GC44 Mortgage Trust
|
OVERVIEW OF MORTGAGE POOL CHARACTERISTICS |
Ten Largest Mortgage Loans | |||||||||
Mortgage Loan | Mortgage Loan Seller | City, State | Property Type | Mortgage Loan Cut-off Date | % of Initial | Cut-off Date | Cut-off | U/W NCF DSCR | U/W NOI Debt Yield(1)(3) |
Century Plaza Towers | GACC | Los Angeles, CA | Office | $75,000,000 | 7.3% | $375 | 39.1% | 4.09x | 13.5% |
180 Water | GACC | New York, NY | Multifamily | 62,500,000 | 6.1% | $239,965 | 30.5% | 3.15x | 11.0% |
The Shoppes at Blackstone Valley | GSMC | Millbury, MA | Retail | 55,000,000 | 5.4% | $208 | 68.7% | 1.53x | 9.0% |
Weston Kentucky Portfolio | GSMC | Louisville, KY | Industrial | 52,253,500 | 5.1% | $36 | 59.5% | 3.06x | 12.3% |
225 Bush | GACC | San Francisco, CA | Office | 50,000,000 | 4.9% | $351 | 34.6% | 3.85x | 13.4% |
USAA Office Portfolio | GSMC | Various, Various | Office | 45,000,000 | 4.4% | $275 | 63.8% | 2.84x | 9.8% |
PCI Pharma Portfolio | GSMC | Various, Various | Various | 40,000,000 | 3.9% | $80 | 65.4% | 2.61x | 9.5% |
Elston Retail Collection | CREFI | Chicago, IL | Retail | 39,918,185 | 3.9% | $391 | 66.5% | 1.44x | 8.9% |
55 Green Street | GSMC | San Francisco, CA | Office | 36,600,000 | 3.6% | $673 | 56.9% | 2.46x | 8.8% |
The Essex Site 2 | GSMC | New York, NY | Mixed Use | 35,100,000 | 3.4% | $571 | 39.9% | 3.66x | 10.3% |
Total/Weighted Average |
|
|
| $491,371,685 | 48.0% |
| 51.0% | 2.95x | 10.9% |
(1) | The Cut-off Date Balance per NRA/Unit Cut-off Date LTV, U/W NCF DSCR after IO and U/W NOI Debt Yield calculations include any related pari passu companion loan(s) and exclude any related subordinate companion loan(s) and/or mezzanine loan(s). |
(2) | With respect to the Weston Kentucky Portfolio and 55 Green Street mortgage loans, the Cut-off Date LTV have been calculated based on the appraised values other than “As Is”. For additional information please see the footnotes to Annex A-1 in the Preliminary Prospectus. |
(3) | With respect to the Weston Kentucky Portfolio mortgage loan (5.1%) the Cut-off Date LTV and U/W NOI Debt Yield are calculated based on the Cut-off Date Balance net of a related earnout reserve. |
Existing Mezzanine Debt Summary | |||||||||
Mortgage Loan | Mortgage Loan |
Pari Passu/ | Mezzanine Debt | Trust | Total Debt | Trust | Total Debt | Trust | Total Debt |
180 Water | $62,500,000 | $202,500,000 | $100,000,000 | 3.15x | 0.85x | 30.5% | 80.8% | 11.0% | 4.1% |
The Essex Site 2 | $35,100,000 | $139,900,000 | $40,000,000 | 3.66x | 1.33x | 39.9% | 73.4% | 10.3% | 5.6% |
(1) | Total Debt U/W NCF DSCR, Total Debt Cut-off Date LTV and Total Debt U/W NOI Debt Yield calculations include any related pari passu companion loan(s), any related subordinate companion loan(s) and/or any related mezzanine loan(s). |
Subordinate Debt Summary | |||||||||
Mortgage Loan | Mortgage Cut-off Date |
Pari Passu | Subordinate Debt | Trust | Total Debt | Trust | Total Debt | Trust | Total Debt |
Century Plaza Towers | $75,000,000 | $825,000,000 | $300,000,000 | 4.09x | 3.07x | 39.1% | 52.1% | 13.5% | 10.1% |
180 Water | $62,500,000 | $75,000,000 | $127,500,000 | 3.15x | 0.85x | 30.5% | 80.8% | 11.0% | 4.1% |
225 Bush | $50,000,000 | $153,600,000 | $146,400,000 | 3.85x | 2.24x | 34.6% | 59.4% | 13.4% | 7.8% |
The Essex Site 2 | $35,100,000 | $81,900,000 | $58,000,000 | 3.66x | 1.33x | 39.9% | 73.4% | 10.3% | 5.6% |
Midtown Center | $32,525,000 | $349,475,000 | $143,000,000 | 3.98x | 2.90x | 39.8% | 54.7% | 12.6% | 9.1% |
(1) | Total Debt U/W NCF DSCR, Total Debt Cut-off Date LTV and Total Debt U/W NOI Debt Yield calculations include any related pari passu companion loan(s), related subordinate companion loan(s) and/or related mezzanine loan(s). |
THE INFORMATION IN THIS STRUCTURAL AND COLLATERAL TERM SHEET IS NOT COMPLETE AND MAY BE AMENDED PRIOR TO THE TIME OF SALE. THIS TERM SHEET IS NOT AN OFFER TO SELL THESE SECURITIES AND IT IS NOT A SOLICITATION OF AN OFFER TO BUY THESE SECURITIES IN ANY JURISDICTION WHERE THE OFFER OR SALE IS NOT PERMITTED.
7
COMM 2019-GC44 Mortgage Trust
|
OVERVIEW OF MORTGAGE POOL CHARACTERISTICS |
Companion Loan Summary |
Loan | Mortgage Loan | Note(s) | Original | Cut-off Date | Holder of Note(1) | Lead | Master | Special |
1 | Century Plaza Towers | A-1-S1, A-1-S2, A-1-S3, A-2-S1, A-2-S2, A-2-S3, A-2-C1, A-2-C3, A-2-C4, A-3-S1, A-3-S2, A-3-S3, A-3-C1, A-3-C3 | $525,000,000 | $525,000,000 | CPTS 2019-CPT | No |
|
|
|
| A-1-C1, A-1-C2, A-1-C6, A-1-C7 | $112,500,000 | $112,500,000 | DBRI | No |
|
|
|
| A-1-C3, A-1-C8 | $62,500,000 | $62,500,000 | JPMDB 2019-COR6 | No |
|
|
|
| A-1-C4, A-1-C5 | $75,000,000 | $75,000,000 | COMM 2019-GC44 | No |
|
|
|
| A-2-C2, A-2-C5, A-2-C6, A-2-C7 | $62,500,000 | $62,500,000 | MSBNA | No |
|
|
|
| A-3-C2, A-3-C4, A-3-C5 | $62,500,000 | $62,500,000 | WFBNA | No |
|
|
|
| Total Senior Notes | $900,000,000 | $900,000,000 |
|
|
|
|
|
| B-1, B-2, B-3 | $300,000,000 | $300,000,000 | CPTS 2019-CPT | Yes | Wells Fargo | CWCapital |
|
| Total | $1,200,000,000 | $1,200,000,000 |
|
|
|
|
2 | 180 Water | A-1 | $50,000,000 | $50,000,000 | Benchmark 2019-B14 | No |
|
|
|
| A-2, A-4, A-5 | $62,500,000 | $62,500,000 | COMM 2019-GC44 | No |
|
|
|
| A-3 | $25,000,000 | $25,000,000 | DBRI | No |
|
|
|
| Total Senior Notes | $137,500,000 | $137,500,000 |
|
|
|
|
|
| B | $127,500,000 | $127,500,000 | COMM 2019-GC44 | Yes(2) | Midland | Rialto |
|
| Total | $265,000,000 | $265,000,000 |
|
|
|
|
3 | The Shoppes at Blackstone Valley | A-1 | $55,000,000 | $55,000,000 | COMM 2019-GC44 | Yes | Midland | Rialto |
|
| A-2, A-3, A-4, A-5, A-6, A-7, A-8, A-9 | $109,000,000 | $109,000,000 | GS Bank | No |
|
|
|
| Total | $164,000,000 | $164,000,000 |
|
|
|
|
5 | 225 Bush | A-1, A-6 | $60,000,000 | $60,000,000 | Benchmark 2019-B14 | No |
|
|
|
| A-2 | $50,000,000 | $50,000,000 | COMM 2019-GC44 | No |
|
|
|
| A-3, A-4, A-5 | $93,600,000 | $93,600,000 | DBRI | No |
|
|
|
| Total Senior Notes | $203,600,000 | $203,600,000 |
|
|
|
|
|
| B | $146,400,000 | $146,400,000 | Benchmark 2019-B14 | Yes(3) | Midland | Midland |
|
| Total | $350,000,000 | $350,000,000 |
|
|
|
|
6 | USAA Office Portfolio | A-1 | $62,400,000 | $62,400,000 | CGCMT 2019-GC41 | Yes | Midland | CWCapital |
|
| A-2 | $45,000,000 | $45,000,000 | GSMS 2019-GC42 | No |
|
|
|
| A-3, A-4 | $75,000,000 | $75,000,000 | CGCMT 2019-GC43 | No |
|
|
|
| A-5 | $15,000,000 | $15,000,000 | GSMS 2019-GSA1 | No |
|
|
|
| A-6, A-7, A-8 | $45,000,000 | $45,000,000 | COMM 2019-GC44 | No |
|
|
|
| Total | $242,400,000 | $242,400,000 |
|
|
|
|
7 | PCI Pharma Portfolio | A-1 | $40,000,000 | $40,000,000 | COMM 2019-GC44 | Yes | Midland | Rialto |
|
| A-2, A-3, A-4, A-5, A-6, A-7 | $68,500,000 | $68,500,000 | GS Bank | No |
|
|
|
| Total | $108,500,000 | $108,500,000 |
|
|
|
|
8 | Elston Retail Collection | A-1 | $40,000,000 | $39,918,185 | COMM 2019-GC44 | Yes | Midland | Rialto |
|
| A-2 | $30,000,000 | $29,938,639 | CREFI | No |
|
|
|
| Total | $70,000,000 | $69,856,824 |
|
|
|
|
THE INFORMATION IN THIS STRUCTURAL AND COLLATERAL TERM SHEET IS NOT COMPLETE AND MAY BE AMENDED PRIOR TO THE TIME OF SALE. THIS TERM SHEET IS NOT AN OFFER TO SELL THESE SECURITIES AND IT IS NOT A SOLICITATION OF AN OFFER TO BUY THESE SECURITIES IN ANY JURISDICTION WHERE THE OFFER OR SALE IS NOT PERMITTED.
8
COMM 2019-GC44 Mortgage Trust
|
OVERVIEW OF MORTGAGE POOL CHARACTERISTICS |
Loan | Mortgage Loan | Note(s) | Original | Cut-off Date | Holder of Note | Lead | Master | Special |
10 | The Essex Site 2 | A-1-1, A-1-3 | $56,900,000 | $56,900,000 | Benchmark 2019-B14 | No | Midland | Midland |
|
| A-1-2 | $25,000,000 | $25,000,000 | JPMCB | No |
|
|
|
| A-1-4 | $35,100,000 | $35,100,000 | COMM 2019-GC44 | No |
|
|
|
| Total Senior Notes | $117,000,000 | $117,000,000 |
|
|
|
|
|
| B-1-1 | $40,600,000 | $40,600,000 | JPMCB | Yes(4) |
|
|
|
| B-1-2 | $17,400,000 | $17,400,000 | GS Bank | Yes(4) |
|
|
|
| Total | $175,000,000 | $175,000,000 |
|
|
|
|
11 | Legends at Village West | A-1 | $50,000,000 | $49,926,144 | Benchmark 2019-B14 | Yes | Midland | Midland |
|
| A-2 | $35,000,000 | $34,948,301 | COMM 2019-GC44 |
|
|
|
|
| A-3 | $35,000,000 | $34,948,301 | CREFI |
|
|
|
|
| Total | $120,000,000 | $119,822,745 |
|
|
|
|
12 | Midtown Center | A-1-1, A-1-2, A-1-3 | $261,000,000 | $261,000,000 | DC Office Trust 2019-MTC | No |
|
|
|
| A-2-1, A-2-2, A-2-3, A-2-4, A-2-5 | $88,475,000 | $88,475,000 | BANK 2019-BNK22 | No |
|
|
|
| A-2-6, A-2-7 | $32,525,000 | $32,525,000 | COMM 2019-GC44 | No |
|
|
|
| Total Senior Notes | $382,000,000 | $382,000,000 |
|
|
|
|
|
| B-1-1, B-1-2, B-1-3 | $143,000,000 | $143,000,000 | DC Office Trust 2019-MTC | Yes | Wells Fargo | CWCapital |
|
| Total | $525,000,000 | $525,000,000 |
|
|
|
|
13 | Broadcasting Square | A-1 | $32,000,000 | $32,000,000 | COMM 2019-GC44 | Yes | Midland | Rialto |
|
| A-2 | $30,000,000 | $30,000,000 | CREFI | No |
|
|
|
| Total | $62,000,000 | $62,000,000 |
|
|
|
|
15 | Cobb Place | A-1 | $25,000,000 | $25,000,000 | COMM 2019-GC44 | Yes | Midland | Rialto |
|
| A-2 | $15,000,000 | $15,000,000 | GS Bank | No |
|
|
|
| Total | $40,000,000 | $40,000,000 |
|
|
|
|
18 | Wind Creek Leased Fee | A-4, A-5-2, A-6 | $41,600,000 | $41,441,447 | Benchmark 2019-B13 | Yes | Midland | CWCapital |
|
| A-1, A-2 | $40,000,000 | $39,847,545 | CD 2019-CD8 | No |
|
|
|
| A-3 | $45,000,000 | $44,828,489 | CGCMT 2019-GC41 | No |
|
|
|
| A-5-1 | $20,000,000 | $19,923,773 | COMM 2019-GC44 | No |
|
|
|
| Total | $146,600,000 | $146,041,254 |
|
|
|
|
28 | Millennium Park Plaza | A-1 | $70,000,000 | $70,000,000 | CGCMT 2019-GC41 | Yes | Midland | Rialto |
|
| A-2 | $30,000,000 | $30,000,000 | GSMS 2019-GC42 | No |
|
|
|
| A-3, A-5 | $60,000,000 | $60,000,000 | CGCMT 2019-GC43 | No |
|
|
|
| A-4 | $35,000,000 | $35,000,000 | GSMS 2019-GSA1 | No |
|
|
|
| A-6, A-7 | $15,000,000 | $15,000,000 | COMM 2019-GC44 | No |
|
|
|
| Total | $210,000,000 | $210,000,000 |
|
|
|
|
(1) | The identification of a securitization trust means we have identified another securitization trust that has closed or as to which a preliminary prospectus (or preliminary offering circular) or final prospectus (or final offering circular) has printed that has or is expected to include the identified Mortgage Note(s). |
(2) | With respect to the 180 Water Whole Loan, the initial Control Note is Note B. During the continuance of a 180 Water Appraisal Period, Note A-1 will be the Control Note. See “Description of the Mortgage Pool—The Whole Loans—The Non-Serviced AB Whole Loans—180 Water Whole Loan” in the Preliminary Prospectus. |
(3) | With respect to the 225 Bush Whole Loan, the initial Control Note is Note B. During the continuance of a 225 Bush Appraisal Period, Note A-1 will be the Control Note. See “Description of the Mortgage Pool—The Whole Loans—The Non-Serviced AB Whole Loans—225 Bush Whole Loan” in the Preliminary Prospectus. |
(4) | With respect to The Essex Site 2 Whole Loan, the controlling noteholder is the holder of a majority of the principal balance of the B notes. During the continuance of a The Essex Site 2 Control Appraisal Period, Note A-1-1 will be the Control Note. See “Description of the Mortgage Pool—The Whole Loans—The Non-Serviced AB Whole Loans—The Essex Site 2 Whole Loan” in the Preliminary Prospectus. |
THE INFORMATION IN THIS STRUCTURAL AND COLLATERAL TERM SHEET IS NOT COMPLETE AND MAY BE AMENDED PRIOR TO THE TIME OF SALE. THIS TERM SHEET IS NOT AN OFFER TO SELL THESE SECURITIES AND IT IS NOT A SOLICITATION OF AN OFFER TO BUY THESE SECURITIES IN ANY JURISDICTION WHERE THE OFFER OR SALE IS NOT PERMITTED.
9
COMM 2019-GC44 Mortgage Trust
|
OVERVIEW OF MORTGAGE POOL CHARACTERISTICS |
Distribution of Cut-off Date Balances(1) |
|
|
|
|
|
|
|
|
|
| Weighted Averages | ||||||||
Range of Cut-off Date Balances |
| Number of |
| Aggregate |
| % of Initial |
| Mortgage |
| Stated |
| U/W NCF |
| Cut-off Date |
| Maturity Date | ||
$5,000,000 | - | $7,499,999 |
| 6 |
| $35,740,000 |
| 3.5% |
| 3.6924% |
| 119 |
| 2.01x |
| 63.8% |
| 62.5% |
$7,500,000 | - | $14,999,999 |
| 9 |
| $106,667,523 |
| 10.4% |
| 3.6986% |
| 119 |
| 2.39x |
| 61.9% |
| 58.0% |
$15,000,000 | - | $24,999,999 |
| 13 |
| $234,545,837 |
| 22.9% |
| 3.9566% |
| 118 |
| 1.94x |
| 66.1% |
| 59.7% |
$25,000,000 | - | $49,999,999 |
| 10 |
| $352,591,485 |
| 34.4% |
| 3.3684% |
| 106 |
| 2.60x |
| 58.1% |
| 54.2% |
$50,000,000 | - | $75,000,000 |
| 5 |
| $294,753,500 |
| 28.8% |
| 3.3597% |
| 96 |
| 3.19x |
| 45.7% |
| 44.6% |
Total/Weighted Average |
| 43 |
| $1,024,298,346 |
| 100.0% |
| 3.5463% |
| 108 |
| 2.58x |
| 56.9% |
| 53.4% | ||
Distribution of Mortgage Rates(1) |
|
|
|
|
|
|
|
|
|
| Weighted Averages | ||||||||
Range of Mortgage Rates |
| Number of |
| Aggregate |
| % of Initial |
| Mortgage |
| Stated |
| U/W NCF |
| Cut-off Date |
| Maturity Date | ||
2.7590% | - | 3.9999% |
| 37 |
| $917,759,598 |
| 89.6% |
| 3.4577% |
| 107 |
| 2.67x |
| 55.7% |
| 52.7% |
4.0000% | - | 4.2499% |
| 3 |
| $50,981,269 |
| 5.0% |
| 4.0212% |
| 119 |
| 1.98x |
| 63.8% |
| 60.4% |
4.2500% | - | 4.7499% |
| 2 |
| $37,423,773 |
| 3.7% |
| 4.3426% |
| 117 |
| 1.54x |
| 72.4% |
| 62.0% |
4.7500% | - | 5.0500% |
| 1 |
| $18,133,706 |
| 1.8% |
| 5.0500% |
| 113 |
| 1.55x |
| 69.2% |
| 52.4% |
Total/Weighted Average |
| 43 |
| $1,024,298,346 |
| 100.0% |
| 3.5463% |
| 108 |
| 2.58x |
| 56.9% |
| 53.4% | ||
Property Type Distribution(1)(3) |
|
|
|
|
|
|
|
|
|
| Weighted Averages | ||||||||||||
Property Type |
| Number of |
| Aggregate |
| % of Initial |
| Number of |
| Cut-off Date |
| Mortgage |
| Stated |
| Occupancy |
| U/W NCF |
| Cut-off Date LTV(2)(4) |
| Maturity |
Retail |
| 10 |
| $274,463,498 |
| 26.8% |
| 2,985,464 |
| $272 |
| 3.6066% |
| 108 |
| 95.6% |
| 2.06x |
| 62.9% |
| 54.8% |
Anchored(5) |
| 8 |
| $249,763,498 |
| 24.4% |
| 2,944,852 |
| $197 |
| 3.6299% |
| 107 |
| 95.5% |
| 1.99x |
| 63.8% |
| 55.0% |
Unanchored |
| 2 |
| $24,700,000 |
| 2.4% |
| 40,612 |
| $1,032 |
| 3.3713% |
| 119 |
| 96.5% |
| 2.80x |
| 53.3% |
| 53.3% |
Office |
| 11 |
| $265,165,178 |
| 25.9% |
| 5,146,896 |
| $380 |
| 3.3454% |
| 107 |
| 97.1% |
| 3.38x |
| 47.8% |
| 46.7% |
CBD |
| 5 |
| $212,258,706 |
| 20.7% |
| 4,203,038 |
| $404 |
| 3.3389% |
| 104 |
| 96.3% |
| 3.52x |
| 43.8% |
| 42.4% |
Suburban/Suburban Flex |
| 6 |
| $52,906,472 |
| 5.2% |
| 943,858 |
| $287 |
| 3.3713% |
| 116 |
| 100.0% |
| 2.81x |
| 64.0% |
| 64.0% |
Multifamily |
| 17 |
| $218,045,000 |
| 21.3% |
| 1,478 |
| $255,689 |
| 3.6696% |
| 102 |
| 96.2% |
| 2.33x |
| 54.0% |
| 53.4% |
Garden |
| 6 |
| $71,155,000 |
| 6.9% |
| 582 |
| $147,443 |
| 3.6160% |
| 119 |
| 95.5% |
| 2.22x |
| 62.2% |
| 61.5% |
Mid Rise |
| 9 |
| $67,790,000 |
| 6.6% |
| 227 |
| $404,072 |
| 3.9054% |
| 119 |
| 96.0% |
| 1.90x |
| 64.0% |
| 64.0% |
High Rise |
| 1 |
| $62,500,000 |
| 6.1% |
| 573 |
| $239,965 |
| 3.4104% |
| 59 |
| 97.0% |
| 3.15x |
| 30.5% |
| 30.5% |
Townhomes |
| 1 |
| $16,600,000 |
| 1.6% |
| 96 |
| $172,917 |
| 3.9123% |
| 119 |
| 96.9% |
| 1.50x |
| 67.2% |
| 60.9% |
Industrial |
| 8 |
| $95,457,318 |
| 9.3% |
| 2,952,480 |
| $53 |
| 3.3879% |
| 119 |
| 98.8% |
| 2.87x |
| 62.1% |
| 65.1% |
Warehouse/Distribution |
| 2 |
| $38,221,105 |
| 3.7% |
| 1,458,560 |
| $40 |
| 3.3616% |
| 119 |
| 100.0% |
| 2.91x |
| 61.5% |
| 65.1% |
Flex |
| 4 |
| $37,821,967 |
| 3.7% |
| 968,500 |
| $40 |
| 3.4191% |
| 119 |
| 97.1% |
| 2.97x |
| 61.0% |
| 64.9% |
R&D/Flex |
| 1 |
| $18,102,929 |
| 1.8% |
| 447,000 |
| $110 |
| 3.3790% |
| 119 |
| 100.0% |
| 2.61x |
| 65.4% |
| 65.4% |
Warehouse |
| 1 |
| $1,311,317 |
| 0.1% |
| 78,420 |
| $45 |
| 3.3790% |
| 119 |
| 100.0% |
| 2.61x |
| 65.4% |
| 65.4% |
Mixed Use |
| 4 |
| $88,989,346 |
| 8.7% |
| 955,540 |
| $391 |
| 3.3037% |
| 104 |
| 98.2% |
| 2.75x |
| 56.2% |
| 53.4% |
Office/Retail |
| 2 |
| $38,889,346 |
| 3.8% |
| 190,387 |
| $235 |
| 3.6578% |
| 119 |
| 96.1% |
| 2.22x |
| 67.2% |
| 60.7% |
Multifamily/Retail |
| 1 |
| $35,100,000 |
| 3.4% |
| 205,070 |
| $571 |
| 2.7590% |
| 83 |
| 100.0% |
| 3.66x |
| 39.9% |
| 39.9% |
Multifamily/Office/Retail |
| 1 |
| $15,000,000 |
| 1.5% |
| 560,083 |
| $375 |
| 3.6600% |
| 116 |
| 99.2% |
| 2.01x |
| 65.8% |
| 65.8% |
Hospitality |
| 4 |
| $62,254,233 |
| 6.1% |
| 510 |
| $123,545 |
| 4.0267% |
| 119 |
| 79.4% |
| 2.00x |
| 63.9% |
| 51.5% |
Extended Stay |
| 2 |
| $30,481,269 |
| 3.0% |
| 229 |
| $134,299 |
| 4.1722% |
| 119 |
| 74.1% |
| 2.00x |
| 61.0% |
| 50.3% |
Full Service |
| 1 |
| $18,000,000 |
| 1.8% |
| 154 |
| $116,883 |
| 3.8390% |
| 118 |
| 89.4% |
| 2.18x |
| 69.8% |
| 58.5% |
Limited Service |
| 1 |
| $13,772,964 |
| 1.3% |
| 127 |
| $108,449 |
| 3.9500% |
| 119 |
| 78.1% |
| 1.76x |
| 62.6% |
| 45.1% |
Leased Fee |
| 1 |
| $19,923,773 |
| 1.9% |
| 2,608,541 |
| $56 |
| 4.3800% |
| 116 |
| NAP |
| 1.27x |
| 84.7% |
| 72.8% |
Total/Weighted Average |
| 55 |
| $1,024,298,346 |
| 100.0% |
|
|
|
|
| 3.5463% |
| 108 |
| 95.7% |
| 2.58x |
| 56.9% |
| 53.4% |
THE INFORMATION IN THIS STRUCTURAL AND COLLATERAL TERM SHEET IS NOT COMPLETE AND MAY BE AMENDED PRIOR TO THE TIME OF SALE. THIS TERM SHEET IS NOT AN OFFER TO SELL THESE SECURITIES AND IT IS NOT A SOLICITATION OF AN OFFER TO BUY THESE SECURITIES IN ANY JURISDICTION WHERE THE OFFER OR SALE IS NOT PERMITTED.
10
COMM 2019-GC44 Mortgage Trust
|
OVERVIEW OF MORTGAGE POOL CHARACTERISTICS |
Geographic Distribution(1)(3) |
|
|
|
|
|
|
|
| Weighted Averages | ||||||||
State/Location |
| Number of |
| Aggregate Cut-off |
| % of Initial |
| Mortgage Rate |
| Stated |
| U/W NCF |
| Cut-off |
| Maturity Date |
California |
| 10 |
| $236,687,742 |
| 23.1% |
| 3.3566% |
| 106 |
| 3.24x |
| 47.3% |
| 46.6% |
Southern |
| 8 |
| $150,087,742 |
| 14.7% |
| 3.3514% |
| 119 |
| 3.22x |
| 49.2% |
| 48.1% |
Northern |
| 2 |
| $86,600,000 |
| 8.5% |
| 3.3655% |
| 84 |
| 3.26x |
| 44.0% |
| 44.0% |
New York |
| 9 |
| $127,390,000 |
| 12.4% |
| 3.3100% |
| 80 |
| 3.00x |
| 41.0% |
| 41.0% |
New York City |
| 9 |
| $127,390,000 |
| 12.4% |
| 3.3100% |
| 80 |
| 3.00x |
| 41.0% |
| 41.0% |
Massachusetts |
| 3 |
| $83,803,000 |
| 8.2% |
| 3.7375% |
| 119 |
| 2.01x |
| 65.9% |
| 58.6% |
Illinois |
| 5 |
| $73,430,414 |
| 7.2% |
| 3.5960% |
| 118 |
| 1.86x |
| 66.0% |
| 55.6% |
Pennsylvania |
| 3 |
| $70,026,701 |
| 6.8% |
| 3.5637% |
| 118 |
| 2.64x |
| 64.6% |
| 61.2% |
Kentucky |
| 3 |
| $52,253,500 |
| 5.1% |
| 3.3530% |
| 119 |
| 3.06x |
| 59.5% |
| 65.0% |
Other |
| 22 |
| $380,706,989 |
| 37.2% |
| 3.7149% |
| 110 |
| 2.21x |
| 62.7% |
| 57.1% |
Total/Weighted Average |
| 55 |
| $1,024,298,346 |
| 100.0% |
| 3.5463% |
| 108 |
| 2.58x |
| 56.9% |
| 53.4% |
Distribution of Cut-off Date LTVs(1)(2)(4) |
|
|
|
|
|
|
|
|
|
| Weighted Averages | ||||||||
Range of Cut-off Date LTVs |
| Number of |
| Aggregate Cut-off |
| % of Initial |
| Mortgage Rate |
| Stated |
| U/W NCF |
| Cut-off Date |
| Maturity Date | ||
30.5% | - | 54.9% |
| 10 |
| $361,496,301 |
| 35.3% |
| 3.2408% |
| 91 |
| 3.44x |
| 40.9% |
| 40.4% |
55.0% | - | 59.9% |
| 4 |
| $123,878,500 |
| 12.1% |
| 3.5719% |
| 119 |
| 2.58x |
| 58.5% |
| 59.6% |
60.0% | - | 64.9% |
| 13 |
| $166,014,523 |
| 16.2% |
| 3.6920% |
| 118 |
| 2.29x |
| 63.2% |
| 60.5% |
65.0% | - | 69.9% |
| 12 |
| $293,786,891 |
| 28.7% |
| 3.7498% |
| 118 |
| 1.91x |
| 67.5% |
| 60.0% |
70.0% | - | 84.7% |
| 4 |
| $79,122,131 |
| 7.7% |
| 3.8405% |
| 107 |
| 1.68x |
| 75.0% |
| 63.3% |
Total/Weighted Average |
| 43 |
| $1,024,298,346 |
| 100.0% |
| 3.5463% |
| 108 |
| 2.58x |
| 56.9% |
| 53.4% | ||
Distribution of Maturity Date or ARD LTVs(1)(2) |
|
|
|
|
|
|
|
|
|
| Weighted Averages | ||||||||
Range of Maturity Date or ARD LTVs |
| Number of |
| Aggregate Cut-off |
| % of Initial |
| Mortgage Rate |
| Stated |
| U/W NCF DSCR |
| Cut-off Date |
| Maturity Date or | ||
30.5% | - | 49.9% |
| 9 |
| $361,264,449 |
| 35.3% |
| 3.3523% |
| 91 |
| 3.12x |
| 43.4% |
| 39.7% |
50.0% | - | 54.9% |
| 6 |
| $102,537,976 |
| 10.0% |
| 3.6992% |
| 118 |
| 2.81x |
| 56.1% |
| 51.5% |
55.0% | - | 59.9% |
| 7 |
| $168,573,358 |
| 16.5% |
| 3.7226% |
| 119 |
| 1.92x |
| 65.4% |
| 57.3% |
60.0% | - | 72.8% |
| 21 |
| $391,922,563 |
| 38.3% |
| 3.6092% |
| 116 |
| 2.29x |
| 66.0% |
| 64.8% |
Total/Weighted Average |
| 43 |
| $1,024,298,346 |
| 100.0% |
| 3.5463% |
| 108 |
| 2.58x |
| 56.9% |
| 53.4% | ||
Distribution of Underwritten NCF Debt Service Coverages(1) |
|
|
|
|
|
|
|
|
|
| Weighted Averages | ||||||||
Range of Underwritten NCF Debt Service Coverages |
| Number of |
| Aggregate Cut-off |
| % of Initial |
| Mortgage Rate |
| Stated |
| U/W NCF DSCR |
| Cut-off Date |
| Maturity Date | ||
1.27x | - | 1.44x |
| 2 |
| $59,841,958 |
| 5.8% |
| 3.8930% |
| 118 |
| 1.38x |
| 72.6% |
| 55.8% |
1.45x | - | 1.74x |
| 6 |
| $149,406,019 |
| 14.6% |
| 3.9938% |
| 104 |
| 1.58x |
| 65.0% |
| 55.0% |
1.75x | - | 2.49x |
| 21 |
| $332,938,579 |
| 32.5% |
| 3.7187% |
| 116 |
| 2.08x |
| 64.8% |
| 60.5% |
2.50x | - | 3.49x |
| 9 |
| $257,486,790 |
| 25.1% |
| 3.4016% |
| 104 |
| 2.94x |
| 53.1% |
| 54.2% |
3.50x | - | 4.09x |
| 5 |
| $224,625,000 |
| 21.9% |
| 3.0664% |
| 100 |
| 3.87x |
| 40.1% |
| 40.1% |
Total/Weighted Average |
| 43 |
| $1,024,298,346 |
| 100.0% |
| 3.5463% |
| 108 |
| 2.58x |
| 56.9% |
| 53.4% | ||
Original Terms to Maturity or ARD(1) |
|
|
|
|
|
|
|
|
|
| Weighted Averages | ||||||||
Original Terms to Maturity or ARD |
| Number of |
| Aggregate Cut-off |
| % of Initial |
| Mortgage Rate |
| Stated |
| U/W NCF DSCR |
| Cut-off Date |
| Maturity Date | ||
60 | - | 84 |
| 5 |
| $207,548,301 |
| 20.3% |
| 3.3659% |
| 66 |
| 3.01x |
| 42.1% |
| 40.4% |
120 | - | 121 |
| 38 |
| $816,750,046 |
| 79.7% |
| 3.5921% |
| 119 |
| 2.47x |
| 60.7% |
| 56.7% |
Total/Weighted Average |
| 43 |
| $1,024,298,346 |
| 100.0% |
| 3.5463% |
| 108 |
| 2.58x |
| 56.9% |
| 53.4% | ||
Distribution of Remaining Terms to Maturity or ARD(1) |
|
|
|
|
|
|
|
|
|
| Weighted Averages | ||||||||
Range of Remaining Terms to Maturity or ARD |
| Number of |
| Aggregate Cut-off |
| % of Initial |
| Mortgage Rate |
| Stated |
| U/W NCF DSCR |
| Cut-off Date |
| Maturity Date | ||
59 | - | 83 |
| 5 |
| $207,548,301 |
| 20.3% |
| 3.3659% |
| 66 |
| 3.01x |
| 42.1% |
| 40.4% |
113 | - | 119 |
| 38 |
| $816,750,046 |
| 79.7% |
| 3.5921% |
| 119 |
| 2.47x |
| 60.7% |
| 56.7% |
Total/Weighted Average |
| 43 |
| $1,024,298,346 |
| 100.0% |
| 3.5463% |
| 108 |
| 2.58x |
| 56.9% |
| 53.4% | ||
THE INFORMATION IN THIS STRUCTURAL AND COLLATERAL TERM SHEET IS NOT COMPLETE AND MAY BE AMENDED PRIOR TO THE TIME OF SALE. THIS TERM SHEET IS NOT AN OFFER TO SELL THESE SECURITIES AND IT IS NOT A SOLICITATION OF AN OFFER TO BUY THESE SECURITIES IN ANY JURISDICTION WHERE THE OFFER OR SALE IS NOT PERMITTED.
11
COMM 2019-GC44 Mortgage Trust
|
OVERVIEW OF MORTGAGE POOL CHARACTERISTICS |
Distribution of Underwritten NOI Debt Yields(1)(4) |
|
|
|
|
|
|
|
|
|
| Weighted Averages | ||||||||
Range of Underwritten NOI Debt Yields |
| Number of |
| Aggregate Cut-off |
| % of Initial |
| Mortgage Rate |
| Stated |
| U/W NCF DSCR |
| Cut-off Date |
| Maturity Date | ||
7.1% | - | 8.9% |
| 16 |
| $251,736,958 |
| 24.6% |
| 3.7636% |
| 119 |
| 1.91x |
| 65.2% |
| 60.8% |
9.0% | - | 9.9% |
| 9 |
| $247,337,313 |
| 24.1% |
| 3.6061% |
| 110 |
| 2.18x |
| 62.9% |
| 58.5% |
10.0% | - | 12.4% |
| 11 |
| $304,661,100 |
| 29.7% |
| 3.4096% |
| 100 |
| 2.77x |
| 53.6% |
| 51.1% |
12.5% | - | 14.1% |
| 7 |
| $220,562,976 |
| 21.5% |
| 3.4200% |
| 105 |
| 3.50x |
| 45.4% |
| 42.4% |
Total/Weighted Average |
| 43 |
| $1,024,298,346 |
| 100.0% |
| 3.5463% |
| 108 |
| 2.58x |
| 56.9% |
| 53.4% | ||
Amortization Types(1) |
|
|
|
|
|
|
|
| Weighted Averages | ||||||||
Amortization Type |
| Number of |
| Aggregate Cut-off |
| % of Initial |
| Mortgage Rate |
| Stated |
| U/W NCF DSCR |
| Cut-off Date |
| Maturity Date |
Interest Only |
| 27 |
| $647,046,790 |
| 63.2% |
| 3.3923% |
| 106 |
| 2.98x |
| 52.2% |
| 52.7% |
Amortizing Balloon |
| 8 |
| $173,876,556 |
| 17.0% |
| 3.9903% |
| 106 |
| 1.62x |
| 66.5% |
| 52.7% |
Interest Only, then Amortizing |
| 7 |
| $170,850,000 |
| 16.7% |
| 3.7653% |
| 114 |
| 1.76x |
| 68.3% |
| 59.4% |
Interest Only, ARD |
| 1 |
| $32,525,000 |
| 3.2% |
| 3.0850% |
| 118 |
| 3.98x |
| 39.8% |
| 39.8% |
Total/Weighted Average |
| 43 |
| $1,024,298,346 |
| 100.0% |
| 3.5463% |
| 108 |
| 2.58x |
| 56.9% |
| 53.4% |
Footnotes:
(1) | The U/W NCF DSCR, Cut-off Date LTV Ratio, Maturity Date or ARD LTV, Underwritten NOI Debt Yield and Cut-off Date Balance per # of NRA/Units/Rooms calculations include any related pari passu companion loan(s) and exclude any related subordinate companion loan(s) and/or mezzanine loan(s). |
(2) | With respect to 5 mortgage loans (15.2%) (including Weston Kentucky Portfolio, 55 Green Street, Legends at Village West, Embassy Suites Laredo and Hampton Inn Summerlin), the Cut-off Date LTV and Maturity Date or ARD LTV have been calculated using a value other than the “As Is” appraised values. For additional information please see the footnotes to Annex A-1 in the Preliminary Prospectus. For additional information please see the footnotes to Annex A-1 in the Preliminary Prospectus. |
(3) | Reflects allocated loan amount for properties securing multi-property Mortgage Loans. |
(4) | With respect to the Weston Kentucky Portfolio mortgage loan (5.1%) the Cut-off Date LTV and U/W NOI Debt Yield are calculated based on the Cut-off Date Balance net of a related earnout reserve. |
(5) | Anchored retail includes one power center property. |
THE INFORMATION IN THIS STRUCTURAL AND COLLATERAL TERM SHEET IS NOT COMPLETE AND MAY BE AMENDED PRIOR TO THE TIME OF SALE. THIS TERM SHEET IS NOT AN OFFER TO SELL THESE SECURITIES AND IT IS NOT A SOLICITATION OF AN OFFER TO BUY THESE SECURITIES IN ANY JURISDICTION WHERE THE OFFER OR SALE IS NOT PERMITTED.
12
COMM 2019-GC44 Mortgage Trust |
|
STRUCTURE OVERVIEW |
Allocation between VRR Interest and the Non-VRR Certificates: |
| The aggregate amount available for distribution to holders of the Pooled Certificates (including the VRR Interest) on each Distribution Date will be: (i) the gross amount of interest, principal, yield maintenance charges and prepayment premiums collected with respect to the Mortgage Loans in the applicable one-month collection period, net of specified expenses of the issuing entity, including fees payable therefrom to, and losses, liabilities, costs and expenses reimbursable or indemnifiable therefrom to, the Master Servicer, the Special Servicer, the Certificate Administrator, the Trustee, the Operating Advisor, the Asset Representations Reviewer and CREFC®; and (ii) allocated to amounts available for distribution to the holders of the VRR Interest, on the one hand, and amounts available for distribution to the holders of the remaining Pooled Certificates (the “Non-VRR Certificates”), on the other hand. On each Distribution Date, the portion of such pooled aggregate available funds allocable to: (a) the VRR Interest will be the product of such pooled aggregate available funds multiplied by a fraction, expressed as a percentage, the numerator of which is the initial VRR Interest Balance, and the denominator of which is the aggregate initial Certificate Balances of the Pooled Principal Balance Certificates and the initial VRR Interest Balance (the “VRR Percentage”); and (b) the Non-VRR Certificates will at all times be the product of such aggregate available funds multiplied by the difference between 100% and the VRR Percentage (such difference, the “Non-VRR Percentage”). See “Credit Risk Retention” and “Description of the Certificates” in the Preliminary Prospectus.
|
Principal Payments: |
| Payments in respect of the Non-VRR Percentage of principal on the Non-VRR Certificates will be distributed, first, to the Class A-SB certificates, until the Certificate Balance of such class is reduced to the planned principal balance for the related Distribution Date set forth on Annex F to the Preliminary Prospectus, then, to the Class A-1, Class A-2, Class A-3, Class A-4, Class A-5, Class A-SB, Class A-M, Class B, Class C, Class D, Class E, Class F, Class G-RR and Class H-RR certificates, in that order, until the Certificate Balance of each such class is reduced to zero. Notwithstanding the foregoing, if the total Certificate Balance of the Class A-M, Class B, Class C, Class D, Class E, Class F, Class G-RR and Class H-RR certificates have been reduced to zero as a result of loss allocation, payments in respect of principal of the certificates will be distributed, first, to the Class A-1, Class A-2, Class A-3, Class A-SB, Class A-4 and Class A-5 certificates, on a pro rata basis, based on the Certificate Balance of each such class, then, to the extent of any recoveries on realized losses, to the Class A-M, Class B, Class C, Class D, Class E, Class F, Class G-RR and Class H-RR certificates, in that order, in each case until the Certificate Balance of each such class is reduced to zero (or previously allocated realized losses have been fully reimbursed).
Each class of Class X Certificates will not be entitled to receive distributions of principal; however, (i) the notional amount of the Class X-A certificates will be reduced by the aggregate amount of principal distributions and realized losses allocated to the Class A-1, Class A-2, Class A-3, Class A-SB, Class A-4, Class A-5 and Class A-M certificates; (ii) the notional amount of the Class X-B certificates will be reduced by the aggregate amount of principal distributions and realized losses allocated to the Class B and Class C certificates; (iii) the notional amount of the Class X-D certificates will be reduced by the aggregate amount of principal distributions and realized losses allocated to the Class D and Class E certificates; and (iv) the notional amount of the Class X-F certificates will be reduced by the principal distributions and realized losses allocated to the Class F certificates.
The holders of the Loan-Specific Certificates will only be entitled to distributions from amounts paid or advanced on and allocated to the Trust Subordinate Companion Loan in accordance with the co-lender agreement relating to the 180 Water Whole Loan and no class of Pooled Certificates will be entitled to distributions paid or advanced on and allocable to the Trust Subordinate Companion Loan.
|
Interest Payments: |
| On each Distribution Date, interest accrued for each class of Non-VRR Certificates at the applicable pass-through rate will be distributed in the following order of priority, to the extent of the Non-VRR Percentage of the pooled aggregate available funds (exclusive of any portion thereof that represents the Non-VRR Percentage of any yield maintenance charges and prepayment premiums): first, to the Class A-1, Class A-2, Class A-3, Class A-SB, Class A-4, Class A-5, Class X-A, Class X-B, Class X-D and Class X-F certificates, on a pro rata basis, based on the accrued and unpaid interest on each such class and then, to the Class A-M, Class B, Class C, Class D, Class E, Class F, Class G-RR and Class H-RR certificates, in that order, in each case until the interest payable to each such class is paid in full. |
THE INFORMATION IN THIS STRUCTURAL AND COLLATERAL TERM SHEET IS NOT COMPLETE AND MAY BE AMENDED PRIOR TO THE TIME OF SALE. THIS TERM SHEET IS NOT AN OFFER TO SELL THESE SECURITIES AND IT IS NOT A SOLICITATION OF AN OFFER TO BUY THESE SECURITIES IN ANY JURISDICTION WHERE THE OFFER OR SALE IS NOT PERMITTED.
13
COMM 2019-GC44 Mortgage Trust |
|
STRUCTURE OVERVIEW |
|
| The pass-through rates applicable to the Class A-1, Class A-2, Class A-3, Class A-SB, Class A-4, Class A-5, Class A-M, Class B, Class C, Class D, Class E, Class F, Class G-RR and Class H-RR certificates for each Distribution Date will equal one of: (i) a fixed per annum rate, (ii) the WAC Rate, (iii) a rate equal to the lesser of a specified pass-through rate and the WAC Rate or (iv) the WAC Rate less a specified rate.
As further described in the Preliminary Prospectus, the pass-through rates applicable to the Class X Certificates for each Distribution Date will generally be equal to the excess of (i) the WAC Rate over (ii) (A) with respect to the Class X-A certificates, the weighted average of the pass-through rates of the Class A-1, Class A-2, Class A-3, Class A-SB, Class A-4, Class A-5 and Class A-M certificates (weighted based on their respective Certificate Balances immediately prior to that Distribution Date), (B) with respect to the Class X-B certificates, the weighted average of the pass-through rates of the Class B and Class C certificates (weighted based on their respective Certificate Balances immediately prior to that Distribution Date), (C) with respect to the Class X-D certificates, the weighted average of the pass-through rates of the Class D and Class E certificates (weighted based on their respective Certificate Balances immediately prior to that Distribution Date) and (D) with respect to the Class X-F certificates, the pass-through rate of the Class F certificates.
No class of Pooled Certificates will be entitled to distributions paid or advanced on and allocable to the Trust Subordinate Companion Loan. The holders of the Loan-Specific Certificates will only be entitled to distributions from amounts paid or advanced on and allocated to the Trust Subordinate Companion Loan in accordance with the co-lender agreement relating to the 180 Water Whole Loan.
|
Prepayment Interest Shortfalls: |
| Prepayment interest shortfalls will be allocated pro rata based on interest entitlements, in reduction of the interest otherwise payable with respect to each of the interest-bearing classes of certificates.
|
Loss Allocation: |
| The Non-VRR Percentage of losses on the Mortgage Loans will be allocated to each class of Non-VRR Certificates entitled to principal in reverse alphabetical order starting with Class H-RR certificates through and including Class A-M certificates and then to Class A-1, Class A-2, Class A-3, Class A-SB, Class A-4 and Class A-5 certificates on a pro rata basis based on the Certificate Balance of each such class. The notional amount of any class of Class X Certificates will be reduced by the aggregate amount of realized losses allocated to the class(es) of certificates that are component(s) of the notional amount of such class of Class X Certificates.
Losses realized on the Trust Subordinate Companion Loan generally will be allocated to the Loan-Specific Certificates.
|
Prepayment Premiums:
|
| A percentage of the Non-VRR Percentage of all prepayment premiums (either fixed prepayment premiums or yield maintenance amounts) collected on the Mortgage Loans will be allocated to each of the Class A-1, Class A-2, Class A-3, Class A-SB, Class A-4, Class A-5, Class A-M, Class B, Class C, Class D and Class E certificates (the “YM P&I Certificates”) then entitled to principal distributions, which percentage will be equal to the product of (a) a fraction, not greater than one, the numerator of which is the amount of principal distributed to such class on such Distribution Date and the denominator of which is the total amount of principal distributed to the holders of the Class A-1, Class A-2, Class A-3, Class A-SB, Class A-4, Class A-5, Class A-M, Class B, Class C, Class D, Class E, Class F, Class G-RR and Class H-RR certificates on such Distribution Date, and the Base Interest Fraction.
The “Base Interest Fraction” for any principal prepayment on any Mortgage Loan and for:
(A) any of the Class A-1 through Class E certificates with a Pass-Through Rate equal to either the WAC Rate or the WAC Rate less a specified rate, will be a fraction (not greater than one)(a) whose numerator is the greater of zero and the amount, if any, by which (i) the Pass-Through Rate on such class of certificates exceeds (ii) the yield rate (as provided by the master servicer) used in calculating the prepayment premium or yield maintenance charge, as applicable, with respect to such principal prepayment and (b) whose denominator is the amount, if any, by which (i) the Net Mortgage Rate on such Mortgage Loan during the related interest accrual period exceeds (ii) the yield rate (as provided by the master servicer) used in calculating the prepayment premium or yield maintenance charge, as applicable, with respect to such principal prepayment; provided, however, that if such yield rate is greater than or equal to the Net Mortgage Rate on such Mortgage Loan during the related interest accrual period, then the respective Base Interest Fraction will be zero; provided, further, that if such yield rate is greater |
THE INFORMATION IN THIS STRUCTURAL AND COLLATERAL TERM SHEET IS NOT COMPLETE AND MAY BE AMENDED PRIOR TO THE TIME OF SALE. THIS TERM SHEET IS NOT AN OFFER TO SELL THESE SECURITIES AND IT IS NOT A SOLICITATION OF AN OFFER TO BUY THESE SECURITIES IN ANY JURISDICTION WHERE THE OFFER OR SALE IS NOT PERMITTED.
14
COMM 2019-GC44 Mortgage Trust |
|
STRUCTURE OVERVIEW |
|
| than or equal to the Net Mortgage Rate on such Mortgage Loan during the related interest accrual period, but less than the Pass-Through Rate described in clause (a)(i) above, then the respective Base Interest Fraction will be one; and
(B) any of the Class A 1 through Class E certificates with a Pass-Through Rate equal to a fixed per annum rate, will be a fraction (not greater than one)(a) whose numerator is the greater of zero and the amount, if any, by which (i) the Pass-Through Rate on such class of certificates exceeds (ii) the yield rate (as provided by the master servicer) used in calculating the prepayment premium or yield maintenance charge, as applicable, with respect to such principal prepayment and (b) whose denominator is the amount, if any, by which (i) the Mortgage Rate on such Mortgage Loan (without regard to any increase in the interest rate of any ARD Loan after the related Anticipated Repayment Date, and net of the Administrative Cost Rate) during the related interest accrual period multiplied by 365/360 exceeds (ii) the yield rate (as provided by the master servicer) used in calculating the prepayment premium or yield maintenance charge, as applicable, with respect to such principal prepayment; provided, however, that if such yield rate is greater than or equal to the amount set forth in clause (b)(i) above, then the respective Base Interest Fraction will be zero; provided, further, that if such yield rate is greater than or equal to the amount set forth in clause (b)(i) above, but less than the Pass-Through Rate described in clause (a)(i) above, then the respective Base Interest Fraction will be one.
|
|
| The remaining percentage of the Non-VRR Percentage of prepayment premiums will be allocated to the Class X-A, Class X-B and Class X-D certificates in the manner described in the Preliminary Prospectus. In general, this formula provides for an increase in the percentage of prepayment premiums allocated to the YM P&I Certificates then entitled to principal distributions relative to the Class X-A, Class X-B and Class X-D certificates as Discount Rates decrease and a decrease in the percentage allocated to such classes as Discount Rates rise.
|
Whole Loans: |
| The mortgaged properties identified on Annex A-1 to the Preliminary Prospectus as Century Plaza Towers, 180 Water, The Shoppes at Blackstone Valley, 225 Bush, USAA Office Portfolio, PCI Pharma Portfolio, Elston Retail Portfolio, The Essex Site 2, Legends at Village West, Midtown Center, Broadcasting Square, Cobb Place, Wind Creek Leased Fee and Millennium Park Plaza each secure both a mortgage loan to be included in the trust fund and one or more other companion loans that will not be included in the trust fund, each of which will be pari passu and/or subordinate in right of payment with the mortgage loan included in the trust fund. We refer to each such group of related loans as a “whole loan”.
As of the Closing Date, the pari passu companion loans and the subordinate companion loans are expected to be held by the party identified in “—Companion Loan Summary” above and the table titled “Whole Loan Control Notes and Non-Control Notes” in “Description of the Mortgage Pool—The Whole Loans—General” in the Preliminary Prospectus.
|
Control Rights and Directing Holder: |
| With respect to any Serviced Mortgage Loan and any related Serviced Companion Loan, the Directing Holder will generally be entitled to direct the Special Servicer to take, or refrain from taking, certain actions with respect to each Serviced Mortgage Loan and any related Serviced Companion Loans. Furthermore, the Directing Holder will also have the right to receive notice and consent to certain material actions that the Master Servicer and the Special Servicer proposes to take with respect to each Serviced Mortgage Loan and any related Serviced Companion Loans.
The “Directing Holder” will be: (i) with respect to each Serviced Mortgage Loan (other than the 180 Water Mortgage Loan), the certificateholder (or its representative) selected by more than 50% of the Controlling Class, by Certificate Balance, as determined by the certificate registrar from time to time (the “Trust Directing Holder”; (ii) with respect to the 180 Water Whole Loan, (a) for so long as no 180 Water Control Appraisal Period exists, the certificateholder (or its representative) selected by more than 50% of the controlling class of the Loan-Specific Certificates and (b) for so long as a 180 Water Control Appraisal Period exists, the holder of Note A-1 (or a “controlling class representative” or any analogous party for any securitization of all or a portion of Note A-1).
It is expected that RREF III-D AIV RR, LLC or its affiliate will be the initial Directing Holder with respect to each Serviced Mortgage Loan (other than the 180 Water Mortgage Loan) and any related Serviced Companion Loans.
A “180 Water Control Appraisal Period” will exist with respect to the 180 Water Whole Loan, if and for so long as the initial principal balance of the Trust Subordinate Companion Loan (taking |
THE INFORMATION IN THIS STRUCTURAL AND COLLATERAL TERM SHEET IS NOT COMPLETE AND MAY BE AMENDED PRIOR TO THE TIME OF SALE. THIS TERM SHEET IS NOT AN OFFER TO SELL THESE SECURITIES AND IT IS NOT A SOLICITATION OF AN OFFER TO BUY THESE SECURITIES IN ANY JURISDICTION WHERE THE OFFER OR SALE IS NOT PERMITTED.
15
COMM 2019-GC44 Mortgage Trust |
|
STRUCTURE OVERVIEW |
|
| into account any appraisal reduction amounts or realized losses allocated to the Trust Subordinate Companion Loan) is less than 25% of the initial principal balance of the Trust Subordinate Companion Loan less any principal payment allocated to and received by the holder.
For a description of the directing holder for each Non-Serviced Whole Loan, see “Description of the Mortgage Pool—The Whole Loans” and “Pooling and Servicing Agreement—The Directing Holder” in the Preliminary Prospectus.
|
Control Eligible Certificates: | Class G-RR and Class H-RR certificates. | |
Controlling Class: |
| The Controlling Class will be the most subordinate class of Control Eligible Certificates then outstanding that has an aggregate Certificate Balance, as notionally reduced by any appraisal reduction amounts and any collateral deficiency amounts allocable to such class, equal to at least 25% of the initial Certificate Balance of such class; provided that if at any time the Certificate Balances of all Control Eligible Certificates, as notionally reduced by any appraisal reduction amounts (but without regard to any collateral deficiency amounts) allocable to such classes, have been reduced to zero, then the “Controlling Class” will be the most subordinate class of Control Eligible Certificates that has an aggregate principal balance greater than zero; provided, further that if at any time the Certificate Balances of the Class A-1, Class A-2, Class A-3, Class A-SB, Class A-4, Class A-5, Class A-M, Class B, Class C, Class D, Class E and Class F certificates have been reduced to zero as a result of the allocation of principal payments on the Mortgage Loans, then the Controlling Class will be the most subordinate class of Control Eligible Certificates that has an aggregate Certificate Balance greater than zero (without regard to the application of appraisal reduction amounts or any collateral deficiency amounts to notionally reduce the Certificate Balance of such class).
The Controlling Class as of the Closing Date will be the Class H-RR certificates.
|
Appraised-Out Class: |
| Any class of Control Eligible Certificates that has been determined, as a result of appraisal reductions amounts and collateral deficiency amounts allocable to such class, to no longer be the Controlling Class.
|
Remedies Available to Holders of an Appraised-Out Class: |
| Holders of the majority of any class of Control Eligible Certificates that is determined at any time of determination to no longer be the Controlling Class as a result of an allocation of appraisal reduction amounts and collateral deficiency amounts in respect of such class will have the right, at their sole expense, to require the Special Servicer to order a second appraisal for any Serviced Mortgage Loan for which an appraisal reduction event has occurred or as to which there exists a collateral deficiency amount. Upon receipt of the second appraisal, the Special Servicer will be required to send the appraisal to the Master Servicer, who will be required to recalculate the appraisal reduction amount or collateral deficiency amount based on the second appraisal, and if required by such recalculation, the Special Servicer will reinstate the Appraised-Out Class as the Controlling Class. The Holders of an Appraised-Out Class requesting a second appraisal will not be entitled to exercise any rights of the Controlling Class until such time, if any, as the class is reinstated as the Controlling Class.
|
Control Termination Event: |
| Will occur (a) with respect to any Mortgage Loan (other than the 180 Water Whole Loan) or Serviced Whole Loan (other than the 180 Water Whole Loan), when one or more of the following is true: (i) the Class G-RR certificates have a Certificate Balance (taking into account the application of any appraisal reduction amounts and collateral deficiency amounts to notionally reduce the Certificate Balance of such class) of less than 25% of the initial Certificate Balance of that class, (ii) the holder of the Class G-RR certificates is the majority Controlling Class Certificateholder and has irrevocably waived its right, in writing, to exercise any of the rights of the Controlling Class Certificateholder and such rights have not been reinstated to a successor controlling class certificateholder pursuant to the terms of the PSA, or (iii) such Mortgage Loan or Whole Loan is an applicable Excluded Loan; and
(b) respect to the 180 Water Whole Loan, when both (i) a 180 Water Control Appraisal Period has occurred and is continuing, and (ii) one or more of the following is true: (A) each holder of Note A-1 (or a portion thereof) has irrevocably waived the right, in writing, to exercise the rights of a 180 Water Controlling Noteholder and such rights have not been reinstated to a successor holder of such promissory note under the terms of a transfer or securitization of such promissory note, or (B) such Whole Loan is an applicable Excluded Loan. |
THE INFORMATION IN THIS STRUCTURAL AND COLLATERAL TERM SHEET IS NOT COMPLETE AND MAY BE AMENDED PRIOR TO THE TIME OF SALE. THIS TERM SHEET IS NOT AN OFFER TO SELL THESE SECURITIES AND IT IS NOT A SOLICITATION OF AN OFFER TO BUY THESE SECURITIES IN ANY JURISDICTION WHERE THE OFFER OR SALE IS NOT PERMITTED.
16
COMM 2019-GC44 Mortgage Trust |
|
STRUCTURE OVERVIEW |
|
| Upon the occurrence and the continuance of a Control Termination Event, the Directing Holder will no longer have any control rights. The Directing Holder will no longer have the right to direct certain actions of the Special Servicer and will no longer have consent rights with respect to certain material actions that the Master Servicer or Special Servicer proposes to take with respect to a Serviced Mortgage Loan and any related Serviced Companion Loans.
Upon the occurrence and continuation of a Control Termination Event, the Directing Holder will retain non-binding consultation rights with respect to certain material actions that the Special Servicer proposes to take with respect to a Serviced Mortgage Loan and any related Serviced Companion Loans. Such consultation rights will continue until the occurrence of a Consultation Termination Event.
|
Consultation Termination Event: |
| Will occur (a) with respect to any Mortgage Loan (other than the 180 Water Whole Loan) or Serviced Whole Loan (other than the 180 Water Whole Loan), when one or more of the following is true: (i) there is no class of Control Eligible Certificates that has a then-outstanding Certificate Balance (without regard to the application of any appraisal reduction amounts or collateral deficiency amounts) equal to at least 25% of the initial Certificate Balance of that class, (ii) the holder of the Class G-RR certificates is the majority Controlling Class Certificateholder and has irrevocably waived its right, in writing, to exercise any of the rights of the Controlling Class Certificateholder and such rights have not been reinstated to a successor controlling class certificateholder pursuant to the terms of the PSA, or (iii) such Mortgage Loan or Whole Loan is an applicable Excluded Loan; and (b) with respect to the 180 Water Whole Loan, when both (i) a 180 Water Control Appraisal Period has occurred and is continuing, and (ii) one or more of the following is true: (A) each holder of Note A-1 (or a portion thereof) has irrevocably waived the right, in writing, to exercise the rights of a 180 Water Controlling Noteholder and such rights have not been reinstated to a successor holder of such promissory note under the terms of a transfer or securitization of such promissory note, or (B) such Whole Loan is an applicable Excluded Loan.
Upon the occurrence and continuance of a Consultation Termination Event, the Directing Holder will have no rights under the PSA other than those rights that all Certificateholders have.
|
Risk Retention Consultation Party: |
| The risk retention consultation parties will have certain non-binding consultation rights with respect to certain material servicing actions. Each holder of the VRR Interest, which is expected to be transferred on the Closing Date by GACC to Deutsche Bank AG, New York Branch (“DBNY”), Goldman Sachs Bank USA (“GS Bank”) and CREFI, will be entitled to appoint a risk retention consultation party with respect to the pooled securitization transaction, and each of DBNY, GSMC and CREFI are expected to be appointed as the initial risk retention consultation parties. DBNY will be entitled to appoint, and is expected to be, the risk retention consultation party with respect to the securitization relating to the Loan-Specific Certificates. |
Appointment and Replacement of Special Servicer: |
| The Directing Holder will appoint the initial Special Servicer with respect to each Serviced Mortgage Loan and any related Serviced Companion Loans as of the Closing Date. Prior to the occurrence and continuance of a Control Termination Event, the Directing Holder generally may replace the Special Servicer with respect to each Serviced Mortgage Loan and any related Serviced Companion Loans with or without cause at any time.
Upon the occurrence and during the continuance of a Control Termination Event, the Directing Holder will no longer have the right to replace the Special Servicer and such replacement (other than with respect to the Non-Serviced Whole Loans) will occur based on a vote of holders of all voting eligible classes of certificates as described below. See “Description of the Mortgage Pool—The Whole Loans” and “Pooling and Servicing Agreement” in the Preliminary Prospectus for a description of the special servicer appointment and replacement rights with respect to Non-Serviced Whole Loans.
|
Replacement of Special Servicer by Vote of Certificateholders: |
| Other than with respect to Non-Serviced Whole Loans and the 180 Water Whole Loan, if a Control Termination Event has occurred and is continuing, upon (i) the written direction of holders of certificates evidencing not less than 25% of the voting rights of all classes of Pooled Principal Balance Certificates and the VRR Interest (taking into account the application of appraisal reduction amounts to notionally reduce the Certificate Balances of classes to which such appraisal reduction amounts are allocable) and requesting a vote to replace the Special Servicer with a replacement special servicer, (ii) payment by such requesting holders to the Certificate Administrator of all reasonable fees and expenses to be incurred by the Certificate Administrator in connection with administering such vote and (iii) delivery by such holders to |
THE INFORMATION IN THIS STRUCTURAL AND COLLATERAL TERM SHEET IS NOT COMPLETE AND MAY BE AMENDED PRIOR TO THE TIME OF SALE. THIS TERM SHEET IS NOT AN OFFER TO SELL THESE SECURITIES AND IT IS NOT A SOLICITATION OF AN OFFER TO BUY THESE SECURITIES IN ANY JURISDICTION WHERE THE OFFER OR SALE IS NOT PERMITTED.
17
COMM 2019-GC44 Mortgage Trust |
|
STRUCTURE OVERVIEW |
|
| the Certificate Administrator and Trustee of written confirmations from each Rating Agency that the appointment of the replacement Special Servicer will not result in a downgrade of the certificates, the Certificate Administrator will be required to promptly post notice of such request on the Certificate Administrator’s website and concurrently provide written notice of such request by mail to all Certificateholders of such request and conduct the solicitation of votes of all certificates in such regard. Upon the written direction (within 180 days) of (i) holders of Pooled Principal Balance Certificates and the VRR Interest evidencing at least 66 2/3% of a Certificateholder Quorum or (ii) holders of Pooled Principal Balance Certificates and the VRR Interest evidencing more than 50% of the aggregate voting rights of Pooled Principal Balance Certificates and the VRR Interest outstanding that has not been reduced to less than 25% of its initial Certificate Balance through the application of appraisal reduction amounts and realized losses), the Trustee will immediately replace the Special Servicer with the replacement Special Servicer (other than with respect to Non-Serviced Whole Loans).
“Certificateholder Quorum” means, in connection with any solicitation of votes in connection with the replacement of the Special Servicer as described above or the Asset Representations Reviewer as described below, the holders of certificates evidencing at least 50% of the aggregate voting rights (taking into account other than with respect to the termination of the Asset Representations Reviewer, the application of any appraisal reduction amounts to notionally reduce the Certificate Balance of the certificates) of all Pooled Principal Balance Certificates and the VRR Interest, on an aggregate basis.
At no time will holders of the Certificates be permitted to replace the special servicer without cause with respect to the 180 Water Whole Loan, other than certain of the Loan-Specific Certificates for so long as they are the Directing Holder of the 180 Water Whole Loan.
In addition, if at any time the Operating Advisor determines, in its sole discretion exercised in good faith, that (1) the Special Servicer is not performing its duties as required under the PSA or is otherwise not acting in accordance with the Servicing Standard and (2) the replacement of the Special Servicer would be in the best interest of the Certificateholders as a collective whole, then the Operating Advisor will have the right to recommend the replacement of the Special Servicer. The Operating Advisor’s recommendation to replace the Special Servicer (other than with respect Non-Serviced Whole Loans and the 180 Water Whole Loan) must be confirmed by a majority of a quorum of Certificateholders (which, for this purpose, is the holders of Certificates that (i) evidence at least 20% of the Voting Rights (taking into account the application of any appraisal reduction amounts to notionally reduce the respective Certificate Balances) of all Pooled Principal Balance Certificates and the VRR Interest on an aggregate basis, and (ii) consist of at least three Certificateholders or Certificate Owners that are not risk retention affiliated with each other) within 180 days from the time such recommendation is posted to the Certificate Administrator website and is subject to the receipt of written confirmations from each Rating Agency that the appointment of the replacement Special Servicer will not result in a downgrade of the certificates.
See “Description of the Mortgage Pool—The Whole Loans” and “Pooling and Servicing Agreement” in the Preliminary Prospectus for a description of the special servicer appointment and replacement rights with respect to Non-Serviced Whole Loans.
|
Cap on Workout and Liquidation Fees: |
| The workout fees and liquidation fees payable to a Special Servicer under the PSA will be an amount equal to the lesser of: (1) 1.0% of each collection of interest and principal following a workout or liquidation, subject to a minimum of $25,000 and (2) $1,000,000 per workout or liquidation. All Modification Fees actually paid to the Special Servicer in connection with a workout or liquidation or in connection with any prior workout or partial liquidation that occurred within the prior 18 months will be deducted from the total workout fee (only after receipt by the Special Servicer of workout fees of $25,000) and/or liquidation fees payable (other than Modification Fees earned while the Mortgage Loan was not in special servicing). In addition, the total amount of workout and liquidation fees actually payable by the Trust under the PSA will be capped in the aggregate at $1,000,000 for each related Mortgage Loan. If a new special servicer begins servicing the related Mortgage Loan, all amounts paid to the prior special servicer will be disregarded for purposes of calculating the cap.
|
Special Servicer Compensation: |
| The special servicing fee will equal 0.25% per annum of the stated principal balance of the related specially serviced loan or REO property, as applicable with a minimum monthly fee of $5,000. The Special Servicer and its affiliates will be prohibited from receiving or retaining any compensation or any other remuneration under the PSA (including, without limitation, in the form of commissions, brokerage fees, rebates, or as a result of any other fee-sharing |
THE INFORMATION IN THIS STRUCTURAL AND COLLATERAL TERM SHEET IS NOT COMPLETE AND MAY BE AMENDED PRIOR TO THE TIME OF SALE. THIS TERM SHEET IS NOT AN OFFER TO SELL THESE SECURITIES AND IT IS NOT A SOLICITATION OF AN OFFER TO BUY THESE SECURITIES IN ANY JURISDICTION WHERE THE OFFER OR SALE IS NOT PERMITTED.
18
COMM 2019-GC44 Mortgage Trust |
|
STRUCTURE OVERVIEW |
|
| arrangement) from any person (including, without limitation, the issuing entity, any borrower, any manager, any guarantor or indemnitor in respect of a Serviced Mortgage Loan and any related Serviced Companion Loans, and any purchaser of any Serviced Mortgage Loan and any related Serviced Companion Loan or REO Property) in connection with the disposition, workout or foreclosure of any Serviced Mortgage Loan and any related Serviced Companion Loans, the management or disposition of any REO Property, or the performance of any other special servicing duties under the PSA, other than as expressly permitted in the PSA and other than commercially reasonable treasury management fees, banking fees, property condition report fees, customary title agent fees and insurance commissions or fees received or retained by the Special Servicer or any of its Affiliates in connection with any services performed by such party with respect to any Mortgage Loan, Serviced Whole Loan or REO Property. Subject to certain limited exceptions, the Special Servicer will also be required to report any compensation or other remuneration the Special Servicer or its affiliates have received from any person and such information will be disclosed in the Certificateholders’ monthly distribution date statement.
|
Operating Advisor: |
| With respect to the Serviced Mortgage Loans and any related Serviced Companion Loans the Operating Advisor will have access to any final asset status report and all information available with respect to the transaction on the Certificate Administrator’s website and will have certain monitoring responsibilities on behalf of the entire trust. After the occurrence and during the continuance of an Operating Advisor Consultation Event, the Operating Advisor will have consultation rights with respect to certain major decisions.
The Operating Advisor will be subject to termination if holders of at least 15% of the aggregate voting rights of the certificates (in connection with termination and replacement relating to the Mortgage Loans) vote to terminate and replace the Operating Advisor and such vote is approved by holders of more than 50% of the applicable voting rights that exercise their right to vote (in the case of each of such vote and approval, taking into account Realized Losses and the application of any appraisal reduction amounts to notionally reduce the Certificate Balance of the certificates), provided that holders of at least 50% of the applicable voting rights have exercised their right to vote. The holders initiating such vote will be responsible for the fees and expenses in connection with the vote and replacement.
The foregoing rights with respect to the 180 Water Whole Loan will be held by the holders of the Loan-Specific Certificates in addition to the holders of the Pooled Certificates.
An “Operating Advisor Consultation Event” will occur upon the earlier of (i) the aggregate Certificate Balances of the HRR Certificates (taking into account the application of any appraisal reduction amounts and any collateral deficiency amounts to notionally reduce the Certificate Balance of any such class of certificates) is 25% or less of the initial aggregate Certificate Balances of the HRR Certificates and (ii) a Control Termination Event has occurred and is continuing (or a Control Termination Event would occur and be continuing if not for the last proviso in the definition of Control Termination Event).
The Operating Advisor will not have consultation rights in respect of Non-Serviced Mortgage Loans.
|
Asset Representations Reviewer: |
| The Asset Representations Reviewer will be required to review certain delinquent Mortgage Loans after a specified delinquency threshold has been exceeded and the required percentage of Certificateholders vote to direct a review of such delinquent Mortgage Loans. An asset review will occur when either (1) Mortgage Loans with an aggregate outstanding principal balance of 25% or more of the aggregate outstanding principal balance of all of the Mortgage Loans (including any REO loans (or a portion of any REO loan in the case of a whole loan)) held by the issuing entity as of the end of the applicable collection period are delinquent loans or (2)(A) prior to and including the second anniversary of the Closing Date, at least 10 Mortgage Loans are delinquent loans as of the end of the applicable collection period and the outstanding principal balance of such delinquent loans in the aggregate constitutes at least 15% of the aggregate outstanding principal balance of all of the Mortgage Loans (including any REO loans (or a portion of any REO loan in the case of a whole loan)) held by the issuing entity as of the end of the applicable collection period, or (B) after the second anniversary of the Closing Date, at least 15 Mortgage Loans are delinquent loans as of the end of the applicable collection period and the outstanding principal balance of such delinquent loans in the aggregate constitutes at least 20% of the aggregate outstanding principal balance of all of the Mortgage Loans (including any REO loans (or a portion of any REO loan in the case of a whole loan)) held by the issuing entity as of the end of the applicable collection period. |
THE INFORMATION IN THIS STRUCTURAL AND COLLATERAL TERM SHEET IS NOT COMPLETE AND MAY BE AMENDED PRIOR TO THE TIME OF SALE. THIS TERM SHEET IS NOT AN OFFER TO SELL THESE SECURITIES AND IT IS NOT A SOLICITATION OF AN OFFER TO BUY THESE SECURITIES IN ANY JURISDICTION WHERE THE OFFER OR SALE IS NOT PERMITTED.
19
COMM 2019-GC44 Mortgage Trust |
|
STRUCTURE OVERVIEW |
|
| The Asset Representations Reviewer may be terminated and replaced without cause. Upon (i) the written direction of Certificateholders evidencing not less than 25% of the voting rights (taking into account Realized Losses, but without regard to the application of any appraisal reduction amounts to notionally reduce the Certificate Balance of the certificates) requesting a vote to terminate and replace the Asset Representations Reviewer with a proposed successor asset representations reviewer that is an eligible asset representations reviewer, and (ii) payment by such holders to the Certificate Administrator of the reasonable fees and expenses to be incurred by the Certificate Administrator in connection with administering such vote, the Certificate Administrator will promptly provide notice to all Certificateholders and the Asset Representations Reviewer of such request by posting such notice on its internet website, and by mailing such notice to all Certificateholders and the Asset Representations Reviewer. Upon the written direction of Certificateholders evidencing at least 75% of a Certificateholder Quorum, the Trustee will terminate all of the rights and obligations of the Asset Representations Reviewer under the PSA by written notice to the Asset Representations Reviewer, and the proposed successor Asset Representations Reviewer will be appointed. See “Pooling and Servicing Agreement—The Asset Representations Reviewer” in the Preliminary Prospectus.
|
Dispute Resolution Provisions: |
| Each Mortgage Loan Seller will be subject to the dispute resolution provisions set forth in the PSA to the extent those provisions are triggered with respect to any Mortgage Loan sold to the depositor by such Mortgage Loan Seller and such Mortgage Loan Seller will be obligated under the related mortgage loan purchase agreement to comply with all applicable provisions and to take part in any mediation or arbitration proceedings that may result.
Generally, in the event that a repurchase request as described in the Preliminary Prospectus is not “Resolved” within 180 days after the related Mortgage Loan Seller receives such Repurchase Request, then the enforcing servicer will be required to send a notice to the initial requesting Certificateholder (if any) indicating the enforcing servicer’s intended course of action with respect to the Repurchase Request. If (a) the enforcing servicer’s intended course of action with respect to the Repurchase Request does not involve pursuing further action to exercise rights against the related Mortgage Loan Seller with respect to the Repurchase Request and the initial requesting Certificateholder, if any, or any other Certificateholder or Certificate Owner wishes to exercise its right to refer the matter to mediation (including nonbinding arbitration) or arbitration, or (b) the enforcing servicer’s intended course of action is to pursue further action to exercise rights against the related Mortgage Loan Seller with respect to the Repurchase Request but the initial requesting Certificateholder, if any, or any other Certificateholder or Certificate Owner does not agree with the dispute resolution method selected by the enforcing servicer, then the initial requesting Certificateholder, if any, or such other Certificateholder or Certificate Owner may deliver a written notice to the enforcing servicer indicating its intent to exercise its right to refer the matter to either mediation or arbitration.
“Resolved” means, with respect to a Repurchase Request, (i) that the related material defect or material breach has been cured, (ii) the related Mortgage Loan has been repurchased in accordance with the related mortgage loan purchase agreement, (iii) a mortgage loan has been substituted for the related Mortgage Loan in accordance with the related mortgage loan purchase agreement, (iv) the applicable Mortgage Loan Seller made the loss of value payment, (v) a contractually binding agreement is entered into between the enforcing servicer, on behalf of the issuing entity, and the related Mortgage Loan Seller that settles the related Mortgage Loan Seller’s obligations under the related mortgage loan purchase agreement, or (vi) the related Mortgage Loan is no longer property of the issuing entity as a result of a sale or other disposition in accordance with the PSA. See “Pooling and Servicing Agreement—Dispute Resolution Provisions” in the Preliminary Prospectus.
|
Liquidated Loan Waterfall: |
| On liquidation of any Mortgage Loan, all net liquidation proceeds will be applied according to the PSA, so that amounts allocated as a recovery of accrued and unpaid interest will not, in the first instance, include (a) any amount by which the interest portion of P&I Advances previously made was reduced as a result of appraisal reduction amounts and (b) Accrued AB Loan Interest. After the adjusted interest amount is so allocated, any remaining net liquidation proceeds will be allocated to pay principal on the Mortgage Loan until the unpaid principal amount of the Mortgage Loan has been reduced to zero. Any remaining liquidation proceeds would then be allocated as a recovery of (a) accrued and unpaid interest corresponding to the amount by which the interest portion of P&I Advances previously made was reduced as a result of appraisal reduction amounts and (b) any Accrued AB Loan Interest. |
THE INFORMATION IN THIS STRUCTURAL AND COLLATERAL TERM SHEET IS NOT COMPLETE AND MAY BE AMENDED PRIOR TO THE TIME OF SALE. THIS TERM SHEET IS NOT AN OFFER TO SELL THESE SECURITIES AND IT IS NOT A SOLICITATION OF AN OFFER TO BUY THESE SECURITIES IN ANY JURISDICTION WHERE THE OFFER OR SALE IS NOT PERMITTED.
20
(THIS PAGE INTENTIONALLY LEFT BLANK)
21
2029 & 2049 Century Park East Los Angeles, CA 90067 | Collateral Asset Summary – Loan No. 1 Century Plaza Towers | Cut-off Date Balance: Cut-off Date LTV: U/W NCF DSCR: U/W NOI Debt Yield: | $75,000,000 39.1% 4.09x 13.5% |
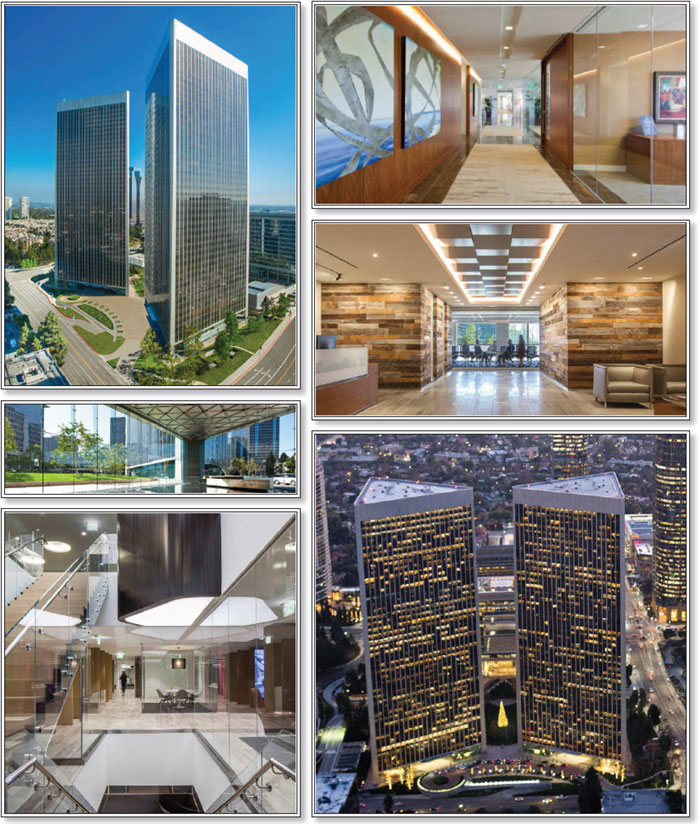
THE INFORMATION IN THIS STRUCTURAL AND COLLATERAL TERM SHEET IS NOT COMPLETE AND MAY BE AMENDED PRIOR TO THE TIME OF SALE. THIS TERM SHEET IS NOT AN OFFER TO SELL THESE SECURITIES AND IT IS NOT A SOLICITATION OF AN OFFER TO BUY THESE SECURITIES IN ANY JURISDICTION WHERE THE OFFER OR SALE IS NOT PERMITTED.
22
2029 & 2049 Century Park East Los Angeles, CA 90067 | Collateral Asset Summary – Loan No. 1 Century Plaza Towers | Cut-off Date Balance: Cut-off Date LTV: U/W NCF DSCR: U/W NOI Debt Yield: | $75,000,000 39.1% 4.09x 13.5% |
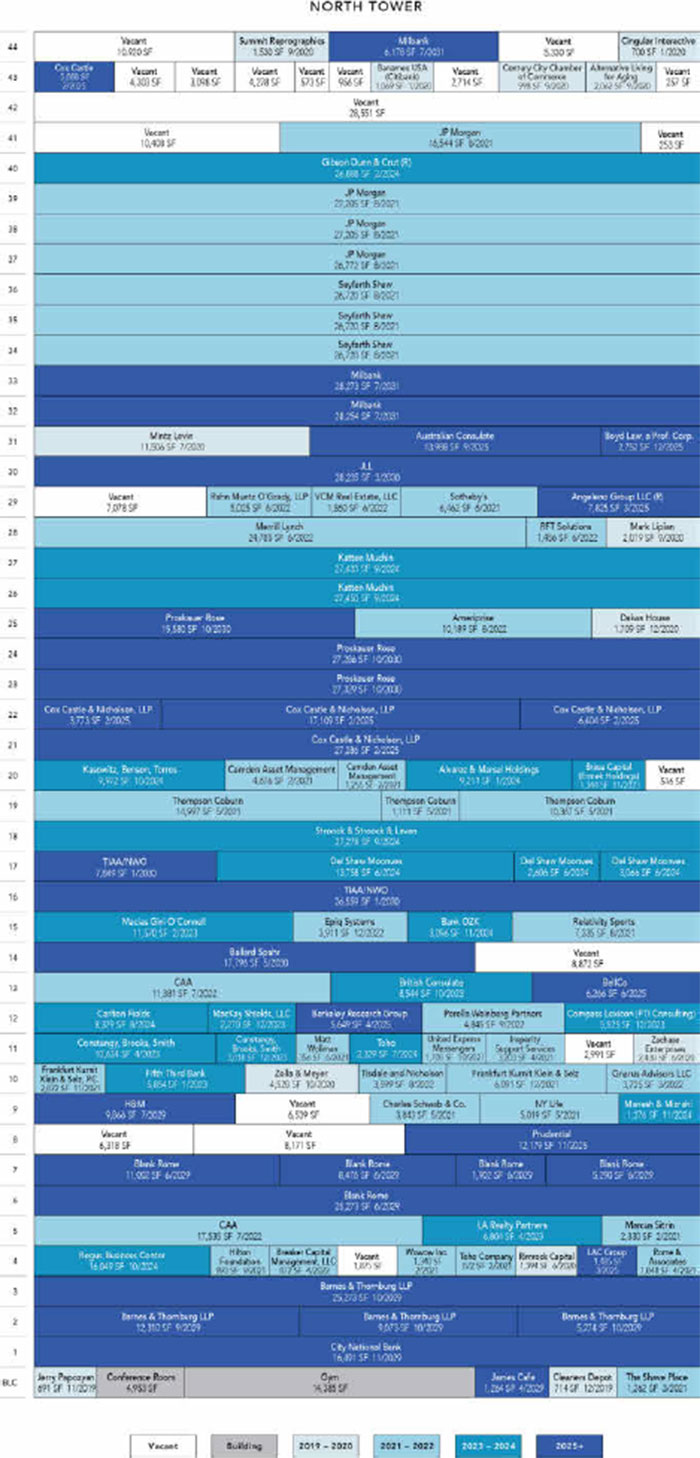
THE INFORMATION IN THIS STRUCTURAL AND COLLATERAL TERM SHEET IS NOT COMPLETE AND MAY BE AMENDED PRIOR TO THE TIME OF SALE. THIS TERM SHEET IS NOT AN OFFER TO SELL THESE SECURITIES AND IT IS NOT A SOLICITATION OF AN OFFER TO BUY THESE SECURITIES IN ANY JURISDICTION WHERE THE OFFER OR SALE IS NOT PERMITTED.
23
2029 & 2049 Century Park East Los Angeles, CA 90067 | Collateral Asset Summary – Loan No. 1 Century Plaza Towers | Cut-off Date Balance: Cut-off Date LTV: U/W NCF DSCR: U/W NOI Debt Yield: | $75,000,000 39.1% 4.09x 13.5% |
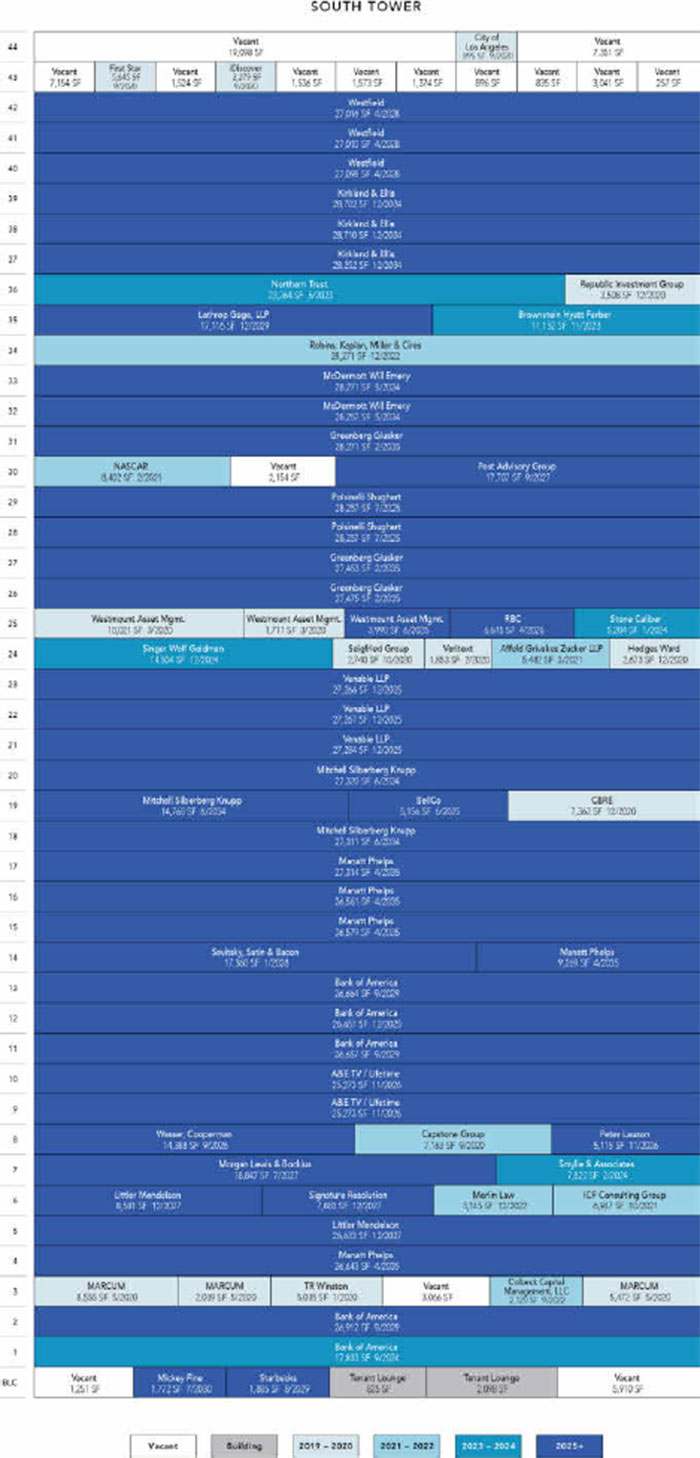
THE INFORMATION IN THIS STRUCTURAL AND COLLATERAL TERM SHEET IS NOT COMPLETE AND MAY BE AMENDED PRIOR TO THE TIME OF SALE. THIS TERM SHEET IS NOT AN OFFER TO SELL THESE SECURITIES AND IT IS NOT A SOLICITATION OF AN OFFER TO BUY THESE SECURITIES IN ANY JURISDICTION WHERE THE OFFER OR SALE IS NOT PERMITTED.
24
2029 & 2049 Century Park East Los Angeles, CA 90067 | Collateral Asset Summary – Loan No. 1 Century Plaza Towers | Cut-off Date Balance: Cut-off Date LTV: U/W NCF DSCR: U/W NOI Debt Yield: | $75,000,000 39.1% 4.09x 13.5% |
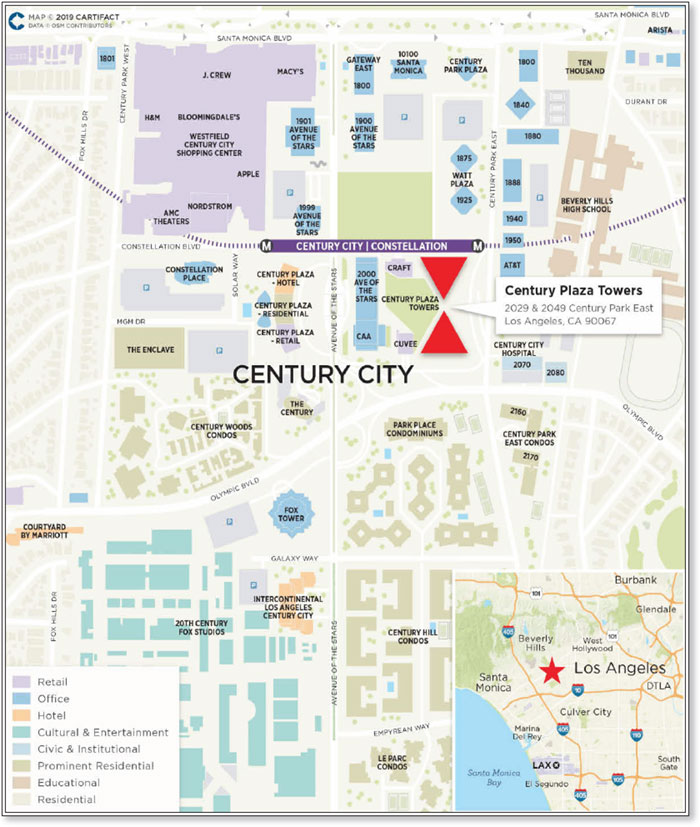
THE INFORMATION IN THIS STRUCTURAL AND COLLATERAL TERM SHEET IS NOT COMPLETE AND MAY BE AMENDED PRIOR TO THE TIME OF SALE. THIS TERM SHEET IS NOT AN OFFER TO SELL THESE SECURITIES AND IT IS NOT A SOLICITATION OF AN OFFER TO BUY THESE SECURITIES IN ANY JURISDICTION WHERE THE OFFER OR SALE IS NOT PERMITTED.
25
2029 & 2049 Century Park East Los Angeles, CA 90067 | Collateral Asset Summary – Loan No. 1 Century Plaza Towers | Cut-off Date Balance: Cut-off Date LTV: U/W NCF DSCR: U/W NOI Debt Yield: | $75,000,000 39.1% 4.09x 13.5% |
Mortgage Loan Information | |
Loan Seller: | GACC |
Loan Purpose: | Refinance |
Credit Assessment |
|
(Fitch/KBRA/Moody’s)(7): | BBB-sf / A+(sf) / Baa1 |
Borrower Sponsor(1): | SPF; Hines JV |
Borrower: | One Hundred Towers L.L.C. |
Original Balance(2): | $75,000,000 |
Cut-off Date Balance(2): | $75,000,000 |
% by Initial UPB: | 7.3% |
Interest Rate: | 3.00450% |
Payment Date: | 9th of each month |
First Payment Date: | December 9, 2019 |
Maturity Date: | November 9, 2029 |
Amortization: | Interest Only |
Additional Debt(2): | $825,000,000 Pari Passu Debt; $300,000,000 Subordinate Debt |
Call Protection(3): | YM1(25), DorYM1(90), O(5) |
Lockbox / Cash Management: | Hard / Springing |
Reserves(4) | |||
| Initial | Monthly | Cap |
Taxes: | $0 | Springing | NAP |
Insurance: | $0 | Springing | NAP |
Replacement: | $0 | $0 | NAP |
TI/LC: | $0 | $0 | NAP |
Outstanding TI/LC: | $71,223,945 | $0 | NAP |
Free Rent: | $29,545,735 | $0 | NAP |
Property Information | ||
Single Asset / Portfolio: | Single Asset | |
Property Type: | CBD Office | |
Collateral: | Fee Simple | |
Location: | Los Angeles, CA | |
Year Built / Renovated: | 1975 / 2015 | |
Total Sq. Ft.: | 2,401,641 | |
Property Management: | CBRE, Inc. | |
Underwritten NOI(5): | $121,145,756 | |
Underwritten NCF: | $112,250,366 | |
Appraised Value: | $2,302,000,000 | |
Appraisal Date: | September 24, 2019 | |
| ||
Historical NOI | ||
Most Recent NOI(5): | $83,342,918 (T-12 September 30, 2019) | |
2018 NOI(6): | $89,024,555 (December 31, 2018) | |
2017 NOI(6): | $83,200,132 (December 31, 2017) | |
2016 NOI: | $80,783,345 (December 31, 2016) | |
| ||
Historical Occupancy | ||
Most Recent Occupancy: | 92.9% (October 1, 2019) | |
2018 Occupancy: | 83.5% (December 31, 2018) | |
2017 Occupancy: | 84.6% (December 31, 2017) | |
2016 Occupancy: | 87.0% (December 31, 2016) | |
|
|
|
Financial Information(2) | ||||||
Tranche | Cut-off Date Balance | Balance per Sq. Ft. Cut-off / Balloon | LTV Cut-off / Balloon | U/W DSCR NOI / NCF | U/W Debt Yield NOI / NCF | U/W Debt Yield at Balloon NOI / NCF |
Mortgage Loan | $75,000,000 |
|
|
|
|
|
Pari Passu Notes | 825,000,000 |
|
|
|
|
|
Total Senior Notes | $900,000,000 | $375 / $375 | 39.1% / 39.1% | 4.42x / 4.09x | 13.5% / 12.5% | 13.5% / 12.5% |
Subordinate Notes | 300,000,000 |
|
|
|
|
|
Whole Loan | $1,200,000,000 | $500 / $500 | 52.1% / 52.1% | 3.31x / 3.07x | 10.1% / 9.4% | 10.1% / 9.4% |
(1) | There is no non-recourse carveout guarantor or separate environmental indemnitor with respect to the Century Plaza Towers Whole Loan (as defined below). Please see “The Borrower / Borrower Sponsor” herein. |
(2) | The Century Plaza Towers Loan (as defined below) consists of the non-controlling Notes A-1-C4 and A-1-C5 and is part of the Century Plaza Towers Whole Loan evidenced by 29 senior pari passu notes and three subordinate notes, with an aggregate outstanding principal balance as of the Cut-off Date of $1.2 billion. For additional information, see “The Loan” herein. |
(3) | The lockout period, with respect to a defeasance of the Century Plaza Towers Whole Loan, will be at least 25 payment dates beginning with and including the first payment date of December 9, 2019. Defeasance of the full $1.2 billion Century Plaza Towers Whole Loan is permitted after the date that is the earlier of (i) two years from the closing date of the securitization that includes the last senior pari passu note to be securitized and (ii) October 21, 2022. Prepayment in whole, but not in part, of the Century Plaza Towers Whole Loan is permitted at any time prior to July 9, 2029 with the payment of a yield maintenance fee. |
(4) | See “Initial and Ongoing Reserves” herein. |
(5) | The increase in Underwritten NOI from Most Recent NOI is primarily attributable to (i) $2,354,778 in straight line rent taken through the earlier of the loan term or the lease term for fourteen tenants, (ii) $3,269,254 of rent steps taken through October 2020 and (iii) new leasing that has been executed since September 2019, accounting for 20.6% of NRA and 24.6% of U/W Gross Potential Rent. |
(6) | The increase in 2018 Net Operating Income from 2017 Net Operating Income is primarily attributable to an approximately $2.4 million fee associated with City National Bank and Tang Media’s termination. |
(7) | Fitch, KBRA and Moody’s provided the listed assessments for the Century Plaza Towers Loan in the context of its inclusion in the mortgage pool. |
THE INFORMATION IN THIS STRUCTURAL AND COLLATERAL TERM SHEET IS NOT COMPLETE AND MAY BE AMENDED PRIOR TO THE TIME OF SALE. THIS TERM SHEET IS NOT AN OFFER TO SELL THESE SECURITIES AND IT IS NOT A SOLICITATION OF AN OFFER TO BUY THESE SECURITIES IN ANY JURISDICTION WHERE THE OFFER OR SALE IS NOT PERMITTED.
26
2029 & 2049 Century Park East Los Angeles, CA 90067 | Collateral Asset Summary – Loan No. 1 Century Plaza Towers | Cut-off Date Balance: Cut-off Date LTV: U/W NCF DSCR: U/W NOI Debt Yield: | $75,000,000 39.1% 4.09x 13.5% |
The Loan. The Century Plaza Towers mortgage loan (the “Century Plaza Towers Loan”) is part of a whole loan (the “Century Plaza Towers Whole Loan”) consisting of 29 pari passu senior notes with an outstanding aggregate principal balance as of the Cut-off Date of $900,000,000 (collectively the “Century Plaza Towers Senior Notes”) and three pari passu subordinate notes with an aggregate outstanding principal balance as of the Cut-of Date of $300,000,000 (the “Century Plaza Towers Subordinate Notes”). The Century Plaza Towers Whole Loan is secured by the borrower’s fee simple interest in a 2,401,641 sq. ft., Class A, office complex consisting of two buildings located in Los Angeles, California (the “Century Plaza Towers Property”). The Century Plaza Towers Loan, which is evidenced by the non-controlling Notes A-1-C4 and A-1-C5, has an aggregate original principal balance and outstanding principal balance as of the Cut-off Date of $75.0 million.
The relationship between the holders of the Century Plaza Towers Whole Loan will be governed by a co-lender agreement as described under “Description of the Mortgage Pool—The Whole Loans—The Non-Serviced AB Whole Loans—Century Plaza Towers Whole Loan” in the Preliminary Prospectus.
Whole Loan Summary | |||||
Note | Original Balance | Cut-off Date Balance |
| Note Holder | Controlling Piece |
A-1-C4, A-1-C5 | $75,000,000 | $75,000,000 |
| COMM 2019-GC44 | No |
A-1-S1, A-1-S2, A-1-S3, A-2-S1, A-2-S2, A-2-S3, A-2-C1, A-2-C3, A-2-C4, A-3-S1, A-3-S2, A-3-S3, A-3-C1, A-3-C3 | 525,000,000 | 525,000,000 |
| CPTS 2019-CPT(1) | No |
A-1-C1, A-1-C2, A-1-C6, A-1-C7 | 112,500,000 | 112,500,000 |
| DBRI | No |
A-1-C3, A-1-C8 | 62,500,000 | 62,500,000 |
| JPMDB 2019-COR6(2) | No |
A-2-C2, A-2-C5, A-2-C6, A-2-C7 | 62,500,000 | 62,500,000 |
| MSBNA | No |
A-3-C2, A-3-C4, A-3-C5 | 62,500,000 | 62,500,000 |
| WFBNA | No |
Senior Notes | $900,000,000 | $900,000,000 |
|
|
|
B-1, B-2, B-3 | 300,000,000 | 300,000,000 |
| CPTS 2019-CPT | Yes |
Whole Loan | $1,200,000,000 | $1,200,000,000 |
|
|
|
(1) The CPTS 2019-CPT securitization transaction is expected to close prior to the Closing Date.
(2) The JPMDB 2019-COR6 securitization transaction is expected to close prior to the Closing Date.
The Century Plaza Towers Whole Loan has a 10-year interest-only term and accrues interest at a rate of 3.00450% per annum. The Century Plaza Towers Whole Loan was primarily used to repay the existing loan, fund upfront reserves, pay closing costs and return approximately $272.9 million to the borrower sponsor. Based on the “As Is” appraised value of $2.302 billion as of September 24, 2019 and the Cut-off Date balance of the Century Plaza Towers Senior Notes, the Cut-off Date LTV Ratio is 39.1%. The most recent financing of the Century Plaza Towers Whole Loan was securitized in the MSC 2014-CPT transaction.
Sources and Uses | ||||||||
Sources | Proceeds | % of Total |
| Uses | Proceeds | % of Total | ||
Whole Loan | $1,200,000,000 | 100.0% |
| Loan Payoff | $823,449,563 | 68.6% | ||
|
|
|
| Upfront Reserves | 100,769,680 | 8.4 | ||
|
|
|
| Closing Costs | 2,834,724 | 0.2 | ||
|
|
|
| Return of Equity | 272,946,032 | 22.7 | ||
Total Sources | $1,200,000,000 | 100.0% |
| Total Uses | $1,200,000,000 | 100.0% | ||
The Borrower / Borrower Sponsor. The borrower is One Hundred Towers L.L.C., a Delaware limited liability company structured to be a bankruptcy-remote entity with two independent directors in its organizational structure. Legal counsel to the borrower delivered a non-consolidation opinion in connection with the origination of the Century Plaza Towers Whole Loan. The borrower sponsor is a joint venture between (i) the Commingled Pension Trust Fund (Strategic Property) of JPMorgan Chase Bank, N.A. (“SPF”) and (ii) a joint venture between an institutional account managed by both Hines and Hines Investment Management Holdings Limited Partnership (the “Hines JV”) (together with SPF, the “Borrower Sponsor” or “JV”). Hines JV is a privately owned global real estate investment, development and management firm, founded in 1957, with a presence in 219 cities in 23 countries and has assets under management for which Hines provides fiduciary investment management services and $60.5 billion for which Hines provides third party property-level services. The Century Plaza Towers Whole Loan is non-recourse to the borrower and there is no nonrecourse carveout guarantor or separate environmental indemnitor for the Century Plaza Towers Whole Loan. In no event will the Borrower Sponsor be obligated to make payments under the Century Plaza Towers Whole Loan.
THE INFORMATION IN THIS STRUCTURAL AND COLLATERAL TERM SHEET IS NOT COMPLETE AND MAY BE AMENDED PRIOR TO THE TIME OF SALE. THIS TERM SHEET IS NOT AN OFFER TO SELL THESE SECURITIES AND IT IS NOT A SOLICITATION OF AN OFFER TO BUY THESE SECURITIES IN ANY JURISDICTION WHERE THE OFFER OR SALE IS NOT PERMITTED.
27
2029 & 2049 Century Park East Los Angeles, CA 90067 | Collateral Asset Summary – Loan No. 1 Century Plaza Towers | Cut-off Date Balance: Cut-off Date LTV: U/W NCF DSCR: U/W NOI Debt Yield: | $75,000,000 39.1% 4.09x 13.5% |
The Property.
Tenant Summary(1) | ||||||||
Tenant | Credit Rating (Fitch/Moody’s/S&P)(2) | Net Rentable Area | % of Net | U/W Base Rent | % of Total U/W Base Rent | Lease Expiration | ||
Bank of America(3) | A+ / A2 / A- | 149,508 | 6.2 | % | $56.98 | 6.5 | % | Various(4) |
Manatt Phelps(5) | NR / NR / NR | 116,366 | 4.8 |
| $62.26 | 5.5 |
| 4/30/2035 |
JPMorgan | AA- / A2 / A- | 97,726 | 4.1 |
| $57.00 | 4.2 |
| 8/31/2021 |
Kirkland & Ellis(6) | NR / NR / NR | 85,664 | 3.6 |
| $68.79 | 4.5 |
| 12/31/2034 |
Greenberg Glusker(7) | NR / NR / NR | 83,199 | 3.5 |
| $66.00 | 4.2 |
| 2/28/2035 |
Venable LLP | NR / NR / NR | 81,817 | 3.4 |
| $57.70 | 3.6 |
| 12/31/2025 |
Westfield(8) | NR / NR / A | 81,124 | 3.4 |
| $52.30 | 3.2 |
| 4/30/2028 |
Seyfarth Shaw | NR / NR / NR | 80,160 | 3.3 |
| $78.51 | 4.8 |
| 8/31/2021 |
Proskauer Rose(9) | NR / NR / NR | 70,195 | 2.9 |
| $57.26 | 3.1 |
| 10/31/2030 |
Mitchell Silberberg Knupp(10) | NR / NR / NR | 69,396 | 2.9 |
| $56.40 | 3.0 |
| 6/30/2034 |
Total / Wtd. Avg. Major Tenants |
| 915,155 | 38.1 | % | $61.09 | 42.6 | % |
|
Remaining Tenants |
| 1,315,465 | 54.8 |
| $57.21 | 57.4 |
|
|
Total / Wtd. Avg. Occupied Collateral |
| 2,230,620 | 92.9 | % | $58.80 | 100.0 | % |
|
Vacant |
| 171,021 | 7.1 |
|
|
|
|
|
Total |
| 2,401,641 | 100.0 | % |
|
|
|
|
| (1) | Based on the underwritten rent roll dated October 1, 2019. |
| (2) | Certain ratings are those of the parent company whether or not the parent company guarantees the lease. |
| (3) | The sq. ft. of Bank of America includes 124,723 sq. ft. occupied by Bank or America on floors 1 through 14 and 24,785 sq. ft. occupied by Merrill Lynch on floors 25 through 33. In addition, the sq. ft. for Bank of America includes 26,664 sq. ft., which Bank of America is expected to begin paying rent and take occupancy in January 2020. |
| (4) | Bank of America has various lease expiration dates: (i) 106,890 sq. ft. with a lease expiration date of September 30, 2029, (ii) 17,833 sq. ft. with a lease expiration date of September 30, 2024 and (iii) 24,785 sq. ft. related to the Merrill Lynch space, with a lease expiration date of June 30, 2022. Bank of America has the right to terminate its lease as of September 30, 2026 upon written notice prior to September 30, 2025 and a termination fee of $1,908,666. |
| (5) | Manatt Phelps is expected to begin paying rent and take occupancy in stages in March 2020, with full occupancy of the space expected in May 2020. Manatt Phelps has the right to terminate its lease on the 4th floor on the last day of the 5th year or 10th year of its lease term. |
| (6) | Kirkland & Ellis is expected to begin paying rent and take occupancy in January 2020. Kirkland & Ellis, has the one-time right to terminate its lease as of January 1, 2032 upon written notice on or before January 1, 2031 and payment of a termination fee |
| (7) | Greenberg Glusker has a one-time right to terminate its lease as of March 1, 2032 upon written notice on or before March 1, 2031 and the payment of a termination fee. |
| (8) | Westfield has a one-time right to terminate its lease on April 30, 2025, with 15 months’ prior notice and the payment of a termination fee of approximately $3.5 million. |
| (9) | Proskauer Rose has a one-time right to terminate its lease on October 31, 2025, upon written notice on or before October 31, 2024 and the payment of a termination fee. |
| (10) | Mitchell Silberberg Knupp has a one-time right to terminate its lease on June 30, 2029, upon written notice on or before June 30, 2028 and the payment of a termination fee. |
Lease Rollover Schedule(1)(2) | ||||||||||
Year | # of Leases Expiring | Total Expiring Sq. Ft. | % of Total Sq. Ft. Expiring | Cumulative Sq. Ft. Expiring | Cumulative % of Sq. Ft. Expiring | Annual U/W Base Rent PSF | % U/W Base Rent Rolling | Cumulative % of U/W Base Rent | ||
MTM | 0 | 0 | 0.0 | % | 0 | 0.0% | $0.00 | 0.0 | % | 0.0% |
2019 | 2 | 1,405 | 0.1 |
| 1,405 | 0.1% | $32.49 | 0.0 |
| 0.0% |
2020 | 26 | 96,896 | 4.0 |
| 98,301 | 4.1% | $50.13 | 3.7 |
| 3.7% |
2021 | 30 | 276,557 | 11.5 |
| 374,858 | 15.6% | $63.47 | 13.4 |
| 17.1% |
2022 | 15 | 122,719 | 5.1 |
| 497,577 | 20.7% | $58.72 | 5.5 |
| 22.6% |
2023 | 14 | 89,979 | 3.7 |
| 587,556 | 24.5% | $56.38 | 3.9 |
| 26.5% |
2024 | 18 | 224,254 | 9.3 |
| 811,810 | 33.8% | $60.00 | 10.3 |
| 36.7% |
2025 | 19 | 258,081 | 10.7 |
| 1,069,891 | 44.5% | $57.45 | 11.3 |
| 48.0% |
2026 | 5 | 76,664 | 3.2 |
| 1,146,555 | 47.7% | $59.56 | 3.5 |
| 51.5% |
2027 | 5 | 79,651 | 3.3 |
| 1,226,206 | 51.1% | $58.43 | 3.5 |
| 55.1% |
2028 | 4 | 98,484 | 4.1 |
| 1,324,690 | 55.2% | $53.30 | 4.0 |
| 59.1% |
2029 | 18 | 257,405 | 10.7 |
| 1,582,095 | 65.9% | $56.29 | 11.0 |
| 70.1% |
2030 & Thereafter(3) | 31 | 648,525 | 27.0 |
| 2,230,620 | 92.9% | $60.44 | 29.9 |
| 100.0% |
Vacant | NAP | 171,021 | 7.1 |
| 2,401,641 | 100.0% | NAP | NAP |
|
|
Total / Wtd. Avg. | 187 | 2,401,641 | 100.0 | % |
|
| $58.80 | 100.0 | % |
|
| (1) | Based on the underwritten rent roll dated October 1, 2019. |
| (2) | Certain tenants may have termination or contraction options (which may become exercisable prior to the originally stated expiration date of the tenant lease) that are not considered in the above Lease Rollover Schedule. |
| (3) | 2030 & Thereafter is inclusive of amenity space. |
THE INFORMATION IN THIS STRUCTURAL AND COLLATERAL TERM SHEET IS NOT COMPLETE AND MAY BE AMENDED PRIOR TO THE TIME OF SALE. THIS TERM SHEET IS NOT AN OFFER TO SELL THESE SECURITIES AND IT IS NOT A SOLICITATION OF AN OFFER TO BUY THESE SECURITIES IN ANY JURISDICTION WHERE THE OFFER OR SALE IS NOT PERMITTED.
28
2029 & 2049 Century Park East Los Angeles, CA 90067 | Collateral Asset Summary – Loan No. 1 Century Plaza Towers | Cut-off Date Balance: Cut-off Date LTV: U/W NCF DSCR: U/W NOI Debt Yield: | $75,000,000 39.1% 4.09x 13.5% |
The Century Plaza Towers Property consists of two Class A, 44-story, trophy, office towers and contains 2,401,641 sq. ft. of office space and a lower level retail concourse. In addition, the Century Plaza Towers Property has an underground garage containing a total of 6,566 parking spaces (of which 5,907 spaces are part of the collateral for the Century Plaza Towers Whole Loan). The Century Plaza Towers Property was originally developed in 1975 for Aluminum Company of America (“Alcoa”) and was designed by Minoru Yamasaki.
The Century Plaza Towers Property includes 26,000 sq. ft. column-free flexible floor plates. The Century Plaza Towers Property underwent an $80.0 million renovation in 2008 and has had approximately $48.0 million of capital expenditures invested since 2014, including a multi-year program currently underway to fully renovate all restrooms, multi-tenant corridors, and elevator lobbies; nearly $28.0 million has been invested since 2015. Together with the property located at 2000 Avenue of the Stars (which is also owned by the loan sponsor), the Century Plaza Towers Property is part of Century Park, a 14-acre campus that includes a four-acre central park, restaurants, cafes, and other amenity retail.
As of October 1, 2019, the Century Plaza Towers Property was 92.9% leased to 122 distinct tenants operating in a variety of industries including financial services, insurance, legal, technology and real estate. The Century Plaza Towers Property tenants have a weighted average remaining lease term of approximately 7.7 years as of October 1, 2019.
Major Tenants.
Bank of America (149,508 sq. ft.; 6.2% of NRA; 6.5% of U/W Base Rent) The largest tenant, Bank of America is an investment and retail banking institution and financial services company based in Charlotte, North Carolina. It is the second largest banking institution in the United States by total assets. The institution’s corporate and investment banking division operates under the name Bank of America Merrill Lynch. Bank of America occupies four suites in the south tower on the 1st, 2nd, 11th and 12th floors totaling 98,059 sq. ft. Bank of America has signed a lease for an additional 26,664 sq. ft. on the 13th floor of the South Tower and is expected to begin paying rent and take occupancy in January 2020. Merrill Lynch occupies one suite in the North Tower totaling 24,785 sq. ft. The firm pays approximately $54 to $61 of gross rent PSF across the North and South Towers. Bank of America has been at the Century Plaza Towers Property since 1994. With respect to the additional space in the South Tower, we cannot assure you that Bank of America will begin paying rent or take occupancy as expected or at all.
Manatt Phelps (116,366 sq. ft.; 4.8% of NRA; 5.5% of U/W Base Rent) Manatt Phelps is a Los Angeles-based law firm that has practices focused on banking, entertainment, media, technology, retail and consumer products, and real estate and energy. Founded in 1965, Manatt Phelps employs over 450 attorneys across Los Angeles, New York, Palo Alto, San Francisco, Orange County, Chicago, Washington, D.C. and Boston. The firm is ranked #105 in the 2019 Am Law rankings. Manatt Phelps has signed a lease for five suites in the South Tower on the 4th, 14th, 15th, 16th and 17th floors totaling 116,366 sq. ft. and is expected to begin paying rent and take occupancy in stages starting in March 2020, with full occupancy of the space expected by May 2020. Manatt Phelps’s contractual rent under its lease is $62 gross rent PSF. We cannot assure you that Manatt Phelps will begin paying rent or take occupancy as expected or at all.
JPMorgan (97,726 sq. ft.; 4.1% of NRA; 4.2% of U/W Base Rent) JPMorgan was founded in 1871, JPMorgan (NYSE: JPM) is a commercial, investment and retail banking institution founded by J.P. Morgan. Headquartered in New York City, JPMorgan is the largest bank in the United States. JPMorgan is affiliated with the borrower. JPMorgan occupies four suites in the North Tower on the 37th, 38th, 39th and 41st floors totaling 97,726 sq. ft. and pays $57 gross rent PSF. JPMorgan has been at the Century Plaza Towers Property since 2011.
Environmental Matters. The Phase I environmental report dated October 15, 2019 recommended no further action at the Century Plaza Towers Property.
The Market. The Century Plaza Towers Property is located in the Century City submarket of West Los Angeles, California. Situated between Beverly Hills to the east, Westwood, Brentwood, and Santa Monica to the west, and the residential neighborhoods of Bel Air, Holmby Hills, and Hollywood Hills to the north, Century City is located near the Westside’s amenities and housing communities. The Century Plaza Towers Property has access to the Santa Monica (I-10) and San Diego (I-405) Freeways and several additional major east-west thoroughfares including Santa Monica Boulevard and Olympic Boulevard.
Prior to the economic downturn in 2007-2008, vacancy rates in the Century City submarket declined to single digits, and reached an historical low direct vacancy rate of 7.1% in 2006. As the economic downturn affected the area, vacancy rates began to increase to 14.4% in 2010. As of year-end 2017, direct vacancy in the Century City submarket declined slightly to 8.2%, representing a 3.6% decrease since 2015. As of the second quarter in 2019, the direct vacancy rate was 6.1%, 80 basis points lower than year-end 2018 (6.9%).
The appraisal identified seven directly competitive office sales comparables in the Los Angeles market. Comparable buildings were built between 1925 and 2017 and range in size from 201,922 sq. ft. to 1,006,645 sq. ft. The weighted average occupancy of the sales comparables was 82.8% and the weighted average sales price PSF was approximately $830.23. Through the first half of 2019, asking rates increased slightly by 1.1% to $52.72 PSF.
THE INFORMATION IN THIS STRUCTURAL AND COLLATERAL TERM SHEET IS NOT COMPLETE AND MAY BE AMENDED PRIOR TO THE TIME OF SALE. THIS TERM SHEET IS NOT AN OFFER TO SELL THESE SECURITIES AND IT IS NOT A SOLICITATION OF AN OFFER TO BUY THESE SECURITIES IN ANY JURISDICTION WHERE THE OFFER OR SALE IS NOT PERMITTED.
29
2029 & 2049 Century Park East Los Angeles, CA 90067 | Collateral Asset Summary – Loan No. 1 Century Plaza Towers | Cut-off Date Balance: Cut-off Date LTV: U/W NCF DSCR: U/W NOI Debt Yield: | $75,000,000 39.1% 4.09x 13.5% |
Cash Flow Analysis.
| Cash Flow Analysis | |||||||
| 2016 | 2017 | 2018 | T-12 9/30/2019 | U/W | U/W PSF | ||
Base Rent(1) | $93,728,374 | $96,736,098 | $101,042,428 | $97,138,295 | $131,169,730 | $54.62 | ||
Vacant Income | 0 | 0 | 0 | 0 | 14,339,776 | 5.97 | ||
Gross Potential Rent | $93,728,374 | $96,736,098 | $101,042,428 | $97,138,295 | $145,509,506 | $60.59 | ||
Total Reimbursements | 2,366,196 | 3,084,229 | 4,320,460 | 4,341,561 | 3,618,229 | 1.51 | ||
Parking Income | 15,328,900 | 14,885,609 | 14,507,607 | 14,942,509 | 14,942,509 | 6.22 | ||
Termination Fees(2) | 73,059 | 100,000 | 2,379,522 | 1,206,827 | 0 | 0.00 | ||
Other Income | 2,443,068 | 2,573,150 | 3,067,428 | 3,261,468 | 3,261,468 | 1.36 | ||
Less: Vacancy | 0 | 0 | 0 | 0 | (8,715,744) | (3.63) | ||
Effective Gross Income | $113,939,597 | $117,379,087 | $125,317,446 | $120,890,660 | $158,615,968 | $66.04 | ||
Total Fixed Expenses | 10,597,318 | 10,746,959 | 10,885,265 | 10,991,770 | 10,951,732 | 4.56 | ||
Total Operating Expenses | 22,558,934 | 23,431,996 | 25,407,626 | 26,555,972 | 26,518,479 | 11.04 | ||
Net Operating Income(3)(4) | $80,783,345 | $83,200,132 | $89,024,555 | $83,342,918 | $121,145,756 | $50.44 | ||
TI/LC | 0 | 0 | 0 | 0 | 8,415,062 | 3.50 | ||
Capital Expenditures | 0 | 0 | 0 | 0 | 480,328 | 0.20 | ||
Net Cash Flow | $80,783,345 | $83,200,132 | $89,024,555 | $83,342,918 | $112,250,366 | $46.74 | ||
| (1) | U/W Base Rent is based on the underwritten rent roll dated October 1, 2019 inclusive of rent steps through October 2020. |
| (2) | 2018 Termination Fees are associated with the City National Bank and Tang Media. 2019 termination fees are due to Tribune Entertainment and BUSA. |
| (3) | The increase in 2018 Net Operating Income from 2017 Net Operating Income is primarily attributable to an approximately $2.4 million fee associated with City National Bank and Tang Media’s termination. |
| (4) | The increase in U/W Net Operating Income from T-12 9/30/2019 Net Operating Income is primarily attributable to (i) $2,354,778 in straight line rent taken through the earlier of the loan term or the lease term for fourteen tenants, (ii) $3,269,254 of rent steps taken through October 2020 and (iii) new leasing that has been executed since September 2019, accounting for 20.6% of NRA and 24.6% of U/W Gross Potential Rent. We cannot assure you that these tenants will begin paying rent or take occupancy as expected or at all. |
Property Management. The Century Plaza Towers Property is managed by CBRE, Inc.
Lockbox / Cash Management. The Century Plaza Towers Whole Loan is structured with a hard lockbox and will have springing cash management during a Trigger Period (as defined below). At origination, a clearing account controlled by the lender (the “Clearing Account”) was established by the borrower, into which all rents, revenues and receipts from the Century Plaza Towers Property are required to be deposited directly by the tenants (with respect to rents). If no Trigger Period exists, the funds in the Clearing Account will be swept on each business day into the borrower’s operating account and, if a Trigger Period exists, such funds will be swept on each business day into a deposit account controlled by the lender (the “CMA”) at a financial institution selected by the lender.
During a Trigger Period, all amounts on deposit in the CMA will be applied to the payment of all monthly amounts due under the Century Plaza Towers Whole Loan documents (including, without limitation, monthly deposits for reserves for taxes and insurance (unless an acceptable blanket policy is in place with regards to insurance), debt service and all other required reserves) and all property costs and expenses set forth in the lender-approved budget. Any funds remaining thereafter will be transferred to a cash collateral account, as additional collateral for the Century Plaza Towers Whole Loan. Under certain circumstances and for limited purposes described in the Century Plaza Towers Whole Loan documents, the borrower may request disbursements of such excess cash flow.
A “Trigger Period” means any period when there exists (i) an uncured event of default under the Century Plaza Towers Whole Loan documents or under a permitted mezzanine loan (as described below) or (ii) a Low Debt Yield Trigger (as defined below).
A “Low Debt Yield Trigger” will occur if the aggregate debt yield on the Century Plaza Towers Whole Loan and any mezzanine loan is less than 5.0% at the end of two consecutive calendar quarters. A Low Debt Yield Trigger will cease to exist if such combined debt yield exceeds 5.0% at the end of any two consecutive quarters. The debt yield may be tested by the lender quarterly.
Initial and Ongoing Reserves. At loan origination, the borrower deposited (i) approximately $71,223,945 into a TI/LC reserve for outstanding landlord work and tenant allowances and (ii) approximately $29,545,735 into a free rent reserve. There are springing reserves during the continuation of a Trigger Period for real estate taxes and insurance premiums.
THE INFORMATION IN THIS STRUCTURAL AND COLLATERAL TERM SHEET IS NOT COMPLETE AND MAY BE AMENDED PRIOR TO THE TIME OF SALE. THIS TERM SHEET IS NOT AN OFFER TO SELL THESE SECURITIES AND IT IS NOT A SOLICITATION OF AN OFFER TO BUY THESE SECURITIES IN ANY JURISDICTION WHERE THE OFFER OR SALE IS NOT PERMITTED.
30
2029 & 2049 Century Park East Los Angeles, CA 90067 | Collateral Asset Summary – Loan No. 1 Century Plaza Towers | Cut-off Date Balance: Cut-off Date LTV: U/W NCF DSCR: U/W NOI Debt Yield: | $75,000,000 39.1% 4.09x 13.5% |
Current Mezzanine or Subordinate Indebtedness. The Century Plaza Towers Subordinate Notes have an aggregate outstanding principal balance as of the Cut-off Date of $300.0 million and accrue interest at a fixed rate of 3.00450% per annum. Each of the Century Plaza Towers Subordinate Notes have a 120-month term and is interest only for the full term. For additional information, see “Description of the Mortgage Pool—The Whole Loans—The Non-Serviced AB Whole Loans—The Century Plaza Towers Whole Loan” in the Preliminary Prospectus.
Future Mezzanine or Subordinate Indebtedness Permitted. The borrower will have a one-time right to cause its owners to incur a mezzanine loan, provided, among other conditions: (i) the aggregate loan-to-value ratio of the Century Plaza Towers Whole Loan and the mezzanine loan is equal to or less than 52.1% (or if a partial prepayment of the Century Plaza Towers Whole Loan has occurred in connection with a conversion, 51.1%), (ii) the aggregate debt service coverage ratio of the Century Plaza Towers Whole Loan and the mezzanine loan is equal to or greater than 3.12x (or if a partial prepayment of the Whole Loan has occurred in connection with a conversion, 3.18x), (iii) the aggregate debt yield of the Century Plaza Towers Whole Loan and the mezzanine loan is equal to or greater than 9.5% (or if a partial prepayment of the Century Plaza Towers Whole Loan has occurred in connection with a conversion (as defined under “Transfer of Development Credits” below), 9.7%), (iv) the mezzanine loan is coterminous with the Century Plaza Towers Whole Loan and (v) the mezzanine borrower enters into a customary intercreditor agreement acceptable to the lender and each Rating Agency.
Partial Release. None.
Transfer of Development Credits. Provided that no event of default under the Century Plaza Towers Whole Loan has occurred and is continuing, the borrower will have the right to perform a Conversion (as defined below), provided that the following conditions are satisfied: (i) such Conversion may not, and may not be reasonably expected to, have a material adverse effect upon, among other things, the value, use or operation of the Century Plaza Towers Property, and (ii) the lender has approved all plans and specification for such Conversion, such approval not to be unreasonably withheld, conditioned or delayed. Provided that no event of default under the Century Plaza Towers Whole Loan is then continuing, the borrower will be permitted to transfer the development credits associated with the Conversion Space (as defined below) to an affiliate in connection with the anticipated commencement of the construction of an additional building at the 2000 Avenue of the Stars parcel owned by such affiliate or to a third party in connection with a sale of the 2000 Avenue of the Stars parcel to a third party, provided that, among other things, (A) such transfer may not, and may not be reasonably expected to, have a material adverse effect upon, among other things, the value, use or operation of the Century Plaza Towers Property, (B) the borrower prepays the Century Plaza Towers Whole Loan in the amount of $30,000,000.00 with the payment of a prepayment fee equal to the greater of a yield maintenance fee and 1% of the unpaid principal balance of the Century Plaza Towers Whole Loan, and (C) REMIC requirements are satisfied. If a transfer involves the proposed project at 2000 Avenue of the Stars, the borrower is permitted to initially post cash or a letter of credit in the required amount in lieu of making a prepayment. In this event, the prepayment will be due (and the posted amount so applied) upon the issuance of a building permit for the proposed project at 2000 Avenue of the Stars or the posted amount will be returned upon a re-transfer of the development credits to the borrower.
A “Conversion” means a conversion of the windowless top-two floors of each tower of the Century Plaza Towers Property (the “Conversion Space”) into non-occupiable space in accordance with all applicable legal requirements.
THE INFORMATION IN THIS STRUCTURAL AND COLLATERAL TERM SHEET IS NOT COMPLETE AND MAY BE AMENDED PRIOR TO THE TIME OF SALE. THIS TERM SHEET IS NOT AN OFFER TO SELL THESE SECURITIES AND IT IS NOT A SOLICITATION OF AN OFFER TO BUY THESE SECURITIES IN ANY JURISDICTION WHERE THE OFFER OR SALE IS NOT PERMITTED.
31
180 Water Street | Collateral Asset Summary – Loan No. 2 | Cut-off Date Balance: | $62,500,000 |

THE INFORMATION IN THIS STRUCTURAL AND COLLATERAL TERM SHEET IS NOT COMPLETE AND MAY BE AMENDED PRIOR TO THE TIME OF SALE. THIS TERM SHEET IS NOT AN OFFER TO SELL THESE SECURITIES AND IT IS NOT A SOLICITATION OF AN OFFER TO BUY THESE SECURITIES IN ANY JURISDICTION WHERE THE OFFER OR SALE IS NOT PERMITTED.
THE INFORMATION IN THIS STRUCTURAL AND COLLATERAL TERM SHEET IS NOT COMPLETE AND MAY BE AMENDED PRIOR TO THE TIME OF SALE. THIS TERM SHEET IS NOT AN OFFER TO SELL THESE SECURITIES AND IT IS NOT A SOLICITATION OF AN OFFER TO BUY THESE SECURITIES IN ANY JURISDICTION WHERE THE OFFER OR SALE IS NOT PERMITTED.
32
180 Water Street | Collateral Asset Summary – Loan No. 2 | Cut-off Date Balance: | $62,500,000 |
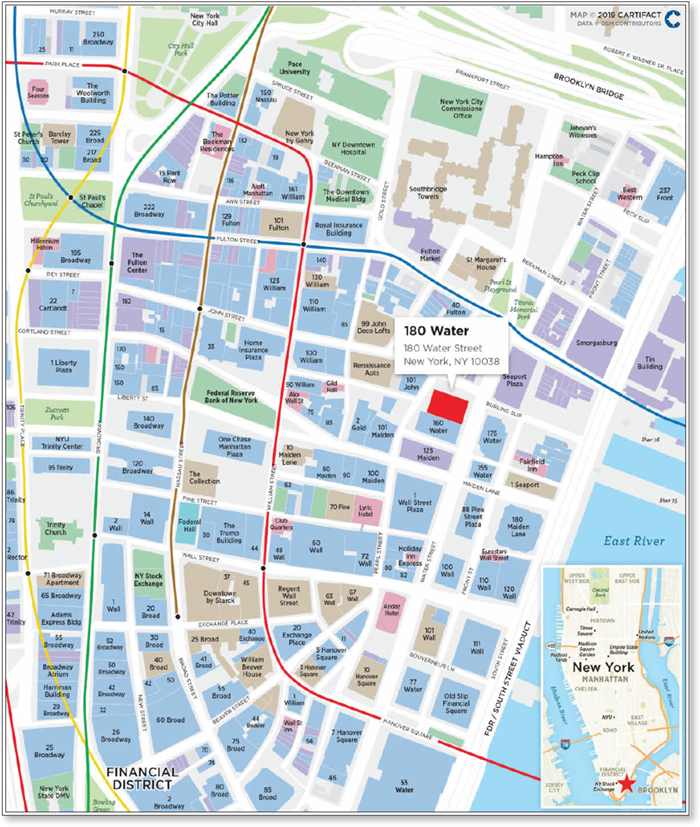
THE INFORMATION IN THIS STRUCTURAL AND COLLATERAL TERM SHEET IS NOT COMPLETE AND MAY BE AMENDED PRIOR TO THE TIME OF SALE. THIS TERM SHEET IS NOT AN OFFER TO SELL THESE SECURITIES AND IT IS NOT A SOLICITATION OF AN OFFER TO BUY THESE SECURITIES IN ANY JURISDICTION WHERE THE OFFER OR SALE IS NOT PERMITTED.
33
180 Water Street | Collateral Asset Summary – Loan No. 2 | Cut-off Date Balance: | $62,500,000 |
Mortgage Loan Information | |
Loan Seller: | GACC |
Loan Purpose: | Refinance |
Credit Assessment |
|
(Fitch/KBRA/Moody’s)(9): | BBB-sf / A(sf) / A2 |
Borrower Sponsor: | Nathan Berman |
Borrower: | 180 Water LLC |
Original Balance(1): | $62,500,000 |
Cut-off Date Balance(1): | $62,500,000 |
% by Initial UPB: | 6.1% |
Interest Rate: | 3.410377% |
Payment Date: | 6th of each month |
First Payment Date: | December 6, 2019 |
Maturity Date: | November 6, 2024 |
Amortization: | Interest Only |
Additional Debt(1)(2): | $75,000,000 Pari Passu Debt; $127,500,000 Subordinate Debt; $100,000,000 Mezzanine Loan; Future Mezzanine Debt Permitted |
Call Protection(3): | L(25), D(31), O(4) |
Lockbox / Cash Management: | Hard / In Place |
Reserves(4) | |||
| Initial | Monthly | Cap |
Taxes: | $2,830,078 | $739,930 | NAP |
Insurance: | $100,505 | $82,813 | NAP |
Replacement: | $0 | $11,936 | NAP |
TI/LC: | $333,406 | $0 | NAP |
Conversion: | $1,808,900 | $0 | NAP |
Operating Shortfall(4)(8): | $1,400,000 | $0 | NAP |
Prepaid Rent(4): | $891,146 | Springing | NAP |
Property Information | |
Single Asset / Portfolio: | Single Asset |
Property Type: | High Rise Multifamily |
Collateral: | Fee Simple |
Location: | New York, NY |
Year Built / Renovated: | 1971 / 2017 |
Total Units: | 573 |
Property Management: | Metro Loft Management, LLC |
Underwritten NOI(5): | $15,073,087 |
Underwritten NCF: | $14,955,732 |
Appraised Value(6): | $451,500,000 |
Appraisal Date: | September 18, 2019 |
| |
Historical NOI(7) | |
Most Recent NOI(5): | $13,118,762 (T-12 June 30, 2019) |
2018 NOI: | $11,665,024 (December 31, 2018) |
2017 NOI: | NAV |
2016 NOI: | NAV |
| |
Historical Occupancy(7) | |
Most Recent Occupancy: | 97.0% (October 17, 2019) |
2018 Occupancy: | 96.0% (December 31, 2018) |
2017 Occupancy: | NAV |
2016 Occupancy: | NAV |
Financial Information(1) | ||||||
Tranche | Cut-off Date | Balance per Unit Cut-off / Balloon | LTV Cut-off / Balloon | U/W DSCR NOI / NCF(8) | U/W Debt Yield NOI / NCF | U/W Debt Yield at Balloon NOI / NCF |
Mortgage Loan | $62,500,000 |
|
|
|
|
|
Pari Passu Notes | 75,000,000 |
|
|
|
|
|
Total Senior Notes | $137,500,000 | $239,965 / $239,965 | 30.5% / 30.5% | 3.17x / 3.15x | 11.0% / 10.9% | 11.0% / 10.9% |
Subordinate Note | 127,500,000 |
|
|
|
|
|
Whole Loan | $265,000,000 | $462,478 / $462,478 | 58.7% / 58.7% | 1.64x / 1.63x | 5.7% / 5.6% | 5.7% / 5.6% |
Mezzanine Loan | 100,000,000 |
|
|
|
|
|
Total Debt | $365,000,000 | $636,998 / $636,998 | 80.8% / 80.8% | 0.86x / 0.85x | 4.1% / 4.1% | 4.1% / 4.1% |
(1) | The 180 Water Loan (as defined below) is part of a whole loan evidenced by five pari passu senior notes with an aggregate outstanding principal balance as of the Cut-off Date of $137.5 million and one subordinate note with a principal balance as of the Cut-off Date of $127.5 million. See “The Loan” herein. |
(2) | See “Current Mezzanine or Subordinate Indebtedness” and “Future Mezzanine or Subordinate Indebtedness Permitted” herein. |
(3) | The lockout period will be at least 25 payments beginning with and including the first payment date of December 6, 2019. The borrower has the option to defease the full $265.0 million 180 Water Whole Loan (as defined below) after the earlier to occur of (i) two years after the closing date of the securitization that includes the last pari passu senior note to be securitized and (ii) December 6, 2022. The assumed lockout period of 25 months is based on the expected closing date of the COMM 2019-GC44 securitization in December 2019. The actual lockout period may be longer. |
(4) | See “Initial and Ongoing Reserves” herein. The Operating Shortfall Reserve includes $200,000 which was deposited by the borrower on November 6, 2019. The Prepaid Rent Reserve represents the $891,146 deposit the borrower made on November 6, 2019. |
(5) | The increase in Underwritten NOI from Most Recent NOI is a result of the lease up and stabilization of occupancy and rents for the residential component of the 180 Water Property (as defined below) and signing of two retail leases. |
(6) | Based on the as-is appraised value. The appraisal also concluded to (i) an “Alternate As-Is” appraised value of $453.5 million and (ii) a “Prospective As Complete” appraised value of $458.5 million. The “Alternate As-Is” value is based on the assumption that the remaining planned capital expenditures for the mezzanine unit additions are fully funded and reserved by the lender, and that these reserved funds would pass with title to any purchaser of the 180 Water Property. The “Prospective As Complete” appraised value assumes the completion of the construction of seven additional residential units to be located on the mezzanine floor of the 180 Water Property as described below. At loan origination, the borrower reserved approximately $1.8 million for the conversion and completion of the mezzanine units. |
(7) | The 180 Water Property was renovated in 2017, therefore Historical NOI and Historical Occupancy information prior to 2018 is not available. |
(8) | At loan origination, the borrower deposited $1.2 million into a shortfall reserve with an additional $200,000 deposited on November 6, 2019. The shortfall reserve will be available to cover cash flow shortfalls in debt service on the Total Debt (as defined below), reserves and operating expenses until the Total Debt debt service coverage ratio is equal to 1.15x. See “Escrows and Reserves” below. The borrower’s current business plan is to (i) lease-up the 180 Water Property’s retail component and (ii) complete the conversion of additional mezzanine space between the grade level and the second floor into seven additional residential units (which is expected to be completed in December 2019). See “The Property” below. |
(9) | Fitch, KBRA and Moody’s provided the listed assessments for the 180 Water Loan in the context of its inclusion in the mortgage pool. |
THE INFORMATION IN THIS STRUCTURAL AND COLLATERAL TERM SHEET IS NOT COMPLETE AND MAY BE AMENDED PRIOR TO THE TIME OF SALE. THIS TERM SHEET IS NOT AN OFFER TO SELL THESE SECURITIES AND IT IS NOT A SOLICITATION OF AN OFFER TO BUY THESE SECURITIES IN ANY JURISDICTION WHERE THE OFFER OR SALE IS NOT PERMITTED.
34
180 Water Street | Collateral Asset Summary – Loan No. 2 | Cut-off Date Balance: | $62,500,000 |
The Loan. The 180 Water mortgage loan (the “180 Water Loan”) is part of a whole loan (the “180 Water Whole Loan”) consisting of five pari passu senior notes with an aggregate outstanding principal balance as of the Cut-off Date of $137.5 million (collectively the “180 Water Senior Notes”) and one subordinate note with an outstanding principal balance as of the Cut-off Date of $127.5 million (the “180 Water Subordinate Note”). The 180 Water Whole Loan is secured by the borrower’s fee simple interest in a 573 unit, Class A, high-rise multifamily property, with ground floor retail, located in the Financial District of New York, New York (the “180 Water Property”). The 180 Water Subordinate Note will be an asset of the trust but will not be pooled together with the other mortgage loans, and payments of interest and principal received in respect of the 180 Water Subordinate Note will be available only to make distributions in respect of the loan-specific classes of certificates.
The relationship between the holders of the 180 Water Whole Loan will be governed by a co-lender agreement as described under “Description of the Mortgage Pool—The Whole Loans—The Serviced AB Whole Loan—180 Water Whole Loan” in the Preliminary Prospectus.
Whole Loan Summary | |||||
Note | Original Balance | Cut-off Date Balance |
| Note Holder | Controlling Piece |
A-1 | $50,000,000 | $50,000,000 |
| Benchmark 2019-B14(1) | No(2) |
A-2 | 40,000,000 | 40,000,000 |
| COMM 2019-GC44 | No |
A-3 | 25,000,000 | 25,000,000 |
| DBRI(3) | No |
A-4 | 15,000,000 | 15,000,000 |
| COMM 2019-GC44 | No |
A-5 | 7,500,000 | 7,500,000 |
| COMM 2019-GC44 | No |
Senior Notes | $137,500,000 | $137,500,000 |
|
|
|
B | 127,500,000 | 127,500,000 |
| COMM 2019-GC44 (loan-specific certificates) | Yes(2) |
Whole Loan | $265,000,000 | $265,000,000 |
|
|
|
(1) | The Benchmark 2019-B14 securitization transaction is expected to close prior to the Closing Date. |
(2) | The initial controlling note is the 180 Water Subordinate Note, so long as no control appraisal period with respect to the 180 Water Whole Loan is continuing. If and for so long as a control appraisal period with respect to the 180 Water Whole Loan has occurred and is continuing, then the controlling note will be Note A-1, which will not be included in the trust. See “Description of the Mortgage Pool—The Whole Loans—The Serviced Pari Passu-AB Whole Loan—180 Water Whole Loan”. |
(3) | Expected to be contributed to one or more future securitization transactions. |
The 180 Water Whole Loan has a five-year term with interest only payments during the loan term. The 180 Water Whole Loan has an interest rate of 3.410377% per annum. The proceeds of the 180 Water Whole Loan, the Mezzanine Loan (as defined below) and new cash contribution from the borrower sponsor were primarily used to pay off existing debt, fund reserves and pay closing costs. Based on the “as is” appraised value of $451.5 million as of September 18, 2019 and Cut-off Date balance of the 180 Water Senior Notes, the Cut-off Date LTV Ratio is 30.5%.
Sources and Uses | ||||||
Sources | Proceeds | % of Total |
| Uses | Proceeds | % of Total |
Whole Loan | $265,000,000 | 68.4% |
| Loan Payoff | $378,415,399 | 97.7% |
Mezzanine Loan | 100,000,000 | 25.8 |
| Closing Costs | 2,746,128 | 0.7 |
Sponsor Equity | 22,434,416 | 5.8 |
| Upfront Reserves | 6,272,889 | 1.6 |
Total Sources | $387,434,416 | 100.0% |
| Total Uses | $387,434,416 | 100.0% |
The Borrower / Borrower Sponsors. The borrower is 180 Water LLC, a single purpose Delaware limited liability company structured to be bankruptcy remote with two independent directors in the organizational structure. Legal counsel to the borrower delivered a non-consolidation opinion in connection with the origination of the 180 Water Whole Loan. The borrower sponsor and nonrecourse carve-out guarantor is Nathan Berman.
Nathan Berman is the founder and owner of Metro Loft Management LLC (“Metro Loft”), a vertically integrated real estate development and management company. Based in New York, Metro Loft focuses on luxury rental and developmental properties in lower Manhattan and is the largest residential manager in downtown Manhattan. Nathan Berman is a developer who has renovated and constructed 14 other former office buildings into residential apartments and condos, including 20 Exchange Place, 63 Wall Street, 116 John Street, 17 John Street, 84 William Street, 135 William Street, 71 Leonard Street, 47 Ann Street, and 443 Greenwich Street.
THE INFORMATION IN THIS STRUCTURAL AND COLLATERAL TERM SHEET IS NOT COMPLETE AND MAY BE AMENDED PRIOR TO THE TIME OF SALE. THIS TERM SHEET IS NOT AN OFFER TO SELL THESE SECURITIES AND IT IS NOT A SOLICITATION OF AN OFFER TO BUY THESE SECURITIES IN ANY JURISDICTION WHERE THE OFFER OR SALE IS NOT PERMITTED.
35
180 Water Street | Collateral Asset Summary – Loan No. 2 | Cut-off Date Balance: | $62,500,000 11.0% |
The Property.
Multifamily Unit Mix(1)(2) | ||||||
Unit Type | # of Units | % of Total Units | Occupancy | Average Unit Size (Sq. Ft.) | Average Rent Per Unit | Average Rent PSF/Year |
Studio | 256 | 44.7% | 96.9% | 455 | $3,165 | $83.64 |
1BR/1BA | 166 | 29.0 | 99.4% | 623 | $4,251 | $81.78 |
1BR/2BA | 50 | 8.7 | 98.0% | 882 | $5,445 | $74.18 |
2BR/2BA | 53 | 9.2 | 98.1% | 878 | $5,641 | $77.32 |
3BR/3BA | 48 | 8.4 | 87.5% | 1,258 | $7,965 | $76.04 |
Total / Wtd. Avg. | 573 | 100.0% | 97.0% | 648 | $4,283 | $80.03 |
(1) | Based on the underwritten rent roll dated October 17, 2019. |
(2) | Occupancy, Average Unit Size (Sq. Ft.), and Average Monthly In-Place Rents represent a weighted average of the various unit type layouts. |
Retail Tenant Summary(1) | ||||||
Tenant | Credit Rating (Fitch/Moody’s/S&P)(1) | Net Rentable Area | % of Net Rentable Area | U/W Base Rent PSF | % of Total U/W Base Rent | Lease Expiration |
Citibank | A / A3 / BBB+ | 3,496 | 25.4% | $225.00 | 82.2% | 2/28/2029 |
Dunkin Donuts | NR / NR / NR | 750 | 5.4 | $226.67 | 17.8 | 8/31/2029 |
Total Occupied |
| 4,246 | 30.8% | $225.29 | 100.0% |
|
Vacant |
| 9,527 | 69.2 |
|
|
|
Total / Wtd. Avg. |
| 13,773 | 100.0% |
|
|
|
|
|
|
|
|
|
|
(1) | Based on the underwritten rent roll dated June 30, 2019. |
The 180 Water Property is a Class A, 573-unit multifamily property located in the Financial District of Manhattan, New York. The 180 Water Property was constructed in 1971 as an office building and was converted into a high-rise multifamily building with ground floor retail, following a gut renovation that was completed in 2017.
Each residential unit features high-end finishes, 8 to 11 foot ceiling heights, and in-unit washer/dryers. The 180 Water Property features 17,184 sq. ft. of amenity space that includes a rooftop pool, landscaped and furnished rooftop terrace, fitness facility, personal storage and bike storage units, 24-hour doorman, on-site valet and on-site concierge (dry cleaning, maid service, laundry and pet care, among others).
As of October 17, 2019, the 180 Water Property residential space was 97.0% occupied with a weighted average rent of $4,283 per unit. The 180 Water Property has 13,773 sq. ft. of ground floor retail occupied by Dunkin Donuts and Citibank collectively. In July 2018, Dunkin Donuts signed a 10-year lease for 750 sq. ft. on the ground floor plus an additional 200 sq. ft. of mezzanine space, and Citibank (rated A/A3/BBB+ by Fitch/Moody’s/S&P) executed a 10-year, 3,496 sq. ft. lease in April 2019. In addition, there is an outstanding letter of intent for Neapolitan Express to occupy approximately 650 sq. ft. at $211 PSF on a 10-year lease (however we cannot assure you that Neapolitan Express will execute its lease or take occupancy as expected or at all).
The borrower currently plans to lease-up the 180 Water Property’s retail component, which is 30.8% occupied as of June 30, 2019, however, the borrower is under no obligation to do so. The borrower also plans, and is required under the 180 Water Whole Loan documents, to complete the conversion of additional mezzanine space between the grade level and the second floor into seven additional residential units (expected to be completed in December 2019). The lease up of the retail component and the construction and lease up of the additional mezzanine units is estimated to add approximately $1.1 million and $400,000 to net cash flow, respectively. We cannot assure you as to whether or when the seven additional residential units will be constructed, or whether such residential units or additional retail units will be leased, or of the rental rates or income on any such units. At loan origination, the borrower deposited approximately $1.8 million into a conversion holdback reserve for the completion of the seven residential units and $333,406 into a rollover reserve for future tenant improvements and leasing commissions.
Environmental Matters. According to Phase I environmental report, dated September 30, 2019, there are no recognized environmental conditions at the 180 Water Property.
The Market. The 180 Water Property is located at the southwest corner of John Street and Water Street in the Financial District of downtown Manhattan. The 180 Water Property is located four blocks from the Fulton Transit Center, two blocks from the FDR Highway, four blocks from the Brooklyn Bridge and is serviced by 12 different New York City subway lines, the PATH trains and numerous bus and ferry lines. According to the appraisal, the 180 Water Property is located in the Financial District residential submarket. As of the second quarter of 2019, the Financial District residential inventory consisted of 26,101 units with a 2.0% vacancy rate and average rent of $4,238 per unit. According to the appraisal, the 2019 estimated population within the 10038 zip code is 21,826; while the 2019 estimated average household income within the zip code is $154,459.
THE INFORMATION IN THIS STRUCTURAL AND COLLATERAL TERM SHEET IS NOT COMPLETE AND MAY BE AMENDED PRIOR TO THE TIME OF SALE. THIS TERM SHEET IS NOT AN OFFER TO SELL THESE SECURITIES AND IT IS NOT A SOLICITATION OF AN OFFER TO BUY THESE SECURITIES IN ANY JURISDICTION WHERE THE OFFER OR SALE IS NOT PERMITTED.
36
180 Water Street | Collateral Asset Summary – Loan No. 2 | Cut-off Date Balance: | $62,500,000 11.0% |
The appraisal identified five comparable multifamily properties proximate to the 180 Water Property. The 180 Water Property comparables range from 475 to 650 units with an average of 580 units. Residential lease comparables are presented in the table below.
Residential Lease Comparables(1) | |||||||||
Property Name | Distance from Subject | Year Built / Renovated | Number of Stories | Occupancy | No. Units | Unit Type | Lease Areas (SF) | Base Rent | Base Rent PSF |
95 Wall Street | 0.10 mile(s) | 1970 / 2008 | 22 | 97.0% | 507 | 0BR | 454 | $3,178 | $84.00 |
|
|
|
|
|
| 1BR | 678 | $4,035 | $71.42 |
|
|
|
|
|
| 2BR | 1079 | $6,000 | $66.73 |
|
|
|
|
|
|
|
|
|
|
2 Gold Street | 0.11 mile(s) | 2005 / NAP | 51 | 99.0% | 650 | 0BR | 446 | $3,090 | $83.14 |
|
|
|
|
|
| 1BR | 680 | $3,700 | $65.29 |
|
|
|
|
|
| 2BR | 880 | $5,740 | $78.27 |
|
|
|
|
|
|
|
|
|
|
10 Hanover Square | 0.11 mile(s) | 1971 / 2005 | 28 | 98.6% | 500 | 0BR | 545 | $3,277 | $72.15 |
|
|
|
|
|
| 1BR | 781 | $5,194 | $79.81 |
|
|
|
|
|
| 2BR | 1,161 | $6,292 | $65.03 |
|
|
|
|
|
|
|
|
|
|
63 Wall Street(2) | 0.10 mile(s) | 1928 / 2003 | 37 | 96.8% | 475 | 0BR | N/A | $3,150 | N/A |
|
|
|
|
|
| 1BR | N/A | $3,870 | N/A |
|
|
|
|
|
| 2BR | N/A | $5,435 | N/A |
|
|
|
|
|
| 3BR | 991 | $6,405 | $77.56 |
|
|
|
|
|
|
|
|
|
|
200 Water Street | 0.00 mile(s) | 1971 / 2009 | 32 | 98.6% | 576 | 0BR | 548 | $3,300 | $72.26 |
|
|
|
|
|
| 0BR | 632 | $3,525 | $66.93 |
|
|
|
|
|
| 1BR | 650 | $4,000 | $73.85 |
|
|
|
|
|
| 1BR | 722 | $4,350 | $72.30 |
|
|
|
|
|
| 2BR | 980 | $6,050 | $74.08 |
(1) Source: Appraisal.
(2) 63 Wall Street is owned by the borrower sponsor.
Cash Flow Analysis.
Cash Flow Analysis | ||||
| 2018 | T-12 6/30/2019 | U/W | U/W Per Unit(1) |
Residential Income |
|
|
|
|
Gross Potential Rent | $27,773,850 | $29,050,974 | $29,637,638 | $51,724 |
Vacancy | (433,534) | (1,076,071) | (1,063,154) | (1,855) |
Concessions | (1,744,444) | (916,613) | (418,728) | (731) |
Net Residential Income | $25,595,872 | $27,058,291 | $28,155,756 | $49,137 |
Commercial Income |
|
|
|
|
Commercial Income | 2,594,772 | 1,729,848 | 2,273,325 | 165 |
Vacancy | (2,465,454) | (1,729,848) | (1,316,725) | (96) |
Net Commercial Income | $129,318 | $0 | $956,600 | $69 |
Other Income(2) | 921,404 | 915,779 | 915,779 | 1,598 |
Effective Gross Income | $26,646,594 | $27,974,070 | $30,028,135 | $52,405 |
Total Variable Expenses | 5,159,727 | 5,336,195 | 5,369,020 | 9,370 |
Total Fixed Expenses | 9,821,843 | 9,519,113 | 9,586,028 | 16,730 |
Total Expenses | $14,981,570 | $14,855,308 | $14,955,048 | $26,100 |
Net Operating Income(3) | $11,665,024 | $13,118,762 | $15,073,087 | $26,306 |
Replacement Reserves | 0 | 0 | 117,355 | 205 |
Net Cash Flow | $11,665,024 | $13,118,762 | $14,955,732 | $26,101 |
(1) | Commercial Income related line items are based on the total commercial sq. ft. of 13,773. All other line items are based on the 573 residential units. |
(2) | Other Income includes surrender income, storage income, pool rental income, late fees, residential electric income, escalation and miscellaneous income. |
(3) | The increase in U/W Net Operating Income from T-12 6/30/2019 Net Operating Income is a result of the lease up and stabilization of occupancy and rents for the residential component of the 180 Water Property and signing of two retail leases. |
Property Management. The 180 Water Property is managed by Metro Loft Management, LLC, an affiliate of the borrower sponsor.
THE INFORMATION IN THIS STRUCTURAL AND COLLATERAL TERM SHEET IS NOT COMPLETE AND MAY BE AMENDED PRIOR TO THE TIME OF SALE. THIS TERM SHEET IS NOT AN OFFER TO SELL THESE SECURITIES AND IT IS NOT A SOLICITATION OF AN OFFER TO BUY THESE SECURITIES IN ANY JURISDICTION WHERE THE OFFER OR SALE IS NOT PERMITTED.
37
180 Water Street | Collateral Asset Summary – Loan No. 2 | Cut-off Date Balance: | $62,500,000 11.0% |
Lockbox / Cash Management. The 180 Water Whole Loan is structured with a hard lockbox and in place cash management. The related borrower is required to cause all rents to be deposited directly into the lender-controlled lockbox account. All funds received by the borrower or the manager are required to be deposited in the lockbox account within one business day following receipt. Funds on deposit in the lockbox account are required to be swept on each business day into a lender-controlled cash management account and applied on each payment date to the payment of debt service (which includes both the 180 Water Whole Loan and the Mezzanine Loan), the funding of required reserves and budgeted and approved extraordinary monthly operating expenses. Provided no Trigger Period (as defined below) is continuing, excess cash in the cash management account will be disbursed to the borrower in accordance with the 180 Water Loan documents. If a Trigger Period is continuing, excess cash in the cash management account will be transferred to an account held by the lender as additional collateral for the 180 Water Whole Loan. As of the origination date of the 180 Water Whole Loan, a Trigger Period existed as a result of a Low DSCR Period (as defined below) with respect to the Total Debt and with respect to the 180 Water Whole Loan.
A “Trigger Period” means a period commencing upon the occurrence of: (i) an event of default; (ii) a Low DSCR Period; or (iii) a default under the Mezzanine Loan.
A Trigger Period may be cured (a) with respect to clause (i) above, upon the acceptance by the lender of a cure of such event of default, (b) with respect to clause (ii) above, the debt service coverage ratio has satisfied the conditions as defined below or (c) with respect to clause (iii) above, upon the receipt by the lender of a notice from the mezzanine lender that such event of default has been cured.
A “Low DSCR Period” will commence upon (i) the aggregate debt service coverage ratio of the 180 Water Whole Loan and the Mezzanine Loan (or any replacement thereof described below) (together, the “Total Debt”) is less than 1.15x as of any calendar quarter or (ii) the debt service coverage ratio of the 180 Water Whole Loan is less than 2.21x as of any calendar quarters and will end if, (a) with respect to a Low DSCR Period continuing pursuant to clause (i), the 180 Water Property achieves an aggregate debt service coverage ratio for the Total Debt of at least 1.15x for two consecutive calendar quarters and (B) with respect to a Low DSCR Period continuing pursuant to clause (ii), the 180 Water Property has achieved a debt service coverage ratio for the 180 Water Whole Loan of at least 2.21x for two consecutive calendar quarters. As of the origination date of the 180 Water Whole Loan, a Low DSCR Period existed with respect to the Total Debt and with respect to the 180 Water Whole Loan.
Initial and Ongoing Reserves. At origination, the borrower deposited (i) $2,830,078 for a tax reserve, (ii) $100,505 for an insurance reserve, (iii) $333,406 for a rollover reserve, (iv) $1,200,000 into an operating shortfall reserve and (v) $1,808,900 into a conversion reserve. On November 6, 2019, the borrower deposited (i) $891,146 into a prepaid rent reserve and (ii) $200,000 into the shortfall reserve.
Tax Reserve – The borrower is required to deposit into a real estate tax reserve, on a monthly basis, 1/12 of the estimated annual real estate taxes (initially estimated at $739,930).
Insurance Reserve – The borrower is required to deposit into an insurance reserve, on a monthly basis, 1/12 of the estimated annual insurance premiums (initially estimated at $82,813), except that deposits will not be required with respect to the premiums for all risk insurance during any period when the borrower maintains coverage under a blanket insurance policy.
Replacement Reserve – The borrower is required to deposit into a replacement reserve, on a monthly basis commencing on November 6, 2019, $20.83 per residential unit (initially estimated at $11,936).
Shortfall Reserve – The shortfall reserve will be available to cover cash flow shortfalls in debt service on the Total Debt, reserves and operating expenses. If the lender determines that the balance of the shortfall reserve is less than the shortfalls expected to occur over the immediately succeeding three-month period, then the lender may notify the borrower, and the borrower will be required to deposit additional funds into the shortfall reserve such that the balance will cover all expected shortfalls to occur over the immediately succeeding six-month period. If the debt service coverage ratio of the Total Debt is equal to or greater than 1.15x as of the end of any calendar quarter and the debt service coverage ratio for the 180 Water Whole Loan is equal to or greater than 2.21x as of the end of any calendar quarter, any remaining balance in the shortfall reserve will be returned to the borrower.
Prepaid Rent Reserve – The borrower is permitted to collect residential rents more than one month (but not more than 12 months) in advance, provided that, within three business days following the borrower’s receipt of any such rents, the borrower deposits such prepaid rents into the prepaid rent reserve. On each monthly payment date, 1/12 of the prepaid rent reserve will be included in the cash flow applied on such monthly payment date pursuant to the cash management provisions described under “Lockbox/Cash Management” below.
Conversion Reserve – Funds in the conversion reserve will be made available to the borrower to cover the costs of converting the mezzanine space of the 180 Water Property into seven additional residential units as described above. The borrower is required to substantially complete such conversion not later than October 18, 2020 (subject to certain force majeure events).
THE INFORMATION IN THIS STRUCTURAL AND COLLATERAL TERM SHEET IS NOT COMPLETE AND MAY BE AMENDED PRIOR TO THE TIME OF SALE. THIS TERM SHEET IS NOT AN OFFER TO SELL THESE SECURITIES AND IT IS NOT A SOLICITATION OF AN OFFER TO BUY THESE SECURITIES IN ANY JURISDICTION WHERE THE OFFER OR SALE IS NOT PERMITTED.
38
180 Water Street | Collateral Asset Summary – Loan No. 2 | Cut-off Date Balance: | $62,500,000 11.0% |
Current Mezzanine or Subordinate Indebtedness. A mezzanine loan (the “Mezzanine Loan”) was funded to the owners of the borrower concurrently with the origination of the 180 Water Whole Loan. The Mezzanine Loan has an original principal balance of $100.0 million, accrues interest at a per annum rate of 8.30000% and is interest-only for its entire term, provided that if the Total Debt debt yield increases to 6.50%, then the interest rate will be reduced to a per annum rate of 7.80000%. The Mezzanine Loan is expected to be sold to an unaffiliated third party. As described above, the borrower incurred the 180 Water Subordinate Note as part of the 180 Water Whole Loan. The 180 Water Subordinate Note has an outstanding principal balance as of the Cut-off Date of $127.5 million and accrues interest at a fixed rate of 3.410377% per annum. The 180 Water Subordinate Note has a 60-month term and is interest only for the full term of the loan. For additional information, see “Description of the Mortgage Pool—The Whole Loans—The Serviced AB Whole Loan—180 Water Whole Loan” in the Preliminary Prospectus.
Future Mezzanine or Subordinate Indebtedness Permitted. The borrower has a one-time right to replace the Mezzanine Loan in whole (but not in part) with a replacement mezzanine loan, so long as certain conditions are satisfied, including that: (i) the principal balance of the replacement mezzanine loan would be no greater than the lesser of (x) the outstanding principal balance of the Mezzanine Loan at such time, or (y) $100.0 million, (ii) the new lender executes an intercreditor agreement that is substantially the same as the initial intercreditor agreement for the Mezzanine Loan, (iii) immediately after the closing of the replacement mezzanine loan, the Total Debt debt service coverage ratio would be no less than the greater of (a) the origination date Total Debt debt service coverage ratio (0.85x) and (b) the Total Debt debt service coverage ratio immediately prior to the closing of the replacement mezzanine loan and (iv) immediately after the closing of the replacement mezzanine loan, the Total Debt debt yield would be no less than the greater of (a) the origination date Total Debt debt yield (4.1%) and (b) the Total Debt debt yield immediately prior to the closing of the replacement mezzanine loan.
Zoning Lot Merger. The borrower has the right to consummate a zoning lot merger of the 180 Water Property with the adjacent property known as 160 Water Street in order to permit the owner of the 160 Water Street property to use a substantial portion of the unused residential density of the 180 Water Property, provided that the borrower sponsor has a material economic interest in the owner of the 160 Water Street property and is actively involved with such owner in the conversion of the 160 Water Street building from office use to residential and/or hotel use. This right is subject to satisfaction of certain conditions set forth in the 180 Water Whole Loan documents, including the execution of certain development right agreements that are approved or pre-approved by the lender; the receipt by the lender of a REMIC opinion; and the satisfaction of certain other customary REMIC requirements. It is anticipated that, prior to the Closing Date, the 180 Water Whole Loan documents will be amended to pre-approve the form of development rights agreements.
Partial Release. None.
THE INFORMATION IN THIS STRUCTURAL AND COLLATERAL TERM SHEET IS NOT COMPLETE AND MAY BE AMENDED PRIOR TO THE TIME OF SALE. THIS TERM SHEET IS NOT AN OFFER TO SELL THESE SECURITIES AND IT IS NOT A SOLICITATION OF AN OFFER TO BUY THESE SECURITIES IN ANY JURISDICTION WHERE THE OFFER OR SALE IS NOT PERMITTED.
39
70 Worcester Providence Turnpike | Collateral Asset Summary – Loan No. 3 | Cut-off Date Balance: Cut-off Date LTV: U/W NCF DSCR: U/W NOI Debt Yield: | $55,000,000 68.7% 1.53x 9.0% |
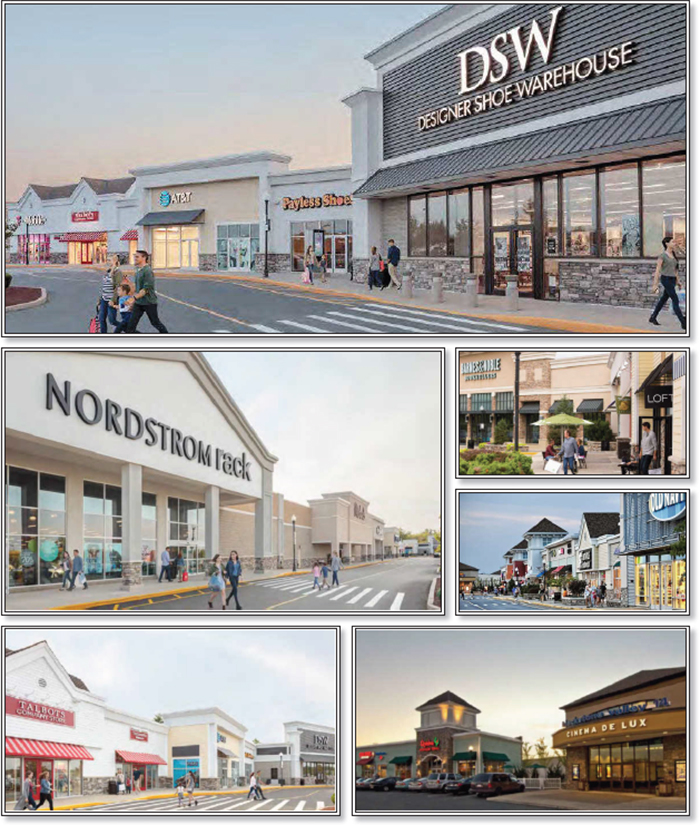
THE INFORMATION IN THIS STRUCTURAL AND COLLATERAL TERM SHEET IS NOT COMPLETE AND MAY BE AMENDED PRIOR TO THE TIME OF SALE. THIS TERM SHEET IS NOT AN OFFER TO SELL THESE SECURITIES AND IT IS NOT A SOLICITATION OF AN OFFER TO BUY THESE SECURITIES IN ANY JURISDICTION WHERE THE OFFER OR SALE IS NOT PERMITTED.
40
70 Worcester Providence Turnpike | Collateral Asset Summary – Loan No. 3 | Cut-off Date Balance: Cut-off Date LTV: U/W NCF DSCR: U/W NOI Debt Yield: | $55,000,000 68.7% 1.53x 9.0% |
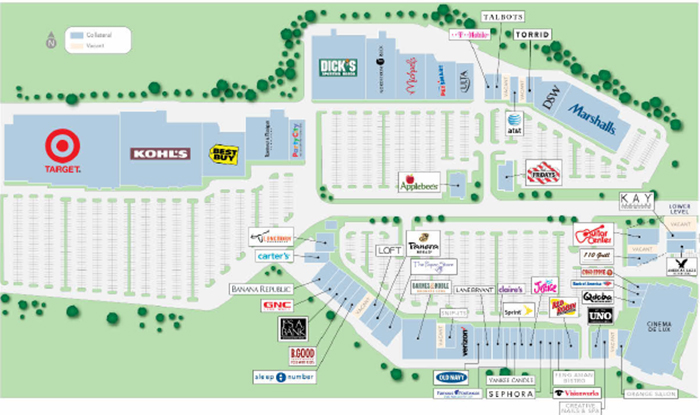
THE INFORMATION IN THIS STRUCTURAL AND COLLATERAL TERM SHEET IS NOT COMPLETE AND MAY BE AMENDED PRIOR TO THE TIME OF SALE. THIS TERM SHEET IS NOT AN OFFER TO SELL THESE SECURITIES AND IT IS NOT A SOLICITATION OF AN OFFER TO BUY THESE SECURITIES IN ANY JURISDICTION WHERE THE OFFER OR SALE IS NOT PERMITTED.
41
70 Worcester Providence Turnpike | Collateral Asset Summary – Loan No. 3 | Cut-off Date Balance: Cut-off Date LTV: U/W NCF DSCR: U/W NOI Debt Yield: | $55,000,000 68.7% 1.53x 9.0% |
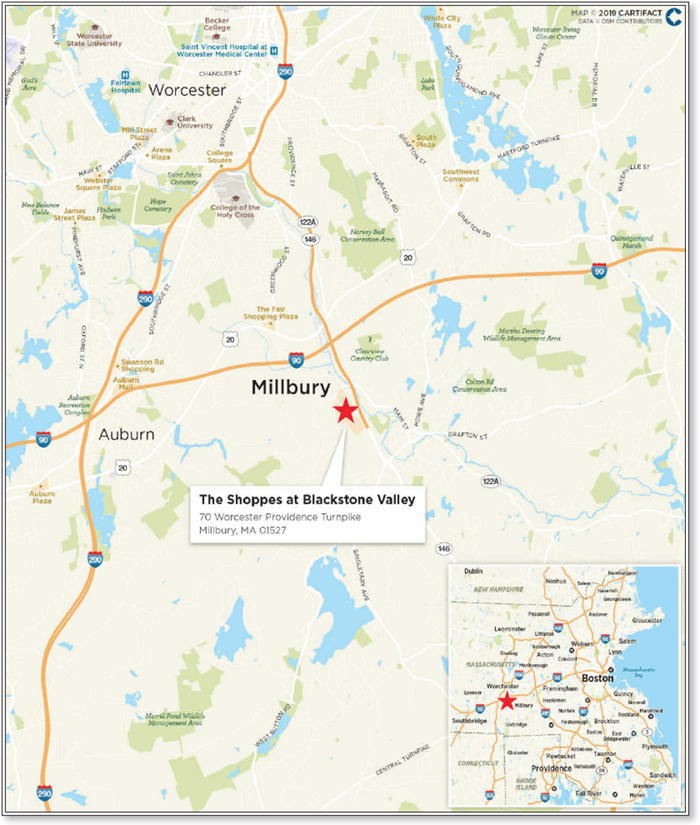
THE INFORMATION IN THIS STRUCTURAL AND COLLATERAL TERM SHEET IS NOT COMPLETE AND MAY BE AMENDED PRIOR TO THE TIME OF SALE. THIS TERM SHEET IS NOT AN OFFER TO SELL THESE SECURITIES AND IT IS NOT A SOLICITATION OF AN OFFER TO BUY THESE SECURITIES IN ANY JURISDICTION WHERE THE OFFER OR SALE IS NOT PERMITTED.
42
70 Worcester Providence Turnpike | Collateral Asset Summary – Loan No. 3 | Cut-off Date Balance: Cut-off Date LTV: U/W NCF DSCR: U/W NOI Debt Yield: | $55,000,000 68.7% 1.53x 9.0% |
Mortgage Loan Information | |
Loan Seller: | GSMC |
Loan Purpose: | Refinance |
Borrower Sponsors(1): | SDM Holdings LLC; WV Holdings LLC; Raanan Katz |
Borrower: | Route 146 Millbury Property LLC |
Original Balance(2): | $55,000,000 |
Cut-off Date Balance(2): | $55,000,000 |
% by Initial UPB: | 5.4% |
Interest Rate: | 3.84430% |
Payment Date: | 1st of each month |
First Payment Date: | December 1, 2019 |
Maturity Date: | November 6, 2029 |
Amortization: | Interest only for first 24 months; 360 months thereafter |
Additional Debt(2): | $109,000,000 Pari Passu Debt; Future Mezzanine Debt Permitted |
Call Protection(3): | L(25), D(88), O(7) |
Lockbox / Cash Management: | Hard / Springing |
Reserves(4) |
| ||
| Initial | Monthly | Cap |
Taxes: | $0 | Springing | NAP |
Insurance: | $0 | Springing | NAP |
Replacement: | $0 | $13,118 | NAP |
TI/LC: | $0 | $114,781 | $6,000,000 |
Unfunded Obligations Reserve: | $806,129 | $0 | NAP |
Property Information | |
Single Asset / Portfolio: | Single Asset |
Property Type: | Anchored Retail |
Collateral: | Fee Simple |
Location: | Millbury, MA |
Year Built / Renovated: | 2003-2004 / NAP |
Total Sq. Ft.: | 787,071 |
Property Management: | WS Asset Management, Inc. |
Underwritten NOI: | $14,818,619 |
Underwritten NCF: | $14,082,919 |
Appraised Value: | $238,700,000 |
Appraisal Date: | August 14, 2019 |
| |
Historical NOI | |
Most Recent NOI: | $14,060,411 (T-12 August 31, 2019) |
2018 NOI: | $14,103,473 (December 31, 2018) |
2017 NOI: | $14,366,723 (December 31, 2017) |
2016 NOI: | $14,044,644 (December 31, 2016) |
| |
Historical Occupancy | |
Most Recent Occupancy: | 96.3% (October 31, 2019) |
2018 Occupancy: | 97.4% (December 31, 2018) |
2017 Occupancy: | 98.7% (December 31, 2017) |
2016 Occupancy: | 99.1% (December 31, 2016) |
Financial Information(2) | ||||||
Tranche | Cut-off Date | Balance per Sq. Ft. | LTV | U/W DSCR | U/W Debt Yield | U/W Debt Yield at Balloon |
Mortgage Loan | $55,000,000 |
|
|
|
|
|
Pari Passu Notes | 109,000,000 |
|
|
|
|
|
Whole Loan | $164,000,000 | $208 / $175 | 68.7% / 57.6% | 1.61x / 1.53x | 9.0% / 8.6% | 10.8% / 10.2% |
(1) | SDM Holdings LLC, WV Holdings LLC and Raanan Katz are the non-recourse carveout guarantors for The Shoppes at Blackstone Valley Whole Loan. |
(2) | The Cut-off Date Balance of $55.0 million represents the controlling note A-1 of the $164.0 million The Shoppes at Blackstone Valley Whole Loan (as defined below) evidenced by nine pari passu notes. See “—The Loan” below. |
(3) | The lockout period will be at least 25 payments beginning with and including the first payment date of December 1, 2019. The borrower has the option to defease the full $164,000,000 The Shoppes at Blackstone Valley Whole Loan after the earlier to occur of (i) two years after the closing date of the securitization that includes the last pari passu note to be securitized and (ii) November 5, 2022. The assumed lockout period of 25 payments is based on the expected COMM 2019-GC44 securitization closing date in December 2019. The actual lockout period may be longer. |
(4) | See “Initial and Ongoing Reserves” herein. |
THE INFORMATION IN THIS STRUCTURAL AND COLLATERAL TERM SHEET IS NOT COMPLETE AND MAY BE AMENDED PRIOR TO THE TIME OF SALE. THIS TERM SHEET IS NOT AN OFFER TO SELL THESE SECURITIES AND IT IS NOT A SOLICITATION OF AN OFFER TO BUY THESE SECURITIES IN ANY JURISDICTION WHERE THE OFFER OR SALE IS NOT PERMITTED.
43
70 Worcester Providence Turnpike | Collateral Asset Summary – Loan No. 3 | Cut-off Date Balance: Cut-off Date LTV: U/W NCF DSCR: U/W NOI Debt Yield: | $55,000,000 68.7% 1.53x 9.0% |
The Loan. The Shoppes at Blackstone Valley mortgage loan (“The Shoppes at Blackstone Valley Loan”) is part of a fixed rate whole loan secured by a first mortgage encumbering the borrower’s fee interest in an anchored retail property located in Millbury, Massachusetts (“The Shoppes at Blackstone Valley Property”). The Shoppes at Blackstone Valley Loan is evidenced by the controlling Note A-1 with an original principal balance and outstanding principal balance as of the Cut-off Date of $55.0 million. The Shoppes at Blackstone Valley Loan is part of a whole loan that is evidenced by nine pari passu promissory notes with an original principal balance and outstanding principal balance as of the Cut-off Date of $164.0 million (“The Shoppes at Blackstone Valley Whole Loan”). Only The Shoppes at Blackstone Valley Loan will be included in the mortgage pool for the COMM 2019-GC44 Mortgage Trust.
The relationship between the holders of The Shoppes at Blackstone Valley Whole Loan will be governed by a co-lender agreement as described under “Description of the Mortgage Pool—The Whole Loans—The Serviced Pari Passu Whole Loans” in the Preliminary Prospectus.
Whole Loan Summary | |||||
Note | Original Balance | Cut-off Date Balance |
| Note Holder | Controlling Piece |
A-1 | $55,000,000 | $55,000,000 |
| COMM 2019-GC44 | Yes |
A-2, A-3, A-4, A-5, A-6, A-7, A-8, A-9 | 109,000,000 | 109,000,000 |
| GS Bank(1) | No |
Whole Loan | $164,000,000 | $164,000,000 |
|
|
|
(1) | Currently held by GS Bank and expected to be contributed to one or more future securitization transactions. |
The Shoppes at Blackstone Valley Whole Loan has a ten-year term, and following a two-year interest-only period, will amortize on a 30-year schedule. The Shoppes at Blackstone Valley Whole Loan accrues interest at a fixed rate of 3.84430% per annum. The Shoppes at Blackstone Valley Whole Loan proceeds were used to refinance existing debt of approximately $183.6 million and pay closing costs of approximately $1.1 million. The most recent prior financing of The Shoppes at Blackstone Valley Property was not included in a securitization.
Sources and Uses | ||||||
Sources | Proceeds | % of Total |
| Uses | Proceeds | % of Total |
Whole Loan Amount | $ 164,000,000 | 88.4% |
| Loan Payoff | $ 183,641,400 | 99.0% |
Borrower Sponsor Equity | 21,501,666 | 11.6 |
| Closing Costs | 1,054,137 | 0.6 |
|
|
|
| Upfront Reserves | 806,129 | 0.4 |
Total Sources | $ 185,501,666 | 100.0% |
| Total Uses | $ 185,501,666 | 100.0% |
The Borrower / Borrower Sponsor. The borrower is Route 146 Millbury Property LLC, a Delaware limited liability company and single purpose entity with two independent managers. Legal counsel to the borrower delivered a non-consolidation opinion in connection with the origination of The Shoppes at Blackstone Valley Whole Loan. The non-recourse carveout guarantors are SDM Holdings LLC, WV Holdings LLC, and Raanan Katz. The borrower sponsors at origination are Stephen R. Weiner, Adam J. Weiner, Jeremy M. Sclar, Thomas J. DeSimone, Richard A. Marks, Raanan Katz and David Katz. The borrower may add Samantha Perry David, Eric Smookler and/or Daniel Preysman as additional borrower sponsors, subject to certain conditions under The Shoppes at Blackstone Valley Whole Loan documents, including satisfaction of the lender’s “know your customer” requirements.
The Property. The Shoppes at Blackstone Valley Property is a 787,071 sq. ft. anchored retail shopping center situated on an approximately 87.74 acre site, located in Millbury, Massachusetts. The improvements were constructed between 2003 and 2004 and contain a mixture of anchor, junior anchor, in-line and restaurant components. The Shoppes at Blackstone Valley Property is anchored by Target, Kohl’s, Cinema de Lux, Dick’s Sporting Goods, Marshalls, Best Buy, Nordstrom Rack and Raymour & Flanigan. Target, Cinema de Lux and Dick’s Sporting Goods are ground leased to the tenants. Junior anchors include Barnes & Noble and Michaels. The Shoppes at Blackstone Valley Property features three, one- and three-story buildings, a restaurant and a three-story movie theatre. The Shoppes at Blackstone Valley Property is served by a total of 3,938 surface parking spaces which is approximately 5.0 spaces per 1,000 sq. ft. of net rentable area. As of October 31, 2019, The Shoppes at Blackstone Valley Property was 96.3% occupied by 53 tenants. The Shoppes at Blackstone Valley Property is located along Route 146 and is approximately 2.5 miles from Interstate-90.
THE INFORMATION IN THIS STRUCTURAL AND COLLATERAL TERM SHEET IS NOT COMPLETE AND MAY BE AMENDED PRIOR TO THE TIME OF SALE. THIS TERM SHEET IS NOT AN OFFER TO SELL THESE SECURITIES AND IT IS NOT A SOLICITATION OF AN OFFER TO BUY THESE SECURITIES IN ANY JURISDICTION WHERE THE OFFER OR SALE IS NOT PERMITTED.
44
70 Worcester Providence Turnpike | Collateral Asset Summary – Loan No. 3 | Cut-off Date Balance: Cut-off Date LTV: U/W NCF DSCR: U/W NOI Debt Yield: | $55,000,000 68.7% 1.53x 9.0% |
Tenant Summary(1) | |||||||||
Tenant / Building | Ratings (Fitch/Moody’s/S&P)(2) | Net Rentable Area (Sq. Ft.) | % of Net Rentable Area | U/W Base Rent PSF | % of Total U/W Base Rent(3) | Tenant Sales | Occupancy | Lease Expiration | |
Target | A-/A2/A | 127,000 | 16.1% | $3.15 | 2.7% | NAV | NAV | 1/31/2029 | |
Kohl’s | BBB/Baa2/BBB | 87,141 | 11.1 | $13.56 | 8.0 | $225 | 7.2% | 2/3/2024 | |
Cinema de Lux | NR/NR/NR | 72,000 | 9.1 | $26.35 | 12.9 | $776,778 | 23.8% | 6/30/2024 | |
Dick’s Sporting Goods | NR/NR/NR | 54,159 | 6.9 | $9.28 | 3.4 | $173 | 7.7% | 1/31/2024 | |
Marshalls | NR/A2/A+ | 42,000 | 5.3 | $16.75 | 4.8 | $462 | 5.1% | 5/31/2024 | |
Best Buy | NR/Baa1/BBB | 32,906 | 4.2 | $14.50 | 3.2 | NAV | NAV | 1/31/2021 | |
Nordstrom Rack | BBB+/Baa2/BBB | 32,778 | 4.2 | $19.00 | 4.2 | NAV | NAV | 9/30/2023 | |
Raymour & Flanigan | NR/NR/NR | 30,606 | 3.9 | $9.08 | 1.9 | NAV | NAV | 1/31/2024 | |
Barnes & Noble | NR/NR/NR | 24,320 | 3.1 | $17.90 | 3.0 | $209 | 11.0% | 1/31/2020 | |
Michaels | NR/NR/BB- | 21,299 | 2.7 | $18.00 | 2.6 | $214 | 10.1% | 2/29/2028 | |
Ten Largest Owned Tenants |
| 524,209 | 66.6% | $13.13 | 46.6% |
|
|
| |
Remaining Occupied |
| 233,791 | 29.7 | $33.68 | 53.4 |
|
|
| |
Total / Wtd. Avg. Occupied |
| 758,000 | 96.3% | $19.47 | 100.0% |
|
|
| |
Vacant Spaces |
| 29,071 | 3.7 |
|
|
|
|
| |
Total |
| 787,071 | 100.0% |
|
|
|
|
| |
|
|
|
|
|
|
|
|
| |
(1) | Based on the underwritten rent roll dated as of October 31, 2019. |
(2) | Certain ratings are those of the parent company whether or not the parent company guarantees the lease. |
(3) | Tenant Sales PSF / Screen are as of August 31, 2019. Cinema de Lux tenant sales per screen is based on 14 screens. |
(4) | Occupancy Cost is calculated using the tenant reported sales as of August 31, 2019 and the total rent. |
Lease Rollover Schedule(1) | ||||||||
Year | # of Leases Expiring | Total Expiring Sq. Ft. | % of Total Sq. Ft. Expiring | Cumulative Expiring | Cumulative % Sq. Ft. Expiring | Annual U/W Base Rent PSF | % U/W Base Rent Rolling | Cumulative % of U/W Base Rent |
MTM | 0 | 0 | 0.0% | 0 | 0.0% | $0.00 | 0.0% | 0.0% |
2019 | 6 | 15,811 | 2.0 | 15,811 | 2.0 | 43.47 | 4.7 | 4.7% |
2020 | 6 | 54,991 | 7.0 | 70,802 | 9.0 | 24.12 | 9.0 | 13.6% |
2021 | 6 | 66,493 | 8.4 | 137,295 | 17.4 | 23.93 | 10.8 | 24.4% |
2022 | 2 | 9,310 | 1.2 | 146,605 | 18.6 | 35.77 | 2.3 | 26.7% |
2023 | 6 | 61,465 | 7.8 | 208,070 | 26.4 | 25.45 | 10.6 | 37.3% |
2024 | 13 | 338,772 | 43.0 | 546,842 | 69.5 | 18.71 | 43.0 | 80.2% |
2025 | 4 | 24,856 | 3.2 | 571,698 | 72.6 | 31.37 | 5.3 | 85.5% |
2026 | 1 | 4,216 | 0.5 | 575,914 | 73.2 | 60.10 | 1.7 | 87.2% |
2027 | 1 | 6,051 | 0.8 | 581,965 | 73.9 | 30.00 | 1.2 | 88.5% |
2028 | 2 | 23,385 | 3.0 | 605,350 | 76.9 | 20.41 | 3.2 | 91.7% |
2029 | 3 | 138,603 | 17.6 | 743,953 | 94.5 | 5.76 | 5.4 | 97.1% |
2030 & Thereafter | 3 | 14,047 | 1.8 | 758,000 | 96.3 | 30.25 | 2.9 | 100.0% |
Vacant | NAP | 29,071 | 3.7 | 787,071 | 100.0 | NAP | NAP |
|
Total / Wtd. Avg. | 53 | 787,071 | 100.0% |
|
| $19.47 | 100.0% |
|
(1) | Based on the underwritten rent roll dated October 31, 2019. |
Major Tenants.
Target (A-/A2/A - Fitch/Moody’s/S&P) (127,000 sq. ft.; 16.1% of NRA; 2.7% of U/W Base Rent). Target leases 127,000 sq. ft. at The Shoppes at Blackstone Valley Property pursuant to a ground lease. Founded in 1902, Target is a publicly traded (NYSE: TGT) retailer, offering general merchandise and groceries through its stores and online business. As of August 2019, Target operated 1,853 stores in the United States. The initial term of the Target ground lease expires in January of 2027 and contains seven, five-year renewal options with an initial option rent of $3.54 per sq. ft.
THE INFORMATION IN THIS STRUCTURAL AND COLLATERAL TERM SHEET IS NOT COMPLETE AND MAY BE AMENDED PRIOR TO THE TIME OF SALE. THIS TERM SHEET IS NOT AN OFFER TO SELL THESE SECURITIES AND IT IS NOT A SOLICITATION OF AN OFFER TO BUY THESE SECURITIES IN ANY JURISDICTION WHERE THE OFFER OR SALE IS NOT PERMITTED.
45
70 Worcester Providence Turnpike | Collateral Asset Summary – Loan No. 3 | Cut-off Date Balance: Cut-off Date LTV: U/W NCF DSCR: U/W NOI Debt Yield: | $55,000,000 68.7% 1.53x 9.0% |
Kohl’s (BBB/Baa2/BBB - Fitch/Moody’s/S&P); (87,141 sq. ft.; 11.1% of NRA; 8.0% of U/W Base Rent). Kohl’s leases 87,141 sq. ft. at The Shoppes at Blackstone Valley Property. The initial term of the Kohl’s lease expires in February 2024 and contains six, five-year renewal options remaining at an initial option rent of $14.24 PSF. Kohl’s is an American department store retail chain that sells home goods and apparel. The tenant reported sales of $19,604,026 or $225 PSF as of August 31, 2019.
Cinema de Lux (72,000 sq. ft.; 9.1% of NRA; 12.9% of U/W Base Rent). Cinema de Lux, a movie theater operator, leases 72,000 sq. ft. at The Shoppes at Blackstone Valley Property pursuant to a ground lease. The tenant features the Chatters Bar & Grill and in-theater dining options serving both food and alcohol in seats, as well as 14 screens at The Shoppes at Blackstone Valley Property. The initial term of the Cinema de Lux lease expires in June 2024 and contains four, five-year renewal options, with an initial option rent of $28.99 PSF. The tenant reported sales of $768,129/screen in 2016, $799,407/screen in 2017, $786,885 in 2018 and $776,778 as of August 31, 2019.
Dick’s Sporting Goods (“Dick’s”) (54,159 sq. ft.; 6.9% of NRA; 3.4% of U/W Base Rent): Dick’s Sporting Goods ground leases 54,159 sq. ft. at The Shoppes at Blackstone Valley Property. The initial term of the Dick’s lease expires in January 2024. The ground lease has six, five-year renewal options, with an initial option rent of $9.77 PSF. Dick’s is a large sporting goods retailer and is listed on the Fortune 500. Dick’s was founded in 1948, has over 800 locations, and is headquartered in Coraopolis, Pennsylvania. Dick’s reported sales of $9,378,102 or $173 PSF as of August 31, 2019.
Marshalls (NR/A2/A+ - Fitch/Moody’s and S&P); (42,000 sq. ft.; 5.3% of NRA; 4.8% of U/W Base Rent): Marshalls leases 42,000 sq. ft. at The Shoppes at Blackstone Valley Property Marshalls is a chain of American off-price department stores and has over 1,000 locations across the United States and Puerto Rico. Marshalls was founded in 1956 and is headquartered in Framingham, Massachusetts. The initial term of the Marshalls lease ends in May 2024 and has one, five-year renewal option, with an initial option rent of $17.75 PSF. Marshalls reported sales of $19,419,840 or $462 PSF as of August 31, 2019.
Environmental Matters. The Phase I environmental report dated October 4, 2019 identified a recognized environmental condition due to the detection, beginning in approximately 2004, of perchlorate in on-site monitoring wells and stormwater drainage features, as well as in the public supply wells across the Blackstone River east of The Shoppes at Blackstone Valley Property. It is suspected that the perchlorate originated from explosives used to blast bedrock during the development of The Shoppes at Blackstone Valley Property. The release was reported to the Massachusetts Department of Environmental Protection, and the portion of the release within the boundaries of The Shoppes at Blackstone Valley Property achieved regulatory closure in September 2012. The remaining portion of the release, which is off-site, is in Remedy Operation Status, which relates to continued monitoring of the off-site portion of the release. One off-site well continues to exceed the regulatory standard. The environmental consultant recommended continued monitoring and reporting of the off-site release.
The Market. The Shoppes at Blackstone Valley Property is located along Route 146 and Route 122A in the Outlying Worcester County submarket of Massachusetts. Route 146 provides access to Interstate 90, an east-west interstate highway connecting Boston, Massachusetts and Seattle, Washington, and is approximately 2.5 miles from The Shoppes at Blackstone Valley Property. Interstates 290 and 395, which are auxiliary highways in Metro Worcester, are located approximately 6 miles from The Shoppes at Blackstone Valley property. Worcester’s colleges and universities (i.e. Holy Cross, Worcester State University, Assumption College, UMASS Medical School, Clark University and Worcester Polytechnic Institute), the City of Worcester, and suburban Worcester communities (i.e. the Towns of Grafton, Millbury, Auburn, Sutton Healthcare (12,906 employees), University of Massachusetts Medical School (4,445 employees), Reliant Medical Group (2,500 employees), Saint Vincent Hospital (2,350 employees) and MAPFRE U.S.A. Corp. (2,103 employees) are nearby demand drivers. The nearest anchored retail center, RK Worcester Fair, is located approximately two miles north of The Shoppes at Blackstone Village Property in Worcester. RK Worcester Fair is a grocery-anchored community center co-anchored by Burlington Coat Factory and contains approximately 200,000 sq. ft. of rentable area.
According to a market research report, The Shoppes at Blackstone Valley Property is located in the Outlying Worcester submarket. As of the second quarter of 2019, the Outlying Worcester submarket had an inventory of approximately 17.0 million sq. ft. with a vacancy rate of 3.6%. The asking rental rate in the submarket is $10.87 per sq. ft., a drop from $11.93 per sq. ft. as of the previous quarter. Current construction projects in the submarket includes (i) the 10,000-seat minor league baseball stadium for the Worcester Red Sox, a Triple-A minor league baseball team expected to move from Pawtucket to Worcester in 2021 and (ii) development plans for an approximately $90 million mixed-use facility surrounding the stadium.
THE INFORMATION IN THIS STRUCTURAL AND COLLATERAL TERM SHEET IS NOT COMPLETE AND MAY BE AMENDED PRIOR TO THE TIME OF SALE. THIS TERM SHEET IS NOT AN OFFER TO SELL THESE SECURITIES AND IT IS NOT A SOLICITATION OF AN OFFER TO BUY THESE SECURITIES IN ANY JURISDICTION WHERE THE OFFER OR SALE IS NOT PERMITTED.
46
70 Worcester Providence Turnpike | Collateral Asset Summary – Loan No. 3 | Cut-off Date Balance: Cut-off Date LTV: U/W NCF DSCR: U/W NOI Debt Yield: | $55,000,000 68.7% 1.53x 9.0% |
Directly Competitive Shopping Centers(1) | |||||
Property | Sub-type | Anchor Tenants | Rentable Area (sq. ft.) | Year Built / Renovated | Distance From Property (Miles) |
The Shoppes at Blackstone Valley | Anchored | Target, Kohl’s, Cinema de Lux, Dick’s Sporting Goods(2) | 787,071(2) | 2003-2004 / NAP | N/A |
Northborough Crossing | Power Center | Wegmans, BJs, Dick’s Sporting Goods, Kohl’s | 645,785 | 2011-2012 / N/A | 10.5 |
Highland Commons | Power Center | Market Basket, Cabela’s, Lowe’s, BJs | 653,635 | 2009-2016 / N/A | 22.8 |
White City Shopping Center | Community Center | Shaw’s | 257,775 | 1962-2012 / N/A | 7.8 |
Auburn Mall | Enclosed Regional Mall | Macy’s, Sears | 583,739 | 1971 / N/A | 3.9 |
Greendale Mall | Enclosed Regional Mall | TJ Maxx & Homegoods, Best Buy | 431,266 | 1987 / N/A | 8.0 |
(1) | Source: Appraisal. |
(2) | Based on the October 31, 2019 rent roll. |
Cash Flow Analysis.
Cash Flow Analysis(1) | ||||||
| 2016 | 2017 | 2018 | TTM 08/31/2019 | U/W(2) | U/W PSF |
Base Rent | $14,284,389 | $14,512,759 | $14,333,987 | $14,318,367 | $14,756,324 | $18.75 |
Overage / Percentage Rent | 610,070 | 674,490 | 697,196 | 654,373 | 679,298 | 0.86 |
Total Reimbursement Revenue | 3,402,730 | 3,777,832 | 3,823,831 | 3,545,438 | 3,551,135 | 4.51 |
Market Revenue from Vacant Units | 0 | 0 | 0 | 0 | 1,006,511 | 1.28 |
Other Revenue | 285,588 | 185,057 | 81,783 | 60,820 | 60,820 | 0.08 |
Gross Revenue | $18,582,777 | $19,150,138 | $18,936,797 | $18,578,998 | $20,054,088 | $25.48 |
Less: Vacancy | 0 | 0 | 0 | 0 | (1,006,511) | (1.28) |
Effective Gross Income | $18,582,777 | $19,150,138 | $18,936,797 | $18,578,998 | $19,047,577 | $24.20 |
Total Expenses | 4,538,133 | 4,783,415 | 4,833,324 | 4,518,587 | 4,228,958 | 5.37 |
Net Operating Income | $14,044,644 | $14,366,723 | $14,103,473 | $14,060,411 | $14,818,619 | $18.83 |
TI/LC | 0 | 0 | 0 | 0 | 666,997 | $0.85 |
Replacement Reserves | 0 | 0 | 0 | 0 | 68,703 | 0.09 |
Net Cash Flow | $14,044,644 | $14,366,723 | $14,103,473 | $14,060,411 | $14,082,919 | $17.89 |
(1) | Certain items such as interest expense, interest income, lease cancellation income, depreciation, amortization, debt service payments and any other non-recurring or non-operating items were excluded from the historical presentation and are not considered for the underwritten cash flow. |
(2) | The U/W Base Rent includes contractual rent steps through December 31, 2020 totaling $125,686. |
Property Management. The Shoppes at Blackstone Valley Property is currently managed by WS Asset Management, Inc., a Massachusetts corporation and an affiliate of the borrower.
Lockbox / Cash Management. The Shoppes at Blackstone Valley Whole Loan documents require a hard lockbox and springing cash management. The borrower was required to deliver tenant direction letters to each existing tenant at The Shoppes at Blackstone Valley Property, within five business days of origination, directing each tenant to remit its payments directly to the lender-controlled lockbox account or post office box. The borrower is also required to deliver a tenant direction letter to each future tenant. So long as no Shoppes Cash Sweep Period then exists, all funds deposited into the lockbox account are required to be transferred on each business day to the borrower’s operating account. Upon the occurrence and during the continuance of a Shoppes Cash Sweep Period (as defined below), all funds in the lockbox account are required to be swept on each business day to a cash management account under the control of the lender to be applied and disbursed to pay debt service, applicable reserves, mezzanine debt service (if any) and budgeted operating expenses and all excess cash remaining in the cash management account after the application of such funds are required to be held by the lender in an excess cash flow reserve account as additional collateral for The Shoppes at Blackstone Valley Whole Loan. Upon the occurrence and during the continuance of an event of default under The Shoppes at Blackstone Valley Whole Loan documents, the lender may apply funds to the debt in such priority as it may determine.
A “Shoppes Cash Sweep Period” means each period that commences when (a) the debt yield as of the last day of any fiscal quarter is less than 7.75% and concludes when the debt yield as of the last day of any subsequent fiscal quarter is at least 7.75%; (b) the borrower fails to deliver required monthly, quarterly or annual financial reports and concludes when such reports are delivered and indicate that no other Shoppes Cash Sweep Period is ongoing; and/or (c) if the Shoppes Permitted Mezzanine Loan (as defined below) is in place, there is an event of default under any of the loan documents for the Shoppes Permitted Mezzanine Loan and concludes when the holder of the Shoppes Permitted Mezzanine Loan has waived the applicable event of default. The Shoppes at Blackstone Valley Whole Loan documents provide that no Shoppes Cash Sweep Period may occur prior to December 31, 2019.
THE INFORMATION IN THIS STRUCTURAL AND COLLATERAL TERM SHEET IS NOT COMPLETE AND MAY BE AMENDED PRIOR TO THE TIME OF SALE. THIS TERM SHEET IS NOT AN OFFER TO SELL THESE SECURITIES AND IT IS NOT A SOLICITATION OF AN OFFER TO BUY THESE SECURITIES IN ANY JURISDICTION WHERE THE OFFER OR SALE IS NOT PERMITTED.
47
70 Worcester Providence Turnpike | Collateral Asset Summary – Loan No. 3 | Cut-off Date Balance: Cut-off Date LTV: U/W NCF DSCR: U/W NOI Debt Yield: | $55,000,000 68.7% 1.53x 9.0% |
Initial and Ongoing Reserves. At loan origination, the borrower was required to deposit approximately $806,129 for unfunded obligations.
Real Estate Taxes and Insurance Reserves – On each payment date, during a Shoppes Cash Sweep Period, the borrower is required to make monthly deposits of: (i) a tax reserve in an amount equal to 1/12 of the amount that the lender estimates will be necessary to pay taxes over the then succeeding 12-month period and (ii) an insurance reserve in an amount equal to 1/12 of the amount that the lender estimates will be necessary to cover premiums over the then succeeding 12-month period; provided that the borrower will not be required to reserve such amounts in respect of insurance premiums so long as no event of default under the related loan documents has occurred and is continuing, and the borrower maintains a blanket policy of insurance meeting the requirements of The Shoppes at Blackstone Valley Whole Loan documents.
TI/LC Reserve – On each payment date, the borrower is required to make monthly deposits to a lender-controlled account of approximately $114,781 for a TI/LC reserve, capped at $6,000,000 (or if, on or after January 1, 2024, The Shoppes at Blackstone Valley Property achieves a debt yield in excess of 9.0%, the TI/LC reserve will be capped at $4,500,000).
Replacement Reserve – On each payment date, the borrower is required to make monthly deposits to a lender-controlled account of approximately $13,118 for a replacement reserve.
Current Mezzanine or Subordinate Indebtedness. None.
Future Mezzanine or Subordinate Indebtedness Permitted. The owner of the direct or indirect equity interests of the borrower is permitted to incur mezzanine debt (the “Shoppes Permitted Mezzanine Loan”) secured by a pledge of direct or indirect equity interests in the borrower, provided that certain conditions set forth in the loan documents are satisfied, including, without limitation: (i) the principal amount of the Shoppes Permitted Mezzanine Loan may not exceed $40,000,000; (ii) after giving effect to the Shoppes Permitted Mezzanine Loan, (a) the loan-to-value ratio on The Shoppes at Blackstone Valley Whole Loan and the Shoppes Permitted Mezzanine Loan (collectively, the “Total Debt”) is no greater than 70%, (b) the debt service coverage ratio on the Total Debt is at least 1.25x, and (c) the debt yield on the Total Debt is at least 9.1%; (iii) the holder of the Shoppes Permitted Mezzanine Loan enters into a subordination and intercreditor agreement with the lender in form and substance reasonably acceptable to the lender; and (iv) a rating agency confirmation is delivered in connection with the consummation of the Shoppes Permitted Mezzanine Loan.
Partial Release. None.
Permitted Ground Leases. Provided that no event of default is continuing, the borrower is permitted to enter into up to two long-term ground leases with a third party (which may be an affiliate of the borrower) with respect to certain parcels of The Shoppes at Blackstone Valley Property (three of which are currently occupied by major tenants and one of which is currently parking space that could be developed in the future). In connection with any such ground lease, the borrower is required to provide a REMIC opinion and obtain rating agency confirmation.
THE INFORMATION IN THIS STRUCTURAL AND COLLATERAL TERM SHEET IS NOT COMPLETE AND MAY BE AMENDED PRIOR TO THE TIME OF SALE. THIS TERM SHEET IS NOT AN OFFER TO SELL THESE SECURITIES AND IT IS NOT A SOLICITATION OF AN OFFER TO BUY THESE SECURITIES IN ANY JURISDICTION WHERE THE OFFER OR SALE IS NOT PERMITTED.
48
(THIS PAGE INTENTIONALLY LEFT BLANK)
49
Various Louisville, KY | Collateral Asset Summary – Loan No. 4 Weston Kentucky Portfolio | Cut-off Date Balance: Cut-off Date LTV: U/W NCF DSCR: U/W NOI Debt Yield: | $52,253,500 59.5% 3.06x 12.3% |
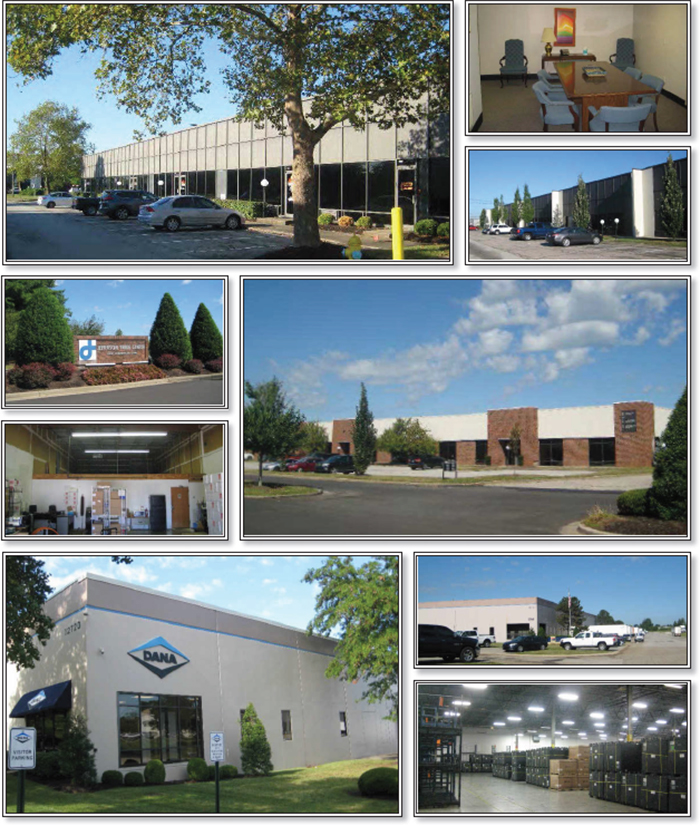
THE INFORMATION IN THIS STRUCTURAL AND COLLATERAL TERM SHEET IS NOT COMPLETE AND MAY BE AMENDED PRIOR TO THE TIME OF SALE. THIS TERM SHEET IS NOT AN OFFER TO SELL THESE SECURITIES AND IT IS NOT A SOLICITATION OF AN OFFER TO BUY THESE SECURITIES IN ANY JURISDICTION WHERE THE OFFER OR SALE IS NOT PERMITTED.
50
Various Louisville, KY | Collateral Asset Summary – Loan No. 4 Weston Kentucky Portfolio | Cut-off Date Balance: Cut-off Date LTV: U/W NCF DSCR: U/W NOI Debt Yield: | $52,253,500 59.5% 3.06x 12.3% |
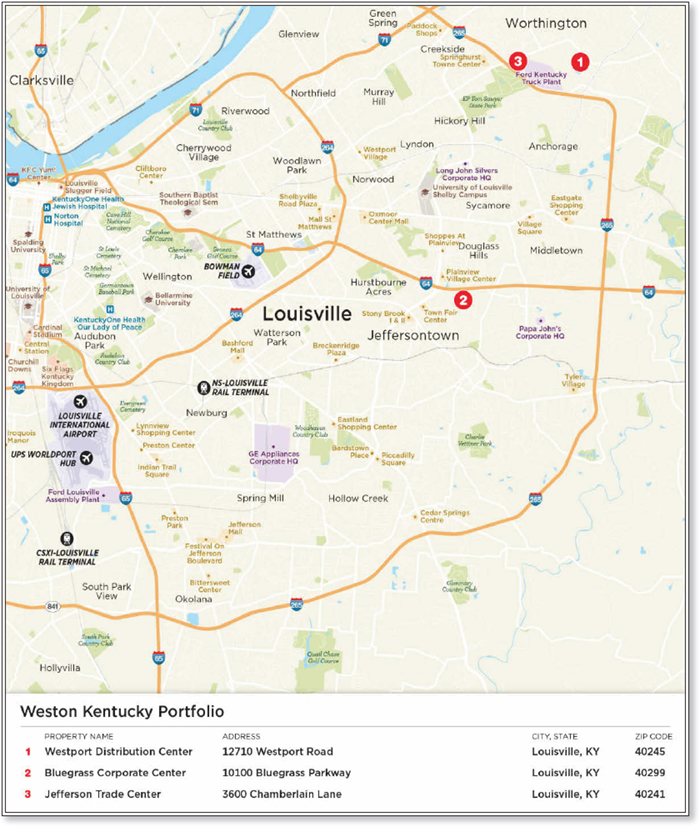
THE INFORMATION IN THIS STRUCTURAL AND COLLATERAL TERM SHEET IS NOT COMPLETE AND MAY BE AMENDED PRIOR TO THE TIME OF SALE. THIS TERM SHEET IS NOT AN OFFER TO SELL THESE SECURITIES AND IT IS NOT A SOLICITATION OF AN OFFER TO BUY THESE SECURITIES IN ANY JURISDICTION WHERE THE OFFER OR SALE IS NOT PERMITTED.
51
Various Louisville, KY | Collateral Asset Summary – Loan No. 4 Weston Kentucky Portfolio | Cut-off Date Balance: Cut-off Date LTV: U/W NCF DSCR: U/W NOI Debt Yield: | $52,253,500 59.5% 3.06x 12.3% |
Mortgage Loan Information | |
Loan Seller: | GSMC |
Loan Purpose: | Refinance |
Borrower Sponsor: | Legacy Properties Group, Inc. |
Borrower: | Weston Kentucky LLC |
Original Balance: | $52,253,500 |
Cut-off Date Balance: | $52,253,500 |
% by Initial UPB: | 5.1% |
Interest Rate: | 3.35300% |
Payment Date: | 6th of each month |
First Payment Date: | December 6, 2019 |
Maturity Date: | November 6, 2029 |
Amortization: | Interest Only |
Additional Debt: | None |
Call Protection: | L(25), YM1(90), O(5) |
Lockbox / Cash Management: | Springing Hard / Springing |
Reserves(1) | |||
| Initial | Monthly | Cap |
Taxes: | $0 | Springing | NAP |
Insurance: | $0 | Springing | NAP |
Replacement: | $0 | $23,334 | $500,000 |
TI/LC: | $1,000,000 | Springing | $1,000,000 |
Earnout Reserve: | $4,840,000 | $0 | NAP |
Unfunded Obligations Reserve: | $326,085 | $0 | NAP |
Property Information | |
Single Asset / Portfolio: | Portfolio of three properties |
Property Type: | Industrial / Various |
Collateral: | Fee Simple |
Location: | Louisville, KY |
Year Built / Renovated: | Various / NAP |
Total Sq. Ft.: | 1,446,260 |
Property Management: | Weston Inc. |
Underwritten NOI: | $5,897,886 |
Underwritten NCF: | $5,443,704 |
Appraised Value(2): | $80,400,000 |
Appraisal Date: | September 25, 2019 |
Historical NOI | |
Most Recent NOI: | $6,105,558 (T-12 August 31, 2019) |
2018 NOI: | $5,873,793 (December 31, 2018) |
2017 NOI: | $5,748,127 (December 31, 2017) |
2016 NOI: | $5,490,929 (December 31, 2016) |
Historical Occupancy | |
Most Recent Occupancy: | 97.8% (October 31, 2019) |
2018 Occupancy: | 99.0% (December 31, 2018) |
2017 Occupancy : | 98.0% (December 31, 2017) |
2016 Occupancy: | 96.0% (December 31, 2016) |
Financial Information | ||||||
Tranche | Cut-off Date | Balance per Sq. Ft. Cut-off / Balloon | LTV Cut-off(3) / Balloon | U/W DSCR NOI / NCF | U/W Debt Yield NOI / NCF(3) | U/W Debt Yield at Balloon NOI / NCF |
Mortgage Loan | $52,253,500 | $36 / $36 | 59.5% / 65.0% | 3.32x / 3.06x | 12.3% / 11.4% | 11.3% / 10.4% |
(1) | See “Initial and Ongoing Reserves” herein. |
(2) | The Appraised Value includes a portfolio premium of approximately 3.7%. The “As Is” Appraised Value for the Weston Kentucky Portfolio, as of August 28, 2019, is $77,500,000. The “As-Is” Cut-off date LTV is 67.4%. |
(3) | The Cut-off Date LTV Ratio is calculated net of the earnout amount of $4,400,000. The Cut-off Date LTV Ratio without netting the earnout amount is 65.0%. Debt Yield Based on Underwritten NOI / NCF is calculated based on the Cut-off Date Principal Balance net of the earnout amount of $47,853,500. The Debt Yield Based on Underwritten NOI / NCF without netting the related earnout amount are 11.3% and 10.4%, respectively. |
THE INFORMATION IN THIS STRUCTURAL AND COLLATERAL TERM SHEET IS NOT COMPLETE AND MAY BE AMENDED PRIOR TO THE TIME OF SALE. THIS TERM SHEET IS NOT AN OFFER TO SELL THESE SECURITIES AND IT IS NOT A SOLICITATION OF AN OFFER TO BUY THESE SECURITIES IN ANY JURISDICTION WHERE THE OFFER OR SALE IS NOT PERMITTED.
52
Various Louisville, KY | Collateral Asset Summary – Loan No. 4 Weston Kentucky Portfolio | Cut-off Date Balance: Cut-off Date LTV: U/W NCF DSCR: U/W NOI Debt Yield: | $52,253,500 59.5% 3.06x 12.3% |
The Loan. The Weston Kentucky Portfolio mortgage loan (the “Weston Kentucky Portfolio Loan”) is a fixed rate loan secured by first mortgages encumbering the borrower’s fee interest in three industrial properties located in Louisville, Kentucky (the “Weston Kentucky Portfolio Properties”). The Weston Kentucky Portfolio Loan is evidenced by a promissory note with an original principal balance and outstanding principal balance as of the Cut-off Date of $52,253,500.
The Weston Kentucky Portfolio Loan has a ten-year interest-only term and accrues interest at a fixed rate of 3.35300% per annum. The Weston Kentucky Portfolio Loan proceeds were used to refinance existing debt of approximately $25.8 million, return equity to the borrower sponsor of approximately $19.6 million, fund upfront reserves of approximately $6.2 million and pay closing costs of approximately $0.6 million. The most recent prior financing of the Weston Kentucky Portfolio Properties was not included in a securitization.
Sources and Uses | ||||||
Sources | Proceeds | % of Total | Uses | Proceeds | % of Total | |
Mortgage Loan | $52,253,500 | 100.0% | Loan Payoff | $25,813,301 | 49.4% | |
|
|
| Return of Equity | 19,634,152 | 37.6 | |
|
|
| Upfront Reserves | 6,166,085 | 11.8 | |
|
|
| Closing Costs | 639,962 | 1.2 | |
Total Sources | $52,253,500 | 100.0% | Total Uses | $52,253,500 | 100.0% | |
The Borrower / Borrower Sponsor. The borrower is Weston Kentucky LLC, a Delaware limited liability company and single purpose entity with two independent directors. Legal counsel to the borrower delivered a non-consolidation opinion in connection with the origination of the Weston Kentucky Portfolio Loan.
The non-recourse carveout guarantor is Legacy Properties Group, Inc. (the “Weston Kentucky Portfolio Guarantor”), a Delaware corporation, which is a privately-owned holding company focusing on the ownership, investment and management of commercial real estate. The Weston Kentucky Portfolio Guarantor owns Weston Inc. (“Weston”), the primary operating company that manages the Weston Kentucky Portfolio Guarantor’s real estate holdings. Weston was founded in 1972 by the Asher family and has offices in Cleveland, Ohio and Louisville, Kentucky.
The Properties.
Tenant Summary(1) |
| ||||||
Tenant / Building | Ratings (Fitch/Moody’s/S&P)(2) | Net Rentable Area (Sq. Ft.) | % of Net Rentable Area | U/W Base Rent PSF(3) | % of Total U/W Base Rent | Lease Expiration |
|
| |||||||
Westport Axle Corporation(3) | NR/NR/NR | 231,000 | 16.0% | $4.35 | 15.1% | Various |
|
Dana Driveshaft Manufacturing, LLC | NR/NR/NR | 156,170 | 10.8 | $3.84 | 9.0 | 2/28/2026 |
|
Conagra Foods | NR/NR/NR | 128,990 | 8.9 | $4.10 | 8.0 | 12/31/2019 |
|
Dakkota Integrated Systems, LLC | NR/NR/NR | 74,000 | 5.1 | $4.20 | 4.7 | 10/31/2020 |
|
Grindmaster Corporation | NR/NR/NR | 37,500 | 2.6 | $3.99 | 2.3 | 7/31/2021 |
|
Bluegrass Packaging Industries, Inc. | NR/NR/NR | 37,500 | 2.6 | $3.85 | 2.2 | 1/31/2022 |
|
ABB EP Industrial Solutions(4) | NR/NR/NR | 37,000 | 2.6 | $5.36 | 3.0 | Various |
|
Vision Dynamics LLC | NR/NR/NR | 28,000 | 1.9 | $5.19 | 2.2 | 3/31/2025 |
|
BellSouth Telecommunications, LLC | NR/NR/NR | 25,000 | 1.7 | $4.00 | 1.5 | 9/30/2020 |
|
Hexagon Chemical | NR/NR/NR | 18,700 | 1.3 | $4.00 | 1.1 | 6/30/2022 |
|
Total / Wtd. Avg. Major Tenants | 773,860 | 53.5% | $4.21 | 49.1% |
|
| |
Remaining Tenants | 640,500 | 44.3 | $5.28 | 50.9% |
|
| |
Total / Wtd. Avg. Occupied Collateral | 1,414,360 | 97.8% | $4.70 | 100.0% |
|
| |
Vacant | 31,900 | 2.2 |
|
|
|
| |
Total | 1,446,260 | 100.0% |
|
|
|
| |
|
|
|
|
|
|
| |
(1) | Based on the underwritten rent roll dated as of October 31, 2019 with rent steps through November 30, 2020. |
(2) | Certain ratings are those of the parent company whether or not the parent guarantees the lease. |
(3) | Westport Axle Corporation leases 181,000 sq. ft. ($4.19 PSF) expiring on May 31, 2020 and 50,000 sq. ft. ($4.95 PSF) expiring on May 31, 2021. |
(4) | ABB EP Industrial Solutions leases 33,000 sq. ft. ($5.26 PSF) expiring on July 31, 2022 and 4,000 sq. ft. ($6.20 PSF) expiring on April 30, 2020. |
THE INFORMATION IN THIS STRUCTURAL AND COLLATERAL TERM SHEET IS NOT COMPLETE AND MAY BE AMENDED PRIOR TO THE TIME OF SALE. THIS TERM SHEET IS NOT AN OFFER TO SELL THESE SECURITIES AND IT IS NOT A SOLICITATION OF AN OFFER TO BUY THESE SECURITIES IN ANY JURISDICTION WHERE THE OFFER OR SALE IS NOT PERMITTED.
53
Various Louisville, KY | Collateral Asset Summary – Loan No. 4 Weston Kentucky Portfolio | Cut-off Date Balance: Cut-off Date LTV: U/W NCF DSCR: U/W NOI Debt Yield: | $52,253,500 59.5% 3.06x 12.3% |
Lease Rollover Schedule(1) | ||||||||
Year | # of Leases Expiring | Total Expiring Sq. Ft. | % of Total Sq. Ft. Expiring | Cumulative Expiring | Cumulative % Sq. Ft. Expiring | Annual U/W Base Rent PSF | % U/W Base Rent Rolling | Cumulative % of U/W Base Rent |
MTM | 5 | 21,480 | 1.5% | 21,480 | 1.5% | $5.68 | 1.8% | 1.8% |
2019 | 5 | 142,390 | 9.8 | 163,870 | 11.3% | $4.15 | 8.9 | 10.7% |
2020 | 44 | 472,679 | 32.7 | 636,549 | 44.0% | $4.63 | 32.9 | 43.7% |
2021 | 47 | 270,422 | 18.7 | 906,971 | 62.7% | $5.06 | 20.6 | 64.3% |
2022 | 47 | 275,599 | 19.1 | 1,182,570 | 81.8% | $4.92 | 20.4 | 84.7% |
2023 | 6 | 45,487 | 3.1 | 1,228,057 | 84.9% | $5.67 | 3.9 | 88.6% |
2024 | 1 | 2,133 | 0.1 | 1,230,190 | 85.1% | $6.36 | 0.2 | 88.8% |
2025 | 1 | 28,000 | 1.9 | 1,258,190 | 87.0% | $5.19 | 2.2 | 91.0% |
2026 | 1 | 156,170 | 10.8 | 1,414,360 | 97.8% | $3.84 | 9.0 | 100.0% |
2027 | 0 | 0 | 0.0 | 1,414,360 | 97.8% | $0.00 | 0.0 | 100.0% |
2028 | 0 | 0 | 0.0 | 1,414,360 | 97.8% | $0.00 | 0.0 | 100.0% |
2029 | 0 | 0 | 0.0 | 1,414,360 | 97.8% | $0.00 | 0.0 | 100.0% |
2030 & Thereafter | 0 | 0 | 0.0 | 1,414,360 | 97.8% | $0.00 | 0.0 | 100.0% |
Vacant | NAP | 31,900 | 2.2 | 1,446,260 | 100.0% | NAP | NAP |
|
Total / Wtd. Avg. | 157 | 1,446,260 | 100.0% |
|
| $4.70 | 100.0% |
|
(1) | Based on the underwritten rent roll dated as of October 31, 2019 with rent steps through November 30, 2020. |
The Weston Kentucky Portfolio Properties are comprised of three industrial properties across 26 separate buildings located in three industrial clusters in Louisville, KY. The Weston Kentucky Portfolio Properties, built between 1972 and 1990, consist of 1,446,260 sq. ft. in the aggregate and are 97.8% occupied as of October 31, 2019. The Weston Kentucky Portfolio Properties are leased to tenants in various industries, such as manufacturing and logistics.
The Bluegrass Corporate Center property is an industrial flex property totaling 394,200 sq. ft. located on a 28.46-acre site. The improvements were built in 1972, are in average condition and have a remaining economic life of 25 years. The Bluegrass Corporate Center property consists of 12, single-story buildings and 529 surface parking spaces for a parking ratio of 1.5 spaces per 1,000 sq. ft. The improvements feature poured concrete slab foundation, structural steel framing and masonry exterior walls. The buildings feature 18 foot clear height, 58 dock high doors and 70 grade level doors.
The Jefferson Trade Center property is an industrial flex property totaling 361,900 sq. ft. located on a 27.86-acre site. The improvements were built in 1981, are in average condition and have a remaining economic life of 25 years. The Jefferson Trade Center property consists of eight, single-story buildings and 716 surface parking spaces for a parking ratio of 1.98 spaces per 1,000 sq. ft. The improvements feature reinforced concrete slab foundation, structural steel framing and concrete block exterior walls. The buildings feature 14-18 foot clear height, 67 dock high doors and 82 grade level doors.
The Westport Distribution Center property is an industrial warehouse/distribution property totaling 690,160 sq. ft. located on a 56.56-acre site. The improvements were built between 1981 and 1990, are in average condition and have a remaining economic life of 25 years. The Westport Distribution Center property consists of six, single-story buildings and 389 surface parking spaces for a parking ratio of 0.56 spaces per 1,000 sq. ft. The improvements feature reinforced concrete slab foundation, structural steel framing, and concrete block and masonry exterior walls. The buildings feature 20 foot clear height, 95 dock high doors, 4 grade level doors and 2 rail doors.
Major Tenants. Westport Axle Corporation (231,000 sq. ft.; 16.0% of NRA; 15.1% of U/W Base Rent). Westport Axle Corporation is a private company headquartered in Louisville, Kentucky that manufactures and assembles machine components. The company provides assembly and subassembly, sequencing metering, warehousing, packaging, sorting, and bulk services. Westport Axle Corporation serves customers across the United States. Westport Axle Corporation leases 181,000 sq. ft. on Westport Road expiring on May 31, 2020, and 50,000 sq. ft. on Collins Lane expiring on May 31, 2021. The Westport Axle Corporation lease on Collins Lane has one, three-year renewal option remaining.
Dana Driveshaft Manufacturing, LLC (“Dana”) (156,170 sq. ft.; 10.8% of NRA; 9.0% of U/W Base Rent). Dana is a supplier of driveline products, power technologies and genuine service parts for light and heavy vehicle manufacturers world-wide. The company’s customer base includes vehicle manufacturers in the global light vehicle, medium/heavy vehicle and off-highway markets. The company operates in five segments: Light Vehicle Driveline, Power Technologies, Structural Products, Commercial Vehicle and Off-Highway. The initial term of the Dana lease expires in February 2026 and has two, five-year renewal options remaining.
THE INFORMATION IN THIS STRUCTURAL AND COLLATERAL TERM SHEET IS NOT COMPLETE AND MAY BE AMENDED PRIOR TO THE TIME OF SALE. THIS TERM SHEET IS NOT AN OFFER TO SELL THESE SECURITIES AND IT IS NOT A SOLICITATION OF AN OFFER TO BUY THESE SECURITIES IN ANY JURISDICTION WHERE THE OFFER OR SALE IS NOT PERMITTED.
54
Various Louisville, KY | Collateral Asset Summary – Loan No. 4 Weston Kentucky Portfolio | Cut-off Date Balance: Cut-off Date LTV: U/W NCF DSCR: U/W NOI Debt Yield: | $52,253,500 59.5% 3.06x 12.3% |
Conagra Foods d.b.a. Bakery Chef, Inc. (“Bakery Chef”) (128,990 sq. ft.; 8.9% of NRA, 8.0% of U/W Base Rent). Founded in 1981 and based in Downers Grove, Illinois, Bakery Chef produces frozen, ready-to-eat and microwaveable biscuits, breads, bread sticks, rolls, buns, muffins, pancakes, waffles and french toast, as well as breakfast, lunch and dinner entrees. It also provides mixes for pancakes and desserts and sells its products to retail grocery, food service, in-store bakery and industrial food operations in the United States, including McDonalds Corp. The Bakery Chef lease expires in December 2019 and has one, three-year option remaining. At origination the lender established an earnout reserve that is to be released when the debt yield is 10.25% or Bakery Chef renews its lease as described under “Initial and Ongoing Reserves” below.
Dakkota Integrated Systems, LLC (“Dakkota”) (74,000 sq. ft.; 5.1% of NRA; 4.7% of U/W Base Rent). Dakkota provides a variety of build-to-order manufacturing processes including cockpit, overhead and fascia systems. Dakkota was founded in 2001. Dakkota develops assembly and sequencing operations along with product development and supply chain management processes to lead the industry in product/process integration, assembly and delivery. The Dakkota lease expires in October 2020 and contains one, three-year renewal option and one six-month extension option.
Environmental Matters. The Phase I environmental reports dated September 13, 2019 (or in the case of the Jefferson Trade Center property, September 18, 2019) identified no recognizable environmental conditions but indicated that based on the age of the buildings there is a potential for asbestos containing materials (“ACMs”) to exist and such suspect ACMs should be managed in-place in good condition under an ACM O&M Program.
The Market. The Louisville Industrial Market has 219.4 million sq. ft. of space with a vacancy of 5.2% according to the appraisal. The Louisville Industrial Market currently has approximately 4.3 million sq. ft. of industrial real estate under construction as of year-end 2018. Average rental rates for the market are reported as $3.97 PSF in Louisville, Kentucky.
The Bluegrass Corporate Center Property is located within the Southeast Louisville Industrial Submarket. The Southeast Louisville Industrial Submarket has approximately 16.1 million sq. ft. of space, with a vacancy of 1.7%. The Southeast Louisville Industrial Submarket currently has 224,000 sq. ft. of industrial real estate new construction and absorbed negative 160,993 net sq. ft. as of year-end 2018. Average rental rates in the submarket were reported at $5.15 PSF.
The Jefferson Trade Center Property and The Westport Distribution Center Property are located within the Hurstbourne/Lyndon Industrial Submarket. The Hurstbourne/Lyndon Industrial Submarket has approximately 12.9 million sq. ft. of space, with a vacancy of 0.6%. The Hurstbourne/Lyndon Industrial submarket currently has no industrial real estate new construction and absorbed negative 33,667 net sq. ft. as of year-end 2018. Average rental rates in the submarket were reported at $6.51 PSF.
The appraisal identified six comparable flex leases for the Bluegrass Corporate Center Property that had base rents ranging from $4.59 to $10.00 PSF with an average of $6.70 PSF.
Comparable Flex Leases(1) | ||||||
Property Name / Location | Year Built | Tenant Name | Tenant Leased Space | Lease Date | Lease Term (years) | Base Rent PSF |
Bluegrass Corporate Center Louisville, KY | 1972 | Vision Dynamics LLC(2) | 28,000(2) | Apr-20(2) | 5.0(2) | $5.19(2) |
11321 Decimal Drive Jeffersontown, KY | 1989 | Confidential | 1,083 | Sep-17 | 3.0 | $7.25 |
10400-10466 Bluegrass Parkway Louisville, KY | 1976-1980 | Confidential | 3,150 | Aug-19 | 3.0 | $7.00 |
Commonwealth Business Center Louisville, KY | 1985 | Confidential | 2,410 | Feb-17 | 4.0 | $10.00 |
Industrial Building Louisville, KY | 1980 | Arjo Hunt Leigh | 4,950 | May-17 | 3.0 | $6.18 |
Jefferson Trade Center Louisville, KY | 1981 | Confidential | 2,500 | June-19 | 3.0 | $5.15 |
Jefferson Trade Center Louisville, KY | 1981 | Confidential | 16,000 | June-19 | 3.0 | $4.59 |
(1) | Source: Appraisal. |
(2) | Based on the underwritten rent roll dated October 31, 2019. |
THE INFORMATION IN THIS STRUCTURAL AND COLLATERAL TERM SHEET IS NOT COMPLETE AND MAY BE AMENDED PRIOR TO THE TIME OF SALE. THIS TERM SHEET IS NOT AN OFFER TO SELL THESE SECURITIES AND IT IS NOT A SOLICITATION OF AN OFFER TO BUY THESE SECURITIES IN ANY JURISDICTION WHERE THE OFFER OR SALE IS NOT PERMITTED.
55
Various Louisville, KY | Collateral Asset Summary – Loan No. 4 Weston Kentucky Portfolio | Cut-off Date Balance: Cut-off Date LTV: U/W NCF DSCR: U/W NOI Debt Yield: | $52,253,500 59.5% 3.06x 12.3% |
The appraisal identified six comparable flex leases for the Jefferson Trade Center Property that had base rents ranging from $4.72 to $10.00 PSF with an average of $6.72 PSF.
Comparable Flex Leases(1) | ||||||
Property Name / Location | Year Built | Tenant Name | Tenant Leased Space | Lease Date | Lease Term (years) | Base Rent PSF |
Jefferson Trade Center Louisville, KY | 1981 | Hexagon Chemical(2) | 18,700(2) | July-19(2) | 3.4(2) | $3.88(2) |
11321 Decimal Drive Jeffersontown, KY | 1986 | Confidential | 1,083 | Sep-17 | 3.0 | $7.25 |
10400-10466 Bluegrass Parkway Louisville, KY | 1976-1980 | Confidential | 3,150 | Aug-19 | 3.0 | $7.00 |
Commonwealth Business Center Louisville, KY | 1985 | Confidential | 2,410 | Feb-17 | 4.0 | $10.00 |
Industrial Building Louisville, KY | 1980 | Arjo Hunt Leigh | 4,950 | May-17 | 3.0 | $6.18 |
1800 Production Court Louisville, KY | 1972 | Confidential | 3,000 | Apr-19 | 3.0 | $4.72 |
1800 Production Court Louisville, KY | 1972 | Confidential | 2,000 | Apr-19 | 3.0 | $5.14 |
(1) | Source: Appraisal. |
(2) | Based on the underwritten rent roll dated October 31, 2019. |
The appraisal identified six comparable distribution leases for the Westport Distribution Center Property that had base rents ranging from $3.95 to $5.27 PSF with an average of $4.62 PSF.
Comparable Distribution Leases(1) | ||||||
Property Name / Location | Year Built | Tenant Name | Tenant Leased Space | Lease Date | Lease Term (years) | Base Rent PSF |
Westport Distribution Center Louisville, KY | 1981-1990 | Westport Axle Corporation(2) | 231,000(2) | Various(2) | Various(2) | $4.19(2) |
12530 Westport Road Louisville, KY | 1995 | Grupo Antolin | 138,126 | Aug-17 | 8.0 | $5.27 |
11400 Interchange Drive Louisville, KY | 1999 | Revzilla | 140,000 | Jan-18 | 6.0 | $3.98 |
4325 Robards Lane Louisville, KY | 2000 | RSCS | 60,000 | Jan-18 | 5.0 | $4.95 |
5100 Jeff Commerce Drive Louisville, KY | 2016 | America’s Best Tires | 98,059 | Aug-17 | 5.0 | $3.95 |
Industrial Building Louisville, KY | 1989 | 651 Vinyl | 22,500 | Nov-17 | 5.0 | $4.60 |
2420-2460 Chamberlain Crossings Drive Louisville, KY | 2006 | Confidential | 68,430 | Apr-17 | 5.0 | $4.95 |
(1) | Source: Appraisal. |
(2) | Based on the underwritten rent roll dated October 31, 2019. Westport Axle Corporation leases 181,000 sq. ft. ($4.19 PSF, five-year term) expiring on May 31, 2020 and 50,000 sq. ft. ($4.95 PSF, approximately three-year term) expiring on May 31, 2021. |
Cash Flow Analysis.
Cash Flow Analysis(1)(2) | ||||||
| 2016 | 2017 | 2018 | T-12 8/31/2019 | U/W | U/W PSF |
Base Rental Revenue | $5,992,105 | $6,198,737 | $6,367,101 | $6,474,718 | $6,641,576 | $4.59 |
Total Reimbursement Revenue | 1,307,876 | 1,387,545 | 1,421,321 | 1,528,380 | 1,406,106 | 0.97 |
Market Revenue from Vacant Units | 0 | 0 | 0 | 0 | 198,248 | 0.14 |
Other Revenue | 15,629 | 30,587 | 15,298 | 15,395 | 15,395 | 0.01 |
Gross Revenue | $7,315,610 | $7,616,869 | $7,803,720 | $8,018,493 | $8,261,325 | $5.71 |
Vacancy Loss | 0 | 0 | 0 | 0 | (431,843) | (0.30) |
Effective Gross Revenue | $7,315,610 | $7,616,869 | $7,803,720 | $8,018,493 | $7,829,482 | $5.41 |
Total Operating Expenses | 1,824,681 | 1,868,742 | 1,929,927 | 1,912,935 | 1,931,595 | 1.34 |
Net Operating Income | $5,490,929 | $5,748,127 | $5,873,793 | $6,105,558 | $5,897,886 | $4.08 |
TI/LC | 0 | 0 | 0 | 0 | 174,172 | $0.12 |
Replacement Reserves | 0 | 0 | 0 | 0 | 280,011 | $0.19 |
Net Cash Flow | $5,490,929 | $5,748,127 | $5,873,793 | $6,105,558 | $5,443,704 | $3.76 |
| (1) | Based on the underwritten rent roll dated as of October 31, 2019 with rent steps through November 30, 2020 totaling $134,087. |
| (2) | Certain items such as interest expense, interest income, lease cancellation income, depreciation, amortization, debt service payments and any other non-recurring or non-operating items were excluded from the historical presentation and are not considered for the underwritten cash flow. |
THE INFORMATION IN THIS STRUCTURAL AND COLLATERAL TERM SHEET IS NOT COMPLETE AND MAY BE AMENDED PRIOR TO THE TIME OF SALE. THIS TERM SHEET IS NOT AN OFFER TO SELL THESE SECURITIES AND IT IS NOT A SOLICITATION OF AN OFFER TO BUY THESE SECURITIES IN ANY JURISDICTION WHERE THE OFFER OR SALE IS NOT PERMITTED.
56
Various Louisville, KY | Collateral Asset Summary – Loan No. 4 Weston Kentucky Portfolio | Cut-off Date Balance: Cut-off Date LTV: U/W NCF DSCR: U/W NOI Debt Yield: | $52,253,500 59.5% 3.06x 12.3% |
Property Management. The Weston Kentucky Portfolio is managed by Weston Inc., a subsidiary of the Weston Kentucky Portfolio Guarantor that manages its real estate holdings. The property management division of Weston focuses on providing management and operational services for both its internal portfolio and for external clients, focusing mainly on industrial properties.
Lockbox / Cash Management. The Weston Kentucky Portfolio Loan is structured with a springing hard lockbox and springing cash management. Upon the occurrence of an initial Weston Kentucky Cash Sweep Event (as defined below), the lender may deliver notices to each tenant instructing them to remit all rents into a lender-controlled lockbox account. At all times from and after an initial Weston Kentucky Cash Sweep Event (regardless of whether such period has concluded), the borrower will be required to cause all rents or other income received by the borrower or the property manager with respect to the Weston Kentucky Portfolio Properties to be deposited into such lockbox account within one business day of receipt. On each business day during the continuance of a Weston Kentucky Cash Sweep Event, all amounts in the lockbox account are required to be remitted to a lender-controlled cash management account. On each business day that no Weston Kentucky Cash Sweep Event is continuing, all funds in the lockbox account are required to be swept into a borrower-controlled operating account. Upon the occurrence and during the continuance of a Weston Kentucky Cash Sweep Event, all funds in the lockbox account are required to be swept on each business day to a cash management account under the control of the lender to be applied and disbursed for payment of taxes, insurance premiums, operating expenses, debt service, reserves, and other amounts payable in accordance with the Weston Kentucky Portfolio Loan documents, and all excess cash flow funds remaining in the cash management account after the application of such funds in accordance with the Weston Kentucky Portfolio Loan documents are required to be held by the lender in an excess cash flow reserve account as additional collateral for the Weston Kentucky Portfolio Loan. Upon the occurrence and during the continuance of an event of default under the Weston Kentucky Portfolio Loan documents, the lender may apply funds to the debt in such priority as it may determine.
A “Weston Kentucky Cash Sweep Event” means each period that commences when (a) the debt service coverage ratio, as of the first day of any fiscal quarter, is less than 1.25x and concludes when the debt service coverage ratio, as of the first day of each of two consecutive fiscal quarters, is at least 1.25x; (b) the Weston Kentucky Portfolio Guarantor fails to maintain (A) a net worth in excess of $20,000,000 or (B) liquid assets in excess of $2,000,000 and concludes when the Weston Kentucky Portfolio Guarantor maintains (A) a net worth in excess of $20,000,000 and (B) liquid assets in excess of $2,000,000; and/or (c) the borrower fails to deliver required monthly, quarterly or annual financial reports and concludes when such reports are delivered and indicate that no other Weston Kentucky Cash Sweep Event is ongoing.
Initial and Ongoing Reserves. At loan origination, the borrower was required to deposit $4,840,000 into an earnout reserve, $1,000,000 for TI/LCs, and approximately $326,085 for unfunded obligations. In the event that the borrower delivers a letter of credit to the lender, the lender will be required to release an amount from the earnout reserve equal to the face value of such letter of credit. The borrower will also be entitled to request the release of funds from the earnout reserve in the event that either (A) the debt yield (excluding any amount that will remain in the earnout reserve and any amount attributable to Bakery Chef unless it has renewed for at least 12 months) is at least 10.25%, or (B) the borrower provides evidence reasonably satisfactory to the lender that the Bakery Chef tenant has renewed or extended its lease for all its space for a term of no less than two years with rents at least equal to the rents currently payable under its lease and is open for business and paying full, unabated rent.
Real Estate Taxes and Insurance Reserves – On each payment date, the borrower is required to make monthly deposits of: (i) a tax reserve in an amount equal to 1/12 of the amount that the lender estimates will be necessary to pay taxes over the then succeeding 12-month period and (ii) an insurance reserve in an amount equal to 1/12 of the amount that the lender estimates will be necessary to cover premiums over the then succeeding 12-month period (such reserve has been conditionally waived so long as no event of default under the related loan documents has occurred and is continuing, the borrower maintains a blanket policy meeting the requirements of the Weston Kentucky Portfolio Loan documents and the borrower provides timely evidence of the payments of the applicable premiums).
TI/LC Reserve – At loan origination, $1,000,000 was funded into the TI/LC reserve. On each payment date, the borrower is required to make monthly deposits of approximately $20,833 to the extent the TI/LC reserve is below the cap of $1,000,000.
Replacement Reserve – On each payment date, the borrower is required to make monthly deposits of $23,334 for a replacement reserve, capped at $500,000.
Current Mezzanine or Subordinate Indebtedness. None.
Future Mezzanine or Subordinate Indebtedness Permitted. None.
Partial Release. The Weston Kentucky Portfolio Loan documents provide that the borrower may obtain the free release of four unimproved parcels, as to which no value was attributed in underwriting or the appraisals, from the lien of the Weston Kentucky Portfolio Loan, subject to the satisfaction of certain terms and conditions including, without limitation (i) no event of default is continuing, and (ii) the borrower has delivered a REMIC opinion.
THE INFORMATION IN THIS STRUCTURAL AND COLLATERAL TERM SHEET IS NOT COMPLETE AND MAY BE AMENDED PRIOR TO THE TIME OF SALE. THIS TERM SHEET IS NOT AN OFFER TO SELL THESE SECURITIES AND IT IS NOT A SOLICITATION OF AN OFFER TO BUY THESE SECURITIES IN ANY JURISDICTION WHERE THE OFFER OR SALE IS NOT PERMITTED.
57
225 Bush Street San Francisco, CA 94104 | Collateral Asset Summary – Loan No. 5 225 Bush | Cut-off Date Balance: Cut-off Date LTV: U/W NCF DSCR: U/W NOI Debt Yield: | $50,000,000 34.6% 3.85x 13.4% |
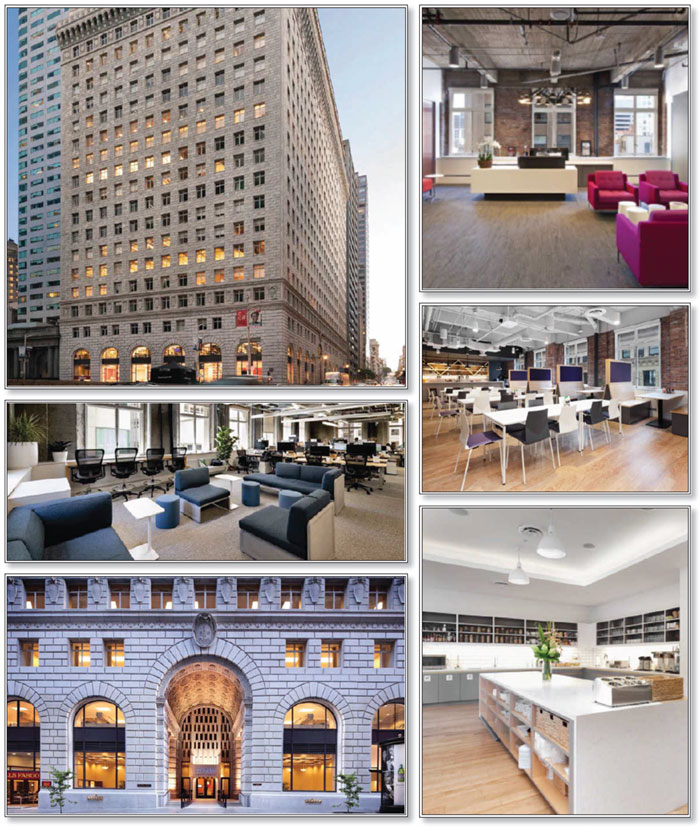
THE INFORMATION IN THIS STRUCTURAL AND COLLATERAL TERM SHEET IS NOT COMPLETE AND MAY BE AMENDED PRIOR TO THE TIME OF SALE. THIS TERM SHEET IS NOT AN OFFER TO SELL THESE SECURITIES AND IT IS NOT A SOLICITATION OF AN OFFER TO BUY THESE SECURITIES IN ANY JURISDICTION WHERE THE OFFER OR SALE IS NOT PERMITTED.
58
225 Bush Street San Francisco, CA 94104 | Collateral Asset Summary – Loan No. 5 225 Bush | Cut-off Date Balance: Cut-off Date LTV: U/W NCF DSCR: U/W NOI Debt Yield: | $50,000,000 34.6% 3.85x 13.4% |
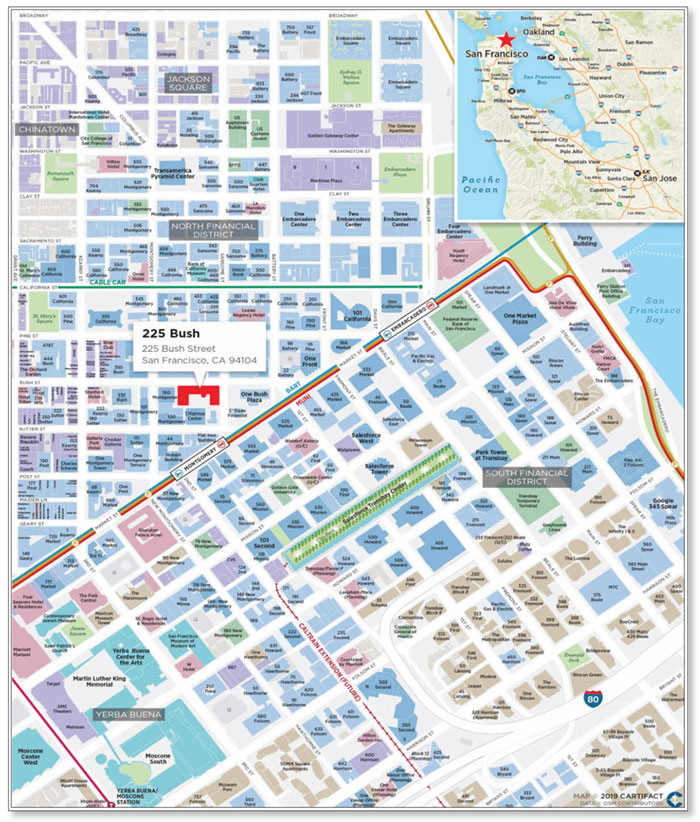
THE INFORMATION IN THIS STRUCTURAL AND COLLATERAL TERM SHEET IS NOT COMPLETE AND MAY BE AMENDED PRIOR TO THE TIME OF SALE. THIS TERM SHEET IS NOT AN OFFER TO SELL THESE SECURITIES AND IT IS NOT A SOLICITATION OF AN OFFER TO BUY THESE SECURITIES IN ANY JURISDICTION WHERE THE OFFER OR SALE IS NOT PERMITTED.
59
225 Bush Street San Francisco, CA 94104 | Collateral Asset Summary – Loan No. 5 225 Bush | Cut-off Date Balance: Cut-off Date LTV: U/W NCF DSCR: U/W NOI Debt Yield: | $50,000,000 34.6% 3.85x 13.4% |
Mortgage Loan Information | |
Loan Seller: | GACC |
Loan Purpose: | Refinance |
Credit Assessment |
|
(Fitch/KBRA/Moody’s)(6): | BBB-sf / A(sf) / Baa3 |
Borrower Sponsor: | Kylli Inc. |
Borrower: | 225 Bush Street Owners LLC |
Original Balance(1): | $50,000,000 |
Cut-off Date Balance(1): | $50,000,000 |
% by Initial UPB: | 4.9% |
Interest Rate: | 3.30300% |
Payment Date: | 6th of each month |
First Payment Date: | December 6, 2019 |
Maturity Date: | November 6, 2024 |
Amortization: | Interest Only |
Additional Debt(1)(2): | $153,600,000 Pari Passu Debt; $146,400,000 Subordinate Debt |
Call Protection(3): | L(25), D(29), O(6) |
Lockbox / Cash Management: | Hard / Springing |
Reserves(4) | |||
| Initial | Monthly | Cap |
Taxes: | $3,012,292 | $376,536 | NAP |
Insurance: | $838,031 | $119,719 | NAP |
Replacement: | $0 | $9,666 | $231,995 |
TI/LC: | $0 | $96,665 | $3,479,922 |
Outstanding TI/LCs: | $4,097,106 | $0 | NAP |
Free Rent: | $886,122 | $0 | NAP |
Property Information | |
Single Asset / Portfolio: | Single Asset |
Property Type: | CBD - Office |
Collateral: | Fee Simple |
Location: | San Francisco, CA |
Year Built / Renovated: | 1922, 1955 / 2010-2013 |
Total SF: | 579,987 |
Property Management: | 225 Bush Street Partners LLC |
Underwritten NOI: | $27,263,666 |
Underwritten NCF: | $26,277,688 |
Appraised Value: | $589,000,000 |
Appraisal Date: | September 5, 2019 |
| |
Historical NOI(5) | |
Most Recent NOI: | $24,512,257 (T-12 August 31, 2019) |
2018 NOI: | $25,674,474 (December 31, 2018) |
2017 NOI: | $24,788,393 (December 31, 2017) |
2016 NOI: | $25,426,362 (December 31, 2016) |
| |
Historical Occupancy | |
Most Recent Occupancy: | 97.8% (September 30, 2019) |
2018 Occupancy: | 92.5% (December 31, 2018) |
2017 Occupancy: | 92.0% (December 31, 2017) |
2016 Occupancy: | 93.4% (December 31, 2016) |
Financial Information(1) | ||||||
Tranche | Cut-off Date Balance | Balance per Sq. Ft. Cut-off / Balloon | LTV Cut-off / Balloon | U/W DSCR NOI / NCF | U/W Debt Yield NOI / NCF | U/W Debt Yield at Balloon NOI / NCF |
Mortgage Loan | $50,000,000 |
|
|
|
|
|
Pari Passu Notes | 153,600,000 |
|
|
|
|
|
Total Senior Notes | $203,600,000 | $351 / $351 | 34.6% / 34.6% | 4.00x / 3.85x | 13.4% / 12.9% | 13.4% / 12.9% |
B Note | 146,400,000 |
|
|
|
|
|
Whole Loan | $350,000,000 | $603 / $603 | 59.4% / 59.4% | 2.33x / 2.24x | 7.8% / 7.5% | 7.8% / 7.5% |
(1) | The 225 Bush Loan (as defined below) is part of a whole loan evidenced by six senior pari passu notes with an aggregate outstanding principal balance as of the Cut-off Date of $203.6 million and one subordinate note with an outstanding principal balance as of the Cut-off Date of $146.4 million. See “The Loan” herein. |
(2) | See “Current Mezzanine or Subordinate Indebtedness” herein. |
(3) | The lockout period will be at least 25 payments beginning with and including the first payment date of December 6, 2019. The borrower has the option to defease the full $350.0 million 225 Bush Whole Loan (as defined below) after the earlier to occur of (i) two years after the closing date of the securitization that includes the last note to be securitized and (ii) October 11, 2022. The assumed lockout period of 25 months is based on the expected closing date of the COMM 2019-GC44 securitization in December 2019. The actual lockout period may be longer. |
(4) | See “Initial and Ongoing Reserves” herein. |
(5) | Historical NOI fluctuations year-over-year are due to tenant rent abatements associated with new leases. |
(6) | Fitch, KBRA and Moody’s provided the listed assessments for the 225 Bush Loan in the context of its inclusion in the mortgage pool. |
THE INFORMATION IN THIS STRUCTURAL AND COLLATERAL TERM SHEET IS NOT COMPLETE AND MAY BE AMENDED PRIOR TO THE TIME OF SALE. THIS TERM SHEET IS NOT AN OFFER TO SELL THESE SECURITIES AND IT IS NOT A SOLICITATION OF AN OFFER TO BUY THESE SECURITIES IN ANY JURISDICTION WHERE THE OFFER OR SALE IS NOT PERMITTED.
60
225 Bush Street San Francisco, CA 94104 | Collateral Asset Summary – Loan No. 5 225 Bush | Cut-off Date Balance: Cut-off Date LTV: U/W NCF DSCR: U/W NOI Debt Yield: | $50,000,000 34.6% 3.85x 13.4% |
The Loan. The 225 Bush mortgage loan (the “225 Bush Loan”) is part of a whole loan (the “225 Bush Whole Loan”) consisting of six pari passu senior notes with an aggregate initial principal balance and Cut-off Date balance of $203,600,000 (collectively the “225 Bush Senior Notes”) and one junior note with an initial principal balance and Cut-off Date balance of $146,400,000 (the “225 Bush Junior Note”). The 225 Bush Whole Loan is secured by the borrower’s fee simple interest in a 579,987 sq. ft., Class A, office building with ground floor retail located in San Francisco, California (the “225 Bush Property”).
The relationship between the holders of the 225 Bush Whole Loan will be governed by a co-lender agreement as described under “Description of the Mortgage Pool—The Whole Loans— The Non-Serviced AB Whole Loans—225 Bush Whole Loan” in the Preliminary Prospectus.
Whole Loan Summary | |||||
Note | Original Balance | Cut-off Date Balance |
| Note Holder | Controlling Piece |
A-1 | $50,000,000 | $50,000,000 |
| Benchmark 2019-B14(1) | No(2) |
A-2 | 50,000,000 | 50,000,000 |
| COMM 2019-GC44 | No |
A-3 | 30,000,000 | 30,000,000 |
| DBRI(3) | No |
A-4 | 35,000,000 | 35,000,000 |
| DBRI(3) | No |
A-5 | 28,600,000 | 28,600,000 |
| DBRI(3) | No |
A-6 | 10,000,000 | 10,000,000 |
| Benchmark 2019-B14(1) | No |
Senior Notes | $203,600,000 | $203,600,000 |
|
|
|
B | 146,400,000 | 146,400,000 |
| Benchmark 2019-B14(1) | Yes(2) |
Whole Loan | $350,000,000 | $350,000,000 |
|
|
|
(1) | The Benchmark 2019-B14 securitization transaction is expected to close prior to the Closing Date. |
(2) | The initial controlling note is Note B, so long as no control appraisal period with respect to the 225 Bush Whole Loan has occurred and is continuing. If and for so long as a control appraisal period with respect to the 225 Bush Whole Loan has occurred and is continuing, then the controlling note will be Note A-1. See “Description of the Mortgage Pool—The Whole Loans—The Non-Serviced AB Whole Loan—225 Bush Whole Loan” in the Preliminary Prospectus. |
(3) | Expected to be contributed to one or more future securitization transactions. |
The 225 Bush Whole Loan has a five-year term with interest only payments during the loan term. The 225 Bush Whole Loan has an interest rate of 3.30300% per annum. The proceeds of the 225 Bush Whole Loan were primarily used to pay off the existing loan, fund reserves, pay closing costs and return equity to the borrower sponsor. Based on the “as is” appraised value of $589.0 million as of September 5, 2019 and Cut-off Date balance of the 225 Bush Senior Notes, the Cut-off Date LTV Ratio is 34.6%.
Sources and Uses | ||||||
Sources | Proceeds | % of Total |
| Uses | Proceeds | % of Total |
Whole Loan | $350,000,000 | 100.0% |
| Loan Payoff | $241,210,092 | 68.9% |
|
|
|
| Upfront Reserves | 8,833,550 | 2.5 |
|
|
|
| Closing Costs | 3,591,605 | 1.0 |
|
|
|
| Return of Equity | 96,364,753 | 27.5 |
Total Sources | $350,000,000 | 100.0% |
| Total Uses | $350,000,000 | 100.0% |
The Borrower / Borrower Sponsors. The borrower is 225 Bush Street Owners LLC, a single purpose Delaware limited liability company structured to be bankruptcy remote with two independent directors in the organizational structure. Legal counsel to the borrower delivered a non-consolidation opinion in connection with the origination of the 225 Bush Whole Loan. The borrower sponsor and nonrecourse carve-out guarantor is Kylli Inc.
Kylli Inc. is a full-service real estate investment management company focused on the acquisition, development and management of assets in the San Francisco Bay Area. Kylli Inc. is a wholly-owned subsidiary of Genzon Investment Group Co., Ltd., which is a privately-held full service investment company headquartered in Shenzhen, China. Kylli Inc.’s assets in the United States, include (i) over 500,000 sq. ft. of office space under management in San Francisco, (ii) 767,000 sq. ft. of office space under construction in Burlingame Point, California fully leased to Facebook and (iii) over 48 acres of developable land in Santa Clara, California.
THE INFORMATION IN THIS STRUCTURAL AND COLLATERAL TERM SHEET IS NOT COMPLETE AND MAY BE AMENDED PRIOR TO THE TIME OF SALE. THIS TERM SHEET IS NOT AN OFFER TO SELL THESE SECURITIES AND IT IS NOT A SOLICITATION OF AN OFFER TO BUY THESE SECURITIES IN ANY JURISDICTION WHERE THE OFFER OR SALE IS NOT PERMITTED.
61
225 Bush Street San Francisco, CA 94104 | Collateral Asset Summary – Loan No. 5 225 Bush | Cut-off Date Balance: Cut-off Date LTV: U/W NCF DSCR: U/W NOI Debt Yield: | $50,000,000 34.6% 3.85x 13.4% |
The Property.
Tenant Summary(1) | |||||||
Tenant |
| Ratings | Net Rentable Area | % of | U/W Base Rent | % of Total | Lease |
Twitch Interactive(3) |
| A+ / A3 / AA- | 84,035 | 14.5% | $62.98 | 14.2% | 8/18/2021 |
LiveRamp, Inc |
| NR / NR / NR | 76,724 | 13.2 | $74.86 | 15.4 | 5/4/2022 |
Benefit Cosmetics, LLC(4)(5) |
| NR / NR / NR | 61,917 | 10.7 | $35.90 | 6.0 | 8/31/2020 |
Handshake |
| NR / NR / NR | 52,735 | 9.1 | $90.01 | 12.7 | 7/30/2027 |
SunRun |
| NR / NR / NR | 43,850 | 7.6 | $81.75 | 9.6 | 5/31/2024 |
Knotel |
| NR / NR / NR | 26,664 | 4.6 | $79.00 | 5.6 | 7/14/2026 |
Jewish Vocational Services(6) |
| NR / NR / NR | 26,497 | 4.6 | $47.59 | 3.4 | 2/28/2021 |
Mesosphere, Inc. |
| NR / NR / NR | 26,339 | 4.5 | $79.31 | 5.6 | 4/30/2023 |
HEAP, Inc. |
| NR / NR / NR | 26,333 | 4.5 | $73.13 | 5.2 | 8/21/2023 |
General Assembly Space, Inc. |
| NR / NR / NR | 26,320 | 4.5 | $64.92 | 4.6 | 8/29/2024 |
Total Major Tenants |
|
| 451,414 | 77.8% | $67.97 | 82.1% |
|
Other Occupied(7) |
|
| 115,919 | 20.0 | $57.58 | 17.9 |
|
Total Occupied |
|
| 567,333 | 97.8% | $65.84 | 100.0% |
|
Vacant |
|
| 12,654 | 2.2 |
|
|
|
Total |
|
| 579,987 | 100.0% |
|
|
|
(1) | Based on the underwritten rent roll dated September 30, 2019. |
(2) | In certain instances, ratings provided are those of the parent company of the entity shown, whether or not the parent company guarantees the lease. |
(3) | The Net Rentable Area (Sq. Ft.) for Twitch Interactive includes 5,574 sq. ft. of storage space with an average base rent of $11.39 PSF. |
(4) | According to the loan sponsor, Benefit Cosmetics has indicated that it will not be extending its lease at the end of its term in August 2020. Benefit Cosmetics is currently in occupancy and paying full rent at $35.90 PSF, which is approximately 60.1% below the appraisal’s concluded market rent for the Benefit Cosmetics space of $90.00 PSF. |
(5) | The Net Rentable Area (Sq. Ft.) for Benefit Cosmetics, LLC includes 1,787 sq. ft. of storage space with an average base rent of $17.83 PSF. |
(6) | The Net Rentable Area (Sq. Ft.) for Jewish Vocational Services includes 305 sq. ft. of storage space with a base rent of $12.00 PSF. |
(7) | Other Occupied is inclusive of a 8,766 sq. ft. of conference room space and fitness center space and 3,957 sq. ft. of storage space and antenna space with no attributable underwritten base rent. |
Lease Rollover Schedule(1)(2) | ||||||||
Year | # of Leases Expiring | Total Expiring Sq. Ft. | % of Total Sq. Ft. Expiring | Cumulative Sq. Ft. Expiring | Cumulative %of Sq. Ft. Expiring | Annual U/W Base Rent PSF | % U/W Base Rent Rolling | Cumulative % of U/W Base Rent |
MTM & 2019 | 0 | 0 | 0.0% | 0 | 0.0% | $0.00 | 0.0% | 0.0% |
2020 | 7 | 67,403 | 11.6 | 67,403 | 11.6% | $37.96 | 6.8 | 6.8% |
2021 | 13 | 141,317 | 24.4 | 208,720 | 36.0% | $60.99 | 23.1 | 29.9% |
2022 | 6 | 92,117 | 15.9 | 300,837 | 51.9% | $73.34 | 18.1 | 48.0% |
2023 | 6 | 56,632 | 9.8 | 357,469 | 61.6% | $75.10 | 11.4 | 59.4% |
2024 | 12 | 94,693 | 16.3 | 452,162 | 78.0% | $74.66 | 18.9 | 78.3% |
2025 | 1 | 20,677 | 3.6 | 472,839 | 81.5% | $58.00 | 3.2 | 81.5% |
2026 | 1 | 26,664 | 4.6 | 499,503 | 86.1% | $79.00 | 5.6 | 87.2% |
2027 | 2 | 52,735 | 9.1 | 552,238 | 95.2% | $90.01 | 12.7 | 99.9% |
2028 | 0 | 0 | 0.0 | 552,238 | 95.2% | $0.00 | 0.0 | 99.9% |
2029 | 0 | 0 | 0.0 | 552,238 | 95.2% | $0.00 | 0.0 | 99.9% |
2030 and Thereafter(3) | 4 | 15,095 | 2.6 | 567,333 | 97.8% | $3.07 | 0.1 | 100.0% |
Vacant | NAP | 12,654 | 2.2 | 579,987 | 100.0% | NAP | NAP |
|
Total | 52 | 579,987 | 100.0% |
|
| $65.84 | 100.0% |
|
(1) | Based on the underwritten rent roll dated September 30, 2019. |
(2) | Certain tenants may have termination or contraction options (which may become exercisable prior to the originally stated expiration date of the tenant lease) that are not considered in the above Lease Rollover Schedule. |
(3) | 2030 and Thereafter is inclusive of a 8,766 sq. ft. of conference room space and fitness center space and 3,957 sq. ft. of storage space and antenna space that have no underwritten rent. |
THE INFORMATION IN THIS STRUCTURAL AND COLLATERAL TERM SHEET IS NOT COMPLETE AND MAY BE AMENDED PRIOR TO THE TIME OF SALE. THIS TERM SHEET IS NOT AN OFFER TO SELL THESE SECURITIES AND IT IS NOT A SOLICITATION OF AN OFFER TO BUY THESE SECURITIES IN ANY JURISDICTION WHERE THE OFFER OR SALE IS NOT PERMITTED.
62
225 Bush Street San Francisco, CA 94104 | Collateral Asset Summary – Loan No. 5 225 Bush | Cut-off Date Balance: Cut-off Date LTV: U/W NCF DSCR: U/W NOI Debt Yield: | $50,000,000 34.6% 3.85x 13.4% |
The 225 Bush Property is a Class A, 22-story, 579,987 sq. ft. office building with ground floor retail located in the North Financial District neighborhood of San Francisco, California. The 225 Bush Property was originally constructed in two phases in 1922 and 1955. Formerly known as the “Standard Oil Building,” the 225 Bush Property was developed by John D. Rockefeller as the headquarters for Standard Oil and later became the headquarters of Chevron. The 225 Bush Property was designed by George W. Kelham and modeled after the Federal Reserve Bank of New York in Manhattan’s financial district. The 225 Bush Property features 26,000 sq. ft. floor plates, a fitness center with locker rooms and showers, 110 subterranean valet parking spaces and is situated on a 0.88-acre site at the corner of Bush Street and Sansome Street, one block north of Market Street.
The borrower sponsor purchased the 225 Bush Property in 2014 for $350.0 million and thereafter invested approximately $5.0 million in building system upgrades and approximately $23.0 million in tenant improvements. Historical investments include a $1.1 million renovation of the east and west lobbies in 2009 which included new lighting, interior paneling, carpeting, artwork, furniture, security desks, and the installation of new street-level property signage. From 2010 to 2013, the 225 Bush Property underwent a $12.8 million renovation which consisted of a full renovation of the terra cotta brick façade, including waterproofing, repairs of the terra cotta brick, refurbishing and painting of the steel windows and storefronts, as well as lobby renovations and the installation of the 13th floor fitness center. The borrower sponsor has indicated that it plans to execute a $7.0 million modernization of the building’s elevator systems which is expected to commence before the end of 2019 and be completed in 2022; however the borrower is under no obligation to conduct the modernization and no amounts were reserved therefor under the 225 Bush Street Whole Loan. We cannot assure you the borrower sponsor will complete such modernization plans.
As of September 30, 2019, the 225 Bush Property was 97.8% leased to 32 office tenants and an investment grade retail tenant, Target, which occupies 20,677 sq. ft. of ground floor retail space. The 225 Bush Property’s 10 largest tenants occupy 77.8% of the net rentable area and no tenant occupies more than 14.5% of the total net rentable area.
Major Tenants.
The largest tenant, Twitch Interactive (“Twitch”) (84,035 sq. ft.; 14.5% of NRA; 14.2% of U/W Base Rent), is a wholly owned subsidiary of Amazon.com, Inc. (“Amazon”) (rated A3/A+/AA- by Moody’s/Fitch/S&P). Twitch is a live social media entertainment company which has developed a platform allowing people to create and live-stream their own original entertainment to a global audience. Twitch is a platform for channels relating to cooking, fitness, music, the arts, talk shows and other genres. According to the Twitch website, in 2018, Twitch viewers watched over 505 billion minutes of original content. Additionally, the Twitch platform has over 3 million unique broadcasters each month on average, over 15 million average daily visitors and over 1.3 million average viewership at any given moment.
Twitch has been in occupancy at the 225 Bush Property since May 2013, originally occupying 26,351 sq. ft. (6th floor) under a five-year lease. In November 2014, the tenant executed a six-year renewal, expanding their premises by 25,653 sq. ft. (8th floor) and 26,457 sq. ft. (9th floor) for a total footprint of 78,461 sq. ft. (not including storage space). Twitch has one, five-year extension option remaining as well as a right of first offer to lease the entire 2nd, 5th, 7th and 10th floors. Amazon fully guarantees Twitch’s lease.
The second largest tenant, LiveRamp, Inc (“LiveRamp”) (76,724 sq. ft.; 13.2% of NRA; 15.4% of U/W Base Rent) provides an identity resolution software platform to companies that enables a customer to use their offline customer data in online advertising. According to LiveRamp’s financial statements, as of March 2019, LiveRamp reported an annual revenue $285.62 million. Subscription revenue was $237 million, up 38% and contributed 83% of total revenue.
LiveRamp has been in occupancy at the 225 Bush Property since May 2015, originally occupying 25,891 sq. ft. (17th floor) under a seven-year lease. LiveRamp expanded at the 225 Bush Property in August 2016 by 25,809 sq. ft. (16th floor) and once more in in July 2017 by an additional 25,024 sq. ft. (15th floor) for a total footprint of 76,724 sq. ft. The tenant has one, five-year extension option remaining for the entirety of its space.
The third largest tenant, Benefit Cosmetics, LLC (Benefit Cosmetics) (61,917 sq. ft.; 10.7% of NRA; 6.0% of U/W Base Rent) is a wholly owned subsidiary of Moët Hennessy – Louis Vuitton (“LVMH”), which is multinational luxury goods conglomerate headquartered in Paris, France. According to the borrower sponsor, Benefit Cosmetics has indicated that it will not be extending its lease at the end of its term in August 2020. Benefit Cosmetics is currently in occupancy and paying full rent at $35.90 PSF, which is approximately 60.1% below the appraisal’s concluded market rent for the Benefit Cosmetics space of $90.00 PSF.
Environmental Matters. According to Phase I environmental report, dated August 15, 2019, there are no recognized environmental conditions at the 225 Bush Property.
The Market. The 225 Bush Property is located in San Francisco’s North Financial District on the corner of Sansome Street and Bush Street, one block from the South of Market (“SOMA”) neighborhood. The 225 Bush Property is approximately 0.5 miles east of Union Square, which features major international retailers such as Nike, Apple, Gucci, Macy’s and Louis Vuitton and approximately 0.1 miles from the popular dining corridor known as Belden Place. In addition, the 225 Bush Property is within walking distance to the Montgomery BART station (0.3 miles), MUNI light rail, bus system stops and the Transbay Terminal development.
THE INFORMATION IN THIS STRUCTURAL AND COLLATERAL TERM SHEET IS NOT COMPLETE AND MAY BE AMENDED PRIOR TO THE TIME OF SALE. THIS TERM SHEET IS NOT AN OFFER TO SELL THESE SECURITIES AND IT IS NOT A SOLICITATION OF AN OFFER TO BUY THESE SECURITIES IN ANY JURISDICTION WHERE THE OFFER OR SALE IS NOT PERMITTED.
63
225 Bush Street San Francisco, CA 94104 | Collateral Asset Summary – Loan No. 5 225 Bush | Cut-off Date Balance: Cut-off Date LTV: U/W NCF DSCR: U/W NOI Debt Yield: | $50,000,000 34.6% 3.85x 13.4% |
As of the second quarter of 2019, the North Financial District office submarket consisted of approximately 30.3 million sq. ft. of office space with an overall market vacancy of 5.2% and average asking rents of approximately $67.81 PSF.
The appraisal identified six directly competitive office rent comparables located in the Financial District submarket. Comparable buildings were built between 1912 and 2000 and range in size from 47,733 sq. ft. to 485,000 SF. Direct asking rents at the comparable properties ranged between $77.00 and $92.00 PSF (full service leases) with a weighted average of approximately $86.29 PSF. The 225 Bush Property’s in-place weighted average office rent is $68.89 PSF, which is lower than the appraisal’s concluded office market rent, which ranges from $75.00 PSF to $90.00 PSF. The 225 Bush Property’s in-place weighted average office rent is approximately 18.1% below the weighted average concluded office market rent.
Appraisal’s Concluded Office Market Rent(1) | |
Floor(s) | Rent PSF |
Partial Floor | $75.00 |
Full Floor | $85.00 |
Benefit Cosmetics Space | $90.00 |
(1) | Source: Appraisal. |
Summary of Lease Comparables(1) | ||||||||
Property Name | Year Built/Renovated | # of Stories | Rentable Area (SF) | Lease Date | Lease Term (mos.) | Lease Size (SF) | Tenant Name | Base Rent |
225 Bush | 1922, 1955 / 2010-2013 | 22 | 579,987 | Various | Various | Various | Various | $68.89(2) |
150 California | 2000 / NAP | 23 | 249,510 | 12/2019 | 84 | 19,541 | City National Bank | $77.00 |
330-332 Pine Street | 1912 / 2012 | 9 | 47,733 | 2/2019 | 62 | 6,345 | Auto List | $80.00 |
The Landmark at One Market | 1917 / 2000 | 11 | 434,396 | 10/2019 | 88 | 62,408 | Duane Morris, LLP | $92.00 |
Embarcadero Center West | 1988 / NAP | 30 | 485,000 | 10/2018 | 96 | 1,559 | Opus Bank | $84.00 |
150 Spear Street | 1981 / NAP | 18 | 264,551 | 9/2018 | 123 | 10,152 | RMA | $78.00 |
353 Sacramento | 1982 / NAP | 23 | 284,751 | 4/2018 | 66 | 11,022 | Crew App | $82.00 |
(1) | Source: Appraisal. |
(2) | Represents the Base Rent PSF of the office space. |
Cash Flow Analysis.
Cash Flow Analysis | ||||||
| 2016 | 2017 | 2018 | T-12 8/31/2019 | U/W | U/W PSF |
Base Rent(1)(2) | $32,955,563 | $32,773,764 | $33,530,722 | $33,115,349 | $38,476,742 | $66.34 |
Vacant Income | 0 | 0 | 0 | 0 | 613,434 | 1.06 |
Gross Potential Rent | $32,955,563 | $32,773,764 | $33,530,722 | $33,115,349 | $39,090,176 | $67.40 |
Total Reimbursements | 3,060,722 | 2,256,601 | 2,572,270 | 2,655,316 | 4,439,738 | 7.65 |
Total Other Income | 833,678 | 776,575 | 679,963 | 760,436 | 476,903 | 0.82 |
Net Rental Income | $36,849,963 | $35,806,940 | $36,782,955 | $36,531,101 | $44,006,816 | $75.88 |
(Vacancy/Credit Loss) | 0 | 0 | 0 | 0 | (2,176,496) | (3.75) |
Effective Gross Income | $36,849,963 | $35,806,940 | $36,782,955 | $36,531,101 | $41,830,321 | $72.12 |
Total Expenses | 11,423,601 | 11,018,547 | 11,108,481 | 12,018,844 | 14,566,655 | 25.12 |
Net Operating Income(3) | $25,426,362 | $24,788,393 | $25,674,474 | $24,512,257 | $27,263,666 | $47.01 |
Total TI/LC, Capex/RR | 0 | 0 | 0 | 0 | 985,978 | 1.70 |
Net Cash Flow | $25,426,362 | $24,788,393 | $25,674,474 | $24,512,257 | $26,277,688 | $45.31 |
(1) | Underwritten Base Rent is based on the in place rent roll as of September 30, 2019 and inclusive Benefit Cosmetics, which has indicated that it will not be extending its lease at the end of its term in August 2020. Benefit Cosmetics is currently in occupancy and paying full rent at $35.90 PSF, which is approximately 60.1% below the appraisal’s concluded market rent for the Benefit Cosmetics space of $90.00 PSF. |
(2) | Underwritten Base Rent is inclusive of (i) rent steps through November 2021 equal to $1,055,382 and (ii) straight line rent for Target and Twitch over the loan term, equal to $66,371. |
(3) | Historical NOI fluctuations year-over-year are due to tenant rent abatements associated with new leases. |
Property Management. The 225 Bush Property is managed by 225 Bush Street Partners LLC, a Delaware limited liability company and an affiliate of the borrower.
THE INFORMATION IN THIS STRUCTURAL AND COLLATERAL TERM SHEET IS NOT COMPLETE AND MAY BE AMENDED PRIOR TO THE TIME OF SALE. THIS TERM SHEET IS NOT AN OFFER TO SELL THESE SECURITIES AND IT IS NOT A SOLICITATION OF AN OFFER TO BUY THESE SECURITIES IN ANY JURISDICTION WHERE THE OFFER OR SALE IS NOT PERMITTED.
64
225 Bush Street San Francisco, CA 94104 | Collateral Asset Summary – Loan No. 5 225 Bush | Cut-off Date Balance: Cut-off Date LTV: U/W NCF DSCR: U/W NOI Debt Yield: | $50,000,000 34.6% 3.85x 13.4% |
Lockbox / Cash Management. The 225 Bush Whole Loan is structured with a hard lockbox and springing cash management. The borrower is required to direct all existing tenants of the 225 Bush Property to directly deposit all rents into a clearing account controlled by the lender. If no Trigger Period (as defined below) exists, the funds in the clearing account will be swept on a daily basis into the borrower’s operating account and, if a Trigger Period exists, such funds are required to be swept on a daily basis into a deposit account controlled by the lender. During a Trigger Period, funds in the deposit account are required to be applied and disbursed in accordance with the 225 Bush Whole Loan documents. During a Trigger Period, all excess cash after payment of the monthly debt service on the 225 Bush Whole Loan, all required reserves and budgeted operating expenses, and certain other items in the payment waterfall described in the 225 Bush Whole Loan documents will be reserved as additional collateral for the 225 Bush Whole Loan. Under certain circumstances and for limited purposes described in the 225 Bush Whole Loan documents, the borrower may request disbursements of such excess cash flow.
A “Trigger Period” means the occurrence and continuation of (i) an event of default or (ii) a Low DSCR Period (as defined below).
A Trigger Period may be cured in accordance with the following conditions: with respect to a Trigger Period caused solely by (a) clause (i) above, the acceptance of a cure by the lender of the related event of default and (b) with respect to clause (ii) above, the debt service coverage ratio is at least 1.60x as of the last day of any calendar quarter.
A “Low DSCR Period” will commence if and when the debt service coverage ratio on the 225 Bush Whole Loan, as of the last day of any calendar quarter, is less than 1.55x and end if and when such event is cured as described above.
Initial and Ongoing Reserves. At loan origination, the borrower deposited (i) $3,012,292 into a tax reserve, (ii) $838,031 into an insurance reserve, (iii) approximately $4,097,106 into an outstanding tenant improvements and leasing commission reserve in connection with five leases and (iv) approximately $886,122 into a free rent reserve in connection with two leases.
Tax Reserve - The borrower is required to deposit into a real estate tax reserve, on a monthly basis, 1/12 of the estimated annual real estate taxes (initially estimated at $376,536).
Insurance Reserve - The borrower is required to deposit into an insurance reserve, on a monthly basis, 1/12 of estimated insurance premiums (initially estimated at $119,719).
Replacement Reserve - The borrower is required to deposit into a replacement reserve, on a monthly basis, an amount equal to $9,666 for replacement reserves (approximately $0.20 PSF annually), subject to a cap of $231,995 (approximately $0.40 PSF).
TI/LC Reserve - The borrower is required to deposit into a TI/LC reserve, on a monthly basis, an amount equal to $96,665 for tenant improvement and leasing commission obligations (approximately $2.00 PSF annually), subject to a cap of $3,479,922 (approximately $6.00 PSF).
Current Mezzanine or Subordinate Indebtedness. The 225 Bush Junior Note has an outstanding principal balance as of the Cut-off Date of $146.4 million, and accrues interest at a fixed rate of 3.30300% per annum. The 225 Bush Junior Note has a five-year term and is interest-only for the full term. For additional information, see “Description of the Mortgage Pool—The Whole Loans—The Non-Serviced AB Whole Loans—225 Bush Whole Loan” in the Preliminary Prospectus.
Future Mezzanine or Subordinate Indebtedness Permitted. None.
Partial Release. None.
THE INFORMATION IN THIS STRUCTURAL AND COLLATERAL TERM SHEET IS NOT COMPLETE AND MAY BE AMENDED PRIOR TO THE TIME OF SALE. THIS TERM SHEET IS NOT AN OFFER TO SELL THESE SECURITIES AND IT IS NOT A SOLICITATION OF AN OFFER TO BUY THESE SECURITIES IN ANY JURISDICTION WHERE THE OFFER OR SALE IS NOT PERMITTED.
65
Various | Collateral Asset Summary – Loan No. 6 | Cut-off Date Balance: | $45,000,000 9.8% |
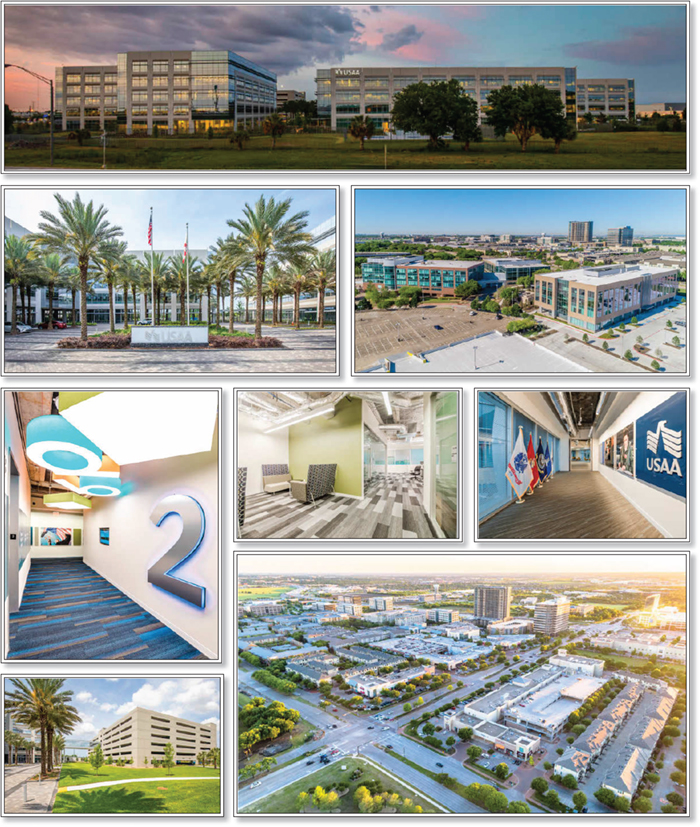
THE INFORMATION IN THIS STRUCTURAL AND COLLATERAL TERM SHEET IS NOT COMPLETE AND MAY BE AMENDED PRIOR TO THE TIME OF SALE. THIS TERM SHEET IS NOT AN OFFER TO SELL THESE SECURITIES AND IT IS NOT A SOLICITATION OF AN OFFER TO BUY THESE SECURITIES IN ANY JURISDICTION WHERE THE OFFER OR SALE IS NOT PERMITTED.
66
Various | Collateral Asset Summary – Loan No. 6 | Cut-off Date Balance: | $45,000,000 9.8% |
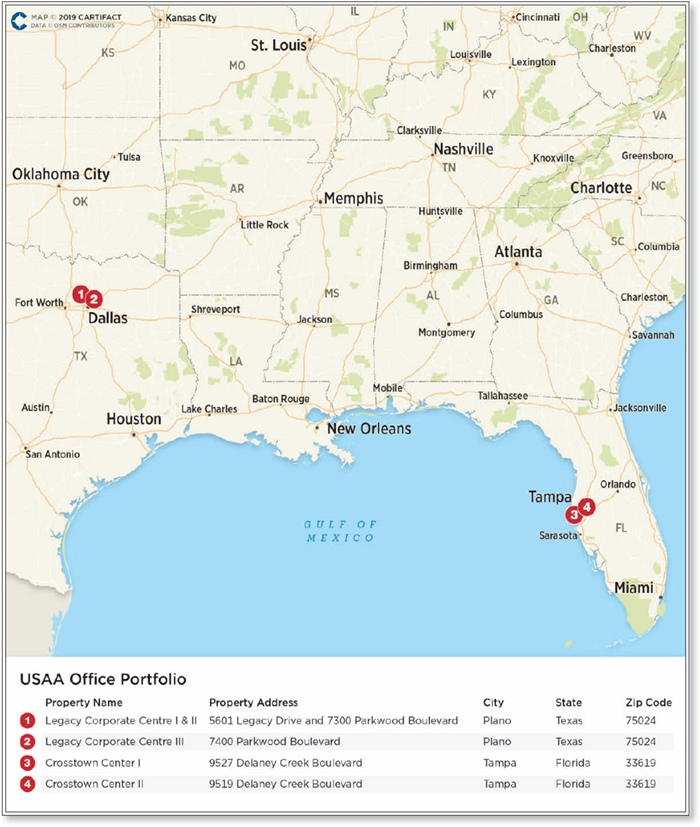
THE INFORMATION IN THIS STRUCTURAL AND COLLATERAL TERM SHEET IS NOT COMPLETE AND MAY BE AMENDED PRIOR TO THE TIME OF SALE. THIS TERM SHEET IS NOT AN OFFER TO SELL THESE SECURITIES AND IT IS NOT A SOLICITATION OF AN OFFER TO BUY THESE SECURITIES IN ANY JURISDICTION WHERE THE OFFER OR SALE IS NOT PERMITTED.
67
Various | Collateral Asset Summary – Loan No. 6 | Cut-off Date Balance: | $45,000,000 9.8% |
Mortgage Loan Information | |
Loan Seller: | GSMC |
Loan Purpose: | Acquisition |
Borrower Sponsor: | JDM Real Estate Funds, LLC |
Borrower: | JDM Legacy TX, LLC; JDM Crosstown FL, LLC |
Original Balance(1): | $45,000,000 |
Cut-off Date Balance(1): | $45,000,000 |
% by Initial UPB: | 4.4% |
Interest Rate: | 3.37000% |
Payment Date: | 6th of each month |
First Payment Date: | August 6, 2019 |
Maturity Date: | August 6, 2029 |
Amortization: | Interest Only |
Additional Debt(1) : | $197,400,000 Pari Passu Debt |
Call Protection: | L(11), YM1(106), O(4) |
Lockbox / Cash Management: | Hard / Springing |
Reserves(2) | |||
| Initial | Monthly | Cap |
Taxes: | $0 | Springing | NAP |
Insurance: | $0 | Springing | NAP |
Replacement: | $0 | Springing | NAP |
TI/LC: | $0 | Springing | NAP |
Property Information | |
Single Asset / Portfolio: | Portfolio of four properties |
Property Type: | Suburban Office |
Collateral: | Fee Simple |
Location: | Various |
Year Built / Renovated: | Various / NAP |
Total Sq. Ft.: | 881,490 |
Property Management: | Tenant Managed |
Underwritten NOI: | $23,657,643 |
Underwritten NCF: | $23,481,345 |
Appraised Value: | $380,000,000 |
Appraisal Date: | June 7, 2019 |
| |
Historical NOI(3) | |
Most Recent NOI: | NAV |
2018 NOI: | NAV |
2017 NOI: | NAV |
2016 NOI: | NAV |
| |
Historical Occupancy(3) | |
Most Recent Occupancy: | 100.0% (November 6, 2019) |
2018 Occupancy: | NAV |
2017 Occupancy: | NAV |
2016 Occupancy: | NAV |
Financial Information(1) | ||||||
Tranche | Cut-off Date Balance | Balance per Sq. Ft. Cut-off / Balloon | LTV Cut-off / Balloon | U/W DSCR NOI / NCF | U/W Debt Yield NOI / NCF | U/W Debt Yield at Balloon NOI / NCF |
Mortgage Loan | $45,000,000 |
|
|
|
|
|
Pari Passu Notes | 197,400,000 |
|
|
|
|
|
Whole Loan | $242,400,000 | $275 / $275 | 63.8% / 63.8% | 2.86x / 2.84x | 9.8% / 9.7% | 9.8% / 9.7% |
(1) | The USAA Office Portfolio Loan (as defined below) consists of the non-controlling Notes A-6, A-7 and A-8 and is part of the USAA Office Portfolio Whole Loan (as defined below) evidenced by eight pari passu notes with an aggregate outstanding principal balance as of the Cut-off Date of $242.4 million. For additional information, see “The Loan” herein. |
(2) | See “Initial and Ongoing Reserves” herein. |
(3) | Historical cash flows and occupancy are not available since the USAA Office Portfolio Properties were acquired at origination. |
THE INFORMATION IN THIS STRUCTURAL AND COLLATERAL TERM SHEET IS NOT COMPLETE AND MAY BE AMENDED PRIOR TO THE TIME OF SALE. THIS TERM SHEET IS NOT AN OFFER TO SELL THESE SECURITIES AND IT IS NOT A SOLICITATION OF AN OFFER TO BUY THESE SECURITIES IN ANY JURISDICTION WHERE THE OFFER OR SALE IS NOT PERMITTED.
68
Various | Collateral Asset Summary – Loan No. 6 | Cut-off Date Balance: | $45,000,000 9.8% |
The Loan. The mortgage loan (the “USAA Office Portfolio Loan”) is part of a whole loan (the “USAA Office Portfolio Whole Loan”) consisting of eight pari passu promissory notes (note A-1, note A-2, note A-3, note A-4, note A-5, note A-6, note A-7 and note A-8) with an aggregate original principal balance of $242,400,000 and is secured by a first mortgage and deed of trust encumbering the borrowers’ respective fee simple interests in a portfolio of four office properties located in Plano, Texas and Tampa, Florida (the “USAA Office Portfolio Properties”). The USAA Office Portfolio Loan, evidenced by non-controlling note A-6, non-controlling note A-7, and non-controlling note A-8, has an aggregate outstanding principal balance as of the Cut-off Date of $45,000,000 and represents approximately 4.4% of the Initial Pool Balance. The related pari passu companion loans are evidenced by the controlling note A-1 (with an outstanding principal balance as of the Cut-off Date of $62,400,000), non-controlling note A-2 (with an outstanding principal balance as of the Cut-off Date of $45,000,000), non-controlling note A-3 (with an outstanding principal balance as of the Cut-off Date of $30,000,000), non-controlling note A-4 (with an outstanding principal balance as of the Cut-off Date of $45,000,000), and non-controlling note A-5 (with an outstanding principal balance as of the Cut-off Date of $15,000,000).
The USAA Office Portfolio Whole Loan had an initial term of 121 months and has a remaining term of 116 months as of the Cut-off Date and requires interest-only payments during its term. The scheduled maturity date of the USAA Office Portfolio Whole Loan is August 6, 2029. The USAA Office Portfolio Whole Loan may be voluntarily prepaid in whole (but not in part) beginning on July 6, 2020. Any voluntary prepayments prior to the payment date in May 2029, require a yield maintenance premium, which may be no less than 1% of the amount prepaid.
The table below summarizes the promissory notes that comprise the USAA Office Portfolio Whole Loan. The relationship between the holders of the USAA Office Portfolio Whole Loan is governed by a co-lender agreement as described under “Description of the Mortgage Pool—The Whole Loans—The Non-Serviced Pari Passu Whole Loans” in the Preliminary Prospectus.
Whole Loan Summary | |||||
Note | Original Balance | Cut-off Date Balance |
| Note Holder | Controlling Piece |
A-1 | $62,400,000 | $62,400,000 |
| CGCMT 2019-GC41 | Yes |
A-2 | 45,000,000 | 45,000,000 |
| GSMS 2019-GC42 | No |
A-3 | 30,000,000 | 30,000,000 |
| CGCMT 2019-GC43 | No |
A-4 | 45,000,000 | 45,000,000 |
| CGCMT 2019-GC43 | No |
A-5 | 15,000,000 | 15,000,000 |
| GSMS 2019-GSA1 | No |
A-6 | 30,000,000 | 30,000,000 |
| COMM 2019-GC44 | No |
A-7 | 10,000,000 | 10,000,000 |
| COMM 2019-GC44 | No |
A-8 | 5,000,000 | 5,000,000 |
| COMM 2019-GC44 | No |
Whole Loan | $242,400,000 | $242,400,000 |
|
|
|
The USAA Office Portfolio Whole Loan was originated by Goldman Sachs Bank USA (“GS Bank”) on July 2, 2019. The USAA Office Portfolio Whole Loan has an interest rate of 3.37000% per annum. The borrowers utilized the proceeds of the USAA Office Portfolio Whole Loan to acquire the USAA Office Portfolio Properties and pay closing costs.
Sources and Uses | ||||||
Sources | Proceeds | % of Total |
| Uses | Proceeds | % of Total |
Whole Loan | $242,400,000 | 64.6% |
| Purchase Price | $375,000,000 | 99.9% |
Principal’s New Cash Contribution | 132,983,640 | 35.4 |
| Closing Costs | 383,640 | 0.1 |
Total Sources | $375,383,640 | 100.0% |
| Total Uses | $375,383,640 | 100.0% |
The Borrower / Borrower Sponsor. The borrowers for the USAA Office Portfolio Whole Loan are JDM Legacy TX, LLC and JDM Crosstown FL, LLC, each a Delaware limited liability company. Legal counsel to the borrowers delivered a non-consolidation opinion in connection with the origination of the USAA Office Portfolio Whole Loan. The non-recourse carveout guarantor and borrower sponsor under the USAA Office Portfolio Whole Loan is JDM Real Estate Funds, LLC, a Delaware limited liability company (“JDM REF”).
JDM REF is a real estate investment fund manager that primarily acquires and holds properties leased to credit tenants through triple-net leases throughout the United States. JDM REF focuses on real estate that is operated by a single tenant, and its diversified portfolio of triple-net leased assets includes corporate offices, data centers, and an industrial facility. JDM REF was founded and is controlled by Jerry Colangelo, David Eaton and Mel Shultz, who have led the business together for over 35 years and who collectively possess over 125 years of real estate, sports and entertainment, development and operational experience. As of December 31, 2018, JDM REF manages a portfolio of 24 individual triple-net leased commercial office, data center and industrial properties located in 17 states comprising approximately 8.5 million rentable square feet of operational space.
The Properties. The USAA Office Portfolio Properties are comprised of five office buildings under four leases that are each 100.0% leased to United Services Automobile Association (“USAA”), a financial services and insurance company, on a long term triple-net lease with 3% annual escalations. The credit rating for USAA is AA and Aa1 by S&P and Moody’s, respectively. The two buildings comprising Legacy Corporate Centre I & II are on the same lease, while each of the three other USAA Office Portfolio Properties is comprised of one
THE INFORMATION IN THIS STRUCTURAL AND COLLATERAL TERM SHEET IS NOT COMPLETE AND MAY BE AMENDED PRIOR TO THE TIME OF SALE. THIS TERM SHEET IS NOT AN OFFER TO SELL THESE SECURITIES AND IT IS NOT A SOLICITATION OF AN OFFER TO BUY THESE SECURITIES IN ANY JURISDICTION WHERE THE OFFER OR SALE IS NOT PERMITTED.
69
Various | Collateral Asset Summary – Loan No. 6 | Cut-off Date Balance: | $45,000,000 9.8% |
building subject to its own individual lease. There are no termination or contraction options except in the case of a major casualty, and the USAA Office Portfolio Properties have a weighted average remaining lease term of approximately 12.0 years as of the Cut-off Date.
Legacy Corporate Centre I & II and Legacy Corporate Centre III are located in the Upper Tollway/West Plano submarket of Plano, Texas. Legacy Corporate Centre I & II were constructed in 1999 and Legacy Corporate Centre III was constructed in 2019. These host one of USAA’s software and technology innovation centers.
Crosstown Center I and Crosstown Center II are located along the I-75 office corridor in Tampa, Florida. Crosstown Center I was built in 2015 and Crosstown Center II was built in 2018. Tampa serves as a strategic command center for USAA’s customer services operations.
Tenant Summary(1) | ||||||
Tenant / Building | Ratings (Fitch/Moody’s/S&P)(2) | Net Rentable Area (Sq. Ft.) | % of Net Rentable Area | U/W Base Rent PSF | % of Total U/W Base Rent | Lease Expiration |
USAA / Crosstown Center I | NR / Aa1 / AA | 260,869 | 29.6% | $23.20 | 29.1% | 8/31/2030 |
USAA / Legacy Corporate Centre I & II | NR / Aa1 / AA | 238,926 | 27.1 | $25.08 | 28.8 | 12/31/2029 |
USAA / Crosstown Center II | NR / Aa1 / AA | 236,550 | 26.8 | $22.66 | 25.8 | 12/31/2033 |
USAA / Legacy Corporate Centre III | NR / Aa1 / AA | 145,145 | 16.5 | $23.49 | 16.4 | 10/31/2033 |
Total / Wtd. Avg. Occupied |
| 881,490 | 100.0% | $23.61 | 100.0% |
|
Vacant |
| 0 | 0.0 |
|
|
|
Total |
| 881,490 | 100.0% |
|
|
|
|
|
|
|
|
|
|
(1) | Based on the underwritten rent roll dated as of November 6, 2019. |
(2) | Certain ratings are those of the parent company whether or not the parent guarantees the lease. |
Lease Rollover Schedule(1)(2) | ||||||||
Year | # of Leases Expiring | Total Expiring Sq. Ft. | % of Total Sq. Ft. Expiring | Cumulative Sq. Ft. Expiring | Cumulative % of Sq. Ft. Expiring | Annual U/W Base Rent PSF | % U/W Base Rent Rolling | Cumulative % of U/W Base Rent |
MTM | 0 | 0 | 0.0% | 0 | 0.0% | $0.00 | 0.0% | 0.0% |
2019 | 0 | 0 | 0.0 | 0 | 0.0% | $0.00 | 0.0 | 0.0% |
2020 | 0 | 0 | 0.0 | 0 | 0.0% | $0.00 | 0.0 | 0.0% |
2021 | 0 | 0 | 0.0 | 0 | 0.0% | $0.00 | 0.0 | 0.0% |
2022 | 0 | 0 | 0.0 | 0 | 0.0% | $0.00 | 0.0 | 0.0% |
2023 | 0 | 0 | 0.0 | 0 | 0.0% | $0.00 | 0.0 | 0.0% |
2024 | 0 | 0 | 0.0 | 0 | 0.0% | $0.00 | 0.0 | 0.0% |
2025 | 0 | 0 | 0.0 | 0 | 0.0% | $0.00 | 0.0 | 0.0% |
2026 | 0 | 0 | 0.0 | 0 | 0.0% | $0.00 | 0.0 | 0.0% |
2027 | 0 | 0 | 0.0 | 0 | 0.0% | $0.00 | 0.0 | 0.0% |
2028 | 0 | 0 | 0.0 | 0 | 0.0% | $0.00 | 0.0 | 0.0% |
2029 | 1 | 238,926 | 27.1 | 238,926 | 27.1% | $25.08 | 28.8 | 28.8% |
2030 & Thereafter | 3 | 642,564 | 72.9 | 881,490 | 100.0% | $23.07 | 71.2 | 100.0% |
Vacant | NAP | 0 | 0.0 | 881,490 | 100.0% | NAP | NAP |
|
Total / Wtd. Avg. | 4 | 881,490 | 100.0% |
|
| $23.61 | 100.0% |
|
(1) | Calculated based on approximate square footage occupied by the sole tenant. |
(2) | Based on the underwritten rent roll dated November 6, 2019. |
Sole Tenant. USAA is a San Antonio, Texas-based Fortune 500 diversified financial services group of companies including a Texas Department of Insurance regulated reciprocal inter-insurance exchange and subsidiaries offering banking, investing, and insurance to people and families who serve, or served, in the United States military. USAA is an interinsurance exchange, the establishment of which is provided for under the Texas Insurance Code. This insurance exchange is made up of current and former military officers and NCOs who have taken out P&C policies with USAA; which simultaneously are insured by each other and, as a group, own USAA’s assets. USAA has two additional, five-year renewal options.
Environmental Matters. According to the Phase I environmental reports dated June 21, 2019 and provided in connection with the origination of the USAA Office Portfolio Whole Loan, there are no recognized environmental conditions or recommendations for further action at the USAA Office Portfolio Properties.
THE INFORMATION IN THIS STRUCTURAL AND COLLATERAL TERM SHEET IS NOT COMPLETE AND MAY BE AMENDED PRIOR TO THE TIME OF SALE. THIS TERM SHEET IS NOT AN OFFER TO SELL THESE SECURITIES AND IT IS NOT A SOLICITATION OF AN OFFER TO BUY THESE SECURITIES IN ANY JURISDICTION WHERE THE OFFER OR SALE IS NOT PERMITTED.
70
Various | Collateral Asset Summary – Loan No. 6 | Cut-off Date Balance: | $45,000,000 9.8% |
The Market. The USAA Office Portfolio Properties total 881,490 sq. ft. of Class A office space and are located in Plano, Texas (43.6% of total sq. ft.) and Tampa, Florida (56.4% of total sq. ft.). Plano and Tampa have highly diversified economies posting corporate employment growth. Plano is located 20 miles north of downtown Dallas and is a hub for major corporate employers, such as PepsiCo, Pizza Hut, Toyota, J.P. Morgan, Fannie Mae, FedEx and Liberty Mutual. East Tampa’s accessibility and affordability have attracted global and national companies including Johnson & Johnson, J.P. Morgan, Citicorp, Progressive Insurance, Spectrum/Bright House, Verizon, and Advent Health.
The leases on the USAA Office Portfolio Properties are structured as triple-net leases, with the tenant responsible for all associated operating expenses.
Since 2015, Plano’s population has grown by an estimated 3.3% to 282,700 in 2018. According to residential development projections by the city’s planning department, the population is projected to grow to 292,900 by 2028 and to 300,000 by 2038. According to the U.S. Census Bureau, the median household income of Plano is $85,085 as of January 2019. The unemployment rate in Plano for fiscal year 2018 remained at 3.2%.
The Crosstown Center properties are located in the East Tampa submarket and approximately 8.5 miles east of downtown Tampa, Florida. The City of Tampa serves a population of approximately 385,430. Tampa is home to several company headquarters including Publix Supermarkets, Raymond James Financial, Jabil, TECO Energy, Sykes Enterprises, ALDI, HCA West Florida and Tech Data.
Comparable Office Leases(1) | |||||||
Property Name / Location | Year Built | Stories | Tenant Name | Tenant Leased Space | Lease Date | Lease Term (years) | Base Rent PSF |
Legacy Corporate Centre I, II & III Plano, TX | 1999, 2019 | 3, 4 | USAA(2) | 238,926 / 145,145(2) | Various(3) | Various(3) | $25.08 / $23.49(2) |
Granite Park VII Plano, TX | 2017 | 10 | Fannie Mae | 300,000 | Dec-17 | 15.0 | $26.25 |
Liberty Mutual Plano, TX | 2017 | 11 | Liberty Mutual | 955,900 | Oct-17 | 20.0 | $25.01 |
Platinum Park Plano, TX | 2016 | 5 | Hewlett-Packard | 106,325 | Jan-19 | 11.0 | $23.37 |
The Campus at Legacy West Plano, TX | 1992 | 3 | NTT Data | 232,744 | Apr-18 | 12.0 | $29.00 |
(1) | Source: Appraisal. |
(2) | Based on the underwritten rent roll dated November 6, 2019. USAA leases 238,926 sq. ft. in Legacy Corporate Centre I & II and 145,145 sq. ft. in Legacy Corporate Centre III. |
(3) | The lease for Legacy Corporate Centre I & II has a 15 year term that ends on December 31, 2029. The lease for Legacy Corporate Centre III has a 15 year term that ends on October 31, 2033. |
Comparable Office Leases(1) | |||||||
Property Name / Location | Year Built | Stories | Tenant Name | Tenant Leased Space | Lease Date | Lease Term (years) | Base Rent PSF |
Crosstown Center I and II Tampa, FL | 2015, 2018 | 4, 5 | USAA(2) | 260,869 / 236,550(2) | Various(3) | Various(3) | $23.20 / $22.66(2) |
Belcan Engineering West Palm Beach, FL | 2000 | 3 | Belcan Corporation | 65,770 | Jan-18 | 12.0 | $19.11 |
Laser Spine Institute at Avion Park Tampa, FL | 2016 | 6 | Asking Rent | 176,089 | Jun-19 | 5.0 | $32.00 |
Highwoods Preserve V Tampa, FL | 2000 | 6 | Asking Rent | 110,739 | Apr-20 | 5.0 | $19.00 |
Plantation Walk Plantation, FL | 1978 | 7 | Aetna | 85,000 | Mar-19 | 10.0 | $20.50 |
Miramar II Miramar, FL | 2001 | 3 | Royal Caribbean | 128,540 | May-16 | 5.0 | $22.88 |
(1) | Source: Appraisal. |
(2) | Based on the underwritten rent roll dated November 6, 2019. USAA leases 260,869 sq. ft. in Crosstown Center I and 236,550 sq. ft. in Crosstown Center II. |
(3) | The lease for Crosstown Center I is a 15 year term that ends on August 31, 2030. The lease for Crosstown Center II is a 15 year term that ends on December 31, 2033. |
THE INFORMATION IN THIS STRUCTURAL AND COLLATERAL TERM SHEET IS NOT COMPLETE AND MAY BE AMENDED PRIOR TO THE TIME OF SALE. THIS TERM SHEET IS NOT AN OFFER TO SELL THESE SECURITIES AND IT IS NOT A SOLICITATION OF AN OFFER TO BUY THESE SECURITIES IN ANY JURISDICTION WHERE THE OFFER OR SALE IS NOT PERMITTED.
71
Various | Collateral Asset Summary – Loan No. 6 | Cut-off Date Balance: | $45,000,000 9.8% |
Cash Flow Analysis.
Cash Flow Analysis(1)(2) | ||
| U/W(3) | U/W PSF |
Base Rent | $20,814,104 | $23.61 |
Contractual Rent Steps | 5,075,757 | 5.76 |
Total Reimbursement Revenue | 6,939,575 | 7.87 |
Gross Revenue | $32,829,436 | $37.24 |
Vacancy Loss | (1,285,912) | (1.46) |
Effective Gross Revenue | $31,543,524 | $35.78 |
Total Operating Expenses | 7,885,881 | 8.95 |
Net Operating Income | $23,657,643 | $26.84 |
TI/LC | 0 | 0.00 |
Replacement Reserves | 176,298 | 0.20 |
Net Cash Flow | $23,481,345 | $26.64 |
(1) | Certain items such as straight line rent, interest expense, interest income, lease cancellation income, depreciation, amortization, debt service payments and any other non-recurring or non-operating items were excluded from the historical presentation and are not considered for the underwritten cash flow. |
(2) | Historical cash flows are not available as the USAA Office Portfolio Properties were acquired at origination. |
(3) | U/W cash flows are based on contractual rents as of November 6, 2019 and contractual rent steps through August 31, 2020. |
Property Management. The USAA Office Portfolio Properties are self-managed by the sole tenant.
Lockbox / Cash Management. The USAA Office Portfolio Whole Loan is structured with a hard lockbox and springing cash management. The borrowers are required to direct each tenant at each USAA Office Portfolio Property to deposit rents directly into a lender-controlled lockbox account. In addition, the borrowers are required to cause all cash revenues relating to the USAA Office Portfolio Properties and all other money received by the borrowers or the property manager with respect to the USAA Office Portfolio Properties (other than tenant security deposits) to be deposited into a lender-controlled lockbox account or, during a continuing USAA Office Portfolio Trigger Period or an event of default, a lender-controlled cash management account within one business day of receipt. On each business day during the continuance of a USAA Office Portfolio Trigger Period (as defined below) or an event of default, all amounts in the lockbox account are required to be remitted to the cash management account. On each business day that no USAA Office Portfolio Trigger Period or event of default is continuing, all funds in the lockbox account are required to be swept into a borrower-controlled operating account.
On each payment date during the continuance of a USAA Office Portfolio Trigger Period or, at the lender’s discretion, during an event of default under the USAA Office Portfolio Whole Loan, all funds on deposit in the cash management account after payment of debt service, required reserves and budgeted operating expenses are required to be reserved as additional collateral for the USAA Office Portfolio Whole Loan, unless such USAA Office Portfolio Trigger Period is solely caused by a USAA Office Portfolio Lease Sweep Period, in which case the amount required to be reserved as additional collateral is equal to the amount necessary to cause the sum of the amounts in the excess cash reserve account, the tenant improvements and leasing commissions reserve account and the capital expenditure reserve account to equal the USAA Office Portfolio Lease Sweep Cap Amount (as defined below).
Initial and Ongoing Reserves. At loan origination, the borrower was not required to make any upfront deposits. On each payment date during the continuance of a USAA Office Portfolio Trigger Period, the borrowers will be required to fund (i) a tax and insurance reserve in an amount equal to 1/12 of the property taxes and insurance premiums that will be payable during the next 12 months, (ii) a tenant improvements and leasing commissions reserve in an amount equal to $73,458 and (iii) a capital expenditure reserve in an amount equal to $14,692.
A “USAA Office Portfolio Trigger Period” means any period during which (i) for any reason other than the continuance of a USAA Office Portfolio Lease Sweep Period (as defined below), net operating income (as calculated under the loan documents) falls below $17,177,566 as of the end of any fiscal quarter, until net operating income (as calculated under the loan documents) exceeds $17,177,566 as of the end of two consecutive fiscal quarters thereafter, (ii) a USAA Office Portfolio Lease Sweep Period is continuing or (iii) an event of default is continuing under any mezzanine loan originated in connection with a request by the lender to restructure the USAA Office Portfolio Whole Loan.
A “USAA Office Portfolio Lease Sweep Period” means any period commencing on the date USAA (i) surrenders, cancels, terminates, or materially modifies any of its leases with the borrowers and ending upon a Replacement Lease Cure (as defined below); (ii) is required to, but has not, exercised any extension option and ending upon the last day for the exercise of such option has lapsed, or the date that is 12 months prior to expiration of such lease (absent a renewal or extension of such lease) and ending upon either (x) USAA renewing or extending the term of the applicable lease for a term of no less than 10 years on arm’s-length prevailing market terms (or on the terms
THE INFORMATION IN THIS STRUCTURAL AND COLLATERAL TERM SHEET IS NOT COMPLETE AND MAY BE AMENDED PRIOR TO THE TIME OF SALE. THIS TERM SHEET IS NOT AN OFFER TO SELL THESE SECURITIES AND IT IS NOT A SOLICITATION OF AN OFFER TO BUY THESE SECURITIES IN ANY JURISDICTION WHERE THE OFFER OR SALE IS NOT PERMITTED.
72
Various | Collateral Asset Summary – Loan No. 6 | Cut-off Date Balance: | $45,000,000 9.8% |
that would have otherwise applied to an extension or renewal if it had been timely renewed or extended) or (y) a Replacement Lease Cure; (iii) defaults in the payment of rent (after any applicable notice and cure periods) under any USAA lease and ending upon either (x) the cure of such default or (y) a Replacement Lease Cure; (iv) files or is the subject of, or its lease guarantor, if any, files or is the subject of, any bankruptcy or similar insolvency proceeding or has its assets made subject to the jurisdiction of a bankruptcy court and ending upon either (x) the assumption by USAA of the applicable USAA lease, or (y) a Replacement Lease Cure; or (v) notifies the borrowers in writing of its election to terminate any of its leases within the next 12 months in accordance with its terms as a result of the occurrence of a casualty or condemnation and ending upon a Replacement Lease Cure. In addition, a USAA Office Portfolio Lease Sweep Period will be deemed to have ended upon (x) the subaccount of the cash management account known as the excess cash flow reserve account containing funds in the amount of the USAA Office Portfolio Lease Sweep Cap Amount (giving credit for amounts (if any) in the tenant improvements and leasing commissions reserve and the capital expenditure reserve) or (y) the borrowers’ delivery of additional collateral to the lender in the form of cash or a letter of credit reasonably acceptable to the lender in an amount equal to the USAA Office Portfolio Lease Sweep Cap Amount.
A “Replacement Lease Cure” means the borrowers entering into one or more qualified replacement leases for at least 90% of the space demised under the applicable lease or with aggregate net effective rent under such replacement lease(s) of no less than 90% of the net effective rent under the replaced lease.
A “USAA Office Portfolio Lease Sweep Cap Amount” means, with respect to any USAA Office Portfolio Trigger Period caused solely by a USAA Office Portfolio Lease Sweep Period, an amount equal to the product of (x) $30, and (y) the rentable square footage under the applicable lease(s) to USAA and to the extent causing the applicable USAA Office Portfolio Lease Sweep Period.
Current Mezzanine or Subordinate Indebtedness. None.
Future Mezzanine or Subordinate Indebtedness Permitted. None.
Partial Release. Provided no event of default under the USAA Office Portfolio Whole Loan is continuing, the borrowers have a one-time right at any time from and after July 6, 2020 to obtain the release of a single USAA Office Portfolio Property subject to the satisfaction of certain conditions, including, among others: (i) prepayment (together with any applicable yield maintenance premium) in an amount equal to the greater of (x) 110% of the allocated loan amount for the applicable USAA Office Portfolio Property or (y) the portion of the net proceeds received by the borrowers in connection with the sale of such USAA Office Portfolio Property that when applied to the repayment of the USAA Office Portfolio Whole Loan would result in a loan-to-value ratio of not greater than 60% (based on a newly acquired appraisal of the applicable USAA Office Portfolio Properties), (ii) after giving effect to such release, the debt yield (as calculated under the loan documents) for the 12-month period ending on the last day of the most recent fiscal quarter, is no less than the greater of (x) 8.3% and (y) the debt yield (as calculated under the loan documents) immediately prior to such release, and (iii) if requested by lender, delivery of a REMIC opinion.
THE INFORMATION IN THIS STRUCTURAL AND COLLATERAL TERM SHEET IS NOT COMPLETE AND MAY BE AMENDED PRIOR TO THE TIME OF SALE. THIS TERM SHEET IS NOT AN OFFER TO SELL THESE SECURITIES AND IT IS NOT A SOLICITATION OF AN OFFER TO BUY THESE SECURITIES IN ANY JURISDICTION WHERE THE OFFER OR SALE IS NOT PERMITTED.
73
Various | Collateral Asset Summary – Loan No. 7 PCI Pharma Portfolio | Cut-off Date Balance: Cut-off Date LTV: U/W NCF DSCR: U/W NOI Debt Yield: | $40,000,000 65.4% 2.61x 9.5% |
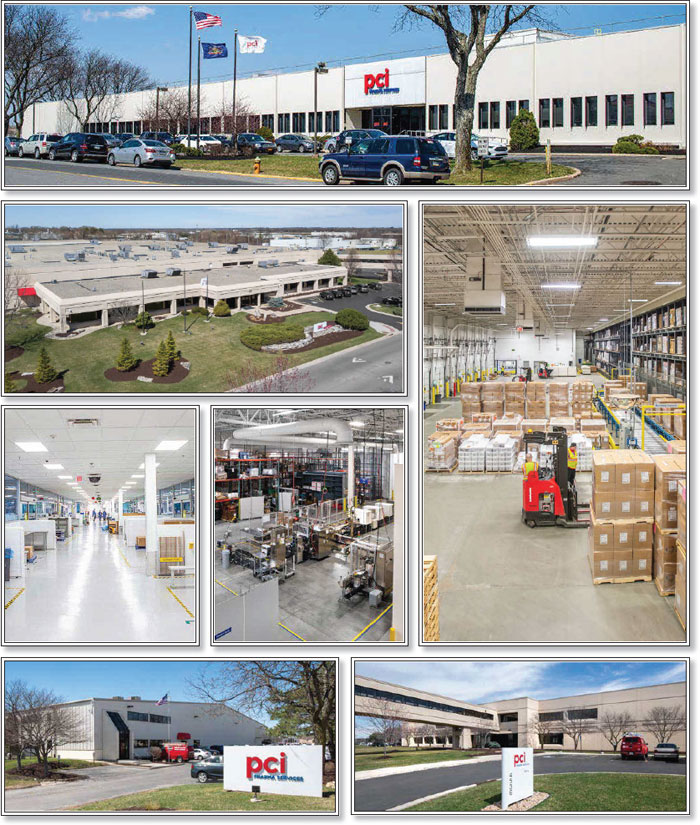
THE INFORMATION IN THIS STRUCTURAL AND COLLATERAL TERM SHEET IS NOT COMPLETE AND MAY BE AMENDED PRIOR TO THE TIME OF SALE. THIS TERM SHEET IS NOT AN OFFER TO SELL THESE SECURITIES AND IT IS NOT A SOLICITATION OF AN OFFER TO BUY THESE SECURITIES IN ANY JURISDICTION WHERE THE OFFER OR SALE IS NOT PERMITTED.
74
Various | Collateral Asset Summary – Loan No. 7 PCI Pharma Portfolio | Cut-off Date Balance: Cut-off Date LTV: U/W NCF DSCR: U/W NOI Debt Yield: | $40,000,000 65.4% 2.61x 9.5% |
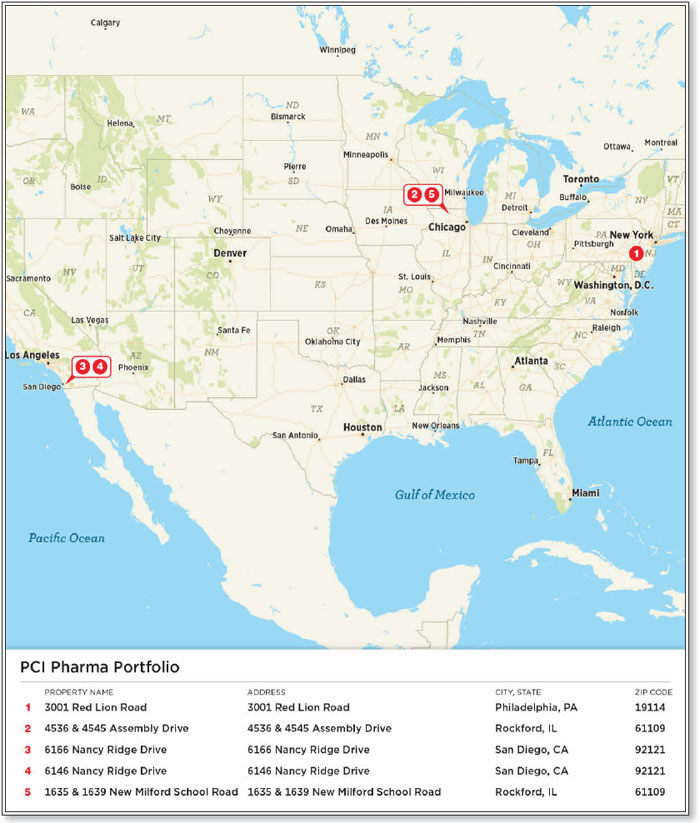
THE INFORMATION IN THIS STRUCTURAL AND COLLATERAL TERM SHEET IS NOT COMPLETE AND MAY BE AMENDED PRIOR TO THE TIME OF SALE. THIS TERM SHEET IS NOT AN OFFER TO SELL THESE SECURITIES AND IT IS NOT A SOLICITATION OF AN OFFER TO BUY THESE SECURITIES IN ANY JURISDICTION WHERE THE OFFER OR SALE IS NOT PERMITTED.
75
Various | Collateral Asset Summary – Loan No. 7 PCI Pharma Portfolio | Cut-off Date Balance: Cut-off Date LTV: U/W NCF DSCR: U/W NOI Debt Yield: | $40,000,000 65.4% 2.61x 9.5% |
Mortgage Loan Information | |
Loan Seller: | GSMC |
Loan Purpose: | Acquisition |
Borrower Sponsors: | New Mountain Net Lease Corporation; New Mountain Net Lease Partners Corporation |
Borrower: | NM PCI, L.P. |
Original Balance(1): | $40,000,000 |
Cut-off Date Balance(1): | $40,000,000 |
% by Initial UPB: | 3.9% |
Interest Rate: | 3.37900% |
Payment Date: | 6th of each month |
First Payment Date: | December 6, 2019 |
Maturity Date: | November 6, 2029 |
Amortization: | Interest Only |
Additional Debt(1): | $68,500,000 Pari Passu Debt |
Call Protection(2): | L(23), YM1(2), DorYM1(91), O(4) |
Lockbox / Cash Management: | Hard / Springing |
Reserves(3) | |||
| Initial | Monthly | Cap |
Taxes: | $0 | Springing | NAP |
Insurance: | $0 | Springing | NAP |
Replacement: | $0 | Springing | $311,923 |
TI/LC: | $0 | Springing | $2,034,282 |
Property Information | ||
Single Asset / Portfolio: | Portfolio of five properties | |
Property Type: | Various | |
Collateral: | Fee Simple | |
Location: | Various | |
Year Built / Renovated: | Various / Various | |
Total Sq. Ft.: | 1,356,188 | |
Property Management: | Self-Managed | |
Underwritten NOI: | $10,283,599 | |
Underwritten NCF: | $9,693,657 | |
Appraised Value: | $165,940,000 | |
Appraisal Date: | Various | |
| ||
Historical NOI(4) | ||
Most Recent NOI: | NAV | |
2018 NOI: | NAV | |
2017 NOI: | NAV | |
2016 NOI: | NAV | |
| ||
Historical Occupancy(4) | ||
Most Recent Occupancy: | 100.0% (November 1, 2019) | |
2018 Occupancy: | NAV | |
2017 Occupancy: | NAV | |
2016 Occupancy: | NAV | |
|
|
|
Financial Information(1) | ||||||
Tranche | Cut-off Date Balance | Balance per Sq. Ft. Cut-off / Balloon | LTV Cut-off / Balloon | U/W DSCR NOI / NCF | U/W Debt Yield NOI / NCF | U/W Debt Yield at Balloon NOI / NCF |
Mortgage Loan | $40,000,000 |
|
|
|
|
|
Pari Passu Notes | 68,500,000 |
|
|
|
|
|
Whole Loan | $108,500,000 | $80 / $80 | 65.4% / 65.4% | 2.77x / 2.61x | 9.5% / 8.9% | 9.5% / 8.9% |
(1) | The PCI Pharma Portfolio Whole Loan (as defined below) is being provided as part of NMNL’s $132.33 million sale leaseback with PCI Pharma Services (“PCI”). The Cut-off Date Balance of $40.0 million represents the controlling note A-1 of the $108.5 million PCI Pharma Portfolio Whole Loan evidenced by seven pari passu notes. See “—The Loan” below. |
(2) | Yield Maintenance of the full $108.5 million PCI Pharma Portfolio Whole Loan is permitted at any time after the prepayment lockout period, which is the date that is 24 months from the origination date of the PCI Pharma Portfolio Whole Loan. In addition, defeasance of the full $108.5 million PCI Pharma Portfolio Whole Loan is permitted at any time after the defeasance lockout period, which date is the earlier to occur of (a) October 31, 2022 and (b) the second anniversary of the closing date of the securitization into which the last PCI Pharma Portfolio note is securitized, with direct, non-callable obligations of the United States of America. See also “Partial Release” herein for a description of partial prepayments (with yield maintenance) and partial defeasance, in each case, in connection with a release of one or more individual PCI Pharma Portfolio Properties. |
(3) | See “Initial and Ongoing Reserves” herein. |
(4) | Historical cash flows and occupancy are not available as the PCI Pharma Portfolio Properties were acquired at origination. |
THE INFORMATION IN THIS STRUCTURAL AND COLLATERAL TERM SHEET IS NOT COMPLETE AND MAY BE AMENDED PRIOR TO THE TIME OF SALE. THIS TERM SHEET IS NOT AN OFFER TO SELL THESE SECURITIES AND IT IS NOT A SOLICITATION OF AN OFFER TO BUY THESE SECURITIES IN ANY JURISDICTION WHERE THE OFFER OR SALE IS NOT PERMITTED.
76
Various | Collateral Asset Summary – Loan No. 7 PCI Pharma Portfolio | Cut-off Date Balance: Cut-off Date LTV: U/W NCF DSCR: U/W NOI Debt Yield: | $40,000,000 65.4% 2.61x 9.5% |
The Loan. The PCI Pharma Portfolio mortgage loan (the “PCI Pharma Portfolio Loan”) is part of a fixed rate loan secured by first mortgages encumbering the borrower’s fee simple interest in three industrial and two office properties located in Illinois, Pennsylvania and California (the “PCI Pharma Portfolio Properties”). The PCI Pharma Portfolio Loan is evidenced by the controlling Note A-1 with an original principal balance and outstanding principal balance as of the Cut-off Date of $40.0 million. The PCI Pharma Portfolio Loan is part of a $108.5 million whole loan that is evidenced by seven pari passu promissory notes (the “PCI Pharma Portfolio Whole Loan”). Only the PCI Pharma Portfolio Loan will be included in the mortgage pool for the COMM 2019-GC44 Mortgage Trust.
The relationship between the holders of the PCI Pharma Portfolio Whole Loan will be governed by a co-lender agreement as described under “Description of the Mortgage Pool—The Whole Loans—The Serviced Pari Passu Whole Loans” in the Preliminary Prospectus.
Whole Loan Summary | |||||
Note | Original Balance | Cut-off Date Balance |
| Note Holder | Controlling Piece |
Note A-1 | $40,000,000 | $40,000,000 |
| COMM 2019-GC44 | Yes |
Note A-2, A-3, A-4, A-5, A-6, A-7 | 68,500,000 | 68,500,000 |
| GS Bank(1) | No |
Whole Loan | $108,500,000 | $108,500,000 |
|
|
|
(1) | Currently held by GS Bank and expected to be contributed to one or more future securitization transactions. |
The PCI Pharma Portfolio Whole Loan has a ten-year interest-only term and accrues interest at a fixed rate of 3.37900% per annum. The PCI Pharma Portfolio Whole Loan proceeds were used to purchase the PCI Pharma Portfolio Properties for $132.33 million and pay closing costs. The most recent prior financing of the PCI Pharma Portfolio Properties was not included in a securitization.
Sources and Uses | ||||||||
Sources | Proceeds | % of Total |
| Uses | Proceeds | % of Total | ||
Whole Loan | $108,500,000 | 81.8% |
| Purchase Price | $132,330,000 | 99.8% | ||
Borrower Sponsor Equity | 24,085,605 | 18.2 |
| Closing Costs | 255,605 | 0.2 | ||
Total Sources | $132,585,605 | 100.0% |
| Total Uses | $132,585,605 | 100.0% | ||
The Borrower / Borrower Sponsor. The borrower is NM PCI, L.P., a Delaware limited partnership and single purpose entity with two independent directors. Legal counsel to the borrower delivered a non-consolidation opinion in connection with the origination of the PCI Pharma Portfolio Whole Loan.
The borrower sponsors and non-recourse carveout guarantors are, jointly and severally, New Mountain Net Lease Corporation and New Mountain Net Lease Partners Corporation, each a Maryland corporation. New Mountain Net Lease Partners Corporation operates under the direction of Teddy Kaplan and generally invests in single tenant industrial, office, and specialized assets, such as cold storage and food manufacturing.
The Properties. The PCI Pharma Portfolio Properties include five of PCI’s primary North American pharmaceutical packaging facilities. The PCI Pharma Portfolio Properties were sold to the borrower as part of a master-leased, 20-year, absolute-net, sale-leaseback transaction with a total contract rental rate of $10,629,000, including 2.00% annual rent increases. PCI’s facilities are customized with significant investment by the tenant and contain over 165 primary and secondary packaging rooms, each with their own dedicated HVAC service, secure DEA vaults to store Schedule II drugs, and highly automated storage and retrieval systems. All of the facilities are Good Manufacturing Practices (“GMP”) certified and are routinely inspected by the FDA, DEA and key customers. Each packaging line must be validated in order to handle a specific drug, a process that takes on average 12 months and can take up to three years to complete. PCI has invested over $91 million into the facilities since 2017 and the facilities contain over $200 million of equipment.
The 3001 Red Lion Road property is a R&D/Flex facility and is located in Philadelphia, Pennsylvania situated on a 16.7-acre site. It comprises 447,000 sq. ft. and features 18 foot to 55 foot clearances, 10 dock height loading doors, and one drive-in door. The improvements were completed in 1954, and were expanded and renovated through 2002. The improvements feature reinforced concrete foundation with masonry and steel structural frame and concrete precast and metal panel exterior walls. Roofing consists of flat metal roof with rubber membrane.
The 1635 & 1639 New Milford School Road property is a 78,420 sq. ft. single-story concrete constructed warehouse facility, situated on an approximately 16.88-acre site located in Rockford, Illinois. The improvements were constructed in 1996 and renovated in 2001. The building contains 19 foot to 20 foot ceiling clearances, six dock doors, and one drive-in door. The office portion has a two-story configuration, of which the second story is being used mainly as storage space. The improvements feature reinforced concrete foundation with masonry and steel structural frame and steel and concrete structural frame.
THE INFORMATION IN THIS STRUCTURAL AND COLLATERAL TERM SHEET IS NOT COMPLETE AND MAY BE AMENDED PRIOR TO THE TIME OF SALE. THIS TERM SHEET IS NOT AN OFFER TO SELL THESE SECURITIES AND IT IS NOT A SOLICITATION OF AN OFFER TO BUY THESE SECURITIES IN ANY JURISDICTION WHERE THE OFFER OR SALE IS NOT PERMITTED.
77
Various | Collateral Asset Summary – Loan No. 7 PCI Pharma Portfolio | Cut-off Date Balance: Cut-off Date LTV: U/W NCF DSCR: U/W NOI Debt Yield: | $40,000,000 65.4% 2.61x 9.5% |
The 6146 Nancy Ridge Drive property is a 24,785 sq. ft. two-story existing lab / research and development building situated on an approximately 1.28-acre site located in San Diego, California. The 6146 Nancy Ridge Drive property is located along Nancy Ridge Drive, a mile west of the 805 freeway, and is part of a business park in the Sorrento Valley area of San Diego. The improvements were constructed in 1987 and most recently renovated in 2017 and feature reinforced concrete foundation and structural frame.
The 6166 Nancy Ridge Drive property is a 37,583 sq. ft. existing lab / research and development building situated on a 262,857 sq. ft. site located in San Diego, California. The two-story asset was built in 1996 and renovated in 2016. This property is located along Nancy Ridge Drive, a mile west of the 805 freeway, and is part of a business park in the Sorrento Valley area of San Diego. The improvements feature reinforced concrete foundation and structural frame.
The 4536 & 4545 Assembly Drive property is a 768,400 sq. ft., two-building, steel and concrete constructed warehouse distribution facility, located in Rockford, Illinois. The improvements were constructed in 1989, with additions or renovations occurring in 2003, 2005, 2012 and 2018. The property contains a total of 17% office area, 20-32 foot ceiling clearance, 30 dock doors and eight drive-in doors. The office areas have a two-story configuration and there is a skyway bridge that connects the two buildings.
Tenant Summary(1) | |||||||
Building | Ratings (Fitch/Moody’s/S&P) | Net Rentable Area (Sq. Ft.) | % of Net Rentable Area | U/W Base Rent PSF | % of Total U/W Base Rent | Lease Expiration | |
4536 & 4545 Assembly Drive | NR/NR/NR | 768,400 | 56.7% | $4.54 | 32.2% | 10/31/2039 | |
3001 Red Lion Road | NR/NR/NR | 447,000 | 33.0 | $10.81 | 44.6 | 10/31/2039 | |
1635 & 1639 New Milford School Road | NR/NR/NR | 78,420 | 5.8 | $4.03 | 2.9 | 10/31/2039 | |
6166 Nancy Ridge Drive | NR/NR/NR | 37,583 | 2.8 | $35.40 | 12.3 | 10/31/2039 | |
6146 Nancy Ridge Drive | NR/NR/NR | 24,785 | 1.8 | $35.40 | 8.1 | 10/31/2039 | |
Total / Wtd. Avg. Occupied |
| 1,356,188 | 100.0% | $7.99 | 100.0% |
| |
Vacant |
| 0 | 0.0 |
|
|
| |
Total |
| 1,356,188 | 100.0% |
|
|
| |
|
|
|
|
|
|
| |
(1) | Based on the underwritten rent roll dated as of November 1, 2019. |
Lease Rollover Schedule(1) | ||||||||
Year | # of Leases Expiring | Total Expiring Sq. Ft. | % of Total Sq. Ft. Expiring | Cumulative Sq. Ft. Expiring | Cumulative %of Sq. Ft. Expiring | Annual U/W Base Rent PSF | % U/W Base Rent Rolling | Cumulative % of U/W Base Rent |
MTM | 0 | 0 | 0.0% | 0 | 0.0% | $0.00 | 0.0% | 0.0% |
2019 | 0 | 0 | 0.0 | 0 | 0.0% | $0.00 | 0.0 | 0.0% |
2020 | 0 | 0 | 0.0 | 0 | 0.0% | $0.00 | 0.0 | 0.0% |
2021 | 0 | 0 | 0.0 | 0 | 0.0% | $0.00 | 0.0 | 0.0% |
2022 | 0 | 0 | 0.0 | 0 | 0.0% | $0.00 | 0.0 | 0.0% |
2023 | 0 | 0 | 0.0 | 0 | 0.0% | $0.00 | 0.0 | 0.0% |
2024 | 0 | 0 | 0.0 | 0 | 0.0% | $0.00 | 0.0 | 0.0% |
2025 | 0 | 0 | 0.0 | 0 | 0.0% | $0.00 | 0.0 | 0.0% |
2026 | 0 | 0 | 0.0 | 0 | 0.0% | $0.00 | 0.0 | 0.0% |
2027 | 0 | 0 | 0.0 | 0 | 0.0% | $0.00 | 0.0 | 0.0% |
2028 | 0 | 0 | 0.0 | 0 | 0.0% | $0.00 | 0.0 | 0.0% |
2029 | 0 | 0 | 0.0 | 0 | 0.0% | $0.00 | 0.0 | 0.0% |
2030 & Thereafter | 5 | 1,356,188 | 100.0 | 1,356,188 | 100.0% | $7.99 | 100.0 | 100.0% |
Vacant | NAP | 0 | 0.0 | 1,356,188 | 100.0% | NAP | NAP |
|
Total / Wtd. Avg. | 5 | 1,356,188 | 100.0% |
|
| $7.99 | 100.0% |
|
(1) | Based on the underwritten rent roll dated November 1, 2019. |
THE INFORMATION IN THIS STRUCTURAL AND COLLATERAL TERM SHEET IS NOT COMPLETE AND MAY BE AMENDED PRIOR TO THE TIME OF SALE. THIS TERM SHEET IS NOT AN OFFER TO SELL THESE SECURITIES AND IT IS NOT A SOLICITATION OF AN OFFER TO BUY THESE SECURITIES IN ANY JURISDICTION WHERE THE OFFER OR SALE IS NOT PERMITTED.
78
Various | Collateral Asset Summary – Loan No. 7 PCI Pharma Portfolio | Cut-off Date Balance: Cut-off Date LTV: U/W NCF DSCR: U/W NOI Debt Yield: | $40,000,000 65.4% 2.61x 9.5% |
Sole Tenant. PCI was founded in 1971 as Packaging Coordinators, Inc. PCI is a global provider of outsourced pharmaceutical services offering commercial and clinical packaging, clinicals for age and distribution services, potent and non-potent drug manufacturing, and selected drug development services. PCI serves a wide array of end markets, including large branded and generic pharmaceutical, over the counter, biotechnology, medical device, dental, animal health, and consumer care across three primary business lines: commercial (packaging and serialization; 73% of revenue), clinical services (17% of revenue), and manufacturing and development services (10% of revenue).
PCI has a client base including Pfizer, Merck, and J&J among others. In addition to the company’s work with “Big Pharma”, PCI’s client base is well-diversified among mid- and small-sized specialty, generic and virtual pharmaceutical and biotech companies. In year-end June 2019, the PCI reported $610 million of revenue and $129 million of adjusted EBITDA.
Environmental Matters. The Phase I environmental reports dated June 6, 2019 and August 21, 2019 recommended no further action at the PCI Pharma Portfolio Properties other than the bulk sampling of all suspect asbestos containing materials, and subsequent removal of any materials that are determined to be asbestos-containing, prior to any renovation or demolition activities at the 6146 Nancy Ridge Drive property.
The Market. The 1635 & 1639 New Milford School Road property and 4536 & 4545 Assembly Drive property are located in Rockford, Illinois. Primary interstate/freeway access to the area is provided by Interstate 90/39, and US Route 20. Interstate 39/90 makes the neighborhood accessible to areas throughout Winnebago County, the Chicago metropolitan statistical area to the east and the Madison, Wisconsin metropolitan statistical area to the north. Chicago Rockford International Airport is located in a three-mile drive from the 1635 & 1639 New Milford School Road property. The PCI Pharma Portfolio Properties are located in the I-39 Corridor/Winnebago County Industrial Submarket of the Rockford metropolitan statistical area market. According to a market research report, as of the third quarter of 2019, the I-39 Corridor/Winnebago County Industrial Submarket had an inventory of 29,387,439 sq. ft. with a vacancy rate of 10.4% and the asking rental rate in the submarket is $3.88 PSF.
The 3001 Red Lion Road property is located in the Greater Northeast neighborhood of the city of Philadelphia. Primary access to the neighborhood is provided by Route 1, which runs in a northeast/southwest direction, connecting Baltimore, Maryland with urban nodes in northern New Jersey. According to a market research report, as of the second quarter of 2019, the total inventory within the City of Philadelphia submarket is over 85.6 million sq. ft. of with a vacancy rate of 5.6%. The average asking rental rate is $4.62 PSF, with 302,500 square foot of space under construction.
The 6146 & 6166 Nancy Ridge Drive properties are located along Nancy Ridge Drive, a mile west of the 805 freeway, and are part of a business park in the Sorrento Valley area of San Diego. Access to the 805 Freeway is provided by Carrol Canyon Road. The closest local rail facility is the Sorrento Valley Coaster Station, which is approximately 3.1 miles northwest from the properties. The properties are located to the northeast of University City High School in the North San Diego submarket of the San Diego market. According to a market research report, as of the third quarter of 2019, the Mira Mesa-Mesa Miramar submarket had an inventory of 4,896,162 sq. ft. with a vacancy rate of 7.9%. As of the third quarter of 2019, a total of 152,099 sq. ft. of space was completed in the submarket with the asking rental rate in the submarket is $22.25 PSF, an increase from $19.85 PSF.
Comparable Industrial Leases(1) | |||||||||||
Property Name / Location | Year Built | Stories | Tenant Name | Tenant Leased Space | Lease Date | Lease Term (years) | Base Rent PSF | ||||
PCI Pharma Portfolio - 4536 & 4545 Assembly Drive Rockford, IL | 1989 | 2 | PCI(2) | 768,400(2) | Oct-19(2) | 20.0(2) | $4.54(2) | ||||
3915 Morreim Drive Belvidere, IL | 2011 | NAV | Syncreon | 60,000 | Jan-17 | 5.0 | $5.00 | ||||
3140 Colley Road Beloit, WI | 2006 | NAV | Staples | 399,652 | Oct-18 | 20.0 | $3.25 | ||||
825 Bluff Road Romeoville, IL | 2005 | NAV | Central American Group | 500,160 | Apr-18 | 6.3 | $3.86 | ||||
775 Logistics Drive Belvidere, IL | 2017 | NAV | Yanfeng Automotive | 336,204 | Apr-17 | 7.0 | $5.10 | ||||
(1) | Source: Appraisal. |
(2) | Based on the underwritten rent roll dated November 1, 2019. |
THE INFORMATION IN THIS STRUCTURAL AND COLLATERAL TERM SHEET IS NOT COMPLETE AND MAY BE AMENDED PRIOR TO THE TIME OF SALE. THIS TERM SHEET IS NOT AN OFFER TO SELL THESE SECURITIES AND IT IS NOT A SOLICITATION OF AN OFFER TO BUY THESE SECURITIES IN ANY JURISDICTION WHERE THE OFFER OR SALE IS NOT PERMITTED.
79
Various | Collateral Asset Summary – Loan No. 7 PCI Pharma Portfolio | Cut-off Date Balance: Cut-off Date LTV: U/W NCF DSCR: U/W NOI Debt Yield: | $40,000,000 65.4% 2.61x 9.5% |
Comparable R&D Leases(1) | ||||||||||
Property Name / Location | Year Built | Stories | Tenant Name | Tenant Leased Space | Lease Date | Lease Term (years) | Base Rent PSF | |||
PCI Pharma Portfolio - 3001 Red Lion Road Philadelphia, PA | 1954 | 1 and part 2 | PCI(2) | 447,000(2) | Oct-19(2) | 20.0(2) | $10.81(2) | |||
3500 Horizon Drive King of Prussia, PA | 1996 | 1 | Jefferson Health System | 65,579 | Nov-19 | 15.0 | $21.00 | |||
1547 North Trooper Road Norristown, PA | 2000 | 1 | TechniTool | 120,000 | Jan-19 | 2.5 | $7.35 | |||
2401 Green Lane Levittown, PA | 2019 | 1 | Urban Outfitters | 308,959 | May-19 | 15.0 | $5.95 | |||
(1) | Source: Appraisal. |
(2) | Based on the underwritten rent roll dated November 1, 2019. |
Comparable Industrial Leases(1) | ||||||||||||
Property Name / Location | Year Built | Stories | Tenant Name | Tenant Leased Space | Lease Date | Lease Term (years) | Base Rent PSF | |||||
PCI Pharma Portfolio - 1635 & 1639 New Milford School Road Rockford, IL | 1996 | 1 | PCI(2) | 78,420(2) | Oct-19(2) | 20.0(2) | $4.03(2) | |||||
3915 Morreim Drive Belvidere, IL | 2011 | 1 | Syncreon | 60,000 | Jan-17 | 5.0 | $5.00 | |||||
4732 Prairie Hill Road South Beloit, IL | 1993 | 1 | OOR | 32,000-68,000 | Sep-18 | 3.0 | $3.85 | |||||
3575 Morreim Drive Belvidere, IL | 2000 | 1 | Corrugated Metals | 100,358 | Apr-17 | 3.2 | $4.40 | |||||
729 Logistics Drive Belvidere, IL | 2005 | 1 | XPO Logistics | 50,000 | Oct-16 | 5.1 | $5.24 | |||||
(1) | Source: Appraisal. |
(2) | Based on the underwritten rent roll dated November 1, 2019. |
Comparable R&D Leases(1) | ||||||||||||
Property Name / Location | Year Built | Stories | Tenant Name | Tenant Leased Space | Lease Date | Lease Term (years) | Base Rent PSF | |||||
PCI Pharma Portfolio - 6146 & 6166 Nancy Ridge Drive San Diego, CA | Various(3) | 2 | PCI(2) | Various(3) | Oct-19(2) | 20.0(2) | $35.40(2) | |||||
10770 Wateridge Circle San Diego, CA | 1990 | 2 | Emergent | 43,000 | Nov-20 | 7.6 | $45.36 | |||||
5451 Oberlin Drive San Diego, CA | 1982 | 0 | CUE | 20,900 | Oct-19 | 10.6 | $43.20 | |||||
6965 Lusk Boulevard San Diego, CA | 1990 | 2 | Omniome | 74,558 | Apr-20 | 7.5 | $42.00 | |||||
15050 Avenue of Science San Diego, CA | 1985 | 2 | Broadridge Financial | 21,909 | Feb-19 | 2.0 | $31.80 | |||||
Enclave Sorrento - Building A San Diego, CA | 1986 | 4 | Samsung | 46,101 | Dec-18 | 6.5 | $36.00 | |||||
(1) | Source: Appraisal. |
(2) | Based on the underwritten rent roll dated November 1, 2019. |
(3) | Built in 1987, PCI leases 24,785 SF at 6146 Nancy Ridge Drive. Built in 1996, PCI leases 37,583 at 6166 Nancy Ridge Drive. |
THE INFORMATION IN THIS STRUCTURAL AND COLLATERAL TERM SHEET IS NOT COMPLETE AND MAY BE AMENDED PRIOR TO THE TIME OF SALE. THIS TERM SHEET IS NOT AN OFFER TO SELL THESE SECURITIES AND IT IS NOT A SOLICITATION OF AN OFFER TO BUY THESE SECURITIES IN ANY JURISDICTION WHERE THE OFFER OR SALE IS NOT PERMITTED.
80
Various | Collateral Asset Summary – Loan No. 7 PCI Pharma Portfolio | Cut-off Date Balance: Cut-off Date LTV: U/W NCF DSCR: U/W NOI Debt Yield: | $40,000,000 65.4% 2.61x 9.5% |
Cash Flow Analysis
| Cash Flow Analysis(1)(2)(3) | |||
| In Place | U/W | U/W PSF | |
| Base Rent | $10,841,580 | $10,841,580 | $7.99 |
| Total Reimbursement Revenue | 0 | 318,049 | 0.23 |
| Gross Revenue | $10,841,580 | $11,159,629 | $8.23 |
| Vacancy Loss | 0 | (557,981) | (0.41) |
| Effective Gross Revenue | $10,841,580 | $10,601,648 | $7.82 |
| Total Operating Expenses | 0 | 318,049 | 0.23 |
| Net Operating Income | $10,841,580 | $10,283,599 | $7.58 |
| TI/LC | 0 | 386,514 | 0.29 |
| Replacement Reserves | 203,428 | 203,428 | 0.15 |
| Net Cash Flow | $10,638,152 | $9,693,657 | $7.15 |
| (1) | Certain items such as interest expense, interest income, lease cancellation income, depreciation, amortization, debt service payments and any other non-recurring or non-operating items were excluded from the historical presentation and are not considered for the underwritten cash flow. |
| (2) | In place rents per the sale lease back executed at closing, with contractual rent steps through November 30, 2020 of $212,580. |
| (3) | Historical cash flows and occupancy are not available as the PCI Pharma Portfolio Properties were acquired at origination and previously owner occupied. |
Property Management. The PCI Pharma Portfolio Properties are currently managed by Packaging Coordinators, Inc. (the “PCI Master Tenant”).
Lockbox / Cash Management. The PCI Pharma Portfolio Whole Loan documents require a hard lockbox and springing cash management. The borrower was required to deliver a tenant direction letter to the PCI Master Tenant directing the PCI Master Tenant to remit its rent check directly to the lender-controlled lockbox. The borrower is also required to deliver a tenant direction letter to each future tenant. So long as no PCI Cash Sweep Event then exists, all funds deposited into the lockbox account are required to be transferred on each business day to the operating account. Upon the occurrence and during the continuance of a PCI Cash Sweep Event, all funds in the lockbox account are required to be swept on each business day to a cash management account under the control of the lender to be applied and disbursed for payment of taxes, insurance premiums, operating expenses, debt service, reserves, and other amounts payable in accordance with the PCI Pharma Portfolio Whole Loan documents, and all excess cash flow funds remaining in the cash management account after the application of such funds in accordance with the PCI Pharma Portfolio Whole Loan documents are required to be held by the lender in an excess cash flow reserve account as additional collateral for the PCI Pharma Portfolio Whole Loan. Upon the occurrence and during the continuance of an event of default under the PCI Pharma Portfolio Whole Loan documents or any bankruptcy action of the borrower, the lender may apply funds to the debt in such priority as it may determine.
A “PCI Cash Sweep Event” means each period that commences when (a) the PCI Master Tenant files for bankruptcy and concludes when (x) the PCI Master Tenant assumes the master lease in connection with such bankruptcy or (y) the borrower has relet the applicable PCI Pharma Portfolio Properties pursuant to a replacement lease reasonably approved by the lender and resulting in a debt yield of at least 8.25%; (b) 30% or more of the aggregate square footage of the PCI Pharma Portfolio Properties has gone dark (a “Go-Dark Event”) and concludes when (x) (1) a Go-Dark Event is no longer continuing and (2) the PCI Master Tenant has provided an estoppel certificate confirming its intent to occupy such PCI Pharma Portfolio Properties in accordance with the master lease, (y) the borrower has relet the applicable PCI Pharma Portfolio Properties pursuant to a replacement lease reasonably approved by the lender and resulting in a debt yield of at least 8.25% or (z) provided that such Go-Dark Event affects less than 40% of the aggregate square footage of the PCI Pharma Portfolio Properties, the balance of the excess cash flow reserve is equal to at least two years of base rent under the master lease; (c) the debt yield, as of the last day of any two consecutive fiscal quarters, is less than 8.25% and concludes when the debt yield, as of the last day of any two consecutive fiscal quarters, is equal to or greater than 8.25%; (d) the corporate family rating (or equivalent) or corporate credit rating (or equivalent) of the highest rated parent entity of the PCI Master Tenant (meaning the overall rating of such entity and not just a portion of its public debt) is downgraded to a rating of “CCC” or below by S&P or “Caa2” or below by Moody’s and concludes when (x) the corporate family rating (or equivalent) or corporate credit rating (or equivalent) of the highest rated parent entity of the PCI Master Tenant (meaning the overall rating of such entity and not just a portion of its public debt) being at least “B-”or above by S&P or “B3” or above by Moody’s or (y) the amount contained on the master lease reserve account is equal to at least two years of base rent under the master lease and/or (e) the borrower fails to deliver required monthly, quarterly or annual financial reports and concludes when such reports are delivered and indicate that no other PCI Cash Sweep Event is ongoing.
Initial and Ongoing Reserves. At loan origination, the borrower was not required to make any upfront deposits.
THE INFORMATION IN THIS STRUCTURAL AND COLLATERAL TERM SHEET IS NOT COMPLETE AND MAY BE AMENDED PRIOR TO THE TIME OF SALE. THIS TERM SHEET IS NOT AN OFFER TO SELL THESE SECURITIES AND IT IS NOT A SOLICITATION OF AN OFFER TO BUY THESE SECURITIES IN ANY JURISDICTION WHERE THE OFFER OR SALE IS NOT PERMITTED.
81
Various | Collateral Asset Summary – Loan No. 7 PCI Pharma Portfolio | Cut-off Date Balance: Cut-off Date LTV: U/W NCF DSCR: U/W NOI Debt Yield: | $40,000,000 65.4% 2.61x 9.5% |
Real Estate Taxes and Insurance Reserves – On each due date, the borrower is required to make monthly deposits of: (i) a tax reserve in an amount equal to 1/12 of the amount that the lender estimates will be necessary to pay taxes over the then succeeding 12-month period (such reserve has been conditionally waived so long as no event of default under the related loan documents has occurred and is continuing, the PCI Master Tenant is required to pay such taxes, and the borrower has provided satisfactory evidence that taxes have been paid in accordance with the requirements of the PCI Pharma Portfolio Whole Loan documents) and (ii) an insurance reserve in an amount equal to 1/12 of the amount that the lender estimates will be necessary to cover premiums over the then succeeding 12-month period (such reserve has been conditionally waived so long as no event of default under the related loan documents has occurred and is continuing, the PCI Master Tenant is required to pay such insurance premiums, and the borrower has provided satisfactory evidence that insurance premiums have been paid in accordance with the requirements of the PCI Pharma Portfolio Whole Loan documents).
TI/LC Reserve – On each due date during a PCI Cash Sweep Event, the borrower is required to make monthly deposits of approximately $113,016 into the TI/LC reserve, capped at $1.50 PSF.
Replacement Reserve – On each due date during a PCI Cash Sweep Event, the borrower is required to make monthly deposits of approximately $16,952 into the replacement reserve, capped at $0.23 PSF.
Current Mezzanine or Subordinate Indebtedness. None.
Future Mezzanine or Subordinate Indebtedness Permitted. None.
Partial Release. The PCI Pharma Portfolio Whole Loan documents provide that the borrower may release up to three of the PCI Pharma Portfolio Properties from the lien of the PCI Pharma Portfolio Whole Loan documents following (x) a casualty or condemnation of a PCI Pharma Portfolio Property that results in the PCI Master Tenant terminating its master lease with respect to such property (y) the occurrence of an event of default with respect to a PCI Pharma Portfolio Property (a “Permitted Release Default Event”), subject to the satisfaction of certain terms and conditions including, without limitation (i) the borrower prepays or defeases a portion of the PCI Pharma Portfolio Whole Loan equal to 115% of the allocated loan amount for such property (or 120% with respect to a release due to a Permitted Release Default Event), plus the payment of a yield maintenance premium (if applicable) (ii) no event of default is continuing, or in the case of a release due to a Permitted Release Default Event, (w) the release would cure such event of default, (x) such event of default is not the result of the borrower’s gross negligence or willful misconduct, (y) no other event of default is continuing, and (z) the release will be completed prior to the expiration of the cure period for such event of default (which may be extended if the borrower is diligently pursuing such cure), and (iii) the borrower has delivered a REMIC opinion.
THE INFORMATION IN THIS STRUCTURAL AND COLLATERAL TERM SHEET IS NOT COMPLETE AND MAY BE AMENDED PRIOR TO THE TIME OF SALE. THIS TERM SHEET IS NOT AN OFFER TO SELL THESE SECURITIES AND IT IS NOT A SOLICITATION OF AN OFFER TO BUY THESE SECURITIES IN ANY JURISDICTION WHERE THE OFFER OR SALE IS NOT PERMITTED.
82
(THIS PAGE INTENTIONALLY LEFT BLANK)
83
2100 North Elston Avenue Chicago, IL 60614 | Collateral Asset Summary – Loan No. 8 Elston Retail Collection | Cut-off Date Balance: Cut-off Date LTV: U/W NCF DSCR: U/W NOI Debt Yield: | $39,918,185 66.5% 1.44x 8.9% |
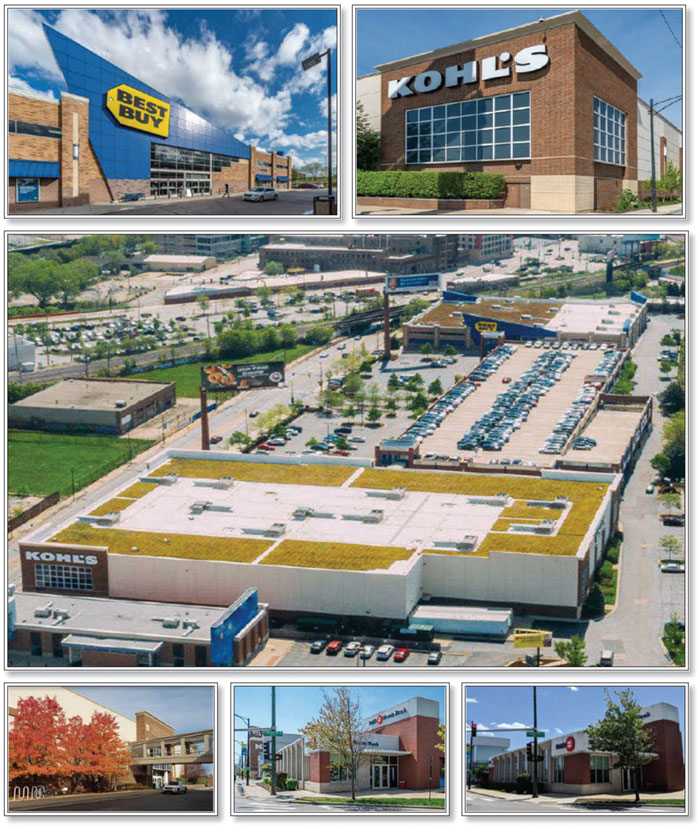
THE INFORMATION IN THIS STRUCTURAL AND COLLATERAL TERM SHEET IS NOT COMPLETE AND MAY BE AMENDED PRIOR TO THE TIME OF SALE. THIS TERM SHEET IS NOT AN OFFER TO SELL THESE SECURITIES AND IT IS NOT A SOLICITATION OF AN OFFER TO BUY THESE SECURITIES IN ANY JURISDICTION WHERE THE OFFER OR SALE IS NOT PERMITTED.
84
2100 North Elston Avenue Chicago, IL 60614 | Collateral Asset Summary – Loan No. 8 Elston Retail Collection | Cut-off Date Balance: Cut-off Date LTV: U/W NCF DSCR: U/W NOI Debt Yield: | $39,918,185 66.5% 1.44x 8.9% |

THE INFORMATION IN THIS STRUCTURAL AND COLLATERAL TERM SHEET IS NOT COMPLETE AND MAY BE AMENDED PRIOR TO THE TIME OF SALE. THIS TERM SHEET IS NOT AN OFFER TO SELL THESE SECURITIES AND IT IS NOT A SOLICITATION OF AN OFFER TO BUY THESE SECURITIES IN ANY JURISDICTION WHERE THE OFFER OR SALE IS NOT PERMITTED.
85
2100 North Elston Avenue Chicago, IL 60614 | Collateral Asset Summary – Loan No. 8 Elston Retail Collection | Cut-off Date Balance: Cut-off Date LTV: U/W NCF DSCR: U/W NOI Debt Yield: | $39,918,185 66.5% 1.44x 8.9% |
Mortgage Loan Information | |
Loan Seller: | CREFI |
Loan Purpose: | Refinance |
Borrower Sponsors: | Warren H. Baker; Marc A. Kahan |
Borrower: | Elston Development I LLC |
Original Balance(1): | $40,000,000 |
Cut-off Date Balance(1): | $39,918,185 |
% by Initial UPB: | 3.9% |
Interest Rate: | 3.65000% |
Payment Date: | 6th of each month |
First Payment Date: | December 6, 2019 |
Maturity Date: | November 6, 2029 |
Amortization: | 300 months |
Additional Debt(1): | $29,938,639 Pari Passu Debt |
Call Protection(2): | L(25),D(92),O(3) |
Lockbox / Cash Management: | Springing Hard / Springing |
Reserves(3) | |||
| Initial | Monthly | Cap |
Taxes: | $0 | Springing | NAP |
Insurance: | $0 | Springing | NAP |
Replacement: | $0 | $2,234 | NAP |
TI/LC: | $0 | $5,065 | NAP |
Required Repairs: | $78,950 | NAP | NAP |
Property Information | |
Single Asset / Portfolio: | Single Asset |
Property Type: | Anchored Retail |
Collateral: | Fee Simple |
Location: | Chicago, IL |
Year Built / Renovated: | 2004 / NAP |
Total Sq. Ft.: | 178,704 |
Property Management: | Baker Development Corporation |
Underwritten NOI: | $6,239,532 |
Underwritten NCF: | $6,151,940 |
Appraised Value: | $105,000,000 |
Appraisal Date: | September 4, 2019 |
| |
Historical NOI | |
Most Recent NOI: | $6,200,262 (Annualized 7 months, July 31, 2019) |
2018 NOI: | $6,191,621 (December 31, 2018) |
2017 NOI: | $6,086,490 (December 31, 2017) |
2016 NOI: | $6,115,563 (December 31, 2016) |
| |
Historical Occupancy | |
Most Recent Occupancy: | 100.0% (August 31, 2019) |
2018 Occupancy: | 100.0% (December 31, 2018) |
2017 Occupancy: | 100.0% (December 31, 2017) |
2016 Occupancy: | 100.0% (December 31, 2016) |
Financial Information(1) | ||||||
Tranche | Cut-off Date | Balance per Sq. Ft. Cut-off / Balloon | LTV Cut-off / Balloon | U/W DSCR NOI / NCF | U/W Debt Yield NOI / NCF | U/W Debt Yield at Balloon NOI / NCF |
Mortgage Loan | $39,918,185 |
|
| |||
Pari Passu Notes | 29,938,639 |
|
| |||
Whole Loan | $69,856,824 | $391 / $278 | 66.5% / 47.3% | 1.46x / 1.44x | 8.9% / 8.8% | 12.6% / 12.4% |
(1) | The Elston Retail Collection Loan (as defined below) consists of the controlling Note A-1 and is part of the Elston Retail Collection Whole Loan (as defined below) evidenced by two pari passu notes with an aggregate outstanding principal balance as of the Cut-off Date of $69,856,824. For additional information, see “The Loan” herein. |
(2) | The Elston Retail Collection Loan’s lockout period is required to be at least 25 payments beginning with and including the first payment date of December 6, 2019. Defeasance of the full $70.0 million whole loan is permitted at any time after the earlier to occur of (i) two years after the closing date of the securitization that includes the last promissory note to be securitized and (ii) October 31, 2023. The assumed lockout period of 25 months is based on the expected closing date of the COMM 2019-GC44 securitization in December 2019. The actual lockout period may be longer. |
(3) | See “Initial and Ongoing Reserves” herein. |
THE INFORMATION IN THIS STRUCTURAL AND COLLATERAL TERM SHEET IS NOT COMPLETE AND MAY BE AMENDED PRIOR TO THE TIME OF SALE. THIS TERM SHEET IS NOT AN OFFER TO SELL THESE SECURITIES AND IT IS NOT A SOLICITATION OF AN OFFER TO BUY THESE SECURITIES IN ANY JURISDICTION WHERE THE OFFER OR SALE IS NOT PERMITTED.
86
2100 North Elston Avenue Chicago, IL 60614 | Collateral Asset Summary – Loan No. 8 Elston Retail Collection | Cut-off Date Balance: Cut-off Date LTV: U/W NCF DSCR: U/W NOI Debt Yield: | $39,918,185 66.5% 1.44x 8.9% |
The Loan. The Elston Retail Collection mortgage loan (the “Elston Retail Collection Loan”) is a fixed rate loan secured by a first mortgage lien on the borrower’s fee simple interest in a 178,704 sq. ft. retail shopping center located in Chicago, Illinois (the “Elston Retail Collection Property”). The Elston Retail Collection Loan is part of a whole loan comprised of two pari passu notes in the aggregate original principal balance of $70.0 million (the “Elston Retail Collection Whole Loan”). The Elston Retail Collection Loan is evidenced by the controlling Note A-1, with an original principal balance of $40,000,000 and outstanding principal balance as of the Cut-off Date of $39,918,185 and is being contributed to the COMM 2019-GC44 mortgage trust. The non-controlling Note A-2 (original principal balance of $30,000,000) is currently held by CREFI and expected to be contributed to one or more future securitization transactions.
The relationship between the holders of the Elston Retail Collection Whole Loan will be governed by a co-lender agreement as described under the “Description of the Mortgage Pool—The Whole Loans—The Serviced Pari Passu Whole Loans” in the Preliminary Prospectus.
Whole Loan Summary | |||||
Note | Original Balance | Cut-off Date Balance |
| Note Holder | Controlling Piece |
Note A-1 | $40,000,000 | $39,918,185 |
| COMM 2019-GC44 | Yes |
Note A-2 | 30,000,000 | 29,938,639 |
| CREFI(1) | No |
Total | $70,000,000 | $69,856,824 |
|
|
|
(1) | Expected to be contributed to one or more future securitization transactions. |
The Elston Retail Collection Whole Loan, which accrues interest at an interest rate of 3.65000% per annum, has an original principal balance of $70.0 million and outstanding principal balance as of the Cut-Off Date of $69,856,824. The Elston Retail Collection Whole Loan had an initial term of 120 months, has a remaining term of 119 months and will amortize on a 25-year schedule. The proceeds of the Elston Retail Collection Whole Loan were primarily used to refinance prior debt secured by the Elston Retail Collection Property, fund upfront reserves, and cover closing costs. Based on the “As-Is” appraised value of $105.0 million as of the September 4, 2019 appraisal, the Elston Retail Collection Whole Loan Cut-Off Date LTV Ratio is 66.5%.
The most recent prior financing of the Elston Retail Collection Property was included in the JPMCC 2012-CIBX securitization transaction.
Sources and Uses | ||||||
Sources | Proceeds | % of Total | Uses | Proceeds | % of Total | |
Whole Loan | $70,000,000 | 99.3% | Loan Payoff | $62,076,038 | 88.1% | |
Sponsor Equity | 498,958 | 0.7 | Defeasance Costs | 5,223,852 | 7.4 | |
|
|
| Mezzanine Debt Payoff | 2,403,427 | 3.4 | |
|
|
| Closing Costs | 716,692 | 1.0 | |
|
|
| Upfront Reserves | 78,950 | 0.1 | |
Total Sources | $70,498,958 | 100.0% | Total Uses | $70,498,958 | 100.0% | |
The Borrower / Borrower Sponsor. The borrowing entity for the Elston Retail Collection Whole Loan is Elston Development I LLC, a Delaware limited liability company and special purpose entity with at least one independent director in its organizational structure. Legal counsel to the borrower delivered a non-consolidation opinion in connection with the origination of the Elston Retail Collection Whole Loan.
The borrower sponsors and non-recourse carveout guarantors are Warren H. Baker and Marc A. Kahan. Warren H. Baker is the President of Baker Development Corporation (“BDC”) and has over 35 years of experience in commercial, residential and industrial development. BDC is a privately owned real estate development company based in Chicago that was founded in 1985. Since then, BDC has been involved in the acquisition, development and construction of nearly $3.0 billion of real estate transactions.
THE INFORMATION IN THIS STRUCTURAL AND COLLATERAL TERM SHEET IS NOT COMPLETE AND MAY BE AMENDED PRIOR TO THE TIME OF SALE. THIS TERM SHEET IS NOT AN OFFER TO SELL THESE SECURITIES AND IT IS NOT A SOLICITATION OF AN OFFER TO BUY THESE SECURITIES IN ANY JURISDICTION WHERE THE OFFER OR SALE IS NOT PERMITTED.
87
2100 North Elston Avenue Chicago, IL 60614 | Collateral Asset Summary – Loan No. 8 Elston Retail Collection | Cut-off Date Balance: Cut-off Date LTV: U/W NCF DSCR: U/W NOI Debt Yield: | $39,918,185 66.5% 1.44x 8.9% |
The Property.
Tenant Summary(1) | |||||||
Tenant | Ratings (Moody’s/S&P/Fitch)(2) | Net Rentable Area (Sq. Ft.) | % of Net Rentable Area |
| U/W Base Rent PSF(3) | % of Total U/W Base Rent(3) | Lease Expiration |
Kohl’s(4) | Baa2 / BBB / BBB | 128,234 | 71.8% |
| $34.94 | 69.8% | 5/31/2030 |
Best Buy(5) | Baa1 / BBB / NR | 45,720 | 25.6% |
| $32.49 | 23.2 | 1/31/2026 |
BMO Harris Bank(6) | Aa2 / A+ / NR | 4,750 | 2.7% |
| $94.74 | 7.0 | 8/31/2025 |
Total Occupied Space |
| 178,704 | 100.0% |
| $35.91 | 100.0% |
|
Vacant |
| 0 | 0.0 |
| NAP |
|
|
Total |
| 178,704 | 100.0% |
| $35.91 |
|
|
| (1) | Based on the underwritten rent roll dated August 31, 2019. |
| (2) | Certain ratings are those of the parent company whether or not the parent guarantees the lease. |
| (3) | U/W Base Rent PSF and % of Total U/W Base Rent includes $341,137 of contractual rent steps underwritten based on the straight line average of all rent steps for Kohl’s through the term of the Elston Retail Collection Loan. |
| (4) | Tenant has eight, five-year renewal options. |
| (5) | Tenant has five, five-year lease renewal options. |
| (6) | Tenant has one, nine-year and 364-day renewal option. |
Lease Rollover Schedule(1)(2) | ||||||||
Year | # of Leases Expiring | Total Expiring Sq. Ft. | % of Total Sq. Ft. Expiring | Cumulative Sq. Ft. Expiring | Cumulative % of Sq. Ft. Expiring | Annual U/W Base Rent PSF(3) | % U/W Base Rent Rolling(3) | Cumulative % of U/W Base Rent(3) |
2019 | 0 | 0 | 0.0% | 0 | 0.0% | $0 | 0.0% | 0.0% |
2020 | 0 | 0 | 0.0 | 0 | 0.0% | $0 | 0.0 | 0.0% |
2021 | 0 | 0 | 0.0 | 0 | 0.0% | $0 | 0.0 | 0.0% |
2022 | 0 | 0 | 0.0 | 0 | 0.0% | $0 | 0.0 | 0.0% |
2023 | 0 | 0 | 0.0 | 0 | 0.0% | $0 | 0.0 | 0.0% |
2024 | 0 | 0 | 0.0 | 0 | 0.0% | $0 | 0.0 | 0.0% |
2025 | 1 | 4,750 | 2.7 | 4,750 | 2.7% | $94.74 | 7.0 | 7.0% |
2026 | 1 | 45,720 | 25.6 | 50,470 | 28.2% | $32.49 | 23.2 | 30.2% |
2027 | 0 | 0 | 0.0 | 50,470 | 28.2% | $0 | 0.0 | 30.2% |
2028 | 0 | 0 | 0.0 | 50,470 | 28.2% | $0 | 0.0 | 30.2% |
2029 | 0 | 0 | 0.0 | 50,470 | 28.2% | $0 | 0.0 | 30.2% |
2030 & Thereafter | 1 | 128,234 | 71.8 | 178,704 | 100.0% | $34.94 | 69.8 | 100.0% |
Vacant | NAP | NAP | NAP | 178,704 | 100.0% | NAP | NAP |
|
Total / Wtd. Avg. | 3 | 178,704 | 100.0% |
|
| $35.91 | 100.0% |
|
| (1) | Based on the underwritten rent roll dated August 31, 2019. |
| (2) | Certain tenants have lease termination options that may become exercisable prior to the originally stated expiration date of the tenant lease that are not considered in the lease rollover schedule. |
| (3) | Annual U/W Base Rent PSF, % U/W Base Rent Rolling and Cumulative % of U/W Base Rent includes contractual rent steps underwritten based on the straight line average of all rent steps for Kohl’s through the term of the Elston Retail Collection Loan. |
The Elston Retail Collection Property is a 178,704 sq. ft. retail shopping center located in Chicago, Illinois. The Elston Retail Collection Property was built on an approximately 9.9 acre site that consists of three separate buildings that are currently 100.0% leased to Kohl’s, Best Buy and BMO Harris Bank along with an 869 space, three-level parking garage that Best Buy and Kohl’s share. Each of Kohl’s, Best Buy and BMO Harris Bank are the original tenants that have occupied their space since the Elston Retail Collection Property was developed in 2004. Best Buy and BMO Harris Bank each own their improvements and have ground leases for their pad site, whereas both the land and improvements for Kohl’s are part of the Elston Retail Property.
Major Tenants.
Kohl’s. (128,234 sq. ft.; 71.8% of NRA; 69.8% of U/W Base Rent): The largest tenant at the Elston Retail Collection Property, Kohl’s (NYSE: KSS, rated Baa2 by Moody’s, BBB by S&P and BBB by Fitch), leases 128,234 sq. ft. across a two-story building on a triple-net lease. Kohl’s has occupied the Elston Retail Collection Property since 2005 with the original lease term expiring on May 31, 2030 plus eight, five-year renewal options and no termination options. Additionally, lease terms call for base rent to increase every five years both during the initial lease term and subsequent renewals. Kohl’s operates more than 1,100 stores across 49 states as of 2019 and generates annual sales of approximately $19.0 billion as of 2018.
THE INFORMATION IN THIS STRUCTURAL AND COLLATERAL TERM SHEET IS NOT COMPLETE AND MAY BE AMENDED PRIOR TO THE TIME OF SALE. THIS TERM SHEET IS NOT AN OFFER TO SELL THESE SECURITIES AND IT IS NOT A SOLICITATION OF AN OFFER TO BUY THESE SECURITIES IN ANY JURISDICTION WHERE THE OFFER OR SALE IS NOT PERMITTED.
88
2100 North Elston Avenue Chicago, IL 60614 | Collateral Asset Summary – Loan No. 8 Elston Retail Collection | Cut-off Date Balance: Cut-off Date LTV: U/W NCF DSCR: U/W NOI Debt Yield: | $39,918,185 66.5% 1.44x 8.9% |
Best Buy (45,720 sq. ft.; 25.6% of NRA; 23.2% of U/W Base Rent): The second largest tenant at the Elston Retail Collection Property, Best Buy (NASDAQ: BBY, rated Baa1 by Moody’s and BBB by S&P), leases 45,720 sq. ft. on a triple-net ground lease that commenced in February 2005. Best Buy currently has a lease expiration date of January 31, 2026 plus five, five-year extension options remaining and no termination options. Best Buy currently operates over 1,000 stores across the United States.
BMO Harris Bank (4,750 sq. ft.; 2.7% of NRA; 7.0% of U/W Base Rent): The third largest tenant at the Elston Retail Collection Property, BMO Harris Bank (NYSE: BMO, rated Aa2 by Moody’s and A+ by S&P), leases 4,750 sq. ft. on a triple-net ground lease that commenced in September 2005. BMO Harris Bank currently has a lease expiration of August 31, 2025 with one, nine-year and 364-day extension option, with no termination options.
Environmental Matters. The Phase I environmental report dated October 4, 2019 identified as a controlled REC historic operations on the Elston Retail Collection Property, which operations included the use of hazardous substances, varnish kettles, above-ground storage tanks, and underground storage tanks, and which resulted in impacts to site soils and groundwater. Based upon remediation subsequently conducted and engineered barriers put in place, the Illinois Environmental Protection Agency issued No Further Remediation (“NFR”) letters for the Elston Retail Collection Property that restrict land use to industrial and commercial purposes, and contain certain other restrictions and requirements. Given the issuance of the NFR letters, the Phase I ESA environmental consultant did not recommend any additional assessment. However, the Phase I ESA consultant did recommend continued implementation of the NFR letters’ requirements. For additional information, see “Description of the Mortgage Pool—Environmental Considerations” in the Preliminary Prospectus.
The Market. The Elston Retail Collection Property is located in the East Bucktown neighborhood of Chicago, east of Interstate 90/94, which provides access to the Chicago CBD and surrounding suburban areas. The Elston Retail Collection Property is also situated approximately 14.0 miles east of the Chicago O’Hare Airport. The primary north-south thoroughfare in the immediate area in Ashland Avenue, which is located directly east of Elston Avenue.
According to a third party report, the Elston Retail Collection Property is located in the retail North submarket of Chicago. As of the first quarter of 2019, the submarket contained approximately 4.0 million sq. ft. of retail space for community shopping centers, which was reportedly 8.2% vacant. The submarket vacancy has remained stable for the last 20 years, with peak vacancy of 9.0% over that timeframe. The submarket has seen average annual rent growth of 1.5% over the last five years. According to the appraisal, market rent for big box space, junior box space and bank space was concluded to be $20.00, $40.00 and $100.00, respectively.
According to a third party report, as of January 1, 2019, the population within a one-, three- and five-mile radius of the Elston Retail Collection Property was 50,310, 520,735, and 1,106,653, respectively. Additionally, the average household income within a one-, three- and five-mile radius of the property was $171,337, $137,783 and $114,793, respectively.
Cash Flow Analysis.
Cash Flow Analysis | ||||||
| 2016 | 2017 | 2018 | T-7 Annualized | U/W(1) | U/W (PSF)(1) |
Base Rent | $6,051,630 | $5,951,492 | $6,075,406 | $6,091,906 | $6,075,406 | $34.00 |
Reimbursements | 325,322 | 337,062 | 289,788 | 302,672 | 2,346,326 | 13.13 |
Rent Steps(1) | 0 | 0 | 0 | 0 | 341,137 | 1.91 |
Gross Potential Rent | $6,376,952 | $6,288,553 | $6,365,194 | $6,394,578 | $8,762,869 | $49.04 |
Other Income(2) | 0 | 24,000 | 42,250 | 42,250 | 42,250 | 0.24 |
Vacancy & Credit Loss(3) | 0 | 0 | 0 | 0 | (247,719) | (1.39) |
Effective Gross Income | $6,376,952 | $6,312,553 | $6,407,444 | $6,436,828 | $8,557,400 | $47.89 |
Real Estate Taxes | 0 | 0 | 0 | 0 | 1,801,645 | $10.08 |
Insurance | 42,007 | 28,072 | 36,253 | 330 | 44,566 | $0.25 |
Management Fee | 0 | 0 | 0 | 0 | 256,722 | $1.44 |
Total Other Expenses | 219,382 | 197,991 | 179,570 | 236,236 | 214,935 | $1.20 |
Net Operating Income | $6,115,563 | $6,086,490 | $6,191,621 | $6,200,262 | $6,239,532 | $34.92 |
Replacement Reserves | 0 | 0 | 0 | 0 | 26,806 | $0.15 |
TI/LC | 0 | 0 | 0 | 0 | 60,786 | $0.34 |
Net Cash Flow | $6,115,563 | $6,086,490 | $6,191,621 | $6,200,262 | $6,151,940 | $34.43 |
(1) | Rent Steps includes $341,137 of contractual rent steps underwritten based on the straight line average of all rent steps for Kohl’s through the term of the Elston Retail Collection Loan. |
(2) | Other Income consists of parking income |
(3) | U/W Vacancy & Credit Loss represents the underwritten economic vacancy of 2.8%. |
THE INFORMATION IN THIS STRUCTURAL AND COLLATERAL TERM SHEET IS NOT COMPLETE AND MAY BE AMENDED PRIOR TO THE TIME OF SALE. THIS TERM SHEET IS NOT AN OFFER TO SELL THESE SECURITIES AND IT IS NOT A SOLICITATION OF AN OFFER TO BUY THESE SECURITIES IN ANY JURISDICTION WHERE THE OFFER OR SALE IS NOT PERMITTED.
89
2100 North Elston Avenue Chicago, IL 60614 | Collateral Asset Summary – Loan No. 8 Elston Retail Collection | Cut-off Date Balance: Cut-off Date LTV: U/W NCF DSCR: U/W NOI Debt Yield: | $39,918,185 66.5% 1.44x 8.9% |
Property Management. The Elston Retail Collection Property is managed by Baker Development Corporation, an Illinois corporation and affiliate of the borrower.
Lockbox / Cash Management. The Elston Retail Whole Loan documents require a springing hard lockbox and springing cash management. The Elston Retail Collection Whole Loan requires that (i) upon the occurrence of an Elston Retail Collection Trigger Period (as defined below), the borrower or property manager, as applicable, deposit into the lockbox account, immediately after receipt, all revenue received by the borrower or property manager, and (ii) within five days after the occurrence of an Elston Retail Collection Trigger Period, the borrower delivers tenant direction letters to all tenants directing such tenants to pay all rents into the lockbox account. All funds deposited into the lockbox are required to be transferred on each business day to or at the direction of the borrower unless an Elston Retail Collection Trigger Period exists. Upon the occurrence and during the continuance of an Elston Retail Collection Trigger Period, all funds in the lockbox account are required to be swept on each business day to a cash management account under the control of the lender to be applied and disbursed in accordance with the Elston Retail Collection Whole Loan documents, and all excess cash flow funds remaining in the cash management account after the application of such funds in accordance with the Elston Retail Collection Whole Loan documents are required to be held by the lender in an excess cash flow reserve account as additional collateral for the Elston Retail Collection Whole Loan. To the extent that no Elston Retail Collection Trigger Period is continuing, all excess cash flow funds are required to be disbursed to the borrower. Upon an event of default under the Elston Retail Collection Whole Loan, the lender has the right to apply funds to the debt in such priority as it may determine.
An “Elston Retail Collection Trigger Period” means a period (A) commencing upon the earliest of (i) an event of default, (ii) the debt service coverage ratio being less than 1.15x or (iii) the occurrence of a Specified Tenant Trigger Period (as defined below), and (B) expiring upon, (a) with respect to clause (i) above, the cure, if applicable, of such event of default, (b) with respect to clause (ii) above, the debt service coverage ratio being at least 1.20x for two consecutive calendar quarters, and (c) with respect to clause (iii) above, a Specified Tenant Trigger Period ceasing to exist.
A “Specified Tenant Trigger Period” means a period (A) commencing on the first to occur of (i) any Specified Tenant (as defined below) being in monetary or material non-monetary default under the applicable Specified Tenant lease beyond applicable notice and cure periods, (ii) any Specified Tenant giving notice to the borrower that it is terminating its lease for all or any portion of its space, (iii) any termination or cancellation of any Specified Tenant lease (including without limitation, rejection in any bankruptcy or similar insolvency proceeding) and/or any Specified Tenant lease failing to otherwise be in full force and effect, (iv) any bankruptcy or similar insolvency of any Specified Tenant, (v) any Specified Tenant failing to renew or extend the applicable Specified Tenant lease on or prior to the applicable Specified Tenant extension deadline, and (vi) Kohl’s and/or Best Buy, in each case, ceasing to satisfy the credit rating condition in accordance with the Elston Retail Collection Whole Loan documents, and (B) expiring upon the first to occur of the lender’s receipt of evidence reasonably acceptable to the lender of (x) the satisfaction of the Specified Tenant cure conditions or (y) the borrower leasing the Specified Tenant space (or applicable portion thereof) in accordance with the Elston Retail Collection Whole Loan documents, the applicable tenant thereunder being in actual, physical occupancy of, and open for business in, the space demised under its lease and paying the full amount of rent due thereunder.
A “Specified Tenant” means (i) Kohl’s, (ii) Best Buy and (iii) any other tenants of the Specified Tenant space (or any portion thereof) and any guarantors of the applicable related Specified Tenant lease.
Initial and Ongoing Reserves. On the origination date of the Elston Retail Collection Whole Loan, the borrower was required to deposit $78,950 for immediate repairs.
Tax Escrows – On a monthly basis, the borrower is required to deposit 1/12 of the estimated annual real estate taxes into a tax reserve account; provided, however, with respect to any portion of the Elston Retail Collection Property that is leased pursuant to a lease that satisfies the Tax Reserve Waiver Conditions (as defined below), the borrower is not required to make such monthly tax reserve deposit allocable to such portion of the Elston Retail Collection Property for so long as the Tax Reserve Waiver Conditions are satisfied. On the origination date of the Elston Retail Collection Whole Loan, the Tax Reserve Waiver Conditions were satisfied with respect to each of the three tenants at the Elston Retail Collection Property.
“Tax Reserve Waiver Conditions” means each of the following: (i) no Elston Retail Collection Trigger Period is continuing, (ii) the applicable tenant’s lease is in full force and effect with no defaults continuing beyond applicable notice and cure periods, (iii) the portion of the Elston Retail Collection Property demised pursuant to the applicable tenant’s lease is separately assessed for taxes from the remainder of the Elston Retail Collection Property, (iv) the applicable tenant is obligated pursuant to its lease to pay directly to the taxing authority all taxes imposed against the portion of the Elston Retail Collection Property demised pursuant to its lease and such tenant is in full compliance with such obligations, and (v) the borrower delivers, or causes to be delivered, to lender evidence reasonably acceptable to the lender that all taxes imposed against the portion of the Elston Retail Collection Property demised pursuant to such tenant’s lease have been paid to the applicable taxing authority prior to the date such taxes were due and payable.
THE INFORMATION IN THIS STRUCTURAL AND COLLATERAL TERM SHEET IS NOT COMPLETE AND MAY BE AMENDED PRIOR TO THE TIME OF SALE. THIS TERM SHEET IS NOT AN OFFER TO SELL THESE SECURITIES AND IT IS NOT A SOLICITATION OF AN OFFER TO BUY THESE SECURITIES IN ANY JURISDICTION WHERE THE OFFER OR SALE IS NOT PERMITTED.
90
2100 North Elston Avenue Chicago, IL 60614 | Collateral Asset Summary – Loan No. 8 Elston Retail Collection | Cut-off Date Balance: Cut-off Date LTV: U/W NCF DSCR: U/W NOI Debt Yield: | $39,918,185 66.5% 1.44x 8.9% |
Insurance Escrows – At the option of lender, if the liability or casualty policy maintained by borrower covering the Elston Retail Collection Property does not constitute an approved blanket or umbrella policy, the lender may require the borrower to deposit, on a monthly basis, 1/12 of the amount that would be sufficient to pay insurance premiums due for the renewal of coverage into an insurance reserve account; provided, however, that, with respect to any portion of the Elston Retail Collection Property that is leased pursuant to a lease that satisfies the Insurance Reserve Waiver Conditions (as defined below), the borrower is not required to make such monthly tax reserve deposit allocable to such portion of the Elston Retail Collection Property for so long as the Insurance Reserve Waiver Conditions are satisfied. On the origination date of the Elston Retail Collection Whole Loan, the Insurance Reserve Waiver Conditions were satisfied with respect to Kohl’s.
“Insurance Reserve Waiver Conditions” means, with respect the applicable portion of the Elston Retail Collection Property demised to a tenant pursuant to such tenant’s lease, each of the following, (i) no Elston Retail Collection Trigger Period is continuing, (ii) the applicable lease is in full force and effect with no defaults thereunder beyond applicable notice and cure periods, (iii) such lease requires such tenant to maintain the insurance policies meeting the requirements set forth in the Elston Retail Collection Whole Loan documents with respect to the portion of the Elston Retail Collection Property demised pursuant to such tenant’s lease and to pay all premiums due in connection therewith (without credit, offset or reimbursement from borrower), and (iv) the borrower provides the lender with satisfactory evidence that such insurance policies are being maintained, including satisfactory evidence of any renewal thereof (and payment therefor) no later than thirty (30) days prior to the applicable expiration date.
Replacement Reserves – On a monthly basis, the borrower is required to escrow $2,234 into a replacement reserve.
TI/LC Reserves – On a monthly basis, the borrower is required to escrow $5,065 into a tenant improvement and leasing commissions reserve.
Current Mezzanine or Subordinate Indebtedness. None.
Future Mezzanine or Subordinate Indebtedness Permitted. None.
Partial Release. The Borrower may, not more than two times during the term of the Elston Retail Collection Whole Loan, obtain a release of one or more billboard parcels consisting of a portion of the Elston Retail Collection Property (each, a “Billboard Release Parcel”) without payment of any release price provided that certain conditions are satisfied, including without limitation, (i) the borrower delivers a REMIC opinion and, if required by lender, a rating agency confirmation, (ii) the release is permitted under applicable REMIC requirements, and (iii) the borrower delivers a reciprocal easement and restrictive covenant agreement containing all reciprocal easements for, among other things, ingress and egress, necessary for operation of the remaining portion of the Elston Retail Collection Property. The Billboard Release Parcels were not assigned any value in the related Elston Retail Collection Property appraisal.
Ownership of Improvements. The borrower may become the owner of the improvements located on the Best Buy premises during the term of the Elston Retail Collection Whole Loan. The initial term of the Best Buy lease expires on January 31, 2026 (subject to five, 5-year options to renew). Pursuant to the terms of the Best Buy lease, Best Buy owns the improvements during the term of the lease. Upon the expiration or earlier termination of the lease, the borrower will become the absolute owner of all permanent improvements then located on the Best Buy premises (including, without limitation, the Best Buy building), free and clear of all rights and claims of Best Buy. Additionally, the initial term of the BMO Harris Bank lease expires on August 31, 2025 (subject to one, 9-year, 364 day option to renew). BMO Harris Bank appears to be the owner of all of the improvements located on the premises during the term of the lease. Upon the expiration or earlier termination of the lease, BMO Harris Bank must surrender the land and the building to the borrower, free and clear of all liens.
THE INFORMATION IN THIS STRUCTURAL AND COLLATERAL TERM SHEET IS NOT COMPLETE AND MAY BE AMENDED PRIOR TO THE TIME OF SALE. THIS TERM SHEET IS NOT AN OFFER TO SELL THESE SECURITIES AND IT IS NOT A SOLICITATION OF AN OFFER TO BUY THESE SECURITIES IN ANY JURISDICTION WHERE THE OFFER OR SALE IS NOT PERMITTED.
91
55 Green Street San Francisco, CA 94111
| Collateral Asset Summary – Loan No. 9 55 Green Street | Cut-off Date Balance: Cut-off Date LTV: U/W NCF DSCR: U/W NOI Debt Yield: | $36,600,000 56.9% 2.46x 8.8% |
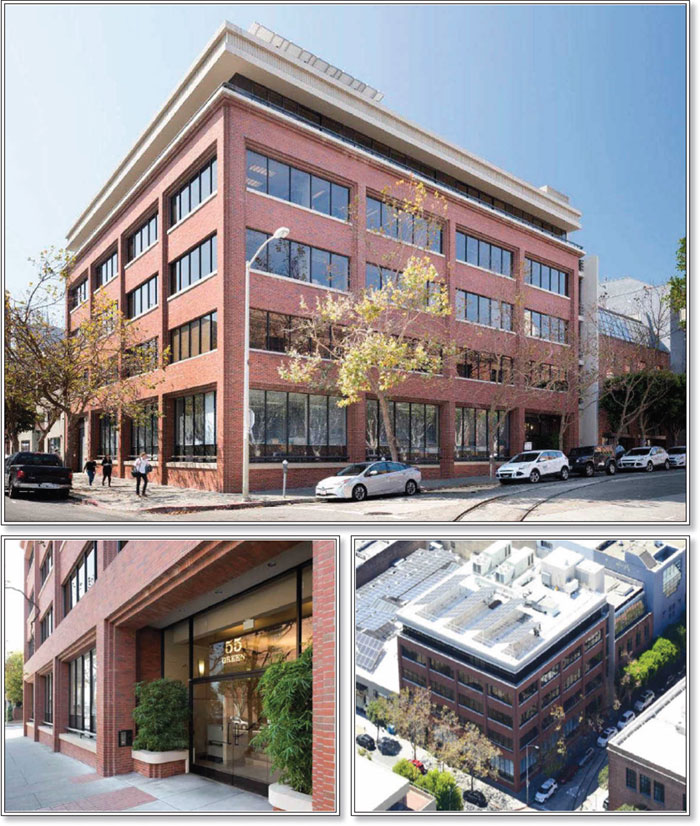
THE INFORMATION IN THIS STRUCTURAL AND COLLATERAL TERM SHEET IS NOT COMPLETE AND MAY BE AMENDED PRIOR TO THE TIME OF SALE. THIS TERM SHEET IS NOT AN OFFER TO SELL THESE SECURITIES AND IT IS NOT A SOLICITATION OF AN OFFER TO BUY THESE SECURITIES IN ANY JURISDICTION WHERE THE OFFER OR SALE IS NOT PERMITTED.
92
55 Green Street San Francisco, CA 94111
| Collateral Asset Summary – Loan No. 9 55 Green Street | Cut-off Date Balance: Cut-off Date LTV: U/W NCF DSCR: U/W NOI Debt Yield: | $36,600,000 56.9% 2.46x 8.8% |
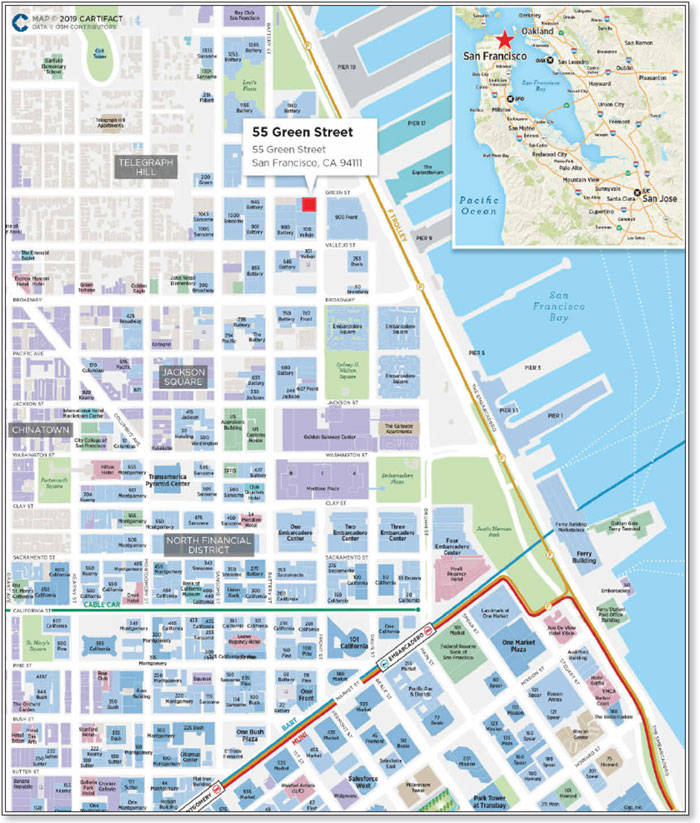
THE INFORMATION IN THIS STRUCTURAL AND COLLATERAL TERM SHEET IS NOT COMPLETE AND MAY BE AMENDED PRIOR TO THE TIME OF SALE. THIS TERM SHEET IS NOT AN OFFER TO SELL THESE SECURITIES AND IT IS NOT A SOLICITATION OF AN OFFER TO BUY THESE SECURITIES IN ANY JURISDICTION WHERE THE OFFER OR SALE IS NOT PERMITTED.
93
55 Green Street San Francisco, CA 94111
| Collateral Asset Summary – Loan No. 9 55 Green Street | Cut-off Date Balance: Cut-off Date LTV: U/W NCF DSCR: U/W NOI Debt Yield: | $36,600,000 56.9% 2.46x 8.8% |
Mortgage Loan Information | |
Loan Seller: | GSMC |
Loan Purpose: | Refinance |
Borrower Sponsor(1): | Sacks Realty LLC; Glenn A. Gilmore |
Borrowers: | Green Front LLC |
Original Balance: | $36,600,000 |
Cut-off Date Balance: | $36,600,000 |
% by Initial UPB: | 3.6% |
Interest Rate: | 3.45100% |
Payment Date: | 6th of each month |
First Payment Date: | December 6, 2019 |
Maturity Date: | November 6, 2029 |
Amortization: | Interest Only |
Additional Debt: | None |
Call Protection: | L(11), YM1(102), O(7) |
Lockbox / Cash Management: | Hard / In-Place |
Reserves(2) | |||
| Initial | Monthly | Cap |
Taxes: | $58,299 | $29,150 | NAP |
Insurance: | $0 | Springing | NAP |
Replacement: | $0 | $6,805 | $163,324 |
TI/LC: | $0 | $0 | NAP |
Property Information | |
Single Asset / Portfolio: | Single Asset |
Property Type: | CBD Office |
Collateral: | Fee Simple |
Location: | San Francisco, CA |
Year Built / Renovated: | 1984 / 2019 |
Total Sq. Ft.: | 54,414 |
Property Management: | IntersectionCRE, Inc. |
Underwritten NOI(3): | $3,238,300 |
Underwritten NCF(3): | $3,149,877 |
Appraised Value(4): | $64,300,000 |
Appraisal Date: | February 1, 2020 |
| |
Historical NOI(5) | |
Most Recent NOI: | NAV |
2018 NOI: | NAV |
2017 NOI: | NAV |
2016 NOI: | NAV |
| |
Historical Occupancy(5) | |
Most Recent Occupancy(5): | 100.0% (November 1, 2019) |
2018 Occupancy: | NAV |
2017 Occupancy: | NAV |
2016 Occupancy: | NAV |
Financial Information | ||||||
Tranche | Cut-off Date Balance | Balance per Sq. Ft. Cut-off / Balloon | LTV Cut-off / Balloon(4) | U/W DSCR NOI / NCF | U/W Debt Yield NOI / NCF | U/W Debt Yield at Balloon NOI / NCF |
Mortgage Loan | $36,600,000 | $673 / $673 | 56.9% / 56.9% | 2.53x / 2.46x | 8.8% / 8.6% | 8.8% / 8.6% |
(1) | Sacks Realty LLC and Glenn A. Gilmore are the nonrecourse carve-out guarantors. |
(2) | See “Initial and Ongoing Reserves” herein. |
(3) | Underwritten NOI and Underwritten NCF are based on the November 1, 2019 rent roll, executed lease and lender adjustments. See “Cash Flow Analysis” herein. |
(4) | Appraised Value, Cut-off Date LTV and Balloon LTV are based on the “As Stabilized” appraised value as of February 1, 2020 of $64.3 million. The “As Stabilized” appraised value assumes an approximately $5.9 million of capital is completed at the 55 Green Street Property. The “As Is” appraised value as of August 12, 2019 is $59.8 million, resulting in a Cut-off Date LTV Ratio and Balloon LTV of 61.2%. |
(5) | Historical cash flows and occupancy are not available as the borrower sponsor purchased the 55 Green Street Property vacant in 2018. Subsequent to the purchase, the building underwent renovations. |
THE INFORMATION IN THIS STRUCTURAL AND COLLATERAL TERM SHEET IS NOT COMPLETE AND MAY BE AMENDED PRIOR TO THE TIME OF SALE. THIS TERM SHEET IS NOT AN OFFER TO SELL THESE SECURITIES AND IT IS NOT A SOLICITATION OF AN OFFER TO BUY THESE SECURITIES IN ANY JURISDICTION WHERE THE OFFER OR SALE IS NOT PERMITTED.
94
55 Green Street San Francisco, CA 94111
| Collateral Asset Summary – Loan No. 9 55 Green Street | Cut-off Date Balance: Cut-off Date LTV: U/W NCF DSCR: U/W NOI Debt Yield: | $36,600,000 56.9% 2.46x 8.8% |
The Loan. The 55 Green Street mortgage loan (the “55 Green Street Loan”) is a fixed rate loan secured by a first mortgage encumbering the borrower’s fee simple interest in an office property located in San Francisco, California (the “55 Green Street Property”). The 55 Green Street Loan is evidenced by a promissory note with an original principal balance and outstanding principal balance as of the Cut-off Date of $36.6 million.
The 55 Green Street Loan has a ten-year interest-only term and accrues interest at a fixed rate of 3.45100% per annum. The 55 Green Street Loan proceeds were used to retire approximately $26.37 million of existing debt, return approximately $9.57 million of equity to the borrower sponsor, fund reserves and pay closing costs.
Sources and Uses | ||||||
Sources | Proceeds | % of Total |
| Uses | Proceeds | % of Total |
Mortgage Loan | $36,600,000 | 100.0% |
| Loan Payoff | $26,377,642 | 72.1% |
|
|
|
| Principal Equity Distribution | 9,577,113 | 26.2 |
|
|
|
| Closing Costs | 586,946 | 1.6 |
|
|
|
| Reserves | 58,299 | 0.2 |
Total Sources | $36,600,000 | 100.0% |
| Total Uses | $36,600,000 | 100.0% |
The Borrower. The borrower is Green Front LLC, a Delaware limited liability company and single purpose entity. Legal counsel to the borrower delivered a non-consolidation opinion in connection with the origination of the 55 Green Street Whole Loan. The nonrecourse carve-out guarantors are Sacks Realty LLC and Glenn A. Gilmore. Sacks Realty, LLC is controlled by David Sacks, an ultra-high net worth individual and tech entrepreneur. Glenn A. Gilmore is one of the founders of The Brick & Timber Collective and is involved in the day-to-day management of the company. Brick & Timber Collective LLC (“Brick & Timber”) is a real estate development and management firm founded by Glenn Gilmore in 2015. They have extensive experience renovating historic office properties in San Francisco. Brick & Timber has ten properties in various stages of renovation and leasing, including 590 Pacific, 855 Front, 831 Montgomery, and 243 Vallejo in San Francisco.
The Property.
Tenant Summary(1) |
| ||||||
Tenant | Ratings (Fitch/Moody’s/S&P) | Net Rentable Area (Sq. Ft.) | % of Net Rentable Area | U/W Base Rent PSF | % of Total U/W Base Rent | Lease Expiration |
|
| |||||||
Getaround(2)(3) | NR / NR / NR | 54,414 | 100.0% | $63.69 | 100.0% | 6/30/2029 |
|
Total / Wtd. Avg. Occupied |
| 54,414 | 100.0% | $63.69 | 100.0% |
|
|
Vacant Space |
| 0 | 0.0% |
|
|
|
|
Total / Wtd. Avg. |
| 54,414 | 100.0% |
|
|
|
|
|
|
|
|
|
|
|
|
(1) | Based on the underwritten rent roll dated November 1, 2019. |
(2) | The 55 Green Property features approximately 45,527 sq. ft. of office space and 8,887 sq. ft. of lower level parking, which includes storage space and 17 parking stalls. Getaround signed an approximately 10-year NNN lease expiring in 2029. |
(3) | Getaround is in the process of completing its buildout with respect to two of the five floors. One floor is expected to be completed in November 2019, and the other by the end of 2019. We cannot assure you this will be completed as anticipated or at all. |
THE INFORMATION IN THIS STRUCTURAL AND COLLATERAL TERM SHEET IS NOT COMPLETE AND MAY BE AMENDED PRIOR TO THE TIME OF SALE. THIS TERM SHEET IS NOT AN OFFER TO SELL THESE SECURITIES AND IT IS NOT A SOLICITATION OF AN OFFER TO BUY THESE SECURITIES IN ANY JURISDICTION WHERE THE OFFER OR SALE IS NOT PERMITTED.
95
55 Green Street San Francisco, CA 94111
| Collateral Asset Summary – Loan No. 9 55 Green Street | Cut-off Date Balance: Cut-off Date LTV: U/W NCF DSCR: U/W NOI Debt Yield: | $36,600,000 56.9% 2.46x 8.8% |
Lease Rollover Schedule(1) | ||||||||
Year | # of Leases Expiring | Total Expiring Sq. Ft. | % of Total Sq. Ft. Expiring | Cumulative Sq. Ft. Expiring | Cumulative % of Sq. Ft. Expiring | Annual U/W Base Rent PSF | % U/W Base Rent Rolling | Cumulative % of U/W Base Rent |
MTM | 0 | 0 | 0.0% | 0 | 0.0% | $0.00 | 0.0% | 0.0% |
2019 | 0 | 0 | 0.0 | 0 | 0.0% | $0.00 | 0.0 | 0.0% |
2020 | 0 | 0 | 0.0 | 0 | 0.0% | $0.00 | 0.0 | 0.0% |
2021 | 0 | 0 | 0.0 | 0 | 0.0% | $0.00 | 0.0 | 0.0% |
2022 | 0 | 0 | 0.0 | 0 | 0.0% | $0.00 | 0.0 | 0.0% |
2023 | 0 | 0 | 0.0 | 0 | 0.0% | $0.00 | 0.0 | 0.0% |
2024 | 0 | 0 | 0.0 | 0 | 0.0% | $0.00 | 0.0 | 0.0% |
2025 | 0 | 0 | 0.0 | 0 | 0.0% | $0.00 | 0.0 | 0.0% |
2026 | 0 | 0 | 0.0 | 0 | 0.0% | $0.00 | 0.0 | 0.0% |
2027 | 0 | 0 | 0.0 | 0 | 0.0% | $0.00 | 0.0 | 0.0% |
2028 | 0 | 0 | 0.0 | 0 | 0.0% | $0.00 | 0.0 | 0.0% |
2029 | 1 | 54,414 | 100.0 | 54,414 | 100.0% | $63.69 | 100.0 | 100.0% |
2030 &Thereafter | 0 | 0 | 0.0 | 54,414 | 100.0% | $0.00 | 0.0 | 100.0% |
Vacant | NAP | 0 | 0.0 | 54,414 | 100.0% | NAP | NAP |
|
Total / Wtd. Avg. | 1 | 54,414 | 100.0% |
|
| $63.69 | 100.0% |
|
(1) | Based on the underwritten rent roll dated November 1, 2019. |
The 55 Green Street Property is a five-story, 54,414 sq. ft., single-tenant, CBD office building located in the Embarcadero district of San Francisco, California. The 55 Green Street Property features 45,527 sq. ft. of office space and 8,887 sq. ft. of lower level parking with 17 parking stalls. The improvements were constructed in 1984 (renovated in 2019) and situated on a 0.21-acre site.
Sole Tenant. Getaround (54,414 sq. ft.; 100.0% of NRA; 100.0% of U/W Base Rent) The 55 Green Street Property is Getaround’s headquarters. Getaround signed an approximately 10-year lease with one, five-year extension option with the intention of using the space as their headquarters. Getaround is a peer-to-peer car rental startup that initially launched at TechCrunch Disrupt NY in 2011 and is led by co-founders Sam Zaid, Jessica Scorpio and Elliot Crow. Getaround was launched to address “car overpopulation,” and the company offers a platform that aims to reduce car ownership and a car’s downtime by making it a shared asset. An affiliate of GS Bank is a minority equity investor in Getaround.
Environmental Matters. The Phase I environmental report dated August 15, 2019 recommended no further action at the 55 Green Street Property.
The Market. The 55 Green Street Property is located in the Embarcadero neighborhood, which falls just north of Jackson Square and San Francisco’s downtown office core within the North Waterfront / Jackson Square submarket which has an average vacancy rate of 3.2%. The North Waterfront / Jackson Square is a historic district located along the northern border of the Financial District and stretching to the waterfront. North Waterfront / Jackson Square has traditionally been home to a diverse tenant base including professional services, large retail companies, and media and advertising. Increasingly, technology and venture capital firms are taking space in the neighborhood with companies such as Esurance, Intel, Azure Capital Partners and Seed Change now calling the submarket home.
The Property is situated at a waterfront location with close proximity to transportation options, including MUNI light rail, MUNI bus lines, BART, Golden Gate Transit and San Francisco Bay Ferry. The nearest bus stop is located one block from the Property at Battery & Green.
The appraisal identified six comparable office leases that had industrial gross, full service or NNN base rents ranging from $65.00 to $97.00 per sq. ft. with an average of $82.79 per sq. ft. The appraiser concluded to a market full-service, with gross receipts tax recovered on a net basis rent of $96.00 per sq. ft. According to the appraisal, the average asking rental rate for Class B space in the submarket is $79.00 per sq. ft. The in-place NNN base rent per sq. ft. at the 55 Green Street Property is $63.69 per sq. ft.
THE INFORMATION IN THIS STRUCTURAL AND COLLATERAL TERM SHEET IS NOT COMPLETE AND MAY BE AMENDED PRIOR TO THE TIME OF SALE. THIS TERM SHEET IS NOT AN OFFER TO SELL THESE SECURITIES AND IT IS NOT A SOLICITATION OF AN OFFER TO BUY THESE SECURITIES IN ANY JURISDICTION WHERE THE OFFER OR SALE IS NOT PERMITTED.
96
55 Green Street San Francisco, CA 94111
| Collateral Asset Summary – Loan No. 9 55 Green Street | Cut-off Date Balance: Cut-off Date LTV: U/W NCF DSCR: U/W NOI Debt Yield: | $36,600,000 56.9% 2.46x 8.8% |
Comparable Office Leases(1) | ||||||
Property Name | Tenant Name | Lease Date | Tenant Leased Space | Lease Term (years) | Lease Type | Base Rent PSF |
55 Green Street(2) | Getaround | 3/14/2019 | 54,414 | 10.3 Yrs. | NNN | $63.69 |
444 De Haro Plaza | Discord | June 2019 | 66,000 | 10.0 Yrs. | Industrial Gross | $92.00 |
100 California Street | Segment IO, Inc. | March 2021 | 20,173 | 8.1 Yrs. | Full Service | $92.76 |
1 Market Plaza | RPX Corporation | December 2018 | 26,967 | 10.2 Yrs. | Full Service | $97.00 |
221 Main Street | Docusign | March 2019 | 10,291 | 5.5 Yrs. | Industrial Gross | $80.00 |
One Tehoma | SoFi | April 2019 | 98,566 | 10.5 Yrs. | NNN | $70.00 |
657-667 Mission St. | Utility Technologies | February 2019 | 148,810 | 12.5 Yrs. | NNN | $65.00 |
| (1) | Source: Appraisal. |
| (2) | Based on the underwritten rent roll dated November 1, 2019. |
Cash Flow Analysis.
Cash Flow Analysis(1) | |||
| U/W(2) |
| U/W PSF |
Base Rent | $3,465,569 |
| $63.69 |
Contractual Rent Steps | 0 |
| 0.00 |
Total Reimbursement Revenue | 1,119,610 |
| 20.58 |
Less: Vacancy(3) | (229,259) |
| (4.21) |
Effective Gross Income | $4,355,920 |
| $80.05 |
Total Operating Expenses | 1,117,620 |
| 20.54 |
Net Operating Income | $3,238,300 |
| $59.51 |
TI/LC | 77,540 |
| 1.43 |
Capital Expenditures | 10,883 |
| 0.20 |
Net Cash Flow | $3,149,877 |
| $57.89 |
(1) | Historical cash flows and occupancy are not available as the borrower sponsor purchased the 55 Green Street Property vacant in 2018. Subsequent to the purchase, the building underwent renovations. |
(2) | U/W Base Rent is based on the underwritten rent roll dated November 1, 2019, with rent steps through January 2021 totaling $100,939. |
(3) | U/W Vacancy includes an adjustment of 5.0%. The building is 100.0% occupied. |
Property Management. The 55 Green Street Property is managed by IntersectionCRE, Inc., a California corporation, who manages 26 properties totaling just over 750,000 sq. ft. in San Francisco.
Lockbox / Cash Management. The 55 Green Street Loan is structured with a hard lockbox and in-place cash management. The Borrower is required under the 55 Green Street Loan to deliver notices to each tenant instructing them to remit all rents into a lender-controlled lockbox account. At all times, the borrower will be required to cause all rents or other income received by the borrower or the property manager with respect to the 55 Green Street Property to be deposited into such lockbox account within one business day of receipt. On each business day, all amounts in the lockbox account are required to be remitted to a lender-controlled cash management account. On each business day that no event of default or 55 Green Trigger Period is continuing, all funds in the cash management account in excess of the amount required to be paid or reserved with the lender on the next payment date are required to be swept into a borrower-controlled operating account. Upon the occurrence and during the continuance of an event of default or a 55 Green Trigger Period, all funds in the lockbox account in excess of the debt service, reserve payments and operating expenses are required (x) during the continuance of a 55 Green Trigger Period caused by a 55 Green Critical Tenant Trigger Event (and no other 55 Green Trigger Period then exists), to be reserved in a critical tenant reserve (capped at $3,000,000), or (y) during the continuance of a 55 Green Trigger Period not caused by a 55 Green Critical Tenant Trigger Event, to be held by the lender in an excess cash flow reserve account as additional collateral for the 55 Green Street Loan. Upon the occurrence and during the continuance of an event of default under the 55 Green Street Loan documents the lender may apply funds to the debt in such priority as it may determine.
A “55 Green Trigger Period” means each period when (a) the debt service coverage ratio as of the first day of any fiscal quarter from and after the due date in March 2020 is less than 1.15x until the debt service coverage ratio as of the first day of each of two consecutive fiscal quarters thereafter, is equal to or greater than 1.15x; and (b) a 55 Green Critical Tenant Trigger Event occurs (and the borrower fails to timely make a cash deposit in the amount of $3,000,000 or provide a letter of credit with a face value of $3,000,000) until the earlier to occur of (x) the satisfaction of the 55 Green Critical Tenant Disbursement Conditions or (y) the balance in the critical tenant reserve is equal to $3,000,000.
THE INFORMATION IN THIS STRUCTURAL AND COLLATERAL TERM SHEET IS NOT COMPLETE AND MAY BE AMENDED PRIOR TO THE TIME OF SALE. THIS TERM SHEET IS NOT AN OFFER TO SELL THESE SECURITIES AND IT IS NOT A SOLICITATION OF AN OFFER TO BUY THESE SECURITIES IN ANY JURISDICTION WHERE THE OFFER OR SALE IS NOT PERMITTED.
97
55 Green Street San Francisco, CA 94111
| Collateral Asset Summary – Loan No. 9 55 Green Street | Cut-off Date Balance: Cut-off Date LTV: U/W NCF DSCR: U/W NOI Debt Yield: | $36,600,000 56.9% 2.46x 8.8% |
A “55 Green Critical Tenant Trigger Event” means the occurrence of any of the following (a) the filing of a bankruptcy petition by or against any 55 Green Critical Tenant (a “55 Green Critical Tenant Bankruptcy Trigger Event”); (b) a 55 Green Critical Tenant giving notice of its intent to terminate its lease or vacate a portion of its premises; (c) the failure of a 55 Green Critical Tenant to give notice to renew its lease as of the earlier of (i) the date required pursuant to its lease or (ii) 12 months prior to the expiration of its lease (a “55 Green Critical Tenant Non-Renewal Trigger Event”); or (d) a 55 Green Critical Tenant going dark with respect to at least 25% of its space for a period of at least 30 days (excluding such events caused by casualty, condemnation or renovations) (a “55 Green Critical Tenant Vacating Trigger Event”).
The “55 Green Critical Tenant Disbursement Conditions” mean the satisfaction of the following conditions: (a) with respect to a 55 Green Critical Tenant Bankruptcy Trigger Event, (1) such bankruptcy case is dismissed 90 days after commencement without any negative impact on the applicable lease and the 55 Green Critical Tenant paying normal monthly rent and otherwise being in compliance with its lease and having provided an updated estoppel certificate, (2) the applicable 55 Green Critical Tenant has assumed or affirmed its lease during the bankruptcy period and the 55 Green Critical Tenant paying normal monthly rent and otherwise being in compliance with its lease and having provided an updated estoppel certificate or (3) such 55 Green Critical Tenant has been terminated and an amount equal to at least 75% of such 55 Green Critical Tenant’s space has been leased pursuant to one or more approved substitute leases for a term of at least five years at market rent and the related tenants thereafter are in occupancy, paying normal monthly rent or will commence within 120 days with any free or abated rents reserved with lender and such tenants provide acceptable estoppel certificates which must include evidence of the satisfaction of the foregoing conditions, that all tenant improvements have been paid and there are no defaults (provided that if less than 100% of such 55 Green Critical Tenant’s space has been leased, the debt yield is at least the greater of (x) 8.61% and (y) the debt yield immediately prior to the occurrence of a 55 Green Critical Tenant Trigger Event) (the conditions in item (3), collectively, the “55 Green Re-Tenanting Condition”); (b) with respect to a 55 Green Critical Tenant Non-Renewal Trigger Event, either (1) such 55 Green Critical Tenant renews its lease, the tenant is in occupancy, paying full monthly rent, open for business and having provided an updated estoppel certificate or (2) the 55 Green Re-Tenanting Condition has been satisfied; and (c) with respect to a 55 Green Critical Tenant Vacating Trigger Event, either (1) the lender has received satisfactory evidence that the applicable 55 Green Critical Tenant has resumed its business and operations in all or substantially all of its premises and having provided an updated estoppel certificate or (2) the 55 Green Re-Tenanting Condition has been satisfied.
A “55 Green Critical Tenant” means either (i) Getaround or (ii) any successor tenant that takes occupancy of all or a portion of Getaround’s current space.
Initial and Ongoing Reserves. At loan origination, the borrower funded an upfront deposit for taxes in the amount of $58,299.
Real Estate Taxes and Insurance Reserves – On each due date, the borrower is required to make monthly deposits of: (i) a tax reserve in an amount equal to 1/12 of the amount that the lender estimates will be necessary to pay taxes over the then succeeding 12-month period and (ii) an insurance reserve in an amount equal to 1/12 of the amount that the lender estimates will be necessary to cover premiums over the then succeeding 12-month period (such reserve has been conditionally waived so long as no event of default under the related loan documents has occurred and is continuing, the borrower maintains a blanket policy meeting the requirements of the 55 Green Street Loan documents and the borrower provides timely evidence of the payment of the applicable premiums).
Replacement Reserves – On each due date, the borrower is required to make monthly deposits of $6,805, capped at $163,324.
Current Mezzanine or Subordinate Indebtedness. None.
Future Mezzanine or Subordinate Indebtedness Permitted. None.
Partial Release. None.
THE INFORMATION IN THIS STRUCTURAL AND COLLATERAL TERM SHEET IS NOT COMPLETE AND MAY BE AMENDED PRIOR TO THE TIME OF SALE. THIS TERM SHEET IS NOT AN OFFER TO SELL THESE SECURITIES AND IT IS NOT A SOLICITATION OF AN OFFER TO BUY THESE SECURITIES IN ANY JURISDICTION WHERE THE OFFER OR SALE IS NOT PERMITTED.
98
(THIS PAGE INTENTIONALLY LEFT BLANK)
99
125 Delancey Street New York, NY 10002 | Collateral Asset Summary – Loan No. 10 The Essex Site 2 | Cut-off Date Balance: Cut-off Date LTV: U/W NCF DSCR: U/W NOI Debt Yield: | $35,100,000 39.9% 3.66x 10.3% |
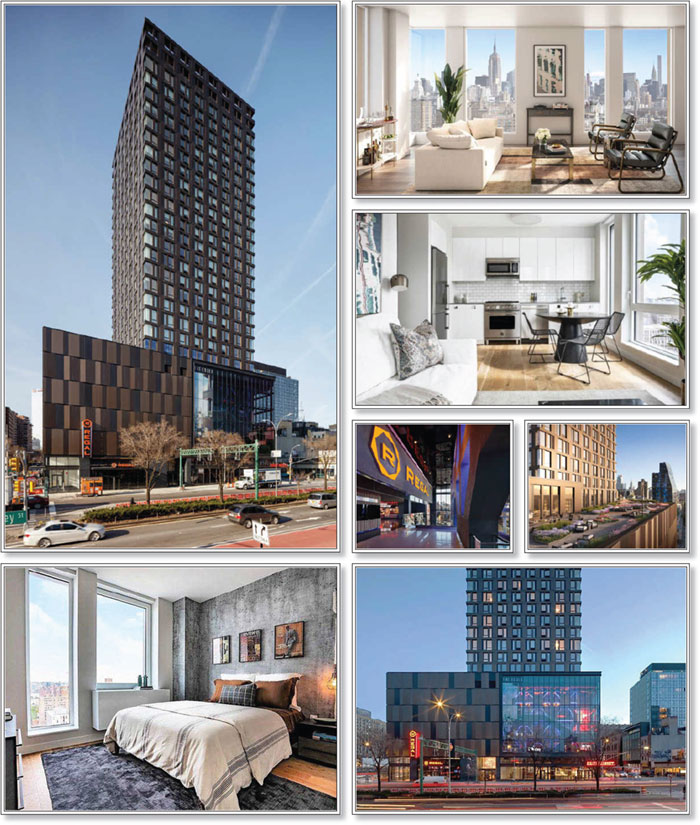
THE INFORMATION IN THIS STRUCTURAL AND COLLATERAL TERM SHEET IS NOT COMPLETE AND MAY BE AMENDED PRIOR TO THE TIME OF SALE. THIS TERM SHEET IS NOT AN OFFER TO SELL THESE SECURITIES AND IT IS NOT A SOLICITATION OF AN OFFER TO BUY THESE SECURITIES IN ANY JURISDICTION WHERE THE OFFER OR SALE IS NOT PERMITTED.
100
125 Delancey Street New York, NY 10002 | Collateral Asset Summary – Loan No. 10 The Essex Site 2 | Cut-off Date Balance: Cut-off Date LTV: U/W NCF DSCR: U/W NOI Debt Yield: | $35,100,000 39.9% 3.66x 10.3% |
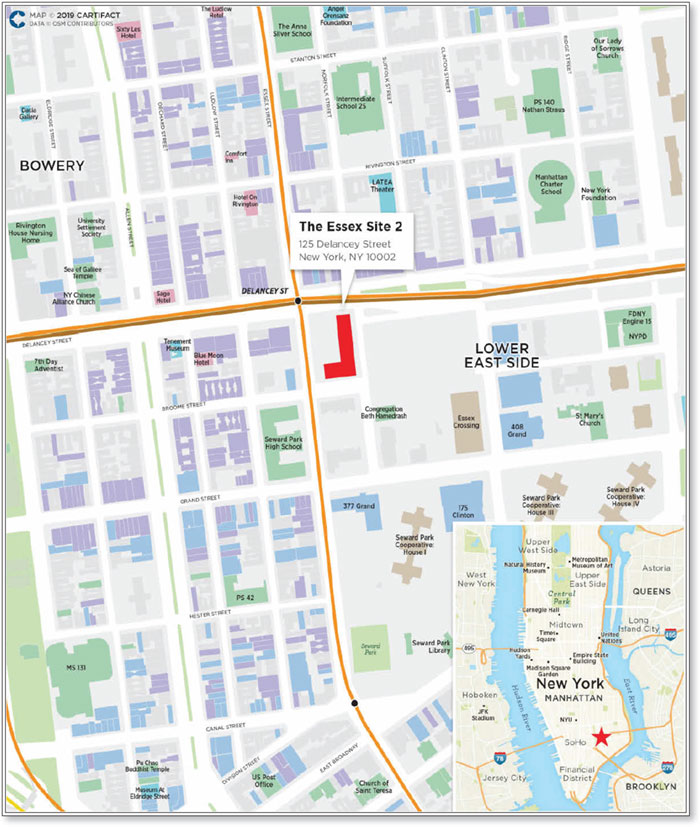
THE INFORMATION IN THIS STRUCTURAL AND COLLATERAL TERM SHEET IS NOT COMPLETE AND MAY BE AMENDED PRIOR TO THE TIME OF SALE. THIS TERM SHEET IS NOT AN OFFER TO SELL THESE SECURITIES AND IT IS NOT A SOLICITATION OF AN OFFER TO BUY THESE SECURITIES IN ANY JURISDICTION WHERE THE OFFER OR SALE IS NOT PERMITTED.
101
125 Delancey Street New York, NY 10002 | Collateral Asset Summary – Loan No. 10 The Essex Site 2 | Cut-off Date Balance: Cut-off Date LTV: U/W NCF DSCR: U/W NOI Debt Yield: | $35,100,000 39.9% 3.66x 10.3% |
Mortgage Loan Information | |
Loan Seller: | GSMC |
Loan Purpose: | Refinance |
Credit Assessment |
|
(Fitch/KBRA)(7): | BBB-sf / BBB-(sf) |
Borrower Sponsors(1): | Various |
Borrowers: | Site 2 DSA Residential LLC, Site 2 DSA Theater LLC |
Original Balance(2): | $35,100,000 |
Cut-off Date Balance(2): | $35,100,000 |
% by Initial UPB: | 3.4% |
Interest Rate: | 2.75900% |
Payment Date: | 1st of each month |
First Payment Date: | December 1, 2019 |
Maturity Date: | November 1, 2026 |
Amortization: | Interest Only |
Additional Debt(2): | $81,900,000 Pari Passu Debt $58,000,000 Subordinate Debt $40,000,000 Mezzanine Loan |
Call Protection(3): | L(25), D(54), O(5) |
Lockbox / Cash Management(4): | Hard / Springing |
Reserves(5) | |||
| Initial | Monthly | Cap |
Taxes: | $311,439 | $62,288 | NAP |
Insurance: | $0 | Springing | NAP |
Replacement: | $4,875 | $5,415 | NAP |
TI/LC: | $0 | $0 | NAP |
Property Information | |
Single Asset / Portfolio: | Single Asset |
Property Type: | Multifamily/Retail |
Collateral: | Fee Simple |
Location: | New York, NY |
Year Built / Renovated: | 2019 / NAP |
Total Sq. Ft.: | 205,070 |
Property Management: | C&C Apartment Management LLC and Taconic Management Company LLC |
Underwritten NOI: | $12,051,963 |
Underwritten NCF: | $11,993,463 |
Appraised Value: | $293,000,000 |
Appraisal Date: | August 21, 2019 |
| |
Historical NOI(6) | |
Most Recent NOI: | NAV |
2018 NOI: | NAV |
2017 NOI: | NAV |
2016 NOI: | NAV |
| |
Historical Occupancy(6) | |
Most Recent Occupancy: | 100.0% (September 10, 2019) |
2018 Occupancy: | NAV |
2017 Occupancy: | NAV |
2016 Occupancy: | NAV |
Financial Information(2) | ||||||
Tranche | Cut-off Date | Balance per Sq. Ft. Cut-off / Balloon | LTV Cut-off / Balloon | U/W DSCR NOI / NCF | U/W Debt Yield NOI / NCF | U/W Debt Yield at Balloon NOI / NCF |
Mortgage Loan | $35,100,000 |
|
|
|
|
|
Pari Passu Notes | 81,900,000 |
|
|
|
|
|
Total Senior Notes | $117,000,000 | $571 / $571 | 39.9% / 39.9% | 3.68x / 3.66x | 10.3% / 10.3% | 10.3% / 10.3% |
Note B-1 | 40,600,000 |
|
|
|
|
|
Note B-2 | 17,400,000 |
|
|
|
|
|
Whole Loan | $175,000,000 | $853 / $853 | 59.7% / 59.7% | 1.89x / 1.89x | 6.9% / 6.9% | 6.9% / 6.9% |
Mezzanine Loan | 40,000,000 |
|
|
|
|
|
Total Debt | $215,000,000 | $1,048 / $1,048 | 73.4% / 73.4% | 1.33x / 1.33x | 5.6% / 5.6% | 5.6% / 5.6% |
(1) | The Borrower Sponsors are Taconic Development Capital LLC, L&M Development Partners Inc., Donald Capoccia, Brandon Baron and Joseph Ferrara. |
(2) | The Cut-off Date Balance of $35.1 million represents the non-controlling note A-1-4 of the $175.0 million Essex Site 2 Whole Loan represented by four pari passu senior notes and two subordinate notes. See “—The Loan” below. The whole loan financial information presented in the chart above reflects the $175.0 million aggregate Cut-off Date balance of The Essex Site 2 Whole Loan, and excludes the related The Essex Site 2 Mezzanine Loan. The total debt financial information presented in the chart above reflects the $215.0 million aggregate Cut-off Date balance of The Essex Site 2 Whole Loan and The Essex Site 2 Mezzanine Loan. |
(3) | The lockout period will be at least 25 payments beginning with and including the first payment date of December 1, 2019. The borrower has the option to defease the full $215,000,000 The Essex Site 2 Whole Loan after the earlier to occur of (i) two years after the closing date of the securitization that includes the last pari passu note to be securitized and (ii) December 1, 2022. The assumed lockout period of 25 payments is based on the expected COMM 2019-GC44 securitization closing date in December 2019. The actual lockout period may be longer. |
(4) | See “Lockbox and Cash Management” herein. |
(5) | See “Initial and Ongoing Reserves” herein. |
(6) | Historical cash flows and occupancy are not available as The Essex Site 2 Property was constructed in 2019. |
(7) | Fitch and KBRA provided the listed assessments for The Essex Site 2 Loan in the context of its inclusion in the mortgage pool. |
THE INFORMATION IN THIS STRUCTURAL AND COLLATERAL TERM SHEET IS NOT COMPLETE AND MAY BE AMENDED PRIOR TO THE TIME OF SALE. THIS TERM SHEET IS NOT AN OFFER TO SELL THESE SECURITIES AND IT IS NOT A SOLICITATION OF AN OFFER TO BUY THESE SECURITIES IN ANY JURISDICTION WHERE THE OFFER OR SALE IS NOT PERMITTED.
102
125 Delancey Street New York, NY 10002 | Collateral Asset Summary – Loan No. 10 The Essex Site 2 | Cut-off Date Balance: Cut-off Date LTV: U/W NCF DSCR: U/W NOI Debt Yield: | $35,100,000 39.9% 3.66x 10.3% |
The Loan. The Essex Site 2 mortgage loan (“The Essex Site 2 Loan”) is part of a fixed rate loan secured by first mortgages encumbering the borrowers’ fee simple interest or beneficial ownership interest in four condominium units: three multifamily condominiums and one retail condominium located in New York, New York. The Essex Site 2 Loan is part of a whole loan with an aggregate outstanding principal balance as of the Cut-off Date of $175.0 million (“The Essex Site 2 Whole Loan”) and is comprised of (i) a senior loan, comprised of four pari passu notes, with an aggregate outstanding principal balance as of the Cut-off Date of $117.0 million (“The Essex Site 2 Senior Notes”) (two of which, Note A-1-1, with an outstanding principal balance as of the Cut-off Date of $30.0 million, and Note A-1-3, with an outstanding principal balance as of the Cut-off Date of $26.9 million are being contributed to the Benchmark 2019-B14 Trust and Note A-1-2, with an outstanding principal of $25.0 million, which is expected to be contributed to one more future securitization trusts (collectively, “The Essex Site 2 Pari Passu Companion Loans”), (ii) a subordinate companion loan, comprised of two pari passu notes, with an aggregate principal balance as of the Cut-off Date of $58.0 million (collectively, “The Essex Site 2 Subordinate Companion Loan”) each as described below.
The relationship between the holders of The Essex Site 2 Senior Notes and The Essex Site 2 Subordinate Companion Loan will be governed by a co-lender agreement as described under “Description of the Mortgage Pool—The Whole Loans—The Non-Serviced AB Whole Loans—The Essex Site 2 Whole Loan” in the Preliminary Prospectus.
Whole Loan Summary | |||||
Note | Original Balance | Cut-off Date Balance |
| Note Holder | Controlling Piece |
Note A-1-1 | $30,000,000 | $30,000,000 |
| Benchmark 2019-B14(1) | No(2) |
Note A-1-2 | 25,000,000 | 25,000,000 |
| JPMCB(3) | No |
Note A-1-3 | 26,900,000 | 26,900,000 |
| Benchmark 2019-B14 | No |
Note A-1-4 | 35,100,000 | 35,100,000 |
| COMM 2019-GC44 | No |
Senior Notes | $117,000,000 | $117,000,000 |
|
|
|
Note B-1 | 40,600,000 | 40,600,000 |
| JPMCB(3) | Yes(2) |
Note B-2 | 17,400,000 | 17,400,000 |
| GS Bank USA(3) | No |
Whole Loan | $175,000,000 | $175,000,000 |
|
|
|
| (1) | The Benchmark 2019-B14 securitization transaction is expected to close prior to Closing Date. |
| (2) | The Essex Site 2 Whole Loan will be serviced pursuant to the Benchmark 2019-B14 pooling and servicing agreement. However, for so long as no The Essex Site 2 Control Appraisal Period has occurred and is continuing, the holder of the related Note B-1 will be the controlling noteholder and will have the right to approve certain modification and consent to certain actions taken with respect to the related whole loan. If and for so long as a The Essex Site 2 Control Appraisal Period has occurred and is continuing, then the controlling note will be Note A-1-1. See “Description of the Mortgage Pool—The Whole Loans—The Non-Serviced AB Whole Loan—The Essex Site 2 Whole Loan” in the Preliminary Prospectus. |
| (3) | Currently held by JPMCB and GS Bank USA and expected to be sold to one or more third party investors. |
The Essex Site 2 Whole Loan has a seven-year interest-only term and accrues interest at a fixed rate of 2.75900% per annum. The Essex Site 2 Whole Loan proceeds were used to refinance existing debt of approximately $154.3 million, pay closing costs of approximately $2.9 million, fund upfront reserves of approximately $0.3 million and return equity to the borrower sponsor of approximately $57.5 million. The most recent prior financing of The Essex Site 2 Property was not included in a securitization.
Sources and Uses | ||||||
Sources | Proceeds | % of Total |
| Uses | Proceeds | % of Total |
Senior Notes | $117,000,000 | 54.4% |
| Loan Payoff | $154,290,280 | 71.8% |
B-Notes | 58,000,000 | 27.0 |
| Return of Equity | 57,512,465 | 26.7 |
Mezzanine Loan | 40,000,000 | 18.6 |
| Closing Costs | 2,880,941 | 1.3 |
|
|
|
| Upfront Reserves | 316,314 | 0.1 |
Total Sources | $215,000,000 | 100.0% |
| Total Uses | $215,000,000 | 100.0% |
The Borrowers / Borrower Sponsors. The borrowers are Site 2 DSA Residential LLC (the “Residential Borrower”), and Site 2 DSA Theater LLC, each a Delaware limited liability company and single purpose entity with two independent directors. Legal counsel to the borrower delivered a non-consolidation opinion in connection with the origination of The Essex Site 2 Loan. An affiliate of Goldman Sachs Mortgage Company has an 85%, indirect ownership interest in the borrowers.
The borrower sponsors and non-recourse carveout guarantors are Taconic Development Capital LLC, L&M Development Partners Inc., Donald Capoccia, Brandon Baron and Joseph Ferrara. Taconic Development Capital LLC is an affiliate of Taconic Investment Partners, an owner, operator and developer of over 13.0 million square feet of office, mixed use and retail space and over 4,000 housing units primarily in New York City. L&M Development Partners Inc. is a developer of affordable, mixed-income and market rate housing, with experience investing over $7.0 billion and acquiring, building or preserving over 22,000 residential units in New York’s tri-state area, the West Coast and Gulf Coast regions. Donald Capoccia, Brandon Baron and Joseph Ferrara are principals at BFC Partners, a real estate firm that has concluded over $1.8 billion in acquisition and development with an additional $2.3 billion of projects under development.
THE INFORMATION IN THIS STRUCTURAL AND COLLATERAL TERM SHEET IS NOT COMPLETE AND MAY BE AMENDED PRIOR TO THE TIME OF SALE. THIS TERM SHEET IS NOT AN OFFER TO SELL THESE SECURITIES AND IT IS NOT A SOLICITATION OF AN OFFER TO BUY THESE SECURITIES IN ANY JURISDICTION WHERE THE OFFER OR SALE IS NOT PERMITTED.
103
125 Delancey Street New York, NY 10002 | Collateral Asset Summary – Loan No. 10 The Essex Site 2 | Cut-off Date Balance: Cut-off Date LTV: U/W NCF DSCR: U/W NOI Debt Yield: | $35,100,000 39.9% 3.66x 10.3% |
The Property. The Essex Site 2 property is a 205,070 square foot, 26-story, mixed-use tower, situated on Site Two of the multi-phase Essex Crossing development located in the Lower East Side of Manhattan, New York (“The Essex Site 2 Property”). Collateral for The Essex Site 2 Whole Loan consists of 140,070 square feet of residential space (195 units) and 65,000 square feet of theater space. Constructed in 2019, The Essex Site 2 Property consists of seven condominium units, four of which serve as collateral for The Essex Site 2 Whole Loan, including three condominium units associated with the multifamily units and one unit associated with a 14-screen movie theater leased to Regal Cinemas. The remaining three condominium units (which do not serve as collateral for The Essex Site 2 Whole Loan) consist of the Market Line, which is owned and operated by Delancey Street Associates, Essex Market, which is owned and operated by New York City, and an urban farm located on the sixth floor terrace of The Essex Site 2 Property. Amenities for the multifamily portion of The Essex Site 2 Property include a 24-hour attended lobby, a fitness center, a resident lounge, a children’s playroom, a conference room, a library, a landscaped terrace and grilling stations on the sixth floor and rooftop terrace. The residential units feature in-unit washers and dryers and offer views of the surrounding cityscape and East River Crossings.
Opened in January 2019, The Essex Site 2 Property is part of the greater Essex Crossing development in the Lower East Side of Manhattan, New York, a 1.9 million square foot development project expected to be completed in 2024, comprised of nine sites with over 1,000 new residences, 300,000 square feet of retail space, including Trader Joe’s and Target, 350,000 square feet of office space and 100,000 square feet of green space, which will be connected by a below-ground, 150,000 square foot market place known as the Market Line. Additional offerings within Essex Crossing include Essex Market, a public market, the Gutter, a 12-lane bowling alley, an outdoor park space featuring a children’s play area and the International Center of Photography, which is expected to open in January 2020. Essex Crossing was developed by Delancey Street Associates, a partnership between L+M Development Partners (5.0%), BFC Partners (5.0%), Taconic Investment Partners (5.0%) and within Taconic, the Prusik Group (2.0% of Taconic’s 5.0% - 0.1%) and the Goldman Sachs Urban Investment Group (85.0%).
The Essex Site 2 Property multifamily unit mix consists of 48 studio, 49 one-bedroom, 71 two-bedroom and 27 three-bedroom units. As part of the overall Essex Crossing master-plan, The Essex Site 2 Property is required to operate 46.0% of the residential units as affordable housing units. The Essex Site 2 Property contains 97 market rate units and 98 affordable units. The affordable units consist of 53 low income units and 45 moderate income units. The low income units are designated for households whose income is between 37.0% and 57.0% of the area median income (“AMI”). The moderate income units are designated for households whose income is between 110.0% and 155.0% of the AMI. Leasing for the residential component started in December 2018 with all units 100.0% occupied as of September 10, 2019.
Residential Unit Summary(1) | ||||||
Unit Type | Units | Occupied Units | % Occupied | Average Unit Size (SF) | Average Monthly In-Place | Average Monthly In- |
Studio | 48 | 48 | 100.0% | 436 | $1,949 | $54 |
1BR | 49 | 49 | 100.0 | 601 | $3,455 | $69 |
2BR | 71 | 71 | 100.0 | 848 | $4,605 | $65 |
3BR | 27 | 27 | 100.0 | 1,093 | $7,093 | $78 |
Total/Wtd. Avg. | 195 | 195 | 100.0% | 718 | $4,007 | $65 |
(1) | Based on the underwritten rent roll dated September 10, 2019. |
Residential Unit Mix(1) | ||||||||||||
| Market | Affordable: Moderate Income | Affordable: Low Income | |||||||||
Unit Type | Units | Average | Average | Average | Units | Average | Average | Average | Units | Average | Average | Average |
Studio | 12 | 497 | $4,288 | $103 | 15 | 415 | $1,695 | $49 | 21 | 415 | $793 | $23 |
1BR | 25 | 626 | $5,455 | $105 | 9 | 575 | $2,227 | $46 | 15 | 575 | $860 | $18 |
2BR | 39 | 906 | $6,804 | $90 | 17 | 776 | $2,660 | $41 | 15 | 778 | $1,091 | $17 |
3BR | 21 | 1,108 | $8,468 | $92 | 4 | 1,040 | $2,919 | $34 | 2 | 1,051 | $1,000 | $11 |
Total/Wtd. Avg. | 97 | 827 | $6,505 | $96 | 45 | 639 | $2,275 | $44 | 53 | 587 | $904 | $19 |
(1) | Based on the underwritten rent roll dated September 10, 2019. |
THE INFORMATION IN THIS STRUCTURAL AND COLLATERAL TERM SHEET IS NOT COMPLETE AND MAY BE AMENDED PRIOR TO THE TIME OF SALE. THIS TERM SHEET IS NOT AN OFFER TO SELL THESE SECURITIES AND IT IS NOT A SOLICITATION OF AN OFFER TO BUY THESE SECURITIES IN ANY JURISDICTION WHERE THE OFFER OR SALE IS NOT PERMITTED.
104
125 Delancey Street New York, NY 10002 | Collateral Asset Summary – Loan No. 10 The Essex Site 2 | Cut-off Date Balance: Cut-off Date LTV: U/W NCF DSCR: U/W NOI Debt Yield: | $35,100,000 39.9% 3.66x 10.3% |
The Essex Site 2 Property’s retail component is 100.0% leased to Regal Cinemas, which operates a 14-screen movie theater located on floors two through five of The Essex Site 2 Property. According to the borrower sponsors, Regal Cinemas spent approximately $11.0 million on theater build out. The theatre has modern reserved seating, a bar, concessions and Regal’s RPX screens. As of October 2019, Regal Cinemas operates 7,221 screens in 550 theatres located in 42 states along with American Samoa, the District of Columbia, Guam and Saipan. In February 2018, Regal Cinemas was acquired by Cineworld Group Plc, an international cinema chain operating in 10 countries. As of year-end 2018, Cineworld reported $4.7 billion in revenue. Regal Cinemas opened in April 2019 and has a lease expiration date of March 2039 with three, five-year renewal options and no termination options.
| Retail Tenant Summary(1) | ||||||
Tenant / Building |
Ratings (Fitch/Moody’s/S&P)(2) | Net Rentable Area (Sq. Ft.) | % of Net Rentable Area | U/W Base Rent PSF | % of Total U/W Base Rent | Lease Expiration |
| Regal Cinemas | NR/NR/NR | 65,000 | 100.0% | $78.85 | 100.0% | 3/31/2039 |
| Total | 65,000 | 100.0% | ||||
(1) | Based on the underwritten rent roll dated as of September 10, 2019. |
(2) | Certain ratings are those of the parent company whether or not the parent company guarantees the lease. |
Retail Lease Rollover Schedule(1) | ||||||||
Year | # of Leases Expiring | Total Expiring Sq. Ft. | % of Total Sq. Ft. Expiring | Cumulative Expiring | Cumulative % Sq. Ft. Expiring | Annual U/W Base Rent PSF | % U/W Base Rent Rolling | Cumulative % of U/W Base Rent |
MTM | 0 | 0 | 0.0% | 0 | 0.0% | $0.00 | 0.0% | 0.0% |
2019 | 0 | 0 | 0.0 | 0 | 0.0% | $0.00 | 0.0 | 0.0% |
2020 | 0 | 0 | 0.0 | 0 | 0.0% | $0.00 | 0.0 | 0.0% |
2021 | 0 | 0 | 0.0 | 0 | 0.0% | $0.00 | 0.0 | 0.0% |
2022 | 0 | 0 | 0.0 | 0 | 0.0% | $0.00 | 0.0 | 0.0% |
2023 | 0 | 0 | 0.0 | 0 | 0.0% | $0.00 | 0.0 | 0.0% |
2024 | 0 | 0 | 0.0 | 0 | 0.0% | $0.00 | 0.0 | 0.0% |
2025 | 0 | 0 | 0.0 | 0 | 0.0% | $0.00 | 0.0 | 0.0% |
2026 | 0 | 0 | 0.0 | 0 | 0.0% | $0.00 | 0.0 | 0.0% |
2027 | 0 | 0 | 0.0 | 0 | 0.0% | $0.00 | 0.0 | 0.0% |
2028 | 0 | 0 | 0.0 | 0 | 0.0% | $0.00 | 0.0 | 0.0% |
2029 | 0 | 0 | 0.0 | 0 | 0.0% | $0.00 | 0.0 | 0.0% |
2030 & Thereafter | 1 | 65,000 | 100.0 | 65,000 | 100.0% | $78.85 | 100.0 | 100.0% |
Vacant | NAP | 0 | 0.0 | 65,000 | 100.0% | NAP | NAP |
|
Total / Wtd. Avg. | 1 | 65,000 | 100.0% |
|
| $78.85 | 100.0% |
|
(1) | Based on the underwritten rent roll dated September 10, 2019. |
Environmental Matters. The Phase I environmental report dated August 27, 2019 recommended no further action at The Essex Site 2 Property.
The Market. The Essex Site 2 Property is located in the Lower East Side neighborhood of Manhattan, New York and offers access to the area’s network of highways including the FDR Drive, Interstate 78 and Interstate 278. The Essex Site 2 Property is located adjacent to Delancey Street Station, a subway stop that provides access to two of New York City’s 24-hour subway lines, and within walking distance to additional subway stations including Grand Street, Second Avenue and East Broadway. Additional transportation options in the area include the MTA Bus system and Port Authority Trans-Hudson Corporation, a heavy rail rapid-transit system that connects Manhattan and New Jersey. According to a third party report, as of the fourth quarter of 2018, New York City’s average household income is $197,449.
According to a third party report, The Essex Site 2 Property is located within the Soho retail submarket within the New York retail market. As of the third quarter of 2019, the New York retail market and Soho retail submarket had overall inventory of 591.7 million square feet and 5.8 million square feet, respectively, and exhibited vacancy rates of 3.8% and 5.8%, respectively. According to a third party report, The Essex Site 2 Property is located within the Lower East Side multifamily submarket within the New York multifamily market. The New York multifamily market is experiencing rent growth of approximately 3.3% in 2019, and as of the third quarter of 2019, reported a vacancy rate of 2.0%. As of the third quarter of 2019, the Lower East Side multifamily submarket reported an average asking rent of $3,683 and vacancy rate of 2.5%.
THE INFORMATION IN THIS STRUCTURAL AND COLLATERAL TERM SHEET IS NOT COMPLETE AND MAY BE AMENDED PRIOR TO THE TIME OF SALE. THIS TERM SHEET IS NOT AN OFFER TO SELL THESE SECURITIES AND IT IS NOT A SOLICITATION OF AN OFFER TO BUY THESE SECURITIES IN ANY JURISDICTION WHERE THE OFFER OR SALE IS NOT PERMITTED.
105
125 Delancey Street New York, NY 10002 | Collateral Asset Summary – Loan No. 10 The Essex Site 2 | Cut-off Date Balance: Cut-off Date LTV: U/W NCF DSCR: U/W NOI Debt Yield: | $35,100,000 39.9% 3.66x 10.3% |
Cash Flow Analysis.
Cash Flow Analysis(1) | ||
| U/W | U/W PSF |
Residential Income(2) | $9,375,660 | $45.72 |
Retail Income | 5,125,000 | 24.99 |
Vacant Income | 0 | 0 |
Gross Potential Rent | $14,500,660 | $70.71 |
Total reimbursements | 998,998 | 4.87 |
Net Rental Income | $15,499,658 | $75.58 |
Vacancy | (684,816) | (3.34) |
Other Income | 94,404 | 0.46 |
Effective Gross Income | $14,909,246 | $72.70 |
Total Expenses(3) | 2,857,283 | 13.93 |
Net Operating Income | $12,051,963 | $58.77 |
Replacement Reserves(4) | 58,500 | 0.29 |
Net Cash Flow | $11,993,463 | $58.48 |
| (1) | Historical cash flows and occupancy are not available as The Essex Site 2 Property was constructed in 2019. |
| (2) | Underwritten Residential Income is based on the in-place rent roll as of September 10, 2019. |
| (3) | The Essex Property is subject to a 421-a tax abatement that started in 2019. Real estate taxes were underwritten to the 12 year average tax expense. |
| (4) | Replacement Reserves include rent from one commercial tenant and all residential units. |
Property Management. The residential units are managed by C&C Apartment Management LLC. The theater unit is managed by Taconic Management Company LLC, a wholly owned subsidiary of Taconic Investment Partners.
Lockbox / Cash Management. The Essex Site 2 Whole Loan is structured with a hard lockbox and springing cash management. The borrowers were required at loan origination to deliver tenant direction letters instructing (a) residential tenants to send all payments in the form of credit card payments or checks to ClickPay who will process such payments and deposit the amount of such payments into a lender controlled lockbox account, and (b) residential tenants and retail tenant to deposit all other payments directly into the lockbox account. Additionally, the property manager is required to deposit all amounts constituting rents that it receives directly into the lockbox account. To the extent no Essex Cash Sweep Event (as defined below) is continuing, all funds in the lockbox account are required to be transferred to or at the direction of the borrowers. Following the occurrence and during the continuance of an Essex Cash Sweep Event, all funds in the lockbox account are required to be swept each business day to a segregated cash management account under the control of the lender and disbursed in accordance with The Essex Site 2 Whole Loan documents. To the extent there is an Essex Cash Sweep Event continuing, all excess cash flow after payment of debt service, required reserves and operating expenses are required to be held as additional collateral for The Essex Site 2 Whole Loan. The lender has been granted a first priority security interest in the cash management account.
An “Essex Cash Sweep Event” means the occurrence of (i) an event of default, (ii) an event of default under The Essex Site 2 Mezzanine Loan, (iii) any bankruptcy action of a borrower or property manager, or (iv) the date on which the debt service coverage ratio (as calculated in The Essex Site 2 Whole Loan documents and based on the trailing three-month period immediately preceding the date of determination) is less than 1.15x.
An Essex Cash Sweep Event Cure may be cured in accordance with the following conditions: with respect to an Essex Cash Sweep Event caused solely by (a) clause (i) above, the acceptance by the lender of a cure of such event of default, (b) clause (ii) above, The Essex Site 2 Mezzanine Loan default has been cured in accordance with the terms of The Essex Site 2 Mezzanine Loan documents, (c) clause (iii) above, the borrowers replace the property manager with a qualified manager under a replacement management agreement within 90 days of such bankruptcy action, and (d) clause (iv) above, the debt service coverage ratio (as calculated in The Essex Site 2 Whole Loan documents and based on the trailing three-month period immediately preceding the date of determination) is at least 1.15x for two consecutive quarters.
Initial and Ongoing Reserves. At loan origination, the borrowers deposited (i) approximately $311,439 into a real estate tax reserve and (ii) $4,875 into a replacement reserve.
Tax Reserve – The borrowers are required to deposit into a real estate tax reserve, on a monthly basis, an amount equal to 1/12 of the estimated annual real estate taxes, which currently equates to approximately $62,288 per month.
THE INFORMATION IN THIS STRUCTURAL AND COLLATERAL TERM SHEET IS NOT COMPLETE AND MAY BE AMENDED PRIOR TO THE TIME OF SALE. THIS TERM SHEET IS NOT AN OFFER TO SELL THESE SECURITIES AND IT IS NOT A SOLICITATION OF AN OFFER TO BUY THESE SECURITIES IN ANY JURISDICTION WHERE THE OFFER OR SALE IS NOT PERMITTED.
106
125 Delancey Street New York, NY 10002 | Collateral Asset Summary – Loan No. 10 The Essex Site 2 | Cut-off Date Balance: Cut-off Date LTV: U/W NCF DSCR: U/W NOI Debt Yield: | $35,100,000 39.9% 3.66x 10.3% |
Insurance Reserve – The borrowers are required to deposit into an insurance reserve, on a monthly basis, an amount equal to 1/12 of estimated insurance premiums. In the event the borrowers obtain and maintain a blanket insurance policy acceptable to the lender and no event of default under The Essex Site 2 Loan or The Essex Site 2 Mezzanine Loan (as defined below) has occurred and is continuing, the requirement for monthly deposits into the insurance reserve will be waived.
Replacements Reserve – The borrowers are required to deposit into a replacement reserve, on a monthly basis, an amount equal to $4,602.50 for the residential units and $812.50 for the theater unit.
Current Mezzanine or Subordinate Indebtedness. The related $58,000,000 B-note accrues at an interest rate of 5.25000%. The related mezzanine loan (“The Essex Site 2 Mezzanine Loan”) was funded concurrently and is coterminous with The Essex Site 2 Whole Loan. The Essex Site 2 Mezzanine Loan has an original principal balance as of the Cut-off Date of $40.0 million, accrues interest at a rate of 6.62500% per annum and is interest-only for the full term.
In connection with the tax abatement described below, the borrowers executed two enforcement notes payable to the order of the City of New York, acting by and through the Department of Housing Preservation and Development in the aggregate amount of $77,799,999 which are secured by two enforcement mortgages. No payments are due under the notes during the term of The Essex Site 2 Whole Loan and the enforcement mortgages are subordinate to the lien of the mortgage in favor of the lender. The notes will mature on October 25, 2099 but no payments of principal and interest are due until the maturity date. Upon a foreclosure of the lien of the mortgage in favor of the lender, the enforcement mortgages would be extinguished.
Condominium. The Essex Site 2 Property consists of four condominium units out of a total of seven condominium units that collectively comprise a condominium regime. The borrowers control three out of the seven votes on the condominium board and the Essex Master Tenant, which is an affiliate of the borrowers, controls two out of the seven votes on the condominium board pursuant to an irrevocably proxy given by the borrower in favor of the Essex Master Tenant under the Essex Master Lease. In the event of a significant casualty or condemnation, the borrowers are required to cause the Essex Master Tenant to vote to rebuild and the failure to do so will result in full recourse to guarantor. Additionally, the lender has been appointed as the insurance trustee. If any amendment, modification or waiver to the condominium documents (i) adversely impairs or changes the priority of the lien held by a mortgagee with respect to a unit, or (ii) terminates the condominium, such amendment, waiver or modification will not be binding upon such mortgagee without its prior written consent.
Master Lease. The affordable housing unit at the Essex Site 2 Property is subject to a master lease (the “Essex Master Lease”) between the Residential Borrower and Site 2 DSA Affordable MT LLC (“Essex Master Tenant”), pursuant to which the Essex Master Tenant will operate the affordable housing unit and enter into subleases with residential tenants. The Essex Master Tenant and the lender entered into a subordination, non-disturbance and attornment agreement with respect to the Essex Master Lease whereby the Essex Master Tenant agreed to subordinate the Essex Master Lease to the lien of the mortgage in exchange for non-disturbance so long as the Essex Master Tenant is not in default under the Essex Master Lease. The Essex Master Tenant is a joint venture between Site 2 DSA Affordable Managers LLC, an affiliate of the Residential Borrower (“Site 2 Affordable Managers”), and Wells Fargo Affordable Housing Community Development Corporation (the “Investor Member”). Site 2 Affordable Managers owns 0.01% of the interests in the Essex Master Tenant and controls the day to day operations of the Essex Master Tenant, and the Investor Member owns 99.99% of the interests in the Essex Master Tenant. The lender has taken a pledge of Site 2 Affordable Manager’s equity interests in the Essex Master Tenant so that, upon foreclosure, an affiliate of Residential Borrower will not control the Essex Master Tenant.
Tax Abatement. The Essex Site 2 Property has received a tax exemption pursuant to Section 421-a of the New York Real Property Tax Law by which the Essex Site 2 Property is currently exempt from the payment of approximately 93.45% of the real estate taxes with respect to the residential units and 84.42% of real property taxes with respect to the theater unit, resulting in a total estimated real estate tax abatement of approximately $28 million. The exemption expires in 2054.
THE INFORMATION IN THIS STRUCTURAL AND COLLATERAL TERM SHEET IS NOT COMPLETE AND MAY BE AMENDED PRIOR TO THE TIME OF SALE. THIS TERM SHEET IS NOT AN OFFER TO SELL THESE SECURITIES AND IT IS NOT A SOLICITATION OF AN OFFER TO BUY THESE SECURITIES IN ANY JURISDICTION WHERE THE OFFER OR SALE IS NOT PERMITTED.
107
1843 Village West Parkway | Collateral Asset Summary – Loan No. 11 | Cut-off Date Balance: | $34,948,301 |
Mortgage Loan Information | |
Loan Seller: | CREFI |
Loan Purpose: | Refinance |
Borrower Sponsors(1): | Various |
Borrower: | W-LD Legends Owner VII, L.L.C. |
Original Balance(2): | $35,000,000 |
Cut-off Date Balance(2): | $34,948,301 |
% by Initial UPB: | 3.4% |
Interest Rate: | 3.86000% |
Payment Date: | 6th of each month |
First Payment Date: | December 6, 2019 |
Maturity Date: | November 6, 2024 |
Amortization: | 360 Months |
Additional Debt(2): | $84,874,444 Pari Passu Debt |
Call Protection(3): | L(25), D(31), O(4) |
Lockbox / Cash Management: | Hard / Springing |
Reserves(4) | |||
| Initial | Monthly | Cap |
Taxes: | $3,569,900 | $594,983 | NAP |
Insurance: | $0 | Springing | NAP |
Replacement: | $0 | $9,955 | NAP |
TI/LC: | $10,000,000 | Springing | $2,500,000 |
Required Repairs: | $227,700 | NAP | NAP |
Property Information | |
Single Asset / Portfolio: | Single Asset |
Property Type: | Anchored Retail |
Collateral: | Fee Simple |
Location: | Kansas City, KS |
Year Built / Renovated: | 2005 / 2019 |
Total Sq. Ft.: | 702,750 |
Property Management: | Legacy Asset Management, LLC |
Underwritten NOI: | $11,374,151 |
Underwritten NCF: | $11,254,688 |
Appraised Value(5): | $225,000,000 |
Appraisal Date: | September 1, 2021 |
| |
Historical NOI | |
Most Recent NOI: | $11,613,298 (T-12 August 31, 2019) |
2018 NOI: | $11,283,528 (December 31, 2018) |
2017 NOI: | $11,786,643 (December 31, 2017) |
2016 NOI: | $10,933,398 (December 31, 2016) |
| |
Historical Occupancy | |
Most Recent Occupancy: | 92.1% (September 15, 2019) |
2018 Occupancy: | 96.6% (December 31, 2018) |
2017 Occupancy: | 90.9% (December 31, 2017) |
2016 Occupancy: | 95.2% (December 31, 2016) |
Financial Information(2) | ||||||
Tranche | Cut-off Date Balance | Balance per Sq. Ft. Cut-off / Balloon | LTV Cut-off / Balloon(5) | U/W DSCR NOI / NCF | U/W Debt Yield NOI / NCF | U/W Debt Yield at Balloon NOI / NCF |
Mortgage Loan | $34,948,301 |
|
|
|
|
|
Pari Passu Notes | 84,874,444 |
|
|
|
|
|
Whole Loan | $119,822,745 | $171 / $155 | 53.3% / 48.3% | 1.68x / 1.67x | 9.5% / 9.4% | 10.5% / 10.4% |
(1) | See “The Borrower / Borrower Sponsor” below. |
(2) | The Legends at Village West loan consists of the non-controlling Note A-2 (the “Legends at Village West Loan”) and is part of a whole loan evidenced by three pari passu notes having an aggregate outstanding principal balance as of the Cut-off Date of approximately $119.8 million (the “Legends at Village West Whole Loan”). See “Whole Loan Summary” chart herein. |
(3) | The Legends at Village West Whole Loan lockout period is required to be at least 25 payments beginning with and including the first payment date of December 6, 2019. Defeasance of the full $120.0 million Legends at Village West Whole Loan is permitted at any time after the earlier to occur of (i) two years after the closing date of the securitization that includes the last promissory note to be securitized and (ii) October 22, 2022. The assumed lockout period of 25 months is based on the expected closing date of the COMM 2019-GC44 securitization in December 2019. The actual lockout period may be longer. |
(4) | For a full description of Escrows and Reserves, see “Initial and Ongoing Reserves”. |
(5) | The appraised value represents the aggregate “as-stabilized” appraised value of the Legends at Village West Property (as defined below) as of September 1, 2021 which assumes the mortgaged property achieves stabilized occupancy. On the origination date of the Legends at Village West Whole Loan, an upfront reserve of $10,000,000 was deposited into the leasing reserve account. The Cut-off Date LTV Ratio and LTV Ratio at Maturity / ARD, calculated based on the aggregate “as-is” Appraised Value of $205,000,000 are 58.5% and 53.0% respectively. |
THE INFORMATION IN THIS STRUCTURAL AND COLLATERAL TERM SHEET IS NOT COMPLETE AND MAY BE AMENDED PRIOR TO THE TIME OF SALE. THIS TERM SHEET IS NOT AN OFFER TO SELL THESE SECURITIES AND IT IS NOT A SOLICITATION OF AN OFFER TO BUY THESE SECURITIES IN ANY JURISDICTION WHERE THE OFFER OR SALE IS NOT PERMITTED.
108
1843 Village West Parkway
| Collateral Asset Summary – Loan No. 11 | Cut-off Date Balance: | $34,948,301 |
The relationship between the holders of the Legends at Village West Whole Loan will be governed by a co-lender agreement as described under “Description of the Mortgage Pool–The Whole Loans–The Non-Serviced Pari Passu Whole Loans” in the Preliminary Prospectus.
Whole Loan Summary | |||||
Note | Original Balance | Cut-off Date Balance |
| Note Holder | Controlling Piece |
Note A-1 | $50,000,000 | $49,926,144 |
| Benchmark 2019-B14(1) | Yes |
Note A-2 | 35,000,000 | 34,948,301 |
| COMM 2019-GC44 | No |
Note A-3 | 35,000,000 | 34,948,301 |
| CREFI(2) | No |
Total | $120,000,000 | $119,822,745 |
|
|
|
| (1) | The Benchmark 2019-B14 securitization transaction is expected to close prior to the Closing Date. |
| (2) | Expected to be contributed to one or more future securitization transactions. |
The Legends at Village West Whole Loan, which accrues interest at an interest rate of 3.86000% per annum, has an outstanding principal balance as of the Cut-Off Date of approximately $119.8 million. The Legends at Village West Whole Loan had an initial term of 60 months, has a remaining term of 59 months and will amortize on a 30-year schedule. The proceeds of the Legends at Village West Whole Loan were primarily used to refinance prior debt secured by the Legends at Village West Property, fund upfront reserves, and cover closing costs. Based on the appraised value of $225.0 million as of the October 4, 2019 appraisal, the Legends at Village West Whole Loan Cut-Off Date LTV Ratio is 53.3%.
The most recent prior financing of the Legends at Village West Property was not included in a prior securitization transaction.
Sources and Uses | ||||||
Sources | Proceeds | % of Total |
| Uses | Proceeds | % of Total |
Whole Loan | $120,000,000 | 84.4% |
| Loan Payoff | $127,397,288 | 89.6% |
Sponsor Equity | 22,257,132 | 15.6 |
| Upfront Reserves | 13,797,600 | 9.7 |
|
|
|
| Closing Costs | 1,062,245 | 0.7 |
Total Sources | $142,257,132 | 100.0% |
| Total Uses | $142,257,132 | 100.0% |
The Borrower / Borrower Sponsor. The borrowing entity for the Legends at Village West Whole Loan is W-LD Legends Owner VII, L.L.C., a Delaware limited liability company and special purpose entity with at least two independent directors in its organizational structure. Legal counsel to the borrower delivered a non-consolidation opinion in connection with the origination of the Legends at Village West Whole Loan.
The loan sponsors and non-recourse carveout guarantors are Walton Street Real Estate FUND VII, L.P., Walton Street Real Estate Investors VII, L.P., Walton Street Real Estate Fund VII-Q, L.P., Walton Street Real Estate Fund VII-E, L.P., Walton Street Real Estate Partners VII, L.P., Walton Street Real Estate Partners VII-NGE, L.P., Walton Street Real Estate Fund VII-NUS, L.P. and WSC Capital Holdings VII, L.P. (collectively, “Walton Street”). Walton Street is required to maintain a net worth of at least $75.0 million and liquidity of at least $7.5 million through the loan term. Walton Street, a private equity real estate investment firm based in Chicago, sponsors equity and debt investment funds and currently has approximately $10.2 billion of real estate assets under management.
The Property.
The Legends at Village West property is a regional open-air outlet shopping center that comprises 702,750 sq. ft. of gross leasable area (including two operation and easement agreement outparcels that contribute to common area maintenance only), located in the southeast quadrant of Village West Parkway and Parallel Parkway in Kansas City, Kansas (the “Legends at Village West Property”). The Legends at Village West Property was developed by RED Development in 2005 and later underwent a conversion, in order to become an entertainment-focused outlet center. The Legends at Village West Property is located on a site that is 79.2 acres and it is part of the 400-acre Village West Tourism District which includes: the Nebraska Furniture Mart, Community America Ballpark, Kansas Speedway, Hollywood Casino, Sporting KC’s soccer stadium (18,500 seats), Kansas City T-Bones stadium (4,800 seats) and the 660,000 square foot Cerner office campus. Kansas Speedway and Village West attract over 10 million visitors annually. In addition, the Legend at Village West Property’s proximity to the Nebraska Furniture Mart, one of the nation’s top two highest-volume furniture outlets in the country, and Cabela’s, brings a large volume of traffic to the Legends at Village West Property.
THE INFORMATION IN THIS STRUCTURAL AND COLLATERAL TERM SHEET IS NOT COMPLETE AND MAY BE AMENDED PRIOR TO THE TIME OF SALE. THIS TERM SHEET IS NOT AN OFFER TO SELL THESE SECURITIES AND IT IS NOT A SOLICITATION OF AN OFFER TO BUY THESE SECURITIES IN ANY JURISDICTION WHERE THE OFFER OR SALE IS NOT PERMITTED.
109
1843 Village West Parkway | Collateral Asset Summary – Loan No. 11 | Cut-off Date Balance: | $34,948,301 |
Major Tenants.
American Multi-Cinema, Inc. (88,270 sq. ft.; 12.6% of NRA; 8.9% of U/W Base Rent): The largest tenant at the Legends at Village West Property, American Multi-Cinema, Inc. (NYSE: “AMC”) has occupied the Legends at Village West Property since 2015 with the original lease term expiring on August 31, 2028 plus three, five-year renewal options. AMC operates 14 screens at the Legends at Village West Property and reported sales of approximately $6.5 million at the Legends at Village West Property location as of August 31, 2019, resulting in sales of $466,417 per screen. Founded in 1920 and headquartered in Leawood, Kansas, AMC is the largest movie theater chain in the United States. As of August 2019, AMC operated approximately 1,000 theaters with 11,000 screens worldwide. The company operates under the Dalian Wanda Group since being acquired by the Chinese media conglomerate in 2012. In the second quarter of 2019, AMC generated roughly $1.5 billion in total revenues, a 4.4% increase year-over-year.
Dave & Buster’s (46,953 sq. ft.; 6.7% of NRA; 6.3% of U/W Base Rent): The second largest tenant at the Legends at Village West Property, Dave & Buster’s (NASDAQ: PLAY), has occupied the Legends at Village West Property since November 2005. Dave & Buster’s currently has a lease expiration date of November 30, 2022 plus three, five-year extension options remaining and no termination options. Dave & Buster’s reported sales of approximately $7.6 million as of August 31, 2019. Dave & Buster’s was founded in 1982 and it is currently headquartered in Dallas, Texas. Dave & Buster’s operates a chain of restaurants offering a variety of American-style menu options, a full bar and entertainment options which include an arcade and sports viewings. As of September 2019, the company operated over 110 locations in 39 states and Puerto Rico and one in Canada. During the second quarter of 2019, Dave & Buster’s reported total revenues of $344.6 million which represented an 8.0% increase from the prior year.
TJ Maxx (29,956 sq. ft.; 4.3% of NRA; 2.1% of U/W Base Rent): The third largest tenant at the Legends at Village West Property, TJ Maxx (NYSE: “TJX”), has been a tenant since October 2005. TJX holds a lease that expires in October 2020 and has four, five-year extension options remaining. TJX reported sales of approximately $9.8 million as of August 31, 2019, a 9.2% increase since December 31, 2018. Founded in 1956 and headquartered in Framingham, Massachusetts, TJX (rated A2/A+ by Moody’s/S&P) is the nation’s largest off-price apparel and home fashion retailer. TJX sells brand-name goods at discounted prices. TJX operated 4,412 stores totaling over 118 million sq. ft. of space across the United States, Canada, Europe, and Australia. This includes 1,260 TJ Maxx stores, 1,107 Marshalls stores, 783 HomeGoods stores, 39 Sierra Trading Post stores and 23 Homesense stores in the United States. TJX Companies reported estimated net sales for 2019 of approximately $39.0 billion which was an 8.7% increase from 2018. For the first half of fiscal 2020, net sales are projected to be $19.1 billion, representing a 5.8% year-over-year increase.
The Legends at Village West Property is located in the Kansas City metropolitan statistical area (“MSA”). According to the appraisal, the Kansas City MSA estimated 2019 population is 2,179,053. The average household income for the MSA in 2019 is estimated to be $88,209. According to a third party report, as of January 1, 2019, the population within a one-, three- and five-mile radius of the Legends at Village West Property was 2,008, 15,177 and 44,455, respectively. Additionally, the average household income within a one-, three- and five-mile radius of the Legends at Village West Property was $98,681, $108,484 and $94,399, respectively.
THE INFORMATION IN THIS STRUCTURAL AND COLLATERAL TERM SHEET IS NOT COMPLETE AND MAY BE AMENDED PRIOR TO THE TIME OF SALE. THIS TERM SHEET IS NOT AN OFFER TO SELL THESE SECURITIES AND IT IS NOT A SOLICITATION OF AN OFFER TO BUY THESE SECURITIES IN ANY JURISDICTION WHERE THE OFFER OR SALE IS NOT PERMITTED.
110
1843 Village West Parkway | Collateral Asset Summary – Loan No. 11 | Cut-off Date Balance: | $34,948,301 |
Tenant Summary(1) | ||||||||||
Tenant | Ratings (Moody’s/S&P/Fitch)(2) | Net Rentable Area (Sq. Ft.) | % of Net Rentable Area |
| U/W Base Rent PSF(3) | % of Total U/W Base Rent(3) | Lease Expiration | Sales PSF(4) | Sales Date | Occupancy Cost(4) |
American Multi-Cinema, Inc.(5) | NR / NR / NR | 88,270 | 12.6% |
| $13.73 | 8.9% | 8/31/2028 | $466,417 | 8/31/2019 | 27.0% |
Dave & Buster’s(5) | NR / NR / NR | 46,953 | 6.7% |
| $18.15 | 6.3% | 11/30/2022 | $161 | 8/31/2019 | 17.0% |
TJ Maxx(6) | A2 / A+ / NR | 29,956 | 4.3% |
| $9.50 | 2.1% | 10/31/2020 | $328 | 8/31/2019 | 7.1% |
H&M(7) | NR / NR / NR | 25,025 | 3.6% |
| $7.42 | 1.4% | 1/31/2028 | $106 | 8/31/2019 | 7.0% |
Off Broadway Shoes(8) | NR / NR / NR | 21,554 | 3.1% |
| $16.75 | 2.7% | 1/31/2026 | $321 | 8/31/2019 | 10.4% |
HomeGoods(6) | A2 / A+ / NR | 20,150 | 2.9% |
| $12.15 | 1.8% | 5/31/2028 | NAV | 8/31/2019 | NAV |
Old Navy(9) | Baa2 / BB+ / NR | 17,266 | 2.5% |
| $15.00 | 1.9% | 7/31/2021 | $294 | 8/31/2019 | 10.6% |
Polo Ralph Lauren(6) | A2 / A- / NR | 16,979 | 2.4% |
| $2.42 | 0.3% | 10/31/2021 | $247 | 8/31/2019 | 2.1% |
Books a Million(10) | NR / NR / NR | 16,846 | 2.4% |
| $7.83 | 1.0% | 1/31/2022 | $73 | 8/31/2019 | 10.8% |
Cavender’s(11) | NR / NR / NR | 16,207 | 2.3% |
| $11.02 | 1.3% | 5/31/2028 | $241 | 8/31/2019 | 8.9% |
Subtotal/Weighted Average |
| 299,206 | 42.6% |
| $12.54 | 27.7% |
|
|
|
|
Other Tenants |
| 348,093 | 49.5% |
| 28.17 | 72.3% |
|
|
|
|
Total Occupied Space |
| 647,299 | 92.1% |
| $20.94 | 100.0% |
|
|
|
|
Vacant |
| 55,451 | 7.9% |
|
|
|
|
|
|
|
Total |
| 702,750 | 100.0% |
|
|
|
|
|
|
|
(1) | Based on the September 15, 2019 rent roll. |
(2) | Certain ratings are those of the parent company whether or not the parent guarantees the lease. |
(3) | U/W Base Rent PSF and % of Total U/W Base Rent of $13,007,843 includes $123,690 of contractual rent steps underwritten through October 2020 and $66,204 related to the present value of all rent steps for Verizon, Converse, Under Armour, and Homegoods through the term of the loan. U/W Base Rent PSF and % of Total Base Rent also includes $547,978 of percentage rent paid by tenants whose rent is calculated monthly as a factor of sales. |
(4) | Sales PSF and Occupancy Cost are as of August 31, 2019. Sales PSF for American Multi-Cinema, Inc. represents sales per screen, 14 screens, at the Legends at Village West Property. |
(5) | Dave & Buster’s has three, five-year renewal options. |
(6) | TJ Maxx has four, five-year lease renewal options, including an option to extend the term (original or having been extended) to the January 31 following term expiration. |
(7) | H&M has four, five-year lease renewal options. |
(8) | Off Broadway Shoes has one, five-year renewal option. |
(9) | Old Navy has two, five-year renewal options. |
(10) | Books a Million has four, five-year renewal options. |
(11) | Cavender’s has one, five-year renewal option. |
Lease Rollover Schedule(1)(2) | ||||||||
Year | # of Leases Expiring | Total Expiring Sq. Ft. | % of Total Sq. Ft. Expiring | Cumulative Sq. Ft. Expiring | Cumulative % of Sq. Ft. Expiring | Annual U/W Base Rent Per Sq. Ft.(3) | % U/W Base Rent Rolling(3) | Cumulative % of U/W Base Rent(3) |
MTM | 0 | 0 | 0.0% | 0 | 0.0% | $0.0 | 0.0% | 0.0% |
2019 | 4 | 30,005 | 4.3 | 30,005 | 4.3% | $5.12 | 1.1 | 1.1% |
2020 | 9 | 63,490 | 9.0 | 93,495 | 13.3% | $18.88 | 8.8 | 10.0% |
2021 | 21 | 126,798 | 18.0 | 220,293 | 31.3% | $20.66 | 19.3 | 29.3% |
2022 | 10 | 92,365 | 13.1 | 312,658 | 44.5% | $22.02 | 15.0 | 44.3% |
2023 | 6 | 21,153 | 3.0 | 333,811 | 47.5% | $32.48 | 5.1 | 49.4% |
2024 | 10 | 23,919 | 3.4 | 357,730 | 50.9% | $30.88 | 5.4 | 54.8% |
2025 | 3 | 11,333 | 1.6 | 369,063 | 52.5% | $38.83 | 3.2 | 58.1% |
2026 | 12 | 69,555 | 9.9 | 438,618 | 62.4% | $29.80 | 15.3 | 73.4% |
2027 | 5 | 35,130 | 5.0 | 473,748 | 67.4% | $28.65 | 7.4 | 80.8% |
2028 | 6 | 157,392 | 22.4 | 631,140 | 89.8% | $12.98 | 15.1 | 95.9% |
2029 | 3 | 11,906 | 1.7 | 643,046 | 91.5% | $16.60 | 1.5 | 97.3% |
2030 & Thereafter | 1 | 4,253 | 0.6 | 647,299 | 92.1% | $85.56 | 2.7 | 100.0% |
Vacant | NAP | 55,451 | 7.9 | 702,750 | 100.0% | NAP | NAP |
|
Total / Wtd. Avg. | 90 | 702,750 | 100.0% |
|
| $28.54 | 100.0% |
|
| (1) | Based on the underwritten rent roll dated September 15, 2019. |
| (2) | Certain tenants have lease termination options that may become exercisable prior to the originally stated expiration date of the tenant lease that are not considered in the lease rollover schedule. |
| (3) | Annual U/W Base Rent per sq. ft., % of U/W Base Rent Rolling, and Cumulative of U/W Base Rent of $13,007,843 includes $123,690 of contractual rent steps underwritten through October 2020 and $66,204 related to the present value of all rent steps for Verizon, Converse, Under Armour, and Homegoods through the term of the Legends at Village West Whole Loan. |
THE INFORMATION IN THIS STRUCTURAL AND COLLATERAL TERM SHEET IS NOT COMPLETE AND MAY BE AMENDED PRIOR TO THE TIME OF SALE. THIS TERM SHEET IS NOT AN OFFER TO SELL THESE SECURITIES AND IT IS NOT A SOLICITATION OF AN OFFER TO BUY THESE SECURITIES IN ANY JURISDICTION WHERE THE OFFER OR SALE IS NOT PERMITTED.
111
1843 Village West Parkway | Collateral Asset Summary – Loan No. 11 | Cut-off Date Balance: | $34,948,301 |
Cash Flow Analysis.
Cash Flow Analysis | ||||||
| 2016 | 2017 | 2018 | T-12 8/31/2019 | U/W(1) | U/W (PSF)(1) |
Base Rent | $11,844,504 | $13,154,702 | $12,727,178 | $12,936,723 | $12,817,949 | $18.24 |
Reimbursements | 7,704,228 | 8,494,591 | 8,394,509 | 8,970,806 | 8,639,619 | 12.29 |
Rent Steps(1) | 0 | 0 | 0 | 0 | 189,893 | 0.27 |
Potential Income | 0 | 0 | 0 | 0 | 2,308,911 | 3.29 |
Gross Potential Rent | $19,548,732 | $21,649,293 | $21,121,687 | $21,907,529 | $23,956,373 | $34.09 |
Other Income(2) | 1,867,831 | 1,211,203 | 1,138,693 | 1,181,898 | 1,109,546 | 1.58 |
Vacancy & Credit Loss(3) | (0) | (0) | (0) | (0) | (2,308,911) | (3.29) |
Effective Gross Income | $21,416,563 | $22,860,496 | $22,260,380 | $23,089,427 | $22,757,007 | $32.38 |
Real Estate Taxes | 6,550,296 | 6,842,850 | 6,542,634 | 6,836,446 | 6,993,185 | 9.95 |
Insurance | 143,226 | 142,175 | 141,469 | 143,680 | 147,985 | 0.21 |
Management Fee | 614,865 | 658,370 | 709,248 | 668,750 | 682,710 | 0.97 |
Total Other Expenses | 3,174,778 | 3,430,458 | 3,583,501 | 3,827,253 | 3,558,977 | 5.06 |
Net Operating Income | $10,933,398 | $11,786,643 | $11,283,528 | $11,613,298 | $11,374,151 | $16.19 |
Replacement Reserves | 0 | 0 | 0 | 0 | 119,463 | 0.17 |
TI/LC | 0 | 0 | 0 | 0 | 0 | 0.00 |
Net Cash Flow | $10,933,398 | $11,786,643 | $11,283,528 | $11,613,298 | $11,254,688 | $16.02 |
(1) | Rent Steps include $123,690 of contractual rent steps underwritten through October 2020 and the present value of all rent steps for Verizon, Converse, Under Armour, and Homegoods through the term of the loan. |
(2) | Other Income consists of percentage rent, storage rent, late fees and marketing funds. |
(3) | U/W Vacancy & Credit Loss represents the underwritten economic vacancy of 9.6%. |
THE INFORMATION IN THIS STRUCTURAL AND COLLATERAL TERM SHEET IS NOT COMPLETE AND MAY BE AMENDED PRIOR TO THE TIME OF SALE. THIS TERM SHEET IS NOT AN OFFER TO SELL THESE SECURITIES AND IT IS NOT A SOLICITATION OF AN OFFER TO BUY THESE SECURITIES IN ANY JURISDICTION WHERE THE OFFER OR SALE IS NOT PERMITTED.
112
(THIS PAGE INTENTIONALLY LEFT BLANK)
113
1100 15th Street Northwest | Collateral Asset Summary – Loan No. 12 | Cut-off Date Balance: | $32,525,000 |
Mortgage Loan Information | |
Loan Seller: | GSMC |
Loan Purpose: | Refinance |
Credit Assessment |
|
(Fitch/KBRA/Moody’s)(6): | BBBsf / A-(sf) / A3 |
Borrower Sponsor: | Carr Properties OC LLC |
Borrower: | 1100 15th Street LLC |
Original Balance(1): | $32,525,000 |
Cut-off Date Balance(1): | $32,525,000 |
% by Initial UPB: | 3.2% |
Interest Rate: | 3.08500% |
Payment Date: | 11th of each month |
First Payment Date: | November 11, 2019 |
Maturity Date(2): | October 11, 2029 |
Amortization(2): | Interest Only, ARD |
Additional Debt(1)(3): | $349,475,000 Pari Passu Debt; $143,000,000 Subordinate Debt |
Call Protection(4): | L(26), D(87), O(7) |
Lockbox / Cash Management: | Hard / Springing |
Reserves | |||
| Initial | Monthly | Cap |
Taxes: | $0 | Springing | NAP |
Insurance: | $0 | Springing | NAP |
Replacement Reserve: | $0 | Springing | $433,827 |
TI/LC Reserve: | $0 | Springing | $1,735,308 |
Rent Concession Reserve: | $1,166,184 | $0 | NAP |
Existing TI/LC Obligations Reserve: | $31,164,159 | $0 | NAP |
Property Information | |
Single Asset / Portfolio: | Single Asset |
Property Type: | CBD Office |
Collateral: | Fee Simple |
Location: | Washington, DC |
Year Built / Renovated: | 2017 / NAP |
Total Sq. Ft.: | 867,654 |
Property Management: | Columbia Equity Services, LLC |
Underwritten NOI: | $48,032,614 |
Underwritten NCF: | $47,551,162 |
Appraised Value: | $960,000,000 |
Appraisal Date: | August 23, 2019 |
| |
Historical NOI(5) | |
Most Recent NOI: | NAV |
2018 NOI: | NAV |
2017 NOI: | NAV |
2016 NOI: | NAV |
| |
Historical Occupancy(5) | |
Most Recent Occupancy: | 99.7% (August 31, 2019) |
2018 Occupancy: | NAV |
2017 Occupancy: | NAV |
2016 Occupancy: | NAV |
Financial Information(1)(2) | ||||||
Tranche | Cut-off Date Balance | Balance per Sq. Ft. Cut-off / Balloon | LTV Cut-off / Balloon | U/W DSCR NOI / NCF | U/W Debt Yield NOI / NCF | U/W Debt Yield at Balloon NOI / NCF |
Mortgage Loan | $32,525,000 |
|
|
|
|
|
Pari Passu Notes | 349,475,000 |
|
|
|
|
|
Total Senior Notes | $382,000,000 | $440 / $440 | 39.8% / 39.8% | 4.02x / 3.98x | 12.6% / 12.4% | 12.6% / 12.4% |
Subordinate Notes | 143,000,000 |
|
|
|
|
|
Total Debt | $525,000,000 | $605 / $605 | 54.7% / 54.7% | 2.93x / 2.90x | 9.1% / 9.1% | 9.1% / 9.1% |
(1) | The Midtown Center loan consists of the non-controlling Notes A-2-6 and A-2-7 with an aggregate original principal balance and outstanding principal balance as of the Cut-off Date of $32.525 million (the “Midtown Center Loan”). The Midtown Center Loan is part of a $525.0 million whole loan that is evidenced by 13 promissory notes: 10 pari passu senior notes with an aggregate original principal balance of $382.0 million (the “Midtown Center Senior Notes”) and three subordinate notes with an aggregate original principal balance of $143.0 million (the “Midtown Center Subordinate Notes”) and, together with the Midtown Center Senior Notes, the “Midtown Center Whole Loan”). Only the Midtown Center Loan will be included in the COMM 2019-GC44 Trust. |
(2) | The Midtown Center Whole Loan has an anticipated repayment date of October 11, 2029 (the “Anticipated Repayment Date” or “ARD”) and a final maturity date of September 30, 2033. In the event of a Fannie Mae termination event (as defined in the offering circular) prior to or contemporaneously with the Anticipated Repayment Date, the final maturity date will be accelerated to the Anticipated Repayment Date. |
(3) | The Midtown Center Subordinate Notes, with an aggregate outstanding principal balance as of the Cut-off Date of $143.0 million, accrue interest at a fixed rate of 3.08500% per annum. The Midtown Center Subordinate Notes each have a 120-month term and are interest only for the full term. For additional information, see “Description of the Mortgage Pool—The Whole Loans—The Non-Serviced AB Whole Loans—Midtown Center Whole Loan” in the Preliminary Prospectus. |
(4) | The lockout period will be at least 26 payments beginning with and including November 11, 2019. The borrower has the option to defease the Midtown Center Whole Loan in full after the earlier to occur of (i) two years after the closing date of the securitization that includes the last note to be securitized and (ii) November 11, 2022. |
(5) | Historical operating statements were not obtained, as the Midtown Center Property was built in 2017 and the majority of leases did not commence until May 2018 or thereafter. |
(6) | Fitch, KBRA and Moody’s provided the listed assessments for the Midtown Center Loan in the context of its inclusion in the mortgage pool. |
THE INFORMATION IN THIS STRUCTURAL AND COLLATERAL TERM SHEET IS NOT COMPLETE AND MAY BE AMENDED PRIOR TO THE TIME OF SALE. THIS TERM SHEET IS NOT AN OFFER TO SELL THESE SECURITIES AND IT IS NOT A SOLICITATION OF AN OFFER TO BUY THESE SECURITIES IN ANY JURISDICTION WHERE THE OFFER OR SALE IS NOT PERMITTED.
114
1100 15th Street Northwest | Collateral Asset Summary – Loan No. 12 | Cut-off Date Balance: | $32,525,000 |
The relationship between the holders of the Midtown Center Whole Loan will be governed by a co-lender agreement as described under “Description of the Mortgage Pool—The Whole Loans—The Non-Serviced AB Whole Loans—Midtown Center” in the Preliminary Prospectus. In addition, there is no controlling class representative and no directing holder under the DC Office Trust 2019-MTC securitization transaction, which holds the Midtown Center Whole Loan control note and governs the servicing of the Midtown Center Whole Loan.
Whole Loan Summary | |||||
Note | Original Balance | Cut-off Date Balance |
| Note Holder | Controlling Piece |
Note A-1-1 | $135,950,000 | $135,950,000 |
| DC Office Trust 2019-MTC | Yes |
Note A-1-2 | 52,525,000 | 52,525,000 |
| DC Office Trust 2019-MTC | No |
Note A-1-3 | 72,525,000 | 72,525,000 |
| DC Office Trust 2019-MTC | No |
Note A-2-1 | 12,068,966 | 12,068,966 |
| BANK 2019-BNK22 | No |
Note A-2-2 | 13,881,034 | 13,881,034 |
| BANK 2019-BNK22 | No |
Note A-2-3 | 10,000,000 | 10,000,000 |
| BANK 2019-BNK22 | No |
Note A-2-4 | 37,931,034 | 37,931,034 |
| BANK 2019-BNK22 | No |
Note A-2-5 | 14,593,966 | 14,593,966 |
| BANK 2019-BNK22 | No |
Note A-2-6 | 6,262,500 | 6,262,500 |
| COMM 2019-GC44 | No |
Note A-2-7 | 26,262,500 | 26,262,500 |
| COMM 2019-GC44 | No |
Senior Notes | $382,000,000 | $382,000,000 |
|
|
|
Note B-1-1 | 64,350,000 | 64,350,000 |
| DC Office Trust 2019-MTC | No |
Note B-1-2 | 39,325,000 | 39,325,000 |
| DC Office Trust 2019-MTC | No |
Note B-1-3 | 39,325,000 | 39,325,000 |
| DC Office Trust 2019-MTC | No |
Whole Loan | $525,000,000 | $525,000,000 |
|
|
|
Sources and Uses | ||||||
Sources | Proceeds | % of Total |
| Uses | Proceeds | % of Total |
Senior Notes | $382,000,000 | 72.8% |
| Loan Payoff | $472,344,264 | 90.0% |
Subordinate Notes | 143,000,000 | 27.2 |
| Upfront Reserves | 32,330,342 | 6.2 |
|
|
|
| Closing Costs | 3,221,663 | 0.6 |
|
|
|
| Return of Equity | 17,103,731 | 3.3 |
Total Sources | $525,000,000 | 100.0% |
| Total Uses | $525,000,000 | 100.0% |
The Borrowers / Borrower Sponsors. The borrower is 1100 15th Street LLC, a Delaware limited liability company and single purpose entity with one independent director. Legal counsel to the borrower delivered a non-consolidation opinion in connection with the origination of the Midtown Center Whole Loan.
The borrower sponsor and nonrecourse carveout guarantor for the Midtown Center Whole Loan is Carr Properties OC LLC (“Carr Properties”). Carr Properties is a privately held real estate investment trust that owns, manages, acquires, and develops properties in Washington, D.C. and Boston, Massachusetts. Carr Properties currently owns a portfolio of 23 commercial office properties totaling over 4.2 million sq. ft. and maintains a pipeline of three development projects that is expected to add a further 1.25 million sq. ft. to its portfolio.
The Property. The Midtown Center Property is comprised of a 14-story, trophy class office building totaling 867,654 sq. ft. and a three-level underground parking garage located at the northwest intersection of 15th Street Northwest and L Street Northwest within downtown Washington, DC. Constructed in 2017, the Midtown Center Property is situated on a 2.2-acre parcel, features a glass and copper-clad façade and was designed to achieve LEED Certified Gold designation.
Designed by New York–based SHoP Architects, the improvements of the Midtown Center Property replaced the former headquarters building of The Washington Post, which the borrower sponsor demolished in 2016 after acquiring the site in 2014. The Midtown Center Property comprises two towers (the “East Tower” and the “West Tower”) that are connected by a series of three bridges. Amenities at the Midtown Center Property include a fitness center, a 5,000 sq. ft. rooftop terrace and a 1,000 sq. ft. rooftop conference room, a bike room with bike repair station and electric car charging stations within the parking garage. The Midtown Center Property features a private alley, located between the retail plaza and the neighboring property, with over 10,000 sq. ft. of outdoor space available for outdoor seating and programming. Per the zoning report, parking is not required at the Midtown Center Property, however, the Midtown Center Property contains an underground parking garage with 546 parking spaces, resulting in a parking ratio of approximately 0.6 spaces per 1,000 sq. ft. of net rentable area.
As of August 31, 2019, the Midtown Center Property was 99.7% leased to nine tenants. Approximately 4.8% of the net rentable area and 3.8% of the underwritten base rent at the Midtown Center Property is attributed to seven ground floor and lower level retail tenants with frontage along 15th Street, including restaurants and a coffee shop.
THE INFORMATION IN THIS STRUCTURAL AND COLLATERAL TERM SHEET IS NOT COMPLETE AND MAY BE AMENDED PRIOR TO THE TIME OF SALE. THIS TERM SHEET IS NOT AN OFFER TO SELL THESE SECURITIES AND IT IS NOT A SOLICITATION OF AN OFFER TO BUY THESE SECURITIES IN ANY JURISDICTION WHERE THE OFFER OR SALE IS NOT PERMITTED.
115
1100 15th Street Northwest | Collateral Asset Summary – Loan No. 12 | Cut-off Date Balance: | $32,525,000 |
Major Tenants.
Fannie Mae (713,500 sq. ft.; 82.2% of NRA; 82.9% of U/W Base Rent; 9/30/2033 lease expiration) – Fannie Mae (AAA/Aaa/AA+ by Fitch/Moody’s/S&P) signed a lease in 2015 to move their global headquarters to the Midtown Center Property. Fannie Mae, a government sponsored enterprise, provides housing finance for homebuyers, rentals and multifamily rental properties in the United States. Fannie Mae provides liquidity to the single-family market by purchasing and guaranteeing mortgage loans that are made by its lender customers and issuing debt securities that attract global investors to finance U.S. housing. Fannie Mae operates regional offices in Virginia, Texas, Georgia, Illinois, California, Pennsylvania, Maryland, Massachusetts and New York.
Fannie Mae occupies the West Tower and a portion of the East Tower (floors 6-14, a portion of floor 5, bridges and below grade space). Fannie Mae’s lease commenced in phases in November 2017 (“Phase One”; 43.7% of total Fannie Mae NRA) and May 2018 (“Phase Two”; 56.3% of total Fannie Mae NRA).
Contraction Option: Fannie Mae has the right to contract its leased premises by one full floor each lease year (subject to the conditions below) on the 6th, 7th, 8th, and 9th anniversaries of the rent commencement date for the Phase Two premises (May 31, 2019), each with 18 months’ prior notice.
| ● | First contraction right to be exercised: Fannie Mae has the option to contract all of the space leased on the then lowest floor of East Tower. |
| ● | Second contraction right to be exercised: Fannie Mae has the option to contract all of the space leased on the then lowest floor of West Tower excluding the 3rd and 4th floors. |
| ● | Third contraction right to be exercised: Fannie Mae has the option to contract all of the space leased on the then lowest floor of (i) if Fannie Mae has expanded its premises, the East Tower or (ii) if the premises have not been expanded, the West Tower (excluding the 3rd and 4th Floors). |
| ● | Fourth contraction right to be exercised: Fannie Mae has the option to contract all of the space leased on the then lowest floor of (i) if the third contraction space was located in the East Tower, the West Tower (excluding the 3rd and 4th floors) or (ii) if the third contraction space was located in the West Tower, the East Tower. |
Fannie Mae is required to pay a contraction fee equal to the prorated portion (based on the proportion of the entire Fannie Mae demised premises) of (A) the tenant allowance actually expended, applied, or credited by the borrower, (B) the brokerage commissions paid by the borrower, (C) $2,800,000 for the Midtown Center Borrower’s base building obligations and tenant improvement items, (D) $8,000,000 for the borrower’s base building work acceleration costs, and (E) $15,000,000 for the borrower’s early termination of lease of the preexisting tenant (collectively, the “Required Fees”). The contraction fee is required to be amortized monthly, with six percent annual interest thereon, on a straight-line basis during the initial term of the Midtown Center Whole Loan (i.e., through the Anticipated Repayment Date).
Termination Option: Fannie Mae has the right to terminate its lease effective as of May 31, 2029, with 32 months’ prior notice. Fannie Mae is required to pay a termination fee of the unamortized portion of landlord’s lease costs as of the termination date (which such amount is $66,191,869 if Fannie Mae’s premises is neither expanded nor contracted as of the termination date). In addition, Fannie Mae exercising its termination option triggers a cash trap event period under the loan documents.
Fannie Mae has the right to extend its lease for two periods of: (i) with respect to the first renewal, either (A) five years or (B) 10 years, and (ii) with respect to the second renewal, either (A) if the first renewal is five years, either (x) five years or (y) nine years and seven months or (B) if the first renewal is 10 years, four years and seven months, in any event, each with 30 months’ notice, at the fair market rental rate.
WeWork (109,943 sq. ft., 12.7% of NRA; 13.4% of U/W Base Rent; November 30, 2036 lease expiration). WeWork Companies Inc. provides furnished and fully-serviced shared workspaces, primarily to small and midmarket enterprises. The entity on the WeWork lease is 1100 15th Street NW Tenant LLC, and the lease is guaranteed by WeWork Companies Inc. The initial maximum aggregate liability of the lease guarantor is limited to 12 months of (i) monthly base rent, (ii) imputed gross up for tenant’s proportional share of operating expenses and real estate taxes equal to $25.00 per rentable square foot, and (iii) guaranty enforcement costs (collectively, the “Guaranteed Obligations”). As long as the tenant is not then in default under its lease beyond any applicable notice and cure periods, the lease guarantor’s cap on liability will be reduced to 10 months of the Guaranteed Obligations beginning in December 2024, eight months of the Guaranteed Obligations beginning December 2025, four months of the Guaranteed Obligations beginning in December 2026, three months of the Guaranteed Obligations beginning in December 2029, two months of the Guaranteed Obligations beginning in December 2031 and the lease guarantors liability will be reduced to $0 from December 2033 through the remainder of the lease term.
Other than Fannie Mae and WeWork, no tenant makes up more than 1.4% of net rentable area or 1.2% of underwritten base rent at the Midtown Center Property.
THE INFORMATION IN THIS STRUCTURAL AND COLLATERAL TERM SHEET IS NOT COMPLETE AND MAY BE AMENDED PRIOR TO THE TIME OF SALE. THIS TERM SHEET IS NOT AN OFFER TO SELL THESE SECURITIES AND IT IS NOT A SOLICITATION OF AN OFFER TO BUY THESE SECURITIES IN ANY JURISDICTION WHERE THE OFFER OR SALE IS NOT PERMITTED.
116
1100 15th Street Northwest | Collateral Asset Summary – Loan No. 12 | Cut-off Date Balance: | $32,525,000 |
Tenant Summary(1) | ||||||
Tenant | Credit Rating (Moody’s/Fitch/S&P)(2) | Net Rentable Area (Sq. Ft.) | % of Net Rentable Area | U/W Base Rent per Sq. Ft. | % of Total U/W Base Rent | Lease Expiration |
Major Tenants |
|
|
|
|
|
|
Fannie Mae(3)(4) | Aaa / AAA / AA+ | 713,500 | 82.2% | $49.83 | 82.9% | 9/30/2033 |
WeWork(5)(6)(7) | NR / NR / NR | 109,943 | 12.7 | $52.19 | 13.4 | 11/30/2036 |
Total Major Tenants |
| 823,443 | 94.9% | 50.14 | 96.2% |
|
Non-Major Tenants(8) |
| 41,728 | 4.8 | 38.65 | 3.8 |
|
Total / Wtd. Avg. Occupied |
| 865,171 | 99.7% | $49.59 | 100.0% |
|
Vacant Space |
| 2,483 | 0.3 |
|
|
|
Total / Wtd. Avg. |
| 867,654 | 100.0% |
|
|
|
(1) | Based on the underwritten rent roll dated August 31, 2019. |
(2) | Certain ratings are those of the parent company whether or not the parent guarantees the lease. |
(3) | The U/W Base Rent per Sq. Ft. shown above represents Fannie Mae’s rental rate including its contractual rent step in December 2019. The lender’s underwriting gives separate credit for straight-line rent averaging through the remaining loan term to the Anticipated Repayment Date. The total implied underwritten rental rate for Fannie Mae, inclusive of the rent step and straight line credit, is approximately $55.21 per Sq. Ft. See “Underwritten Net Cash Flow” below. |
(4) | Fannie Mae has a contraction options and a termination option that are further detailed in the “Major Tenants” section above. |
(5) | The entity on the WeWork lease is 1100 15th Street NW Tenant LLC, and the lease is guaranteed by WeWork Companies Inc. (which is the rated entity). The maximum aggregate liability of the lease guarantor is detailed in “The Property” section above. |
(6) | The U/W Base Rent per Sq. Ft. and % of Total U/W Base Rent shown above represent WeWork’s rental rate including its contractual rent step in September 2020. With respect to 39,785 sq. ft. on the 4th floor of the West Tower (“4W Space”; 36.2% of the total WeWork NRA), the lender has given additional underwriting credit by straight-line rent averaging through the remaining loan term to the Anticipated Repayment Date, because Fannie Mae is (i) obligated to begin paying rent attributable to the 4W Space in the event the WeWork lease is terminated due to a lease default or bankruptcy; and (ii) required to pay the borrower the related share of any losses it incurs with respect to the 4W Space (as a proportion of WeWork’s total net rentable area) that are attributable to WeWork’s non-performance of its lease obligations. The total implied underwritten rental rate for WeWork, inclusive of the rent step and straight line credit for the 4W Space, is approximately $53.92 per sq. ft. See “Underwritten Net Cash Flow” below. $1,166,184 representing future rent credits and abatements under the WeWork lease were reserved for at the time of origination of the Midtown Center Whole Loan. |
(7) | WeWork is entitled to free rent through December 2019. A rent concession reserve was required at origination for full abated amounts. |
(8) | Non-Major Tenants include seven ground floor and lower level retail tenants. |
Lease Rollover Schedule(1) | ||||||||
Year | # of Leases Expiring | Total Expiring Sq. Ft. | % of Total Sq. Ft. Expiring | Cumulative Sq. Ft. Expiring | Cumulative % of Sq. Ft. Expiring | Annual U/W Base Rent PSF | % U/W Base Rent Rolling | Cumulative % of U/W Base Rent |
MTM | 0 | 0 | 0.0% | 0 | 0.0% | $0.00 | 0.0% | 0.0% |
2019 | 0 | 0 | 0.0 | 0 | 0.0% | $0.00 | 0.0 | 0.0% |
2020 | 0 | 0 | 0.0 | 0 | 0.0% | $0.00 | 0.0 | 0.0% |
2021 | 0 | 0 | 0.0 | 0 | 0.0% | $0.00 | 0.0 | 0.0% |
2022 | 0 | 0 | 0.0 | 0 | 0.0% | $0.00 | 0.0 | 0.0% |
2023 | 0 | 0 | 0.0 | 0 | 0.0% | $0.00 | 0.0 | 0.0% |
2024 | 0 | 0 | 0.0 | 0 | 0.0% | $0.00 | 0.0 | 0.0% |
2025 | 0 | 0 | 0.0 | 0 | 0.0% | $0.00 | 0.0 | 0.0% |
2026 | 0 | 0 | 0.0 | 0 | 0.0% | $0.00 | 0.0 | 0.0% |
2027 | 0 | 0 | 0.0 | 0 | 0.0% | $0.00 | 0.0 | 0.0% |
2028 | 1 | 2,055 | 0.2 | 2,055 | 0.2% | $46.35 | 0.2 | 0.2% |
2029 | 4 | 21,432 | 2.5 | 23,487 | 2.7% | $35.60 | 1.8 | 2.0% |
2030 & Thereafter | 5 | 841,684 | 97.0 | 865,171 | 99.7% | $49.95 | 98.0 | 100.0% |
Vacant | NAP | 2,483 | 0.3 | 867,654 | 100.0% | NAP | NAP |
|
Total / Wtd. Avg. | 10 | 867,654 | 100.0% |
|
| $49.59 | 100.0% |
|
|
|
|
|
|
|
|
|
|
(1) | Based on the underwritten rent roll dated August 31, 2019. |
THE INFORMATION IN THIS STRUCTURAL AND COLLATERAL TERM SHEET IS NOT COMPLETE AND MAY BE AMENDED PRIOR TO THE TIME OF SALE. THIS TERM SHEET IS NOT AN OFFER TO SELL THESE SECURITIES AND IT IS NOT A SOLICITATION OF AN OFFER TO BUY THESE SECURITIES IN ANY JURISDICTION WHERE THE OFFER OR SALE IS NOT PERMITTED.
117
1100 15th Street Northwest | Collateral Asset Summary – Loan No. 12 | Cut-off Date Balance: | $32,525,000 |
Cash Flow Analysis.
Cash Flow Analysis(1) | ||
| U/W | U/W PSF(2) |
Base Rent(3) | $41,872,354 | $48.26 |
Rent Average Benefit(4) | 4,031,666 | 4.65 |
Contractual Rent Step(5) | 1,030,620 | 1.19 |
Grossed Up Vacant Space | 124,150 | 0.14 |
Gross Potential Rent | $47,058,790 | $54.24 |
Other Income | 1,980,000 | 2.28 |
Total Recoveries | 20,408,599 | 23.52 |
Net Rental Income | $69,447,389 | $80.04 |
(Vacancy & Credit Loss) | (689,650) | (0.79) |
Effective Gross Income | $68,757,739 | $79.25 |
Real Estate Taxes | 11,734,113 | 13.52 |
Insurance | 189,402 | 0.22 |
Management Fee | 1,000,000 | 1.15 |
Other Operating Expenses | 7,801,610 | 8.99 |
Total Operating Expenses | $20,725,125 | $23.89 |
Net Operating Income | $48,032,614 | $55.36 |
Replacement Reserves | 173,531 | 0.20 |
TI/LC | 307,921 | 0.35 |
Net Cash Flow | $47,551,162 | $54.80 |
| (1) | Based on the underwritten rent roll dated August 31, 2019. Historical operating statements were not obtained and were not considered relevant to the lender’s underwriting, as the majority of leases at the Midtown Center Property did not commence until May 2018 or thereafter. |
| (2) | U/W PSF is based on 867,654 sq. ft. |
| (3) | Base Rent is inclusive of all in-place rent currently collected at the Midtown Center Property. |
| (4) | Rent Average Benefit: Straight line average of contractual steps through the Anticipated Repayment Date. |
| (5) | Represents contractual rent steps through September 2020. |
THE INFORMATION IN THIS STRUCTURAL AND COLLATERAL TERM SHEET IS NOT COMPLETE AND MAY BE AMENDED PRIOR TO THE TIME OF SALE. THIS TERM SHEET IS NOT AN OFFER TO SELL THESE SECURITIES AND IT IS NOT A SOLICITATION OF AN OFFER TO BUY THESE SECURITIES IN ANY JURISDICTION WHERE THE OFFER OR SALE IS NOT PERMITTED.
118
(THIS PAGE INTENTIONALLY LEFT BLANK)
119
2756 Paper Mill Road
| Collateral Asset Summary – Loan No. 13 | Cut-off Date Balance: | $32,000,000 |
Mortgage Loan Information | |
Loan Seller: | CREFI |
Loan Purpose: | Refinance |
Borrower Sponsors: | POA Trust U/I/T Louise B. Grass 9/14/1994; Martin L. Grass Irrevocable Trust |
Borrowers: | Spring Ridge LP; S Ridge Holdings LLC; GH Spring Ridge Associates, Inc.; GH Spring Ridge Associates, L.P. |
Original Balance(1): | $32,000,000 |
Cut-off Date Balance(1): | $32,000,000 |
% by Initial UPB: | 3.1% |
Interest Rate: | 3.16000% |
Payment Date: | 6th of each month |
First Payment Date: | December 6, 2019 |
Maturity Date: | November 6, 2029 |
Amortization: | Interest Only |
Additional Debt(1): | $30,000,000 Pari Passu Debt; |
Call Protection(2): | L(25), D(92), O(3) |
Lockbox / Cash Management: | Hard / In Place |
Reserves | |||
| Initial | Monthly | Cap |
Taxes: | $551,285 | $137,821 | NAP |
Insurance: | $0 | Springing | NAP |
Replacement: | $0 | $12,561 | NAP |
TI/LC: | $0 | $28,548 | NAP |
Required Repairs: | $5,000 | NAP | NAP |
Property Information | |
Single Asset / Portfolio: | Single Asset |
Property Type: | Power Center Retail |
Collateral: | Fee Simple |
Location: | Wyomissing, PA |
Year Built / Renovated: | 2000 / NAP |
Total Sq. Ft.: | 471,735 |
Property Management: | S Ridge Management LLC |
Underwritten NOI: | $7,606,926 |
Underwritten NCF: | $6,943,331 |
Appraised Value: | $120,000,000 |
Appraisal Date: | September 9, 2019 |
Historical NOI | |
Most Recent NOI(3): | $8,463,935 (T-12 August 31, 2019) |
2018 NOI(3): | $8,552,703 (December 31, 2018) |
2017 NOI: | $8,566,956 (December 31, 2017) |
2016 NOI: | $8,460,017 (December 31, 2016) |
| |
Historical Occupancy | |
Most Recent Occupancy: | 93.8% (September 27, 2019) |
2018 Occupancy: | 93.0% (December 31, 2018) |
2017 Occupancy: | 100.0% (December 31, 2017) |
2016 Occupancy: | 100.0% (December 31, 2016) |
Financial Information(1) | ||||||
Tranche | Cut-off Date Balance | Balance per Sq. Ft. Cut-off / Balloon | LTV Cut-off / Balloon | U/W DSCR NOI / NCF | U/W Debt Yield NOI / NCF | U/W Debt Yield at Balloon NOI / NCF |
Mortgage Loan | $32,000,000 |
|
|
|
|
|
Pari Passu Notes | 30,000,000 |
|
|
|
|
|
Whole Loan | $62,000,000 | $131 / $131 | 51.7% / 51.7% | 3.83x / 3.50x | 12.3% / 11.2% | 12.3% / 11.2% |
(1) | The Broadcasting Square loan consists of the controlling Note A-1 (the “Broadcasting Square Loan”) and is part of a whole loan evidenced by two pari passu notes having an aggregate outstanding principal balance as of the Cut-off Date of $62.0 million (the “Broadcasting Square Whole Loan”). See “Whole Loan Summary” chart herein. |
(2) | The lockout period, with respect to a defeasance of the Broadcasting Square Whole Loan, will be at least 25 payment dates beginning with and including the first payment date of December 6, 2019. Defeasance of the full $62.0 million Broadcasting Square Whole Loan is permitted after the date that is the earlier of (i) two years from the closing date of the securitization that includes the last pari passu note to be securitized and (ii) November 1, 2023. |
(3) | The 2018 NOI is higher than the Most Recent NOI due to Babies R US and Subway vacating the Broadcasting Square Property (as defined below). |
THE INFORMATION IN THIS STRUCTURAL AND COLLATERAL TERM SHEET IS NOT COMPLETE AND MAY BE AMENDED PRIOR TO THE TIME OF SALE. THIS TERM SHEET IS NOT AN OFFER TO SELL THESE SECURITIES AND IT IS NOT A SOLICITATION OF AN OFFER TO BUY THESE SECURITIES IN ANY JURISDICTION WHERE THE OFFER OR SALE IS NOT PERMITTED.
120
2756 Paper Mill Road
| Collateral Asset Summary – Loan No. 13 | Cut-off Date Balance: | $32,000,000 |
The relationship between the holders of the Broadcasting Square Whole Loan will be governed by a co-lender agreement as described under “Description of the Mortgage Pool—The Whole Loans—The Serviced Pari Passu Whole Loans” in the Preliminary Prospectus.
Whole Loan Summary | |||||
Note | Original Balance | Cut-off Date Balance |
| Note Holder | Controlling Piece |
A-1 | $32,000,000 | $32,000,000 |
| COMM 2019-GC44 | Yes |
A-2 | 30,000,000 | 30,000,000 |
| CREFI | No |
Whole Loan | $62,000,000 | $62,000,000 |
|
|
|
Sources and Uses | ||||||
Sources | Proceeds | % of Total |
| Uses | Proceeds | % of Total |
Whole Loan | $62,000,000 | 100.0% |
| Loan Payoff | $53,557,578 | 86.4% |
|
|
|
| Closing Costs | 939,605 | 1.5 |
|
|
|
| Upfront Reserves | 556,285 | 0.9 |
|
|
|
| Return of Equity | 6,946,532 | 11.2 |
Total Sources | $62,000,000 | 100.0% |
| Total Uses | $62,000,000 | 100.0% |
The Borrower / Borrower Sponsor. The borrowers are Spring Ridge LP, a Delaware limited partnership, S Ridge Holdings LLC, a Delaware limited liability company, GH Spring Ridge Associates, Inc., a Pennsylvania corporation and GH Spring Ridge Associates, L.P., a Pennsylvania limited partnership, each structured to be a bankruptcy-remote entity with two independent directors in its organizational structure or in its members’ organizational structures. The borrower sponsor and nonrecourse guarantors are the POA Trust U/I/T Louise B. Grass 9/14/1994 and the Martin L. Grass Irrevocable Trust. The trustees of the POA Trust U/I/T Louise B Grass 9/14/1994 are Elizabeth Weese, Steven Wilds, and Jonathan Weese; the trustee of the Martin L Grass Irrevocable Trust is Stephen Geduldig. Legal counsel to the borrowers delivered a non-consolidation opinion in connection with the origination of the Broadcasting Square Whole Loan.
The Property. The Broadcasting Square property consists of a 471,735 sq. ft. retail power center located in Wyomissing, Pennsylvania, 65 miles northwest of Philadelphia (the “Broadcasting Square Property”). The Broadcasting Square Property was built in 2000 on an 81.02 acre site and as of September 27, 2019, was 93.8% leased to 46 distinct tenants. A 124,410 sq. ft. Target shadow-anchors the Broadcasting Square Property. No tenant at the Broadcasting Square Property comprises more than 8.1% of underwritten base rent. 2018 weighted average sales per sq. ft. at the Broadcasting Square Property were approximately $415, which equates to a 4.4% weighted average occupancy cost based on the underwritten rent. The borrower sponsor is the original developer of the Broadcasting Square Property.
THE INFORMATION IN THIS STRUCTURAL AND COLLATERAL TERM SHEET IS NOT COMPLETE AND MAY BE AMENDED PRIOR TO THE TIME OF SALE. THIS TERM SHEET IS NOT AN OFFER TO SELL THESE SECURITIES AND IT IS NOT A SOLICITATION OF AN OFFER TO BUY THESE SECURITIES IN ANY JURISDICTION WHERE THE OFFER OR SALE IS NOT PERMITTED.
121
2756 Paper Mill Road
| Collateral Asset Summary – Loan No. 13 | Cut-off Date Balance: | $32,000,000 |
Tenant Summary(1) | ||||||||||
Tenant | Ratings (Moody’s/S&P/Fitch)(2) | Net Rentable Area (Sq. Ft.) | % of Net Rentable Area |
| U/W Base Rent PSF(3) | % of Total U/W Base Rent(3) | Lease Expiration | Sales PSF(4) | Sales Date | Occupancy Cost(5) |
Weis Markets, Inc.(6) | NR / NR / NR | 52,976 | 11.2% |
| $12.81 | 8.1% | 9/30/2025 | $472 | 12/31/2018 | 2.7% |
Dick’s Sporting Goods(7) | NR / NR / NR | 45,101 | 9.6 |
| $11.72 | 6.3 | 1/31/2021 | $296 | 12/31/2018 | 4.0% |
Bed Bath & Beyond, Inc.(8) | Baa3 / BB / NR | 30,066 | 6.4 |
| $12.65 | 4.5 | 1/31/2021 | $275 | 12/31/2018 | 4.6% |
Marmaxx Corp.(9) | A2 / A+ / NR | 30,000 | 6.4 |
| $12.50 | 4.5 | 1/31/2023 | $367 | 12/31/2018 | 3.4% |
Ross(10) | A2 / A- / NR | 29,828 | 6.3 |
| $13.75 | 4.9 | 1/31/2022 | $480 | 12/31/2018 | 2.9% |
Barnes & Noble(11) | NR / NR / NR | 24,107 | 5.1 |
| $12.00 | 3.4 | 1/31/2022 | $228 | 12/31/2018 | 5.3% |
Michaels Stores, Inc.(12) | B1 / NR / NR | 23,929 | 5.1 |
| $12.25 | 3.5 | 3/31/2022 | $181 | 12/31/2018 | 6.8% |
Bob’s Discount Furniture(13) | NR / B / NR | 19,653 | 4.2 |
| $23.00 | 5.4 | 9/30/2025 | $536 | 12/31/2018 | 4.3% |
Petco(14) | NR / NR / NR | 16,510 | 3.5 |
| $21.03 | 4.1 | 5/31/2027 | $210 | 12/31/2018 | 10.0% |
Party City(15) | NR / NR / NR | 12,000 | 2.5 |
| $20.00 | 2.9 | 8/31/2027 | $191 | 12/31/2018 | 10.4% |
Subtotal/Weighted Average |
| 284,170 | 60.2% |
| $14.06 | 47.6% |
|
|
|
|
Remaining Tenants |
| 158,105 | 33.5 |
| $27.80 | 52.4 |
|
|
|
|
Total Occupied |
| 442,275 | 93.8% |
| $18.97 | 100.0% |
|
|
|
|
Vacant |
| 29,460 | 6.2 |
|
|
|
|
|
|
|
Total |
| 471,735 | 100.0% |
|
|
|
|
|
|
|
(1) | Based on the underwritten rent roll dated September 27, 2019. |
(2) | Certain ratings are those of the parent company whether or not the parent guarantees the lease. |
(3) | U/W Base Rent PSF and % of Total U/W Base Rent includes $63,302 of contractual rent steps underwritten through October 2020. |
(4) | Most Recent Sales PSF are as of December 31, 2019. |
(5) | Occupancy Cost are as of September 30, 2019. |
(6) | Tenant has one, four-year renewal option currently in effect with 11 months remaining. |
(7) | Tenant has two remaining renewal options; first is for five-year; second is for four-years and six months. Both renewal options include rent bumps. Tenant may terminate lease if an exclusive violation occurs and is uncured 6 months after commencement of rental abatement. |
(8) | Tenant has two remaining renewal options; first renewal option is for five-years; second is for four-years 11 months and five days. Both renewal options include rent bumps. Tenant may terminate if exclusive violation is not cured one year after commencement of rental abatement. |
(9) | Tenant has one, five-year renewal option. |
(10) | Tenant has two, five-year renewal options; both with rent bumps. Tenant may terminate the lease if landlord violates exclusive use in excess of 12 months. |
(11) | Tenant has one, five-year renewal option that includes rent steps. |
(12) | Tenant has two renewal options; the first is for five years, second is for four years and six months. Both renewal options include rent bumps. Tenant may terminate if exclusive violation occurs and is uncured within 60 days of notice. |
(13) | Tenant holds three, five-year renewal options, that include rent bumps. Tenant may terminate the lease after six months of 25% reduced rent due to a landlord violation of exclusive use. |
(14) | Tenant holds one, five-year renewal option with a rent bump. Tenant may terminate lease if an exclusive violation occurs and is uncured for additional 12 months after the initial 60 day violation period. Tenant may abate rent for remainder of period during which the landlord makes changes to portion of common area known as “No Build Area” that results in material impact on tenant. |
(15) | Tenant may terminate the lease within three months after the landlord does not cure the exclusion violation with six months’ notice. |
Lease Rollover Schedule(1)(2) | ||||||||
Year | # of Leases Expiring | Total Expiring Sq. Ft. | % of Total Sq. Ft. Expiring | Cumulative Sq. Ft. Expiring | Cumulative % of Sq. Ft. Expiring | Annual U/W Base Rent PSF(3) | % U/W Base Rent Rolling(3) | Cumulative % of U/W Base Rent(3) |
MTM | 0 | 0 | 0.0% | 0 | 0.0% | $0.0 | 0.0% | 0.0% |
2019 | 0 | 0 | 0.0% | 0 | 0.0% | $0.00 | 0.0% | 0.0% |
2020 | 4 | 18,813 | 4.0% | 18,813 | 4.0% | $23.04 | 5.2% | 5.2% |
2021 | 6 | 100,429 | 21.3% | 119,242 | 25.3% | $15.59 | 18.7% | 23.8% |
2022 | 15 | 127,055 | 26.9% | 246,297 | 52.2% | $19.40 | 29.4% | 53.2% |
2023 | 3 | 40,737 | 8.6% | 287,034 | 60.8% | $15.53 | 7.5% | 60.7% |
2024 | 4 | 20,026 | 4.2% | 307,060 | 65.1% | $27.10 | 6.5% | 67.2% |
2025 | 4 | 77,199 | 16.4% | 384,259 | 81.5% | $16.37 | 15.1% | 82.3% |
2026 | 1 | 4,464 | 0.9% | 388,723 | 82.4% | $42.35 | 2.3% | 84.5% |
2027 | 5 | 42,192 | 8.9% | 430,915 | 91.3% | $21.61 | 10.9% | 95.4% |
2028 | 1 | 5,320 | 1.1% | 436,235 | 92.5% | $34.02 | 2.2% | 97.6% |
2029 | 2 | 3,000 | 0.6% | 439,235 | 93.1% | $38.00 | 1.4% | 98.9% |
2030 & Thereafter | 1 | 3,040 | 0.6% | 442,275 | 93.8% | $30.00 | 1.1% | 100.0% |
Vacant | NAP | 29,460 | 6.2% | 471,735 | 100.0% | NAP | NAP |
|
Total / Wtd. Avg. | 46 | 471,735 | 100.0% |
|
| $18.97 | 100.0% |
|
(1) | Based on the underwritten rent roll dated September 27, 2019. |
(2) | Certain tenants have lease termination options that may become exercisable prior to the originally stated expiration date of the tenant lease that are not considered in the lease rollover schedule. |
(3) | Annual U/W Base Rent PSF, % U/W Base Rent Rolling and Cumulative % of Base Rent includes $63,302 of contractual rent steps underwritten through October 2020. |
THE INFORMATION IN THIS STRUCTURAL AND COLLATERAL TERM SHEET IS NOT COMPLETE AND MAY BE AMENDED PRIOR TO THE TIME OF SALE. THIS TERM SHEET IS NOT AN OFFER TO SELL THESE SECURITIES AND IT IS NOT A SOLICITATION OF AN OFFER TO BUY THESE SECURITIES IN ANY JURISDICTION WHERE THE OFFER OR SALE IS NOT PERMITTED.
122
2756 Paper Mill Road
| Collateral Asset Summary – Loan No. 13 | Cut-off Date Balance: | $32,000,000 |
Cash Flow Analysis.
Cash Flow Analysis | ||||||
| 2016 | 2017 | 2018 | T-12 8/31/2019 | U/W(1) | U/W (PSF)(1) |
Base Rent | $8,431,630 | $8,631,742 | $8,635,184 | $8,495,365 | $8,326,910 | $17.65 |
Reimbursements | 2,610,852 | 2,480,882 | 2,669,534 | 2,707,553 | 2,381,406 | 5.05 |
Rent Steps(1) | 0 | 0 | 0 | 0 | 63,302 | 0.13 |
Potential Income | 0 | 0 | 0 | 0 | 1,143,326 | 2.42 |
Gross Potential Rent | $11,042,482 | $11,112,624 | $11,304,718 | $11,202,918 | $11,914,944 | $25.26 |
Other Income(2) | 2,664 | 7,409 | 4,128 | 5,059 | 4,176 | 0.01 |
Vacancy & Credit Loss(3) | 0 | 0 | 0 | 0 | (1,143,326) | (2.42) |
Effective Gross Income | $11,045,145 | $11,120,033 | $11,308,845 | $11,207,977 | $10,775,794 | $22.84 |
Real Estate Taxes | 1,450,175 | 1,492,463 | 1,520,960 | 1,544,935 | 1,575,101 | 3.34 |
Insurance | 103,016 | 87,281 | 82,373 | 85,208 | 85,948 | 0.18 |
Management Fee | 77,045 | 79,368 | 82,431 | 84,050 | 431,032 | 0.91 |
Total Other Expenses | 954,892 | 893,965 | 1,070,379 | 1,029,849 | 1,076,788 | 2.28 |
Net Operating Income(4) | $8,460,017 | $8,566,956 | $8,552,703 | $8,463,935 | $7,606,926 | $16.13 |
Replacement Reserves | 0 | 0 | 0 | 0 | 155,673 | 0.33 |
TI/LC | 0 | 0 | 0 | 0 | 507,923 | 1.08 |
Net Cash Flow | $8,460,017 | $8,566,956 | $8,552,703 | $8,463,935 | $6,943,331 | $14.72 |
| (1) | Rent Steps include $63,302 of contractual rent steps underwritten through October 2020. Total sq. ft. of 471,735 and U/W Base Rent does not include Target or Wendy’s. |
| (2) | Other Income consists of percentage rent and late fees. |
| (3) | U/W Vacancy & Credit Loss represents the underwritten economic vacancy of 9.6%. |
| (4) | The 2018 NOI is higher than the Most Recent NOI due to Babies R US and Subway vacating the Broadcasting Square Property. |
THE INFORMATION IN THIS STRUCTURAL AND COLLATERAL TERM SHEET IS NOT COMPLETE AND MAY BE AMENDED PRIOR TO THE TIME OF SALE. THIS TERM SHEET IS NOT AN OFFER TO SELL THESE SECURITIES AND IT IS NOT A SOLICITATION OF AN OFFER TO BUY THESE SECURITIES IN ANY JURISDICTION WHERE THE OFFER OR SALE IS NOT PERMITTED.
123
1251-1291 South Decatur Boulevard Las Vegas, NV 89102 | Collateral Asset Summary – Loan No. 14 | Cut-off Date Balance: | $31,500,000 |
Mortgage Loan Information | |
Loan Seller: | GSMC |
Loan Purpose: | Acquisition |
Borrower Sponsors: | Kamyar Mateen; Tyler Mateen |
Borrower: | Westland Fair, LP |
Original Balance: | $31,500,000 |
Cut-off Date Balance: | $31,500,000 |
% by Initial UPB: | 3.1% |
Interest Rate: | 3.40000% |
Payment Date: | 6th of each month |
First Payment Date: | December 6, 2019 |
Maturity Date: | November 6, 2029 |
Amortization: | Interest only for first 60 months; 360 months thereafter |
Additional Debt: | None |
Call Protection: | L(25), D(91), O(4) |
Lockbox / Cash Management: | Hard / Springing |
Reserves | |||
| Initial | Monthly | Cap |
Taxes: | $83,851 | $14,161 | NAP |
Insurance: | $14,919 | $7,459 | NAP |
Replacement: | $0 | $3,569 | NAP |
TI/LC: | $500,000 | Springing | $500,000 |
Engineering Reserve: | $6,600 | $0 | NAP |
Unfunded Obligations Reserve: | $35,000 | $0 | NAP |
Property Information | |
Single Asset / Portfolio: | Single Asset |
Property Type: | Anchored Retail |
Collateral: | Fee Simple |
Location: | Las Vegas, NV |
Year Built / Renovated: | 1971-2006 / 2006 |
Total Sq. Ft.: | 214,127 |
Property Management: | Westland Fair GP, LLC |
Underwritten NOI: | $3,376,366 |
Underwritten NCF: | $3,199,238 |
Appraised Value: | $45,100,000 |
Appraisal Date: | September 10, 2019 |
| |
Historical NOI | |
Most Recent NOI: | $3,306,753 (T-12 December 31, 2018) |
2017 NOI: | $3,380,384 (December 31, 2017) |
2016 NOI: | $3,261,297 (December 31, 2016) |
| |
Historical Occupancy | |
Most Recent Occupancy(1): | 93.3% (July 1, 2019) |
2018 Occupancy: | 91.8% (December 31, 2018) |
2017 Occupancy: | 90.3% (December 31, 2017) |
2016 Occupancy: | 94.7% (December 31, 2016) |
Financial Information(1) | ||||||
Tranche | Cut-off Date Balance | Balance per Sq. Ft. Cut-off / Balloon | LTV Cut-off / Balloon | U/W DSCR NOI / NCF | U/W Debt Yield NOI / NCF | U/W Debt Yield at Balloon NOI / NCF |
Mortgage Loan | $31,500,000 | $147 / $132 | 69.8% / 62.7% | 2.01x / 1.91x | 10.7% / 10.2% | 11.9% / 11.3% |
(1) | Most Recent Occupancy includes one tenant Nex Level Barber Shop (1,800 sq. ft., $18.00 PSF) which has executed a lease but has not yet taken occupancy of its space. The Most Recent Occupancy excluding this tenant is 92.4%. Nex Level Barber Shop is anticipated to take occupancy of its space in December 2019. We cannot assure you that they will take occupancy or pay rent as anticipated or at all. |
THE INFORMATION IN THIS STRUCTURAL AND COLLATERAL TERM SHEET IS NOT COMPLETE AND MAY BE AMENDED PRIOR TO THE TIME OF SALE. THIS TERM SHEET IS NOT AN OFFER TO SELL THESE SECURITIES AND IT IS NOT A SOLICITATION OF AN OFFER TO BUY THESE SECURITIES IN ANY JURISDICTION WHERE THE OFFER OR SALE IS NOT PERMITTED.
124
1251-1291 South Decatur Boulevard Las Vegas, NV 89102 | Collateral Asset Summary – Loan No. 14 | Cut-off Date Balance: | $31,500,000 |
Sources and Uses | |||||
Sources | Proceeds | % of Total | Uses | Proceeds | % of Total |
Loan Amount | $31,500,000 | 71.0% | Purchase Price | $43,500,000 | 98.1% |
Principal’s New Cash Contribution | 12,858,606 | 29.0 | Upfront Reserve | 640,370 | 1.4 |
|
|
| Closing Costs | 218,236 | 0.5 |
Total Sources | $44,358,606 | 100.0% | Total Uses | $44,358,606 | 100.0% |
The Borrower / Borrower Sponsors. The borrower is Westland Fair, LP with Kamyar Mateen and Tyler Mateen being the non-recourse carveout guarantors. Kamyar Mateen is the CEO of Cannon Commercial. Mr. Mateen has been involved in the real estate business for over 40 years. Mr. Mateen’s son, Tyler Mateen, is also a borrower sponsor and carve-out guarantor for the loan. Cannon Commercial is a real estate investment and management company based in Los Angeles, California with a diversified real estate portfolio including office, retail, multifamily, and industrial assets. Cannon Commercial is affiliated with the borrower, and manages a majority of the borrower sponsor’s real estate holdings. Throughout the past 24 years, the borrower sponsors have been involved in approximately 80 real estate transactions. Legal counsel to the borrowers delivered a non-consolidation opinion in connection with the origination of the Westland Fair Loan.
The Property. The Westland Fair Property is a 214,127 sq. ft. anchored shopping center located on the southeast corner of Decatur Boulevard and Charleston Boulevard in Las Vegas, Nevada. The Westland Fair Property was constructed in 1971 through 2006 and renovated in 2006 and is situated on a 23.26-acre site. The Westland Fair Property features 11, single-story buildings and includes multiple pad sites for freestanding buildings with superior frontage and visibility. The Westland Fair Property features 70,855 sq. ft. of anchor space, 40,390 sq. ft. of junior anchor space, 42,335 sq. ft. of large in-line space, 20,167 sq. ft. of free standing pad space and 18,275 sq. ft. of high visibility space. The Westland Fair Property is 93.3% occupied with 3 suites vacant (14,404 sq. ft.) as of July 1, 2019. Major tenants at the Westland Fair Property include Michael’s (24,975 sq. ft.; 11.7% NRA), PetSmart (24,880 sq. ft.; 11.6% NRA) and Smart and Final (21,000 sq. ft.; 9.8% NRA).
Tenant Summary(1) | ||||||||
Tenant | Credit Rating (Moody’s/Fitch/S&P)(2) | Net Rentable Area (Sq. Ft.) | % of Net Rentable Area(3) | U/W Base Rent PSF | % of Total U/W Base Rent | Sales PSF(4) | Occupancy Cost(5) | Lease Expiration |
Michael’s(6) | NR / NR / BB- | 24,975 | 11.7% | $9.00 | 6.1% | NAV | NAV | 2/28/2021 |
PetSmart | Caa2 / NR / B- | 24,880 | 11.6 | $12.75 | 8.6 | 163 | 9.9% | 4/30/2025 |
Smart and Final | NR / NR / NR | 21,000 | 9.8 | $3.93 | 2.2 | NAV | NAV | 12/31/2020 |
Skechers Outlet | NR / NR / NR | 15,000 | 7.0 | $20.00 | 8.2 | 245 | 10.9% | 6/30/2026 |
Office Depot | NR / NR / B | 14,990 | 7.0 | $15.68 | 6.4 | NAV | NAV | 6/30/2024 |
WSS | NR / NR / NR | 10,400 | 4.9 | $13.00 | 3.7 | 272 | 6.4% | 6/30/2020 |
Rainbow | NR / NR / NR | 7,100 | 3.3 | $13.20 | 2.5 | 141 | 12.5% | 1/31/2021 |
CiCi’s Pizza | NR / NR / NR | 6,800 | 3.2 | $17.43 | 3.2 | NAV | NAV | 10/31/2024 |
Easyhome | NR / NR / NR | 5,400 | 2.5 | $14.63 | 2.1 | NAV | NAV | 11/30/2019 |
Lucky Buffet | NR / NR / NR | 5,200 | 2.4 | $36.88 | 5.2 | NAV | NAV | 7/31/2028 |
Sub Total / Wtd. Avg. |
| 135,745 | 63.4% | $13.10 | 48.4% |
|
|
|
Remaining Tenants |
| 63,978 | 29.9 | $29.67 | 51.6 |
|
|
|
Occupied Subtotal / Wtd. Avg. |
| 199,723 | 93.3% | $18.41 | 100.0% |
|
|
|
Vacant Space |
| 14,404 | 6.7 |
|
|
|
|
|
Total / Wtd. Avg. |
| 214,127 | 100.0% |
|
|
|
|
|
(1) | Based on the underwritten rent roll dated July 1, 2019, with rent steps through November 30, 2020 totaling $15,795. |
(2) | Certain ratings are those of the parent company whether or not the parent guarantees the lease. |
(3) | % of Net Rentable Area includes one tenant Nex Level Barber Shop (1,800 sq. ft., $18.00 PSF) who has executed a lease but has not yet taken occupancy of its space. Nex Level Barber Shop is anticipated to take occupancy of its space in December 2019. We cannot assure you that they will take occupancy or pay rent as anticipated or at all. |
(4) | Sales PSF are as of July 31, 2019. |
(5) | Occupancy Cost is calculated using the tenant reported sales as of July 31, 2019 and the total rent. |
(6) | Michael’s is subleasing from CFSMC Las Vegas, LLC (successor in interest to Service Merchandise, Inc.). Michael’s has been a sublessee at the Property since 2004. Per the Michael’s Sublease, Tenant currently pays $1.00 PSF more than the in-place rent. |
THE INFORMATION IN THIS STRUCTURAL AND COLLATERAL TERM SHEET IS NOT COMPLETE AND MAY BE AMENDED PRIOR TO THE TIME OF SALE. THIS TERM SHEET IS NOT AN OFFER TO SELL THESE SECURITIES AND IT IS NOT A SOLICITATION OF AN OFFER TO BUY THESE SECURITIES IN ANY JURISDICTION WHERE THE OFFER OR SALE IS NOT PERMITTED.
125
1251-1291 South Decatur Boulevard Las Vegas, NV 89102 | Collateral Asset Summary – Loan No. 14 | Cut-off Date Balance: | $31,500,000 |
Lease Rollover Schedule | ||||||||
Year | # of Leases Expiring | Total Expiring Sq. Ft. | % of Total Sq. Ft. Expiring | Cumulative Sq. Ft. Expiring | Cumulative % of Sq. Ft. Expiring | Annual U/W Base Rent PSF(1) | % U/W Base Rent Rolling(1) | Cumulative % of U/W Base Rent(1) |
MTM | 1 | 2,910 | 1.4% | 2,910 | 1.4% | $8.25 | 0.7% | 0.7% |
2019 | 1 | 5,400 | 2.5 | 8,310 | 3.9% | $14.63 | 2.1 | 2.8% |
2020 | 8 | 45,386 | 21.2 | 53,696 | 25.1% | $13.26 | 16.4 | 19.2% |
2021 | 4 | 42,265 | 19.7 | 95,961 | 44.8% | $13.89 | 16.0 | 35.1% |
2022 | 6 | 12,626 | 5.9 | 108,587 | 50.7% | $40.14 | 13.8 | 48.9% |
2023 | 3 | 12,175 | 5.7 | 120,762 | 56.4% | $26.36 | 8.7 | 57.7% |
2024 | 3 | 23,590 | 11.0 | 144,352 | 67.4% | $16.36 | 10.5 | 68.2% |
2025 | 2 | 26,280 | 12.3 | 170,632 | 79.7% | $13.67 | 9.8 | 77.9% |
2026 | 3 | 19,750 | 9.2 | 190,382 | 88.9% | $23.00 | 12.4 | 90.3% |
2027 | 0 | 0 | 0.0 | 190,382 | 88.9% | $0.00 | 0.0 | 90.3% |
2028 | 1 | 5,200 | 2.4 | 195,582 | 91.3% | $36.88 | 5.2 | 95.5% |
2029 | 1 | 1,400 | 0.7 | 196,982 | 92.0% | $32.25 | 1.2 | 96.7% |
2030 & Thereafter | 1 | 2,741 | 1.3 | 199,723 | 93.3% | $43.78 | 3.3 | 100.0% |
Vacant | NAP | 14,404 | 6.7 | 214,127 | 100.0% | NAP | NAP |
|
Total / Wtd. Avg. | 34 | 214,127 | 100.0% |
|
| $18.41 | 100.0% |
|
|
|
|
|
|
|
|
|
|
(1) Based on the underwritten rent roll dated July 1, 2019 with rent steps through November 30, 2020 totaling $15,795.
Cash Flow Analysis.
Cash Flow Analysis(1) | |||||
| 2016 | 2017 | 2018 | U/W | U/W PSF |
Base Rent | $3,573,514 | $3,607,796 | $3,599,400 | $3,675,953 | $17.17 |
Total Reimbursement Revenue | 632,371 | 670,578 | 678,795 | 772,965 | 3.61 |
Market Revenue from Vacant Units | 0 | 0 | 0 | 719,943 | 3.36 |
Other Revenue | 6,178 | 36,504 | 6,428 | 0 | 0.00 |
Vacancy Loss | 0 | 0 | 0 | (719,943) | (3.36) |
Effective Gross Revenue | $4,212,063 | $4,314,878 | $4,284,623 | $4,448,918 | $20.78 |
Real Estate Taxes | 198,111 | 200,839 | 207,684 | 232,782 | 1.09 |
Insurance | 32,315 | 31,381 | 30,557 | 89,511 | 0.42 |
Management Fee | 168,027 | 175,240 | 174,885 | 177,957 | 0.83 |
Other Operating Expenses | 552,313 | 527,034 | 564,744 | 572,302 | 2.67 |
Total Operating Expenses | $950,766 | $934,494 | 977,870 | 1,072,552 | $5.01 |
Net Operating Income | $3,261,297 | $3,380,384 | $3,306,753 | $3,376,366 | $15.77 |
TI/LC | 0 | 0 | 0 | 134,302 | 0.63 |
Capital Expenditures | 0 | 0 | 0 | 42,825 | 0.20 |
Net Cash Flow | $3,261,297 | $3,380,384 | $3,306,753 | $3,199,238 | $14.94 |
(1) | Based on the underwritten rent roll dated July 1, 2019 with rent steps through November 30, 2020 totaling $15,795. |
THE INFORMATION IN THIS STRUCTURAL AND COLLATERAL TERM SHEET IS NOT COMPLETE AND MAY BE AMENDED PRIOR TO THE TIME OF SALE. THIS TERM SHEET IS NOT AN OFFER TO SELL THESE SECURITIES AND IT IS NOT A SOLICITATION OF AN OFFER TO BUY THESE SECURITIES IN ANY JURISDICTION WHERE THE OFFER OR SALE IS NOT PERMITTED.
126
(THIS PAGE INTENTIONALLY LEFT BLANK)
127
840 Ernest W Barrett Parkway Northwest Kennesaw, GA 30144 | Collateral Asset Summary – Loan No. 15 Cobb Place | Cut-off Date Balance: Cut-off Date LTV: U/W NCF DSCR: U/W NOI Debt Yield: | $25,000,000 73.4% 1.90x 10.8% |
Mortgage Loan Information | |
Loan Seller: | GSMC |
Loan Purpose: | Acquisition |
Borrower Sponsor: | WPCM Relative Value Fund I, LLC |
Borrower: | Cobb Place Property, LLC |
Original Balance(1): | $25,000,000 |
Cut-off Date Balance(1): | $25,000,000 |
% by Initial UPB: | 2.4% |
Interest Rate: | 3.54200% |
Payment Date: | 6th of each month |
First Payment Date: | December 6, 2019 |
Maturity Date: | November 6, 2026 |
Amortization: | Interest only for first 24 months, 360 months thereafter |
Additional Debt: | $15,000,000 Pari Passu Debt |
Call Protection(2): | L(25), D(54), O(5) |
Lockbox / Cash Management: | Hard / In Place |
Reserves | |||
| Initial | Monthly | Cap |
Taxes: | $107,436 | $53,718 | NAP |
Insurance: | $13,234 | $6,617 | NAP |
Replacement: | $0 | $5,866 | NAP |
TI/LC: | $500,000 | $20,833 | $1,250,000 |
Unfunded Obligations: | $291,231 | $0 | NAP |
Required Repairs: | $32,588 | NAP | NAP |
Property Information | |
Single Asset / Portfolio: | Single Asset |
Property Type: | Anchored Retail |
Collateral: | Fee Simple |
Location: | Kennesaw, GA |
Year Built / Renovated: | 1987 / NAP |
Total Sq. Ft.: | 335,191 |
Property Management: | Crawford Square Real Estate Advisors, LLC |
Underwritten NOI: | $4,325,478 |
Underwritten NCF: | $4,105,956 |
Appraised Value: | $54,500,000 |
Appraisal Date: | September 25, 2019 |
| |
Historical NOI | |
Most Recent NOI: | $4,349,237 (T-12 June 30, 2019) |
2018 NOI: | $4,434,183 (December 31, 2018) |
2017 NOI: | $4,286,971 (December 31, 2017) |
2016 NOI: | $3,695,371 (December 31, 2016) |
| |
Historical Occupancy | |
Most Recent Occupancy: | 94.7% (October 1, 2019) |
2018 Occupancy: | 97.3% (December 31, 2018) |
2017 Occupancy: | 96.0% (December 31, 2017) |
2016 Occupancy: | 94.5% (December 31, 2016) |
Financial Information(1) |
Tranche |
| Cut-off Date |
| Balance per Sq. Ft. Cut-off / Balloon |
| LTV Cut-off / Balloon |
| U/W DSCR |
| U/W Debt Yield |
| U/W Debt Yield at Balloon |
Mortgage Loan |
| $25,000,000 |
|
|
|
|
|
|
|
|
|
|
Pari Passu Notes |
| 15,000,000 |
|
|
|
|
|
|
|
|
|
|
Whole Loan |
| $40,000,000 |
| $119 / $107 |
| 73.4% / 66.1% |
| 2.00x / 1.90x |
| 10.8% / 10.3% |
| 12.0% / 11.4% |
(1) | The Cobb Place loan consists of the non-controlling Note A-1 (the “Cobb Place Loan”) and is part of a whole loan evidenced by two pari passu notes having an aggregate outstanding principal balance as of the Cut-off Date of $40.0 million (the “Cobb Place Whole Loan”). See the “Whole Loan Summary” chart herein. |
(2) | The lockout period will be at least 25 payments beginning with and including December 6, 2019. The borrower has the option to defease the Cobb Place Whole Loan in full after the earlier to occur of (i) two years after the closing date of the securitization that includes the last note to be securitized and (ii) October 24, 2022. |
THE INFORMATION IN THIS STRUCTURAL AND COLLATERAL TERM SHEET IS NOT COMPLETE AND MAY BE AMENDED PRIOR TO THE TIME OF SALE. THIS TERM SHEET IS NOT AN OFFER TO SELL THESE SECURITIES AND IT IS NOT A SOLICITATION OF AN OFFER TO BUY THESE SECURITIES IN ANY JURISDICTION WHERE THE OFFER OR SALE IS NOT PERMITTED.
128
840 Ernest W Barrett Parkway Northwest Kennesaw, GA 30144 | Collateral Asset Summary – Loan No. 15 Cobb Place | Cut-off Date Balance: Cut-off Date LTV: U/W NCF DSCR: U/W NOI Debt Yield: | $25,000,000 73.4% 1.90x 10.8% |
The relationship between the holders of the Cobb Place Whole Loan is governed by a co-lender agreement as described under “Description of the Mortgage Pool—The Whole Loans—The Serviced Pari Passu Whole Loans” in the Preliminary Prospectus.
Whole Loan Summary |
Note |
| Original Balance |
| Cut-off Date Balance |
| Note Holder |
| Controlling Piece |
Note A-1 |
| $25,000,000 |
| $25,000,000 |
| COMM 2019-GC44 |
| Yes |
Note A-2 |
| 15,000,000 |
| 15,000,000 |
| GS Bank(1) |
| No |
Whole Loan |
| $40,000,000 |
| $40,000,000 |
|
|
|
|
| (1) | Anticipated to be contributed to one or more securitization transactions. |
Sources and Uses |
Sources |
| Proceeds |
| % of Total |
| Uses |
| Proceeds |
| % of Total |
Whole Loan |
| $40,000,000 |
| 72.9% |
| Purchase Price |
| $53,500,000 |
| 97.5% |
Borrower Cash Contribution |
| 14,875,557 |
| 27.1 |
| Upfront Reserves |
| 944,489 |
| 1.7 |
|
|
|
|
|
| Closing Costs |
| 431,068 |
| 0.8 |
Total Sources |
| $54,875,557 |
| 100.0% |
| Total Uses |
| $54,875,557 |
| 100.0% |
The Borrower / Borrower Sponsor. The borrower is Cobb Place Property, LLC, a Delaware limited liability company and single purpose entity with one independent director. Legal counsel to the borrower delivered a non-consolidation opinion in connection with the origination of the Cobb Place Loan.
The non-recourse carveout guarantor is WPCM Relative Value Fund I, LLC, which is Wicker Park Capital Management’s (“WPCM”) first discretionary, closed-end fund. WPCM is a privately held real estate investment firm focused on the acquisition and asset management of apartment and retail properties in the Southeast United States. WPCM was founded in March of 2013 and has two offices in Savannah, Georgia and Birmingham, Alabama. Since its formation, WPCM has made over 24 investments, which combined include nearly 2 million sq. ft. of retail and 14 apartment communities.
The Property. The Cobb Place Property is a 335,191 sq. ft., 94.7% occupied anchored retail center located within the main retail thoroughfare of Kennesaw, Georgia, just west of I-75 along Barrett Lakes Boulevard. The two, single-story buildings comprising the Cobb Place Property were constructed in 1987 and are situated on a 34.96-acre site. The Cobb Place Property is anchored by DSW Shoes, Bed Bath & Beyond, American Signature, Ashley Furniture Home Store, and Hobbytown USA. The improvements feature 243,410 sq. ft. of anchor space, 61,391 sq. ft. of large inline space, 26,689 sq. ft. of small inline space and 3,700 sq. ft. of restaurant space. The Cobb Place Property is served by 1,649 surface parking spaces at 4.92 spaces per 1,000 sq. ft.
The Cobb Place Property is located within two miles of a Target, Walmart, Costco, Total Wine, Dicks Sporting Goods, and Whole Foods. Kennesaw State University, which is the third largest university in the state of Georgia with over 35,000 students enrolled, is approximately 5 miles from the Cobb Place Property. The overall economic impact on the surrounding area from Kennesaw State University is estimated to be over $1.5 billion. The Kennesaw State University bus route offers routine transit access to the Cobb Place Property.
THE INFORMATION IN THIS STRUCTURAL AND COLLATERAL TERM SHEET IS NOT COMPLETE AND MAY BE AMENDED PRIOR TO THE TIME OF SALE. THIS TERM SHEET IS NOT AN OFFER TO SELL THESE SECURITIES AND IT IS NOT A SOLICITATION OF AN OFFER TO BUY THESE SECURITIES IN ANY JURISDICTION WHERE THE OFFER OR SALE IS NOT PERMITTED.
129
840 Ernest W Barrett Parkway Northwest Kennesaw, GA 30144 | Collateral Asset Summary – Loan No. 15 Cobb Place | Cut-off Date Balance: Cut-off Date LTV: U/W NCF DSCR: U/W NOI Debt Yield: | $25,000,000 73.4% 1.90x 10.8% |
Tenant Summary(1) |
Tenant |
| Ratings (Fitch/Moody’s/S&P)(2) |
| Net Rentable Area (Sq. ft.) |
| % of Net Rentable Area |
| U/W Base Rent PSF(3) |
| % of Total U/W Base Rent |
| Sales PSF(4) |
| Occupancy Cost(5) |
| Lease Expiration |
American Signature Home |
| NR/NR/NR |
| 50,000 |
| 14.9% |
| $9.00 |
| 9.8% |
| $143 |
| 8.4% |
| 1/31/2024 |
Ashley Furniture |
| NR/NR/NR |
| 42,871 |
| 12.8% |
| $10.50 |
| 9.8% |
| NAV |
| NAV |
| 4/14/2022 |
DSW Shoes |
| NR/NR/NR |
| 36,899 |
| 11.0% |
| $11.00 |
| 8.9% |
| NAV |
| NAV |
| 1/31/2024 |
Bed Bath & Beyond |
| NR/Baa3/BB |
| 35,096 |
| 10.5% |
| $11.24 |
| 8.6% |
| NAV |
| NAV |
| 1/31/2024 |
Hobbytown USA |
| NR/NR/NR |
| 30,277 |
| 9.0% |
| $6.72 |
| 4.4% |
| $119 |
| 9.4% |
| 12/31/2028 |
Cost Plus |
| NR/NR/NR |
| 18,277 |
| 5.5% |
| $15.00 |
| 6.0% |
| NAV |
| NAV |
| 1/31/2024 |
Bassett Furniture |
| NR/NR/NR |
| 15,000 |
| 4.5% |
| $24.20 |
| 7.9% |
| NAV |
| NAV |
| 11/30/2027 |
Fried Tomato Buffet |
| NR/NR/NR |
| 7,283 |
| 2.2% |
| $15.97 |
| 2.5% |
| $297 |
| 6.9% |
| 2/28/2027 |
Petland(6) |
| NR/NR/NR |
| 6,282 |
| 1.9% |
| $19.13 |
| 2.6% |
| NAV |
| NAV |
| 5/31/2026 |
Sideline Sports Grill |
| NR/NR/NR |
| 6,021 |
| 1.8% |
| $24.41 |
| 3.2% |
| $192 |
| 14.5% |
| 12/31/2026 |
Ten Largest Owned Tenants |
|
|
| 248,006 |
| 74.0% |
| $11.79 |
| 63.8% |
|
|
|
|
|
|
Remaining Occupied |
|
|
| 69,492 |
| 20.7% |
| $23.89 |
| 36.2% |
|
|
|
|
|
|
Total / Wtd. Avg. Occupied |
|
|
| 317,498 |
| 94.7% |
| $14.44 |
| 100.0% |
|
|
|
|
|
|
Vacant Spaces |
|
|
| 17,693 |
| 5.3% |
|
|
|
|
|
|
|
|
|
|
Total |
|
|
| 335,191 |
| 100.0% |
|
|
|
|
|
|
|
|
|
|
|
|
|
|
|
|
|
|
|
|
|
|
|
|
|
|
|
(1) | Based on the underwritten rent roll dated as of October 1, 2019. |
(2) | Certain ratings are those of the parent company whether or not the parent guarantees the lease. |
(3) | U/W Base Rent PSF based on in-place rents from the Cobb Place Property with rent steps through November 30, 2020 totaling $22,033. |
(4) | Tenant Sales per SF are as of June 30, 2019. |
(5) | Occupancy Cost is calculated using the tenant reported sales as of June 30, 2019 and the total rent. |
(6) | Petland has the right to terminate its lease upon 60 days’ prior written notice to landlord in the event of a local or state government ruling preventing the sale of live animals. In the event Petland terminates its lease, it has to pay the borrower the cost of its improvement allowance. |
Lease Rollover Schedule(1) |
Year |
| # of Leases Expiring |
| Total Expiring Sq. Ft. |
| % of Total Sq. Ft. Expiring |
| Cumulative Sq. Ft. Expiring |
| Cumulative % of Sq. Ft. Expiring |
| Annual U/W Base Rent PSF |
| % U/W Base Rent Rolling |
| Cumulative % of U/W Base Rent |
MTM |
| 0 |
| 0 |
| 0.0% |
| 0 |
| 0.0% |
| $0.00 |
| 0.0% |
| 0.0% |
2019 |
| 0 |
| 0 |
| 0.0% |
| 0 |
| 0.0% |
| $0.00 |
| 0.0 |
| 0.0% |
2020 |
| 1 |
| 862 |
| 0.3% |
| 862 |
| 0.3% |
| $26.52 |
| 0.5 |
| 0.5% |
2021 |
| 4 |
| 8,365 |
| 2.5% |
| 9,227 |
| 2.8% |
| $21.38 |
| 3.9 |
| 4.4% |
2022 |
| 4 |
| 49,387 |
| 14.7% |
| 58,614 |
| 17.5% |
| $12.46 |
| 13.4 |
| 17.8% |
2023 |
| 3 |
| 7,631 |
| 2.3% |
| 66,245 |
| 19.8% |
| $34.55 |
| 5.8 |
| 23.6% |
2024 |
| 9 |
| 151,314 |
| 45.1% |
| 217,559 |
| 64.9% |
| $11.78 |
| 38.9 |
| 62.5% |
2025 |
| 1 |
| 1,200 |
| 0.4% |
| 218,759 |
| 65.3% |
| $21.49 |
| 0.6 |
| 63.0% |
2026 |
| 3 |
| 15,450 |
| 4.6% |
| 234,209 |
| 69.9% |
| $22.48 |
| 7.6 |
| 70.6% |
2027 |
| 5 |
| 31,068 |
| 9.3% |
| 265,277 |
| 79.1% |
| $22.19 |
| 15.0 |
| 85.6% |
2028 |
| 5 |
| 40,229 |
| 12.0% |
| 305,506 |
| 91.1% |
| $10.45 |
| 9.2 |
| 94.8% |
2029 |
| 4 |
| 11,991 |
| 3.6% |
| 317,497 |
| 94.7% |
| $19.87 |
| 5.2 |
| 100.0% |
2030 & Thereafter |
| 1 |
| 0 |
| 0.0% |
| 317,498 |
| 94.7% |
| $0.00 |
| 0.0 |
| 100.0% |
Vacant |
| NAP |
| 17,693 |
| 5.3% |
| 335,191 |
| 100.0% |
| NAP |
| NAP |
|
|
Total / Wtd. Avg. |
| 40 |
| 335,191 |
| 100.0% |
|
|
|
|
| $14.44 |
| 100.0% |
|
|
| (1) | Based on the underwritten rent roll dated October 1, 2019 with rent steps through November 30, 2020 totaling $22,033. |
THE INFORMATION IN THIS STRUCTURAL AND COLLATERAL TERM SHEET IS NOT COMPLETE AND MAY BE AMENDED PRIOR TO THE TIME OF SALE. THIS TERM SHEET IS NOT AN OFFER TO SELL THESE SECURITIES AND IT IS NOT A SOLICITATION OF AN OFFER TO BUY THESE SECURITIES IN ANY JURISDICTION WHERE THE OFFER OR SALE IS NOT PERMITTED.
130
840 Ernest W Barrett Parkway Northwest Kennesaw, GA 30144 | Collateral Asset Summary – Loan No. 15 Cobb Place | Cut-off Date Balance: Cut-off Date LTV: U/W NCF DSCR: U/W NOI Debt Yield: | $25,000,000 73.4% 1.90x 10.8% |
Cash Flow Analysis.
Cash Flow Analysis(1) |
|
| 2016 |
| 2017 |
| 2018 |
| T-12 6/30/2019(2) |
| U/W(2) |
| U/W PSF |
Base Rent (2) |
| $4,156,946 |
| $4,380,410 |
| $4,562,799 |
| $4,568,291 |
| $4,584,930 |
| $13.68 |
Overage / Percentage Rent |
| 0 |
| 61,094 |
| 0 |
| 0 |
| 0 |
| 0.00 |
Total Reimbursement Revenue |
| 1,402,192 |
| 1,127,306 |
| 1,131,077 |
| 1,211,143 |
| 1,101,386 |
| 3.29 |
Market Revenue from Vacant Units |
| 0 |
| 0 |
| 0 |
| 0 |
| 292,077 |
| 0.87 |
Other Revenue |
| 21,685 |
| 18,660 |
| 25,058 |
| 27,582 |
| 27,582 |
| 0.08 |
Gross Revenue |
| $5,580,822 |
| $5,587,471 |
| $5,718,934 |
| $5,807,016 |
| $6,005,975 |
| $17.92 |
Less: Vacancy |
| 0 |
| 0 |
| 0 |
| 0 |
| (294,586) |
| (0.88) |
Effective Gross Income |
| $5,580,822 |
| $5,587,471 |
| $5,718,934 |
| $5,807,016 |
| $5,711,389 |
| $17.04 |
Total Operating Expenses |
| 1,885,451 |
| 1,300,499 |
| 1,284,751 |
| 1,457,779 |
| 1,385,911 |
| 4.13 |
Net Operating Income |
| $3,695,371 |
| $4,286,971 |
| $4,434,183 |
| $4,349,237 |
| $4,325,478 |
| $12.90 |
TI/LC(3) |
| 0 |
| 0 |
| 0 |
| 0 |
| 149,132 |
| 0.44 |
Replacement Reserves |
| 0 |
| 0 |
| 0 |
| 0 |
| 70,390 |
| 0.21 |
Net Cash Flow |
| $3,695,371 |
| $4,286,971 |
| $4,434,183 |
| $4,349,237 |
| $4,105,956 |
| $12.25 |
(1) | Certain items such as interest expense, interest income, lease cancellation income, depreciation, amortization, debt service payments and any other non-recurring or non-operating items were excluded from the historical presentation and are not considered for the underwritten cash flow. |
(2) | Underwritten based on the in place rent roll dated October 1, 2019, with rent steps through November 30, 2020 totaling $22,033. |
(3) | Underwritten based on $0.25 PSF for anchors and $0.50 PSF for all other tenants; adjusted for the $500,000 upfront reserve. |
THE INFORMATION IN THIS STRUCTURAL AND COLLATERAL TERM SHEET IS NOT COMPLETE AND MAY BE AMENDED PRIOR TO THE TIME OF SALE. THIS TERM SHEET IS NOT AN OFFER TO SELL THESE SECURITIES AND IT IS NOT A SOLICITATION OF AN OFFER TO BUY THESE SECURITIES IN ANY JURISDICTION WHERE THE OFFER OR SALE IS NOT PERMITTED.
131
STATEMENT REGARDING ASSUMPTIONS AS TO SECURITIES, PRICING ESTIMATES AND OTHER INFORMATION
This material is for your information, and none of Deutsche Bank Securities Inc., Goldman Sachs & Co. LLC, Citigroup Global Markets Inc., Academy Securities, Inc. and Drexel Hamilton, LLC or any other underwriter, (the “Underwriters”) are soliciting any action based upon it. This material is not to be construed as an offer to sell or the solicitation of any offer to buy any security in any jurisdiction where such an offer or solicitation would be illegal.
Neither this document nor anything contained herein shall form the basis for any contract or commitment whatsoever. The information contained herein is preliminary as of the date hereof. These materials are subject to change, completion or amendment from time to time. The information contained herein will be superseded by similar information delivered to you as part of the preliminary prospectus relating to the COMM 2019-GC44 Mortgage Trust Commercial Mortgage Pass-Through Certificates, Series 2019-GC44 (the "Offering Document"). The information contained herein supersedes any such information previously delivered and should be reviewed only in conjunction with the entire Offering Document. All of the information contained herein is subject to the same limitations and qualifications contained in the Offering Document. The information contained herein does not contain all relevant information relating to the underlying mortgage loans or mortgaged properties. Such information is described elsewhere in the Offering Document. The information contained herein will be more fully described elsewhere in the Offering Document. The information contained herein should not be viewed as projections, forecasts, predictions or opinions with respect to value. Prior to making any investment decision, prospective investors are strongly urged to read the Offering Document its entirety. Neither the Securities and Exchange Commission nor any state securities commission has approved or disapproved of these securities or determined if this free writing prospectus is truthful or complete. Any representation to the contrary is a criminal offense.
The attached information contains certain tables and other statistical analyses (the “Computational Materials”) which have been prepared in reliance upon information furnished by the Mortgage Loan Sellers. Numerous assumptions were used in preparing the Computational Materials, which may or may not be reflected herein. As such, no assurance can be given as to the Computational Materials’ accuracy, appropriateness or completeness in any particular context; or as to whether the Computational Materials and/or the assumptions upon which they are based reflect present market conditions or future market performance. The Computational Materials should not be construed as either projections or predictions or as legal, tax, financial or accounting advice. You should consult your own counsel, accountant and other advisors as to the legal, tax, business, financial and related aspects of a purchase of these securities. Any weighted average lives, yields and principal payment periods shown in the Computational Materials are based on prepayment and/or loss assumptions, and changes in such prepayment and/or loss assumptions may dramatically affect such weighted average lives, yields and principal payment periods. In addition, it is possible that prepayments or losses on the underlying assets will occur at rates higher or lower than the rates shown in the attached Computational Materials. The specific characteristics of the securities may differ from those shown in the Computational Materials due to differences between the final underlying assets and the preliminary underlying assets used in preparing the Computational Materials. The principal amount and designation of any security described in the Computational Materials are subject to change prior to issuance. None of Underwriters or any of their respective affiliates makes any representation or warranty as to the actual rate or timing of payments or losses on any of the underlying assets or the payments or yield on the securities.
This document contains forward-looking statements. Those statements are subject to certain risks and uncertainties that could cause the success of collections and the actual cash flow generated to differ materially from the information set forth herein. While such information reflects projections prepared in good faith based upon methods and data that are believed to be reasonable and accurate as of the dates thereof, the depositor undertakes no obligation to revise these forward-looking statements to reflect subsequent events or circumstances. Individuals should not place undue reliance on forward-looking statements and are advised to make their own independent analysis and determination with respect to the forecasted periods, which reflect the issuer’s view only as of the date hereof.
IMPORTANT NOTICE RELATING TO AUTOMATICALLY GENERATED EMAIL DISCLAIMERS
Any legends, disclaimers or other notices that may appear at the bottom of the email communication to which this free writing prospectus is attached relating to (1) these materials not constituting an offer (or a solicitation of an offer), (2) no representation being made that these materials are accurate or complete and may not be updated or (3) these materials possibly being confidential, are not applicable to these materials and should be disregarded. Such legends, disclaimers or other notices have been automatically generated as a result of these materials having been sent via Bloomberg or another system.