
Exhibit 99.2 Reinforcing Our Strategy Core Midland Basin Acquisition & Bakken Divestiture April 3, 2023 1
Cautionary Statements For convenience, references in this presentation to “Ovintiv”, “OVV”, the “Company”, “we”, “us” and “our” may, where applicable, refer only to or include any relevant direct and indirect subsidiary entities and partnerships (“Subsidiaries”) of Ovintiv Inc., and the assets, activities and initiatives of such Subsidiaries. The terms “include”, “includes”, “including” and “included” are to be construed as if they were immediately followed by the words “without limitation”, except where explicitly stated otherwise. The term “liquids” is used to represent oil, NGLs and condensate. The term “condensate” refers to plant condensate. The conversion of natural gas volumes to barrels of oil equivalent (“BOE”) is on the basis of six thousand cubic feet to one barrel. BOE is based on a generic energy equivalency conversion method primarily applicable at the burner tip and does not represent economic value equivalency at the wellhead. Readers are cautioned that BOE may be misleading, particularly if used in isolation. There is no certainty that Ovintiv will drill all gross premium well inventory locations and if drilled there is no certainty that such locations will result in additional oil and gas reserves or production. The locations on which Ovintiv will actually drill wells, including the number and timing thereof, is ultimately dependent upon the availability of capital, regulatory and partner approvals, seasonal restrictions, equipment and personnel, oil and natural gas prices, costs, actual drilling results, transportation constraints and other factors. Reserves are the estimated remaining quantities of oil and natural gas and related substances anticipated to be recoverable from known accumulations, from a given date forward, based on an analysis of drilling, geological, geophysical and engineering data; the use of established technology; and specified economic conditions, which are generally accepted as being reasonable. Proved reserves are those reserves which can be estimated with a high degree of certainty to be recoverable. All reserves estimates referenced in this presentation are effective as of December 31, 2022 and prepared by qualified reserves evaluators in accordance with United States Securities and Exchange Commission (“SEC”) regulations. Detailed U.S. protocol disclosure, as well as additional information relating to risks associated with the estimates of reserves, is contained in the Company’s most recent Annual Report on Form 10-K. Certain measures in this presentation do not have any standardized meaning as prescribed by U.S. GAAP and, therefore, are considered non-GAAP measures. These measures may not be comparable to similar measures presented by other companies and should not be viewed as a substitute for measures reported under U.S. GAAP These measures are commonly used in the oil and gas industry and/or by Ovintiv to provide shareholders and potential investors with additional information regarding the Company’s liquidity and its ability to generate funds to finance its operations. For additional information regarding non-GAAP measures, including reconciliations, see the Company’s website and Ovintiv’s most recent Annual Report on Form 10-K. This presentation contains references to non-GAAP measures as follows: • Non-GAAP Cash Flow is a non-GAAP measure. Non-GAAP Cash Flow is defined as cash from (used in) operating activities excluding net change in other assets and liabilities, and net change in non-cash working capital. Ovintiv has not provided a reconciliation of Non-GAAP Cash Flow to cash from operating activities, the most comparable financial measure calculated in accordance with GAAP. Cash from operating activities includes certain items which may be significant and difficult to project with a reasonable degree of accuracy. Therefore, cash from operating activities, and a reconciliation of Non-GAAP Cash Flow to cash from operating activities, are not available without unreasonable effort. • Non-GAAP Free Cash Flow and Non-GAAP Free Cash Flow Yield are non-GAAP measures. Non-GAAP Free Cash Flow is defined as Non-GAAP Cash Flow in excess of capital expenditures, excluding net acquisitions and divestitures. Non-GAAP Free Cash Flow Yield is defined as Annualized Non-GAAP Free Cash Flow compared to the Company's market capitalization. Ovintiv has not provided a reconciliation of Non-GAAP Free Cash Flow to cash from operating activities or a reconciliation of Non-GAAP Free Cash Flow Yield to annualized net cash from operating activities compared to market capitalization, the most comparable financial measures calculated in accordance with GAAP. Cash from operating activities includes certain items which may be significant and difficult to project with a reasonable degree of accuracy. Therefore, cash from operating activities, and a reconciliation of Non-GAAP Free Cash Flow to cash from operating activities and Non-GAAP Free Cash Flow Yield to annualized cash from operating activities compared to market capitalization, are not available without unreasonable effort. • Adjusted EBITDA is defined as trailing 12-month net earnings (loss) before income taxes, DD&A, impairments, accretion of asset retirement obligation, interest, unrealized gains/losses on risk management, foreign exchange gains/losses, gains/losses on divestitures and other gains/losses. Ovintiv has not provided a reconciliation of Adjusted EBITDA to net income (loss), the most comparable financial measure calculated in accordance with GAAP. Net income (loss) includes certain items which may be significant and difficult to project with a reasonable degree of accuracy. Therefore, net income (loss), and a reconciliation of Adjusted EBITDA to net income (loss), are not available without unreasonable effort. • Debt to Adjusted EBITDA is a non-GAAP measure monitored by management as an indicator of the Company’s overall financial strength. Ovintiv has not provided a reconciliation of Debt to Adjusted EBITDA to total debt to net income (loss), the most comparable financial measure calculated in accordance with GAAP. Total debt to net income (loss) includes certain items which may be significant and difficult to project with a reasonable degree of accuracy. Therefore, total debt to net income (loss), and a reconciliation of Debt to Adjusted EBITDA to total debt to net income (loss), are not available without unreasonable effort. . 2

Forward Looking Statements This presentation contains forward-looking statements or information (collectively, “forward-looking statements”) within the meaning of applicable securities legislation, including Section 27A of the Securities Act of 1933, as amended, and Section 21E of the Securities Exchange Act of 1934, as amended. All statements, except for statements of historical fact, that relate to the anticipated future activities, plans, strategies, objectives or expectations of the Company are forward-looking statements. When used in this presentation, the use of words and phrases including “anticipates,” “believes,” “continue,” “could,” “estimates,” “expects,” “focused on,” “forecast,” “guidance,” “intends,” “maintain,” “may,” “opportunities,” “outlook,” “plans,” “potential,” “strategy,” “targets,” “will,” “would” and other similar terminology is intended to identify forward-looking statements, although not all forward-looking statements contain such identifying words or phrases. Readers are cautioned against unduly relying on forward-looking statements which, are based on current expectations and by their nature, involve numerous assumptions that are subject to both known and unknown risks and uncertainties (many of which are beyond our control) that may cause such statements not to occur, or actual results to differ materially and/or adversely from those expressed or implied. These assumptions include, without limitation: future commodity prices and basis differentials; the Company’s ability to consummate any pending acquisition transactions (including the transactions described herein); future foreign exchange rates; the ability of the Company to access credit facilities and capital markets; data contained in key modeling statistics; the availability of attractive commodity or financial hedges and the enforceability of risk management programs; the Company’s ability to capture and maintain gains in productivity and efficiency; benefits from technology and innovations; expectations that counterparties will fulfill their obligations pursuant to gathering, processing, transportation and marketing agreements; access to adequate gathering, transportation, processing and storage facilities; assumed tax, royalty and regulatory regimes; expectations and projections made in light of, and generally consistent with, the Company’s historical experience and its perception of historical industry trends, including with respect to the pace of technological development; and the other assumptions contained herein. Risks and uncertainties that may affect the Company’s financial or operating performance include: market and commodity price volatility, including widening price or basis differentials, and the associated impact to the Company’s stock price, credit rating, financial condition, oil and natural gas reserves and access to liquidity; uncertainties, costs and risks involved in our operations, including hazards and risks incidental to both the drilling and completion of wells and the production, transportation, marketing and sale of oil, condensate, NGL and natural gas; availability of equipment, services, resources and personnel required to perform the Company’s operating activities; service or material cost inflation; our ability to generate sufficient cash flow to meet our obligations and reduce debt; the impact of a pandemic, epidemic or other widespread outbreak of an infectious disease (such as the ongoing COVID-19 pandemic) on commodity prices and the Company’s operations; our ability to secure adequate transportation and storage for oil, condensate, NGL and natural gas, as well as access to end markets or physical sales locations; interruptions to oil, condensate, NGL and natural gas production, including potential curtailments of gathering, transportation or refining operations; variability and discretion of the Company’s board of directors to declare and pay dividends, if any; the timing and costs associated with drilling and completing wells, and the construction of well facilities and gathering and transportation pipelines; business interruption, property and casualty losses (including weather related losses) or unexpected technical difficulties and the extent to which insurance covers any such losses; counterparty and credit risk; the actions of members of OPEC and other state-controlled oil companies with respect to oil, condensate, NGLs and natural gas production and the resulting impacts on oil, condensate, NGLs and natural gas prices; the impact of changes in our credit rating and access to liquidity, including costs thereof; changes in political or economic conditions in the United States and Canada, including fluctuations in foreign exchange rates, tariffs, taxes, interest rates and inflation rates; failure to achieve or maintain our cost and efficiency initiatives; risks associated with technology, including electronic, cyber and physical security breaches; changes in royalty, tax, environmental, greenhouse gas, carbon, accounting and other laws or regulations or the interpretations thereof; our ability to timely obtain environmental or other necessary government permits or approvals; the Company’s ability to utilize U.S. net operating loss carryforwards and other tax attributes; risks associated with existing and potential lawsuits and regulatory actions made against the Company, including with respect to environmental liabilities and other liabilities that are not adequately covered by an effective indemnity or insurance; risks related to the purported causes and impact of climate change, and the costs therefrom; the impact of disputes arising with our partners, including suspension of certain obligations and inability to dispose of assets or interests in certain arrangements; the Company’s ability to acquire or find additional oil and natural gas reserves; imprecision of oil and natural gas reserves estimates and estimates of recoverable quantities, including the impact to future net revenue estimates; land, legal, regulatory and ownership complexities inherent in the U.S., Canada and other applicable jurisdictions; risks associated with past and future acquisitions or divestitures of oil and natural gas assets, including the receipt of any contingent amounts contemplated in the transaction agreements (such transactions may include third-party capital investments, farm-ins, farm-outs or partnerships); our ability to repurchase the Company’s outstanding shares of common stock, including risks associated with obtaining any necessary stock exchange approvals; the existence of alternative uses for the Company’s cash resources which may be superior to the payment of dividends or effecting repurchases of the Company’s outstanding shares of common stock; risks associated with decommissioning activities, including the timing and cost thereof; risks and uncertainties described in Item the “Risk Factors” and “Management’s Discussion and Analysis of Financial Condition and Results of Operations” sections of the Company’s most recent Annual Report on Form 10-K; and other risks and uncertainties impacting the Company’s business as described from time to time in the Company’s periodic filings with the SEC or Canadian securities regulators. Readers are cautioned that the assumptions, risks and uncertainties referenced above are not exhaustive. Although the Company believes the expectations represented by its forward-looking statements are reasonable based on the information available to it as of the date such statements are made, forward-looking statements are only predictions and statements of our current beliefs and there can be no assurance that such expectations will prove to be correct. Unless otherwise stated herein, all statements, including forward-looking statements, contained in this presentation are made as of the date of this presentation and, except as required by law, the Company undertakes no obligation to update publicly, revise or keep current any such statements. The forward-looking statements contained in this presentation and all subsequent 3 forward-looking statements attributable to the Company, whether written or oral, are expressly qualified by these cautionary statements.
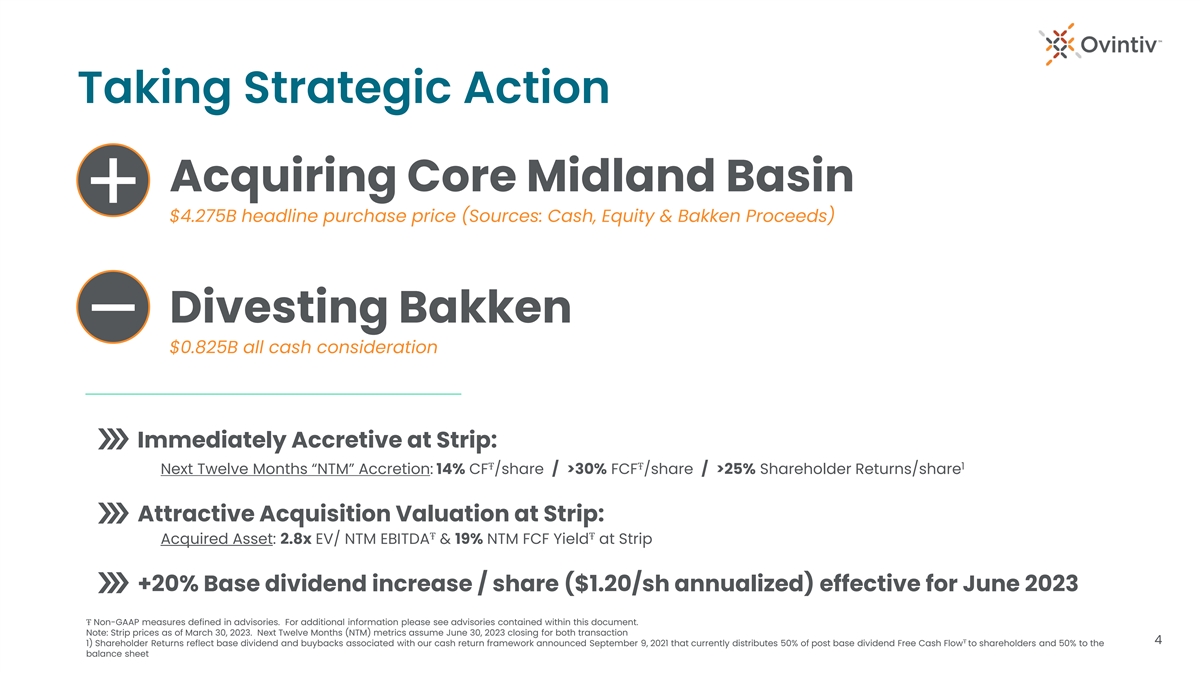
Taking Strategic Action Acquiring Core Midland Basin + $4.275B headline purchase price (Sources: Cash, Equity & Bakken Proceeds) Divesting Bakken – $0.825B all cash consideration Immediately Accretive at Strip: ŦŦ 1 Next Twelve Months “NTM” Accretion: 14% CF /share / >30% FCF /share / >25% Shareholder Returns/share Attractive Acquisition Valuation at Strip: ŦŦ Acquired Asset: 2.8x EV/ NTM EBITDA & 19% NTM FCF Yield at Strip +20% Base dividend increase / share ($1.20/sh annualized) effective for June 2023 Ŧ Non-GAAP measures defined in advisories. For additional information please see advisories contained within this document. Note: Strip prices as of March 30, 2023. Next Twelve Months (NTM) metrics assume June 30, 2023 closing for both transaction Ŧ 4 1) Shareholder Returns reflect base dividend and buybacks associated with our cash return framework announced September 9, 2021 that currently distributes 50% of post base dividend Free Cash Flow to shareholders and 50% to the balance sheet
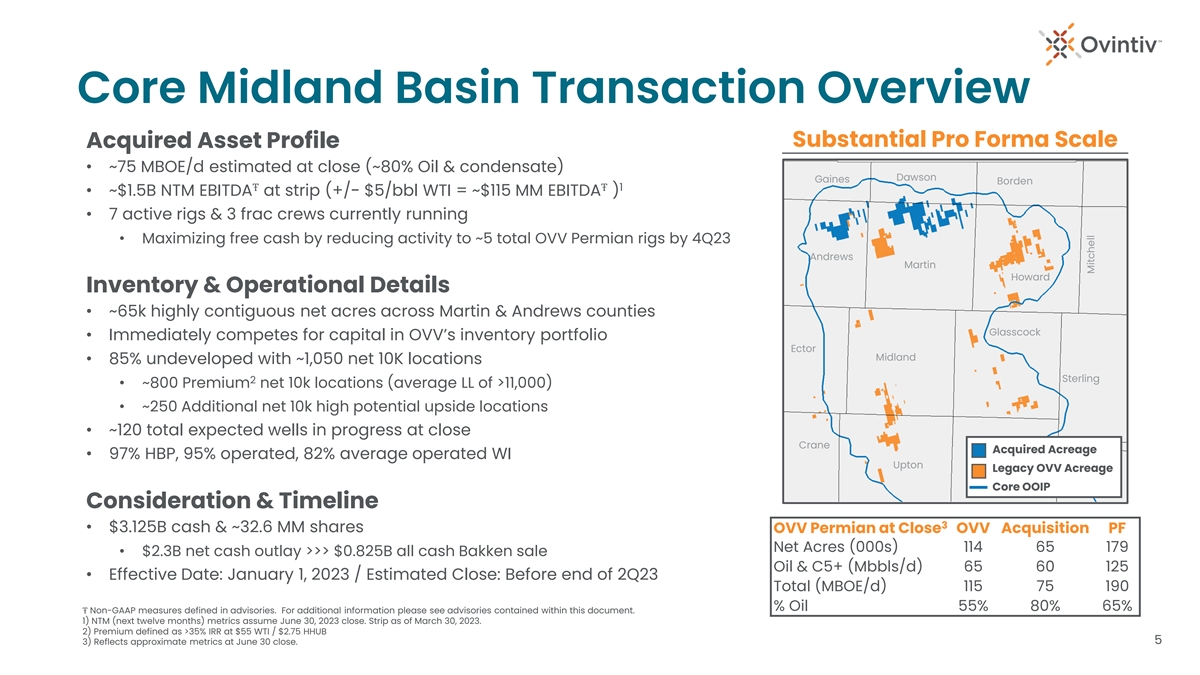
Core Midland Basin Transaction Overview Substantial Pro Forma Scale Acquired Asset Profile • ~75 MBOE/d estimated at close (~80% Oil & condensate) Dawson Gaines Borden ŦŦ 1 • ~$1.5B NTM EBITDA at strip (+/- $5/bbl WTI = ~$115 MM EBITDA ) • 7 active rigs & 3 frac crews currently running • Maximizing free cash by reducing activity to ~5 total OVV Permian rigs by 4Q23 Andrews Martin Howard Inventory & Operational Details • ~65k highly contiguous net acres across Martin & Andrews counties Glasscock • Immediately competes for capital in OVV’s inventory portfolio Ector Midland • 85% undeveloped with ~1,050 net 10K locations Sterling 2 • ~800 Premium net 10k locations (average LL of >11,000) • ~250 Additional net 10k high potential upside locations • ~120 total expected wells in progress at close Crane Acquired Acreage Reagan • 97% HBP, 95% operated, 82% average operated WI Irion Upton Legacy OVV Acreage Core OOIP Consideration & Timeline 3 • $3.125B cash & ~32.6 MM shares OVV Permian at Close OVV Acquisition PF Net Acres (000s) 114 65 179 • $2.3B net cash outlay >>> $0.825B all cash Bakken sale Oil & C5+ (Mbbls/d) 65 60 125 • Effective Date: January 1, 2023 / Estimated Close: Before end of 2Q23 Total (MBOE/d) 115 75 190 % Oil 55% 80% 65% Ŧ Non-GAAP measures defined in advisories. For additional information please see advisories contained within this document. 1) NTM (next twelve months) metrics assume June 30, 2023 close. Strip as of March 30, 2023. 2) Premium defined as >35% IRR at $55 WTI / $2.75 HHUB 5 3) Reflects approximate metrics at June 30 close. Mitchell
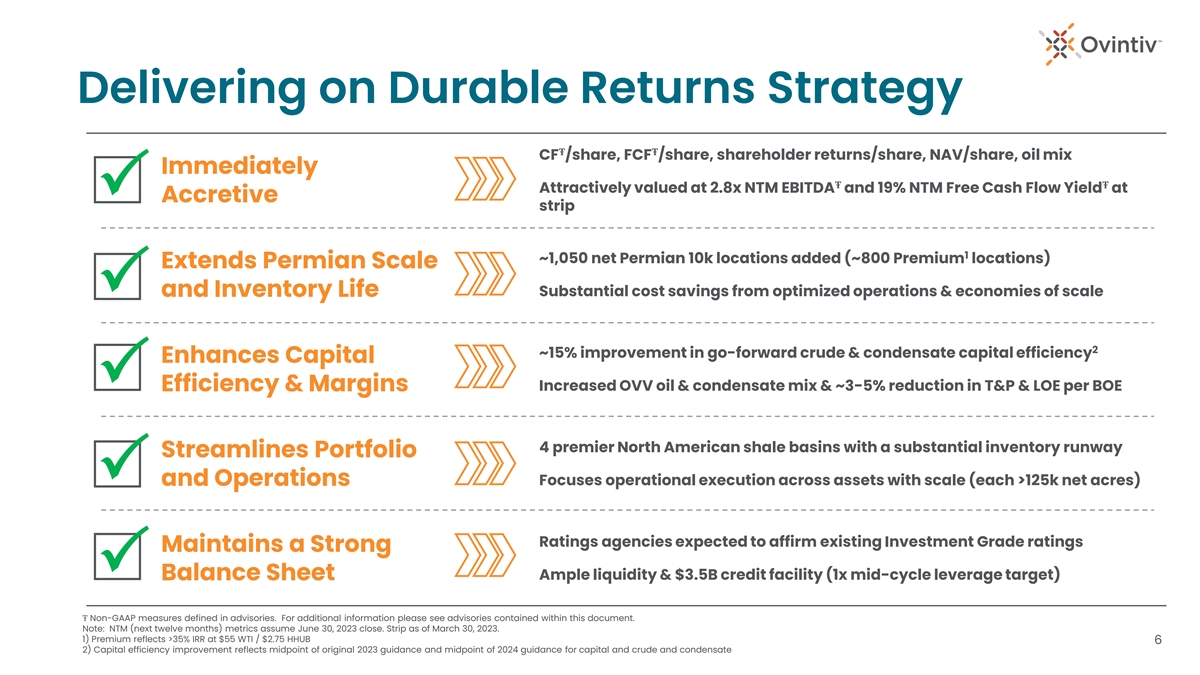
Delivering on Durable Returns Strategy ŦŦ CF /share, FCF /share, shareholder returns/share, NAV/share, oil mix Immediately ŦŦ Attractively valued at 2.8x NTM EBITDA and 19% NTM Free Cash Flow Yield at P Accretive strip 1 ~1,050 net Permian 10k locations added (~800 Premium locations) Extends Permian Scale Substantial cost savings from optimized operations & economies of scale and Inventory Life P 2 ~15% improvement in go-forward crude & condensate capital efficiency Enhances Capital P Efficiency & Margins Increased OVV oil & condensate mix & ~3-5% reduction in T&P & LOE per BOE 4 premier North American shale basins with a substantial inventory runway Streamlines Portfolio Focuses operational execution across assets with scale (each >125k net acres) and Operations P Ratings agencies expected to affirm existing Investment Grade ratings Maintains a Strong P Balance Sheet Ample liquidity & $3.5B credit facility (1x mid-cycle leverage target) Ŧ Non-GAAP measures defined in advisories. For additional information please see advisories contained within this document. Note: NTM (next twelve months) metrics assume June 30, 2023 close. Strip as of March 30, 2023. 1) Premium reflects >35% IRR at $55 WTI / $2.75 HHUB 6 2) Capital efficiency improvement reflects midpoint of original 2023 guidance and midpoint of 2024 guidance for capital and crude and condensate

Achieves Key Financial Targets Key Accretion Metrics at Strip NTM 2024 Per Share Accretion • Attractive Acquisition Valuation: P ŦŦ 2.8x NTM EBITDA & 19% NTM FCF Yield at strip Ŧ Cash Flow +14% +12% Immediately • +20% per share base dividend increase Ŧ supported through incremental cash flow Free Cash Flow >30% >45% Accretive • Substantial free cash flow to shareholders Shareholder Returns >25% >40% through well defined return framework Balanced Financing Structure • Ratings agencies expected to affirm P Bakken Divestiture existing Investment Grade ratings (All Cash Proceeds) Temporary Debt Maintains (5-yrs or less) 1 • ~1.4x closing Leverage Ratio at strip a Strong 1 • ~1.0 mid-cycle Leverage target = ~$4B debt Balance Sheet Equity to Seller • Ample Liquidity and $3.5B senior unsecured credit facility with limited covenants Long-Term Debt (>5-yrs) Ŧ Non-GAAP measures defined in advisories. For additional information please see advisories contained within this document. Note: NTM (next twelve months) metrics assume June 30, 2023 close. Strip as of March 30, 2023. 7 ŦŦ 1) Post close Leverage Ratio reflects projected post close debt assuming a June 30, 2023 close and NTM EBITDA . 1.0x mid-cycle leverage target reflects ~$4B of mid-cycle EBITDA

Acquired Acreage Aligns with Core Permian 1 Wells Consistent with Legacy OVV Strong and Repeatable Well Results Permian: 12 Month Cumulative Oil Mbbls / 1,000 ft • Multi-zone development across up to 6 benches today • Further delineating additional promising horizons across our acreage 18 • Substantial resource in place supports spacing and stacking approach 16 14 Primed For Full-Field Cube Development 12 • Positioned to maximize recovery across ~85% undeveloped footprint • Contiguous position in close proximity to current OVV acreage 10 • Plan to execute OVV’s proven concurrent multi-zone development 8 • Well delineated: >180 producing hz. wells & substantial offset activity 6 4 Upside – Potential to Unlock Even Stronger Results 2 Continuously optimizing completion design and stage architecture P 0 Right-sizing artificial lift equipment and strategy to maximize production P ’21 + ’22 ’22 OVV ’23 OVV ’21 OVV OVV '21 OVV ' 22 OVV '23 Highlander Acquired 2 Materially less OFI from a normalized activity level across a larger asset base Acreage P 1) Includes latest actuals for all 2021 wells and actuals and forecasts for all OVV wells in 2022 and 2023. Acquired acreage reflects public Enverus data 8 2) OFI = Offset Frac Interference. Current acquired acreage operations are running 7 rigs on ~65k net acres. OVV plans to normalize down to 5 rigs across its ~179k net pro forma acres

Encouraging Upside From Offset OVV Wells 1 Strong 1Q23 Results 1Q23 OVV Sugarloaf Development in Northern Martin 2023 OVV Permian Average 22 • 7 well pad development across 4 benches (MSB, JM, UL SPRBY, Dean) 1Q23 OVV Sugarloaf Actuals • Optimized completion design with increased sand to water ratio 20 1Q23 OVV Sugarloaf Forecast 2022 North Midland Basin Offset Industry Activity Continues to Impress Industry Average 18 • See similar productive capability across acquired acreage footprint 16 • Northern Midland Basin seeing supportive well productivity trends 14 Gaines Dawson 12 10 8 Strong Recent OVV Sugarloaf Highlights 6 ~1,500 Bo/d IP30 (Pad Avg.) 1Q23 Offset OVV P Andrews Martin 4 Best Ever OVV Jo Mill IP Well Results P Repeatable Performance Acquired Acreage P 2 Legacy OVV Acreage Optimized Completions P Core OOIP 0 1Q23 OVV Sugarloaf Pad 0 60 120 180 240 300 360 9 1) Includes latest actuals and forecasts for all OVV wells in 2023 across OVV’s legacy acreage. 2022 North Midland Basin average reflects 2022 public Enverus data for all operators across Andrews, Howard and Martin counties. Cume. Oil Mbbls / 1,000 ft
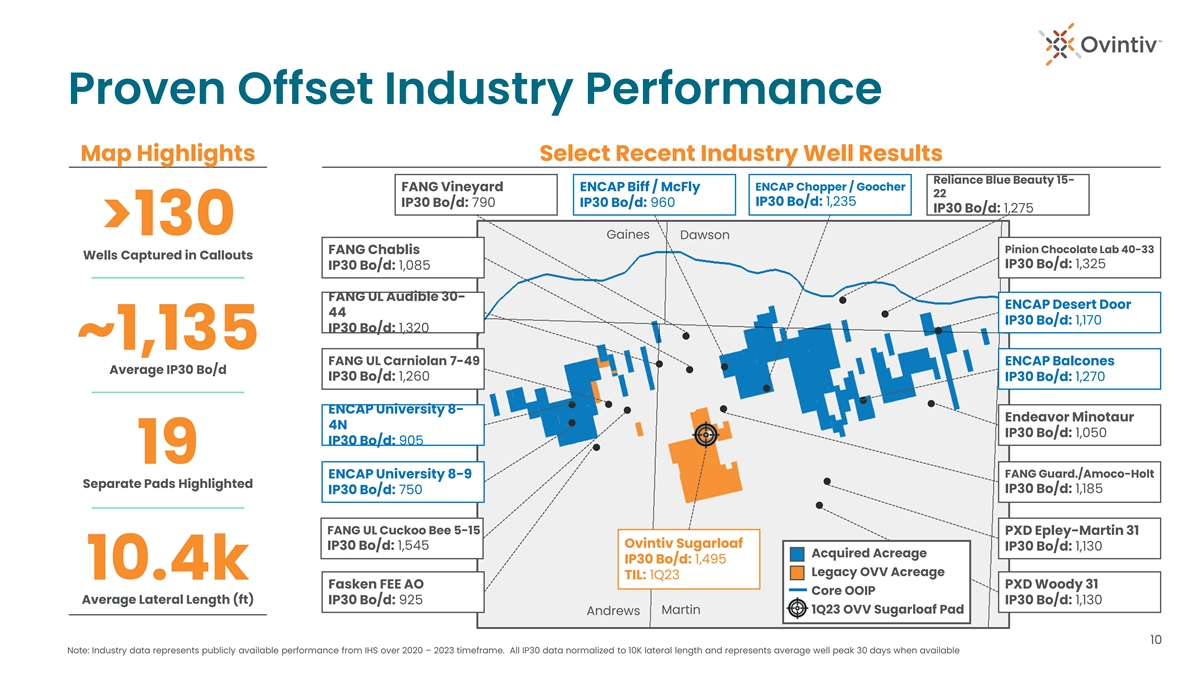
Proven Offset Industry Performance Map Highlights Select Recent Industry Well Results Reliance Blue Beauty 15- FANG Vineyard ENCAP Biff / McFly ENCAP Chopper / Goocher 22 IP30 Bo/d: 1,235 IP30 Bo/d: 790 IP30 Bo/d: 960 IP30 Bo/d: 1,275 >130 Gaines Dawson FANG Chablis Pinion Chocolate Lab 40-33 Wells Captured in Callouts IP30 Bo/d: 1,325 IP30 Bo/d: 1,085 FANG UL Audible 30- ENCAP Desert Door 44 IP30 Bo/d: 1,170 IP30 Bo/d: 1,320 ~1,135 FANG UL Carniolan 7-49 ENCAP Balcones Average IP30 Bo/d IP30 Bo/d: 1,260 IP30 Bo/d: 1,270 ENCAP University 8- Endeavor Minotaur 4N IP30 Bo/d: 1,050 IP30 Bo/d: 905 19 FANG Guard./Amoco-Holt ENCAP University 8-9 Separate Pads Highlighted IP30 Bo/d: 1,185 IP30 Bo/d: 750 FANG UL Cuckoo Bee 5-15 PXD Epley-Martin 31 Ovintiv Sugarloaf IP30 Bo/d: 1,545 IP30 Bo/d: 1,130 Acquired Acreage IP30 Bo/d: 1,495 Legacy OVV Acreage 10.4k TIL: 1Q23 Fasken FEE AO PXD Woody 31 Core OOIP Average Lateral Length (ft) IP30 Bo/d: 925 IP30 Bo/d: 1,130 Martin 1Q23 OVV Sugarloaf Pad Andrews 10 Note: Industry data represents publicly available performance from IHS over 2020 – 2023 timeframe. All IP30 data normalized to 10K lateral length and represents average well peak 30 days when available

Enhances ’23 Program with a Strong ’24 Outlook Updated 2024 Streamlined and enhanced portfolio supports 2023 2023 Scale through-cycle durable return strategy Total Production 500 – 525 520 – 545 (MBOE/d) >200 ~3-5% reduction in LOE & T&P per BOE post close Crude & Condensate • Detailed cost guidance update with 1Q23 earnings Oil & Condensate (Mbbls/d) 165 – 175 185 – 195 (Mbbls/d) Project +10% oil & condensate in ‘23 and +18% in ’24 $2.1 - $2.5 NGLs C2 – C4 Capex 80 – 85 80 – 85 (Mbbls/d) ($B) 2023 updated capital guide impacted by high activity on target acreage position Natural Gas 1,525 – 1,575 1,525 – 1,575 ~15% • Plan for ~5 rigs across acquired & legacy position by 4Q23 (MMcf/d) Capital Efficiency Improvement Capital (Oil & C5+ vs. original ‘23) $2.15 - $2.35 $2.6 - $2.9 ($B) Strong 1Q23 Performance *See appendix slide 16 for more details on rig schedule cadence and quarterly timing *Assumes June 30, 2023 close date for both transactions Combined Permian Rigs ~165 Mbbls/d – Beat oil & condensate production ~10 ~10 Updated 2023 guidance ultimately ~510 MBOE/d – Beat total production 1Q23 dependent on close date for ~5 Updates BOTH transactions $610 - $620 MM – Beat & narrowed capex guide (Guidance assumes June 30, 2023) ~$200 MM – Premium oil focused bolt-ons 1Q23 2Q23 3Q23 4Q23 11

12

Appendix

Optimized Portfolio High-Quality Multi-Basin Portfolio P • Four high return assets each with deep Premium inventory Montney • Innovation and best practices distributed across the portfolio Strong production across all products & advantaged costs Operational Excellence Drives Efficiencies P • In-basin operational flexibility and margin enhancement • Optimized development programs across asset base Multi-Product Commodity Exposure P • Premium return options across oil & condensate and gas • Maximized price realizations through market diversification Uinta Emerging and undeveloped Deep Premium Inventory Depth P high-margin oil option • >10-yrs of oil & condensate & >20-yrs of natural gas Premium inventory • Proven organic assessment and appraisal program Anadarko Strong Free Cash Flow & quick cycle multi-product option Premium Multi-Basin Portfolio & Resource Efficient Resource to Free Cash Flow Conversion Durable Returns Disciplined Capital Allocation Recipe = Durable Return Profile Permian Strong oil mix, substantial resource & proven well results 14 Note: Premium defined as >35% IRR at $55 WTI / $2.75 HHUB

Acquisition Adds to Well Positioned Permian Ops Midland Basin Wet Sand Mine Combined Permian Scale Provides Efficiencies • Cross-basin economies of scale driven by extended footprint • Increased operational flexibility and reduced rig moves • Improves utilization of existing facilities, contracts and services OVV Primed for Operational Control • Planning for full utilization of wet sand and simul-frac operations • Incremental cost and operational efficiencies from owned infrastructure Acquired Assets Well Positioned on Services & Takeaway • Limited service contracts with nothing extending beyond 2023 1 • Gas takeaway firmly in-hand (acquired assets bring ~20 MMCF/d of gas) • Plan to continue proven WAHA gas basis risk management Existing local wet sand mine Substantial Undeveloped Resource supports low cost & efficient operations Acquired Black Swan, Piedra, PetroLegacy and Endeavor Infrastructure Substantial water infrastructure rank best among private operators based on the lowers LOE and reduces well D&C Benefits Operations percentage of undeveloped acreage. 2 (14 active SWD wells & >50 miles owned pipe) Enverus - Permian Development: Hunting for Undeveloped Sections Dec 2022 1) Estimated closing gas production assuming June 30, 2023 close 15 2) As of announcement
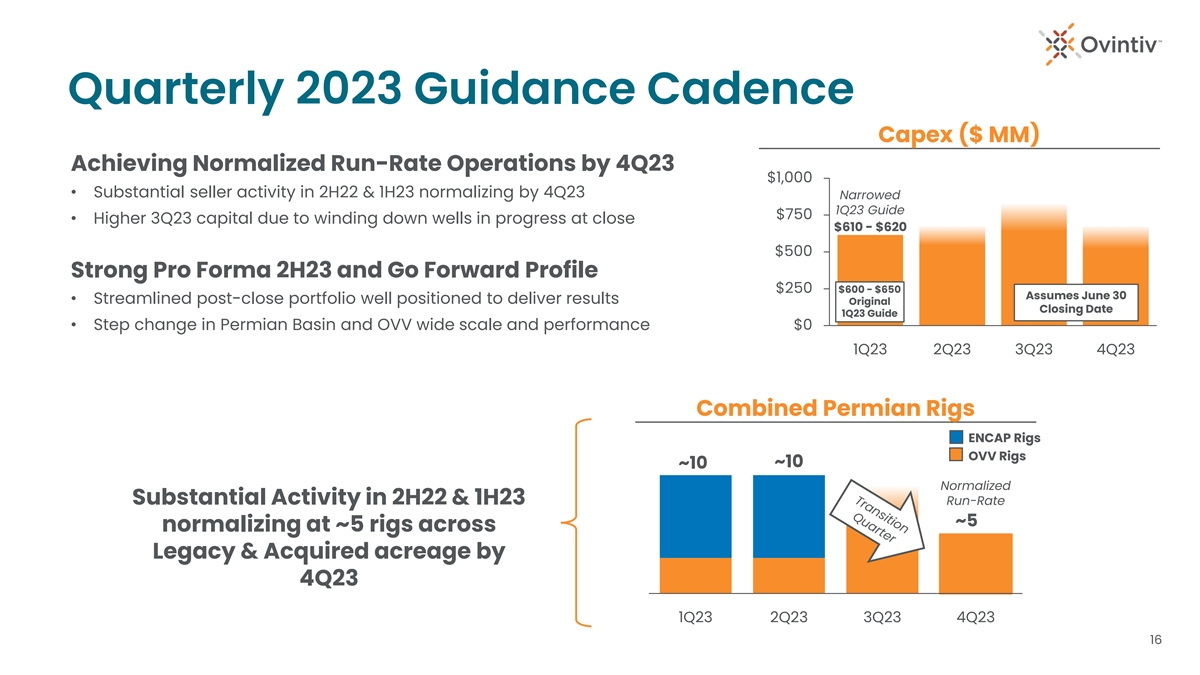
Quarterly 2023 Guidance Cadence Capex ($ MM) Achieving Normalized Run-Rate Operations by 4Q23 $1,000 • Substantial seller activity in 2H22 & 1H23 normalizing by 4Q23 Narrowed 1Q23 Guide $750 • Higher 3Q23 capital due to winding down wells in progress at close $610 - $620 $500 Strong Pro Forma 2H23 and Go Forward Profile $600 - $650 $250 Assumes June 30 • Streamlined post-close portfolio well positioned to deliver results Original Closing Date 1Q23 Guide • Step change in Permian Basin and OVV wide scale and performance $0 1Q23 2Q23 3Q23 4Q23 Combined Permian Rigs ENCAP Rigs OVV Rigs ~10 ~10 Normalized Substantial Activity in 2H22 & 1H23 Run-Rate ~5 normalizing at ~5 rigs across Legacy & Acquired acreage by 4Q23 1Q23 2Q23 3Q23 4Q23 16
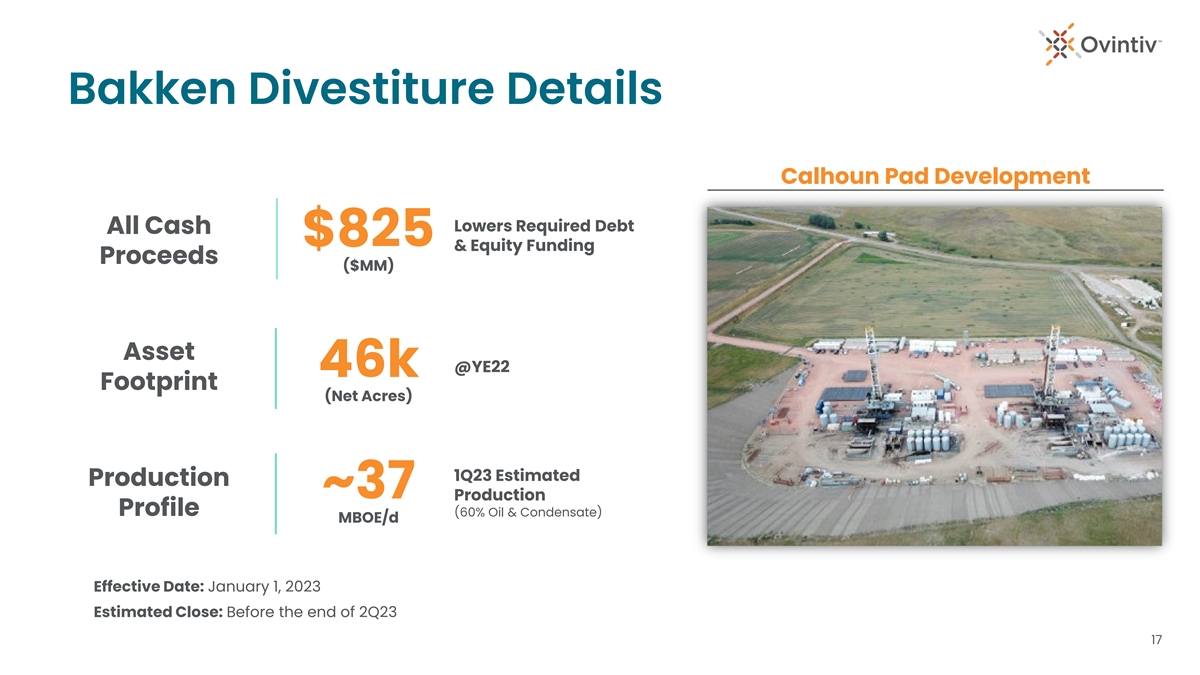
Bakken Divestiture Details Calhoun Pad Development Lowers Required Debt All Cash $825 & Equity Funding Proceeds ($MM) Asset @YE22 46k Footprint (Net Acres) 1Q23 Estimated Production ~37 Production Profile (60% Oil & Condensate) MBOE/d Effective Date: January 1, 2023 Estimated Close: Before the end of 2Q23 17

Committed to Capital Allocation Framework Our Proven Ŧ ~$4B pro forma mid-cycle EBITDA Framework Ŧ 1x Mid-Cycle +$1B from previous level ($3B was old mid-cycle EBITDA ) Leverage Target Post Base Dividend Ŧ Substantial increase in operational scale Reaffirmed Free Cash Flow >200 Mbbls/d 2024 oil & condensate Incremental free cash supports debt reduction Shareholder Returns High return & short payback inventory generates substantial free cash Rapid Debt Share Buybacks Reduction Simple free cash allocation framework 50% Variable Dividend 50% of post base dividend FCF to the Balance Sheet At least Balance Sheet +20% base dividend increase ($1.20/sh annualized) Debt Paydown Supported by larger operational scale and confidence in operations Base Dividend Low-cost 50% property bolt-ons Increase Up to Further opportunity to grow the base dividend Ŧ Targeting absolute base dividend at ~10% of mid-cycle EBITDA Focused on debt paydown portion of “Balance Sheet” allocation near-term Ŧ Non-GAAP measures defined in advisories. For additional information please see advisories contained within this document. 18
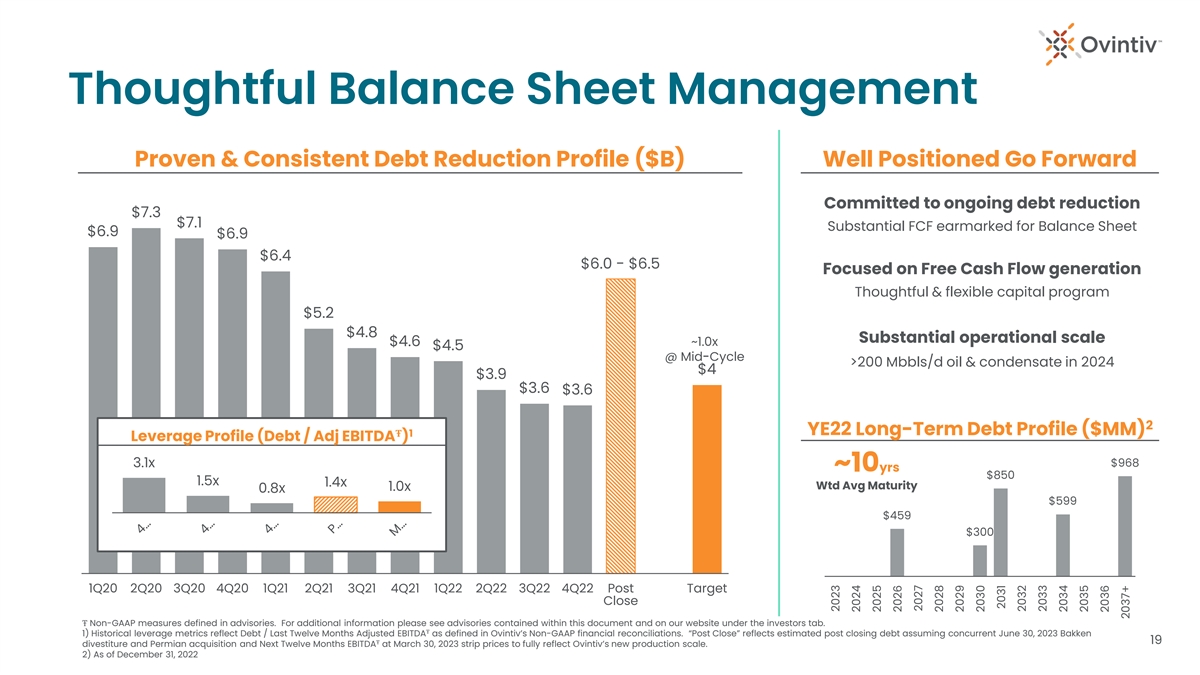
Thoughtful Balance Sheet Management Proven & Consistent Debt Reduction Profile ($B) Well Positioned Go Forward Committed to ongoing debt reduction $7.3 $7.1 Substantial FCF earmarked for Balance Sheet $6.9 $6.9 $6.4 $6.0 - $6.5 Focused on Free Cash Flow generation Thoughtful & flexible capital program $5.2 $4.8 Substantial operational scale $4.6 ~1.0x $4.5 @ Mid-Cycle >200 Mbbls/d oil & condensate in 2024 $4 $3.9 $3.6 $3.6 2 YE22 Long-Term Debt Profile ($MM) Ŧ 1 Leverage Profile (Debt / Adj EBITDA ) $968 3.1x ~10yrs $850 1.5x 1.4x Wtd Avg Maturity 1.0x 0.8x $599 $459 $300 1Q20 2Q20 3Q20 4Q20 1Q21 2Q21 3Q21 4Q21 1Q22 2Q22 3Q22 4Q22 Post GAP Target Close Ŧ Non-GAAP measures defined in advisories. For additional information please see advisories contained within this document and on our website under the investors tab. Ŧ 1) Historical leverage metrics reflect Debt / Last Twelve Months Adjusted EBITDA as defined in Ovintiv’s Non-GAAP financial reconciliations. “Post Close” reflects estimated post closing debt assuming concurrent June 30, 2023 Bakken 19 Ŧ divestiture and Permian acquisition and Next Twelve Months EBITDA at March 30, 2023 strip prices to fully reflect Ovintiv’s new production scale. 2) As of December 31, 2022 2023 2024 2025 2026 2027 2028 2029 2030 2031 2032 2033 2034 2035 2036 2037+