Exhibit 99.1
November 9, 2021
Fellow Shareholders,
DoorDash's mission is to grow and empower local economies. We have invested heavily to drive economic growth and strengthen our marketplace through product improvements, added selection, and economic benefits for our key constituents. Over the last two years, we reduced average consumer fees per order by 9%, increased average earnings per active hour for Dashers by over 30%, and reduced the average commission rate paid by Marketplace partners. Among key achievements in Q3 2021, DoorDash:
•Drove DashPass members and orders to an all-time high, exiting the quarter with over 9 million members
•Increased the percentage of MAU engaging with a new vertical to 12% in September from 10% in June
•Increased Contribution Profit as a percentage of GOV from the U.S. Restaurant marketplace on both a quarter-over-quarter ("Q/Q") and year-over-year ("Y/Y") basis
Q3 2021 Key Financial Metrics
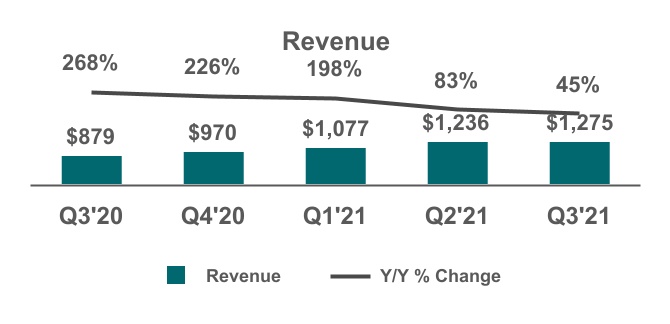
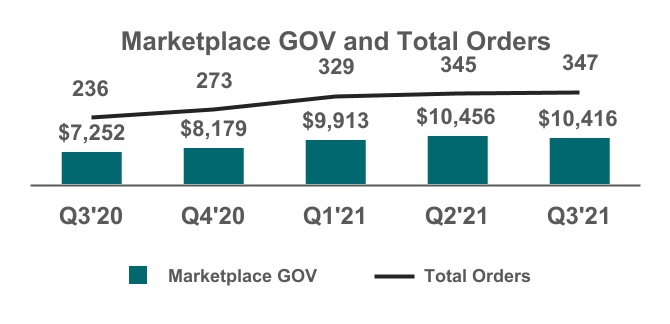
•Revenue grew 45% Y/Y to $1.3 billion, Total Orders grew 47% Y/Y to 347 million, and Marketplace GOV grew 44% Y/Y to $10.4 billion
•GAAP gross profit of $665 million, increased 42% Y/Y from $469 million in Q3 2020
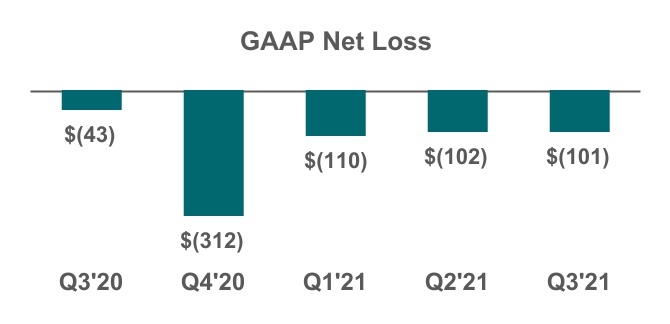
•GAAP net loss of $101 million, compared to GAAP net loss of $43 million in Q3 2020
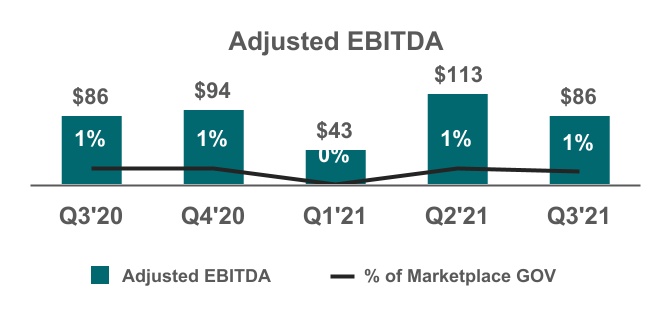
•Adjusted EBITDA of $86 million, was in line with $86 million in Q3 2020
(Figure in millions, except percentages)
Operating Trends
CONSUMERS
Our Marketplace offers products that most people consume on a daily basis. We have always believed the transaction velocity in these verticals would give us a unique opportunity to add value in people’s lives. Our goal has been, and will continue to be, to provide the right combination of selection, quality, affordability, and delight that allows our service to become a regular and valuable part of consumers' lives in the communities we serve.
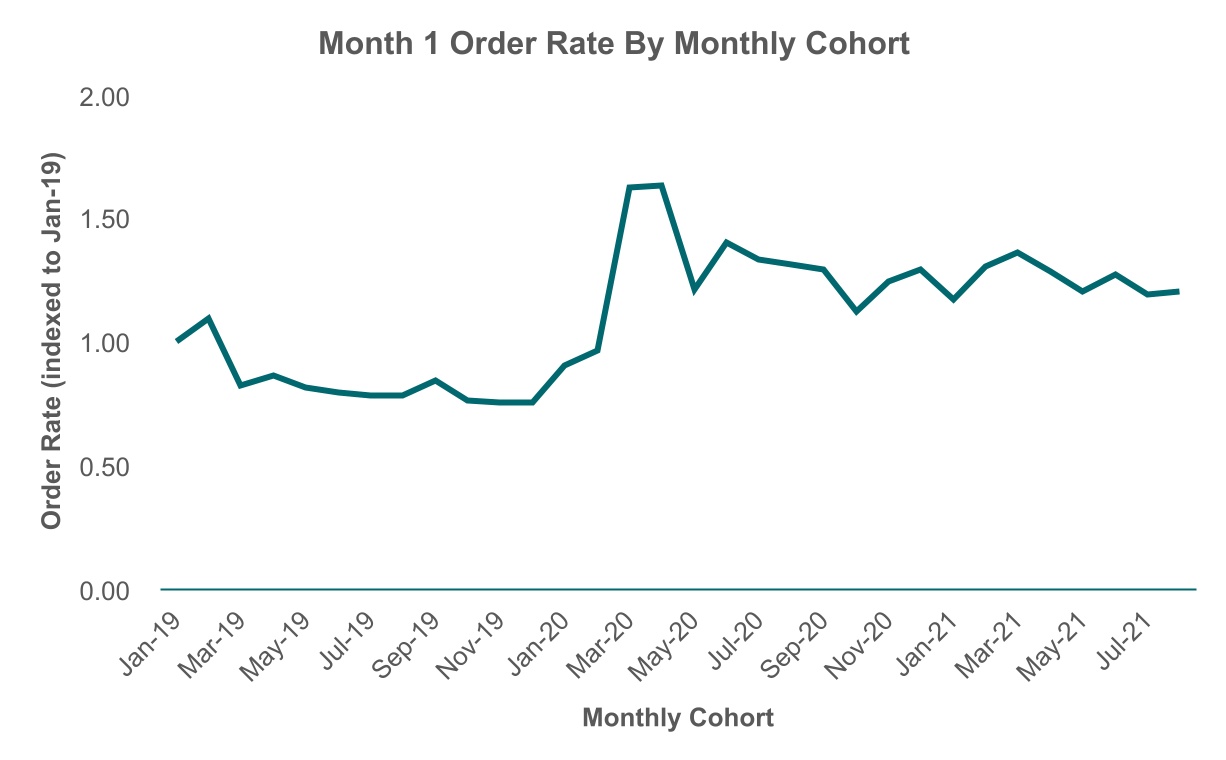
Our MAU grew to a record high in Q3. Average order frequency in Q3 remained consistent with the all-time high reached in Q2 and increased by a double digit percentage versus Q3 2020. Improvements to our service, along with growing awareness of it, are also visible in new consumer metrics. The consumers we acquired in Q3 demonstrated initial order rates1 that were largely consistent with recent quarters, and well above levels from 2019 and prior. The number of new consumers acquired in Q3 was down versus peak levels in 2020, but remained well above levels in 2019 and prior year periods.
Source: DoorDash internal data
While we have seen improving engagement metrics for our consumer base as a whole in recent years, we have seen the most progress in engagement among DashPass members, who order significantly more than non-DashPass users on average, are ordering from new verticals in expanding numbers, and are increasingly leveraging new features like pickup and DoubleDash.
We exited Q3 with over 9 million DashPass members and DashPass orders reached an all-time high as a percentage of total Marketplace orders in the quarter. Restaurant deliveries continue to make up the vast majority of DashPass order volume. However, DashPass members are increasingly leveraging the service in new ways and in new verticals. In September, the percentage of DashPass members who placed an order in a non-restaurant vertical was more than twice
1 Order rate is the product of retention and order frequency.
as high as the percentage of non-DashPass users. DashPass members also grew their average use of pickup by 25% Y/Y in September.
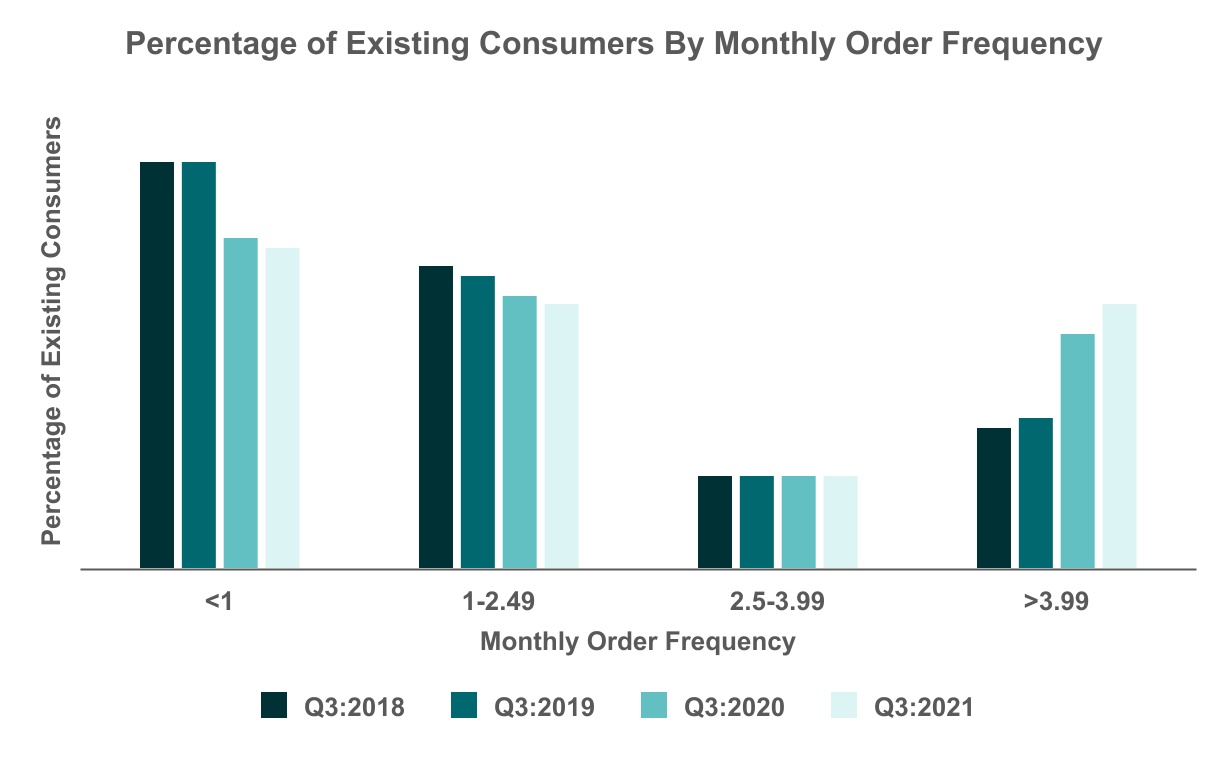
We are proud of our progress growing DashPass members and excited by the opportunity ahead of us. There is a much larger group of people who are not members and order much less frequently on average, as well as an even larger group who do not use DoorDash. We believe the vast majority of consumers still view our service as a point solution for restaurant delivery or a luxury service. To attract these consumers and win their consistency, we intend to continue investing to expand the number of merchants we connect people with, broaden the range of services we offer, improve our quality and ease-of-use, and extend our affordability. If we execute effectively, we believe we can earn the loyalty of many new consumers and drive increases in retention and engagement for many years to come.
Source: DoorDash internal data
In international markets, we have focused primarily on improving selection and promoting the value of DashPass in recent quarters. We believe this is having a positive impact. Third party data suggests we gained meaningful category share in both Canada and Australia in Q3. Our efforts in Japan remain in the extremely early stages. While we are seeing strong month-over-month ("M/M") order growth in the country, we are focused primarily on broadening selection and improving the quality of the product.
We are pleased with the improvements in our consumer value proposition to date. However, we remain far away from our ultimate goal of connecting consumers to all of local commerce. To achieve this, we must continue to increase the value we provide consumers, while also finding new ways to inform and delight them throughout their decision journeys.
DASHERS
DoorDash continued providing meaningful earnings opportunities for millions of Dashers in Q3. Over 3 million people dashed in Q3, earning over $2.8 billion. As we create efficiencies in our network, we aim to pass a portion of the gains to Dashers in the form of higher earnings. In Q3, Dasher earnings per active hour increased by 9% versus Q3 2020 and by more than 30% versus Q3 2019.
Trends in Dasher applications and the number of new Dashers in Q3 remained consistent with trends in the first half of the year. We believe the persistent interest in dashing in a tight labor market with rising wages highlights the complementary nature of dashing to traditional structured work. Dashing offers low barriers to entry, rapid access to earnings (including free daily payouts via DasherDirect), and flexibility in when to work, how much to work, and how frequently to work over time.
The unique characteristics of dashing are fundamentally different from those offered by structured work, which we believe increases choice in the labor market. This enables individuals to leverage a broader set of tools as they look to optimize their mix of work, income, and flexibility at various points in their lives. If dashing did not exist or was forced into an artificial structure to make it more like traditional work, we believe much of the earnings from dashing would be lost; 27% of Dashers say that they simply would not work to replace their dashing income if platforms like DoorDash weren’t an option.
In addition to anecdotal evidence from the labor market, results from Dasher surveys and data around Dasher behavior suggest that dashing is complementary to traditional structured work. In the most recent U.S. Dasher survey we conducted in July 2021, 60% of Dashers had other full-time or part-time jobs or were self-employed (an additional 26% were students, retired, or full-time parents or caregivers). Additionally, 64% of Dashers said a main reason they dash is because “it allows me to supplement my income whenever I need to.”
Many Dashers use the supplemental income from dashing to help in periods of financial strain. 79% of Dashers say their top financial goal when dashing is to pay monthly bills like rent, mortgage payments, or car payments. Sometimes, Dashers use the income from dashing during periods of disruption in traditional employment or to avoid government assistance; 75% of Dashers earning less than $50,000 per year said they have dashed to make up for lost income or reduced hours at work, and 52% of Dashers said they have dashed to avoid applying for government assistance programs. Many of these periods are transitory and we believe the accessibility and flexibility of dashing allow it to meet people’s needs in a way that traditional structured work does not.
We believe choice is empowering. Having ample options for traditional employment is essential to a healthy economy. However, the consistent demand for dashing in recent quarters suggests traditional employment alone does not fully address the needs of a varied and complex population. We believe dashing provides additive features to the labor market that, if removed or impaired, would risk damaging the millions of people who simply want an opportunity to earn more money in a manner that works for their lives.
We firmly believe we can make dashing even better, and we remain committed to improving the accessibility, flexibility, and earnings potential we offer to ensure Dashers have the opportunity to choose what is best for them.
MERCHANTS
Our vision is to help all local merchants connect with consumers in their communities, both through our Marketplace and by leveraging our Platform Services. We exited Q3 with well over 500,000 partner merchants and continue to add selection at a pace that is faster than pre-pandemic levels.
We continued to generate strong revenue for restaurants in Q3, which complemented in-store sales. According to the U.S. Census Bureau, Food Services and Drinking Places retail sales reached an all-time high in Q3, exceeding the previous all-time high set in Q2 2021. The simultaneous growth of in-store dining with continued growth in delivery through 2021 suggests the demand we create and fulfill has been incremental to the in-store experience at restaurants, and additive to the industry as a whole.
Beyond simply driving demand, we aim to provide the best set of tools available for merchants to build, analyze, and grow their omni-channel businesses. We recently enhanced our Insights Hub to help merchants make critical operational decisions, launched our Merchant Experience Partner Program to provide dedicated support for all partner merchants,
launched the DoorDash Business Manager app so partners can track their business at all times, and introduced sponsored listings to help merchants reach new customers and grow sales.
We are excited by the recent expansion of our advertising platform and believe sponsored listings will be complementary to promotions and other marketing efforts to help merchants attract new customers, retain existing customers, and grow sales. We also expect our expanded advertising platform to drive incremental revenue for DoorDash. Our intention for the foreseeable future is to reinvest the gross profit associated with our ad revenue back into the business in order to strengthen our value proposition to merchants, consumers and Dashers, and expand our long-term potential.
Our goal for merchants in non-restaurant categories is the same as it is in restaurants; drive incremental demand and provide world class services that help merchants build and manage their omni-channel businesses. In Q3, we added meaningful new partnerships that span both our Marketplace and Platform Services, including: Total Wine & More, Weis Markets, Cardenas Markets, and Bed Bath & Beyond. Exiting Q3, our Marketplace included over 40,000 non-restaurant stores.
Source: DoorDash internal data
We exited Q3 operating under price controls in 65 jurisdictions, down from a peak of 108. Price controls expired in 33 jurisdictions in Q3 and no jurisdictions implemented new price controls in the quarter. In Q3, we estimate price controls had a net negative impact on our revenue of $23 million. We expect the impact to decline slightly in Q4.
Of note, we recently surpassed 1 million deliveries on behalf of food banks, food pantries, and other social impact partners through Project DASH. This equates to an estimated 21 million meals, as well as an immeasurable amount of time saved and dignity preserved for people in need. We are incredibly grateful for the opportunity to contribute to our communities through Project DASH and look forward to continuing to broaden its availability.
Financial and Operational Highlights
In Q3 2021, we grew Total Orders 47% Y/Y to 347 million. On a Y/Y basis, order growth was driven by increased average order frequency, growth in new consumers, and growth in orders through Drive. International orders grew substantially faster than domestic orders on a Y/Y basis in Q3.
Q3 2021 Marketplace GOV grew 44% Y/Y to $10.4 billion. Growth in Marketplace GOV drove Q3 2021 revenue up 45% Y/Y to $1.3 billion. Q3 revenue also benefited from the recognition of $36 million in gift card breakage revenue, as we built enough history to estimate breakage rates. Going forward, we will estimate and recognize gift card breakage concurrent with the sale of gift cards.
Net Revenue Margin, which in the past we referred to as Take Rate and is defined as Revenue as a percentage of Marketplace GOV, was 12.2% in Q3. Excluding the revenue from gift card breakage, Q3 Net Revenue Margin would have been 11.9%, consistent with 11.8% in Q2 2021 and down slightly from 12.1% in Q3 2020. Lower Dasher costs as a percentage of GOV positively contributed to Net Revenue Margin in Q3. This was offset by growth in order volume in new verticals and international markets, which currently carry lower Net Revenue Margins than order volume from our U.S. restaurant marketplace.
Adjusted Gross Profit increased 42% Y/Y to $709 million in Q3 2021. Adjusted Gross Profit was 6.8% of Marketplace GOV in Q3 2021, which was up slightly from 6.7% in Q2 2021 and down slightly from 6.9% in Q3 2020. Adjusted Cost of Revenue as a percentage of GOV increased on a Q/Q and Y/Y basis, due primarily to growth in first party product sales for which we take control of inventory and recognize product costs in Adjusted Cost of Revenue. Adjusted Gross Profit also benefited from gift card breakage revenue in Q3.
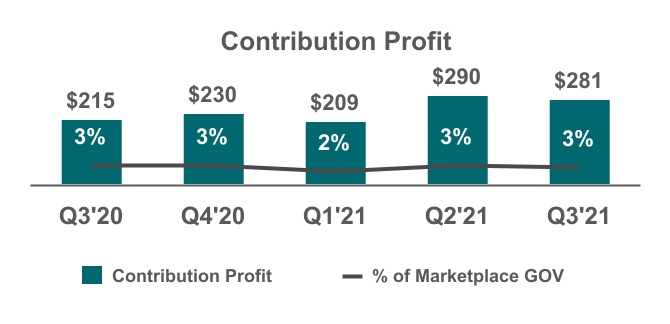
Adjusted sales and marketing as a percentage of Marketplace GOV was 4.1% in Q3 2021, up from 3.9% in both Q2 2021 and Q3 2020. Relative to Q2 2021, consumer acquisition costs and Dasher acquisition costs increased slightly as a percentage of GOV. On a Y/Y basis, consumer acquisition costs declined as a percentage of GOV, while Dasher acquisition costs increased as a percentage of GOV. The payback period on new consumer acquisition remained within our thresholds in Q3. Q3 2021 Contribution Profit increased 31% Y/Y to $281 million or 2.7% of Marketplace GOV.
Adjusted EBITDA reached $86 million in Q3 2021, a decrease of 24% compared to Q2 2021 and relatively flat on a Y/Y basis. Excluding revenue from gift card breakage, Q3 adjusted EBITDA would have been $50 million. In Q3, we continued to invest aggressively in international markets and new verticals. We expect to continue investing in these areas going forward, as we remain optimistic about their potential to add value to our platform over time.
In Q3 2021, operating cash flow was $107 million and free cash flow was $48 million. We ended the quarter with $4.7 billion of cash, cash equivalents, and marketable securities and no debt.
Q4 Outlook
We expect Q4 Marketplace GOV to be in a range of $10.3 billion to $10.7 billion, with Q4 Adjusted EBITDA in a range of $0 million to $100 million.
Among other factors, our Q4 outlook anticipates ongoing investment in new categories, international markets, and Platform Services. Our Q4 outlook also anticipates the continued normalization of retention and order frequency among newer and lesser engaged cohorts as in-store dining and holiday travel resume. We caution investors that significant uncertainty remains and consumer behavior could deviate from the expectations included in our guidance.
Conclusion
The world of local commerce is in a constant state of evolution. Around the world, we are now seeing the development of new kitchen concepts, new grocery warehouses, newly architected supply chains, and new distribution networks. We expect this process to continue for many decades, and intend to play a leading role in this evolution to enable local businesses to grow and consumers to get faster, higher quality, and more affordable access to what they want.
We believe we have done a good job so far at expanding the opportunity for our restaurant partners, both through our Marketplace and our Platform Services. However, even in our most developed vertical, there is significantly more work yet to be done. Among other areas, we remain heavily focused on driving new forms of demand, increasing efficiency in restaurant operations, improving marketing and customer service, and helping optimize kitchen infrastructure.
Beyond restaurants, the work to do is even more foundational and nascent. Most local merchants are still optimized around the in-store shopping experience. Providing services that enable them to successfully transition to omni-channel commerce will require extraordinary innovation and execution. Our expectations of ourselves are high. We will do our best to exceed them.
We could not be more grateful to our employees and stakeholders for the confidence they place in us, or more humbled by our shareholders who entrust us with their capital. Thank you for making this journey possible.
Sincerely,
Tony Xu, Co-founder, CEO and Board Chair, and Prabir Adarkar, CFO
| | | | | |
IR Contact: Andy Hargreaves, CFA ir@doordash.com | PR Contact: Press at DoorDash press@doordash.com |
Webcast
DoorDash will host a webcast today at 2:00 p.m. Pacific Time (5:00 p.m. Eastern Time) to discuss these financial results and business highlights. To listen to a live audio webcast, please visit our Investor Relations page at https://ir.doordash.com. The archived webcast will be available on our Investor Relations page shortly after the call.
Available Information
We announce material information to the public about us, our products and services, and other matters through a variety of means, including filings with the SEC, press releases, public conference calls, webcasts, the investor relations section of our website (ir.doordash.com), our blog (blog.doordash.com), and our Twitter account (@DoorDash) in order to achieve broad, non-exclusionary distribution of information to the public and for complying with our disclosure obligations under Regulation FD.
Forward-Looking Statements
This investor letter contains forward-looking statements within the meaning of Section 27A of the Securities Act of 1933, as amended, and Section 21E of the Securities Exchange Act of 1934, as amended, which statements involve substantial risks and uncertainties. Forward-looking statements generally relate to future events or our future financial or operating performance. In some cases, you can identify forward-looking statements because they contain words such as “may,” “will,” “should,” “expect,” “plan,” “anticipate,” “could,” “would,” “intend,” “target,” “project,” “contemplate,” “believe,” “estimate,” “predict,” “potential” or “continue” or the negative of these words or other similar terms or expressions that concern our expectations, strategy, plans or intentions. Forward-looking statements in this investor letter include, but are not limited to, our expectations regarding our financial position and operating performance, including our outlook and guidance for the fourth quarter of 2021, trends in our business, including the effect of price controls, the effectiveness of our strategies, our market opportunity, and demand for our platform and for local logistics platforms in general. Our expectations and beliefs regarding these matters may not materialize, and actual results in future periods are subject to risks and uncertainties that could cause actual results to differ materially from those projected, including risks and uncertainties related to: competition, managing our growth and corporate culture, financial performance, including the impact of the COVID-19 pandemic on our business and operations and our ability to forecast our performance due to our limited operating history and the COVID-19 pandemic, investments in new products or offerings, our ability to attract merchants, consumers and Dashers to our platform, legal proceedings and regulatory matters and developments, any future changes to our business or our financial or operating model, and our brand and reputation. The forward-looking statements contained in this investor letter are also subject to other risks and uncertainties that could cause actual results to differ from the results predicted, including those more fully described in our filings with the SEC, including our Annual Report on Form 10-K for the year ended December 31, 2020 and our quarterly reports on Form 10-Q. All forward-looking statements in this investor letter are based on information available to DoorDash and assumptions and beliefs as of the date hereof, and we disclaim any obligation to update any forward-looking statements, except as required by law.
Use of Non-GAAP Financial Measures
To supplement our financial information presented in accordance with GAAP, we consider certain financial measures that are not prepared in accordance with GAAP, including adjusted cost of revenue, adjusted sales and marketing expense, adjusted research and development expense, adjusted general and administrative expense, Adjusted Gross Profit (Loss), Adjusted Gross Margin, Contribution Profit (Loss), Contribution Margin, Adjusted EBITDA, Adjusted EBITDA Margin, and free cash flow. We use these financial measures in conjunction with GAAP measures as part of our overall assessment of our performance, including the preparation of our annual operating budget and quarterly forecasts, to evaluate the effectiveness of our business strategies and to communicate with our board of directors concerning our business and financial performance. We believe that these non-GAAP financial measures provide useful information to investors about our business and financial performance, enhance their overall understanding of our past performance and future prospects, and allow for greater transparency with respect to metrics used by our management in their financial and operational decision making. We are presenting these non-GAAP financial measures to assist investors in seeing our business and financial performance through the eyes of management, and because we believe that these non-GAAP financial measures provide an additional tool for investors to use in comparing results of operations of our business over multiple periods with other companies in our industry. We have also presented certain measures excluding revenue from gift card breakage to enable readers to compare our results over multiple periods on the same basis.
We define adjusted cost of revenue as cost of revenue, exclusive of depreciation and amortization, excluding stock-based compensation expense and certain payroll tax expense, and allocated overhead. Allocated overhead is determined based on an allocation of shared costs, such as facilities (including rent and utilities) and information technology costs, among all departments based on employee headcount. We define adjusted sales and marketing expense as sales and marketing expenses excluding stock-based compensation expense and certain payroll tax expense, and allocated overhead. We define adjusted research and development expense as research and development expenses excluding stock-based compensation expense and certain payroll tax expense, and allocated overhead. We define adjusted general and administrative expense as general and administrative expenses excluding stock-based compensation expense and certain payroll tax expense, certain legal, tax, and regulatory settlements, reserves, and expenses, transaction-related costs, impairment expenses, and including allocated overhead from cost of revenue, sales and marketing, and research and development.
We define Adjusted Gross Profit (Loss) as gross profit (loss) plus (i) depreciation and amortization expense related to cost of revenue, (ii) stock-based compensation expense and certain payroll tax expense included in cost of revenue, and (iii) allocated overhead included in cost of revenue. Gross profit (loss) is defined as revenue less (i) cost of revenue, exclusive of depreciation and amortization and (ii) depreciation and amortization related to cost of revenue. Adjusted Gross Margin is defined as Adjusted Gross Profit (Loss) as a percentage of revenue for the same period.
We define Contribution Profit (Loss) as our gross profit (loss) less sales and marketing expense plus (i) depreciation and amortization expense related to cost of revenue, (ii) stock-based compensation expense and certain payroll tax expense included in cost of revenue and sales and marketing expenses, and (iii) allocated overhead included in cost of revenue and sales and marketing expenses. We define gross margin as gross profit (loss) as a percentage of revenue for the same period and we define Contribution Margin as Contribution Profit (Loss) as a percentage of revenue for the same period.
We define Adjusted EBITDA as net income (loss), adjusted to exclude (i) certain legal, tax, and regulatory settlements, reserves, and expenses, (ii) a one-time non-cash change in fair value of a forward contract related to the issuance of our Series F redeemable convertible preferred stock, (iii) loss on disposal of property and equipment, (iv) transaction-related costs, (v) impairment expenses, (vi) provision for income taxes, (vii) interest income and expense, (viii) foreign exchange gain (loss), (ix) stock-based compensation expense and certain payroll tax expense, and (x) depreciation and amortization expense. Adjusted EBITDA Margin is calculated by dividing Adjusted EBITDA by revenue for the same period.
We define free cash flow as cash flows from operating activities less purchases of property and equipment and capitalized software and website development costs.
Our definitions may differ from the definitions used by other companies and therefore comparability may be limited. In addition, other companies may not publish these or similar metrics. Further, these metrics have certain limitations in that they do not include the impact of certain expenses that are reflected in our consolidated statements of operations. Thus, our adjusted cost of revenue, adjusted sales and marketing expense, adjusted research and development expense, adjusted general and administrative expense, Adjusted Gross Profit (Loss), Adjusted Gross Margin, Contribution Profit (Loss), Contribution Margin, Adjusted EBITDA, Adjusted EBITDA Margin, and free cash flow should be considered in addition to, not as substitutes for, or in isolation from, measures prepared in accordance with GAAP.
DOORDASH, INC.
CONDENSED CONSOLIDATED BALANCE SHEETS
(In millions)
(Unaudited)
| | | | | | | | | | | |
| December 31,
2020 | | September 30,
2021 |
| Assets | | | |
| Current assets: | | | |
| Cash and cash equivalents | $ | 4,345 | | | $ | 2,861 | |
| Short-term marketable securities | 514 | | | 1,299 | |
| Funds held at payment processors | 146 | | | 119 | |
| Accounts receivable, net | 291 | | | 286 | |
| Prepaid expenses and other current assets | 221 | | | 142 | |
| Total current assets | 5,517 | | | 4,707 | |
| Long-term marketable securities | — | | | 554 | |
| Property and equipment, net | 210 | | | 355 | |
| Operating lease right-of-use assets | 203 | | | 301 | |
| Goodwill | 316 | | | 316 | |
| Intangible assets, net | 74 | | | 64 | |
| Other assets | 33 | | | 61 | |
| Total assets | $ | 6,353 | | | $ | 6,358 | |
| Liabilities and Stockholders’ Equity | | | |
| Current liabilities: | | | |
| Accounts payable | $ | 80 | | | $ | 86 | |
| Operating lease liabilities | 15 | | | 27 | |
| Convertible notes | 364 | | | — | |
| Accrued expenses and other current liabilities | 943 | | | 1,226 | |
| Total current liabilities | 1,402 | | | 1,339 | |
| Operating lease liabilities | 238 | | | 339 | |
| Other liabilities | 13 | | | 14 | |
| Total liabilities | 1,653 | | | 1,692 | |
| Stockholders’ equity: | | | |
| Common stock | — | | | — | |
| Additional paid-in capital | 6,313 | | | 6,592 | |
| | | |
| Accumulated deficit | (1,613) | | | (1,926) | |
| Total stockholders’ equity | 4,700 | | | 4,666 | |
| Total liabilities and stockholders’ equity | $ | 6,353 | | | $ | 6,358 | |
DOORDASH, INC.
CONDENSED CONSOLIDATED STATEMENTS OF OPERATIONS
(In millions, except share amounts which are reflected in thousands, and per share data)
(Unaudited)
| | | | | | | | | | | | | | | | | | | | | | | |
| Three Months Ended September 30, | | Nine Months Ended September 30, |
| 2020 | | 2021 | | 2020 | | 2021 |
| Revenue | $ | 879 | | | $ | 1,275 | | | $ | 1,916 | | | $ | 3,588 | |
| Costs and expenses: | | | | | | | |
| Cost of revenue, exclusive of depreciation and amortization shown separately below | 382 | | | 585 | | | 899 | | | 1,703 | |
| Sales and marketing | 290 | | | 446 | | | 610 | | | 1,206 | |
| Research and development | 41 | | | 115 | | | 112 | | | 297 | |
| General and administrative | 167 | | | 188 | | | 337 | | | 573 | |
| Depreciation and amortization | 34 | | | 41 | | | 89 | | | 107 | |
| Total costs and expenses | 914 | | | 1,375 | | | 2,047 | | | 3,886 | |
| Loss from operations | (35) | | | (100) | | | (131) | | | (298) | |
| Interest income | 1 | | | — | | | 6 | | | 2 | |
| Interest expense | (9) | | | — | | | (22) | | | (13) | |
| Other income (expense), net | 1 | | | (1) | | | — | | | (1) | |
| Loss before provision for income taxes | (42) | | | (101) | | | (147) | | | (310) | |
| Provision for income taxes | 1 | | | — | | | 2 | | | 3 | |
| Net loss | (43) | | | (101) | | | (149) | | | (313) | |
| Net loss per share, basic and diluted | $ | (0.96) | | | $ | (0.30) | | | $ | (3.34) | | | $ | (0.94) | |
| Weighted-average number of shares outstanding used to compute net loss per share, basic and diluted | 45,016 | | | 340,169 | | | 44,568 | | | 334,277 | |
DOORDASH, INC.
CONDENSED CONSOLIDATED STATEMENTS OF CASH FLOWS
(In millions)
(Unaudited)
| | | | | | | | | | | |
| Nine Months Ended September 30, |
| 2020 | | 2021 |
| Cash flows from operating activities | | | |
| Net loss | $ | (149) | | | $ | (313) | |
| Adjustments to reconcile net loss to net cash provided by operating activities: | | | |
| Depreciation and amortization | 89 | | | 107 | |
| Stock-based compensation | 11 | | | 357 | |
| Bad debt expense | 15 | | | 31 | |
| Reduction of operating lease right-of-use assets and accretion of operating lease liabilities | 30 | | | 37 | |
| Non-cash interest expense | 22 | | | 11 | |
| Impairment of operating lease right-of-use assets | 11 | | | 1 | |
| Other | 7 | | | 17 | |
| Changes in operating assets and liabilities: | | | |
| Funds held at payment processors | (30) | | | 27 | |
| Accounts receivable, net | (139) | | | (26) | |
| Prepaid expenses and other current assets | 6 | | | 86 | |
| Other assets | (14) | | | (32) | |
| Accounts payable | 12 | | | 8 | |
| Accrued expenses and other current liabilities | 452 | | | 241 | |
| Payments for operating lease liabilities | (19) | | | (29) | |
| Other liabilities | 11 | | | 2 | |
| Net cash provided by operating activities | 315 | | | 525 | |
| Cash flows from investing activities | | | |
| Purchases of property and equipment | (86) | | | (94) | |
| Capitalized software and website development costs | (36) | | | (73) | |
| Purchases of marketable securities | (445) | | | (1,968) | |
| Maturities of marketable securities | 434 | | | 502 | |
| Sales of marketable securities | 4 | | | 121 | |
| Other investing activities | — | | | (8) | |
| Net cash used in investing activities | (129) | | | (1,520) | |
| Cash flows from financing activities | | | |
| Proceeds from issuance of preferred stock, net of issuance costs | 382 | | | — | |
| Proceeds from issuance of convertible notes, net of issuance costs | 333 | | | — | |
| Repayment of convertible notes | — | | | (333) | |
| Proceeds from exercise of stock options | 4 | | | 28 | |
| Deferred offering costs paid | (5) | | | (10) | |
| Taxes paid related to net share settlement of equity awards | — | | | (172) | |
| | | |
| Net cash provided by (used in) financing activities | 714 | | | (487) | |
| Foreign currency effect on cash, cash equivalents, and restricted cash | — | | | (1) | |
| Net increase (decrease) in cash, cash equivalents, and restricted cash | 900 | | | (1,483) | |
| Cash, cash equivalents, and restricted cash | | | |
| Cash, cash equivalents, and restricted cash, beginning of period | 287 | | | 4,345 | |
| Cash, cash equivalents, and restricted cash, end of period | $ | 1,187 | | | $ | 2,862 | |
| Reconciliation of cash, cash equivalents, and restricted cash to the condensed consolidated balance sheets | | | |
| Cash and cash equivalents | $ | 1,096 | | | $ | 2,861 | |
| Restricted cash | 91 | | | 1 | |
| Total cash, cash equivalents, and restricted cash | $ | 1,187 | | | $ | 2,862 | |
| Supplemental disclosure of cash flow information | | | |
| Cash paid for interest | $ | — | | | $ | 42 | |
| Cash paid for income taxes | $ | 1 | | | $ | 4 | |
| Non-cash investing and financing activities | | | |
| Purchases of property and equipment not yet settled | $ | 9 | | | $ | 24 | |
| Leasehold improvements acquired through tenant improvement allowance | $ | 9 | | | $ | 4 | |
| Unrealized gain on marketable securities | $ | 1 | | | $ | — | |
| Stock-based compensation included in capitalized software and website development costs | $ | 2 | | | $ | 66 | |
| Deferred offering costs not yet paid | $ | 2 | | | $ | — | |
DOORDASH, INC.
NON-GAAP FINANCIAL MEASURES
(Unaudited)
| | | | | | | | | | | | | | | | | | | | | | | | | | | | | | | | | | | | | | | | | | | | | | | | | | |
| | Three Months Ended |
| (In millions) | | Dec. 31,
2019 | | Mar. 31,
2020 | | Jun. 30,
2020 | | Sept. 30,
2020 | | Dec. 31,
2020 | | Mar.31,
2021 | | Jun. 30,
2021 | | Sept. 30,
2021 |
| | | | | | | | | | | | | | | | |
| Cost of revenue, exclusive of depreciation and amortization | | $ | 170 | | | $ | 194 | | | $ | 323 | | | $ | 382 | | | $ | 469 | | | $ | 563 | | | $ | 555 | | | $ | 585 | |
| Adjusted to exclude the following: | | | | | | | | | | | | | | | | |
| Stock-based compensation expense and certain payroll tax expense | | — | | | (1) | | | — | | | — | | | (31) | | | (9) | | | (13) | | | (12) | |
| Allocated overhead | | (7) | | | (5) | | | (5) | | | (4) | | | (4) | | | (5) | | | (6) | | | (7) | |
| Adjusted cost of revenue | | $ | 163 | | | $ | 188 | | | $ | 318 | | | $ | 378 | | | $ | 434 | | | $ | 549 | | | $ | 536 | | | $ | 566 | |
| | | | | | | | | | | | | | | | |
| Sales and marketing | | $ | 149 | | | $ | 152 | | | $ | 168 | | | $ | 290 | | | $ | 347 | | | $ | 333 | | | $ | 427 | | | $ | 446 | |
| Adjusted to exclude the following: | | | | | | | | | | | | | | | | |
| Stock-based compensation expense and certain payroll tax expense | | — | | | (1) | | | — | | | — | | | (37) | | | (10) | | | (14) | | | (15) | |
| Allocated overhead | | (4) | | | (2) | | | (4) | | | (4) | | | (4) | | | (4) | | | (3) | | | (3) | |
| Adjusted sales and marketing | | $ | 145 | | | $ | 149 | | | $ | 164 | | | $ | 286 | | | $ | 306 | | | $ | 319 | | | $ | 410 | | | $ | 428 | |
| | | | | | | | | | | | | | | | |
| Research and development | | $ | 34 | | | $ | 33 | | | $ | 38 | | | $ | 41 | | | $ | 209 | | | $ | 82 | | | $ | 100 | | | $ | 115 | |
| Adjusted to exclude the following: | | | | | | | | | | | | | | | | |
| Stock-based compensation expense and certain payroll tax expense | | (2) | | | (1) | | | (2) | | | (2) | | | (172) | | | (36) | | | (47) | | | (49) | |
| Allocated overhead | | (4) | | | (4) | | | (3) | | | (4) | | | (3) | | | (3) | | | (3) | | | (4) | |
| Adjusted research and development | | $ | 28 | | | $ | 28 | | | $ | 33 | | | $ | 35 | | | $ | 34 | | | $ | 43 | | | $ | 50 | | | $ | 62 | |
| | | | | | | | | | | | | | | | |
| General and administrative | | $ | 66 | | | $ | 82 | | | $ | 88 | | | $ | 167 | | | $ | 219 | | | $ | 169 | | | $ | 216 | | | $ | 188 | |
| Adjusted to exclude the following: | | | | | | | | | | | | | | | | |
| Stock-based compensation expense and certain payroll tax expense | | (2) | | | (2) | | | (1) | | | (1) | | | (82) | | | (45) | | | (65) | | | (49) | |
Certain legal, tax, and regulatory settlements, reserves, and expenses(1) | | (13) | | | (24) | | | (12) | | | (79) | | | (45) | | | (13) | | | (36) | | | (17) | |
| Transaction-related costs | | (1) | | | — | | | — | | | — | | | (1) | | | — | | | — | | | (2) | |
Impairment expenses(2) | | — | | | — | | | (6) | | | (5) | | | — | | | — | | | — | | | (1) | |
| Allocated overhead from cost of revenue, sales and marketing, and research and development | | 15 | | | 11 | | | 12 | | | 12 | | | 11 | | | 12 | | | 12 | | | 14 | |
| Adjusted general and administrative | | $ | 65 | | | $ | 67 | | | $ | 81 | | | $ | 94 | | | $ | 102 | | | $ | 123 | | | $ | 127 | | | $ | 133 | |
(1)We exclude certain costs and expenses from our calculation of adjusted general and administrative expense because management believes that these costs and expenses are not indicative of our core operating performance, do not reflect the underlying economics of our business, and are not necessary to operate our business. These excluded costs and expenses consist of (i) certain legal costs primarily related to worker classification matters, (ii) reserves for the collection of sales and indirect taxes that we do not expect to incur on a recurring basis, (iii) costs related to the settlement of an intellectual property matter, (iv) expenses related to supporting various policy matters, including those related to worker classification and price controls, and (v) donations as part of our COVID-19 pandemic relief efforts. We believe it is appropriate to
exclude the foregoing matters from our calculation of adjusted general and administrative expense because (1) the timing and magnitude of such expenses are unpredictable and thus not part of management’s budgeting or forecasting process, and (2) with respect to worker classification matters, management currently expects such expenses will not be material to our results of operations over the long term as a result of increasing legislative and regulatory certainty in this area, including as a result of Proposition 22 and similar legislation.
(2)Consists of impairment expense related to an operating lease right-of-use asset associated with our former headquarters.
| | | | | | | | | | | | | | | | | | | | | | | | | | | | | | | | | | | | | | | | | | | | | | | | | | |
| | Three Months Ended |
| (In millions, except percentages) | | Dec. 31,
2019 | | Mar. 31,
2020 | | Jun. 30,
2020 | | Sept. 30,
2020 | | Dec. 31,
2020 | | Mar. 31,
2021 | | Jun. 30,
2021 | | Sept. 30,
2021 |
| | | | | | | | | | | | | | | | |
| Revenue | | $ | 298 | | | $ | 362 | | | $ | 675 | | | $ | 879 | | | $ | 970 | | | $ | 1,077 | | | $ | 1,236 | | | $ | 1,275 | |
| Less: Cost of revenue, exclusive of depreciation and amortization | | (170) | | | (194) | | | (323) | | | (382) | | | (469) | | | (563) | | | (555) | | | (585) | |
| Less: Depreciation and amortization related to cost of revenue | | (12) | | | (20) | | | (25) | | | (28) | | | (24) | | | (21) | | | (24) | | | (25) | |
| Gross profit | | $ | 116 | | | $ | 148 | | | $ | 327 | | | $ | 469 | | | $ | 477 | | | $ | 493 | | | $ | 657 | | | $ | 665 | |
| Gross Margin | | 39 | % | | 41 | % | | 48 | % | | 53 | % | | 49 | % | | 46 | % | | 53 | % | | 52 | % |
| Less: Sales and marketing | | (149) | | | (152) | | | (168) | | | (290) | | | (347) | | | (333) | | | (427) | | | (446) | |
| Add: Depreciation and amortization related to cost of revenue | | 12 | | | 20 | | | 25 | | | 28 | | | 24 | | | 21 | | | 24 | | | 25 | |
| Add: Stock-based compensation expense and certain payroll tax expense included in cost of revenue and sales and marketing | | — | | | 2 | | | — | | | — | | | 68 | | | 19 | | | 27 | | | 27 | |
| Add: Allocated overhead included in cost of revenue and sales and marketing | | 11 | | | 7 | | | 9 | | | 8 | | | 8 | | | 9 | | | 9 | | | 10 | |
| Contribution Profit (Loss) | | $ | (10) | | | $ | 25 | | | $ | 193 | | | $ | 215 | | | $ | 230 | | | $ | 209 | | | $ | 290 | | | $ | 281 | |
| Contribution Margin | | (3) | % | | 7 | % | | 29 | % | | 24 | % | | 24 | % | | 19 | % | | 23 | % | | 22 | % |
| | | | | | | | | | | | | | | | | | | | | | | | | | | | | | | | | | | | | | | | | | | | | | | | | | |
| | Three Months Ended |
| (In millions, except percentages) | | Dec. 31,
2019 | | Mar. 31,
2020 | | Jun. 30,
2020 | | Sept. 30,
2020 | | Dec. 31,
2020 | | Mar. 31,
2021 | | June 30, 2021 | | Sept. 30,
2021 |
| | | | | | | | | | | | | | | | |
| Gross profit | | $ | 116 | | | $ | 148 | | | $ | 327 | | | $ | 469 | | | $ | 477 | | | $ | 493 | | | $ | 657 | | | $ | 665 | |
| Add: Depreciation and amortization related to cost of revenue | | 12 | | | 20 | | | 25 | | | 28 | | | 24 | | | 21 | | | 24 | | | 25 | |
| Add: Stock-based compensation expense and certain payroll tax expense included in cost of revenue | | — | | | 1 | | | — | | | — | | | 31 | | | 9 | | | 13 | | | 12 | |
| Add: Allocated overhead included in cost of revenue | | 7 | | | 5 | | | 5 | | | 4 | | | 4 | | | 5 | | | 6 | | | 7 | |
| Adjusted Gross Profit | | $ | 135 | | | $ | 174 | | | $ | 357 | | | $ | 501 | | | $ | 536 | | | $ | 528 | | | $ | 700 | | | $ | 709 | |
| Adjusted Gross Margin | | 45 | % | | 48 | % | | 53 | % | | 57 | % | | 55 | % | | 49 | % | | 57 | % | | 56 | % |
| | | | | | | | | | | | | | | | | | | | | | | | | | | | | | | | | | | | | | | | | | | | | | | | | | |
| | Three Months Ended |
| (In millions, except percentages) | | Dec. 31,
2019 | | Mar. 31,
2020 | | Jun. 30,
2020 | | Sept. 30,
2020 | | Dec. 31,
2020 | | Mar. 31,
2021 | | Jun. 30,
2021 | | Sept. 30,
2021 |
| | | | | | | | | | | | | | | | |
| Net income (loss) | | $ | (134) | | | $ | (129) | | | $ | 23 | | | $ | (43) | | | $ | (312) | | | $ | (110) | | | $ | (102) | | | $ | (101) | |
Certain legal, tax, and regulatory settlements, reserves, and expenses(1) | | 13 | | | 24 | | | 12 | | | 79 | | | 45 | | | 13 | | | 36 | | | 17 | |
| | | | | | | | | | | | | | | | |
| Loss on disposal of property and equipment | | 1 | | | — | | | — | | | — | | | — | | | — | | | — | | | — | |
| Transaction-related costs | | 1 | | | — | | | — | | | — | | | $ | 1 | | | — | | | — | | | 2 | |
Impairment expenses(2) | | — | | | — | | | 6 | | | 5 | | | — | | | — | | | — | | | 1 | |
| Provision for income taxes | | — | | | 1 | | | — | | | 1 | | | 1 | | | 1 | | | 2 | | | — | |
| Interest income and expense | | (4) | | | 1 | | | 7 | | | 8 | | | $ | 9 | | | 10 | | | 1 | | | — | |
| Other (income) expense, net | | — | | | 4 | | | (3) | | | (1) | | | (3) | | | — | | | — | | | 1 | |
| Stock-based compensation expense and certain payroll tax expense | | 4 | | | 5 | | | 3 | | | 3 | | | $ | 322 | | | 100 | | | 139 | | | 125 | |
| Depreciation and amortization expense | | 16 | | | 24 | | | 31 | | | 34 | | | 31 | | | 29 | | | 37 | | | 41 | |
| Adjusted EBITDA | | $ | (103) | | | $ | (70) | | | $ | 79 | | | $ | 86 | | | $ | 94 | | | $ | 43 | | | $ | 113 | | | $ | 86 | |
| Adjusted EBITDA Margin | | (35) | % | | (19) | % | | 12 | % | | 10 | % | | 10 | % | | 4 | % | | 9 | % | | 7 | % |
(1)We exclude certain costs and expenses from our calculation of Adjusted EBITDA because management believes that these costs and expenses are not indicative of our core operating performance, do not reflect the underlying economics of our business, and are not necessary to operate our business. These excluded costs and expenses consist of (i) certain legal costs primarily related to worker classification matters, (ii) reserves for the collection of sales and indirect taxes that we do not expect to incur on a recurring basis, (iii) costs related to the settlement of an intellectual property matter, (iv) expenses related to supporting various policy matters, including those related to worker classification and price controls, and (v) donations as part of our COVID-19 pandemic relief efforts. We believe it is appropriate to exclude the foregoing matters from our calculation of Adjusted EBITDA because (1) the timing and magnitude of such expenses are unpredictable and thus not part of management’s budgeting or forecasting process, and (2) with respect to worker classification matters, management currently expects such expenses will not be material to our results of operations over the long term as a result of increasing legislative and regulatory certainty in this area, including as a result of Proposition 22 and similar legislation.
(2)Consists of impairment expense related to an operating lease right-of-use asset associated with our former headquarters.
| | | | | | | | | | | | | | |
| | Nine Months Ended September 30, |
| (In millions) | | 2020 | | 2021 |
| | |
| Net cash provided by operating activities | | $ | 315 | | | $ | 525 | |
| Purchases of property and equipment | | (86) | | | (94) | |
| Capitalized software and website development costs | | (36) | | | (73) | |
| Free cash flow | | $ | 193 | | | $ | 358 | |