Exhibit 99.1
August 4, 2022
Fellow Shareholders,
DoorDash’s mission is to grow and empower local economies. In Q2, we drove strong growth in Total Orders and Marketplace GOV, continued expanding Contribution Profit as a percentage of Marketplace GOV in our U.S. Restaurant Marketplace, and were thrilled to complete our combination with Wolt. Joining forces with Wolt increases the size of our opportunity ahead and significantly enhances our talent. This should enable us to remain focused on superb product development and efficient execution as we seek to drive growth in local commerce around the world.
Second Quarter 2022 Key Financial Metrics
•Revenue grew 30% year-over-year ("Y/Y") to $1.6 billion, Total Orders grew 23% Y/Y to 426 million, and Marketplace GOV grew 25% Y/Y to $13.1 billion
•GAAP gross profit of $686 million, increased 4% Y/Y from $657 million in Q2 2021
•GAAP net loss of $263 million, compared to GAAP net loss of $102 million in Q2 2021
•Adjusted EBITDA of $103 million, decreased from $113 million in Q2 2021
| | | | | | | | | | | | | | | | | | | | | | | | | | | | | | | | |
| | Three Months Ended |
| (In millions, except percentages) | | Jun. 30,
2021 | | Sept. 30,
2021 | | Dec. 31,
2021 | | Mar. 31,
2022 | | Jun. 30,
2022 |
| Total Orders | | 345 | | | 347 | | | 369 | | | 404 | | | 426 | |
| Total Orders Y/Y growth | | 69 | % | | 47 | % | | 35 | % | | 23 | % | | 23 | % |
| Marketplace GOV | | $ | 10,456 | | | $ | 10,416 | | | $ | 11,159 | | | $ | 12,353 | | | $ | 13,081 | |
| Marketplace GOV Y/Y growth | | 70 | % | | 44 | % | | 36 | % | | 25 | % | | 25 | % |
| Revenue | | $ | 1,236 | | | $ | 1,275 | | | $ | 1,300 | | | $ | 1,456 | | | $ | 1,608 | |
| Revenue Y/Y growth | | 83 | % | | 45 | % | | 34 | % | | 35 | % | | 30 | % |
| Net Revenue Margin | | 11.8 | % | | 12.2 | % | | 11.6 | % | | 11.8 | % | | 12.3 | % |
| GAAP Gross Profit | | $ | 657 | | | $ | 665 | | | $ | 637 | | | $ | 662 | | | $ | 686 | |
| Contribution Profit | | $ | 290 | | | $ | 281 | | | $ | 291 | | | $ | 319 | | | $ | 381 | |
| Contribution Profit as a % of Marketplace GOV | | 2.8 | % | | 2.7 | % | | 2.6 | % | | 2.6 | % | | 2.9 | % |
| GAAP Net Loss | | $ | (102) | | | $ | (101) | | | $ | (155) | | | $ | (167) | | | $ | (263) | |
| Adjusted EBITDA | | $ | 113 | | | $ | 86 | | | $ | 47 | | | $ | 54 | | | $ | 103 | |
| Adjusted EBITDA as a % of Marketplace GOV | | 1.1 | % | | 0.8 | % | | 0.4 | % | | 0.4 | % | | 0.8 | % |
| | | | | | | | |
| | 1 |
A Brief Review of Q2
In Q2, we executed well in an uncertain and rapidly shifting macroeconomic environment. On a reported basis, including Wolt from May 31, 2022, Marketplace GOV grew 25% Y/Y to $13.1 billion in Q2. Excluding Wolt, DoorDash Marketplace GOV grew 22% Y/Y to $12.8 billion, driven primarily by growth in the number of consumers and in average order frequency, with a small benefit from increased average order values (AOVs) on the DoorDash Marketplace associated with inflation. Similar to recent quarters, Marketplace GOV in DoorDash’s international and new verticals businesses grew faster on a Y/Y basis than the Marketplace GOV in our U.S. Restaurant Marketplace in Q2.
| | | | | | | | | | | | | | | | | | | | |
| | Three Months Ended June 30, 2022 |
| (In millions) | | DoorDash | | Wolt - as reported from 5/31/2022 | | Combined |
| Total Orders | | 414 | | | 12 | | | 426 | |
Marketplace GOV(1) | | $ | 12,792 | | | $ | 288 | | | $ | 13,081 | |
| Revenue | | $ | 1,576 | | | $ | 32 | | | $ | 1,608 | |
(1) numbers may not add up due to rounding
The increase in Marketplace GOV, along with healthy Dasher supply and leverage on advertising expenses drove Q2 Adjusted EBITDA to $103 million, which was above the high end of our outlook range.
Excluding Wolt, Q2 GAAP Net Loss for DoorDash was $218 million. Wolt GAAP Net Loss for the period from May 31 through the end of Q2 was $45 million. Q2 Adjusted EBITDA of $103 million included $128 million of Adjusted EBITDA from DoorDash, and ($25) million of Adjusted EBITDA from Wolt, which was included from May 31 through the end of the quarter. Excluding Wolt, Q2 Adjusted EBITDA from DoorDash was the highest in our history, driven by further growth in Contribution Profit from our U.S. Restaurant Marketplace, offset by further investments in international markets and new verticals.
Wolt and Excellent Execution
While we are proud of our continued execution in Q2, our most significant accomplishment in the quarter was completing our combination with Wolt. We are incredibly pleased to have found a talented and like-minded team to join forces with and excited about the company we will build together. Wolt CEO Miki Kuusi now leads DoorDash International and will spearhead our efforts outside of the U.S.
Based on third party data, we estimate our business currently addresses global markets with more than 300 million households and 750 million people, total restaurant spend of over $1.0 trillion, and total grocery and convenience spend of over $2.5 trillion. Based on those estimates, we believe the Wolt and DoorDash Marketplaces currently represent just 5% of restaurant spend in these markets and well under 1% of convenience, grocery, and non-food spend.
Low penetration rates do not suggest an easy road to growth. To the contrary, we expect consumer expectations to rise relentlessly and competition to remain fierce, so success will require exceptional innovation and execution. Nonetheless, the low current levels of penetration suggest a large opportunity for growth if we execute well.
We believe enabling high quality logistics is critical to our growth and to the future of local commerce around the world. When done well, enabling logistics has the potential to delight consumers, increase merchants’ sales, provide earnings opportunities that are incremental to traditional labor, and increase the potential of local economies.
Enabling logistics also offers potential advantages over demand-generation focused marketplaces, where the selection is limited to merchants that possess in-house delivery staff and the delivery experience is less consistent. This is likely why local commerce marketplaces around the world have shifted toward logistics enablement in recent years. As this transition continues, we believe operating with extraordinary order-level execution is the key to generating competitive advantages in the industry.
In marketplaces such as ours that facilitate logistics as an elemental service, we believe superb order-level execution is the primary determinant of long-term growth and margin potential. The reason for this is simple: the delivery is the
| | | | | | | | |
| | 2 |
instance of physical interaction with our platform, and the experience that consumers, merchants, and Dashers have with each order becomes a key moment of judgment that influences future orders.
At scale, even small differences in the quality of execution can compound and have meaningful impacts on consumer retention and order frequency. All else being equal, a local commerce marketplace with less effective order-level execution is likely to have lower consumer retention and order frequency growth, which would require it to spend more in new consumer acquisition to generate the same amount of order growth. A business with lower logistics quality is also likely to generate less variable profit per order, leaving less margin to cover fixed costs and invest in growth initiatives. Consequently, we believe operating at leading levels of order-level execution is critical to maximizing long-term growth and profitability. This is the reason we obsess over minute details internally, and why we focus on key indicators of execution when evaluating potential partners.
Wolt’s retention and order frequency metrics suggest a foundation based on operational excellence and customer obsession that mirrors our own. In June, Wolt operated with 12-month retention1 of nearly 30% which we believe is outstanding in our industry.
Wolt also has a track record of driving consistent growth in cohort-level order frequency. When combined with retention, we believe this suggests an ability to execute effectively, delight consumers in a variety of markets, and support superior growth rates and margin expansion over time.
| | | | | | | | | | | | | | | | | |
| Wolt Average Monthly Order Frequency By Cohort: Indexed to Y1 Of The 2017 Cohort |
| Y1 | Y2 | Y3 | Y4 | Y5 |
| 2017 Cohort | 100% | 114% | 129% | 159% | 196% |
| 2018 Cohort | 112% | 129% | 162% | 195% | |
| 2019 Cohort | 130% | 173% | 212% | | |
| 2020 Cohort | 152% | 174% | | | |
| 2021 Cohort | 145% | | | | |
Source: Wolt internal data
We believe Wolt's focus on execution is evident in its Marketplace GOV growth, which was over 50% Y/Y in Q2 (measured in Euro). Additionally, despite being a relatively young business, Wolt generated positive Contribution Profit in Q2, excluding Germany, Japan, and Wolt Markets (Wolt's first-party distribution business). We believe this highlights the team's ability to drive strong consumer retention and order frequency, while also being efficient with capital.
As many have pointed out, Wolt is not currently profitable. However, we believe the building blocks to a large and profitable business are in place. The combination of excellent order level execution, relatively low penetration rates, and a talented team provides an outstanding foundation that we intend to build on and augment with our own base of knowledge and experience.
Consumer Spending
We spend the majority of our time and energy building products and working to improve our execution. However, given the amount of uncertainty in the current macroeconomic backdrop, we wanted to share what we have seen. Although we have noticed several external indications of shifts in consumer discretionary spending, so far we have not seen changes to consumer engagement on our U.S. Marketplace that are measurable or distinguishable from normal seasonal patterns.
1 Based on weighted average customer retention of monthly cohorts from January 2018 to June 2021.
| | | | | | | | |
| | 3 |
One metric we use to evaluate consumer engagement is order rate for existing consumers2. Order rate for existing consumers typically peaks around the end of February and then enters a seasonally slow period (in 2021, the peak was pushed out slightly because of fiscal stimulus in March). Starting from the typical peak, the trend so far in 2022 is similar to what we experienced in 2021 and 2019 (2020 is an outlier due to the onset of the COVID-19 pandemic), with the consistency holding across income brackets. Similarly, we have not seen evidence of a consumer slowdown in our new consumer acquisition metrics, as new consumers acquired in Q2 2022 were in line with the year-ago period. This is not to say there has been no impact, as it seems likely that our order volume would have been stronger in a healthier discretionary spending environment. Nonetheless, our consumer engagement metrics remained healthy in Q2 and we believe demand for our service has continued to grow faster than many other areas of e-commerce and local commerce.
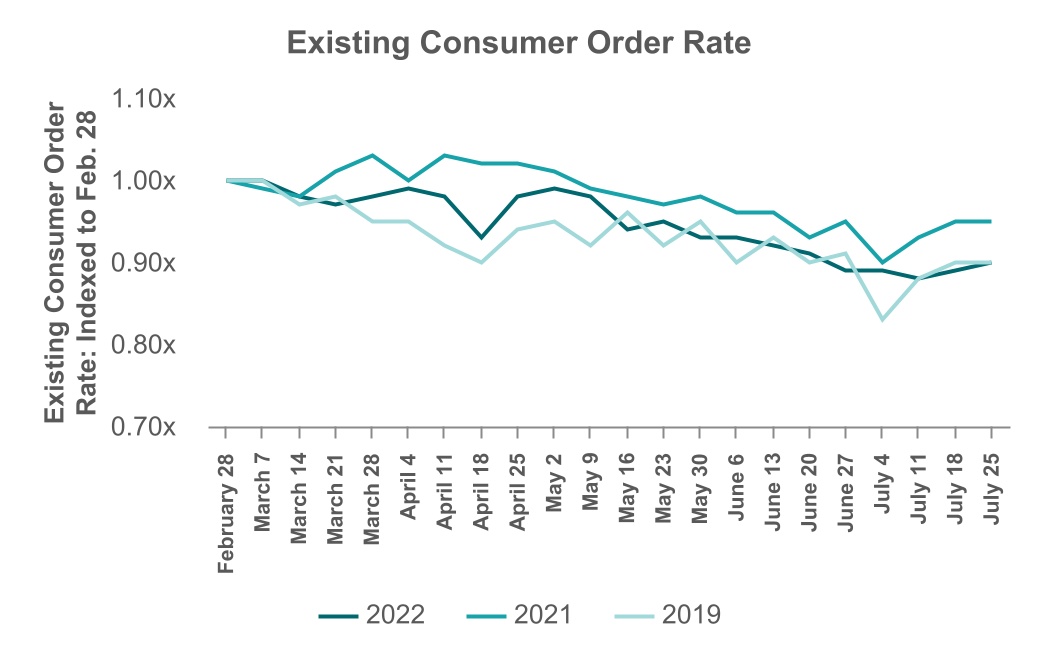
Source: DoorDash internal data
We believe there are three main reasons we have not seen a larger impact from shifts in discretionary spending:
1.Our service continues to improve. In the 12 months ending June 30, we added more than 80,000 net new merchants to our DoorDash Marketplace, improved key quality metrics, innovated in our consumer app to improve the experience, and increased DashPass adoption, which helps lower the total cost to consumers. Combined, this has contributed to a steadily improving consumer experience that helps drive engagement.
2.Our market penetration remains low. Based on third-party data, we estimate U.S. Marketplace GOV represents less than 8% of total restaurant spend and less than 1% of total grocery and convenience spend. This provides room for continued growth in consumers and spend.
3.People need to and typically enjoy eating. Food has been a relatively inelastic category historically. Data from the U.S. Bureau of Economic Analysis suggests spending on restaurants and groceries have each declined on a Y/Y basis only twice in the last 60 years. We believe we facilitate enjoyable eating experiences that our consumers have shown strong and consistent demand for.
We are pleased with our ability to earn consumers' business to date, and will work to earn more by continually improving the combination of selection, quality, affordability, and service we offer. However, we will also continue assessing the impacts of changing consumer behavior on our business. If consumer engagement changes more meaningfully going forward, it could prompt tactical changes to the amount of capital we deploy or how we deploy it. In any environment, we intend to maintain our long-term focus on building products that delight our customers and improve the potential of local commerce.
2 Order rate equals retention times order frequency for the period being analyzed. For this purpose, we isolate existing consumers to remove variability associated with seasonality in new consumer acquisition.
| | | | | | | | |
| | 4 |
Inflation
In Q2, merchants increased prices on our U.S. Marketplace at a pace that was similar to the rise in food-away-from-home consumer price inflation. Consumers responded to this by ordering slightly fewer items per order on average, which drove subtotals on our U.S. Marketplace up by a low single-digit percentage on a Y/Y basis in Q2. Since a meaningful portion of our consumer and merchant fees are calculated as a percentage of subtotals, the increase in subtotals positively impacted our Revenue and Adjusted EBITDA in Q2, relative to our expectations.
We do not believe the increase in subtotals had a meaningful impact on order volume in Q2, largely because of ongoing adoption of DashPass. Q2 was the second largest period for DashPass net additions in the last eight quarters. The steady growth in DashPass over the last year has helped drive a reduction in average consumer fees per order. This has helped offset the impact of higher subtotals and resulted in only a slight Y/Y increase in the total consumer cost of an average order. This has improved our affordability compared to alternatives, and highlights the benefit of DashPass to consumers as an affordability tool, to merchants as a way to drive volume in a variety of environments, and to our business.
Dashers are also feeling the impact of increased prices. In order to help offset some of the impact of higher gas prices, we extended our gas savings program through August 2022. In Q2, we spent over $40 million providing extra gas savings and mileage-based bonus payments. Dashers have viewed this program positively, with 74% rating it as either “excellent” or “good” in a recent survey. We believe the gas rewards program contributed to improved Dasher retention in Q2, which helped reduce Dasher acquisition costs and improve quality on our platform.
Dashing continues to show that it is a valuable earning opportunity that complements traditional employment and provides greater levels of accessibility, flexibility, and choice in the labor market. In the current environment, with increasing interest rates and consumer prices rising faster than wages for many, we believe there are more instances when people’s short term financial needs exceed the income provided by their full or part-time jobs. In these cases, the unique accessibility and flexibility of dashing make it an attractive choice for people looking to pay monthly bills or other expenses without taking on additional debt. We believe this is part of the reason we continue to see strong demand for dashing despite persistently low unemployment.
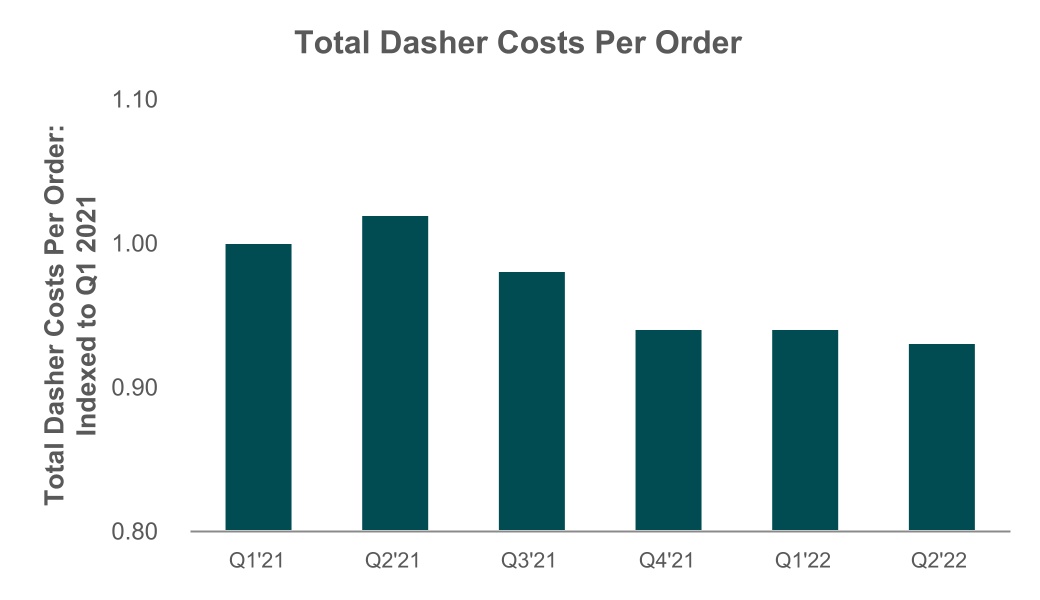
The combination of strong retention, high organic acquisition of Dashers, improved efficiency, and benefits from our gas rewards program led our total Dasher costs3 per order to decline by 9% Y/Y in Q2, even while DoorDash Dasher pay per active hour increased Y/Y. In Q2, our total Dasher cost per order reached the lowest level since Q4 2020, which was prior to the implementation of California’s Proposition 22.
Source: DoorDash internal data
3 Total Dasher costs include Dasher acquisition costs, Dasher pay, and the cost of Dasher benefits, including the gas rewards and mileage-based payment programs.
| | | | | | | | |
| | 5 |
Conclusion
At DoorDash, we are always trying to look around corners and exceed our customers' perpetually rising expectations. Our creativity, agility, and execution prowess have been put to the test in recent years by the need to react to a global pandemic, a changing regulatory environment, extraordinary levels of stimulus, rapid shifts in consumer behavior, and more recently, shifting consumer spending patterns and rising inflation.
Through it all, our vision and our strategy have remained consistent. We believe this has been critical to our culture and to our team’s ability to execute, which they have done at an exceptional level.
In volatile environments, it is important to consciously lift our gaze from the work of the day and remain builders in pursuit of the future. In doing so, it's equally important for us to continue dreaming and inventing for our customers as it is to stay disciplined about which bets to continue; this is always the challenge we as operators must execute against. Innovation doesn't always work, but we will keep innovating, as this is the best way to empower local economies, build scale in our business, and maximize long-term free cash flow per share. Our expectations of ourselves are high. We will do our best to exceed them.
We could not be more grateful to our employees and stakeholders for the confidence they place in us, or more humbled by our shareholders who entrust us with their capital. Thank you for making this journey possible.
Sincerely,
Tony Xu, Co-founder, CEO and Board Chair, and Prabir Adarkar, CFO
| | | | | | | | |
| | 6 |
Financial and Operational Highlights
Total Orders in Q2 2022 increased 23% Y/Y to 426 million, driven by 20% Y/Y growth in DoorDash orders and the addition of Wolt. Excluding Wolt, the Y/Y growth in DoorDash Total Orders was driven by growth in consumers and average order frequency.
Q2 2022 Marketplace GOV increased 25% Y/Y to $13.1 billion, driven by 22% Y/Y growth in DoorDash Marketplace GOV and the addition of Wolt. Excluding Wolt, the Y/Y growth in DoorDash Marketplace GOV was driven primarily by growth in Total Orders.
Q2 2022 Revenue increased 30% Y/Y to $1.6 billion, driven by 28% Y/Y growth in DoorDash Revenue and the addition of Wolt. Net Revenue Margin, defined as Revenue as a percentage of Marketplace GOV, was 12.3% in Q2 2022, compared to 11.8% in Q2 2021. The Y/Y increase in Net Revenue Margin was driven primarily by improved Dasher supply, which offset an increased mix of orders from DashPass, international markets, and non-restaurant categories.
GAAP cost of revenue, exclusive of depreciation and amortization, increased by 59% to $880 million in Q2 2022 from
$555 million in Q2 2021. Q2 2022 adjusted cost of revenue increased by 57% Y/Y to $839 million, driven by growth in Total Orders, increased insurance reserves, and costs associated with our first party distribution business.
GAAP gross profit increased 4% to $686 million in Q2 2022 from $657 million in Q2 2021. Q2 2022 Adjusted Gross Profit increased by 10% Y/Y to $769 million, driven by the Y/Y increase in Revenue offset by the Y/Y increase in adjusted cost of revenue.
GAAP sales and marketing expenses decreased 1% to $421 million in Q2 2022 from $427 million in Q2 2021. Q2 2022 adjusted sales & marketing expense decreased by 5% Y/Y to $388 million, driven by a decline in advertising costs, partially offset by growth in headcount and the addition of Wolt.
Q2 2022 Contribution Profit increased by 31% Y/Y to $381 million. Contribution Profit as a percentage of Marketplace GOV increased to 2.9% in Q2 2022 from 2.8% in Q2 2021, driven primarily by the increase in Net Revenue Margin and the decrease in Adjusted Sales and Marketing as a percentage of Marketplace GOV, offset by the increase in adjusted cost of revenue as a percentage of Marketplace GOV.
GAAP research and development expenses increased 105% to $205 million in Q2 2022 from $100 million in Q2 2021. Q2 2022 Adjusted Research & Development increased 112% Y/Y to $106 million, driven by growth in headcount and the addition of Wolt.
GAAP general and administrative expenses increased 36% to $294 million in Q2 2022 from $216 million in Q2 2021. Q2 2022 Adjusted General & Administrative increased 35% Y/Y to $172 million, driven primarily by growth in headcount and the addition of Wolt, partially offset by a decrease in bad-debt expense.
GAAP net loss was $263 million in Q2 2022 compared to a GAAP net loss of $102 million in Q2 2021. Q2 2022 Adjusted EBITDA was $103 million, compared to $113 million in Q2 2021.
Operating cash flow in Q2 2022 was $165 million and free cash flow was $86 million. Both operating cash flow and free cash flow included a $100 million cash payment associated with a legal settlement for which we had previously reserved. On a trailing 12-month basis, we generated operating cash flow of $419 million and free cash flow of $140 million.
Between July 7, 2022 and August 4, 2022, we repurchased 5.4 million shares of our Class A common stock for a total of $383 million. The repurchases were made as part of the $400 million stock repurchase program we announced in May 2022.
| | | | | | | | |
| | 7 |
Q3 and 2022 Outlook
We currently expect Q3 Marketplace GOV to be in a range of $13.0 billion to $13.5 billion, with Q3 Adjusted EBITDA expected to be in a range of $25 million to $75 million.
We currently expect 2022 Marketplace GOV to be in a range of $51.0 billion to $53.0 billion, with 2022 Adjusted EBITDA expected to be in a range of $200 million to $500 million.
| | | | | | | | |
| Period | Marketplace GOV | Adj. EBITDA |
| Q3 | $13.0B - $13.5B | $25 - $75M |
| 2022 | $51.0B - $53.0B | $200 - $500M |
Among other things, our Q3 and 2022 outlook anticipates a softer consumer spending environment in the second half of 2022 than what we experienced in the first half of the year. It also anticipates significant levels of ongoing investment in new verticals and international markets. Our forecast assumes that key foreign currency rates will remain stable at current levels. We caution investors that consumer spending could deteriorate faster or to a greater degree than we anticipate, which could drive results below our expectations. Additionally, our increased international exposure heightens risks associated with operating in foreign markets, including geopolitical and currency risks, and changes in the international operating environment could negatively impact results versus our current outlook.
Analyst and Investor Conference Call
We will host an analyst and investor conference call to discuss our quarterly results at 3:00 PM (PT) today. Members of the investor community interested in listening to the call can register and attend at ir.doordash.com.
| | | | | |
IR Contact: Andy Hargreaves, CFA ir@doordash.com | PR Contact: Press at DoorDash press@doordash.com |
Webcast
DoorDash will host a webcast today at 3:00 p.m. Pacific Time (6:00 p.m. Eastern Time) to discuss these financial results and business highlights. To listen to a live audio webcast, please visit our Investor Relations page at https://ir.doordash.com. The archived webcast will be available on our Investor Relations page shortly after the call.
Available Information
We announce material information to the public about us, our products and services, and other matters through a variety of means, including filings with the SEC, press releases, public conference calls, webcasts, the investor relations section of our website (ir.doordash.com), our blog (doordash.news), and our Twitter account (@DoorDash) in order to achieve broad, non-exclusionary distribution of information to the public and for complying with our disclosure obligations under Regulation FD.
| | | | | | | | |
| | 8 |
Forward-Looking Statements
This investor letter contains forward-looking statements within the meaning of Section 27A of the Securities Act of 1933, as amended, and Section 21E of the Securities Exchange Act of 1934, as amended, which statements involve substantial risks and uncertainties. Forward-looking statements generally relate to future events or our future financial or operating performance. In some cases, you can identify forward-looking statements because they contain words such as “may,” “will,” “should,” “expect,” “plan,” “anticipate,” “could,” “would,” “intend,” “target,” “project,” “contemplate,” “believe,” “estimate,” "aim", "try", “predict,” “potential” or “continue” or the negative of these words or other similar terms or expressions that concern our expectations, strategy, plans or intentions. Forward-looking statements in this investor letter include, but are not limited to, our expectations regarding our financial position and operating performance, including our outlook and guidance for the third quarter and full year of 2022, our expectations regarding the Wolt business, our plans and expectations regarding our non-U.S. Restaurant Marketplace categories, our plans and expectations about our investment approach, our expectations about our operating performance in the U.S. Restaurant Marketplace, our local commerce opportunity, trends in our business, including the effect of the macroeconomic environment and inflation on us and our stakeholders, and the effectiveness of our strategies, our market opportunity, and demand for our platform and for local commerce platforms in general. Our expectations and beliefs regarding these matters may not materialize, and actual results in future periods are subject to risks and uncertainties that could cause actual results to differ materially from those projected, including risks and uncertainties related to: competition, managing our growth and corporate culture, financial performance, including the impact of the COVID-19 pandemic on our business and operations and our ability to forecast our performance due to our limited operating history and the COVID-19 pandemic, investments in new products or offerings, our ability to attract merchants, consumers and Dashers to our platform, legal proceedings and regulatory matters and developments, any future changes to our business or our financial or operating model, and our brand and reputation. The forward-looking statements contained in this investor letter are also subject to other risks and uncertainties that could cause actual results to differ from the results predicted, including those more fully described in our filings with the SEC, including our Annual Report on Form 10-K for the year ended December 31, 2021 and our quarterly reports on Form 10-Q. All forward-looking statements in this investor letter are based on information available to DoorDash and assumptions and beliefs as of the date hereof, and we disclaim any obligation to update any forward-looking statements, except as required by law.
Use of Non-GAAP Financial Measures
To supplement our financial information presented in accordance with GAAP, we consider certain financial measures that are not prepared in accordance with GAAP, including adjusted cost of revenue, adjusted sales and marketing expense, adjusted research and development expense, adjusted general and administrative expense, Adjusted Gross Profit (Loss), Adjusted Gross Margin, Contribution Profit (Loss), Contribution Margin, Adjusted EBITDA, Adjusted EBITDA Margin, and free cash flow. We use these financial measures in conjunction with GAAP measures as part of our overall assessment of our performance, including the preparation of our annual operating budget and quarterly forecasts, to evaluate the effectiveness of our business strategies and to communicate with our board of directors concerning our business and financial performance. We believe that these non-GAAP financial measures provide useful information to investors about our business and financial performance, enhance their overall understanding of our past performance and future prospects, and allow for greater transparency with respect to metrics used by our management in their financial and operational decision making. We are presenting these non-GAAP financial measures to assist investors in seeing our business and financial performance through the eyes of management, and because we believe that these non-GAAP financial measures provide an additional tool for investors to use in comparing results of operations of our business over multiple periods with other companies in our industry. We have also presented certain measures excluding revenue from gift card breakage to enable readers to compare our results over multiple periods on the same basis and certain measures excluding results from Wolt to enable investors to compare our current results to prior periods on the same basis.
| | | | | | | | |
| | 9 |
We define adjusted cost of revenue as cost of revenue, exclusive of depreciation and amortization, excluding stock-based compensation expense and certain payroll tax expense, allocated overhead, and inventory write off related to restructuring. Allocated overhead is determined based on an allocation of shared costs, such as facilities (including rent and utilities) and information technology costs, among all departments based on employee headcount. We define adjusted sales and marketing expense as sales and marketing expenses excluding stock-based compensation expense and certain payroll tax expense, and allocated overhead. We define adjusted research and development expense as research and development expenses excluding stock-based compensation expense and certain payroll tax expense, and allocated overhead. We define adjusted general and administrative expense as general and administrative expenses excluding stock-based compensation expense and certain payroll tax expense, certain legal, tax, and regulatory settlements, reserves, and expenses, transaction-related costs (primarily consists of acquisition, integration, and investment related costs), impairment expenses, restructuring charges, and including allocated overhead from cost of revenue, sales and marketing, and research and development.
We define Adjusted Gross Profit (Loss) as gross profit (loss) plus (i) depreciation and amortization expense related to cost of revenue, (ii) stock-based compensation expense and certain payroll tax expense included in cost of revenue, (iii) allocated overhead included in cost of revenue, and (iv) inventory write off related to restructuring. Gross profit (loss) is defined as revenue less (i) cost of revenue, exclusive of depreciation and amortization and (ii) depreciation and amortization related to cost of revenue. Adjusted Gross Margin is defined as Adjusted Gross Profit (Loss) as a percentage of revenue for the same period.
We define Contribution Profit (Loss) as our gross profit (loss) less sales and marketing expense plus (i) depreciation and amortization expense related to cost of revenue, (ii) stock-based compensation expense and certain payroll tax expense included in cost of revenue and sales and marketing expenses, (iii) allocated overhead included in cost of revenue and sales and marketing expenses, and (iv) inventory write off related to restructuring. We define gross margin as gross profit (loss) as a percentage of revenue for the same period and we define Contribution Margin as Contribution Profit (Loss) as a percentage of revenue for the same period. Wolt Contribution Profit (Loss) is defined in the same manner, but relates only to Wolt financial results.
Adjusted EBITDA is a measure that we use to assess our operating performance and the operating leverage in our business. We define Adjusted EBITDA as net income (loss), adjusted to exclude (i) certain legal, tax, and regulatory settlements, reserves, and expenses, (ii) loss on disposal of property and equipment, (iii) transaction-related costs (primarily consists of acquisition, integration, and investment related costs), (iv) impairment expenses, (v) restructuring charges, (vi) inventory write off related to restructuring, (vii) provision for (benefit from) income taxes, (viii) interest income and expense, (ix) other income (expense), net, (x) stock-based compensation expense and certain payroll tax expense, and (xi) depreciation and amortization expense. Adjusted EBITDA Margin is calculated by dividing Adjusted EBITDA by revenue for the same period. Wolt Adjusted EBITDA is defined in the same manner, but relates only to Wolt financial results.
We define free cash flow as cash flows from operating activities less purchases of property and equipment and capitalized software and website development costs.
Our definitions may differ from the definitions used by other companies and therefore comparability may be limited. In addition, other companies may not publish these or similar metrics. Further, these metrics have certain limitations in that they do not include the impact of certain expenses that are reflected in our consolidated statements of operations. Thus, our adjusted cost of revenue, adjusted sales and marketing expense, adjusted research and development expense, adjusted general and administrative expense, Adjusted Gross Profit (Loss), Adjusted Gross Margin, Contribution Profit (Loss), Contribution Margin, Adjusted EBITDA, Adjusted EBITDA Margin, and free cash flow should be considered in addition to, not as substitutes for, or in isolation from, measures prepared in accordance with GAAP.
| | | | | | | | |
| | 10 |
DOORDASH, INC.
CONDENSED CONSOLIDATED BALANCE SHEETS
(In millions)
(Unaudited)
| | | | | | | | | | | |
| December 31,
2021 | | June 30,
2022 |
| Assets | | | |
| Current assets: | | | |
| Cash and cash equivalents | $ | 2,504 | | | $ | 2,727 | |
| Short-term marketable securities | 1,253 | | | 1,272 | |
| Funds held at payment processors | 320 | | | 246 | |
| Accounts receivable, net | 349 | | | 346 | |
| Prepaid expenses and other current assets | 139 | | | 242 | |
| Total current assets | 4,565 | | | 4,833 | |
| Long-term marketable securities | 650 | | | 495 | |
| Operating lease right-of-use assets | 336 | | | 426 | |
| Property and equipment, net | 402 | | | 529 | |
| Intangible assets, net | 61 | | | 809 | |
| Goodwill | 316 | | | 2,315 | |
| Non-marketable equity securities | 409 | | | 412 | |
| Other assets | 70 | | | 109 | |
| Total assets | $ | 6,809 | | | $ | 9,928 | |
| Liabilities and Stockholders’ Equity | | | |
| Current liabilities: | | | |
| Accounts payable | $ | 161 | | | $ | 207 | |
| Operating lease liabilities | 26 | | | 47 | |
| | | |
| Accrued expenses and other current liabilities | 1,573 | | | 1,772 | |
| Total current liabilities | 1,760 | | | 2,026 | |
| Operating lease liabilities | 373 | | | 449 | |
| Other liabilities | 9 | | | 43 | |
| Total liabilities | 2,142 | | | 2,518 | |
| Stockholders’ equity: | | | |
| Common stock | — | | | — | |
| Additional paid-in capital | 6,752 | | | 10,028 | |
| Accumulated other comprehensive loss | (4) | | | (107) | |
| Accumulated deficit | (2,081) | | | (2,511) | |
| Total stockholders’ equity | 4,667 | | | 7,410 | |
| Total liabilities and stockholders’ equity | $ | 6,809 | | | $ | 9,928 | |
| | | | | | | | |
| | 11 |
DOORDASH, INC.
CONDENSED CONSOLIDATED STATEMENTS OF OPERATIONS
(In millions, except share amounts which are reflected in thousands, and per share data)
(Unaudited)
| | | | | | | | | | | | | | | | | | | | | | | |
| Three Months Ended June 30, | | Six Months Ended June 30, |
| 2021 | | 2022 | | 2021 | | 2022 |
| Revenue | $ | 1,236 | | | $ | 1,608 | | | $ | 2,313 | | | $ | 3,064 | |
| Costs and expenses: | | | | | | | |
| Cost of revenue, exclusive of depreciation and amortization shown separately below | 555 | | | 880 | | | 1,118 | | | 1,643 | |
| Sales and marketing | 427 | | | 421 | | | 760 | | | 835 | |
| Research and development | 100 | | | 205 | | | 182 | | | 353 | |
| General and administrative | 216 | | | 294 | | | 385 | | | 539 | |
| Depreciation and amortization | 37 | | | 81 | | | 66 | | | 140 | |
| Total costs and expenses | 1,335 | | | 1,881 | | | 2,511 | | | 3,510 | |
| Loss from operations | (99) | | | (273) | | | (198) | | | (446) | |
| Interest income | — | | | 5 | | | 2 | | | 6 | |
| Interest expense | (1) | | | (1) | | | (13) | | | (1) | |
| Other (expense) income, net | — | | | (3) | | | — | | | 2 | |
| Loss before provision for income taxes | (100) | | | (272) | | | (209) | | | (439) | |
| Provision for (benefit from) income taxes | 2 | | | (9) | | | 3 | | | (9) | |
| Net loss | $ | (102) | | | $ | (263) | | | $ | (212) | | | $ | (430) | |
| Net loss per share, basic and diluted | $ | (0.30) | | | $ | (0.72) | | | $ | (0.64) | | | $ | (1.21) | |
| Weighted-average number of shares outstanding used to compute net loss per share, basic and diluted | 334,707 | | | 363,961 | | | 331,280 | | | 356,630 | |
| | | | | | | | |
| | 12 |
DOORDASH, INC.
CONDENSED CONSOLIDATED STATEMENTS OF CASH FLOWS
(In millions)
(Unaudited)
| | | | | | | | | | | |
| Six Months Ended June 30, |
| 2021 | | 2022 |
| Cash flows from operating activities | | | |
| Net loss | $ | (212) | | | $ | (430) | |
| Adjustments to reconcile net loss to net cash provided by operating activities: | | | |
| Depreciation and amortization | 66 | | | 140 | |
| Stock-based compensation | 235 | | | 360 | |
| Bad debt expense | 31 | | | — | |
| Reduction of operating lease right-of-use assets and accretion of operating lease liabilities | 23 | | | 35 | |
| Non-cash interest expense | 11 | | | — | |
| | | |
| Other | 11 | | | 14 | |
| Changes in assets and liabilities, net of assets acquired and liabilities assumed from acquisitions: | | | |
| Funds held at payment processors | 26 | | | 109 | |
| Accounts receivable, net | 14 | | | 20 | |
| Prepaid expenses and other current assets | 77 | | | (51) | |
| Other assets | (17) | | | (44) | |
| Accounts payable | 17 | | | 38 | |
| Accrued expenses and other current liabilities | 153 | | | (6) | |
| Payments for operating lease liabilities | (18) | | | (32) | |
| Other liabilities | 1 | | | (8) | |
| Net cash provided by operating activities | 418 | | | 145 | |
| Cash flows from investing activities | | | |
| Purchases of property and equipment | (63) | | | (77) | |
| Capitalized software and website development costs | (45) | | | (73) | |
| Purchases of marketable securities | (1,112) | | | (1,078) | |
| Maturities of marketable securities | 292 | | | 992 | |
| Sales of marketable securities | — | | | 245 | |
| Other investing activities | (8) | | | — | |
| Net cash acquired in acquisitions | — | | | 71 | |
| Net cash (used in) provided by investing activities | (936) | | | 80 | |
| Cash flows from financing activities | | | |
| | | |
| | | |
| Proceeds from exercise of stock options | 23 | | | 8 | |
| Deferred offering costs paid | (10) | | | — | |
| Repayment of convertible notes | (333) | | | — | |
| Taxes paid related to net share settlement of equity awards | (172) | | | — | |
| | | |
| Net cash (used in) provided by financing activities | (492) | | | 8 | |
| Foreign currency effect on cash, cash equivalents, and restricted cash | — | | | (8) | |
| Net (decrease) increase in cash, cash equivalents, and restricted cash | (1,010) | | | 225 | |
| Cash, cash equivalents, and restricted cash | | | |
| Cash, cash equivalents, and restricted cash, beginning of period | 4,345 | | | 2,506 | |
| Cash, cash equivalents, and restricted cash, end of period | $ | 3,335 | | | $ | 2,731 | |
| Reconciliation of cash, cash equivalents, and restricted cash to the condensed consolidated balance sheets | | | |
| Cash and cash equivalents | $ | 3,334 | | | $ | 2,727 | |
| Restricted cash | 1 | | | 4 | |
| Total cash, cash equivalents, and restricted cash | $ | 3,335 | | | $ | 2,731 | |
| Supplemental disclosure of cash flow information | | | |
| Cash paid for interest | $ | 42 | | | $ | — | |
| | | |
| Non-cash investing and financing activities | | | |
| Purchases of property and equipment not yet settled | $ | 21 | | | $ | 39 | |
| | | |
| | | |
| Stock-based compensation included in capitalized software and website development costs | $ | 45 | | | $ | 66 | |
| Holdback consideration for acquisition | $ | — | | | $ | 9 | |
| | | |
| | | | | | | | |
| | 13 |
DOORDASH, INC.
NON-GAAP FINANCIAL MEASURES
(Unaudited)
| | | | | | | | | | | | | | | | | | | | | | | | | | | | | | | | | | | | | | | | | | | | | | | | | | |
| | Three Months Ended |
| (In millions) | | Sept. 30,
2020 | | Dec. 31,
2020 | | Mar. 31,
2021 | | Jun. 30,
2021 | | Sept. 30,
2021 | | Dec. 31,
2021 | | Mar. 31,
2022 | | Jun. 30,
2022 |
| | | | | | | | | | | | | | | | |
| Cost of revenue, exclusive of depreciation and amortization | | $ | 382 | | | $ | 469 | | | $ | 563 | | | $ | 555 | | | $ | 585 | | | $ | 635 | | | $ | 763 | | | $ | 880 | |
| Adjusted to exclude the following: | | | | | | | | | | | | | | | | |
| Stock-based compensation expense and certain payroll tax expense | | — | | | (31) | | | (9) | | | (13) | | | (12) | | | (14) | | | (12) | | | (31) | |
| Allocated overhead | | (4) | | | (4) | | | (5) | | | (6) | | | (7) | | | (7) | | | (9) | | | (8) | |
| Inventory write off related to restructuring | | — | | | — | | | — | | | — | | | — | | | — | | | — | | | (2) | |
| Adjusted cost of revenue | | $ | 378 | | | $ | 434 | | | $ | 549 | | | $ | 536 | | | $ | 566 | | | $ | 614 | | | $ | 742 | | | $ | 839 | |
| | | | | | | | | | | | | | | | |
| Sales and marketing | | $ | 290 | | | $ | 347 | | | $ | 333 | | | $ | 427 | | | $ | 446 | | | $ | 413 | | | $ | 414 | | | $ | 421 | |
| Adjusted to exclude the following: | | | | | | | | | | | | | | | | |
| Stock-based compensation expense and certain payroll tax expense | | — | | | (37) | | | (10) | | | (14) | | | (15) | | | (14) | | | (14) | | | (29) | |
| Allocated overhead | | (4) | | | (4) | | | (4) | | | (3) | | | (3) | | | (4) | | | (5) | | | (4) | |
| Adjusted sales and marketing | | $ | 286 | | | $ | 306 | | | $ | 319 | | | $ | 410 | | | $ | 428 | | | $ | 395 | | | $ | 395 | | | $ | 388 | |
| | | | | | | | | | | | | | | | |
| Research and development | | $ | 41 | | | $ | 209 | | | $ | 82 | | | $ | 100 | | | $ | 115 | | | $ | 133 | | | $ | 148 | | | $ | 205 | |
| Adjusted to exclude the following: | | | | | | | | | | | | | | | | |
| Stock-based compensation expense and certain payroll tax expense | | (2) | | | (172) | | | (36) | | | (47) | | | (49) | | | (54) | | | (56) | | | (95) | |
| Allocated overhead | | (4) | | | (3) | | | (3) | | | (3) | | | (4) | | | (3) | | | (4) | | | (4) | |
| Adjusted research and development | | $ | 35 | | | $ | 34 | | | $ | 43 | | | $ | 50 | | | $ | 62 | | | $ | 76 | | | $ | 88 | | | $ | 106 | |
| | | | | | | | | | | | | | | | |
| General and administrative | | $ | 167 | | | $ | 219 | | | $ | 169 | | | $ | 216 | | | $ | 188 | | | $ | 224 | | | $ | 245 | | | $ | 294 | |
| Adjusted to exclude the following: | | | | | | | | | | | | | | | | |
| Stock-based compensation expense and certain payroll tax expense | | (1) | | | (82) | | | (45) | | | (65) | | | (49) | | | (51) | | | (48) | | | (76) | |
Certain legal, tax, and regulatory settlements, reserves, and expenses(1) | | (79) | | | (45) | | | (13) | | | (36) | | | (17) | | | (11) | | | (24) | | | (15) | |
Transaction-related costs(2) | | — | | | (1) | | | — | | | — | | | (2) | | | (8) | | | (14) | | | (44) | |
Impairment expenses(3) | | (5) | | | — | | | — | | | — | | | (1) | | | — | | | — | | | — | |
| Restructuring charges | | — | | | — | | | — | | | — | | | — | | | — | | | — | | | (3) | |
| Allocated overhead from cost of revenue, sales and marketing, and research and development | | 12 | | | 11 | | | 12 | | | 12 | | | 14 | | | 14 | | | 18 | | | 16 | |
| Adjusted general and administrative | | $ | 94 | | | $ | 102 | | | $ | 123 | | | $ | 127 | | | $ | 133 | | | $ | 168 | | | $ | 177 | | | $ | 172 | |
(1)We exclude certain costs and expenses from our calculation of adjusted general and administrative expense because management believes that these costs and expenses are not indicative of our core operating performance, do not reflect the underlying economics of our business, and are not necessary to operate our business. These excluded costs and expenses consist of (i) certain legal costs primarily related to worker
| | | | | | | | |
| | 14 |
classification matters, (ii) reserves for the collection of sales and indirect taxes that we do not expect to incur on a recurring basis, (iii) costs related to the settlement of an intellectual property matter, (iv) expenses related to supporting various policy matters, including those related to worker classification and price controls, and (v) donations as part of our relief efforts in connection with the COVID-19 pandemic and Russia's invasion of Ukraine. We believe it is appropriate to exclude the foregoing matters from our calculation of adjusted general and administrative expense because (1) the timing and magnitude of such expenses are unpredictable and thus not part of management’s budgeting or forecasting process, and (2) with respect to worker classification matters, management currently expects such expenses will not be material to our results of operations over the long term as a result of increasing legislative and regulatory certainty in this area, including as a result of Proposition 22 and similar legislation.
(2)Consists of acquisition, integration, and investment related costs, primarily related to Wolt acquisition for the three months ended June 30, 2022.
(3)Consists of impairment expense related to an operating lease right-of-use asset associated with our former headquarters.
| | | | | | | | | | | | | | | | | | | | | | | | | | | | | | | | | | | | | | | | | | | | | | | | | | |
| | Three Months Ended |
| (In millions, except percentages) | | Sept. 30,
2020 | | Dec. 31,
2020 | | Mar. 31,
2021 | | Jun. 30,
2021 | | Sept. 30,
2021 | | Dec. 31,
2021 | | Mar. 31,
2022 | | June 30,
2022 |
| | | | | | | | | | | | | | | | |
| Revenue | | $ | 879 | | | $ | 970 | | | $ | 1,077 | | | $ | 1,236 | | | $ | 1,275 | | | $ | 1,300 | | | $ | 1,456 | | | $ | 1,608 | |
| Less: Cost of revenue, exclusive of depreciation and amortization | | (382) | | | (469) | | | (563) | | | (555) | | | (585) | | | (635) | | | (763) | | | (880) | |
| Less: Depreciation and amortization related to cost of revenue | | (28) | | | (24) | | | (21) | | | (24) | | | (25) | | | (28) | | | (31) | | | (42) | |
| Gross profit | | $ | 469 | | | $ | 477 | | | $ | 493 | | | $ | 657 | | | $ | 665 | | | $ | 637 | | | $ | 662 | | | $ | 686 | |
| Gross Margin | | 53.4 | % | | 49.2 | % | | 45.8 | % | | 53.2 | % | | 52.2 | % | | 49.0 | % | | 45.5 | % | | 42.7 | % |
| Less: Sales and marketing | | (290) | | | (347) | | | (333) | | | (427) | | | (446) | | | (413) | | | (414) | | | (421) | |
| Add: Depreciation and amortization related to cost of revenue | | 28 | | | 24 | | | 21 | | | 24 | | | 25 | | | 28 | | | 31 | | | 42 | |
| Add: Stock-based compensation expense and certain payroll tax expense included in cost of revenue and sales and marketing | | — | | | 68 | | | 19 | | | 27 | | | 27 | | | 28 | | | 26 | | | 60 | |
| Add: Allocated overhead included in cost of revenue and sales and marketing | | 8 | | | 8 | | | 9 | | | 9 | | | 10 | | | 11 | | | 14 | | | 12 | |
| Add: Inventory write off related to restructuring | | — | | | — | | | — | | | — | | | — | | | — | | | — | | | 2 | |
| Contribution Profit | | $ | 215 | | | $ | 230 | | | $ | 209 | | | $ | 290 | | | $ | 281 | | | $ | 291 | | | $ | 319 | | | $ | 381 | |
| Contribution Margin | | 24.5 | % | | 23.7 | % | | 19.4 | % | | 23.5 | % | | 22.0 | % | | 22.4 | % | | 21.9 | % | | 23.7 | % |
| | | | | | | | |
| | 15 |
| | | | | | | | | | | | | | | | | | | | | | | | | | | | | | | | | | | | | | | | | | | | | | | | | | |
| | Three Months Ended |
| (In millions, except percentages) | | Sept. 30,
2020 | | Dec. 31,
2020 | | Mar. 31,
2021 | | June 30,
2021 | | Sept. 30,
2021 | | Dec. 31,
2021 | | Mar. 31,
2022 | | June 30,
2022 |
| | | | | | | | | | | | | | | | |
| Gross profit | | $ | 469 | | | $ | 477 | | | $ | 493 | | | $ | 657 | | | $ | 665 | | | $ | 637 | | | $ | 662 | | | $ | 686 | |
| Add: Depreciation and amortization related to cost of revenue | | 28 | | | 24 | | | 21 | | | 24 | | | 25 | | | 28 | | | 31 | | | 42 | |
| Add: Stock-based compensation expense and certain payroll tax expense included in cost of revenue | | — | | | 31 | | | 9 | | | 13 | | | 12 | | | 14 | | | 12 | | | 31 | |
| Add: Allocated overhead included in cost of revenue | | 4 | | | 4 | | | 5 | | | 6 | | | 7 | | | 7 | | | 9 | | | 8 | |
| Add: Inventory write off related to restructuring | | — | | | — | | | — | | | — | | | — | | | — | | | — | | | 2 | |
| Adjusted Gross Profit | | $ | 501 | | | $ | 536 | | | $ | 528 | | | $ | 700 | | | $ | 709 | | | $ | 686 | | | $ | 714 | | | $ | 769 | |
| Adjusted Gross Margin | | 57.0 | % | | 55.3 | % | | 49.0 | % | | 56.6 | % | | 55.6 | % | | 52.8 | % | | 49.0 | % | | 47.8 | % |
| | | | | | | | | | | | | | | | | | | | | | | | | | | | | | | | | | | | | | | | | | | | | | | | | | |
| | Three Months Ended |
| (In millions, except percentages) | | Sept. 30,
2020 | | Dec. 31,
2020 | | Mar. 31,
2021 | | Jun. 30,
2021 | | Sept. 30,
2021 | | Dec. 31,
2021 | | Mar. 31,
2022 | | June 30,
2022 |
| | | | | | | | | | | | | | | | |
| Net income (loss) | | $ | (43) | | | $ | (312) | | | $ | (110) | | | $ | (102) | | | $ | (101) | | | $ | (155) | | | $ | (167) | | | $ | (263) | |
Certain legal, tax, and regulatory settlements, reserves, and expenses(1) | | 79 | | | 45 | | | 13 | | | 36 | | | 17 | | | 11 | | | 24 | | | 15 | |
| | | | | | | | | | | | | | | | |
| | | | | | | | | | | | | | | | |
Transaction-related costs(2) | | — | | | 1 | | | — | | | — | | | 2 | | | 8 | | | 14 | | | 44 | |
Impairment expenses(3) | | 5 | | | — | | | — | | | — | | | 1 | | | — | | | — | | | — | |
| Restructuring charges | | — | | | — | | | — | | | — | | | — | | | — | | | — | | | 3 | |
| Inventory write off related to restructuring | | — | | | — | | | — | | | — | | | — | | | — | | | — | | | 2 | |
| Provision for (benefit from) income taxes | | 1 | | | 1 | | | 1 | | | 2 | | | — | | | 2 | | | — | | | (9) | |
| Interest income and expense | | 8 | | | 9 | | | 10 | | | 1 | | | — | | | — | | | (1) | | | (4) | |
| Other (income) expense, net | | (1) | | | (3) | | | — | | | — | | | 1 | | | (1) | | | (5) | | | 3 | |
| Stock-based compensation expense and certain payroll tax expense | | 3 | | | 322 | | | 100 | | | 139 | | | 125 | | | 133 | | | 130 | | | 231 | |
| Depreciation and amortization expense | | 34 | | | 31 | | | 29 | | | 37 | | | 41 | | | 49 | | | 59 | | | 81 | |
| Adjusted EBITDA | | $ | 86 | | | $ | 94 | | | $ | 43 | | | $ | 113 | | | $ | 86 | | | $ | 47 | | | $ | 54 | | | $ | 103 | |
| Adjusted EBITDA Margin | | 9.8 | % | | 9.7 | % | | 4.0 | % | | 9.1 | % | | 6.7 | % | | 3.6 | % | | 3.7 | % | | 6.4 | % |
(1)We exclude certain costs and expenses from our calculation of Adjusted EBITDA because management believes that these costs and expenses are not indicative of our core operating performance, do not reflect the underlying economics of our business, and are not necessary to operate our business. These excluded costs and expenses consist of (i) certain legal costs primarily related to worker classification matters, (ii) reserves for the collection of sales and indirect taxes that we do not expect to incur on a recurring basis, (iii) costs related to the settlement of an intellectual property matter, (iv) expenses related to supporting various policy matters, including those related to worker classification and price controls, and (v) donations as part of our relief efforts in connection with the COVID-19 pandemic and Russia's invasion of Ukraine. We believe it is appropriate to exclude the foregoing matters from our calculation of Adjusted EBITDA because (1) the timing and magnitude of such expenses are unpredictable and thus not part of management’s budgeting or forecasting process, and (2) with respect to worker classification matters, management currently expects such expenses will not be material to our results of operations over the long term as a result of increasing legislative and regulatory certainty in this area, including as a result of Proposition 22 and similar legislation.
(2)Consists of acquisition, integration, and investment related costs, primarily related to Wolt acquisition for the three months ended June 30, 2022.
| | | | | | | | |
| | 16 |
(3)Consists of impairment expense related to an operating lease right-of-use asset associated with our former headquarters.
| | | | | | | | | | | | | | |
| | Six Months Ended June 30, |
| (In millions) | | 2021 | | 2022 |
| | |
| Net cash provided by operating activities | | $ | 418 | | | $ | 145 | |
| Purchases of property and equipment | | (63) | | | (77) | |
| Capitalized software and website development costs | | (45) | | | (73) | |
| Free cash flow | | $ | 310 | | | $ | (5) | |
The following table presents certain financial information derived from our consolidated financial statements related to our subsidiary, Wolt Enterprises Oy, a limited liability company incorporated and existing under the laws of Finland (“Wolt”), as well as certain Wolt key business and non-GAAP metrics. The financial information presented below is presented in accordance with U.S. generally accepted accounting principles (“GAAP”). Such financial statements have not been audited. Wolt’s historical financial information is not necessarily indicative of the results that may be expected in the future and the results of a particular quarter or other interim period are not necessarily indicative of the results for a full year. For more information on potential risks and uncertainties that could cause actual results to differ from the results predicted, please see our Annual Report on Form 10-K for the year ended December 31, 2021 and subsequent Form 10-Qs or Form 8-Ks filed with the Securities and Exchange Commission.
| | | | | | | | | | | | | | | | | | | | | | | | | | | | | | | | |
| | Three Months Ended |
| (In millions, except percentages) | | Jun. 30,
2021 | | Sept. 30,
2021 | | Dec. 31,
2021 | | Mar. 31,
2022 | | Jun. 30,
2022 |
| Total Orders | | 25 | | | 26 | | | 31 | | | 34 | | | 36 | |
Y/Y % Change(1) | | 162 | % | | 146 | % | | 91 | % | | 53 | % | | 43 | % |
| Marketplace GOV | | € | 542 | | | € | 553 | | | € | 682 | | | € | 791 | | | € | 821 | |
Y/Y % Change(1) | | 142 | % | | 137 | % | | 83 | % | | 55 | % | | 52 | % |
| Revenue | | € | 48 | | | € | 52 | | | € | 59 | | | € | 78 | | | € | 93 | |
Net Revenue Margin(1) | | 8.9 | % | | 9.3 | % | | 8.7 | % | | 9.9 | % | | 11.4 | % |
(1) Percentages are calculated on unrounded numbers.
| | | | | | | | |
| | 17 |