UNITED STATES
SECURITIES AND EXCHANGE COMMISSION
Washington, D.C. 20549
FORM N-CSR
CERTIFIED SHAREHOLDER REPORT OF REGISTERED
MANAGEMENT INVESTMENT COMPANIES
Investment Company Act file number 811-23487
Legg Mason ETF Investment Trust II
(Exact name of registrant as specified in charter)
620 Eighth Avenue, 47th Floor, New York, NY 10018
(Address of principal executive offices) (Zip code)
Harris Goldblat
Franklin Templeton
100 First Stamford Place
Stamford, CT 06902
(Name and address of agent for service)
Registrant’s telephone number, including area code: 1-877-721-1926
Date of fiscal year end: March 31
Date of reporting period: March 31, 2024
ITEM 1. REPORT TO STOCKHOLDERS.
The Annual Report to Stockholders is filed herewith.

| | |
| Annual Report | | March 31, 2024 |
CLEARBRIDGE
FOCUS VALUE
ESG ETF
CFCV
The Securities and Exchange Commission has adopted new regulations that will result in changes to the design and delivery of annual and semi-annual shareholder reports beginning in July 2024.
If you have previously elected to receive shareholder reports electronically, you will continue to do so and need not take any action.
Otherwise, paper copies of the Fund’s shareholder reports will be mailed to you beginning in July 2024. If you would like to receive shareholder reports and other communications from the Fund electronically instead of by mail, you may make that request at any time by contacting your financial intermediary (such as a broker-dealer or bank).

|
| INVESTMENT PRODUCTS: NOT FDIC INSURED • NO BANK GUARANTEE • MAY LOSE VALUE |
Fund objective
The Fund seeks long-term capital appreciation.
Letter from the president

Dear Shareholder,
We are pleased to provide the annual report of ClearBridge Focus Value ESG ETF for the twelve-month reporting period ended March 31, 2024. Please read on for a detailed look at prevailing economic and market conditions during the Fund’s reporting period and to learn how those conditions have affected Fund performance.
Special shareholder notice
Effective December 31, 2023, Robert Feitler, Jr. retired and stepped down and Deepon Nag joined the Fund’s portfolio management team.
As always, we remain committed to providing you with excellent service and a full spectrum of investment choices. We also remain committed to supplementing the support you receive from your financial advisor. One way we accomplish this is through our website, www.franklintempleton.com. Here you can gain immediate access to market and investment information, including:
| • | | Fund net asset value and market price, |
| • | | Market insights and commentaries from our portfolio managers, and |
| • | | A host of educational resources. |
We look forward to helping you meet your financial goals.
Sincerely,

Patrick O’Connor
President and Chief Executive Officer - Investment Management
April 30, 2024
| | |
| II | | ClearBridge Focus Value ESG ETF |
Fund overview
Q. What is the Fund’s investment strategy?
A. The ClearBridge Focus Value ESG ETF (the “Fund”) seeks long-term capital appreciation. By employing fundamental research, in an effort to identify securities with attractive risk-adjusted returns (where the potential returns on the investment are favorable relative to the potential risks of the investment), the Fund’s portfolio management team constructs the portfolio on a bottom-up basis. Under normal circumstances, the Fund invests at least 80% of its net assets, plus borrowings for investment purposes, if any, in equity securities, or other investments with similar economic characteristics, of companies with large market capitalizations and which meet its financial and environmental, social and governance (“ESG”) criteria. The Fund may also invest up to 20% of its net assets in equity securities, or other investments with similar economic characteristics, of companies with lower market capitalizations that meet its financial and ESG criteria. Under normal circumstances, the Fund invests in a diversified portfolio typically consisting of the securities of 30 to 40 issuers.
Q. What were the overall market conditions during the Fund’s reporting period?
A. Equities delivered positive returns during the period, with the broad market Standard & Poor’s® 500 Index (S&P® 500)i advancing 29.88%. The strong performance of artificial intelligence (AI) beneficiaries, optimism over an economic soft landing and a dovish pivot by the Federal Reserve late in 2023 helped overcome persistent inflation, higher interest rates and fears of a recession.
With returns earlier in 2023 concentrated in a handful of mega cap companies in the information technology (IT), consumer discretionary and communication services sectors, market leadership began to broaden by the beginning of the third quarter of 2023 as better-than-expected corporate earnings and cooling inflation created a growing chorus for a soft landing for the economy (rather than a recession).
Growing optimism over an economic soft landing helped the financials and industrials sectors (which gained 36.96% and 30.48%, respectively) lead the benchmark Russell 1000® Value Indexii, which rose 20.27% in the twelve-month period. Investor enthusiasm about the potential for AI led to outsize returns by the IT (+25.39%), communication services (+26.78%) and consumer discretionary (+18.66%) sectors. Defensive and rate-sensitive sectors such as utilities (+0.89%), consumer staples (+4.92%), health care (+6.72%) and real estate (+9.93%) trailed as expectations for rate cuts kept getting pushed out as economic growth remained steady and inflation data, while decreasing, stayed elevated.
Q. How did we respond to these changing market conditions?
A. Our approach for the Fund is to avoid making factor bets and instead make stock selection decisions based on bottom-up fundamentals. A factor-driven market crowded in a few select winners has therefore created excellent opportunities to be active in other areas of the market where great companies are either underearning and/or are being improperly valued. We seek to analyze industry and franchise risks as part of an iterative and thorough risk management process, and our disciplined valuation approach assures we allow for a margin of error.
Once we have identified individual stocks to consider, we first evaluate how attractive an industry is by examining its market structure, growth rates and cyclicality, while also assessing multiple risks, including technological disintermediation and regulation. At an
| | | | |
| ClearBridge Focus Value ESG ETF 2024 Annual Report | | | | 1 |
Fund overview (cont’d)
individual company level, we look for strong franchises with sustainable competitive edge (whether based on product innovation, customer lock-in or a differentiated business model), pricing flexibility, solid fundamentals, such as reliable cash flows and balance sheet health, and management with a proven history of execution and sound capital discipline. We only consider valuation after we’ve evaluated, and are comfortable with, the industry dynamics and franchise qualities of a company. While we don’t use valuation as an initial screening tool, valuation is crucial for identifying attractive entry points and for knowing when to reduce or exit a position.
Our industry-level analysis initiated a new position in XPO, a less-than-truckload (LTL) shipping company. Within the transport sector LTL seems to have favorable sector dynamics with the bankruptcy of Yellow Corp. driving tighter industry capacity and favorable industry pricing. The LTL industry also appears to have demonstrated much stronger growth across cycles than, say, the small package industry, led by higher barriers to entry (a large national network of terminals is very difficult to replicate) as well as stronger pricing power with its customers (LTL’s serve more B2B customers, which are historically much more focused on service quality as opposed to price).
The media industry has been evolving over the past several years with the introduction of new broadband options (such as fixed wireless) and more cord cutting. The increased competition in the broadband space led us to exit Charter Communications as subscriber additions come under pressure and COVID-era government subsidy programs lapse. We see the new media landscape as increasingly favorable to new position Disney, however, as its large intellectual property library and differentiated content allowed it to pivot quickly from a model of linear distribution through intermediaries such as cable and telco to become a larger direct-to-consumer (DTC) streaming business. We’ve long been concerned about the focus of DTC participants on subscriber additions over profitability, but the industry has become more rational as several media companies have pulled back on customer acquisition and content spending, and industry bellwether Netflix has started raising pricing and cracking down on password sharing. Given that Disney’s DTC business is now larger than its legacy linear entertainment franchise, we believe the much more favorable industry structure should disproportionately benefit the company.
Considering alternative investment opportunities at a company franchise level, we exited our position in TE Connectivity, replacing it with a new and larger position in Microchip Technology. Although both companies are exposed to similar trends — increasing electrification of industrial and automotive verticals — we believe that TE Connectivity’s products are more susceptible to price competition resulting in slower growth and lower margins, while Microchip specializes in embedded microcontroller units (MCUs), an attractive industry with a diversified and fragmented customer base, high barriers to entry and very few reasonable substitutes. We also expect Microchip to outgrow the industry due to favorable end market exposure and better pricing.
Applying our valuation discipline, we decided to recycle some of the capital out of our long-term holding American Express and initiated a new position in Capital One. Although it is credit sensitive and cyclical in nature, we view the consumer finance industry as among the most attractive in the financials sector. American Express management has executed exceptionally well over the past several years, with the stock’s valuation now reflecting both the high-quality nature of its franchise and the consistent operational performance of the business.
| | | | |
2 | | | | ClearBridge Focus Value ESG ETF 2024 Annual Report |
Capital One is a diversified financial services company with a long and successful legacy as one of the major credit card operators in the industry. It announced the acquisition of Discover in the first quarter, a deal that we think has sound short- to medium-term economics and offers compelling long-term optionality. While facing a lengthy and uncertain regulatory approval process, if approved the combined entity would be the largest credit card issuer in the U.S, with a fully scaled domestic credit card network being run by arguably one of the best management teams in the industry. This transaction puts in place key ingredients to permanently improve Capital One returns characteristics, hopefully leading to the business rerating over the long term. While Capital One’s combination of assets with Discover remain unproven relative to those of American Express, we’d note that the latter trades at nearly 5x higher tangible book value relative to the former, which we believe provides substantial upside for Capital One over the coming years as it executes on its strategy.
The period thus offers a good case study of our investment philosophy and process in action. It illustrates our fundamentally driven bottom-up-focused analytical framework as we capitalize on opportunities created by a momentum-driven market while simultaneously taking profits and planting seeds for future success.
Performance review
For the 12-month period ended March 31, 2024, ClearBridge Focus Value ESG ETF generated a +24.87% return on a net asset value (“NAV”)iii basis and +25.26% based on its market priceiv per share.
The performance table shows the Fund’s total return for the 12 months ended March 31, 2024, based on its NAV and market price as of March 31, 2024. The Fund’s benchmark, the Russell 1000® Value Index, returned +20.27% over the same time frame.
| | | | | | | | |
Performance Snapshot as of March 31, 2024 (unaudited) | |
| ClearBridge Focus Value ESG ETF: | | 6 months | | | 12 months | |
$37.74 (NAV) | | | 19.06 | % | | | 24.87 | %*† |
$37.82 (Market Price) | | | 19.35 | % | | | 25.26 | %*‡ |
| Russell 1000® Value Index | | | 19.34 | % | | | 20.27 | % |
The performance shown represents past performance. Past performance is no guarantee of future results and current performance may be higher or lower than the performance shown above. Principal value and investment returns will fluctuate so shares, when sold, may be worth more or less than their original cost. Performance data current to the most recent month-end is available at www.franklintempleton.com.
Investors buy and sell shares of an exchange-traded fund (“ETF”) at market price (not NAV) in the secondary market throughout the trading day. These shares are not individually available for direct purchase from or direct redemption to the ETF. Market price returns are typically based upon the official closing price of the Fund’s shares. These returns do not represent investors’ returns had they traded shares at other times. Performance figures for periods shorter than one year represent cumulative figures and are not annualized.
Information showing the Fund’s net asset value, market price, premiums and discounts, and bid-ask spreads for various time periods is available by visiting the Fund’s website at www.franklintempleton.com.
| | | | |
| ClearBridge Focus Value ESG ETF 2024 Annual Report | | | | 3 |
Fund overview (cont’d)
As of the Fund’s current prospectus dated August 1, 2023, as supplemented March 4, 2024, the gross total annual fund operating expense ratio for the Fund was 0.48%.
* Total returns are based on changes in NAV or market price, respectively. Returns reflect the deduction of all Fund expenses. Returns do not reflect the deduction of brokerage commissions or taxes that investors pay on distributions or the sale of shares.
† Total return assumes the reinvestment of all distributions at NAV.
‡ Total return assumes the reinvestment of all distributions at market price, which typically is based upon the official closing price of the Fund’s shares.
Q. What were the leading contributors to performance?
A. On an absolute basis, the Fund had positive returns in nine of the 11 economic sectors in which it was invested during the reporting period, with the greatest contribution to returns coming from the financials, IT and communication services sectors. Relative to the benchmark Russell 1000® Value Index, stock selection in the materials, health care, financials and IT sectors drove positive performance the most. In terms of sector allocation, underweights to the real estate and consumer staples sectors and overweights to the IT and financials sectors aided performance.
In terms of individual Fund holdings, leading contributors to performance for the period included Meta Platforms, Intel, JPMorgan Chase, Vertiv and Bank of America.
Q. What were the leading detractors from performance?
A. On an absolute basis, the real estate sector was the sole detractor. Relative to the benchmark, stock selection in the industrials, utilities, real estate and energy sectors were the main detractors. Overweights to the utilities, health care and materials sectors and an industrials underweight also detracted.
In terms of individual Fund holdings, leading detractors from performance for the period included Air Products and Chemicals, United Parcel Service, Cisco Systems, Dish Network and Amgen.
Q. Were there any significant changes to the Fund during the reporting period?
A. In addition to portfolio activity outlined above, over the course of the reporting period larger new positions included CVS Health, McKesson and Thermo Fisher Scientific in the health care sector, Sherwin-Williams in the materials sector and WEC Energy in the utilities sector. Larger positions closed included Berkshire Hathaway in the financials sector, Cisco Systems in the IT sector, Air Products and Chemicals and PPG Industries in the materials sector and Amgen in the health care sector.
Looking for additional information?
The Fund’s daily NAV is available online at www.franklintempleton.com. The Fund is traded under the symbol “CFCV” and its closing market price is available on most financial websites. In a continuing effort to provide information concerning the Fund, shareholders may call 1-877-721-1926 (toll free), Monday through Friday from 8:00 a.m. to 5:30 p.m. Eastern time, for the Fund’s current NAV, market price and other information.
Effective December 31, 2023, Robert Feitler, Jr. retired and stepped down and Deepon Nag joined the Fund’s portfolio management team.
| | | | |
4 | | | | ClearBridge Focus Value ESG ETF 2024 Annual Report |
Thank you for your investment in ClearBridge Focus Value ESG ETF. As always, we appreciate that you have chosen us to manage your assets and we remain focused on achieving the Fund’s investment goals.
Sincerely,

Deepon Nag
Portfolio Manager
ClearBridge Investments, LLC

Dmitry Khaykin
Portfolio Manager
ClearBridge Investments, LLC
April 15, 2024
RISKS: The market values of securities or other assets will fluctuate, sometimes sharply and unpredictably, due to changes in general market conditions, overall economic trends or events, governmental actions or intervention, actions taken by the U.S. Federal Reserve or foreign central banks, market disruptions caused by trade disputes or other factors, political developments, armed conflicts, economic sanctions and countermeasures in response to sanctions, major cybersecurity events, investor sentiment, the global and domestic effects of a pandemic, and other factors that may or may not be related to the issuer of the security or other asset.
Portfolio holdings and breakdowns are as of March 31, 2024, and are subject to change and may not be representative of the portfolio manager’s current or future investments. The Fund’s top ten holdings (as a percentage of net assets) as of March 31, 2024, were: Intel Corp. (6.45%), CVS health Corp. (4.94%), Bank of America Corp. (4.77%), JPMorgan Chase & Co. (4.74%), McKesson Corp. (4.33%), Comcast Corp. (3.97%), Microchip Technology Inc. (3.93%), Sempra (3.92%), Charles Schwab Corp. (3.83%) and Johnson & Johnson (3.78%). Please refer to pages 12 through 14 for a list and percentage breakdown of the Fund’s holdings.
The mention of sector breakdowns is for informational purposes only and should not be construed as a recommendation to purchase or sell any securities. The information provided regarding such sectors is not a sufficient basis upon which to make an investment decision. Investors seeking financial advice regarding the appropriateness of investing in any securities or investment strategies discussed should consult their financial professional. The Fund’s top five sector holdings (as a percentage of net assets) as of March 31, 2024, were: financials (22.13%), health care (21.05%), information technology (16.05%), industrials (11.47%), and utilities (9.65%). The Fund’s composition may differ over time.
| | | | |
| ClearBridge Focus Value ESG ETF 2024 Annual Report | | | | 5 |
Fund overview (cont’d)
All investments involve risks, including possible loss of principal. Equity securities are subject to price fluctuation and possible loss of principal. Derivative instruments can be illiquid, may disproportionately increase losses, and have a potentially large impact on performance. The investment style may become out of favor, which may have a negative impact on performance. The managers’ environmental, social and governance (ESG) strategies may limit the types and number of investments available and, as a result, may forgo favorable market opportunities or underperform strategies that are not subject to such criteria. There is no guarantee that the strategy’s ESG directives will be successful or will result in better performance. These and other risks are discussed in the Fund’s prospectus.
The information provided is not intended to be a forecast of future events, a guarantee of future results or investment advice. Views expressed may differ from those of the firm as a whole.
| i | Standard & Poor’s® 500 Index (S&P 500®) is a market capitalization-weighted index of 500 stocks designed to measure total U.S. equity market performance. |
| ii | The Russell 1000® Value Index measures the performance of the large-cap value segment of the U.S. equity universe. It includes those Russell 1000 Index companies with lower price-to-book ratios and lower expected growth values. (A price-to-book ratio is the price of a stock compared to the difference between a company’s assets and liabilities). Russell® is a trademark of Frank Russell Company. |
| iii | Net Asset Value (NAV) is calculated by subtracting total liabilities from total assets and dividing the results by the number of shares outstanding. |
| iv | Market price is determined by supply and demand. It is the price at which an investor purchases or sells shares of the Fund. The Market Price may differ from the Fund’s NAV. |
| | | | |
6 | | | | ClearBridge Focus Value ESG ETF 2024 Annual Report |
Fund at a glance† (unaudited)
Investment breakdown (%) as a percent of total investments
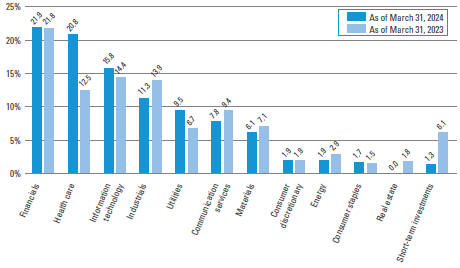
| † | The bar graph above represents the composition of the Fund’s investments as of March 31, 2024 and March 31, 2023. The Fund is actively managed. As a result, the composition of the Fund’s investments is subject to change at any time. |
| | | | |
| ClearBridge Focus Value ESG ETF 2024 Annual Report | | | | 7 |
Fund expenses (unaudited)
Example
As a shareholder of the Fund, you may incur two types of costs: (1) transaction costs, such as brokerage commissions paid on purchases and sales of Fund shares; and (2) ongoing costs, including management fees; and other Fund expenses. This example is intended to help you understand your ongoing costs (in dollars) of investing in the Fund and to compare these costs with the ongoing costs of investing in other funds.
This example is based on an investment of $1,000 invested on October 1, 2023 and held for the six months ended March 31, 2024.
Actual expenses
The table below titled “Based on actual total return” provides information about actual account values and actual expenses. You may use the information provided in this table, together with the amount you invested, to estimate the expenses that you paid over the period. To estimate the expenses you paid on your account, divide your ending account value by $1,000 (for example, an $8,600 ending account value divided by $1,000 = 8.6), then multiply the result by the number under the heading entitled “Expenses Paid During the Period”.
Hypothetical example for comparison purposes
The table below titled “Based on hypothetical total return” provides information about hypothetical account values and hypothetical expenses based on the actual expense ratio and an assumed rate of return of 5.00% per year before expenses, which is not the Fund’s actual return. The hypothetical account values and expenses may not be used to estimate the actual ending account balance or expenses you paid for the period. You may use the information provided in this table to compare the ongoing costs of investing in the Fund and other funds. To do so, compare the 5.00% hypothetical example relating to the Fund with the 5.00% hypothetical examples that appear in the shareholder reports of the other funds.
Please note that the expenses shown in the table below are meant to highlight your ongoing costs only and do not reflect any transactional costs, such as brokerage commissions paid on purchases and sales of Fund shares. Therefore, the table is useful in comparing ongoing costs only, and will not help you determine the relative total costs of owning different funds. In addition, if these transaction costs were included, your costs would have been higher.
| | | | | | | | | | | | | | | | | | | | |
| | |
| Based on actual total return1 | | | | Based on hypothetical total return1 |
Actual
Total
Return2 | | Beginning
Account
Value | | Ending
Account
Value | | Annualized
Expense
Ratio | | Expenses
Paid During
the Period3 | | | | Hypothetical
Annualized
Total Return | | Beginning
Account
Value | | Ending
Account
Value | | Annualized
Expense
Ratio | | Expenses
Paid During
the Period3 |
| 19.06% | | $1,000.00 | | $1,190.60 | | 0.49% | | $2.68 | | | | 5.00% | | $1,000.00 | | $1,022.55 | | 0.49% | | $2.48 |
| 1 | For the six months ended March 31, 2024. |
| 2 | Assumes the reinvestment of all distributions, including returns of capital, if any, at net asset value. Total return is not annualized, as it may not be representative of the total return for the year. Performance figures may reflect fee waivers and/or expense reimbursements. In the absence of fee waivers and/or expense reimbursements, the total return would have been lower. Past performance is no guarantee of future results. |
| 3 | Expenses (net of fee waivers and/or expense reimbursements) are equal to the Fund’s annualized expense ratio multiplied by the average account value over the period, multiplied by the number of days in the most recent fiscal half-year (183), then divided by 366. |
| | | | |
8 | | | | ClearBridge Focus Value ESG ETF 2024 Annual Report |
Fund performance (unaudited)
| | | | |
| Net Asset Value | | | |
| Average annual total returns1 | | | |
| Twelve Months Ended 3/31/24 | | | 24.87 | % |
| Inception date of 5/27/20 through 3/31/24 | | | 14.88 | |
| |
| Cumulative total returns1 | | | |
| Inception date of 5/27/20 through 3/31/24 | | | 70.42 | % |
| | | | |
| Market Price | | | |
| Average annual total returns2 | | | |
| Twelve Months Ended 3/31/24 | | | 25.26 | % |
| Inception date of 5/27/20 through 3/31/24 | | | 14.95 | |
| |
| Cumulative total returns2 | | | |
| Inception date of 5/27/20 through 3/31/24 | | | 70.83 | % |
All figures represent past performance and are not a guarantee of future results. Investment returns and principal value of an investment will fluctuate so that an investor’s shares, when sold, may be worth more or less than their original cost. NAV returns assume that dividends and capital gain distributions have been reinvested in the Fund at NAV. The returns shown do not reflect the deduction of brokerage commissions or taxes that investors would pay on distributions or the sale of shares. Performance figures may reflect fee waivers and/or expense reimbursements. In the absence of fee waivers and/or expense reimbursements, the total return would have been lower.
Investors buy and sell shares of the Fund at market price, not NAV, in the secondary market throughout the trading day. These shares are not individually available for direct purchase from or direct redemption to the Fund. The Fund’s per share NAV is the value of one share of the Fund and is calculated by dividing the value of total assets less total liabilities by the number of shares outstanding. The NAV return is based on the NAV of the Fund and effective July 1, 2020, market price returns typically are based upon the official closing price of the Fund’s shares. These returns do not represent investors’ returns had they traded shares at other times. NAV and market price returns assume that dividends and capital gain distributions have been reinvested in the Fund at NAV and market price, respectively. As with other exchange-traded funds, NAV returns and market price returns may differ because of factors such as the supply and demand for Fund shares and investors’ assessment of the underlying value of the Fund’s portfolio securities.
| 1 | Assumes the reinvestment of all distributions, including returns of capital, if any, at net asset value. |
| 2 | Assumes the reinvestment of all distributions, including returns of capital, if any, at market price. |
| | | | |
| ClearBridge Focus Value ESG ETF 2024 Annual Report | | | | 9 |
Fund performance (unaudited) (cont’d)
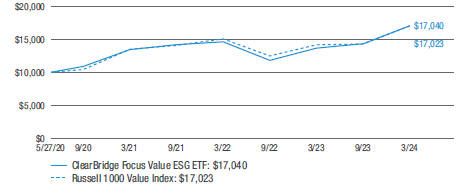
Historical performance
Value of $10,000 invested in
ClearBridge Focus Value ESG ETF vs Russell 1000 Value Index† — May 27, 2020 - March 31, 2024
All figures represent past performance and are not a guarantee of future results. Investment returns and principal value of an investment will fluctuate so that an investor’s shares, when sold, may be worth more or less than their original cost. NAV returns assume that dividends and capital gain distributions have been reinvested in the Fund at NAV. The returns shown do not reflect the deduction of brokerage commissions or taxes that investors would pay on distributions or the sale of shares. Performance figures may reflect fee waivers and/or expense reimbursements. In the absence of fee waivers and/or expense reimbursements, the total return would have been lower.
| † | Hypothetical illustration of $10,000 invested in ClearBridge Focus Value ESG ETF on May 27, 2020 (inception date), assuming the reinvestment of all distributions, including returns of capital, if any, at net asset value through March 31, 2024. The hypothetical illustration also assumes a $10,000 investment in the Russell 1000 Value Index. The Fund’s per share NAV is the value of one share of the Fund and is calculated by dividing the value of total assets less total liabilities by the number of shares outstanding. The NAV return is based on the NAV of the Fund. The Russell 1000 Value Index (the “Index”) measures the performance of the large-cap value segment of the U.S. equity universe. The Index is not subject to the same management and trading expenses as a fund. An index is a statistical composite that tracks a specified financial market, sector, or rules-based investment process. Unlike a fund, an index does not actually hold a portfolio of securities and therefore does not incur the expenses incurred by a fund. These expenses negatively impact fund performance. All index performance reflects no deduction for fees, expenses or taxes. Please note that an investor cannot invest directly in an index. |
| | | | |
10 | | | | ClearBridge Focus Value ESG ETF 2024 Annual Report |
Schedule of investments
March 31, 2024
ClearBridge Focus Value ESG ETF
(Percentages shown based on Fund net assets)
| | | | | | | | |
| Security | | Shares | | | Value | |
| Common Stocks — 99.9% | | | | | | | | |
| Communication Services — 7.9% | | | | | | | | |
Entertainment — 0.9% | | | | | | | | |
Walt Disney Co. | | | 269 | | | $ | 32,915 | |
Interactive Media & Services — 3.0% | | | | | | | | |
Alphabet Inc., Class A Shares | | | 229 | | | | 34,563 | * |
Meta Platforms Inc., Class A Shares | | | 146 | | | | 70,895 | |
Total Interactive Media & Services | | | | | | | 105,458 | |
Media — 4.0% | | | | | | | | |
Comcast Corp., Class A Shares | | | 3,246 | | | | 140,714 | |
Total Communication Services | | | | | | | 279,087 | |
| Consumer Discretionary — 2.0% | | | | | | | | |
Specialty Retail — 2.0% | | | | | | | | |
Home Depot Inc. | | | 182 | | | | 69,815 | |
| Consumer Staples — 1.7% | | | | | | | | |
Food Products — 0.4% | | | | | | | | |
Nestle SA, ADR | | | 134 | | | | 14,231 | |
Personal Care Products — 1.3% | | | | | | | | |
Haleon PLC, ADR | | | 5,343 | | | | 45,362 | |
Total Consumer Staples | | | | | | | 59,593 | |
| Energy — 1.9% | | | | | | | | |
Oil, Gas & Consumable Fuels — 1.9% | | | | | | | | |
TC Energy Corp. | | | 1,692 | | | | 68,018 | |
| Financials — 22.1% | | | | | | | | |
Banks — 9.5% | | | | | | | | |
Bank of America Corp. | | | 4,463 | | | | 169,237 | |
JPMorgan Chase & Co. | | | 840 | | | | 168,252 | |
Total Banks | | | | | | | 337,489 | |
Capital Markets — 3.8% | | | | | | | | |
Charles Schwab Corp. | | | 1,878 | | | | 135,854 | |
Consumer Finance — 4.5% | | | | | | | | |
American Express Co. | | | 540 | | | | 122,953 | |
Capital One Financial Corp. | | | 245 | | | | 36,478 | |
Total Consumer Finance | | | | | | | 159,431 | |
Financial Services — 1.3% | | | | | | | | |
Visa Inc., Class A Shares | | | 159 | | | | 44,374 | |
See Notes to Financial Statements.
| | | | |
| ClearBridge Focus Value ESG ETF 2024 Annual Report | | | | 11 |
Schedule of investments (cont’d)
March 31, 2024
ClearBridge Focus Value ESG ETF
(Percentages shown based on Fund net assets)
| | | | | | | | |
| Security | | Shares | | | Value | |
Insurance — 3.0% | | | | | | | | |
Marsh & McLennan Cos. Inc. | | | 312 | | | $ | 64,265 | |
Progressive Corp. | | | 212 | | | | 43,846 | |
Total Insurance | | | | | | | 108,111 | |
Total Financials | | | | | | | 785,259 | |
| Health Care — 21.0% | | | | | | | | |
Health Care Equipment & Supplies — 2.9% | | | | | | | | |
Becton Dickinson & Co. | | | 419 | | | | 103,681 | |
Health Care Providers & Services — 11.0% | | | | | | | | |
CVS Health Corp. | | | 2,196 | | | | 175,153 | |
McKesson Corp. | | | 286 | | | | 153,539 | |
UnitedHealth Group Inc. | | | 125 | | | | 61,838 | |
Total Health Care Providers & Services | | | | | | | 390,530 | |
Life Sciences Tools & Services — 3.3% | | | | | | | | |
Thermo Fisher Scientific Inc. | | | 204 | | | | 118,567 | |
Pharmaceuticals — 3.8% | | | | | | | | |
Johnson & Johnson | | | 848 | | | | 134,145 | |
Total Health Care | | | | | | | 746,923 | |
| Industrials — 11.5% | | | | | | | | |
Air Freight & Logistics — 3.2% | | | | | | | | |
United Parcel Service Inc., Class B Shares | | | 753 | | | | 111,919 | |
Commercial Services & Supplies — 1.6% | | | | | | | | |
Veralto Corp. | | | 633 | | | | 56,122 | |
Ground Transportation — 0.9% | | | | | | | | |
XPO Inc. | | | 276 | | | | 33,680 | * |
Machinery — 5.8% | | | | | | | | |
Deere & Co. | | | 82 | | | | 33,681 | |
Illinois Tool Works Inc. | | | 297 | | | | 79,694 | |
Otis Worldwide Corp. | | | 924 | | | | 91,725 | |
Total Machinery | | | | | | | 205,100 | |
Total Industrials | | | | | | | 406,821 | |
| Information Technology — 16.0% | | | | | | | | |
Communications Equipment — 2.1% | | | | | | | | |
Motorola Solutions Inc. | | | 213 | | | | 75,611 | |
Semiconductors & Semiconductor Equipment — 12.8% | | | | | | | | |
Intel Corp. | | | 5,183 | | | | 228,933 | |
Lam Research Corp. | | | 88 | | | | 85,498 | |
Microchip Technology Inc. | | | 1,555 | | | | 139,499 | |
Total Semiconductors & Semiconductor Equipment | | | | | | | 453,930 | |
See Notes to Financial Statements.
| | | | |
12 | | | | ClearBridge Focus Value ESG ETF 2024 Annual Report |
ClearBridge Focus Value ESG ETF
(Percentages shown based on Fund net assets)
| | | | | | | | | | | | |
| Security | | | | | Shares | | | Value | |
Software — 1.1% | | | | | | | | | | | | |
Microsoft Corp. | | | | | | | 95 | | | $ | 39,969 | |
Total Information Technology | | | | | | | | | | | 569,510 | |
| Materials — 6.1% | | | | | | | | | | | | |
Chemicals — 3.6% | | | | | | | | | | | | |
Sherwin-Williams Co. | | | | | | | 365 | | | | 126,776 | |
Construction Materials — 2.5% | | | | | | | | | | | | |
Martin Marietta Materials Inc. | | | | | | | 148 | | | | 90,863 | |
Total Materials | | | | | | | | | | | 217,639 | |
| Utilities — 9.7% | | | | | | | | | | | | |
Electric Utilities — 2.3% | | | | | | | | | | | | |
Edison International | | | | | | | 1,134 | | | | 80,208 | |
Multi-Utilities — 7.4% | | | | | | | | | | | | |
Sempra | | | | | | | 1,938 | | | | 139,206 | |
WEC Energy Group Inc. | | | | | | | 1,499 | | | | 123,098 | |
Total Multi-Utilities | | | | | | | | | | | 262,304 | |
Total Utilities | | | | | | | | | | | 342,512 | |
Total Investments before Short-Term Investments (Cost — $2,727,221) | | | | | | | | 3,545,177 | |
| | | |
| | | Rate | | | | | | | |
| Short-Term Investments — 1.4% | | | | | | | | | | | | |
JPMorgan 100% U.S. Treasury Securities Money Market Fund, Institutional Class (Cost — $47,383) | | | 5.155 | % | | | 47,383 | | | | 47,383 | (a) |
Total Investments — 101.3% (Cost — $2,774,604) | | | | | | | | | | | 3,592,560 | |
Liabilities in Excess of Other Assets — (1.3)% | | | | | | | | | | | (44,644 | ) |
Total Net Assets — 100.0% | | | | | | | | | | $ | 3,547,916 | |
| * | Non-income producing security. |
| (a) | Rate shown is one-day yield as of the end of the reporting period. |
| | |
Abbreviation(s) used in this schedule: |
|
| ADR — American Depositary Receipts |
See Notes to Financial Statements.
| | | | |
| ClearBridge Focus Value ESG ETF 2024 Annual Report | | | | 13 |
Statement of assets and liabilities
March 31, 2024
| | | | |
| |
| Assets: | | | | |
Investments, at value (Cost — $2,774,604) | | $ | 3,592,560 | |
Dividends receivable | | | 6,627 | |
Total Assets | | | 3,599,187 | |
| |
| Liabilities: | | | | |
Payable for securities purchased | | | 49,884 | |
Investment management fee payable | | | 1,387 | |
Total Liabilities | | | 51,271 | |
| Total Net Assets | | $ | 3,547,916 | |
| |
| Net Assets: | | | | |
Par value (Note 5) | | $ | 1 | |
Paid-in capital in excess of par value | | | 2,676,710 | |
Total distributable earnings (loss) | | | 871,205 | |
| Total Net Assets | | $ | 3,547,916 | |
| |
| Shares Outstanding | | | 94,000 | |
| |
| Net Asset Value | | $ | 37.74 | |
See Notes to Financial Statements.
| | | | |
14 | | | | ClearBridge Focus Value ESG ETF 2024 Annual Report |
Statement of operations
For the Year Ended March 31, 2024
| | | | |
| |
| Investment Income: | | | | |
Dividends | | $ | 62,971 | |
Less: Foreign taxes withheld | | | (762) | |
Total Investment Income | | | 62,209 | |
| |
| Expenses: | | | | |
Investment management fee (Note 2) | | | 15,390 | |
Total Expenses | | | 15,390 | |
| Net Investment Income | | | 46,819 | |
|
| Realized and Unrealized Gain (Loss) on Investments and Foreign Currency Transactions (Notes 1 and 3): | |
Net Realized Gain (Loss) From: | | | | |
Investment transactions | | | 102,415 | |
Foreign currency transactions | | | (106) | |
Net Realized Gain | | | 102,309 | |
Change in Net Unrealized Appreciation (Depreciation) From: | | | | |
Investments | | | 567,835 | |
Foreign currencies | | | 4 | |
Change in Net Unrealized Appreciation (Depreciation) | | | 567,839 | |
| Net Gain on Investments and Foreign Currency Transactions | | | 670,148 | |
| Increase in Net Assets From Operations | | $ | 716,967 | |
See Notes to Financial Statements.
| | | | |
| ClearBridge Focus Value ESG ETF 2024 Annual Report | | | | 15 |
Statements of changes in net assets
| | | | | | | | |
| For the Years Ended March 31, | | 2024 | | | 2023 | |
| | |
| Operations: | | | | | | | | |
Net investment income | | $ | 46,819 | | | $ | 47,499 | |
Net realized gain | | | 102,309 | | | | 247,513 | |
Change in net unrealized appreciation (depreciation) | | | 567,839 | | | | (565,220) | |
Increase (Decrease) in Net Assets From Operations | | | 716,967 | | | | (270,208) | |
| | |
| Distributions to Shareholders From (Note 1): | | | | | | | | |
Total distributable earnings | | | (77,088) | | | | (86,723) | |
Decrease in Net Assets From Distributions to Shareholders | | | (77,088) | | | | (86,723) | |
| | |
| Fund Share Transactions (Note 5): | | | | | | | | |
Net proceeds from sale of shares (0 and 20,000 shares issued, respectively) | | | — | | | | 624,321 | |
Cost of shares repurchased (0 and 40,000 shares repurchased, respectively) | | | — | | | | (1,245,345) | |
Decrease in Net Assets From Fund Share Transactions | | | — | | | | (621,024) | |
Increase (Decrease) in Net Assets | | | 639,879 | | | | (977,955) | |
| | |
| Net Assets: | | | | | | | | |
Beginning of year | | | 2,908,037 | | | | 3,885,992 | |
End of year | | $ | 3,547,916 | | | $ | 2,908,037 | |
See Notes to Financial Statements.
| | | | |
16 | | | | ClearBridge Focus Value ESG ETF 2024 Annual Report |
Financial highlights
| | | | | | | | | | | | | | | | | | | | |
For a share of beneficial interest outstanding throughout each year ended March 31, unless otherwise noted: | |
| | | 20241 | | | 20231 | | | 20221,2 | | | 20211,3 | | | 20201,4 | |
| | | | | |
| Net asset value, beginning of period | | | $30.94 | | | | $34.09 | | | | $34.54 | | | | $27.09 | | | | $24.99 | |
| | | | | |
| Income (loss) from operations: | | | | | | | | | | | | | | | | | | | | |
Net investment income | | | 0.50 | | | | 0.44 | | | | 0.19 | | | | 0.38 | | | | 0.15 | |
Net realized and unrealized gain (loss) | | | 7.12 | | | | (2.72) | | | | 0.91 | | | | 7.74 | | | | 2.06 | |
Total income (loss) from operations | | | 7.62 | | | | (2.28) | | | | 1.10 | | | | 8.12 | | | | 2.21 | |
| | | | | |
| Less distributions from: | | | | | | | | | | | | | | | | | | | | |
Net investment income | | | (0.48) | | | | (0.46) | | | | (0.19) | | | | (0.38) | | | | (0.11) | |
Net realized gains | | | (0.34) | | | | (0.41) | | | | (1.36) | | | | (0.29) | | | | — | |
Total distributions | | | (0.82) | | | | (0.87) | | | | (1.55) | | | | (0.67) | | | | (0.11) | |
| | | | | |
| Net asset value, end of period | | | $37.74 | | | | $30.94 | | | | $34.09 | | | | $34.54 | | | | $27.09 | |
Total return, based on NAV5 | | | 24.87 | % | | | (6.56) | % | | | 3.01 | % | | | 30.22 | % | | | 8.87 | % |
| | | | | |
| Net assets, end of period (000s) | | | $3,548 | | | | $2,908 | | | | $3,886 | | | | $3,938 | | | | $2,817 | |
| | | | | |
| Ratios to average net assets: | | | | | | | | | | | | | | | | | | | | |
Gross expenses | | | 0.49 | %6 | | | 0.49 | % | | | 0.49 | %7 | | | 0.49 | % | | | 0.49 | %7 |
Net expenses | | | 0.49 | 6 | | | 0.49 | | | | 0.49 | 7 | | | 0.49 | | | | 0.49 | 7 |
Net investment income | | | 1.49 | | | | 1.44 | | | | 1.07 | 7 | | | 1.17 | | | | 1.65 | 7 |
| | | | | |
| Portfolio turnover rate | | | 43 | % | | | 8 | %8 | | | 7 | %8 | | | 21 | %8 | | | 5 | %8 |
| 1 | Per share amounts have been calculated using the average shares method. |
| 2 | For the period October 1, 2021 through March 31, 2022. |
| 3 | For the year ended September 30. |
| 4 | For the period May 27, 2020 (inception date) to September 30, 2020. |
| 5 | Performance figures may reflect fee waivers and/or expense reimbursements. In the absence of fee waivers and/or expense reimbursements, the total return would have been lower. The total return calculation assumes that distributions are reinvested at NAV. Past performance is no guarantee of future results. Total returns for periods of less than one year are not annualized. |
| 6 | Effective March 1, 2024, the Fund’s management fee was reduced to 0.47%. Prior to March 1, 2024, the Fund paid a fee equal to an annual rate of 0.49% of the value of the average daily net assets of the Fund. |
| 8 | Portfolio turnover excludes the value of portfolio securities received or delivered as a result of in-kind fund share transactions. |
See Notes to Financial Statements.
| | | | |
| ClearBridge Focus Value ESG ETF 2024 Annual Report | | | | 17 |
Notes to financial statements
1. Organization and significant accounting policies
ClearBridge Focus Value ESG ETF (the “Fund”) is a separate diversified investment series of Legg Mason ETF Investment Trust II (formerly ActiveShares®ETF Trust) (the “Trust”). The Trust, a Maryland statutory trust, is registered under the Investment Company Act of 1940, as amended (the “1940 Act”), as an open-end management investment company.
The Fund is an actively managed exchange-traded fund (“ETF”). ETFs are funds that trade like other publicly-traded securities. Unlike shares of a mutual fund, which can be bought from and redeemed by the issuing fund by all shareholders at a price based on net asset value (“NAV”), shares of the Fund may be directly purchased from and redeemed by the Fund at NAV solely by certain large institutional investors who have entered into agreements with the Fund’s distributor (“Authorized Participants”). Also unlike shares of a mutual fund, shares of the Fund are listed on a national securities exchange and trade in the secondary market at market prices that change throughout the day.
Shares of the Fund are listed and traded at market prices on Cboe BZX Exchange, Inc. The market price for the Fund’s shares may be different from the Fund’s NAV. The Fund issues and redeems shares at NAV only in blocks of a specified number of shares or multiples thereof (“Creation Units”). Only Authorized Participants may purchase or redeem Creation Units directly with the Fund at NAV. Creation Units are created and redeemed principally in-kind (although under some circumstances its shares are created and redeemed partially for cash).
The Fund seeks long-term capital appreciation.
The Fund follows the accounting and reporting guidance in Financial Accounting Standards Board (“FASB”) Accounting Standards Codification Topic 946, Financial Services – Investment Companies (“ASC 946”). The following are significant accounting policies consistently followed by the Fund and are in conformity with U.S. generally accepted accounting principles (“GAAP”), including, but not limited to, ASC 946. Estimates and assumptions are required to be made regarding assets, liabilities and changes in net assets resulting from operations when financial statements are prepared. Changes in the economic environment, financial markets and any other parameters used in determining these estimates could cause actual results to differ. Subsequent events have been evaluated through the date the financial statements were issued.
(a) Investment valuation. Equity securities for which market quotations are available are valued at the last reported sales price or official closing price on the primary market or exchange on which they trade. The valuations for fixed income securities (which may include, but are not limited to, corporate, government, municipal, mortgage-backed, collateralized mortgage obligations and asset-backed securities) and certain derivative instruments are typically the prices supplied by independent third party pricing services, which may use market prices or broker/dealer quotations or a variety of valuation techniques and methodologies. The independent third party pricing services typically use
| | | | |
18 | | | | ClearBridge Focus Value ESG ETF 2024 Annual Report |
inputs that are observable such as issuer details, interest rates, yield curves, prepayment speeds, credit risks/spreads, default rates and quoted prices for similar securities. Investments in open-end funds are valued at the closing net asset value per share of each fund on the day of valuation. When the Fund holds securities or other assets that are denominated in a foreign currency, the Fund will use the currency exchange rates, generally determined as of 4:00 p.m. (London Time). If independent third party pricing services are unable to supply prices for a portfolio investment, or if the prices supplied are deemed by the manager to be unreliable, the market price may be determined by the manager using quotations from one or more broker/dealers or at the transaction price if the security has recently been purchased and no value has yet been obtained from a pricing service or pricing broker. When reliable prices are not readily available, such as when the value of a security has been significantly affected by events after the close of the exchange or market on which the security is principally traded, but before the Fund calculates its net asset value, the Fund values these securities as determined in accordance with procedures approved by the Fund’s Board of Trustees.
Pursuant to policies adopted by the Board of Trustees, the Fund’s manager has been designated as the valuation designee and is responsible for the oversight of the daily valuation process. The Fund’s manager is assisted by the Global Fund Valuation Committee (the “Valuation Committee”). The Valuation Committee is responsible for making fair value determinations, evaluating the effectiveness of the Fund’s pricing policies, and reporting to the Fund’s manager and the Board of Trustees. When determining the reliability of third party pricing information for investments owned by the Fund, the Valuation Committee, among other things, conducts due diligence reviews of pricing vendors, monitors the daily change in prices and reviews transactions among market participants.
The Valuation Committee will consider pricing methodologies it deems relevant and appropriate when making fair value determinations. Examples of possible methodologies include, but are not limited to, multiple of earnings; discount from market of a similar freely traded security; discounted cash-flow analysis; book value or a multiple thereof; risk premium/yield analysis; yield to maturity; and/or fundamental investment analysis. The Valuation Committee will also consider factors it deems relevant and appropriate in light of the facts and circumstances. Examples of possible factors include, but are not limited to, the type of security; the issuer’s financial statements; the purchase price of the security; the discount from market value of unrestricted securities of the same class at the time of purchase; analysts’ research and observations from financial institutions; information regarding any transactions or offers with respect to the security; the existence of merger proposals or tender offers affecting the security; the price and extent of public trading in similar securities of the issuer or comparable companies; and the existence of a shelf registration for restricted securities.
For each portfolio security that has been fair valued pursuant to the policies adopted by the Board of Trustees, the fair value price is compared against the last available and next
| | | | |
| ClearBridge Focus Value ESG ETF 2024 Annual Report | | | | 19 |
Notes to financial statements (cont’d)
available market quotations. The Valuation Committee reviews the results of such back testing monthly and fair valuation occurrences are reported to the Board of Trustees quarterly.
The Fund uses valuation techniques to measure fair value that are consistent with the market approach and/or income approach, depending on the type of security and the particular circumstance. The market approach uses prices and other relevant information generated by market transactions involving identical or comparable securities. The income approach uses valuation techniques to discount estimated future cash flows to present value.
GAAP establishes a disclosure hierarchy that categorizes the inputs to valuation techniques used to value assets and liabilities at measurement date. These inputs are summarized in the three broad levels listed below:
| • | | Level 1 — unadjusted quoted prices in active markets for identical investments |
| • | | Level 2 — other significant observable inputs (including quoted prices for similar investments, interest rates, prepayment speeds, credit risk, etc.) |
| • | | Level 3 — significant unobservable inputs (including the Fund’s own assumptions in determining the fair value of investments) |
The inputs or methodologies used to value securities are not necessarily an indication of the risk associated with investing in those securities.
The following is a summary of the inputs used in valuing the Fund’s assets carried at fair value:
| | | | | | | | | | | | | | | | |
| ASSETS | |
| Description | | Quoted Prices
(Level 1) | | | Other Significant Observable Inputs (Level 2) | | | Significant Unobservable Inputs (Level 3) | | | Total | |
| Common Stocks† | | $ | 3,545,177 | | | | — | | | | — | | | $ | 3,545,177 | |
| Short-Term Investments† | | | 47,383 | | | | — | | | | — | | | | 47,383 | |
| Total Investments | | $ | 3,592,560 | | | | — | | | | — | | | $ | 3,592,560 | |
| † | See Schedule of Investments for additional detailed categorizations. |
(b) Foreign currency translation. Investment securities and other assets and liabilities denominated in foreign currencies are translated into U.S. dollar amounts based upon prevailing exchange rates on the date of valuation. Purchases and sales of investment securities and income and expense items denominated in foreign currencies are translated into U.S. dollar amounts based upon prevailing exchange rates on the respective dates of such transactions.
The Fund does not isolate that portion of the results of operations resulting from fluctuations in foreign exchange rates on investments from the fluctuations arising from
| | | | |
20 | | | | ClearBridge Focus Value ESG ETF 2024 Annual Report |
changes in market prices of securities held. Such fluctuations are included with the net realized and unrealized gain or loss on investments.
Net realized foreign exchange gains or losses arise from sales of foreign currencies, including gains and losses on forward foreign currency contracts, currency gains or losses realized between the trade and settlement dates on securities transactions, and the difference between the amounts of dividends, interest, and foreign withholding taxes recorded on the Fund’s books and the U.S. dollar equivalent of the amounts actually received or paid. Net unrealized foreign exchange gains and losses arise from changes in the values of assets and liabilities, other than investments in securities, on the date of valuation, resulting from changes in exchange rates.
Foreign security and currency transactions may involve certain considerations and risks not typically associated with those of U.S. dollar denominated transactions as a result of, among other factors, the possibility of lower levels of governmental supervision and regulation of foreign securities markets and the possibility of political or economic instability.
(c) Foreign investment risks. The Fund’s investments in foreign securities may involve risks not present in domestic investments. Since securities may be denominated in foreign currencies, may require settlement in foreign currencies or may pay interest or dividends in foreign currencies, changes in the relationship of these foreign currencies to the U.S. dollar can significantly affect the value of the investments and earnings of the Fund. Foreign investments may also subject the Fund to foreign government exchange restrictions, expropriation, taxation or other political, social or economic developments, all of which affect the market and/or credit risk of the investments.
(d) Security transactions and investment income. Security transactions are accounted for on a trade date basis. Interest income (including interest income from payment-in-kind securities) is recorded on the accrual basis. Amortization of premiums and accretion of discounts on debt securities are recorded to interest income over the lives of the respective securities, except for premiums on certain callable debt securities, which are amortized to the earliest call date. Dividend income is recorded on the ex-dividend date for dividends received in cash and/or securities. Foreign dividend income is recorded on the ex-dividend date or as soon as practicable after the Fund determines the existence of a dividend declaration after exercising reasonable due diligence. The cost of investments sold is determined by use of the specific identification method. To the extent any issuer defaults or a credit event occurs that impacts the issuer, the Fund may halt any additional interest income accruals and consider the realizability of interest accrued up to the date of default or credit event.
(e) REIT distributions. The character of distributions received from Real Estate Investment Trusts (‘‘REITs’’) held by the Fund is generally comprised of net investment income, capital gains, and return of capital. It is the policy of the Fund to estimate the character of
| | | | |
| ClearBridge Focus Value ESG ETF 2024 Annual Report | | | | 21 |
Notes to financial statements (cont’d)
distributions received from underlying REITs based on historical data provided by the REITs. After each calendar year end, REITs report the actual tax character of these distributions. Differences between the estimated and actual amounts reported by the REITs are reflected in the Fund’s records in the year in which they are reported by the REITs by adjusting related investment cost basis, capital gains and income, as necessary.
(f) Distributions to shareholders. Distributions from net investment income of the Fund, if any, are declared and paid on a quarterly basis. Distributions of net realized gains, if any, are declared at least annually. Distributions to shareholders of the Fund are recorded on the ex-dividend date and are determined in accordance with income tax regulations, which may differ from GAAP.
(g) Federal and other taxes. It is the Fund’s policy to comply with the federal income and excise tax requirements of the Internal Revenue Code of 1986 (the “Code”), as amended, applicable to regulated investment companies. Accordingly, the Fund intends to distribute its taxable income and net realized gains, if any, to shareholders in accordance with timing requirements imposed by the Code. Therefore, no federal or state income tax provision is required in the Fund’s financial statements.
Management has analyzed the Fund’s tax positions taken on income tax returns for all open tax years and has concluded that as of March 31, 2024, no provision for income tax is required in the Fund’s financial statements. The Fund’s federal and state income and federal excise tax returns for tax years for which the applicable statutes of limitations have not expired are subject to examination by the Internal Revenue Service and state departments of revenue.
Under the applicable foreign tax laws, a withholding tax may be imposed on interest, dividends and capital gains at various rates.
(h) Reclassification. GAAP requires that certain components of net assets be reclassified to reflect permanent differences between financial and tax reporting. These reclassifications have no effect on net assets or net asset value per share. During the current year, the Fund had no reclassifications.
2. Investment management agreement and other transactions with affiliates
Franklin Templeton Fund Adviser, LLC (“FTFA”) (formerly known as Legg Mason Partners Fund Advisor, LLC (“LMPFA”) prior to November 30, 2023) is the Fund’s investment manager and ClearBridge Investments, LLC (“ClearBridge”) is the Fund’s subadviser. Western Asset Management Company, LLC (“Western Asset”) manages the portion of the Fund’s cash and short-term instruments allocated to it. FTFA, ClearBridge and Western Asset are indirect, wholly-owned subsidiaries of Franklin Resources, Inc. (“Franklin Resources”).
The Fund pays an investment management fee, calculated daily and paid monthly, at an annual rate of 0.47% of the Fund’s average daily net assets. Prior to March 1, 2024, the Fund paid an investment management fee, calculated daily and paid monthly, at an annual
| | | | |
22 | | | | ClearBridge Focus Value ESG ETF 2024 Annual Report |
rate of 0.49% of the Fund’s average daily net assets. Pursuant to the Management Agreement, FTFA is responsible for substantially all expenses of the Fund and, subject to the general supervision of the Board, provides or causes to be furnished all investment management, supervisory, administrative and other services reasonably necessary for the operation of the Fund, including certain distribution services (provided pursuant to a separate distribution agreement) and investment advisory services (provided pursuant to separate subadvisory agreements), under what is essentially an all-in fee or a unitary fee structure. FTFA is not responsible for, and the Fund bears, the investment management fee and certain other fees and expenses, including taxes, any future 12b-1 fees, acquired fund fees and expenses and extraordinary expenses (such as litigation and indemnification expenses), all of which may vary and will affect the total level of expenses paid by the Fund.
FTFA delegates to ClearBridge the day-to-day portfolio management of the Fund, except for any portion of the Fund’s cash and short-term instruments that is allocated to Western Asset. As compensation for its subadvisory services, FTFA pays ClearBridge a fee monthly, at an annual rate equal to 70% of the management fee paid by the Fund to FTFA, net of (i) all fees and expenses incurred by FTFA under the investment management agreement (including without limitation any subadvisory fee paid to another subadviser to the Fund) and (ii) expense waivers, if any, and reimbursements. FTFA pays Western Asset monthly a fee of 0.02% of the portion of the Fund’s average daily net assets allocated to Western Asset for the management of cash and other short-term instruments, net of expense waivers, if any, and reimbursements.
Franklin Distributors, LLC (“Franklin Distributors”) serves as the distributor of Creation Units for the Fund on an agency basis. Franklin Distributors is an indirect, wholly-owned broker-dealer subsidiary of Franklin Resources.
The Fund’s Board of Trustees has adopted a Rule 12b-1 shareholder services and distribution plan and under that plan, the Fund is authorized to pay service and/or distribution fees calculated at an annual rate of up to 0.25% of its average daily net assets. No service and/or distribution fees are currently paid by the Fund, and there are no current plans to impose these fees.
All officers and one Trustee of the Trust are employees of Franklin Resources or its affiliates and do not receive compensation from the Trust.
3. Investments
During the year ended March 31, 2024, the aggregate cost of purchases and proceeds from sales of investments (excluding in-kind transactions and short-term investments) were as follows:
| | | | |
| Purchases | | $ | 1,482,130 | |
| Sales | | | 1,316,449 | |
| | | | |
| ClearBridge Focus Value ESG ETF 2024 Annual Report | | | | 23 |
Notes to financial statements (cont’d)
During the year ended March 31, 2024, there were no in-kind transactions (Note 5).
At March 31, 2024, the aggregate cost of investments and the aggregate gross unrealized appreciation and depreciation of investments for federal income tax purposes were as follows:
| | | | | | | | | | | | | | | | |
| | | Cost | | | Gross
Unrealized
Appreciation | | | Gross
Unrealized
Depreciation | | | Net
Unrealized
Appreciation | |
| Securities | | $ | 2,775,479 | | | $ | 843,179 | | | $ | (26,098) | | | $ | 817,081 | |
4. Derivative instruments and hedging activities
During the year ended March 31, 2024, the Fund did not invest in derivative instruments.
5. Fund share transactions
At March 31, 2024, the Trust had an unlimited number of shares of beneficial interest authorized with a par value of $0.00001 per share. Fund shares are issued and redeemed by the Fund only in Creation Units or Creation Unit aggregations, where 10,000 shares of the Fund constitute a Creation Unit. Such transactions are made principally on an in-kind basis and under some circumstances partially on a cash basis, with a separate cash payment, which is a balancing cash component to equate the transaction to the net asset value per share of the Fund on the transaction date. Transactions in capital shares of the Fund are disclosed in detail in the Statement of Changes in Net Assets. Authorized Participants are subject to standard creation and redemption transaction fees to offset transfer and other transaction costs associated with the issuance and redemption of Creation Units. Such transactions fees are treated as increases in capital and are disclosed in the Funds’ Statements of Changes in Net Assets. Creations and redemptions for cash (when cash creations and redemptions are available or specified) may be subject to an additional variable fee.
6. Income tax information and distributions to shareholders
The tax character of distributions paid during the fiscal years ended March 31, was as follows:
| | | | | | | | |
| | | 2024 | | | 2023 | |
| Distributions paid from: | | | | | | | | |
| Ordinary income | | $ | 77,088 | | | $ | 58,031 | |
| Net long-term capital gains | | | — | | | | 28,692 | |
| Total distributions paid | | $ | 77,088 | | | $ | 86,723 | |
| | | | |
24 | | | | ClearBridge Focus Value ESG ETF 2024 Annual Report |
As of March 31, 2024, the components of distributable earnings (loss) on a tax basis were as follows:
| | | | |
| Undistributed ordinary income — net | | $ | 16,924 | |
| Undistributed long-term capital gains — net | | | 37,196 | |
| Total undistributed earnings | | $ | 54,120 | |
| Unrealized appreciation (depreciation)(a) | | | 817,085 | |
| Total distributable earnings (loss) — net | | $ | 871,205 | |
| (a) | The difference between book-basis and tax-basis unrealized appreciation (depreciation) is attributable to the tax deferral of losses on wash sales. |
| | | | |
| ClearBridge Focus Value ESG ETF 2024 Annual Report | | | | 25 |
Report of independent registered public accounting firm
To the Board of Trustees of Legg Mason ETF Investment Trust II and Shareholders of ClearBridge Focus Value ESG ETF
Opinion on the Financial Statements
We have audited the accompanying statement of assets and liabilities, including the schedule of investments, of ClearBridge Focus Value ESG ETF (constituting Legg Mason ETF Investment Trust II, referred to hereafter as the “Fund”) as of March 31, 2024, the related statement of operations for the year ended March 31, 2024, the statements of changes in net assets for each of the two years in the period ended March 31, 2024, including the related notes, and the financial highlights for each of the two years in the period ended March 31, 2024, the period October 1, 2021 through March 31, 2022, the year ended September 30, 2021 and the period May 27, 2020 (inception date) to September 30, 2020 (collectively referred to as the “financial statements”). In our opinion, the financial statements present fairly, in all material respects, the financial position of the Fund as of March 31, 2024, the results of its operations for the year ended March 31, 2024, the changes in its net assets for each of the two years in the period ended March 31, 2024 and the financial highlights for each of the two years in the period ended March 31, 2024, the period October 1, 2021 through March 31, 2022, the year ended September 30, 2021 and the period May 27, 2020 (inception date) to September 30, 2020 in conformity with accounting principles generally accepted in the United States of America.
Basis for Opinion
These financial statements are the responsibility of the Fund’s management. Our responsibility is to express an opinion on the Fund’s financial statements based on our audits. We are a public accounting firm registered with the Public Company Accounting Oversight Board (United States) (PCAOB) and are required to be independent with respect to the Fund in accordance with the U.S. federal securities laws and the applicable rules and regulations of the Securities and Exchange Commission and the PCAOB.
We conducted our audits of these financial statements in accordance with the standards of the PCAOB. Those standards require that we plan and perform the audit to obtain reasonable assurance about whether the financial statements are free of material misstatement, whether due to error or fraud.
Our audits included performing procedures to assess the risks of material misstatement of the financial statements, whether due to error or fraud, and performing procedures that respond to those risks. Such procedures included examining, on a test basis, evidence regarding the amounts and disclosures in the financial statements. Our audits also included evaluating the accounting principles used and significant estimates made by management, as well as evaluating the overall presentation of the financial statements. Our procedures included confirmation of securities owned as of March 31, 2024 by correspondence with the custodian and broker; when replies were not received from brokers, we performed other auditing procedures. We believe that our audits provide a reasonable basis for our opinion.
/s/PricewaterhouseCoopers LLP
San Francisco, CA
May 22, 2024
We have served as the auditor of one or more investment companies in the Franklin Templeton Group of Funds since 1948.
| | | | |
26 | | | | ClearBridge Focus Value ESG ETF 2024 Annual Report |
Additional information (unaudited)
Information about Trustees and Officers
The business and affairs of ClearBridge Focus Value ESG ETF (the “Fund”) are conducted by management under the supervision and subject to the direction of its Board of Trustees. The business address of each Trustee is One Franklin Parkway, San Mateo, California 94403-1906.
Information pertaining to the Trustees and officers of the Fund is set forth below. The Statement of Additional Information includes additional information about Trustees and is available, without charge, upon request by calling the Fund at 1-877-721-1926.
| | |
| Independent Trustees† |
| Rohit Bhagat |
| |
| Year of birth | | 1964 |
| Position(s) with Trust | | Lead Independent Trustee |
| Term of office1 and length of time served2 | | Since 2021 |
| Principal occupation(s) during the past five years | | Managing Member, Mukt Capital, LLC (private investment firm) (2014-present); and formerly, Chairman, Asia Pacific, BlackRock (investment management) (2009-2012); Global Chief Operating Officer, Barclays Global Investors (investment management) (2005-2009); and Senior Partner, The Boston Consulting Group (management consulting) (1992-2005) |
| Number of funds in fund complex overseen by Trustee | | 60 |
| Other Directorships held by Trustee during the past five years | | AssetMark Financial Holdings, Inc. (investment solutions) (2018- present) and PhonePe (payment and financial services) (2020- present); Meesho (eCommerce) (2023-present); and formerly, Axis Bank (financial) (2013-2021), FlipKart Limited (eCommerce company) (2019-2020), CapFloat Financial Services Pvt., Ltd. (non-banking finance company) (2018) and Zentific Investment Management (hedge fund) (2015-2018); Advisor, Optimal Asset Management (investment technology and advisory services company) (2015-2018); Chief Executive Officer and Director, FinTech Evolution Acquisition (February 2021- March 2023) |
|
| Deborah D. McWhinney |
| |
| Year of birth | | 1955 |
| Position(s) with Trust | | Trustee |
| Term of office1 and length of time served2 | | Since 2021 |
| Principal occupation(s) during the past five years | | Director of various companies; and formerly, Board Member, Lloyds Banking Group (2015-2018) (financial institution) and Fresenius Medical Group (2016-2018) (healthcare); Chief Executive Officer (2013-2014) and Chief Operating Officer (2011- 2013), CitiGroup Global Enterprise Payments (financial services); and President, Citi’s Personal Banking and Wealth Management (2009-2011) |
| |
| Number of funds in fund complex overseen by Trustee | | 60 |
| |
| Other Directorships held by Trustee during the past five years | | IHS Markit (information services) (2015-present), Borg Warner (automotive) (2018-present), LegalShield (consumer services) (2020-present); and formerly, IHS Markit (information services) (2015-2022), Fluor Corporation (construction and engineering) (2014-2020) and Focus Financial Partner, LLC (financial services) (2018-2020) |
| | | | |
| ClearBridge Focus Value ESG ETF | | | | 27 |
Additional information (unaudited) (cont’d)
Information about Trustees and Officers
| | |
| Independent Trustees† (cont’d) |
| | |
|
| Anantha K. Pradeep |
| |
| Year of birth | | 1963 |
| |
| Position(s) with Trust | | Trustee |
| |
| Term of office1 and length of time served2 | | Since 2021 |
| |
| Principal occupation(s) during the past five years | | Chief Executive Officer, Smilable, Inc. (technology company) (2014-present); Chief Executive Officer, MachineVantage (technology company) (2018-present); Founder and Managing Partner, Consult Meridian, LLC (consulting company) (2009- present); and formerly, Founder, BoardVantage (board portal solutions provider delivering paperless process for boards and leadership) (2000-2002) |
| |
| Number of funds in fund complex overseen by Trustee | | 60 |
| |
| Other Directorships held by Trustee during the past five years | | None |
| | |
| Interested Trustee and Officer |
| | |
|
| Jennifer M. Johnson3 |
| |
| Year of birth | | 1964 |
| |
| Position(s) with Trust | | Trustee and Chairperson of the Board |
| |
| Term of office1 and length of time served2 | | Since 2021 |
| |
| Principal occupation(s) during the past five years | | Chief Executive Officer, President and Director, Franklin Resources, Inc.; officer and/or director or trustee, of some of the other subsidiaries of Franklin Resources, Inc. and of certain funds in the Franklin Templeton/Legg Mason fund complex; and formerly, Chief Operating Officer and Executive Vice President, Franklin Resources, Inc. (1994-2015); Executive Vice President of Operations and Technology, Franklin Resources, Inc. (2005-2010); and Senior Vice President, Franklin Resources, Inc. (2003-2005) |
| |
| Number of funds in fund complex overseen by Trustee | | 70 |
| |
| Other Directorships held by Trustee during the past five years | | None |
| | |
|
| Fred Jensen |
| Franklin Templeton |
| 280 Park Avenue, 8th Floor, New York, NY 10017 |
| |
| Year of birth | | 1963 |
| Position(s) with Trust | | Chief Compliance Officer |
| Term of office1 and length of time served2 | | Since 2021 |
| Principal occupation(s) during the past five years | | Director - Global Compliance of Franklin Templeton; Managing Director of Legg Mason & Co.; Director of Compliance, Legg Mason Office of the Chief Compliance Officer; Chief Compliance Officer, Franklin Advisory Services, LLC; Compliance Officer, Franklin Advisers, Inc.; officer of certain funds in the Franklin Templeton/Legg Mason fund complex; formerly, Chief Compliance Officer of Legg Mason Global Asset Allocation; Chief Compliance Officer, Legg Mason Private Portfolio; Chief Compliance Officer to The Reserves Funds (investment adviser, funds and broker-dealer) and Ambac Financial Group (investment adviser, funds and broker-dealer) |
| | | | |
28 | | | | ClearBridge Focus Value ESG ETF |
| | |
| Additional Officers (cont’d) |
|
| Harris Goldblat |
| Franklin Templeton |
| 100 First Stamford Place, 6th Floor, Stamford, CT 06902 |
| |
| Year of birth | | 1969 |
| |
| Position(s) with Trust | | Vice President and Secretary |
| |
| Term of office1 and length of time served2 | | Since June 2023 |
| |
| Principal occupation(s) during the past five years | | Associate General Counsel, Franklin Templeton; officer of certain funds in the Franklin Templeton fund complex; formerly, Managing Director and Associate General Counsel for Legg Mason & Co. |
|
| Susan Kerr |
| Franklin Templeton |
| 280 Park Avenue, 8th Floor, New York, NY 10017 |
| |
| Year of birth | | 1949 |
| |
| Position(s) with Trust | | Vice President – AML Compliance |
| |
| Term of office1 and length of time served2 | | Since 2021 |
| |
| Principal occupation(s) during the past five years | | Senior Compliance Analyst, Franklin Templeton; Chief Anti- Money Laundering Compliance Officer, Legg Mason & Co., or its affiliates; Anti Money Laundering Compliance Officer; Senior Compliance Officer, LMIS; and officer of certain funds in the Franklin Templeton/Legg Mason fund complex |
|
| Christopher Kings |
| Franklin Templeton |
| One Franklin Parkway, San Mateo, CA 94403-1906 |
| |
| Year of birth | | 1974 |
| |
| Position(s) with Trust | | Chief Executive Officer - Finance and Administration |
| |
| Term of office1 and length of time served2 | | Since January 2024 |
| |
| Principal occupation(s) during the past five years | | Senior Vice President, Franklin Templeton Services, LLC; and officer of certain funds in the Franklin Templeton fund complex |
|
| Thomas C. Mandia |
| Franklin Templeton |
| 100 First Stamford Place, 6th Floor, Stamford, CT 06902 |
| |
| Year of birth | | 1962 |
| |
| Position(s) with Trust | | Vice President and Assistant Secretary |
| |
| Term of office1 and length of time served2 | | Since 2021 |
| |
| Principal occupation(s) during the past five years | | Senior Associate General Counsel to Franklin Templeton (since 2020); Secretary of FTFA (since 2006); Assistant Secretary of certain funds associated with Legg Mason & Co. or its affiliates (since 2006); Secretary of LMAS (since 2002) and LMFAM (formerly registered investment advisers) (since 2013); formerly, Managing Director and Deputy General Counsel of Legg Mason & Co. (2005 to 2020) |
| | | | |
| ClearBridge Focus Value ESG ETF | | | | 29 |
Additional information (unaudited) (cont’d)
Information about Trustees and Officers
| | |
| Additional Officers (cont’d) |
|
| David Mann |
| Franklin Templeton |
| One Franklin Parkway, San Mateo, CA 94403-1906 |
| |
| Year of birth | | 1973 |
| |
| Position(s) with Trust | | Vice President |
| |
| Term of office1 and length of time served2 | | Since 2023 |
| |
| Principal occupation(s) during the past five years | | Head of Global ETF Product and Capital Markets, Franklin Templeton; and officer of certain funds in the Franklin Templeton/Legg Mason fund complex |
|
| Todd Mathias |
| Franklin Templeton |
| One Franklin Parkway, San Mateo, CA 94403-1906 |
| |
| Year of birth | | 1983 |
| |
| Position(s) with Trust | | Vice President |
| |
| Term of office1 and length of time served2 | | Since 2023 |
| |
| Principal occupation(s) during the past five years | | Head of US ETF Product Strategy, Franklin Templeton; and officer of certain funds in the Franklin Templeton/Legg Mason fund complex |
|
| Patrick O’Connor |
| Franklin Templeton |
| One Franklin Parkway, San Mateo, CA 94403-1906 |
| |
| Year of birth | | 1967 |
| |
| Position(s) with Trust | | President and Chief Executive Officer – Investment Management |
| |
| Term of office1 and length of time served2 | | Since 2021 |
| |
| Principal occupation(s) during the past five years | | President and Chief Investment Officer, Franklin Advisory Services, LLC; Senior Vice President, Franklin Advisers, Inc.; and officer of certain funds in the Franklin Templeton/Legg Mason fund complex |
|
| Vivek Pai |
| Franklin Templeton |
| 300 S.E. 2nd Street, Fort Lauderdale, FL 33301-1923 |
| |
| Year of birth | | 1970 |
| |
| Position(s) with Trust | | Treasurer, Chief Financial Officer and Chief Accounting Officer |
| |
| Term of office1 and length of time served2 | | Since 2021 |
| |
| Principal occupation(s) during the past five years | | Treasurer, U.S. Fund Administration & Reporting and officer of certain funds in the Franklin Templeton/Legg Mason fund complex |
| | FTFA, referenced above, was formerly known as LMPFA prior to November 30, 2023. |
| † | Trustees who are not “interested persons” of the Fund within the meaning of Section 2(a)(19) of the Investment Company Act of 1940, as amended (the “1940 Act”). |
| 1 | Each Trustee and officer serves until his or her respective successor has been duly elected and qualified or until his or her earlier death, resignation, retirement or removal. |
| | | | |
30 | | | | ClearBridge Focus Value ESG ETF |
| 2 | Indicates the earliest year in which the Trustee became a board member for a fund in the Legg Mason fund complex or the officer took such office. |
| 3 | Ms. Johnson is an “interested person” of the Fund, as defined in the 1940 Act, because of her position with FTFA and/or certain of its affiliates. |
| | | | |
| ClearBridge Focus Value ESG ETF | | | | 31 |
Important tax information (unaudited)
By mid-February, tax information related to a shareholder’s proportionate share of distributions paid during the preceding calendar year will be received, if applicable. Please also refer to www.franklintempleton.com for per share tax information related to any distributions paid during the preceding calendar year. Shareholders are advised to consult with their tax advisors for further information on the treatment of these amounts on their tax returns.
The following tax information for the Fund is required to be furnished to shareholders with respect to income earned and distributions paid during its fiscal period.
The Fund hereby reports the following amounts, or if subsequently determined to be different, the maximum allowable amounts, for the fiscal period ended March 31, 2024:
| | | | | | |
| | | Pursuant to: | | Amount Reported | |
| Income Eligible for Dividends Received Deduction (DRD) | | §854(b)(1)(A) | | $ | 49,270 | |
| Qualified Dividend Income Earned (QDI) | | §854(b)(1)(B) | | $ | 56,837 | |
| Qualified Net Interest Income (QII) | | §871(k)(1)(C) | | $ | 1,903 | |
| Short-Term Capital Gain Dividends Distributed | | §871(k)(2)(C) | | $ | 32,077 | |
| Qualified Business Income Dividends Earned | | §199A | | $ | 1,213 | |
| Interest Earned from Federal Obligations | | Note (1) | | $ | 2,243 | |
Note (1) - The law varies in each state as to whether and what percentage of dividend income attributable to Federal obligations is exempt from state income tax. Shareholders are advised to consult with their tax advisors to determine if any portion of the dividends received is exempt from state income taxes.
| | | | | | |
| | 32 | | | | | ClearBridge Focus Value ESG ETF |
ClearBridge
Focus Value ESG ETF
Trustees
Rohit Bhagat
Deborah D. McWhinney
Anantha K. Pradeep
Jennifer M. Johnson
Chair
Investment manager
Franklin Templeton Fund Adviser, LLC*
Subadviser
ClearBridge Investments, LLC
Custodian
The Bank of New York Mellon
Transfer agent
The Bank of New York Mellon
240 Greenwich Street
New York, NY 10286
Independent registered public accounting firm
PricewaterhouseCoopers LLP
San Francisco, CA
| * | Formerly known as Legg Mason Partners Fund Advisor, LLC. |
ClearBridge Focus Value ESG ETF
The Fund is a separate investment series of Legg Mason ETF Investment Trust II (formerly ActiveShares® ETF Trust), a Maryland statutory trust.
ClearBridge Focus Value ESG ETF
Legg Mason Funds
620 Eighth Avenue, 47th Floor
New York, NY 10018
The Fund files its complete schedule of portfolio holdings with the Securities and Exchange Commission (“SEC”) for the first and third quarters of each fiscal year as an exhibit to its reports on Form N-PORT. The Fund’s Forms N-PORT are available on the SEC’s website at www.sec.gov. To obtain information on Form N-PORT, shareholders can call the Fund at 1-877-721-1926.
Information on how the Fund voted proxies relating to portfolio securities during the prior 12-month period ended June 30th of each year and a description of the policies and procedures that the Fund uses to determine how to vote proxies related to portfolio transactions are available (1) without charge, upon request, by calling the Fund at 1-877-721-1926, (2) at www.franklintempleton.com and (3) on the SEC’s website at www.sec.gov.
This report is submitted for the general information of the shareholders of ClearBridge Focus Value ESG ETF. This report is not authorized for distribution to prospective investors in the Fund unless preceded or accompanied by a current prospectus.
Investors should consider the Fund’s investment objectives, risks, charges and expenses carefully before investing. The prospectus contains this and other important information about the Fund. Please read the prospectus carefully before investing.
www.franklintempleton.com
© 2024 Franklin Distributors, LLC, Member FINRA/SIPC. All rights reserved.
www.franklintempleton.com
© 2024 Franklin Distributors, LLC, Member FINRA/SIPC. All rights reserved.
CBAX620359 5/24
The registrant has adopted a code of ethics that applies to the registrant’s principal executive officer, principal financial officer, principal accounting officer or controller.
| ITEM 3. | AUDIT COMMITTEE FINANCIAL EXPERT. |
The Board of Trustees of the registrant has determined that Rohit Bhagat and Deborah D. McWhinney possesses the technical attributes identified in Instruction 2(b) of Item 3 to Form N-CSR to qualify as an “audit committee financial expert,” and has designated Mr. Bhagat and Ms. McWhinney as its Audit Committee’s financial experts. Mr. Bhagat and Ms. McWhinney are “independent” Trustees pursuant to paragraph (a)(2) of Item 3 to Form N-CSR.
| ITEM 4. | PRINCIPAL ACCOUNTANT FEES AND SERVICES. |
a) Audit Fees. The aggregate fees billed in the last two fiscal years ending March 31, 2023 and March 31, 2024 (the “Reporting Periods”) for professional services rendered by the Registrant’s principal accountant (the “Auditor”) for the audit of the Registrant’s annual financial statements, or services that are normally provided by the Auditor in connection with the statutory and regulatory filings or engagements for the Reporting Periods, were $16,320 in March 31, 2023 and $16,810 in March 31, 2024.
b) Audit-Related Fees. The aggregate fees billed in the Reporting Period for assurance and related services by the Auditor that are reasonably related to the performance of the Registrant’s financial statements were $0 in March 31, 2023 and $0 in March 31, 2024.
(c) Tax Fees. The aggregate fees billed in the Reporting Periods for professional services rendered by the Auditor for tax compliance, tax advice and tax planning (“Tax Services”) were $20,000 in March 31, 2023 and $10,000 in March 31, 2024. These services consisted of (i) review or preparation of U.S. federal, state, local and excise tax returns; (ii) U.S. federal, state and local tax planning, advice and assistance regarding statutory, regulatory or administrative developments, and (iii) tax advice regarding tax qualification matters and/or treatment of various financial instruments held or proposed to be acquired or held.
There were no fees billed for tax services by the Auditors to service affiliates during the Reporting Periods that required pre-approval by the Audit Committee.
d) All Other Fees.
The aggregate fees billed in the Reporting Periods for products and services provided by the Auditor, other than the services reported in paragraphs (a) through (c) for the Item 4 for the Legg Mason ETF Investment Trust II, were $0 in the previous fiscal year and $0 in March 31, 2024.
All Other Fees. There were no other non-audit services rendered by the Auditor to Franklin Templeton Fund Advisors, LLC (“FTFA”), Formerly known as Legg Mason Partners Fund Advisor, LLC(“FTFA”), and any entity controlling, controlled by or under common control with FTFA that provided ongoing services to Legg Mason ETF Investment Trust II requiring pre-approval by the Audit Committee in the Reporting Period.
(e) Audit Committee’s pre–approval policies and procedures described in paragraph (c) (7) of Rule 2-01 of Regulation S-X.
(1) The Charter for the Audit Committee (the “Committee”) of the Board of each registered investment company (the “Fund”) advised by FTFA or one of their affiliates (each, an “Adviser”) requires that the Committee shall approve (a) all audit and permissible non-audit services to be provided to the Fund and (b) all permissible non-audit services to be provided by the Fund’s independent auditors to the Adviser and any Covered Service Providers if the engagement relates directly to the operations and financial reporting of the Fund. The Committee may implement policies and procedures by which such services are approved other than by the full Committee.
The Committee shall not approve non-audit services that the Committee believes may impair the independence of the auditors. As of the date of the approval of this Audit Committee Charter, permissible non-audit services include any professional services (including tax services), that are not prohibited services as described below, provided to the Fund by the independent auditors, other than those provided to the Fund in connection with an audit or a review of the financial statements of the Fund. Permissible non-audit services may not include: (i) bookkeeping or other services related to the accounting records or financial statements of the Fund; (ii) financial information systems design and implementation; (iii) appraisal or valuation services, fairness opinions or contribution-in-kind reports; (iv) actuarial services; (v) internal audit outsourcing services; (vi) management functions or human resources; (vii) broker or dealer, investment adviser or investment banking services; (viii) legal services and expert services unrelated to the audit; and (ix) any other service the Public Company Accounting Oversight Board determines, by regulation, is impermissible.
Pre-approval by the Committee of any permissible non-audit services is not required so long as: (i) the aggregate amount of all such permissible non-audit services provided to the Fund, the Adviser and any service providers controlling, controlled by or under common control with the Adviser that provide ongoing services to the Fund (“Covered Service Providers”) constitutes not more than 5% of the total amount of revenues paid to the independent auditors during the fiscal year in which the permissible non-audit services are provided to (a) the Fund, (b) the Adviser and (c) any entity controlling, controlled by or under common control with the Adviser that provides ongoing services to the Fund during the fiscal year in which the services are provided that would have to be approved by the Committee; (ii) the permissible non-audit services were not recognized by the Fund at the time of the engagement to be non-audit services; and (iii) such services are promptly brought to the attention of the Committee and approved by the Committee (or its delegate(s)) prior to the completion of the audit.
(2) None of the services described in paragraphs (b) through (d) of this Item were performed in reliance on paragraph (c)(7)(i)(C) of Rule 2-01 of Regulation S-X.
(f) Not applicable.
(g) Non-audit fees billed by the Auditor for services rendered to Legg Mason ETF Investment Trust II, FTFA and any entity controlling, controlled by, or under common control with FTFA that provides ongoing services to Legg Mason ETF Investment Trust II during the reporting period were $608,059 in the previous fiscal year and $0 in March 31, 2024.
(h) Yes. Legg Mason ETF Investment Trust II’s Audit Committee has considered whether the provision of non-audit services that were rendered to Service Affiliates, which were not pre-approved (not requiring pre-approval), is compatible with maintaining the Accountant’s independence. All services provided by the Auditor to the Legg Mason ETF Investment Trust II or to Service Affiliates, which were required to be pre-approved, were pre-approved as required.
(i) Not applicable.
(j) Not applicable.
| ITEM 5. | AUDIT COMMITTEE OF LISTED REGISTRANTS. |
| | a) | The independent board members are acting as the registrant’s audit committee as specified in Section 3(a)(58)(B) of the Exchange Act. The Audit Committee consists of the following Board members: |
Rohit Bhagat
Deborah D. McWhinney
Anantha K. Pradeep
| ITEM 6. | SCHEDULE OF INVESTMENTS. |
Included herein under Item 1.
| ITEM 7. | DISCLOSURE OF PROXY VOTING POLICIES AND PROCEDURES FOR CLOSED-END MANAGEMENT INVESTMENT COMPANIES. |
Not applicable.
| ITEM 8. | PORTFOLIO MANAGERS OF CLOSED-END MANAGEMENT INVESTMENT COMPANIES. |
Not applicable.
| ITEM 9. | PURCHASES OF EQUITY SECURITIES BY CLOSED-END MANAGEMENT INVESTMENT COMPANY AND AFFILIATED PURCHASERS. |
Not applicable.
| ITEM 10. | SUBMISSION OF MATTERS TO A VOTE OF SECURITY HOLDERS. |
Not applicable.
| ITEM 11. | CONTROLS AND PROCEDURES. |
| | (a) | The registrant’s principal executive officer and principal financial officer have concluded that the registrant’s disclosure controls and procedures (as defined in Rule 31a- 3(c) under the Investment Company Act of 1940, as amended (the “1940 Act”)) are effective as of a date within 90 days of the filing date of this report that includes the disclosure required by this paragraph, based on their evaluation of the disclosure controls and procedures required by Rule 31a-3(b) under the 1940 Act and 15d-15(b) under the Securities Exchange Act of 1934. |
| | (b) | There were no changes in the registrant’s internal control over financial reporting (as defined in Rule 31a-3(d) under the 1940 Act) that occurred during the period covered by this report that have materially affected, or are likely to materially affect the registrant’s internal control over financial reporting. |
| ITEM 12. | DISCLOSURE OF SECURITIES LENDING ACTIVITIES FOR CLOSED-END MANAGEMENT INVESTMENT COMPANIES. |
Not applicable.
| Item 13. | Recovery of Erroneously Awarded Compensation. |
(a) N/A
(b) N/A
(a) (1) Code of Ethics attached hereto.
Exhibit 99.CODE ETH
(a) (2) Certifications pursuant to section 302 of the Sarbanes-Oxley Act of 2002 attached hereto.
Exhibit 99.CERT
(a)(2)(1) There were no written solicitations to purchase securities under Rule 23c-1 under the Act sent or given during the period covered by the report by or on behalf of the Registrant to 10 or more persons.
(a)(2)(2) There was no change in the Registrant’s independent public accountant during the period covered by the report.
(b) Certifications pursuant to Section 906 of the Sarbanes-Oxley Act of 2002 attached hereto.
Exhibit 99.906CERT
SIGNATURES
Pursuant to the requirements of the Securities Exchange Act of 1934 and the Investment Company Act of 1940, the registrant has duly caused this Report to be signed on its behalf by the undersigned, there unto duly authorized.
Legg Mason ETF Investment Trust II
| | |
| By: | | /s/ Christopher King |
| | Christopher Kings |
| | Chief Executive Officer |
Date: May 29, 2024
Pursuant to the requirements of the Securities Exchange Act of 1934 and the Investment Company Act of 1940, this report has been signed below by the following persons on behalf of the registrant and in the capacities and on the dates indicated.
| | |
| By: | | /s/ Christopher King |
| | Christopher Kings |
| | Chief Executive Officer |
Date: May 29, 2024
| | |
| By: | | /s/ Vivek Pai |
| | Vivek Pai |
| | Principal Financial Officer |
Date: May 29, 2024