Washington, D.C. 20549
Mark L. Winget
Form N-CSR is to be used by management investment companies to file reports with the Commission not later than 10 days after the transmission to stockholders of any report that is required to be transmitted to stockholders under Rule 30e-1 under the Investment Company Act of 1940 (17 CFR 270.30e-1). The Commission may use the information provided on Form N-CSR in its regulatory, disclosure review, inspection, and policymaking roles.
A registrant is required to disclose the information specified by Form N-CSR, and the Commission will make this information public. A registrant is not required to respond to the collection of information contained in Form N-CSR unless the Form displays a currently valid Office of Management and Budget (“OMB”) control number. Please direct comments concerning the accuracy of the information collection burden estimate and any suggestions for reducing the burden to Secretary, Securities and Exchange Commission, 450 Fifth Street, NW, Washington, DC 20549-0609. The OMB has reviewed this collection of information under the clearance requirements of 44 U.S.C. ss. 3507.
ITEM 1. REPORTS TO STOCKHOLDERS.
| Closed-End | 30 April |
| Funds | 2021 |
Nuveen Municipal Closed-End Funds
| | |
| NVG | Nuveen AMT-Free Municipal Credit Income Fund |
| NZF | Nuveen Municipal Credit Income Fund |
| NMZ | Nuveen Municipal High Income Opportunity Fund |
| NMCO | Nuveen Municipal Credit Opportunities Fund
|
| NDMO | Nuveen Dynamic Municipal Opportunities Fund
|
As permitted by regulations adopted by the Securities and Exchange Commission, paper copies of the Funds’ annual and semi-annual shareholder reports will not be sent to you by mail unless you specifically request paper copies of the reports. Instead, the reports will be made available on the Funds’ website (www.nuveen.com), and you will be notified by mail each time a report is posted and provided with a website link to access the report.
You may elect to receive shareholder reports and other communications from the Funds electronically at any time by contacting the financial intermediary (such as a broker-dealer or bank) through which you hold your Fund shares or, if you are a direct investor, by enrolling at www.nuveen.com/e-reports.
You may elect to receive all future shareholder reports in paper free of charge at any time by contacting your financial intermediary or, if you are a direct investor, by calling 800-257-8787 and selecting option #2 or (ii) by logging into your Investor Center account at www.computershare.com/investor and clicking on “Communication Preferences”. Your election to receive reports in paper will apply to all funds held in your account with your financial intermediary or, if you are a direct investor, to all your directly held Nuveen Funds and any other directly held funds within the same group of related investment companies.
Semiannual
Report
Life is Complex.
Nuveen makes things e-simple.
It only takes a minute to sign up for e-Reports. Once enrolled, you’ll receive an e-mail as soon as your Nuveen Fund information is ready—no more waiting for delivery by regular mail. Just click on the link within the e-mail to see the report and save it on your computer if you wish.
Free e-Reports
right to your e-mail!
www.investordelivery.com
If you receive your Nuveen Fund
dividends and statements from your
financial professional or brokerage account.
or
www.nuveen.com/client-access
If you receive your Nuveen Fund
dividends and statements directly from
Nuveen.
NOT FDIC INSURED MAY LOSE
VALUE NO BANK GUARANTEE
Table of Contents
| 4 |
| | |
| 5 |
| | |
| 10 |
| | |
| 12 |
| | |
| 15 |
| | |
| 25 |
| | |
| 160 |
| | |
| 161 |
| | |
| 162 |
| | |
| 165 |
| | |
| 168 |
| | |
| 176 |
| | |
| 194 |
| | |
| 196 |
| | |
| 197 |
3
Chair’s Letterto Shareholders Dear Shareholders,
More than a year has passed since the World Health Organization declared COVID-19 a global pandemic in March 2020, resulting in a year of global economic recession, financial market turbulence and some immeasurable losses. Although the health crisis persists, with the widespread distribution of vaccines in the U.S. and extraordinary economic interventions by governments and central banks around the world, we collectively look forward to what our “new normal” might be.
With vaccine progress and economic stimulus providing real benefits to the global economy, markets continue to anticipate a strong rebound in growth, especially in the U.S., along with higher inflation. To extend relief programs enacted earlier in the crisis, the U.S. government passed $900 billion in aid to individuals and businesses in late December 2020. Another $1.9 tril-lion relief package was signed into law in March 2021 providing extended unemployment benefits, direct payments to individuals and families, assistance to state and local municipalities, grants to education and public health, and other support. Currently, Congress is working on an infrastructure spending plan, although its final shape and whether it passes remains to be seen. The U.S. Federal Reserve (Fed) and other central banks around the world remain committed to supporting the recovery by maintaining accommodative monetary conditions. However, as economies have reopened, the surge in consumer demand has outpaced supply chain capacity, resulting in a jump in inflation indicators in recent months. Whether inflation persists is a subject of debate by economists and market observers, while the Fed and other central banks believe it to be more transitory.
While the markets’ longer-term outlook has brightened, we expect intermittent bouts of volatility to continue. Markets are closely monitoring central bank signals, particularly if inflation remains elevated, as a sooner-than-expected shift to monetary tightening could slow the economic recovery. Additionally, COVID-19 cases are still elevated in some regions, as more virulent strains have spread and vaccination rollouts have been uneven around the world. The recovery hinges on controlling the virus, and estimates vary considerably on when economic activity might be fully restored and what level of public inoculation would be sufficient to contain the virus spread. On the political front, the Biden administration’s full policy agenda and the potential for Congressional gridlock remain to be seen, either of which could cause investment outlooks to shift. Short-term market fluctuations can provide your Fund opportunities to invest in new ideas as well as upgrade existing positioning while providing long-term value for shareholders. For more than 120 years, the careful consideration of risk and reward has guided Nuveen’s focus on delivering long-term results to our shareholders.
If you have concerns about what’s coming next, it can be an opportune time to assess your portfolio. We encourage you to review your time horizon, risk tolerance and investment goals with your financial professional. On behalf of the other members of the Nuveen Fund Board, we look forward to continuing to earn your trust in the months and years ahead.
Sincerely,
Terence J. Toth
Chair of the Board
June 22, 2021
4
Portfolio Managers’ Comments
Nuveen AMT-Free Municipal Credit Income Fund (NVG)
Nuveen Municipal Credit Income Fund (NZF)
Nuveen Municipal High Income Opportunity Fund (NMZ)
Nuveen Municipal Credit Opportunities Fund (NMCO)
Nuveen Dynamic Municipal Opportunities Fund (NDMO)
These Funds feature portfolio management by Nuveen Asset Management, LLC (NAM), an affiliate of Nuveen Fund Advisors, LLC, the Funds’ investment adviser. Portfolio managers John V. Miller, CFA, Steve M. Hlavin, Paul L. Brennan, CFA, Scott R. Romans, PhD and Timothy T. Ryan, CFA discuss key investment strategies and the six-month performance of NVG, NZF, NMZ, NMCO and NDMO. Paul has managed NVG since 2006, Scott assumed portfolio management responsibility for NZF in 2016, John has managed NMZ since its inception in 2003, John and Steve have managed NMCO since its inception in 2019 and John and Tim have managed NDMO since its inception in 2020.
An Update on COVID-19 Coronavirus and its Impact on the Securities Markets
Vaccination progress across Western countries has been encouraging for the markets, although the spread of new variants of the COVID-19 coronavirus is being closely watched. Although the pace of vaccinations in the U.S. has recently slowed, half of U.S. states and Washington D.C. have fully vaccinated at least 50% of their adult populations as of May 2021 according to the Centers for Disease Control and Prevention. In other regions of the world, vaccine rollouts have been slower than expected. Nevertheless, there are more vaccines still in development, some of which have announced positive trial results, vaccine trials have begun for children and governments are looking to adjust rollout plans to speed and/or broaden distribution.
After moderating in late 2020, the U.S. economic recovery reaccelerated in early 2021 as vaccinations, reopening and federal stimulus checks encouraged consumer spending. Pledges from central banks and governments to sustain the recovery with policy support are underpinning positive economic outlooks for the full year and beyond. The U.S. government approved a $900 billion relief package in late December 2020 and followed with another $1.9 trillion stimulus plan in March 2021. The Biden administration has proposed a $2 trillion infrastructure improvement plan and a $1.8 trillion families plan investing in education, child care, paid family leave and other support, although the specifics of both proposals are expected to be highly debated in Congress.
Markets rallied on optimism for normalization in daily life and in the economy, furthering the recovery from the March 2020 sell-off. Although the detection of the virus in China was made public in December 2019, markets did not start to fully acknowledge the risks
This material is not intended to be a recommendation or investment advice, does not constitute a solicitation to buy, sell or hold a security or an investment strategy and is not provided in a fiduciary capacity. The information provided does not take into account the specific objectives or circumstances of any particular investor, or suggest any specific course of action. Investment decisions should be made based on an investor’s objectives and circumstances and in consultation with his or her advisors.Certain statements in this report are forward-looking statements. Discussions of specific investments are for illustration only and are not intended as recommendations of individual investments. The forward-looking statements and other views expressed herein are those of the portfolio managers as of the date of this report. Actual future results or occurrences may differ significantly from those anticipated in any forward-looking statements, and the views expressed herein are subject to change at any time, due to numerous market and other factors. The Funds disclaim any obligation to update publicly or revise any forward-looking statements or views expressed herein.
The ratings disclosed are the lowest rating given by one of the following national rating agencies: Standard & Poor’s Group (S&P), Moody’s Investors Service, Inc. (Moody’s) or Fitch, Inc. (Fitch). Credit ratings are subject to change. AAA, AA, A and BBB are investment grade ratings, while BB, B, CCC, CC, C and D are below investment grade ratings. Holdings designated N/R are not rated by these national rating agencies.
Bond insurance guarantees only the payment of principal and interest on the bond when due, and not the value of the bonds themselves, which will fluctuate with the bond market and the financial success of the issuer and the insurer. Insurance relates specifically to the bonds in the portfolio and not to the share prices of a Fund. No representation is made as to the insurers’ ability to meet their commitments.
Refer to the Glossary of Terms Used in this Report for further definition of the terms used within this section.
5
Portfolio Managers’ Comments (continued)
and potential economic impact until the latter portion of February 2020, when outbreaks outside of China were first reported. Global stock markets sold off severely, with the S&P 500® Index reaching a bear market (a 20% drop from the previous high) within three weeks, the fastest bear market decline in history. Even certain parts of the bond market suffered; below investment grade municipal and corporate bonds generally dropped the furthest, mostly out of concerns for the continued financial stability of lower quality issuers. Demand for safe-haven assets, along with mounting recession fears, drove the yield on the 10-year U.S. Treasury note to 0.5% in March 2020, an all-time low. Additionally, oil prices collapsed to an 18-year low on supply glut concerns, as shut-downs across the global economy sharply reduced oil demand, although oil prices have recovered to well above those lows.
Nuveen Fund Advisors, LLC, and the portfolio management teams are monitoring the situation carefully and managing the Funds to best pursue investment objectives while mitigating risks through all market environments.
What key strategies were used to manage the five Funds during the six-month reporting period ended April 30, 2021, and how did these strategies influence performance?
The Nuveen AMT-Free Municipal Credit Income Fund seeks to provide current income exempt from regular federal income tax and to enhance portfolio value relative to the municipal bond market by investing in tax-exempt municipal bonds that the Fund’s investment adviser believes are underrated or undervalued or that represent municipal market sectors that are undervalued. The Fund invests in municipal securities that are exempt from federal income taxes. The Fund uses leverage. By investment policy, the Fund may invest up to 55% of its managed assets in municipal securities rated at the time of investment Baa/BBB and below or judged to be of comparable quality by the Fund’s portfolio management team.
The Nuveen Municipal Credit Income Fund seeks to provide current income exempt from regular federal income tax by investing in an actively managed portfolio of tax-exempt municipal securities. Up to 55% of its managed assets may be in securities rated BBB and below at the time of purchase or, if unrated, judged to be of comparable quality by the Fund’s portfolio management team, and the Fund uses leverage.
The Nuveen Municipal High Income Opportunity Fund seeks to provide high current income exempt from regular federal income tax. Its secondary investment objective is to seek attractive total return consistent with its primary objective. The Fund invests in municipal securities that are exempt from federal income taxes; the Fund uses leverage. By investment policy, up to 75% of its managed assets may be invested in municipal securities rated, at the time of investment, Baa/BBB or lower by at least one nationally recognized statistical rating organization including below investment grade securities, or unrated securities judged by the manager to be of comparable quality. No more than 10% of the Fund’s managed assets may be invested in municipal securities rated belowB3/B-, or that are unrated but judged to be of comparable quality by the Fund’s portfolio management team.
The Nuveen Municipal Credit Opportunities Fund seeks to provide a high level of current income exempt from regular U.S. federal income tax and secondarily, total return. The Fund invests primarily in high yielding, low- to medium-quality municipal securities that, at the time of investment, are rated Baa/BBB or lower or, if unrated, are judged to be of comparable quality by the Fund’s portfolio management team. No more than 30% of the Fund’s managed assets will be in municipal securities rated CCC+/Caa1 or lower at the time of investment or unrated but judged to be of comparable quality. No more than 10% of the Fund’s managed assets can be in defaulted securities or securities of issuers in bankruptcy or insolvency proceedings at the time of investment. The Fund uses leverage and has a 12-year term with the potential to convert to perpetual.
The Nuveen Dynamic Municipal Opportunities Fund seeks to provide a total return through income exempt from regular federal income taxes and capital appreciation. The Fund invests primarily in municipal securities, the income on which is exempt from regular U.S. federal income tax. The Fund may invest in municipal securities of any maturity and credit quality, without limit in below investment grade municipal securities rated BB+/Ba1 or lower at the time of investment or unrated but judged to be of comparable quality by the Fund’s portfolio management team, and without limit in municipal securities that generate income subject to the U.S. federal alternative minimum tax (“AMT Bonds”). No more than 20% of Managed Assets can be in taxable debt obligations, including taxable municipal securities, and no more than 10% of Managed Assets can be in defaulted securities or securities of issuers in bank-
6
ruptcy or insolvency proceedings at the time of investment. The Fund uses leverage and has a 12-year term with the potential to convert to perpetual.
In the six-month reporting period, the municipal bond market continued to recover amid upgraded economic forecasts, additional fiscal stimulus and the Federal Reserve’s commitment to accommodative monetary policy. Municipal yields declined for most maturities, and the municipal yield curve flattened slightly. Credit spreads narrowed further as the municipal credit outlook improved and investors continued to seek higher yielding investments lower down the credit spectrum. Against this backdrop, municipal bonds had positive performance in the six-month reporting period. We continued to take a bottom-up approach to discovering sectors that appeared undervalued as well as individual credits that we believed had the potential to perform well over the long term. Our trading activity continued to focus on pursuing the Funds’ investment objectives.
NVG’s trading activity was relatively light during this reporting period, driven largely by the reinvestment of cash flows from called and maturing bonds and coupon income, net of Fund dividends and expenses. While the NVG’s average credit quality was unchanged during the reporting period, purchases were slightly skewed toward higher credit quality, given incrementally better relative value and the available opportunity set in the investment grade market at the time. High grade paper NVG bought included tax supported (Triborough Bridge and Tunnel Authority MTA Payroll Mobility Tax Bonds and Dormitory Authority of the State of New York Personal Income Tax Bonds), single- and multi-family housing bonds (issued in Colorado, Massachusetts, North Dakota and Minnesota), transportation (Harris County Toll Revenue and Maintenance Tax Bonds and Illinois State Toll Highway Authority Revenue Bonds) and utility (New York City Municipal Water & Sewer System and Georgia Transmission Corporation Pollution Control Revenue Bonds). NVG also bought lower rated investment grade and below investment grade issues for Puerto Rico sales tax revenue (known as COFINAs), New Jersey State Transportation Trust Fund Authority Bonds, EnergyHarbor senior debt (refinanc-ing), Denver Transit Partners LLC Eagle P3 Project Private Activity Bonds, Metropolitan Transportation Authority (MTA) Transportation Revenue Bonds (New York), Queens Ballpark Company LLC Revenue Bonds (New York), Family Life Academy Charter School Revenue Bonds (New York) and Tobacco Settlement Authority of Iowa (refinancing). Redemptions from NVG’s portfolio during this reporting period were mainly pre-refunded bonds, with some tactical selling across various sectors.
With interest rates lower and credit spreads recovering to near their pre-COVID-19 levels, NZF’s trading activity was relatively lighter during the six-month reporting period compared to the six months preceding this reporting period. Purchases were primarily driven by incoming cash from called and maturing bonds and, when needed, selling some very short dated pre-refunded bonds to make opportunistic investments. Given the tightness of credit spreads and lower overall yields on offer in the prevailing market, NZF tended to focus more on buying high grade bonds that offered liquidity and incremental spread. NZF added high grade, state general obligation (GO) bonds for Wisconsin and California, and a New York City GO. NZF also invested in mid-grade (A and BBB rated) credits including health care, transportation (toll roads) and New Jersey appropriation debt, as well as selectively added to below investment grade exposure with buys in Florida high-speed train Brightline, Puerto Rico COFINAs and health care. Some of NZF’s COFINAs exposure was bought as part of a rotation strategy that pared the Fund’s Chicago exposure, as spreads have contracted significantly for the Chicago bonds and upside performance appears more limited from here, and rotated into COFINAs. We also executed some tax loss swaps within the COFINA position. This strategy entailed selling depreciated COFINA bonds with lower yields and buying similarly structured but higher yielding COFINA bonds. We implemented this approach to enhance the Fund’s income earning capability and seek to make the Fund more tax efficient.
For NMZ, the proceeds from called and maturing bonds provided ample cash to reinvest in new opportunities. Some of the more prominent bonds redeemed during this reporting period included Puerto Rico Aqueduct and Sewer (PRASA), Brightline, Regional Transportation District of Colorado and Castle Oaks Metropolitan District (Colorado). There was no active selling for credit reasons in this reporting period. NMZ continued to buy bonds across its longstanding themes, including charter schools (California Crosspoint Academy), industrial development revenue (Hoover Industrial Development Board for U.S. Steel), real estate backed (Colorado Northfield Metropolitan District), a new issue for Brightline (Florida) to fund the completion of its next phase and Puerto Rico COFINAs. Buying was mainly in the new issue market, where there was more relative value on offer, as the secondary market has stabilized since the high yield sell-off early in the COVID-19 crisis.
7
Portfolio Managers’ Comments (continued)
NMCO was somewhat active in this reporting period, buying bonds across a diverse group of sectors and focusing on those credits that still represented good relative values and wider credit spreads. New purchases were made with coupon income and the proceeds from called and maturing bonds. NMCO continued to build a position in Puerto Rico GOs, where the credit outlook has improved, and participated in a new issue for Brightline after holdings in some older, lower coupon Brightline bonds were refunded. There were no notable sales from NMCO’s portfolio in this reporting period.
NDMO, which began operations in August 2020, completed its invest-up phase. The portfolio was fully invested during this reporting period, emphasizing longer duration and lower rated, higher yielding bonds (including lower rated investment grade, below investment grade and non-rated debt) for their higher income earnings and total return potential. NDMO reinvested the cash flows from coupon income and maturing bonds to stay fully invested.
NDMO managed the duration of its portfolio by shorting interest rate futures contracts. The interest rate futures had a negligible impact on the performance during the reporting period.
As of April 30, 2021, the Funds continued to use inverse floating rate securities. The Funds employ inverse floaters for a variety of reasons, including duration management and income and total return enhancement.
How did the five Funds perform during the six-month reporting period ended April 30, 2021?
The tables in each Fund’s Performance Overview and Holding Summaries section of this report provide the Funds’ total returns at net asset value (NAV) for the period ended April 30, 2021. Each Fund’s total returns at NAV are compared with the performance of a corresponding market index.
For the six months ended April 30, 2021, the total returns at NAV for NVG and NZF outperformed the return for the national S&P Municipal Bond Index. NVG and NZF outperformed the return for the secondary benchmark (the “Blended Index” composed of 60% S&P Municipal Bond Investment Grade Index and 40% S&P Municipal Bond High Yield Index), and NMZ, NMCO and NDMO outperformed the return on the S&P Municipal Yield Index. For the purposes of this Performance Commentary, mentions of relative performance comparisons are as follows: NVG and NZF (Blended Index), NMZ, NMCO and NDMO (S&P Municipal Yield Index).
The main factors influencing the Funds’ relative performance in this reporting period were yield curve and duration positioning, credit quality allocation and sector allocation. In addition, the use of regulatory leverage was an important factor affecting performance of the Funds. Leverage is discussed in more detail later in the Fund Leverage section of this report.
During the reporting period, yields fell across the shortest and longest maturities, but rose in the short-intermediate part of the curve. Given this dynamic, longer duration bonds generally performed the best. The Funds remained positioned with overweights to longer duration bonds, which was favorable to performance. Additionally, with short-term interest rates near zero, the Funds’ borrowing costs have been significantly reduced, the benefit of which accrued to the Funds’ earnings and total return.
Looking at credit ratings, lower rated and high yield bonds outperformed high grade (AAA and AA rated) bonds in this reporting period. The Funds were well positioned for the environment, with overweights to the lower rated, higher yielding credit categories and underweights to the highest credit qualities. NVG’s slight overweight to credits rated BBB and lower (and underweight to AAA and AA rated bonds) was a positive influence relative to the Blended Index, although an overweight to the A-rated category detracted somewhat. For NZF relative to the Blended Index, the overweight to the BBB rated category added the most, followed by an underweight to AAA rated paper, while an underweight to non-rated credits had a slightly negative impact on performance. Relative to the S&P Municipal Yield Index, NMZ, NMCO and NDMO benefited from their overweight allocations to below investment grade and non-rated bonds.
Sector positioning yielded mixed results during the reporting period. NVG’s sector weightings overall detracted relative to the Blended Index, mostly due to an overweight to the significantly lagging pre-refunded sector and sub-sector weightings in health care (hospitals) and transportation (commuter rail). NZF’s sector positioning resulted in a neutral impact relative to the Blended
8
Index, as the contributors and detractors were balanced. The Blended Index’s outperforming sectors in this reporting period were industrial development revenue (IDR), tobacco, education, transportation, health care and dedicated tax, while underperforming sectors included pre-refunded, utilities and tax supported. Relative to the S&P Municipal Yield Index, NMCO outperformed in its overweight to the IDR sector, which was the best performing sector in this reporting period, and the Fund’s credit selection was also strongly positive within the sector. NMCO also benefited from an overweight to higher education, underweight to health care and underweight to tobacco. Although an underweight allocation to transportation detracted from NMCO’s relative gains, credit selection in the sector outperformed. NMCO’s Puerto Rico and Illinois exposures also added value due to strong credit selection. For NDMO, sector allocations detracted somewhat relative to the S&P Municipal Yield Index, largely due to its positioning in state and local GOs. Although NDMO was overweight in state GOs, it held an underweight in Illinois GOs, which was disadvantageous relative to the index because Illinois GOs outperformed. NDMO’s positioning within health care also detracted, as performance within the sector was dominated by the outperformance of lower rated health care credits, many of which are senior living/life care names. NDMO was overweight in hospital bonds but underweighted in senior living/life care bonds.
Individual credit selection contributed positively to the Funds’ performance. Virus-sensitive credits were particularly strong performers on credit spread recovery and a municipal credit outlook that improved with upgraded economic growth forecasts, economic reopening and vaccinations, and federal aid to state and local governments.
NVG benefited from holdings in tax supported bonds (state of Illinois, city of Chicago, Chicago Board of Education, Metropolitan Pier and Exposition Authority McCormick Place, State of New Jersey, American Dream megamall/entertainment complex, Puerto Rico COFINA and Birmingham-Jefferson Civic Center); utility (Energy Harbor common stock and bank-backed pre-paid gas bonds); other revenue bonds (3 World Trade Center, Baltimore Convention, Franklin County Convention); education bonds (student housing projects and lower-rated colleges and universities); and pre-refunded bonds (due to favorable yield curve/duration selection). Offsetting these contributors were lagging positions in transportation (due to unfavorable yield curve/duration positioning in airport bonds despite strong performance from New York MTA credits); tobacco (which performed well for the Fund but lagged versus the much stronger performance of the Blended Index’s tobacco sector); IDR (investor-owned utilities such as PPL Energy Supply and Poseidon Resources and economically sensitive projects such as NuStar, Iowa Fertilizer and Hunt Refining performed well but lagged slightly due to the Fund’s yield curve/duration selection); and housing (primarily state single-family housing).
NMZ’s largest individual contributors included American Dream, Brightline, Metropolitan Pier and Exposition Authority McCormick Place, Hoover Industrial Development Board for U.S. Steel and Puerto Rico Electric Power Authority (PREPA). NMZ’s position in Energy Harbor common stock was another top contributor, as the company reported strong earnings results, continued to distance itself from the predecessor company’s political risk and previous bankruptcy, and faced a more favorable policy outlook given greener policy initiatives in Washington D.C. Detractors were Pyrolyx USA Indiana LLC Solid Waste Facility Revenue Bonds and Provision Cares Proton Therapy Center (Tennessee) Revenue Bonds, but the losses were far outweighed by the positive contributors.
NMCO’s top contributors included Energy Harbor common stock, American Dream, U.S. Steel, PREPA, Baltimore Convention, Brightline, Illinois GOs, Chicago, Columbus (Ohio) Convention, Admiral at the Lake (Illinois) senior living facility and several airlines.
Adding the most value to NDMO’s performance were selections in plastics recycler PureCycle, American Airlines JFK Airport, Puerto Rico GO, Big River Steel, New York MTA, Brightline, American Dream, Colorado International Center Metropolitan District 8 Limited Tax GOs and Allegheny County U.S. Steel. Detractors had a very marginal negative impact. NDMO held California taxable GOs and Syracuse Carousel Center taxable bonds, which lagged as taxable municipal bonds underperformed relative to tax exempt municipal bonds in this reporting period. Additionally, during the invest-up phase, the Fund held temporary cash positions that were a relative drag on performance, given the market’s rally.
NVG, NZF, NMZ and NMCO own Energy Harbor common stock, acquired when holdings of certain municipal bonds issued by FirstEnergy Solutions were converted into Energy Harbor equity as part of the company’s emergence from bankruptcy protection. Over time, the Funds’ expect to sell these shares and reinvest the proceeds into municipal bonds. Other municipal bonds issued by FirstEnergy Solutions, now known as Energy Harbor, were reinstated, which the Funds still held in their portfolios.
9
IMPACT OF THE FUNDS’ LEVERAGE STRATEGIES ON PERFORMANCE
One important factor impacting the returns of the Funds’ common shares relative to their comparative benchmarks was the Funds’ use of leverage through their issuance of preferred shares, reverse repurchase agreements, borrowings and/or investments in inverse floating rate securities, which represent leveraged investments in underlying bonds. The Funds use leverage because our research has shown that, over time, leveraging provides opportunities for additional income. The opportunity arises when short-term rates that a Fund pays on its leveraging instruments are lower than the interest a Fund earns on its portfolio of long-term bonds that it has bought with the proceeds of that leverage. This has been particularly true in the recent market environment where short-term rates have been low by historical standards.
However, use of leverage can expose Fund common shares to additional price volatility. When a Fund uses leverage, the Fund’s common shares will experience a greater increase in their net asset value if the municipal bonds acquired through the use of leverage increase in value, but will also experience a correspondingly larger decline in their net asset value if the bonds acquired through leverage decline in value. All this will make the shares’ total return performance more variable over time.
In addition, common share income in levered funds will typically decrease in comparison to unlevered funds when short-term interest rates increase and increase when short-term interest rates decrease. In recent quarters, fund leverage expenses have generally tracked the overall movement of short-term tax-exempt interest rates. While fund leverage expenses are somewhat higher than their recent lows, leverage nevertheless continues to provide the opportunity for incremental common share income, particularly over longer-term periods.
The use of leverage had a positive impact on the total return performance of the Funds over the reporting period.
As of April 30, 2021, the Funds’ percentages of leverage are as shown in the accompanying table.
| | | | | | |
| NVG | NZF | NMZ | NMCO | NDMO |
Effective Leverage* | 37.00% | 36.61% | 37.69% | 37.13% | 29.16% |
Regulatory Leverage* | 34.14% | 36.18% | 17.04% | 36.02% | 16.32% |
* | Effective Leverage is a Fund’s effective economic leverage, and includes both regulatory leverage and the leverage effects of certain derivative and other investments in a Fund’s portfolio that increase the Fund’s investment exposure. Currently, the leverage effects of Tender Option Bond (TOB) inverse floater holdings and reverse repurchase agreements are included in effective lever- age values, in addition to any regulatory leverage. Regulatory leverage consists of preferred shares issued or borrowings of a Fund. Both of these are part of a Fund’s capital structure. A Fund, however, may from time to time borrow on a typically transient basis in connection with its day-to-day operations, primarily in connection with the need to settle portfolio trades. Such incidental borrowings are excluded from the calculation of a Fund’s effective leverage ratio. Regulatory leverage is subject to asset coverage limits set forth in the Investment Company Act of 1940. |
10
THE FUNDS’ REGULATORY LEVERAGE
As of April 30, 2021, the following Funds have issued and outstanding preferred shares as shown in the accompanying table.
| | | | |
| | Variable Rate | |
| Variable Rate | Remarketed | |
| Preferred* | Preferred** | |
| Shares Issued | Shares Issued at | |
| at Liquidation | at Liquidation | |
| Preference | Preference | Total |
NVG | $ 317,400,000 | $1,611,600,000 | $1,929,000,000 |
NZF | $1,172,000,000 | $ 196,000,000 | $1,368,000,000 |
NMZ | $ 257,000,000 | $ — | $ 257,000,000 |
NMCO | $ 350,000,000 | $ 100,000,000 | $ 450,000,000 |
* | Preferred shares of the Fund featuring a floating rate dividend based on a predetermined formula or spread to an index rate. Includes the following preferred shares AMTP, iMTP, MFP-VRM and VRDP in Special Rate Mode, where applicable. See Notes to Financial Statements, Note 5 – Fund Shares for further details. |
** | Preferred shares of the Fund featuring floating rate dividends set by a remarketing agent via a regular remarketing. Includes the following preferred shares VRDP not in Special Rate Mode, MFP- VRRM and MFP-VRDM, where applicable. See Notes to Financial Statements, Note 5 – Fund Shares for further details. |
Refer to Notes to Financial Statements, Note 5 – Fund Shares for further details on preferred shares and each Fund’s respective transactions.
Reverse Repurchase Agreements
As noted previously, during the current fiscal period, NDMO used reverse repurchase agreements, in which the Fund sells to a counterparty a security that it holds with a contemporaneous agreement to repurchase the same security at an agreed upon price and date. The Funds’ transactions in reverse repurchase agreements are as shown in the accompanying table.
| | | | | | | | |
| | | | | | Subsequent to the Close of |
| | Current Reporting Period | | | | the Reporting Period |
| Outstanding | | | Outstanding | Average | | | Outstanding |
| Balance as of | | | Balance as of | Balance | | | Balance as of |
| November 1, 2020 | Sales | Purchases | April 30, 2021 | Outstanding | Sales | Purchases | June 28, 2021 |
$ — | $34,700,000 | $ — | $34,700,000 | $25,512,500 | $ — | $ — | $34,700,000 |
Refer to Notes to Financial Statements, Note 9 – Borrowing Arrangements for further details.
Bank Borrowings
As noted previously, NDMO employs leverage through the use of bank borrowings. The Fund’s bank borrowing activities are as shown in the accompanying table. Paydowns reflect on-going leverage management activity that seeks to maintain the Fund’s leverage ratio within a specified internal operating range.
| | | | | | | | |
| | | | | | Subsequent to the Close of |
| | Current Reporting Period | | | the Reporting Period |
| Outstanding | | | Outstanding | Average | | | Outstanding |
| Balance as of | | | Balance as of | Balance | | | Balance as of |
| November 1, 2021 | Draws | Paydowns | April 30, 2021 | Outstanding | Draws | Paydowns | June 28, 2021 |
$ — | $176,900,000 | $ — | $176,900,000 | $141,514,599 | $15,000,000 | $ — | $191,900,000 |
Refer to Notes to Financial Statements, Note 9 – Borrowing Arrangements for further details.
11
COMMON SHARE DISTRIBUTION INFORMATION
The following information regarding the Funds’ distributions is current as of April 30, 2021. Each Fund’s distribution levels may vary over time based on each Fund’s investment activity and portfolio investments value changes.
During the current reporting period, each Fund’s distributions to common shareholders were as shown in the accompanying table.
| | | | | | |
| | | Per Common Share Amounts | |
| Monthly Distributions (Ex-Dividend Date) | NVG | NZF | NMZ | NMCO | NDMO |
November 2020 | $0.0675 | $0.0660 | $0.0620 | $0.0620 | $0.0765 |
December | 0.0675 | 0.0660 | 0.0620 | 0.0620 | 0.0765 |
January | 0.0675 | 0.0660 | 0.0620 | 0.0620 | 0.0765 |
February | 0.0675 | 0.0660 | 0.0620 | 0.0620 | 0.0765 |
March | 0.0675 | 0.0660 | 0.0620 | 0.0620 | 0.0765 |
April 2021 | 0.0675 | 0.0660 | 0.0620 | 0.0620 | 0.0765 |
| Total Distributions from Net Investment Income | $0.4050 | $0.3960 | $0.3750 | $0.3720 | $0.4590 |
| Total Distributions from Long Term Capital Gains* | $0.0874 | $ — | $ — | $ — | $ — |
| Total Distributions | $0.4924 | $0.3960 | $0.3750 | $0.3720 | $0.4590 |
| |
| Yields | | | | | |
Market Yield** | 4.71% | 4.78% | 5.26% | 5.03% | 5.53% |
Taxable-Equivalent Yield** | 7.91% | 8.06% | 8.74% | 8.37% | 9.28% |
* | Distribution paid in December 2020. |
** | Market Yield is based on the Fund’s current annualized monthly dividend divided by the Fund’s current market price as of the end of the reporting period. Taxable-Equivalent Yield represents the yield that must be earned on a fully taxable investment in order to equal the yield of the Fund on an after-tax basis. It is based on an income tax rate of 40.8%. Your actual federal income tax rate may differ from the assumed rate. The Taxable-Equivalent Yield also takes into account the percentage of the Fund’s income generated and paid by the Fund (based on payments made during the previous calendar year) that was not exempt from federal income tax. Separately, if the comparison were instead to investments that generate qualified dividend income, which is taxable at a rate lower than an individual’s ordinary graduated tax rate, the fund’s Taxable-Equivalent Yield would be lower. |
Each Fund seeks to pay regular monthly dividends out of its net investment income at a rate that reflects its past and projected net income performance. To permit each Fund to maintain a more stable monthly dividend, the Fund may pay dividends at a rate that may be more or less than the amount of net income actually earned by the Fund during the period. Distributions to common shareholders are determined on a tax basis, which may differ from amounts recorded in the accounting records. In instances where the monthly dividend exceeds the earned net investment income, the Fund would report a negative undistributed net ordinary income. Refer to Note 6 — Income Tax Information for additional information regarding the amounts of undistributed net ordinary income and undistributed net long-term capital gains and the character of the actual distributions paid by the Fund during the period.
All monthly dividends paid by each Fund during the current reporting period were paid from net investment income. If a portion of the Fund’s monthly distributions is sourced or comprised of elements other than net investment income, including capital gains and/or a return of capital, shareholders will be notified of those sources. For financial reporting purposes, the per share amounts of each Fund’s distributions for the reporting period are presented in this report’s Financial Highlights. For income tax purposes,
12
distribution information for each Fund as of its most recent tax year end is presented in Note 6 — Income Tax Information within the Notes to Financial Statements of this report.
NUVEEN CLOSED-END FUND DISTRIBUTION AMOUNTS
The Nuveen Closed-End Funds’ monthly and quarterly periodic distributions to shareholders are posted on www.nuveen.com and can be found on Nuveen’s enhanced closed-end fund resource page, which is at https://www.nuveen.com/resource-center-closedendfunds, along with other Nuveen closed-end fund product updates. To ensure timely access to the latest information, shareholders may use a subscribe function, which can be activated at this web page (https://www.nuveen.com/subscriptions).
COMMON SHARE EQUITY SHELF PROGRAM
During the current reporting period, NMZ and NMCO were authorized by the Securities and Exchange Commission to issue additional common shares through an equity shelf program (Shelf Offering). Under these programs, NMZ and NMCO, subject to market conditions, may raise additional capital from time to time in varying amounts and offering methods at a net price at or above each Fund’s NAV per common share. The total amount of common shares authorized and maximum aggregate offering under these Shelf Offerings, are as shown in the accompanying tables.
| | |
| NMZ* |
Additional authorized common shares | 19,500,000 |
* | Represents additional authorized common shares for the period November 1, 2020 through February 28, 2021, on which day the Fund carried forward 13,340,607 common shares to the new offering on March 8, 2021. |
| | | |
| NMZ* | NMCO** |
Maximum aggregate offering | Unlimited | 90,000,000 |
* | Represents maximum aggregate offering for the period March 8, 2021 through April 30, 2021. |
** | Represents maximum aggregate offering for the period March 25, 2021 through April 30, 2021. |
During the current reporting period, NMZ sold common shares through its Shelf Offering at a weighted average premium to its NAV per common share as shown in the accompanying table.
| | |
| NMZ |
Common shares sold through shelf offering | 3,929,090 |
Weighted average premium to NAV per common share sold | 1.79% |
Refer to Notes to Financial Statements, Note 5 – Fund Shares for further details on Shelf Offerings and each Fund’s transactions.
13
Common Share Information (continued)
COMMON SHARE REPURCHASES
During August 2020, the Funds’ Board of Trustees reauthorized an open-market share repurchase program, allowing NVG, NZF, NMZ and NMCO to repurchase an aggregate of up to approximately 10% of its outstanding common shares.
As of April 30, 2021, and since the inception of the Funds’ repurchase programs, the following Funds have cumulatively repurchased and retired their outstanding common shares as shown in the accompanying table.
| | | | | |
| NVG | NZF | NMZ | NMCO |
Common shares cumulatively repurchased and retired | 202,500 | 47,500 | 0 | 0 |
Common shares authorized for repurchase | 21,335,000 | 14,210,000 | 8,170,000 | 5,325,000 |
During the current reporting period, the Funds did not repurchase any of their outstanding common shares. | | |
OTHER COMMON SHARE INFORMATION
As of April 30, 2021, the Funds’ common share prices were trading at an average premium/(discount) to their common share NAVs and trading at an average premium/(discount) to NAV during the current reporting period, as follows.
| | | | | | |
| NVG | NZF | NMZ | NMCO | NDMO |
Common share NAV | $17.44 | $16.98 | $14.39 | $15.00 | $15.94 |
Common share price | $17.20 | $16.56 | $14.84 | $14.79 | $16.60 |
Premium/(Discount) to NAV | (1.38)% | (2.47)% | 3.13% | (1.40)% | 4.14% |
Average premium/(discount) to NAV | (3.84)% | (4.63)% | 1.33% | (5.20)% | (0.08)% |
14
| | |
| Nuveen AMT-Free Municipal Credit |
| Income Fund |
| Performance Overview and Holding Summaries as of April 30, 2021 |
Refer to the Glossary of Terms Used in this Report for further definition of the terms used within this section.
Average Annual Total Returns as of April 30, 2021
| | | | | |
| Cumulative | | Average Annual | |
| 6-Month | 1-Year | 5-Year | 10-Year |
NVG at Common Share NAV | 7.05% | 19.44% | 6.19% | 7.57% |
NVG at Common Share Price | 13.41% | 30.35% | 8.04% | 8.52% |
S&P Municipal Bond Index | 2.42% | 7.40% | 3.46% | 4.51% |
NVG Custom Blended Fund Performance Benchmark(1) | 4.08% | 11.22% | 4.52% | 5.06% |
Past performance is not predictive of future results. Current performance may be higher or lower than the data shown. Returns do not reflect the deduction of taxes that shareholders may have to pay on Fund distributions or upon the sale of Fund shares. Returns at NAV are net of Fund expenses, and assume reinvestment of distributions. Comparative index return information is provided for the Fund’s shares at NAV only. Indexes are not available for direct investment.
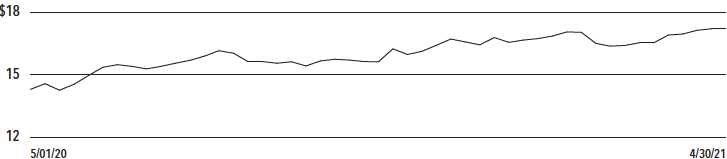
Common Share Price Performance — Weekly Closing Price
1 The Blended Index consists of the returns of the S&P Municipal Bond Investment Grade Index prior to 4/11/16 and thereafter: 1) 60% of the return of the S&P Municipal Bond Investment Grade Index and 2) 40% of the return of the S&P Municipal Bond High Yield Index.
15
| | |
| NVG | Performance Overview and Holding Summaries as of |
| April 30, 2021 (continued) |
This data relates to the securities held in the Fund’s portfolio of investments as of the end of the reporting period. It should not be construed as a measure of performance for the Fund itself. Holdings are subject to change.
The ratings disclosed are the lowest rating given by one of the following national rating agencies: Standard & Poor’s Group, Moody’s Investors Service, Inc. or Fitch, Inc. Credit ratings are subject to change. AAA, AA, A and BBB are investment grade ratings; BB, B, CCC, CC, C and D are below-investment grade ratings. Holdings designated N/R are not rated by these national rating agencies.
| | |
| Fund Allocation | |
| (% of net assets) | |
Long-Term Municipal Bonds | 155.0% |
Common Stocks | 0.5% |
Other Assets Less Liabilities | 1.3% |
| Net Assets Plus Floating Rate Obligations, | |
| AMTP Shares, net of deferred offering | |
| costs, MFP Shares, net of deferred | |
| offering costs & VRDP Shares, | |
| net of deferred offering costs | 156.8% |
Floating Rate Obligations | (5.1)% |
AMTP Shares, net of deferred | |
offering costs | (3.0)% |
MFP Shares, net of deferred | |
offering costs | (10.9)% |
VRDP Shares, net of deferred | |
offering costs | (37.8)% |
| Net Assets | 100% |
|
| Portfolio Credit Quality | |
| (% of total investment exposure) | |
U.S. Guaranteed | 11.2% |
AAA | 2.7% |
AA | 11.9% |
A | 24.8% |
BBB | 20.3% |
BB or Lower | 14.1% |
N/R (not rated) | 14.7% |
N/A (not applicable) | 0.3% |
| Total | 100% |
| | |
| Portfolio Composition | |
| (% of total investments) | |
Tax Obligation/Limited | 19.3% |
Health Care | 18.0% |
Transportation | 11.3% |
U.S. Guaranteed | 10.5% |
Education and Civic Organizations | 10.1% |
Tax Obligation/General | 9.8% |
Utilities | 9.8% |
Consumer Staples | 5.2% |
Other | 6.0% |
| Total | 100% |
| | |
| States and Territories | |
| (% of total municipal bonds) | |
Illinois | 15.4% |
California | 7.7% |
Texas | 7.3% |
Colorado | 6.5% |
Ohio | 5.9% |
New York | 5.4% |
Connecticut | 4.1% |
Pennsylvania | 3.9% |
New Jersey | 3.7% |
Florida | 2.9% |
Wisconsin | 2.7% |
Puerto Rico | 2.6% |
Georgia | 2.0% |
South Carolina | 2.0% |
Massachusetts | 1.8% |
Indiana | 1.8% |
District of Columbia | 1.7% |
Arizona | 1.6% |
Missouri | 1.5% |
Other1 | 19.5% |
| Total | 100% |
1 See Portfolio of Investments for details on “other” States and Territories.
16
| | |
| NZF | Nuveen Municipal Credit Income Fund |
| Performance Overview and Holding Summaries as of April 30, 2021 |
| | | | | |
Refer to the Glossary of Terms Used in this Report for further definition of the terms used within this section. | | |
| Average Annual Total Returns as of April 30, 2021 | | | | |
|
| Cumulative | Average Annual |
| 6-Month | 1-Year | 5-Year | 10-Year |
NZF at Common Share NAV | 8.92% | 20.67% | 5.83% | 7.71% |
NZF at Common Share Price | 15.15% | 32.50% | 7.28% | 8.26% |
S&P Municipal Bond Index | 2.42% | 7.40% | 3.46% | 4.51% |
NZF Custom Blended Fund Performance Benchmark(1) | 4.08% | 11.22% | 4.52% | 5.06% |
Past performance is not predictive of future results. Current performance may be higher or lower than the data shown. Returns do not reflect the deduction of taxes that shareholders may have to pay on Fund distributions or upon the sale of Fund shares. Returns at NAV are net of Fund expenses, and assume reinvestment of distributions. Comparative index return information is provided for the Fund’s shares at NAV only. Indexes are not available for direct investment.
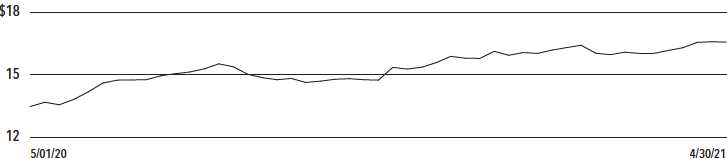
Common Share Price Performance — Weekly Closing Price
1 The Blended Index consists of the returns of the S&P Municipal Bond Investment Grade Index prior to 4/11/16 and thereafter: 1) 60% of the return of the S&P Municipal Bond Investment Grade Index and 2) 40% of the return of the S&P Municipal Bond High Yield Index.
17
| | |
| NZF | Performance Overview and Holding Summaries as of |
| April 30, 2021 (continued) |
This data relates to the securities held in the Fund’s portfolio of investments as of the end of the reporting period. It should not be construed as a measure of performance for the Fund itself. Holdings are subject to change.
The ratings disclosed are the lowest rating given by one of the following national rating agencies: Standard & Poor’s Group, Moody’s Investors Service, Inc. or Fitch, Inc. Credit ratings are subject to change. AAA, AA, A and BBB are investment grade ratings; BB, B, CCC, CC, C and D are below-investment grade ratings. Holdings designated N/R are not rated by these national rating agencies.
| | |
| Fund Allocation | |
| (% of net assets) | |
Long-Term Municipal Bonds | 153.4% |
Common Stocks | 1.4% |
Investment Companies | 0.1% |
Other Assets Less Liabilities | 2.1% |
| Net Assets Plus Floating Rate | |
| Obligations, MFP Shares, net of | |
| deferred offering costs & VRDP | |
| Shares, net of deferred offering costs | 157.0% |
Floating Rate Obligations | (0.6)% |
MFP Shares, net of deferred | |
offering costs | (26.5)% |
VRDP Shares, net of deferred | |
offering costs | (29.9)% |
| Net Assets | 100% |
|
| Portfolio Credit Quality | |
| (% of total investment exposure) | |
U.S. Guaranteed | 8.0% |
AAA | 0.6% |
AA | 11.3% |
A | 27.2% |
BBB | 19.7% |
BB or Lower | 18.9% |
N/R (not rated) | 13.3% |
N/A (not applicable) | 1.0% |
| Total | 100% |
| | |
| Portfolio Composition | |
| (% of total investments) | |
Tax Obligation/Limited | 20.9% |
Transportation | 19.4% |
Health Care | 15.3% |
Tax Obligation/General | 14.5% |
Utilities | 11.1% |
U.S. Guaranteed | 7.8% |
Education and Civic Organizations | 4.1% |
Other | 6.9% |
| Total | 100% |
| | |
| States and Territories | |
| (% of total municipal bonds) | |
Illinois | 18.6% |
California | 14.5% |
New York | 11.5% |
Texas | 10.1% |
Florida | 4.9% |
New Jersey | 3.9% |
Colorado | 3.5% |
Puerto Rico | 3.5% |
Pennsylvania | 3.3% |
Missouri | 2.4% |
Indiana | 2.2% |
Ohio | 1.9% |
Oklahoma | 1.7% |
Other1 | 18.0% |
| Total | 100% |
1 See Portfolio of Investments for details on “other” States and Territories.
18
| | |
| NMZ | Nuveen Municipal High Income |
| Opportunity Fund |
| Performance Overview and Holding Summaries as of April 30, 2021 |
Refer to the Glossary of Terms Used in this Report for further definition of the terms used within this section.
Average Annual Total Returns as of April 30, 2021
| | | | | |
| Cumulative | | Average Annual | |
| 6-Month | 1-Year | 5-Year | 10-Year |
NMZ at Common Share NAV | 11.69% | 25.19% | 6.54% | 9.73% |
NMZ at Common Share Price | 15.26% | 30.60% | 6.88% | 9.07% |
S&P Municipal Yield Index | 7.02% | 18.18% | 6.12% | 7.13% |
S&P Municipal Bond High Yield Index | 7.16% | 18.40% | 6.44% | 7.44% |
S&P Municipal Bond Index | 2.42% | 7.40% | 3.46% | 4.51% |
Past performance is not predictive of future results. Current performance may be higher or lower than the data shown. Returns do not reflect the deduction of taxes that shareholders may have to pay on Fund distributions or upon the sale of Fund shares. Returns at NAV are net of Fund expenses, and assume reinvestment of distributions. Comparative index return information is provided for the Fund’s shares at NAV only. Indexes are not available for direct investment.
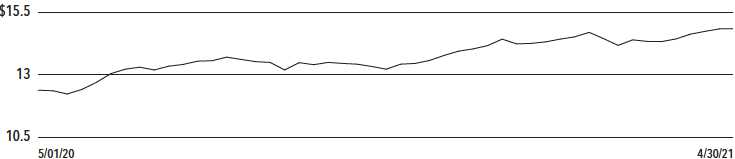
Common Share Price Performance — Weekly Closing Price
19
| | |
| NMZ | Performance Overview and Holding Summaries as of |
| April 30, 2021 (continued) |
This data relates to the securities held in the Fund’s portfolio of investments as of the end of the reporting period. It should not be construed as a measure of performance for the Fund itself. Holdings are subject to change.
The ratings disclosed are the lowest rating given by one of the following national rating agencies: Standard & Poor’s Group, Moody’s Investors Service, Inc. or Fitch, Inc. Credit ratings are subject to change. AAA, AA, A and BBB are investment grade ratings; BB, B, CCC, CC, C and D are below-investment grade ratings. Holdings designated N/R are not rated by these national rating agencies.
| | |
| Fund Allocation | |
| (% of net assets) | |
Long-Term Municipal Bonds | 138.0% |
Common Stocks | 2.1% |
Corporate Bonds | 0.7% |
Other Assets Less Liabilities | 14.4% |
| Net Assets Plus Floating Rate | |
| Obligations & AMTP Shares, | |
| net of deferred offering costs | 155.2% |
Floating Rate Obligations | (34.7)% |
AMTP Shares, net of deferred | |
offering costs | (20.5)% |
| Net Assets | 100% |
| Portfolio Credit Quality | |
| (% of total investment exposure) | |
U.S. Guaranteed | 4.2% |
AA | 11.2% |
A | 11.2% |
BBB | 15.7% |
BB or Lower | 17.9% |
N/R (not rated) | 38.2% |
N/A (not applicable) | 1.6% |
| Total | 100% |
| | |
| Portfolio Composition | |
| (% of total investments) | |
Tax Obligation/Limited | 29.3% |
Health Care | 14.2% |
Transportation | 13.8% |
Education and Civic Organizations | 11.2% |
Utilities | 6.6% |
Tax Obligation/General | 6.5% |
Consumer Staples | 4.4% |
Other | 14.0% |
| Total | 100% |
| | |
| States and Territories | |
| (% of total municipal bonds) | |
Illinois | 17.8% |
California | 11.2% |
Florida | 10.7% |
New York | 6.8% |
Colorado | 5.8% |
Puerto Rico | 5.7% |
Ohio | 4.7% |
Wisconsin | 4.1% |
Kentucky | 3.9% |
New Jersey | 3.7% |
Texas | 2.5% |
South Carolina | 1.9% |
Tennessee | 1.8% |
Other1 | 19.4% |
| Total | 100% |
1 See Portfolio of Investments for further details on “other” States and Territories.
20
| | |
| NMCO | Nuveen Municipal Credit Opportunities Fund |
| Performance Overview and Holding Summaries as of April 30, 2021 |
Refer to the Glossary of Terms Used in this Report for further definition of the terms used within this section.
Average Annual Total Returns as of April 30, 2021
| | | | |
| Cumulative | Average Annual |
| 6-Month | 1-Year | |
NMCO at Common Share NAV | 20.16% | 39.64% | 5.05% |
NMCO at Common Share Price | 30.11% | 41.26% | 4.32% |
S&P Municipal Yield Index | 7.02% | 18.18% | 6.50% |
S&P Municipal Bond High Yield Index | 7.16% | 18.40% | 6.74% |
Since inception returns are from 9/16/19. Past performance is not predictive of future results. Current performance may be higher or lower than the data shown. Returns do not reflect the deduction of taxes that shareholders may have to pay on Fund distributions or upon the sale of Fund shares. Returns at NAV are net of Fund expenses, and assume reinvestment of distributions. Comparative index return information is provided for the Fund’s shares at NAV only. Indexes are not available for direct investment.
Common Share Price Performance — Weekly Closing Price
21
| | |
| NMCO | Performance Overview and Holding Summaries as of |
| April 30, 2021 (continued) |
This data relates to the securities held in the Fund’s portfolio of investments as of the end of the reporting period. It should not be construed as a measure of performance for the Fund itself. Holdings are subject to change.
The ratings disclosed are the lowest rating given by one of the following national rating agencies: Standard & Poor’s Group, Moody’s Investors Service, Inc. or Fitch, Inc. Credit ratings are subject to change. AAA, AA, A and BBB are investment grade ratings; BB, B, CCC, CC, C and D are below-investment grade ratings. Holdings designated N/R are not rated by these national rating agencies.
| | |
| Fund Allocation | |
| (% of net assets) | |
Long-Term Municipal Bonds | 151.5% |
Common Stocks | 3.1% |
Exchange-Traded Funds | 0.3% |
Short-Term Municipal Bonds | 0.1% |
Other Assets Less Liabilities | 4.0% |
| Net Assets Plus Floating | |
| Rate Obligations, MFP Shares, | |
| net of deferred offerings | 159.0% |
Floating Rate Obligations | (2.8)% |
MFP Shares, net of deferred | |
offerings | (56.2)% |
| Net Assets | 100% |
|
| Portfolio Credit Quality | |
| (% of total investment exposure) | |
U.S. Guaranteed | 0.1% |
AA | 2.0% |
A | 1.0% |
BBB | 9.1% |
BB or Lower | 37.0% |
N/R (not rated) | 48.6% |
N/A (not applicable) | 2.2% |
| Total | 100% |
| | |
| Portfolio Composition | |
| (% of total investments) | |
Tax Obligation/Limited | 20.8% |
Industrials | 15.8% |
Transportation | 12.0% |
Education and Civic Organizations | 10.4% |
Tax Obligation/General | 9.8% |
Health Care | 7.9% |
Utilities | 7.3% |
Consumer Staples | 6.7% |
Long-Term Care | 6.3% |
Other | 3.0% |
| Total | 100% |
| | |
| States and Territories | |
| (% of total municipal bonds) | |
Florida | 12.2% |
Illinois | 12.1% |
Puerto Rico | 8.2% |
New York | 7.9% |
Ohio | 6.3% |
Colorado | 6.0% |
Wisconsin | 5.5% |
Alabama | 4.6% |
Pennsylvania | 4.6% |
California | 4.1% |
Arizona | 2.8% |
New Jersey | 2.7% |
Virgin Islands | 2.5% |
Arkansas | 2.4% |
Other1 | 18.1% |
| Total | 100% |
1 See Portfolio of Investments for further details on “other” States and Territories.
22
| |
| NDMO | Nuveen Dynamic Municipal Opportunities Fund
|
| Performance Overview and Holding Summaries as of April 30, 2021
|
Refer to the Glossary of Terms Used in this Report for further definition of the terms used within this section.
Cumulative Total Returns as of April 30, 2021
| | | |
| | Since |
| 6-Month | Inception |
NDMO at Common Share NAV | 9.99% | 9.97% |
NDMO at Common Share Price | 13.93% | 14.52% |
S&P Municipal Yield Index | 7.02% | 7.17% |
S&P Municipal Bond Index | 2.42% | 2.20% |
Since inception returns are from 8/26/20. Past performance is not predictive of future results. Current performance may be higher or lower than the data shown. Returns do not reflect the deduction of taxes that shareholders may have to pay on Fund distributions or upon the sale of Fund shares. Returns at NAV are net of Fund expenses, and assume reinvestment of distributions. Comparative index return information is provided for the Fund’s shares at NAV only. Indexes are not available for direct investment.
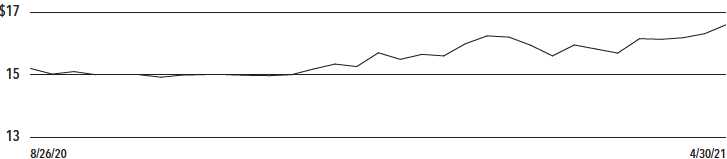
Common Share Price Performance — Weekly Closing Price
23
| | |
| NDMO | Performance Overview and Holding Summaries as of |
| April 30, 2021 (continued) |
This data relates to the securities held in the Fund’s portfolio of investments as of the end of the reporting period. It should not be construed as a measure of performance for the Fund itself. Holdings are subject to change.
The ratings disclosed are the lowest rating given by one of the following national rating agencies: Standard & Poor’s Group, Moody’s Investors Service, Inc. or Fitch, Inc. Credit ratings are subject to change. AAA, AA, A and BBB are investment grade ratings; BB, B, CCC, CC, C and D are below-investment grade ratings. Holdings designated N/R are not rated by these national rating agencies.
| | |
| Fund Allocation | |
| (% of net assets) | |
Long-Term Municipal Bonds | 146.1% |
Corporate Bonds | 0.2% |
Other Assets Less Liabilities | (1.3)% |
| Net Assets Plus Borrowings, Floating | |
| Rate Obligations & Reverse | |
| Repurchase Agreements, including | |
| accrued interest | 145.0% |
Borrowings | (19.5)% |
Floating Rate Obligations | (21.7)% |
Reverse Repurchase Agreements, | |
including accrued interest | (3.8)% |
| Net Assets | 100% |
|
| Portfolio Credit Quality | |
| (% of total investment exposure) | |
AAA | 0.9% |
AA | 17.4% |
A | 21.1% |
BBB | 17.6% |
BB or Lower | 13.8% |
N/R (not rated) | 29.2% |
| Total | 100% |
| | |
| Portfolio Composition | |
| (% of total investments) | |
Tax Obligation/Limited | 29.6% |
Transportation | 15.8% |
Health Care | 14.7% |
Education and Civic Organizations | 13.3% |
Tax Obligation/General | 8.3% |
Utilities | 6.0% |
Other | 12.3% |
| Total | 100% |
| | |
| States and Territories | |
| (% of total municipal bonds) | |
New York | 16.6% |
California | 15.2% |
Florida | 10.1% |
Colorado | 7.8% |
Arizona | 4.8% |
Illinois | 4.8% |
New Jersey | 4.6% |
Texas | 4.3% |
Ohio | 4.3% |
Puerto Rico | 3.8% |
Virginia | 3.0% |
Missouri | 2.3% |
Other1 | 18.4% |
| Total | 100% |
1 See Portfolio of Investments for further details on “other” States and Territories.
24
| | |
| Nuveen AMT-Free Municipal Credit |
| Income Fund |
| Portfolio of Investments |
| April 30, 2021 (Unaudited) |
| | | | | | |
| Principal | | | Optional Call | | |
| Amount (000) | | Description (1) | Provisions (14) | Ratings (2) | Value |
| | LONG-TERM INVESTMENTS – 155.5% (100.0% of Total Investments) | | | |
|
| | MUNICIPAL BONDS – 155.0% (99.7% of Total Investments) | | | |
|
| | Alabama – 2.1% (1.3% of Total Investments) | | | |
| $ 3,645 | | Alabama Private Colleges and University Facilities Authority, Limited Obligation Bonds, | 9/25 at 100.00 | N/R | $ 4,001,445 |
| | University of Mobile Project, Series 2015A, 6.000%, 9/01/45, 144A | | | |
| 5,000 | | Birmingham-Jefferson Civic Center Authority, Alabama, Special Tax Bonds, Series 2018A, | 7/28 at 100.00 | A– | 5,592,200 |
| | 4.000%, 7/01/43 | | | |
| 22,655 | | Lower Alabama Gas District, Alabama, Gas Project Revenue Bonds, Series 2016A, | No Opt. Call | A2 | 33,133,391 |
| | 5.000%, 9/01/46 | | | |
| 8,100 | | Mobile Spring Hill College Educational Building Authority, Alabama, Revenue Bonds, | 4/25 at 100.00 | N/R | 8,753,994 |
| | Spring Hill College Project, Series 2015, 5.875%, 4/15/45 | | | |
| | Opelika Utilities Board, Alabama, Utility Revenue Bonds, Series 2011B: | | | |
| 1,250 | | 4.000%, 6/01/29 (Pre-refunded 6/01/21) – AGM Insured | 6/21 at 100.00 | Aa3 (3) | 1,253,662 |
| 1,000 | | 4.250%, 6/01/31 (Pre-refunded 6/01/21) – AGM Insured | 6/21 at 100.00 | Aa3 (3) | 1,003,120 |
| | The Improvement District of the City of Mobile – McGowin Park Project, Alabama, Sales | | | |
| | Tax Revenue Bonds, Series 2016A: | | | |
| 1,000 | | 5.250%, 8/01/30 | 8/26 at 100.00 | N/R | 1,053,940 |
| 1,300 | | 5.500%, 8/01/35 | 8/26 at 100.00 | N/R | 1,364,701 |
| 5,970 | | Tuscaloosa County Industrial Development Authority, Alabama, Gulf Opportunity Zone | 5/29 at 100.00 | N/R | 6,950,453 |
| | Bonds, Hunt Refining Project, Refunding Series 2019A, 5.250%, 5/01/44, 144A | | | |
| 12,000 | | UAB Medicine Finance Authority, Alabama, Revenue Bonds, Series 2019B, 4.000%, 9/01/44 | 9/29 at 100.00 | AA– | 14,024,040 |
| 61,920 | | Total Alabama | | | 77,130,946 |
| | Alaska – 0.5% (0.4% of Total Investments) | | | |
| | Northern Tobacco Securitization Corporation, Alaska, Tobacco Settlement Asset-Backed | | | |
| | Bonds, Series 2006A: | | | |
| 7,010 | | 5.000%, 6/01/32 | 5/21 at 100.00 | B3 | 7,123,772 |
| 12,635 | | 5.000%, 6/01/46 | 5/21 at 100.00 | B3 | 12,793,822 |
| 19,645 | | Total Alaska | | | 19,917,594 |
| | Arizona – 2.5% (1.6% of Total Investments) | | | |
| 4,230 | | Apache County Industrial Development Authority, Arizona, Pollution Control Revenue | 3/22 at 100.00 | A– | 4,335,708 |
| | Bonds, Tucson Electric Power Company, Series 20102A, 4.500%, 3/01/30 | | | |
| 1,475 | | Arizona Industrial Development Authority, Arizona, Education Facility Revenue Bonds, | 7/27 at 100.00 | BB | 1,659,995 |
| | Basis Schools, Inc Projects, Series 2017D, 5.000%, 7/01/47, 144A | | | |
| 6,290 | | Arizona Industrial Development Authority, Arizona, Education Revenue Bonds, Academies of | 7/29 at 100.00 | BB | 7,135,628 |
| | Math & Science Projects, Series 2019, 5.000%, 7/01/54, 144A | | | |
| 3,260 | | Arizona Industrial Development Authority, Education Facility Revenue Bonds, Caurus | 6/28 at 100.00 | N/R | 3,717,769 |
| | Academy Project, Series 2018A, 6.375%, 6/01/39, 144A | | | |
| 10,000 | | Arizona Sports and Tourism Authority, Tax Revenue Bonds, Multipurpose Stadium Facility | 7/22 at 100.00 | A | 10,410,100 |
| | Project, Refunding Senior Series 2012A, 5.000%, 7/01/31 | | | |
| 3,142 | | Cahava Springs Revitalization District, Cave Creek, Arizona, Special Assessment Bonds, | 7/27 at 100.00 | N/R | 2,419,491 |
| | Series 2017A, 7.000%, 7/01/41, 144A (4) | | | |
| 4,885 | | Glendale Industrial Development Authority, Arizona, Senior Living Revenue Bonds, Royal | 5/26 at 103.00 | BBB– | 5,457,229 |
| | Oaks Royal Oaks – Inspirata Pointe Project, Series 2020A, 5.000%, 5/15/56 | | | |
| | Maricopa County Industrial Development Authority, Arizona, Education Revenue Bonds, | | | |
| | Legacy Traditional Schools Projects, Taxable Series 2019B: | | | |
| 1,730 | | 5.000%, 7/01/49, 144A | 7/29 at 100.00 | Ba2 | 1,974,639 |
| 1,975 | | 5.000%, 7/01/54, 144A | 7/29 at 100.00 | Ba2 | 2,246,622 |
| 800 | | Maricopa County Industrial Development Authority, Arizona, Education Revenue Bonds, Reid | 7/26 at 100.00 | Baa3 | 882,784 |
| | Traditional School Projects, Series 2016, 5.000%, 7/01/47 | | | |
25
| | |
| NVG | Nuveen AMT-Free Municipal Credit Income Fund |
| Portfolio of Investments (continued) |
| April 30, 2021 (Unaudited) |
| | | | | | |
| Principal | | | Optional Call | | |
| Amount (000) | | Description (1) | Provisions (14) | Ratings (2) | Value |
| | Arizona (continued) | | | |
| | Phoenix Civic Improvement Corporation, Arizona, Revenue Bonds, Civic Plaza Expansion | | | |
| | Project, Series 2005B: | | | |
| $ 6,000 | | 5.500%, 7/01/37 – FGIC Insured | No Opt. Call | AA | $ 8,985,660 |
| 8,755 | | 5.500%, 7/01/39 – FGIC Insured | No Opt. Call | AA | 13,443,302 |
| | Phoenix Industrial Development Authority, Arizona, Education Facility Revenue Bonds, | | | |
| | Basis Schools, Inc Projects, Series 2016A: | | | |
| 620 | | 5.000%, 7/01/35, 144A | 7/25 at 100.00 | BB | 683,928 |
| 1,025 | | 5.000%, 7/01/46, 144A | 7/25 at 100.00 | BB | 1,114,575 |
| 2,045 | | Phoenix Industrial Development Authority, Arizona, Multifamily Housing Revenue Bonds, | 7/24 at 101.00 | N/R | 2,096,636 |
| | Deer Valley Veterans Assisted Living Project, Series 2016A, 5.125%, 7/01/36 | | | |
| | Pima County Industrial Development Authority, Arizona, Education Facility Revenue Bonds, | | | |
| | Edkey Charter Schools Project, Series 2016: | | | |
| 1,130 | | 5.250%, 7/01/36 | 7/26 at 100.00 | BB– | 1,208,275 |
| 1,850 | | 5.375%, 7/01/46 | 7/26 at 100.00 | BB– | 1,952,416 |
| 2,135 | | 5.500%, 7/01/51 | 7/26 at 100.00 | BB– | 2,257,400 |
| 2,920 | | Pima County Industrial Development Authority, Arizona, Education Facility Revenue Bonds, | 7/26 at 103.00 | N/R | 3,215,592 |
| | Edkey Charter Schools Project, Series 2019, 5.875%, 7/01/51, 144A | | | |
| 885 | | Pima County Industrial Development Authority, Arizona, Education Facility Revenue Bonds, | 2/24 at 100.00 | N/R | 933,365 |
| | San Tan Montessori School Project, Series 2016, 6.500%, 2/01/48, 144A | | | |
| 3,050 | | Pima County Industrial Development Authority, Arizona, Education Facility Revenue Bonds, | 2/28 at 100.00 | N/R | 3,467,758 |
| | San Tan Montessori School Project, Series 2017, 6.750%, 2/01/50, 144A | | | |
| | Salt Verde Financial Corporation, Arizona, Senior Gas Revenue Bonds, Citigroup Energy | | | |
| | Inc Prepay Contract Obligations, Series 2007: | | | |
| 6,820 | | 5.000%, 12/01/32 | No Opt. Call | BBB+ | 9,062,552 |
| 2,465 | | 5.000%, 12/01/37 | No Opt. Call | BBB+ | 3,468,945 |
| 2,000 | | Yavapai County Industrial Development Authority, Arizona, Hospital Revenue Bonds, | 8/23 at 100.00 | A2 | 2,181,520 |
| | Yavapai Regional Medical Center, Series 2013A, 5.250%, 8/01/33 | | | |
| 79,487 | | Total Arizona | | | 94,311,889 |
| | Arkansas – 0.3% (0.2% of Total Investments) | | | |
| | Arkansas Development Finance Authority, Tobacco Settlement Revenue Bonds, Arkansas | | | |
| | Cancer Research Center Project, Series 2006: | | | |
| 2,595 | | 0.000%, 7/01/36 – AMBAC Insured | No Opt. Call | Aa2 | 1,776,433 |
| 20,480 | | 0.000%, 7/01/46 – AMBAC Insured | No Opt. Call | Aa2 | 9,524,019 |
| 23,075 | | Total Arkansas | | | 11,300,452 |
| | California – 11.9% (7.7% of Total Investments) | | | |
| 6,135 | | Alhambra Unified School District, Los Angeles County, California, General Obligation | No Opt. Call | AA | 5,326,284 |
| | Bonds, Capital Appreciation Series 2009B, 0.000%, 8/01/30 – AGC Insured | | | |
| | Anaheim Public Financing Authority, California, Lease Revenue Bonds, Public Improvement | | | |
| | Project, Series 1997C: | | | |
| 5,795 | | 0.000%, 9/01/35 – AGM Insured | No Opt. Call | AA | 4,314,493 |
| 6,820 | | 0.000%, 9/01/35 – AGM Insured (ETM) | No Opt. Call | AA (3) | 5,427,970 |
| 4,100 | | Antelope Valley Healthcare District, California, Revenue Bonds, Series 2016A, 5.000%, | 3/26 at 100.00 | Ba3 | 4,174,169 |
| | 3/01/41 | | | |
| 5,000 | | Bay Area Toll Authority, California, Revenue Bonds, San Francisco Bay Area Toll Bridge, | 4/23 at 100.00 | A1 (3) | 5,467,950 |
| | Series 2013S-4, 5.000%, 4/01/38 (Pre-refunded 4/01/23) | | | |
| 1,430 | | California County Tobacco Securitization Agency, Tobacco Settlement Asset-Backed Bonds, | 6/30 at 100.00 | BBB+ | 1,658,528 |
| | Los Angeles County Securitization Corporation, Series 2020A, 4.000%, 6/01/49 | | | |
| 580 | | California County Tobacco Securitization Agency, Tobacco Settlement Asset-Backed Bonds, | 6/30 at 100.00 | BBB– | 709,717 |
| | Los Angeles County Securitization Corporation, Series 2020B-1, 5.000%, 6/01/49 | | | |
| 50,460 | | California County Tobacco Securitization Agency, Tobacco Settlement Asset-Backed Bonds, | 6/30 at 26.72 | N/R | 9,865,435 |
| | Los Angeles County Securitization Corporation, Series 2020B-2, 0.000%, 6/01/55 | | | |
| 22,965 | | California Educational Facilities Authority, Revenue Bonds, Stanford University Series | No Opt. Call | AAA | 35,102,232 |
| | | 2016U-7, 5.000%, 6/01/46 (UB) (5)
| | | |
26
| | | | | | |
| Principal | | | Optional Call | | |
| Amount (000) | | Description (1) | Provisions (14) | Ratings (2) | Value |
| | California (continued) | | | |
| $ 15,850 | | California Educational Facilities Authority, Revenue Bonds, Stanford University Series | No Opt. Call | AAA | $ 24,754,847 |
| | 2019V-1, 5.000%, 5/01/49 | | | |
| 10,000 | | California Health Facilities Financing Authority, Revenue Bonds, Lucile Salter Packard | 8/22 at 100.00 | A+ | 10,622,800 |
| | Children’s Hospital, Series 2012A, 5.000%, 8/15/51 | | | |
| 1,600 | | California Health Facilities Financing Authority, Revenue Bonds, Saint Joseph Health | 7/23 at 100.00 | AA– | 1,755,088 |
| | System, Series 2013A, 5.000%, 7/01/37 | | | |
| 6,665 | | California Health Facilities Financing Authority, Revenue Bonds, Stanford Hospitals and | 8/25 at 100.00 | AA– | 7,732,533 |
| | Clinics, Series 2015A, 5.000%, 8/15/54 (UB) (5) | | | |
| | California Health Facilities Financing Authority, Revenue Bonds, Stanford Hospitals and | | | |
| | Clinics, Tender Option Bond Trust 2016-XG0049: | | | |
| 1,555 | | 9.424%, 8/15/51 (Pre-refunded 8/15/22), 144A (IF) (5) | 8/22 at 100.00 | AA– (3) | 1,748,535 |
| 1,650 | | 9.432%, 8/15/51 (Pre-refunded 8/15/22), 144A (IF) (5) | 8/22 at 100.00 | AA– (3) | 1,855,541 |
| 4,075 | | 9.432%, 8/15/51 (Pre-refunded 8/15/22), 144A (IF) (5) | 8/22 at 100.00 | AA– (3) | 4,582,623 |
| 5,000 | | California Health Facilities Financing Authority, Revenue Bonds, Sutter Health, Series | 8/23 at 100.00 | A (3) | 5,547,000 |
| | 2013A, 5.000%, 8/15/52 (Pre-refunded 8/15/23) | | | |
| | California Municipal Finance Authority, Charter School Revenue Bonds, Palmdale Aerospace | | | |
| | Academy Project, Series 2016A: | | | |
| 3,065 | | 5.000%, 7/01/31, 144A | 7/26 at 100.00 | BB | 3,460,477 |
| 1,000 | | 5.000%, 7/01/36, 144A | 7/26 at 100.00 | BB | 1,113,590 |
| 555 | | 5.000%, 7/01/41, 144A | 7/26 at 100.00 | BB | 612,404 |
| 195 | | 5.000%, 7/01/46, 144A | 7/26 at 100.00 | BB | 213,794 |
| | California Municipal Finance Authority, Education Revenue Bonds, American Heritage | | | |
| | Foundation Project, Series 2016A: | | | |
| 260 | | 5.000%, 6/01/36 | 6/26 at 100.00 | BBB– | 298,119 |
| 435 | | 5.000%, 6/01/46 | 6/26 at 100.00 | BBB– | 491,498 |
| 3,000 | | California Municipal Finance Authority, Revenue Bonds, Simpson University, Series 2020A, | 10/27 at 103.00 | N/R | 3,137,970 |
| | 6.000%, 10/01/50 | | | |
| 5,425 | | California Pollution Control Financing Authority, Water Furnishing Revenue Bonds, San | 1/29 at 100.00 | Baa3 | 6,473,164 |
| | Diego County Water Authority Desalination Project Pipeline, Refunding Series 2019, 5.000%, | | | |
| | 11/21/45, 144A | | | |
| 2,050 | | California Public Finance Authority, Revenue Bonds, Henry Mayo Newhall Hospital, Series | 10/26 at 100.00 | BBB– | 2,343,991 |
| | 2017, 5.000%, 10/15/47 | | | |
| 735 | | California School Finance Authority, Charter School Revenue Bonds, Downtown College | 6/26 at 100.00 | N/R | 796,858 |
| | Prep – Obligated Group, Series 2016, 5.000%, 6/01/46, 144A | | | |
| 715 | | California School Finance Authority, Charter School Revenue Bonds, Rocketship Education | 6/25 at 100.00 | N/R | 782,088 |
| | ? Obligated Group, Series 2016A, 5.000%, 6/01/36, 144A | | | |
| 570 | | California School Finance Authority, Charter School Revenue Bonds, Rocketship Education | 6/26 at 100.00 | N/R | 629,155 |
| | ? Obligated Group, Series 2017A, 5.125%, 6/01/47, 144A | | | |
| 80 | | California State, General Obligation Bonds, Series 2002, 5.000%, 10/01/32 – NPFG Insured | 6/21 at 100.00 | AA– | 80,293 |
| 5 | | California State, General Obligation Bonds, Series 2004, 5.000%, 4/01/31 – AMBAC Insured | 6/21 at 100.00 | AA– | 5,018 |
| 12,710 | | California Statewide Communities Development Authority, California, Revenue Bonds, Loma | 12/24 at 100.00 | BB– | 14,241,809 |
| | Linda University Medical Center, Series 2014A, 5.500%, 12/01/54 | | | |
| 65,505 | | California Statewide Communities Development Authority, California, Revenue Bonds, Loma | 6/26 at 100.00 | BB– | 73,836,581 |
| | Linda University Medical Center, Series 2016A, 5.250%, 12/01/56, 144A | | | |
| 10,130 | | California Statewide Communities Development Authority, California, Revenue Bonds, Loma | 6/28 at 100.00 | BB– | 12,009,115 |
| | Linda University Medical Center, Series 2018A, 5.500%, 12/01/58, 144A | | | |
| 4,000 | | California Statewide Communities Development Authority, Revenue Bonds, Huntington | 7/24 at 100.00 | A– | 4,245,360 |
| | Memorial Hospital, Refunding Series 2014B, 4.000%, 7/01/39 | | | |
| | California Statewide Community Development Authority, Revenue Bonds, Daughters of | | | |
| | Charity Health System, Series 2005A: | | | |
| 507 | | 5.750%, 7/01/30 (4) | 6/21 at 100.00 | N/R | 482,127 |
| 1,465 | | 5.750%, 7/01/35 (4) | 6/21 at 100.00 | N/R | 1,391,415 |
| 5,000 | | Clovis Unified School District, Fresno County, California, General Obligation Bonds, | No Opt. Call | Baa2 (3) | 4,897,250 |
| | Series 2001A, 0.000%, 8/01/25 – FGIC Insured (ETM) | | | |
| 3,400 | | Coachella Valley Unified School District, Riverside County, California, General | No Opt. Call | A2 | 2,656,454 |
| | Obligation Bonds, Election 2005 Series 2010C, 0.000%, 8/01/33 – AGM Insured | | | |
27
| | |
| NVG | Nuveen AMT-Free Municipal Credit Income Fund |
| Portfolio of Investments (continued) |
| April 30, 2021 (Unaudited) |
| | | | | | |
| Principal | | | Optional Call | | |
| Amount (000) | | Description (1) | Provisions (14) | Ratings (2) | Value |
| | California (continued) | | | |
| $ 14,375 | | Corona-Norco Unified School District, Riverside County, California, General Obligation | No Opt. Call | Aa3 | $ 8,634,919 |
| | Bonds, Capital Appreciation, Election 2006 Refunding Series 2009C, 0.000%, 8/01/39 – | | | |
| | AGM Insured | | | |
| | El Rancho Unified School District, Los Angeles County, California, General Obligation | | | |
| | Bonds, Election 2010 Series 2011A: | | | |
| 2,615 | | 0.000%, 8/01/31 – AGM Insured (6) | 8/28 at 100.00 | A1 | 3,169,955 |
| 3,600 | | 0.000%, 8/01/34 – AGM Insured (6) | 8/28 at 100.00 | A1 | 4,343,580 |
| | Foothill/Eastern Transportation Corridor Agency, California, Toll Road Revenue Bonds, | | | |
| | Refunding Senior Lien Series 2015A: | | | |
| 3,960 | | 0.000%, 1/15/34 – AGM Insured | No Opt. Call | BBB | 2,989,364 |
| 5,000 | | 0.000%, 1/15/35 – AGM Insured | No Opt. Call | BBB | 3,661,050 |
| | Foothill/Eastern Transportation Corridor Agency, California, Toll Road Revenue Bonds, | | | |
| | Refunding Series 2013A: | | | |
| 910 | | 0.000%, 1/15/42 (6) | 1/31 at 100.00 | Baa2 | 1,092,173 |
| 6,610 | | 6.000%, 1/15/49 (Pre-refunded 1/15/24) | 1/24 at 100.00 | Baa2 (3) | 7,642,680 |
| 4,445 | | Foothill/Eastern Transportation Corridor Agency, California, Toll Road Revenue Bonds, | 7/29 at 100.00 | Baa2 | 4,968,754 |
| | Refunding Term Rate Sub-Series 2013B-1, 3.500%, 1/15/53 | | | |
| | Golden State Tobacco Securitization Corporation, California, Tobacco Settlement | | | |
| | Asset-Backed Bonds, Series 2018A-1: | | | |
| 9,795 | | 5.000%, 6/01/47 | 6/22 at 100.00 | N/R | 10,120,684 |
| 6,240 | | 5.250%, 6/01/47 | 6/22 at 100.00 | N/R | 6,466,013 |
| 10,250 | | Golden State Tobacco Securitization Corporation, California, Tobacco Settlement | 6/22 at 100.00 | N/R | 10,590,812 |
| | Asset-Backed Bonds, Series 2018A-2, 5.000%, 6/01/47 | | | |
| | Kern Community College District, California, General Obligation Bonds, Safety, Repair & | | | |
| | Improvement, Election 2002 Series 2006: | | | |
| 5,600 | | 0.000%, 11/01/24 – AGM Insured | No Opt. Call | AA | 5,493,600 |
| 5,795 | | 0.000%, 11/01/25 – AGM Insured | No Opt. Call | AA | 5,604,113 |
| 1,105 | | Lincoln Public Financing Authority, Placer County, California, Twelve Bridges Limited | 9/21 at 100.00 | AA | 1,118,448 |
| | Obligation Revenue Bonds, Refunding Series 2011A, 4.375%, 9/02/25 – AGM Insured | | | |
| 7,575 | | Mount San Antonio Community College District, Los Angeles County, California, General | 8/35 at 100.00 | AA | 8,531,041 |
| | Obligation Bonds, Election of 2008, Series 2013A, 0.000%, 8/01/43 (6) | | | |
| 3,310 | | M-S-R Energy Authority, California, Gas Revenue Bonds, Citigroup Prepay Contracts, | No Opt. Call | BBB+ | 5,425,520 |
| | Series 2009B, 6.500%, 11/01/39 | | | |
| | Oceanside Unified School District, San Diego County, California, General Obligation | | | |
| | Bonds, Capital Appreciation, 2008 Election Series 2009A: | | | |
| 530 | | 0.000%, 8/01/26 – AGC Insured (ETM) | No Opt. Call | Aa3 (3) | 510,401 |
| 605 | | 0.000%, 8/01/26 – AGC Insured (ETM) | No Opt. Call | Aa3 (3) | 582,627 |
| 4,770 | | 0.000%, 8/01/26 – AGC Insured | No Opt. Call | Aa3 | 4,549,769 |
| 225 | | 0.000%, 8/01/28 – AGC Insured (ETM) | No Opt. Call | Aa3 (3) | 208,415 |
| 1,995 | | 0.000%, 8/01/28 – AGC Insured | No Opt. Call | Aa3 | 1,822,073 |
| 1,020 | | Ontario Redevelopment Financing Authority, San Bernardino County, California, Revenue | 6/21 at 100.00 | N/R (3) | 1,061,239 |
| | Bonds, Redevelopment Project 1, Series 1993, 5.850%, 8/01/22 – NPFG Insured (ETM) | | | |
| 3,905 | | Orange County, California, Special Tax Bonds, Community Facilities District 2015-1 | 8/25 at 100.00 | N/R | 4,249,070 |
| | Esencia Village, Series 2015A, 4.250%, 8/15/38 | | | |
| 3,700 | | Palomar Pomerado Health, California, General Obligation Bonds, Capital Appreciation, | No Opt. Call | BBB– | 3,554,331 |
| | Election of 2004, Series 2007A, 0.000%, 8/01/25 – NPFG Insured | | | |
| 7,875 | | Palomar Pomerado Health, California, General Obligation Bonds, Series 2009A, 7.000%, | 8/29 at 100.00 | BBB– | 11,224,237 |
| | 8/01/38 – AGC Insured | | | |
| 9,145 | | Pittsburg Redevelopment Agency, California, Tax Allocation Bonds, Los Medanos Community | No Opt. Call | A | 7,688,933 |
| | Development Project, Series 1999, 0.000%, 8/01/30 – AMBAC Insured | | | |
| 4,150 | | Placentia-Yorba Linda Unified School District, Orange County, California, Certificates | 10/21 at 100.00 | A1 | 4,247,359 |
| | of Participation, Refunding Series 2011, 6.250%, 10/01/28 – AGM Insured | | | |
| 670 | | Riverside County Transportation Commission, California, Toll Revenue Senior Lien Bonds, | 6/23 at 100.00 | BBB+ | 730,695 |
| | Series 2013A, 5.750%, 6/01/48 | | | |
28
| | | | | | |
| Principal | | | Optional Call | | |
| Amount (000) | | Description (1) | Provisions (14) | Ratings (2) | Value |
| | California (continued) | | | |
| | San Clemente, California, Special Tax Revenue Bonds, Community Facilities District | | | |
| | 2006-1 Marblehead Coastal, Series 2015: | | | |
| $ 485 | | 5.000%, 9/01/40 | 9/25 at 100.00 | N/R | $ 548,234 |
| 910 | | 5.000%, 9/01/46 | 9/25 at 100.00 | N/R | 1,021,402 |
| 4,000 | | San Francisco Airports Commission, California, Revenue Bonds, San Francisco | 5/23 at 100.00 | A | 4,346,560 |
| | International Airport, Governmental Purpose, Second Series 2013B, 5.000%, 5/01/43 | | | |
| | San Joaquin Hills Transportation Corridor Agency, Orange County, California, Toll Road | | | |
| | Revenue Bonds, Refunding Senior Lien Series 2014A: | | | |
| 2,680 | | 5.000%, 1/15/44 | 1/25 at 100.00 | BBB | 3,005,942 |
| 8,275 | | 5.000%, 1/15/50 | 1/25 at 100.00 | BBB | 9,228,528 |
| 7,210 | | San Joaquin Hills Transportation Corridor Agency, Orange County, California, Toll Road | No Opt. Call | Baa2 | 7,011,653 |
| | Revenue Bonds, Refunding Series 1997A, 0.000%, 1/15/23 – NPFG Insured | | | |
| 3,250 | | San Mateo County Community College District, California, General Obligation Bonds, | No Opt. Call | AAA | 2,855,905 |
| | Series 2006C, 0.000%, 9/01/30 – NPFG Insured | | | |
| 4,325 | | San Ysidro School District, San Diego County, California, General Obligation Bonds, 1997 | No Opt. Call | AA | 3,399,537 |
| | Election Series 2012G, 0.000%, 8/01/34 – AGM Insured | | | |
| 5,690 | | San Ysidro School District, San Diego County, California, General Obligation Bonds, | 8/25 at 41.10 | A3 | 2,193,836 |
| | Refunding Series 2015, 0.000%, 8/01/42 | | | |
| | Santa Ana Financing Authority, California, Lease Revenue Bonds, Police Administration | | | |
| | and Housing Facility, Series 1994A: | | | |
| 4,630 | | 6.250%, 7/01/24 (ETM) | No Opt. Call | Baa2 (3) | 5,097,213 |
| 4,630 | | 6.250%, 7/01/24 | No Opt. Call | Baa2 | 5,099,899 |
| 3,500 | | Saugus Union School District, Los Angeles County, California, General Obligation Bonds, | No Opt. Call | A+ | 3,458,945 |
| | Series 2006, 0.000%, 8/01/23 – FGIC Insured | | | |
| 610 | | Temecula Public Financing Authority, California, Special Tax Bonds, Community Facilities | 9/27 at 100.00 | N/R | 674,477 |
| | District 16-01, Series 2017, 6.250%, 9/01/47, 144A | | | |
| 450,457 | | Total California | | | 443,068,261 |
| | Colorado – 10.1% (6.5% of Total Investments) | | | |
| 850 | | Aviation Station North Metropolitan District 2, Denver County, Colorado, Limited Tax | 9/24 at 103.00 | N/R | 919,674 |
| | General Obligation Bonds, Refunding & Improvement Series 2019A, 5.000%, 12/01/39 | | | |
| | Base Village Metropolitan District 2, Colorado, General Obligation Bonds, Refunding | | | |
| | Series 2016A: | | | |
| 883 | | 5.500%, 12/01/36 | 12/21 at 103.00 | N/R | 922,187 |
| 1,175 | | 5.750%, 12/01/46 | 12/21 at 103.00 | N/R | 1,226,653 |
| 1,100 | | Belleview Station Metropolitan District 2, Denver City and County, Colorado, General | 12/21 at 103.00 | N/R | 1,143,989 |
| | Obligation Bonds, Limited Tax Convertible to Unlimited Tax Refunding & Improvement Series | | | |
| | 2017, 5.000%, 12/01/36 | | | |
| 700 | | Brighton Crossing Metropolitan District 4, Colorado, General Obligation Bonds, Limited | 12/22 at 103.00 | N/R | 739,256 |
| | Tax Convertible to Unlimited Tax, Series 2017A, 5.000%, 12/01/47 | | | |
| 3,410 | | Canyons Metropolitan District 5, Douglas County, Colorado, Limited Tax General | 12/22 at 103.00 | N/R | 3,613,884 |
| | Obligation and Special Revenue Bonds, Refunding & Improvement Series 2017A, 6.125%, 12/01/47 | | | |
| 1,690 | | Canyons Metropolitan District 6, Douglas County, Colorado, Limited Tax General | 12/22 at 103.00 | N/R | 1,791,045 |
| | Obligation and Special Revenue Bonds, Refunding & Improvement Series 2017A, 6.125%, 12/01/47 | | | |
| | Centerra Metropolitan District 1, Loveland, Colorado, Special Revenue Bonds, Refunding & | | | |
| | Improvement Series 2017: | | | |
| 1,140 | | 5.000%, 12/01/37, 144A | 12/22 at 103.00 | N/R | 1,207,602 |
| 5,465 | | 5.000%, 12/01/47, 144A | 12/22 at 103.00 | N/R | 5,765,575 |
| 1,475 | | Centerra Metropolitan District 1, Loveland, Colorado, Special Revenue Bonds, Refunding & | 12/25 at 103.00 | N/R | 1,613,414 |
| | Improvement Series 2020A, 5.000%, 12/01/51 | | | |
| 195 | | Central Platte Valley Metropolitan District, Colorado, General Obligation Bonds, | 12/23 at 100.00 | BB | 206,606 |
| | Refunding Series 2014, 5.000%, 12/01/43 | | | |
| 1,200 | | Clear Creek Station Metropolitan District 2, Adams County, Colorado, Limited Tax General | 12/22 at 103.00 | N/R | 1,264,512 |
| | Obligation Refunding & Improvement Series 2017A, 5.000%, 12/01/47 | | | |
29
| | |
| NVG | Nuveen AMT-Free Municipal Credit Income Fund |
| Portfolio of Investments (continued) |
| April 30, 2021 (Unaudited) |
| | | | | | |
| Principal | | | Optional Call | | |
| Amount (000) | | Description (1) | Provisions (14) | Ratings (2) | Value |
| | Colorado (continued) | | | |
| $ 930 | | Colorado Educational and Cultural Facilities Authority, Charter School Revenue Bonds, | 8/26 at 100.00 | A+ | $ 984,479 |
| | Flagstaff Academy Project, Refunding Series 2016, 3.625%, 8/01/46 | | | |
| 1,165 | | Colorado Educational and Cultural Facilities Authority, Charter School Revenue Bonds, | 12/24 at 100.00 | A+ | 1,297,484 |
| | The Classical Academy Project, Refunding Series 2015A, 5.000%, 12/01/38 | | | |
| 3,675 | | Colorado Educational and Cultural Facilities Authority, Charter School Revenue Bonds, | 6/26 at 100.00 | A+ | 3,907,150 |
| | Vanguard School Project, Refunding & Improvement Series 2016, 3.750%, 6/15/47 | | | |
| 1,750 | | Colorado Educational and Cultural Facilities Authority, Charter School Revenue Bonds, | 6/26 at 100.00 | A+ | 1,821,907 |
| | Weld County School District 6 – Frontier Academy, Refunding & Improvement Series 2016, | | | |
| | 3.250%, 6/01/46 | | | |
| | Colorado Health Facilities Authority, Colorado, Health Facilities Revenue Bonds, The | | | |
| | Evangelical Lutheran Good Samaritan Society Project, Refunding Series 2017: | | | |
| 2,460 | | 5.000%, 6/01/42 (Pre-refunded 6/01/27) | 6/27 at 100.00 | N/R (3) | 3,071,433 |
| 23,470 | | 5.000%, 6/01/47 (Pre-refunded 6/01/27) | 6/27 at 100.00 | N/R (3) | 29,303,468 |
| 11,520 | | Colorado Health Facilities Authority, Colorado, Revenue Bonds, Catholic Health | 1/23 at 100.00 | BBB+ (3) | 12,482,611 |
| | Initiatives, Series 2013A, 5.250%, 1/01/45 (Pre-refunded 1/01/23) | | | |
| | Colorado Health Facilities Authority, Colorado, Revenue Bonds, CommonSpirit Health, | | | |
| | Series 2019A-2: | | | |
| 2,585 | | 4.000%, 8/01/49 | 8/29 at 100.00 | BBB+ | 2,917,483 |
| 3,320 | | 4.000%, 8/01/49 (UB) (5) | 8/29 at 100.00 | BBB+ | 3,747,018 |
| 4,900 | | Colorado Health Facilities Authority, Colorado, Revenue Bonds, Covenant Living | 12/27 at 103.00 | A– | 5,462,618 |
| | Communities & Services, Series 2020A, 4.000%, 12/01/50 | | | |
| | Colorado Health Facilities Authority, Colorado, Revenue Bonds, Covenant Retirement | | | |
| | Communities Inc, Refunding Series 2012B: | | | |
| 1,640 | | 5.000%, 12/01/22 (ETM) | No Opt. Call | A– (3) | 1,765,066 |
| 2,895 | | 5.000%, 12/01/23 (Pre-refunded 12/01/22) | 12/22 at 100.00 | A– (3) | 3,115,773 |
| 4,200 | | 5.000%, 12/01/24 (Pre-refunded 12/01/22) | 12/22 at 100.00 | A– (3) | 4,520,292 |
| | Colorado Health Facilities Authority, Colorado, Revenue Bonds, Evangelical Lutheran Good | | | |
| | Samaritan Society Project, Series 2013: | | | |
| 765 | | 5.500%, 6/01/33 (Pre-refunded 6/01/23) | 6/23 at 100.00 | N/R (3) | 849,418 |
| 1,575 | | 5.625%, 6/01/43 (Pre-refunded 6/01/23) | 6/23 at 100.00 | N/R (3) | 1,752,880 |
| | Colorado Health Facilities Authority, Colorado, Revenue Bonds, Evangelical Lutheran Good | | | |
| | Samaritan Society Project, Series 2013A: | | | |
| 1,410 | | 5.000%, 6/01/32 (Pre-refunded 6/01/25) | 6/25 at 100.00 | N/R (3) | 1,672,514 |
| 2,000 | | 5.000%, 6/01/33 (Pre-refunded 6/01/25) | 6/25 at 100.00 | N/R (3) | 2,372,360 |
| 5,870 | | 5.000%, 6/01/40 (Pre-refunded 6/01/25) | 6/25 at 100.00 | N/R (3) | 6,962,877 |
| 6,920 | | 5.000%, 6/01/45 (Pre-refunded 6/01/25) | 6/25 at 100.00 | N/R (3) | 8,208,366 |
| 2,035 | | Colorado Health Facilities Authority, Colorado, Revenue Bonds, Frasier Meadows Project, | 5/27 at 100.00 | BB+ | 2,355,085 |
| | Refunding & Improvement Series 2017A, 5.250%, 5/15/47 | | | |
| 13,610 | | Colorado Housing and Finance Authority, Multifamily Project Bonds, Class I Series 2020B, | 10/29 at 100.00 | AAA | 13,829,121 |
| | 2.350%, 10/01/43 | | | |
| 4,105 | | Colorado International Center Metropolitan District 14, Denver, Colorado, Limited Tax | 12/23 at 103.00 | N/R | 4,458,112 |
| | General Obligation Bonds, Refunding & Improvement Series 2018, 5.875%, 12/01/46 | | | |
| 600 | | Copperleaf Metropolitan District 4, Arapahoe County, Colorado, Limited Tax General | 3/25 at 103.00 | N/R | 649,950 |
| | Obligation Bonds, Convertible to Unlimited Tax Series 2020A, 5.000%, 12/01/49 | | | |
| 1,480 | | Cornerstar Metropolitan District, Arapahoe County, Colorado, General Obligation Bonds, | 12/22 at 103.00 | N/R | 1,562,022 |
| | Limited Tax Convertible to Unlimited Tax, Refunding Series 2017A, 5.250%, 12/01/47 | | | |
| 1,273 | | Cornerstar Metropolitan District, Arapahoe County, Colorado, General Obligation Bonds, | 12/22 at 103.00 | N/R | 1,342,964 |
| | Limited Tax Convertible to Unlimited Tax, Refunding Series 2017B, 5.250%, 12/01/47 | | | |
| 500 | | Crystal Crossing Metropolitan District, Colorado, General Obligation Limited Tax Bonds, | 12/25 at 100.00 | N/R | 542,775 |
| | Refunding Series 2016, 5.250%, 12/01/40 | | | |
| 10,640 | | Denver City and County, Colorado, Airport System Revenue Bonds, Subordinate Lien Series | 11/23 at 100.00 | A | 11,725,918 |
| | 2013B, 5.000%, 11/15/43 | | | |
| 505 | | Denver Connection West Metropolitan District, City and County of Denver, Colorado, | 12/22 at 103.00 | N/R | 534,361 |
| | Limited Tax General Obligation Bonds, Convertible to Unlimited Tax Series 2017A, 5.375%, 8/01/47 | | | |
30
| | | | | | |
| Principal | | | Optional Call | | |
| Amount (000) | | Description (1) | Provisions (14) | Ratings (2) | Value |
| | Colorado (continued) | | | |
| | Denver Urban Renewal Authority, Colorado, Tax Increment Revenue Bonds, 9th and Colorado | | | |
| | Urban Redevelopment Area, Series 2018A: | | | |
| $ 1,005 | | 5.250%, 12/01/39, 144A | 12/23 at 103.00 | N/R | $ 1,103,420 |
| 2,310 | | 5.250%, 12/01/39, 144A | 12/23 at 103.00 | N/R | 2,537,327 |
| 11,700 | | E-470 Public Highway Authority, Colorado, Senior Revenue Bonds, Capital Appreciation | No Opt. Call | A | 7,097,571 |
| | Series 2010A, 0.000%, 9/01/41 | | | |
| | E-470 Public Highway Authority, Colorado, Senior Revenue Bonds, Series 1997B: | | | |
| 35,995 | | 0.000%, 9/01/23 – NPFG Insured | No Opt. Call | A | 35,609,494 |
| 6,525 | | 0.000%, 9/01/26 – NPFG Insured | No Opt. Call | A | 6,186,026 |
| | E-470 Public Highway Authority, Colorado, Senior Revenue Bonds, Series 2000B: | | | |
| 17,030 | | 0.000%, 9/01/25 – NPFG Insured | No Opt. Call | A | 16,424,754 |
| 9,990 | | 0.000%, 9/01/32 – NPFG Insured | No Opt. Call | A | 8,090,002 |
| 43,090 | | 0.000%, 9/01/33 – NPFG Insured | No Opt. Call | A | 33,924,326 |
| | E-470 Public Highway Authority, Colorado, Toll Revenue Bonds, Series 2004A: | | | |
| 20,000 | | 0.000%, 9/01/27 – NPFG Insured | No Opt. Call | A | 18,565,800 |
| 1,180 | | 0.000%, 9/01/28 – NPFG Insured | No Opt. Call | A | 1,068,750 |
| 7,000 | | 0.000%, 9/01/34 – NPFG Insured | No Opt. Call | A | 5,356,190 |
| 500 | | Flatiron Meadows Metropolitan District, Boulder County, Colorado, General Obligation | 12/21 at 103.00 | N/R | 519,525 |
| | Limited Tax Bonds, Series 2016, 5.125%, 12/01/46 | | | |
| 590 | | Foothills Metropolitan District, Fort Collins, Colorado, Special Revenue Bonds, Series | 12/24 at 100.00 | N/R | 624,485 |
| | 2014, 6.000%, 12/01/38 | | | |
| 825 | | Forest Trace Metropolitan District 3, Aurora City, Arapahoe County, Colorado, General | 12/21 at 103.00 | N/R (3) | 872,809 |
| | Obligation Bonds, Limited Tax Convertible to Unlimited Tax, Series 2016A, 5.000%, 12/01/46 | | | |
| | (Pre-refunded 12/01/21) | | | |
| 1,355 | | Great Western Park Metropolitan District 2, Broomfield City and County, Colorado, | 12/21 at 100.00 | N/R | 1,407,384 |
| | General Obligation Bonds, Series 2016A, 5.000%, 12/01/46 | | | |
| 742 | | Green Gables Metropolitan District No 1, Jefferson County, Colorado, General Obligation | 12/21 at 103.00 | N/R (3) | 784,702 |
| | Bonds, Series 2016A, 5.300%, 12/01/46 (Pre-refunded 12/01/21) | | | |
| 700 | | Harmony Technology Park Metropolitan District 2, Fort Collins, Colorado, General | 12/22 at 103.00 | N/R (3) | 772,555 |
| | Obligation Bonds, Limited Tax Convertible to Unlimited Tax Series 2017, 5.000%, 9/01/47 | | | |
| | (Pre-refunded 12/01/22) | | | |
| 500 | | Iron Mountain Metropolitan District 2, Windsor, Weld County, Colorado, Limited Tax | 12/24 at 103.00 | N/R | 537,525 |
| | General Obligation Bonds, Refunding & Improvement Series 2019A, 5.000%, 12/01/39 | | | |
| | Johnstown Plaza Metropolitan District, Colorado, Special Revenue Bonds, Series 2016A: | | | |
| 2,325 | | 5.250%, 12/01/36 | 12/21 at 103.00 | N/R | 2,419,534 |
| 8,955 | | 5.375%, 12/01/46 | 12/21 at 103.00 | N/R | 9,312,842 |
| | Lambertson Farms Metropolitan District 1, Colorado, Revenue Bonds, Refunding & | | | |
| | Improvement Series 2015: | | | |
| 1,005 | | 5.750%, 12/15/46 | 12/23 at 100.00 | N/R | 824,954 |
| 5,355 | | 6.000%, 12/15/50 | 12/23 at 100.00 | N/R | 4,508,482 |
| 980 | | Leyden Rock Metropolitan District No 10, In the City of Arvada, Colorado, Limited Tax | 12/21 at 103.00 | N/R | 1,019,220 |
| | General Obligation Bonds, Refunding and Improvement Series 20016A, 5.000%, 12/01/45 | | | |
| 500 | | Littleton Village Metropolitan District No 2, Colorado, Limited Tax General Obligation | 6/21 at 103.00 | N/R | 515,670 |
| | and Special Revenue Bonds, Series 2015, 5.375%, 12/01/45 | | | |
| 860 | | Mountain Shadows Metropolitan District, Colorado, General Obligation Limited Tax Bonds, | 12/25 at 100.00 | N/R | 934,132 |
| | Refunding Series 2016, 5.000%, 12/01/35 | | | |
| 5,155 | | North Range Metropolitan District 1, Adams County, Colorado, General Obligation Bonds, | 12/25 at 100.00 | A2 | 5,489,456 |
| | Series 2016B, 3.500%, 12/01/45 | | | |
| | North Range Metropolitan District 2, Adams County, Colorado , Limited Tax General | | | |
| | Obligation Bonds, Refunding Special Revenue & Improvement Series 2017A: | | | |
| 1,000 | | 5.625%, 12/01/37 | 12/22 at 103.00 | N/R | 1,067,810 |
| 1,000 | | 5.750%, 12/01/47 | 12/22 at 103.00 | N/R | 1,065,500 |
| 585 | | Overlook Metropolitan District in the Town of Parker, Douglas County, Colorado, General | 12/21 at 103.00 | N/R | 608,646 |
| | Obligation Limited Tax Bonds, Series 2016A, 5.500%, 12/01/46 | | | |
31
| | |
| NVG | Nuveen AMT-Free Municipal Credit Income Fund |
| Portfolio of Investments (continued) |
| April 30, 2021 (Unaudited) |
| | | | | | |
| Principal | | | Optional Call | | |
| Amount (000) | | Description (1) | Provisions (14) | Ratings (2) | Value |
| | Colorado (continued) | | | |
| | Painted Prairie Public Improvement Authority, Aurora, Colorado, Special Revenue Bonds, | | | |
| | Series 2019: | | | |
| $ 3,380 | | 5.000%, 12/01/39 | 12/24 at 103.00 | N/R | $ 3,709,584 |
| 6,900 | | 5.000%, 12/01/49 | 12/24 at 103.00 | N/R | 7,505,889 |
| | Park 70 Metropolitan District, Aurora, Colorado, General Obligation Bonds, Limited Tax | | | |
| | Refunding & Improvement Series 2016: | | | |
| 660 | | 5.000%, 12/01/36 | 12/26 at 100.00 | Baa3 | 764,214 |
| 1,060 | | 5.000%, 12/01/46 | 12/26 at 100.00 | Baa3 | 1,209,418 |
| 660 | | Park Creek Metropolitan District, Colorado, Senior Limited Property Tax Supported | 12/25 at 100.00 | A | 759,667 |
| | Revenue Bonds, Refunding Series 2015A, 5.000%, 12/01/45 | | | |
| 665 | | Peak Metropolitan District 1, Colorado Springs, El Paso County, Colorado, Limited Tax | 3/26 at 103.00 | N/R | 734,260 |
| | General Obligation Bonds, Series 2021A, 5.000%, 12/01/41, 144A | | | |
| 2,760 | | Prairie Center Metropolitan District No 3, In the City of Brighton, Adams County, | 12/26 at 100.00 | N/R | 2,999,430 |
| | Colorado, Limited Property Tax Supported Primary Improvements Revenue Bonds, Refunding | | | |
| | Series 2017A, 5.000%, 12/15/41, 144A | | | |
| | Reata South Metropolitan District, Douglas County, Colorado, Limited Tax General | | | |
| | Obligation Bonds, Refunding Series 2018: | | | |
| 1,310 | | 5.375%, 12/01/37 | 12/23 at 103.00 | N/R | 1,415,311 |
| 2,765 | | 5.500%, 12/01/47 | 12/23 at 103.00 | N/R | 2,975,085 |
| 5,050 | | Regional Transportation District, Colorado, Private Activity Bonds, Denver Transit | 1/31 at 100.00 | Baa2 | 5,369,867 |
| | Partners Eagle P3 Project, Series 2020A, 3.000%, 7/15/37 | | | |
| 1,280 | | Sierra Ridge Metropolitan District 2, Douglas County, Colorado, General Obligation | 12/21 at 103.00 | N/R | 1,332,902 |
| | Bonds, Limited Tax Series 2016A, 5.500%, 12/01/46 | | | |
| 930 | | SouthGlenn Metropolitan District, Colorado, Special Revenue Bonds, Refunding Series | 12/21 at 103.00 | N/R | 965,954 |
| | 2016, 5.000%, 12/01/46 | | | |
| 1,000 | | St Vrain Lakes Metropolitan District No 2, Weld County, Colorado, Limited Tax General | 12/22 at 103.00 | N/R | 1,070,120 |
| | Obligation Bonds, Series 2017A, 5.000%, 12/01/37 | | | |
| | STC Metropolitan District 2, Superior, Boulder County, Colorado, Limited Tax General | | | |
| | Obligation and Special Revenue Bonds, Refunding & improvement Series 2019A: | | | |
| 1,000 | | 5.000%, 12/01/38 | 12/24 at 103.00 | N/R | 1,094,260 |
| 570 | | 5.000%, 12/01/49 | 12/24 at 103.00 | N/R | 618,427 |
| 765 | | Sterling Ranch Community Authority Board, Douglas County, Colorado, Limited Tax | 12/25 at 102.00 | N/R | 850,994 |
| | Supported District 2, Refunding & Improvement Senior Series 2020A, 4.250%, 12/01/50 | | | |
| 2,765 | | Sterling Ranch Metropolitan District 1, El Paso County, Colorado, General Obligation | 12/25 at 103.00 | N/R | 3,039,011 |
| | Limited Tax Bonds, Series 2020, 5.125%, 12/01/50 | | | |
| 500 | | Table Mountain Metropolitan District, Jefferson County, Colorado, Limited Tax General | 12/21 at 103.00 | N/R | 520,115 |
| | Obligation Bonds, Series 2016A, 5.250%, 12/01/45 | | | |
| 500 | | The Village at Dry Creek Metropolitan District No 2, In the City of Thornton, Adams | 9/24 at 103.00 | N/R | 526,640 |
| | County, Colorado, Limited Tax General Obligation and Special Revenue Bonds, Series 2019, | | | |
| | 4.375%, 12/01/44 | | | |
| 500 | | Transport Metropolitan District 3, In the City of Aurora, Adams County, Colorado, | 3/26 at 103.00 | N/R | 436,155 |
| | General Obligation Limited Bonds, Convertible Capital Appreciation Series 2021A-2, 0.000%, | | | |
| | 12/01/51 (6) | | | |
| 900 | | Transport Metropolitan District 3, In the City of Aurora, Adams County, Colorado, | 3/26 at 103.00 | N/R | 988,614 |
| | General Obligation Limited Bonds, Series 2021A-1, 5.000%, 12/01/51 | | | |
| 8,500 | | University of Colorado Hospital Authority, Colorado, Revenue Bonds, Series 2012A, | 11/22 at 100.00 | Aa3 | 9,042,045 |
| | 5.000%, 11/15/42 | | | |
| 3,410 | | Vauxmont Metropolitan District, Arvada, Colorado, Limited Tax General Obligation and | 12/29 at 100.00 | AA | 4,231,674 |
| | Special Revenue Bonds, Convertible to Unlimited Tax Refunding Subordinate Series 2020, | | | |
| | 5.000%, 12/01/50 – AGM Insured | | | |
| 373,668 | | Total Colorado | | | 375,038,429 |
32
| | | | | | |
| Principal | | | Optional Call | | |
| Amount (000) | | Description (1) | Provisions (14) | Ratings (2) | Value |
| | Connecticut – 6.3% (4.1% of Total Investments) | | | |
| | Bridgeport, Connecticut, General Obligation Bonds, Series 2014A: | | | |
| $ 2,345 | | 5.000%, 7/01/32 – AGM Insured | 7/24 at 100.00 | A2 | $ 2,631,723 |
| 1,600 | | 5.000%, 7/01/34 – AGM Insured | 7/24 at 100.00 | A2 | 1,790,784 |
| 2,800 | | Bridgeport, Connecticut, General Obligation Bonds, Series 2016D, 5.000%, 8/15/41 – | 8/26 at 100.00 | A2 | 3,295,852 |
| | AGM Insured | | | |
| | Bridgeport, Connecticut, General Obligation Bonds, Series 2017A: | | | |
| 1,470 | | 5.000%, 11/01/36 | 11/27 at 100.00 | Baa1 | 1,774,040 |
| 750 | | 5.000%, 11/01/37 | 11/27 at 100.00 | Baa1 | 903,105 |
| 5,500 | | Connecticut Health and Educational Facilities Authority Revenue Bonds, Hartford | 7/25 at 100.00 | A | 6,251,685 |
| | HealthCare, Series 2015F, 5.000%, 7/01/45 | | | |
| 4,250 | | Connecticut Health and Educational Facilities Authority, Revenue Bonds, Connecticut | 7/26 at 100.00 | A2 | 4,713,760 |
| | College, Refunding Series 2016L-1, 4.000%, 7/01/46 | | | |
| 1,150 | | Connecticut Health and Educational Facilities Authority, Revenue Bonds, Connecticut | 7/21 at 100.00 | A2 (3) | 1,158,855 |
| | College, Series 2011H, 5.000%, 7/01/41 (Pre-refunded 7/01/21) | | | |
| 1,100 | | Connecticut Health and Educational Facilities Authority, Revenue Bonds, Duncaster, Inc, | 8/24 at 100.00 | BBB | 1,181,873 |
| | Series 2014A, 5.000%, 8/01/44 | | | |
| 5,565 | | Connecticut Health and Educational Facilities Authority, Revenue Bonds, Fairfield | 7/26 at 100.00 | A– | 6,556,627 |
| | University, Series 2016Q-1, 5.000%, 7/01/46 | | | |
| 7,025 | | Connecticut Health and Educational Facilities Authority, Revenue Bonds, Hartford | 7/21 at 100.00 | A (3) | 7,079,654 |
| | HealthCare, Series 2011A, 5.000%, 7/01/41 (Pre-refunded 7/01/21) | | | |
| 500 | | Connecticut Health and Educational Facilities Authority, Revenue Bonds, Hartford | 7/24 at 100.00 | A | 555,920 |
| | HealthCare, Series 2014E, 5.000%, 7/01/42 | | | |
| | Connecticut Health and Educational Facilities Authority, Revenue Bonds, Healthcare | | | |
| | Facility Expansion Church Home of Hartford Inc Project, Series 2016A: | | | |
| 590 | | 5.000%, 9/01/46, 144A | 9/26 at 100.00 | BB | 649,785 |
| 740 | | 5.000%, 9/01/53, 144A | 9/26 at 100.00 | BB | 812,305 |
| 3,000 | | Connecticut Health and Educational Facilities Authority, Revenue Bonds, Mary Wade Home | 10/24 at 104.00 | BB | 3,133,830 |
| | Issue, Series 2019A-1, 5.000%, 10/01/54, 144A | | | |
| | Connecticut Health and Educational Facilities Authority, Revenue Bonds, Middlesex | | | |
| | Hospital, Series 2011N: | | | |
| 1,105 | | 5.000%, 7/01/25 (Pre-refunded 7/01/21) | 7/21 at 100.00 | A3 (3) | 1,113,509 |
| 400 | | 5.000%, 7/01/26 (Pre-refunded 7/01/21) | 7/21 at 100.00 | A3 (3) | 403,080 |
| 500 | | 5.000%, 7/01/27 (Pre-refunded 7/01/21) | 7/21 at 100.00 | A3 (3) | 503,850 |
| 1,915 | | Connecticut Health and Educational Facilities Authority, Revenue Bonds, Middlesex | 7/25 at 100.00 | A3 | 2,176,723 |
| | Hospital, Series 2015O, 5.000%, 7/01/36 | | | |
| 1,125 | | Connecticut Health and Educational Facilities Authority, Revenue Bonds, Norwich Free | 7/23 at 100.00 | A | 1,197,011 |
| | Academy, Series 2013B, 4.000%, 7/01/34 | | | |
| | Connecticut Health and Educational Facilities Authority, Revenue Bonds, Nuvance Health | | | |
| | Series 2019A: | | | |
| 1,000 | | 4.000%, 7/01/41 | 7/29 at 100.00 | Baa2 | 1,129,880 |
| 1,370 | | 4.000%, 7/01/49 | 7/29 at 100.00 | Baa2 | 1,528,509 |
| | Connecticut Health and Educational Facilities Authority, Revenue Bonds, Quinnipiac | | | |
| | University, Refunding Series 2015L: | | | |
| 10,105 | | 4.125%, 7/01/41 | 7/25 at 100.00 | A– | 10,970,796 |
| 7,030 | | 5.000%, 7/01/45 | 7/25 at 100.00 | A– | 7,962,740 |
| | Connecticut Health and Educational Facilities Authority, Revenue Bonds, Quinnipiac | | | |
| | University, Series 2016M: | | | |
| 500 | | 5.000%, 7/01/34 | 7/26 at 100.00 | A– | 589,415 |
| 1,250 | | 5.000%, 7/01/36 | 7/26 at 100.00 | A– | 1,468,738 |
| 250 | | Connecticut Health and Educational Facilities Authority, Revenue Bonds, Sacred Heart | 7/21 at 100.00 | A3 (3) | 251,975 |
| | University, Series 2011G, 5.125%, 7/01/26 (Pre-refunded 7/01/21) | | | |
| 6,145 | | Connecticut Health and Educational Facilities Authority, Revenue Bonds, Sacred Heart | 7/27 at 100.00 | A3 | 7,328,343 |
| | University, Series 2017I-1, 5.000%, 7/01/42 | | | |
| 1,275 | | Connecticut Health and Educational Facilities Authority, Revenue Bonds, Stamford | 7/21 at 100.00 | BBB+ | 1,284,716 |
| | Hospital, Series 2010-I, 5.000%, 7/01/30 | | | |
33
| | |
| NVG | Nuveen AMT-Free Municipal Credit Income Fund |
| Portfolio of Investments (continued) |
| April 30, 2021 (Unaudited) |
| | | | | | |
| Principal | | | Optional Call | | |
| Amount (000) | | Description (1) | Provisions (14) | Ratings (2) | Value |
| | Connecticut (continued) | | | |
| | Connecticut Health and Educational Facilities Authority, Revenue Bonds, Stamford | | | |
| | Hospital, Series 2012J: | | | |
| $ 1,000 | | 5.000%, 7/01/37 | 7/22 at 100.00 | BBB+ | $ 1,041,120 |
| 8,055 | | 5.000%, 7/01/42 | 7/22 at 100.00 | BBB+ | 8,370,353 |
| 4,000 | | Connecticut Health and Educational Facilities Authority, Revenue Bonds, Stamford | 7/26 at 100.00 | BBB+ | 4,297,320 |
| | Hospital, Series 2016K, 4.000%, 7/01/46 | | | |
| | Connecticut Health and Educational Facilities Authority, Revenue Bonds, The Loomis | | | |
| | Chaffee School Issue, Series 2011-I: | | | |
| 560 | | 5.000%, 7/01/23 (Pre-refunded 7/01/21) – AGM Insured | 7/21 at 100.00 | A1 (3) | 564,312 |
| 225 | | 5.000%, 7/01/24 (Pre-refunded 7/01/21) – AGM Insured | 7/21 at 100.00 | A1 (3) | 226,733 |
| | Connecticut Health and Educational Facilities Authority, Revenue Bonds, Trinity Health | | | |
| | Credit Group, Series 2016CT: | | | |
| 2,650 | | 5.000%, 12/01/41 | 6/26 at 100.00 | AA– | 3,175,601 |
| 770 | | 5.000%, 12/01/45 | 6/26 at 100.00 | AA– | 919,580 |
| 2,250 | | Connecticut Health and Educational Facilities Authority, Revenue Bonds, University of | 7/28 at 100.00 | BBB– | 2,592,225 |
| | New Haven, Series 2018K-1, 5.000%, 7/01/38 | | | |
| 4,000 | | Connecticut Health and Educational Facilities Authority, Revenue Bonds, Western | 7/21 at 100.00 | N/R (3) | 4,030,480 |
| | Connecticut Health, Series 2011N, 5.000%, 7/01/29 (Pre-refunded 7/01/21) | | | |
| | Connecticut Health and Educational Facilities Authority, Revenue Bonds, Yale-New Haven | | | |
| | Health Issue, Series 2014E: | | | |
| 2,610 | | 5.000%, 7/01/32 | 7/24 at 100.00 | AA– | 2,975,870 |
| 2,740 | | 5.000%, 7/01/33 | 7/24 at 100.00 | AA– | 3,122,257 |
| 900 | | 5.000%, 7/01/34 | 7/24 at 100.00 | AA– | 1,024,947 |
| 5,580 | | Connecticut Health and Educational Facilities Authority, Revenue Bonds, Connecticut | 11/23 at 100.00 | A (3) | 6,249,823 |
| | State University System, Series 2013N, 5.000%, 11/01/31 (Pre-refunded 11/01/23) | | | |
| 1,185 | | Connecticut Housing Finance Authority, State Supported Special Obligation Bonds, | 6/21 at 100.00 | A | 1,188,993 |
| | Refunding Series 2010-16, 5.000%, 6/15/30 | | | |
| | Connecticut Municipal Electric Energy Cooperative, Power Supply System Revenue Bonds, | | | |
| | Tender Option Bond Trust 2016-XG0059: | | | |
| 1,295 | | 17.846%, 1/01/32, 144A (IF) (5) | 1/23 at 100.00 | Aa3 | 1,680,786 |
| 410 | | 17.679%, 1/01/38, 144A (IF) (5) | 1/23 at 100.00 | Aa3 | 525,325 |
| 1,000 | | Connecticut State, General Obligation Bonds, Series 2011D, 5.000%, 11/01/31 | 11/21 at 100.00 | A | 1,022,370 |
| 3,500 | | Connecticut State, General Obligation Bonds, Series 2014F, 5.000%, 11/15/34 | 11/24 at 100.00 | A | 4,016,740 |
| 2,630 | | Connecticut State, General Obligation Bonds, Series 2015F, 5.000%, 11/15/34 | 11/25 at 100.00 | A | 3,100,691 |
| 3,730 | | Connecticut State, General Obligation Bonds, Series 2017A, 5.000%, 4/15/35 | 4/27 at 100.00 | A | 4,549,556 |
| | Connecticut State, General Obligation Bonds, Series 2018A: | | | |
| 3,500 | | 5.000%, 4/15/35 (UB) (5) | 4/28 at 100.00 | A | 4,364,080 |
| 5,000 | | 5.000%, 4/15/38 (UB) (5) | 4/28 at 100.00 | A | 6,189,400 |
| 3,855 | | Connecticut State, Special Tax Obligation Bonds, Transportation Infrastructure Purposes | 10/23 at 100.00 | A+ | 4,251,063 |
| | Series 2013A, 5.000%, 10/01/33 | | | |
| 1,380 | | Connecticut State, Special Tax Obligation Bonds, Transportation Infrastructure Purposes | 8/25 at 100.00 | A+ | 1,611,219 |
| | Series 2015A, 5.000%, 8/01/33 | | | |
| | Connecticut State, Special Tax Obligation Bonds, Transportation Infrastructure Purposes | | | |
| | Series 2016A: | | | |
| 5,300 | | 5.000%, 9/01/33 | 9/26 at 100.00 | A+ | 6,380,034 |
| 1,075 | | 5.000%, 9/01/34 | 9/26 at 100.00 | A+ | 1,291,591 |
| 3,500 | | Connecticut State, Special Tax Obligation Bonds, Transportation Infrastructure Purposes, | 9/24 at 100.00 | A+ | 3,982,650 |
| | Series 2014A, 5.000%, 9/01/33 | | | |
| | Connecticut Transmission Municipal Electric Energy Cooperative, Transmission System | | | |
| | Revenue Bonds, Series 2012A: | | | |
| 655 | | 5.000%, 1/01/31 | 1/22 at 100.00 | Aa3 | 674,833 |
| 500 | | 5.000%, 1/01/32 | 1/22 at 100.00 | Aa3 | 515,105 |
| 2,830 | | 5.000%, 1/01/42 | 1/22 at 100.00 | Aa3 | 2,909,014 |
| | | | | | |
| Principal | | | Optional Call | | |
| Amount (000) | | Description (1) | Provisions (14) | Ratings (2) | Value |
| | Connecticut (continued) | | | |
| | Greater New Haven Water Pollution Control Authority, Connecticut, Regional Wastewater | | | |
| | System Revenue Bonds, Refunding Series 2014B: | | | |
| $ 500 | | 5.000%, 8/15/30 (Pre-refunded 8/15/24) | 8/24 at 100.00 | A1 (3) | $ 577,900 |
| 1,000 | | 5.000%, 8/15/31 (Pre-refunded 8/15/24) | 8/24 at 100.00 | A1 (3) | 1,155,800 |
| 55 | | Greater New Haven Water Pollution Control Authority, Connecticut, Regional Wastewater | 6/21 at 100.00 | A1 | 55,202 |
| | System Revenue Bonds, Series 2005A, 5.000%, 8/15/35 – NPFG Insured | | | |
| 225 | | Hamden, Connecticut, General Obligation Bonds, Series 2016, 5.000%, 8/15/32 – BAM Insured | 8/24 at 100.00 | AA | 253,085 |
| 2,315 | | Harbor Point Infrastructure Improvement District, Connecticut, Special Obligation | 4/27 at 100.00 | N/R | 2,663,917 |
| | Revenue Bonds, Harbor Point Project, Refunding Series 2017, 5.000%, 4/01/39, 144A | | | |
| 10,015 | | Hartford County Metropolitan District, Connecticut, Clean Water Project Revenue Bonds, | 11/24 at 100.00 | AA– | 11,330,971 |
| | Refunding Green Bond Series 2014A, 5.000%, 11/01/42 | | | |
| | Hartford County Metropolitan District, Connecticut, Clean Water Project Revenue Bonds, | | | |
| | Series 2013A: | | | |
| 4,100 | | 5.000%, 4/01/36 (Pre-refunded 4/01/22) | 4/22 at 100.00 | AA– (3) | 4,282,737 |
| 2,500 | | 5.000%, 4/01/39 (Pre-refunded 4/01/22) | 4/22 at 100.00 | AA– (3) | 2,611,425 |
| 2,285 | | Hartford County Metropolitan District, Connecticut, General Obligation Bonds, Series | 7/28 at 100.00 | Aa3 | 2,846,859 |
| | 2018, 5.000%, 7/15/36 | | | |
| 870 | | Hartford, Connecticut, General Obligation Bonds, Series 2009A, 5.000%, 8/15/28 – | 6/21 at 100.00 | A1 | 873,028 |
| | AGC Insured | | | |
| | Milford, Connecticut, General Obligation Bonds, Series 2018: | | | |
| 1,055 | | 4.000%, 11/01/36 | 11/24 at 100.00 | AA+ | 1,160,300 |
| 1,055 | | 4.000%, 11/01/37 | 11/24 at 100.00 | AA+ | 1,158,801 |
| 1,550 | | New Haven, Connecticut, General Obligation Bonds, Refunding Series 2016A, 5.000%, | 8/26 at 100.00 | BBB | 1,832,271 |
| | 8/15/35 – AGM Insured | | | |
| 985 | | New Haven, Connecticut, General Obligation Bonds, Series 2014A, 5.000%, 8/01/33 – | 8/24 at 100.00 | BBB | 1,103,998 |
| | AGM Insured | | | |
| | New Haven, Connecticut, General Obligation Bonds, Series 2015: | | | |
| 790 | | 5.000%, 9/01/32 – AGM Insured | 9/25 at 100.00 | BBB | 914,386 |
| 1,620 | | 5.000%, 9/01/33 – AGM Insured | 9/25 at 100.00 | BBB | 1,871,375 |
| 500 | | 5.000%, 9/01/35 – AGM Insured | 9/25 at 100.00 | BBB | 575,765 |
| | New Haven, Connecticut, General Obligation Bonds, Series 2017A: | | | |
| 1,000 | | 5.000%, 8/01/35 | 8/27 at 100.00 | BBB | 1,179,900 |
| 1,425 | | 5.000%, 8/01/36 | 8/27 at 100.00 | BBB | 1,677,510 |
| 900 | | North Haven, Connecticut, General Obligation Bonds, Series 2006, 5.000%, 7/15/24 | No Opt. Call | Aa1 | 1,035,927 |
| 795 | | South Central Connecticut Regional Water Authority Water System Revenue Bonds, Thirtieth | 8/24 at 100.00 | AA– (3) | 917,398 |
| | Series 2014A, 5.000%, 8/01/44 (Pre-refunded 8/01/24) | | | |
| | South Central Connecticut Regional Water Authority, Water System Revenue Bonds, | | | |
| | Refunding Thirty-Second Series 2016B: | | | |
| 2,715 | | 4.000%, 8/01/36 | 8/26 at 100.00 | AA– | 3,067,787 |
| 2,220 | | 5.000%, 8/01/37 | 8/26 at 100.00 | AA– | 2,673,102 |
| 3,870 | | South Central Connecticut Regional Water Authority, Water System Revenue Bonds, | 8/21 at 100.00 | AA– (3) | 3,915,976 |
| | Twentieth-Sixth Series, 2011, 5.000%, 8/01/41 (Pre-refunded 8/01/21) | | | |
| 3,250 | | South Central Connecticut Regional Water Authority, Water System Revenue Bonds, | 8/22 at 100.00 | AA– (3) | 3,447,535 |
| | Twenty-Seventh Series 2012, 5.000%, 8/01/33 (Pre-refunded 8/01/22) | | | |
| 500 | | Stamford, Connecticut, Water Pollution Control System and Facility Revenue Bonds, Series | 8/23 at 100.00 | Aa2 | 553,540 |
| | 2013A, 5.250%, 8/15/43 | | | |
| | Stamford, Connecticut, Water Pollution Control System and Facility Revenue Bonds, Series 2019: | | | |
| 200 | | 4.000%, 4/01/37 | 4/29 at 100.00 | AA+ | 238,510 |
| 250 | | 4.000%, 4/01/38 | 4/29 at 100.00 | AA+ | 297,390 |
| 600 | | Stratford, Connecticut, General Obligation Bonds, Series 2014, 5.000%, 12/15/32 | 12/22 at 100.00 | A2 (3) | 646,884 |
| | (Pre-refunded 12/15/22) | | | |
| 1,500 | | Stratford, Connecticut, General Obligation Bonds, Series 2017, 4.000%, 1/01/39 – | 1/27 at 100.00 | A2 | 1,701,810 |
| | BAM Insured | | | |
35
| | |
| NVG | Nuveen AMT-Free Municipal Credit Income Fund |
| Portfolio of Investments (continued) |
| April 30, 2021 (Unaudited) |
| | | | | | |
| Principal | | | Optional Call | | |
| Amount (000) | | Description (1) | Provisions (14) | Ratings (2) | Value |
| | Connecticut (continued) | | | |
| $ 1,000 | | Town of Hamden, Connecticut, General Obligation Bonds, Refunding Series 2018A, 5.000%, | 8/28 at 100.00 | BBB | $ 1,236,780 |
| | 8/15/30 – BAM Insured | | | |
| 2,500 | | University of Connecticut, General Obligation Bonds, Series 2013A, 5.000%, 8/15/32 | 8/23 at 100.00 | A | 2,740,350 |
| 760 | | University of Connecticut, General Obligation Bonds, Series 2014A, 5.000%, 2/15/31 | 2/24 at 100.00 | A | 852,462 |
| 2,250 | | University of Connecticut, General Obligation Bonds, Series 2015A, 5.000%, 3/15/31 | 3/26 at 100.00 | A | 2,697,772 |
| | Waterbury, Connecticut, General Obligation Bonds, Lot A Series 2015: | | | |
| 445 | | 5.000%, 8/01/30 – BAM Insured | 8/25 at 100.00 | AA– | 523,618 |
| 390 | | 5.000%, 8/01/31 – BAM Insured | 8/25 at 100.00 | AA– | 458,722 |
| 610 | | 5.000%, 8/01/32 – BAM Insured | 8/25 at 100.00 | AA– | 716,933 |
| 445 | | 5.000%, 8/01/33 – BAM Insured | 8/25 at 100.00 | AA– | 522,599 |
| 445 | | 5.000%, 8/01/34 – BAM Insured | 8/25 at 100.00 | AA– | 521,989 |
| 208,530 | | Total Connecticut | | | 234,135,468 |
| | Delaware – 0.1% (0.1% of Total Investments) | | | |
| | Kent County, Delaware, Student Housing & Dining Facility Revenue Bonds, Collegiate | | | |
| | Housing Foundation – Dover LLC Delaware State University Project, Series 2018A: | | | |
| 2,585 | | 5.000%, 7/01/53 | 1/28 at 100.00 | BB– | 2,881,603 |
| 1,000 | | 5.000%, 7/01/58 | 1/28 at 100.00 | BB– | 1,111,560 |
| 3,585 | | Total Delaware | | | 3,993,163 |
| | District of Columbia – 2.6% (1.7% of Total Investments) | | | |
| 3,780 | | District of Columbia Student Dormitory Revenue Bonds, Provident Group – Howard | 10/22 at 100.00 | BB– | 3,848,758 |
| | Properties LLC Issue, Series 2013, 5.000%, 10/01/45 | | | |
| 3,990 | | District of Columbia Tobacco Settlement Corporation, Tobacco Settlement Asset-Backed | No Opt. Call | Baa1 | 4,430,097 |
| | Bonds, Series 2001, 6.500%, 5/15/33 | | | |
| 186,000 | | District of Columbia Tobacco Settlement Corporation, Tobacco Settlement Asset-Backed | 6/21 at 21.42 | N/R | 39,653,340 |
| | Bonds, Series 2006A, 0.000%, 6/15/46 | | | |
| 1,500 | | District of Columbia, Revenue Bonds, Ingleside at Rock Creek Project, Series 2017A, | 7/24 at 103.00 | N/R | 1,582,755 |
| | 5.000%, 7/01/42 | | | |
| 1,810 | | Metropolitan Washington Airports Authority, District of Columbia, Dulles Toll Road | 10/29 at 100.00 | A2 | 2,077,500 |
| | Revenue Bonds, Dulles Metrorail & Capital improvement Projects, Refunding & Subordinate Lien | | | |
| | Series 2019B, 4.000%, 10/01/53 – AGM Insured | | | |
| 3,000 | | Metropolitan Washington Airports Authority, District of Columbia, Dulles Toll Road | 10/28 at 100.00 | A | 3,641,910 |
| | Revenue Bonds, Dulles Metrorail & Capital Improvement Projects, Refunding First Senior Lien | | | |
| | Series 2019A, 5.000%, 10/01/44 | | | |
| 14,945 | | Metropolitan Washington Airports Authority, District of Columbia, Dulles Toll Road | 4/22 at 100.00 | Baa1 | 15,498,563 |
| | Revenue Bonds, Dulles Metrorail & Capital Improvement Projects, Refunding Second Senior Lien | | | |
| | Series 2014A, 5.000%, 10/01/53 | | | |
| 11,000 | | Metropolitan Washington Airports Authority, District of Columbia, Dulles Toll Road | 10/26 at 100.00 | A3 | 14,133,900 |
| | Revenue Bonds, Dulles Metrorail & Capital improvement Projects, Second Senior Lien Series | | | |
| | 2009C, 6.500%, 10/01/41 – AGC Insured | | | |
| 10,000 | | Metropolitan Washington Airports Authority, District of Columbia, Dulles Toll Road | 10/28 at 100.00 | Baa1 | 13,409,400 |
| | Revenue Bonds, Dulles Metrorail Capital Appreciation, Second Senior Lien Series 2010B, | | | |
| | 6.500%, 10/01/44 | | | |
| 236,025 | | Total District of Columbia | | | 98,276,223 |
| | Florida – 4.5% (2.9% of Total Investments) | | | |
| 990 | | Bexley Community Development District, Pasco County, Florida, Special Assessment Revenue | 5/26 at 100.00 | N/R | 1,065,478 |
| | Bonds, Series 2016, 4.700%, 5/01/36 | | | |
| 1,000 | | Capital Trust Agency, Florida, Educational Facilities Lease Revenue Bonds, Franklin | 7/26 at 100.00 | N/R | 1,083,010 |
| | Academy Projects, Series 2020, 5.000%, 12/15/50, 144A | | | |
| | Capital Trust Agency, Florida, Revenue Bonds, Babcock Neighborhood School Inc, Series 2018: | | | |
| 1,290 | | 6.100%, 8/15/38, 144A | 8/28 at 100.00 | N/R | 1,418,497 |
| 1,045 | | 6.200%, 8/15/48, 144A | 8/28 at 100.00 | N/R | 1,135,915 |
36
| | | | | | |
| Principal | | | Optional Call | | |
| Amount (000) | | Description (1) | Provisions (14) | Ratings (2) | Value |
| | Florida (continued) | | | |
| | Capital Trust Agency, Florida, Revenue Bonds, Odyssey Charter School Project, Series 2017A: | | | |
| $ 1,065 | | 5.375%, 7/01/37, 144A | 7/27 at 100.00 | Ba1 | $ 1,203,652 |
| 1,470 | | 5.500%, 7/01/47, 144A | 7/27 at 100.00 | Ba1 | 1,645,342 |
| 5,225 | | Capital Trust Agency, Florida, Revenue Bonds, Provision CARES Proton Therapy Center, | 6/28 at 100.00 | N/R | 1,985,500 |
| | Orlando Project, Series 2018, 7.500%, 6/01/48, 144A (4), (7) | | | |
| | Capital Trust Agency, Florida, Revenue Bonds, Renaissance Charter School Project, Series 2017A: | | | |
| 6,050 | | 5.125%, 6/15/37, 144A | 6/27 at 100.00 | N/R | 6,734,194 |
| 1,885 | | 5.250%, 6/15/47, 144A | 6/27 at 100.00 | N/R | 2,087,279 |
| 880 | | Capital Trust Agency, Florida, Revenue Bonds, Viera Charter School Project, Series | 10/27 at 100.00 | Ba2 | 968,906 |
| | 2017A, 5.000%, 10/15/37, 144A | | | |
| 735 | | Capital Trust Agency, Florida, Revenue Bonds, Viera Charter School Project, Series | 10/27 at 100.00 | Ba2 | 795,035 |
| | 2019A, 5.000%, 10/15/49, 144A | | | |
| 4,670 | | City of Miami Beach, Florida, Stormwater Revenue Bonds, Series 2015, 5.000%, 9/01/41 | 9/25 at 100.00 | AA– | 5,454,700 |
| 1,025 | | Cityplace Community Development District, Florida, Special Assessment and Revenue | No Opt. Call | A | 1,169,299 |
| | Bonds, Refunding Series 2012, 5.000%, 5/01/26 | | | |
| 1,480 | | Collier County Educational Facilities Authority, Florida, Revenue Bonds, Hodges | 11/23 at 100.00 | BB+ | 1,583,970 |
| | University, Refunding Series 2013, 6.125%, 11/01/43 | | | |
| | Creekside at Twin Creeks Community Development District, Florida, Special Assessment | | | |
| | Bonds, Area 1 Project, Series 2016A-1: | | | |
| 240 | | 5.250%, 11/01/37 | 11/28 at 100.00 | N/R | 271,555 |
| 310 | | 5.600%, 11/01/46 | 11/28 at 100.00 | N/R | 353,921 |
| | Davie, Florida, Educational Facilities Revenue Bonds, Nova Southeastern University | | | |
| | Project, Series 2013A: | | | |
| 3,445 | | 6.000%, 4/01/42 (Pre-refunded 4/01/23) | 4/23 at 100.00 | Baa1 (3) | 3,824,673 |
| 1,720 | | 5.625%, 4/01/43 (Pre-refunded 4/01/23) | 4/23 at 100.00 | Baa1 (3) | 1,898,674 |
| 4,000 | | Davie, Florida, Water and Sewer Revenue Bonds, Series 2011, 5.000%, 10/01/41 | 10/21 at 100.00 | A1 (3) | 4,080,320 |
| | (Pre-refunded 10/01/21) – AGM Insured | | | |
| | Downtown Doral Community Development District, Florida, Special Assessment Bonds, | | | |
| | Series 2015: | | | |
| 280 | | 5.250%, 5/01/35 | 5/26 at 100.00 | N/R | 301,862 |
| 315 | | 5.300%, 5/01/36 | 5/26 at 100.00 | N/R | 339,564 |
| 475 | | 5.500%, 5/01/45 | 5/26 at 100.00 | N/R | 514,910 |
| 655 | | 5.500%, 5/01/46 | 5/26 at 100.00 | N/R | 709,712 |
| | Florida Development Finance Corporation, Educational Facilities Revenue Bonds, Classical | | | |
| | Preparatory Incorporated Project, Series 2017A: | | | |
| 255 | | 6.000%, 6/15/37, 144A | 6/26 at 100.00 | N/R | 275,426 |
| 665 | | 6.125%, 6/15/46, 144A | 6/26 at 100.00 | N/R | 713,831 |
| 415 | | Florida Development Finance Corporation, Educational Facilities Revenue Bonds, Classical | 6/26 at 100.00 | N/R | 448,242 |
| | Preparatory Incorporated Project, Series 2018A, 6.000%, 6/15/37, 144A | | | |
| | Florida Development Finance Corporation, Educational Facilities Revenue Bonds, Downtown | | | |
| | Doral Charter Upper School Project, Series 2017C: | | | |
| 2,375 | | 5.650%, 7/01/37, 144A | 7/27 at 101.00 | N/R | 2,663,776 |
| 3,735 | | 5.750%, 7/01/47, 144A | 7/27 at 101.00 | N/R | 4,138,156 |
| | Florida Development Finance Corporation, Educational Facilities Revenue Bonds, Florida | | | |
| | Charter Foundation Inc Projects, Series 2016A: | | | |
| 1,485 | | 6.250%, 6/15/36, 144A | 6/26 at 100.00 | N/R | 1,740,598 |
| 2,075 | | 4.750%, 7/15/36, 144A | 7/26 at 100.00 | N/R | 2,238,074 |
| 4,350 | | 6.375%, 6/15/46, 144A | 6/26 at 100.00 | N/R | 5,050,002 |
| 1,335 | | 5.000%, 7/15/46, 144A | 7/26 at 100.00 | N/R | 1,442,174 |
| | Florida Development Finance Corporation, Educational Facilities Revenue Bonds, Mater | | | |
| | Academy Projects, Series 2020A: | | | |
| 4,330 | | 5.000%, 6/15/50 | 6/27 at 100.00 | BBB | 4,913,424 |
| 3,405 | | 5.000%, 6/15/55 | 6/27 at 100.00 | BBB | 3,841,044 |
37
| | |
| NVG | Nuveen AMT-Free Municipal Credit Income Fund |
| Portfolio of Investments (continued) |
| April 30, 2021 (Unaudited) |
| | | | | | |
| Principal | | | Optional Call | | |
| Amount (000) | | Description (1) | Provisions (14) | Ratings (2) | Value |
| | Florida (continued) | | | |
| | Florida Development Finance Corporation, Educational Facilities Revenue Bonds, | | | |
| | Renaissance Charter School Income Projects, Series 2015A: | | | |
| $ 3,090 | | 6.000%, 6/15/35, 144A | 6/25 at 100.00 | N/R | $ 3,516,667 |
| 3,450 | | 6.125%, 6/15/46, 144A | 6/25 at 100.00 | N/R | 3,887,391 |
| 550 | | Florida Development Finance Corporation, Educational Facilities Revenue Bonds, | 6/24 at 100.00 | N/R | 598,659 |
| | Renaissance Charter School, Inc Projects, Series 2014A, 6.125%, 6/15/44 | | | |
| 4,380 | | Florida Development Finance Corporation, Educational Facilities Revenue Bonds, Southwest | 6/27 at 100.00 | N/R | 4,691,243 |
| | Charter Foundation Inc Projects, Series 2017A, 6.125%, 6/15/47, 144A | | | |
| 1,435 | | Grand Bay at Doral Community Development District, Miami-Dade County, Florida, Special | 5/26 at 100.00 | N/R | 1,527,988 |
| | Assessment Bonds, South Parcel Assessment Area Project, Series 2016, 4.750%, 5/01/36 | | | |
| 600 | | Jacksonville, Florida, Better Jacksonville Sales Tax Revenue Bonds, Refunding Series | 10/22 at 100.00 | A+ | 639,552 |
| | 2012, 5.000%, 10/01/30 | | | |
| 2,215 | | Jacksonville, Florida, Educational Facilities Revenue Bonds, Jacksonville University | 6/28 at 100.00 | N/R | 2,587,629 |
| | Project, Series 2018B, 5.000%, 6/01/53, 144A | | | |
| 1,000 | | Lakeland, Florida, Hospital System Revenue Bonds, Lakeland Regional Health, Refunding | 11/21 at 100.00 | A2 | 1,022,940 |
| | Series 2011, 5.000%, 11/15/25 | | | |
| 625 | | Lakewood Ranch Stewardship District, Florida, Special Assessment Revenue Bonds, Del Webb | 5/27 at 100.00 | N/R | 695,619 |
| | Project, Series 2017, 5.000%, 5/01/37, 144A | | | |
| 4,125 | | Martin County Health Facilities Authority, Florida, Hospital Revenue Bonds, Martin | 11/24 at 100.00 | N/R (3) | 4,808,512 |
| | Memorial Medical Center, Series 2015, 5.000%, 11/15/45 (Pre-refunded 11/15/24) | | | |
| | Miami Dade County Industrial Development Authority, Florida, Educational Facilities | | | |
| | Revenue Bonds, South Florida Autism Charter School Project, Series 2017: | | | |
| 1,080 | | 5.875%, 7/01/37, 144A | 7/27 at 100.00 | N/R | 1,188,875 |
| 1,920 | | 6.000%, 7/01/47, 144A | 7/27 at 100.00 | N/R | 2,093,741 |
| 5,965 | | Miami Dade County, Florida, Rickenbacker Causeway Revenue Bonds, Series 2014, | 10/24 at 100.00 | BBB+ | 6,551,717 |
| | 5.000%, 10/01/43 | | | |
| 2,130 | | Miami Health Facilities Authority, Florida, Health Facilities Revenue Bonds, Miami | 7/27 at 100.00 | BB+ | 1,960,708 |
| | Jewish Health System Inc Project, Series 2017, 5.125%, 7/01/46 | | | |
| 5,000 | | Miami-Dade County Expressway Authority, Florida, Toll System Revenue Bonds, Series | 7/24 at 100.00 | BBB+ | 5,610,400 |
| | 2014A, 5.000%, 7/01/44 | | | |
| 2,400 | | Miami-Dade County, Florida, Special Obligation Bonds, Refunding Subordinate Series | 10/22 at 100.00 | A2 (3) | 2,565,456 |
| | 2012B, 5.000%, 10/01/37 (Pre-refunded 10/01/22) | | | |
| 6,305 | | Miami-Dade County, Florida, Water and Sewer System Revenue Bonds, Series 2013A, 5.000%, | 10/22 at 100.00 | A+ (3) | 6,739,667 |
| | 10/01/42 (Pre-refunded 10/01/22) | | | |
| 4,785 | | Northern Palm Beach County Improvement District, Florida, Water Control and Improvement | 8/26 at 100.00 | N/R | 5,447,435 |
| | Bonds, Development Unit 53, Series 2015, 5.350%, 8/01/35 | | | |
| 4,270 | | Orange County Health Facilities Authority, Florida, Hospital Revenue Bonds, Orlando | 4/22 at 100.00 | A2 (3) | 4,458,307 |
| | Health, Inc, Series 2012A, 5.000%, 10/01/42 (Pre-refunded 4/01/22) | | | |
| | Osceola County, Florida, Transportation Revenue Bonds, Osceola Parkway, Refunding & | | | |
| | Improvement Series 2019A-1: | | | |
| 1,245 | | 5.000%, 10/01/44 | 10/29 at 100.00 | BBB– | 1,540,277 |
| 1,645 | | 5.000%, 10/01/49 | 10/29 at 100.00 | BBB– | 2,022,462 |
| 3,345 | | 4.000%, 10/01/54 | 10/29 at 100.00 | BBB– | 3,780,251 |
| 230 | | Palm Beach County Health Facilities Authority, Florida, Revenue Bonds, Sinai Residences | 6/22 at 102.00 | N/R | 246,760 |
| | of Boca Raton Project, Series 2014A, 7.250%, 6/01/34 | | | |
| 825 | | Reunion West Community Development District, Florida, Special Assessment Bonds, Area 3 | 11/26 at 100.00 | N/R | 895,274 |
| | Project, Series 2016, 5.000%, 11/01/46 | | | |
| | Six Mile Creek Community Development District, Florida, Capital Improvement Revenue | | | |
| | Bonds, Assessment Area 2, Series 2016: | | | |
| 225 | | 4.750%, 11/01/28 | 11/27 at 100.00 | N/R | 241,729 |
| 375 | | 5.375%, 11/01/36 | 11/27 at 100.00 | N/R | 415,744 |
| 920 | | South Fork III Community Development District, Florida, Special Assessment Revenue | 5/27 at 100.00 | N/R | 1,022,166 |
| | Bonds, Refunding Series 2016, 5.375%, 5/01/37 | | | |
38
| | | | | | |
| Principal | | | Optional Call | | |
| Amount (000) | | Description (1) | Provisions (14) | Ratings (2) | Value |
| | Florida (continued) | | | |
| $ 1,200 | | St Lucie County, Florida, Utility System Revenue Refunding Bonds, Series 1993, 5.500%, | No Opt. Call | N/R (3) | $ 1,225,788 |
| | 10/01/21 – FGIC Insured (ETM) | | | |
| 4,120 | | Tampa, Florida, Health System Revenue Bonds, Baycare Health System, Series 2012A, | 5/22 at 100.00 | Aa2 | 4,308,943 |
| | 5.000%, 11/15/33 | | | |
| 560 | | Tampa, Florida, Healthcare System Revenue Bonds, Allegany Health System – St Joseph’s | 6/21 at 100.00 | N/R (3) | 587,412 |
| | Hospital, Series 1993, 5.125%, 12/01/23 – NPFG Insured (ETM) | | | |
| 1,735 | | Tampa, Florida, Revenue Bonds, H Lee Moffitt Cancer Center and Research Institute, | 7/30 at 100.00 | A– | 2,161,671 |
| | Series 2020B, 5.000%, 7/01/50 | | | |
| 10,105 | | Tampa-Hillsborough County Expressway Authority, Florida, Revenue Bonds, Refunding Series | 7/22 at 100.00 | A2 (3) | 10,671,890 |
| | 2012B, 5.000%, 7/01/42 (Pre-refunded 7/01/22) | | | |
| 2,000 | | Volusia County Educational Facilities Authority, Florida, Revenue Bonds, Embry-Riddle | 10/21 at 100.00 | A2 (3) | 2,043,060 |
| | Aeronautical University, Inc Project, Refunding Series 2011, 5.000%, 10/15/29 (Pre-refunded | | | |
| | 10/15/21) – AGM Insured | | | |
| 5,000 | | Volusia County Educational Facilities Authority, Florida, Revenue Bonds, Stetson | 6/25 at 100.00 | A– | 5,781,450 |
| | University Inc Project, Series 2015, 5.000%, 6/01/40 | | | |
| 153,530 | | Total Florida | | | 165,628,098 |
| | Georgia – 3.1% (2.0% of Total Investments) | | | |
| 11,985 | | Burke County Development Authority, Georgia, Pollution Control Revenue Bonds, Georgia | 5/31 at 100.00 | A1 | 11,987,397 |
| | Transmission Corporation Vogtle Project, Series 2012, 2.750%, 1/01/52 (WI/DD, Settling 5/05/21) | | | |
| 5,715 | | Burke County Development Authority, Georgia, Pollution Control Revenue Bonds, Oglethorpe | 2/28 at 100.00 | BBB+ | 6,401,771 |
| | Power Corporation Vogtle Project, Series 2017C, 4.125%, 11/01/45 | | | |
| 11,255 | | Burke County Development Authority, Georgia, Pollution Control Revenue Bonds, Oglethorpe | 2/28 at 100.00 | BBB+ | 12,607,513 |
| | Power Corporation Vogtle Project, Series 2017D, 4.125%, 11/01/45 | | | |
| 2,000 | | Fairburn, Georgia, General Obligation Bonds, Series 2011, 5.750%, 12/01/31 (Pre-refunded | 12/21 at 100.00 | A2 (3) | 2,065,160 |
| | 12/01/21) – AGM Insured | | | |
| 10,000 | | Fulton County Development Authority, Georgia, Revenue Bonds, Piedmont Healthcare, Inc | 7/29 at 100.00 | A1 | 11,524,600 |
| | Project, Series 2019A, 4.000%, 7/01/49 | | | |
| 15,305 | | Gainesville and Hall County Hospital Authority, Georgia, Revenue Anticipation | 2/25 at 100.00 | AA– | 17,615,902 |
| | Certificates, Northeast Georgia Health Services Inc, Series 2014A, 5.500%, 8/15/54 | | | |
| | Georgia Housing and Finance Authority, Single Family Mortgage Bonds, Series 2018A: | | | |
| 2,730 | | 3.950%, 12/01/43 | 6/27 at 100.00 | AAA | 2,869,940 |
| 4,085 | | 4.000%, 12/01/48 | 6/27 at 100.00 | AAA | 4,293,090 |
| 1,300 | | Macon-Bibb County Urban Development Authority, Georgia, Revenue Bonds, Academy for | 6/27 at 100.00 | N/R | 1,418,560 |
| | Classical Education, Series 2017, 5.750%, 6/15/37, 144A | | | |
| 4,000 | | Marietta Development Authority, Georgia, University Facilities Revenue Bonds, Life | 11/27 at 100.00 | Ba3 | 4,295,240 |
| | University, Inc Project, Refunding Series 2017A, 5.000%, 11/01/47, 144A | | | |
| 10,825 | | Municipal Electric Authority of Georgia, Plant Vogtle Units 3 & 4 Project J Bonds, | 7/25 at 100.00 | Baa1 | 12,238,637 |
| | Series 2015A, 5.000%, 7/01/60 | | | |
| | Municipal Electric Authority of Georgia, Plant Vogtle Units 3 & 4 Project J Bonds, | | | |
| | Series 2019A: | | | |
| 8,680 | | 5.000%, 1/01/49 | 7/28 at 100.00 | Baa1 | 10,370,343 |
| 4,000 | | 5.000%, 1/01/59 | 7/28 at 100.00 | Baa1 | 4,740,560 |
| 1,000 | | Private Colleges and Universities Authority, Georgia, Revenue Bonds, Mercer University, | 10/22 at 100.00 | Baa1 | 1,052,470 |
| | Refunding Series 2012C, 5.250%, 10/01/27 | | | |
| 10,090 | | Private Colleges and Universities Authority, Georgia, Revenue Bonds, Mercer University, | 10/25 at 100.00 | Baa1 | 11,175,785 |
| | Series 2015, 5.000%, 10/01/40 | | | |
| 1,710 | | Valdosta and Lowndes County Hospital Authority, Georgia, Revenue Certificates, South | 10/21 at 100.00 | AA– (3) | 1,744,337 |
| | Georgia Medical Center Project, Series 2011B, 5.000%, 10/01/41 (Pre-refunded 10/01/21) | | | |
| 104,680 | | Total Georgia | | | 116,401,305 |
39
| | |
| NVG | Nuveen AMT-Free Municipal Credit Income Fund |
| Portfolio of Investments (continued) |
| April 30, 2021 (Unaudited) |
| | | | | | |
| Principal | | | Optional Call | | |
| Amount (000) | | Description (1) | Provisions (14) | Ratings (2) | Value |
| | Guam – 0.5% (0.3% of Total Investments) | | | |
| $ 1,500 | | Government of Guam, Business Privilege Tax Bonds, Refunding Series 2015D, 5.000%, 11/15/39 | 11/25 at 100.00 | BB | $ 1,681,155 |
| | Government of Guam, Business Privilege Tax Bonds, Series 2011A: | | | |
| 840 | | 5.250%, 1/01/36 | 1/22 at 100.00 | BB | 864,797 |
| 3,200 | | 5.125%, 1/01/42 | 1/22 at 100.00 | BB | 3,292,448 |
| | Guam Government Waterworks Authority, Water and Wastewater System Revenue Bonds, | | | |
| | Refunding Series 2017: | | | |
| 1,335 | | 5.000%, 7/01/36 | 7/27 at 100.00 | Baa2 | 1,561,296 |
| 890 | | 5.000%, 7/01/40 | 7/27 at 100.00 | Baa2 | 1,033,156 |
| 3,695 | | Guam Government Waterworks Authority, Water and Wastewater System Revenue Bonds, Series | 7/23 at 100.00 | Baa2 (3) | 4,106,327 |
| | 2013, 5.500%, 7/01/43 (Pre-refunded 7/01/23) | | | |
| 235 | | Guam Government Waterworks Authority, Water and Wastewater System Revenue Bonds, Series | 7/26 at 100.00 | Baa2 | 265,329 |
| | 2016, 5.000%, 1/01/46 | | | |
| 4,770 | | Guam Government Waterworks Authority, Water and Wastewater System Revenue Bonds, Series | 7/30 at 100.00 | Baa2 | 5,812,436 |
| | 2020A, 5.000%, 1/01/50 | | | |
| 250 | | Guam Power Authority, Revenue Bonds, Series 2012A, 5.000%, 10/01/34 – AGM Insured | 10/22 at 100.00 | A2 | 263,798 |
| 16,715 | | Total Guam | | | 18,880,742 |
| | Hawaii – 0.3% (0.2% of Total Investments) | | | |
| 1,500 | | Hawaii Department of Budget and Finance, Special Purpose Revenue Bonds, Chaminade | 1/25 at 100.00 | Ba3 | 1,528,365 |
| | University of Honolulu, Series 2015A, 5.000%, 1/01/45, 144A | | | |
| 5,000 | | Hawaii Department of Budget and Finance, Special Purpose Revenue Bonds, Hawaii Pacific | 7/23 at 100.00 | A1 | 5,506,300 |
| | Health Obligated Group, Series 2013A, 5.500%, 7/01/43 | | | |
| 170 | | Hawaii Department of Budget and Finance, Special Purpose Revenue Bonds, Hawaii Pacific | 7/23 at 100.00 | BB | 184,402 |
| | University, Series 2013A, 6.875%, 7/01/43 | | | |
| 5,075 | | Hawaii Department of Budget and Finance, Special Purpose Revenue Bonds, Queens Health | 7/25 at 100.00 | A1 | 5,485,771 |
| | Systems, Series 2015A, 4.000%, 7/01/40 | | | |
| 11,745 | | Total Hawaii | | | 12,704,838 |
| | Idaho – 0.8% (0.5% of Total Investments) | | | |
| | Idaho Health Facilities Authority, Revenue Bonds, Kootenai Health Project, Series 2014: | | | |
| 3,300 | | 4.375%, 7/01/34, 144A | 7/24 at 100.00 | A | 3,543,408 |
| 12,495 | | 4.750%, 7/01/44, 144A | 7/24 at 100.00 | A | 13,394,765 |
| 1,250 | | Idaho Health Facilities Authority, Revenue Bonds, Madison Memorial Hospital Project, | 9/26 at 100.00 | BB+ | 1,392,125 |
| | Refunding Series 2016, 5.000%, 9/01/37 | | | |
| 8,730 | | Idaho Health Facilities Authority, Revenue Bonds, Saint Luke’s Health System Project, | 3/22 at 100.00 | A– | 9,010,233 |
| | Series 2012A, 5.000%, 3/01/47 | | | |
| 1,000 | | Idaho Health Facilities Authority, Revenue Bonds, Saint Luke’s Health System Project, | 3/24 at 100.00 | A– | 1,053,440 |
| | Series 2014A, 4.125%, 3/01/37 | | | |
| | Idaho Housing and Finance Association NonProfit Facilities Revenue Bonds, Gem Prep | | | |
| | Meridian North LLC, Series 2020A: | | | |
| 500 | | 5.000%, 7/01/40, 144A | 7/25 at 100.00 | N/R | 512,785 |
| 1,415 | | 5.250%, 7/01/55, 144A | 7/25 at 100.00 | N/R | 1,450,432 |
| 28,690 | | Total Idaho | | | 30,357,188 |
| | | | | | |
| | Illinois – 23.8% (15.3% of Total Investments) | | | |
| 675 | | Bolingbrook, Will and DuPage Counties, Illinois, General Obligation Bonds, Refunding | 7/23 at 100.00 | A2 (3) | 745,976 |
| | Series 2013A, 5.000%, 1/01/25 (Pre-refunded 7/01/23) | | | |
| 67,135 | | Chicago Board of Education, Illinois, Dedicated Capital Improvement Tax Revenue Bonds, | 4/27 at 100.00 | A– | 80,700,969 |
| | Series 2016, 6.000%, 4/01/46 | | | |
| 1,000 | | Chicago Board of Education, Illinois, Dedicated Capital Improvement Tax Revenue Bonds, | 4/27 at 100.00 | A– | 1,141,220 |
| | Series 2017, 5.000%, 4/01/46 | | | |
| | Chicago Board of Education, Illinois, General Obligation Bonds, Dedicated Revenues | | | |
| | Series 2011A: | | | |
| 6,210 | | 5.500%, 12/01/39 | 12/21 at 100.00 | Ba3 | 6,339,416 |
| 1,810 | | 5.000%, 12/01/41 | 12/21 at 100.00 | Ba3 | 1,841,657 |
40
| | | | | | |
| Principal | | | Optional Call | | |
| Amount (000) | | Description (1) | Provisions (14) | Ratings (2) | Value |
| | Illinois (continued) | | | |
| $ 5,235 | | Chicago Board of Education, Illinois, General Obligation Bonds, Dedicated Revenues | 12/22 at 100.00 | Ba3 | $ 5,461,780 |
| | Series 2012A, 5.000%, 12/01/42 | | | |
| 8,400 | | Chicago Board of Education, Illinois, General Obligation Bonds, Dedicated Revenues, | 12/27 at 100.00 | BB | 10,866,744 |
| | Refunding Series 2017B, 7.000%, 12/01/42, 144A | | | |
| | Chicago Board of Education, Illinois, General Obligation Bonds, Dedicated Revenues, | | | |
| | Refunding Series 2017H: | | | |
| 5,835 | | 5.000%, 12/01/36 | 12/27 at 100.00 | BB | 6,880,399 |
| 4,940 | | 5.000%, 12/01/46 | 12/27 at 100.00 | BB | 5,693,646 |
| 6,055 | | Chicago Board of Education, Illinois, General Obligation Bonds, Dedicated Revenues, | 12/28 at 100.00 | BB | 7,089,800 |
| | Refunding Series 2018D, 5.000%, 12/01/46 | | | |
| 38,905 | | Chicago Board of Education, Illinois, General Obligation Bonds, Dedicated Revenues, | 12/25 at 100.00 | BB | 46,950,554 |
| | Series 2016A, 7.000%, 12/01/44 | | | |
| 14,805 | | Chicago Board of Education, Illinois, General Obligation Bonds, Dedicated Revenues, | 12/26 at 100.00 | BB | 18,033,526 |
| | Series 2016B, 6.500%, 12/01/46 | | | |
| 19,585 | | Chicago Board of Education, Illinois, General Obligation Bonds, Dedicated Revenues, | 12/27 at 100.00 | BB | 25,118,546 |
| | Series 2017A, 7.000%, 12/01/46, 144A | | | |
| 1,410 | | Chicago Board of Education, Illinois, Unlimited Tax General Obligation Bonds, Dedicated | No Opt. Call | BB | 1,131,863 |
| | Tax Revenues, Series 1998B-1, 0.000%, 12/01/30 – NPFG Insured | | | |
| 2,235 | | Chicago Transit Authority, Illinois, Capital Grant Receipts Revenue Bonds, Federal | 6/21 at 100.00 | A2 | 2,243,448 |
| | Transit Administration Section 5307 Urbanized Area Formula Funds, Refunding Series 2011, | | | |
| | 5.250%, 6/01/26 – AGM Insured | | | |
| | Chicago Transit Authority, Illinois, Sales Tax Receipts Revenue Bonds, Second Lien | | | |
| | Series 2020A: | | | |
| 1,405 | | 4.000%, 12/01/50 | 12/29 at 100.00 | A+ | 1,597,345 |
| 2,585 | | 5.000%, 12/01/55 | 12/29 at 100.00 | A+ | 3,168,874 |
| 1,100 | | Chicago Transit Authority, Illinois, Sales Tax Receipts Revenue Bonds, Series 2011, | 12/21 at 100.00 | A3 (3) | 1,132,681 |
| | 5.250%, 12/01/40 (Pre-refunded 12/01/21) | | | |
| 12,215 | | Chicago Transit Authority, Illinois, Sales Tax Receipts Revenue Bonds, Series 2014, | 12/24 at 100.00 | AA | 14,183,081 |
| | 5.250%, 12/01/49 | | | |
| | Chicago, Illinois, General Obligation Bonds, City Colleges, Series 1999: | | | |
| 1,500 | | 0.000%, 1/01/31 – NPFG Insured | No Opt. Call | BBB– | 1,180,695 |
| 32,670 | | 0.000%, 1/01/32 – FGIC Insured | No Opt. Call | BBB– | 24,862,850 |
| 12,360 | | 0.000%, 1/01/37 – FGIC Insured | No Opt. Call | BBB– | 7,842,296 |
| 2,500 | | Chicago, Illinois, General Obligation Bonds, Project & Refunding Series 2014A, 5.250%, 1/01/33 | 1/24 at 100.00 | Ba1 | 2,722,500 |
| 17,605 | | Chicago, Illinois, General Obligation Bonds, Project & Refunding Series 2017A, 6.000%, 1/01/38 | 1/27 at 100.00 | BBB– | 21,364,548 |
| 1,000 | | Chicago, Illinois, General Obligation Bonds, Project Series 2011A, 5.250%, 1/01/35 | 6/21 at 100.00 | Ba1 | 1,002,260 |
| 10,200 | | Chicago, Illinois, General Obligation Bonds, Project Series 2012A, 5.000%, 1/01/33 | 1/22 at 100.00 | Ba1 | 10,415,424 |
| 2,605 | | Chicago, Illinois, General Obligation Bonds, Refunding Series 2016C, 5.000%, 1/01/38 | 1/26 at 100.00 | BBB– | 2,937,919 |
| 3,000 | | Chicago, Illinois, Wastewater Transmission Revenue Bonds, Second Lien Series 2008C, | 1/25 at 100.00 | A– | 3,434,580 |
| | 5.000%, 1/01/39 | | | |
| 10,000 | | Cook County Community College District 508, Illinois, General Obligation Bonds, Chicago | 12/23 at 100.00 | BBB | 10,856,200 |
| | City Colleges, Series 2013, 5.250%, 12/01/43 | | | |
| | Illinois Educational Facilities Authority, Revenue Bonds, Field Museum of Natural | | | |
| | History, Series 2002RMKT: | | | |
| 2,500 | | 4.450%, 11/01/36 | 11/25 at 102.00 | A2 | 2,928,200 |
| 3,400 | | 5.500%, 11/01/36 | 11/23 at 100.00 | A | 3,823,368 |
| 2,820 | | Illinois Educational Facilities Authority, Revenue Bonds, Robert Morris College, Series | 6/21 at 100.00 | Baa2 | 2,828,319 |
| | 2000, 5.800%, 6/01/30 – NPFG Insured | | | |
| | Illinois Finance Authority, Charter School Revenue Bonds, Intrinsic Charter Schools | | | |
| | Belmont School Project, Series 2015A: | | | |
| 1,700 | | 5.750%, 12/01/35, 144A | 12/25 at 100.00 | N/R | 1,884,603 |
| 115 | | 6.000%, 12/01/45, 144A | 12/25 at 100.00 | N/R | 128,237 |
41
| | |
| NVG | Nuveen AMT-Free Municipal Credit Income Fund |
| Portfolio of Investments (continued) |
| April 30, 2021 (Unaudited) |
| | | | | | |
| Principal | | | Optional Call | | |
| Amount (000) | | Description (1) | Provisions (14) | Ratings (2) | Value |
| | Illinois (continued) | | | |
| | Illinois Finance Authority, Health Services Facility Lease Revenue Bonds, Provident | | | |
| | Group – UIC Surgery Center, LLC – University of Illinois Health Services Facility Project, | | | |
| | Series 2020: | | | |
| $ 3,835 | | 4.000%, 10/01/50 | 10/30 at 100.00 | BBB+ | $ 4,347,318 |
| 5,190 | | 4.000%, 10/01/55 | 10/30 at 100.00 | BBB+ | 5,859,770 |
| | Illinois Finance Authority, Revenue Bonds, Ascension Health/fkaPresence Health Network, | | | |
| | Series 2016C: | | | |
| 80 | | 4.000%, 2/15/41 (Pre-refunded 2/15/27) | 2/27 at 100.00 | N/R (3) | 94,531 |
| 1,755 | | 4.000%, 2/15/41 (Pre-refunded 2/15/27) | 2/27 at 100.00 | N/R (3) | 2,073,778 |
| 37,840 | | 4.000%, 2/15/41 | 2/27 at 100.00 | Aa2 | 42,489,401 |
| 6,750 | | Illinois Finance Authority, Revenue Bonds, Centegra Health System, Series 2012, | 9/22 at 100.00 | AA+ | 7,146,698 |
| | 5.000%, 9/01/38 | | | |
| | Illinois Finance Authority, Revenue Bonds, Centegra Health System, Series 2014A: | | | |
| 1,485 | | 5.000%, 9/01/34 | 9/24 at 100.00 | AA+ | 1,673,580 |
| 19,025 | | 5.000%, 9/01/42 | 9/24 at 100.00 | AA+ | 21,348,143 |
| 1,750 | | Illinois Finance Authority, Revenue Bonds, Ingalls Health System, Series 2013, 4.250%, | 5/22 at 100.00 | A1 (3) | 1,820,140 |
| | 5/15/43 (Pre-refunded 5/15/22) | | | |
| 4,000 | | Illinois Finance Authority, Revenue Bonds, Lutheran Home and Services, Series 2019A, | 11/26 at 103.00 | N/R | 4,417,840 |
| | 5.000%, 11/01/49 | | | |
| 15,805 | | Illinois Finance Authority, Revenue Bonds, Mercy Health Corporation, Series 2016, | 6/26 at 100.00 | A3 | 18,683,407 |
| | 5.000%, 12/01/46 | | | |
| 1,630 | | Illinois Finance Authority, Revenue Bonds, Northwestern Memorial HealthCare, Series | 8/22 at 100.00 | Aa2 | 1,722,617 |
| | 2013, 5.000%, 8/15/37 | | | |
| 1,435 | | Illinois Finance Authority, Revenue Bonds, Rehabilitation Institute of Chicago, Series | 7/23 at 100.00 | A– | 1,559,687 |
| | 2013A, 6.000%, 7/01/43 | | | |
| | Illinois Finance Authority, Revenue Bonds, Rosalind Franklin University Research | | | |
| | Building Project, Series 2017C: | | | |
| 1,000 | | 5.000%, 8/01/42 | 8/27 at 100.00 | BBB+ | 1,158,900 |
| 1,000 | | 5.000%, 8/01/46 | 8/27 at 100.00 | BBB+ | 1,153,760 |
| 1,000 | | 5.000%, 8/01/47 | 8/27 at 100.00 | BBB+ | 1,153,610 |
| | Illinois Finance Authority, Revenue Bonds, Silver Cross Hospital and Medical Centers, | | | |
| | Refunding Series 2015C: | | | |
| 560 | | 5.000%, 8/15/35 | 8/25 at 100.00 | BBB+ | 636,507 |
| 6,140 | | 5.000%, 8/15/44 | 8/25 at 100.00 | BBB+ | 6,895,404 |
| 8,960 | | Illinois Finance Authority, Revenue Bonds, The Carle Foundation, Series 2011A, 6.000%, | 8/21 at 100.00 | A2 | 9,106,944 |
| | 8/15/41 – AGM Insured | | | |
| | Illinois Finance Authority, Revenue Bonds, University of Chicago, Refunding Series 2015A: | | | |
| 2,235 | | 5.000%, 10/01/46 (UB) | 10/25 at 100.00 | AA– | 2,633,568 |
| 17,765 | | 5.000%, 10/01/46 (Pre-refunded 10/01/25) (UB) (5) | 10/25 at 100.00 | N/R (3) | 21,271,811 |
| 19,975 | | Illinois Finance Authority, Revenue Bonds, University of Chicago, Series 2012A, | 10/21 at 100.00 | AA– | 20,342,740 |
| | 5.000%, 10/01/51 | | | |
| 3,665 | | Illinois Sports Facility Authority, State Tax Supported Bonds, Refunding Series 2014, | 6/24 at 100.00 | BB+ | 4,085,815 |
| | 5.250%, 6/15/31 – AGM Insured | | | |
| | Illinois State, General Obligation Bonds, December Series 2017A: | | | |
| 11,800 | | 5.000%, 12/01/38 | 12/27 at 100.00 | BBB– | 13,864,646 |
| 1,330 | | 5.000%, 12/01/39 | 12/27 at 100.00 | BBB– | 1,560,077 |
| | Illinois State, General Obligation Bonds, February Series 2014: | | | |
| 3,275 | | 5.000%, 2/01/24 | No Opt. Call | BBB– | 3,661,810 |
| 1,575 | | 5.250%, 2/01/34 | 2/24 at 100.00 | BBB– | 1,731,713 |
| 7,500 | | 5.000%, 2/01/39 | 2/24 at 100.00 | BBB– | 8,159,400 |
| 5,200 | | Illinois State, General Obligation Bonds, January Series 2016, 5.000%, 1/01/29 | 1/26 at 100.00 | BBB– | 6,031,064 |
| | Illinois State, General Obligation Bonds, May Series 2014: | | | |
| 510 | | 5.000%, 5/01/36 | 5/24 at 100.00 | BBB– | 560,312 |
| 1,915 | | 5.000%, 5/01/39 | 5/24 at 100.00 | BBB– | 2,097,883 |
42
| | | | | | |
| Principal | | | Optional Call | | |
| Amount (000) | | Description (1) | Provisions (14) | Ratings (2) | Value |
| | Illinois (continued) | | | |
| $ 4,460 | | Illinois State, General Obligation Bonds, May Series 2020, 5.500%, 5/01/39 | 5/30 at 100.00 | BBB– | $ 5,692,387 |
| 13,200 | | Illinois State, General Obligation Bonds, November Series 2016, 5.000%, 11/01/41 | 11/26 at 100.00 | BBB– | 15,105,024 |
| 31,735 | | Illinois State, General Obligation Bonds, November Series 2017C, 5.000%, 11/01/29 | 11/27 at 100.00 | BBB– | 37,823,042 |
| 2,040 | | Illinois State, General Obligation Bonds, November Series 2017D, 5.000%, 11/01/27 | No Opt. Call | BBB– | 2,474,438 |
| 5,000 | | Illinois State, General Obligation Bonds, November Series 2019B, 4.000%, 11/01/35 | 11/29 at 100.00 | BBB– | 5,718,500 |
| 5,000 | | Illinois State, General Obligation Bonds, October Series 2016, 5.000%, 2/01/29 | 2/27 at 100.00 | BBB– | 5,945,450 |
| 1,190 | | Illinois State, General Obligation Bonds, Refunding Series 2012, 5.000%, 8/01/25 | 8/22 at 100.00 | BBB– | 1,255,426 |
| | Illinois State, General Obligation Bonds, Series 2013: | | | |
| 2,000 | | 5.250%, 7/01/31 | 7/23 at 100.00 | BBB– | 2,170,080 |
| 4,140 | | 5.500%, 7/01/38 | 7/23 at 100.00 | BBB– | 4,493,059 |
| 5,000 | | Illinois Toll Highway Authority, Toll Highway Revenue Bonds, Senior Lien Series 2013A, | 1/23 at 100.00 | A1 | 5,370,700 |
| | 5.000%, 1/01/35 | | | |
| 18,920 | | Illinois Toll Highway Authority, Toll Highway Revenue Bonds, Senior Lien Series 2015A, | 7/25 at 100.00 | A1 | 22,011,528 |
| | 5.000%, 1/01/40 | | | |
| 10,000 | | Illinois Toll Highway Authority, Toll Highway Revenue Bonds, Senior Lien Series 2019A, | 7/29 at 100.00 | A1 | 12,394,400 |
| | 5.000%, 1/01/44 | | | |
| 12,010 | | Illinois Toll Highway Authority, Toll Highway Revenue Bonds, Senior Lien Series 2020A, | 1/31 at 100.00 | A1 | 15,294,134 |
| | 5.000%, 1/01/45 | | | |
| 1,395 | | Illinois Toll Highway Authority, Toll Highway Revenue Bonds, Tender Option Bond Trust | 1/23 at 100.00 | A1 | 1,799,508 |
| | 2015-XF0052, 17.627%, 1/01/38, 144A (IF) | | �� | |
| 17,510 | | Metropolitan Pier and Exposition Authority, Illinois, McCormick Place Expansion Project | 6/22 at 100.00 | BB+ | 18,097,110 |
| | Bonds, Refunding Series 2012B, 5.000%, 6/15/52 | | | |
| 540 | | Metropolitan Pier and Exposition Authority, Illinois, McCormick Place Expansion Project | 12/25 at 100.00 | BB+ | 610,918 |
| | Bonds, Refunding Series 2015B, 5.000%, 6/15/52 | | | |
| | Metropolitan Pier and Exposition Authority, Illinois, McCormick Place Expansion Project | | | |
| | Bonds, Refunding Series 2020A: | | | |
| 12,325 | | 4.000%, 6/15/50 | 12/29 at 100.00 | BB+ | 13,840,852 |
| 15,160 | | 5.000%, 6/15/50 | 12/29 at 100.00 | BB+ | 18,236,722 |
| | Metropolitan Pier and Exposition Authority, Illinois, McCormick Place Expansion Project | | | |
| | Bonds, Series 2015A: | | | |
| 2,890 | | 0.000%, 12/15/52 | No Opt. Call | BB+ | 1,011,876 |
| 5,185 | | 5.000%, 6/15/53 | 12/25 at 100.00 | BB+ | 5,863,457 |
| 5,700 | | 5.500%, 6/15/53 | 12/25 at 100.00 | BB+ | 6,570,846 |
| | Metropolitan Pier and Exposition Authority, Illinois, Revenue Bonds, McCormick Place | | | |
| | Expansion Project, Capital Appreciation Refunding Series 2010B-1: | | | |
| 25,000 | | 0.000%, 6/15/44 – AGM Insured | No Opt. Call | BB+ | 13,053,000 |
| 43,200 | | 0.000%, 6/15/45 – AGM Insured | No Opt. Call | BB+ | 21,618,144 |
| 10,000 | | 0.000%, 6/15/46 – AGM Insured | No Opt. Call | BB+ | 4,845,700 |
| 8,750 | | Metropolitan Pier and Exposition Authority, Illinois, Revenue Bonds, McCormick Place | No Opt. Call | BBB | 7,686,350 |
| | Expansion Project, Series 1994B, 0.000%, 6/15/28 – NPFG Insured | | | |
| | Metropolitan Pier and Exposition Authority, Illinois, Revenue Bonds, McCormick Place | | | |
| | Expansion Project, Series 2002A: | | | |
| 18,085 | | 0.000%, 12/15/24 – NPFG Insured | No Opt. Call | BB+ | 17,322,717 |
| 20,045 | | 0.000%, 12/15/35 – AGM Insured | No Opt. Call | BB+ | 14,263,220 |
| 9,000 | | 0.000%, 6/15/37 – NPFG Insured | No Opt. Call | BB+ | 5,790,690 |
| 465 | | Morton Grove, Illinois, Tax Increment Revenue Bonds, Sawmill Station Redevelopment | 1/26 at 100.00 | N/R | 476,606 |
| | Project, Senior Lien Series 2019, 5.000%, 1/01/39 | | | |
| 1,846 | | Plano, Illinois, Special Tax Bonds, Special Service Area 1 & 2 Lakewood Springs Project, | 3/24 at 100.00 | AA | 2,024,840 |
| | Refunding Series 2014, 5.000%, 3/01/34 – AGM Insured | | | |
| 2,600 | | Regional Transportation Authority, Cook, DuPage, Kane, Lake, McHenry and Will Counties, | No Opt. Call | A2 | 3,528,070 |
| | Illinois, General Obligation Bonds, Series 2000A, 6.500%, 7/01/30 – NPFG Insured | | | |
| 7,025 | | Southwestern Illinois Development Authority, Health Facility Revenue Bonds, Memorial | 11/23 at 100.00 | N/R (3) | 8,314,931 |
| | Group, Inc, Series 2013, 7.625%, 11/01/48 (Pre-refunded 11/01/23) | | | |
43
| | |
| NVG | Nuveen AMT-Free Municipal Credit Income Fund |
| Portfolio of Investments (continued) |
| April 30, 2021 (Unaudited) |
| | | | | | |
| Principal | | | Optional Call | | |
| Amount (000) | | Description (1) | Provisions (14) | Ratings (2) | Value |
| | Illinois (continued) | | | |
| $ 4,000 | | Southwestern Illinois Development Authority, School Revenue Bonds, Triad School District 2, | No Opt. Call | Baa2 | $ 3,786,560 |
| | Madison County, Illinois, Series 2006, 0.000%, 10/01/25 – NPFG Insured | | | |
| 12,125 | | Springfield, Illinois, Electric Revenue Bonds, Refunding Senior Lien Series 2015, | 3/25 at 100.00 | A2 | 13,984,490 |
| | 5.000%, 3/01/40 – AGM Insured | | | |
| | Will County Community Unit School District 201-U Crete-Monee, Illinois, General | | | |
| | Obligation Bonds, Capital Appreciation Series 2004: | | | |
| 780 | | 0.000%, 11/01/22 – NPFG Insured (ETM) | No Opt. Call | Baa2 (3) | 775,593 |
| 2,555 | | 0.000%, 11/01/22 – NPFG Insured | No Opt. Call | Baa2 | 2,522,935 |
| 6,415 | | Will County School District 122, New Lenox, Illinois, General Obligation Bonds, Capital | No Opt. Call | Aa3 | 6,216,969 |
| | Appreciation School Series 2004D, 0.000%, 11/01/24 – AGM Insured | | | |
| 848,791 | | Total Illinois | | | 885,866,670 |
| | Indiana – 2.7% (1.8% of Total Investments) | | | |
| 2,650 | | Crown Point Multi-School Building Corporation, Indiana, First Mortgage Bonds, Crown | No Opt. Call | Baa2 | 2,607,203 |
| | Point Community School Corporation, Series 2000, 0.000%, 1/15/24 – NPFG Insured | | | |
| 12,045 | | Indiana Finance Authority, Educational Facilities Revenue Bonds, Valparaiso University | 10/24 at 100.00 | Baa1 | 12,981,378 |
| | Project, Series 2014, 5.000%, 10/01/44 | | | |
| 10,425 | | Indiana Finance Authority, Hospital Revenue Bonds, Community Health Network Project, | 5/23 at 100.00 | A (3) | 11,436,642 |
| | Series 2012A, 5.000%, 5/01/42 (Pre-refunded 5/01/23) | | | |
| 10,000 | | Indiana Finance Authority, Hospital Revenue Bonds, Indiana University Health Obligation | 12/29 at 100.00 | AA | 11,522,700 |
| | Group, Fixed Rate Series 2019A, 4.000%, 12/01/49 | | | |
| 13,880 | | Indiana Finance Authority, Wastewater Utility Revenue Bonds, CWA Authority Project, | 10/21 at 100.00 | A1 | 14,138,584 |
| | Series 2011B, 5.000%, 10/01/41 | | | |
| 17,970 | | Indiana Finance Authority, Wastewater Utility Revenue Bonds, CWA Authority Project, | 10/24 at 100.00 | A+ | 20,449,680 |
| | Series 2014A, 5.000%, 10/01/44 | | | |
| | Indianapolis Local Public Improvement Bond Bank, Indiana, Series 1999E: | | | |
| 10,000 | | 0.000%, 2/01/26 – AMBAC Insured | No Opt. Call | AA– | 9,630,800 |
| 20,000 | | 0.000%, 2/01/28 – AMBAC Insured | No Opt. Call | AA– | 18,521,000 |
| 96,970 | | Total Indiana | | | 101,287,987 |
| | Iowa – 2.1% (1.4% of Total Investments) | | | |
| 10,000 | | Iowa Finance Authority, Health Facilities Revenue Bonds, UnityPoint Health Project, | 2/23 at 100.00 | A1 (3) | 10,915,900 |
| | Series 2013A, 5.250%, 2/15/44 (Pre-refunded 2/15/23) | | | |
| 10,690 | | Iowa Finance Authority, Iowa, Midwestern Disaster Area Revenue Bonds, Iowa Fertilizer | 12/23 at 100.00 | B+ | 11,718,592 |
| | Company Project, Series 2013, 5.250%, 12/01/25 | | | |
| 21,280 | | Iowa Finance Authority, Iowa, Midwestern Disaster Area Revenue Bonds, Iowa Fertilizer | 12/22 at 105.00 | BB– | 23,527,806 |
| | Company Project, Series 2018B, 5.250%, 12/01/50 (Mandatory Put 12/01/37) | | | |
| 5,700 | | Iowa Finance Authority, Senior Housing Revenue Bonds, PHS Council Bluffs, Inc Project, | 8/23 at 102.00 | N/R | 5,953,992 |
| | Series 2018, 5.250%, 8/01/55 | | | |
| | Iowa Tobacco Settlement Authority, Asset Backed Settlement Revenue Bonds, Series 2005C: | | | |
| 56,850 | | Iowa Tobacco Settlement Authority, Tobacco Settlement Asset-Backed Bonds, Class 2 | 6/31 at 25.58 | N/R | 9,953,298 |
| | Capital Appreciation Senior Lien Series 2021B-2, 0.000%, 6/01/65 | | | |
| 14,430 | | Iowa Tobacco Settlement Authority, Tobacco Settlement Asset-Backed Bonds, Senior Lien | 6/31 at 100.00 | BBB | 16,568,670 |
| | Series Class 2 Series 2021B-1, 4.000%, 6/01/49 | | | |
| 118,950 | | Total Iowa | | | 78,638,258 |
| | Kansas – 0.3% (0.2% of Total Investments) | | | |
| 1,000 | | Lenexa, Kansas, Health Care Facilities Revenue Bonds, Lakeview Village Inc, Series | 5/27 at 100.00 | BB+ | 1,098,570 |
| | 2017A, 5.000%, 5/15/43 | | | |
| | Wyandotte County-Kansas City Unified Government, Kansas, Sales Tax Special Obligation | | | |
| | Bonds, Vacation Village Project Area 1 and 2A, Series 2015: | | | |
| 3,920 | | 5.000%, 9/01/27 | 9/25 at 100.00 | N/R | 3,953,359 |
| 2,380 | | 5.750%, 9/01/32 | 9/25 at 100.00 | N/R | 2,404,419 |
| 2,575 | | 6.000%, 9/01/35 | 9/25 at 100.00 | N/R | 2,601,239 |
| 9,875 | | Total Kansas | | | 10,057,587 |
44
| | | | | | |
| Principal | | | Optional Call | | |
| Amount (000) | | Description (1) | Provisions (14) | Ratings (2) | Value |
| | Kentucky – 1.7% (1.1% of Total Investments) | | | |
| $ 4,565 | | Christian County, Kentucky, Hospital Revenue Bonds, Jennie Stuart Medical Center, Series | 2/26 at 100.00 | BB+ | $ 5,048,708 |
| | 2016, 5.500%, 2/01/44 | | | |
| 3,770 | | Kentucky Bond Development Corporation, Tax Increment Revenue Bonds, Summit Lexington | No Opt. Call | N/R | 3,809,660 |
| | Project, Series 2016A, 4.400%, 10/01/24 | | | |
| 10,000 | | Kentucky Economic Development Finance Authority, Hospital Revenue Bonds, Owensboro | 6/27 at 100.00 | BB+ | 11,308,000 |
| | Health, Refunding Series 2017A, 5.000%, 6/01/37 | | | |
| | Kentucky Economic Development Finance Authority, Revenue Bonds, Next Generation Kentucky | | | |
| | Information Highway Project, Senior Series 2015A: | | | |
| 4,345 | | 5.000%, 7/01/37 | 7/25 at 100.00 | Baa2 | 4,866,226 |
| 17,615 | | 5.000%, 1/01/45 | 7/25 at 100.00 | Baa2 | 19,548,070 |
| | Kentucky Public Transportation Infrastructure Authority, First Tier Toll Revenue Bonds, | | | |
| | Downtown Crossing Project, Convertible Capital Appreciation Series 2013C: | | | |
| 4,360 | | 0.000%, 7/01/43 (6) | 7/31 at 100.00 | Baa2 | 5,224,414 |
| 8,510 | | 0.000%, 7/01/46 (6) | 7/31 at 100.00 | Baa2 | 10,215,659 |
| | Kentucky Public Transportation Infrastructure Authority, First Tier Toll Revenue Bonds, | | | |
| | Downtown Crossing Project, Series 2013A: | | | |
| 2,390 | | 5.750%, 7/01/49 | 7/23 at 100.00 | Baa2 | 2,636,959 |
| 480 | | 6.000%, 7/01/53 | 7/23 at 100.00 | Baa2 | 531,763 |
| 56,035 | | Total Kentucky | | | 63,189,459 |
| | | | | | |
| | Louisiana – 1.2% (0.8% of Total Investments) | | | |
| 2,765 | | Ascension Parish Industrial development Board, Louisiana, Revenue Bonds, Impala | 7/23 at 100.00 | N/R | 2,939,942 |
| | Warehousing (US) LLC Project, Series 2013, 6.000%, 7/01/36 | | | |
| | Louisiana Public Facilities Authority, Hospital Revenue Bonds, Franciscan Missionaries | | | |
| | of Our Lady Health System, Series 1998A: | | | |
| 135 | | 5.750%, 7/01/25 (ETM) (UB) | No Opt. Call | A2 (3) | 164,754 |
| 8,435 | | 5.750%, 7/01/25 (UB) | No Opt. Call | A2 | 9,397,518 |
| 5,080 | | Louisiana Public Facilities Authority, Hospital Revenue Bonds, Louisiana Children’s | 6/30 at 100.00 | A+ | 5,792,114 |
| | Medical Center Hospital, Series 2020A, 4.000%, 6/01/50 | | | |
| 11,000 | | Louisiana Public Facilities Authority, Revenue Bonds, Loyola University Project, | 10/33 at 100.00 | BBB | 11,400,840 |
| | Refunding Series 2017, 0.000%, 10/01/46 (6) | | | |
| | Louisiana Public Facilities Authority, Revenue Bonds, Ochsner Clinic Foundation Project, | | | |
| | Series 2015: | | | |
| 1,000 | | 4.250%, 5/15/40 | 5/25 at 100.00 | A3 | 1,100,220 |
| 6,970 | | 5.000%, 5/15/47 | 5/25 at 100.00 | A3 | 7,954,094 |
| 1,000 | | New Orleans, Louisiana, Sewerage Service Revenue Bonds, Refunding Series 2014, 4.250%, | 6/24 at 100.00 | A (3) | 1,121,790 |
| | 6/01/34 (Pre-refunded 6/01/24) | | | |
| 3,275 | | Saint James Parish, Louisiana, Revenue Bonds, NuStar Logistics, LP Project, Series | 6/30 at 100.00 | BB– | 4,231,333 |
| | 2010A, 6.350%, 10/01/40, 144A | | | |
| 39,660 | | Total Louisiana | | | 44,102,605 |
| | Maine – 1.4% (0.9% of Total Investments) | | | |
| 7,530 | | Maine Health and Higher Educational Facilities Authority Revenue Bonds, Eastern Maine | 7/23 at 100.00 | Ba1 | 7,861,094 |
| | Medical Center Obligated Group Issue, Series 2013, 5.000%, 7/01/43 | | | |
| | Maine Health and Higher Educational Facilities Authority Revenue Bonds, Eastern Maine | | | |
| | Medical Center Obligated Group Issue, Series 2016A: | | | |
| 5,450 | | 4.000%, 7/01/41 | 7/26 at 100.00 | Ba1 | 5,606,361 |
| 10,215 | | 4.000%, 7/01/46 | 7/26 at 100.00 | Ba1 | 10,421,649 |
| | Maine Health and Higher Educational Facilities Authority, Revenue Bonds, Maine General | | | |
| | Medical Center, Series 2011: | | | |
| 1,050 | | 6.750%, 7/01/41 (Pre-refunded 7/01/21) | 7/21 at 100.00 | N/R (3) | 1,061,025 |
| 1,000 | | 6.950%, 7/01/41 (Pre-refunded 7/01/21) | 7/21 at 100.00 | N/R (3) | 1,010,820 |
| 10,000 | | Maine Health and Higher Educational Facilities Authority, Revenue Bonds, Mainehealth | 7/24 at 100.00 | A+ | 11,053,000 |
| | Issue, Series 2015, 5.000%, 7/01/39 | | | |
45
| | |
| NVG | Nuveen AMT-Free Municipal Credit Income Fund |
| Portfolio of Investments (continued) |
| April 30, 2021 (Unaudited) |
| | | | | | |
| Principal | | | Optional Call | | |
| Amount (000) | | Description (1) | Provisions (14) | Ratings (2) | Value |
| | Maine (continued) | | | |
| | Maine Health and Higher Educational Facilities Authority, Revenue Bonds, MaineHealth | | | |
| | Issue, Series 2020A: | | | |
| $ 2,745 | | 4.000%, 7/01/45 | 7/30 at 100.00 | A+ | $ 3,184,282 |
| 5,000 | | 4.000%, 7/01/50 | 7/30 at 100.00 | A+ | 5,768,750 |
| 6,695 | | Maine State Housing Authority, Single Family Mortgage Purchase Bonds, Series 2020D, | 5/29 at 100.00 | AA+ | 6,935,351 |
| | 2.800%, 11/15/45 | | | |
| 49,685 | | Total Maine | | | 52,902,332 |
| | Maryland – 1.4% (0.9% of Total Investments) | | | |
| | Baltimore, Maryland, Convention Center Hotel Revenue Bonds, Refunding Series 2017: | | | |
| 1,280 | | 5.000%, 9/01/33 | 9/27 at 100.00 | CCC | 1,342,093 |
| 3,050 | | 5.000%, 9/01/39 | 9/27 at 100.00 | CCC | 3,201,402 |
| 3,025 | | 5.000%, 9/01/46 | 9/27 at 100.00 | CCC | 3,177,127 |
| 1,000 | | Howard County, Maryland, Special Obligation Bonds, Downtown Columbia Project, Series | 2/26 at 100.00 | N/R | 1,055,290 |
| | 2017A, 4.375%, 2/15/39, 144A | | | |
| 2,500 | | Maryland Health and Higher Educational Facilities Authority, Revenue Bonds, Adventist | 1/22 at 100.00 | Baa3 | 2,594,300 |
| | Healthcare, Series 2011A, 6.000%, 1/01/26 | | | |
| 13,315 | | Maryland Health and Higher Educational Facilities Authority, Revenue Bonds, Adventist | 1/27 at 100.00 | Baa3 | 15,710,635 |
| | Healthcare, Series 2016A, 5.500%, 1/01/46 | | | |
| 10,000 | | Maryland Health and Higher Educational Facilities Authority, Revenue Bonds, LifeBridge | 7/25 at 100.00 | A+ | 11,607,400 |
| | Health System, Series 2015, 5.000%, 7/01/47 | | | |
| 1,500 | | Maryland Health and Higher Educational Facilities Authority, Revenue Bonds, Peninsula | 7/24 at 100.00 | A3 (3) | 1,722,450 |
| | Regional Medical Center Issue, Refunding Series 2015, 5.000%, 7/01/45 (Pre-refunded 7/01/24) | | | |
| 3,010 | | Maryland Health and Higher Educational Facilities Authority, Revenue Bonds, University | 7/22 at 100.00 | A– (3) | 3,180,697 |
| | of Maryland Medical System Issue, Series 2013A, 5.000%, 7/01/43 (Pre-refunded 7/01/22) | | | |
| | Prince George’s County Revenue Authority, Maryland, Special Obligation Bonds, | | | |
| | Suitland-Naylor Road Project, Series 2016: | | | |
| 2,000 | | 4.750%, 7/01/36, 144A | 1/26 at 100.00 | N/R | 2,160,060 |
| 2,300 | | 5.000%, 7/01/46, 144A | 1/26 at 100.00 | N/R | 2,493,384 |
| | Rockville Mayor and Council, Maryland, Economic Development Revenue Bonds, Series 2017B: | | | |
| 1,335 | | 4.250%, 11/01/37 | 11/24 at 103.00 | B– | 1,339,499 |
| 1,250 | | 4.500%, 11/01/43 | 11/24 at 103.00 | B– | 1,266,137 |
| 2,650 | | 5.000%, 11/01/47 | 11/24 at 103.00 | B– | 2,754,092 |
| 48,215 | | Total Maryland | | | 53,604,566 |
| | Massachusetts – 2.8% (1.8% of Total Investments) | | | |
| | Massachusetts Development Finance Agency Revenue Bonds, Lawrence General Hospital Issue, | | | |
| | Series 2014A: | | | |
| 2,245 | | 5.250%, 7/01/34 | 7/24 at 100.00 | B | 2,250,635 |
| 6,195 | | 5.500%, 7/01/44 | 7/24 at 100.00 | B | 6,203,487 |
| | Massachusetts Development Finance Agency Revenue Refunding Bonds, NewBridge on the | | | |
| | Charles, Inc Issue, Series 2017: | | | |
| 8,200 | | 4.125%, 10/01/42, 144A | 10/22 at 105.00 | BB+ | 8,822,380 |
| 3,000 | | 5.000%, 10/01/57, 144A | 10/22 at 105.00 | BB+ | 3,276,420 |
| 10,000 | | Massachusetts Development Finance Agency, Revenue Bonds, CareGroup Issue, Series | 7/28 at 100.00 | A3 | 11,974,600 |
| | 2018J-2, 5.000%, 7/01/53 | | | |
| | Massachusetts Development Finance Agency, Revenue Bonds, Emerson College, Series 2015: | | | |
| 4,020 | | 4.500%, 1/01/45 | 1/25 at 100.00 | Baa2 | 4,341,841 |
| 2,950 | | 5.000%, 1/01/45 | 1/25 at 100.00 | Baa2 | 3,261,815 |
| 4,035 | | Massachusetts Development Finance Agency, Revenue Bonds, Emmanuel College, Series 2016A, | 10/26 at 100.00 | Baa2 | 4,420,706 |
| | 4.000%, 10/01/46 | | | |
| 16,280 | | Massachusetts Development Finance Agency, Revenue Bonds, Massachusetts Institute of | No Opt. Call | AAA | 25,524,761 |
| | Technology, Series 2020P, 5.000%, 7/01/50 | | | |
| 900 | | Massachusetts Development Finance Agency, Revenue Bonds, Milford Regional Medical Center | 7/30 at 100.00 | BB+ | 1,035,360 |
| | Issue, Series 2020G, 5.000%, 7/15/46, 144A | | | |
46
| | | | | | |
| Principal | | | Optional Call | | |
| Amount (000) | | Description (1) | Provisions (14) | Ratings (2) | Value |
| | Massachusetts (continued) | | | |
| $ 6,000 | | Massachusetts Development Finance Authority, Revenue Bonds, WGBH Educational Foundation, | No Opt. Call | AA– | $ 9,312,720 |
| | Series 2002A, 5.750%, 1/01/42 – AMBAC Insured | | | |
| 7,405 | | Massachusetts Health and Educational Facilities Authority, Revenue Bonds, Massachusetts | No Opt. Call | AAA | 10,679,713 |
| | Institute of Technology, Series 2002K, 5.500%, 7/01/32 (UB) (5) | | | |
| 2,800 | | Massachusetts Housing Finance Agency, Housing Bonds, Series 2014D, 3.875%, 12/01/39 | 6/24 at 100.00 | AA– | 2,963,828 |
| 4,500 | | Massachusetts Housing Finance Agency, Single Family Housing Revenue Bonds, Social Series | 6/30 at 100.00 | AA+ | 4,508,640 |
| | 2020-220, 2.300%, 12/01/44 | | | |
| 4,560 | | Massachusetts School Building Authority, Dedicated Sales Tax Revenue Bonds, Senior | 5/23 at 100.00 | Aa2 (3) | 5,011,167 |
| | Series 2013A, 5.000%, 5/15/43 (Pre-refunded 5/15/23) | | | |
| 425 | | Massachusetts Water Pollution Abatement Trust, Revenue Bonds, MWRA Loan Program, | 6/21 at 100.00 | AAA | 426,738 |
| | Subordinate Series 1999A, 5.750%, 8/01/29 | | | |
| 83,515 | | Total Massachusetts | | | 104,014,811 |
| | Michigan – 2.2% (1.4% of Total Investments) | | | |
| 5,490 | | Detroit City School District, Wayne County, Michigan, Unlimited Tax School Building and | No Opt. Call | AA | 6,803,373 |
| | Site Improvement Bonds, Series 2001A, 6.000%, 5/01/29 – AGM Insured (UB) | | | |
| 3,665 | | Detroit Downtown Development Authority, Michigan, Tax Increment Revenue Bonds, Catalyst | 7/24 at 100.00 | AA | 4,112,423 |
| | Development Project, Series 2018A, 5.000%, 7/01/48 – AGM Insured | | | |
| 2,985 | | Detroit Water and Sewerage Department, Michigan, Sewage Disposal System Revenue Bonds, | 7/22 at 100.00 | A1 (3) | 3,162,906 |
| | Refunding Senior Lien Series 2012A, 5.250%, 7/01/39 (Pre-refunded 7/01/22) | | | |
| | Michigan Finance Authority, Hospital Revenue Bonds, Sparrow Obligated Group, Refunding | | | |
| | Series 2015: | | | |
| 4,495 | | 4.000%, 11/15/35 | 5/25 at 100.00 | A | 4,879,817 |
| 2,550 | | 4.000%, 11/15/36 | 5/25 at 100.00 | A | 2,763,920 |
| | Michigan Finance Authority, Michigan, Revenue Bonds, Trinity Health Credit Group, | | | |
| | Refunding Series 2016MI: | | | |
| 145 | | 5.000%, 12/01/45 (Pre-refunded 6/01/26) (UB) (5) | 6/26 at 100.00 | N/R (3) | 176,680 |
| 9,855 | | 5.000%, 12/01/45 (UB) | 6/26 at 100.00 | AA– | 11,769,432 |
| | Michigan Finance Authority, Revenue Bonds, Trinity Health Credit Group, Refunding Series 2011MI: | | | |
| 10 | | 5.000%, 12/01/39 (Pre-refunded 12/01/21) | 12/21 at 100.00 | N/R (3) | 10,274 |
| 3,240 | | 5.000%, 12/01/39 (Pre-refunded 12/01/21) | 12/21 at 100.00 | AA– (3) | 3,331,595 |
| 2,705 | | Michigan Finance Authority, Tobacco Settlement Asset- Backed Bonds, 2006 Sold Tobacco | 12/30 at 100.00 | BBB | 3,441,328 |
| | Receipts Senior Current Interest Series 2020A-2, 5.000%, 6/01/40 | | | |
| 1,000 | | Michigan Finance Authority, Tobacco Settlement Asset- Backed Bonds, 2007 Sold Tobacco | 12/30 at 100.00 | BBB+ | 1,139,800 |
| | Receipts, Series 2020A-CL-1, 4.000%, 6/01/49 | | | |
| 4,000 | | Michigan Public Power Agency, AFEC Project Revenue Bonds, Series 2012A, 5.000%, 1/01/43 | 1/22 at 100.00 | BBB+ | 4,101,720 |
| | Michigan State Building Authority, Revenue Bonds, Facilities Program, Refunding Series 2011-II-A: | | | |
| 2,750 | | 5.375%, 10/15/36 (Pre-refunded 10/15/21) | 10/21 at 100.00 | AA– (3) | 2,815,092 |
| 8,260 | | 5.375%, 10/15/41 (Pre-refunded 10/15/21) | 10/21 at 100.00 | AA– (3) | 8,455,514 |
| 13,855 | | Michigan State Hospital Finance Authority, Revenue Bonds, Trinity Health Care Group, | 6/22 at 100.00 | AA– (3) | 14,576,430 |
| | Series 2009C, 5.000%, 12/01/48 (Pre-refunded 6/01/22) | | | |
| | Wayne County Airport Authority, Michigan, Revenue Bonds, Detroit Metropolitan Wayne | | | |
| | County Airport, Series 2015D: | | | |
| 3,550 | | 5.000%, 12/01/40 | 12/25 at 100.00 | A– | 4,171,889 |
| 3,600 | | 5.000%, 12/01/45 | 12/25 at 100.00 | A– | 4,218,336 |
| 72,155 | | Total Michigan | | | 79,930,529 |
| | Minnesota – 1.8% (1.2% of Total Investments) | | | |
| | Baytown Township, Minnesota Charter School Lease Revenue Bonds, Saint Croix Preparatory | | | |
| | Academy, Refunding Series 2016A: | | | |
| 155 | | 4.000%, 8/01/36 | 8/26 at 100.00 | BB+ | 165,016 |
| 440 | | 4.000%, 8/01/41 | 8/26 at 100.00 | BB+ | 464,020 |
| 2,000 | | Brooklyn Park, Minnesota, Charter School Lease Revenue Bonds, Prairie Seeds Academy | 3/25 at 100.00 | BB– | 2,091,100 |
| | Project, Refunding Series 2015A, 5.000%, 3/01/34 | | | |
47
| | |
| NVG | Nuveen AMT-Free Municipal Credit Income Fund |
| Portfolio of Investments (continued) |
| April 30, 2021 (Unaudited) |
| | | | | | |
| Principal | | | Optional Call | | |
| Amount (000) | | Description (1) | Provisions (14) | Ratings (2) | Value |
| | Minnesota (continued) | | | |
| $ 1,720 | | Deephaven, Minnesota, Charter School Lease Revenue Bonds, Eagle Ridge Academy Project, | 7/25 at 100.00 | BB+ | $ 1,903,868 |
| | Series 2015A, 5.500%, 7/01/50 | | | |
| | Duluth Economic Development Authority, Minnesota, Health Care Facilities Revenue Bonds, | | | |
| | Essentia Health Obligated Group, Series 2018A: | | | |
| 9,560 | | 4.250%, 2/15/43 | 2/28 at 100.00 | A– | 10,793,622 |
| 27,325 | | 4.250%, 2/15/48 | 2/28 at 100.00 | A– | 30,659,470 |
| 1,410 | | Minneapolis, Minnesota, Charter School Lease Revenue Bonds, Hiawatha Academies Project, | 7/24 at 102.00 | N/R | 1,494,868 |
| | Series 2016A, 5.000%, 7/01/47 | | | |
| 2,735 | | Minnesota Housing Finance Agency, Residential Housing Finance Bonds, Series 2020E, | 7/29 at 100.00 | AA+ | 2,836,003 |
| | 2.700%, 7/01/44 | | | |
| | Minnesota Housing Finance Agency, Residential Housing Finance Bonds, Series 2020I: | | | |
| 2,485 | | 2.150%, 7/01/45 | 1/30 at 100.00 | AA+ | 2,502,171 |
| 3,970 | | 2.200%, 1/01/51 | 1/30 at 100.00 | AA+ | 3,989,493 |
| | Saint Cloud, Minnesota, Charter School Lease Revenue Bonds, Stride Academy Project, | | | |
| | Series 2016A: | | | |
| 405 | | 5.000%, 4/01/36 (4) | 4/26 at 100.00 | N/R | 373,313 |
| 605 | | 5.000%, 4/01/46 (4) | 4/26 at 100.00 | N/R | 527,959 |
| 2,500 | | Saint Paul Housing and Redevelopment Authority, Minnesota, Health Care Facility Revenue | 7/25 at 100.00 | A | 2,710,650 |
| | Bonds, HealthPartners Obligated Group, Refunding Series 2015A, 4.000%, 7/01/35 | | | |
| 130 | | Saint Paul Housing and Redevelopment Authority, Minnesota, Multifamily Housing Revenue | 4/23 at 100.00 | N/R | 133,843 |
| | Bonds, 2700 University at Westgate Station, Series 2015B, 4.250%, 4/01/25 | | | |
| | St Paul Housing and Redevelopment Authority, Minnesota, Hospital Revenue Bonds, | | | |
| | HealthEast Inc, Series 2015A: | | | |
| 2,785 | | 5.000%, 11/15/40 (Pre-refunded 11/15/25) | 11/25 at 100.00 | N/R (3) | 3,348,461 |
| 3,190 | | 5.000%, 11/15/44 (Pre-refunded 11/15/25) | 11/25 at 100.00 | N/R (3) | 3,835,401 |
| 61,415 | | Total Minnesota | | | 67,829,258 |
| | Mississippi – 0.2% (0.1% of Total Investments) | | | |
| 5,445 | | Mississippi Development Bank, Special Obligation Bonds, Gulfport Water and Sewer System | No Opt. Call | A2 (3) | 6,020,101 |
| | Project, Series 2005, 5.250%, 7/01/24 – AGM Insured (ETM) | | | |
| 1,000 | | Mississippi Home Corporation, Single Family Mortgage Revenue Bonds, Series 2021A, | 6/30 at 100.00 | Aaa | 1,001,520 |
| | 2.125%, 12/01/44 | | | |
| 6,445 | | Total Mississippi | | | 7,021,621 |
| | Missouri – 2.3% (1.5% of Total Investments) | | | |
| 2,960 | | Chesterfield Valley Transportation Development District, Missouri, Transportation Sales | 5/23 at 100.00 | A– | 3,049,362 |
| | Tax Revenue Bonds, Series 2015, 3.625%, 5/15/31 | | | |
| | Kansas City Industrial Development Authority, Missouri, Sales Tax Revenue Bonds, Ward | | | |
| | Parkway Center Community Improvement District, Senior Refunding & Improvement Series 2016: | | | |
| 400 | | 5.000%, 4/01/36, 144A | 4/26 at 100.00 | N/R | 419,832 |
| 1,520 | | 5.000%, 4/01/46, 144A | 4/26 at 100.00 | N/R | 1,578,824 |
| 15,000 | | Kansas City Municipal Assistance Corporation, Missouri, Leasehold Revenue Bonds, | No Opt. Call | A2 | 13,747,350 |
| | Improvement Series 2004B-1, 0.000%, 4/15/28 – AMBAC Insured | | | |
| 4,345 | | Kirkwood Industrial Development Authority, Missouri, Retirement Community Revenue Bonds, | 5/27 at 100.00 | BB | 4,730,445 |
| | Aberdeen Heights Project, Refunding Series 2017A, 5.250%, 5/15/50 | | | |
| | Liberty, Missouri, Special Obligation Tax Increment and Special Districts Bonds, Liberty | | | |
| | Commons Project, Series 2015A: | | | |
| 1,575 | | 5.750%, 6/01/35, 144A | 6/25 at 100.00 | N/R | 1,633,244 |
| 1,055 | | 6.000%, 6/01/46, 144A | 6/25 at 100.00 | N/R | 1,099,321 |
| 2,460 | | Missouri Health and Educational Facilities Authority, Educational Facilities Revenue | 5/23 at 100.00 | BBB | 2,603,147 |
| | Bonds, Saint Louis College of Pharmacy, Series 2013, 5.500%, 5/01/43 | | | |
| | Missouri Health and Educational Facilities Authority, Educational Facilities Revenue | | | |
| | Bonds, Saint Louis College of Pharmacy, Series 2015B: | | | |
| 1,410 | | 5.000%, 5/01/40 | 11/23 at 100.00 | BBB | 1,491,230 |
| 2,000 | | 5.000%, 5/01/45 | 11/23 at 100.00 | BBB | 2,107,160 |
48
| | | | | | |
| Principal | | | Optional Call | | |
| Amount (000) | | Description (1) | Provisions (14) | Ratings (2) | Value |
| | Missouri (continued) | | | |
| $ 7,040 | | Missouri Health and Educational Facilities Authority, Health Facilities Revenue Bonds, | 11/23 at 100.00 | A2 | $ 7,712,038 |
| | CoxHealth, Series 2013A, 5.000%, 11/15/48 | | | |
| 2,250 | | Missouri Health and Educational Facilities Authority, Health Facilities Revenue Bonds, | 2/22 at 100.00 | A1 | 2,318,333 |
| | Heartland Regional Medical Center, Series 2012, 5.000%, 2/15/43 | | | |
| | Missouri Health and Educational Facilities Authority, Health Facilities Revenue Bonds, | | | |
| | Mosaic Health System, Series 2019A: | | | |
| 6,330 | | 4.000%, 2/15/44 | 2/29 at 100.00 | A1 | 7,281,652 |
| 13,545 | | 4.000%, 2/15/49 | 2/29 at 100.00 | A1 | 15,485,728 |
| 1,010 | | Plaza at Noah’s Ark Community Improvement District, Saint Charles, Missouri, Tax | 6/21 at 100.00 | N/R | 1,010,838 |
| | Increment and Improvement District Revenue Bonds, Series 2015, 5.000%, 5/01/30 | | | |
| 405 | | Saint Louis County Industrial Development Authority, Missouri, Revenue Bonds, Friendship | 9/23 at 100.00 | BB+ | 437,007 |
| | Village of Sunset Hills, Series 2013A, 5.875%, 9/01/43 | | | |
| | Saint Louis County Industrial Development Authority, Missouri, Revenue Bonds, Saint | | | |
| | Andrew’s Resources for Seniors, Series 2015A: | | | |
| 1,650 | | 5.000%, 12/01/35 | 12/25 at 100.00 | N/R | 1,769,609 |
| 455 | | 5.125%, 12/01/45 | 12/25 at 100.00 | N/R | 484,015 |
| 4,125 | | Saint Louis, Missouri, Airport Revenue Bonds, Lambert-St Louis International Airport, | No Opt. Call | A– | 5,529,769 |
| | Series 2005, 5.500%, 7/01/29 – NPFG Insured | | | |
| 15,350 | | Springfield Public Building Corporation, Missouri, Lease Revenue Bonds, Jordan Valley | No Opt. Call | N/R | 11,607,670 |
| | Park Projects, Series 2000A, 0.000%, 6/01/30 – AMBAC Insured | | | |
| 84,885 | | Total Missouri | | | 86,096,574 |
| | Montana – 0.0% (0.0% of Total Investments) | | | |
| | Kalispell, Montana, Housing and Healthcare Facilities Revenue Bonds, Immanuel Lutheran | | | |
| | Corporation, Series 2017A: | | | |
| 1,175 | | 5.250%, 5/15/37 | 5/25 at 102.00 | N/R | 1,229,273 |
| 375 | | 5.250%, 5/15/47 | 5/25 at 102.00 | N/R | 385,121 |
| 1,550 | | Total Montana | | | 1,614,394 |
| | Nebraska – 1.2% (0.8% of Total Investments) | | | |
| 10,665 | | Central Plains Energy Project, Nebraska, Gas Project 3 Revenue Bonds, Refunding | No Opt. Call | BBB+ | 15,320,486 |
| | Crossover Series 2017A, 5.000%, 9/01/42 | | | |
| 4,435 | | Central Plains Energy Project, Nebraska, Gas Project 3 Revenue Bonds, Series 2012, | 9/22 at 100.00 | BBB+ | 4,714,050 |
| | 5.000%, 9/01/32 | | | |
| 1,330 | | Douglas County Hospital Authority 2, Nebraska, Health Facilities Revenue Bonds, Nebraska | 11/25 at 100.00 | A | 1,535,405 |
| | Methodist Health System, Refunding Series 2015, 5.000%, 11/01/45 | | | |
| | Douglas County Hospital Authority 3, Nebraska, Health Facilities Revenue Bonds, Nebraska | | | |
| | Methodist Health System, Refunding Series 2015: | | | |
| 2,090 | | 4.125%, 11/01/36 | 11/25 at 100.00 | A | 2,276,177 |
| 2,325 | | 5.000%, 11/01/48 | 11/25 at 100.00 | A | 2,674,238 |
| 4,010 | | Lincoln County Hospital Authority 1, Nebraska, Hospital Revenue and Refunding Bonds, Great | 11/21 at 100.00 | N/R (3) | 4,104,917 |
| | Plains Regional Medical Center Project, Series 2012, 5.000%, 11/01/42 (Pre-refunded 11/01/21) | | | |
| 8,185 | | Nebraska Investment Finance Authority, Single Family Housing Revenue Bonds, Series | 3/29 at 100.00 | AA+ | 8,503,233 |
| | 2020A, 2.700%, 9/01/43 | | | |
| 6,800 | | Scotts Bluff County Hospital Authority 1, Nebraska, Hospital Revenue Bonds, Regional | 2/27 at 100.00 | BB+ | 7,206,640 |
| | West Medical Center Project, Refunding & Improvement Series 2016A, 5.250%, 2/01/37 | | | |
| 39,840 | | Total Nebraska | | | 46,335,146 |
| | Nevada – 1.1% (0.7% of Total Investments) | | | |
| 410 | | Director of the State of Nevada Department of Business and Industry, Charter School | 12/25 at 100.00 | BB | 454,961 |
| | Lease Revenue Bonds, Somerset Academy, Series 2018A, 5.000%, 12/15/38, 144A | | | |
| 23,605 | | Las Vegas Convention and Visitors Authority, Nevada, Convention Center Expansion Revenue | 7/28 at 100.00 | A | 26,209,576 |
| | Bonds, Series 2018B, 4.000%, 7/01/49 | | | |
| 3,150 | | Las Vegas Convention and Visitors Authority, Nevada, Revenue Bonds, Refunding Series | 7/27 at 100.00 | A | 3,510,360 |
| | 2017B, 4.000%, 7/01/36 | | | |
49
| | |
| NVG | Nuveen AMT-Free Municipal Credit Income Fund |
| Portfolio of Investments (continued) |
| April 30, 2021 (Unaudited) |
| | | | | | |
| Principal | | | Optional Call | | |
| Amount (000) | | Description (1) | Provisions (14) | Ratings (2) | Value |
| | Nevada (continued) | | | |
| $ 1,000 | | Las Vegas, Nevada, Sales Tax Increment Revenue Bonds, Symphony Park Tourism Improvement | 6/21 at 100.00 | N/R | $ 1,000,760 |
| | District, Series 2016, 4.375%, 6/15/35, 144A | | | |
| 500 | | Neveda State Director of the Department of Business and Industry, Charter School Revenue | 7/25 at 100.00 | BB+ | 548,240 |
| | Bonds, Doral Academy of Nevada, Series 2017A, 5.000%, 7/15/37, 144A | | | |
| 4,000 | | Reno, Nevada, Subordinate Lien Sales Tax Revenue Refunding Bonds, ReTrac-Reno | 12/28 at 100.00 | A3 | 4,213,800 |
| | Transportation Rail Access Corridor Project, Series 2018A, 4.000%, 6/01/43 | | | |
| 4,500 | | Reno, Nevada, Subordinate Lien Sales Tax Revenue Refunding Capital Appreciation Bonds, | 7/38 at 31.26 | N/R | 734,490 |
| | ReTrac-Reno Transportation Rail Access Corridor Project, Series 2018C, 0.000%, 7/01/58, 144A | | | |
| 3,210 | | Tahoe-Douglas Visitors Authority, Nevada, Stateline Revenue Bonds, Series 2020, | 7/30 at 100.00 | N/R | 3,664,664 |
| | 5.000%, 7/01/51 | | | |
| 40,375 | | Total Nevada | | | 40,336,851 |
| | New Hampshire – 0.2% (0.1% of Total Investments) | | | |
| 5,000 | | National Finance Authority, New Hampshire, Resource Recovery Revenue Bonds, Covanta | 7/23 at 100.00 | B | 5,219,550 |
| | Project, Refunding Series 2018B, 4.625%, 11/01/42, 144A | | | |
| 1,185 | | National Finance Authority, New Hampshire, Resource Recovery Revenue Bonds, Covanta | 7/25 at 100.00 | B | 1,228,750 |
| | Project, Refunding Series 2020A, 3.625%, 7/01/43 (Mandatory Put 7/02/40), 144A | | | |
| 500 | | New Hampshire Health and Education Facilities Authority, Revenue Bonds, Kendal at | 10/26 at 100.00 | BBB+ | 569,635 |
| | Hanover, Series 2016, 5.000%, 10/01/40 | | | |
| 6,685 | | Total New Hampshire | | | 7,017,935 |
| | New Jersey – 5.8% (3.7% of Total Investments) | | | |
| | New Jersey Economic Development Authority, School Facilities Construction Bonds, | | | |
| | Refunding Series 2016BBB: | | | |
| 34,310 | | 5.500%, 6/15/29 | 12/26 at 100.00 | BBB | 42,361,185 |
| 2,110 | | 5.500%, 6/15/30 | 12/26 at 100.00 | BBB | 2,590,932 |
| | New Jersey Economic Development Authority, School Facilities Construction Bonds, Series 2005N-1: | | | |
| 6,835 | | 5.500%, 9/01/24 – AMBAC Insured | No Opt. Call | BBB | 7,979,042 |
| 5,025 | | 5.500%, 9/01/28 – NPFG Insured | No Opt. Call | BBB | 6,579,082 |
| | New Jersey Economic Development Authority, School Facilities Construction Bonds, Series 2015WW: | | | |
| 655 | | 5.250%, 6/15/40 (Pre-refunded 6/15/25) | 6/25 at 100.00 | N/R (3) | 786,269 |
| 11,335 | | 5.250%, 6/15/40 | 6/25 at 100.00 | BBB | 13,021,081 |
| 600 | | New Jersey Health Care Facilities Financing Authority, New Jersey, Revenue Bonds, Saint | 7/21 at 100.00 | BB+ | 603,780 |
| | Peters University Hospital, Refunding Series 2011, 6.000%, 7/01/26 | | | |
| 1,500 | | New Jersey Health Care Facilities Financing Authority, New Jersey, Revenue Bonds, Saint | 6/21 at 100.00 | BB+ | 1,504,530 |
| | Peters University Hospital, Series 2007, 5.750%, 7/01/37 | | | |
| 3,310 | | New Jersey Health Care Facilities Financing Authority, Revenue Bonds, Barnabas Health, | 7/24 at 100.00 | A1 | 3,735,037 |
| | Refunding Series 2014A, 5.000%, 7/01/44 | | | |
| 2,015 | | New Jersey Transportation Trust Fund Authority, Transportation System Bonds, Capital | No Opt. Call | BBB | 1,870,424 |
| | Appreciation Series 2010A, 0.000%, 12/15/26 | | | |
| 20,000 | | New Jersey Transportation Trust Fund Authority, Transportation System Bonds, Refunding | No Opt. Call | BBB+ | 15,573,600 |
| | Series 2006C, 0.000%, 12/15/33 – AGM Insured | | | |
| 20,040 | | New Jersey Transportation Trust Fund Authority, Transportation System Bonds, Series | 6/24 at 100.00 | BBB | 22,225,162 |
| | 2014AA, 5.000%, 6/15/44 | | | |
| | New Jersey Transportation Trust Fund Authority, Transportation System Bonds, Series 2015AA: | | | |
| 13,690 | | 4.750%, 6/15/38 | 6/25 at 100.00 | BBB | 15,341,835 |
| 8,240 | | 5.000%, 6/15/45 | 6/25 at 100.00 | BBB | 9,357,509 |
| 5,000 | | New Jersey Transportation Trust Fund Authority, Transportation System Bonds, Series | 12/28 at 100.00 | BBB | 6,151,100 |
| | 2019AA, 5.250%, 6/15/43 | | | |
| 7,305 | | New Jersey Transportation Trust Fund Authority, Transportation System Bonds, Series | 12/30 at 100.00 | BBB | 9,011,813 |
| | 2020AA, 5.000%, 6/15/50 | | | |
| 33,200 | | New Jersey Turnpike Authority, Revenue Bonds, Refunding Series 2005D-1, 5.250%, | No Opt. Call | A2 | 40,201,216 |
| | 1/01/26 – AGM Insured | | | |
50
| | | | | | |
| Principal | | | Optional Call | | |
| Amount (000) | | Description (1) | Provisions (14) | Ratings (2) | Value |
| | New Jersey (continued) | | | |
| | New Jersey Turnpike Authority, Revenue Bonds, Tender Option Bond Trust 2016-XF1057: | | | |
| $ 74 | | 17.497%, 1/01/43 (Pre-refunded 7/01/22), 144A (IF) | 7/22 at 100.00 | A2 (3) | $ 90,626 |
| 126 | | 17.497%, 1/01/43 (Pre-refunded 7/01/22), 144A (IF) | 7/22 at 100.00 | N/R (3) | 154,640 |
| 1,150 | | Rutgers State University, New Jersey, Revenue Bonds, Refunding Series 2013L, 5.000%, | 5/23 at 100.00 | A+ (3) | 1,261,596 |
| | 5/01/43 (Pre-refunded 5/01/23) | | | |
| 5,000 | | South Jersey Transportation Authority, New Jersey, Transportation System Revenue Bonds, | 11/30 at 100.00 | Baa2 | 5,727,700 |
| | Series 2020A, 4.000%, 11/01/50 | | | |
| 3,000 | | Tobacco Settlement Financing Corporation, New Jersey, Tobacco Settlement Asset-Backed | 6/28 at 100.00 | BBB+ | 3,629,190 |
| | Bonds, Series 2018A, 5.250%, 6/01/46 | | | |
| 3,410 | | Tobacco Settlement Financing Corporation, New Jersey, Tobacco Settlement Asset-Backed | 6/28 at 100.00 | BB+ | 3,995,770 |
| | Bonds, Series 2018B, 5.000%, 6/01/46 | | | |
| 1,330 | | Washington Township Board of Education, Mercer County, New Jersey, General Obligation | No Opt. Call | A2 | 1,586,929 |
| | Bonds, Series 2005, 5.250%, 1/01/26 – AGM Insured | | | |
| 189,260 | | Total New Jersey | | | 215,340,048 |
| | New Mexico – 0.1% (0.0% of Total Investments) | | | |
| | Santa Fe, New Mexico, Retirement Facilities Revenue Bonds, EL Castillo Retirement | | | |
| | Residences Project, Series 2019A: | | | |
| 670 | | 5.000%, 5/15/44 | 5/26 at 103.00 | BB+ | 741,094 |
| 1,200 | | 5.000%, 5/15/49 | 5/26 at 103.00 | BB+ | 1,323,180 |
| 1,870 | | Total New Mexico | | | 2,064,274 |
| | New York – 8.4% (5.4% of Total Investments) | | | |
| 15,275 | | Build NYC Resource Corporation, New York, Revenue Bonds, Albert Einstein College of | 9/25 at 100.00 | N/R | 16,943,183 |
| | Medicine, Inc, Series 2015, 5.500%, 9/01/45, 144A | | | |
| 9,320 | | Build NYC Resource Corporation, New York, Revenue Bonds, Family Life Academy Charter | 12/30 at 100.00 | N/R | 9,514,229 |
| | School, Series 2020A-1, 5.500%, 6/01/55, 144A | | | |
| 7,390 | | Build NYC Resource Corporation, New York, Revenue Bonds, Family Life Academy Charter | 12/30 at 100.00 | N/R | 7,692,103 |
| | School, Series 2020B-1, 5.000%, 6/01/55, 144A | | | |
| 20,000 | | Dormitory Authority of the State of New York, State Personal Income Tax Revenue Bonds, | 3/31 at 100.00 | AA+ | 23,436,200 |
| | General Purpose, Series 2021B, 4.000%, 3/15/47 | | | |
| 2,250 | | Dormitory Authority of the State of New York, Insured Revenue Bonds, Mount Sinai School | No Opt. Call | Baa2 | 2,478,600 |
| | of Medicine, Series 1994A, 5.150%, 7/01/24 – NPFG Insured | | | |
| 9,700 | | Dormitory Authority of the State of New York, Revenue Bonds, Columbia University, Series | No Opt. Call | AAA | 15,010,459 |
| | 2017A, 5.000%, 10/01/47 (UB) (5) | | | |
| 4,070 | | Dormitory Authority of the State of New York, Revenue Bonds, Icahn School of Medicine at | 7/25 at 100.00 | A– | 4,675,372 |
| | Mount Sinai, Refunding Series 2015A, 5.000%, 7/01/45 | | | |
| | Dormitory Authority of the State of New York, Revenue Bonds, Orange Regional Medical | | | |
| | Center Obligated Group, Series 2015: | | | |
| 2,700 | | 5.000%, 12/01/40, 144A | 6/25 at 100.00 | BBB– | 3,010,095 |
| 5,600 | | 5.000%, 12/01/45, 144A | 6/25 at 100.00 | BBB– | 6,208,272 |
| 7,520 | | Dormitory Authority of the State of New York, Revenue Bonds, Rockefeller University, | 7/29 at 100.00 | AA | 8,697,106 |
| | Series 2019C, 4.000%, 7/01/49 | | | |
| 2,120 | | Hempstead Town Local Development Corporation, New York, Education Revenue Bonds, The | 2/30 at 100.00 | N/R | 2,466,980 |
| | Academy Charter School Project, Refunding Series 2020B, 5.570%, 2/01/41 | | | |
| 2,695 | | Hempstead Town Local Development Corporation, New York, Education Revenue Bonds, The | 2/27 at 100.00 | N/R | 3,109,222 |
| | Academy Charter School Project, Series 2017A, 6.240%, 2/01/47 | | | |
| 2,965 | | Hempstead Town Local Development Corporation, New York, Education Revenue Bonds, The | 2/28 at 100.00 | N/R | 3,604,343 |
| | Academy Charter School Project, Series 2018A, 6.760%, 2/01/48 | | | |
| 1,270 | | Hempstead Town Local Development Corporation, New York, Education Revenue Bonds, The | 2/30 at 100.00 | N/R | 1,474,356 |
| | Academy Charter School Project, Series 2020A, 5.730%, 2/01/50 | | | |
51
| | |
| NVG | Nuveen AMT-Free Municipal Credit Income Fund |
| Portfolio of Investments (continued) |
| April 30, 2021 (Unaudited) |
| | | | | | |
| Principal | | | Optional Call | | |
| Amount (000) | | Description (1) | Provisions (14) | Ratings (2) | Value |
| | New York (continued) | | | |
| | Hudson Yards Infrastructure Corporation, New York, Revenue Bonds, Senior Fiscal 2012 | | | |
| | Series 2011A: | | | |
| $ 2,255 | | 5.250%, 2/15/47 | 6/21 at 100.00 | A+ | $ 2,262,960 |
| 320 | | 5.750%, 2/15/47 | 6/21 at 100.00 | A+ | 321,290 |
| | Long Island Power Authority, New York, Electric System Revenue Bonds, Series 2012A: | | | |
| 3,320 | | 5.000%, 9/01/42 (Pre-refunded 9/01/22) | 9/22 at 100.00 | N/R (3) | 3,535,800 |
| 6,680 | | 5.000%, 9/01/42 | 9/22 at 100.00 | A2 | 7,081,735 |
| 6,850 | | Metropolitan Transportation Authority, New York, Transportation Revenue Bonds, Bond | No Opt. Call | N/R | 7,401,767 |
| | Anticipation Note Series 2020A-1, 5.000%, 2/01/23 | | | |
| | Metropolitan Transportation Authority, New York, Transportation Revenue Bonds, Green | | | |
| | Climate Bond Certified Series 2020C-1: | | | |
| 2,790 | | 5.000%, 11/15/50 | 5/30 at 100.00 | BBB+ | 3,418,671 |
| 3,155 | | 5.250%, 11/15/55 | 5/30 at 100.00 | BBB+ | 3,924,031 |
| 8,380 | | Metropolitan Transportation Authority, New York, Transportation Revenue Bonds, Green | 11/30 at 100.00 | BBB+ | 9,546,747 |
| | Climate Bond Certified Series 2020D-2, 4.000%, 11/15/48 | | | |
| 5,000 | | Metropolitan Transportation Authority, New York, Transportation Revenue Bonds, Green | 11/30 at 100.00 | BBB+ | 5,691,400 |
| | Climate Bond Certified Series 2020D-3, 4.000%, 11/15/49 | | | |
| 2,210 | | Metropolitan Transportation Authority, New York, Transportation Revenue Bonds, Refunding | No Opt. Call | BBB+ | 2,566,053 |
| | Green Climate Certified Series 2017C-1, 5.000%, 11/15/24 | | | |
| 7,500 | | Metropolitan Transportation Authority, New York, Transportation Revenue Bonds, Refunding | 11/30 at 100.00 | BBB+ | 8,570,025 |
| | Green Climate Certified Series 2020E, 4.000%, 11/15/45 | | | |
| 3,585 | | Monroe County Industrial Development Corporation, New York, Revenue Bonds, Saint Ann?s | 1/26 at 103.00 | N/R | 3,897,504 |
| | Community Project, Series 2019, 5.000%, 1/01/50 | | | |
| 1,000 | | Nassau County Local Economic Assistance Corporation, New York, Revenue Bonds, Catholic | 7/24 at 100.00 | A– | 1,119,760 |
| | Health Services of Long Island Obligated Group Project, Series 2014, 5.000%, 7/01/31 | | | |
| 15,000 | | New York City Housing Development Corporation, New York, Sustainable Impact Revenue | 2/28 at 100.00 | Aa2 | 15,215,250 |
| | Bonds, Williamsburg Housing Preservation LP, Series 2020A, 2.800%, 2/01/50 | | | |
| 15,915 | | New York City Industrial Development Agency, New York, PILOT Payment in Lieu of Taxes | 1/31 at 100.00 | BBB | 16,678,283 |
| | Revenue Bonds, Queens Baseball Stadium Project, Refunding Series 2021A, 3.000%, | | | |
| | 1/01/46 – AGM Insured | | | |
| 11,570 | | New York City Municipal Water Finance Authority, New York, Water and Sewer System Second | 6/25 at 100.00 | AA+ | 13,519,661 |
| | General Resolution Revenue Bonds, Fiscal 2016 Series BB-1, 5.000%, 6/15/46 (UB) (5) | | | |
| 11,245 | | New York City Municipal Water Finance Authority, New York, Water and Sewer System Second | 12/30 at 100.00 | AA+ | 13,428,217 |
| | General Resolution Revenue Bonds, Fiscal 2021 Series BB-2, 4.000%, 6/15/42 | | | |
| 5 | | New York City, New York, General Obligation Bonds, Fiscal Series 2005M, 5.000%, | 6/21 at 100.00 | AA– | 5,019 |
| | 4/01/26 – FGIC Insured | | | |
| 28,615 | | New York Liberty Development Corporation, New York, Liberty Revenue Bonds, 3 World Trade | 11/24 at 100.00 | N/R | 31,321,979 |
| | Center Project, Class 1 Series 2014, 5.000%, 11/15/44, 144A | | | |
| 2,560 | | New York Liberty Development Corporation, New York, Liberty Revenue Bonds, Bank of | 3/29 at 100.00 | Baa2 | 2,563,558 |
| | America Tower at One Bryant Park Project, Second Priority Refunding Series 2019 Class 3, | | | |
| | 2.800%, 9/15/69 | | | |
| 3,500 | | New York State Housing Finance Agency, Affordable Housing Revenue Bonds, Climate Bond | 5/28 at 100.00 | Aa2 | 3,633,560 |
| | Certified/Sustainability Series 2019P, 3.050%, 11/01/49 | | | |
| 6,500 | | New York State Mortgage Agency, Homeowner Mortgage Revenue Bonds, Series 211, | 4/27 at 100.00 | Aa1 | 7,003,035 |
| | 3.750%, 10/01/43 | | | |
| 5,655 | | Onondaga Civic Development Corporation, New York, Revenue Bonds, Saint Joseph’s Hospital | 7/22 at 100.00 | N/R (3) | 5,969,531 |
| | Health Center Project, Series 2012, 5.000%, 7/01/42 (Pre-refunded 7/01/22) | | | |
| 20,925 | | Triborough Bridge and Tunnel Authority, New York, Payroll Mobility Tax Bonds, Senior | 5/31 at 100.00 | AA+ | 26,951,400 |
| | Lien Subseries 2021A-1, 5.000%, 5/15/51 (WI/DD, Settling 5/03/21) | | | |
| 7,110 | | TSASC Inc, New York, Tobacco Asset-Backed Bonds, Series 2006, 5.000%, 6/01/48 | 6/27 at 100.00 | N/R | 7,717,265 |
| 274,520 | | Total New York | | | 311,665,021 |
52
| | | | | | |
| Principal | | | Optional Call | | |
| Amount (000) | | Description (1) | Provisions (14) | Ratings (2) | Value |
| | North Carolina – 0.6% (0.4% of Total Investments) | | | |
| $ 10,000 | | North Carolina Medical Care Commission, Health Care Facilities Revenue Bonds, Duke | 6/22 at 100.00 | AA (3) | $ 10,526,300 |
| | University Health System, Series 2012A, 5.000%, 6/01/42 (Pre-refunded 6/01/22) | | | |
| 4,725 | | North Carolina Medical Care Commission, Health Care Facilities Revenue Bonds, Vidant | 6/22 at 100.00 | A2 (3) | 4,973,677 |
| | Health, Refunding Series 2012A, 5.000%, 6/01/36 (Pre-refunded 6/01/22) | | | |
| 2,150 | | North Carolina Medical Care Commission, Health Care Facilities Revenue Bonds, WakeMed, | 10/22 at 100.00 | A2 | 2,266,981 |
| | Refunding Series 2012A, 5.000%, 10/01/38 | | | |
| 2,150 | | North Carolina Medical Care Commission, Retirement Facilities First Mortgage Revenue | 7/27 at 100.00 | N/R | 2,223,487 |
| | Bonds, Aldersgate United Retirement Community Inc, Refunding Series 2017A, 5.000%, 7/01/47 | | | |
| 1,690 | | North Carolina Turnpike Authority, Monroe Expressway Toll Revenue Bonds, Series 2017A, | 7/26 at 100.00 | Baa3 | 1,924,572 |
| | 5.000%, 7/01/54 | | | |
| 1,625 | | North Carolina Turnpike Authority, Triangle Expressway System Revenue Bonds, Senior Lien | 1/30 at 100.00 | BBB | 1,850,615 |
| | Series 2019, 4.000%, 1/01/55 – AGM Insured | | | |
| 22,340 | | Total North Carolina | | | 23,765,632 |
| | North Dakota – 2.2% (1.4% of Total Investments) | | | |
| 9,950 | | Cass County, North Dakota, Health Care Facilities Revenue Bonds, Essential Health | 2/28 at 100.00 | A– | 11,164,198 |
| | Obligated Group, Series 2018B, 4.250%, 2/15/48 | | | |
| | Grand Forks, North Dakota, Health Care System Revenue Bonds, Altru Health System | | | |
| | Obligated Group, Series 2012: | | | |
| 7,000 | | 5.000%, 12/01/29 | 12/21 at 100.00 | Baa2 | 7,103,950 |
| 6,650 | | 5.000%, 12/01/32 | 12/21 at 100.00 | Baa2 | 6,737,514 |
| 2,245 | | 5.000%, 12/01/35 | 12/21 at 100.00 | Baa2 | 2,272,524 |
| 4,525 | | Grand Forks, North Dakota, Health Care System Revenue Bonds, Altru Health System | 12/27 at 100.00 | Baa2 | 5,000,080 |
| | Obligated Group, Series 2017A, 5.000%, 12/01/42 | | | |
| 1,000 | | Grand Forks, North Dakota, Senior Housing & Nursing Facilities Revenue Bonds, Valley | 12/26 at 100.00 | N/R | 1,043,400 |
| | Homes and Services Obligated Group, Series 2017, 5.000%, 12/01/36 | | | |
| 4,125 | | North Dakota Housing Finance Agency, Home Mortgage Finance Program Bonds, Series 2020B, | 1/30 at 100.00 | Aa1 | 4,201,477 |
| | 2.500%, 7/01/44 | | | |
| | Ward County Health Care, North Dakota, Revenue Bonds, Trinity Obligated Group, Series 2017C: | | | |
| 10,000 | | 5.000%, 6/01/38 | 6/28 at 100.00 | BBB– | 11,619,100 |
| 28,000 | | 5.000%, 6/01/53 | 6/28 at 100.00 | BBB– | 31,809,120 |
| 2,535 | | Williston, North Dakota, Multifamily Housing Revenue Bonds, Eagle Crest Apartments LLC | 9/23 at 100.00 | N/R | 1,527,338 |
| | Project, Series 2013, 7.750%, 9/01/38 (4) | | | |
| 76,030 | | Total North Dakota | | | 82,478,701 |
| | Ohio – 9.1% (5.8% of Total Investments) | | | |
| 2,000 | | Akron, Bath and Copley Joint Township Hospital District, Ohio, Hospital Facilities | 11/30 at 100.00 | Baa2 | 2,047,380 |
| | Revenue Bonds, Summa Health Obligated Group, Refunding Series 2020, 3.000%, 11/15/40 | | | |
| 4,185 | | Akron, Bath and Copley Joint Township Hospital District, Ohio, Hospital Revenue Bonds, | 5/22 at 100.00 | A1 | 4,352,609 |
| | Children’s Hospital Medical Center, Improvement & Refunding Series 2012, 5.000%, 11/15/42 | | | |
| | Allen County, Ohio, Hospital Facilities Revenue Bonds, Catholic Health Partners, | | | |
| | Refunding and Improvement Series 2012A: | | | |
| 2,740 | | 4.000%, 5/01/33 (Pre-refunded 5/01/22) | 5/22 at 100.00 | A+ (3) | 2,845,874 |
| 1,930 | | 5.000%, 5/01/33 (Pre-refunded 5/01/22) | 5/22 at 100.00 | A+ (3) | 2,023,701 |
| 3,405 | | 5.000%, 5/01/42 (Pre-refunded 5/01/22) | 5/22 at 100.00 | A+ (3) | 3,570,313 |
| 70,220 | | Buckeye Tobacco Settlement Financing Authority, Ohio, Tobacco Settlement Asset-Backed | 6/30 at 22.36 | N/R | 10,961,342 |
| | Revenue Bonds, Refunding Senior Lien Capital Appreciation Series 2020B-3 Class 2, | | | |
| | 0.000%, 6/01/57 | | | |
| | Buckeye Tobacco Settlement Financing Authority, Ohio, Tobacco Settlement Asset-Backed | | | |
| | Revenue Bonds, Refunding Senior Lien Series 2020A-2 Class 1: | | | |
| 41,535 | | 3.000%, 6/01/48 | 6/30 at 100.00 | BBB+ | 42,700,057 |
| 7,535 | | 4.000%, 6/01/48 | 6/30 at 100.00 | BBB+ | 8,519,297 |
| 40,425 | | Buckeye Tobacco Settlement Financing Authority, Ohio, Tobacco Settlement Asset-Backed | 6/30 at 100.00 | N/R | 45,444,572 |
| | Revenue Bonds, Refunding Senior Lien Series 2020B-2 Class 2, 5.000%, 6/01/55 | | | |
53
| | |
| NVG | Nuveen AMT-Free Municipal Credit Income Fund |
| Portfolio of Investments (continued) |
| April 30, 2021 (Unaudited) |
| | | | | | |
| Principal | | | Optional Call | | |
| Amount (000) | | Description (1) | Provisions (14) | Ratings (2) | Value |
| | Ohio (continued) | | | |
| $ 10,000 | | Buckeye Tobacco Settlement Financing Authority, Ohio, Tobacco Settlement Asset-Backed | 6/22 at 100.00 | N/R (3) | $ 10,657,200 |
| | Revenue Bonds, Senior Lien Series 2007A-3, 6.250%, 6/01/37 (Pre-refunded 6/01/22) | | | |
| | Centerville, Ohio Health Care Improvement Revenue Bonds, Graceworks Lutheran Services, | | | |
| | Refunding & Improvement Series 2017: | | | |
| 2,750 | | 5.250%, 11/01/37 | 11/27 at 100.00 | N/R | 2,935,075 |
| 3,200 | | 5.250%, 11/01/47 | 11/27 at 100.00 | N/R | 3,359,488 |
| 3,345 | | Cleveland Heights-University Heights City School District, Ohio, General Obligation | 6/23 at 100.00 | A1 | 3,610,192 |
| | Bonds, School Improvement Series 2014, 5.000%, 12/01/51 | | | |
| 5,000 | | County of Lucas, Ohio, Hospital Revenue Bonds, ProMedica Healthcare Obligated Group, | 11/28 at 100.00 | Baa3 | 5,776,000 |
| | Series 2018A, 5.250%, 11/15/48 | | | |
| 37,150 | | Cuyahoga County, Ohio, Certificates of Participation, Convention Hotel Project, Series | 6/24 at 100.00 | A1 | 39,657,625 |
| | 2014, 4.375%, 12/01/44 (UB) (5) | | | |
| | Darke County, Ohio, Hospital Facilities Revenue Bonds, Wayne Healthcare Project, Series 2019A: | | | |
| 1,165 | | 4.000%, 9/01/40 | 9/29 at 100.00 | BB+ | 1,218,823 |
| 1,750 | | 4.000%, 9/01/45 | 9/29 at 100.00 | BB+ | 1,810,777 |
| 2,000 | | 5.000%, 9/01/49 | 9/29 at 100.00 | BB+ | 2,239,420 |
| 6,840 | | Franklin County Convention Facilities Authority, Ohio, Hotel Project Revenue Bonds, | 12/29 at 100.00 | BBB– | 7,936,452 |
| | Greater Columbus Convention Center Hotel Expansion Project, Series 2019, 5.000%, 12/01/51 | | | |
| 7,870 | | Franklin County, Ohio, Hospital Revenue Bonds, Nationwide Children’s Hospital Project, | 5/22 at 100.00 | Aa2 | 8,242,408 |
| | Improvement Series 2012A, 5.000%, 11/01/42 | | | |
| 3,985 | | Franklin County, Ohio, Revenue Bonds, Trinity Health Credit Group, Series 2017A, | 12/27 at 100.00 | AA– | 4,296,747 |
| | 3.250%, 12/01/42 | | | |
| | JobsOhio Beverage System, Ohio, Statewide Liquor Profits Revenue Bonds, Senior Lien | | | |
| | Series 2013A: | | | |
| 6,425 | | 5.000%, 1/01/38 (Pre-refunded 1/01/23) (UB) (5) | 1/23 at 100.00 | Aa3 (3) | 6,946,453 |
| | JobsOhio Beverage System, Ohio, Statewide Senior Lien Liquor Profits Revenue Bonds, | | | |
| | Tender Option Bond Trust 2016-XG0052: | | | |
| 390 | | 17.823%, 1/01/38 (Pre-refunded 1/01/23), 144A (IF) (5) | 1/23 at 100.00 | Aa3 (3) | 515,654 |
| 1,750 | | 17.946%, 1/01/38 (Pre-refunded 1/01/23), 144A (IF) | 1/23 at 100.00 | Aa3 (3) | 2,317,857 |
| 625 | | 17.955%, 1/01/38 (Pre-refunded 1/01/23), 144A (IF) (5) | 1/23 at 100.00 | Aa3 (3) | 827,919 |
| 1,250 | | 17.955%, 1/01/38 (Pre-refunded 1/01/23), 144A (IF) (5) | 1/23 at 100.00 | Aa3 (3) | 1,655,837 |
| 1,725 | | 17.955%, 1/01/38 (Pre-refunded 1/01/23), 144A (IF) (5) | 1/23 at 100.00 | Aa3 (3) | 2,285,056 |
| 2,000 | | 17.955%, 1/01/38 (Pre-refunded 1/01/23), 144A (IF) (5) | 1/23 at 100.00 | Aa3 (3) | 2,649,340 |
| 2,885 | | Lucas County, Ohio, Hospital Revenue Bonds, ProMedica Healthcare Obligated Group, | 11/21 at 100.00 | Baa3 (3) | 2,975,243 |
| | Series 2011A, 6.000%, 11/15/41 (Pre-refunded 11/15/21) | | | |
| | Middletown City School District, Butler County, Ohio, General Obligation Bonds, | | | |
| | Refunding Series 2007: | | | |
| 4,380 | | 5.250%, 12/01/27 – AGM Insured | No Opt. Call | A2 | 5,551,562 |
| 6,000 | | 5.250%, 12/01/31 – AGM Insured | No Opt. Call | A2 | 8,027,760 |
| 12,000 | | Muskingum County, Ohio, Hospital Facilities Revenue Bonds, Genesis HealthCare System | 2/23 at 100.00 | Ba2 | 12,459,960 |
| | Obligated Group Project, Series 2013, 5.000%, 2/15/48 | | | |
| 8,500 | | Ohio Air Quality Development Authority, Ohio, Air Quality Development Revenue Bonds, | No Opt. Call | N/R | 10,625 |
| | FirstEnergy Generation Corporation Project, Series 2009A, 5.700%, 8/01/21 (4) | | | |
| 1,050 | | Ohio Air Quality Development Authority, Ohio, Pollution Control Revenue Bonds, | No Opt. Call | N/R | 1,313 |
| | FirstEnergy Generation Corporation Project, Refunding Series 2009B, 3.100%, 3/01/23 (4) | | | |
| 2,020 | | Ohio Air Quality Development Authority, Ohio, Pollution Control Revenue Bonds, | No Opt. Call | N/R | 2,525 |
| | FirstEnergy Nuclear Generation Corporation Project, Refunding Series 2010B, 3.750%, 6/01/33 (4) | | | |
| 1,000 | | Ohio Air Quality Development Authority, Ohio, Pollution Control Revenue Bonds, | No Opt. Call | N/R | 1,250 |
| | FirstEnergy Nuclear Generation Project, Refunding Series 2005B, 3.125%, 1/01/34 (4) | | | |
| 20,765 | | Ohio Air Quality Development Authority, Ohio, Pollution Control Revenue Bonds, | No Opt. Call | N/R | 21,377,567 |
| | FirstEnergy Nuclear Generation Project, Refunding Series 2009A, 4.375%, 6/01/33 (Mandatory | | | |
| | Put 6/01/22) | | | |
| 1,240 | | Ohio State, Turnpike Revenue Bonds, Ohio Turnpike and Infrastructure Commission | 2/31 at 100.00 | A+ | 1,538,071 |
| | Infrastructure Projects, Junior Lien, Capital Appreciation Series 2013A-3, 0.000%, 2/15/36 (6) | | | |
54
| | | | | | |
| Principal | | | Optional Call | | |
| Amount (000) | | Description (1) | Provisions (14) | Ratings (2) | Value |
| | Ohio (continued) | | | |
| $ 4,975 | | Ohio State, Turnpike Revenue Bonds, Ohio Turnpike and Infrastructure Commission | 2/23 at 100.00 | A+ (3) | $ 5,403,845 |
| | Infrastructure Projects, Junior Lien, Current Interest Series 2013A-1, 5.000%, 2/15/48 | | | |
| | (Pre-refunded 2/15/23) | | | |
| 1,610 | | Ohio Water Development Authority, Pollution Control Revenue Bonds, FirstEnergy Nuclear | No Opt. Call | N/R | 2,013 |
| | Generating Corporation Project, Refunding Series 2010C, 4.000%, 6/01/33 (4) | | | |
| 1,130 | | Ohio Water Development Authority, Pollution Control Revenue Refunding Bonds, FirstEnergy | No Opt. Call | N/R | 1,413 |
| | Nuclear Generating Corporation Project, Series 2006B, 4.000%, 12/01/33 (4) | | | |
| 20,405 | | Ohio Water Development Authority, Pollution Control Revenue Refunding Bonds, FirstEnergy | No Opt. Call | N/R | 21,006,947 |
| | Nuclear Generating Corporation Project, Series 2009A, 4.375%, 6/01/33 (Mandatory Put 6/01/22) | | | |
| 20,480 | | Ohio Water Development Authority, Pollution Control Revenue Refunding Bonds, FirstEnergy | No Opt. Call | N/R | 21,084,160 |
| | Nuclear Generating Corporation Project, Series 2010B, 4.375%, 6/01/33 (Mandatory Put 6/01/22) | | | |
| 3,000 | | Port of Greater Cincinnati Development Authority, Ohio, Special Obligation Tax Increment | 11/30 at 100.00 | N/R | 3,041,760 |
| | Financing Revenue Bonds, Cooperative Township Public Parking Project, Gallery at Kenwood, | | | |
| | Senior Lien Series 2019A, 5.000%, 11/01/51 | | | |
| | Southeastern Ohio Port Authority, Hospital Facilities Revenue Bonds, Memorial Health | | | |
| | System Obligated Group Project, Refunding and Improvement Series 2012: | | | |
| 1,095 | | 5.750%, 12/01/32 | 12/22 at 100.00 | BB– | 1,153,539 |
| 870 | | 6.000%, 12/01/42 | 12/22 at 100.00 | BB– | 897,675 |
| 1,330 | | Tuscarawas County Economic Development and Finance Alliance, Ohio, Higher Education | 3/25 at 100.00 | N/R | 1,448,490 |
| | Facilities Revenue Bonds, Ashland University, Refunding & Improvement Series 2015, | | | |
| | 6.000%, 3/01/45 | | | |
| 387,930 | | Total Ohio | | | 337,389,186 |
| | Oklahoma – 0.7% (0.4% of Total Investments) | | | |
| 1,090 | | Fort Sill Apache Tribe of Oklahoma Economic Development Authority, Gaming Enterprise | 8/21 at 100.00 | N/R (3) | 1,117,512 |
| | Revenue Bonds, Fort Sill Apache Casino, Series 2011A, 8.500%, 8/25/26 (Pre-refunded | | | |
| | 8/25/21), 144A | | | |
| | Oklahoma City Water Utilities Trust, Oklahoma, Water and Sewer Revenue Bonds, Series 2011: | | | |
| 1,500 | | 5.000%, 7/01/40 (Pre-refunded 7/01/21) | 7/21 at 100.00 | AAA | 1,511,670 |
| 1,000 | | 5.375%, 7/01/40 (Pre-refunded 7/01/21) | 7/21 at 100.00 | AAA | 1,008,380 |
| | Oklahoma Development Finance Authority, Health System Revenue Bonds, OU Medicine | | | |
| | Project, Series 2018B: | | | |
| 5,290 | | 5.500%, 8/15/52 | 8/28 at 100.00 | BB+ | 6,496,649 |
| 10,530 | | 5.500%, 8/15/57 | 8/28 at 100.00 | BB+ | 12,902,409 |
| 2,340 | | Tulsa County Industrial Authority, Oklahoma, Senior Living Community Revenue Bonds, | 11/25 at 102.00 | BBB– | 2,564,640 |
| | Montereau, Inc Project, Refunding Series 2017, 5.250%, 11/15/45 | | | |
| 21,750 | | Total Oklahoma | | | 25,601,260 |
| | Oregon – 0.1% (0.1% of Total Investments) | | | |
| | Clackamas County Hospital Facility Authority, Oregon, Revenue Bonds, Rose Villa Inc, | | | |
| | Series 2020A: | | | |
| 500 | | 5.125%, 11/15/40 | 11/25 at 102.00 | N/R | 542,525 |
| 220 | | 5.250%, 11/15/50 | 11/25 at 102.00 | N/R | 236,867 |
| 315 | | 5.375%, 11/15/55 | 11/25 at 102.00 | N/R | 339,680 |
| | Multnomah County Hospital Facilities Authority, Oregon, Revenue Bonds, Mirabella South | | | |
| | Waterfront, Refunding Series 2014A: | | | |
| 1,000 | | 5.400%, 10/01/44 | 10/24 at 100.00 | N/R | 1,072,480 |
| 800 | | 5.500%, 10/01/49 | 10/24 at 100.00 | N/R | 856,800 |
| 1,670 | | Oregon State, General Obligation Bonds, Oregon University System Projects, Series 2011G, | 8/21 at 100.00 | AA+ (3) | 1,690,074 |
| | 5.000%, 8/01/36 (Pre-refunded 8/02/21) | | | |
| 4,505 | | Total Oregon | | | 4,738,426 |
55
| | |
| NVG | Nuveen AMT-Free Municipal Credit Income Fund |
| Portfolio of Investments (continued) |
| April 30, 2021 (Unaudited) |
| | | | | | |
| Principal | | | Optional Call | | |
| Amount (000) | | Description (1) | Provisions (14) | Ratings (2) | Value |
| | Pennsylvania – 6.0% (3.9% of Total Investments) | | | |
| $ 14,855 | | Allegheny County Hospital Development Authority, Pennsylvania, Revenue Bonds, Allegheny | 4/28 at 100.00 | A | $ 16,434,532 |
| | Health Network Obligated Group Issue, Series 2018A, 4.000%, 4/01/44 | | | |
| 2,540 | | Allentown Neighborhood Improvement Zone Development Authority, Pennsylvania, Tax Revenue | 5/27 at 100.00 | Baa3 | 2,934,081 |
| | Bonds, City Center Refunding Project, Series 2017, 5.000%, 5/01/42, 144A | | | |
| | Beaver County Industrial Development Authority, Pennsylvania, Pollution Control Revenue | | | |
| | Bonds, FirstEnergy Generation Project, Refunding Series 2006A: | | | |
| 13,235 | | 4.375%, 1/01/35 (Mandatory Put 7/01/22) | No Opt. Call | N/R | 13,628,344 |
| 3,145 | | 3.500%, 4/01/41 (4) | No Opt. Call | N/R | 3,931 |
| 1,245 | | Beaver County Industrial Development Authority, Pennsylvania, Pollution Control Revenue | No Opt. Call | N/R | 1,556 |
| | Bonds, FirstEnergy Nuclear Generation Project, Refunding Series 2005A, 4.000%, 1/01/35 (4) | | | |
| 1,240 | | Beaver County Industrial Development Authority, Pennsylvania, Pollution Control Revenue | No Opt. Call | N/R | 1,550 |
| | Bonds, FirstEnergy Nuclear Generation Project, Series 2006B, 3.500%, 12/01/35 (4) | | | |
| 9,365 | | Beaver County Industrial Development Authority, Pennsylvania, Pollution Control Revenue | 4/31 at 100.00 | N/R | 9,842,802 |
| | Refunding Bonds, FirstEnergy Generation Project, Series 2008B, 3.750%, 10/01/47 | | | |
| 22,245 | | Berks County Industrial Development Authority, Pennsylvania, Health System Revenue | 11/27 at 100.00 | B+ | 22,508,381 |
| | Bonds, Tower Health Project, Series 2017, 5.000%, 11/01/50 | | | |
| | Bucks County Industrial Development Authority, Pennsylvania, Revenue Bonds, School Lane | | | |
| | Charter School Project, Series 2016: | | | |
| 2,410 | | 5.125%, 3/15/36 | 3/27 at 100.00 | BBB– | 2,746,990 |
| 6,420 | | 5.125%, 3/15/46 | 3/27 at 100.00 | BBB– | 7,195,151 |
| 10,850 | | Commonwealth Financing Authority, Pennsylvania, State Appropriation Lease Bonds, Master | 6/28 at 100.00 | A1 | 12,402,743 |
| | Settlement, Series 2018, 4.000%, 6/01/39 – AGM Insured (UB) (5) | | | |
| | Cumberland County Municipal Authority, Pennsylvania, Revenue Bonds, Diakon Lutheran | | | |
| | Social Ministries Project, Series 2015: | | | |
| 170 | | 5.000%, 1/01/29 (Pre-refunded 1/01/25) | 1/25 at 100.00 | N/R (3) | 197,897 |
| 830 | | 5.000%, 1/01/29 | 1/25 at 100.00 | BBB+ | 929,866 |
| 7,665 | | Dauphin County General Authority, Pennsylvania, Health System Revenue Bonds, Pinnacle | 6/22 at 100.00 | A | 7,984,937 |
| | Health System Project, Series 2012A, 5.000%, 6/01/42 | | | |
| 3,000 | | Dubois Hospital Authority, Pennsylvania, Hospital Revenue Bonds, Penn Highlands | 1/28 at 100.00 | A– | 3,530,190 |
| | Healthcare, Series 2018, 5.000%, 7/15/48 | | | |
| 1,250 | | Lancaster County Hospital Authority, Pennsylvania, Revenue Bonds, Landis Homes | 7/25 at 100.00 | BBB– | 1,341,938 |
| | Retirement Community Project, Refunding Series 2015A, 5.000%, 7/01/45 | | | |
| | Lehigh County Authority, Pennsylvania, Water and Sewer Revenue Bonds, Allentown | | | |
| | Concession, Series 2013A: | | | |
| 695 | | 5.125%, 12/01/47 | 12/23 at 100.00 | A | 769,115 |
| 805 | | 5.125%, 12/01/47 (Pre-refunded 12/01/23) | 12/23 at 100.00 | N/R (3) | 905,883 |
| | Montgomery County Industrial Development Authority, Pennsylvania, Health System Revenue | | | |
| | Bonds, Albert Einstein Healthcare Network Issue, Series 2015A: | | | |
| 10,530 | | 5.250%, 1/15/45 | 1/25 at 100.00 | Ba1 | 11,703,463 |
| 1,200 | | 5.250%, 1/15/46 | 1/25 at 100.00 | Ba1 | 1,333,296 |
| 10,765 | | Pennsylvania Economic Development Financing Authority, Exempt Facilities Revenue | 9/25 at 100.00 | CCC+ | 9,737,588 |
| | Refunding Bonds, PPL Energy Supply, LLC Project, Series 2009A, 6.400%, 12/01/38 | | | |
| 3,500 | | Pennsylvania Housing Finance Agency, Single Family Mortgage Revenue Bonds, Series | 4/29 at 100.00 | Aa2 | 3,703,735 |
| | 2019-131A, 3.100%, 10/01/44 | | | |
| 13,500 | | Pennsylvania Turnpike Commission, Oil Franchise Tax Revenue Bonds, Senior Series 2018A, | 12/28 at 100.00 | Aa3 | 17,395,155 |
| | 5.250%, 12/01/44 | | | |
| 3,705 | | Pennsylvania Turnpike Commission, Turnpike Revenue Bonds, Series 2015A-1, 5.000%, 12/01/45 | 6/25 at 100.00 | A+ | 4,284,314 |
| 6,450 | | Pennsylvania Turnpike Commission, Turnpike Revenue Bonds, Series 2018A-2, 5.000%, 12/01/43 | 12/28 at 100.00 | A1 | 7,990,518 |
| 11,000 | | Pennsylvania Turnpike Commission, Turnpike Revenue Bonds, Subordinate Series 2009C, | 6/26 at 100.00 | A2 | 13,901,360 |
| | 6.250%, 6/01/33 – AGM Insured | | | |
| 15,000 | | Pennsylvania Turnpike Commission, Turnpike Revenue Bonds, Subordinate Series 2015B-1, | 12/25 at 100.00 | A3 | 17,531,250 |
| | 5.000%, 12/01/45 | | | |
56
| | | | | | |
| Principal | | | Optional Call | | |
| Amount (000) | | Description (1) | Provisions (14) | Ratings (2) | Value |
| | Pennsylvania (continued) | | | |
| $ 5,000 | | Pennsylvania Turnpike Commission, Turnpike Revenue Bonds, Subordinate Series 2019A, | 12/29 at 100.00 | A3 | $ 5,744,400 |
| | 4.000%, 12/01/49 | | | |
| 10,305 | | Philadelphia Hospitals and Higher Education Facilities Authority, Pennsylvania, Hospital | 7/22 at 100.00 | Ba1 | 10,823,651 |
| | Revenue Bonds, Temple University Health System Obligated Group, Series 2012A, | | | |
| | 5.625%, 7/01/42 | | | |
| 7,055 | | Pittsburgh and Allegheny County Sports and Exhibition Authority, Pennsylvania, Hotel | 6/21 at 100.00 | A2 | 7,071,861 |
| | Room Excise Tax Revenue Bonds, Refunding Series 2010, 5.000%, 2/01/35 – AGM Insured | | | |
| | Scranton, Pennsylvania, Sewer Authority Revenue Bonds, Series 2011A: | | | |
| 1,125 | | 5.250%, 12/01/31 (Pre-refunded 12/01/21) – AGM Insured | 12/21 at 100.00 | AA (3) | 1,158,424 |
| 1,000 | | 5.500%, 12/01/35 (Pre-refunded 12/01/21) – AGM Insured | 12/21 at 100.00 | AA (3) | 1,031,150 |
| 5,790 | | Susquehanna Area Regional Airport Authority, Pennsylvania, Airport System Revenue Bonds, | 1/23 at 100.00 | Baa3 | 5,871,697 |
| | Series 2012B, 4.000%, 1/01/33 | | | |
| 207,890 | | Total Pennsylvania | | | 222,641,749 |
| | Puerto Rico – 4.0% (2.6% of Total Investments) | | | |
| 4,934 | | Cofina Class 2 Trust Tax-Exempt Class 2047 Unit, Puerto Rico, 0.000%, 8/01/47 | No Opt. Call | N/R | 1,495,770 |
| 9,761 | | Cofina Class 2 Trust Tax-Exempt Class 2054 Unit, Puerto Rico, 0.000%, 8/01/54 | No Opt. Call | N/R | 2,083,568 |
| 26,925 | | Puerto Rico Aqueduct and Sewerage Authority, Revenue Bonds, Refunding Senior Lien Series | 7/30 at 100.00 | N/R | 31,531,867 |
| | 2020A, 5.000%, 7/01/47, 144A | | | |
| | Puerto Rico Aqueduct and Sewerage Authority, Revenue Bonds, Senior Lien Series 2012A: | | | |
| 2,200 | | 5.125%, 7/01/37 | 7/22 at 100.00 | CCC | 2,325,114 |
| 8,080 | | 5.250%, 7/01/42 | 7/22 at 100.00 | CCC | 8,551,549 |
| 8,315 | | 6.000%, 7/01/47 | 7/22 at 100.00 | CCC | 8,874,101 |
| 590 | | Puerto Rico Highway and Transportation Authority, Highway Revenue Bonds, Series 2004J, | 6/21 at 100.00 | Baa2 | 605,629 |
| | 5.000%, 7/01/29 – NPFG Insured | | | |
| 1,500 | | Puerto Rico Municipal Finance Agency, Series 2002A, 5.250%, 8/01/21 – AGM Insured | 6/21 at 100.00 | A2 | 1,508,790 |
| 950 | | Puerto Rico Public Finance Corporation, Commonwealth Appropriation Bonds, Series 1998A, | No Opt. Call | AA+ | 1,009,859 |
| | 5.125%, 6/01/24 – AMBAC Insured | | | |
| | Puerto Rico Sales Tax Financing Corporation, Sales Tax Revenue Bonds, Restructured 2018A-1: | | | |
| 3,013 | | 0.000%, 7/01/31 | 7/28 at 91.88 | N/R | 2,355,202 |
| 9,828 | | 0.000%, 7/01/33 | 7/28 at 86.06 | N/R | 7,120,779 |
| 259 | | 4.500%, 7/01/34 | 7/25 at 100.00 | N/R | 283,248 |
| 2,661 | | 0.000%, 7/01/46 | 7/28 at 41.38 | N/R | 844,309 |
| 14,546 | | 0.000%, 7/01/51 | 7/28 at 30.01 | N/R | 3,345,289 |
| 17,398 | | 4.750%, 7/01/53 | 7/28 at 100.00 | N/R | 19,353,535 |
| 23,055 | | 5.000%, 7/01/58 | 7/28 at 100.00 | N/R | 26,030,478 |
| 723 | | Puerto Rico Sales Tax Financing Corporation, Sales Tax Revenue Bonds, Restructured | 7/28 at 100.00 | N/R | 793,413 |
| | Cofina Project Series 2019B-2, 4.536%, 7/01/53 | | | |
| | Puerto Rico Sales Tax Financing Corporation, Sales Tax Revenue Bonds, Taxable | | | |
| | Restructured Cofina Project Series 2019A-2: | | | |
| 7,857 | | 4.329%, 7/01/40 | 7/28 at 100.00 | N/R | 8,608,129 |
| 11,680 | | 4.329%, 7/01/40 | 7/28 at 100.00 | N/R | 12,796,374 |
| 9,037 | | 4.784%, 7/01/58 | 7/28 at 100.00 | N/R | 10,078,153 |
| 163,312 | | Total Puerto Rico | | | 149,595,156 |
| | Rhode Island – 1.5% (0.9% of Total Investments) | | | |
| 1,000 | | Rhode Island Health and Educational Building Corporation, Revenue Bonds, Care New | 9/23 at 100.00 | N/R (3) | 1,135,470 |
| | England Health System, Series 2013A, 6.000%, 9/01/33 (Pre-refunded 9/01/23) | | | |
| 5,650 | | Rhode Island Housing & Mortgage Finance Corporation, Homeownership Opportunity Bond | 4/29 at 100.00 | AA+ | 5,978,886 |
| | Program, 2019 Series 71, 3.100%, 10/01/44 | | | |
| 292,435 | | Rhode Island Tobacco Settlement Financing Corporation, Tobacco Settlement Asset-Backed | 5/21 at 15.96 | CCC– | 47,432,957 |
| | Bonds, Series 2007A, 0.000%, 6/01/52 | | | |
| 299,085 | | Total Rhode Island | | | 54,547,313 |
57
| | |
| NVG | Nuveen AMT-Free Municipal Credit Income Fund |
| Portfolio of Investments (continued) |
| April 30, 2021 (Unaudited) |
| | | | | | |
| Principal | | | Optional Call | | |
| Amount (000) | | Description (1) | Provisions (14) | Ratings (2) | Value |
| | South Carolina – 3.0% (2.0% of Total Investments) | | | |
| $ 7,600 | | Piedmont Municipal Power Agency, South Carolina, Electric Revenue Bonds, Series 2004A-2, | No Opt. Call | A– | $ 6,335,132 |
| | 0.000%, 1/01/31 – AMBAC Insured | | | |
| | South Carolina Jobs-Economic Development Authority, Economic Development Revenue Bonds, | | | |
| | Bishop Gadsden Episcopal Retirement Community, Series 2019A: | | | |
| 890 | | 5.000%, 4/01/49 | 4/26 at 103.00 | BBB– | 988,078 |
| 1,165 | | 4.000%, 4/01/54 | 4/26 at 103.00 | BBB– | 1,206,532 |
| 1,630 | | 5.000%, 4/01/54 | 4/26 at 103.00 | BBB– | 1,805,665 |
| | South Carolina Jobs-Economic Development Authority, Economic Development Revenue Bonds, | | | |
| | Hilton Head Christian Academy, Series 2020: | | | |
| 405 | | 5.000%, 1/01/40, 144A | 1/30 at 100.00 | N/R | 407,940 |
| 1,000 | | 5.000%, 1/01/55, 144A | 1/30 at 100.00 | N/R | 1,004,810 |
| | South Carolina Jobs-Economic Development Authority, Health Facilities Revenue Bonds, | | | |
| | Lutheran Homes of South Carolina Inc, Refunding Series 2017B: | | | |
| 1,000 | | 5.000%, 5/01/37 | 5/23 at 104.00 | N/R | 1,053,350 |
| 750 | | 5.000%, 5/01/42 | 5/23 at 104.00 | N/R | 777,870 |
| 1,250 | | South Carolina Jobs-Economic Development Authority, Hospital Revenue Bonds, Palmetto | 8/21 at 100.00 | AA (3) | 1,269,125 |
| | Health, Refunding Series 2011A, 6.500%, 8/01/39 (Pre-refunded 8/01/21) – AGM Insured | | | |
| 4,000 | | South Carolina Jobs-Economic Development Authority, Hospital Revenue Bonds, Prisma | 5/28 at 100.00 | A3 | 4,779,880 |
| | Health Obligated Group, Series 2018A, 5.000%, 5/01/48 | | | |
| | South Carolina Public Service Authority, Santee Cooper Revenue Obligations, Refunding & | | | |
| | Improvement Series 2015A: | | | |
| 11,305 | | 5.000%, 12/01/50 | 6/25 at 100.00 | A– | 13,053,997 |
| 34,000 | | 5.000%, 12/01/50 (UB) (5) | 6/25 at 100.00 | A– | 39,260,140 |
| 8,630 | | South Carolina Public Service Authority, Santee Cooper Revenue Obligations, Refunding & | 12/30 at 100.00 | A– | 10,992,462 |
| | Improvement Series 2020A, 5.000%, 12/01/43 | | | |
| 5,075 | | South Carolina Public Service Authority, Santee Cooper Revenue Obligations, Refunding | 12/24 at 100.00 | A– | 5,801,182 |
| | Series 2014C, 5.000%, 12/01/46 | | | |
| 1,310 | | South Carolina Public Service Authority, Santee Cooper Revenue Obligations, Series | 12/23 at 100.00 | A– | 1,458,567 |
| | 2013A, 5.125%, 12/01/43 | | | |
| 10,300 | | South Carolina Public Service Authority, Santee Cooper Revenue Obligations, Series | 6/24 at 100.00 | A– | 11,704,405 |
| | 2014A, 5.500%, 12/01/54 | | | |
| 10,250 | | Spartanburg Regional Health Services District, Inc, South Carolina, Hospital Revenue | 4/22 at 100.00 | A3 | 10,674,350 |
| | Bonds, Refunding Series 2012A, 5.000%, 4/15/32 | | | |
| 100,560 | | Total South Carolina | | | 112,573,485 |
| | South Dakota – 1.1% (0.7% of Total Investments) | | | |
| 15,000 | | South Dakota Health and Educational Facilities Authority, Revenue Bonds, Avera Health, | 7/27 at 100.00 | A1 | 17,856,750 |
| | Refunding Series 2017, 5.000%, 7/01/46 | | | |
| 11,400 | | South Dakota Health and Educational Facilities Authority, Revenue Bonds, Monument | 9/30 at 100.00 | A1 | 12,891,348 |
| | Health, Inc, Series 2020A, 4.000%, 9/01/50 | | | |
| 3,765 | | South Dakota Health and Educational Facilities Authority, Revenue Bonds, Regional | 9/27 at 100.00 | A1 | 4,465,102 |
| | Health, Refunding Series 2017, 5.000%, 9/01/40 | | | |
| 4,350 | | South Dakota Health and Educational Facilities Authority, Revenue Bonds, Avera Health, | 7/21 at 100.00 | A1 (3) | 4,383,843 |
| | Series 2012A, 5.000%, 7/01/42 (Pre-refunded 7/01/21) | | | |
| 34,515 | | Total South Dakota | | | 39,597,043 |
| | Tennessee – 0.8% (0.5% of Total Investments) | | | |
| 12,895 | | Chattanooga Health, Educational and Housing Facility Board, Tennessee, Revenue Bonds, | 1/23 at 100.00 | BBB+ (3) | 13,961,159 |
| | Catholic Health Initiatives, Series 2013A, 5.250%, 1/01/45 (Pre-refunded 1/01/23) | | | |
| 1,850 | | Chattanooga-Hamilton County Hospital Authority, Tennessee, Hospital Revenue Bonds, | 10/24 at 100.00 | Baa3 | 2,036,295 |
| | Erlanger Health System, Refunding Series 2014A, 5.000%, 10/01/39 | | | |
| 2,000 | | Knox County Health, Educational and Housing Facility Board, Tennessee, Hospital Revenue | 2/29 at 100.00 | A | 2,230,720 |
| | Bonds, East Tennessee Children’s Hospital, Series 2019, 4.000%, 11/15/48 | | | |
58
| | | | | | |
| Principal | | | Optional Call | | |
| Amount (000) | | Description (1) | Provisions (14) | Ratings (2) | Value |
| | Tennessee (continued) | | | |
| $ 2,645 | | Memphis/Shelby County Economic Development Growth Engine Industrial Development Board, | 7/27 at 100.00 | N/R | $ 2,659,785 |
| | Tennessee, Tax Increment Revenue Bonds, Graceland Project, Senior Series 2017A, 5.500%, 7/01/37 | | | |
| 3,560 | | Metropolitan Government of Nashville-Davidson County Health and Educational Facilities | 6/27 at 100.00 | N/R | 2,136,000 |
| | Board, Tennessee, Revenue Bonds, Knowledge Academy Charter School, Series 2017A, 5.500%, | | | |
| | 6/15/37, 144A (4) | | | |
| 1,010 | | Tennessee Housing Development Agency, Residential Finance Program Bonds, Series 2020-3A, | 7/29 at 100.00 | AA+ | 1,034,038 |
| | 2.550%, 1/01/45 | | | |
| 10,000 | | The Health and Educational Facilities Board of the City of Franklin, Tennessee, Revenue | 6/27 at 100.00 | N/R | 5,500,000 |
| | Bonds, Provision Cares Proton Therapy Center, Nashville Project, Series 2017A, 7.500%, | | | |
| | 6/01/47, 144A (4), (7) | | | |
| 33,960 | | Total Tennessee | | | 29,557,997 |
| | Texas – 11.3% (7.3% of Total Investments) | | | |
| 735 | | Arlington Higher Education Finance Corporation, Texas, Education Revenue Bonds, Wayside | 8/21 at 100.00 | BB | 736,279 |
| | Schools, Series 2016A, 4.375%, 8/15/36 | | | |
| 3,580 | | Aubrey, Denton County, Texas, Special Assessment Revenue Bonds, Jackson Ridge Public | 9/23 at 103.00 | N/R | 3,855,051 |
| | Improvement District Phase 1 Project, Series 2015, 7.250%, 9/01/45 | | | |
| 3,045 | | Aubrey, Denton County, Texas, Special Assessment Revenue Bonds, Jackson Ridge Public | 9/23 at 103.00 | N/R | 3,272,218 |
| | Improvement District Phases 2-3 Major Improvements Project, Series 2015, 8.250%, 9/01/40 | | | |
| 5,480 | | Austin, Texas, Electric Utility System Revenue Bonds, Refunding Series 2015A, 5.000%, | 11/25 at 100.00 | Aa3 | 6,416,258 |
| | 11/15/45 (UB) (5) | | | |
| 2,500 | | Board of Managers, Joint Guadalupe County-Seguin City Hospital, Texas, Hospital Mortgage | 12/25 at 100.00 | BB | 2,611,125 |
| | Revenue Bonds, Refunding & Improvement Series 2015, 5.000%, 12/01/45 | | | |
| 2,315 | | Celina, Texas, Special Assessment Revenue Bonds, Sutton Fields II Public Improvement | 3/23 at 103.00 | N/R | 2,444,571 |
| | District Neighborhood Improvement Area 1 Project, Series 2015, 7.250%, 9/01/45 | | | |
| 4,145 | | Celina, Texas, Special Assessment Revenue Bonds, Sutton Fields II Public Improvement | 3/23 at 103.00 | N/R | 4,368,416 |
| | District Neighborhood Improvement Areas 2-5 Major Improvement Project, Series 2015, | | | |
| | 8.250%, 9/01/40 | | | |
| 380 | | Celina, Texas, Special Assessment Revenue Bonds, Wells South Public Improvement District | 9/24 at 100.00 | N/R | 402,097 |
| | Neighborhood Improvement Area 1 Project, Series 2015, 6.250%, 9/01/45 | | | |
| | Central Texas Regional Mobility Authority, Revenue Bonds, Senior Lien Series 2020A: | | | |
| 3,000 | | 5.000%, 1/01/44 | 1/30 at 100.00 | Baa1 | 3,745,350 |
| 3,940 | | 5.000%, 1/01/49 | 1/30 at 100.00 | Baa1 | 4,868,382 |
| 3,335 | | Central Texas Regional Mobility Authority, Revenue Bonds, Senior Lien Series 2020E, | 1/30 at 100.00 | Baa1 | 4,153,976 |
| | 5.000%, 1/01/45 | | | |
| 13,685 | | Central Texas Regional Mobility Authority, Revenue Bonds, Senior Lien, Series 2015A, | 7/25 at 100.00 | Baa1 | 15,686,568 |
| | 5.000%, 1/01/45 | | | |
| 6,375 | | Central Texas Regional Mobility Authority, Revenue Bonds, Senior Lien, Series 2016, | 1/26 at 100.00 | Baa1 | 6,809,648 |
| | 3.375%, 1/01/41 | | | |
| 535 | | Clifton Higher Education Finance Corporation, Texas, Education Revenue Bonds, Idea | No Opt. Call | A– | 545,416 |
| | Public Schools, Series 2012, 3.750%, 8/15/22 | | | |
| | Clifton Higher Education Finance Corporation, Texas, Education Revenue Bonds, Uplift | | | |
| | Education Charter School, Series 2013A: | | | |
| 765 | | 4.350%, 12/01/42 | 12/22 at 100.00 | BBB– | 786,405 |
| 685 | | 4.400%, 12/01/47 | 12/22 at 100.00 | BBB– | 703,536 |
| 4,000 | | Clifton Higher Education Finance Corporation, Texas, Education Revenue Bonds, Uplift | 6/25 at 100.00 | BBB– | 4,398,400 |
| | Education Charter School, Series 2015A, 5.000%, 12/01/45 | | | |
| | Club Municipal Management District 1, Texas, Special Assessment Revenue Bonds, | | | |
| | Improvement Area 1 Project, Series 2016: | | | |
| 580 | | 5.750%, 9/01/28 | 9/23 at 103.00 | N/R | 641,805 |
| 745 | | 6.500%, 9/01/46 | 9/23 at 103.00 | N/R | 822,338 |
| 11,735 | | Dallas-Fort Worth International Airport, Texas, Joint Revenue Bonds, Refunding & | 11/21 at 100.00 | A | 12,001,033 |
| | Improvement Series 2012C, 5.000%, 11/01/45 | | | |
59
| | |
| NVG | Nuveen AMT-Free Municipal Credit Income Fund |
| Portfolio of Investments (continued) |
| April 30, 2021 (Unaudited) |
| | | | | | |
| Principal | | | Optional Call | | |
| Amount (000) | | Description (1) | Provisions (14) | Ratings (2) | Value |
| | Texas (continued) | | | |
| $ 2,520 | | Decatur Hospital Authority, Texas, Revenue Bonds, Wise Regional Health System, Series | 9/23 at 100.00 | N/R | $ 2,776,536 |
| | 2013A, 6.375%, 9/01/42 | | | |
| 400 | | Decatur Hospital Authority, Texas, Revenue Bonds, Wise Regional Health System, Series | 9/24 at 100.00 | BBB– | 446,144 |
| | 2014A, 5.250%, 9/01/44 | | | |
| 1,255 | | Fort Bend County Industrial Development Corporation, Texas, Revenue Bonds, NRG Energy | 11/22 at 100.00 | Baa2 | 1,320,536 |
| | Inc Project, Series 2012A RMKT, 4.750%, 5/01/38 | | | |
| 8,920 | | Fort Bend County Industrial Development Corporation, Texas, Revenue Bonds, NRG Energy | 11/22 at 100.00 | Baa2 | 9,386,338 |
| | Inc Project, Series 2012B, 4.750%, 11/01/42 | | | |
| 6,660 | | Grand Parkway Transportation Corporation, Texas, System Toll Revenue Bonds, Refunding | 4/30 at 100.00 | A2 | 7,746,845 |
| | First Tier Series 2020C, 4.000%, 10/01/49 | | | |
| | Grand Parkway Transportation Corporation, Texas, System Toll Revenue Bonds, Subordinate | | | |
| | Lien Series 2013B: | | | |
| 20,000 | | 5.250%, 10/01/51 (Pre-refunded 10/01/23) | 10/23 at 100.00 | AA (3) | 22,466,600 |
| 10,000 | | 5.000%, 4/01/53 (Pre-refunded 10/01/23) (UB) (5) | 10/23 at 100.00 | AA (3) | 11,173,200 |
| 5,470 | | Grand Parkway Transportation Corporation, Texas, System Toll Revenue Bonds, Tender | 10/23 at 100.00 | AA (3) | 8,037,673 |
| | Option Bond Trust 2015-XF0228, 18.108%, 11/01/44 (Pre-refunded 10/01/23), 144A (IF) (5) | | | |
| 4,255 | | Harris County Cultural Education Facilities Finance Corporation, Texas, Revenue Bonds, | 6/25 at 100.00 | AA | 4,890,484 |
| | Houston Methodist Hospital System, Series 2015, 5.000%, 12/01/45 | | | |
| 4,645 | | Harris County Metropolitan Transit Authority, Texas, Sales and Use Tax Revenue Bonds, | 11/21 at 100.00 | Aa2 (3) | 4,757,316 |
| | Series 2011A, 5.000%, 11/01/41 (Pre-refunded 11/01/21) | | | |
| 4,080 | | Harris County, Texas, General Obligation Toll Road Revenue Bonds, Tender Option Bond | No Opt. Call | AAA | 9,296,362 |
| | Trust 2015-XF0074, 14.383%, 8/15/32 – AGM Insured, 144A (IF) | | | |
| 10,000 | | Harris County, Texas, Toll Road Revenue Bonds, Refunding First Lien Series 2021A, | 8/30 at 100.00 | Aa2 | 11,916,300 |
| | 4.000%, 8/15/50 | | | |
| 6,000 | | Harris County-Houston Sports Authority, Texas, Revenue Bonds, Capital Appreciation | 11/31 at 44.13 | A2 | 1,847,460 |
| | Refunding Senior Lien Series 2014A, 0.000%, 11/15/48 | | | |
| 6,000 | | Harris County-Houston Sports Authority, Texas, Revenue Bonds, Refunding Senior Lien | 11/24 at 100.00 | BBB | 6,711,420 |
| | Series 2014A, 5.000%, 11/15/53 | | | |
| | Harris County-Houston Sports Authority, Texas, Revenue Bonds, Third Lien Series 2004A-3: | | | |
| 1,940 | | 0.000%, 11/15/34 (Pre-refunded 11/15/24) – NPFG Insured | 11/24 at 55.69 | Baa2 (3) | 1,059,279 |
| 14,055 | | 0.000%, 11/15/34 – NPFG Insured | 11/24 at 55.69 | BB | 7,109,019 |
| 5,000 | | Houston Higher Education Finance Corporation, Texas, Education Revenue Bonds, KIPP, Inc, | 8/25 at 100.00 | AAA | 5,377,550 |
| | Refunding Series 2015, 4.000%, 8/15/44 | | | |
| | Houston, Texas, Hotel Occupancy Tax and Special Revenue Bonds, Convention and | | | |
| | Entertainment Project, Series 2001B: | | | |
| 4,130 | | 0.000%, 9/01/26 – AMBAC Insured | No Opt. Call | A2 | 3,855,768 |
| 4,865 | | 0.000%, 9/01/27 – AGM Insured | No Opt. Call | A2 | 4,434,593 |
| 4,715 | | Houston, Texas, Hotel Occupancy Tax and Special Revenue Bonds, Refunding Series 2015, | 9/24 at 100.00 | A | 5,090,408 |
| | 5.000%, 9/01/40 | | | |
| 17,000 | | Houston, Texas, Water and Sewerage System Revenue Bonds, Refunding Junior Lien Series | No Opt. Call | A2 (3) | 25,382,190 |
| | 2002A, 5.750%, 12/01/32 – AGM Insured (ETM) | | | |
| 6,700 | | Hutto Independent School District, Williamson County, Texas, General Obligation Bonds, | 8/21 at 100.00 | A+ | 6,770,685 |
| | Refunding Series 2012A, 5.000%, 8/01/46 | | | |
| 940 | | Kerrville Health Facilities Development Corporation, Texas, Revenue Bonds, Sid Peterson | 8/25 at 100.00 | A– | 1,082,062 |
| | Memorial Hospital Project, Series 2015, 5.000%, 8/15/30 | | | |
| 1,000 | | Lower Colorado River Authority, Texas, Transmission Contract Revenue Bonds, LCRA | 5/25 at 100.00 | A | 1,148,820 |
| | Transmission Services Corporation Project, Refunding Series 2015, 5.000%, 5/15/45 | | | |
| | McCamey County Hospital District, Texas, General Obligation Bonds, Series 2013: | | | |
| 3,095 | | 5.750%, 12/01/33 | 12/25 at 100.00 | B1 | 3,392,244 |
| 3,125 | | 6.125%, 12/01/38 | 12/25 at 100.00 | B1 | 3,436,031 |
60
| | | | | | |
| Principal | | | Optional Call | | |
| Amount (000) | | Description (1) | Provisions (14) | Ratings (2) | Value |
| | Texas (continued) | | | |
| | Montgomery County Toll Road Authority, Texas, Toll Road Revenue Bonds, Senior Lien | | | |
| | Series 2018: | | | |
| $ 1,900 | | 5.000%, 9/15/43 | 9/25 at 100.00 | BBB– | $ 2,128,703 |
| 1,785 | | 5.000%, 9/15/48 | 9/25 at 100.00 | BBB– | 1,993,042 |
| | New Hope Cultural Education Facilities Finance Corporation, Texas, Retirement Facility | | | |
| | Revenue Bonds, Legacy at Willow Bend Project, Series 2016: | | | |
| 2,335 | | 5.000%, 11/01/46 | 11/23 at 103.00 | BBB– | 2,504,871 |
| 6,015 | | 5.000%, 11/01/51 | 11/23 at 103.00 | BBB– | 6,445,012 |
| 745 | | New Hope Cultural Education Facilities Finance Corporation, Texas, Retirement Facility | 1/25 at 100.00 | N/R | 775,940 |
| | Revenue Bonds, Wesleyan Homes, Inc Project, Series 2014, 5.500%, 1/01/43 | | | |
| 210 | | New Hope Cultural Education Facilities Finance Corporation, Texas, Student Housing | 4/26 at 100.00 | N/R (3) | 254,510 |
| | Revenue Bonds, CHF-Collegiate Housing Corpus Christi II, LLC-Texas A&M University-Corpus | | | |
| | Christi Project, Series 2016A, 5.000%, 4/01/48 (Pre-refunded 4/01/26) | | | |
| 4,530 | | New Hope Cultural Education Facilities Finance Corporation, Texas, Student Housing | 4/24 at 100.00 | A2 | 4,838,991 |
| | Revenue Bonds, CHF-Collegiate Housing Foundation – College Station I LLC – Texas A&M | | | |
| | University Project, Series 2014A, 4.100%, 4/01/34 – AGM Insured | | | |
| 820 | | New Hope Cultural Education Facilities Finance Corporation, Texas, Student Housing | 4/26 at 100.00 | N/R (3) | 991,593 |
| | Revenue Bonds, CHF-Collegiate Housing Foundation – San Antonio 1, LLC – Texas A&M | | | |
| | University – San Antonio Project,, 5.000%, 4/01/48 (Pre-refunded 4/01/26) | | | |
| | New Hope Cultural Education Facilities Finance Corporation, Texas, Student Housing | | | |
| | Revenue Bonds, CHF-Collegiate Housing Foundation – Stephenville II, LLC – Tarleton State | | | |
| | University Project, Series 2014A: | | | |
| 1,000 | | 5.000%, 4/01/34 (Pre-refunded 4/01/24) | 4/24 at 100.00 | N/R (3) | 1,126,350 |
| 2,200 | | 5.000%, 4/01/39 (Pre-refunded 4/01/24) | 4/24 at 100.00 | N/R (3) | 2,477,970 |
| 1,600 | | 5.000%, 4/01/46 (Pre-refunded 4/01/24) | 4/24 at 100.00 | N/R (3) | 1,802,160 |
| 5,540 | | New Hope Cultural Education Facilities Finance Corporation, Texas, Student Housing | 4/24 at 100.00 | N/R (3) | 6,274,382 |
| | Revenue Bonds, CHF-Collegiate Housing Galveston-Texas A&M University at Galveston Project, | | | |
| | Series 2014A, 5.000%, 4/01/39 (Pre-refunded 4/01/24) | | | |
| 3,220 | | North Fort Bend Water Authority, Texas, Water System Revenue Bonds, Series 2011, 5.000%, | 12/21 at 100.00 | A2 | 3,311,126 |
| | 12/15/36 – AGM Insured | | | |
| | North Texas Tollway Authority, Special Projects System Revenue Bonds, Convertible | | | |
| | Capital Appreciation Series 2011C: | | | |
| 2,590 | | 0.000%, 9/01/43 (Pre-refunded 9/01/31) (6) | 9/31 at 100.00 | N/R (3) | 3,575,961 |
| 3,910 | | 0.000%, 9/01/45 (Pre-refunded 9/01/31) (6) | 9/31 at 100.00 | N/R (3) | 5,843,534 |
| 6,155 | | North Texas Tollway Authority, System Revenue Bonds, Refunding First Tier, Series 2015B, | 1/23 at 100.00 | A+ | 6,573,171 |
| | 5.000%, 1/01/40 | | | |
| 2,000 | | North Texas Tollway Authority, System Revenue Bonds, Refunding Second Tier, Series | 1/25 at 100.00 | A | 2,293,600 |
| | 2015A, 5.000%, 1/01/38 | | | |
| 610 | | Reagan Hospital District of Reagan County, Texas, Limited Tax Revenue Bonds, Series | 2/24 at 100.00 | Ba1 | 650,260 |
| | 2014A, 5.125%, 2/01/39 | | | |
| 1,000 | | Red River Education Finance Corporation, Texas, Higher Education Revenue Bonds, Saint | 6/26 at 100.00 | BBB | 1,074,750 |
| | Edward?s University Project, Series 2016, 4.000%, 6/01/41 | | | |
| 2,410 | | Tarrant County Cultural Education Facilities Finance Corporation, Texas, Hospital | 11/21 at 100.00 | AA– (3) | 2,472,877 |
| | Revenue Bonds, Baylor Health Care System, Series 2011A, 5.000%, 11/15/30 (Pre-refunded 11/15/21) | | | |
| 1,870 | | Tarrant County Cultural Education Facilities Finance Corporation, Texas, Hospital | 9/23 at 100.00 | A3 (3) | 2,098,832 |
| | Revenue Bonds, Hendrick Medical Center, Refunding Series 2013, 5.500%, 9/01/43 (Pre-refunded | | | |
| | 9/01/23) | | | |
| 17,640 | | Tarrant County Cultural Education Facilities Finance Corporation, Texas, Hospital | 5/26 at 100.00 | AA– | 20,801,088 |
| | Revenue Bonds, Scott & White Healthcare Project, Series 2016A, 5.000%, 11/15/45 (UB) (5) | | | |
| 4,565 | | Texas City Industrial Development Corporation, Texas, Industrial Development Revenue | 2/25 at 100.00 | Baa2 | 4,986,623 |
| | Bonds, NRG Energy, inc Project, Fixed Rate Series 2012, 4.125%, 12/01/45 | | | |
| 4,000 | | Texas Department of Housing and Community Affairs, Single Family Mortgage Revenue Bonds, | 9/27 at 100.00 | AA+ | 4,434,920 |
| | Series 2018A, 4.250%, 9/01/43 | | | |
61
| | |
| NVG | Nuveen AMT-Free Municipal Credit Income Fund |
| Portfolio of Investments (continued) |
| April 30, 2021 (Unaudited) |
| | | | | | |
| Principal | | | Optional Call | | |
| Amount (000) | | Description (1) | Provisions (14) | Ratings (2) | Value |
| | Texas (continued) | | | |
| | Texas Private Activity Bond Surface Transportation Corporation, Senior Lien Revenue | | | |
| | Bonds, LBJ Infrastructure Group LLC IH-635 Managed Lanes Project, Refunding Series 2020A: | | | |
| $ 5,810 | | 4.000%, 12/31/36 | 12/30 at 100.00 | BBB– | $ 6,799,908 |
| 2,735 | | 4.000%, 6/30/37 | 12/30 at 100.00 | BBB– | 3,195,683 |
| 3,150 | | Texas Transportation Commission, Central Texas Turnpike System Revenue Bonds, Refunding | 8/22 at 100.00 | A3 (3) | 3,343,253 |
| | First Tier Series 2012A, 5.000%, 8/15/41 (Pre-refunded 8/15/22) | | | |
| | Texas Transportation Commission, Central Texas Turnpike System Revenue Bonds, Refunding | | | |
| | First Tier Series 2015B: | | | |
| 11,280 | | 0.000%, 8/15/36 | 8/24 at 59.60 | A3 | 6,256,001 |
| 10,000 | | 0.000%, 8/15/37 | 8/24 at 56.94 | A3 | 5,288,100 |
| | Texas Transportation Commission, Central Texas Turnpike System Revenue Bonds, Refunding | | | |
| | Second Tier Series 2015C: | | | |
| 5,000 | | 5.000%, 8/15/37 | 8/24 at 100.00 | Baa1 | 5,595,350 |
| 31,810 | | 5.000%, 8/15/42 | 8/24 at 100.00 | Baa1 | 35,417,572 |
| 7,500 | | Texas Transportation Commission, State Highway 249 System Revenue Bonds, First Tier Toll | 2/29 at 100.00 | Baa3 | 8,765,400 |
| | Series 2019A, 5.000%, 8/01/57 | | | |
| 4,400 | | Texas Turnpike Authority, Central Texas Turnpike System Revenue Bonds, First Tier Series | No Opt. Call | A3 | 4,217,224 |
| | 2002A, 0.000%, 8/15/25 – AMBAC Insured | | | |
| 1,840 | | Ysleta Independent School District Public Facility Corporation, Texas, Lease Revenue | 11/21 at 100.00 | AA– | 1,890,269 |
| | Refunding Bonds, Series 2001, 5.375%, 11/15/24 – AMBAC Insured | | | |
| 390,505 | | Total Texas | | | 420,679,761 |
| | Virgin Islands – 0.1% (0.0% of Total Investments) | | | |
| 1,790 | | Virgin Islands Public Finance Authority, Gross Receipts Taxes Loan Note, Refunding | 10/22 at 100.00 | A2 | 1,881,183 |
| | Series 2012A, 5.000%, 10/01/32 – AGM Insured | | | |
| | Virginia – 0.8% (0.5% of Total Investments) | | | |
| | Embrey Mill Community Development Authority, Virginia, Special Assessment Revenue Bonds, | | | |
| | Series 2015: | | | |
| 1,200 | | 5.300%, 3/01/35, 144A | 3/25 at 100.00 | N/R | 1,274,424 |
| 1,085 | | 5.600%, 3/01/45, 144A | 3/25 at 100.00 | N/R | 1,151,869 |
| 5,500 | | Hampton Roads Transportation Accountability Commission, District of Columbia, Revenue | 7/30 at 100.00 | AA | 6,910,530 |
| | Bonds, Senior Lien Series 2020A, 5.000%, 7/01/60 | | | |
| 11,380 | | Hampton Roads Transportation Accountability Commission, Virginia, Hampton Roads | 1/28 at 100.00 | AA | 14,163,320 |
| | Transportation Fund Revenue Bonds, Senior Lien Series 2018A, 5.500%, 7/01/57 | | | |
| 2,000 | | Peninsula Town Center Community Development Authority, Virginia, Special Obligation | 9/27 at 100.00 | N/R | 2,177,020 |
| | Bonds, Refunding Series 2018, 5.000%, 9/01/45, 144A | | | |
| 1,000 | | Virginia College Building Authority, Educational Facilities Revenue Bonds, Marymount | 7/25 at 100.00 | Ba2 | 1,071,520 |
| | University Project, Green Series 2015B, 5.250%, 7/01/35, 144A | | | |
| 2,025 | | Virginia Small Business Finance Authority, Tourism Development Financing Program Revenue | 4/28 at 112.76 | N/R | 2,508,631 |
| | Bonds, Downtown Norfolk and Virginia Beach Oceanfront Hotel Projects, Series 2018A, | | | |
| | 8.375%, 4/01/41, 144A | | | |
| 24,190 | | Total Virginia | | | 29,257,314 |
| | Washington – 1.9% (1.2% of Total Investments) | | | |
| 5,000 | | Energy Northwest, Washington, Electric Revenue Bonds, Columbia Generating Station, | 7/25 at 100.00 | AA– | 5,819,250 |
| | Refunding Series 2015A, 5.000%, 7/01/38 (UB) (5) | | | |
| 1,250 | | Washington Health Care Facilities Authority, Revenue Bonds, Providence Health & | 10/24 at 100.00 | AA– | 1,916,750 |
| | Services, Tender Option Bond Trust 2015-XF0148, 17.892%, 10/01/44, 144A (IF) (5) | | | |
| 20,455 | | Washington Health Care Facilities Authority, Revenue Bonds, Seattle Cancer Center | 9/30 at 100.00 | A2 | 25,682,071 |
| | Alliance, Series 2020, 5.000%, 9/01/55 | | | |
| 6,655 | | Washington Health Care Facilities Authority, Revenue Bonds, Seattle Children’s Hospital, | 10/22 at 100.00 | Aa2 (3) | 7,108,871 |
| | Series 2012A, 5.000%, 10/01/42 (Pre-refunded 10/01/22) | | | |
62
| | | | | | |
| Principal | | | Optional Call | | |
| Amount (000) | | Description (1) | Provisions (14) | Ratings (2) | Value |
| | Washington (continued) | | | |
| | Washington State Housing Finance Commission, Non-profit Housing Revenue Bonds, | | | |
| | Presbyterian Retirement Communities Northwest Project, Refunding Series 2016A: | | | |
| $ 5,450 | | 5.000%, 1/01/46, 144A | 1/25 at 102.00 | BB | $ 5,837,822 |
| 3,650 | | 5.000%, 1/01/51, 144A | 1/25 at 102.00 | BB | 3,903,201 |
| 21,510 | | Washington State, Motor Vehicle Fuel Tax General Obligation Bonds, Series 2002-03C, | No Opt. Call | AA+ | 19,826,842 |
| | 0.000%, 6/01/28 – NPFG Insured (UB) (5) | | | |
| 63,970 | | Total Washington | | | 70,094,807 |
| | West Virginia – 1.3% (0.8% of Total Investments) | | | |
| 1,900 | | Monongalia County Commission, West Virginia, Special District Excise Tax Revenue, | 6/27 at 100.00 | N/R | 2,062,203 |
| | University Town Centre Economic Opportunity Development District, Refunding & Improvement | | | |
| | Series 2017A, 5.500%, 6/01/37, 144A | | | |
| 40,950 | | West Virginia Hospital Finance Authority, Hospital Revenue Bonds, West Virginia United | 6/23 at 100.00 | A (3) | 45,423,378 |
| | Health System Obligated Group, Refunding & Improvement Series 2013A, 5.500%, 6/01/44 | | | |
| | (Pre-refunded 6/01/23) | | | |
| 42,850 | | Total West Virginia | | | 47,485,581 |
| | Wisconsin – 4.1% (2.6% of Total Investments) | | | |
| | Public Finance Authority of Wisconsin, Charter School Revenue Bonds, Cornerstone Charter | | | |
| | Academy, North Carolina, Series 2016A: | | | |
| 1,750 | | 5.000%, 2/01/36, 144A | 2/26 at 100.00 | N/R | 1,881,880 |
| 305 | | 5.125%, 2/01/46, 144A | 2/26 at 100.00 | N/R | 325,228 |
| 1,715 | | Public Finance Authority of Wisconsin, Charter School Revenue Bonds, Corvian Community | 6/26 at 100.00 | N/R | 1,816,305 |
| | School Bonds, North Carolina, Series 2019A, 5.000%, 6/15/49, 144A | | | |
| 500 | | Public Finance Authority of Wisconsin, Charter School Revenue Bonds, Corvian Community | 6/24 at 100.00 | N/R | 520,750 |
| | School, North Carolina, Series 2017A, 5.125%, 6/15/47, 144A | | | |
| 1,480 | | Public Finance Authority of Wisconsin, Charter School Revenue Bonds, Envision Science | 5/26 at 100.00 | N/R | 1,568,386 |
| | Academy Project, Series 2016A, 5.125%, 5/01/36, 144A | | | |
| 6,000 | | Public Finance Authority of Wisconsin, Charter School Revenue Bonds, Phoenix Academy | 6/24 at 100.00 | N/R | 6,108,240 |
| | Charter School, North Carolina, Series 2017A, 5.625%, 6/15/37, 144A | | | |
| | Public Finance Authority of Wisconsin, Charter School Revenue Bonds, Uwharrie Charter | | | |
| | Academy, North Carolina, Series 2017A: | | | |
| 1,000 | | 5.500%, 6/15/37, 144A | 6/27 at 100.00 | N/R | 1,018,350 |
| 1,790 | | 5.625%, 6/15/47, 144A | 6/27 at 100.00 | N/R | 1,839,655 |
| 35,100 | | Public Finance Authority of Wisconsin, Limited Obligation PILOT Revenue Bonds, American | 12/27 at 100.00 | N/R | 40,541,202 |
| | Dream @ Meadowlands Project, Series 2017, 7.000%, 12/01/50, 144A | | | |
| 1,700 | | Public Finance Authority of Wisconsin, Revenue Bonds, Alabama Proton Therapy Center, | 10/27 at 100.00 | N/R | 1,745,135 |
| | Senior Series 2017A, 7.000%, 10/01/47, 144A | | | |
| | Public Finance Authority of Wisconsin, Revenue Bonds, Prime Healthcare Foundation, Inc, | | | |
| | Series 2017A: | | | |
| 1,410 | | 5.000%, 12/01/27 | No Opt. Call | BBB– | 1,562,717 |
| 1,815 | | 5.200%, 12/01/37 | 12/27 at 100.00 | BBB– | 2,068,828 |
| | Public Finance Authority of Wisconsin, Revenue Bonds, Roseman University of Health | | | |
| | Sciences, Series 2020: | | | |
| 1,300 | | 5.000%, 4/01/40, 144A | 4/30 at 100.00 | BB | 1,522,950 |
| 4,765 | | 5.000%, 4/01/50, 144A | 4/30 at 100.00 | BB | 5,488,899 |
| | Public Finance Authority, Wisconsin, Educational Revenue Bonds, Lake Norman Charter | | | |
| | School, Series 2018A: | | | |
| 4,050 | | 5.000%, 6/15/38, 144A | 6/26 at 100.00 | BBB– | 4,524,619 |
| 1,575 | | 5.000%, 6/15/48, 144A | 6/26 at 100.00 | BBB– | 1,738,170 |
| 2,500 | | Public Finance Authority, Wisconsin, Exempt Facilities Revenue Bonds, Celanese Project, | 5/26 at 100.00 | BBB– | 2,754,800 |
| | Refunding Series 2016C, 4.050%, 11/01/30 | | | |
| 8,460 | | Wisconsin Health and Educational Facilities Authority, Revenue Bonds, Aurora Health | 7/21 at 100.00 | Aa3 (3) | 8,541,131 |
| | Care, Inc, Series 2012A, 5.000%, 7/15/25 (Pre-refunded 7/15/21) | | | |
63
| | |
| NVG | Nuveen AMT-Free Municipal Credit Income Fund |
| Portfolio of Investments (continued) |
| April 30, 2021 (Unaudited) |
| | | | | | |
| Principal | | | Optional Call | | |
| Amount (000) | | Description (1) | Provisions (14) | Ratings (2) | Value |
| | Wisconsin (continued) | | | |
| $ 6,620 | | Wisconsin Health and Educational Facilities Authority, Revenue Bonds, Froedtert Health | 10/22 at 100.00 | AA | $ 6,961,129 |
| | Inc Obligated Group, Series 2012A, 5.000%, 4/01/42 | | | |
| | Wisconsin Health and Educational Facilities Authority, Revenue Bonds, Marshfield Clinic, | | | |
| | Series 2012B: | | | |
| 3,505 | | 4.500%, 2/15/40 | 2/22 at 100.00 | A– | 3,560,905 |
| 1,485 | | 5.000%, 2/15/40 | 2/22 at 100.00 | A– | 1,527,738 |
| | Wisconsin Health and Educational Facilities Authority, Revenue Bonds, Mercy Alliance, | | | |
| | Inc, Series 2012: | | | |
| 11,000 | | 5.000%, 6/01/32 | 6/22 at 100.00 | A3 | 11,459,140 |
| 1,500 | | 5.000%, 6/01/39 | 6/22 at 100.00 | A3 | 1,562,610 |
| 1,450 | | Wisconsin Health and Educational Facilities Authority, Revenue Bonds, Rocket Education | 6/26 at 100.00 | N/R | 1,598,175 |
| | Obligated Group, Series 2017C, 5.250%, 6/01/40, 144A | | | |
| 16,190 | | Wisconsin Health and Educational Facilities Authority, Revenue Bonds, Gundersen | 10/21 at 100.00 | A1 | 16,493,886 |
| | Lutheran, Series 2011A, 5.250%, 10/15/39 | | | |
| 1,000 | | Wisconsin Health and Educational Facilities Authority, Wisconsin, Revenue Bonds, | 8/24 at 103.00 | N/R | 1,059,910 |
| | American Baptist Homes of the Midwest Obligated Group, Refunding Series 2017, | | | |
| | 5.000%, 8/01/37 | | | |
| 2,505 | | Wisconsin Health and Educational Facilities Authority, Wisconsin, Revenue Bonds, Aurora | 4/23 at 100.00 | Aa3 (3) | 2,741,021 |
| | Health Care, Inc, Series 2013A, 5.125%, 4/15/31 (Pre-refunded 4/15/23) | | | |
| | Wisconsin Health and Educational Facilities Authority, Wisconsin, Revenue Bonds, Dickson | | | |
| | Hollow Project Series 2014: | | | |
| 1,000 | | 5.375%, 10/01/44 | 10/22 at 102.00 | N/R | 1,040,890 |
| 1,500 | | 5.500%, 10/01/49 | 10/22 at 102.00 | N/R | 1,563,450 |
| 1,000 | | Wisconsin Health and Educational Facilities Authority, Wisconsin, Revenue Bonds, Rogers | 7/24 at 100.00 | A | 1,108,240 |
| | Memorial Hospital, Inc, Series 2014A, 5.000%, 7/01/34 | | | |
| 1,850 | | Wisconsin Health and Educational Facilities Authority, Wisconsin, Revenue Bonds, Saint | 11/26 at 103.00 | N/R | 1,939,965 |
| | Camillus Health System Inc, Series 2019A, 5.000%, 11/01/54 | | | |
| | Wisconsin Health and Educational Facilities Authority, Wisconsin, Revenue Bonds, Saint | | | |
| | John’s Communities Inc, Series 2015B: | | | |
| 550 | | 5.000%, 9/15/37 | 9/22 at 100.00 | BBB– | 567,034 |
| 1,350 | | 5.000%, 9/15/45 | 9/22 at 100.00 | BBB– | 1,386,491 |
| 1,000 | | Wisconsin Health and Educational Facilities Authority, Wisconsin, Revenue Bonds, Three | 8/23 at 100.00 | BBB+ (3) | 1,109,880 |
| | Pillars Senior Living Communities, Refunding Series 2013, 5.000%, 8/15/33 (Pre-refunded 8/15/23) | | | |
| | Wisconsin Health and Educational Facilities Authority, Wisconsin, Revenue Bonds, | | | |
| | Woodland Hills Senior Housing Project, Series 2014: | | | |
| 2,565 | | 5.000%, 12/01/44 | 12/22 at 102.00 | N/R | 2,661,880 |
| 1,775 | | 5.250%, 12/01/49 | 12/22 at 102.00 | N/R | 1,846,816 |
| | Wisconsin Housing and Economic Development Authority, Housing Revenue Bonds, | | | |
| | Series 2019A: | | | |
| 2,800 | | 3.150%, 11/01/44 | 11/28 at 100.00 | Aa3 | 2,964,192 |
| 4,000 | | 3.200%, 11/01/49 | 11/28 at 100.00 | Aa3 | 4,211,840 |
| 141,860 | | Total Wisconsin | | | 152,932,437 |
| | Wyoming – 0.1% (0.0% of Total Investments) | | | |
| | Teton County Hospital District, Wyoming, Hospital Revenue Bonds, St John’s Medical | | | |
| | Center Project, Series 2011B: | | | |
| 1,000 | | 5.500%, 12/01/27 (Pre-refunded 12/01/21) | 12/21 at 100.00 | N/R (3) | 1,030,260 |
| 1,000 | | 6.000%, 12/01/36 (Pre-refunded 12/01/21) | 12/21 at 100.00 | N/R (3) | 1,033,010 |
| 2,000 | | Total Wyoming | | | 2,063,270 |
| $ 5,921,490 | | Total Municipal Bonds (cost $5,141,689,818) | | | 5,766,940,823 |
64
| | | | |
| Shares | | Description (1) | Value |
| | COMMON STOCKS – 0.5% (0.3% of Total Investments) | |
| | Electric Utilities – 0.5% (0.3% of Total Investments) | |
| 676,308 | | Energy Harbor Corp (8), (9), (10) | $ 19,486,462 |
| | Total Common Stocks (cost $15,015,822) | 19,486,462 |
| | Total Long-Term Investments (cost $5,156,705,640) | 5,786,427,285 |
| | Floating Rate Obligations – (5.1)% | (187,925,000) |
| | MuniFund Preferred Shares, net of deferred offering costs – (10.9)% (11) | (404,082,522) |
| | Adjustable Rate MuniFund Term Preferred Shares, net of deferred offering costs – (3.0)% (12) | (111,918,480) |
| | Variable Rate Demand Preferred Shares, net of deferred offering costs – (37.8)% (13) | (1,408,136,995) |
| | Other Assets Less Liabilities – 1.3% | 46,464,503 |
| | Net Assets Applicable to Common Shares – 100% | $ 3,720,828,791 |
| | |
(1) | All percentages shown in the Portfolio of Investments are based on net assets applicable to common shares unless otherwise noted. |
(2) | The ratings disclosed are the lowest of Standard & Poor’s Group (“Standard & Poor’s”), Moody’s Investors Service, Inc. (“Moody’s”) or Fitch, Inc. (“Fitch”) rating. Ratings below BBB by Standard & Poor’s, Baa by Moody’s or BBB by Fitch are considered to be below investment grade. Holdings designated N/R are not rated by any of these national rating agencies. Backed by an escrow or trust containing sufficient U.S. Government or U.S. Government agency securities, which ensure the timely payment of principal and interest. |
(3) | BBB by Standard & Poor’s, Baa by Moody’s or BBB by Fitch are considered to be below investment grade. Holdings designated N/R are not rated by any of these national rating agencies. Backed by an escrow or trust containing sufficient U.S. Government or U.S. Government agency securities, which ensure the timely payment of principal and interest. |
(4) | Defaulted security. A security whose issuer has failed to fully pay principal and/or interest when due, or is under the protection of bankruptcy. |
(5) | Investment, or portion of investment, has been pledged to collateralize the net payment obligations for investments in inverse floating rate transactions. |
(6) | Step-up coupon bond, a bond with a coupon that increases (“steps up”), usually at regular intervals, while the bond is outstanding. The rate shown is the coupon as of the end of the reporting period.
|
(7) | Investment valued at fair value using methods determined in good faith by, or at the discretion of, the Board. For fair value measurement disclosure purposes, investment classified as Level 3. See Notes to Financial Statements, Note 3 – Investment Valuation and Fair Value Measurements for more information.
|
(8) | Common Stock received as part of the bankruptcy settlements during February 2020 for Beaver County Industrial Development Authority, Pennsylvania, Pollution Control Revenue Bonds, FirstEnergy Nuclear Generation Project, Refunding Series 2005A, 4.000%, 1/01/35, Beaver County Industrial Development Authority, Pennsylvania, Pollution Control Revenue Refunding Bonds, FirstEnergy Nuclear Generation Project, Series 2006A, 3.500%, 4/01/41, Beaver County Industrial Development Authority, Pennsylvania, Pollution Control Revenue Refunding Bonds, FirstEnergy Nuclear Generation Project, Series 2006B, 3.500%, 12/01/35, Ohio Air Quality Development Authority, Ohio, Air Quality Development Revenue Bonds, FirstEnergy Generation Corporation Project, Series 2009A, 5.700%, 8/01/20, Ohio Air Quality Development Authority, Ohio, Pollution Control Revenue Bonds, FirstEnergy Generation Corporation Project, Refunding Series 2009B, 3.100%, 3/01/23, Ohio Air Quality Development Authority, Ohio, Pollution Control Revenue Bonds, FirstEnergy Nuclear Generation Corporation Project, Refunding Series 2010B, 3.750%, 6/01/33, Ohio Air Quality Development Authority, Ohio, Pollution Control Revenue Bonds, FirstEnergy Nuclear Generation Project, Refunding Series 2006B, 3.125%, 1/01/34, Ohio Water Development Authority, Pollution Control Revenue Refunding Bonds, FirstEnergy Nuclear Generating Corporation Project, Series 2006B, 4.000%, 12/01/33, Ohio Water Development Authority, Pollution Control Revenue Refunding Bonds, FirstEnergy Nuclear Generating Corporation Project, Series 2010C, 4.000%, 6/01/33. |
(9) | For fair value measurement disclosure purposes, investment classified as Level 2. See Notes to Financial Statements, Note 3 – Investment Valuation and Fair Value Measurements for more information.
|
(10) | Non-income producing; issuer has not declared an ex-dividend date within the past twelve months. |
(11) | MuniFund Preferred Shares, net of deferred offering costs as a percentage of Total Investments is 7.0%. |
(12) | Adjustable Rate MuniFund Term Preferred Shares, net of deferred offering costs as a percentage of Total Investments is 1.9%. |
(13) | Variable Rate Demand Preferred Shares, net of deferred offering costs as a percentage of Total Investments is 24.3%. |
(14) | Optional Call Provisions: Dates (month and year) and prices of the earliest optional call or redemption. There may be other call provisions at varying prices at later dates. Certain mortgage-backed securities may be subject to periodic principal paydowns.
|
144A | Investment is exempt from registration under Rule 144A of the Securities Act of 1933, as amended. These investments may only be resold in transactions exempt from registration, which are normally those transactions with qualified institutional buyers.
|
ETM | Escrowed to maturity. |
IF | Inverse floating rate security issued by a tender option bond (“TOB”) trust, the interest rate on which varies inversely with the Securities Industry Financial Markets Association (SIFMA) short-term rate, which resets weekly, or a similar short-term rate, and is reduced by the expenses related to the TOB trust.
|
UB | Underlying bond of an inverse floating rate trust reflected as a financing transaction. See Notes to Financial Statements, Note 4 – Portfolio Securities and Investments in Derivatives for more information.
|
WI/DD | Purchased on a when-issued or delayed delivery basis. |
See accompanying notes to financial statements.
65
| | |
| NZF | Nuveen Municipal Credit Income Fund |
| Portfolio of Investments |
| April 30, 2021 (Unaudited) |
| | | | | | |
| Principal | | | Optional Call | | |
| Amount (000) | | Description (1) | Provisions (2) | Ratings (3) | Value |
| | LONG-TERM INVESTMENTS – 154.9% (100.0% of Total Investments) | | | |
|
| | MUNICIPAL BONDS – 153.4% (99.0% of Total Investments) | | | |
|
| | Alabama – 1.0% (0.6% of Total Investments) | | | |
| $ 8,585 | | Alabama Private Colleges and University Facilities Authority, Limited Obligation Bonds, | 9/25 at 100.00 | N/R | $ 9,424,527 |
| | University of Mobile Project, Series 2015A, 6.000%, 9/01/45, 144A | | | |
| 5,250 | | Alabama Special Care Facilities Financing Authority, Birmingham, Hospital Revenue Bonds, | 6/21 at 100.00 | N/R (5) | 5,609,205 |
| | Daughters of Charity National Health System – Providence Hospital and St Vincent’s Hospital, | | | |
| | Series 1995, 5.000%, 11/01/25 (ETM) | | | |
| 5,835 | | Lower Alabama Gas District, Alabama, Gas Project Revenue Bonds, Series 2016A, 5.000%, 9/01/46 | No Opt. Call | A2 | 8,533,804 |
| 19,670 | | Total Alabama | | | 23,567,536 |
| | Alaska – 0.3% (0.2% of Total Investments) | | | |
| | Alaska Industrial Development and Export Authority, Power Revenue Bonds, Snettisham | | | |
| | Hydroelectric Project, Refunding Series 2015: | | | |
| 1,000 | | 5.000%, 1/01/31 (AMT) | 7/25 at 100.00 | Baa2 | 1,110,500 |
| 2,950 | | 5.000%, 1/01/33 (AMT) | 7/25 at 100.00 | Baa2 | 3,265,532 |
| 2,900 | | 5.000%, 1/01/34 (AMT) | 7/25 at 100.00 | Baa2 | 3,202,064 |
| 35 | | Northern Tobacco Securitization Corporation, Alaska, Tobacco Settlement Asset-Backed | 5/21 at 100.00 | A1 | 35,568 |
| | Bonds, Series 2006A, 4.625%, 6/01/23 | | | |
| 6,885 | | Total Alaska | | | 7,613,664 |
| | Arizona – 1.9% (1.2% of Total Investments) | | | |
| 1,300 | | Apache County Industrial Development Authority, Arizona, Pollution Control Revenue | 3/22 at 100.00 | A– | 1,332,487 |
| | Bonds, Tucson Electric Power Company, Series 20102A, 4.500%, 3/01/30 | | | |
| 2,820 | | Arizona Health Facilities Authority, Revenue Bonds, Scottsdale Lincoln Hospitals | 12/24 at 100.00 | A2 | 3,184,316 |
| | Project, Refunding Series 2014A, 5.000%, 12/01/39 | | | |
| 10,450 | | Arizona Sports and Tourism Authority, Tax Revenue Bonds, Multipurpose Stadium Facility | 7/22 at 100.00 | A | 10,881,062 |
| | Project, Refunding Senior Series 2012A, 5.000%, 7/01/30 | | | |
| 2,131 | | Cahava Springs Revitalization District, Cave Creek, Arizona, Special Assessment Bonds, | 7/27 at 100.00 | N/R | 1,640,888 |
| | Series 2017A, 7.000%, 7/01/41, 144A (4) | | | |
| 3,185 | | Eastmark Community Facilities District 1, Mesa, Arizona, General Obligation Bonds, | 7/25 at 100.00 | N/R | 3,395,847 |
| | Series 2015, 5.000%, 7/15/39, 144A | | | |
| 1,750 | | Maricopa County Industrial Development Authority, Arizona, Hospital Revenue Bonds, | 9/28 at 100.00 | A2 | 2,161,285 |
| | HonorHealth, Series 2019A, 5.000%, 9/01/42 | | | |
| | Phoenix Mesa Gateway Airport Authority, Arizona, Special Facility Revenue Bonds, Mesa | | | |
| | Project, Series 2012: | | | |
| 400 | | 5.000%, 7/01/27 (AMT) | 7/22 at 100.00 | A1 | 422,028 |
| 950 | | 5.000%, 7/01/32 (AMT) | 7/22 at 100.00 | A1 | 998,327 |
| | Pima County Industrial Development Authority, Arizona, Education Facility Revenue Bonds, | | | |
| | Edkey Charter Schools Project, Series 2016: | | | |
| 1,790 | | 5.375%, 7/01/46 | 7/26 at 100.00 | BB– | 1,889,094 |
| 2,140 | | 5.500%, 7/01/51 | 7/26 at 100.00 | BB– | 2,262,686 |
| 595 | | Pima County Industrial Development Authority, Arizona, Education Facility Revenue Bonds, | 2/24 at 100.00 | N/R | 627,517 |
| | San Tan Montessori School Project, Series 2016, 6.500%, 2/01/48, 144A | | | |
| 2,060 | | Pima County Industrial Development Authority, Arizona, Education Facility Revenue Bonds, | 2/28 at 100.00 | N/R | 2,342,158 |
| | San Tan Montessori School Project, Series 2017, 6.750%, 2/01/50, 144A | | | |
| 3,710 | | Pinal County Electrical District 3, Arizona, Electric System Revenue Bonds, Refunding | 7/21 at 100.00 | A+ (5) | 3,740,348 |
| | Series 2011, 5.250%, 7/01/41 (Pre-refunded 7/01/21) | | | |
| 7,235 | | Salt Verde Financial Corporation, Arizona, Senior Gas Revenue Bonds, Citigroup Energy | No Opt. Call | BBB+ | 10,181,671 |
| | Inc Prepay Contract Obligations, Series 2007, 5.000%, 12/01/37 | | | |
| 40,516 | | Total Arizona | | | 45,059,714 |
66
| | | | | | |
| Principal | | | Optional Call | | |
| Amount (000) | | Description (1) | Provisions (2) | Ratings (3) | Value |
| | California – 22.2% (14.3% of Total Investments) | | | |
| $ 2,000 | | ABC Unified School District, Los Angeles County, California, General Obligation Bonds, | No Opt. Call | AA– | $ 1,985,840 |
| | Series 2000B, 0.000%, 8/01/23 – FGIC Insured | | | |
| 4,225 | | Alameda Unified School District, Alameda County, California, General Obligation Bonds, | No Opt. Call | AA | 3,839,384 |
| | Series 2005B, 0.000%, 8/01/28 – AGM Insured | | | |
| 535 | | Antelope Valley Healthcare District, California, Revenue Bonds, Series 2016A, 5.000%, 3/01/41 | 3/26 at 100.00 | Ba3 | 544,678 |
| 1,900 | | Blythe Redevelopment Agency Successor Agency, California, Tax Allocation Bonds, | 11/25 at 100.00 | N/R | 2,158,856 |
| | Redevelopment Project 1, Refunding Series 2015, 5.000%, 5/01/38 | | | |
| | Calexico Unified School District, Imperial County, California, General Obligation Bonds, | | | |
| | Series 2005B: | | | |
| 4,070 | | 0.000%, 8/01/32 – FGIC Insured | No Opt. Call | A | 3,251,482 |
| 6,410 | | 0.000%, 8/01/34 – FGIC Insured | No Opt. Call | A | 4,824,999 |
| 1,515 | | California Community Housing Agency, California, Essential Housing Revenue Bonds, | 8/29 at 100.00 | N/R | 1,732,342 |
| | Verdant at Green Valley Apartments, Series 2019A, 5.000%, 8/01/49, 144A | | | |
| 1,295 | | California County Tobacco Securitization Agency, Tobacco Settlement Asset-Backed Bonds, | 5/21 at 100.00 | N/R | 1,295,479 |
| | Golden Gate Tobacco Funding Corporation, Turbo, Series 2007A, 5.000%, 6/01/36 | | | |
| | California Health Facilities Financing Authority, Revenue Bonds, Saint Joseph Health | | | |
| | System, Series 2013A: | | | |
| 3,840 | | 5.000%, 7/01/33 | 7/23 at 100.00 | AA– | 4,232,333 |
| 710 | | 5.000%, 7/01/37 | 7/23 at 100.00 | AA– | 778,820 |
| 825 | | California Municipal Finance Authority, Charter School Lease Revenue Bonds, Santa Rosa | 7/25 at 100.00 | BB+ | 897,996 |
| | Academy Project, Series 2015, 5.375%, 7/01/45, 144A | | | |
| 1,795 | | California Pollution Control Financing Authority, Water Furnishing Revenue Bonds, San | 1/29 at 100.00 | Baa3 | 2,169,886 |
| | Diego County Water Authority Desalination Project Pipeline, Refunding Series 2019, 5.000%, | | | |
| | 7/01/39, 144A | | | |
| 2,000 | | California School Finance Authority, Charter School Revenue Bonds, Downtown College Prep – | 6/26 at 100.00 | N/R | 2,163,440 |
| | Obligated Group, Series 2016, 5.000%, 6/01/51, 144A | | | |
| 2,000 | | California State Public Works Board, Lease Revenue Bonds, Judicial Council of | 3/23 at 100.00 | A+ | 2,164,040 |
| | California, Various Projects Series 2013A, 5.000%, 3/01/38 | | | |
| 4,500 | | California State Public Works Board, Lease Revenue Bonds, Various Capital Projects, | 10/21 at 100.00 | A+ | 4,591,125 |
| | Series 2011A, 5.125%, 10/01/31 | | | |
| 3,000 | | California State, General Obligation Bonds, Various Purpose Series 2011, 5.250%, 10/01/32 | 10/21 at 100.00 | AA– | 3,062,790 |
| 16,050 | | California State, General Obligation Bonds, Various Purpose Series 2021, 5.000%, 12/01/35 | 12/30 at 100.00 | AA– | 21,362,229 |
| 10,000 | | California Statewide Communities Development Authority, California, Revenue Bonds, Loma | 12/24 at 100.00 | BB– | 11,205,200 |
| | Linda University Medical Center, Series 2014A, 5.500%, 12/01/54 | | | |
| | California Statewide Communities Development Authority, California, Revenue Bonds, Loma | | | |
| | Linda University Medical Center, Series 2016A: | | | |
| 2,250 | | 5.000%, 12/01/41, 144A | 6/26 at 100.00 | BB– | 2,538,968 |
| 17,155 | | 5.000%, 12/01/46, 144A | 6/26 at 100.00 | BB– | 19,246,194 |
| 7,335 | | 5.250%, 12/01/56, 144A | 6/26 at 100.00 | BB– | 8,267,939 |
| 27,545 | | California Statewide Communities Development Authority, California, Revenue Bonds, Loma | 6/28 at 100.00 | BB– | 32,654,597 |
| | Linda University Medical Center, Series 2018A, 5.500%, 12/01/58, 144A | | | |
| 331 | | California Statewide Community Development Authority, Revenue Bonds, Daughters of | 6/21 at 100.00 | N/R | 314,089 |
| | Charity Health System, Series 2005A, 5.500%, 7/01/39 (4) | | | |
| 223 | | California Statewide Community Development Authority, Revenue Bonds, Daughters of | 6/21 at 100.00 | N/R | 212,010 |
| | Charity Health System, Series 2005H, 5.750%, 7/01/25 (4) | | | |
| 9,955 | | Capistrano Unified School District, Orange County, California, Special Tax Bonds, | No Opt. Call | Baa2 | 7,940,008 |
| | Community Facilities District 98-2, Series 2005, 0.000%, 9/01/31 – FGIC Insured | | | |
| | Clovis Unified School District, Fresno County, California, General Obligation Bonds, | | | |
| | Election 2012 Series 2013B: | | | |
| 1,135 | | 5.000%, 8/01/38 (Pre-refunded 8/01/23) | 8/23 at 100.00 | AA (5) | 1,259,759 |
| 1,865 | | 5.000%, 8/01/38 (Pre-refunded 8/01/23) | 8/23 at 100.00 | N/R (5) | 2,067,781 |
| 4,000 | | Coast Community College District, Orange County, California, General Obligation Bonds, | No Opt. Call | AA+ | 3,990,640 |
| | Series 2005, 0.000%, 8/01/22 – NPFG Insured | | | |
67
| | |
| NZF | Nuveen Municipal Credit Income Fund |
| Portfolio of Investments (continued) April 30, 2021 (Unaudited) |
|
| | | | | | |
| Principal | | | Optional Call | | |
| Amount (000) | | Description (1) | Provisions (2) | Ratings (3) | Value |
| | California (continued) | | | |
| $ 3,795 | | Colton Joint Unified School District, San Bernardino County, California, General | No Opt. Call | A+ | $ 2,643,521 |
| | Obligation Bonds, Series 2006C, 0.000%, 2/01/37 – FGIC Insured | | | |
| 925 | | Contra Costa County, California, GNMA Mortgage-Backed Securities Program Home Mortgage | No Opt. Call | AA+ (5) | 959,882 |
| | Revenue Bonds, Series 1989, 7.750%, 5/01/22 (AMT) (ETM) | | | |
| 6,215 | | CSCDA Community Improvement Authority, California, Essential Housing Revenue Bonds, | 10/31 at 100.00 | N/R | 6,660,553 |
| | Altana Glendale, Series 2021A-2, 4.000%, 10/01/56, 144A | | | |
| 1,320 | | Davis, California, Special Tax Bonds, Community Facilities District 2015-1 Series 2015, | 9/25 at 100.00 | N/R | 1,492,682 |
| | 5.000%, 9/01/40 | | | |
| 5,000 | | Escondido Union School District, San Diego County, California, General Obligation Bonds, | 8/27 at 100.00 | Aa2 | 5,684,550 |
| | Election 2014 Series 2018B, 4.000%, 8/01/47 | | | |
| 2,510 | | Folsom Cordova Unified School District, Sacramento County, California, General | No Opt. Call | AA– | 2,264,020 |
| | Obligation Bonds, School Facilities Improvement District 1, Series 2004B, 0.000%, 10/01/28 – | | | |
| | NPFG Insured | | | |
| 3,360 | | Folsom Cordova Unified School District, Sacramento County, California, General | No Opt. Call | AA– | 3,131,117 |
| | Obligation Bonds, School Facilities Improvement District 2, Series 2002A, 0.000%, 7/01/27 – | | | |
| | NPFG Insured | | | |
| 3,725 | | Foothill/Eastern Transportation Corridor Agency, California, Toll Road Revenue Bonds, | No Opt. Call | BBB | 2,811,965 |
| | Refunding Senior Lien Series 2015A, 0.000%, 1/15/34 – AGM Insured | | | |
| | Foothill/Eastern Transportation Corridor Agency, California, Toll Road Revenue Bonds, | | | |
| | Refunding Series 2013A: | | | |
| 3,000 | | 0.000%, 1/15/26 (6) | No Opt. Call | Baa2 | 3,133,320 |
| 1,560 | | 5.750%, 1/15/46 (Pre-refunded 1/15/24) | 1/24 at 100.00 | Baa2 (5) | 1,795,061 |
| 3,560 | | 6.000%, 1/15/49 (Pre-refunded 1/15/24) | 1/24 at 100.00 | Baa2 (5) | 4,116,179 |
| 4,505 | | Foothill-De Anza Community College District, Santa Clara County, California, Election of | No Opt. Call | AAA | 3,921,963 |
| | 1999 General Obligation Bonds, Series A, 0.000%, 8/01/30 – NPFG Insured | | | |
| 5,855 | | Fremont Union High School District, Santa Clara County, California, General Obligation | 8/27 at 100.00 | AAA | 6,815,981 |
| | Bonds, Refunding Series 2017A, 4.000%, 8/01/46 | | | |
| 2,315 | | Gateway Unified School District, California, General Obligation Bonds, Series 2004B, | No Opt. Call | A+ | 1,849,430 |
| | 0.000%, 8/01/32 – FGIC Insured | | | |
| 1,000 | | Gavilan Joint Community College District, Santa Clara and San Benito Counties, | 8/21 at 100.00 | Aa3 (5) | 1,013,740 |
| | California, General Obligation Bonds, Election of 2004 Series 2011D, 5.750%, 8/01/35 | | | |
| | (Pre-refunded 8/01/21) | | | |
| 8,495 | | Golden State Tobacco Securitization Corporation, California, Enhanced Tobacco Settlement | 6/25 at 100.00 | A+ | 9,892,428 |
| | Asset-Backed Revenue Bonds, Refunding Series 2015A, 5.000%, 6/01/45 | | | |
| 3,170 | | Golden State Tobacco Securitization Corporation, California, Enhanced Tobacco Settlement | No Opt. Call | Aa3 | 3,028,301 |
| | Asset-Backed Revenue Bonds, Series 2005A, 0.000%, 6/01/26 – AGM Insured | | | |
| 8,550 | | Golden State Tobacco Securitization Corporation, California, Tobacco Settlement | 6/22 at 100.00 | N/R | 8,859,681 |
| | Asset-Backed Bonds, Series 2018A-1, 5.250%, 6/01/47 | | | |
| 500 | | Golden State Tobacco Securitization Corporation, California, Tobacco Settlement | 6/22 at 100.00 | N/R | 516,625 |
| | Asset-Backed Bonds, Series 2018A-2, 5.000%, 6/01/47 | | | |
| 7,150 | | Grossmont Healthcare District, California, General Obligation Bonds, Series 2011B, | 7/21 at 100.00 | Aaa | 7,235,157 |
| | 6.125%, 7/15/40 (Pre-refunded 7/15/21) | | | |
| 3,190 | | Hillsborough City School District, San Mateo County, California, General Obligation | No Opt. Call | AAA | 2,996,846 |
| | Bonds, Series 2006B, 0.000%, 9/01/27 | | | |
| 5,000 | | Huntington Beach Union High School District, Orange County, California, General | No Opt. Call | Aa2 | 4,200,500 |
| | Obligation Bonds, Series 2005, 0.000%, 8/01/31 – NPFG Insured | | | |
| 2,500 | | Huntington Beach Union High School District, Orange County, California, General | No Opt. Call | AA– | 2,046,775 |
| | Obligation Bonds, Series 2007, 0.000%, 8/01/32 – FGIC Insured | | | |
| 14,565 | | Los Angeles Department of Airports, California, Revenue Bonds, Los Angeles International | 5/28 at 100.00 | A+ | 17,599,326 |
| | Airport, Subordinate Lien Series 2018A, 5.000%, 5/15/44 (AMT) | | | |
| 2,750 | | Los Angeles Regional Airports Improvement Corporation, California, Lease Revenue Bonds, | 1/22 at 100.00 | A– | 2,824,415 |
| | LAXFUEL Corporation at Los Angeles International Airport, Refunding Series 2012, | | | |
| | 4.500%, 1/01/27 (AMT) | | | |
68
| | | | | | |
| Principal | | | Optional Call | | |
| Amount (000) | | Description (1) | Provisions (2) | Ratings (3) | Value |
| | California (continued) | | | |
| $ 2,000 | | Martinez Unified School District, Contra Costa County, California, General Obligation | 8/24 at 100.00 | AA (5) | $ 2,366,540 |
| | Bonds, Series 2011, 5.875%, 8/01/31 (Pre-refunded 8/01/24) | | | |
| 1,000 | | Mendocino-Lake Community College District, Mendocino and Lake Counties, California, | 8/26 at 100.00 | A1 | 1,249,170 |
| | General Obligation Bonds, Election 2006, Series 2011B, 5.600%, 8/01/31 – AGM Insured | | | |
| 10,000 | | Milpitas Municipal Financing Authority, California, Wastewater Revenue Bonds, Series | 11/29 at 100.00 | AA+ | 11,791,800 |
| | 2019, 4.000%, 11/01/49 | | | |
| 2,335 | | Morongo Band of Mission Indians, California, Enterprise Revenue Bonds, Series 2018A, | 10/28 at 100.00 | BBB– | 2,717,146 |
| | 5.000%, 10/01/42, 144A | | | |
| | Mount San Antonio Community College District, Los Angeles County, California, General | | | |
| | Obligation Bonds, Election of 2008, Series 2013A: | | | |
| 1,030 | | 0.000%, 8/01/28 (6) | 2/28 at 100.00 | AA | 1,215,153 |
| 2,320 | | 0.000%, 8/01/43 (6) | 8/35 at 100.00 | AA | 2,612,807 |
| 5,420 | | M-S-R Energy Authority, California, Gas Revenue Bonds, Citigroup Prepay Contracts, | No Opt. Call | BBB+ | 8,884,085 |
| | Series 2009B, 6.500%, 11/01/39 | | | |
| | M-S-R Energy Authority, California, Gas Revenue Bonds, Citigroup Prepay Contracts, | | | |
| | Series 2009C: | | | |
| 2,700 | | 7.000%, 11/01/34 | No Opt. Call | BBB+ | 4,266,999 |
| 2,200 | | 6.500%, 11/01/39 | No Opt. Call | BBB+ | 3,606,086 |
| | North Orange County Community College District, California, General Obligation Bonds, | | | |
| | Election of 2002 Series 2003B: | | | |
| 7,735 | | 0.000%, 8/01/25 – FGIC Insured | No Opt. Call | AA+ | 7,496,685 |
| 4,180 | | 0.000%, 8/01/26 – FGIC Insured | No Opt. Call | AA+ | 3,987,009 |
| 10,885 | | Norwalk La Mirada Unified School District, Los Angeles County, California, General | No Opt. Call | A+ | 10,522,856 |
| | Obligation Bonds, Election 2002 Series 2005B, 0.000%, 8/01/25 – FGIC Insured | | | |
| 6,000 | | Palomar Pomerado Health, California, General Obligation Bonds, Capital Appreciation, | No Opt. Call | BBB– | 5,856,300 |
| | Election of 2004, Series 2007A, 0.000%, 8/01/24 – NPFG Insured | | | |
| 12,210 | | Palomar Pomerado Health, California, General Obligation Bonds, Convertible Capital | 8/30 at 100.00 | BBB– | 16,837,712 |
| | Appreciation, Election 2004 Series 2010A, 6.750%, 8/01/40 | | | |
| 5,000 | | Palomar Pomerado Health, California, General Obligation Bonds, Series 2009A, 7.000%, | 8/29 at 100.00 | BBB– | 7,126,500 |
| | 8/01/38 – AGC Insured | | | |
| 1,750 | | Paramount Unified School District, Los Angeles County, California, General Obligation | No Opt. Call | Aa3 | 1,734,863 |
| | Bonds, Series 2001B, 0.000%, 9/01/23 – AGM Insured | | | |
| 9,315 | | Perris, California, GNMA Mortgage-Backed Securities Program Single Family Mortgage | No Opt. Call | AA+ (5) | 10,392,466 |
| | Revenue Bonds, Series 1989A, 7.600%, 1/01/23 (AMT) (ETM) | | | |
| 3,850 | | Placentia-Yorba Linda Unified School District, Orange County, California, Certificates | 10/21 at 100.00 | A1 | 3,940,321 |
| | of Participation, Refunding Series 2011, 6.250%, 10/01/28 – AGM Insured | | | |
| 3,200 | | Redlands Unified School District, San Bernardino County, California, General Obligation | No Opt. Call | A2 | 2,960,192 |
| | Bonds, Series 2003, 0.000%, 7/01/27 – AGM Insured | | | |
| 205 | | Riverside County Transportation Commission, California, Toll Revenue Senior Lien Bonds, | 6/23 at 100.00 | BBB+ | 223,569 |
| | Series 2013A, 5.750%, 6/01/44 | | | |
| 2,755 | | Sacramento City Unified School District, Sacramento County, California, General | No Opt. Call | BBB+ | 2,652,927 |
| | Obligation Bonds, Series 2007, 0.000%, 7/01/25 – AGM Insured | | | |
| 3,550 | | San Buenaventura, California, Revenue Bonds, Community Memorial Health System, Series | 12/21 at 100.00 | BB | 3,669,671 |
| | 2011, 7.500%, 12/01/41 | | | |
| 165 | | San Clemente, California, Special Tax Revenue Bonds, Community Facilities District | 9/25 at 100.00 | N/R | 186,513 |
| | 2006-1 Marblehead Coastal, Series 2015, 5.000%, 9/01/40 | | | |
| 3,000 | | San Diego Community College District, California, General Obligation Bonds, 13.845%, | 8/21 at 100.00 | AAA | 3,107,400 |
| | 8/01/41 (Pre-refunded 8/01/21), 144A (IF) (7) | | | |
| 50,510 | | San Francisco Airports Commission, California, Revenue Bonds, San Francisco | 5/28 at 100.00 | A | 60,943,346 |
| | International Airport, Second Series 2018D, 5.000%, 5/01/48 (AMT) | | | |
69
| | |
| NZF | Nuveen Municipal Credit Income Fund |
| Portfolio of Investments (continued) April 30, 2021 (Unaudited) |
|
| | | | | | |
| Principal | | | Optional Call | | |
| Amount (000) | | Description (1) | Provisions (2) | Ratings (3) | Value |
| | California (continued) | | | |
| | San Francisco Airports Commission, California, Revenue Bonds, San Francisco | | | |
| | International Airport, Second Series 2019A: | | | |
| $ 1,000 | | 5.000%, 5/01/44 (AMT) | 5/29 at 100.00 | A | $ 1,226,570 |
| 22,975 | | 5.000%, 5/01/49 (AMT) | 5/29 at 100.00 | A | 28,032,027 |
| 2,700 | | San Joaquin Hills Transportation Corridor Agency, Orange County, California, Toll Road | 1/25 at 100.00 | BBB– | 3,026,673 |
| | Revenue Bonds, Refunding Junior Lien Series 2014B, 5.250%, 1/15/44 | | | |
| | San Joaquin Hills Transportation Corridor Agency, Orange County, California, Toll Road | | | |
| | Revenue Bonds, Refunding Senior Lien Series 2014A: | | | |
| 6,630 | | 5.000%, 1/15/44 | 1/25 at 100.00 | BBB | 7,436,341 |
| 3,160 | | 5.000%, 1/15/50 | 1/25 at 100.00 | BBB | 3,524,127 |
| 7,205 | | San Joaquin Hills Transportation Corridor Agency, Orange County, California, Toll Road | No Opt. Call | Baa2 | 7,006,790 |
| | Revenue Bonds, Refunding Series 1997A, 0.000%, 1/15/23 – NPFG Insured | | | |
| 9,750 | | San Luis Obispo County Community College District, California, General Obligation Bonds, | 8/28 at 100.00 | AA– | 11,376,788 |
| | Election of 2014 Series 2018B, 4.000%, 8/01/43 | | | |
| 5,760 | | San Ysidro School District, San Diego County, California, General Obligation Bonds, | 8/25 at 34.92 | A3 | 1,880,064 |
| | Refunding Series 2015, 0.000%, 8/01/45 | | | |
| 5,520 | | Silicon Valley Clean Water, Mateo County, California, Wastewater Revenue Bonds, Series | 2/28 at 100.00 | AA | 6,345,902 |
| | 2018, 4.000%, 8/01/42 | | | |
| | Silicon Valley Tobacco Securitization Authority, California, Tobacco Settlement | | | |
| | Asset-Backed Bonds, Santa Clara County Tobacco Securitization Corporation, Series 2007A: | | | |
| 7,500 | | 0.000%, 6/01/36 | 6/21 at 43.51 | N/R | 3,251,625 |
| 37,555 | | 0.000%, 6/01/47 | 6/21 at 23.19 | N/R | 8,677,458 |
| 1,820 | | Southwestern Community College District, San Diego County, California, General | 8/27 at 100.00 | AA– | 2,082,408 |
| | Obligation Bonds, Election of 2016, Series 2017A, 4.000%, 8/01/42 | | | |
| 1,800 | | Walnut Valley Unified School District, Los Angeles County, California, General | No Opt. Call | AA– | 1,677,816 |
| | Obligation Bonds, Election 2000 Series 2003D, 0.000%, 8/01/27 – FGIC Insured | | | |
| | Wiseburn School District, Los Angeles County, California, General Obligation Bonds, | | | |
| | Series 2011B: | | | |
| 4,005 | | 0.000%, 8/01/36 – AGM Insured (6) | 8/31 at 100.00 | AA | 4,531,738 |
| 3,900 | | 5.625%, 5/01/41 (Pre-refunded 8/01/21) – AGM Insured | 8/21 at 100.00 | AA (5) | 3,952,416 |
| 3,000 | | Yuba Community College District, California, General Obligation Bonds, Election 2006 | 8/21 at 100.00 | Aa2 (5) | 3,037,590 |
| | Series 2011C, 5.250%, 8/01/47 (Pre-refunded 8/01/21) | | | |
| 520,574 | | Total California | | | 535,661,371 |
| | Colorado – 5.4% (3.5% of Total Investments) | | | |
| 1,500 | | Anthem West Metropolitan District, Colorado, General Obligation Bonds, Refunding Series | 12/25 at 100.00 | A1 | 1,756,920 |
| | 2015, 5.000%, 12/01/35 – BAM Insured | | | |
| 1,206 | | Base Village Metropolitan District 2, Colorado, General Obligation Bonds, Refunding | 12/21 at 103.00 | N/R | 1,259,522 |
| | Series 2016A, 5.500%, 12/01/36 | | | |
| | Canyons Metropolitan District 5, Douglas County, Colorado, Limited Tax General | | | |
| | Obligation and Special Revenue Bonds, Refunding & Improvement Series 2017A: | | | |
| 775 | | 6.000%, 12/01/37 | 12/22 at 103.00 | N/R | 821,477 |
| 2,320 | | 6.125%, 12/01/47 | 12/22 at 103.00 | N/R | 2,458,713 |
| 685 | | Canyons Metropolitan District 6, Douglas County, Colorado, Limited Tax General | 12/22 at 103.00 | N/R | 725,956 |
| | Obligation and Special Revenue Bonds, Refunding & Improvement Series 2017A, 6.125%, 12/01/47 | | | |
| | Centerra Metropolitan District 1, Loveland, Colorado, Special Revenue Bonds, Refunding & | | | |
| | Improvement Series 2017: | | | |
| 770 | | 5.000%, 12/01/37, 144A | 12/22 at 103.00 | N/R | 815,661 |
| 2,210 | | 5.000%, 12/01/47, 144A | 12/22 at 103.00 | N/R | 2,331,550 |
| 625 | | Central Platte Valley Metropolitan District, Colorado, General Obligation Bonds, | 12/23 at 100.00 | BBB– | 681,544 |
| | Refunding Series 2013A, 6.000%, 12/01/38 | | | |
| 976 | | Cherry Creek Corporate Center Metropolitan District, Arapahoe County, Colorado, Revenue | 12/25 at 100.00 | N/R | 1,052,343 |
| | Bonds, Refunding Senior Lien Series 2015A, 5.000%, 6/01/37 | | | |
70
| | | | | | |
| Principal | | | Optional Call | | |
| Amount (000) | | Description (1) | Provisions (2) | Ratings (3) | Value |
| | Colorado (continued) | | | |
| $ 9,335 | | Colorado Health Facilities Authority, Colorado, Revenue Bonds, Catholic Health | 1/23 at 100.00 | BBB+ (5) | $ 10,115,033 |
| | Initiatives, Series 2013A, 5.250%, 1/01/45 (Pre-refunded 1/01/23) | | | |
| 2,000 | | Colorado Health Facilities Authority, Colorado, Revenue Bonds, Children’s Hospital | 12/23 at 100.00 | A+ | 2,194,040 |
| | Colorado Project, Series 2013A, 5.000%, 12/01/36 | | | |
| | Colorado Health Facilities Authority, Colorado, Revenue Bonds, CommonSpirit Health, | | | |
| | Series 2019A-2: | | | |
| 4,000 | | 5.000%, 8/01/37 | 8/29 at 100.00 | BBB+ | 5,007,560 |
| 8,335 | | 5.000%, 8/01/38 | 8/29 at 100.00 | BBB+ | 10,408,748 |
| 6,500 | | 5.000%, 8/01/39 | 8/29 at 100.00 | BBB+ | 8,098,805 |
| 2,000 | | Colorado Health Facilities Authority, Colorado, Revenue Bonds, Craig Hospital Project, | 12/22 at 100.00 | A+ | 2,058,680 |
| | Series 2012, 4.000%, 12/01/42 | | | |
| 585 | | Colorado Health Facilities Authority, Colorado, Revenue Bonds, Evangelical Lutheran Good | 6/23 at 100.00 | N/R (5) | 651,070 |
| | Samaritan Society Project, Series 2013, 5.625%, 6/01/43 (Pre-refunded 6/01/23) | | | |
| 3,655 | | Colorado Health Facilities Authority, Colorado, Revenue Bonds, Evangelical Lutheran Good | 6/25 at 100.00 | N/R (5) | 4,335,488 |
| | Samaritan Society Project, Series 2013A, 5.000%, 6/01/45 (Pre-refunded 6/01/25) | | | |
| 2,105 | | Colorado International Center Metropolitan District 14, Denver, Colorado, Limited Tax | 12/23 at 103.00 | N/R | 2,286,072 |
| | General Obligation Bonds, Refunding & Improvement Series 2018, 5.875%, 12/01/46 | | | |
| 2,250 | | Colorado Springs, Colorado, Utilities System Revenue Bonds, Improvement Series 2013B-1, | 11/23 at 100.00 | Aa2 | 2,497,612 |
| | 5.000%, 11/15/38 | | | |
| 2,200 | | Denver City and County, Colorado, Airport System Revenue Bonds, Series 2012B, 5.000%, | 11/22 at 100.00 | A+ (5) | 2,363,042 |
| | 11/15/32 (Pre-refunded 11/15/22) | | | |
| 3,870 | | Denver City and County, Colorado, Airport System Revenue Bonds, Subordinate Lien Series | 11/23 at 100.00 | A | 4,264,972 |
| | 2013B, 5.000%, 11/15/43 | | | |
| | Denver Urban Renewal Authority, Colorado, Tax Increment Revenue Bonds, 9th and Colorado | | | |
| | Urban Redevelopment Area, Series 2018A: | | | |
| 835 | | 5.250%, 12/01/39, 144A | 12/23 at 103.00 | N/R | 916,772 |
| 1,310 | | 5.250%, 12/01/39, 144A | 12/23 at 103.00 | N/R | 1,438,917 |
| 10,000 | | E-470 Public Highway Authority, Colorado, Senior Revenue Bonds, Capital Appreciation | No Opt. Call | A | 6,066,300 |
| | Series 2010A, 0.000%, 9/01/41 | | | |
| 8,845 | | E-470 Public Highway Authority, Colorado, Senior Revenue Bonds, Series 1997B, 0.000%, | No Opt. Call | A | 8,385,502 |
| | 9/01/26 – NPFG Insured | | | |
| | E-470 Public Highway Authority, Colorado, Senior Revenue Bonds, Series 2000B: | | | |
| 7,550 | | 0.000%, 9/01/29 – NPFG Insured | No Opt. Call | A | 6,650,342 |
| 11,100 | | 0.000%, 9/01/31 – NPFG Insured | No Opt. Call | A | 9,232,203 |
| 10,000 | | 0.000%, 9/01/32 – NPFG Insured | No Opt. Call | A | 8,098,100 |
| | Eaton Area Park and Recreation District, Colorado, General Obligation Limited Tax Bonds, | | | |
| | Series 2015: | | | |
| 475 | | 5.500%, 12/01/30 (Pre-refunded 12/01/22) | 12/22 at 100.00 | N/R (5) | 514,173 |
| 180 | | 5.250%, 12/01/34 (Pre-refunded 12/01/22) | 12/22 at 100.00 | N/R (5) | 194,137 |
| 896 | | Flatiron Meadows Metropolitan District, Boulder County, Colorado, General Obligation | 12/21 at 103.00 | N/R | 930,989 |
| | Limited Tax Bonds, Series 2016, 5.125%, 12/01/46 | | | |
| | Foothills Metropolitan District, Fort Collins, Colorado, Special Revenue Bonds, Series 2014: | | | |
| 1,125 | | 5.750%, 12/01/30 | 12/24 at 100.00 | N/R | 1,212,997 |
| 1,000 | | 6.000%, 12/01/38 | 12/24 at 100.00 | N/R | 1,058,450 |
| 770 | | Great Western Park Metropolitan District 2, Broomfield City and County, Colorado, | 12/21 at 100.00 | N/R | 799,768 |
| | General Obligation Bonds, Series 2016A, 5.000%, 12/01/46 | | | |
| | Johnstown Plaza Metropolitan District, Colorado, Special Revenue Bonds, Series 2016A: | | | |
| 1,590 | | 5.250%, 12/01/36 | 12/21 at 103.00 | N/R | 1,654,649 |
| 6,130 | | 5.375%, 12/01/46 | 12/21 at 103.00 | N/R | 6,374,955 |
| 1,000 | | Meridian Metropolitan District, Douglas County, Colorado, General Obligation Refunding | 12/21 at 100.00 | A– (5) | 1,027,090 |
| | Bonds, Series 2011A, 5.000%, 12/01/41 (Pre-refunded 12/01/21) | | | |
| 825 | | North Range Metropolitan District 2, Adams County, Colorado , Limited Tax General | 12/22 at 103.00 | N/R | 879,038 |
| | Obligation Bonds, Refunding Special Revenue & Improvement Series 2017A, 5.750%, 12/01/47 | | | |
71
| | |
| NZF | Nuveen Municipal Credit Income Fund |
| Portfolio of Investments (continued) April 30, 2021 (Unaudited) |
|
| | | | | | |
| Principal | | | Optional Call | | |
| Amount (000) | | Description (1) | Provisions (2) | Ratings (3) | Value |
| | Colorado (continued) | | | |
| $ 4,310 | | Painted Prairie Public Improvement Authority, Aurora, Colorado, Special Revenue Bonds, | 12/24 at 103.00 | N/R | $ 4,730,268 |
| | Series 2019, 5.000%, 12/01/39 | | | |
| 1,870 | | Park Creek Metropolitan District, Colorado, Senior Limited Property Tax Supported | 12/25 at 100.00 | A | 2,152,389 |
| | Revenue Bonds, Refunding Series 2015A, 5.000%, 12/01/45 | | | |
| 500 | | Parker Automotive Metropolitan District (In the Town of Parker, Colorado), General | 12/26 at 100.00 | N/R | 544,805 |
| | Obligation Bonds, Refunding Series 2016, 5.000%, 12/01/45 | | | |
| 989 | | Reserve Metropolitan District 2, Mount Crested Butte, Colorado, Limited Tax General | 12/26 at 100.00 | N/R | 1,074,469 |
| | Obligation Bonds, Refunding Series 2016A, 5.000%, 12/01/45 | | | |
| 525 | | Sierra Ridge Metropolitan District 2, Douglas County, Colorado, General Obligation | 12/21 at 103.00 | N/R | 546,698 |
| | Bonds, Limited Tax Series 2016A, 5.500%, 12/01/46 | | | |
| 55 | | Water Valley Metropolitan District 1, Colorado, General Obligation Bonds, Refunding | 12/26 at 100.00 | N/R | 60,921 |
| | Series 2016, 5.250%, 12/01/40 | | | |
| 105 | | Water Valley Metropolitan District 2, Windsor, Colorado, General Obligation Bonds, | 12/26 at 100.00 | N/R | 116,587 |
| | Refunding Series 2016, 5.250%, 12/01/40 | | | |
| 129,887 | | Total Colorado | | | 130,845,327 |
| | Connecticut – 0.3% (0.2% of Total Investments) | | | |
| 1,500 | | Connecticut Health and Educational Facilities Authority, Revenue Bonds, Hartford | 7/21 at 100.00 | A (5) | 1,511,670 |
| | HealthCare, Series 2011A, 5.000%, 7/01/41 (Pre-refunded 7/01/21) | | | |
| 5,000 | | Connecticut Health and Educational Facilities Authority, Revenue Bonds, Trinity Health | 6/26 at 100.00 | AA– | 5,971,300 |
| | Credit Group, Series 2016CT, 5.000%, 12/01/45 | | | |
| 6,500 | | Total Connecticut | | | 7,482,970 |
| | District of Columbia – 0.5% (0.4% of Total Investments) | | | |
| 10,935 | | Metropolitan Washington DC Airports Authority, Airport System Revenue Bonds, Refunding | 10/27 at 100.00 | A+ | 13,123,094 |
| | Series 2017, 5.000%, 10/01/47 (AMT) | | | |
| | Florida – 7.5% (4.8% of Total Investments) | | | |
| 6,495 | | Alachua County Health Facilities Authority, Florida, Health Facilties Revenue Bonds, | 12/29 at 100.00 | A3 | 7,369,227 |
| | Shands Teaching Hospital & Clinics, Inc at the University of Florida Project, Series 2019A, | | | |
| | 4.000%, 12/01/49 | | | |
| | Bay County, Florida, Educational Facilities Revenue Refunding Bonds, Bay Haven Charter | | | |
| | Academy, Inc Project, Series 2013A: | | | |
| 1,005 | | 5.000%, 9/01/43 | 9/23 at 100.00 | BBB | 1,060,737 |
| 865 | | 5.000%, 9/01/45 | 9/23 at 100.00 | BBB | 911,814 |
| 625 | | Belmont Community Development District, Florida, Capital Improvement Revenue Bonds, | 11/27 at 100.00 | N/R | 702,669 |
| | Series 2016A, 5.375%, 11/01/36 | | | |
| 665 | | Bexley Community Development District, Pasco County, Florida, Special Assessment Revenue | 5/26 at 100.00 | N/R | 715,700 |
| | Bonds, Series 2016, 4.700%, 5/01/36 | | | |
| 1,480 | | Broward County, Florida, Fuel System Revenue Bonds, Fort Lauderdale Fuel Facilities LLC | 4/23 at 100.00 | AA | 1,596,787 |
| | Project, Series 2013A, 5.000%, 4/01/33 – AGM Insured (AMT) | | | |
| 4,390 | | Capital Trust Agency, Florida, Multifamily Housing Revenue Bonds, The Gardens Apartments | 7/25 at 100.00 | CCC+ | 3,315,021 |
| | Project, Series 2015A, 5.000%, 7/01/50 | | | |
| | Creekside at Twin Creeks Community Development District, Florida, Special Assessment | | | |
| | Bonds, Area 1 Project, Series 2016A-1: | | | |
| 120 | | 5.250%, 11/01/37 | 11/28 at 100.00 | N/R | 135,778 |
| 155 | | 5.600%, 11/01/46 | 11/28 at 100.00 | N/R | 176,960 |
| | Downtown Doral Community Development District, Florida, Special Assessment Bonds, | | | |
| | Series 2015: | | | |
| 555 | | 5.250%, 5/01/35 | 5/26 at 100.00 | N/R | 598,334 |
| 615 | | 5.300%, 5/01/36 | 5/26 at 100.00 | N/R | 662,958 |
| 955 | | 5.500%, 5/01/45 | 5/26 at 100.00 | N/R | 1,035,239 |
| 1,305 | | 5.500%, 5/01/46 | 5/26 at 100.00 | N/R | 1,414,007 |
72
| | | | | | |
| Principal | | | Optional Call | | |
| Amount (000) | | Description (1) | Provisions (2) | Ratings (3) | Value |
| | Florida (continued) | | | |
| | Florida Development Finance Corporation, Educational Facilities Revenue Bonds, Downtown | | | |
| | Doral Charter Upper School Project, Series 2017C: | | | |
| $ 1,115 | | 5.650%, 7/01/37, 144A | 7/27 at 101.00 | N/R | $ 1,250,573 |
| 3,385 | | 5.750%, 7/01/47, 144A | 7/27 at 101.00 | N/R | 3,750,377 |
| | Florida Development Finance Corporation, Educational Facilities Revenue Bonds, Florida | | | |
| | Charter Foundation Inc Projects, Series 2016A: | | | |
| 1,015 | | 6.250%, 6/15/36, 144A | 6/26 at 100.00 | N/R | 1,189,702 |
| 1,420 | | 4.750%, 7/15/36, 144A | 7/26 at 100.00 | N/R | 1,531,598 |
| 2,475 | | 6.375%, 6/15/46, 144A | 6/26 at 100.00 | N/R | 2,873,277 |
| 1,465 | | 5.000%, 7/15/46, 144A | 7/26 at 100.00 | N/R | 1,582,610 |
| | Florida Development Finance Corporation, Educational Facilities Revenue Bonds, Pepin | | | |
| | Academies Inc, Series 2016A: | | | |
| 1,000 | | 5.000%, 7/01/36 | 7/26 at 100.00 | N/R | 1,040,930 |
| 6,785 | | 5.125%, 7/01/46 | 7/26 at 100.00 | N/R | 6,990,450 |
| | Florida Development Finance Corporation, Educational Facilities Revenue Bonds, | | | |
| | Renaissance Charter School Income Projects, Series 2015A: | | | |
| 900 | | 6.000%, 6/15/35, 144A | 6/25 at 100.00 | N/R | 1,024,272 |
| 560 | | 6.125%, 6/15/46, 144A | 6/25 at 100.00 | N/R | 630,997 |
| 120 | | Florida Development Finance Corporation, Educational Facilities Revenue Bonds, | 9/27 at 100.00 | N/R | 133,952 |
| | Renaissance Charter School, Inc Projects, Series 2020C, 5.000%, 9/15/40, 144A | | | |
| 10,000 | | Florida Development Finance Corporation, Florida, Surface Transportation Facility | 1/24 at 107.00 | N/R | 10,400,000 |
| | Revenue Bonds, Brightline Passenger Rail Project, Green Series 2019B, 7.375%, | | | |
| | 1/01/49 (AMT), 144A | | | |
| | Florida Development Finance Corporation, Florida, Surface Transportation Facility | | | |
| | Revenue Bonds, Virgin Trains USA Passenger Rail Project , Series 2019A: | | | |
| 19,155 | | 6.250%, 1/01/49 (AMT) (Mandatory Put 1/01/24), 144A | 6/21 at 103.00 | N/R | 19,236,217 |
| 10,000 | | 6.375%, 1/01/49 (AMT) (Mandatory Put 1/01/26), 144A | 6/21 at 104.00 | N/R | 10,027,900 |
| 10,000 | | 6.500%, 1/01/49 (AMT) (Mandatory Put 1/01/29), 144A | 6/21 at 104.00 | N/R | 10,012,400 |
| 320 | | Grand Bay at Doral Community Development District, Miami-Dade County, Florida, Special | 5/26 at 100.00 | N/R | 340,736 |
| | Assessment Bonds, South Parcel Assessment Area Project, Series 2016, 4.750%, 5/01/36 | | | |
| 14,505 | | Greater Orlando Aviation Authority, Florida, Airport Facilities Revenue Bonds, Series | 10/29 at 100.00 | A+ | 16,617,798 |
| | 2019A, 4.000%, 10/01/44 (AMT) | | | |
| 5,000 | | Greater Orlando Aviation Authority, Florida, Orlando Airport Facilities Revenue Bonds, | 10/27 at 100.00 | A | 5,983,700 |
| | Priority Subordinated Series 2017, 5.000%, 10/01/47 (AMT) | | | |
| 14,375 | | Halifax Hospital Medical Center, Daytona Beach, Florida, Hospital Revenue Bonds, | 6/26 at 100.00 | A– | 16,815,875 |
| | Refunding & Improvement Series 2016, 5.000%, 6/01/36 | | | |
| 1,750 | | Hillsborough County Aviation Authority, Florida, Revenue Bonds, Tampa International | 10/24 at 100.00 | A | 1,983,992 |
| | Airport, Subordinate Lien Series 2015B, 5.000%, 10/01/40 (AMT) | | | |
| 4,695 | | Hillsborough County Aviation Authority, Florida, Tampa International Airport Customer | 10/24 at 100.00 | BBB+ | 5,322,768 |
| | Facility Charge Revenue Bonds, Series 2015A, 5.000%, 10/01/44 | | | |
| 2,490 | | Miami-Dade County, Florida, Special Obligation Bonds, Refunding Subordinate Series | 10/22 at 100.00 | A2 (5) | 2,661,661 |
| | 2012B, 5.000%, 10/01/37 (Pre-refunded 10/01/22) | | | |
| 7,045 | | Miami-Dade County, Florida, Water and Sewer System Revenue Bonds, Series 2013A, 5.000%, | 10/22 at 100.00 | A+ (5) | 7,530,682 |
| | 10/01/42 (Pre-refunded 10/01/22) | | | |
| 2,140 | | Northern Palm Beach County Improvement District, Florida, Water Control and Improvement | 8/26 at 100.00 | N/R | 2,436,262 |
| | Bonds, Development Unit 53, Series 2015, 5.350%, 8/01/35 | | | |
| 2,185 | | Orange County Health Facilities Authority, Florida, Hospital Revenue Bonds, Orlando | 4/22 at 100.00 | A2 (5) | 2,281,358 |
| | Health, Inc, Series 2012A, 5.000%, 10/01/42 (Pre-refunded 4/01/22) | | | |
| 2,335 | | Orlando, Florida, Capital Improvement Special Revenue Bonds, Series 2014B, | 10/24 at 100.00 | Aa2 | 2,656,483 |
| | 5.000%, 10/01/46 | | | |
| 13,080 | | Palm Beach County Health Facilities Authority, Florida, Hospital Revenue Bonds, Baptist | 8/29 at 100.00 | A1 | 15,024,211 |
| | Health Systems of South Florida Obligated Group, Series 2019, 4.000%, 8/15/49 | | | |
| 85 | | Palm Beach County Health Facilities Authority, Florida, Revenue Bonds, Sinai Residences | 6/22 at 102.00 | N/R | 91,194 |
| | of Boca Raton Project, Series 2014A, 7.250%, 6/01/34 | | | |
73
| | |
| NZF | Nuveen Municipal Credit Income Fund |
| Portfolio of Investments (continued) April 30, 2021 (Unaudited) |
|
| | | | | | |
| Principal | | | Optional Call | | |
| Amount (000) | | Description (1) | Provisions (2) | Ratings (3) | Value |
| | Florida (continued) | | | |
| $ 1,745 | | Palm Beach County, Florida, Revenue Bonds, Provident Group – PBAU Properties LLC – Palm | 4/29 at 100.00 | Ba1 | $ 1,951,242 |
| | Beach Atlantic University Housing Project, Series 2019A, 5.000%, 4/01/39, 144A | | | |
| 545 | | Reunion West Community Development District, Florida, Special Assessment Bonds, Area 3 | 11/26 at 100.00 | N/R | 591,423 |
| | Project, Series 2016, 5.000%, 11/01/46 | | | |
| | Six Mile Creek Community Development District, Florida, Capital Improvement Revenue | | | |
| | Bonds, Assessment Area 2, Series 2016: | | | |
| 160 | | 4.750%, 11/01/28 | 11/27 at 100.00 | N/R | 171,896 |
| 265 | | 5.375%, 11/01/36 | 11/27 at 100.00 | N/R | 293,792 |
| 365 | | South Village Community Development District, Clay County, Florida, Capital Improvement | 5/26 at 100.00 | A | 389,528 |
| | Revenue Bonds, Refunding Series 2016A1, 3.625%, 5/01/35 | | | |
| | South Village Community Development District, Clay County, Florida, Capital Improvement | | | |
| | Revenue Bonds, Refunding Series 2016A2: | | | |
| 100 | | 4.350%, 5/01/26 | No Opt. Call | N/R | 105,402 |
| 100 | | 4.875%, 5/01/35 | 5/26 at 100.00 | N/R | 109,053 |
| 1,350 | | Sumter County Industrial Development Authority, Florida, Hospital Revenue Bonds, Central | 1/24 at 100.00 | A– | 1,483,690 |
| | Florida Health Alliance Projects, Series 2014A, 5.125%, 7/01/34 | | | |
| 3,300 | | Tampa, Florida, Health System Revenue Bonds, Baycare Health System, Series 2012A, | 5/22 at 100.00 | Aa2 | 3,451,338 |
| | 5.000%, 11/15/33 | | | |
| 85 | | Tolomato Community Development District, Florida, Special Assessment Bonds, Convertible, | 5/22 at 100.00 | N/R | 74,070 |
| | Capital Appreciation, Series 2012A-4, 0.000%, 5/01/40 (6) | | | |
| 110 | | Tolomato Community Development District, Florida, Special Assessment Bonds, Hope Note, | 6/21 at 100.00 | N/R | 1 |
| | Series 2007-3, 6.650%, 5/01/40 (4) | | | |
| 295 | | Tolomato Community Development District, Florida, Special Assessment Bonds, Refunding | 6/21 at 100.00 | N/R | 283,244 |
| | Series 2015-1, 0.000%, 5/01/40 (6) | | | |
| 180 | | Tolomato Community Development District, Florida, Special Assessment Bonds, Refunding | 6/21 at 100.00 | N/R | 134,950 |
| | Series 2015-2, 0.000%, 5/01/40 (6) | | | |
| 195 | | Tolomato Community Development District, Florida, Special Assessment Bonds, Refunding | 6/21 at 100.00 | N/R | 2 |
| | Series 2015-3, 6.610%, 5/01/40 (4) | | | |
| 300 | | Union Park Community Development District, Florida, Capital Improvement Revenue Bonds, | 11/27 at 100.00 | N/R | 335,919 |
| | Series 2016A-1, 5.375%, 11/01/37 | | | |
| 167,725 | | Total Florida | | | 180,492,756 |
| | Georgia – 0.8% (0.5% of Total Investments) | | | |
| 2,725 | | Atlanta Development Authority, Georgia, Revenue Bonds, New Downtown Atlanta Stadium | 7/25 at 100.00 | A+ | 3,152,934 |
| | Project, Senior Lien Series 2015A-1, 5.250%, 7/01/40 | | | |
| 3,010 | | Atlanta, Georgia, Water and Wastewater Revenue Bonds, Series 1999A, 5.500%, 11/01/22 – | No Opt. Call | AA– | 3,172,991 |
| | FGIC Insured | | | |
| 840 | | Macon-Bibb County Urban Development Authority, Georgia, Revenue Bonds, Academy for | 6/27 at 100.00 | N/R | 908,074 |
| | Classical Education, Series 2017, 5.875%, 6/15/47, 144A | | | |
| 1,070 | | Main Street Natural Gas Inc, Georgia, Gas Supply Revenue Bonds, Series 2019A, 5.000%, 5/15/43 | 5/29 at 100.00 | A3 | 1,282,609 |
| 3,000 | | Marietta Development Authority, Georgia, University Facilities Revenue Bonds, Life | 11/27 at 100.00 | Ba3 | 3,221,430 |
| | University, Inc Project, Refunding Series 2017A, 5.000%, 11/01/47, 144A | | | |
| 2,750 | | Monroe County Development Authority, Georgia, Pollution Control Revenue Bonds, Georgia | 6/24 at 100.00 | Baa1 | 2,835,278 |
| | Power Company – Scherer Plant, First Series 1995, 2.250%, 7/01/25 | | | |
| 4,010 | | Municipal Electric Authority of Georgia, Plant Vogtle Units 3 & 4 Project J Bonds, | 7/25 at 100.00 | Baa1 | 4,533,666 |
| | Series 2015A, 5.000%, 7/01/60 | | | |
| 17,405 | | Total Georgia | | | 19,106,982 |
| | Guam – 0.0% (0.0% of Total Investments) | | | |
| 810 | | Guam Government Waterworks Authority, Water and Wastewater System Revenue Bonds, Series | 7/23 at 100.00 | Baa2 (5) | 900,169 |
| | 2013, 5.500%, 7/01/43 (Pre-refunded 7/01/23) | | | |
74
| | | | | | |
| Principal | | | Optional Call | | |
| Amount (000) | | Description (1) | Provisions (2) | Ratings (3) | Value |
| | Hawaii – 0.2% (0.1% of Total Investments) | | | |
| $ 3,000 | | Hawaii Department of Budget and Finance, Special Purpose Revenue Bonds, Hawaii Pacific | 7/23 at 100.00 | A1 | $ 3,303,780 |
| | Health Obligated Group, Series 2013A, 5.500%, 7/01/43 | | | |
| 1,175 | | Hawaii Department of Budget and Finance, Special Purpose Revenue Bonds, Hawaii Pacific | 7/23 at 100.00 | BB | 1,278,753 |
| | University, Series 2013A, 6.625%, 7/01/33 | | | |
| 4,175 | | Total Hawaii | | | 4,582,533 |
| | Idaho – 0.1% (0.1% of Total Investments) | | | |
| 1,175 | | Idaho Health Facilities Authority, Revenue Bonds, Madison Memorial Hospital Project, | 9/26 at 100.00 | BB+ | 1,308,597 |
| | Refunding Series 2016, 5.000%, 9/01/37 | | | |
| 595 | | Idaho Water Resource Board, Water Resource Loan Program Revenue, Ground Water Rights | 9/22 at 100.00 | A3 | 629,641 |
| | Mitigation Series 2012A, 5.000%, 9/01/32 | | | |
| 1,770 | | Total Idaho | | | 1,938,238 |
| | Illinois – 28.5% (18.4% of Total Investments) | | | |
| 50,000 | | Chicago Board of Education, Illinois, Dedicated Capital Improvement Tax Revenue Bonds, | 4/27 at 100.00 | A– | 60,103,500 |
| | Series 2016, 6.000%, 4/01/46 | | | |
| 1,000 | | Chicago Board of Education, Illinois, General Obligation Bonds, Dedicated Revenues | 12/21 at 100.00 | Ba3 | 1,020,840 |
| | Series 2011A, 5.500%, 12/01/39 | | | |
| 8,500 | | Chicago Board of Education, Illinois, General Obligation Bonds, Dedicated Revenues, | 12/22 at 100.00 | Ba3 | 8,923,980 |
| | Refunding Series 2012B, 5.000%, 12/01/33 | | | |
| 8,400 | | Chicago Board of Education, Illinois, General Obligation Bonds, Dedicated Revenues, | 12/27 at 100.00 | BB | 10,866,744 |
| | Refunding Series 2017B, 7.000%, 12/01/42, 144A | | | |
| | Chicago Board of Education, Illinois, General Obligation Bonds, Dedicated Revenues, | | | |
| | Series 2016A: | | | |
| 1,800 | | 7.000%, 12/01/26 | 12/25 at 100.00 | BB | 2,256,606 |
| 51,780 | | 7.000%, 12/01/44 | 12/25 at 100.00 | BB | 62,488,104 |
| 6,210 | | Chicago Board of Education, Illinois, General Obligation Bonds, Dedicated Revenues, | 12/27 at 100.00 | BB | 7,964,573 |
| | Series 2017A, 7.000%, 12/01/46, 144A | | | |
| 450 | | Chicago Board of Education, Illinois, General Obligation Bonds, Series 1999A, 0.000%, | No Opt. Call | BB | 412,074 |
| | 12/01/26 – NPFG Insured | | | |
| | Chicago Board of Education, Illinois, Unlimited Tax General Obligation Bonds, Dedicated | | | |
| | Tax Revenues, Series 1998B-1: | | | |
| 1,715 | | 0.000%, 12/01/26 – NPFG Insured | No Opt. Call | BB | 1,570,460 |
| 1,765 | | 0.000%, 12/01/30 – NPFG Insured | No Opt. Call | BB | 1,416,836 |
| | Chicago Board of Education, Illinois, Unlimited Tax General Obligation Bonds, Dedicated | | | |
| | Tax Revenues, Series 1999A: | | | |
| 2,585 | | 0.000%, 12/01/27 – NPFG Insured | No Opt. Call | BB | 2,298,944 |
| 8,565 | | 0.000%, 12/01/31 – NPFG Insured | No Opt. Call | BB | 6,644,984 |
| 2,430 | | Chicago Transit Authority, Illinois, Sales Tax Receipts Revenue Bonds, Second Lien | 12/29 at 100.00 | A+ | 2,995,728 |
| | Series 2020A, 5.000%, 12/01/45 | | | |
| 4,300 | | Chicago Transit Authority, Illinois, Sales Tax Receipts Revenue Bonds, Series 2011, | 12/21 at 100.00 | A3 (5) | 4,427,753 |
| | 5.250%, 12/01/40 (Pre-refunded 12/01/21) | | | |
| 15,000 | | Chicago Transit Authority, Illinois, Sales Tax Receipts Revenue Bonds, Series 2014, | 12/24 at 100.00 | AA | 17,416,800 |
| | 5.250%, 12/01/49 | | | |
| | Chicago, Illinois, General Obligation Bonds, City Colleges, Series 1999: | | | |
| 25,755 | | 0.000%, 1/01/29 – NPFG Insured | No Opt. Call | BBB– | 21,800,577 |
| 8,765 | | 0.000%, 1/01/34 – FGIC Insured | No Opt. Call | BBB– | 6,214,648 |
| 17,310 | | 0.000%, 1/01/37 – FGIC Insured | No Opt. Call | BBB– | 10,983,022 |
| 670 | | Chicago, Illinois, General Obligation Bonds, Neighborhoods Alive 21 Program, Series | 1/25 at 100.00 | Ba1 | 758,246 |
| | 2002B, 5.500%, 1/01/31 | | | |
| 2,695 | | Chicago, Illinois, General Obligation Bonds, Project & Refunding Series 2014A, 5.000%, 1/01/35 | 1/24 at 100.00 | Ba1 | 2,910,816 |
| 13,205 | | Chicago, Illinois, General Obligation Bonds, Project & Refunding Series 2017A, 6.000%, 1/01/38 | 1/27 at 100.00 | BBB– | 16,024,928 |
75
| | |
| NZF | Nuveen Municipal Credit Income Fund |
| Portfolio of Investments (continued) April 30, 2021 (Unaudited) |
|
| | | | | | |
| Principal | | | Optional Call | | |
| Amount (000) | | Description (1) | Provisions (2) | Ratings (3) | Value |
| | Illinois (continued) | | | |
| $ 2,000 | | Chicago, Illinois, General Obligation Bonds, Project and Refunding Series 2005D, | 1/25 at 100.00 | Ba1 | $ 2,232,820 |
| | 5.500%, 1/01/40 | | | |
| 4,930 | | Chicago, Illinois, General Obligation Bonds, Project Series 2011A, 5.250%, 1/01/35 | 6/21 at 100.00 | Ba1 | 4,941,142 |
| 550 | | Chicago, Illinois, General Obligation Bonds, Project Series 2012A, 5.000%, 1/01/34 | 1/22 at 100.00 | Ba1 | 561,418 |
| | Chicago, Illinois, General Obligation Bonds, Refunding Series 2007E: | | | |
| 10,115 | | 5.500%, 1/01/35 | 1/25 at 100.00 | Ba1 | 11,368,653 |
| 5,890 | | 5.500%, 1/01/42 | 1/25 at 100.00 | Ba1 | 6,558,809 |
| 765 | | Chicago, Illinois, General Obligation Bonds, Refunding Series 2016C, 5.000%, 1/01/35 | 1/26 at 100.00 | BBB– | 867,028 |
| 1,610 | | Chicago, Illinois, General Obligation Bonds, Series 1999, 0.000%, 1/01/30 | No Opt. Call | A2 | 1,348,311 |
| | Chicago, Illinois, General Obligation Bonds, Series 2015A: | | | |
| 1,000 | | 5.500%, 1/01/35 | 1/25 at 100.00 | BBB– | 1,123,940 |
| 9,800 | | 5.500%, 1/01/39 | 1/25 at 100.00 | BBB– | 10,952,186 |
| 5,630 | | Chicago, Illinois, Sales Tax Revenue Bonds, Series 2011A, 5.250%, 1/01/38 | 1/22 at 100.00 | N/R (5) | 5,821,476 |
| | (Pre-refunded 1/01/22) | | | |
| 3,095 | | Cook County Forest Preserve District, Illinois, General Obligation Bonds, Personal | 6/22 at 100.00 | A2 | 3,248,264 |
| | Property Replacement Tax Alternate Source, Series 2012C, 5.000%, 12/15/37 – AGM Insured | | | |
| 800 | | Illinois Finance Authority, Charter School Revenue Bonds, Intrinsic Charter Schools | 12/25 at 100.00 | N/R | 886,328 |
| | Belmont School Project, Series 2015A, 5.500%, 12/01/30, 144A | | | |
| | Illinois Finance Authority, Charter School Revenue Bonds, Uno Charter School Network, | | | |
| | Refunding and Improvement Series 2011A: | | | |
| 1,300 | | 6.875%, 10/01/31 | 10/21 at 100.00 | BB+ | 1,323,816 |
| 2,535 | | 7.125%, 10/01/41 | 10/21 at 100.00 | BB+ | 2,578,019 |
| 2,675 | | Illinois Finance Authority, Revenue Bonds, Columbia College Chicago, Series 2015A, | 12/25 at 100.00 | BBB+ | 2,976,820 |
| | 5.000%, 12/01/37 | | | |
| 845 | | Illinois Finance Authority, Revenue Bonds, Illinois Wesleyan University, Refunding | 9/26 at 100.00 | Baa2 | 974,336 |
| | Series 2016, 5.000%, 9/01/46 | | | |
| 5,015 | | Illinois Finance Authority, Revenue Bonds, Ingalls Health System, Series 2013, 5.000%, | 5/22 at 100.00 | A1 (5) | 5,254,667 |
| | 5/15/43 (Pre-refunded 5/15/22) | | | |
| 20,000 | | Illinois Finance Authority, Revenue Bonds, Northwestern Memorial Healthcare, Series | 1/28 at 100.00 | Aa2 | 24,267,000 |
| | 2017A, 5.000%, 7/15/42 | | | |
| | Illinois Finance Authority, Revenue Bonds, Rehabilitation Institute of Chicago, Series 2013A: | | | |
| 415 | | 5.500%, 7/01/28 | 7/23 at 100.00 | A– | 448,221 |
| 905 | | 6.000%, 7/01/43 | 7/23 at 100.00 | A– | 983,635 |
| 1,050 | | Illinois Finance Authority, Revenue Bonds, Silver Cross Hospital and Medical Centers, | 8/25 at 100.00 | BBB+ | 1,179,182 |
| | Refunding Series 2015C, 5.000%, 8/15/44 | | | |
| | Illinois Finance Authority, Revenue Bonds, University of Chicago, Refunding Series 2015A: | | | |
| 300 | | 5.000%, 10/01/46 (UB) | 10/25 at 100.00 | AA– | 353,499 |
| 2,700 | | 5.000%, 10/01/46 (Pre-refunded 10/01/25) (UB) | 10/25 at 100.00 | N/R (5) | 3,232,980 |
| 4,125 | | Illinois Finance Authority, Revenue Bonds, University of Chicago, Series 2012A, | 10/21 at 100.00 | AA– | 4,200,941 |
| | 5.000%, 10/01/51 | | | |
| | Illinois State, General Obligation Bonds, April Series 2014: | | | |
| 6,165 | | 5.000%, 4/01/38 | 4/24 at 100.00 | BBB– | 6,742,784 |
| 5,000 | | 5.000%, 4/01/39 | 4/24 at 100.00 | BBB– | 5,464,850 |
| | Illinois State, General Obligation Bonds, February Series 2014: | | | |
| 4,100 | | 5.250%, 2/01/31 | 2/24 at 100.00 | BBB– | 4,523,202 |
| 2,200 | | 5.250%, 2/01/32 | 2/24 at 100.00 | BBB– | 2,424,994 |
| 2,435 | | 5.250%, 2/01/33 | 2/24 at 100.00 | BBB– | 2,680,594 |
| 6,000 | | 5.000%, 2/01/39 | 2/24 at 100.00 | BBB– | 6,527,520 |
| 1,785 | | Illinois State, General Obligation Bonds, May Series 2020, 5.500%, 5/01/39 | 5/30 at 100.00 | BBB– | 2,278,231 |
| | Illinois State, General Obligation Bonds, November Series 2016: | | | |
| 3,100 | | 5.000%, 11/01/35 | 11/26 at 100.00 | BBB– | 3,598,728 |
| 3,000 | | 5.000%, 11/01/37 | 11/26 at 100.00 | BBB– | 3,460,380 |
| 2,400 | | 5.000%, 11/01/40 | 11/26 at 100.00 | BBB– | 2,751,288 |
76
| | | | | | |
| Principal | | | Optional Call | | |
| Amount (000) | | Description (1) | Provisions (2) | Ratings (3) | Value |
| | Illinois (continued)
| | | |
| $ 5,795 | | Illinois State, General Obligation Bonds, November Series 2017C, 5.000%, 11/01/29 | 11/27 at 100.00 | BBB– | $ 6,906,713 |
| 3,800 | | Illinois State, General Obligation Bonds, November Series 2017D, 5.000%, 11/01/27 | No Opt. Call | BBB– | 4,609,248 |
| 5,000 | | Illinois State, General Obligation Bonds, October Series 2016, 5.000%, 2/01/27 | No Opt. Call | BBB– | 6,044,050 |
| 5,350 | | Illinois State, General Obligation Bonds, Refunding April Series 2019B, 5.125%, 9/01/26 | No Opt. Call | BBB– | 6,457,771 |
| 27,215 | | Illinois State, General Obligation Bonds, Series 2013, 5.500%, 7/01/38 | 7/23 at 100.00 | BBB– | 29,535,895 |
| 7,250 | | Illinois Toll Highway Authority, Toll Highway Revenue Bonds, Senior Lien Series 2013A, | 1/23 at 100.00 | A1 | 7,774,972 |
| | 5.000%, 1/01/38 | | | |
| 2,755 | | Illinois Toll Highway Authority, Toll Highway Revenue Bonds, Senior Lien Series 2015A, | 7/25 at 100.00 | A1 | 3,205,167 |
| | 5.000%, 1/01/40 | | | |
| 560 | | Illinois Toll Highway Authority, Toll Highway Revenue Bonds, 17.627%, 1/01/38, 144A (IF) | 1/23 at 100.00 | A1 | 722,383 |
| 2,500 | | Kane & DeKalb Counties Community Unit School District 301, Illinois, General Obligation | No Opt. Call | Aa2 | 2,451,375 |
| | Bonds, Series 2006, 0.000%, 12/01/23 – NPFG Insured | | | |
| 13,785 | | Metropolitan Pier and Exposition Authority, Illinois, McCormick Place Expansion Project | 6/22 at 100.00 | BB+ | 14,301,662 |
| | Bonds, Refunding Series 2012A, 5.000%, 6/15/42 – NPFG Insured | | | |
| 2,500 | | Metropolitan Pier and Exposition Authority, Illinois, McCormick Place Expansion Project | 6/22 at 100.00 | BB+ | 2,583,825 |
| | Bonds, Refunding Series 2012B, 5.000%, 6/15/52 | | | |
| 5,400 | | Metropolitan Pier and Exposition Authority, Illinois, McCormick Place Expansion Project | 12/25 at 100.00 | BB+ | 6,109,182 |
| | Bonds, Refunding Series 2015B, 5.000%, 6/15/52 | | | |
| | Metropolitan Pier and Exposition Authority, Illinois, McCormick Place Expansion Project | | | |
| | Bonds, Refunding Series 2020A: | | | |
| 15,000 | | 4.000%, 6/15/50 | 12/29 at 100.00 | BB+ | 16,844,850 |
| 7,945 | | 5.000%, 6/15/50 | 12/29 at 100.00 | BB+ | 9,557,438 |
| | Metropolitan Pier and Exposition Authority, Illinois, McCormick Place Expansion Project | | | |
| | Bonds, Series 2015A: | | | |
| 23,110 | | 0.000%, 12/15/52 | No Opt. Call | BB+ | 8,091,504 |
| 2,455 | | 5.000%, 6/15/53 | 12/25 at 100.00 | BB+ | 2,776,237 |
| 45,000 | | Metropolitan Pier and Exposition Authority, Illinois, Revenue Bonds, McCormick Place | No Opt. Call | BB+ | 24,327,000 |
| | Expansion Project, Capital Appreciation Refunding Series 2010B-1, 0.000%, 6/15/43 – AGM Insured | | | |
| | Metropolitan Pier and Exposition Authority, Illinois, Revenue Bonds, McCormick Place | | | |
| | Expansion Project, Refunding Series 1998A: | | | |
| 145 | | 5.500%, 6/15/29 – NPFG Insured (ETM) | No Opt. Call | Baa2 (5) | 169,269 |
| 2,680 | | 5.500%, 6/15/29 – NPFG Insured | No Opt. Call | BB+ | 3,181,750 |
| 1,165 | | Metropolitan Pier and Exposition Authority, Illinois, Revenue Bonds, McCormick Place | No Opt. Call | Baa2 (5) | 1,164,557 |
| | Expansion Project, Series 1993A, 0.000%, 6/15/21 – FGIC Insured (ETM) | | | |
| | Metropolitan Pier and Exposition Authority, Illinois, Revenue Bonds, McCormick Place | | | |
| | Expansion Project, Series 2002A: | | | |
| 2,195 | | 5.700%, 6/15/24 (Pre-refunded 6/15/22) | 6/22 at 101.00 | N/R (5) | 2,348,562 |
| 7,305 | | 5.700%, 6/15/24 | 6/22 at 101.00 | BB+ | 7,807,219 |
| 8,400 | | 0.000%, 12/15/30 – NPFG Insured | No Opt. Call | BB+ | 6,786,612 |
| 7,940 | | 0.000%, 6/15/33 – NPFG Insured | No Opt. Call | BB+ | 5,918,476 |
| 450 | | 0.000%, 12/15/34 – NPFG Insured | No Opt. Call | BB+ | 318,866 |
| 12,500 | | 0.000%, 6/15/35 – NPFG Insured | No Opt. Call | BB+ | 8,715,625 |
| 10,620 | | 0.000%, 12/15/35 – NPFG Insured | No Opt. Call | BB+ | 7,257,496 |
| 11,505 | | 0.000%, 12/15/36 – NPFG Insured | No Opt. Call | BB+ | 7,551,537 |
| 65,000 | | 0.000%, 12/15/38 – NPFG Insured | No Opt. Call | BB+ | 39,495,950 |
| 38,040 | | 0.000%, 6/15/40 – NPFG Insured | No Opt. Call | BB+ | 21,769,531 |
| 3,720 | | 0.000%, 6/15/41 – NPFG Insured | No Opt. Call | BB+ | 2,045,033 |
| | Quad Cities Regional Economic Development Authority, Illinois, Revenue Bonds, Augustana | | | |
| | College, Series 2012: | | | |
| 480 | | 5.000%, 10/01/25 | 10/22 at 100.00 | Baa1 | 504,230 |
| 400 | | 5.000%, 10/01/26 | 10/22 at 100.00 | Baa1 | 419,520 |
| 780 | | Railsplitter Tobacco Settlement Authority, Illinois, Tobacco Settlement Revenue Bonds, | No Opt. Call | A | 782,878 |
| | Series 2010, 5.250%, 6/01/21 | | | |
77
| | |
| NZF | Nuveen Municipal Credit Income Fund |
| Portfolio of Investments (continued) April 30, 2021 (Unaudited) |
|
| | | | | | |
| Principal | | | Optional Call | | |
| Amount (000) | | Description (1) | Provisions (2) | Ratings (3) | Value |
| | Illinois (continued) | | | |
| $ 11,690 | | Sales Tax Securitization Corporation, Illinois, Sales Tax Securitization Bonds, Series | 1/28 at 100.00 | AA– | $ 14,062,369 |
| | 2018A, 5.000%, 1/01/37 | | | |
| 3,815 | | Southwestern Illinois Development Authority, Environmental Improvement Revenue Bonds, US | 8/22 at 100.00 | Caa1 | 3,952,149 |
| | Steel Corporation Project, Series 2012, 5.750%, 8/01/42 (AMT) | | | |
| 1,580 | | University of Illinois, Health Services Facilities System Revenue Bonds, Series 2013, | 10/23 at 100.00 | Baa1 | 1,767,672 |
| | 6.000%, 10/01/32 | | | |
| 11,350 | | Will County Community High School District 210 Lincoln-Way, Illinois, General Obligation | No Opt. Call | A2 | 11,017,672 |
| | Bonds, Series 2006, 0.000%, 1/01/24 – AGM Insured | | | |
| 734,315 | | Total Illinois | | | 686,972,470 |
| | Indiana – 3.4% (2.2% of Total Investments) | | | |
| | Carmel Redevelopment Authority, Indiana, Lease Rent Revenue Bonds, Series 2005: | | | |
| 1,950 | | 0.000%, 2/01/24 | No Opt. Call | Aa3 | 1,899,573 |
| 2,705 | | 0.000%, 2/01/25 | No Opt. Call | Aa3 | 2,589,388 |
| 4,400 | | Crown Point Multi-School Building Corporation, Indiana, First Mortgage Bonds, Crown | No Opt. Call | Baa2 | 4,328,940 |
| | Point Community School Corporation, Series 2000, 0.000%, 1/15/24 – NPFG Insured | | | |
| 680 | | Indiana Finance Authority, Educational Facilities Revenue Bonds, Butler University | 2/22 at 100.00 | A– | 701,848 |
| | Project, Refunding Series 2012B, 5.000%, 2/01/29 | | | |
| 1,230 | | Indiana Finance Authority, Environmental Improvement Revenue Bonds, United States Steel | 8/22 at 100.00 | Caa1 | 1,274,219 |
| | Corporation Project, Series 2012, 5.750%, 8/01/42 (AMT) | | | |
| 1,815 | | Indiana Finance Authority, Hospital Revenue Bonds, Community Health Network Project, | 5/23 at 100.00 | A (5) | 1,991,128 |
| | Series 2012A, 5.000%, 5/01/42 (Pre-refunded 5/01/23) | | | |
| 9,300 | | Indiana Finance Authority, Hospital Revenue Bonds, Major Hospital Project, Series 2014A, | 10/23 at 100.00 | N/R (5) | 10,391,076 |
| | 5.000%, 10/01/44 (Pre-refunded 10/01/23) | | | |
| | Indiana Finance Authority, Private Activity Bonds, Ohio River Bridges East End Crossing | | | |
| | Project, Series 2013A: | | | |
| 5,380 | | 5.000%, 7/01/44 (AMT) | 7/23 at 100.00 | BBB+ | 5,851,234 |
| 5,100 | | 5.000%, 7/01/48 (AMT) | 7/23 at 100.00 | BBB+ | 5,543,445 |
| 5,370 | | 5.250%, 1/01/51 (AMT) | 7/23 at 100.00 | BBB+ | 5,863,557 |
| 6,700 | | Indiana Finance Authority, Wastewater Utility Revenue Bonds, CWA Authority Project, | 10/21 at 100.00 | A1 | 6,824,821 |
| | Series 2011B, 5.000%, 10/01/41 | | | |
| 13,000 | | Indiana Finance Authority, Water Utility Revenue Bonds, Citizens Energy Group Project, | 10/24 at 100.00 | A+ | 14,793,870 |
| | First Lien Series 2014A, 5.000%, 10/01/44 | | | |
| 5,100 | | Indianapolis Local Public Improvement Bond Bank, Indiana, Airport Authority Project | 1/30 at 100.00 | A | 6,441,504 |
| | Revenue Bonds, Series 2019I-1, 5.000%, 1/01/44 | | | |
| 10,000 | | Indianapolis Local Public Improvement Bond Bank, Indiana, Series 1999E, 0.000%, 2/01/26 | No Opt. Call | AA– | 9,630,800 |
| | – AMBAC Insured | | | |
| 1,000 | | Merrillville, Indiana, Economic Development Revenue Bonds, Belvedere Housing Project, | 4/24 at 102.00 | N/R | 1,038,400 |
| | Series 2016, 5.750%, 4/01/36 | | | |
| 1,250 | | Shoals, Indiana, Exempt Facilities Revenue Bonds, National Gypsum Company Project, | 11/23 at 100.00 | N/R | 1,322,912 |
| | Series 2013, 7.250%, 11/01/43 (AMT) | | | |
| 830 | | Valparaiso, Indiana, Exempt Facilities Revenue Bonds, Pratt Paper LLC Project, Series | 1/24 at 100.00 | N/R | 934,124 |
| | 2013, 7.000%, 1/01/44 (AMT) | | | |
| 75,810 | | Total Indiana | | | 81,420,839 |
| | Iowa – 0.3% (0.2% of Total Investments) | | | |
| 1,255 | | Iowa Finance Authority, Iowa, Midwestern Disaster Area Revenue Bonds, Iowa Fertilizer | 12/23 at 100.00 | B+ | 1,375,756 |
| | Company Project, Series 2013, 5.250%, 12/01/25 | | | |
| 1,710 | | Iowa Finance Authority, Iowa, Midwestern Disaster Area Revenue Bonds, Iowa Fertilizer | 12/22 at 103.00 | BB– | 1,858,667 |
| | Company Project, Series 2018A, 5.250%, 12/01/50 (Mandatory Put 12/01/33) | | | |
| 1,630 | | Iowa Higher Education Loan Authority, Private College Facility Revenue Bonds, University | 10/21 at 100.00 | BBB | 1,661,492 |
| | of Dubuque Project, Refunding Series 2011, 6.000%, 10/01/31 | | | |
78
| | | | | | |
| Principal | | | Optional Call | | |
| Amount (000) | | Description (1) | Provisions (2) | Ratings (3) | Value |
| | Iowa (continued) | | | |
| $ 1,900 | | Iowa Higher Education Loan Authority, Private College Facility Revenue Bonds, Upper Iowa | 9/23 at 100.00 | N/R (5) | $ 2,115,194 |
| | University Project, Series 2012, 5.000%, 9/01/43 (Pre-refunded 9/01/23) | | | |
| | Iowa Tobacco Settlement Authority, Asset Backed Settlement Revenue Bonds, Series 2005C: | | | |
| 6,495 | | Total Iowa | | | 7,011,109 |
| | Kansas – 0.2% (0.2% of Total Investments) | | | |
| | Johnson/Miami County Unified School District 230 Spring Hill, Kansas, General Obligation | | | |
| | Bonds, Series 2011A: | | | |
| 2,000 | | 5.000%, 9/01/26 | 9/21 at 100.00 | A1 | 2,031,700 |
| 1,000 | | 5.000%, 9/01/27 | 9/21 at 100.00 | A1 | 1,015,880 |
| 2,000 | | Kansas Development Finance Authority, Hospital Revenue Bonds, Adventist Health | 5/22 at 100.00 | AA | 2,098,320 |
| | System/Sunbelt Obligated Group, Series 2012A, 5.000%, 11/15/28 | | | |
| 345 | | Overland Park Transportation Development District, Kansas, Sales Tax Revenue Bonds, Oak | 6/21 at 100.00 | BBB | 345,152 |
| | Park Mall Project, Series 2010, 5.900%, 4/01/32 | | | |
| 5,345 | | Total Kansas | | | 5,491,052 |
| | Kentucky – 2.2% (1.4% of Total Investments) | | | |
| | Christian County, Kentucky, Hospital Revenue Bonds, Jennie Stuart Medical Center, Series 2016: | | | |
| 5,000 | | 5.375%, 2/01/36 | 2/26 at 100.00 | BB+ | 5,563,650 |
| 435 | | 5.500%, 2/01/44 | 2/26 at 100.00 | BB+ | 481,093 |
| | Kentucky Economic Development Finance Authority, Kentucky, Healthcare Facilities Revenue | | | |
| | Bonds, Rosedale Green Project, Refunding Series 2015: | | | |
| 500 | | 5.750%, 11/15/45 | 11/25 at 100.00 | N/R | 508,945 |
| 2,250 | | 5.750%, 11/15/50 | 11/25 at 100.00 | N/R | 2,284,830 |
| 19,575 | | Kentucky Economic Development Finance Authority, Revenue Bonds, CommonSpirit Health, | 8/29 at 100.00 | BBB+ | 23,884,632 |
| | Series 2019A-2, 5.000%, 8/01/49 | | | |
| 5,070 | | Kentucky Economic Development Finance Authority, Revenue Bonds, Next Generation Kentucky | 7/25 at 100.00 | Baa2 | 5,626,382 |
| | Information Highway Project, Senior Series 2015A, 5.000%, 1/01/45 | | | |
| | Kentucky Public Transportation Infrastructure Authority, First Tier Toll Revenue Bonds, | | | |
| | Downtown Crossing Project, Convertible Capital Appreciation Series 2013C: | | | |
| 1,335 | | 0.000%, 7/01/43 (6) | 7/31 at 100.00 | Baa2 | 1,599,677 |
| 2,295 | | 0.000%, 7/01/46 (6) | 7/31 at 100.00 | Baa2 | 2,754,987 |
| | Kentucky Public Transportation Infrastructure Authority, First Tier Toll Revenue Bonds, | | | |
| | Downtown Crossing Project, Series 2013A: | | | |
| 3,080 | | 5.750%, 7/01/49 | 7/23 at 100.00 | Baa2 | 3,398,256 |
| 615 | | 6.000%, 7/01/53 | 7/23 at 100.00 | Baa2 | 681,322 |
| 5,400 | | Lexington-Fayette Urban County Government Public Facilities Corporation, Kentucky State | 6/21 at 100.00 | A– | 5,421,438 |
| | Lease Revenue Bonds, Eastern State Hospital Project, Series 2011A, 5.250%, 6/01/29 | | | |
| 215 | | Warren County, Kentucky, Hospital Revenue Bonds, Bowling Green-Warren County Community | 10/22 at 100.00 | A+ | 223,348 |
| | Hospital Corporation, Series 2012A, 4.000%, 10/01/29 | | | |
| 45,770 | | Total Kentucky | | | 52,428,560 |
| | Louisiana – 2.1% (1.4% of Total Investments) | | | |
| 2,000 | | Jefferson Parish Hospital Service District 2, Louisiana, Hospital Revenue Bonds, East | 7/21 at 100.00 | N/R (5) | 2,019,680 |
| | Jefferson General Hospital, Refunding Series 2011, 6.375%, 7/01/41 (Pre-refunded 7/01/21) | | | |
| 5,000 | | Louisiana Public Facilities Authority, Louisiana, Revenue Bonds, Ochsner Clinic Foundation | 5/27 at 100.00 | A3 | 5,934,150 |
| | Project, Refunding Series 2017, 5.000%, 5/15/46 | | | |
| 18,525 | | Louisiana Public Facilities Authority, Louisiana, Revenue Bonds, Ochsner Clinic Foundation | 5/30 at 100.00 | A3 | 21,380,258 |
| | Project, Series 2020A, 4.000%, 5/15/49 | | | |
| 6,625 | | Louisiana Public Facilities Authority, Dock and Wharf Revenue Bonds, Impala Warehousing | 7/23 at 100.00 | N/R | 7,127,374 |
| | (US) LLC Project, Series 2013, 6.500%, 7/01/36 (AMT), 144A | | | |
| | Louisiana Public Facilities Authority, Hospital Revenue Bonds, Franciscan Missionaries | | | |
| | of Our Lady Health System, Refunding Series 2015A: | | | |
| 10 | | 5.000%, 7/01/39 (Pre-refunded 7/01/25) | 7/25 at 100.00 | N/R (5) | 11,895 |
| 1,450 | | 5.000%, 7/01/39 | 7/25 at 100.00 | A | 1,660,134 |
79
| | |
| NZF | Nuveen Municipal Credit Income Fund |
| Portfolio of Investments (continued) April 30, 2021 (Unaudited) |
|
| | | | | | |
| Principal | | | Optional Call | | |
| Amount (000) | | Description (1) | Provisions (2) | Ratings (3) | Value |
| | Louisiana (continued) | | | |
| $ 1,060 | | Louisiana Public Facilities Authority, Revenue Bonds, Southwest Louisiana Charter | 12/23 at 100.00 | N/R | $ 1,123,632 |
| | Academy Foundation Project, Series 2013A, 8.375%, 12/15/43 | | | |
| 2,235 | | Louisiana Stadium and Exposition District, Revenue Refunding Bonds, Senior Lien Series | 7/23 at 100.00 | A2 | 2,448,845 |
| | 2013A, 5.000%, 7/01/36 | | | |
| 5,100 | | New Orleans Aviation Board, Louisiana, General Airport Revenue Bonds, North Terminal | 1/25 at 100.00 | A– | 5,795,385 |
| | Project, Series 2015B, 5.000%, 1/01/45 (AMT) | | | |
| 2,560 | | New Orleans, Louisiana, Sewerage Service Revenue Bonds, Refunding Series 2014, 5.000%, | 6/24 at 100.00 | A (5) | 2,930,534 |
| | 6/01/44 (Pre-refunded 6/01/24) | | | |
| 44,565 | | Total Louisiana | | | 50,431,887 |
| | Maine – 0.5% (0.3% of Total Investments) | | | |
| 4,965 | | Maine Health and Higher Educational Facilities Authority Revenue Bonds, Eastern Maine | 7/26 at 100.00 | Ba1 | 5,372,825 |
| | Medical Center Obligated Group Issue, Series 2016A, 5.000%, 7/01/46 | | | |
| 2,750 | | Maine Health and Higher Educational Facilities Authority Revenue Bonds, MaineHealth | 7/28 at 100.00 | A+ | 3,327,775 |
| | Issue, Series 2018A, 5.000%, 7/01/43 | | | |
| | Maine Health and Higher Educational Facilities Authority, Revenue Bonds, Maine General | | | |
| | Medical Center, Series 2011: | | | |
| 2,000 | | 6.750%, 7/01/36 (Pre-refunded 7/01/21) | 7/21 at 100.00 | N/R (5) | 2,021,000 |
| 1,050 | | 6.750%, 7/01/41 (Pre-refunded 7/01/21) | 7/21 at 100.00 | N/R (5) | 1,061,025 |
| 10,765 | | Total Maine | | | 11,782,625 |
| | Maryland – 0.5% (0.3% of Total Investments) | | | |
| 2,000 | | Maryland Economic Development Corporation, Revenue Bonds, Chesapeake Bay Hyatt | 6/21 at 100.00 | N/R | 1,200,000 |
| | Conference Center, Series 2006A, 5.000%, 12/01/31 (4) | | | |
| 7,145 | | Maryland Health and Higher Educational Facilities Authority, Revenue Bonds, Adventist | 1/27 at 100.00 | Baa3 | 8,430,529 |
| | Healthcare, Series 2016A, 5.500%, 1/01/46 | | | |
| 555 | | Maryland Health and Higher Educational Facilities Authority, Revenue Bonds, Mercy Ridge | 5/21 at 100.00 | A | 555,361 |
| | Retirement Community, Series 2007, 4.750%, 7/01/34 | | | |
| 2,000 | | Maryland Health and Higher Educational Facilities Authority, Revenue Bonds, Peninsula | 7/24 at 100.00 | A3 (5) | 2,296,600 |
| | Regional Medical Center Issue, Refunding Series 2015, 5.000%, 7/01/45 (Pre-refunded 7/01/24) | | | |
| 355 | | Prince George’s County Revenue Authority, Maryland, Special Obligation Bonds, | 1/26 at 100.00 | N/R | 384,848 |
| | Suitland-Naylor Road Project, Series 2016, 5.000%, 7/01/46, 144A | | | |
| 12,055 | | Total Maryland | | | 12,867,338 |
| | Massachusetts – 1.7% (1.1% of Total Investments) | | | |
| 475 | | Massachusetts Development Finance Agency, Revenue Bonds, Boston Medical Center Issue, | 7/25 at 100.00 | BBB | 535,976 |
| | Green Bonds, Series 2015D, 5.000%, 7/01/44 | | | |
| 1,525 | | Massachusetts Development Finance Agency, Revenue Bonds, Emerson College, Series 2015, | 1/25 at 100.00 | Baa2 | 1,647,092 |
| | 4.500%, 1/01/45 | | | |
| 17,820 | | Massachusetts Educational Financing Authority, Education Loan Revenue Bonds, Series | 7/24 at 100.00 | A | 18,214,535 |
| | 2016J, 3.500%, 7/01/33 (AMT) | | | |
| 7,000 | | Massachusetts Port Authority, Revenue Bonds, Series 2021E, 5.000%, 7/01/46 (AMT) | 7/31 at 100.00 | AA– | 8,902,250 |
| 400 | | Massachusetts Port Authority, Special Facilities Revenue Bonds, ConRac Project, Series | 7/21 at 100.00 | BBB+ (5) | 403,128 |
| | 2011A, 5.125%, 7/01/41 (Pre-refunded 7/01/21) | | | |
| 4,560 | | Massachusetts School Building Authority, Dedicated Sales Tax Revenue Bonds, Senior | 5/23 at 100.00 | Aa2 (5) | 5,011,166 |
| | Series 2013A, 5.000%, 5/15/43 (Pre-refunded 5/15/23) | | | |
| 7,175 | | Metropolitan Boston Transit Parking Corporation, Massachusetts, Systemwide Parking | 7/21 at 100.00 | A– | 7,230,247 |
| | Revenue Bonds, Senior Lien Series 2011, 5.000%, 7/01/41 | | | |
| 38,955 | | Total Massachusetts | | | 41,944,394 |
80
| | | | | | |
| Principal | | | Optional Call | | |
| Amount (000) | | Description (1) | Provisions (2) | Ratings (3) | Value |
| | Michigan – 1.9% (1.3% of Total Investments) | | | |
| | Detroit Academy of Arts and Sciences, Michigan, Public School Academy Revenue Bonds, | | | |
| | Refunding Series 2013: | | | |
| $ 840 | | 6.000%, 10/01/33 | 10/23 at 100.00 | N/R | $ 862,235 |
| 1,250 | | 6.000%, 10/01/43 | 10/23 at 100.00 | N/R | 1,271,725 |
| 15,000 | | Detroit City School District, Wayne County, Michigan, Unlimited Tax School Building and | No Opt. Call | AA | 18,588,450 |
| | Site Improvement Bonds, Series 2001A, 6.000%, 5/01/29 – AGM Insured (UB) (7) | | | |
| 1,930 | | Detroit Water and Sewerage Department, Michigan, Sewage Disposal System Revenue Bonds, | 7/22 at 100.00 | A1 (5) | 2,045,028 |
| | Refunding Senior Lien Series 2012A, 5.250%, 7/01/39 (Pre-refunded 7/01/22) | | | |
| 5 | | Detroit, Michigan, Second Lien Sewerage Disposal System Revenue Bonds, Series 2005A, | 6/21 at 100.00 | A2 | 5,015 |
| | 4.500%, 7/01/35 – NPFG Insured | | | |
| 3,000 | | Detroit, Michigan, Senior Lien Sewerage Disposal System Revenue Bonds, Series 2001B, | No Opt. Call | A2 | 3,703,980 |
| | 5.500%, 7/01/29 – NPFG Insured | | | |
| 5 | | Detroit, Michigan, Sewer Disposal System Revenue Bonds, Second Lien, Series 2006B, | 6/21 at 100.00 | A2 | 5,017 |
| | 5.000%, 7/01/36 – FGIC Insured | | | |
| 2,000 | | Detroit, Michigan, Water Supply System Revenue Bonds, Senior Lien Series 2011A, 5.250%, | 7/21 at 100.00 | A1 (5) | 2,016,360 |
| | 7/01/41 (Pre-refunded 7/01/21) | | | |
| 2,000 | | Grand Traverse County Hospital Finance Authority, Michigan, Revenue Bonds, Munson | 7/24 at 100.00 | A1 | 2,226,980 |
| | Healthcare, Series 2014A, 5.000%, 7/01/47 | | | |
| 3,580 | | Lansing Board of Water and Light, Michigan, Utility System Revenue Bonds, Series 2011A, | 7/21 at 100.00 | AA– (5) | 3,610,681 |
| | 5.500%, 7/01/41 (Pre-refunded 7/01/21) | | | |
| 1,000 | | Michigan Finance Authority, Local Government Loan Program Revenue Bonds, Detroit Water & | 7/24 at 100.00 | A2 | 1,132,770 |
| | Sewerage Department Water Supply System Local Project, Series 2014D-6, 5.000%, 7/01/36 – | | | |
| | NPFG Insured | | | |
| | Michigan Finance Authority, Revenue Bonds, Trinity Health Credit Group, Refunding Series 2011MI: | | | |
| 20 | | 5.000%, 12/01/39 (Pre-refunded 12/01/21) | 12/21 at 100.00 | N/R (5) | 20,548 |
| 4,980 | | 5.000%, 12/01/39 (Pre-refunded 12/01/21) | 12/21 at 100.00 | AA– (5) | 5,120,785 |
| 1,350 | | Michigan Finance Authority, Tobacco Settlement Asset- Backed Bonds, 2006 Sold Tobacco | 12/30 at 100.00 | BBB | 1,717,483 |
| | Receipts Senior Current Interest Series 2020A-2, 5.000%, 6/01/40 | | | |
| 2,250 | | Michigan State Building Authority, Revenue Bonds, Facilities Program, Refunding Series | 10/21 at 100.00 | AA– (5) | 2,303,257 |
| | 2011-I-A, 5.375%, 10/15/41 (Pre-refunded 10/15/21) | | | |
| 2,000 | | Wayne County Airport Authority, Michigan, Revenue Bonds, Detroit Metropolitan Wayne | 12/22 at 100.00 | A– | 2,137,700 |
| | County Airport, Series 2012A, 5.000%, 12/01/37 | | | |
| 41,210 | | Total Michigan | | | 46,768,014 |
| | Minnesota – 0.8% (0.5% of Total Investments) | | | |
| 700 | | City of Ham Lake, Minnesota, Charter School Lease Revenue Bonds, DaVinci Academy | 7/24 at 102.00 | N/R | 754,600 |
| | Project,Series 2016A, 5.000%, 7/01/47 | | | |
| 1,500 | | Forest Lake, Minnesota, Charter School Lease Revenue Bonds, Lakes International Language | 8/22 at 102.00 | BB+ | 1,586,340 |
| | Academy, Series 2014A, 5.750%, 8/01/44 | | | |
| 795 | | Minneapolis, Minnesota, Charter School Lease Revenue Bonds, Hiawatha Academies Project, | 7/24 at 102.00 | N/R | 848,774 |
| | Series 2016A, 5.000%, 7/01/36 | | | |
| | Saint Paul Housing & Redevelopment Authority, Minnesota, Charter School Lease Revenue | | | |
| | Bonds, Hmong College Prep Academy Project, Series 2016A: | | | |
| 750 | | 5.750%, 9/01/46 | 9/26 at 100.00 | BB+ | 874,043 |
| 4,000 | | 6.000%, 9/01/51 | 9/26 at 100.00 | BB+ | 4,700,320 |
| 5,265 | | Saint Paul Housing and Redevelopment Authority, Minnesota, Health Care Facility Revenue | 7/25 at 100.00 | A | 6,108,979 |
| | Bonds, HealthPartners Obligated Group, Refunding Series 2015A, 5.000%, 7/01/33 | | | |
| 4,250 | | Saint Paul Port Authority, Minnesota, Lease Revenue Bonds, Regions Hospital Parking Ramp | 6/21 at 100.00 | N/R | 4,254,335 |
| | Project, Series 2007-1, 5.000%, 8/01/36 | | | |
| 17,260 | | Total Minnesota | | | 19,127,391 |
81
| | |
| NZF | Nuveen Municipal Credit Income Fund |
| Portfolio of Investments (continued) April 30, 2021 (Unaudited) |
|
| | | | | | |
| Principal | | | Optional Call | | |
| Amount (000) | | Description (1) | Provisions (2) | Ratings (3) | Value |
| | Missouri – 3.7% (2.4% of Total Investments) | | | |
| $ 1,400 | | Bi-State Development Agency of the Missouri-Illinois Metropolitan District, Mass Transit | 10/22 at 100.00 | Aa2 (5) | $ 1,496,516 |
| | Sales Tax Appropriation Bonds, Refunding Combined Lien Series 2013A, 5.000%, 10/01/44 | | | |
| | (Pre-refunded 10/01/22) | | | |
| 1,025 | | Cape Girardeau County Industrial Development Authority, Missouri, Health Facilities | 3/23 at 103.00 | Ba1 | 1,126,034 |
| | Revenue Bonds, Southeasthealth, Series 2016A, 6.000%, 3/01/33 | | | |
| | Kansas City Industrial Development Authority, Missouri, Airport Special Obligation | | | |
| | Bonds, Kansas City International Airport Terminal Modernization Project, Series 2019B: | | | |
| 19,950 | | 5.000%, 3/01/46 (AMT) | 3/29 at 100.00 | A– | 24,277,953 |
| 13,000 | | 5.000%, 3/01/54 (AMT) | 3/29 at 100.00 | A– | 15,822,820 |
| 135 | | Kansas City Industrial Development Authority, Missouri, Sales Tax Revenue Bonds, Ward | 4/26 at 100.00 | N/R | 140,224 |
| | Parkway Center Community Improvement District, Senior Refunding & Improvement Series 2016, | | | |
| | 5.000%, 4/01/46, 144A | | | |
| 12,005 | | Kansas City Municipal Assistance Corporation, Missouri, Leasehold Revenue Bonds, | No Opt. Call | A2 | 10,715,183 |
| | Improvement Series 2004B-1, 0.000%, 4/15/29 – AMBAC Insured | | | |
| 650 | | Land Clearance for Redevelopment Authority of Kansas City, Missouri, Project Revenue | 2/28 at 100.00 | N/R | 700,375 |
| | Bonds, Convention Center Hotel Project – TIF Financing, Series 2018B, 5.000%, 2/01/40, 144A | | | |
| 1,000 | | Liberty Public School District 53, Clay County, Missouri, Lease Participation | 4/22 at 100.00 | AA– | 1,041,650 |
| | Certificates, School Boards Association, Series 2014, 5.000%, 4/01/31 | | | |
| | Liberty, Missouri, Special Obligation Tax Increment and Special Districts Bonds, Liberty | | | |
| | Commons Project, Series 2015A: | | | |
| 1,430 | | 5.125%, 6/01/25, 144A | No Opt. Call | N/R | 1,502,515 |
| 3,810 | | 5.750%, 6/01/35, 144A | 6/25 at 100.00 | N/R | 3,950,894 |
| 3,695 | | 6.000%, 6/01/46, 144A | 6/25 at 100.00 | N/R | 3,850,227 |
| | Missouri Health and Educational Facilities Authority, Educational Facilities Revenue | | | |
| | Bonds, Kansas City University of Medicine and Biosciences, Series 2013A: | | | |
| 1,590 | | 5.000%, 6/01/30 | 6/23 at 100.00 | A1 | 1,741,527 |
| 2,700 | | 5.000%, 6/01/33 | 6/23 at 100.00 | A1 | 2,955,879 |
| 665 | | Missouri Health and Educational Facilities Authority, Educational Facilities Revenue | 5/23 at 100.00 | BBB | 702,912 |
| | Bonds, Saint Louis College of Pharmacy, Series 2013, 5.250%, 5/01/33 | | | |
| 505 | | Missouri Health and Educational Facilities Authority, Educational Facilities Revenue | 10/23 at 100.00 | A+ | 560,217 |
| | Bonds, University of Central Missouri, Series 2013C-2, 5.000%, 10/01/34 | | | |
| | Missouri Health and Educational Facilities Authority, Health Facilities Revenue Bonds, | | | |
| | CoxHealth, Series 2013A: | | | |
| 50 | | 5.000%, 11/15/44 | 11/23 at 100.00 | A2 | 54,773 |
| 6,930 | | 5.000%, 11/15/48 | 11/23 at 100.00 | A2 | 7,591,538 |
| 2,000 | | Missouri Health and Educational Facilities Authority, Health Facilities Revenue Bonds, | 11/24 at 100.00 | A+ | 2,263,040 |
| | Mercy Health, Series 2014F, 5.000%, 11/15/45 | | | |
| 2,500 | | Missouri Health and Educational Facilities Authority, Revenue Bonds, Washington | 11/21 at 100.00 | AA+ (5) | 2,565,225 |
| | University, Series 2011B, 5.000%, 11/15/37 (Pre-refunded 11/15/21) | | | |
| | Saint Louis County Industrial Development Authority, Missouri, Health Facilities Revenue | | | |
| | Bonds, Ranken-Jordan Project, Refunding & Improvement Series 2016: | | | |
| 1,275 | | 5.000%, 11/15/41 | 11/25 at 100.00 | N/R | 1,344,628 |
| 1,105 | | 5.000%, 11/15/46 | 11/25 at 100.00 | N/R | 1,158,758 |
| 430 | | Saint Louis County Industrial Development Authority, Missouri, Revenue Bonds, Friendship | 9/23 at 100.00 | BB+ | 463,983 |
| | Village of Sunset Hills, Series 2013A, 5.875%, 9/01/43 | | | |
| | Saint Louis County Industrial Development Authority, Missouri, Revenue Bonds, Saint | | | |
| | Andrew’s Resources for Seniors, Series 2015A: | | | |
| 450 | | 5.000%, 12/01/35 | 12/25 at 100.00 | N/R | 482,620 |
| 130 | | 5.125%, 12/01/45 | 12/25 at 100.00 | N/R | 138,290 |
| 895 | | Stoddard County Industrial Development Authority, Missouri, Health Facility Revenue | 3/23 at 103.00 | Ba1 | 980,526 |
| | Bonds, Southeasthealth, Series 2016B, 6.000%, 3/01/37 | | | |
| 700 | | The Industrial Development Authority of the City of Saint Louis, Missouri, Development | 11/26 at 100.00 | N/R | 713,104 |
| | Financing Revenue Bonds, Ballpark Village Development Project, Series 2017A, 4.750%, 11/15/47 | | | |
| 80,025 | | Total Missouri | | | 88,341,411 |
82
| | | | | | |
| Principal | | | Optional Call | | |
| Amount (000) | | Description (1) | Provisions (2) | Ratings (3) | Value |
| | Nebraska – 0.6% (0.4% of Total Investments) | | | |
| $ 580 | | Douglas County Hospital Authority 2, Nebraska, Health Facilities Revenue Bonds, Nebraska | 11/25 at 100.00 | A | $ 669,575 |
| | Methodist Health System, Refunding Series 2015, 5.000%, 11/01/45 | | | |
| | Douglas County Hospital Authority 2, Nebraska, Hospital Revenue Bonds, Madonna | | | |
| | Rehabilitation Hospital Project, Series 2014: | | | |
| 1,930 | | 5.000%, 5/15/27 | 5/24 at 100.00 | A– | 2,162,121 |
| 3,000 | | 5.000%, 5/15/36 | 5/24 at 100.00 | A– | 3,304,920 |
| | Douglas County Hospital Authority 3, Nebraska, Health Facilities Revenue Bonds, Nebraska | | | |
| | Methodist Health System, Refunding Series 2015: | | | |
| 4,070 | | 5.000%, 11/01/45 | 11/25 at 100.00 | A | 4,698,571 |
| 2,110 | | 5.000%, 11/01/48 | 11/25 at 100.00 | A | 2,426,943 |
| 500 | | Lincoln County Hospital Authority 1, Nebraska, Hospital Revenue and Refunding Bonds, Great | 11/21 at 100.00 | N/R (5) | 511,835 |
| | Plains Regional Medical Center Project, Series 2012, 5.000%, 11/01/42 (Pre-refunded 11/01/21) | | | |
| 12,190 | | Total Nebraska | | | 13,773,965 |
| | Nevada – 0.6% (0.4% of Total Investments) | | | |
| 10,000 | | Las Vegas Valley Water District, Nevada, General Obligation Bonds, Refunding Series | 6/21 at 100.00 | AA | 10,036,500 |
| | 2011C, 5.000%, 6/01/38 | | | |
| 4,000 | | Las Vegas Valley Water District, Nevada, General Obligation Bonds, Refunding Series | 12/24 at 100.00 | AA | 4,593,920 |
| | 2015, 5.000%, 6/01/39 | | | |
| 14,000 | | Total Nevada | | | 14,630,420 |
| | New Jersey – 5.9% (3.8% of Total Investments) | | | |
| 475 | | Gloucester County Pollution Control Financing Authority, New Jersey, Pollution Control | No Opt. Call | Ba1 | 498,218 |
| | Revenue Bonds, Logan Project, Refunding Series 2014A, 5.000%, 12/01/24 (AMT) | | | |
| 1,100 | | New Jersey Economic Development Authority, Private Activity Bonds, The Goethals Bridge | 1/24 at 100.00 | BBB+ | 1,228,271 |
| | Replacement Project, Series 2013, 5.125%, 7/01/42 – AGM Insured (AMT) | | | |
| 17,580 | | New Jersey Economic Development Authority, School Facilities Construction Bonds, | 12/26 at 100.00 | BBB | 21,521,788 |
| | Refunding Series 2016BBB, 5.500%, 6/15/31 | | | |
| | New Jersey Economic Development Authority, School Facilities Construction Bonds, | | | |
| | Series 016AAA: | | | |
| 1,000 | | 5.000%, 6/15/36 | 12/26 at 100.00 | BBB | 1,181,940 |
| 10,000 | | 5.000%, 6/15/41 | 12/26 at 100.00 | BBB | 11,736,700 |
| 2,000 | | New Jersey Economic Development Authority, School Facilities Construction Bonds, Series | 6/27 at 100.00 | BBB | 2,392,360 |
| | 2017DDD, 5.000%, 6/15/35 | | | |
| 15,040 | | New Jersey Economic Development Authority, School Facilities Construction Bonds, Series | 12/28 at 100.00 | BBB | 18,175,088 |
| | 2018EEE, 5.000%, 6/15/48 | | | |
| 1,120 | | New Jersey Educational Facilities Authority, Revenue Bonds, Seton Hall University, | 7/23 at 100.00 | BBB+ | 1,199,397 |
| | Series 2013D, 5.000%, 7/01/33 | | | |
| 600 | | New Jersey Health Care Facilities Financing Authority, New Jersey, Revenue Bonds, Saint | 7/21 at 100.00 | BB+ | 603,780 |
| | Peters University Hospital, Refunding Series 2011, 6.000%, 7/01/26 | | | |
| 405 | | New Jersey Health Care Facilities Financing Authority, Revenue Bonds, University | 7/25 at 100.00 | BB– | 464,118 |
| | Hospital Issue, Refunding Series 2015A, 5.000%, 7/01/46 – AGM Insured | | | |
| 5,600 | | New Jersey State, General Obligation Bonds, Covid-19 Emergency Series 2020A, | No Opt. Call | BBB+ | 6,957,496 |
| | 4.000%, 6/01/31 | | | |
| | New Jersey Transportation Trust Fund Authority, Transportation System Bonds, Capital | | | |
| | Appreciation Series 2010A: | | | |
| 3,130 | | 0.000%, 12/15/28 | No Opt. Call | BBB | 2,742,537 |
| 3,000 | | 0.000%, 12/15/31 | No Opt. Call | BBB | 2,389,170 |
| 12,715 | | 0.000%, 12/15/33 | No Opt. Call | BBB | 9,513,236 |
| 610 | | 0.000%, 12/15/34 | No Opt. Call | BBB | 442,238 |
| 2,480 | | 0.000%, 12/15/40 | No Opt. Call | BBB | 1,443,310 |
| 10,000 | | New Jersey Transportation Trust Fund Authority, Transportation System Bonds, Refunding | No Opt. Call | BBB+ | 7,786,800 |
| | Series 2006C, 0.000%, 12/15/33 – AGM Insured | | | |
83
| | |
| NZF | Nuveen Municipal Credit Income Fund |
| Portfolio of Investments (continued) April 30, 2021 (Unaudited) |
|
| | | | | | |
| Principal | | | Optional Call | | |
| Amount (000) | | Description (1) | Provisions (2) | Ratings (3) | Value |
| | New Jersey (continued) | | | |
| $ 19,175 | | New Jersey Transportation Trust Fund Authority, Transportation System Bonds, Series | No Opt. Call | BBB | $ 13,448,578 |
| | 2008A, 0.000%, 12/15/35 | | | |
| 15,000 | | New Jersey Transportation Trust Fund Authority, Transportation System Bonds, Series | No Opt. Call | BBB | 9,059,400 |
| | 2009A, 0.000%, 12/15/39 | | | |
| 5,000 | | New Jersey Transportation Trust Fund Authority, Transportation System Bonds, Series | 12/24 at 100.00 | BBB | 5,770,900 |
| | 2009C, 5.250%, 6/15/32 | | | |
| 6,305 | | New Jersey Transportation Trust Fund Authority, Transportation System Bonds, Series | 6/25 at 100.00 | BBB | 7,160,084 |
| | 2015AA, 5.000%, 6/15/45 | | | |
| 2,880 | | New Jersey Transportation Trust Fund Authority, Transportation System Bonds, Series | 6/31 at 100.00 | BBB | 3,422,016 |
| | 2021A, 4.000%, 6/15/35 | | | |
| 1,595 | | Tobacco Settlement Financing Corporation, New Jersey, Tobacco Settlement Asset-Backed | 6/28 at 100.00 | BBB+ | 1,891,829 |
| | Bonds, Series 2018A, 5.000%, 6/01/46 | | | |
| 10,000 | | Tobacco Settlement Financing Corporation, New Jersey, Tobacco Settlement Asset-Backed | 6/28 at 100.00 | BB+ | 11,717,800 |
| | Bonds, Series 2018B, 5.000%, 6/01/46 | | | |
| 146,810 | | Total New Jersey | | | 142,747,054 |
| | New Mexico – 0.4% (0.3% of Total Investments) | | | |
| 4,185 | | New Mexico Hospital Equipment Loan Council, Hospital Revenue Bonds, Presbyterian | 8/29 at 100.00 | Aa3 | 5,211,664 |
| | Healthcare Services, Series 2019A, 5.000%, 8/01/44 | | | |
| 4,180 | | Winrock Town Center Tax Increment Development District, Albuquerque, New Mexico, Gross | 6/21 at 102.00 | N/R | 4,266,861 |
| | Receipts Tax Increment Bonds, Senior Lien Series 2015, 5.750%, 5/01/30, 144A | | | |
| 8,365 | | Total New Mexico | | | 9,478,525 |
| | New York – 17.7% (11.4% of Total Investments) | | | |
| 1,755 | | Albany Industrial Development Agency, New York, Revenue Bonds, Brighter Choice Charter | 6/21 at 100.00 | BB | 1,759,352 |
| | Schools, Series 2007A, 5.000%, 4/01/32 | | | |
| | Brooklyn Arena Local Development Corporation, New York, Payment in Lieu of Taxes Revenue | | | |
| | Bonds, Barclays Center Project, Series 2009: | | | |
| 3,400 | | 0.000%, 7/15/44 | No Opt. Call | Ba1 | 1,735,530 |
| 12,020 | | 0.000%, 7/15/46 | No Opt. Call | Ba1 | 5,468,619 |
| 450 | | Buffalo and Erie County Industrial Land Development Corporation, New York, Revenue | 7/25 at 100.00 | BBB | 519,084 |
| | Bonds, Catholic Health System, Inc Project, Series 2015, 5.250%, 7/01/35 | | | |
| 200 | | Build New York City Resource Corporation, New York, Revenue Bonds, Metropolitan College | 11/24 at 100.00 | BB | 215,714 |
| | of New York, Series 2014, 5.000%, 11/01/39 | | | |
| 3,170 | | Dormitory Authority of the State of New York, Revenue Bonds, New School University, | 7/25 at 100.00 | BBB+ | 3,631,869 |
| | Series 2015A, 5.000%, 7/01/50 | | | |
| 15,270 | | Dormitory Authority of the State of New York, Revenue Bonds, Vaughn College of | 12/26 at 100.00 | BB– | 16,254,762 |
| | Aeronautics & Technology, Series 2016A, 5.500%, 12/01/46, 144A | | | |
| 12,500 | | Dormitory Authority of the State of New York, State Personal Income Tax Revenue Bonds, | 3/31 at 100.00 | AA+ | 14,972,250 |
| | General Purpose, Series 2021A, 4.000%, 3/15/38 | | | |
| 81,270 | | Erie County Tobacco Asset Securitization Corporation, New York, Tobacco Settlement | 6/21 at 16.20 | N/R | 11,903,617 |
| | Asset-Backed Bonds, Series 2005C, 0.000%, 6/01/50, 144A | | | |
| | Hudson Yards Infrastructure Corporation, New York, Revenue Bonds, Senior Fiscal 2012 | | | |
| | Series 2011A: | | | |
| 5,790 | | 5.250%, 2/15/47 | 6/21 at 100.00 | A+ | 5,810,439 |
| 785 | | 5.750%, 2/15/47 | 6/21 at 100.00 | A+ | 788,164 |
| 3,000 | | Long Island Power Authority, New York, Electric System General Revenue Bonds, Series | 9/24 at 100.00 | A | 3,405,210 |
| | 2014A, 5.000%, 9/01/39 | | | |
| | Long Island Power Authority, New York, Electric System Revenue Bonds, Series 2012A: | | | |
| 1,990 | | 5.000%, 9/01/42 (Pre-refunded 9/01/22) | 9/22 at 100.00 | N/R (5) | 2,119,350 |
| 4,010 | | 5.000%, 9/01/42 | 9/22 at 100.00 | A2 | 4,251,161 |
| 6,280 | | Metropolitan Transportation Authority, New York, Transportation Revenue Bonds, Green | 5/30 at 100.00 | BBB+ | 7,810,750 |
| | Climate Bond Certified Series 2020C-1, 5.250%, 11/15/55 | | | |
84
| | | | | | |
| Principal | | | Optional Call | | |
| Amount (000) | | Description (1) | Provisions (2) | Ratings (3) | Value |
| | New York (continued) | | | |
| $ 4,210 | | Metropolitan Transportation Authority, New York, Transportation Revenue Bonds, Refunding | 11/26 at 100.00 | BBB+ | $ 5,013,268 |
| | Green Series 2016B, 5.000%, 11/15/34 | | | |
| 1,000 | | Metropolitan Transportation Authority, New York, Transportation Revenue Bonds, Refunding | 11/25 at 100.00 | BBB+ | 1,159,400 |
| | Series 2015F, 5.000%, 11/15/35 | | | |
| 5,000 | | Metropolitan Transportation Authority, New York, Transportation Revenue Bonds, Refunding | 5/28 at 100.00 | BBB+ | 6,153,250 |
| | Series 2017D, 5.000%, 11/15/32 | | | |
| | Metropolitan Transportation Authority, New York, Transportation Revenue Bonds, Series 011A: | | | |
| 285 | | 5.000%, 11/15/41 (Pre-refunded 11/15/21) | 11/21 at 100.00 | N/R (5) | 292,450 |
| 465 | | 5.000%, 11/15/41 (Pre-refunded 11/15/21) | 11/21 at 100.00 | BBB+ (5) | 477,155 |
| 2,500 | | Metropolitan Transportation Authority, New York, Transportation Revenue Bonds, Series | 5/23 at 100.00 | BBB+ | 2,685,000 |
| | 2013A, 5.000%, 11/15/38 | | | |
| 6,095 | | Metropolitan Transportation Authority, New York, Transportation Revenue Bonds, Series | 11/23 at 100.00 | BBB+ | 6,655,313 |
| | 2013D, 5.000%, 11/15/38 | | | |
| 4,400 | | New York City Municipal Water Finance Authority, New York, Water and Sewer System Second | 6/30 at 100.00 | AA+ | 5,648,104 |
| | General Resolution Revenue Bonds, Fiscal 2020 Series FF, 5.000%, 6/15/41 | | | |
| | New York City Municipal Water Finance Authority, New York, Water and Sewer System Second | | | |
| | General Resolution Revenue Bonds, Fiscal 2020 Series GG-1: | | | |
| 11,000 | | 4.000%, 6/15/50 | 6/30 at 100.00 | AA+ | 12,852,840 |
| 19,335 | | 5.000%, 6/15/50 | 6/30 at 100.00 | AA+ | 24,511,173 |
| 19,305 | | New York City Municipal Water Finance Authority, New York, Water and Sewer System Second | 12/29 at 100.00 | AA+ | 24,306,153 |
| | General Resolution Revenue Bonds, Fiscal 2020 Series BB-1, 5.000%, 6/15/49 | | | |
| 5,000 | | New York City Municipal Water Finance Authority, New York, Water and Sewer System Second | 12/30 at 100.00 | AA+ | 5,970,750 |
| | General Resolution Revenue Bonds, Fiscal 2021 Series BB-2, 4.000%, 6/15/42 | | | |
| 5,000 | | New York City Transitional Finance Authority, New York, Building Aid Revenue Bonds, | 7/28 at 100.00 | Aa3 | 6,131,100 |
| | Fiscal 2019 Subseries S-1, 5.000%, 7/15/45 | | | |
| 4,440 | | New York City Transitional Finance Authority, New York, Building Aid Revenue Bonds, | 7/28 at 100.00 | Aa3 | 5,555,905 |
| | Fiscal 2019 Subseries S-3A, 5.000%, 7/15/36 | | | |
| 10,000 | | New York City Transitional Finance Authority, New York, Future Tax Secured Bonds, | 5/23 at 100.00 | Aa1 | 10,895,600 |
| | Subordinate Fiscal 2013 Series I, 5.000%, 5/01/38 | | | |
| 10,000 | | New York City, New York, General Obligation Bonds, Fiscal 2021 Series F-1, 5.000%, 3/01/43 | 3/31 at 100.00 | AA– | 12,825,700 |
| 63,090 | | New York Liberty Development Corporation, New York, Liberty Revenue Bonds, 3 World Trade | 11/24 at 100.00 | N/R | 69,058,314 |
| | Center Project, Class 1 Series 2014, 5.000%, 11/15/44, 144A | | | |
| 5,200 | | New York Liberty Development Corporation, New York, Liberty Revenue Bonds, 3 World Trade | 11/24 at 100.00 | N/R | 5,812,144 |
| | Center Project, Class 2 Series 2014, 5.150%, 11/15/34, 144A | | | |
| | New York Liberty Development Corporation, New York, Liberty Revenue Bonds, 4 World Trade | | | |
| | Center Project, Series 2011: | | | |
| 1,870 | | 5.000%, 11/15/44 | 11/21 at 100.00 | A– | 1,913,515 |
| 2,000 | | 5.750%, 11/15/51 | 11/21 at 100.00 | A– | 2,055,780 |
| 3,000 | | New York State Power Authority, General Revenue Bonds, Series 2011A, 5.000%, 11/15/38 | 11/21 at 100.00 | Aa2 (5) | 3,078,420 |
| | (Pre-refunded 11/15/21) | | | |
| 5,000 | | New York State Thruway Authority, General Revenue Junior Indebtedness Obligations, | 1/26 at 100.00 | A– | 5,844,000 |
| | Series 2016A, 5.000%, 1/01/51 | | | |
| 3,450 | | New York State Urban Development Corporation, State Personal Income Tax Revenue Bonds, | 3/30 at 100.00 | AA+ | 4,060,823 |
| | General Purpose, Series 2020E, 4.000%, 3/15/39 | | | |
| | New York Transportation Development Corporation, New York, Special Facilities Bonds, | | | |
| | LaGuardia Airport Terminal B Redevelopment Project, Series 2016A: | | | |
| 1,800 | | 4.000%, 7/01/41 (AMT) | 7/24 at 100.00 | Baa3 | 1,948,230 |
| 10,680 | | 5.000%, 7/01/41 (AMT) | 7/24 at 100.00 | Baa3 | 12,051,633 |
| 16,810 | | 5.000%, 7/01/46 (AMT) | 7/24 at 100.00 | Baa3 | 18,942,012 |
| 29,150 | | 5.250%, 1/01/50 (AMT) | 7/24 at 100.00 | Baa3 | 32,996,343 |
85
| | |
| NZF | Nuveen Municipal Credit Income Fund |
| Portfolio of Investments (continued)
|
| | April 30, 2021 (Unaudited) |
|
| | | | | | |
| Principal | | | Optional Call | | |
| Amount (000) | | Description (1) | Provisions (2) | Ratings (3) | Value |
| | New York (continued) | | | |
| | New York Transportation Development Corporation, New York, Special Facility Revenue | | | |
| | Bonds, American Airlines, Inc John F Kennedy International Airport Project, Refunding | | | |
| | Series 2016: | | | |
| $ 2,565 | | 5.000%, 8/01/26 (AMT) | 8/21 at 100.00 | B– | $ 2,592,086 |
| 16,200 | | 5.000%, 8/01/31 (AMT) | 8/21 at 100.00 | B– | 16,365,240 |
| 4,825 | | New York Transportation Development Corporation, New York, Special Facility Revenue | 8/30 at 100.00 | B– | 6,038,198 |
| | Bonds, American Airlines, Inc John F Kennedy International Airport Project, Series 2020, | | | |
| | 5.250%, 8/01/31 (AMT) | | | |
| 4,350 | | New York Transportation Development Corporation, Special Facility Revenue Bonds, Delta | 1/28 at 100.00 | BB+ | 5,325,749 |
| | Air Lines, Inc – LaGuardia Airport Terminals C&D Redevelopment Project, Series 2018, 5.000%, | | | |
| | 1/01/31 (AMT) | | | |
| 2,100 | | New York Transportation Development Corporation, Special Facility Revenue Bonds, Delta | 10/30 at 100.00 | BB+ | 2,681,826 |
| | Air Lines, Inc – LaGuardia Airport Terminals C&D Redevelopment Project, Series 2020, 5.000%, | | | |
| | 10/01/35 (AMT) | | | |
| 10,000 | | Port Authority of New York and New Jersey, Consolidated Revenue Bonds, Two Hundred | 4/27 at 100.00 | A+ | 12,018,000 |
| | Series 2017, 5.250%, 10/15/57 | | | |
| 2,500 | | Triborough Bridge and Tunnel Authority, New York, General Purpose Revenue Bonds, | 5/25 at 100.00 | AA– | 2,872,050 |
| | Refunding Series 2015A, 5.000%, 11/15/50 | | | |
| 6,945 | | Triborough Bridge and Tunnel Authority, New York, General Revenue Bonds, MTA Bridges & | 11/30 at 100.00 | AA– | 8,804,454 |
| | Tunnels, Series 2020A, 5.000%, 11/15/49 | | | |
| 451,460 | | Total New York | | | 426,237,849 |
| | North Carolina – 0.1% (0.1% of Total Investments) | | | |
| 3,300 | | North Carolina Medical Care Commission, Health Care Facilities Revenue Bonds, WakeMed, | 10/22 at 100.00 | A2 | 3,479,553 |
| | Refunding Series 2012A, 5.000%, 10/01/31 | | | |
| | North Dakota – 2.3% (1.5% of Total Investments) | | | |
| 1,000 | | Burleigh County, North Dakota, Health Care Revenue Bonds, Saint Alexius Medical Center | 7/21 at 100.00 | N/R (5) | 1,007,130 |
| | Project, Series 2014A, 5.000%, 7/01/35 (Pre-refunded 7/01/21) | | | |
| | Fargo, North Dakota, Health System Revenue Bonds, Sanford Health, Refunding Series 2011: | | | |
| 1,500 | | 6.000%, 11/01/28 (Pre-refunded 11/01/21) | 11/21 at 100.00 | A+ (5) | 1,542,345 |
| 2,190 | | 6.250%, 11/01/31 (Pre-refunded 11/01/21) | 11/21 at 100.00 | A+ (5) | 2,254,517 |
| | Grand Forks, North Dakota, Health Care System Revenue Bonds, Altru Health System | | | |
| | Obligated Group, Series 2012: | | | |
| 3,000 | | 5.000%, 12/01/29 | 12/21 at 100.00 | Baa2 | 3,044,550 |
| 1,875 | | 5.000%, 12/01/32 | 12/21 at 100.00 | Baa2 | 1,899,675 |
| 39,670 | | Ward County Health Care, North Dakota, Revenue Bonds, Trinity Obligated Group, Series | 6/28 at 100.00 | BBB– | 45,066,707 |
| | 2017C, 5.000%, 6/01/53 | | | |
| 49,235 | | Total North Dakota | | | 54,814,924 |
| | Ohio – 2.9% (1.9% of Total Investments) | | | |
| 800 | | Allen County, Ohio, Hospital Facilities Revenue Bonds, Catholic Health Partners, | 5/22 at 100.00 | A+ (5) | 838,840 |
| | Refunding and Improvement Series 2012A, 5.000%, 5/01/42 (Pre-refunded 5/01/22) | | | |
| 8,015 | | Buckeye Tobacco Settlement Financing Authority, Ohio, Tobacco Settlement Asset-Backed | 6/30 at 100.00 | BBB+ | 9,061,999 |
| | Revenue Bonds, Refunding Senior Lien Series 2020A-2 Class 1, 4.000%, 6/01/48 | | | |
| 20,305 | | Buckeye Tobacco Settlement Financing Authority, Ohio, Tobacco Settlement Asset-Backed | 6/30 at 100.00 | N/R | 22,826,272 |
| | Revenue Bonds, Refunding Senior Lien Series 2020B-2 Class 2, 5.000%, 6/01/55 | | | |
| 5,800 | | Franklin County, Ohio, Hospital Revenue Bonds, OhioHealth Corporation, Series 2011A, | 11/21 at 100.00 | Aa2 (5) | 5,951,322 |
| | 5.000%, 11/15/41 (Pre-refunded 11/15/21) | | | |
| 4,615 | | Lucas County, Ohio, Hospital Revenue Bonds, ProMedica Healthcare Obligated Group, Series | 11/21 at 100.00 | Baa3 (5) | 4,759,357 |
| | 2011A, 6.000%, 11/15/41 (Pre-refunded 11/15/21) | | | |
| 1,000 | | Ohio Air Quality Development Authority, Ohio, Pollution Control Revenue Bonds, | No Opt. Call | N/R | 1,250 |
| | FirstEnergy Nuclear Generation Project, Refunding Series 2008C, 3.950%, 11/01/32 (4) | | | |
| 10 | | Ohio Air Quality Development Authority, Ohio, Revenue Bonds, AK Steel Holding | 2/22 at 100.00 | CCC | 10,227 |
| | Corporation, Refunding Series 2012A, 6.750%, 6/01/24 (AMT) | | | |
86
| | | | | | |
| Principal | | | Optional Call | | |
| Amount (000) | | Description (1) | Provisions (2) | Ratings (3) | Value |
| | Ohio (continued) | | | |
| $ 6,945 | | Ohio State, Hospital Revenue Bonds, University Hospitals Health System, Inc, Series | 1/30 at 100.00 | A | $ 8,615,620 |
| | 2020A, 5.000%, 1/15/50 | | | |
| 2,000 | | Ohio State, Turnpike Revenue Bonds, Ohio Turnpike and Infrastructure Commission | 2/23 at 100.00 | A+ | 2,169,340 |
| | Infrastructure Projects, Junior Lien, Current Interest Series 2013A-1, 5.250%, 2/15/33 | | | |
| 330 | | Ohio Water Development Authority, Ohio, Environmental Improvement Bonds, United States | 11/21 at 100.00 | Caa1 | 337,534 |
| | Steel Corporation Project, Refunding Series 2011, 6.600%, 5/01/29 | | | |
| 3,000 | | Ohio Water Development Authority, Pollution Control Revenue Bonds, FirstEnergy Nuclear | No Opt. Call | N/R | 3,750 |
| | Generating Corporation Project, Refunding Series 2008C, 3.950%, 11/01/32 (4) | | | |
| 13,350 | | Ohio Water Development Authority, Pollution Control Revenue Refunding Bonds, FirstEnergy | No Opt. Call | N/R | 13,743,825 |
| | Nuclear Generating Corporation Project, Series 2009A, 4.375%, 6/01/33 (Mandatory Put 6/01/22) | | | |
| 2,500 | | Ohio Water Development Authority, Pollution Control Revenue Refunding Bonds, FirstEnergy | No Opt. Call | N/R | 2,573,750 |
| | Nuclear Generating Corporation Project, Series 2010B, 4.375%, 6/01/33 (Mandatory Put 6/01/22) | | | |
| 68,670 | | Total Ohio | | | 70,893,086 |
| | Oklahoma – 2.6% (1.7% of Total Investments) | | | |
| 1,555 | | Fort Sill Apache Tribe of Oklahoma Economic Development Authority, Gaming Enterprise | 8/21 at 100.00 | N/R (5) | 1,594,248 |
| | Revenue Bonds, Fort Sill Apache Casino, Series 2011A, 8.500%, 8/25/26 (Pre-refunded | | | |
| | 8/25/21), 144A | | | |
| | Oklahoma Development Finance Authority, Health System Revenue Bonds, OU Medicine | | | |
| | Project, Series 2018B: | | | |
| 3,515 | | 5.250%, 8/15/43 | 8/28 at 100.00 | BB+ | 4,283,766 |
| 11,870 | | 5.250%, 8/15/48 | 8/28 at 100.00 | BB+ | 14,393,325 |
| 10,570 | | 5.500%, 8/15/52 | 8/28 at 100.00 | BB+ | 12,981,017 |
| 22,735 | | 5.500%, 8/15/57 | 8/28 at 100.00 | BB+ | 27,857,195 |
| 2,055 | | Tulsa Airports Improvement Trust, Oklahoma, General Airport Revenue Bonds, Series 2013A, | 6/23 at 100.00 | Baa1 | 2,247,040 |
| | 5.375%, 6/01/33 (AMT) | | | |
| 52,300 | | Total Oklahoma | | | 63,356,591 |
| | Oregon – 0.1% (0.0% of Total Investments) | | | |
| 1,270 | | Forest Grove, Oregon, Campus Improvement Revenue Bonds, Pacific University Project, | 5/22 at 100.00 | BBB | 1,307,770 |
| | Refunding Series 2014A, 5.000%, 5/01/40 | | | |
| | Pennsylvania – 5.1% (3.3% of Total Investments) | | | |
| 380 | | Allegheny Country Industrial Development Authority, Pennsylvania, Environmental | 8/22 at 100.00 | Caa1 | 393,661 |
| | Improvement Revenue Bonds, United States Steel Corporation Project, Series 2012, 5.750%, | | | |
| | 8/01/42 (AMT) | | | |
| 1,355 | | Allentown Neighborhood Improvement Zone Development Authority, Pennsylvania, Tax Revenue | 5/27 at 100.00 | Baa3 | 1,565,228 |
| | Bonds, City Center Refunding Project, Series 2017, 5.000%, 5/01/42, 144A | | | |
| 10,650 | | Beaver County Industrial Development Authority, Pennsylvania, Pollution Control Revenue | No Opt. Call | N/R | 10,966,518 |
| | Bonds, FirstEnergy Generation Project, Refunding Series 2006A, 4.375%, 1/01/35 (Mandatory | | | |
| | Put 7/01/22) | | | |
| 32,785 | | Beaver County Industrial Development Authority, Pennsylvania, Pollution Control Revenue | No Opt. Call | N/R | 40,981 |
| | Bonds, FirstEnergy Nuclear Generation Project, Series 2006B, 3.500%, 12/01/35 (4) | | | |
| 1,030 | | Beaver County Industrial Development Authority, Pennsylvania, Pollution Control Revenue | 4/31 at 100.00 | N/R | 1,082,551 |
| | Refunding Bonds, FirstEnergy Generation Project, Series 2008B, 3.750%, 10/01/47 (Mandatory | | | |
| | Put 4/01/21) | | | |
| | Berks County Industrial Development Authority, Pennsylvania, Health System Revenue | | | |
| | Bonds, Tower Health Project, Series 2017: | | | |
| 7,480 | | 5.000%, 11/01/47 | 11/27 at 100.00 | B+ | 7,544,852 |
| 16,190 | | 5.000%, 11/01/50 | 11/27 at 100.00 | B+ | 16,381,690 |
| 2,950 | | Commonwealth Financing Authority, Pennsylvania, State Appropriation Lease Bonds, Master | 6/28 at 100.00 | A | 3,616,228 |
| | Settlement, Series 2018, 5.000%, 6/01/35 | | | |
87
| | |
| NZF | Nuveen Municipal Credit Income Fund |
| Portfolio of Investments (continued) April 30, 2021 (Unaudited) |
|
| | | | | | |
| Principal | | | Optional Call | | |
| Amount (000) | | Description (1) | Provisions (2) | Ratings (3) | Value |
| | Pennsylvania (continued) | | | |
| | Cumberland County Municipal Authority, Pennsylvania, Revenue Bonds, Diakon Lutheran | | | |
| | Social Ministries Project, Series 2015: | | | |
| $ 205 | | 5.000%, 1/01/38 (Pre-refunded 1/01/25) | 1/25 at 100.00 | N/R (5) | $ 238,641 |
| 1,875 | | 5.000%, 1/01/38 | 1/25 at 100.00 | BBB+ | 2,066,137 |
| 6,335 | | Geisinger Authority, Montour County, Pennsylvania, Health System Revenue Bonds, | 2/27 at 100.00 | A1 | 7,522,116 |
| | Geisinger Health System, Series 2017A-1, 5.000%, 2/15/45 | | | |
| 22,875 | | Geisinger Authority, Montour County, Pennsylvania, Health System Revenue Bonds, | 4/30 at 100.00 | A1 | 27,043,740 |
| | Geisinger Health System, Series 2020A, 4.000%, 4/01/39 | | | |
| | Montgomery County Industrial Development Authority, Pennsylvania, Health System Revenue | | | |
| | Bonds, Albert Einstein Healthcare Network Issue, Series 2015A: | | | |
| 6,190 | | 5.250%, 1/15/36 | 1/25 at 100.00 | Ba1 | 6,944,313 |
| 3,535 | | 5.250%, 1/15/45 | 1/25 at 100.00 | Ba1 | 3,928,940 |
| 2,206 | | Northampton County Industrial Development Authority, Pennsylvania, Recovery Revenue | 6/21 at 100.00 | N/R | 551,431 |
| | Bonds, Northampton Generating Project, Senior Lien Series 2013A0 & AE2, 1.250%, 12/31/23 | | | |
| 744 | | Northampton County Industrial Development Authority, Pennsylvania, Recovery Revenue | No Opt. Call | N/R | 185,988 |
| | Bonds, Northampton Generating Project, Senior Lien Taxable Series 2013B, 1.250%, 12/31/23 | | | |
| | (cash 5.000%, PIK 5.000%) | | | |
| 4,135 | | Pennsylvania Economic Development Financing Authority, Exempt Facilities Revenue Bonds, | 11/24 at 100.00 | N/R | 4,305,155 |
| | National Gypsum Company, Refunding Series 2014, 5.500%, 11/01/44 (AMT) | | | |
| 11,750 | | Pennsylvania Economic Development Financing Authority, Exempt Facilities Revenue | 9/25 at 100.00 | CCC+ | 10,628,580 |
| | Refunding Bonds, PPL Energy Supply, LLC Project, Series 2009A, 6.400%, 12/01/38 | | | |
| 1,085 | | Pennsylvania Economic Development Financing Authority, Private Activity Revenue Bonds, | 6/26 at 100.00 | BBB | 1,265,663 |
| | Pennsylvania Rapid Bridge Replacement Project, Series 2015, 5.000%, 12/31/38 (AMT) | | | |
| 5,140 | | Pennsylvania Turnpike Commission, Motor License Fund-Enhanced Turnpike Special Revenue | 12/21 at 100.00 | A2 (5) | 5,285,308 |
| | Bonds, Subordinate Series 2011B, 5.000%, 12/01/34 (Pre-refunded 12/01/21) | | | |
| 5,660 | | Pennsylvania Turnpike Commission, Turnpike Revenue Bonds, Series 2015A-1, | 6/25 at 100.00 | A+ | 6,544,998 |
| | 5.000%, 12/01/45 | | | |
| 3,170 | | Pennsylvania Turnpike Commission, Turnpike Revenue Bonds, Subordinate Series 2016A-1, | 12/25 at 100.00 | A3 | 3,702,845 |
| | 5.000%, 12/01/46 | | | |
| | The Redevelopment Authority of the City of Scranton, Lackawanna county, Pennsylvania, | | | |
| | Guaranteed Lease Revenue Bonds, Series 2016A: | | | |
| 220 | | 5.000%, 11/15/21 | No Opt. Call | BB+ | 221,531 |
| 1,255 | | 5.000%, 11/15/28 | 5/24 at 100.00 | BB+ | 1,287,580 |
| 149,200 | | Total Pennsylvania | | | 123,314,675 |
| | Puerto Rico – 5.3% (3.4% of Total Investments) | | | |
| 1,804 | | Cofina Class 2 Trust Tax-Exempt Class 2054 Unit, Puerto Rico, 0.000%, 8/01/54 | No Opt. Call | N/R | 385,215 |
| 26,925 | | Puerto Rico Aqueduct and Sewerage Authority, Revenue Bonds, Refunding Senior Lien Series | 7/30 at 100.00 | N/R | 31,531,867 |
| | 2020A, 5.000%, 7/01/47, 144A | | | |
| | Puerto Rico Aqueduct and Sewerage Authority, Revenue Bonds, Senior Lien Series 2012A: | | | |
| 1,800 | | 5.500%, 7/01/28 | 7/22 at 100.00 | CCC | 1,910,394 |
| 6,640 | | 5.750%, 7/01/37 | 7/22 at 100.00 | CCC | 7,066,952 |
| 5,425 | | 6.000%, 7/01/47 | 7/22 at 100.00 | CCC | 5,789,777 |
| 215 | | Puerto Rico Highway and Transportation Authority, Highway Revenue Bonds, Series 2007N, | No Opt. Call | C | 239,145 |
| | 5.500%, 7/01/29 – AMBAC Insured | | | |
| | Puerto Rico Sales Tax Financing Corporation, Sales Tax Revenue Bonds, Restructured 2018A-1: | | | |
| 15,985 | | 0.000%, 7/01/46 | 7/28 at 41.38 | N/R | 5,071,881 |
| 24,954 | | 0.000%, 7/01/51 | 7/28 at 30.01 | N/R | 5,738,921 |
| 62,339 | | 5.000%, 7/01/58 | 7/28 at 100.00 | N/R | 70,384,471 |
| 493 | | Puerto Rico Sales Tax Financing Corporation, Sales Tax Revenue Bonds, Taxable | 7/28 at 100.00 | N/R | 541,013 |
| | Restructured Cofina Project Series 2019A-2, 4.536%, 7/01/53 | | | |
| 146,580 | | Total Puerto Rico | | | 128,659,636 |
88
| | | | | | |
| Principal | | | Optional Call | | |
| Amount (000) | | Description (1) | Provisions (2) | Ratings (3) | Value |
| | Rhode Island – 0.2% (0.1% of Total Investments) | | | |
| $ 21,570 | | Rhode Island Tobacco Settlement Financing Corporation, Tobacco Settlement Asset-Backed | 5/21 at 15.96 | CCC– | $ 3,498,654 |
| | Bonds, Series 2007A, 0.000%, 6/01/52 | | | |
| | South Carolina – 2.6% (1.7% of Total Investments) | | | |
| | Piedmont Municipal Power Agency, South Carolina, Electric Revenue Bonds, Series 2004A-2: | | | |
| 1,220 | | 0.000%, 1/01/23 – FGIC Insured | No Opt. Call | A– | 1,207,056 |
| 21,570 | | 0.000%, 1/01/30 – AMBAC Insured | No Opt. Call | A– | 18,503,177 |
| 5,560 | | 0.000%, 1/01/31 – AGC Insured | No Opt. Call | A3 | 4,679,185 |
| 10,000 | | South Carolina Public Service Authority, Santee Cooper Revenue Obligations, Refunding & | 6/25 at 100.00 | A– | 11,547,100 |
| | Improvement Series 2015A, 5.000%, 12/01/50 | | | |
| 7,110 | | South Carolina Public Service Authority, Santee Cooper Revenue Obligations, Refunding & | 12/30 at 100.00 | A– | 8,406,224 |
| | Improvement Series 2020A, 4.000%, 12/01/40 | | | |
| 6,930 | | South Carolina Public Service Authority, Santee Cooper Revenue Obligations, Refunding | 12/24 at 100.00 | A– | 7,925,633 |
| | Series 2014C, 5.000%, 12/01/39 | | | |
| 9,155 | | South Carolina Public Service Authority, Santee Cooper Revenue Obligations, Series | 6/24 at 100.00 | A– | 10,403,284 |
| | 2014A, 5.500%, 12/01/54 | | | |
| 61,545 | | Total South Carolina | | | 62,671,659 |
| | South Dakota – 0.2% (0.1% of Total Investments) | | | |
| 4,455 | | South Dakota Health and Educational Facilities Authority, Revenue Bonds, Sanford Health, | 11/24 at 100.00 | A+ | 5,063,330 |
| | Series 2014B, 5.000%, 11/01/44 | | | |
| | Tennessee – 1.2% (0.7% of Total Investments) | | | |
| 8,890 | | Chattanooga Health, Educational and Housing Facility Board, Tennessee, Revenue Bonds, | 1/23 at 100.00 | BBB+ (5) | 9,625,025 |
| | Catholic Health Initiatives, Series 2013A, 5.250%, 1/01/45 (Pre-refunded 1/01/23) | | | |
| 4,000 | | Chattanooga Health, Educational and Housing Facility Board, Tennessee, Revenue Bonds, | 8/29 at 100.00 | BBB+ | 4,531,680 |
| | CommonSpirit Health, Series 2019A-1, 4.000%, 8/01/44 | | | |
| 1,665 | | Chattanooga Health, Educational and Housing Facility Board, Tennessee, Revenue Bonds, | 8/29 at 100.00 | BBB+ | 2,051,929 |
| | CommonSpirit Health, Series 2019A-2, 5.000%, 8/01/44 | | | |
| 2,395 | | Chattanooga-Hamilton County Hospital Authority, Tennessee, Hospital Revenue Bonds, | 10/24 at 100.00 | Baa3 | 2,623,004 |
| | Erlanger Health System, Refunding Series 2014A, 5.000%, 10/01/44 | | | |
| 2,540 | | Metropolitan Government of Nashville-Davidson County Health and Educational Facilities | 6/27 at 100.00 | N/R | 1,524,000 |
| | Board, Tennessee, Revenue Bonds, Knowledge Academy Charter School, Series 2017A, | | | |
| | 5.500%, 6/15/37, 144A (4) | | | |
| 5,830 | | Metropolitan Nashville Airport Authority, Tennessee, Airport Revenue Bonds, Subordinate | 7/30 at 100.00 | A2 | 7,302,017 |
| | Series 2019A, 5.000%, 7/01/54 | | | |
| 25,320 | | Total Tennessee | | | 27,657,655 |
| | Texas – 15.5% (10.0% of Total Investments) | | | |
| | Arlington Higher Education Finance Corporation, Texas, Education Revenue Bonds, Uplift | | | |
| | Education, Series 2016A: | | | |
| 165 | | 5.000%, 12/01/36 | 12/26 at 100.00 | BBB– | 189,644 |
| 130 | | 5.000%, 12/01/46 | 12/26 at 100.00 | BBB– | 147,306 |
| 760 | | 5.000%, 12/01/51 | 12/26 at 100.00 | BBB– | 859,264 |
| 495 | | Arlington Higher Education Finance Corporation, Texas, Education Revenue Bonds, Wayside | 8/21 at 100.00 | BB | 495,861 |
| | Schools, Series 2016A, 4.375%, 8/15/36 | | | |
| 900 | | Aubrey, Denton County, Texas, Special Assessment Revenue Bonds, Jackson Ridge Public | 9/23 at 103.00 | N/R | 969,147 |
| | Improvement District Phase 1 Project, Series 2015, 7.250%, 9/01/45 | | | |
| 765 | | Aubrey, Denton County, Texas, Special Assessment Revenue Bonds, Jackson Ridge Public | 9/23 at 103.00 | N/R | 822,084 |
| | Improvement District Phases 2-3 Major Improvements Project, Series 2015, 8.250%, 9/01/40 | | | |
| | Board of Managers, Joint Guadalupe County-Seguin City Hospital, Texas, Hospital Mortgage | | | |
| | Revenue Bonds, Refunding & Improvement Series 2015: | | | |
| 3,135 | | 5.250%, 12/01/35 | 12/25 at 100.00 | BB | 3,431,477 |
| 3,340 | | 5.000%, 12/01/40 | 12/25 at 100.00 | BB | 3,521,462 |
89
| | |
| NZF | Nuveen Municipal Credit Income Fund |
| Portfolio of Investments (continued) April 30, 2021 (Unaudited) |
|
| | | | | | |
| Principal | | | Optional Call | | |
| Amount (000) | | Description (1) | Provisions (2) | Ratings (3) | Value |
| | Texas (continued) | | | |
| $ 1,020 | | Celina, Texas, Special Assessment Revenue Bonds, Sutton Fields II Public Improvement | 3/23 at 103.00 | N/R | $ 1,077,089 |
| | District Neighborhood Improvement Area 1 Project, Series 2015, 7.250%, 9/01/45 | | | |
| 1,815 | | Celina, Texas, Special Assessment Revenue Bonds, Sutton Fields II Public Improvement | 3/23 at 103.00 | N/R | 1,912,829 |
| | District Neighborhood Improvement Areas 2-5 Major Improvement Project, Series 2015, | | | |
| | 8.250%, 9/01/40 | | | |
| | Central Texas Regional Mobility Authority, Revenue Bonds, Senior Lien, Series 2015A: | | | |
| 2,000 | | 5.000%, 1/01/40 | 7/25 at 100.00 | Baa1 | 2,293,440 |
| 3,625 | | 5.000%, 1/01/45 | 7/25 at 100.00 | Baa1 | 4,155,193 |
| | Club Municipal Management District 1, Texas, Special Assessment Revenue Bonds, | | | |
| | Improvement Area 1 Project, Series 2016: | | | |
| 530 | | 6.250%, 9/01/35 | 9/23 at 103.00 | N/R | 585,502 |
| 505 | | 6.500%, 9/01/46 | 9/23 at 103.00 | N/R | 557,424 |
| 4,000 | | Dallas-Fort Worth International Airport, Texas, Joint Revenue Bonds, Improvement Series | 11/22 at 100.00 | A | 4,254,880 |
| | 2013C, 5.000%, 11/01/38 (AMT) | | | |
| 2,600 | | Dallas-Fort Worth International Airport, Texas, Joint Revenue Bonds, Refunding & | 11/21 at 100.00 | A | 2,658,942 |
| | Improvement Series 2012C, 5.000%, 11/01/45 | | | |
| 1,000 | | Fort Bend County Industrial Development Corporation, Texas, Revenue Bonds, NRG Energy | 11/22 at 100.00 | Baa2 | 1,052,220 |
| | Inc Project, Series 2012A RMKT, 4.750%, 5/01/38 | | | |
| 2,335 | | Grand Parkway Transportation Corporation, Texas, System Toll Revenue Bonds, First Tier | 10/23 at 100.00 | BBB | 2,484,697 |
| | Series 2013A, 5.125%, 10/01/43 | | | |
| 38,140 | | Grand Parkway Transportation Corporation, Texas, System Toll Revenue Bonds, Refunding | 4/30 at 100.00 | A2 | 44,364,067 |
| | First Tier Series 2020C, 4.000%, 10/01/49 | | | |
| 17,000 | | Grand Parkway Transportation Corporation, Texas, System Toll Revenue Bonds, Subordinate | 10/23 at 100.00 | AA (5) | 19,096,610 |
| | Lien Series 2013B, 5.250%, 10/01/51 (Pre-refunded 10/01/23) | | | |
| 4,410 | | Grand Parkway Transportation Corporation, Texas, System Toll Revenue Bonds, Subordinate | 4/28 at 100.00 | AA | 5,424,035 |
| | Lien Series 2018A Tela Supported, 5.000%, 10/01/48 | | | |
| 1,140 | | Grand Parkway Transportation Corporation, Texas, System Toll Revenue Bonds, 18.108%, | 10/23 at 100.00 | AA (5) | 1,675,127 |
| | 11/01/44 (Pre-refunded 10/01/23), 144A (IF) (7) | | | |
| 10,000 | | Gulf Coast Industrial Development Authority, Texas, Solid Waste Disposal Revenue Bonds, | 6/21 at 100.00 | B3 | 10,013,200 |
| | Citgo Petroleum Corporation Project, Series 1998, 8.000%, 4/01/28 (AMT) | | | |
| 3,480 | | Harris County Cultural Education Facilities Finance Corporation, Texas, Revenue Bonds, | 6/25 at 100.00 | AA | 3,999,738 |
| | Houston Methodist Hospital System, Series 2015, 5.000%, 12/01/45 | | | |
| | Harris County-Houston Sports Authority, Texas, Revenue Bonds, Capital Appreciation | | | |
| | Refunding Senior Lien Series 2014A: | | | |
| 295 | | 0.000%, 11/15/41 – AGM Insured | 11/31 at 62.66 | A2 | 131,464 |
| 590 | | 0.000%, 11/15/42 – AGM Insured | 11/31 at 59.73 | A2 | 250,337 |
| 1,000 | | 0.000%, 11/15/43 – AGM Insured | 11/31 at 56.93 | A2 | 403,180 |
| 2,000 | | 0.000%, 11/15/44 – AGM Insured | 11/31 at 54.25 | A2 | 765,900 |
| 2,600 | | 0.000%, 11/15/45 – AGM Insured | 11/31 at 51.48 | A2 | 942,526 |
| 4,180 | | 0.000%, 11/15/53 – AGM Insured | 11/31 at 33.96 | A2 | 980,252 |
| 6,170 | | Harris County-Houston Sports Authority, Texas, Revenue Bonds, Junior Lien Series 2001H, | 11/31 at 69.08 | BB+ | 3,029,038 |
| | 0.000%, 11/15/37 – NPFG Insured | | | |
| 4,565 | | Harris County-Houston Sports Authority, Texas, Revenue Bonds, Third Lien Series 2004A-3, | 11/24 at 52.47 | BB | 2,173,123 |
| | 0.000%, 11/15/35 – NPFG Insured | | | |
| 40,500 | | Harris County-Houston Sports Authority, Texas, Special Revenue Bonds, Refunding Senior | 11/30 at 54.04 | A2 | 16,391,970 |
| | Lien Series 2001A, 0.000%, 11/15/40 – NPFG Insured | | | |
| 3,855 | | Houston, Texas, Airport System Revenue Bonds, Refunding Subordinate Lien Series Series | 7/22 at 100.00 | A (5) | 4,064,327 |
| | 2012A, 5.000%, 7/01/32 (Pre-refunded 7/01/22) (AMT) | | | |
| 2,000 | | Houston, Texas, Airport System Special Facilities Revenue Bonds, United Airlines Inc | 7/25 at 100.00 | B | 2,214,960 |
| | Terminal Improvement Project, Refunding Series 2015B-1, 5.000%, 7/15/35 (AMT) | | | |
| 235 | | Houston, Texas, Airport System Special Facilities Revenue Bonds, United Airlines, Inc | 7/24 at 100.00 | B | 256,984 |
| | Terminal E Project, Refunding Series 2014, 5.000%, 7/01/29 (AMT) | | | |
90
| | | | | | |
| Principal | | | Optional Call | | |
| Amount (000) | | Description (1) | Provisions (2) | Ratings (3) | Value |
| | Texas (continued) | | | |
| $ 2,845 | | Houston, Texas, Airport System Special Facilities Revenue Bonds, United Airlines, Inc | No Opt. Call | B– | $ 3,366,346 |
| | Terminal E Project, Refunding Series 2020A, 5.000%, 7/01/27 (AMT) | | | |
| 3,750 | | Houston, Texas, Airport System Special Facilities Revenue Bonds, United Airlines, Inc | No Opt. Call | B– | 4,440,037 |
| | Terminal Improvements Project, Refunding Series 2020B-2, 5.000%, 7/15/27 (AMT) | | | |
| 10,000 | | Houston, Texas, Combined Utility System Revenue Bonds, First Lien Series 2011D, 5.000%, | 11/21 at 100.00 | AA (5) | 10,260,900 |
| | 11/15/40 (Pre-refunded 11/15/21) | | | |
| 5,000 | | Houston, Texas, Combined Utility System Revenue Bonds, Refunding First Lien Series | 11/30 at 100.00 | Aa2 | 6,050,200 |
| | 2020C, 4.000%, 11/15/43 | | | |
| | Houston, Texas, Hotel Occupancy Tax and Special Revenue Bonds, Convention and | | | |
| | Entertainment Project, Series 2001B: | | | |
| 28,305 | | 0.000%, 9/01/28 – AMBAC Insured | No Opt. Call | A | 24,383,059 |
| 5,000 | | 0.000%, 9/01/30 – AMBAC Insured | No Opt. Call | A | 4,013,400 |
| 5,765 | | 0.000%, 9/01/31 – AMBAC Insured | No Opt. Call | A | 4,468,567 |
| 6,000 | | Houston, Texas, Water and Sewerage System Revenue Bonds, Refunding Junior Lien Series | No Opt. Call | AA+ (5) | 7,763,100 |
| | 2001B, 5.500%, 12/01/29 – NPFG Insured (ETM) | | | |
| 7,500 | | Houston, Texas, Water and Sewerage System Revenue Bonds, Refunding Junior Lien Series | No Opt. Call | A2 (5) | 11,198,025 |
| | 2002A, 5.750%, 12/01/32 – AGM Insured (ETM) | | | |
| 720 | | Kerrville Health Facilities Development Corporation, Texas, Revenue Bonds, Sid Peterson | 8/25 at 100.00 | A– | 820,433 |
| | Memorial Hospital Project, Series 2015, 5.000%, 8/15/35 | | | |
| 2,750 | | Lower Colorado River Authority, Texas, Transmission Contract Revenue Bonds, LCRA | 5/25 at 100.00 | A | 3,179,248 |
| | Transmission Services Corporation Project, Refunding Series 2015, 5.000%, 5/15/40 | | | |
| 1,750 | | Martin County Hospital District, Texas, Combination Limited Tax and Revenue Bonds, | 6/21 at 100.00 | BBB+ | 1,755,495 |
| | Series 2011A, 7.250%, 4/01/36 | | | |
| 2,505 | | Matagorda County Navigation District 1, Texas, Collateralized Revenue Refunding Bonds, | No Opt. Call | A | 3,173,058 |
| | Houston Light and Power Company, Series 1997, 5.125%, 11/01/28 – AMBAC Insured (AMT) | | | |
| 8,630 | | Mission Economic Development Corporation, Texas, Revenue Bonds, Natgasoline Project, | 10/21 at 105.00 | BB– | 9,158,760 |
| | Senior Lien Series 2018, 4.625%, 10/01/31 (AMT), 144A | | | |
| 15,329 | | Mission Economic Development Corporation, Texas, Water Supply Revenue Bonds, Enviro | 1/26 at 102.00 | N/R | 393,446 |
| | Water Minerals Project, Green Bonds, Series 2015, 7.750%, 1/01/45 (AMT), 144A (4), (9) | | | |
| 150 | | New Hope Cultural Education Facilities Finance Corporation, Texas, Student Housing | 4/26 at 100.00 | N/R (5) | 181,793 |
| | Revenue Bonds, CHF-Collegiate Housing Corpus Christi II, LLC-Texas A&M University-Corpus | | | |
| | Christi Project, Series 2016A, 5.000%, 4/01/48 (Pre-refunded 4/01/26) | | | |
| 565 | | New Hope Cultural Education Facilities Finance Corporation, Texas, Student Housing | 4/26 at 100.00 | N/R (5) | 683,232 |
| | Revenue Bonds, CHF-Collegiate Housing Foundation – San Antonio 1, LLC – Texas A&M | | | |
| | University – San Antonio Project,, 5.000%, 4/01/48 (Pre-refunded 4/01/26) | | | |
| | North Texas Tollway Authority, Special Projects System Revenue Bonds, Convertible | | | |
| | Capital Appreciation Series 2011C: | | | |
| 6,330 | | 0.000%, 9/01/43 (Pre-refunded 9/01/31) (6) | 9/31 at 100.00 | N/R (5) | 8,739,704 |
| 9,130 | | 0.000%, 9/01/45 (Pre-refunded 9/01/31) (6) | 9/31 at 100.00 | N/R (5) | 13,644,876 |
| | North Texas Tollway Authority, System Revenue Bonds, Refunding First Tier Capital | | | |
| | Appreciation Series 2008I: | | | |
| 2,555 | | 6.200%, 1/01/42 – AGC Insured | 1/25 at 100.00 | A1 | 3,021,901 |
| 7,000 | | 6.500%, 1/01/43 | 1/25 at 100.00 | A+ | 8,329,230 |
| 10,000 | | North Texas Tollway Authority, System Revenue Bonds, Refunding First Tier, Series 2008D, | No Opt. Call | A1 | 9,251,300 |
| | 0.000%, 1/01/28 – AGC Insured | | | |
| | North Texas Tollway Authority, System Revenue Bonds, Refunding First Tier, Series 2015B: | | | |
| 2,870 | | 5.000%, 1/01/40 | 1/23 at 100.00 | A+ | 3,064,988 |
| 4,880 | | 5.000%, 1/01/45 | 1/25 at 100.00 | A+ | 5,552,903 |
| | North Texas Tollway Authority, System Revenue Bonds, Refunding Second Tier, Series 2015A: | | | |
| 7,855 | | 5.000%, 1/01/33 | 1/25 at 100.00 | A | 9,066,477 |
| 2,205 | | 5.000%, 1/01/34 | 1/25 at 100.00 | A | 2,541,615 |
| 1,000 | | 5.000%, 1/01/35 | 1/25 at 100.00 | A | 1,151,100 |
| 2,345 | | 5.000%, 1/01/38 | 1/25 at 100.00 | A | 2,689,246 |
91
| | |
| NZF | Nuveen Municipal Credit Income Fund |
| Portfolio of Investments (continued) April 30, 2021 (Unaudited) |
|
| | | | | | |
| Principal | | | Optional Call | | |
| Amount (000) | | Description (1) | Provisions (2) | Ratings (3) | Value |
| | Texas (continued) | | | |
| $ 1,570 | | Reagan Hospital District of Reagan County, Texas, Limited Tax Revenue Bonds, Series | 2/24 at 100.00 | Ba1 | $ 1,676,383 |
| | 2014A, 5.000%, 2/01/34 | | | |
| 13,000 | | San Antonio, Texas, Electric and Gas Systems Revenue Bonds, Refunding Junior Lien Series | 2/31 at 100.00 | A+ | 16,754,400 |
| | 2021A, 5.000%, 2/01/46 | | | |
| 1,500 | | Texas Municipal Gas Acquisition and Supply Corporation I, Gas Supply Revenue Bonds, | No Opt. Call | A– | 1,762,620 |
| | Senior Lien Series 2008D, 6.250%, 12/15/26 | | | |
| 2,000 | | Texas Private Activity Bond Surface Transportation Corporation, Senior Lien Revenue | 9/23 at 100.00 | Baa3 | 2,283,020 |
| | Bonds, NTE Mobility Partners Segments 3 LLC Segments 3A & 3B Facility, Series 2013, 7.000%, | | | |
| | 12/31/38 (AMT) | | | |
| 5,355 | | Texas Transportation Commission, Central Texas Turnpike System Revenue Bonds, Refunding | 8/22 at 100.00 | A3 (5) | 5,683,529 |
| | First Tier Series 2012A, 5.000%, 8/15/41 (Pre-refunded 8/15/22) | | | |
| 13,000 | | Texas Transportation Commission, Central Texas Turnpike System Revenue Bonds, Refunding | 8/30 at 100.00 | A3 | 16,734,250 |
| | First Tier Series 2020A, 5.000%, 8/15/39 | | | |
| | Texas Transportation Commission, Central Texas Turnpike System Revenue Bonds, Refunding | | | |
| | Second Tier Series 2015C: | | | |
| 4,000 | | 5.000%, 8/15/32 | 8/24 at 100.00 | Baa1 | 4,506,840 |
| 1,875 | | 5.000%, 8/15/37 | 8/24 at 100.00 | Baa1 | 2,098,256 |
| | Texas Turnpike Authority, Central Texas Turnpike System Revenue Bonds, First Tier Series 2002A: | | | |
| 300 | | 0.000%, 8/15/21 – AMBAC Insured (ETM) | No Opt. Call | A3 (5) | 299,889 |
| 1,020 | | 0.000%, 8/15/21 – AMBAC Insured | No Opt. Call | A3 | 1,018,796 |
| 3,600 | | 0.000%, 8/15/25 – AMBAC Insured | No Opt. Call | A3 | 3,450,456 |
| 5,000 | | Texas Water Development Board, State Water Implementation Revenue Fund Bonds, Master | 10/27 at 100.00 | AAA | 5,894,150 |
| | Trust Series 2017A, 4.000%, 10/15/37 | | | |
| 2,400 | | Travis County Health Facilities Development Corporation, Texas, Hospital Revenue Bonds, | 6/21 at 100.00 | N/R (5) | 2,421,840 |
| | Daughters of Charity National Health System, Series 1993B, 6.000%, 11/15/22 (ETM) | | | |
| 388,634 | | Total Texas | | | 374,572,167 |
| | Utah – 0.2% (0.1% of Total Investments) | | | |
| 2,030 | | Box Elder County, Utah, Solid Waste Disposal Revenue Bonds, Promontory Point Res, LLC, | 12/27 at 100.00 | N/R | 1,715,715 |
| | Senior Series 2017A, 8.000%, 12/01/39 (AMT), 144A (4) | | | |
| 3,000 | | Salt Lake City, Utah, Airport Revenue Bonds, International Airport Series 2018A, 5.000%, | 7/28 at 100.00 | A | 3,628,320 |
| | 7/01/48 (AMT) | | | |
| 5,030 | | Total Utah | | | 5,344,035 |
| | Virginia – 0.6% (0.4% of Total Investments) | | | |
| 540 | | Embrey Mill Community Development Authority, Virginia, Special Assessment Revenue Bonds, | 3/25 at 100.00 | N/R | 573,280 |
| | Series 2015, 5.600%, 3/01/45, 144A | | | |
| 1,800 | | Henrico County Economic Development Authority, Virginia, Revenue Bonds, Bon Secours | 11/22 at 100.00 | N/R (5) | 1,930,014 |
| | Health System Obligated Group, Series 2013, 5.000%, 11/01/30 (Pre-refunded 11/01/22) | | | |
| 1,810 | | Virginia Small Business Financing Authority, Senior Lien Revenue Bonds, 95 Express Lanes | 1/22 at 100.00 | BBB– | 1,860,752 |
| | LLC Project, Series 2012, 5.000%, 1/01/40 (AMT) | | | |
| | Virginia Small Business Financing Authority, Senior Lien Revenue Bonds, Elizabeth River | | | |
| | Crossing, Opco LLC Project, Series 2012: | | | |
| 1,885 | | 5.250%, 1/01/32 (AMT) | 7/22 at 100.00 | BBB– | 1,981,946 |
| 4,480 | | 6.000%, 1/01/37 (AMT) | 7/22 at 100.00 | BBB– | 4,751,757 |
| 3,810 | | 5.500%, 1/01/42 (AMT) | 7/22 at 100.00 | BBB– | 4,012,349 |
| 14,325 | | Total Virginia | | | 15,110,098 |
| | Washington – 1.4% (0.9% of Total Investments) | | | |
| 1,260 | | Central Puget Sound Regional Transit Authority, Washington, Sales Tax and Motor Vehicle | 6/21 at 100.00 | AAA | 1,403,350 |
| | Excise Tax Bonds, Series 1999, 4.750%, 2/01/28 – FGIC Insured | | | |
| 6,000 | | Energy Northwest, Washington, Electric Revenue Bonds, Columbia Generating Station, | 7/25 at 100.00 | AA– | 6,983,100 |
| | Refunding Series 2015A, 5.000%, 7/01/38 (UB) (7) | | | |
92
| | | | | | |
| Principal | | | Optional Call | | |
| Amount (000) | | Description (1) | Provisions (2) | Ratings (3) | Value |
| | Washington (continued) | | | |
| $ 6,065 | | Washington Health Care Facilities Authority, Revenue Bonds, Central Washington Health | 7/25 at 100.00 | Baa1 | $ 6,492,643 |
| | Services Association, Refunding Series 2015, 4.000%, 7/01/36 | | | |
| 3,300 | | Washington Health Care Facilities Authority, Revenue Bonds, Seattle Cancer Center | 9/30 at 100.00 | A2 | 4,175,589 |
| | Alliance, Series 2020, 5.000%, 9/01/50 | | | |
| 2,185 | | Washington Health Care Facilities Authority, Revenue Bonds, Seattle Children’s Hospital, | 10/22 at 100.00 | Aa2 (5) | 2,334,017 |
| | Series 2012A, 5.000%, 10/01/42 (Pre-refunded 10/01/22) | | | |
| 8,780 | | Washington State Convention Center Public Facilities District, Lodging Tax Revenue | 7/28 at 100.00 | BB+ | 10,303,154 |
| | Bonds, Series 2018, 5.000%, 7/01/43 | | | |
| 1,410 | | Washington State, Motor Vehicle Fuel Tax General Obligation Bonds, Series 2003F, 0.000%, | No Opt. Call | AA+ | 1,381,589 |
| | 12/01/24 – NPFG Insured | | | |
| 29,000 | | Total Washington | | | 33,073,442 |
| | West Virginia – 0.5% (0.3% of Total Investments) | | | |
| 5,160 | | West Virginia Hospital Finance Authority, Hospital Revenue Bonds, West Virginia United | 6/23 at 100.00 | A (5) | 5,723,678 |
| | Health System Obligated Group, Refunding & Improvement Series 2013A, 5.500%, 6/01/44 | | | |
| | (Pre-refunded 6/01/23) | | | |
| 5,000 | | West Virginia Hospital Finance Authority, Revenue Bonds, West Virginia University Health | 6/27 at 100.00 | A | 5,857,700 |
| | System Obligated Group, Improvement Series 2017A, 5.000%, 6/01/47 | | | |
| 10,160 | | Total West Virginia | | | 11,581,378 |
| | Wisconsin – 1.4% (0.9% of Total Investments) | | | |
| 1,000 | | Public Finance Authority of Wisconsin, Charter School Revenue Bonds, Envision Science | 5/26 at 100.00 | N/R | 1,059,720 |
| | Academy Project, Series 2016A, 5.125%, 5/01/36, 144A | | | |
| | Public Finance Authority of Wisconsin, Charter School Revenue Bonds, North Carolina | | | |
| | Charter Educational Foundation Project, Series 2016A: | | | |
| 5,375 | | 5.000%, 6/15/36, 144A | 6/26 at 100.00 | N/R | 5,588,334 |
| 4,430 | | 5.000%, 6/15/46, 144A | 6/26 at 100.00 | N/R | 4,540,130 |
| | Public Finance Authority of Wisconsin, Conference Center and Hotel Revenue Bonds, | | | |
| | Lombard Public Facilities Corporation, First Tier Series 2018A-1: | | | |
| 80 | | 0.000%, 1/01/47, 144A (4) | No Opt. Call | N/R | 2,364 |
| 70 | | 0.000%, 1/01/48, 144A (4) | No Opt. Call | N/R | 2,036 |
| 69 | | 0.000%, 1/01/49, 144A (4) | No Opt. Call | N/R | 1,963 |
| 66 | | 0.000%, 1/01/50, 144A (4) | No Opt. Call | N/R | 1,828 |
| 65 | | 0.000%, 1/01/51, 144A (4) | No Opt. Call | N/R | 1,767 |
| 85 | | 0.000%, 1/01/52, 144A (4) | No Opt. Call | N/R | 2,211 |
| 84 | | 0.000%, 1/01/53, 144A (4) | No Opt. Call | N/R | 2,144 |
| 81 | | 0.000%, 1/01/54, 144A (4) | No Opt. Call | N/R | 2,019 |
| 79 | | 0.000%, 1/01/55, 144A (4) | No Opt. Call | N/R | 1,936 |
| 77 | | 0.000%, 1/01/56, 144A (4) | No Opt. Call | N/R | 1,867 |
| 4,002 | | 5.500%, 7/01/56, 144A (4) | 3/28 at 100.00 | N/R | 3,112,515 |
| 86 | | 0.000%, 1/01/57, 144A (4) | No Opt. Call | N/R | 2,014 |
| 84 | | 0.000%, 1/01/58, 144A (4) | No Opt. Call | N/R | 1,920 |
| 81 | | 0.000%, 1/01/59, 144A (4) | No Opt. Call | N/R | 1,837 |
| 80 | | 0.000%, 1/01/60, 144A (4) | No Opt. Call | N/R | 1,744 |
| 79 | | 0.000%, 1/01/61, 144A (4) | No Opt. Call | N/R | 1,674 |
| 76 | | 0.000%, 1/01/62, 144A (4) | No Opt. Call | N/R | 1,589 |
| 75 | | 0.000%, 1/01/63, 144A (4) | No Opt. Call | N/R | 1,524 |
| 73 | | 0.000%, 1/01/64, 144A (4) | No Opt. Call | N/R | 1,465 |
| 72 | | 0.000%, 1/01/65, 144A (4) | No Opt. Call | N/R | 1,398 |
| 78 | | 0.000%, 1/01/66, 144A (4) | No Opt. Call | N/R | 1,436 |
| 935 | | 0.000%, 1/01/67, 144A (4) | No Opt. Call | N/R | 16,099 |
| 1,200 | | Public Finance Authority of Wisconsin, Exempt Facilities Revenue Bonds, National Gypsum | 8/26 at 100.00 | N/R | 1,206,708 |
| | Company Project, Refunding Series 2016, 4.000%, 8/01/35 (AMT) | | | |
| 1,000 | | Public Finance Authority, Wisconsin, Exempt Facilities Revenue Bonds, Celanese Project, | 5/26 at 100.00 | BBB– | 1,113,770 |
| | Refunding Series 2016C, 4.300%, 11/01/30 (AMT) | | | |
93
| | |
| NZF | Nuveen Municipal Credit Income Fund |
| Portfolio of Investments (continued) April 30, 2021 (Unaudited) |
|
| | | | | | |
| Principal | | | Optional Call | | |
| Amount (000) | | Description (1) | Provisions (2) | Ratings (3) | Value |
| | Wisconsin (continued) | | | |
| $ 1,250 | | Wisconsin Health and Educational Facilities Authority, Revenue Bonds, Marshfield Clinic, | 2/22 at 100.00 | A– | $ 1,285,975 |
| | Series 2012B, 5.000%, 2/15/32 | | | |
| | Wisconsin Health and Educational Facilities Authority, Revenue Bonds, Mercy Alliance, | | | |
| | Inc, Series 2012: | | | |
| 2,105 | | 5.000%, 6/01/32 | 6/22 at 100.00 | A3 | 2,192,863 |
| 2,500 | | 5.000%, 6/01/39 | 6/22 at 100.00 | A3 | 2,604,350 |
| 1,120 | | Wisconsin Health and Educational Facilities Authority, Wisconsin, Revenue Bonds, Dickson | 10/22 at 102.00 | N/R | 1,165,629 |
| | Hollow Project Series 2014, 5.250%, 10/01/39 | | | |
| 4,000 | | Wisconsin Health and Educational Facilities Authority, Wisconsin, Revenue Bonds, | 8/24 at 100.00 | A+ | 4,469,040 |
| | ProHealth Care, Inc Obligated Group, Refunding Series 2015, 5.000%, 8/15/39 | | | |
| | Wisconsin Health and Educational Facilities Authority, Wisconsin, Revenue Bonds, Rogers | | | |
| | Memorial Hospital, Inc, Series 2014A: | | | |
| 1,415 | | 5.000%, 7/01/27 | 7/24 at 100.00 | A | 1,596,233 |
| 1,310 | | 5.000%, 7/01/29 | 7/24 at 100.00 | A | 1,466,453 |
| 3,000 | | Wisconsin Health and Educational Facilities Authority, Wisconsin, Revenue Bonds, Rogers | 7/24 at 100.00 | A | 3,315,900 |
| | Memorial Hospital, Inc, Series 2014B, 5.000%, 7/01/44 | | | |
| 36,182 | | Total Wisconsin | | | 34,770,455 |
| $ 3,739,023 | | Total Municipal Bonds (cost $3,270,934,956) | | | 3,700,998,365 |
|
| Shares | | Description (1) | | | Value |
| | COMMON STOCKS – 1.4% (0.9% of Total Investments) | | | |
| | Electric Utilities – 1.4% (0.9% of Total Investments) | | | |
| 1,189,215 | | Energy Harbor Corp (9), (10), (11) | | | $ 34,264,852 |
| | Total Common Stocks (cost $34,264,852) | | | 34,264,852 |
|
| Shares | | Description (1) | | | Value |
| | INVESTMENT COMPANIES – 0.1% (0.1% of Total Investments) | | | |
| 6,266 | | BlackRock MuniHoldings Fund Inc | | | $ 102,324 |
| 26,880 | | BNY Mellon Strategic Municipals Inc | | | 233,050 |
| 30,000 | | Invesco Municipal Opportunity Trust | | | 404,700 |
| 43,020 | | Invesco Trust for Investment Grade Municipals | | | 590,664 |
| 43,420 | | PIMCO Municipal Income Fund II | | | 645,655 |
| | Total Investment Companies (cost $1,976,393) | | | 1,976,393 |
| | Total Long-Term Investments (cost $3,307,176,201) | | | 3,737,239,610 |
| | Floating Rate Obligations – (0.6)% | | | (14,400,000) |
| | MuniFund Preferred Shares, net of deferred offering costs – (26.5)% (12) | | | (640,028,521) |
| | Variable Rate Demand Preferred Shares, net of deferred offering costs – (29.9)% (13) | | | (722,640,864) |
| | Other Assets Less Liabilities – 2.1% | | | 53,126,975 |
| | Net Assets Applicable to Common Shares – 100% | | | $2,413,297,200 |
94
(1) | All percentages shown in the Portfolio of Investments are based on net assets applicable to common shares unless otherwise noted. |
(2) | Optional Call Provisions: Dates (month and year) and prices of the earliest optional call or redemption. There may be other call provisions at varying prices at later dates. Certain mortgage-backed securities may be subject to periodic principal paydowns.
|
(3) | The ratings disclosed are the lowest of Standard & Poor’s Group (“Standard & Poor’s”), Moody’s Investors Service, Inc. (“Moody’s”) or Fitch, Inc. (“Fitch”) rating. Ratings below BBB by Standard & Poor’s, Baa by Moody’s or BBB by Fitch are considered to be below investment grade. Holdings designated N/R are not rated by any of these national rating agencies. |
(4) | Defaulted security. A security whose issuer has failed to fully pay principal and/or interest when due, or is under the protection of bankruptcy. |
(5) | Backed by an escrow or trust containing sufficient U.S. Government or U.S. Government agency securities, which ensure the timely payment of principal and interest. |
(6) | Step-up coupon bond, a bond with a coupon that increases (“steps up”), usually at regular intervals, while the bond is outstanding. The rate shown is the coupon as of the end of the reporting period.
|
(7) | Investment, or portion of investment, has been pledged to collateralize the net payment obligations for investments in inverse floating rate transactions. |
(8) | Investment valued at fair value using methods determined in good faith by, or at the discretion of, the Board. For fair value measurement disclosure purposes, investment classified as Level 3. See Notes to Financial Statements, Note 3 – Investment Valuation and Fair Value Measurements for more information.
|
(9) | Common Stock received as part of the bankruptcy settlements during February 2020 for Beaver County Industrial Development Authority, Pennsylvania, Pollution Control Revenue Refunding Bonds, FirstEnergy Nuclear Generation Project, Series 2006B, 3.500%, 12/01/35, Ohio Air Quality Development Authority, Ohio, Pollution Control Revenue Bonds, FirstEnergy Nuclear Generation Project, Refunding Series 2008C, 3.950%, 11/01/32, Ohio Water Development Authority, Pollution Control Revenue Refunding Bonds, FirstEnergy Nuclear Generating Corporation Project, Series 2008C, 3.950%, 11/01/32. |
(10) | For fair value measurement disclosure purposes, investment classified as Level 2. See Notes to Financial Statements, Note 3 – Investment Valuation and Fair Value Measurements for more information.
|
(11) | Non-income producing; issuer has not declared an ex-dividend date within the past twelve months. |
(12) | MuniFund Preferred Shares, net of deferred offering costs as a percentage of Total Investments is 17.1%. |
(13) | Variable Rate Demand Preferred Shares, net of deferred offering costs as a percentage of Total Investments is 19.3%. |
144A | Investment is exempt from registration under Rule 144A of the Securities Act of 1933, as amended. These investments may only be resold in transactions exempt from registration, which are normally those transactions with qualified institutional buyers.
|
AMT | Alternative Minimum Tax. |
ETM | Escrowed to maturity. |
IF | Inverse floating rate security issued by a tender option bond (“TOB”) trust, the interest rate on which varies inversely with the Securities Industry Financial Markets Association (SIFMA) short-term rate, which resets weekly, or a similar short-term rate, and is reduced by the expenses related to the TOB trust.
|
PIK | Payment-in-kind (“PIK”) security. Depending on the terms of the security, income may be received in the form of cash, securities, or a combination of both. The PIK rate shown, where applicable, represents the annualized rate of the last PIK payment made by the issuer as of the end of the reporting period.
|
UB | Underlying bond of an inverse floating rate trust reflected as a financing transaction. See Notes to Financial Statements, Note 4 – Portfolio Securities and Investments in Derivatives for more information.
|
See accompanying notes to financial statements.
95
| | |
| NMZ | Nuveen Municipal High Income |
| Opportunity Fund |
| Portfolio of Investments |
| April 30, 2021 (Unaudited) |
| | | | | | |
| Principal | | | Optional Call | | |
| Amount (000) | | Description (1) | Provisions (2) | Ratings (3) | Value |
| | LONG-TERM INVESTMENTS – 140.8% (100.0% of Total Investments) | | | |
|
| | MUNICIPAL BONDS – 138.0% (98.0% of Total Investments) | | | |
|
| | Alabama – 2.4% (1.7% of Total Investments) | | | |
| $ 182 | | Adamsville Solid Waste Disposal Authority, Alabama, Solid Waste Disposal Revenue Bonds, | 6/21 at 100.00 | N/R | $ 2 |
| | Big Sky Environmental LLC Project, Refunding Taxable Series 2017C, 1.000%, 9/01/37, 144A (4) | | | |
| 1,000 | | Adamsville Solid Waste Disposal Authority, Alabama, Solid Waste Disposal Revenue Bonds, | 9/27 at 100.00 | N/R | 700,000 |
| | Big Sky Environmental LLC Project, Series 2017A, 6.750%, 9/01/37, 144A (4) | | | |
| 213 | | Adamsville Solid Waste Disposal Authority, Alabama, Solid Waste Disposal Revenue Bonds, | 9/27 at 100.00 | N/R | 148,646 |
| | Big Sky Environmental LLC Project, Taxable Series 2017B, 6.750%, 9/01/37, 144A (4) | | | |
| 1,000 | | Alabama Industrial Development Authority, Solid Waste Disposal Revenue Bonds, Pine City | 6/21 at 100.00 | B1 | 1,001,340 |
| | Fiber Co Project, Series 1993, 6.450%, 12/01/23 (AMT) | | | |
| 2,000 | | Alabama Private Colleges and University Facilities Authority, Limited Obligation Bonds, | 9/25 at 100.00 | N/R | 2,195,580 |
| | University of Mobile Project, Series 2015A, 6.000%, 9/01/45, 144A | | | |
| 1,000 | | Hoover Industrial Development Board, Alabama, Environmental Improvement Revenue Bonds, | No Opt. Call | Caa1 | 1,263,740 |
| | United States Steel Corporation Project, Green Series 2020, 6.375%, 11/01/50 (AMT) | | | |
| | (Mandatory Put 11/01/30) | | | |
| 10,765 | | Hoover Industrial Development Board, Alabama, Environmental Improvement Revenue Bonds, | 10/29 at 100.00 | Caa1 | 12,584,070 |
| | United States Steel Corporation Project, Series 2019, 5.750%, 10/01/49 (AMT) | | | |
| 5,000 | | Jefferson County, Alabama, Sewer Revenue Warrants, Capital Appreciation Subordinate Lien | 10/23 at 105.00 | BB | 5,128,450 |
| | Series 2013F, 7.900%, 10/01/50 (5) | | | |
| 1,000 | | Jefferson County, Alabama, Sewer Revenue Warrants, Senior Lien Series 2013C, 6.500%, | 10/23 at 105.00 | BB+ | 1,026,270 |
| | 10/01/38 – AGM Insured (5) | | | |
| 2,000 | | Mobile County, Alabama, Limited Obligation Warrants, Gomesa Projects, Series 2020, | 11/29 at 100.00 | N/R | 2,071,400 |
| | 4.000%, 11/01/45, 144A | | | |
| | Tuscaloosa County Industrial Development Authority, Alabama, Gulf Opportunity Zone | | | |
| | Bonds, Hunt Refining Project, Refunding Series 2019A: | | | |
| 2,260 | | 4.500%, 5/01/32, 144A | 5/29 at 100.00 | N/R | 2,583,813 |
| 1,000 | | 5.250%, 5/01/44, 144A | 5/29 at 100.00 | N/R | 1,164,230 |
| 27,420 | | Total Alabama | | | 29,867,541 |
| | Arizona – 2.5% (1.8% of Total Investments) | | | |
| | Arizona Industrial Development Authority, Arizona, Education Revenue Bonds, Arizona | | | |
| | Christian University Project, Series 2019A: | | | |
| 400 | | 5.500%, 10/01/40, 144A | 10/26 at 103.00 | N/R | 422,280 |
| 800 | | 5.625%, 10/01/49, 144A | 10/26 at 103.00 | N/R | 839,536 |
| 5,000 | | Arizona Industrial Development Authority, Arizona, Education Revenue Bonds, Pinecrest | 9/23 at 105.00 | BB+ | 5,649,400 |
| | Academy of Nevada ? Sloan Canyon Campus Project, Series 2020A-2, 6.150%, 9/15/53, 144A | | | |
| 1,000 | | Arizona Industrial Development Authority, Education Facility Revenue Bonds, Caurus | 6/28 at 100.00 | N/R | 1,130,980 |
| | Academy Project, Series 2018A, 6.500%, 6/01/50, 144A | | | |
| 1,000 | | Maricopa County Industrial Development Authority, Arizona, Education Revenue Bonds, | 1/30 at 100.00 | N/R | 1,055,700 |
| | Gateway Academy Project, Series 2019A, 5.750%, 1/01/50, 144A | | | |
| 3,000 | | Phoenix Industrial Development Authority, Arizona, Lease Revenue Bonds, Rowan University | 6/22 at 100.00 | A3 | 3,464,280 |
| | Project, 17.481%, 6/01/42, 144A (IF) (6) | | | |
| 435 | | Phoenix Industrial Development Authority, Arizona, Multifamily Housing Revenue Bonds, | 7/24 at 101.00 | N/R | 445,984 |
| | Deer Valley Veterans Assisted Living Project, Series 2016A, 5.125%, 7/01/36 | | | |
| 1,000 | | Pima County Industrial Development Authority, Arizona, Charter School Revenue Bonds, | 5/24 at 100.00 | N/R | 1,096,690 |
| | Desert Heights Charter School, Series 2014, 7.250%, 5/01/44 | | | |
| 3,000 | | Pima County Industrial Development Authority, Arizona, Education Facility Revenue Bonds, | 7/26 at 103.00 | N/R | 3,223,140 |
| | Edkey Charter Schools Project, Refunding Series 2020, 5.000%, 7/01/49, 144A | | | |
96
| | | | | | |
| Principal | | | Optional Call | | |
| Amount (000) | | Description (1) | Provisions (2) | Ratings (3) | Value |
| | Arizona (continued) | | | |
| | Pima County Industrial Development Authority, Arizona, Education Facility Revenue Bonds, | | | |
| | Edkey Charter Schools Project, Series 2016: | | | |
| $ 245 | | 5.250%, 7/01/36 | 7/26 at 100.00 | BB– | $ 261,971 |
| 400 | | 5.375%, 7/01/46 | 7/26 at 100.00 | BB– | 422,144 |
| 475 | | 5.500%, 7/01/51 | 7/26 at 100.00 | BB– | 502,232 |
| 1,000 | | Pima County Industrial Development Authority, Arizona, Education Facility Revenue Bonds, | 7/26 at 103.00 | N/R | 1,101,230 |
| | Edkey Charter Schools Project, Series 2019, 5.875%, 7/01/51, 144A | | | |
| 2,000 | | Pima County Industrial Development Authority, Arizona, Education Facility Revenue Bonds, | 2/24 at 100.00 | N/R | 2,274,860 |
| | San Tan Montessori School Project, Series 2014A, 9.000%, 2/01/44 | | | |
| 365 | | Pima County Industrial Development Authority, Arizona, Education Facility Revenue Bonds, | 6/28 at 100.00 | N/R | 385,998 |
| | Synergy Public Charter School Project, Series 2020, 5.000%, 6/15/35, 144A | | | |
| 100 | | Pima County Industrial Development Authority, Arizona, Education Facility Revenue Bonds, | 7/25 at 100.00 | N/R | 105,401 |
| | The Paideia Academies Project, 2019, 5.125%, 7/01/39 | | | |
| 2,500 | | Pima County Industrial Development Authority, Arizona, Education Revenue Bonds, Carden | 1/22 at 100.00 | B– | 2,507,875 |
| | Traditional Schools Project, Series 2012, 7.500%, 1/01/42 | | | |
| 605 | | Pinal County Industrial Development Authority, Arizona, Correctional Facilities Contract | 6/21 at 100.00 | BBB– | 605,780 |
| | Revenue Bonds, Florence West Prison LLC, Series 2002A, 5.250%, 10/01/22 – ACA Insured | | | |
| 1,095 | | Quechan Indian Tribe of the Fort Yuma Reservation, Arizona, Tribal Economic Development | 5/22 at 100.00 | N/R | 1,139,304 |
| | Bonds, Series 2012A, 9.750%, 5/01/25 | | | |
| 2,500 | | Salt Verde Financial Corporation, Arizona, Senior Gas Revenue Bonds, Citigroup Energy | No Opt. Call | Ba3 | 3,657,325 |
| | Inc Prepay Contract Obligations, Series 2007, 5.500%, 12/01/37, 144A | | | |
| 915 | | Yuma County Industrial Development Authority, Arizona, Exempt Revenue Bonds, Far West | 6/21 at 100.00 | N/R | 914,259 |
| | Water & Sewer Inc Refunding, Series 2007A, 6.375%, 12/01/37 (AMT) | | | |
| 27,835 | | Total Arizona | | | 31,206,369 |
| | Arkansas – 0.4% (0.2% of Total Investments) | | | |
| 4,000 | | Arkansas Development Finance Authority, Industrial Development Revenue Bonds, Big River | 9/26 at 103.00 | B– | 4,374,680 |
| | Steel Project, Series 2019, 4.500%, 9/01/49 (AMT), 144A | | | |
| | California – 15.5% (11.0% of Total Investments) | | | |
| 18,875 | | Alameda Corridor Transportation Authority, California, Revenue Bonds, Refunding Second | 10/26 at 100.00 | Baa2 | 22,244,942 |
| | Subordinate Lien Series 2016B, 5.000%, 10/01/37 (UB) (6) | | | |
| 5,000 | | California Community Housing Agency, California, Essential Housing Revenue Bonds, | 8/31 at 100.00 | N/R | 5,337,600 |
| | Creekwood, Series 2021A, 4.000%, 2/01/56, 144A (WI/DD, Settling 5/4/21) | | | |
| 2,000 | | California Community Housing Agency, California, Essential Housing Revenue Bonds, Ester | 8/31 at 100.00 | N/R | 2,178,840 |
| | Apartments, Series 2021A-2, 4.000%, 2/01/43, 144A | | | |
| 2,250 | | California Enterprise Development Authority, Charter School Revenue Bonds, Norton | 7/27 at 102.00 | N/R | 2,411,910 |
| | Science and Language Academy Project, Series 2020, 6.250%, 7/01/58, 144A | | | |
| | California Health Facilities Financing Authority, Refunding Revenue Bonds, Stanford | | | |
| | Hospital and Clinics, Tender Option Bond Trust 2016-XF2353, Formerly Tender Option | | | |
| | Bond Trust 3267: | | | |
| 1,250 | | 18.943%, 11/15/40 (Pre-refunded 11/15/21), 144A (IF) (6) | 11/21 at 100.00 | AA– (7) | 1,387,625 |
| 1,875 | | 19.933%, 11/15/40 (Pre-refunded 11/15/21), 144A (IF) (6) | 11/21 at 100.00 | AA– (7) | 2,091,394 |
| | California Health Facilities Financing Authority, Revenue Bonds, Children’s Hospital Los | | | |
| | Angeles, Series 2017A: | | | |
| 5,165 | | 5.000%, 8/15/42 (UB) (6) | 8/27 at 100.00 | Baa2 | 6,082,769 |
| 22,115 | | 5.000%, 8/15/47 (UB) (6) | 8/27 at 100.00 | Baa2 | 25,954,164 |
| 12,500 | | California Health Facilities Financing Authority, Revenue Bonds, Kaiser Permanente | 11/27 at 100.00 | AA– | 14,356,375 |
| | System, Series 2017A-2, 4.000%, 11/01/44 (UB) (6) | | | |
| | California Health Facilities Financing Authority, Revenue Bonds, Stanford Hospitals and | | | |
| | Clinics, Tender Option Bond Trust 2016-XG0049: | | | |
| 1,000 | | 18.254%, 8/15/51, 144A (IF) (6) | 8/22 at 100.00 | AA– | 1,249,080 |
| 250 | | 18.259%, 8/15/51, 144A (IF) (6) | 8/22 at 100.00 | AA– | 312,288 |
97
| | |
| NMZ | Nuveen Municipal High Income Opportunity Fund |
| Portfolio of Investments (continued) |
| April 30, 2021 (Unaudited) |
| | | | | | |
| Principal | | | Optional Call | | |
| Amount (000) | | Description (1) | Provisions (2) | Ratings (3) | Value |
| | California (continued) | | | |
| $ 1,020 | | California Municipal Finance Authority, Mobile Home Park Revenue Bonds, Caritas | 8/24 at 100.00 | N/R | $ 1,097,347 |
| | Affordable Housing Inc Projects, Series 2014B, 5.875%, 8/15/49 | | | |
| 500 | | California Municipal Finance Authority, Revenue Bonds, California Baptist University, | 11/26 at 100.00 | N/R | 568,715 |
| | Series 2016A, 5.000%, 11/01/36, 144A | | | |
| 7,430 | | California Municipal Finance Authority, Revenue Bonds, Eisenhower Medical Center, | 7/27 at 100.00 | BBB– | 7,964,143 |
| | Refunding Series 2017B, 4.000%, 7/01/42 (UB) (6) | | | |
| 20,925 | | California Municipal Finance Authority, Revenue Bonds, Linxs APM Project, Senior Lien | 6/28 at 100.00 | BBB– | 23,502,123 |
| | Series 2018A, 4.000%, 12/31/47 (AMT) (UB) (6) | | | |
| 2,000 | | California Municipal Finance Authority, Special Facility Revenue Bonds, United Airlines, | No Opt. Call | B+ | 2,306,180 |
| | Inc Los Angeles International Airport Project, Series 2019, 4.000%, 7/15/29 (AMT) | | | |
| 400 | | California Pollution Control Financing Authority, Solid Waste Disposal Revenue Bonds, | No Opt. Call | N/R | 120,000 |
| | Aemerge Redpak Services Southern California, LLC Project, Subordinate Series 2017, 8.000%, | | | |
| | 12/01/27 (AMT), 144A (4) | | | |
| 1,000 | | California Public Finance Authority, Charter School Lease Revenue Bonds, California | 7/28 at 100.00 | N/R | 1,057,880 |
| | Crosspoint Academy Project, Series 2020A, 5.125%, 7/01/55, 144A | | | |
| 1,000 | | California School Finance Authority, California, Charter School Revenue Bonds, Alta | 6/28 at 102.00 | N/R | 1,094,370 |
| | Public Schools – Obligated Group, Series 2020A, 6.000%, 6/01/59, 144A | | | |
| 1,000 | | California School Finance Authority, Charter School Revenue Bonds, Scholarship Prep | 6/28 at 100.00 | N/R | 1,016,630 |
| | Public Schools ? Obligated Group, Series 2020A, 5.000%, 6/01/60, 144A | | | |
| | California Statewide Communities Development Authority, California, Revenue Bonds, Loma | | | |
| | Linda University Medical Center, Series 2014A: | | | |
| 800 | | 5.250%, 12/01/44 | 12/24 at 100.00 | BB– | 893,472 |
| 1,000 | | 5.500%, 12/01/54 | 12/24 at 100.00 | BB– | 1,120,520 |
| 6,940 | | California Statewide Communities Development Authority, California, Revenue Bonds, Loma | 6/26 at 100.00 | BB– | 7,822,699 |
| | Linda University Medical Center, Series 2016A, 5.250%, 12/01/56, 144A | | | |
| 500 | | California Statewide Communities Development Authority, Revenue Bonds, Lancer | 6/26 at 100.00 | N/R | 544,280 |
| | Educational Student Housing Project, Refunding Series 2016A, 5.000%, 6/01/46, 144A | | | |
| 1,000 | | California Statewide Communities Development Authority, Special Tax Bonds, Community | 9/22 at 100.00 | N/R | 1,049,090 |
| | Facilities District 2012-01, Fancher Creek, Series 2013A, 5.700%, 9/01/43 | | | |
| 1,530 | | California Statewide Communities Development Authority, Statewide Community | 9/21 at 100.00 | N/R | 1,530,398 |
| | Infrastructure Program Revenue Bonds, Series 2011A, 8.000%, 9/02/41 | | | |
| 1,000 | | California Statewide Communities Development Authority, Statewide Community | 9/31 at 100.00 | N/R | 1,090,420 |
| | Infrastructure Program Revenue Bonds, Series 2021A, 4.000%, 9/02/51 (WI/DD, Settling 5/12/21) | | | |
| 500 | | California Statewide Community Development Authority, Revenue Bonds, California Baptist | 11/21 at 100.00 | N/R (7) | 517,950 |
| | University, Series 2011A, 7.500%, 11/01/41 (Pre-refunded 11/01/21) | | | |
| 496 | | California Statewide Community Development Authority, Revenue Bonds, Daughters of | 6/21 at 100.00 | N/R | 471,134 |
| | Charity Health System, Series 2005A, 5.500%, 7/01/39 (4) | | | |
| 5,800 | | CSCDA Community Improvement Authority, California, Essential Housing Revenue Bonds, | 8/31 at 100.00 | N/R | 5,591,606 |
| | Jefferson-Anaheim Series 2021A-2, 3.125%, 8/01/56, 144A | | | |
| 1,000 | | CSCDA Community Improvement Authority, California, Essential Housing Revenue Bonds, Moda | 10/31 at 100.00 | N/R | 1,025,590 |
| | at Monrovia Station, Social Series 2021A-1, 3.400%, 10/01/46, 144A | | | |
| 1,775 | | Daly City Housing Development Finance Agency, California, Mobile Home Park Revenue | 6/21 at 100.00 | N/R | 1,777,787 |
| | Bonds, Franciscan Mobile Home Park Project, Refunding Third Tier Series 2007C, | | | |
| | 6.500%, 12/15/47 | | | |
| 2,000 | | Daly City Housing Development Finance Agency, California, Mobile Home Park Revenue | 6/21 at 100.00 | A+ | 2,003,720 |
| | Bonds, Franciscan Mobile Home Park, Refunding Series 2007A, 5.000%, 12/15/37 | | | |
| | Golden State Tobacco Securitization Corporation, California, Enhanced Tobacco Settlement | | | |
| | Asset-Backed Revenue Bonds, Refunding Series 2015A: | | | |
| 2,000 | | 5.000%, 6/01/40 (UB) (6) | 6/25 at 100.00 | A+ | 2,331,720 |
| 2,000 | | 5.000%, 6/01/45 (UB) (6) | 6/25 at 100.00 | A+ | 2,329,000 |
| 3,500 | | Golden State Tobacco Securitization Corporation, California, Tobacco Settlement | 6/22 at 100.00 | B– | 3,632,440 |
| | Asset-Backed Bonds, Senior Convertible Series 2007A-2, 5.300%, 6/01/37 | | | |
98
| | | | | | |
| Principal | | | Optional Call | | |
| Amount (000) | | Description (1) | Provisions (2) | Ratings (3) | Value |
| | California (continued) | | | |
| $ 5,960 | | Golden State Tobacco Securitization Corporation, California, Tobacco Settlement | 6/22 at 100.00 | N/R | $ 6,158,170 |
| | Asset-Backed Bonds, Series 2018A-1, 5.000%, 6/01/47 | | | |
| 5,000 | | Golden State Tobacco Securitization Corporation, California, Tobacco Settlement | 6/22 at 100.00 | N/R | 5,166,250 |
| | Asset-Backed Bonds, Series 2018A-2, 5.000%, 6/01/47 | | | |
| 860 | | Golden State Tobacco Securitization Corporation, California, Tobacco Settlement | 6/25 at 100.00 | A+ | 1,425,596 |
| | Asset-Backed Bonds, 17.548%, 6/01/45, 144A (IF) (6) | | | |
| 1,500 | | Grossmont Healthcare District, California, General Obligation Bonds, 22.470%, 7/15/40 | 7/21 at 100.00 | Aaa (7) | 1,571,490 |
| | (Pre-refunded 7/15/21), 144A (IF) (6) | | | |
| | Hercules Redevelopment Agency, California, Tax Allocation Bonds, Merged Project Area, | | | |
| | Series 2005: | | | |
| 1,000 | | 5.000%, 8/01/25 – AMBAC Insured | 6/21 at 100.00 | N/R | 1,003,260 |
| 1,000 | | 5.000%, 8/01/35 – AMBAC Insured | 6/21 at 100.00 | N/R | 1,001,400 |
| 390 | | Lee Lake Public Financing Authority, California, Junior Lien Revenue Bonds, Series | 9/23 at 100.00 | N/R | 422,058 |
| | 2013B, 5.250%, 9/01/32 | | | |
| 850 | | Los Angeles County, California, Community Development Commission Headquarters Office | 9/21 at 100.00 | Aa3 | 902,504 |
| | Building, Lease Revenue Bonds, Community Development Properties Los ANgeles County Inc, | | | |
| | 18.569%, 9/01/42, 144A (IF) (6) | | | |
| 1,000 | | Lynwood Redevelopment Agency, California, Tax Allocation Revenue Bonds, Project Area A, | 9/21 at 100.00 | A | 1,016,680 |
| | Subordinate Lien Series 2011A, 7.000%, 9/01/31 | | | |
| 1,500 | | March Joint Powers Redevelopment Agency, California, Tax Allocation Revenue Bonds, March | 8/21 at 100.00 | N/R (7) | 1,526,460 |
| | Air Force Base Redevelopment Project, Series 2011A, 7.500%, 8/01/41 (Pre-refunded 8/01/21) | | | |
| 500 | | National City Community Development Commission, California, Tax Allocation Bonds, | 8/21 at 100.00 | N/R (7) | 508,315 |
| | National City Redevelopment Project, Series 2011, 7.000%, 8/01/32 (Pre-refunded 8/01/21) | | | |
| 330 | | Novato Redevelopment Agency, California, Tax Allocation Bonds, Hamilton Field | 9/21 at 100.00 | N/R (7) | 337,082 |
| | Redevelopment Project, Series 2011, 6.750%, 9/01/40 (Pre-refunded 9/01/21) | | | |
| 1,200 | | Riverside County Redevelopment Agency, California, Tax Allocation Bonds, Jurupa Valley | 10/21 at 100.00 | A | 1,232,364 |
| | Project Area, Series 2011B, 6.750%, 10/01/30 | | | |
| | Sacramento City Financing Authority California, Lease Revenue Bonds, Master Lease | | | |
| | Program Facilities Projects, Tender Option Bond Trust 2016-XG0100: | | | |
| 750 | | 19.205%, 12/01/30 – AMBAC Insured, 144A (IF) (6) | No Opt. Call | AA– | 1,666,162 |
| 2,015 | | 18.991%, 12/01/33 – AMBAC Insured, 144A (IF) (6) | No Opt. Call | AA– | 5,053,197 |
| | San Buenaventura, California, Revenue Bonds, Community Memorial Health System, Series 2011: | | | |
| 960 | | 8.000%, 12/01/26 | 12/21 at 100.00 | BB | 996,845 |
| 1,000 | | 8.000%, 12/01/31 | 12/21 at 100.00 | BB | 1,037,140 |
| 4,095 | | San Francisco City and County Redevelopment Agency Successor Agency, California, Tax | 8/21 at 61.78 | N/R | 2,514,002 |
| | Allocation Bonds, Mission Bay South Redevelopment Project, Subordinate Series 2016D, | | | |
| | 0.000%, | 8/01/31, 144A | | |
| 960 | | Santa Margarita Water District, California, Special Tax Bonds, Community Facilities | 9/23 at 100.00 | N/R | 1,044,432 |
| | District 2013-1 Village of Sendero, Series 2013, 5.625%, 9/01/43 | | | |
| 1,065 | | Temecula Public Financing Authority, California, Special Tax Bonds, Community Facilities | 9/27 at 100.00 | N/R | 1,177,570 |
| | District 16-01, Series 2017, 6.250%, 9/01/47, 144A | | | |
| 650 | | Twentynine Palms Redevelopment Agency, California, Tax Allocation Bonds, Four Corners | 9/21 at 100.00 | BBB+ (7) | 665,743 |
| | Project Area, Series 2011A, 7.650%, 9/01/42 (Pre-refunded 9/01/21) | | | |
| 1,250 | | University of California, General Revenue Bonds, 17.990%, 5/15/39, 144A (IF) (6) | 5/23 at 100.00 | AA | 1,705,087 |
| 173,231 | | Total California | | | 194,198,008 |
| | Colorado – 8.0% (5.7% of Total Investments) | | | |
| 500 | | Aviation Station North Metropolitan District 2, Denver County, Colorado, Limited Tax | 9/24 at 103.00 | N/R | 528,170 |
| | General Obligation Bonds, Subordinate Series 2019B, 7.750%, 12/15/48 | | | |
| 1,500 | | Belford North Metropolitan District, Douglas County, Colorado, General Obligation | 12/25 at 103.00 | N/R | 1,635,570 |
| | Limited Tax Bonds, Series 2020A, 5.500%, 12/01/50 | | | |
| 1,000 | | Bennett Ranch Metropolitan District 1, Adams County, Colorado, General Obligation | 3/26 at 103.00 | N/R | 1,076,050 |
| | Limited Tax Bonds, Convertible to Unlimited Tax Series 2021A, 5.000%, 12/01/51 | | | |
99
| | |
| NMZ | Nuveen Municipal High Income Opportunity Fund |
| Portfolio of Investments (continued) |
| April 30, 2021 (Unaudited) |
| | | | | | |
| Principal | | | Optional Call | | |
| Amount (000) | | Description (1) | Provisions (2) | Ratings (3) | Value |
| | Colorado (continued) | | | |
| $ 1,835 | | Broadway Station Metropolitan District 3, Denver City and County, Colorado, General | 6/24 at 103.00 | N/R | $ 2,022,665 |
| | Obligation Limited Tax Bonds, Convertible to Unlimited Series 2019A, 5.000%, 12/01/39 | | | |
| 500 | | Cherry Creek Corporate Center Metropolitan District, Arapahoe County, Colorado, Revenue | 12/21 at 103.00 | N/R | 516,825 |
| | Bonds, Refunding Subordinate Lien Series 2016B, 8.000%, 6/15/37 | | | |
| 1,000 | | Cielo Metropolitan District, Douglas County, Colorado, Limited Tax General Obligation | 6/26 at 103.00 | N/R | 1,010,290 |
| | Bonds, Series 2021(3), 5.250%, 12/01/50 | | | |
| 600 | | Clear Creek Transit Metropolitan District 2, Adams County, Colorado, Revenue Supported | 12/26 at 103.00 | N/R | 654,582 |
| | Limited Tax General Obligation Bonds, Series 2021A, 5.000%, 12/01/41 | | | |
| 685 | | Colorado Educational and Cultural Facilities Authority, Charter School Revenue Bonds, | 6/21 at 100.00 | BB+ | 687,240 |
| | Community Leadership Academy Project, Series 2008, 6.250%, 7/01/28 | | | |
| 2,140 | | Colorado Educational and Cultural Facilities Authority, Charter School Revenue Bonds, | 10/22 at 100.00 | N/R | 2,221,277 |
| | Mountain Phoenix Community School, Series 2012, 7.000%, 10/01/42 | | | |
| 560 | | Colorado Educational and Cultural Facilities Authority, Charter School Revenue Bonds, | 7/24 at 100.00 | BB | 600,292 |
| | Skyview Academy Project, Series 2014, 5.375%, 7/01/44, 144A | | | |
| 720 | | Colorado Educational and Cultural Facilities Authority, Revenue Bonds, Global Village | 12/30 at 100.00 | N/R | 770,278 |
| | Academy – Northglenn Project, Series 2020, 5.000%, 12/01/55, 144A | | | |
| 2,500 | | Colorado Health Facilities Authority, Colorado, Revenue Bonds, American Baptist Homes of | 2/24 at 100.00 | N/R | 2,669,175 |
| | the Midwest Obligated Group, Series 2013, 8.000%, 8/01/43 | | | |
| 1,000 | | Colorado Health Facilities Authority, Colorado, Revenue Bonds, American Baptist Homes | 2/26 at 100.00 | N/R | 1,018,770 |
| | Project, Series 2016, 6.125%, 2/01/46, 144A | | | |
| 1,285 | | Colorado Health Facilities Authority, Colorado, Revenue Bonds, Craig Hospital Project, | 12/22 at 100.00 | A+ | 1,358,849 |
| | Series 2012, 5.000%, 12/01/32 (UB) (6) | | | |
| 518 | | Colorado Housing and Finance Authority, Revenue Bonds, Confluence Energy LLC Project, | No Opt. Call | N/R | 5 |
| | Series 2007, 5.000%, 9/30/21 (4), (8) | | | |
| | Colorado Housing and Finance Authority, Revenue Bonds, Confluence Energy LLC Project, | | | |
| | Series 2017: | | | |
| 4,831 | | 0.000%, 4/01/27 (AMT) (4), (8) | No Opt. Call | N/R | 66,666 |
| 2,130 | | 0.000%, 10/01/27 (AMT) (4), (8) | No Opt. Call | N/R | 29,388 |
| 3,144 | | Colorado International Center Metropolitan District 8, Adams County, Colorado, Limited | 9/25 at 103.00 | N/R | 3,360,496 |
| | Tax General Obligation Bonds, Series 2020, 6.500%, 12/01/50 | | | |
| 2,000 | | Compark Business Campus Metropolitan District, Douglas County, Colorado, General | 12/22 at 100.00 | N/R (7) | 2,199,840 |
| | Obligation Bonds, Series 2012A, 6.750%, 12/01/39 (Pre-refunded 12/01/22) | | | |
| | Confluence Metropolitan District, Colorado, General Obligation Limited Tax Bonds, | | | |
| | Series 2007: | | | |
| 1,000 | | 5.400%, 12/01/27 (4) | 6/21 at 100.00 | N/R | 800,000 |
| 1,500 | | 5.450%, 12/01/34 (4) | 6/21 at 100.00 | N/R | 1,200,000 |
| 1,000 | | Crowfoot Valley Ranch Metropolitan District No 2, Douglas County, Colorado, Limited Tax | 12/23 at 103.00 | N/R | 1,090,760 |
| | General Obligation Bonds, Series 2018A, 5.625%, 12/01/38 | | | |
| 1,000 | | Dacono Urban Renewal Authority, Weld County, Colorado, Tax Increment Revenue Bonds, | 12/25 at 103.00 | N/R | 1,071,940 |
| | Series 2020, 6.250%, 12/01/39 | | | |
| 10,000 | | Denver City and County, Colorado, Airport System Revenue Bonds, Subordinate Lien Series | 12/28 at 100.00 | A | 11,243,400 |
| | 2018A, 4.000%, 12/01/48 (AMT) (UB) (6) | | | |
| 3,000 | | Denver City and County, Colorado, Special Facilities Airport Revenue Bonds, United | 10/23 at 100.00 | B | 3,205,230 |
| | Airlines, Inc Project, Refunding Series 2017, 5.000%, 10/01/32 (AMT) | | | |
| 495 | | Dinosaur Ridge Metropolitan District, Golden, Jefferson County, Colorado, Special | 6/24 at 103.00 | N/R | 529,972 |
| | Revenue Refunding and Improvement Bonds, Series 2019A, 5.000%, 6/01/49 | | | |
| 1,000 | | Elbert and Highway 86 Commercial Metropolitan District, Elbert County, Colorado, Special | 6/26 at 103.00 | N/R | 1,076,710 |
| | Revenue and Tax Supported Bonds, Refunding & Improvement Senior Series 2021A, | | | |
| | 5.000%, 12/01/51, 144A | | | |
| | Foothills Metropolitan District, Fort Collins, Colorado, Special Revenue Bonds, Series 2014: | | | |
| 1,000 | | 5.750%, 12/01/30 | 12/24 at 100.00 | N/R | 1,078,220 |
| 2,080 | | 6.000%, 12/01/38 | 12/24 at 100.00 | N/R | 2,201,576 |
100
| | | | | | |
| Principal | | | Optional Call | | |
| Amount (000) | | Description (1) | Provisions (2) | Ratings (3) | Value |
| | Colorado (continued) | | | |
| $ 500 | | Fourth Street Crossing Business Improvement District, Silverthorne, Summit County, | 6/24 at 103.00 | N/R | $ 539,760 |
| | Colorado, Special Revenue and Tax Supported Bonds, Senior Series 2019A, | | | |
| | 5.375%, 12/01/49, 144A | | | |
| 3,000 | | Future Legends Sports Park Metropolitan District 2, Colorado, Limited Tax General | 6/25 at 103.00 | N/R | 3,034,800 |
| | Obligation Bonds, Series 2020A, 5.500%, 6/01/50, 144A | | | |
| 1,000 | | Great Western Metropolitan District 5, Colorado, General Obligation Limited Tax Revenue | 12/25 at 102.00 | N/R | 1,060,700 |
| | Bonds, Refunding Series 2020, 4.750%, 12/01/50 | | | |
| 2,000 | | Heritage Todd Creek Metropolitan District, Colorado, General Obligation Bonds Limited | 12/24 at 100.00 | N/R | 2,167,220 |
| | Tax, Refunding & Improvement Series 2015, 6.125%, 12/01/44 | | | |
| 305 | | Iliff Commons Metropolitan District 2, Aurora, Arapahoe County, Colorado, General | 12/21 at 103.00 | N/R | 315,718 |
| | Obligation Bonds, Subordinated Limited Tax Convertible to Unlimited Tax Series 2016B, | | | |
| | 8.000%, 12/15/46 | | | |
| 810 | | Jefferson Center Metropolitan District 1, Arvada, Jefferson County, Colorado, Special | 12/23 at 103.00 | N/R | 868,879 |
| | Revenue Bonds, Subordinate Series 2020B, 5.750%, 12/15/50 | | | |
| | Johnstown Plaza Metropolitan District, Colorado, Special Revenue Bonds, Series 2016A: | | | |
| 675 | | 5.250%, 12/01/36 | 12/21 at 103.00 | N/R | 702,445 |
| 1,265 | | 5.375%, 12/01/46 | 12/21 at 103.00 | N/R | 1,315,549 |
| 1,000 | | Johnstown Village Metropolitan District 2, Weld County, own of Johnstown, Colorado, | 9/25 at 103.00 | N/R | 1,083,580 |
| | General Obligation Limited Tax Bonds, Series 2020A, 5.000%, 12/01/50 | | | |
| 1,700 | | Jones District Community Authority Board, Centennial, Colorado, Special Revenue | 12/25 at 103.00 | N/R | 1,473,305 |
| | Convertible Capital Appreciation Bonds, Series 2020A, 5.750%, 12/01/50 | | | |
| 2,685 | | Kit Carson County Health Service District, Colorado, Health Care Facility Revenue Bonds, | 6/21 at 100.00 | N/R | 2,686,074 |
| | Series 2007, 6.750%, 1/01/34 | | | |
| 500 | | Lanterns Metropolitan District 1, Castle Rock, Douglas County, Colorado, Limited Tax | 9/24 at 103.00 | N/R | 538,480 |
| | General Obligation Bonds, Series 2019A, 5.000%, 12/01/49 | | | |
| 500 | | Larkridge Metropolitan District No 2, In the City of Thornton, Adams County, Colorado, | 12/23 at 103.00 | N/R | 536,230 |
| | General Obligation, Limited Tax Convertible to Unlimited Tax, Improvement Bonds, Refunding | | | |
| | Series 2019, 5.250%, 12/01/48 | | | |
| 500 | | Leyden Rock Metropolitan District No 10, In the City of Arvada, Colorado, Limited Tax | 12/21 at 103.00 | N/R | 520,010 |
| | General Obligation Bonds, Refunding and Improvement Series 20016A, 5.000%, 12/01/45 | | | |
| 500 | | Leyden Rock Metropolitan District No 10, In the City of Arvada, Colorado, Limited Tax | 12/21 at 103.00 | N/R | 518,370 |
| | General Obligation Bonds, Refunding and Improvement Series 20016B, 7.250%, 12/15/45 | | | |
| 500 | | Midcities Metropolitan District No 2, In the City and County of Broomfield, Colorado, | 12/21 at 103.00 | N/R | 517,695 |
| | Subordinate Special Revenue Refunding Bonds, Series 2016B, 7.750%, 12/15/46 | | | |
| 2,000 | | Murphy Creek Metropolitan District 3, Aurora, Colorado, General Obligation Bonds, | 6/21 at 100.00 | N/R | 2,000,000 |
| | Refunding & Improvement Series 2006, 6.125%, 12/01/35 (4) | | | |
| 1,000 | | North Range Metropolitan District 3, Adams County, Colorado, Limited Tax General | 12/25 at 103.00 | N/R | 1,109,790 |
| | Obligation Bonds, Series 2020A-3, 5.250%, 12/01/50 | | | |
| 1,535 | | North Vista Highlands Metropolitan District 3, Pueblo County, Colorado, Limited Tax | 3/25 at 103.00 | N/R | 1,662,083 |
| | General Obligation Bonds, Series 2020, 5.125%, 12/01/49 | | | |
| 1,000 | | Northfield Metropolitan District 2, Fort Collins, Larimer County, Colorado, Limited Tax | 12/25 at 103.00 | N/R | 1,078,140 |
| | General Obligation Bonds, Series 2020A, 5.000%, 12/01/50 | | | |
| | Painted Prairie Public Improvement Authority, Aurora, Colorado, Special Revenue Bonds, | | | |
| | Series 2019: | | | |
| 1,500 | | 5.000%, 12/01/39 | 12/24 at 103.00 | N/R | 1,646,265 |
| 5,000 | | 5.000%, 12/01/49 | 12/24 at 103.00 | N/R | 5,439,050 |
| 500 | | Palisade Park West Metropolitan District, Broomfield County, Colorado, Limited Tax | 6/24 at 103.00 | N/R | 537,265 |
| | General Obligation Bonds, Convertible to Unlimited Tax, Series 2019A, 5.125%, 12/01/49 | | | |
| 500 | | Parkdale Community Authority, Erie, Colorado, Limited Tax Supported Revenue Bonds, | 9/25 at 103.00 | N/R | 544,610 |
| | District 1, Series 2020A, 5.250%, 12/01/50 | | | |
| 550 | | Patriot Park Metropolitan District 2, Colorado Springs, Colorado, Limited Tax General | 12/25 at 103.00 | N/R | 564,294 |
| | Obligation Bonds, Series 2021, 4.300%, 12/01/50 | | | |
101
| | |
| NMZ | Nuveen Municipal High Income Opportunity Fund |
| Portfolio of Investments (continued) |
| April 30, 2021 (Unaudited) |
| | | | | | |
| Principal | | | Optional Call | | |
| Amount (000) | | Description (1) | Provisions (2) | Ratings (3) | Value |
| | Colorado (continued) | | | |
| $ 1,000 | | Pueblo Urban Renewal Authority, Colorado, Tax Increment Revenue Bonds, EVRAZ Project, | 12/30 at 100.00 | N/R | $ 1,119,540 |
| | Series 2021A, 4.750%, 12/01/45, 144A | | | |
| 500 | | Raindance Metropolitan District 1, Acting by and through its Water Activity Enterprise | 12/25 at 103.00 | N/R | 545,310 |
| | In the Town of Windsor, Weld County, Colorado, Non-Potable Water Enterprise Revenue Bonds, | | | |
| | Series 2020, 5.250%, 12/01/50 | | | |
| 1,000 | | Remuda Ranch Metropolitan District, Douglas County, Colorado, Limited Tax General | 12/25 at 103.00 | N/R | 1,101,050 |
| | Obligation Bonds, Series 2020A, 5.000%, 12/01/50 | | | |
| 500 | | Ritoro Metropolitan District In the Town of Elizabeth, Elbert County, Colorado, Limited | 6/24 at 103.00 | N/R | 537,445 |
| | Tax , Convertible to Unlimited Tax, General Obligation Bonds, Series 2019A, 5.000%, 12/01/49 | | | |
| 500 | | Riverdale Ranch Metropolitan District, Thornton City, Adams County, Colorado, Limited | 9/24 at 103.00 | N/R | 536,720 |
| | Tax General Obligation Bonds, Convertible to Unlimited Tax Series 2019A, 5.000%, 12/01/49 | | | |
| 1,025 | | Silver Leaf Metropolitan District, Jefferson County, Colorado, General Obligation | 6/26 at 103.00 | N/R | 1,024,969 |
| | Limited Tax Bonds, Series 2021A-3, 5.250%, 12/01/50 (WI/DD, Settling 5/12/21) | | | |
| 1,000 | | South Aurora Regional Improvement Authority, Aurora, Colorado, Special Revenue Bonds, | 12/23 at 103.00 | N/R | 1,072,930 |
| | Series 2018, 6.250%, 12/01/57 | | | |
| 2,790 | | Sterling Ranch Metropolitan District 1, El Paso County, Colorado, General Obligation | 12/25 at 103.00 | N/R | 3,066,489 |
| | Limited Tax Bonds, Series 2020, 5.125%, 12/01/50 | | | |
| 3,000 | | Stone Ridge Metropolitan District 2, Colorado, General Obligation Bonds, Limited Tax | 6/21 at 100.00 | N/R | 480,000 |
| | Convertible to Unlimited, Series 2007, 0.000%, 12/01/31 (4) | | | |
| 685 | | Three Springs Metropolitan District 1, Durango, La Plata County, Colorado, Limited Tax | 12/25 at 103.00 | N/R | 699,734 |
| | General Obligation Bonds, Refunding Subordinate Series 2020B, 7.125%, 12/15/50 | | | |
| 2,000 | | Transport Metropolitan District 3, In the City of Aurora, Adams County, Colorado, | 3/26 at 103.00 | N/R | 2,196,920 |
| | General Obligation Limited Bonds, Series 2021A-1, 5.000%, 12/01/51 | | | |
| 965 | | VDW Metropolitan District 2, Larimer County, Colorado, General Obligation Bonds, | 12/21 at 103.00 | N/R | 1,003,253 |
| | Refunding Limited Tax Series 2016B, 7.250%, 12/15/45 | | | |
| 1,000 | | Velocity Metropolitan District 3, In the City of Aurora, Colorado, Limited Tax General | 12/23 at 103.00 | N/R | 1,081,850 |
| | Obligation Bonds, Series 2019, 5.375%, 12/01/39 | | | |
| 1,500 | | Velocity Metropolitan District 5, In the City of Aurora, Colorado, Limited Tax General | 12/23 at 81.31 | N/R | 1,081,950 |
| | Obligation Bonds, Convertible Capital Appreciation Series 2020A-2, 6.000%, 12/01/50 | | | |
| 1,570 | | Velocity Metropolitan District 5, In the City of Aurora, Colorado, Limited Tax General | 12/23 at 103.00 | N/R | 1,667,340 |
| | Obligation Bonds, Series 2020A-1, 5.375%, 12/01/50 | | | |
| 1,000 | | Verve Metropolitan District 1, Jefferson County and the City and County of Broomfield, | 3/26 at 103.00 | N/R | 1,089,040 |
| | Colorado, General Obligation Bonds, Refunding and Improvement Limited Tax Series 2021, | | | |
| | 5.000%, 12/01/51 | | | |
| 500 | | Village East Community Metropolitan District, Frederick, Weld County, Colorado, Limited | 9/25 at 103.00 | N/R | 546,655 |
| | Tax General Obligation Bonds, Series 2020A, 5.250%, 12/01/50 | | | |
| 1,100 | | Village Metropolitan District In the Town of Avon, Eagle County, Colorado, Special | 12/25 at 103.00 | N/R | 1,221,374 |
| | Revenue and Limited Property Tax Bonds, Refunding & Improvement Series 2020, 5.000%, 12/01/40 | | | |
| 705 | | Windsor Highlands Metropolitan District 9, Windsor, Larimer County, Colorado, Limited | 9/24 at 103.00 | N/R | 756,028 |
| | Tax Supported Revenue Bonds, Series 2019, 5.000%, 12/01/49 | | | |
| 830 | | Woodmen Heights Metropolitan District 2, El Paso County, Colorado, General Obligation | 12/25 at 103.00 | N/R | 866,155 |
| | Limited Tax Bonds, Taxable Converting to Tax-Exempt Refunding Subordinate Series 2020B-1, | | | |
| | 6.250%, 12/15/40 | | | |
| 104,718 | | Total Colorado | | | 100,079,300 |
| | Connecticut – 0.1% (0.1% of Total Investments) | | | |
| 500 | | Great Pond Improvement District, Connecticut, Special Obligation Revenue Bonds, Great | 10/26 at 102.00 | N/R | 521,540 |
| | Pond Phase 1 Project, Series 20019, 4.750%, 10/01/48, 144A | | | |
| 6,266 | | Mashantucket Western Pequot Tribe, Connecticut, Special Revenue Bonds, Subordinate | No Opt. Call | N/R | 532,657 |
| | Series 2013A, 6.050%, 7/01/31 (cash 4.000%, PIK 2.050%) (4) | | | |
| 6,766 | | Total Connecticut | | | 1,054,197 |
102
| | | | | | |
| Principal | | | Optional Call | | |
| Amount (000) | | Description (1) | Provisions (2) | Ratings (3) | Value |
| | Delaware – 0.2% (0.2% of Total Investments) | | | |
| $ 2,500 | | Delaware Economic Development Authority, Revenue Bonds, Odyssey Charter School Inc | 3/25 at 100.00 | N/R | $ 2,808,625 |
| | Project, Series 2015A, 7.000%, 9/01/45, 144A | | | |
| | District of Columbia – 0.2% (0.1% of Total Investments) | | | |
| 105 | | District of Columbia Tobacco Settlement Corporation, Tobacco Settlement Asset-Backed | No Opt. Call | Baa1 | 116,582 |
| | Bonds, Series 2001, 6.500%, 5/15/33 | | | |
| 250 | | District of Columbia, Revenue Bonds, KIPP DC Issue, Series 2013A, 6.000%, 7/01/33 | 7/23 at 100.00 | N/R (7) | 281,152 |
| | (Pre-refunded 7/01/23) | | | |
| 2,000 | | District of Columbia, Revenue Bonds, Saint Paul on Fouth Street, Inc, Series 2019A, | 5/30 at 100.00 | N/R | 2,008,520 |
| | 5.250%, 5/15/55, 144A | | | |
| 2,355 | | Total District of Columbia | | | 2,406,254 |
| | Florida – 14.8% (10.5% of Total Investments) | | | |
| 500 | | Academical Village Community Development District, Davie, Florida, Special Assessment | 5/30 at 100.00 | N/R | 523,735 |
| | Revenue Bonds, Series 2020, 4.000%, 5/01/51 | | | |
| 1,500 | | Alachua County Health Facilities Authority, Florida, Health Facilties Revenue Bonds, | 11/21 at 100.00 | N/R | 1,501,950 |
| | Terraces at Bonita Springs Project, Series 2011A, 8.125%, 11/15/46 | | | |
| 2,245 | | Ave Maria Stewardship Community District, Florida, Capital Improvement Revenue Bonds, | 5/31 at 100.00 | N/R | 2,314,079 |
| | Ave Maria National Project, Series 2021, 4.000%, 5/01/51 | | | |
| 1,740 | | Ave Maria Stewardship Community District, Florida, Capital Improvement Revenue Bonds, | 5/22 at 100.00 | N/R | 1,808,156 |
| | Series 2012, 6.700%, 5/01/42 | | | |
| 1,685 | | Ave Maria Stewardship Community District, Florida, Capital Improvement Revenue Bonds, | 5/25 at 100.00 | N/R | 1,774,777 |
| | Series 2015, 5.375%, 5/01/45 | | | |
| 995 | | Babcock Ranch Community Independent Special District, Charlotte County, Florida, Special | 11/25 at 100.00 | N/R | 1,089,734 |
| | Assessment Bonds, Series 2015, 5.250%, 11/01/46 | | | |
| 905 | | Belmont Community Development District, Florida, Capital Improvement Revenue Bonds, | No Opt. Call | N/R | 1,106,734 |
| | Phase 1 Project, Series 2013A, 6.125%, 11/01/33 | | | |
| 1,695 | | Boggy Creek Improvement District, Orlando, Florida, Special Assessment Revenue Bonds, | 5/23 at 100.00 | N/R | 1,785,649 |
| | Refunding Series 2013, 5.125%, 5/01/43 | | | |
| 2,500 | | Capital Trust Agency, Florida, Educational Facilities Revenue Bonds, LLT Academy South | 6/25 at 105.00 | N/R | 2,700,025 |
| | Bay Project, Series 2020A, 6.000%, 6/15/55, 144A | | | |
| 2,000 | | Capital Trust Agency, Florida, Revenue Bonds, Educational Growth Fund, LLC, Charter | 7/31 at 100.00 | N/R | 2,255,940 |
| | School Portfolio Projects, Series 2021A-1, 5.000%, 7/01/56, 144A | | | |
| 3,135 | | Capital Trust Agency, Florida, Revenue Bonds, Provision CARES Proton Therapy Center, | 6/28 at 100.00 | N/R | 1,191,300 |
| | Orlando Project, Series 2018, 7.500%, 6/01/48, 144A (4), (8) | | | |
| 830 | | Capital Trust Agency, Florida, Revenue Bonds, Renaissance Charter School Project, Series | 6/26 at 100.00 | N/R | 906,891 |
| | 2019A, 5.000%, 6/15/39, 144A | | | |
| 1,000 | | Capital Trust Agency, Florida, Revenue Bonds, St Johns Classical Academy, Refunding | 6/30 at 100.00 | N/R | 1,012,550 |
| | Series 2021A, 4.000%, 6/15/56, 144A | | | |
| 1,000 | | Capital Trust Agency, Florida, Revenue Bonds, Tuscan Gardens of Palm Coast Project, | 4/24 at 103.00 | N/R | 505,090 |
| | Series 2017A, 7.000%, 10/01/49, 144A | | | |
| 1,000 | | Capital Trust Agency, Florida, Senior Living Facilities Revenue Bonds, Elim Senior | 8/24 at 103.00 | N/R | 863,490 |
| | Housing, Inc Project, Series 2017, 5.875%, 8/01/52, 144A | | | |
| 955 | | Celebration Pointe Community Development District 1, Alachua County, Florida, Special | 5/24 at 100.00 | N/R | 1,000,095 |
| | Assessment Revenue Bonds, Series 2014, 5.125%, 5/01/45 | | | |
| 500 | | Charlotte County Industrial Development Authority, Florida, Utility System Revenue | 10/27 at 100.00 | N/R | 554,770 |
| | Bonds, Town & Country Utilities Project, Series 2019, 5.000%, 10/01/49 (AMT), 144A | | | |
| 2,000 | | Collier County Industrial Development Authority, Florida, Continuing Care Community | 5/24 at 100.00 | N/R | 1,360,000 |
| | Revenue Bonds, Arlington of Naples Project, Series 2014A, 0.000%, 5/15/35, 144A (4) | | | |
| 845 | | Cordoba Ranch Community Development District, Hillsborough County, Florida, Special | 5/21 at 100.00 | N/R | 848,439 |
| | Assessment Revenue Bonds, Series 2006, 5.550%, 5/01/37 | | | |
103
| | |
| NMZ | Nuveen Municipal High Income Opportunity Fund |
| Portfolio of Investments (continued) |
| April 30, 2021 (Unaudited) |
| | | | | | |
| Principal | | | Optional Call | | |
| Amount (000) | | Description (1) | Provisions (2) | Ratings (3) | Value |
| | Florida (continued) | | | |
| $ 995 | | Cross Creek North Community Development District, Clay County, Florida, Special | 11/29 at 100.00 | N/R | $ 1,127,425 |
| | Assessment Bonds, Series 2018, 5.375%, 11/01/50, 144A | | | |
| 1,605 | | Cypress Mill Community Development District, Hillsborough County, Florida, Special | 6/30 at 100.00 | N/R | 1,706,869 |
| | Assessment Bonds, Assessment Area 2, Series 2020, 4.000%, 6/15/40 | | | |
| 525 | | East Nassau Stewardship District, Florida, Special Assessment Revenue Bonds, Series | 5/31 at 100.00 | N/R | 541,154 |
| | 2021, 4.000%, 5/01/51 | | | |
| 700 | | Fishhawk Community Development District IV, Hillsborough County, Florida, Special | 5/23 at 100.00 | N/R | 767,137 |
| | Assessment Revenue Bonds, Series 2013A, 7.000%, 5/01/33 | | | |
| 1,850 | | Florida Development Finance Corporation, Educational Facilities Revenue Bonds, Downtown | 7/24 at 100.00 | N/R | 1,993,782 |
| | Doral Charter Elementary School Project, Series 2014A, 6.500%, 7/01/44 | | | |
| 1,000 | | Florida Development Finance Corporation, Educational Facilities Revenue Bonds, Downtown | 7/27 at 100.00 | N/R | 1,078,060 |
| | Doral Charter Elementary School Project, Series 2017A, 5.750%, 7/01/44, 144A | | | |
| 565 | | Florida Development Finance Corporation, Educational Facilities Revenue Bonds, Florida | 7/26 at 100.00 | N/R | 610,358 |
| | Charter Foundation Inc Projects, Series 2016A, 5.000%, 7/15/46, 144A | | | |
| 1,000 | | Florida Development Finance Corporation, Educational Facilities Revenue Bonds, Miami | 6/24 at 100.00 | N/R | 913,840 |
| | Arts Charter School Projects, Series 2014, 6.000%, 6/15/44, 144A | | | |
| 655 | | Florida Development Finance Corporation, Educational Facilities Revenue Bonds, Pepin | 1/27 at 100.00 | N/R | 692,938 |
| | Academies of Pasco County Inc, Series 2020A, 5.000%, 1/01/50, 144A | | | |
| 2,000 | | Florida Development Finance Corporation, Educational Facilities Revenue Bonds, | 6/21 at 100.00 | N/R (7) | 2,017,100 |
| | Renaissance Charter School, Inc Projects, Series 2011A, 7.625%, 6/15/41 | | | |
| | (Pre-refunded 6/15/21) | | | |
| 5,000 | | Florida Development Finance Corporation, Educational Facilities Revenue Bonds, | 6/23 at 100.00 | N/R | 5,597,350 |
| | Renaissance Charter School, Inc Projects, Series 2013A, 8.500%, 6/15/44 | | | |
| 120 | | Florida Development Finance Corporation, Educational Facilities Revenue Bonds, | 9/27 at 100.00 | N/R | 132,270 |
| | Renaissance Charter School, Inc Projects, Series 2020C, 5.000%, 9/15/50, 144A | | | |
| 17,250 | | Florida Development Finance Corporation, Florida, Surface Transportation Facility | 1/24 at 107.00 | N/R | 17,940,000 |
| | Revenue Bonds, Brightline Passenger Rail Project, Green Series 2019B, 7.375%, | | | |
| | 1/01/49 (AMT), 144A | | | |
| | Florida Development Finance Corporation, Florida, Surface Transportation Facility | | | |
| | Revenue Bonds, Virgin Trains USA Passenger Rail Project , Series 2019A: | | | |
| 5,590 | | 6.250%, 1/01/49 (AMT) (Mandatory Put 1/01/24), 144A | 6/21 at 103.00 | N/R | 5,613,702 |
| 31,170 | | 6.375%, 1/01/49 (AMT) (Mandatory Put 1/01/26), 144A | 6/21 at 104.00 | N/R | 31,256,964 |
| 6,485 | | 6.500%, 1/01/49 (AMT) (Mandatory Put 1/01/29), 144A | 6/21 at 104.00 | N/R | 6,493,041 |
| | FRERC Community Development District, Ocoee, Florida, Special Assessment Bonds, | | | |
| | Series 2020: | | | |
| 2,750 | | 5.375%, 11/01/40 | 11/29 at 100.00 | N/R | 2,947,367 |
| 2,000 | | 5.500%, 11/01/50 | 11/29 at 100.00 | N/R | 2,147,700 |
| 2,500 | | Grand Bay at Doral Community Development District, Miami-Dade County, Florida, Special | 11/22 at 100.00 | N/R | 2,609,125 |
| | Assessment Bonds, Doral Breeze Project Series 2012, 5.500%, 11/01/32 | | | |
| 1,000 | | Grand Bay at Doral Community Development District, Miami-Dade County, Florida, Special | 5/24 at 100.00 | N/R | 1,106,070 |
| | Assessment Improvement Bonds, Assessment Area Two Project, Refunding Series 2014A-2, | | | |
| | 6.500%, 5/01/39 | | | |
| 200 | | Gulfstream Polo Community Development District, Palm Beach County, Florida, Special | 11/29 at 100.00 | N/R | 215,884 |
| | Assessment Bonds, Phase 2 Project, Series 2019, 4.375%, 11/01/49 | | | |
| 1,000 | | Hammock Reserve Community Development District, Haines City, Florida, Special Assessment | 5/31 at 100.00 | N/R | 1,042,550 |
| | Revenue Bonds, Area 2 Project, Series 2021, 4.000%, 5/01/51 (WI/DD, Settling 5/18/21) | | | |
| 1,895 | | Harmony Community Development District, Florida, Capital Improvement Revenue Bonds, | 5/24 at 100.00 | N/R | 1,998,334 |
| | Special Assessment, Refunding Series 2014, 5.250%, 5/01/32 | | | |
| 200 | | Hawkstone Community Development District, Florida, Special Assessment Revenue Bonds, | 11/29 at 100.00 | N/R | 211,800 |
| | Assessment Area 2, Series 2019, 4.000%, 11/01/39 | | | |
| 1,000 | | Lakes by the Bay South Community Development District, Florida, Special Assessment | 11/22 at 100.00 | N/R | 1,046,720 |
| | Bonds, Series 2012, 5.750%, 11/01/42 | | | |
104
| | | | | | |
| Principal | | | Optional Call | | |
| Amount (000) | | Description (1) | Provisions (2) | Ratings (3) | Value |
| | Florida (continued) | | | |
| $ 265 | | Lakes of Sarasota Community Development District, Florida, Improvement Revenue Bonds, | 5/31 at 100.00 | N/R | $ 269,349 |
| | Capital Phase 1 Project 2021A-1, 4.100%, 5/01/51 | | | |
| 500 | | Lakes of Sarasota Community Development District, Florida, Improvement Revenue Bonds, | 5/31 at 100.00 | N/R | 506,080 |
| | Capital Phase 1 Project 2021B-1, 4.300%, 5/01/51 | | | |
| 610 | | Lakewood Park Community Development District, Florida, Special Assessment Revenue Bonds, | 5/31 at 100.00 | N/R | 627,739 |
| | Assessment Area 1, Series 2021, 4.000%, 5/01/52 | | | |
| 625 | | Lakewood Ranch Stewardship District, Florida, Special Assessment Revenue Bonds, Lakewood | 5/25 at 100.00 | N/R | 664,687 |
| | Centre North Project, Series 2015, 4.875%, 5/01/45 | | | |
| 2,000 | | Lee County Industrial Development Authority, Florida, Charter School Revenue Bonds, Lee | 6/21 at 100.00 | BB– | 2,001,880 |
| | County Community Charter Schools, Series 2007A, 5.375%, 6/15/37 | | | |
| 630 | | Lee County Industrial Development Authority, Florida, Healthcare Facilities Revenue | 12/22 at 105.00 | N/R | 645,901 |
| | Bonds, Preserve Project, Series 2017A, 5.750%, 12/01/52, 144A | | | |
| 1,000 | | Magic Place Community Development District, Osceola County, Florida, Special Assessment | 5/30 at 100.00 | N/R | 1,065,660 |
| | Revenue Bonds, Series 2019, 4.500%, 5/01/51 | | | |
| 12,190 | | Miami Beach, Florida, Resort Tax Revenue Bonds, Series 2015, 5.000%, 9/01/45 (UB) (6) | 9/25 at 100.00 | AA– | 14,195,377 |
| 750 | | Miami Dade County Industrial Development Authority, Florida, Educational Facilities | 7/27 at 100.00 | N/R | 817,867 |
| | Revenue Bonds, South Florida Autism Charter School Project, Series 2017, 6.000%, 7/01/47, 144A | | | |
| 2,085 | | Miami World Center Community Development District, Miami-Dade County, Florida, Special | 11/27 at 100.00 | N/R | 2,318,249 |
| | Assessment Bonds, Series 2017, 5.250%, 11/01/49 | | | |
| 1,750 | | Miami-Dade County Industrial Development Authority, Florida, Revenue Bonds, Youth Co-Op | 9/25 at 100.00 | N/R | 1,916,985 |
| | Charter Schools Project, Series 2015A, 6.000%, 9/15/45, 144A | | | |
| 505 | | Mirada Community Development District, Pasco County, Florida, Bond Anticipation Note, | 6/21 at 100.00 | N/R | 505,717 |
| | Assessment Area 3, Series 2019, 4.500%, 5/01/24 | | | |
| 400 | | North Park Isle Community Development District, Plant City, Florida, Special Assessment | 5/29 at 100.00 | N/R | 432,120 |
| | Revenue Bonds, Assessment Area 1, Series 2019, 4.750%, 5/01/50 | | | |
| 930 | | Northern Palm Beach County Improvement District, Florida, Water Control and Improvement | 8/26 at 100.00 | N/R | 1,045,720 |
| | Bonds, Development Unit 53, Series 2015, 5.500%, 8/01/46 | | | |
| 1,000 | | Northern Palm Beach County Improvement District, Florida, Water Control and Improvement | 8/31 at 100.00 | N/R | 1,048,830 |
| | Bonds, Development Unit 53, Series 2021, 4.000%, 8/01/51 | | | |
| | Palm Beach County Health Facilities Authority, Florida, Revenue Bonds, Sinai Residences | | | |
| | of Boca Raton Project, Series 2014A: | | | |
| 620 | | 7.000%, 6/01/29 | 6/22 at 102.00 | N/R | 665,279 |
| 3,110 | | 7.500%, 6/01/49 | 6/22 at 102.00 | N/R | 3,336,128 |
| 685 | | Palm Beach County, Florida, Revenue Bonds, Provident Group – LU Properties LLC Lynn | 6/31 at 100.00 | N/R | 693,083 |
| | University Housing Project, Series 2021A, 5.000%, 6/01/57 (WI/DD, Settling 5/12/21) | | | |
| 500 | | Palm Beach County, Florida, Revenue Bonds, Provident Group – PBAU Properties LLC – Palm | 4/29 at 100.00 | Ba1 | 549,230 |
| | Beach Atlantic University Housing Project, Series 2019A, 5.000%, 4/01/51, 144A | | | |
| 3,215 | | Pine Island Community Development District, Florida, Special Assessment Bonds, Bella | 6/21 at 100.00 | N/R | 3,219,469 |
| | Collina, Series 2004, 5.750%, 5/01/35 | | | |
| 500 | | Portico Community Development District, Lee County, Florida, Special Assessment, | 5/30 at 100.00 | N/R | 521,880 |
| | Improvement Series 2020-2, 4.000%, 5/01/50 | | | |
| 1,545 | | Reunion West Community Development District, Florida, Special Assessment Bonds, Series | 5/22 at 100.00 | N/R | 1,595,985 |
| | 2004A-1, 6.250%, 5/01/36 | | | |
| 910 | | Rivers Edge II Community Development District, Florida, Capital Improvement Revenue | 5/31 at 100.00 | N/R | 941,859 |
| | Bonds, Series 2021, 4.000%, 5/01/51 | | | |
| 2,500 | | Rolling Oaks Community Development District, Florida, Special Assessment Bonds, Series | 11/27 at 100.00 | N/R | 2,921,725 |
| | 2016, 6.000%, 11/01/47 | | | |
| 1,000 | | Saddle Creek Preserve of Polk County Community Development District, Florida, Special | 6/30 at 100.00 | N/R | 1,050,650 |
| | Assessment Bonds, Series 2020, 4.000%, 6/15/50 | | | |
| 500 | | Shingle Creek Community Development District, Osceola County, Florida, Special | 6/31 at 100.00 | N/R | 521,120 |
| | Assessment Revenue Bonds, Bronson, Series 2021, 4.000%, 6/15/51 | | | |
105
| | |
| NMZ | Nuveen Municipal High Income Opportunity Fund |
| Portfolio of Investments (continued) |
| April 30, 2021 (Unaudited) |
| | | | | | |
| Principal | | | Optional Call | | |
| Amount (000) | | Description (1) | Provisions (2) | Ratings (3) | Value |
| | Florida (continued) | | | |
| $ 990 | | Shingle Creek Community Development District, Osceola County, Florida, Special | 11/25 at 100.00 | N/R | $ 1,098,811 |
| | Assessment Revenue Bonds, Series 2015, 5.400%, 11/01/45 | | | |
| 1,000 | | Three Rivers Community Development District, Florida, Special Assessment Revenue Bonds, | No Opt. Call | N/R | 1,014,180 |
| | Series 2021B, 4.500%, 5/01/36 | | | |
| 1,540 | | Tolomato Community Development District, Florida, Special Assessment Bonds, Convertible, | 5/22 at 100.00 | N/R | 1,341,971 |
| | Capital Appreciation, Series 2012A-4, 0.000%, 5/01/40 (5) | | | |
| | Tolomato Community Development District, Florida, Special Assessment Bonds, Hope Note, | | | |
| | Series 2007-3: | | | |
| 120 | | 6.375%, 5/01/21 (4) | No Opt. Call | N/R | 1 |
| 1,360 | | 6.650%, 5/01/40 (4) | 6/21 at 100.00 | N/R | 14 |
| 2,845 | | Tolomato Community Development District, Florida, Special Assessment Bonds, Hope Note, | 6/21 at 100.00 | N/R | 28 |
| | Series 2007A-2, 5.250%, 5/01/39 (4) | | | |
| 3,740 | | Tolomato Community Development District, Florida, Special Assessment Bonds, Refunding | 6/21 at 100.00 | N/R | 3,590,961 |
| | Series 2015-1, 0.000%, 5/01/40 (5) | | | |
| 2,300 | | Tolomato Community Development District, Florida, Special Assessment Bonds, Refunding | 6/21 at 100.00 | N/R | 1,724,356 |
| | Series 2015-2, 0.000%, 5/01/40 (5) | | | |
| 2,505 | | Tolomato Community Development District, Florida, Special Assessment Bonds, Refunding | 6/21 at 100.00 | N/R | 25 |
| | Series 2015-3, 6.610%, 5/01/40 (4) | | | |
| 1,230 | | Touchstone Community Development District, Hillsborough County, Florida, Special | 12/29 at 100.00 | N/R | 1,331,586 |
| | Assessment Bonds, 2019 Project, Series 2019, 4.000%, 12/15/40 | | | |
| | Turtle Run Community Development District, Florida, Special Assessment Benefit Tax | | | |
| | Bonds, Series 2017-2: | | | |
| 1,000 | | 5.000%, 5/01/37 | 5/28 at 100.00 | A2 | 1,176,210 |
| 2,020 | | 5.000%, 5/01/47 | 5/28 at 100.00 | A2 | 2,349,523 |
| 1,790 | | Twin Creeks North Community Development District, Florida, Special Assessment Bonds, | 11/31 at 100.00 | N/R | 2,084,509 |
| | Master Infrastructure Improvements, Series 2016A-1, 6.375%, 11/01/47 | | | |
| 3,590 | | Twin Creeks North Community Development District, Florida, Special Assessment Bonds, | 11/31 at 100.00 | N/R | 4,180,663 |
| | Master Infrastructure Improvements, Series 2016A-2, 6.375%, 11/01/47 | | | |
| 500 | | Two Lakes Community Development District, Hialeah, Florida, Special Assessment Bonds, | 12/29 at 100.00 | N/R | 529,890 |
| | Expansion Area Project, Series 2019, 4.000%, 12/15/49 | | | |
| 1,000 | | V-Dana Community Development District, Lee County, Florida,Special Assessment Bonds, | 5/31 at 100.00 | N/R | 1,033,310 |
| | Area 1 – 2021 Project, Series 2021, 4.000%, 5/01/52 | | | |
| 1,000 | | Venetian Parc Community Development District, Miami-Dade County, Florida, Special | 11/28 at 100.00 | N/R | 1,321,430 |
| | Assessment Bonds, Area One Project, Series 2013, 6.500%, 11/01/43 | | | |
| 975 | | Waterset North Community Development District, Hillsborough County, Florida, Special | 11/24 at 100.00 | N/R | 1,043,854 |
| | Assessment Revenue Bonds, Series 2014, 5.500%, 11/01/45 | | | |
| 185,915 | | Total Florida | | | 184,810,835 |
| | Georgia – 0.5% (0.3% of Total Investments) | | | |
| 1,000 | | Atlanta Urban Residential Finance Authority, Georgia, Multifamily Housing Revenue Bonds, | 11/23 at 100.00 | BB+ | 1,007,900 |
| | Testletree Village Apartments, Series 2013A, 5.000%, 11/01/48 | | | |
| 1,880 | | Douglas County Development Authority, Georgia, Charter School Revenue Bonds, Brighten | 10/23 at 100.00 | N/R | 2,003,271 |
| | Academy Project, Series 2013A, 7.125%, 10/01/43 | | | |
| 1,000 | | Fulton County Development Authority, Georgia, Revenue Bonds, Amana Academy Project, | 4/23 at 100.00 | N/R (7) | 1,115,840 |
| | Series 2013A, 6.500%, 4/01/43 (Pre-refunded 4/01/23) | | | |
| | Liberty County Industrial Authority, Georgia, Revenue Bonds, Series 2014: | | | |
| 211 | | 5.500%, 7/15/23 (Pre-refunded 7/15/21) | 7/21 at 100.00 | N/R (7) | 213,444 |
| 767 | | 5.500%, 7/15/30 (Pre-refunded 7/15/21) | 7/21 at 100.00 | N/R (7) | 774,702 |
| 842 | | 5.500%, 1/15/36 (Pre-refunded 7/15/21) | 7/21 at 100.00 | N/R (7) | 850,487 |
| 5,700 | | Total Georgia | | | 5,965,644 |
106
| | | | | | |
| Principal | | | Optional Call | | |
| Amount (000) | | Description (1) | Provisions (2) | Ratings (3) | Value |
| | Guam – 0.0% (0.0% of Total Investments) | | | |
| $ 330 | | Guam International Airport Authority, Revenue Bonds, Series 2013C, 6.375%, 10/01/43 (AMT) | 10/23 at 100.00 | BB+ | $ 354,724 |
| | Idaho – 0.7% (0.5% of Total Investments) | | | |
| 7,400 | | Idaho Falls Auditorium District, Idaho, Certifications of Participation, Annual | 5/26 at 102.00 | N/R | 7,417,094 |
| | Appropriation Series 2021, 5.250%, 5/15/51 (WI/DD, Settling 5/18/21) | | | |
| 500 | | Idaho Health Facilities Authority, Revenue Bonds, Saint Luke’s Health System Project, | 3/22 at 100.00 | A– | 564,200 |
| | 17.117%, 3/01/47, 144A (IF) (6) | | | |
| 565 | | Idaho Housing and Finance Association NonProfit Facilities Revenue Bonds, Gem Prep | 7/25 at 100.00 | N/R | 579,148 |
| | Meridian North LLC, Series 2020A, 5.250%, 7/01/55, 144A | | | |
| 8,465 | | Total Idaho | | | 8,560,442 |
| | Illinois – 24.6% (17.4% of Total Investments) | | | |
| 492 | | Bolingbrook, Illinois, Sales Tax Revenue Bonds, Series 2005, 6.250%, 1/01/24 | 6/21 at 100.00 | N/R | 473,071 |
| 10,670 | | Chicago Board of Education, Illinois, Dedicated Capital Improvement Tax Revenue Bonds, | 4/27 at 100.00 | A– | 12,826,087 |
| | Series 2016, 6.000%, 4/01/46 (UB) (6) | | | |
| 1,500 | | Chicago Board of Education, Illinois, General Obligation Bonds, Dedicated Revenues, | 12/24 at 100.00 | BB | 1,658,145 |
| | Project Series 2015C, 5.250%, 12/01/39 | | | |
| 15,385 | | Chicago Board of Education, Illinois, General Obligation Bonds, Dedicated Revenues, | 12/25 at 100.00 | BB | 18,566,618 |
| | Series 2016A, 7.000%, 12/01/44 | | | |
| 2,025 | | Chicago Board of Education, Illinois, General Obligation Bonds, Dedicated Revenues, | 12/26 at 100.00 | BB | 2,466,592 |
| | Series 2016B, 6.500%, 12/01/46 | | | |
| 9,910 | | Chicago Board of Education, Illinois, General Obligation Bonds, Dedicated Revenues, | 12/27 at 100.00 | BB | 12,709,971 |
| | Series 2017A, 7.000%, 12/01/46, 144A | | | |
| 3,000 | | Chicago Greater Metropolitan Water Reclamation District, Illinois, General Obligation | 12/24 at 100.00 | AA | 3,436,290 |
| | Bonds, Capital Improvement, Green 2014 Series 2015A, 5.000%, 12/01/44 (UB) (6) | | | |
| 7,500 | | Chicago Transit Authority, Illinois, Sales Tax Receipts Revenue Bonds, Series 2011, | 12/21 at 100.00 | A3 (7) | 7,722,825 |
| | 5.250%, 12/01/40 (Pre-refunded 12/01/21) (UB) (6) | | | |
| 1,308 | | Chicago, Illinois, Certificates of Participation Tax Increment Bonds, 35th and State | 5/21 at 100.00 | N/R | 1,308,117 |
| | Redevelopment Project, Series 2012, 6.100%, 1/15/29 | | | |
| 2,125 | | Chicago, Illinois, Certificates of Participation, Tax Increment Allocation Revenue | 6/21 at 100.00 | N/R | 1,600,630 |
| | Bonds, Diversey-Narragansett Project, Series 2006, 7.460%, 2/15/26 (4) | | | |
| 5,000 | | Chicago, Illinois, General Airport Revenue Bonds, O’Hare International Airport, | 1/29 at 100.00 | A | 5,730,550 |
| | Refunding Senior Lien Series 2018A, 4.000%, 1/01/43 (AMT) (UB) (6) | | | |
| 30,500 | | Chicago, Illinois, General Airport Revenue Bonds, O’Hare International Airport, Senior | 1/29 at 100.00 | A | 37,221,895 |
| | Lien Series 2018B, 5.000%, 1/01/48 (UB) (6) | | | |
| 2,000 | | Chicago, Illinois, General Obligation Bonds, Project & Refunding Series 2014A, 5.250%, 1/01/30 | 1/24 at 100.00 | Ba1 | 2,183,500 |
| 9,400 | | Chicago, Illinois, General Obligation Bonds, Project & Refunding Series 2017A, 6.000%, 1/01/38 | 1/27 at 100.00 | BBB– | 11,407,370 |
| 1,000 | | Chicago, Illinois, General Obligation Bonds, Project and Refunding Series 2005D, | 1/25 at 100.00 | Ba1 | 1,120,540 |
| | 5.500%, 1/01/37 | | | |
| 130 | | Chicago, Illinois, General Obligation Bonds, Refunding Series 2016C, 5.000%, 1/01/38 | 1/26 at 100.00 | BBB– | 146,614 |
| | Chicago, Illinois, General Obligation Bonds, Series 2019A: | | | |
| 7,500 | | 5.000%, 1/01/44 (UB) (6) | 1/29 at 100.00 | BBB– | 8,839,500 |
| 8,000 | | 5.500%, 1/01/49 (UB) | 1/29 at 100.00 | BBB– | 9,651,920 |
| 1,500 | | Chicago, Illinois, General Obligation Bonds, VAribale Rate Demand Series 2007F, | 1/25 at 100.00 | Ba1 | 1,670,325 |
| | 5.500%, 1/01/42 | | | |
| 5,000 | | Illinois Finance Authority Revenue Bonds, Ness Healthcare NFP, Series 2016A, 6.375%, | 11/26 at 100.00 | N/R | 3,977,350 |
| | 11/01/46, 144A (4) | | | |
| | Illinois Finance Authority, Revenue Bonds, Ascension Health/fkaPresence Health Network, | | | |
| | Series 2016C: | | | |
| 25 | | 4.000%, 2/15/41 (Pre-refunded 2/15/27) (UB) | 2/27 at 100.00 | N/R (7) | 29,541 |
| 495 | | 4.000%, 2/15/41 (Pre-refunded 2/15/27) (UB) | 2/27 at 100.00 | N/R (7) | 584,912 |
| 10,655 | | 4.000%, 2/15/41 (UB) | 2/27 at 100.00 | Aa2 | 11,964,180 |
107
| | |
| NMZ | Nuveen Municipal High Income Opportunity Fund |
| Portfolio of Investments (continued) |
| April 30, 2021 (Unaudited) |
| | | | | | |
| Principal | | | Optional Call | | |
| Amount (000) | | Description (1) | Provisions (2) | Ratings (3) | Value |
| | Illinois (continued) | | | |
| $ 1,000 | | Illinois Finance Authority, Revenue Bonds, Lake Forest College, Series 2012A, 6.000%, 10/01/48 | 10/22 at 100.00 | BBB– | $ 1,036,180 |
| 5,000 | | Illinois Finance Authority, Revenue Bonds, Northwestern Memorial Healthcare, Series | 1/28 at 100.00 | Aa2 | 5,657,450 |
| | 2017A, 4.000%, 7/15/47 (UB) (6) | | | |
| 2,000 | | Illinois Finance Authority, Revenue Bonds, Roosevelt University, Series 2018B, 6.125%, | 10/28 at 100.50 | N/R | 2,390,960 |
| | 4/01/58, 144A | | | |
| | Illinois Finance Authority, Revenue Bonds, The Carle Foundation, Tender Option Bond | | | |
| | Trust 2015-XF0121: | | | |
| 1,685 | | 21.674%, 8/15/41 – AGM Insured, 144A (IF) (6) | 8/21 at 100.00 | A2 | 1,795,452 |
| 250 | | 21.689%, 8/15/41 – AGM Insured, 144A (IF) (6) | 8/21 at 100.00 | A2 | 266,400 |
| 5,000 | | Illinois Finance Authority, Revenue Bonds, The University of Chicago Medical Center, | 2/27 at 100.00 | A1 | 5,513,650 |
| | Series 2016B, 4.000%, 8/15/41 (UB) (6) | | | |
| 1,715 | | Illinois State, General Obligation Bonds, May Series 2020, 5.750%, 5/01/45 | 5/30 at 100.00 | BBB– | 2,201,528 |
| | Illinois State, General Obligation Bonds, November Series 2016: | | | |
| 1,000 | | 5.000%, 11/01/35 | 11/26 at 100.00 | BBB– | 1,160,880 |
| 1,000 | | 5.000%, 11/01/37 | 11/26 at 100.00 | BBB– | 1,153,460 |
| 9,945 | | Illinois State, General Obligation Bonds, November Series 2017D, 5.000%, 11/01/27 (UB) (6) | No Opt. Call | BBB– | 12,062,887 |
| 630 | | Illinois State, General Obligation Bonds, Series 2012A, 5.000%, 3/01/36 | 3/22 at 100.00 | BBB– | 652,560 |
| 5,445 | | Illinois State, Sales Tax Revenue Bonds, Build Illinois, Refunding Junior Obligation | 6/26 at 100.00 | BBB | 6,004,419 |
| | September Series 2016C, 4.000%, 6/15/31 (UB) (6) | | | |
| 2,000 | | Lombard Public Facilities Corporation, Illinois, Conference Center and Hotel Revenue | 3/28 at 100.00 | N/R | 1,977,520 |
| | Bonds, First Tier Series 2005A-2, 5.500%, 1/01/36, 144A (4) | | | |
| | Metropolitan Pier and Exposition Authority, Illinois, McCormick Place Expansion Project | | | |
| | Bonds, Refunding Series 2020A: | | | |
| 16,000 | | 4.000%, 6/15/50 | 12/29 at 100.00 | BB+ | 17,967,840 |
| 45,550 | | 4.000%, 6/15/50 (UB) (6) | 12/29 at 100.00 | BB+ | 51,152,194 |
| 2,500 | | 5.000%, 6/15/50 | 12/29 at 100.00 | BB+ | 3,007,375 |
| 800 | | Railsplitter Tobacco Settlement Authority, Illinois, Tobacco Settlement Revenue Bonds, | 6/21 at 100.00 | N/R (7) | 803,536 |
| | Series 2010, 6.000%, 6/01/28 (Pre-refunded 6/01/21) | | | |
| 830 | | Rantoul, Champaign County, Illinois, Tax Increment Revenue Bonds, Evans Road Series | 12/23 at 100.00 | N/R | 856,253 |
| | 2013B, 7.000%, 12/01/33 | | | |
| | Sales Tax Securitization Corporation, Illinois, Sales Tax Securitization Bonds, Series 2018C: | | | |
| 9,875 | | 5.000%, 1/01/36 (UB) (6) | 1/29 at 100.00 | AA– | 12,162,544 |
| 17,750 | | 5.250%, 1/01/48 (UB) (6) | 1/29 at 100.00 | AA– | 21,679,495 |
| 895 | | Yorkville United City Business District, Illinois, Storm Water and Water Improvement | 5/21 at 100.00 | N/R | 366,950 |
| | Project Revenue Bonds, Series 2007, 4.800%, 1/01/26 (4) | | | |
| 265,990 | | Total Illinois | | | 307,166,076 |
| | Indiana – 1.0% (0.7% of Total Investments) | | | |
| 2,445 | | Carmel Redevelopment District, Indiana, Tax Increment Revenue Bonds, Series 2004A, | 6/21 at 100.00 | N/R | 2,470,306 |
| | 6.650%, 7/15/24 | | | |
| 1,000 | | Indiana Bond Bank, Special Program Bonds, Hendricks Regional Health Project, 18.465%, | No Opt. Call | AA | 2,315,330 |
| | 4/01/30 – AMBAC Insured, 144A (IF) (6) | | | |
| 1,000 | | Indiana Finance Authority, Educational Facilities Revenue Bonds, Discovery Charter | 12/25 at 100.00 | BB– | 1,103,390 |
| | School Project, Series 2015A, 7.250%, 12/01/45 | | | |
| 1,000 | | Indiana Finance Authority, Environmental Improvement Revenue Bonds, United States Steel | No Opt. Call | Caa1 | 1,088,950 |
| | Corporation Project, Refunding Series 2021A, 4.125%, 12/01/26 | | | |
| 2,000 | | Indiana Finance Authority, Environmental Improvement Revenue Bonds, United States Steel | 8/22 at 100.00 | Caa1 | 2,071,900 |
| | Corporation Project, Series 2012, 5.750%, 8/01/42 (AMT) | | | |
| 500 | | Indiana Finance Authority, Hospital Revenue Bonds, King’s Daughters’ Hospital and Health | 6/21 at 100.00 | Baa2 | 500,965 |
| | Services, Series 2010, 5.500%, 8/15/45 | | | |
| 880 | | Saint Joseph County, Indiana, Economic Development Revenue Bonds, Chicago Trail Village | 6/21 at 100.00 | N/R | 883,388 |
| | Apartments, Series 2005A, 7.500%, 7/01/35 | | | |
108
| | | | | | |
| Principal | | | Optional Call | | |
| Amount (000) | | Description (1) | Provisions (2) | Ratings (3) | Value |
| | Indiana (continued) | | | |
| $ 1,000 | | Shoals, Indiana, Exempt Facilities Revenue Bonds, National Gypsum Company Project, | 11/23 at 100.00 | N/R | $ 1,058,330 |
| | Series 2013, 7.250%, 11/01/43 (AMT) | | | |
| 1,375 | | Terre Haute, Indiana, Economic Development Solid Waste Facility Revenue Bonds, Pyrolyx | No Opt. Call | N/R | 618,750 |
| | USA Indiana, LLC Project, Series 2017A, 0.000%, 12/01/28 (AMT) (4) | | | |
| 11,200 | | Total Indiana | | | 12,111,309 |
| | Iowa – 0.3% (0.2% of Total Investments) | | | |
| 1,030 | | Iowa Finance Authority, Iowa, Midwestern Disaster Area Revenue Bonds, Alcoa Inc Project, | 8/22 at 100.00 | Ba2 | 1,064,793 |
| | Series 2012, 4.750%, 8/01/42 | | | |
| 2,000 | | Iowa Finance Authority, Iowa, Midwestern Disaster Area Revenue Bonds, Iowa Fertilizer | 12/23 at 100.00 | B+ | 2,192,440 |
| | Company Project, Series 2013, 5.250%, 12/01/25 | | | |
| | Iowa Tobacco Settlement Authority, Asset Backed Settlement Revenue Bonds, Series 2005C: | | | |
| 3,030 | | Total Iowa | | | 3,257,233 |
| | Kansas – 0.6% (0.4% of Total Investments) | | | |
| 5,305 | | University of Kansas Hospital Authority, Health Facilities Revenue Bonds, KU Health | 9/25 at 100.00 | AA– | 6,167,063 |
| | System, Refunding & Improvement Series 2015, 5.000%, 9/01/45 (UB) (6) | | | |
| 1,000 | | Wyandotte County-Kansas City Unified Government, Kansas, Sales Tax Special Obligation | 9/25 at 100.00 | N/R | 1,010,260 |
| | Bonds, Vacation Village Project Area 1 and 2A, Series 2015, 5.750%, 9/01/32 | | | |
| 6,305 | | Total Kansas | | | 7,177,323 |
| | Kentucky – 5.4% (3.8% of Total Investments) | | | |
| 1,385 | | Bell County, Kentucky, Special Assessment Industrial Building Revenue Bonds, Boone’s | 12/30 at 100.00 | N/R | 1,454,873 |
| | Ridge Project, Series 2020, 6.000%, 12/01/40 | | | |
| | Kentucky Economic Development Finance Authority, Hospital Revenue Bonds, Owensboro | | | |
| | Health, Refunding Series 2017A: | | | |
| 5,450 | | 5.000%, 6/01/41 | 6/27 at 100.00 | BB+ | 6,120,187 |
| 3,300 | | 5.000%, 6/01/45 | 6/27 at 100.00 | BB+ | 3,675,375 |
| 12,665 | | 5.000%, 6/01/45 (UB) (6) | 6/27 at 100.00 | BB+ | 14,105,644 |
| | Kentucky Economic Development Finance Authority, Revenue Bonds, Next Generation Kentucky | | | |
| | Information Highway Project, Senior Series 2015A: | | | |
| 11,000 | | 5.000%, 7/01/37 (UB) | 7/25 at 100.00 | Baa2 | 12,319,560 |
| 9,295 | | 5.000%, 7/01/40 (UB) | 7/25 at 100.00 | Baa2 | 10,372,290 |
| 16,800 | | 5.000%, 1/01/45 (UB) | 7/25 at 100.00 | Baa2 | 18,643,632 |
| 1,000 | | Newport, Kentucky, Special Obligation Revenue Bonds, Newport Clifton Project, Series | 12/30 at 100.00 | N/R | 1,019,330 |
| | 2020B, 5.500%, 12/01/60 | | | |
| 60,895 | | Total Kentucky | | | 67,710,891 |
| | Louisiana – 1.0% (0.7% of Total Investments) | | | |
| 2,050 | | Ascension Parish Industrial development Board, Louisiana, Revenue Bonds, Impala | 7/23 at 100.00 | N/R | 2,179,704 |
| | Warehousing (US) LLC Project, Series 2013, 6.000%, 7/01/36 | | | |
| 500 | | Louisiana Public Facilities Authority, Louisiana, Revenue Bonds, Lake Charles College Prep | 6/27 at 100.00 | N/R | 517,710 |
| | Project, Series 2019A, 5.000%, 6/01/58, 144A | | | |
| 500 | | Louisiana Public Facilities Authority, Louisiana, Revenue Bonds, Young Audiences Charter | 4/27 at 100.00 | N/R | 512,300 |
| | School, Series 2019A, 5.000%, 4/01/57, 144A | | | |
| 1,910 | | Louisiana Public Facilities Authority, Dock and Wharf Revenue Bonds, Impala Warehousing | 7/23 at 100.00 | N/R | 2,054,835 |
| | (US) LLC Project, Series 2013, 6.500%, 7/01/36 (AMT), 144A | | | |
| 1,615 | | Louisiana Public Facilities Authority, Revenue Bonds, Lake Charles Charter Academy | 12/21 at 100.00 | N/R | 1,661,738 |
| | Foundation Project, Series 2011A, 7.750%, 12/15/31 | | | |
| 2,000 | | Louisiana Public Facilities Authority, Revenue Bonds, Loyola University Project, | No Opt. Call | BBB | 2,087,480 |
| | Refunding Series 2017, 5.250%, 10/01/33 (5) | | | |
| 2,110 | | Louisiana Public Facilities Authority, Revenue Bonds, Southwest Louisiana Charter | 12/23 at 100.00 | N/R | 2,268,820 |
| | Academy Foundation Project, Series 2013A, 8.125%, 12/15/33 | | | |
109
| | |
| NMZ | Nuveen Municipal High Income Opportunity Fund |
| Portfolio of Investments (continued) |
| April 30, 2021 (Unaudited) |
| | | | | | |
| Principal | | | Optional Call | | |
| Amount (000) | | Description (1) | Provisions (2) | Ratings (3) | Value |
| | Louisiana (continued) | | | |
| $ 2,000 | | Louisiana Public Facilities Authority, Solid Waste Disposal Facility Revenue Bonds, | No Opt. Call | N/R | $ 20 |
| | Louisiana Pellets Inc Project, Series 2015, 7.000%, 7/01/24 (AMT), 144A (4) | | | |
| 540 | | Saint James Parish, Louisiana, Revenue Bonds, NuStar Logistics, LP Project, Series 2010, | 6/30 at 100.00 | BB– | 697,685 |
| | 6.350%, 7/01/40, 144A | | | |
| 13,225 | | Total Louisiana | | | 11,980,292 |
| | Maryland – 0.8% (0.5% of Total Investments) | | | |
| 1,595 | | Baltimore, Maryland, Convention Center Hotel Revenue Bonds, Refunding Series 2017, | 9/27 at 100.00 | CCC | 1,674,335 |
| | 5.000%, 9/01/42 | | | |
| 3,000 | | Maryland Economic Development Corporation, Port Facilities Revenue Bonds, CNX Marine | 6/21 at 100.00 | BB– | 3,031,050 |
| | Terminals Inc Port of Baltimore Facility, Refunding Series 2010, 5.750%, 9/01/25 | | | |
| 4,000 | | Maryland Economic Development Corporation, Revenue Bonds, Chesapeake Bay Hyatt | 6/21 at 100.00 | N/R | 2,400,000 |
| | Conference Center, Series 2006A, 0.000%, 12/01/31 (4) | | | |
| 2,500 | | Maryland Economic Development Corporation, Revenue Bonds, Chesapeake Bay Hyatt | 6/21 at 100.00 | N/R | 1,500,000 |
| | Conference Center, Series 2006B, 0.000%, 12/01/31 (4) | | | |
| 1,000 | | Maryland Economic Development Corporation, Special Obligation Bonds, Port Covington | 9/30 at 100.00 | N/R | 1,103,030 |
| | Project, Series 2020, 4.000%, 9/01/50 | | | |
| 12,095 | | Total Maryland | | | 9,708,415 |
| | Massachusetts – 1.2% (0.9% of Total Investments) | | | |
| 5,735 | | Massachusetts Educational Financing Authority, Education Loan Revenue Bonds, Issue K, | 7/26 at 100.00 | A | 6,112,822 |
| | Series 2017B, 4.250%, 7/01/46 (AMT) (UB) (6) | | | |
| 5,000 | | Massachusetts State, General Obligation Bonds, Consolidated Loan, Series 2016A, 5.000%, | 3/24 at 100.00 | AA | 5,603,050 |
| | 3/01/46 (UB) (6) | | | |
| 2,985 | | Massachusetts State, General Obligation Bonds, Consolidated Loan, Series 2016E, 4.000%, | 4/25 at 100.00 | AA | 3,359,110 |
| | 4/01/33 (UB) (6) | | | |
| 13,720 | | Total Massachusetts | | | 15,074,982 |
| | Michigan – 1.5% (1.1% of Total Investments) | | | |
| | Detroit Local Development Finance Authority, Michigan, Tax Increment Bonds, Series 1998A: | | | |
| 5 | | 5.500%, 5/01/21 – ACA Insured | 3/21 at 100.00 | B– | 5,000 |
| 170 | | 5.500%, 5/01/21 | 3/21 at 100.00 | B– | 170,000 |
| 87 | | Detroit, Wayne County, Michigan, General Obligation Bonds, Series 2003A, 5.250%, 4/01/22 | 6/21 at 100.00 | N/R | 87,729 |
| 1,000 | | Michigan Finance Authority, Public School Academy Limited Obligation Revenue Bonds, | 8/31 at 100.00 | BB | 1,125,760 |
| | Hanley International Academy, Inc Project, Refunding Series 2021, 5.000%, 9/01/40 | | | |
| 885 | | Michigan Finance Authority, Public School Academy Limited Obligation Revenue Bonds, Hope | 6/21 at 100.00 | B | 860,804 |
| | Academy Project, Series 2011, 8.125%, 4/01/41 | | | |
| 1,235 | | Michigan Finance Authority, Public School Academy Limited Obligation Revenue Bonds, | 7/27 at 100.00 | N/R | 1,088,257 |
| | Voyageur Academy Project, Refunding Series 2017 Private Placement of 2017, 5.900%, | | | |
| | 7/15/46, 144A | | | |
| | Michigan Housing Development Authority, Rental Housing Revenue Bonds, Series 2015A: | | | |
| 2,225 | | 4.350%, 10/01/45 (UB) (6) | 10/24 at 100.00 | AA | 2,386,068 |
| 4,500 | | 4.600%, 4/01/52 (UB) (6) | 10/24 at 100.00 | AA | 4,841,910 |
| 1,515 | | Michigan Public Educational Facilities Authority, Charter School Revenue Bonds, American | 6/21 at 100.00 | N/R | 1,517,227 |
| | Montessori Academy, Series 2007, 6.500%, 12/01/37 | | | |
| 1,000 | | Michigan Public Educational Facilities Authority, Limited Obligation Revenue Bonds, | 6/21 at 100.00 | BBB– | 1,002,120 |
| | Chandler Park Academy Project, Series 2008, 6.500%, 11/01/35 | | | |
| 100,000 | | Michigan Tobacco Settlement Finance Authority, Tobacco Settlement Asset-Backed Revenue | 6/33 at 11.41 | N/R | 5,062,000 |
| | Bonds, Capital Appreciation Turbo Term Series 2008C, 0.000%, 6/01/58 | | | |
| 500 | | Summit Academy, Michigan, Revenue Bonds, Public School Academy Series 2005, | 6/21 at 100.00 | B+ | 500,610 |
| | 6.375%, 11/01/35 | | | |
| 113,122 | | Total Michigan | | | 18,647,485 |
110
| | | | | | |
| Principal | | | Optional Call | | |
| Amount (000) | | Description (1) | Provisions (2) | Ratings (3) | Value |
| | Minnesota – 0.6% (0.4% of Total Investments) | | | |
| $ 665 | | Brooklyn Park, Minnesota, Charter School Lease Revenue Bonds, Athlos Leadership Academy | 7/25 at 100.00 | N/R | $ 716,817 |
| | Project, Series 2015A, 5.500%, 7/01/35 | | | |
| 1,000 | | Columbus, Minnesota, Charter School Lease Revenue Bonds, New Millennium Academy Project, | 7/25 at 100.00 | B | 1,023,110 |
| | Series 2015A, 6.000%, 7/01/45 | | | |
| 505 | | Greenwood, Minnesota, Charter School Lease Revenue Bonds, Main Street School of | 7/26 at 100.00 | N/R | 528,780 |
| | Performing Arts Project, Series 2016A, 5.000%, 7/01/47 | | | |
| 100 | | Minneapolis, Minnesota, Charter School Lease Revenue Bonds, Northeast College Prep | 7/30 at 100.00 | N/R | 107,600 |
| | Project, Series 2020A, 5.000%, 7/01/55 | | | |
| 2,000 | | Saint Paul Housing & Redevelopment Authority, Minnesota, Charter School Lease Revenue | 7/26 at 100.00 | N/R | 2,178,080 |
| | Bonds, Community School of Excellence, Series 2016A, 5.750%, 7/01/47, 144A | | | |
| 3,000 | | Saint Paul Port Authority, Minnesota, Solid Waste Disposal Revenue Bonds, Gerdau Saint | 10/22 at 100.00 | BBB– | 3,071,100 |
| | Paul Steel Mill Project, Series 2012-7, 4.500%, 10/01/37 (AMT), 144A | | | |
| 7,270 | | Total Minnesota | | | 7,625,487 |
| | Mississippi – 0.1% (0.1% of Total Investments) | | | |
| 500 | | Mississippi Business Finance Corporation, Gulf Opportunity Zone Revenue Bonds, King | 10/26 at 100.00 | N/R | 475,605 |
| | Edward Mixed-Use Project, Refunding Series 2019A, 4.250%, 10/15/49 (Mandatory | | | |
| | Put 10/15/39), 144A | | | |
| 569 | | Mississippi Home Corporation, Multifamily Housing Revenue Bonds, Tupelo Personal Care | 6/21 at 100.00 | N/R | 568,722 |
| | Apartments, Series 2004-2, 6.125%, 9/01/34 (AMT) | | | |
| 1,069 | | Total Mississippi | | | 1,044,327 |
| | Missouri – 1.3% (0.9% of Total Investments) | | | |
| 655 | | Kansas City Industrial Development Authority, Missouri, Sales Tax Revenue Bonds, Ward | 4/26 at 100.00 | N/R | 680,349 |
| | Parkway Center Community Improvement District, Senior Refunding & Improvement Series 2016, | | | |
| | 5.000%, 4/01/46, 144A | | | |
| 2,000 | | Liberty, Missouri, Special Obligation Tax Increment and Special Districts Bonds, Liberty | 6/25 at 100.00 | N/R | 2,065,880 |
| | Commons Project, Subordinate Lien Series 2015B, 8.500%, 6/15/46, 144A | | | |
| 10,000 | | Missouri Health and Educational Facilities Authority, Health Facilities Revenue Bonds, | 11/27 at 100.00 | A+ | 11,255,600 |
| | Mercy Health, Series 2017C, 4.000%, 11/15/49 (UB) (6) | | | |
| 1,100 | | Saint Louis Industrial Development Authority, Missouri, Confluence Academy Project, | 6/21 at 100.00 | N/R | 1,100,066 |
| | Series 2007A, 5.350%, 6/15/32 | | | |
| 1,353 | | Saint Louis, Missouri, Tax Increment Financing Revenue Bonds, Fashion Square | 9/21 at 100.00 | N/R | 541,200 |
| | Redevelopment Project, Series 2008A, 6.300%, 8/22/26 | | | |
| 732 | | Saint Louis, Missouri, Tax Increment Financing Revenue Bonds, Grace Lofts Redevelopment | No Opt. Call | N/R | 146,400 |
| | Projects, Series 2007A, 6.000%, 12/31/26 | | | |
| 15,840 | | Total Missouri | | | 15,789,495 |
| | Nevada – 1.3% (0.9% of Total Investments) | | | |
| 995 | | City of Henderson, Nevada, Local Improvement District No T-20 Rainbow Canyon, Local | 9/28 at 100.00 | N/R | 1,122,529 |
| | Improvement Bonds, Series 2018, 5.375%, 9/01/48 | | | |
| 2,000 | | Director of Nevada State Department of Business & Industry, Environmental Improvement | 2/31 at 100.00 | N/R | 2,022,520 |
| | Revenue Bonds, Fulcrum Sierra BioFuels LLC Project, Green Series 2020, 6.750%, 2/15/38, 144A | | | |
| 2,000 | | Director of Nevada State Department of Business & Industry, Environmental Improvement | 8/29 at 100.00 | N/R | 1,859,460 |
| | Revenue Bonds, Fulcrum Sierra Holdings LLC, Green Series 2019, 5.750%, 2/15/38 (AMT), 144A | | | |
| 10,000 | | Las Vegas Convention and Visitors Authority, Nevada, Convention Center Expansion Revenue | 7/28 at 100.00 | A | 11,103,400 |
| | Bonds, Series 2018B, 4.000%, 7/01/49 (UB) (6) | | | |
| 575 | | North Las Vegas, Nevada, Local Improvement Bonds, Special Improvement District 64 Valley | 12/28 at 100.00 | N/R | 639,527 |
| | Vista, Series 2019, 4.625%, 6/01/49 | | | |
| 15,570 | | Total Nevada | | | 16,747,436 |
111
| | |
| NMZ | Nuveen Municipal High Income Opportunity Fund |
| Portfolio of Investments (continued) |
| April 30, 2021 (Unaudited) |
| | | | | | |
| Principal | | | Optional Call | | |
| Amount (000) | | Description (1) | Provisions (2) | Ratings (3) | Value |
| | New Jersey – 5.1% (3.7% of Total Investments) | | | |
| $ 2,500 | | New Jersey Economic Development Authority, Lease Revenue Bonds, State Government | 12/27 at 100.00 | BBB | $ 2,979,650 |
| | Buildings-Health Department & Taxation Division Office Project, Series 2018A, | | | |
| | 5.000%, 6/15/47 (UB) (6) | | | |
| 5,000 | | New Jersey Economic Development Authority, Lease Revenue Bonds, State Government | 12/27 at 100.00 | BBB | 5,959,300 |
| | Buildings-Juvenile Justice Commission Facilities Project, Series 2018C, 5.000%, 6/15/47 (UB) (6) | | | |
| 9,500 | | New Jersey Economic Development Authority, School Facilities Construction Bonds, Series | 6/27 at 100.00 | BBB | 11,266,905 |
| | 2017DDD, 5.000%, 6/15/42 (UB) (6) | | | |
| 4,100 | | New Jersey Economic Development Authority, Special Facilities Revenue Bonds, Continental | 8/22 at 101.00 | B+ | 4,352,027 |
| | Airlines Inc, Series 1999, 5.250%, 9/15/29 (AMT) | | | |
| 2,080 | | New Jersey Economic Development Authority, Special Facilities Revenue Bonds, Continental | 3/24 at 101.00 | B+ | 2,334,488 |
| | Airlines Inc, Series 2000A & 2000B, 5.625%, 11/15/30 (AMT) | | | |
| 5,200 | | New Jersey Health Care Facilities Financing Authority, New Jersey, Revenue Bonds, Saint | 6/21 at 100.00 | BB+ | 5,215,704 |
| | Peters University Hospital, Series 2007, 5.750%, 7/01/37 | | | |
| 40,000 | | New Jersey Transportation Trust Fund Authority, Transportation System Bonds, Refunding | No Opt. Call | BBB | 27,710,800 |
| | Series 2006C, 0.000%, 12/15/36 – AMBAC Insured (UB) (6) | | | |
| 1,750 | | New Jersey Transportation Trust Fund Authority, Transportation System Bonds, Series | 12/28 at 100.00 | BBB | 1,958,810 |
| | 2019BB, 4.000%, 6/15/50 | | | |
| 2,200 | | Tobacco Settlement Financing Corporation, New Jersey, Tobacco Settlement Asset-Backed | 6/28 at 100.00 | BB+ | 2,577,916 |
| | Bonds, Series 2018B, 5.000%, 6/01/46 | | | |
| 72,330 | | Total New Jersey | | | 64,355,600 |
| | New Mexico – 0.5% (0.3% of Total Investments) | | | |
| 320 | | Mariposa East Public Improvement District, New Mexico, Revenue Bonds, Capital | 9/21 at 59.54 | N/R | 162,166 |
| | Appreciation Taxable Series 2015D, 0.000%, 3/01/32 | | | |
| 50 | | Mariposa East Public Improvement District, New Mexico, Special Levy Revenue Bonds, | 9/25 at 100.00 | N/R | 51,629 |
| | Series 2015A, 5.900%, 9/01/32 | | | |
| 215 | | Mariposa East Public Improvement District, New Mexico, Special Levy Revenue Bonds, | 9/25 at 100.00 | N/R | 222,003 |
| | Series 2015B, 5.900%, 9/01/32 | | | |
| 375 | | Mariposa East Public Improvement District, New Mexico, Special Levy Revenue Bonds, | No Opt. Call | N/R | 383,561 |
| | Series 2015C, 5.900%, 9/01/32 | | | |
| 1,210 | | Mesa Del Sol Public Improvement District 1, Albuquerque, New Mexico, Special Levy | 10/23 at 100.00 | N/R | 1,255,133 |
| | Revenue Bonds, Series 2013, 7.250%, 10/01/43 | | | |
| 1,020 | | Volterra Public Improvement District, Albuquerque, New Mexico, Special Levy Revenue | 10/24 at 100.00 | N/R | 1,065,502 |
| | Bonds, Series 2014, 6.750%, 10/01/33 | | | |
| 1,500 | | Winrock Town Center Tax Increment Development District 1, Albuquerque, New Mexico, Gross | 11/23 at 103.00 | N/R | 1,534,695 |
| | Receipts Tax Increment Bonds, Subordinate Lien Series 2020, 8.000%, 5/01/40, 144A | | | |
| 1,452 | | Winrock Town Center Tax Increment Development District, Albuquerque, New Mexico, Gross | 6/21 at 102.00 | N/R | 1,481,388 |
| | Receipts Tax Increment Bonds, Senior Lien Series 2015, 6.000%, 5/01/40, 144A | | | |
| 6,142 | | Total New Mexico | | | 6,156,077 |
| | New York – 9.4% (6.7% of Total Investments) | | | |
| 2,455 | | Build NYC Resource Corporation, New York, Revenue Bonds, Albert Einstein College of | 9/25 at 100.00 | N/R | 2,723,111 |
| | Medicine, Inc, Series 2015, 5.500%, 9/01/45, 144A | | | |
| | Build NYC Resource Corporation, New York, Revenue Bonds, Family Life Academy Charter | | | |
| | School, Series 2020A-1: | | | |
| 5,000 | | 5.250%, 6/01/40, 144A | 12/30 at 100.00 | N/R | 5,109,250 |
| 2,000 | | 5.500%, 6/01/55, 144A | 12/30 at 100.00 | N/R | 2,041,680 |
| | Build NYC Resource Corporation, New York, Revenue Bonds, Family Life Academy Charter | | | |
| | School, Series 2020C-1: | | | |
| 1,000 | | 5.000%, 6/01/40, 144A | 12/30 at 100.00 | N/R | 1,061,690 |
| 2,000 | | 5.000%, 6/01/55, 144A | 12/30 at 100.00 | N/R | 2,081,760 |
| 10,000 | | Dormitory Authority of the State of New York, Revenue Bonds, Montefiore Obligated Group, | 3/30 at 100.00 | A2 | 10,223,100 |
| | Series 2020A, 3.000%, 9/01/50 – AGM Insured (UB) (6) | | | |
112
| | | | | | |
| Principal | | | Optional Call | | |
| Amount (000) | | Description (1) | Provisions (2) | Ratings (3) | Value |
| | New York (continued) | | | |
| $ 200 | | Dormitory Authority of the State of New York, Revenue Bonds, Orange Regional Medical | 6/27 at 100.00 | BBB– | $ 229,680 |
| | Center Obligated Group, Series 2017, 5.000%, 12/01/36, 144A | | | |
| 1,000 | | Hempstead Town Local Development Corporation, New York, Education Revenue Bonds, The | 2/30 at 100.00 | N/R | 1,160,910 |
| | Academy Charter School Project, Series 2020A, 5.730%, 2/01/50 | | | |
| 1,000 | | Madison County Capital Resource Corporation, New York, Revenue Bonds, Cazenovia College | 6/22 at 100.00 | N/R | 1,004,080 |
| | Project, Series 2019A, 5.500%, 9/01/22 | | | |
| 1,000 | | Metropolitan Transportation Authority, New York, Transportation Revenue Bonds, Green | 11/30 at 100.00 | BBB+ | 1,248,870 |
| | Climate Bond Certified Series 2020D-1, 5.000%, 11/15/43 (UB) (6) | | | |
| 1,000 | | Metropolitan Transportation Authority, New York, Transportation Revenue Bonds, Green | 11/30 at 100.00 | BBB+ | 1,138,280 |
| | Climate Bond Certified Series 2020D-3, 4.000%, 11/15/49 (UB) (6) | | | |
| 10,000 | | Metropolitan Transportation Authority, New York, Transportation Revenue Bonds, Series | 11/26 at 100.00 | BBB+ | 11,638,800 |
| | 2016C-1, 5.000%, 11/15/56 (UB) (6) | | | |
| 14,260 | | New York City Housing Development Corporation, New York, Multifamily Housing Revenue | 9/26 at 100.00 | Aa2 | 15,642,364 |
| | Bonds, Sustainable Neighborhood Series 2018K, 4.125%, 11/01/53 (UB) (6) | | | |
| | New York City Industrial Development Agency, New York, Civic Facility Revenue Bonds, | | | |
| | Bronx Parking Development Company, LLC Project, Series 2007: | | | |
| 1,500 | | 0.000%, 10/01/37 (4) | 6/21 at 100.00 | N/R | 1,125,000 |
| 5,000 | | 0.000%, 10/01/46 (4) | 6/21 at 100.00 | N/R | 3,750,000 |
| 320 | | New York City Industrial Development Agency, New York, Civic Facility Revenue Bonds, | 6/21 at 100.00 | N/R | 308,406 |
| | Special Needs Facilities Pooled Program, Series 2008A-1, 5.800%, 7/01/23 | | | |
| 7,075 | | New York City, New York, General Obligation Bonds, Fiscal 2017 Series A-1, 5.000%, | 8/26 at 100.00 | AA– | 8,470,968 |
| | 8/01/38 (UB) (6) | | | |
| 2,000 | | New York Counties Tobacco Trust IV, Tobacco Settlement Pass-Through Bonds, Turbo Term | 5/21 at 100.00 | B– | 2,021,940 |
| | Series 2005A, 5.000%, 6/01/42 | | | |
| 500 | | New York Liberty Development Corporation, Liberty Revenue Bonds, Secured by Port | 12/21 at 100.00 | A+ | 553,460 |
| | Authority Consolidated Bonds, 18.055%, 12/15/41, 144A (IF) (6) | | | |
| 1,000 | | New York Liberty Development Corporation, New York, Liberty Revenue Bonds, 3 World Trade | 11/24 at 100.00 | N/R | 1,094,600 |
| | Center Project, Class 1 Series 2014, 5.000%, 11/15/44, 144A | | | |
| 3,250 | | New York Liberty Development Corporation, New York, Liberty Revenue Bonds, 3 World Trade | 11/24 at 100.00 | N/R | 3,632,590 |
| | Center Project, Class 2 Series 2014, 5.150%, 11/15/34, 144A | | | |
| 6,000 | | New York Liberty Development Corporation, New York, Liberty Revenue Bonds, 3 World Trade | 11/24 at 100.00 | N/R | 6,667,320 |
| | Center Project, Class 3 Series 2014, 7.250%, 11/15/44, 144A | | | |
| 4,985 | | New York Transportation Development Corporation, New York, Special Facilities Bonds, | 7/24 at 100.00 | A2 | 5,642,272 |
| | LaGuardia Airport Terminal B Redevelopment Project, Series 2016A, 5.000%, 7/01/46 – AGM | | | |
| | Insured (AMT) (UB) (6) | | | |
| 10,000 | | New York Transportation Development Corporation, New York, Special Facility Revenue | 8/21 at 100.00 | B– | 10,102,000 |
| | Bonds, American Airlines, Inc John F Kennedy International Airport Project, Refunding Series | | | |
| | 2016, 5.000%, 8/01/31 (AMT) | | | |
| 3,070 | | New York Transportation Development Corporation, New York, Special Facility Revenue | 8/30 at 100.00 | B– | 3,797,007 |
| | Bonds, American Airlines, Inc John F Kennedy International Airport Project, Series 2020, | | | |
| | 5.375%, 8/01/36 (AMT) | | | |
| 3,265 | | Port Authority of New York and New Jersey, Consolidated Revenue Bonds, Two Hundred | 4/27 at 100.00 | A+ | 3,857,598 |
| | Series 2017, 5.000%, 4/15/57 (UB) (6) | | | |
| 605 | | Suffolk County Industrial Development Agency, New York, Revenue Bonds, Nissequogue | 6/21 at 100.00 | N/R | 610,397 |
| | Cogeneration Partners Facility, Series 1998, 5.500%, 1/01/23 (AMT) | | | |
| 9,975 | | Westchester County Local Development Corporation, New York, Revenue Bonds, Westchester | 11/25 at 100.00 | BBB– | 11,217,486 |
| | Medical Center Obligated Group Project, Refunding Series 2016, 5.000%, 11/01/46 (UB) (6) | | | |
| 109,460 | | Total New York | | | 118,154,619 |
113
| | |
| NMZ | Nuveen Municipal High Income Opportunity Fund |
| Portfolio of Investments (continued) |
| April 30, 2021 (Unaudited) |
| | | | | | |
| Principal | | | Optional Call | | |
| Amount (000) | | Description (1) | Provisions (2) | Ratings (3) | Value |
| | North Carolina – 0.1% (0.0% of Total Investments) | | | |
| $ 940 | | Charlotte-Mecklenberg Hospital Authority, North Carolina, Health Care Revenue Bonds, DBA | 4/21 at 100.00 | AA– | $ 952,201 |
| | Carolinas HealthCare System, 18.752%, 1/15/42, 144A (IF) | | | |
| | North Dakota – 0.1% (0.1% of Total Investments) | | | |
| 2,000 | | Williston, North Dakota, Multifamily Housing Revenue Bonds, Eagle Crest Apartments LLC | 9/23 at 100.00 | N/R | 1,205,000 |
| | Project, Series 2013, 7.750%, 9/01/38 (4) | | | |
| | Ohio – 6.5% (4.6% of Total Investments) | | | |
| 82,120 | | Buckeye Tobacco Settlement Financing Authority, Ohio, Tobacco Settlement Asset-Backed | 6/30 at 22.36 | N/R | 12,818,932 |
| | Revenue Bonds, Refunding Senior Lien Capital Appreciation Series 2020B-3 Class 2, | | | |
| | 0.000%, 6/01/57 | | | |
| 32,045 | | Buckeye Tobacco Settlement Financing Authority, Ohio, Tobacco Settlement Asset-Backed | 6/30 at 100.00 | N/R | 36,024,028 |
| | Revenue Bonds, Refunding Senior Lien Series 2020B-2 Class 2, 5.000%, 6/01/55 | | | |
| 5,455 | | Buckeye Tobacco Settlement Financing Authority, Ohio, Tobacco Settlement Asset-Backed | 6/22 at 100.00 | N/R (7) | 5,813,503 |
| | Revenue Bonds, Senior Lien Series 2007A-3, 6.250%, 6/01/37 (Pre-refunded 6/01/22) | | | |
| 1,500 | | Butler County Port Authority, Ohio, Public Infrastructure Revenue Bonds, Liberty Center | 12/22 at 100.00 | N/R | 1,517,850 |
| | Project, Liberty Community Authority, Series 2014C, 6.000%, 12/01/43 | | | |
| 340 | | Evans Farm New Community Authority, Ohio, Community Development Charge Revenue Bonds, | 6/29 at 100.00 | N/R | 348,592 |
| | Evans Farm Mixed-Use Project, Series 2020, 4.000%, 12/01/46 | | | |
| 11,160 | | Montgomery County, Ohio, Hospital Facilities Revenue Bonds, Kettering Health Network | 8/26 at 100.00 | A2 | 12,323,765 |
| | Obligated Group, Series 2016, 4.000%, 8/01/47 (UB) (6) | | | |
| 2,800 | | Ohio Air Quality Development Authority, Ohio, Air Quality Development Revenue Bonds, | No Opt. Call | N/R | 3,500 |
| | FirstEnergy Generation Corporation Project, Series 2009A, 5.700%, 8/01/21 (4) | | | |
| 3,310 | | Ohio Air Quality Development Authority, Ohio, Exempt Facilities Revenue Bonds, AMG | 7/29 at 100.00 | B– | 3,666,983 |
| | Vanadium Project, Series 2019, 5.000%, 7/01/49 (AMT), 144A | | | |
| 365 | | Ohio Air Quality Development Authority, Ohio, Pollution Control Revenue Bonds, | No Opt. Call | N/R | 456 |
| | FirstEnergy Generation Corporation Project, Refunding Series 2009B, 3.100%, 3/01/23 (4) | | | |
| 4,750 | | Ohio Air Quality Development Authority, Ohio, Pollution Control Revenue Bonds, | No Opt. Call | N/R | 5,937 |
| | FirstEnergy Nuclear Generation Project, Refunding Series 2008C, 3.950%, 11/01/32 (4) | | | |
| 3,085 | | Ohio Water Development Authority, Pollution Control Revenue Bonds, FirstEnergy | No Opt. Call | N/R | 3,856 |
| | Generating Corporation Project, Refunding Series 2006A, 3.000%, 5/15/49 (4) | | | |
| 3,000 | | Ohio Water Development Authority, Pollution Control Revenue Bonds, FirstEnergy Nuclear | No Opt. Call | N/R | 3,750 |
| | Generating Corporation Project, Refunding Series 2005B, 4.000%, 1/01/34 (4) | | | |
| 255 | | Ohio Water Development Authority, Pollution Control Revenue Bonds, FirstEnergy Nuclear | No Opt. Call | N/R | 319 |
| | Generating Corporation Project, Refunding Series 2008B, 3.625%, 10/01/33 (4) | | | |
| 1,015 | | Ohio Water Development Authority, Pollution Control Revenue Bonds, FirstEnergy Nuclear | No Opt. Call | N/R | 1,269 |
| | Generating Corporation Project, Refunding Series 2008C, 3.950%, 11/01/32 (4) | | | |
| 2,725 | | Ohio Water Development Authority, Pollution Control Revenue Bonds, FirstEnergy Nuclear | No Opt. Call | N/R | 3,406 |
| | Generating Corporation Project, Refunding Series 2010A, 3.750%, 7/01/33 (4) | | | |
| 3,000 | | Ohio Water Development Authority, Pollution Control Revenue Refunding Bonds, FirstEnergy | No Opt. Call | N/R | 3,088,500 |
| | Nuclear Generating Corporation Project, Series 2010B, 4.375%, 6/01/33 (Mandatory Put 6/01/22) | | | |
| 1,000 | | Port of Greater Cincinnati Development Authority, Ohio, Public Improvement TOT Revenue | 12/28 at 100.00 | N/R | 1,006,410 |
| | Bonds, Series 2021, 4.250%, 12/01/50, 144A | | | |
| 1,000 | | Port of Greater Cincinnati Development Authority, Ohio, Special Obligation Tax Increment | 11/30 at 100.00 | N/R | 1,013,920 |
| | Financing Revenue Bonds, Cooperative Township Public Parking Project, Gallery at Kenwood, | | | |
| | Senior Lien Series 2019A, 5.000%, 11/01/51 | | | |
| 1,500 | | Southern Ohio Port Authority, Ohio, Facility Revenue Bonds, Purecycle Project, Series | 12/27 at 103.00 | N/R | 1,699,695 |
| | 2020A, 7.000%, 12/01/42 (AMT), 144A | | | |
| 2,000 | | Tuscarawas County Economic Development and Finance Alliance, Ohio, Higher Education | 3/25 at 100.00 | N/R | 2,178,180 |
| | Facilities Revenue Bonds, Ashland University, Refunding & Improvement Series 2015, | | | |
| | 6.000%, 3/01/45 | | | |
| 162,425 | | Total Ohio | | | 81,522,851 |
114
| | | | | | |
| Principal | | | Optional Call | | |
| Amount (000) | | Description (1) | Provisions (2) | Ratings (3) | Value |
| | Oklahoma – 1.6% (1.2% of Total Investments) | | | |
| $ 1,550 | | Fort Sill Apache Tribe of Oklahoma Economic Development Authority, Gaming Enterprise | 8/21 at 100.00 | N/R (7) | $ 1,589,122 |
| | Revenue Bonds, Fort Sill Apache Casino, Series 2011A, 8.500%, 8/25/26 (Pre-refunded | | | |
| | 8/25/21), 144A | | | |
| 15,000 | | Tulsa Municipal Airport Trust, Oklahoma, Revenue Bonds, American Airlines Inc, Refunding | 6/23 at 100.00 | N/R | 16,130,250 |
| | Series 2000B, 5.500%, 6/01/35 (AMT) | | | |
| 2,600 | | Tulsa Municipal Airport Trust, Oklahoma, Revenue Bonds, American Airlines Inc, Refunding | 6/23 at 100.00 | N/R | 2,795,910 |
| | Series 2001B, 5.500%, 12/01/35 (AMT) | | | |
| 19,150 | | Total Oklahoma | | | 20,515,282 |
| | Oregon – 0.1% (0.1% of Total Investments) | | | |
| | Clackamas and Washington Counties School District 3JT, Oregon, General Obligation Bonds, | | | |
| | Series 2020A: | | | |
| 1,750 | | 0.000%, 6/15/49 | 6/30 at 57.54 | Aa1 | 808,203 |
| 2,000 | | 0.000%, 6/15/50 | 6/30 at 55.67 | Aa1 | 892,500 |
| 3,750 | | Total Oregon | | | 1,700,703 |
| | Pennsylvania – 1.8% (1.3% of Total Investments) | | | |
| 980 | | Allentown Neighborhood Improvement Zone Development Authority, Pennsylvania, Tax Revenue | 5/31 at 100.00 | N/R | 1,221,982 |
| | Bonds, 615 Waterfront Project, Senior Series 2021, 6.000%, 5/01/42, 144A | | | |
| 1,250 | | Allentown Neighborhood Improvement Zone Development Authority, Pennsylvania, Tax Revenue | 5/28 at 100.00 | N/R | 1,477,950 |
| | Bonds, City Center Project, Subordinate Lien, Series 2018, 5.125%, 5/01/32, 144A | | | |
| 2,500 | | Beaver County Industrial Development Authority, Pennsylvania, Pollution Control Revenue | No Opt. Call | N/R | 3,125 |
| | Bonds, FirstEnergy Generation Project, Refunding Series 2006A, 3.500%, 4/01/41 (4) | | | |
| 2,715 | | Beaver County Industrial Development Authority, Pennsylvania, Pollution Control Revenue | No Opt. Call | N/R | 3,394 |
| | Bonds, FirstEnergy Nuclear Generation Project, Series 2006B, 3.500%, 12/01/35 (4) | | | |
| 500 | | Beaver County Industrial Development Authority, Pennsylvania, Pollution Control Revenue | 4/31 at 100.00 | N/R | 525,510 |
| | Refunding Bonds, FirstEnergy Generation Project, Series 2008B, 3.750%, 10/01/47 (Mandatory | | | |
| | Put 4/01/21) | | | |
| 290 | | Berks County Municipal Authority, Pennsylvania, Revenue Bonds, Alvernia University | 10/29 at 100.00 | BB+ | 310,523 |
| | Project, Series 2020, 5.000%, 10/01/49 | | | |
| 1,000 | | Dauphin County General Authority, Pennsylvania, Revenue Bonds, Harrisburg University of | 10/27 at 100.00 | BB | 1,001,650 |
| | Science & Technology Project, Series 2017, 5.125%, 10/15/41, 144A | | | |
| 1,500 | | Dauphin County General Authority, Pennsylvania, Revenue Bonds, Harrisburg University of | 10/28 at 100.00 | BB | 1,590,465 |
| | Science & Technology Project, Series 2020, 6.250%, 10/15/53, 144A | | | |
| 1,720 | | Pennsylvania Economic Development Financing Authority, Exempt Facilities Revenue Bonds, | 6/30 at 100.00 | N/R | 1,850,290 |
| | KDC Agribusiness Fairless Hills LLC Project, Series 2020A-1, 10.000%, 12/01/40, 144A | | | |
| 1,720 | | Pennsylvania Economic Development Financing Authority, Exempt Facilities Revenue Bonds, | 6/30 at 100.00 | N/R | 1,850,290 |
| | KDC Agribusiness Fairless Hills LLC Project, Series 2020A-2, 10.000%, 12/01/40 (AMT), 144A | | | |
| 5 | | Pennsylvania Economic Development Financing Authority, Exempt Facilities Revenue Bonds, | No Opt. Call | N/R | 6 |
| | Shippingport Project, First Energy Guarantor, Series 2006A, 2.550%, 11/01/41 (4) | | | |
| 6,650 | | Pennsylvania Economic Development Financing Authority, Exempt Facilities Revenue | 9/25 at 100.00 | CCC+ | 6,015,324 |
| | Refunding Bonds, PPL Energy Supply, LLC Project, Series 2009A, 6.400%, 12/01/38 | | | |
| 1,000 | | Philadelphia Authority for Industrial Development, Pennsylvania, Revenue Bonds, Mariana | 12/27 at 100.00 | N/R | 1,069,270 |
| | Bracetti Academy Project, Series 2020A, 5.375%, 6/15/50, 144A | | | |
| | Philadelphia Authority for Industrial Development, Pennsylvania, Revenue Bonds, Mariana | | | |
| | Bracetti Academy Project, Taxable Series 2020B: | | | |
| 995 | | 6.875%, 12/15/35, 144A | 12/27 at 100.00 | N/R | 1,012,830 |
| 1,000 | | 7.125%, 12/15/44, 144A | 12/27 at 100.00 | N/R | 1,027,940 |
| 2,500 | | Philadelphia Authority for Industrial Development, Pennsylvania, Revenue Bonds, Nueva | 1/23 at 100.00 | N/R (7) | 2,815,475 |
| | Esperanza, Inc – Esperanza Academy Charter School, Series 2013, 8.000%, 1/01/33 | | | |
| | (Pre-refunded 1/01/23) | | | |
| 510 | | Philadelphia Hospitals and Higher Education Facilities Authority, Pennsylvania, Hospital | 7/22 at 100.00 | Ba1 | 536,510 |
| | Revenue Bonds, Temple University Health System Obligated Group, Series 2012A, | | | |
| | 5.625%, 7/01/36 | | | |
115
| | |
| NMZ | Nuveen Municipal High Income Opportunity Fund |
| Portfolio of Investments (continued) |
| April 30, 2021 (Unaudited) |
| | | | | | |
| Principal | | | Optional Call | | |
| Amount (000) | | Description (1) | Provisions (2) | Ratings (3) | Value |
| | Pennsylvania (continued) | | | |
| $ 180 | | The Redevelopment Authority of the City of Scranton, Lackawanna county, Pennsylvania, | 5/24 at 100.00 | BB+ | $ 184,673 |
| | Guaranteed Lease Revenue Bonds, Series 2016A, 5.000%, 11/15/28 | | | |
| 27,015 | | Total Pennsylvania | | | 22,497,207 |
| | Puerto Rico – 7.8% (5.6% of Total Investments) | | | |
| | Puerto Rico Aqueduct and Sewerage Authority, Revenue Bonds, Senior Lien Series 2012A: | | | |
| 4,870 | | 5.125%, 7/01/37 | 7/22 at 100.00 | CCC | 5,146,957 |
| 1,000 | | 5.250%, 7/01/42 | 7/22 at 100.00 | CCC | 1,058,360 |
| 2,000 | | 6.000%, 7/01/47 | 7/22 at 100.00 | CCC | 2,134,480 |
| 8,625 | | Puerto Rico Electric Power Authority, Power Revenue Bonds, Federally Taxable Build | 6/21 at 100.00 | D | 7,891,875 |
| | America Bonds, Series 2010YY, 4.050%, 7/01/40 (4) | | | |
| | Puerto Rico Electric Power Authority, Power Revenue Bonds, Refunding Series 2012A: | | | |
| 4,835 | | 3.957%, 7/01/42 (4) | 7/22 at 100.00 | D | 4,484,462 |
| 185 | | 3.961%, 7/01/42 (4) | 7/22 at 100.00 | D | 171,588 |
| 2,000 | | Puerto Rico Electric Power Authority, Power Revenue Bonds, Series 2003NN, 3.999%, | No Opt. Call | N/R | 1,850,000 |
| | 7/01/21 (4) | | | |
| 1,025 | | Puerto Rico Electric Power Authority, Power Revenue Bonds, Series 2007TT, 3.957%, | 6/21 at 100.00 | D | 950,687 |
| | 7/01/37 (4) | | | |
| | Puerto Rico Electric Power Authority, Power Revenue Bonds, Series 2010AAA: | | | |
| 5,690 | | 3.978%, 7/01/22 (4) | 6/21 at 100.00 | D | 5,291,700 |
| 1,186 | | 3.978%, 7/01/28 (4) | 6/21 at 100.00 | D | 1,102,980 |
| 890 | | 3.978%, 7/01/29 (4) | 6/21 at 100.00 | D | 827,700 |
| 658 | | 3.978%, 7/01/31 (4) | 6/21 at 100.00 | D | 611,940 |
| 405 | | Puerto Rico Electric Power Authority, Power Revenue Bonds, Series 2010CCC, 3.957%, | 6/21 at 100.00 | D | 375,638 |
| | 7/01/28 (4) | | | |
| 1,350 | | Puerto Rico Electric Power Authority, Power Revenue Bonds, Series 2010XX, 3.978%, | 6/21 at 100.00 | D | 1,255,500 |
| | 7/01/40 (4) | | | |
| 3,000 | | Puerto Rico Electric Power Authority, Power Revenue Bonds, Series 2010ZZ, 3.978%, | 6/21 at 100.00 | D | 2,790,000 |
| | 7/01/25 (4) | | | |
| 1,000 | | Puerto Rico Electric Power Authority, Power Revenue Bonds, Series 2013A, 4.102%, 7/01/36 (4) | 7/23 at 100.00 | D | 951,250 |
| | Puerto Rico Electric Power Authority, Power Revenue Bonds, Series WW: | | | |
| 360 | | 3.988%, 7/01/22 (4) | 6/21 at 100.00 | D | 335,250 |
| 710 | | 3.988%, 7/01/23 (4) | 6/21 at 100.00 | D | 661,187 |
| 375 | | 5.250%, 7/01/33 (4) | 6/21 at 100.00 | D | 348,750 |
| 5,500 | | Puerto Rico Electric Power Authority, Power Revenue Bonds, Taxable Build America Bond | 6/21 at 100.00 | D | 5,032,500 |
| | Series 2010EE, 4.044%, 7/01/32 (4) | | | |
| | Puerto Rico Sales Tax Financing Corporation, Sales Tax Revenue Bonds, Restructured 2018A-1: | | | |
| 74,000 | | 0.000%, 7/01/46 | 7/28 at 41.38 | N/R | 23,479,460 |
| 86,600 | | 0.000%, 7/01/51 | 7/28 at 30.01 | N/R | 19,916,268 |
| 1,000 | | 4.750%, 7/01/53 | 7/28 at 100.00 | N/R | 1,112,400 |
| 6,000 | | 5.000%, 7/01/58 | 7/28 at 100.00 | N/R | 6,774,360 |
| 4,500 | | Puerto Rico, General Obligation Bonds, Public Improvement, Series 2014A, 3.180%, 7/01/35 (4) | 6/21 at 100.00 | D | 3,611,250 |
| 217,764 | | Total Puerto Rico | | | 98,166,542 |
| | Rhode Island – 0.2% (0.2% of Total Investments) | | | |
| 18,260 | | Rhode Island Tobacco Settlement Financing Corporation, Tobacco Settlement Asset-Backed | 5/21 at 15.96 | CCC– | 2,961,772 |
| | Bonds, Series 2007A, 0.000%, 6/01/52 | | | |
| | South Carolina – 2.6% (1.9% of Total Investments) | | | |
| 4,000 | | Lancaster County, South Carolina, Special Assessment Bonds, Edgewater II Improvement | 6/21 at 100.00 | N/R | 840,000 |
| | District, Series 2007A, 7.750%, 11/01/39 (4) | | | |
| 3,477 | | Lancaster County, South Carolina, Special Assessment Bonds, Edgewater II Improvement | No Opt. Call | N/R | 730,170 |
| | District, Series 2007B, 7.700%, 11/01/21 (4) | | | |
116
| | | | | | |
| Principal | | | Optional Call | | |
| Amount (000) | | Description (1) | Provisions (2) | Ratings (3) | Value |
| | South Carolina (continued) | | | |
| $ 1,000 | | South Carolina Jobs Economic Development Authority, Educational Facilities Revenue | 11/26 at 100.00 | N/R | $ 1,013,950 |
| | Bonds, Hoese Creek Academy Project, Series 2021A, 5.000%, 11/15/55, 144A | | | |
| 5,000 | | South Carolina Jobs-Economic Development Authority, Economic Development Revenue Bonds, | 8/26 at 100.00 | N/R (7) | 6,106,800 |
| | Custodial Receipts CR-086, 5.000%, 8/15/36 (Pre-refunded 8/15/26), 144A | | | |
| 400 | | South Carolina Jobs-Economic Development Authority, Economic Development Revenue Bonds, | 1/30 at 100.00 | N/R | 401,924 |
| | Hilton Head Christian Academy, Series 2020, 5.000%, 1/01/55, 144A | | | |
| 980 | | South Carolina Jobs-Economic Development Authority, Economic Development Revenue Bonds, | 11/26 at 100.00 | N/R | 1,158,566 |
| | Midland Valley Preparatory School Project, Series 2014, 7.750%, 11/15/45, 144A | | | |
| 4,215 | | South Carolina Jobs-Economic Development Authority, Educational Facilities Revenue | 12/29 at 100.00 | Baa3 | 4,788,746 |
| | Bonds, Lowcountry Leadership Charter School Project, Series 2019A, 5.000%, 12/01/49, 144A | | | |
| 1,250 | | South Carolina Jobs-Economic Development Authority, Hospital Revenue Bonds, Palmetto | 8/21 at 100.00 | AA (7) | 1,269,125 |
| | Health, Refunding Series 2011A, 6.500%, 8/01/39 (Pre-refunded 8/01/21) – AGM Insured | | | |
| 3,000 | | South Carolina Public Service Authority Santee Cooper Revenue Obligations, Refunding | 12/26 at 100.00 | A– | 3,610,830 |
| | Series 2016B, 5.000%, 12/01/46 (UB) (6) | | | |
| 11,615 | | South Carolina Public Service Authority, Santee Cooper Revenue Obligations, Series | 6/24 at 100.00 | A– | 13,046,897 |
| | 2014A, 5.000%, 12/01/49 (UB) (6) | | | |
| 34,937 | | Total South Carolina | | | 32,967,008 |
| | Tennessee – 2.5% (1.8% of Total Investments) | | | |
| 1,000 | | Memphis/Shelby County Economic Development Growth Engine Industrial Development Board, | 7/27 at 100.00 | N/R | 1,006,960 |
| | Tennessee, Tax Increment Revenue Bonds, Graceland Project, Senior Series 2017A, | | | |
| | 5.625%, 1/01/46 | | | |
| | Metropolitan Government of Nashville-Davidson County Health and Educational Facilities | | | |
| | Board, Tennessee, Revenue Bonds, Vanderbilt University Medical Center, Series 2016A: | | | |
| 11,095 | | 5.000%, 7/01/40 (UB) | 7/26 at 100.00 | Aa1 | 13,294,140 |
| 5,240 | | 5.000%, 7/01/46 (UB) (6) | 7/26 at 100.00 | Aa1 | 6,231,198 |
| 5,000 | | The Health and Educational Facilities Board of the City of Franklin, Tennessee, Revenue | 6/27 at 100.00 | N/R | 2,750,000 |
| | Bonds, Provision Cares Proton Therapy Center, Nashville Project, Series 2017A, 7.500%, | | | |
| | 6/01/47, 144A (4), (8) | | | |
| 6,024 | | The Tennessee Energy Acquisition Corporation, Gas Revenue Bonds, Series 2006B, | No Opt. Call | BBB | 7,403,918 |
| | 5.625%, 9/01/26 | | | |
| 915 | | Wilson County Health and Educational Facilities Board, Tennessee, Senior Living Revenue | 6/21 at 100.00 | N/R | 828,340 |
| | Bonds, Rutland Place Inc Project, Series 2015A, 5.500%, 1/01/46 | | | |
| 29,274 | | Total Tennessee | | | 31,514,556 |
| | Texas – 3.5% (2.4% of Total Investments) | | | |
| 1,000 | | Arlington Higher Education Finance Corporation, Texas, Education Revenue Bonds, Brooks | 6/26 at 100.00 | N/R | 1,046,260 |
| | Academies, Series 2021A, 5.000%, 1/15/51 | | | |
| 500 | | Celina, Texas, Special Assessment Revenue Bonds, Celina Sutton Fields II Public | 9/29 at 100.00 | N/R | 539,630 |
| | Improvement District Neighborhood Improvement Areas 2-3 Project, Series 2019, 4.250%, | | | |
| | 9/01/49, 144A | | | |
| 995 | | Celina, Texas, Special Assessment Revenue Bonds, Creeks of Legacy Public Improvement | 9/22 at 103.00 | N/R | 1,048,989 |
| | District Phase 1 Project, Series 2014, 7.000%, 9/01/40 | | | |
| 4,165 | | Dallas Area Rapid Transit, Texas, Sales Tax Revenue Bonds, Refunding Series 2016A, | 12/25 at 100.00 | Aa2 | 4,872,300 |
| | 5.000%, 12/01/48 (UB) (6) | | | |
| | Decatur Hospital Authority, Texas, Revenue Bonds, Wise Regional Health System, Series 2013A: | | | |
| 365 | | 6.625%, 9/01/31 | 9/23 at 100.00 | N/R | 407,909 |
| 1,000 | | 6.375%, 9/01/42 | 9/23 at 100.00 | N/R | 1,101,800 |
| 165 | | Fate, Rockwall County, Texas, Special Assessment Revenue Bonds, Williamsburg Public | 8/27 at 100.00 | N/R | 178,487 |
| | Improvement District 1 Phase 2B, 2C & 3A1, Series 2019, 4.250%, 8/15/49, 144A | | | |
| 1,500 | | Fort Bend County Industrial Development Corporation, Texas, Revenue Bonds, NRG Energy | 11/22 at 100.00 | Baa2 | 1,578,330 |
| | Inc Project, Series 2012A RMKT, 4.750%, 5/01/38 | | | |
117
| | |
| NMZ | Nuveen Municipal High Income Opportunity Fund |
| Portfolio of Investments (continued) |
| April 30, 2021 (Unaudited) |
| | | | | | |
| Principal | | | Optional Call | | |
| Amount (000) | | Description (1) | Provisions (2) | Ratings (3) | Value |
| | Texas (continued) | | | |
| $ 1,000 | | Gulf Coast Industrial Development Authority, Texas, Solid Waste Disposal Revenue Bonds, | 6/21 at 100.00 | B3 | $ 1,001,320 |
| | Citgo Petroleum Corporation Project, Series 1998, 8.000%, 4/01/28 (AMT) | | | |
| 125 | | Haslett, Texas, Special Assessment Revenue Bonds, Haslet Public Improvement District 5 | 9/29 at 100.00 | N/R | 137,519 |
| | Improvement Area 1 Project, Series 2019, 4.375%, 9/01/49, 144A | | | |
| 775 | | Heart of Texas Education Finance Corporation, Texas, Gateway Charter Academy, Series | 6/21 at 100.00 | N/R | 775,357 |
| | 2006A, 6.000%, 2/15/36 | | | |
| 1,000 | | Houston, Texas, Airport System Special Facilities Revenue Bonds, Continental Airlines | 7/21 at 100.00 | B | 1,015,370 |
| | Inc – Terminal Improvement Project, Refunding Series 2011, 6.625%, 7/15/38 (AMT) | | | |
| 500 | | Hutto, Texas, Special Assessment Revenue Bonds, Emory Crossing, Public Improvement | 9/29 at 100.00 | N/R | 508,130 |
| | Area 1 Project Series 2021, 4.000%, 9/01/56, 144A | | | |
| 3,165 | | Jefferson County Industrial Development Corporation, Texas, Hurricane Ike Disaster Area | 7/22 at 100.00 | N/R (7) | 3,432,031 |
| | Revenue Bonds, Port of Beaumont Petroleum Transload Terminal, LLC Project, Series 2012, | | | |
| | 8.250%, 7/01/32 (Pre-refunded 7/01/22) | | | |
| 500 | | Kaufman,Texas, Special Assessment Revenue Bonds, Kaufman Public Improvement District 1 | 9/31 at 100.00 | N/R | 510,630 |
| | Phase 1A-1B Project, Series 2021, 4.000%, 9/15/50, 144A | | | |
| 1,170 | | McLendon-Chisholm, Texas, Special Assessment Revenue Bonds, Sonoma Public Improvement | 9/29 at 100.00 | N/R | 1,313,302 |
| | District Improvement Area 2 Project, Series 2019, 4.250%, 9/15/39, 144A | | | |
| | Mesquite, Texas, Special Assessment Bonds, Iron Horse Public Improvement District | | | |
| | Project, Series 2019: | | | |
| 300 | | 5.750%, 9/15/39, 144A | 9/29 at 100.00 | N/R | 336,765 |
| 500 | | 6.000%, 9/15/49, 144A | 9/29 at 100.00 | N/R | 559,900 |
| 1,965 | | Mission Economic Development Corporation, Texas, Water Supply Revenue Bonds, Enviro | 1/26 at 102.00 | N/R | 50,442 |
| | Water Minerals Project, Green Bonds, Series 2015, 7.750%, 1/01/45 (AMT), 144A (4), (8) | | | |
| 1,000 | | New Hope Cultural Education Facilities Finance Corporation, Texas, Student Housing | 4/24 at 100.00 | N/R (7) | 1,134,110 |
| | Revenue Bonds, CHF-Collegiate Housing Corpus Christi I, LLC-Texas A&M University-Corpus | | | |
| | Christi Project, Series 2014A, 5.000%, 4/01/44 (Pre-refunded 4/01/24) | | | |
| 1,000 | | New Hope Cultural Education Facilities Finance Corporation, Texas, Student Housing | 4/26 at 100.00 | N/R (7) | 1,209,260 |
| | Revenue Bonds, CHF-Collegiate Housing Foundation – San Antonio 1, LLC – Texas A&M | | | |
| | University – San Antonio Project,, 5.000%, 4/01/48 (Pre-refunded 4/01/26) | | | |
| 1,000 | | New Hope Cultural Education Facilities Finance Corporation, Texas, Student Housing | 4/24 at 100.00 | N/R (7) | 1,132,560 |
| | Revenue Bonds, CHF-Collegiate Housing Galveston-Texas A&M University at Galveston Project, | | | |
| | Series 2014A, 5.000%, 4/01/44 (Pre-refunded 4/01/24) | | | |
| | New Hope Cultural Education Facilities Finance Corporation, Texas, Student Housing | | | |
| | Revenue Bonds, NCCD – College Station Properties LLC – Texas A&M University Project, | | | |
| | Series 2015A: | | | |
| 1,250 | | 5.000%, 7/01/35 | 7/25 at 100.00 | CCC | 1,081,250 |
| 2,445 | | 5.000%, 7/01/47 | 7/25 at 100.00 | CCC | 2,102,700 |
| 2,250 | | North Texas Tollway Authority, Special Projects System Revenue Bonds, 19.841%, 9/01/41 | 9/21 at 100.00 | N/R (7) | 2,406,960 |
| | (Pre-refunded 9/01/21), 144A (IF) | | | |
| 1,070 | | Oak Point, Denton County, Texas, Special Assessment Revenue Bonds, Oak Point Public | 9/30 at 100.00 | N/R | 1,120,022 |
| | Improvement District 2 Project, Series 2020, 4.000%, 9/01/50, 144A | | | |
| 440 | | Port Beaumont Navigation District, Jefferson County, Texas, Dock and Wharf Facility | 1/22 at 103.00 | N/R | 456,042 |
| | Revenue Bonds, Jefferson Gulf Coast Energy Project, Series 2020, 4.000%, 1/01/50 (AMT), 144A | | | |
| 205 | | Princeton, Texas, Special Assessment Revenue Bonds, Whitewing Trails Public Improvement | 9/29 at 100.00 | N/R | 225,221 |
| | District 2 Phase 1 Project, Series 2019, 4.750%, 9/01/49, 144A | | | |
| 185 | | Princeton, Texas, Special Assessment Revenue Bonds, Whitewing Trails Public Improvement | 9/29 at 100.00 | N/R | 210,795 |
| | District 2 Phase 2-6 Major Improvement Project, Series 2019, 5.500%, 9/01/39, 144A | | | |
| 2,000 | | Red River Health Facilities Development Corporation, Texas, First Mortgage Revenue | 12/21 at 100.00 | N/R | 1,325,000 |
| | Bonds, Eden Home Inc, Series 2012, 4.293%, 12/15/32 (4) | | | |
| 160 | | Rowlett, Texas, Special Assessment Revenue Bonds, Bayside Public Improvement District | 3/24 at 102.00 | N/R | 167,638 |
| | North Improvement Area, Series 2016, 5.750%, 9/15/36 | | | |
| 5,000 | | Texas Department of Housing and Community Affairs, Single Family Mortgage Revenue Bonds, | 9/27 at 100.00 | AA+ | 5,467,800 |
| | Series 2018A, 4.250%, 9/01/48 (UB) (6) | | | |
118
| | | | | | |
| Principal | | | Optional Call | | |
| Amount (000) | | Description (1) | Provisions (2) | Ratings (3) | Value |
| | Texas (continued) | | | |
| $ 755 | | Texas Public Finance Authority Charter School Finance Corporation, Charter School | 6/21 at 100.00 | B– | $ 755,272 |
| | Revenue Bonds, School of Excellence Education Project, Series 2004A, 7.000%, 12/01/34 | | | |
| 2,030 | | Texas State Affordable Housing Corporation Multifamily Housing Revenue Bonds, Peoples El | 1/34 at 100.00 | N/R | 2,228,355 |
| | Shaddai Village and St James Manor Apartments Project, Series 2016, 4.850%, 12/01/56, 144A | | | |
| 1,653 | | Viridian Municipal Management District, Texas, Assessment Revenue Bonds, Series 2017, | 12/25 at 100.00 | N/R | 1,772,479 |
| | 4.250%, 12/01/44 | | | |
| 43,133 | | Total Texas | | | 43,209,935 |
| | Utah – 0.1% (0.1% of Total Investments) | | | |
| 1,000 | | Utah Charter School Finance Authority, Charter School Revenue Bonds, Paradigm High | 1/25 at 102.00 | N/R | 1,029,490 |
| | School Project, Series 2020A, 5.125%, 7/15/51, 144A | | | |
| | Vermont – 0.3% (0.2% of Total Investments) | | | |
| 3,400 | | Vermont Educational and Health Buildings Financing Agency, Revenue Bonds, University of | 6/26 at 100.00 | A3 | 3,951,956 |
| | Vermont Medical Center Project, Green Series 2016B, 5.000%, 12/01/46 (UB) (6) | | | |
| | Virgin Islands – 0.8% (0.6% of Total Investments) | | | |
| | Virgin Islands Public Finance Authority, Gross Receipts Taxes Loan Note, Refunding | | | |
| | Series 2014C: | | | |
| 1,000 | | 5.000%, 10/01/30 | 10/24 at 100.00 | N/R | 955,550 |
| 5,000 | | 5.000%, 10/01/39 | 10/24 at 100.00 | N/R | 4,629,900 |
| 1,000 | | Virgin Islands Public Finance Authority, Matching Fund Revenue Loan Note – Diageo | 6/21 at 100.00 | Caa3 | 1,008,140 |
| | Project, Series 2009A, 6.750%, 10/01/37 | | | |
| 3,270 | | Virgin Islands Water and Power Authority, Electric System Revenue Bonds, Bond | No Opt. Call | N/R | 3,278,474 |
| | Anticipation Notes, Series 2020A, 7.500%, 7/01/22, 144A | | | |
| 10,270 | | Total Virgin Islands | | | 9,872,064 |
| | Virginia – 2.0% (1.4% of Total Investments) | | | |
| 762 | | Celebrate Virginia North Community Development Authority, Special Assessment Revenue | No Opt. Call | N/R | 457,200 |
| | Bonds, Series 2003B, 4.125%, 3/01/21 (4) | | | |
| 10,000 | | Industrial Development Authority of the City of Newport News, Virginia, Health System | 7/27 at 100.00 | N/R | 11,202,300 |
| | Revenue Bonds, Riverside Health System, Series 2017A, 5.000%, 7/01/46, 144A | | | |
| 1,000 | | Tobacco Settlement Financing Corporation of Virginia, Tobacco Settlement Asset Backed | 5/21 at 100.00 | B– | 1,005,550 |
| | Bonds, Series 2007B1, 5.000%, 6/01/47 | | | |
| 7,000 | | Virginia Small Business Finance Authority, Educational Facilities Revenue Bonds, | 7/34 at 100.00 | N/R | 6,488,720 |
| | Provident Resource Group – Rixey Student Housing Project, Series 2019A, 5.500%, 7/01/54, 144A | | | |
| 7,000 | | Virginia Small Business Finance Authority, Educational Facilities Revenue Bonds, | No Opt. Call | N/R | 6,061,510 |
| | Provident Resource Group – Rixey Student Housing Project, Series 2019B, 7.500%, 7/01/52, 144A | | | |
| | Virginia Small Business Financing Authority, Senior Lien Revenue Bonds, Elizabeth River | | | |
| | Crossing, Opco LLC Project, Series 2012: | | | |
| 80 | | 6.000%, 1/01/37 (AMT) | 7/22 at 100.00 | BBB– | 84,853 |
| 130 | | 5.500%, 1/01/42 (AMT) | 7/22 at 100.00 | BBB– | 136,904 |
| 25,972 | | Total Virginia | | | 25,437,037 |
| | Washington – 2.0% (1.4% of Total Investments) | | | |
| 1,000 | | King County Public Hospital District 4, Washington, Hospital Revenue Bonds, Snoqualmie | 12/25 at 100.00 | N/R | 1,109,570 |
| | Valley Hospital, Series 2015A, 6.250%, 12/01/45 | | | |
| 1,000 | | Kitsap County Consolidated Housing Authority, Washington, Pooled Tax Credit Housing | 6/21 at 100.00 | N/R | 1,001,180 |
| | Revenue Bonds, Series 2007, 5.600%, 6/01/37 (AMT) | | | |
| 1,300 | | Port of Seattle Industrial Development Corporation, Washington, Special Facilities | 4/23 at 100.00 | BB | 1,391,858 |
| | Revenue Refunding Bonds, Delta Air Lines, Inc Project, Series 2012, 5.000%, 4/01/30 (AMT) | | | |
| 195 | | Tacoma Consolidated Local Improvement District 65, Washington, Special Assessment Bonds, | 5/21 at 100.00 | N/R | 196,948 |
| | Series 2013, 5.750%, 4/01/43 | | | |
| 3,065 | | Washington Economic Development Finance Authority, Environmental Facilities Revenue | 1/28 at 100.00 | N/R | 2,298,750 |
| | Bonds, Columbia Pulp I, LLC Project, Series 2017A, 7.500%, 1/01/32 (AMT), 144A (4) | | | |
119
| | |
| NMZ | Nuveen Municipal High Income Opportunity Fund |
| Portfolio of Investments (continued) |
| April 30, 2021 (Unaudited) |
| | | | | | |
| Principal | | | Optional Call | | |
| Amount (000) | | Description (1) | Provisions (2) | Ratings (3) | Value |
| | Washington (continued) | | | |
| $ 545 | | Washington Economic Development Finance Authority, Environmental Facilities Revenue | 1/28 at 100.00 | N/R | $ 408,750 |
| | Bonds, Columbia Pulp I, LLC Project, Series 2018, 7.250%, 1/01/32 (AMT), 144A (4) | | | |
| 1,565 | | Washington Economic Development Finance Authority, Environmental Facilities Revenue | 1/28 at 100.00 | N/R | 1,173,750 |
| | Bonds, Columbia Pulp I, LLC Project, Series 2019A, 7.500%, 1/01/32 (AMT), 144A | | | |
| 7,330 | | Washington Health Care Facilities Authority, Revenue Bonds, Virginia Mason Medical | 8/27 at 100.00 | BBB– | 8,015,575 |
| | Center, Series 2017, 4.000%, 8/15/42 (UB) | | | |
| 8,525 | | Washington State Higher Education Facilities Authority Revenue Bonds, Gonzaga University | 10/29 at 100.00 | A2 | 8,837,185 |
| | Project, Series 2019A, 3.000%, 4/01/49 (UB) (6) | | | |
| 1,000 | | Washington State Housing Finance Commission, Non-Profit Housing Revenue Bonds, Mirabella | 10/22 at 100.00 | N/R (7) | 1,090,480 |
| | Project, Series 2012A, 6.750%, 10/01/47 (Pre-refunded 10/03/22), 144A | | | |
| 25,525 | | Total Washington | | | 25,524,046 |
| | West Virginia – 0.4% (0.3% of Total Investments) | | | |
| 1,348 | | Berkeley, Hardy and Jefferson Counties, West Virginia, as Joint Issuers, Commercial | 12/23 at 100.00 | N/R | 1,382,091 |
| | Development Revenue Bonds, Scattered Site Housing Projects, Series 2010, 5.750%, 12/01/44 | | | |
| 1,125 | | Monongalia County Commission, West Virginia, Special District Excise Tax Revenue, | 6/27 at 100.00 | N/R | 1,222,627 |
| | University Town Centre Economic Opportunity Development District, Refunding & Improvement | | | |
| | Series 2017A, 5.750%, 6/01/43, 144A | | | |
| 1,000 | | West Virginia Economic Development Authority, Dock and Wharf Facilities Revenue Bonds, | 12/27 at 103.00 | N/R | 1,035,240 |
| | Empire Trimodal Terminal, LLC Project, Series 2020, 7.625%, 12/01/40, 144A | | | |
| 1,000 | | West Virginia Economic Development Authority, Solid Waste Disposal Facilities Revenue | 1/25 at 100.00 | B | 1,026,780 |
| | Bonds, Arch Resources Project, Series 2021, 4.125%, 7/01/45 (AMT) (Mandatory Put 7/01/25) | | | |
| 4,473 | | Total West Virginia | | | 4,666,738 |
| | Wisconsin – 5.6% (4.0% of Total Investments) | | | |
| 2,000 | | Lac Courte Oreilles Band of Lake Superior Chippewa Indians, Wisconsin, General Revenue | 12/27 at 100.00 | N/R | 2,063,960 |
| | Bonds, Refunding Series 2017, 6.750%, 6/01/32 | | | |
| 150 | | Public Finance Authority of Wisconsin, Charter School Revenue Bonds, Founders Academy of | 7/28 at 100.00 | BB– | 161,766 |
| | Las Vegas, Series 2020A, 5.000%, 7/01/55, 144A | | | |
| 4,985 | | Public Finance Authority of Wisconsin, Charter School Revenue Bonds, North Carolina | 6/26 at 100.00 | N/R | 5,108,927 |
| | Charter Educational Foundation Project, Series 2016A, 5.000%, 6/15/46, 144A | | | |
| 500 | | Public Finance Authority of Wisconsin, Charter School Revenue Bonds, Point College | 6/27 at 103.00 | N/R | 524,980 |
| | Preparatory, Series 2020A, 5.000%, 6/15/55, 144A | | | |
120
| | | | | | |
| Principal | | | Optional Call | | |
| Amount (000) | | Description (1) | Provisions (2) | Ratings (3) | Value |
| | Wisconsin (continued) | | | �� |
| | Public Finance Authority of Wisconsin, Conference Center and Hotel Revenue Bonds, | | | |
| | Lombard Public Facilities Corporation, First Tier Series 2018A-1: | | | |
| $ 13 | | 0.000%, 1/01/47, 144A (4) | No Opt. Call | N/R | $ 373 |
| 11 | | 0.000%, 1/01/48, 144A (4) | No Opt. Call | N/R | 321 |
| 11 | | 0.000%, 1/01/49, 144A (4) | No Opt. Call | N/R | 310 |
| 10 | | 0.000%, 1/01/50, 144A (4) | No Opt. Call | N/R | 289 |
| 10 | | 0.000%, 1/01/51, 144A (4) | No Opt. Call | N/R | 279 |
| 13 | | 0.000%, 1/01/52, 144A (4) | No Opt. Call | N/R | 349 |
| 13 | | 0.000%, 1/01/53, 144A (4) | No Opt. Call | N/R | 338 |
| 13 | | 0.000%, 1/01/54, 144A (4) | No Opt. Call | N/R | 319 |
| 12 | | 0.000%, 1/01/55, 144A (4) | No Opt. Call | N/R | 305 |
| 12 | | 0.000%, 1/01/56, 144A (4) | No Opt. Call | N/R | 295 |
| 632 | | 0.000%, 7/01/56, 144A (4) | 3/28 at 100.00 | N/R | 491,331 |
| 14 | | 0.000%, 1/01/57, 144A (4) | No Opt. Call | N/R | 318 |
| 13 | | 0.000%, 1/01/58, 144A (4) | No Opt. Call | N/R | 303 |
| 13 | | 0.000%, 1/01/59, 144A (4) | No Opt. Call | N/R | 290 |
| 13 | | 0.000%, 1/01/60, 144A (4) | No Opt. Call | N/R | 275 |
| 12 | | 0.000%, 1/01/61, 144A (4) | No Opt. Call | N/R | 264 |
| 12 | | 0.000%, 1/01/62, 144A (4) | No Opt. Call | N/R | 251 |
| 12 | | 0.000%, 1/01/63, 144A (4) | No Opt. Call | N/R | 240 |
| 12 | | 0.000%, 1/01/64, 144A (4) | No Opt. Call | N/R | 231 |
| 11 | | 0.000%, 1/01/65, 144A (4) | No Opt. Call | N/R | 221 |
| 12 | | 0.000%, 1/01/66, 144A (4) | No Opt. Call | N/R | 227 |
| 148 | | 0.000%, 1/01/67, 144A (4) | No Opt. Call | N/R | 2,541 |
| | Public Finance Authority of Wisconsin, Conference Center and Hotel Revenue Bonds, | | | |
| | Lombard Public Facilities Corporation, Second Tier Series 2018B: | | | |
| 24 | | 0.000%, 1/01/46, 144A (4) | No Opt. Call | N/R | 741 |
| 24 | | 0.000%, 1/01/47, 144A (4) | No Opt. Call | N/R | 704 |
| 24 | | 0.000%, 1/01/48, 144A (4) | No Opt. Call | N/R | 689 |
| 23 | | 0.000%, 1/01/49, 144A (4) | No Opt. Call | N/R | 670 |
| 23 | | 0.000%, 1/01/50, 144A (4) | No Opt. Call | N/R | 635 |
| 25 | | 0.000%, 1/01/51, 144A (4) | No Opt. Call | N/R | 685 |
| 652 | | 0.000%, 7/01/51, 144A (4) | 3/28 at 100.00 | N/R | 448,623 |
| 25 | | 0.000%, 1/01/52, 144A (4) | No Opt. Call | N/R | 655 |
| 25 | | 0.000%, 1/01/53, 144A (4) | No Opt. Call | N/R | 635 |
| 25 | | 0.000%, 1/01/54, 144A (4) | No Opt. Call | N/R | 614 |
| 24 | | 0.000%, 1/01/55, 144A (4) | No Opt. Call | N/R | 593 |
| 24 | | 0.000%, 1/01/56, 144A (4) | No Opt. Call | N/R | 576 |
| 24 | | 0.000%, 1/01/57, 144A (4) | No Opt. Call | N/R | 557 |
| 23 | | 0.000%, 1/01/58, 144A (4) | No Opt. Call | N/R | 537 |
| 23 | | 0.000%, 1/01/59, 144A (4) | No Opt. Call | N/R | 524 |
| 23 | | 0.000%, 1/01/60, 144A (4) | No Opt. Call | N/R | 504 |
| 23 | | 0.000%, 1/01/61, 144A (4) | No Opt. Call | N/R | 484 |
| 23 | | 0.000%, 1/01/62, 144A (4) | No Opt. Call | N/R | 469 |
| 22 | | 0.000%, 1/01/63, 144A (4) | No Opt. Call | N/R | 453 |
| 22 | | 0.000%, 1/01/64, 144A (4) | No Opt. Call | N/R | 442 |
| 22 | | 0.000%, 1/01/65, 144A (4) | No Opt. Call | N/R | 425 |
| 22 | | 0.000%, 1/01/66, 144A (4) | No Opt. Call | N/R | 399 |
| 281 | | 0.000%, 1/01/67, 144A (4) | No Opt. Call | N/R | 4,838 |
| 4,700 | | Public Finance Authority of Wisconsin, Contract Revenue Bonds, Mercer Crossing Public | 3/27 at 100.00 | N/R | 5,395,600 |
| | Improvement District Project, Series 2017, 7.000%, 3/01/47, 144A | | | |
| 1,500 | | Public Finance Authority of Wisconsin, Education Revenue Bonds, Pioneer Springs | 6/27 at 100.00 | N/R | 1,580,670 |
| | Community School, Series 2020A, 6.250%, 6/15/40, 144A | | | |
| 2,000 | | Public Finance Authority of Wisconsin, Educational Facilities Revenue Bonds, Lake Erie | 10/29 at 100.00 | N/R | 2,093,660 |
| | College, Series 2019A, 5.875%, 10/01/54, 144A | | | |
| 830 | | Public Finance Authority of Wisconsin, Educational Facility Revenue Bonds, Cottonwood | 12/22 at 100.00 | N/R (7) | 908,360 |
| | Classical Preparatory School in Albuquerque, New Mexico, Series 2012A, 6.250%, 12/01/42 | | | |
| | (Pre-refunded 12/01/22) | | | |
121
| | |
| NMZ | Nuveen Municipal High Income Opportunity Fund |
| Portfolio of Investments (continued) |
| April 30, 2021 (Unaudited) |
| | | | | | |
| Principal | | | Optional Call | | |
| Amount (000) | | Description (1) | Provisions (2) | Ratings (3) | Value |
| | Wisconsin (continued) | | | |
| $ 335 | | Public Finance Authority of Wisconsin, Exempt Facilities Revenue Bonds, National Gypsum | 8/26 at 100.00 | N/R | $ 336,873 |
| | Company Project, Refunding Series 2016, 4.000%, 8/01/35 (AMT) | | | |
| | Public Finance Authority of Wisconsin, Limited Obligation Grant Revenue Bonds, American | | | |
| | Dream @ Meadowlands Project, Series 2017A: | | | |
| 1,665 | | 6.250%, 8/01/27, 144A | No Opt. Call | N/R | 1,810,554 |
| 1,000 | | 6.750%, 8/01/31, 144A | No Opt. Call | N/R | 1,118,400 |
| | Public Finance Authority of Wisconsin, Limited Obligation PILOT Revenue Bonds, American | | | |
| | Dream @ Meadowlands Project, Series 2017: | | | |
| 2,000�� | | 6.750%, 12/01/42, 144A | 12/27 at 100.00 | N/R | 2,293,980 |
| 17,335 | | 7.000%, 12/01/50, 144A | 12/27 at 100.00 | N/R | 20,022,272 |
| 400 | | Public Finance Authority of Wisconsin, Retirement Facility Revenue Bonds, Shalom Park | No Opt. Call | N/R | 263,604 |
| | Development Project, Series 2019, 0.000%, 12/31/24, 144A | | | |
| 3,500 | | Public Finance Authority of Wisconsin, Revenue Bonds, Alabama Gulf Coast Zoo, Series | 9/28 at 100.00 | N/R | 3,204,705 |
| | 2018A, 6.500%, 9/01/48 | | | |
| 500 | | Public Finance Authority of Wisconsin, Revenue Bonds, Alabama Proton Therapy Center, | 10/27 at 100.00 | N/R | 513,275 |
| | Senior Series 2017A, 7.000%, 10/01/47, 144A | | | |
| | Public Finance Authority of Wisconsin, Revenue Bonds, Procure Proton Therapy Center, | | | |
| | Senior Series 2018A: | | | |
| 2,415 | | 6.950%, 7/01/38, 144A | 7/28 at 100.00 | N/R | 2,653,868 |
| 4,585 | | 7.000%, 7/01/48, 144A | 7/28 at 100.00 | N/R | 5,037,402 |
| 1,060 | | Public Finance Authority of Wisconsin, Revenue Bonds, Roseman University of Health | 4/25 at 100.00 | BB | 1,199,146 |
| | Sciences, Series 2015, 5.875%, 4/01/45 | | | |
| 1,000 | | Public Finance Authority of Wisconsin, Revenue Bonds, SearStone Continuing Care | 6/25 at 104.00 | N/R | 1,034,830 |
| | Retirement Community, Series 2020, 6.000%, 6/01/53, 144A | | | |
| 1,000 | | Public Finance Authority of Wisconsin, Revenue Bonds, SearStone Retirement Community of | 6/22 at 104.00 | N/R | 1,039,510 |
| | Cary North Carolina, Series 2016, 6.000%, 6/01/49, 144A | | | |
| | Public Finance Authority of Wisconsin, Senior Revenue Bonds, Maryland Proton Treatment | | | |
| | Center, Series 2018A-1: | | | |
| 1,000 | | 6.125%, 1/01/33, 144A | 1/28 at 100.00 | N/R | 870,100 |
| 2,000 | | 6.250%, 1/01/38, 144A | 1/28 at 100.00 | N/R | 1,701,920 |
| 3,500 | | 6.375%, 1/01/48, 144A | 1/28 at 100.00 | N/R | 2,911,335 |
| 91 | | Public Finance Authority, Wisconsin, Revenue Bonds, Minnesota College of Osteopathic | 12/28 at 100.00 | N/R | 45,647 |
| | Medicine, Senior Series 2019A-1, 0.000%, 12/01/48, 144A (4) | | | |
| | Wisconsin Health and Educational Facilities Authority, Wisconsin, Revenue Bonds, | | | |
| | Ascension Health Alliance Senior Credit Group, Series 2016A: | | | |
| 1,400 | | 4.000%, 11/15/46 (Pre-refunded 5/15/26) (UB) (6) | 5/26 at 100.00 | N/R (7) | 1,634,010 |
| 3,600 | | 4.000%, 11/15/46 (UB) | 5/26 at 100.00 | AA+ | 3,997,332 |
| 67,499 | | Total Wisconsin | | | 70,491,808 |
| $ 1,973,285 | | Total Municipal Bonds (cost $1,617,560,959) | | | 1,726,579,862 |
122
| | | | | | | |
| Shares | | Description (1) | | | | Value |
| | COMMON STOCKS – 2.1% (1.5% of Total Investments) | | | | |
| | Airlines – 0.4% (0.3% of Total Investments) | | | | |
| 227,514 | | American Airlines Group Inc (9), (10) | | | | $ 4,941,604 |
| | Electric Utilities – 1.7% (1.2% of Total Investments) | | | | |
| 750,823 | | Energy Harbor Corp (10), (11), (12) | | | | 21,633,463 |
|
| Total Common Stocks (cost $27,440,408) | | | | 26,575,067 |
| | | | | | | |
| Principal | | | | | | |
| Amount (000) | | Description (1) | Coupon | Maturity | Ratings (3) | Value |
| | CORPORATE BONDS – 0.7% (0.5% of Total Investments) | | | | |
| | Consumer Discretionary – 0.3% (0.2% of Total Investments) | | | | |
| $ 15,000 | | Mashantucket Western Pequot Tribe, Corporate High Yield Bond (cash 6.350%, | 7.350% | 7/01/26 | N/R | $ 2,662,500 |
| | PIK 1.000%) (4) | | | | |
| | Materials – 0.4% (0.3% of Total Investments) | | | | |
| 5,000 | | United States Steel Corp | 6.650% | 6/01/37 | Caa1 | 5,114,950 |
| | Real Estate – 0.0% (0.0% of Total Investments) | | | | |
| 300 | | Zilkha Biomass Selma LLC (4), (8) | 5.000% | 8/01/28 | N/R | 128,070 |
| 3,170 | | Zilkha Biomass Selma LLC (4), (8) | 10.000% | 8/01/38 | N/R | 32 |
| 3,470 | | Total Real Estate | | | | 128,102 |
| $ 23,470 | | Total Corporate Bonds (cost $11,686,534) | | | | 7,905,552 |
| | Total Long-Term Investments (cost $1,656,687,901) | | | | 1,761,060,481 |
| | Floating Rate Obligations – (34.7)% | | | | (434,618,000) |
| | Adjustable Rate MuniFund Term Preferred Shares, net of deferred offering costs – (20.5)% (13) | | | (256,636,154) |
| | Other Assets Less Liabilities – 14.4% | | | | 181,385,442 |
| | Net Assets Applicable to Common Shares – 100% | | | | $ 1,251,191,769 |
123
| | |
| NMZ | Nuveen Municipal High Income Opportunity Fund |
| Portfolio of Investments (continued) |
| April 30, 2021 (Unaudited) |
| | |
(1) | All percentages shown in the Portfolio of Investments are based on net assets applicable to common shares unless otherwise noted. |
(2) | Optional Call Provisions: Dates (month and year) and prices of the earliest optional call or redemption. There may be other call provisions at varying prices at later dates. Certain mortgage-backed securities may be subject to periodic principal paydowns.
|
(3) | The ratings disclosed are the lowest of Standard & Poor’s Group (“Standard & Poor’s”), Moody’s Investors Service, Inc. (“Moody’s”) or Fitch, Inc. (“Fitch”) rating. Ratings below BBB by Standard & Poor’s, Baa by Moody’s or BBB by Fitch are considered to be below investment grade. Holdings designated N/R are not rated by any of these national rating agencies. |
(4) | Defaulted security. A security whose issuer has failed to fully pay principal and/or interest when due, or is under the protection of bankruptcy. |
(5) | Step-up coupon bond, a bond with a coupon that increases (“steps up”), usually at regular intervals, while the bond is outstanding. The rate shown is the coupon as of the end of the reporting period.
|
(6) | Investment, or portion of investment, has been pledged to collateralize the net payment obligations for investments in inverse floating rate transactions. |
(7) | Backed by an escrow or trust containing sufficient U.S. Government or U.S. Government agency securities, which ensure the timely payment of principal and interest. |
(8) | Investment valued at fair value using methods determined in good faith by, or at the discretion of, the Board. For fair value measurement disclosure purposes, investment classified as Level 3. See Notes to Financial Statements, Note 3 – Investment Valuation and Fair Value Measurements for more information.
|
(9) | On November 28, 2011, AMR Corp. (“AMR”), the parent company of American Airlines Group, Inc. (“AAL”) filed for federal bankruptcy protection. On December 9, 2013, AMR emerged from federal bankruptcy with the acceptance of its reorganization plan by the bankruptcy court. Under the settlement agreement established to meet AMR’s unsecured bond obligations, the bondholders, including the Fund, received a distribution of AAL preferred stock which was converted to AAL common stock over a 120-day period. Every 30 days, a quarter of the preferred stock was converted to AAL common stock based on the 5-day volume-weighted average price and the amount of preferred shares tendered during the optional preferred conversion period. |
(10) | Non-income producing; issuer has not declared an ex-dividend date within the past twelve months. |
(11) | Common Stock received as part of the bankruptcy settlements during February 2020 for Beaver County Industrial Development Authority, Pennsylvania, Pollution Control Revenue Refunding Bonds, FirstEnergy Nuclear Generation Project, Series 2006A, 3.500%, 4/01/41, Beaver County Industrial Development Authority, Pennsylvania, Pollution Control Revenue Refunding Bonds, FirstEnergy Nuclear Generation Project, Series 2006B, 3.500%, 12/01/35, Ohio Air Quality Development Authority, Ohio, Air Quality Development Revenue Bonds, FirstEnergy Generation Corporation Project, Series 2009A, 5.700%, 8/01/20, Ohio Air Quality Development Authority, Ohio, Pollution Control Revenue Bonds, FirstEnergy Generation Corporation Project, Refunding Series 2009B, 3.100%, 3/01/23, Ohio Air Quality Development Authority, Ohio, Pollution Control Revenue Bonds, FirstEnergy Nuclear Generation Project, Refunding Series 2008C, 3.950%, 11/01/32, Ohio Water Development Authority, Pollution Control Revenue Refunding Bonds, FirstEnergy Nuclear Generating Corporation Project, Series 2005B, 4.000%, 1/01/34, Ohio Water Development Authority, Pollution Control Revenue Refunding Bonds, FirstEnergy Nuclear Generating Corporation Project, Series 2006A, 3.000%, 5/15/20, Ohio Water Development Authority, Pollution Control Revenue Refunding Bonds, FirstEnergy Nuclear Generating Corporation Project, Series 2008B, 3.625%, 10/01/33, Ohio Water Development Authority, Pollution Control Revenue Refunding Bonds, FirstEnergy Nuclear Generating Corporation Project, Series 2008C, 3.950%, 11/01/32, Ohio Water Development Authority, Pollution Control Revenue Refunding Bonds, FirstEnergy Nuclear Generating Corporation Project, Series 2010A, 3.750%, 7/01/33, Pennsylvania Economic Development Financing Authority, Exempt Facilities Revenue Bonds, Shippingport Project, First Energy Guarantor, Series 2006A, 2.550%, 11/01/41. |
(12) | For fair value measurement disclosure purposes, investment classified as Level 2. See Notes to Financial Statements, Note 3 – Investment Valuation and Fair Value Measurements for more information.
|
(13) | Adjustable Rate MuniFund Term Preferred Shares, net of deferred offering costs as a percentage of Total Investments is 14.6%. |
AMT | Alternative Minimum Tax. |
IF | Inverse floating rate security issued by a tender option bond (“TOB”) trust, the interest rate on which varies inversely with the Securities Industry Financial Markets Association (SIFMA) short-term rate, which resets weekly, or a similar short-term rate, and is reduced by the expenses related to the TOB trust.
|
PIK | Payment-in-kind (“PIK”) security. Depending on the terms of the security, income may be received in the form of cash, securities, or a combination of both. The PIK rate shown, where applicable, represents the annualized rate of the last PIK payment made by the issuer as of the end of the reporting period.
|
UB | Underlying bond of an inverse floating rate trust reflected as a financing transaction. See Notes to Financial Statements, Note 4 – Portfolio Securities and Investments in Derivatives for more information.
|
WI/DD | Purchased on a when-issued or delayed delivery basis. |
144A | Investment is exempt from registration under Rule 144A of the Securities Act of 1933, as amended. These investments may only be resold in transactions exempt from registration, which are normally those transactions with qualified institutional buyers.
|
See accompanying notes to financial statements.
124
| | |
| NMCO | Nuveen Municipal Credit Opportunities Fund |
| Portfolio of Investments |
| April 30, 2021 (Unaudited) |
| | | | | | |
| Principal | | | Optional Call | | |
| Amount (000) | | Description (1) | Provisions (2) | Ratings (3) | Value |
| | LONG-TERM INVESTMENTS – 154.9% (99.9% of Total Investments) | | | |
|
| | MUNICIPAL BONDS – 151.5% (97.8% of Total Investments) | | | |
|
| | Alabama – 7.0% (4.5% of Total Investments) | | | |
| $ 500 | | Hoover Industrial Development Board, Alabama, Environmental Improvement Revenue Bonds, | No Opt. Call | Caa1 | $ 631,870 |
| | United States Steel Corporation Project, Green Series 2020, 6.375%, 11/01/50 (AMT) | | | |
| | (Mandatory Put 11/01/30) | | | |
| 43,450 | | Hoover Industrial Development Board, Alabama, Environmental Improvement Revenue Bonds, | 10/29 at 100.00 | Caa1 | 50,792,181 |
| | United States Steel Corporation Project, Series 2019, 5.750%, 10/01/49 (AMT) | | | |
| | Tuscaloosa County Industrial Development Authority, Alabama, Gulf Opportunity Zone | | | |
| | Bonds, Hunt Refining Project, Refunding Series 2019A: | | | |
| 500 | | 4.500%, 5/01/32, 144A | 5/29 at 100.00 | N/R | 571,640 |
| 3,500 | | 5.250%, 5/01/44, 144A | 5/29 at 100.00 | N/R | 4,074,805 |
| 47,950 | | Total Alabama | | | 56,070,496 |
| | Alaska – 0.9% (0.5% of Total Investments) | | | |
| | Northern Tobacco Securitization Corporation, Alaska, Tobacco Settlement Asset-Backed | | | |
| | Bonds, Series 2006A: | | | |
| 1,510 | | 5.000%, 6/01/32 | 5/21 at 100.00 | B3 | 1,534,507 |
| 5,195 | | 5.000%, 6/01/46 | 5/21 at 100.00 | B3 | 5,260,301 |
| 6,705 | | Total Alaska | | | 6,794,808 |
| | Arizona – 4.3% (2.8% of Total Investments) | | | |
| 4,000 | | Arizona Industrial Development Authority, Arizona, Education Facility Revenue Bonds, | 7/24 at 101.00 | N/R | 4,228,360 |
| | Leman Academy of Excellence ? East Tucson & Central Tucson Projects, Series 2019A, 5.000%, | | | |
| | 7/01/49, 144A | | | |
| | Arizona Industrial Development Authority, Arizona, Education Revenue Bonds, Academies of | | | |
| | Math & Science Projects, Series 2019: | | | |
| 1,860 | | 5.000%, 7/01/49, 144A | 7/29 at 100.00 | BB | 2,118,689 |
| 1,500 | | 5.000%, 7/01/54, 144A | 7/29 at 100.00 | BB | 1,701,660 |
| 340 | | Arizona Industrial Development Authority, Arizona, Education Revenue Bonds, Pinecrest | 7/28 at 100.00 | BB+ | 363,667 |
| | Academy-Cadence Campus Project, Series 2020A, 4.000%, 7/15/40, 144A | | | |
| 1,000 | | Maricopa County Industrial Development Authority, Arizona, Education Revenue Bonds, | 1/30 at 100.00 | N/R | 1,055,700 |
| | Gateway Academy Project, Series 2019A, 5.750%, 1/01/50, 144A | | | |
| | Maricopa County Industrial Development Authority, Arizona, Education Revenue Bonds, | | | |
| | Legacy Traditional Schools Projects, Taxable Series 2019B: | | | |
| 2,000 | | 5.000%, 7/01/39, 144A | 7/29 at 100.00 | Ba2 | 2,328,360 |
| 5,355 | | 5.000%, 7/01/49, 144A | 7/29 at 100.00 | Ba2 | 6,112,251 |
| 1,525 | | 5.000%, 7/01/54, 144A | 7/29 at 100.00 | Ba2 | 1,734,733 |
| 315 | | Maricopa County Industrial Development Authority, Arizona, Educational Facilities | 10/27 at 103.00 | N/R | 343,158 |
| | Revenue Bonds, Ottawa University Projects, Series 2020, 5.500%, 10/01/51, 144A | | | |
| 600 | | Phoenix Industrial Development Authority, Arizona, Education Facility Revenue Bonds, | 7/25 at 100.00 | BB | 661,866 |
| | Basis Schools, Inc Projects, Series 2016A, 5.000%, 7/01/35, 144A | | | |
| 280 | | Phoenix Industrial Development Authority, Arizona, Education Facility Revenue Bonds, | 9/30 at 100.00 | Ba2 | 304,097 |
| | Northwest Christian School Project, Series 2020A, 5.000%, 9/01/55, 144A | | | |
| 2,700 | | Phoenix Industrial Development Authority, Arizona, Lease Revenue Bonds, Guam Facilities | 2/24 at 100.00 | B+ | 2,810,025 |
| | Foundation, Inc Project, Series 2014, 5.375%, 2/01/41 | | | |
| 3,540 | | Pima County Industrial Development Authority, Arizona, Education Facility Revenue Bonds, | 6/22 at 100.00 | N/R | 3,600,853 |
| | American Leadership Academy Project, Series 2017, 5.000%, 6/15/52, 144A | | | |
| 500 | | Pima County Industrial Development Authority, Arizona, Education Facility Revenue Bonds, | 6/25 at 100.00 | N/R | 528,285 |
| | American Leadership Academy Project, Series 2019, 5.000%, 6/15/52, 144A | | | |
| 1,000 | | Pima County Industrial Development Authority, Arizona, Education Facility Revenue Bonds, | 7/26 at 103.00 | N/R | 1,101,230 |
| | Edkey Charter Schools Project, Series 2019, 5.875%, 7/01/51, 144A | | | |
125
| | |
| NMCO | Nuveen Municipal Credit Opportunities Fund |
| Portfolio of Investments (continued) |
| April 30, 2021 (Unaudited) |
| | | | | | |
| Principal | | | Optional Call | | |
| Amount (000) | | Description (1) | Provisions (2) | Ratings (3) | Value |
| | Arizona (continued) | | | |
| $ 50 | | Pima County Industrial Development Authority, Arizona, Education Facility Revenue Bonds, | 7/26 at 100.00 | N/R | $ 53,194 |
| | Imagine East Mesa Charter Schools Project, Series 2019, 5.000%, 7/01/49, 144A | | | |
| 380 | | Pima County Industrial Development Authority, Arizona, Education Facility Revenue Bonds, | 6/28 at 100.00 | N/R | 397,871 |
| | Synergy Public Charter School Project, Series 2020, 5.250%, 6/15/50, 144A | | | |
| | Tempe Industrial Development Authority, Arizona, Revenue Bonds, Mirabella at ASU | | | |
| | Project, Series 2017A: | | | |
| 2,205 | | 6.000%, 10/01/37, 144A | 10/27 at 100.00 | N/R | 2,418,091 |
| 2,350 | | 6.125%, 10/01/52, 144A | 10/27 at 100.00 | N/R | 2,542,770 |
| 31,500 | | Total Arizona | | | 34,404,860 |
| | Arkansas – 3.7% (2.4% of Total Investments) | | | |
| 27,050 | | Arkansas Development Finance Authority, Industrial Development Revenue Bonds, Big River | 9/26 at 103.00 | B– | 29,583,773 |
| | Steel Project, Series 2019, 4.500%, 9/01/49 (AMT), 144A | | | |
| | California – 6.2% (4.0% of Total Investments) | | | |
| 2,500 | | California Community Housing Agency, California, Essential Housing Revenue Bonds, | 2/30 at 100.00 | N/R | 2,865,275 |
| | Serenity at Larkspur Apartments, Series 2020A, 5.000%, 2/01/50, 144A | | | |
| 1,555 | | California County Tobacco Securitization Agency, Tobacco Settlement Asset-Backed Bonds, | 6/30 at 26.72 | N/R | 304,018 |
| | Los Angeles County Securitization Corporation, Series 2020B-2, 0.000%, 6/01/55 | | | |
| 1,530 | | California Enterprise Development Authority, Charter School Revenue Bonds, Norton | 7/27 at 102.00 | N/R | 1,640,099 |
| | Science and Language Academy Project, Series 2020, 6.250%, 7/01/58, 144A | | | |
| 4,000 | | California Municipal Finance Authority, Revenue Bonds, Simpson University, Series 2020A, | 10/27 at 103.00 | N/R | 4,183,960 |
| | 6.000%, 10/01/50 | | | |
| 2,500 | | California Municipal Finance Authority, Special Facility Revenue Bonds, United Airlines, | No Opt. Call | B+ | 2,882,725 |
| | Inc Los Angeles International Airport Project, Series 2019, 4.000%, 7/15/29 (AMT) | | | |
| 1,385 | | California Public Finance Authority, Charter School Lease Revenue Bonds, California | 7/28 at 100.00 | N/R | 1,465,164 |
| | Crosspoint Academy Project, Series 2020A, 5.125%, 7/01/55, 144A | | | |
| | California School Finance Authority, California, Charter School Revenue Bonds, Encore | | | |
| | Education Obligated Group, Series 2016A: | | | |
| 4,020 | | 5.000%, 6/01/42, 144A | 6/26 at 100.00 | N/R | 3,848,145 |
| 4,380 | | 5.000%, 6/01/52, 144A | 6/26 at 100.00 | N/R | 4,061,486 |
| | California School Finance Authority, Charter School Revenue Bonds, Arts in Action | | | |
| | Charter Schools – Obligated Group, Series 2020A: | | | |
| 1,410 | | 5.000%, 6/01/50, 144A | 6/27 at 100.00 | N/R | 1,545,811 |
| 700 | | 5.000%, 6/01/59, 144A | 6/27 at 100.00 | N/R | 763,791 |
| 1,000 | | California School Finance Authority, Charter School Revenue Bonds, Scholarship Prep | 6/28 at 100.00 | N/R | 1,016,630 |
| | Public Schools ? Obligated Group, Series 2020A, 5.000%, 6/01/60, 144A | | | |
| 2,065 | | California Statewide Communities Development Authority, California, Revenue Bonds, Loma | 12/24 at 100.00 | BB– | 2,313,874 |
| | Linda University Medical Center, Series 2014A, 5.500%, 12/01/54 | | | |
| | California Statewide Communities Development Authority, California, Revenue Bonds, Loma | | | |
| | Linda University Medical Center, Series 2016A: | | | |
| 1,480 | | 5.000%, 12/01/41, 144A | 6/26 at 100.00 | BB– | 1,670,076 |
| 10,090 | | 5.250%, 12/01/56, 144A | 6/26 at 100.00 | BB– | 11,373,347 |
| 1,095 | | California Statewide Communities Development Authority, California, Revenue Bonds, Loma | 6/28 at 100.00 | BB– | 1,298,122 |
| | Linda University Medical Center, Series 2018A, 5.500%, 12/01/58, 144A | | | |
| | California Statewide Community Development Authority, Revenue Bonds, Daughters of | | | |
| | Charity Health System, Series 2005A: | | | |
| 1,045 | | 5.750%, 7/01/24 (4) | 6/21 at 100.00 | N/R | 992,521 |
| 13 | | 5.750%, 7/01/30 (4) | 6/21 at 100.00 | N/R | 12,564 |
| 501 | | 5.750%, 7/01/35 (4) | 6/21 at 100.00 | N/R | 475,845 |
| 820 | | California Statewide Community Development Authority, Revenue Bonds, Daughters of | 6/21 at 100.00 | N/R | 778,941 |
| | Charity Health System, Series 2005G, 5.500%, 7/01/22 (4) | | | |
| 373 | | California Statewide Community Development Authority, Revenue Bonds, Daughters of | 6/21 at 100.00 | N/R | 354,921 |
| | Charity Health System, Series 2005H, 5.750%, 7/01/25 (4) | | | |
| 25,000 | | California Statewide Financing Authority, Tobacco Settlement Asset-Backed Bonds, Pooled | 5/21 at 21.42 | N/R | 5,344,500 |
| | Tobacco Securitization Program, Series 2006A, 0.000%, 6/01/46 | | | |
| 67,462 | | Total California | | | 49,191,815 |
126
| | | | | | |
| Principal | | | Optional Call | | |
| Amount (000) | | Description (1) | Provisions (2) | Ratings (3) | Value |
| | Colorado – 9.0% (5.8% of Total Investments) | | | |
| $ 1,000 | | Broadway Station Metropolitan District 3, Denver City and County, Colorado, General | 6/24 at 103.00 | N/R | $ 1,097,240 |
| | Obligation Limited Tax Bonds, Convertible to Unlimited Series 2019A, 5.000%, 12/01/49 | | | |
| 1,000 | | Broadway Station Metropolitan District 3, Denver City and County, Colorado, General | 6/24 at 79.97 | N/R | 679,830 |
| | Obligation Limited Tax Bonds, Subordinate Convertible to Senior Capital Appreciation Series | | | |
| | 2019B, 7.500%, 12/01/49 | | | |
| 500 | | Colorado Educational and Cultural Facilities Authority, Charter School Revenue Bonds | 10/27 at 100.00 | N/R | 525,800 |
| | World Compass Academy Project, Series 2017, 5.375%, 10/01/37 | | | |
| | Colorado Educational and Cultural Facilities Authority, Charter School Revenue Bonds, | | | |
| | Loveland Classical Schools Project, Series 2016: | | | |
| 530 | | 3.750%, 7/01/26, 144A | No Opt. Call | BB | 550,903 |
| 500 | | 5.000%, 7/01/36, 144A | 7/26 at 100.00 | BB | 551,460 |
| 10,170 | | Colorado Educational and Cultural Facilities Authority, Revenue Bonds, Rocky Mountain | 10/27 at 100.00 | Ba1 | 11,130,150 |
| | Classical Academy Project, Refunding Series 2019, 5.000%, 10/01/59, 144A | | | |
| 12,485 | | Colorado Health Facilities Authority, Colorado, Revenue Bonds, CommonSpirit Health, | 8/29 at 100.00 | BBB+ | 13,246,086 |
| | Series 2019A-2, 3.250%, 8/01/49 | | | |
| 1,000 | | Copper Ridge Metropolitan District, Colorado Springs, Colorado, Tax Increment and Sales | 12/24 at 103.00 | N/R | 1,062,740 |
| | Tax Supported Revenue Bonds, Series 2019, 5.000%, 12/01/39 | | | |
| 14,000 | | Hess Ranch Metropolitan District 6, Parker, Colorado, Limited Tax General Obligation | 3/25 at 93.28 | N/R | 11,000,080 |
| | Bonds, Convertible Capital Appreciation Series 2020A-2, 0.000%, 12/01/49 (5) | | | |
| 5,500 | | Hess Ranch Metropolitan District 6, Parker, Colorado, Limited Tax General Obligation | 3/25 at 103.00 | N/R | 5,994,230 |
| | Bonds, Series 2020A-1, 5.000%, 12/01/49 | | | |
| 1,075 | | Indy Oak Tod Metropolitan District, Lakewood, Jefferson County, Colorado, Limited Tax | 6/25 at 103.00 | N/R | 1,188,735 |
| | General Obligation Bonds, Convertible to Unlimited Tax Series 2020A, 5.500%, 12/01/50, 144A | | | |
| 500 | | Iron Mountain Metropolitan District 2, Windsor, Weld County, Colorado, Limited Tax | 12/24 at 103.00 | N/R | 533,530 |
| | General Obligation Bonds, Refunding & Improvement Series 2019A, 5.000%, 12/01/49 | | | |
| 500 | | Mountain Shadows Metropolitan District, Colorado, General Obligation Limited Tax Bonds, | 12/25 at 100.00 | N/R | 528,925 |
| | Refunding Series 2016, 4.000%, 12/01/26 | | | |
| 1,000 | | North Range Metropolitan District 3, Adams County, Colorado, Limited Tax General | 12/25 at 103.00 | N/R | 1,109,790 |
| | Obligation Bonds, Series 2020A-3, 5.250%, 12/01/50 | | | |
| 515 | | North Vista Highlands Metropolitan District 3, Pueblo County, Colorado, Limited Tax | 3/25 at 103.00 | N/R | 557,637 |
| | General Obligation Bonds, Series 2020, 5.125%, 12/01/49 | | | |
| | Painted Prairie Public Improvement Authority, Aurora, Colorado, Special Revenue Bonds, | | | |
| | Series 2019: | | | |
| 5,000 | | 5.000%, 12/01/39 | 12/24 at 103.00 | N/R | 5,487,550 |
| 5,000 | | 5.000%, 12/01/49 | 12/24 at 103.00 | N/R | 5,439,050 |
| 1,000 | | Palisade Metropolitan District 2, Broomfield County, Colorado, General Obligation | 12/24 at 103.00 | N/R | 1,047,310 |
| | Limited Tax Bonds, Subordinate Series 2019, 7.250%, 12/15/49 | | | |
| 705 | | Penrith Park Metropolitan District, Adams County, Colorado, General Obligation Limited | 12/24 at 103.00 | N/R | 759,200 |
| | Tax Bonds, Series 2019A, 5.000%, 12/01/49 | | | |
| 1,200 | | Sky Ranch Community Authority Board, Arapahoe County, Colorado, Limited Tax Supported | 12/24 at 102.00 | N/R | 1,326,972 |
| | District 1 Revenue Bonds, Senior Series 2019A, 5.000%, 12/01/49 | | | |
| 880 | | Sky Ranch Community Authority Board, Arapahoe County, Colorado, Limited Tax Supported | 12/24 at 102.00 | N/R | 1,015,942 |
| | District 1 Revenue Bonds, Subordinate Series 2019B, 7.625%, 12/15/49 | | | |
| 500 | | STC Metropolitan District 2, Superior, Boulder County, Colorado, Limited Tax General | 12/24 at 103.00 | N/R | 542,480 |
| | Obligation and Special Revenue Bonds, Refunding & improvement Series 2019A, 5.000%, 12/01/49 | | | |
| 760 | | Talon Pointe Metropolitan District, Adams County, Colorado, Limited Tax General Obligation | 12/25 at 103.00 | N/R | 833,690 |
| | Bonds, Convertible to Unlimited Tax Refunding & Improvement Series 2019A, 5.250%, 12/01/51 | | | |
| | Thompson Crossing Metropolitan District 4, Johnstown, Larimer County, Colorado, General | | | |
| | Obligation Bonds, Limited Tax Convertible to Unlimited Tax, Refunding & Improvement Series 2019: | | | |
| 1,400 | | 5.000%, 12/01/39 | 9/24 at 103.00 | N/R | 1,528,296 |
| 2,125 | | 5.000%, 12/01/49 | 9/24 at 103.00 | N/R | 2,289,326 |
| 1,000 | | Ward TOD Metropolitan District 1, Wheat Ridge, Jefferson County, Colorado, Limited Tax | 12/24 at 103.00 | N/R | 1,076,110 |
| | General Obligation Bonds, Convertible to Unlimited Tax Series 2019A, 5.000%, 12/01/49 | | | |
127
| | |
| NMCO | Nuveen Municipal Credit Opportunities Fund |
| Portfolio of Investments (continued) |
| April 30, 2021 (Unaudited) |
| | | | | | |
| Principal | | | Optional Call | | |
| Amount (000) | | Description (1) | Provisions (2) | Ratings (3) | Value |
| | Colorado (continued) | | | |
| $ 1,000 | | Willow Bend Metropolitan District, City of Thornton, Adams County, Colorado, Limited Tax | 9/24 at 103.00 | N/R | $ 1,077,000 |
| | General Obligation Bonds, Convertible to Unlimited Tax Series 2019A, 5.000%, 12/01/49 | | | |
| 70,845 | | Total Colorado | | | 72,180,062 |
| | Connecticut – 0.1% (0.1% of Total Investments) | | | |
| 12,252 | | Mashantucket Western Pequot Tribe, Connecticut, Special Revenue Bonds, Subordinate | No Opt. Call | N/R | 1,041,459 |
| | Series 2013A, 6.050%, 7/01/31 (cash 4.000%, PIK 2.050%) (4) | | | |
| | District of Columbia – 2.6% (1.7% of Total Investments) | | | |
| 87,000 | | District of Columbia Tobacco Settlement Corporation, Tobacco Settlement Asset-Backed | 6/21 at 21.42 | N/R | 18,547,530 |
| | Bonds, Series 2006A, 0.000%, 6/15/46 | | | |
| 2,000 | | District of Columbia, Revenue Bonds, Saint Paul on Fouth Street, Inc, Series 2019A, | 5/30 at 100.00 | N/R | 2,008,520 |
| | 5.250%, 5/15/55, 144A | | | |
| 89,000 | | Total District of Columbia | | | 20,556,050 |
| | Florida – 18.4% (11.9% of Total Investments) | | | |
| | Academical Village Community Development District, Davie, Florida, Special Assessment | | | |
| | Revenue Bonds, Series 2020: | | | |
| 2,000 | | 3.625%, 5/01/40 | 5/30 at 100.00 | N/R | 2,083,820 |
| 1,000 | | 4.000%, 5/01/51 | 5/30 at 100.00 | N/R | 1,047,470 |
| | Cape Coral Health Facilities Authority, Florida, Senior Housing Revenue Bonds, Gulf Care | | | |
| | Inc Project, Series 2015: | | | |
| 4,370 | | 5.875%, 7/01/40, 144A | 7/25 at 100.00 | N/R | 4,665,237 |
| 2,500 | | 6.000%, 7/01/45, 144A | 7/25 at 100.00 | N/R | 2,668,900 |
| | Capital Trust Agency, Florida, Educational Facilities Lease Revenue Bonds, Franklin | | | |
| | Academy Projects, Series 2020: | | | |
| 140 | | 5.000%, 12/15/35, 144A | 7/26 at 100.00 | N/R | 154,690 |
| 100 | | 5.000%, 12/15/50, 144A | 7/26 at 100.00 | N/R | 108,301 |
| 100 | | Capital Trust Agency, Florida, Educational Facilities Revenue Bonds, Imagine School at | 12/30 at 100.00 | Ba1 | 113,639 |
| | Land O’Lakes Project, Series 2020A, 5.000%, 12/15/49, 144A | | | |
| 1,950 | | Capital Trust Agency, Florida, Educational Facilities Revenue Bonds, Pineapple Cove | 1/29 at 100.00 | N/R | 2,188,992 |
| | Classical Academy, Series 2019A, 5.125%, 7/01/39, 144A | | | |
| 1,000 | | Capital Trust Agency, Florida, Revenue Bonds, Provision CARES Proton Therapy Center, | 6/28 at 100.00 | N/R | 380,000 |
| | Orlando Project, Series 2018, 7.500%, 6/01/48, 144A (4), (6) | | | |
| 1,000 | | Capital Trust Agency, Florida, Revenue Bonds, Tuscan Gardens Senior Living Community | 4/22 at 103.00 | N/R | 528,190 |
| | Project, Series 2015A, 7.000%, 4/01/49 (4) | | | |
| | Capital Trust Agency, Florida, Senior Living Facilities Revenue Bonds, Elim Senior | | | |
| | Housing, Inc Project, Series 2017: | | | |
| 1,490 | | 5.625%, 8/01/37, 144A | 8/24 at 103.00 | N/R | 1,347,750 |
| 3,735 | | 5.875%, 8/01/52, 144A | 8/24 at 103.00 | N/R | 3,225,135 |
| 170 | | Cypress Preserve Community Development District, Pasco County, Florida, Special | 11/29 at 100.00 | N/R | 178,146 |
| | Assessment Bonds, Assessment Area 2, Series 2019, 4.125%, 11/01/50 | | | |
| | Epperson North Community Development District, Florida, Capital Improvement Revenue | | | |
| | Bonds, Assessment Area 1, Series 2018A-1: | | | |
| 1,000 | | 5.500%, 11/01/39, 144A | 11/29 at 100.00 | N/R | 1,164,180 |
| 1,000 | | 5.750%, 11/01/49, 144A | 11/29 at 100.00 | N/R | 1,165,750 |
| | Florida Development Finance Corporation, Educational Facilities Revenue Bonds, Miami | | | |
| | Arts Charter School Projects, Series 2014: | | | |
| 165 | | 5.000%, 6/15/24, 144A | No Opt. Call | N/R | 162,012 |
| 2,500 | | 5.875%, 6/15/34, 144A | 6/24 at 100.00 | N/R | 2,381,275 |
| 5,795 | | 6.000%, 6/15/44, 144A | 6/24 at 100.00 | N/R | 5,295,703 |
| | Florida Development Finance Corporation, Educational Facilities Revenue Bonds, Pepin | | | |
| | Academies of Pasco County Inc, Series 2020A: | | | |
| 2,435 | | 5.000%, 1/01/40, 144A | 1/27 at 100.00 | N/R | 2,602,844 |
| 500 | | 5.000%, 1/01/50, 144A | 1/27 at 100.00 | N/R | 528,960 |
| 3,000 | | Florida Development Finance Corporation, Educational Facilities Revenue Bonds, | 6/23 at 100.00 | N/R | 3,358,410 |
| | Renaissance Charter School, Inc Projects, Series 2013A, 8.500%, 6/15/44 | | | |
128
| | | | | | |
| Principal | | | Optional Call | | |
| Amount (000) | | Description (1) | Provisions (2) | Ratings (3) | Value |
| | Florida (continued) | | | |
| $ 1,575 | | Florida Development Finance Corporation, Educational Facilities Revenue Bonds, Southwest | 6/27 at 100.00 | N/R | $ 1,703,457 |
| | Charter Foundation Inc Projects, Series 2017A, 6.000%, 6/15/37, 144A | | | |
| 18,000 | | Florida Development Finance Corporation, Florida, Surface Transportation Facility Revenue | 1/24 at 107.00 | N/R | 18,720,000 |
| | Bonds, Brightline Passenger Rail Project, Green Series 2019B, 7.375%, 1/01/49 (AMT), 144A | | | |
| | Florida Development Finance Corporation, Florida, Surface Transportation Facility | | | |
| | Revenue Bonds, Virgin Trains USA Passenger Rail Project , Series 2019A: | | | |
| 7,535 | | 6.250%, 1/01/49 (AMT) (Mandatory Put 1/01/24), 144A | 6/21 at 103.00 | N/R | 7,566,948 |
| 3,200 | | 6.375%, 1/01/49 (AMT) (Mandatory Put 1/01/26), 144A | 6/21 at 104.00 | N/R | 3,208,928 |
| 40,225 | | 6.500%, 1/01/49 (AMT) (Mandatory Put 1/01/29), 144A | 6/21 at 104.00 | N/R | 40,274,879 |
| 7,000 | | Florida Development Finance Corporation, Student Housing Revenue Bonds, Midtown Campus | 12/23 at 105.00 | N/R | 6,860,000 |
| | Properties LLC Project, Series 2019, 6.875%, 12/01/38, 144A (4) | | | |
| | Greater Orlando Aviation Authority, Florida, Special Purpose Airport Facilities Revenue | | | |
| | Bonds, JetBlue Airways Corporation, Series 2013: | | | |
| 2,500 | | 5.000%, 11/15/26 (AMT) | 5/23 at 100.00 | N/R | 2,664,700 |
| 1,740 | | 5.000%, 11/15/36 (AMT) | 5/23 at 100.00 | N/R | 1,843,704 |
| 1,475 | | Lee County Industrial Development Authority, Florida, Charter School Revenue Bonds, Lee | 6/21 at 100.00 | BB– | 1,476,888 |
| | County Community Charter Schools, Series 2007A, 5.250%, 6/15/27 | | | |
| | Lee County Industrial Development Authority, Florida, Healthcare Facilities Revenue | | | |
| | Bonds, Preserve Project, Series 2017A: | | | |
| 1,000 | | 5.375%, 12/01/32, 144A | 12/22 at 105.00 | N/R | 1,040,620 |
| 1,100 | | 5.625%, 12/01/37, 144A | 12/22 at 105.00 | N/R | 1,142,438 |
| 1,300 | | 5.750%, 12/01/52, 144A | 12/22 at 105.00 | N/R | 1,332,812 |
| 690 | | LT Ranch Community Development District, Sarasota County, Florida, Capital Improvement | 5/30 at 100.00 | N/R | 732,483 |
| | Revenue Bonds, Series 2019, 4.000%, 5/01/40 | | | |
| | Miami Health Facilities Authority, Florida, Health Facilities Revenue Bonds, Miami | | | |
| | Jewish Health System Inc Project, Series 2017: | | | |
| 1,260 | | 5.000%, 7/01/26 | No Opt. Call | BB+ | 1,251,445 |
| 1,000 | | 5.000%, 7/01/27 | No Opt. Call | BB+ | 989,500 |
| 1,410 | | Miami World Center Community Development District, Miami-Dade County, Florida, Special | 11/27 at 100.00 | N/R | 1,574,082 |
| | Assessment Bonds, Series 2017, 5.125%, 11/01/39 | | | |
| 4,935 | | North Springs Improvement District, Broward County, Florida, Special Assessment Bonds, | 5/28 at 100.00 | N/R | 5,537,317 |
| | Area C, Series 2017, 5.000%, 5/01/38 | | | |
| 500 | | Osceola County, Florida, Transportation Revenue Bonds, Osceola Parkway, Refunding & | 10/29 at 40.38 | BBB– | 156,330 |
| | Improvement Capital Appreciation Series 2019A-2, 0.000%, 10/01/54 | | | |
| 100 | | Parker Road Community Development District, Florida, Capital Improvement Revenue Bonds, | 5/30 at 100.00 | N/R | 105,274 |
| | Refunding Series 2020, 3.875%, 5/01/40 | | | |
| 125 | | Portico Community Development District, Lee County, Florida, Special Assessment, | 5/30 at 100.00 | N/R | 128,901 |
| | Refunding Improvement Series 2020-1, 3.500%, 5/01/37 | | | |
| | Seminole County Industrial Development Authority, Florida, Retirement Facility Revenue | | | |
| | Bonds, Legacy Pointe At UCF Project, Series 2019A: | | | |
| 3,970 | | 5.500%, 11/15/49 | 11/26 at 103.00 | N/R | 3,874,998 |
| 2,440 | | 5.750%, 11/15/54 | 11/26 at 103.00 | N/R | 2,444,807 |
| 2,550 | | Three Rivers Community Development District, Florida, Special Assessment Revenue Bonds, | 5/29 at 100.00 | N/R | 2,754,765 |
| | Series 2019A-1, 4.750%, 5/01/50 | | | |
| 1,005 | | Three Rivers Community Development District, Florida, Special Assessment Revenue Bonds, | No Opt. Call | N/R | 1,075,712 |
| | Series 2019A-2, 4.750%, 5/01/29 | | | |
| 1,785 | | Twin Creeks North Community Development District, Florida, Special Assessment Bonds, | 11/31 at 100.00 | N/R | 2,078,686 |
| | Master Infrastructure Improvements, Series 2016A-1, 6.375%, 11/01/47 | | | |
| 500 | | West Villages Improvement District, Florida, Special Assessment Revenue Bonds, Unit of | No Opt. Call | N/R | 522,755 |
| | Development 1, Series 2017, 4.000%, 5/01/27 | | | |
| 900 | | Westside Community Development District, Florida, Special Assessment Revenue Bonds, | 5/29 at 100.00 | N/R | 967,491 |
| | Refunding Series 2019, 4.125%, 5/01/38, 144A | | | |
| 145,770 | | Total Florida | | | 147,379,324 |
129
| | |
| NMCO | Nuveen Municipal Credit Opportunities Fund |
| Portfolio of Investments (continued) |
| April 30, 2021 (Unaudited) |
| | | | | | |
| Principal | | | Optional Call | | |
| Amount (000) | | Description (1) | Provisions (2) | Ratings (3) | Value |
| | Georgia – 2.3% (1.5% of Total Investments) | | | |
| | Atlanta Development Authority, Georgia, Senior Health Care Facilities Revenue Bonds, | | | |
| | Georgia Proton Treatment Center Project, Current Interest Series 2017A-1: | | | |
| $ 1,250 | | 6.500%, 1/01/29 | 1/28 at 100.00 | N/R | $ 810,000 |
| 7,030 | | 6.750%, 1/01/35 | 1/28 at 100.00 | N/R | 4,536,037 |
| 18,430 | | 7.000%, 1/01/40 | 1/28 at 100.00 | N/R | 11,905,780 |
| 441 | | Georgia Local Governments, Certificates of Participation, Georgia Municipal Association, | No Opt. Call | Baa2 | 496,288 |
| | Series 1998A, 4.750%, 6/01/28 – NPFG Insured | | | |
| 850 | | White County Development Authority, Georgia, Revenue Bonds Truett McConnell University, | 10/26 at 103.00 | N/R | 896,555 |
| | Series 2019, 5.125%, 10/01/39 | | | |
| 28,001 | | Total Georgia | | | 18,644,660 |
| | Guam – 0.6% (0.4% of Total Investments) | | | |
| 4,150 | | Guam Government, General Obligation Bonds, Series 2019, 5.000%, 11/15/31 (AMT) | 5/29 at 100.00 | BB– | 4,643,310 |
| | Hawaii – 0.7% (0.4% of Total Investments) | | | |
| 1,150 | | Hawaii Department of Budget and Finance, Special Purpose Revenue Bonds, Chaminade | 1/25 at 100.00 | Ba3 | 1,171,747 |
| | University of Honolulu, Series 2015A, 5.000%, 1/01/45, 144A | | | |
| 4,090 | | Hawaii State Department of Transportation, Special Facility Revenue Bonds, Continental | 6/21 at 100.00 | B+ | 4,104,683 |
| | Airlines Inc, Series 1997, 5.625%, 11/15/27 (AMT) | | | |
| 5,240 | | Total Hawaii | | | 5,276,430 |
| | Illinois – 18.2% (11.8% of Total Investments) | | | |
| | Chicago, Illinois, General Obligation Bonds, Project Series 2011A: | | | |
| 7,075 | | 5.250%, 1/01/35 | 6/21 at 100.00 | Ba1 | 7,090,989 |
| 2,500 | | 5.000%, 1/01/40 | 6/21 at 100.00 | Ba1 | 2,504,825 |
| 2,800 | | Chicago, Illinois, General Obligation Bonds, Refunding Series 2016C, 5.000%, 1/01/38 | 1/26 at 100.00 | BBB– | 3,157,840 |
| | Chicago, Illinois, General Obligation Bonds, Series 2019A: | | | |
| 4,485 | | 5.000%, 1/01/44 | 1/29 at 100.00 | BBB– | 5,286,021 |
| 9,475 | | 5.500%, 1/01/49 | 1/29 at 100.00 | BBB– | 11,431,493 |
| 3,965 | | Chicago, Illinois, General Obligation Bonds, VAribale Rate Demand Series 2007F, 5.500%, 1/01/42 | 1/25 at 100.00 | Ba1 | 4,415,226 |
| 345 | | Evergreen Park, Cook County, Illinois, Sales Tax Revenue Bonds, Evergreen Plaza | 12/29 at 100.00 | N/R | 345,410 |
| | Development Project, Senior Lien Series 2019A, 4.375%, 12/01/36, 144A | | | |
| 11,850 | | Illinois Finance Authority, Revenue Bonds, Admiral at the Lake Project, Refunding Series | 5/24 at 103.00 | N/R | 11,685,048 |
| | 2017, 5.250%, 5/15/54 | | | |
| 5,000 | | Illinois Finance Authority, Student Housing Revenue Bonds, CHF-Collegiate Housing | 7/25 at 100.00 | B– | 4,416,000 |
| | Foundation – Cook LLC Northeastern Illinois University Project, Series 2015A, 5.000%, 7/01/47 | | | |
| 1,000 | | Illinois State, General Obligation Bonds, June Series 2016, 4.000%, 6/01/34 | 6/26 at 100.00 | BBB– | 1,095,780 |
| 4,840 | | Illinois State, General Obligation Bonds, May Series 2018A, 5.000%, 5/01/32 | 5/28 at 100.00 | BBB– | 5,824,843 |
| 890 | | Illinois State, General Obligation Bonds, May Series 2020, 5.500%, 5/01/39 | 5/30 at 100.00 | BBB– | 1,135,925 |
| | Illinois State, General Obligation Bonds, November Series 2017D: | | | |
| 4,600 | | 5.000%, 11/01/28 | 11/27 at 100.00 | BBB– | 5,529,246 |
| 10,000 | | 5.000%, 11/01/28 (UB) (7) | 11/27 at 100.00 | BBB– | 12,020,100 |
| | Illinois State, General Obligation Bonds, November Series 2019C: | | | |
| 15,000 | | 4.000%, 11/01/43 | 11/29 at 100.00 | BBB– | 16,753,800 |
| 4,000 | | 4.000%, 11/01/44 | 11/29 at 100.00 | BBB– | 4,457,320 |
| 3,700 | | Metropolitan Pier and Exposition Authority, Illinois, McCormick Place Expansion Project | 6/22 at 100.00 | BB+ | 3,838,676 |
| | Bonds, Refunding Series 2012A, 5.000%, 6/15/42 – NPFG Insured | | | |
| | Metropolitan Pier and Exposition Authority, Illinois, McCormick Place Expansion Project | | | |
| | Bonds, Refunding Series 2012B: | | | |
| 3,135 | | 0.000%, 12/15/50 | No Opt. Call | BB+ | 1,179,983 |
| 2,500 | | 0.000%, 12/15/51 | No Opt. Call | BB+ | 907,600 |
| | Metropolitan Pier and Exposition Authority, Illinois, McCormick Place Expansion Project | | | |
| | Bonds, Refunding Series 2020A: | | | |
| 6,025 | | 4.000%, 6/15/50 | 12/29 at 100.00 | BB+ | 6,766,015 |
| 7,935 | | 5.000%, 6/15/50 | 12/29 at 100.00 | BB+ | 9,545,408 |
130
| | | | | | |
| Principal | | | Optional Call | | |
| Amount (000) | | Description (1) | Provisions (2) | Ratings (3) | Value |
| | Illinois (continued) | | | |
| | Metropolitan Pier and Exposition Authority, Illinois, McCormick Place Expansion Project | | | |
| | Bonds, Series 2017A: | | | |
| $ 22,000 | | 0.000%, 12/15/56 – BAM Insured | No Opt. Call | AA | $ 7,562,500 |
| 22,500 | | 0.000%, 12/15/56 – AGM Insured | No Opt. Call | A2 | 7,734,375 |
| 4,565 | | 5.000%, 6/15/57 | 12/27 at 100.00 | BB+ | 5,378,392 |
| 10,000 | | Metropolitan Pier and Exposition Authority, Illinois, McCormick Place Expansion Project | No Opt. Call | BB+ | 3,437,500 |
| | Bonds, Series 2017B, 0.000%, 12/15/56 – AGM Insured | | | |
| 500 | | Morton Grove, Illinois, Tax Increment Revenue Bonds, Sawmill Station Redevelopment | 1/26 at 100.00 | N/R | 512,480 |
| | Project, Senior Lien Series 2019, 5.000%, 1/01/39 | | | |
| | Sales Tax Securitization Corporation, Illinois, Sales Tax Securitization Bonds, Second | | | |
| | Lien Series 2020A: | | | |
| 150 | | 4.000%, 1/01/38 | 1/30 at 100.00 | AA– | 174,324 |
| 120 | | 4.000%, 1/01/39 | 1/30 at 100.00 | AA– | 139,094 |
| 1,000 | | Yorkville United City Business District, Illinois, Storm Water and Water Improvement | 5/21 at 100.00 | N/R | 410,000 |
| | Project Revenue Bonds, Series 2007, 4.800%, 1/01/26 (4) | | | |
| 935 | | Yorkville, Illinois, Special Tax Bonds, Special Service Area 2006-113 Cannoball & | 6/21 at 100.00 | N/R | 936,113 |
| | Beecher, Series 2007, 5.750%, 3/01/28 | | | |
| 172,890 | | Total Illinois | | | 145,672,326 |
| | Indiana – 0.8% (0.5% of Total Investments) | | | |
| 140 | | Anderson, Indiana, Multifamily Housing Revenue Bonds, Sweet Galilee at the Wigwam | 1/27 at 102.00 | N/R | 145,189 |
| | Project, Series 2020A, 5.375%, 1/01/40 | | | |
| 3,105 | | Indiana Finance Authority, Educational Facilities Revenue Bonds, Earlham College, | 10/23 at 100.00 | N/R | 3,265,901 |
| | Refunding Series 2013, 5.000%, 10/01/32 | | | |
| 500 | | Indiana Finance Authority, Environmental Improvement Revenue Bonds, United States Steel | 11/30 at 100.00 | Caa1 | 624,765 |
| | Corporation Project, Series 2020, 6.750%, 5/01/39 (AMT) | | | |
| 2,325 | | Valparaiso, Indiana, Exempt Facilities Revenue Bonds, Pratt Paper LLC Project, Series | 1/24 at 100.00 | N/R | 2,616,671 |
| | 2013, 7.000%, 1/01/44 (AMT) | | | |
| 6,070 | | Total Indiana | | | 6,652,526 |
| | Iowa – 2.0% (1.3% of Total Investments) | | | |
| 8,540 | | Iowa Finance Authority, Iowa, Midwestern Disaster Area Revenue Bonds, Alcoa Inc Project, | 8/22 at 100.00 | Ba2 | 8,828,481 |
| | Series 2012, 4.750%, 8/01/42 | | | |
| 1,320 | | Iowa Finance Authority, Iowa, Midwestern Disaster Area Revenue Bonds, Iowa Fertilizer | 12/23 at 100.00 | B+ | 1,447,010 |
| | Company Project, Series 2013, 5.250%, 12/01/25 | | | |
| 4,125 | | Iowa Finance Authority, Iowa, Midwestern Disaster Area Revenue Bonds, Iowa Fertilizer | 12/22 at 103.00 | BB– | 4,483,628 |
| | Company Project, Series 2018A, 5.250%, 12/01/50 (Mandatory Put 12/01/33) | | | |
| 750 | | Iowa Finance Authority, Iowa, Midwestern Disaster Area Revenue Bonds, Iowa Fertilizer | 12/22 at 105.00 | BB– | 829,223 |
| | Company Project, Series 2018B, 5.250%, 12/01/50 (Mandatory Put 12/01/37) | | | |
| 14,735 | | Total Iowa | | | 15,588,342 |
| | Kansas – 0.4% (0.3% of Total Investments) | | | |
| 1,800 | | Overland Park Transportation Development District, Kansas, Sales Tax Revenue Bonds, Oak | 6/21 at 100.00 | BBB | 1,800,792 |
| | Park Mall Project, Series 2010, 5.900%, 4/01/32 | | | |
| 1,365 | | Wyandotte County-Kansas City Unified Government, Kansas, Sales Tax Special Obligation | 9/25 at 100.00 | N/R | 1,379,005 |
| | Bonds, Vacation Village Project Area 1 and 2A, Series 2015, 5.750%, 9/01/32 | | | |
| 3,165 | | Total Kansas | | | 3,179,797 |
| | Louisiana – 1.7% (1.1% of Total Investments) | | | |
| 7,005 | | Louisiana Local Government Environmental Facilities and Community Development Authority, | 11/29 at 100.00 | N/R | 7,296,969 |
| | Louisiana, Revenue Bonds, Jefferson Parish GOMESA Project, Series 2019, 4.000%, 11/01/44, 144A | | | |
| 260 | | Louisiana Public Facilities Authority, Louisiana, Revenue Bonds, Lake Charles College Prep | 6/27 at 100.00 | N/R | 269,209 |
| | Project, Series 2019A, 5.000%, 6/01/58, 144A | | | |
131
| | |
| NMCO | Nuveen Municipal Credit Opportunities Fund |
| Portfolio of Investments (continued) |
| April 30, 2021 (Unaudited) |
| | | | | | |
| Principal | | | Optional Call | | |
| Amount (000) | | Description (1) | Provisions (2) | Ratings (3) | Value |
| | Louisiana (continued) | | | |
| $ 200 | | Saint James Parish, Louisiana, Revenue Bonds, NuStar Logistics, LP Project, Series 2008, | No Opt. Call | BB– | $ 254,402 |
| | 6.100%, 6/01/38 (Mandatory Put 6/01/30), 144A | | | |
| 1,235 | | Saint James Parish, Louisiana, Revenue Bonds, NuStar Logistics, LP Project, Series 2010, | 6/30 at 100.00 | BB– | 1,595,632 |
| | 6.350%, 7/01/40, 144A | | | |
| 800 | | Saint James Parish, Louisiana, Revenue Bonds, NuStar Logistics, LP Project, Series | 6/30 at 100.00 | BB– | 1,033,608 |
| | 2010A, 6.350%, 10/01/40, 144A | | | |
| 695 | | Saint James Parish, Louisiana, Revenue Bonds, NuStar Logistics, LP Project, Series | No Opt. Call | BB– | 884,047 |
| | 2010B, 6.100%, 12/01/40 (Mandatory Put 6/01/30), 144A | | | |
| 1,085 | | Saint James Parish, Louisiana, Revenue Bonds, NuStar Logistics, LP Project, Series 2011, | No Opt. Call | BB– | 1,238,528 |
| | 5.850%, 8/01/41 (Mandatory Put 6/01/25), 144A | | | |
| 975 | | Saint John the Baptist Parish, Louisiana, Revenue Bonds, Marathon Oil Corporation | No Opt. Call | BBB– | 996,362 |
| | Project, Refunding Series 2017A-1, 2.000%, 6/01/37 (Mandatory Put 4/01/23) | | | |
| 12,255 | | Total Louisiana | | | 13,568,757 |
| | Maryland – 0.9% (0.6% of Total Investments) | | | |
| | Baltimore, Maryland, Convention Center Hotel Revenue Bonds, Refunding Series 2017: | | | |
| 1,480 | | 5.000%, 9/01/24 | No Opt. Call | CCC | 1,537,276 |
| 1,000 | | 5.000%, 9/01/39 | 9/27 at 100.00 | CCC | 1,049,640 |
| 680 | | 5.000%, 9/01/46 | 9/27 at 100.00 | CCC | 714,197 |
| 2,000 | | Maryland Economic Development Corporation, Private Activity Revenue Bonds FCP, Purple | 11/21 at 100.00 | B– | 2,050,300 |
| | Line Light Rail Project, Green Bonds, Series 2016B, 5.000%, 9/30/26 (AMT) | | | |
| 2,000 | | Maryland Economic Development Corporation, Private Activity Revenue Bonds RSA, Purple | 11/21 at 100.00 | B– | 2,050,300 |
| | Line Light Rail Project, Green Bonds, Series 2016A, 5.000%, 3/31/24 (AMT) | | | |
| 7,160 | | Total Maryland | | | 7,401,713 |
| | Massachusetts – 1.9% (1.2% of Total Investments) | | | |
| 1,620 | | Lowell, Massachusetts, Collegiate Charter School Revenue Bonds, Series 2019, 5.000%, 6/15/54 | 6/26 at 100.00 | N/R | 1,764,472 |
| | Massachusetts Development Finance Agency Revenue Bonds, Lawrence General Hospital Issue, | | | |
| | Series 2017: | | | |
| 1,000 | | 5.000%, 7/01/37 | 7/27 at 100.00 | B | 968,320 |
| 3,900 | | 5.000%, 7/01/42 | 7/27 at 100.00 | B | 3,712,917 |
| 9,500 | | 5.000%, 7/01/47 | 7/27 at 100.00 | B | 8,946,910 |
| 16,020 | | Total Massachusetts | | | 15,392,619 |
| | Michigan – 0.5% (0.3% of Total Investments) | | | |
| 40 | | Advanced Technology Academy, Michigan, Public School Academy Revenue Bonds, Refunding | 11/27 at 102.00 | BB | 43,924 |
| | Series 2019, 5.000%, 11/01/44 | | | |
| 74,130 | | Michigan Tobacco Settlement Finance Authority, Tobacco Settlement Asset-Backed Revenue | 6/33 at 11.41 | N/R | 3,752,461 |
| | Bonds, Capital Appreciation Turbo Term Series 2008C, 0.000%, 6/01/58 | | | |
| 74,170 | | Total Michigan | | | 3,796,385 |
| | Minnesota – 0.7% (0.5% of Total Investments) | | | |
| 500 | | Bethel, Minnesota Charter School Lease Revenue Bonds, Partnership Academy Project, | 7/26 at 102.00 | N/R | 538,275 |
| | Series 2018A, 5.000%, 7/01/53 | | | |
| 1,300 | | Brooklyn Park, Minnesota, Charter School Lease Revenue Bonds, Athlos Leadership Academy | 7/25 at 100.00 | N/R | 1,393,483 |
| | Project, Series 2015A, 5.750%, 7/01/46 | | | |
| 2,440 | | Columbia Heights, Minnesota, Charter School Lease Revenue Bonds, Prodeo Academy Project, | 7/27 at 102.00 | N/R | 2,605,651 |
| | Series 2019A, 5.000%, 7/01/54 | | | |
| 130 | | Minneapolis, Minnesota, Charter School Lease Revenue Bonds, Friendship Academy of the | 12/27 at 100.00 | N/R | 138,922 |
| | Arts Project, Series 2019A, 5.250%, 12/01/52, 144A | | | |
| 30 | | Minneapolis, Minnesota, Charter School Lease Revenue Bonds, Northeast College Prep | 7/30 at 100.00 | N/R | 32,907 |
| | Project, Series 2020A, 5.000%, 7/01/40 | | | |
| 1,000 | | Scanlon, Minnesota, Health Care Facilities Revenue Bonds, Duluth Health Services | 3/25 at 101.00 | N/R | 898,200 |
| | Project, Refunding Series 2020, 3.950%, 3/01/50 | | | |
| 5,400 | | Total Minnesota | | | 5,607,438 |
132
| | | | | | |
| Principal | | | Optional Call | | |
| Amount (000) | | Description (1) | Provisions (2) | Ratings (3) | Value |
| | Missouri – 0.0% (0.0% of Total Investments) | | | |
| $ 315 | | Boone County, Missouri, Hospital Revenue Bonds, Boone Hospital Center, Refunding Series | 8/26 at 100.00 | Ba1 | $ 325,590 |
| | 2016, 4.000%, 8/01/38 | | | |
| | Nevada – 3.3% (2.1% of Total Investments) | | | |
| 9,385 | | Director of Nevada State Department of Business & Industry, Environmental Improvement Revenue | 8/28 at 100.00 | N/R | 9,658,385 |
| | Bonds, Fulcrum Sierra BioFuels LLC Project, Green Series 2018, 6.950%, 2/15/38 (AMT), 144A | | | |
| 2,000 | | Director of Nevada State Department of Business & Industry, Environmental Improvement | 2/31 at 100.00 | N/R | 2,022,520 |
| | Revenue Bonds, Fulcrum Sierra BioFuels LLC Project, Green Series 2020, 6.750%, 2/15/38, 144A | | | |
| | Director of Nevada State Department of Business & Industry, Environmental Improvement | | | |
| | Revenue Bonds, Fulcrum Sierra BioFuels LLC Project, Series 2017: | | | |
| 2,400 | | 5.875%, 12/15/27 (AMT), 144A | No Opt. Call | N/R | 2,429,640 |
| 340 | | 6.250%, 12/15/37 (AMT), 144A | 12/27 at 100.00 | N/R | 336,508 |
| 2,750 | | Director of Nevada State Department of Business & Industry, Environmental Improvement | 8/29 at 100.00 | N/R | 2,556,758 |
| | Revenue Bonds, Fulcrum Sierra Holdings LLC, Green Series 2019, 5.750%, 2/15/38 (AMT), 144A | | | |
| 56,000 | | Reno, Nevada, Subordinate Lien Sales Tax Revenue Refunding Capital Appreciation Bonds, | 7/38 at 31.26 | N/R | 9,140,320 |
| | ReTrac-Reno Transportation Rail Access Corridor Project, Series 2018C, 0.000%, 7/01/58, 144A | | | |
| 72,875 | | Total Nevada | | | 26,144,131 |
| | New Hampshire – 0.1% (0.0% of Total Investments) | | | |
| 470 | | National Finance Authority, New Hampshire, Resource Recovery Revenue Bonds, Covanta | 7/23 at 100.00 | B | 493,091 |
| | Project, Refunding Series 2018C, 4.875%, 11/01/42 (AMT), 144A | | | |
| | New Jersey – 4.1% (2.6% of Total Investments) | | | |
| 4,000 | | New Jersey Economic Development Authority Revenue Bonds, Black Horse EHT Urban Renewal | 10/27 at 102.00 | N/R | 4,018,880 |
| | LLC Project, Series 2019A, 5.000%, 10/01/39, 144A | | | |
| 1,500 | | New Jersey Economic Development Authority, Fixed Rate Revenue Bonds, Lions Gate Project, | 1/24 at 100.00 | N/R | 1,516,245 |
| | Series 2014, 5.000%, 1/01/34 | | | |
| 5,475 | | New Jersey Economic Development Authority, Revenue Bonds, White Horse HMT Urban Renewal | 1/28 at 102.00 | N/R | 5,480,749 |
| | LLC Project, Series 2020, 5.000%, 1/01/40, 144A | | | |
| 7,500 | | New Jersey Economic Development Authority, Special Facilities Revenue Bonds, Continental | 9/22 at 100.00 | B | 7,802,400 |
| | Airlines Inc, Refunding Series 2012, 5.750%, 9/15/27 (AMT) | | | |
| 2,500 | | New Jersey Economic Development Authority, Special Facilities Revenue Bonds, Continental | 8/22 at 101.00 | B+ | 2,653,675 |
| | Airlines Inc, Series 1999, 5.250%, 9/15/29 (AMT) | | | |
| 15,000 | | New Jersey Transportation Trust Fund Authority, Transportation System Bonds, Series | No Opt. Call | BBB | 9,059,400 |
| | 2009A, 0.000%, 12/15/39 (UB) (7) | | | |
| | South Jersey Port Corporation, New Jersey, Marine Terminal Revenue Bonds, Subordinate | | | |
| | Series 2017B: | | | |
| 1,260 | | 5.000%, 1/01/37 (AMT) | 1/28 at 100.00 | Baa1 | 1,482,680 |
| 500 | | 5.000%, 1/01/42 (AMT) | 1/28 at 100.00 | Baa1 | 582,345 |
| 37,735 | | Total New Jersey | | | 32,596,374 |
| | New Mexico – 1.4% (0.9% of Total Investments) | | | |
| 9,500 | | New Mexico Hospital Equipment Loan Council, Hospital Revenue Bonds, Presbyterian | 8/29 at 100.00 | Aa3 | 9,994,665 |
| | Healthcare Services, Series 2019A, 3.000%, 8/01/48 | | | |
| 825 | | Winrock Town Center Tax Increment Development District 1, Albuquerque, New Mexico, Gross | 11/23 at 103.00 | N/R | 844,082 |
| | Receipts Tax Increment Bonds, Subordinate Lien Series 2020, 8.000%, 5/01/40, 144A | | | |
| 10,325 | | Total New Mexico | | | 10,838,747 |
| | New York – 12.0% (7.7% of Total Investments) | | | |
| 950 | | Build New York City Resource Corporation, New York, Revenue Bonds, Metropolitan College | 11/24 at 100.00 | BB | 1,037,495 |
| | of New York, Series 2014, 5.250%, 11/01/34 | | | |
| 1,140 | | Build NYC Resource Corporation, New York, Revenue Bonds, Albert Einstein College of | 9/25 at 100.00 | N/R | 1,264,499 |
| | Medicine, Inc, Series 2015, 5.500%, 9/01/45, 144A | | | |
| 2,910 | | Build NYC Resource Corporation, New York, Revenue Bonds, Family Life Academy Charter | 12/30 at 100.00 | N/R | 2,970,644 |
| | School, Series 2020A-1, 5.500%, 6/01/55, 144A | | | |
133
| | |
| NMCO | Nuveen Municipal Credit Opportunities Fund |
| Portfolio of Investments (continued) |
| April 30, 2021 (Unaudited) |
| | | | | | |
| Principal | | | Optional Call | | |
| Amount (000) | | Description (1) | Provisions (2) | Ratings (3) | Value |
| | New York (continued) | | | |
| $ 1,590 | | Build NYC Resource Corporation, New York, Revenue Bonds, Family Life Academy Charter | 12/30 at 100.00 | N/R | $ 1,654,999 |
| | School, Series 2020C-1, 5.000%, 6/01/55, 144A | | | |
| 450 | | Dormitory Authority of the State of New York, Revenue Bonds, Montefiore Obligated Group, | 8/28 at 100.00 | Baa3 | 508,590 |
| | Series 2018A, 4.000%, 8/01/38 | | | |
| 36,150 | | Erie County Tobacco Asset Securitization Corporation, New York, Tobacco Settlement | 6/21 at 5.35 | N/R | 1,714,233 |
| | Asset-Backed Bonds, Series 2006A, 0.000%, 6/01/60, 144A | | | |
| 650 | | Hempstead Town Local Development Corporation, New York, Education Revenue Bonds, The | 2/30 at 100.00 | N/R | 754,592 |
| | Academy Charter School Project, Series 2020A, 5.730%, 2/01/50 | | | |
| 1,570 | | Metropolitan Transportation Authority, New York, Transportation Revenue Bonds, Green | 5/30 at 100.00 | BBB+ | 1,952,688 |
| | Climate Bond Certified Series 2020C-1, 5.250%, 11/15/55 | | | |
| 5,000 | | Metropolitan Transportation Authority, New York, Transportation Revenue Bonds, Series | 11/23 at 100.00 | BBB+ | 5,501,250 |
| | 2014A-1, 5.250%, 11/15/39 (UB) (7) | | | |
| 5,900 | | New York City, New York, General Obligation Bonds, Fiscal 2021 Series C, 4.000%, 8/01/39 (UB) (7) | 8/30 at 100.00 | AA– | 6,974,036 |
| 12,500 | | New York Liberty Development Corporation, New York, Liberty Revenue Bonds, 3 World Trade | 11/24 at 100.00 | N/R | 13,682,500 |
| | Center Project, Class 1 Series 2014, 5.000%, 11/15/44, 144A | | | |
| | New York Liberty Development Corporation, New York, Liberty Revenue Bonds, 3 World Trade | | | |
| | Center Project, Class 2 Series 2014: | | | |
| 3,235 | | 5.150%, 11/15/34, 144A | 11/24 at 100.00 | N/R | 3,615,824 |
| 6,960 | | 5.375%, 11/15/40, 144A | 11/24 at 100.00 | N/R | 7,769,378 |
| | New York Transportation Development Corporation, New York, Special Facility Revenue Bonds, | | | |
| | American Airlines, Inc John F Kennedy International Airport Project, Refunding Series 2016: | | | |
| 2,410 | | 5.000%, 8/01/21 (AMT) | No Opt. Call | B– | 2,436,679 |
| 8,170 | | 5.000%, 8/01/26 (AMT) | 8/21 at 100.00 | B– | 8,256,275 |
| 3,000 | | 5.000%, 8/01/31 (AMT) | 8/21 at 100.00 | B– | 3,030,600 |
| 875 | | New York Transportation Development Corporation, New York, Special Facility Revenue | 8/30 at 100.00 | B– | 1,082,209 |
| | Bonds, American Airlines, Inc John F Kennedy International Airport Project, Series 2020, | | | |
| | 5.375%, 8/01/36 (AMT) | | | |
| | New York Transportation Development Corporation, Special Facility Revenue Bonds, Delta | | | |
| | Air Lines, Inc – LaGuardia Airport Terminals C&D Redevelopment Project, Series 2020: | | | |
| 2,450 | | 5.000%, 10/01/40 (AMT) | 10/30 at 100.00 | BB+ | 3,076,171 |
| 2,775 | | 4.375%, 10/01/45 (AMT) | 10/30 at 100.00 | BB+ | 3,252,411 |
| | Syracuse Industrial Development Authority, New York, PILOT Revenue Bonds, Carousel | | | |
| | Center Project, Refunding Series 2016A: | | | |
| 2,950 | | 5.000%, 1/01/32 (AMT) | 1/26 at 100.00 | B3 | 2,968,054 |
| 3,000 | | 5.000%, 1/01/33 (AMT) | 1/26 at 100.00 | B3 | 3,015,870 |
| 2,500 | | 5.000%, 1/01/35 (AMT) | 1/26 at 100.00 | B3 | 2,506,000 |
| 2,775 | | 5.000%, 1/01/36 (AMT) | 1/26 at 100.00 | B3 | 2,779,357 |
| 12,700 | | TSASC Inc, New York, Tobacco Asset-Backed Bonds, Series 2006, 5.000%, 6/01/48 | 6/27 at 100.00 | N/R | 13,784,707 |
| 122,610 | | Total New York | | | 95,589,061 |
| | Ohio – 9.6% (6.2% of Total Investments) | | | |
| 89,235 | | Buckeye Tobacco Settlement Financing Authority, Ohio, Tobacco Settlement Asset-Backed | 6/30 at 22.36 | N/R | 13,929,583 |
| | Revenue Bonds, Refunding Senior Lien Capital Appreciation Series 2020B-3 Class 2, | | | |
| | 0.000%, 6/01/57 | | | |
| 325 | | Buckeye Tobacco Settlement Financing Authority, Ohio, Tobacco Settlement Asset-Backed | 6/30 at 100.00 | BBB+ | 334,116 |
| | Revenue Bonds, Refunding Senior Lien Series 2020A-2 Class 1, 3.000%, 6/01/48 | | | |
| 16,325 | | Buckeye Tobacco Settlement Financing Authority, Ohio, Tobacco Settlement Asset-Backed | 6/30 at 100.00 | N/R | 18,352,075 |
| | Revenue Bonds, Refunding Senior Lien Series 2020B-2 Class 2, 5.000%, 6/01/55 | | | |
| | Butler County Port Authority, Ohio, Public Infrastructure Revenue Bonds, Liberty Center | | | |
| | Project, Liberty Community Authority, Series 2014C: | | | |
| 535 | | 5.000%, 12/01/24 | 12/22 at 100.00 | N/R | 545,909 |
| 1,000 | | 5.750%, 12/01/34 | 12/22 at 100.00 | N/R | 1,011,780 |
| 1,000 | | 6.000%, 12/01/43 | 12/22 at 100.00 | N/R | 1,011,900 |
134
| | | | | | |
| Principal | | | Optional Call | | |
| Amount (000) | | Description (1) | Provisions (2) | Ratings (3) | Value |
| | Ohio (continued) | | | |
| $ 7,610 | | Cleveland, Ohio, Airport Special Revenue Bonds, Continental Airlines Inc Project, Series | 6/21 at 100.00 | B | $ 7,635,950 |
| | 1998, 5.375%, 9/15/27 (AMT) | | | |
| | Evans Farm New Community Authority, Ohio, Community Development Charge Revenue Bonds, | | | |
| | Evans Farm Mixed-Use Project, Series 2020: | | | |
| 2,170 | | 3.750%, 12/01/38 | 6/29 at 100.00 | N/R | 2,240,156 |
| 140 | | 4.000%, 12/01/46 | 6/29 at 100.00 | N/R | 143,538 |
| 5,000 | | Franklin County Convention Facilities Authority, Ohio, Hotel Project Revenue Bonds, | 12/29 at 100.00 | BBB– | 5,801,500 |
| | Greater Columbus Convention Center Hotel Expansion Project, Series 2019, 5.000%, 12/01/51 | | | |
| 940 | | Hilliard Hickory Chase Community Authority, Ohio, Infrastructure Improvement Revenue | 12/29 at 100.00 | N/R | 1,014,345 |
| | Bonds, Hickory Chase Project, Senior Series 2019A, 5.000%, 12/01/40, 144A | | | |
| 5,020 | | Ohio Air Quality Development Authority, Ohio, Air Quality Development Revenue Bonds, | No Opt. Call | N/R | 6,275 |
| | FirstEnergy Generation Corporation Project, Series 2009A, 5.700%, 8/01/21 (4) | | | |
| 14,950 | | Ohio Air Quality Development Authority, Ohio, Exempt Facilities Revenue Bonds, AMG | 7/29 at 100.00 | B– | 16,562,357 |
| | Vanadium Project, Series 2019, 5.000%, 7/01/49 (AMT), 144A | | | |
| 2,085 | | Ohio Air Quality Development Authority, Ohio, Pollution Control Revenue Bonds, | No Opt. Call | N/R | 2,606 |
| | FirstEnergy Generation Corporation Project, Refunding Series 2009B, 3.100%, 3/01/23 (4) | | | |
| 4,140 | | Ohio Air Quality Development Authority, Ohio, Pollution Control Revenue Bonds, | No Opt. Call | N/R | 5,175 |
| | FirstEnergy Generation Project, Refunding Series 2006A, 3.750%, 12/01/23 (4) | | | |
| 2,895 | | Ohio Air Quality Development Authority, Ohio, Pollution Control Revenue Bonds, FirstEnergy | No Opt. Call | N/R | 2,980,402 |
| | Nuclear Generation Project, Refunding Series 2009A, 4.375%, 6/01/33 (Mandatory | | | |
| | Put 6/01/22) | | | |
| 2,000 | | Ohio Air Quality Development Authority, Ohio, Revenue Bonds, AK Steel Holding | 2/22 at 100.00 | CCC | 2,045,400 |
| | Corporation, Refunding Series 2012A, 6.750%, 6/01/24 (AMT) | | | |
| 2,470 | | Ohio Water Development Authority, Pollution Control Revenue Bonds, FirstEnergy | No Opt. Call | N/R | 3,088 |
| | Generating Corporation Project, Refunding Series 2006A, 3.000%, 5/15/49 (4) | | | |
| 2,000 | | Ohio Water Development Authority, Pollution Control Revenue Bonds, FirstEnergy Nuclear | No Opt. Call | N/R | 2,500 |
| | Generating Corporation Project, Refunding Series 2010C, 4.000%, 6/01/33 (4) | | | |
| 2,510 | | Ohio Water Development Authority, Pollution Control Revenue Refunding Bonds, FirstEnergy | No Opt. Call | N/R | 3,138 |
| | Nuclear Generating Corporation Project, Series 2006B, 4.000%, 12/01/33 (4) | | | |
| 2,015 | | Ohio Water Development Authority, Pollution Control Revenue Refunding Bonds, FirstEnergy | No Opt. Call | N/R | 2,074,443 |
| | Nuclear Generating Corporation Project, Series 2010B, 4.375%, 6/01/33 (Mandatory Put 6/01/22) | | | |
| 1,000 | | Port of Greater Cincinnati Development Authority, Ohio, Special Obligation Tax Increment | 11/30 at 100.00 | N/R | 1,013,920 |
| | Financing Revenue Bonds, Cooperative Township Public Parking Project, Gallery at Kenwood, | | | |
| | Senior Lien Series 2019A, 5.000%, 11/01/51 | | | |
| 165,365 | | Total Ohio | | | 76,720,156 |
| | Oklahoma – 0.9% (0.6% of Total Investments) | | | |
| 2,475 | | Tulsa Municipal Airport Trust, Oklahoma, Revenue Bonds, American Airlines Inc, Refunding | 6/23 at 100.00 | N/R | 2,661,491 |
| | Series 2000B, 5.500%, 6/01/35 (AMT) | | | |
| 860 | | Tulsa Municipal Airport Trust, Oklahoma, Revenue Bonds, American Airlines Inc, Refunding | 6/23 at 100.00 | N/R | 924,801 |
| | Series 2001B, 5.500%, 12/01/35 (AMT) | | | |
| 3,475 | | Tulsa Municipal Airport Trust, Oklahoma, Revenue Bonds, American Airlines Inc, Refunding | 6/25 at 100.00 | B– | 3,885,120 |
| | Series 2015, 5.000%, 6/01/35 (AMT) (Mandatory Put 6/01/25) | | | |
| 6,810 | | Total Oklahoma | | | 7,471,412 |
| | Oregon – 0.0% (0.0% of Total Investments) | | | |
| 100 | | Oregon Facilities Authority, Revenue Bonds, Metro East Web Academy Project, Series | 6/27 at 102.00 | N/R | 107,564 |
| | 2019A, 5.000%, 6/15/49, 144A | | | |
| | Pennsylvania – 7.0% (4.5% of Total Investments) | | | |
| 600 | | Allegheny Country Industrial Development Authority, Pennsylvania, Environmental | 12/21 at 100.00 | Caa1 | 616,512 |
| | Improvement Revenue Bonds, United States Steel Corporation Project, Refunding Series 2011, | | | |
| | 6.750%, 12/01/27 | | | |
135
| | |
| NMCO | Nuveen Municipal Credit Opportunities Fund |
| Portfolio of Investments (continued) |
| April 30, 2021 (Unaudited) |
| | | | | | |
| Principal | | | Optional Call | | |
| Amount (000) | | Description (1) | Provisions (2) | Ratings (3) | Value |
| | Pennsylvania (continued) | | | |
| $ 1,125 | | Allegheny Country Industrial Development Authority, Pennsylvania, Environmental | 8/22 at 100.00 | Caa1 | $ 1,165,444 |
| | Improvement Revenue Bonds, United States Steel Corporation Project, Series 2012, 5.750%, | | | |
| | 8/01/42 (AMT) | | | |
| | Allegheny County Industrial Development Authority, Pennsylvania, Environmental | | | |
| | Improvement Revenue Bonds, United States Steel Corp, Refunding Series 2019: | | | |
| 5,970 | | 4.875%, 11/01/24 | No Opt. Call | Caa1 | 6,512,255 |
| 6,995 | | 5.125%, 5/01/30 | No Opt. Call | Caa1 | 8,093,145 |
| 355 | | Allentown Neighborhood Improvement Zone Development Authority, Pennsylvania, Tax Revenue | 5/31 at 100.00 | N/R | 442,657 |
| | Bonds, 615 Waterfront Project, Senior Series 2021, 6.000%, 5/01/42, 144A | | | |
| | Beaver County Industrial Development Authority, Pennsylvania, Pollution Control Revenue | | | |
| | Bonds, FirstEnergy Generation Project, Refunding Series 2006A: | | | |
| 3,300 | | 4.375%, 1/01/35 (Mandatory Put 7/01/22) | No Opt. Call | N/R | 3,398,076 |
| 560 | | 3.500%, 4/01/41 (4) | No Opt. Call | N/R | 700 |
| 1,440 | | Beaver County Industrial Development Authority, Pennsylvania, Pollution Control Revenue | No Opt. Call | N/R | 1,800 |
| | Bonds, FirstEnergy Nuclear Generation Project, Refunding Series 2005A, 4.000%, 1/01/35 (4) | | | |
| 1,025 | | Beaver County Industrial Development Authority, Pennsylvania, Pollution Control Revenue | No Opt. Call | N/R | 1,281 |
| | Bonds, FirstEnergy Nuclear Generation Project, Refunding Series 2008A, 2.700%, 4/01/35 (4) | | | |
| 5,355 | | Beaver County Industrial Development Authority, Pennsylvania, Pollution Control Revenue | No Opt. Call | N/R | 6,694 |
| | Bonds, FirstEnergy Nuclear Generation Project, Series 2006B, 3.500%, 12/01/35 (4) | | | |
| 1,555 | | Beaver County Industrial Development Authority, Pennsylvania, Pollution Control Revenue | 4/31 at 100.00 | N/R | 1,634,336 |
| | Refunding Bonds, FirstEnergy Generation Project, Series 2008B, 3.750%, 10/01/47 (Mandatory | | | |
| | Put 4/01/21) | | | |
| 2,565 | | Berks County Municipal Authority, Pennsylvania, Revenue Bonds, Alvernia University | 10/29 at 100.00 | BB+ | 2,746,525 |
| | Project, Series 2020, 5.000%, 10/01/49 | | | |
| 3,100 | | Berks County Municipal Authority, Pennsylvania, Revenue Bonds, Reading Hospital & | 5/22 at 100.00 | B+ | 3,107,874 |
| | Medical Center Project, Series 2012A, 5.000%, 11/01/44 | | | |
| 1,000 | | Chester County Health and Education Facilities Authority, Pennsylvania, Revenue Bonds, | 12/25 at 100.00 | N/R | 1,038,850 |
| | Simpson Senior Services Project, Series 2015A, 5.000%, 12/01/30 | | | |
| | Chester County Industrial Development Authority, Pennsylvania, Revenue Bonds, Collegium | | | |
| | Charter School Project, Series 2017A: | | | |
| 1,870 | | 5.125%, 10/15/37 | 4/27 at 100.00 | BB | 2,108,818 |
| 3,250 | | 5.250%, 10/15/47 | 4/27 at 100.00 | BB | 3,626,772 |
| | Cumberland County Municipal Authority, Pennsylvania, Revenue Bonds, Asbury Pennsylvania | | | |
| | Obligated Group, Refunding Series 2019: | | �� | |
| 2,160 | | 5.000%, 1/01/39 | 1/25 at 104.00 | N/R | 2,382,005 |
| 1,240 | | 5.000%, 1/01/45 | 1/25 at 104.00 | N/R | 1,357,391 |
| 3,555 | | Dauphin County General Authority, Pennsylvania, Revenue Bonds, Harrisburg University of | 10/28 at 100.00 | BB | 3,769,402 |
| | Science & Technology Project, Series 2020, 6.250%, 10/15/53, 144A | | | |
| 1,720 | | Pennsylvania Economic Development Financing Authority, Exempt Facilities Revenue Bonds, | 6/30 at 100.00 | N/R | 1,850,290 |
| | KDC Agribusiness Fairless Hills LLC Project, Series 2020A-1, 10.000%, 12/01/40, 144A | | | |
| 1,720 | | Pennsylvania Economic Development Financing Authority, Exempt Facilities Revenue Bonds, | 6/30 at 100.00 | N/R | 1,850,290 |
| | KDC Agribusiness Fairless Hills LLC Project, Series 2020A-2, 10.000%, 12/01/40 (AMT), 144A | | | |
| 9,220 | | Pennsylvania Economic Development Financing Authority, Exempt Facilities Revenue | 9/25 at 100.00 | CCC+ | 8,340,043 |
| | Refunding Bonds, PPL Energy Supply, LLC Project, Series 2009A, 6.400%, 12/01/38 | | | |
| 1,025 | | Pennsylvania Higher Educational Facilities Authority, Revenue Bonds, University of the | 11/25 at 100.00 | BBB | 1,192,372 |
| | Sciences in Philadelphia, Series 2015A, 5.000%, 11/01/27 | | | |
| 545 | | Philadelphia Authority for Industrial Development, Pennsylvania, Revenue Bonds, Mariana | 12/27 at 100.00 | N/R | 582,752 |
| | Bracetti Academy Project, Series 2020A, 5.375%, 6/15/50, 144A | | | |
| 61,250 | | Total Pennsylvania | | | 55,826,284 |
| | Puerto Rico – 12.3% (8.0% of Total Investments) | | | |
| 2,500 | | Puerto Rico Aqueduct and Sewerage Authority, Revenue Bonds, Refunding Senior Lien Series | 7/30 at 100.00 | N/R | 2,927,750 |
| | 2020A, 5.000%, 7/01/47, 144A | | | |
136
| | | | | | |
| Principal | | | Optional Call | | |
| Amount (000) | | Description (1) | Provisions (2) | Ratings (3) | Value |
| | Puerto Rico (continued) | | | |
| | Puerto Rico Aqueduct and Sewerage Authority, Revenue Bonds, Senior Lien Series 2012A: | | | |
| $ 405 | | 5.000%, 7/01/21 | No Opt. Call | CCC | $ 408,609 |
| 2,415 | | 5.000%, 7/01/33 | 7/22 at 100.00 | CCC | 2,548,767 |
| 2,085 | | 6.000%, 7/01/47 | 7/22 at 100.00 | CCC | 2,225,195 |
| | Puerto Rico Electric Power Authority, Power Revenue Bonds, Refunding Series 2012A: | | | |
| 2,070 | | 3.957%, 7/01/29 (4) | 7/22 at 100.00 | D | 1,919,925 |
| 3,170 | | 3.957%, 7/01/42 (4) | 7/22 at 100.00 | D | 2,940,175 |
| 1,000 | | 3.961%, 7/01/42 (4) | 7/22 at 100.00 | D | 927,500 |
| | Puerto Rico Electric Power Authority, Power Revenue Bonds, Series 2007TT: | | | |
| 130 | | 3.957%, 7/01/21 (4) | 6/21 at 100.00 | D | 120,575 |
| 3,750 | | 3.957%, 7/01/26 (4) | 6/21 at 100.00 | D | 3,478,125 |
| 310 | | 3.957%, 7/01/32 (4) | 6/21 at 100.00 | D | 287,525 |
| 1,860 | | 3.957%, 7/01/37 (4) | 6/21 at 100.00 | D | 1,725,150 |
| 1,750 | | Puerto Rico Electric Power Authority, Power Revenue Bonds, Series 2007VV, 5.250%, | No Opt. Call | D | 1,958,635 |
| | 7/01/32 – NPFG Insured | | | |
| | Puerto Rico Electric Power Authority, Power Revenue Bonds, Series 2010AAA: | | | |
| 1,124 | | 3.978%, 7/01/28 (4) | 6/21 at 100.00 | D | 1,045,320 |
| 468 | | 3.978%, 7/01/29 (4) | 6/21 at 100.00 | D | 435,240 |
| 346 | | 3.978%, 7/01/31 (4) | 6/21 at 100.00 | D | 321,780 |
| | Puerto Rico Electric Power Authority, Power Revenue Bonds, Series 2010CCC: | | | |
| 2,995 | | 3.957%, 7/01/28 (4) | 6/21 at 100.00 | D | 2,777,863 |
| 500 | | 3.978%, 7/01/28 (4) | 6/21 at 100.00 | D | 465,000 |
| | Puerto Rico Electric Power Authority, Power Revenue Bonds, Series 2010XX: | | | |
| 100 | | 3.978%, 7/01/27 (4) | 6/21 at 100.00 | D | 93,000 |
| 4,000 | | 3.978%, 7/01/35 (4) | 6/21 at 100.00 | D | 3,720,000 |
| 400 | | Puerto Rico Electric Power Authority, Power Revenue Bonds, Series 2010ZZ, 3.978%, | 6/21 at 100.00 | D | 372,000 |
| | 7/01/24 (4) | | | |
| | Puerto Rico Electric Power Authority, Power Revenue Bonds, Series 2013A: | | | |
| 5,000 | | 4.123%, 7/01/33 (4) | 7/23 at 100.00 | D | 4,768,750 |
| 10,000 | | 4.102%, 7/01/36 (4) | 7/23 at 100.00 | D | 9,512,500 |
| 1,000 | | Puerto Rico Electric Power Authority, Power Revenue Bonds, Series 2016A-4-RSA-1, | No Opt. Call | N/R | 980,000 |
| | 4.371%, 7/01/21 (4) | | | |
| | Puerto Rico Electric Power Authority, Power Revenue Bonds, Series WW: | | | |
| 190 | | 3.988%, 7/01/22 (4) | 6/21 at 100.00 | D | 176,938 |
| 373 | | 3.988%, 7/01/23 (4) | 6/21 at 100.00 | D | 347,356 |
| 25 | | 5.250%, 7/01/33 (4) | 6/21 at 100.00 | D | 23,250 |
| 3,000 | | Puerto Rico Highway and Transportation Authority, Highway Revenue Bonds, Series 2007N, | No Opt. Call | A3 | 3,693,360 |
| | 5.250%, 7/01/36 – AGC Insured | | | |
| | Puerto Rico Sales Tax Financing Corporation, Sales Tax Revenue Bonds, Restructured | | | |
| | 2018A-1: | | | |
| 22,095 | | 0.000%, 7/01/46 | 7/28 at 41.38 | N/R | 7,010,537 |
| 49,583 | | 0.000%, 7/01/51 | 7/28 at 30.01 | N/R | 11,402,946 |
| – (8) | | 5.000%, 7/01/58 | 7/28 at 100.00 | N/R | 88 |
| 36,865 | | Puerto Rico, General Obligation Bonds, Public Improvement, Series 2014A, 3.180%, 7/01/35 (4) | 6/21 at 100.00 | D | 29,584,162 |
| 500 | | University of Puerto Rico, University System Revenue Bonds, Series 2006Q, 5.000%, 6/01/24 | 6/21 at 100.00 | C | 492,500 |
| 160,009 | | Total Puerto Rico | | | 98,690,521 |
| | South Carolina – 0.1% (0.1% of Total Investments) | | | |
| 430 | | Berkeley County, South Carolina, Special Assessment Revenue Bonds, Nexton Improvement | 11/29 at 100.00 | N/R | 479,145 |
| | District, Series 2019, 4.375%, 11/01/49 | | | |
| 400 | | South Carolina Jobs-Economic Development Authority, Economic Development Revenue Bonds, | 1/30 at 100.00 | N/R | 401,924 |
| | Hilton Head Christian Academy, Series 2020, 5.000%, 1/01/55, 144A | | | |
| 830 | | Total South Carolina | | | 881,069 |
137
| | |
| NMCO | Nuveen Municipal Credit Opportunities Fund |
| Portfolio of Investments (continued) |
| April 30, 2021 (Unaudited) |
| | | | | | |
| Principal | | | Optional Call | | |
| Amount (000) | | Description (1) | Provisions (2) | Ratings (3) | Value |
| | Tennessee – 1.0% (0.6% of Total Investments) | | | |
| $ 1,000 | | Bristol Industrial Development Board, Tennessee, State Sales Tax Revenue Bonds, Pinnacle | No Opt. Call | N/R | $ 586,120 |
| | Project, Capital Appreciation Series 2016B, 0.000%, 12/01/31, 144A | | | |
| 4,000 | | Bristol Industrial Development Board, Tennessee, State Sales Tax Revenue Bonds, Pinnacle | 12/26 at 100.00 | N/R | 3,981,720 |
| | Project, Series 2016A, 5.125%, 12/01/42, 144A | | | |
| 2,000 | | Knox County Health, Educational, and Housing Facilities Board, Tennessee, Revenue Bonds, | 11/24 at 100.00 | N/R | 1,400,000 |
| | Provision Center for Proton Therapy Project, Series 2014, 5.250%, 5/01/25, 144A (4), (6) | | | |
| 1,000 | | Memphis/Shelby County Economic Development Growth Engine Industrial Development Board, | 7/27 at 100.00 | N/R | 1,006,960 |
| | Tennessee, Tax Increment Revenue Bonds, Graceland Project, Senior Series 2017A, 5.625%, 1/01/46 | | | |
| 1,500 | | The Health and Educational Facilities Board of the City of Franklin, Tennessee, Revenue | No Opt. Call | N/R | 825,000 |
| | Bonds, Provision Cares Proton Therapy Center, Nashville Project, Series 2017A, 6.500%, | | | |
| | 6/01/27, 144A (4), (6) | | | |
| 9,500 | | Total Tennessee | | | 7,799,800 |
| | Texas – 2.3% (1.5% of Total Investments) | | | |
| | Austin Convention Enterprises Inc, Texas, Convention Center Hotel Revenue Bonds, | | | |
| | Refunding First Tier Series 2017A: | | | |
| 500 | | 5.000%, 1/01/31 | 1/27 at 100.00 | BB+ | 559,290 |
| 500 | | 5.000%, 1/01/32 | 1/27 at 100.00 | BB+ | 557,210 |
| | Austin Convention Enterprises Inc, Texas, Convention Center Hotel Revenue Bonds, | | | |
| | Refunding Second Tier Series 2017B: | | | |
| 540 | | 5.000%, 1/01/25 | No Opt. Call | B | 561,524 |
| 475 | | 5.000%, 1/01/29 | 1/27 at 100.00 | B | 485,564 |
| 850 | | 5.000%, 1/01/34 | 1/27 at 100.00 | B | 852,227 |
| 4,665 | | Houston, Texas, Airport System Special Facilities Revenue Bonds, Continental Airlines | 7/21 at 100.00 | B | 4,738,707 |
| | Inc – Terminal Improvement Project, Refunding Series 2011, 6.500%, 7/15/30 (AMT) | | | |
| 650 | | Houston, Texas, Airport System Special Facilities Revenue Bonds, United Airlines, Inc | 7/24 at 100.00 | B | 710,807 |
| | Terminal E Project, Refunding Series 2014, 5.000%, 7/01/29 (AMT) | | | |
| 250 | | Leander, Texas, Special Assessment Revenue Bonds, Deerbrooke Public Improvement District | 9/26 at 100.00 | N/R | 260,848 |
| | Southern Improvement Area Project, Series 2017, 4.750%, 9/01/37, 144A | | | |
| 200 | | Manor, Texas, Special Assessment Revenue Bonds, Lagos Public Improvement District Major | 9/30 at 100.00 | N/R | 222,894 |
| | Improvement Area Project, Series 2020, 4.625%, 9/15/49, 144A | | | |
| 520 | | New Hope Cultural Education Facilities Finance Corporation, Texas, Education Revenue | 8/24 at 100.00 | N/R | 544,081 |
| | Bonds, Beta Academy, Series 2019A, 5.000%, 8/15/49, 144A | | | |
| 625 | | New Hope Cultural Education Facilities Finance Corporation, Texas, Student Housing | 4/26 at 100.00 | N/R | 757,469 |
| | Revenue Bonds, CHF-Collegiate Housing Corpus Christi II, LLC-Texas A&M University-Corpus | | | |
| | Christi Project, Series 2016A, 5.000%, 4/01/48 (Pre-refunded 4/01/26) | | | |
| 400 | | New Hope Cultural Education Facilities Finance Corporation, Texas, Student Housing | 4/24 at 100.00 | N/R | 453,024 |
| | Revenue Bonds, CHF-Collegiate Housing Galveston-Texas A&M University at Galveston Project, | | | |
| | Series 2014A, 5.000%, 4/01/29 (Pre-refunded 4/01/24) | | | |
| 2,100 | | New Hope Cultural Education Facilities Finance Corporation, Texas, Student Housing | No Opt. Call | CCC | 2,076,753 |
| | Revenue Bonds, NCCD – College Station Properties LLC – Texas A&M University Project, Series | | | |
| | 2015B, 4.375%, 7/01/21 | | | |
| 110 | | North Richland Hills, Texas, Special Assessment Revenue Bonds, City Point Public | 9/30 at 100.00 | N/R | 120,098 |
| | Improvement District Zone B Project, Series 2019, 5.375%, 9/01/50, 144A | | | |
| 145 | | Royse CIty, Rockwall County, Texas, Special Assessment Revenue Bonds, Waterscape Public | 9/27 at 100.00 | N/R | 159,773 |
| | improvement District Improvement Area 2 Project, Series 2019, 4.750%, 9/15/49, 144A | | | |
| 1,930 | | Tarrant County Cultural Education Facilities Finance Corporation, Texas, Retirement | 11/25 at 100.00 | N/R | 873,325 |
| | Facility Revenue Bonds, Buckingham Senior Living Community, Inc Project, Series 2015A, | | | |
| | 5.250%, 11/15/35 (4) | | | |
| | Tarrant County Cultural Education Facilities Finance Corporation, Texas, Retirement | | | |
| | Facility Revenue Bonds, CC Young Memorial Home Project, Series 2016A: | | | |
| 1,000 | | 6.375%, 2/15/41 (4) | 2/27 at 100.00 | N/R | 811,210 |
| 4,575 | | 6.375%, 2/15/48 (4) | 2/27 at 100.00 | N/R | 3,712,567 |
| 20,035 | | Total Texas | | | 18,457,371 |
138
| | | | | | |
| Principal | | | Optional Call | | |
| Amount (000) | | Description (1) | Provisions (2) | Ratings (3) | Value |
| | Utah – 0.1% (0.1% of Total Investments) | | | |
| $ 1,000 | | Utah Charter School Finance Authority, Charter School Revenue Bonds, Leadership Learning | 6/27 at 102.00 | N/R | $ 1,091,100 |
| | Academy Project, Series 2019A, 5.000%, 6/15/50, 144A | | | |
| | Virgin Islands – 3.8% (2.4% of Total Investments) | | | |
| 710 | | Virgin Islands Public Finance Authority, Gross Receipts Taxes Loan Note, Refunding | 10/22 at 100.00 | N/R | 672,803 |
| | Series 2012A, 5.000%, 10/01/32 | | | |
| 16,000 | | Virgin Islands Public Finance Authority, Gross Receipts Taxes Loan Note, Refunding | 10/24 at 100.00 | N/R | 15,288,800 |
| | Series 2014C, 5.000%, 10/01/30 | | | |
| 570 | | Virgin Islands Public Finance Authority, Gross Receipts Taxes Loan Note, Working Capital | No Opt. Call | N/R | 557,380 |
| | Series 2014A, 5.000%, 10/01/24 | | | |
| 1,000 | | Virgin Islands Public Finance Authority, Matching Fund Loan Notes Revenue Bonds, | 6/21 at 100.00 | Caa3 | 984,460 |
| | Subordinate Lien Series 2010B, 5.250%, 10/01/29 | | | |
| 12,735 | | Virgin Islands Public Finance Authority, Matching Fund Revenue Loan Note – Diageo | 6/21 at 100.00 | Caa3 | 12,838,663 |
| | Project, Series 2009A, 6.625%, 10/01/29 | | | |
| 31,015 | | Total Virgin Islands | | | 30,342,106 |
| | Virginia – 1.4% (0.9% of Total Investments) | | | |
| | Roanoke Economic Development Authority, Virginia Residential Care Facility Revenue | | | |
| | Bonds, Richfield Living, Series 2020: | | | |
| 5,870 | | 5.000%, 9/01/50 | 9/27 at 103.00 | N/R | 5,763,224 |
| 4,840 | | 5.125%, 9/01/55 | 9/27 at 103.00 | N/R | 4,766,529 |
| 500 | | Virginia Small Business Finance Authority, Educational Facilities Revenue Bonds, Provident | No Opt. Call | N/R | 432,965 |
| | Resource Group – Rixey Student Housing Project, Series 2019B, 7.500%, 7/01/52, 144A | | | |
| 11,210 | | Total Virginia | | | 10,962,718 |
| | Washington – 0.3% (0.2% of Total Investments) | | | |
| 1,125 | | Port of Seattle Industrial Development Corporation, Washington, Special Facilities | 4/23 at 100.00 | BB | 1,204,493 |
| | Revenue Refunding Bonds, Delta Air Lines, Inc Project, Series 2012, 5.000%, 4/01/30 (AMT) | | | |
| 1,000 | | Washington State Housing Finance Commission, Nonprofit Housing Revenue Bonds, Rockwood | 1/26 at 103.00 | N/R | 1,039,910 |
| | Retirement Communities Project, Series 2020A, 5.000%, 1/01/51, 144A | | | |
| 2,125 | | Total Washington | | | 2,244,403 |
| | West Virginia – 0.6% (0.4% of Total Investments) | | | |
| | Monongalia County Commission, West Virginia, Special District Excise Tax Revenue, University | | | |
| | Town Centre Economic Opportunity Development District, Refunding & Improvement | | | |
| | Series 2017A: | | | |
| 3,000 | | 5.500%, 6/01/37, 144A | 6/27 at 100.00 | N/R | 3,256,110 |
| 625 | | 5.750%, 6/01/43, 144A | 6/27 at 100.00 | N/R | 679,237 |
| 1,000 | | West Virginia Economic Development Authority, Solid Waste Disposal Facilities Revenue | 1/25 at 100.00 | B | 1,026,780 |
| | Bonds, Arch Resources Project, Series 2021, 4.125%, 7/01/45 (AMT) (Mandatory Put 7/01/25) | | | |
| 4,625 | | Total West Virginia | | | 4,962,127 |
| | Wisconsin – 8.3% (5.4% of Total Investments) | | | |
| | Public Finance Authority of Wisconsin, Charter School Revenue Bonds, 21st Century Public | | | |
| | Academy Project, Series 2020A: | | | |
| 750 | | 5.000%, 6/01/40, 144A | 6/28 at 102.00 | N/R | 815,378 |
| 1,340 | | 5.000%, 6/01/49, 144A | 6/28 at 102.00 | N/R | 1,431,629 |
| 365 | | Public Finance Authority of Wisconsin, Charter School Revenue Bonds, Corvian Community | 6/26 at 100.00 | N/R | 386,561 |
| | School Bonds, North Carolina, Series 2019A, 5.000%, 6/15/49, 144A | | | |
| | Public Finance Authority of Wisconsin, Charter School Revenue Bonds, North Carolina | | | |
| | Charter Educational Foundation Project, Series 2016A: | | | |
| 3,000 | | 5.000%, 6/15/36, 144A | 6/26 at 100.00 | N/R | 3,119,070 |
| 4,240 | | 5.000%, 6/15/46, 144A | 6/26 at 100.00 | N/R | 4,345,406 |
| 2,000 | | Public Finance Authority of Wisconsin, Educational Facilities Revenue Bonds, Lake Erie | 10/29 at 100.00 | N/R | 2,093,660 |
| | College, Series 2019A, 5.875%, 10/01/54, 144A | | | |
139
| | |
| NMCO | Nuveen Municipal Credit Opportunities Fund |
| Portfolio of Investments (continued) |
| April 30, 2021 (Unaudited) |
| | | | | | |
| Principal | | | Optional Call | | |
| Amount (000) | | Description (1) | Provisions (2) | Ratings (3) | Value |
| | Wisconsin (continued) | | | |
| | Public Finance Authority of Wisconsin, Limited Obligation Grant Revenue Bonds, American | | | |
| | Dream @ Meadowlands Project, Series 2017A: | | | |
| $ 12,695 | | 6.250%, 8/01/27, 144A | No Opt. Call | N/R | $ 13,804,797 |
| 1,125 | | 6.750%, 8/01/31, 144A | No Opt. Call | N/R | 1,258,200 |
| | Public Finance Authority of Wisconsin, Limited Obligation PILOT Revenue Bonds, American | | | |
| | Dream @ Meadowlands Project, Series 2017: | | | |
| 555 | | 6.500%, 12/01/37, 144A | 12/27 at 100.00 | N/R | 632,778 |
| 13,915 | | 7.000%, 12/01/50, 144A | 12/27 at 100.00 | N/R | 16,072,103 |
| 215 | | Public Finance Authority of Wisconsin, Retirement Facility Revenue Bonds, Shalom Park | No Opt. Call | N/R | 141,687 |
| | Development Project, Series 2019, 0.000%, 12/31/24, 144A | | | |
| 1,000 | | Public Finance Authority of Wisconsin, Revenue Bonds, Alabama Proton Therapy Center, | 10/27 at 100.00 | N/R | 652,500 |
| | Senior Series 2017B, 8.500%, 10/01/47, 144A | | | |
| | Public Finance Authority of Wisconsin, Revenue Bonds, Prime Healthcare Foundation, Inc, | | | |
| | Series 2017A: | | | |
| 255 | | 5.000%, 12/01/27 | No Opt. Call | BBB– | 282,619 |
| 1,765 | | 5.200%, 12/01/37 | 12/27 at 100.00 | BBB– | 2,011,835 |
| 2,000 | | Public Finance Authority of Wisconsin, Revenue Bonds, Procure Proton Therapy Center, | 7/28 at 100.00 | N/R | 2,197,340 |
| | Senior Series 2018A, 7.000%, 7/01/48, 144A | | | |
| 635 | | Public Finance Authority of Wisconsin, Revenue Bonds, Roseman University of Health | 4/30 at 100.00 | BB | 731,469 |
| | Sciences, Series 2020, 5.000%, 4/01/50, 144A | | | |
| | Public Finance Authority of Wisconsin, Senior Revenue Bonds, Maryland Proton Treatment | | | |
| | Center, Series 2018A-1: | | | |
| 5,885 | | 6.125%, 1/01/33, 144A | 1/28 at 100.00 | N/R | 5,120,539 |
| 250 | | 6.250%, 1/01/38, 144A | 1/28 at 100.00 | N/R | 212,740 |
| 8,735 | | 6.375%, 1/01/48, 144A | 1/28 at 100.00 | N/R | 7,265,860 |
| 4,500 | | Wisconsin Center District, Dedicated Tax Revenue Bonds, Supported by State Moral | 12/30 at 29.95 | A1 | 1,011,960 |
| | Obligation Junior Series 2020D, 0.000%, 12/15/60 – AGM Insured | | | |
| 3,000 | | Wisconsin Health and Educational Facilities Authority, Wisconsin, Revenue Bonds, Saint | 11/26 at 103.00 | N/R | 3,145,890 |
| | Camillus Health System Inc, Series 2019A, 5.000%, 11/01/54 | | | |
| 68,225 | | Total Wisconsin | | | 66,734,021 |
| $ 1,634,219 | | Total Municipal Bonds (cost $1,142,781,087) | | | 1,210,904,596 |
|
| Shares | | Description (1) | | | Value |
| | COMMON STOCKS – 3.1% (2.0% of Total Investments) | | | |
| | Electric Utilities – 3.1% (2.0% of Total Investments) | | | |
| 859,113 | | Energy Harbor Corp (9), (10), (11) | | | $ 24,753,623 |
| | Total Common Stocks (cost $24,407,228) | | | 24,753,623 |
|
| Shares | | Description (1) | | | Value |
| | EXCHANGE-TRADED FUNDS – 0.3% (0.1% of Total Investments) | | | |
| 32 | | VanEck Vectors High Yield Muni ETF | | | $ 2,005,760 |
| | Total Exchange-Traded Funds (cost $2,058,659) | | | 2,005,760 |
| | Total Long-Term Investments (cost $1,169,246,974) | | | 1,237,663,979 |
140
| | | | | | |
| Principal | | | Optional Call | | |
| Amount (000) | | Description (1) | Provisions (2) | Ratings (3) | Value |
| | SHORT-TERM INVESTMENTS – 0.1% (0.1% of Total Investments) | | | |
| | MUNICIPAL BONDS – 0.1% (0.1% of Total Investments) | | | |
| | Illinois – 0.1% (0.1% of Total Investments) | | | |
| $ 962 | | Yorkville United City, Kendall County, Illinois, Sales Tax Revenue Bonds, Kendall Marketplace | 5/21 at 100.00 | N/R | $ 865,417 |
| | Project, Series 2007, 6.000%, 1/01/26 (4), (12) | | | |
| $ 962 | | Total Short-Term Investments (cost $798,107) | | | 865,417 |
| | Total Investments (cost $1,170,045,081) – 155.0% | | | 1,238,529,396 |
| | Floating Rate Obligations – (2.8)% | | | (21,996,000) |
| | MuniFund Preferred Shares, net of deferred offering costs – (56.2)% (13) | | | (448,852,763) |
| | Other Assets Less Liabilities – 4.0% | | | 31,594,116 |
| | Net Assets Applicable to Common Shares – 100% | | | $ 799,274,749 |
(1) | All percentages shown in the Portfolio of Investments are based on net assets applicable to common shares unless otherwise noted. |
(2) | Optional Call Provisions: Dates (month and year) and prices of the earliest optional call or redemption. There may be other call provisions at varying prices at later dates. Certain mortgage-backed securities may be subject to periodic principal paydowns.
|
(3) | The ratings disclosed are the lowest of Standard & Poor’s Group (“Standard & Poor’s”), Moody’s Investors Service, Inc. (“Moody’s”) or Fitch, Inc. (“Fitch”) rating. Ratings below BBB by Standard & Poor’s, Baa by Moody’s or BBB by Fitch are considered to be below investment grade. Holdings designated N/R are not rated by any of these national rating agencies. |
(4) | Defaulted security. A security whose issuer has failed to fully pay principal and/or interest when due, or is under the protection of bankruptcy. |
(5) | Step-up coupon bond, a bond with a coupon that increases (“steps up”), usually at regular intervals, while the bond is outstanding. The rate shown is the coupon as of the end of the reporting period.
|
(6) | Investment valued at fair value using methods determined in good faith by, or at the discretion of, the Board. For fair value measurement disclosure purposes, investment classified as Level 3. See Notes to Financial Statements, Note 3 – Investment Valuation and Fair Value Measurements for more information.
|
(7) | Investment, or portion of investment, has been pledged to collateralize the net payment obligations for investments in inverse floating rate transactions. |
(8) | Principal Amount (000) rounds to less than $1,000. |
(9) | Common Stock received as part of the bankruptcy settlements during February 2020 for Beaver County Industrial Development Authority, Pennsylvania, Pollution Control Revenue Bonds, FirstEnergy Nuclear Generation Project, Refunding Series 2005A, 4.000%, 1/01/35, Beaver County Industrial Development Authority, Pennsylvania, Pollution Control Revenue Refunding Bonds, FirstEnergy Nuclear Generation Project, Series 2006A, 3.500%, 4/01/41, Beaver County Industrial Development Authority, Pennsylvania, Pollution Control Revenue Refunding Bonds, FirstEnergy Nuclear Generation Project, Series 2006B, 3.500%, 12/01/35, Beaver County Industrial Development Authority, Pennsylvania, Pollution Control Revenue Refunding Bonds, FirstEnergy Nuclear Generation Project, Series 2008A, 2.700%, 4/01/35, Ohio Air Quality Development Authority, Ohio, Air Quality Development Revenue Bonds, FirstEnergy Generation Corporation Project, Series 2009A, 5.700%, 8/01/20, Ohio Air Quality Development Authority, Ohio, Pollution Control Revenue Bonds, FirstEnergy Generation Corporation Project, Refunding Series 2009B, 3.100%, 3/01/23, Ohio Air Quality Development Authority, Ohio, Pollution Control Revenue Bonds, FirstEnergy Generation Project, Refunding Series 2006A, 3.750%, 12/01/23, Ohio Water Development Authority, Pollution Control Revenue Refunding Bonds, FirstEnergy Nuclear Generating Corporation Project, Series 2006A, 3.000%, 5/15/20, Ohio Water Development Authority, Pollution Control Revenue Refunding Bonds, FirstEnergy Nuclear Generating Corporation Project, Series 2006B, 4.000%, 12/01/33, Ohio Water Development Authority, Pollution Control Revenue Refunding Bonds, FirstEnergy Nuclear Generating Corporation Project, Series 2010C, 4.000%, 6/01/33. |
(10) | For fair value measurement disclosure purposes, investment classified as Level 2. See Notes to Financial Statements, Note 3 – Investment Valuation and Fair Value Measurements for more information.
|
(11) | Non-income producing; issuer has not declared an ex-dividend date within the past twelve months. |
(12) | Investment has a maturity of greater than one year, but has variable rate and/or demand features which qualify it as a short-term investment. The rate disclosed, as well as the reference rate and spread, where applicable, is that in effect as of the end of the reporting period. This rate changes periodically based on market conditions or a specified market index. |
(13) | MuniFund Preferred Shares, net of deferred offering costs as a percentage of Total Investments is 28.2%. |
144A | Investment is exempt from registration under Rule 144A of the Securities Act of 1933, as amended. These investments may only be resold in transactions exempt from registration, which are normally those transactions with qualified institutional buyers.
|
AMT | Alternative Minimum Tax |
ETF | Exchange-Traded Fund |
PIK | Payment-in-kind (“PIK”) security. Depending on the terms of the security, income may be received in the form of cash, securities, or a combination of both. The PIK rate shown, where applicable, represents the annualized rate of the last PIK payment made by the issuer as of the end of the reporting period.
|
UB | Underlying bond of an inverse floating rate trust reflected as a financing transaction. See Notes to Financial Statements, Note 4 – Portfolio Securities and Investments in Derivatives for more information.
|
|
|
141
See accompanying notes to financial statements.
| |
NDMO Nuveen Dynamic Municipal Opportunities Fund |
| Portfolio of Investments |
| April 30, 2021 (Unaudited) |
| | | | | | |
| Principal | | | Optional Call | | |
| Amount (000) | | Description (1) | Provisions (2) | Ratings (3) | Value |
| | LONG-TERM INVESTMENTS – 146.3% (100.0% of Total Investments) | | | |
|
| | MUNICIPAL BONDS – 146.1% (99.8% of Total Investments) | | | |
|
| | Alabama – 2.6% (1.7% of Total Investments) | | | |
| $ 3,000 | | Hoover Industrial Development Board, Alabama, Environmental Improvement Revenue Bonds, | No Opt. Call | Caa1 | $ 3,791,220 |
| | United States Steel Corporation Project, Green Series 2020, 6.375%, 11/01/50 (AMT) | | | |
| | (Mandatory Put 11/01/30) | | | |
| | Huntsville Healthcare Authority, Alabama, Revenue Bonds, Series 2020B: | | | |
| 1,500 | | 3.000%, 6/01/50 – AGM Insured | 6/30 at 100.00 | A1 | 1,594,275 |
| 11,920 | | 3.000%, 6/01/50 – AGM Insured (UB) (4) | 6/30 at 100.00 | A1 | 12,669,172 |
| 5,000 | | Mobile County, Alabama, Limited Obligation Warrants, Gomesa Projects, Series 2020, | 11/29 at 100.00 | N/R | 5,178,500 |
| | 4.000%, 11/01/45, 144A | | | |
| 21,420 | | Total Alabama | | | 23,233,167 |
| | Alaska – 0.1% (0.1% of Total Investments) | | | |
| 1,000 | | Alaska Municipal Bond Bank, General Obligation Bonds, Refunding One Series 2020, | No Opt. Call | A+ | 1,309,200 |
| | 5.000%, 12/01/30 | | | |
| | Arizona – 7.0% (4.8% of Total Investments) | | | |
| | Arizona Industrial Development Authority, Arizona, Education Revenue Bonds, Mater | | | |
| | Academy of Nevada – Bonanza Campus Project, Series 2020A: | | | |
| 920 | | 5.000%, 12/15/40, 144A | 12/28 at 100.00 | BB | 1,058,570 |
| 1,500 | | 5.000%, 12/15/50, 144A | 12/28 at 100.00 | BB | 1,700,610 |
| 1,500 | | Arizona Industrial Development Authority, Arizona, Education Revenue Bonds, Social Bonds | 7/28 at 100.00 | BB– | 1,581,975 |
| | ? Pensar Academy Project, Series 2020, 5.000%, 7/01/55, 144A | | | |
| 2,500 | | Arizona Industrial Development Authority, Arizona, Lease Revenue Bonds, Children’s | 9/30 at 100.00 | A1 | 2,611,025 |
| | National Prince County Regional Medical Center, Series 2020A, 3.000%, 9/01/50 | | | |
| 6,035 | | Arizona Industrial Development Authority, Hospital Revenue Bonds, Phoenix Children’s | 2/30 at 100.00 | A | 6,381,530 |
| | Hospital, Series 2020A, 3.000%, 2/01/45 (UB) (4) | | | |
| 1,090 | | Coconino County Industrial Development Authority, Arizona, Education Revenue Bonds, | 7/28 at 100.00 | N/R | 1,135,682 |
| | Flagstaff Arts & Leadership Academy Project, Refunding Series 2020, 5.500%, 7/01/40, 144A | | | |
| 1,000 | | Maricopa County Industrial Development Authority, Arizona, Educational Facilities | 10/27 at 103.00 | N/R | 1,089,700 |
| | Revenue Bonds, Ottawa University Projects, Series 2020, 5.250%, 10/01/40, 144A | | | |
| 15,000 | | Maricopa County Industrial Development Authority, Arizona, Revenue Bonds, Banner Health, | 7/30 at 100.00 | AA– | 15,761,400 |
| | Series 2019E, 3.000%, 1/01/49 (UB) (4) | | | |
| | Phoenix Civic Improvement Corporation, Arizona, Rental Car Facility Charge Revenue | | | |
| | Bonds, Series 2019A: | | | |
| 5,895 | | 5.000%, 7/01/34 | 7/29 at 100.00 | BBB+ | 7,075,356 |
| 2,500 | | 5.000%, 7/01/39 | 7/29 at 100.00 | BBB+ | 2,963,500 |
| 3,405 | | Phoenix Industrial Development Authority, Arizona, Education Facility Revenue Bonds, | 9/30 at 100.00 | Ba2 | 3,698,034 |
| | Northwest Christian School Project, Series 2020A, 5.000%, 9/01/55, 144A | | | |
| | Pima County Industrial Development Authority, Arizona, Education Facility Revenue Bonds, | | | |
| | Edkey Charter Schools Project, Refunding Series 2020: | | | |
| 5,265 | | 5.000%, 7/01/35, 144A | 7/26 at 103.00 | N/R | 5,790,289 |
| 6,800 | | 5.000%, 7/01/40, 144A | 7/26 at 103.00 | N/R | 7,393,232 |
| 4,580 | | Pima County Industrial Development Authority, Arizona, Education Facility Revenue Bonds, | 6/28 at 100.00 | N/R | 4,869,639 |
| | Synergy Public Charter School Project, Series 2020-1, 5.000%, 6/15/50, 144A | | | |
| 57,990 | | Total Arizona | | | 63,110,542 |
142
| | | | | | |
| Principal | | | Optional Call | | |
| Amount (000) | | Description (1) | Provisions (2) | Ratings (3) | Value |
| | Arkansas – 2.5% (1.7% of Total Investments) | | | |
| $ 3,000 | | Arkansas Development Finance Authority, Industrial Development Revenue Bonds, Big River | 9/26 at 103.00 | B– | $ 3,281,010 |
| | Steel Project, Series 2019, 4.500%, 9/01/49 (AMT), 144A | | | |
| 17,000 | | Arkansas Development Finance Authority, Industrial Development Revenue Bonds, Big River | 9/27 at 103.00 | B– | 19,018,920 |
| | Steel Project, Series 2020A, 4.750%, 9/01/49 (AMT), 144A | | | |
| 20,000 | | Total Arkansas | | | 22,299,930 |
| | California – 22.2% (15.2% of Total Investments) | | | |
| 3,815 | | California Community Housing Agency, California, Essential Housing Revenue Bonds, | 8/31 at 100.00 | N/R | 4,072,589 |
| | Creekwood, Series 2021A, 4.000%, 2/01/56, 144A | | | |
| 3,520 | | California Community Housing Agency, California, Essential Housing Revenue Bonds, | 8/31 at 100.00 | N/R | 3,780,022 |
| | Glendale Properties, Junior Series 2021A-2, 4.000%, 8/01/47, 144A | | | |
| 9,000 | | California Community Housing Agency, California, Essential Housing Revenue Bonds, | 2/30 at 100.00 | N/R | 10,314,990 |
| | Serenity at Larkspur Apartments, Series 2020A, 5.000%, 2/01/50, 144A | | | |
| 10,000 | | California County Tobacco Securitization Agency, Tobacco Settlement Asset-Backed Bonds, | 12/30 at 34.02 | N/R | 2,442,400 |
| | Sonoma County Tobacco Securitization Corporation, Series 2020B-2, 0.000%, 6/01/55 | | | |
| 1,500 | | California Health Facilities Financing Authority, Revenue Bonds, Lucile Salter Packard | 5/32 at 100.00 | A+ | 1,698,645 |
| | Children’s Hospital at Stanford, Refunding Series 2022A Forward Delivery, 4.000%, 5/15/46 | | | |
| | (WI/DD, Settling 5/17/22) | | | |
| | California Health Facilities Financing Authority, Revenue Bonds, CommonSpirit Health, | | | |
| | Series 2020A: | | | |
| 5,000 | | 4.000%, 4/01/44 (UB) (4) | 4/30 at 100.00 | BBB+ | 5,801,250 |
| 8,000 | | 4.000%, 4/01/45 (UB) (4) | 4/30 at 100.00 | BBB+ | 9,259,040 |
| 4,010 | | 4.000%, 4/01/49 (UB) (4) | 4/30 at 100.00 | BBB+ | 4,621,124 |
| 3,601 | | California Housing Finance Agency, Municipal Certificate Revenue Bonds, Class A Series | No Opt. Call | BBB+ | 4,190,568 |
| | 2021-1, 3.500%, 11/20/35 | | | |
| 1,250 | | California Infrastructure and Economic Development Bank Infrastructure State, Revolving | 10/30 at 100.00 | AAA | 1,238,988 |
| | Fund Revenue Bonds, Tax Series 2020A, 2.786%, 10/01/43 | | | |
| 15,500 | | California Infrastructure and Economic Development Bank, Revenue Bonds, Los Angeles | 7/30 at 100.00 | A2 | 16,283,835 |
| | County Museum of Natural History Foundation, Series 2020, 3.000%, 7/01/50 (UB) (4) | | | |
| 2,000 | | California Municipal Finance Authority, Revenue Bonds, University of the Pacific, | 11/30 at 100.00 | A2 | 2,065,760 |
| | Refunding Series 2020A, 3.000%, 11/01/48 | | | |
| 5,000 | | California Municipal Finance Authority, Special Facility Revenue Bonds, United Airlines, | No Opt. Call | B+ | 5,765,450 |
| | Inc Los Angeles International Airport Project, Series 2019, 4.000%, 7/15/29 (AMT) | | | |
| 5,000 | | California Public Finance Authority, Charter School Lease Revenue Bonds, California | 7/28 at 100.00 | N/R | 5,289,400 |
| | Crosspoint Academy Project, Series 2020A, 5.125%, 7/01/55, 144A | | | |
| 2,000 | | California School Finance Authority, Charter School Revenue Bonds, Scholarship Prep | 6/28 at 100.00 | N/R | 2,033,260 |
| | Public Schools ? Obligated Group, Series 2020A, 5.000%, 6/01/60, 144A | | | |
| | California State Public Works Board, Lease Revenue Bonds, Various Capital Projects, | | | |
| | Refunding Series 2022A: | | | |
| 2,500 | | 5.000%, 8/01/28 (WI/DD, Settling 3/17/22) | No Opt. Call | A+ | 3,080,050 |
| 2,000 | | 5.000%, 8/01/29 (WI/DD, Settling 3/17/22) | No Opt. Call | A+ | 2,499,440 |
| 2,500 | | 5.000%, 8/01/30 (WI/DD, Settling 3/17/22) | No Opt. Call | A+ | 3,178,025 |
| | California State Public Works Board, Lease Revenue Bonds, Various Capital Projects, | | | |
| | Series 2021B: | | | |
| 1,000 | | 4.000%, 5/01/37 | 5/31 at 100.00 | A+ | 1,228,990 |
| 1,500 | | 4.000%, 5/01/41 | 5/31 at 100.00 | A+ | 1,818,510 |
| 2,500 | | California State University, Systemwide Revenue Bonds, Taxable Series 2020D, 1.338%, 11/01/27 | No Opt. Call | AA– | 2,486,550 |
| 2,000 | | California State, General Obligation Bonds, Refunding Various Purpose Series 2020, | 11/30 at 100.00 | AA– | 2,270,740 |
| | 3.000%, 11/01/35 | | | |
| | California State, General Obligation Bonds, Refunding Various Purpose Series 2021 | | | |
| | Forward Delivery: | | | |
| 3,125 | | 5.000%, 9/01/31 (WI/DD, Settling 9/02/21) | No Opt. Call | AA– | 4,204,812 |
| 3,125 | | 5.000%, 9/01/41 (WI/DD, Settling 9/02/21) | 9/31 at 100.00 | AA– | 4,057,937 |
143
| | |
| NDMO | Nuveen Dynamic Municipal Opportunities Fund |
| Portfolio of Investments (continued) April 30, 2021 (Unaudited) |
| | | | | | |
| Principal | | | Optional Call | | |
| Amount (000) | | Description (1) | Provisions (2) | Ratings (3) | Value |
| | California (continued) | | | |
| $ 12,500 | | California State, General Obligation Bonds, Taxable Various Purpose Construction Series | No Opt. Call | AA– | $ 13,318,750 |
| | 2019 Bid Group A, 2.375%, 10/01/26 (4) | | | |
| 2,785 | | California State, General Obligation Bonds, Various Purpose Series 2020, 4.000%, 11/01/34 | 11/30 at 100.00 | AA– | 3,442,316 |
| 1,000 | | California State, General Obligation Bonds, Various Purpose Series 2021, 5.000%, 12/01/34 | 12/30 at 100.00 | AA– | 1,334,710 |
| 9,750 | | California Statewide Communities Development Authority, California, Revenue Bonds, Loma | 12/24 at 100.00 | BB– | 10,925,070 |
| | Linda University Medical Center, Series 2014A, 5.500%, 12/01/54 | | | |
| 2,500 | | California Statewide Communities Development Authority, California, Revenue Bonds, Loma | No Opt. Call | BB– | 2,805,125 |
| | Linda University Medical Center, Series 2014B, 6.000%, 12/01/24 | | | |
| 5,525 | | CSCDA Community Improvement Authority, California, Essential Housing Revenue Bonds, | 10/31 at 100.00 | N/R | 5,715,226 |
| | Altana Glendale, Series 2021A-1, 3.500%, 10/01/46, 144A | | | |
| 6,180 | | CSCDA Community Improvement Authority, California, Essential Housing Revenue Bonds, | 1/31 at 100.00 | N/R | 7,203,841 |
| | Center City Anaheim, Series 2020A, 5.000%, 1/01/54, 144A | | | |
| 445 | | CSCDA Community Improvement Authority, California, Essential Housing Revenue Bonds, | 9/31 at 100.00 | N/R | 450,465 |
| | Oceanaire-Long Beach, Series 2021A-1, 3.200%, 9/01/46, 144A | | | |
| 910 | | CSCDA Community Improvement Authority, California, Essential Housing Revenue Bonds, | 8/31 at 100.00 | N/R | 978,532 |
| | Parallel-Anaheim Series 2021A, 4.000%, 8/01/56, 144A | | | |
| 1,000 | | CSCDA Community Improvement Authority, California, Essential Housing Revenue Bonds, | 7/31 at 100.00 | N/R | 1,159,580 |
| | Renaissance at City Center, Series 2020A, 5.000%, 7/01/51, 144A | | | |
| | Fairfield, California, Certificates of Participation, Fairfield Water Financing Series 2007A: | | | |
| 1,915 | | 0.000%, 4/01/36 – SYNCORA GTY Insured | No Opt. Call | AA | 1,409,938 |
| 2,990 | | 0.000%, 4/01/37 – SYNCORA GTY Insured | No Opt. Call | AA | 2,142,066 |
| 6,650 | | Golden State Tobacco Securitization Corporation, California, Tobacco Settlement | 6/22 at 100.00 | N/R | 6,871,112 |
| | Asset-Backed Bonds, Series 2018A-1, 5.000%, 6/01/47 | | | |
| 6,300 | | Golden State Tobacco Securitization Corporation, California, Tobacco Settlement | 6/22 at 100.00 | N/R | 6,509,475 |
| | Asset-Backed Bonds, Series 2018A-2, 5.000%, 6/01/47 | | | |
| 3,250 | | Hartnell Community College District, Monterey County, California, General Obligation | 8/28 at 100.00 | Aa2 | 3,438,207 |
| | Bonds, Election 2016 Series 2020B, 3.000%, 8/01/48 | | | |
| | Huntington Beach, California, Pension Obligation Bonds, Taxable Series 2021: | | | |
| 1,000 | | 1.344%, 6/15/26 – BAM Insured | No Opt. Call | AA+ | 1,000,810 |
| 1,125 | | 1.911%, 6/15/28 – BAM Insured | No Opt. Call | AA+ | 1,127,183 |
| 4,830 | | 2.963%, 6/15/36 – BAM Insured | 6/31 at 100.00 | AA+ | 4,872,359 |
| | Los Angeles Municipal Improvement Corporation, California, Lease Revenue Bonds, Capital | | | |
| | Equipment Program, Refunding Series 2021A: | | | |
| 1,000 | | 1.197%, 11/01/26 | No Opt. Call | AA– | 988,530 |
| 1,565 | | 1.448%, 11/01/27 | No Opt. Call | AA– | 1,539,428 |
| 1,885 | | 1.648%, 11/01/28 | No Opt. Call | AA– | 1,844,133 |
| 995 | | Northstar Community Services District, Special Tax Bonds, Community Facilities District | 9/21 at 100.00 | N/R | 686,550 |
| | 1, Series 2006, 5.000%, 9/01/37 | | | |
| 1,575 | | Palomar Community College District, San Diego County, California, General Obligation | 8/40 at 100.00 | AA | 1,774,505 |
| | Bonds, Series 2010B, 6.375%, 8/01/45 (5) | | | |
| 5,345 | | Palomar Pomerado Health, California, General Obligation Bonds, Convertible Capital | No Opt. Call | A2 | 3,646,092 |
| | Appreciation, Election 2004 Series 2010A, 0.000%, 8/01/39 – AGM Insured | | | |
| 750 | | San Francisco Community College District, California, General Obligation Bonds, Taxable | 6/30 at 100.00 | A+ | 771,915 |
| | Election 2020 Series 2020A-1, 3.165%, 6/15/41 | | | |
| | San Francisco Municipal Transportation Agency, Revenue Bonds, Taxable Refunding Series 2021A: | | | |
| 690 | | 0.824%, 3/01/26 | No Opt. Call | AA– | 681,416 |
| 750 | | 1.302%, 3/01/28 | No Opt. Call | AA– | 733,215 |
| | San Jose, California, Airport Revenue Bonds, Refunding Series 2021C: | | | |
| 500 | | 1.882%, 3/01/28 | No Opt. Call | A– | 498,150 |
| 290 | | 2.310%, 3/01/30 | No Opt. Call | A– | 289,426 |
| 1,750 | | 2.960%, 3/01/36 | 3/31 at 100.00 | A– | 1,766,905 |
| 2,000 | | 3.060%, 3/01/37 | 3/31 at 100.00 | A– | 2,022,120 |
| 420 | | 3.290%, 3/01/41 | 3/31 at 100.00 | A– | 425,607 |
144
| | | | | | |
| Principal | | | Optional Call | | |
| Amount (000) | | Description (1) | Provisions (2) | Ratings (3) | Value |
| | California (continued) | | | |
| $ 500 | | Silicon Valley Clean Water, Mateo County, California, Wastewater Revenue Bonds, Taxable | No Opt. Call | AA | $ 497,575 |
| | Refunding Series 2021A, 1.380%, 8/01/27 | | | |
| 410 | | Tobacco Securitization Authority of Northern California, Tobacco Settlement Asset-Backed | 12/30 at 100.00 | BBB– | 467,093 |
| | Bonds, Refunding Sacramento County Tobacco Securitization Corporation Series 2021B Class 2, | | | |
| | 4.000%, 6/01/49 | | | |
| | University of California, General Revenue Bonds, Taxable Series 2021BI: | | | |
| 2,500 | | 0.870%, 5/15/26 | No Opt. Call | AA | 2,473,750 |
| 1,000 | | 1.272%, 5/15/27 | No Opt. Call | AA | 993,530 |
| 1,360 | | 1.372%, 5/15/28 | No Opt. Call | AA | 1,335,248 |
| 195,386 | | Total California | | | 201,822,328 |
| | Colorado – 11.4% (7.8% of Total Investments) | | | |
| 2,370 | | 64th Avenue ARI Authority, Adams County, Colorado, Special Revenue Bonds, Series 2020, | 12/25 at 103.00 | N/R | 2,569,365 |
| | 6.500%, 12/01/43 | | | |
| 1,240 | | Arista Metropolitan District, Broomfield County, Colorado, General Obligation Limited | 12/23 at 103.00 | N/R | 1,339,770 |
| | Tax Bonds, Refunding & Improvement Convertible to Unlimited Tax Series 2018A, | | | |
| | 5.000%, 12/01/38 | | | |
| 1,060 | | Aurora Crossroads Metropolitan District 2, Colorado, Limited Tax General Obligation | 9/25 at 103.00 | N/R | 1,150,619 |
| | Bonds, Series 2020A, 5.000%, 12/01/50 | | | |
| 2,285 | | Aurora Crossroads Metropolitan District 2, Colorado, Limited Tax General Obligation | 9/25 at 103.00 | N/R | 2,387,482 |
| | Bonds, Subordinate Series 2020B, 7.750%, 12/15/50 | | | |
| 500 | | Aviation Station North Metropolitan District 2, Denver County, Colorado, Limited Tax | 9/24 at 103.00 | N/R | 535,140 |
| | General Obligation Bonds, Refunding & Improvement Series 2019A, 4.000%, 12/01/29 | | | |
| 1,725 | | Belford North Metropolitan District, Douglas County, Colorado, General Obligation | 12/25 at 103.00 | N/R | 1,880,906 |
| | Limited Tax Bonds, Series 2020A, 5.500%, 12/01/50 | | | |
| 1,000 | | Bennett Ranch Metropolitan District 1, Adams County, Colorado, General Obligation | 3/26 at 103.00 | N/R | 1,076,050 |
| | Limited Tax Bonds, Convertible to Unlimited Tax Series 2021A, 5.000%, 12/01/51 | | | |
| 745 | | Blue Lake Metropolitan District 3, Lochbuie, Weld County, Colorado, Limited Tax General | 12/23 at 103.00 | N/R | 761,561 |
| | Obligation Bonds, Convertible to Unlimited Tax Series 2018A, 5.250%, 12/01/48 | | | |
| 500 | | Broadway Park North Metropolitan District 2, Denver, Colorado, Limited Tax General | 12/25 at 103.00 | N/R | 552,340 |
| | Obligation Bonds, Refunding & Improvement Series 2020, 5.000%, 12/01/40, 144A | | | |
| 500 | | Castle Pines Commercial Metropolitan District 1, Castle Rock, Colorado, Limited Tax | 6/21 at 100.00 | N/R | 500,525 |
| | Supported Revenue Bonds, Series 2015, 5.000%, 12/01/39 | | | |
| 500 | | Centerra Metropolitan District 1, Loveland, Colorado, Special Revenue Bonds, Refunding & | No Opt. Call | N/R | 524,170 |
| | Improvement Series 2017, 5.000%, 12/01/22, 144A | | | |
| 2,755 | | Centerra Metropolitan District 1, Loveland, Colorado, Special Revenue Bonds, Refunding & | 12/25 at 103.00 | N/R | 3,013,529 |
| | Improvement Series 2020A, 5.000%, 12/01/51 | | | |
| 1,450 | | Citadel on Colfax Business Improvement District, Aurora, Colorado, Special Revenue and | 12/25 at 103.00 | N/R | 1,568,204 |
| | Tax Supported Bonds, Senior Series 2020A, 5.350%, 12/01/50 | | | |
| 2,700 | | Colorado Bridge Enterprise, Revenue Bonds, Central 70 Project, Senior Series 2017, | 12/27 at 100.00 | A– | 2,922,318 |
| | 4.000%, 6/30/51 (AMT) | | | |
| 1,000 | | Colorado Educational and Cultural Facilities Authority, Revenue Bonds, Global Village | 12/30 at 100.00 | N/R | 1,069,830 |
| | Academy – Northglenn Project, Series 2020, 5.000%, 12/01/55, 144A | | | |
| 500 | | Colorado Health Facilities Authority, Colorado, Revenue Bonds, Cappella of Grand | 12/26 at 103.00 | N/R | 504,840 |
| | Junction Project, Series 2019, 5.000%, 12/01/54, 144A | | | |
| 16,000 | | Colorado International Center Metropolitan District 8, Adams County, Colorado, Limited | 9/25 at 103.00 | N/R | 17,101,760 |
| | Tax General Obligation Bonds, Series 2020, 6.500%, 12/01/50 | | | |
| 6,500 | | Crystal Valley Metropolitan District 2, Douglas County, Colorado, Limited Tax General | 12/30 at 100.00 | A2 | 6,789,835 |
| | Obligation Bonds, Refunding & Improvement Series 2020A, 3.000%, 12/01/49 – | | | |
| | AGM Insured (UB) (4) | | | |
| 1,000 | | Dacono Urban Renewal Authority, Weld County, Colorado, Tax Increment Revenue Bonds, | 12/25 at 103.00 | N/R | 1,071,940 |
| | Series 2020, 6.250%, 12/01/39 | | | |
| 1,000 | | Foothills Metropolitan District, Fort Collins, Colorado, Special Revenue Bonds, Series | 12/24 at 100.00 | N/R | 1,058,450 |
| | 2014, 6.000%, 12/01/38 | | | |
145
| | |
| NDMO | Nuveen Dynamic Municipal Opportunities Fund |
| Portfolio of Investments (continued) April 30, 2021 (Unaudited) |
| | | | | | |
| Principal | | | Optional Call | | |
| Amount (000) | | Description (1) | Provisions (2) | Ratings (3) | Value |
| | Colorado (continued) | | | |
| $ 1,130 | | Fourth Street Crossing Business Improvement District, Silverthorne, Summit County, | 6/24 at 103.00 | N/R | $ 1,220,106 |
| | Colorado, Special Revenue and Tax Supported Bonds, Senior Series 2019A, | | | |
| | 5.125%, 12/01/38, 144A | | | |
| 2,000 | | Future Legends Sports Park Metropolitan District 2, Colorado, Limited Tax General | 6/25 at 103.00 | N/R | 2,023,200 |
| | Obligation Bonds, Series 2020A, 5.500%, 6/01/50, 144A | | | |
| 1,000 | | Great Western Metropolitan District 5, Colorado, General Obligation Limited Tax Revenue | 12/25 at 102.00 | N/R | 1,060,700 |
| | Bonds, Refunding Series 2020, 4.750%, 12/01/50 | | | |
| 5,250 | | Jefferson Center Metropolitan District 1, Arvada, Jefferson County, Colorado, Special | 12/23 at 103.00 | N/R | 5,631,623 |
| | Revenue Bonds, Subordinate Series 2020B, 5.750%, 12/15/50 | | | |
| 2,000 | | Jones District Community Authority Board, Centennial, Colorado, Special Revenue | 12/25 at 103.00 | N/R | 1,733,300 |
| | Convertible Capital Appreciation Bonds, Series 2020A, 5.750%, 12/01/50 | | | |
| 1,000 | | Kinston Metropolitan District 5, Loveland, Larimer County, Colorado, Limited Tax General | 12/25 at 103.00 | N/R | 1,110,890 |
| | Obligation Bonds, Series 2020A, 5.125%, 12/01/50 | | | |
| 1,380 | | Lanterns Metropolitan District 1, Castle Rock, Douglas County, Colorado, Limited Tax | 9/24 at 103.00 | N/R | 1,498,114 |
| | General Obligation Bonds, Series 2019A, 5.000%, 12/01/39 | | | |
| 1,000 | | North Range Metropolitan District 3, Adams County, Colorado, Limited Tax General | 12/25 at 103.00 | N/R | 1,109,790 |
| | Obligation Bonds, Series 2020A-3, 5.250%, 12/01/50 | | | |
| 1,810 | | Northfield Metropolitan District 2, Fort Collins, Larimer County, Colorado, Limited Tax | 12/25 at 103.00 | N/R | 1,951,433 |
| | General Obligation Bonds, Series 2020A, 5.000%, 12/01/50 | | | |
| 285 | | Peak Metropolitan District 1, Colorado Springs, El Paso County, Colorado, Limited Tax | 3/26 at 103.00 | N/R | 311,850 |
| | General Obligation Bonds, Series 2021A, 5.000%, 12/01/51, 144A | | | |
| 925 | | Pinon Pines Metropolitan District 2, El Paso County, Colorado, General Obligation | 9/25 at 103.00 | N/R | 1,014,707 |
| | Limited Tax Bonds, Series 2020, 5.000%, 12/01/40 | | | |
| 5,350 | | Rampart Range Metropolitan District 1, Lone Tree, Colorado, Limited Tax Supported and | 12/27 at 100.00 | A2 | 6,483,237 |
| | Special Revenue Bonds, Refunding & Improvement Series 2017, 5.000%, 12/01/47 | | | |
| 500 | | Regional Transportation District, Colorado, Private Activity Bonds, Denver Transit | 1/31 at 100.00 | Baa2 | 594,340 |
| | Partners Eagle P3 Project, Series 2020A, 4.000%, 7/15/38 | | | |
| 1,055 | | Sabell Metropolitan District, Arvada, Colorado, Limited Tax General Obligation Bonds, | 3/25 at 103.00 | N/R | 1,148,431 |
| | Convertible to Unlimited Tax Series 2020A, 5.000%, 12/01/50, 144A | | | |
| 1,000 | | Sterling Ranch Community Authority Board, Douglas County, Colorado, Limited Tax | 12/25 at 102.00 | N/R | 1,095,310 |
| | Supported District 2, Refunding & Improvement Senior Series 2020A, 3.750%, 12/01/40 | | | |
| 750 | | Sterling Ranch Community Authority Board, Douglas County, Colorado, Limited Tax | 12/25 at 102.00 | N/R | 794,858 |
| | Supported District 2, Subordinate Series 2020B, 7.125%, 12/15/50 | | | |
| | Sterling Ranch Metropolitan District 1, El Paso County, Colorado, General Obligation | | | |
| | Limited Tax Bonds, Series 2020: | | | |
| 2,350 | | 5.000%, 12/01/40 | 12/25 at 103.00 | N/R | 2,593,625 |
| 2,300 | | 5.125%, 12/01/50 | 12/25 at 103.00 | N/R | 2,527,930 |
| 2,175 | | Sunlight Metropolitan District, Steamboat Springs, Colorado, Limited Tax General | 12/25 at 103.00 | N/R | 2,360,636 |
| | Obligation Bonds, Series 2020, 5.000%, 12/01/50 | | | |
| 500 | | Tallman Gulch Metropolitan District, Douglas County, Colorado, Limited Tax General | 12/22 at 103.00 | N/R | 531,325 |
| | Obligation Refunding and Improvement Bonds,Subordinate Limited Tax General | | | |
| | Obligation Bonds, Series 2018A, 5.250%, 12/01/47 | | | |
| 1,000 | | Transport Metropolitan District 3, In the City of Aurora, Adams County, Colorado, | 3/26 at 103.00 | N/R | 872,310 |
| | General Obligation Limited Bonds, Convertible Capital Appreciation Series 2021A-2, 5.500%, | | | |
| | 12/01/51 (5) | | | |
| 1,270 | | Transport Metropolitan District 3, In the City of Aurora, Adams County, Colorado, | 3/26 at 103.00 | N/R | 1,408,328 |
| | General Obligation Limited Bonds, Series 2021A-1, 5.000%, 12/01/41 | | | |
| 5,000 | | Velocity Metropolitan District 5, In the City of Aurora, Colorado, Limited Tax General | 12/23 at 81.31 | N/R | 3,606,500 |
| | Obligation Bonds, Convertible Capital Appreciation Series 2020A-2, 6.000%, 12/01/50 | | | |
| 10,000 | | Velocity Metropolitan District 5, In the City of Aurora, Colorado, Limited Tax General | 12/23 at 103.00 | N/R | 10,620,000 |
| | Obligation Bonds, Series 2020A-1, 5.375%, 12/01/50 | | | |
146
| | | | | | |
| Principal | | | Optional Call | | |
| Amount (000) | | Description (1) | Provisions (2) | Ratings (3) | Value |
| | Colorado (continued) | | | |
| $ 1,000 | | Verve Metropolitan District 1, Jefferson County and the City and County of Broomfield, | 3/26 at 103.00 | N/R | $ 1,089,040 |
| | Colorado, General Obligation Bonds, Refunding and Improvement Limited Tax Series 2021, | | | |
| | 5.000%, 12/01/51 | | | |
| 1,000 | | Woodmen Heights Metropolitan District 2, El Paso County, Colorado, General Obligation | 12/25 at 103.00 | N/R | 1,043,560 |
| | Limited Tax Bonds, Taxable Converting to Tax-Exempt Refunding Subordinate Series 2020B-1, | | | |
| | 6.250%, 12/15/40 | | | |
| 98,360 | | Total Colorado | | | 103,813,777 |
| | Connecticut – 1.1% (0.7% of Total Investments) | | | |
| 500 | | Connecticut Health and Educational Facilities Authority, Revenue Bonds, Stamford | No Opt. Call | BBB+ | 609,465 |
| | Hospital, Series 2021L-1, 4.000%, 7/01/30 | | | |
| | Connecticut State, Special Tax Obligation Bonds, Transportation Infrastructure Purposes, | | | |
| | Series 2020A: | | | |
| 3,750 | | 5.000%, 5/01/37 | 5/30 at 100.00 | A+ | 4,849,800 |
| 750 | | 5.000%, 5/01/38 | 5/30 at 100.00 | A+ | 965,910 |
| | Connecticut State, Special Tax Obligation Bonds, Transportation Infrastructure Purposes, | | | |
| | Series 2021A: | | | |
| 1,605 | | 4.000%, 5/01/36 (WI/DD, Settling 5/12/21) | 5/31 at 100.00 | A+ | 1,954,072 |
| 1,015 | | 5.000%, 5/01/41 (WI/DD, Settling 5/12/21) | 5/31 at 100.00 | A+ | 1,321,804 |
| 7,620 | | Total Connecticut | | | 9,701,051 |
| | District of Columbia – 0.2% (0.1% of Total Investments) | | | |
| | Washington Convention and Sports Authority, Washington DC, Dedicated Tax Revenue Bonds, | | | |
| | Refunding Senior Lien Series 2021A: | | | |
| 505 | | 4.000%, 10/01/35 (WI/DD, Settling 5/27/21) | 10/30 at 100.00 | A+ | 604,783 |
| 1,060 | | 4.000%, 10/01/38 (WI/DD, Settling 5/27/21) | 10/30 at 100.00 | A+ | 1,258,602 |
| 1,565 | | Total District of Columbia | | | 1,863,385 |
| | Florida – 14.7% (10.1% of Total Investments) | | | |
| 1,565 | | Ave Maria Stewardship Community District, Florida, Capital Improvement Revenue Bonds, | 5/31 at 100.00 | N/R | 1,605,721 |
| | Ave Maria National Project, Series 2021, 3.750%, 5/01/41 | | | |
| 1,310 | | Banyan Cay Community Development District, West Palm Beach, Florida, Special Assessment | 11/30 at 100.00 | N/R | 1,343,313 |
| | Bonds, 2020-1, 4.000%, 11/01/51 | | | |
| 1,500 | | Belmont II Community Development District, Hillsborough County, Florida, Special | 12/30 at 100.00 | N/R | 1,571,970 |
| | Assessment Revenue Bonds, 2020 Assessment Area, Series 2020, 4.000%, 12/15/50 | | | |
| | Broward County, Florida, Port Facilities Revenue Bonds, Series 2019B: | | | |
| 7,500 | | 4.000%, 9/01/37 (AMT) (4) | 9/29 at 100.00 | A | 8,649,300 |
| 2,500 | | 4.000%, 9/01/39 (AMT) (UB) (4) | 9/29 at 100.00 | A | 2,869,225 |
| | Capital Trust Agency, Florida, Educational Facilities Lease Revenue Bonds, South Tech | | | |
| | Schools Project, Series 2020A: | | | |
| 1,235 | | 5.000%, 6/15/40, 144A | 6/27 at 100.00 | N/R | 1,329,070 |
| 1,260 | | 5.000%, 6/15/55, 144A | 6/27 at 100.00 | N/R | 1,337,503 |
| 1,000 | | Capital Trust Agency, Florida, Revenue Bonds, Educational Growth Fund, LLC, Charter | 7/31 at 100.00 | N/R | 1,127,970 |
| | School Portfolio Projects, Series 2021A-1, 5.000%, 7/01/56, 144A | | | |
| 1,000 | | Capital Trust Agency, Florida, Revenue Bonds, St Johns Classical Academy, Refunding | 6/30 at 100.00 | N/R | 1,012,550 |
| | Series 2021A, 4.000%, 6/15/56, 144A | | | |
| | Central Florida Expressway Authority, Revenue Bonds, Refunding Senior Lien Series 2021: | | | |
| 1,070 | | 4.000%, 7/01/34 – AGM Insured | 7/31 at 100.00 | AA | 1,328,619 |
| 195 | | 4.000%, 7/01/37 – AGM Insured | 7/31 at 100.00 | AA | 239,598 |
| 600 | | 4.000%, 7/01/38 – AGM Insured | 7/31 at 100.00 | AA | 734,346 |
| 525 | | 4.000%, 7/01/39 – AGM Insured | 7/31 at 100.00 | AA | 640,720 |
| 6,485 | | Currents Community Development District, Collier County, Florida, Capital Improvement | No Opt. Call | N/R | 7,053,281 |
| | Revenue Bonds, Series 2020B, 4.250%, 5/01/41, 144A | | | |
| 1,500 | | Cypress Park Estates Community Development District, Florida, Special Assessment Revenue | 5/32 at 100.00 | N/R | 1,566,855 |
| | Bonds, Assessment Area 1 Project, Series 2020, 4.000%, 5/01/51, 144A | | | |
147
| | |
| NDMO | Nuveen Dynamic Municipal Opportunities Fund |
| Portfolio of Investments (continued) April 30, 2021 (Unaudited) |
| | | | | | |
| Principal | | | Optional Call | | |
| Amount (000) | | Description (1) | Provisions (2) | Ratings (3) | Value |
| | Florida (continued) | | | |
| $ 2,500 | | Cypress Preserve Community Development District, Pasco County, Florida, Special | 11/29 at 100.00 | N/R | $ 2,619,800 |
| | Assessment Bonds, Assessment Area 2, Series 2019, 4.125%, 11/01/50 | | | |
| 1,000 | | Edgewater East Community Development District, Osceola County, Florida, Special | 5/31 at 100.00 | N/R | 1,042,680 |
| | Assessment Revenue Bonds, Assessment Area 1 Series 2021, 4.000%, 5/01/51 | | | |
| 10,000 | | Florida Development Finance Corporation, Educational Facilities Revenue Bonds, Discovery | 6/29 at 100.00 | N/R | 10,900,000 |
| | High School Project, Series 2020A, 5.000%, 6/01/55, 144A | | | |
| 1,100 | | Florida Development Finance Corporation, Educational Facilities Revenue Bonds, Mater | 6/27 at 100.00 | BBB | 1,248,214 |
| | Academy Projects, Series 2020A, 5.000%, 6/15/50 | | | |
| 500 | | Florida Development Finance Corporation, Educational Facilities Revenue Bonds, River | 7/28 at 100.00 | Baa3 | 535,215 |
| | City Science Academy Projects, Series 2021A, 4.000%, 7/01/55 | | | |
| 17,650 | | Florida Development Finance Corporation, Florida, Surface Transportation Facility | 1/24 at 107.00 | N/R | 18,356,000 |
| | Revenue Bonds, Brightline Passenger Rail Project, Green Series 2019B, 7.375%, | | | |
| | 1/01/49 (AMT), 144A | | | |
| 5,890 | | Florida Development Finance Corporation, Florida, Surface Transportation Facility | 6/21 at 104.00 | N/R | 5,897,304 |
| | Revenue Bonds, Virgin Trains USA Passenger Rail Project , Series 2019A, 6.500%, 1/01/49 (AMT) | | | |
| | (Mandatory Put 1/01/29), 144A | | | |
| 1,100 | | Florida Higher Educational Facilities Financing Authority, Revenue Bonds, Jacksonville | 6/28 at 100.00 | N/R | 1,288,958 |
| | University Project, Series 2018A-1, 5.000%, 6/01/48, 144A | | | |
| 11,180 | | Florida Higher Educational Facilities Financing Authority, Revenue Bonds, Rollins | 12/30 at 100.00 | A2 | 11,791,658 |
| | College Project, Refunding Series 2020A, 3.000%, 12/01/48 (UB) (4) | | | |
| 1,000 | | Forest Lake Community Development District, Polk County, Florida, Special Assessment | 5/30 at 100.00 | N/R | 1,042,950 |
| | Bonds, Assessment Area One Project, Series 2020, 4.000%, 5/01/51, 144A | | | |
| | Grand Oaks Community Development District, Saint Johns County, Florida, Special | | | |
| | Assessment Bonds, Assessment Area 2, Series 2020: | | | |
| 1,100 | | 4.250%, 5/01/40 | 5/31 at 100.00 | N/R | 1,158,608 |
| 1,500 | | 4.500%, 5/01/52 | 5/31 at 100.00 | N/R | 1,582,800 |
| 1,000 | | Hammock Reserve Community Development District, Haines City, Florida, Special Assessment | 5/30 at 100.00 | N/R | 1,041,320 |
| | Revenue Bonds, Area1 Project, Series 2020, 4.000%, 5/01/51 | | | |
| | Hillsborough County Industrial Development Authority, Florida, Hospital Revenue Bonds, | | | |
| | Florida Health Sciences Center Inc D/B/A Tampa General Hospital, Series 2020A: | | | |
| 3,550 | | 4.000%, 8/01/45 (4) | 2/31 at 100.00 | Baa1 | 4,069,436 |
| 10,000 | | 3.500%, 8/01/55 (UB) (4) | 2/31 at 100.00 | Baa1 | 10,722,200 |
| 1,250 | | Lakewood Ranch Stewardship District, Florida, Special Assessment Revenue Bonds, | 5/30 at 100.00 | N/R | 1,306,675 |
| | Northeast Sector Project, Phase 2B, Series 2020, 4.000%, 5/01/50, 144A | | | |
| 1,225 | | Miami Dade County Industrial Development Authority, Florida, Educational Facilities | 6/26 at 103.00 | N/R | 1,276,560 |
| | Revenue Bonds, Miami Community Charter School Inc Project, Series 2020A, 5.000%, | | | |
| | 6/01/47, 144A | | | |
| 8,000 | | Miami-Dade County Expressway Authority, Florida, Toll System Revenue Bonds, Series | 7/24 at 100.00 | BBB+ | 8,976,640 |
| | 2014A, 5.000%, 7/01/44 | | | |
| 1,500 | | Miami-Dade County, Florida, Aviation Revenue Bonds, Refunding Series 2020A, | 10/30 at 100.00 | A– | 1,777,650 |
| | 4.000%, 10/01/41 | | | |
| | Miami-Dade County, Florida, Water and Sewer System Revenue Bonds, Series 2021: | | | |
| 515 | | 3.000%, 10/01/36 | 4/31 at 100.00 | A+ | 575,518 |
| 1,200 | | 3.000%, 10/01/40 | 4/31 at 100.00 | A+ | 1,317,360 |
| 1,500 | | Mirada II Community Development District, Florida, Capital Improvement Revenue Bonds, | 5/31 at 100.00 | N/R | 1,548,690 |
| | Series 2021, 4.000%, 5/01/51 | | | |
| 1,000 | | North Powerline Road Community Development District, Polk County, Florida, Special | 5/30 at 100.00 | N/R | 1,036,720 |
| | Assessment Revenue Bonds, Series 2020, 4.000%, 5/01/51 | | | |
| 1,000 | | Northern Palm Beach County Improvement District, Florida, Water Control and Improvement | 8/31 at 100.00 | N/R | 1,048,830 |
| | Bonds, Development Unit 53, Series 2021, 4.000%, 8/01/51 | | | |
| 1,500 | | Parrish Plantation Community Development District, Manatee County, Florida, Special | 5/31 at 100.00 | N/R | 1,553,790 |
| | Assessment Revenue Bonds, Assessment Area 1, Series 2021, 4.000%, 5/01/52 | | | |
148
| | | | | | |
| Principal | | | Optional Call | | |
| Amount (000) | | Description (1) | Provisions (2) | Ratings (3) | Value |
| | Florida (continued) | | | |
| $ 1,500 | | Stoneybrook South Championsgate Community Development District, Florida, Special | 12/30 at 100.00 | N/R | $ 1,534,035 |
| | Assessment Revenue Bonds, Fox South Assessment Area, Series 2020, 3.750%, 12/15/50, 144A | | | |
| 16,435 | | Tampa, Florida, Capital Improvement Cigarette Tax Allocation Bonds, H Lee Moffitt Cancer | 9/30 at 38.62 | A+ | 4,908,477 |
| | Center Project, Series 2020A, 0.000%, 9/01/53 | | | |
| 1,010 | | Windward Community Development District, Florida, Special Assessment Bonds, Series | No Opt. Call | N/R | 1,086,396 |
| | 2020A-2, 4.400%, 11/01/35 | | | |
| 135,950 | | Total Florida | | | 133,654,525 |
| | Guam – 0.2% (0.2% of Total Investments) | | | |
| 1,600 | | Government of Guam, Hotel Occupancy Tax Revenue Bonds, Refunding Series 2021A, | 5/31 at 100.00 | Ba1 | 1,987,760 |
| | 5.000%, 11/01/40 | | | |
| | Hawaii – 0.3% (0.2% of Total Investments) | | | |
| | Hawaii State, Harbor System Revenue Bonds, Series 2020A: | | | |
| 1,375 | | 4.000%, 7/01/33 (AMT) | 7/30 at 100.00 | Aa3 | 1,635,425 |
| 270 | | 4.000%, 7/01/34 (AMT) | 7/30 at 100.00 | Aa3 | 320,080 |
| 205 | | 4.000%, 7/01/35 (AMT) | 7/30 at 100.00 | Aa3 | 242,478 |
| 430 | | 4.000%, 7/01/36 (AMT) | 7/30 at 100.00 | Aa3 | 506,953 |
| 2,280 | | Total Hawaii | | | 2,704,936 |
| | Idaho – 0.2% (0.1% of Total Investments) | | | |
| | Idaho Housing and Finance Association, Grant and Revenue Anticipation Bonds, Federal | | | |
| | Highway Trust Funds, Series 2021A: | | | |
| 645 | | 4.000%, 7/15/38 (WI/DD, Settling 5/06/21) | 7/31 at 100.00 | A+ | 780,321 |
| 500 | | 4.000%, 7/15/39 (WI/DD, Settling 5/06/21) | 7/31 at 100.00 | A2 | 603,195 |
| 1,145 | | Total Idaho | | | 1,383,516 |
| | Illinois – 6.9% (4.7% of Total Investments) | | | |
| 3,000 | | Chicago Board of Education, Illinois, General Obligation Bonds, Dedicated Revenues, | 12/27 at 100.00 | BB | 3,581,370 |
| | Refunding Series 2017C, 5.000%, 12/01/30 | | | |
| 1,445 | | Chicago Board of Education, Illinois, General Obligation Bonds, Dedicated Revenues, | 12/30 at 100.00 | BB | 1,810,758 |
| | Refunding Series 2021B, 5.000%, 12/01/31 | | | |
| | Chicago Board of Education, Illinois, General Obligation Bonds, Dedicated Revenues, | | | |
| | Series 2021A: | | | |
| 2,935 | | 5.000%, 12/01/32 | 12/30 at 100.00 | BB | 3,663,643 |
| 1,650 | | 5.000%, 12/01/39 | 12/30 at 100.00 | BB | 2,024,501 |
| | Chicago Transit Authority, Illinois, Sales Tax Receipts Revenue Bonds, Series 2014: | | | |
| 5,000 | | 5.250%, 12/01/49 (UB) (4) | 12/24 at 100.00 | AA | 5,805,600 |
| 10,000 | | 5.250%, 12/01/49 | 12/24 at 100.00 | AA | 11,611,200 |
| 2,000 | | Chicago, Illinois, General Obligation Bonds, Project Series 2011A, 5.000%, 1/01/40 | 6/21 at 100.00 | Ba1 | 2,003,860 |
| | Cook County, Illinois, General Obligation Bonds, Refunding Series 2021A: | | | |
| 1,825 | | 5.000%, 11/15/31 | 11/30 at 100.00 | A2 | 2,414,493 |
| 1,200 | | 5.000%, 11/15/32 | 11/30 at 100.00 | A2 | 1,581,432 |
| 1,175 | | 5.000%, 11/15/33 | 11/30 at 100.00 | A2 | 1,542,681 |
| | Cook County, Illinois, Sales Tax Revenue Bonds, Series 2021A: | | | |
| 175 | | 4.000%, 11/15/39 | 11/30 at 100.00 | AA– | 208,658 |
| 475 | | 4.000%, 11/15/40 | 11/30 at 100.00 | AA– | 564,946 |
| 5,085 | | DuPage County, Illinois, Revenue Bonds, Morton Arboretum Project, Green Series 2020, | 5/30 at 100.00 | A1 | 5,191,073 |
| | 3.000%, 5/15/47 | | | |
| 10,000 | | Illinois Finance Authority, Revenue Bonds, OSF Healthcare System, Series 2020A, 3.000%, | 11/30 at 100.00 | A3 | 10,455,700 |
| | 5/15/50 (UB) (4) | | | |
| | Illinois State, General Obligation Bonds, March Series 2021A: | | | |
| 375 | | 4.000%, 3/01/39 | 3/31 at 100.00 | BBB– | 431,205 |
| 300 | | 4.000%, 3/01/41 | 3/31 at 100.00 | BBB– | 342,660 |
149
| | |
| NDMO | Nuveen Dynamic Municipal Opportunities Fund |
| Portfolio of Investments (continued) April 30, 2021 (Unaudited) |
| | | | | | |
| Principal | | | Optional Call | | |
| Amount (000) | | Description (1) | Provisions (2) | Ratings (3) | Value |
| | Illinois (continued) | | | |
| $ 3,300 | | Metropolitan Pier and Exposition Authority, Illinois, McCormick Place Expansion Project | 12/30 at 100.00 | BB+ | $ 4,083,750 |
| | Bonds, Series 2020B, 5.000%, 6/15/42 | | | |
| 5,190 | | Romeoville, Will County, Illinois, Revenue Bonds, Lewis University Project, Series 2015, | 4/25 at 100.00 | BBB | 5,695,817 |
| | 5.000%, 10/01/35 | | | |
| 55,130 | | Total Illinois | | | 63,013,347 |
| | Indiana – 1.0% (0.7% of Total Investments) | | | |
| 1,415 | | Gary Local Public Improvement Bond Bank, Indiana, Economic Development Revenue Bonds, | 6/30 at 100.00 | N/R | 1,490,123 |
| | Drexel Foundation for Educational Excellence Project, Refunding Series 2020A, 5.875%, | | | |
| | 6/01/55, 144A | | | |
| 3,445 | | Indiana Finance Authority, Educational Facilities Revenue Bonds, Rose Hulman Institute | 12/28 at 100.00 | A2 | 4,243,241 |
| | Of Technology Project, Series 2018, 5.000%, 6/01/39 | | | |
| 1,000 | | Indiana Finance Authority, Environmental Improvement Revenue Bonds, United States Steel | No Opt. Call | Caa1 | 1,088,950 |
| | Corporation Project, Refunding Series 2021A, 4.125%, 12/01/26 | | | |
| 1,625 | | Indiana Finance Authority, Environmental Improvement Revenue Bonds, United States Steel | 11/30 at 100.00 | Caa1 | 2,030,486 |
| | Corporation Project, Series 2020, 6.750%, 5/01/39 (AMT) | | | |
| 7,485 | | Total Indiana | | | 8,852,800 |
| | Kansas – 0.1% (0.1% of Total Investments) | | | |
| 1,000 | | Kansas Independent College Finance Authority, Educational Facilities Revenue Bonds, | 6/22 at 103.00 | N/R | 1,062,440 |
| | Ottawa University Project, Series 2015, 7.000%, 6/01/45, 144A | | | |
| | Kentucky – 0.8% (0.5% of Total Investments) | | | |
| 3,000 | | Bell County, Kentucky, Special Assessment Industrial Building Revenue Bonds, Boone’s | 12/30 at 100.00 | N/R | 3,151,350 |
| | Ridge Project, Series 2020, 6.000%, 12/01/40 | | | |
| 2,515 | | Kentucky Municipal Power Agency, Power System Revenue Bonds, Prairie State Project, | 9/26 at 100.00 | Baa1 | 3,058,366 |
| | Refunding Series 2016A, 5.000%, 9/01/36 – NPFG Insured | | | |
| 1,000 | | Newport, Kentucky, Special Obligation Revenue Bonds, Newport Clifton Project, Series | 12/30 at 100.00 | N/R | 1,019,330 |
| | 2020B, 5.500%, 12/01/60 | | | |
| 6,515 | | Total Kentucky | | | 7,229,046 |
| | Louisiana – 2.1% (1.4% of Total Investments) | | | |
| 1,150 | | Louisiana Public Facilities Authority, Louisiana, Revenue Bonds, Lincoln Preparatory | 6/31 at 100.00 | N/R | 1,242,425 |
| | School Project, Series 2021A, 5.250%, 6/01/51, 144A | | | |
| | Louisiana Public Facilities Authority, Louisiana, Revenue Bonds, Ochsner Clinic Foundation | | | |
| | Project, Series 2020A: | | | |
| 5,355 | | 3.000%, 5/15/47 (UB) (4) | 5/30 at 100.00 | A3 | 5,673,569 |
| 2,145 | | 4.000%, 5/15/49 (UB) (4) | 5/30 at 100.00 | A3 | 2,475,609 |
| 2,000 | | New Orleans Aviation Board, Louisiana, General Airport Revenue Bonds, North Terminal | 1/27 at 100.00 | A– | 2,357,580 |
| | Project, Series 2017B, 5.000%, 1/01/48 (AMT) | | | |
| | New Orleans, Louisiana, Sewerage Service Revenue Bonds, Taxable Refunding Series 2021: | | | |
| 2,000 | | 2.839%, 6/01/41 – AGM Insured | 6/31 at 100.00 | BBB+ | 1,936,600 |
| 1,500 | | 2.939%, 6/01/45 – AGM Insured | 6/31 at 100.00 | BBB+ | 1,452,285 |
| 1,100 | | New Orleans, Louisiana, Water Revenue Bonds, Taxable Refunding Series 2021, 2.889%, | 12/31 at 100.00 | BBB+ | 1,050,489 |
| | 12/01/41 – AGM Insured | | | |
| 2,000 | | Saint James Parish, Louisiana, Revenue Bonds, NuStar Logistics, LP Project, Series 2010, | 6/30 at 100.00 | BB– | 2,584,020 |
| | 6.350%, 7/01/40, 144A | | | |
| 17,250 | | Total Louisiana | | | 18,772,577 |
| | Maryland – 1.3% (0.9% of Total Investments) | | | |
| 2,200 | | Frederick County, Maryland, Special Obligation Bonds, Urbana Community Development | 7/30 at 100.00 | N/R | 2,472,404 |
| | Authority, Refunding Series 2020C, 4.000%, 7/01/50 | | | |
| 5,455 | | Frederick County, Maryland, Special Tax Limited Obligation Bonds, Jefferson Technology | 7/30 at 102.00 | N/R | 6,277,505 |
| | Park Project, Refunding Series 2020A, 5.000%, 7/01/43, 144A | | | |
150
| | | | | | |
| Principal | | | Optional Call | | |
| Amount (000) | | Description (1) | Provisions (2) | Ratings (3) | Value |
| | Maryland (continued) | | | |
| $ 1,000 | | Maryland Economic Development Corporation, Special Obligation Bonds, Port Covington | 9/30 at 100.00 | N/R | $ 1,103,030 |
| | Project, Series 2020, 4.000%, 9/01/50 | | | |
| 1,250 | | Maryland Economic Development Corporation, Student Housing Revenue Bonds, Morgan State | 7/30 at 100.00 | BBB– | 1,500,937 |
| | University Project, Series 2020, 5.000%, 7/01/50 | | | |
| 9,905 | | Total Maryland | | | 11,353,876 |
| | Massachusetts – 2.1% (1.4% of Total Investments) | | | |
| 260 | | Massachusetts Development Finance Agency, Revenue Bonds, Southcoast Health System | 7/31 at 100.00 | BBB+ | 328,320 |
| | Obligated Group Issue, Series 2021G, 5.000%, 7/01/50 | | | |
| | Massachusetts Port Authority, Revenue Bonds, Series 2021E: | | | |
| 2,050 | | 5.000%, 7/01/37 (AMT) | 7/31 at 100.00 | AA– | 2,679,330 |
| 2,000 | | 5.000%, 7/01/38 (AMT) | 7/31 at 100.00 | AA– | 2,601,940 |
| 2,240 | | 5.000%, 7/01/39 (AMT) | 7/31 at 100.00 | AA– | 2,903,712 |
| 2,420 | | 5.000%, 7/01/40 (AMT) | 7/31 at 100.00 | AA– | 3,122,211 |
| 3,725 | | 5.000%, 7/01/41 (AMT) | 7/31 at 100.00 | AA– | 4,791,728 |
| 2,500 | | Massachusetts School Building Authority, Dedicated Sales Tax Revenue Bonds, Taxable | No Opt. Call | Aa2 | 2,499,100 |
| | Refunding Senior Series 2020B, 1.134%, 8/15/26 | | | |
| 15,195 | | Total Massachusetts | | | 18,926,341 |
| | Michigan – 1.3% (0.9% of Total Investments) | | | |
| 5,000 | | Detroit, Wayne County, Michigan, General Obligation Bonds, Financial Recovery Series | 6/21 at 100.00 | N/R | 4,776,900 |
| | 2014B-1, 4.000%, 4/01/44 | | | |
| 1,500 | | Detroit, Wayne County, Michigan, General Obligation Bonds, Series 2020, 5.500%, 4/01/45 | 4/30 at 100.00 | BB– | 1,861,785 |
| | Detroit, Wayne County, Michigan, General Obligation Bonds, Social Bond Series 2021A: | | | |
| 350 | | 5.000%, 4/01/46 | 4/31 at 100.00 | BB– | 426,265 |
| 2,000 | | 5.000%, 4/01/50 | 4/31 at 100.00 | BB– | 2,422,900 |
| 16,110 | | Michigan Finance Authority, Tobacco Settlement Asset- Backed Bonds, 2007 Sold Tobacco | 12/30 at 18.38 | N/R | 2,074,968 |
| | Receipts, Series 2020B2-CL2, 0.000%, 6/01/65 | | | |
| 24,960 | | Total Michigan | | | 11,562,818 |
| | Minnesota – 0.1% (0.1% of Total Investments) | | | |
| 1,140 | | Saint Paul Housing & Redevelopment Authority, Minnesota, Charter School Lease Revenue | 12/28 at 102.00 | BB | 1,209,403 |
| | Bonds, Hope Community Academy Project, Series 2020A, 5.000%, 12/01/55 | | | |
| | Missouri – 3.3% (2.3% of Total Investments) | | | |
| 5,315 | | Kansas City Industrial Development Authority, Missouri, Airport Special Obligation | 3/29 at 100.00 | A– | 6,480,739 |
| | Bonds, Kansas City International Airport Terminal Modernization Project, Series 2019A, | | | |
| | 5.000%, 3/01/44 (AMT) (4) | | | |
| 3,835 | | Kansas City Industrial Development Authority, Missouri, Airport Special Obligation | 3/29 at 100.00 | A– | 4,666,965 |
| | Bonds, Kansas City International Airport Terminal Modernization Project, Series 2019B, | | | |
| | 5.000%, 3/01/46 (AMT) (4) | | | |
| 1,100 | | M150 and 135th Street Transportation Development District, Kansas City, Missouri, | 10/27 at 100.00 | N/R | 1,135,926 |
| | Transportation Sales Tax Revenue Bonds, Series 2020A, 4.250%, 10/01/43 | | | |
| 4,940 | | Missouri Health and Educational Facilities Authority, Health Facilities Revenue Bonds, | 6/30 at 100.00 | A+ | 5,175,490 |
| | Mercy Health, Series 2020, 3.000%, 6/01/53 (UB) (4) | | | |
| 3,155 | | Saint Louis Municipal Finance Corporation, Missouri, Leasehold Revenue Bonds, Convention | 10/30 at 100.00 | A2 | 3,945,864 |
| | Center, Expansion & Improvement Projects Series 2020, 5.000%, 10/01/45 – AGM Insured (UB) (4) | | | |
| | Southeast Missouri State University, System Facilities Revenue Bonds, Refunding Series 2020: | | | |
| 2,500 | | 5.000%, 4/01/28 | No Opt. Call | A | 3,086,200 |
| 2,905 | | 5.000%, 4/01/29 (4) | No Opt. Call | A | 3,648,186 |
| 1,470 | | 5.000%, 4/01/30 | No Opt. Call | A | 1,866,826 |
| 25,220 | | Total Missouri | | | 30,006,196 |
151
| | |
| NDMO | Nuveen Dynamic Municipal Opportunities Fund |
| Portfolio of Investments (continued) April 30, 2021 (Unaudited) |
| | | | | | |
| Principal | | | Optional Call | | |
| Amount (000) | | Description (1) | Provisions (2) | Ratings (3) | Value |
| | Nevada – 1.1% (0.8% of Total Investments) | | | |
| $ 5,920 | | Clark County School District, Nevada, General Obligation Bonds, Limited Tax Building | 6/30 at 100.00 | A1 | $ 6,467,186 |
| | Series 2020B, 3.000%, 6/15/38 – BAM Insured | | | |
| 2,000 | | Director of Nevada State Department of Business & Industry, Environmental Improvement | 2/31 at 100.00 | N/R | 2,022,520 |
| | Revenue Bonds, Fulcrum Sierra BioFuels LLC Project, Green Series 2020, 6.750%, 2/15/38, 144A | | | |
| | Las Vegas, Nevada, Local Improvement Bonds, Special Improvement District 611 Sunstone | | | |
| | Phase I and II, Series 2020: | | | |
| 450 | | 4.000%, 6/01/40 | 6/30 at 100.00 | N/R | 484,025 |
| 1,150 | | 4.125%, 6/01/50 | 6/30 at 100.00 | N/R | 1,229,430 |
| 9,520 | | Total Nevada | | | 10,203,161 |
| | New Hampshire – 0.6% (0.4% of Total Investments) | | | |
| 4,400 | | National Finance Authority, Federal Lease Revenue Bonds, VA Birmingham Health Care | 10/35 at 100.00 | A2 | 4,395,556 |
| | Center Project, Taxable Series 2021, 3.778%, 1/01/36 | | | |
| 1,250 | | New Hampshire Health and Education Facilities Authority, Revenue Bonds, Catholic Medical | 7/27 at 100.00 | Baa3 | 1,349,550 |
| | Center, Series 2017, 3.750%, 7/01/40 | | | |
| 5,650 | | Total New Hampshire | | | 5,745,106 |
| | New Jersey – 6.8% (4.6% of Total Investments) | | | |
| | New Jersey Economic Development Authority, School Facilities Construction Bonds, Social | | | |
| | Series 2021QQQ: | | | |
| 2,750 | | 4.000%, 6/15/46 | 12/30 at 100.00 | BBB | 3,134,505 |
| 7,850 | | 4.000%, 6/15/46 (UB) (4) | 12/30 at 100.00 | BBB | 8,947,587 |
| 9,500 | | New Jersey Health Care Facilities Financing Authority, Revenue Bonds, Saint Joseph’s | 7/26 at 100.00 | BBB– | 10,465,295 |
| | Healthcare System Obligated Group Issue, Refunding Series 2016, 4.000%, 7/01/48 | | | |
| 1,000 | | New Jersey State, General Obligation Bonds, Covid-19 Emergency Series 2020A, | No Opt. Call | BBB+ | 1,135,160 |
| | 3.000%, 6/01/32 | | | |
| | New Jersey Transportation Trust Fund Authority, Transportation System Bonds, Forward | | | |
| | Delivery Series 2022A: | | | |
| 620 | | 4.000%, 6/15/38 (WI/DD, Settling 4/27/22) | 6/32 at 100.00 | BBB | 695,200 |
| 770 | | 4.000%, 6/15/39 (WIDD, Settling 4/27/22) | 6/32 at 100.00 | BBB | 859,520 |
| 700 | | 4.000%, 6/15/40 (WI/DD, Settling 4/27/22) | 6/32 at 100.00 | BBB | 778,246 |
| 640 | | 4.000%, 6/15/41 (WI/DD, Settling 4/27/22) | 6/32 at 100.00 | BBB | 709,120 |
| 520 | | 4.000%, 6/15/42 (WI/DD, Settling 4/27/22) | 6/32 at 100.00 | BBB | 574,200 |
| | New Jersey Transportation Trust Fund Authority, Transportation System Bonds, Series 2020AA: | | | |
| 25,990 | | 3.000%, 6/15/50 (UB) (4) | 12/30 at 100.00 | BBB | 26,742,930 |
| 545 | | 4.000%, 6/15/50 (UB) (4) | 12/30 at 100.00 | BBB | 618,510 |
| | New Jersey Transportation Trust Fund Authority, Transportation System Bonds, Series 2021A: | | | |
| 935 | | 4.000%, 6/15/34 | 6/31 at 100.00 | BBB | 1,114,585 |
| 385 | | 4.000%, 6/15/35 | 6/31 at 100.00 | BBB | 457,457 |
| 440 | | 4.000%, 6/15/36 | 6/31 at 100.00 | BBB | 520,960 |
| 3,125 | | South Jersey Transportation Authority, New Jersey, Transportation System Revenue Bonds, | 11/30 at 100.00 | Baa2 | 3,579,812 |
| | Series 2020A, 4.000%, 11/01/50 | | | |
| 1,100 | | South Jersey Transportation Authority, New Jersey, Transportation System Revenue Bonds, | 11/30 at 100.00 | Baa3 | 1,274,328 |
| | Subordinate Series 2020A, 4.000%, 11/01/50 – BAM Insured | | | |
| 56,870 | | Total New Jersey | | | 61,607,415 |
| | New Mexico – 0.8% (0.5% of Total Investments) | | | |
| 7,000 | | Winrock Town Center Tax Increment Development District 1, Albuquerque, New Mexico, Gross | 11/23 at 103.00 | N/R | 7,161,910 |
| | Receipts Tax Increment Bonds, Subordinate Lien Series 2020, 8.000%, 5/01/40, 144A | | | |
| | New York – 24.3% (16.6% of Total Investments) | | | |
| 6,000 | | Build NYC Resource Corporation, New York, Revenue Bonds, Albert Einstein College of | 9/25 at 100.00 | N/R | 6,655,260 |
| | Medicine, Inc, Series 2015, 5.500%, 9/01/45, 144A | | | |
| 5,000 | | Build NYC Resource Corporation, New York, Revenue Bonds, Family Life Academy Charter | 12/30 at 100.00 | N/R | 5,104,200 |
| | School, Series 2020A-1, 5.500%, 6/01/55, 144A | | | |
152
| | | | | | |
| Principal | | | Optional Call | | |
| Amount (000) | | Description (1) | Provisions (2) | Ratings (3) | Value |
| | New York (continued) | | | |
| | Build NYC Resource Corporation, New York, Revenue Bonds, Family Life Academy Charter | | | |
| | School, Series 2020C-1: | | | |
| $ 1,310 | | 5.000%, 6/01/40, 144A | 12/30 at 100.00 | N/R | $ 1,390,814 |
| 3,000 | | 5.000%, 6/01/55, 144A | 12/30 at 100.00 | N/R | 3,122,640 |
| 10,000 | | Dormitory Authority of the State of New York, Revenue Bonds, Catholic Health System | 7/29 at 100.00 | BBB | 11,335,500 |
| | Obligated Group Series 2019A, 4.000%, 7/01/45 (UB) (4) | | | |
| 9,120 | | Dormitory Authority of the State of New York, Revenue Bonds, NYU Langone Hospitals | 7/30 at 100.00 | A3 | 10,587,408 |
| | Obligated Group, Series 2020A, 4.000%, 7/01/53 (UB) (4) | | | |
| 20,000 | | Dormitory Authority of the State of New York, State Personal Income Tax Revenue Bonds, | 9/30 at 100.00 | Aa2 | 21,020,800 |
| | General Purpose, Series 2020A Bidding Group 1 thru 5, 3.000%, 3/15/50 (UB) (4) | | | |
| | Dormitory Authority of the State of New York, State Personal Income Tax Revenue Bonds, | | | |
| | General Purpose, Series 2021A: | | | |
| 3,000 | | 4.000%, 3/15/37 | 3/31 at 100.00 | AA+ | 3,607,350 |
| 3,000 | | 4.000%, 3/15/38 | 3/31 at 100.00 | AA+ | 3,593,340 |
| 3,000 | | 4.000%, 3/15/39 | 3/31 at 100.00 | AA+ | 3,579,900 |
| 3,000 | | 4.000%, 3/15/40 | 3/31 at 100.00 | AA+ | 3,571,980 |
| 3,000 | | 4.000%, 3/15/41 | 3/31 at 100.00 | AA+ | 3,561,870 |
| 2,640 | | Metropolitan Transportation Authority, New York, Transportation Revenue Bonds, Refunding | 5/28 at 100.00 | BBB+ | 2,963,717 |
| | Series 2017D, 4.000%, 11/15/42 | | | |
| 10,000 | | Metropolitan Transportation Authority, New York, Transportation Revenue Bonds, Series | 11/24 at 100.00 | BBB+ | 11,312,500 |
| | 2014D-1, 5.250%, 11/15/44 (UB) (4) | | | |
| | Monroe County Industrial Development Corporation, New York, Revenue Bonds, Rochester | | | |
| | Regional Health Project, Series 2020A: | | | |
| 715 | | 3.000%, 12/01/37 | 12/30 at 100.00 | BBB+ | 759,566 |
| 2,200 | | 3.000%, 12/01/40 | 12/30 at 100.00 | BBB+ | 2,299,330 |
| 1,000 | | 4.000%, 12/01/46 | 12/30 at 100.00 | BBB+ | 1,142,400 |
| | Nassau County Interim Finance Authority, New York, Sales Tax Secured Bonds, Taxable | | | |
| | Series 2021B: | | | |
| 3,500 | | 0.829%, 11/15/26 | No Opt. Call | AAA | 3,431,645 |
| 5,750 | | 1.459%, 11/15/29 | No Opt. Call | AAA | 5,588,080 |
| | New York City Industrial Development Agency, New York, PILOT Payment in Lieu of Taxes | | | |
| | Revenue Bonds, Queens Baseball Stadium Project, Refunding Series 2021A: | | | |
| 1,000 | | 3.000%, 1/01/34 – AGM Insured | 1/31 at 100.00 | BBB | 1,100,800 |
| 1,205 | | 3.000%, 1/01/37 – AGM Insured | 1/31 at 100.00 | BBB | 1,305,196 |
| | New York City Industrial Development Agency, New York, PILOT Payment in Lieu of Taxes | | | |
| | Revenue Bonds, Yankee Stadium Project, Series 2020A: | | | |
| 5,385 | | 3.000%, 3/01/39 – AGM Insured (UB) (4) | 9/30 at 100.00 | BBB+ | 5,790,652 |
| 3,845 | | 3.000%, 3/01/40 – AGM Insured (UB) (4) | 9/30 at 100.00 | BBB+ | 4,125,570 |
| 3,500 | | 4.000%, 3/01/45 (4) | 9/30 at 100.00 | BBB+ | 3,982,720 |
| 2,275 | | 3.000%, 3/01/49 (UB) (4) | 9/30 at 100.00 | BBB+ | 2,328,508 |
| 7,695 | | New York City Municipal Water Finance Authority, New York, Water and Sewer System Second | 12/29 at 100.00 | AA+ | 9,688,467 |
| | General Resolution Revenue Bonds, Fiscal 2020 Series BB-1, 5.000%, 6/15/49 | | | |
| 3,375 | | New York City Municipal Water Finance Authority, New York, Water and Sewer System Second | 12/30 at 100.00 | AA+ | 3,971,835 |
| | General Resolution Revenue Bonds, Fiscal 2021 Series BB-1, 4.000%, 6/15/50 | | | |
| | New York City Municipal Water Finance Authority, New York, Water and Sewer System Second | | | |
| | General Resolution Revenue Bonds, Fiscal 2021 Series DD: | | | |
| 330 | | 5.000%, 6/15/29 | No Opt. Call | AA+ | 436,082 |
| 500 | | 5.000%, 6/15/31 | No Opt. Call | AA+ | 687,170 |
| 2,500 | | New York City Transitional Finance Authority, New York, Future Tax Secured Bonds, | 11/30 at 100.00 | Aa1 | 2,977,525 |
| | Subordinate Fiscal 2021 Subseries C-1, 4.000%, 5/01/39 | | | |
153
| | |
| NDMO | Nuveen Dynamic Municipal Opportunities Fund |
| Portfolio of Investments (continued) April 30, 2021 (Unaudited) |
| | | | | | |
| Principal | | | Optional Call | | |
| Amount (000) | | Description (1) | Provisions (2) | Ratings (3) | Value |
| | New York (continued) | | | |
| | New York City Transitional Finance Authority, New York, Future Tax Secured Bonds, | | | |
| | Subordinate Fiscal 2021 Subseries F-1: | | | |
| $ 1,250 | | 5.000%, 11/01/33 | 5/31 at 100.00 | Aa1 | $ 1,669,962 |
| 500 | | 5.000%, 11/01/34 | 5/31 at 100.00 | Aa1 | 666,020 |
| | New York City, New York, General Obligation Bonds, Fiscal 2021 Series D: | | | |
| 1,500 | | 1.216%, 8/01/26 | No Opt. Call | AA– | 1,491,330 |
| 1,000 | | 1.623%, 8/01/28 | No Opt. Call | AA– | 985,860 |
| 1,410 | | 2.223%, 8/01/35 | No Opt. Call | AA– | 1,348,171 |
| 1,790 | | New York City, New York, General Obligation Bonds, Fiscal 2021 Series E, 1.623%, 8/01/28 | No Opt. Call | AA– | 1,764,689 |
| 4,000 | | New York Counties Tobacco Trust IV, Tobacco Settlement Pass-Through Bonds, Turbo Term | 5/21 at 100.00 | B– | 4,043,880 |
| | Series 2005A, 5.000%, 6/01/42 | | | |
| 3,000 | | New York Liberty Development Corporation, New York, Liberty Revenue Bonds, 3 World Trade | 11/24 at 100.00 | N/R | 3,283,800 |
| | Center Project, Class 1 Series 2014, 5.000%, 11/15/44, 144A | | | |
| 7,500 | | New York State, General Obligation Bonds, Taxable Series 2021B, 1.940%, 3/15/31 (4) | No Opt. Call | Aa2 | 7,505,175 |
| 180 | | New York Transportation Development Corporation, New York, Facility Revenue Bonds, | 10/31 at 100.00 | BBB– | 208,917 |
| | Thruway Service Areas Project, Series 2021, 4.000%, 10/31/41 (AMT) | | | |
| | New York Transportation Development Corporation, New York, Special Facility Revenue | | | |
| | Bonds, American Airlines, Inc John F Kennedy International Airport Project, Series 2020: | | | |
| 13,000 | | 5.250%, 8/01/31 (AMT) | 8/30 at 100.00 | B– | 16,268,720 |
| 3,400 | | 5.375%, 8/01/36 (AMT) | 8/30 at 100.00 | B– | 4,205,154 |
| 1,000 | | New York Transportation Development Corporation, New York, Special Facility Revenue | 12/30 at 100.00 | BBB | 1,176,000 |
| | Bonds, Terminal 4 John F Kennedy International Airport Project, Series 2020C, 4.000%, 12/01/41 | | | |
| | New York Transportation Development Corporation, Special Facility Revenue Bonds, Delta | | | |
| | Air Lines, Inc – LaGuardia Airport Terminals C&D Redevelopment Project, Series 2020: | | | |
| 1,000 | | 4.000%, 10/01/30 (AMT) | No Opt. Call | BB+ | 1,184,290 |
| 4,000 | | 5.000%, 10/01/35 (AMT) | 10/30 at 100.00 | BB+ | 5,108,240 |
| 6,000 | | 5.000%, 10/01/40 (AMT) | 10/30 at 100.00 | BB+ | 7,533,480 |
| 6,250 | | 4.375%, 10/01/45 (AMT) | 10/30 at 100.00 | BB+ | 7,325,250 |
| 2,200 | | Port Authority of New York and New Jersey, Consolidated Revenue Bonds, Two Hundred | 9/28 at 100.00 | A+ | 2,540,978 |
| | Eleventh Series 2018, 4.000%, 9/01/43 | | | |
| 2,350 | | Port Authority of New York and New Jersey, Consolidated Revenue Bonds, Two Hundred | 7/31 at 100.00 | A+ | 2,759,229 |
| | Twenty-Third Series 2021, 4.000%, 7/15/40 (AMT) | | | |
| 5,000 | | Syracuse Industrial Development Authority, New York, PILOT Revenue Bonds, Carousel | No Opt. Call | B3 | 5,019,600 |
| | Center Project, Taxable Series 2007B, 5.693%, 1/01/28 – SYNCORA GTY Insured, 144A | | | |
| 2,390 | | Triborough Bridge and Tunnel Authority, New York, Payroll Mobility Tax Bonds, Senior | 5/31 at 100.00 | AA+ | 3,078,320 |
| | Lien Subseries 2021A-1, 5.000%, 5/15/51 (WI/DD, Settling 5/12/21) | | | |
| 195,565 | | Total New York | | | 220,189,890 |
| | Ohio – 6.2% (4.2% of Total Investments) | | | |
| | Akron, Bath and Copley Joint Township Hospital District, Ohio, Hospital Facilities | | | |
| | Revenue Bonds, Summa Health Obligated Group, Refunding Series 2020: | | | |
| 220 | | 4.000%, 11/15/36 (UB) (4) | 11/30 at 100.00 | Baa2 | 254,058 |
| 1,500 | | 4.000%, 11/15/38 (UB) (4) | 11/30 at 100.00 | Baa2 | 1,714,965 |
| 10,325 | | 3.000%, 11/15/40 (UB) (4) | 11/30 at 100.00 | Baa2 | 10,569,599 |
| 7,750 | | Buckeye Tobacco Settlement Financing Authority, Ohio, Tobacco Settlement Asset-Backed | 6/30 at 100.00 | BBB+ | 7,967,388 |
| | Revenue Bonds, Refunding Senior Lien Series 2020A-2 Class 1, 3.000%, 6/01/48 | | | |
| 9,180 | | Buckeye Tobacco Settlement Financing Authority, Ohio, Tobacco Settlement Asset-Backed | 6/30 at 100.00 | N/R | 10,319,881 |
| | Revenue Bonds, Refunding Senior Lien Series 2020B-2 Class 2, 5.000%, 6/01/55 | | | |
| 125 | | Montgomery County, Ohio, Hospital Facilities Revenue Bonds, Kettering Health Network | 2/31 at 100.00 | A2 | 147,736 |
| | Obligated Group Project, Refunding & Improvement Series 2021, 4.000%, 8/01/41 | | | |
| 2,500 | | Ohio Air Quality Development Authority, Ohio, Exempt Facilities Revenue Bonds, AMG | 7/29 at 100.00 | B– | 2,769,625 |
| | Vanadium Project, Series 2019, 5.000%, 7/01/49 (AMT), 144A | | | |
| 20,000 | | Southern Ohio Port Authority, Ohio, Facility Revenue Bonds, Purecycle Project, Series | 12/27 at 103.00 | N/R | 22,662,600 |
| | 2020A, 7.000%, 12/01/42 (AMT), 144A | | | |
| 51,600 | | Total Ohio | | | 56,405,852 |
154
| | | | | | |
| Principal | | | Optional Call | | |
| Amount (000) | | Description (1) | Provisions (2) | Ratings (3) | Value |
| | Oklahoma – 0.1% (0.1% of Total Investments) | | | |
| $ 1,000 | | Mannford Public Works Authority, Oklahoma, Revenue Bonds, Capital Improvement Series | 1/29 at 100.00 | N/R | $ 956,320 |
| | 2021, 3.250%, 1/01/51 | | | |
| | Oregon – 0.8% (0.6% of Total Investments) | | | |
| 5,000 | | Oregon State Department of Transportation, Highway User Tax Revenue Bonds, Taxable | No Opt. Call | Aa1 | 4,916,300 |
| | Refunding Senior Lien Series 2020B, 1.330%, 11/15/28 | | | |
| | Oregon State, General Obligation Bonds, Article XI-Q State Projects, Taxable | | | |
| | Sustainability Green Series 2021C: | | | |
| 1,160 | | 1.024%, 5/01/26 | No Opt. Call | AA+ | 1,155,499 |
| 725 | | 1.528%, 5/01/28 | No Opt. Call | AA+ | 723,463 |
| | Oregon State, General Obligation Bonds, Article XI-Q State Projects, Taxable Various | | | |
| | Series 2021B: | | | |
| 545 | | 1.024%, 5/01/26 | No Opt. Call | AA+ | 546,853 |
| 250 | | 1.528%, 5/01/28 | No Opt. Call | AA+ | 251,290 |
| 7,680 | | Total Oregon | | | 7,593,405 |
| | Pennsylvania – 1.8% (1.2% of Total Investments) | | | |
| 5,000 | | Allegheny County Industrial Development Authority, Pennsylvania, Environmental | No Opt. Call | Caa1 | 5,784,950 |
| | Improvement Revenue Bonds, United States Steel Corp, Refunding Series 2019, 5.125%, 5/01/30 | | | |
| 980 | | Allentown Neighborhood Improvement Zone Development Authority, Pennsylvania, Tax Revenue | 5/31 at 100.00 | N/R | 1,221,982 |
| | Bonds, 615 Waterfront Project, Senior Series 2021, 6.000%, 5/01/42, 144A | | | |
| 500 | | Beaver County Industrial Development Authority, Pennsylvania, Pollution Control Revenue | 4/31 at 100.00 | N/R | 525,510 |
| | Refunding Bonds, FirstEnergy Generation Project, Series 2008B, 3.750%, 10/01/47 (Mandatory | | | |
| | Put 4/01/21) | | | |
| 1,000 | | Dauphin County General Authority, Pennsylvania, Revenue Bonds, Harrisburg University of | 10/27 at 100.00 | BB | 1,001,650 |
| | Science & Technology Project, Series 2017, 5.125%, 10/15/41, 144A | | | |
| 2,000 | | Dauphin County General Authority, Pennsylvania, Revenue Bonds, Harrisburg University of | 10/28 at 100.00 | BB | 2,120,620 |
| | Science & Technology Project, Series 2020, 6.250%, 10/15/53, 144A | | | |
| | Pennsylvania Economic Development Financing Authority, Parking System Revenue Bonds, | | | |
| | Capitol Region Parking System, Junior Guaranteed Series 2013B: | | | |
| 995 | | 0.000%, 1/01/45 – BAM Insured | No Opt. Call | A2 | 542,663 |
| 940 | | 0.000%, 1/01/46 – BAM Insured | No Opt. Call | A2 | 498,435 |
| 1,025 | | 0.000%, 1/01/47 – BAM Insured | No Opt. Call | A2 | 529,238 |
| 2,500 | | Pennsylvania Economic Development Financing Authority, Private Activity Revenue Bonds, | 6/26 at 100.00 | BBB | 2,932,825 |
| | Pennsylvania Rapid Bridge Replacement Project, Series 2015, 5.000%, 12/31/34 (AMT) | | | |
| 750 | | Pennsylvania Turnpike Commission, Turnpike Revenue Bonds, Subordinate Series 2021A, | 12/30 at 100.00 | A3 | 799,185 |
| | 3.000%, 12/01/42 | | | |
| 500 | | Philadelphia Authority for Industrial Development, Pennsylvania, Charter School Revenue | 6/28 at 100.00 | BB+ | 576,120 |
| | Bonds, Philadelphia Performing Arts: A String Theory Charter School, Series 2020, 5.000%, | | | |
| | 6/15/50, 144A | | | |
| 16,190 | | Total Pennsylvania | | | 16,533,178 |
| | Puerto Rico – 5.5% (3.8% of Total Investments) | | | |
| | Puerto Rico Aqueduct and Sewerage Authority, Revenue Bonds, Senior Lien Series 2012A: | | | |
| 7,450 | | 5.000%, 7/01/23 | 6/21 at 100.00 | CCC | 7,468,625 |
| 5,020 | | 5.125%, 7/01/37 | 7/22 at 100.00 | CCC | 5,305,487 |
| 2,000 | | 6.000%, 7/01/47 | 7/22 at 100.00 | CCC | 2,134,480 |
| | Puerto Rico Sales Tax Financing Corporation, Sales Tax Revenue Bonds, Restructured 2018A-1: | | | |
| 20,000 | | 0.000%, 7/01/46 | 7/28 at 41.38 | N/R | 6,345,800 |
| 35,000 | | 0.000%, 7/01/51 | 7/28 at 30.01 | N/R | 8,049,300 |
| 5,514 | | 4.750%, 7/01/53 | 7/28 at 100.00 | N/R | 6,133,774 |
| 2,500 | | 5.000%, 7/01/58 | 7/28 at 100.00 | N/R | 2,822,650 |
| 15,000 | | Puerto Rico, General Obligation Bonds, Public Improvement, Series 2014A, 3.180%, 7/01/35 (4), (6) | 6/21 at 100.00 | D | 12,037,500 |
| 92,484 | | Total Puerto Rico | | | 50,297,616 |
155
| | |
| NDMO | Nuveen Dynamic Municipal Opportunities Fund |
| Portfolio of Investments (continued) April 30, 2021 (Unaudited) |
| | | | | | |
| Principal | | | Optional Call | | |
| Amount (000) | | Description (1) | Provisions (2) | Ratings (3) | Value |
| | South Carolina – 0.2% (0.2% of Total Investments) | | | |
| $ 1,000 | | South Carolina Jobs Economic Development Authority, Educational Facilities Revenue | 11/26 at 100.00 | N/R | $ 1,013,950 |
| | Bonds, Hoese Creek Academy Project, Series 2021A, 5.000%, 11/15/55, 144A | | | |
| 1,000 | | South Carolina Jobs-Economic Development Authority, Educational Facilities Revenue | 10/27 at 103.00 | N/R | 1,061,040 |
| | Bonds, Columbia College, Refunding Series 2020A, 5.625%, 10/01/40 | | | |
| 2,000 | | Total South Carolina | | | 2,074,990 |
| | South Dakota – 0.5% (0.3% of Total Investments) | | | |
| | South Dakota Health and Educational Facilities Authority, Revenue Bonds, Monument | | | |
| | Health, Inc, Series 2020A: | | | |
| 2,145 | | 3.000%, 9/01/45 (UB) (4) | 9/30 at 100.00 | A1 | 2,216,557 |
| 1,800 | | 4.000%, 9/01/50 (UB) (4) | 9/30 at 100.00 | A1 | 2,035,476 |
| 3,945 | | Total South Dakota | | | 4,252,033 |
| | Tennessee – 2.0% (1.3% of Total Investments) | | | |
| 15,000 | | Tennergy Corporation, Tennessee, Gas Revenue Bonds, Series 2021A, 4.000%, 12/01/51 | 6/28 at 100.68 | A1 | 17,801,400 |
| | (Mandatory Put 9/01/28) (WI/DD, Settling 5/04/2021) | | | |
| | Texas – 6.3% (4.3% of Total Investments) | | | |
| 750 | | Austin Convention Enterprises Inc, Texas, Convention Center Hotel Revenue Bonds, | 1/27 at 100.00 | BB+ | 856,320 |
| | Refunding First Tier Series 2017A, 5.000%, 1/01/28 | | | |
| | Austin, Texas, Rental Car Special Facility Revenue Bonds, Taxable Refunding Series 2021: | | | |
| 500 | | 1.027%, 11/15/26 – AGM Insured | No Opt. Call | A– | 490,235 |
| 625 | | 1.325%, 11/15/27 – AGM Insured | No Opt. Call | A– | 608,544 |
| 500 | | 1.710%, 11/15/29 – AGM Insured | No Opt. Call | A– | 483,060 |
| | Carrollton-Farmers Branch Independent School District, Dallas County, Texas, General | | | |
| | Obligation Bonds, School Building Series 2021: | | | |
| 190 | | 3.000%, 2/15/37 | 2/30 at 100.00 | AAA | 215,669 |
| 175 | | 3.000%, 2/15/38 | 2/30 at 100.00 | AAA | 198,067 |
| 145 | | 3.000%, 2/15/39 | 2/30 at 100.00 | AAA | 163,663 |
| 115 | | 3.000%, 2/15/40 | 2/30 at 100.00 | AAA | 129,527 |
| 1,000 | | Central Texas Regional Mobility Authority, Revenue Bonds, Senior Lien Series 2021B, | 1/31 at 100.00 | Baa1 | 1,188,320 |
| | 4.000%, 1/01/41 | | | |
| 1,000 | | Flower Mound, Texas, Special Assessment Revenue Bonds, River Walk Public Improvement | 9/31 at 100.00 | N/R | 994,090 |
| | District 1, Refunding Series 2021, 3.500%, 9/01/36, 144A | | | |
| 500 | | Grand Parkway Transportation Corporation, Texas, System Toll Revenue Bonds, Refunding | 4/30 at 100.00 | A2 | 581,595 |
| | First Tier Series 2020C, 4.000%, 10/01/49 | | | |
| 1,200 | | Hays County, Texas, Special Assessment Revenue Bonds, La Cima Public Improvement | 9/30 at 100.00 | N/R | 1,259,244 |
| | District Neighbor Improvement Areas 1-2 Project, Series 2020, 4.000%, 9/15/50, 144A | | | |
| | Houston Community College System, Texas, General Obligation Bonds, Taxable Refunding | | | |
| | Limited Tax Series 2021B: | | | |
| 1,000 | | 2.059%, 2/15/36 | 2/31 at 100.00 | AA+ | 978,050 |
| 750 | | 2.109%, 2/15/37 | 2/31 at 100.00 | AA+ | 731,363 |
| 750 | | 2.209%, 2/15/38 | 2/31 at 100.00 | AA+ | 733,785 |
| 750 | | 2.259%, 2/15/39 | 2/31 at 100.00 | AA+ | 731,678 |
| 4,750 | | Houston, Texas, Airport System Revenue Bonds, Refunding Subordinate Lien Series 2020A, | 7/30 at 100.00 | A | 5,460,267 |
| | 4.000%, 7/01/47 (AMT) | | | |
| 1,000 | | Kyle, Texas, Special Assessment Revenue Bonds, 6 Creeks Public Improvement District | 9/30 at 100.00 | N/R | 1,029,000 |
| | Improvement Area 2 Project, Series 2020, 4.000%, 9/01/46, 144A | | | |
| | Lower Colorado River Authority, Texas, Transmission Contract Revenue Bonds, LCRA | | | |
| | Transmission Services Corporation Project, Refunding Series 2021: | | | |
| 1,625 | | 5.000%, 5/15/38 | 5/30 at 100.00 | A | 2,081,852 |
| 1,665 | | 5.000%, 5/15/39 | 5/30 at 100.00 | A | 2,127,554 |
| 2,625 | | 5.000%, 5/15/40 | 5/30 at 100.00 | A | 3,347,741 |
| 375 | | 5.000%, 5/15/41 | 5/30 at 100.00 | A | 476,978 |
| 625 | | McLendon-Chisholm, Texas, Special Assessment Revenue Bonds, Sonoma Public Improvement | 9/31 at 100.00 | N/R | 619,638 |
| | District Improvement Area 3 Project, Series 2021, 3.625%, 9/15/41, 144A | | | |
156
| | | | | | |
| Principal | | | Optional Call | | |
| Amount (000) | | Description (1) | Provisions (2) | Ratings (3) | Value |
| | Texas (continued) | | | |
| $ 4,175 | | New Hope Cultural Education Facilities Finance Corporation, Texas, Education Revenue | 8/25 at 103.00 | BB+ | $ 4,610,995 |
| | Bonds, Southwest Preparatory School, Series 2020A, 5.000%, 8/15/50, 144A | | | |
| 2,035 | | Sachse, Texas, Special Assessment Bonds, Sachse Public Improvement District 1 Major | 9/30 at 100.00 | N/R | 2,140,311 |
| | Improvement Area Project, Series 2020, 5.375%, 9/15/40, 144A | | | |
| | San Antonio, Texas, Electric and Gas Systems Revenue Bonds, Refunding Junior Lien Series 2021A: | | | |
| 805 | | 5.000%, 2/01/32 | 2/31 at 100.00 | A+ | 1,076,454 |
| 1,410 | | 5.000%, 2/01/33 | 2/31 at 100.00 | A+ | 1,879,459 |
| 1,520 | | 5.000%, 2/01/34 | 2/31 at 100.00 | A+ | 2,018,484 |
| 1,885 | | 5.000%, 2/01/35 | 2/31 at 100.00 | A+ | 2,496,946 |
| 1,875 | | 5.000%, 2/01/36 | 2/31 at 100.00 | A+ | 2,476,162 |
| | Tarrant County Cultural Education Facilities Finance Corporation, Texas, Hospital | | | |
| | Revenue Bonds, Hendrick Medical Center, Taxable Series 2021: | | | |
| 450 | | 3.292%, 9/01/40 – AGM Insured | 9/30 at 100.00 | A2 | 457,475 |
| 350 | | 3.422%, 9/01/50 – AGM Insured | 9/30 at 100.00 | A2 | 353,353 |
| 3,810 | | Texas Private Activity Bond Surface Transportation Corporation, Senior Lien Revenue Bonds, | 6/29 at 100.00 | Baa3 | 4,586,592 |
| | NTE Mobility Partners Segments 3 LLC Segments 3C Project, Series 2019, 5.000%, 6/30/58 (AMT) | | | |
| | Texas Private Activity Bond Surface Transportation Corporation, Senior Lien Revenue | | | |
| | Bonds, LBJ Infrastructure Group LLC IH-635 Managed Lanes Project, Refunding Series 2020A: | | | |
| 2,630 | | 4.000%, 6/30/35 | 12/30 at 100.00 | BBB– | 3,096,615 |
| 1,540 | | 4.000%, 6/30/36 | 12/30 at 100.00 | BBB– | 1,805,573 |
| 2,195 | | 4.000%, 12/31/37 | 12/30 at 100.00 | BBB– | 2,560,994 |
| 2,000 | | 4.000%, 6/30/40 | 12/30 at 100.00 | BBB– | 2,314,880 |
| 49,295 | | Total Texas | | | 57,360,533 |
| | Utah – 0.2% (0.1% of Total Investments) | | | |
| 1,000 | | Utah Charter School Finance Authority, Charter School Revenue Bonds, Paradigm High | 1/25 at 102.00 | N/R | 1,029,490 |
| | School Project, Series 2020A, 5.125%, 7/15/51, 144A | | | |
| | Utah Infrastructure Agency, Telecommunications Revenue Bonds, Series 2021: | | | |
| 375 | | 4.000%, 10/15/41 | 4/31 at 100.00 | BBB– | 434,681 |
| 500 | | 3.000%, 10/15/45 | 4/31 at 100.00 | BBB– | 514,045 |
| 1,875 | | Total Utah | | | 1,978,216 |
| | Virginia – 4.3% (3.0% of Total Investments) | | | |
| 12,500 | | Hampton Roads Transportation Accountability Commission, Revenue Bonds, Senior Lien Series | 7/30 at 100.00 | AA | 16,088,125 |
| | 2020A, 5.250%, 7/01/60 | | | |
| 10,750 | | Roanoke Economic Development Authority, Virginia, Hospital Revenue Bonds, Carilion | 7/30 at 100.00 | AA– | 12,557,827 |
| | Clinic Obligated Group, Series 2020A, 4.000%, 7/01/51 (UB) (4) | | | |
| 1,550 | | Tobacco Settlement Financing Corporation of Virginia, Tobacco Settlement Asset Backed | 6/25 at 100.00 | B– | 1,617,797 |
| | Bonds, Refunding Senior Lien Series 2007A, 6.706%, 6/01/46 | | | |
| 3,000 | | Virginia Small Business Financing Authority, Private Activity Revenue Bonds, Transform | 6/27 at 100.00 | Baa3 | 3,593,640 |
| | 66 P3 Project, Senior Lien Series 2017, 5.000%, 12/31/49 (AMT) | | | |
| | Virginia Small Business Financing Authority, Revenue Bonds, National Senior Campuses Inc | | | |
| | Obligated Group, Series 2020A: | | | |
| 1,280 | | 4.000%, 1/01/45 | 7/27 at 103.00 | A | 1,414,938 |
| 2,380 | | 4.000%, 1/01/51 | 7/27 at 103.00 | A | 2,621,046 |
| 1,000 | | Virginia Small Business Financing Authority, Tourism Development Financing Program | 10/30 at 120.40 | N/R | 1,288,610 |
| | Revenue Bonds, Virginia Beach Oceanfront South Hotel Project, Senior Series 2020A-1, 8.000%, | | | |
| | 10/01/43, 144A | | | |
| 32,460 | | Total Virginia | | | 39,181,983 |
| | Washington – 0.2% (0.1% of Total Investments) | | | |
| 1,230 | | King and Pierce Counties School District 408 Auburn, Washington, General Obligation | 12/30 at 100.00 | Aaa | 1,387,305 |
| | Bonds, Refunding Series 2020, 3.000%, 12/01/38 | | | |
157
| | |
| NDMO | Nuveen Dynamic Municipal Opportunities Fund |
| Portfolio of Investments (continued) April 30, 2021 (Unaudited) |
| | | | | | |
| Principal | | | Optional Call | | |
| Amount (000) | | Description (1) | Provisions (2) | Ratings (3) | Value |
| | West Virginia – 0.6% (0.4% of Total Investments) | | | |
| $ 4,000 | | West Virginia Economic Development Authority, Dock and Wharf Facilities Revenue Bonds, | 12/27 at 103.00 | N/R | $ 4,140,960 |
| | Empire Trimodal Terminal, LLC Project, Series 2020, 7.625%, 12/01/40, 144A | | | |
| 1,000 | | West Virginia Economic Development Authority, Solid Waste Disposal Facilities Revenue | 1/25 at 100.00 | B | 1,026,780 |
| | Bonds, Arch Resources Project, Series 2021, 4.125%, 7/01/45 (AMT) (Mandatory Put 7/01/25) | | | |
| 5,000 | | Total West Virginia | | | 5,167,740 |
| | Wisconsin – 2.3% (1.6% of Total Investments) | | | |
| 6,350 | | Public Finance Authority of Wisconsin, Charter School Revenue Bonds, Freedom Classical | 1/28 at 100.00 | N/R | 6,763,448 |
| | Academy Inc, Series 2020A, 5.000%, 1/01/56, 144A | | | |
| | Public Finance Authority of Wisconsin, Health Care Facilities Revenue Bonds, Appalachian | | | |
| | Regional Healthcare System Obligated Group, Series 2021A: | | | |
| 300 | | 5.000%, 7/01/35 | 1/31 at 100.00 | BBB | 384,042 |
| 190 | | 5.000%, 7/01/38 | 1/31 at 100.00 | BBB | 240,930 |
| | Public Finance Authority of Wisconsin, Hospital Revenue Bonds, Renown Regional Medical | | | |
| | Center Project, Refunding Series 2020A: | | | |
| 2,035 | | 3.000%, 6/01/45 (UB) (4) | 6/30 at 100.00 | A+ | 2,149,164 |
| 5,415 | | 3.000%, 6/01/45 – AGM Insured (UB) (4) | 6/30 at 100.00 | A+ | 5,764,484 |
| 5,000 | | Public Finance Authority of Wisconsin, Limited Obligation PILOT Revenue Bonds, American | 12/27 at 100.00 | N/R | 5,775,100 |
| | Dream @ Meadowlands Project, Series 2017, 7.000%, 12/01/50, 144A | | | |
| 19,290 | | Total Wisconsin | | | 21,077,168 |
| $ 1,281,770 | | Total Municipal Bonds (cost $1,264,535,358) | | | 1,325,848,182 |
|
| Principal | | | | | | |
| Amount (000) | | Description (1) | Coupon | Maturity | Ratings (3) | Value |
| | CORPORATE BONDS – 0.2% (0.2% of Total Investments) | | | | |
| | Real Estate – 0.1% (0.1% of Total Investments) | | | | |
| $ 1,000 | | Benloch Ranch Improvement Association No 1 | 9.750% | 12/01/39 | N/R | $ 1,088,300 |
| | Utilities – 0.1% (0.1% of Total Investments) | | | | |
| 1,500 | | Talen Energy Supply LLC | 6.000% | 12/15/36 | B | 920,025 |
| $ 2,500 | | Total Corporate Bonds (cost $1,758,923) | | | | 2,008,325 |
| | Total Long-Term Investments (cost $1,266,294,281) | | | | 1,327,856,507 |
| | Borrowings – (19.5)% (7) | | | | (176,900,000) |
| | Floating Rate Obligations – (21.7)% | | | | (196,590,000) |
| | Reverse Repurchase Agreements, including accrued interest – (3.8)% (8), (9) | | | | (34,709,210) |
| | Other Assets Less Liabilities – (1.3)% | | | | (12,312,211) |
| | Net Assets Applicable to Common Shares – 100% | | | | $ 907,345,086 |
158
| | | | | | | |
| Investments in Derivatives | | | | | | |
| Futures Contracts - Short | | | | | | |
| | | | | | Variation |
| | | | | Unrealized | Margin |
| Number of | Expiration | Notional | | Appreciation | Receivable/ |
| Description | Contracts | Date | Amount | Value | (Depreciation) | (Payable) |
U.S. Treasury 10-Year Note | (503) | 6/21 | $ (67,487,533) | $ (66,411,719) | $1,075,815 | $(23,578) |
U.S. Treasury Ultra Bond | (152) | 6/21 | (28,380,619) | (28,257,750) | 122,869 | (47,500) |
U.S. Treasury Long Bond | (122) | 6/21 | (18,947,807) | (19,184,500) | (236,693) | (7,625) |
Total | | | $(114,815,960) | $(113,853,969) | $ 961,991 | $(78,703) |
Total receivable for variation margin on futures contracts | | | | | | — |
Total payable for variation margin on futures contracts | | | | | | $(78,703) |
(1) | All percentages shown in the Portfolio of Investments are based on net assets applicable to common shares unless otherwise noted. |
(2) | Optional Call Provisions: Dates (month and year) and prices of the earliest optional call or redemption. There may be other call provisions at varying prices at later dates. Certain mortgage-backed securities may be subject to periodic principal paydowns.
|
(3) | The ratings disclosed are the lowest of Standard & Poor’s Group (“Standard & Poor’s”), Moody’s Investors Service, Inc. (“Moody’s”) or Fitch, Inc. (“Fitch”) rating. Ratings below BBB by Standard & Poor’s, Baa by Moody’s or BBB by Fitch are considered to be below investment grade. Holdings designated N/R are not rated by any of these national rating agencies. |
(4) | Investment, or portion of investment, has been pledged to collateralize the net payment obligations for investments in inverse floating rate transactions and/or reverse repurchase agreements. As of the end of the reporting period, investments with a value of $40,723,566 have been pledged as collateral for reverse repurchase agreements.
|
(5) | Step-up coupon bond, a bond with a coupon that increases (“steps up”), usually at regular intervals, while the bond is outstanding. The rate shown is the coupon as of the end of the reporting period.
|
(6) | Defaulted security. A security whose issuer has failed to fully pay principal and/or interest when due, or is under the protection of bankruptcy. |
(7) | Borrowings as a percentage of Total Investments is 13.3%. |
(8) | The Fund segregates 100% of its eligible investments (excluding any investments separately pledged as collateral for specific investments in derivatives, when applicable) in the Portfolio of Investments as collateral for borrowings.
|
(9) | Reverse Repurchase Agreements as a percentage of Total Investments is 2.6%. |
144A | Investment is exempt from registration under Rule 144A of the Securities Act of 1933, as amended. These investments may only be resold in transactions exempt from registration, which are normally those transactions with qualified institutional buyers.
|
AMT | Alternative Minimum Tax. |
UB | Underlying bond of an inverse floating rate trust reflected as a financing transaction. See Notes to Financial Statements, Note 4 – Portfolio Securities and Investments in Derivatives for more information.
|
WI/DD | Purchased on a when-issued or delayed delivery basis. |
159
See accompanying notes to financial statements.
Statement of Assets and Liabilities
April 30, 2021 (Unaudited)
| | | | | | |
| NVG | NZF | NMZ | NMCO | NDMO |
| Assets | | | | | |
Long-term investments, at value (cost $5,156,705,640, | | | | | |
| $3,307,176,201, $1,656,687,901, $1,169,246,974 | | | | | |
| and $1,266,294,281, respectively) | $5,786,427,285 | $3,737,239,610 | $1,761,060,481 | $1,237,663,979 | $1,327,856,507 |
Short-term investments, at value ($—, $—, $—, $798,107, $—) | — | — | — | 865,417 | — |
Cash | 980,990 | — | 160,712,310 | 8,733,635 | 16,628,183 |
Cash collateral at brokers for investments in futures contracts1 | — | — | — | — | 2,405,775 |
Receivable for: | | | | | |
| Dividends | — | 2,941 | — | — | — |
| Interest | 237,020,341 | 66,418,211 | 276,694,105 | 31,597,374 | 95,294,240 |
| Investments sold | 37,381,670 | 27,657,198 | 8,978,433 | 7,054,172 | 14,945,280 |
| Shares sold | — | — | 1,759,290 | — | — |
Deferred offering costs | — | — | 208,848 | 220,000 | — |
Other assets | 2,132,643 | 938,249 | 122,395 | 103,667 | 48,481 |
| Total assets | 6,063,942,929 | 3,832,256,209 | 2,209,535,862 | 1,286,238,244 | 1,457,178,466 |
| Liabilities | | | | | |
Cash overdraft | — | 5,974,283 | — | — | — |
Borrowings | — | — | — | — | 176,900,000 |
Reverse repurchase agreements, including | | | | | |
| accrued interest | — | — | — | — | 34,709,210 |
Floating rate obligations | 187,925,000 | 14,400,000 | 434,618,000 | 21,996,000 | 196,590,000 |
Payable for: | | | | | |
| Dividends | 13,646,657 | 8,905,662 | 5,507,418 | 3,187,655 | 3,793,979 |
Interest2 | 164,831,704 | 20,246,713 | 247,417,256 | 11,550,440 | 79,965,054 |
| Investments purchased – regular settlement | 4,761,619 | 3,416,314 | 1,071,128 | — | 7,044,549 |
| Investments purchased – when-issued/ | | | | | |
| delayed-delivery settlement | 42,803,989 | — | 11,238,260 | — | 49,582,163 |
| Offering costs | — | — | 235,001 | — | — |
| Variation margin on futures contracts | — | — | — | — | 78,703 |
Adjustable Rate MuniFund Term Preferred (“AMTP”) Shares, | | | | | |
| net of deferred offering costs (liquidation preference | | | | | |
| $112,000,000, $—, $257,000,000, $— and $—, respectively) | 111,918,480 | — | 256,636,154 | — | — |
MuniFund Preferred (“MFP”) Shares, net of deferred | | | | | |
| offering costs (liquidation preference $405,400,000, | | | | | |
| $641,000,000, $—, $450,000,000 and $—, respectively) | 404,082,522 | 640,028,521 | — | 448,852,763 | — |
Variable Rate Demand Preferred (“VRDP”) Shares, net of | | | | | |
| deferred offering costs (liquidation preference $1,411,600,000, | | | | | |
| $727,000,000, $—, $— and $—, respectively) | 1,408,136,995 | 722,640,864 | — | — | — |
Accrued expenses: | | | | | |
| Management fees | 2,862,135 | 1,869,644 | 1,005,257 | 907,260 | 875,270 |
| Trustees fees | 1,243,349 | 817,795 | 137,384 | 25,881 | 15,695 |
| Shelf offering costs | — | — | 174,284 | 198,557 | 16,000 |
| Other | 901,688 | 659,213 | 303,951 | 244,939 | 262,757 |
| Total liabilities | 2,343,114,138 | 1,418,959,009 | 958,344,093 | 486,963,495 | 549,833,380 |
| Commitments and contingencies (Note 8) | | | | | |
Net assets applicable to common shares | $3,720,828,791 | $2,413,297,200 | $1,251,191,769 | $ 799,274,749 | $ 907,345,086 |
Common shares outstanding | 213,370,544 | 142,125,906 | 86,969,499 | 53,276,080 | 56,908,892 |
Net asset value (“NAV”) per common share outstanding | $ 17.44 | $ 16.98 | $ 14.39 | $ 15.00 | $ 15.94 |
| Net assets applicable to common shares consist of: | | | | | |
Common shares, $0.01 par value per share | $ 2,133,705 | $ 1,421,259 | $ 869,695 | $ 532,761 | $ 569,089 |
Paid-in surplus | 3,082,824,003 | 2,008,031,222 | 1,133,611,978 | 798,487,595 | 853,141,885 |
Total distributable earnings | 635,871,083 | 403,844,719 | 116,710,096 | 254,393 | 53,634,112 |
Net assets applicable to common shares | $3,720,828,791 | $2,413,297,200 | $1,251,191,769 | $ 799,274,749 | $ 907,345,086 |
Authorized shares: | | | | | |
| Common | Unlimited | Unlimited | Unlimited | Unlimited | Unlimited |
| Preferred | Unlimited | Unlimited | Unlimited | Unlimited | Unlimited |
1 | Cash pledged to collateralize the net payment obligations for investments in derivatives. |
2 | Excludes accrued interest on reverse repurchase agreements, which is recognized above. |
See accompanying notes to financial statements.
160
Six Months Ended April 30, 2021 (Unaudited)
| | | | | | |
| NVG | NZF | NMZ | NMCO | NDMO |
| Investment Income | $117,657,047 | $ 76,787,590 | $ 40,296,854 | $ 31,347,593 | $19,984,990 |
| Expenses | | | | | |
Management fees | 17,233,909 | 11,225,912 | 5,698,895 | 5,337,705 | 4,946,898 |
Interest expense and amortization of offering costs | 3,530,482 | 6,723,251 | 1,942,307 | 2,388,367 | 1,095,572 |
Liquidity fees | 5,300,759 | 802,940 | — | 406,974 | — |
Remarketing fees | 1,011,388 | 49,000 | — | 50,278 | — |
Custodian fees | 225,928 | 157,081 | 78,165 | 82,003 | 42,215 |
Trustees fees | 82,101 | 54,787 | 18,521 | 16,982 | 13,553 |
Professional fees | 537,658 | 126,081 | 76,607 | 91,391 | 89,094 |
Shareholder reporting expenses | 147,579 | 96,287 | 50,269 | 38,245 | 38,858 |
Shareholder servicing agent fees | 48,752 | 22,654 | 7,298 | — | 141 |
Stock exchange listing fees | 28,755 | 19,153 | 27,243 | 7,182 | — |
Investor relations expenses | 98,359 | 65,046 | 24,535 | 19,055 | 46,904 |
Other | 164,002 | 63,601 | 186,190 | 47,441 | 196,688 |
Total expenses | 28,409,672 | 19,405,793 | 8,110,030 | 8,485,623 | 6,469,923 |
Net investment income (loss) | 89,247,375 | 57,381,797 | 32,186,824 | 22,861,970 | 13,515,067 |
| Realized and Unrealized Gain (Loss) | | | | | |
Net realized gain (loss) from investments | 2,539,820 | 2,742,270 | 2,570,821 | 3,409,741 | 6,949,167 |
Change in net unrealized appreciation (depreciation) of: | | | | | |
| Investments | 157,749,684 | 141,489,510 | 94,290,858 | 110,311,367 | 62,855,885 |
| Futures contracts | — | — | — | — | 961,991 |
Net realized and unrealized gain (loss) | 160,289,504 | 144,231,780 | 96,861,679 | 113,721,108 | 70,767,043 |
Net increase (decrease) in net assets applicable to | | | | | |
| common shares from operations | $249,536,879 | $201,613,577 | $129,048,503 | $136,583,078 | $84,282,110 |
See accompanying notes to financial statements.
161
Statement of Changes in Net Assets
| | | | | |
| NVG | NZF |
| Six Months | | Six Months | |
| Ended | | Ended | |
| 4/30/21 | Year Ended | 4/30/21 | Year Ended |
| (Unaudited) | 10/31/20 | (Unaudited) | 10/31/20 |
| Operations | | | | |
Net investment income (loss) | $ 89,247,375 | $ 174,547,176 | $ 57,381,797 | $ 113,578,493 |
Net realized gain (loss) from investments | 2,539,820 | 20,352,040 | 2,742,270 | (13,050,569) |
Change in net unrealized appreciation (depreciation) of: | | | | |
| Investments | 157,749,684 | (104,484,643) | 141,489,510 | (88,994,829) |
| Futures contracts | — | — | — | — |
Net increase (decrease) in net assets applicable to | | | | |
common shares from operations | 249,536,879 | 90,414,573 | 201,613,577 | 11,533,095 |
| Distributions to Common Shareholders | | | | |
Dividends | (105,063,656) | (175,828,479) | (56,281,858) | (107,589,117) |
Decrease in net assets applicable to common shares from | | | | |
| distributions to common shareholders | (105,063,656) | (175,828,479) | (56,281,858) | (107,589,117) |
| Capital Share Transactions | | | | |
Common shares: | | | | |
| Proceeds from sale of shares, net of offering costs | — | — | — | — |
| Proceeds from shelf offering, net of offering costs | — | — | — | — |
| Net proceeds from shares issued to shareholders | | | | |
| due to reinvestment of distributions | — | — | — | — |
| Issued in the merger | — | 184,807,196 | — | — |
Net increase (decrease) in net assets applicable to | | | | |
| common shares from capital share transactions | — | 184,807,196 | — | — |
Net increase (decrease) in net assets applicable to | | | | |
| common shares | 144,473,223 | 99,393,290 | 145,331,719 | (96,056,022) |
Net assets applicable to common shares at the | | | | |
| beginning of period | 3,576,355,568 | 3,476,962,278 | 2,267,965,481 | 2,364,021,503 |
Net assets applicable to common shares at the end | | | | |
| of period | $3,720,828,791 | $3,576,355,568 | $2,413,297,200 | $2,267,965,481 |
See accompanying notes to financial statements.
162
| | | | | |
| NMZ | NMCO |
| Six Months | | Six Months | |
| Ended | | Ended | |
| 4/30/21 | Year Ended | 4/30/21 | Year Ended |
| (Unaudited) | 10/31/20 | (Unaudited) | 10/31/20 |
| Operations | | | | |
Net investment income (loss) | $ 32,186,824 | $ 54,821,399 | $ 22,861,970 | $ 37,835,962 |
Net realized gain (loss) from investments | 2,570,821 | 1,845,773 | 3,409,741 | (76,019,228) |
Change in net unrealized appreciation (depreciation) of: | | | | |
| Investments | 94,290,858 | (64,189,142) | 110,311,367 | (43,965,731) |
| Futures contracts | — | — | — | — |
Net increase (decrease) in net assets applicable to | | | | |
| common shares from operations | 129,048,503 | (7,521,970) | 136,583,078 | (82,148,997) |
| Distributions to Common Shareholders | | | | |
Dividends | (31,719,826) | (57,470,993) | (19,818,702) | (38,645,307) |
Decrease in net assets applicable to common shares from | | | | |
| distributions to common shareholders | (31,719,826) | (57,470,993) | (19,818,702) | (38,645,307) |
| Capital Share Transactions | | | | |
Common shares: | | | | |
| Proceeds from sale of shares, net of offering costs | — | — | — | — |
| Proceeds from shelf offering, net of offering costs | 56,013,050 | 192,765,554 | — | — |
| Net proceeds from shares issued to shareholders | | | | |
| due to reinvestment of distributions | 432,242 | 576,782 | — | 258,968 |
| Issued in the merger | — | — | — | — |
Net increase (decrease) in net assets applicable to | | | | |
| common shares from capital share transactions | 56,445,292 | 193,342,336 | — | 258,968 |
Net increase (decrease) in net assets applicable to | | | | |
| common shares | 153,773,969 | 128,349,373 | 116,764,376 | (120,535,336) |
Net assets applicable to common shares at the | | | | |
| beginning of period | 1,097,417,800 | 969,068,427 | 682,510,373 | 803,045,709 |
Net assets applicable to common shares at the end | | | | |
| of period | $1,251,191,769 | $1,097,417,800 | $799,274,749 | $ 682,510,373 |
See accompanying notes to financial statements.
163
Statement of Changes in Net Assets (Unaudited) (continued)
| | | |
| NDMO |
| | For the period |
| Six Months | 8/26/20 |
| Ended | (commencement |
| 4/30/21 | of operations) |
| (Unaudited) | through 10/31/20 |
| Operations | | |
Net investment income (loss) | $ 13,515,067 | $ 1,525,599 |
Net realized gain (loss) from investments | 6,949,167 | (449,948) |
Change in net unrealized appreciation (depreciation) of: | | |
| Investments | 62,855,885 | (1,293,659) |
| Futures contracts | 961,991 | — |
Net increase (decrease) in net assets applicable to | | |
| common shares from operations | 84,282,110 | (218,008) |
| Distributions to Common Shareholders | | |
Dividends | (26,088,105) | (4,341,885) |
Decrease in net assets applicable to common shares from | | |
| distributions to common shareholders | (26,088,105) | (4,341,885) |
| Capital Share Transactions | | |
Common shares: | | |
| Proceeds from sale of shares, net of offering costs | — | 851,250,000 |
| Proceeds from shelf offering, net of offering costs | — | — |
| Net proceeds from shares issued to shareholders | | |
| due to reinvestment of distributions | 2,360,969 | — |
| Issued in the merger | — | — |
Net increase (decrease) in net assets applicable to | | |
| common shares from capital share transactions | 2,360,969 | 851,250,000 |
Net increase (decrease) in net assets applicable to | | |
| common shares | 60,554,974 | 846,690,107 |
Net assets applicable to common shares at the | | |
| beginning of period | 846,790,112 | 100,005 |
Net assets applicable to common shares at the end | | |
| of period | $907,345,086 | $846,790,112 |
See accompanying notes to financial statements.
164
Six Months Ended April 30, 2021 (Unaudited)
| | | | | | |
| NVG | NZF | NMZ | NMCO | NDMO |
| Cash Flows from Operating Activities: | | | | | |
| Net Increase (Decrease) in Net Assets Applicable to | | | | | |
| Common Shares from Operations | $249,536,879 | $ 201,613,577 | $ 129,048,503 | $ 136,583,078 | $ 84,282,110 |
Adjustments to reconcile the net increase (decrease) in | | | | | |
| net assets applicable to common shares from operations | | | | | |
| to net cash provided by (used in) operating activities: | | | | | |
Purchases of investments | (402,872,367) | (319,958,407) | (125,384,606) | (94,546,324) | (700,265,538) |
Proceeds from sales and maturities of investments | 422,794,490 | 341,912,765 | 54,065,211 | 76,932,156 | 336,294,213 |
Proceeds from (Purchases of) short-term investments, net | — | — | — | 14,469,743 | — |
Payment-in-kind distributions | — | (4,200) | — | — | — |
Taxes paid | (509,607) | (30,648) | (10,035) | (11,581) | — |
Amortization (Accretion) of premiums and discounts, net | (3,679,030) | (4,272,545) | (387,425) | (1,644,491) | 2,825,807 |
Amortization of deferred offering costs | 174,578 | 132,215 | 8,797 | 229,947 | — |
(Increase) Decrease in: | | | | | |
| Receivable for dividends and interest | (163,512,247) | (17,574,176) | (248,086,287) | (12,747,017) | (88,830,740) |
| Receivable for investments sold | (20,039,525) | (20,157,691) | (3,035,022) | (2,394,172) | 11,385,156 |
| Other assets | (229,457) | (118,786) | (9,605) | (22,840) | (47,641) |
Increase (Decrease) in: | | | | | |
| Payable for interest | 164,394,936 | 20,202,029 | 246,384,166 | 11,497,859 | 79,916,943 |
| Payable for investments purchased – regular settlement | 4,761,619 | 3,416,314 | (1,428,872) | (1,249,022) | (3,986,127) |
| Payable for investments purchased – when-issued/ | | | | | |
delayed-delivery settlement | 16,525,618 | (8,054,279) | 4,722,590 | (2,180,119) | (3,517,935) |
| Payable for offering costs | — | — | 235,001 | — | — |
| Payable for variation margin on futures contracts | — | — | — | — | 78,703 |
| Accrued management fees | (38,536) | (1,740) | 105,878 | 62,759 | 295,437 |
| Accrued Trustees fees | 254,684 | 167,437 | 35,005 | 17,337 | 13,413 |
| Accrued other expenses | 443,152 | 250,967 | 135,887 | 93,036 | 164,602 |
Net realized (gain) loss from: | | | | | |
| Investments | (2,539,820) | (2,742,270) | (2,570,821) | (3,409,741) | (6,949,167) |
| Paydowns | 3,335 | (96,253) | (6,893) | (345,677) | 542 |
Change in net unrealized (appreciation) depreciation of | | | | | |
| investments | (157,749,684) | (141,489,510) | (94,290,858) | (110,311,367) | (62,855,885) |
Net cash provided by (used in) operating activities | 107,719,018 | 53,194,799 | (40,469,386) | 11,023,564 | (351,196,107) |
See accompanying notes to financial statements.
165
Statement of Cash Flows (Unaudited) (continued)
| | | | | | | |
| NVG | NZF | | NMZ | NMCO | NDMO |
| Cash Flows from Financing Activities: | | | | | | |
Proceeds from borrowings | $ 32,950,827 | $ — | $ — | $ — | $ 176,900,000 |
(Repayments of) borrowings | (32,950,827) | — | | — | — | — |
Proceeds from reverse repurchase agreements | 11,000,000 | — | | — | — | — |
(Repayments of) repurchase agreements | (11,000,000) | — | | — | — | 34,709,210 |
Proceeds from AMTP Shares issued, at liquidation preference | — | — | 170,000,000 | — | — |
(Payments for) deferred offering costs | — | — | | (255,000) | (220,000) | — |
Proceeds from shelf offering, net of offering costs | — | — | 54,280,909 | — | — |
Increase (Decrease) in: | | | | | | |
| Cash overdraft | — | 4,956,168 | | — | — | — |
| Accrued shelf offering costs | — | — | | (16,714) | 198,557 | 16,000 |
Proceeds from floating rate obligations | 225,000 | — | | 567,000 | 73,000 | 52,500,000 |
(Repayments of) floating rate obligations | (3,375,000) | (1,875,000) | | — | — | — |
Cash distribution paid to common shareholders | (105,051,615) | (56,275,967) | (30,842,017) | (19,822,122) | (23,757,124) |
Net cash provided by (used in) financing activities | (108,201,615) | (53,194,799) | 193,734,178 | (19,770,565) | 240,368,086 |
Net Increase (Decrease) in Cash and Cash | | | | | | |
| Collateral at Brokers | (482,597) | — | 153,264,792 | (8,747,001) | (110,828,021) |
Cash and cash collateral at brokers at the beginning | | | | | | |
| of period | 1,463,587 | — | 7,447,518 | 17,480,636 | 129,861,979 |
Cash and cash collateral at brokers at the end of period | $ 980,990 | $ — | $ 160,712,310 | $ 8,733,625 | $ 19,033,958 |
|
The following table provides a reconciliation of cash and cash collateral at brokers to the statement of assets and liabilities: | | | |
| NVG | NZF | | NMZ | NMCO | NDMO |
Cash | $ 980,990 | $ — | $ 160,712,310 | $ 8,733,635 | $ 16,628,183 |
Cash collateral at brokers for investments in futures | — | — | | — | — | 2,405,775 |
Total cash and cash collateral at brokers | $ 980,990 | $ — | $ 160,712,310 | $ 8,733,635 | $ 19,033,958 |
|
| Supplemental Disclosure of Cash Flow Information | | | | | | |
Cash paid for interest on borrowings (excluding borrowing | | | | | | |
| and amortization of offering costs) | $(161,042,654) | $ (13,622,353) | $(244,450,656) | $ (9,162,069) | $ (79,312,825) |
Non-cash financing activities not included herein consists | | | | | | |
| of reinvestments of common share distributions | — | — | | 432,242 | — | 2,360,969 |
166
THIS PAGE INTENTIONALLY LEFT BLANK
167
Selected data for a common share outstanding throughout each period:
| | | | | | | | | | |
| | | | | Less Distributions to | | | |
| | Investment Operations | | Common Shareholders | | Common Share
|
| |
| | | | | | | From | | | |
| | Beginning | Net | Net | | From | Accumulated | | | |
| | Common | Investment | Realized/ | | Net | Net | | | Ending |
| | Share | Income | Unrealized | | Investment | Realized | | Ending | Share |
| | NAV | (Loss) | Gain (Loss) | Total | Income | Gains | Total | NAV | Price |
| NVG | | | | | | | | | |
Year Ended 10/31: | | | | | | | | | |
2021(e) | $16.76 | $0.42 | $ 0.76 | $ 1.18 | $(0.41) | $(0.09) | $(0.50) | $17.44 | $17.20 |
2020 | 17.17 | 0.82 | (0.41) | 0.41 | (0.79) | (0.03) | (0.82) | 16.76 | 15.62 |
2019 | 15.48 | 0.79 | 1.72 | 2.51 | (0.79) | (0.03) | (0.82) | 17.17 | 16.45 |
2018 | 16.39 | 0.81 | (0.88) | (0.07) | (0.84) | — | (0.84) | 15.48 | 13.40 |
2017 | 16.64 | 0.84 | (0.19) | 0.65 | (0.87) | (0.03) | (0.90) | 16.39 | 15.17 |
2016 | 16.03 | 0.73 | 0.77 | 1.50 | (0.86) | (0.03) | (0.89) | 16.64 | 15.05 |
|
| NZF | | | | | | | | | |
Year Ended 10/31: | | | | | | | | | |
2021(e) | 15.96 | 0.40 | 1.02 | 1.42 | (0.40) | — | (0.40) | 16.98 | 16.56 |
2020 | 16.63 | 0.80 | (0.71) | 0.09 | (0.76) | — | (0.76) | 15.96 | 14.74 |
2019 | 15.07 | 0.75 | 1.60 | 2.35 | (0.79) | — | (0.79) | 16.63 | 16.03 |
2018 | 16.03 | 0.81 | (0.94) | (0.13) | (0.83) | — | (0.83) | 15.07 | 13.29 |
2017 | 16.34 | 0.87 | (0.29) | 0.58 | (0.89) | —* | (0.89) | 16.03 | 15.01 |
2016 | 15.75 | 0.72 | 0.74 | 1.46 | (0.87) | — | (0.87) | 16.34 | 14.82 |
(a) | Total Return Based on Common Share NAV is the combination of changes in common share NAV, reinvested dividend income at NAV and reinvested capital gains distributions at NAV, if any. The last dividend declared in the period, which is typically paid on the first business day of the following month, is assumed to be reinvested at the ending NAV. The actual reinvest price for the last dividend declared in the period may often be based on the Fund’s market price (and not its NAV), and therefore may be different from the price used in the calculation. Total returns are not annualized. |
| Total Return Based on Common Share Price is the combination of changes in the market price per share and the effect of reinvested dividend income and reinvested capital gains distributions, if any, at the average price paid per share at the time of reinvestment. The last dividend declared in the period, which is typically paid on the first business day of the following month, is assumed to be reinvested at the ending market price. The actual reinvestment for the last dividend declared in the period may take place over several days, and in some instances may not be based on the market price, so the actual reinvestment price may be different from the price used in the calculation. Total returns are not annualized. |
168
| | | | | Common Share Supplemental Data/ | | |
| | | | | Ratios Applicable to Common Shares | | |
Common Share Total Returns | | Ratios to Average Net Assets | Ratio to Average Net Assets | |
| | Before Reimbursement(b) | After Reimbursement(b) | |
| | Based | Ending | | | | | |
| Based | on | Net | | Net | | Net | Portfolio |
| on | Share | Assets | | Investment | | Investment | Turnover |
| NAV(a) | Price(a) | (000) | Expenses | Income (Loss) | Expenses | Income (Loss) | Rate(c) |
| | | | | | | | |
| 7.05% | 13.41% | $3,720,829 | 1.55%** | 4.88%** | N/A | N/A | 7% |
| 2.53 | 0.06 | 3,576,356 | 1.98 | 4.89 | N/A | N/A | 15 |
| 16.52 | 29.47 | 3,476,962 | 2.49 | 4.82 | N/A | N/A | 6 |
| (0.50) | (6.49) | 3,134,970 | 2.40 | 5.02 | N/A | N/A | 15 |
| 4.25 | 7.10 | 3,319,775 | 2.05 | 5.26 | 2.04%(d) | 5.27%(d) | 18 |
| 9.40 | 13.46 | 3,370,157 | 1.81 | 4.87 | 1.75(d) | 4.93(d) | 21 |
| |
| |
| 8.92 | 15.15 | 2,413,297 | 1.64** | 4.86** | N/A | N/A | 9 |
| 0.58 | (3.34) | 2,267,965 | 2.04 | 4.95 | N/A | N/A | 21 |
| 15.90 | 27.08 | 2,364,022 | 2.60 | 4.68 | N/A | N/A | 12 |
| (0.85) | (6.21) | 2,141,680 | 2.43 | 5.17 | N/A | N/A | 25 |
| 3.88 | 7.61 | 2,278,904 | 2.12 | 5.58 | 2.11(d) | 5.59(d) | 21 |
| 9.36 | 13.26 | 2,321,756 | 1.86 | 5.03 | 1.81(d) | 5.08(d) | 20 |
(b) | • Net Investment Income (Loss) ratios reflect income earned and expenses incurred on assets attributable to preferred shares issued by the Fund, where applicable. |
| • The expense ratios reflect, among other things, all interest expense and other costs related to preferred shares (as described in Note 5 – Fund Shares), and/or the interest expense deemed to have been paid by the Fund on the floating rate certificates issued by the special purpose trusts for the self-deposited inverse floaters held by the Fund (as described in Note 4 – Portfolio Securities and Investments in Derivatives), where applicable, as follows: |
| NVG | | NZF | |
Year Ended 10/31: | | Year Ended 10/31: | |
2021(e) | 0.54%** | 2020(e) | 0.64%** |
2020 | 0.97 | 2020 | 1.01 |
2019 | 1.47 | 2019 | 1.55 |
2018 | 1.37 | 2018 | 1.38 |
2017 | 1.02 | 2017 | 1.09 |
2016 | 0.78 | 2016 | 0.84 |
(c) | Portfolio Turnover Rate is calculated based on the lesser of long-term purchases or sales (as disclosed in Note 4 – Portfolio Securities and Investments in Derivatives) divided by the average long-term market value during the period.
|
(d) | During the fiscal years ended October 31, 2017 and October 31, 2016, the Adviser voluntarily reimbursed the Fund for certain expenses incurred in connection with its reorganization.
|
(e) | Unaudited. For the six months ended April 30, 2021. |
N/A | Fund does not have or no longer has a contractual reimbursement with the Adviser. |
* | Rounds to less than $0.01 per share. |
** | Annualized |
See accompanying notes to financial statements.
169
Financial Highlights (continued)
Selected data for a common share outstanding throughout each period:
| | | | | | | | | | | | |
| | | | | Less Distributions to | | | | | |
| | Investment Operations | | Common Shareholders | | | Common Share | |
| | | | | | | | Premium | | | |
| | | | | | | | Per | | | |
| | | | | | From | | Share | | | |
| Beginning | Net | Net | | From Accumulated | | Sold | | | |
| Common Investment | Realized/ | | Net | Net | | through | Shelf | | Ending |
| Share | Income | Unrealized | | Investment | Realized | | Shelf | Offering | Ending | Share |
| NAV | (Loss) Gain (Loss) | Total | Income | Gains | Total | Offering | Costs | NAV | Price |
|
| NMZ | | | | | | | | | | | |
Year Ended 10/31: | | | | | | | | | | | |
2021(e) | $13.22 | $0.37 | $ 1.17 | $ 1.54 | $(0.38) | $ — | $(0.38) | $0.01 | $ —* | $14.39 | $14.84 |
2020 | 14.04 | 0.70 | (0.82) | (0.12) | (0.73) | — | (0.73) | 0.03 | —* | 13.22 | 13.22 |
2019 | 12.77 | 0.76 | 1.20 | 1.96 | (0.70) | — | (0.70) | 0.01 | — | 14.04 | 14.22 |
2018 | 13.47 | 0.82 | (0.78) | 0.04 | (0.74) | — | (0.74) | —* | — | 12.77 | 11.76 |
2017 | 13.68 | 0.80 | (0.22) | 0.58 | (0.81) | — | (0.81) | 0.02 | — | 13.47 | 13.53 |
2016 | 13.66 | 0.86 | 0.04 | 0.90 | (0.91) | — | (0.91) | 0.03 | — | 13.68 | 13.32 |
|
| NMCO | | | | | | | | | | | |
Year Ended 10/31: | | | | | | | | | | | |
2021(e) | 12.81 | 0.43 | 2.13 | 2.56 | (0.37) | — | (0.37) | — | — | 15.00 | 14.79 |
2020 | 15.08 | 0.71 | (2.25) | (1.54) | (0.73) | — | (0.73) | — | — | 12.81 | 11.68 |
2019(d) | 15.00 | 0.04 | 0.04 | 0.08 | — | — | — | — | — | 15.08 | 15.39 |
(a) | Total Return Based on Common Share NAV is the combination of changes in common share NAV, reinvested dividend income at NAV and reinvested capital gains distributions at NAV, if any. The last dividend declared in the period, which is typically paid on the first business day of the following month, is assumed to be reinvested at the ending NAV. The actual reinvest price for the last dividend declared in the period may often be based on the Fund’s market price (and not its NAV), and therefore may be different from the price used in the calculation. Total returns are not annualized. |
| Total Return Based on Common Share Price is the combination of changes in the market price per share and the effect of reinvested dividend income and reinvested capital gains distributions, if any, at the average price paid per share at the time of reinvestment. The last dividend declared in the period, which is typically paid on the first business day of the following month, is assumed to be reinvested at the ending market price. The actual reinvestment for the last dividend declared in the period may take place over several days, and in some instances may not be based on the market price, so the actual reinvestment price may be different from the price used in the calculation. Total returns are not annualized. |
170
| | | | Common Share Supplemental Data/ | |
| | | | Ratios Applicable to Common Shares | |
Common Share Total Returns
| | | | |
| | Ratios to Average Net Assets(b) | |
| | Based | Ending | | | |
| Based | on | Net | | Net | Portfolio |
| on | Share | Assets | | Investment | Turnover |
| NAV(a) | Price(a) | (000) | Expenses | Income (Loss) | Rate(c) |
| |
| 11.69% | 15.26% | $1,251,192 | 1.38%** | 5.47%** | 3% |
| (0.49) | (1.84) | 1,097,418 | 1.68 | 5.19 | 10 |
| 15.75 | 27.45 | 969,068 | 2.20 | 5.67 | 15 |
| 0.25 | (7.93) | 818,439 | 1.95 | 6.17 | 11 |
| 4.73 | 8.04 | 853,745 | 1.54 | 6.14 | 10 |
| 6.91 | 3.34 | 788,577 | 1.28 | 6.27 | 11 |
| |
| 20.16 | 30.11 | 799,275 | 2.25 | 6.07 | 8 |
| (10.33) | (19.78) | 682,510 | 2.41 | 5.24 | 70 |
| 0.53 | 2.60 | 803,046 | 1.01** | 2.58** | 8 |
(b) | • Net Investment Income (Loss) ratios reflect income earned and expenses incurred on assets attributable to preferred shares issued by the Fund. |
| • The expense ratios reflect, among other things, all interest expense and other costs related to preferred shares (as described in Note 5 – Fund Shares) and/or the interest expense deemed to have been paid by the Fund on the floating rate certificates issued by the special purpose trusts for the self-deposited inverse floaters held by the Fund (as described in Note 4 – Portfolio Securities and Investments in Derivatives), where applicable, as follows: |
| NMZ | | | NMCO | |
Year Ended 10/31: | | | Year Ended 10/31: | |
2021(e) | 0.33%** | | 2021(e) | 0.76%** |
2020 | 0.66 | | 2020 | 1.00 |
2019 | 1.16 | | 2019(d) | 0.05** |
2018 | 0.91 | | | |
2017 | 0.49 | | | |
2016 | 0.24 | | | |
(c) | Portfolio Turnover Rate is calculated based on the lesser of long-term purchases or sales (as disclosed in Note 4 – Portfolio Securities and Investments in Derivatives) divided by the average long-term market value during the period.
|
(d) | For the period September 16, 2019 (commencement of operations) through October 31, 2019. |
(e) | Unaudited. For the six months ended April 30, 2021. |
* | Rounds to less than $0.01 per share. |
** | Annualized. |
See accompanying notes to financial statements.
171
Financial Highlights (continued)
Selected data for a common share outstanding throughout each period:
| | | | | | | | | | |
| | | | | | Less Distributions to | | | |
| | | Investment Operations | | Common Shareholders | | Common Share |
| | | | | | | From | | | |
| | Beginning | Net | Net | | From | Accumulated | | | |
| | Common | Investment | Realized/ | | Net | Net | | | Ending |
| | Share | Income | Unrealized | | Investment | Realized | | Ending | Share |
| | NAV | (Loss) | Gain (Loss) | Total | Income | Gains | Total | NAV | Price |
| NDMO | | | | | | | | | |
Year Ended 10/31: | | | | | | | | | |
2021(e) | $14.92 | $0.24 | $ 1.24 | $1.48 | $(0.46) | $ — | $(0.46) | $15.94 | $16.60 |
2020(d) | 15.00 | 0.03 | (0.03) | — | (0.08) | — | (0.08) | 14.92 | 15.00 |
(a) | Total Return Based on Common Share NAV is the combination of changes in common share NAV, reinvested dividend income at NAV and reinvested capital gains distributions at NAV, if any. The last dividend declared in the period, which is typically paid on the first business day of the following month, is assumed to be reinvested at the ending NAV. The actual reinvest price for the last dividend declared in the period may often be based on the Fund’s market price (and not its NAV), and therefore may be different from the price used in the calculation. Total returns are not annualized. |
| Total Return Based on Common Share Price is the combination of changes in the market price per share and the effect of reinvested dividend income and reinvested capital gains distributions, if any, at the average price paid per share at the time of reinvestment. The last dividend declared in the period, which is typically paid on the first business day of the following month, is assumed to be reinvested at the ending market price. The actual reinvestment for the last dividend declared in the period may take place over several days, and in some instances may not be based on the market price, so the actual reinvestment price may be different from the price used in the calculation. Total returns are not annualized. |
172
| | | | | | |
| | | | Common Share Supplemental Data/ | |
| | | | Ratios Applicable to Common Shares | |
Common Share Total Returns | | | | |
| | Ratios to Average Net Assets | |
| | Based | Ending | | | |
| Based | on | Net | | Net | Portfolio |
| on | Share | Assets | | Investment | Turnover |
| NAV(a) | Price(a) | (000) | Expenses(b) | Income (Loss) | Rate(c) |
| |
| |
| 9.99% | 13.93% | $907,345 | 1.46%* | 3.06%* | 28% |
| (0.02) | 0.51 | 846,790 | 0.89* | 1.06* | 4 |
(b) | • Net Investment Income (Loss) ratios reflect income earned and expenses incurred on assets attributable to borrowings and/or reverse repurchase agreements, where applicable. |
| • The expense ratios reflect, among other things, all interest expense and other costs related to borrowings and/or reverse repurchase agreements (as described in Note 9 – Borrowing Arrangements) and/or the interest expense deemed to have been paid by the Fund on the floating rate certificates issued by the special purpose trusts for the self-deposited inverse floaters held by the Fund (as described in Note 4 – Portfolio Securities and Investments in Derivatives), where applicable, as follows: |
| | | |
| NDMO | |
Year Ended 10/31: | |
2021(e) | 0.25%* |
2020(d) | 0.03* |
| | |
(c) | Portfolio Turnover Rate is calculated based on the lesser of long-term purchases or sales (as disclosed in Note 4 – Portfolio Securities and Investments in Derivatives) divided by the average long-term market value during the period.
|
(d) | For the period August 26, 2020 (commencement of operations) through October 31, 2020. |
(e) | Unaudited. For the six months ended April 30, 2021. |
* | Annualized. |
See accompanying notes to financial statements.
173
Financial Highlights (Unaudited) (continued)
| | | | | | | | | | | | | |
| | | | | | | | | | | | | AMTP, iMTP, |
| | | | | | | | | | | | | MFP, VMTP |
| | | | | | | | | | | | | and /or |
| | | | | | | | | | | | | VRDP Shares |
| | AMTP Shares | iMTP Shares | MFP Shares | | VMTP Shares | VRDP Shares | at the End |
| | at the End of Period | at the End of Period | at the End of Period | | at the End of Period | at the End of Period | of the Period |
| | | | | | | | | | | | | Asset |
| | Aggregate | Asset | Aggregate | Asset | Aggregate | Asset | | Aggregate | Asset | Aggregate | Asset | Coverage |
| | Amount | Coverage | Amount | Coverage | Amount | Coverage | | Amount | Coverage | Amount | Coverage | Per $1 |
| | Outstanding | Per $100,000
| Outstanding | Per $5,000 | Outstanding | Per $100,000
| Outstanding | Per $100,000
| Outstanding | Per $100,000
| Liquidation |
| (000) | Share | (000) | Share | (000) | Share(a) | (000) | Share | (000) | Share | Preference |
| NVG | | | | | | | | | | | | |
Year Ended 10/31: | | | | | | | | | | | | |
2021(c) | $112,000 | $292,889 | $ — | $ — | $405,400 | $292,889 | | $ — | $ — | $1,411,600 | $292,889 | $2.93 |
2020 | 112,000 | 285,399 | — | — | 405,400 | 285,399 | | — | — | 1,411,600 | 285,399 | 2.85 |
2019 | — | — | — | — | 405,400 | 291,357 | | — | — | 1,411,600 | 291,357 | 2.91 |
2018 | — | — | — | — | 405,400 | 272,535 | | — | — | 1,411,600 | 272,535 | 2.73 |
2017 | — | — | — | — | — | — | | 240,400 | 300,955 | 1,411,600 | 300,955 | 3.01 |
2016 | — | — | — | — | — | — | | 240,400 | 304,005 | 1,411,600 | 304,005 | 3.04 |
|
| NZF | | | | | | | | | | | | |
Year Ended 10/31: | | | | | | | | | | | | |
2021(c) | — | — | — | — | 641,000 | 276,411 | | — | — | 727,000 | 276,411 | 2.76 |
2020 | — | — | — | — | 641,000 | 265,787 | | — | — | 727,000 | 265,787 | 2.66 |
2019 | — | — | — | — | 641,000 | 272,809 | | — | — | 727,000 | 272,809 | 2.73 |
2018 | — | — | — | — | 641,000 | 256,556 | | — | — | 727,000 | 256,556 | 2.57 |
2017 | — | — | — | — | 150,000 | 287,873 | | 336,000 | 287,873 | 727,000 | 287,873 | 2.88 |
2016 | — | — | 150,000 | 14,570 | — | — | | 336,000 | 291,406 | 727,000 | 291,406 | 2.91 |
(a) | NVG’s Series B MFP Shares have a $1,000 liquidation preference per share, while all other MFP Shares have a $100,000 liquidation preference per share. The asset coverage per $1,000 share for NVG’s Series B MFP Shares were as follows: |
| | |
| Asset |
| Coverage |
| Per $1,000 |
| NVG | Share |
| Series B | |
Year Ended 10/31: | |
2021(c) | $2,929 |
2020 | 2,854 |
2019 | 2,914 |
2018 | — |
2017 | — |
2016 | — |
See accompanying notes to financial statements.
174
| | | | | | | | | | | |
| | Borrowings | AMTP Shares | MFP Shares | | VMTP Shares | |
| | at the End of Period | at the End of Period | at the End of Period | at the End of Period |
| | Aggregate | Asset | Aggregate | Asset | Aggregate | | Asset | Aggregate | | Asset |
| | Amount | Coverage | Amount | Coverage | Amount | Coverage | Amount | Coverage |
| | Outstanding | Per $1,000 | Outstanding | Per $100,000 | Outstanding | Per $100,000 | Outstanding | Per $100,000 |
| | (000) | Share | (000) | Share | (000) | | Share | (000) | | Share |
| |
| NMZ | | | | | | | | | | |
Year Ended 10/31: | | | | | | | | | | |
2021(c) | $ — | $ — | $257,000 | $ 586,845 | $ — | $ — | $ — | $ — |
2020 | — | — | 87,000 | 1,361,400 | — | | — | — | | — |
2019 | — | — | 87,000 | 1,213,872 | — | | — | — | | — |
2018 | — | — | 87,000 | 1,040,734 | — | | — | — | | — |
2017 | — | — | — | — | — | | — | 87,000 | 1,081,317 |
2016 | — | — | — | — | — | | — | 87,000 | 1,006,411 |
|
| NMCO | | | | | | | | | | |
Year Ended 10/31: | | | | | | | | | | |
2021(c) | — | — | — | — | 450,000 | 277,617 | — | | — |
2020 | — | — | — | — | 450,000 | 251,669 | — | | — |
2019(b) | — | — | — | — | — | | — | — | | — |
|
| NDMO | | | | | | | | | | |
Year Ended 10/31: | | | | | | | | | | |
2021 (c) | 176,900 | 6,129 | — | — | — | | — | — | | — |
2020 (d) | — | — | — | — | — | | — | — | | — |
| | |
(b) | For the period September 16, 2019 (commencement of operations) through October 31, 2019. |
(c) | Unaudited. For the six months ended April 30, 2021. |
(d) | For the period August 26, 2020 (commencement of operations) through October 31, 2020. |
See accompanying notes to financial statements.
175
Notes to
Financial Statements
(Unaudited)
1. General Information
Fund Information
The funds covered in this report and their corresponding New York Stock Exchange (“NYSE”) symbols are as follows (each a “Fund” and collectively, the “Funds”):
| • | Nuveen AMT-Free Municipal Credit Income Fund (NVG) |
| • | Nuveen Municipal Credit Income Fund (NZF) |
| • | Nuveen Municipal High Income Opportunity Fund (NMZ) |
| • | Nuveen Municipal Credit Opportunities Fund (NMCO) |
| • | Nuveen Dynamic Municipal Opportunities Fund (NDMO) |
The Funds are registered under the Investment Company Act of 1940 (the “1940 Act”), as amended, as diversified closed-end management investment companies. NVG, NZF, NMZ, NMCO and NDMO were organized as Massachusetts business trusts on July 12, 1999, March 21, 2001, October 8, 2003, April 18, 2019 and November 4, 2019, respectively.
The end of the reporting period for the Funds is April 30, 2021 and the period covered by these Notes to Financial Statements is for the six months ended April 30, 2021 (the “current fiscal period”).
Investment Adviser and Sub-Adviser
The Funds’ investment adviser is Nuveen Fund Advisors, LLC (the “Adviser”), a subsidiary of Nuveen, LLC (“Nuveen”). Nuveen is the investment management arm of Teachers Insurance and Annuity Association of America (TIAA). The Adviser has overall responsibility for management of the Funds, oversees the management of the Funds’ portfolios, manages the Funds’ business affairs and provides certain clerical, bookkeeping and other administrative services, and, if necessary, asset allocation decisions. The Adviser has entered into sub-advisory agreements with Nuveen Asset Management, LLC (the “Sub-Adviser”), a subsidiary of the Adviser, under which the Sub-Adviser manages the investment portfolios of the Funds.
Other Matters
The outbreak of the novel coronavirus (“COVID-19”) and subsequent global pandemic began significantly impacting the U.S. and global financial markets and economies during the calendar quarter ended March 31, 2020. The worldwide spread of COVID-19 has created significant uncertainty in the global economy. The duration and extent of COVID-19 over the long-term cannot be reasonably estimated at this time. The ultimate impact of COVID-19 and the extent to which COVID-19 impacts the Funds’ normal course of business, results of operations, investments, and cash flows will depend on future developments, which are highly uncertain and difficult to predict. Management continues to monitor and evaluate this situation.
2. Significant Accounting Policies
The accompanying financial statements were prepared in accordance with accounting principles generally accepted in the United States of America (“U.S. GAAP”), which may require the use of estimates made by management and the evaluation of subsequent events. Actual results may differ from those estimates. Each Fund is an investment company and follows the accounting guidance in the Financial Accounting Standards Board (“FASB”) Accounting Standards Codification 946, Financial Services—Investment Companies. The NAV for financial reporting purposes may differ from the NAV for processing security and common share transactions. The NAV for financial reporting purposes includes security and common share transactions through the date of the report. Total return is computed based on the NAV used for processing security and common share transactions. The following is a summary of the significant accounting policies consistently followed by the Funds.
Compensation
The Funds pay no compensation directly to those of its trustees who are affiliated with the Adviser or to its officers, all of whom receive remuneration for their services to the Funds from the Adviser or its affiliates. The Funds’ Board of Trustees (the “Board”) has adopted a deferred compensation plan for independent trustees that enables trustees to elect to defer receipt of all or a portion of the annual compensation they are entitled to receive from certain Nuveen-advised funds. Under the plan, deferred amounts are treated as though equal dollar amounts had been invested in shares of select Nuveen-advised funds.
176
Distributions to Common Shareholders
Distributions to common shareholders are recorded on the ex-dividend date. The amount, character and timing of distributions are determined in accordance with federal income tax regulations, which may differ from U.S. GAAP.
Indemnifications
Under the Funds’ organizational documents, their officers and trustees are indemnified against certain liabilities arising out of the performance of their duties to the Funds. In addition, in the normal course of business, the Funds enter into contracts that provide general indemnifications to other parties. The Funds’ maximum exposure under these arrangements is unknown as this would involve future claims that may be made against the Funds that have not yet occurred. However, the Funds have not had prior claims or losses pursuant to these contracts and expect the risk of loss to be remote.
Investments and Investment Income
Securities transactions are accounted for as of the trade date for financial reporting purposes. Realized gains and losses on securities transactions are based upon the specific identification method. Investment income is comprised of interest income, which is recorded on an accrual basis and includes amortization of premiums and accretion of discounts for financial reporting purposes. Investment income also reflects payment-in-kind (“PIK”) interest and paydown gains and losses, if any. PIK interest represents income received in the form of securities in lieu of cash. Investment income also reflects dividend income, which is recorded on the ex-dividend date.
Netting Agreements
In the ordinary course of business, the Funds may enter into transactions subject to enforceable International Swaps and Derivative Association, Inc. (ISDA) master agreements or other similar arrangements (“netting agreements”). Generally, the right to offset in netting agreements allows each Fund to offset certain securities and derivatives with a specific counterparty, when applicable, as well as any collateral received or delivered to that counterparty based on the terms of the agreements. Generally, each Fund manages its cash collateral and securities collateral on a counterparty basis.
The Funds’ investments subject to netting agreements as of the end of the reporting period, if any, are further described in Note 4 – Portfolio Securities and Investments in Derivatives.
New Accounting Pronouncements and Rule Issuances
Reference Rate Reform
In March 2020, FASB issued Accounting Standards Update (“ASU”) 2020-04, Reference Rate Reform: Facilitation of the Effects of Reference Rate Reform on Financial Reporting. The main objective of the new guidance is to provide relief to companies that will be impacted by the expected change in benchmark interest rates at the end of 2021, when participating banks will no longer be required to submit London Interbank Offered Rate (LIBOR) quotes by the UK Financial Conduct Authority (FCA). The new guidance allows companies to, provided the only change to existing contracts are a change to an approved benchmark interest rate, account for modifications as a continuance of the existing contract without additional analysis. For new and existing contracts, the Funds may elect to apply the amendments as of March 12, 2020 through December 31, 2022. Management has not yet elected to apply the amendments, is continuously evaluating the potential effect a discontinuation of LIBOR could have on the Funds’ investments and has currently determined that it is unlikely the ASU’s adoption will have a significant impact on the Funds’ financial statements and various filings.
Securities and Exchange Commission (“SEC”) Adopts New Rules to Modernize Fund Valuation Framework
In December 2020, the SEC voted to adopt a new rule governing fund valuation practices. New Rule 2a-5 under the 1940 Act establishes requirements for determining fair value in good faith for purposes of the 1940 Act. Rule 2a-5 will permit fund boards to designate certain parties to perform fair value determinations, subject to board oversight and certain other conditions. Rule 2a-5 also defines when market quotations are “readily available” for purposes of Section 2(a)(41) of the 1940 Act, which requires a fund to fair value a security when market quotation are not readily available. The SEC also adopted new Rule 31a-4 under the 1940 Act, which sets forth the recordkeeping requirements associated with fair value determinations. Finally, the SEC is rescinding previously issued guidance on related issues, including the role of a board in determining fair value and the accounting and auditing of fund investments. Rule 2a-5 and Rule 31a-4 became effective on March 8, 2021, with a compliance date of September 8, 2022. A fund may voluntarily comply with the rules after the effective date, and in advance of the compliance date, under certain conditions. Management is currently assessing the impact of these provisions on the Fund’s financial statements.
3. Investment Valuation and Fair Value Measurements
The Funds’ investments in securities are recorded at their estimated fair value utilizing valuation methods approved by the Board. Fair value is defined as the price that would be received upon selling an investment or transferring a liability in an orderly transaction to an independent buyer in the principal or most advantageous market for the investment. U.S. GAAP establishes the three-tier hierarchy which is used to maximize the use of
177
Notes to Financial Statements (Unaudited) (continued)
observable market data and minimize the use of unobservable inputs and to establish classification of fair value measurements for disclosure purposes. Observable inputs reflect the assumptions market participants would use in pricing the asset or liability. Observable inputs are based on market data obtained from sources independent of the reporting entity. Unobservable inputs reflect management’s assumptions about the assumptions market participants would use in pricing the asset or liability. Unobservable inputs are based on the best information available in the circumstances. The following is a summary of the three-tiered hierarchy of valuation input levels.
Level 1 – Inputs are unadjusted and prices are determined using quoted prices in active markets for identical securities.
Level 2 – Prices are determined using other significant observable inputs (including quoted prices for similar securities, interest rates, credit spreads, etc.).
Level 3 – Prices are determined using significant unobservable inputs (including management’s assumptions in determining the fair value of investments).
A description of the valuation techniques applied to the Funds’ major classifications of assets and liabilities measured at fair value follows:
Prices of fixed-income securities are generally provided by an independent pricing service (“pricing service”) approved by the Board. The pricing service establishes a security’s fair value using methods that may include consideration of the following: yields or prices of investments of comparable quality, type of issue, coupon, maturity and rating, market quotes or indications of value from security dealers, evaluations of anticipated cash flows or collateral, general market conditions and other information and analysis, including the obligor’s credit characteristics considered relevant. In pricing certain securities, particularly less liquid and lower quality securities, the pricing service may consider information about a security, its issuer or market activity provided by the Adviser. These securities are generally classified as Level 2.
Investments in investment companies are valued at their respective NAVs on the valuation date and are generally classified as Level 1.
Equity securities and exchange-traded funds listed or traded on a national market or exchange are valued based on their sale price at the official close of business of such market or exchange on the valuation date. Foreign equity securities and registered investment companies that trade on a foreign exchange are valued at the last sale price or official closing price reported on the exchange where traded and converted to U.S. dollars at the prevailing rates of exchange on the date of valuation. To the extent these securities are actively traded and that valuation adjustments are not applied, they are generally classified as Level 1. If there is no official close of business, then the latest available sale price is utilized. If no sales are reported, then the mean of the latest available bid and ask prices is utilized and these securities are generally classified as Level 2.
Futures contracts are valued using closing settlement price or, in the absence of such a price, the last traded price and are generally classified as level 1.
Any portfolio security or derivative for which market quotations are not readily available or for which the above valuation procedures are deemed not to reflect fair value are valued at fair value, as determined in good faith using procedures approved by the Board. As a general principle, the fair value of a security would appear to be the amount that the owner might reasonably expect to receive for it in a current sale. A variety of factors may be considered in determining the fair value of such securities, which may include consideration of the following: yields or prices of investments of comparable quality, type of issue, coupon, maturity and rating, market quotes or indications of value from security dealers, evaluations of anticipated cash flows or collateral, general market conditions and other information and analysis, including the obligor’s credit characteristics considered relevant. To the extent the inputs are observable and timely, the values would be classified as Level 2 of the fair value hierarchy; otherwise they would be classified as Level 3.
178
The following table summarizes the market value of the Funds’ investments as of the end of the reporting period, based on the inputs used to value them:
| | | | | |
| NVG | Level 1 | Level 2 | Level 3 | Total |
Long-Term Investments: | | | | |
| Municipal Bonds* | $ — | $5,759,455,323 | $7,485,500*** | $5,766,940,823 |
| Common Stock** | — | 19,486,462**** | — | 19,486,462 |
Total | $ — | $5,778,941,785 | $7,485,500 | $5,786,427,285 |
|
| NZF | | | | |
Long-Term Investments: | | | | |
| Municipal Bonds* | $ — | $3,700,604,919 | $393,446*** | $3,700,998,365 |
| Common Stock** | — | 34,264,852**** | — | 34,264,852 |
| Investment Companies | 1,976,393 | — | — | 1,976,393 |
Total | $1,976,393 | $3,734,869,771 | $393,446 | $3,737,239,610 |
|
| NMZ | | | | |
Long-Term Investments: | | | | |
| Municipal Bonds* | $ — | $1,722,492,061 | $ 4,087,801*** | $1,726,579,862 |
| Common Stock** | 4,941,604 | 21,633,463**** | — | 26,575,067 |
| Corporate Bonds** | — | 7,777,450 | 128,102*** | 7,905,552 |
Total | $4,941,604 | $1,751,902,974 | $ 4,215,903 | $1,761,060,481 |
|
| NMCO | | | | |
Long-Term Investments: | | | | |
| Municipal Bonds* | $ — | $1,208,299,596 | $2,605,000*** | $1,210,904,596 |
| Common Stock** | — | 24,753,623**** | — | 24,753,623 |
| Exchange-Traded Funds | 2,005,760 | — | — | 2,005,760 |
Short-Term Investments: | | | | |
| Municipal Bonds* | — | 865,417 | — | 865,417 |
Total | $2,005,760 | $1,233,918,636 | $2,605,000*** | $1,238,529,396 |
|
| NDMO | | | | |
Long-Term Investments: | | | | |
| Municipal Bonds* | $ — | $1,325,848,182 | $ — | $1,325,848,182 |
| Corporate Bonds** | — | 2,008,325 | — | 2,008,325 |
Investments in Derivatives | | | | |
| Futures Contracts***** | 961,991 | — | — | 961,991 |
Total | $961,991 | $1,327,856,507 | $ — | $1,328,818,498 |
* | Refer to the Fund’s Portfolio of Investments for state classifications. |
** | Refer to the Fund’s Portfolio of Investments for industry classifications. |
*** | Refer to the Fund’s Portfolio of Investments for securities classified as Level 3. |
**** | Refer to the Fund’s Portfolio of Investments for securities classified as Level 2. |
***** | Represents net unrealized appreciation (depreciation) as reported in the Fund’s Portfolio of Investments.
|
The Funds hold liabilities in floating rate obligations and preferred shares, where applicable, which are not reflected in the tables above. The fair values of the Funds’ liabilities for floating rate obligations approximate their liquidation values. Floating rate obligations are generally classified as Level 2 and further described in Note 4 – Portfolio Securities and Investments in Derivatives. The fair values of the Funds’ liabilities for preferred shares approximate their liquidation preference. Preferred shares are generally classified as Level 2 and further described in Note 5 – Fund Shares.
4. Portfolio Securities and Investments in Derivatives
Portfolio Securities
Inverse Floating Rate Securities
Each Fund is authorized to invest in inverse floating rate securities. An inverse floating rate security is created by depositing a municipal bond (referred to as an “Underlying Bond”), typically with a fixed interest rate, into a special purpose tender option bond (“TOB”) trust (referred to as the “TOB Trust”) created by or at the direction of one or more Funds. In turn, the TOB Trust issues (a) floating rate certificates (referred to as “Floaters”) in face amounts equal to some fraction of the Underlying Bond’s par amount or market value, and (b) an inverse floating rate certificate (referred to as an
179
Notes to Financial Statements (Unaudited) (continued)
“Inverse Floater”) that represents all remaining or residual interest in the TOB Trust. Floaters typically pay short-term tax-exempt interest rates to third parties who are also provided a right to tender their certificate and receive its par value, which may be paid from the proceeds of a remarketing of the Floaters, by a loan to the TOB Trust from a third party liquidity provider (“Liquidity Provider”), or by the sale of assets from the TOB Trust. The Inverse Floater is issued to a long term investor, such as one or more of the Funds. The income received by the Inverse Floater holder varies inversely with the short-term rate paid to holders of the Floaters, and in most circumstances the Inverse Floater holder bears substantially all of the Underlying Bond’s downside investment risk and also benefits disproportionately from any potential appreciation of the Underlying Bond’s value. The value of an Inverse Floater will be more volatile than that of the Underlying Bond because the interest rate is dependent on not only the fixed coupon rate of the Underlying Bond but also on the short-term interest paid on the Floaters, and because the Inverse Floater essentially bears the risk of loss (and possible gain) of the greater face value of the Underlying Bond.
The Inverse Floater held by a Fund gives the Fund the right to (a) cause the holders of the Floaters to tender their certificates at par (or slightly more than par in certain circumstances), and (b) have the trustee of the TOB Trust (the “Trustee”) transfer the Underlying Bond held by the TOB Trust to the Fund, thereby collapsing the TOB Trust.
The Fund may acquire an Inverse Floater in a transaction where it (a) transfers an Underlying Bond that it owns to a TOB Trust created by a third party or (b) transfers an Underlying Bond that it owns, or that it has purchased in a secondary market transaction for the purpose of creating an Inverse Floater, to a TOB Trust created at its direction, and in return receives the Inverse Floater of the TOB Trust (referred to as a “self-deposited Inverse Floater”). A Fund may also purchase an Inverse Floater in a secondary market transaction from a third party creator of the TOB Trust without first owning the Underlying Bond (referred to as an “externally-deposited Inverse Floater”).
An investment in a self-deposited Inverse Floater is accounted for as a “financing” transaction (i.e., a secured borrowing). For a self-deposited Inverse Floater, the Underlying Bond deposited into the TOB Trust is identified in the Fund’s Portfolio of Investments as “(UB) – Underlying bond of an inverse floating rate trust reflected as a financing transaction,” with the Fund recognizing as liabilities, labeled “Floating rate obligations” on the Statement of Assets and Liabilities, (a) the liquidation value of Floaters issued by the TOB Trust, and (b) the amount of any borrowings by the TOB Trust from a Liquidity Provider to enable the TOB Trust to purchase outstanding Floaters in lieu of a remarketing. In addition, the Fund recognizes in “Investment Income” the entire earnings of the Underlying Bond, and recognizes (a) the interest paid to the holders of the Floaters or on the TOB Trust’s borrowings, and (b) other expenses related to remarketing, administration, trustee, liquidity and other services to a TOB Trust, as a component of “Interest expense and amortization of offering costs” on the Statement of Operations. Earnings due from the Underlying Bond and interest due to the holders of the Floaters as of the end of the reporting period are recognized as components of “Receivable for interest” and “Payable for interest” on the Statement of Assets and Liabilities, respectively.
In contrast, an investment in an externally-deposited Inverse Floater is accounted for as a purchase of the Inverse Floater and is identified in the Fund’s Portfolio of Investments as “(IF) – Inverse floating rate investment.” For an externally-deposited Inverse Floater, a Fund’s Statement of Assets and Liabilities recognizes the Inverse Floater and not the Underlying Bond as an asset, and the Fund does not recognize the Floaters, or any related borrowings from a Liquidity Provider, as a liability. Additionally, the Fund reflects in “Investment Income” only the net amount of earnings on the Inverse Floater (net of the interest paid to the holders of the Floaters or the Liquidity Provider as lender, and the expenses of the Trust), and does not show the amount of that interest paid or the expenses of the TOB Trust as described above as interest expense on the Statement of Operations.
Fees paid upon the creation of a TOB Trust for self-deposited Inverse Floaters and externally-deposited Inverse Floaters are recognized as part of the cost basis of the Inverse Floater and are capitalized over the term of the TOB Trust.
As of the end of the reporting period, the aggregate value of Floaters issued by each Fund’s TOB Trust for self-deposited Inverse Floaters and externally-deposited Inverse Floaters was as follows:
| | | | | | |
| Floating Rate Obligations Outstanding | NVG | NZF | NMZ | NMCO | NDMO |
Floating rate obligations: self-deposited Inverse Floaters | $181,925,000 | $14,400,000 | $434,618,000 | $21,996,000 | $196,590,000 |
Floating rate obligations: externally-deposited Inverse Floaters | 74,675,000 | 11,095,000 | 65,140,000 | — | — |
Total | $256,600,000 | $25,495,000 | $499,758,000 | $21,996,000 | $196,590,000 |
During the current fiscal period, the average amount of Floaters (including any borrowings from a Liquidity Provider) outstanding, and the average annual interest rate and fees related to self-deposited Inverse Floaters, were as follows:
| | | | | | |
| Self-Deposited Inverse Floaters | NVG | NZF | NMZ | NMCO | NDMO |
Average floating rate obligations outstanding | $184,484,836 | $15,895,902 | $434,261,689 | $21,950,126 | $159,765,191 |
Average annual interest rate and fees | 0.64% | 0.68% | 1.75% | 0.71% | 0.76% |
TOB Trusts are supported by a liquidity facility provided by a Liquidity Provider pursuant to which the Liquidity Provider agrees, in the event that Floaters are (a) tendered to the Trustee for remarketing and the remarketing does not occur, or (b) subject to mandatory tender pursuant to the terms of the TOB Trust agreement, to either purchase Floaters or to provide the Trustee with an advance from a loan facility to fund the purchase of Floaters
180
by the TOB Trust. In certain circumstances, the Liquidity Provider may otherwise elect to have the Trustee sell the Underlying Bond to retire the Floaters that were tendered and not remarketed prior to providing such a loan. In these circumstances, the Liquidity Provider remains obligated to provide a loan to the extent that the proceeds of the sale of the Underlying Bond is not sufficient to pay the purchase price of the Floaters.
The size of the commitment under the loan facility for a given TOB Trust is at least equal to the balance of that TOB Trust’s outstanding Floaters plus any accrued interest. In consideration of the loan facility, fee schedules are in place and are charged by the Liquidity Provider(s). Any loans made by the Liquidity Provider will be secured by the purchased Floaters held by the TOB Trust. Interest paid on any outstanding loan balances will be effectively borne by the Fund that owns the Inverse Floaters of the TOB Trust that has incurred the borrowing and may be at a rate that is greater than the rate that would have been paid had the Floaters been successfully remarketed.
As described above, any amounts outstanding under a liquidity facility are recognized as a component of “Floating rate obligations” on the Statement of Assets and Liabilities by the Fund holding the corresponding Inverse Floaters issued by the borrowing TOB Trust. As of the end of the reporting there were no loans outstanding under any such facility.
Each Fund may also enter into shortfall and forbearance agreements (sometimes referred to as a “recourse arrangement”) (TOB Trusts involving such agreements are referred to herein as “Recourse Trusts”), under which a Fund agrees to reimburse the Liquidity Provider for the Trust’s Floaters, in certain circumstances, for the amount (if any) by which the liquidation value of the Underlying Bond held by the TOB Trust may fall short of the sum of the liquidation value of the Floaters issued by the TOB Trust plus any amounts borrowed by the TOB Trust from the Liquidity Provider, plus any shortfalls in interest cash flows. Under these agreements, a Fund’s potential exposure to losses related to or on an Inverse Floater may increase beyond the value of the Inverse Floater as a Fund may potentially be liable to fulfill all amounts owed to holders of the Floaters or the Liquidity Provider. Any such shortfall amount in the aggregate is recognized as “Unrealized depreciation on Recourse Trusts” on the Statement of Assets and Liabilities.
As of the end of the reporting period, each Fund’s maximum exposure to the Floaters issued by Recourse Trusts for self-deposited Inverse Floaters and externally-deposited Inverse Floaters was as follows:
| | | | | | |
| Floating Rate Obligations – Recourse Trusts | NVG | NZF | NMZ | NMCO | NDMO |
Maximum exposure to Recourse Trusts: self-deposited Inverse Floaters | $179,180,000 | $ 6,900,000 | $409,838,000 | $21,996,000 | $196,590,000 |
Maximum exposure to Recourse Trusts: externally-deposited Inverse Floaters | 62,320,000 | 9,420,000 | 65,140,000 | — | — |
Total | $241,500,000 | $16,320,000 | $474,978,000 | $21,996,000 | $196,590,000 |
Zero Coupon Securities
A zero coupon security does not pay a regular interest coupon to its holders during the life of the security. Income to the holder of the security comes from accretion of the difference between the original purchase price of the security at issuance and the par value of the security at maturity and is effectively paid at maturity. The market prices of zero coupon securities generally are more volatile than the market prices of securities that pay interest periodically.
Investment Transactions
Long-term purchases and sales (including maturities but excluding derivative transactions, where applicable) during the current fiscal period were as follows:
| | | | | | |
| | NVG | NZF | NMZ | NMCO | NDMO |
Purchases | $402,872,367 | $319,958,407 | $125,384,606 | $94,546,324 | $700,265,538 |
Sales and maturities | $422,794,490 | $341,912,765 | $54,065,211 | $76,932,156 | $336,294,213 |
The Funds may purchase securities on a when-issued or delayed-delivery basis. Securities purchased on a when-issued or delayed-delivery basis may have extended settlement periods; interest income is not accrued until settlement date. Any securities so purchased are subject to market fluctuation during this period. The Funds have earmarked securities in their portfolios with a current value at least equal to the amount of the when-issued/delayed delivery purchase commitments. If a Fund has outstanding when-issued/delayed-delivery purchases commitments as of the end of the reporting period, such amounts are recognized on the Statement of Assets and Liabilities.
Investments in Derivatives
In addition to the inverse floating rate securities in which each Fund may invest, which are considered portfolio securities for financial reporting purposes, each Fund is authorized to invest in certain other derivative instruments such as futures, options and swap contracts. Each Fund limits its investments in futures, options on futures and swap contracts to the extent necessary for the Adviser to claim the exclusion from registration by the Commodity Futures Trading Commission as a commodity pool operator with respect to the Fund. The Funds record derivative instruments at fair value, with changes in fair value recognized on the Statement of Operations, when applicable. Even though the Funds’ investments in derivatives may represent economic hedges, they are not considered to be hedge transactions for financial reporting purposes.
181
Notes to Financial Statements (Unaudited) (continued)
Futures Contracts
Upon execution of a futures contract, a Fund is obligated to deposit cash or eligible securities, also known as “initial margin,” into an account at its clearing broker equal to a specified percentage of the contract amount. Cash held by the broker to cover initial margin requirements on open futures contracts, if any, is recognized as “Cash collateral at brokers for investments in futures contracts” on the Statement of Assets and Liabilities. Investments in futures contracts obligate a Fund and the clearing broker to settle monies on a daily basis representing changes in the prior days “mark-to-market” of the open contracts. If a Fund has unrealized appreciation the clearing broker would credit the Fund’s account with an amount equal to appreciation and conversely if a Fund has unrealized depreciation the clearing broker would debit the Fund’s account with an amount equal to depreciation. These daily cash settlements are also known as “variation margin.” Variation margin is recognized as a receivable and/or payable for “Variation margin on futures contracts” on the Statement of Assets and Liabilities.
During the period the futures contract is open, changes in the value of the contract are recognized as an unrealized gain or loss by “marking-to-market” on a daily basis to reflect the changes in market value of the contract, which is recognized as a component of “Change in net unrealized appreciation (depreciation) of futures contracts” on the Statement of Operations. When the contract is closed or expired, a Fund records a realized gain or loss equal to the difference between the value of the contract on the closing date and value of the contract when originally entered into, which is recognized as a component of “Net realized gain (loss) from futures contracts” on the Statement of Operations.
Risks of investments in futures contracts include the possible adverse movement in the price of the securities or indices underlying the contracts, the possibility that there may not be a liquid secondary market for the contracts and/or that a change in the value of the contract may not correlate with a change in the value of the underlying securities or indices.
During the current reporting period, NDMO managed the duration of its portfolio by shorting interest rate futures contracts.
The average notional amount of futures contracts outstanding during the current fiscal period was as follows:
| | |
| | NDMO |
Average notional amount of futures contracts outstanding* | $114,815,960 |
* The average notional amount is calculated based on the absolute aggregate notional amount of contracts outstanding at the beginning of the current fiscal period and at the end of each fiscal quarter within the current fiscal period.
The following table presents the fair value of all futures contracts held by the Fund as of the end of the reporting period, the location of these instruments on the Statement of Assets and Liabilities and the primary underlying risk exposure.
| | | Location on the Statement of Assets and Liabilities | |
| Underlying Risk | Derivative | | Asset Derivatives | | (Liability) Derivatives | |
| Exposure | Instrument | Location | | Value | Location | Value |
| NDMO | | | | | | |
Interest rate | Futures contracts | — | | $ — | Payable for variation margin | $1,198,684 |
| | | | | on futures contracts* | |
| | | | | Payable for variation margin | |
| | | | | on futures contracts* | $(236,693) |
* Value represents the cumulative unrealized appreciation (depreciation) of futures contracts as reported in the Fund’s Portfolio of Investments and not the daily asset and/or liability derivatives location as described in the table above.
The following table presents the amount of net realized gain (loss) and change in net unrealized appreciation (depreciation) recognized on futures contracts on the Statement of Operations during the current fiscal period, and the primary underlying risk exposure.
| | | | | |
| | | Net Realized | Change in Net Unrealized |
| Underlying Risk | Derivative | Gain (Loss) from | Appreciation (Depreciation) of |
| Fund | Exposure | Instrument | Futures Contracts | Futures contracts |
| NDMO | Interest rate | Futures contracts | $ — | $961,991 |
Market and Counterparty Credit Risk
In the normal course of business each Fund may invest in financial instruments and enter into financial transactions where risk of potential loss exists due to changes in the market (market risk) or failure of the other party to the transaction to perform (counterparty credit risk). The potential loss could exceed the value of the financial assets recorded on the financial statements. Financial assets, which potentially expose each Fund to counterparty credit risk, consist principally of cash due from counterparties on forward, option and swap transactions, when applicable. The extent of each Fund’s exposure to counterparty credit risk in respect to these financial assets approximates their carrying value as recorded on the Statement of Assets and Liabilities.
Each Fund helps manage counterparty credit risk by entering into agreements only with counterparties the Adviser believes have the financial resources to honor their obligations and by having the Adviser monitor the financial stability of the counterparties. Additionally, counterparties may be required to pledge collateral daily (based on the daily valuation of the financial asset) on behalf of each Fund with a value approximately equal to the amount of any unrealized gain above a pre-determined threshold. Reciprocally, when each Fund has an unrealized loss, the Funds have instructed the custodian to
182
pledge assets of the Funds as collateral with a value approximately equal to the amount of the unrealized loss above a pre-determined threshold. Collateral pledges are monitored and subsequently adjusted if and when the valuations fluctuate, either up or down, by at least the pre-determined threshold amount.
5. Fund Shares
Common Shares
Common Shares Equity Shelf Programs and Offering Costs
NMZ and NMCO have filed a registration statement with the Securities and Exchange Commission (“SEC”) authorizing each Fund to issue additional common shares through one or more equity shelf programs (“Shelf Offering”), which became effective with the SEC during a prior or current fiscal period.
Under these Shelf Offerings, the Funds, subject to market conditions, may raise additional equity capital by issuing additional common shares from time to time in varying amounts and by different offering methods at a net price at or above each Fund’s NAV per common share. In each event the Fund’s Shelf Offering registration statement is no longer current, the Funds may not issue additional common shares until a post-effective amendment to the registration statement has been filed with the SEC.
Additional authorized common shares, common shares sold and offering proceeds, net of offering costs under the Funds’ Shelf Offering during the Funds’ current and prior fiscal period were as follows:
| | | | | |
| | NMZ | NCMO |
| | Six Months | Year | Six Months | Year |
| | Ended | Ended | Ended | Ended |
| | 4/30/21* | 10/31/20 | 4/30/21** | 10/31/20 |
Additional authorized common shares | 13,340,607 | 19,500,000 | — | — |
Maximum aggregate offering | Unlimited | — | 90,000,000 | — |
Common shares sold | 3,929,090 | 13,935,297 | — | — |
Offering proceeds, net of offering costs | $56,013,050 | $192,765,554 | — | — |
* | For the period March 8, 2021 through April 30, 2021. The Fund carried forward 13,340,607 common shares from the 19,500,000 additional previously authorized common shares. |
** | For the period March 25, 2021 through April 30, 2021. |
Costs incurred by the Fund in connection with its initial shelf registration are recorded as a prepaid expense and recognized as “Deferred offering costs” on the Statement of Assets and Liabilities. These costs are amortized pro rata as common shares are sold and are recognized as a component of “Proceeds from shelf offering, net of offering costs” on the Statement of Changes in Net Assets. Any deferred offering costs remaining after the effectiveness of the initial shelf registration will be expensed. Costs incurred by the Funds to keep the shelf registration current are expensed as incurred and recognized as a component of “Other expenses” on the Statement of Operations.
Common Share Transactions
Transactions in common shares for the Funds during the Funds’ current and prior fiscal period, where applicable, were as follows:
| | | | |
| | | NVG | |
| | Six Months | | Year |
| | Ended | | Ended |
| | 4/30/21 | | 10/31/20 |
Common shares: | | | |
| Issued in the Merger | — | | 10,817,649 |
|
| | NMZ | |
| Six Months | | Year |
| Ended | | Ended |
| 4/30/21 | | 10/31/20 |
Common shares: | | | |
| Issued to shareholders due to reinvestment of distributions | 31,033 | | 42,176 |
| Sold through shelf offering | 3,929,090 | | 13,935,297 |
Weighted average common share: | | | |
| Premium to NAV per shelf offering share sold | 1.79% | | 1.38% |
183
Notes to Financial Statements (Unaudited) (continued)
| | | | | |
| | NMCO* | NDMO* |
| | | | | For the |
| | | | | period 8/26/20 |
| | | | | (commencement |
| | Six Months | Year | Six Months | of operations) |
| | Ended | Ended | Ended | through |
| | 4/30/21 | 10/31/20 | 4/30/21 | 10/31/20 |
Common shares: | | | | |
| Issued to shareholders due to reinvestment of distributions | — | 19,413 | 152,225 | — |
| Sold | — | — | — | 56,750,000 |
| |
* Prior to the commencement of operations, the Adviser purchased 6,667 shares, which are still held as of the end of the reporting period.
|
Preferred Shares
Adjustable Rate MuniFund Term Preferred Shares
The following Funds have issued and have outstanding Adjustable Rate MuniFund Term Preferred (“AMTP”) Shares, with a $100,000 liquidation preference per share. AMTP Shares are issued via private placement and are not publicly available.
As of the end of the reporting period, NVG and NMZ had $111,918,480 and $256,636,154 AMTP Shares at liquidation preference, net of deferred offering costs, respectively. Further details of each Fund’s AMTP Shares outstanding as of the end of the reporting period, were as follows:
| | | | |
| | | Shares | Liquidation |
| Fund | Series | Outstanding | Preference |
| NVG | 2028 | 1,120 | $112,000,000 |
| NMZ | 2028 | 870 | $ 87,000,000 |
| | 2031 | 1,700 | 170,000,000 |
Each Fund is obligated to redeem its AMTP Shares by the date as specified in its offering document (“Term Redemption Date”), unless earlier redeemed by the Fund. AMTP Shares are subject to optional and mandatory redemption in certain circumstances. The AMTP Shares may be redeemed at the option of the Fund, subject to payment of premium for approximately six months following the date of issuance (“Premium Expiration Date”), and at the redemption price per share thereafter. The redemption price per share is equal to the sum of the liquidation preference per share plus any accumulated but unpaid dividends.
AMTP Shares are short-term or short/intermediate-term instruments that pay a variable dividend rate tied to a short-term index, plus an additional fixed “spread” amount which is initially established at the time of issuance and may be adjusted in the future based upon a mutual agreement between the majority owner and the Fund. From time-to-time the majority owner may propose to the Fund an adjustment to the dividend rate. Should the majority owner and the Fund fail to agree upon an adjusted dividend rate, and such proposed dividend rate adjustment is not withdrawn, the Fund will be required to redeem all outstanding shares upon the end of a notice period.
In addition, the Funds may be obligated to redeem a certain amount of the AMTP Shares if the Funds fails to maintain certain asset coverage and leverage ratio requirements and such failures are not cured by the applicable cure date. The Term Redemption Date and Premium Expiration Date for each Fund’s AMTP Shares are as follows:
| | | | | |
| | Notice | | Term | Premium |
| Fund | Period | Series | Redemption Date | Expiration Date |
| NVG | 540-day | 2028 | December 1, 2028** | February 13, 2019 |
| NMZ | 360-day | 2028 | March 1, 2028** | August 31, 2018 |
| 360-day | 2031 | April 1, 2031** | April 18, 2022 |
** Subject to early termination by either the Fund or the holder.
|
The average liquidation preference of AMTP Shares outstanding and annualized dividend rate for each Fund during the current fiscal period were as follows:
| | | |
| | NVG | NMZ |
Average liquidation preference of AMTP Shares outstanding | $112,000,000 | $98,270,718 |
Annualized dividend rate | 0.89% | 0.93% |
AMTP Shares are subject to restrictions on transfer, generally do not trade, and market quotations are generally not available. The fair value of AMTP Shares is expected to be approximately their liquidation preference so long as the fixed “spread” on the AMTP Shares remains roughly in line with the “spread” being demanded by investors on instruments having similar terms in the current market environment. In present market conditions, the Funds’
184
Adviser has determined that the fair value of AMTP Shares is approximately their liquidation preference, but their fair value could vary if market conditions change materially. For financial reporting purposes, the liquidation preference of AMTP Shares is a liability and is recognized as a component of “Adjustable Rate MuniFund Term Preferred (“AMTP”) Shares, net of deferred offering costs” on the Statement of Assets and Liabilities.
AMTP Share dividends are treated as interest payments for financial reporting purposes. Unpaid dividends on AMTP Shares are recognized as a component of “Interest payable” on the Statement of Assets and Liabilities. Dividends accrued on AMTP Shares are recognized as a component of “Interest expense and amortization of offering costs” on the Statement of Operations.
NMZ incurred offering costs of $255,000 in connection with its offering of AMTP Shares, which were recorded as a deferred charge, and are being amortized over the life of the shares. These offering costs are recognized as components of “Adjustable Rate MuniFund Term Preferred (“AMTP”) Shares, net of deferred offering costs” on the Statement of Assets and Liabilities and “Interest expense and amortization of offering costs” on the Statement of Operations.
MuniFund Preferred Shares
The following Funds have issued and have outstanding MuniFund Preferred (“MFP”) Shares, with a $100,000 ($1,000 for NVG’s Series B) liquidation preference per share. These MFP Shares were issued via private placement and are not publically available.
The Funds are obligated to redeem their MFP Shares by the date as specified in its offering documents (“Term Redemption Date”), unless earlier redeemed by the Funds. MFP Shares are initially issued in a pre-specified mode, however, MFP Shares can be subsequently designated as an alternative mode at a later date at the discretion of the Funds. The modes within MFP Shares detail the dividend mechanics and are described as follows. At a subsequent date, the Fund may establish additional mode structures with the MFP Share.
| |
• Variable Rate Remarketed Mode (“VRRM”) – Dividends for MFP Shares within this mode will be established by a remarketing agent; therefore, the |
| market value of the MFP Shares is expected to approximate its liquidation preference. Shareholders have the ability to request a best-efforts tender |
| of their shares upon seven days notice. If the remarketing agent is unable to identify an alternative purchaser, the shares will be retained by the |
| shareholder requesting tender and the subsequent dividend rate will increase to its step-up dividend rate. If after one consecutive year of unsuccess- |
| ful remarketing attempts, the Fund will be required to designate an alternative mode or redeem the shares. |
|
| Each Fund will pay a remarketing fee on the aggregate principal amount of all MFP Shares while designated in VRRM. Payments made by the Fund |
| to the remarketing agent are recognized as “Remarketing fees” on the Statement of Operations. |
|
• Variable Rate Mode (“VRM”) – Dividends for MFP Shares designated in this mode are based upon a short-term index plus an additional fixed |
| “spread” amount established at the time of issuance or renewal / conversion of its mode. At the end of the period of the mode, the Fund will be |
| required to either extend the term of the mode, designate an alternative mode or redeem the MFP Shares. |
|
| The fair value of MFP Shares while in VRM are expected to approximate their liquidation preference so long as the fixed “spread” on the shares |
| remains roughly in line with the “spread” being demanded by investors on instruments having similar terms in the current market. In current market |
| conditions, the Adviser has determined that the fair value of the shares are approximately their liquidation preference, but their fair value could vary if |
| market conditions change materially. |
|
• Variable Rate Demand Mode (“VRDM”) – Dividends for MFP Shares designated in this mode will be established by a remarketing agent; therefore, |
| the market value of the MFP Shares is expected to approximate its liquidation preference. While in this mode, shares will have an unconditional |
| liquidity feature that enables its shareholders to require a liquidity provider, with which the Fund has entered into a contractual agreement, to |
| purchase shares in the event that the shares are not able to be successfully remarketed. In the event that shares within this mode are unable to be |
| successfully remarketed and are purchased by the liquidity provider, the dividend rate will be the maximum rate which is designed to escalate |
| according to a specified schedule in order to enhance the remarketing agent’s ability to successfully remarket the shares. Each Fund is required to |
| redeem any shares that are still owned by a liquidity provider after six months of continuous, unsuccessful remarketing. |
The Fund will pay a liquidity and remarketing fee on the aggregate principal amount of all MFP shares while within VRDM. Payments made by the Fund to the liquidity provider and remarketing agent are recognized as “Liquidity fees” and “Remarketing fees”, respectively, on the Statement of Operations.
For financial reporting purposes, the liquidation preference of MFP Shares is recorded as a liability and is recognized as a component of “MuniFund Preferred (“MFP”) Shares, net of deferred offering costs” on the Statement of Assets and Liabilities. Dividends on the MFP shares are treated as interest payments for financial reporting purposes. Unpaid dividends on MFP shares are recognized as a component on “Interest payable” on the Statement of Assets and Liabilities. Dividends accrued on MFP Shares are recognized as a component of “Interest expense and amortization of offering costs” on the Statement of Operations.
185
Notes to Financial Statements (Unaudited) (continued)
Subject to certain conditions, MFP Shares may be redeemed, in whole or in part, at any time at the option of the Fund. The Fund may also be required to redeem certain MFP shares if the Fund fails to maintain certain asset coverage requirements and such failures are not cured by the applicable cure date. The redemption price per share in all circumstances is equal to the liquidation preference per share plus any accumulated but unpaid dividends.
Costs incurred in connection with the Funds’ offering of MFP Shares were recorded as deferred charges, which are amortized over the life of the shares. These offering costs are recognized as a component of “MuniFund Preferred (“MFP”) Shares, net of deferred offering costs” on the Statement of Assets and Liabilities and “Interest expense and amortization of offering costs” on the Statement of Operations.
As of the end of the reporting period, NVG, NZF and NMCO had $404,082,522, $640,028,521 and $448,852,763 of MFP Shares at liquidation preference, net of deferred offering costs, respectively. Further details of each Fund’s MFP Shares outstanding as of the end of the reporting period, were as follows:
| | | | | | | |
| | | | | | | Mode |
| | Shares | Liquidation | Term | | Termination |
| Fund | Series | Outstanding | Preference | Redemption Date | Mode | Date |
| NVG | A | 2,054 | $205,400,000 | January 3, 2028 | VRM | January 3, 2028* |
| B | 200,000 | 200,000,000 | March 1, 2029 | VRRM | N/A |
| NZF | A | 1,500 | $150,000,000 | May 1, 2047 | VRM | May 4, 2022 |
| B | 1,550 | 155,000,000 | February 3, 2048 | VRM | February 3, 2048* |
| C | 3,360 | 336,000,000 | June 1, 2048 | VRM | June 21, 2023 |
| NMCO | A | 1,000 | $100,000,000 | October 1, 2031 | VRDM | N/A |
| B | 2,250 | 225,000,000 | October 1, 2031 | VRM | December 28, 2022 |
| C | 1,250 | 125,000,000 | October 1, 2031 | VRM | February 16, 2022 |
* Subject to earlier termination by either the Fund or the holder. | | | | | | |
The average liquidation preference of MFP Shares outstanding and annualized dividend rate for the Funds during the current fiscal period were as follows:
| | | | |
| NVG | NZF | NMCO |
Average liquidation preference of MFP Shares outstanding | $405,400,000 | $641,000,000 | $450,000,000 |
Annualized dividend rate | 0.70% | 1.15% | 1.01% |
Variable Rate Demand Preferred Shares
The following Funds have issued and have outstanding Variable Rate Demand Preferred (“VRDP”) Shares, with a $100,000 liquidation preference per share. VRDP Shares are issued via private placement and are not publicly available.
As of the end of the reporting period, NVG and NZF had $1,408,136,995 and $722,640,864 of VRDP Shares at liquidation preference, net of deferred offering costs, respectively. Further details of the Funds’ VRDP Shares outstanding as of the end of the reporting period, were as follows:
| | | | | | | |
| | | Shares | Remarketing | Liquidation | |
| Fund | Series | Outstanding | Fees* | Preference | Maturity |
| NVG | | 1 | 1,790 | 0.10% | $179,000,000 | December 1, 2043 |
| | 2 | 3,854 | 0.10 | $385,400,000 | December 1, 2040 |
| | 4 | 1,800 | 0.10 | $180,000,000 | June 1, 2046 |
| | 5 | 3,405 | 0.10 | $340,500,000 | December 1, 2040 |
| | 6 | 3,267 | 0.10 | $326,700,000 | December 1, 2040 |
| NZF | | 1 | 2,688 | N/A | $268,800,000 | March 1, 2040 |
| | 2 | 2,622 | N/A | $262,200,000 | March 1, 2040 |
| | 3 | 1,960 | 0.05 | $196,000,000 | June 1, 2040 |
|
* | Remarketing fees as a percentage of aggregate principal amount of all VRDP Shares outstanding of each series. | | | |
N/A | Not applicable. Series is considered to be Special Rate VRDP and therefore does not pay a remarketing fee. | | | |
VRDP Shares include a liquidity feature that allows VRDP shareholders to have their shares purchased by a liquidity provider with whom each Fund has contracted in the event that the VRDP Shares are not able to be successfully remarketed. Each Fund is required to redeem any VRDP Shares that are still owned by the liquidity provider after six months of continuous, unsuccessful remarketing. Each Fund pays an annual remarketing fee on the aggregate principal amount of all VRDP Shares outstanding. Each Fund’s VRDP Shares have successfully remarketed since issuance.
186
NZF’s Series 1 and Series 2 VRDP Shares are considered to be Special Rate VRDP, which are sold to institutional investors. The special rate period will expire on March 1, 2040 for the Fund’s Series 1 and 2 VRDP Shares, but is subject to earlier termination by either the Fund or the holder. During the special rate period, the VRDP Shares will not be remarketed by a remarketing agent, be subject to optional or mandatory tender events, or be supported by a liquidity provider and are not subject to remarketing fees or liquidity fees. During the special rate period, VRDP dividends will be set monthly as a floating rate based on the predetermined formula. Following the initial special rate period, Special Rate Period VRDP Shares may transition to traditional VRDP Shares with dividends set at weekly remarketings, and be supported by a designated liquidity provider, or the Board may approve a subsequent special rate period.
Dividends on the VRDP Shares (which are treated as interest payments for financial reporting purposes) are set at a rate established by a remarketing agent; therefore, the market value of the VRDP Shares is expected to approximate its liquidation preference. In the event that VRDP Shares are unable to be successfully remarketed, the dividend rate will be the maximum rate which is designed to escalate according to a specified schedule in order to enhance the remarketing agent’s ability to successfully remarket the VRDP Shares.
Subject to certain conditions, VRDP Shares may be redeemed, in whole or in part, at any time at the option of each Fund. Each Fund may also redeem certain of the VRDP Shares if the Fund fails to maintain certain asset coverage requirements and such failures are not cured by the applicable cure date. The redemption price per share is equal to the sum of the liquidation preference per share plus any accumulated but unpaid dividends.
The average liquidation preference of VRDP Shares outstanding and annualized dividend rate for each Fund during the current fiscal period were as follows:
| | | |
| NVG | NZF |
Average liquidation preference of VRDP Shares outstanding | $1,411,600,000 | $727,000,000 |
Annualized dividend rate | 0.12% | 0.80% |
For financial reporting purposes, the liquidation preference of VRDP Shares is a liability and is recognized as a component of “Variable Rate Demand Preferred (“VRDP”) Shares, net of deferred offering costs” on the Statement of Assets and Liabilities. Unpaid dividends on VRDP Shares are recognized as a component of “Interest payable” on the Statement of Assets and Liabilities, when applicable. Dividends accrued on VRDP Shares are recognized as a component of “Interest expense and amortization of offering costs” on the Statement of Operations. Costs incurred by the Funds in connection with their offerings of VRDP Shares were recorded as a deferred charge, which are amortized over the life of the shares and are recognized as a component of “Variable Rate Demand Preferred (“VRDP”) Shares, net of deferred offering costs” on the Statement of Assets and Liabilities and “Interest expense and amortization of offerings costs” on the Statement of Operations. In addition to interest expense, each Fund also pays a per annum liquidity fee to the liquidity provider, as well as a remarketing fee, which are recognized as “Liquidity fees” and “Remarketing fees,” respectively, on the Statement of Operations.
Preferred Share Transactions
Transactions in preferred shares for the Funds during the Funds’ current and prior fiscal period, where applicable, are noted in the following tables.
| | | | |
Transactions in AMTP Shares for the Funds, where applicable, were as follows: | | | |
| Six Months Ended April 30, 2021 |
|
| NVG | Series | Shares | Amount |
AMTP Shares issued | 2031 | 1,700 | $170,000,000 |
|
| Year Ended
October 31, 2020 |
|
| NVG | Series | Shares | Amount |
AMTP Shares issued in connection with the Merger | 2028 | 1,120 | $112,000,000 |
Transactions in MFP Shares for the Funds, where applicable, were as follows: | | | |
| Year Ended
October 31, 2020 |
|
| NMCO | Series | Shares | Amount |
| MFP Shares issued | A | 1,000 | $100,000,000 |
| B | 2,250 | 225,000,000 |
| C | 1,250 | 125,000,000 |
Total | | 4,500 | $450,000,000 |
187
Notes to Financial Statements (Unaudited) (continued)
6. Income Tax Information
Each Fund is a separate taxpayer for federal income tax purposes. Each Fund intends to distribute substantially all of its net investment income and net capital gains to shareholders and to otherwise comply with the requirements of Subchapter M of the Internal Revenue Code applicable to regulated investment companies. Therefore, no federal income tax provision is required. Furthermore, each Fund intends to satisfy conditions that will enable interest from municipal securities, which is exempt from regular federal income tax, to retain such tax-exempt status when distributed to shareholders of the Funds. Net realized capital gains and ordinary income distributions paid by the Funds are subject to federal taxation.
For all open tax years and all major taxing jurisdictions, management of the Funds has concluded that there are no significant uncertain tax positions that would require recognition in the financial statements. Open tax years are those that are open for examination by taxing authorities (i.e., generally the last four tax year ends and the interim tax period since then). Furthermore, management of the Funds is also not aware of any tax positions for which it is reasonably possible that the total amounts of unrecognized tax benefits will significantly change in the next twelve months.
The following information is presented on an income tax basis. Differences between amounts for financial statement and federal income tax purposes are primarily due to timing differences in recognizing taxable market discount, timing differences in recognizing certain gains and losses on investment transactions and the treatment of investments in inverse floating rate securities reflected as financing transactions, if any. To the extent that differences arise that are permanent in nature, such amounts are reclassified within the capital accounts as detailed below. Temporary differences do not require reclassification. Temporary and permanent differences do not impact the NAVs of the Funds.
The table below presents the cost and unrealized appreciation (depreciation) of each Fund’s investment portfolio, as determined on a federal income tax basis, as of April 30, 2021.
For purposes of this disclosure, derivative tax cost is generally the sum of any upfront fees or premiums exchanged and any amounts unrealized for income statement reporting but realized in income and/or capital gains for tax reporting. If a particular derivative category does not disclose any tax unrealized appreciation or depreciation, the change in value of those derivatives have generally been fully realized for tax purposes.
| | | | | | |
| NVG | NZF | NMZ | NMCO | NDMO |
Tax cost of investments | $4,962,267,405 | $3,289,972,768 | $1,217,520,996 | $1,154,148,599 | $1,070,489,764 |
Gross unrealized: | | | | | |
| Appreciation | 653,931,843 | 459,050,007 | 152,504,374 | 89,945,263 | 64,449,948 |
| Depreciation | (17,695,775) | (26,183,639) | (43,583,072) | (27,560,346) | (2,710,356) |
Net unrealized appreciation (depreciation) of investments | $ 636,236,068 | $ 432,866,368 | $ 108,921,302 | $ 62,384,917 | $ 61,739,592 |
Permanent differences, primarily due to federal taxes paid, nondeductible offering costs, taxable market discount, nondeductible reorganization expenses, reorganization adjustments, paydowns, and treatment of notional principal contracts, resulted in reclassifications among the Funds’ components of common share net assets as of October 31, 2020, the Funds’ last tax year end.
The tax components of undistributed net tax-exempt income, net ordinary income and net long-term capital gains as of October 31, 2020, the Funds’ last tax year end, were as follows:
| | | | | | |
| NVG | NZF | NMZ | NMCO | NDMO |
Undistributed net tax-exempt income1 | $ 7,215,271 | $5,518,539 | $10,923,431 | $3,254,558 | $1,447,380 |
Undistributed net ordinary income2 | 2,620,185 | 891,633 | 1,999,315 | 364,252 | 41,844 |
Undistributed net long-term capital gains | 20,803,556 | — | — | — | — |
1 | Undistributed net tax-exempt income (on a tax basis) has not been reduced for the dividend declared on October 1, 2020 and paid on November 2, 2020. |
2 | Net ordinary income consists of taxable market discount income and net short-term capital gains, if any. |
The tax character of distributions paid during the Funds’ last tax year ended October 31, 2020 was designated for purposes of the dividends paid deduction as follows:
| | | | | | |
| NVG | NZF | NMZ | NMCO | NDMO3 |
Distributions from net tax-exempt income | $188,593,024 | $128,462,681 | $57,189,031 | $44,454,196 | $4,341,885 |
Distributions from net ordinary income2 | 578,198 | 52,126 | 1,828,548 | 104,004 | — |
Distributions from net long-term capital gains | 6,121,637 | — | — | — | — |
2 | Net ordinary income consists of taxable market discount income and net short-term capital gains, if any |
3 | For the period August 26, 2020 (commencement of operations) through October 31, 2020. |
188
As of October 31, 2020, the Funds’ last tax year end, the Funds had unused capital losses carrying forward available for federal income tax purposes to be applied against future capital gains, if any. The capital losses are not subject to expiration.
| | | | | | |
| | NVG4 | NZF | NMZ | NMCO | NDMO |
Not subject to expiration: | | | | | |
| Short-term | $1,434,595 | $30,169,235 | $2,509,306 | $68,035,418 | $449,926 |
| Long-term | 2,040,935 | — | — | — | — |
Total | $3,475,530 | $30,169,235 | $2,509,306 | $68,035,418 | $449,926 |
4 A portion of NVG’s capital loss carryforward is subject to an annual limitation under the Internal Revenue Code and related regulations.
During the Funds’ last tax year ended October 31, 2020, the following Fund utilized capital loss carryforwards as follows:
| | |
| | NVG |
Utilized capital loss carryforwards | $4,625,194 |
7. Management Fees and Other Transactions with Affiliates
Management Fees
Each Fund’s management fee compensates the Adviser for overall investment advisory and administrative services and general office facilities. The Sub-Adviser is compensated for its services to the Funds from the management fees paid to the Adviser.
Each Fund’s management fee consists of two components – a fund-level fee, based only on the amount of assets within each individual Fund, and a complex-level fee, based on the aggregate amount of all eligible fund assets managed by the Adviser. This pricing structure enables Fund shareholders to benefit from growth in the assets within their respective Fund as well as from growth in the amount of complex-wide assets managed by the Adviser.
The annual fund-level fee, payable monthly, for each Fund is calculated according to the following schedules:
| | | | | |
| NVG | | | |
| NZF | NMZ | NMCO | NDMO |
| Average Daily Managed Assets* | Fund-Level Fee Rate | Fund-Level Fee Rate | Fund-Level Fee Rate | Fund-Level Fee Rate |
For the first $125 million | 0.5000% | 0.5500% | 0.7500% | 0.7000% |
For the next $125 million | 0.4875 | 0.5375 | 0.7375 | 0.6875 |
For the next $250 million | 0.4750 | 0.5250 | 0.7250 | 0.6750 |
For the next $500 million | 0.4625 | 0.5125 | 0.7125 | 0.6625 |
For the next $1 billion | 0.4500 | 0.5000 | 0.7000 | 0.6500 |
For the next $3 billion | 0.4250 | 0.4750 | 0.6750 | 0.6250 |
For managed assets over $5 billion | 0.4125 | 0.4625 | 0.6625 | 0.6125 |
189
Notes to Financial Statements (Unaudited) (continued)
The annual complex-level fee, payable monthly, for each Fund is calculated by multiplying the current complex-wide fee rate, determined according to the following schedule by the Funds’ daily managed assets:
| | |
| Complex-Level Eligible Asset Breakpoint Level* | Effective Complex-Level Fee Rate at Breakpoint Level |
$55 billion | 0.2000% |
$56 billion | 0.1996 |
$57 billion | 0.1989 |
$60 billion | 0.1961 |
$63 billion | 0.1931 |
$66 billion | 0.1900 |
$71 billion | 0.1851 |
$76 billion | 0.1806 |
$80 billion | 0.1773 |
$91 billion | 0.1691 |
$125 billion | 0.1599 |
$200 billion | 0.1505 |
$250 billion | 0.1469 |
$300 billion | 0.1445 |
| * | For the complex-level fees, managed assets include closed-end fund assets managed by the Adviser that are attributable to certain types of leverage. For these purposes, leverage includes the funds’ use of preferred stock and borrowings and certain investments in the residual interest certificates (also called inverse floating rate securities) in tender option bond (TOB) trusts, including the portion of assets held by a TOB trust that has been effectively financed by the trust’s issuance of floating rate securities, subject to an agreement by the Adviser as to certain funds to limit the amount of such assets for determining managed assets in certain circumstances. The complex-level fee is calculated based upon the aggregate daily managed assets of all Nuveen open-end and closed-end funds that constitute “eligible assets.” Eligible assets do not include assets attributable to investments in other Nuveen funds or assets in excess of a determined amount (originally $2 billion) added to the Nuveen fund complex in connection with the Adviser’s assumption of the management of the former First American Funds effective January 1, 2011, but do not include certain Nuveen funds that were reorganized into funds advised by an affiliate of the Adviser during the 2019 calendar year. As of April 30, 2021, the complex-level fee for each Fund was 0.1544%. |
Other Transactions with Affiliates
Each Fund is permitted to purchase or sell securities from or to certain other funds or accounts managed by the Sub-Adviser (“Affiliated Entity”) under specified conditions outlined in procedures adopted by the Board (“cross-trade”). These procedures have been designed to ensure that any cross-trade of securities by the Fund from or to an Affiliated Entity by virtue of having a common investment adviser (or affiliated investment adviser), common officer and/or common trustee complies with Rule 17a-7 under the 1940 Act. These transactions are effected at the current market price (as provided by an independent pricing service) without incurring broker commissions.
During the current fiscal period, the following Funds engaged in cross-trades pursuant to these procedures as follows:
| | | |
| Cross-Trades | NZF | NMCO |
Purchases | $11,661,624 | $812,891 |
Sales | 10,632,310 | — |
Realized gain/loss | (440,461) | — |
8. Commitments and Contingencies
In the normal course of business, each Fund enters into a variety of agreements that may expose the Fund to some risk of loss. These could include recourse arrangements for certain TOB Trusts and certain agreements related to preferred shares, which are described elsewhere in these Notes to Financial Statements. The risk of future loss arising from such agreements, while not quantifiable, is expected to be remote. As of the end of the reporting period, the Funds did not have any unfunded commitments.
From time to time, the Funds may be party to certain legal proceedings in the ordinary course of business, including proceedings relating to the enforcement of the Funds’ rights under contracts. As of the end of the reporting period, the Funds are not subject to any material legal proceedings.
9. Borrowing Arrangements
Committed Line of Credit
NVG, NZF, NMZ and NMCO, along with certain other funds managed by the Adviser (“Participating Funds”), have established a 364-day, $2.405 billion standby credit facility with a group of lenders, under which the Participating Funds may borrow for various purposes other than leveraging for investment purposes. Each Participating Fund is allocated a designated proportion of the facility’s capacity (and its associated costs, as described below) based upon a multi-factor assessment of the likelihood and frequency of its need to draw on the facility, the size of the Fund and its anticipated draws, and the potential importance of such draws to the operations and well-being of the Fund, relative to those of the other Funds. A Fund may
190
effect draws on the facility in excess of its designated capacity if and to the extent that other Participating Funds have undrawn capacity. The credit facility expires in June 2021 unless extended or renewed.
The credit facility has the following terms: a 0.10% upfront fee, 0.15% per annum on unused commitment amounts and a drawn interest rate equal to the higher of (a) one-month LIBOR (London Inter-Bank Offered Rate) plus 1.25% per annum or (b) the Fed Funds rate plus 1.25% per annum on amounts borrowed. Interest expense incurred by the Participating Funds, when applicable, is recognized as a component of “Other expense” on the Statement of Operations. Participating Funds paid administration, legal and arrangement fees, which are recognized as a component of “Other expenses” on the Statement of Operations, and along with commitment fees, have been allocated among such Participating Funds based upon the relative proportions of the facility’s aggregate capacity reserved for them and other factors deemed relevant by the Adviser and the Board of each Participating Fund.
During the current fiscal period, the following Fund utilized this facility. The Fund’s maximum outstanding balance during the utilization period was as follows:
| NVG |
Maximum outstanding balance | $32,950,827 |
During the Fund’s utilization period(s) during the current fiscal period, the average daily balance outstanding and average annual interest rate on the Borrowings were as follows:
| | |
| NVG |
Utilization period (days outstanding) | 4 |
Average daily balance outstanding | $32,950,827 |
Average annual interest rate | 1.39% |
Borrowings outstanding as of the end of the reporting period, if any, are recognized as “Borrowings” on the Statement of Assets and Liabilities, where applicable.
Borrowing Information for NDMO
On November 3, 2020, NDMO entered into a $215 million committed line of credit (“Borrowings”) agreement with its custodian bank, as a means of leverage. The credit agreement expires on November 2, 2021 unless extended or renewed.
Interest is charged on the Borrowings drawn amount for a Base Rate Loan at a rate per annum equal to the higher of (a) one-month LIBOR plus 0.75% or (b) the Federal Funds Rate plus 0.85% or for a LIBOR Loan at a rate per annum equal to the LIBOR Offered Rate plus 0.75%. NDMO also accrues a 0.15% per annum commitment fee on the undrawn balance based on the maximum commitment amount of the Borrowings to the extent the unused portion of the Borrowings is less than 25% of the maximum commitment amount, otherwise the per annum commitment fee is 0.25%. NDMO also incurred a 0.05% upfront fee.
During the current fiscal period, the average daily balance outstanding (which was for the period December 15, 2020 through April 30, 2021) and average annual interest rate on these Borrowings were $141,514,599 and 0.92%, respectively.
In order to maintain these Borrowings, the Fund must meet certain collateral, asset coverage and other requirements. Borrowings outstanding are fully secured by securities in the Fund’s portfolio of investments.
Borrowings outstanding are recognized as “Borrowings” on the Statement of Assets and Liabilities. Interest expense incurred on the drawn amount and undrawn balance are recognized as a component of “Interest expense and amortization of offering costs” on the Statement of Operations.
Reverse Repurchase Agreements
During the current fiscal period NVG utilized reverse repurchase agreements for temporary purposes other than leveraging. During the current fiscal period NDMO utilized reverse repurchase agreements as a means of leverage.
The Fund may enter into a reverse repurchase agreements. In a reverse repurchase agreement, the Fund sells to the counterparty a security that it holds with a contemporaneous agreement to repurchase the same security at an agreed-upon price and date, reflecting the interest rate effective for the term of the agreement. It may also be viewed as the borrowing of money by the Fund. Cash received in exchange for securities delivered, plus accrued interest payments to be made by the Fund to a counterparty, are reflected as a liability on the Statement of Assets and Liabilities. Interest payments made by the Fund to counterparties are recognized as a component of “Interest expense” on the Statement of Operations.
In a reverse repurchase agreement, the Fund retains the risk of loss associated with the sold security. In order to minimize risk, the Fund identifies for coverage securities and cash as collateral with a fair value at least equal to its purchase obligations under these agreements (including accrued interest).
191
Notes to Financial Statements (Unaudited) (continued)
Reverse repurchase agreements also involve the risk that the purchaser fails to return the securities as agreed upon, files for bankruptcy or becomes insolvent. Upon a bankruptcy or insolvency of a counterparty, the Fund is considered to be an unsecured creditor with respect to excess collateral and as such the return of excess collateral may be delayed. The Fund will pledge assets determined to be liquid by the Adviser to cover its obligations under reverse repurchase agreements.
As of the end of the reporting period, the Fund’s outstanding balances on its reverse repurchase agreements were as follows:
| | | | | | | |
| | Interest | Principal | | | Value and |
| Fund | Counterparty | Rate | Amount | Maturity | Value | Accrued Interest |
| NDMO | | | | | | |
| Royal Bank of Canada | 0.76% | $(14,700,000) | 6/7/21 | $(14,700,000) | $(14,702,793) |
| Royal Bank of Canada | 0.77% | (20,000,000) | 6/17/21 | (20,000,000) | (20,006,417) |
| | | | $(34,700,000) | | $(34,700,000) | $(34,709,210) |
During the current fiscal period, the average daily balance outstanding and average interest rate on the reverse repurchase agreements were as follows:
| | | |
| | NVG | NDMO |
Utilization period (days outstanding) | 6 | 24 |
Average daily balance outstanding | $(11,000,000) | $(25,512,500) |
Average interest rate | 0.85% | 0.77% |
The following table presents the reverse repurchase agreements subject to netting agreements and the collateral delivered related to those reverse repurchase agreements.
| | | | |
| | | Collateral |
| | Reverse Repurchase | Pledged to |
| Fund | Counterparty | Agreements* | Counterparty |
| NDMO | Royal Bank of Canada | $(34,709,210) | $40,723,566 |
* Represents gross value and accrued interest for the counterparty as reported in the preceding table.
10. Inter-Fund Borrowing and Lending
Inter-Fund Borrowing and Lending
The SEC has granted an exemptive order permitting registered open-end and closed-end Nuveen funds to participate in an inter-fund lending facility whereby the Nuveen funds may directly lend to and borrow money from each other for temporary purposes (e.g., to satisfy redemption requests or when a sale of securities “fails,” resulting in an unanticipated cash shortfall) (the “Inter-Fund Program”). The closed-end Nuveen funds, including the Funds covered by this shareholder report, will participate only as lenders, and not as borrowers, in the Inter-Fund Program because such closed-end funds rarely, if ever, need to borrow cash to meet redemptions. The Inter-Fund Program is subject to a number of conditions, including, among other things, the requirements that (1) no fund may borrow or lend money through the Inter-Fund Program unless it receives a more favorable interest rate than is typically available from a bank or other financial institution for a comparable transaction; (2) no fund may borrow on an unsecured basis through the Inter-Fund Program unless the fund’s outstanding borrowings from all sources immediately after the inter-fund borrowing total 10% or less of its total assets; provided that if the borrowing fund has a secured borrowing outstanding from any other lender, including but not limited to another fund, the inter-fund loan must be secured on at least an equal priority basis with at least an equivalent percentage of collateral to loan value; (3) if a fund’s total outstanding borrowings immediately after an inter-fund borrowing would be greater than 10% of its total assets, the fund may borrow through the inter-fund loan on a secured basis only; (4) no fund may lend money if the loan would cause its aggregate outstanding loans through the Inter-Fund Program to exceed 15% of its net assets at the time of the loan; (5) a fund’s inter-fund loans to any one fund shall not exceed 5% of the lending fund’s net assets; (6) the duration of inter-fund loans will be limited to the time required to receive payment for securities sold, but in no event more than seven days; and (7) each inter-fund loan may be called on one business day’s notice by a lending fund and may be repaid on any day by a borrowing fund. In addition, a Nuveen fund may participate in the Inter-Fund Program only if and to the extent that such participation is consistent with the fund’s investment objective and investment policies. The Board is responsible for overseeing the Inter-Fund Program.
The limitations detailed above and the other conditions of the SEC exemptive order permitting the Inter-Fund Program are designed to minimize the risks associated with Inter-Fund Program for both the lending fund and the borrowing fund. However, no borrowing or lending activity is without risk. When a fund borrows money from another fund, there is a risk that the loan could be called on one day’s notice or not renewed, in which case the fund
192
may have to borrow from a bank at a higher rate or take other actions to payoff such loan if an inter-fund loan is not available from another fund. Any delay in repayment to a lending fund could result in a lost investment opportunity or additional borrowing costs.
During the current reporting period, none of the Funds covered by this shareholder report have entered into any inter-fund loan activity.
11. Subsequent Events
Committed Line of Credit
During June 2021, the Participating Funds renewed the standby credit facility through June 2022. In conjunction with this renewal the commitment amount increased from $2.405 billion to $2.635 billion and the interest rate changed from the higher of a) LIBOR plus 1.25% or b) the Fed Funds rate plus 1.25% to the higher of a) OBFR (Overnight Bank Funding Rate) plus 1.20% or b) the Fed Funds Rate plus 1.20%. The Participating Funds also incurred a 0.05% upfront fee on the increase of the commitment amount. All other terms remain relatively unchanged.
193
Risk Considerations
(Unaudited)
Fund shares are not guaranteed or endorsed by any bank or other insured depository institution, and are not federally insured by the Federal Deposit Insurance Corporation.
Nuveen AMT-Free Municipal Credit Income Fund (NVG)
Investing in closed-end funds involves risk; principal loss is possible. There is no guarantee the Fund’s investment objectives will be achieved. Closed-end fund shares may frequently trade at a discount or premium to their net asset value. Debt or fixed income securities such as those held by the Fund, are subject to market risk, credit risk, interest rate risk, derivatives risk, liquidity risk, and income risk. As interest rates rise, bond prices fall. Lower credit debt securities may be more likely to fail to make timely interest or principal payments. Leverage increases return volatility and magnifies the Fund’s potential return and its risks; there is no guarantee a fund’s leverage strategy will be successful. These and other risk considerations such as inverse floater risk and tax risk are described in more detail on the Fund’s web page at www.nuveen.com/NVG.
Nuveen Municipal Credit Income Fund (NZF)
Investing in closed-end funds involves risk; principal loss is possible. There is no guarantee the Fund’s investment objectives will be achieved. Closed-end fund shares may frequently trade at a discount or premium to their net asset value. Debt or fixed income securities such as those held by the Fund, are subject to market risk, credit risk, interest rate risk, derivatives risk, liquidity risk, and income risk. As interest rates rise, bond prices fall. Lower credit debt securities may be more likely to fail to make timely interest or principal payments. Leverage increases return volatility and magnifies the Fund’s potential return and its risks; there is no guarantee a fund’s leverage strategy will be successful. These and other risk considerations such as inverse floater risk and tax risk are described in more detail on the Fund’s web page at www.nuveen.com/NZF.
Nuveen Municipal High Income Opportunity Fund (NMZ)
Investing in closed-end funds involves risk; principal loss is possible. There is no guarantee the Fund’s investment objectives will be achieved. Closed-end fund shares may frequently trade at a discount or premium to their net asset value. Debt or fixed income securities such as those held by the Fund, are subject to market risk, credit risk, interest rate risk, derivatives risk, liquidity risk, and income risk. As interest rates rise, bond prices fall. Lower credit debt securities may be more likely to fail to make timely interest or principal payments. Leverage increases return volatility and magnifies the Fund’s potential return and its risks; there is no guarantee a fund’s leverage strategy will be successful. These and other risk considerations such as inverse floater risk and tax risk are described in more detail on the Fund’s web page at www.nuveen.com/NMZ.
Nuveen Municipal Credit Opportunities Fund (NMCO)
Investing in closed-end funds involves risk; principal loss is possible. There is no guarantee the Fund’s investment objectives will be achieved. Closed-end fund shares may frequently trade at a discount or premium to their net asset value. Debt or fixed income securities such as those held by the Fund, are subject to market risk, credit risk, interest rate risk, derivatives risk, liquidity risk, and income risk. As interest rates rise, bond prices fall. Lower credit debt securities may be more likely to fail to make timely interest or principal payments. Leverage increases return volatility and magnifies the Fund’s potential return and its risks; there is no guarantee a fund’s leverage strategy will be successful. These and other risk considerations such as inverse floater risk and tax risk are described in more detail on the Fund’s web page at www.nuveen.com/NMCO.
194
Nuveen Dynamic Municipal Opportunities Fund (NDMO)
Investing involves risk; principal loss is possible. There is no guarantee the Fund’s investment objectives will be achieved. Closed-end fund shares may frequently trade at a discount or premium to their net asset value. The values of municipal securities held by the Fund may be adversely affected by local political and economic conditions and developments. Debt or fixed income securities such as those municipal securities held by the Fund, are subject to market risk, credit risk, interest rate risk, liquidity risk and income risk. As interest rates rise, bond prices fall. Lower quality municipal securities may be more likely to fail to make timely interest or principal payments. Leverage increases return volatility and magnifies the Fund’s potential return and its risks; there is no guarantee a fund’s leverage strategy will be successful. These and other risk considerations such as inverse floater risk, derivatives risk and tax risk are described in more detail on the Fund’s web page at www.nuveen.com/NDMO.
195
Additional Fund Information
(Unaudited)
| | | | | | |
| Board of Trustees | | | | | |
Jack B. Evans | William C. Hunter | Amy B. R. Lancellotta* | Joanne T. Medero* | Albin F. Moschner | John K. Nelson |
Judith M. Stockdale | Carole E. Stone | Mathew Thornton III | Margaret L. Wolff | Robert L. Young | |
* Effective June 1, 2021. | | | | | |
| | | | | |
| Investment Adviser | Custodian | Legal Counsel | Independent Registered | Transfer Agent and |
Nuveen Fund Advisors, LLC | State Street Bank | Chapman and Cutler LLP | Public Accounting Firm | Shareholder Services |
333 West Wacker Drive | and Trust Company | Chicago, IL 60603 | KPMG LLP | Computershare Trust |
Chicago, IL 60606 | One Lincoln Street | | 200 East | Company, N.A. |
| Boston, MA 02111 | | Randolph Street | 150 Royall Street |
| | | Chicago, IL 60601 | Canton, MA 02021 |
| | | | (800) 257-8787 |
Portfolio of Investments InformationEach Fund is required to file its complete schedule of portfolio holdings with the Securities and Exchange Commission (SEC) for the first and third quarters of each fiscal year as an exhibit to its report on Form N-PORT. You may obtain this information on the SEC’s website at http://www.sec.gov.
Nuveen Funds’ Proxy Voting InformationYou may obtain (i) information regarding how each fund voted proxies relating to portfolio securities held during the most recent twelve-month period ended June 30, without charge, upon request, by calling Nuveen toll-free at (800) 257-8787 or on Nuveen’s website at www.nuveen.com and (ii) a description of the policies and procedures that each fund used to determine how to vote proxies relating to portfolio securities without charge, upon request, by calling Nuveen toll free at (800) 257-8787. You may also obtain this information directly from the SEC. Visit the SEC on-line at http://www.sec.gov.
CEO Certification DisclosureEach Fund’s Chief Executive Officer (CEO) has submitted to the New York Stock Exchange (NYSE) the annual CEO certification as required by Section 303A.12(a) of the NYSE Listed Company Manual. Each Fund has filed with the SEC the certification of its CEO and Chief Financial Officer required by Section 302 of the Sarbanes-Oxley Act.
Common Share RepurchasesNVG, NZF, NMZ and NMCO intend to repurchase, through their open-market share repurchase program, shares of their own common stock at such times and in such amounts as is deemed advisable. During the period covered by this report, each Fund repurchased shares of its common stock as shown in the accompanying table. Any future repurchases will be reported to shareholders in the next annual or semi-annual report.
| | NVG | NZF | NMZ | NMCO |
Common shares repurchased | 0 | 0 | 0 | 0 |
FINRA BrokerCheck
The Financial Industry Regulatory Authority (FINRA) provides information regarding the disciplinary history of FINRA member firms and associated investment professionals. This information as well as an investor brochure describing FINRA BrokerCheck is available to the public by calling the FINRA BrokerCheck Hotline number at (800) 289-9999 or by visiting www.FINRA.org.
196
Glossary of Terms Used in this Report
(Unaudited)
| |
n Average Annual Total Return: This is a commonly used method to express an investment’s performance over a particular, usually |
| multi-year time period. It expresses the return that would have been necessary each year to equal the investment’s actual cumula- |
| tive performance (including change in NAV or market price and reinvested dividends and capital gains distributions, if any) over |
| the time period being considered. |
n Duration: Duration is a measure of the expected period over which a bond’s principal and interest will be paid, and consequently |
| is a measure of the sensitivity of a bond’s or bond fund’s value to changes when market interest rates change. Generally, the |
| longer a bond’s or fund’s duration, the more the price of the bond or fund will change as interest rates change. |
n Effective Leverage: Effective leverage is a fund’s effective economic leverage, and includes both regulatory leverage (see leverage) |
| and the leverage effects of certain derivative investments in the fund’s portfolio. Currently, the leverage effects of Tender Option |
| Bond (TOB) inverse floater holdings are included in effective leverage values, in addition to any regulatory leverage. |
n Industrial Development Revenue Bond (IDR): A unique type of revenue bond issued by a state or local government agency on |
| behalf of a private sector company and intended to build or acquire factories or other heavy equipment and tools. |
n Inverse Floating Rate Securities: Inverse floating rate securities, also known as inverse floaters or tender option bonds (TOBs), are |
| created by depositing a municipal bond, typically with a fixed interest rate, into a special purpose trust. This trust, in turn, (a) issues |
| floating rate certificates typically paying short-term tax-exempt interest rates to third parties in amounts equal to some fraction of the |
| deposited bond’s par amount or market value, and (b) issues an inverse floating rate certificate (sometimes referred to as an “inverse |
| floater”) to an investor (such as a fund) interested in gaining investment exposure to a long-term municipal bond. The income |
| received by the holder of the inverse floater varies inversely with the short-term rate paid to the floating rate certificates’ holders, and |
| in most circumstances the holder of the inverse floater bears substantially all of the underlying bond’s downside investment risk. The |
| holder of the inverse floater typically also benefits disproportionately from any potential appreciation of the underlying bond’s value. |
| Hence, an inverse floater essentially represents an investment in the underlying bond on a leveraged basis. |
n Leverage: Leverage is created whenever a fund has investment exposure (both reward and/or risk) equivalent to more than 100% |
| of the investment capital. |
n NVG and NZF Custom Blended Fund Performance Benchmark: The Fund Performance Benchmark is an unleveraged index |
| consisting of the returns of the S&P Municipal Bond Index prior to 4/11/16 and thereafter the returns of an 60%/40% blend of the |
| S&P Municipal Bond Investment Grade Index and the S&P Municipal Bond High Yield Index, respectively. The S&P Municipal Bond |
| Index is an unmanaged, market value-weighted index designed to measure the performance of tax-exempt municipal bonds. The |
| S&P Municipal Bond Investment Grade Index is an unmanaged, market value-weighted index designed to measure the perform- |
| ance of tax-exempt municipal bonds rated investment grade by Standard & Poor’s, Moody’s and/or Fitch. The S&P Municipal Bond |
| High Yield Index is an unmanaged, market value-weighted index designed to measure the performance of the tax-exempt, high |
| yield municipal bonds. Index returns assume compounding and do not include the effects of any fees or expenses. |
n Net Asset Value (NAV) Per Share: A fund’s Net Assets is equal to its total assets (securities, cash, accrued earnings and receivables) |
| less its total liabilities. NAV per share is equal to the fund’s Net Assets divided by its number of shares outstanding. |
197
Glossary of Terms Used in this Report (Unaudited) (continued)
| |
n Pre-Refunding: Pre-Refunding, also known as advanced refundings or refinancings, is a procedure used by state and local govern- |
| ments to refinance municipal bonds to lower interest expenses. The issuer sells new bonds with a lower yield and uses the |
| proceeds to buy U.S. Treasury securities, the interest from which is used to make payments on the higher-yielding bonds. Because |
| of this collateral, pre-refunding generally raises a bond’s credit rating and thus its value. |
n Regulatory Leverage: Regulatory leverage consists of preferred shares issued by or borrowings of a fund. Both of these are part |
| of a fund’s capital structure. Regulatory leverage is subject to asset coverage limits set in the Investment Company Act of 1940. |
n S&P Municipal Bond High Yield Index: An unleveraged, market value-weighted index designed to measure the performance of |
| the tax-exempt, investment grade U.S. high yield municipal bond market. Index returns assume reinvestment of distributions, but |
| do not reflect any applicable sales charges or management fees. |
n S&P Municipal Bond Index: An unleveraged, market value-weighted index designed to measure the performance of the tax- |
| exempt, investment-grade U.S. municipal bond market. Index returns assume reinvestment of distributions, but do not reflect any |
| applicable sales charges or management fees. |
n S&P Municipal Yield Index: An unleveraged, market value-weighted index containing all bonds in the S&P Municipal Bond Index |
| that are non-rated bonds or whose ratings are BB+ by S&P and BA-1 by Moody’s Investors Service, Inc. or lower. This index does |
| not contain bonds that are pre-refunded or escrowed to maturity. Index returns assume reinvestment of distributions, but do not |
| reflect any applicable sales charges or management fees. |
n Total Investment Exposure: Total investment exposure is a fund’s assets managed by the Adviser that are attributable to financial |
| leverage. For these purposes, financial leverage includes a fund’s use of preferred stock and borrowings and investments in the resid- |
| ual interest certificates (also called inverse floating rate securities) in tender option bond (TOB) trusts, including the portion of assets |
| held by a TOB trust that has been effectively financed by the trust’s issuance of floating rate securities. |
n Zero Coupon Bond: A zero coupon bond does not pay a regular interest coupon to its holders during the life of the bond. Income |
| to the holder of the bond comes from accretion of the difference between the original purchase price of the bond at issuance and |
| the par value of the bond at maturity and is effectively paid at maturity. The market prices of zero coupon bonds generally are |
| more volatile than the market prices of bonds that pay interest periodically. |
198
Notes
199
Nuveen:
Serving Investors for Generations
Since 1898, financial professionals and their clients have relied on Nuveen to provide dependable investment solutions through continued adherence to proven, long-term investing principles. Today, we offer a range of high quality solutions designed to be integral components of a well-diversified core portfolio.
Focused on meeting investor needs.
Nuveen is the investment manager of TIAA. We have grown into one of the world’s premier global asset managers, with specialist knowledge across all major asset classes and particular strength in solutions that provide income for investors and that draw on our expertise in alternatives and responsible investing. Nuveen is driven not only by the independent investment processes across the firm, but also the insights, risk management, analytics and other tools and resources that a truly world-class platform provides. As a global asset manager, our mission is to work in partnership with our clients to create solutions which help them secure their financial future.
Find out how we can help you.
To learn more about how the products and services of Nuveen may be able to help you meet your financial goals, talk to your financial professional, or call us at (800) 257-8787. Please read the information provided carefully before you invest. Investors should consider the investment objective and policies, risk considerations, charges and expenses of any investment carefully. Where applicable, be sure to obtain a prospectus, which contains this and other relevant information. To obtain a prospectus, please contact your securities representative or Nuveen, 333 W. Wacker Dr., Chicago, IL 60606. Please read the prospectus carefully before you invest or send money.
Learn more about Nuveen Funds at: www.nuveen.com/closed-end-funds
Nuveen Securities, LLC, member FINRA and SIPC | 333 West Wacker Drive Chicago, IL 60606 | www.nuveen.com
ESA-C-0421D 1668433-INV-B-06/22
ITEM 2. CODE OF ETHICS.
Not applicable to this filing.
ITEM 3. AUDIT COMMITTEE FINANCIAL EXPERT.
Not applicable to this filing.
ITEM 4. PRINCIPAL ACCOUNTANT FEES AND SERVICES.
Not applicable to this filing.
ITEM 5. AUDIT COMMITTEE OF LISTED REGISTRANTS.
Not applicable to this filing.
ITEM 6. SCHEDULE OF INVESTMENTS.
(a) See Portfolio of Investments in Item 1.
(b) Not applicable.
ITEM 7. DISCLOSURE OF PROXY VOTING POLICIES AND PROCEDURES FOR CLOSED-END MANAGEMENT INVESTMENT COMPANIES.
Not applicable to this filing.
ITEM 8. PORTFOLIO MANAGERS OF CLOSED-END MANAGEMENT INVESTMENT COMPANIES.
Not applicable to this filing.
ITEM 9. PURCHASES OF EQUITY SECURITIES BY CLOSED-END MANAGEMENT INVESTMENT COMPANY AND AFFILIATED PURCHASERS.
Not applicable.
ITEM 10. SUBMISSION OF MATTERS TO A VOTE OF SECURITY HOLDERS.
There have been no material changes to the procedures by which shareholders may recommend nominees to the registrant’s Board implemented after the registrant last provided disclosure in response to this Item.
ITEM 11. CONTROLS AND PROCEDURES.
Pursuant to the requirements of the Securities Exchange Act of 1934 and the Investment Company Act of 1940, the registrant has duly caused this report to be signed on its behalf by the undersigned, thereunto duly authorized.
Mark L. Winget
Pursuant to the requirements of the Securities Exchange Act of 1934 and the Investment Company Act of 1940, this report has been signed below by the following persons on behalf of the registrant and in the capacities and on the dates indicated.
David J. Lamb