- PPD Dashboard
- Financials
- Filings
-
Holdings
- Transcripts
-
ETFs
- Insider
- Institutional
- Shorts
-
8-K Filing
PPD (PPD) 8-KTermination of a Material Definitive Agreement
Filed: 18 Feb 20, 6:41am

Lender Presentation* * Select pages Exhibit 99.1
Disclaimer This presentation contains forward-looking statements within the meaning of the federal securities laws. These forward-looking statements, which are subject to risks, uncertainties and assumptions about PPD, Inc. “the (“Company”), may include projections of the Company’s future financial performance, future service offerings, potential market opportunity, anticipated growth strategies and anticipated trends in its business. In some cases, these statements are identifiable by forward-looking words such as “anticipate”, “expect”, “suggest”, “plan”, “believe”, “intend”, “project”, “forecast”, “estimate”, “target”, “project”, “should”, “could”, “would”, “may”, “might” or “will”, the negative of these terms and other similar expressions. It is not possible for the Company to predict all risks, nor can it assess the impact of all factors on its business or the extent to which any factor, or combination of factors, may cause actual results to differ materially and adversely from those contained in any forward-looking statements it may make. Although the Company believes the expectations reflected in the forward-looking statements are reasonable, it cannot guarantee future results, level of activity, performance or achievements. No representations or warranties are made by the Company or any of its affiliates as to the accuracy of any such statements or projections. These statements are inherently uncertain and you are cautioned not to place undue reliance on such forward-looking statements as predictions of future performance or otherwise. Information contained in this presentation concerning the Company’s industry and the markets in which it operates, including its general expectations and market position, market opportunity and market size, is based on information from various sources, on assumptions that it has made that are based on such information and other similar sources and on knowledge of, and expectations about, the markets for its service offerings. This information involves a number of assumptions and limitations and the Recipient is cautioned not to give undue weight to such estimates. This presentation (i) contains non-GAAP measures, (ii) uses terms which are not generally used in presentations made in accordance with GAAP, (iii) uses terms which are not measures of financial condition or profitability and (iv) contains terms which are unlikely to be comparable to similar measures used by other companies in the Company’s industry. As a result, these financial measures have limitations as analytical and comparative tools and the Recipient should not consider these items in isolation, or as a substitute for analysis of the Company’s results as reported under GAAP. For a reconciliation of non-GAAP measures used in this presentation to the closest comparable GAAP measure, see the Appendix hereto.
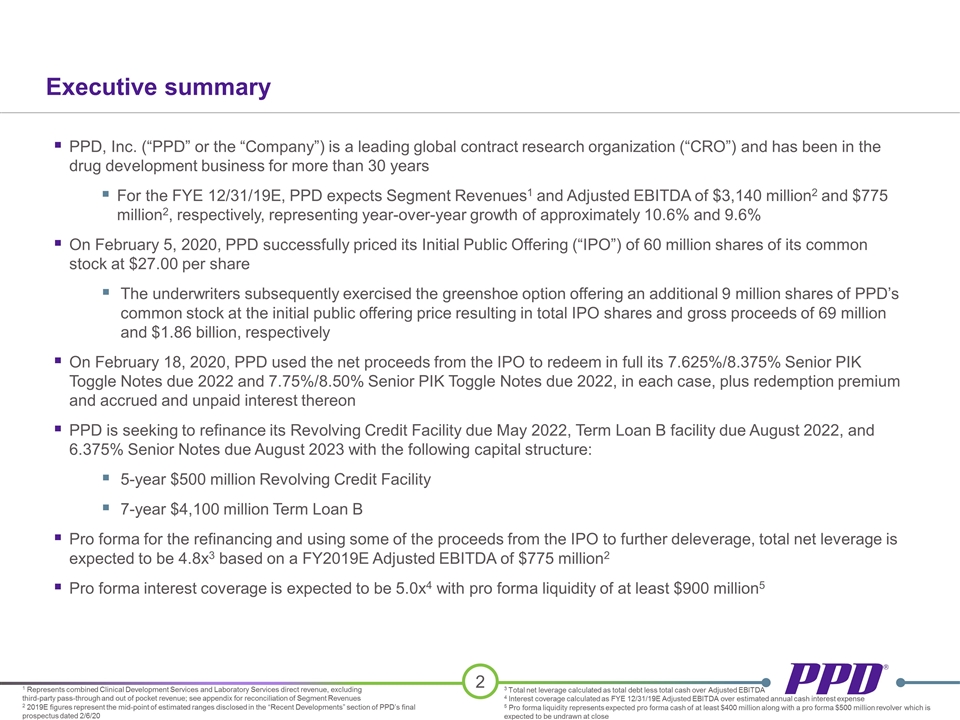
Executive summary PPD, Inc. (“PPD” or the “Company”) is a leading global contract research organization (“CRO”) and has been in the drug development business for more than 30 years For the FYE 12/31/19E, PPD expects Segment Revenues1 and Adjusted EBITDA of $3,140 million2 and $775 million2, respectively, representing year-over-year growth of approximately 10.6% and 9.6% On February 5, 2020, PPD successfully priced its Initial Public Offering (“IPO”) of 60 million shares of its common stock at $27.00 per share The underwriters subsequently exercised the greenshoe option offering an additional 9 million shares of PPD’s common stock at the initial public offering price resulting in total IPO shares and gross proceeds of 69 million and $1.86 billion, respectively On February 18, 2020, PPD used the net proceeds from the IPO to redeem in full its 7.625%/8.375% Senior PIK Toggle Notes due 2022 and 7.75%/8.50% Senior PIK Toggle Notes due 2022, in each case, plus redemption premium and accrued and unpaid interest thereon PPD is seeking to refinance its Revolving Credit Facility due May 2022, Term Loan B facility due August 2022, and 6.375% Senior Notes due August 2023 with the following capital structure: 5-year $500 million Revolving Credit Facility 7-year $4,100 million Term Loan B Pro forma for the refinancing and using some of the proceeds from the IPO to further deleverage, total net leverage is expected to be 4.8x3 based on a FY2019E Adjusted EBITDA of $775 million2 Pro forma interest coverage is expected to be 5.0x4 with pro forma liquidity of at least $900 million5 1 Represents combined Clinical Development Services and Laboratory Services direct revenue, excluding third-party pass-through and out of pocket revenue; see appendix for reconciliation of Segment Revenues 2 2019E figures represent the mid-point of estimated ranges disclosed in the “Recent Developments” section of PPD’s final prospectus dated 2/6/20 3 Total net leverage calculated as total debt less total cash over Adjusted EBITDA 4 Interest coverage calculated as FYE 12/31/19E Adjusted EBITDA over estimated annual cash interest expense 5 Pro forma liquidity represents expected pro forma cash of at least $400 million along with a pro forma $500 million revolver which is expected to be undrawn at close
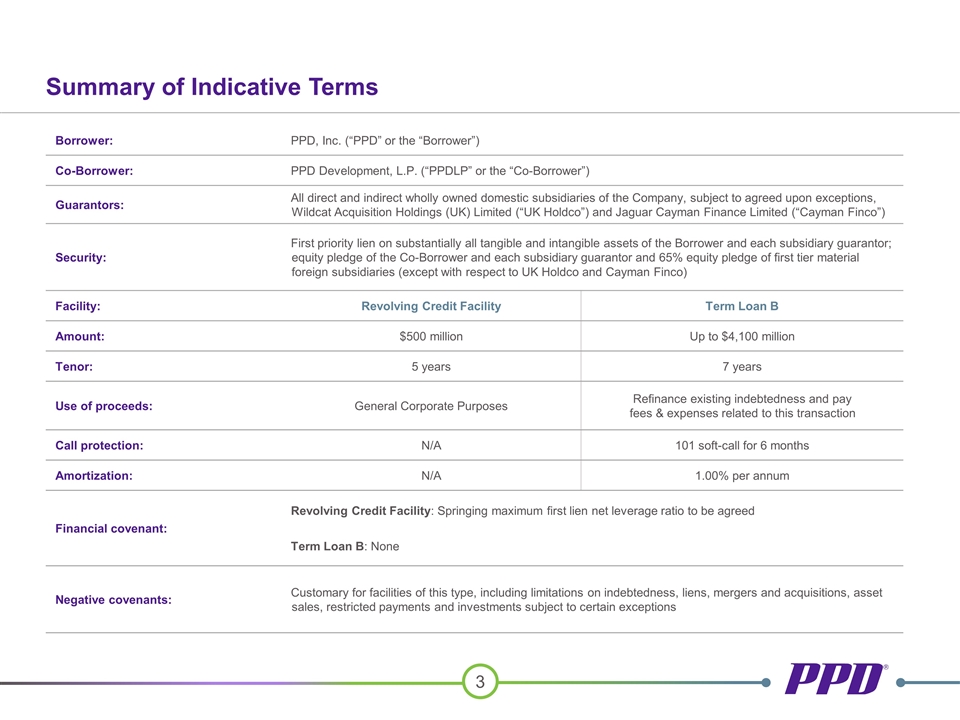
Summary of Indicative Terms Borrower: PPD, Inc. (“PPD” or the “Borrower”) Co-Borrower: PPD Development, L.P. (“PPDLP” or the “Co-Borrower”) Guarantors: All direct and indirect wholly owned domestic subsidiaries of the Company, subject to agreed upon exceptions, Wildcat Acquisition Holdings (UK) Limited (“UK Holdco”) and Jaguar Cayman Finance Limited (“Cayman Finco”) Security: First priority lien on substantially all tangible and intangible assets of the Borrower and each subsidiary guarantor; equity pledge of the Co-Borrower and each subsidiary guarantor and 65% equity pledge of first tier material foreign subsidiaries (except with respect to UK Holdco and Cayman Finco) Facility: Revolving Credit Facility Term Loan B Amount: $500 million Up to $4,100 million Tenor: 5 years 7 years Use of proceeds: General Corporate Purposes Refinance existing indebtedness and pay fees & expenses related to this transaction Call protection: N/A 101 soft-call for 6 months Amortization: N/A 1.00% per annum Financial covenant: Revolving Credit Facility: Springing maximum first lien net leverage ratio to be agreed Term Loan B: None Negative covenants: Customary for facilities of this type, including limitations on indebtedness, liens, mergers and acquisitions, asset sales, restricted payments and investments subject to certain exceptions
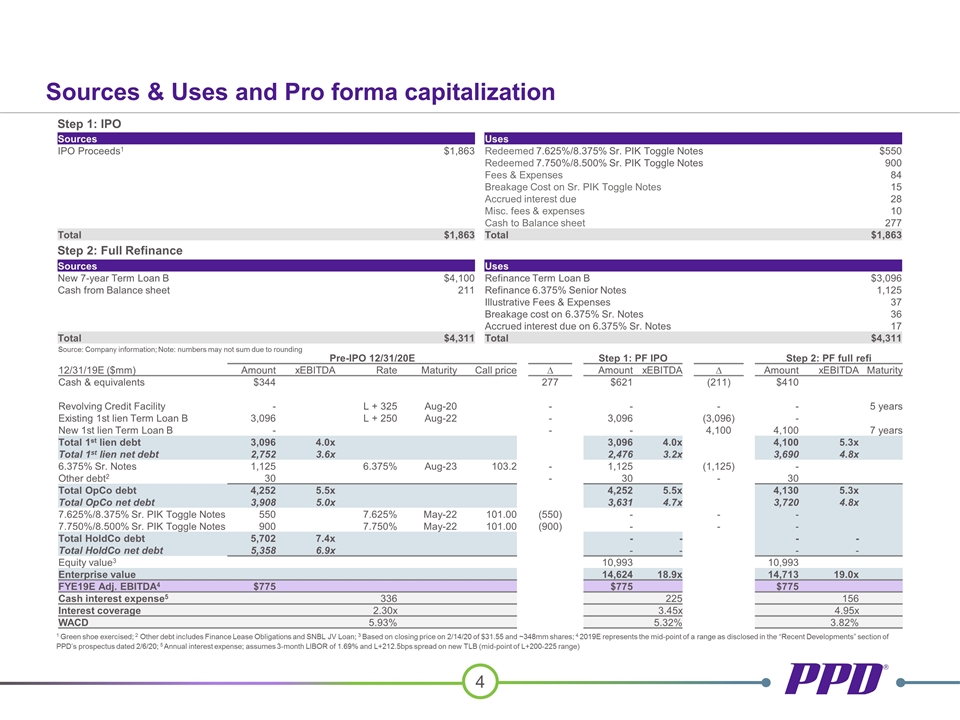
Pre-IPO 12/31/20E Step 1: PF IPO Step 2: PF full refi 12/31/19E ($mm) Amount xEBITDA Rate Maturity Call price ∆ Amount xEBITDA ∆ Amount xEBITDA Maturity Cash & equivalents $344 277 $621 (211) $410 Revolving Credit Facility - L + 325 Aug-20 - - - - 5 years Existing 1st lien Term Loan B 3,096 L + 250 Aug-22 - 3,096 (3,096) - New 1st lien Term Loan B - - - 4,100 4,100 7 years Total 1st lien debt 3,096 4.0x 3,096 4.0x 4,100 5.3x Total 1st lien net debt 2,752 3.6x 2,476 3.2x 3,690 4.8x 6.375% Sr. Notes 1,125 6.375% Aug-23 103.2 - 1,125 (1,125) - Other debt2 30 - 30 - 30 Total OpCo debt 4,252 5.5x 4,252 5.5x 4,130 5.3x Total OpCo net debt 3,908 5.0x 3,631 4.7x 3,720 4.8x 7.625%/8.375% Sr. PIK Toggle Notes 550 7.625% May-22 101.00 (550) - - - 7.750%/8.500% Sr. PIK Toggle Notes 900 7.750% May-22 101.00 (900) - - - Total HoldCo debt 5,702 7.4x - - - - Total HoldCo net debt 5,358 6.9x - - - - Equity value3 10,993 10,993 Enterprise value 14,624 18.9x 14,713 19.0x FYE19E Adj. EBITDA4 $775 $775 $775 Cash interest expense5 336 225 156 Interest coverage 2.30x 3.45x 4.95x WACD 5.93% 5.32% 3.82% Sources & Uses and Pro forma capitalization Sources Uses IPO Proceeds1 $1,863 Redeemed 7.625%/8.375% Sr. PIK Toggle Notes $550 Redeemed 7.750%/8.500% Sr. PIK Toggle Notes 900 Fees & Expenses 84 Breakage Cost on Sr. PIK Toggle Notes 15 Accrued interest due 28 Misc. fees & expenses 10 Cash to Balance sheet 277 Total $1,863 Total $1,863 Sources Uses New 7-year Term Loan B $4,100 Refinance Term Loan B $3,096 Cash from Balance sheet 211 Refinance 6.375% Senior Notes 1,125 Illustrative Fees & Expenses 37 Breakage cost on 6.375% Sr. Notes 36 Accrued interest due on 6.375% Sr. Notes 17 Total $4,311 Total $4,311 1 Green shoe exercised; 2 Other debt includes Finance Lease Obligations and SNBL JV Loan; 3 Based on closing price on 2/14/20 of $31.55 and ~348mm shares; 4 2019E represents the mid-point of a range as disclosed in the “Recent Developments” section of PPD’s prospectus dated 2/6/20; 5 Annual interest expense; assumes 3-month LIBOR of 1.69% and L+212.5bps spread on new TLB (mid-point of L+200-225 range) Step 1: IPO Step 2: Full Refinance Source: Company information; Note: numbers may not sum due to rounding
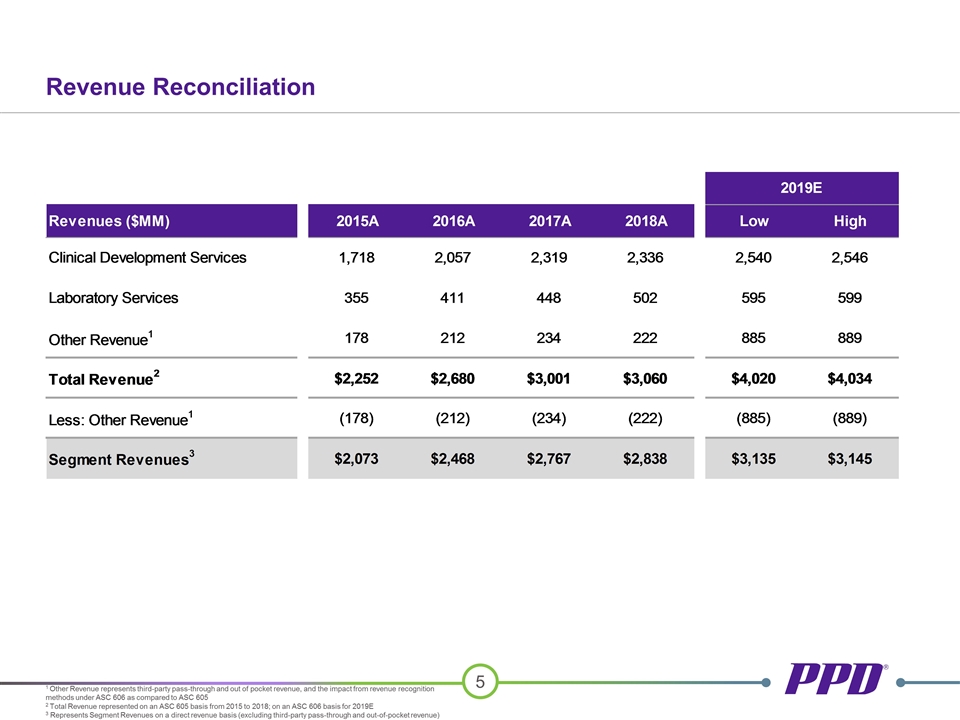
Revenue Reconciliation 1 Other Revenue represents third-party pass-through and out of pocket revenue, and the impact from revenue recognition methods under ASC 606 as compared to ASC 605 2 Total Revenue represented on an ASC 605 basis from 2015 to 2018; on an ASC 606 basis for 2019E 3 Represents Segment Revenues on a direct revenue basis (excluding third-party pass-through and out-of-pocket revenue)
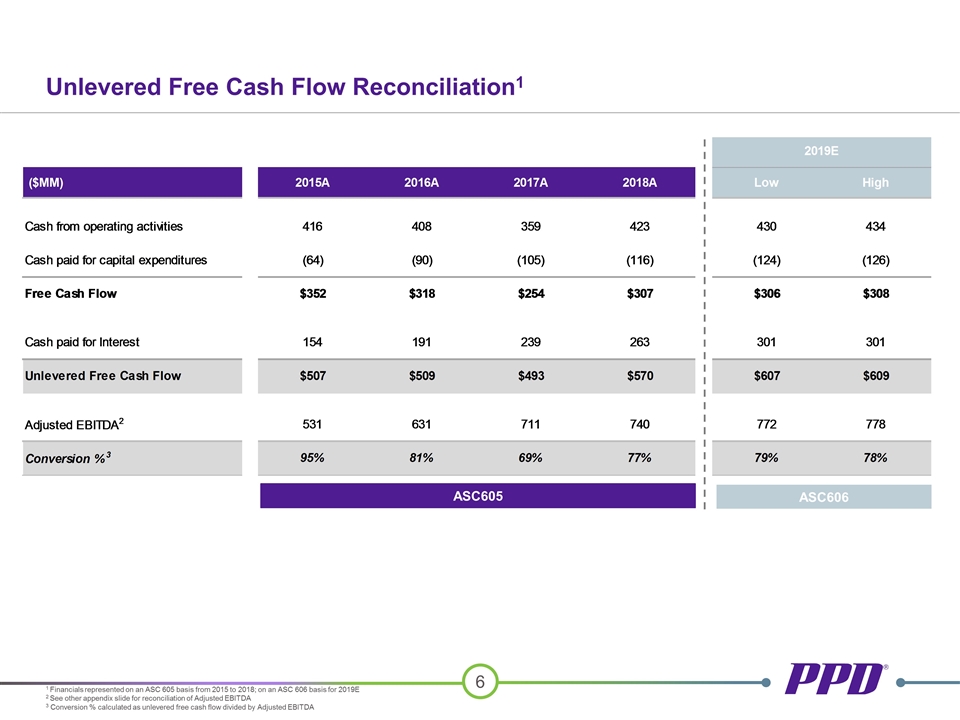
1 Financials represented on an ASC 605 basis from 2015 to 2018; on an ASC 606 basis for 2019E 2 See other appendix slide for reconciliation of Adjusted EBITDA 3 Conversion % calculated as unlevered free cash flow divided by Adjusted EBITDA Unlevered Free Cash Flow Reconciliation1 ASC605 ASC606
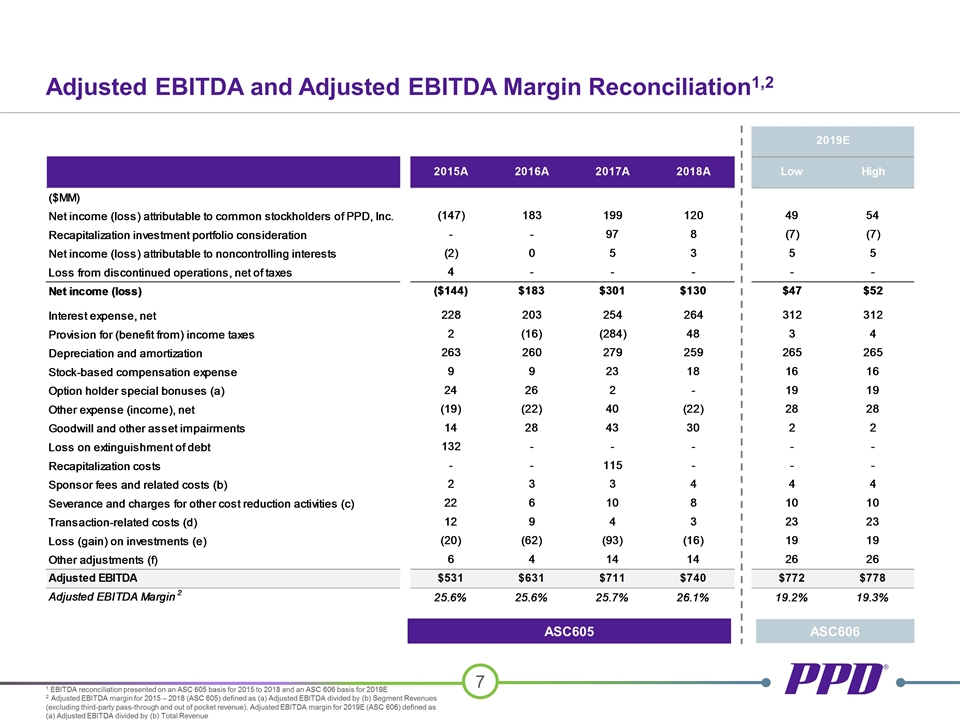
Adjusted EBITDA and Adjusted EBITDA Margin Reconciliation1,2 1 EBITDA reconciliation presented on an ASC 605 basis for 2015 to 2018 and an ASC 606 basis for 2019E 2 Adjusted EBITDA margin for 2015 – 2018 (ASC 605) defined as (a) Adjusted EBITDA divided by (b) Segment Revenues (excluding third-party pass-through and out of pocket revenue). Adjusted EBITDA margin for 2019E (ASC 606) defined as (a) Adjusted EBITDA divided by (b) Total Revenue ASC605 ASC606
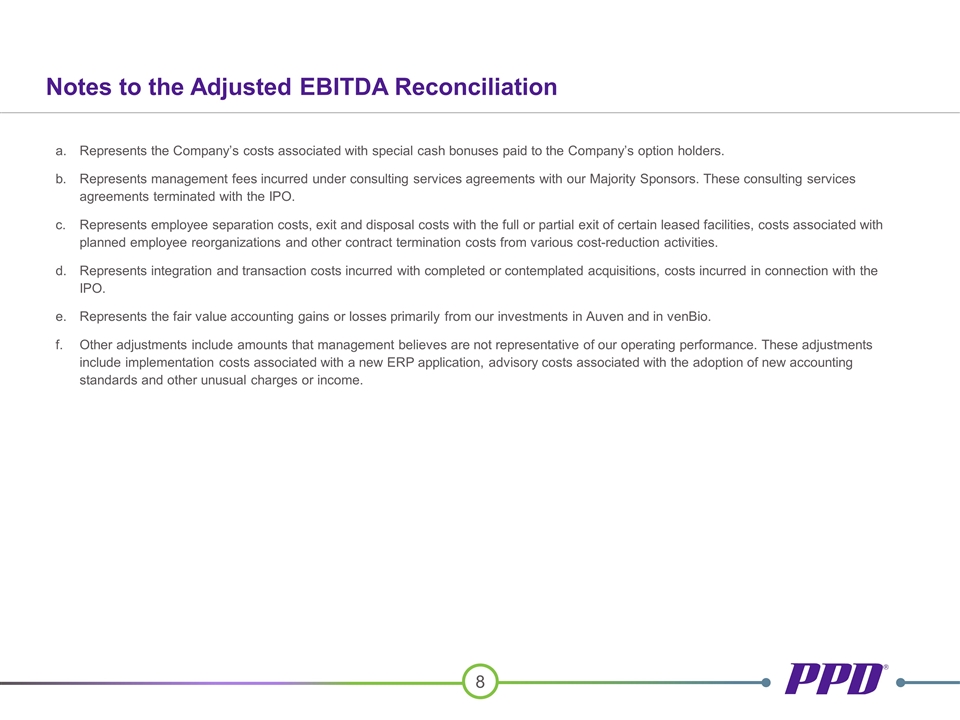
Represents the Company’s costs associated with special cash bonuses paid to the Company’s option holders. Represents management fees incurred under consulting services agreements with our Majority Sponsors. These consulting services agreements terminated with the IPO. Represents employee separation costs, exit and disposal costs with the full or partial exit of certain leased facilities, costs associated with planned employee reorganizations and other contract termination costs from various cost-reduction activities. Represents integration and transaction costs incurred with completed or contemplated acquisitions, costs incurred in connection with the IPO. Represents the fair value accounting gains or losses primarily from our investments in Auven and in venBio. Other adjustments include amounts that management believes are not representative of our operating performance. These adjustments include implementation costs associated with a new ERP application, advisory costs associated with the adoption of new accounting standards and other unusual charges or income. Notes to the Adjusted EBITDA Reconciliation