UNITED STATES
SECURITIES AND EXCHANGE COMMISSION
Washington, D.C. 20549
SCHEDULE 14A
Proxy Statement Pursuant to Section 14(a) of the
Securities Exchange Act of 1934
Filed by the Registrant ☐ Filed by a Party other than the Registrant ☒
Check the appropriate box:
| | |
| ☐ | | Preliminary Proxy Statement |
| |
| ☐ | | Confidential, for Use of the Commission Only (as permitted by Rule 14a-6(e)(2)) |
| |
| ☐ | | Definitive Proxy Statement |
| |
| ☐ | | Definitive Additional Materials |
| |
| ☒ | | Soliciting Material Pursuant to§240.14a-11(c) or§240.14a-12 |
AIRCASTLE LTD
(Name of Registrant as Specified in Its Charter)
MIZUHO LEASING CO., LTD
(Name of Person(s) Filing Proxy Statement, if Other Than the Registrant)
Payment of Filing Fee (check the appropriate box):
| | | | |
| |
| ☒ | | No fee required. |
| |
| ☐ | | Fee computed on table below per Exchange Act Rules 14a-6(i)(1) and 0-11. |
| | |
| | (1) | | Title of each class of securities to which transaction applies: |
| | (2) | | Aggregate number of securities to which transaction applies: |
| | (3) | | Per unit price or other underlying value of transaction computed pursuant to Exchange Act Rule 0-11 (set forth the amount on which the filing fee is calculated and state how it was determined): |
| | (4) | | Proposed maximum aggregate value of transaction: |
| | (5) | | Total fee paid: |
| |
| ☐ | | Fee paid previously with preliminary materials. |
| |
| ☐ | | Check box if any part of the fee is offset as provided by Exchange ActRule 0-11(a)(2) and identify the filing for which the offsetting fee was paid previously. Identify the previous filing by registration statement number, or the Form or Schedule and the date of its filing. |
| | |
| | (1) | | Amount Previously Paid: |
| | (2) | | Form, Schedule or Registration Statement No.: |
| | (3) | | Filing Party: |
| | (4) | | Date Filed: |

FY2019 First-Half Financial Results Presentation Materials November 14, 2019 (Japan time) Mizuho Leasing Co., Ltd.
Table of Contents Financial Results and Business Performance Overview Status of Sixth Mid-term Management Plan Appendix ・・・ P.3 ・・・ P.12 ・・・ P.24 2
Financial Results and Business Performance Overview
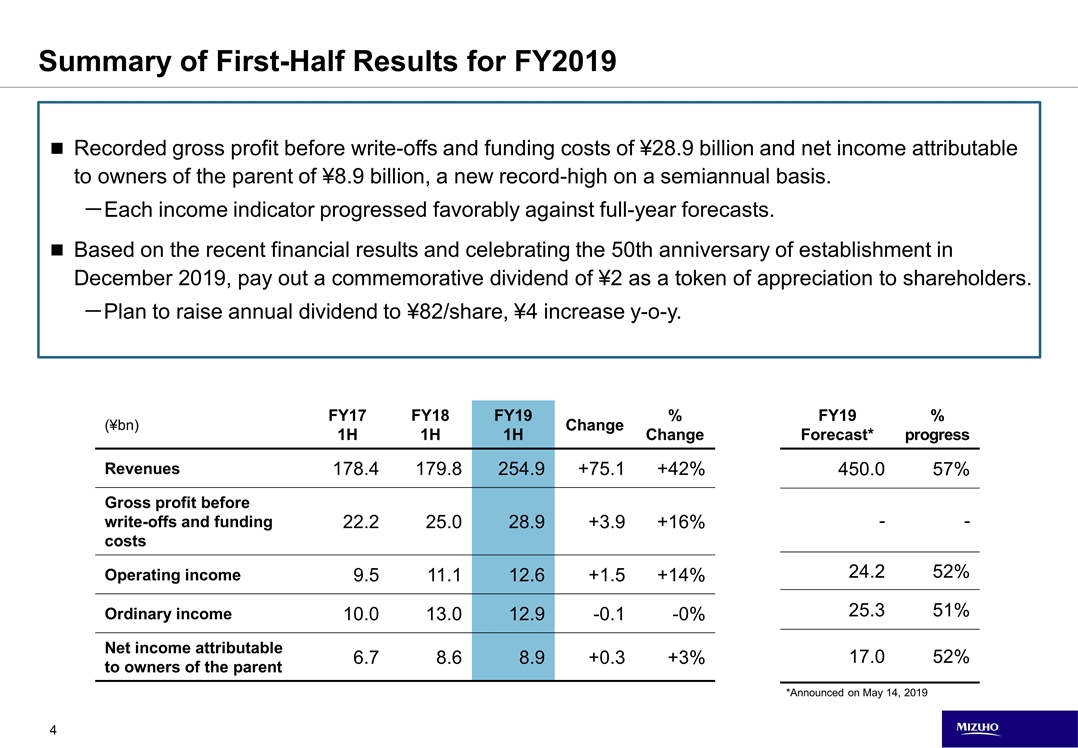
Recorded gross profit before write-offs and funding costs of ¥28.9 billion and net income attributable to owners of the parent of ¥8.9 billion, a new record-high on a semiannual basis. -Each income indicator progressed favorably against full-year forecasts. Based on the recent financial results and celebrating the 50th anniversary of establishment in December 2019, pay out a commemorative dividend of ¥2 as a token of appreciation to shareholders. -Plan to raise annual dividend to ¥82/share, ¥4 increase y-o-y. Summary of First-Half Results for FY2019 (¥bn) FY17 1H FY18 1H FY19 1H Change % Change Revenues 178.4 179.8 254.9 +75.1 +42% Gross profit before write-offs and funding costs 22.2 25.0 28.9 +3.9 +16% Operating income 9.5 11.1 12.6 +1.5 +14% Ordinary income 10.0 13.0 12.9 -0.1 -0% Net income attributable to owners of the parent 6.7 8.6 8.9 +0.3 +3% FY19 Forecast* % progress 450.0 57% - - 24.2 52% 25.3 51% 17.0 52% *Announced on May 14, 2019
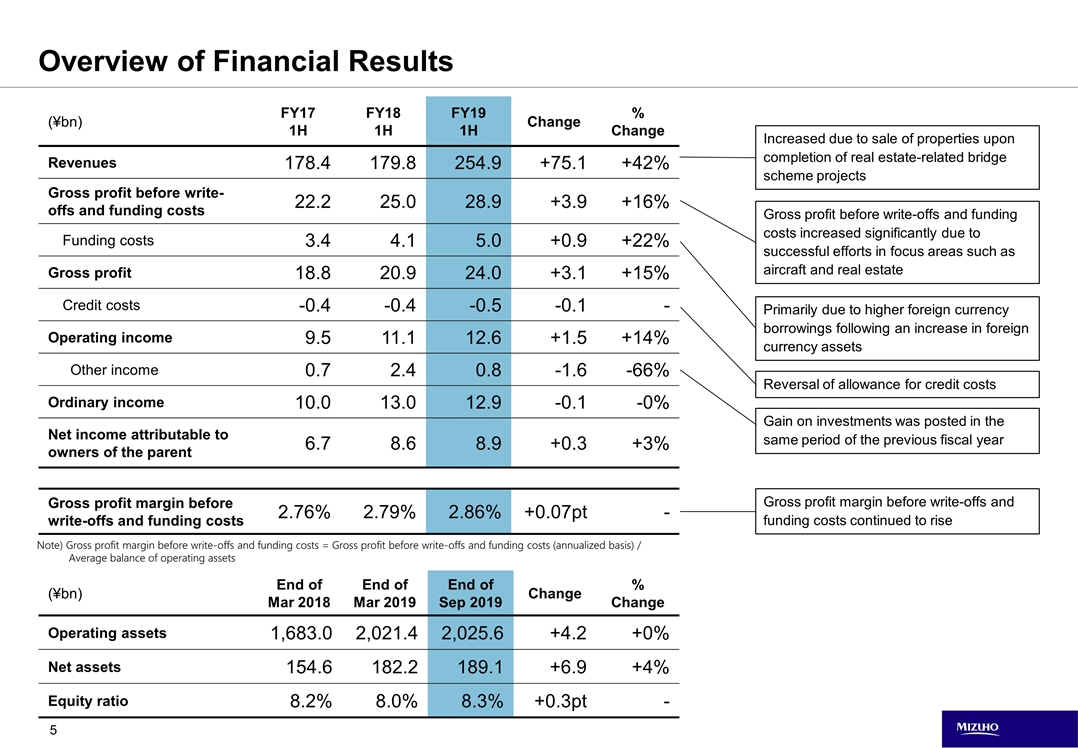
(¥bn) FY17 1H FY18 1H FY19 1H Change % Change Revenues 178.4 179.8 254.9 +75.1 +42% Gross profit before write-offs and funding costs 22.2 25.0 28.9 +3.9 +16% Funding costs 3.4 4.1 5.0 +0.9 +22% Gross profit 18.8 20.9 24.0 +3.1 +15% Credit costs -0.4 -0.4 -0.5 -0.1 - Operating income 9.5 11.1 12.6 +1.5 +14% Other income 0.7 2.4 0.8 -1.6 -66% Ordinary income 10.0 13.0 12.9 -0.1 -0% Net income attributable to owners of the parent 6.7 8.6 8.9 +0.3 +3% Gross profit margin before write-offs and funding costs 2.76% 2.79% 2.86% +0.07pt - Increased due to sale of properties upon completion of real estate-related bridge scheme projects Overview of Financial Results (¥bn) End of Mar 2018 End of Mar 2019 End of Sep 2019 Change % Change Operating assets 1,683.0 2,021.4 2,025.6 +4.2 +0% Net assets 154.6 182.2 189.1 +6.9 +4% Equity ratio 8.2% 8.0% 8.3% +0.3pt - Note) Gross profit margin before write-offs and funding costs = Gross profit before write-offs and funding costs (annualized basis) / Average balance of operating assets Gross profit before write-offs and funding costs increased significantly due to successful efforts in focus areas such as aircraft and real estate Primarily due to higher foreign currency borrowings following an increase in foreign currency assets Reversal of allowance for credit costs Gain on investments was posted in the same period of the previous fiscal year Gross profit margin before write-offs and funding costs continued to rise
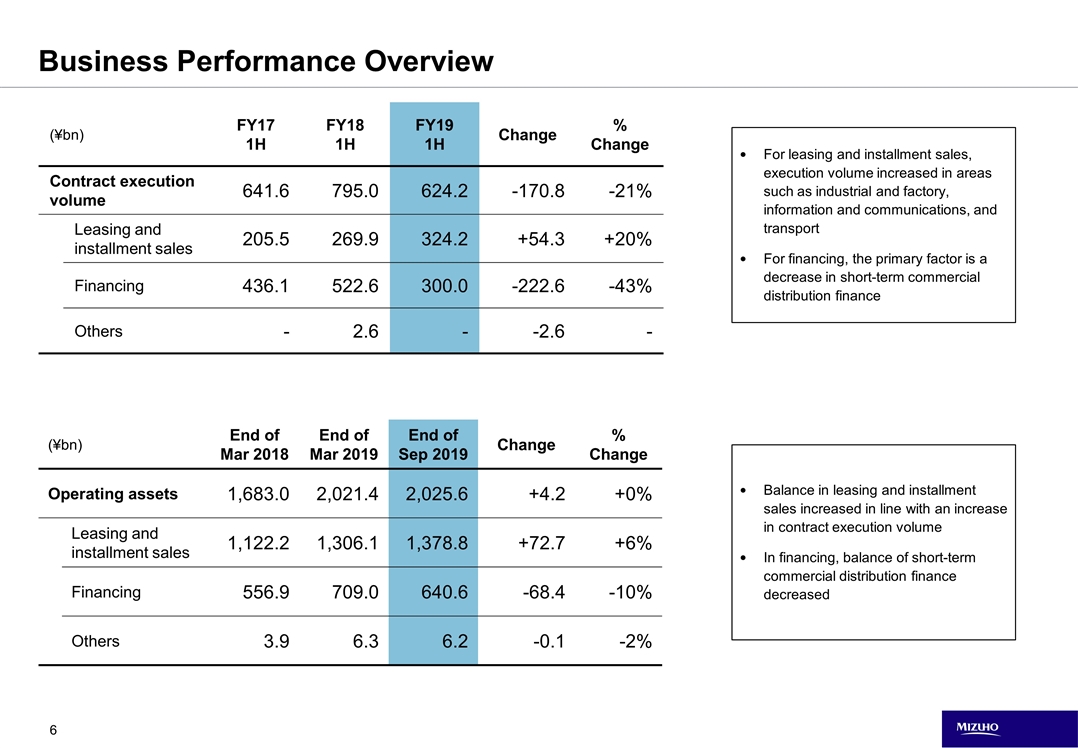
For leasing and installment sales, execution volume increased in areas such as industrial and factory, information and communications, and transport For financing, the primary factor is a decrease in short-term commercial distribution finance (¥bn) FY17 1H FY18 1H FY19 1H Change % Change Contract execution volume 641.6 795.0 624.2 -170.8 -21% Leasing and installment sales 205.5 269.9 324.2 +54.3 +20% Financing 436.1 522.6 300.0 -222.6 -43% Others - 2.6 - -2.6 - Business Performance Overview (¥bn) End of Mar 2018 End of Mar 2019 End of Sep 2019 Change % Change Operating assets 1,683.0 2,021.4 2,025.6 +4.2 +0% Leasing and installment sales 1,122.2 1,306.1 1,378.8 +72.7 +6% Financing 556.9 709.0 640.6 -68.4 -10% Others 3.9 6.3 6.2 -0.1 -2% Balance in leasing and installment sales increased in line with an increase in contract execution volume In financing, balance of short-term commercial distribution finance decreased
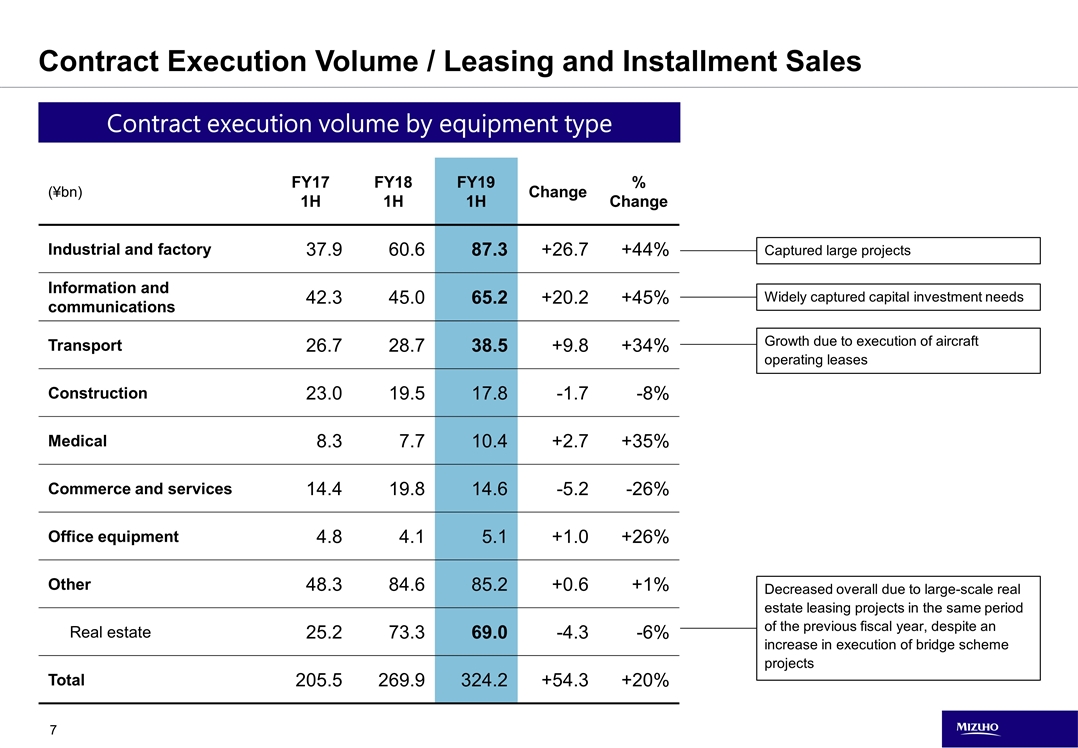
(¥bn) FY17 1H FY18 1H FY19 1H Change % Change Industrial and factory 37.9 60.6 87.3 +26.7 +44% Information and communications 42.3 45.0 65.2 +20.2 +45% Transport 26.7 28.7 38.5 +9.8 +34% Construction 23.0 19.5 17.8 -1.7 -8% Medical 8.3 7.7 10.4 +2.7 +35% Commerce and services 14.4 19.8 14.6 -5.2 -26% Office equipment 4.8 4.1 5.1 +1.0 +26% Other 48.3 84.6 85.2 +0.6 +1% Real estate 25.2 73.3 69.0 -4.3 -6% Total 205.5 269.9 324.2 +54.3 +20% Contract Execution Volume / Leasing and Installment Sales Contract execution volume by equipment type Captured large projects Widely captured capital investment needs Growth due to execution of aircraft operating leases Decreased overall due to large-scale real estate leasing projects in the same period of the previous fiscal year, despite an increase in execution of bridge scheme projects
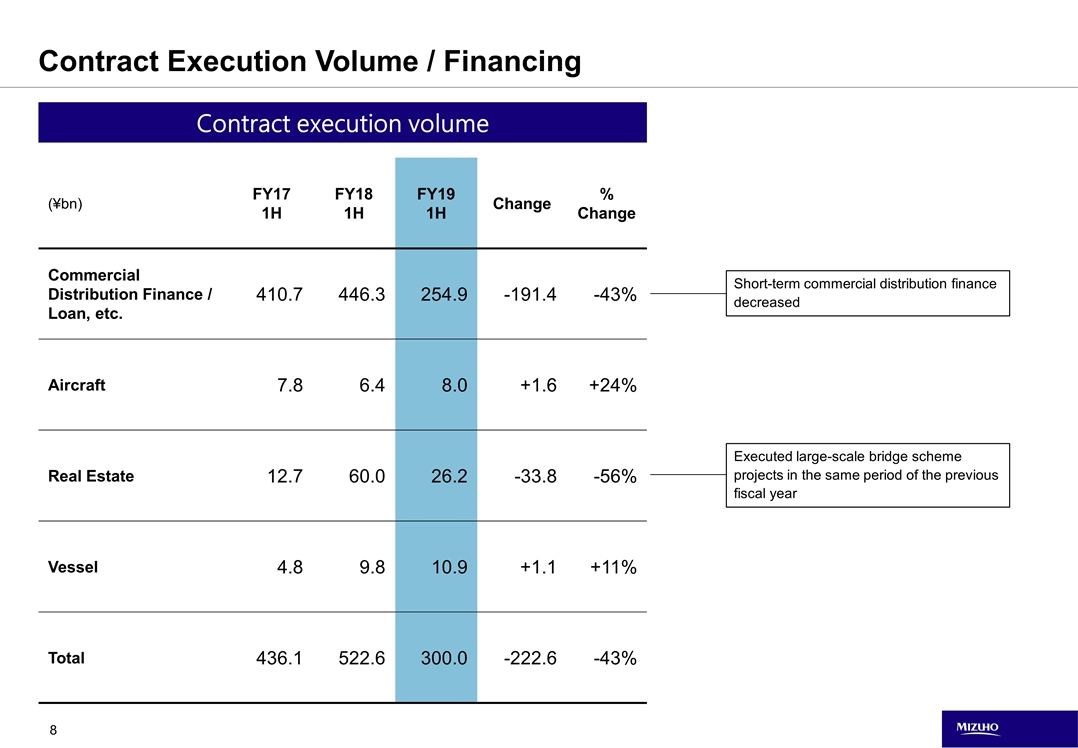
Contract Execution Volume / Financing Contract execution volume (¥bn) FY17 1H FY18 1H FY19 1H Change % Change Commercial Distribution Finance / Loan, etc. 410.7 446.3 254.9 -191.4 -43% Aircraft 7.8 6.4 8.0 +1.6 +24% Real Estate 12.7 60.0 26.2 -33.8 -56% Vessel 4.8 9.8 10.9 +1.1 +11% Total 436.1 522.6 300.0 -222.6 -43% Short-term commercial distribution finance decreased Executed large-scale bridge scheme projects in the same period of the previous fiscal year
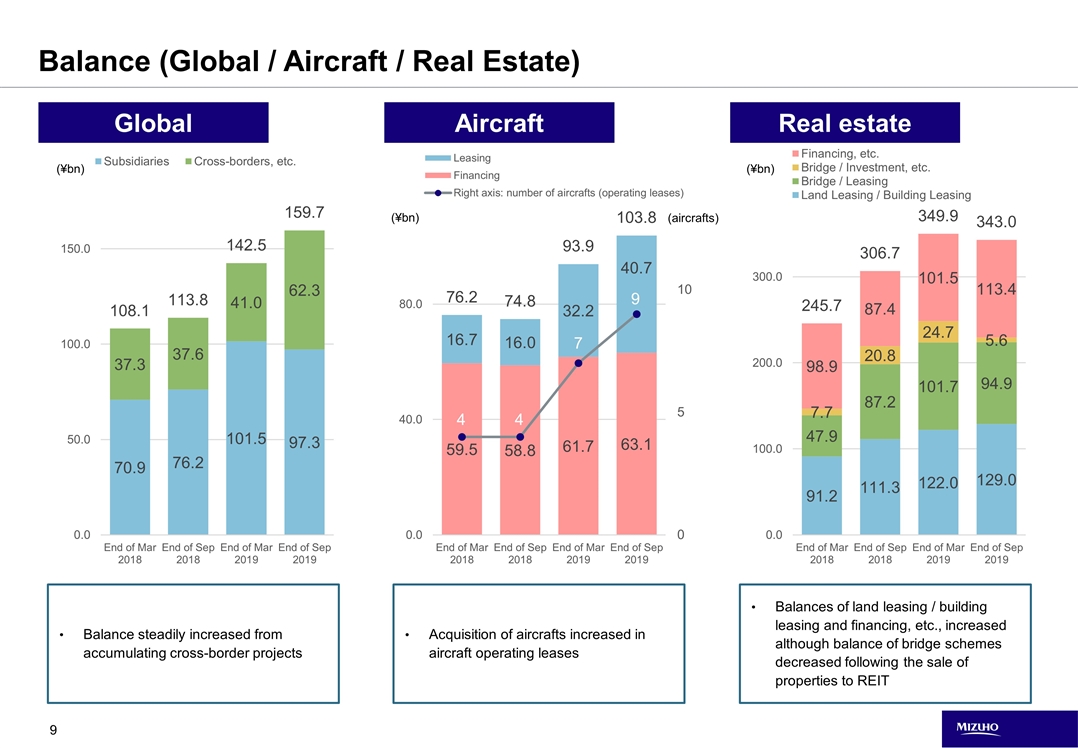
Balance (Global / Aircraft / Real Estate) Global Aircraft Real estate (¥bn) Balance steadily increased from accumulating cross-border projects Balances of land leasing / building leasing and financing, etc., increased although balance of bridge schemes decreased following the sale of properties to REIT (¥bn) (¥bn) Acquisition of aircrafts increased in aircraft operating leases (aircrafts) 4 7 9
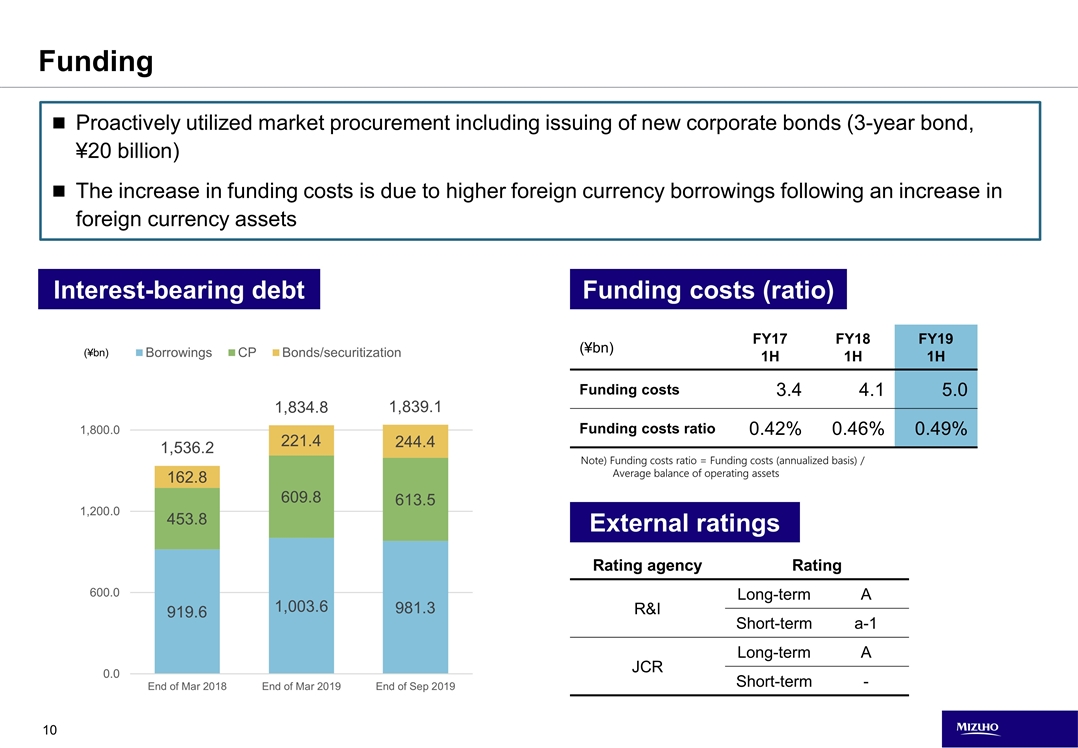
Proactively utilized market procurement including issuing of new corporate bonds (3-year bond, ¥20 billion) The increase in funding costs is due to higher foreign currency borrowings following an increase in foreign currency assets Funding Interest-bearing debt (¥bn) Funding costs (ratio) (¥bn) FY17 1H FY18 1H FY19 1H Funding costs 3.4 4.1 5.0 Funding costs ratio 0.42% 0.46% 0.49% External ratings Note) Funding costs ratio = Funding costs (annualized basis) / Average balance of operating assets Rating agency Rating R&I Long-term A Short-term a-1 JCR Long-term A Short-term -
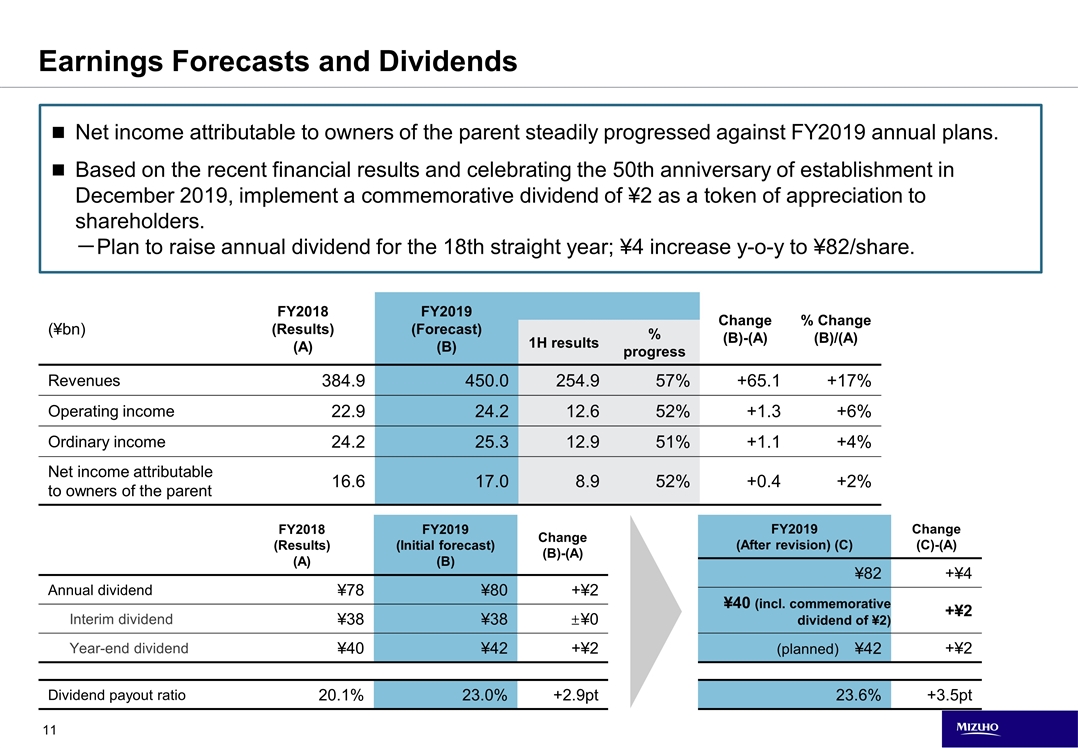
Net income attributable to owners of the parent steadily progressed against FY2019 annual plans. Based on the recent financial results and celebrating the 50th anniversary of establishment in December 2019, implement a commemorative dividend of ¥2 as a token of appreciation to shareholders. -Plan to raise annual dividend for the 18th straight year; ¥4 increase y-o-y to ¥82/share. Earnings Forecasts and Dividends (¥bn) FY2018 (Results) (A) FY2019 (Forecast) (B) Change (B)-(A) % Change (B)/(A) 1H results % progress Revenues 384.9 450.0 254.9 57% +65.1 +17% Operating income 22.9 24.2 12.6 52% +1.3 +6% Ordinary income 24.2 25.3 12.9 51% +1.1 +4% Net income attributable to owners of the parent 16.6 17.0 8.9 52% +0.4 +2% FY2018 (Results) (A) FY2019 (Initial forecast) (B) Change (B)-(A) Annual dividend ¥78 ¥80 +¥2 Interim dividend ¥38 ¥38 ±¥0 Year-end dividend ¥40 ¥42 +¥2 Dividend payout ratio 20.1% 23.0% +2.9pt FY2019 (After revision) (C) Change (C)-(A) ¥82 +¥4 ¥40 (incl. commemorative dividend of ¥2) +¥2 (planned) ¥42 +¥2 23.6% +3.5pt

Status of Sixth Mid-term Management Plan
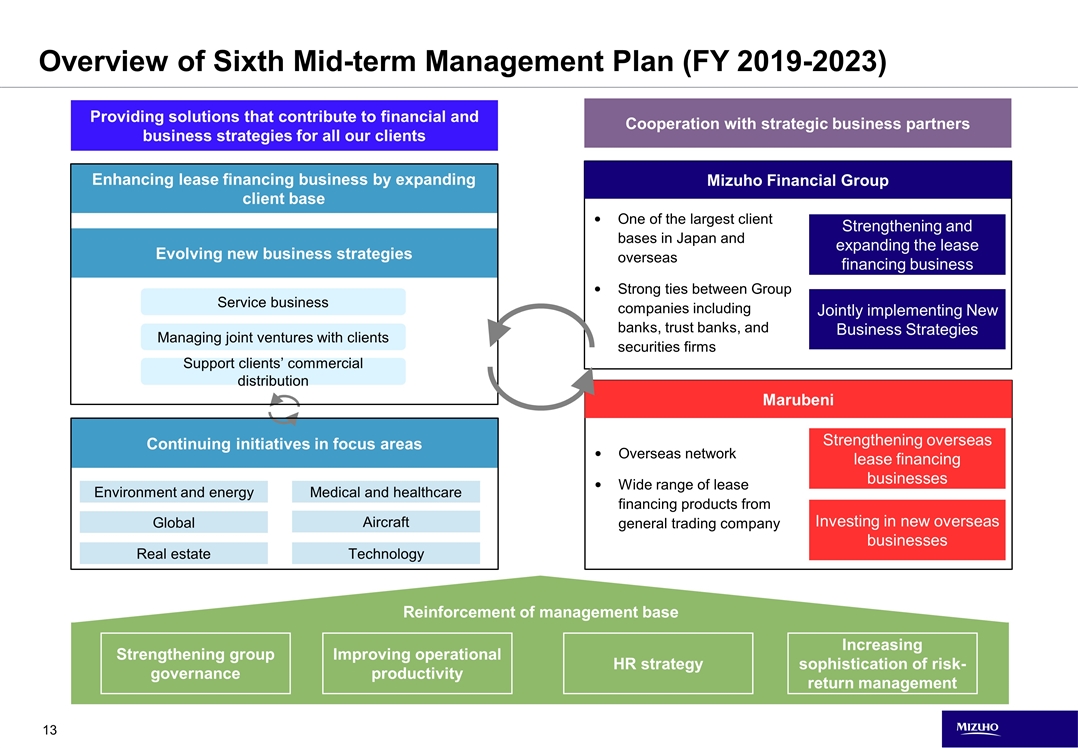
Overseas network Wide range of lease financing products from general trading company One of the largest client bases in Japan and overseas Strong ties between Group companies including banks, trust banks, and securities firms Overview of Sixth Mid-term Management Plan (FY 2019-2023) Service business Managing joint ventures with clients Support clients’ commercial distribution Evolving new business strategies Strengthening and expanding the lease financing business Jointly implementing New Business Strategies Real estate Environment and energy Technology Medical and healthcare Global Aircraft Enhancing lease financing business by expanding client base Cooperation with strategic business partners (※1) Providing solutions that contribute to financial and business strategies for all our clients Continuing initiatives in focus areas Mizuho Financial Group Marubeni Strengthening overseas lease financing businesses Investing in new overseas businesses Reinforcement of management base Strengthening group governance Improving operational productivity HR strategy Increasing sophistication of risk-return management
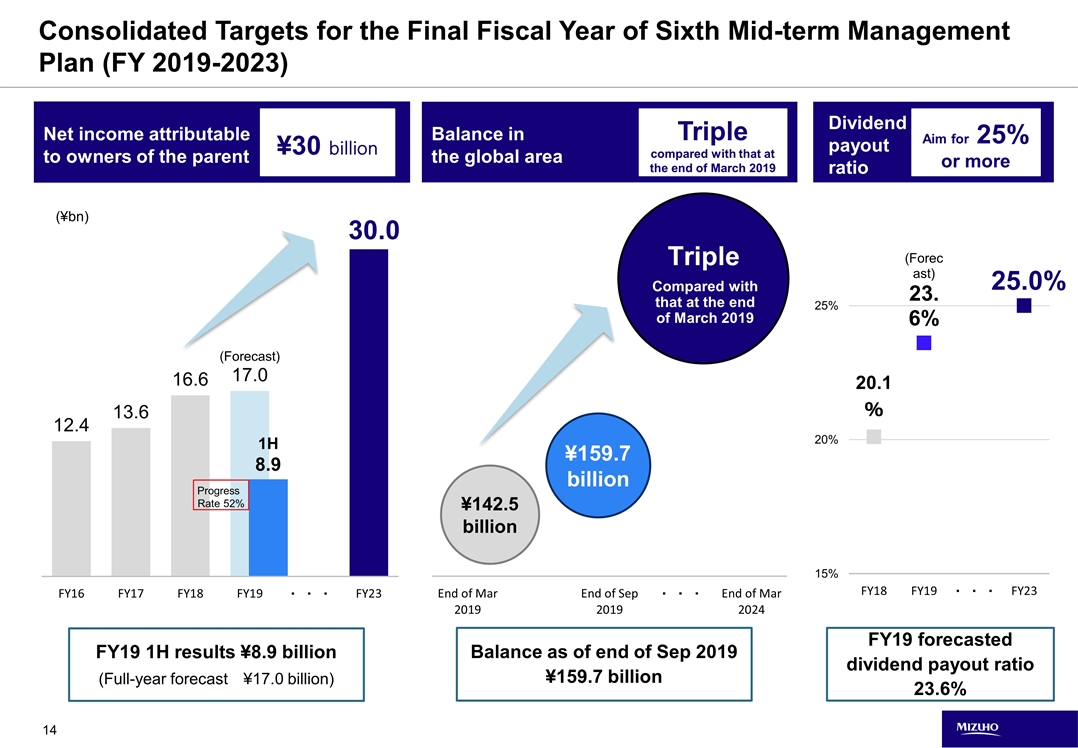
Consolidated Targets for the Final Fiscal Year of Sixth Mid-term Management Plan (FY 2019-2023) Net income attributable to owners of the parent Balance in the global area Compared with that at the end of March 2019 Dividend payout ratio ¥30 billion Triple compared with that at the end of March 2019 Aim for 25% or more FY19 1H results ¥8.9 billion (Full-year forecast ¥17.0 billion) Balance as of end of Sep 2019 ¥159.7 billion FY19 forecasted dividend payout ratio 23.6% 1H 8.9 Progress Rate 52% 25.0% 30.0 Triple
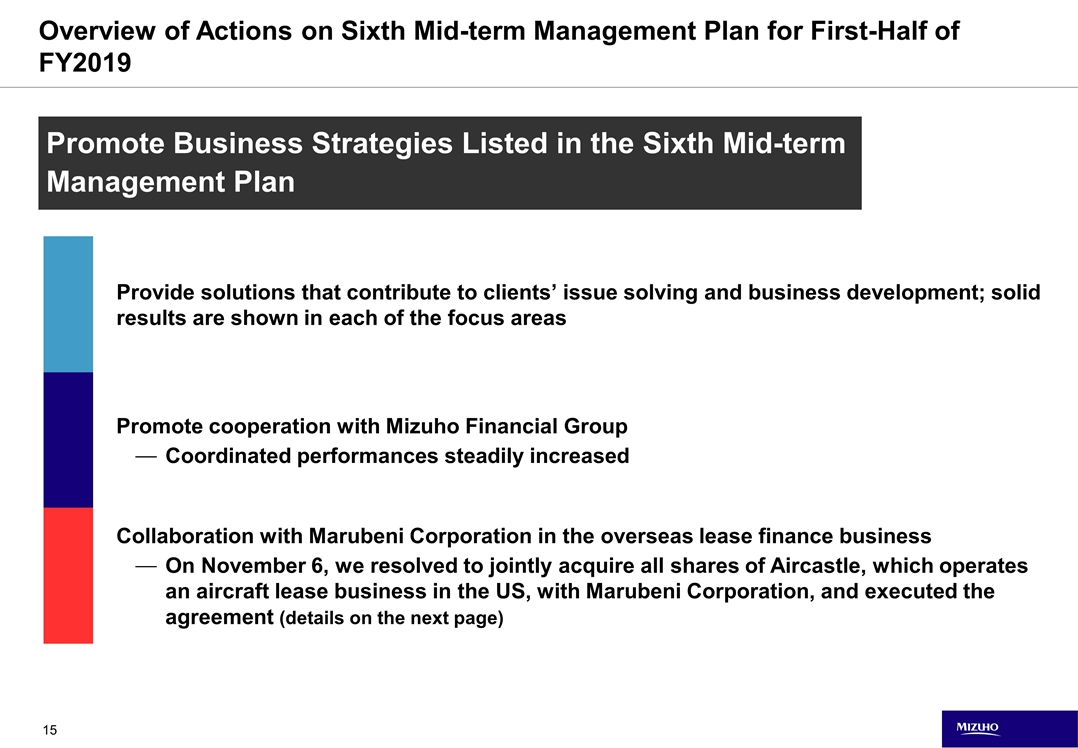
Promote Business Strategies Listed in the Sixth Mid-term Management Plan Overview of Actions on Sixth Mid-term Management Plan for First-Half of FY2019 Provide solutions that contribute to clients’ issue solving and business development; solid results are shown in each of the focus areas Promote cooperation with Mizuho Financial Group Coordinated performances steadily increased Collaboration with Marubeni Corporation in the overseas lease finance business On November 6, we resolved to jointly acquire all shares of Aircastle, which operates an aircraft lease business in the US, with Marubeni Corporation, and executed the agreement (details on the next page)
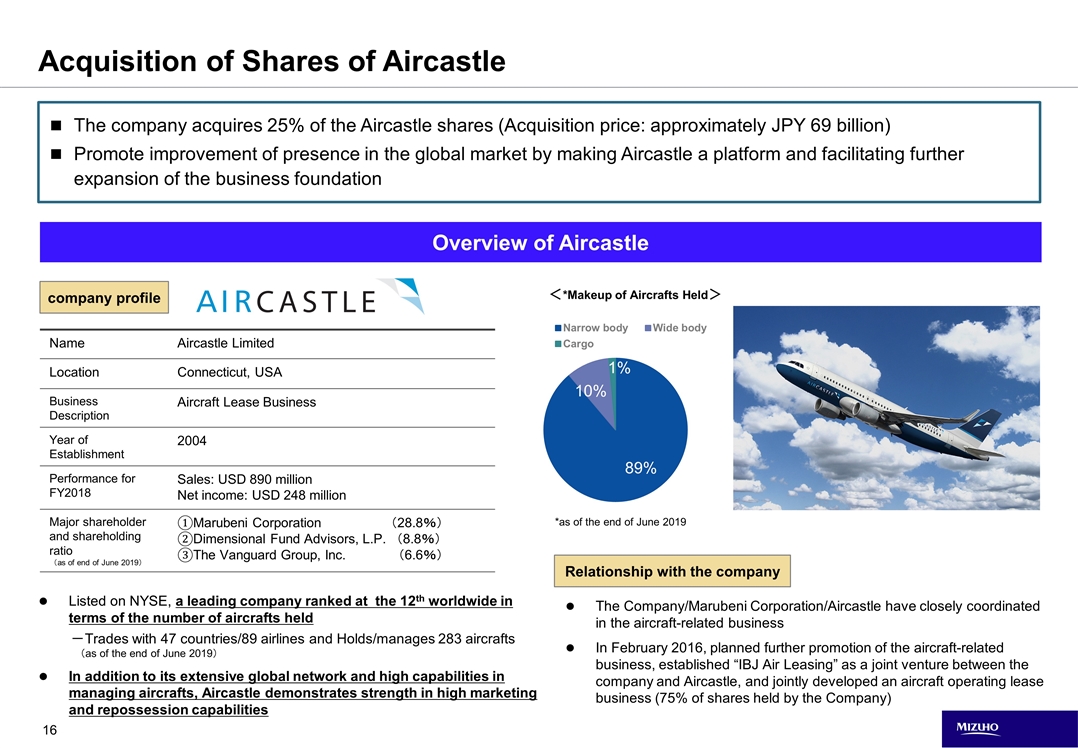
Acquisition of Shares of Aircastle The company acquires 25% of the Aircastle shares (Acquisition price: approximately JPY 69 billion) Promote improvement of presence in the global market by making Aircastle a platform and facilitating further expansion of the business foundation Name Aircastle Limited Location Connecticut, USA Business Description Aircraft Lease Business Year of Establishment 2004 Performance for FY2018 Sales: USD 890 million Net income: USD 248 million Major shareholder and shareholding ratio (as of end of June 2019) ①Marubeni Corporation (28.8%) ②Dimensional Fund Advisors, L.P. (8.8%) ③The Vanguard Group, Inc. (6.6%) company profile Relationship with the company Overview of Aircastle Listed on NYSE, a leading company ranked at the 12th worldwide in terms of the number of aircrafts held -Trades with 47 countries/89 airlines and Holds/manages 283 aircrafts (as of the end of June 2019) In addition to its extensive global network and high capabilities in managing aircrafts, Aircastle demonstrates strength in high marketing and repossession capabilities The Company/Marubeni Corporation/Aircastle have closely coordinated in the aircraft-related business In February 2016, planned further promotion of the aircraft-related business, established “IBJ Air Leasing” as a joint venture between the company and Aircastle, and jointly developed an aircraft operating lease business (75% of shares held by the Company) <*Makeup of Aircrafts Held> *as of the end of June 2019
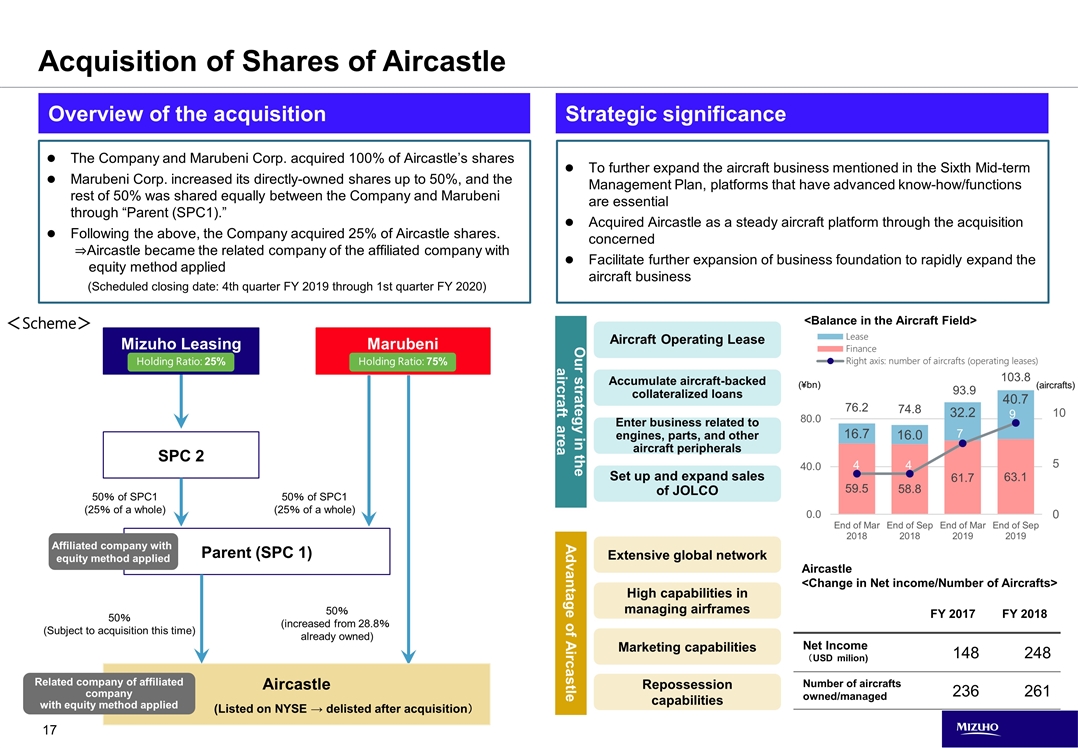
50% of SPC1 (25% of a whole) Overview of the acquisition Acquisition of Shares of Aircastle 50% (Subject to acquisition this time) SPC 2 Parent (SPC 1) Marubeni Aircastle (Listed on NYSE → delisted after acquisition) Mizuho Leasing 50% (increased from 28.8% already owned) 50% of SPC1 (25% of a whole) Holding Ratio: 75% Affiliated company with equity method applied Holding Ratio: 25% Related company of affiliated company with equity method applied The Company and Marubeni Corp. acquired 100% of Aircastle’s shares Marubeni Corp. increased its directly-owned shares up to 50%, and the rest of 50% was shared equally between the Company and Marubeni through “Parent (SPC1).” Following the above, the Company acquired 25% of Aircastle shares. ⇒Aircastle became the related company of the affiliated company with equity method applied (Scheduled closing date: 4th quarter FY 2019 through 1st quarter FY 2020) Aircraft Operating Lease Accumulate aircraft-backed collateralized loans Enter business related to engines, parts, and other aircraft peripherals Set up and expand sales of JOLCO To further expand the aircraft business mentioned in the Sixth Mid-term Management Plan, platforms that have advanced know-how/functions are essential Acquired Aircastle as a steady aircraft platform through the acquisition concerned Facilitate further expansion of business foundation to rapidly expand the aircraft business Strategic significance Our strategy in the aircraft area Advantage of Aircastle Extensive global network High capabilities in managing airframes Marketing capabilities Repossession capabilities <Balance in the Aircraft Field> FY 2017 FY 2018 Net Income (USD milion) 148 248 Number of aircrafts owned/managed 236 261 Aircastle <Change in Net income/Number of Aircrafts> <Scheme> (¥bn) (aircrafts)
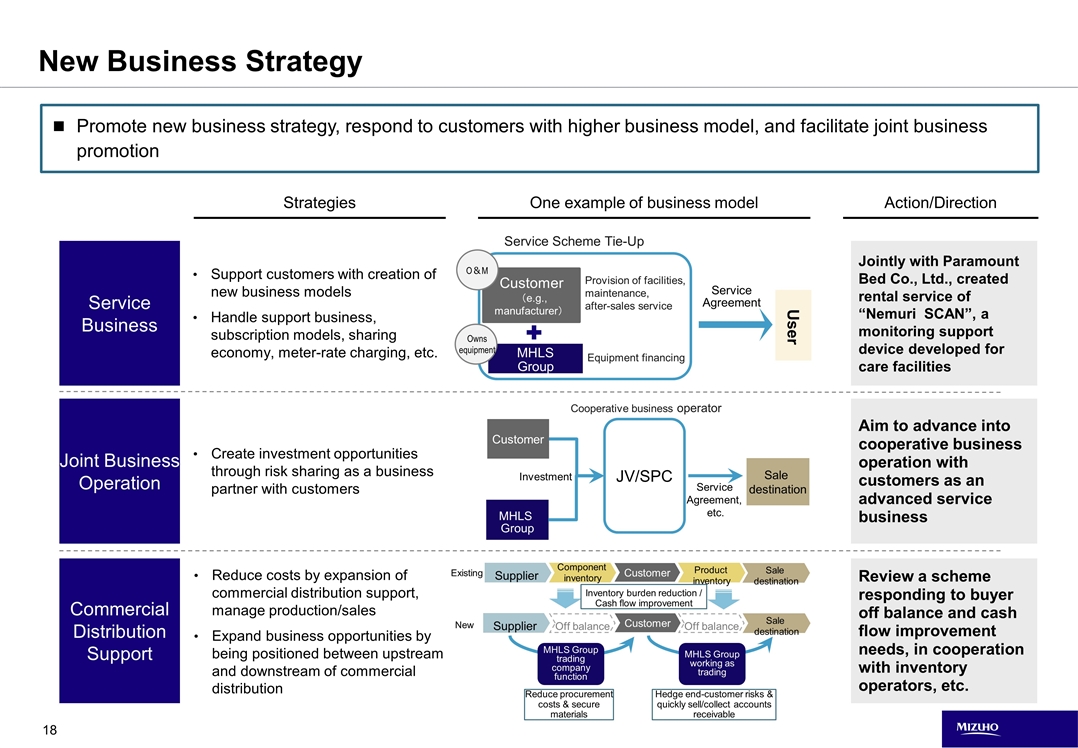
New Business Strategy Joint Business Operation Commercial Distribution Support Service Business Jointly with Paramount Bed Co., Ltd., created rental service of “Nemuri SCAN”, a monitoring support device developed for care facilities Aim to advance into cooperative business operation with customers as an advanced service business Supplier Component inventory Customer Sale destination Off balance Product inventory Off balance Existing MHLS Group trading company function Customer Supplier Sale destination New Inventory burden reduction / Cash flow improvement MHLS Group working as trading Service Agreement, etc. MHLS Group Customer JV/SPC Investment Sale destination Cooperative business operator Service Scheme Tie-Up Review a scheme responding to buyer off balance and cash flow improvement needs, in cooperation with inventory operators, etc. Reduce costs by expansion of commercial distribution support, manage production/sales Expand business opportunities by being positioned between upstream and downstream of commercial distribution Support customers with creation of new business models Handle support business, subscription models, sharing economy, meter-rate charging, etc. Customer (e.g., manufacturer) MHLS Group Equipment financing Provision of facilities, maintenance, after-sales service User Service Agreement Owns equipment O&M One example of business model Strategies Action/Direction Promote new business strategy, respond to customers with higher business model, and facilitate joint business promotion Reduce procurement costs & secure materials Hedge end-customer risks & quickly sell/collect accounts receivable Create investment opportunities through risk sharing as a business partner with customers
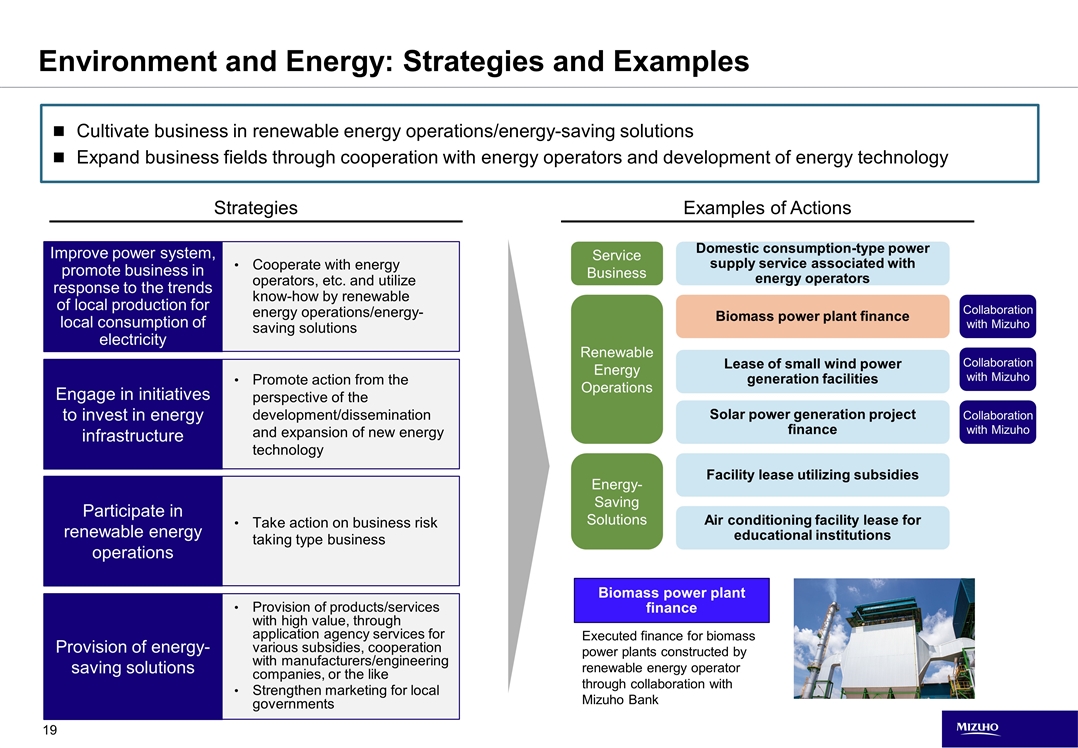
Environment and Energy: Strategies and Examples Improve power system, promote business in response to the trends of local production for local consumption of electricity Engage in initiatives to invest in energy infrastructure Provision of energy-saving solutions Participate in renewable energy operations Provision of products/services with high value, through application agency services for various subsidies, cooperation with manufacturers/engineering companies, or the like Strengthen marketing for local governments Take action on business risk taking type business Cooperate with energy operators, etc. and utilize know-how by renewable energy operations/energy-saving solutions Promote action from the perspective of the development/dissemination and expansion of new energy technology Biomass power plant finance Lease of small wind power generation facilities Air conditioning facility lease for educational institutions Solar power generation project finance Facility lease utilizing subsidies Domestic consumption-type power supply service associated with energy operators Strategies Service Business Renewable Energy Operations Energy-Saving Solutions Biomass power plant finance Examples of Actions Cultivate business in renewable energy operations/energy-saving solutions Expand business fields through cooperation with energy operators and development of energy technology Executed finance for biomass power plants constructed by renewable energy operator through collaboration with Mizuho Bank Collaboration with Mizuho Collaboration with Mizuho Collaboration with Mizuho
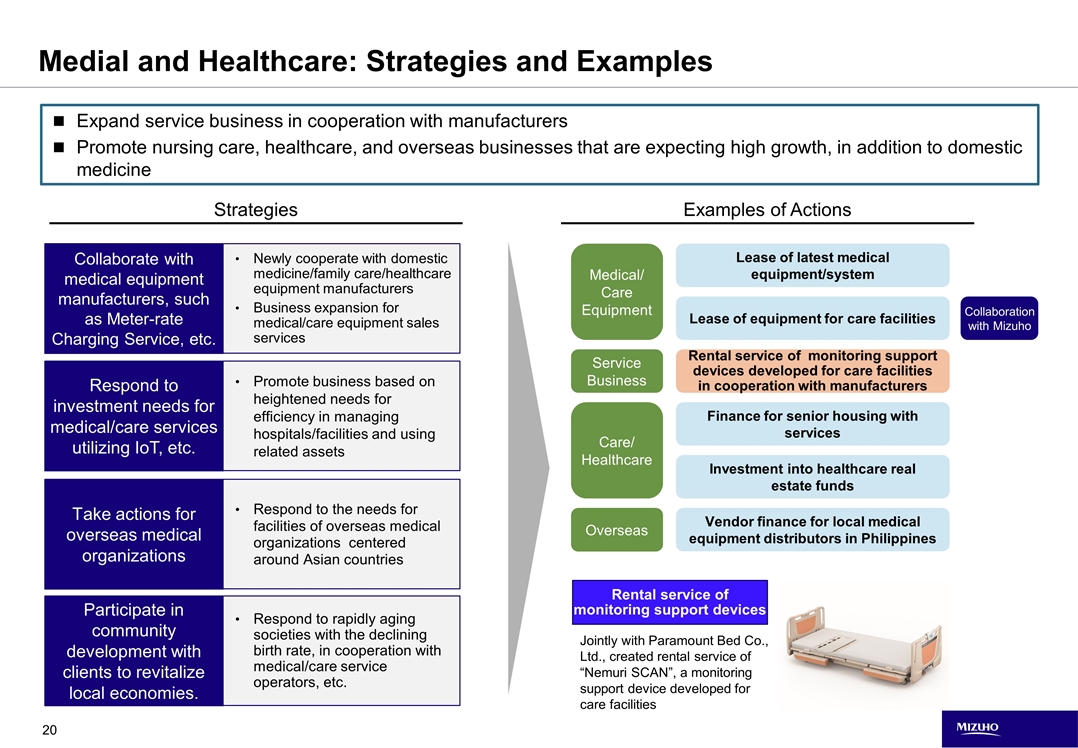
Medial and Healthcare: Strategies and Examples Collaborate with medical equipment manufacturers, such as Meter-rate Charging Service, etc. Respond to investment needs for medical/care services utilizing IoT, etc. Participate in community development with clients to revitalize local economies. Take actions for overseas medical organizations Respond to rapidly aging societies with the declining birth rate, in cooperation with medical/care service operators, etc. Respond to the needs for facilities of overseas medical organizations centered around Asian countries Newly cooperate with domestic medicine/family care/healthcare equipment manufacturers Business expansion for medical/care equipment sales services Promote business based on heightened needs for efficiency in managing hospitals/facilities and using related assets Vendor finance for local medical equipment distributors in Philippines Rental service of monitoring support devices developed for care facilities in cooperation with manufacturers Finance for senior housing with services Investment into healthcare real estate funds Lease of latest medical equipment/system Strategies Medical/ Care Equipment Service Business Care/ Healthcare Rental service of monitoring support devices Examples of Actions Expand service business in cooperation with manufacturers Promote nursing care, healthcare, and overseas businesses that are expecting high growth, in addition to domestic medicine Overseas Lease of equipment for care facilities Collaboration with Mizuho Jointly with Paramount Bed Co., Ltd., created rental service of “Nemuri SCAN”, a monitoring support device developed for care facilities
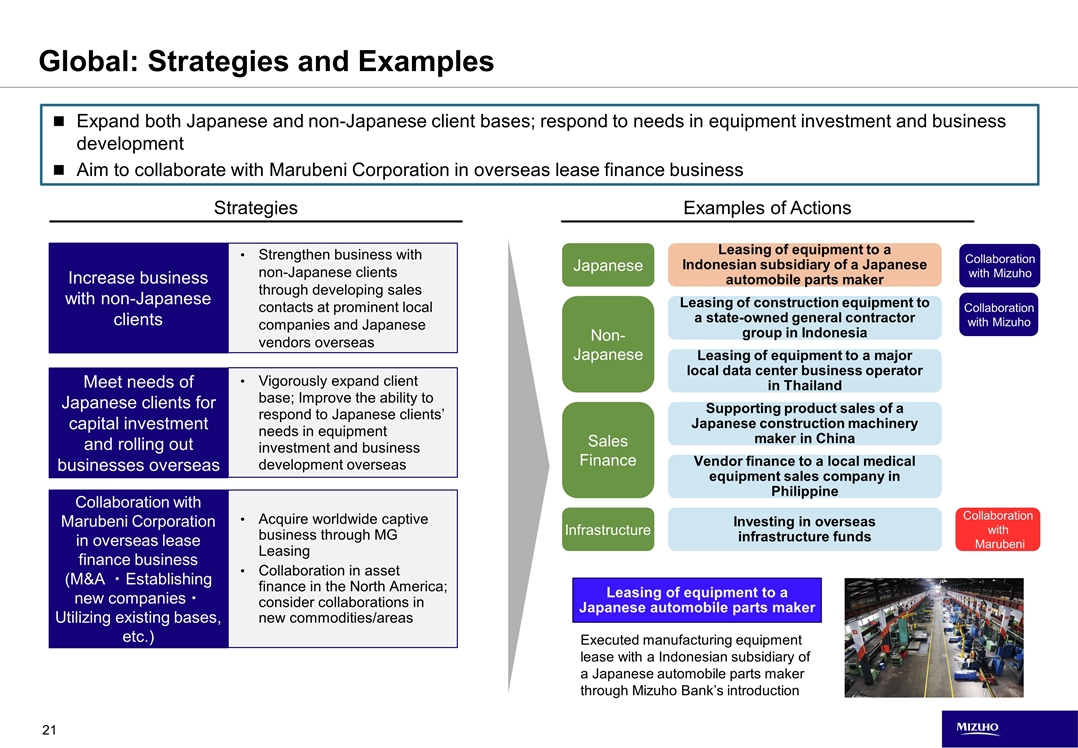
Global: Strategies and Examples Collaboration with Marubeni Corporation in overseas lease finance business (M&A ・Establishing new companies・Utilizing existing bases, etc.) Increase business with non-Japanese clients Meet needs of Japanese clients for capital investment and rolling out businesses overseas Vigorously expand client base; Improve the ability to respond to Japanese clients’ needs in equipment investment and business development overseas Acquire worldwide captive business through MG Leasing Collaboration in asset finance in the North America; consider collaborations in new commodities/areas Strengthen business with non-Japanese clients through developing sales contacts at prominent local companies and Japanese vendors overseas Vendor finance to a local medical equipment sales company in Philippine Leasing of equipment to a major local data center business operator in Thailand Leasing of construction equipment to a state-owned general contractor group in Indonesia Supporting product sales of a Japanese construction machinery maker in China Leasing of equipment to a Indonesian subsidiary of a Japanese automobile parts maker Investing in overseas infrastructure funds Strategies Infrastructure Non-Japanese Sales Finance Leasing of equipment to a Japanese automobile parts maker Examples of Actions Expand both Japanese and non-Japanese client bases; respond to needs in equipment investment and business development Aim to collaborate with Marubeni Corporation in overseas lease finance business Japanese Executed manufacturing equipment lease with a Indonesian subsidiary of a Japanese automobile parts maker through Mizuho Bank’s introduction Collaboration with Mizuho Collaboration with Mizuho Collaboration with Marubeni
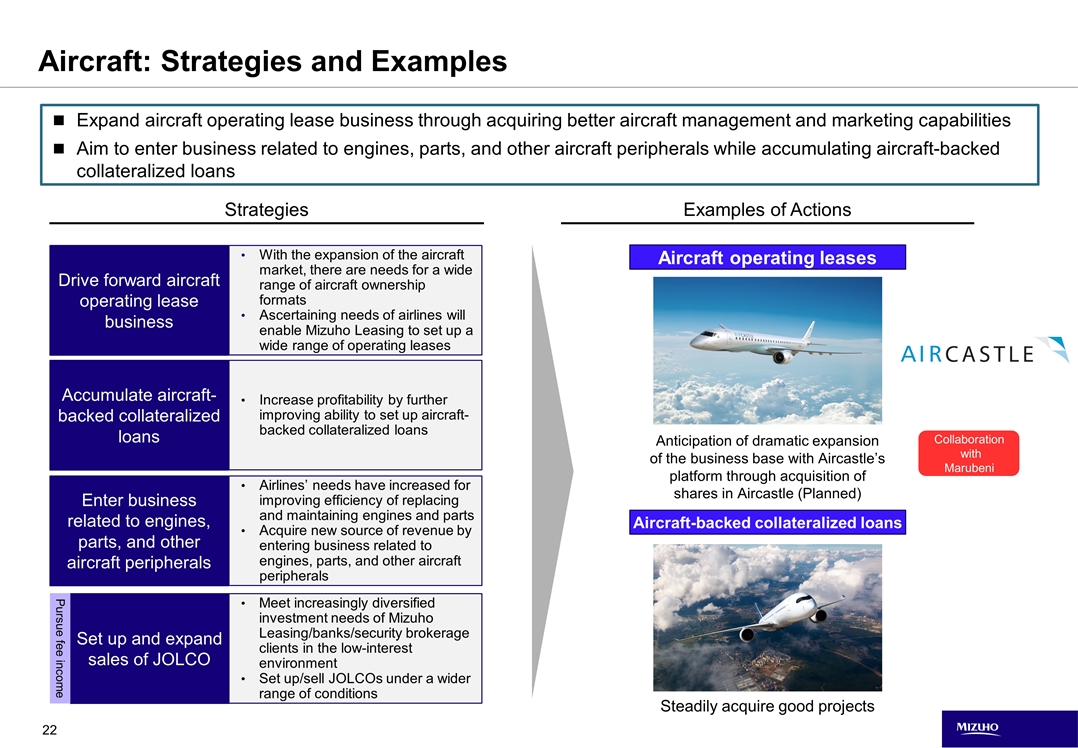
Aircraft: Strategies and Examples Drive forward aircraft operating lease business Accumulate aircraft-backed collateralized loans Set up and expand sales of JOLCO Enter business related to engines, parts, and other aircraft peripherals Meet increasingly diversified investment needs of Mizuho Leasing/banks/security brokerage clients in the low-interest environment Set up/sell JOLCOs under a wider range of conditions Airlines’ needs have increased for improving efficiency of replacing and maintaining engines and parts Acquire new source of revenue by entering business related to engines, parts, and other aircraft peripherals With the expansion of the aircraft market, there are needs for a wide range of aircraft ownership formats Ascertaining needs of airlines will enable Mizuho Leasing to set up a wide range of operating leases Increase profitability by further improving ability to set up aircraft-backed collateralized loans Strategies Expand aircraft operating lease business through acquiring better aircraft management and marketing capabilities Aim to enter business related to engines, parts, and other aircraft peripherals while accumulating aircraft-backed collateralized loans Pursue fee income Anticipation of dramatic expansion of the business base with Aircastle’s platform through acquisition of shares in Aircastle (Planned) Steadily acquire good projects Aircraft operating leases Aircraft-backed collateralized loans Examples of Actions Collaboration with Marubeni
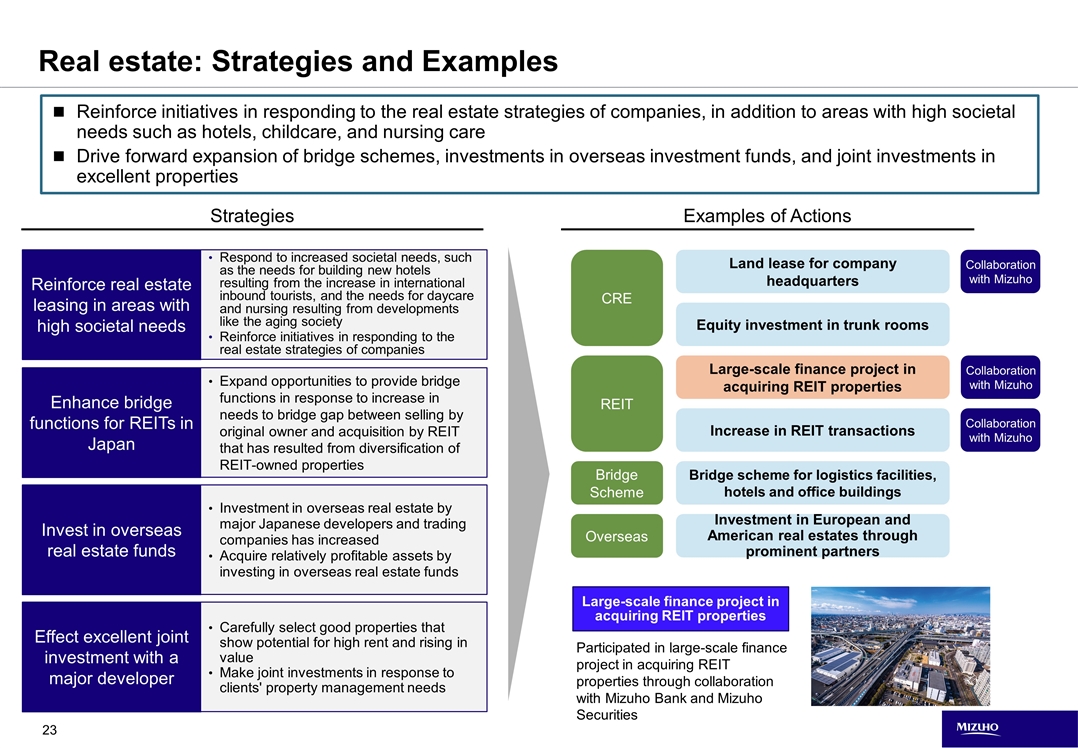
Real estate: Strategies and Examples Reinforce real estate leasing in areas with high societal needs Enhance bridge functions for REITs in Japan Effect excellent joint investment with a major developer Invest in overseas real estate funds Carefully select good properties that show potential for high rent and rising in value Make joint investments in response to clients' property management needs Investment in overseas real estate by major Japanese developers and trading companies has increased Acquire relatively profitable assets by investing in overseas real estate funds Respond to increased societal needs, such as the needs for building new hotels resulting from the increase in international inbound tourists, and the needs for daycare and nursing resulting from developments like the aging society Reinforce initiatives in responding to the real estate strategies of companies Expand opportunities to provide bridge functions in response to increase in needs to bridge gap between selling by original owner and acquisition by REIT that has resulted from diversification of REIT-owned properties Investment in European and American real estates through prominent partners Large-scale finance project in acquiring REIT properties Equity investment in trunk rooms Increase in REIT transactions Land lease for company headquarters Strategies CRE REIT Large-scale finance project in acquiring REIT properties Examples of Actions Reinforce initiatives in responding to the real estate strategies of companies, in addition to areas with high societal needs such as hotels, childcare, and nursing care Drive forward expansion of bridge schemes, investments in overseas investment funds, and joint investments in excellent properties Overseas Bridge scheme for logistics facilities, hotels and office buildings Bridge Scheme Participated in large-scale finance project in acquiring REIT properties through collaboration with Mizuho Bank and Mizuho Securities Collaboration with Mizuho Collaboration with Mizuho Collaboration with Mizuho

Appendix
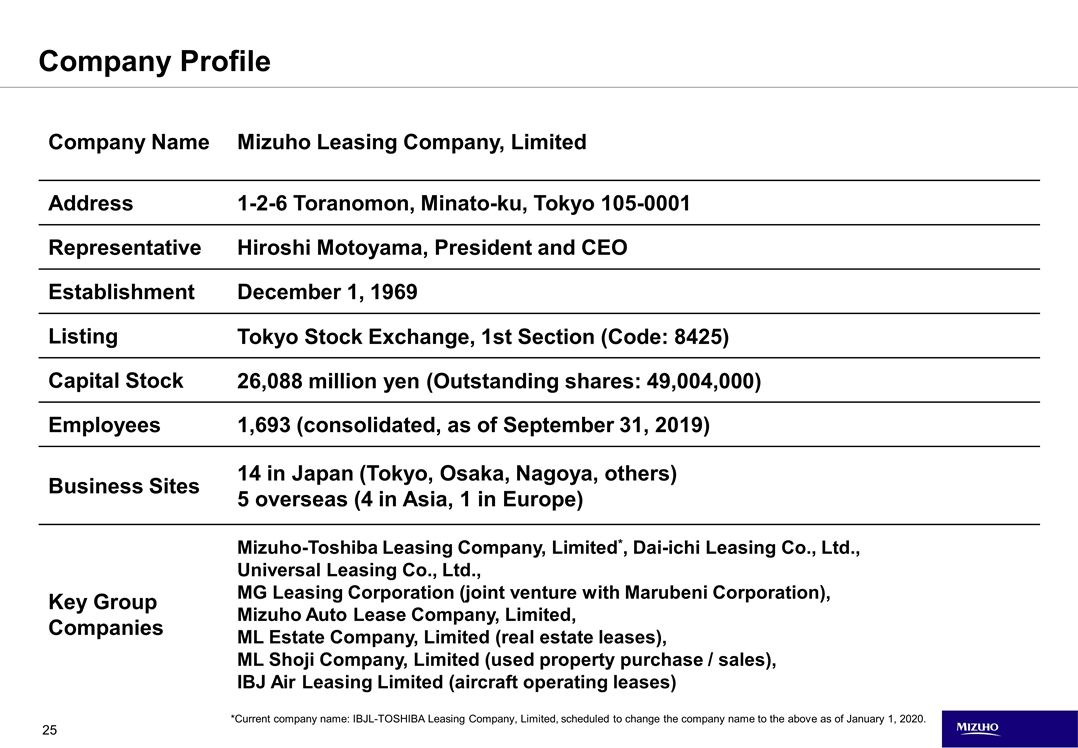
Company Profile Company Name Mizuho Leasing Company, Limited Address 1-2-6 Toranomon, Minato-ku, Tokyo 105-0001 Representative Hiroshi Motoyama, President and CEO Establishment December 1, 1969 Listing Tokyo Stock Exchange, 1st Section (Code: 8425) Capital Stock 26,088 million yen (Outstanding shares: 49,004,000) Employees 1,693 (consolidated, as of September 31, 2019) Business Sites 14 in Japan (Tokyo, Osaka, Nagoya, others) 5 overseas (4 in Asia, 1 in Europe) Key Group Companies Mizuho-Toshiba Leasing Company, Limited*, Dai-ichi Leasing Co., Ltd., Universal Leasing Co., Ltd., MG Leasing Corporation (joint venture with Marubeni Corporation), Mizuho Auto Lease Company, Limited, ML Estate Company, Limited (real estate leases), ML Shoji Company, Limited (used property purchase / sales), IBJ Air Leasing Limited (aircraft operating leases) *Current company name: IBJL-TOSHIBA Leasing Company, Limited, scheduled to change the company name to the above as of January 1, 2020.
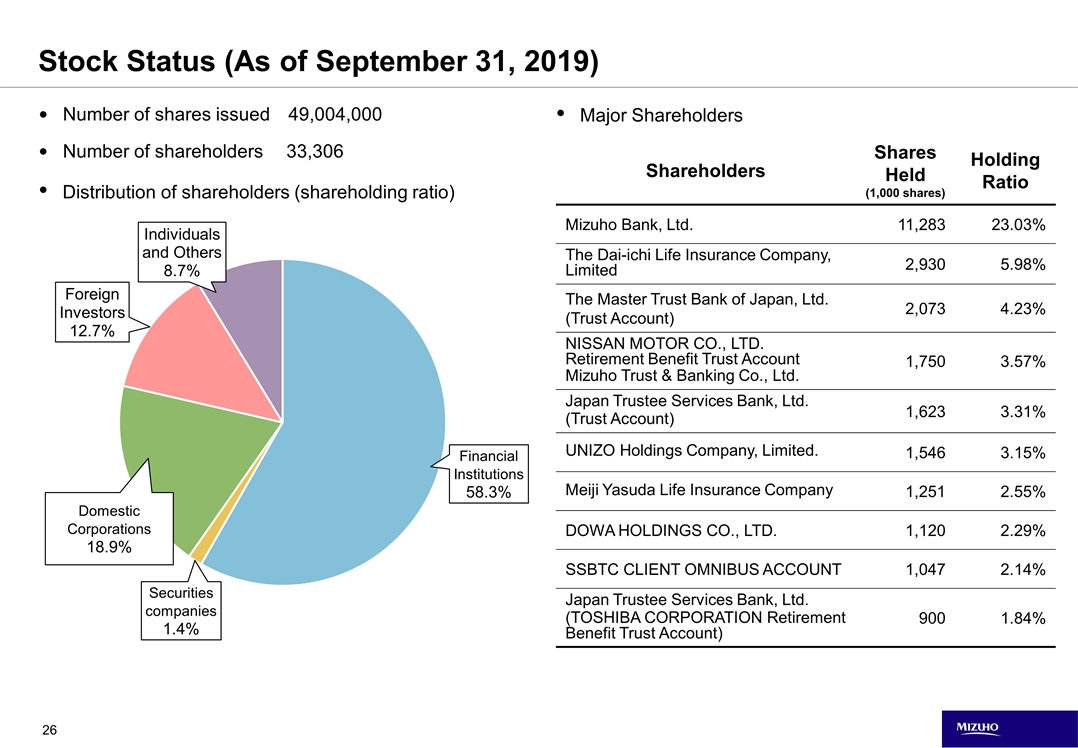
Number of shares issued 49,004,000 Number of shareholders 33,306 Distribution of shareholders (shareholding ratio) Major Shareholders Stock Status (As of September 31, 2019) Shareholders Shares Held (1,000 shares) Holding Ratio Mizuho Bank, Ltd. 11,283 23.03% The Dai-ichi Life Insurance Company, Limited 2,930 5.98% The Master Trust Bank of Japan, Ltd. (Trust Account) 2,073 4.23% NISSAN MOTOR CO., LTD. Retirement Benefit Trust Account Mizuho Trust & Banking Co., Ltd. 1,750 3.57% Japan Trustee Services Bank, Ltd. (Trust Account) 1,623 3.31% UNIZO Holdings Company, Limited. 1,546 3.15% Meiji Yasuda Life Insurance Company 1,251 2.55% DOWA HOLDINGS CO., LTD. 1,120 2.29% SSBTC CLIENT OMNIBUS ACCOUNT 1,047 2.14% Japan Trustee Services Bank, Ltd. (TOSHIBA CORPORATION Retirement Benefit Trust Account) 900 1.84%
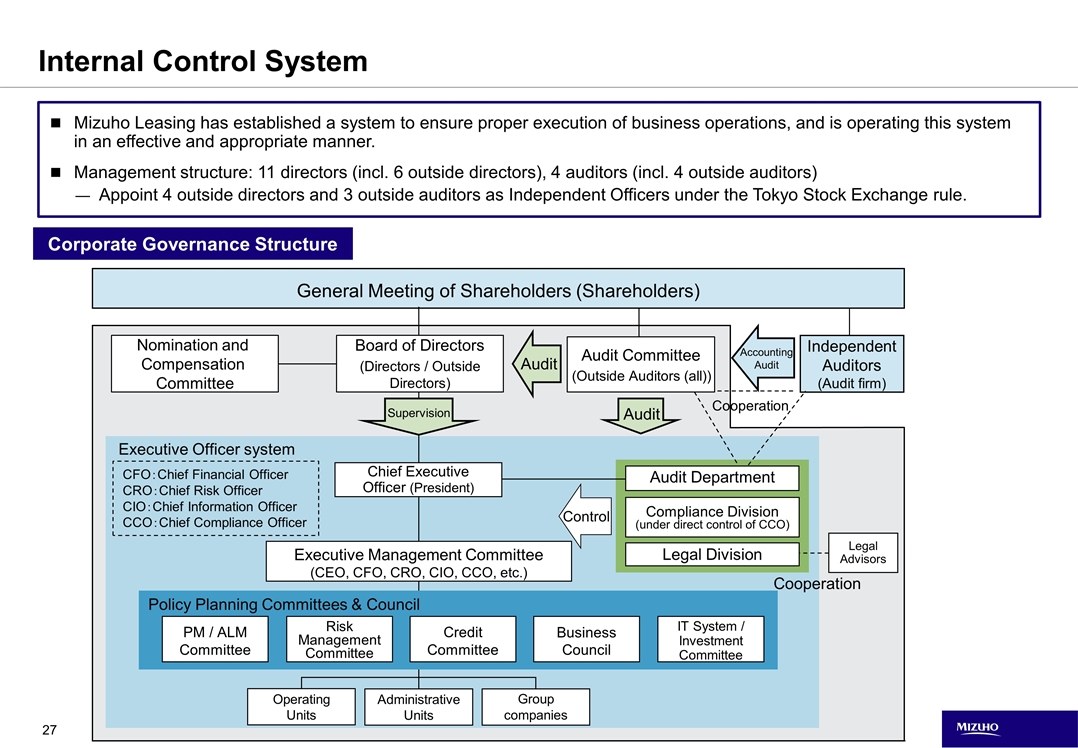
Mizuho Leasing has established a system to ensure proper execution of business operations, and is operating this system in an effective and appropriate manner. Management structure: 11 directors (incl. 6 outside directors), 4 auditors (incl. 4 outside auditors) Appoint 4 outside directors and 3 outside auditors as Independent Officers under the Tokyo Stock Exchange rule. Internal Control System Corporate Governance Structure Operating Units Cooperation Audit General Meeting of Shareholders (Shareholders) Accounting Audit Audit Independent Auditors (Audit firm) Audit Committee (Outside Auditors (all)) Group companies Cooperation CFO:Chief Financial Officer CRO:Chief Risk Officer CIO:Chief Information Officer CCO:Chief Compliance Officer Compliance Division (under direct control of CCO) Legal Advisors Legal Division Control Audit Department Administrative Units Board of Directors (Directors / Outside Directors) Policy Planning Committees & Council PM / ALM Committee Risk Management Committee IT System / Investment Committee Business Council Credit Committee Chief Executive Officer (President) Executive Management Committee (CEO, CFO, CRO, CIO, CCO, etc.) Supervision Executive Officer system Nomination and Compensation Committee
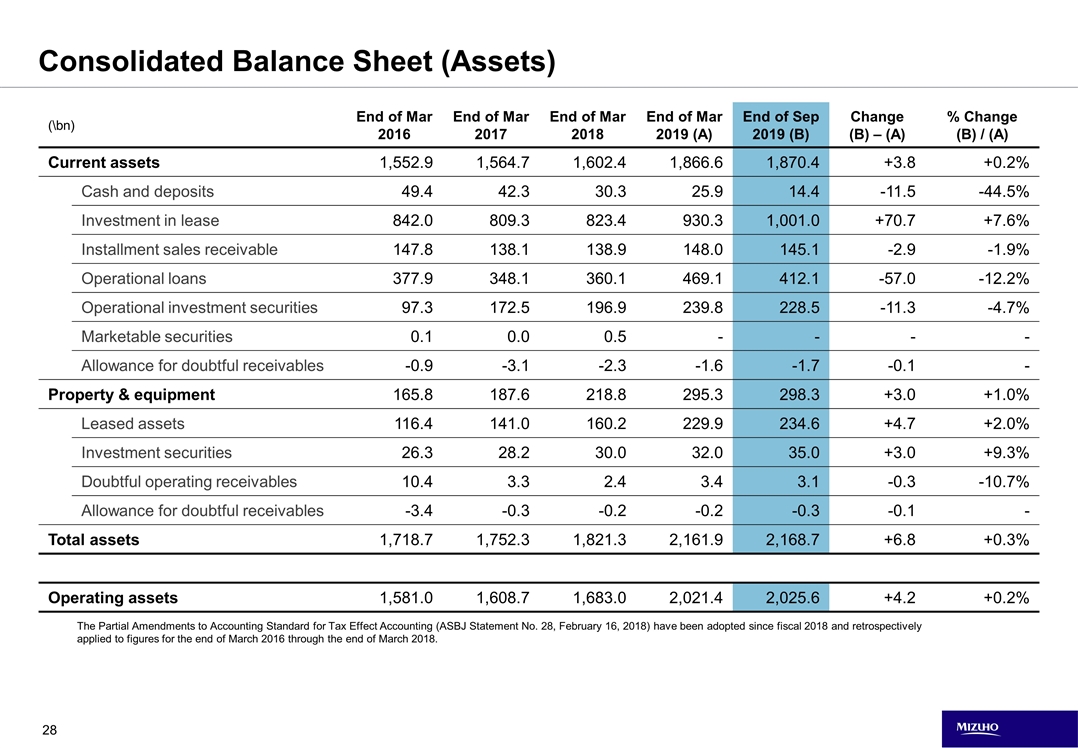
(\bn) End of Mar 2016 End of Mar 2017 End of Mar 2018 End of Mar 2019 (A) End of Sep 2019 (B) Change (B) – (A) % Change (B) / (A) Current assets 1,552.9 1,564.7 1,602.4 1,866.6 1,870.4 +3.8 +0.2% Cash and deposits 49.4 42.3 30.3 25.9 14.4 -11.5 -44.5% Investment in lease 842.0 809.3 823.4 930.3 1,001.0 +70.7 +7.6% Installment sales receivable 147.8 138.1 138.9 148.0 145.1 -2.9 -1.9% Operational loans 377.9 348.1 360.1 469.1 412.1 -57.0 -12.2% Operational investment securities 97.3 172.5 196.9 239.8 228.5 -11.3 -4.7% Marketable securities 0.1 0.0 0.5 - - - - Allowance for doubtful receivables -0.9 -3.1 -2.3 -1.6 -1.7 -0.1 - Property & equipment 165.8 187.6 218.8 295.3 298.3 +3.0 +1.0% Leased assets 116.4 141.0 160.2 229.9 234.6 +4.7 +2.0% Investment securities 26.3 28.2 30.0 32.0 35.0 +3.0 +9.3% Doubtful operating receivables 10.4 3.3 2.4 3.4 3.1 -0.3 -10.7% Allowance for doubtful receivables -3.4 -0.3 -0.2 -0.2 -0.3 -0.1 - Total assets 1,718.7 1,752.3 1,821.3 2,161.9 2,168.7 +6.8 +0.3% Operating assets 1,581.0 1,608.7 1,683.0 2,021.4 2,025.6 +4.2 +0.2% Consolidated Balance Sheet (Assets) The Partial Amendments to Accounting Standard for Tax Effect Accounting (ASBJ Statement No. 28, February 16, 2018) have been adopted since fiscal 2018 and retrospectively applied to figures for the end of March 2016 through the end of March 2018.
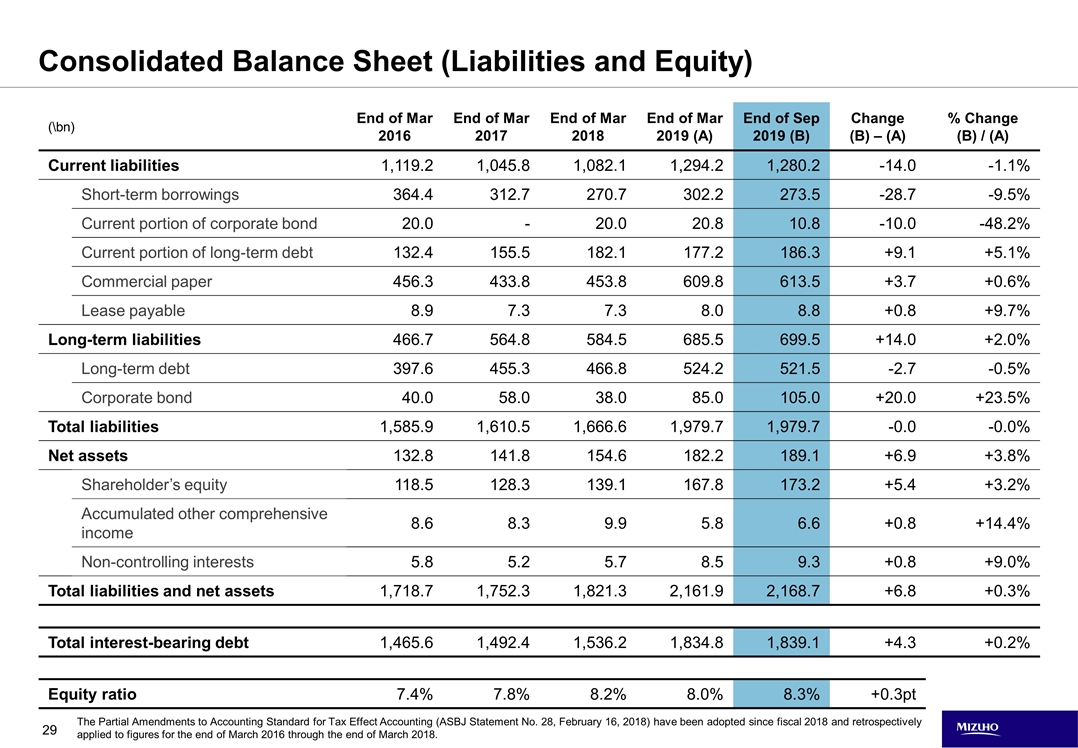
The Partial Amendments to Accounting Standard for Tax Effect Accounting (ASBJ Statement No. 28, February 16, 2018) have been adopted since fiscal 2018 and retrospectively applied to figures for the end of March 2016 through the end of March 2018. (\bn) End of Mar 2016 End of Mar 2017 End of Mar 2018 End of Mar 2019 (A) End of Sep 2019 (B) Change (B) – (A) % Change (B) / (A) Current liabilities 1,119.2 1,045.8 1,082.1 1,294.2 1,280.2 -14.0 -1.1% Short-term borrowings 364.4 312.7 270.7 302.2 273.5 -28.7 -9.5% Current portion of corporate bond 20.0 - 20.0 20.8 10.8 -10.0 -48.2% Current portion of long-term debt 132.4 155.5 182.1 177.2 186.3 +9.1 +5.1% Commercial paper 456.3 433.8 453.8 609.8 613.5 +3.7 +0.6% Lease payable 8.9 7.3 7.3 8.0 8.8 +0.8 +9.7% Long-term liabilities 466.7 564.8 584.5 685.5 699.5 +14.0 +2.0% Long-term debt 397.6 455.3 466.8 524.2 521.5 -2.7 -0.5% Corporate bond 40.0 58.0 38.0 85.0 105.0 +20.0 +23.5% Total liabilities 1,585.9 1,610.5 1,666.6 1,979.7 1,979.7 -0.0 -0.0% Net assets 132.8 141.8 154.6 182.2 189.1 +6.9 +3.8% Shareholder’s equity 118.5 128.3 139.1 167.8 173.2 +5.4 +3.2% Accumulated other comprehensive income 8.6 8.3 9.9 5.8 6.6 +0.8 +14.4% Non-controlling interests 5.8 5.2 5.7 8.5 9.3 +0.8 +9.0% Total liabilities and net assets 1,718.7 1,752.3 1,821.3 2,161.9 2,168.7 +6.8 +0.3% Total interest-bearing debt 1,465.6 1,492.4 1,536.2 1,834.8 1,839.1 +4.3 +0.2% Equity ratio 7.4% 7.8% 8.2% 8.0% 8.3% +0.3pt Consolidated Balance Sheet (Liabilities and Equity)
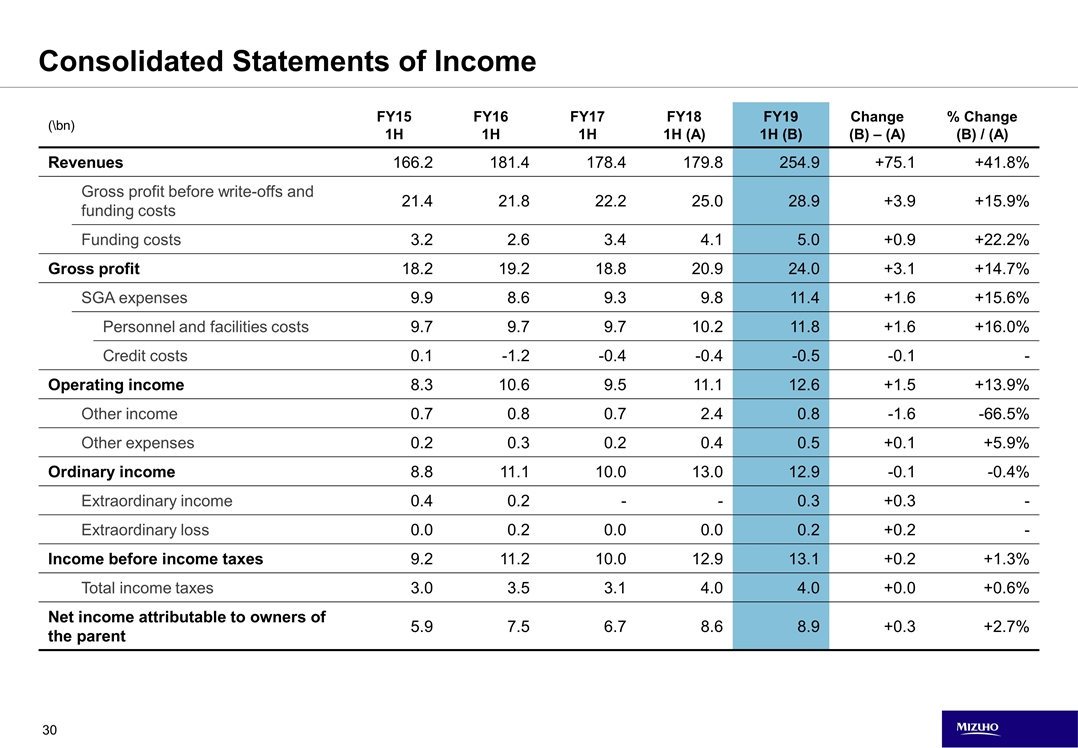
(\bn) FY15 1H FY16 1H FY17 1H FY18 1H (A) FY19 1H (B) Change (B) – (A) % Change (B) / (A) Revenues 166.2 181.4 178.4 179.8 254.9 +75.1 +41.8% Gross profit before write-offs and funding costs 21.4 21.8 22.2 25.0 28.9 +3.9 +15.9% Funding costs 3.2 2.6 3.4 4.1 5.0 +0.9 +22.2% Gross profit 18.2 19.2 18.8 20.9 24.0 +3.1 +14.7% SGA expenses 9.9 8.6 9.3 9.8 11.4 +1.6 +15.6% Personnel and facilities costs 9.7 9.7 9.7 10.2 11.8 +1.6 +16.0% Credit costs 0.1 -1.2 -0.4 -0.4 -0.5 -0.1 - Operating income 8.3 10.6 9.5 11.1 12.6 +1.5 +13.9% Other income 0.7 0.8 0.7 2.4 0.8 -1.6 -66.5% Other expenses 0.2 0.3 0.2 0.4 0.5 +0.1 +5.9% Ordinary income 8.8 11.1 10.0 13.0 12.9 -0.1 -0.4% Extraordinary income 0.4 0.2 - - 0.3 +0.3 - Extraordinary loss 0.0 0.2 0.0 0.0 0.2 +0.2 - Income before income taxes 9.2 11.2 10.0 12.9 13.1 +0.2 +1.3% Total income taxes 3.0 3.5 3.1 4.0 4.0 +0.0 +0.6% Net income attributable to owners of the parent 5.9 7.5 6.7 8.6 8.9 +0.3 +2.7% Consolidated Statements of Income
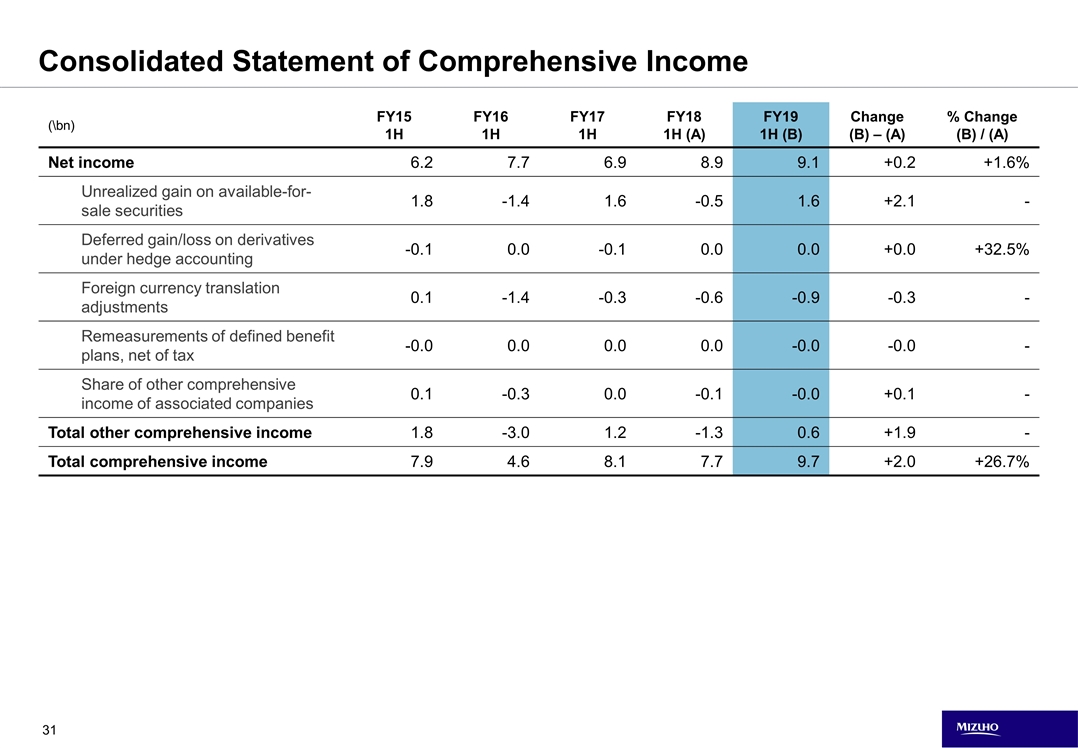
(\bn) FY15 1H FY16 1H FY17 1H FY18 1H (A) FY19 1H (B) Change (B) – (A) % Change (B) / (A) Net income 6.2 7.7 6.9 8.9 9.1 +0.2 +1.6% Unrealized gain on available-for-sale securities 1.8 -1.4 1.6 -0.5 1.6 +2.1 - Deferred gain/loss on derivatives under hedge accounting -0.1 0.0 -0.1 0.0 0.0 +0.0 +32.5% Foreign currency translation adjustments 0.1 -1.4 -0.3 -0.6 -0.9 -0.3 - Remeasurements of defined benefit plans, net of tax -0.0 0.0 0.0 0.0 -0.0 -0.0 - Share of other comprehensive income of associated companies 0.1 -0.3 0.0 -0.1 -0.0 +0.1 - Total other comprehensive income 1.8 -3.0 1.2 -1.3 0.6 +1.9 - Total comprehensive income 7.9 4.6 8.1 7.7 9.7 +2.0 +26.7% Consolidated Statement of Comprehensive Income
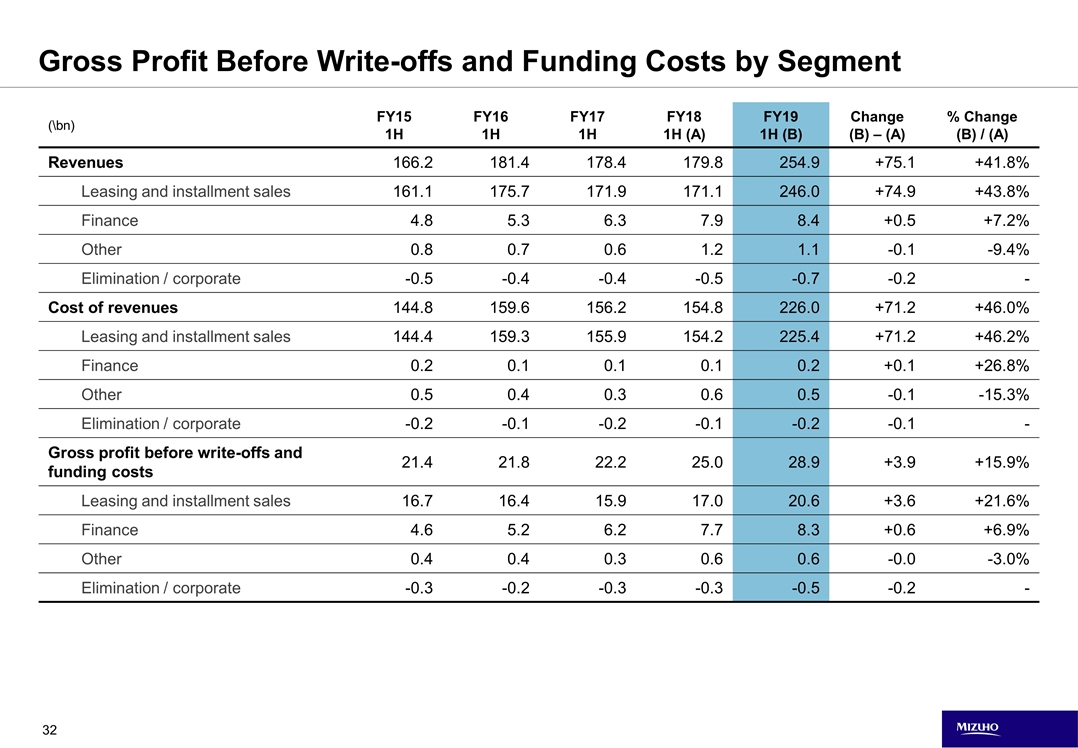
(\bn) FY15 1H FY16 1H FY17 1H FY18 1H (A) FY19 1H (B) Change (B) – (A) % Change (B) / (A) Revenues 166.2 181.4 178.4 179.8 254.9 +75.1 +41.8% Leasing and installment sales 161.1 175.7 171.9 171.1 246.0 +74.9 +43.8% Finance 4.8 5.3 6.3 7.9 8.4 +0.5 +7.2% Other 0.8 0.7 0.6 1.2 1.1 -0.1 -9.4% Elimination / corporate -0.5 -0.4 -0.4 -0.5 -0.7 -0.2 - Cost of revenues 144.8 159.6 156.2 154.8 226.0 +71.2 +46.0% Leasing and installment sales 144.4 159.3 155.9 154.2 225.4 +71.2 +46.2% Finance 0.2 0.1 0.1 0.1 0.2 +0.1 +26.8% Other 0.5 0.4 0.3 0.6 0.5 -0.1 -15.3% Elimination / corporate -0.2 -0.1 -0.2 -0.1 -0.2 -0.1 - Gross profit before write-offs and funding costs 21.4 21.8 22.2 25.0 28.9 +3.9 +15.9% Leasing and installment sales 16.7 16.4 15.9 17.0 20.6 +3.6 +21.6% Finance 4.6 5.2 6.2 7.7 8.3 +0.6 +6.9% Other 0.4 0.4 0.3 0.6 0.6 -0.0 -3.0% Elimination / corporate -0.3 -0.2 -0.3 -0.3 -0.5 -0.2 - Gross Profit Before Write-offs and Funding Costs by Segment
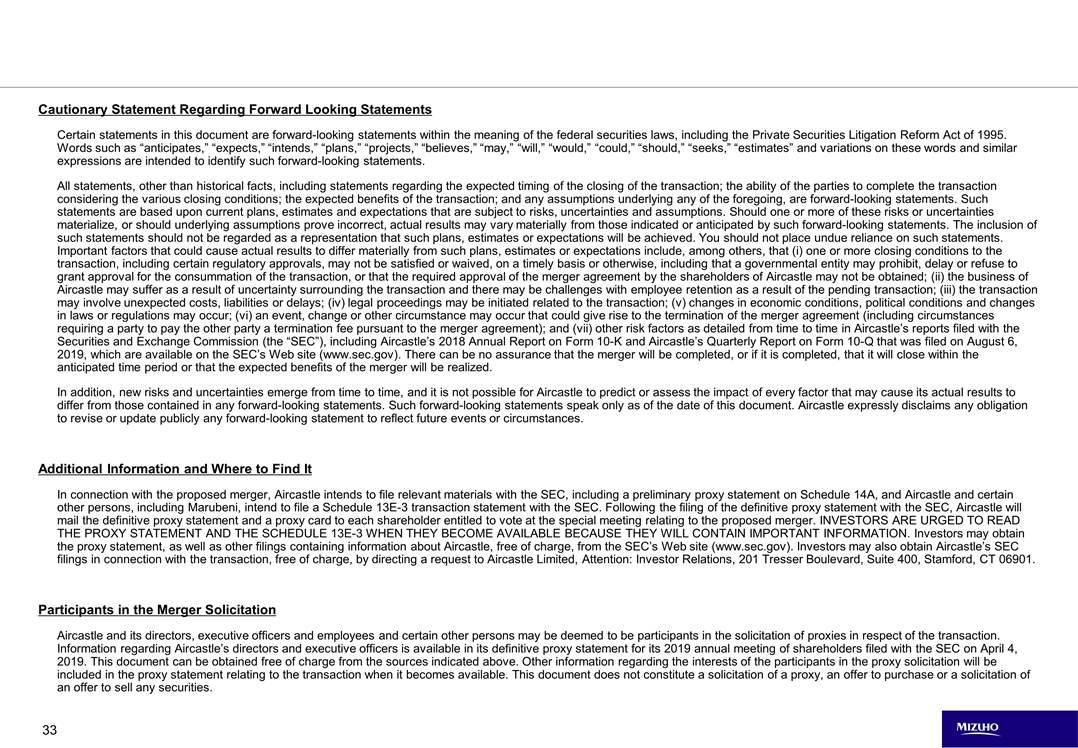
Cautionary Statement Regarding Forward Looking Statements Certain statements in this document are forward-looking statements within the meaning of the federal securities laws, including the Private Securities Litigation Reform Act of 1995. Words such as “anticipates,” “expects,” “intends,” “plans,” “projects,” “believes,” “may,” “will,” “would,” “could,” “should,” “seeks,” “estimates” and variations on these words and similar expressions are intended to identify such forward-looking statements. All statements, other than historical facts, including statements regarding the expected timing of the closing of the transaction; the ability of the parties to complete the transaction considering the various closing conditions; the expected benefits of the transaction; and any assumptions underlying any of the foregoing, are forward-looking statements. Such statements are based upon current plans, estimates and expectations that are subject to risks, uncertainties and assumptions. Should one or more of these risks or uncertainties materialize, or should underlying assumptions prove incorrect, actual results may vary materially from those indicated or anticipated by such forward-looking statements. The inclusion of such statements should not be regarded as a representation that such plans, estimates or expectations will be achieved. You should not place undue reliance on such statements. Important factors that could cause actual results to differ materially from such plans, estimates or expectations include, among others, that (i) one or more closing conditions to the transaction, including certain regulatory approvals, may not be satisfied or waived, on a timely basis or otherwise, including that a governmental entity may prohibit, delay or refuse to grant approval for the consummation of the transaction, or that the required approval of the merger agreement by the shareholders of Aircastle may not be obtained; (ii) the business of Aircastle may suffer as a result of uncertainty surrounding the transaction and there may be challenges with employee retention as a result of the pending transaction; (iii) the transaction may involve unexpected costs, liabilities or delays; (iv) legal proceedings may be initiated related to the transaction; (v) changes in economic conditions, political conditions and changes in laws or regulations may occur; (vi) an event, change or other circumstance may occur that could give rise to the termination of the merger agreement (including circumstances requiring a party to pay the other party a termination fee pursuant to the merger agreement); and (vii) other risk factors as detailed from time to time in Aircastle’s reports filed with the Securities and Exchange Commission (the “SEC”), including Aircastle’s 2018 Annual Report on Form 10-K and Aircastle’s Quarterly Report on Form 10-Q that was filed on August 6, 2019, which are available on the SEC’s Web site (www.sec.gov). There can be no assurance that the merger will be completed, or if it is completed, that it will close within the anticipated time period or that the expected benefits of the merger will be realized. In addition, new risks and uncertainties emerge from time to time, and it is not possible for Aircastle to predict or assess the impact of every factor that may cause its actual results to differ from those contained in any forward-looking statements. Such forward-looking statements speak only as of the date of this document. Aircastle expressly disclaims any obligation to revise or update publicly any forward-looking statement to reflect future events or circumstances. Additional Information and Where to Find It In connection with the proposed merger, Aircastle intends to file relevant materials with the SEC, including a preliminary proxy statement on Schedule 14A, and Aircastle and certain other persons, including Marubeni, intend to file a Schedule 13E-3 transaction statement with the SEC. Following the filing of the definitive proxy statement with the SEC, Aircastle will mail the definitive proxy statement and a proxy card to each shareholder entitled to vote at the special meeting relating to the proposed merger. INVESTORS ARE URGED TO READ THE PROXY STATEMENT AND THE SCHEDULE 13E-3 WHEN THEY BECOME AVAILABLE BECAUSE THEY WILL CONTAIN IMPORTANT INFORMATION. Investors may obtain the proxy statement, as well as other filings containing information about Aircastle, free of charge, from the SEC’s Web site (www.sec.gov). Investors may also obtain Aircastle’s SEC filings in connection with the transaction, free of charge, by directing a request to Aircastle Limited, Attention: Investor Relations, 201 Tresser Boulevard, Suite 400, Stamford, CT 06901. Participants in the Merger Solicitation Aircastle and its directors, executive officers and employees and certain other persons may be deemed to be participants in the solicitation of proxies in respect of the transaction. Information regarding Aircastle’s directors and executive officers is available in its definitive proxy statement for its 2019 annual meeting of shareholders filed with the SEC on April 4, 2019. This document can be obtained free of charge from the sources indicated above. Other information regarding the interests of the participants in the proxy solicitation will be included in the proxy statement relating to the transaction when it becomes available. This document does not constitute a solicitation of a proxy, an offer to purchase or a solicitation of an offer to sell any securities.

Inquiries Mizuho Leasing Company, Limited Corporate Planning Department Corporate Communication Division Tel: +81-3-5253-6540 Fax: +81-3-5253-6539 This document contains forecasts and other forward-looking statements that are based on information available at the time of preparation of this document and subject to certain risks and uncertainties, and is not intended to guarantee that the company would achieve them. Actual business results may differ materially from those expressed or implied by such forward-looking statements due to various factors.


