Exhibit 99.1
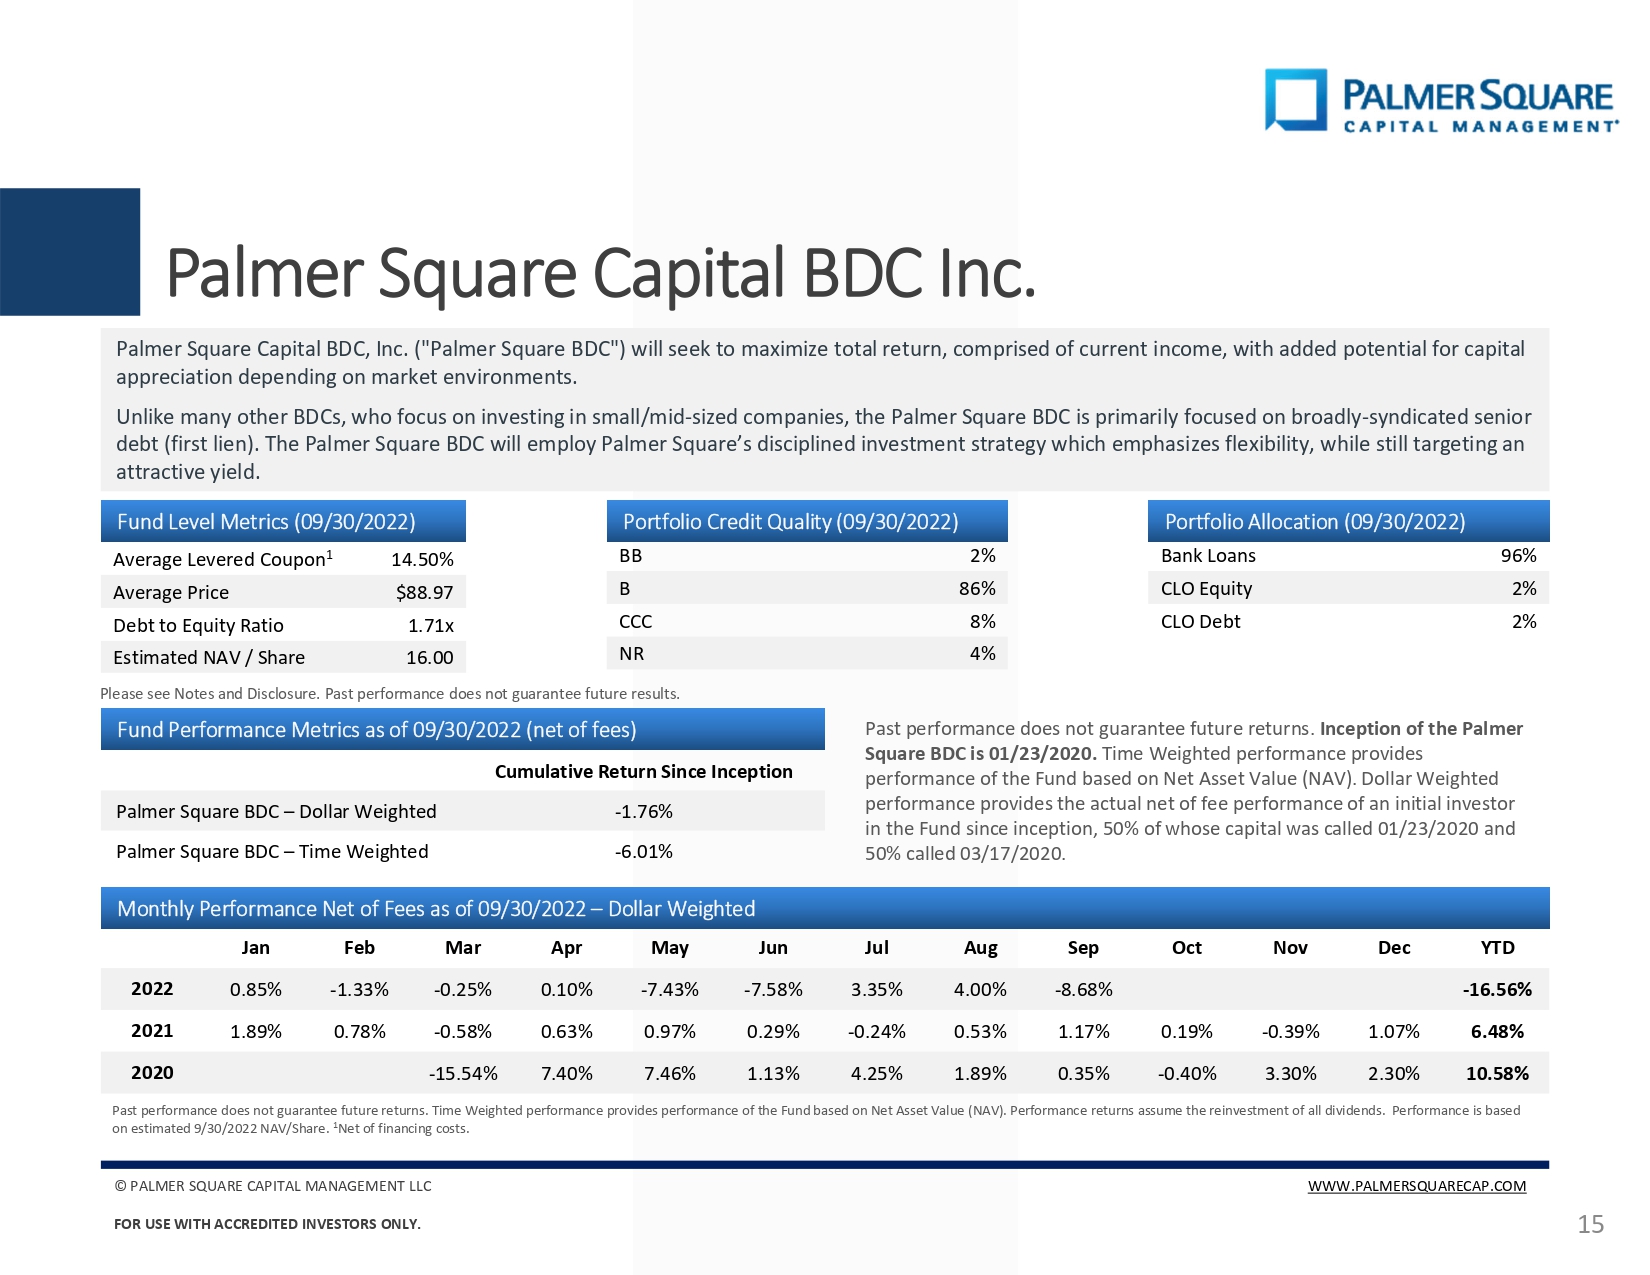
Palmer Square Capital BDC Inc. Palmer Square Capital BDC, Inc . ("Palmer Square BDC") will seek to maximize total return, comprised of current income, with added potential for capital appreciation depending on market environments . Unlike many other BDCs, who focus on investing in small/mid-sized companies, the Palmer Square BDC is primarily focused on broadly-syndicated senior debt (first lien) . The Palmer Square BDC will employ Palmer Square's disciplined investment strategy which emphasizes flexibility, while still targeting an attractive yield . Past performance does not guarantee future returns. Time Weighted performance provides performance of the Fund based on Net Asset Value (NAV). Performance returns assume the reinvestment of all dividends. Performance is based on estimated 9/30/2022 NAV/Share. 1 Net of financing costs. Past performance does not guarantee future returns. Inception of the Palmer Square BDC is 01/23/2020. Time Weighted performance provides performance of the Fund based on Net Asset Value (NAV). Dollar Weighted performance provides the actual net of fee performance of an initial investor in the Fund since inception, 50% of whose capital was called 01/23/2020 and 50% called 03/17/2020. 15 Fund Level Metrics (09/30/2022) Portfolio Credit Quality (09/30/2022) Portfolio Allocation (09/30/2022) Average Levered Coupon 1 14.50% BB 2% Bank Loans 96% Average Price $88.97 B 86% CLO Equity 2% Debt to Equity Ratio 1.71x CCC 8% CLO Debt 2% Estimated NAV / Share 16.00 NR 4% Fund Performance Metrics as of 09/30/2022 (net of fees) Cumulative Return Since Inception Palmer Square BDC - Dollar Weighted -1.76% Palmer Square BDC - Time Weighted -6.01% Monthly Performance Net of Fees as of 09/30/2022 - Dollar Weighted Please see Notes and Disclosure. Past performance does not guarantee future results. Jan Feb Mar Apr May Jun Jul Aug Sep Oct Nov Dec YTD 2022 0.85% -1.33% -0.25% 0.10% -7.43% -7.58% 3.35% 4.00% -8.68% -16.56% 2021 1.89% 0.78% -0.58% 0.63% 0.97% 0.29% -0.24% 0.53% 1.17% 0.19% -0.39% 1.07% 6.48% 2020 -15.54% 7.40% 7.46% 1.13% 4.25% 1.89% 0.35% -0.40% 3.30% 2.30% 10.58% PALMER SQUARE CAPITAL MANAGEMENT LLC WWW.PALMERSQUARECAP.COM FOR USE WITH ACCREDITED INVESTORS ONLY.
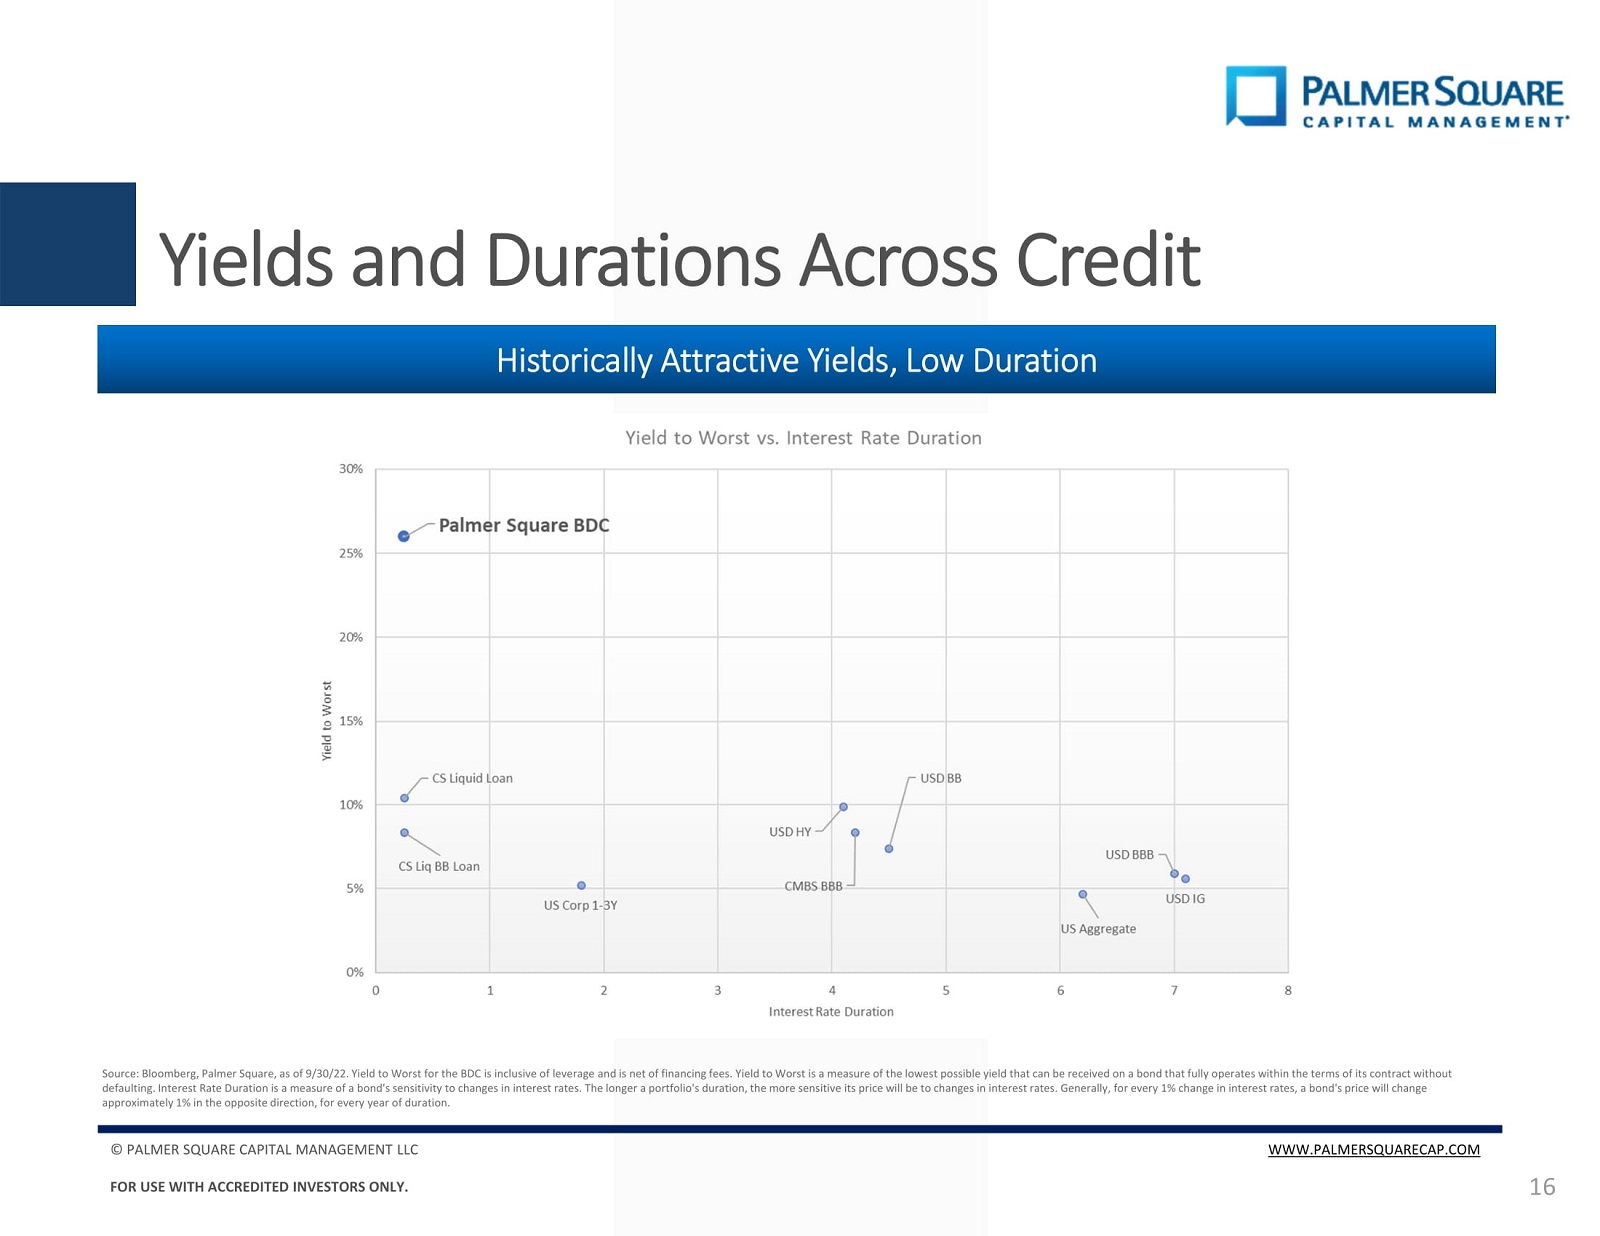
Yields and Durations Across Credit 16 Historically Attractive Yields, Low Duration Historically Attractive Yields, Low Duration Source: Bloomberg, Palmer Square, as of 9/30/22. Yield to Worst for the BDC is inclusive of leverage and is net of financing fees. Yield to Worst is a measure of the lowest possible yield that can be received on a bond that fully operates within the terms of its contract without defaulting. Interest Rate Duration is a measure of a bond's sensitivity to changes in interest rates. The longer a portfolio's duration, the more sensitive its price will be to changes in interest rates. Generally, for every 1% change in interest rates, a bond's price will change approximately 1% in the opposite direction, for every year of duration. © PALMER SQUARE CAPITAL MANAGEMENT LLC WWW.PALMERSQUARECAP.COM FOR USE WITH ACCREDITED INVESTORS ONLY.