UNITED STATES
SECURITIES AND EXCHANGE COMMISSION
Washington, D.C. 20549
FORM N-CSR
CERTIFIED SHAREHOLDER REPORT OF REGISTERED
MANAGEMENT INVESTMENT COMPANIES
Investment Company Act File Number: 811-23494
T. Rowe Price Exchange-Traded Funds, Inc.
(Exact name of registrant as specified in charter)
100 East Pratt Street, Baltimore, MD 21202
(Address of principal executive offices)
David Oestreicher
100 East Pratt Street, Baltimore, MD 21202
(Name and address of agent for service)
Registrant’s telephone number, including area code: (410) 345-2000
Date of fiscal year end: December 31
Date of reporting period: December 31, 2022
Item 1. Reports to Shareholders
(a) Report pursuant to Rule 30e-1
ANNUAL REPORT
December 31, 2022
| | T. ROWE PRICE |
| TEQI | Equity Income ETF |
| | For more insights from T. Rowe Price investment professionals, go to troweprice.com. |
T. ROWE PRICE EQUITY INCOME ETF
HIGHLIGHTS
| ■ | The Equity Income ETF outperformed the Russell 1000 Value Index and its Lipper peer group for the 12 months ended December 31, 2022. |
| ■ | While the fund benefited from an environment that favored lower-valuation names and dividend payers, stock selection drove positive results. Top relative detractors were focused in the energy sector, where some of our picks underperformed a strong sector due to idiosyncratic reasons. |
| ■ | Changes in sector allocations resulted from bottom-up stock selection. Our focus on valuation and a willingness to invest in names under near-term stress benefited the portfolio’s returns. More recently, we found opportunities in cyclical names that priced in a correction as they sold off. |
| ■ | Going forward, our aim is to create a portfolio that is balanced for a variety of market settings, investing in ideas where the risk/reward ratio is particularly attractive while being cognizant of our beta. As always, our focus is on investing in higher-quality companies that offer compelling valuations, attractive long-term fundamentals, and strong dividend yields. |
Sign up for e-delivery of your statements, confirmations, and prospectuses or shareholder reports.
If you invest directly with T. Rowe Price, go to troweprice.com/paperless.
If you invest through an investment advisor, a bank, or a brokerage firm, please contact that organization and ask if it can provide electronic documentation.
It’s fast—receive your statements and
confirmations faster than U.S. mail.
It’s convenient—access your important account documents whenever you need them.
It’s secure—we protect your online accounts using “True Identity” to confirm new accounts and make verification faster and more secure.
It can save you money—where applicable,
T. Rowe Price passes on the cost savings to
fund holders.*
Log in to your account at troweprice.com for more information.
*Certain mutual fund accounts that are assessed an annual account service fee can also save money by switching to e-delivery.
T. ROWE PRICE EQUITY INCOME ETF
Market Commentary
Dear Shareholder
Nearly all major global stock and bond indexes fell sharply in 2022, as investors contended with persistently high inflation, tightening financial conditions, and slowing economic and corporate earnings growth.
Double-digit losses were common in equity markets around the world, and bond investors also faced a historically tough environment amid a sharp rise in interest rates. Value shares declined but outperformed growth stocks by a considerable margin as equity investors turned risk averse and as rising rates put downward pressure on growth stock valuations. Emerging markets stocks generally underperformed shares in developed markets. Meanwhile, the U.S. dollar strengthened versus most currencies during the period, which weighed on returns for U.S. investors in international securities.
Within the S& P 500 Index, energy was a rare bright spot, gaining more than 60% as oil prices jumped in response to Russia’s invasion of Ukraine and concerns over commodity supply shortages. Defensive shares, such as utilities, consumer staples, and health care, held up relatively well and finished the year with roughly flat returns. Conversely, communication services, consumer discretionary, and information technology shares suffered the largest declines.
Elevated inflation remained a leading concern for investors throughout the period, although there were signs that price increases were moderating by year-end. November’s consumer price index data showed headline inflation rising 7.1% on a 12-month basis, the lowest level since December 2021 but still well above the Federal Reserve’s 2% long-term target.
In response to the high inflation readings, global central banks tightened monetary policy, and investors focused on communications from central bank officials on how high rates would have to go. The Fed, which at the end of 2021 had forecast that it would only need to raise interest rates 0.75 percentage point in all of 2022, raised its short-term lending benchmark from near zero in March to a target range of 4.25% to 4.50% by December and indicated that additional hikes are likely.
Bond yields increased considerably across the U.S. Treasury yield curve as the Fed tightened monetary policy, with the yield on the benchmark 10-year U.S. Treasury note climbing from 1.52% at the start of the period to 3.88% at the end of the year. Significant inversions in the yield curve, which are often considered a warning sign of a coming recession, occurred during the period as shorter-maturity Treasuries experienced the largest yield increases. The sharp
T. ROWE PRICE EQUITY INCOME ETF
increase in yields led to historically weak results across the fixed income market, with the Bloomberg U.S. Aggregate Bond Index delivering its worst year on record. (Bond prices and yields move in opposite directions.)
As the period came to an end, the economic backdrop appeared mixed. Although manufacturing gauges have drifted toward contraction levels, the U.S. jobs market remained resilient, and corporate and household balance sheets appeared strong. Meanwhile, the housing market has weakened amid rising mortgage rates.
The past year has been a trying time for investors as few sectors remained untouched by the broad headwinds that markets faced, and volatility may continue in the near term as central banks tighten policy amid slowing economic growth. However, in our view, there continue to be opportunities for selective investors focused on fundamentals. Valuations in most global equity markets have improved markedly, although U.S. equities still appear relatively expensive by historical standards, while bond yields have reached some of the most attractive levels since the 2008 global financial crisis.
We believe this environment makes skilled active management a critical tool for identifying risks and opportunities, and our investment teams will continue to use fundamental research to identify securities that can add value to your portfolio over the long term.
Thank you for your continued confidence in T. Rowe Price.
Sincerely,
Robert Sharps
CEO and President
T. ROWE PRICE EQUITY INCOME ETF
Management’s Discussion of Fund Performance
INVESTMENT OBJECTIVE
The fund seeks a high level of dividend income and long-term capital growth primarily through investments in stocks.
FUND COMMENTARY
How did the fund perform in the past 12 months?
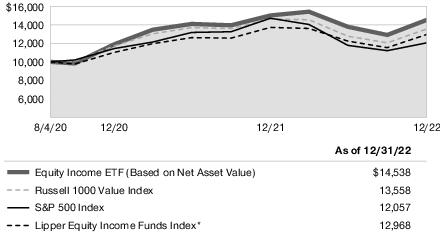
The Equity Income ETF returned -3.25% (based on net asset value) and -3.33% (at market price) for the 12-month period ended December 31, 2022. The fund outperformed the Russell 1000 Value Index and its peer group, the Lipper Equity Income Funds Index. (Past performance cannot guarantee future results.)
What factors influenced the fund’s performance?
Investors shunned riskier assets in 2022 amid various headwinds, including Russia’s invasion of Ukraine, elevated inflation exacerbated by rising commodity prices and supply bottlenecks, surging U.S. Treasury yields, tightening financial conditions, and slowing economic and corporate earnings growth.
PERFORMANCE COMPARISON
| | Total Return |
| Periods Ended 12/31/22 | 6 Months | 12 months |
| Equity Income ETF (Based on Net Asset Value) | 5.39% | -3.25% |
| Equity Income ETF (At Market Price)* | 5.10 | -3.33 |
| Russell 1000 Value Index | 6.11 | -7.54 |
| S&P 500 Index | 2.31 | -18.11 |
| Lipper Equity Income Funds Index | 5.91 | -5.58 |
*Market returns are based on the midpoint of the bid/ask spread at market close (typically, 4 p.m. ET) and do not represent returns an investor would have received if shares were traded at other times.
T. ROWE PRICE EQUITY INCOME ETF
The Equity Income ETF outpaced its benchmark, driven by stock selection and sector allocation. The portfolio was well prepared for an environment of higher interest rates and commodity prices after we repositioned our holdings during the worst of the coronavirus pandemic. This positioning, combined with our valuation discipline and focus on dividend yield, helped relative returns as much of the pain in equity markets over 2022 was in higher-multiple stocks.
Financials sector names contributed to relative results, particularly those within the insurance industry. Our positions in American International Group (AIG) and Chubb continued to perform well amid a property and casualty (P&C) upcycle. AIG posted solid gains, although the stock was briefly pressured by the spinoff of its life and retirement business in September before advancing as the positive impact of the company’s focus on its P&C business became clearer to investors. MetLife also benefited from operational excellence early in the year and rising interest rates that helped the company’s investment returns. (Please refer to the portfolio of investments for a complete list of holdings and the amount each represents in the portfolio.)
Consumer discretionary names helped performance due to stock selection and an underweight allocation to the sector. Our position in Las Vegas Sands was a notable contributor. The casino and resort operator lagged its peers early in the period as China’s pandemic lockdowns delayed reopening in Macau. However, in the year’s second half, Las Vegas Sands’ shares rose amid a strong recovery in the company’s Singapore operations followed by optimism after China eased some of its COVID-19 restrictions. The company also had its gaming concession renewed to continue operating in Macau, removing a significant regulatory overhang on the stock. TJX, a leading off-price retailer, also added value as bargain-seeking consumers flocked to discount stores amid rising inflation. TJX also benefited from an excess of retail inventory throughout the year, which created a favorable buying environment for the retailer.
In the materials sector, CF Industries, a hydrogen and nitrogen products manufacturer, supported relative returns, as surging natural gas and fertilizer prices pushed the stock higher for most of the period. A decline in fertilizer demand weighed on the stock in the fourth quarter; however, we believe this is a temporary headwind.
Conversely, French integrated energy producer TotalEnergies was an absolute contributor but detracted from relative performance as its shares advanced yet underperformed the broader energy sector. TotalEnergies shares fell early in the year amid concerns about its Russia exposure but subsequently recovered when the company was selected to participate in a multibillion-dollar liquefied natural gas project in Qatar. More recently, the shares fell again due to the stronger U.S.
T. ROWE PRICE EQUITY INCOME ETF
dollar and after the company reported increased capital expenditure. TC Energy, a pipeline and storage facilities operator, also detracted as cost overruns at key development projects heightened concerns about increased financing costs in a rising interest rate environment.
In information technology, chipmaker Qualcomm and software company Microsoft detracted from relative results as rising inflation and interest rates impacted the sector and led investors to reevaluate the earnings growth potential of technology companies in a slowing economic environment. Weakening personal computer demand after a pandemic-driven sales boom also held back Microsoft’s shares.
SECTOR DIVERSIFICATION
| | Percent of Net Assets |
| | 6/30/22 | 12/31/22 |
| Financials | 20.1 % | 21.4 % |
| Health Care | 18.3 | 18.0 |
| Industrials and Business Services | 9.3 | 10.0 |
| Energy | 7.6 | 8.7 |
| Utilities | 10.2 | 8.5 |
| Consumer Staples | 7.2 | 7.1 |
| Information Technology | 7.7 | 7.0 |
| Communication Services | 5.2 | 5.2 |
| Consumer Discretionary | 3.7 | 4.4 |
| Materials | 5.3 | 4.4 |
| Real Estate | 4.4 | 4.0 |
| Other and Reserves | 1.0 | 1.3 |
| Total | 100.0% | 100.0% |
Historical weightings reflect current industry/sector classifications.
T. ROWE PRICE EQUITY INCOME ETF
How is the fund positioned?
The Equity Income ETF seeks to buy well-established, large-cap companies that have a strong record of paying dividends and appear to be undervalued by the market. The fund’s holdings tend to be solid, higher-quality companies going through a period of controversy or stress, reflecting our dual focus on valuation and dividend yield. Each position is the product of careful stock picking based on the fundamental research generated by T. Rowe Price’s equity analysts team, as opposed to selection based on broader market or macroeconomic trends.
Top purchases covered varied sectors of the market. In industrials and business services, we initiated a position in tool manufacturing company Stanley Black & Decker. The company has excellent brands, in our view, but has struggled with capital allocation and broader market fears around a housing slowdown, supply chain volatility, and rising inflation. However, we believe the company has improved and streamlined its portfolio and that the current backdrop offered an opportunity for improvement.
In communication services, we started a position in telecommunications conglomerate Verizon Communications. We believe that the company’s operating performance in wireless is stabilizing and management’s forecast decline in capital expenditure should help drive free cash flow growth. Within financials, the banking industry presented several compelling opportunities. We purchased shares of U.S. Bancorp, one of the largest U.S. banks, for its defensive credit profile and attractive valuation.
Turning to sales, our largest sale was biopharmaceutical company AbbVie, which we sold shares of to manage our position size. We continue to believe that the company will successfully navigate competition from Humira biosimilars but believe the stock’s risk/reward profile is more balanced at current levels. In utilities, we reduced and ultimately eliminated our position in electric and natural gas utility XCEL Energy in the year’s latter half to focus on other ideas with more compelling risk/reward profiles. In financials, we sold shares of investment bank Goldman Sachs to moderate our capital markets industry exposure.
What is portfolio management’s outlook?
The range of outcomes in the equity market remains abnormally wide. We expect continued volatility, as investors react to new metrics as they are reported. Amid the uncertainty, we believe there is risk in being too anchored to a particular macro outlook. The balance of economic data suggests that a recession is imminent, although such an event is broadly anticipated, making the eventual
T. ROWE PRICE EQUITY INCOME ETF
recession arguably the “most consensus” one in history. In all likelihood, the severity of the recession will depend on the degree to which the Federal Reserve targets the labor market, which remains tight even as economic data weaken. Should the Fed “declare victory” at an inflation level above its stated target, the equity market would likely rally. Conversely, if the Fed’s aim is to disrupt the labor market, the equity market may move lower.
We believe it is important to respect the uncertainty of this investing environment and use it to our clients’ advantage by selectively leaning into weakness and trimming on strength. We strive to maintain balance in the portfolio, which should help make our performance less dependent on a particular macroeconomic outcome and offer a chance to outperform in a variety of markets. While there are many near-term unknowns affecting the market’s trajectory, we remain confident that our approach centered on individual stock picking, company fundamentals, and attention to valuation will help generate strong returns for shareholders over time.
The views expressed reflect the opinions of T. Rowe Price as of the date of this report and are subject to change based on changes in market, economic, or other conditions. These views are not intended to be a forecast of future events and are no guarantee of future results.
T. ROWE PRICE EQUITY INCOME ETF
RISKS OF INVESTING IN THE FUND
DIVIDEND-PAYING STOCKS
The fund’s emphasis on dividend-paying stocks could cause the fund to underperform similar funds that invest without consideration of a company’s track record of paying dividends. There is no guarantee that the issuers of the stocks held by the fund will declare dividends in the future or that, if dividends are declared, they will remain at their current levels or increase over time. For example, a sharp rise in interest rates or an economic downturn could cause a company to unexpectedly reduce or eliminate its dividend. In addition, stocks of companies with a history of paying dividends may not benefit from a broad market advance to the same degree as the overall stock market.
STOCK INVESTING
The fund’s share price can fall because of weakness in the overall stock markets, a particular industry, or specific holdings. Stock markets as a whole can be volatile and decline for many reasons, such as adverse local, political, regulatory, or economic developments; changes in investor psychology; or heavy institutional selling at the same time by major institutional investors in the market, such as mutual funds, pension funds, and banks. The prospects for an industry or company may deteriorate because of a variety of factors, including disappointing earnings or changes in the competitive environment. In addition, the adviser’s assessment of companies whose stocks are held by the fund may prove incorrect, resulting in losses or poor performance, even in rising markets. In the event an issuer is liquidated or declares bankruptcy, the claims of owners of the issuer’s bonds and preferred stock take precedence over the claims of those who own common stock.
For a more thorough discussion of risks, please see the fund’s prospectus.
BENCHMARK INFORMATION
Note: London Stock Exchange Group plc and its group undertakings (collectively, the “LSE Group”). © LSE Group 2023. FTSE Russell is a trading name of certain of the LSE Group companies. Russell® is a trade mark of the relevant LSE Group companies and is used by any other LSE Group company under license. All rights in the FTSE Russell indexes or data vest in the relevant
T. ROWE PRICE EQUITY INCOME ETF
LSE Group company which owns the index or the data. Neither LSE Group nor its licensors accept any liability for any errors or omissions in the indexes or data and no party may rely on any indexes or data contained in this communication. No further distribution of data from the LSE Group is permitted without the relevant LSE Group company’s express written consent. The LSE Group does not promote, sponsor or endorse the content of this communication. The LSE Group is not responsible for the formatting or configuration of this material or for any inaccuracy in T. Rowe Price’s presentation thereof.
Note: Portions of the mutual fund information contained in this report was supplied by Lipper, a Refinitiv Company, subject to the following: Copyright 2023 © Refinitiv. All rights reserved. Any copying, republication or redistribution of Lipper content is expressly prohibited without the prior written consent of Lipper. Lipper shall not be liable for any errors or delays in the content, or for any actions taken in reliance thereon.
T. ROWE PRICE EQUITY INCOME ETF
PORTFOLIO HIGHLIGHTS
TWENTY-FIVE LARGEST ISSUERS
| | Percent of
Net Assets |
| | 12/31/22 |
| TotalEnergies | 3.2 % |
| Wells Fargo | 3.1 |
| Southern Company | 3.0 |
| GE | 3.0 |
| American International Group | 2.6 |
| Elevance Health | 2.3 |
| Qualcomm | 2.1 |
| Becton, Dickinson & Company | 2.1 |
| Sempra Energy | 2.0 |
| Johnson & Johnson | 2.0 |
| Chubb | 2.0 |
| UPS | 2.0 |
| CF Industries | 1.8 |
| Philip Morris International | 1.7 |
| Conagra Brands | 1.7 |
| L3Harris Technologies | 1.6 |
| Kimberly-Clark | 1.6 |
| News Corp | 1.6 |
| MetLife | 1.6 |
| Equitable Holdings | 1.6 |
| ExxonMobil | 1.6 |
| Weyerhaeuser | 1.6 |
| AbbVie | 1.5 |
| Equity Residential | 1.4 |
| International Paper | 1.4 |
| Total | 50.1% |
Note: The information shown does not reflect any exchange-traded funds (ETFs), cash reserves, or collateral for securities lending that may be held in the portfolio.
T. ROWE PRICE EQUITY INCOME ETF
GROWTH OF $10,000
This chart shows the value of a hypothetical $10,000 investment in the fund over the past 10 fiscal year periods or since inception (for funds lacking 10-year records). The result is compared with benchmarks, which include a broad-based market index and may also include a peer group average or index. Market indexes do not include expenses, which are deducted from fund returns as well as mutual fund averages and indexes.
Equity Income ETF
Note: See the Average Annual Compound Total Return table.
*Since 8/31/20.
T. ROWE PRICE EQUITY INCOME ETF
AVERAGE ANNUAL COMPOUND TOTAL RETURN
| Periods Ended 12/31/22 | One Year | Since
Inception
8/4/20 |
| Equity Income ETF (Based on Net Asset Value) | -3.25% | 16.82% |
| Equity Income ETF (At Market Price) | -3.33 | 16.79 |
The fund’s performance information represents only past performance and is not necessarily an indication of future results. Current performance may be lower or higher than the performance data cited. Share price, principal value, and return will vary, and you may have a gain or loss when you sell your shares. Market returns are based on the midpoint of the bid/ask spread at market close (typically, 4 p.m. ET) and do not represent returns an investor would have received if shares were traded at other times. For the most recent month-end performance, please visit our website (troweprice.com).
This table shows how the fund would have performed each year if its actual (or cumulative) returns had been earned at a constant rate. Average annual total return figures include changes in principal value, reinvested dividends, and capital gain distributions. Returns do not reflect taxes that the shareholder may pay on fund distributions or the redemption of fund shares. When assessing performance, investors should consider both short- and long-term returns.
PREMIUM/DISCOUNT INFORMATION
The frequency at which the daily market prices were at a discount or premium to the fund’s net asset value is available on the fund’s website (troweprice.com).
EXPENSE RATIO
The expense ratio shown is as of the fund’s most recent prospectus. This number may vary from the expense ratio shown elsewhere in this report because it is based on a different time period and, if applicable, includes acquired fund fees and expenses but does not include fee or expense waivers.
T. ROWE PRICE EQUITY INCOME ETF
FUND EXPENSE EXAMPLE
As a shareholder, you may incur two types of costs: (1) transaction costs, such as brokerage commissions on purchases and sales, and (2) ongoing costs, including management fees and other fund expenses. The following example is intended to help you understand your ongoing costs (in dollars) of investing in the fund and to compare these costs with the ongoing costs of investing in other funds. The example is based on an investment of $1,000 invested at the beginning of the most recent six-month period and held for the entire period.
Actual Expenses
The first line of the following table (Actual) provides information about actual account values and expenses based on the fund’s actual returns. You may use the information on this line, together with your account balance, to estimate the expenses that you paid over the period. Simply divide your account value by $1,000 (for example, an $8,600 account value divided by $1,000 = 8.6), then multiply the result by the number on the first line under the heading “Expenses Paid During Period” to estimate the expenses you paid on your account during this period.
Hypothetical Example for Comparison Purposes
The information on the second line of the table (Hypothetical) is based on hypothetical account values and expenses derived from the fund’s actual expense ratio and an assumed 5% per year rate of return before expenses (not the fund’s actual return). You may compare the ongoing costs of investing in the fund with other funds by contrasting this 5% hypothetical example and the 5% hypothetical examples that appear in the shareholder reports of the other funds. The hypothetical account values and expenses may not be used to estimate the actual ending account balance or expenses you paid for the period.
You should also be aware that the expenses shown in the table highlight only your ongoing costs and do not reflect any transaction costs, such as brokerage commissions paid on purchases and sales of shares. Therefore, the second line of the table is useful in comparing ongoing costs only and will not help you determine the relative total costs of owning different funds. To the extent a fund charges transaction costs, however, the total cost of owning that fund is higher.
T. ROWE PRICE EQUITY INCOME ETF
FUND EXPENSE EXAMPLE (continued)
Equity Income ETF
| | Beginning
Account Value
7/1/22 | Ending
Account Value
12/31/22 | Expenses Paid
During Period*
7/1/22 to 12/31/22 |
| Actual | $1,000.00 | $1,053.90 | $2.80 |
| Hypothetical (assumes 5% return before expenses) | 1,000.00 | 1,022.48 | 2.75 |
| * | Expenses are equal to the fund’s annualized expense ratio for the 6-month period (0.54%), multiplied by the average account value over the period, multiplied by the number of days in the most recent fiscal half year (184), and divided by the days in the year (365) to reflect the half-year period. |
T. ROWE PRICE EQUITY INCOME ETF
For a share outstanding throughout each period
| | Year
Ended | | 8/4/20 (1)
Through |
| | 12/31/22 | 12/31/21 | 12/31/20 |
| NET ASSET VALUE | | | |
| Beginning of period | $ 36.08 | $ 29.49 | $ 25.00 |
| Investment activities | | | |
| Net investment income(2) (3) | 0.74 | 0.64 | 0.27 |
| Net realized and unrealized gain/loss | (1.93) | 7.04 | 4.46 |
| Total from investment activities | (1.19) | 7.68 | 4.73 |
| Distributions | | | |
| Net investment income | (0.70) | (0.59) | (0.24) |
| Net realized gain | (0.09) | (0.50) | - |
| Total distributions to shareholders | (0.79) | (1.09) | (0.24) |
| NET ASSET VALUE | | | |
| End of period | $ 34.10 | $ 36.08 | $ 29.49 |
| Ratios/Supplemental Data |
| Total return, based on NAV(3) (4) | (3.25)% | 26.25% | 19.01% |
Ratios to average net
assets:(3) | | | |
Gross expenses before
waivers/payments by
Price Associates | 0.54% | 0.54% | 0.54% (5) |
Net expenses after
waivers/payments by
Price Associates | 0.54% | 0.54% | 0.54% (5) |
| Net investment income | 2.13% | 1.85% | 2.44% (5) |
| Portfolio turnover rate(6) | 19.7% | 24.5% | 9.0% |
Net assets, end of period
(in thousands) | $ 99,063 | $ 57,722 | $ 23,883 |
| (1) | Inception date |
| (2) | Per share amounts calculated using average shares outstanding method. |
| (3) | See Note 6 for details to expense-related arrangements with Price Associates. |
| (4) | Total return reflects the rate that an investor would have earned on an investment in the fund during each period, assuming reinvestment of all distributions. Total return is not annualized for periods less than one year. |
| (5) | Annualized |
| (6) | Portfolio turnover excludes securities received or delivered through in-kind share transactions. |
The accompanying notes are an integral part of these financial statements.
T. ROWE PRICE EQUITY INCOME ETF
December 31, 2022
| PORTFOLIO OF INVESTMENTS‡ | Shares | $ Value |
| (Cost and value in $000s) | | |
| COMMON STOCKS 98.7% |
| COMMUNICATION SERVICES 5.2% |
| Diversified Telecommunication Services 0.8% | | |
| AT&T | 10,622 | 195 |
| Verizon Communications | 15,554 | 613 |
| | | 808 |
| Entertainment 1.2% | | |
| Walt Disney (1) | 12,866 | 1,118 |
| Warner Bros Discovery (1) | 4,436 | 42 |
| | | 1,160 |
| Interactive Media & Services 0.5% | | |
| Meta Platforms, Class A (1) | 4,122 | 496 |
| | | 496 |
| Media 2.7% | | |
| Comcast, Class A | 28,489 | 996 |
| Fox, Class B | 3,560 | 101 |
| News, Class A | 85,854 | 1,563 |
| Paramount Global | 3,916 | 66 |
| | | 2,726 |
| Total Communication Services | | 5,190 |
| CONSUMER DISCRETIONARY 4.4% |
| Automobiles 1.0% | | |
| General Motors | 29,485 | 992 |
| | | 992 |
| Hotels Restaurants & Leisure 1.0% | | |
| Las Vegas Sands (1) | 20,165 | 969 |
| | | 969 |
T. ROWE PRICE EQUITY INCOME ETF
| | Shares | $ Value |
| (Cost and value in $000s) | | |
| Leisure Products 0.7% | | |
| Mattel (1) | 36,734 | 656 |
| | | 656 |
| Multiline Retail 0.4% | | |
| Kohl's | 17,381 | 439 |
| | | 439 |
| Specialty Retail 1.3% | | |
| Best Buy | 5,478 | 439 |
| TJX | 10,488 | 835 |
| | | 1,274 |
| Total Consumer Discretionary | | 4,330 |
| CONSUMER STAPLES 7.1% |
| Beverages 0.2% | | |
| Coca-Cola | 122 | 8 |
| Constellation Brands, Class A | 900 | 208 |
| | | 216 |
| Food & Staples Retailing 0.9% | | |
| Walmart | 6,378 | 904 |
| | | 904 |
| Food Products 2.7% | | |
| Conagra Brands | 42,735 | 1,654 |
| Mondelez International | 2,186 | 146 |
| Tyson Foods, Class A | 13,471 | 838 |
| | | 2,638 |
| Household Products 1.6% | | |
| Kimberly-Clark | 11,688 | 1,587 |
| | | 1,587 |
T. ROWE PRICE EQUITY INCOME ETF
| | Shares | $ Value |
| (Cost and value in $000s) | | |
| Tobacco 1.7% | | |
| Philip Morris International | 16,872 | 1,708 |
| | | 1,708 |
| Total Consumer Staples | | 7,053 |
| ENERGY 8.7% |
| Oil, Gas & Consumable Fuels 8.7% | | |
| Chevron | 1,843 | 331 |
| Enbridge | 6,530 | 255 |
| EOG Resources | 8,967 | 1,161 |
| Exxon Mobil | 13,945 | 1,538 |
| Hess | 6,168 | 875 |
| Targa Resources | 1,066 | 78 |
| TC Energy | 29,138 | 1,162 |
| TotalEnergies, ADR | 51,419 | 3,192 |
| Williams | 2,252 | 74 |
| Total Energy | | 8,666 |
| FINANCIALS 21.2% |
| Banks 7.9% | | |
| Bank of America | 16,722 | 554 |
| Citigroup | 11,770 | 532 |
| Fifth Third Bancorp | 31,499 | 1,034 |
| Huntington Bancshares | 92,291 | 1,301 |
| JPMorgan Chase | 5,437 | 729 |
| PNC Financial Services Group | 1,305 | 206 |
| US Bancorp | 10,000 | 436 |
| Wells Fargo | 74,007 | 3,056 |
| | | 7,848 |
| Capital Markets 3.4% | | |
| Charles Schwab | 6,686 | 557 |
| Franklin Resources | 3,642 | 96 |
| Goldman Sachs Group | 3,579 | 1,229 |
T. ROWE PRICE EQUITY INCOME ETF
| | Shares | $ Value |
| (Cost and value in $000s) | | |
| Morgan Stanley | 8,629 | 734 |
| Raymond James Financial | 1,004 | 107 |
| State Street | 8,025 | 622 |
| | | 3,345 |
| Diversified Financial Services 1.8% | | |
| Apollo Global Management | 3,218 | 205 |
| Equitable Holdings | 54,092 | 1,553 |
| | | 1,758 |
| Insurance 8.1% | | |
| American International Group | 40,008 | 2,530 |
| Chubb | 9,092 | 2,006 |
| Hartford Financial Services Group | 12,708 | 964 |
| Loews | 17,585 | 1,026 |
| Marsh & McLennan | 24 | 4 |
| MetLife | 21,522 | 1,557 |
| | | 8,087 |
| Total Financials | | 21,038 |
| HEALTH CARE 18.0% |
| Biotechnology 1.8% | | |
| AbbVie | 9,435 | 1,525 |
| Biogen (1) | 1,063 | 294 |
| | | 1,819 |
| Health Care Equipment & Supplies 4.2% | | |
| Becton Dickinson | 8,063 | 2,051 |
| Medtronic | 11,712 | 910 |
| Zimmer Biomet Holdings | 9,076 | 1,157 |
| | | 4,118 |
| Health Care Providers & Services 5.9% | | |
| Cardinal Health | 7,869 | 605 |
| Centene (1) | 7,908 | 649 |
T. ROWE PRICE EQUITY INCOME ETF
| | Shares | $ Value |
| (Cost and value in $000s) | | |
| Cigna | 3,619 | 1,199 |
| CVS Health | 11,861 | 1,105 |
| Elevance Health | 4,519 | 2,318 |
| | | 5,876 |
| Pharmaceuticals 6.1% | | |
| AstraZeneca, ADR | 8,478 | 575 |
| GSK, ADR | 114 | 4 |
| Johnson & Johnson | 11,429 | 2,019 |
| Merck | 8,431 | 935 |
| Pfizer | 26,086 | 1,337 |
| Sanofi, ADR | 20,678 | 1,001 |
| Viatris | 17,980 | 200 |
| | | 6,071 |
| Total Health Care | | 17,884 |
| INDUSTRIALS & BUSINESS SERVICES 10.0% |
| Aerospace & Defense 2.5% | | |
| Boeing (1) | 4,800 | 914 |
| L3Harris Technologies | 7,672 | 1,598 |
| | | 2,512 |
| Air Freight & Logistics 2.0% | | |
| United Parcel Service, Class B | 11,497 | 1,999 |
| | | 1,999 |
| Airlines 0.5% | | |
| Southwest Airlines (1) | 14,053 | 473 |
| | | 473 |
| Commercial Services & Supplies 0.7% | | |
| Stericycle (1) | 12,857 | 641 |
| | | 641 |
T. ROWE PRICE EQUITY INCOME ETF
| | Shares | $ Value |
| (Cost and value in $000s) | | |
| Industrial Conglomerates 3.1% | | |
| 3M | 1,282 | 154 |
| General Electric | 35,000 | 2,932 |
| | | 3,086 |
| Machinery 1.2% | | |
| Cummins | 1,082 | 262 |
| Flowserve | 2,841 | 87 |
| PACCAR | 1,796 | 178 |
| Stanley Black & Decker | 8,596 | 646 |
| | | 1,173 |
| Total Industrials & Business Services | | 9,884 |
| INFORMATION TECHNOLOGY 7.0% |
| Communications Equipment 0.4% | | |
| Cisco Systems | 8,917 | 425 |
| | | 425 |
| Electronic Equipment, Instruments & Components 0.3% | | |
| TE Connectivity | 2,249 | 258 |
| | | 258 |
| IT Services 1.0% | | |
| Accenture, Class A | 648 | 173 |
| Fiserv (1) | 8,333 | 842 |
| | | 1,015 |
| Semiconductors & Semiconductor Equipment 4.0% | | |
| Applied Materials | 7,408 | 721 |
| NXP Semiconductors | 949 | 150 |
| QUALCOMM | 18,814 | 2,068 |
| Texas Instruments | 6,298 | 1,041 |
| | | 3,980 |
T. ROWE PRICE EQUITY INCOME ETF
| | Shares | $ Value |
| (Cost and value in $000s) | | |
| Software 1.3% | | |
| Microsoft | 5,164 | 1,239 |
| | | 1,239 |
| Total Information Technology | | 6,917 |
| MATERIALS 4.4% |
| Chemicals 3.0% | | |
| CF Industries Holdings | 21,515 | 1,833 |
| DuPont de Nemours | 1,479 | 102 |
| International Flavors & Fragrances | 6,477 | 679 |
| PPG Industries | 144 | 18 |
| RPM International | 3,154 | 307 |
| | | 2,939 |
| Containers & Packaging 1.4% | | |
| International Paper | 40,246 | 1,394 |
| | | 1,394 |
| Total Materials | | 4,333 |
| REAL ESTATE 4.0% |
| Equity Real Estate Investment Trusts 4.0% | | |
| Equity Residential, REIT | 23,787 | 1,404 |
| Rayonier, REIT | 23,903 | 788 |
| Simon Property Group, REIT | 88 | 10 |
| Vornado Realty Trust, REIT | 2,785 | 58 |
| Welltower, REIT | 2,608 | 171 |
| Weyerhaeuser, REIT | 49,613 | 1,538 |
| Total Real Estate | | 3,969 |
| UTILITIES 8.5% |
| Electric Utilities 3.7% | | |
| NextEra Energy | 6,413 | 536 |
| PG&E (1) | 7,220 | 118 |
| Southern | 42,165 | 3,011 |
T. ROWE PRICE EQUITY INCOME ETF
| | Shares | $ Value |
| (Cost and value in $000s) | | |
| Xcel Energy | 48 | 3 |
| | | 3,668 |
| Multi-Utilities 4.8% | | |
| Ameren | 7,438 | 662 |
| Dominion Energy | 19,475 | 1,194 |
| NiSource | 29,951 | 821 |
| Sempra Energy | 13,138 | 2,030 |
| | | 4,707 |
| Total Utilities | | 8,375 |
| Total Miscellaneous Common Stocks 0.2% (2) | | 167 |
| Total Common Stocks (Cost $95,338) | | 97,806 |
| SHORT-TERM INVESTMENTS 1.1% |
| Money Market Funds 1.1% | | |
| State Street Institutional U.S. Government Money Market Fund, 4.12% (3) | 1,085,550 | 1,086 |
| Total Short-Term Investments (Cost $1,086) | | 1,086 |
Total Investments in Securities
99.8% of Net Assets (Cost $96,424) | | $ 98,892 |
| ‡ | Shares are denominated in U.S. dollars unless otherwise noted. |
| (1) | Non-income producing. |
| (2) | The identity of certain securities has been concealed to protect the fund while it completes a purchase or selling program for the securities. |
| (3) | Seven-day yield |
| ADR | American Depositary Receipts |
| REIT | A domestic Real Estate Investment Trust whose distributions pass-through with original tax character to the shareholder |
The accompanying notes are an integral part of these financial statements.
T. ROWE PRICE EQUITY INCOME ETF
December 31, 2022
STATEMENT OF ASSETS AND LIABILITIES
($000s, except shares and per share amounts)
| Assets | |
| Investments in securities, at value (cost $96,424) | $ 98,892 |
| Receivable for shares sold | 1,367 |
| Dividends receivable | 212 |
| Other assets | 9 |
| Total assets | 100,480 |
| Liabilities | |
| Payable for investment securities purchased | 1,361 |
| Investment management and administrative fees payable | 47 |
| Other liabilities | 9 |
| Total liabilities | 1,417 |
| NET ASSETS | $ 99,063 |
| Net assets consists of: | |
| Total distributable earnings (loss) | $ 2,050 |
Paid-in capital applicable to 2,905,000 shares of $0.0001 par value
capital stock outstanding; 4,000,000,000 shares authorized | 97,013 |
| NET ASSETS | $ 99,063 |
| NET ASSET VALUE PER SHARE | $ 34.10 |
The accompanying notes are an integral part of these financial statements.
T. ROWE PRICE EQUITY INCOME ETF
STATEMENT OF OPERATIONS
($000s)
| | Year
Ended |
| | 12/31/22 |
| Investment Income (Loss) | |
| Dividend income (net of foreign taxes of $47) | $ 2,312 |
| Investment management and administrative expense | 468 |
| Net investment income | 1,844 |
| Realized and Unrealized Gain / Loss | |
| Net realized gain (loss) | |
| Securities | (462) |
| In-kind redemptions | 3,317 |
| Net realized gain | 2,855 |
| Change in net unrealized gain / loss on securities | (7,462) |
| Net realized and unrealized gain / loss | (4,607) |
| DECREASE IN NET ASSETS FROM OPERATIONS | $ (2,763) |
The accompanying notes are an integral part of these financial statements.
T. ROWE PRICE EQUITY INCOME ETF
STATEMENT OF CHANGES IN NET ASSETS
($000s)
| | Year
Ended | | |
| | 12/31/22 | | 12/31/21 |
| Increase (Decrease) in Net Assets | | | |
| Operations | | | |
| Net investment income | $ 1,844 | | $ 814 |
| Net realized gain | 2,855 | | 1,021 |
| Change in net unrealized gain / loss | (7,462) | | 6,716 |
| Increase (Decrease) in net assets from operations | (2,763) | | 8,551 |
| Distributions to shareholders | | | |
| Net earnings | (2,076) | | (1,590) |
| Capital share transactions* | | | |
| Shares sold | 58,424 | | 26,878 |
| Shares redeemed | (12,244) | | — |
| Increase in net assets from capital share transactions | 46,180 | | 26,878 |
| Net Assets | | | |
| Increase during period | 41,341 | | 33,839 |
| Beginning of period | 57,722 | | 23,883 |
| End of period | $ 99,063 | | $ 57,722 |
| *Share information | | | |
| Shares sold | 1,655 | | 790 |
| Shares redeemed | (350) | | — |
| Increase in shares outstanding | 1,305 | | 790 |
The accompanying notes are an integral part of these financial statements.
T. ROWE PRICE EQUITY INCOME ETF
NOTES TO FINANCIAL STATEMENTS
T. Rowe Price Exchange-Traded Funds, Inc. (the corporation) is registered under the Investment Company Act of 1940 (the 1940 Act). The Equity Income ETF (the fund) is a diversified, open-end management investment company established by the corporation. The fund seeks a high level of dividend income and long-term capital growth primarily through investments in stocks.
The fund is considered an actively-managed exchange-traded fund (ETF) that does not disclose its portfolio holdings daily, which is different from a traditional ETF and may create additional risks. In order to provide market participants with information on the fund’s investments, the fund publishes a “Proxy Portfolio” on its website daily. A Proxy Portfolio is a basket of securities that is designed to closely track the daily performance of the fund’s portfolio holdings. While the Proxy Portfolio includes some of the fund’s holdings, it is not the fund’s actual portfolio. The fund does disclose its full portfolio holdings on a quarterly basis, similar to mutual funds.
NOTE 1 – SIGNIFICANT ACCOUNTING POLICIES
Basis of Preparation
The fund is an investment company and follows accounting and reporting guidance in the Financial Accounting Standards Board (FASB) Accounting Standards Codification Topic 946 (ASC 946). The accompanying financial statements were prepared in accordance with accounting principles generally accepted in the United States of America (GAAP), including, but not limited to, ASC 946. GAAP requires the use of estimates made by management. Management believes that estimates and valuations are appropriate; however, actual results may differ from those estimates, and the valuations reflected in the accompanying financial statements may differ from the value ultimately realized upon sale or maturity.
Investment Transactions, Investment Income, and Distributions
Investment transactions are accounted for on the trade date basis. Income and expenses are recorded on the accrual basis. Realized gains and losses are reported on the identified cost basis. Income tax-related interest and penalties, if incurred, are recorded as income tax expense. Dividends received from other investment companies are reflected as dividend income; capital gain distributions are reflected as realized gain/loss. Dividend income and capital gain distributions are recorded on the ex-dividend date. Distributions from REITs are initially recorded as dividend income and, to the extent such represent a return of capital or capital gain for tax purposes, are reclassified when such information becomes
T. ROWE PRICE EQUITY INCOME ETF
available. Non-cash dividends, if any, are recorded at the fair market value of the asset received. Proceeds from litigation payments, if any, are included in net realized gain (loss) or change in net unrealized gain/loss from securities. Distributions to shareholders are recorded on the ex-dividend date. Income distributions, if any, are declared and paid quarterly. A capital gain distribution, if any, may also be declared and paid by the fund annually. Dividends and distributions cannot be automatically reinvested in additional shares of the fund.
Capital Share Transactions
The fund issues and redeems shares at its net asset value (NAV) only with Authorized Participants and only in large blocks of 5,000 shares (each, a “Creation Unit”). The fund’s NAV per share is computed at the close of the New York Stock Exchange (NYSE). However, the NAV per share may be calculated at a time other than the normal close of the NYSE if trading on the NYSE is restricted, if the NYSE closes earlier, or as may be permitted by the SEC. Individual fund shares may not be purchased or redeemed directly with the fund. An Authorized Participant may purchase or redeem a Creation Unit of the fund each business day that the fund is open in exchange for the delivery of a designated portfolio of in-kind securities and/or cash. When purchasing or redeeming Creation Units, Authorized Participants are also required to pay a fixed and/or variable purchase or redemption transaction fee as well as any applicable additional variable charge to defray the transaction cost to a fund.
Individual fund shares may be purchased and sold only on a national securities exchange through brokers. Shares are listed for trading on NYSE Arca, Inc. (NYSE Arca) and because the shares will trade at market prices rather than NAV, shares may trade at prices greater than NAV (at a premium), at NAV, or less than NAV (at a discount). The fund’s shares are ordinarily valued as of the close of regular trading (normally 4:00 p.m. Eastern time) on each day that the NYSE Arca is open.
New Accounting Guidance
In June 2022, the FASB issued Accounting Standards Update (ASU), ASU 2022-03, Fair Value Measurement (Topic 820) – Fair Value Measurement of Equity Securities Subject to Contractual Sale Restrictions, which clarifies that a contractual restriction on the sale of an equity security is not considered part of the unit of account of the equity security and, therefore, is not considered in measuring fair value. The amendments under this ASU are effective for fiscal years beginning after December 15, 2023; however, the fund opted to early adopt, as permitted, effective December 1, 2022. Adoption of the guidance did not have a material impact on the fund’s financial statements.
T. ROWE PRICE EQUITY INCOME ETF
Indemnification
In the normal course of business, the fund may provide indemnification in connection with its officers and directors, service providers, and/or private company investments. The fund’s maximum exposure under these arrangements is unknown; however, the risk of material loss is currently considered to be remote.
NOTE 2 – VALUATION
Security Valuation
The fund’s financial instruments are valued at the close of the NYSE and are reported at fair value, which GAAP defines as the price that would be received to sell an asset or paid to transfer a liability in an orderly transaction between market participants at the measurement date. The fund's Board of Directors (the Board) has designated T. Rowe Price Associates, Inc. as the fund's valuation designee (Valuation Designee). Subject to oversight by the Board, the Valuation Designee performs the following functions in performing fair value determinations: assesses and manages valuation risks; establishes and applies fair value methodologies; tests fair value methodologies; and evaluates pricing vendors and pricing agents. The duties and responsibilities of the Valuation Designee are performed by its Valuation Committee. The Valuation Designee provides periodic reporting to the Board on valuation matters.
Various valuation techniques and inputs are used to determine the fair value of financial instruments. GAAP establishes the following fair value hierarchy that categorizes the inputs used to measure fair value:
Level 1 – quoted prices (unadjusted) in active markets for identical financial instruments that the fund can access at the reporting date
Level 2 – inputs other than Level 1 quoted prices that are observable, either directly or indirectly (including, but not limited to, quoted prices for similar financial instruments in active markets, quoted prices for identical or similar financial instruments in inactive markets, interest rates and yield curves, implied volatilities, and credit spreads)
Level 3 – unobservable inputs (including the Valuation Designee’s assumptions in determining fair value)
Observable inputs are developed using market data, such as publicly available information about actual events or transactions, and reflect the assumptions that market participants would use to price the financial instrument. Unobservable inputs are those for which market data are not available and are developed using the best information available about
T. ROWE PRICE EQUITY INCOME ETF
the assumptions that market participants would use to price the financial instrument. GAAP requires valuation techniques to maximize the use of relevant observable inputs and minimize the use of unobservable inputs. When multiple inputs are used to derive fair value, the financial instrument is assigned to the level within the fair value hierarchy based on the lowest-level input that is significant to the fair value of the financial instrument. Input levels are not necessarily an indication of the risk or liquidity associated with financial instruments at that level but rather the degree of judgment used in determining those values.
Valuation Techniques
Equity securities, including exchange-traded funds, listed or regularly traded on a securities exchange or in the over-the-counter (OTC) market are valued at the last quoted sale price or, for certain markets, the official closing price at the time the valuations are made. A security that is listed or traded on more than one exchange is valued at the quotation on the exchange determined to be the primary market for such security. Listed securities not traded on a particular day are valued at the mean of the closing bid and asked prices for domestic securities and the last quoted sale or closing price for international securities.
Investments in mutual funds are valued at the mutual fund’s closing NAV per share on the day of valuation. Assets and liabilities other than financial instruments, including short-term receivables and payables, are carried at cost, or estimated realizable value, if less, which approximates fair value.
Investments for which market quotations are not readily available or deemed unreliable are valued at fair value as determined in good faith by the Valuation Designee. The Valuation Designee has adopted methodologies for determining the fair value of investments for which market quotations are not readily available or deemed unreliable, including the use of other pricing sources. Factors used in determining fair value vary by type of investment and may include market or investment specific considerations. The Valuation Designee typically will afford greatest weight to actual prices in arm’s length transactions, to the extent they represent orderly transactions between market participants, transaction information can be reliably obtained, and prices are deemed representative of fair value. However, the Valuation Designee may also consider other valuation methods such as market-based valuation multiples; a discount or premium from market value of a similar, freely traded security of the same issuer; discounted cash flows; yield to maturity; or some combination. Fair value determinations are reviewed on a regular basis. Because any fair value determination involves a significant amount of judgment, there is a degree of subjectivity inherent in such pricing decisions. Fair value prices determined by the
T. ROWE PRICE EQUITY INCOME ETF
Valuation Designee could differ from those of other market participants, and it is possible that the fair value determined for a security may be materially different from the value that could be realized upon the sale of that security.
Valuation Inputs
On December 31, 2022, all of the fund’s financial instruments were classified as Level 1, based on the inputs used to determine their fair values.
NOTE 3 – OTHER INVESTMENT TRANSACTIONS
Purchases and sales of portfolio securities excluding in-kind transactions and short-term securities aggregated $16,835,000 and $16,700,000, respectively, for the year ended December 31, 2022. Portfolio securities received or delivered through in-kind transactions aggregated $57,172,000 and $11,627,000, respectively, for the year ended December 31, 2022.
NOTE 4 – FEDERAL INCOME TAXES
Generally, no provision for federal income taxes is required since the fund intends to continue to qualify as a regulated investment company under Subchapter M of the Internal Revenue Code and distribute to shareholders all of its taxable income and gains. Distributions determined in accordance with federal income tax regulations may differ in amount or character from net investment income and realized gains for financial reporting purposes.
The fund files U.S. federal, state, and local tax returns as required. The fund’s tax returns are subject to examination by the relevant tax authorities until expiration of the applicable statute of limitations, which is generally three years after the filing of the tax return but which can be extended to six years in certain circumstances. Tax returns for open years have incorporated no uncertain tax positions that require a provision for income taxes.
Capital accounts within the financial reporting records are adjusted for permanent book/tax differences to reflect tax character but are not adjusted for temporary differences. The permanent book/tax adjustments, if any, have no impact on results of operations or net assets. The permanent book/tax adjustments relate primarily to redemptions in kind and the character of dividends received from real estate investment trusts (REITs).
The tax character of distributions paid for the periods presented was as follows:
T. ROWE PRICE EQUITY INCOME ETF
| ($000s) | | |
| | December 31 | December 31 |
| | 2022 | 2021 |
| Ordinary income (including short-term capital gains, if any) | $ 1,868 | $ 1,406 |
| Long-term capital gain | 208 | 184 |
| Total distribution | $ 2,076 | $ 1,590 |
At December 31, 2022, the tax-basis cost of investments, (including derivatives, if any) and gross unrealized appreciation and depreciation were as follows:
| ($000s) | |
| Cost of investments | $ 96,514 |
| Unrealized appreciation | $ 7,970 |
| Unrealized depreciation | (5,592) |
| Net unrealized appreciation (depreciation) | $ 2,378 |
At December 31, 2022, the tax-basis components of accumulated net earnings (loss) were as follows:
| ($000s) | |
| Net unrealized appreciation (depreciation) | 2,378 |
| Loss carryforwards and deferrals | (328) |
| Total distributable earnings (loss) | $ 2,050 |
Temporary differences between book-basis and tax-basis components of total distributable earnings (loss) arise when certain items of income, gain, or loss are recognized in different periods for financial statement purposes versus for tax purposes; these differences will reverse in a subsequent reporting period. The temporary differences relate primarily to the deferral of losses from wash sales. The loss carryforwards and deferrals primarily relate to capital loss carryforwards. Capital loss carryforwards are available indefinitely to offset future realized capital gains.
T. ROWE PRICE EQUITY INCOME ETF
NOTE 5 – FOREIGN TAXES
The fund is subject to foreign income taxes imposed by certain countries in which it invests. Additionally, capital gains realized upon disposition of securities issued in or by certain foreign countries are subject to capital gains tax imposed by those countries. All taxes are computed in accordance with the applicable foreign tax law, and, to the extent permitted, capital losses are used to offset capital gains. Taxes attributable to income are accrued by the fund as a reduction of income. Current and deferred tax expense attributable to capital gains is reflected as a component of realized or change in unrealized gain/loss on securities in the accompanying financial statements. To the extent that the fund has country specific capital loss carryforwards, such carryforwards are applied against net unrealized gains when determining the deferred tax liability. Any deferred tax liability incurred by the fund is included in either Other liabilities or Deferred tax liability on the accompanying Statement of Assets and Liabilities.
NOTE 6 – RELATED PARTY TRANSACTIONS
The fund is managed by T. Rowe Price Associates, Inc. (Price Associates), a wholly owned subsidiary of T. Rowe Price Group, Inc. (Price Group). The investment management and administrative agreement between the fund and Price Associates provides for an all-inclusive annual fee equal to 0.54% of the fund’s average daily net assets. The fee is computed daily and paid monthly. The all-inclusive fee covers investment management services and ordinary, recurring operating expenses, but does not cover interest and borrowing expenses; taxes; brokerage commissions and other transaction costs; fund proxy expenses; and nonrecurring expenses and extraordinary expenses.
As of December 31, 2022, T. Rowe Price Group, Inc., or its wholly owned subsidiaries, owned 600,000 shares of the fund, representing 21% of the fund’s net assets.
The fund may participate in securities purchase and sale transactions with other funds or accounts advised by Price Associates (cross trades), in accordance with procedures adopted by the fund’s Board and Securities and Exchange Commission rules, which require, among other things, that such purchase and sale cross trades be effected at the independent current market price of the security. During the year ended December 31, 2022, the fund had no purchases or sales cross trades with other funds or accounts advised by Price Associates.
T. ROWE PRICE EQUITY INCOME ETF
Price Associates has voluntarily agreed to reimburse the fund from its own resources on a monthly basis for the cost of investment research embedded in the cost of the fund’s securities trades. This agreement may be rescinded at any time. For the year ended December 31, 2022, this reimbursement amounted to $1,000, which is included in Net realized gain (loss) on Securities in the Statement of Operations.
NOTE 7 – OTHER MATTERS
Unpredictable events such as environmental or natural disasters, war, terrorism, pandemics, outbreaks of infectious diseases, and similar public health threats may significantly affect the economy and the markets and issuers in which the fund invests. Certain events may cause instability across global markets, including reduced liquidity and disruptions in trading markets, while some events may affect certain geographic regions, countries, sectors, and industries more significantly than others, and exacerbate other pre-existing political, social, and economic risks.
Since 2020, a novel strain of coronavirus (COVID-19) has resulted in disruptions to global business activity and caused significant volatility and declines in global financial markets.
In February 2022, Russian forces entered Ukraine and commenced an armed conflict leading to economic sanctions being imposed on Russia and certain of its citizens, creating impacts on Russian-related stocks and debt and greater volatility in global markets.
These are recent examples of global events which may have a negative impact on the values of certain portfolio holdings or the fund’s overall performance. Management is actively monitoring the risks and financial impacts arising from these events.
T. ROWE PRICE EQUITY INCOME ETF
REPORT OF INDEPENDENT REGISTERED PUBLIC ACCOUNTING FIRM
To the Board of Directors of T. Rowe Price Exchange-Traded Funds, Inc. and Shareholders of T. Rowe Price Equity Income ETF
Opinion on the Financial Statements
We have audited the accompanying statement of assets and liabilities, including the portfolio of investments, of T. Rowe Price Equity Income ETF (one of the funds constituting T. Rowe Price Exchange-Traded Funds, Inc., referred to hereafter as the "Fund") as of December 31, 2022, the related statement of operations for the year ended December 31, 2022, the statement of changes in net assets for each of the two years in the period ended December 31, 2022, including the related notes, and the financial highlights for each of the years ended December 31, 2022 and 2021, and for the period August 4, 2020 (Inception) through December 31, 2020 (collectively referred to as the “financial statements”). In our opinion, the financial statements present fairly, in all material respects, the financial position of the Fund as of December 31, 2022, the results of its operations for the year ended December 31, 2022, the changes in its net assets for each of the two years in the period ended December 31, 2022 and the financial highlights for each of the years ended December 31, 2022 and 2021, and for the period August 4, 2020 (Inception) through December 31, 2020 in conformity with accounting principles generally accepted in the United States of America.
Basis for Opinion
These financial statements are the responsibility of the Fund’s management. Our responsibility is to express an opinion on the Fund’s financial statements based on our audits. We are a public accounting firm registered with the Public Company Accounting Oversight Board (United States) (PCAOB) and are required to be independent with respect to the Fund in accordance with the U.S. federal securities laws and the applicable rules and regulations of the Securities and Exchange Commission and the PCAOB.
We conducted our audits of these financial statements in accordance with the standards of the PCAOB. Those standards require that we plan and perform the audit to obtain reasonable assurance about whether the financial statements are free of material misstatement, whether due to error or fraud.
T. ROWE PRICE EQUITY INCOME ETF
REPORT OF INDEPENDENT REGISTERED PUBLIC ACCOUNTING FIRM
(CONTINUED)
Our audits included performing procedures to assess the risks of material misstatement of the financial statements, whether due to error or fraud, and performing procedures that respond to those risks. Such procedures included examining, on a test basis, evidence regarding the amounts and disclosures in the financial statements. Our audits also included evaluating the accounting principles used and significant estimates made by management, as well as evaluating the overall presentation of the financial statements. Our procedures included confirmation of securities owned as of December 31, 2022 by correspondence with the custodian and brokers; when replies were not received from brokers, we performed other auditing procedures. We believe that our audits provide a reasonable basis for our opinion.
PricewaterhouseCoopers LLP
Baltimore, Maryland
February 16, 2023
We have served as the auditor of one or more investment companies in the T. Rowe Price group of investment companies since 1973.
T. ROWE PRICE EQUITY INCOME ETF
TAX INFORMATION (UNAUDITED) FOR THE TAX YEAR ENDED 12/31/22
We are providing this information as required by the Internal Revenue Code. The amounts shown may differ from those elsewhere in this report because of differences between tax and financial reporting requirements. The fund’s distributions to shareholders included:
$208,000 from long-term capital gains, subject to long-term capital gains tax rate of not greater than 20%.
For taxable non-corporate shareholders, $2,175,000 of the fund’s income represents qualified dividend income subject to a long-term capital gains tax rate of not greater than 20%.
For corporate shareholders, $1,814,000 of the fund’s income qualifies for the dividends received deduction.
INFORMATION ON PROXY VOTING POLICIES, PROCEDURES, AND RECORDS
A description of the policies and procedures used by T. Rowe Price funds to determine how to vote proxies relating to portfolio securities is available in each fund’s Statement of Additional Information. You may request this document by calling 1-800-638-5660 or by accessing the SEC’s website, sec.gov.
The description of our proxy voting policies and procedures is also available on our corporate website. To access it, please visit the following Web page:
https://www.troweprice.com/corporate/en/utility/policies.html
Scroll down to the section near the bottom of the page that says, “Proxy Voting Policies.” Click on the Proxy Voting Policies link in the shaded box.
Each fund’s most recent annual proxy voting record is available on our website and through the SEC’s website. To access it through T. Rowe Price, visit the website location shown above, and scroll down to the section near the bottom of the page that says, “Proxy Voting Records.” Click on the Proxy Voting Records link in the shaded box.
HOW TO OBTAIN QUARTERLY PORTFOLIO HOLDINGS
The fund files a complete schedule of portfolio holdings with the Securities and Exchange Commission (SEC) for the first and third quarters of each fiscal year as an exhibit to its reports on Form N-PORT. The fund’s Form N-PORT is available electronically on the SEC’s website (sec.gov).
T. ROWE PRICE EQUITY INCOME ETF
LIQUIDITY RISK MANAGEMENT PROGRAM
In accordance with Rule 22e-4 (Liquidity Rule) under the Investment Company Act of 1940, as amended, the fund has established a liquidity risk management program (Liquidity Program) reasonably designed to assess and manage the fund’s liquidity risk, which generally represents the risk that the fund would not be able to meet redemption requests without significant dilution of remaining investors’ interests in the fund. The fund’s Board of Directors (Board) has appointed the fund’s investment adviser, T. Rowe Price Associates, Inc. (Adviser), as the administrator of the Liquidity Program. As administrator, the Adviser is responsible for overseeing the day-to-day operations of the Liquidity Program and, among other things, is responsible for assessing, managing, and reviewing with the Board at least annually the liquidity risk of each T. Rowe Price fund. The Adviser has delegated oversight of the Liquidity Program to a Liquidity Risk Committee (LRC), which is a cross-functional committee composed of personnel from multiple departments within the Adviser.
The Liquidity Program’s principal objectives include supporting the T. Rowe Price funds’ compliance with limits on investments in illiquid assets and mitigating the risk that the fund will be unable to timely meet its redemption obligations. The Liquidity Program also includes a number of elements that support the management and assessment of liquidity risk, including an annual assessment of factors that influence the fund’s liquidity and the periodic classification and reclassification of a fund’s investments into categories that reflect the LRC’s assessment of their relative liquidity under current market conditions. Under the Liquidity Program, every investment held by the fund is classified at least monthly into one of four liquidity categories based on estimations of the investment’s ability to be sold during designated time frames in current market conditions without significantly changing the investment’s market value.
As required by the Liquidity Rule, at a meeting held on July 25, 2022, the Board was presented with an annual assessment prepared by the LRC, on behalf of the Adviser, that addressed the operation of the Liquidity Program and assessed its adequacy and effectiveness of implementation, including any material changes to the Liquidity Program and the determination of each fund’s Highly Liquid Investment Minimum (HLIM). The annual assessment included consideration of the following factors, as applicable: the fund’s investment strategy and liquidity of portfolio investments during normal and reasonably foreseeable stressed conditions, including whether the investment strategy is appropriate for an open-end fund, the extent to which the strategy involves a relatively concentrated portfolio or large positions in particular issuers, and the use of borrowings for investment purposes and derivatives; short-term and long-term cash flow projections covering both normal and reasonably foreseeable stressed conditions; and holdings of cash and cash equivalents, as well as available borrowing arrangements.
For the fund and other T. Rowe Price funds, the annual assessment incorporated a report related to a fund’s holdings, shareholder and portfolio concentration, any borrowings during the period, cash flow projections, and other relevant data for the period of April 1, 2021, through March 31, 2022. The report described the methodology for classifying a fund’s investments (including any derivative transactions) into one of four liquidity
T. ROWE PRICE EQUITY INCOME ETF
categories, as well as the percentage of a fund’s investments assigned to each category. It also explained the methodology for establishing a fund’s HLIM and noted that the LRC reviews the HLIM assigned to each fund no less frequently than annually.
During the period covered by the annual assessment, the LRC has concluded, and reported to the Board, that the Liquidity Program continues to operate adequately and effectively and is reasonably designed to assess and manage the fund’s liquidity risk.
T. ROWE PRICE EQUITY INCOME ETF
ABOUT THE FUND’S DIRECTORS AND OFFICERS
Your fund is overseen by a Board of Directors (Board) that meets regularly to review a wide variety of matters affecting or potentially affecting the fund, including performance, investment programs, compliance matters, advisory fees and expenses, service providers, and business and regulatory affairs. The Board elects the fund’s officers, who are listed in the final table. The directors who are also employees or officers of T. Rowe Price are considered to be “interested” directors as defined in Section 2(a)(19) of the 1940 Act because of their relationships with T. Rowe Price and its affiliates. The business address of each director and officer is 100 East Pratt Street, Baltimore, Maryland 21202. The Statement of Additional Information includes additional information about the fund directors and is available without charge by calling a T. Rowe Price representative at 1-800-638-5660.
INDEPENDENT DIRECTORS(a)
Name
(Year of Birth)
Year Elected
[Number of T. Rowe Price
Portfolios Overseen] | Principal Occupation(s) and Directorships of Public Companies and
Other Investment Companies During the Past Five Years |
Teresa Bryce Bazemore
(1959)
2020
[205] | President and Chief Executive Officer, Federal Home Loan
Bank of San Francisco (2021 to present); President, Radian Guaranty
(2008 to 2017); Chief Executive Officer, Bazemore Consulting LLC
(2018 to 2021); Director, Chimera Investment Corporation (2017 to
2021); Director, First Industrial Realty Trust (2020 to present);
Director, Federal Home Loan Bank of Pittsburgh (2017 to 2019) |
Ronald J. Daniels(b)
(1959)
2018
[0] | President, The Johns Hopkins University and Professor, Political
Science Department, The Johns Hopkins University (2009 to present);
Director, Lyndhurst Holdings (2015 to present); Director, BridgeBio
Pharma, Inc. (2020 to present) |
Bruce W. Duncan
(1951)
2020
[205] | President, Chief Executive Officer, and Director, CyrusOne, Inc. (2020 to
2021); Chief Executive Officer and Director (2009 to 2016), Chair of the
Board (2016 to 2020), and President (2009 to 2016), First Industrial
Realty Trust, owner and operator of industrial properties; Chair of the
Board (2005 to 2016) and Director (1999 to 2016), Starwood Hotels &
Resorts, a hotel and leisure company; Member, Investment Company
Institute Board of Governors (2017 to 2019); Member, Independent
Directors Council Governing Board (2017 to 2019); Senior Advisor, KKR
(2018 to present); Director, Boston Properties (2016 to present);
Director, Marriott International, Inc. (2016 to 2020) |
Robert J. Gerrard, Jr.
(1952)
2020
[205] | Advisory Board Member, Pipeline Crisis/Winning Strategies, a
collaborative working to improve opportunities for young African
Americans (1997 to 2016); Chair of the Board, all funds (July 2018 to
present) |
T. ROWE PRICE EQUITY INCOME ETF
INDEPENDENT DIRECTORS(a) (continued)
Name
(Year of Birth)
Year Elected
[Number of T. Rowe Price
Portfolios Overseen] | Principal Occupation(s) and Directorships of Public Companies and
Other Investment Companies During the Past Five Years |
Paul F. McBride
(1956)
2020
[205] | Advisory Board Member, Vizzia Technologies (2015 to present); Board
Member, Dunbar Armored (2012 to 2018) |
Kellye L. Walker(c)
(1966)
2021
[205] | Executive Vice President and Chief Legal Officer, Eastman Chemical
Company (April 2020 to present); Executive Vice President and Chief
Legal Officer, Huntington Ingalls Industries, Inc. (January 2015 to March
2020); Director, Lincoln Electric Company (October 2020 to present) |
(a)All information about the independent directors was current as of December 31, 2021, unless otherwise indicated, except for the number of portfolios overseen, which is current as of the date of this report.
(b)Effective April 27, 2022, Mr. Daniels resigned from his role as an independent director of the Price Funds.
(c)Effective November 8, 2021, Ms. Walker was appointed as an independent director of the Price Funds.
INTERESTED DIRECTORS(a)
Name
(Year of Birth)
Year Elected
[Number of T. Rowe Price
Portfolios Overseen] | Principal Occupation(s) and Directorships of Public Companies and
Other Investment Companies During the Past Five Years |
David Oestreicher
(1967)
2020
[205] | Director, Vice President, and Secretary, T. Rowe Price, T. Rowe Price
Investment Services, Inc., T. Rowe Price Retirement Plan Services,
Inc., and T. Rowe Price Services, Inc.; Director and Secretary,
T. Rowe Price Investment Management, Inc. (Price Investment
Management); Vice President and Secretary, T. Rowe Price
international (Price International); Vice President, T. Rowe Price Hong
Kong (Price Hong Kong), T. Rowe Price Japan (Price Japan), and
T. Rowe Price Singapore (Price Singapore); General Counsel, Vice
President, and Secretary, T. Rowe Price Group, Inc.; Chair of the
Board, Chief Executive Officer, President, and Secretary, T. Rowe
Price Trust Company; Principal Executive Officer and Executive Vice
President, all funds |
T. ROWE PRICE EQUITY INCOME ETF
INTERESTED DIRECTORS(a) (continued)
Name
(Year of Birth)
Year Elected
[Number of T. Rowe Price
Portfolios Overseen] | Principal Occupation(s) and Directorships of Public Companies and
Other Investment Companies During the Past Five Years |
Robert W. Sharps, CFA, CPA(b)
(1971)
2020
[0] | Director and Vice President, T. Rowe Price; Director, Price Investment
Management; Chief Executive Officer and President, T. Rowe Price
Group, Inc.; Vice President, T. Rowe Price Trust Company |
Eric L. Veiel, CFA
(1972)
2022
[205] | Director and Vice President, T. Rowe Price; Vice President, T. Rowe
Price Group, Inc., and T. Rowe Price Trust Company |
(a)All information about the interested directors was current as of January 1, 2022, unless otherwise indicated, except for the number of portfolios overseen, which is current as of the date of this report.
(b)Effective February 3, 2022, Mr. Sharps resigned from his role as an interested director of the Price Funds.
OFFICERS
Name (Year of Birth)
Position Held With Exchange-Traded
Funds, Inc. | Principal Occupation(s) |
Armando (Dino) Capasso (1974)
Chief Compliance Officer | Chief Compliance Officer and Vice President, T. Rowe Price and Price Investment Management; Vice President, T. Rowe Price Group, Inc.; formerly, Chief Compliance Officer, PGIM Investments LLC and AST Investment Services, Inc. (ASTIS) (to 2022); Chief Compliance Officer, PGIM Retail Funds complex and Prudential Insurance Funds (to 2022); Vice President and Deputy Chief Compliance Officer, PGIM Investments LLC and ASTIS (to 2019); Senior Vice President and Senior Counsel, Pacific Investment Management Company LLC (to 2017) |
Timothy Coyne (1967)
Executive Vice President | Vice President, T. Rowe Price and T. Rowe Price Group, Inc. |
Alan S. Dupski, CPA (1982)
Principal Financial Officer, Vice
President, and Treasurer | Vice President, Price Investment Management, T. Rowe Price, T. Rowe Price Group, Inc., and T. Rowe Price Trust Company |
Joseph B. Fath, CPA (1971)
Executive Vice President | Vice President, T. Rowe Price, T. Rowe Price Group, Inc., and T. Rowe Price Trust Company |
T. ROWE PRICE EQUITY INCOME ETF
OFFICERS (continued)
Name (Year of Birth)
Position Held With Exchange-Traded
Funds, Inc. | Principal Occupation(s) |
Gary J. Greb (1961)
Vice President | Vice President, Price Investment Management, T. Rowe Price, Price International, and T. Rowe Price Trust Company |
Paul Greene II (1978)
Executive Vice President | Vice President, T. Rowe Price and T. Rowe Price Group, Inc. |
Cheryl Hampton, CPA (1969)
Vice President | Vice President, T. Rowe Price; formerly, Tax Director, Invesco Ltd. (to 2021); Vice President, Oppenheimer Funds, Inc. (to 2019) |
Ann M. Holcomb, CFA (1972)
Executive Vice President | Vice President, T. Rowe Price, T. Rowe Price Group, Inc., and T. Rowe Price Trust Company |
Thomas J. Huber, CFA (1966)
Executive Vice President | Vice President, T. Rowe Price, T. Rowe Price Group, Inc., and T. Rowe Price Trust Company |
Benjamin Kersse, CPA (1989)
Vice President | Vice President, T. Rowe Price |
Paul J. Krug, CPA (1964)
Vice President | Vice President, T. Rowe Price, T. Rowe Price Group, Inc., and T. Rowe Price Trust Company |
John D. Linehan, CFA (1965)
Executive Vice President | Vice President, T. Rowe Price, T. Rowe Price Group, Inc., and T. Rowe Price Trust Company |
Jason Nogueira, CFA (1974)
Executive Vice President | Vice President, T. Rowe Price and T. Rowe Price Group, Inc. |
Fran M. Pollack-Matz (1961)
Vice President and Secretary | Vice President, T. Rowe Price, T. Rowe Price Group, Inc., T. Rowe Price Investment Services, Inc., and T. Rowe Price Services, Inc. |
Jason Benjamin Polun, CFA (1974)
Executive Vice President | Vice President, T. Rowe Price, T. Rowe Price Group, Inc., and T. Rowe Price Trust Company |
Shannon H. Rauser (1987)
Assistant Secretary | Assistant Vice President, T. Rowe Price |
Megan Warren (1968)
Vice President | OFAC Sanctions Compliance Officer and Vice President, Price Investment Management; Vice President, T. Rowe Price, T. Rowe Price Group, Inc., T. Rowe Price Retirement Plan Services, Inc., T. Rowe Price Services, Inc., and T. Rowe Price Trust Company |
Thomas H. Watson (1977)
Executive Vice President | Director and Vice President, T. Rowe Price Trust Company; Vice President, T. Rowe Price and T. Rowe Price Group, Inc. |
Unless otherwise noted, officers have been employees of T. Rowe Price or T. Rowe Price International for at least 5 years.
This page intentionally left blank.
This page intentionally left blank.
100 East Pratt Street
Baltimore, MD 21202
Call 1-800-638-5660 to request a prospectus or summary prospectus; each includes investment objectives, risks, fees, expenses, and other information that you should read and consider carefully before investing.
T. Rowe Price Investment Services, Inc.
Item 1. (b) Notice pursuant to Rule 30e-3.
Not applicable.
Item 2. Code of Ethics.
The registrant has adopted a code of ethics, as defined in Item 2 of Form N-CSR, applicable to its principal executive officer, principal financial officer, principal accounting officer or controller, or persons performing similar functions. A copy of this code of ethics is filed as an exhibit to this Form N-CSR. No substantive amendments were approved or waivers were granted to this code of ethics during the period covered by this report.
Item 3. Audit Committee Financial Expert.
The registrant’s Board of Directors has determined that Ms. Teresa Bryce Bazemore qualifies as an audit committee financial expert, as defined in Item 3 of Form N-CSR. Ms. Bazemore is considered independent for purposes of Item 3 of Form N-CSR.
Item 4. Principal Accountant Fees and Services.
(a) – (d) Aggregate fees billed for the last two fiscal years for professional services rendered to, or on behalf of, the registrant by the registrant’s principal accountant were as follows:
| | | | | | | | | | |
| | | | | 2022 | | | 2021 | |
| | Audit Fees | | $ | 25,028 | | | $ | 21,358 | |
| | Audit-Related Fees | | | - | | | | - | |
| | Tax Fees | | | 4,448 | | | | 4,688 | |
| | All Other Fees | | | - | | | | - | |
Audit fees include amounts related to the audit of the registrant’s annual financial statements and services normally provided by the accountant in connection with statutory and regulatory filings. Audit-related fees include amounts reasonably related to the performance of the audit of the registrant’s financial statements and specifically include the issuance of a report on internal controls and, if applicable, agreed-upon procedures related to fund acquisitions. Tax fees include amounts related to services for tax compliance, tax planning, and tax advice. The nature of these services specifically includes the review of distribution calculations and the preparation of Federal, state, and excise tax returns. All other fees include the registrant’s pro-rata share of amounts for agreed-upon procedures in conjunction with service contract approvals by the registrant’s Board of Directors/Trustees.
(e)(1) The registrant’s audit committee has adopted a policy whereby audit and non-audit services performed by the registrant’s principal accountant for the registrant, its investment adviser, and any entity controlling, controlled by, or under common control with the investment adviser that provides ongoing services to the registrant require pre-approval in advance at regularly scheduled audit committee meetings. If such a service is required between regularly scheduled audit committee meetings, pre-approval may be authorized by one audit committee member with ratification at the next scheduled audit committee meeting. Waiver of pre-approval for audit or non-audit services requiring fees of a de minimis amount is not permitted.
(2) No services included in (b) – (d) above were approved pursuant to paragraph (c)(7)(i)(C) of Rule 2-01 of Regulation S-X.
(f) Less than 50 percent of the hours expended on the principal accountant’s engagement to audit the registrant’s financial statements for the most recent fiscal year were attributed to work performed by persons other than the principal accountant’s full-time, permanent employees.
(g) The aggregate fees billed for the most recent fiscal year and the preceding fiscal year by the registrant’s principal accountant for non-audit services rendered to the registrant, its investment adviser, and any entity controlling, controlled by, or under common control with the investment adviser that provides ongoing services to the registrant were $2,037,000 and $3,732,000, respectively.
(h) All non-audit services rendered in (g) above were pre-approved by the registrant’s audit committee. Accordingly, these services were considered by the registrant’s audit committee in maintaining the principal accountant’s independence.
Item 5. Audit Committee of Listed Registrants.
Not applicable.
Item 6. Investments.
(a) Not applicable. The complete schedule of investments is included in Item 1 of this Form N-CSR.
(b) Not applicable.
Item 7. Disclosure of Proxy Voting Policies and Procedures for Closed-End Management Investment Companies.
Not applicable.
Item 8. Portfolio Managers of Closed-End Management Investment Companies.
Not applicable.
Item 9. Purchases of Equity Securities by Closed-End Management Investment Company and Affiliated Purchasers.
Not applicable.
Item 10. Submission of Matters to a Vote of Security Holders.
There has been no change to the procedures by which shareholders may recommend nominees to the registrant’s board of directors.
Item 11. Controls and Procedures.
(a) The registrant’s principal executive officer and principal financial officer have evaluated the registrant’s disclosure controls and procedures within 90 days of this filing and have concluded that the registrant’s disclosure controls and procedures were effective, as of that date, in ensuring that information required to be disclosed by the registrant in this Form N-CSR was recorded, processed, summarized, and reported timely.
(b) The registrant’s principal executive officer and principal financial officer are aware of no change in the registrant’s internal control over financial reporting that occurred during the period covered by this report that has materially affected, or is reasonably likely to materially affect, the registrant’s internal control over financial reporting.
Item 12. Disclosure of Securities Lending Activities for Closed-End Management Investment Companies.
Not applicable.
Item 13. Exhibits.
SIGNATURES
Pursuant to the requirements of the Securities Exchange Act of 1934 and the Investment Company Act of 1940, the registrant has duly caused this report to be signed on its behalf by the undersigned, thereunto duly authorized.
T. Rowe Price Exchange-Traded Funds, Inc.
| | |
| By | | /s/ David Oestreicher |
| | David Oestreicher |
| | Principal Executive Officer |
| |
| Date | | February 16, 2023 |
Pursuant to the requirements of the Securities Exchange Act of 1934 and the Investment Company Act of 1940, this report has been signed below by the following persons on behalf of the registrant and in the capacities and on the dates indicated.
| | |
| |
| By | | /s/ David Oestreicher |
| | David Oestreicher |
| | Principal Executive Officer |
| |
| Date | | February 16, 2023 |
| |
| By | | /s/ Alan S. Dupski |
| | Alan S. Dupski |
| | Principal Financial Officer |
| |
| Date | | February 16, 2023 |