UNITED STATES
SECURITIES AND EXCHANGE COMMISSION
Washington, D.C. 20549
FORM N-CSR
CERTIFIED SHAREHOLDER REPORT OF REGISTERED
MANAGEMENT INVESTMENT COMPANIES
Investment Company Act File Number: 811-23494
T. Rowe Price Exchange-Traded Funds, Inc.
(Exact name of registrant as specified in charter)
100 East Pratt Street, Baltimore, MD 21202
(Address of principal executive offices)
David Oestreicher
100 East Pratt Street, Baltimore, MD 21202
(Name and address of agent for service)
Registrant’s telephone number, including area code: (410) 345-2000
Date of fiscal year end: May 31
Date of reporting period: November 30, 2023
Item 1. Reports to Shareholders
(a) Report pursuant to Rule 30e-1
SEMIANNUAL REPORT
November 30, 2023
| | T. ROWE PRICE |
| TBUX | Ultra Short-Term Bond ETF |
| | For more insights from T. Rowe Price investment professionals, go to troweprice.com. |
T. ROWE PRICE ULTRA SHORT-TERM BOND ETF
Go Paperless
Going paperless offers a host of benefits, which include:
| ■ | Timely delivery of important documents |
| ■ | Convenient access to your documents anytime, anywhere |
| ■ | Strong security protocols to safeguard sensitive data |
If you invest through a financial intermediary such as an investment advisor, a bank, or a brokerage firm, please contact that organization and ask if it can provide electronic documentation.
T. ROWE PRICE ULTRA SHORT-TERM BOND ETF
Market Commentary
Dear Shareholder
Major global stock and bond indexes produced mixed returns during the first half of your fund’s fiscal year, the six-month period ended November 30, 2023. Nearly all equity benchmarks finished the period with positive results after a strong rally in November; however, rising U.S. Treasury yields left some fixed income sectors in negative territory.
Within the S& P 500 Index, the financials sector recovered from the failure of three large regional banks earlier in the year and recorded the best results for the period. The information technology sector also delivered strong gains as technology companies benefited from investor enthusiasm for artificial intelligence developments. Outside the U.S., stocks in developed markets generally outpaced their counterparts in emerging markets, although emerging Europe and Latin America produced very strong returns at the regional level.
The U.S. economy was the strongest among the major markets during the period, with gross domestic product growth coming in at 5.2% in the third quarter’s revised estimate, the highest since the end of 2021. Corporate fundamentals were also broadly supportive. Although year-over-year earnings growth contracted in the first and second quarters of 2023, results were better than expected, and earnings growth turned positive again in the third quarter.
Inflation remained a concern for both investors and policymakers, but lower-than-expected inflation data in November helped spur a rally late in the period as many investors concluded that the Federal Reserve had reached the end of its hiking cycle. The Fed raised its short-term lending benchmark rate to a target range of 5.25% to 5.50% in July, the highest level since March 2001, and then held rates steady for the remainder of the period.
Despite a drop in yields as investor sentiment shifted in November, intermediate- and longer-term U.S. Treasury yields finished the period notably higher. After starting the period at 3.64%, the yield on the benchmark 10-year Treasury note briefly reached 5.00% in October for the first time since late 2007 before falling to 4.37% by the end of November. The rise in yields led to negative returns in some fixed income sectors, but both investment-grade and high yield corporate bonds produced solid returns, supported by the higher coupons that have become available over the past year as well as by increasing hopes that the economy might be able to avoid a recession.
Global economies and markets showed surprising resilience in 2023, but considerable uncertainty remains as we look ahead. Geopolitical events, the path of monetary policy, and the impact of the Fed’s rate hikes on the economy all
T. ROWE PRICE ULTRA SHORT-TERM BOND ETF
raise the potential for additional volatility. We believe this environment makes skilled active management a critical tool for identifying risks and opportunities, and our investment teams will continue to use fundamental research to help identify securities that can add value to your portfolio over the long term.
You may notice that this report no longer contains the commentary on your fund’s performance and positioning that we previously included in the semiannual shareholder letters. The Securities and Exchange Commission adopted new rules recently that will require fund reports to transition to a new format known as a Tailored Shareholder Report. This change will require a much more concise summary of performance rather than the level of detail we have provided historically while also aiming to be more visually engaging. As we prepare to make changes to the annual reports to meet the new regulatory requirements by mid-2024, we felt the time was right to discontinue the optional six-month semiannual fund letter to focus on the changes to come.
Although semiannual fund letters will no longer be produced, you may continue to access current fund information as well as insights and perspectives from our investment team on our personal investing website.
Thank you for your continued confidence in T. Rowe Price.
Sincerely,
Robert Sharps
CEO and President
T. ROWE PRICE ULTRA SHORT-TERM BOND ETF
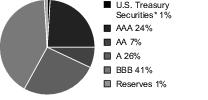
Portfolio Summary
CREDIT QUALITY DIVERSIFICATION
Based on net assets as of 11/30/23.
*U.S. Treasury securities are issued by the U.S. Treasury and are backed by the full faith and credit of the U.S. government. The ratings of U.S. Treasury securities are derived from the ratings on the U.S. government.
Sources: Credit ratings for the securities held in the fund are provided by Moody’s, Standard & Poor’s and Fitch and are converted to the Standard & Poor’s nomenclature. A rating of AAA represents the highest-rated securities, and a rating of D represents the lowest-rated securities. If the rating agencies differ, the highest rating is applied to the security. If a rating is not available, the security is classified as Not Rated (NR). T. Rowe Price uses the rating of the underlying investment vehicle to determine the creditworthiness of credit default swaps. The fund is not rated by any agency. Securities that have not been rated by any rating agency totaled 0.01% of the portfolio at the end of the reporting period.
Note: Copyright © 2023 Fitch Ratings, Inc., Fitch Ratings Ltd. and its subsidiaries.
Note: © 2023, Moody’s Corporation, Moody’s Investors Service, Inc., Moody’s Analytics, Inc. and/or their licensors and affiliates (collectively, “Moody’s”). All rights reserved. Moody’s ratings and other information (“Moody’s Information”) are proprietary to Moody’s and/or its licensors and are protected by copyright and other intellectual property laws. Moody’s Information is licensed to Client by Moody’s. MOODY’S INFORMATION MAY NOT BE COPIED OR OTHERWISE REPRODUCED, REPACKAGED, FURTHER TRANSMITTED, TRANSFERRED, DISSEMINATED, REDISTRIBUTED OR RESOLD, OR STORED FOR SUBSEQUENT USE FOR ANY SUCH PURPOSE, IN WHOLE OR IN PART, IN ANY FORM OR MANNER OR BY ANY MEANS WHATSOEVER, BY ANY PERSON WITHOUT MOODY’S PRIOR WRITTEN CONSENT. Moody's® is a registered trademark.
Note: Copyright © 2023, S&P Global Market Intelligence (and its affiliates, as applicable). Reproduction of any information, data or material, including ratings (“Content”) in any form is prohibited except with the prior written permission of the relevant party. Such party, its affiliates and suppliers (“Content Providers”) do not guarantee the accuracy, adequacy, completeness, timeliness or availability of any Content and are not responsible for any errors or omissions
T. ROWE PRICE ULTRA SHORT-TERM BOND ETF
(negligent or otherwise), regardless of the cause, or for the results obtained from the use of such Content. In no event shall Content Providers be liable for any damages, costs, expenses, legal fees, or losses (including lost income or lost profit and opportunity costs) in connection with any use of the Content. A reference to a particular investment or security, a rating or any observation concerning an investment that is part of the Content is not a recommendation to buy, sell or hold such investment or security, does not address the appropriateness of an investment or security and should not be relied on as investment advice. Credit ratings are statements of opinions and are not statements of fact.
T. ROWE PRICE ULTRA SHORT-TERM BOND ETF
FUND EXPENSE EXAMPLE
As a shareholder, you may incur two types of costs: (1) transaction costs, such as brokerage commissions on purchases and sales, and (2) ongoing costs, including management fees and other fund expenses. The following example is intended to help you understand your ongoing costs (in dollars) of investing in the fund and to compare these costs with the ongoing costs of investing in other funds. The example is based on an investment of $1,000 invested at the beginning of the most recent six-month period and held for the entire period.
Actual Expenses
The first line of the following table (Actual) provides information about actual account values and expenses based on the fund’s actual returns. You may use the information on this line, together with your account balance, to estimate the expenses that you paid over the period. Simply divide your account value by $1,000 (for example, an $8,600 account value divided by $1,000 = 8.6), then multiply the result by the number on the first line under the heading “Expenses Paid During Period” to estimate the expenses you paid on your account during this period.
Hypothetical Example for Comparison Purposes
The information on the second line of the table (Hypothetical) is based on hypothetical account values and expenses derived from the fund’s actual expense ratio and an assumed 5% per year rate of return before expenses (not the fund’s actual return). You may compare the ongoing costs of investing in the fund with other funds by contrasting this 5% hypothetical example and the 5% hypothetical examples that appear in the shareholder reports of the other funds. The hypothetical account values and expenses may not be used to estimate the actual ending account balance or expenses you paid for the period.
You should also be aware that the expenses shown in the table highlight only your ongoing costs and do not reflect any transaction costs, such as brokerage commissions paid on purchases and sales of shares. Therefore, the second line of the table is useful in comparing ongoing costs only and will not help you determine the relative total costs of owning different funds. To the extent a fund charges transaction costs, however, the total cost of owning that fund is higher.
T. ROWE PRICE ULTRA SHORT-TERM BOND ETF
FUND EXPENSE EXAMPLE (continued)
Ultra Short-Term Bond ETF
| | Beginning
Account Value
6/1/23 | Ending
Account Value
11/30/23 | Expenses Paid
During Period*
6/1/23 to 11/30/23 |
| Actual | $1,000.00 | $1,032.30 | $0.86 |
| Hypothetical (assumes 5% return before expenses) | 1,000.00 | 1,024.15 | 0.86 |
| * | Expenses are equal to the fund’s annualized expense ratio for the 6-month period (0.17%), multiplied by the average account value over the period, multiplied by the number of days in the most recent fiscal half year (183), and divided by the days in the year (366) to reflect the half-year period. |
T. ROWE PRICE ULTRA SHORT-TERM BOND ETF
Unaudited
For a share outstanding throughout each period
| | 6 Months
Ended | Year
Ended | 9/28/21 (1)
Through |
| | 11/30/23 | 5/31/23 | 5/31/22 |
| NET ASSET VALUE | | | |
| Beginning of period | $ 48.67 | $ 49.07 | $ 50.00 |
| Investment activities | | | |
| Net investment income(2) (3) | 1.26 | 1.63 | 0.31 |
| Net realized and unrealized gain/loss | 0.32 | (0.13) | (0.94) |
| Total from investment activities | 1.58 | 1.50 | (0.63) |
| Distributions | | | |
| Net investment income | (1.19) | (1.69) | (0.27) |
| Net realized gain | - | (0.21) | (0.03) |
| Total distributions | (1.19) | (1.90) | (0.30) |
| NET ASSET VALUE | | | |
| End of period | $ 49.06 (4) | $ 48.67 | $ 49.07 |
T. ROWE PRICE ULTRA SHORT-TERM BOND ETF
Unaudited
For a share outstanding throughout each period
| | 6 Months
Ended | Year
Ended | 9/28/21 (1)
Through |
| | 11/30/23 | 5/31/23 | 5/31/22 |
| Ratios/Supplemental Data |
| Total return, based on NAV(3) (5) | 3.23% (4) | 3.15% | (1.31)% |
Ratios to average net
assets:(3) | | | |
Gross expenses before
waivers/payments by
Price Associates | 0.17% (6) | 0.17% | 0.17% (6) |
Net expenses after
waivers/payments by
Price Associates | 0.17% (6) | 0.17% | 0.17% (6) |
| Net investment income | 5.14% (6) | 3.34% | 0.94% (6) |
| Portfolio turnover rate(7) | 45.6% | 61.2% | 12.5% |
Net assets, end of period
(in thousands) | $ 112,834 | $ 54,755 | $ 36,801 |
| (1) | Inception date |
| (2) | Per share amounts calculated using average shares outstanding method. |
| (3) | See Note 6 for details to expense-related arrangements with Price Associates. |
| (4) | Net asset value and Total return include adjustments made in accordance with U.S. generally accepted accounting principles for financial reporting purposes and may differ from the net asset value and total returns for share holder transactions. |
| (5) | Total return reflects the rate that an investor would have earned on an investment in the fund during each period, assuming reinvestment of all distributions. Total return is not annualized for periods less than one year. |
| (6) | Annualized |
| (7) | Portfolio turnover excludes securities received or delivered through in-kind share transactions. |
The accompanying notes are an integral part of these financial statements.
T. ROWE PRICE ULTRA SHORT-TERM BOND ETF
November 30, 2023 Unaudited
| PORTFOLIO OF INVESTMENTS‡ | Par/Shares | $ Value |
| (Amounts in 000s) | | |
| ASSET-BACKED SECURITIES 18.8% |
| Auto Backed 10.4% | | |
| Ally Auto Receivables Trust, Series 2023-A, Class A2, 6.15%, 1/17/34 (1) | 296 | 297 |
| Ally Auto Receivables Trust, Series 2023-A, Class B, 6.01%, 1/17/34 (1) | 178 | 177 |
| AmeriCredit Automobile Receivables Trust, Series 2020-3, Class C, 1.06%, 8/18/26 | 100 | 96 |
| ARI Fleet Lease Trust, Series 2023-B, Class A2, 6.05%, 7/15/32 (1) | 200 | 201 |
| CarMax Auto Owner Trust, Series 2020-4, Class B, 0.85%, 6/15/26 | 327 | 310 |
| CarMax Auto Owner Trust, Series 2023-3, Class A2B, FRN, SOFR30A + 0.60%, 5.924%, 11/16/26 | 510 | 510 |
| CarMax Auto Owner Trust, Series 2023-3, Class A3, 5.28%, 5/15/28 | 340 | 340 |
| Carvana Auto Receivables Trust, Series 2021-N4, Class B, 1.24%, 9/11/28 | 10 | 9 |
| Carvana Auto Receivables Trust, Series 2022-N1, Class A1, 2.31%, 12/11/28 (1) | 35 | 35 |
| Carvana Auto Receivables Trust, Series 2023-N1, Class A, 6.36%, 4/12/27 (1) | 71 | 71 |
| Carvana Auto Receivables Trust, Series 2023-N3, Class A, 6.41%, 9/10/27 (1) | 212 | 212 |
| Carvana Auto Receivables Trust, Series 2023-P3, Class A2, 6.09%, 11/10/26 (1) | 425 | 425 |
| Chase Auto Credit Linked Notes, Series 2021-3, Class B, 0.76%, 2/26/29 (1) | 425 | 409 |
| Drive Auto Receivables Trust, Series 2020-2, Class D, 3.05%, 5/15/28 | 42 | 42 |
| Enterprise Fleet Financing, Series 2020-2, Class A2, 0.61%, 7/20/26 (1) | 7 | 7 |
| Enterprise Fleet Financing, Series 2021-2, Class A3, 0.74%, 5/20/27 (1) | 305 | 288 |
| Enterprise Fleet Financing, Series 2022-3, Class A2, 4.38%, 7/20/29 (1) | 532 | 524 |
| Enterprise Fleet Financing, Series 2023-2, Class A2, 5.56%, 4/22/30 (1) | 400 | 398 |
T. ROWE PRICE ULTRA SHORT-TERM BOND ETF
| | Par/Shares | $ Value |
| (Amounts in 000s) | | |
| Enterprise Fleet Financing LLC, Series 2023-3, Class A2, 6.40%, 3/20/30 (1) | 275 | 278 |
| Exeter Automobile Receivables Trust, Series 2022-3A, Class B, 4.86%, 12/15/26 | 100 | 100 |
| Exeter Automobile Receivables Trust, Series 2022-4A, Class B, 4.57%, 1/15/27 | 250 | 248 |
| Exeter Automobile Receivables Trust, Series 2022-5A, Class B, 5.97%, 3/15/27 | 200 | 199 |
| Exeter Automobile Receivables Trust, Series 2022-6A, Class A3, 5.70%, 8/17/26 | 25 | 25 |
| Exeter Automobile Receivables Trust, Series 2023-1A, Class B, 5.72%, 4/15/27 | 310 | 309 |
| Exeter Automobile Receivables Trust, Series 2023-3A, Class B, 6.11%, 9/15/27 | 165 | 165 |
| Exeter Automobile Receivables Trust, Series 2023-4A, Class A2, 6.07%, 12/15/25 | 425 | 425 |
| Exeter Automobile Receivables Trust, Series 2023-4A, Class B, 6.31%, 10/15/27 | 275 | 275 |
| Ford Credit Auto Lease Trust, Series 2023-A, Class B, 5.29%, 6/15/26 | 120 | 119 |
| Ford Credit Auto Lease Trust, Series 2023-B, Class B, 6.20%, 2/15/27 | 180 | 181 |
| Ford Credit Auto Owner Trust, Series 2020-1, Class B, 2.29%, 8/15/31 (1) | 635 | 606 |
| Ford Credit Floorplan Master Owner Trust, Series 2023-1, Class B, 5.31%, 5/15/28 (1) | 100 | 99 |
| GM Financial Automobile Leasing Trust, Series 2023-2, Class B, 5.54%, 5/20/27 | 80 | 79 |
| HPEFS Equipment Trust, Series 2023-1A, Class A2, 5.43%, 8/20/25 (1) | 144 | 144 |
| JPMorgan Chase, Series 2021-1, Class B, 0.875%, 9/25/28 (1) | 173 | 169 |
| JPMorgan Chase, Series 2021-2, Class B, 0.889%, 12/26/28 (1) | 43 | 42 |
| JPMorgan Chase, Series 2021-2, Class C, 0.969%, 12/26/28 (1) | 44 | 43 |
| JPMorgan Chase Bank, Series 2021-3, Class D, 1.009%, 2/26/29 (1) | 183 | 176 |
| Navistar Financial Dealer Note Master Owner Trust II, Series 2023-1, Class A, 6.18%, 8/25/28 (1) | 185 | 185 |
T. ROWE PRICE ULTRA SHORT-TERM BOND ETF
| | Par/Shares | $ Value |
| (Amounts in 000s) | | |
| Octane Receivables Trust, Series 2023-1A, Class A, 5.87%, 5/21/29 (1) | 67 | 67 |
| Octane Receivables Trust, Series 2023-1A, Class B, 5.96%, 7/20/29 (1) | 200 | 198 |
| Octane Receivables Trust, Series 2023-3A, Class A2, 6.44%, 3/20/29 (1) | 925 | 927 |
| Octane Receivables Trust, Series 2023-3A, Class B, 6.48%, 7/20/29 (1) | 265 | 267 |
| Santander Consumer Auto Receivables Trust, Series 2021-BA, Class B, 1.45%, 10/16/28 (1) | 2 | 2 |
| Santander Drive Auto Receivables Trust, Series 2022-5, Class B, 4.43%, 3/15/27 | 250 | 246 |
| Santander Drive Auto Receivables Trust, Series 2022-6, Class B, 4.72%, 6/15/27 | 150 | 147 |
| Santander Drive Auto Receivables Trust, Series 2022-7, Class A2, 5.81%, 1/15/26 | 26 | 25 |
| Santander Drive Auto Receivables Trust, Series 2023-1, Class B, 4.98%, 2/15/28 | 85 | 84 |
| Santander Drive Auto Receivables Trust, Series 2023-3, Class A3, 5.61%, 10/15/27 | 635 | 634 |
| Santander Drive Auto Receivables Trust, Series 2023-4, Class A2, 6.18%, 2/16/27 | 555 | 556 |
| Santander Drive Auto Receivables Trust, Series 2023-4, Class A3, 5.73%, 4/17/28 | 190 | 190 |
| SFS Auto Receivables Securitization Trust, Series 2023-1A, Class A2B, FRN, SOFR30A + 0.80%, 6.125%, 3/22/27 (1) | 63 | 63 |
| World Omni Auto Receivables Trust, Series 2021-A, Class B, 0.64%, 12/15/26 | 25 | 23 |
| World Omni Select Auto Trust, Series 2020-A, Class B, 0.84%, 6/15/26 | 84 | 83 |
| | | 11,730 |
| Collateralized Debt Obligations 0.4% | | |
| BlueMountain, Series 2015-3A, Class A1R, CLO, FRN, 3M TSFR + 1.26%, 6.677%, 4/20/31 (1) | 224 | 223 |
| Symphony Static, Series 2021-1A, Class A, CLO, FRN, 3M TSFR + 1.09%, 6.47%, 10/25/29 (1) | 181 | 180 |
| | | 403 |
T. ROWE PRICE ULTRA SHORT-TERM BOND ETF
| | Par/Shares | $ Value |
| (Amounts in 000s) | | |
| Equipment Lease Heavy Duty 0.7% | | |
| MMAF Equipment Finance, Series 2020-A, Class A3, 0.97%, 4/9/27 (1) | 400 | 379 |
| MMAF Equipment Finance, Series 2020-BA, Class A5, 0.85%, 4/14/42 (1) | 100 | 93 |
| MMAF Equipment Finance, Series 2023-A, Class A2, 5.79%, 11/13/26 (1) | 105 | 105 |
| SCF Equipment Leasing, Series 2023-1A, Class A2, 6.56%, 1/22/30 (1) | 220 | 220 |
| | | 797 |
| Other Asset-Backed Securities 6.8% | | |
| ARI Fleet Lease Trust, Series 2021-A, Class A2, 0.37%, 3/15/30 (1) | 14 | 14 |
| Axis Equipment Finance Receivables, Series 2021-1A, Class A2, 0.75%, 11/20/26 | 16 | 16 |
| Dell Equipment Finance Trust, Series 2023-2, Class A3, 5.65%, 1/22/29 (1) | 100 | 100 |
| Dell Equipment Finance Trust, Series 2023-3, Class A3, 6.57%, 4/23/29 (1) | 245 | 247 |
| DLLAA, Series 2021-1A, Class A3, 0.67%, 4/17/26 (1) | 125 | 121 |
| DLLAA, Series 2023-1A, Class A2, 5.93%, 7/20/26 (1) | 525 | 526 |
| DLLAA, Series 2023-1A, Class A3, 5.64%, 2/22/28 (1) | 325 | 325 |
| DLLAD, Series 2023-1A, Class A2, 5.19%, 4/20/26 (1) | 247 | 245 |
| Elara HGV Timeshare Issuer, Series 2017-A, Class A, 2.69%, 3/25/30 (1) | 11 | 11 |
| Hardee's Funding, Series 2018-1A, Class A2II, 4.959%, 6/20/48 (1) | 57 | 54 |
| Hilton Grand Vacations Trust, Series 2018-AA, Class A, 3.54%, 2/25/32 (1) | 229 | 222 |
| HPEFS Equipment Trust, Series 2021-2A, Class D, 1.29%, 3/20/29 (1) | 300 | 290 |
| HPEFS Equipment Trust, Series 2022-1A, Class B, 1.79%, 5/21/29 (1) | 1,000 | 972 |
| HPEFS Equipment Trust, Series 2023-2A, Class A3, 5.99%, 1/21/31 (1) | 250 | 251 |
T. ROWE PRICE ULTRA SHORT-TERM BOND ETF
| | Par/Shares | $ Value |
| (Amounts in 000s) | | |
| HPEFS Equipment Trust, Series 2023-2A, Class B, 6.25%, 1/21/31 (1) | 110 | 111 |
| Kubota Credit Owner Trust, Series 2023-2A, Class A2, 5.61%, 7/15/26 (1) | 685 | 684 |
| Kubota Credit Owner Trust, Series 2023-2A, Class A3, 5.28%, 1/18/28 (1) | 525 | 524 |
| M&T Equipment Notes, Series 2023-1A, Class A2, 6.09%, 7/15/30 (1) | 430 | 430 |
| M&T Equipment Notes, Series 2023-1A, Class A3, 5.74%, 7/15/30 (1) | 580 | 578 |
| MVW, Series 2020-1A, Class A, 1.74%, 10/20/37 (1) | 83 | 77 |
| MVW, Series 2021-1WA, Class A, 1.14%, 1/22/41 (1) | 43 | 39 |
| Navient Private Education Refi Loan Trust, Series 2021-CA, Class A, 1.06%, 10/15/69 (1) | 60 | 52 |
| Nelnet Student Loan Trust, Series 2021-DA, Class AFL, FRN, 1M TSFR + 0.80%, 6.136%, 4/20/62 (1) | 60 | 59 |
| Octane Receivables Trust, Series 2021-1A, Class A, 0.93%, 3/22/27 (1) | 18 | 17 |
| Octane Receivables Trust, Series 2021-2A, Class A, 1.21%, 9/20/28 (1) | 61 | 59 |
| Octane Receivables Trust, Series 2022-1A, Class A2, 4.18%, 3/20/28 (1) | 43 | 43 |
| Octane Receivables Trust, Series 2022-2A, Class A, 5.11%, 2/22/28 (1) | 55 | 55 |
| Octane Receivables Trust, Series 2023-2A, Class A2, 5.88%, 6/20/31 (1) | 166 | 165 |
| Santander Bank Auto Credit-Linked Notes, Series 2021-1A, Class B, 1.833%, 12/15/31 (1) | 59 | 58 |
| Santander Bank Auto Credit-Linked Notes, Series 2022-A, Class B, 5.281%, 5/15/32 (1) | 168 | 166 |
| Santander Bank Auto Credit-Linked Notes, Series 2022-B, Class B, 5.721%, 8/16/32 (1) | 99 | 99 |
| Santander Retail Auto Lease Trust, Series 2020-A, Class B, 1.61%, 1/20/26 (1) | 180 | 173 |
| Sierra Timeshare Receivables Funding, Series 2019-3A, Class A, 2.34%, 8/20/36 (1) | 41 | 39 |
| Sierra Timeshare Receivables Funding, Series 2020-2A, Class A, 1.33%, 7/20/37 (1) | 36 | 34 |
T. ROWE PRICE ULTRA SHORT-TERM BOND ETF
| | Par/Shares | $ Value |
| (Amounts in 000s) | | |
| Verdant Receivables, Series 2023-1A, Class A2, 6.24%, 1/13/31 (1) | 590 | 589 |
| Verizon Master Trust, Series 2021-1, Class B, 0.69%, 5/20/27 | 269 | 262 |
| | | 7,707 |
| Student Loans 0.3% | | |
| Navient Private Education Refi Loan Trust, Series 2019-A, Class A2A, 3.42%, 1/15/43 (1) | 69 | 66 |
| Navient Private Education Refi Loan Trust, Series 2020-FA, Class A, 1.22%, 7/15/69 (1) | 61 | 54 |
| Navient Private Education Refi Loan Trust, Series 2020-GA, Class A, 1.17%, 9/16/69 (1) | 70 | 62 |
| Navient Private Education Refi Loan Trust, Series 2020-HA, Class A, 1.31%, 1/15/69 (1) | 89 | 81 |
| Navient Private Education Refi Loan Trust, Series 2021-GA, Class A, 1.58%, 4/15/70 (1) | 75 | 64 |
| SMB Private Education Loan Trust, Series 2016-B, Class A2B, FRN, 1M TSFR + 1.56%, 6.887%, 2/17/32 (1) | 32 | 32 |
| | | 359 |
| Whole Loans Backed 0.2% | | |
| Progress Residential Trust, Series 2020-SFR3, Class B, CMO, ARM, 1.495%, 10/17/27 (1) | 235 | 216 |
Total Asset-Backed Securities
(Cost $21,238) | | 21,212 |
| CORPORATE BONDS 63.7% |
| Advertising 0.5% | | |
| WPP Finance, 3.75%, 9/19/24 | 600 | 588 |
| | | 588 |
| Airlines 0.3% | | |
| SMBC Aviation Capital Finance, 3.55%, 4/15/24 (1) | 400 | 396 |
| | | 396 |
T. ROWE PRICE ULTRA SHORT-TERM BOND ETF
| | Par/Shares | $ Value |
| (Amounts in 000s) | | |
| Automotive 3.9% | | |
| Daimler Trucks Finance North America, FRN, SOFR + 0.75%, 6.097%, 12/13/24 (1) | 300 | 300 |
| Ford Motor Credit, 2.30%, 2/10/25 | 300 | 285 |
| Ford Motor Credit, 3.664%, 9/8/24 | 300 | 294 |
| Ford Motor Credit, 4.134%, 8/4/25 | 250 | 240 |
| Hyundai Capital America, 1.30%, 1/8/26 (1) | 250 | 228 |
| Hyundai Capital America, 1.80%, 10/15/25 (1) | 410 | 381 |
| Hyundai Capital America, 5.50%, 3/30/26 (1) | 85 | 84 |
| Hyundai Capital America, 5.65%, 6/26/26 (1) | 200 | 199 |
| Hyundai Capital America, 6.25%, 11/3/25 (1) | 70 | 71 |
| LeasePlan, 2.875%, 10/24/24 (1) | 600 | 582 |
| Nissan Motor, 3.522%, 9/17/25 (1) | 295 | 281 |
| Nissan Motor Acceptance, 1.125%, 9/16/24 (1) | 416 | 399 |
| Volkswagen Group of America Finance, 5.80%, 9/12/25 (1) | 300 | 300 |
| Volkswagen Group of America Finance, 6.00%, 11/16/26 (1) | 545 | 550 |
| Volkswagen Group of America Finance, FRN, SOFR + 0.95%, 6.296%, 6/7/24 (1) | 200 | 200 |
| | | 4,394 |
| Banking 22.4% | | |
| ABN AMRO Bank, VR, 6.339%, 9/18/27 (1)(2) | 200 | 201 |
| Australia & New Zealand Banking Group, 4.50%, 3/19/24 (1) | 800 | 796 |
| Banco Santander, 5.147%, 8/18/25 | 400 | 395 |
| Bangkok Bank, 4.05%, 3/19/24 | 250 | 249 |
| Bank of America, 4.45%, 3/3/26 | 400 | 390 |
| Bank of America, VR, 4.83%, 7/22/26 (2) | 200 | 197 |
| Bank of America, VR, 5.08%, 1/20/27 (2) | 200 | 198 |
| Bank of America, FRN, SOFR + 0.66%, 6.007%, 2/4/25 | 200 | 199 |
| Bank of Ireland Group, VR, 6.25%, 9/16/26 (1)(2) | 400 | 399 |
| Bank of Montreal, 5.30%, 6/5/26 | 550 | 549 |
| Banque Federative du Credit Mutuel, 4.935%, 1/26/26 (1) | 400 | 394 |
| Banque Federative du Credit Mutuel, 5.896%, 7/13/26 (1) | 400 | 402 |
| Barclays, 4.375%, 9/11/24 | 400 | 393 |
T. ROWE PRICE ULTRA SHORT-TERM BOND ETF
| | Par/Shares | $ Value |
| (Amounts in 000s) | | |
| Barclays, VR, 5.304%, 8/9/26 (2) | 400 | 392 |
| BPCE SA, 2.375%, 1/14/25 (1) | 500 | 481 |
| CaixaBank, VR, 6.684%, 9/13/27 (1)(2) | 550 | 554 |
| Canadian Imperial Bank of Commerce, FRN, SOFRINDX + 0.40%, 5.747%, 12/14/23 | 300 | 300 |
| Capital One Financial, VR, 1.34%, 12/6/24 (2) | 400 | 400 |
| Capital One Financial, 4.25%, 4/30/25 (3) | 180 | 175 |
| Capital One Financial, FRN, SOFR + 1.35%, 6.697%, 5/9/25 | 200 | 199 |
| Citigroup, 4.40%, 6/10/25 | 400 | 392 |
| Citigroup, FRN, SOFR + 0.69%, 6.042%, 1/25/26 | 500 | 496 |
| Cooperatieve Rabobank, 4.625%, 12/1/23 | 750 | 750 |
| Danske Bank, VR, 3.77%, 3/28/25 (1)(2) | 400 | 396 |
| Danske Bank, VR, 6.259%, 9/22/26 (1)(2) | 235 | 236 |
| Deutsche Bank, VR, 1.45%, 4/1/25 (2) | 300 | 295 |
| Deutsche Bank, 3.70%, 5/30/24 | 200 | 197 |
| Discover Bank, 2.45%, 9/12/24 | 900 | 873 |
| Emirates NBD Bank PJSC, 2.625%, 2/18/25 | 400 | 384 |
| Fifth Third Bancorp, 2.375%, 1/28/25 | 160 | 154 |
| Fifth Third Bank, 3.85%, 3/15/26 | 650 | 615 |
| Goldman Sachs Group, FRN, SOFR + 0.50%, 5.847%, 9/10/24 | 100 | 99 |
| Goldman Sachs Group, FRN, SOFR + 0.70%, 6.049%, 1/24/25 | 400 | 399 |
| Goldman Sachs Group, FRN, SOFR + 1.39%, 6.737%, 3/15/24 | 50 | 50 |
| Huntington Bancshares, 2.625%, 8/6/24 (3) | 225 | 219 |
| Huntington National Bank, VR, 5.70%, 11/18/25 (2) | 335 | 327 |
| ING Groep, VR, 3.87%, 3/28/26 (2) | 800 | 778 |
| Intesa Sanpaolo, 3.25%, 9/23/24 (1) | 500 | 488 |
| Intesa Sanpaolo, 5.25%, 1/12/24 | 300 | 300 |
| Intesa Sanpaolo, 7.00%, 11/21/25 (1) | 200 | 202 |
| Lloyds Banking Group, VR, 2.44%, 2/5/26 (2) | 635 | 608 |
| Lloyds Banking Group, 4.50%, 11/4/24 | 400 | 393 |
| Mitsubishi UFJ Financial Group, VR, 5.06%, 9/12/25 (2) | 400 | 397 |
| Mitsubishi UFJ Financial Group, VR, 5.72%, 2/20/26 (2) | 400 | 400 |
| Morgan Stanley, VR, 5.05%, 1/28/27 (2)(3) | 240 | 237 |
| Morgan Stanley Bank, FRN, SOFR + 0.78%, 6.13%, 7/16/25 | 800 | 799 |
T. ROWE PRICE ULTRA SHORT-TERM BOND ETF
| | Par/Shares | $ Value |
| (Amounts in 000s) | | |
| NatWest Group, VR, 5.85%, 3/2/27 (2) | 400 | 399 |
| PNC Bank NA, 3.875%, 4/10/25 | 500 | 486 |
| PNC Financial Services Group, VR, 5.812%, 6/12/26 (2)(3) | 240 | 240 |
| Santander U.K. Group Holdings, VR, 1.09%, 3/15/25 (2) | 400 | 393 |
| Siam Commercial Bank, 3.90%, 2/11/24 | 400 | 399 |
| Societe Generale, 4.25%, 4/14/25 (1) | 500 | 485 |
| Societe Generale, 5.00%, 1/17/24 (1) | 400 | 399 |
| Standard Chartered, VR, 3.97%, 3/30/26 (1)(2) | 200 | 194 |
| Standard Chartered, 5.20%, 1/26/24 (1) | 400 | 399 |
| Standard Chartered, VR, 6.187%, 7/6/27 (1)(2) | 400 | 401 |
| Toronto-Dominion Bank, FRN, SOFR + 1.08%, 6.42%, 7/17/26 | 550 | 549 |
| Truist Financial, FRN, SOFR + 0.40%, 5.747%, 6/9/25 | 445 | 436 |
| UBS Group, VR, 2.59%, 9/11/25 (1)(2) | 500 | 485 |
| UBS Group, VR, 6.327%, 12/22/27 (1)(2) | 300 | 303 |
| US Bancorp, 3.60%, 9/11/24 | 100 | 98 |
| US Bancorp, VR, 5.73%, 10/21/26 (2) | 465 | 462 |
| Wells Fargo, 3.00%, 4/22/26 | 800 | 757 |
| Wells Fargo, 4.10%, 6/3/26 | 290 | 282 |
| Woori Bank, 4.75%, 4/30/24 | 400 | 398 |
| | | 25,312 |
| Broadcasting 0.4% | | |
| Interpublic Group, 4.20%, 4/15/24 | 400 | 396 |
| | | 396 |
| Building & Real Estate 0.2% | | |
| EMG SUKUK, 4.564%, 6/18/24 | 200 | 198 |
| | | 198 |
| Cable Operators 0.2% | | |
| Cox Communications, 3.15%, 8/15/24 (1) | 200 | 196 |
| | | 196 |
| Chemicals 0.5% | | |
| Celanese US Holdings, 1.40%, 8/5/26 | 348 | 310 |
T. ROWE PRICE ULTRA SHORT-TERM BOND ETF
| | Par/Shares | $ Value |
| (Amounts in 000s) | | |
| LG Chem, 4.375%, 7/14/25 | 280 | 274 |
| | | 584 |
| Consumer Products 0.2% | | |
| Mattel, 3.375%, 4/1/26 (1) | 285 | 266 |
| | | 266 |
| Diversified Chemicals 0.2% | | |
| Bayer US Finance II, 4.25%, 12/15/25 (1) | 290 | 279 |
| | | 279 |
| Drugs 1.3% | | |
| AbbVie, 3.80%, 3/15/25 | 525 | 514 |
| BNP Paribas SA, 4.25%, 10/15/24 | 500 | 492 |
| Viatris, 1.65%, 6/22/25 | 515 | 483 |
| | | 1,489 |
| Electric Utilities 0.2% | | |
| Israel Electric, 5.00%, 11/12/24 | 200 | 196 |
| | | 196 |
| Energy 4.7% | | |
| APA Infrastructure, 4.20%, 3/23/25 (1) | 800 | 783 |
| DCP Midstream Operating, 5.375%, 7/15/25 | 740 | 739 |
| Energy Transfer, 6.05%, 12/1/26 | 315 | 319 |
| Energy Transfer , 5.75%, 4/1/25 | 200 | 199 |
| EQT, 6.125%, 2/1/25 | 200 | 200 |
| Gray Oak Pipeline, 2.60%, 10/15/25 (1) | 125 | 117 |
| MPLX, 4.875%, 12/1/24 | 500 | 494 |
| MPLX, 4.875%, 6/1/25 | 200 | 197 |
| Occidental Petroleum, 5.50%, 12/1/25 | 300 | 300 |
| Occidental Petroleum, 5.55%, 3/15/26 | 150 | 150 |
| Occidental Petroleum, 5.875%, 9/1/25 | 478 | 480 |
| Occidental Petroleum, 8.50%, 7/15/27 | 125 | 135 |
| Reliance Industries, 4.125%, 1/28/25 | 250 | 245 |
T. ROWE PRICE ULTRA SHORT-TERM BOND ETF
| | Par/Shares | $ Value |
| (Amounts in 000s) | | |
| Sabine Pass Liquefaction, 5.75%, 5/15/24 | 156 | 156 |
| Western Midstream Operating, 3.10%, 2/1/25 | 322 | 312 |
| Western Midstream Operating, 3.95%, 6/1/25 | 500 | 485 |
| | | 5,311 |
| Exploration & Production 0.2% | | |
| Aker BP, 2.00%, 7/15/26 (1) | 300 | 273 |
| | | 273 |
| Financial 4.2% | | |
| AerCap Ireland Capital, 3.15%, 2/15/24 | 300 | 298 |
| AerCap Ireland Capital DAC/AerCap Global Aviation Trust, 6.10%, 1/15/27 | 225 | 226 |
| Air Lease, 4.25%, 2/1/24 | 200 | 199 |
| Ally Financial, 3.875%, 5/21/24 (3) | 400 | 395 |
| Ally Financial, 4.625%, 3/30/25 | 200 | 196 |
| Ally Financial, 5.125%, 9/30/24 | 200 | 198 |
| CNO Financial Group, 5.25%, 5/30/25 | 577 | 571 |
| Fab Sukuk Co, 3.875%, 1/22/24 | 200 | 199 |
| General Motors Financial, 4.00%, 1/15/25 | 100 | 98 |
| General Motors Financial, 6.05%, 10/10/25 | 300 | 301 |
| General Motors Financial, FRN, SOFR + 0.76%, 6.107%, 3/8/24 | 390 | 390 |
| Indian Railway Finance, 3.73%, 3/29/24 | 400 | 398 |
| LSEGA Financing, 1.375%, 4/6/26 (1) | 400 | 363 |
| QNB Finance, 3.50%, 3/28/24 | 200 | 198 |
| Synchrony Financial, 4.25%, 8/15/24 | 190 | 187 |
| Western Union, 2.85%, 1/10/25 | 510 | 492 |
| | | 4,709 |
| Food/Tobacco 0.5% | | |
| Imperial Brands Finance, 3.125%, 7/26/24 (1) | 200 | 196 |
| Imperial Brands Finance, 4.25%, 7/21/25 (1) | 400 | 390 |
| | | 586 |
T. ROWE PRICE ULTRA SHORT-TERM BOND ETF
| | Par/Shares | $ Value |
| (Amounts in 000s) | | |
| Forest Products 0.2% | | |
| Celulosa Arauco Constitucion, 4.50%, 8/1/24 | 200 | 197 |
| | | 197 |
| Gas & Gas Transmission 0.2% | | |
| Kinder Morgan Energy, 4.25%, 9/1/24 | 200 | 198 |
| | | 198 |
| Health Care 1.4% | | |
| Baxter International, FRN, SOFRINDX + 0.44%, 5.785%, 11/29/24 | 250 | 249 |
| HCA, 5.375%, 2/1/25 | 950 | 943 |
| Utah Acquisition Sub, 3.95%, 6/15/26 | 420 | 400 |
| | | 1,592 |
| Information Technology 0.8% | | |
| Microchip Technology, 0.972%, 2/15/24 | 500 | 495 |
| NXP, 4.875%, 3/1/24 | 400 | 398 |
| | | 893 |
| Insurance 4.6% | | |
| Athene Global Funding, 2.514%, 3/8/24 (1) | 250 | 248 |
| Athene Global Funding, FRN, SOFRINDX + 0.72%, 6.063%, 1/7/25 (1) | 200 | 198 |
| Brighthouse Financial Global Funding, 1.00%, 4/12/24 (1) | 125 | 123 |
| Brighthouse Financial Global Funding, 1.20%, 12/15/23 (1) | 150 | 149 |
| Brighthouse Financial Global Funding, FRN, SOFR + 0.76%, 6.108%, 4/12/24 (1) | 245 | 244 |
| Brown & Brown, 4.20%, 9/15/24 | 150 | 148 |
| CNO Global Funding, 1.65%, 1/6/25 (1) | 400 | 379 |
| Corebridge Financial, 3.50%, 4/4/25 | 1,200 | 1,161 |
| Equitable Financial Life Global Funding, 1.40%, 7/7/25 (1) | 185 | 172 |
| Equitable Financial Life Global Funding, 5.50%, 12/2/25 (1) | 621 | 616 |
| First American Financial, 4.60%, 11/15/24 | 650 | 640 |
| Principal Financial Group, 3.40%, 5/15/25 | 250 | 241 |
T. ROWE PRICE ULTRA SHORT-TERM BOND ETF
| | Par/Shares | $ Value |
| (Amounts in 000s) | | |
| Voya Financial, 3.65%, 6/15/26 | 900 | 858 |
| | | 5,177 |
| Manufacturing 1.3% | | |
| Carrier Global, 5.80%, 11/30/25 (1) | 305 | 307 |
| POSCO, 4.375%, 8/4/25 | 400 | 392 |
| VF, 2.40%, 4/23/25 | 785 | 740 |
| | | 1,439 |
| Media & Communications 0.5% | | |
| Warnermedia Holdings, 3.638%, 3/15/25 | 589 | 573 |
| | | 573 |
| Media & Entertainment 0.4% | | |
| Take-Two Interactive Software, 5.00%, 3/28/26 | 450 | 447 |
| | | 447 |
| Metals & Mining 0.4% | | |
| ABJA Investment, 5.95%, 7/31/24 | 400 | 398 |
| Freeport-McMoRan, 5.00%, 9/1/27 | 5 | 5 |
| | | 403 |
| Oil Field Services 0.3% | | |
| Energy Transfer, 5.875%, 1/15/24 (3) | 350 | 350 |
| | | 350 |
| Other Telecommunications 0.4% | | |
| British Telecommunications, 4.50%, 12/4/23 | 400 | 400 |
| | | 400 |
| Real Estate Investment Trust Securities 3.5% | | |
| Brixmor Operating Partnership, 3.65%, 6/15/24 | 391 | 385 |
| Brixmor Operating Partnership, 3.85%, 2/1/25 | 200 | 194 |
| Brixmor Operating Partnership, 4.125%, 6/15/26 | 100 | 96 |
| CubeSmart, 4.00%, 11/15/25 | 675 | 652 |
| Essex Portfolio, 3.875%, 5/1/24 | 750 | 743 |
T. ROWE PRICE ULTRA SHORT-TERM BOND ETF
| | Par/Shares | $ Value |
| (Amounts in 000s) | | |
| Kilroy Realty, 3.45%, 12/15/24 | 575 | 556 |
| Scentre Group Trust, 3.50%, 2/12/25 (1) | 900 | 875 |
| WP Carey, 4.60%, 4/1/24 | 400 | 398 |
| | | 3,899 |
| Retail 0.9% | | |
| 7-Eleven, 0.80%, 2/10/24 (1) | 95 | 94 |
| Advance Auto Parts, 5.90%, 3/9/26 | 100 | 99 |
| Nordstrom, 2.30%, 4/8/24 | 85 | 84 |
| Walgreens Boots Alliance, 3.80%, 11/18/24 | 750 | 733 |
| | | 1,010 |
| Transportation 0.7% | | |
| Penske Truck Leasing, 2.70%, 11/1/24 (1) | 200 | 194 |
| Penske Truck Leasing, 3.45%, 7/1/24 (1) | 400 | 394 |
| Penske Truck Leasing, 3.95%, 3/10/25 (1) | 200 | 195 |
| | | 783 |
| Transportation Services 0.3% | | |
| HPHT Finance, 2.875%, 11/5/24 | 400 | 390 |
| | | 390 |
| Utilities 4.1% | | |
| American Electric Power, 2.031%, 3/15/24 | 500 | 494 |
| American Electric Power, 5.699%, 8/15/25 | 278 | 278 |
| Constellation Energy Generation, 3.25%, 6/1/25 | 1,096 | 1,058 |
| Enel Finance International NV, 6.80%, 10/14/25 (1) | 400 | 406 |
| NextEra Energy Capital Holdings, 6.051%, 3/1/25 | 200 | 200 |
| NRG Energy, 3.75%, 6/15/24 (1) | 200 | 196 |
| Pacific Gas and Electric, 3.15%, 1/1/26 | 595 | 561 |
| Pacific Gas and Electric, 4.95%, 6/8/25 | 200 | 197 |
| Sempra Energy, 3.30%, 4/1/25 | 100 | 97 |
| Southern, 4.48%, 8/1/24 | 495 | 489 |
| Southern California Edison, FRN, SOFRINDX + 0.83%, 6.177%, 4/1/24 | 25 | 25 |
T. ROWE PRICE ULTRA SHORT-TERM BOND ETF
| | Par/Shares | $ Value |
| (Amounts in 000s) | | |
| Vistra Operations, 3.55%, 7/15/24 (1) | 545 | 534 |
| Vistra Operations, 5.125%, 5/13/25 (1) | 135 | 133 |
| | | 4,668 |
| Wireless Communications 3.8% | | |
| American Tower, 1.60%, 4/15/26 | 975 | 888 |
| American Tower, 2.40%, 3/15/25 | 186 | 178 |
| Crown Castle, 1.05%, 7/15/26 | 395 | 352 |
| Crown Castle, 1.35%, 7/15/25 (3) | 300 | 280 |
| Crown Castle International, 4.45%, 2/15/26 | 500 | 488 |
| Rogers Communications, 2.95%, 3/15/25 | 475 | 458 |
| Rogers Communications, 3.625%, 12/15/25 | 400 | 383 |
| Sprint, 7.125%, 6/15/24 | 750 | 753 |
| Sprint, 7.625%, 3/1/26 | 500 | 519 |
| | | 4,299 |
Total Corporate Bonds
(Cost $71,935) | | 71,891 |
| FOREIGN GOVERNMENT OBLIGATIONS & MUNICIPALITIES 1.0% |
| Foreign Govt & Muni (Excl Canadian) 1.0% | | |
| Japan Treasury Discount Bill, (0.246)%, 2/13/24 (JPY) | 169,400 | 1,143 |
| | | 1,143 |
Total Foreign Government Obligations & Municipalities
(Cost $1,118) | | 1,143 |
| NON-U.S. GOVERNMENT MORTGAGE-BACKED SECURITIES 7.6% |
| Commercial Mortgage-Backed Securities 2.8% | | |
| Austin Fairmont Hotel Trust, Series 2019-FAIR, Class A, ARM, 1M TSFR + 1.10%, 6.42%, 9/15/32 (1) | 475 | 472 |
| BX Trust, Series 2020-VKNG, Class A, ARM, 1M TSFR + 1.04%, 6.367%, 10/15/37 (1) | 596 | 591 |
| BX Trust, Series 2021-ARIA, Class A, ARM, 1M TSFR + 1.01%, 6.337%, 10/15/36 (1) | 665 | 646 |
| COMM Mortgage Trust, Series 2014-CR21, Class A3, 3.528%, 12/10/47 | 20 | 20 |
T. ROWE PRICE ULTRA SHORT-TERM BOND ETF
| | Par/Shares | $ Value |
| (Amounts in 000s) | | |
| COMM Mortgage Trust, Series 2014-LC15, Class A4, 4.006%, 4/10/47 | 308 | 306 |
| Fontainebleau Miami Beach Trust, Series 2019-FBLU, Class A, 3.144%, 12/10/36 (1) | 450 | 433 |
| Great Wolf Trust, Series 2019-WOLF, Class A, ARM, 1M TSFR + 1.15%, 6.472%, 12/15/36 (1) | 625 | 621 |
| ONE Mortgage Trust, Series 2021-PARK, Class A, ARM, 1M TSFR + 0.81%, 6.137%, 3/15/36 (1) | 115 | 108 |
| | | 3,197 |
| Whole Loans Backed 4.8% | | |
| Angel Oak Mortgage Trust, Series 2019-5, Class A1, CMO, ARM, 2.59%, 10/25/49 (1) | 54 | 52 |
| Angel Oak Mortgage Trust, Series 2021-2, Class A1, CMO, ARM, 0.99%, 4/25/66 (1) | 94 | 77 |
| Angel Oak Mortgage Trust, Series 2021-5, Class A1, CMO, ARM, 0.95%, 7/25/66 (1) | 120 | 99 |
| Angel Oak Mortgage Trust, Series 2022-1, Class A1, CMO, ARM, 2.88%, 12/25/66 (1) | 98 | 85 |
| Bellemeade Re, Series 2022-1, Class M1A, CMO, ARM, SOFR30A + 1.75%, 7.078%, 1/26/32 (1) | 104 | 104 |
| BINOM Securitization Trust, Series 2021-INV1, Class A1, CMO, ARM, 2.03%, 6/25/56 (1) | 67 | 56 |
| COLT Funding, Series 2021-4, Class A1, CMO, ARM, 1.40%, 10/25/66 (1) | 78 | 60 |
| Connecticut Avenue Securities Trust, Series 2021-R01, Class 1M1, CMO, ARM, SOFR30A + 0.75%, 6.078%, 10/25/41 (1) | 1 | 1 |
| Connecticut Avenue Securities Trust, Series 2021-R03, Class 1M1, CMO, ARM, SOFR30A + 0.85%, 6.178%, 12/25/41 (1) | 53 | 53 |
| Connecticut Avenue Securities Trust, Series 2023-R05, Class 1M1, CMO, ARM, SOFR30A + 1.90%, 7.229%, 6/25/43 (1) | 54 | 54 |
| Connecticut Avenue Securities Trust, Series 2023-R06, Class 1M1, CMO, ARM, SOFR30A + 1.70%, 7.028%, 7/25/43 (1) | 219 | 220 |
| Eagle RE, Series 2021-2, Class M1A, CMO, ARM, SOFR30A + 1.55%, 6.878%, 4/25/34 (1) | 8 | 8 |
| Ellington Financial Mortgage Trust, Series 2023-1, Class A1, CMO, ARM, 5.73%, 2/25/68 (1) | 167 | 164 |
| Freddie Mac Stacr Remic Trust, Series 2023-HQA3, Class A1, CMO, ARM, SOFR30A + 1.85%, 7.173%, 11/25/43 (1) | 115 | 116 |
T. ROWE PRICE ULTRA SHORT-TERM BOND ETF
| | Par/Shares | $ Value |
| (Amounts in 000s) | | |
| Freddie Mac STACR REMIC Trust, Series 2022-DNA1, Class M1A, CMO, ARM, SOFR30A + 1.00%, 6.328%, 1/25/42 (1) | 145 | 144 |
| Freddie Mac STACR REMIC Trust, Series 2022-DNA2, Class M1A, CMO, ARM, SOFR30A + 1.30%, 6.628%, 2/25/42 (1) | 192 | 191 |
| Freddie Mac STACR REMIC Trust, Series 2022-DNA5, Class M1A, CMO, ARM, SOFR30A + 2.95%, 8.278%, 6/25/42 (1) | 200 | 205 |
| New Residential Mortgage Loan Trust, Series 2023-NQM1, Class A1A, CMO, ARM, 6.864%, 10/25/63 (1) | 683 | 685 |
| OBX Trust, Series 2022-NQM1, Class A1, CMO, ARM, 2.31%, 11/25/61 (1) | 156 | 130 |
| OBX Trust, Series 2023-NQM10, Class A1, CMO, ARM, 6.465%, 10/25/63 (1) | 460 | 460 |
| Progress Residential Trust, Series 2019-SFR4, Class B, CMO, ARM, 2.937%, 10/17/36 (1) | 800 | 775 |
| Verus Securitization Trust, Series 2019-INV3, Class A1, CMO, ARM, 3.692%, 11/25/59 (1) | 96 | 93 |
| Verus Securitization Trust, Series 2021-2, Class A1, CMO, ARM, 1.03%, 2/25/66 (1) | 100 | 83 |
| Verus Securitization Trust, Series 2021-4, Class A1, CMO, ARM, 0.94%, 7/25/66 (1) | 101 | 78 |
| Verus Securitization Trust, Series 2021-5, Class A1, CMO, ARM, 1.01%, 9/25/66 (1) | 135 | 105 |
| Verus Securitization Trust, Series 2021-R3, Class A1, CMO, ARM, 1.02%, 4/25/64 (1) | 74 | 66 |
| Verus Securitization Trust, Series 2023-3, Class A1, CMO, ARM, 5.93%, 3/25/68 (1) | 299 | 296 |
| Verus Securitization Trust, Series 2023-INV1, Class A1, CMO, ARM, 5.999%, 2/25/68 (1) | 132 | 131 |
| Verus Securitization Trust, Series 2023-INV3, Class A1, CMO, ARM, 6.876%, 11/25/68 (1) | 770 | 773 |
| Vista Point Securitization Trust, Series 2020-2, Class A1, CMO, ARM, 1.48%, 4/25/65 (1) | 70 | 63 |
| | | 5,427 |
Total Non-U.S. Government Mortgage-Backed Securities
(Cost $8,821) | | 8,624 |
T. ROWE PRICE ULTRA SHORT-TERM BOND ETF
| | Par/Shares | $ Value |
| (Amounts in 000s) | | |
| U.S. GOVERNMENT AGENCY OBLIGATIONS (EXCLUDING MORTGAGE-BACKED) 2.2% |
| U.S. Treasury Obligations 2.2% | | |
| U.S. Treasury Bills, 5.195%, 11/29/24 | 650 | 618 |
| U.S. Treasury Bills, 5.383%, 5/30/24 | 650 | 633 |
| U.S. Treasury Bills, 5.466%, 4/18/24 (4) | 565 | 554 |
| U.S. Treasury Notes, 4.625%, 11/15/26 | 480 | 482 |
| U.S. Treasury Notes, 4.875%, 11/30/25 | 170 | 170 |
| | | 2,457 |
Total U.S. Government Agency Obligations (Excluding Mortgage-Backed)
(Cost $2,455) | | 2,457 |
| SHORT-TERM INVESTMENTS 5.6% |
| Commercial Paper 5.6% | | |
| Bacardi-Martini, 5.977%, 12/19/23 (5) | 500 | 499 |
| Bayer, 6.297%, 7/9/24 (5) | 550 | 530 |
| Canadian Natural Resources, 6.022%, 12/22/23 (5) | 300 | 299 |
| Crown Castle, 6.035%, 12/5/23 (5) | 300 | 300 |
| Harley-Davidson Financial Services, 6.039%, 12/5/23 (5) | 700 | 699 |
| Harley-Davidson Financial Services, 6.037%, 12/6/23 (5) | 300 | 300 |
| Ovintiv, 6.156%, 12/19/23 | 750 | 748 |
| Ovintiv, 6.123%, 12/20/23 | 250 | 249 |
| Stanley Black & Decker, 6.051%, 1/18/24 (5) | 750 | 744 |
| Syngenta Wilmington, 6.281%, 12/5/23 (5) | 1,100 | 1,099 |
| Targa Resources, 6.001%, 12/1/23 (5) | 300 | 300 |
| Walgreens Boots Alliance, 6.281%, 12/29/23 (5) | 250 | 249 |
| Western Midstream Operating, 6.207%, 1/3/24 (5) | 300 | 298 |
| | | 6,314 |
T. ROWE PRICE ULTRA SHORT-TERM BOND ETF
| | Par/Shares | $ Value |
| (Amounts in 000s) | | |
| Money Market Funds 0.0% | | |
| T. Rowe Price Government Reserve Fund, 5.42% (6)(7) | 1 | 1 |
Total Short-Term Investments
(Cost $6,315) | | 6,315 |
| SECURITIES LENDING COLLATERAL 1.6% |
| Investments in a Pooled Account through Securities Lending Program with State Street Bank 1.6% | | |
| Money Market Funds 1.6% | | |
| T. Rowe Price Government Reserve Fund, 5.42% (6)(7) | 1,792 | 1,792 |
| Total Investments in a Pooled Account through Securities Lending Program with State Street Bank | | 1,792 |
Total Securities Lending Collateral
(Cost $1,792) | | 1,792 |
T. ROWE PRICE ULTRA SHORT-TERM BOND ETF
(Amount in 000s, except for contracts)
| Options Purchased 0.0% |
| OTC Options Purchased 0.0% |
| Description | Contracts | Notional
Amount | $ Value |
| Counterparty: Bank of America, Credit Default Swap, Protection Bought (Relevant Credit: Markit CDX.NA.IG-S41, 1 Year Index, 12/20/28), Pay 1.00% Quarterly, Receive upon credit default, 01/17/24 @ 0.73% (8) | 1 | 5,000 | 3 |
| Total Options Purchased (Cost $4) | | 3 |
Total Investments in Securities
100.5% of Net Assets (Cost $113,678) | | $113,437 |
| ‡ | Par/Shares and Notional Amount are denominated in U.S. dollars unless otherwise noted. |
| (1) | Security was purchased pursuant to Rule 144A under the Securities Act of 1933 and may be resold in transactions exempt from registration only to qualified institutional buyers. Total value of such securities at period-end amounts to $43,318 and represents 38.4% of net assets. |
| (2) | Security is a fix-to-float security, which carries a fixed coupon until a certain date, upon which it switches to a floating rate. Reference rate and spread are provided if the rate is currently floating. |
| (3) | All or a portion of this security is on loan at November 30, 2023. See Note 4. |
| (4) | At November 30, 2023, all or a portion of this security is pledged as collateral and/or margin deposit to cover future funding obligations. |
| (5) | Commercial paper exempt from registration under Section 4(2) of the Securities Act of 1933 and may be resold in transactions exempt from registration only to dealers in that program or other "accredited investors" -- total value of such securities at period-end amounts to $5,317 and represents 4.7 % of net assets. |
| (6) | Seven-day yield |
| (7) | Affiliated Companies |
| (8) | Non-income producing. |
| 1M TSFR | One month term SOFR (Secured overnight financing rate) |
| 3M TSFR | Three month term SOFR (Secured overnight financing rate) |
| ARM | Adjustable Rate Mortgage (ARM); rate shown is effective rate at period-end. The rates for certain ARMs are not based on a published reference rate and spread but may be determined using a formula based on the rates of the underlying loans. |
| CLO | Collateralized Loan Obligation |
T. ROWE PRICE ULTRA SHORT-TERM BOND ETF
| CMO | Collateralized Mortgage Obligation |
| FRN | Floating Rate Note |
| JPY | Japanese Yen |
| OTC | Over-the-counter |
| SOFR | Secured overnight financing rate |
| SOFR30A | 30-day Average term SOFR (Secured Overnight Financing Rate) |
| SOFRINDX | SOFR (Secured overnight financing rate) Index |
| USD | U.S. Dollar |
| VR | Variable Rate; rate shown is effective rate at period-end. The rates for certain variable rate securities are not based on a published reference rate and spread but are determined by the issuer or agent and based on current market conditions. |
T. ROWE PRICE ULTRA SHORT-TERM BOND ETF
| Description | Notional
Amount | $ Value | Initial
$ Value | Unrealized
$ Gain/(Loss) |
| CENTRALLY CLEARED SWAPS 0.0% |
| Credit Default Swaps, Protection Sold 0.0% |
| Protection Sold (Relevant Credit: AT&T, Baa2*), Receive 1.00% Quarterly, Pay upon credit default 12/20/23 | 125 | — | — | — |
| Protection Sold (Relevant Credit: Citigroup, A3*), Receive 1.00% Quarterly, Pay upon credit default 12/20/23 | 60 | — | — | — |
| Protection Sold (Relevant Credit: Bank of America, A1*), Receive 1.00% Quarterly, Pay upon credit default 12/20/23 | 60 | — | — | — |
| Protection Sold (Relevant Credit: Verizon Communications, Baa1*), Receive 1.00% Quarterly, Pay upon credit default 12/20/23 | 125 | — | — | — |
| Protection Sold (Relevant Credit: Freeport-McMoran, Baa2*), Receive 1.00% Quarterly, Pay upon credit default 6/20/24 | 200 | 1 | — | 1 |
T. ROWE PRICE ULTRA SHORT-TERM BOND ETF
| Description | Notional
Amount | $ Value | Initial
$ Value | Unrealized
$ Gain/(Loss) |
| Protection Sold (Relevant Credit: Hess, Baa3*), Receive 1.00% Quarterly, Pay upon credit default 6/20/24 | 100 | 1 | — | 1 |
| Protection Sold (Relevant Credit: Devon Energy, Baa2*), Receive 1.00% Quarterly, Pay upon credit default 6/20/24 | 100 | 1 | — | 1 |
| Protection Sold (Relevant Credit: AT&T, Baa2*), Receive 1.00% Quarterly, Pay upon credit default 6/20/24 | 275 | 2 | 1 | 1 |
| Protection Sold (Relevant Credit: Verizon Communications, Baa1*), Receive 1.00% Quarterly, Pay upon credit default 6/20/24 | 275 | 2 | 1 | 1 |
| Protection Sold (Relevant Credit: AT&T, Baa2*), Receive 1.00% Quarterly, Pay upon credit default 12/20/24 | 275 | 2 | 1 | 1 |
| Total Centrally Cleared Credit Default Swaps, Protection Sold | 6 |
| Net payments (receipts) of variation margin to date | $ (6) |
| Variation margin receivable (payable) on centrally cleared swaps | $(—) |
| * | Credit ratings as of November 30, 2023. Ratings shown are from Moody’s Investors Service and if Moody’s does not rate a security, then Standard & Poor’s (S&P) is used. Fitch is used for securities that are not rated by either Moody’s or S&P. |
T. ROWE PRICE ULTRA SHORT-TERM BOND ETF
| FORWARD CURRENCY EXCHANGE CONTRACTS |
| Counterparty | Settlement | Receive | | Deliver | | Unrealized
Gain/(Loss) |
| JP Morgan Chase Bank | 2/13/24 | USD | 1,136 | JPY | 169,400 | $(19) |
Net unrealized gain (loss) on open forward
currency exchange contracts | $(19) |
T. ROWE PRICE ULTRA SHORT-TERM BOND ETF
| | Expiration
Date | Notional
Amount | Value and
Unrealized
Gain (Loss) |
| Short, 66 Three Month SOFR Futures contracts | 09/24 | (15,674) | $ (23) |
| Short, 31 U.S. Treasury Notes five year contracts | 03/24 | (3,288) | (24) |
| Short, 1 U.S. Treasury Notes ten year contracts | 03/24 | (109) | — |
| Short, 58 U.S. Treasury Notes two year contracts | 03/24 | (11,833) | (26) |
| Short, 2 Ultra U.S. Treasury Notes ten year contracts | 03/24 | (226) | (1) |
| Long, 25 Three Month SOFR Futures contracts | 06/24 | 5,921 | 5 |
| Net payments (receipts) of variation margin to date | 105 |
| Variation margin receivable (payable) on open futures contracts | $ 36 |
T. ROWE PRICE ULTRA SHORT-TERM BOND ETF
AFFILIATED COMPANIES
($000s)
The fund may invest in certain securities that are considered affiliated companies. As defined by the 1940 Act, an affiliated company is one in which the fund owns 5% or more of the outstanding voting securities, or a company that is under common ownership or control. The following securities were considered affiliated companies for all or some portion of the six months ended November 30, 2023. Net realized gain (loss), investment income, change in net unrealized gain/loss, and purchase and sales cost reflect all activity for the period then ended.
| Affiliate | Net Realized Gain
(Loss) | Changes in Net
Unrealized
Gain/Loss | Investment
Income |
| T. Rowe Price Government Reserve Fund | $ — | $— | $—++ |
| Totals | $—# | $— | $ —+ |
| Supplementary Investment Schedule |
| Affiliate | Value
5/31/23 | Purchase
Cost | Sales
Cost | Value
11/30/23 |
| T. Rowe Price Government Reserve Fund | $ 86 | ¤ | ¤ | $ 1,793 |
| | Total | | | $1,793^ |
| ++ | Excludes earnings on securities lending collateral, which are subject to rebates and fees as described in Note 4. |
| # | Capital gain distributions from mutual funds represented $0 of the net realized gain (loss). |
| + | Investment income comprised $0 of dividend income and $0 of interest income. |
| ¤ | Purchase and sale information not shown for cash management funds. |
| ^ | The cost basis of investments in affiliated companies was $1,793. |
The accompanying notes are an integral part of these financial statements.
T. ROWE PRICE ULTRA SHORT-TERM BOND ETF
November 30, 2023 Unaudited
STATEMENT OF ASSETS AND LIABILITIES
($000s, except shares and per share amounts)
| Assets | |
| Investments in securities, at value (cost $113,678) | $ 113,437 |
| Receivable for investment securities sold | 2,596 |
| Interest and dividends receivable | 849 |
| Cash deposits on centrally cleared swaps | 195 |
| Variation margin receivable on futures contracts | 36 |
| Total assets | 117,113 |
| Liabilities | |
| Payable for investment securities purchased | 2,396 |
| Obligation to return securities lending collateral | 1,792 |
| Due to custodian | 56 |
| Unrealized loss on forward currency exchange contracts | 19 |
| Investment management and administrative fees payable | 16 |
| Total liabilities | 4,279 |
| NET ASSETS | $ 112,834 |
| Net assets consists of: | |
| Total distributable earnings (loss) | $ (277) |
Paid-in capital applicable to 2,300,000 shares of $0.0001 par value
capital stock outstanding; 4,000,000,000 shares authorized | 113,111 |
| NET ASSETS | $112,834 |
| NET ASSET VALUE PER SHARE | $ 49.06 |
The accompanying notes are an integral part of these financial statements.
T. ROWE PRICE ULTRA SHORT-TERM BOND ETF
Unaudited
STATEMENT OF OPERATIONS
($000s)
| | 6 Months
Ended |
| | 11/30/23 |
| Investment Income (Loss) | |
| Income | |
| Interest | $ 2,568 |
| Securities lending | 2 |
| Total income | 2,570 |
| Expenses | |
| Investment management and administrative expense | 82 |
| Miscellaneous expense | 1 |
| Total expenses | 83 |
| Net investment income | 2,487 |
| Realized and Unrealized Gain / Loss | |
| Net realized gain (loss) | |
| Securities | (129) |
| Futures | 312 |
| Swaps | 2 |
| Options written | (14) |
| Forward currency exchange contracts | 52 |
| Net realized gain | 223 |
| Change in net unrealized gain / loss | |
| Securities | 481 |
| Futures | (79) |
| Swaps | 5 |
| Options written | 3 |
| Forward currency exchange contracts | (29) |
| Change in unrealized gain / loss | 381 |
| Net realized and unrealized gain / loss | 604 |
| INCREASE IN NET ASSETS FROM OPERATIONS | $3,091 |
The accompanying notes are an integral part of these financial statements.
T. ROWE PRICE ULTRA SHORT-TERM BOND ETF
Unaudited
STATEMENT OF CHANGES IN NET ASSETS
($000s)
| | 6 Months
Ended | | Year
Ended |
| | 11/30/23 | | 5/31/23 |
| Increase (Decrease) in Net Assets | | | |
| Operations | | | |
| Net investment income | $ 2,487 | | $ 1,680 |
| Net realized gain (loss) | 223 | | (25) |
| Change in net unrealized gain / loss | 381 | | (7) |
| Increase in net assets from operations | 3,091 | | 1,648 |
| Distributions to shareholders | | | |
| Net earnings | (2,491) | | (1,976) |
| Capital share transactions* | | | |
| Shares sold | 57,479 | | 26,775 |
| Shares redeemed | — | | (8,493) |
| Increase in net assets from capital share transactions | 57,479 | | 18,282 |
| Net Assets | | | |
| Increase during period | 58,079 | | 17,954 |
| Beginning of period | 54,755 | | 36,801 |
| End of period | $112,834 | | $54,755 |
| *Share information | | | |
| Shares sold | 1,175 | | 550 |
| Shares redeemed | — | | (175) |
| Increase in shares outstanding | 1,175 | | 375 |
The accompanying notes are an integral part of these financial statements.
T. ROWE PRICE ULTRA SHORT-TERM BOND ETF
Unaudited
NOTES TO FINANCIAL STATEMENTS
T. Rowe Price Exchange-Traded Funds, Inc. (the corporation) is registered under the Investment Company Act of 1940 (the 1940 Act). The Ultra Short-Term Bond ETF (the fund) is a diversified, open-end management investment company established by the corporation. The fund seeks a high level of income consistent with low volatility of principal value.
NOTE 1 – SIGNIFICANT ACCOUNTING POLICIES
Basis of Preparation
The fund is an investment company and follows accounting and reporting guidance in the Financial Accounting Standards Board (FASB) Accounting Standards Codification Topic 946 (ASC 946). The accompanying financial statements were prepared in accordance with accounting principles generally accepted in the United States of America (GAAP), including, but not limited to, ASC 946. GAAP requires the use of estimates made by management. Management believes that estimates and valuations are appropriate; however, actual results may differ from those estimates, and the valuations reflected in the accompanying financial statements may differ from the value ultimately realized upon sale or maturity.
Investment Transactions, Investment Income, and Distributions
Investment transactions are accounted for on the trade date basis. Income and expenses are recorded on the accrual basis. Realized gains and losses are reported on the identified cost basis. Premiums and discounts on debt securities are amortized for financial reporting purposes. Paydown gains and losses are recorded as an adjustment to interest income. Income tax-related interest and penalties, if incurred, are recorded as income tax expense. Dividends received from other investment companies are reflected as dividend income; capital gain distributions are reflected as realized gain/loss. Dividend income and capital gain distributions are recorded on the ex-dividend date. Non-cash dividends, if any, are recorded at the fair market value of the asset received. Distributions to shareholders are recorded on the ex-dividend date. Income distributions, if any, are declared and paid monthly. A capital gain distribution, if any, may also be declared and paid by the fund annually. Dividends and distributions cannot be automatically reinvested in additional shares of the fund.
T. ROWE PRICE ULTRA SHORT-TERM BOND ETF
Currency Translation
Assets, including investments, and liabilities denominated in foreign currencies are translated into U.S. dollar values each day at the prevailing exchange rate, using the mean of the bid and asked prices of such currencies against U.S. dollars as provided by an outside pricing service. Purchases and sales of securities, income, and expenses are translated into U.S. dollars at the prevailing exchange rate on the respective date of such transaction. The effect of changes in foreign currency exchange rates on realized and unrealized security gains and losses is not bifurcated from the portion attributable to changes in market prices.
Capital Transactions
The fund issues and redeems shares at its net asset value (NAV) only with Authorized Participants and only in large blocks of 25,000 shares (each, a “Creation Unit”). The fund’s NAV per share is computed at the close of the New York Stock Exchange (NYSE). However, the NAV per share may be calculated at a time other than the normal close of the NYSE if trading on the NYSE is restricted, if the NYSE closes earlier, or as may be permitted by the SEC. Individual fund shares may not be purchased or redeemed directly with the fund. An Authorized Participant may purchase or redeem a Creation Unit of the fund each business day that the fund is open in exchange for the delivery of a designated portfolio of in-kind securities and/or cash. When purchasing or redeeming Creation Units, Authorized Participants are also required to pay a fixed and/or variable purchase or redemption transaction fee as well as any applicable additional variable charge to defray the transaction cost to a fund.
Individual fund shares may be purchased and sold only on a national securities exchange through brokers. Shares are listed for trading on NYSE Arca, Inc. (NYSE Arca) and because the shares will trade at market prices rather than NAV, shares may trade at prices greater than NAV (at a premium), at NAV, or less than NAV (at a discount). The fund’s shares are ordinarily valued as of the close of regular trading (normally 4:00 p.m. Eastern time) on each day that the NYSE Arca is open.
New Accounting Guidance
The FASB issued Accounting Standards Update (ASU), ASU 2020-04, Reference Rate Reform (Topic 848) – Facilitation of the Effects of Reference Rate Reform on Financial Reporting in March 2020 and ASU 2021-01 in January 2021 which provided further amendments and clarifications to Topic 848. These ASUs provide optional, temporary relief with respect to the financial reporting of contracts subject to certain types of modifications due to the planned discontinuation of the London Interbank Offered Rate (LIBOR), and other interbank-offered based reference rates, through December 31, 2022. In December 2022, FASB issued ASU 2022-06 which defers the sunset date of Topic 848 from December 31, 2022 to December 31, 2024, after which entities will no longer be
T. ROWE PRICE ULTRA SHORT-TERM BOND ETF
permitted to apply the relief in Topic 848. Management intends to rely upon the relief provided under Topic 848, which is not expected to have a material impact on the fund’s financial statements.
Indemnification
In the normal course of business, the fund may provide indemnification in connection with its officers and directors, service providers, and/or private company investments. The fund’s maximum exposure under these arrangements is unknown; however, the risk of material loss is currently considered to be remote.
NOTE 2 – VALUATION
Fair Value
The fund’s financial instruments are valued at the close of the NYSE and are reported at fair value, which GAAP defines as the price that would be received to sell an asset or paid to transfer a liability in an orderly transaction between market participants at the measurement date. The fund’s Board of Directors (the Board) has designated T. Rowe Price Associates, Inc. as the fund’s valuation designee (Valuation Designee). Subject to oversight by the Board, the Valuation Designee performs the following functions in performing fair value determinations: assesses and manages valuation risks; establishes and applies fair value methodologies; tests fair value methodologies; and evaluates pricing vendors and pricing agents. The duties and responsibilities of the Valuation Designee are performed by its Valuation Committee. The Valuation Designee provides periodic reporting to the Board on valuation matters.
Various valuation techniques and inputs are used to determine the fair value of financial instruments. GAAP establishes the following fair value hierarchy that categorizes the inputs used to measure fair value:
Level 1 – quoted prices (unadjusted) in active markets for identical financial instruments that the fund can access at the reporting date
Level 2 – inputs other than Level 1 quoted prices that are observable, either directly or indirectly (including, but not limited to, quoted prices for similar financial instruments in active markets, quoted prices for identical or similar financial instruments in inactive markets, interest rates and yield curves, implied volatilities, and credit spreads)
Level 3 – unobservable inputs (including the Valuation Designee’s assumptions in determining fair value)
T. ROWE PRICE ULTRA SHORT-TERM BOND ETF
Observable inputs are developed using market data, such as publicly available information about actual events or transactions, and reflect the assumptions that market participants would use to price the financial instrument. Unobservable inputs are those for which market data are not available and are developed using the best information available about the assumptions that market participants would use to price the financial instrument. GAAP requires valuation techniques to maximize the use of relevant observable inputs and minimize the use of unobservable inputs. When multiple inputs are used to derive fair value, the financial instrument is assigned to the level within the fair value hierarchy based on the lowest-level input that is significant to the fair value of the financial instrument. Input levels are not necessarily an indication of the risk or liquidity associated with financial instruments at that level but rather the degree of judgment used in determining those values.
Valuation Techniques
Debt securities are generally traded in the over-the-counter (OTC) market and are valued at prices furnished by independent pricing services or by broker dealers who make markets in such securities. When valuing securities, the independent pricing services consider factors such as, but not limited to, the yield or price of bonds of comparable quality, coupon, maturity, and type, as well as prices quoted by dealers who make markets in such securities.
Investments in mutual funds are valued at the mutual fund’s closing NAV per share on the day of valuation. Listed options, and OTC options with a listed equivalent, are valued at the mean of the closing bid and asked prices and exchange-traded options on futures contracts are valued at closing settlement prices. Swaps are valued at prices furnished by an independent pricing service or independent swap dealers. Forward currency exchange contracts are valued using the prevailing forward exchange rate. Futures contracts are valued at closing settlement prices. Assets and liabilities other than financial instruments, including short-term receivables and payables, are carried at cost, or estimated realizable value, if less, which approximates fair value.
Investments for which market quotations are not readily available or deemed unreliable are valued at fair value as determined in good faith by the Valuation Designee. The Valuation Designee has adopted methodologies for determining the fair value of investments for which market quotations are not readily available or deemed unreliable, including the use of other pricing sources. Factors used in determining fair value vary by type of investment and may include market or investment specific considerations. The Valuation Designee typically will afford greatest weight to actual prices in arm’s length transactions, to the extent they represent orderly transactions between market participants, transaction information can be reliably obtained, and prices are deemed representative of fair value. However, the Valuation Designee may also consider other valuation methods such as
T. ROWE PRICE ULTRA SHORT-TERM BOND ETF
market-based valuation multiples; a discount or premium from market value of a similar, freely traded security of the same issuer; discounted cash flows; yield to maturity; or some combination. Fair value determinations are reviewed on a regular basis. Because any fair value determination involves a significant amount of judgment, there is a degree of subjectivity inherent in such pricing decisions. Fair value prices determined by the Valuation Designee could differ from those of other market participants, and it is possible that the fair value determined for a security may be materially different from the value that could be realized upon the sale of that security.
Valuation Inputs
The following table summarizes the fund’s financial instruments, based on the inputs used to determine their fair values on November 30, 2023 (for further detail by category, please refer to the accompanying Portfolio of Investments):
| ($000s) | Level 1 | Level 2 | Level 3 | Total Value |
| Assets | | | | |
| Fixed Income1 | $ — | $105,327 | $— | $105,327 |
| Short-Term Investments | 1 | 6,314 | — | 6,315 |
| Securities Lending Collateral | 1,792 | — | — | 1,792 |
| Options Purchased | — | 3 | — | 3 |
| Total Securities | 1,793 | 111,644 | — | 113,437 |
| Swaps* | — | 6 | — | 6 |
| Futures Contracts* | 5 | — | — | 5 |
| Total | $1,798 | $111,650 | $— | $113,448 |
| Liabilities | | | | |
| Forward Currency Exchange Contracts | $ — | $ 19 | $— | $ 19 |
| Futures Contracts* | 74 | — | — | 74 |
| Total | $ 74 | $ 19 | $— | $ 93 |
| 1 | Includes Asset-Backed Securities, Corporate Bonds, Foreign Government Obligations & Municipalities, Non-U.S. Government Mortgage-Backed Securities, U.S. Government & Agency Mortgage-Backed Securities and U.S. Government Agency Obligations (Excluding Mortgage-Backed). |
| * | The fair value presented includes cumulative gain (loss) on open futures contracts and centrally cleared swaps; however, the net value reflected on the accompanying Portfolio of Investments is only the unsettled variation margin receivable (payable) at that date. |
T. ROWE PRICE ULTRA SHORT-TERM BOND ETF
NOTE 3 – DERIVATIVE INSTRUMENTS
During the six months ended November 30, 2023, the fund invested in derivative instruments. As defined by GAAP, a derivative is a financial instrument whose value is derived from an underlying security price, foreign exchange rate, interest rate, index of prices or rates, or other variable; it requires little or no initial investment and permits or requires net settlement. The fund invests in derivatives only if the expected risks and rewards are consistent with its investment objectives, policies, and overall risk profile, as described in its prospectus and Statement of Additional Information. The fund may use derivatives for a variety of purposes and may use them to establish both long and short positions within the fund’s portfolio. Potential uses include to hedge against declines in principal value, increase yield, invest in an asset with greater efficiency and at a lower cost than is possible through direct investment, to enhance return, or to adjust portfolio duration and credit exposure. The risks associated with the use of derivatives are different from, and potentially much greater than, the risks associated with investing directly in the instruments on which the derivatives are based.
The fund values its derivatives at fair value and recognizes changes in fair value currently in its results of operations. Accordingly, the fund does not follow hedge accounting, even for derivatives employed as economic hedges. Generally, the fund accounts for its derivatives on a gross basis. It does not offset the fair value of derivative liabilities against the fair value of derivative assets on its financial statements, nor does it offset the fair value of derivative instruments against the right to reclaim or obligation to return collateral. The following table summarizes the fair value of the fund’s derivative instruments held as of November 30, 2023, and the related location on the accompanying Statement of Assets and Liabilities, presented by primary underlying risk exposure:
T. ROWE PRICE ULTRA SHORT-TERM BOND ETF
| ($000s) | Location on Statement of
Assets and Liabilities | Fair Value |
| Assets | | |
| Interest rate derivatives | Futures* | $ 5 |
| Credit derivatives | Centrally cleared swaps* and Securities^ | 9 |
| Total | | $14 |
| Liabilities | | |
| Interest rate derivatives | Futures* | $74 |
| Foreign exchange derivatives | Forwards | 19 |
| Total | | $93 |
| | |
| * | The fair value presented includes cumulative gain (loss) on open futures contracts and centrally cleared swaps; however, the value reflected on the accompanying Statement of Assets and Liabilities is only the unsettled variation margin receivable (payable) at that date. |
| ^ | Options purchased are reported as securities. |
Additionally, the amount of gains and losses on derivative instruments recognized in fund earnings during the six months ended November 30, 2023, and the related location on the accompanying Statement of Operations is summarized in the following table by primary underlying risk exposure:
T. ROWE PRICE ULTRA SHORT-TERM BOND ETF
| ($000s) | Location of Gain (Loss) on Statement of Operations |
| | Securities^ | Options
Written | Futures | Forward
Currency
Exchange
Contracts | Swaps | Total |
| Realized Gain (Loss) | | | | | | |
| Interest rate derivatives | $(1) | $(14) | $312 | $ — | $— | $ 297 |
| Foreign exchange derivatives | — | — | — | 52 | — | 52 |
| Credit derivatives | — | — | — | — | 2 | 2 |
| Total | $(1) | $(14) | $312 | $ 52 | $ 2 | $ 351 |
| Change in Unrealized Gain (Loss) | | | | | | |
| Interest rate derivatives | $ 1 | $ 3 | $ (79) | $ — | $— | $ (75) |
| Foreign exchange derivatives | — | — | — | (29) | — | (29) |
| Credit derivatives | (1) | — | — | — | 5 | 4 |
| Total | $ — | $ 3 | $ (79) | $(29) | $ 5 | $(100) |
| | |
| ^ | Options purchased are reported as securities and are reflected in the accompanying Portfolio of Investments. |
Counterparty Risk and Collateral
The fund invests in derivatives in various markets, which expose it to differing levels of counterparty risk. Counterparty risk on exchange-traded and centrally cleared derivative contracts, such as futures, exchange-traded options, and centrally cleared swaps, is minimal because the clearinghouse provides protection against counterparty defaults. For futures and centrally cleared swaps, the fund is required to deposit collateral in an amount specified by the clearinghouse and the clearing firm (margin requirement), and the margin requirement must be maintained over the life of the contract. Each clearinghouse and clearing firm, in its sole discretion, may adjust the margin requirements applicable to the fund.
T. ROWE PRICE ULTRA SHORT-TERM BOND ETF
Derivatives, such as non-cleared bilateral swaps, forward currency exchange contracts, and OTC options, that are transacted and settle directly with a counterparty (bilateral derivatives) may expose the fund to greater counterparty risk. To mitigate this risk, the fund has entered into master netting arrangements (MNAs) with certain counterparties that permit net settlement under specified conditions and, for certain counterparties, also require the exchange of collateral to cover mark-to-market exposure. MNAs may be in the form of International Swaps and Derivatives Association master agreements (ISDAs) or foreign exchange letter agreements (FX letters).
MNAs provide the ability to offset amounts the fund owes a counterparty against amounts the counterparty owes the fund (net settlement). Both ISDAs and FX letters generally allow termination of transactions and net settlement upon the occurrence of contractually specified events, such as failure to pay or bankruptcy. In addition, ISDAs specify other events, the occurrence of which would allow one of the parties to terminate. For example, a downgrade in credit rating of a counterparty below a specified rating would allow the fund to terminate, while a decline in the fund’s net assets of more than a specified percentage would allow the counterparty to terminate. Upon termination, all transactions with that counterparty would be liquidated and a net termination amount settled. ISDAs typically include collateral agreements whereas FX letters do not. Collateral requirements are determined daily based on the net aggregate unrealized gain or loss on all bilateral derivatives with a counterparty, subject to minimum transfer amounts that typically range from $100,000 to $250,000. Any additional collateral required due to changes in security values is typically transferred the next business day.
Collateral may be in the form of cash or debt securities issued by the U.S. government or related agencies, although other securities may be used depending on the terms outlined in the applicable MNA. Cash posted by the fund is reflected as cash deposits in the accompanying financial statements and generally is restricted from withdrawal by the fund; securities posted by the fund are so noted in the accompanying Portfolio of Investments; both remain in the fund’s assets. Collateral pledged by counterparties is not included in the fund’s assets because the fund does not obtain effective control over those assets. For bilateral derivatives, collateral posted or received by the fund is held in a segregated account at the fund’s custodian. While typically not sold in the same manner as equity or fixed income securities, exchange-traded or centrally cleared derivatives may be closed out only on the exchange or clearinghouse where the contracts were cleared, and OTC and bilateral derivatives may be unwound with counterparties or transactions assigned to other counterparties to allow the fund to exit the transaction. This ability is subject to the liquidity of underlying positions. As of November 30, 2023, no collateral was pledged by either the fund or counterparties for bilateral derivatives. As of November 30, 2023, cash of $195,000 and securities valued at $554,000 had been posted by the fund for exchange-traded and/or centrally cleared derivatives.
T. ROWE PRICE ULTRA SHORT-TERM BOND ETF
Forward Currency Exchange Contracts
The fund is subject to foreign currency exchange rate risk in the normal course of pursuing its investment objectives. It may use forward currency exchange contracts (forwards) primarily to protect its non-U.S. dollar-denominated securities from adverse currency movements or to increase exposure to a particular foreign currency, to shift the fund's foreign currency exposure from one country to another, or to enhance the fund's return. A forward involves an obligation to purchase or sell a fixed amount of a specific currency on a future date at a price set at the time of the contract. Although certain forwards may be settled by exchanging only the net gain or loss on the contract, most forwards are settled with the exchange of the underlying currencies in accordance with the specified terms. Forwards are valued at the unrealized gain or loss on the contract, which reflects the net amount the fund either is entitled to receive or obligated to deliver, as measured by the difference between the forward exchange rates at the date of entry into the contract and the forward rates at the reporting date. Appreciated forwards are reflected as assets and depreciated forwards are reflected as liabilities on the accompanying Statement of Assets and Liabilities. When a contract is closed, a realized gain or loss is recorded on the accompanying Statement of Operations. Risks related to the use of forwards include the possible failure of counterparties to meet the terms of the agreements; that anticipated currency movements will not occur, thereby reducing the fund’s total return; and the potential for losses in excess of the fund’s initial investment. During the six months ended November 30, 2023, the volume of the fund’s activity in forwards, based on underlying notional amounts, was generally between 0% and 2% of net assets.
Futures Contracts
The fund is subject to interest rate risk in the normal course of pursuing its investment objectives and uses futures contracts to help manage such risk. The fund may enter into futures contracts to manage exposure to interest rate and yield curve movements, security prices, foreign currencies, credit quality, and mortgage prepayments; as an efficient means of adjusting exposure to all or part of a target market; to enhance income; as a cash management tool; or to adjust portfolio duration and credit exposure. A futures contract provides for the future sale by one party and purchase by another of a specified amount of a specific underlying financial instrument at an agreed-upon price, date, time, and place. The fund currently invests only in exchange-traded futures, which generally are standardized as to maturity date, underlying financial instrument, and other contract terms. Payments are made or received by the fund each day to settle daily fluctuations in the value of the contract (variation margin), which reflect changes in the value of the underlying financial instrument. Variation margin is recorded as unrealized gain or loss until the contract is closed. The value of a futures contract included in net assets is the amount of unsettled variation margin; net variation margin receivable is reflected as an asset and net variation margin payable is reflected as a liability on the accompanying Statement of Assets and Liabilities. When a contract is closed, a realized gain or loss is
T. ROWE PRICE ULTRA SHORT-TERM BOND ETF
recorded on the accompanying Statement of Operations. Risks related to the use of futures contracts include possible illiquidity of the futures markets, contract prices that can be highly volatile and imperfectly correlated to movements in hedged security values and/or interest rates, and potential losses in excess of the fund’s initial investment. During the six months ended November 30, 2023, the volume of the fund’s activity in futures, based on underlying notional amounts, was generally between 12% and 16% of net assets.
Options
The fund is subject to interest rate risk and credit risk in the normal course of pursuing its investment objectives and uses options to help manage such risk. The fund may use options to manage exposure to security prices, interest rates, foreign currencies, and credit quality; as an efficient means of adjusting exposure to all or a part of a target market; to enhance income; as a cash management tool; or to adjust credit exposure. The fund may buy or sell options that can be settled either directly with the counterparty (OTC option) or through a central clearinghouse (exchange-traded option). Options are included in net assets at fair value, options purchased are included in Investments in Securities, and Options written are separately reflected as a liability on the accompanying Statement of Assets and Liabilities. Premiums on unexercised, expired options are recorded as realized gains or losses on the accompanying Statement of Operations; premiums on exercised options are recorded as an adjustment to the proceeds from the sale or cost of the purchase. The difference between the premium and the amount received or paid in a closing transaction is also treated as realized gain or loss on the accompanying Statement of Operations. In return for a premium paid, call and put options on futures give the holder the right, but not the obligation, to purchase or sell, respectively, a position in a particular futures contract at a specified exercise price. In return for a premium paid, options on swaps give the holder the right, but not the obligation, to enter a specified swap contract on predefined terms. The exercise price of an option on a credit default swap is stated in terms of a specified spread that represents the cost of credit protection on the reference asset, including both the upfront premium to open the position and future periodic payments. The exercise price of an interest rate swap is stated in terms of a fixed interest rate; generally, there is no upfront payment to open the position.Risks related to the use of options include possible illiquidity of the options markets; trading restrictions imposed by an exchange or counterparty; possible failure of counterparties to meet the terms of the agreements; movements in the underlying asset values and interest rates, and for options written, the potential for losses to exceed any premium received by the fund. During the six months ended November 30, 2023, the volume of the fund’s activity in options, based on underlying notional amounts, was generally between 4% to 10% of net assets.
T. ROWE PRICE ULTRA SHORT-TERM BOND ETF
Swaps
The fund is subject to credit risk in the normal course of pursuing its investment objectives and uses swap contracts to help manage such risk. The fund may use swaps in an effort to manage both long and short exposure to changes in interest rates, inflation rates, and credit quality; to adjust overall exposure to certain markets; to enhance total return or protect the value of portfolio securities; to serve as a cash management tool; or to adjust portfolio duration and credit exposure. Swap agreements can be settled either directly with the counterparty (bilateral swap) or through a central clearinghouse (centrally cleared swap). Fluctuations in the fair value of a contract are reflected in unrealized gain or loss and are reclassified to realized gain or loss on the accompanying Statement of Operations upon contract termination or cash settlement. Net periodic receipts or payments required by a contract increase or decrease, respectively, the value of the contract until the contractual payment date, at which time such amounts are reclassified from unrealized to realized gain or loss. For bilateral swaps, cash payments are made or received by the fund on a periodic basis in accordance with contract terms; unrealized gain on contracts and premiums paid are reflected as assets and unrealized loss on contracts and premiums received are reflected as liabilities on the accompanying Statement of Assets and Liabilities on the accompanying Statement of Operations. For bilateral swaps, premiums paid or received are amortized over the life of the swap and are recognized as realized gain or loss on the accompanying Statement of Operations. For centrally cleared swaps, payments are made or received by the fund each day to settle the daily fluctuation in the value of the contract (variation margin). Accordingly, the value of a centrally cleared swap included in net assets is the unsettled variation margin; net variation margin receivable is reflected as an asset and net variation margin payable is reflected as a liability on the accompanying Statement of Assets and Liabilities.
Credit default swaps are agreements where one party (the protection buyer) agrees to make periodic payments to another party (the protection seller) in exchange for protection against specified credit events, such as certain defaults and bankruptcies related to an underlying credit instrument, or issuer or index of such instruments. Upon occurrence of a specified credit event, the protection seller is required to pay the buyer the difference between the notional amount of the swap and the value of the underlying credit, either in the form of a net cash settlement or by paying the gross notional amount and accepting delivery of the relevant underlying credit. For credit default swaps where the underlying credit is an index, a specified credit event may affect all or individual underlying securities included in the index and will be settled based upon the relative weighting of the affected underlying security(ies) within the index. Generally, the payment risk for the seller of protection is inversely related to the current market price or credit rating of the underlying credit or the market value of the contract relative to the notional amount, which are indicators of the markets’ valuation of credit quality. As of November 30, 2023, the notional amount of protection sold by the fund totaled $1,595,000 (1.4% of net assets),
T. ROWE PRICE ULTRA SHORT-TERM BOND ETF
which reflects the maximum potential amount the fund could be required to pay under such contracts. Risks related to the use of credit default swaps include the possible inability of the fund to accurately assess the current and future creditworthiness of underlying issuers, the possible failure of a counterparty to perform in accordance with the terms of the swap agreements, potential government regulation that could adversely affect the fund’s swap investments, and potential losses in excess of the fund’s initial investment.
During the six months ended November 30, 2023, the volume of the fund’s activity in swaps, based on underlying notional amounts, was generally between 1% and 3% of net assets.
NOTE 4 – OTHER INVESTMENT TRANSACTIONS
Consistent with its investment objective, the fund engages in the following practices to manage exposure to certain risks and/or to enhance performance. The investment objective, policies, program, and risk factors of the fund are described more fully in the fund’s prospectus and Statement of Additional Information.
Restricted Securities
The fund invests in securities that are subject to legal or contractual restrictions on resale. Prompt sale of such securities at an acceptable price may be difficult and may involve substantial delays and additional costs.
Collateralized Loan Obligations
The fund invests in collateralized loan obligations (CLOs) which are entities backed by a diversified pool of syndicated bank loans. The cash flows of the CLO can be split into multiple segments, called “tranches” or “classes”, which will vary in risk profile and yield. The riskiest segments, which are the subordinate or “equity” tranches, bear the greatest risk of loss from defaults in the underlying assets of the CLO and serve to protect the other, more senior, tranches. Senior tranches will typically have higher credit ratings and lower yields than the securities underlying the CLO. Despite the protection from the more junior tranches, senior tranches can experience substantial losses.
Mortgage-Backed Securities
The fund invests in mortgage-backed securities (MBS or pass-through certificates) that represent an interest in a pool of specific underlying mortgage loans and entitle the fund to the periodic payments of principal and interest from those mortgages. MBS may be issued by government agencies or corporations, or private issuers. Most MBS issued by government agencies are guaranteed; however, the degree of protection differs based on
T. ROWE PRICE ULTRA SHORT-TERM BOND ETF
the issuer. MBS are sensitive to changes in economic conditions that affect the rate of prepayments and defaults on the underlying mortgages; accordingly, the value, income, and related cash flows from MBS may be more volatile than other debt instruments.
Securities Lending
The fund may lend its securities to approved borrowers to earn additional income. Its securities lending activities are administered by a lending agent in accordance with a securities lending agreement. Security loans generally do not have stated maturity dates, and the fund may recall a security at any time. The fund receives collateral in the form of cash or U.S. government securities. Collateral is maintained over the life of the loan in an amount not less than the value of loaned securities; any additional collateral required due to changes in security values is delivered to the fund the next business day. Cash collateral is invested in accordance with investment guidelines approved by fund management. Additionally, the lending agent indemnifies the fund against losses resulting from borrower default. Although risk is mitigated by the collateral and indemnification, the fund could experience a delay in recovering its securities and a possible loss of income or value if the borrower fails to return the securities, collateral investments decline in value, and the lending agent fails to perform. Securities lending revenue consists of earnings on invested collateral and borrowing fees, net of any rebates to the borrower, compensation to the lending agent, and other administrative costs. In accordance with GAAP, investments made with cash collateral are reflected in the accompanying financial statements, but collateral received in the form of securities is not. At November 30, 2023, the value of loaned securities was $1,755,000; the value of cash collateral and related investments was $1,792,000.
Other
Purchases and sales of portfolio securities excluding in-kind transactions and short-term and U.S. government securities aggregated $70,942,000 and $26,493,000, respectively, for the six months ended November 30, 2023. Purchases and sales of U.S. government securities, excluding in-kind transactions and short-term securities, aggregated $8,607,000 and $8,273,000, respectively, for the six months ended November 30, 2023.
NOTE 5 – FEDERAL INCOME TAXES
Generally, no provision for federal income taxes is required since the fund intends to continue to qualify as a regulated investment company under Subchapter M of the Internal Revenue Code and distribute to shareholders all of its taxable income and gains. Distributions determined in accordance with federal income tax regulations may differ in amount or character from net investment income and realized gains for financial reporting purposes. Financial reporting records are adjusted for permanent book/tax differences to
T. ROWE PRICE ULTRA SHORT-TERM BOND ETF
reflect tax character but are not adjusted for temporary differences. The amount and character of tax-basis distributions and composition of net assets are finalized at fiscal year-end; accordingly, tax-basis balances have not been determined as of the date of this report.
At November 30, 2023, the cost of investments (including derivatives, if any) for federal income tax purposes was $113,682,000. Net unrealized loss aggregated $324,000 at period-end, of which $273,000 related to appreciated investments and $597,000 related to depreciated investments.
NOTE 6 – RELATED PARTY TRANSACTIONS
The fund is managed by T. Rowe Price Associates, Inc. (Price Associates), a wholly owned subsidiary of T. Rowe Price Group, Inc. (Price Group). Price Associates has entered into a sub-advisory agreement(s) with one or more of its wholly owned subsidiaries, to provide investment advisory services to the fund. The investment management and administrative agreement between the fund and Price Associates provides for an all-inclusive annual fee equal to 0.17% of the fund’s average daily net assets. The fee is computed daily and paid monthly. The all-inclusive fee covers investment management services and ordinary, recurring operating expenses, but does not cover interest and borrowing expenses; taxes; brokerage commissions and other transaction costs; fund proxy expenses; and nonrecurring and extraordinary expenses.
T. Rowe Price Investment Services, Inc. (Investment Services) serves as distributor to the fund. Pursuant to an underwriting agreement, no compensation for any distribution services provided is paid to Investment Services by the fund.
The fund may invest its cash reserves in certain open-end management investment companies managed by Price Associates and considered affiliates of the fund: the T. Rowe Price Government Reserve Fund or the T. Rowe Price Treasury Reserve Fund, organized as money market funds (together, the Price Reserve Funds). The Price Reserve Funds are offered as short-term investment options to mutual funds, trusts, and other accounts managed by Price Associates or its affiliates and are not available for direct purchase by members of the public. Cash collateral from securities lending, if any, is invested in the T. Rowe Price Government Reserve Fund. The Price Reserve Funds pay no investment management fees.
As of November 30, 2023, T. Rowe Price Group, Inc., or its wholly owned subsidiaries, owned 1,548,392 shares of the fund, representing 67% of the fund’s net assets.
T. ROWE PRICE ULTRA SHORT-TERM BOND ETF
The fund may participate in securities purchase and sale transactions with other funds or accounts advised by Price Associates (cross trades), in accordance with procedures adopted by the fund’s Board and Securities and Exchange Commission rules, which require, among other things, that such purchase and sale cross trades be effected at the independent current market price of the security. During the six months ended November 30, 2023, the fund had no purchases or sales cross trades with other funds or accounts advised by Price Associates.
NOTE 7 – BORROWING
At November 30, 2023, the fund had outstanding borrowings from State Street Bank of $56,000 at an annual rate of 8.64%.
NOTE 8 – OTHER MATTERS
Unpredictable events such as environmental or natural disasters, war and conflict, terrorism, geopolitical events, and public health epidemics, and similar public health threats may significantly affect the economy and the markets and issuers in which the fund invests. Certain events may cause instability across global markets, including reduced liquidity and disruptions in trading markets, while some events may affect certain geographic regions, countries, sectors, and industries more significantly than others, and exacerbate other pre-existing political, social, and economic risks.
The global outbreak of COVID-19 and related governmental and public responses have led and may continue to lead to increased market volatility and the potential for illiquidity in certain classes of securities and sectors of the market either in specific countries or worldwide.
In February 2022, Russian forces entered Ukraine and commenced an armed conflict, leading to economic sanctions being on Russia that target certain of its citizens and issuers and sectors of the Russian economy, creating impacts on Russian-related stocks and debt and greater volatility in global markets.
In March 2023, the banking industry experienced heightened volatility, which sparked concerns of potential broader adverse market conditions. The extent of impact of these events on the US and global markets is highly uncertain.
These are recent examples of global events which may have a negative impact on the values of certain portfolio holdings or the fund’s overall performance. Management is actively monitoring the risks and financial impacts arising from these events.
T. ROWE PRICE ULTRA SHORT-TERM BOND ETF
INFORMATION ON PROXY VOTING POLICIES, PROCEDURES, AND RECORDS
A description of the policies and procedures used by T. Rowe Price funds and portfolios to determine how to vote proxies relating to portfolio securities is available in each fund’s Statement of Additional Information. You may request this document by calling 1-800-638-5660 or by accessing the SEC’s website, sec.gov.
The description of our proxy voting policies and procedures is also available on our corporate website. To access it, please visit the following Web page:
https://www.troweprice.com/corporate/en/utility/policies.html
Scroll down to the section near the bottom of the page that says, “Proxy Voting Policies.” Click on the Proxy Voting Policies link in the shaded box.
Each fund’s most recent annual proxy voting record is available on our website and through the SEC’s website. To access it through T. Rowe Price, visit the website location shown above, and scroll down to the section near the bottom of the page that says, “Proxy Voting Records.” Click on the Proxy Voting Records link in the shaded box.
RESULTS OF PROXY VOTING
A Special Meeting of Shareholders was held on July 24, 2023 for shareholders of record on April 27, 2023, to elect the following director-nominees to serve on the Board of all Price Funds. The newly elected Directors took office effective July 24, 2023.
The results of the voting were as follows:
| | Votes For | Votes Withheld |
| Melody Bianchetto | 13,058,976 | 207,279 |
| Mark J. Parrell | 13,008,567 | 257,689 |
| Eric L. Veiel | 13,038,692 | 227,564 |
| Kellye L. Walker | 13,058,746 | 207,511 |
| | | |
Teresa Bryce Bazemore, Bruce W. Duncan, Robert J. Gerrard, Jr., Paul F. McBride and David Oestreicher continue to serve as Directors on the Board of all Price Funds.
HOW TO OBTAIN QUARTERLY PORTFOLIO HOLDINGS
The fund files a complete schedule of portfolio holdings with the Securities and Exchange Commission (SEC) for the first and third quarters of each fiscal year as an exhibit to its reports on Form N-PORT. The fund’s Form N-PORT is available electronically on the SEC’s website (sec.gov). In addition, most T. Rowe Price funds disclose their first and third fiscal quarter-end holdings at troweprice.com.
T. ROWE PRICE ULTRA SHORT-TERM BOND ETF
TAILORED SHAREHOLDER REPORTS FOR MUTUAL FUNDS AND EXCHANGE TRADED FUNDS
In October 2022, the Securities and Exchange Commission (SEC) adopted rule and form amendments requiring Mutual Funds and Exchange-Traded Funds to transmit concise and visually engaging streamlined annual and semiannual reports that highlight key information to shareholders. Other information, including financial statements, will no longer appear in the funds’ shareholder reports but will be available online, delivered free of charge upon request, and filed on a semiannual basis on Form N-CSR. The rule and form amendments have a compliance date of July 24, 2024.
T. ROWE PRICE ULTRA SHORT-TERM BOND ETF
Liquidity Risk Management Program
In accordance with Rule 22e-4 (Liquidity Rule) under the Investment Company Act of 1940, as amended, the fund has established a liquidity risk management program (Liquidity Program) reasonably designed to assess and manage the fund’s liquidity risk, which generally represents the risk that the fund would not be able to meet redemption requests without significant dilution of remaining investors’ interests in the fund. The fund’s Board of Directors (Board) has appointed the fund’s investment adviser, T. Rowe Price Associates, Inc. (Adviser), as the administrator of the Liquidity Program. As administrator, the Adviser is responsible for overseeing the day-to-day operations of the Liquidity Program and, among other things, is responsible for assessing, managing, and reviewing with the Board at least annually the liquidity risk of each T. Rowe Price fund. The Adviser has delegated oversight of the Liquidity Program to a Liquidity Risk Committee (LRC), which is a cross-functional committee composed of personnel from multiple departments within the Adviser.
The Liquidity Program’s principal objectives include supporting the T. Rowe Price funds’ compliance with limits on investments in illiquid assets and mitigating the risk that the fund will be unable to timely meet its redemption obligations. The Liquidity Program also includes a number of elements that support the management and assessment of liquidity risk, including an annual assessment of factors that influence the fund’s liquidity and the periodic classification and reclassification of a fund’s investments into categories that reflect the LRC’s assessment of their relative liquidity under current market conditions. Under the Liquidity Program, every investment held by the fund is classified at least monthly into one of four liquidity categories based on estimations of the investment’s ability to be sold during designated time frames in current market conditions without significantly changing the investment’s market value.
As required by the Liquidity Rule, at a meeting held on July 24, 2023, the Board was presented with an annual assessment that was prepared by the LRC on behalf of the Adviser and addressed the operation of the Liquidity Program and assessed its adequacy and effectiveness of implementation, including any material changes to the Liquidity Program and the determination of each fund’s Highly Liquid Investment Minimum (HLIM). The annual assessment included consideration of the following factors, as applicable: the fund’s investment strategy and liquidity of portfolio investments during normal and reasonably foreseeable stressed conditions, including whether the investment strategy is appropriate for an open-end fund, the extent to which the strategy involves a relatively concentrated portfolio or large positions in particular issuers, and the use of borrowings for investment purposes and derivatives; short-term and long-term cash flow projections covering both normal and reasonably foreseeable stressed conditions; and holdings of cash and cash equivalents, as well as available borrowing arrangements.
For the fund and other T. Rowe Price funds, the annual assessment incorporated a report related to a fund’s holdings, shareholder and portfolio concentration, any borrowings during the period, cash flow projections, and other relevant data for the period of April 1, 2022, through March 31, 2023. The report described the methodology for classifying a fund’s investments (including any derivative transactions) into one of four liquidity
T. ROWE PRICE ULTRA SHORT-TERM BOND ETF
categories, as well as the percentage of a fund’s investments assigned to each category. It also explained the methodology for establishing a fund’s HLIM and noted that the LRC reviews the HLIM assigned to each fund no less frequently than annually.
During the period covered by the annual assessment, the LRC has concluded, and reported to the Board, that the Liquidity Program continues to operate adequately and effectively and is reasonably designed to assess and manage the fund’s liquidity risk.
This page intentionally left blank.
This page intentionally left blank.
This page intentionally left blank.
This page intentionally left blank.
100 East Pratt Street
Baltimore, MD 21202
Call 1-800-638-5660 to request a prospectus or summary prospectus; each includes investment objectives, risks, fees, expenses, and other information that you should read and consider carefully before investing.
T. Rowe Price Investment Services, Inc.
Item 1. (b) Notice pursuant to Rule 30e-3.
Not applicable.
Item 2. Code of Ethics.
A code of ethics, as defined in Item 2 of Form N-CSR, applicable to its principal executive officer, principal financial officer, principal accounting officer or controller, or persons performing similar functions is filed as an exhibit to the registrant’s annual Form N-CSR. No substantive amendments were approved or waivers were granted to this code of ethics during the registrant’s most recent fiscal half-year.
Item 3. Audit Committee Financial Expert.
Disclosure required in registrant’s annual Form N-CSR.
Item 4. Principal Accountant Fees and Services.
Disclosure required in registrant’s annual Form N-CSR.
Item 5. Audit Committee of Listed Registrants.
Not applicable.
Item 6. Investments.
(a) Not applicable. The complete schedule of investments is included in Item 1 of this Form N-CSR.
(b) Not applicable.
Item 7. Disclosure of Proxy Voting Policies and Procedures for Closed-End Management Investment Companies.
Not applicable.
Item 8. Portfolio Managers of Closed-End Management Investment Companies.
Not applicable.
Item 9. Purchases of Equity Securities by Closed-End Management Investment Company and Affiliated Purchasers.
Not applicable.
Item 10. Submission of Matters to a Vote of Security Holders.
There has been no change to the procedures by which shareholders may recommend nominees to the registrant’s board of directors.
Item 11. Controls and Procedures.
(a) The registrant’s principal executive officer and principal financial officer have evaluated the registrant’s disclosure controls and procedures within 90 days of this filing and have concluded that the registrant’s disclosure controls and procedures were effective, as of that date, in ensuring that information required to be disclosed by the registrant in this Form N-CSR was recorded, processed, summarized, and reported timely.
(b) The registrant’s principal executive officer and principal financial officer are aware of no change in the registrant’s internal control over financial reporting that occurred during the period covered by this report that has materially affected, or is reasonably likely to materially affect, the registrant’s internal control over financial reporting.
Item 12. Disclosure of Securities Lending Activities for Closed-End Management Investment Companies.
Not applicable.
Item 13. Exhibits.
SIGNATURES
Pursuant to the requirements of the Securities Exchange Act of 1934 and the Investment Company Act of 1940, the registrant has duly caused this report to be signed on its behalf by the undersigned, thereunto duly authorized.
| | | | |
| T. Rowe Price Exchange-Traded Funds, Inc. |
| | |
| By | | /s/ David Oestreicher | | |
| | David Oestreicher | | |
| | Principal Executive Officer | | |
| | |
| Date | | January 19, 2024 | | |
Pursuant to the requirements of the Securities Exchange Act of 1934 and the Investment Company Act of 1940, this report has been signed below by the following persons on behalf of the registrant and in the capacities and on the dates indicated.
| | | | |
| By | | /s/ David Oestreicher | | |
| | David Oestreicher | | |
| | Principal Executive Officer | | |
| | |
| Date | | January 19, 2024 | | |
| | | | |
| By | | /s/ Alan S. Dupski | | |
| | Alan S. Dupski | | |
| | Principal Financial Officer | | |
| | |
| Date | | January 19, 2024 | | |