UNITED STATES
SECURITIES AND EXCHANGE COMMISSION
Washington, D.C. 20549
FORM N-CSR
CERTIFIED SHAREHOLDER REPORT OF REGISTERED
MANAGEMENT INVESTMENT COMPANIES
Investment Company Act File Number: 811-23494
T. Rowe Price Exchange-Traded Funds, Inc.
(Exact name of registrant as specified in charter)
100 East Pratt Street, Baltimore, MD 21202
(Address of principal executive offices)
David Oestreicher
100 East Pratt Street, Baltimore, MD 21202
(Name and address of agent for service)
Registrant’s telephone number, including area code: (410) 345-2000
Date of fiscal year end: December 31
Date of reporting period: December 31, 2024
Item 1. Reports to Shareholders
(a) Report pursuant to Rule 30e-1
Annual Shareholder Report
December 31, 2024
Principal Listing Exchange: NYSE Arca, Inc.
This annual shareholder report contains important information about Growth ETF (the "fund") for the period of January 1, 2024 to December 31, 2024. You can find the fund’s prospectus, financial information on Form N-CSR (which includes required tax information for dividends), holdings, proxy voting information, and other information at www.troweprice.com/prospectus. You can also request this information without charge by contacting T. Rowe Price at 1-800-638-5660 or info@troweprice.com or by contacting your intermediary.This report describes changes to the fund that occurred during the reporting period.
What were the fund costs for the last year? (based on a hypothetical $10,000 investment)
| Fund name | Costs of a $10,000 investment | Costs paid as a percentage of a $10,000 investment |
|---|
| Growth ETF | $44 | 0.38% |
|---|
What drove fund performance during the past 12 months?
U.S. stocks advanced during the period, mainly driven higher by a narrow group of companies expected to benefit from artificial intelligence (AI) developments. Although inflation remained above the Federal Reserve’s long-term 2% target, the central bank shifted its focus toward the moderating labor market in the second half of the year and began reducing interest rates in mid-September. In the final months of the year, equity investors generally welcomed looser monetary policy and the U.S. election results.
From an absolute perspective, the leading contributor to performance was the portfolio’s position in NVIDIA as shares benefited from a significant step-up in demand for advanced graphics processing units that are critical for the buildout of AI infrastructure. Amazon.com also added value as investors appreciated improvements in the company’s retail operations and accelerating growth in its Amazon Web Services segment.
Conversely, the leading detractor from absolute performance was Adobe. Shares of the software provider traded lower amid concerns around rising competition and the company’s lagging AI monetization ramp-up. Our stake in Dollar General also hurt returns. The stock fell when it became clear that an operational turnaround at the company was unlikely to materialize in the near term.
The fund seeks to provide long-term capital growth by investing in a diversified portfolio of primarily large-cap stocks with rapid and/or durable earnings growth, above-average cash flow growth, the potential to benefit from innovation and/or disruption, and attractive valuations.
How has the fund performed?
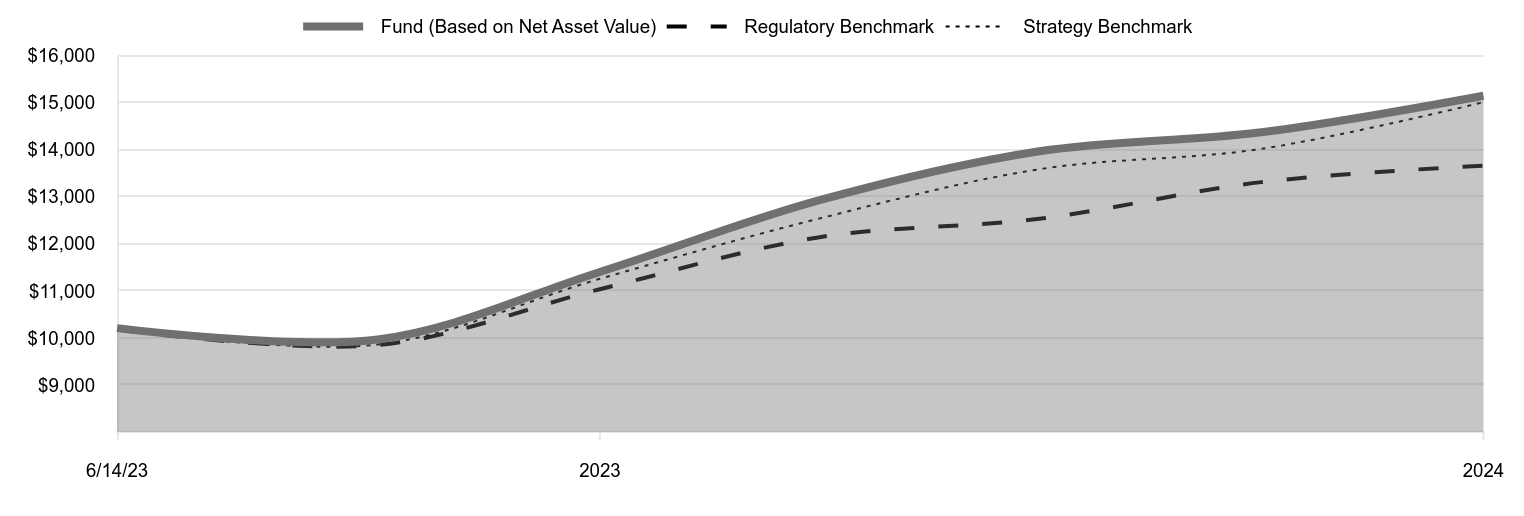
Cumulative Returns of a Hypothetical $10,000 Investment as of December 31, 2024
| Fund (Based on Net Asset Value) | Regulatory Benchmark | Strategy Benchmark |
|---|
| 6/14/23 | 10,208 | 10,179 | 10,179 |
|---|
| 9/30/23 | 9,968 | 9,848 | 9,860 |
|---|
| 12/31/23 | 11,403 | 11,036 | 11,257 |
|---|
| 3/31/24 | 12,928 | 12,142 | 12,541 |
|---|
| 6/30/24 | 13,969 | 12,533 | 13,587 |
|---|
| 9/30/24 | 14,373 | 13,313 | 14,020 |
|---|
| 12/31/24 | 15,150 | 13,664 | 15,011 |
|---|
202501-4140718, 202502-4108561
Average Annual Total Returns
| Fund | 1 Year | Since Inception 6/14/23 |
|---|
| Growth ETF (Based on Net Asset Value) | 32.86% | 30.75% |
|---|
| Russell 3000 Index (Regulatory Benchmark) | 23.81% | 22.32% |
|---|
| Russell 1000 Growth Index (Strategy Benchmark) | 33.36% | 29.98% |
|---|
The preceding line graph shows the value of a hypothetical $10,000 investment in the fund over the past 10 fiscal year periods or since inception (for funds lacking 10-year records). The fund’s performance information included in the line graph and table above is compared with a regulatory required index that represents an overall securities market (Regulatory Benchmark). In addition, the line graph and table may also include one or more indexes that more closely aligns to the fund's investment strategy (Strategy Benchmark(s)). Due to new SEC Rules on shareholder reporting the fund adopted a new broad-based securities market index, referred to as the Regulatory Benchmark. Market index returns do not include expenses, which are deducted from fund returns. The fund's total return figures reflect the reinvestment of dividends and capital gains, if any. Neither the fund’s returns nor the index returns reflect the deduction of taxes that a shareholder would pay on fund distributions or redemptions of fund shares. The fund’s past performance is not a good predictor of the fund’s future performance. Updated performance information can be found at www.troweprice.com.
What are some fund statistics?
- Total Net Assets (000s)$410,377
- Number of Portfolio Holdings84
- Investment Advisory Fees Paid (000s)$878
- Portfolio Turnover Rate21.2%
What did the fund invest in?
Sector Allocation (as a % of Net Assets)
| Information Technology | 47.2% |
| Consumer Discretionary | 15.1 |
| Communication Services | 13.7 |
| Health Care | 9.1 |
| Financials | 9.1 |
| Industrials & Business Services | 4.0 |
| Consumer Staples | 1.0 |
| Materials | 0.4 |
| Energy | 0.2 |
| Other | 0.2 |
Top Ten Holdings (as a % of Net Assets)
| Microsoft | 10.8% |
| NVIDIA | 10.8 |
| Apple | 9.8 |
| Amazon.com | 7.5 |
| Alphabet | 6.9 |
| Meta Platforms | 4.9 |
| Eli Lilly | 2.7 |
| Mastercard | 2.6 |
| Broadcom | 2.3 |
| Visa | 2.2 |
How has the fund changed?
This is a summary of certain material changes to Growth ETF.
Effective March 1, 2025, the fund has adopted a policy to invest at least 80% of its net assets (plus any borrowings for investment purposes) in securities of companies with growth characteristics. The fund’s March 1, 2025 prospectus contains more information.
If you invest directly with T. Rowe Price, you can elect to receive future shareholder reports or other important documents through electronic delivery by enrolling at www.troweprice.com/paperless. If you invest through a financial intermediary such as an investment advisor, a bank, retirement plan sponsor or a brokerage firm, please contact that organization and ask if it can provide electronic delivery.
Frank Russell Company "LSE" does not accept any liability for any errors or omissions in the indexes or data, and hereby expressly disclaim all warranties of originality, accuracy, completeness, timeliness, merchantability and fitness for a particular purpose. No party may rely on any indexes or data contained in this communication. Visit www.troweprice.com/en/us/market-data-disclosures for additional legal notices & disclaimers.
T. Rowe Price Investment Services, Inc.
100 East Pratt Street
Baltimore, MD 21202
Principal Listing Exchange: NYSE Arca, Inc.
Item 1. (b) Notice pursuant to Rule 30e-3.
Not applicable.
Item 2. Code of Ethics.
The registrant has adopted a code of ethics, as defined in Item 2 of Form N-CSR, applicable to its principal executive officer, principal financial officer, principal accounting officer or controller, or persons performing similar functions. A copy of this code of ethics is filed as an exhibit to this Form N-CSR. No substantive amendments were approved or waivers were granted to this code of ethics during the period covered by this report.
Item 3. Audit Committee Financial Expert.
The registrant’s Board of Directors has determined that Mr. Paul F. McBride qualifies as an audit committee financial expert, as defined in Item 3 of Form N-CSR. Mr. McBride is considered independent for purposes of Item 3 of Form N-CSR.
Item 4. Principal Accountant Fees and Services.
(a) – (d) Aggregate fees billed for the last two fiscal years for professional services rendered to, or on behalf of, the registrant by the registrant’s principal accountant were as follows:
| | | | | | | | | | | | | | |
| | | 2024 | | | | | | 2023 | | | |
Audit Fees | | $ | 23,525 | | | | | | | $ | 25,357 | |
Audit-Related Fees | | | - | | | | | | | | - | |
Tax Fees | | | - | | | | | | | | - | |
All Other Fees | | | - | | | | | | | | - | |
Audit fees include amounts related to the audit of the registrant’s annual financial statements and services normally provided by the accountant in connection with statutory and regulatory filings. Audit-related fees include amounts reasonably related to the performance of the audit of the registrant’s financial statements and specifically include the issuance of a report on internal controls and, if applicable, agreed-upon procedures related to fund acquisitions. Tax fees include amounts related to services for tax compliance, tax planning, and tax advice. The nature of these services specifically includes the review of distribution calculations and the preparation of Federal, state, and excise tax returns. All other fees include the registrant’s pro-rata share of amounts for agreed-upon procedures in conjunction with service contract approvals by the registrant’s Board of Directors/Trustees.
(e)(1) The registrant’s audit committee has adopted a policy whereby audit and non-audit services performed by the registrant’s principal accountant for the registrant, its investment adviser, and any entity controlling, controlled by, or under common control with the investment adviser that provides ongoing services to the registrant require pre-approval in advance at regularly scheduled audit committee meetings. If such a service is required between regularly scheduled audit committee meetings, pre-approval may be authorized by one audit committee member with ratification at the next scheduled audit committee meeting. Waiver of pre-approval for audit or non-audit services requiring fees of a de minimis amount is not permitted.
(2) No services included in (b) – (d) above were approved pursuant to paragraph (c)(7)(i)(C) of Rule 2-01 of Regulation S-X.
(f) Less than 50 percent of the hours expended on the principal accountant’s engagement to audit the registrant’s financial statements for the most recent fiscal year were attributed to work performed by persons other than the principal accountant’s full-time, permanent employees.
(g) The aggregate fees billed for the most recent fiscal year and the preceding fiscal year by the registrant’s principal accountant for non-audit services rendered to the registrant, its investment adviser, and any entity controlling, controlled by, or under common control with the investment adviser that provides ongoing services to the registrant were $1,262,000 and $1,524,000, respectively.
(h) All non-audit services rendered in (g) above were pre-approved by the registrant’s audit committee. Accordingly, these services were considered by the registrant’s audit committee in maintaining the principal accountant’s independence.
(i) Not applicable.
(j) Not applicable.
Item 5. Audit Committee of Listed Registrants.
Not applicable.
Item 6. Investments.
(a) Not applicable. The complete schedule of investments is included in Item 7 of this Form N-CSR.
(b) Not applicable.
Item 7. Financial Statements and Financial Highlights for Open-End Management Investment Companies.
(a – b) Report pursuant to Regulation S-X.
Financial Statements and Other Information
December 31, 2024
| | T. ROWE PRICE |
| TGRT | Growth ETF |
| | For more insights from T. Rowe Price investment professionals, go to troweprice.com. |
For a share outstanding throughout each period
| | Year
Ended | 6/14/23(1)
Through |
| | 12/31/24 | 12/31/23 |
| NET ASSET VALUE | | |
| Beginning of period | $ 28.49 | $ 25.00 |
| Investment activities | | |
| Net investment income(2)(3) | 0.06 | 0.03 |
| Net realized and unrealized gain/loss | 9.30 | 3.48 |
| Total from investment activities | 9.36 | 3.51 |
| Distributions | | |
| Net investment income | (0.03) | (0.02) |
| NET ASSET VALUE | | |
| End of period | $ 37.82 | $ 28.49 |
| Ratios/Supplemental Data |
| Total return, based on NAV(3)(4) | 32.86% | 14.03% |
Ratios to average net
assets:(3) | | |
Gross expenses before
waivers/payments by
Price Associates | 0.38% | 0.38%(5) |
Net expenses after
waivers/payments by
Price Associates | 0.38% | 0.38%(5) |
| Net investment income | 0.16% | 0.22%(5) |
| Portfolio turnover rate(6) | 21.2% | 4.9% |
Net assets, end of period
(in thousands) | $ 410,377 | $ 61,261 |
| (1) | Inception date |
| (2) | Per share amounts calculated using average shares outstanding method. |
| (3) | Includes the impact of expense-related arrangements with Price Associates. |
| (4) | Total return reflects the rate that an investor would have earned on an investment in the fund during each period, assuming reinvestment of all distributions. Total return is not annualized for periods less than one year. |
| (5) | Annualized |
| (6) | Portfolio turnover excludes securities received or delivered through in-kind share transactions. |
The accompanying notes are an integral part of these financial statements.
T. ROWE PRICE GROWTH ETF
December 31, 2024
| PORTFOLIO OF INVESTMENTS‡ | Shares | $ Value |
| (Cost and value in $000s) | | |
| | | |
| COMMON STOCKS 99.8% |
| COMMUNICATION SERVICES 13.7% |
| Entertainment 1.9% | | |
| Netflix (1) | 7,432 | 6,624 |
| Spotify Technology (1) | 2,907 | 1,301 |
| | | 7,925 |
| Interactive Media & Services 11.8% | | |
| Alphabet, Class A | 148,699 | 28,149 |
| Meta Platforms, Class A | 34,427 | 20,157 |
| | | 48,306 |
| Total Communication Services | | 56,231 |
| CONSUMER DISCRETIONARY 15.1% |
| Automobiles 1.8% | | |
| Tesla (1) | 18,579 | 7,503 |
| | | 7,503 |
| Broadline Retail 8.5% | | |
| Amazon.com (1) | 140,152 | 30,748 |
| Coupang, Class A (1) | 83,126 | 1,827 |
| MercadoLibre (1) | 1,229 | 2,090 |
| | | 34,665 |
| Hotels, Restaurants & Leisure 2.7% | | |
| Booking Holdings | 876 | 4,352 |
| Chipotle Mexican Grill (1) | 35,837 | 2,161 |
| DraftKings (1) | 20,018 | 745 |
| Hilton Worldwide Holdings | 7,636 | 1,887 |
| Starbucks | 18,625 | 1,700 |
| | | 10,845 |
| | Shares | $ Value |
| (Cost and value in $000s) | | |
| Specialty Retail 1.7% | | |
| Home Depot | 9,180 | 3,571 |
| O'Reilly Automotive (1) | 1,324 | 1,570 |
| Ross Stores | 13,271 | 2,007 |
| | | 7,148 |
| Textiles, Apparel & Luxury Goods 0.4% | | |
| Lululemon Athletica (1) | 4,419 | 1,690 |
| | | 1,690 |
| Total Consumer Discretionary | | 61,851 |
| CONSUMER STAPLES 1.0% |
| Consumer Staples Distribution & Retail 1.0% | | |
| Costco Wholesale | 4,441 | 4,069 |
| Total Consumer Staples | | 4,069 |
| ENERGY 0.2% |
| Energy Equipment & Services 0.2% | | |
| Schlumberger | 27,166 | 1,041 |
| Total Energy | | 1,041 |
| FINANCIALS 9.1% |
| Capital Markets 1.8% | | |
| Ares Management | 7,456 | 1,320 |
| Cboe Global Markets | 3,012 | 588 |
| Charles Schwab | 25,695 | 1,902 |
| S&P Global | 1,267 | 631 |
| Tradeweb Markets, Class A | 21,127 | 2,766 |
| | | 7,207 |
| Financial Services 7.0% | | |
| Apollo Global Management | 8,183 | 1,351 |
| Fiserv (1) | 35,722 | 7,338 |
| Mastercard, Class A | 20,489 | 10,789 |
| | Shares | $ Value |
| (Cost and value in $000s) | | |
| Visa, Class A | 29,147 | 9,212 |
| | | 28,690 |
| Insurance 0.3% | | |
| Marsh & McLennan | 6,622 | 1,407 |
| | | 1,407 |
| Total Financials | | 37,304 |
| HEALTH CARE 9.1% |
| Biotechnology 0.7% | | |
| Argenx SE, ADR (1) | 2,907 | 1,788 |
| Legend Biotech, ADR (1) | 12,634 | 411 |
| Vertex Pharmaceuticals (1) | 2,129 | 857 |
| | | 3,056 |
| Health Care Equipment & Supplies 3.0% | | |
| Becton Dickinson | 3,369 | 764 |
| Intuitive Surgical (1) | 12,635 | 6,595 |
| Sonova Holding, ADR | 24,460 | 1,591 |
| Stryker | 9,909 | 3,568 |
| | | 12,518 |
| Health Care Providers & Services 2.1% | | |
| Cigna | 8,164 | 2,254 |
| McKesson | 2,613 | 1,489 |
| UnitedHealth Group | 9,500 | 4,806 |
| | | 8,549 |
| Life Sciences Tools & Services 0.6% | | |
| Danaher | 10,394 | 2,386 |
| | | 2,386 |
| | Shares | $ Value |
| (Cost and value in $000s) | | |
| Pharmaceuticals 2.7% | | |
| Eli Lilly | 14,118 | 10,899 |
| | | 10,899 |
| Total Health Care | | 37,408 |
| INDUSTRIALS & BUSINESS SERVICES 4.0% |
| Aerospace & Defense 1.1% | | |
| Howmet Aerospace | 27,223 | 2,977 |
| TransDigm Group | 1,218 | 1,544 |
| | | 4,521 |
| Commercial Services & Supplies 0.5% | | |
| Cintas | 7,267 | 1,328 |
| Waste Connections | 4,118 | 706 |
| | | 2,034 |
| Ground Transportation 0.3% | | |
| Old Dominion Freight Line | 6,920 | 1,221 |
| | | 1,221 |
| Industrial Conglomerates 0.2% | | |
| Roper Technologies | 1,683 | 875 |
| | | 875 |
| Machinery 0.6% | | |
| Ingersoll-Rand | 27,554 | 2,493 |
| | | 2,493 |
| Professional Services 1.1% | | |
| Automatic Data Processing | 4,841 | 1,417 |
| Broadridge Financial Solutions | 2,564 | 580 |
| Equifax | 8,784 | 2,238 |
| | | 4,235 |
| | Shares | $ Value |
| (Cost and value in $000s) | | |
| Trading Companies & Distributors 0.2% | | |
| Fastenal | 12,203 | 877 |
| | | 877 |
| Total Industrials & Business Services | | 16,256 |
| INFORMATION TECHNOLOGY 47.2% |
| Communications Equipment 0.4% | | |
| Arista Networks (1) | 14,880 | 1,645 |
| | | 1,645 |
| Electronic Equipment, Instruments & Components 1.3% | | |
| Amphenol, Class A | 74,698 | 5,188 |
| | | 5,188 |
| IT Services 0.9% | | |
| Shopify, Class A (1) | 36,279 | 3,858 |
| | | 3,858 |
| Semiconductors & Semiconductor Equipment 15.0% | | |
| Advanced Micro Devices (1) | 6,858 | 828 |
| Analog Devices | 3,605 | 766 |
| ASML Holding NV | 2,203 | 1,527 |
| Broadcom | 41,098 | 9,528 |
| Entegris | 7,348 | 728 |
| NVIDIA | 328,855 | 44,162 |
| QUALCOMM | 10,598 | 1,628 |
| Taiwan Semiconductor Manufacturing, ADR | 11,351 | 2,242 |
| | | 61,409 |
| Software 19.8% | | |
| Adobe (1) | 4,710 | 2,094 |
| AppLovin, Class A (1) | 2,776 | 899 |
| Atlassian, Class A (1) | 8,186 | 1,992 |
| Autodesk (1) | 4,669 | 1,380 |
| | Shares | $ Value |
| (Cost and value in $000s) | | |
| Cadence Design Systems (1) | 2,869 | 862 |
| Dynatrace (1) | 19,305 | 1,049 |
| Fair Isaac (1) | 1,213 | 2,415 |
| Fortinet (1) | 21,413 | 2,023 |
| HubSpot (1) | 3,196 | 2,227 |
| Intuit | 13,205 | 8,299 |
| Microsoft | 105,137 | 44,315 |
| Palo Alto Networks (1) | 6,242 | 1,136 |
| Salesforce.com | 8,520 | 2,849 |
| Samsara, Class A (1) | 21,687 | 948 |
| ServiceNow (1) | 6,085 | 6,451 |
| Synopsys (1) | 3,344 | 1,623 |
| Workday (1) | 3,121 | 805 |
| | | 81,367 |
| Technology Hardware, Storage & Peripherals 9.8% | | |
| Apple | 160,955 | 40,306 |
| | | 40,306 |
| Total Information Technology | | 193,773 |
| MATERIALS 0.4% |
| Chemicals 0.4% | | |
| Linde | 2,432 | 1,018 |
| Sherwin-Williams | 1,684 | 573 |
| Total Materials | | 1,591 |
| Total Common Stocks (Cost $354,419) | | 409,524 |
| | Shares | $ Value |
| (Cost and value in $000s) | | |
| SHORT-TERM INVESTMENTS 0.2% |
| Money Market Funds 0.2% | | |
| State Street Institutional U.S. Government Money Market Fund, 4.43% (2) | 930,718 | 931 |
| Total Short-Term Investments (Cost $931) | | 931 |
Total Investments in Securities
100.0% of Net Assets (Cost $355,350) | | $410,455 |
| | |
| ‡ | Shares are denominated in U.S. dollars unless otherwise noted. |
| (1) | Non-income producing. |
| (2) | Seven-day yield |
| ADR | American Depositary Receipts |
The accompanying notes are an integral part of these financial statements.
T. ROWE PRICE GROWTH ETF
December 31, 2024
STATEMENT OF ASSETS AND LIABILITIES
($000s, except shares and per share amounts)
| Assets | |
| Investments in securities, at value (cost $355,350) | $410,455 |
| Receivable for investment securities sold | 1,888 |
| Dividends receivable | 57 |
| Total assets | 412,400 |
| Liabilities | |
| Payable for fund shares repurchased | 1,891 |
| Investment management and administrative fees payable | 132 |
| Total liabilities | 2,023 |
| NET ASSETS | $410,377 |
| Net Assets Consists of: | |
| Total distributable earnings (loss) | $51,449 |
Paid-in capital applicable to 10,850,000 shares of $0.0001 par value
capital stock outstanding; 4,000,000,000 shares of the Corporation authorized | 358,928 |
| NET ASSETS | $410,377 |
| NET ASSET VALUE PER SHARE | $37.82 |
The accompanying notes are an integral part of these financial statements.
STATEMENT OF OPERATIONS
($000s)
| | Year
Ended |
| | 12/31/24 |
| Investment Income (Loss) | |
| Dividend income (net of foreign taxes of $4) | $1,253 |
| Investment management and administrative expense | 878 |
| Net investment income | 375 |
| Realized and Unrealized Gain / Loss | |
| Net realized gain (loss) | |
| Securities | (3,572) |
| In-kind redemptions | 5,522 |
| Net realized gain | 1,950 |
| Change in net unrealized gain / loss on securities | 48,487 |
| Net realized and unrealized gain / loss | 50,437 |
| INCREASE IN NET ASSETS FROM OPERATIONS | $50,812 |
The accompanying notes are an integral part of these financial statements.
STATEMENT OF CHANGES IN NET ASSETS
($000s)
| | Year
Ended | | 6/14/23
Through |
| | 12/31/24 | | 12/31/23 |
| Increase (Decrease) in Net Assets | | | |
| Operations | | | |
| Net investment income | $375 | | $37 |
| Net realized gain (loss) | 1,950 | | (17) |
| Change in net unrealized gain / loss | 48,487 | | 6,618 |
| Increase in net assets from operations | 50,812 | | 6,638 |
| Distributions to shareholders | | | |
| Net earnings | (351) | | (37) |
| Capital share transactions* | | | |
| Shares sold | 314,964 | | 55,940 |
| Shares redeemed | (16,309) | | (1,280) |
| Increase in net assets from capital share transactions | 298,655 | | 54,660 |
| Net Assets | | | |
| Increase during period | 349,116 | | 61,261 |
| Beginning of period | 61,261 | | - |
| End of period | $410,377 | | $61,261 |
| *Share information (000s) | | | |
| Shares sold | 9,150 | | 2,200 |
| Shares redeemed | (450) | | (50) |
| Increase in shares outstanding | 8,700 | | 2,150 |
The accompanying notes are an integral part of these financial statements.
NOTES TO FINANCIAL STATEMENTS
T. Rowe Price Exchange-Traded Funds, Inc. (the corporation) is registered under the Investment Company Act of 1940 (the 1940 Act). The Growth ETF (the fund) is a nondiversified, open-end management investment company established by the corporation. The fund incepted on June 14, 2023. The fund seeks to provide long-term capital growth.
NOTE 1 – SIGNIFICANT ACCOUNTING POLICIES
Basis of Preparation
The fund is an investment company and follows accounting and reporting guidance in the Financial Accounting Standards Board (FASB) Accounting Standards Codification Topic 946 (ASC 946). The accompanying financial statements were prepared in accordance with accounting principles generally accepted in the United States of America (GAAP), including, but not limited to, ASC 946. GAAP requires the use of estimates made by management. Management believes that estimates and valuations are appropriate; however, actual results may differ from those estimates, and the valuations reflected in the accompanying financial statements may differ from the value ultimately realized upon sale or maturity.
Investment Transactions, Investment Income, and Distributions
Investment transactions are accounted for on the trade date basis. Income and expenses are recorded on the accrual basis. Realized gains and losses are reported on the identified cost basis. Income tax-related interest and penalties, if incurred, are recorded as income tax expense. Dividends received from other investment companies are reflected as dividend income; capital gain distributions are reflected as realized gain/loss. Dividend income and capital gain distributions are recorded on the ex-dividend date. Non-cash dividends, if any, are recorded at the fair market value of the asset received. Proceeds from litigation payments, if any, are included in either net realized gain (loss) or change in net unrealized gain/loss from securities. Distributions to shareholders are recorded on the ex-dividend date. Income distributions, if any, are declared and paid annually. A capital gain distribution, if any, may also be declared and paid by the fund annually. Dividends and distributions cannot be automatically reinvested in additional shares of the fund.
Capital Transactions
The fund issues and redeems shares at its net asset value (NAV) only with Authorized Participants and only in large blocks of 50,000 shares (each, a “Creation Unit”). The fund’s NAV per share is computed at the close of the New York Stock Exchange (NYSE), normally 4 p.m. Eastern time, each day the NYSE is open for business. However, the NAV per share may be calculated at a time other than the normal close of the NYSE if trading on the NYSE is restricted, if the NYSE closes earlier, or as may be permitted by the SEC. Individual fund shares may not be purchased or redeemed directly with the fund. An Authorized Participant may purchase or redeem a Creation Unit of the fund each business day that the fund is open in exchange for the delivery of a designated portfolio of in-kind securities and/or cash. When purchasing or redeeming Creation Units, Authorized Participants are also required to pay a fixed and/or variable purchase or redemption transaction fee as well as any applicable additional variable charge to defray the transaction cost to a fund.
Individual fund shares may be purchased and sold only on a national securities exchange through brokers. Shares are listed for trading on NYSE Arca, Inc. and because the shares will trade at market prices rather than NAV, shares may trade at prices greater than NAV (at a premium), at NAV, or less than NAV (at a discount).
New Accounting Guidance
In December 2023, the FASB issued Accounting Standards Update (ASU), ASU 2023-09, Income Taxes (Topic 740) – Improvements to Income Taxes Disclosures, which enhances the transparency of income tax disclosures. The ASU requires public entities, on an annual basis, to provide disclosure of specific categories in the rate reconciliation, as well as disclosure of income taxes paid disaggregated by jurisdiction. The amendments under this ASU are required to be applied prospectively and are effective for fiscal years beginning after December 15, 2024. Management expects that adoption of the guidance will not have a material impact on the fund’s financial statements.
Indemnification
In the normal course of business, the fund may provide indemnification in connection with its officers and directors, service providers, and/or private company investments. The fund’s maximum exposure under these arrangements is unknown; however, the risk of material loss is currently considered to be remote.
NOTE 2 – VALUATION
Fair Value
The fund’s financial instruments are valued at the close of the NYSE and are reported at fair value, which GAAP defines as the price that would be received to sell an asset or paid to transfer a liability in an orderly transaction between market participants at the measurement date. The fund’s Board of Directors (the Board) has designated T. Rowe Price Associates, Inc. as the fund’s valuation designee (Valuation Designee). Subject to oversight by the Board, the Valuation Designee performs the following functions in performing fair value determinations: assesses and manages valuation risks; establishes and applies fair value methodologies; tests fair value methodologies; and evaluates pricing vendors and pricing agents. The duties and responsibilities of the Valuation Designee are performed by its Valuation Committee. The Valuation Designee provides periodic reporting to the Board on valuation matters.
Various valuation techniques and inputs are used to determine the fair value of financial instruments. GAAP establishes the following fair value hierarchy that categorizes the inputs used to measure fair value:
Level 1 – quoted prices (unadjusted) in active markets for identical financial instruments that the fund can access at the reporting date
Level 2 – inputs other than Level 1 quoted prices that are observable, either directly or indirectly (including, but not limited to, quoted prices for similar financial instruments in active markets, quoted prices for identical or similar financial instruments in inactive markets, interest rates and yield curves, implied volatilities, and credit spreads)
Level 3 – unobservable inputs (including the Valuation Designee’s assumptions in determining fair value)
Observable inputs are developed using market data, such as publicly available information about actual events or transactions, and reflect the assumptions that market participants would use to price the financial instrument. Unobservable inputs are those for which market data are not available and are developed using the best information available about the assumptions that market participants would use to price the financial instrument. GAAP requires valuation techniques to maximize the use of relevant observable inputs and minimize the use of unobservable inputs. When multiple inputs are used to derive fair value, the financial instrument is assigned to the level within the fair value hierarchy based on the lowest-level input that is significant to the fair value of the financial
instrument. Input levels are not necessarily an indication of the risk or liquidity associated with financial instruments at that level but rather the degree of judgment used in determining those values.
Valuation Techniques
Equity securities, including exchange-traded funds, listed or regularly traded on a securities exchange or in the over-the-counter (OTC) market are valued at the last quoted sale price or, for certain markets, the official closing price at the time the valuations are made. A security that is listed or traded on more than one exchange is valued at the quotation on the exchange determined to be the primary market for such security. Listed securities not traded on a particular day are valued at the mean of the closing bid and asked prices for domestic securities.
Investments in mutual funds are valued at the mutual fund’s closing NAV per share on the day of valuation. Assets and liabilities other than financial instruments, including short-term receivables and payables, are carried at cost, or estimated realizable value, if less, which approximates fair value.
Investments for which market quotations are not readily available or deemed unreliable are valued at fair value as determined in good faith by the Valuation Designee. The Valuation Designee has adopted methodologies for determining the fair value of investments for which market quotations are not readily available or deemed unreliable, including the use of other pricing sources. Factors used in determining fair value vary by type of investment and may include market or investment specific considerations. The Valuation Designee typically will afford greatest weight to actual prices in arm’s length transactions, to the extent they represent orderly transactions between market participants, transaction information can be reliably obtained, and prices are deemed representative of fair value. However, the Valuation Designee may also consider other valuation methods such as market-based valuation multiples; a discount or premium from market value of a similar, freely traded security of the same issuer; discounted cash flows; yield to maturity; or some combination. Fair value determinations are reviewed on a regular basis. Because any fair value determination involves a significant amount of judgment, there is a degree of subjectivity inherent in such pricing decisions. Fair value prices determined by the Valuation Designee could differ from those of other market participants, and it is possible that the fair value determined for a security may be materially different from the value that could be realized upon the sale of that security.
Valuation Inputs
On December 31, 2024, all of the fund’s financial instruments were classified as Level 1, based on the inputs used to determine their fair values.
NOTE 3 – OTHER INVESTMENT TRANSACTIONS
Purchases and sales of portfolio securities excluding in-kind transactions and short-term securities aggregated $55,974,000 and $49,438,000, respectively, for the year ended December 31, 2024. Portfolio securities received and delivered through in-kind transactions aggregated $307,635,000 and $16,161,000, respectively, for the year ended December 31, 2024.
NOTE 4 – FEDERAL INCOME TAXES
Generally, no provision for federal income taxes is required since the fund intends to continue to qualify as a regulated investment company under Subchapter M of the Internal Revenue Code and distribute to shareholders all of its taxable income and gains. Distributions determined in accordance with federal income tax regulations may differ in amount or character from net investment income and realized gains for financial reporting purposes.
The fund files U.S. federal, state, and local tax returns as required. The fund’s tax returns are subject to examination by the relevant tax authorities until expiration of the applicable statute of limitations, which is generally three years after the filing of the tax return but which can be extended to six years in certain circumstances. Tax returns for open years have incorporated no uncertain tax positions that require a provision for income taxes.
Capital accounts within the financial reporting records are adjusted for permanent book/tax differences to reflect tax character but are not adjusted for temporary differences. The permanent book/tax adjustments, if any, have no impact on results of operations or net assets. The permanent book/tax adjustments relate primarily to redemptions in kind.
The tax character of distributions paid for the periods presented was as follows:
| ($000s) | | |
| | December 31, | December 31, |
| | 2024 | 2023 |
| Ordinary income (including short-term capital gains, if any) | $351 | $37 |
At December 31, 2024, the tax-basis cost of investments, (including derivatives, if any) and gross unrealized appreciation and depreciation were as follows:
| ($000s) | |
| Cost of investments | $355,469 |
| Unrealized appreciation | $58,296 |
| Unrealized depreciation | (3,310) |
| Net unrealized appreciation (depreciation) | $54,986 |
At December 31, 2024, the tax-basis components of accumulated net earnings (loss) were as follows:
| ($000s) | |
| Net unrealized appreciation (depreciation) | $54,986 |
| Loss carryforwards and deferrals | (3,537) |
| Total distributable earnings (loss) | $51,449 |
Temporary differences between book-basis and tax-basis components of total distributable earnings (loss) arise when certain items of income, gain, or loss are recognized in different periods for financial statement purposes versus for tax purposes; these differences will reverse in a subsequent reporting period. The temporary differences relate primarily to the deferral of losses from wash sales. The loss carryforwards and deferrals primarily relate to capital loss carryforwards. Capital loss carryforwards are available indefinitely to offset future realized capital gains.
NOTE 5 – FOREIGN TAXES
The fund is subject to foreign income taxes imposed by certain countries in which it invests. Additionally, capital gains realized upon disposition of securities issued in or by certain foreign countries are subject to capital gains tax imposed by those countries. All taxes are computed in accordance with the applicable foreign tax law, and, to the extent permitted, capital losses are used to offset capital gains. Taxes attributable to income are accrued by the fund as a reduction of income. Current and deferred tax expense attributable to capital gains is reflected as a component of realized or change in unrealized gain/loss on securities in the accompanying financial statements. To the extent that the fund has country specific capital loss carryforwards, such carryforwards are applied against net
unrealized gains when determining the deferred tax liability. Any deferred tax liability incurred by the fund is included in either Other liabilities or Deferred tax liability on the accompanying Statement of Assets and Liabilities.
NOTE 6 – RELATED PARTY TRANSACTIONS
The fund is managed by T. Rowe Price Associates, Inc. (Price Associates), a wholly owned subsidiary of T. Rowe Price Group, Inc. (Price Group). The investment management and administrative agreement between the fund and Price Associates provides for an annual all-inclusive fee equal to 0.38% of the fund’s average daily net assets. The fee is computed daily and paid monthly. The all-inclusive fee covers investment management services and ordinary, recurring operating expenses but does not cover interest and borrowing expenses; taxes; brokerage commissions and other transaction costs; fund proxy expenses; and nonrecurring and extraordinary expenses.
T. Rowe Price Investment Services, Inc. (Investment Services) serves as distributor to the fund. Pursuant to an underwriting agreement, no compensation for any distribution services provided is paid to Investment Services by the fund.
As of December 31, 2024, T. Rowe Price Group, Inc., or its wholly owned subsidiaries, owned 2,258,862 shares of the fund, representing 21% of the fund’s net assets.
The fund may participate in securities purchase and sale transactions with other funds or accounts advised by Price Associates (cross trades), in accordance with procedures adopted by the fund’s Board and Securities and Exchange Commission rules, which require, among other things, that such purchase and sale cross trades be effected at the independent current market price of the security. During the year ended December 31, 2024, the fund had no purchases or sales cross trades with other funds or accounts advised by Price Associates.
NOTE 7 – SEGMENT REPORTING
Operating segments are defined as components of a company that engage in business activities and for which discrete financial information is available and regularly reviewed by the chief operating decision maker (CODM) in deciding how to allocate resources and assess performance. The Management Committee of Price Associates acts as the fund’s CODM. The fund makes investments in
accordance with its investment objective as outlined in the Prospectus and is considered one reportable segment because the CODM allocates resources and assesses the operating results of the fund on the whole.
The fund’s revenue is derived from investments in portfolio of securities. The CODM allocates resources and assesses performance based on the operating results of the fund, which is consistent with the results presented in the statement of operations, statement of changes in net assets and financial highlights. The CODM compares the fund’s performance to its benchmark index and evaluates the positioning of the fund in relation to its investment objective. The measure of segment assets is net assets of the fund which is disclosed in the statement of assets and liabilities.
The accounting policies of the segment are the same as those described in the summary of significant accounting policies. The financial statements include all details of the segment assets, segment revenue and expenses; and reflect the financial results of the segment.
NOTE 8 – OTHER MATTERS
Unpredictable environmental, political, social and economic events, including but not limited to, environmental or natural disasters, war and conflict (including Russia’s military invasion of Ukraine and the conflict in Israel, Gaza and surrounding areas), terrorism, geopolitical developments (including trading and tariff arrangements, sanctions and cybersecurity attacks), and public health epidemics (including the global outbreak of COVID-19) and similar public health threats, may significantly affect the economy and the markets and issuers in which a fund invests. The extent and duration of such events and resulting market disruptions cannot be predicted. These and other similar events may cause instability across global markets, including reduced liquidity and disruptions in trading markets, while some events may affect certain geographic regions, countries, sectors, and industries more significantly than others, and exacerbate other pre-existing political, social, and economic risks. The fund’s performance could be negatively impacted if the value of a portfolio holding were harmed by these or such events. Management actively monitors the risks and financial impacts arising from such events.
REPORT OF INDEPENDENT REGISTERED PUBLIC ACCOUNTING FIRM
To the Board of Directors of T. Rowe Price Exchange-Traded Funds, Inc. and Shareholders of T. Rowe Price Growth ETF
Opinion on the Financial Statements
We have audited the accompanying statement of assets and liabilities, including the portfolio of investments, of T. Rowe Price Growth ETF (one of the funds constituting T. Rowe Price Exchange-Traded Funds, Inc., referred to hereafter as the "Fund") as of December 31, 2024, the related statement of operations for the year ended December 31, 2024 and the statement of changes in net assets and the financial highlights for the year ended December 31, 2024 and for the period June 14, 2023 (Inception) through December 31, 2023, including the related notes (collectively referred to as the “financial statements”). In our opinion, the financial statements present fairly, in all material respects, the financial position of the Fund as of December 31, 2024, the results of its operations for the year ended December 31, 2024 and the changes in its net assets and the financial highlights for the year ended December 31, 2024 and for the period June 14, 2023 (Inception) through December 31, 2023 in conformity with accounting principles generally accepted in the United States of America.
Basis for Opinion
These financial statements are the responsibility of the Fund’s management. Our responsibility is to express an opinion on the Fund’s financial statements based on our audits. We are a public accounting firm registered with the Public Company Accounting Oversight Board (United States) (PCAOB) and are required to be independent with respect to the Fund in accordance with the U.S. federal securities laws and the applicable rules and regulations of the Securities and Exchange Commission and the PCAOB.
We conducted our audits of these financial statements in accordance with the standards of the PCAOB. Those standards require that we plan and perform the audit to obtain reasonable assurance about whether the financial statements are free of material misstatement, whether due to error or fraud.
REPORT OF INDEPENDENT REGISTERED PUBLIC ACCOUNTING FIRM
(CONTINUED)
Our audits included performing procedures to assess the risks of material misstatement of the financial statements, whether due to error or fraud, and performing procedures that respond to those risks. Such procedures included examining, on a test basis, evidence regarding the amounts and disclosures in the financial statements. Our audits also included evaluating the accounting principles used and significant estimates made by management, as well as evaluating the overall presentation of the financial statements. Our procedures included confirmation of securities owned as of December 31, 2024 by correspondence with the custodian. We believe that our audits provide a reasonable basis for our opinion.
/s/ PricewaterhouseCoopers LLP
Baltimore, Maryland
February 18, 2025
We have served as the auditor of one or more investment companies in the T. Rowe Price group of investment companies since 1973.
TAX INFORMATION (UNAUDITED) FOR THE TAX YEAR ENDED 12/31/24
We are providing this information as required by the Internal Revenue Code. The amounts shown may differ from those elsewhere in this report because of differences between tax and financial reporting requirements.
The fund’s distributions to shareholders included:
For taxable non-corporate shareholders, $2,372,000 of the fund’s income represents qualified dividend income subject to a long-term capital gains tax rate of not greater than 20%.
100 East Pratt Street
Baltimore, MD 21202
Call 1-800-638-5660 to request a prospectus or summary prospectus; each includes investment objectives, risks, fees, expenses, and other information that you should read and consider carefully before investing.
T. Rowe Price Investment Services, Inc.
Item 8. Changes in and Disagreements with Accountants for Open-End Management Investment Companies.
Not applicable.
Item 9. Proxy Disclosures for Open-End Management Investment Companies.
Not applicable.
Item 10. Remuneration Paid to Directors, Officers, and Others of Open-End Management Investment Companies.
Remuneration paid to Directors is included in Item 7 of this Form N-CSR.
Item 11. Statement Regarding Basis for Approval of Investment Advisory Contract.
If applicable, see Item 7.
Item 12. Disclosure of Proxy Voting Policies and Procedures for Closed-End Management Investment Companies.
Not applicable.
Item 13. Portfolio Managers of Closed-End Management Investment Companies.
Not applicable.
Item 14. Purchases of Equity Securities by Closed-End Management Investment Company and Affiliated Purchasers.
Not applicable.
Item 15. Submission of Matters to a Vote of Security Holders.
There has been no change to the procedures by which shareholders may recommend nominees to the registrant’s board of directors.
Item 16. Controls and Procedures.
(a) The registrant’s principal executive officer and principal financial officer have evaluated the registrant’s disclosure controls and procedures within 90 days of this filing and have concluded that the registrant’s disclosure controls and procedures were effective, as of that date, in ensuring that information required to be disclosed by the registrant in this Form N-CSR was recorded, processed, summarized, and reported timely.
(b) The registrant’s principal executive officer and principal financial officer are aware of no change in the registrant’s internal control over financial reporting that occurred during the period covered by this report that has materially affected, or is reasonably likely to materially affect, the registrant’s internal control over financial reporting.
Item 17. Disclosure of Securities Lending Activities for Closed-End Management Investment Companies.
Not applicable.
Item 18. Recovery of Erroneously Awarded Compensation.
Not applicable.
Item 19. Exhibits.
SIGNATURES
Pursuant to the requirements of the Securities Exchange Act of 1934 and the Investment Company Act of 1940, the registrant has duly caused this report to be signed on its behalf by the undersigned, thereunto duly authorized.
| | | | |
| T. Rowe Price Exchange-Traded Funds, Inc. |
| | |
| By | | /s/ David Oestreicher | | |
| | David Oestreicher | | |
| | Principal Executive Officer | | |
| | |
| Date | | February 18, 2025 | | |
Pursuant to the requirements of the Securities Exchange Act of 1934 and the Investment Company Act of 1940, this report has been signed below by the following persons on behalf of the registrant and in the capacities and on the dates indicated.
| | | | |
| By | | /s/ David Oestreicher | | |
| | David Oestreicher | | |
| | Principal Executive Officer | | |
| | |
| Date | | February 18, 2025 | | |
| | | | |
| By | | /s/ Alan S. Dupski | | |
| | Alan S. Dupski | | |
| | Principal Financial Officer | | |
| | |
| Date | | February 18, 2025 | | |