|
|
CERTIFICATE OF QUALIFIED PERSON
Peter Mehrfert, P.Eng.
I, Peter Mehrfert, P. Eng., certify that I am employed as a Process Engineer with Ausenco Engineering Canada ULC, with an office at 1050 W Pender St, Vancouver, BC V6E 3S7.
1. This certificate applies to the technical report titled "Panuco Project NI 43-101 Technical Report & Preliminary Economic Assessment" that has an effective date of July 24, 2024 (the "Effective Date").
2. I graduated from the University of British Columbia in 1996 where I obtained a Bachelor of Applied Science in Mining and Mineral Process Engineering.
3. I am a Professional Engineer, registered with Engineers and Geoscientists of British Columbia, member number 24527.
4. I have practiced my profession continuously for 28 years and have been involved in the design, evaluation, and operation of mineral processing facilities during that time. Approximately half of my professional practice has been the supervision and management of metallurgical test work related to feasibility and prefeasibility studies of projects involving flotation technologies. Previous projects that I have worked on that have similar features to the Panuco Project are Lemhi, Courageous Lake, Springpole, and Eskay Creek. Project financial models that I have reviewed and contributed to the inputs include Berg, Copper Creek, Santo Tomas, Kwanika, and Northisle Copper & Gold.
5. I have read the definition of "Qualified Person" set out in the National Instrument 43-101 Standards of Disclosure for Mineral Projects ("NI 43-101") and certify that by virtue of my education, affiliation to a professional association and past relevant work experience, I fulfill the requirements to be a "Qualified Person" for those sections of the Technical Report that I am responsible for preparing.
6. I have visited the Panuco Project between April 8th and 10th, 2024.
7. I am responsible 1.1, 1.7, 1.10, 1.11.1-1.11.6, 1.12, 1.14-1.17, 2.1-2.4.1, 2.5-2.7, 3.4, 12.4, 12.5, 13, 17, 18.1-18.3.7, 19, 21.1-21.2.2, 21.2.4-21.2.10, 21.3.1, 21.3.2, 21.3.4, 21.3.5, 22, 24, 25.1, 25.5, 25.8, 25.9.1, 25.10, 25.12-25.14, 25.15.1.2, 25.15.1.4, 25.15.1.8, 25.15.2.2, 25.15.2.4,25.15.2.7, 26.1, 26.3, 26.5, 26.9 and 27 of the Technical Report
8. I am independent of the Vizsla Silver Corp. as independence is defined in Section 1.5 of NI 43-101.
9. I have had previous involvement with the Panuco Project, serving as QP and contributing author to the Panuco NI 43-101 Technical Report on the Updated Mineral Resource Estimate with an effective date of September 1, 2023. I have also managed metallurgical test programs on samples from the Panuco deposits on behalf of Vizsla Silver Corp.
10. I have read NI 43-101 and the sections of the Technical Report for which I am responsible have been prepared in compliance with that Instrument. As of the effective date of the Technical Report, to the best of my knowledge, information and belief, the sections of the Technical Report for which I am responsible contain all scientific and technical information that is required to be disclosed to make those sections of the Technical Report not misleading.
Dated: August 23, 2024
"Signed and Sealed"
Peter Mehrfert, P. Eng.
|
|
CERTIFICATE OF QUALIFIED PERSON
James Millard, P. Geo.
I, James Millard, P. Geo., certify that I am employed as a Director, Strategic Projects with Ausenco Sustainability ULC, a wholly owned subsidiary of Ausenco Engineering Canada ULC ("Ausenco"), with an office address of Suite 100, 2 Ralston Avenue, Dartmouth, NS, B3B 1H7, Canada.
1. This certificate applies to the technical report titled "Panuco Project NI 43-101 Technical Report & Preliminary Economic Assessment" that has an effective date of July 24, 2024 (the "Effective Date").
2. I graduated from Brock University in St. Catharines, Ontario in 1986 with a Bachelor of Science in Geological Sciences, and from Queen's University in Kingston, Ontario in 1995 with a Master of Science in Environmental Engineering.
3. I am a member (P. Geo.) of the Association of Professional Geoscientists of Nova Scotia, Membership No. 021.
4. I have practiced my profession for 25 years. I have worked for mid- and large-size mining companies where I have acted in senior technical and management roles, in senior environmental consulting roles, and provided advise and/or expertise in a number of key subject areas. These key areas included: feasibility-level study reviews; NI 43-101 report writing and review; due diligence review of environmental, social, and governance areas for proposed mining operations and acquisitions, and directing environmental impact assessments and permitting applications to support construction, operations, and closure of mining projects. In addition to the above, I have been responsible for conducting baseline data assessments, surface and groundwater quantity and quality studies, mine rock geochemistry and water quality predictions, mine reclamation and closure plan development, and community stakeholder and Indigenous peoples' engagement initiatives. Recently, I acted in the following project roles: Qualified Person for the environmental/sustainability aspects for "Puquios Project, Feasibility Study Report, La Higuera, Coquimbo Region, Chile", "Volcan Project, NI 43-101 Technical Report on Preliminary Economic Assessment, Tierra Amarilla, Atacama Region, Chile" and, "Colomac Gold Project, NI 43-101 Technical Report and Preliminary Economic Assessment, Northwest Territories, Canada"; and principal author for the environmental/sustainability sections for the "Kwanika- Stardust Project, NI 43-101 Technical Report and, Preliminary Economic Assessment, British Columbia, Canada".
5. I have read the definition of "Qualified Person" set out in the National Instrument 43-101 Standards of Disclosure for Mineral Projects ("NI 43-101") and certify that by virtue of my education, affiliation to a professional association and past relevant work experience, I fulfill the requirements to be a "Qualified Person" for those sections of the Technical Report that I am responsible for preparing.
6. I have not visited the Panuco Project site.
7. I am responsible for 1.13, 3.3, 20, 25.11, 25.15.1.7, 25.15.2.6, 26.8 and 27 of the Technical Report.
8. I am independent of the Vizsla Silver Corp as independence is defined in Section 1.5 of NI 43-101.
9. I have had no previous involvement with Panuco Project.
10. I have read NI 43-101 and the sections of the Technical Report for which I am responsible have been prepared in compliance with that Instrument. As of the effective date of the Technical Report, to the best of my knowledge, information and belief, the sections of the Technical Report for which I am responsible contain all scientific and technical information that is required to be disclosed to make those sections of the Technical Report not misleading.
Dated: August 23, 2024
"Signed and Sealed"
James Millard, M. Sc, P. Geo.
|
|
CERTIFICATE OF QUALIFIED PERSON
Scott Cameron Elfen, P.E.
I, Scott Cameron Elfen, P.E., certify that I am employed as the Global Lead Geotechnical and Civil Services within Ausenco Engineering Canada ULC, with an office address of 1050 West Pender Street, Suite 1200, Vancouver, BC V6E 3S7, Canada.
1. This certificate applies to the technical report titled "Panuco Project NI 43-101 Technical Report & Preliminary Economic Assessment" that has an effective date of July 24, 2024 (the "Effective Date").
2. I graduated from the University of California, Davis, California, in 1991 with Bachelor of Science degree in Civil Engineering (Geotechnical).
3. I am a Registered Civil Engineer in the State of California (license no. C56527) by exam since 1996 and I am also a member in good standing of the American Society of Civil Engineers (ASCE), and the Society for Mining, Metallurgy & Exploration (SME).
4. I have practiced my profession continuously for 26 years with experience in the development, design, construction and operations of mine waste storage facilities, such as waste rock storage facilities and tailings storage facilities ranging from slurry to dry stack facilities, focusing on precious and base metals, both domestic and international. In addition, I have developed geotechnical design parameters for pit slope design, plant foundation design, and other supporting infrastructure. Examples of projects I have worked on include Skeena's Eskay Creek Project PEA, PFS and FS, O3 Mining's Marban Project PEA and PFS, First Mining Gold's Springpole PEA and PFS. SSR Mining's Puna Silver In-Pit Tailings Disposal PFS, and Detailing Engineering, and the Company's Cangrejos Project PEA.
5. I have read the definition of "Qualified Person" set out in the National Instrument 43-101 Standards of Disclosure for Mineral Projects ("NI 43-101") and certify that by virtue of my education, affiliation to a professional association and past relevant work experience, I fulfill the requirements to be a "Qualified Person" for those sections of the Technical Report that I am responsible for preparing.
6. I visited the Panuco Project on August 15, 2024, for a visit duration of 1 day.
7. I am responsible for sections 1.11.7, 1.11.8, 2.4.4, 18.3.8, 18.3.9, 25.9.2, 25.15.1.5, 26.6, 26.7 and 27 of the Technical Report.
8. I am independent of Vizsla Silver Corp. as independence is described by Section 1.5 of the NI 43-101.
9. I have had no previous involvement with the Panuco Project.
10. I have read NI 43-101 and the sections of the Technical Report for which I am responsible have been prepared in compliance with that Instrument. As of the effective date of the Technical Report, to the best of my knowledge, information and belief, the sections of the Technical Report for which I am responsible contain all scientific and technical information that is required to be disclosed to make those sections of the Technical Report not misleading.
Dated: August 23, 2024
"Signed and Sealed"
Scott Cameron Elfen, P.E.
|
|
CERTIFICATE OF QUALIFIED PERSON
JONATHAN COOPER, P.ENG.
I, Jonathan Cooper, P. Eng., certify that I am employed as a Water Resources Engineer with Ausenco Sustainability ULC ("Ausenco"), with an office address of 11 King Street West, Suite 1500, Toronto, Ontario M5H 4C7.
11. This certificate applies to the technical report titled "Panuco Project NI 43-101 Technical Report & Preliminary Economic Assessment" that has an effective date of July 24, 2024 (the "Effective Date").
12. I graduated from the University of Western Ontario with a Bachelor of Engineering Science in Civil Engineering in 2008, and University of Edinburgh with a Master of Environmental Management in 2010.
13. I am a Professional Engineer registered and in good standing with Order of Engineers of Quebec (temporary engineer permit #6067376), Professional Engineers Ontario (registration #100191626), Engineers and Geoscientists British Columbia (registration #37864) and Northwest Territories and Nunavut Association of Professional Engineers and Geoscientists (registration # L4227).
14. I have practiced my profession for continuously for over 15 years with experience in the development, design, operation, and commissioning of surface water infrastructure. Previous projects that I have worked on that have similar features to the Novador Project are the Kwanika-Stardust for NorthWest Copper located in British Columbia, Colomac Gold Project located in the Northwest Territories and the Crawford Project located in Ontario.
15. I have read the definition of "Qualified Person" set out in the National Instrument 43-101 Standards of Disclosure for Mineral Projects ("NI 43-101") and certify that by virtue of my education, affiliation to a professional association and past relevant work experience, I fulfil the requirements to be a "Qualified Person" for those sections of the Technical Report that I am responsible for preparing.
16. I have not visited the Panuco Project
17. I am responsible for sections 18.3.10, 25.9.3, 25.15.1.6, 25.15.2.5, and 27 of the Technical Report.
18. I am independent of Vizsla Silver Corp Corp. as independence is defined in Section 1.5 of NI 43-101.
19. I have had no previous involvement with the Panuco Project.
20. I have read NI 43-101 and the sections of the Technical Report for which I am responsible have been prepared in compliance with that Instrument. As of the effective date of the Technical Report, to the best of my knowledge, information and belief, the sections of the Technical Report for which I am responsible contain all scientific and technical information that is required to be disclosed to make those sections of the Technical Report not misleading.
Dated: August 23, 2024
"Signed and Sealed"
Jonathan Cooper, P.Eng.
|
|

CERTIFICATE OF QUALIFIED PERSON
Allan Armitage, P.Geo.
I, Allan E. Armitage, Ph. D., P. Geol. of 62 River Front Way, Fredericton, New Brunswick, hereby certify that, I am a Senior Resource Geologist with SGS Canada Inc., 10 de la Seigneurie E Blvd., Unit 203 Blainville, QC, Canada, J7C 3V5.
1. This certificate applies to the technical report titled "Panuco Project NI 43-101 Technical Report & Preliminary Economic Assessment" that has an effective date of July 24, 2024 (the "Effective Date")
2. I am a graduate of Acadia University having obtained the degree of Bachelor of Science - Honours in Geology in 1989, a graduate of Laurentian University having obtained the degree of Master of Science in Geology in 1992 and a graduate of the University of Western Ontario having obtained a Doctor of Philosophy in Geology in 1998.
3. I have been employed as a geologist for every field season (May - October) from 1987 to 1996. I have been continuously employed as a geologist since March of 1997.
4. I have been involved in mineral exploration and resource modeling at the grass roots to advanced exploration stage, including producing mines, since 1991, including mineral resource estimation and mineral resource and mineral reserve auditing since 2006 in Canada and internationally. I have extensive experience in Archean and Proterozoic load gold deposits, volcanic and sediment hosted base metal massive sulphide deposits, porphyry copper-gold-silver deposits, low and intermediate sulphidation epithermal gold and silver deposits, magmatic Ni-Cu-PGE deposits, and unconformity- and sandstone-hosted uranium deposits. I am a member of the following: the Association of Professional Engineers, Geologists and Geophysicists of Alberta (P.Geol.) (License No. 64456; 1999), the Association of Professional Engineers and Geoscientists of British Columbia (P.Geo.) (Licence No. 38144; 2012), the Professional Geoscientists Ontario (P.Geo.) (Licence No. 2829; 2017), and Northwest Territories and Nunavut Association of Professional Engineers and Geoscientists (NAPEG) (License No. L4375: 2019).
5. I have read the definition of "Qualified Person" set out in National Instrument 43-101 - Standards of Disclosure for Mineral Projects - ("Nl 43-101") and certify that by reason of my education, affiliation with a professional association (as defined in NI 43 101) and past relevant work experience, I fulfill the requirements to be a "Qualified Person" for the purposes of NI 43 101.
6. I am an author of the Technical Report and responsible for sections 1.2, 1.8, 2.4.3, 3.1, 4, 8, 12.2, 12.3, 12.6, 14, 15, 23, 25.2, 25.6, 25.15.1.1, 25.15.2.1, 26.2 and 27. I have reviewed these sections and accept professional responsibility for these sections of the Technical Report.
7. I have conducted three site visits to the Property. I conducted a site visit to the Project on May 29, 2023, a second site visit November 6 to November 8, 2023, and a third site visit on May 23, 2024.
8. I have had prior involvement with the Panuco Property. I was an author of the previous NI 43-101 Technical Reports for the Property, dated March 10, 2023, and February 12, 2024, for Vizsla.
9. I am independent of the Company as described in Section 1.5 of NI 43-101.
10. As of the effective date of the Technical Report, to the best of my knowledge, information and belief, the Technical Report contains all scientific and technical information that is required to be disclosed to make the Technical Report not misleading. I have read NI 43-101 and Form 43-101F1 (the "Form"), and the Technical Report has been prepared in compliance with NI 43-101 and the Form.
Dated: August 23, 2024
"Signed and Sealed"
Allan E. Armitage, Ph. D., P. Geo.
|

CERTIFICATE OF QUALIFIED PERSON
Ben Eggers, P. Geo.
I, Benjamin K. Eggers, B.Sc. (Hons), MAIG, P.Geo. of Tofino, British Columbia, hereby certify that, I am a Senior Geologist with SGS Canada Inc., 10 Boulevard de la Seigneurie E., Suite 203, Blainville, QC, J7C 3V5, Canada.
1. This certificate applies to the technical report titled "Panuco Project NI 43-101 Technical Report & Preliminary Economic Assessment" that has an effective date of July 24, 2024 (the "Effective Date").
2. I am a graduate of the University of Otago, New Zealand having obtained the degree of Bachelor of Science (Honours) in Geology in 2004.
3. I have been continuously employed as a geologist since February of 2005.
4. I have been involved in mineral exploration and resource modeling at the greenfield to advanced exploration stages, including at producing mines, in Canada, Australia, and internationally since 2005, and in mineral resource estimation since 2022 in Canada and internationally. I have experience in lode gold deposits, porphyry copper-gold-silver deposits, low and high sulphidation epithermal gold and silver deposits, volcanic and sediment hosted base metal massive sulphide deposits, and albitite-hosted uranium deposits. I am a member of the Association of Professional Engineers and Geoscientists of British Columbia and use the designation (P.Geo.) (EGBC Licence No. 40384; 2014), and I am a member of the Australian Institute of Geoscientists and use the designation (MAIG) (AIG Licence No. 3824; 2013).
5. I have read the definition of "Qualified Person" set out in National Instrument 43-101 - Standards of Disclosure for Mineral Projects - ("Nl 43-101") and certify that by reason of my education, affiliation with a professional association (as defined in NI 43-101) and past relevant work experience, I fulfill the requirements to be a "Qualified Person" for the purposes of NI 43-101.
6. I am an author of the Technical Report and responsible for sections 1.3-1.6, 5, 6, 7, 9, 10, 11, 12.1, 25.3, 25.4, and 27. I have reviewed these sections and accept professional responsibility for these sections of the Technical Report.
7. I have not personally conducted a site visit.
8. I have had prior involvement with the Panuco Property. I was an author of the previous NI 43-101 Technical Reports for the Property, dated March 10, 2023, and February 12, 2024, for Vizsla.
9. I am independent of the Company as described in Section 1.5 of NI 43-101.
10. As of the effective date of the Technical Report, to the best of my knowledge, information and belief, the Technical Report contains all scientific and technical information that is required to be disclosed to make the Technical Report not misleading. I have read NI 43-101 and Form 43-101F1 (the "Form"), and the Technical Report has been prepared in compliance with NI 43-101 and the Form.
Dated: August 23, 2024
"Signed and Sealed"
Benjamin K. Eggers, B.Sc. (Hons), MAIG, P.Geo
|
|
CERTIFICATE OF QUALIFIED PERSON
Ramon Mendoza Reyes, P.Eng.
I, Ramon Mendoza Reyes, P.Eng., certify that: am employed as a Principal Consultant with Entech Mining Ltd., with an office address of 1100 Melville Street, Vancouver, BC, Canada, V6E 4A6.
1. This certificate applies to the technical report titled "Panuco Project NI 43-101 Technical Report & Preliminary Economic Assessment" that has an effective date of July 24, 2024 (the "Effective Date").
2. I graduated from the National Autonomous University of Mexico with a Bachelor of Science Degree in Mining Engineering in 1989, and also obtained a Master of Science Degree in Mining and Earth Systems Engineering from the Colorado School of Mines in Golden, Colorado, in 2003.
3. I am a professional engineer registered with the Engineers and Geoscientists British Columbia (Reg. No. 158547).
4. I have practiced my profession continuously since 1990 and have been involved in numerous precious and base metal mine projects and operations in Mexico, Canada, the United States of America, Chile, Peru, and Argentina, overseeing technical and operational aspects including mine design, mine planning, mining operations and mineral reserves estimation.
5. I have read the definition of "Qualified Person" set out in the National Instrument 43-101 Standards of Disclosure for Mineral Projects ("NI 43-101") and certify that by virtue of my education, affiliation to a professional association and past relevant work experience, I fulfill the requirements to be a "Qualified Person" for those sections of the Technical Report that I am responsible for preparing.
6. I visited the Panuco project site and carried out a personal inspection on April 9-10 of 2024.
7. I am responsible for Sections 1.9, 2.4.2, 3.2, 16, 21.2.3, 21.3.3, 25.7, 25.15.1.3, 25.15.2.3, 26.4 and 27 of the technical report.
8. I am independent of Vizsla Silver Corp. as independence is defined in Section 1.5 of NI 43-101.
9. I have not been previously involved with the Panuco Project.
10. I have read NI 43-101, and the sections of the Technical Report for which I am responsible have been prepared in compliance with that Instrument. As of the effective date of the Technical Report, to the best of my knowledge, information and belief, the sections of the Technical Report for which I am responsible contain all scientific and technical information that is required to be disclosed to make those sections of the Technical Report not misleading.
Dated: August 23, 2024
"Signed and Sealed"
Ramon Mendoza Reyes, P.Eng.
|
|
Important Notice
This report was prepared as National Instrument 43-101 Technical Report for Panuco Project by Ausenco Engineering Canada ULC and Ausenco Sustainability ULC (collectively Ausenco), SGS Canada Inc - Geological Services (SGS) and Entech Mining Ltd. (Entech) collectively the Report Authors. The quality of information, conclusions, and estimates contained herein is consistent with the level of effort involved in the Report Authors' services, based on i) information available at the time of preparation, ii) data supplied by outside sources, and iii) the assumptions, conditions, and qualifications set forth in this report. This report is intended for use by Vizsla subject to terms and conditions of its contracts with each of the Report Authors. Except for the purposed legislated under Canadian provincial and territorial securities law, any other uses of this report by any third party are at that party's sole risk.
|
|
Table of Contents
| 1 Summary | 1 |
| 1.1 Introduction | 1 |
| 1.2 Mineral Tenure, Surface Rights, Water Rights, Royalties and Agreements | 2 |
| 1.3 Geology Mineralization | 2 |
| 1.4 History | 4 |
| 1.5 Exploration | 5 |
| 1.6 Drilling | 5 |
| 1.7 Metallurgical Test Work | 6 |
| 1.8 Mineral Resource Estimate | 8 |
| 1.9 Mining Methods | 11 |
| 1.10 Recovery Methods | 12 |
| 1.11 Project Infrastructure | 15 |
| 1.11.1 Overview | 15 |
| 1.11.2 Site Access | 17 |
| 1.11.3 Power Supply | 17 |
| 1.11.4 Water Supply | 17 |
| 1.11.5 On-Site Roads | 17 |
| 1.11.6 Buildings | 17 |
| 1.11.7 Waste Rock Storage Facility | 17 |
| 1.11.8 Tailings Storage Facility | 17 |
| 1.12 Markets and Contracts | 18 |
| 1.13 Environmental, Permitting and Social Considerations | 18 |
| 1.13.1 Environmental Considerations | 18 |
| 1.13.2 Permitting Considerations | 19 |
| 1.13.3 Social and Community Considerations | 20 |
| 1.13.4 Closure and Reclamation Planning | 20 |
| 1.14 Capital and Operating Cost Estimates | 21 |
| 1.14.1 Capital Cost Estimates | 21 |
| 1.14.2 Average Operating Cost Estimate | 21 |
| 1.15 Economic Analysis | 22 |
| 1.15.1 Sensitivity Analysis | 24 |
| 1.16 Interpretations and Conclusions | 25 |
| 1.17 Recommendations | 25 |
|
|
| 2 Introduction | 26 |
| 2.1 Introduction | 26 |
| 2.2 Terms of Reference | 26 |
| 2.3 Qualified Persons | 26 |
| 2.4 Site Visits and Scope of Personal Inspection | 28 |
| 2.4.1 Site Inspection by Peter Mehrfert, P.Eng. | 28 |
| 2.4.2 Site Inspection by Ramon Mendoza Reyes, P.Eng. | 28 |
| 2.4.3 Site Inspection by Allan Armitage, P.Geo | 28 |
| 2.4.4 Site Inspection by Scott Elfen, P.E. | 29 |
| 2.5 Effective Dates | 29 |
| 2.6 Information Sources and References | 29 |
| 2.6.1 Previous Technical Reports | 29 |
| 2.7 Currency, Units, Abbreviations and Definitions | 30 |
| 3 Reliance on Other Experts | 33 |
| 3.1 Property Agreements, Mineral Tenure, Surface Rights and Royalties | 33 |
| 3.2 Property Ownership | 33 |
| 3.3 Environmental, Permitting, Closure, and Social and Community Impacts | 33 |
| 3.4 Taxation | 34 |
| 4 Property Description and Location | 35 |
| 4.1 Introduction | 35 |
| 4.2 Land Tenure and Mining Concessions | 35 |
| 4.3 Underlying Agreements | 41 |
| 4.3.1 Canam Alpine Ventures Ltd. | 41 |
| 4.3.2 Silverstone Resources S.A. de C.V. | 42 |
| 4.3.3 Minera Rio Panuco S.A. de C.V. | 42 |
| 4.3.4 Strategic Investment in Prismo Metals | 42 |
| 4.3.5 Royalty Spin Out | 42 |
| 4.3.6 San Enrique Acquisition | 43 |
| 4.4 Surface Rights | 43 |
| 4.4.1 Canam and Ejido Panuco | 44 |
| 4.4.2 Silverstone Resources S.A. de C.V., Canam, and Ejido Platanar de los Ontiverose | 44 |
| 4.4.3 Canam and Comunidad Copala | 45 |
| 4.4.4 Canam and El Habal Ejido | 45 |
| 4.4.5 Canam and San Miguel Del Carrizal | 45 |
| 4.5 Permits | 45 |
| 4.6 Environmental Considerations | 46 |
| 4.7 Other Relevant Factors | 46 |
|
|
| 5 Accessibility, Climate, Local Resources, Infrastructure and Physiography | 47 |
| 5.1 Accessibility | 47 |
| 5.2 Local Resources and Infrastructure | 47 |
| 5.3 Climate | 47 |
| 5.4 Physiography | 47 |
| 5.5 Vegetation and Wildlife | 48 |
| 6 History | 49 |
| 6.1 Property Exploration History | 49 |
| 7 Geological Setting and Mineralization | 51 |
| 7.1 Regional Geology | 51 |
| 7.2 Project Geology | 54 |
| 7.3 Mineralization | 59 |
| 7.3.1 Animas-Refugio Corridor | 61 |
| 7.3.2 Cordon del Oro Corridor | 64 |
| 7.3.3 Cinco Señores and Napoleon Corridor | 66 |
| 7.3.4 Other Mineralized Structures | 70 |
| 7.4 Structural Controls | 72 |
| 7.5 Alteration | 72 |
| 7.6 Mineral Petrology | 73 |
| 8 Deposit Types | 75 |
| 8.1 Deposit Model | 75 |
| 8.2 Epithermal Systems | 75 |
| 9 Exploration | 78 |
| 9.1 Introduction | 78 |
| 9.2 Geological Mapping | 78 |
| 9.3 2019-2021 Surface and Underground Sampling | 79 |
| 9.4 Geophysics | 80 |
| 9.5 2023 LiDAR Survey | 83 |
| 9.6 2022 Surface Sampling | 83 |
| 9.7 2023 Surface Sampling | 85 |
| 9.8 2024 Surface Sampling | 87 |
| 10 Drilling | 90 |
| 10.1 Overview | 90 |
| 10.2 2019 Drilling | 92 |
| 10.3 2020 Drilling | 92 |
| 10.4 2021 Drilling | 95 |
| 10.5 2022 Drilling | 99 |
|
|
| 10.6 2023 Drilling | 101 |
| 10.7 2024 Drilling | 103 |
| 11 Sample Preparation, Analyses, and Security | 106 |
| 11.1 Overview | 106 |
| 11.2 2019 - 2024 Rock Sampling (Vizsla) | 107 |
| 11.2.1 Sampling Methods and Security | 107 |
| 11.2.2 Sample Preparation and Analyses | 108 |
| 11.3 2019 - 2024 Drilling Programs (Vizsla) | 108 |
| 11.3.1 Sampling Methods | 108 |
| 11.3.2 Sample Security and Storage | 109 |
| 11.3.3 Sample Preparation and Analyses | 110 |
| 11.3.4 Bulk Density | 110 |
| 11.3.5 Data Management | 111 |
| 11.3.6 Quality Assurance/Quality Control | 111 |
| 11.3.7 Certified Reference Material | 112 |
| 11.3.8 Blank Material | 125 |
| 11.3.9 Duplicate Material | 129 |
| 11.3.10 Check Assaying | 132 |
| 11.4 QP's Comments | 135 |
| 12 Data Verification | 136 |
| 12.1 Introduction | 136 |
| 12.2 Drill Sample Database | 136 |
| 12.3 Site Visit - Allan Armitage | 136 |
| 12.3.1 2023 Site Visits | 136 |
| 12.3.2 2024 Site Visit | 137 |
| 12.4 Site Visit - Peter Mehrfert | 138 |
| 12.5 Metallurgical Data Verification - Peter Mehrfert | 138 |
| 12.6 Conclusion | 139 |
| 13 Mineral Processing and Metallurgical Testing | 140 |
| 13.1 Introduction | 140 |
| 13.2 Sample Origin and Composite Assembly | 140 |
| 13.3 Sample Chemistry and Mineralogy | 141 |
| 13.4 Comminution Testing | 143 |
| 13.5 Gravity Concentration | 144 |
| 13.6 Flotation | 145 |
| 13.6.1 Sequential Flotation | 145 |
| 13.6.2 Bulk Flotation | 147 |
|
|
| 13.7 Cyanidation | 149 |
| 13.7.1 Whole Feed Cyanidation | 149 |
| 13.7.2 Flotation Concentrate Cyanidation | 152 |
| 13.7.3 Flotation Tailings Cyanidation | 154 |
| 13.7.4 Combined Flotation Plus Leach Performance | 155 |
| 13.8 Recovery Estimates | 156 |
| 13.9 Deleterious Elements | 157 |
| 13.10 Comments on Mineral Processing and Metallurgical Testing | 157 |
| 14 Mineral Resource Estimates | 159 |
| 14.1 Introduction | 159 |
| 14.2 Drill Hole Database | 159 |
| 14.3 Mineral Resource Modelling and Wireframing | 161 |
| 14.4 Bulk Density | 165 |
| 14.5 Compositing | 166 |
| 14.6 Grade Capping | 171 |
| 14.7 Block Model Parameters | 173 |
| 14.8 Grade Interpolation | 177 |
| 14.9 Mineral Resource Classification Parameters | 181 |
| 14.9.1 Indicated Mineral Resource | 182 |
| 14.9.2 Inferred Mineral Resource | 182 |
| 14.10 Reasonable Prospects of Eventual Economic Extraction | 183 |
| 14.11 Mineral Resource Statement | 183 |
| 14.12 Model Validation and Sensitivity Analysis | 193 |
| 14.12.1 Sensitivity to Cut-off Grade | 195 |
| 14.13 Comparison of the current MRE to the January 2023 MRE | 199 |
| 14.14 Disclosure | 200 |
| 15 Mineral Reserve Estimates | 201 |
| 16 Mining Methods | 202 |
| 16.1 Introduction | 202 |
| 16.2 Geotechnical and Hydrogeological Considerations | 202 |
| 16.2.1 Hydrogeology Considerations | 202 |
| 16.2.2 Geotechnical | 202 |
| 16.2.3 Collected Data | 202 |
| 16.2.4 Rock Mass Characterisation | 205 |
| 16.2.5 Stope Sizes | 206 |
| 16.2.6 Geotechnical - Ground Support | 209 |
| 16.2.7 Geotechnical - Backfill | 209 |
|
|
| 16.2.8 Geotechnical - Stand-off and Pillar Sizes | 210 |
| 16.3 Mine Dilution and Mining Recovery | 210 |
| 16.4 Proposed Mining Methods | 214 |
| 16.4.1 Net Smelter Return (NSR) | 215 |
| 16.4.2 Cut-Off Value | 215 |
| 16.4.3 Stope Design Parameters | 216 |
| 16.5 Underground Mine Design | 220 |
| 16.5.1 Mine Operations | 220 |
| 16.5.2 Development | 222 |
| 16.5.3 Production | 224 |
| 16.6 Mine Schedule | 226 |
| 16.6.1 Activity and Equipment Rates | 226 |
| 16.6.2 Lateral Development | 227 |
| 16.6.3 Vertical Development | 228 |
| 16.6.4 Longhole Drilling | 230 |
| 16.6.5 Material Movement | 231 |
| 16.6.6 Backfill | 234 |
| 16.6.7 Run-of-Mine Plan | 236 |
| 16.7 Underground Infrastructure and Services | 237 |
| 16.7.1 Portals | 237 |
| 16.7.2 Primary Ventilation | 237 |
| 16.7.3 Auxiliary Ventilation | 241 |
| 16.7.4 Secondary Means of Egress and Refuge Chambers | 241 |
| 16.7.5 Water Management | 242 |
| 16.7.6 Compressed Air | 244 |
| 16.7.7 Electrical Power | 244 |
| 16.8 Mine Personnel | 244 |
| 17 Recovery Methods | 246 |
| 17.1 Overview | 246 |
| 17.2 Process Design Criteria | 246 |
| 17.3 Process Plant Description | 247 |
| 17.3.1 Process Flowsheet | 248 |
| 17.3.2 Mill Feed Schedule | 248 |
| 17.3.3 Phase 1 Design | 251 |
| 17.3.4 Phase 2 Design | 254 |
| 17.4 Reagents Handling and Storage | 255 |
| 17.5 Plant Services | 256 |
| 17.5.1 Raw Water | 256 |
|
|
| 17.5.2 Process Water | 257 |
| 17.5.3 Gland Seal Water | 257 |
| 17.5.4 Fire Water | 257 |
| 17.5.5 Potable Water | 257 |
| 17.5.6 Air | 257 |
| 17.5.7 Oxygen | 257 |
| 17.5.8 Power | 257 |
| 18 Project Infrastructure | 258 |
| 18.1 Introduction | 258 |
| 18.2 Off-site Infrastructure | 261 |
| 18.2.1 Site Access | 261 |
| 18.2.2 Water Supply | 261 |
| 18.2.3 Power Supply and Distribution | 261 |
| 18.2.4 Plant Nursery | 261 |
| 18.3 On-site Infrastructure | 262 |
| 18.3.1 Site Preparation | 262 |
| 18.3.2 On-Site Roads | 263 |
| 18.3.3 On-Site Infrastructure | 263 |
| 18.3.4 Fuel System | 264 |
| 18.3.5 Power Distribution | 264 |
| 18.3.6 Mining Infrastructure | 264 |
| 18.3.7 Process Plant Infrastructure | 265 |
| 18.3.8 Tailings Storage Facility | 265 |
| 18.3.9 Waste Storage Facilities | 271 |
| 18.3.10 Water Supply and Management | 271 |
| 19 Market Studies and Contracts | 277 |
| 19.1 Market Studies | 277 |
| 19.2 Commodity Price Projections | 277 |
| 19.3 Contracts | 277 |
| 20 Environmental Studies, Permitting, and Social or Community Impact | 278 |
| 20.1 Introduction | 278 |
| 20.2 Environmental Baseline and Supporting Studies | 279 |
| 20.2.1 Meteorology and Climate | 280 |
| 20.2.2 Hydrogeological Investigation | 282 |
| 20.2.3 Hydrology | 284 |
| 20.2.4 Surface Water Quality | 285 |
| 20.2.5 Regional Groundwater Aquifer Characterization | 287 |
|
|
| 20.2.6 Air Quality | 287 |
| 20.2.7 Noise | 288 |
| 20.2.8 Soils | 289 |
| 20.2.9 Fauna | 291 |
| 20.2.10 Flora | 292 |
| 20.2.11 Fauna and Flora - Environmental Management | 292 |
| 20.3 Water and Waste Management | 292 |
| 20.4 Permitting Considerations | 294 |
| 20.4.1 Existing Exploration Permits | 294 |
| 20.4.2 Mexican Legal Framework and Permitting | 294 |
| 20.4.3 Amendments to Mexican Mining Regulation | 300 |
| 20.5 Environmental Management and Monitoring System | 300 |
| 20.6 Closure and Reclamation Planning | 301 |
| 20.7 Socio-Economic and Cultural Baseline Studies | 302 |
| 20.8 Community Engagement | 304 |
| 21 Capital and Operating Costs | 306 |
| 21.1 Introduction | 306 |
| 21.2 Capital Cost Estimate | 306 |
| 21.2.1 Capital Cost Summary | 306 |
| 21.2.2 Basis of Estimate | 307 |
| 21.2.3 Area 1000 - Mining Capital Costs | 307 |
| 21.2.4 Area 2000 - Process Capital Costs | 308 |
| 21.2.5 Area 3000 - Additional Facilities | 309 |
| 21.2.6 Area 4000 - On-Site Infrastructure Capital Costs | 309 |
| 21.2.7 Area 5000 - Off-Site Infrastructure Capital Costs | 310 |
| 21.2.8 Area 6000-9000 - Indirect Capital Costs | 310 |
| 21.2.9 Area 8000 - Owner (Corporate) Capital Costs | 311 |
| 21.2.10 Closure and Reclamation Planning | 312 |
| 21.3 Operating Costs | 312 |
| 21.3.1 Average Operating Cost Summary | 312 |
| 21.3.2 Basis of Estimate | 312 |
| 21.3.3 Mine Operating Costs | 313 |
| 21.3.4 Process Plant Operating Costs | 314 |
| 21.3.5 General & Administrative Costs | 316 |
| 22 Economic Analysis | 318 |
| 22.1 Forward-Looking Information Cautionary Statements | 318 |
| 22.2 Methodologies Used | 319 |
|
|
| 22.3 Financial Model Parameters | 319 |
| 22.3.1 Assumptions | 319 |
| 22.3.2 Taxes | 320 |
| 22.3.3 Royalties | 320 |
| 22.4 Economic Analysis | 320 |
| 22.5 Sensitivity Analysis | 325 |
| 23 Adjacent Properties | 330 |
| 24 Other Relevant Data and Information | 331 |
| 25 Interpretation and Conclusions | 332 |
| 25.1 Introduction | 332 |
| 25.2 Mineral Tenure, Surface Rights, Water Rights, Royalties and Agreements | 332 |
| 25.3 Geology and Mineralization | 333 |
| 25.4 Exploration, Drilling and Analytical Data Collection in Support of Mineral Resource Estimation | 333 |
| 25.5 Metallurgical Test Work | 334 |
| 25.6 Mineral Resource Estimate | 335 |
| 25.6.1 Panuco Project Updated Mineral Resource Estimate Notes: | 337 |
| 25.7 Mining Methods | 338 |
| 25.8 Recovery Methods | 338 |
| 25.9 Infrastructure | 339 |
| 25.9.1 Site Infrastructure | 339 |
| 25.9.2 Tailings Storage Facility | 339 |
| 25.9.3 Water Management | 339 |
| 25.10 Markets and Contracts | 340 |
| 25.11 Environmental, Permitting and Community | 340 |
| 25.12 Capital Cost Estimate | 341 |
| 25.13 Operating Cost Estimate | 342 |
| 25.14 Economic Analysis | 342 |
| 25.15 Risks and Opportunities | 342 |
| 25.15.1 Risks | 342 |
| 25.15.2 Opportunities | 345 |
| 26 Recommendations | 348 |
| 26.1 Overall Recommendations | 348 |
| 26.2 Exploration & Drilling | 348 |
| 26.2.1 Resource Extension Targets | 349 |
| 26.2.2 Proximal Targets | 349 |
| 26.2.3 District Targets | 349 |
| 26.2.4 Bulk Sample / Test Mine | 349 |
|
|
| 26.2.5 Key Objectives for 2024 | 349 |
| 26.3 Metallurgical Test Work | 350 |
| 26.4 Mining Methods | 351 |
| 26.5 Process and Infrastructure Engineering | 352 |
| 26.6 Site Geotechnical Field and Laboratory Program | 352 |
| 26.7 Tailings Storage and Waste Rock Storage Design | 354 |
| 26.8 Environmental Studies, Permitting, Social or Community Recommendations | 354 |
| 26.8.1 Water Resources | 354 |
| 26.8.2 Geochemistry | 355 |
| 26.8.3 Other Environmental Baseline Studies | 355 |
| 26.8.4 Socio-Economic, Cultural Baseline Studies and Community Engagement | 356 |
| 26.8.5 Environmental Constraints Mapping | 356 |
| 26.9 Market Studies | 356 |
| 27 References | 357 |
List of Tables
| Table 1-1: Panuco Project Mineral Resource Estimate, September 1, 2023 | 9 |
| Table 1-2: Panuco Project Mineral Resource Estimate by Area, September 1, 2023 | 9 |
| Table 1-3: Total and Annual Material Movement Schedule for the Panuco Project | 12 |
| Table 1-4: Capital Costs Summary | 21 |
| Table 1-5: Average LOM Operating Cost | 22 |
| Table 1-6: Economic Analysis Summary Table | 22 |
| Table 1-7: Cost Summary for the Recommended Future Work | 25 |
| Table 2-1: Report Contributors | 27 |
| Table 2-2: Abbreviations and Acronyms | 30 |
| Table 2-3: Units of Measurement | 31 |
| Table 4-1: Property Mineral Concessions Held 100% By Vizsla | 38 |
| Table 7-1: General Description of Estimated Veins Included in the Mineral Resources Estimate for the Panuco Project | 60 |
| Table 9-1: Summary of Surface and Underground Rock Geochemistry Samples between 2019 and 2021 | 79 |
| Table 9-2: Panuco Project Surface Samples in 2022 | 84 |
| Table 9-3: Selected High-Grade Samples Taken During 2022 Surface Exploration | 84 |
| Table 9-4: Panuco Project Surface Samples in 2023 | 86 |
| Table 9-5: Selected High-Grade Samples Taken During 2023 Surface Exploration | 86 |
| Table 9-6: Panuco Project Surface Samples in 2024, to June 18 | 88 |
| Table 9-7: Selected High-Grade Samples Taken During 2024 Surface Exploration, to June 18 | 88 |
| Table 10-1: Summary Drilling Conducted by Vizsla on the Panuco Project, to June 18, 2024 | 90 |
| Table 10-2: Highlights of the 2019 - 2020 Drilling | 93 |
|
|
| Table 10-3: Highlights of the 2021 Drilling | 96 |
| Table 10-4: Highlights of the 2022 Drilling | 100 |
| Table 10-5: Highlights of the 2023 Drilling | 102 |
| Table 10-6: Highlights of the 2024 Drilling (to June 18, 2024) | 104 |
| Table 11-1: Summary of Drilling Samples from the Property by Year | 106 |
| Table 11-2: Summary of Drill Core Analytical Labs and Analysis Methods 2019 - 2024 | 107 |
| Table 11-3: QC Sample Statistics for Vizsla Core Sampling 2019 - 2024 | 111 |
| Table 11-4: CRM Sample Ag Performance for the 2019-2024 Drill Programs | 113 |
| Table 11-5: CRM Sample Au Performance for the 2019-2024 Drill Programs | 113 |
| Table 11-6: CRM Sample Pb Performance for the 2019-2024 Drill Programs | 114 |
| Table 11-7: CRM Sample Zn Performance for the 2019-2024 Drill Programs | 114 |
| Table 11-8: Average Relative Error of Duplicate Samples for Ag, Au, Pb, and Zn from 2019-2024 | 129 |
| Table 11-9: Relative Bias and Average Relative Error of Check Samples for Ag from 2022-2024 | 133 |
| Table 11-10: Relative Bias and Average Relative Error of Check Samples for Au from 2022-2024 | 133 |
| Table 13-1: Metallurgical Test Work Summary Table | 140 |
| Table 13-2 Metallurgical Sample Origin Details | 140 |
| Table 13-3: Chemical Composition of the Composites and Variability Samples | 141 |
| Table 13-4: Mineralogical Composition of the Composites | 142 |
| Table 13-5: Liberation Characteristics of the Composites - % Distribution | 142 |
| Table 13-6: Comminution Test Results | 143 |
| Table 13-7: Gravity Concentration Test Results | 144 |
| Table 13-8: Sequential Rougher Flotation Data - Master Composites | 145 |
| Table 13-9: Metallurgical Balance - Napoleon Cleaner Test 14 | 147 |
| Table 13-10: Bulk Flotation Rougher Recoveries | 148 |
| Table 13-11: Whole Feed Leach Results | 150 |
| Table 13-12: Flotation Concentrate Leach Results | 152 |
| Table 13-13: Rougher Flotation Tailings Leach Results | 154 |
| Table 13-14: Combined Flotation Plus Leach Results - Copala | 156 |
| Table 13-15: Whole Ore Leach Recovery Estimates | 157 |
| Table 13-16: Flotation Plus Leach Recovery Estimates | 157 |
| Table 14-1: Project Drill Hole Totals | 160 |
| Table 14-2: Property Domain Descriptions | 162 |
| Table 14-3: Statistical Analysis of the Drill Assay Data from Within the Deposit Mineral Domains - by Area | 166 |
| Table 14-4: Statistical Analysis of the 1.5M Composite Data from Within the Deposit Mineral Domains by Area | 169 |
| Table 14-5: Composite Capping Summary - by Domain/Deposit Area | 172 |
| Table 14-6: Deposit Block Model Geometry | 173 |
| Table 14-7: Grade Interpolation Parameters by Area and Domain | 178 |
| Table 14-8: Parameters used for Underground Cut-off Grade Calculation | 183 |
| Table 14-9: Panuco Project Mineral Resource Estimate, September 1, 2023 | 184 |
| Table 14-10: Panuco Project Mineral Resource Estimate by Area, September 1, 2023 | 186 |
| Table 14-11: Comparison of Average Composite Grades with Block Model Grades | 193 |
| Table 14-12: Underground Mineral Resource Estimate at Various AgEq Cut-off Grades, September 1, 2023 | 196 |
| Table 14-13: Comparison of the January 2023 MRE to the September 2023 MRE for the Project | 200 |
|
|
| Table 16-1: Geotechnical Logged Drillholes to Date | 203 |
| Table 16-2: Results of Machine Learning Rock Mass Categorization | 205 |
| Table 16-3: 2023 Geotechnical Drilling Campaign Results (Q') | 205 |
| Table 16-4: Stope Spans for the Panuco Project | 207 |
| Table 16-5: Stope Stability Assessment (Factor A) | 207 |
| Table 16-6: Stope Stability Assessment (Factor B) | 207 |
| Table 16-7: Stope Stability Assessment (Factor C) | 208 |
| Table 16-8: Excavation and Ground Support Standards for the Panuco Project | 209 |
| Table 16-9: Mineralization (M), Waste (W) and Fill (F) Surface Contacts for Each Mining Method | 213 |
| Table 16-10: Dilution and Recovery Summary | 214 |
| Table 16-11: Stope Dimensions by Mining Method | 214 |
| Table 16-12: Parameters used to estimate NSR | 215 |
| Table 16-13: Grade Multipliers ($USD / unit) Used to Estimate NSR in the Block Model | 215 |
| Table 16-14: Costs to be Included in the Various Cut-Off Values | 216 |
| Table 16-15: Summary of the Various Cut-Off Values - Preliminary Estimates | 216 |
| Table 16-16: Preliminary MSO Parameters | 217 |
| Table 16-17: Key Economic Screening Parameters | 217 |
| Table 16-18: Development Profiles for the Panuco Project | 223 |
| Table 16-19: Development Activity and Equipment Rates for the Panuco Project | 226 |
| Table 16-20: Production Activity and Equipment Rates the Panuco Project | 226 |
| Table 16-21: Total and Annual Lateral Development Schedule for the Panuco Project | 228 |
| Table 16-22: Total and Annual Vertical Development Schedule for the Panuco Project | 229 |
| Table 16-23: Total and Annual Longhole Drilling Schedule for the Panuco Project | 231 |
| Table 16-24: Load and Haul Fleet for the Panuco Project | 231 |
| Table 16-25: Total and Annual Material Movement Schedule for the Panuco Project | 233 |
| Table 16-26: Backfill Schedule by type for the Panuco Project | 235 |
| Table 16-27: Waste Backfill Balance for the Panuco Project | 236 |
| Table 16-28: Annualized Mineralised Material Delivered to ROM | 237 |
| Table 16-29: Mineralised Material Classification Summary | 237 |
| Table 16-30: Ventilation Demand Estimate for the Copala Mine | 239 |
| Table 16-31: Ventilation Demand Estimate for the Napoleon Mine | 240 |
| Table 16-32: Panuco Project Power Estimate (Mining Activities Only) | 244 |
| Table 16-33: Panuco Project Mine Personnel Estimate | 245 |
| Table 17-1: Process Design Criteria | 246 |
| Table 17-2: Mill Production Schedule | 250 |
| Table 17-3: Reagents Handling and Storage | 255 |
| Table 17-4: Major Reagent and Operating Consumable Consumption Summary | 256 |
| Table 18-1: Panuco Building List | 263 |
| Table 18-2: Life-of-Mine Tailings Deposition Schedule | 269 |
| Table 18-3: Details of Climate Stations Including Name, ID, Coordinates, and Distance to Site | 272 |
| Table 18-4: Summary of Temperature, Precipitation ad Evaporation Data at Potrerillos Station | 272 |
| Table 18-5: Intensity-Duration-Frequency Values for Panuco Site | 272 |
| Table 18-6: Dimensions of the Collection Dam | 273 |
|
|
| Table 18-7: Water Balance Summary | 275 |
| Table 18-8: Site Wide Water Balance for an Average Year - Scenario 1 | 276 |
| Table 19-1: Metal Price Projections | 277 |
| Table 20-1: Baseline Characterization / Monitoring Rounds and Their Focuses | 280 |
| Table 20-2: Groundwater balance parameters for the aquifer | 287 |
| Table 20-3: Types of soils in the Project area | 290 |
| Table 20-4: List of Fauna Detected (CIMA Consultants MIA, 2020). | 291 |
| Table 20-5: Permitting Requirements | 295 |
| Table 21-1: Capital Costs Summary | 306 |
| Table 21-2: Mining Capital Costs | 308 |
| Table 21-3: Process Plant Initial Capital Cost | 309 |
| Table 21-4: Additional Facilities Cost | 309 |
| Table 21-5: On-Site Infrastructure Capital Costs | 310 |
| Table 21-6: Off-Site Infrastructure Capital Costs | 310 |
| Table 21-7: Indirect Capital Cost Summary | 311 |
| Table 21-8: Average LOM Operating Cost | 312 |
| Table 21-9: Mining Operating Costs Summary | 313 |
| Table 21-10: Mining Production Costs | 313 |
| Table 21-11: Process Plant Operating Cost Summary | 314 |
| Table 21-12: Reagents and Consumables Cost Summary | 315 |
| Table 21-13: G&A Cost Summary | 317 |
| Table 22-1: Economic Analysis Summary Table | 322 |
| Table 22-2: Life of Mine Economics | 323 |
| Table 22-3: Pre-Tax NPV (US$M) and IRR (%) Sensitivity Analysis | 326 |
| Table 22-4: Post-Tax NPV (US$M) and IRR (%) Sensitivity Analysis | 327 |
| Table 25-1: Panuco Project Mineral Resource Estimate, September 1, 2023 | 336 |
| Table 25-2: Panuco Project Mineral Resource Estimate by Area, September 1, 2023 | 336 |
| Table 25-3: Metal Price Projections | 340 |
| Table 26-1: Cost Summary for the Recommended Future Work | 348 |
List of Figures
| Figure 1-1: Process Flow Diagram | 14 |
| Figure 1-2: Panuco Project Site Layout | 16 |
| Figure 1-3: Project Post-Tax Unlevered Cashflow | 23 |
| Figure 1-4: Post-Tax NPV and IRR Sensitivity Results | 24 |
| Figure 4-1: Property Location Map | 36 |
| Figure 4-2: Mining Concessions (WGS 84 UTM Zone 13N) | 37 |
| Figure 4-3: Location of Ejidos and Outline of Panuco Project | 44 |
| Figure 7-1: Metallogenic Setting Map. Illustrates Geological Setting of Western Mexico with Main Porphyry and Epithermal Deposits of the Sierra Madre Occidental | 52 |
|
|
| Figure 7-2: Regional Geologic Setting Map. Illustrates Regional Geological Central Sierra Madre Occidental | 53 |
| Figure 7-3: Regional Geology Map | 54 |
| Figure 7-4: Stratigraphic Column for the Project Area | 55 |
| Figure 7-5: Property Geology Map Showing Claim Outline and Known Mineralized Structures | 58 |
| Figure 7-6: Schematic Cross-Section of Panuco Veining Illustrating that Veins May Be Listric Faults Developed from Reactivated Laramide Thrust Faults (Starling 2019) | 59 |
| Figure 7-7: Panuco Project Claims Showing Known Veins, Including the Four Resource Areas Comprising Eleven Veins Included in the Mineral Resource Estimate | 61 |
| Figure 7-8: Animas-Refugio Geology and Silver Geochemistry (Section A-A' Shown in Figure 7-9) | 63 |
| Figure 7-9: Animas-Refugio Vein Cross-Section Looking Northwest | 64 |
| Figure 7-10: Cordon del Oro Geology and Silver Geochemistry | 66 |
| Figure 7-11: Cinco Señores-Napoleon Geology and Silver Geochemistry | 67 |
| Figure 7-12: Descubridora Mine Geology and Geochemistry | 68 |
| Figure 7-13: Drill-hole Intercepts Showing Tilted Mineralization on Napoleon Main Vein | 69 |
| Figure 8-1: Genetic Model for Epithermal Deposits | 76 |
| Figure 8-2: Schematic of Alteration and Mineralization in Low Sulphidation Precious Metal Deposits | 77 |
| Figure 9-1: Panuco District Mapped Areas at 1:1,000 Scale as of December 2023 | 78 |
| Figure 9-2: Surface Sampling at Panuco Project between 2019 and 2021 | 80 |
| Figure 9-3: Airborne Magnetics RTP from 2016 with Known Veining and Possible Fault Offset Shown in Diorite | 82 |
| Figure 9-4: Results from 2021 Airborne Magnetics RTP Geophysical Survey Over the Napoleon Area | 83 |
| Figure 9-5: Surface Sampling at Panuco Project in 2022 | 85 |
| Figure 9-6: Surface Sampling at Panuco Project in 2023 | 87 |
| Figure 9-7: Surface Sampling at Panuco Project in 2024, to June 18 | 89 |
| Figure 10-1: Resource Models and Location of Drill Holes on the Panuco Project from 2019-2024 | 91 |
| Figure 10-2: Resource Models and Location of 2019 - 2020 Drill Holes on the Panuco Project | 93 |
| Figure 10-3: Resource Models and Location of Drill Holes on the Panuco Project from 2021 | 96 |
| Figure 10-4: Resource Models and Location of Drill Holes on the Panuco Project from 2022 | 100 |
| Figure 10-5: Resource Models and Location of Drill Holes on the Panuco Project from 2023 | 102 |
| Figure 10-6: Resource Models and Location of Drill Holes on the Panuco Project from 2024 (to June 18) | 104 |
| Figure 11-1: Vizsla Core-Logging Facility in Concordia, Sinaloa. Left: Core logging area; Right: Long-Term, Covered and Fenced, Core Storage Area | 109 |
| Figure 11-2: CRM Control Chart for Ag for the 2020 Drill Program | 115 |
| Figure 11-3: CRM Control Chart for Au for the 2020 Drill Program | 116 |
| Figure 11-4: CRM Control Chart for Pb for the 2020 Drill Program | 116 |
| Figure 11-5: CRM Control Chart for Zn for the 2020 Drill Program | 117 |
| Figure 11-6: CRM Control Chart for Ag for the 2021 Drill Program | 117 |
| Figure 11-7: CRM Control Chart for Au for the 2021 Drill Program | 118 |
| Figure 11-8: CRM Control Chart for Pb for the 2021 Drill Program | 118 |
| Figure 11-9: CRM Control Chart for Zn for the 2021 Drill Program | 119 |
| Figure 11-10: CRM Control Chart for Ag for the 2022 Drill Program | 119 |
| Figure 11-11: CRM Control Chart for Au for the 2022 Drill Program | 120 |
| Figure 11-12: CRM Control Chart for Pb for the 2022 Drill Program | 120 |
| Figure 11-13: CRM Control Chart for Zn for the 2022 Drill Program | 121 |
|
|
| Figure 11-14: CRM Control Chart for Ag for the 2023 Drill Program | 121 |
| Figure 11-15: CRM Control Chart for Au for the 2023 Drill Program | 122 |
| Figure 11-16: CRM Control Chart for Pb for the 2023 Drill Program | 122 |
| Figure 11-17: CRM Control Chart for Zn for the 2023 Drill Program | 123 |
| Figure 11-18: CRM Control Chart for Ag for the 2024 Drill Program | 123 |
| Figure 11-19: CRM Control Chart for Au for the 2024 Drill Program | 124 |
| Figure 11-20: CRM Control Chart for Pb for the 2024 Drill Program | 124 |
| Figure 11-21: CRM Control Chart for Zn for the 2024 Drill Program | 125 |
| Figure 11-22: Blank Sample Chart for Ag for the 2020 Drill Program | 126 |
| Figure 11-23: Blank Sample Chart for Ag for the 2021 Drill Program | 127 |
| Figure 11-24: Blank Sample Chart for Ag for the 2022 Drill Program | 127 |
| Figure 11-25: Blank Sample Chart for Ag for the 2023 Drill Program | 128 |
| Figure 11-26: Blank Sample Chart for Ag for the 2024 Drill Program | 128 |
| Figure 11-27: Plots of Field Duplicate Samples for Ag, Au, Pb, and Zn from the 2019-2024 Drill Program | 130 |
| Figure 11-28: Plots of Coarse Reject Duplicate Samples for Ag, Au, Pb, and Zn from the 2019-2024 Drill Program | 131 |
| Figure 11-29: Plots of Pulp Duplicate Samples for Ag, Au, Pb, and Zn from the 2023-2024 Drill Program | 132 |
| Figure 11-30: Plots of SGS Check Samples for Ag and Au Assayed in 2022 | 134 |
| Figure 11-31: Plots of SGS Check Samples for Ag and Au Assayed in 2023 | 134 |
| Figure 11-32: Plots of SGS Check Samples for Ag and Au Assayed in 2024 | 135 |
| Figure 13-1: Gravity Gold Recovery Vs. Feed Grade | 144 |
| Figure 13-2: Sequential Rougher Flotation Results - Silver Deportment | 146 |
| Figure 13-3: Sequential Rougher Flotation Results - Gold Deportment | 146 |
| Figure 13-4: Bulk Flotation Recoveries Vs Feed Grades | 148 |
| Figure 13-5: Bulk Cleaner Flotation Upgrading Results | 149 |
| Figure 13-6: Whole Feed Leach Results - Silver Extraction Vs. Silver in Feed | 151 |
| Figure 13-7: Whole Feed Leach Results - Gold Extraction Vs. Gold in Feed | 151 |
| Figure 13-8: Silver Leach Results on Flotation Concentrates Vs. Leach Feed Grade and Regrind Size | 153 |
| Figure 13-9: Gold Leach Results on Flotation Concentrates Vs. Leach Feed Grade and Regrind Size | 153 |
| Figure 13-10: Silver Leach Data on Flotation Tailings | 155 |
| Figure 13-11: Gold Leach Data on Flotation Tailings | 155 |
| Figure 14-1: Plan View: Distribution of Surface Drill Holes on the Property (WGS 84) as of September 2023, on Topography | 160 |
| Figure 14-2: Isometric View Looking Northwest: Distribution of Surface Drill Holes in the Copala-Napoleon-Cruz-La Luisa Area (WGS84) | 161 |
| Figure 14-3: Plan View: Property Mineral Resource Models | 163 |
| Figure 14-4: Isometric View Looking Northeast: Property Mineral Resource Models | 164 |
| Figure 14-5: Isometric View Looking Northwest: Property Mineral Resource Models, Copala-Napoleon-La Luisa Areas | 165 |
| Figure 14-6: Plan View: Distribution of Mineral Resource Block Models and Mineralization Domains | 175 |
| Figure 14-7: Isometric View looking NW: Distribution of Mineral Resource Block Models and Mineralization Domains on the Property | 176 |
| Figure 14-8: Isometric View looking NW: Distribution of Mineral Resource Block Models and Mineralization Domains in the Napoleon-Copala Areas | 177 |
|
|
| Figure 14-9: Plan View: Mineral Resource Block Grades and Block Class for the Copala-Cristiano-Tajitos Deposit Area | 187 |
| Figure 14-10: Isometric View Looking West: Mineral Resource Block Grades and Block Class for the Copala-Cristiano-Tajitos Deposit Area | 88 |
| Figure 14-11: Isometric View Looking NNE: Mineral Resource Block Grades and Block Class for the Copala-Cristiano-Tajitos Deposit Area | 189 |
| Figure 14-12 Plan View: Mineral Resource Block Grades and Block Class for the Napoleon, Cruz, Josephine and La Luisa Areas | 190 |
| Figure 14-13: Isometric View Looking Northwest: Mineral Resource Block Grades and Block Class for the Napoleon, Cruz, Josephine and La Luisa Areas | 191 |
| Figure 14-14: Isometric View Looking NNE: Mineral Resource Block Grades and Block Class for the Napoleon, Cruz, Josephine and La Luisa Areas | 192 |
| Figure 14-15: Comparison of ID3, ID2 & NN Models for the Napoleon-Josephine-Cruz Deposit Area | 194 |
| Figure 14-16: Comparison of ID3, ID2 & NN Models for the Copala-Cristiano Deposit Area | 195 |
| Figure 16-1: Geotechnically Logged Diamond Drill Hole Locations - RQD | 203 |
| Figure 16-2: Geotechnically Logged Diamond Drill Hole Locations - Point Load Testing | 204 |
| Figure 16-3: Geotechnically Logged Diamond Drill Hole Locations - Geotehnical Holes | 204 |
| Figure 16-4: Estimated Domain Conditions (Q') | 206 |
| Figure 16-5: Extended Matthews Stability Graph (Mawdesley et al. 2001) | 208 |
| Figure 16-6: Dilution - Longhole Stoping | 211 |
| Figure 16-7: Ore Loss - Longhole Stoping | 212 |
| Figure 16-8: Stope Shapes (Blue) and Dilution Contacts (Orange) | 213 |
| Figure 16-9: MSO Selection following Orphans and Width | 218 |
| Figure 16-10: Stope Shape Width for the Panuco Project | 219 |
| Figure 16-11: Stope Shape Width for the Panuco Project - Copala Mine | 219 |
| Figure 16-12: Stope Shape Width for the Panuco Project - Napoleon Mine | 220 |
| Figure 16-13: MSO Outputs and Proposed Development by Geological Domain | 221 |
| Figure 16-14: MSO Output and Proposed Development by Geological Domain: Copala Mine | 221 |
| Figure 16-15: MSO Output and Proposed Development by Geological Domain: Napoleon Mine | 222 |
| Figure 16-16: Panuco Project Development Level Layout | 223 |
| Figure 16-17: Proposed Mining Method for the Copala Mine | 224 |
| Figure 16-18: Proposed Mining Method for the Napoleon Mine | 225 |
| Figure 16-19: Proposed Stope Shapes by NSR ($US /t) for the Panuco Project | 225 |
| Figure 16-20: Annual Lateral Development Schedule for the Panuco Project | 227 |
| Figure 16-21: Annual Vertical Development Schedule for the Panuco Project | 229 |
| Figure 16-22: Annual Longhole Drilling Schedule for the Panuco Project | 230 |
| Figure 16-23: Annual Trucking Requirements & Capacity (Peak) | 232 |
| Figure 16-24: Mineralised Material Plan for the Panuco Project | 233 |
| Figure 16-25: Annual Backfill Schedule for the Panuco Project | 234 |
| Figure 16-26: Primary Ventilation Layout of the Copala Mine | 239 |
| Figure 16-27: Primary Ventilation Layout of the Napoleon Mine | 240 |
| Figure 16-28: Egress Layout of the Copala Mine | 241 |
| Figure 16-29: Egress Layout of the Napoleon Mine | 242 |
|
|
| Figure 16-30: Proposed Primary Dewatering - Copala Mine | 243 |
| Figure 16-31: Proposed Primary Dewatering - Napoleon Mine | 243 |
| Figure 17-1: Process Flow Diagram | 249 |
| Figure 18-1: Panuco Project Site Layout | 259 |
| Figure 18-2: Process Plant Layout | 260 |
| Figure 18-3: Plant Nursery | 262 |
| Figure 18-4: TSF General Layout | 266 |
| Figure 18-5: TSF Ultimate LOM Configuration | 268 |
| Figure 18-6: TSF Embankment Section | 270 |
| Figure 18-7: Water Management Structures for Panuco Mine Site | 274 |
| Figure 20-1: Property Location Map | 279 |
| Figure 20-2: Average Monthly Precipitation at the Panuco-Capala Project | 281 |
| Figure 20-3: Average Temperature and Precipitation for the Project Area | 282 |
| Figure 20-4: Completed Drillhole Locations | 283 |
| Figure 20-5: Rivers and Basins in the Region | 284 |
| Figure 20-6: Panuco Hydrological Region, Basin and Sub-basin. | 285 |
| Figure 20-7: Location of Water Sampling Points | 286 |
| Figure 20-8: Air Quality Monitoring Points | 288 |
| Figure 20-9: Noise Monitoring Points | 289 |
| Figure 20-10: Soil Units | 290 |
| Figure 20-11: Population per Locality | 303 |
| Figure 20-12: Prediction of Social Impacts | 304 |
| Figure 22-1: Project Post-Tax Unlevered Cashflow | 321 |
| Figure 22-2: Pre-Tax Sensitivity Analysis Results | 328 |
| Figure 22-3: Post-Tax Sensitivity Analysis Results | 329 |
| Figure 26-1: Plan Map of the Panuco District Highlighting Primary 2024 Exploration Targets Relative to Mapped and Sampled Mineralized Veins. | 350 |
|
|
1 SUMMARY
1.1 Introduction
Vizsla Silver Corp. (Vizsla or the Company) commissioned Ausenco Engineering Canada ULC and Ausenco Sustainability ULC (Ausenco) to compile a preliminary economic assessment (PEA) of the Panuco Project (the Property or the Project). The PEA was prepared in accordance with the Canadian disclosure requirements of National Instrument 43-101 - Standards and Disclosure for Mineral Projects (NI 43-101) and the requirements of Form 43-101 F1.
The responsibilities of the engineering companies contracted by Vizsla to prepare this report are as follows:
Ausenco managed and coordinated the work related to the technical report, developed PEA-level design, capital and operating cost estimates for the process plant and general site infrastructure. Ausenco also undertook the review of the environment and permitting studies and completed the economic analysis.
SGS prepared the mineral resource estimate (MRE) for the Project and completed the work related to the geological setting, deposit type, drilling, exploration works, sample preparation and analysis and data verification.
Entech completed the mine design, mine production schedule and provided the mining capital and operating costs.
The property hosts nine known polymetallic precious metal deposits:
Copala,
Cristiano,
Tajitos,
Napoleon,
La Luisa,
Cruz Negra,
Josephine,
San Antonio, and
Animas.
Silver and gold are the metals of interest.
|
|
1.2 Mineral Tenure, Surface Rights, Water Rights, Royalties and Agreements
The Panuco Project is in the Panuco-Copala mining district in the municipality of Concordia, southern Sinaloa state, along the western margin of the Sierra Madre Occidental physiographic province in western Mexico. The Project comprises 119 titled mining concessions in nineteen blocks, covering a total area of 16,536.87 ha, and two mineral concessions covering 1,321.15 ha. The mining concessions are held 100% by Vizsla. The concessions are granted for 50 years, except San Carlos that was originally granted for 100 years, provided semi-annual property tax payments are made in January and July each year and if minimum annual investment requirements are met, or if there is minimum annual production equal to the amount of the annual investment requirement. The concession owner may apply for a second 50-year term. Property tax payments of MX$2.03M were made in January and July of 2023 and MX$2.116M were paid in January of 2024 by Vizsla. Additionally, the company paid MX$2.421M of outstanding taxes in May 2024, for the recently acquired El Richard and San Enrique claims.
On January 17, 2024, Vizsla announced its intention to spin out the shares of Vizsla Royalties Corp, a wholly owned subsidiary of Vizsla, to the Company's shareholders. Vizsla Royalties currently holds, indirectly, a net smelter royalty (the "Royalty") on any potential future mineral production at Vizsla's flagship, 100% owned Panuco silver-gold project located in Sinaloa, Mexico. The Royalty consists of: (i) a 2.0% net smelter return royalty on certain unencumbered concessions comprising the Project; and (ii) a 0.5% net smelter return royalty on certain encumbered concessions comprising the Project, which have a pre-existing 3.0% net smelter return royalty (the "Underlying Royalty"). Vizsla is also expected to: (i) transfer to Vizsla Royalties the right to purchase one-half of the 3% Underlying Royalty; (ii) grant Vizsla Royalties the right to acquire a royalty on any future projects acquired by Vizsla in the 24-month period after completion of the Spinout, which right would automatically terminate upon a change of control of Vizsla Royalties or Vizsla and (iii) make a cash injection into Vizsla Royalties.
Most of the surface rights in the municipality of Concordia are owned by ejidos, which are areas of communal land used for agriculture. Community members individually farm designated parcels and collectively maintain communal holdings comprising the ejido. Ejidos are registered with Mexico's National Agrarian Registry (Registro Agrario Nacional). Surface rights to most of the land underlying the Project area are owned by six ejidos. Mining concession owners have the right to obtain the expropriation, temporary occupancy, or creation of land easements required to complete exploration and mining work, including the deposit of rock dumps, tailings, and slag. Vizsla has agreements in place with 5 ejidos covering a total of 15,029.63 ha within the Property with rights to extend the area as required with the same consideration per hectare.
1.3 Geology Mineralization
The Project is on the western margin of the Sierra Madre Occidental (SMO), a high plateau and physiographic province that extends from the U.S.A.-Mexico border to the east-trending Trans-Mexican Volcanic Belt. The SMO is a Large Igneous Province (LIP) recording continental magmatic activity from the Late Cretaceous to the Miocene in three main episodes. The first episode, termed the Lower Volcanic Complex (LVC), comprises a suite of intrusive bodies, including the Sonora, Sinaloa, and Jalisco batholiths and andesitic volcanic rock units with minor dacite and rhyolite tuffs and ignimbrites that are correlative with the Tarahumara Formation in Sonora of Late Cretaceous to Eocene age. The second magmatic episode is dominated by rhyolitic ignimbrites and tuffs that built one of the earth's largest silicic volcanic provinces and has been termed the Upper Volcanic Supergroup (UVS). These dominantly rhyolitic units were extruded in two episodes, from about 32 to 28 Ma and 24 to 20 Ma. These two periods of magmatic activity are associated with the subduction of the Farallon plate under North America and the Laramide orogeny that occurred between the Upper Cretaceous - Paleocene and the Eocene. The third episode comprises post-subduction alkali basalts and ignimbrites associated with the opening of the Gulf of California between the late Miocene and Pleistocene - Quaternary.
|
|
The western part of the SMO in Sonora and Sinaloa is cut by north-northwest-trending normal fault systems developed during the opening of the Gulf of California between 27 and 15 Ma. The normal fault systems favoured the formation of elongated basins that were subsequently filled with continental sedimentary rocks. The basins occur in a north-northwest-trending belt extending from western Sonora to most of Sinaloa.
The basement to the SMO is locally exposed in northern Sinaloa, near Mazatlan and on small outcrops within the project area. It comprises folded metasedimentary and metavolcanic rocks, deformed granitoids, phyllitic sandstones, quartzites, and schists of the Tahue terrane of Jurassic to Early Cretaceous age (Montoya-Lopera et al., 2019, Sedlock et al., 1993 and Campa and Coney 1982).
In the broader Project area, the LVC comprises granite, granodiorite, and diorite intrusive phases correlative with the Late Cretaceous to Early Paleocene San Ignacio and Eocene Piaxtla batholiths in San Dimas district. The andesite lavas, rhyolite-dacite tuffs, and ignimbrites are locally intruded by the Late Cretaceous to Early Paleocene intrusive phases and younger Eocene-Oligocene felsic dikes and domes. Northwest trending intermontane basins filled with continental conglomerates and sandstones incise the UVS and LVC in the Project area. The Oligocene age ignimbrites of the UVS occur east of the property towards Durango state.
The structure of the Project area is dominated by north-northwest-trending extensional and transtensional faults developed or reactivated during the Basin and Range tectonic event (~28 to 18 Ma). The extensional belt is associated with aligned rhyolite domes and dikes and Late Oligocene to Middle Miocene grabens.
Mineralization on the Panuco Property comprises several epithermal quartz veins. Previous workers and recent mapping and prospecting works conducted by Vizsla's geologists determined a cumulate length of veins traces of 86 km. Individual vein corridors are up to 7.6 km long, and individual veins range from decimetres to greater than 10 m wide. Veins have narrow envelopes of silicification, and local argillic alteration, commonly marked by clay gouge. Propylitic alteration consisting of chlorite-epidote in patches and veins affecting the andesites and diorite are common either proximal or distal to the veins.
The primary mineralization along the vein corridors comprises hydrothermal quartz veins and breccias with evidence of four to five different quartz stages: generally white, grey, and translucent and varying grain size from amorphous-microcrystalline-coarse. A late stage of amethyst quartz is also observed in some veins. The grey colour in quartz is due to the presence of fine-grained disseminated sulphides, believed to be mainly pyrite and acanthite. Vizsla has delineated several hydrothermal breccias with grey quartz occurring more commonly at lower levels of the vein structures. Barren to low grade, quartz is typically white and is more common in the upper parts of the veins and breccias. Locally, mineralized structures are cut by narrow, banded quartz veins with thin, dark argentite/acanthite, sphalerite, galena, and pyrite bands. Bladed and lattice quartz pseudomorphs after calcite have been noted at several locations within the veins and indicate boiling conditions during mineral deposition. Later quartz veinlets cut all the mineralized zones with a mix of white quartz and purple amethyst. The amethyst is related to mixing near-surface waters as the hydrothermal system is collapsing, as has been noted in the nearby San Dimas district (Montoya-Lopera et al., 2019).
|
|
The Mineral Resource includes ten mineralized vein systems: the Napoleon, Napoleon hanging wall, Josephine, and Cruz Negra veins; the Copala, Cristiano, Tajitos and Copala 2 veins; the San Antonio vein; and the Rosarito vein. These trends are west to east within the Napoleon, Cinco Senores, Cordon del Oro, and Animas-Refugio corridors. The bulk of the resource veins strike north-northwest to north-northeast, with thicknesses varying from 1.5 m to over 10 m.
1.4 History
Capitan Francisco de Ibarra founded Concordia in 1565 and gold and silver veins in Panuco and Copala were first exploited in the centuries that followed, Sim (2008) and Robinson (2019). Although production has been carried out on the Panuco Project over the last 460 years, no production records are available to Vizsla.
The first recorded modern mining activity commenced late in the 20th century. The Mineral Resources Council (Consejo de Recursos Minerales [CRM], the predecessor of the Mexican Geological Service [SGM]) carried out 1:50,000 scale mapping on map sheets, F13-A37, F13-A36, and F13-A46 and fine-fraction stream sediment sampling in 1999, 2003, and 019 respectively (Avila-Ramirez, 1999, Polanco-Salas et al., 2003, Rosendo-Brito et al., 2019).
In 1989 the CRM optioned and sold several mineral concessions in the district, including to Grupo Minero Bacis (Bacis). Bacis drilled 19 holes totalling 2,822.8 m along the Animas-Refugio corridor, but only collar and survey records exist of this work.
From 1999 to 2001, Minera Rio Panuco S.A de C.V. (Rio Panuco) explored the Animas-Refugio and Cordon del Oro structures culminating in 45 holes, for 8,358.6 m. No geological drill logs, downhole survey data, downhole sample data or downhole geochemical assay data have been preserved.
Capstone Mining Corp. (Capstone) optioned the Bacis concessions in 2004 and carried out geologic mapping and sampling of the Animas-Refugio and Cordon del Oro structures. In 2005, Capstone drilled 15,374 m in 131 holes on down-dip extensions of the Clemens and El Muerto mines on the Animas-Refugio vein. In 2007, Capstone explored the La Colorada structure with surface mapping and sampling followed by 6,659 m of drilling in 64 holes.
Also, in 2007, Capstone transferred the claims of the Copala, Claudia, Promontorio, Montoros, and Martha projects to Silverstone Corp. (Silverstone). Capstone and Silverstone completed 21,641 m of drilling in 200 holes from 2005 to 2008 (Christopher and Sim, 2008).
Christopher and Sim (2008) prepared two Mineral Resource estimates on the property for Silverstone on October 16, 2008. The Mineral Resource estimates were prepared for the La Colorada vein-manto and the La Pipa, El Muerto and Clemens portions of the Animas-Refugio Vein.
Silverstone merged with Silver Wheaton Ltd. (Silver Wheaton) in 2009 and Silver Wheaton subsequently sold the shares of concession owner Silverstone to Mexican owners. The Silverstone owners mined out a portion of the Mineral Resource defined in 2008 over the next decade. Silverstone mined parts of the Clemens, El Muerto, La Pipa, Mariposa, El 40, and San Martin mineralized shoots until mining encountered the water table, preventing further mining. Silverstone or unauthorized mining activity in the intervening years exploited most of the Mineral Resources estimated by Christopher and Sim (2008).
|
|
Rio Panuco contracted Geophysical Surveys S.A. de C.V. of Mexico City in 2016 to conduct an airborne magnetics survey. However, no data are available, and no survey or flight specifications are included in the report. The survey was flown in two blocks.
In 2019, Silverstone and Rio Panuco optioned their mineral concessions to Minera CANAM.
1.5 Exploration
Vizsla commenced exploration on the Project in July 2019. Surface exploration to date has included geological mapping, rock geochemical sampling, geophysical surveys. The 1:1,000 scale geological mapping of the Property completed as of December 2023 amounts to 4,330 ha mapped out of a total of 7,074 ha held by the company, which represents 61.4% of the total area mapped. Rock geochemical sampling completed between 2019 and 2024 amounts to 5,930 samples. Vizsla has conducted airborne and ground surveys since 2019. These include Fixed Loop Electromagnetic surveys (FLEM) or ground EM surveys, drone magnetic surveys, and LiDAR.
1.6 Drilling
Since initiating drilling on the Property in November 2019, Vizsla has conducted a number of significant drill campaigns in the Napoleon, Copala-Tajitos, Animas and San Antonio areas. Up to June 18, 2024 (data cut-off date for the PEA technical report), Vizsla has completed 973 drill holes totaling 371,576.72 m and collected 56,198 assays. Vizsla has continued to drill at the Project since June 2024.
In November 2019, Vizsla began drilling on the Panuco Project on the Animas-Refugio corridor near the La Pipa and Mariposa mine areas. A total of 820.50 m in three drill holes was completed in 2019.
Drilling for 2020 totalled 28,643.42 m in 129 drill holes. The four main corridors of Napoleon, Cinco Senores, Cordon del Oro, and Animas-Refugio were tested. Drilling was focused on initially on targets proximal to areas of historical mapped and worked veins.
Drilling at the Panuco Project in 2021 totalled 100,242.55 m in 320 drill holes. The drilling focused along the Napoleon and Tajitos vein areas, with 54,759.15 m in 180 drill holes and 34,769.35 m in 104 drill holes, respectively. Additionally, 4,438.50 m in 14 drill holes were drilled in the Animas-Refugio corridor, and 6,275.55 m in 22 drill holes in the Cordon del Oro corridor.
At Napoleon and Tajitos, infill and delineation drilling focussed on denser drilling to inform the Mineral Resource estimate and expand the structure's strike length. Drilling discoveries in 2021 included the Josephine and Copala veins. Further drill testing included the Cruz Negra, Alacran, Cinco Senores, and Colorada vein areas. In the Animas-Refugio corridor, drilling tested the Rosarito segment included in the Mineral Resource estimate, in addition to the Peralta and Cuevillas veins. Drilling at the Cordon del Oro corridor targeted the San Antonio structure in addition to exploration near the Aguita Zarca vein.
|
|
Drilling for 2022 totalled 121,582.40 m in 297 drill holes. The four main corridors of Napoleon, Cinco Senores, Cordon del Oro, and Animas-Refugio were tested. Drilling at the Napoleon corridor included 109 drill holes tested the Napoleon structure, for 53,412.80 m. At the Cordon del Oro corridor, drilling totalled 7,225.80 m in 30 drill holes. Drilling at the Copala/Tajitos veins included 135 drill holes for 52,045.10 m. Additionally, 6,588.90 m in 16 drill holes were drilled in the Animas-Refugio corridor and 2,309.80 m in 7 drill holes were drilled in the Broche de Oro area.
The bulk of 2022 drilling was centred on the western portion of the district, focused on upgrading and expanding resources at the Copala and Napoleon areas. At Copala, mineralization was traced over 1,150 m along strike, 400 m down dip, and remains open to the north and southeast. At Napoleon, drilling throughout 2022 successfully expanded mineralization along strike and down plunge to the south, several vein splays were identified in the hanging wall and footwall of the main structure. Other notable discoveries included the Cristiano and La Luisa Veins.
Drilling for 2023 totalled 99,800.65 m in 180 drill holes. The main Napoleon and Cinco Senores corridors were primarily tested with limited drilling in the Animas-Refugio corridor. Drilling at the Napoleon corridor included 75 drill holes testing the Napoleon structure, for 40,926.80 m. Drilling at the Copala/Tajitos veins included 86 drill holes for 52,083.65 m. Drilling in the Animas-Refugio corridor included 8 drill holes for 2,548.50 m. Additional geotechnical drilling was completed at Napoleon, 6 drill holes for 2,375.70 m, and Cordon del Oro, 5 drill holes for 1,866.00 m.
The 2023 drilling was centred on the western portion of the district, focused on upgrading and expanding resources at the Copala and Napoleon areas. At Copala, mineralization has now been traced over 1,700 m along strike and to depths of 450 to 550 m and remains open to the north and southeast. At Napoleon, drilling throughout 2023 successfully expanded mineralization along strike and down plunge/dip to the south, several vein splays were identified in the hanging wall and footwall of the main structure. Other notable discoveries include the La Luisa Vein and the Molino Vein.
Drilling for 2024 (to June 18) totalled 20,487.20 m in 44 drill holes. The main Napoleon and Cinco Senores corridors were tested. Drilling at the Napoleon corridor included 16 drill holes testing the Napoleon structure, for 8,885.20 m. Drilling at the Copala/Tajitos veins included 28 drill holes for 11,602.00 m.
The 2024 drilling was centred on the western portion of the district, primarily focused on infill drilling at 50 m centres to upgrade resources within the Copala and Napoleon areas. Drilling at La Luisa focused on infill holes within high-grade shoots of the La Luisa and Footwall vein splay. The discovery of the El Molino vein in 2023 occurred approximately 250 m west of the Copala and Tajitos veins, but new interpretations and drilling confirmed that the vein extends southwest and intersects with Napoleon.
1.7 Metallurgical Test Work
Preliminary metallurgical test programs have been completed on each of the 3 main deposits that form the Panuco resource. All test programs were conducted at ALS Metallurgy in Kamloops, BC, Canada. The Napoleon test program was conducted in 2021 on samples obtained from 7 drill holes in the 2020 and 2021 drill programs. The Tajitos test program was conducted in 2022 on samples from 22 drill holes in the 2020 and 2021 drill programs. The Copala test program was conducted in 2023 on samples from 8 drill holes in the 2022 drill program.
|
|
The sample selections covered a range of identified lithologies. Master composites were assembled to obtain feed grades that were similar to the expected average resource grades, variability composites were assembled to cover ranges of grades and lithologies. The majority of the testing was completed on the master composites of each deposit.
Comminution testing was completed which suggested that the materials were competent with respect to both impact and attrition breakage. Drop Weight tests (SMC) were only conducted on the Copala samples and returned an average Axb value of 33. Bond ball mill tests conducted on samples from all three deposits measured ball mill work index (BMWi) values ranging from 16.4 to 18.9 kWhr/tonne.
Mineralogical assessments on the feed samples using QEMSCAN indicated that the host rock was primarily quartz and feldspars. Quartz contents ranged from 55 to 86%. The samples contained generally low levels of sulphide minerals, with pyrite as the most abundant sulphide mineral. The Napoleon samples contained elevated levels of galena and sphalerite, these base metal mineral contents were generally quite low in the Tajitos and Copala samples. Analyses on the Tajitos and Copala samples indicated that silver was mostly present in the form of a silver sulphide mineral acanthite, although small amounts were present in silver-copper sulphides. Detailed analyses on the Copala samples indicated a significant portion of the silver bearing sulphide minerals were quite fine grained and poorly liberated, suggesting that somewhat fine primary grind sizes may be required to achieve high silver recoveries.
Froth flotation tests were conducted on all samples, investigating the potential to sequentially float lead and zinc, as well as simply recovering a bulk sulphide concentrate. Open circuit cleaner testing on the Napoleon master composite demonstrated that production of lead and zinc concentrates that meet standard marketing grade targets would be possible using industry-proven processing conditions. In this flowsheet, about 70 and 80 percent of the silver and gold, respectively, would report to the lead concentrate. The zinc concentrates contained approximately 0.4% cadmium, which may be of concern for marketing, otherwise no other deleterious elements were measured at penalty levels.
Lead-zinc sequential flotation was only investigated in rougher flotation protocols on the Tajitos and Copala samples, distributions of silver and gold to the rougher concentrates were similar to the Napoleon material. Bulk sulphide flotation on all three deposits indicated that bulk sulphide concentrates containing 50 to 60 g/t gold could be generated on each material, silver concentrations ranged from 1500 to over 8000 g/t depending on the sulphide mineral contents in the feed. In general, about 80 to 90% of the silver and gold reported to bulk rougher concentrates at the primary grind sizes tested, recoveries to cleaner concentrates were not confirmed as tests were only conducted in open circuit.
Cyanide leaching of the rougher flotation tails was investigated on the Tajitos and Copala samples. Approximately 60 to 70% of the silver and 80 to 85% of the gold remaining in the rougher tails could be extracted in tests conducted over 48 and 72 hours. Leaching of rougher flotation concentrates was investigated on all deposits, but most extensively on the Copala samples. Silver extractions ranged from 85 to 98% and gold extractions ranged from 93 to 97% after 48 hours of leaching the concentrates, depending on the level of regrinding applied.
Whole ore leaching was investigated on samples from all deposits, which indicated that about 83-86% of the silver and 90 to 94% of the gold could be extracted after 96 hours of leaching. These tests were conducted at primary grind sizes ranging from 63 to 100µm P80.
|
|
1.8 Mineral Resource Estimate
Updated MREs for the Napoleon-La Luisa and Copala-Tajitos deposit areas were published on January 08, 2024 (Armitage et al., 2024), as well as MREs for the Animas and San Antonio areas previously published (Armitage et al., 2023).
Completion of the updated MREs for the Napoleon-La Luisa and Copala-Tajitos deposit areas involved the assessment of an updated drill hole database, which included all data for surface drilling completed between November 2019 and September 2023. The MREs for the Animas and San Antonio deposit areas included data for surface drilling completed between November 2019 and September 2022; there has been limited new drilling on the Animas and San Antonio deposit areas and these MREs previously published are considered current. The effective date for the Updated Mineral Resource Estimate is September 1, 2023. Completion of the MREs also included the assessment of updated three-dimensional (3D) mineral resource models (resource domains), 3D topographic surface models, 3D models of historical underground workings, and available written reports.
The Inverse Distance Squared ("ID2") calculation method restricted to mineralized domains was used to interpolate grades for Ag (g/t), Au (g/t), Pb (ppm) and Zn (ppm) into block models for all deposit areas.
Indicated and Inferred mineral resources are reported in the summary tables in Section 14.11. The MREs presented below take into consideration that all deposits on the Property may be mined by underground mining methods.
The reporting of the updated MRE complies with all disclosure requirements for Mineral Resources set out in the NI 43-101 Standards of Disclosure for Mineral Projects. The classification of the updated MRE is consistent with the 2014 Canadian Institute of Mining, Metallurgy and Petroleum (CIM) Definition Standards (2014 CIM Definitions) and adheres as best as possible to the 2019 CIM Estimation of Mineral Resources & Mineral Reserves Best Practice Guidelines (2019 CIM Guidelines).
The updated MRE for the Project is presented in Table 1-1 and Table 1-2.
Highlights of the Project Mineral Resource Estimate are as follows:
- Indicated Mineral Resources are estimated at 9.48 Mt grading 289 g/t silver, 2.41 g/t gold, 0.27% lead, and 0.84% zinc (511 AgEq). The current MRE includes indicated mineral resources of 88.2 Moz of silver, 736 koz of gold, 56 Mlbs of lead, and 176 Mlbs of zinc (155.8 Moz AgEq).
- Inferred Mineral Resources are estimated at 12.19 Mt grading 239 g/t silver, 1.93 g/t gold, 0.29% lead, and 1.03% zinc (433 g/t AgEq). The current MRE includes inferred mineral resources of 93.7 Moz of silver, 758 koz of gold, 78 Mlbs of lead, and 276 Mlbs of zinc (169.6 Moz AgEq).
|
|
Table 1-1: Panuco Project Mineral Resource Estimate, September 1, 2023
Resource | Tonnes | Grade | Total Metal | ||||||||
Au g/t | Ag g/t | Pb % | Zn % | AgEq* | Au (koz) | Ag (koz) | Pb | Zn | AgEq* | ||
Indicated | 9.48 | 2.41 | 289 | 0.27 | 0.84 | 511 | 736 | 88,192 | 56.0 | 176.1 | 155,841 |
Inferred | 12.19 | 1.93 | 239 | 0.29 | 1.03 | 433 | 758 | 93,653 | 78.1 | 276.2 | 169,647 |
* AgEq = Ag ppm + (((Au ppm x Au price/gram) + (Pb% x Pb price/t) + (Zn% x Zn price/t))/Ag price/gram) with price assumptions of $24.00/oz Ag, $1800/oz Au, $1.10/lb Pb and $1.35/lb Zn
Table 1-2: Panuco Project Mineral Resource Estimate by Area, September 1, 2023
Copala Area: Copala, Tajitos and Cristiano
Area | Resource | Tonnes | Grade | Total Metal | ||||||||
Au g/t | Ag g/t | Pb % | Zn % | AgEq | Au | Ag | Pb | Zn (Mlbs) | AgEq | |||
Copala | Indicated | 4.52 | 2.46 | 380 | 0.08 | 0.15 | 573 | 358 | 55,201 | 8.2 | 15.3 | 83,270 |
Inferred | 3.16 | 1.77 | 332 | 0.12 | 0.20 | 476 | 179 | 33,722 | 8.2 | 13.6 | 48,320 | |
Tajitos | Indicated | 0.63 | 2.24 | 358 | 0.12 | 0.21 | 538 | 46 | 7,295 | 1.6 | 2.9 | 10,953 |
Inferred | 1.04 | 2.04 | 365 | 0.22 | 0.39 | 540 | 69 | 12,260 | 5.2 | 8.9 | 18,140 | |
Cristiano | Indicated | 0.21 | 3.37 | 581 | 0.25 | 0.43 | 858 | 23 | 3,961 | 1.1 | 2.0 | 5,851 |
Inferred | 0.72 | 2.54 | 443 | 0.15 | 0.29 | 650 | 59 | 10,213 | 2.4 | 4.5 | 14,974 | |
Total | Indicated | 5.37 | 2.48 | 385 | 0.09 | 0.17 | 580 | 427 | 66,457 | 10.9 | 20.2 | 100,074 |
Inferred | 4.92 | 1.94 | 355 | 0.15 | 0.25 | 515 | 307 | 56,195 | 15.8 | 27.0 | 81,434 | |
Napoleon Area: Napoleon, Cruz, Josephine and La Luisa
Area | Resource | Tonnes | Grade | Total Metal | ||||||||
Au g/t | Ag g/t | Pb % | Zn % | AgEq | Au | Ag | Pb | Zn | AgEq | |||
La Luisa | Indicated | 0.27 | 2.56 | 177 | 0.39 | 2.01 | 459 | 22 | 1,556 | 2.3 | 12.1 | 4,027 |
Inferred | 2.04 | 2.13 | 159 | 0.30 | 1.51 | 386 | 139 | 10,439 | 13.3 | 67.9 | 25,326 | |
Cruz Negra | Indicated | 0.03 | 2.01 | 144 | 0.37 | 1.71 | 373 | 2 | 153 | 0.3 | 1.2 | 396 |
Inferred | 0.31 | 3.75 | 170 | 0.31 | 1.48 | 519 | 37 | 1,698 | 2.1 | 10.1 | 5,169 | |
Josephine | Indicated | 0.07 | 2.88 | 221 | 0.39 | 1.11 | 492 | 6 | 491 | 0.6 | 1.7 | 1,092 |
Inferred | 0.22 | 2.05 | 161 | 0.33 | 1.00 | 364 | 15 | 1,161 | 1.6 | 4.9 | 2,618 | |
Napoleon_HW(4) | Indicated | 0.43 | 1.72 | 164 | 0.42 | 1.53 | 365 | 24 | 2,259 | 4.0 | 14.4 | 5,029 |
Inferred | 0.85 | 2.17 | 220 | 0.59 | 2.02 | 479 | 59 | 5,976 | 10.9 | 37.6 | 13,027 | |
Napoleon+Splays | Indicated | 3.31 | 2.39 | 162 | 0.52 | 1.73 | 425 | 255 | 17,276 | 37.8 | 126.5 | 45,223 |
Inferred | 3.18 | 1.64 | 137 | 0.45 | 1.76 | 342 | 168 | 14,045 | 31.8 | 123.2 | 35,063 | |
Total | Indicated | 4.12 | 2.34 | 164 | 0.50 | 1.72 | 421 | 309 | 21,735 | 45.0 | 155.9 | 55,767 |
Inferred | 6.60 | 1.97 | 157 | 0.41 | 1.68 | 383 | 418 | 33,319 | 59.7 | 243.7 | 81,203 | |
|
|
San Antonio Area: Generales and Animas Area: Cuevillas and Rosarito
Area | Resource | Tonnes | Grade | Total Metal | |||||||||
Au g/t | Ag g/t | Pb % | Zn % | AgEq | Au (koz) | Ag | Pb | Zn | AgEq | ||||
San Antonio | Inferred | 0.28 | 1.30 | 226 | 0.01 | 0.03 | 325 | 12 | 2,038 | 0.1 | 0.2 | 2,936 | |
Animas | Inferred | 0.39 | 1.68 | 169 | 0.29 | 0.60 | 327 | 21 | 2,101 | 2.5 | 5.2 | 4,074 | |
Total | Inferred | 0.67 | 2.98 | 395 | 0.30 | 0.63 | 652 | 33 | 4,139 | 2.6 | 5.4 | 7,010 | |
Panuco Project Updated Mineral Resource Estimate Notes:
The classification of the Updated Mineral Resource Estimate into indicated and inferred mineral resources is consistent with current 2014 CIM Definition Standards for Mineral Resources and Mineral Reserves. The effective date for the Updated Mineral Resource Estimate is September 1, 2023.
All figures are rounded to reflect the relative accuracy of the estimate and numbers may not add due to rounding.
All mineral resources are presented undiluted and in situ, constrained by continuous 3D wireframe models, and are considered to have reasonable prospects for eventual economic extraction.
Mineral resources are not mineral reserves. Mineral resources which are not mineral reserves, do not have demonstrated economic viability. An Inferred Mineral Resource has a lower level of confidence than that applying to an Indicated Mineral Resource and must not be converted to a Mineral Reserve. It is reasonably expected that the majority of Inferred Mineral Resources could be upgraded to Indicated Mineral Resources with continued exploration.
The database comprises a total of 822 drill holes for 302,931 m of drilling completed by Vizsla between November 2019 and September 2023.
The mineral resource estimate is based on 28 three-dimensional ("3D") resource models, constructed in Leapfrog, representing the Napoleon area (15 wireframes), the Copala area (7 wireframes), Tajitos (1 wireframe), Animas (5 wireframes) and San Antonio (1 wireframe).
Silver, gold, lead, and zinc were estimated for each mineralization domain in the Panuco Project. Blocks within each mineralized domain were interpolated using 1.5 m capped composites assigned to that domain. To generate grade within the blocks, the inverse distance squared (ID2) interpolation method was used for all domains. All estimates are based on variable block dimensions (by deposit area) and estimation search parameters (by domain).
Average density values were assigned per zone based on 1,919 samples analysed by ALS in Zacatecas, Mexico or inhouse with 5% checks by ALS.
It is envisioned that the Panuco Project deposits may be mined using underground mining methods. Mineral resources are reported at a base case cut-off grade of 150 g/t AgEq. The mineral resource grade blocks were quantified above the base case cut-off grade, below surface and within the constraining mineralized wireframes.
The base-case AgEq Cut-off grade considers metal prices of $24.00/oz Ag, $1800/oz Au, $1.10/lb Pb and $1.35/lb Zn and considers metal recoveries of 93% for silver, 90% for gold, 94% for Pb and 94% for Zn.
|
|
The base case cut-off grade of 150 g/t AgEq considers a mining cost of US$45.00/t rock and processing, treatment and refining, transportation, and G&A cost of US$50.00/t of mineralized material.
The Updated Mineral Resource Estimate may be materially affected by environmental, permitting, legal, title, taxation, socio-political, marketing, or other relevant issues.
1.9 Mining Methods
The Panuco Project is a collection of silver-gold deposits located in the Panuco-Copala mining district in Sinaloa, Mexico, which extend from surface to over 800 m in depth. The deposits range in thickness from 1.5 m to greater than 20 m.
Based on the characteristics of the deposit, longhole stoping (LHS) was selected as the primary mining method, with drift-and-fill (DAF) selected for the northern portion of the Copala North Zone located directly under the Copala township. LHS considered a sublevel spacing of 20 m, stoping panels 20 m long, and on average were 8 m wide. Stope strike lengths were reduced in poor ground conditions to reduce excessive unplanned dilution. Where DAF was used, drifts are proposed to be 4 m high with five lifts per sublevel.
The mining methods considered for the Panuco Project are proposed to use a combination of cemented rock backfill (CRF), uncemented rock backfill, and paste backfill for stope support.
For the preliminary design of the Panuco Project, planned dilution and unplanned rock dilution was accounted for using the Datamine Mineable Shape Optimiser® (MSO). Dilution within MSO was estimated at 53% and additional unplanned dilution from backfill dilution, sill development and DAF mining was estimated at 9.2%. Mining recovery of 92% for LHS and 98% for DAF was applied as a factor to the shapes created by MSO within the production schedule.
A Net Smelter Return (NSR) model was used to estimate the revenue of the mineralized material. Preliminary process recoveries, doré grades, smelting and refining terms, and transportation costs were used to estimate the NSR value. A Cut-Off Value ("COV") was used to flag material by whether the revenue in a block exceeds the costs of extraction and processing of that block. There were three COVs used to assess mining at Panuco: Fully Costed COV; an Elevated COV; and, the Marginal COV.
The Fully Costed COV represents the break-even value of mineralized material required to cover all the associated operating and sustaining capital costs of extraction and processing. Fully costed COVs were assumed for Panuco at US$106.6/t for LHS and US$120.7/t for DAF. The Elevated COV of US$200/t was considered during the pre-production period and the first three years of processing. The Marginal COV of US$22/t was assumed when the operation has committed to development and preparation of stoping blocks.
Due to the distance between the various geological deposits, the project was designed into two separate underground mines. The Copala Mine, the larger of the two, accesses the Copala, Cristiano, and Tajitos deposits. The Napoleon Mine which is located to the west of the Copala Mine accesses the Napoleon, La Luisa, Cruz Negra, and Josephine deposits.
Contractor mining is currently proposed for the Panuco Project to minimise up front capital and achieve higher productivities. The material movement is summarized in Table 1-3.
|
|
Table 1-3: Total and Annual Material Movement Schedule for the Panuco Project
Feed | Tonnes | Ag | Au | Pb | Zn | AgEq(1) | Ag | Au | Pb | Zn | AgEq |
Total | 14,607 | 228 | 1.90 | 0.19% | 0.60% | 382 | 107,190 | 891.3 | 625 | 1,937 | 179,326 |
Y-02 | 26 | 217 | 2.33 | 0.03 | 0.06 | 405 | 184 | 2.0 | 0 | 0 | 343 |
Y-01 | 409 | 364 | 2.26 | 0.06 | 0.13 | 547 | 4,785 | 29.7 | 6 | 12 | 7,186 |
Y01 | 790 | 399 | 2.40 | 0.09 | 0.18 | 593 | 10,140 | 60.9 | 17 | 31 | 15,072 |
Y02 | 1,285 | 370 | 2.25 | 0.09 | 0.16 | 552 | 15,307 | 92.9 | 26 | 47 | 22,823 |
Y03 | 1,397 | 276 | 1.82 | 0.07 | 0.15 | 424 | 12,412 | 81.9 | 22 | 47 | 19,042 |
Y04 | 1,549 | 226 | 1.65 | 0.10 | 0.23 | 360 | 11,259 | 82.3 | 35 | 79 | 17,920 |
Y05 | 1,526 | 205 | 1.73 | 0.15 | 0.40 | 345 | 10,053 | 84.8 | 50 | 136 | 16,917 |
Y06 | 1,404 | 210 | 1.79 | 0.23 | 0.73 | 355 | 9,501 | 80.7 | 72 | 225 | 16,032 |
Y07 | 1,381 | 179 | 1.94 | 0.25 | 0.84 | 336 | 7,962 | 85.9 | 75 | 255 | 14,917 |
Y08 | 1,412 | 150 | 1.83 | 0.25 | 0.88 | 298 | 6,798 | 83.1 | 77 | 273 | 13,526 |
Y09 | 1,400 | 150 | 1.86 | 0.32 | 1.13 | 300 | 6,745 | 83.6 | 98 | 348 | 13,513 |
Y10 | 1,404 | 198 | 1.92 | 0.32 | 1.10 | 354 | 8,951 | 86.8 | 99 | 342 | 15,977 |
Y11 | 623 | 155 | 1.83 | 0.35 | 1.03 | 303 | 3,093 | 36.7 | 48 | 142 | 6,060 |
(1): AgEq: The Ag-Eq grade was calculated considering revenue from silver and gold only, using the formula below and the economic parameters listed in Table 16-12 and Table 16-13: Ag-Eq Grade = Ag Grade + Au Grade * (Au Recovery * Au Payable * Au Price) / (Ag Recovery * Ag Payable * Ag Price)
1.10 Recovery Methods
The process design is based on processing mineralized material from the Panuco deposits, through crushing, grinding cyanide leaching and precious metal recovery via the Merrill Crowe process in phase 1 and converted to bulk flotation with concentrate regrind and concentrate leach in Year 4. The design is based on previous test work programs performed on the deposit, Ausenco's extensive database of reference projects, and in-house process modelling. The process plant has been designed with assumed availabilities of 65% for the crushing plant, and 92% for all other processing circuits, based on industry-proven industry values. The plant will operate with two 12-hour shifts per day, 365 days per year.
A staged expansion approach for the process plant has been selected. A simple Whole Ore Leach flowsheet for Year 1-3 will treat Copala material and bulk float-con leach-tail leach configuration will be added when Napoleon material is introduced from Year 4.The expansion of the plant over the life of mine occurs as follows:
Phase 1 (Years 1 to 3) - 3 stage crushing, ball milling, followed by whole ore leach recovery at a throughput of 1.2 Mt/a,
Phase 2 (Years 4+) - conversion to bulk flotation with concentrate regrind, with concentrate and flotation tailings leach recovery at a throughput of 1.5 Mt/a.
The process plant features the following:
- Three-stage crushing of run of mine (ROM) material,
|
|
Ball milling in closed circuit with a classifying cyclone,
Bulk rougher flotation and concentrate regrind (Phase 2 only),
Cyanide leaching of the flotation concentrate (Phase 2 only),
Bulk leaching of the cyclone overflow (Phase 1) or of the flotation tailings and concentrate leach residue (Phase 2),
Counter-current decantation (CCD),
Zinc precipitation of the clarified pregnant solution and smelting to produce doré,
Cyanide detoxification,
Tailings thickening, and
Paste backfill mixing system.
The simplified process flow diagram for the project is shown in Figure 1-1.
|
|
Figure 1-1: Process Flow Diagram
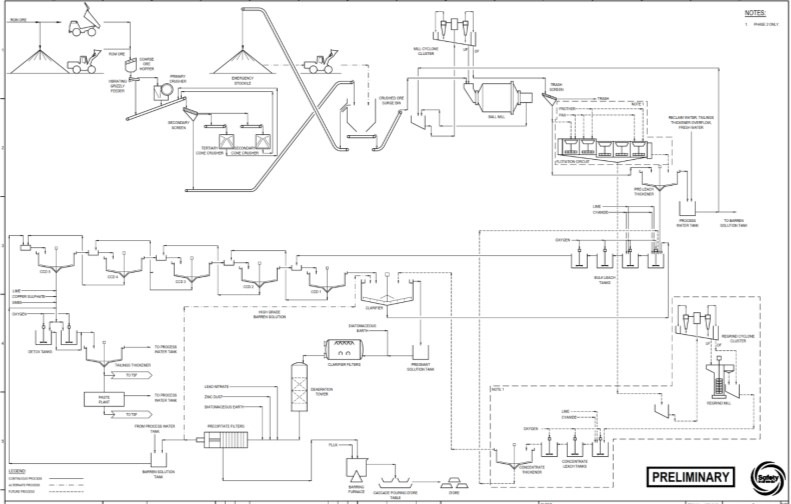
Source: Ausenco, 2024.
|
|
1.11 Project Infrastructure
1.11.1 Overview
The major project facilities include the site access road, process plant, tailings storage facility and water management structures. Support facilities also include the gold room, truckshop, cemented backfill paste plant, administration office, laboratory, and warehouse.
The Panuco site will be 'drive-in', as such no permanent camp facilities are considered on the property. Operators will be housed in Concordia and Copala and the surrounding towns and will be transported to site every day.
The overall site layout is shown in Figure 1-2.
|
|
Figure 1-2: Panuco Project Site Layout
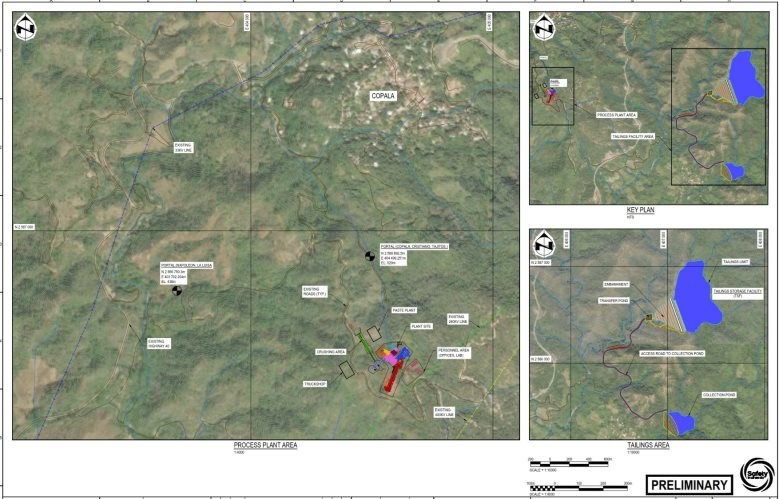
Source: Ausenco, 2024.
|
|
1.11.2 Site Access
The Property is located near the town of Copala, 80 km northeast of city of Mazatlan in Sinaloa, Mexico. The site can be accessed by travelling 25 km east along Highway 15, then travelling 43 km northeast along Highway 40. This leads to an entrance to a gravel access road that can be used to navigate across the property.
1.11.3 Power Supply
Power will be provided from a connection to Comisión Federal de Electricidad (CFE) electrical grid via a 69 kV transmission line. The transmission line will be stepped down to the 13.8 kV at the substation for distribution to different power requirements across the project site.
1.11.4 Water Supply
Fresh water will be sourced from the UG workings and site water collection which will be supplemented by water from the Panuco River as required. The water will be transported through pumps. 2.6 km of overland pipeline will be installed from Panuco River to the process plant where freshwater tanks will be located. This water will be the source of potable and fire water on site, used for administration buildings and process plant.
1.11.5 On-Site Roads
The project site has unpaved roads connecting the existing access road to the nearby highway. The existing roads will be upgrade to 4m - two lane roads from the process plant to Highway 40, and single lane road from Highway 40 to the Tailings Storage Facility (TSF).
1.11.6 Buildings
The plant site consists of the necessary infrastructure to support the processing operations. All infrastructure buildings and structures will be built and constructed as per applicable codes and regulations. The project site will include an administration building, plant maintenance shop and warehouse, and other buildings.
1.11.7 Waste Rock Storage Facility
Currently the waste rock will be utilized for the development of the TSF and other infrastructure. However, if in the next phase, if its determined that a waste rock facility will be required, a siting study will need to be performed.
1.11.8 Tailings Storage Facility
A siting and depostion tradeoff study was performed to determine best location and deposition technology. Several sites were analyzed and the outcome of the study was a slurry tailings storage facility located approximately 2.5 km to the east of the process plant in a small watershed. The TSF has been design to store 8.8 Mt of tailings but has capacity to expand if additional resources are discovered. The TSF has been designed with 4 stages over the life of the project. The starter embankment crest has a heigth of 573 m.a.s.l. and the final crest elevation of 612 m.a.s.l. to contain the required volume of tailings, operational water, and stormwater plus freeboard. In addition, spillways will be designed for every dam raise to pass the design storm event. The TSF is designed in accordance with best practices and Global Industry Standard on Tailings Management (GISTM) and International Council on Mining & Metals (ICMM's).
|
|
Tailings will be slurried from the process plant to the TSF by way of a pipelines that will extend 2/3rd around the perimeter of these facilities. Spigots around the facilities will discharge tailings into them to provide a uniform tailings surface and maximize the storage volume. Tailings are planned to be discharged at 65% solids and will have an overall final dry bulk density of 1.45 t/m3. The TSF will provide a portion of the water for the process plant from excess tailings water and rainfall runoff. Any water from the underdrain and emergency spillway will be collected in the transfer pond located at the base of the TSF and conveyed to the collection pond located approximately 1 km downstream in a small drainage.
1.12 Markets and Contracts
The Ag + Au doré bars will be trucked from the project site to Mazatlán, where the doré will be subsequently transported by air to clients. Doré will be sold into the general market to North American smelters and refineries.
Project economics are estimated based on long-term metal prices of US$26.00/oz Ag and US$1,975/oz Au.
Transportation and off-take agreements for doré are not currently in place but are expected to be negotiated within the industry norms. Similarly, there are no contracts currently in place for supply of reagents, utilities or other bulk commodities required to construct and operate the Project.
1.13 Environmental, Permitting and Social Considerations
The Panuco Project is in the Panuco-Copala mining district in the municipality of Concordia, southern Sinaloa State, along the western margin of the Sierra Madre Occidental physiographic province in western Mexico. Mountain ranges characterize the province's topography up to 1,640 m, cut by steep gorges. The climate is subtropical, with heavy rain in June through September.
1.13.1 Environmental Considerations
The baseline environmental information provided in this report have been largely gathered by consultants during the period January 2022 to February 2023 (WSP, 2022-2023). These studies were intended to serve as a reference and support for the preparation of the Environmental Impact Assessment, EIA (MIA in Mexico) required by the Ministry of Environment and Natural Resources (SEMARNAT) to support ongoing exploration activities and to provide initial data to support proposed future mining operations for the Project. At the time of issuing the documents in 2022 and 2023, the location and design of the Project infrastructure had not yet been finalized.
Currently, baseline data is available for the following subject areas: meteorology and climate, surface water, groundwater, air quality, noise, and flora and fauna. A preliminary desktop study was completed on the social aspects of the Project and on regional hydrogeological aspects (Flores Doncel 2022) .
|
|
A geotechnical and hydrogeological investigation was conducted by consultants in 2023-2024 (SRK 2024). The results of this investigation provided preliminary characterization focused on geotechnical and hydrogeological properties of the deposit and production access ramps. Additional hydrogeological investigations will be required to collect sufficient hydrogeological testing and monitoring data that can be used, coupled with geological models, to develop a groundwater conceptual model for the Project and study area.
At the time of this study, data was not availble from public or other sources for the subject areas of geochemistry and archaeology, for the Project site. To support the next stage of the Project design work and to support future environmental assessment and permitting activities, additional site-based targeted environmental and local socioeconomic studies will need to be initiated. With regard to archaeological resources, a survey will need to be conducted and findings registered with the INAH (Instituto Nacional de Antropologia e Historia, National Institute of Anthropology and History).
Currently, the only known environmental liabilities are associated with the exploration site activities and access roads. and existing underground workings from former operations Remediation of surface disturbances and removal of wastes will be mitigated by compliance with applicable Mexican regulatory requirements.
As the Project progresses though future and EIS/permitting stages, environmental management and monitoring plans will be required to guide the development and operation of the Project to mitigate and limit environmental impacts. These plans will be complementary to the engineered designs that will be required for the storage of tailings, waste rock, mineralized material, and conveyance/storage and processing of these materials.
1.13.2 Permitting Considerations
The Project is currently in the exploration stage and operates under three permits for mine exploration issued in 2020 and 2021, by SEMARANT (Secretary of Environmental Media and Natural Resource). An Informe Preventivo (IP) is in force for the area of the of the Panuco Project that permits drilling and exploration activities.
There are a number of environmental permits required for the operation of the project. Mining regulations are managed at the federal, state and local levels. Application for these permits have not yet been made but are in the preliminary preparation stage. Three major federal permits required by the Secretary of Environmental Media and Natural Resources (SEMARNAT) prior to construction include the Environmental Impact Assessment, EIA (MIA in Mexico), Land Use Change (CUS), and Risk Analysis (RA). A detailed list and description of required authorizations and permits for the Project are provided in Table 20-5.
In March 2023, the Mexican Federal Executive Branch (Poder Ejecutivo) first submitted a bill to amend the Mining Law and other national laws impacting new mining and water concessions (known as the Amendments). The primary goal of the bill to regulate the granting, maintenance, supervision and termination of mining concessions and water concessions for mining purposes. However, The amendments have been postponed as declared in The Official Gazette of the Mexican Nation as of July 11, 2024, by the Supreme Court of Justice of the Nation. The Amendments, which focus principally but not exclusively, on the process of granting new concessions, are generally applicable to new concessions only. The Amendments are not seen as materially affecting the advancement of the Project given that the Project is comprised entirely of existing concessions. However, there does remain some minor uncertainty as to how the Amendments may be applied by Mexican regulators in the future, and the situation should be monitored closely.
|
|
1.13.3 Social and Community Considerations
The Panuco Mining Exploration Project is in the northwest of the municipality of Concordia, Sinaloa. This region is made up of six rural agrarian centers with large extensions of Common Use Lands and 32 towns. The municipality of Concordia has an estimated population of 24,899 (2020 census) within an area of 2,167 km2. Many of these populations consist of emigration flows of people displaced from their original communities due to organized crime conflicts. Within the local area of Panuco, there are six agrarian settlements with large areas of Common Use Lands, and within it, there are 32 localities with rural characteristics. The estimated population of this area is 2,400 inhabitants, of which 28% have active agrarian rights (communeros or ejidatarios), and 72% are settlers (without agrarian rights). The total population is distributed across 20 localities, with 12 localities recorded as uninhabited. The Project's positive impact on the community may include employment generation, economic output and incorporation into social security programs. The Company will need to establish measures to mitigate negative impacts, especially if they are of concern to the population.
Vizsla reports that it is in the process of establishing guiding principles for community outreach and developing a strategic plan aligned with the organizational philosophy and the objectives of the Project. The implementation of actions must be accompanied by monitoring and measurement to evaluate performance and results. A community engagement plan and management system would enable relations with the community by controlling social risks, and enabling favorable conditions for the development of the Project in the long term. In addition such an engagement and management system would allow for the orderly development and justify sufficent budgets to allow for meaningful social investment, thereby reducing Project risks and costs due to potential community opposition and contribute to the responsible development of the community in accordance with community needs.
Supporting social activities and recreation for the Ejidos population is a main contribution that the Company has been supporting over the years. The support includes financial resources per request of the people and needed for the festivities and recreational activities that as a society are performed locally.
Vizsla has reportedly commenced conversations with local stakeholders to express the intention of developing a mining project within Common Use Lands and ejido property land that would aim to provide socio-economic well-being for the local population. The Company intends to maintain this relationship throughout the Project's lifecycle.
1.13.4 Closure and Reclamation Planning
In accordance with the general work schedule of the Panuco Project, the abandonment phase will commence after Year 11 from the start of operations, after which the approved Closure and Reclamation Plan will be implemented. At this time no formal Closure and Reclamation Plan has been prepared for the Panuco project for the purpose of regulatory submission; one will be required as the Project advances through subsequent project stages of feasibility-level design and as part of the MIA. An environmental monitoring plan will need to be developed once closure measures are implemented.
However, for the purpose of Project design, a conceptual closure and reclamation plan for the Project has been preliminarily developed that involves the identification of risks and associated mitigation measures for various Project components. The associated cost of reclamation and closure has been preliminarily estimated at US$31.8M (refer to Section 21.2.10).
|
|
1.14 Capital and Operating Cost Estimates
1.14.1 Capital Cost Estimates
The capital costs provided in this PEA are reported in United States Dollars (US$) with no allowance for escalation or exchange rate fluctuations. The capital cost estimate conforms to Class 5 guidelines of the Association for the Advancement of Cost Engineering International (AACE International) with an estimated accuracy of +50%/-30%. The capital cost estimate was developed in Q3 2024 dollars based on budgetary quotations for equipment and construction contracts, as well as in-house database of projects and advanced studies including experience from similar operations.
The total initial capital cost for the Panuco Project is US$223.5M, expansion capital cost is US$11.1M and LOM sustaining cost including financing and closure cost of US$31.8M is US$262.0M. The capital cost summary is presented below in Table 1-4.
Table 1-4: Capital Costs Summary
WBS | WBS Description | Initial Capital Cost | Sustaining Capital | Expansion Capital | Total Cost |
1000 | Mine | 64.5 | 207.7 | - | 272.3 |
2000 | Process Plant | 63.2 | - | 7.2 | 70.4 |
3000 | Additional Process Facilities | 8.7 | 22.4 | - | 31.1 |
4000 | On-Site Infrastructure | 13.5 | - | - | 13.5 |
5000 | Off-Site Infrastructure | 0.8 | - | - | 0.8 |
Total Directs | 150.7 | 230.2 | 7.2 | 388.2 | |
6000 | Project Indirects | 6.1 | - | 0.6 | 6.7 |
7000 | Project Delivery | 12.9 | - | 0.7 | 13.7 |
Total Indirect | 19.0 | - | 1.3 | 20.4 | |
8000 | Owner's Cost | 7.5 | - | 0.4 | 7.9 |
9000 | Provisions (Contingency incl. closure) | 46.3 | 31.8 | 2.1 | 80.2 |
Project Totals | 223.5 | 262.0 | 11.1 | 496.7 | |
Note: *Total may not add up due to rounding.
1.14.2 Average Operating Cost Estimate
The costs considered on-site operating costs are those related to mining, processing, tailings handling, maintenance, power and general and administrative activities.
A summary of the operating costs is presented below in Table 1-5.
The unit operating cost is US$76.40/t processed, including an annual G&A cost of US$9.9M.
|
|
Table 1-5: Average LOM Operating Cost
Cost Area | Average Annual Costs (US$M) | US$/t Processed |
Mining | 64.7 | 47.21 |
Process | 29.7 | 21.96 |
G&A | 9.9 | 7.24 |
Total | 104.3 | 76.40 |
Note: *Total may not add up due to rounding.
1.15 Economic Analysis
The economic analysis was performed assuming a 5% discount rate. The pre-tax net present value (NPV) discounted at 5% is US$1,778M; the internal rate of return (IRR) is 124.1%, and payback period is 0.6 years. On a post-tax basis, the NPV discounted at 5% is US$1,137M, the IRR is 85.7%, and the payback period is 0.8 years. A summary of project economics is shown in Table 1-6. The analysis was done on an annual cashflow basis; the cashflow output is shown graphically in Figure 1-3.
Readers are cautioned that the PEA is preliminary in nature. It includes inferred mineral resources that are considered too speculative geologically to have the economic considerations applied to them that would enable them to be categorized as mineral reserves, and there is no certainty that the PEA will be realized.
Table 1-6: Economic Analysis Summary Table
| Description | Unit | Life-of-Mine Total / Average |
| General | ||
| Discount Rate | % | 5.0 |
| Silver Price | US$/oz | 26.00 |
| Gold Price | US$/oz | 1,975 |
| Production | ||
| Head Grade - Ag | g/t | 228 |
| Head Grade - Au | g/t | 1.90 |
| Recovery Rate - Ag to doré | koz | 92.2% |
| Recovery Rate - Au to doré | koz | 93.8% |
| Total Metal Payable - Ag | koz | 98,697 |
| Total Metal Payable - Au | koz | 835 |
| Average Annual Payable Production - Ag | koz/year | 9,268 |
| Average Annual Payable Production - Au | koz/year | 78 |
| Average Annual Payable Production - AgEq | koz/year | 15,225 |
| Operating Costs | ||
| Mining Cost | US$/t processed | 47.21 |
| Processing Cost (incl. TSF) | US$/t processed | 21.96 |
|
|
Description | Unit | Life-of-Mine Total / Average |
Site G&A Costs | US$/t processed | 7.24 |
Total Operating Costs | US$/t processed | 76.40 |
Cash Costs and All-in Sustaining Costs (Co-Product Basis) | ||
Cash Cost* | US$/oz AgEq | 7.98 |
All-in Sustaining Cost** | US$/oz AgEq | 9.40 |
Capital Expenditures | ||
Initial Capital | US$M | 224 |
Expansion Capital | US$M | 11 |
Sustaining Capital (excl. Closure Costs and Salvage Value) | US$M | 230 |
Closure Costs | US$M | 32 |
Salvage Value | US$M | 9 |
Economics | ||
Pre-tax NPV @ 5% | US$M | 1,778 |
Pre-tax IRR | % | 124.1 |
Pre-tax Payback | years | 0.6 |
Post-tax NPV @ 5% | US$M | 1,137 |
Post-tax IRR | % | 85.7 |
Post-tax Payback | years | 0.8 |
Notes: * Total cash costs consist of operating cash costs plus royalties and offsite (refining & transport) charges. ** AISC consist of total cash costs plus sustaining capital.
Figure 1-3: Project Post-Tax Unlevered Cashflow
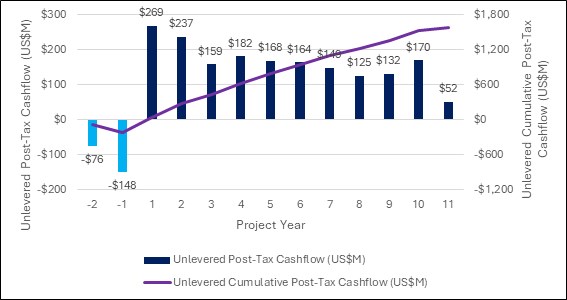
Source: Ausenco (2024)
|
|
1.15.1 Sensitivity Analysis
A sensitivity analysis was conducted on the base case NPV and IRR of the project using the following variables: discount rate, head grade, recovery, total operating cost, initial capital cost, as well as silver and gold prices, which were encompassed in a single variable, metal price. As illustrated in Figure 1-4, the sensitivity analysis revealed that the project is most sensitive to changes in head grade and metal price.
Figure 1-4: Post-Tax NPV and IRR Sensitivity Results
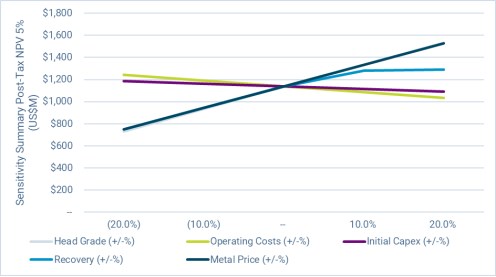
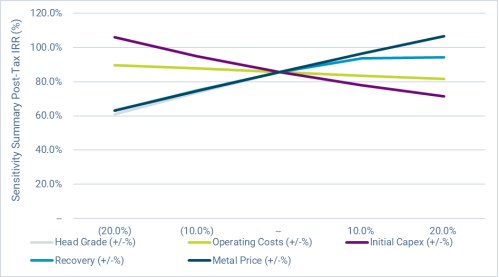
Source: Ausenco, 2024.
Note: Series lines for metal price and head grade overlap on the above figures.
|
|
1.16 Interpretations and Conclusions
The MRE includes Indicated resource of 9.48 Mt grading 289 g/t silver, 2.41 g/t gold, 0.27% lead, and 0.84% zinc (511 g/t AgEq) plus an additional 12.19 Mt grading 239 g/t silver, 1.93 g/t gold, 0.29% lead, and 1.03% zinc (433 g/t AgEq) in the Inferred category. The process design is based on processing mineralized material from the Panuco deposits, through crushing, grinding cyanide leaching and precious metal recovery via the Merrill Crowe process in phase 1 and converted to bulk flotation with concentrate regrind and concentrate leach in Year 4.
The mining method selected for the Panuco Project is LHS backfill with a combination of Cemented Rock Fill ("CRF") and paste backfill. Mining operations will feed 1.2 Mt/a of mineralized material (387 g/t Ag, 2.35 g/t Au) in Phase 1 and 1.5 Mt/a of mineralized material (230 g/t Ag, 1.77 g/t AU) in Phase 2 for processing over a 11-year project life. Based on the assumptions and parameters in this technical report, the PEA shows a positive economics (i.e. US$ 1,137M post-tax NPV (5%) and 85.7% IRR). The PEA supports a decision to carry out additional studies to progress the project further into detailed assessment.
1.17 Recommendations
The Panuco Project demonstrates positive economics, as shown by the results presented in this technical report.
It is recommended to continue developing the Project through FS. The recommended work program to advance through FS includes additional drilling to convert inferred resources to indicated resources, metallurgical work and trade-off studies to further improve the process plant design, additional geotechnical drilling to improve the mine plan, further work to characterise the water management and tailings storage facility and expansion and ongoing data collection of environmental data for future permitting. Table 1-7 summarized the estimated cost for the recommended future work on the Panuco Project.
Table 1-7: Cost Summary for the Recommended Future Work
Program Component | Estimated Total Cost (US$M) |
Exploration and Drilling | 8.40 |
Metallurgical Test work | 0.60 |
Geotechnical and Geohydrological Drilling (supplemental holes) | 0.40 |
Mining & Geotechnical Studies, including backfilling | 2.00 |
Process and Infrastructure Engineering | 1.50 |
Geotechnical Field Work | 0.56 |
Tailings Storage Facility | 0.35 |
Environmental Studies | 0.87 |
Market Studies | 0.06 |
Total | 14.74 |
Note: Totals may not sum due to rounding.
|
|
2 INTRODUCTION
2.1 Introduction
Vizsla commissioned Ausenco to compile a PEA of the Panuco Project. The PEA was prepared in accordance with the Canadian disclosure requirements of National Instrument 43-101 - Standards and Disclosure for Mineral Projects (NI43-101) and the requirements of Form 43-101 F1.
The responsibilities of the engineering companies contracted by Vizsla to prepare this technical report are as follows:
Ausenco managed and coordinated the work related to the technical report, developed PEA-level design, capital and operating cost estimates for the process plant and general site infrastructure. Ausenco also undertook the review of the environment and permitting studies and completed the economic analysis.
SGS developed the mineral resource estimate (MRE) for the Project and completed the work related to the geological setting, deposit type, drilling, exploration works, sample preparation and analysis and data verification.
Entech designed the underground mining, mine production schedule and provided the mining capital and operating costs.
2.2 Terms of Reference
The purpose of this technical report is to present the results of the PEA and to support the Vizsla disclosure in a news release dated July 24, 2024. Titled "Vizsla Delivers Exceptional Economics for Panuco in Preliminary Economic Assessment: After-Tax NPV (5%) of US$1,137 million, After-Tax IRR of 85.7%, Initial Capex of US$224 million, Average Annual Production of 15.2 million oz AgEq at AISC of US$9.40 per oz AgEq"
All measure units used in this technical report are metric unless otherwise noted and currency is expressed in United States Dollars (US$). This technical report uses English.
Mineral Resources are estimated in accordance with the 2019 edition of the Canadian Institute of Mining, Metallurgy and Exploration (CIM) Estimation of Mineral Resources and Mineral Reserves Best Practice Guidelines (2019 CIP Best Practice Guidelines) and are reported using the 2014 CIM Definition Standards for Mineral Resources and Mineral Reserves (2014 CIM Definition Standards).
Readers are cautioned that the PEA is preliminary in nature. It includes inferred mineral resources that are considered too speculative geologically to have the economic considerations applied to them that would enable them to be categorized as mineral reserves, and there is no certainty that the PEA will be realized.
2.3 Qualified Persons
The Qualified Persons for the report are listed in Table 2-1. By virtue of their education, experience and professional association membership, they are considered Qualified Person as defined by NI 43-101.
|
|
Table 2-1: Report Contributors
Qualified Person | Professional Designation | Position | Employer | Independent of Vizsla | Report Section |
Peter Mehrfert | P. Eng | Principal Process Engineer | Ausenco Engineering Canada ULC | Yes | 1.1, 1.7, 1.10, 1.11.1-1.11.6, 1.12, 1.14-1.17, 2.1-2.4.1, 2.5-2.7, 3.4, 12.4, 12.5, 13, 17, 18.1-18.3.7, 19, 21.1-21.2.2, 21.2.4-21.2.10, 21.3.1, 21.3.2, 21.3.4, 21.3.5, 22, 24, 25.1, 25.5, 25.8, 25.9.1, 25.10, 25.12-25.14, 25.15.1.2, 25.15.1.4, 25.15.1.8, 25.15.2.2, 25.15.2.4,25.15.2.7, 26.1, 26.3, 26.5, 26.9 and 27 |
James Millard | P. Geo. | Director, Strategic Projects | Ausenco Sustainability ULC | Yes | 1.13, 3.3, 20, 25.11, 25.15.1.7, 25.15.2.6, 26.8 and 27 |
Scott Elfen | P. E. | Global Lead Geotechnical and Civil Services | Ausenco Engineering Canada ULC | Yes | 1.11.7, 1.11.8, 2.4.4, 18.3.8, 18.3.9, 25.9.2, 25.15.1.5, 26.6, 26.7 and 27 |
Jonathan Cooper | P. Eng | Team Lead - Water Resources | Ausenco Sustainability ULC | Yes | 18.3.10,25.9.3, 25.15.1.6, 25.15.2.5, and 27 |
Allan Armitage | P. Geo. | Technical Manager and Senior Resource Geologist | SGS Canada Inc. - Geological services | Yes | 1.2, 1.8, 2.4.3, 3.1, 4, 8, 12.2, 12.3, 12.6, 14, 15, 23, 25.2, 25.6, 25.15.1.1, 25.15.2.1, 26.2 and 27 |
Ben Eggers | P. Geo. | Senior Geologist | SGS Canada Inc. - Geological services | Yes | 1.3-1.6, 5, 6, 7, 9, 10, 11, 12.1, 25.3, 25.4, and 27 |
Ramon Mendoza Reyes | P. Eng | Principal Consultant | Entech Mining Ltd. | Yes | 1.9, 2.4.2, 3.2, 16, 21.2.3, 21.3.3, 25.7, 25.15.1.3, 25.15.2.3, 26.4 and 27 |
|
|
2.4 Site Visits and Scope of Personal Inspection
2.4.1 Site Inspection by Peter Mehrfert, P.Eng.
Peter Mehrfert visited the site on April 08 through 10, 2024 for the purpose of:
Inspection of the drill core logging, processing and storage facility
Review of a preliminary mine stope design model with Vizsla technical staff and drill hole intersections of the resource model and proposed mining stopes,
Inspection of the project site to access accessibility, topography, available infrastructure and proximity to towns and roads,
Review potential locations for the processing plant.
2.4.2 Site Inspection by Ramon Mendoza Reyes, P.Eng.
The Panuco Project property was visited by Ramon Mendoza Reyes on April 09 and 10, 2024 and conducted personal inspection of the project site including:
Inspection of drilling core to assess rock mass characteristics and mineralization type,
Inspection of project site to assess accessibility, topography, available infrastructure and proximity to towns and roads,
Review of site conditions of potential mine portal locations, and
Review of local geology and environmental aspects.
2.4.3 Site Inspection by Allan Armitage, P.Geo.
The Panuco Project property was visited by Allan Armitage on May 29, 2023, November 6 to November 8, 2023, and May 23, 2024 for the purpose of:
Inspection of selected drill sites and outcrops to review the drill and local geology,
Inspection of the drill core logging, processing and storage facility,
Reviewing current core sampling, QA/QC and core security procedures, and
Inspection of drill core, drill logs, and assay certificates to validate sampling, confirm the presence of mineralization in witness half-core samples, and review of the local geology.
|
|
2.4.4 Site Inspection by Scott Elfen, P.E.
The Panuco Project property was visited by Scott Elfen on August 15, 2024, he conducted an inspection of the project site including:
Inspection of the project site access, topography, surface geotechnical conditions, and proximity to towns and roads, and
Inspection of the process plant and tailings storage facility locations.
2.5 Effective Dates
The effective date of the overall technical report is July 24, 2024.
The effective date of the Mineral Resource Estimate (MRE) is September 01, 2023.
2.6 Information Sources and References
The documents listed in Section 3 and Section 27 were used to support preparation of the technical report. The authors are not experts with respect to legal, socio-economic, land title or political issues and are therefore not qualified to comment on issues related to the status of permitting, legal agreements and royalties. The sources of information supplied by Vizsla include historical data and reports compiled by previous consultants and researchers of the project, as well as other documents cited throughout the technical report and referenced in Section 27. The QPs have relied on Vizsla's internal experts and legal counsel for details on project history and information related to ownership. The QPs used their experience to determine if the information from previous reports was suitable for inclusion in this technical report and adjusted information that required amending. This report includes technical information that required subsequent calculations to derive subtotals, totals and weighted averages. Such calculations inherently involve a degree of rounding and consequently introduce a margin of error. Where these occur, the QPs do not consider them to be material.
2.6.1 Previous Technical Reports
Armitage, A., Eggers, B., and Mehrfert, P., 2024 Technical Report and Updated MRE for the Panuco Ag-Au-Pb-Zn Project, Sinaloa State, Mexico, Effective Date September 01, 2023, Report Date February 12, 2024, prepared for Vizsla
Armitage, A., Eggers, B., and Camus, Y., 2023, Technical Report and Updated MRE for the Panuco Ag-Au-Pb-Zn Project, Sinaloa State, Mexico, Effective Date January 19, 2023, Report date March 10, 2023, prepared for Vizsla
Maunula, T., Murray, K., 2022, Technical Report and MRE for the Panuco Project Concordia, Sinaloa, Mexico, Effective Date March 01, 2022, Report Date April 07, 2022, prepared for Vizsla
Harris, S., 2020, Technical Report for the Panuco Silver-Gold Project Concordia, Sinaloa, Mexico, Effective Date June 15, 2020, Report Date June 15, 2020, prepared for Vizsla Resources Corp.
|
|
- Robinson, M., 2019, Technical Report on the Panuco-Copala Project Concordia, Sinaloa, Mexico, Effective Date October 22, 2019, Report Date November 06, 2019, prepared for Vizsla Resources Corp.
2.7 Currency, Units, Abbreviations and Definitions
All units of measurement in this report are metric and all currencies are expressed in United States dollars (symbol: US$ or currency: USD) unless otherwise stated. Contained silver and gold metal is expressed as troy ounces (oz), where 1 oz = 31.1035 g. All material tonnes are expressed as dry tonnes (t) unless stated otherwise. A list of abbreviations and acronyms is provided in Table 2-2, and units of measurement are listed in Table 2-3.
Table 2-2: Abbreviations and Acronyms
Abbreviation | Description |
3D | three-dimensional |
AA | atomic absorption spectroscopy |
AACE | Association for the Advancement of Cost Engineering |
Ag | Silver |
AgEq | Silver equivalent |
ANP | Áreas Naturales Protegidas |
Ar | Argon |
ARD | acid rock drainage |
AS | analytical signal |
As | arsenic |
Au | gold |
AuEq | Gold Equivalent |
Ba | barium |
BC | British Columbia |
BMWi | Ball mill work index |
CAD:USD | Canadian American exchange rate |
CCD | counter-current decantation |
CFE | Comisión Federal de Electricidad |
CIM | Canadian Institute of Mining, Metallurgy and Petroleum |
CIM Definition Standards | CIM Definition Standards for Mineral Resources and Mineral Reserves 2014 |
CNA | Comisión Nacional del Agua |
COC | Chain of custody |
CRM | Consejo de Recursos Minerales |
Cu | Copper |
DCF | discounted cash flow |
DL | detection limit |
EIA | Environmental Impact Assessment |
EM | Electromagnetic |
F | Fluorine |
FLEM | Fixed Loop Electromagnetic surveys |
|
|
Abbreviation | Description |
FS | Feasibility Study |
G&A | General and Administration |
GISTM | Global Industry Standard on Tailings Management |
Hg | mercury |
HW | Hanging Wall |
ICP | Inductively Coupled Plasma |
ICP-OES | Inductively Coupled Plasma - Optical Emission Spectrometry |
ID2 | inverse distance squared |
ID3 | inverse distance cubed |
IEC | International Electrotechnical Commission |
INAH | National Institute of Anthropology and History |
Incl. | include |
IOCG | iron oxide copper gold |
IP | induced polarization |
IRGS | intrusion-related gold system |
IRR | Internal rate of return |
ISO | International Organization for Standardization |
K | potassium |
K/Ar | Potassium/Argon |
LEGEEPA | General Law of Ecological Equilibrium and Environmental Protection (Ley General de Equilibrio Ecologico y Proteccion al Ambiente) |
LiDAR | Light Detection and Ranging |
LIP | Large Igneous Province |
LVC | Lower Volcanic Complex |
LVC | Lower Volcanic Complex |
MIA | Manifiesto de Impacto Ambiental |
Mn | manganese |
MRE | Mineral resource estimate |
MRP | Minera Rio Panuco |
NaCl | sodium chloride |
Table 2-3: Units of Measurement
Abbreviation | Description |
% | percent |
% solids | percent solids by weight |
CAD | Canadian dollar (currency) |
C$ | Canadian dollar (as symbol) |
$/t | dollars per metric ton |
° | angular degree |
°C | degree Celsius |
μm | micron (micrometer) |
cm | centimeter |
|
|
Abbreviation | Description |
cm3 | cubic centimeter |
CVAVR% | Average Coefficient of Variation |
ft | foot (12 inches) |
g | gram |
g/cm3 | gram per cubic centimeter |
g/L | gram per liter |
g/t | gram per metric ton (tonne) |
h | hour (60 minutes) |
ha | hectare |
kg | kilogram |
kg/t | kilogram per tonne |
km | kilometer |
km2 | square kilometer |
kV | kilovolts |
kW | kilowatt |
kWh/t | kilowatt-hour per tonne |
L | liter |
lb | pound |
m, m2, m3 | meter, square meter, cubic meter |
MX$ | Mexican Pesos (as symbol) |
M | million |
Ma | million years (annum) |
masl | meters above mean sea level |
mm | millimeter |
Moz | million (troy) ounces |
Mt | million tonnes |
MW | megawatt |
oz | troy ounce |
oz/t | ounce (troy) per tonne |
oz/ton | ounce (troy) per short ton (2,000 lbs) |
ppb | parts per billion |
ppm | parts per million |
t | metric tonne (1,000 kg) |
ton | short ton (2,000 lbs) |
t/d | tonnes per day |
USD | US dollars (currency) |
US$ | US dollar (as symbol) |
|
|
3 RELIANCE ON OTHER EXPERTS
3.1 Property Agreements, Mineral Tenure, Surface Rights and Royalties
Final verification of information concerning Property status and ownership, which are presented in Section 4 below, have been provided to the Author by Jesus Valador for Vizsla, by way of E-mail titled "RE: [EXTERNAL] Panuco PEA - Technical Report Update" on August 13, 2024. The Author only reviewed the land tenure in a preliminary fashion and has not independently verified the legal status or ownership of the Property or any underlying agreements or obligations attached to ownership of the Property. However, the Author has no reason to doubt that the title situation is other than what is presented in this technical report (Section 4). The Author is not qualified to express any legal opinion with respect to Property titles or current ownership.
3.2 Property Ownership
The Mining QP has fully relied upon, and disclaim responsibility for, information supplied by Vizsla related to mineral rights, mining concessions, land tenure, surface access agreements and related cost of mining rights, surface rights and royalties as follows:
E-mail from Fernando Martinez, Project Director, Vizsla, on March 26, 2024, and referenced files uploaded in data room:
VizslaClaim Limit_03142014.dxf
Royalty_Claims_03142024.dxf
Ejidos Limits_Panuco_03142024.dxf
This information was relied upon in Section 16.
3.3 Environmental, Permitting, Closure, and Social and Community Impacts
The QPs have fully relied upon, and disclaim responsibility for, information supplied by Vizsla and experts retained by Vizsla. For information related to environment, permitting, closure planning and related cost estimation and social and community impacts as follows:
Armitage, A., Eggers, B., and Mehrfert, P., 2024 Technical Report and Updated MRE for the Panuco Ag-Au-Pb-Zn Project, Sinaloa State, Mexico, Effective Date September 01, 2023, Report Date February 12, 2024, prepared for Vizsla.
Data Mexico. (2024). Sinaloa: Economy, employment, equity, quality of life, education, health and public safety. Available: https://www.economia.gob.mx/datamexico/en/profile/geo/sinaloa (Accessed July 2024).
Geoinformation Portal 2024. Geoportal of the National Biodiversity Information System [16,861]. Available: http://www.conabio.gob.mx/informacion/gis/ (Accessed July 2024).
|
|
PueblosAmerica.com. (2024). Pánuco (Sinaloa) Concordia. Available: https://en.mexico.pueblosamerica.com/i/ panuco-2/ (Accessed July 2024).
Vizsla Silver Corp. (2024) Maps & Figures. Available: https://vizslasilvercorp.com/projects/panuco-project/maps-figures/ (Accessed July 2024).
INEGI (2020). Instituto Nacional de Estadística y Geografía. Available: https://www.inegi.org.mx/ (Accessed July 2024).
Flores Doncel Consultores, SC (Abril 2022). Estudio De Línea Báse. Prepared for Vizsla Silver Corp.
Flores Doncel Y Muniz Consultores, SC (Diciembre 2022). Evaluación De Impacto Social, Proyecto De Exploración Minera Pánuco, Concordia. Prepared for Vizsla Silver Corp.
(CIMA) Consultores Interdisciplinarios En Medio Ambiente S.C. (October 2020). Manifestación de Impacto Ambiental Modalidad Particular Proyecto "Exploración Panuco-Copala". Prepared for Vizsla Silver Corp.
WSP Golder, (Mayo 2022). Resultados de la Primera Campana de Muestreos de Línea Base Ambiental, Proyecto Panuco. Prepared for Minera CANAM, S.A. de C.V.
WSP Golder, (Septiembre 2022). Resultados de la Segunda Campana de Muestreos de Línea Base Ambiental, Proyecto Panuco. Prepared for Minera CANAM, S.A. de C.V.
WSP Golder, (Febrero 2023). Proyecto Panuco - Tercer Campana De Muestreo. Prepared for Vizsla Silver Corp. through Minera CANAM, S.A. de C.V.
WSP Golder, (Febrero 2023). Proyecto Panuco - Cuarta Campana De Muestreo. Prepared for Vizsla Silver Corp. through Minera CANAM, S.A. de C.V.
WSP Golder, (Junio 2023). Memorando Técnico 5TA Ronda De Muestreos De Estudios De Linea Basea Ambiental Proyecto Panuco. Prepared for Vizsla Silver Corp. through Minera CANAM, S.A. de C.V.
WSP Golder, (Marzo 2024). Memorando Técnico 6° Ronda de Muestreos De Estudios De Linea Basea Ambiental Proyecto Panuco, Prepared for Vizsla Silver Corp. through Minera CANAM, S.A. de C.V.
WSP Golder, (Marzo 2024). Memorando Técnico 6° Ronda de Mestrões De Flora Y Fauna, Estúdios De Linea Basea Ambiental Proyecto Panuco, Prepared for Vizsla Silver Corp. through Minera CANAM, S.A. de C.V.
This information was relied upon in Section 1.13, 20 and 25.11.
3.4 Taxation
The QPs have fully relied upon and disclaim responsibility for information supplied by Vizsla Chief Financial Officer, Mahesh Liyanage relating to the tax model used in the economic analysis, according to the file "105942-09 Vizsla Panuco PEA Financial Model_2024-07-18" received via email on July 22, 2024.
This information was relied upon in Sections, 1.15, 22 and 25.14.
|
|
4 PROPERTY DESCRIPTION AND LOCATION
4.1 Introduction
The Panuco Project is in the Panuco-Copala mining district in the municipality of Concordia, southern Sinaloa state, along the western margin of the Sierra Madre Occidental physiographic province in western Mexico. The Project is centred at 23⁰ 25' north latitude and 105⁰ 56' west longitude on map sheet F13A-37. The Project location is shown in Figure 4-1.
4.2 Land Tenure and Mining Concessions
The Project comprises 119 titled mining concessions in nineteen blocks, covering a total area of 16,536.87 ha, and two mineral concessions covering 1,321.15 ha. The mining concessions are held 100% by Vizsla. The mineral concessions are presented in Figure 4-2 and Table 4-1. The concessions are granted for 50 years, except San Carlos that was originally granted for 100 years, provided semi-annual property tax payments are made in January and July each year and if minimum annual investment requirements are met, or if there is minimum annual production equal to the amount of the annual investment requirement. The concession owner may apply for a second 50-year term. Property tax payments of MX$2.03M were made in January and July of 2023 and MX$2.12M were paid in January of 2024 by Vizsla. Additionally, the company paid MX$2.42M of outstanding taxes in May 2024, for the recently acquired El Richard and San Enrique claims.
|
|
Figure 4-1: Property Location Map

Source: Vizsla, 2024
|
|
Figure 4-2: Mining Concessions (WGS 84 UTM Zone 13N)
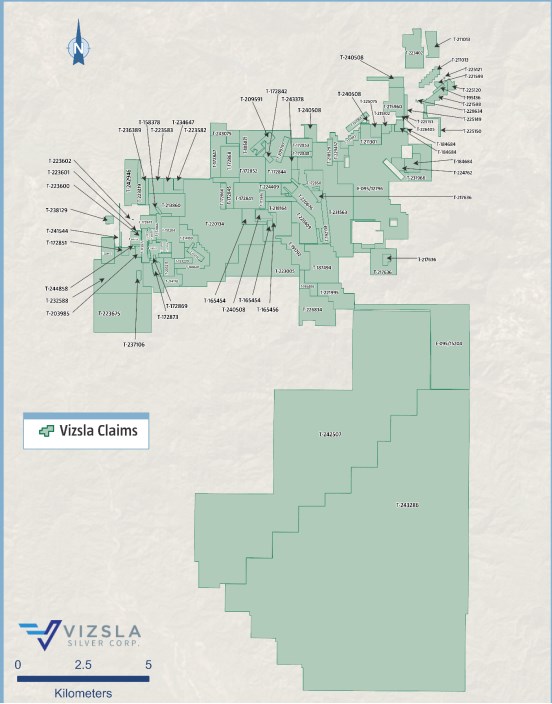
Source: Vizsla, 2024
|
|
Table 4-1: Property Mineral Concessions Held 100% By Vizsla
Title Name | Title Number | Issue Date | Expiry Date | Area (ha) |
San Carlos* | 151204 | 26-Mar-69 | 25-Mar-69 | 98 |
Amp. a la Casualidad* | 153220 | 30-Jul-20 | 29-Jul-70 | 14 |
La Esmeralda* | 158378 | 29-Mar-23 | 28-Mar-73 | 2.9728 |
Mazatlan* | 158416 | 30-Mar-23 | 29-Mar-73 | 23.7804 |
Clemens* | 165452 | 18-Oct-79 | 17-Oct-29 | 11.6195 |
Nuevo Refugio III* | 187494 | 5-Jul-90 | 4-Jul-40 | 171.3344 |
Amp. de San Carlos* | 189601 | 5-Dec-90 | 4-Dec-40 | 62.2643 |
Cordon del Oro* | 191792 | 19-Dec-91 | 18-Dec-41 | 100 |
Nuevo Refugio II* | 192134 | 19-Dec-91 | 18-Dec-41 | 49.7339 |
Nuevo Refugio IV* | 195406 | 14-Sep-92 | 13-Sep-42 | 33 |
Liliana* | 203370 | 19-Jul-96 | 18-Jul-46 | 12.7018 |
Laura* | 205215 | 8-Jul-97 | 7-Jul-47 | 28 |
San Carlos Dos* | 212112 | 29-Aug-00 | 30-Aug-50 | 16 |
Ampl. Cordon del Oro* | 218164 | 11-Oct-02 | 10-Oct-52 | 117.631 |
Nuevo Refugio I* | 220409 | 25-Jul-03 | 24-Jul-53 | 110.5006 |
Nueva Argentita* | 221598 | 4-Mar-04 | 3-Mar-54 | 32.8499 |
Nueva Argentita Fracc. I* | 221599 | 4-Mar-04 | 3-Mar-54 | 5.2532 |
Cordon del Oro Sur* | 221995 | 27-Apr-04 | 26-Apr-54 | 96 |
San Carlos Tres* | 221994 | 27-Apr-04 | 26-Apr-54 | 7.3847 |
Nueva Sierrita* | 223402 | 10-Dec-04 | 9-Dec-54 | 96.3188 |
Nuevo Remedios* | 223419 | 14-Dec-04 | 13-Dec-54 | 38.2786 |
La Olvidada* | 223599 | 21-Jan-05 | 20-Jan-55 | 0.6176 |
Nuevo Remedios Fracc. 1* | 223600 | 21-Jan-05 | 20-Jan-55 | 0.7091 |
Nuevo Remedios Fracc. 2* | 223601 | 21-Jan-05 | 20-Jan-55 | 0.2533 |
Nuevo Remedios Fracc. 3* | 223602 | 21-Jan-05 | 20-Jan-55 | 0.0667 |
El Trece Sur* | 223675 | 2-Feb-05 | 1-Feb-55 | 330 |
Ampl. La Reforma* | 211301 | 28-Apr-00 | 27-Apr-50 | 43.8826 |
Fracc. Ampl. La Reforma* | 211302 | 28-Apr-00 | 27-Apr-50 | 13.3141 |
La Providencia* | 213860 | 2-Jul-01 | 2-Jul-51 | 112.2468 |
Dos en Uno* | 214169 | 9-Aug-01 | 9-Aug-51 | 43.1376 |
Dos en Uno Fraccion* | 214170 | 9-Jul-01 | 9-Aug-51 | 94.8158 |
La Esperanza* | 214099 | 9-Aug-01 | 9-Aug-51 | 42.6467 |
La Sencilla* | 215960 | 1-Apr-02 | 1-Apr-52 | 80.723 |
San Jose de la Plata* | 220134 | 12-Jun-03 | 11-Jun-53 | 701.4589 |
San Jose del Refugio* | 220676 | 12-Sep-03 | 11-Sep-53 | 146.0569 |
|
|
Title Name | Title Number | Issue Date | Expiry Date | Area (ha) |
La Fortuna* | 223005 | 30-Sep-04 | 29-Sep-54 | 288.4859 |
El Brillante* | 225120 | 22-Jul-05 | 21-Jul-55 | 9.9325 |
El Brillante Fracc. 1 | 225121 | 22-Jul-05 | 21-Jul-55 | 0.3259 |
3 en 1* | 225149 | 26-Jul-05 | 25-Jul-55 | 9.677 |
3 en 1 Fracc. 1* | 225150 | 26-Jul-05 | 25-Jul-55 | 12.2476 |
3 en 1 Fracc. 2* | 225151 | 26-Jul-05 | 25-Jul-55 | 0.0786 |
3 en 1 Fracc. 3* | 225152 | 26-Jul-05 | 25-Jul-55 | 2.735 |
Santa Rosa* | 225353 | 24-Aug-05 | 23-Aug-55 | 33.6247 |
El Encino* | 226404 | 13-Jan-06 | 12-Jan-56 | 14.0066 |
El Encino Fracc. 1* | 226405 | 13-Jan-06 | 12-Jan-56 | 0.9327 |
Sta. Angela* | 228412 | 10-Nov-06 | 9-Nov-56 | 50 |
Nueva Argentita Fracc. II* | 228634 | 15-Dec-06 | 14-Dec-56 | 0.5647 |
El Coco | 231563 | 7-Mar-08 | 6-Mar-58 | 354.9912 |
El Trece* | 232588 | 10-Sep-08 | 9-Sep-58 | 265.9922 |
Carlos IV* | 232777 | 21-Oct-08 | 20-Oct-58 | 11.3962 |
La Guasima | 234647 | 24-Jul-09 | 23-Jul-59 | 24.3958 |
Unificacion Refugio* | 224409 | 4-May-05 | 3-May-55 | 39.9221 |
Guayanera* | 224507 | 17-May-05 | 16-May-55 | 19.3092 |
Nueva Reforma* | 225075 | 12-Jul-05 | 11-Jul-55 | 18.9332 |
La Guasimita* | 236389 | 18-Jun-10 | 17-Oct-60 | 16.9601 |
Purpura | 236551 | 9-Jul-10 | 8-Jul-60 | 0.6882 |
Purpura Fraccion II | 236553 | 9-Jul-10 | 8-Jul-60 | 0.1966 |
Purpura Fraccion I | 236552 | 9-Jul-10 | 8-Jul-60 | 0.5832 |
El Tesoro | 237106 | 29-Oct-10 | 28-Oct-60 | 6.5443 |
Ariana | 241544 | 19-Dec-12 | 18-Dec-62 | 5.0017 |
Minillas* | 242946 | 2-Apr-14 | 1-Apr-64 | 86.7828 |
Panuco Num. Dos | 172867 | 29-Jun-84 | 28-Jun-34 | 71.9225 |
Panuco Numero Tres | 172852 | 29-Jun-84 | 28-Jun-34 | 99.861 |
Panuco No. 4 | 172844 | 29-Jun-84 | 28-Jun-34 | 90.6725 |
Panuco No. 5 | 172841 | 29-Jun-84 | 28-Jun-34 | 100 |
Panuco Seis | 172866 | 29-Jun-84 | 28-Jun-34 | 20 |
San Jose de Panuco | 172847 | 29-Jun-84 | 28-Jun-34 | 77 |
Nueva Sorpresa | 172846 | 29-Jun-84 | 28-Jun-34 | 14 |
El Siglo | 172848 | 29-Jun-84 | 28-Jun-34 | 16 |
Nueva Constancia | 172850 | 29-Jun-84 | 28-Jun-34 | 47.8548 |
San Francisco | 172853 | 29-Jun-84 | 28-Jun-34 | 40 |
San Jorge | 172868 | 29-Jun-84 | 28-Jun-34 | 84 |
|
|
Title Name | Title Number | Issue Date | Expiry Date | Area (ha) |
Nueva Luisa | 172845 | 29-Jun-84 | 28-Jun-34 | 50 |
La Bomba | 172842 | 29-Jun-84 | 28-Jun-34 | 8 |
Luz | 209797 | 9-Aug-99 | 8-Aug-49 | 19.9682 |
La Angelita | 172869 | 29-Jun-84 | 28-Jun-34 | 1.5 |
Patricia | 172872 | 29-Jun-84 | 28-Jun-34 | 28.1437 |
Alma Rosa | 172873 | 29-Jun-84 | 28-Jun-34 | 13.6864 |
Santa Elena lll | 172851 | 29-Jun-84 | 28-Jun-34 | 9 |
Los Remedios | 172843 | 29-Jun-84 | 28-Jun-34 | 30 |
Montana 3 | 172870 | 29-Jun-84 | 28-Jun-34 | 28.5563 |
Montana 4 | 180372 | 24-Mar-87 | 24-Mar-37 | 9.172 |
Montana 5 | 172876 | 29-Jun-84 | 28-Jun-34 | 0.4159 |
Montana 6 | 172875 | 29-Jun-84 | 28-Jun-34 | 3.786 |
Montana 7 | 172871 | 29-Jun-84 | 28-Jun-34 | 10.0165 |
La Galeana | 218529 | 5-Nov-02 | 4-Nov-52 | 20 |
La Galeana lV | 236390 | 18-Jun-10 | 17-Jun-60 | 27.3181 |
La Fortuna | 221292 | 20-Jan-04 | 19-Jan-54 | 26.1068 |
La Fortuna Fraccion | 221293 | 20-Jan-04 | 19-Jan-54 | 1.9765 |
San Dimas ll | 217636 | 6-Aug-02 | 5-Aug-52 | 80 |
El Nacaral | 157062 | 21-Jun-22 | 20-Jun-72 | 20 |
Diego | 238129 | 29-Jul-11 | 28-Jul-61 | 9 |
El Mojocuan 2 | 240508 | 12-Jun-12 | 11-Jun-62 | 19.6224 |
Nueva Santa Rosa | 165454 | 18-Oct-79 | 17-Oct-29 | 37.8867 |
Oro Fino | 165455 | 18-Oct-79 | 19-Oct-29 | 8 |
Sandra | 209591 | 3-Aug-99 | 2-Aug-49 | 23.4924 |
Diego l | 246778 | 23-Nov-18 | 22-Nov-68 | 19.5869 |
Los Cristos | 243378 | 12-Sep-14 | 11-Sep-64 | 11.424 |
La Galeana ll | 229457 | 24-Apr-07 | 23-Apr-57 | 41.935 |
Napoleon | 172874 | 29-Jun-84 | 28-Jun-84 | 6 |
Nuevo San Dimas | 193647 | 19-Dec-91 | 18-Dec-41 | 11 |
Constancia Dos | 172849 | 29-Jun-84 | 28-Jun-34 | 22.014 |
Constancia Uno | 183577 | 17-Nov-88 | 16-Nov-38 | 12.234 |
Mojocuan 22 | 222623 | 30-Jun-04 | 30-Jun-54 | 4.591 |
El Lucero | 226834 | 3-Oct-06 | 3-Oct-56 | 145.3505 |
San Antonio | 165456 | 18-Oct-79 | 17-Oct-29 | 7.2862 |
La Cruz Negra | 203895 | 26-Nov-96 | 25-Nov-46 | 11.3079 |
La Cruz Negra 2 | 244858 | 16-Feb-16 | 15-Feb-66 | 3.444 |
Maria Chuchena | 243075 | 30-May-14 | 29-May-64 | 54.9574 |
|
|
Title Name | Title Number | Issue Date | Expiry Date | Area (ha) |
Los Compadres | 184684 | 22-Nov-89 | 20-Nov-39 | 36.90 |
Jesusita | 195136 | 25-Aug-92 | 24-Aug-42 | 5.2081 |
Nuestra Señora del Rosario | 223582 | 18-Jan-05 | 17-Jan-55 | 21.679 |
El Oregano | 224762 | 7-Jun-05 | 6-Jun-55 | 20.50 |
El Oregano 2 | 231966 | 23-May-08 | 22-May-58 | 129.19 |
Panuco Num Uno | 185871 | 14-Dec-89 | 13-Dec-39 | 85.81 |
Santa Lucia | 211013 | 15-Mar-00 | 14-Mar-50 | 27.00 |
Santa Maria | 223583 | 18-Jan-05 | 17-Jan-55 | 33.6334 |
Richard Fraccion A | 242507 | 31-Oct-13 | 30-Oct-63 | 3,688.645 |
San Enrique | 243286 | 29-Aug-14 | 28-Aug-64 | 6,978.3929 |
Sub-Total: Mining Concessions |
|
|
| 16,536.9079 |
Libertad (Pending) | E-095-15204 |
|
| 633 |
La Galeana III (Pending) | E-095-12796 |
|
| 688.1488 |
Sub-Total: Mineral Concessions |
|
|
| 1,321.15 |
Total |
|
|
| 17,858.0576 |
Note: *Concession has 3% NSR to Compania Minera Bacis, S.A. de C.V. Vizsla has the right to buy back 1.5% of the 3% NSR for US$1.9M
4.3 Underlying Agreements
4.3.1 Canam Alpine Ventures Ltd.
On November 6, 2019, Vizsla closed a share purchase agreement to purchase Canam Alpine Ventures Ltd. (Canam) for C$45,000 and 6.0M common shares and 12.0M common shares of Vizsla on the occurrence of milestone events as follows:
- Milestone event 1: 6.5M shares upon exercise of any defined options Milestone event 2: 5.5M shares upon definition of a resource greater than 200,000 gold-equivalent ounces (AuEq oz).
The payment shares are subject to voluntary pooling restrictions, with 12.5% released each quarter.
Further, a finder's fee of 750,000 shares is payable by Vizsla to Doug Seaton of Nakusp, British Columbia (B.C.) in the following increments:
250,000 shares on signing,
250,000 shares upon the occurrence of milestone event 1 as stated above, and
250,000 shares the occurrence of milestone event 2 as stated above.
|
|
4.3.2 Silverstone Resources S.A. de C.V.
On July 20, 2021, Vizsla Corp announced that it had executed a binding option exercise notice ("Copala Exercise Notice") with Silverstone Resources. The executed agreement constituted accelerating and exercising the Company's option to acquire 100% of the Copala silver-gold district.
Upon closing of the transactions contemplated by the Copala Amending Agreement, Vizsla acquired a 100% ownership interest in the Copala Property (comprising 64 mining concessions with a combined surface area of
5,547 ha) in consideration for:
A cash payment of US$9,500,000 was paid to Copala upon the completion of the transfer of the Copala Property on August 3, 2021 (paid), and
The issuance to Copala of 4,944,672 common shares of Vizsla priced at C$2.44 per share upon the completion of the transfer of the Copala Property (issued).
4.3.3 Minera Rio Panuco S.A. de C.V.
On July 21, 2021, Vizsla announced that it had signed an agreement with Minera Rio Panuco (MRP). Upon closing, Vizsla acquired a 100% ownership interest in the Property (comprising 43 mining concessions with a combined surface area of 3,839 ha and the "El Coco" mill (the Mill) in consideration for:
A cash payment of US$4,250,000 was paid to MRP upon signing of the Amending Agreement,
The issuance to MRP of 6,245,902 common shares of Vizsla priced at C$2.44 per share (for a total value of US$12,000,000), and
A cash payment of US$6,100,000 on February 1, 2022, following the refurbishment and transfer of ownership of the mill, which is to occur on January 31, 2022. US$250,000 was paid on August 19, 2021, and US$850,000 was paid on February 1, 2022, for the mineral claims around the Coco mill. US$5.0M was paid for the receipt of the mill in good standing.
4.3.4 Strategic Investment in Prismo Metals
On January 9, 2023, Vizsla closed a strategic investment into Prismo Metals Inc. (Prismo). Under the Strategic Investment, the Company acquired 1) a right of first refusal to purchase the Palos Verdes project from Prismo, and 2) 4,000,000 units of Prismo, for aggregate consideration of C$2,000,000. The consideration for the Strategic Investment consisted of a cash payment of C$500,000 and 1,000,000 common shares of Vizsla. In connection with the Strategic Investment, Prismo and Vizsla formed a technical committee to pursue district-scale exploration of the Panuco silver-gold district.
4.3.5 Royalty Spin Out
On January 17, 2024, Vizsla announced its intention to spin out the shares of Vizsla Royalties Corp, a wholly owned subsidiary of Vizsla, to the Company's shareholders. Vizsla Royalties currently holds, indirectly, a net smelter royalty (the "Royalty") on any potential future mineral production at Vizsla's flagship, 100% owned Panuco silver-gold project located in Sinaloa, Mexico.
|
|
The Royalty consists of: (i) a 2.0% net smelter return royalty on certain unencumbered concessions comprising the Project; and (ii) a 0.5% net smelter return royalty on certain encumbered concessions comprising the Project, which have a pre-existing 3.0% net smelter return royalty (the "Underlying Royalty").
Vizsla is also expected to: (i) transfer to Vizsla Royalties the right to purchase one-half of the 3% Underlying Royalty; (ii) grant Vizsla Royalties the right to acquire a royalty on any future projects acquired by Vizsla in the 24-month period after completion of the Spinout, which right would automatically terminate upon a change of control of Vizsla Royalties or Vizsla and (iii) make a cash injection into Vizsla Royalties.
4.3.6 San Enrique Acquisition
On March 5, 2024, Vizsla, through its subsidiary Minera Canam, S.A. de C.V., entered into a share purchase Acquisition Agreement with Inca Azteca Gold S.A.P.I. de C.V. for two large claims comprising 10,667.00 Ha (the "San Enrique prospect") located south and partially adjacent to Panuco District. Pursuant to the Acquisition Agreement, the company issued 448,137 common shares at a price of C$1.97 for total consideration of C$882,830 (US$650,000).
4.4 Surface Rights
Most of the surface rights in the municipality of Concordia are owned by Ejidos, which are areas of communal land used for agriculture. Community members individually farm designated parcels and collectively maintain communal holdings comprising the ejido. Ejidos are registered with Mexico's National Agrarian Registry (Registro Agrario Nacional).
Surface rights to most of the land underlying the Project area are owned by six ejidos (Figure 4-3). Mining concession owners have the right to obtain the expropriation, temporary occupancy, or creation of land easements required to complete exploration and mining work, including the deposit of rock dumps, tailings, and slag. Vizsla has surface-access agreements. Material terms of the surface-access agreements are summarized below.
|
|
Figure 4-3: Location of Ejidos and Outline of Panuco Project
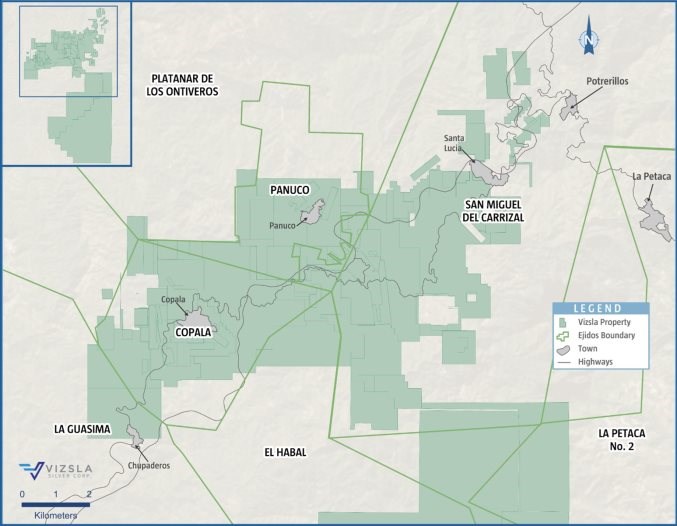
Source: Vizsla, 2024
4.4.1 Canam and Ejido Panuco
A 30-year agreement was executed February 13, 2022, between Canam and Ejido Panuco with the right to an additional 30-year extension. The exploration, Mining and Operation activities are included in the occupancy agreement. The total area is 960.97 hain the Ejido area with additional rights to extend areas for consideration per hectare.
4.4.2 Canam, and Ejido Platanar de los Ontiverose
A 30-year agreement was executed January 22, 2023, between Canam and Ejido Platanar de los Ontiveros with the right to an additional 30-year extension. The exploration, Mining and Operation activities are included in the occupancy agreement. The total area is 500.00 ha in the Ejido area with additional rights to extend areas for consideration per hectare.
|
|
4.4.3 Canam and Comunidad Copala
A 30-year term agreement with the right to an additional 30-year extension between Canam and Comunidad Copala with anticipated termination as convenient to Canam was established on December 12, 2021. The agreement outlines rights for Exploration, Mining, and Operation activities included in the occupancy agreement. The area is 1,942.35 ha out of 2,227.63 ha of total Ejido area, with a right to extend the area as required by Canam with the same consideration per hectare.
4.4.4 Canam and El Habal Ejido
A 30-year agreement was executed on September 12, 2021, between Canam and El Habal Ejido with rights to an additional 30-year extension and anticipated termination as convenient to Canam. The rights are to Exploration, Mining and Operation activities. The area is 427.88 ha out of 4,395 ha of total Ejido area, with a right to extend the area as required by Canam with the same consideration per hectare.
4.4.5 Canam and San Miguel Del Carrizal
A 30-year agreement was executed February 04, 2024, between Canam and Ejido San Miguel Del Carrizal with the right to an additional 30-year extension. The exploration, Mining and Operation activities are included in the occupancy agreement. The total area is 7,122.20 ha in the Ejido area with additional rights to extend areas for consideration per hectare.
4.5 Permits
Exploration and mining activities in Mexico are regulated by the General Law of Ecological Equilibrium and Environmental Protection (Ley General de Equilibrio Ecologico y Proteccion al Ambiente [LGEEPA]), and the Regulations Environmental Impact Assessment [REIA]. Laws pertaining to mining and exploration activities are administered by SEMARNAT and the Federal Attorney for Environmental Protection (Procuraduria Federal de Proteccion al Ambiente [PROFEPA]) enforces SEMARNAT laws and policy.
Activities that exceed specified limits require authorization from SEMARNAT and comprise the presentation of an environmental impact assessment (Manifiesto de Impacto Ambiental [MIA]). SEMARNAT authorizes activities that fall below the specified threshold under Article 31 of the LGEEPA and require the submission of a report known as an Informe Preventivo.
Exploration activities that are expected to generate impacts to the physical or social environment that are assessed as potentially of low significance by the regulators are regulated under Norma Oficial Mexicana-120-SEMARNAT-2020 (NOM-120-SEMARNAT-2020), and its subsequent modifications.
The Project is not included within any of the specially protected, federally designated, ecological zones known as Áreas Naturales Protegidas (ANP).
|
|
The following permits issued by the Ministry of Environmental and Natural Resources to Minera Canam S.A. de C.V. are in force: an Informe Preventivo for the area of the Panuco ejido that permits drilling activities according with official notice DF/145/2.1. 1/0053/2020. 0060 dated January 21, 2020, a Drilling Permit that allows drilling activities according with official notice DF/145-2.1.1/0566/2020.-0765 dated December 01, 2020, and a MIA-P permit with official notice DF/145/2.1.1-0272/.-0566 dated April 29, 2021.
There are no development permits currently obtained for the Project. The major permits required for the project include the following: the Environmental Impact Statement (MIA), Land Use Change (CUS), Risk Analysis (RA), a construction permit from the local municipality, an archaeological release letter from the National Institute of Anthropology and History (INAH), explosives permit from the Ministry of Defence prior to construction and a Social Impact Assessment study must be submitted prior to construction of the electrical transmission line. The timeline to secure these permits varies from 90 to 240 business days.
4.6 Environmental Considerations
The Panuco Project is within the Panuco-Copala mining district and has been subject to extensive historical mining since 1565. The mineralized bodies and the enclosing host rocks are anomalous in base and precious metals and have generated elevated metal values in sediments that extend well beyond known workings. The mineralized veins have low contents of sulfide minerals, but may have the potential for acid rock drainage (ARD) and subsequent metal leaching. Vizsla's Coco Mill and tailings storage facility are located on the Property; the mill is currently idle, and the associated tailings storage facility is at capacity. The El Arco (aka Manuel Hernández) and Santa Rosa plants are also located on the Property but are not under the control of Vizsla. Other old mine workings, excavations, and dumps are on and adjacent to the Property. Some of the previously referenced disturbance is on mining lands held by Vizsla, while others are on lands held by third parties.
Environmental impacts within the Project site result from historical activities and through current and intermittent operations of surrounding mines by third parties, and by informal and unauthorized miners working when companies are inactive. Under the Mexican environmental and regulatory system, these impacts due to historical activities are considered pre-existing environmental liabilities deemed not significant and acknowledged by regulators.
4.7 Other Relevant Factors
The Project has no outstanding environmental liabilities from prior mining activities. The QP is unaware of any other significant factors and risks that may affect access, title, or the right, or ability to perform exploration work recommended for the Property.
|
|
5 ACCESSIBILITY, CLIMATE, LOCAL RESOURCES, INFRASTRUCTURE AND PHYSIOGRAPHY
5.1 Accessibility
The Panuco Project area is located 80 km by road northeast of the city of Mazatlán, accessed via Federal Highway 15 to Villa Union, then on either Highway 40 or Highway 40D (Figure 4-1) . Drive time from Mazatlán to the Project is approximately one hour and 45 minutes. Highway 40 crosscuts the Project area and most of the vein structures. Toll Highway 40D also crosses the Project. In addition, local dirt roads provide access to most of the workings, but some require repairs or are overgrown, and four-wheel-drive vehicles are recommended in the wet season.
5.2 Local Resources and Infrastructure
The Project is in the Concordia municipality, which has a population of 27,000 inhabitants. Public services, including health clinics and police, are in the town of Concordia. Residents provide an experienced mine labour force. Contractors in Durango and Hermosillo have a strong mining tradition and provide the Project with a local source of knowledgeable labour and contract mining services. Drilling companies and mining contractors are available in Mazatlán, Durango, Hermosillo, Zacatecas, Fresnillo, and other areas of Mexico. The Project area is also used for cattle grazing, with limited agricultural use.
Two power lines connecting Durango and Mazatlán cross the Project, with 400 kV and 230 kV capacities.
Vizsla owns the 500 tonnes per day (tpd) Coco mill on its property. In addition, there are some mineral processing plants held by third parties in the district that range from 200 to 700 tpd in capacity.
5.3 Climate
The climate is subtropical, with heavy rain in June through September. Summer temperatures reach 40°C, and the minimum winter temperature is close to 10°C. The average rainfall is around 1,100 mm, with the majority falling in the June to September rainy season. The area has sufficient water for exploration and mining purposes. Work on the Property, including drilling, can be conducted year-round.
5.4 Physiography
The Project area is in the Barranca sub-province of the Sierra Madre Occidental Physiographic province; mountain ranges characterize the province's topography up to 1,640 m, cut by steep gorges. Historic mine workings and mineralized structures on the Project generally occur between 500 and 1,000 m above sea level (asl). The principal drainages are the northerly trending Rio Baluarte east of the Property and the northeasterly trending Rio Presidio to the north. Dendritic intermittent streams feed the rivers. Project vegetation is mainly dry tropical forest comprising tropical bushes and shrubs at lower elevations and oak and pine forest at higher elevations.
|
|
5.5 Vegetation and Wildlife
Most of the vegetation in the Project area is classified as "selva baja caducifolia", which is characterized mainly by trees less than 15 m tall. Typical plant species include tepemezquite, ebano, tepehuaje, huanacaxtle, berraco, amapa, apomo, cedro, nacario and garabato. At higher elevations, the temperatures are cooler, and vegetation is characterized as "bosque templado" (temperate forest). Plants typical of the higher areas are encino, madroño, chicle, palo cuate, arrancillo, vainillo, maguey and guasima. Animals in the Project area include jaguars, squirrels, rabbits, coyotes, rats, foxes, deer, bats, tejónes, guacamayas, rattlesnakes and iguanas.
|
|
6 HISTORY
6.1 Property Exploration History
Capitan Francisco de Ibarra founded Concordia in 1565, and gold and silver veins in Panuco and Copala were first exploited in the centuries that followed (Sim, 2008 and Robinson, 2019). Although production has been carried out on the Panuco Project over the last 460 years, no production records are available to Vizsla.
The first recorded modern mining activity on the Property commenced late in the 20th century. The Mineral Resources Council (Consejo de Recursos Minerales, the predecessor of the Mexican Geological Service [SGM]) carried out 1:50,000 scale mapping on map sheet F13-A37 and fine-fraction stream sediment sampling in 1999 (Avila-Ramirez, 1999). In 2003, the Consejo de Recursos Minerales published additional 1:50,000 scale mapping on map sheet F13-A36, and fine-fraction stream sediment sampling (Polanco-Salas et al., 2003). In 2019 the SGM conducted 1:50,000 scale geological mapping and fine-fraction stream sediment sampling on map sheet F13-A46 (Rosendo-Brito et al., 2019).
In 1989 the Consejo de Recursos Minerales optioned and sold several mineral concessions in the district, including to Grupo Minera Bacis (Bacis) in 1989. Bacis subsequently acquired claims from other parties active in the area, including Minas del Oro y del Refugio S.A. de C.V. Bacis drilled 19 holes totalling 2,822.8 m along the Animas-Refugio corridor, but only collar and survey records exist of this work.
From 1999 to 2001, Minera Rio Panuco S.A. de C.V. (Rio Panuco) explored the Animas-Refugio and Cordon del Oro structures culminating in 45 holes, for 8,358.6 m. No geological drill logs, downhole survey data, downhole sample data or downhole geochemical assay data have been preserved. Graphic drill-hole sections are available, with limited downhole geology and geochemical data. The Rio Panuco drill data cannot be relied upon, as material data are unavailable for hole deviation, core recovery, assaying, or quality assurance/quality control (QA/QC).
Capstone Mining Corp. (Capstone) optioned the Bacis concessions in 2004 and carried out geologic mapping and sampling of the Animas-Refugio and Cordon del Oro structures. In 2005, Capstone drilled 15,374.0 m in 131 holes on down-dip extensions of the Clemens and El Muerto mines on the Animas-Refugio vein. In 2007, Capstone explored the La Colorada structure with surface mapping and sampling followed by 6,659.0 m of drilling in 64 holes.
Also, in 2007, Capstone transferred the claims of the Copala, Claudia, Promontorio, Montoros, and Martha projects to Silverstone Corp. (Silverstone). Capstone and Silverstone completed 21,641.0 m of drilling in 200 holes from 2005 to 2008 (Christopher and Sim, 2008).
Christopher and Sim (2008) prepared two Mineral Resource estimates on the property for Silverstone on October 16, 2008. The Mineral Resource estimates were prepared for the La Colorada vein-manto and the La Pipa, El Muerto and Clemens portions of the Animas-Refugio Vein.
Silverstone merged with Silver Wheaton Ltd. (Silver Wheaton) in 2009 and Silver Wheaton subsequently sold the shares of concession owner Silverstone to Mexican owners. The Silverstone owners mined out a portion of the Mineral Resource defined in 2008 over the next decade. Silverstone mined parts of the Clemens, El Muerto, La Pipa, Mariposa, El 40, and San Martin mineralized shoots until mining encountered the water table, preventing further mining. Silverstone or unauthorized mining activity in the intervening years exploited most of the Mineral Resources estimated by Christopher and Sim (2008).
|
|
Rio Panuco contracted Geophysical Surveys S.A. de C.V. of Mexico City in 2016 to conduct an airborne magnetics survey. However, no data is available, and no survey or flight specifications are included in the report. The survey was flown in two blocks.
In 2019, Silverstone and Rio Panuco optioned their mineral concessions to Canam.
|
|
7 GEOLOGICAL SETTING AND MINERALIZATION
7.1 Regional Geology
The Project is on the western margin of the Sierra Madre Occidental (SMO), a high plateau and physiographic province that extends from the U.S.A.-Mexico border to the east-trending Trans-Mexican Volcanic Belt (Figure 7-1). The SMO is a Large Igneous Province (LIP) recording continental magmatic activity from the Late Cretaceous to the Miocene in three main episodes. The first episode, termed the Lower Volcanic Complex (LVC), comprises a suite of intrusive bodies, including the Sonora, Sinaloa, and Jalisco batholiths and andesitic volcanic rock units with minor dacite and rhyolite tuffs and ignimbrites that are correlative with the Tarahumara Formation in Sonora of Late Cretaceous to Eocene age. The second magmatic episode is dominated by rhyolitic ignimbrites and tuffs that built one of the earth's largest silicic volcanic provinces and has been termed the Upper Volcanic Supergroup (UVS). These dominantly rhyolitic units were extruded in two episodes, from about 32 to 28 Ma and 24 to 20 Ma. These two periods of magmatic activity are associated with the subduction of the Farallon plate under North America and the Laramide orogeny that occurred between the Upper Cretaceous - Paleocene and the Eocene. The third episode comprises post-subduction alkali basalts and ignimbrites associated with the opening of the Gulf of California between the late Miocene and Pleistocene - Quaternary.
The western part of the SMO in Sonora and Sinaloa is cut by north-northwest-trending normal fault systems developed during the opening of the Gulf of California between 27 and 15 Ma. The normal fault systems favoured the formation of elongated basins that were subsequently filled with continental sedimentary rocks. The basins occur in a north-northwest-trending belt extending from western Sonora to most of Sinaloa.
The basement to the SMO is locally exposed in northern Sinaloa, near Mazatlan and on small outcrops within the project area. It comprises folded metasedimentary and metavolcanic rocks, deformed granitoids, phyllitic sandstones, quartzites, and schists of the Tahue terrane of Jurassic to Early Cretaceous age (Montoya-Lopera et al., 2019, Sedlock et al., 1993 and Campa and Coney 1982).
In the broader Project area, the LVC comprises granite, granodiorite, and diorite intrusive phases correlative with the Late Cretaceous to Early Paleocene San Ignacio and Eocene Piaxtla batholiths in San Dimas district. The andesite lavas, rhyolite-dacite tuffs, and ignimbrites are locally intruded by the Late Cretaceous to Early Paleocene intrusive phases and younger Eocene-Oligocene felsic dikes and domes. Northwest trending intermontane basins filled with continental conglomerates and sandstones incise the UVS and LVC in the Project area. The Oligocene age ignimbrites of the UVS occur east of the property towards Durango state.
The structure of the Project area is dominated by north-northwest-trending extensional and transtensional faults developed or reactivated during the Basin and Range tectonic event (~28 to 18 Ma). The extensional belt is associated with aligned rhyolite domes and dikes and Late Oligocene to Middle Miocene grabens (Figure 7-2). Figure 7-3 shows the regional geology of the area.
|
|
Figure 7-1: Metallogenic Setting Map. Illustrates Geological Setting of Western Mexico with Main Porphyry and Epithermal Deposits of the Sierra Madre Occidental

Source: Vizsla, 2024.
|
|
Figure 7-2: Regional Geologic Setting Map. Illustrates Regional Geological Central Sierra Madre Occidental
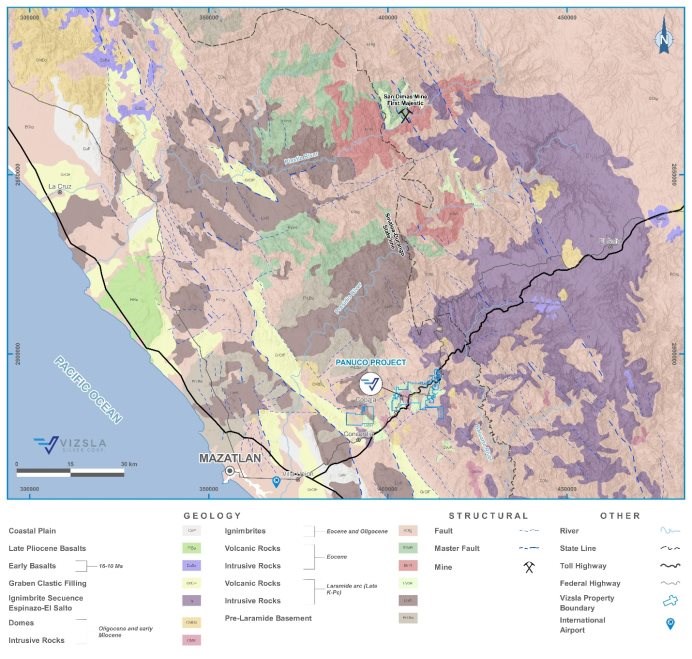
Source: Vizsla, 2024, adapted from Montoya-Lopera et al., 2019
|
|
Figure 7-3: Regional Geology Map
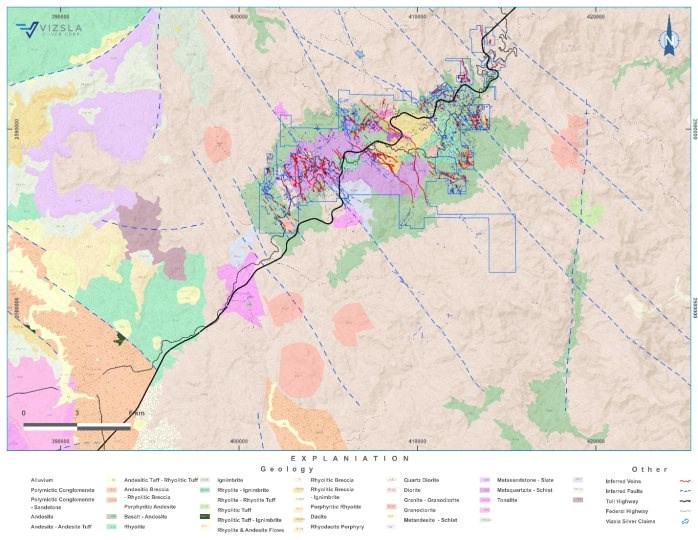
Source: Vizsla, 2024
7.2 Project Geology
The stratigraphic column in the Project consists predominantly of intrusive, volcanic and volcaniclastic rocks of intermediate to felsic composition of the LVC that have been intruded by younger domes and dikes of rhyolite and basalt compositions of the UVS. An approximately 9 by 3 km pluton of diorite to quartz diorite composition and lavas and tuffs of andesite composition are the district's main host lithologies of the epithermal veins. The rhyolites and dacites on top of the andesite (upper part of the LVS) host vein mineralization in a minor proportion. Fieldwork and interpretations conducted in the Project, indicate that the andesites of the LVC units are correlative with the Tarahumara formation of Sonora, and the ~77 to 69 Ma Socavon, Buelna and Portal members described in San Dimas.
|
|
| The rocks of the LVC in San Dimas are intruded by the Piaxtla batholith, dated at 49 to 44 Ma, whereas the age of epithermal mineralization has been constrained there between 41 and 37.8 (Enriquez et al, 2018 and Montoya et al, 2019). The diorite to quartz diorite pluton in Panuco has not been dated, but it is interpreted to be older than the Piaxtla intrusive, and correlative with the 64 Ma San Ignacio batholith dated by Montoya et al, (2019) in a locality west of San Dimas. Dating of two adularia samples by the 40Ar/39Ar method, from each of Napoleon and Copala, resolved Late Oligocene age for epithermal mineralization in Panuco. The rhyolite-dacite dome in the Animas zone, adjacent to the El Muerto mine shows strong silicification and quartz veining as well, suggesting post-dome emplacement hydrothermal activity in the area. A stratigraphic column is in Figure 7-4. |
Figure 7-4: Stratigraphic Column for the Project Area
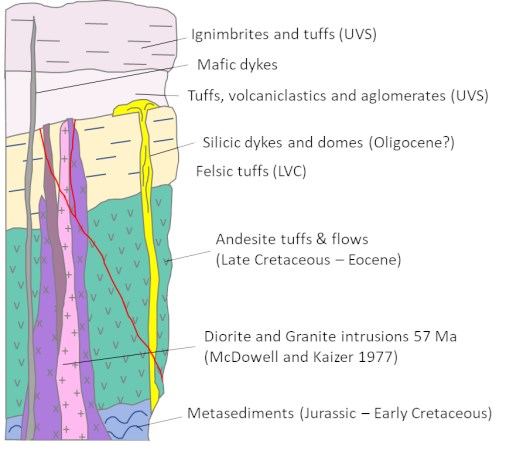
Source: Vizsla, 2023
Additionally, the Jurassic - Early Cretaceous basement (Tahue terrane), comprised of metasediments (phyllites and sandstones) has been recognized through tectonic/erosional "windows" into the LVS and in some drill holes. The basement rocks are unconformably overlain by the LVC andesites and felsic rocks of the Tarahumara Formation and are subsequently intruded by the diorite-granodiorite and granite plutons centered in the Panuco project. Locally, the diorite intrusion has been observed to contain clasts of the andesite in contact-breccias. Another intrusive phase of granodiorite to quartz-monzonite composition that may be coeval with the main diorite pluton, has been mapped in the footwall of the Animas-Refugio structure (Henry, 2003). The granite intrusion has a reported K/Ar age of 57 Ma (McDowell and Kayzer 1977), it outcrops around the Panuco town and has been observed to contain clasts of diorite. Granodiorite porphyry in Malpica located 30 km southeast of the Project area was dated at 54.2 Ma by K/Ar (Henry, 1975). Following the deposition of the Tarahumara andesites, a quiescence period in volcanism, concomitant with uplift and erosion, favoured the formation of lakes and deposition of water-lain hyaloclastites and volcaniclastics composed of alternating rhyolite and andesite tuffs of Eocene age. These volcaniclastic units are believed to be correlative with the Productive andesite member in San Dimas. The unit is hundreds of metres thick and has been intruded also by felsic stocks, plugs and dikes of the UVS.
|
|
The project area has recorded multiple deformation events associated with the subduction of the Farallon plate under North America and the opening of the Gulf of California from the Cretaceous to the Miocene. Starling (2019) recognized five main deformation episodes spanning the Laramide orogeny and Basin and Range and younger post-Miocene extension events:
D1 - early Laramide ENE compression and fold-thrust deformation (~80-60 Ma),
D2 - late Laramide NNE compression and contractional deformation (~60-40 Ma),
D3 - early post-Laramide N-S to NNE extension (~38-28 Ma)
D4 - main stage Basin and Range ENE extension (~28 - 18 Ma)
D5 - WNW extension in central and southern Mexico (~12 - 0 Ma)
According to Starling, the Laramide deformation is quite subtle but likely created some of the initial major structures that underlie the geometry of the later vein systems. Analysis of kinematic indicators in the Project conducted by Starling (2019), determined that epithermal mineralization occurred during a phase of north-northeast to northeast-southwest regional extension, which favored the development of the following mineralized trends:
WNW (~120°N) extensional/normal faults orthogonal to D3 extension but also likely to have originated as shears under D1 and D2 compression (e.g., Animas, Cordon de Oro),
NNW to N-S (~160-180°N) sinistral shears that helped to accommodate D3 extension (e.g., San Carlos, Napoleon) and conjugate with
ENE (~060°N) dextral shears (e.g., San Antonio), and
NNE (~020-040°N) steep tear faults formed sub-parallel to D3 extension.
Similarly, structural studies done in San Dimas by Horner and Enriquez (1999), report three major deformational events developing east-west, northeast-southwest and north-south sub-vertical structures carrying epithermal silver-gold mineralization. Major north-northwest-trending post-mineralization normal-faults, developed during the last deformation event, defined blocks tilted to the east-northeast or west-southwest (Horner J. T. and Enriquez E., 1999). The fault-tilted blocks are interpreted to be the result of a northeast-southwest extension like that observed in Panuco in D4.
|
|
The extensional event in Panuco was probably accompanied by significant hydrothermal activity that formed the district's epithermal veins. The hydrothermal activity must have been sufficiently strong and long-lived to develop veins with multiple orientations in Panuco. Pebble dikes, suggestive of extensive hydrothermal activity are present, although the paragenesis of the dykes with respect to mineralization has not been established. However, the pebble dykes appear to be concomitant with the widespread dissemination of fine-grained pyrite into the volcanic units. A late event of magmatism and extension favored the emplacement of post-mineralization rhyolite dikes along some of the mineralized structures. The rhyolite dikes appear to be synchronous with D4 extensional deformation, as they are locally dissected and/or necked. Finally, post-mineralization andesite dykes intruded the whole column; these dikes do not show evidence of faulting and are recognized as the youngest expression of magmatic activity in the Project.
It is interpreted that north-northeast extension developed a series of west-northwest-trending veins (Figure 7-5). Starling (2019) also noted that the low dipping angle of some of these veins and the observed tilting of rhyolites in the hanging wall of the Animas-Refugio structure, resulted from reactivated Laramide thrust-faults into listric faults, as seen in Figure 7-6. This geometry indicates the potential for multiple second-order, subparallel veins in the hanging walls of these west-northwest-trending veins. The mineralized shoots associated with these listric normal faults will tend to be sub horizontal to depth. The western part of the Project is characterized by the tilting of the volcanic sequence to the southwest, leading to the veins in the central part of the project having been more deeply eroded. Also, veins in the west portion of the district show shallower levels of exposure on surface consistent with weaker surface anomalies (e.g. La Luisa). Recent mapping works on the northeastern side of the property, at high-topographic elevation, indicate the veins are exposed to shallow levels and the recorded presence of kaolinite in at least a couple of vein outcrops suggests proximity to the paleosurface. Late- to post-mineral north-northwest, north-northeast, and east-northeast steep faults have partitioned the structural corridors, and the geometry and locations of economic shoots in each block may be distinct from neighboring blocks.
|
|
Figure 7-5: Property Geology Map Showing Claim Outline and Known Mineralized Structures
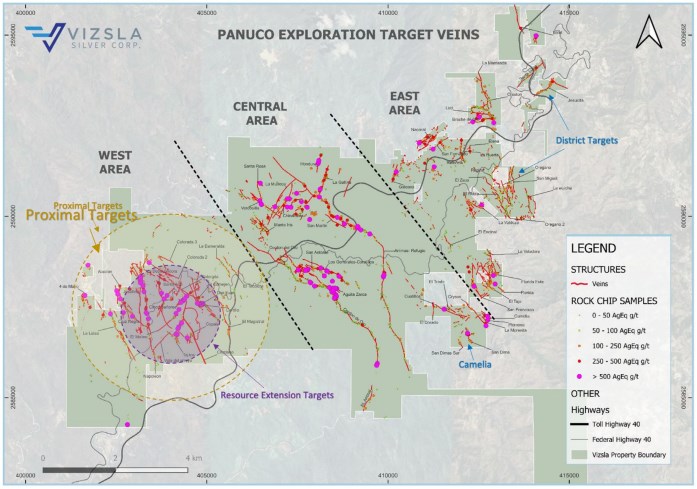
Source: Vizsla, 2023
|
|
Figure 7-6: Schematic Cross-Section of Panuco Veining Illustrating that Veins May Be Listric Faults Developed from Reactivated Laramide Thrust Faults (Starling 2019)
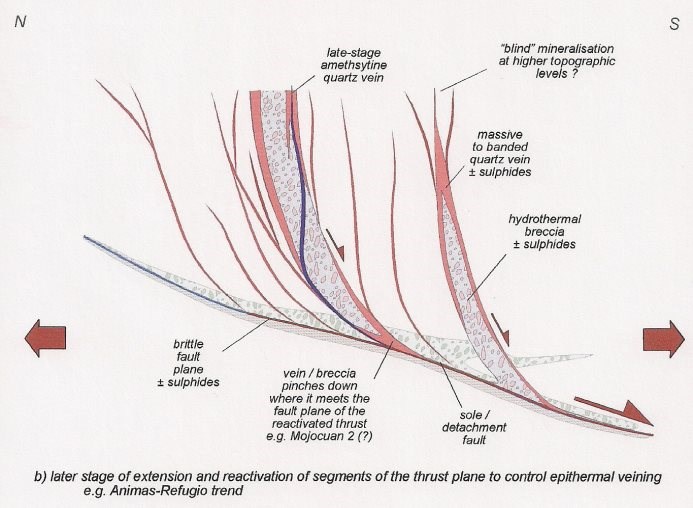
Source: Starling, 2019
7.3 Mineralization
Mineralization on the Panuco Property comprises several epithermal quartz veins. Previous workers and recent mapping and prospecting works conducted by Vizsla's geologists determined a cumulate length of veins traces of 86 km. Individual vein corridors are up to 7.6 km long and individual veins range from decimetres to greater than 10 m wide. Veins have narrow envelopes of silicification, and local argillic alteration, commonly marked by clay gouge. Propylitic alteration consisting of chlorite-epidote in patches and veins affecting the andesites and diorite are common either proximal or distal to the veins.
The primary mineralization along the vein corridors comprises hydrothermal quartz veins and breccias with evidence of four to five different quartz stages: generally white, grey and translucent and varying grain size from amorphous-microcrystalline-coarse. A late stage of amethyst quartz is also observed in some veins. The grey color in quartz is due to the presence of fine-grained disseminated sulfides, believed to be mainly pyrite and acanthite. Vizsla has defined several hydrothermal breccias with grey quartz occurring more commonly at lower levels of the vein structures. Barren to low grade, quartz is typically white and is more common in the upper parts of the veins and breccias. Locally, mineralized structures are cut by narrow, banded quartz veins with thin, dark argentite/acanthite, sphalerite, galena, and pyrite bands. Bladed and lattice quartz pseudomorphs after calcite have been noted at several locations within the veins and indicate boiling conditions during deposition. Later quartz veinlets cut all the mineralized zones with a mix of white quartz and purple amethyst. The amethyst is related to mixing near-surface waters as the hydrothermal system is collapsing, as has been noted in the nearby San Dimas district (Montoya-Lopera et al., 2019).
|
|
The Mineral Resource includes eleven mineralized vein systems: the Napoleon, Napoleon hanging wall, Josephine, and Cruz Negra veins; the Copala, Cristiano, Tajitos and Copala 2 veins; the San Antonio vein; and the Rosaritos and Cuevillas veins. These trends are west to east within the Napoleon, Cinco Senores, Cordon del Oro, and Animas-Refugio corridors. Table 7-1 presents a general description of the geometry of the seven veins comprising the bulk of the mineralization. The bulk of the resource veins strike north-northwest to north-northeast, with thicknesses varying from 1.5 m to over 10 m. Figure 7-7 shows the location of the veins included in the Mineral Resource Estimate.
Table 7-1: General Description of Estimated Veins Included in the Mineral Resources Estimate for the Panuco Project
Name | Orientation | Dimension | |||
Strike (°) | Dip (°) | Thickness | Strike | Dip | |
(m) | (m) | (m) | |||
Napoleon | 350 | 80-85 | 3.00 to 3.50 | 2,500 | 550 |
Josephine | 355 | 75-85 | 1.50 to 2.50 | 1,500 | 500 |
Napoleon HW | 350 | 60-65 | 2.00 to 3.00 | 2,000 | 250 |
Tajitos | 20 | 70-75 | 2.00 to 3.00 | 1,500 | 400 |
La Luisa | 155 | 70-80 | 1.10 to 11.20 | 1,670 | 450 |
Copala | 15 | 35-55 | 2.00 to 35.00 | 950 | 400 |
Copala 2 | 355 | 45-55 | 1.00 to 2.00 | 400 | 300 |
Cristiano | 330 | 80-90 | 0.50 to 3.00 | 500 | 300 |
San Antonio | 105 | 55-65 | 1.50 to 7.00 | 650 | 300 |
Rosaritos | 125 | 50-55 | 1.50 to 5.50 | 180 | 130 |
Cruz Negra | 325 | 75-85 | 0.50 to 2.50 | 400 | 200 |
Cuevillas | 30 | 80-55 | 0.40 to 1.80 | 200 | 200 |
|
|
Figure 7-7: Panuco Project Claims Showing Known Veins, Including the Four Resource Areas Comprising Eleven Veins Included in the Mineral Resource Estimate
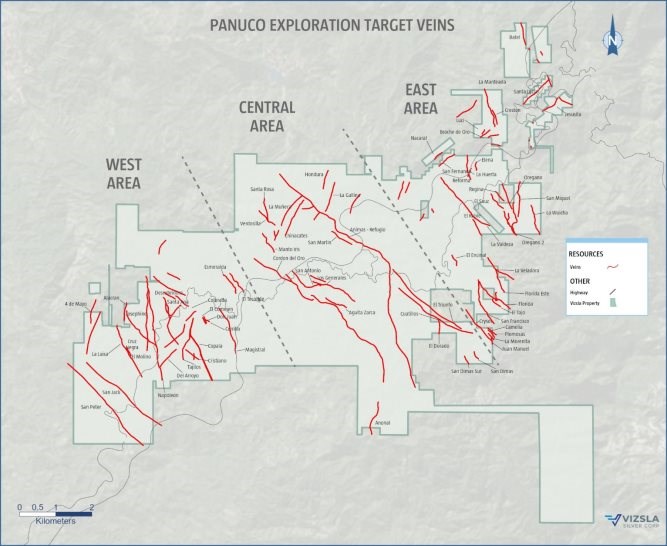
Source: Vizsla, 2024
7.3.1 Animas-Refugio Corridor
The Animas-Refugio structural corridor is a significant fault zone central in the Project area; it hosts the largest number of historical and current workings (Figure 7-8) and includes the Rosarito and Cuevillas veins reported in the current MRE. Overall, the corridor trends northwest southeast and dips moderately southwest. Typically, the fault zone that defines this corridor has a clay fault-gouge contact in either the hanging wall and or the footwall contact and ranges from a few metres to over 20 m wide. It has a strike length of over 7.2 km and extends from the San Carlos mine in the southeast to the claim boundary in the northwest. Historical references note that the corridor continues to the southeast of the San Carlos mine. Ten main mineralized shoots have been exploited along this corridor; from southeast to northwest these are San Carlos, Clemens, El Muerto, La Pipa, Mariposa, El 40, San Martin, El 150, El 200, Rosarito, and La Bomba. The oldest workings date back to the 1500s. Rosarito and Cuevillas in the northwest sector of Animas are included in the MRE in the Inferred Mineral Resource category. In addition to the main, moderately dipping, mineralized zone there are numerous secondary mineralized structures, including a hanging wall splay at the Mariposa mine and the Paloma vein.
|
|
The Animas-Refugio structural corridor was first drilled by Minera Bacis in the late 1990s, but no details of this work are available. MRP subsequently drilled the corridor between 1999 and 2001, and Silverstone between 2007 and 2008.
The hanging wall of the fault zone is composed of a package of water-lain volcanic rocks with interlayered andesite tuffs and flows and rhyolite tuffs higher up in the sequence. Quenched textures in andesite tuffs, like those observed in hyaloclastites, support deposition in aqueous environment. A fine-grained diorite has been observed at lower levels within the hanging wall section. The footwall package consists of fine- to medium-grained diorite to granodiorite.
The Animas-Refugio corridor is a reactivated northwest- to west-northwest-trending normal fault that dips to the southwest, likely reactivated from a Laramide-age thrust fault with its dip shallowing at depth Starling 2019. The structure is steeper in high topographies where the structure has preserved the upper portions of the system. The normal fault defining the Animas-Refugio corridor is interpreted as the east side of a graben structure, with the Cordon del Oro trend comprising the west side of the graben. The graben structure has been cut by north-northeast- and north-northwest-trending subvertical faults that accommodated extension during the main mineralizing phase. Slickensides on these cross faults show a shallow to moderate dip to the southwest, with minimal offset. The fault splays accommodate extension along the fault and do not offset the main trend of the Animas-Refugio structure. These cross faults appear to have provided local boundaries within the fault zone that control the intrusion of post-mineral andesite dykes.
Related to the Animas-Refugio corridor are a series of hanging-wall splays, such as the San Martin splay near the Mariposa mine, the Paloma vein proximal to the Rosarito and Cuevillas veins, and Nieves coming off La Bomba. These splays are near vertical, and subparallel to the Animas-Refugio trend, and their possible intersection zones with the main structure are attractive exploration targets. These veins vary from narrow 1 m-wide to over 4 m-wide structures and have been mined extensively down to the 575 m.a.s.l. level.
Rosarito is a re-brecciated vein consisting of white quartz cemented by white silica with minor and variable amounts of grey quartz patches and fine-grained sulfides. The vein strikes to the southeast, dipping 35° to the southwest, and is traceable 200 m on surface. The vein pinches and swells between 2 and 25 m with average width determined through mapping of 4 m. Drilling reported intervals with estimated true width of 2.13 m in average. Figure 7-9 shows a section with drilling intercepts of note for the Animas-Refugio vein.
|
|
Figure 7-8: Animas-Refugio Geology and Silver Geochemistry (Section A-A' Shown in Figure 7-9)

Source: Vizsla, 2023
|
|
Figure 7-9: Animas-Refugio Vein Cross-Section Looking Northwest
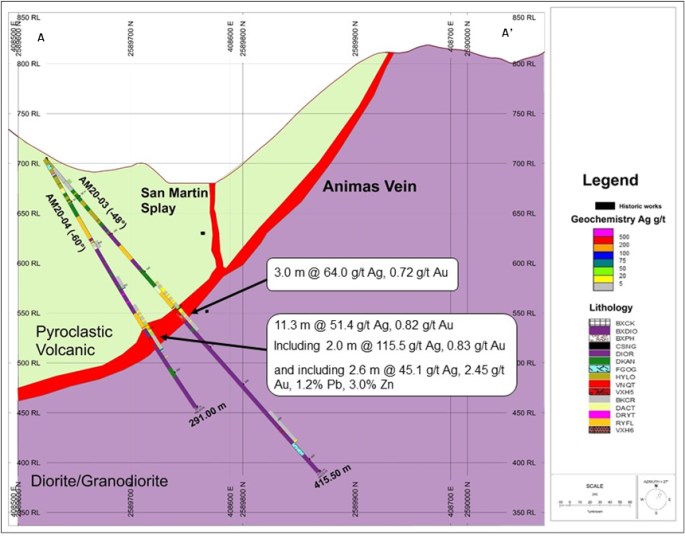
Source: Vizsla, 2023
7.3.2 Cordon del Oro Corridor
The Cordon del Oro structural corridor is an east-dipping normal fault zone in the west-central portion of the Project area that trends roughly north-northwest and dips moderately to the east (Figure 7-10). The mineral resource estimate contains the San Antonio structure, within the Cordon del Oro corridor, in the Inferred Mineral Resource categories.
The Cordon del Oro structure has a small number of historical workings. The fault typically has clay fault-gouge contacts that range from metre scale to over 15 m wide. To date, the structure has been traced with mapping for approximately 7.6 km from the Anonal mine in the southeast to the Santa Rosa plant in the northwest. It is interpreted that Cordon del Oro is the west side of a graben, with the Animas structure defining the east margin. Only five mineralized shoots have been exploited along the main Cordon del Oro corridor; from the southeast to the northwest, these are Peralta, La Cobriza, Mojocuan 1, 2, and Mojocuan 4. Four additional mineralized shoots occur along the San Antonio vein Los Generales, Coralillo, San Antonio, and La Venada.
|
|
The Cordon del Oro corridor is not known to have been drilled, and mining completed to date occurred in the last century, with workings of less than 100 m in length. Most mining extended only about 10 to 30 m below the surface, and the deepest of the historical mining appears to have reached about 60 m below the surface. Only the Coralillo mine has more than one level of development and was mined to a depth of about 60 m and approximately 150 m along strike.
At lower elevations, the Cordon del Oro structure cuts a fine-grained diorite that is weakly to strongly magnetic and corresponds with a magnetic anomaly in regional airborne magnetic surveys. The structure cuts dacite and granodiorite in the Mojocuan 1 and Mojocuan 2 mine areas (Figure 7-10). In the central part of the vein corridor and along the San Antonio splay, the structure cuts a series of shallowly west-dipping rhyolite tuffs and andesite flows at higher elevations. Local rhyolite and andesite dykes intrude on the host rocks and along the mineralized structure. A quartz porphyry and granite porphyry are noted in underground workings at the Mojocuan 1 and Mojocuan 2 mines.
The Cordon del Oro structure is interpreted as a north- to north-northwest-trending normal fault on the west side of a graben subjected to repeated movement and later cross-faulting (Starling, 2019). The San Antonio structure is an east-west-trending set of subparallel faults that dip mainly to the south and is interpreted as a hanging wall splay of the main Cordon del Oro structure.
The San Antonio vein is an east striking, moderately dipping structure with 325 m of interpreted strike length and 300 m of down-dip extension. The average width is generally 1.5 to 3 m, with pinching and swelling between 1 and 7.5 m. Vizsla has completed 31 drill-holes along the San Antonio vein between 2020 and 2022, 19 of those holes were completed in 2022.
|
|
Figure 7-10: Cordon del Oro Geology and Silver Geochemistry
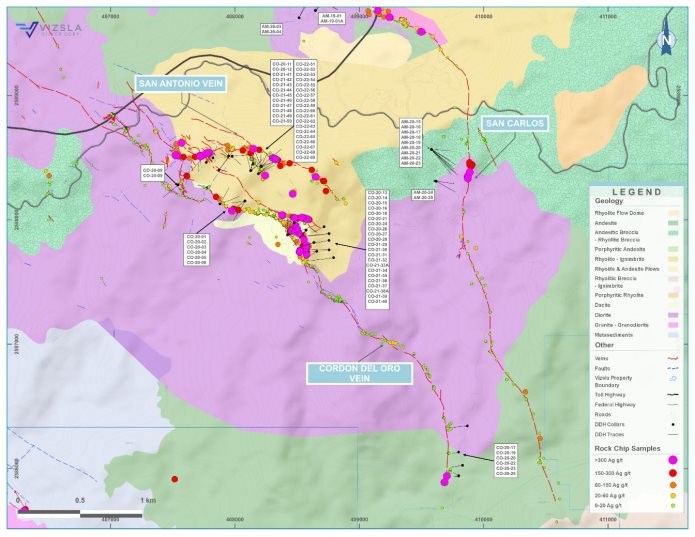
Source: Vizsla, 2023
7.3.3 Cinco Señores and Napoleon Corridor
The Cinco Señores and Napoleon structural corridors comprise two subparallel, mineralized fault-zones in the western portion of the Project area that trend north-northwest, at sub-vertical dip angles (Figure 7-11). Cinco Señores has a strike length of around 2.6 km, from the El Tajito mine in the southeast to El Cajon in the northwest. Twelve mineralized structures are included in the Cinco Señores corridor: Copala, Tajitos, Cristiano, Copala 2, La Colorada, La Tlacoacha, Santa Ana, Descubridora, Cinco Señores 01, Cinco Señores 03, La Manzanilla, and El Cajon. Copala, Tajitos, Cristiano and Copala 2 contain over 50% of the global resource in Panuco project. The Cinco Señores structure comprises a single, narrow fault zone with quartz veining approximately 1 m to 2 m wide. One moderately northeast-dipping notable splay of Cinco Señores was mined out at La Descubridora, west of the town of Copala (Figure 7-12).
|
|
The Napoleon corridor contains the Napoleon Main, Napoleon Hanging wall, Josephine, Cruz Negra, La Luisa, and other minor vein splays in southern Napoleon at the Ojo de Agua area. Together they constitute a significant portion of the Mineral Resources. Moreover, the current Mineral Resource estimate includes the Cinco Senores veins of Copala, Tajitos, Cristiano and Copala 2 structures. The Cinco Señores and Napoleon structural corridors host the second-largest concentration of historical workings on the property, some of which date to the 1500s.
The Napoleon and Cinco Señores structural corridors are interpreted as north- to north-northwest-trending strike-slip faults that have been reactivated, mineralized, and later subjected to cross-faulting (Starling, 2019). Later cross-faulting, likely related to the basin and range extension, imposed an effect of post-mineralization dextral trans tensional displacement across the east-west- to west-northwest-trending reactivated faults. Vein mineralization is hosted predominantly by two lithologies, a fine-grained, weakly to strongly magnetic diorite at lower elevations and a series of shallowly west-dipping rhyolite tuffs and andesite flows at high elevations.
Figure 7-11: Cinco Señores-Napoleon Geology and Silver Geochemistry
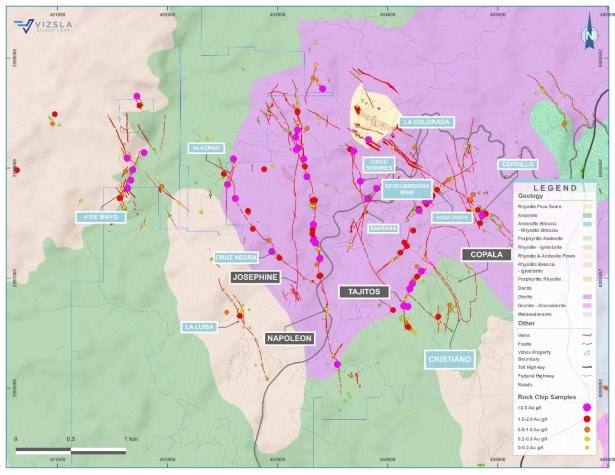
Source: Vizsla, 2023
|
|
Figure 7-12: Descubridora Mine Geology and Geochemistry

Note: Sample Widths are Estimated at 65% to 100% of True Widths. Source: Vizsla, 2023.
The Napoleon vein comprises a fissure vein with subparallel vein splays and faults 20 m apart that host quartz cemented breccias. Dilational fault jogs and cymoid loops are developed by some faults. At least 13 main mineralized shoots have been exploited along the Napoleon corridor. From south to north, they are Napoleon Sur (Ojo de Agua), El Gallinero, Napoleon 07, Napoleon 05, Napoleon 04, El Hundido, La Higuera, Limoncito, Los Rieles, El Papayo, El Agua Prieta, Aguajes, and La Estrella. The subparallel faults and dilational jogs are more common in the southern portion of the structure; the northern part comprises a single fissure vein for the most part. Moreover, local horsetail splays are a common occurrence in southern Napoleon at the Ojo de Agua area. Mineralization in the Napoleon vein is traced along 2,500 m of strike length and approximately 550 m of depth. The system is tilted 20° to 25° to the south which favored the exposure on the surface of base metals-rich vein mineralization in the north and low base metals plus low Ag/Au ratios in the south at the Ojo de Agua area. This tilting condition is also responsible for the lower silver values and thinner widths to the south on the surface, and therefore points to a high elevation in the vein system (Figure 7-13).
|
|
Figure 7-13: Drill-hole Intercepts Showing Tilted Mineralization on Napoleon Main Vein
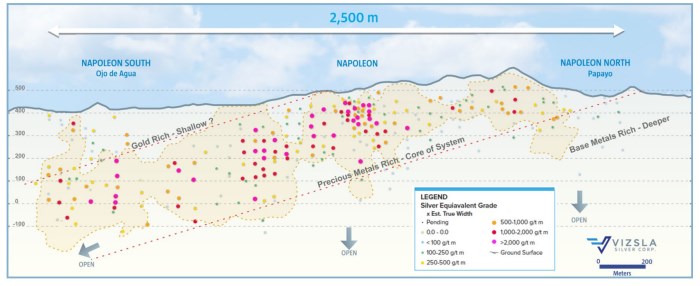
Source: Vizsla, 2023.
The Napoleon Main, Josephine, Napoleon Hanging Wall, Cruz Negra veins and vein splays in Ojo de Agua form the Napoleon vein corridor and constitute the bulk of the Mineral Resource contained herein. Josephine is a sub-vertical vein west and subparallel to the Napoleon Main vein and was discovered in 2021 in drill hole NP-21-132. Josephine widths are generally between 1 and 3 m, with semi-massive sulphide mineralization indicating higher grades. Josephine is traced 1.5 km along strike and has been tested 500 m down dip. The Napoleon hanging wall vein runs subparallel to Napoleon Main to the east at a moderate dip and is generally 2 to 3 m wide. The Cruz Negra Vein, located 250 m west of the Napoleon resource area, is a northwest striking vein-breccia dipping steeply to the northeast. The vein breccia consists of quartz veining and quartz cement bearing disseminated sphalerite and galena. Drilling to date has tested Cruz Negra along ~400 m of strike and 300 m to depth in proximity to the Josephine Vein. Mineralized intercepts at Cruz Negra, highlight a range of estimated true widths from 0.65-3.10 m with grades ranging from 265 to 3,499 g/t AgEq, at the mineralized elevation.
The Copala, Tajitos, Cristiano, and Copala 2 vein structures are within the Cinco Senores corridor and amount to over 50% of the Mineral Resource estimate given in this Technical Report. The Copala structure strikes north-northwest and is situated east and on the hanging wall side of the Tajitos vein. Initial drilling during 2020 intersected the structure with maximum true width of 82 m and based on mineralized intercepts we estimate an average true width of 10 m. Due to its exceptional width and high grade, Copala has seen the fastest growth in terms of Indicated and Inferred Mineral Resources and is the single structure with the largest global resource (Indicated and Inferred) at the Panuco project. The structure pinches and swells from approximately 2 m to 82 m, has an average dip of 46° with variable dip angles of ~35° in the north, close to the Copala town, to a maximum of ~55° in its southern extent. Copala consists typically of crackle and hydrothermal breccias, stockworks and vein zones with banded and massive quartz ubiquitous rhodochrosite, rhodonite and calcite. Other gangue minerals include adularia and white phyllosilicates (illite, illite-smectite, and montmorillonite).
|
|
Drilling at Copala has now traced mineralization along approximately 1,770 m of strike length and approximately 400 m down dip. High-grade silver-gold mineralization remains open to the north and southeast. On the west, Copala is bounded by the high-grade Cristiano vein and to the east, it is bounded by a northwest-trending post-mineralization fault. Holes CS-22-202, CS-22-207 and CS-22-219, drilled across the fault, indicate an uplifted block of basement metasediments in fault contact with andesites and diorite on the east side of Copala.
The Tajitos epithermal vein is traced over 1.5 km of strike and has been tested 500 m down dip. The vein pinches and swells from sub-metre to 10 m widths, but generally the width is between 2 m and 3 m. The vein is composed of massive white quartz to locally banded quartz, usually brecciated and sealed by white quartz. Locally there are distinct hydrothermal breccias with grey quartz in the matrix and clasts, typically carrying higher grades. Bladed quartz textures, indicative of extensive fluid boiling (Drummond and Ohmoto, 1985), a well-known mechanism for gold deposition, are also observed in the Tajitos vein. Amethyst quartz and rhodochrosite are also present in high-grade zones. Amethyst quartz is believed to represent the mixing of hydrothermal fluids with Fe-rich meteoric waters.
The Cristiano Vein is a precious metals-rich structure located at the southwestern margin of the Copala structure. Cristiano is marked by a quartz-carbonate epithermal vein striking N25°W that dips sub-vertical (85°) to the NE. Drill holes intersecting Cristiano to date, highlight a high-grade zone plunging to the NW, with a vertical extent of 300 m and an approximate strike length of 600 m with a thickness ranging from 0.7 m to 3.5 m. The Cristiano Vein was initially discovered while targeting the Tajitos-Copala veins, where drilling intercepted the well-mineralized, NW-SE trending fault. Ongoing drilling has now led to new observations and interpretations allowing Vizsla geologists to plan drill holes specifically designed to explore Cristiano along strike and to depth. To the northwest, Cristiano intersects and offsets the Tajitos Vein, suggesting Cristiano post-dates Tajitos mineralization, thus creating a drill target on the footwall of Tajitos.
7.3.4 Other Mineralized Structures
Numerous other structures on the Panuco claims are actively being explored. The following subsections outline the geology of a few of these earlier-stage prospective structures. Figure 7-7 shows the location of the prospects described below, among others.
7.3.4.1 La Colorada
The La Colorada silver and gold deposit is 1 km northwest of the village of Copala. Christopher and Sim (2008) described the geology of La Colorada as a manto-and-feeder vein system hosted in andesite, overlying a large diorite intrusive. The manto is cut by a north-striking rhyolite dyke that may be associated with a rhyolite flow dome on the northwest flank of the manto. The veins and manto in the La Colorada area are bounded by northwest-striking faults. A keel marking the thickest manto development strikes north, parallel to felsic dyking in this area. This north-south trend was interpreted as the result of a combination of strike-slip movements on northwest- and northeast-striking orthogonal faults.
The La Colorada vein system occurs along a pronounced northwest-striking lineament that bisects the largest of a series of circular features that Christopher and Sim (2008) interpret as caldera margins.
|
|
7.3.4.2 Copala Town Area
Mapping in 2020 identified several vein and manto-type structures around the town of Copala (Agua Zarca, Cuernavaca, Huaco). Historic mining underneath the town, along those structures, is believed to have occurred to estimated depths of 100 m below surface. Some of the old shafts in the middle of the town have been backfilled or built over, thus limiting the access to the underground workings. Four main structures trending northwest have been mapped thus far, although further mapping is likely impossible due to the presence of the town. These structures, along with Copala, appear to be part of the low-angle Copala-Colorada-Pajaros vein structural corridor. Cerrillo vein on the east side of the town is another example of northwest-trending and shallowly northeast-dipping vein. The El Estadio vein is a vertical structure to the north of Cerrillo that shows potential for drill testing. Mapping has identified other veins near Cerrillo and El Estadio that have minimal exposure; their extent and orientation are speculative.
7.3.4.3 El Batel Corridor
The El Batel mine area is in the northeast portion of the Vizsla claim block at elevations between 1,100 and
1,400 m.a.s.l. It is composed of a central northwest-trending vein 2 to 4 m wide, dipping moderately to the northeast, and hosted in a package of andesitic tuffs. There is minimal outcrop, and most of the samples collected in the area are from hanging wall splays. A series of hanging wall splays are also of low angle, subparallel to the main vein, suggesting a tension release-style vein.
7.3.4.4 Broche del Oro
The Broche de Oro Corridor is a northeast-trending vein system in the northeast portion of the Vizsla claim block. Currently, the structure has been traced over 4,300 m of strike length; however, only 40% of it is on Vizsla-controlled claims. The longest segment held by Vizsla, at 980 m, is the Broche de Oro area. The old Broche de Oro mine is at the bottom of a deep canyon with over 300 vertical metres of andesite and dacite tuffs overlying a diorite intrusive. The diorite is likely different from the main microdiorite as the microdiorite is magnetic, and the Broche de Oro area is in a magnetic low. At the old mine level, the vein is still hosted in the andesitic tuffs and shows widths from 2 to 4 m. The dip of the central segment of the vein is to the southeast, while several other subparallel veins have dips to the northwest, suggesting there may be a small horst block in that area, or that the other veins are remnant footwall splays. The Manteada vein is another perpendicular structure in that area that underwent considerable past mining to the north of Broche de Oro. The Manteada vein has been mapped for 1,300 m north-northwest from the Broche de Oro workings, dipping moderately to the west, and widths from 2 to over 5 m. It appears to have been mined near its northern end, where it either changes strike or intersects the northeast-trending San Ramon vein. The Manteada vein textures are massive white quartz with very little sulfide, and local patches of bladed calcite pseudomorphed with silica. Many outcrops show a brecciated vein, while only a few exhibits the massive white silica with bladed calcite. Vizsla completed seven drill-holes during 2021 at the Broche de Oro zone but no significant mineralization was intercepted at the time.
7.3.4.5 La Galeana
The Galeana vein is likely a significant splay structure off the longer San Fernando-Broche de Oro-Nacaral vein system that trends north-northeast some 1,400 m to the southwest of the Nacaral mine. The vein saw three different past workings spread out over 80 m of vertical relief. The principal working was the upper one, where a shaft was sunk directly on the vein, but has since collapsed. Several small splays (1 to 10s of metres long) come off the main vein here, with the main one being only 1 to 2 m wide. A broader, subparallel, 4- to 5 m-wide vein was some 140 m to the northeast of the collapsed shaft area.
|
|
7.4 Structural Controls
Mineralized structures in Panuco resulted from a long history of deformation accompanied by multiple hydrothermal-mineralization events spanning from the late-Laramide orogeny to the Basin and Range extension. Multiple deformation events resulted in west-northwest thrusts and conjugate north-northwest to north-south dextral and east-northeast sinistral shears that were developed during the two peaks of the Laramide compressional orogeny. Some of these older structures served as well as conduits for the emplacement of porphyry type deposits in western Mexico. The Laramide age main thrust and conjugate faults were subsequently reactivated during post-Laramide extensional events during the late-Eocene, Oligocene, and Miocene. Therefore, structures like Napoleon and Copala originated as late-Laramide conjugate shears that were reactivated and opened to the fluid passage and epithermal mineralization during the Laramide extensional deformation D3 event. Steeply dipping structures, the conjugate components to the low angle thrust shears, were also reactivated during post Laramide extension and some of them were mineralized as well. Napoleon is interpreted to be a reactivated conjugate sinistral shear. During post Laramide extension, events D3, D4 and D5, occurred significant block faulting and tilting. Some of this faulting and tilting occurred concomitant or after mineralization, thus segmenting or tilting mineralized structures. A clear example of this tilting occurs in Napoleon, where infill and step-out (expansionary) drilling conducted during 2021, supported by geological and geochemical interpretations (alteration and metal zonation) confirmed that the Napoleon vein system is tilted to the south, with the southern extent being at the top of the mineralized horizon near surface. Copala on the other hand, is a low-angle dipping structure bounded to the west by the steep dipping Tajitos and Cristiano veins that also shows variable dip angle from shallow (35°) in the north to moderate (55°) in the south. Because there is a significant component of strike-slip displacement imposed on most structures, pinching and swelling is common.
Tajitos is interpreted as a conjugate shear, and according to Starling (2019), it exhibits an early sinistral transpressional shear sense overlapped by a dextral tensional shear sense. The diorite stock emplaced along an east-northeast-trending central fault zone that likely originated during the early-Laramide deformation. Many of the structures hosted by the diorite appear to have better continuity than those hosted by the andesites and rhyolitic volcanics.
7.5 Alteration
Generally, alteration is prominent propylitic alteration, defined by chlorite and epidote that extends 50 to 100 m peripheral to main fluid conduits. Silicification, white phyllosilicates in fractures and minor quartz veinlets are present immediately adjacent to veins and fault structures. The fault structures host mineralization comprising distinct quartz veins and moderate-to-strong pervasive silicification with associated crackle breccia veining. The upper and lower boundaries of mineralized zones are occasionally within faults and are usually marked by clay gouge zones with common milled clasts. The milled clasts comprise wall rock and white quartz vein fragments, indicating that these faults experienced significant movement post-mineralization. The footwall contact of the fault zone commonly has a clay gouge contact, and local crackle brecciation and silicification that overprints earlier propylitic alteration in the diorite to granodiorite. Patchy silicification, minor quartz veinlets, and fracturing are occasionally present more proximal to the structure, and local, weakly developed argillic alteration may also be present.
|
|
In 2020, Vizsla retained the services of Scott Haley to analyze and interpret Panuco's extensive assay database. A database consisting of over 33,400 core samples and over 3,700 rock samples was used in the analysis with the main objective of characterizing rock compositions and alteration assemblages. The main alteration mineral determined outboard the veins were albite, chlorite and sericite, whereas the main alteration minerals within the veins were adularia and sericite (Haley, 2020).
7.6 Mineral Petrology
In 2021 Vizsla commissioned Applied Petrologic Services & Research, Wanaka, New Zealand, to carry out a petrographic and fluid inclusion study on 14 samples (one from each of Animas and Cordon del Oro, three from Tajitos, and nine from Napoleon) (Coote, 2021a). Coote's findings indicate sustained hydrothermal fluid flow evidenced by fracture-fill multi-stage silica and breccia cement due to a penetrative and long-lasting structurally focused fracturing and brecciation. Evidence of boiling conditions, an environment conducive to epithermal precious metal mineralization, is indicated by fluid inclusion assemblages in quartz. Further evidence of boiling conditions is the presence of adularia, bladed quartz pseudomorphs after calcite and colloform banding of the fracture-filled and locally brecciated vein assemblages. Bladed carbonate, ferrous, manganoan, and calcitic-rich carbonates proximal to drusy quartz also indicate a successive emplacement of later hydrothermal fluids evidencing a long-lasting system for emplacement of epithermal veins.
The following petrologic features apply to the Animas, Cordon del Oro, Cinco Senores and Napoleon vein corridors. They are important in defining base- and precious-metal mineralization of the low-sulphidation, epithermal environment:
Sphalerite, galena, chalcopyrite, tennantite/tetrahedrite and minor amounts of bornite comprise base-metal sulphide and sulphosalt mineralogy enclosed by interstitial multi-phase, mosaic-drusy quartz and pyrite
Very-fine to ultra-fine-grained chalcopyrite is concentrated as inclusions within sphalerite margins and partly defines internal zoning.
Supergene chalcocite and covellite locally replace chalcopyrite, bornite, and tennantite/tetrahedrite.
Furthermore, multiple stages of base-metal sulfides and sulphosalts are present, filling cavities and fractures within brittle, deformed pyrite and mosaic-drusy quartz, which form in places cemented-to-brecciated pyrite. Galena, chalcopyrite, and tennantite-tetrahedrite solid solution (ss) are present, filling, and cementing fracturing and brecciation of coarse-grained, and locally more-voluminous sphalerite. Multiple stages of base-metal sulfides are ductile-to-brittle deformed and recrystallized in relation to tectonic and hydrothermal overprinting.
Precious-metal mineralogy as acanthite, proustite, native gold, electrum, and native silver occur in close-spatial and interpreted-temporal association with base-metal sulfides and sulphosalts. Native gold and electrum are interstitial to and occurs as inclusions in mosaic-drusy quartz. Furthermore, pyrite and base-metal sulfides and silver sulphosalts (pyrargyrite-proustite ss) occur as intergrowths with acanthite; pyrargyrite-proustite ss are best represented in the Animas, Cordon del Oro, and Cinco Senores vein corridor.
Additionally, Cinco Senores hosts acanthite, native gold and electrum occurring interstitial to fluorite and mosaic quartz in fracture-fill/breccia cement assemblages. Native silver also fills cavities and microfractures within mosaic quartz. Native gold is also relict as intergrowths and inclusions within pyrite altered to supergene goethite and hematite in rock from Cinco Senores.
|
|
Coote (2021b) also conducted a fluid inclusion study using microthermometric data from the Animas, Cordon del Oro, Cinco Senores, and Napoleon vein corridors. The homogenization temperatures determined from fluid-inclusion microthermometry on quartz minerals within fracture-fill/breccia cement, are consistent with epithermal temperatures reported for other deposits elsewhere in Mexico. Furthermore, salinities calculated from freezing temperatures are low, consistent with diluted fluids and typical of epithermal precious-metal deposits. The temperatures and salinities determined for quartz-hosted fluid inclusions associated with silver and gold mineralization in Panuco range from 196°C to 293°C and 1.9 to 3.1 wt% NaCl Eq. Temperature and salinity ranges, gangue mineralogy (adularia-quartz) and hydrothermal alteration in Panuco veins are consistent with typical low- to intermediate-sulfidation epithermal types of deposits. Contrasting concentrations of base metals (moderate to very low) and silver/gold ratios (<100 - >150) between Napoleon and Copala, point to distinct fluid compositions; intermediate sulfidation for Napoleon and low sulfidation for Copala.
|
|
8 DEPOSIT TYPES
8.1 Deposit Model
Mineralization in Panuco occurs in veins and mantos with mineralogical characteristics, alteration assemblages, temperature, and salinities typical of low to intermediate sulfidation epithermal deposits. Because of the region's long and complex deformation and hydrothermal history, the Panuco Project has the potential to host other deposit styles. Late Cretaceous to Paleocene batholiths that intrude the Tarahumara Formation rocks in Panuco, are prospective for porphyry copper and molybdenum deposits elsewhere in the SMO. Late Cretaceous - Eocene plutons that intrude basement metasediments and limestones are prospective for gold-rich and polymetallic skarns and replacement deposits. However, the mineralized structures that are exposed and that have been explored to date in the property are only the epithermal silver and gold veins that were developed or reactivated during the extensional tectonics of the SMO volcanic arc.
8.2 Epithermal Systems
Epithermal deposits form at depths of 1.0 to 1.5 km in volcanic-hydrothermal and geothermal environments. They define a spectrum with two end members, low and high sulfidation (Hedenquist et al., 2000). Figure 8-1 shows the genetic model for epithermal deposits proposed by Hedenquist et al., (2000). Low and Intermediate sulfidation deposits form part of the epithermal spectrum. Their genesis is complex due to the participation of fluids with meteoric and magmatic origin during their formation and the fluid evolution during water-rock interactions. According to several authors, the fluids that formed the Mexican epithermal deposits represent a mixture of fluids with diverse origins varying from meteoric to magmatic (Simmons et al., 1988; Benton, 1991; Norman et al., 1997; Simmons, 1991; Albinson et al., 2001; Camprubí et al., 2006; Camprubí and Albinson, 2007). Mineral deposits in Panuco exhibit characteristics of the low-to-intermediate sulphidation types of deposits.
Epithermal deposits typically consist of fissure veins and disseminations with gold, silver, and base metals concentrations. Most low sulfidation epithermal deposits form as open-space filling of faults and fractures resulting in vein deposits. Some gold deposits occur as replacements or disseminations in permeable host rocks, particularly the high-sulfidation types. Epithermal deposits are more common in extensional settings in volcanic island and continent margin arcs. Due to its relatively shallow deposition level within the Earth's crust, most epithermal deposits are preserved in Tertiary or younger volcanic rocks. Mineral deposition in the epithermal environment occurs due to complex fluid boiling and mixing processes that involve cooling, decompression, and degassing. Veins in Panuco contain adularia and colloform banded quartz, representing strong evidence of fluid boiling during mineral deposition.
Historically, epithermal gold and silver deposits are an important part of the world's precious metal budget. Approximately 6% and 16% of the world's gold and silver have been produced from epithermal deposits. These deposits are significant in Mexico. Mineable epithermal vein deposits range from 50,000 to more than 2,000,000 tonnes in size, with typical grades ranging from 1 to 20 g/t gold (Au) and 10 to 1,000 g/t silver (Ag). Locally exceptional, or "bonanza" grades above 20 g/t Au are important contributors to many gold deposits. Lead and zinc are also important contributors to epithermal deposits' low- and intermediate-sulphidation classes. Veins that host mineralization are about several kilometres long; however, economic mineralization is present in plunging mineralized shoots with dimensions of tens of metres to hundreds of metres or more. Single veins commonly host multiple mineralized shoots. The wide range of tonnage and grade characteristics make these deposits attractive targets for small and large mining companies.
|
|
Quartz veins are typical hosts for low and intermediate sulphidation mineralization, and these veins have characteristic alteration assemblages that indicate temperatures of deposition between 100°C and 300°C. These alteration assemblages include quartz, carbonates, adularia white phyllosilicates, and barite in the veins; illite, adularia, smectite, mixed-layer clays, and chlorite proximal to the vein walls; and distal chlorite, calcite, epidote, and pyrite more peripherally. Also, unmineralized but related, steam-heated argillic alteration and silica sinters may be present above, or above and laterally from, the veins.
Vein textures are also important guides for targeting low-and intermediate-sulphidation mineralization. Quartz commonly occurs with cockade and comb textures, as breccias; as microcrystalline, chalcedonic, and colloform banded quartz; and as bladed or lattice quartz. Bladed or lattice quartz forms by replacing bladed calcite formed from a boiling fluid and is a diagnostic indication of the level of boiling in a vein.
Ore minerals include pyrite, electrum, gold, silver, argentite, acanthite, silver sulphosalts, sphalerite, galena, chalcopyrite, and/or selenide minerals. In alkalic host rocks, tellurides, vanadium mica (roscoelite), and fluorite may be abundant, with lesser molybdenite. These mineralized systems have strong geochemical signatures in rocks, soils, and sediments and Au, Ag, Zn, Pb, Cu, As, Sb, Ba, F, Mn, Te, Hg, and Se may be used to vector to mineralization.
Figure 8-2 shows the associated alteration components of epithermal systems and mineralization.
Figure 8-1: Genetic Model for Epithermal Deposits
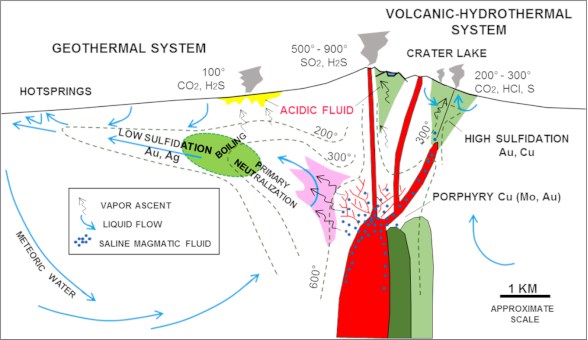
Source: Hedenquist et. al., 2000
|
|
Figure 8-2: Schematic of Alteration and Mineralization in Low Sulphidation Precious Metal Deposits

Source: Hedenquist et al., 2000
|
|
9 EXPLORATION
9.1 Introduction
Vizsla commenced exploration on the Project in July 2019. Surface exploration to date has included geological mapping, rock geochemical sampling, geophysical surveys, and diamond drilling (see section 10).
9.2 Geological Mapping
Geological mapping and prospecting are key ongoing processes in exploring and understanding the geology of the Panuco Property. Mapping is conducted on a reconnaissance scale with detailed scale testing. Mappers generally use a 1:1,000 scale and, in notable outcrops, 1:500 scale. The 1:1,000 scale geological mapping completed as of December 2023 is shown in Figure 9-1. Mapping of the district amounts to 4,800 ha mapped out of a total of 7,189.5 ha held by the company, which represents 67% of the total area mapped.
Figure 9-1: Panuco District Mapped Areas at 1:1,000 Scale as of December 2023

Source: Vizsla, 2024
|
|
9.3 2019-2021 Surface and Underground Sampling
Rock sampling is usually conducted in conjunction with geological mapping and prospecting. Geologists take chip, float, outcrop samples (including channels), and underground sampling where it is safe to do so. Table 9-1 outlines the rock geochemistry sampling done by Vizsla from 2019 to 2021 The locations of these samples are shown in Figure 9-2.
Overall, 3,777 rock samples were collected from surface and underground exposures. The lithology, alteration, and structure of outcrop and underground exposures are mapped to determine controls on mineralization. To the degree possible, samples were oriented perpendicular to mineralized structures and variations in mineralization and are sampled separately. At least one sample on either side of the mineralized structure was also collected. Samples are collected as continuous chip channel, with minimum sample lengths ranging from 30 cm to 1.5 m. The sample length and the width of the chipped channel, typically 10 to 15 cm, are recorded along with the sample's estimated true width.
Sampling is carried out by geologists or trained field assistants under the direct supervision of a geologist. All the chips of the channel sample are collected on a tarp. Once the sample has been collected, the sample is mixed by folding the tarp in half in four different directions, rolling the material over itself and thus homogenizing the sample material. One-quarter of homogenized sample is poured into a labelled sample bag containing the uniquely labelled sample ticket. In the case of field duplicates, a second quarter of that sample (from the opposite quadrant) is then poured into a second labelled sample bag with a uniquely labelled sample ticket. Bags are sealed with a plastic cinch cable tie, and sample bags are transported to Vizsla's secured warehouse.
Table 9-1: Summary of Surface and Underground Rock Geochemistry Samples between 2019 and 2021
Location | Sample Type | Sample Count |
Surface | Chip | 100 |
Float | 46 | |
Mine Outcrop | 156 | |
Channel | 2,686 | |
Total surface | 2,988 | |
Underground | Underground | 789 |
Total |
| 3,777 |
|
|
Figure 9-2: Surface Sampling at Panuco Project between 2019 and 2021

Source: Vizsla, 2023
9.4 Geophysics
Geophysics has been a tool to identify targets on the Panuco Property. Silverstone flew helicopter airborne magnetics in 2016, and Vizsla has conducted airborne and ground surveys since 2019.
Silverstone conducted an airborne magnetic survey over Panuco property in 2016. The main magnetic high corresponded well with the mapped micro-diorite and showed a potential offset. The micro-diorite is the main host rock in the Napoleon area but is covered by an andesite-to-rhyolitic tuff package in the other vein areas. Figure 9-3 shows the airborne reduced-to-pole (RTP) magnetic survey results from 2016 with interpreted offset in the micro-diorite.
|
|
In April and May of 2021 Zonge International was contracted to complete a trial ground Fixed Loop Electromagnetic survey (FLEM) or ground EM and a drone Magnetic Survey over the Napoleon - Cinco Señores corridor. FLEM detects massive sulphide mineralization by running a current through a large loop of wire laid on the ground to induce a magnetic field in the earth. As the weakening magnetic field moves through the earth it sets up a circulating electrical field in the shape of any massive sulphide body that it passes through. This new electrical field in turn weakens, setting up a secondary magnetic field that is measured on surface. Geophysicists with modern computer programs can back calculate (inverse modelling) the shape of the conducting massive sulphide and model a 3D "plate" representing the source of the anomaly.
The trial FLEM survey covered target zones within an area of approximately 1.5 km by 2 km over the Cinco Señores and Napoleon Corridors. The survey results showed that modelled EM plates fit with mineralization drilled at the Napoleon discovery and culminated with the discovery of the Josephine vein located west of Napoleon. In addition, five new priority conductive trends were modelled along with many more subtle anomalies.
The drone magnetic survey was conducted over 205-line km, at 50 m line spacings and a nominal height of 50 m (Figure 9-4). The test area was over the Napoleon trend, and thus the line orientation was chosen to be at 45° to try and intersect the vein corridor orthogonally.
Four different products were delivered from the drone magnetic survey: an RTP map, an analytical signal (AS) map, a residual-signal (RES) map and a first vertical derivative (1D) map. The results from the RTP fit well with Vizsla mapping of the micro-diorite. While the concept of the Napoleon vein being in a magnetic low trend is not completely clear in the RTP data, it becomes more apparent in the AS data, as those tend to plot the magnetic features clearly over their source regions.
In addition to the magnetic surveys, Vizsla has been collecting magnetic susceptibility readings from most of the drill core. These data have been compiled in Excel tables, and each drill hole has a downhole graph of the susceptibility readings. These graphs have been included in the compilation of the drilling cross-sections and are often very useful in distinguishing rock types.
|
|
Figure 9-3: Airborne Magnetics RTP from 2016 with Known Veining and Possible Fault Offset Shown in Diorite
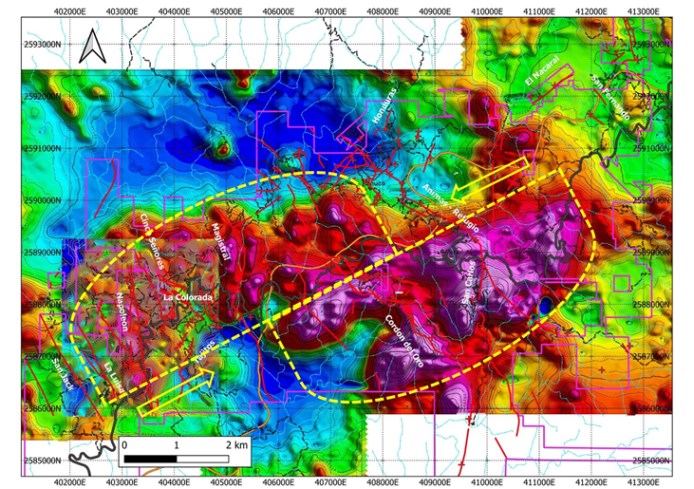
Source: Maunula and Murray, 2022
|
|
Figure 9-4: Results from 2021 Airborne Magnetics RTP Geophysical Survey Over the Napoleon Area
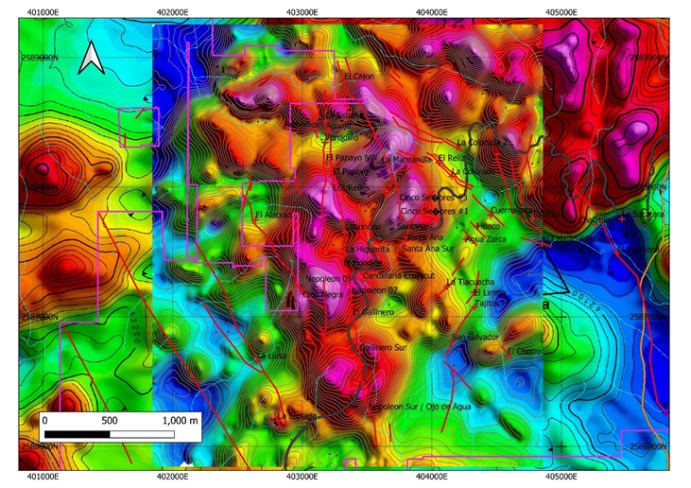
Source: Maunula and Murray, 2022
9.5 2023 LiDAR Survey
The LiDAR survey was completed by Eagle Mapping out of Langley, BC in June of 2022 and received by Vizsla received in August of 2022. The LiDAR survey covered ~6,200 ha of the property and is to be utilized in geologic-resource modelling and for future planning of mine and plant infrastructure. Additionally, these high-resolution products (elevation model and orthophotos) are being used to support lithology and structural mapping activities, and as a prospecting tool to find vein outcrops and old mine workings covered by vegetation.
9.6 2022 Surface Sampling
Surface sampling at Panuco in 2022 totalled 1,202 rock samples (Table 9-2 and Table 9-3). The location of these samples is shown in Figure 9-5. The sampling follows the same procedure outlined in Section 9.3.
|
|
Of these samples, 838 were analyzed at ALS Minerals laboratory by Au-AA23 and ME-ICP61 multi-element package and provided to the QP in Excel format. Overlimits used Ag-OG62 and GRA21. Sampling followed standard best practice procedures, including the insertion of control samples. Assays ranged from below detection limit to 31 g/t gold and 1,660 g/t silver.
Further 364 samples were analyzed at an SGS laboratory by Au-GE-FAA30V5 and GE-CP40Q12 multi-element package and provided to the QP in Excel format. Overlimits used Ag-GO-FAG37V. Assays ranged from below detection limit to 4.35 g/t gold and 399 g/t silver. The results from this testing guided subsequent drill targeting.
Table 9-2: Panuco Project Surface Samples in 2022
Panuco Project 2022 Surface Sample Type | |
Sample Type | Number of Samples |
Float Grab | 24 |
Outcrop Channel | 1,157 |
Outcrop Grab | 1 |
Mine Channel | 6 |
Mine Dump | 6 |
Mine Outcrop | 8 |
Total | 1,202 |
Table 9-3: Selected High-Grade Samples Taken During 2022 Surface Exploration
Panuco Project 2022 Surface Sample Highlights | |||||
Sample_ID | Au (g/t) | Ag (g/t) | Pb (ppm) | Zn (ppm) | Sample Type |
E958352 | 3.24 | 594 | 1,170 | 1,155 | Outcrop Channel |
E958366 | 2.79 | 575 | 6,190 | 1,435 | Outcrop Channel |
E958312 | 3.79 | 30 | 49,000 | 21,700 | Outcrop Channel |
E958507 | 7.72 | 26 | 10 | 42 | Outcrop Channel |
E958822 | 8.16 | 510 | 113 | 66 | Outcrop Channel |
E958286 | 4.25 | 244 | 398 | 911 | Outcrop Channel |
E958951 | 8.99 | 342 | 168 | 58 | Outcrop Channel |
E959024 | 4.28 | 576 | 576 | 784 | Outcrop Channel |
E959027 | 2.80 | 1,420 | 1,955 | 2,860 | Mine Dump |
E959262 | 31.00 | 54 | 1,100 | 838 | Mine Outcrop |
E959271 | 4.43 | 307 | 268 | 513 | Outcrop Channel |
E959272 | 2.52 | 399 | 1,997 | 768 | Float Grab |
|
|
Figure 9-5: Surface Sampling at Panuco Project in 2022
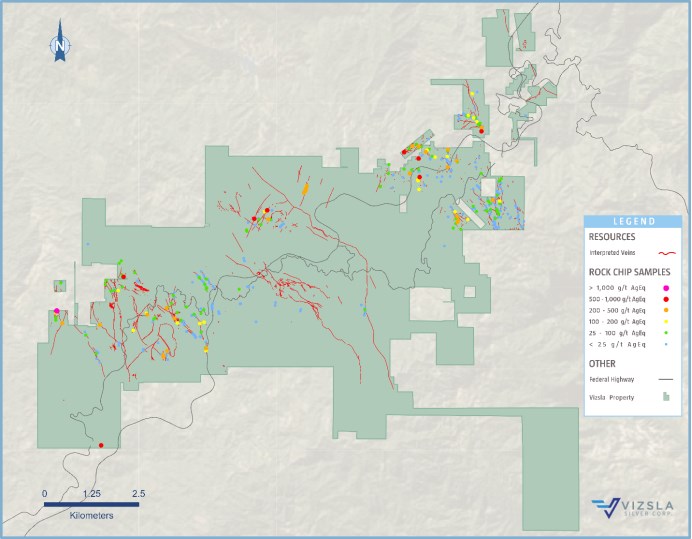
Source: Vizsla, 2023
Note : AgEq =Ag*0.93+Au*0.9*1800/24+Pb*0.94*1.1*31.1035/453.592/24+Zn*0.94*1.35*31.1035/453.592/24).
9.7 2023 Surface Sampling
Surface sampling at Panuco in 2023 totalled 638 rock samples (Table 9-4 and Table 9-5). The locations of these samples are shown in Figure 9-6. The sampling follows the same procedure outlined in Section 9.3.
These samples were analyzed at ALS Minerals laboratory by Au-AA23 and ME-ICP61 multi-element package and provided to the QP in Excel format. Overlimits used Ag-OG62. Sampling followed standard best practice procedures, including the insertion of control samples. Assays ranged from below detection limit to 5.9 g/t gold and 939 g/t silver. The results from this testing guided subsequent drill targeting.
|
|
Table 9-4: Panuco Project Surface Samples in 2023
Panuco Project 2023 Surface Sample Type | |
Sample Type | Number of Samples |
Float Grab | 10 |
Outcrop Channel | 613 |
Outcrop Grab | 3 |
High Grade Grab | 1 |
Mine Dump | 7 |
Mine Outcrop | 4 |
Total | 638 |
Table 9-5: Selected High-Grade Samples Taken During 2023 Surface Exploration
Panuco Project 2023 Surface Sample Highlights | |||||
Sample_ID | Au (g/t) | Ag (g/t) | Pb (ppm) | Zn (ppm) | Sample Type |
E959649 | 4.731 | 939 | 409 | 320 | Outcrop Channel |
E959743 | 1.783 | 539 | 1,067 | 980 | Outcrop Channel |
E959806 | 2.426 | 777 | 696 | 985 | Outcrop Channel |
E959809 | 1.537 | 428 | 11,100 | 4,510 | Float Grab |
G562569 | 0.833 | 392 | 136 | 464 | Outcrop Channel |
G562571 | 1.589 | 383 | 91 | 60 | Outcrop Channel |
G562578 | 4.991 | 771 | 300 | 490 | Outcrop Channel |
G562584 | 1.551 | 307 | 1,598 | 2,144 | Mine Dump |
G562586 | 1.349 | 340 | 280 | 620 | Mine Dump |
G562587 | 5.187 | 184 | 310 | 354 | Mine Outcrop |
G562667 | 4.092 | 111 | 88 | 129 | Outcrop Channel |
G562668 | 5.913 | 55 | 18 | 19 | Outcrop Channel |
G562671 | 2.977 | 939 | 589 | 997 | Outcrop Channel |
G562882 | 6.060 | 396 | 61 | 183 | Outcrop Channel |
G562940 | 2.073 | 83 | 5,374 | 493 | Outcrop Channel |
G562964 | 1.546 | 720 | 8,510 | 17,000 | Mine Outcrop |
G566549 | 4.282 | 405 | 185 | 126 | Outcrop Channel |
G566567 | 3.191 | 238 | 2,629 | 3,810 | Mine Dump |
G566568 | 2.054 | 99 | 3,897 | 7,133 | Mine Dump |
G566619 | 0.062 | 323 | 200 | 175 | Outcrop Channel |
|
|
Figure 9-6: Surface Sampling at Panuco Project in 2023
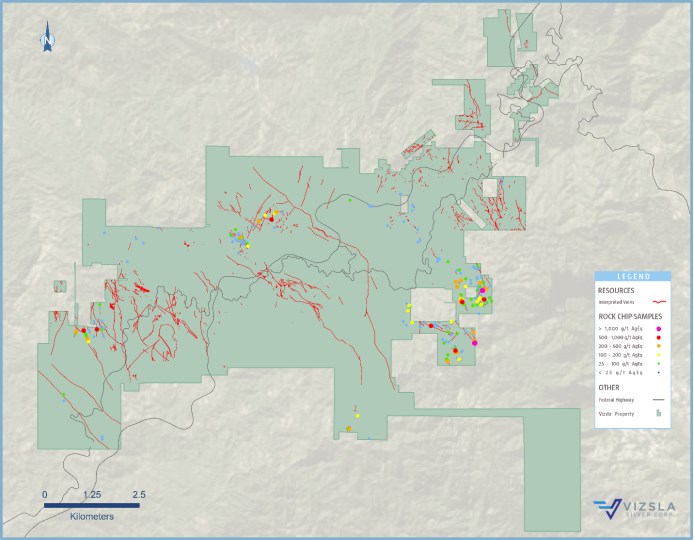
Source: Vizsla, 2024.
Note: AgEq =Ag*0.93+Au*0.9*1800/24+Pb*0.94*1.1*31.1035/453.592/24+Zn*0.94*1.35*31.1035/453.592/24).
9.8 2024 Surface Sampling
Surface sampling at Panuco in 2024, to June 18th, totalled 313 rock samples (Table 9-6 and Table 9-7). The locations of these samples are shown in Figure 9-7. The sampling follows the same procedure outlined in Section 9.3.
These samples were analyzed at an SGS laboratory by Au-GE-FAA30V5 and GE-CP40Q12 multi-element package and provided to the QP in Excel format. Overlimits used Ag-GO-FAG37V. Sampling followed standard best practice procedures, including the insertion of control samples. Assays ranged from below detection limit to 8.2 g/t gold and 427 g/t silver.
|
|
Table 9-6: Panuco Project Surface Samples in 2024, to June 18
Panuco Project 2024 Surface Sample Type | |
Sample Type | Number of Samples |
Rock Chip | 4 |
Float Grab | 3 |
Mine Dump | 1 |
Outcrop Channel | 304 |
Outcrop Grab | 1 |
Total | 313 |
Table 9-7: Selected High-Grade Samples Taken During 2024 Surface Exploration, to June 18
Panuco Project 2024 Surface Sample Highlights | |||||
Sample_ID | Au g/t | Ag g/t | Pb ppm | Zn ppm | Sample Type |
G566821 | 4.25 | 427 | 85 | 40 | Outcrop Channel |
G566588 | 1.79 | 417 | 6612 | 555 | Float Grab |
G566878 | 2.85 | 396 | 363 | 31 | Outcrop Channel |
G566893 | 2.88 | 259 | 103 | 203 | Outcrop Channel |
G566586 | 8.16 | 91 | 637 | 550 | Float Grab |
G575168 | 2.52 | 66 | 72 | 306 | Outcrop Channel |
G575057 | 2.38 | 23 | 21 | 55 | Outcrop Channel |
|
|
Figure 9-7: Surface Sampling at Panuco Project in 2024, to June 18
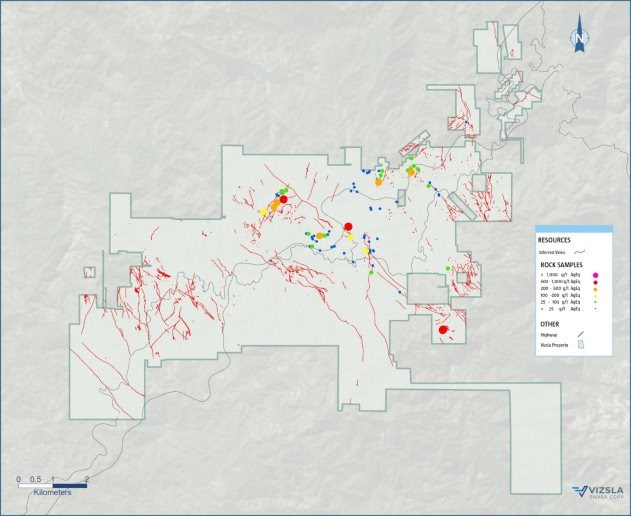
Source: Vizsla, June 2024.
Note: AgEq =Ag*0.93+Au*0.9*1800/24+Pb*0.94*1.1*31.1035/453.592/24+Zn*0.94*1.35*31.1035/453.592/24).
|
|
10 DRILLING
10.1 Overview
Since initiating drilling on the Property in November 2019, Vizsla has conducted several significant drill campaigns in the Napoleon, Copala-Tajitos, Animas and San Antonio areas. Up to September 2023 (data cut-off date for the current MRE), Vizsla had completed 824 drill holes totaling 303,626.42 m and collected 47,694 assays. Vizsla has continued to drill at the Project since the data cut off for the Mineral Resource estimate.
Up to June 18, 2024 (data cut-off date for the PEA technical report), Vizsla has completed 973 drill holes (Table 10-1) totaling 371,576.72 m and collected 56,198 assays. Drilling completed in late 2023 and 2024 was centred on the western portion of the district, primarily focused on infill drilling at 50 m centres to upgrade resources within the Copala and Napoleon areas.
Results of the Vizsla drilling completed subsequent to September 1, 2023, have not yet been considered in the geological interpretation, and assay results have not been incorporated into the mineral resource estimate.
Diamond drill holes are generally oriented to test structures perpendicular to their strike. Holes are typically HQ diameter, with reduction to NQ diameter when ground conditions necessitate it. Drill-hole collars are surveyed by Trimble differential GPS and Total Station. Downhole orientations of drill-hole azimuth, inclination, and total magnetic field are recorded by a Devico survey instrument every 50 m downhole. A magnetic declination of 7° was used for correcting drill-hole azimuths. Drill-hole geology is recorded for lithology, alteration, mineralization, structures, and veins. Furthermore, drill-hole recovery and RQD are recorded for all drilled intervals.
Table 10-1: Summary Drilling Conducted by Vizsla on the Panuco Project, to June 18, 2024
| Year | Drill-Hole Start | Drill-Hole Finish | Drill-Hole Count | Target Corridor | Length Drilled (m) |
| 2019 | AM-19-1,1A | AM-19-2 | 3 | Animas | 820.50 |
| 2019 Total | 3 | 820.50 | |||
| 2020 | AM-20-3 | AM-20-25 | 23 | Animas | 6,738.25 |
| 2020 | CO-20-01 | CO-20-28 | 28 | Cordon del Oro | 6,432.05 |
| 2020 | CS-20-01 | CS-20-14 | 14 | Copala - Tajitos | 2,927.10 |
| 2020 | NP-20-01 | NP-20-63 | 64 | Napoleon | 12,546.02 |
| 2020 Total | 129 | 28,643.42 | |||
| 2021 | AM-21-26 | AM-21-39 | 14 | Animas | 4,438.50 |
| 2021 | CO-21-29 | CO-21-50 | 22 | Cordon del Oro | 6,275.55 |
| 2021 | CS-21-15 | CS-21-117 | 104 | Copala - Tajitos | 34,769.35 |
| 2021 | NP-21-64 | NP-21-246 | 180 | Napoleon | 54,759.15 |
| 2021 Total | 320 | 100,242.55 | |||
| 2022 | AM-22-40 | AM-22-55 | 16 | Animas | 6,588.90 |
|
|
| Year | Drill-Hole Start | Drill-Hole Finish | Drill-Hole Count | Target Corridor | Length Drilled (m) |
| 2022 | BO-22-01 | BO-22-07 | 7 | Broche de Oro | 2,309.80 |
| 2022 | CO-22-51 | CO-22-80 | 30 | Cordon del Oro | 7,225.80 |
| 2022 | CS-22-118 | CS-22-252 | 135 | Copala - Tajitos | 52,045.10 |
| 2022 | NP-22 243 | NP-22-351 | 109 | Napoleon | 53,412.80 |
| 2022 Total | 297 | 121,582.40 | |||
| 2023 | AM-23-56 | AM-23-63 | 8 | Animas | 2,548.50 |
| 2023 | COP-2023-001 | COP-2023-005 | 5 | Cordon del Oro | 1,866.00 |
| 2023 | CS-23-253 | CS-23-335 | 86 | Copala - Tajitos | 52,083.65 |
| 2023 | NP-23-352 | NP-23-426 | 75 | Napoleon | 40,926.80 |
| 2023 | NAP-2023-001 | NAP-2023-006 | 6 | Napoleon | 2,375.70 |
| 2023 Total | 180 | 99,800.65 | |||
| 2024 | CS-24-336 | CS-24-366 | 28 | Tajitos - Copala | 11,602.00 |
| 2024 | NP-24-427 | NP-24-442 | 16 | Napoleon | 8,885.20 |
| 2024 Total | 44 | 20,487.20 | |||
| Total | 973 | 371,576.72 | |||
Figure 10-1: Resource Models and Location of Drill Holes on the Panuco Project from 2019-2024
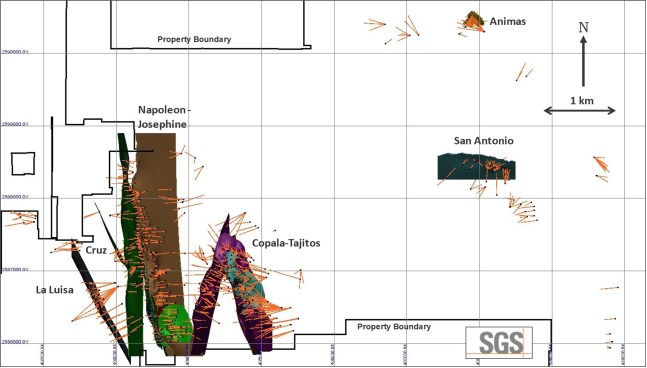
Source: SGS, 2024
Note: Drillhole collars as black circles, drillhole traces as orange lines, MRE vein models coloured by zone
|
|
10.2 2019 Drilling
In November 2019, Vizsla began drilling on the Panuco Project on the Animas-Refugio corridor near the La Pipa and Mariposa mine areas. A total of 820.50 m in three drill holes was completed in 2019. The three drill holes targeted the La Pipa structure to test below the historically mined mineralization. Results showed low-grade and narrow widths, and no further test work was carried out.
Drill holes AMS-19-01A and AMS-19-02 were drilled to test the downdip extension of the La Pipa mineralized shoot that has seen extensive mining. The first hole intersected historic workings and a footwall vein over 5.5 m at 135.0 m downhole. Deeper in the hole a 2.0 m wide quartz-amethyst vein was intersected at 241.5 m downhole. The second hole was completed 77 m down dip on the same section and intersected a shallow hanging wall vein with 3 m grading 125.3 g/t Ag and 0.59 g/t Au and a zone of low-grade veinlets in the projection of the Animas Vein.
10.3 2020 Drilling
Drilling for 2020 totaled 28,643.42 m in 129 drill holes (Figure 10-2). The four main corridors of Napoleon, Cinco Senores, Cordon del Oro, and Animas-Refugio were tested.
In January 2020, drilling resumed at the Mariposa mine area, another historically mined area. Other targets in the Animas-Refugio corridor included, from south to north, Mojocuan, San Carlos, Paloma, and Honduras veins.
Drilling at the Napoleon corridor began in June 2020. A total of 64 drill holes tested the Napoleon structure, for 12,546.02 m. Targets were in the central part of the north-south-trending structure, below old mine workings, and 650 m north in the Papayo area.
At the Cordon del Oro corridor, drilling totalled 6,432.05 m in 28 drill holes. The drilling targeted the Mojocuan, San Carlos, and Peralta mine areas, in addition to the Aguita Zarca vein.
Cinco Senores corridor saw 2,927.10 m of drilling in 14 drill holes. The Tajitos vein was the drilling target, and previously unknown workings were encountered in the first four holes.
Highlights of the 2019-2020 drilling are presented in Table 10-2.
|
|
Figure 10-2: Resource Models and Location of 2019 - 2020 Drill Holes on the Panuco Project
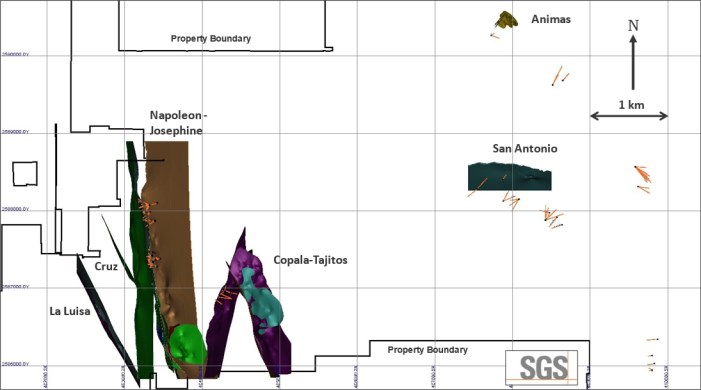
Source: SGS, 2024
Notes: Drillhole collars as black circles, drillhole traces as orange lines, MRE vein models coloured by zone
Table 10-2: Highlights of the 2019 - 2020 Drilling
Drillhole | From | Down Hole Length | Est. True Width | Gold | Silver | Lead | Zinc | Vein |
AM-20-16* | 286.40 | 6.75 | n/a | 2.19 | 231.00 | - | - | AM-20-16 |
Incl. | 286.40 | 1.50 | n/a | 5.08 | 821.00 | - | - | Incl. |
CO-20-13* | 60.15 | 18.15 | n/a | 3.71 | 117.90 | - | - | CO-20-13 |
Incl. | 61.55 | 5.95 | n/a | 10.49 | 243.80 | - | - | Incl. |
CS-20-01* | 75.90 | 4.50 | n/a | 7.29 | 1,200.60 | - | - | CS-20-01 |
Incl. | 78.65 | 1.15 | n/a | 16.13 | 2,209.60 | - | - | Incl. |
CS-20-02* | 110.00 | 1.15 | n/a | 4.59 | 812.50 | - | - | CS-20-02 |
CS-20-06* | 96.00 | 13.50 | n/a | 4.35 | 536.00 | - | - | CS-20-06 |
Incl. | 96.00 | 7.55 | n/a | 7.68 | 946.80 | - | - | Incl. |
Incl. | 99.00 | 1.50 | n/a | 15.00 | 1,870.00 | - | - | Incl. |
NP-20-02 | 108.60 | 8.20 | n/a | 11.06 | 738.90 | - | - | NP-20-02 |
Incl. | 108.60 | 2.00 | n/a | 24.90 | 1,527.50 | - | - | Incl. |
|
|
Drillhole | From | Down Hole Length | Est. True Width | Gold | Silver | Lead | Zinc | Vein |
NP-20-03 | 76.00 | 2.50 | n/a | 9.20 | 453.80 | - | - | NP-20-03 |
And | 102.40 | 5.10 | n/a | 8.00 | 309.30 | 2.22 | 4.75 | And |
Incl. | 103.50 | 1.80 | n/a | 15.63 | 186.30 | 1.12 | 7.73 | Incl. |
NP-20-07 | 69.00 | 6.00 | n/a | 66.80 | 1,808.20 | 2.99 | 3.30 | NP-20-07 |
Incl. | 69.50 | 3.70 | n/a | 107.90 | 2,889.20 | 4.80 | 4.56 | Incl. |
Incl. | 72.35 | 0.85 | n/a | 199.00 | 2,240.00 | 12.85 | 3.27 | Incl. |
NP-20-05 | 112.35 | 10.65 | n/a | 1.34 | 134.30 | 0.49 | 0.91 | NP-20-05 |
Incl. | 118.60 | 1.00 | n/a | 5.10 | 719.00 | 0.71 | 1.42 | Incl. |
NP-20-08 | 173.50 | 4.50 | n/a | 2.52 | 494.90 | 0.51 | 1.10 | NP-20-08 |
Incl. | 175.00 | 2.00 | n/a | 5.22 | 1,039.00 | 1.04 | 2.32 | Incl. |
NP-20-09 | 68.00 | 22.60 | n/a | 1.05 | 141.40 | 0.48 | 0.83 | NP-20-09 |
Incl. | 68.00 | 1.00 | n/a | 5.54 | 619.00 | 2.55 | 3.05 | Incl. |
NP-20-18 | 141.50 | 2.50 | n/a | 3.76 | 689.50 | 0.25 | 0.63 | NP-20-18 |
Incl. | 141.50 | 1.00 | n/a | 7.96 | 1,515.00 | 0.50 | 1.20 | Incl. |
NP-20-25 | 124.70 | n/a | 15.30 | 2.02 | 254.70 | 0.31 | 0.61 | NP-20-25 |
Incl. | 127.50 | n/a | 0.70 | 17.00 | 2790.00 | 1.88 | 3.88 | Incl. |
And | 145.20 | n/a | 0.73 | 18.20 | 1915.00 | 1.15 | 1.57 | And |
NP-20-27 | 116.55 | n/a | 2.58 | 8.70 | 869.90 | 0.85 | 2.02 | NP-20-27 |
Incl. | 117.95 | n/a | 0.74 | 14.80 | 1395.00 | 1.56 | 3.43 | Incl. |
And | 106.35 | n/a | 2.01 | 2.90 | 415.00 | 2.01 | 2.07 | And |
Incl. | 107.25 | n/a | 0.54 | 4.83 | 725.00 | 0.82 | 1.24 | Incl. |
NP-20-42 | 149.15 | n/a | 11.02 | 2.27 | 180.10 | 0.44 | 1.31 | NP-20-42 |
Incl. | 163.80 | n/a | 1.09 | 13.88 | 974.80 | 1.63 | 5.83 | Incl. |
NP-20-31 | 47.05 | n/a | 3.54 | 3.75 | 181.20 | 0.59 | 1.52 | NP-20-31 |
NP-20-13 | 130.35 | n/a | 3.23 | 2.57 | 262.30 | 1.26 | 2.00 | NP-20-13 |
NP-20-50 | 132.40 | n/a | 1.91 | 0.96 | 198.00 | 1.43 | 4.53 | NP-20-50 |
Incl. | 132.40 | n/a | 0.69 | 2.19 | 477.90 | 3.67 | 11.70 | Incl. |
NP-20-36 | 184.50 | n/a | 2.46 | 1.21 | 144.30 | 0.75 | 2.41 | NP-20-36 |
NP-20-54 | 317.25 | n/a | 2.42 | 18.45 | 86.50 | 1.27 | 3.36 | NP-20-54 |
Incl. | 317.25 | n/a | 0.43 | 101.00 | 307.00 | 2.88 | 10.50 | Incl. |
NP-20-49 | 163.30 | n/a | 6.00 | 1.54 | 63.00 | 0.23 | 1.24 | NP-20-49 |
Incl. | 168.75 | n/a | 1.45 | 5.80 | 215.90 | 0.30 | 3.95 | Incl. |
Notes: * No material Pb and Zn grades in Aminas, Tajitos, and Copala Mineralization
** Where intersection estimated true widths are not available down hole core lengths are presented.
|
|
10.4 2021 Drilling
Drilling at the Panuco Project in 2021 totalled 100,242.55 m in 320 drill holes (Figure 10-3). The drilling focused along the Napoleon and Tajitos vein areas, with 54,759.15 m in 180 drill holes and 34,769.35 m in 104 drill holes, respectively (Table 10-3). Additionally, 4,438.50 m in 14 drill holes were drilled in the Animas-Refugio corridor, and 6,275.55 m in 22 drill holes in the Cordon del Oro corridor. Highlights of the 2021 drilling are presented below.
At Napoleon, infill and delineation drilling focused on denser drilling to inform the Mineral Resource estimate and expand the structure's strike length. The Josephine vein, a subparallel system to Napoleon which was identified initially as an electromagnetic geophysical target, was first intersected in Hole NP-21-132, leading to additional targeting in the area and its inclusion in the Mineral Resource estimate. Further drill testing included the Cruz Negra and Alacran vein areas.
Drilling at the Tajitos vein area focused on delineation and infilling, with additional exploration drilling to the north. The Tajitos resource drilling led to the discovery of the Copala vein -- a relatively thick subhorizontal structure on the Tajitos northeastern extent. Other exploration drilling along the Cinco Senores corridor included the Cinco Senores and Colorada veins to north of Tajitos.
In the Animas-Refugio corridor, drilling tested the Rosarito segment included in the Mineral Resource estimate, in addition to the Peralta and Cuevillas veins.
Drilling at the Cordon del Oro corridor targeted the San Antonio structure included in the Mineral Resource estimate, in addition to exploration near the Aguita Zarca vein.
|
|
Figure 10-3: Resource Models and Location of Drill Holes on the Panuco Project from 2021
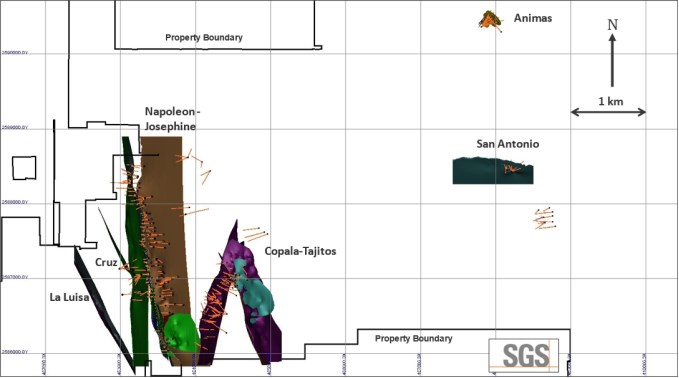
Source: SGS, 2024
Notes: Drillhole collars as black circles, drillhole traces as orange lines, MRE vein models coloured by zone
Table 10-3: Highlights of the 2021 Drilling
Drillhole | From | To | Down Hole | Est. True | Gold | Silver | Lead | Zinc |
Napoleon Trend | ||||||||
NP-21-84 | 238.50 | 248.20 | 9.70 | 7.58 | 1.06 | 58 | 0.47 | 1.28 |
Inc. | 246.00 | 246.85 | 0.85 | 0.66 | 2.89 | 235 | 1.26 | 3.03 |
NP-21-89 | 92.00 | 108.80 | 16.80 | 10.30 | 3.13 | 356 | 0.80 | 0.81 |
Inc. | 94.80 | 95.15 | 0.35 | 0.21 | 1.66 | 398 | 20.00 | 4.49 |
And | 100.05 | 100.50 | 0.45 | 0.28 | 21.00 | 1,070 | 0.43 | 4.14 |
And | 106.75 | 107.60 | 0.85 | 0.52 | 13.95 | 3,150 | 0.76 | 1.33 |
NP-21-90 | 192.30 | 194.75 | 2.45 | 1.92 | 7.28 | 106 | 0.70 | 2.87 |
Inc. | 192.30 | 194.15 | 1.85 | 1.45 | 9.39 | 131 | 0.76 | 3.15 |
NP-21-91 | 248.40 | 250.50 | 2.10 | 1.61 | 1.10 | 110 | 1.29 | 2.19 |
NP-21-93 | 63.25 | 64.90 | 1.65 | 1.09 | 2.09 | 85 | 0.15 | 0.36 |
NP-21-94 | 221.90 | 228.70 | 6.80 | 4.46 | 19.99 | 890 | 0.71 | 1.76 |
inc. | 225.10 | 226.50 | 1.40 | 0.92 | 91.91 | 3,804 | 1.50 | 3.48 |
NP-21-95 | 56.10 | 60.50 | 4.40 | 1.67 | 1.17 | 132 | 0.12 | 0.25 |
|
|
Drillhole | From | To | Down Hole | Est. True | Gold | Silver | Lead | Zinc |
NP-21-99 | 247.35 | 259.80 | 12.45 | 6.15 | 5.14 | 87 | 0.38 | 1.37 |
Incl. | 249.75 | 251.00 | 1.25 | 0.62 | 31.70 | 113 | 0.44 | 1.86 |
NP-21-102 | 319.10 | 328.85 | 9.75 | 3.93 | 1.93 | 41 | 0.80 | 3.10 |
Incl. | 320.65 | 321.55 | 0.90 | 0.36 | 7.53 | 113 | 5.46 | 21.50 |
NP-21-104 | 209.20 | 213.40 | 4.20 | 3.45 | 25.97 | 1,275 | 0.75 | 3.00 |
Incl. | 209.60 | 211.60 | 2.00 | 1.64 | 49.26 | 2,374 | 0.86 | 3.50 |
incl. | 210.20 | 211.00 | 0.80 | 0.66 | 88.20 | 5,410 | 1.02 | 1.95 |
NP-21-105 | 71.65 | 74.60 | 2.95 | 1.61 | 2.16 | 354 | 0.39 | 2.35 |
NP-21-107 | 237.70 | 242.35 | 4.65 | 3.73 | 2.85 | 105 | 0.67 | 1.44 |
Incl. | 240.00 | 241.50 | 1.50 | 1.20 | 4.71 | 156 | 0.65 | 1.79 |
NP-21-110 | 128.30 | 131.70 | 3.40 | 2.62 | 5.51 | 476 | 1.49 | 1.06 |
Incl. | 130.80 | 131.70 | 0.90 | 0.69 | 14.40 | 1,545 | 1.23 | 2.67 |
NP-21-112 | 142.55 | 155.05 | 12.50 | 8.36 | 5.58 | 372 | 0.24 | 0.94 |
Incl. | 142.55 | 146.00 | 3.45 | 2.31 | 18.88 | 1,306 | 0.73 | 2.07 |
Incl. | 142.55 | 144.55 | 2.00 | 1.34 | 31.93 | 2,243 | 1.23 | 3.53 |
NP-21-114 | 259.85 | 263.70 | 3.85 | 2.94 | 2.06 | 47 | 0.62 | 1.76 |
NP-21-115 | 99.55 | 100.00 | 0.45 | n/a | 2.24 | 590 | 0.97 | 4.99 |
NP-21-116 | 164.25 | 184.90 | 20.65 | 11.34 | 3.11 | 88 | 0.26 | 2.13 |
Incl. | 164.75 | 165.55 | 0.80 | 0.44 | 7.04 | 118 | 1.76 | 2.69 |
And | 169.10 | 170.40 | 1.30 | 0.71 | 12.85 | 36 | 0.47 | 2.17 |
And | 178.90 | 180.50 | 1.60 | 0.88 | 9.57 | 618 | 0.43 | 1.21 |
NP-21-116 | 202.55 | 213.00 | 10.45 | 5.24 | 4.43 | 67 | 1.30 | 1.13 |
NP-21-117 | 205.85 | 208.50 | 2.65 | 1.00 | 0.76 | 127 | 0.21 | 1.25 |
NP-21-118 | 150.20 | 158.65 | 8.45 | 4.87 | 3.70 | 112 | 0.35 | 1.52 |
Incl. | 150.55 | 151.15 | 0.60 | 0.35 | 28.90 | 226 | 1.95 | 7.32 |
And | 155.25 | 156.00 | 0.75 | 0.43 | 6.13 | 234 | 0.71 | 4.16 |
NP-21-129 | 63.00 | 64.65 | 1.65 | n/a | 0.84 | 1,210 | 0.25 | 0.70 |
Incl. | 64.35 | 64.65 | 0.30 | n/a | 4.58 | 5,750 | 1.34 | 3.67 |
NP-21-133 | 248.25 | 250.60 | 2.35 | 1.46 | 10.74 | 188 | 1.27 | 3.47 |
NP-21-135 | 322.00 | 324.10 | 2.10 | 1.26 | 0.61 | 126 | 0.06 | 1.66 |
NP-21-142 | 289.50 | 295.70 | 6.20 | 3.01 | 3.62 | 40 | 0.80 | 3.98 |
NP-21-145 | 328.40 | 333.25 | 4.85 | 3.40 | 3.10 | 110 | 1.20 | 1.11 |
NP-21-148 | 339.20 | 340.60 | 1.40 | n/a | 6.49 | 114 | 0.78 | 8.02 |
Incl. | 340.00 | 340.30 | 0.30 | 0.11 | 25.20 | 365 | 2.71 | 22.90 |
NP-21-149 | 210.45 | 218.60 | 8.15 | 5.93 | 11.35 | 185 | 0.49 | 2.25 |
Incl. | 211.85 | 214.45 | 2.60 | 1.89 | 33.78 | 344 | 1.17 | 6.30 |
NP-21-150* | 65.25 | 68.15 | 2.90 | n/a | 3.95 | 34 | n/a | n/a |
Incl. | 66.50 | 67.70 | 1.20 | n/a | 6.77 | 41 | n/a | n/a |
NP-21-153* | 83.55 | 85.25 | 1.70 | n/a | 6.87 | 55 | n/a | n/a |
Incl. | 83.55 | 84.40 | 0.85 | n/a | 9.14 | 86 | n/a | n/a |
NP-21-154 | 165.45 | 169.55 | 4.10 | 2.37 | 0.31 | 27 | 0.20 | 0.70 |
|
|
Drillhole | From | To | Down Hole | Est. True | Gold | Silver | Lead | Zinc |
NP-21-155 | 248.00 | 257.00 | 9.00 | 6.33 | 1.79 | 52 | 0.17 | 1.14 |
Incl. | 253.00 | 256.55 | 3.55 | 2.50 | 3.03 | 64 | 0.24 | 2.42 |
Incl. | 256.00 | 256.55 | 0.55 | 0.39 | 6.21 | 58 | 0.50 | 3.05 |
NP-21-157 | 391.50 | 401.60 | 10.10 | 3.96 | 1.79 | 82 | 0.76 | 5.22 |
NP-21-164 | 354.00 | 362.65 | 8.65 | 6.96 | 2.12 | 74 | 0.40 | 2.10 |
Incl. | 354.90 | 358.15 | 3.25 | 2.62 | 3.50 | 104 | 0.21 | 3.95 |
NP-21-167 | 351.15 | 360.02 | 8.87 | 4.37 | 1.26 | 111 | 0.96 | 3.02 |
Incl. | 351.15 | 359.75 | 8.60 | 2.77 | 1.78 | 165 | 1.30 | 4.21 |
Incl. | 353.30 | 353.60 | 0.30 | 0.15 | 7.96 | 988 | 1.63 | 15.95 |
NP-21-168 | 292.25 | 306.25 | 14.00 | 5.76 | 0.81 | 56 | 0.84 | 2.55 |
NP-21-172 | 362.75 | 370.50 | 7.75 | 7.32 | 1.34 | 114 | 0.21 | 0.77 |
Incl. | 369.00 | 370.50 | 1.50 | 1.42 | 2.56 | 458 | 0.14 | 0.50 |
NP-21-173 | 108.50 | 112.20 | 3.70 | n/a | 6.80 | 99 | 0.20 | 1.83 |
Incl. | 108.50 | 109.40 | 0.90 | n/a | 26.00 | 263 | 0.28 | 5.40 |
And | 136.05 | 141.30 | 5.25 | 1.83 | 2.57 | 277 | 0.27 | 3.70 |
Incl. | 136.05 | 136.80 | 0.75 | 0.26 | 13.95 | 1,430 | 0.66 | 23.30 |
NP-21-176 | 167.45 | 169.50 | 2.05 | 1.06 | 0.66 | 64 | 4.37 | 3.18 |
And | 176.90 | 177.35 | 0.45 | n/a | 18.75 | 1,090 | 4.18 | 8.19 |
And | 216.00 | 217.50 | 1.50 | n/a | 2.41 | 71 | 0.36 | 1.02 |
NP-21-178 | 228.15 | 241.25 | 13.10 | 10.69 | 1.21 | 220 | 0.41 | 0.77 |
Incl. | 237.00 | 241.25 | 4.25 | 3.47 | 2.81 | 469 | 0.66 | 1.17 |
NP-21-181 | 462.00 | 463.10 | 1.10 | 0.74 | 1.72 | 9 | 0.21 | 0.26 |
NP-21-183 | 275.55 | 276.95 | 1.40 | n/a | 3.57 | 24 | 1.32 | 1.57 |
NP-21-184 | 358.85 | 363.25 | 4.40 | 1.63 | 2.69 | 34 | 0.19 | 2.16 |
NP-21-191 | 545.20 | 547.90 | 2.70 | 0.80 | 0.29 | 148 | 0.25 | 3.44 |
NP-21-192A | 143.60 | 145.50 | 1.90 | 1.14 | 4.75 | 128 | 1.20 | 2.53 |
NP-21-194 | 113.65 | 114.30 | 0.65 | 0.39 | 7.76 | 286 | 1.68 | 3.42 |
NP-21-198 | 85.25 | 88.50 | 3.25 | 2.90 | 0.76 | 210 | 2.22 | 1.84 |
Tajitos Vein* | ||||||||
CS-21-37* | 207.30 | 209.20 | 1.90 | 1.34 | 7.94 | 960 | - | - |
Incl. | 207.30 | 208.50 | 1.20 | 0.85 | 12.05 | 1,465 | - | - |
And | 223.20 | 223.90 | 0.70 | n/a | 4.16 | 2,082 | - | - |
Incl. | 223.20 | 223.50 | 0.30 | n/a | 9.01 | 4,590 | - | - |
CS-21-41* | 226.65 | 229.50 | 2.85 | 2.15 | 1.09 | 188 | - | - |
CS-21-44* | 261.25 | 263.10 | 1.80 | 1.38 | 2.83 | 527 | - | - |
Incl. | 261.25 | 262.00 | 0.75 | 0.57 | 3.17 | 639 | - | - |
Incl. | 313.60 | 314.70 | 1.10 | n/a | 1.78 | 418 | - | - |
CS-21-49* | 176.05 | 184.50 | 8.45 | n/a | 2.56 | 304 | - | - |
Incl. | 179.45 | 181.00 | 1.55 | n/a | 8.27 | 816 | - | - |
CS-21-50* | 251.40 | 254.30 | 2.85 | 1.99 | 2.46 | 615 | - | - |
Incl. | 251.40 | 252.40 | 1.00 | 0.70 | 6.45 | 1,640 | - | - |
|
|
Drillhole | From | To | Down Hole | Est. True | Gold | Silver | Lead | Zinc |
CS-21-52* | 291.75 | 293.00 | 1.25 | 0.86 | 3.37 | 315 | - | - |
CS-21-60* | 334.50 | 345.20 | 10.70 | 6.82 | 1.40 | 201 | - | - |
Incl. | 339.80 | 345.20 | 5.40 | 3.44 | 2.27 | 308 | - | - |
Cs-21-66* | 175.45 | 176.80 | 1.30 | n/a | 2.47 | 600 | - | - |
And | 348.30 | 350.50 | 2.20 | 1.50 | 9.90 | 2,607 | - | - |
CS-21-71* | 201.50 | 205.50 | 4.00 | 3.84 | 3.25 | 901 | - | - |
Incl. | 201.50 | 203.60 | 2.10 | 2.02 | 5.88 | 1,618 | - | - |
CS-21-77* | 159.70 | 160.40 | 0.70 | n/a | 5.73 | 1,115 | - | - |
* No material Pb and Zn grades in Tajitos and Copala Mineralization
** Where intersection estimated true widths are not available down hole core lengths are presented.
10.5 2022 Drilling
Drilling for 2022 totalled 121,582.4 m in 297 drill holes (Figure 10-4) (Table 10-4. The four main corridors of Napoleon, Cinco Senores, Cordon del Oro, and Animas-Refugio were tested.
Drilling at the Napoleon corridor included 109 drill holes tested the Napoleon structure, for 53,412.80 m. At the Cordon del Oro corridor, drilling totalled 7,225.80 m in 30 drill holes. Drilling at the Copala/Tajitos veins included 135 drill holes for 52,045.10 m. Additionally, 6,588.90 m in 16 drill holes were drilled in the Animas-Refugio corridor and 2,309.80 m in 7 drill holes were drilled in the Broche de Oro area.
The bulk of 2022 drilling was centred on the western portion of the district, focused on upgrading and expanding resources at the Copala and Napoleon areas. At Copala, mineralization has now been traced over 1,150 meters along strike, 400 m down dip, and remains open to the north and southeast.
At Napoleon, drilling throughout 2022 successfully expanded mineralization along strike and down plunge to the south, several vein splays were identified in the hanging wall and footwall of the main structure.
Other notable discoveries include the Cristiano Vein; marked by high precious metal grades up to 1,935 g/t Ag and 15.47 g/t Au over 1.46 m, located immediately adjacent to Copala; and La Luisa Vein, located ~700 m west of Napoleon which continues to display similar silver and gold zonation as that seen at Napoleon.
|
|
Figure 10-4: Resource Models and Location of Drill Holes on the Panuco Project from 2022
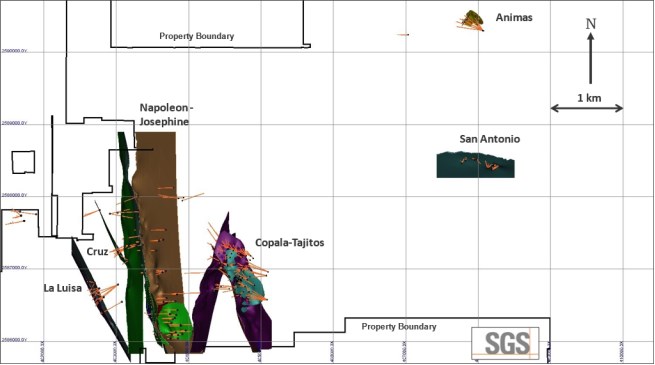
Source: SGS, 2024
Notes: Drillhole collars as black circles, drillhole traces as orange lines, MRE vein models coloured by zone
Table 10-4: Highlights of the 2022 Drilling
Drillhole | From | To | Down Hole Length | Est. True Width | Gold | Silver | Lead | Zinc | Vein |
CS-22-191* | 370.95 | 374.85 | 3.90 | 3.28 | 14.23 | 4,804 | - | - | Copala FW |
NP-22-281 | 477.50 | 480.00 | 2.50 | 1.40 | 25.84 | 3,585 | 0.32 | 1.07 | Napoleon HW |
CS-22-161* | 226.10 | 229.80 | 3.70 | 2.65 | 13.16 | 2,461 | - | - | Copala |
CS-22-182* | 42.70 | 44.55 | 1.85 | 1.46 | 15.47 | 1,935 | - | - | Cristiano |
NP-22-316 | 390.00 | 391.05 | 1.05 | 1.00 | 1.6 | 2,642 | 1.87 | 4.08 | Napoleon FW |
CS-22-205* | 283.00 | 288.50 | 5.50 | 5.30 | 9.54 | 2,101 | - | - | Copala |
CS-22-159* | 187.70 | 192.20 | 4.50 | 2.66 | 8.6 | 2,011 | - | - | Copala FW |
CS-22-193* | 171.40 | 184.90 | 13.50 | 10.20 | 10.94 | 1,404 | - | - | Copala |
NP-22-258 | 493.15 | 498.55 | 5.40 | 4.30 | 11.48 | 1,139 | 0.32 | 0.85 | Napoleon |
CS-22-154* | 124.45 | 136.50 | 12.05 | 9.35 | 5.44 | 1,010 | - | - | Copala |
NP-22-300 | 347.95 | 353.85 | 5.90 | 3.90 | 5.28 | 913 | 0.15 | 0.25 | Napoleon |
|
|
Drillhole | From | To | Down Hole Length | Est. True Width | Gold | Silver | Lead | Zinc | Vein |
CS-22-169* | 162.95 | 188.35 | 25.40 | 20.45 | 4.23 | 780 | - | - | Copala |
CS-22-191* | 348.20 | 363.10 | 14.90 | 12.52 | 4.93 | 706 | - | - | Copala |
CS-22-155* | 159.00 | 174.35 | 15.35 | 14.50 | 3.89 | 667 | - | n/a | Copala |
CS-22-200* | 150.00 | 166.00 | 16.00 | 14.24 | 4.3 | 632 | - | - | Copala |
CS-22-173* | 256.15 | 270.90 | 14.75 | 14.46 | 2.9 | 663 | - | - | Copala |
NP-22-271 | 456.05 | 465.25 | 9.20 | 7.00 | 2.76 | 223 | 1.54 | 5.01 | Napoleon HW |
NP-22-271 | 508.05 | 516.25 | 8.20 | 6.24 | 2.92 | 393 | 0.40 | 0.94 | Napoleon |
Note: * No material Pb and Zn grades in Tajitos and Copala Mineralization
10.6 2023 Drilling
Drilling for 2023 totalled 99,800.65 m in 180 drill holes (Figure 10-5) (Table 10-5). The main Napoleon and Cinco Senores corridors were primarily tested with limited drilling in the Animas-Refugio corridor.
Drilling at the Napoleon corridor included 75 drill holes testing the Napoleon structure, for 40,926.80 m. Drilling at the Copala/Tajitos veins included 86 drill holes for 52,083.65 m. Drilling in the Animas-Refugio corridor included eight drill holes for 2,548.50 m. Additional geotechnical drilling was completed at Napoleon, 6 drill holes for
2,375.70 m, and Cordon del Oro, five drill holes for 1,866.00 m.
The 2023 drilling was centred on the western portion of the district, focused on upgrading and expanding resources at the Copala and Napoleon areas. At Copala, mineralization was traced over 1,700 m along strike and to depths of 450 to 550 m and remains open to the north and southeast.
At Napoleon, drilling throughout 2023 successfully expanded mineralization along strike and down plunge/dip to the south, several vein splays were identified in the hanging wall and footwall of the main structure. Other notable discoveries include the La Luisa Vein and the Molino Vein. La Luisa is a high-grade structure located ~700 m west of Napoleon. To the end of 2023, drilling completed at La Luisa had traced mineralization along 1,670 m of strike length and to an average depth of 450 m. With 44 holes completed, La Luisa had an average width of 3.21 m and a weighted average grade of 497 g/t AgEq.
El Molino Vein, situated in between the Copala and Napoleon resource areas, is a near-surface vein that was discovered during preliminary condemnation drilling. El Molino is marked by high precious metal grades up to
1,552 g/t Ag and 8.37 g/t Au over 1.65 m.
|
|
Figure 10-5: Resource Models and Location of Drill Holes on the Panuco Project from 2023
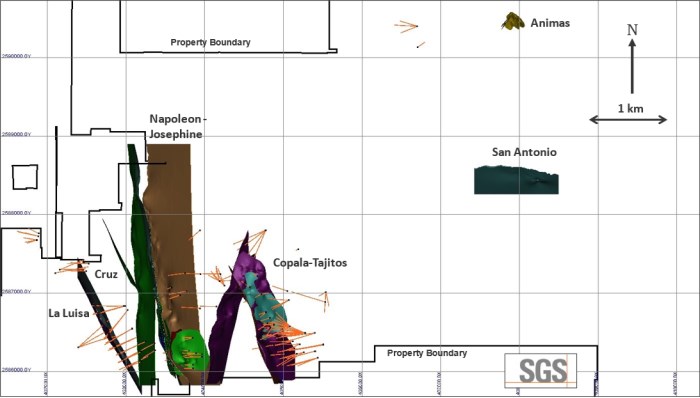
Source: SGS, 2024
Notes: Drillhole collars as black circles, drillhole traces as orange lines, MRE vein models coloured by zone
Table 10-5: Highlights of the 2023 Drilling
Drillhole | From | To | Down Hole | Est. True | Gold | Silver | Lead | Zinc | Vein |
CS-23-265 | 380.60 | 388.95 | 8.35 | 5.89 | 4.24 | 1,403 | - | - | Copala |
NP-23-395 | 657.10 | 669.30 | 12.20 | 11.2 | 7.14 | 229 | 0.34 | 1.64 | La Luisa Main |
NP-23-358 | 501.30 | 513.90 | 12.60 | 5.60 | 11.13 | 257 | 0.42 | 2.03 | La Luisa Main |
CS-23-254 | 535.40 | 538.30 | 2.90 | 2.14 | 22.46 | 1,319 | - | - | Copala |
CS-23-253 | 295.40 | 297.50 | 2.10 | 2.10 | 10.91 | 1,920 | - | - | Copala |
CS-23-304 | 468.00 | 471.30 | 3.30 | 2.80 | 6.80 | 1,366 | - | - | Copala |
CS-23-290 | 557.80 | 588.70 | 30.90 | 5.05 | 3.48 | 565 | - | - | Copala 2 |
NP-23-359 | 80.00 | 82.05 | 2.05 | 1.65 | 8.37 | 1,552 | 0.47 | 1.22 | El Molino |
NP-23-391 | 526.15 | 528.20 | 2.05 | 1.90 | 7.37 | 908 | 1.62 | 4.91 | Napoleon FW2 |
NP-23-362 | 618.25 | 626.30 | 8.05 | 3.05 | 5.82 | 372 | 2.15 | 3.15 | La Luisa HW 2 |
Note: * Table of Top 10 Drill Composites of 2023, ordered from highest to lowest grade AgEq (see press release dated December 19, 2023)
|
|
10.7 2024 Drilling
Drilling for 2024 (to June 18) totalled 20,487.20 m in 44 drill holes (Figure 10-6) (Table 10-6). The main Napoleon and Cinco Senores corridors were tested.
Drilling at the Napoleon corridor included 16 drill holes testing the Napoleon structure, for 8,885.20 m. Drilling at the Copala/Tajitos veins included 28 drill holes for 11,602.00 m.
The 2024 drilling was centred on the western portion of the district, primarily focused on infill drilling at 50 m centres to upgrade resources within the Copala and Napoleon areas.
At Copala, infill drilling in the north-central zone targeted the main Copala structure, with some holes also intersecting the Copala 3 and Copala 4 veins.
At Napoleon, infill drilling assay results confirmed additional high-grade silver and gold values particularly in the shallow dipping Hanging Wall 4 (HW4) vein. The HW4 vein dips to the east at shallow angle (35° to 55°) and is situated on the hanging wall of main Napoleon vein (the vein splits off from Napoleon main vein) and it remains open to the east particularly in its southern extent where the vein shows higher silver and gold grades. The vein is typically narrow (1.00 metre in average) but at some locations it develops cymoid loops with more than one vein intercept as seen in holes NP-24-429 and NP-24-436.
Drilling at La Luisa focused on infill holes within high-grade shoots of the La Luisa and Footwall vein splay.
The discovery of the El Molino vein in 2023 occurred approximately 250 m west of the Copala and Tajitos veins, but new interpretations and drilling confirmed that the vein extends southwest and intersects with Napoleon.
|
|
Figure 10-6: Resource Models and Location of Drill Holes on the Panuco Project from 2024 (to June 18)
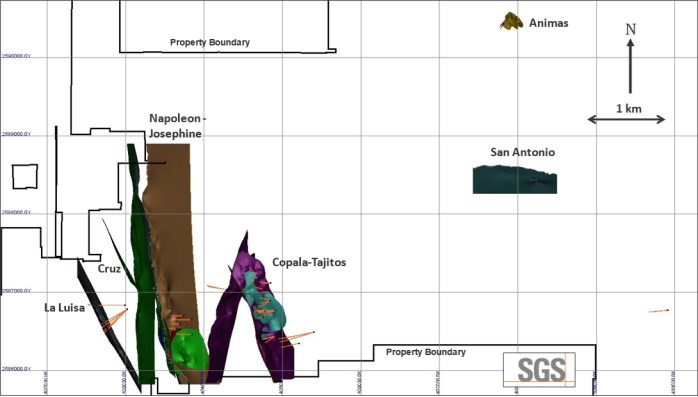
Source: SGS, 2024
Notes: Drillhole collars as black circles, drillhole traces as orange lines, MRE vein models coloured by zone
Table 10-6: Highlights of the 2024 Drilling (to June 18, 2024)
Drillhole | From | To | Down Hole | Est. True | Gold | Silver | Lead | Zinc | Vein |
CS-24-342* | 675.20 | 675.85 | 0.65 | 0.60 | 3.83 | 1,435 | - | - | Copala 4 |
NP-24-433 | 504.30 | 505.50 | 1.20 | 0.75 | 2.78 | 827 | 0.57 | 1.80 | HW |
NP-24-438 | 445.80 | 446.40 | 0.60 | 0.48 | 61.60 | 3,310 | 0.78 | 1.33 | HW |
NP-24-429 | 433.75 | 435.10 | 1.35 | 1.30 | 28.10 | 2,390 | 2.19 | 9.61 | HW4 |
NP-24-429 | 470.60 | 471.55 | 0.95 | 0.80 | 28.04 | 2,508 | 1.78 | 6.82 | HW1 |
Incl. | 470.60 | 471.10 | 0.50 | 0.42 | 35.10 | 2,380 | 2.00 | 8.76 | HW1 |
NP-24-431 | 428.55 | 431.15 | 2.60 | 2.40 | 14.08 | 1,551 | 0.97 | 3.84 | HW4 |
Includes | 428.55 | 429.90 | 1.35 | 1.24 | 23.20 | 2,460 | 1.57 | 6.10 | HW4 |
NP-24-432 | 302.00 | 303.40 | 1.40 | 0.60 | 6.06 | 1,420 | 0.50 | 0.72 | HW2 Splay |
NP-24-435 | 244.00 | 245.60 | 1.60 | 1.40 | 11.76 | 1,429 | 0.32 | 0.68 | HW4 |
NP-24-436 | 312.00 | 313.00 | 1.00 | 0.90 | 12.30 | 1,115 | 0.71 | 1.55 | HW4 |
|
|
Drillhole | From | To | Down Hole | Est. True | Gold | Silver | Lead | Zinc | Vein |
CS-24-344* | 561.95 | 573.90 | 11.95 | 8.70 | 5.18 | 1,096 | - | - | Copala |
Incl. | 563.10 | 564.00 | 0.90 | 0.66 | 36.60 | 8,720 | - | - |
|
CS-24-345* | 401.45 | 406.85 | 5.40 | 5.00 | 1.85 | 414 | - | - | Copala |
Incl. | 402.50 | 404.55 | 2.05 | 1.89 | 4.04 | 844 | - | - |
|
CS-24-346* | 388.00 | 393.25 | 5.25 | 2.75 | 10.77 | 720 | - | - | Copala |
CS-24-347* | 287.85 | 294.00 | 6.15 | 6.00 | 10.31 | 1,882 | - | - | Copala |
Incl. | 289.00 | 291.45 | 2.45 | 2.39 | 20.51 | 3,859 | - | - |
|
CS-24-348* | 333.85 | 337.50 | 3.65 | 3.45 | 3.89 | 439 | - | - | Copala |
Incl. | 335.25 | 336.00 | 0.75 | 0.71 | 10.80 | 946 | - | - |
|
CS-24-348* | 349.50 | 351.50 | 2.00 | 1.95 | 5.39 | 1,312 | - | - | Copala |
Incl. | 350.50 | 351.50 | 1.00 | 0.95 | 9.60 | 2,390 | - | - |
|
CS-24-350* | 328.50 | 334.55 | 6.05 | 4.05 | 1.97 | 636 | - | - | Copala |
Incl. | 333.05 | 334.55 | 2.50 | 1.67 | 3.50 | 1,265 | - | - |
|
CS-24-351* | 336.35 | 338.80 | 2.45 | 2.40 | 5.52 | 1,541 | - | - | Copala |
Incl. | 336.85 | 337.55 | 0.70 | 0.69 | 16.75 | 4,710 | - | - |
|
CS-24-352* | 198.00 | 201.00 | 3.00 | 2.80 | 4.53 | 572 | - | - | Copala |
Incl. | 199.50 | 201.00 | 1.50 | 1.40 | 8.46 | 1,050 | - | - |
|
CS-24-352* | 211.80 | 217.25 | 5.45 | 5.00 | 22.95 | 1,378 | - | - | Copala |
Incl. | 213.00 | 216.00 | 3.00 | 2.75 | 39.10 | 2,115 | - | - |
|
CS-24-354* | 153.50 | 168.30 | 14.80 | 13.00 | 8.19 | 1,017 | - | - | Copala |
Incl. | 153.50 | 155.10 | 1.60 | 1.40 | 35.11 | 4,124 | - | - |
|
Incl. | 157.55 | 159.05 | 1.50 | 1.31 | 21.30 | 2,540 | - | - |
|
Note: * No material Pb and Zn grades in Tajitos and Copala Mineralization
|
|
11 SAMPLE PREPARATION, ANALYSES, AND SECURITY
11.1 Overview
Since initiating drilling on the Property in November 2019, Vizsla has maintained a comprehensive and consistent system for the sample preparation, analysis and security of all surface samples and drill core samples, including the implementation of an extensive QA/QC program. The current MRE is limited to drilling data collected by Vizsla since the acquisition of the Property as summarized in Table 11-1. The following describes sample preparation, analyses and security protocols implemented by Vizsla, with analytical labs and analysis methods summarised in Table 11-2, and has been updated to include all drilling data collected by Vizsla up to June 18, 2024 (data cut-off date for this PEA technical report).
Since the beginning of drilling in 2019, all samples are shipped to ALS Limited ("ALS") in Zacatecas, Zacatecas, Mexico for sample preparation and for analysis at the ALS laboratory in North Vancouver, BC, Canada. The ALS Zacatecas and North Vancouver facilities are ISO 9001 and ISO/IEC 17025 certified. Samples are dried, weighed, and crushed to at least 70% passing 2mm, and a 250 g split is pulverized to at least 85% passing 75 µm. Silver and base metals are analyzed using a four-acid digestion with an inductively coupled plasma (ICP) finish and gold was assayed by
30-gram fire assay with atomic absorption (AA) spectroscopy finish. Over-limit analyses for silver, lead and zinc are re-assayed using an ore-grade four-acid digestion with an ICP finish. Samples with over-limit silver assays > 1500 ppm are fire assayed by gravimetric methods on 30 g sample pulps. Control samples comprising certified reference samples, duplicates and blank samples were systematically inserted into the sample stream and analyzed as part of the Company's QA/QC protocol. Check assaying of sample pulps has been completed by SGS De Mexico ("SGS"), S.A De C.V. in Durango, Mexico, matching ALS methodology as closely as possible. The SGS Durango facilities are ISO/IEC 17025 certified. ALS and SGS Geochemistry are independent of Vizsla, the QPs, and SGS Geological Services.
Table 11-1: Summary of Drilling Samples from the Property by Year
Year | Company | Hole Type | Drillhole Start | Drillhole Finish | Drillhole Count | Total Samples |
2019 | Vizsla | DDH | AM-19-1,1A | AM-19-2 | 3 | 107 |
2020 | Vizsla | DDH | AM-20-3 | AM-20-25 | 23 | 961 |
2020 | Vizsla | DDH | CO-20-01 | CO-20-28 | 28 | 2376 |
2020 | Vizsla | DDH | CS-20-01 | CS-20-14 | 14 | 326 |
2020 | Vizsla | DDH | NP-20-01 | NP-20-63 | 64 | 2519 |
2021 | Vizsla | DDH | AM-21-26 | AM-21-39 | 14 | 591 |
2021 | Vizsla | DDH | CO-21-29 | CO-21-50 | 22 | 2185 |
2021 | Vizsla | DDH | CS-21-15 | CS-21-117 | 104 | 4935 |
2021 | Vizsla | DDH | NP-21-64 | NP-21-246 | 180 | 6731 |
2022 | Vizsla | DDH | AM-22-40 | AM-22-55 | 16 | 943 |
2022 | Vizsla | DDH | BO-22-01 | BO-22-07 | 7 | 831 |
2022 | Vizsla | DDH | CO-22-51 | CO-22-80 | 30 | 1124 |
|
|
Year | Company | Hole Type | Drillhole Start | Drillhole Finish | Drillhole Count | Total Samples |
2022 | Vizsla | DDH | CS-22-118 | CS-22-252 | 135 | 9690 |
2022 | Vizsla | DDH | NP-22-243 | NP-22-351 | 109 | 7487 |
2023 | Vizsla | DDH | AM-23-56 | AM-23-63 | 8 | 250 |
2023 | Vizsla | DDH | COP-2023-001 | COP-2023-005 | 5 | 311 |
2023 | Vizsla | DDH | CS-23-253 | CS-23-335 | 86 | 7770 |
2023 | Vizsla | DDH | NP-23-352 | NP-23-426 | 75 | 4444 |
2023 | Vizsla | DDH | NAP-2023-001 | NAP-2023-006 | 6 | 228 |
2024 | Vizsla | DDH | CS-24-336 | CS-24-366 | 28 | 1274 |
2024 | Vizsla | DDH | NP-24-427 | NP-24-442 | 16 | 1127 |
Total |
| 973 | 56,210 | |||
Table 11-2: Summary of Drill Core Analytical Labs and Analysis Methods 2019 - 2024
Year | Company | Lab & Location | Prep Code | Fire Assay Method | Fire Assay Code | Multi- | Multi- |
2019-2024 | Vizsla | ALS Limited Zacatecas, Mexico | PREP-31 | Pb fire assay 30g fusion - over-limit Ag gravimetric finish, | Ag-GRA21, | 4 Acid digestion ICP-AES with ore-grade over-limit | ME-ICP61, |
11.2 2019 - 2024 Rock Sampling (Vizsla)
11.2.1 Sampling Methods and Security
Surface and underground sampling consists of chip, float, and channel samples. Samples are oriented perpendicular to mineralized structures, local variations in mineralization, and are sampled separately. At least one sample on either side of the mineralized structure is also collected. Samples are collected as continuous chip channel, with minimum sample lengths of 30 cm and maximum sample lengths of 1.5 m. The sample length and the width of the chipped channel, typically 10 to 15 cm, is recorded along with the sample's estimated true width.
In the warehouse, certified reference materials and blanks are inserted into the sample sequence of surface and underground samples. The samples are packed into large (reused rice/sugar) sacks for transport. A control file with sack number and rock sample numbers contained in each sack and the laboratory sample dispatch form accompanies the sample shipment (used to control and monitor the shipment). The control files are used to track the progress of the samples to the lab and through to receiving results. The sample shipment is delivered to the laboratory via a parcel transport company. The lab then sends a confirmation note and sample log by electronic mail to confirm sample delivery.
|
|
11.2.2 Sample Preparation and Analyses
From 2019 to 2021, and again in 2024, rock samples were shipped to ALS in Zacatecas, Zacatecas, Mexico for sample preparation and reduction and sample pulps were further sent to ALS in North Vancouver, BC, Canada for analysis. The ALS Zacatecas and North Vancouver facilities are ISO 9001 and ISO/IEC 17025 certified. Samples were dried, weighed, and crushed to at least 70% passing 2mm, and a 250 g split is pulverized to at least 85% passing 75 µm (ALS Method Code PREP-31).
Silver, base metals and pathfinder elements are analyzed using a four-acid digestion method with an inductively coupled plasma (ICP) finish as part of a geochemical suite (ALS Method Code ME-ICP61). Over-limit analyses for silver (>100 ppm), lead (>10,000 ppm), and zinc (>10,000 ppm) are re-assayed using an ore-grade four-acid digestion with inductively coupled plasma (ICP) finish (ALS Method Code OG62). Samples with over-limit silver assays >1500 ppm are fire assayed by gravimetric methods on 30 g sample pulps (ALS Method Code Ag-GRA21). Samples with over-limit silver assays >10,000 ppm are reanalyzed with a concentrate and bullion grade method using fire assay and gravimetric finish (ALS Method Code Ag-CON01). Gold is fire assayed with AA spectroscopy finish on 30 g sample pulps (ALS Method Code Au-AA23) and gold over-limits (>10 ppm) are reanalyzed by fire assay with gravimetric finish (ALS Method Code Au-GRA21).
Beginning in 2022, rock samples were shipped to the SGS De Mexico, S.A De C.V. in Durango, Mexico for sample preparation, reduction, and analysis. The SGS Durango facilities are ISO/IEC 17025 certified.
Samples are dried, weighed, and crushed to at least 75% passing 2mm, and a 250 g split is pulverized to at least 85% passing 75 µm (SGS Method Code PUL85_CR).
Silver, base metals and pathfinder elements are analyzed using a four-acid digestion method with an inductively coupled plasma (ICP) finish as part of a geochemical suite (SGS Method Code GE_ICP40Q12). Over-limit analyses for lead (>10,000 ppm) and zinc (>10,000 ppm) are re-assayed using an ore-grade sodium peroxide digestion with inductively coupled plasma (ICP) finish (SGS Method Code GO_ICP90Q100). Samples with over-limit silver assays >100 ppm are fire assayed by gravimetric methods on 30 g sample pulps (SGS Method Code GO_FAG37V). Gold is fire assayed with AA spectroscopy finish on 30 g sample pulps (SGS Method Code GE_FAA30V5) and gold over-limits (>10 ppm) are reanalyzed by fire assay with gravimetric finish (SGS Method Code GO_FAG30V).
11.3 2019 - 2024 Drilling Programs (Vizsla)
11.3.1 Sampling Methods
Core is collected into boxes with lids at the drill site and marked with the drill-hole number. At the end of each core-run, the driller places the core carefully into the box and marks the down-hole depth and recovered interval on wooden blocks. When a core box is full with core, the core boxes are tightly closed and tied using raffia or rubber-band straps prior to transportation from drill-site to the core shack. Transportation of the core boxes is done by the drilling contractors.
Upon arrival at the core shack, the drill core is cleaned prior to being photographed. The drill core is logged for lithology, structure, alteration, and mineralization prior to marking out sample intervals. Lithologic and sample logging is done digitally using the Geobank software. Figure 11-1 shows the core logging facility and longer -term core storage area at the Concordia, Sinaloa facility. Sample intervals are defined to honor vein, mineralization, alteration, and lithology contacts. Suspect high-grade intervals are sampled separately. The maximum sample length is 1.5 m, and the minimum sample length is 0.20 m. Before sampling, the geologist also marks a saw line along the core axis trying to split the vein or mineralized structure into two symmetrical halves.
|
|
The sampler saws HQ core in half, with half being submitted for analysis and half remaining in the core box as a record. The sampler saws PQ core such that one-quarter of the core is submitted for analysis, and the remaining three-quarters remain in the core box as a record. Only one piece of core is removed from the core box at a time, and care is taken to replace the unsampled portion of the core in the core box in the original orientation. The drill-hole number and sample intervals are clearly entered into a sample book to back up the digital logging files. The geologist staples the portion of the uniquely numbered sample ticket at the beginning of the corresponding sample interval in the core box, and the sampler places one portion of the ticket in the sample bag. The sample ticket book is archived at the Concordia camp. Sample bags are sealed with a plastic strap and are stored in Vizsla's secure warehouse. No directors or officers of the company are involved in sample collection or preparation.
Figure 11-1: Vizsla Core-Logging Facility in Concordia, Sinaloa. Left: Core logging area; Right: Long-Term, Covered and Fenced, Core Storage Area

Source: SGS, 2023
11.3.2 Sample Security and Storage
All exploration samples taken were collected by Vizsla staff. Chain of custody (COC) of samples was carefully maintained from collection at the drill rig to delivery at the laboratories to prevent inadvertent contamination or mixing of samples and render active tampering as difficult as possible.
In the warehouse, certified reference materials and blanks are inserted into the sample stream, and then the samples are bagged in sacks for transport. A control file, the laboratory sample dispatch form, includes the sack number and contained sample-bag numbers in each sack. The laboratory sample dispatch form accompanies the sample shipment and is used to control and monitor the shipment. The control files are used to keep track of the time it takes to the samples to get to the lab, and time taken to receive assay certificates, the turn around time. The sample shipment is delivered to ALS in Zacatecas via a parcel transport company. ALS sends a confirmation email with detail of samples received upon delivery.
|
|
Drill core is stored at the core-logging facilities in Concordia under a roof to preserve its condition. The area is fenced and guarded by security. The plastic boxes containing the core boxes are properly tagged with the corresponding drilling information and stored in an organized way and under acceptable conditions.
11.3.3 Sample Preparation and Analyses
Sample preparation and reduction is carried out at ALS in Zacatecas, Zacatecas, Mexico and sample pulps are further sent to ALS in North Vancouver, BC, Canada for analysis. The ALS Zacatecas and North Vancouver facilities are ISO 9001 and ISO/IEC 17025 certified. Samples are dried, weighed, and crushed to at least 70% passing 2mm, and a 250 g split is pulverized to at least 85% passing 75 µm (ALS Method Code PREP-31).
Silver, base metals and pathfinder elements are analyzed using a four-acid digestion method with an inductively coupled plasma (ICP) finish as part of a geochemical suite (ALS Method Code ME-ICP61). Over-limit analyses for silver (>100 ppm), lead (>10,000 ppm), and zinc (>10,000 ppm) are re-assayed using an ore-grade four-acid digestion with inductively coupled plasma (ICP) finish (ALS Method Code OG62). Samples with over-limit silver assays >1500 ppm are fire assayed by gravimetric methods on 30 g sample pulps (ALS Method Code Ag-GRA21). Samples with over-limit silver assays >10,000 ppm are reanalyzed with a concentrate and bullion grade method using fire assay and gravimetric finish (ALS Method Code Ag-CON01). Gold is fire assayed with AA spectroscopy finish on 30 g sample pulps (ALS Method Code Au-AA23) and gold over-limits (>10 ppm) are reanalyzed by fire assay with gravimetric finish (ALS Method Code Au-GRA21).
11.3.4 Bulk Density
Drill core samples were submitted to ALS for bulk density determinations using the water displacement method on wax-coated core (Code OA-GRA09A). To date Vizsla has obtained a total of 511 bulk density determinations for the Property. Bulk density determinations from 2020 drill core totaled 37 samples, 20 samples from Napoleon and 17 samples from Tajitos. Bulk density determinations from 2021 drill core totaled 164 samples, 81 samples from Napoleon and 83 samples from Tajitos. Bulk density determinations from 2022 drill core totaled 310 samples, 128 samples from Napoleon, 151 samples from Tajitos, and 31 samples from Cordon del Oro.
In May of 2022, Vizsla began taking bulk density measurements on site. Specific gravity testing on drill core is conducted on 10cm wide core samples using the volumetric displacement in water method. Samples are weighed using a high precision electronic scale, in air and suspended in a bucket of water. Each pair of measurements produces a specific gravity (SG) using the following equation:
![]()
|
|
The scale is calibrated with a certified weight. The scale is tared/zeroed before every measurement, and measurement will not proceed until the scale has stabilized at each reading.
11.3.5 Data Management
Data are verified and double-checked by senior geologists on site for data entry verification, error analysis, and adherence to strict analytical quality-control protocols.
11.3.6 Quality Assurance/Quality Control
Sampling QA/QC programs are set in place to ensure the reliability and trustworthiness of exploration data. They include written field procedures and independent verifications of drilling, surveying, sampling, assaying, data management, and database integrity. Appropriate documentation of quality control measures and regular analysis of quality-control data are essential for the project data and form the basis for the quality-assurance program implemented during exploration.
Analytical quality control measures typically involve internal and external laboratory control measures implemented to monitor sampling, preparation, and assaying precision and accuracy. They are also essential to prevent sample mix-up and monitor the voluntary or inadvertent contamination of samples. Sampling QA/QC protocols typically involve regular duplicate and replicate assays as well as the insertion of blanks and standards (certified reference materials - "CRMs"). Routine monitoring of quality control samples is undertaken to ensure that the analytical process remains in control and confirms the accuracy and precision of laboratory analyses. In addition to laboratory internal quality control protocols, sample batches should be evaluated for evidence of suspected cross-sample contamination, certified reference material performance evaluated relative to established warning and failure limits to ensure the analytical process remains in control while maintaining an acceptable level of accuracy and precision, duplicate and replicate assay performance evaluated, and any concerns communicated to the laboratory in a timely fashion. Check assaying is typically performed as an additional reliability test of assaying results. These checks involve re-assaying a set number of coarse rejects and pulps at a second umpire laboratory.
Vizsla's QA/QC program comprises the systematic insertion of standards or certified reference materials (CRMs), blanks, field, coarse reject, and pulp duplicates. QC samples are inserted into the sample sequence at a frequency of approximately 1 sample per 20 samples for CRM and blank QC sample types, 1 sample per 40 samples for field and coarse reject duplicates, and 1 sample per 100 samples for pulp duplicates. Approximately 15% of samples assayed have been QC samples in the drilling programs from 2019 to 2024. Combined QC sample statistics for this period are presented in Table 11-3. All QC samples listed were analyzed by the primary analytical lab (ALS). Check sampling of selected pulps was also completed at a secondary lab (SGS Durango, Mexico) in 2022 to 2024.
Table 11-3: QC Sample Statistics for Vizsla Core Sampling 2019 - 2024
Original Samples | Standards | Blanks | Field Duplicates | Coarse Reject | Pulp Duplicates | QC Sample Total | QC Sample % |
56,210 | 3,394 | 3,588 | 1,639 pairs | 1,569 pairs | 159 pairs | 10,349 | 15.5% |
|
|
Sample batches with suspected cross-sample contamination or certified reference materials returning assay values outside of the mean ± 3SD control limits are considered analytical failures by Vizsla, and affected batches were generally re-analyzed to ensure data accuracy.
ALS has its own internal QA/QC program, which is reported in the assay certificates, but no account is taken of this in the determination of batch acceptance or failure.
11.3.7 Certified Reference Material
A selection of sixteen CRMs have been used to-date by Vizsla in the course of the Panuco Project drill program: multi-element standards from CDN Resource Laboratories in Langley, B.C. (CDN-ME-1405, CDN-ME-1704, CDN ME 1802, CDN-ME-1803, CDN-ME-1804, CDN-ME-1806, CDN-ME-1811, CDN-ME-1901, CDN-ME-1902, CDN-ME-1903, CDN-ME-2001, CDN-ME-2003, and CDN-ME-2105), Ore Research & Exploration in Bayswater North, Australia (OREAS-601c and OREAS-602b), and Au-Ag standard SN97 from Rocklabs in Auckland, New Zealand. The means, standard deviations (SD), warning, and control limits for standards are utilized as per the QA/QC program described below.
CRM performance and analytical accuracy is evaluated using the assay concentration values relative to the certified mean concentration to define the Z-score relative to sample sequence with warning and failure limits. Warning limits are indicated by a Z-score of between ±2 SD and ±3 SD, and control limits/failures are indicated by a Z-score of greater than ±3 SD from the certified mean. Sample batches with certified reference materials returning assay values outside of the mean ± 3SD control limits, or with suspected cross sample contamination indicated by blank sample analysis, are considered as analytical failures and selected affected batches are re-analyzed to ensure data accuracy.
For geochemical exploration analysis methods, laboratory benchmark standards are to achieve a precision and accuracy of plus or minus 10% (of the concentration) ±1 Detection Limit (DL) for duplicate analyses, in-house standards and client submitted standards, when conducting routine geochemical analyses for gold and base metals. These limits apply at, or greater than, 20 times the limit of detection. For samples containing coarse gold, native silver or copper, precision limits on duplicate analyses can exceed plus or minus 10% (of the concentration).
For mineralized material grade analysis methods, laboratory benchmark standards are to achieve a precision and accuracy of plus or minus 5% (of the concentration) ± 1 DL for duplicate analyses, in-house standards and client submitted standards. These limits apply at 20 times the limit of detection. As in the case of routine geochemical analyses, samples containing coarse gold, native silver or copper are less likely to meet the expected precision levels for mineralized material grade analysis.
CRM analytical results for the Vizsla drilling programs are summarized in Table 11-4 to Table 11-7 for Ag, Au, Pb, and Zn to evaluate analytical accuracy (bias), precision (average coefficient of variation "CVAVR%"), warning rates, and failure rates. Shewhart CRM control charts for Ag, Au, Pb, and Zn for the Vizsla drilling programs are presented in Figure 11-2 to Figure 11-21.
The QA/QC program from 2019 - 2024 included the insertion of a total of 3,394 CRM samples. The combined CRM failure rates during this period were 1.2% for Ag, 3.7% for Au, 3.0% for Pb, and 2.0% for Zn. A greater frequency of failures was noted associated with CDN-ME-1901 and CDN-ME-1811 with respect to Au values. Vizsla decided to discontinue the use of these CRMs in July 2021 and early 2023 respectively. CRM analytical results confirm acceptable analytical accuracy (bias less than ±5%) and acceptable analytical precision (CVAVR% within ±5%) for Ag, Au, Pb, and Zn. The QP considers this CRM performance acceptable and within industry standards. Review of the Company's CRM QC program indicates that there are no significant issues with the drill core assay data.
|
|
Table 11-4: CRM Sample Ag Performance for the 2019-2024 Drill Programs
CRM | Certified Value | 2019-2024 | ||||||||
Mean | SD | Count | Mean | Bias % | CVAVR% | Warning | Warning | Failure | Failure % | |
ME-1405 | 88.8 | 3.30 | 197 | 90.0 | 1.3 | 2.3 | 8 | 4.1 | 0 | 0.0 |
ME-1704 | 11.6 | 0.65 | 180 | 11.7 | 0.6 | 3.4 | 3 | 1.7 | 1 | 0.6 |
ME-1802 | 75.0 | 2.20 | 128 | 75.2 | 0.3 | 2.4 | 7 | 5.5 | 1 | 0.8 |
ME-1803 | 46.0 | 1.50 | 198 | 45.5 | -1.1 | 2.7 | 13 | 6.6 | 1 | 0.5 |
ME-1804 | 137.0 | 3.50 | 191 | 137.4 | 0.3 | 1.7 | 7 | 3.7 | 2 | 1.0 |
ME-1806 | 371.0 | 5.00 | 6 | 362.2 | -2.4 | 1.8 | 1 | 16.7 | 1 | 16.7 |
ME-1811 | 90.0 | 2.00 | 409 | 91.7 | 1.9 | 2.4 | 58 | 14.2 | 21 | 5.1 |
ME-1901 | 373.0 | 8.50 | 299 | 375.8 | 0.8 | 1.5 | 11 | 3.7 | 0 | 0.0 |
ME-1902 | 349.0 | 8.50 | 113 | 356.9 | 2.3 | 2.1 | 14 | 12.4 | 1 | 0.9 |
ME-1903 | 180.0 | 5.50 | 193 | 180.6 | 0.3 | 1.6 | 3 | 1.6 | 0 | 0.0 |
ME-2001 | 582.0 | 9.50 | 616 | 585.7 | 0.6 | 1.3 | 42 | 6.8 | 9 | 1.5 |
ME-2003 | 108.0 | 3.00 | 177 | 108.0 | 0.0 | 1.9 | 7 | 4.0 | 1 | 0.6 |
ME-2105 | 153.0 | 4.50 | 200 | 158.3 | 3.5 | 2.9 | 34 | 17.0 | 2 | 1.0 |
OREAS-601c | 50.3 | 2.31 | 198 | 50.6 | 0.6 | 2.0 | 1 | 0.5 | 0 | 0.0 |
OREAS-602b | 119.0 | 4.00 | 189 | 120.9 | 1.6 | 1.6 | 0 | 0.0 | 0 | 0.0 |
SN-97 | 53.1 | 1.90 | 101 | 54.1 | 1.9 | 2.5 | 3 | 3.0 | 1 | 1.0 |
Total |
|
| 3,395 |
|
|
| 212 | 6.2 | 41 | 1.2 |
Table 11-5: CRM Sample Au Performance for the 2019-2024 Drill Programs
CRM | Certified Value | 2019-2024 | ||||||||
Mean | SD | Count | Mean | Bias % | CVAVR% | Warning | Warning | Failure | Failure % | |
ME-1405 | 1.295 | 0.037 | 197 | 1.325 | 2.3 | 3.2 | 34 | 17.3 | 9 | 4.6 |
ME-1704 | 0.995 | 0.44 | 180 | 1.003 | 0.8 | 4.5 | 0 | 0.0 | 0 | 0.0 |
ME-1802 | 1.255 | 0.033 | 128 | 1.236 | -1.5 | 2.3 | 6 | 4.7 | 5 | 3.9 |
ME-1803 | 1.308 | 0.034 | 198 | 1.312 | 0.3 | 2.3 | 16 | 8.1 | 2 | 1.0 |
ME-1804 | 1.602 | 0.046 | 189 | 1.584 | -1.1 | 2.1 | 10 | 5.3 | 0 | 0.0 |
ME-1806 | 3.425 | 0.12 | 6 | 3.523 | 2.9 | 3.9 | 1 | 16.7 | 0 | 0.0 |
ME-1811 | 2.05 | 0.12 | 409 | 2.158 | 5.3 | 7.8 | 77 | 18.8 | 52 | 12.7 |
ME-1901 | 7.85 | 0.185 | 297 | 7.679 | -2.2 | 3.2 | 51 | 17.2 | 13 | 4.4 |
ME-1902 | 5.38 | 0.21 | 113 | 5.242 | -2.6 | 4.4 | 9 | 8.0 | 9 | 8.0 |
ME-1903 | 3.035 | 0.121 | 193 | 3.088 | 1.8 | 4.1 | 29 | 15.0 | 7 | 3.6 |
ME-2001 | 1.317 | 0.0695 | 616 | 1.334 | 1.3 | 5.5 | 82 | 13.3 | 21 | 3.4 |
ME-2003 | 1.301 | 0.0675 | 177 | 1.328 | 2.1 | 4.7 | 22 | 12.4 | 4 | 2.3 |
ME-2105 | 3.88 | 0.1355 | 200 | 3.864 | -0.4 | 2.7 | 6 | 3.0 | 1 | 0.5 |
|
|
CRM | Certified Value | 2019-2024 | ||||||||
Mean | SD | Count | Mean | Bias % | CVAVR% | Warning | Warning | Failure | Failure % | |
OREAS-601c | 0.996 | 0.048 | 198 | 1.046 | 5.1 | 4.0 | 9 | 4.5 | 1 | 0.5 |
OREAS-602b | 2.29 | 0.094 | 189 | 2.297 | 0.3 | 3.1 | 9 | 4.8 | 3 | 1.6 |
SN-97 | 9.026 | 0.2 | 101 | 8.959 | -0.7 | 1.3 | 1 | 1.0 | 0 | 0.0 |
Total | - | - | 3,391 | - | - | - | 362 | 10.7 | 127 | 3.7 |
Table 11-6: CRM Sample Pb Performance for the 2019-2024 Drill Programs
CRM | Certified Value | 2019-2024 | ||||||||
Mean | SD | Count | Mean | Bias % | CVAVR% | Warning | Warning | Failure | Failure % | |
ME-1405 | 6380 | 260 | 197 | 6308 | -1.1 | 3.0 | 6 | 3.0 | 1 | 0.5 |
ME-1704 | 490 | 15 | 180 | 486 | -0.8 | 2.0 | 7 | 3.9 | 0 | 0.0 |
ME-1802 | 26000 | 450 | 128 | 25409 | -2.3 | 2.1 | 28 | 21.9 | 6 | 4.7 |
ME-1803 | 12100 | 200 | 198 | 11742 | -3.0 | 2.8 | 30 | 15.2 | 29 | 14.6 |
ME-1804 | 43300 | 950 | 191 | 42775 | -1.2 | 1.7 | 9 | 4.7 | 3 | 1.6 |
ME-1806 | 58900 | 1350 | 6 | 59250 | 0.6 | 0.9 | 0 | 0.0 | 0 | 0.0 |
ME-1811 | 3040 | 80 | 409 | 3064 | 0.8 | 1.8 | 17 | 4.2 | 2 | 0.5 |
ME-1901 | 25600 | 550 | 299 | 25625 | 0.1 | 1.4 | 6 | 2.0 | 1 | 0.3 |
ME-1902 | 22000 | 500 | 113 | 21864 | -0.6 | 1.6 | 1 | 0.9 | 1 | 0.9 |
ME-1903 | 10600 | 200 | 193 | 10415 | -1.7 | 1.9 | 8 | 4.1 | 13 | 6.7 |
ME-2001 | 7800 | 155 | 616 | 7701 | -1.3 | 2.2 | 87 | 14.1 | 30 | 4.9 |
ME-2003 | 4750 | 80 | 177 | 4703 | -1.0 | 2.2 | 39 | 22.0 | 15 | 8.5 |
ME-2105 | 3570 | 100 | 200 | 3519 | -1.4 | 2.1 | 11 | 5.5 | 1 | 0.5 |
OREAS-601c | 328 | 18 | 198 | 329 | 0.3 | 2.0 | 1 | 0.5 | 0 | 0.0 |
OREAS-602b | 493 | 19 | 189 | 495 | 0.5 | 2.0 | 5 | 2.6 | 0 | 0.0 |
SN-97 | - | - | 101 | 94 | - | - | - | - | - | - |
Total | - | - | 3,395 | - | - | - | 255 | 7.5 | 102 | 3.0 |
Table 11-7: CRM Sample Zn Performance for the 2019-2024 Drill Programs
CRM | Certified Value | 2019-2024 | ||||||||
Mean | SD | Count | Mean | Bias % | CVAVR% | Warning | Warning | Failure | Failure % | |
ME-1405 | 30200 | 550 | 197 | 29862 | -1.1 | 1.2 | 9 | 4.6 | 3 | 1.5 |
ME-1704 | 8000 | 200 | 180 | 7955 | -0.6 | 2.0 | 12 | 6.7 | 2 | 1.1 |
ME-1802 | 61100 | 1450 | 128 | 60545 | -0.9 | 1.4 | 3 | 2.3 | 0 | 0.0 |
ME-1803 | 28200 | 500 | 197 | 27287 | -3.2 | 2.9 | 31 | 15.7 | 30 | 15.2 |
ME-1804 | 99400 | 2200 | 188 | 98737 | -0.7 | 1.7 | 9 | 4.8 | 4 | 2.1 |
ME-1806 | 140000 | 2100 | 6 | 140417 | 0.3 | 0.7 | 0 | 0.0 | 0 | 0.0 |
ME-1811 | 15500 | 300 | 409 | 15469 | -0.2 | 1.4 | 21 | 5.1 | 6 | 1.5 |
ME-1901 | 28900 | 550 | 296 | 28883 | -0.1 | 1.5 | 9 | 3.0 | 2 | 0.7 |
ME-1902 | 36600 | 1250 | 113 | 36295 | -0.8 | 2.2 | 0 | 0.0 | 1 | 0.9 |
|
|
CRM | Certified Value | 2019-2024 | ||||||||
Mean | SD | Count | Mean | Bias % | CVAVR% | Warning | Warning | Failure | Failure % | |
ME-1903 | 17500 | 350 | 193 | 17419 | -0.5 | 1.4 | 12 | 6.2 | 1 | 0.5 |
ME-2001 | 15000 | 250 | 616 | 15144 | 1.0 | 1.4 | 64 | 10.4 | 13 | 2.1 |
ME-2003 | 10500 | 250 | 177 | 10653 | 1.5 | 1.8 | 9 | 5.1 | 1 | 0.6 |
ME-2105 | 6700 | 155 | 200 | 6740 | 0.6 | 2.0 | 18 | 9.0 | 2 | 1.0 |
OREAS-601c | 425 | 16 | 198 | 429 | 0.9 | 2.5 | 8 | 4.0 | 1 | 0.5 |
OREAS-602b | 764 | 24 | 189 | 773 | 1.1 | 2.3 | 9 | 4.8 | 1 | 0.5 |
SN-97 | - | - | 101 | 176 | - | - | - | - | - | - |
Total |
|
| 3,388 |
|
|
| 214 | 6.3 | 67 | 2.0 |
Figure 11-2: CRM Control Chart for Ag for the 2020 Drill Program
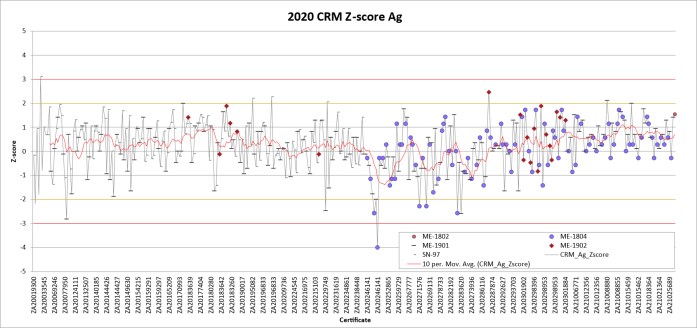
Source: SGS, 2024
|
|
Figure 11-3: CRM Control Chart for Au for the 2020 Drill Program
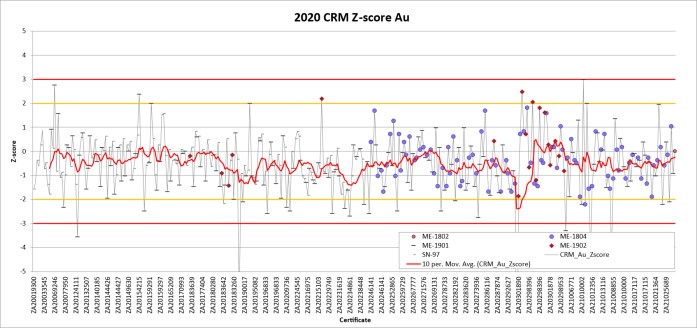
Source: SGS, 2024
Figure 11-4: CRM Control Chart for Pb for the 2020 Drill Program
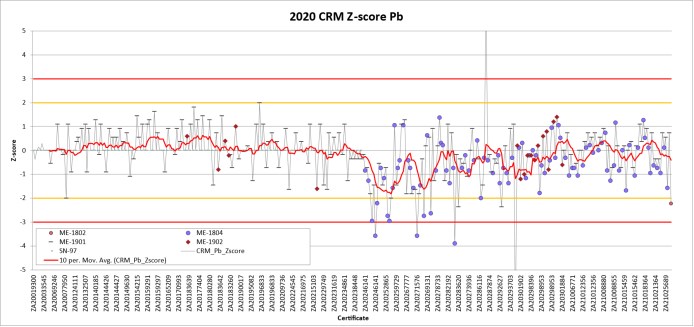
Source: SGS, 2024
|
|
Figure 11-5: CRM Control Chart for Zn for the 2020 Drill Program
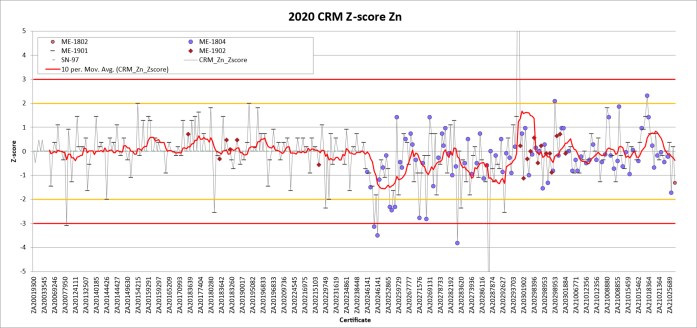
Source: SGS, 2024
Figure 11-6: CRM Control Chart for Ag for the 2021 Drill Program
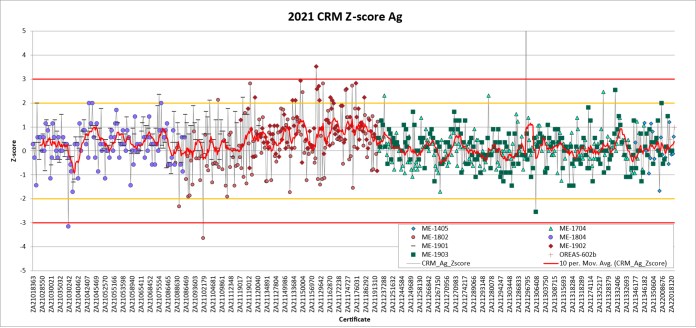
Source: SGS, 2024
|
|
Figure 11-7: CRM Control Chart for Au for the 2021 Drill Program
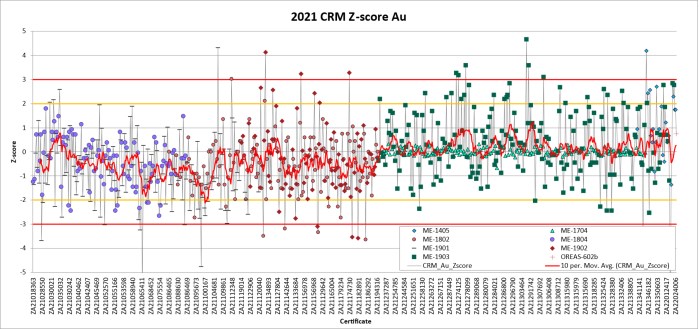
Source: SGS, 2024
Figure 11-8: CRM Control Chart for Pb for the 2021 Drill Program
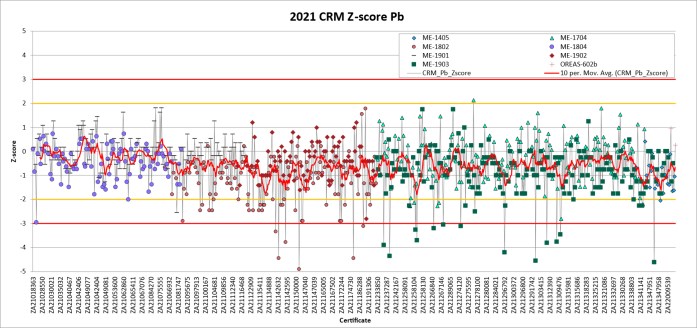
Source: SGS, 2024
|
|
Figure 11-9: CRM Control Chart for Zn for the 2021 Drill Program

Source: SGS, 2024
Figure 11-10: CRM Control Chart for Ag for the 2022 Drill Program
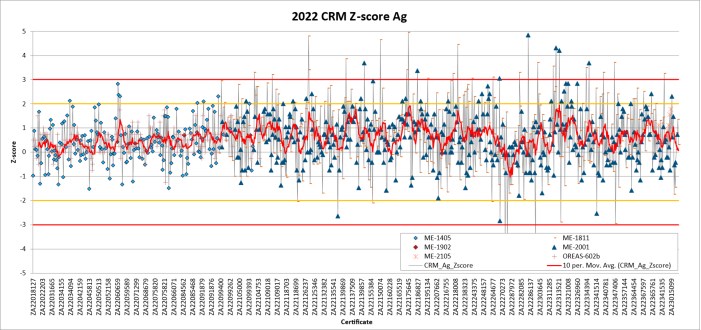
Source: SGS, 2024
|
|
Figure 11-11: CRM Control Chart for Au for the 2022 Drill Program
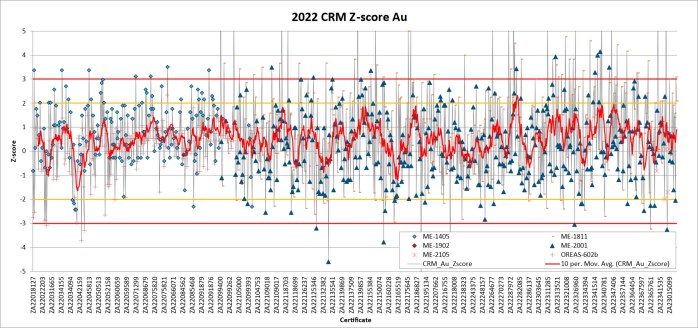
Source: SGS, 2024
Figure 11-12: CRM Control Chart for Pb for the 2022 Drill Program
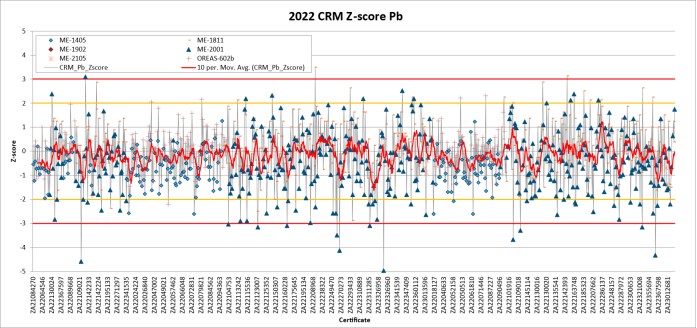
Source: SGS, 2024
|
|
Figure 11-13: CRM Control Chart for Zn for the 2022 Drill Program
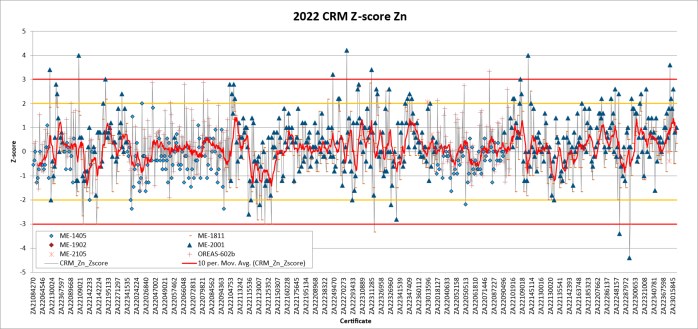
Source: SGS, 2024
Figure 11-14: CRM Control Chart for Ag for the 2023 Drill Program
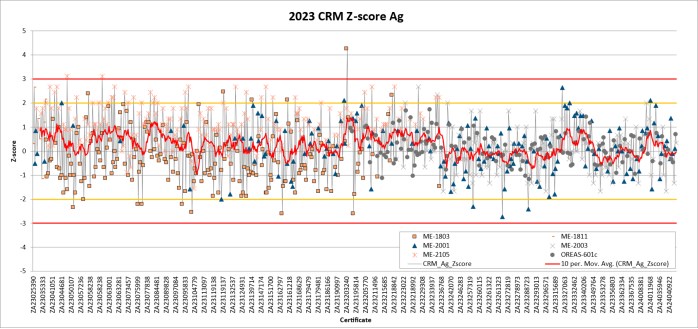
Source: SGS, 2024
|
|
Figure 11-15: CRM Control Chart for Au for the 2023 Drill Program
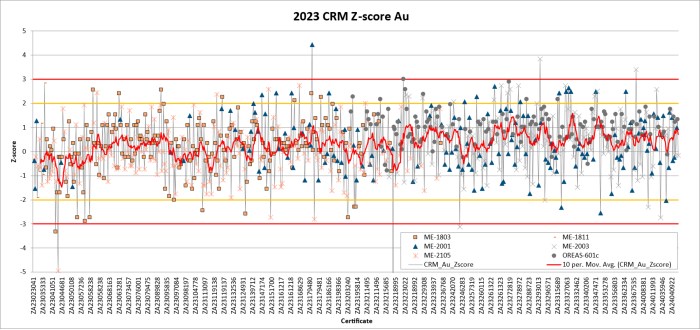
Source: SGS, 2024
Figure 11-16: CRM Control Chart for Pb for the 2023 Drill Program
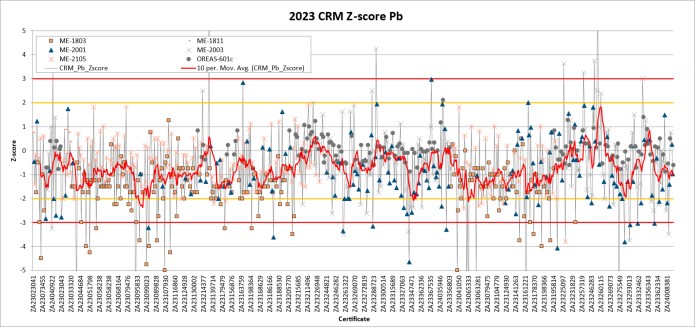
Source: SGS, 2024
|
|
Figure 11-17: CRM Control Chart for Zn for the 2023 Drill Program

Source: SGS, 2024
Figure 11-18: CRM Control Chart for Ag for the 2024 Drill Program
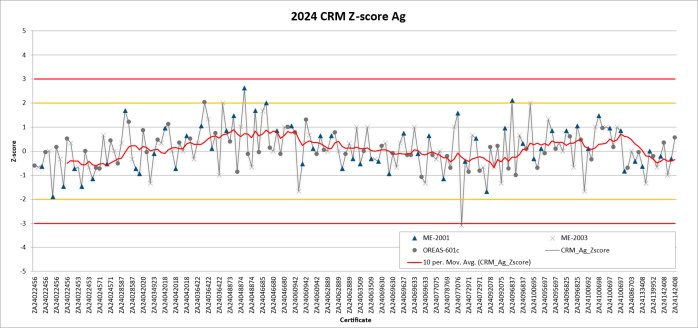
Source: SGS, 2024
|
|
Figure 11-19: CRM Control Chart for Au for the 2024 Drill Program

Source: SGS, 2024
Figure 11-20: CRM Control Chart for Pb for the 2024 Drill Program
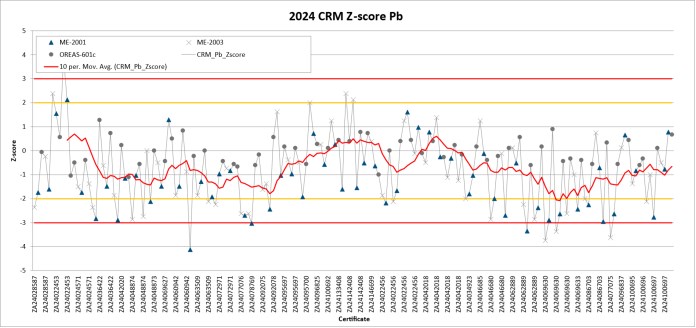
Source: SGS, 2024
|
|
Figure 11-21: CRM Control Chart for Zn for the 2024 Drill Program

Source: SGS, 2024
11.3.8 Blank Material
Blank samples comprising obsidian from sources in Jalisco were inserted into the sample stream in the field to determine the degree of sample carryover contamination after sample collection, particularly during the sample preparation process. This material does not have certified values established by a third party through round robin lab testing.
The QA/QC program from 2019 - 2024 included the insertion of a total of 3,588 blank samples (Table 11-3). For blank sample values, failure is more subjective. Some carryover within sample batches is to be expected in routine sample preparation. To minimize sample carryover within a batch, equipment is cleaned thoroughly with compressed air to remove any remaining loose material. For routine protocols, with samples of similar weights, sample carryover is usually considered acceptable if it is less than 1.0%. To ensure no batch-to-batch carryover occurs, standard quality control procedures include passing barren wash material through crushing and pulverising equipment at the start of each new batch of samples.
Evaluation of blank samples using a failure ceiling for Ag of 2.5 ppm (5x detection limit) indicates that the combined blank failure rate from 2019 - 2024 was 1.9%. The highest result from a blank sample was 457 g/t Ag, the second highest results was 64.10 g/t Ag, and in total ten blank samples (0.3%) returned values over 10 ppm Ag (Figure 11-22 to Figure 11-26). Alternatively, evaluation of blank samples using a failure ceiling for Au of 0.015 ppm (3x detection limit) indicates that the combined blank failure rate from 2019 - 2024 was 2.9%.
|
|
The blank failure rate is considered acceptable by industry standards. Based on the low risk of cross-sample carryover contamination and the low amounts of Ag and Au sample carryover that may have contaminated blank material, it is considered unlikely that there is a carryover contamination problem with the Project drilling data.
Figure 11-22: Blank Sample Chart for Ag for the 2020 Drill Program
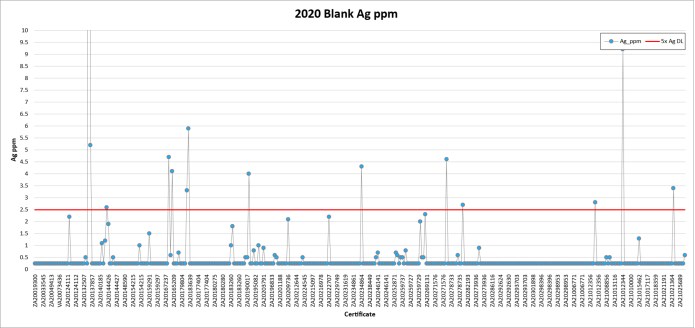
Source: SGS, 2024
|
|
Figure 11-23: Blank Sample Chart for Ag for the 2021 Drill Program
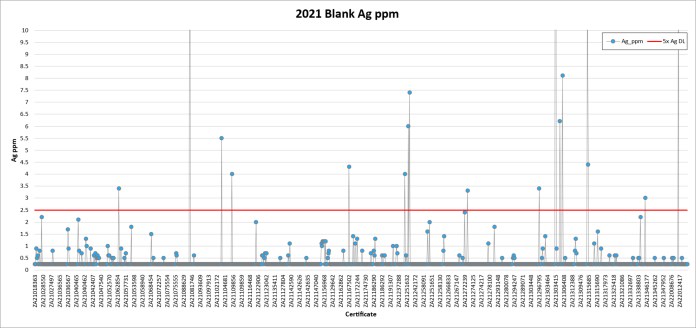
Source: SGS, 2024
Figure 11-24: Blank Sample Chart for Ag for the 2022 Drill Program

Source: SGS, 2024
|
|
Figure 11-25: Blank Sample Chart for Ag for the 2023 Drill Program
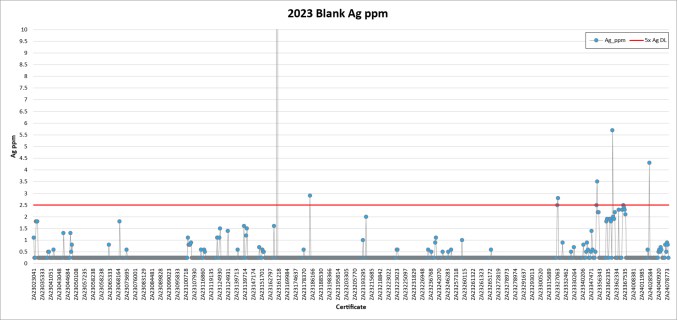
Source: SGS, 2024
Figure 11-26: Blank Sample Chart for Ag for the 2024 Drill Program
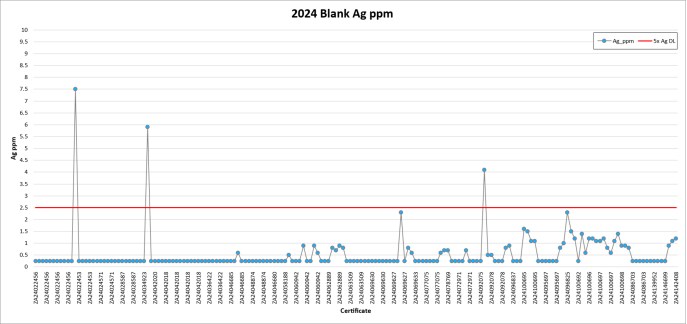
Source: SGS, 2024
|
|
11.3.9 Duplicate Material
Vizsla's QA/QC program from 2019 - 2024 Vizsla included the insertion of field duplicate and coarse reject duplicate samples. Pulp duplicate sampling was added to the QA/QC program in 2023. From 2019 - 2024 a total of 1,639 field duplicates (1/4 core), 1,569 coarse reject duplicates, and 159 pulp duplicate samples were assayed (Table 11-3). Duplicate samples were analyzed at the primary lab (ALS) to evaluate analytical precision and sampling error.
Figure 11-27 to Figure 11-29 illustrate the comparative assay results and precision of duplicate sample analyses for Ag, Au, Pb, and Zn.
To obtain a relatively accurate estimate of the sampling precision or average relative error a large number of duplicate data pairs are required. Reliably determining the base metal data precision, which typically exhibits relatively small average relative errors (such as 5%), would require 500 - 1000 duplicate data pairs, while reliable determination of gold data precision, which typically exhibits relatively large average relative errors (such as 25%), would require greater than 2500 duplicate data pairs (Stanley and Lawie, 2007).
In the case of the Panuco deposits, based on the current duplicate data set size for field and coarse reject duplicates, analysis of the precision should be considered as reliable for Pb, Zn, and likely Ag, while it should be considered approximate in nature only for Au until a larger dataset is available. Estimates of pulp duplicate precision should be treated as preliminary until additional data is available. The average Coefficient of Variation (CVAVR%) for Ag, Au, Pb, and Zn is shown in Table 11-8, calculated using the root mean square coefficient of variation calculated from the individual coefficients of variation.
The estimates of precisions errors (CVAVR%) for Panuco sampling indicates that the sampling precision is acceptable by industry standards for duplicates for this style of mineralization (Abzalov, 2008). The precision of duplicates should continue to be monitored as the drill program progresses and the size of the duplicate data set, particularly for pulp duplicates, becomes more representative.
Table 11-8: Average Relative Error of Duplicate Samples for Ag, Au, Pb, and Zn from 2019-2024
Drillhole Series | Duplicate Type | Count | Ag CVAVR% | Au CVAVR% | Pb CVAVR% | Zn CVAVR% |
2019-2024 Drilling | Field | 1,639 duplicate pairs | 28.6 | 31.5 | 26.6 | 23.2 |
2019-2024 Drilling | Coarse Reject | 1,569 duplicate pairs | 15.4 | 18.4 | 8.1 | 6.5 |
2023-2024 Drilling | Pulp | 159 duplicate pairs | 12.0 | 19.2 | 6.3 | 3.3 |
|
|
Figure 11-27: Plots of Field Duplicate Samples for Ag, Au, Pb, and Zn from the 2019-2024 Drill Program
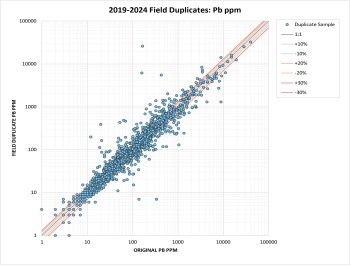 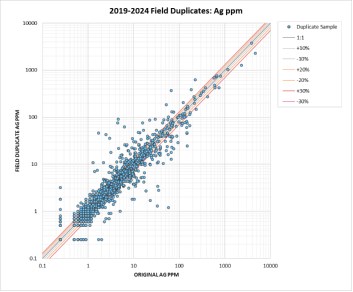 |  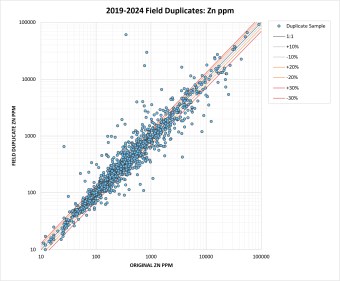 |
Source: SGS, 2024
|
|
Figure 11-28: Plots of Coarse Reject Duplicate Samples for Ag, Au, Pb, and Zn from the 2019-2024 Drill Program
|
|
|
|
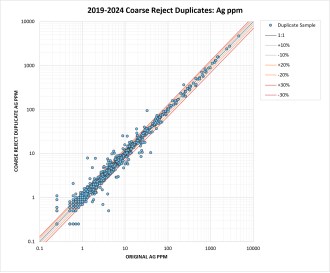
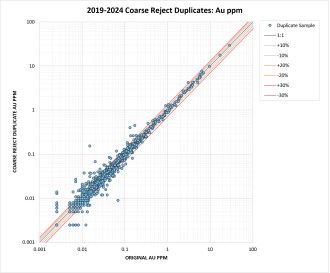
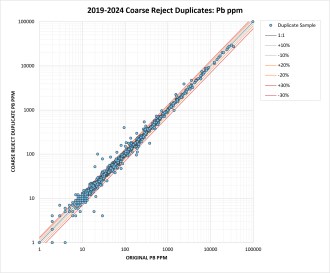
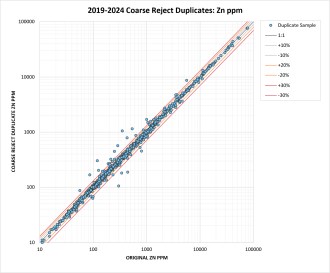
Source: SGS, 2024
|
|
Figure 11-29: Plots of Pulp Duplicate Samples for Ag, Au, Pb, and Zn from the 2023-2024 Drill Program
|
|
|
|
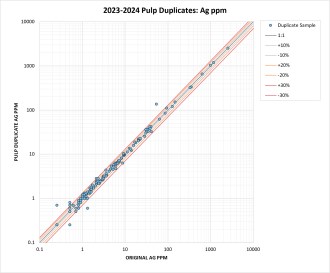
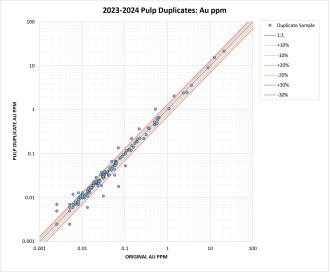
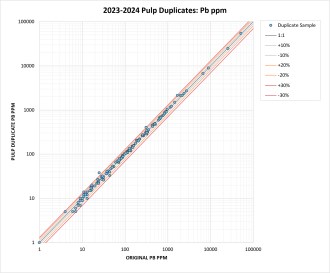
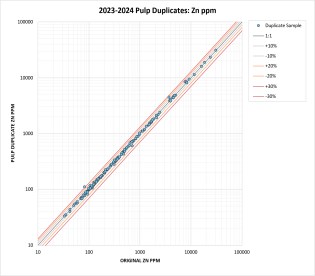
Source: SGS, 2024
11.3.10 Check Assaying
The use of a third-party laboratory for routine check assaying was employed by Vizsla from 2022 to 2024 as an additional QA/QC measure to confirm the accuracy of the primary laboratory assays.
A selection of 209 mineralized pulp samples from the 2019-2022 drilling programs, originally assayed by ALS, were re-assayed at SGS De Mexico, S.A De C.V. in Durango, Mexico in 2022. In 2023 - 2024, 755 mineralized pulp samples from the 2022-2023 drilling programs, originally assayed by ALS, were re-assayed at SGS. In 2024, 49 mineralized pulp samples from the 2024 drilling programs, originally assayed by ALS, were re-assayed at SGS. In total, 964 umpire check samples have been analysed at SGS by Vizsla, matching ALS methodology as closely as possible. The SGS Durango facilities are ISO/IEC 17025 certified. This check assaying represents 1.7% of the total original samples (56,210) collected by Vizsla during the 2019 - 2024 drill programs.
|
|
Table 11-9 and Table 11-10 detail the relative bias and the average relative error of the umpire check sampling for Ag and Au, and the log x-y plots in Figure 11-30 to Figure 11-32 illustrate the comparative assay results and precision of duplicate sample analyses.
The 2020 to 2024 program umpire check assay results returned from SGS, with respect to the corresponding original ALS analyses, indicate that Ag and Au assay accuracy (relative bias) is acceptable and within industry standards. The level of precision (average relative error) observed is considered reasonable for Ag and Au for this style of mineralization.
Table 11-9: Relative Bias and Average Relative Error of Check Samples for Ag from 2022-2024
Drilling | Duplicate Type | Primary | Check | Ag Count | Mean Ag ppm | Mean Ag ppm | Ag Bias % | Ag CVAVR% |
2019-2022 | Pulp Duplicates | ALS | SGS | 209 | 311.3 | 297.6 | -4.4 | 10.0 |
2022-2023 | Pulp Duplicates | ALS | SGS | 754 | 389.1 | 384.5 | -1.2 | 9.3 |
2024* | Pulp Duplicates | ALS | SGS | 49 | 694.5 | 694.5 | 1.4 | 7.0 |
Table 11-10: Relative Bias and Average Relative Error of Check Samples for Au from 2022-2024
Drilling | Duplicate Type | Primary Lab | Check | Au Count | Mean Au ppm | Mean Au ppm | Au Bias % | Au CVAVR% |
2019-2022 | Pulp Duplicates | ALS | SGS | 209 | 5.2 | 5.1 | -2.3 | 12.5 |
2022-2023 | Pulp Duplicates | ALS | SGS | 755 | 3.1 | 2.9 | -7.0 | 13.9 |
2024* | Pulp Duplicates | ALS | SGS | 49 | 4.1 | 4.2 | 1.4 | 10.2 |
|
|
Figure 11-30: Plots of SGS Check Samples for Ag and Au Assayed in 2022
|
|
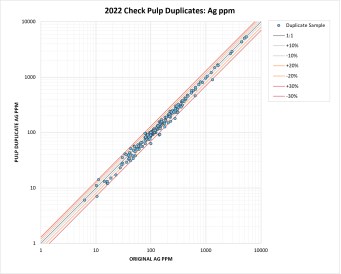
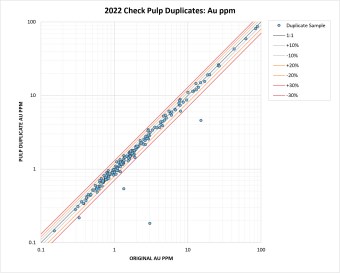
Source: SGS, 2024
Figure 11-31: Plots of SGS Check Samples for Ag and Au Assayed in 2023
|
|

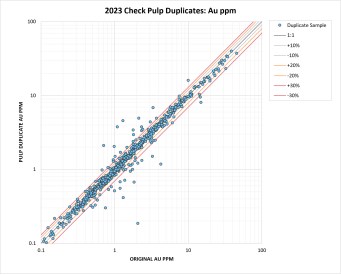
Source: SGS, 2024
|
|
Figure 11-32: Plots of SGS Check Samples for Ag and Au Assayed in 2024
|
|
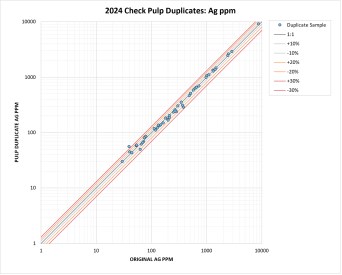
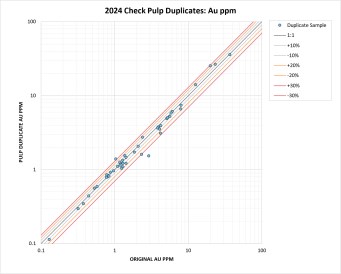
Source: SGS, 2024
11.4 QP's Comments
It is QP's opinion, based on a review of all possible information, that the sample preparation, analyses and security used on the Project by the Company meet acceptable industry standards (past and current). Review of the Company's QA/QC program indicates that there are no significant issues with the drill core assay data. The data verification programs undertaken on the data collected from the Project support the geological interpretations, and the analytical and database quality, and therefore data can support resource estimation of Indicated and Inferred mineral resources.
|
|
12 DATA VERIFICATION
12.1 Introduction
The following section summarises the data verification procedures that were carried out and completed and documented by the QP for this technical report, including verification of all drill data collected by Vizsla during their 2019 to 2024 drill programs, as of the effective date of this report.
12.2 Drill Sample Database
Eggers conducted an independent verification of the assay data in the drill sample database used for the current MRE. Approximately 15% of the digital assay records were randomly selected and checked against the available laboratory assay certificate reports. Assay certificates were available for all diamond drilling completed by Vizsla. Eggers reviewed the assay database for errors, including overlaps and gapping in intervals and typographical errors in assay values. In general, the database was in good condition and no adjustments were required to be made to the assay values contained in the assay database.
Verifications were also carried out on drill hole locations, down hole surveys, lithology, SG and topography information. The database is considered of sufficient quality to be used for the current MRE.
Eggers has reviewed the sample preparation, analyses, and security (see Section 11) completed by Vizsla for the Property. Based on a review of all possible information, the sample preparation, analyses, and security used on the Project by Vizsla, including QA/QC procedures, are consistent with standard industry practices and the drill data is used for geological and resource modeling, and resource estimation of Indicated and Inferred mineral resources.
12.3 Site Visit - Allan Armitage
12.3.1 2023 Site Visits
Armitage conducted a site visit to the Project on May 29, 2023, accompanied by Martin Dupuis, COO, Jesus Velador, VP of Exploration and Steve Mancell, Director of Mineral Resources, of Vizsla. During the site visit, Armitage inspected the core logging and core sampling facilities and core storage areas in the City of Concordia. The following facilities were inspected:
Office Area
Area used for the geologists to log core.
Area used to make pictures of the core with controlled light (core both wet and dry)
Area used to measure density (by drying, measuring unwaxed weight, waxed weight and weight in water)
Area for cutting the core.
|
|
Area for sampling the core.
Area to update geological sections on paper.
Core storage area
During the site visit Armitage examined several selected mineralized core intervals from recently completed (2019-2022) diamond drill holes from the Property. Armitage examined accompanying drill logs and assay certificates and assays were examined against the drill core mineralized zones. The QP reviewed current core sampling, QA/QC and core security procedures. Core boxes for drill holes reviewed are properly stored in the warehouse, easily accessible and well labelled. Sample tags are present in the boxes, and it was possible to validate sample numbers and confirm the presence of mineralization in witness half-core samples from the mineralized zones.
As drilling and core logging was in progress during the time of the site visit, Armitage had the opportunity to review and discuss the entire path of the drill core, from the drill rig to the logging and sampling facility and finally to the laboratory. Armitage is of the opinion that current protocols in place, as have been described and documented by Vizsla, are adequate.
The QP participated in a field tour of the Property area including visits to several outcrops to review the local Geology, the drill, and recent drill sites. All areas were easily accessible by road.
Armitage conducted a second site visit to the Project on November 6 to November 8, 2023, accompanied by Henri Gouin, Mining Engineer with SGS, and Martin Dupuis, Fernando Martínez, Director of Projects, Hernando Rueda, Country Manager and Steve Mancell, of Vizsla. During the second site visit, Armitage again inspected the core logging and core sampling facilities and core storage areas in the City of Concordia.
Armitage examined several selected mineralized core intervals from recently completed (2023) diamond drill holes from the Property. Armitage examined accompanying drill logs and assay certificates and assays were examined against the drill core mineralized zones. The QP reviewed current core sampling, QA/QC and core security procedures. Core boxes for drill holes reviewed are properly stored in the warehouse, easily accessible and well labelled. Sample tags are present in the boxes, and it was possible to validate sample numbers and confirm the presence of mineralization in witness half-core samples from the mineralized zones.
As drilling and core logging was in progress during the time of the second site visit, Armitage had the opportunity to review and discuss the entire path of the drill core, from the drill rig to the logging and sampling facility and finally to the laboratory. Armitage is of the opinion that current protocols in place, as have been described and documented by Vizsla, are adequate.
The QP participated in a field tour of the Property area including visits to several outcrops to review the local Geology, the drill, and recent (2023) drill sites.
12.3.2 2024 Site Visit
Armitage conducted a third site visit to the Project on May 23, 2024, accompanied by Steve Mancell. During the third site visit, Armitage, for the third time, inspected the core logging and core sampling facilities and core storage areas in the City of Concordia. Vizsla has maintained a comprehensive and consistent system for core storage, core security procedures, drill core logging, drill core data collection. As well Vizsla has maintained consistent procedures for sample preparation, analysis and security of all surface samples and drill core samples, including the implementation of an extensive QA/QC program. Armitage is of the opinion that current protocols in place, as have been described and documented by Vizsla, is adequate and to industry standards.
|
|
Armitage examined several selected mineralized core intervals from recently completed (2023-2024) diamond drill holes from the Property. Armitage examined accompanying drill logs and assay certificates and assays were examined against the drill core mineralized zones.
Armitage participated in a field tour of the property area including visits to several outcrops to review the local Geology, the drill, and recent (2023-2024) drill sites.
As a result of the three site visits, Armitage was able to become familiar with conditions on the Property. Armitage was able to observe and gain an understanding of the geology and various styles mineralization, which guided the current mineral resource modeling, was able to verify the work done and, on that basis, can review and recommend to Vizsla an appropriate exploration program.
Armitage considers the site visit completed in May 2024 as current, per Section 6.2 of NI 43-101CP. To the QP's knowledge there is no new material scientific or technical information about the Property since that personal inspection. The technical report contains all material information about the Property.
12.4 Site Visit - Peter Mehrfert
Mehrfert conducted a site visit to the Project on April 8th through 10th, 2024, accompanied by Fernando Martinez, Director of Projects, and Jesus Velador, VP of Exploration, of Vizsla. During the site visit, Mehrfert inspected the core logging and core sampling facilities and core storage areas in the City of Concordia.
Mehrfert dedicated one day of the site visit to reviewing the block model and a preliminary mine design with Vizsla technical staff. Locations of drill holes and intersections with the proposed mining stopes were reviewed, including the locations of drill core intersections provided for metallurgical testing.
As a result of the visit, Mehrfert was able to gain an understanding of the geology and potential underground mine development plan, was able to confirm the origin of the metallurgical samples and, on that basis, can confirm that the samples tested provide a suitable representation of the deposits for this level of study.
12.5 Metallurgical Data Verification - Peter Mehrfert
Mehrfert reviewed the metallurgical data generated in the Napoleon and Tajitos test programs, and coordinated and managed the metallurgical testing of the Copala material. During the Copala test program, Mehrfert visited the laboratory to review the drill core samples and observe testing activities. Results were reviewed as the Copala test program progressed and on numerous occasions requests were made to re-assay test products, conduct additional analyses, and check anomalous results.
|
|
12.6 Conclusion
All geological data has been reviewed and verified as being accurate to the extent possible, and to the extent possible, all geologic information was reviewed and confirmed. There were no significant or material errors or issues identified with the drill database. Based on a review of all possible information, the QPs are of the opinion that the database is of sufficient quality to be used for the current Indicated and Inferred MRE.
|
|
13 MINERAL PROCESSING AND METALLURGICAL TESTING
Metallurgical test work has been conducted by Vizsla on the Napoleon, Tajitos, and Copala deposits for the Panuco project dating back to 2021.
13.1 Introduction
Three phases of test work have been conducted on the Panuco project since 2021. Each program was completed by ALS Metallurgy on behalf of Vizsla Each phase focused on a specific deposit for the project. Theses phases are described in Table 13-1.
Table 13-1: Metallurgical Test Work Summary Table
| Year | Laboratory/Location | Report no. | Deposit Analyzed | Testwork performed |
| 2021 | ALS Metallurgy, Kamloops | KM6454 | Napoleon | Sample chemistry and mineralogy, comminution tests, bulk rougher and cleaner flotation, sequential rougher and cleaner flotation, whole ore cyanidation, bulk rougher concentrate cyanidation and gravity concentration |
| 2022 | ALS Metallurgy, Kamloops | KM6657 | Tajitos | Sample chemistry and mineralogy, comminution tests, bulk rougher and cleaner flotation, sequential rougher flotation, whole ore cyanidation, bulk rougher concentrate and tailings cyanidation, diagnostic leaching and gravity concentration |
| 2023 | ALS Metallurgy, Kamloops | KM6937 | Copala | Sample chemistry and mineralogy, comminution tests, bulk rougher flotation, sequential rougher flotation, whole ore cyanidation, rougher concentrate and tailings cyanidation, diagnostic leaching, regrind testing and gravity concentration |
13.2 Sample Origin and Composite Assembly
The samples selected in each of the ALS programs were chosen to represent each deposit with respect to grade, spatial coverage, and lithology. A summary of sample origin data is presented in Table 13-2.
Table 13-2 Metallurgical Sample Origin Details
Detail | Napoleon | Tajitos | Copala | |
Drill Hole Information | Year Drilled | 2020 | 2020, 2021 | 2022 |
# of drill holes | 11 | 22 | 8 | |
Depth ranges (m) | 46-201 | 51-345 | 111-386 | |
intervals selected for testing (m) | 74 | 101 | 78 | |
mass (kg) | 230 | 300 | 280 | |
|
|
Detail | Napoleon | Tajitos | Copala | |
Composites Assembled | Sub-composites | 11 | 22 | 6 |
Master Composites | Grindability - comm. testing only | Diorite Comp. | Master Comp | |
A total of 74 meters of ½ HQ drill core intervals selected from 11 holes in the 2020 drill campaign were used to assemble the Napoleon composites. The intervals ranged in depth from 46 to 201 meters and had a total mass of 230 kg. The material from each drill hole was prepared into sub-composites and analyzed for chemical composition. A master composite was assembled from portions of 7 sub-composites in order to achieve a feed grade that was representative of the average resource grade. The master composite was used for the majority of the metallurgicial testing, however a small amount of testing was also conducted on one of the sub-composites, Composite G. A grindability composite was assembled from portions of 9 sub-composites and used for comminution tests.
A total of 101 meters of ½ HQ drill core intervals selected from 22 holes in the 2020 and 2021 drill campaign were used to assemble the Tajitos composites. The intervals ranged in depth from 51 to 345 meters and had a total mass of 300 kg. The material from each drill hole was prepared into sub-composites and analyzed for chemical composition. Three lithology composites for metallurgical testing were assembled from portions of the sub-composites, with masses selected to achieve average resource grades.
A total of 78 meters of ½ HQ drill core intervals selected from 8 holes in the 2022 drill campaign were used to assemble the Copala composites. The intervals ranged in depth from 111 to 386 meters and had a total mass of 280 kg. The material from each drill hole was prepared into sub-composites, with two sub-composites receiving material from 2 drill holes each and analyzed for chemical composition. A single master composite was assembled from portions of the sub-composites, with masses selected to achieve average resource grades. The sub-composites were also tested individually for variability assessment.
13.3 Sample Chemistry and Mineralogy
Chemical analyses were completed on each of the feed samples used in the metallurgical test program using standard analytical techniques, results are presented in Table 13-3. Mineralogical composition and texture characteristics were measured using QEMSCAN technology, summarized composition data is presented in Table 13-4.
Table 13-3: Chemical Composition of the Composites and Variability Samples
Deposit | Composite | Assay - g/t | Assay - % | ||||
Ag | Au | S | Cu | Pb | Zn | ||
Napoleon | Master Composite | 123 | 3.10 | 2.37 | 0.13 | 1.09 | 1.05 |
Tajitos | Diorite MC | 239 | 1.18 | 1.26 | 0.02 | 0.15 | 0.21 |
Andesite MC | 242 | 1.37 | 0.63 | 0.01 | 0.04 | 0.11 | |
Andesite - Low MnOX MC | 275 | 2.46 | 1.14 | 0.02 | 0.08 | 0.16 | |
|
|
| Deposit | Composite | Assay - g/t | Assay - % | ||||
| Ag | Au | S | Cu | Pb | Zn | ||
| Copala | Master Composite | 312 | 2.18 | 0.94 | 0.01 | 0.08 | 0.15 |
| Var 1 | 364 | 2.94 | 0.35 | 0.01 | 0.03 | 0.05 | |
| Var 2 | 173 | 1.13 | 1.26 | 0.03 | 0.36 | 0.52 | |
| Var 3 | 266 | 1.81 | 0.32 | 0.01 | 0.01 | 0.05 | |
| Var 4 | 330 | 6.91 | 0.06 | 0.01 | 0.04 | 0.07 | |
| Var 5 | 248 | 1.36 | 1.56 | 0.01 | 0.02 | 0.04 | |
| Var 6 | 619 | 2.86 | 1.32 | 0.01 | 0.07 | 0.17 | |
Silver and gold are the primary metals of interest in the feed materials. The Napoleon master composite had lower silver contents and high gold contents than the Tajitos and Copala samples, however all samples had significant levels of these precious metals. The Napoleon material had higher levels of sulphide minerals and base metals compared to the Tajitos and Copala samples.
Table 13-4: Mineralogical Composition of the Composites
| Mineral | Content - percent | ||||
| Napoleon | Tajitos | Copala | |||
| MC | Diorite | Andesite | And. - Low MnOx | MC | |
| Silver Minerals | <0.1 | <0.1 | <0.1 | <0.1 | <0.1 |
| Copper Sulphides | 0.3 | <0.1 | <0.1 | <0.1 | <0.1 |
| Galena | 1.5 | 0.1 | <0.1 | 0.1 | <0.1 |
| Sphalerite | 1.6 | 0.2 | 0.1 | 0.3 | 0.2 |
| Pyrite | 3.5 | 2.0 | 1.1 | 1.9 | 1.4 |
| Quartz | 68.1 | 55.2 | 65.8 | 73.2 | 60.4 |
| Feldspars | 14.2 | 32.5 | 25.9 | 14.9 | 18.6 |
| Chlorite | 3.7 | 5.2 | 3.3 | 1.5 | 3.3 |
| Micas | 2.2 | 1.6 | 1.1 | 0.3 | 3.9 |
| Calcium Carbonates | 2.3 | 0.3 | 0.3 | 2.5 | 6.5 |
| Mn Carbonate/Silicate | <0.1 | 0.7 | 0.2 | 3.2 | 3.3 |
| Others | 2.6 | 2.2 | 2.2 | 2.1 | 2.4 |
The most abundant host rock minerals in the samples were quartz and feldspars. Copala contained higher levels of calcium carbonates. The Napoleon material contained higher levels of sulphide minerals than Tajitos or Copala. Pyrite hosted the greatest portion of the sulphur in each of the composites.
Detailed mineralogy was conducted on sized fractions of the Napoleon and Copala master composites following grinding to typical processing size distributions, 80 percent passing 63µm for Napoleon and 67µm for Copala. Selected liberation data is presented in Table 13-5.
Table 13-5: Liberation Characteristics of the Composites - % Distribution
Mineral Status | Napoleon (63µm P80) | Copala (67µm P80) | |||||
Galena | Sphalerite | Pyrite | Ag-Sulphide | Cu Sulphides | Sphalerite | Pyrite | |
Liberated | 73.9 | 64.1 | 69.3 | 14.7 | 38.5 | 70.1 | 65.3 |
Binary - Ag Mineral | - | - | - | - | 7.0 | 0.1 | 0.2 |
|
|
Mineral Status | Napoleon (63µm P80) | Copala (67µm P80) | |||||
Galena | Sphalerite | Pyrite | Ag-Sulphide | Cu Sulphides | Sphalerite | Pyrite | |
Binary - Cu Sulphides | - | - | - | 26.3 | - | 7.7 | 0.9 |
Binary - Galena | - | 3.7 | 1.9 | 0 | 0 | 2.6 | 1.9 |
Binary - Sphalerite | 6.9 | - | 3.6 | 0.4 | 5.0 | - | 0.8 |
Binary - Pyrite | 6.4 | 4.8 | - | 2.5 | 25.8 | 4.6 | - |
Binary - Gangue | 9.9 | 23.8 | 22.4 | 50.5 | 15.6 | 11.1 | 28.4 |
Multiphase | 2.9 | 3.6 | 2.9 | 5.5 | 8.1 | 3.8 | 2.5 |
The sulphide minerals in the Napoleon composite were well liberated for selective rougher flotation, approximately 64 to 74% at the grind size evaluated. Silver and copper bearing minerals were not examined in the Napoleon assessment.
Sphalerite and pyrite were 70 and 65% liberated in the Copala composite, while copper sulphides were 39% liberated. Silver sulphide minerals, identified as approximately 90% acanthite and 10% Ag-Cu sulphides, were poorly liberated at 15%. 50% of the silver sulphides were present as binaries with gangue, the remaining 35% was in either binary or mult-phase form with other sulphide minerals. Grain size assessments were conducted on the silver sulphides which indicated that the estimated median diameter (D50) on a mass basis was 18µm, and approximately 20% of the grain mass was finer than 10µm.
13.4 Comminution Testing
Comminution tests were conducted on composites assembled from each deposit, with the majority of the available results coming from the Copala test program. The results are presented in Table 13-6.
Table 13-6: Comminution Test Results
| Deposit | Sample | Specific Gravity | SMC Axb | Bond RWi | Bond BWi | Abrasion Index |
| g/cm3 | kWh/t | kWh/t | ||||
| Napoleon | Composite G | - | - | 15.0 | - | 0.599 |
| Grindability Composite | - | - | 15.4 | - | - | |
| Master Composite | - | - | - | 16.8 | - | |
| Tajitos | Diorite MC | - | - | - | 17.6 | - |
| Andesite MC | - | - | - | 16.5 | - | |
| Andesite - Low MnOx MC | - | - | - | 17.1 | - | |
| Copala | Var 1 | 2.61 | 27.9 | - | 18.5 | 0.390 |
| Var 2 | 2.65 | 36.0 | - | 16.4 | 0.455 | |
| Var 3 | 2.58 | 37.2 | - | 17.8 | 0.608 | |
| Var 4 | 2.62 | 34.0 | - | 18.1 | 0.612 | |
| Var 5 | 2.68 | 32.6 | - | 17.2 | 0.377 | |
| Var 6 | 2.67 | 30.1 | - | 18.9 | 0.416 | |
| Master Composite | - | - | - | 18.6 | - |
The Bond ball work index is relatively constant across the three deposits, fluctuating within the range of 16.4 - 18.9 kWh/t. This indicates that material for the Panuco project is moderately hard and is amenable to many common comminution technologies. For the Copala samples, Axb values in the range of 27.9 to 37.2 and abrasion indices ranging from 0.390 to 0.612 indicate it is a competent, abrasive material.
|
|
13.5 Gravity Concentration
Gravity concentration tests were conducted on composites from each deposit using a Knelson concentrator, followed by hand panning of the Knelson concentrate. Each test was conducted on a 2kg charge, at grind sizes of 80% passing 63µm for Napoleon, 92 and 101µm for Tajitos, and 97µm for Copala. Summarized results are presented in Table 13-7.
Table 13-7: Gravity Concentration Test Results
Deposit | Sample | Calculated head grade (g/t) | Mass (%) | Recovery (%) | |||
Silver | Gold | Pan Con | Tails | Silver | Gold | ||
Napoleon | Master Composite | 133 | 2.83 | 0.6 | 99.4 | 11.9 | 25.7 |
Tajitos | Diorite MC | 296 | 1.27 | 0.6 | 99.4 | 8.7 | 8.6 |
Andesite MC | 288 | 1.39 | 0.5 | 99.5 | 10.2 | 12.2 | |
Copala | Master Composite | 339 | 2.44 | 0.7 | 99.3 | 12.0 | 23.0 |
Precious metal recoveries to the gravity concentrate were low, ranging from 8.7 to 12.0% for silver and 8.6 to 25.7% for gold. No correlation between recovery and head grade was observed for silver. Gold recovery showed a logarithmic relationship to head grade, as indicated by Figure 13-1.
Figure 13-1: Gravity Gold Recovery Vs. Feed Grade
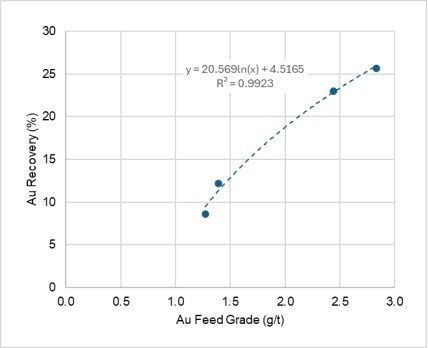
Source: Ausenco, 2024
|
|
13.6 Flotation
Froth flotation tests were conducted on all the samples described in Section 13.3. Sequential flotation to produce separate lead-silver, zinc and pyrite concentrates was investigated, as well as generating bulk sulphide concentrates. The most relevant results of this testing are summarized in the following sections.
13.6.1 Sequential Flotation
A sequential flotation flowsheet consisting of lead-silver, zinc and pyrite flotation was investigated for the three deposits. Typical lead-zinc circuit chemistry was applied. In all tests, Aerophine 3418A and sodium isopropyl xanthate (SIPX) were used as lead-silver and zinc collectors respectively. Sodium cyanide and zinc sulphate were used as sphalerite and pyrite depressants within the lead-silver flotation step. Copper sulphate was used to reactivate the sphalerite in zinc flotation. SIPX was applied at a higher dose in the pyrite circuit to collect any remaining sulphides.
The effect of primary grind size was evaluated on most samples using rougher kinetic test protocols. In general, precious metal recoveries were negatively affected as coarser primary grind sizes were applied. Silver and gold deportment to sequential rougher concentrates in selected tests following primary grinding to a nominal size of 70µm P80 are presented in Table 13-8 and graphically in Figure 13-2 and Figure 13-3.
Table 13-8: Sequential Rougher Flotation Data - Master Composites
Rougher Concentrate | Parameter | Napoleon | Tajitos | Copala | ||
MC | Diorite | Andesite | Low MnOx | MC | ||
Sample | Test # | T8 | T18 | T19 | T20 | T4 |
P. Grind (µm P80) | 63.0 | 71.0 | 71.0 | 76.0 | 69.0 | |
Lead | Mass (%) | 6.6 | 7.7 | 11.7 | 8.3 | 1.8 |
Ag (g/t) | 1156 | 2548 | 1744 | 2560 | 14008 | |
Au (g/t) | 26.5 | 10.1 | 8.5 | 22.2 | 77.5 | |
Ag Rec. (%) | 80.7 | 72.9 | 78.4 | 76.3 | 77.9 | |
Au Rec.(%) | 82.4 | 65.2 | 73.7 | 83.3 | 71.8 | |
Zinc | Mass (%) | 5.6 | 8.6 | 9.1 | 8.7 | 1.6 |
Ag (g/t) | 183 | 242 | 205 | 220 | 560 | |
Au (g/t) | 2.2 | 1.7 | 1.4 | 1.4 | 4.6 | |
Ag Rec. (%) | 8.8 | 7.8 | 7.2 | 6.8 | 2.7 | |
Au Rec.(%) | 4.6 | 12.2 | 9.6 | 5.5 | 3.7 | |
Pyrite | Mass (%) | 5.3 | 5.3 | 4.1 | 4.3 | 4.4 |
Ag (g/t) | 131 | 173 | 138 | 112 | 326 | |
Au (g/t) | 2.2 | 0.9 | 0.9 | 0.5 | 3.4 | |
Ag Rec. (%) | 5.8 | 3.5 | 2.2 | 1.7 | 4.4 | |
Au Rec.(%) | 4.3 | 4.1 | 2.7 | 1.0 | 7.6 | |
|
|
Figure 13-2: Sequential Rougher Flotation Results - Silver Deportment

Source: Ausenco 2024
Figure 13-3: Sequential Rougher Flotation Results - Gold Deportment
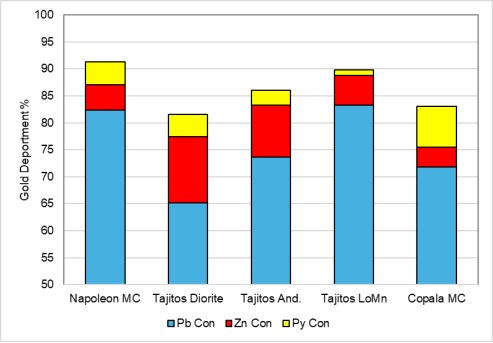
Source: Ausenco 2024
|
|
The majority of the silver and gold reported to the first sequential concentate with galena, between 76 to 81% of the silver and 65 to 83% of the gold in the flotation feed. The deportment of silver and gold to concentrates in these rougher kinetic tests is not what would be measured in a full circuit with closed cleaner tails circulation, but it provides a reference of ultimate recovery levels and distribution.
Recovery of silver and gold to flotation concentrates demonstrated relatively high payability for Napoleon, however the losses to flotation tails for Tajitos and Copala was shown to have unfavourable economics for a flotation only process. Furthermore, precious metal payment terms to lead and particularly zinc concentrates would detract from the recovered silver and gold values. Finally, the value of gold and silver in a pyrite concentrate is somewhat uncertain, as this stream is likely not marketable and would require a dedicated cyanide leach circuit to recover dore.
The lower zinc content in the Tajitos and Copala deposits may also pose a challenge to consistently produce marketable grade zinc concentrates. For these reasons, limited sequential flotation testing was investigated in the metallurgical test programs. Open circuit cleaner tests were completed on the Napoleon master composite, which indicated that marketable concentrates could be produced with sufficient regrinding. Metallurgical balance data of a semi-closed circuit test with regrinding are presented in Table 13-9.
Table 13-9: Metallurgical Balance - Napoleon Cleaner Test 14
Stream | Mass % | Assay % | Assay g/t | Distribution % | |||||||
Cu | Pb | Zn | Ag | Au | Cu | Pb | Zn | Ag | Au | ||
Bulk Concentrate | 2.0 | 3.98 | 54.2 | 6.9 | 4260 | 111 | 69.0 | 88.7 | 12.6 | 68.8 | 77.5 |
Bulk 2nd Cleaner Tail | 0.6 | 0.39 | 4.58 | 5.20 | 480 | 5.7 | 1.9 | 2.1 | 2.7 | 2.2 | 1.1 |
Bulk Cleaner Scav Con | 0.3 | 1.48 | 7.00 | 7.70 | 1320 | 11.6 | 3.5 | 1.5 | 1.9 | 2.9 | 1.1 |
Zinc Concentrate | 1.6 | 1.09 | 2.17 | 53.6 | 780 | 11.6 | 14.9 | 2.8 | 77.2 | 10.0 | 6.4 |
Zinc Cleaner Tails | 6.4 | 0.07 | 0.35 | 0.24 | 50 | 0.63 | 3.8 | 1.8 | 1.4 | 2.6 | 1.4 |
Pyrite Rougher Con | 6.4 | 0.04 | 0.19 | 0.22 | 124 | 1.84 | 2.0 | 1.0 | 1.3 | 6.4 | 4.1 |
Pyrite Rougher Tails | 82.7 | 0.01 | 0.03 | 0.04 | 11 | 0.29 | 5.0 | 2.0 | 3.0 | 7.3 | 8.3 |
Feed | 100 | 0.12 | 1.23 | 1.11 | 125 | 2.88 | 100 | 100 | 100 | 100 | 100 |
13.6.2 Bulk Flotation
Bulk sulphide flotation tests were conducted on the composites from each deposit, as well as variability samples from the Copala deposit. These were performed using a typical rougher flotation circuit to produce a bulk concentrate. Each of the tests were conducted at the natural pH of the ground feed, which ranged from 8.0 to 8.5, and used either potassium amyl xanthate (PAX) or SIPX as a collector. Copper sulphate was included as an activator in the Napoleon tests. Results are presented in Table 13-10 and graphicaly in Figure 13-4. Silver recoveries the rougher concentrates ranged from 77.1 to 96.8% and gold recoveries ranged from 77.0 to 92.3%. Mass recoveries varied from 5.1% to 19.7%, and were generally higher at finer primary grinds, indicative of higher entrainment.
|
|
Table 13-10: Bulk Flotation Rougher Recoveries
Sample | # of Tests | Prim. Grind | Feed Grade (g/t) | Recovery (%) | |||
Au | Ag | mass | Au | Ag | |||
Napoleon MC | 1 | 63 | 2.66 | 122 | 14.3 | 88.4 | 93.7 |
Tajitos - Diorite | 1 | 70 | 1.28 | 284 | 19.7 | 81.2 | 87.6 |
Tajitos - Andesite | 1 | 70 | 1.46 | 267 | 18.1 | 86.5 | 85.3 |
Tajitos - Diorite | 3 | 100 | 1.54 | 263 | 13.3 | 81.3 | 83.7 |
Tajitos - Andesite | 3 | 100 | 1.34 | 257 | 10.8 | 77.3 | 82.9 |
Tajitos - Low MnOx | 2 | 100 | 2.47 | 291 | 11 | 86.5 | 81.6 |
Copala MC | 5 | 100 | 2.38 | 349 | 5.1 | 79.0 | 79.6 |
Copala MC | 1 | 70 | 2.38 | 346 | 6.5 | 77.0 | 84.1 |
Copala Var 1 | 1 | 62 | 2.92 | 370 | 9.6 | 82.6 | 86.8 |
Copala Var 2 | 1 | 71 | 1.19 | 175 | 8.0 | 90.0 | 96.8 |
Copala Var 3 | 1 | 66 | 1.95 | 277 | 6.3 | 85.6 | 84.1 |
Copala Var 4 | 1 | 72 | 6.64 | 353 | 13.4 | 92.3 | 88.2 |
Copala Var 5 | 1 | 74 | 1.31 | 245 | 10.8 | 78.1 | 77.1 |
Copala Var 6 | 1 | 67 | 2.93 | 648 | 16.9 | 82.4 | 82.8 |
Note: Values are averaged for conditions with more than 1 test per sample.
Figure 13-4: Bulk Flotation Recoveries Vs Feed Grades
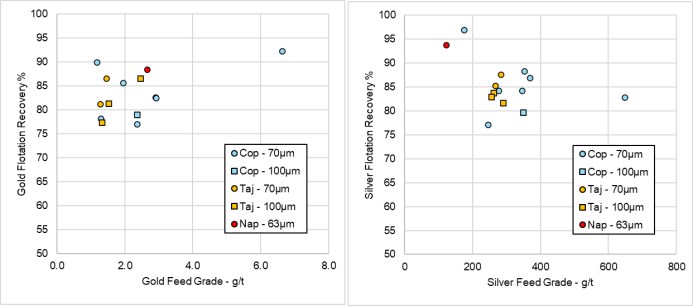
Source: Ausenco 2024
Open circuit cleaner tests were also conducted on Napoleon and Tajitos composites using two stages of cleaner flotation following regrinding of the rougher concentrates to produce higher-grade final concentrates. Results are presented graphically in Figure 13-5. While these concentrates may be marketable, the payment terms for the precious metal contents are uncertain. Losses to the cleaner tailings streams would result in unfavourable economics for this flotation only process.
|
|
Figure 13-5: Bulk Cleaner Flotation Upgrading Results
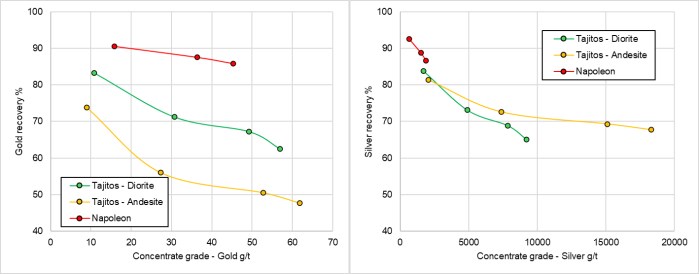
Source: Ausenco 2024
13.7 Cyanidation
13.7.1 Whole Feed Cyanidation
Several bottle roll tests were conducted during each of the metallurgical programs to assess the amenability of materials to whole feed cyanide (NaCN) leaching. Tests on the Tajitos and Copala samples were conducted at 1000 mg/L NaCN with leach times from 48 to 96 hours. Napoleon tests were conducted with 2000 or 3000 mg/L NaCN and 48 hours of leach time. Nominal grind sizes of 70µm or 100µm P80 were applied. The results are presented in Table 13-11 and graphically in Figure 13-6 and Figure 13-7.
Silver leach kinetics were considerably slower than gold and appeared to require 96 hours of residence time to stabilize at a final extraction value, which were generally lower than the gold extractions. Average silver and gold extractions of the three deposits, based on best performing master composite tests, were 84.7 and 92.3%, respectively.
|
|
Table 13-11: Whole Feed Leach Results
Deposit | Sample | Prim. | Pre- | NaCN | Leach | Feed Grade (g/t) | Residue Grade | Extraction (%) | |||
Au | Ag | Au | Ag | Au | Ag | ||||||
Napoleon | Master Composite | 63 | - | 6400 | 48 | 2.85 | 137 | 0.21 | 30 | 92.6 | 78.1 |
63 | 8 | 2500 | 48 | 2.76 | 128 | 0.20 | 17 | 92.8 | 86.7 | ||
Tajitos | Diorite MC | 71 | - | 2300 | 48 | 1.31 | 256 | 0.15 | 50 | 88.5 | 80.5 |
101 | - | 1600 | 48 | 1.32 | 257 | 0.18 | 52 | 86.4 | 79.8 | ||
101 | - | 1400 | 96 | 1.53 | 263 | 0.16 | 43 | 89.5 | 83.7 | ||
Andesite MC | 71 | - | 1000 | 48 | 1.49 | 243 | 0.12 | 83 | 91.9 | 65.8 | |
92 | - | 1600 | 48 | 1.54 | 250 | 0.12 | 78 | 92.2 | 68.8 | ||
95 | - | 1200 | 96 | 1.67 | 248 | 0.11 | 42 | 93.4 | 83.1 | ||
Andesite Low MnOX | 76 | - | 800 | 48 | 3.65 | 265 | 0.22 | 60 | 94.0 | 77.4 | |
103 | - | 2000 | 48 | 2.35 | 267 | 0.23 | 82 | 90.2 | 69.3 | ||
103 | - | 2000 | 96 | 2.46 | 276 | 0.25 | 59 | 89.8 | 78.6 | ||
Copala | Master Composite | 69 | - | 2400 | 72 | 2.28 | 363 | 0.21 | 66 | 90.8 | 81.8 |
97 | - | 2500 | 72 | 2.40 | 360 | 0.25 | 72 | 89.6 | 80.0 | ||
97 | 16 | 400 | 72 | 2.43 | 352 | 0.32 | 84 | 86.8 | 76.1 | ||
97 | 1 | 600 | 96 | 2.47 | 360 | 0.20 | 50 | 91.9 | 86.1 | ||
Var 1 | 101 | 2 | 600 | 96 | 2.23 | 403 | 0.21 | 34 | 90.6 | 91.6 | |
Var 2 | 102 | 2 | 1000 | 96 | 1.27 | 192 | 0.21 | 12 | 83.5 | 93.8 | |
Var 3 | 96 | 2 | 500 | 96 | 1.78 | 302 | 0.19 | 32 | 89.3 | 89.4 | |
Var 4 | 89 | 2 | 700 | 96 | 5.85 | 388 | 0.28 | 36 | 95.2 | 90.7 | |
Var 5 | 103 | 2 | 500 | 98 | 1.40 | 269 | 0.21 | 48 | 85.0 | 82.2 | |
Var 6 | 94 | 2 | 1100 | 96 | 3.04 | 636 | 0.59 | 31 | 80.6 | 95.1 | |
Var 6 | 94 | 2 | 900 | 96 | 2.9 | 672 | 0.50 | 119 | 82.8 | 82.3 | |
The consumption rates of sodium cyanide were signficantly lower in tests in which pre-aeration was applied, particularly for the Napoleon composite which had the highest sulphide mineral content. Sodium cyanide consumption rates averaged 1400 g/t for the three deposits, based on the best performing leach tests on master composites.
|
|
Figure 13-6: Whole Feed Leach Results - Silver Extraction Vs. Silver in Feed

Source: Ausenco 2024
Figure 13-7: Whole Feed Leach Results - Gold Extraction Vs. Gold in Feed

Source: Ausenco 2024
|
|
13.7.2 Flotation Concentrate Cyanidation
Bottle roll tests were conducted on flotation concentrate products collected during each of the test work programs. Cyanidation tests were carried out at 2000 mg/L NaCN for Tajitos tests and 3000 mg/L for Napoleon and Copala tests, and leach times varied from 24 to 72 hours. Results are summarized in Table 13-12 and shown graphically in Figure 13-8 and Figure 13-9.
Table 13-12: Flotation Concentrate Leach Results
| Deposit | Sample | Prim. Grind (µm P80) | Pre- aeration (hrs) | NaCN consumption (g/t) | Leach Duration (hrs) | Feed Grade (g/t) | Residue Grade (g/t) | Extraction (%) | |||
| Au | Ag | Au | Ag | Au | Ag | ||||||
| Napoleon | Master Composite | 63 | 8 | 6400 | 48 | 14.4 | 853 | 1.12 | 121 | 92.2 | 85.8 |
| 31 | 8 | 7100 | 48 | 13.9 | 576 | 0.63 | 86 | 95.5 | 85.1 | ||
| Tajitos | Diorite MC | 50 | - | 3900 | 48 | 5.91 | 1457 | 0.74 | 162 | 87.5 | 88.9 |
| 33 | - | 4700 | 48 | 8.21 | 1778 | 0.62 | 90 | 92.4 | 94.9 | ||
| Andesite MC | 52 | - | 3100 | 48 | 6.64 | 1277 | 0.4 | 188 | 94.0 | 85.3 | |
| 28 | - | 3700 | 48 | 9.4 | 1663 | 0.33 | 124 | 96.5 | 92.5 | ||
| Andesite Low MnOX | 51 | - | 4500 | 48 | 12.2 | 1693 | 1.04 | 240 | 91.5 | 85.8 | |
| Copala | Master Composite | 54 | - | 12900 | 72 | 56.2 | 7221 | 4.13 | 384 | 92.7 | 94.7 |
| 18 | - | 15800 | 72 | 58.8 | 8495 | 1.88 | 162 | 96.8 | 98.1 | ||
| 19 | 1 | 12600 | 48 | 27.6 | 4785 | 1.15 | 103 | 95.9 | 97.8 | ||
| 23 | 1 | 13200 | 48 | 34.7 | 5344 | 1.17 | 127 | 96.6 | 97.6 | ||
| 51 | - | 6600 | 72 | 23.3 | 3456 | 1.29 | 322 | 94.5 | 90.7 | ||
| 15 | 1 | 9200 | 24 | 28 | 4454 | 1.06 | 53 | 96.2 | 98.8 | ||
| Var 1 | 18 | 16 | 7700 | 24 | 30.2 | 5332 | 0.62 | 294 | 97.9 | 94.5 | |
| Var 2 | 23 | 16 | 10600 | 24 | 20.8 | 3876 | 1.69 | 161 | 91.9 | 95.8 | |
| Var 3 | 17 | 16 | 11000 | 24 | 42.2 | 7595 | 2.28 | 232 | 94.6 | 96.9 | |
| Var 4 | 22 | 16 | 9300 | 24 | 94.6 | 5807 | 0.83 | 200 | 99.1 | 96.6 | |
| Var 5 | 22 | 16 | 7500 | 24 | 20.2 | 3032 | 0.38 | 122 | 98.1 | 96.0 | |
| Var 6 | 23 | 16 | 6400 | 24 | 20.2 | 4842 | 1.93 | 221 | 90.4 | 95.4 | |
| Var 6 | 23 | 16 | 7200 | 48 | 19.5 | 4743 | 2.17 | 169 | 88.9 | 96.4 | |
Both silver and gold leach kinetics were quite fast appeared to require 24 hours of residence time to stabilize at final extraction values. Increased levels of regrinding resulted in the highest extraction values, a regrind discharge size range of 15 to 20µm was most beneficial. Average silver and gold extractions from the rougher concentrates of the three deposits, based on best performing master composite tests, were 91.7 and 95.1%, respectively. It should be noted that this average is biased low due to insufficient regrinding applied to Napoleon and Tajitos composites, which were conducted prior to more comprehensively investigating the effect of finer regrinding during the Copala test program.
|
|
Figure 13-8: Silver Leach Results on Flotation Concentrates Vs. Leach Feed Grade and Regrind Size

Source: Ausenco 2024
Figure 13-9: Gold Leach Results on Flotation Concentrates Vs. Leach Feed Grade and Regrind Size
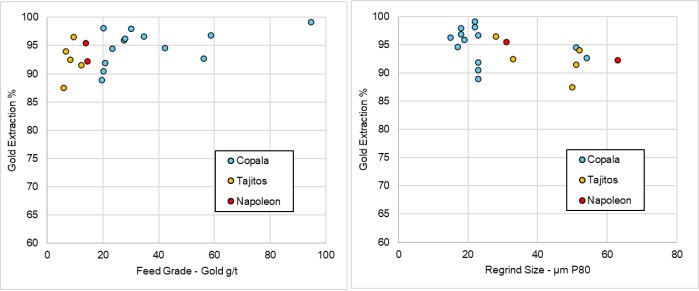
Source: Ausenco 2024
|
|
13.7.3 Flotation Tailings Cyanidation
Bottle roll tests were also conducted on several tailings samples generated following rougher flotation in the Tajitos and Copala programs. This strategy was not yet considered during the Napoleon test program. Each test was conducted with 1000 mg/L NaCN with leach times between 48 and 72 hours. Pre-aeration was not applied prior to leaching as the flotation process provided aeration, and the tailings were mostly depleted of sulphide minerals. The results are provided in Table 13-13 and presented graphically in Figure 13-10 and Figure 13-11 .
Table 13-13: Rougher Flotation Tailings Leach Results
Deposit | Sample | Prim. | NaCN | Leach | Feed Grade (g/t) | Residue Grade (g/t) | Extraction (%) | |||
Au | Ag | Au | Ag | Au | Ag | |||||
Tajitos | Diorite MC | 90 | 500 | 48 | 0.41 | 49 | 0.07 | 17 | 82.9 | 65.3 |
Andesite MC | 93 | 600 | 48 | 0.41 | 43 | 0.06 | 16 | 85.4 | 62.8 | |
Andesite Low MnOX | 97 | 300 | 48 | 0.42 | 51 | 0.09 | 23 | 78.6 | 54.9 | |
Copala | Master Composite | 69 | 1200 | 48 | 0.58 | 59 | 0.11 | 19 | 81.0 | 67.8 |
97 | 100 | 72 | 0.48 | 74 | 0.14 | 30 | 70.8 | 59.5 | ||
97 | 400 | 72 | 0.59 | 70 | 0.13 | 33 | 78.0 | 52.9 | ||
103 | 600 | 48 | 0.55 | 79 | 0.13 | 36 | 77.5 | 54.3 | ||
176 | 400 | 48 | 0.62 | 87 | 0.13 | 45 | 79.1 | 48.0 | ||
97 | 300 | 72 | 0.50 | 77 | 0.10 | 31 | 80.0 | 59.6 | ||
Var 1 | 99 | 200 | 72 | 0.81 | 78 | 0.15 | 32 | 81.5 | 59.0 | |
Var 2 | 103 | 700 | 72 | 0.20 | 18 | 0.06 | 6 | 69.6 | 68.6 | |
Var 3 | 101 | 1500 | 72 | 0.44 | 63 | 0.10 | 27 | 77.1 | 57.9 | |
Var 4 | 106 | 700 | 72 | 1.00 | 71 | 0.19 | 32 | 80.9 | 54.6 | |
Var 5 | 108 | 600 | 72 | 0.34 | 81 | 0.11 | 35 | 67.6 | 57.3 | |
Var 6 | 108 | 500 | 72 | 0.87 | 130 | 0.26 | 29 | 70.8 | 77.5 | |
Var 6 | 94 | 1100 | 48 | 0.79 | 144 | 0.22 | 47 | 72.2 | 67.4 | |
Similar to the whole feed leach tests, silver leach kinetics were considerably slower than gold and appeared to require longer residence times to stabilize at final extraction values, which were lower than the gold extractions. Average silver and gold extractions of the Tajitos deposit and the best performing Copala master composite test were 64.4 and 81.7%, respectively.
Gold extraction from the rougher tails was somewhat insensitve to the leach feed grade. Silver extraction however tended to decrease with increasing feed grade on the Copala samples, excluding the high grade Var 6 sample which was tested in duplicate.
|
|
Figure 13-10: Silver Leach Data on Flotation Tailings
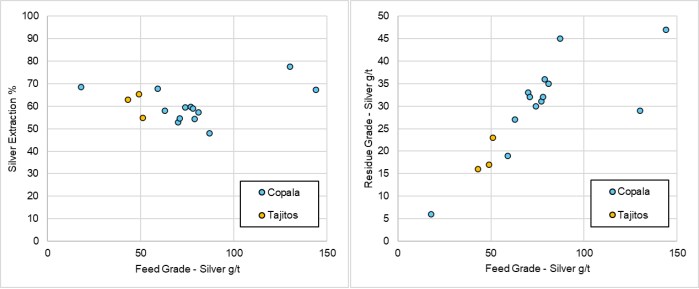
Source: Ausenco 2024
Figure 13-11: Gold Leach Data on Flotation Tailings
![]()
Source: Ausenco 2024
13.7.4 Combined Flotation Plus Leach Performance
Total flotation plus leach circuit performance data on selected tests from the Copala test program are presented in Table 13-14. Each test employed regrinding of the flotation concentrate to a discharge size within a range of 14 to 23µm P80. Leaching was conducted on each product separately, except for test 60 in which the concentrate leach slurry was combined with the tailings leach slurry after 24 hours separate leaching, and the combined mixture was leached for an additional 48 hours. The silver and gold combined extractions for tests conducted with a 100µm nominal primary grind size averaged 89.5 and 91.4%, respectively.
|
|
Table 13-14: Combined Flotation Plus Leach Results - Copala
Test # | Sample | Prim. | NaCN | Leach Duration (hrs) | Feed Grade (g/t) | Residue Grade (g/t) | Extraction (%) | ||||
Con | Tailings | Au | Ag | Au | Ag | Au | Ag | ||||
31 | Var 1 | 101 | 730 | 24 | 72 | 2.73 | 421 | 0.18 | 49 | 93.4 | 88.3 |
32 | Var 2 | 102 | 1200 | 24 | 72 | 1.17 | 200 | 0.14 | 13 | 88.3 | 93.6 |
33 | Var 3 | 96 | 1800 | 24 | 72 | 1.81 | 310 | 0.17 | 33 | 90.5 | 89.3 |
34 | Var 4 | 89 | 1200 | 24 | 72 | 6.21 | 391 | 0.23 | 42 | 96.4 | 89.4 |
35 | Var 5 | 103 | 1000 | 24 | 72 | 1.59 | 267 | 0.13 | 40 | 92.0 | 84.9 |
64 | Var 6 | 94 | 1900 | 24 | 72 | 2.92 | 670 | 0.44 | 61 | 84.9 | 90.9 |
55 | Master Composite | 69 | 1800 | 48 | 48 | 2.38 | 346 | 0.17 | 22 | 93.0 | 93.8 |
14 | 97 | 930 | 72 | 72 | 2.41 | 332 | 0.18 | 37 | 92.3 | 89.0 | |
60 | 97 | 1300 | 24 | 72 | 2.63 | 344 | 0.17 | 32 | 93.7 | 90.6 | |
13.8 Recovery Estimates
Silver and gold recovery estimates were determined for each of the three main deposits, for both whole feed leaching and the flotation plus leaching circuit, following primary grinding to 80% passing 70µm. Kinetic rate equations were fitted to whole feed leach results from the Napoleon and Tajitos deposits and used to estimate extractions following 96 hours of leach residence time for a 70µm grind size. Logarithmic relationships for Copala silver and gold whole feed leach extraction as function of feed grade were determined from 100µm grind data and adjusted for a 70µm grind size. Kinetic rate equations were fit to the Copala leach data on flotation products, and rougher tail extractions were adjusted for a 70µm grind size. Tajitos and Napoleon concentrate leach results following regrinding to 20µm were estimated from the available data. Tajitos flotation tails extractions were estimated using kinetic rate equations fit to the available data. Napoleon rougher tails leach extractions were conservatively estimated due to a lack of test data. Average flotation recoveries were determined for each deposit and the corresponding leach extractions were applied to the concentrate and rougher tailings streams.
Constant recoveries were estimated by the above methodology for each deposit and respective flowsheet, except for the Copala whole feed leach extractions which were estimated as a function of feed grades. The resulting recovery estimates presented in Table 13-15 and Table 13-16 were used in the financial model.
|
|
Table 13-15: Whole Feed Leach Recovery Estimates
Metal | Napoleon | Tajitos | Copala |
Gold (%) | 92.7 | 93.2 | R= 12.5*ln(Au feed) + 82.1 |
max 95% | |||
Silver (%) | 82.4 | 85.3 | R= 17.5*ln(Ag feed) - 12.3 |
max 93% |
Table 13-16: Flotation Plus Leach Recovery Estimates
Circuit Component | Stream | Napoleon | Tajitos | Copala | |||
Au (%) | Ag (%) | Au (%) | Ag (%) | Au (%) | Ag (%) | ||
Flotation Deportment | Concentrate | 88.0 | 90.0 | 82.0 | 84.6 | 80.0 | 82.0 |
Tails | 12.0 | 10.0 | 18.0 | 15.4 | 20.0 | 18.0 | |
Leach Extraction | Concentrate | 97.0 | 97.0 | 97.0 | 97.0 | 97.1 | 97.4 |
Tails | 84.0 | 70.0 | 85.2 | 68.2 | 83.1 | 73.0 | |
Total Circuit Recovery |
| 95.4 | 94.3 | 94.9 | 92.6 | 94.3 | 93.0 |
13.9 Deleterious Elements
Cyanide soluble copper appears to be present in some of the samples tested, particularly for the Napoleon deposit. Copper is known to impact cyanide consumption within a leaching process, however further test work is required to determine whether the higher consumption per tonne observed in the whole ore bottle roll tests is a result of copper content, or simply higher NaCN requirements.
The sphalerite contents previously identified in Section 13.2 may also lead to zinc contamination of the leach solution. This could result in increased cyanide consumption within the leach and passivation of the zinc surface during Merrill-Crowe, leading to build-up of precious metal concentrations in the barren solution and subsequent metal losses during bleeds. To completely assess the impact of zinc minerals, further metallurgical test work is required.
No other deleterious elements that may have significant impacts on potential economic extraction have been identified at this time, however it is recommended that further chemical characterization of leach solutions should be conducted as part of future test work campaigns.
13.10 Comments on Mineral Processing and Metallurgical Testing
The metallurgical test programs completed on the three deposits provide a comprehensive preliminary assessment of metallurgical performance of the Panuco materials. The Copala materials appear to be competent with respect to impact breakage in a SAG mill, however these tests were not completed on the Napoleon and Tajitos samples. Bond ball mill work index tests were completed on all three deposits and suggest that the materials are moderately hard with respect to ball mill grinding, with BMWi values averaging approximately 17 kWhr/tonne.
The Napoleon samples contained elevated levels of lead and zinc which would likely be sufficient for production of saleable bulk lead/silver and zinc concentrates by standard flotation techniques. The Tajitos and Copala samples contained low levels of base metals and the generation of separate lead/silver and zinc concentrates from these materials was not evaluated any further than rougher flotation testing. A flotation only processing strategy was determined to have lower economic benefits than a process that included leaching with sodium cyanide.
|
|
The highest gold and silver recoveries were achieved with a combination of bulk flotation and separate leaching of the reground flotation concentrate and tailings. Whole feed leaching was effective at extracting silver and gold, although finer primary grind sizes and 96 hour leach durations were generally required to acheive comparable silver extractions.
|
|
14 MINERAL RESOURCE ESTIMATES
14.1 Introduction
Updated MREs for the Napoleon-La Luisa and Copala-Tajitos deposit areas were published on January 8, 2024 (Armitage et al., 2024), as well as MREs for the Animas and San Antonio areas previously published (Armitage et al., 2023).
Completion of the updated MREs for the Napoleon-La Luisa and Copala-Tajitos deposit areas involved the assessment of an updated drill hole database, which included all data for surface drilling completed between November 2019 and September 2023. The MREs for the Animas and San Antonio deposit areas included data for surface drilling completed between November 2019 and September 2022; there had been only limited drilling on the Animas and San Antonio deposit areas and these MREs previously published (Armitage et al., 2023) are considered current. The effective date for the Updated Mineral Resource Estimate is September 1, 2023. Completion of the MREs also included the assessment of updated three-dimensional (3D) mineral resource models (resource domains), 3D topographic surface models, 3D models of historical underground workings, and available written reports.
The Inverse Distance Squared (ID2) calculation method restricted to mineralized domains was used to interpolate grades for Ag (g/t), Au (g/t), Pb (ppm) and Zn (ppm) into block models for all deposit areas.
Indicated and Inferred mineral resources are reported in the summary tables in Section 14.11. The MREs presented below take into consideration that all deposits on the Property may be mined by underground mining methods.
The reporting of the updated MRE complies with all disclosure requirements for Mineral Resources set out in the NI 43-101 Standards of Disclosure for Mineral Projects. The classification of the updated MRE is consistent with the 2014 Canadian Institute of Mining, Metallurgy and Petroleum (CIM) Definition Standards (2014 CIM Definitions) and adheres as best as possible to the 2019 CIM Estimation of Mineral Resources & Mineral Reserves Best Practice Guidelines (2019 CIM Guidelines).
14.2 Drill Hole Database
To complete the current MREs for the Property, a database comprising a series of comma delimited spreadsheets containing surface diamond drill hole information was provided by Vizsla for the Napoleon-La Luisa, Tajitos-Copala, Animas and San Antonio areas. The database included hole location information, down-hole survey data, assay data for all metals of interest, lithology data and density data. The data in the geochemistry/assay tables included data for the elements of interest including Ag (g/t), Au (g/t), Pb (ppm or %) and Zn (ppm or %). After review of the database, the data was then imported into GEOVIA GEMS version 6.8.3 software (GEMS) for statistical analysis, block modeling and resource estimation. No errors were identified when importing the data. The data was validated in GEMS and no erroneous data, data overlaps or duplication of data was identified.
|
|
The database provided by Vizsla for the MREs, to September 2023, include data for 822 surface diamond drill holes, completed on the Property, totalling 302,931 m (Table 14-1, Figure 14-1 and Figure 14-2). The database totals 47,694 assay intervals representing 55,368 m of drilling. The average assay sample length is 1.16 m.
The database was checked for typographical errors in drill hole locations, down hole surveys, lithology, assay values and supporting information on source of assay values. Overlaps and gapping in survey, lithology and assay values in intervals were checked. All assays had analytical values for Ag (g/t), Au (g/t) Pb (ppm) and Zn (ppm).
Table 14-1: Project Drill Hole Totals
Deposit Area | Drill | Drill Hole # | Total | No. of | Tot. Assay Length | Avg. Assay Length |
Napoleon - Josephine - La Luisa | 393 | NP-20-01 to NP-23-396 | 144,867 | 19,362 | 21,759 | 1.12 |
Copala - Tajitos | 309 | CS-20-01 to CS-23-312 | 124,224 | 20,740 | 24,590 | 1.19 |
Animas | 51 | AM-19-01 to AM-22-50 | 16,881 | 2,322 | 2,764 | 1.19 |
San Antonio | 69 | CO-20-01 to CO-22-69 | 16,959 | 5,270 | 6,255 | 1.19 |
Total | 822 | - | 302,931 | 47,694 | 55,368 | - |
Figure 14-1: Plan View: Distribution of Surface Drill Holes on the Property (WGS 84) as of September 2023, on Topography
![]()
Source: SGS, 2024
|
|
Figure 14-2: Isometric View Looking Northwest: Distribution of Surface Drill Holes in the Copala-Napoleon-Cruz-La Luisa Area (WGS84)
![]()
Source: SGS, 2024
14.3 Mineral Resource Modelling and Wireframing
For the current MREs, Vizsla provided the author with a total of 28 3D resource models, constructed in Leapfrog Geo version 2022.1, representing the Napoleon area (13 models), including 1 model representing Cruz and 1 model representing Josephine; the La Luisa area (2 models); the Copala area (7 models), including 1 model for Cristiano and 1 model for Tajitos; the Animas area (5 models); and San Antonio (Generales) (1 model) (Table 14-2) (Figure 14-3 to Figure 14-5). The author was also provided with digital elevation surface models (LiDAR) for the Napoleon-Copala, Animas and San Antonio areas. All 3D resource models were clipped to topography. The surface models were derived from data collected during a LiDAR survey completed by Eagle Mapping out of Langley, BC, in June of 2022. The data was received by Vizsla in August of 2022.
The author has reviewed the resource models on section and in the author's' opinion the models provided are well constructed and accurately represent the main structures identified on the Property and the distribution of the Ag-Au-Pb-Zn mineralization within these structures. Minor errors were identified by the author during the review process and were corrected by Vizsla before final resource estimation. All models have been extended well beyond the limits of the current drilling for the purpose of providing guidance for continued exploration. However, the extension of the mineral resource beyond the limits of drilling is limited by the search radius during the interpolation procedure (generally 100 m past drilling for most areas, 110 for Napoleon), as well as the Property boundary.
|
|
Mineralization in the Napoleon area extends for roughly 2,600 m along strike and up to 550 m vertically (main Napoleon structures) and is hosted in multiple, variably oriented structures. The main Napoleon structure and FW zones trend roughly 350° and dip east at -80⁰. The Napoleon HW zones variably trend from 315⁰ to 355⁰ to 2⁰ and dips range from -38 to -80° east. The Josephine structure trends 355° and dips to the east at roughly -75°. The Cruz zone trends roughly 330° and dips to the northeast at -85°. Mineralization in the Luisa structure extends for up to 950 m and to depths of 600 m. The La Luisa models' trend 335⁰ and are near vertical.
Mineralization in the Copala structure extends for up to 1,700 m along strike and to depths of 450 to 550 m below surface, and is hosted in multiple, variably oriented structures. The main Copala structures trend 320 - 340 ° with dips ranging from -30° to -60⁰ east. The Cristiano structure trends 335° and dips -80⁰ east. The Tajitos structure trends 20° and dips to the east at -65°.
In the Animas area, mineralization extends to depths of up to 230 m and is hosted in multiple structures which trend 35° (near vertical) and 140° (dips roughly -55°).
The San Antonio structure is in the Cordon del Oro area and trends 195° and dips -55° to the south. Mineralization within the San Antonio structure extends for 650 along strike and up to 340 m below surface.
Table 14-2: Property Domain Descriptions
Model (Vizsla Models) | Rock Code | Block Rock Code | Bulk Density |
GEMS | |||
Napoleon_Area_GM - HW3 | HW3 | 306 | 2.86 |
Napoleon_Area_GM - Josephine | JOSEPHIN | 312 | 2.69 |
Napoleon_Area_GM - Napoleon | NAPOLEON | 300 | 2.69 |
Napoleon_Area_GM - NP FW1 | FW1 | 301 | 2.76 |
Napoleon_Area_GM - NP-FW2 | FW2 | 302 | 2.76 |
Napoleon_Area_GM - NP-FW3 | FW3 | 303 | 2.76 |
Napoleon_Area_GM - NP-HW-1 | HW1 | 304 | 2.86 |
Napoleon_Area_GM - NP-HW-4 | HW4 | 307 | 2.86 |
Napoleon_Area_GM - NP-HW-5 | HW5 | 308 | 2.86 |
Napoleon_Area_GM - NP-HW-6 | HW6 | 309 | 2.86 |
Napoleon_Area_GM - NP-HW-7 | HW7 | 310 | 2.86 |
Napoleon_Area_GM - Cruz negra | CRUZ | 311 | 2.69 |
Napoleon_Area_GM - HW-2 | HW2 | 305 | 2.86 |
Luisa_GM - luisa | LUISA | 400 | 2.81 |
Luisa_GM - luisa_hw | LUISA_HW | 401 | 2.81 |
TAJITOS_GM_SM - Copala_2 | COPALA2 | 234 | 2.71 |
TAJITOS_GM_SM - Copala_4 | COPALA4 | 236 | 2.71 |
TAJITOS_GM_SM - Copala_3 | COPALA3 | 235 | 2.71 |
TAJITOS_GM_SM - Cristiano | CRISTIAN | 240 | 2.71 |
TAJITOS_GM_SM - Tajitos | TAJITOS | 250 | 2.65 |
TAJITOS_GM_SM - Copala_Main North | COPALAN | 233 | 2.71 |
TAJITOS_GM_SM - Copala_Main | COPALA | 243 | 2.71 |
|
|
Model (Vizsla Models) | Rock Code | Block Rock Code | Bulk Density |
GEMS | |||
TAJITOS_GM_SM - Copala_5 North | COPALA5N | 247 | 2.71 |
TAJITOS_GM_SM - Copala_5 | COPALA5 | 237 | 2.71 |
Animas - Cuevillas | CUEVILLA | 101 | 2.60 |
Animas - Cuevillas_fw | CUEVFW | 102 | 2.60 |
Animas - Rosarito | ROSARITO | 104 | 2.60 |
Animas - Rosarito_splay | ROSARSPL | 106 | 2.60 |
Animas - Rosarito_splay_hw | ROSARHW | 105 | 2.60 |
Los Generales Vein - Generales_Vein20230110 | GENERAL | 103 | 2.60 |
Figure 14-3: Plan View: Property Mineral Resource Models
![]()
Source: SGS, 2024
|
|
Figure 14-4: Isometric View Looking Northeast: Property Mineral Resource Models
![]()
Source: SGS, 2024
|
|
Figure 14-5: Isometric View Looking Northwest: Property Mineral Resource Models, Copala-Napoleon-La Luisa Areas
![]()
Source: SGS, 2024
14.4 Bulk Density
The author was provided with an updated database of 1,919 bulk density measurements for the current MREs. Samples were collected from the Napoleon (839 samples, average 2.69), Copala (1,049 samples, average 2.68) and the Animas (31 samples, average 2.51) areas.
Of the data collected, 568 samples are from mineralized material. Based on a review of the available density data, it was decided that a fixed value be used for each resource model. The average density used by domain for the current MRE are presented in Table 14-2 above.
It is recommended that Vizsla continue to collect additional density data as drilling continues, collecting samples from the various structures, representing different styles of mineralization, ranges in grade of Ag, Au, Pb and Zn and at different depths of the deposits. It is recommended that Vizsla continue the current bulk density sampling program as the drill program continues.
|
|
14.5 Compositing
The assay sample database available for the revised resource modelling totalled 47,694 samples representing 55,368 m of drilling (Table 14-1). A statistical analysis of the assay data from within the mineralized domains, by area, is presented in Table 14-3. There are a total of 6,516 assays within the resource domains.
Table 14-3: Statistical Analysis of the Drill Assay Data from Within the Deposit Mineral Domains - by Area
Copala Area: Copala, Tajitos and Cristiano
Variable | Ag g/t | Au g/t | Pb ppm | Zn ppm |
Copala Area: Copala Main, Copala 1-5, Cristiano | ||||
Total # Assay Samples | 2,814 | |||
Average Sample Length | 1.11 m | |||
Minimum Grade | 0.25 | 0.00 | 2 | 9 |
Maximum Grade | 23,058 | 205 | 104,000 | 88,800 |
Mean | 237 | 1.40 | 822 | 1,613 |
Standard Deviation | 890 | 5.86 | 3,483 | 4,950 |
Coefficient of variation | 3.75 | 4.18 | 4.23 | 3.07 |
97.5 Percentile | 1,850 | 11.15 | 6,000 | 11,550 |
Variable | Ag g/t | Au g/t | Pb ppm | Zn ppm |
Tajitos | ||||
Total # Assay Samples | 382 | |||
Average Sample Length | 0.96 m | |||
Minimum Grade | 0.25 | 0.00 | 6 | 9 |
Maximum Grade | 4,420 | 23.4 | 35,700 | 54,100 |
Mean | 237 | 1.35 | 1,509 | 3,133 |
Standard Deviation | 549 | 2.96 | 3,662 | 6,320 |
Coefficient of variation | 2.32 | 2.20 | 2.43 | 2.02 |
97.5 Percentile | 1,992 | 11.3 | 10,440 | 22,850 |
Napoleon Area: Napoleon, Cruz, Josephine and La Luisa
Variable | Ag g/t | Au g/t | Pb ppm | Zn ppm |
Napoleon_HW (4) | ||||
Total # Assay Samples | 319 | |||
Average Sample Length | 0.86 m | |||
Minimum Grade | 0.25 | 0.00 | 11 | 33 |
Maximum Grade | 5,010 | 34.6 | 72,800 | 267,000 |
|
|
Variable | Ag g/t | Au g/t | Pb ppm | Zn ppm |
Napoleon_HW (4) | ||||
Mean | 128 | 1.16 | 2,647 | 10,434 |
Standard Deviation | 428 | 3.39 | 6,886 | 24,551 |
Coefficient of variation | 3.35 | 2.93 | 2.60 | 2.35 |
97.5 Percentile | 1,120 | 9.75 | 20,625 | 72,650 |
Variable | Ag g/t | Au g/t | Pb ppm | Zn ppm |
Napoleon + Splays: Napoleon and NP_HW 1,2,3,5,6,7 and NP_FW1, 2, 3 | ||||
Total # Assay Samples | 2,236 | |||
Average Sample Length | 0.96 m | |||
Minimum Grade | 0.25 | 0.00 | 2 | 18 |
Maximum Grade | 8,050 | 199 | 210,000 | 237,000 |
Mean | 122 | 1.86 | 4,496 | 13,217 |
Standard Deviation | 396 | 8.69 | 13,705 | 24,703 |
Coefficient of variation | 3.25 | 4.66 | 3.05 | 1.87 |
97.5 Percentile | 895 | 13.85 | 25,700 | 84,650 |
Variable | Ag g/t | Au g/t | Pb ppm | Zn ppm |
Cruz | ||||
Total # Assay Samples | 50 | |||
Average Sample Length | 0.88 m | |||
Minimum Grade | 3.50 | 0.03 | 49 | 81 |
Maximum Grade | 2,490 | 21.0 | 12,650 | 114,500 |
Mean | 217 | 3.24 | 2,432 | 14,522 |
Standard Deviation | 489 | 5.26 | 3,067 | 22,557 |
Coefficient of variation | 2.26 | 1.62 | 1.26 | 1.55 |
97.5 Percentile | 2,158 | 20.4 | 11,950 | 98,600 |
Variable | Ag g/t | Au g/t | Pb ppm | Zn ppm |
Josephine | ||||
Total # Assay Samples | 89 | |||
Average Sample Length | 0.99 m | |||
Minimum Grade | 0.25 | 0.00 | 1 | 9 |
Maximum Grade | 11,413 | 100 | 36,200 | 99,000 |
Mean | 219 | 2.86 | 2,758 | 9,889 |
Standard Deviation | 1,247 | 12.4 | 5,684 | 18,395 |
Coefficient of variation | 5.71 | 3.99 | 2.06 | 1.86 |
97.5 Percentile | 2,014 | 4.33 | 20,425 | 66,300 |
Variable | Ag g/t | Au g/t | Pb ppm | Zn ppm |
La Luisa | ||||
Total # Assay Samples | 248 | |||
|
|
Variable | Ag g/t | Au g/t | Pb ppm | Zn ppm |
La Luisa | ||||
Average Sample Length | 1.05 m | |||
Minimum Grade | 0.25 | 0.00 | 15 | 87 |
Maximum Grade | 11,502 | 121 | 136,000 | 277,000 |
Mean | 186 | 3.05 | 4,213 | 15,623 |
Standard Deviation | 825 | 12.1 | 12,893 | 34,342 |
Coefficient of variation | 4.44 | 3.97 | 3.06 | 2.20 |
97.5 Percentile | 1,450 | 27.6 | 30,450 | 149,250 |
Animas Area: Cuevillas and Rosarito
Variable | Ag g/t | Au g/t | Pb ppm | Zn ppm |
Animas Area | ||||
Total # Assay Samples | 145 | |||
Average Sample Length | 1.04 m | |||
Minimum Grade | 0.25 | 0.00 | 8 | 8 |
Maximum Grade | 4,420 | 24.3 | 55,600 | 116,000 |
Mean | 119 | 1.17 | 2,343 | 6,653 |
Standard Deviation | 388 | 2.43 | 6,919 | 16,955 |
Coefficient of variation | 3.27 | 2.07 | 2.95 | 2.55 |
97.5 Percentile | 566 | 6.71 | 18,100 | 64,400 |
San Antonio Area: Generales
Variable | Ag g/t | Au g/t | Pb ppm | Zn ppm |
San Antonio Area | ||||
Total # Assay Samples | 233 | |||
Average Sample Length | 1.13 m | |||
Minimum Grade | 0.25 | 0.00 | 3 | 18 |
Maximum Grade | 2,940 | 34.2 | 1,005 | 1,295 |
Mean | 107 | 0.68 | 106 | 253 |
Standard Deviation | 272 | 2.71 | 121 | 201 |
Coefficient of variation | 2.55 | 3.99 | 1.14 | 0.79 |
97.5 Percentile | 759 | 4.03 | 483 | 799 |
The average length of the assay sample intervals ranges from 0.30 to 1.65. Of the 6,516 assays, approximately 21% are 1.5 m in length; 37% of the assays are >1.25 m; 51% of the assays are > 1.00 m. To minimize the dilution and over smoothing due to compositing, a composite length of 1.50 m was chosen as an appropriate composite length for all areas, for the current MRE.
For the current MRE, composites for the Copala and Napoleon areas were generated within each domain to a nominal length of 1.5 m. Composites were normalized in each interval to create equal length composites. Tolerances of 0.25 m composite lengths were allowed. Un-assayed intervals were given a value of 0.0001 for Ag, Au, Pb and Zn. The composites were extracted to point files for statistical analysis and capping studies. The constrained composites were grouped based on the mineral domain (rock code) of the constraining wireframe model.
|
|
Composites for the Animas and San Antonio areas were generated starting from the collar of each hole. Un-assayed intervals were given a value of 0.0001 for Ag, Au, Pb and Zn. Composites were then constrained to the individual mineral domains. The constrained composites were extracted to point files for statistical analysis and capping studies. The constrained composites were grouped based on the mineral domain (rock code) of the constraining wireframe model.
A total of 5,397 composite sample points occur within the resource models. A statistical analysis of the composite data from within the mineralized domains, by area, is presented in (Table 14-4). These values were used to interpolate grade into resource blocks.
Table 14-4: Statistical Analysis of the 1.5 M Composite Data from Within the Deposit Mineral Domains - by Area
Copala Area: Copala, Tajitos and Cristiano
Variable | Ag g/t | Au g/t | Pb ppm | Zn ppm |
Copala Area: Copala Main, Copala 1-5, Cristiano | ||||
Total # Assay Samples | 2,331 | |||
Average Sample Length | 1.49 m | |||
Minimum Grade | 0.00 | 0.00 | 0 | 0 |
Maximum Grade | 8,239 | 72.2 | 40,048 | 46,483 |
Mean | 182 | 1.08 | 604 | 1,259 |
Standard Deviation | 547 | 3.27 | 1,943 | 3,482 |
Coefficient of variation | 3.00 | 3.04 | 3.22 | 2.77 |
97.5 Percentile | 1,625 | 9.70 | 4,299 | 9,345 |
Variable | Ag g/t | Au g/t | Pb ppm | Zn ppm |
Tajitos | ||||
Total # Assay Samples | 312 | |||
Average Sample Length | 1.46 m | |||
Minimum Grade | 0.00 | 0.00 | 0 | 0 |
Maximum Grade | 2,333 | 15.0 | 24,201 | 28,567 |
Mean | 184 | 1.06 | 1,047 | 2,111 |
Standard Deviation | 397 | 2.25 | 2,609 | 4,380 |
Coefficient of variation | 2.16 | 2.11 | 2.49 | 2.07 |
97.5 Percentile | 1,548 | 8.68 | 8,712 | 13,740 |
Napoleon Area: Napoleon, Cruz, Josephine and La Luisa
Variable | Ag g/t | Au g/t | Pb ppm | Zn ppm |
Napoleon_HW (4) | ||||
Total # Assay Samples | 354 | |||
Average Sample Length | 1.46 m | |||
Minimum Grade | 0.00 | 0.00 | 0 | 0 |
Maximum Grade | 2,279 | 17.7 | 65,447 | 204,395 |
|
|
Variable | Ag g/t | Au g/t | Pb ppm | Zn ppm |
Napoleon_HW (4) | ||||
Mean | 50.7 | 0.46 | 1,139 | 4,400 |
Standard Deviation | 196 | 3.55 | 4,524 | 15,499 |
Coefficient of variation | 3.87 | 2.93 | 3.97 | 3.52 |
97.5 Percentile | 426 | 3.84 | 9,276 | 38,576 |
Variable | Ag g/t | Au g/t | Pb ppm | Zn ppm |
Napoleon + Splays: Napoleon and NP_HW 1,2,3,5,6,7 and NP_FW1, 2, 3 | ||||
Total # Assay Samples | 1,764 | |||
Average Sample Length | 1.46 m | |||
Minimum Grade | 0.00 | 0.00 | 0 | 0 |
Maximum Grade | 7,034 | 137 | 191,808 | 204,060 |
Mean | 92.4 | 1.41 | 3,135 | 9,546 |
Standard Deviation | 296 | 6.22 | 8,448 | 17,263 |
Coefficient of variation | 3.20 | 4.40 | 2.70 | 1.81 |
97.5 Percentile | 741 | 10.4 | 19,973 | 62,116 |
Variable | Ag g/t | Au g/t | Pb ppm | Zn ppm |
Cruz | ||||
Total # Assay Samples | 31 | |||
Average Sample Length | 1.44 m | |||
Minimum Grade | 0.00 | 0.00 | 0 | 0 |
Maximum Grade | 1,063 | 16.4 | 12,546 | 102,928 |
Mean | 164 | 2.86 | 2,520 | 15,990 |
Standard Deviation | 260 | 3.94 | 3,074 | 22,434 |
Coefficient of variation | 1.58 | 1.38 | 1.22 | 1.40 |
97.5 Percentile | 999 | 13.1 | 11,277 | 83,177 |
Variable | Ag g/t | Au g/t | Pb ppm | Zn ppm |
Josephine | ||||
Total # Assay Samples | 115 | |||
Average Sample Length | 1.49 m | |||
Minimum Grade | 0.00 | 0.00 | 0 | 0 |
Maximum Grade | 5,423 | 59.9 | 17,410 | 54,909 |
Mean | 81.9 | 1.37 | 1,114 | 3,626 |
Standard Deviation | 512 | 7.10 | 2,632 | 9,081 |
Coefficient of variation | 6.25 | 5.19 | 2.36 | 2.50 |
97.5 Percentile | 502 | 4.53 | 8,731 | 29,520 |
Variable | Ag g/t | Au g/t | Pb ppm | Zn ppm |
La Luisa | ||||
Total # Assay Samples | 183 | |||
|
|
Variable | Ag g/t | Au g/t | Pb ppm | Zn ppm |
La Luisa | ||||
Average Sample Length | 1.49 m | |||
Minimum Grade | 0.00 | 0.00 | 0 | 0 |
Maximum Grade | 5,118 | 53.7 | 53,085 | 145,469 |
Mean | 149 | 2.44 | 3,287 | 12,377 |
Standard Deviation | 480 | 7.08 | 7,138 | 21,843 |
Coefficient of variation | 3.23 | 2.90 | 2.17 | 1.76 |
97.5 Percentile | 879 | 19.0 | 24,335 | 71,484 |
Animas Area
Variable | Ag g/t | Au g/t | Pb ppm | Zn ppm |
Animas Area: | ||||
Total # Composite Samples | 120 | |||
Composite Length | 1.50 m | |||
Minimum Grade | 0.00 | 0.00 | 0.00 | 0.00 |
Maximum Grade | 1,124 | 7.39 | 40,800 | 86,460 |
Mean | 78.3 | 0.83 | 1,760 | 4,940 |
Standard Deviation | 156 | 1.37 | 4,825 | 11,817 |
Coefficient of variation | 2.00 | 1.65 | 2.74 | 2.39 |
97.5 Percentile | 592 | 6.14 | 16,850 | 46,298 |
San Antonio Area
Variable | Ag g/t | Au g/t | Pb ppm | Zn ppm |
San Antonio Area: | ||||
Total # Composite Samples | 187 | |||
Composite Length | 1.50 m | |||
Minimum Grade | 0.00 | 0.00 | 0.00 | 0.00 |
Maximum Grade | 2,379 | 27.6 | 756 | 1,251 |
Mean | 90.9 | 0.61 | 98.0 | 246 |
Standard Deviation | 226 | 2.34 | 101 | 188 |
Coefficient of variation | 2.49 | 3.86 | 1.03 | 0.76 |
97.5 Percentile | 564 | 2.94 | 350 | 727 |
14.6 Grade Capping
A statistical analysis of the composite database within the resource models (the "resource" population) was conducted to investigate the presence of high-grade outliers which can have a disproportionately large influence on the average grade of a mineral deposit. High grade outliers in the composite data were investigated using statistical data (Table 14-4), histogram plots, and cumulative probability plots of the 1.5 m composite data. The statistical analysis was completed by deposit area and was completed using GEMS.
After review, it is the opinion that capping of high-grade composites to limit their influence during the grade estimation is necessary for Ag, Au, Pb and Zn for all areas. A summary of grade capping values within the mineralized domains, by area, is presented in Table 14-5. In the opinion of the author, the capping applied to the deposit composites has had the desired effect of limiting the influence of high-grade outliers on the global MRE. The capped composites are used for grade interpolation into the Deposit block models.
|
|
Table 14-5: Composite Capping Summary - by Domain/Deposit Area
Domain/Deposit Area | Total # of | Attribute | Capping | # | Mean of Raw | Mean of | CoV of Raw | CoV of |
Copala Area |
|
|
|
|
|
|
|
|
Copala + Cristiano | 2,331 | Ag g/t | 2,500 | 27 | 182 | 164 | 3.00 | 2.49 |
|
| Au g/t | 24.0 | 6 | 1.08 | 1.05 | 3.04 | 2.73 |
|
| Pb ppm | 10,000 | 23 | 604 | 542 | 3.22 | 2.42 |
|
| Zn ppm | 16,000 | 23 | 1,259 | 1,129 | 2.77 | 2.11 |
Tajitos | 312 | Ag g/t | 1,400 | 11 | 184 | 169 | 2.16 | 1.97 |
|
| Au g/t | 10.0 | 6 | 1.06 | 1.03 | 2.11 | 1.99 |
|
| Pb ppm | 10,000 | 4 | 1,047 | 945 | 2.49 | 2.06 |
|
| Zn ppm | 12,000 | 13 | 2,111 | 1,788 | 2.07 | 1.63 |
Napoleon Area |
|
|
|
|
|
|
|
|
Napoleon_HW and _FW | 1,087 | Ag g/t | 1,200 | 8 | 65.2 | 54 | 4.54 | 2.93 |
| Au g/t | 12 | 8 | 0.64 | 0.55 | 4.08 | 2.92 | |
|
| Pb ppm | 30,000 | 9 | 1,763 | 1,389 | 4.81 | 2.88 |
|
| Zn ppm | 90,000 | 6 | 5,501 | 5,332 | 2.81 | 2.63 |
Napoleon Main | 1,031 | Ag g/t | 1,800 | 4 | 107 | 103 | 2.48 | 2.20 |
|
| Au g/t | 40 | 5 | 1.90 | 1.63 | 4.05 | 2.74 |
|
| Pb ppm | 40,000 | 7 | 3,896 | 3,751 | 1.86 | 1.62 |
|
| Zn ppm | 90,000 | 8 | 12,042 | 11,777 | 1.50 | 1.39 |
Cruz | 31 | Ag g/t | 600 | 2 | 164 | 138 | 1.58 | 1.33 |
|
| Au g/t | 10 | 1 | 2.86 | 2.66 | 1.38 | 1.26 |
|
| Pb ppm | 10,000 | 2 | 2,520 | 2,438 | 1.22 | 1.16 |
|
| Zn ppm | 30,000 | 7 | 15,999 | 11,489 | 1.40 | 1.03 |
Josephine | 115 | Ag g/t | 700 | 1 | 81.9 | 40.8 | 6.25 | 3.05 |
|
| Au g/t | 10 | 2 | 1.37 | 0.6 | 5.19 | 2.67 |
|
| Pb ppm | 10,000 | 2 | 1,114 | 1,049 | 2.36 | 2.19 |
|
| Zn ppm | 30,000 | 2 | 3,626 | 3,255 | 2.50 | 2.27 |
La Luisa | 183 | Ag g/t | 900 | 5 | 149 | 105 | 3.23 | 1.73 |
|
| Au g/t | 8 | 9 | 2.44 | 1.45 | 2.90 | 1.48 |
|
| Pb ppm | 10,000 | 13 | 3,287 | 2,212 | 2.17 | 1.28 |
|
| Zn ppm | 60,000 | 8 | 12,377 | 10,965 | 1.76 | 1.45 |
|
|
|
|
|
|
|
|
|
Animas Area | 120 | Ag g/t | 550 | 3 | 78.3 | 70.5 | 2.00 | 1.66 |
|
|
Domain/Deposit Area | Total # of | Attribute | Capping | # | Mean of Raw | Mean of | CoV of Raw | CoV of |
|
| Au g/t | 4.5 | 5 | 0.83 | 0.75 | 1.65 | 1.42 |
|
| Pb ppm | 20,000 | 1 | 1,760 | 1,587 | 2.74 | 2.30 |
|
| Zn ppm | 25,000 | 5 | 4,940 | 3,753 | 2.39 | 1.68 |
|
|
|
|
|
|
|
|
|
San Antonio Area | 187 | Ag g/t | 800 | 4 | 90.9 | 80.4 | 2.49 | 1.86 |
|
| Au g/t | 8 | 4 | 0.61 | 0.48 | 3.86 | 2.57 |
|
| Pb ppm | No Cap | 0 | 98 | 98 | 1.03 | 1.03 |
|
| Zn ppm | No Cap | 0 | 246 | 246 | 0.76 | 0.76 |
14.7 Block Model Parameters
The Property mineral resource domains are used to constrain composite values chosen for interpolation, and the mineral blocks reported in the estimate of the mineral resources. Separate block models, within UTM coordinate space, were created for the Napoleon, La Luisa, Copala, Tajitos, San Antonio and Animas areas (Table 14-6 and Figure 14-6 to Figure 14-8). Block model dimensions, in the x (east m), y (north m) and z (level m) directions were placed over the grade shells (restricted to the Property) with only that portion of each block inside the shell recorded (as a percentage of the block) as part of the MRE (% Block Model). The block size for each block model was selected based on drillhole spacing, composite length, the geometry and shape of the mineralized domains, and the selected mining methods (underground). At the scale of the deposit models, the selected block size for each model provides a reasonable block size for discerning grade distribution, while still being large enough not to mislead when looking at higher cut-off grade distribution within the model. The models were intersected with surface topography to exclude blocks, or portions of blocks, that extend above the bedrock surface.
Table 14-6: Deposit Block Model Geometry
Block Model | Napoleon Area: Napoleon and Josephine | ||
X (East) | Y (North) | Z (Level) | |
Origin (WGS 84) | 402960 | 2585930 | 625 m |
Extent (blocks) | 510 | 542 | 185 |
Block Size | 2 m | 10 m | 5 m |
Rotation (counterclockwise) | 0° | ||
Block Model | Napoleon Area: Luisa | ||
X (East) | Y (North) | Z (Level) | |
Origin (WGS 84) | 403000 | 2585950 | 550 m |
Extent (blocks) | 120 | 230 | 180 |
Block Size | 2 m | 5 m | 5 m |
Rotation (counterclockwise) | 30° | ||
|
|
Block Model | Copala Area: Copala and Cristiano | ||
X (East) | Y (North) | Z (Level) | |
Origin (WGS 84) | 404285 | 2585930 | 635 m |
Extent (blocks) | 300 | 540 | 250 |
Block Size | 3 m | 3 m | 3 m |
Rotation (counterclockwise) | 0° | ||
Block Model | Copala Area: Tajitos | ||
X (East) | Y (North) | Z (Level) | |
Origin (WGS 84) | 404000 | 2586255 | 570 m |
Extent (blocks) | 220 | 520 | 190 |
Block Size | 3 m | 3 m | 3 m |
Rotation (counterclockwise) | 0° | ||
Block Model | San Antonio Area | ||
X (East) | Y (North) | Z (Level) | |
Origin (WGS 84) | 407550 | 2588250 | 1150 m |
Extent (blocks) | 200 | 185 | 250 |
Block Size | 5 m | 2 m | 2 m |
Rotation (counterclockwise) | 0° | ||
Block Model | Animas Area: Cuevillas and Rosarito | ||
X (East) | Y (North) | Z (Level) | |
Origin (WGS 84) | 407700 | 2590300 | 650 m |
Extent (blocks) | 150 | 120 | 100 |
Block Size | 3 m | 3 m | 3 m |
Rotation (counterclockwise) | 0° | ||
|
|
Figure 14-6: Plan View: Distribution of Mineral Resource Block Models and Mineralization Domains
![]()
Source: SGS, 2024
|
|
Figure 14-7: Isometric View looking NW: Distribution of Mineral Resource Block Models and Mineralization Domains on the Property
![]()
Source: SGS, 2024
|
|
Figure 14-8: Isometric View looking NW: Distribution of Mineral Resource Block Models and Mineralization Domains in the Napoleon-Copala Areas
![]()
Source: SGS, 2024
14.8 Grade Interpolation
Silver, gold, lead, and zinc as were estimated for each mineralization domain within each block model. Blocks within each mineralized domain were interpolated using composites assigned to that domain. To generate grade within the blocks, the inverse distance squared (ID2) interpolation method was used for all domains.
For all domains, the search ellipse used to interpolate grade into the resource blocks was interpreted based on orientation and size of the mineralized domains. The search ellipse axes are generally oriented to reflect the observed preferential long axis (geological trend) of the domain and the observed trend of the mineralization down dip/down plunge (Table 14-7).
Two passes were used to interpolate grade into all the blocks in the grade shells. For Pass 1 the search ellipse size for all mineralized domains ranged from 60 by 60 by 20 to 65 by 65 by 20; for Pass 2 the search ellipse size was set at 100 x 100 x 40. Blocks were classified as Indicated if they were populated with grade during Pass 1 of the interpolation procedure and Inferred if they were populated with grade during Pass 2 of the interpolation procedure.
|
|
Grades were interpolated into blocks using a minimum of 5 and maximum of eight composites to generate block grades during Pass 1 (maximum of three sample composites per drill hole), and a minimum of three and maximum of eight composites to generate block grades during pass 2 (maximum of two sample composites per drill hole).
Table 14-7: Grade Interpolation Parameters by Area and Domain
Napoleon Area: Includes Napoleon and Josephine
Parameter | Domain - Josephine | Domain - Napoleon Main | Domain - NAP-FW | Domain - NAP-HW-1 | ||||
Pass 1 | Pass 2 | Pass 1 | Pass 2 | Pass 1 | Pass 2 | Pass 1 | Pass 2 | |
Indicated | Inferred | Indicated | Inferred | Indicated | Inferred | Indicated | Inferred | |
Calculation Method | Inverse Distance squared | Inverse Distance squared | Inverse Distance squared | Inverse Distance squared | ||||
Search Type | Ellipsoid | Ellipsoid | Ellipsoid | Ellipsoid | ||||
Principle Azimuth | 85° | 170° | 78° | 85° | ||||
Principle Dip | -72° | -10° | -80° | -38° | ||||
Intermediate Azimuth | 175° | 80° | 348° | 355° | ||||
Anisotropy X range | 60 | 100 | 65 | 100 | 65 | 100 | 60 | 100 |
Anisotropy Y range | 60 | 100 | 20 | 40 | 65 | 100 | 60 | 100 |
Anisotropy Z range | 20 | 40 | 65 | 100 | 20 | 40 | 20 | 40 |
Min. Samples | 5 | 3 | 5 | 3 | 5 | 3 | 5 | 3 |
Max. Samples | 8 | 8 | 8 | 8 | 8 | 8 | 8 | 8 |
Min. Drill Holes | 2 | 2 | 2 | 2 | 2 | 2 | 2 | 2 |
Parameter | Domain - NAP-HW2 | Domain - NAP-HW3 | Domain - NAP-HW-4 | Domain - NAP-HW-5,6,7 | ||||
Pass 1 | Pass 2 | Pass 1 | Pass 2 | Pass 1 | Pass 2 | Pass 1 | Pass 2 | |
Indicated | Inferred | Indicated | Inferred | Indicated | Inferred | Indicated | Inferred | |
Calculation Method | Inverse Distance squared | Inverse Distance squared | Inverse Distance squared | Inverse Distance squared | ||||
Search Type | Ellipsoid | Ellipsoid | Ellipsoid | Ellipsoid | ||||
Principle Azimuth | 45° | 92° | 85° | 76° | ||||
Principle Dip | -63° | -70° | -55° | -80° | ||||
Intermediate Azimuth | 315° | 2° | 355° | 346° | ||||
Anisotropy X range | 60 | 100 | 60 | 100 | 60 | 100 | 65 | 100 |
Anisotropy Y range | 60 | 100 | 60 | 100 | 60 | 100 | 65 | 100 |
Anisotropy Z range | 20 | 40 | 20 | 40 | 20 | 40 | 20 | 40 |
Min. Samples | 5 | 3 | 5 | 3 | 5 | 3 | 5 | 3 |
Max. Samples | 8 | 8 | 8 | 8 | 8 | 8 | 8 | 8 |
Min. Drill Holes | 2 | 2 | 2 | 2 | 2 | 2 | 2 | 2 |
|
|
Napoleon Area:La Luisa and Cruz
Parameter | Domain - La Luisa and La Luisa HW | Domain - Cruz | ||
Pass 1 | Pass 2 | Pass 1 | Pass 2 | |
Indicated | Inferred | Indicated | Inferred | |
Calculation Method | Inverse Distance squared | Inverse Distance squared | ||
Search Type | Ellipsoid | Ellipsoid | ||
Principle Azimuth | 65° | 63° | ||
Principle Dip | -85° | -85° | ||
Intermediate Azimuth | 335° | 333° | ||
Anisotropy X range | 60 | 100 | 60 | 100 |
Anisotropy Y range | 60 | 100 | 60 | 100 |
Anisotropy Z range | 20 | 40 | 20 | 40 |
Min. Samples | 5 | 3 | 5 | 3 |
Max. Samples | 8 | 8 | 8 | 8 |
Min. Drill Holes | 2 | 2 | 2 | 2 |
Copala Area: Copala and Cristiano
Parameter | Domain - Copala, Copala5 | Domain - Copala North, Copala5 North | ||
Pass 1 | Pass 2 | Pass 1 | Pass 2 | |
Indicated | Inferred | Indicated | Inferred | |
Calculation Method | Inverse Distance squared | Inverse Distance squared | ||
Search Type | Ellipsoid | Ellipsoid | ||
Principle Azimuth | 67° | 70° | ||
Principle Dip | -54° | -30° | ||
Intermediate Azimuth | 337° | 340° | ||
Anisotropy X range | 60 | 100 | 60 | 100 |
Anisotropy Y range | 60 | 100 | 60 | 100 |
Anisotropy Z range | 20 | 40 | 20 | 40 |
Min. Samples | 5 | 3 | 5 | 3 |
Max. Samples | 8 | 8 | 8 | 8 |
Min. Drill Holes | 2 | 2 | 2 | 2 |
Parameter | Domain - Copala2 | Domain - Copala 3 | Domain - Copala4 | Domain - Cristiano | ||||
Pass 1 | Pass 2 | Pass 1 | Pass 2 | Pass 1 | Pass 2 | Pass 1 | Pass 2 | |
Indicated | Inferred | Indicated | Inferred | Indicated | Inferred | Indicated | Inferred | |
Calculation Method | Inverse Distance squared | Inverse Distance squared | Inverse Distance squared | Inverse Distance squared | ||||
Search Type | Ellipsoid | Ellipsoid | Ellipsoid | Ellipsoid | ||||
Principle Azimuth | 114° | 67° | 48° | 66° | ||||
Principle Dip | -51° | -44° | -60° | -80° | ||||
Intermediate Azimuth | 24° | 337° | 318° | 336° | ||||
Anisotropy X range | 60 | 100 | 60 | 100 | 60 | 100 | 60 | 100 |
Anisotropy Y range | 60 | 100 | 60 | 100 | 60 | 100 | 60 | 100 |
Anisotropy Z range | 20 | 40 | 20 | 40 | 20 | 40 | 20 | 40 |
|
|
Parameter | Domain - Copala2 | Domain - Copala 3 | Domain - Copala4 | Domain - Cristiano | ||||
Pass 1 | Pass 2 | Pass 1 | Pass 2 | Pass 1 | Pass 2 | Pass 1 | Pass 2 | |
Indicated | Inferred | Indicated | Inferred | Indicated | Inferred | Indicated | Inferred | |
Min. Samples | 5 | 3 | 5 | 3 | 5 | 3 | 5 | 3 |
Max. Samples | 8 | 8 | 8 | 8 | 8 | 8 | 8 | 8 |
Min. Drill Holes | 2 | 2 | 2 | 2 | 2 | 2 | 2 | 2 |
Copala Area: Tajitos
Parameter | Domain - Tajitos | |
Pass 1 | Pass 2 | |
Indicated | Inferred | |
Calculation Method | Inverse Distance squared | |
Search Type | Ellipsoid | |
Principle Azimuth | 108° | |
Principle Dip | -66° | |
Intermediate Azimuth | 18° | |
Anisotropy X range | 60 | 100 |
Anisotropy Y range | 60 | 100 |
Anisotropy Z range | 20 | 40 |
Min. Samples | 5 | 3 |
Max. Samples | 8 | 8 |
Min. Drill Holes | 2 | 2 |
San Antonio Area
Parameter | Domain - San Antonio | |
Pass 1 | Pass 2 | |
Indicated | Inferred | |
Calculation Method | Inverse Distance squared | |
Search Type | Ellipsoid | |
Principle Azimuth | 195° | |
Principle Dip | -55° | |
Intermediate Azimuth | 105° | |
Anisotropy X range | 60 | 100 |
Anisotropy Y range | 60 | 100 |
Anisotropy Z range | 20 | 40 |
Min. Samples | 5 | 3 |
Max. Samples | 8 | 8 |
Min. Drill Holes | 2 | 2 |
|
|
Animas Area: Cuevillas and Rosarito
Parameter | Domain - Cuevillas | Domain - Rosarito | ||
Pass 1 | Pass 2 | Pass 1 | Pass 2 | |
Indicated | Inferred | Indicated | Inferred | |
Calculation Method | Inverse Distance squared | Inverse Distance squared | ||
Search Type | Ellipsoid | Ellipsoid | ||
Principle Azimuth | 135° | 230° | ||
Principle Dip | -85° | -55° | ||
Intermediate Azimuth | 40° | 140° | ||
Anisotropy X range | 60 | 100 | 60 | 100 |
Anisotropy Y range | 60 | 100 | 60 | 100 |
Anisotropy Z range | 20 | 40 | 20 | 40 |
Min. Samples | 5 | 3 | 5 | 3 |
Max. Samples | 8 | 8 | 8 | 8 |
Min. Drill Holes | 2 | 2 | 2 | 2 |
14.9 Mineral Resource Classification Parameters
The MREs presented in this Technical Report are disclosed in compliance with all current disclosure requirements for mineral resources set out in the NI 43-101 Standards of Disclosure for Mineral Projects (2016). The classification of the current MREs into Indicated and Inferred are consistent with current 2014 CIM Definition Standards - For Mineral Resources and Mineral Reserves, including the critical requirement that all mineral resources "have reasonable prospects for eventual economic extraction".
The current MREs are sub-divided, in order of increasing geological confidence, into the Indicated and Inferred categories. An Inferred Mineral Resource has a lower level of confidence than that applied to an Indicated Mineral Resource. An Indicated Mineral Resource has a higher level of confidence than an Inferred Mineral Resource but has a lower level of confidence than a Measured Mineral Resource. There are no Measured Mineral Resources reported.
A Mineral Resource is a concentration or occurrence of solid material of economic interest in or on the Earth's crust in such form, grade or quality and quantity that there are reasonable prospects for eventual economic extraction.
Interpretation of the word 'eventual' in this context may vary depending on the commodity or mineral involved. For example, for some coal, iron, potash deposits and other bulk minerals or commodities, it may be reasonable to envisage 'eventual economic extraction' as covering time periods in excess of 50 years. For many gold or base metal deposits, application of the concept would normally be perhaps 10 to 15 years.
The location, quantity, grade or quality, continuity and other geological characteristics of a Mineral Resource are known, estimated or interpreted from specific geological evidence and knowledge, including sampling.
|
|
14.9.1 Indicated Mineral Resource
An 'Indicated Mineral Resource' is that part of a Mineral Resource for which quantity, grade or quality, densities, shape and physical characteristics can be estimated with a level of confidence sufficient to allow the appropriate application of technical and economic parameters, to support mine planning and evaluation of the economic viability of the deposit.
Geological evidence is derived from adequately detailed and reliable exploration, sampling and testing and is sufficient to assume geological and grade or quality continuity between points of observation.
An Indicated Mineral Resource has a lower level of confidence than that applying to a Measured Mineral Resource and may only be converted to a Probable Mineral Reserve.
Mineralization may be classified as an Indicated Mineral Resource by the Qualified Person when the nature, quality, quantity and distribution of data are such as to allow confident interpretation of the geological framework and to reasonably assume the continuity of mineralization. The Qualified Person must recognize the importance of the Indicated Mineral Resource category to the advancement of the feasibility of the project. An Indicated Mineral Resource Estimate is of sufficient quality to support a Preliminary Feasibility Study which can serve as the basis for major development decisions.
14.9.2 Inferred Mineral Resource
An Inferred Mineral Resource is that part of a Mineral Resource for which quantity and grade or quality are estimated on the basis of limited geological evidence and sampling. Geological evidence is sufficient to imply but not verify geological and grade or quality continuity.
An Inferred Mineral Resource has a lower level of confidence than that applying to an Indicated Mineral Resource and must not be converted to a Mineral Reserve. It is reasonably expected that the majority of Inferred Mineral Resources could be upgraded to Indicated Mineral Resources with continued exploration.
An Inferred Mineral Resource is based on limited information and sampling gathered through appropriate sampling techniques from locations such as outcrops, trenches, pits, workings and drill holes. Inferred Mineral Resources must not be included in the economic analysis, production schedules, or estimated mine life in publicly disclosed Pre-Feasibility or Feasibility Studies, or in the Life of Mine plans and cash flow models of developed mines. Inferred Mineral Resources can only be used in economic studies as provided under NI 43-101.
There may be circumstances, where appropriate sampling, testing, and other measurements are sufficient to demonstrate data integrity, geological and grade/quality continuity of a Measured or Indicated Mineral Resource, however, quality assurance and quality control, or other information may not meet all industry norms for the disclosure of an Indicated or Measured Mineral Resource. Under these circumstances, it may be reasonable for the Qualified Person to report an Inferred Mineral Resource if the Qualified Person has taken steps to verify the information meets the requirements of an Inferred Mineral Resource.
|
|
14.10 Reasonable Prospects of Eventual Economic Extraction
The general requirement that all Mineral Resources have "reasonable prospects for economic extraction" implies that the quantity and grade estimates meet certain economic thresholds and that the Mineral Resources are reported at an appropriate cut-off grade taking into account extraction scenarios and processing recoveries. To meet this requirement, the Author considers that the deposits within the project area are amenable to underground extraction.
To determine the quantities of material offering "reasonable prospects for economic extraction" by underground mining methods, reasonable mining assumptions to evaluate the proportions of the block model (Indicated and Inferred blocks) that could be "reasonably expected" to be mined from underground are used. Based on the location, size, shape, general thickness, and orientation of the of the mineralized zones within the project area, it is envisioned that the deposits may be mined using a combination of underground mining methods including sub-level stoping (SLS) and/or cut and fill (CAF) mining. The underground parameters used, based on these potential mining methods, are summarized in Table 14-8. Underground Mineral Resources are reported at a base case cut-off grade of 150 g/t AgEq. A base case cut-off grade of 150 g/t AgEq is applied to identify blocks that will have reasonable prospects of eventual economic extraction.
The reporting of the underground resources is presented undiluted and in situ, constrained by continuous 3D wireframe models, and are considered to have reasonable prospects for eventual economic extraction. The underground mineral resource grade blocks were quantified above the base case cut-off grade, below topography and within the 3D constraining mineralized wireframes (the constraining volumes).
Table 14-8: Parameters used for Underground Cut-off Grade Calculation
Parameter | Value | Unit |
Silver Price | 24.00 | US$ per oz (US$/oz) |
Gold Price | 1,800 | US$ per oz (US$/oz) |
Zinc Price | 1.35 | US$ per pound (US$/lb) |
Lead Price | 1.10 | US$ per pound (US$/lb) |
Underground Mining Cost | 45.00 | US$ per tonne mined (US$/t) |
Processing Cost (incl. crushing) | 30.00 | US$ per tonne milled (US$/t) |
Underground General and Administrative | 20.00 | US$ tonne of feed (US$/t) |
Silver Recovery | 93.0 | Percent (%) |
Gold Recovery | 90.0 | Percent (%) |
Lead Recovery | 94.0 | Percent (%) |
Zinc Recovery | 94.0 | Percent (%) |
Mining loss/Dilution (underground) | 10/10 | Percent (%) / Percent (%) |
Base Case Cut-off grade | 150 g/t AgEq | - |
14.11 Mineral Resource Statement
The updated MRE for the Project is presented in Table 14-9 and Table 14-10 (Figure 14-9 to Figure 14-14).
Highlights of the Project Mineral Resource Estimate are as follows:
|
|
Indicated Mineral Resources are estimated at 9.48 Mt grading 289 g/t silver, 2.41 g/t gold, 0.27% lead, and 0.84% zinc (511 AgEq). The current MRE includes indicated mineral resources of 88.2 Moz of silver, 736 koz of gold, 56 Mlbs of lead, and 176 Mlbs of zinc (155.8 Moz AgEq).
Inferred Mineral Resources are estimated at 12.19 Mt grading 239 g/t silver, 1.93 g/t gold, 0.29% lead, and 1.03% zinc (433 g/t AgEq). The current MRE includes inferred mineral resources of 93.7 Moz of silver, 758 koz of gold, 78 Mlbs of lead, and 276 Mlbs of zinc (169.6 Moz AgEq).
Table 14-9: Panuco Project Mineral Resource Estimate, September 1, 2023
Resource | Tonnes | Grade | Total Metal | ||||||||
Au g/t | Ag g/t | Pb % | Zn % | AgEq* (g/t) | Au (koz) | Ag (koz) | Pb | Zn | AgEq | ||
Indicated | 9.48 | 2.41 | 289 | 0.27 | 0.84 | 511 | 736 | 88,192 | 56.0 | 176.1 | 155,841 |
Inferred | 12.19 | 1.93 | 239 | 0.29 | 1.03 | 433 | 758 | 93,653 | 78.1 | 276.2 | 169,647 |
Note: *Ag (gpt) + [Au ppm x (Au price / Ag Price)] [Pb (%) X 2204.6 X Pb Price / Ag Price X 31.1] + [Zn (%) X 2204.6 X Zn Price / Ag Price X 31.1]. Metal price assumptions are $24.00/oz silver, $1,800/oz gold, $1.10/lb lead and $1.35/t zinc.
Panuco Project Updated Mineral Resource Estimate Notes:
The classification of the Updated Mineral Resource Estimate into Indicated and Inferred mineral resources is consistent with current 2014 CIM Definition Standards - For Mineral Resources and Mineral Reserves. The effective date for the Updated Mineral Resource Estimate is September 01, 2023.
All figures are rounded to reflect the relative accuracy of the estimate and numbers may not add due to rounding.
All mineral resources are presented undiluted and in situ, constrained by continuous 3D wireframe models and are considered to have reasonable prospects for eventual economic extraction.
Mineral resources are not mineral reserves. Mineral resources which are not mineral reserves do not have demonstrated economic viability. An Inferred Mineral Resource has a lower level of confidence than that applying to an Indicated Mineral Resource and must not be converted to a Mineral Reserve. It is reasonably expected that the majority of Inferred Mineral Resources could be upgraded to Indicated Mineral Resources with continued exploration.
The database comprises a total of 822 drill holes for 302,931 m of drilling completed by Vizsla between November 2019 and September 2023.
The mineral resource estimate is based on 28 three-dimensional ("3D") resource models, constructed in Leapfrog, representing the Napoleon area (15 wireframes), the Copala area (7 wireframes), Tajitos (1 wireframe), Animas (5 wireframes) and San Antonio (1 wireframe).
Silver, gold, lead, and zinc were estimated for each mineralization domain in the Panuco Project. Blocks within each mineralized domain were interpolated using 1.5 m capped composites assigned to that domain. To generate grade within the blocks, the inverse distance squared (ID2) interpolation method was used for all domains. All estimates are based on variable block dimensions (by deposit area) and estimation search parameters (by domain).
|
|
Average density values were assigned per zone based on 1,919 samples analysed by ALS in Zacatecas, Mexico or inhouse with 5% checks by ALS.
It is envisioned that the Project deposits may be mined using underground mining methods. Mineral resources are reported at a base case cut-off grade of 150 g/t AgEq. The mineral resource grade blocks were quantified above the base case cut-off grade, below surface and within the constraining mineralized wireframes.
The base-case AgEq Cut-off grade considers metal prices of $24.00/oz Ag, $1800/oz Au, $1.10/lb Pb and $1.35/lb Zn and considers metal recoveries of 93% for Ag, 90% for Au, 94% for Pb and 94% for Zn.
The base case cut-off grade of 150 g/t AgEq considers a mining cost of US$45.00/t material and processing, treatment, and refining, transportation and G&A cost of US$50.00/t of mineralized material.
The Updated Mineral Resource Estimate may be materially affected by environmental, permitting, legal, title, taxation, socio-political, marketing, or other relevant issues.
|
|
Table 14-10: Panuco Project Mineral Resource Estimate by Area, September 1, 2023
Copala Area: Copala, Tajitos and Cristiano
Area | Resource | Tonnes | Grade | Total Metal | ||||||||
Au g/t | Ag | Pb % | Zn % | AgEq | Au | Ag | Pb | Zn | AgEq | |||
Copala | Indicated | 4.52 | 2.46 | 380 | 0.08 | 0.15 | 573 | 358 | 55,201 | 8.2 | 15.3 | 83,270 |
Inferred | 3.16 | 1.77 | 332 | 0.12 | 0.20 | 476 | 179 | 33,722 | 8.2 | 13.6 | 48,320 | |
Tajitos | Indicated | 0.63 | 2.24 | 358 | 0.12 | 0.21 | 538 | 46 | 7,295 | 1.6 | 2.9 | 10,953 |
Inferred | 1.04 | 2.04 | 365 | 0.22 | 0.39 | 540 | 69 | 12,260 | 5.2 | 8.9 | 18,140 | |
Cristiano | Indicated | 0.21 | 3.37 | 581 | 0.25 | 0.43 | 858 | 23 | 3,961 | 1.1 | 2.0 | 5,851 |
Inferred | 0.72 | 2.54 | 443 | 0.15 | 0.29 | 650 | 59 | 10,213 | 2.4 | 4.5 | 14,974 | |
Total | Indicated | 5.37 | 2.48 | 385 | 0.09 | 0.17 | 580 | 427 | 66,457 | 11 | 20 | 100,074 |
Inferred | 4.92 | 1.94 | 355 | 0.15 | 0.25 | 515 | 307 | 56,195 | 16 | 27 | 81,434 | |
Napoleon Area: Napoleon, Cruz, Josephine and La Luisa
Area | Resource | Tonnes | Grade | Total Metal | ||||||||
Au g/t | Ag | Pb % | Zn % | AgEq | Au | Ag | Pb | Zn | AgEq | |||
La Luisa | Indicated | 0.27 | 2.56 | 177 | 0.39 | 2.01 | 459 | 22 | 1,556 | 2.3 | 12.1 | 4,027 |
Inferred | 2.04 | 2.13 | 159 | 0.30 | 1.51 | 386 | 139 | 10,439 | 13.3 | 67.9 | 25,326 | |
Cruz/Negra | Indicated | 0.03 | 2.01 | 144 | 0.37 | 1.71 | 373 | 2 | 153 | 0.3 | 1.2 | 396 |
Inferred | 0.31 | 3.75 | 170 | 0.31 | 1.48 | 519 | 37 | 1,698 | 2.1 | 10.1 | 5,169 | |
Josephine | Indicated | 0.07 | 2.88 | 221 | 0.39 | 1.11 | 492 | 6 | 491 | 0.6 | 1.7 | 1,092 |
Inferred | 0.22 | 2.05 | 161 | 0.33 | 1.00 | 364 | 15 | 1,161 | 1.6 | 4.9 | 2,618 | |
Napoleon_HW(4) | Indicated | 0.43 | 1.72 | 164 | 0.42 | 1.53 | 365 | 24 | 2,259 | 4.0 | 14.4 | 5,029 |
Inferred | 0.85 | 2.17 | 220 | 0.59 | 2.02 | 479 | 59 | 5,976 | 10.9 | 37.6 | 13,027 | |
Napoleon+Splays | Indicated | 3.31 | 2.39 | 162 | 0.52 | 1.73 | 425 | 255 | 17,276 | 37.8 | 126.5 | 45,223 |
Inferred | 3.18 | 1.64 | 137 | 0.45 | 1.76 | 342 | 168 | 14,045 | 31.8 | 123.2 | 35,063 | |
Total | Indicated | 4.12 | 2.34 | 164 | 0.50 | 1.72 | 421 | 309 | 21,735 | 45 | 156 | 55,767 |
Inferred | 6.60 | 1.97 | 157 | 0.41 | 1.68 | 383 | 418 | 33,319 | 60 | 244 | 81,203 | |
San Antonio Area: Generales and Animas Area: Cuevillas and Rosarito
Area | Resource | Tonnes | Grade | Total Metal | ||||||||
Au g/t | Ag g/t | Pb % | Zn % | AgEq | Au | Ag | Pb | Zn | AgEq | |||
San Antonio | Inferred | 0.28 | 1.30 | 226 | 0.01 | 0.03 | 325 | 12 | 2,038 | 0.1 | 0.2 | 2,936 |
Animas | Inferred | 0.39 | 1.68 | 169 | 0.29 | 0.60 | 327 | 21 | 2,101 | 2.5 | 5.2 | 4,074 |
|
|
Figure 14-9: Plan View: Mineral Resource Block Grades and Block Class for the Copala-Cristiano-Tajitos Deposit Area
![]()
![]()
Source: SGS, 2024
|
|
Figure 14-10: Isometric View Looking West: Mineral Resource Block Grades and Block Class for the Copala-Cristiano-Tajitos Deposit Area
![]()
![]()
Source: SGS, 2024
|
|
Figure 14-11: Isometric View Looking NNE: Mineral Resource Block Grades and Block Class for the Copala-Cristiano-Tajitos Deposit Area
![]()
![]()
Source: SGS, 2024
|
|
Figure 14-12 Plan View: Mineral Resource Block Grades and Block Class for the Napoleon, Cruz, Josephine and La Luisa Areas
![]()
![]()
Source: SGS, 2024
|
|
Figure 14-13: Isometric View Looking Northwest: Mineral Resource Block Grades and Block Class for the Napoleon, Cruz, Josephine and La Luisa Areas
![]()
![]()
Source: SGS, 2024
|
|
Figure 14-14: Isometric View Looking NNE: Mineral Resource Block Grades and Block Class for the Napoleon, Cruz, Josephine and La Luisa Areas
![]()
![]()
Source: SGS, 2024
|
|
14.12 Model Validation and Sensitivity Analysis
Visual checks of block grades against the composite data and assay data on vertical section showed good correlation between block grades and drill intersections.
A comparison of the average capped composite grades (≥0.001) and average assay grades by model/domain with the average grades of all the blocks in the block model at a 0.001% AgEq cut-off grade was completed and is presented in Table 14-11. The block model average grades compared well with the composite average grades.
For comparison purposes, additional grade models were generated using a varied inverse distance weighting (ID3) and nearest neighbor (NN) interpolation methods. The results of these models are compared to the chosen models (ID2) at various cut-off grades in a series of grade/tonnage graphs shown in Figure 14-15 and Figure 14-16. In general, the ID2 and ID3 models show similar results, and both are much more conservative and smoother than the NN model. For models well-constrained by wireframes and well-sampled (close spacing of data), ID2 should yield very similar results to other interpolation methods such as ID3 or Ordinary Kriging.
Table 14-11: Comparison of Average Composite Grades with Block Model Grades
Domain | Variable | Ag g/t | Au g/t | Pb ppm | Zn ppm |
Copala Area: Copala, Tajitos and Cristiano | |||||
Copala + Cristiano | Assays | 237 | 1.40 | 0.08 | 0.16 |
Composites Capped | 183 | 1.17 | 0.06 | 0.13 | |
Blocks | 148 | 0.89 | 0.06 | 0.11 | |
Tajitos | Assays | 237 | 1.35 | 0.15 | 0.31 |
Composites Capped | 215 | 1.31 | 0.12 | 0.23 | |
Blocks | 206 | 1.20 | 0.14 | 0.26 | |
Napoleon Area: Napoleon, Cruz, Josephine and La Luisa | |||||
Napoleon_HW and _FW | Assays | 122 | 1.15 | 0.36 | 1.06 |
Composites Capped | 89.3 | 0.90 | 0.23 | 0.88 | |
Blocks | 68.5 | 0.69 | 0.18 | 0.71 | |
Napoleon Main | Assays | 123 | 2.24 | 0.48 | 1.46 |
Composites Capped | 111 | 1.75 | 0.40 | 1.27 | |
Blocks | 90.6 | 1.37 | 0.38 | 1.26 | |
Cruz | Assays | 217 | 3.24 | 0.24 | 1.45 |
Composites Capped | 143 | 2.74 | 0.25 | 1.19 | |
Blocks | 148 | 3.14 | 0.29 | 1.32 | |
Josephine | Assays | 219 | 2.86 | 0.28 | 0.99 |
Composites Capped | 82.3 | 1.22 | 0.21 | 0.66 | |
Blocks | 75.2 | 0.85 | 0.14 | 0.41 | |
La Luisa | Assays | 186 | 3.05 | 0.42 | 1.56 |
Composites Capped | 110 | 1.53 | 0.23 | 1.15 | |
Blocks | 113 | 1.55 | 0.23 | 1.19 | |
Animas Area: Cuevillas and Rosarito | |||||
|
|
Domain | Variable | Ag g/t | Au g/t | Pb ppm | Zn ppm |
Animas | Assays | 119 | 1.17 | 0.23 | 0.67 |
Composites Capped | 92.1 | 0.98 | 0.21 | 0.58 | |
Blocks | 98.1 | 1.03 | 0.20 | 0.44 | |
San Antonio Area: Generales | |||||
San Antonio | Assays | 107 | 0.68 | 0.01 | 0.03 |
Composites Capped | 96.1 | 0.64 | 0.01 | 0.03 | |
Blocks | 49.2 | 0.26 | 0.01 | 0.02 | |
Figure 14-15: Comparison of ID3, ID2 & NN Models for the Napoleon-Josephine-Cruz Deposit Area
![]()
Source: SGS, 2024
|
|
Figure 14-16: Comparison of ID3, ID2 & NN Models for the Copala-Cristiano Deposit Area
![]()
Source: SGS, 2024
14.12.1 Sensitivity to Cut-off Grade
The Project Mineral Resources have been estimated at a range of cut-off grades presented in Table 14-12 to demonstrate the sensitivity of the resources to cut-off grades. The current Mineral Resources are reported at a base-case cut-off grade of 150 g/t AgEq (highlighted).
Note: Values in these tables reported above and below the base-case cut-off 150 g/t AgEq for underground Mineral Resources should not be misconstrued with a Mineral Resource Statement. The values are only presented to show the sensitivity of the block model estimates to the selection of the base case cut-off grade. All values are rounded to reflect the relative accuracy of the estimate and numbers may not add due to rounding.
|
|
Table 14-12: Underground Mineral Resource Estimate at Various AgEq Cut-off Grades, September 1, 2023
Copala Area: Copala, Tajitos and Cristiano
Copala
Resource | Cut-off | Tonnes | Grade | Total Metal | ||||||||
Au g/t | Ag g/t | Pb % | Zn % | AgEq | Au | Ag | Pb | Zn | AgEq | |||
Indicated | 90 | 5.9 | 2.0 | 308.3 | 0.1 | 0.1 | 466 | 380 | 58,513 | 9.5 | 17.9 | 88,485 |
100 | 5.6 | 2.1 | 320.5 | 0.1 | 0.1 | 484 | 377 | 57,982 | 9.3 | 17.5 | 87,649 | |
120 | 5.1 | 2.2 | 344.8 | 0.1 | 0.1 | 521 | 369 | 56,867 | 8.9 | 16.6 | 85,900 | |
150 | 4.5 | 2.5 | 379.8 | 0.1 | 0.2 | 573 | 358 | 55,201 | 8.2 | 15.3 | 83,270 | |
200 | 3.8 | 2.8 | 432.0 | 0.1 | 0.2 | 650 | 339 | 52,634 | 7.4 | 13.6 | 79,173 | |
250 | 3.2 | 3.1 | 481.3 | 0.1 | 0.2 | 722 | 321 | 50,111 | 6.7 | 12.3 | 75,204 | |
300 | 2.8 | 3.3 | 524.9 | 0.1 | 0.2 | 786 | 305 | 47,882 | 6.2 | 11.2 | 71,677 | |
Inferred | 90 | 4.1 | 1.4 | 272.2 | 0.1 | 0.2 | 391 | 193 | 36,264 | 9.6 | 15.8 | 52,046 |
100 | 4.0 | 1.5 | 282.4 | 0.1 | 0.2 | 405 | 191 | 35,865 | 9.4 | 15.4 | 51,459 | |
120 | 3.6 | 1.6 | 303.1 | 0.1 | 0.2 | 435 | 186 | 35,002 | 8.9 | 14.6 | 50,192 | |
150 | 3.2 | 1.8 | 332.0 | 0.1 | 0.2 | 476 | 179 | 33,722 | 8.2 | 13.6 | 48,320 | |
200 | 2.6 | 2.0 | 379.3 | 0.1 | 0.2 | 544 | 168 | 31,389 | 7.4 | 12.3 | 45,040 | |
250 | 2.1 | 2.3 | 422.8 | 0.1 | 0.2 | 608 | 158 | 29,172 | 6.7 | 11.1 | 41,966 | |
300 | 1.8 | 2.6 | 472.4 | 0.2 | 0.3 | 681 | 146 | 26,777 | 6.1 | 9.9 | 38,595 | |
Tajitos
Resource | Cut-off | Tonnes | Grade | Total Metal | ||||||||
Au g/t | Ag g/t | Pb % | Zn % | AgEq | Au | Ag | Pb | Zn | AgEq | |||
Indicated | 90 | 0.7 | 2.0 | 318.3 | 0.1 | 0.2 | 478 | 47 | 7,563 | 1.7 | 3.2 | 11,361 |
100 | 0.7 | 2.0 | 324.4 | 0.1 | 0.2 | 487 | 47 | 7,532 | 1.7 | 3.1 | 11,314 | |
120 | 0.7 | 2.1 | 337.6 | 0.1 | 0.2 | 507 | 47 | 7,446 | 1.7 | 3.0 | 11,184 | |
150 | 0.6 | 2.2 | 358.4 | 0.1 | 0.2 | 538 | 46 | 7,295 | 1.6 | 2.9 | 10,953 | |
200 | 0.6 | 2.4 | 392.4 | 0.1 | 0.2 | 588 | 44 | 7,028 | 1.5 | 2.6 | 10,530 | |
250 | 0.5 | 2.6 | 424.3 | 0.1 | 0.2 | 635 | 42 | 6,726 | 1.4 | 2.4 | 10,062 | |
300 | 0.4 | 2.9 | 460.6 | 0.1 | 0.2 | 688 | 39 | 6,368 | 1.2 | 2.2 | 9,510 | |
Inferred | 90 | 1.3 | 1.7 | 311.0 | 0.2 | 0.4 | 462 | 72 | 12,818 | 5.9 | 10.4 | 19,051 |
100 | 1.2 | 1.8 | 319.8 | 0.2 | 0.4 | 475 | 71 | 12,741 | 5.8 | 10.1 | 18,923 | |
120 | 1.2 | 1.9 | 339.0 | 0.2 | 0.4 | 503 | 70 | 12,557 | 5.5 | 9.6 | 18,617 | |
150 | 1.0 | 2.0 | 365.2 | 0.2 | 0.4 | 540 | 69 | 12,260 | 5.2 | 8.9 | 18,140 | |
200 | 0.9 | 2.3 | 415.4 | 0.2 | 0.4 | 611 | 65 | 11,702 | 4.5 | 7.6 | 17,199 | |
250 | 0.7 | 2.5 | 463.1 | 0.2 | 0.4 | 677 | 61 | 11,139 | 4.0 | 6.7 | 16,279 | |
300 | 0.6 | 2.8 | 507.6 | 0.3 | 0.4 | 741 | 58 | 10,527 | 3.7 | 6.1 | 15,375 | |
|
|
Cristiano
Resource | Cut-off | Tonnes | Grade | Total Metal | ||||||||
Au g/t | Ag g/t | Pb % | Zn % | AgEq | Au | Ag | Pb | Zn | AgEq | |||
Indicated | 90 | 0.3 | 2.8 | 490.7 | 0.2 | 0.4 | 726 | 24 | 4,071 | 1.2 | 2.2 | 6,022 |
100 | 0.2 | 3.0 | 514.2 | 0.2 | 0.4 | 760 | 23 | 4,051 | 1.2 | 2.2 | 5,990 | |
120 | 0.2 | 3.2 | 544.3 | 0.2 | 0.4 | 805 | 23 | 4,008 | 1.2 | 2.1 | 5,924 | |
150 | 0.2 | 3.4 | 581.1 | 0.2 | 0.4 | 858 | 23 | 3,961 | 1.1 | 2.0 | 5,851 | |
200 | 0.2 | 3.8 | 649.5 | 0.3 | 0.5 | 959 | 22 | 3,864 | 1.1 | 1.9 | 5,706 | |
250 | 0.2 | 4.2 | 717.1 | 0.3 | 0.5 | 1,060 | 22 | 3,759 | 1.0 | 1.8 | 5,553 | |
300 | 0.1 | 4.5 | 771.7 | 0.3 | 0.5 | 1,141 | 21 | 3,648 | 0.9 | 1.6 | 5,393 | |
Inferred | 90 | 0.9 | 2.1 | 365.8 | 0.1 | 0.3 | 536 | 61 | 10,703 | 2.7 | 5.3 | 15,691 |
100 | 0.9 | 2.2 | 379.9 | 0.1 | 0.3 | 557 | 60 | 10,614 | 2.7 | 5.2 | 15,560 | |
120 | 0.8 | 2.3 | 411.1 | 0.1 | 0.3 | 602 | 60 | 10,431 | 2.5 | 4.8 | 15,284 | |
150 | 0.7 | 2.5 | 443.0 | 0.1 | 0.3 | 650 | 59 | 10,213 | 2.4 | 4.5 | 14,974 | |
200 | 0.6 | 3.0 | 509.8 | 0.2 | 0.3 | 748 | 56 | 9,721 | 2.1 | 4.0 | 14,271 | |
250 | 0.5 | 3.4 | 584.7 | 0.2 | 0.3 | 860 | 54 | 9,212 | 1.9 | 3.6 | 13,548 | |
300 | 0.4 | 3.8 | 633.9 | 0.2 | 0.3 | 934 | 52 | 8,866 | 1.8 | 3.3 | 13,067 | |
Napoleon Area: Napoleon, Cruz, Josephine and La Luisa
Napoleon + Splays
Resource | Cut-off | Tonnes | Grade | Total Metal | ||||||||
Au g/t | Ag g/t | Pb % | Zn % | AgEq | Au | Ag | Pb | Zn | AgEq | |||
Indicated | 90 | 4.3 | 2.0 | 136.7 | 0.4 | 1.5 | 357 | 270 | 18,712 | 42.0 | 141.7 | 48,836 |
100 | 4.1 | 2.0 | 140.9 | 0.5 | 1.6 | 368 | 267 | 18,500 | 41.4 | 139.6 | 48,309 | |
120 | 3.8 | 2.2 | 149.0 | 0.5 | 1.6 | 389 | 263 | 18,056 | 40.1 | 134.9 | 47,196 | |
150 | 3.3 | 2.4 | 162.2 | 0.5 | 1.7 | 425 | 255 | 17,276 | 37.8 | 126.5 | 45,223 | |
200 | 2.7 | 2.8 | 186.7 | 0.6 | 1.9 | 486 | 238 | 15,943 | 32.9 | 110.5 | 41,541 | |
250 | 2.1 | 3.2 | 212.9 | 0.6 | 2.0 | 554 | 220 | 14,471 | 28.4 | 95.0 | 37,639 | |
300 | 1.7 | 3.7 | 239.7 | 0.6 | 2.1 | 622 | 204 | 13,096 | 24.1 | 79.7 | 33,976 | |
Inferred | 90 | 4.4 | 1.3 | 110.1 | 0.4 | 1.5 | 280 | 187 | 15,680 | 39.6 | 147.2 | 39,828 |
100 | 4.2 | 1.4 | 114.1 | 0.4 | 1.6 | 289 | 185 | 15,453 | 38.6 | 144.0 | 39,167 | |
120 | 3.8 | 1.5 | 123.0 | 0.4 | 1.6 | 310 | 178 | 14,903 | 36.0 | 136.4 | 37,594 | |
150 | 3.2 | 1.6 | 137.2 | 0.5 | 1.8 | 342 | 168 | 14,045 | 31.8 | 123.2 | 35,063 | |
200 | 2.4 | 1.9 | 160.1 | 0.5 | 1.9 | 396 | 151 | 12,450 | 26.3 | 102.7 | 30,774 | |
250 | 1.8 | 2.3 | 186.1 | 0.5 | 2.0 | 453 | 134 | 10,860 | 21.4 | 81.3 | 26,435 | |
300 | 1.4 | 2.6 | 210.2 | 0.6 | 2.2 | 505 | 117 | 9,483 | 17.4 | 66.7 | 22,795 | |
|
|
Napoleon_HW(4)
Resource | Cut-off | Tonnes | Grade | Total Metal | ||||||||
Au g/t | Ag g/t | Pb % | Zn % | AgEq | Au | Ag | Pb | Zn | AgEq | |||
Indicated | 90 | 0.6 | 1.4 | 136.2 | 0.3 | 1.2 | 297 | 26 | 2,592 | 4.4 | 15.7 | 5,656 |
100 | 0.6 | 1.4 | 139.2 | 0.3 | 1.2 | 304 | 26 | 2,559 | 4.3 | 15.6 | 5,599 | |
120 | 0.5 | 1.6 | 150.6 | 0.4 | 1.4 | 332 | 25 | 2,417 | 4.1 | 15.0 | 5,331 | |
150 | 0.4 | 1.7 | 164.2 | 0.4 | 1.5 | 365 | 24 | 2,259 | 4.0 | 14.4 | 5,029 | |
200 | 0.3 | 2.0 | 189.8 | 0.5 | 1.8 | 426 | 21 | 1,989 | 3.5 | 12.9 | 4,464 | |
250 | 0.2 | 2.4 | 239.5 | 0.6 | 2.4 | 532 | 17 | 1,663 | 3.0 | 11.4 | 3,698 | |
300 | 0.2 | 2.7 | 267.8 | 0.7 | 2.7 | 594 | 15 | 1,498 | 2.8 | 10.4 | 3,323 | |
Inferred | 90 | 1.0 | 1.9 | 188.2 | 0.5 | 1.8 | 413 | 62 | 6,263 | 11.5 | 40.7 | 13,741 |
100 | 1.0 | 1.9 | 194.3 | 0.5 | 1.8 | 426 | 62 | 6,211 | 11.4 | 40.2 | 13,614 | |
120 | 0.9 | 2.0 | 204.2 | 0.5 | 1.9 | 446 | 61 | 6,132 | 11.2 | 39.1 | 13,398 | |
150 | 0.8 | 2.2 | 219.7 | 0.6 | 2.0 | 479 | 59 | 5,976 | 10.9 | 37.6 | 13,027 | |
200 | 0.6 | 2.7 | 284.4 | 0.8 | 2.7 | 614 | 51 | 5,386 | 10.0 | 35.0 | 11,624 | |
250 | 0.5 | 2.9 | 308.7 | 0.8 | 2.9 | 662 | 48 | 5,201 | 9.6 | 33.5 | 11,146 | |
300 | 0.5 | 3.0 | 331.2 | 0.9 | 3.1 | 704 | 46 | 5,027 | 9.3 | 32.0 | 10,692 | |
Josephine
Resource | Cut-off | Tonnes | Grade | Total Metal | ||||||||
Au g/t | Ag g/t | Pb % | Zn % | AgEq | Au | Ag | Pb | Zn | AgEq | |||
Indicated | 90 | 0.1 | 2.8 | 212.4 | 0.4 | 1.1 | 472 | 6 | 499 | 0.6 | 1.7 | 1,108 |
100 | 0.1 | 2.8 | 214.3 | 0.4 | 1.1 | 476 | 6 | 496 | 0.6 | 1.7 | 1,102 | |
120 | 0.1 | 2.8 | 216.5 | 0.4 | 1.1 | 481 | 6 | 494 | 0.6 | 1.7 | 1,098 | |
150 | 0.1 | 2.9 | 221.2 | 0.4 | 1.1 | 492 | 6 | 491 | 0.6 | 1.7 | 1,092 | |
200 | 0.1 | 3.0 | 227.4 | 0.4 | 1.1 | 507 | 6 | 483 | 0.6 | 1.7 | 1,076 | |
250 | 0.1 | 3.1 | 233.7 | 0.4 | 1.2 | 521 | 6 | 466 | 0.6 | 1.6 | 1,039 | |
300 | 0.1 | 3.2 | 240.9 | 0.4 | 1.2 | 538 | 6 | 457 | 0.5 | 1.5 | 1,020 | |
Inferred | 90 | 0.3 | 1.6 | 133.0 | 0.3 | 0.8 | 293 | 16 | 1,343 | 1.9 | 5.6 | 2,963 |
100 | 0.3 | 1.7 | 137.0 | 0.3 | 0.8 | 305 | 16 | 1,309 | 1.9 | 5.5 | 2,913 | |
120 | 0.3 | 1.8 | 144.4 | 0.3 | 0.9 | 326 | 16 | 1,249 | 1.8 | 5.3 | 2,819 | |
150 | 0.2 | 2.0 | 161.1 | 0.3 | 1.0 | 364 | 15 | 1,161 | 1.6 | 4.9 | 2,618 | |
200 | 0.2 | 2.2 | 179.8 | 0.4 | 1.1 | 402 | 13 | 1,081 | 1.5 | 4.6 | 2,418 | |
250 | 0.2 | 2.4 | 192.8 | 0.4 | 1.2 | 427 | 12 | 1,017 | 1.4 | 4.3 | 2,253 | |
300 | 0.1 | 2.5 | 211.2 | 0.4 | 1.2 | 456 | 11 | 930 | 1.2 | 3.7 | 2,011 | |
|
|
Cruz
Resource | Cut-off | Tonnes | Grade | Total Metal | ||||||||
Au g/t | Ag g/t | Pb % | Zn % | AgEq | Au | Ag | Pb | Zn | AgEq | |||
Indicated | 90 | 0.0 | 1.8 | 129.7 | 0.3 | 1.5 | 336 | 2 | 163 | 0.3 | 1.3 | 421 |
100 | 0.0 | 1.9 | 131.2 | 0.3 | 1.5 | 340 | 2 | 160 | 0.3 | 1.3 | 416 | |
120 | 0.0 | 1.9 | 136.7 | 0.3 | 1.6 | 353 | 2 | 158 | 0.3 | 1.3 | 409 | |
150 | 0.0 | 2.0 | 144.5 | 0.4 | 1.7 | 373 | 2 | 153 | 0.3 | 1.2 | 396 | |
200 | 0.0 | 2.2 | 158.8 | 0.4 | 1.9 | 407 | 2 | 143 | 0.3 | 1.2 | 366 | |
250 | 0.0 | 2.2 | 162.3 | 0.4 | 1.9 | 418 | 2 | 136 | 0.3 | 1.1 | 349 | |
300 | 0.0 | 2.2 | 163.8 | 0.5 | 2.0 | 423 | 2 | 137 | 0.3 | 1.1 | 354 | |
Inferred | 90 | 0.3 | 3.7 | 167.1 | 0.3 | 1.5 | 507 | 38 | 1,714 | 2.2 | 10.2 | 5,205 |
100 | 0.3 | 3.7 | 167.5 | 0.3 | 1.5 | 509 | 38 | 1,713 | 2.2 | 10.2 | 5,202 | |
120 | 0.3 | 3.7 | 168.5 | 0.3 | 1.5 | 512 | 37 | 1,707 | 2.2 | 10.2 | 5,186 | |
150 | 0.3 | 3.7 | 170.3 | 0.3 | 1.5 | 519 | 37 | 1,698 | 2.1 | 10.1 | 5,169 | |
200 | 0.3 | 3.9 | 177.1 | 0.3 | 1.5 | 541 | 37 | 1,651 | 2.1 | 9.8 | 5,047 | |
250 | 0.3 | 4.2 | 186.6 | 0.4 | 1.6 | 577 | 36 | 1,566 | 2.0 | 9.2 | 4,846 | |
300 | 0.2 | 4.6 | 193.5 | 0.4 | 1.7 | 612 | 34 | 1,450 | 1.9 | 8.6 | 4,587 | |
La Luisa
Resource | Cut-off | Tonnes | Grade | Total Metal | ||||||||
Au g/t | Ag g/t | Pb % | Zn % | AgEq | Au | Ag | Pb | Zn | AgEq | |||
Indicated | 90 | 0.4 | 2.0 | 131.8 | 0.3 | 1.6 | 349 | 25 | 1,708 | 2.7 | 13.9 | 4,516 |
100 | 0.4 | 2.0 | 136.9 | 0.3 | 1.6 | 362 | 25 | 1,685 | 2.6 | 13.7 | 4,454 | |
120 | 0.3 | 2.2 | 152.3 | 0.3 | 1.8 | 401 | 24 | 1,620 | 2.5 | 13.2 | 4,266 | |
150 | 0.3 | 2.6 | 177.3 | 0.4 | 2.0 | 459 | 22 | 1,556 | 2.3 | 12.1 | 4,027 | |
200 | 0.3 | 2.7 | 186.9 | 0.4 | 2.1 | 480 | 22 | 1,526 | 2.2 | 11.6 | 3,918 | |
250 | 0.2 | 2.8 | 199.7 | 0.4 | 2.2 | 506 | 21 | 1,477 | 2.1 | 10.9 | 3,742 | |
300 | 0.2 | 2.9 | 210.6 | 0.4 | 2.2 | 529 | 20 | 1,415 | 2.0 | 10.3 | 3,557 | |
Inferred | 90 | 2.6 | 1.8 | 133.5 | 0.3 | 1.4 | 330 | 151 | 11,100 | 14.9 | 77.7 | 27,452 |
100 | 2.5 | 1.9 | 136.8 | 0.3 | 1.4 | 338 | 149 | 11,000 | 14.7 | 76.6 | 27,194 | |
120 | 2.3 | 2.0 | 144.2 | 0.3 | 1.4 | 355 | 146 | 10,805 | 14.3 | 74.0 | 26,594 | |
150 | 2.0 | 2.1 | 159.3 | 0.3 | 1.5 | 386 | 139 | 10,439 | 13.3 | 67.9 | 25,326 | |
200 | 1.7 | 2.4 | 182.8 | 0.3 | 1.6 | 435 | 128 | 9,730 | 11.6 | 58.7 | 23,175 | |
250 | 1.3 | 2.7 | 209.4 | 0.3 | 1.7 | 487 | 115 | 8,949 | 10.1 | 49.9 | 20,824 | |
300 | 1.1 | 3.0 | 239.3 | 0.4 | 1.8 | 544 | 100 | 8,080 | 8.6 | 42.0 | 18,356 | |
14.13 Comparison of the current MRE to the January 2023 MRE
The current MRE is compared to the January 2023 MRE for the Project (Table 14-13). The main difference in the resource estimates is due to the additional drilling completed by Vizsla between September 2022 and September 2023, completed in the Napoleon and Tajitos-Copala deposit areas. The additional drilling resulted in the discovery of additional vein structures, extension of existing vein structures down dip/plunge and along strike and increased the confidence in the existing resource resulting in an increase in Indicated resources, and the expansion of known mineralized zones down dip/plunge and along strike.
|
|
Highlights:
- 48.7% increase in Indicated resources from 104.8 to 155.8 Moz AgEq
- 48.7% increase in Inferred resources from 114.1 to 169.6 Moz AgEq
- 17% increase in average Indicated resource grade from 437 to 511 g/t AgEq.
Table 14-13: Comparison of the January 2023 MRE to the September 2023 MRE for the Project
Resource | Tonnes | Grade | Total Metal | ||||||||
Au g/t | Ag g/t | Pb % | Zn % | *AgEq | Au | Ag | Pb | Zn | AgEq | ||
Mineral Resource Estimate, January 19, 2023 | |||||||||||
Indicated | 7.5 | 2.12 | 243 | 0.23 | 0.71 | 437 | 58,330 | 508 | 38.0 | 117.4 | 104,793 |
Inferred | 7.2 | 2.14 | 304 | 0.19 | 0.54 | 491 | 70,672 | 496 | 30.2 | 85.7 | 114,113 |
Mineral Resource Estimate, September 1, 2023 | |||||||||||
Indicated | 9.48 | 2.41 | 289 | 0.27 | 0.84 | 511 | 736 | 88,192 | 56.0 | 176.1 | 155,841 |
Inferred | 12.2 | 1.93 | 239 | 0.29 | 1.03 | 433 | 758 | 93,653 | 78.1 | 276.2 | 169,647 |
*Ag (gpt) + [Au ppm x (Au price / Ag Price)] [Pb (%) X 2204.6 X Pb Price / Ag Price X 31.1] + [Zn (%) X 2204.6 X Zn Price / Ag Price X 31.1]
14.14 Disclosure
All relevant data and information regarding the Project are included in other sections of this Technical Report. There is no other relevant data or information available that is necessary to make the technical report understandable and not misleading.
The Authors are not aware of any known mining, processing, metallurgical, environmental, infrastructure, economic, permitting, legal, title, taxation, socio-political, or marketing issues, or any other relevant factors not reported in this technical report, that could materially affect the updated MRE.
|
|
15 MINERAL RESERVE ESTIMATES
This section is not relevant to this Report.
|
|
16 MINING METHODS
16.1 Introduction
The Panuco Project is a collection of silver-gold deposits located in the Panuco-Copala mining district in Sinaloa, Mexico, that extends from surface to over 800 m in depth. The vein-type deposits range in thickness from 1.5 m to greater than 20m. Although some parts of the deposits occur near the surface, the deposits have been selected for underground extraction due to the extensive nature of the strike, depth and the structure of the local topography. Due to the currently understood geotechnical considerations and to maximise mining recovery, a combination of longitudinal longhole stoping and drift-and-fill mining with cemented and unconsolidated rock-backfill and paste-backfill is proposed for the site.
Longhole stoping while leaving pillars for support as opposed to backfilling was initially considered but was discarded due to the high-grade nature of the deposit. This supports the application of a higher mining recovery method. Other bulk mining methods such as sub level caving were not considered for this study due to the potential impact on the nearby town and infrastructure, as well as the additional dilution inherent to these methods.
16.2 Geotechnical and Hydrogeological Considerations
16.2.1 Hydrogeology Considerations
For this Preliminary Economic Assessment, mine water pumping requirements were assumed to be 20-40 l/s throughout the life of the project. As this project continues to advance, it is recommended that data collection and evaluation of the potential mine water ingress be completed to improve the accuracy of this assumption.
16.2.2 Geotechnical
16.2.3 Collected Data
Geotechnical data collection has been performed by the Vizsla team on exploration boreholes since September 2022. Partial geotechnical information was also collected from borehole drilling in 2021. There are no 3D structural models currently available, however a Machine-Learning algorithm ("ML") was used to identify fracturing within the rock mass. This was performed on 241 km of core for the Copala, Tajitos, and Napoleon deposits, and resulted in them being classified into six geotechnical classes. Material described as "Fair" to "Good" is categorised within Class 1 - 3, and accounted for 91% of the material, while the remaining 9% was categorised as Class 4 - 6, which is described as Poor to Very Poor (SRK, 2022 and SRK, 2023b).
Information on the Rock Quality Designation ("RQD"), Point Load Testing ("PLT") and detailed descriptions of major faults has been documented and reviewed for this study. The quantity of holes and the type of data collected is summarised in Table 16-1 below.
|
|
Table 16-1: Geotechnical Logged Drillholes to Date
Deposit | # of holes drilled | Holes with RQD Data | Holes with PLT Data | # of Geotechnical Holes |
Copala | 136 | 134 | 43 | 5 |
Tajitos | 216 | 210 | 3 | 0 |
Napoleon + Josephine | 344 | 340 | 23 | 6 |
La Luisa | 49 | 49 | 27 | 0 |
The drillholes and PLTs that were used for the study are illustrated with respect to the proposed mine plan presented in Figure 16-1, Figure 16-2 and Figure 16-3.
Figure 16-1: Geotechnically Logged Diamond Drill Hole Locations - RQD
![]()
Source: Entech, July 2024
|
|
Figure 16-2: Geotechnically Logged Diamond Drill Hole Locations - Point Load Testing
![]()
Source: Entech, July 2024
Figure 16-3: Geotechnically Logged Diamond Drill Hole Locations - Geotehnical Holes
![]()
Source: Entech, July 2024
|
|
16.2.4 Rock Mass Characterisation
Core logging was conducted by the Vizsla team on exploration boreholes near mineralised zones, with data for RQD, PLT, and ISRM Field Strength being collected. The rock mass was primarily characterised using the ML algorithm (SRK, 2022 and SRK, 2023b) to define areas of "Poor to Very Poor" and "Fair to Good" conditions in the 6 aforementioned sub-categories. The core quality observed during the site inspection matches the geotechnical domains developed with the ML approach, except in the north portion of the Napoleon Vein, where core photographs of more recent drillholes near the fault show "Very Poor" ground quality that is not captured by the geotechnical domains developed.
The ML results were filtered within ± 10 m of the vein solids and used to create a wireframe of these domains. The categorization of the core into each category is summarised in Table 16-2.
Table 16-2: Results of Machine Learning Rock Mass Categorization
Description | Category | Length | Cumulative % |
Fair - Good | 1 | 30,205 | 25 |
2 | 59,300 | 75 | |
3 | 19,231 | 91 | |
Poor - Very Poor | 4 | 8,533 | 98 |
5 | 2,074 | 100 | |
6 | 423 | 100 |
A geotechnical drilling campaign was executed between October 2023 and January 2024. It involved 11 oriented boreholes (six in the Napoleon deposit and five in the Copala deposit) and laboratory testing is still ongoing, with results yet to be reported. The drilling conducted in 2023 indicates that there are significant, continuous zones of "Poor" material within the rock mass, likely related to faults. Outside of the fault zones, the rock mass is predominantly "Strong" to "Very Strong." Upon inspection of the 2023 geotechnical boreholes, the results don't appear to align with the fault model developed internally by Vizsla. It is recommended that the model be refined using the results of the 2023-2024 campaign.
The results of the 2023-2024 geotechnical data using the Q' parameter ± 25 m of the veins for the Copala, Napoleon, and Tajitos deposits, is summarised in Table 16-3 and illustrated in Figure 16-4. Approximately 19% of the logging data indicating "Very Poor" to "Poor" ground.
Table 16-3: 2023 Geotechnical Drilling Campaign Results (Q')
Deposit | Geotechnical | Q' | ||
Drilling Length (m) | P25 | P50 | P75 | |
1 | 751 | 4.8 | 9.6 | 16.7 |
2 | 862 | 4.1 | 8.0 | 12.4 |
3 | 110 | 6.2 | 12.1 | 16.5 |
Total | 1,724 | 4.2 | 8.3 | 16.2 |
|
|
Figure 16-4: Estimated Domain Conditions (Q')
![]()
Source: Equilibrium Mining, May 2024
The observations are summarised as follows:
Core quality generally aligns with geotechnical domains, however some refinement of domains in the north portion of the Napoleon vein is required,
The rock mass has significant and continuous zones of poor material (~19% of 2023 Geotechnical Data) that is highly fractured and likely related to the presence of faults. The variability in thickness and rock mass quality in these "Poor" to "Very Poor" categories is not well understood,
Outside of the fault zones, the rock mass near and within the mineralization is "Strong" to "Very Strong," and
Longitudinal Longhole Stoping in "Poor" ground is anticipated to incur additional dilution, and in "Very Poor" ground may unravel and impact mining recovery.
16.2.5 Stope Sizes
Stope stability was assessed using the Mathews stability graph developed by Mathews et al. (1980) and extended by Mawdesley et al. (2001). This method evaluates stope face stability based on the hydraulic radius ("HR") and the stability number ("N"). The stability number N is calculated by adjusting the Q' value for induced stresses (Factor A), discontinuity orientation (Factor B), and excavation surface orientation (Factor C), following the formula N = Q' x A x B x C.
A stope stability assessment was completed for excavations in the Copala, Napoleon, and Tajitos zones to determine the recommended mining dimensions based on the Longitudinal Longhole stoping mining method. These are summarised by deposit and hanging wall dip angle in Table 16-4.
|
|
Table 16-4: Stope Spans for the Panuco Project
Deposit | HW Dip (°) | P50 Depth below Surface | Maximum Depth below Surface | ||
Length (m) | Width (m) | Length (m) | Width (m) | ||
Copala | 50 | 15 | 15 | 10 | 10 |
70 | 30 | 15 | 15 | 15 | |
Napoleon | 50 | 15 | 15 | 10 | 10 |
70 | 40 | 15 | 25 | 10 | |
Tajitos | 50 | 15 | 15 | 15 | 15 |
70 | 30 | 15 | 25 | 15 | |
* Drift-and-fill mining was only considered for the portion of the deposit below the Copala town.
Assumptions made in the calculation of Stability Number (N'):
Average deposit dips of 50° and 70°,
20 m high stopes,
Factor A - The induced stresses were estimated using stress curves developed by Stewart and Forsyth (1995), after Mathews at al. (1980). The selected Factor A with depth below ground level for a mean UCS of 70 Mpa is illustrated in Table 16-5,
Factor B - The structural trends suggest potential for unfavourable joint orientations relative to the hanging wall/footwall with steep inclination, side walls and back stope face orientations. The selected Factor B is summarised in Table 16-6, and
Factor C - The likely failure mechanism(s) for footwall and hanging wall exposures were identified as sliding and gravity fall/slabbing induced type failures respectively. The Factor C was determined by the orientation of the excavation and is summarised in Table 16-7.
Table 16-5: Stope Stability Assessment (Factor A)
Depth below Ground (m) | Factor A | ||
Backs | Side Wall | Hanging-wall / Foot-wall | |
100 | 1.00 | 1.00 | 1.00 |
200 | 0.50 | 0.52 | 1.00 |
300 | 0.29 | 0.31 | 1.00 |
400 | 0.20 | 0.21 | 1.00 |
500 | 0.14 | 0.15 | 0.78 |
Table 16-6: Stope Stability Assessment (Factor B)
Stope Face | Factor B |
Backs | 0.3 |
Hanging-wall / Foot-wall | 0.3 |
Side walls | 0.5 |
|
|
Table 16-7: Stope Stability Assessment (Factor C)
Deposit | Stope Face | Angle from Horizontal (°) | Factor C |
Copala & Tajitos | Backs | 0 | 1.0 |
Hanging Wall | 50 | 3.5 | |
Hanging Wall | 80 | 6.8 | |
Side Wall | 90 | 8.0 | |
Napoleon | Backs | 0 | 1.0 |
Hanging Wall | 50 | 3.5 | |
Hanging Wall | 70 | 6.8 | |
Side Wall | 90 | 8.0 |
For this assessment, the stope is considered stable if the N value for the median Q' plots above the 70% probability of stability curve as illustrated in Figure 16-5.
Figure 16-5: Extended Matthews Stability Graph (Mawdesley et al. 2001)
![]()
Source: Equilibrium Mining, May 2024
|
|
16.2.6 Geotechnical - Ground Support
For cost estimation purposes, ground support regimes for development were estimated based on statistics calculated using the 2023 geotechnical data, assuming dry ground with minor inflow. A 10% overbreak of the planned development profile was considered.
For mine development, ground support consisting of 2.4 m rock bolts with mesh to mid-drift for "Fair" to "Good" ground or with fibercrete to the floor for "Poor" to "Very Poor" ground. Intersection cable bolts are required at all intersections. A summary of the assumed bolting plan is summarised in Table 16-8.
Table 16-8: Excavation and Ground Support Standards for the Panuco Project
Excavation Type | Profile | Ground | Support Type | Wall | Bolts | |||
Width | Height | Shape | Conditions | Coverage | Length | Spacing | ||
Capital Lateral | 5.5 m | 5.0 m | Arch | Fair - Good | Bolts & Mesh | Mid-drift | 2.4 m | 1.5 m |
Poor - Very Poor | Bolts, Fibrecrete (75mm) | To floor | 2.4 m | 1.2 m | ||||
Operating Lateral | 4.0 m | 4.0 m | Arch | Fair - Good | Bolts & Mesh | Mid-drift | 2.4 m | 1.5 m |
Poor - Very Poor | Bolts, Fibrecrete (75mm) | To floor | 2.4 m | 1.2 m | ||||
Support was also considered for stoping activities with two cable bolts (6 m long) in the brow in "Fair" to "Good" ground, and eight cable bolts (6 m long) for every 20m of strike.
16.2.7 Geotechnical - Backfill
The mining methods considered for the Panuco Project are proposed to use a combination of cemented and uncemented rock backfill, as well as paste backfill for stope support. For costing purposes, the following cement binder was considered and has been observed at other operations:
- Paste backfill:
Stope plug (6 m) with 6.0 % cement; and,
Main pour (14 m) with 3.0 % cement.
- Cemented backfill:
Face/bottom of stope fill (55% of void) with 6.0 % cement (undercut exposure) or 3% (near wall exposure); and,
Back/top of stope fill (45% of void) with no cement.
The mining study assumed that all stope voids would be backfilled. Future backfill studies are proposed in future study phases to further refine stability assessments and cost estimates. The assumed price for cement was US$270/t.
|
|
16.2.8 Geotechnical - Stand-off and Pillar Sizes
Development was positioned to allow for a minimum 2:1 pillar size (minimum lateral offset is 2 x height of opening) where the pillar width was a minimum of 10 m. For positioning ramp infrastructure, a minimum of 50 m was considered.
16.3 Mine Dilution and Mining Recovery
Mining factors are used to account for the combination of dilution and recovery that affects the material quality and quantity of an operation. Dilution is waste material that enters the material movement stream and results in two negative impacts:
Increased cost (mining, processing, treatment and increasing the storage of tailings), and
Increased mined material loss (through processing and impacting on mining recoveries).
The sources of dilution can be classified into two categories:
Planned dilution, and
Unplanned dilution.
Planned dilution is additional waste that is deliberately mined concurrently with the mineralised material, resulting in the mineralised material being recovered at an overall lower grade. This planned excavation is driven by the minimum mining width, which incorporates drilling and blasting activities to be executed effectively.
Unplanned dilution is waste material that unintentionally finds its way into the plant-feed during extraction. This can be from a variety of sources, including:
Over-break during blasting and geotechnical conditions,
Backfill dilution ravelling from adjacent stopes after blasting,
Mucking of waste material (backfill or road base material) during the mucking of mineralised material,
Misrouting and dumping of waste material on the plant-feed stockpile, and
Misrouting and dumping of waste in mineralised material locations (stockpiles, mineralised material passes) leading to a mixing of mineralised material and waste rock.
Mining loss has a significant impact on the business, with a reduction of revenue through the loss of mineralised material. Mining loss can occur in a variety of different ways such as poor blasting, poor recovery of blasted muck, and weak ground conditions impacting on the access to the mineralised material, among others. Mining loss was considered as an allowance for a reduction in production and revenue.
|
|
An example of dilution and underbreak due to blasting performance is illustrated in Figure 16-6 and Figure 16-7. Underbreak in waste is an economic benefit; however, it also reflects that the operation is not achieving the targeted mining shape.
Figure 16-6: Dilution - Longhole Stoping
![]()
Source: Entech, July 2024
|
|
Figure 16-7: Ore Loss - Longhole Stoping
![]()
Source: Entech, July 2024
For preliminary design at the Panuco Project, planned dilution and unplanned rock dilution was accounted for using the Datamine Mineable Stope Optimiser® (MSO). Unplanned fill dilution and mining loss was applied as a factor to the shapes created by MSO within the schedule. A diagram of the mining shapes and the contact surfaces to which the fill dilution was applied is illustrated in Figure 16-8.
|
|
Figure 16-8: Stope Shapes (Blue) and Dilution Contacts (Orange)
![]()
Source: Entech, July 2024
A summary of the surface contacts is shown in Figure 16-8, where mineralisation and waste are included in the mining shape, while fill is added as a factor during post-processing. A summary of the depth of failure by contact type is providing in Table 16-9.
Table 16-9: Mineralization (M), Waste (W) and Fill (F) Surface Contacts for Each Mining Method
Method | Side (HW/FW) | Near | Far | Backs | Floor |
Longitudinal Longhole Stoping | W / W | F | - | - | F |
Depth of Failure | 0.5 / 0.5 | 1.0 | - | - | 0.3 |
Drift-and-fill Production | W / W | - | - | - | F |
Depth of Failure | 0.3 / 0.0 | - | - | - | 0.3 |
Conservative estimates were employed due to the preliminary nature of the study, with mining recovery for longhole stoping assumed to be 92%, mining recovery for drift-and-fill assumed at 98% and mining recovery for development assumed at 100%. Table 16-10 shows the summary of Dilution and Mining Recovery assumptions. Unless dilution was informed during the MSO process supported by the values in the block model, dilution was assigned a grade of zero.
|
|
Table 16-10: Dilution and Recovery Summary
Description | Value |
Longhole Stoping | |
Planned Dilution1 | 47.0% |
Unplanned Dilution3 | 9.2% |
Recovery | 92% |
Drift and Fill Stoping | |
Planned Dilution1 | 38.9% |
Unplanned Dilution3 | 7.8% |
Recovery | 98% |
Development | |
Unplanned Dilution2 | 10.0% |
Recovery | 100% |
1. Included in a Minimum Mining Width MSO Shape as Planned and Unplanned Dilution (stoping only) and expressed as total material below cut-off divided by target mineralisation above cut-off.
2. Applied to Development only (mineralisation only).
3. Applied as Factor to the volume of the shape (assumed density of backfill 1.93 t/m3).
16.4 Proposed Mining Methods
Based on the characteristics of the deposit, longhole stoping ("LHS") was selected as the primary mining method, with sublevel spacing of 20 m and variable stope strike lengths depending on prevailing ground conditions. Drift-and-fill ("DAF") was selected for the Copala North zone. Four-meter-high DAF drifts (5 lifts per sublevel) were designed, and a crown pillar thickness of 60 m was assumed with the aim of reducing the impact of vibrations from blasting and mining activities.
LHS backfill will be a combination of Cemented Rock Fill ("CRF") and paste backfill. As the paste plant is not commissioned until approximately 36 months after excavation of the portal, all filling will be conducted with CRF. Upon completion of the paste plant, a transition to paste backfill will occur, while CRF will still be employed where wide stopes (>20m) will be undercut or where it can improve mining productivity (such as narrow stopes).
DAF backfill will use CRF for the first lift of each sublevel so that it may be undercut, and also the primary drifts along level. Uncemented rock fill will be used to backfill secondary drifts where no exposure is anticipated to occur.
Table 16-11 summarises the dimensions and mining direction for each method.
Table 16-11: Stope Dimensions by Mining Method
Method | Mineralisation Width | Length | Height | Width | Mining Direction1 |
Longitudinal LHS | ≤20 m | 10 - 20 m | 20 m | ≤20 m | Bottom-Up |
Drift-and-fill | 2 - 20 m | Variable | 4 m | 4 m | Bottom-Up |
1 Predominate direction indicated. Some sequencing variances may occur.
|
|
16.4.1 Net Smelter Return (NSR)
A Net Smelter Return (NSR) model was used to estimate the revenue for each block. Preliminary process recoveries, concentrate properties, smelting terms, refining costs and transportation costs were assumed to determine the final value of metal in each block. The value of metal was then divided by the estimated feed grade to arrive at a grade multiplier for each block. These grade multipliers were then applied to the block grades and summed to arrive at the block value. Entech only considered silver and gold revenue in the estimation of NSR to be used in the MSO process.
The unit sales prices of each metal, metallurgical recovery and payability are summarised in Table 16-12. These values may differ slightly from the values used in the financial model, due to the timing of the study and adjustments to consensus pricing.
Table 16-12: Parameters used to estimate NSR
Metal | Unit | Value |
Silver metal price | $USD/oz | 24.00 |
Gold metal price | $USD/oz | 1,850.00 |
Silver Metallurgical Recovery Copala / Napoleon | % | 93 |
Gold Metallurgical Recovery Copala / Napoleon | % | 94 |
Silver Metallurgical Recovery Tajitos | % | 92 |
Gold Metallurgical Recovery Tajitos | % | 95 |
Silver Payable | % | 98.0 |
Gold Payable | % | 99.5 |
Refining charges Silver | $/oz | 0.50 |
Refining charges Gold | $/oz | 5.00 |
Royalties | % | 3.5 |
Based on the NSR values presented in Table 16-12, multipliers estimated by Entech are summarised below in Table 16-13 and were used in the MSO process.
Table 16-13: Grade Multipliers ($USD / unit) Used to Estimate NSR in the Block Model
Metal | Unit | Grade Multiplier | Grade Multiplier |
Copala / Napoleon | Tajitos | ||
Silver | $ / g | 0.6615 | 0.6544 |
Gold | $ /g | 53.5384 | 54.108 |
16.4.2 Cut-Off Value
A Cut-Off Value ("COV") is used to segregate material by whether the revenue in a block exceeds the costs of extraction and processing of that block. There were four COVs used to assess and schedule mining at Panuco: Fully Costed; Elevated; Incremental; and Marginal COV.
|
|
The fully costed COV represents the value the mineralised material must meet to cover all associated operating and sustaining capital costs of extraction and processing.
To reduce the capital payback period, an elevated COV of US$200/t was employed during the pre-production period, as well as the first three years of processing for both mining methods.
The incremental COV can be used when the operation has invested in development and access infrastructure and no further investment in development is required to access the material on existing designs. At this stage the COV can exclude the costs of development and partially exclude the costs of sustaining capital. The incremental cut-off would only require that the material value exceed the costs of the incremental surface handing, processing, G&A, mining, and a partial allocation of the sustaining capital.
The marginal COV can be used when the operation has committed to mining and treatment of mineralised material and this process will not generate additional mining costs. At this stage the COV can exclude all mining costs, as these costs will occur whether the material is treated or sent to the waste facility. The marginal COV would only require that the material value exceed the costs of the incremental surface handing, processing, and G&A.
A summary of the included costs in calculating COV are summarised in Table 16-14.
Table 16-14: Costs to be Included in the Various Cut-Off Values
Cut-Off Value | G&A | Processing | Surface Handling | Mining | Sustaining | Operating |
Fully Costed | Y | Y | Y | Y | Y | Y |
Incremental | Y | Y | Y | Y | Partial | N |
Marginal | Y | Y | Y | N | N | N |
The Cut-Off value was based on estimates provided by Ausenco, as well as benchmarks from similar operations and is summarised in Table 16-15.
Table 16-15: Summary of the Various Cut-Off Values - Preliminary Estimates
COV Type | Unit | LHS | DAF |
Fully Costed | NSR / t | 106.60 | 120.70 |
Incremental | NSR / t | 62.00 | 82.00 |
Marginal | NSR / t | 22.00 | 22.00 |
Elevated | NSR / t | 200.00 | 200.00 |
16.4.3 Stope Design Parameters
Due to the variability in the veins of the deposit and the anticipated mining methods, a range of stope design parameters were discussed and selected to be used to generate the stope shapes. These are summarised in Table 16-16. Following generation of the shapes, a preliminary evaluation (orphan analysis) was completed to assess whether the selected shapes would pay for the proposed development. The parameters used to complete the orphan analysis are summarised in Table 16-17.
|
|
Table 16-16: Preliminary MSO Parameters
Parameter | Unit | Copala - LHS | Copala - DAF | Napoleon - LHS | Other - LHS |
COV | $/t NSR | 106.60 | 120.70 | 106.60 | 106.60 |
Minimum Mining Width | m | 4.0 | 4.0 | 3.0 | 2.0 |
Height | m | 20 | 4.0 | 20 | 20 |
Strike Length | m | 5 | N/A | 5 | 5 |
HW Dilution | m | 0.5 | - | 0.5 | 0.5 |
FW Dilution | m | 0.5 | 0.3 | 0.5 | 0.5 |
Table 16-17: Key Economic Screening Parameters
Parameter | Unit | Value |
Development - Capital - Lateral | $/m | 2,950 |
Development - Operating - Lateral | $/m | 2,450 |
Development - Capital - Vertical | $/m | 6,000 |
Allocated Mining Costs [LHS / DAF] | $/t mined | 64.40 / 78.50 |
Allocated Milling, G&A Costs | $/t mined | 42.20 |
Revenue Factor | $ / NSR mined | 1 |
Figure 16-9 illustrates the stope width for MSO shapes passing the orphan analysis process showing an average stope width of 7.96m (excluding Drift-and-fill development). Figure 16-10, Figure 16-11 and Figure 16-12 illustrate the final design with stope widths coloured in ranges.
|
|
Figure 16-9: MSO Selection following Orphans and Width
![]()
Source: Entech, July 2024
|
|
Figure 16-10: Stope Shape Width for the Panuco Project
![]()
Source: Entech, July 2024
Figure 16-11: Stope Shape Width for the Panuco Project - Copala Mine
![]()
Source: Entech, July 2024
|
|
Figure 16-12: Stope Shape Width for the Panuco Project - Napoleon Mine
![]()
Source: Entech, July 2024
16.5 Underground Mine Design
16.5.1 Mine Operations
Due to the distance between the various mineral deposits, the project was designed into two separate underground mines. The Copala Mine portal, the larger of the two designs, accesses the Copala, Cristiano, and Tajitos deposits. The Napoleon Mine portal accesses the Napoleon, La Luisa, Cruz Negra, and Josephine deposits which are located to the west of the Copala Mine.
The outputs from MSO and associated development design for the Panuco Project are illustrated in Figure 16-13, with additional detail provided in Figure 16-14 and Figure 16-15 for the Copala Mine and Napoleon Mine respectively. The proposed development has been positioned to access mineralisation as early as possible.
|
|
Figure 16-13: MSO Outputs and Proposed Development by Geological Domain
![]()
Source: Entech, July 2024
Figure 16-14: MSO Output and Proposed Development by Geological Domain: Copala Mine
![]()
Source: Entech, July 2024
|
|
Figure 16-15: MSO Output and Proposed Development by Geological Domain: Napoleon Mine
![]()
Source: Entech, July 2024
16.5.2 Development
The development design incorporates a minimum stand-off distance of 50 m to locate the ramp away from mineralisation. This distance is assumed to avoid damage to the ramp due to ground stress changes and blasting from stope extraction. This stand-off distance also allows sufficient space between the ramp and the mineralised body for the excavation of the level accesses, stockpiles, and sumps.
A ramp mined with an arched profile will be excavated to a width of 5.5 m and a height of 5.0 m. This profile allows sufficient room to accommodate a larger underground fleet as well as secondary ventilation ducting and service piping. Other planned development includes the following:
Access drifts,
Sills (development on mineralisation),
Operating waste development (sills mining material below cut-off),
Sumps, escapeways, and accesses to the escapeways,
Return airways and accesses to the return airways,
Stockpiles, and
|
|
- Footwall drifts, where required.
A conventional level layout for the mine is provided in Figure 16-16.
Figure 16-16: Panuco Project Development Level Layout
![]()
Source: Entech, July 2024
The various development profiles are shown in Table 16-18.
Table 16-18: Development Profiles for the Panuco Project
Development Type | Profile Shape | Width (m) | Height (m) |
Ramp | Arch | 5.5 | 5.0 |
Access | Arch | 5.5 | 5.0 |
Stockpile | Arch | 5.5 | 5.0 |
Sump | Arch | 5.5 | 5.0 |
Ventilation Accesses | Arch | 5.5 | 5.0 |
Escapeway Access | Arch | 5.0 | 5.0 |
Production Access Drift (Past level infrastructure) | Arch | 4.0 | 4.0 |
Production Drift | Arch | 4.0 | 4.0 |
Escapeway Raises | Circular | 2.4 | - |
Ventilation Raises ( > 20 m ) | Circular | 4.5 | - |
Ventilation Raises ( ≤ 20 m ) | Rectangle | 4.0 | 4.0 |
|
|
16.5.3 Production
The mining methods selected for the different locations within mining blocks are as follows:
Longitudinal longhole stoping pastefill (CRF prior to plant commissioning), and
Drift-and-fill with CRF and unconsolidated backfill.
Figure 16-17 and Figure 16-18 illustrate the selected mining method that is proposed for the Copala Mine and Napoleon Mine respectively. In addition to the mining methods, the stope shapes coded by NSR are illustrated in Figure 16-19.
Figure 16-17: Proposed Mining Method for the Copala Mine
![]()
Source: Entech, July 2024
|
|
Figure 16-18: Proposed Mining Method for the Napoleon Mine
![]()
Source: Entech, July 2024
Figure 16-19: Proposed Stope Shapes by NSR ($US /t) for the Panuco Project
![]()
Source: Entech, July 2024
|
|
16.6 Mine Schedule
16.6.1 Activity and Equipment Rates
Contractor mining is currently proposed for the Panuco Project to minimise up front capital and achieve higher productivities. The development rates used are inclusive of the time taken to drill, blast, ventilate, muck, and install ground support. These rates are similar to observations by Entech at other operations in Mexico and similar mining jurisdictions. Contractors would expect to achieve 210 m/mth per jumbo with the proposed single heading advance rates summarized in Table 16-19.
Table 16-19: Development Activity and Equipment Rates for the Panuco Project
Activity | Units | Single Heading Rate |
Lateral Development - Capital | m / day | 3.5 |
Lateral Development - Operating | m / day | 1.75 |
Vertical Development | m / day | 2.0 |
Production rates are broken into specific activities due to the longer duration for each. The equipment is set to meet the capacity of each individual activity which can only be completed sequentially. LHS drilling assumes a modern longhole drill rig, while both production activities assume the use of stope loaders for mucking. The truck loading and hauling rates are factored into the production activity rates. These rates are summarized in Table 16-20.
Table 16-20: Production Activity and Equipment Rates the Panuco Project
Activity | Units | Activity Rate |
Drilling - Reamer | drill m / day | 200 |
Drilling - Slot | m / day | 200 |
Drilling - Production | m / day | 200 |
Drilling - Cablebolt | m / day | 200 |
Drilling - Fill/Breather | m / day | 200 |
Stope Mucking - Longitudinal | t / day | 200 - 1,000 |
Drift-and-fill Production | t / day | 130 |
Pastefill | m3 / day | 1,500 |
Stope loader productivity was adjusted based on the loader tram distance for longitudinal stoping, with an average mucking rate of approximately 375 t/d. For drift-and-fill production, a rate of 3.0m per day per heading was scheduled, which equates to approximately 130 t/d. The 17 t capacity loaders were scaled down to approximately 14 t to allow for efficiency losses (equipment availability, fill factors, and operator effectiveness) for stoping and development mucking activities and scaled down to 16 t for truck loading. It is expected that operators could achieve an average of 50 buckets per shift (scaled down for longer trams) when in production and 60 buckets per shift for development and truck loading.
|
|
16.6.2 Lateral Development
There are a maximum of seven jumbos proposed for mine for development, split across the two portals, which is considered sufficient to meet the estimated annual lateral development requirements.
The annual lateral development schedule is illustrated in Figure 16-20, while the total and initial lateral development schedule is summarized in Table 16-21.
Figure 16-20: Annual Lateral Development Schedule for the Panuco Project
![]()
Source: Entech, July 2024
|
|
Table 16-21: Total and Annual Lateral Development Schedule for the Panuco Project
Development Lateral | Capital | Ramp | Other | Operating | Sills | Other | Total |
Year \ Total | 43.9 | 20.3 | 23.6 | 82.2 | 72.4 | 9.8 | 126.2 |
Y-02 | 2.4 | 1.3 | 1.1 | 1.2 | 1.0 | 0.2 | 3.5 |
Y-01 | 1.6 | 0.7 | 0.9 | 5.6 | 5.0 | 0.6 | 7.3 |
Y01 | 4.8 | 2.8 | 2.1 | 5.9 | 4.4 | 1.4 | 10.7 |
Y02 | 7.1 | 3.5 | 3.6 | 4.4 | 4.1 | 0.4 | 11.5 |
Y03 | 6.1 | 2.4 | 3.8 | 8.3 | 6.7 | 1.6 | 14.5 |
Y04 | 4.8 | 2.2 | 2.6 | 9.6 | 8.6 | 1.0 | 14.4 |
Y05 | 2.9 | 1.4 | 1.4 | 11.0 | 10.3 | 0.7 | 13.9 |
Y06 | 3.6 | 1.4 | 2.2 | 10.9 | 9.5 | 1.4 | 14.5 |
Y07 | 4.6 | 2.3 | 2.3 | 10.3 | 8.9 | 1.4 | 14.9 |
Y08 | 4.5 | 1.8 | 2.7 | 10.3 | 9.4 | 0.8 | 14.8 |
Y09 | 1.4 | 0.5 | 0.9 | 4.7 | 4.5 | 0.2 | 6.1 |
Y10 | - | - | - | - | - | - | - |
Y11 | - | - | - | - | - | - | - |
16.6.3 Vertical Development
Vertical development is completed by a combination of longhole mining techniques and raiseboring. For ventilation raises greater than 20 m vertical in length, a 4.5 m diameter raisebore is proposed. For shorter raises, longhole blasting is proposed to excavate a profile of 4.0 m by 4.0 m. Egress raises will be completed by a 2.4 m diameter raisebore for raises greater than 20m in length or longhole blasting of 2.4 m by 2.4 m for raises less than 20 m vertical. For scheduling, a development rate of 2 m per day was applied to all vertical development.
The annual vertical development schedule is illustrated in Figure 16-21, while the total and initial lateral development schedule is summarized in Table 16-22.
|
|
Figure 16-21: Annual Vertical Development Schedule for the Panuco Project
![]()
Source: Entech, July 2024
Table 16-22: Total and Annual Vertical Development Schedule for the Panuco Project
Development Vertical | Ventilation | Egress | Total |
Year\Total | 3.00 | 2.60 | 5.60 |
Y-02 | 0.11 | 0.09 | 0.20 |
Y-01 | 0.12 | 0.08 | 0.20 |
Y01 | 0.20 | 0.15 | 0.35 |
Y02 | 0.78 | 0.64 | 1.43 |
Y03 | 0.28 | 0.17 | 0.44 |
Y04 | 0.36 | 0.31 | 0.68 |
Y05 | 0.18 | 0.19 | 0.37 |
Y06 | 0.25 | 0.21 | 0.45 |
Y07 | 0.26 | 0.31 | 0.58 |
Y08 | 0.30 | 0.31 | 0.61 |
Y09 | 0.14 | 0.14 | 0.29 |
Y10 | - | - | - |
Y11 | - | - | - |
|
|
16.6.4 Longhole Drilling
Longhole drilling productivity is expected to be 200 m per day on average for the drilling activities undertaken. For the Panuco mine, up to five longhole drill rigs are estimated to meet the estimated annual drilling requirements.
The annual longhole drilling schedule is illustrated in Figure 16-22 while the total and initial longhole drilling schedule is summarized in Table 16-23.
Figure 16-22: Annual Longhole Drilling Schedule for the Panuco Project
![]()
Source: Entech, July 2024
|
|
Table 16-23: Total and Annual Longhole Drilling Schedule for the Panuco Project
Drilling | Production | Cable bolt | Other | Total |
Year\Total | 2,853.0 | 77.3 | 85.0 | 3,015.3 |
Y-02 | 0.0 | 1.0 | 0.0 | 1.0 |
Y-01 | 46.8 | 2.1 | 0.0 | 48.9 |
Y01 | 133.3 | 4.5 | 1.3 | 139.1 |
Y02 | 206.3 | 6.1 | 4.8 | 217.3 |
Y03 | 208.0 | 6.7 | 3.6 | 218.3 |
Y04 | 228.2 | 6.2 | 5.7 | 240.1 |
Y05 | 239.4 | 7.1 | 7.5 | 254.1 |
Y06 | 263.2 | 7.9 | 9.9 | 281.0 |
Y07 | 288.2 | 8.2 | 10.5 | 306.8 |
Y08 | 282.1 | 9.0 | 8.9 | 300.0 |
Y09 | 356.8 | 7.2 | 13.1 | 377.1 |
Y10 | 417.9 | 7.4 | 13.9 | 439.2 |
Y11 | 182.8 | 3.9 | 5.8 | 192.5 |
16.6.5 Material Movement
The load-and-haul fleet is proposed to comprise of large and efficient fleet of 17 t loaders and 51 t trucks. The estimated annual quantities are summarized in Table 16-24 and the trucking requirements illustrated in Figure 16-23. The trucking requirements are split between two separate mining areas at Copala and Napoleon.
Table 16-24: Load and Haul Fleet for the Panuco Project
Equipment Type | Description | Annual Peak Requirements |
Development Loaders | LH514 | 3 |
Production Loaders | LH514 | 7 |
Truck Loaders | LH517 | 5 |
Trucks | TH551 | 6 |
|
|
Figure 16-23: Annual Trucking Requirements & Capacity (Peak)
![]()
Source: Entech, July 2024
Annual mineralisation movement is illustrated in Figure 16-24 and summarized in Table 16-25. COVs for the High-Grade (HG), Medium-Grade (MG), and Low-Grade (LG) bins are $400/t NSR, $300/t NSR, and < $300/t NSR respectively. The purpose of the stockpiles is to allow higher grading mineralisation to be preferentially processed allowing a lower grade stockpile to build over time.
|
|
Figure 16-24: Mineralised Material Plan for the Panuco Project
![]()
Source: Entech, July 2024
Table 16-25: Total and Annual Material Movement Schedule for the Panuco Project
Period | Waste | Development | Stoping | Mineralised Material | Total Material |
(kt) | (kt) | (kt) | (kt) | (kt) | |
Year\Total | 4,975 | 2,848 | 11,759 | 14,607 | 19,582 |
Y-02 | 227 | 26 | - | 26 | 253 |
Y-01 | 178 | 226 | 183 | 409 | 587 |
Y01 | 498 | 194 | 597 | 790 | 1,288 |
Y02 | 711 | 170 | 1,116 | 1,285 | 1,996 |
Y03 | 697 | 231 | 1,166 | 1,398 | 2,094 |
Y04 | 574 | 337 | 1,213 | 1,549 | 2,123 |
Y05 | 402 | 396 | 1,131 | 1,526 | 1,928 |
Y06 | 477 | 369 | 1,035 | 1,404 | 1,882 |
Y07 | 535 | 355 | 1,026 | 1,381 | 1,916 |
Y08 | 492 | 388 | 1,024 | 1,412 | 1,903 |
Y09 | 186 | 156 | 1,244 | 1,400 | 1,586 |
Y10 | - | 1 | 1,403 | 1,404 | 1,404 |
Y11 | - | - | 623 | 623 | 623 |
|
|
16.6.6 Backfill
All production voids are proposed to be filled. A combination of cemented rock fill (CRF) and waste rock fill (WRF), along with paste backfill will be utilised. Prior to commissioning of the paste plant, stopes will be mined in a "bottom-up" sequence. This will allow for the voids to be filled with CRF and a portion of RF. When paste filling commences, the mining sequence will convert in many areas to a "top-down" sequence which will facilitate mining.
When mining top-down, binder content will likely be higher for the plug (the initial pour of approximately 6 m of the 20 m high stope void) to reduce the amount of dilution when the fill is exposed from below. When mining bottom-up, the fill is proposed to have a lower binder content, given that the exposure is primarily to side of the stope. For the purposes of costing, the plug is to contain 6% binder, while the main pour is to contain 3% binder.
The annual backfill profile is illustrated in Figure 16-25 while the total and initial annual backfill schedule is summarized in Table 16-26.
Figure 16-25: Annual Backfill Schedule for the Panuco Project
![]()
Source: Entech, July 2024
|
|
Table 16-26: Backfill Schedule by type for the Panuco Project
Backfill | Pastefill - High | Pastefill - Low | Rockfill - High | Rockfill - Low Cement | Rockfill - No | Total Backfill |
Year\Total | 802 | 2,746 | 179 | 787 | 880 | 5,388 |
Y-02 | - | - | - | - | - | - |
Y-01 | - | - | - | 43 | 35 | 78 |
Y01 | - | - | 31 | 88 | 92 | 213 |
Y02 | 51 | 156 | 90 | 84 | 133 | 512 |
Y03 | 64 | 176 | 20 | 113 | 138 | 511 |
Y04 | 75 | 218 | 21 | 141 | 144 | 599 |
Y05 | 59 | 205 | 15 | 120 | 142 | 541 |
Y06 | 81 | 280 | 3 | 64 | 73 | 502 |
Y07 | 95 | 308 | - | 31 | 30 | 464 |
Y08 | 82 | 311 | - | 29 | 34 | 456 |
Y09 | 114 | 431 | - | 13 | 10 | 567 |
Y10 | 133 | 449 | - | 42 | 34 | 658 |
Y11 | 47 | 205 | - | 19 | 16 | 287 |
The Panuco project will have a surplus of waste produced. This will be placed in waste storage facilities on surface. The balance of waste produced and the waste placed as backfill is shown in Table 16-27.
|
|
Table 16-27: Waste Backfill Balance for the Panuco Project
Waste Balance | Waste Mined | Total Backfill | Waste Backfill | Paste Backfill | Waste Backfill | Waste-Backfill Balance | Cumulative |
Year\Total | 4,975 | 5,388 | 1,846 | 3,542 | 3,563 | 1,412 |
|
Y-02 | 227 | - | - | - | - | 227 | 227 |
Y-01 | 178 | 78 | 78 | - | 150 | 28 | 255 |
Y01 | 498 | 213 | 211 | 1 | 408 | 90 | 345 |
Y02 | 711 | 512 | 306 | 206 | 591 | 119 | 464 |
Y03 | 697 | 511 | 271 | 240 | 522 | 175 | 639 |
Y04 | 574 | 599 | 307 | 293 | 592 | -18 | 621 |
Y05 | 402 | 541 | 276 | 265 | 533 | -132 | 490 |
Y06 | 477 | 502 | 140 | 361 | 271 | 206 | 696 |
Y07 | 535 | 464 | 61 | 404 | 117 | 417 | 1,113 |
Y08 | 492 | 456 | 63 | 393 | 121 | 371 | 1,484 |
Y09 | 186 | 567 | 23 | 545 | 44 | 142 | 1,627 |
Y10 | 0 | 658 | 76 | 582 | 147 | -147 | 1,479 |
Y11 | 0 | 287 | 35 | 252 | 67 | -67 | 1,412 |
16.6.7 Run-of-Mine Plan
Mined material will be delivered by the underground fleet to a surface stockpile outside each portal and then transported via surface haul trucks to the Run-of-Mine (ROM) stockpile for processing. The total and initial annual ROM production schedule is summarized in Table 16-28 and the subset of Mineral Resources within the PEA mine plan breakdown is shown in Table 16-29.
|
|
Table 16-28: Annualized Mineralised Material Delivered to ROM
Feed | Tonnes | Ag | Au | Pb | Zn | AgEq(1) | Ag | Au | Pb | Zn | AgEq |
Total | 14,607 | 228 | 1.90 | 0.19% | 0.60% | 382 | 107,190 | 891.3 | 625 | 1,937 | 179,326 |
Y-02 | 26 | 217 | 2.33 | 0.03% | 0.06% | 405 | 184 | 2.0 | 0 | 0 | 343 |
Y-01 | 409 | 364 | 2.26 | 0.06% | 0.13% | 547 | 4,785 | 29.7 | 6 | 12 | 7,186 |
Y01 | 790 | 399 | 2.40 | 0.09% | 0.18% | 593 | 10,140 | 60.9 | 17 | 31 | 15,072 |
Y02 | 1,285 | 370 | 2.25 | 0.09% | 0.16% | 552 | 15,307 | 92.9 | 26 | 47 | 22,823 |
Y03 | 1,397 | 276 | 1.82 | 0.07% | 0.15% | 424 | 12,412 | 81.9 | 22 | 47 | 19,042 |
Y04 | 1,549 | 226 | 1.65 | 0.10% | 0.23% | 360 | 11,259 | 82.3 | 35 | 79 | 17,920 |
Y05 | 1,526 | 205 | 1.73 | 0.15% | 0.40% | 345 | 10,053 | 84.8 | 50 | 136 | 16,917 |
Y06 | 1,404 | 210 | 1.79 | 0.23% | 0.73% | 355 | 9,501 | 80.7 | 72 | 225 | 16,032 |
Y07 | 1,381 | 179 | 1.94 | 0.25% | 0.84% | 336 | 7,962 | 85.9 | 75 | 255 | 14,917 |
Y08 | 1,412 | 150 | 1.83 | 0.25% | 0.88% | 298 | 6,798 | 83.1 | 77 | 273 | 13,526 |
Y09 | 1,400 | 150 | 1.86 | 0.32% | 1.13% | 300 | 6,745 | 83.6 | 98 | 348 | 13,513 |
Y10 | 1,404 | 198 | 1.92 | 0.32% | 1.10% | 354 | 8,951 | 86.8 | 99 | 342 | 15,977 |
Y11 | 623 | 155 | 1.83 | 0.35% | 1.03% | 303 | 3,093 | 36.7 | 48 | 142 | 6,060 |
(1): AgEq: The Ag-Eq grade was calculated considering revenue from silver and gold only, using the formula below and the economic parameters listed in Table 16-12 and Table 16-13: Ag-Eq Grade = Ag Grade + Au Grade * (Au Recovery * Au Payable * Au Price) / (Ag Recovery * Ag Payable * Ag Price)
Table 16-29: Mineralised Material Classification Summary
Classification | % | Tonnes (kt) | Ag (g/t) | Au (g/t) | Pb (%) | Zn (%) | AgEq (g/t) |
Measured | - | - | - | - | - | - | - |
Indicated | 32.5 | 4,749 | 367 | 3.04 | 0.28 | 0.82 | 613 |
Inferred | 31.9 | 4,664 | 341 | 2.85 | 0.32 | 1.06 | 571 |
Dilution1 | 35.6 | 5,194 | - | - | - | - | - |
Total | 100.0 | 14,607 | 228 | 1.90 | 0.19 | 0.60 | 382 |
1-Dilution is non-mineralised material outside of the proposed stopes that already include planned and unplanned dilution
16.7 Underground Infrastructure and Services
16.7.1 Portals
There are two portal locations planned for the Panuco Project: one for the Copala, Cristiano and Tajitos deposits and another for the Napoleon, La Luisa, Cruz Negra, and Josephine deposits. The Napoleon Portal will commence approximately 36 months after the Copala Portal is excavated, and both portals will remain active until the end of the planned mine life. There will be approximately 11 years of production from the mine.
16.7.2 Primary Ventilation
The proposed ventilation system for the Panuco Project is to use a pull system with fresh air being drawn through the main ramps for each mine. For both portals, a fresh air ventilation raise will be required in addition to the portals to provide supplement airflow and reduce airspeeds along the ramp. Spent air will then exhaust out of the series of exhaust vent raises to surface access from each production level.
|
|
The ventilation circuit for each underground project was imported into Ventsim®, an industry-standard software used in ventilation modelling to simulate the flows predicted for the mine. The ventilation demand was estimated based on Mexican regulations that require a minimum ventilation airflow of 75 CFM per HP (0.047m3/s per kW) of mobile equipment. An additional allowance for leakage, mine loss, and maintaining a minimum airflow velocity of 0.5 m/s has also been considered for each portal.
It is recommended that all primary fans should be equipped with variable speed/frequency drives (VSFD) and have adjustable pitch angles. This and the use of automated louvres, will reduce the overall operating costs associated with ventilation and provide flexibility for the mobile fleet should reassignment amongst the ramps be required.
There are 4 surface exhaust raises planned for the Copala Portal, located atop each of the four ramps to be developed, with a total installed fan power of 720 kW, which will provide approximately 372 m3/s (92 m3/s per ramp) during the peak production phase of the mine (~ Year 4 of production). The ventilation demand is summarised in Table 16-30 and the ventilation fan installations for the Copala Portal is illustrated in Figure 16-21.
There is a single surface exhaust raise planned for the Napoleon Portal, with a total installed fan power of 880 kW, which will provide approximately 246 m3/s (80 m3/s per ramp) during the peak production phase of the mine (~ Year 10 of production). The ventilation demand is summarised in Table 16-31 and the ventilation fan installation for Napoleon Portal is illustrated in Figure 16-27.
|
|
Table 16-30: Ventilation Demand Estimate for the Copala Mine
Equipment/Unit | Model | Quantity (#) | Engine Power (kW) | Utilisation | Demand (m3/s) |
Trucks | TH551 | 5 | 450 | 80% | 108.0 |
Loaders | LH514 | 8 | 256 | 80% | 98.3 |
Loaders - Truck | LH517 | 3 | 310 | 80% | 44.6 |
Development Drill | DD321 | 4 | 89 | 40% | 8.5 |
Production Drill | DLS321 | 3 | 134 | 40% | 9.6 |
Ground Support Drill | DD311 | 3 | 59 | 40% | 4.2 |
ANFO Loaders | SF404 | 2 | 96 | 40% | 6.9 |
Light Vehicles | Various | 9 | 122 | 20% | 13.2 |
Scaler | Scamec 2000 | 3 | 104 | 20% | 3.7 |
Sprayer | Spraycon 313 | 3 | 140 | 20% | 5.0 |
Grader | 120 AWD | 1 | 97 | 60% | 3.5 |
Mine Services Truck | MF100 | 2 | 82 | 20% | 2.0 |
Integrated Tool Carrier | TL943D | 2 | 82 | 20% | 2.0 |
Subtotal | - | - | - | - | 309.7 |
Mine Leakage | 20% | - | - | - | 61.9 |
Total | - | - | - | - | 371.6 |
Figure 16-26: Primary Ventilation Layout of the Copala Mine
![]()
Source: Entech, July 2024
|
|
Table 16-31: Ventilation Demand Estimate for the Napoleon Mine
Equipment/Unit | Model | Quantity (#) | Engine Power (kW) | Utilisation | Demand (m3/s) |
Truck | TH551 | 3 | 450 | 80% | 64.8 |
Loaders | LH514 | 5 | 256 | 80% | 61.4 |
Loaders - Truck | LH517 | 2 | 310 | 80% | 29.8 |
Development Drill | DD321 | 3 | 89 | 50% | 8.0 |
Production Drill | DLS321 | 2 | 134 | 50% | 8.0 |
Ground Support Drill | DD311 | 2 | 59 | 50% | 3.5 |
Anfo Loaders | SF404 | 3 | 96 | 25% | 4.3 |
Light Vehicles | Various | 6 | 122 | 25% | 11.0 |
Scaler | Scamec 2000 | 2 | 104 | 25% | 3.1 |
Sprayer | Spraycon 313 | 2 | 140 | 25% | 4.2 |
Grader | 120 AWD | 1 | 97 | 75% | 4.4 |
Mine Services Truck | MF100 | 1 | 82 | 25% | 1.2 |
Integrated Tool Carrier | TL943D | 1 | 82 | 25% | 1.2 |
Subtotal | - | - | - | - | 205.0 |
Mine Leakage | 20% | - | - | - | 41.0 |
Total | - | - | - | - | 246.0 |
Figure 16-27: Primary Ventilation Layout of the Napoleon Mine
![]()
Source: Entech, July 2024
|
|
16.7.3 Auxiliary Ventilation
Where headings are located outside of the primary ventilation circuit, auxiliary fans are required to push the air to the working headings. A variety of secondary fans, typically 45 - 90 kW in size, will be installed to deliver the required airflow through flexible ducting to the working headings. The aim is to deliver up to approximately 10 - 15m3/s of airflow to each active heading face depending on requirements. As levels are configured for truck loading to occur in flow-through ventilation, the auxiliary ventilation is predominantly to cater for mucking activities.
16.7.4 Secondary Means of Egress and Refuge Chambers
A secondary means of egress will be excavated between each level, with a connection from the top level of each mine to surface. Egress raises will be developed between levels via raisebore. These will then be outfitted with emergency egress ladderways and access double doors installed in a wall to reduce entry of smoke and other contaminants.
Emergency alarm and stench gas systems will be installed to notify personnel of an emergency. These will be installed on surface at the entrance to the main ramp and in the compressed air line. The egress routes for both the Copala Portal and Napoleon Portal are illustrated Figure 16-28 and Figure 16-29, respectively.
Figure 16-28: Egress Layout of the Copala Mine
![]()
Source: Entech, July 2024
|
|
Figure 16-29: Egress Layout of the Napoleon Mine
![]()
Source: Entech, July 2024
16.7.5 Water Management
A series of helical rotor pumps are currently proposed for the Panuco Project, capable of pumping mine water containing up to 5% solids. The proposed system is to manage solids within the pumped water and transport it to surface for desliming and potential use for processing or reuse underground. Both dewatering systems are to incorporate an eight-inch (8") Schedule 40 steel pipe to surface that is capable of handling approximately 80 l/s. The pumping system is proposed to be comprised of three 75 kw pumps (2 duty, 1 standby) capable of pumping ~40 l/s over 200-240 m of head. For the Copala Portal, five pump stations are proposed, with another five pump stations at the Napoleon Portal.
Figure 16-30 and Figure 16-31 illustrate the proposed pumping stations for the project. The primary pump stations will be supported by travelling helical-rotor pumps (skid mounted) that will be periodically moved with the advancing development. Additional 8-15 kW sump pumps with compliment the system and have been included in the cost estimate.
|
|
Figure 16-30: Proposed Primary Dewatering - Copala Mine
![]()
Source: Entech, July 2024
Figure 16-31: Proposed Primary Dewatering - Napoleon Mine
![]()
Source: Entech, July 2024
|
|
16.7.6 Compressed Air
A single air compressor installed on surface at each portal is proposed to support compressed air needs. The compressed air is transferred through a single four-inch pipe that is routed via main ramps and service holes between levels. All compressors will be installed with an air accumulator.
16.7.7 Electrical Power
Electrical power is supplied by the site power station located at the processing facility. The power station produces energy at 4,160 V and is routed through the mine to the primary substations. Power is then stepped down via a transformer for use by plant and equipment. Several electrical transformers are strategically located underground to provide the necessary power for mining activities.
An estimate that includes equipment utilisation for plant and the mobile fleet has been summarised in Table 16-32.
Table 16-32: Panuco Project Power Estimate (Mining Activities Only)
Year | Energy Consumption (MWh) | Power (kW) |
Y-02 | 5,635 | 643 |
Y-01 | 11,646 | 1,330 |
Y01 | 16,215 | 1,851 |
Y02 | 19,587 | 2,236 |
Y03 | 27,007 | 3,083 |
Y04 | 31,301 | 3,573 |
Y05 | 33,178 | 3,787 |
Y06 | 33,276 | 3,799 |
Y07 | 33,616 | 3,837 |
Y08 | 33,375 | 3,810 |
Y09 | 28,890 | 3,298 |
Y10 | 24,589 | 2,807 |
Y11 | 19,003 | 2,169 |
16.8 Mine Personnel
The Panuco Project is proposed to operate seven days a week with two 12-hr shifts for 365 days per year. It is assumed that the contractor would select a time rotation to attract and retain labour. The estimated labour quantities are summarised in Table 16-33.
|
|
Table 16-33: Panuco Project Mine Personnel Estimate
Position Description | Headcount (max) |
Management | 2 |
Senior Engineers, Geologist, Surveyor, Geotechnical | 6 |
Engineers, Geologists, Surveyors, Geotechnical | 29 |
Technicians, Samplers | 12 |
Subtotal Owners | 49 |
Contractor Operations Labour1 | 150 |
Contractor Maintenance Labour1 | 60 |
Contractor Management, Supervision, Support | 54 |
Subtotal Contractor | 264 |
Total | 313 |
(1) On site to cover two 12-hours shifts operation.
|
|
17 RECOVERY METHODS
17.1 Overview
The process design is based on processing mineralized material from the Panuco deposits, through crushing, grinding cyanide leaching and precious metal recovery via the Merrill Crowe process and converted to bulk flotation with concentrate regrind and concentrate leach in Year 4. The design is based on previous test work programs performed on the deposit, Ausenco's extensive database of reference projects, and in-house process modelling. The process plant has been designed with assumed availabilities of 65% for the crushing plant, and 92% for all other processing circuits, based on industry-proven industry values. The plant will operate with two 12-hour shifts per day, 365 days per year.
A staged expansion approach for the process plant has been selected. A simple Whole Ore Leach flowsheet for Year 1-3 will treat Copala material and bulk float-con leach-tail leach configuration will be added when Napoleon material is introduced from Year 4.
The expansion of the plant over the life of mine occurs as follows:
Phase 1 (Years 1 to 3) - 3 stage crushing, ball milling, followed by whole ore leach recovery at a throughput of 1.2 Mt/a,
Phase 2 (Years 4+) - conversion to bulk flotation with concentrate regrind, with concentrate and flotation tailings leach recovery at a throughput of 1.5 Mt/a.
17.2 Process Design Criteria
Table 17-1 presents the design criteria developed for the process plant.
Table 17-1: Process Design Criteria
Parameter | Units | Value | |
Phase 1 | Phase 2 | ||
Plant capacity | Mt/a | 1.2 | 1.5 |
Life of mine | years | 11 | |
Silver head grade, design | g/t | 387 | 230 |
Gold head grade, design | g/t | 2.35 | 1.77 |
Crushing plant availability | % | 65 | |
Grinding availability | % | 92 | |
JK Axb parameter, design | - | 31 | |
Bond ball mill work index, design | kWh/t | 18.3 | |
Bond abrasion index, design | g | 0.453 | |
Specific gravity | - | 2.64 | |
|
|
Parameter | Units | Value | |
Phase 1 | Phase 2 | ||
Crushing plant feed size, F80 | mm | 265 | |
Crushing plant product size, P80 | mm | 9 | |
Ball mill circulating load | % | 400 | |
Grinding circuit product size, P80 | µm | 70 | |
Primary cyclone overflow density | % solids w/w | 35 | |
Bulk flotation mass pull, design | % plant feed | - | 14.3 |
Bulk flotation regrind mill product size, P80 | microns | - | 20 |
Bulk flotation regrind specific energy | kWh/t | - | 9.8 |
Concentrate leaching residence time | hrs | - | 48 |
Concentrate residue thickener settling rate | t/h/m2 | - | 0.25 |
Concentrate residue thickener underflow density | % solids w/w | - | 50 |
Bulk leaching pre-leach thickener settling rate | t/h/m2 | 0.80 | |
Bulk leaching pre-leach thickener underflow density | % solids w/w | 50 | |
Bulk leaching residence time | hrs | 96 | 72 |
Counter current decantation settling rate | t/h/m2 | 0.50 | |
Counter current decantation underflow density | % solids w/w | 50 | |
Counter current decantation wash ratio | m3 water: m3 feed slurry | 3.5 | |
Clarifier rise rate | m/h | 1.0 | |
Clarifying filter specific capacity | m3/h/m2 | 2.2 | |
Zinc precipitation filter specific capacity | m3/h/m2 | 1.7 | |
Cyanide detoxification residence time | mins | 90 | |
Cyanide detoxification density | % solids w/w | 45 | |
Tailings thickener settling rate | t/h/m2 | 0.80 | |
Tailings thickener underflow density | % solids w/w | 65 | |
Paste plant capacity | t/d | 2400 | |
Paste plant utilization | % | 75 | |
17.3 Process Plant Description
The process design consists of the following major components:
Three-stage crushing of run of mine (ROM) material,
Ball milling in closed circuit with a classifying cyclone,
Bulk rougher flotation and concentrate regrind (Phase 2 only),
|
|
Cyanide leaching of the flotation concentrate (Phase 2 only),
Bulk leaching of the cyclone overflow (Phase 1) or of the flotation tailings and concentrate leach residue (Phase 2),
Counter-current decantation (CCD),
Zinc precipitation of the clarified pregnant solution and smelting to produce doré,
Cyanide detoxification,
Tailings thickening., and
Paste backfill plant
17.3.1 Process Flowsheet
The overall process flowsheet is presented below in Figure 17-1.
17.3.2 Mill Feed Schedule
The mill production schedule targets an annual production rate of 1.2 Mt from Years 1-3 and 1.5 Mt from Year 4. The LOM Mill feed schedule is presented below in Table 17-2.
|
|
Figure 17-1: Process Flow Diagram
![]()
Source: Ausenco, 2024.
|
|
Table 17-2: Mill Production Schedule
Schedule | Units | Total | Y01 | Y02 | Y03 | Y04 | Y05 | Y06 | Y07 | Y08 | Y09 | Y10 | Y11 |
High Grade Stockpile | kt | 12,185 | 1,096 | 1,167 | 1,124 | 1,231 | 1,163 | 1,119 | 1,128 | 1,132 | 1,188 | 1,290 | 548 |
Ag Grade | g/t | 257 | 419 | 399 | 316 | 265 | 245 | 244 | 204 | 169 | 163 | 208 | 162 |
Au Grade | g/t | 2.14 | 2.57 | 2.42 | 1.97 | 2.02 | 2.06 | 2.08 | 2.22 | 2.10 | 2.04 | 2.02 | 1.97 |
Pb Grade | % | 0.21 | 0.09 | 0.10 | 0.07 | 0.12 | 0.16 | 0.26 | 0.28 | 0.28 | 0.35 | 0.34 | 0.38 |
Zn Grade | % | 0.66 | 0.17 | 0.18 | 0.14 | 0.26 | 0.44 | 0.82 | 0.94 | 0.98 | 1.26 | 1.17 | 1.13 |
Low Grade Stockpile | kt | 2,422 | - | 33 | 76 | 229 | 297 | 341 | 332 | 328 | 272 | 170 | 343 |
Ag Grade | g/t | 82 | - | 91 | 97 | 90 | 77 | 82 | 74 | 75 | 79 | 91 | 91 |
Au Grade | g/t | 0.69 | - | 0.51 | 0.62 | 0.71 | 0.68 | 0.63 | 0.65 | 0.73 | 0.77 | 0.77 | 0.64 |
Pb Grade | % | 0.10 | - | 0.03 | 0.04 | 0.08 | 0.10 | 0.11 | 0.10 | 0.13 | 0.13 | 0.11 | 0.08 |
Zn Grade | % | 0.29 | - | 0.06 | 0.09 | 0.21 | 0.30 | 0.34 | 0.34 | 0.41 | 0.34 | 0.27 | 0.17 |
Total Tonnes | kt | 14,607 | 1,096 | 1,200 | 1,200 | 1,460 | 1,460 | 1,460 | 1,460 | 1,460 | 1,460 | 1,460 | 891 |
Ag Grade | g/t | 228 | 419 | 390 | 302 | 238 | 211 | 206 | 174 | 148 | 147 | 194 | 135 |
Au Grade | g/t | 1.90 | 2.57 | 2.37 | 1.89 | 1.82 | 1.78 | 1.74 | 1.86 | 1.79 | 1.81 | 1.87 | 1.46 |
Pb Grade | % | 0.19 | 0.09 | 0.09 | 0.07 | 0.11 | 0.15 | 0.23 | 0.24 | 0.24 | 0.31 | 0.31 | 0.26 |
Zn Grade | % | 0.60 | 0.17 | 0.17 | 0.14 | 0.25 | 0.41 | 0.71 | 0.80 | 0.85 | 1.09 | 1.07 | 0.76 |
|
|
17.3.3 Phase 1 Design
17.3.3.1 Crushing Circuit
The crushing circuit is a three-stage process that reduces run of mine (ROM) material from an 80% passing feed size (F80) of 265mm to an 80% passing product size (P80) of 9mm before being forwarded to the grinding circuit.
ROM material will be hauled from the mine and dumped into a hopper that feeds a vibrating grizzly screen. Oversize from this screen will be crushed by a jaw crusher before blending with the undersize to feed a double deck vibrating screen via conveyor. Oversize material from the top deck will be fed via conveyor to a secondary cone crusher, while oversize material from the bottom deck will feed via conveyor a tertiary cone crusher. The crushers will discharge onto the secondary screen feed conveyor. Undersize material from the screen will be sent via conveyor to a surge bin. A belt feeder will withdraw material from the surge bin to feed the grinding circuit. Overflow from the bin will be collected on a conveyor and sent to an emergency stockpile, which will be reintroduced to the plant feed by a front-end loader (FEL).
Major equipment in this area will include:
ROM hopper with static grizzly,
Vibrating grizzly screen,
Primary jaw crusher,
Secondary screen and feed conveyor,
Secondary cone crusher and feed conveyor,
Tertiary cone crusher and feed conveyor,
Surge bin and feed conveyor, and
Emergency stockpile and feed conveyor.
17.3.3.2 Grinding circuit
The grinding circuit consists of a ball mill operating in closed circuit with a classifying hydrocyclone to produce a primary grind size of 70 µm.
A belt feeder will withdraw crushed material from the surge bin and advance it directly to the ball mill feed chute. The ball mill will discharge through a trommel screen, with the undersize reporting to the cyclone feed pump box. Process water will be introduced to the pump box to dilute the slurry to the desired density before being pumped to the cyclone cluster. Overflow from the cyclone will pass through a trash screen before being transferred to the downstream processes. Underflow from the cyclone will be fed to the ball mill for additional size reduction.
Major equipment in this area will include:
|
|
Classification primary cyclone cluster,
Ball mill, and
Trash screen.
17.3.3.3 Bulk Leaching
Discharge from the trash screen will gravitate to a pre-leach thickener where flocculant will be added to facilitate solids settling. Thickener overflow will be forwarded to the process water tank, while underflow will be pumped to the bulk leaching tanks. Leaching will occur in a series of tanks that provide a total of 96 hours of retention time. Discharge from the final bulk leaching tank will gravitate to the counter current decantation (CCD) circuit.
Oxygen is sparged to the tanks to maintain the required levels of dissolved oxygen. Hydrated lime and sodium cyanide will be added to the first two tanks in the series to provide pH control and to maintain the required levels of cyanide respectively.
Major equipment in this area will include:
Pre-leach thickener, and
Four mechanically agitated leaching tanks.
17.3.3.4 Counter Current Decantation
Leached solids will be washed of pregnant solution through a series of counter current decantation thickeners. In each thickener, solids will be washed through the addition of overflow from the subsequent stage, while settling will be facilitated through flocculant addition. Thickener overflow will be advanced to the preceding stage to continuously increase precious metal concentration before being forwarded from the first thickener in series to the pregnant solution clarifier. Clarifier overflow will advance to a pregnant solution tank for feeding to the Merrill Crowe circuit. Underflow from the clarifier will be pumped as required back to the start of the bulk leaching circuit.
Thickener underflow will be pumped to the subsequent stage for further washing, until it passes out of the circuit from the last thickener in series with a maximum soluble metal content of 0.5 mg/L. Wash water in the form of barren solution will be added to the last thickener to maintain the circuit mass balance.
Major equipment in this area will include:
Five counter current decantation thickeners, and
One pregnant solution clarifier.
17.3.3.5 Merrill Crowe Circuit
Overflow from the clarifier will advance to the pregnant solution tank for storage prior to precious metal recovery via zinc precipitation. Solution will be pumped from the pregnant solution tank through rotating disk filters to further reduce total suspended solids (TSS) and subsequently a deaeration tower to reduce dissolved oxygen content. Deaeration tower bottoms will then be contacted with zinc powder and pumped to two plate and frame filters to recover the precious metal rich precipitate. Solids from the filters will be discharged and manually moved to the refinery for doré production, while filtrate advances to the barren solution tank. Barren solution will then be distributed to the CCD circuit as wash water and the detoxification circuit for dilution as necessary.
|
|
Antiscalant will be added to the pregnant and barren solution tanks to inhibit scale formation within the Merrill Crowe circuit. Diatomaceous earth will be added to both the clarifying and precipitation filters to improve filter performance. Zinc powder and lead nitrate will be added to precipitation filter feed to provide the necessary levels of zinc for precipitation and to improve reaction efficiency respectively.
Major equipment in this area will include:
Pregnant solution tank,
Two rotating disk clarifying filters,
Deaeration tower,
Two plate and frame precipitation filters, and
Barren solution tank.
17.3.3.6 Refinery
Precipitate from the Merrill Crowe circuit will be manually transferred to the refinery for smelting into silver-gold doré. Smelting will occur in batch mode in a secure, enclosed area with restricted access.
The refinery will be a vendor package and will include the following major equipment:
Melting furnace,
Flux dosing and mixing system,
Doré scale and storage vault,
Slag handling equipment, and
Dust collection system.
17.3.3.7 Cyanide Detoxification and Tailings Thickening
Final underflow from the CCD circuit will be pumped to the cyanide detoxification tanks where free weak acid dissociable cyanide (CNWAD) will be destroyed using the SO2/air process. Barren solution will be added to the tank to achieve the desired solids density. Cyanide detoxification will be conducted using parallel tanks that provide a total residence time of 90 minutes and reduce CNWAD concentration to below 5 mg/L. The discharge slurry from these tanks will flow by gravity to the tailings thickener where flocculant will be added to support solids settling. Overflow from the thickener will be pumped to the process water tank, while underflow will be pumped to either the tailings storage facility (TSF) or the paste backfill plant.
|
|
Copper sulphate will be added to the cyanide detoxification tanks to act as a catalyst for the destruction reaction. Oxygen gas and sodium metabisulphite (SMBS) will also be added as reactants. Hydrated lime will be added to the tanks to maintain the required reaction pH.
Major equipment in this area will include:
Two mechanically cyanide detoxification tanks, and
Tailings thickener.
17.3.3.8 Paste Backfill Plant
Thickened tailings will be pumped to a paste backfill mixing plant on an as required basis. The plant will include a cement binder silo, a binder dosing system, a paste mixer and hopper, and a positive displacement paste pump.
17.3.4 Phase 2 Design
During Phase 2 a flotation and concentrate leaching circuit is introduced to the flowsheet to support improved recoveries of Napoleon deposit material. The following subsections will describe the new additions to the flowsheet only; all other aspects of the plant design remain as described in Section 17.3.2.
17.3.4.1 Bulk Flotation
After expansion, the trash screen discharge will be diverted from the pre-leach thickener and instead now feed a froth flotation circuit. Flotation will be conducted in a series of conventional, forced air tank cells. Concentrate from each cell will be collected in launders and advanced to the regrind circuit. Tailings from the final flotation cell will feed by gravity into the pre-leach thickener from which it will continue through the process as described in Section 17.3.2. The Phase 2 throughput increase will result in a flotation tailings leach residence time of 72 hours.
Flotation concentrate will report to the regrind cyclone cluster, where fine material and water will be removed from the stream via the overflow and bypass the regrind mill. Underflow from the cyclone will be pumped to a vertical regrind mill for further size reduction and mineral liberation. Discharge from the regrind mill will be combined with the regrind cyclone overflow before being forwarded to the concentrate leaching circuit.
Potassium amyl xanthate (PAX) will be introduced to the flotation circuit as a collector to support sulphide mineral collection. Methyl isobutyl carbinol (MIBC) will be used as a frother to support froth generation and stability.
Major equipment in this area will include:
Five conventional forced air flotation tank cells,
Dewatering regrind cyclone cluster, and
|
|
- Vertical stirred regrind mill.
17.3.4.2 Concentrate Leaching
Discharge from the regrind circuit will be pumped to the concentrate leaching tanks. Leaching will occur in a series of tanks that provide a total of 48 hours of retention time. Discharge from the final concentrate leaching tank will advance to the concentrate leach residue thickener where flocculant will be added to facilitate solids settling. Thickener overflow will be forwarded to the pregnant solution clarifier, where the process continues as described in 17.3.3. Thickener underflow will be pumped to the bulk leaching tanks, where the process continues as described in Section 17.3.2.
Oxygen is sparged to the tanks to maintain the required levels of dissolved oxygen. Hydrated lime and sodium cyanide will be added to the first two tanks in the series to provide pH control and to maintain the required levels of cyanide respectively.
Major equipment in this area will include:
Three mechanically agitated leaching tanks, and
Residue thickener.
17.4 Reagents Handling and Storage
The reagent handling system (Table 17-3) will include unloading and storage facilities, mixing and storage tanks, and feeding equipment as needed for each of the required plant reagents. Each set of compatible reagents will be located in a dedicated containment area to prevent environmental contamination and mixing of incompatible reagents. Appropriate ventilation, fire, safety protection, eyewash stations, and safety data sheet (SDS) stations, will be located throughout the area. Sumps and sump pumps will be provided for each containment area for spillage control.
Table 17-3: Reagents Handling and Storage
Reagent | Preparation Method | Use |
Quicklime | Received as powder in bulk shipments and stored in a silo; slaked with raw water in a vertical mill and pumped to a storage tank; distributed via ring main to the leaching circuits and detox circuit | pH control |
Sodium cyanide | Received as powder in bulk bags; dissolved and transferred to a storage tank; distributed to cyanide leaching circuits | Leaching reagent |
PAX | Received as pellets in bulk bags; dissolved and transferred to a storage tank; distributed to flotation circuit | Flotation collector |
MIBC | Received as intermediate bulk containers; distributed neat to flotation circuit | Flotation frother |
Copper sulphate | Received as powder in bulk bags; dissolved and transferred to a storage tank; distributed to cyanide detoxification circuit | Cyanide destruction catalyst |
Lead nitrate | Received as powder in bulk bags; dissolved and transferred to a storage tank; distributed to Merrill Crowe circuit | Precipitation reagent |
|
|
Reagent | Preparation Method | Use |
Diatomaceous earth | Received as powder in bulk bags; dissolved and transferred to a storage tank; distributed to Merrill Crowe circuit | Filter aid |
Zinc powder | Received as powder in drums; dissolved and transferred to a storage tank; distributed to Merrill Crowe circuit | Precipitation reagent |
SMBS | Received as powder in bulk bags; dissolved and transferred to a storage tank; distributed to cyanide detoxification circuit | Cyanide destruction reagent |
Flux | Received as powder in bulk bags; mixed with calcined charges for smelting | Fusion reagent |
Antiscalant | Received as intermediate bulk containers; distributed neat to pregnant and barren solution tanks | Scale inhibitor |
Flocculant | Received as powder in bulk bags; dissolved and transferred to a storage tank; distributed to thickeners across the plant | Flocculation promotor |
Reagent consumptions were estimated based on test work results as described in Section 13. A summary of average annual consumption rates for each reagent and operating consumable in Table 17-4.
Table 17-4: Major Reagent and Operating Consumable Consumption Summary
Item | Unit | Phase 1 | Phase 2 |
Quicklime | t/a | 2,020 | 2,152 |
Sodium cyanide | t/a | 1,200 | 1,295 |
PAX | t/a | - | 24 |
MIBC | t/a | - | 38 |
Copper sulphate | t/a | 64 | |
Lead nitrate | t/a | 116 | |
Diatomaceous earth | t/a | 882 | |
Zinc powder | t/a | 307 | |
SMBS | t/a | 1,171 | |
Flux | t/a | 210 | |
Antiscalant | m3/a | 58 | |
Flocculant | t/a | 264 | 266 |
Ball mill media | t/a | 2,180 | |
Regrind mill media | t/a | - | 12 |
17.5 Plant Services
17.5.1 Raw Water
Raw water will be provided to the plant and stored in a raw water storage tank where it will be distributed to the various users across the plant site such as reagent preparation, gland seal water, potable water, and plant make-up. Approximately 350,000 m3 per annum will be required for consumption by the process plant.
|
|
17.5.2 Process Water
Process water for the plant will consist of pre-leach thickener overflow, tailings thickener overflow, and reclaim water from the TSF. Raw water will be provided as required for makeup. Process water will be stored in a storage tank before being pumped across the plant site to the various end users.
17.5.3 Gland Seal Water
Gland seal water for the plant will be sourced from the raw water tank and pumped to the various pumps across the plant site.
17.5.4 Fire Water
Fire water for the process plant will be stored in a dedicated volume within the raw water tank. A dedicated pump skid consisting of an electrical pump, jockey pump, and diesel pump will supply water from the fire water reserve volume to the distribution system.
17.5.5 Potable Water
Potable water will be produced by an on-site potable water plant which processes water from the freshwater tank. Potable water will be stored in a dedicated storage tank before being distributed to the various end users in the process plant.
17.5.6 Air
High-pressure air will be produced by compressors to meet plant requirements. The high-pressure air supply will be collected in a plant air received before being distributed across the plant. A dryer will be fed by the plant air receiver and discharge into an instrument air receiver prior to plant distribution.
17.5.7 Oxygen
Oxygen gas for the cyanide leaching and detoxification circuits will be generated from an on-site oxygen plant. The oxygen plant will employ vacuum swing adsorption (VSA) technology and will produce an oxygen stream of 93% purity at 100 psig.
17.5.8 Power
The total installed power requirement for the process plant is estimated at 5.4MW in Phase 1 and 6.1MW in Phase 2. Further discussion regarding the power supply and distribution system is available in Section 18. Further discussion around the operating costs associated with the plant power consumption is available in Section 21.
|
|
18 PROJECT INFRASTRUCTURE
18.1 Introduction
Infrastructure for the Panuco project will include on-site and off-site infrastructure such as civil workings, buildings and facilities, water and power supply systems, and other miscellaneous systems that support operations. The site infrastructure will include:
Mine facilities include the paste plant, truck shop, explosives storage, and other miscellaneous facilities,
Process facilities including the process plant, crusher facilities, assay lab, plant workshop and warehouse,
Tailings storage facility,
Administration offices and
Mine, process administration facilities will be serviced with potable water, fire water, compressed air, power, diesel, communication and sanitary systems.
Site selection was performed based the following inputs:
Selecting a site within the Vizsla claim boundary while maximizing the use of previously disturbed land,
Locating the primary crushing and ROM pad sites near portals to minimize haulage distance,
Balancing earthwork cut and fill across the process plant and ROM pad,
Arranging administration, offices and mine dry in close proximity to minimize footprint and walking distance,
Locating the TSF in the most economic location, balancing costs for dam construction and tailings material handling, and
Utilizing natural changes in elevation to the greatest extent possible.
The Panuco site layout is shown in Figure 18-1 and process plant layout is shown in Figure 18-2 .
|
|
Figure 18-1: Panuco Project Site Layout
![]()
|
|
Figure 18-2: Process Plant Layout
![]()
Source: Ausenco, 2024.
|
|
18.2 Off-site Infrastructure
18.2.1 Site Access
The Panuco project is located near the town of Copala, 80 km northeast of city of Mazatlan in Sinaloa, Mexico. The site is accessed by travelling 25 km east along Highway 15, then travelling 43 km northeast along Highway 40. This leads to an entrance to a gravel access road system that will be used to navigate across the property.
Highways 15 and 40 are part of the national highway system and are well maintained. The current gravel access road system avoids residential areas in the region and provides access to the proposed mine portal locations. The existing system will be updated as part of project development.
The Panuco site will be 'drive-in', as such no permanent camp facilities are considered on the property. Operators will be housed in Concordia and Copala and will be transported to site every day.
18.2.2 Water Supply
Fresh water will be sourced from the UG workings and site water collection which will be supplemented by water from the Panuco River as required. The water will be transported through pumps. 2.6 km of overland pipeline will be installed from Panuco River to the process plant where freshwater tanks will be located. This water will be the source of potable and fire water on site, used for administration buildings and process plant.
18.2.3 Power Supply and Distribution
Permanent electrical power is provided by transmission line and connects to the Comisión Federal de Electricidad (CFE) electrical grid. This assumes the right of way for transmission lines and estimated alignment and design. The power line transmits power at 230 kV. A 69 kV transmission line will connect to a substation at the site before being stepped own to 13.8 kV for distribution to different power requirements across the project site.
18.2.4 Plant Nursery
A plant nursery (Refer to Figure 18-3) in the nearby town of Copala, with species from and weathered with the soil type and pH in the area, will be used to ensure the long-term remediation and conserve flora rescued from the areas where infrastructure, including the processing plant, roads, slopes, bridges, tailings facility, and power lines, will be built. More than 4,000 plants with a variety of 19 species from the Panuco-Copala basin have grown in the nursery since late 2023.
|
|
Figure 18-3: Plant Nursery
![]()
Source: Vizsla, 2024
18.3 On-site Infrastructure
18.3.1 Site Preparation
The existing access road and on-site road system will be upgraded to provide access to the project site. The standard methods of clearing, topsoil removal, and excavation will be employed while incorporating drains, safety bunds and backfilling with granular material and suitable aggregates for road structure. Civil work for the site will include design for the following infrastructure:
Roads for light vehicles and heavy equipment,
Access roads,
Topsoil stockpiling,
Mine and process facility platforms,
|
|
ROM stockpiling,
Tailings storage,
Water management facilities, ditches, and drainage channels, and
Explosives storage.
18.3.2 On-Site Roads
The project site has unpaved roads connecting the existing access road to the nearby highway. The existing roads will be upgrade to 4 m - two lane roads from the process plant to Highway 40, and single lane road from highway 40 to the tailings storage facility.
18.3.3 On-Site Infrastructure
Three types of buildings have been considered for the Panuco project: modular, fabric, and pre-engineered. The buildings for each area are listed in Table 18-1.
Table 18-1: Panuco Building List
Building Name | Building Type | L (m) | W (m) | H (m) | Area (m2) |
Truckshop | Pre-Engineered | 40 | 21 | 18 | 840 |
Refinery and Dore room | Pre-cast concrete walls and cladding roof | 25 | 13 | 6 | 325 |
Gatehouse and Security Buildings | Modular Building | 6 | 4 | 3 | 24 |
Office and Administration Buildings | Modular Building | 34 | 22 | 3 | 748 |
Warehouse | Pre-Engineered Building | 30 | 33 | 8 | 990 |
Laboratory and Sample Preparation | Pre-Engineered Building | 38 | 19 | 3 | 722 |
Reagents Storage | Pre-Engineered Building | 49 | 17 | 4.5 | 833 |
Mine Changehouse | Modular Building | 45 | 18 | 3 | 810 |
Plant Changehouse | Modular Building | 24 | 12 | 3 | 288 |
Training Buildings | Modular Building | 31 | 8 | 3 | 248 |
18.3.3.1 Accommodation
No camp accommodation is planned for the project as workers will reside in, and commute from nearby communities.
18.3.3.2 Gate House and Security
The gate house will be a security trailer office with a lockable gate and communications to the mine site. The truck scale will be located adjacent to the main access road by the guard house. The security building will be a modular building located near the gate house. The facility will include rooms for personnel screening during rotations in and out of site. The facility will be equipped with fire protection and an alarm system.Security
|
|
18.3.3.3 Main Administration Building
The main administration building will be a modular, multiple level building comprised of a change/lunch facility, offices, meeting rooms, washrooms, and medical facility. The building will be equipped with fire protection and alarm systems. The offices will have enough space for relevant employees. The medical facility will include first aid and emergency response rooms for on-site treatment and headquarters for the mine rescue team.
18.3.4 Fuel System
Fuel will be delivered to the project site by tanker truck to service mine equipment and mobile fleet. The fuel storage system will consist of several above ground tanks, including diesel, and gasoline tanks.
Diesel fuel will be stored on site adjacent to the ROM pad for heavy and light vehicles. The fuel supply system will be provided by a fuel supplier and include offloading pumps, dispensing pumps, associated piping and an electronic fuel control and tracking system.
18.3.5 Power Distribution
The high-voltage transmission from the grid will be connected by distribution line to a 69/13.8 kV substation on site. The substation will distribute power to various areas on the project including the process plant, administration building, and the mining areas. Three distribution lines will be constructed at the project site to provide stepped down power to the site administration and process facilities, Copala and Napoleon portals.
18.3.6 Mining Infrastructure
18.3.6.1 Truck Shops
The truck shop will be a pre-engineered building with a concrete floor, overhead crane, overhead doors, and fire protection and alarm systems. Several bay-doors will be provided for preventative and corrective maintenance, welding, truck washing and multi-purpose use.
An underground shop and fuel bay will be added to the maintenance facilities in early production years to provide support during underground development.
18.3.6.2 Mine Dewatering
Mine dewatering will be facilitated by a system of sumps and submersible pumps. Sumps are designed off of all level access drifts in the mine schedule. Submersible trash pumps situated within each of the sumps will be activated by float switches to run as required. The size and specifications of the pumps will be determined based on ground water inflow prior to and during operations.
|
|
18.3.6.3 Explosives Storage
A bulk explosives magazine will be located on the site at a location that will meet all regulatory requirements. There will be one bunker for bulk explosives and a second bunker for high explosives (blasting caps and boosters) and consumables (firing line, non-electric cords, and delays). The surface magazine has been sized to hold 120,000 kg of bulk emulsion, which would translate to three weeks of planned underground production. A magazine of this size would need to be 1.1 km away from inhabited buildings, traffic, fuel storage and power lines.
An underground powder magazine and cap magazine will also be constructed for storage of explosives needed in early production years.
18.3.6.4 Stockpiling
Mineralized material will be stockpiled at the ROM pad and segregated based on grade to allow for prioritization of high and medium grade material. Low grade mineralized material will be stockpiled near the Copala portal where it will be feed the mill to maintain the mill capacity. The low-grade stockpile will reach a maximum capacity of 600,000 t in Year 5 of the mine plan and will be drawn down to elimination over the life of the mine. Despite acid rock drainage not forecast to be a concern for the Panuco project, contact water channels will capture and manage any runoff from the ROM pad.
18.3.7 Process Plant Infrastructure
18.3.7.1 Plant Warehouse and Shop
The plant warehouse and shop will be a pre-engineered building with a concrete floor, overhead doors, and fire protection and alarm systems. This building will be used for storage of general items and equipment spares for the process plant, to maintain and store light vehicles and to repair and maintain process equipment as necessary.
18.3.7.2 Assay Lab
The assay lab will be a modular building comprised of storage and office space, a scale room, an atomic absorption room, a wet lab and met labs. This building will be equipped with fire protection and alarm systems. The lab will require bottled nitrogen and ventilation hoods.
18.3.7.3 Refinery and Doré Room
The refinery and doré room will be constructed with thick concrete floors and walls, entry/exit gates, CCTVs, motion sensors and alarms. The facility will be monitored 24 hours a day by security personnel and will have restricted access. Fenced areas will be provided for controlled entry and exit of the armoured transport vehicles used for doré transportation.
18.3.8 Tailings Storage Facility
The TSF and associated surface water management design features are described below.
|
|
18.3.8.1 Site Selection and Deposition Technology
A desktop TSF siting and deposition technology study was undertaken for the PEA. Ausenco reviewed satellite imagery and topographic maps to identify potential TSF sites within a 10 km range of the proposed plant site. The project physiography consists of rugged mountainous terrain with a maze of streams. Figure 18-4 shows the general physiographic and hydrogeological setting.
Figure 18-4: TSF General Layout
![]()
Source: Ausenco, 2024
The total tailings produced over the LOM is 14.6 Mt of which 8.8 Mt will be stored in the tailings storage facility and the rest will be used for paste backfill. The general design criteria for the siting study considered a tailings storage requirement of 8.8 Mt considering a surface tailings facility.
The tailings siting study also looked at deposition technologies of slurry tailings and filtered tailings along with placement in a TSF or dry stack tailings facility (DSTF). The area is very rugged mountainous terrain with low tailings to dam ratios for slurry tailings options. The filtered tailings for the size of the project was eliminated due to high overall cost of this option for a low life of mine storage requirement.
|
|
The final location of the TSF is 2.5 km to the east of the process plant in a small watershed with the best local tailings to dam ratio. The TSF requires a single embankment to contain the LOM tailings that will be constructed in phases. The TSF dams ranges in height between 28 and 64 m to contain the required volume of tailings.
18.3.8.2 Tailings Storage Facility Design Assumptions/Criteria
The proposed process plant is located 2.5 km west of the TSF. The process will produce a slurry tailing stream.
Design criteria included:
Required storage of 8.8 Mt tailings,
Slurry Percent solids 65%,
Dry tailings density of 1.45 t/m3,
Subaerial deposition,
Limiting watershed disturbance to a single catchment basin,
Limiting impacts to wildlife resources,
Designing for closure, and
Meeting or exceeding applicable regulatory requirements and industry guidelines for stability and design flood events.
The proposed TSF design assumptions include:
Multiple embankment raises,
Centreline dam raises with downstream rock shell dam with filter, low permeability material, and geomembrane along the upstream embankment faces,
Embankment with 3:1 (H:V) downstream slope,
Rip-rap and mortar spillway,
Minimum freeboard of 5.0 m,
Containment of the 1 in 475-year event and pass the 1 in 2,475-year event,
withstand the 1 in 2,475-year seismic event, and
Max embankment heights ranging from 28 to 64m from crest to downstream toe.
|
|
18.3.8.3 Tailings Disposal Design
The project is in a moderate seismic zone and the embankments are designed to meet Global Industry Standard on Tailings Management (GISTM) guidelines. The TSF is 600 m long and 400 m wide and its long axis orientation is southwest to northeast. The facility ranges in depth from 50 m at the southwest end to 0 m in the northeast end. The volume over the LOM is 8.8 Mt (Refer to Figure 18-5). The ultimate tailings dam crest will reach 617 m.a.s.l., including operational, stormwater, and freeboard.
Figure 18-5: TSF Ultimate LOM Configuration
![]()
Source: Ausenco, 2024
Tailings will be slurried from the process plant to the TSF by way of a pipeline, which will extend 2/3rd around the TSF and discharge through multiple spigots to develop an even tailings distribution across the TSF. The excess slurry water will be reclaimed for processing through the reclaim water system. The site wide water balance discusses available water from the TSF that includes reclaimable slurry water and rainfall runoff.
The tailings deposition rate is provided in Table 18-2. The projected TSF storage capacities are outlined in Table 18-2. Tailings are planned to be discharged at 65% solids with an overall dry bulk density of 1.45 t/m3.
|
|
Table 18-2: Life-of-Mine Tailings Deposition Schedule
Year | Annual Tailings | Accumulated Tailings | Annual Tailings | Accumulated Tailings |
1 | 840 | 840 | 579 | 579 |
2 | 840 | 1,680 | 579 | 1,159 |
3 | 840 | 2,520 | 579 | 1,738 |
4 | 840 | 3,360 | 579 | 2,317 |
5 | 840 | 4,200 | 579 | 2,897 |
6 | 840 | 5,040 | 579 | 3,476 |
7 | 840 | 5,880 | 579 | 4,055 |
8 | 840 | 6,720 | 579 | 4,634 |
9 | 840 | 7,560 | 579 | 5,214 |
10 | 840 | 8,400 | 579 | 5,793 |
11 | 375 | 8,775 | 259 | 6,052 |
Source: Ausenco, 2024
18.3.8.4 TSF Embankment Design
The tailings embankments will be constructed with compacted rock fill and an upstream filter zone, low permeability soil zone and a geomembrane to minimize seepage through the embankment. The embankments will range in size from be 28 to 64 m. They will have overall slopes of 3:1 (H:V) on the downstream face. Spillways will be built in phases during each embankment raise and is designed to pass the 2,475-year event. A section of the east main dam is shown in Figure 18-6.
|
|
Figure 18-6: TSF Embankment Section
![]()
Source: Ausenco, 2024
|
|
18.3.8.5 Tailings Storage Facility Stability
A section through the tallest portion of the east embankment was selected as the critical section as shown in Figure 18-6. Stability of the embankment was assessed using the limit-equilibrium modelling software Slope/W, (Geostudio, 2018) for the following scenarios:
Static: effective friction angles applied to tailings embankment; no seismic loading,
Pseudo-static: rockfill effective friction angle with the design horizontal seismic coefficient equal to 50% of the peak ground acceleration.
Stability analyses were undertaken for both static and pseudo-static conditions with the calculated factors of safety (FOS) higher than the minimum required values in accordance with GISTM guidelines. The tailings embankment is designed to withstand potential dynamic displacement without release of tailings during the maximum design earthquake event. The embankment stability analysis exceeds both static and pseudo-static GISTM guidelines.
18.3.8.6 Tailings Disposal Closure
TSF closure will consist of removing the tailings discharge pipeline, water reclaim pipeline, and reclamation of any road not required for post closure monitoring. The tailings will be covered with a cap consisting of a waste rock, soil and vegetative cover.
18.3.9 Waste Storage Facilities
Currently the waste rock coming to the surface will be utilized for the development of the TSF and other infrastructure. However, if in the next phase, if it is determined that a waste rock facility will be required, a siting study will need to be performed.
18.3.10 Water Supply and Management
18.3.10.1 Climate Data
Four different climate stations were evaluated for this project: two regional climate stations and two onsite weather stations. The location details of the stations and their vicinity to the project area are summarized in Table 18-3. The meteorological data used for sizing surface water infractrucure was sourced from the Potrerillos climate station (ID 25074), located 12.5 km east of the mine site with records from 1969 to 2018. This station was selected due to its representative meteorological data for the site. Table 18-4 summarizes the monthly precipitation and evaporation records for the station. Table 18-5 presents the IDF values, which indicates the expected rainfall intensity for various durations (e.g., 5 minute) and return periods (e.g., 2 years) as well as the overall point precipitation for the events.
|
|
Table 18-3: Details of Climate Stations Including Name, ID, Coordinates, and Distance to Site
Name | ID | Location | Record Years | Latitude | Longitude | Altitude | Distance from |
Potrerillos | 25074 | Concordia, Sinaloa | 1969-2018 | 23.454 | -105.826 | 1572 m | 12.48 km |
Concordia (CFE) | 25011 | Concordia, Sinaloa | 1961-2001 | 23.27083 | -106.0675 | 141 m | 19.58 km |
On-Site Weather Stations | Napoleon Tajitos | Panuco Site | 2022-2024 | 404194 | 2588593 | - | N/A |
Table 18-4: Summary of Temperature, Precipitation and Evaporation Data at Potrerillos Station
Parameter | Jan | Feb | Mar | Apr | May | Jun | Jul | Aug | Sep | Oct | Nov | Dec | Average |
Max Average Temperature (°C) | 21.1 | 21.9 | 23.6 | 25.5 | 26.8 | 26.1 | 24.5 | 24.8 | 24.6 | 23.9 | 23.4 | 21.8 | 24.02 |
Min Average Temperature (°C) | 10.9 | 11.0 | 12.3 | 14.2 | 15.8 | 16.7 | 16.5 | 16.7 | 16.8 | 15.2 | 13.5 | 12.0 | 14.3 |
Mean Precipitation (mm) | 1.3 | 0.7 | 0.3 | 0.1 | 0.2 | 4.6 | 11.6 | 9.0 | 8.2 | 3.1 | 1.8 | 1.4 | 3.48 |
Mean Pan Evaporation (mm) | 0.0 | 0.0 | 0.0 | 0.0 | 1.2 | 0.8 | 2.4 | 0.0 | 0.0 | 0.0 | 0.0 | 0.5 | 0.5 |
Table 18-5: Intensity-Duration-Frequency Values for Panuco Site
Return Period | 2 | 10 | 25 | 50 | 75 | 100 |
Rainfall (mm) | 94.01 | 162.67 | 197.22 | 222.86 | 237.76 | 248.30 |
5 min | 0.33 | 0.56 | 0.68 | 0.77 | 0.83 | 0.86 |
10 min | 0.65 | 1.13 | 1.37 | 1.55 | 1.65 | 1.72 |
15 min | 0.98 | 1.69 | 2.05 | 2.32 | 2.48 | 2.59 |
30 min | 1.96 | 3.39 | 4.11 | 4.64 | 4.95 | 5.17 |
1 hr | 3.92 | 6.78 | 8.22 | 9.29 | 9.91 | 10.35 |
2 hr | 7.83 | 13.56 | 16.44 | 18.57 | 19.81 | 20.69 |
12 hr | 47.00 | 81.33 | 98.61 | 111.43 | 118.88 | 124.15 |
24 hr | 94.01 | 162.67 | 197.22 | 222.86 | 237.76 | 248.30 |
18.3.10.2 Water Management Structures
Water management at the Panuco mine site requires consideration of the water flows between facilities and the associated catchment areas. Surface water runoff that comes to contact with disturbed areas of the mine (contact water) will be captured for use as process water. Based on a review of the process water demands and a preliminary site water balance, it is anticipated that the site will be at a water deficit and water will be required for process purposes. At this stage, diversion channels are included in the proposed plan to intercpet non-contact water and re-direct around mine infrastructure to be stored for process make-up water. It should be noted that these diversion will collect water natually reporting to the process area but will be interecped further upstream to avoid excess water being managed within the process area itself. The general site wide water management strategy is shown Figure 18-7 and- Table 18-6 comprises:
|
|
Diversion channels are designed to divert non-contact runoff away from mine infrastructure, thereby minimizing the volume of contact runoff that needs on-site management. These channels are designed to safely convey a 1:100-year, 24-hour storm without overflow. Four diversion channels, with a combined length of 970 m are proposed to intercept hillside runoff prior to reaching the process area. At this stage, these channels are proposed to have a base width of 1 m, 2.5H:1V side slopes and range in depth from 0.9 to 2 m.
A collection dam receives captured surface water the process plant catchment area as well as the diversion. Stored water will be re-used for process purposes. The height of the diversion dam will depend on the anticipated amount of runoff received and the expected process water requirements. A stage storage relationship of the proposed dam location is shown on Figure 18-7.
Table 18-6: Dimensions of the Collection Dam
Item | Elevation (m) | Pond Surface Area - Top (m2) | Pond Volume (m3) |
Collection Dam | 553 | 38.3 | 1,690 |
554 | 128 | 30,873 | |
556 | 358 | 60,671 | |
557 | 506 | 109,681 |
|
|
Figure 18-7: Water Management Structures for Panuco Mine Site
![]()
Source: Ausenco, 2024.
18.3.10.3 Site Wide Water Balance
A preliminary site-wide water balance analysis was performed to assess the potential water availble for process purposes. Three different scenarios were analyzed to identify the potential range of available suface water from the site:
Dry Scenario based on the historical driest year obtained from the Potrerillos station
Average scenario based on historical data obtained from the Potrerillos station
Site data based on limited ( complete year of 2023) climate data from on-site weather stations.
The water balance included runoff from disturbed mine components as well as the surrounding catchments that would ultimately report to the process area. Table 18-7 shows the overall annual and peak monthly runoff for each of the water balance scenarios along with the required collection dam height needed to contain the inflow. The water balance for the average year is shown in Table 18-8. It should be noted that groundwater or underground dewatering has not been considered and the water balance includes surface water only.
|
|
Table 18-7: Water Balance Summary
Water Balance Scenario | Annual Runoff | Peak Monthly Runoff | Required Dam Height to Runoff |
Potrerillos station Dry Year | 8,788 | 6,355 | 1.3 |
Potrerillos station Average Year | 83,842 | 29,587 | 3.0 |
Site Data | 17,767 | 14,341 | 1.8 |
|
|
Table 18-8: Site Wide Water Balance for an Average Year - Scenario 1
Climate Station Data - Scenario 1 - Average year Petrerillos Station - Year 1973 | |||||||||||||
Month | Jan | Feb | Mar | Apr | May | Jun | Jul | Aug | Sep | Oct | Nov | Dec | Year |
Precipitation | |||||||||||||
Accumulated Precipitation for the average year - Petrerillos Station (Year 1973) (mm/mon) | 17 | 82 | 0 | 2 | 2 | 78 | 298 | 428 | 246 | 44 | 0 | 16 | 1,214 |
Site Runoff and Evaporation | |||||||||||||
Runoff from the disturbed Process Plant Area (m3/mon) | 567 | 2,812 | 0 | 78 | 68 | 2,665 | 10,160 | 14,617 | 8,409 | 1,488 | 0 | 556 | 41,420 |
Runoff from non-contact area intercepted prior to reaching process area (m3/mon) | 580 | 2,880 | 0 | 80 | 70 | 2,730 | 10,405 | 14,970 | 8,612 | 1,524 | 0 | 570 | 42,422 |
Ponds Evaporation (m3/mon) | 0 | 0 | 0 | 0 | 0 | 0 | 0 | 0 | 0 | 0 | 0 | 0 | 0 |
Water Available for Process Demands | |||||||||||||
Available water for process (m3/mon) | 1,147 | 5,692 | 0 | 158 | 138 | 5,395 | 20,565 | 29,587 | 17,021 | 3,012 | 0 | 1,126 | 83,842 |
Expected Process Water required (m3/mon) | 40,920 | 36,960 | 40,920 | 39,600 | 40,920 | 39,600 | 40,920 | 40,920 | 39,600 | 40,920 | 39,600 | 40,920 | 481,800 |
Process make-up water deficiet (m3/mon) | 39,773 | 31,268 | 40,920 | 39,441 | 40,782 | 34,205 | 20,355 | 11,333 | 22,579 | 37,908 | 39,600 | 39,794 | 397,958 |
|
|
19 MARKET STUDIES AND CONTRACTS
19.1 Market Studies
The Ag + Au doré bars will be trucked from the project site to Mazatlán, where it will be subsequently transported by air to clients. Ag + Au doré will be sold into the general market to North American smelters and refineries.
Vizsla and its consultants have conducted no market study on the sale of the Ag doré. Therefore, the market terms for this study are based on the terms proposed by Vizsla as per their discussion with Ausenco and recently published terms from similar studies. The QP is of the opinion that the marketing and commodity price information is suitable to be used in cash flow analyses to support this technical report.
19.2 Commodity Price Projections
For this technical report, the metal prices presented below in Table 19-1 were used for financial modelling. The metal price assumption is supported by the latest consensus forecast from numerous financial institutions. The QP has reviewed the studies and analyses and the results support the assumptions in the technical report. These prices are also consistent with the range of prices used for recent, comparable studies.
Table 19-1: Metal Price Projections
Metal | Commodity Unit | Study Unit Price (US$) |
Silver | Troy ounce (oz.) | 26.00 |
Gold | Troy ounce (oz.) | 1,975 |
19.3 Contracts
There are currently no sales contracts or refining agreements in place for the project.
Vizsla may enter into contracts for forward sales of silver or other similar contracts under terms and conditions that would be consistent within the industry in Mexico and United States and in countries throughout the world.
For the PEA, payability and refining costs have been assumed for the Panuco project based on terms recently published for comparable projects. Payabilities within the doré product are assumed to be 99.9% for silver and 99.9% for gold. Treatment and refining costs are assumed to be US$0.50/oz Ag and US$5.00/oz Au.
|
|
20 ENVIRONMENTAL STUDIES, PERMITTING, AND SOCIAL OR COMMUNITY IMPACT
20.1 Introduction
This section provides an overview of the environmental setting of the Panuco Mining Project. Based on currently available information, it outlines existing biological and physical baseline conditions, proposed baseline studies to support future permitting applications, existing permits, and future regulatory and permitting requirements including required management plans for water, site environmental monitoring, and waste disposal. In addition, this section also discusses socio-economic baseline conditions, the status of community consultation and engagement, and conceptual mine closure and reclamation planning for the Project.
The Project site currently operates under three permits for mine exploration issued in 2020 and 2021, by SEMARANT (Secretary of Environmental Media and Natural Resource). Once the exploration work is completed and depending on the results that it yields, it will be determined if the area will be abandoned or will continue to be used for the exploitation of the desired minerals. In the case the area continues to be used, the corresponding environmental permits will be requested from SEMARNAT and compensation work will be carried out in areas surrounding the project.
Currently, the only known environmental liabilities are associated with the exploration site activities and access roads. and existing underground workings from former operations Remediation of surface disturbances and removal of wastes will be mitigated by compliance with applicable Mexican regulatory requirements.
The Panuco Project is in the Panuco-Copala mining district in the municipality of Concordia, southern Sinaloa State, along the western margin of the Sierra Madre Occidental physiographic province in western Mexico. Mountain ranges characterize the province's topography up to 1,640 m, cut by steep gorges. The principal drainages are the northerly trending Rio Baluarte east of the Property and the northeasterly trending Rio Presidio to the north. Dendritic intermittent streams feed the rivers. Project vegetation is mainly dry tropical forest comprising tropical bushes and shrubs at lower elevations and oak and pine forest at higher elevations. The Project is centred at 23⁰ 25' north latitude and 105⁰ 56' west longitude. The Project location is shown in Figure 20-1.
|
|
Figure 20-1: Property Location Map
![]()
Source: Vizsla, 2024
20.2 Environmental Baseline and Supporting Studies
During the period January 2022 to February 2023, Golder Associates (now WSP) conducted environmental and social baseline studies for the Panuco project. The studies consisted of a desktop study followed by multiple field monitoring events. These baseline studies were intended to serve as a reference and support for the preparation of the Environmental Impact Assessment, EIA (MIA in Mexico) required by the Ministry of Environment and Natural Resources (SEMARNAT) to support ongoing exploration activities for the Project. At the time of issuing the documents in 2022 and 2023, the location and design of the Project infrastructure had not yet been finalized.
Table 20-1 presents the WSP (2022-2023) baseline study characterization/monitoring events and their main focuses.
|
|
Table 20-1: Baseline Characterization / Monitoring Rounds and Their Focuses
| Baseline Monitoring Round | Study Dates | Environmental Aspects | ||
| Abiotic Factors | Biotic Factors | Social Aspects | ||
| 1st | Jan - Feb 2022 | - climate, - surface water, - air quality - noise | - flora - fauna | desk research |
| 2nd | Apr - May 2022 | - surface water - soil - air quality | - flora - fauna - landscape | None |
| 3rd | Jul - Aug 2022 | - surface water - soil - air quality | - flora - fauna | None |
| 4th | Nov 2022 | - surface water - soil - air quality | - flora - fauna | None |
| 5th | Feb 2023 | - surface water - air quality | - flora - fauna | None |
Source: Environmental Baseline Characterization Reports, WSP, 2022 to 2023
The delineation of the study area for the evaluation of the biotic and abiotic components was determined based on consideration and conformance with the provisions of the "Guide for the Presentation of the Mining Environmental Impact Statement" (SEMARNAT, 2002). The guide considers the micro-basins adjacent to the mineralized areas or veins known as Tajito and Napoleon, as well as the scope of the Project and its relationship with terrestrial ecosystems (Golder, 2022).
The results of these baseline studies are described in the following sections. Baseline data assoicated with the subject areas of geochemistry and archaeology were not available at the time of this study. Targeted field studies, focusing on the Project area will need to be conducted during the next phase of project design and to support permitting requirements. With regard to archaeological resources, a survey will need to be conducted and findings registered with the INAH (Instituto Nacional de Antropologia e Historia, National Institute of Anthropology and History).
20.2.1 Meteorology and Climate
The climate is subtropical, with heavy rain in June through September. Summer temperatures reach 40°C, while the minimum winter temperature is approximately 10°C. The average annual rainfall is around 1,100 mm, with the majority falling in the June to September rainy season. The area has sufficient water for exploration and mining purposes. Work on the Property, including drilling, can be conducted year-round (SGS, 2024).
Four climate stations were used as a source of meteorlogic data for the Project: two regional climate stations and two on-site weather stations. The location details of the stations and their vicinity to the Project area are summarized in Table 18-3 (Section 18). Figure 18-2 (Section 18) shows the locations of the two regional climate stations relative to the site. Table 18-4 (Section 18) presents a summary of temperature, precipitation, and evaporation data at Potrerillos weather station, located 12.5 km from the site. The data frorm this station were used for designing and managing the water management infrasture at the site by means of the development of a preliminary site water balance. Figure 20-2 and Figure 20-3, present graphically the temperature and precipitation data for the Project Area.
|
|
Figure 20-2: Average Monthly Precipitation at the Panuco-Capala Project
![]()
Source: SGS, 2024.
|
|
Figure 20-3: Average Temperature and Precipitation for the Project Area
![]()
Source: SGS, 2024
20.2.2 Hydrogeological Investigation
A geotechnical and hydrogeological investigation was conducted by SRK in 2023-2024. The results are reported in SRK (2024) This factual report summarizes the hydrogeological data collected from the diamond drillholes completed between October 2023 and January 2024.
A total of 4,230 m of drilling spread over 11 diamond drillholes were completed for the 2023 field program to investigate the Copala and southern portion of the Napoleon deposits. The hydrogeological scope consisted of hydraulic conductivity testing and shut-in pressure monitoring. This was carried out using packer equipment in all drillholes, and installation of vibrating wire piezometers (VWPs) in selected drillholes. Selected drill holes are presented in Figure 20-4. The drilling program was designed to characterize the geotechical and hydrogeological properties of the deposit and production access ramps.
Downhole testing of hydraulic conductivity (K) in drillholes was conducted using a single-packer testing system. A total of 67 successful packer tests were completed in 11 boreholes, with intervals ranging from 14.70 to 112.70 m in length. Hydraulic conductivity values ranged from very low (1.0E-11 m/s) to high (1.0E-04 m/s) with a geometric mean of 5.3X10⁻⁸ m/sec.
|
|
Figure 20-4: Completed Drillhole Locations
![]()
Source: SRK, 2024
Permanent nested vibrating wire piezometers (VWPs) were installed in four drill holes. Each installation was completed with three VWPs. VWPs are used to measure both stable and transient piezometric pressures within different lithological units and across geologic structures. These pressure data are used to determine the general piezometric levels (water levels) in the groundwater system, as well as to monitor transient effects such as response to precipitation events or drain down responses during excavation. At the time of the SRK report, the VWP sensors were still stabilizing and therefore meaningful and useful data from these instruments is not currently available. Future data collected from the VWPs will help to establish the general piezometric levels (water levels) in the groundwater system including the vertical and horizontal hydraulic gradients.
Additional hydrogeological investigations will be required to collect sufficient hydrogeological testing and monitoring data that can be used, coupled with geological models, to develop a groundwater conceptual model. A valid groundwater conceptual model can be used as a basis for the development of a three dimensional numerical groundwater model for the study area that can be used as a predictive tool for the purpose of aquifer response and flow predictions.
|
|
20.2.3 Hydrology
Surface streams with an intermittent regime and perennial rivers are found in the area (refer to Figure 20-5). The Baluarte River is to the west and south of the area and is the most important perennial river. It originates in the Sierra Madre Occidental, in the territory of the State of Durango, on a small plateau near the town of La Peña in the municipality of Pueblo Nuevo, Durango, at an altitude of 2,600 m.a.s.l., following the NE-SW direction for 45 km with the name of Quebrada de Guadalupe, after receiving contributions from a small tributary, El Zapote, it changes its course to the NW-SE and is called Rio Rosario or Baluarte, serving along 35 km of state border between Durango and Sinaloa and finally flows into the Pacific Ocean, (CONAGUA, 2020). Another important water body is the Presidio River that is located north of the Panuco project. It originates in the mountains of Durango, flowing southwest into Sinaloa before joining the Pacific Ocean southeast of Mazatlan.
Figure 20-5: Rivers and Basins in the Region
![]()
Source: WSP, Baseline Studies, 2022
|
|
The study area "Panuco-Copala Exploration" belongs to the Presidio-San Pedro hydrological region (RH-11, National Institute of Statistics, Geography and Informatics - INEGI), in the R. Baluarte basin (RH-11C), with the Project area specifically in the R. Panuco sub-basin (RH-11Ce). (CIMA, MIA 2020).
RH-11 Presidio-San Pedro is located in the extreme northwest of the state and extends towards the states of Sinaloa, Durango and Zacatecas; within Nayarit it comprises 36.05% of the state area. It is bordered to the east by RH-12, Lerma-Santiago; to the south by RH-13, Huicicila; and to the west by the Pacific Ocean. The main drainages descend from the western flank of the Sierra.
With data obtained from the Hydrographic Basin Water Flow Simulator (SIATL) extension of INEGI, the area occupied by each part was established, starting from the hydrological region to the sub-basin. Figure 20-6 shows the hydrological egion, basin and sub-basins encompassing the study area and adjacent region.
Figure 20-6: Panuco Hydrological Region, Basin and Sub-basin.
![]()
Source: CIMA, MIA, 2020
20.2.4 Surface Water Quality
To evaluate the existing water quality conditions in the study area, the Mexican Official Standards NOM-001-SEMARNAT-2021 ("which establishes the permissible limits of pollutants in wastewater discharges into receiving bodies owned by the nation") were used as a reference for the characterization of surface water. (WSP, Baseline Studies, 2022).
|
|
ALS-Indequim, a laboratory accredited by the Mexican Accreditation Entity (EMA), was retained to collect and analyze surface water quality parameters. Sample locations were selected based on the following criteria:
proximity and potential influence to the mineralization (the Napoleon and Tajitos areas)
proximity and potential influence of nearby urban areas
streams displaying perennial or near-perennial flows
Figure 20-7 shows the location of water sampling points. Samples were analyzed for a range of organic and inorganic parameters. The results of the analyses are presented in WSP, Baseline Studies, 2022.
Figure 20-7: Location of Water Sampling Points
![]()
Source: WSP, Baseline Studies, 2022
|
|
20.2.5 Regional Groundwater Aquifer Characterization
In the Baluarte River valley, 40 groundwater monitoring locations were included as part of the WSP baseline study (WSP 2022). Static water levels ranged from 2 m depth in the vicinity of the Baluarte River bed and on both banks, increasing towards the upper parts of the valley until reaching values close to 10 m away from the river and its tributaries.
Table 20-2 shows the results of the groundwater balance parameters of the aquifer for the Panuco Project area (WSP, Baseline Studies, 2022), which indicate that there is a volume of over 24 Mm3 per year, available for the different activities within the aquifer. Water availability will vary over time, depending on changes in the natural recharge regime and water management.
Table 20-2: Groundwater balance parameters for the aquifer
Aquifer Area | Parameters |
Natural Recharge | 66.5 hm3/year |
Induced Recharge | 2.4 hm3/year |
Outflows | 29.3 hm3/year |
Natural Discharge | 15.8 hm3/year |
Pumping | 13.8 hm3/year |
Total Recharge | 79.6 hm3/year |
Concessioned Volume | 34,613,197 m3 annual |
Availability of Groundwater | 24,286,803 m3 annual |
Source: WSP, Baseline Studies, 2022
20.2.6 Air Quality
Five sampling campaigns were carried out to characterize the baseline air quality (WSP, Baseline Studies, 2022), taking as reference the Mexican Official Standards NOM-025-SSA1-2014, (Environmental health. Permissible limit values for the concentration of suspended particles PM10 and P2.5 in the air and evaluation criteria) and NOM-035-SEMARNAT-1993 (which establishes the measurement methods to determine the concentration of total suspended particles in the air and the procedure for the calibration of measurement equipment). Seven sampling points were located in the project polygon, as shown in Figure 20-8.
|
|
Figure 20-8: Air Quality Monitoring Points
![]()
Source: WSP, Baseline Studies, 2022
The results of the air quality monitoring show that, generally, that baseline results comply with the requirements of the current official regulations. The results showed that the concentrations of PSTs, PM10 and PM2.5 do not currently exceed the Maximum Permissible Limit indicated in the Mexican Standards NOM-025-SSA1-2014 and NOM-035-SEMARNAT-1993. The baseline monitoring locations can be used as a basis for detecting future potential air quality impacts from mining operations for nearby receptors including nearby communities and residents as well as wildlife flora and fauna (WSP, Baseline Studies, 2022).
20.2.7 Noise
Noise monitoring was conducted in the Panuco area to characterize the current environmental noise scenarios taking as a reference the Mexican Official Standard NOM-081-SEMARNAT-1994 (which establishes the maximum permissible limits of noise emission from fixed sources and their measurement method, and their normative references) (WSP, Baseline Studies, 2022). Moinitoring points were distributed throughout the Project area at no less than 1.2 m from the ground level, as shown in Figure 20-9.
|
|
Figure 20-9: Noise Monitoring Points
![]()
Source: WSP, Baseline Studies, 2022
Currently, there is no infrastructure associated with the Project that can modify this factor in the environment, so the results of the analysis were as expected for an area with little disturbance. The baseline monitoring locations can be used as a bais for detecting future potential noise impacts from mining operations for nearby receptors including community, residents, and wildlife fauna (WSP, Baseline Studies, 2022).
20.2.8 Soils
Soil types present within the regional area along with their general characteristics are provided below (CIMA, MIA, 2023):
- Lithosol are temperate soils, they are limited by a continuous and hard rock in the first 25 cm, or by a material with more than 40% of calcium carbonate equivalent, or they contain less than 10% of fine earth up to a minimum depth of 75 cm. They can only present a mollic, umbric, ocric, yermic or vertic horizon.
|
|
Regosols are mineral soils, weakly developed in unconsolidated materials that have only a superficial ochric horizon (poor in organic matter) and that are not very shallow (like lithosol), sandy (like arenosols) or with fluvic properties (fluvisols).
Regosols are very extensive in eroded lands, particularly in arid, semi-arid lands and mountainous regions.
Table 20-3 shows the percentage of estimated surface area for each of the soil types found within the project and Figure 20-10 illustrates the distribution of the soil types.
Table 20-3: Types of soils in the Project area
Edaphology of the Project area | ||
Soil Type | Area (Ha) | % |
Lithosol | 5,658 | 33.13 |
Regosol | 11,422 | 66.87 |
Total | 17,079 | 100 |
Source: CIMA, MIA, 2020
Figure 20-10: Soil Units
![]()
Source: CIMA, MIA, 2020
|
|
20.2.9 Fauna
Species classified as endangered in the NOM-059-SEMARNAT-2010 were identified within the Project area as under special protection or threatened. These are Crotalus atrox (Western damondback rattlesnake), Crotalus pricei (Pit viper), Accipiter cooperii (Cooper's hawk), Crotalus molossus (Black-tailed rattlesnake) that are under special protection (Pr) and the Thamnophis cyrtopsis (Black-necked garter snake) and Thamnophis eques (Mexican garter snake) as threatened (A).
Table 20-4 provides a list of fauna detected within and adjacent to the Project area, including mammals, birds, amphibians and reptiles. (CIMA Consultants, MIA, 2020).
Table 20-4: List of Fauna Detected (CIMA Consultants MIA, 2020).
Scientific Name | Common Name | Family | Regulation | Reg. Status | Red list | ||
Ara militaris | Military macaw | Psittacidae | NOM-059-SEMARNAT-2010 | Endangered |
| ||
Asio stygius | Stygian owl | Strigidae | NOM-059-SEMARNAT-2010 | Threatened |
| ||
Crotalus basiliscus | Mexican west coast rattle snake | Viparedae | NOM-059-SEMARNAT-2010 | Protected |
| ||
Cyanocorax dickeyi | Tufted jay | Corvidae | NOM-059-SEMARNAT-2010 | Endangered |
| ||
Eleutherodactylus saxatilis | Rana fisgona marmoleada | Eleutherodactyli dae | NOM-059-SEMARNAT-2010 | Endangered (globally) | Red listed | ||
Eupsittula canicularis | Orange-fronted parakeet | Psittacidae | NOM-059-SEMARNAT-2010 | Protected |
| ||
Icterus pustulatus | Streak-backed oriole | Icteridae | NOM-059-SEMARNAT-2010 | Protected |
| ||
Kinosternon integrum | Mexican mud turtle | Kinosternidae | NOM-059-SEMARNAT-2010 | Protected |
| ||
Leopardus pardalis | Ocelot | Felinae | NOM-059-SEMARNAT-2010 | Endangered |
| ||
Leopardus Wiedii | Margay | Felinae | NOM-059-SEMARNAT-2010 | Engangered |
| ||
Myadestes Occidentalis | Brown-backed solitaire | Turdidae | NOM-059-SEMARNAT-2010 | Protected |
| ||
Panthera onca | Jaguar | Felinae | NOM-059-SEMARNAT-2010 | Endangered |
| ||
Penelope purpurascens | Crested guan | Cracidae | NOM-059-SEMARNAT-2010 | Threatened |
| ||
Progne sinaloae | Sinaloa martin | Hirundinidae | NOM-059-SEMARNAT-2010 | Protected |
| ||
Thamnophis cyrtopsis | Black-necked gartersnake | Colubridae | NOM-059-SEMARNAT-2010 | Threatened |
| ||
Troglodytes aedon | House wren | Troglodytidae | NOM-059-SEMARNAT-2010 | Protected |
| ||
|
|
20.2.10 Flora
The vegetation found in and near the Project area is typical of the southern region of Sinaloa. Due to anthropogenic influence, little variation in biodiversity has occurred in recent years (CIMA Consultant, MIA, 2020). Native species are still present, and degradation is due to natural processes and the influence of the growth and development of the human population (CIMA Consultant, MIA, 2020).
A majority of the vegetation in the Project area is classified as "selva baja caducifolia", which is characterized primarily by trees less than 15 meters tall. Typical plant species include tepemezquite, ebano, tepehuaje, huanacaxtle, berraco, amapa, apomo, cedro, nacario and garabato. At higher elevations with cooler temperatures, vegetation is characterized as "bosque templado" (temperate forest). Plants typical of the higher areas are encino, madroño, chicle, palo cuate, arrancillo, vainillo, maguey and guasima (SGS, 2024).
Areas of ecological importance contain pine-oak forests, pine forests, induced pasture, secondary arboreal vegetation of low deciduous forest, secondary shrubby vegetation of oak forest, and secondary shrub vegetation of pine forest (CIMA Consultant, MIA, 2020).
Based on the information reviewed, none of the flora species in the area were reported under NOM-059-SEMARNAT-2010.
20.2.11 Fauna and Flora - Environmental Management
Mining activities will be carried out in areas of importance for many species of endangered and/or protected flora and fauna (CIMA Consultant, MIA, 2020). To comply with regulations, programs are in place to preserve the environment where development will occur. Any existing species protected by law will be relocated to adjacent areas. The Project will include the recovery of flora and fauna, and rescue work in areas affected by land usage (CIMA Consultant, MIA, 2020). Work will be monitored to ensure that only the authorized areas for use will be affected by the Project's development. No slash and burn methods, herbicides, or chemical products will be used. Work will be done manually and with motorized equipment (CIMA Consultant, MIA, 2020). Mitigation and prevention measures are proposed for the rescue and rehabilitation of flora and fauna species with status under Mexican Official Standard NOM-059-SEMARNAT-2010. In the case of wildlife, protection, repelling, rescue, and relocation measures are proposed, with special emphasis on slow-moving species (CIMA Consultant, MIA, 2020).
The surface areas that are disturbed from exploration and future mining activities will be scarified to encourage water infiltration and vegetation growth. The original topography will be restored before the addition of new topsoil. The rehabilitated topsoil will be spread on the impacted area, and the new soil will be scarified to promote soil regeneration. Restoration of vegetation will rehabilitate the habitats and promote recolonization of the fauna (CIMA Consultant, MIA, 2020).
20.3 Water and Waste Management
The aquifers in the Project area are currently not well defined and require additional site investigation. Sources of recharge, direction of groundwater movement, and aquifer zonation and connectivity require additional interpretation that will be based on an adequate groundwater monitoring and testing program. A preliminary water balance for the site that did not take into consideration mine dewatering was conducted and the results provided in Section 18.3.10. For the preliminary water balance, it was determined that there would be suffiicent water for exploration and future mining operations, utilizing a collection dam to store surface mine contact water, and a system of diversion channels around the perimeter of the operational footprint. Diversion channels are designed to divert non-contact runoff away from the mine infrastruture, thereby minimizing the volume of contact runoff that needs on-site water management. A collection pond receives captured surface water from the diversion channels and the process plant catchment areas. The preliminary water balance indicates a minor water surplus for the scenarios that were considered. In addition, excess slurry water from the Tailings Storage Facility (TSF) would be reclaimed for processing through the reclaim water system (refer to Section 18.3.8).
|
|
It is anticipated that a total of 8.4 Mt of tailings will be stored in the TSF located 2.5 km to the east of the process plant. The selected TSF location and deposition technology was reported to be based on a siting study that was best suited to the TSF design criteria. A key criteira was that the TSF was to meet or exceed applicable regulatory requirements and industry guidelines for stability and design flood events.
The Panuco Project will have a surplus of waste rock produced that will be deposited in waste storage facilities on surface. The balance of the waste rock produced will be placed as backfill. Excess waste rock excavated during mining activities will be placed in the Waste Rock Storage Facility (WRSF) with a total capacity of approximately 500,000 T.
The potential for ARD and metal leaching of waste rock and tailings has not yet been assessed, and this work is planned as part of the next phase. Only non-PAG rock will be utilized for construction purposes and any surplus water released from the site will meet applicable effluent requirements by means of water treatment if needed.
Potable and raw water sources have not been identified as part of this study, however, in consideration that there will not be a camp located at the site, the potable and raw water requirements will be low and likely adequately supplied by groundwater supply wells or local surface water sources.
Most of the waste currently generated by the Project falls into the category of non-hazardous municipal waste, which is subject to control (CIMA Consultant, MIA, 2020). Waste management falls under the jurisdiction of the General Environment Protection Act (Ley General de Protección al Ambiente), Article 3, Fraction XXXII and applicable Mexican Official Standards.
Food waste and garbage generated by workers usually consist of wrappers, containers and food scraps, which will be stored in containers and disposed of in an appropriate place. Organic waste, the product of vegetation removal, will be stored next to the sheets to be later used in the remediation process since it provides moisture that encourages the growth of vegetative species, and also serves as a physical barrier to prevent rapid degradation by wind and water (CIMA Consultant, MIA, 2020).
All waste from used oils - for example, impregnated rags, impregnated soil or similar, as well as solvents - will be handled, separated, temporarily stored and sent for final disposal in accordance with the applicable regulations on hazardous waste (CIMA Consultant, MIA, 2020).
|
|
For the proposed Project, reagents to be used for the process as well as handling/storage measures and estimated consumption are provided in Section 17.4. The reagents to be used in the process include: quickline, sodium cyanide, PAX, MIBC, copper sulphate, lead nitrate, diatomaceous earth, zinc powder, SMBS, flux, antiscalant, and flocculant.
20.4 Permitting Considerations
20.4.1 Existing Exploration Permits
The Project site currently operates under three permits for mine exploration issued in 2020 and 2021, by SEMARANT (Secretary of Environmental Media and Natural Resource). An Informe Preventivo is in force for the area of the Panuco Project that permits drilling activities according with official notice DF/145/2.1. 1/0053/2020. 0060. This is dated January 21, 2020, and issued by the Ministry of Environmental and Natural Resources to Minera Canam S.A. de C.V.
20.4.2 Mexican Legal Framework and Permitting
There are a number of environmental permits required for the operation of the project. Mining regulations are managed at the federal, state and local levels, as outlined in Table 20-5. Application for these permits have not yet been made but are in the preliminary preparation stage. Three major federal permits required by the Secretary of Environmental Media and Natural Resources (SEMARNAT) prior to construction include the Environmental Impact Assessment, EIA (MIA in Mexico), Land Use Change (CUS), and Risk Analysis (RA). A construction permit is required from the local municipality and an archaeological release letter from the National Institute of Anthropology and History (INAH). An explosives permit is required from the Ministry of Defence prior to construction. A Social Impact Assessment study must be submitted to SENER prior to construction of the electrical transmission line.
|
|
Table 20-5: Permitting Requirements
Permit | Agency | Required Stage | Description/Inclusions | Agency Process |
Environmental Impact Assessment and Risk Analysis | Secretaria de Medio Ambiente y Recursos Naturales (SEMARNAT) | Prior to construction | • Description and engineering details from the Civil, Mechanical, Electrical and Fire Protection System disciplines, • A description and discussion of natural resources and socioeconomic aspects, including the effects of the project on the Regional Environmental System (SAR area), and • Identification of the activities that will create an ecological imbalance, along with corresponding prevention and mitigation measures for the identified environmental impacts. | Approximately 120 working days (Mon-Fri) |
Land Use Change | Secretaria de Medio Ambiente y Recursos Naturales (SEMARNAT) | Prior to construction | Basic information surrounding the natural resources and socioeconomic aspects of the project: • Description of the Regional Environmental System (SAR) and socioeconomics of the affected area, • Identification of endangered species and flora removal, • Provision of locations with protected species and outlining of habitat conservation measures, • Description of potential impacts and effects caused by clearing and grubbing of flora, • Definition of forest land, • Identification of the activities that may create an ecological imbalance, and • Definition of the prevention and mitigation measures for environmental impacts. | Approximately 160 working days (Mon-Fri) |
|
|
Permit | Agency | Required Stage | Description/Inclusions | Agency Process |
Archaeological Release Letter | INAH (State Office) | Prior to construction | INAH must authorize any project work required near archaeological, historic, or artistic monuments with an Archaeological Release Letter, in advance of work. | Approximately 120 days (Mon-Fri) |
Permit for Access, Crossings and | Secretaría de Comunicaciones y Transporte (SCT) State Office | Prior to construction | Presentation of the engineering project that will be carried out to connect the access road to the mine using the Durango-Torreon Highway. Presentation of the land acquisition where the project will be executed. | Approximately 90 days (Mon-Fri) |
Environmental Impact Assessment | Secretaria de Medio Ambiente y Recursos Naturales (SEMARNAT) | Prior to construction | • Detailed process description with engineering details from the Civil, Mechanical, Electrical and Fire Protection System disciplines, • Description and discussion of natural resources and socioeconomic aspects, including the effects of the project on the Regional Environmental System (SAR area). • Identification of the activities that may contribute to an ecological imbalance, and corresponding prevention and mitigation measures for the identified environmental impacts. | Approximately 120 working days (Mon-Fri) |
Land Use Change | Secretaria de Medio Ambiente y Recursos Naturales (SEMARNAT) | Prior to construction | Basic information on the natural resources and socioeconomic aspects of the project, • Description of the Regional Environmental System (SAR) and socioeconomics of the affected area, • Identification of endangered species and flora removal, • Delineation of areas with protected species and outline habitat conservation measures, • Description of impacts and effects caused by clearing and grubbing of flora, • Definition of forest land, • Identification the activities that may contribute to an ecological imbalance, and • Definition of the prevention and mitigation measures for the environmental impacts. | Approximately 160 working days (Mon-Fri) |
|
|
Permit | Agency | Required Stage | Description/Inclusions | Agency Process |
Archaeological Release Letter | INAH (State office) | Prior to construction | INAH must authorize any project work required near archeological, historic, or artistic monuments with an Archaeological Release Letter in advance. | Approximately 120 days (Mon-Fri) |
Social Impact Studies (Power line) | Secretaría de Energía (SENER) Central Office | Prior to construction | • Description of the project and its area of influence, • Identification and characterization of communities and towns that are in the area of influence of the project, • Identification, characterization, prediction and assessment of the positive and negative social impacts that could derive from the project, and • Provision of prevention or mitigation measures, and social management plans. | Approximately 90 working days (Mon-Fri) |
New Concession or Useful Allotment of Groundwater | Secretaria de Medio Ambiente y Recursos Naturales (SEMARNAT) | Prior Construction | Required to extract or utilise groundwater from areas regulated by the Federal Government for public interest. | Approximately 90 working days (Mon-Fri) |
Authorization for the Transfer of Titles and Registration. | Secretaria de Medio Ambiente y Recursos Naturales (SEMARNAT) | As required | Required when the interested party has a valid concession title or assignment of rights and is registered in the state water rights record office and wants to transfer their rights for either surface water within the same basin or groundwater within an aquifer. | Approximately 90 working days (Mon-Fri) |
Concession for Material Extraction in Rivers Deposits | Secretaria de Medio Ambiente y Recursos Naturales (SEMARNAT) | As required | According to Article 113 of the National Water Law, this submittal is applicable for the exploitation and use of construction materials when: • The area is regulated by the National Water Commission, • The area is on land occupied by lakes, lagoons, estuaries, or natural deposits whose water is national property, and • The area has riverbeds with national water currents. | Approximately 90 working days (Mon-Fri) |
|
|
Permit | Agency | Required Stage | Description/Inclusions | Agency Process |
Permission to carry out Hydraulics Construction | Secretaria de Medio Ambiente y Recursos Naturales (SEMARNAT) | Prior Construction | Required when working within National Property regulated by National Water Commission for: • River-Crossing Structures, • Flow channels, • Channel Dams, • Tailing Dams, • Storage Dams, and • Bypass Constructions. | Approximately 240 working days (Mon-Fri) |
Concession for Occupation of Federal Land under the Jurisdiction of National Water Commission | Secretaria de Medio Ambiente y Recursos Naturales (SEMARNAT) | As required | This submittal is required when there will be land use or exploitation of federal channels, riverbeds, lakes, or lagoons, as well as creeks, zones and other national assets regulated by the National Water Law. | Approximately 90 working days (Mon-Fri) |
Use of Explosives | Secretaria de la Defensa Nacional (SEDENA) | When required to buy, transport, store, or use explosives | Transactions are made in Mexico City and must comply with the following format: • Letter of notification from the State Governor, • Safety Certificate, • Location map of powder magazines and accessories, with reference to the places where the explosives are used and stored in relation to human occupation, • The type and quantity of explosives to be consumed monthly, and • Legal documentation of the company. | Approximately 90 working days (Mon-Fri) after a Technician of SEDENA performs a site inspection visit |
|
|
Permit | Agency | Required Stage | Description/Inclusions | Agency Process |
Compliance with Environmental Risk and Impact Regulations | Secretaria de Medio Ambiente y Recursos Naturales (SEMARNAT) Procuraduría Federal de Protección al Ambiente (PROFEPA) State Office | All | The authorisation of the Environmental Impact and Risk Analysis defines rules for the construction and start-up of operations to protect the environment. | - |
Residual Water Discharge Register and Permission | Secretaria de Medio Ambiente y Recursos Naturales (SEMARNAT) Comisión Nacional del Agua (CNA) State Office | Prior to water usage | Required when permanently, intermittently, or incidentally discharging or infiltrating sewage into national water bodies (ocean/sea, riverbeds) or lands that are national assets, with a risk of contaminating the subsoil or aquifer. | 90 working days (Mon-Fri) |
Construction License | Municipality | Prior to construction | Required to comply with construction regulations. | Check with country |
Land Use License | Municipality | Prior to construction | The Project must be registered and approved by the County. | Check with country |
|
|
20.4.3 Amendments to Mexican Mining Regulation
The Mexican Federal Executive Branch (Poder Ejecutivo) first submitted a bill to amend the four laws on March 24, 2023. The primary goal of the bill, as provided under the statement of purposes (exposición de motivos), was to "recover the state's control over the mineral and water resources found in the Mexican subsoil and which are the direct domain of the nation." The bill was intended to regulate the granting, maintenance, supervision and termination of mining concessions and water concessions for mining purposes. However, The amendments have been postponed as declared in The Official Gazette of the Mexican Nation states in the General Agreement number 3/2024, of July 11, 2024, of the Plenary Session of the Supreme Court of Justice of the Nation. The Amendments, which focus principally but not exclusively, on the process of granting new concessions, are generally applicable to new concessions only. The Amendments are not seen as materially affecting the advancement of the Project given that the Project is comprised entirely of existing concessions. However, there does remain some minor uncertainty as to how the Amendments may be applied by Mexican regulators in the future, and the situation should be monitored closely.
20.5 Environmental Management and Monitoring System
As the Project progresses though future and EIS/permitting stages, environmental management and monitoring plans will be required to guide the development and operation of the Project to mitigate and limit environmental impacts. These plans will be complementary to the engineered designs that will be required for the storage of tailings, waste rock, mineralized material, and conveyance/storage (refer to Section 18). Environmental management and monitoring will be directed by environmental professionals empowered to ensure that plans and monitoring protocols and practice are in full compliance with Mexican environmental regulations and international governance norms and best practices. Environment and Social governance will collaborate to ensure business compliance meets the regulatory and social norms for stable business operations.
A preliminary list of the plans that should be considered are provided below:
Explosives Management Plan.
Hazardous Materials Management Plan.
Waste Management Plan.
Emergency Response Plan.
Fire Prevention and Response Plan.
Wildlife Management and Monitoring Plan.
Greenhouse Gas Inventory Management Plan.
Public Access Control Plan.
Air Quality Management and Monitoring Plan.
Waste Rock Management Plan.
|
|
Geochemical Characterization and Monitoring Plan.
Spill Prevention and Response Plan.
Mine Site Traffic Management Plan.
Fugitive Dust Control and Monitoring Plan.
Terrestrial and Aquatic Habitat Management and Monitoring Plan.
Surface and Groundwater Management and Monitoring Plan.
Reclamation and Closure Plan.
Revegetation Plan
20.6 Closure and Reclamation Planning
Mexico requires the preparation of a conceptual closure plan as part of the MIA, and no financial surety (bonding) is required of mining companies. SEMARNAT requires the granting of insurance or guarantees regarding compliance with the conditions established in the authorization when during the execution of the works, serious damage to ecosystems may occur (Article 35 of the LGEEPA). These cases that can cause serious damage to ecosystems are defined within the document. Insurance or guarantees may be established for each stage of the project that, and the amounts must be updated annually (articles 52 and 53 of the Regulation).
There is no specific regulatory framework. NOM-120-SEMARNAT-2020 (NOM-120) is applicable to the closure of mine projects during exploration that establishes when the exploration project is completed. In the event of abandonment, the person in charge of the project must carry out the restoration program (Section 4.1.18). There are other regulations that establish criteria for closure during operation. In accordance with the general work schedule of the Panuco Project, the abandonment phase will commence after Year 11 from the start of operations, after which the approved Closure and Reclamation Plan will be implemented. At this time no formal Closure and Reclamation Plan has been prepared for the Panuco project for the purpose of regulatory submission; one will be required as the Project advances through subsequent project stages of feasibility-level design. An environmental monitoring plan will need to be developed once closure measures are implemented
However, for the purpose of Project design, a conceptual closure and reclamation plan for the Project has been preliminarily developed that involves the identification of risks and associated mitigation measures for various Project components as follows:
partial backfilling of underground workings with available mine rock waste and flooding of workings.
stabilization and plugging of underground workings/openings to prevent access by the public and by wildlife
the plant and infrastructure pad will be dismantled, removed, and re-contoured and revegetated
waste rock stockpile(s) footprints to be reclaimed and vegetated
the tailings dam will be vegetated to establish an erosion resistant surface
|
|
the tailings beach will be capped with soil and vegetated
implement and continue water treatment until such time site contact water meets discharge standards
once the contact water at the mine site meets water quality discharge criteria direct flows to the downstream receiving environment can be re-established
The associated cost of reclamation and closure has been preliminarily estimated at US$31.8M (refer to Section 21.2.10).
20.7 Socio-Economic and Cultural Baseline Studies
Baseline socio-economic and cultural studies have not yet been completed for the Panuco Project. No Archaeological Assessment has been completed for the site. National Institute of Anthropology and History (INAH) personnel will be required to survey the area to document and register any important archaeological sites.
The information provided in this section comes from the Flores Doncel (2022) study.
The Panuco Mining Exploration Project is in the northwest of the municipality of Concordia, Sinaloa. This region is made up of six rural agrarian centers with large extensions of Common Use Lands and 32 towns. The muncipality of Concordia has an estimated population of 24,899 (2020 cencus) within an area of a 2,167 km2. In the year 2020 there were 12,539 men and 12,360 women, giving a ratio of 101.45 men for every 100 women. Many of these populations consist of emigration flows of people displaced from their original communities due to organized crime conflicts. Much of the population has permanent residence in the municipality of Mazatlán (FDC, Concordia, 2022). The communities of Pánuco and San Miguel del Carrizal have health centers.
Figure 20-11 shows the population per locality near the Panuco Project (FDMC, EIS, 2022).
|
|
Figure 20-11: Population per Locality
![]()
Source: FDMC, EIS, 2022
It is anticipated that the following areas will be affected by the Project: Cópala, El Habal, La Guásima, Pánuco, San Miguel del Carrizal, and Platanar de los Ontiveros. The Project will take place and develop in the areas of Cópala, Pánuco, and San Miguel del Carrizal. Due to their close proximity to central operations, the areas of El Habal and Platanar de los Ontiveros may be directly affected. La Guásima is slightly further and may only be indirectly affected by project development.
Within the local area of Panuco consists of six agrarian settlements with large areas of Common Use Lands, and within it, there are 32 localities with rural characteristics. The estimated population of this area is 2,400 inhabitants, of which 28% have active agrarian rights (communeros or ejidatarios), and 72% are settlers (without agrarian rights). The total population is distributed across 20 localities, with 12 localities recorded as uninhabited.
The region covers a total area of 58,840 ha, of which 99% are assigned to agrarian settlements, and only 1% correspond to population settlements under the civil regime of private property.
The Project's positive impact on the community may include employment generation, economic output and incorporation into social security through the IMSS. Project management will need to establish measures to mitigate negative impacts, especially if they are of concern to the population.
Figure 20-12 shows the Prediction of Social Impacts for the exploration phase of the Project. It is anticipated that similar impacts will be triggered by the mining phase of the Project.
|
|
Figure 20-12: Prediction of Social Impacts
![]()
Source: FDMC, EIS, 2022
20.8 Community Engagement
Vizsla is in the process of establishing guiding principles for community outreach and developing a strategic plan aligned with the organizational philosophy and the objectives of the Project. The implementation of actions must be accompanied by monitoring and measurement to evaluate performance and results. A community engagement plan and management system would enable relations with the community by controlling social risks and enabling favourable conditions for the development of the Project in the long term. In addition such an engagement and management system would allow for the orderly development and justify sufficient budgets to allow for meaningful social investment, thereby reducing Project risks and costs due to potential community opposition and contribute to the responsible development of the community in accordance with community needs.
Vizsla has commenced conversations with local stakeholders to express the intention of developing a mining project within Common Use Land and ejido property land that would aim to provide socio-economic well-being for the local population. The Company intends to maintain this relationship throughout the Project's lifecycle.
The Panuco Project aims to offer over 100 potential temporary and permanent jobs to the region. Special effort will be made during the Project to provide support to the local communities, including assisting with the introduction and improvement of basic services and educational institutions.
|
|
Vizsla aims to generate a state of trust and reciprocity with local populations that is maintained to date that will be reflected with the employment of the population that resides in surrounding towns and community.
It is Important that Vizsla commit efforts to the local communities, including assisting with introducing and improving basic services and educational institutions. It is of vital importance for the Company to have a relationship with the population and society in the area. The company needs to reach out to the community through various means with the intention of developing a mining project within private and ejido property land, that would provide a socio-economic well-being for the local and foreign population that boosts local economy.
In addition, social activities and recreation for the Ejidos population is a main contribution that the Company has been supporting over the years. The support includes financial resources per request of the people and needed for the festivities and recreational activities that as a society are performed locally, such as health fairs, Mother's Day, Children's Day, Christmas festivities, *sport activities, among others.
It is recommended that Vizsla continue to engage with the nearby communities to stay informed about community concerns and potential projects that the Company can support by means of economic aid and other resources.
|
|
21 CAPITAL AND OPERATING COSTS
21.1 Introduction
The capital and operating cost estimates presented in this PEA provide substantiated costs that can be used to assess the preliminary economics of the Panuco Project. The estimates are primarily based on an underground mine operation, process plant construction and operation, tailings storage facility construction and operation and owner's costs and provisions. The processing plant nameplate capacity for Years 1-3 is 3,300 t/d (1.2 Mt/a) and from Year 4 onwards the throughput is 4,000 t/d (1.46 Mt/a) with a life of mine (LOM) of 10.6 years.
All capital and operational cost estimates are presented in United States dollars (US$), with exchange rate variations factored in.
21.2 Capital Cost Estimate
21.2.1 Capital Cost Summary
The capital cost estimate conforms to Class 5 guidelines of the Association for the Advancement of Cost Engineering International (AACE International) with an estimated accuracy of +50%/-30% accuracy. The capital cost estimate was developed in Q3 2024 United States dollars. The process plant, tailings storage facility, paste plant and infrastructure costs were estimated by Ausenco, and mining cost was estimated by Entech.
The total initial capital cost for the Panuco Project is US$223.5M, expansion capital cost is US$11.1M and the LOM sustaining cost including financing and closure cost of US$31.8M is US$262.0M. The capital cost summary is presented below in Table 21-1.
Table 21-1: Capital Costs Summary
WBS | WBS Description | Initial Capital | Sustaining Capital | Expansion Capital | Total Cost |
1000 | Mine | 64.5 | 207.7 | - | 272.3 |
2000 | Process Plant | 63.2 | - | 7.2 | 70.4 |
3000 | Additional Process Facilities | 8.7 | 22.4 | - | 31.1 |
4000 | On-Site Infrastructure | 13.5 | - | - | 13.5 |
5000 | Off-Site Infrastructure | 0.8 | - | - | 0.8 |
Total Directs | 150.7 | 230.2 | 7.2 | 388.2 | |
6000 | Project Indirects | 6.1 | - | 0.6 | 6.7 |
7000 | Project Delivery | 12.9 | - | 0.7 | 13.7 |
Total Indirect | 19.0 | - | 1.3 | 20.4 | |
8000 | Owner's Cost | 7.5 | - | 0.4 | 7.9 |
9000 | Provisions (Contingency incl. closure) | 46.3 | 31.8 | 2.1 | 80.2 |
Project Totals | 223.5 | 262.0 | 11.1 | 496.7 | |
Note: Total may not add up due to rounding.
|
|
The cost for the Project was split into initial capital costs, sustaining capital costs, expansion costs and closure costs. The initial capital is project development costs incurred during the pre-production years. Sustaining capital is the capital incurred to support production from the Project. Expansion cost is incurred during Year 4 while expanding the process plant to include the float-leach circuit and throughput of 4,000 t/d. Closure costs include all measures to remove all processing infrastructure and rehabilitate the site.
21.2.2 Basis of Estimate
The data for the estimates were derived from a variety of sources, included the following:
Mine Production Schedule,
Conceptual engineering designs by Ausenco, Entech and SGS,
Major mechanical equipment costs based on vendor quotations, first principles and Ausenco's database of historical projects,
Material take-offs (MTOs) for concrete, steel, electrical, instrumentation, in-plant piping and platework factored by benchmarking against similar projects with equivalent technologies and unit operations,
Topographical information,
Engineering design at a PEA level,
Cost escalation to 2024 when historical pricing is considered, and
Contingency allowance.
21.2.3 Area 1000 - Mining Capital Costs
Mine development and production at the Panuco Project is proposed to be executed by mining contractors with the Company's team providing technical services and site management. The main mining contractor will be responsible for provision of mine personnel, mining equipment, maintenance, and consumables to support mining activities, excluding power, explosives, diesel, and ground control, which are considered to be provided by the Company.
The Company is assumed to provide the required surface infrastructure to support the mining contractor including ventilation infrastructure, maintenance facilities, fixed mine equipment including main pumps and main fans, and other mine facilities including messing, changerooms, explosive storage, wash bay, waste rock storage, mineralized material stockpile pad, and water management infrastructure.
|
|
Mining capital costs have been derived from vendor quotations and historic data collected by Entech at other underground mining operations.
Pre-production mine operating costs, which are the mining costs incurred before the processing facility starts operation are capitalized. Pre-production operating costs include drill and blast, load and haul, support, and general mine operations expenses.
The dominant capital expense is the development cost required to establish production. When considering the reallocation of operating costs and the development cost (direct and indirect costs for both lateral and vertical development) over the pre-production period, approximately US$ 28.9M will be expensed. The life of mine sustaining cost for the project is estimated at US$ 207.7M. Most of the estimated sustaining mining costs is comprised of the direct cost of development, which is estimated to cost approximately US$M 151.4M. Purchases for the mine equipment (primarily fixed equipment) is scheduled throughout the life of mine and capitalized through the sustaining periods of the project. The mine infrastructure costs include the following considerations:
continuation of mining services (power supply, dewatering);
escapeways, ventilation walls, escapeway walls; and,
main paste pipe distribution).
Table 21-2 summarizes the Mining Initial Capital Cost and the Sustaining Capital Cost estimates for the Panuco Project.
Table 21-2: Mining Capital Costs
Description | Initial Capital Cost | Sustaining Capital | Total Capital Cost |
Capital Development | 21.6 | 151.4 | 173.0 |
Fixed Mine Equipment and Mobilization | 4.6 | 13.3 | 17.9 |
Underground Mine Infrastructure | 2.5 | 28.8 | 31.3 |
Fixed Equipment Rebuilds | 7.0 | 4.5 | 11.5 |
Surface Mine Infrastructure | 28.9 | 9.7 | 38.6 |
Total Mining Sustaining Capital Costs | 64.5 | 207.7 | 272.2 |
It is the QP's opinion that these estimates are reasonable for the location and planned mine development and can be used for the PEA of the Panuco Project.
21.2.4 Area 2000 - Process Capital Costs
The definition of process equipment requirements was based on process flowsheets and process design criteria, as defined in Section 17. All major equipment was sized based on the process design criteria to derive a mechanical equipment list. Mechanical scopes of work were developed, and major equipment was sent for budgetary pricing to equipment suppliers. For mechanical equipment costs, 58% of the value was sourced from budgetary quotes; the remainder was sourced by benchmarking against similar silver-gold mine projects and studies.
|
|
In support of the major installation construction contracts, engineering for the process plant was completed to a PEA level of definition. Bulk material quantities were derived for earthworks and priced from other benchmark projects. All other quantities for electrical and instrumentation, concrete, steel, piping, cable and platework were factored and priced.
Process plant costs are summarized in Table 21-3 and described in the following sections. Direct costs include all contractors' direct and indirect labour, permanent equipment, materials, freight and mobile equipment associated with the physical construction of the areas.
Table 21-3: Process Plant Initial Capital Cost
WBS | WBS Description | Initial Capital Cost (US$M) | Expansion Capital Cost (US$M) |
2100 | Crushing and Stockpile | 10.1 | - |
2200 | Grinding | 13.1 | - |
2300 | Flotation & Regrind | - | 5.0 |
2500 | Leaching | 17.5 | 1.4 |
2600 | Merrill Crowe & Refinery | 12.0 | - |
2700 | Detox | 0.6 | - |
2800 | Tailings Handling | 1.6 | - |
2900 | Reagents & Plant Services | 8.2 | 0.8 |
Total Initial Process Plant Costs | 63.2 | 7.2 | |
Note: Total may not add up due to rounding.
21.2.5 Area 3000 - Additional Facilities
The additional facilities that will be constructed and operated include tailings storage facility and paste plant. The initial capital and sustaining capital project delivery are provided in Table 21-4.
Table 21-4: Additional Facilities Cost
WBS | WBS Description | Initial Capital Cost | Sustaining Capital Cost | Total Cost |
3100 | Tailings Storage Facility | 8.7 | 14.6 | 23.3 |
3200 | Paste Plant | - | 7.8 | 7.8 |
Total Initial Additional Facilities Costs | 8.7 | 22.4 | 31.1 | |
Note: Total may not add up due to rounding.
21.2.6 Area 4000 - On-Site Infrastructure Capital Costs
In support of the major installation construction contracts, engineering for the project was completed to a PEA-level of definition. Bulk material quantities were derived for earthworks including the entire project site, process plant and priced from other benchmark projects. The power requirements for the project were estimated based on the electrical equipment list developed for the process plant, power demand for the mining operations; the cost of substation and cable routing was estimated based on benchmarked North American projects.
|
|
The buildings required for the operation were sized and costed based on benchmark projects with similar weather and temperature conditions located in Mexico.
The breakdown of the on-site infrastructure capital costs is shown in Table 21-5.
The on-site infrastructure covers the cost of the site earthworks, site-wide electrical distribution, fuel storage, sewers and various infrastructure buildings.
Table 21-5: On-Site Infrastructure Capital Costs
WBS | WBS Description | Initial Capital Cost (US$M) |
4100 | Bulk Earthworks | 3.6 |
4200 | Water Management | 0.8 |
4300 | HV Power Switchyard and Power Distribution | 7.0 |
4400 | Fuel Storage | 0.1 |
4500 | Sewage | 0.1 |
4600 | Infrastructure Buildings | 1.8 |
Total Initial Additional Facilities Costs | 13.5 | |
Note: Total may not add up due to rounding.
21.2.7 Area 5000 - Off-Site Infrastructure Capital Costs
The breakdown of the costs for the off-site infrastructure planned for the project is shown in Table 21-6.
The off-site infrastructure costs include building the main access road, water supply and overland pipeline, and high-voltage power supply.
Table 21-6: Off-Site Infrastructure Capital Costs
WBS | WBS Description | Initial Capital Cost - Phase 1 |
5100 | Main Access Road | 0.3 |
5200 | Water Supply | 0.3 |
5300 | Power Supply | 0.3 |
Total Initial Off-Site Infrastructure Costs | 0.8 | |
Note: Total may not add up due to rounding.
21.2.8 Area 6000-9000 - Indirect Capital Costs
Indirect capital costs are calculated as a percentage of the direct costs. The indirect capital costs are summarized in Table 21-7 and described below.
Project indirect costs include the following:
- Temporary construction facilities and services,
|
|
Messing and catering during construction,
Vendor reps and assistance,
Equipment Spares,
First fills and initial charges, and
Project delivery.
Provision costs include the following:
- Contingency.
Table 21-7: Indirect Capital Cost Summary
WBS | WBS Description | Initial Capital | Expansion | Total Cost |
6100 | Temporary Construction Facilities and Services | 2.6 | 0.2 | 2.8 |
6200 | Commissioning Assistance and Ops Readiness | 0.7 | 0.1 | 0.8 |
6300 | Spares | 1.8 | 0.2 | 2.0 |
6400 | First Fill | 0.9 | 0.1 | 1.0 |
Project Preliminaries | 6.1 | 0.6 | 6.7 | |
7100 | Engineering and Procurement | 8.6 | 0.4 | 9.0 |
7200 | Construction Management | 4.3 | 0.4 | 4.7 |
Project Delivery | 12.9 | 0.7 | 13.7 | |
8100 | Owner's Cost | 7.5 | 0.4 | 7.9 |
Owner's Cost | 7.5 | 0.4 | 7.9 | |
Total Project Preliminaries, Project Delivery, Owner's Cost | 32.6 | 2.3 | 34.9 | |
9100 | Contingency - Ausenco | 46.3 | 2.1 | 48.5 |
Total Contingency | 46.3 | 2.1 | 48.5 | |
Total Indirects | 72.9 | 3.8 | 76.7 | |
Note: Total may not add up due to rounding.
21.2.9 Area 8000 - Owner (Corporate) Capital Costs
The owner's costs are estimated as 5% of total direct costs and are calculated to be US$7.9M over the life of the project. Owner's costs include such things as project staffing and miscellaneous expenses, pre-production labour, home office project management, home office finance, legal costs, insurance and bonds, licences and fees.
|
|
21.2.10 Closure and Reclamation Planning
The closure cost for the project is estimated at US$31.8M.
21.3 Operating Costs
21.3.1 Average Operating Cost Summary
The costs considered on-site operating costs are those related to mining, processing, tailings handling, maintenance, power and general and administrative activities.
A summary of the operating costs is presented below in Table 21-8.
The average operating cost is US$76.40/t processed, including an annual G&A cost of US$9.9M.
Table 21-8: Average LOM Operating Cost
Cost Area | Average Annual Costs (US$M) | US$/t Processed |
Mining | 64.7 | 47.21 |
Process | 29.7 | 21.96 |
G&A | 9.9 | 7.24 |
Total | 104.3 | 76.40 |
Note: Total may not add up due to rounding.
21.3.2 Basis of Estimate
Key Assumptions were made to estimate the operating costs for the project:
Cost estimates are based on Q3 2024,
Costs are expressed in United States Dollars (US$),
Power cost of US$0.118 per kilowatt-hour (kWh) was assumed,
A diesel cost of US$1.24 per litre was assumed based on trailing 3-year average price,
A throughput of 3,300t/d or 1.20Mt/a was used for the processing plant for Phase 1, and 4,000 t/d or 1.5 Mt/a for Phase 2,
Crushing circuit availability is assumed to be 65%, grinding and floatation availability is assumed to be 92% and filtration availability is assumed to be 85%,
ROM and concentrate grades and recoveries are based on metallurgical test work results described in Section 13,
Material and equipment are purchased as new,
Reagent consumption rates are based on metallurgical test work results and in-house benchmarks, and
|
|
- Grinding media consumption rates are based on mineral material characteristics as described in Section 13.
21.3.3 Mine Operating Costs
The mining operating costs reflect a contractor mining option that defers capital and leverages a contractor's experience for the mine's initial construction and development. Entech developed mining costs from its own cost database, which includes pricing from mining contractors, benchmarked from comparable mines operated in Mexico, and other project studies that utilize LHS as their main mining method and extract similar commodities.
Operating costs are summarized as follows:
Total underground mining operating costs are approximately US$689.5M over the life-of-mine at an average of US$62.7M/a,
Operating development (including non-capital development) of US$2,196/m (direct costs of US$1,643/m) and averages on a per tonne basis of US$11.34/t, and,
Production costs of US$35.86/t of mined mineralized material of which US$26.46/t are direct costs and $9.40/t are indirect costs which includes mine management, technical services, power, fixed mine equipment maintenance and other minor costs.
Unit mining operating costs are summarised in Table 21-9 and production costs in Table 21-10.
Table 21-9: Mining Operating Costs Summary
Item | LOM Operating Cost (US$M) | Unit Cost (US$/t) |
Operating Development | 165.7 | 11.34 |
Production | 523.8 | 35.86 |
Total Development and Production Costs | 689.5 | 47.21 |
Table 21-10: Mining Production Costs
Item | LOM Operating Cost (US$M) | Unit Cost (US$/t) |
Operating Development (Direct Costs) | 118.7 | 8.13 |
Production (Direct Stoping Costs) | 369.7 | 25.31 |
Management & Technical Services | 26.2 | 1.79 |
Maintenance Fixed Mine Equipment | 80.7 | 5.52 |
Power | 30.2 | 2.07 |
Diesel | 22.2 | 1.52 |
Other Mining Costs | 42.0 | 2.87 |
Total Production Cost | 689.5 | 47.21 |
|
|
21.3.4 Process Plant Operating Costs
The process operating cost estimate is based on 3,300 t/d in Phase 1 and 4,000 t/d in Phase 2 mill, consisting of crushing, grinding, flotation, concentrate regrind, concentrate dewatering, leach and Merrill Crowe and tailings handling. This is broken down into two phases.
These include:
1. Phase 1 (Years 1 and 2): The process plant will produce doré through a whole ore leach process at a nominal throughput of 1.2 Mt/a, and
2. Phase 2 (Years 4+): The process plant will produce doré through separate leaching of bulk flotation products at a nominal throughput of 1.5 Mt/a.
The process operating costs are estimated to be US$22.01/t and US$21.45/t for Phase 1 and 2, respectively, averaging to US$21.96/t over LOM. Table 21-11 summarizes the operating costs for the process plant over the different operating periods.
Table 21-11: Process Plant Operating Cost Summary
Cost Area | Phase 1 | Phase 2 | ||
Annual Costs (US$M) | US$/t Processed | Annual Costs (US$M) | US$/t Processed | |
Power | 5.3 | 4.39 | 6.9 | 4.70 |
Reagents & Consumables | 15.8 | 13.15 | 18.8 | 12.90 |
Maintenance | 1.1 | 0.94 | 1.2 | 0.83 |
Labour | 1.9 | 1.61 | 2.0 | 1.38 |
Mobile Equipment | 1.2 | 1.02 | 1.2 | 0.84 |
Lab Services | 0.6 | 0.46 | 0.6 | 0.38 |
Fresh Water Supply | 0.5 | 0.43 | 0.6 | 0.43 |
Total | 6.4 | 22.01 | 31.3 | 21.45 |
Note: Total may not add up due to rounding.
21.3.4.1 Reagents and Consumables
Reagents, grinding media and various consumables are required to process the mineralized material from the Copala and Napoleon Deposits. The consumption rates of each of the consumable items are based on the metallurgical test work outlined in Section 13 and based on the planned process plant throughput of 3,300 t/d in Phase 1 and 4,000 t/d in Phase 2. The total costs of the reagents and consumables by area as well as the costs of mobile equipment used are shown below in Table 21-12.
|
|
Table 21-12: Reagents and Consumables Cost Summary
Cost Area | Phase 1 | Phase 2 | ||
Annual Costs (US$M) | US$/t Processed | Annual Costs (US$M) | US$/t Processed | |
Crushing & Reclaim | 1.6 | 1.33 | 1.6 | 1.10 |
Grinding | 2.6 | 2.20 | 3.2 | 2.17 |
Flotation | - | - | 0.4 | 0.28 |
Leaching | 3.4 | 2.79 | 5.2 | 3.54 |
Precious Metal Recovery | 5.8 | 4.81 | 5.5 | 3.80 |
Detox | 2.2 | 1.87 | 2.7 | 1.87 |
Tailings | 0.2 | 0.14 | 0.2 | 0.14 |
Total | 15.8 | 13.15 | 18.8 | 12.90 |
Note: Total may not add up due to rounding.
21.3.4.2 Maintenance Consumables
Annual maintenance consumable costs were calculated based on a total installed mechanical capital cost by area using a weighted average factor from 3% to 4%. During Phase 1, the process area includes the 3-stage crushing-grinding circuit, whole ore leach and Merrill Crowe circuit, reagent handling and plant services areas. During Phase 2, the process area also includes the flotation-leach circuit and associated reagent handling and plant services area. The total maintenance consumable operating cost is US$1.1M/a or US$0.94/t of feed in Phase 1 and US$1.2M/a or US0.83/t of feed in Phase 2.
21.3.4.3 Power
Power operating costs are calculated from an estimate of annual power consumption using a unit cost of US$0.118/kwh. The annual power consumption for the processing plant is based on the average utilization of each motor on the electrical load list for the process plant.
The process plant energy consumption is estimated to be 44.7MWh per year in Phase 1, and 58.2MWh in Phase 2. The total power operating cost is US$5.3M/a or US$4.39/t of feed in Phase 1 and US$6.9M/a or US$4.70/t of feed in Phase 2.
21.3.4.4 Labour
Labour includes all processing and maintenance labour costs.
Processing production labour was developed using benchmarks from similar projects and includes operation departments such as metallurgy, mill operations, maintenance and the assay lab.
|
|
Each position was defined and classified as salary and wages. Costs included taxes and benefits. For process operations labour, the annual cost is US$1.1M/a in Phase 1, and US$1.2M/a in Phase 2. For process maintenance labour, the total cost is US$0.8M/a in Phase 1, and US$0.8M/a in Phase 2.
The total labour operating cost is US$1.9M/a or US$1.61/t of feed in Phase 1, and US$2.0M/a or US$1.38/t of feed in Phase 2. The estimated labour force was estimated at 128 and 134 people for Phases 1 and 2, respectively. The estimate was based on providing a labour force to support continuous operations at 24 hours per day and 365 days per year.
21.3.4.5 Mobile Equipment
Vehicle costs are based on a scheduled number of light vehicles and mobile equipment for the process plant. The costs include fuel, annual maintenance, spares and tires, annual insurance, and equipment leasing costs. Mobile equipment costs for the process plant are estimated at US$1.2 M/a for Phase 1 and US$1.2 M/a for Phase 2.
21.3.4.6 On-site Laboratory Services
Operating costs for the assay lab were estimated based on a review of benchmark projects with similar flowsheets and sampling requirements. The lab is expected to handle grade control samples, mill solid and aqueous samples, water testing, doré quality testing, and other miscellaneous tests as required. Annual operating costs are estimated at US$0.6M/a for Phase 1 and 2.
21.3.4.7 Make-up Water Supply
Water supply costs were calculated using the expected annual makeup requirements of the process plant from the mass balance. Groundwater that is subject to government fees was assumed as the fresh water source, and a unit rate of US$1.40/m3 was applied.
Annual average water supply costs are estimated at US$0.5M/a for Phase 1 and US$0.6 M/a for Phase 2. The estimated values for water supply costs per tonne of mill feed are US$0.43/t for Phase 1 and US$0.43/t for Phase 2.
21.3.5 General & Administrative Costs
The general and administrative (G&A) operating costs cover the expenses of the operating departments, and a summary is presented in Table 21-13.
General and administrative (G&A) costs were developed using Ausenco's in-house data on existing Mexican operations. The costs were estimated based on the following items:
Site maintenance (including G&A mobile equipment, on-site road maintenance),
Human Resources and Health & Safety (including personnel, recruiting, training, community relations, personal protective equipment and first-aid),
Environmental (including sampling and DSTF operation),
|
|
Administration Costs (including office supplies, IT hardware & software, and support services), and
Contract services (including insurance, sanitation, licence fees and legal fees).
The total annual G&A cost was estimated at US$9.9M/a during production or US$7.24/t plant feed.
Table 21-13: G&A Cost Summary
G&A Expenses | Average Annual Costs (US$M) | US$/t Processed |
Site Maintenance | 1.1 | 0.84 |
Human Resources & Health and Safety | 3.8 | 2.75 |
Environmental Costs | 0.6 | 0.41 |
Administration Costs | 1.2 | 0.91 |
Contract Services | 3.2 | 2.34 |
Total | 9.9 | 7.24 |
Note: Total may not add up due to rounding.
|
|
22 ECONOMIC ANALYSIS
22.1 Forward-Looking Information Cautionary Statements
The results of the economic analysis discussed in this section represent forward-looking information as defined under Canadian securities law. The results depend on inputs that are subject to a number of known and unknown risks, uncertainties and other factors that may cause actual results to differ materially from those presented here.
Information that is forward-looking includes:
Mineral resource and mineral reserve estimates,
Assumed commodity prices and exchange rates,
The proposed mine production plan,
Projected mining and process recovery rates,
Assumptions as to mining dilution,
Capital and operating cost estimates and working capital requirements,
Assumptions as to closure costs and closure requirements,
Assumptions as to environmental, permitting and social consideration and risks.
Additional risks to the forward-looking information include:
Changes to costs of production from what is assumed,
Unrecognized environmental risks,
Unanticipated reclamation expenses,
Unexpected variations in quantity of mineralized material, grade or recovery rates,
Geotechnical or hydrogeological considerations differing from what was assumed,
Failure of mining methods to operate as anticipated.
Failure of plant, equipment or processes to operate as anticipated.
Changes to assumptions as to the availability of electrical power, and the power rates used in the operating cost estimates and financial analysis.
Ability to maintain the social licence to operate.
Accidents, labour disputes and other risks of the mining industry.
|
|
Changes to interest rates.
Changes to tax rates and availability of allowances for depreciation and amortization.
This preliminary economic assessment is preliminary in nature; it includes inferred mineral resources that are considered too speculative geologically to have the economic considerations applied to them that would enable them to be categorized as mineral reserves, and there is no certainty that the preliminary economic assessment will be realized.
22.2 Methodologies Used
The project has been evaluated using a discounted cash flow (DCF) analysis based on a 5% discount rate. Cash inflows consist of annual revenue projections. Cash outflows consist of capital expenditures, including pre-production costs, operating costs, taxes, and royalties. These are subtracted from the inflows to arrive at the annual cash flow projections. Cash flows are taken to occur at the mid-point of each period.
It must be noted that tax calculations involve complex variables that can only be accurately determined during operations, and as such, the actual post-tax results may differ from those estimated. A sensitivity analysis was performed to assess the impact of variations in metals price, discount rate, head grade, recovery, total operating costs, and initial capital costs. The capital and operating cost estimates developed specifically for this project are presented in Section 21 of this report in Q3 2024 US dollars, using exchange rates as noted in Section 21. The economic analysis has been run on a constant dollar basis with no inflation.
22.3 Financial Model Parameters
22.3.1 Assumptions
The economic analysis was performed assuming the base case silver price of US$26.00/oz and gold price of US$1,975/oz. The forecasts used are meant to reflect the average metals price expectation over the life of the project. No price inflation or escalation factors were taken into account. Commodity prices can be volatile, and there is the potential for deviation from the forecast.
The economic analysis also used the following assumptions:
The construction period will be 18 months.
The production life is 10.6 years, with the last year being a partial year.
Cost estimates are in constant Q3 2024 US dollars for capital and operating costs, with no inflation or escalation factors considered.
Results are based on 100% ownership with a 0.5% Government royalty applying to gross revenue from gold and silver production, and 2.5% private royalty applying to NSR.
Capital costs are funded with 100% equity (no financing assumed).
|
|
All cash flows are discounted to the start of the construction period using a mid-period discounting convention.
All metal products will be sold in the same year they are produced.
Project revenue will be derived from the sale of silver-gold doré bars.
No contractual arrangement for refining currently exists.
22.3.2 Taxes
The project has been evaluated on a post-tax basis to provide an approximate value of potential economics. The tax model was compiled by an independent tax consultant and calculations are based on the tax regime as of the date of the PEA technical report. At the effective date of this report, the project was assumed to be subject to the following tax regime:
The Mexican corporate income tax system (Federal Income Tax) consists of 30% income tax. Federal income tax is applied on Project income after deductions of eligible expenses including depreciation of assets, construction costs, exploration costs, and any losses carried forward.
Mining tax in Mexico (Special Mining Tax) consists of 7.5% on revenue less offsite charges, operating expenses and the sale of capital assets.
At the assumed metal prices, total payments are estimated to be US$852M over the LOM.
22.3.3 Royalties
Royalties payable for the Panuco project include a 0.5% government royalty applicable to gross revenue from gold and silver as an "Extraordinary Mining Duty", and a 2.5% private NSR royalty. Total royalty payments are US$125M over the life of the mine and are part of the project economics.
22.4 Economic Analysis
The economic analysis was performed assuming an 5% discount rate. The pre-tax NPV discounted at 5% is US$1,778M; the IRR is 124.1%, and payback period is 0.6 years. On a post-tax basis, the NPV discounted at 5% is US$1,137M, the IRR is 85.7%, and the payback period is 0.8 years. A summary of project economics is shown graphically in Figure 22-1 and listed in Table 22-1. The analysis was done on an annual cashflow basis; the cashflow output is shown Table 22-2.
Readers are cautioned that the PEA is preliminary in nature. It includes inferred mineral resources that are considered too speculative geologically to have the economic considerations applied to them that would enable them to be categorized as mineral reserves, and there is no certainty that the PEA will be realized.
|
|
Figure 22-1: Project Post-Tax Unlevered Cashflow
![]()
Source: Ausenco, 2024.
|
|
Table 22-1: Economic Analysis Summary Table
Description | Unit | Life-of-Mine Total / Average |
General | ||
Discount Rate | % | 5.0 |
Silver Price | US$/oz | 26.00 |
Gold Price | US$/oz | 1,975 |
Production | ||
Head Grade - Ag | g/t | 228 |
Head Grade - Au | g/t | 1.90 |
Recovery Rate - Ag to doré | koz | 92.2% |
Recovery Rate - Au to doré | koz | 93.8% |
Total Metal Payable - Ag | koz | 98,697 |
Total Metal Payable - Au | koz | 835 |
Average Annual Payable Production - Ag | koz/year | 9,268 |
Average Annual Payable Production - Au | koz/year | 78 |
Average Annual Payable Production - AgEq | koz/year | 15,225 |
Operating Costs | ||
Mining Cost | US$/t processed | 47.21 |
Processing Cost (incl. TSF) | US$/t processed | 21.96 |
Site G&A Costs | US$/t processed | 7.24 |
Total Operating Costs | US$/t processed | 76.40 |
Cash Costs and All-in Sustaining Costs (Co-Product Basis) | ||
Cash Cost* | US$/oz AgEq | 7.98 |
All-in Sustaining Cost** | US$/oz AgEq | 9.40 |
Capital Expenditures | ||
Initial Capital | US$M | 224 |
Expansion Capital | US$M | 11 |
Sustaining Capital (excl. Closure Costs and Salvage Value) | US$M | 230 |
Closure Costs | US$M | 32 |
Salvage Value | US$M | 9 |
Economics | ||
Pre-tax NPV @ 5% | US$M | 1,778 |
Pre-tax IRR | % | 124.1 |
Pre-tax Payback | years | 0.6 |
Post-tax NPV @ 5% | US$M | 1,137 |
Post-tax IRR | % | 85.7 |
Post-tax Payback | years | 0.8 |
Notes: * Total cash costs consist of operating cash costs plus royalties and offsite (refining & transport) charges. ** AISC consist of total cash costs plus sustaining capital
|
|
Table 22-2: Life of Mine Economics
Free Cash Flow | Units | Total/Avg | Project Year | ||||||||||||
Y-2 | Y-1 | Y1 | Y2 | Y3 | Y4 | Y5 | Y6 | Y7 | Y8 | Y9 | Y10 | Y11 | |||
Revenue | US$M | 4,216 | -- | -- | 522 | 528 | 399 | 430 | 395 | 385 | 359 | 322 | 323 | 383 | 171 |
Operating Expenses | US$M | (1,116) | -- | -- | (73) | (94) | (106) | (118) | (120) | (116) | (111) | (110) | (106) | (103) | (58) |
Offsite Charges (refining & transport) | US$M | (54) | -- | -- | (7) | (7) | (5) | (6) | (5) | (5) | (4) | (4) | (4) | (5) | (2) |
Royalties (including EMD) | US$M | (125) | -- | -- | (15) | (16) | (12) | (13) | (12) | (11) | (11) | (10) | (10) | (11) | (5) |
EBITDA | US$M | 2,921 | -- | -- | 426 | 411 | 275 | 294 | 258 | 252 | 233 | 199 | 204 | 264 | 105 |
Initial Capital | US$M | (224) | (76) | (148) | -- | -- | -- | -- | -- | -- | -- | -- | -- | -- | -- |
Expansion Capital | US$M | (11) | -- | -- | -- | -- | (11) | -- | -- | -- | -- | -- | -- | -- | -- |
Sustaining Capex | US$M | (230) | -- | -- | (34) | (42) | (27) | (25) | (18) | (19) | (23) | (23) | (10) | (8) | (2) |
Closure Capex | US$M | (32) | -- | -- | -- | -- | -- | -- | -- | -- | -- | -- | -- | -- | (32) |
Salvage Value | US$M | 9 | -- | -- | -- | -- | -- | -- | -- | -- | -- | -- | -- | -- | 9 |
Change in Working Capital | US$M | -- | -- | -- | -- | -- | -- | -- | -- | -- | -- | -- | -- | -- | -- |
Pre-Tax Unlevered Free Cash Flow | US$M | 2,434 | (76) | (148) | 392 | 369 | 238 | 269 | 239 | 233 | 210 | 176 | 194 | 256 | 81 |
Pre-Tax Cumulative Unlevered Free Cash Flow | US$M | 2,434 | (76) | (224) | 168 | 537 | 775 | 1,043 | 1,283 | 1,516 | 1,726 | 1,902 | 2,096 | 2,352 | 2,434 |
Total Corporate Taxes | US$M | (852) | -- | -- | (123) | (132) | (79) | (87) | (72) | (69) | (61) | (51) | (63) | (86) | (30) |
Post-Tax Unlevered Free Cash Flow | US$M | 1,582 | (76) | (148) | 269 | 237 | 159 | 182 | 168 | 164 | 149 | 125 | 132 | 170 | 52 |
Post-Tax Cumulative Unlevered Free Cash Flow | US$M | 1,582 | (76) | (224) | 45 | 282 | 441 | 623 | 790 | 955 | 1,104 | 1,229 | 1,360 | 1,530 | 1,582 |
Mining |
|
|
|
|
|
|
|
|
|
|
|
|
|
|
|
Mineralized Material Mined | kt | 14,607 | 26 | 409 | 790 | 1,285 | 1,397 | 1,549 | 1,526 | 1,404 | 1,381 | 1,412 | 1,400 | 1,404 | 623 |
Processing |
|
|
|
|
|
|
|
|
|
|
|
|
|
|
|
Total Mill Feed |
|
|
|
|
|
|
|
|
|
|
|
|
|
|
|
Mill Tonnes | kt | 14,607 | -- | -- | 1,096 | 1,200 | 1,200 | 1,460 | 1,460 | 1,460 | 1,460 | 1,460 | 1,460 | 1,460 | 891 |
Ag Grade | g/t | 228 | -- | -- | 419 | 390 | 302 | 238 | 211 | 206 | 174 | 148 | 147 | 194 | 135 |
Au Grade | g/t | 1.90 | -- | -- | 2.57 | 2.37 | 1.89 | 1.82 | 1.78 | 1.74 | 1.86 | 1.79 | 1.81 | 1.87 | 1.46 |
AgEq Grade | g/t | 350 | -- | -- | 614 | 567 | 436 | 353 | 319 | 308 | 288 | 255 | 259 | 319 | 192 |
Doré Recovery |
|
|
|
|
|
|
|
|
|
|
|
|
|
|
|
Ag | % | 92.2% | -- | -- | 92.7% | 92.0% | 88.5% | 93.7% | 93.2% | 92.6% | 92.3% | 92.1% | 92.0% | 92.8% | 92.6% |
Au | % | 93.8% | -- | -- | 93.1% | 93.1% | 91.2% | 94.2% | 94.3% | 94.4% | 94.4% | 94.4% | 94.4% | 94.3% | 94.3% |
Production Profile |
|
|
|
|
|
|
|
|
|
|
|
|
|
|
|
Metal Produced |
|
|
|
|
|
|
|
|
|
|
|
|
|
|
|
Ag | koz | 98,796 | -- | -- | 13,681 | 13,860 | 10,315 | 10,449 | 9,218 | 8,946 | 7,555 | 6,386 | 6,360 | 8,453 | 3,572 |
Au | koz | 836 | -- | -- | 84 | 85 | 66 | 80 | 79 | 77 | 83 | 79 | 80 | 83 | 39 |
AgEq | koz | 162,333 | -- | -- | 20,087 | 20,329 | 15,362 | 16,553 | 15,191 | 14,809 | 13,827 | 12,414 | 12,441 | 14,751 | 6,569 |
Metal Payable |
|
|
|
|
|
|
|
|
|
|
|
|
|
|
|
Ag | koz | 98,697 | -- | -- | 13,667 | 13,846 | 10,305 | 10,439 | 9,209 | 8,937 | 7,548 | 6,379 | 6,354 | 8,444 | 3,568 |
|
|
Free Cash Flow | Units | Total/Avg | Project Year | ||||||||||||
Y-2 | Y-1 | Y1 | Y2 | Y3 | Y4 | Y5 | Y6 | Y7 | Y8 | Y9 | Y10 | Y11 | |||
Au | koz | 835 | -- | -- | 84 | 85 | 66 | 80 | 79 | 77 | 82 | 79 | 80 | 83 | 39 |
AgEq | koz | 162,139 | -- | -- | 20,064 | 20,306 | 15,344 | 16,534 | 15,173 | 14,791 | 13,810 | 12,398 | 12,425 | 14,733 | 6,561 |
Revenue | Units | Total/Avg | Y-2 | Y-1 | Y1 | Y2 | Y3 | Y4 | Y5 | Y6 | Y7 | Y8 | Y9 | Y10 | Y11 |
Ag Revenue | US$M | 2,566 | -- | -- | 355 | 360 | 268 | 271 | 239 | 232 | 196 | 166 | 165 | 220 | 93 |
Au Revenue | US$M | 1,649 | -- | -- | 166 | 168 | 131 | 158 | 155 | 152 | 163 | 156 | 158 | 164 | 78 |
Gross Revenue | US$M | 4,216 | -- | -- | 522 | 528 | 399 | 430 | 395 | 385 | 359 | 322 | 323 | 383 | 171 |
Transport & Refining Charges | US$M | 54 | -- | -- | 7 | 7 | 5 | 6 | 5 | 5 | 4 | 4 | 4 | 5 | 2 |
Net Revenue | US$M | 4,162 | -- | -- | 514 | 521 | 393 | 424 | 390 | 380 | 355 | 319 | 319 | 378 | 169 |
Royalties |
|
|
|
|
|
|
|
|
|
|
|
|
|
|
|
Extraordinary Mining Duty | US$M | 21 | -- | -- | 3 | 3 | 2 | 2 | 2 | 2 | 2 | 2 | 2 | 2 | 1 |
Private NSR Royalty | US$M | 104 | -- | -- | 13 | 13 | 10 | 11 | 10 | 9 | 9 | 8 | 8 | 9 | 4 |
Operating Costs |
|
|
|
|
|
|
|
|
|
|
|
|
|
|
|
Mining | US$M | 690 | -- | -- | 38 | 57 | 69 | 76 | 79 | 75 | 69 | 68 | 64 | 61 | 32 |
Processing (including TSF handling) | US$M | 321 | -- | -- | 25 | 27 | 27 | 32 | 32 | 32 | 32 | 32 | 32 | 32 | 20 |
G&A | US$M | 106 | -- | -- | 10 | 10 | 10 | 10 | 10 | 10 | 10 | 10 | 10 | 10 | 6 |
Cash Costs (Co-product Basis) |
|
|
|
|
|
|
|
|
|
|
|
|
|
|
|
Total Cash Costs* | $/oz AgEq | 7.98 | -- | -- | 4.78 | 5.77 | 8.05 | 8.23 | 9.03 | 8.96 | 9.12 | 9.94 | 9.57 | 8.08 | 9.95 |
All-in Sustaining Costs** | $/oz AgEq | 9.40 | -- | -- | 6.47 | 7.83 | 9.79 | 9.75 | 10.24 | 10.23 | 10.82 | 11.80 | 10.35 | 8.61 | 10.18 |
Capital Expenditures |
|
|
|
|
|
|
|
|
|
|
|
|
|
|
|
Initial Capital | US$M | 224 | 76 | 148 | -- | -- | -- | -- | -- | -- | -- | -- | -- | -- | -- |
Expansion Capital | US$M | 11 | -- | -- | -- | -- | 11 | -- | -- | -- | -- | -- | -- | -- | -- |
Sustaining Capital | US$M | 230 | -- | -- | 34 | 42 | 27 | 25 | 18 | 19 | 23 | 23 | 10 | 8 | 2 |
Closure Cost | US$M | 32 | -- | -- | -- | -- | -- | -- | -- | -- | -- | -- | -- | -- | 32 |
Salvage Value | US$M | (9) | -- | -- | -- | -- | -- | -- | -- | -- | -- | -- | -- | -- | (9) |
Total Capital Expenditures | US$M | 487 | 76 | 148 | 34 | 42 | 38 | 25 | 18 | 19 | 23 | 23 | 10 | 8 | 24 |
Notes: All values in 2024 real US dollars unless otherwise noted * Total cash costs consist of operating cash costs plus royalties and offsite (refining & transport) charges. ** AISC consist of total cash costs plus sustaining capital
|
|
22.5 Sensitivity Analysis
A sensitivity analysis was conducted on the base case NPV and IRR of the project using the following variables: discount rate, head grade, recovery, total operating cost, initial capital cost, as well as silver and gold prices, which were encompassed in a single variable, metal price.
Table 22-3 and Table 22-4 summarize the pre-tax and post-tax sensitivities of the project. As shown in Figure 22-2 and Figure 22-3, the sensitivity analysis revealed that the project is most sensitive to changes in head grade and metal price.
|
|
Table 22-3: Pre-Tax NPV (US$M) and IRR (%) Sensitivity Analysis
| Pre-Tax NPV5% Sensitivity to Discount Rate | Pre-Tax IRR Sensitivity to Discount Rate | ||||||||||||
| Metal Price |
| Metal Price | |||||||||||
Discount Rate |
| (20%) | (10%) | 0% | 10% | 20% | Discount Rate |
| (20%) | (10%) | 0% | 10% | 20% | |
1.0% | 1,511 | 1,895 | 2,279 | 2,664 | 3,048 | 1.0% | 92.0 | 108.5 | 124.1 | 139.0 | 153.3 | |||
3.0% | 1,327 | 1,667 | 2,008 | 2,348 | 2,689 | 3.0% | 92.0 | 108.5 | 124.1 | 139.0 | 153.3 | |||
5.0% | 1,171 | 1,474 | 1,778 | 2,081 | 2,385 | 5.0% | 92.0 | 108.5 | 124.1 | 139.0 | 153.3 | |||
8.0% | 978 | 1,236 | 1,495 | 1,753 | 2,011 | 8.0% | 92.0 | 108.5 | 124.1 | 139.0 | 153.3 | |||
10.0% | 872 | 1,105 | 1,338 | 1,572 | 1,805 | 10.0% | 92.0 | 108.5 | 124.1 | 139.0 | 153.3 | |||
| Pre-Tax NPV5% Sensitivity to Operating Costs | Pre-Tax IRR Sensitivity to Operating Costs | ||||||||||||
| Metal Price |
| Metal Price | |||||||||||
Operating Costs |
| (20%) | (10%) | 0% | 10% | 20% | Operating Costs |
| (20%) | (10%) | 0% | 10% | 20% | |
(20.0%) | 1,331 | 1,635 | 1,938 | 2,242 | 2,545 | (20.0%) | 98.2 | 114.2 | 129.4 | 144.0 | 158.1 | |||
(10.0%) | 1,251 | 1,555 | 1,858 | 2,162 | 2,465 | (10.0%) | 95.1 | 111.4 | 126.8 | 141.5 | 155.7 | |||
-- | 1,171 | 1,474 | 1,778 | 2,081 | 2,385 | -- | 92.0 | 108.5 | 124.1 | 139.0 | 153.3 | |||
10.0% | 1,091 | 1,394 | 1,698 | 2,001 | 2,304 | 10.0% | 88.8 | 105.6 | 121.4 | 136.4 | 150.9 | |||
20.0% | 1,010 | 1,314 | 1,617 | 1,921 | 2,224 | 20.0% | 85.5 | 102.6 | 118.6 | 133.8 | 148.4 | |||
| Pre-Tax NPV5% Sensitivity to Initial Capital | Pre-Tax IRR Sensitivity to Initial Capital | ||||||||||||
| Metal Price |
| Metal Price | |||||||||||
Initial Capital |
| (20%) | (10%) | 0% | 10% | 20% | Initial Capital |
| (20%) | (10%) | 0% | 10% | 20% | |
(20.0%) | 1,219 | 1,522 | 1,826 | 2,129 | 2,433 | (20.0%) | 113.8 | 133.0 | 151.2 | 168.6 | 185.2 | |||
(10.0%) | 1,195 | 1,498 | 1,802 | 2,105 | 2,409 | (10.0%) | 101.8 | 119.6 | 136.4 | 152.4 | 167.8 | |||
-- | 1,171 | 1,474 | 1,778 | 2,081 | 2,385 | -- | 92.0 | 108.5 | 124.1 | 139.0 | 153.3 | |||
10.0% | 1,147 | 1,450 | 1,754 | 2,057 | 2,361 | 10.0% | 83.8 | 99.2 | 113.8 | 127.7 | 141.1 | |||
20.0% | 1,123 | 1,426 | 1,730 | 2,033 | 2,337 | 20.0% | 76.8 | 91.3 | 105.0 | 118.1 | 130.7 | |||
| Pre-Tax NPV5% Sensitivity to Head Grade | Pre-Tax IRR Sensitivity to Head Grade | ||||||||||||
| Metal Price |
| Metal Price | |||||||||||
Head Grade |
| (20%) | (10%) | 0% | 10% | 20% | Head Grade |
| (20%) | (10%) | 0% | 10% | 20% | |
(20.0%) | 669 | 908 | 1,148 | 1,388 | 1,627 | (20.0%) | 60.5 | 75.1 | 88.8 | 101.8 | 114.2 | |||
(10.0%) | 920 | 1,192 | 1,463 | 1,735 | 2,007 | (10.0%) | 76.9 | 92.4 | 107.1 | 121.0 | 134.4 | |||
-- | 1,171 | 1,474 | 1,778 | 2,081 | 2,385 | -- | 92.0 | 108.5 | 124.1 | 139.0 | 153.3 | |||
10.0% | 1,415 | 1,750 | 2,084 | 2,419 | 2,753 | 10.0% | 105.4 | 122.7 | 139.1 | 154.8 | 169.9 | |||
20.0% | 1,658 | 2,024 | 2,389 | 2,755 | 3,120 | 20.0% | 118.0 | 136.1 | 153.4 | 169.9 | 185.8 | |||
| Pre-Tax NPV5% Sensitivity to Recovery | Pre-Tax IRR Sensitivity to Recovery | ||||||||||||
| Metal Price |
| Metal Price | |||||||||||
Recovery |
| (20%) | (10%) | 0% | 10% | 20% | Recovery |
| (20%) | (10%) | 0% | 10% | 20% | |
(20.0%) | 693 | 935 | 1,178 | 1,421 | 1,663 | (20.0%) | 63.5 | 78.5 | 92.4 | 105.7 | 118.3 | |||
(10.0%) | 932 | 1,205 | 1,478 | 1,751 | 2,024 | (10.0%) | 78.2 | 93.9 | 108.7 | 122.8 | 136.2 | |||
-- | 1,171 | 1,474 | 1,778 | 2,081 | 2,385 | -- | 92.0 | 108.5 | 124.1 | 139.0 | 153.3 | |||
10.0% | 1,349 | 1,675 | 2,001 | 2,327 | 2,653 | 10.0% | 102.0 | 119.1 | 135.3 | 150.8 | 165.7 | |||
20.0% | 1,357 | 1,685 | 2,012 | 2,339 | 2,666 | 20.0% | 102.7 | 119.9 | 136.1 | 151.7 | 166.6 | |||
|
|
Table 22-4: Post-Tax NPV (US$M) and IRR (%) Sensitivity Analysis
| Post-Tax NPV5% Sensitivity to Discount Rate | Post-Tax IRR Sensitivity to Discount Rate | ||||||||||||
| Metal Price |
| Metal Price | |||||||||||
Discount Rate |
| (20%) | (10%) | 0% | 10% | 20% | Discount Rate |
| (20%) | (10%) | 0% | 10% | 20% | |
1.0% | 982 | 1,229 | 1,477 | 1,725 | 1,972 | 1.0% | 62.9 | 74.6 | 85.7 | 96.3 | 106.5 | |||
3.0% | 854 | 1,074 | 1,293 | 1,513 | 1,732 | 3.0% | 62.9 | 74.6 | 85.7 | 96.3 | 106.5 | |||
5.0% | 747 | 942 | 1,137 | 1,333 | 1,528 | 5.0% | 62.9 | 74.6 | 85.7 | 96.3 | 106.5 | |||
8.0% | 614 | 780 | 946 | 1,112 | 1,278 | 8.0% | 62.9 | 74.6 | 85.7 | 96.3 | 106.5 | |||
10.0% | 541 | 691 | 840 | 990 | 1,140 | 10.0% | 62.9 | 74.6 | 85.7 | 96.3 | 106.5 | |||
| Post-Tax NPV5% Sensitivity to Operating Costs | Post-Tax IRR Sensitivity to Operating Costs | ||||||||||||
| Metal Price |
| Metal Price | |||||||||||
Operating Costs |
| (20%) | (10%) | 0% | 10% | 20% | Operating Costs |
| (20%) | (10%) | 0% | 10% | 20% | |
(20.0%) | 850 | 1,046 | 1,241 | 1,437 | 1,632 | (20.0%) | 67.6 | 78.9 | 89.7 | 100.1 | 110.2 | |||
(10.0%) | 798 | 994 | 1,189 | 1,385 | 1,580 | (10.0%) | 65.3 | 76.8 | 87.7 | 98.2 | 108.4 | |||
-- | 747 | 942 | 1,137 | 1,333 | 1,528 | -- | 62.9 | 74.6 | 85.7 | 96.3 | 106.5 | |||
10.0% | 695 | 890 | 1,086 | 1,281 | 1,477 | 10.0% | 60.5 | 72.4 | 83.6 | 94.3 | 104.7 | |||
20.0% | 643 | 838 | 1,034 | 1,229 | 1,425 | 20.0% | 58.0 | 70.1 | 81.5 | 92.4 | 102.8 | |||
| Post-Tax NPV5% Sensitivity to Initial Capital | Post-Tax IRR Sensitivity to Initial Capital | ||||||||||||
| Metal Price |
| Metal Price | |||||||||||
Initial Capital |
| (20%) | (10%) | 0% | 10% | 20% | Initial Capital |
| (20%) | (10%) | 0% | 10% | 20% | |
(20.0%) | 795 | 990 | 1,185 | 1,381 | 1,576 | (20.0%) | 79.2 | 92.9 | 105.9 | 118.4 | 130.4 | |||
(10.0%) | 771 | 966 | 1,161 | 1,357 | 1,552 | (10.0%) | 70.3 | 82.8 | 94.8 | 106.3 | 117.3 | |||
-- | 747 | 942 | 1,137 | 1,333 | 1,528 | -- | 62.9 | 74.6 | 85.7 | 96.3 | 106.5 | |||
10.0% | 722 | 918 | 1,113 | 1,309 | 1,504 | 10.0% | 56.9 | 67.7 | 78.0 | 87.9 | 97.5 | |||
20.0% | 698 | 894 | 1,089 | 1,285 | 1,480 | 20.0% | 51.7 | 61.9 | 71.6 | 80.8 | 89.8 | |||
| Post-Tax NPV5% Sensitivity to Head Grade | Post-Tax IRR Sensitivity to Head Grade | ||||||||||||
| Metal Price |
| Metal Price | |||||||||||
Head Grade |
| (20%) | (10%) | 0% | 10% | 20% | Head Grade |
| (20%) | (10%) | 0% | 10% | 20% | |
(20.0%) | 423 | 577 | 732 | 886 | 1,040 | (20.0%) | 41.1 | 51.3 | 60.9 | 70.0 | 78.8 | |||
(10.0%) | 585 | 760 | 935 | 1,110 | 1,285 | (10.0%) | 52.4 | 63.3 | 73.6 | 83.5 | 93.1 | |||
-- | 747 | 942 | 1,137 | 1,333 | 1,528 | -- | 62.9 | 74.6 | 85.7 | 96.3 | 106.5 | |||
10.0% | 904 | 1,119 | 1,335 | 1,550 | 1,766 | 10.0% | 72.4 | 84.7 | 96.4 | 107.7 | 118.5 | |||
20.0% | 1,061 | 1,296 | 1,531 | 1,767 | 2,002 | 20.0% | 81.4 | 94.3 | 106.7 | 118.5 | 130.0 | |||
| Post-Tax NPV5% Sensitivity to Recovery | Post-Tax IRR Sensitivity to Recovery | ||||||||||||
| Metal Price |
| Metal Price | |||||||||||
Recovery |
| (20%) | (10%) | 0% | 10% | 20% | Recovery |
| (20%) | (10%) | 0% | 10% | 20% | |
(20.0%) | 438 | 595 | 751 | 907 | 1,064 | (20.0%) | 43.0 | 53.4 | 63.2 | 72.6 | 81.6 | |||
(10.0%) | 592 | 768 | 944 | 1,120 | 1,296 | (10.0%) | 53.3 | 64.3 | 74.7 | 84.7 | 94.3 | |||
-- | 747 | 942 | 1,137 | 1,333 | 1,528 | -- | 62.9 | 74.6 | 85.7 | 96.3 | 106.5 | |||
10.0% | 861 | 1,071 | 1,281 | 1,491 | 1,701 | 10.0% | 70.0 | 82.1 | 93.7 | 104.8 | 115.5 | |||
20.0% | 867 | 1,077 | 1,288 | 1,499 | 1,710 | 20.0% | 70.5 | 82.7 | 94.3 | 105.4 | 116.1 | |||
|
|
Figure 22-2: Pre-Tax Sensitivity Analysis Results
![]()
![]()
Source: Ausenco, 2024.
Note: Series lines for metal price and head grade overlap on the above figures.
|
|
Figure 22-3: Post-Tax Sensitivity Analysis Results
![]()
![]()
Source: Ausenco, 2024.
Note: Series lines for metal price and head grade overlap on the above figures.
|
|
23 ADJACENT PROPERTIES
There is no information on properties adjacent to the Property necessary to make the technical report understandable and not misleading.
|
|
24 OTHER RELEVANT DATA AND INFORMATION
This section is not relevant to this Report.
|
|
25 INTERPRETATION AND CONCLUSIONS
25.1 Introduction
The QPs note the following interpretations and conclusions in their respective areas of expertise, based on the review of data available for this Report.
25.2 Mineral Tenure, Surface Rights, Water Rights, Royalties and Agreements
The Panuco Project is in the Panuco-Copala mining district in the municipality of Concordia, southern Sinaloa state, along the western margin of the Sierra Madre Occidental physiographic province in western Mexico. The Project comprises 119 titled mining concessions in nineteen blocks, covering a total area of 16,536.87 ha, and two mineral concessions covering 1,321.15 ha. The mining concessions are held 100% by Vizsla. The concessions are granted for 50 years, except San Carlos that was originally granted for 100 years, provided semi-annual property tax payments are made in January and July each year and if minimum annual investment requirements are met, or if there is minimum annual production equal to the amount of the annual investment requirement. The concession owner may apply for a second 50-year term. Property tax payments of MX$2.03M were made in January and July of 2023 and MX$2.116M were paid in January of 2024 by Vizsla. Additionally, the company paid MX$2.421M of outstanding taxes in May 2024, for the recently acquired El Richard and San Enrique claims.
On January 17, 2024, Vizsla announced its intention to spin out the shares of Vizsla Royalties Corp, a wholly owned subsidiary of Vizsla, to the Company's shareholders. Vizsla Royalties currently holds, indirectly, a net smelter royalty (the "Royalty") on any potential future mineral production at Vizsla's flagship, 100% owned Panuco silver-gold project located in Sinaloa, Mexico. The Royalty consists of: (i) a 2.0% net smelter return royalty on certain unencumbered concessions comprising the Project; and (ii) a 0.5% net smelter return royalty on certain encumbered concessions comprising the Project, which have a pre-existing 3.0% net smelter return royalty (the "Underlying Royalty"). Vizsla is also expected to: (i) transfer to Vizsla Royalties the right to purchase one-half of the 3% Underlying Royalty; (ii) grant Vizsla Royalties the right to acquire a royalty on any future projects acquired by Vizsla in the 24-month period after completion of the Spinout, which right would automatically terminate upon a change of control of Vizsla Royalties or Vizsla and (iii) make a cash injection into Vizsla Royalties.
Most of the surface rights in the municipality of Concordia are owned by ejidos, which are areas of communal land used for agriculture. Community members individually farm designated parcels and collectively maintain communal holdings comprising the ejido. Ejidos are registered with Mexico's National Agrarian Registry (Registro Agrario Nacional). Surface rights to most of the land underlying the Project area are owned by six ejidos. Mining concession owners have the right to obtain the expropriation, temporary occupancy, or creation of land easements required to complete exploration and mining work, including the deposit of rock dumps, tailings, and slag. Vizsla has agreements in place with 5 ejidos covering a total of 15,029.63 ha within the Property with rights to extend the area as required with the same consideration per hectare.
|
|
25.3 Geology and Mineralization
Vizsla commenced exploration on the Project in July 2019. Surface exploration to date has included geological mapping, rock geochemical sampling, geophysical surveys. The 1:1,000 scale geological mapping of the Property completed as of December 2023 amounts to 4,330 hectares mapped out of a total of 7,074 hectares held by the company, which represents 61.4% of the total area mapped. Rock geochemical sampling completed between 2019 and 2024 amounts to 5,930 samples. Vizsla has conducted airborne and ground surveys since 2019. These include Fixed Loop Electromagnetic surveys (FLEM) or ground EM surveys, drone magnetic surveys, and LiDAR.
25.4 Exploration, Drilling and Analytical Data Collection in Support of Mineral Resource Estimation
Since intitating drilling on the Property in November 2019, Vizsla has conducted a number of significant drill campaigns in the Napoleon, Copala-Tajitos, Animas and San Antonio areas. Up to June 18, 2024 (data cut-off date for the PEA technical report), Vizsla has completed 973 drill holes totaling 371,576.72 m and collected 56,198 assays. Vizsla has continued to drill at the Project since June, 2024.
In November 2019, Vizsla began drilling on the Panuco Project on the Animas-Refugio corridor near the La Pipa and Mariposa mine areas. A total of 820.50 m in three drill holes was completed in 2019.
Drilling for 2020 totalled 28,643.42 m in 129 drill holes. The four main corridors of Napoleon, Cinco Senores, Cordon del Oro, and Animas-Refugio were tested. Drilling was focused on initially on targets proximal to areas of historical mapped and worked veins.
Drilling at the Panuco Project in 2021 totalled 100,242.55 m in 320 drill holes. The drilling focused along the Napoleon and Tajitos vein areas, with 54,759.15 m in 180 drill holes and 34,769.35 m in 104 drill holes, respectively. Additionally, 4,438.50 m in 14 drill holes were drilled in the Animas-Refugio corridor, and 6,275.55 m in 22 drill holes in the Cordon del Oro corridor.
At Napoleon and Tajitos, infill and delineation drilling focussed on denser drilling to inform the Mineral Resource estimate and expand the structure's strike length. Drilling discoveries in 2021 included the Josephine and Copala veins. Further drill testing included the Cruz Negra, Alacran, Cinco Senores, and Colorada vein areas. In the Animas-Refugio corridor, drilling tested the Rosarito segment included in the Mineral Resource estimate, in addition to the Peralta and Cuevillas veins. Drilling at the Cordon del Oro corridor targeted the San Antonio structure in addition to exploration near the Aguita Zarca vein.
Drilling for 2022 totalled 121,582.4 m in 297 drill holes. The four main corridors of Napoleon, Cinco Senores, Cordon del Oro, and Animas-Refugio were tested. Drilling at the Napoleon corridor included 109 drill holes tested the Napoleon structure, for 53,412.80 m. At the Cordon del Oro corridor, drilling totalled 7,225.8 m in 30 drill holes. Drilling at the Copala/Tajitos veins included 135 drill holes for 52,045.10 m. Additionally, 6,588.90 m in 16 drill holes were drilled in the Animas-Refugio corridor and 2,309.80 m in 7 drill holes were drilled in the Broche de Oro area.
The bulk of 2022 drilling was centred on the western portion of the district, focused on upgrading and expanding resources at the Copala and Napoleon areas. At Copala, mineralization was traced over 1,150 meters along strike, 400 m down dip, and remains open to the north and southeast. At Napoleon, drilling throughout 2022 successfully expanded mineralization along strike and down plunge to the south, several vein splays were identified in the hanging wall and footwall of the main structure. Other notable discoveries included the Cristiano and La Luisa Veins.
|
|
Drilling for 2023 totalled 99,800.65 m in 180 drill holes. The main Napoleon and Cinco Senores corridors were primarily tested with limited drilling in the Animas-Refugio corridor. Drilling at the Napoleon corridor included 75 drill holes testing the Napoleon structure, for 40,926.80 m. Drilling at the Copala/Tajitos veins included 86 drill holes for 52,083.65 m. Drilling in the Animas-Refugio corridor included 8 drill holes for 2,548.50 m. Additional geotechnical drilling was completed at Napoleon, 6 drill holes for 2,375.70 m, and Cordon del Oro, 5 drill holes for 1,866.00 m.
The 2023 drilling was centred on the western portion of the district, focused on upgrading and expanding resources at the Copala and Napoleon areas. At Copala, mineralization has now been traced over 1,700 m along strike and to depths of 450 to 550 m and remains open to the north and southeast. At Napoleon, drilling throughout 2023 successfully expanded mineralization along strike and down plunge/dip to the south, several vein splays were identified in the hanging wall and footwall of the main structure. Other notable discoveries include the La Luisa Vein and the Molino Vein.
Drilling for 2024 (to June 18) totalled 20,487.20 m in 44 drill holes. The main Napoleon and Cinco Senores corridors were tested. Drilling at the Napoleon corridor included 16 drill holes testing the Napoleon structure, for 8,885.20 m. Drilling at the Copala/Tajitos veins included 28 drill holes for 11,602.00 m.
The 2024 drilling was centred on the western portion of the district, primarily focused on infill drilling at 50 m centres to upgrade resources within the Copala and Napoleon areas. Drilling at La Luisa focused on infill holes within high-grade shoots of the La Luisa and Footwall vein splay. The discovery of the El Molino vein in 2023 occurred approximately 250 m west of the Copala and Tajitos veins, but new interpretations and drilling confirmed that the vein extends southwest and intersects with Napoleon.
25.5 Metallurgical Test Work
A series of preliminary metallurgical test programs have been completed on ½ drill core samples that are representative of the Napoleon, Tajitos and Copala deposits. Variability samples and master composites were assembled from numerous drill holes from each deposit, targeting feed grades that were representative of each potential resource.
Comminution testing indicated that the materials were competent with respect to impact and attrition grinding. Impact breakage tests indicative of SAG milling requirements were only conducted on the Copala deposit, returning average Axb values of approximately 33. Bond ball mill work index tests completed on samples from all three deposits returned values ranging from 16.4 to 18.9 kWhr/tonne.
The samples varied in base metal contents. The Napolean samples contained elevated levels of galena and sphalerite which responded well to sequential froth flotation and demonstrated the potential to produce separate lead and zinc concentrates. Lead and zinc contents were considerably lower in the Tajitos and Copala samples, therefore investigation of separate flotation concentrate production was limited.
Bulk sulphide flotaton testing on samples from all three deposits suggested that about 80-90% of the silver and gold could be recovered to a single bulk sulphide concentrate. Cyanide leaching of the bulk rougher flotation tails was effective at recovering about 65% of the silver and 85% of the gold remaining in these streams. Cyanide leaching of the reground bulk flotation concentrate combined with rougher tail leaching generally returned the highest silver and gold recoveries of a dore production only circuit, achieving approximately 91 and 94% silver and gold extraction, respectively, on a Copala master composite. This circuit was more comprehensively tested on the Copala samples and to a lesser degree on the Napoleon and Tajitos samples.
|
|
Whole feed leaching was investigated on samples from all deposits, which indicated that about 83 to 86% of the silver and 90 to 94% of the gold could be extracted after 96 hours of leaching. These tests were conducted at primary grind sizes ranging from 63 to 100µm P80.
25.6 Mineral Resource Estimate
Updated MREs for the Napoleon-La Luisa and Copala-Tajitos deposit areas were published on January 8th, 2024 (Armitage et al., 2024), as well as MREs for the Animas and San Antonio areas previously published (Armitage et al., 2023).
Completion of the updated MREs for the Napoleon-La Luisa and Copala-Tajitos deposit areas involved the assessment of an updated drill hole database, which included all data for surface drilling completed between November 2019 and September 2023. The MREs for the Animas and San Antonio deposit areas included data for surface drilling completed between November 2019 and September 2022; there has been no new drilling on the Animas and San Antonio deposit areas and these MREs previously published are considered current. Completion of the MREs also included the assessment of updated three-dimensional (3D) mineral resource models (resource domains), 3D topographic surface models, 3D models of historical underground workings, and available written reports.
The Inverse Distance Squared ("ID2") calculation method restricted to mineralized domains was used to interpolate grades for Ag (g/t), Au (g/t), Pb (ppm) and Zn (ppm) into block models for all deposit areas.
Indicated and Inferred mineral resources are reported in the summary tables in Section 14.11. The MREs presented below take into consideration that all deposits on the Property may be mined by underground mining methods.
The reporting of the updated MRE complies with all disclosure requirements for Mineral Resources set out in the NI 43-101 Standards of Disclosure for Mineral Projects. The classification of the updated MRE is consistent with the 2014 Canadian Institute of Mining, Metallurgy and Petroleum (CIM) Definition Standards (2014 CIM Definitions) and adheres as best as possible to the 2019 CIM Estimation of Mineral Resources & Mineral Reserves Best Practice Guidelines (2019 CIM Guidelines).
The updated MRE for the Project is presented in Table 25-1 and Table 25-2.
Highlights of the Project Mineral Resource Estimate are as follows:
- Indicated Mineral Resources are estimated at 9.48 Mt grading 289 g/t silver, 2.41 g/t gold, 0.27% lead, and 0.84% zinc (511 AgEq). The current MRE includes indicated mineral resources of 88.2 Moz of silver, 736 koz of gold, 56 Mlbs of lead, and 176 Mlbs of zinc (155.8 Moz AgEq).
|
|
- Inferred Mineral Resources are estimated at 12.19 Mt grading 239 g/t silver, 1.93 g/t gold, 0.29% lead, and 1.03% zinc (433 g/t AgEq). The current MRE includes inferred mineral resources of 93.7 Moz of silver, 758 koz of gold, 78 Mlbs of lead, and 276 Mlbs of zinc (169.6 Moz AgEq).
Table 25-1: Panuco Project Mineral Resource Estimate, September 1, 2023
Resource | Tonnes | Grade | Total Metal | ||||||||
Au g/t | Ag g/t | Pb % | Zn % | AgEq | Au | Ag | Pb | Zn | AgEq* | ||
Indicated | 9.48 | 2.41 | 289 | 0.27 | 0.84 | 511 | 736 | 88,192 | 56.0 | 176.1 | 155,841 |
Inferred | 12.19 | 1.93 | 239 | 0.29 | 1.03 | 433 | 758 | 93,653 | 78.1 | 276.2 | 169,647 |
* AgEq = Ag ppm + (((Au ppm x Au price/gram) + (Pb% x Pb price/t) + (Zn% x Zn price/t))/Ag price/gram) with price assumptions of $24.00/oz Ag, $1800/oz Au, $1.10/lb Pb and $1.35/lb Zn
Table 25-2: Panuco Project Mineral Resource Estimate by Area, September 1, 2023
Copala Area: Copala, Tajitos and Cristiano
Area | Resource | Tonnes | Grade | Total Metal | ||||||||
Au g/t | Ag g/t | Pb % | Zn % | AgEq | Au | Ag | Pb | Zn | AgEq | |||
Copala | Indicated | 4.52 | 2.46 | 380 | 0.08 | 0.15 | 573 | 358 | 55,201 | 8.2 | 15.3 | 83,270 |
Inferred | 3.16 | 1.77 | 332 | 0.12 | 0.20 | 476 | 179 | 33,722 | 8.2 | 13.6 | 48,320 | |
Tajitos | Indicated | 0.63 | 2.24 | 358 | 0.12 | 0.21 | 538 | 46 | 7,295 | 1.6 | 2.9 | 10,953 |
Inferred | 1.04 | 2.04 | 365 | 0.22 | 0.39 | 540 | 69 | 12,260 | 5.2 | 8.9 | 18,140 | |
Cristiano | Indicated | 0.21 | 3.37 | 581 | 0.25 | 0.43 | 858 | 23 | 3,961 | 1.1 | 2.0 | 5,851 |
Inferred | 0.72 | 2.54 | 443 | 0.15 | 0.29 | 650 | 59 | 10,213 | 2.4 | 4.5 | 14,974 | |
Total | Indicated | 5.37 | 2.48 | 385 | 0.09 | 0.17 | 580 | 427 | 66,457 | 11 | 20 | 100,074 |
Inferred | 4.92 | 1.94 | 355 | 0.15 | 0.25 | 515 | 307 | 56,195 | 16 | 27 | 81,434 | |
Napoleon Area: Napoleon, Cruz, Josephine and La Luisa
Area | Resource | Tonnes | Grade | Total Metal | ||||||||
Au g/t | Ag g/t | Pb % | Zn % | AgEq | Au | Ag | Pb | Zn | AgEq | |||
La Luisa | Indicated | 0.27 | 2.56 | 177 | 0.39 | 2.01 | 459 | 22 | 1,556 | 2.3 | 12.1 | 4,027 |
Inferred | 2.04 | 2.13 | 159 | 0.30 | 1.51 | 386 | 139 | 10,439 | 13.3 | 67.9 | 25,326 | |
Cruz/Negra | Indicated | 0.03 | 2.01 | 144 | 0.37 | 1.71 | 373 | 2 | 153 | 0.3 | 1.2 | 396 |
Inferred | 0.31 | 3.75 | 170 | 0.31 | 1.48 | 519 | 37 | 1,698 | 2.1 | 10.1 | 5,169 | |
Josephine | Indicated | 0.07 | 2.88 | 221 | 0.39 | 1.11 | 492 | 6 | 491 | 0.6 | 1.7 | 1,092 |
Inferred | 0.22 | 2.05 | 161 | 0.33 | 1.00 | 364 | 15 | 1,161 | 1.6 | 4.9 | 2,618 | |
Napoleon_HW(4) | Indicated | 0.43 | 1.72 | 164 | 0.42 | 1.53 | 365 | 24 | 2,259 | 4.0 | 14.4 | 5,029 |
Inferred | 0.85 | 2.17 | 220 | 0.59 | 2.02 | 479 | 59 | 5,976 | 10.9 | 37.6 | 13,027 | |
|
|
Area | Resource | Tonnes | Grade | Total Metal | ||||||||
Au g/t | Ag g/t | Pb % | Zn % | AgEq | Au | Ag | Pb | Zn | AgEq | |||
Napoleon+Splays | Indicated | 3.31 | 2.39 | 162 | 0.52 | 1.73 | 425 | 255 | 17,276 | 37.8 | 126.5 | 45,223 |
Inferred | 3.18 | 1.64 | 137 | 0.45 | 1.76 | 342 | 168 | 14,045 | 31.8 | 123.2 | 35,063 | |
Total | Indicated | 4.12 | 2.34 | 164 | 0.50 | 1.72 | 421 | 309 | 21,735 | 45 | 156 | 55,767 |
Inferred | 6.60 | 1.97 | 157 | 0.41 | 1.68 | 383 | 418 | 33,319 | 60 | 244 | 81,203 | |
San Antonio Area: Generales and Animas Area: Cuevillas and Rosarito
Area | Resource | Tonnes | Grade | Total Metal | ||||||||
Au g/t | Ag g/t | Pb % | Zn % | AgEq | Au | Ag | Pb | Zn | AgEq | |||
San Antonio | Inferred | 0.28 | 1.30 | 226 | 0.01 | 0.03 | 325 | 12 | 2,038 | 0.1 | 0.2 | 2,936 |
Animas | Inferred | 0.39 | 1.68 | 169 | 0.29 | 0.60 | 327 | 21 | 2,101 | 2.5 | 5.2 | 4,074 |
25.6.1 Panuco Project Updated Mineral Resource Estimate Notes:
The classification of the Updated Mineral Resource Estimate into indicated and inferred mineral resources is consistent with current 2014 CIM Definition Standards for Mineral Resources and Mineral Reserves. The effective date for the Updated Mineral Resource Estimate is September 1, 2023.
All figures are rounded to reflect the relative accuracy of the estimate and numbers may not add due to rounding.
All mineral resources are presented undiluted and in situ, constrained by continuous 3D wireframe models, and are considered to have reasonable prospects for eventual economic extraction.
Mineral resources are not mineral reserves. Mineral resources which are not mineral reserves, do not have demonstrated economic viability. An Inferred Mineral Resource has a lower level of confidence than that applying to an Indicated Mineral Resource and must not be converted to a Mineral Reserve. It is reasonably expected that the majority of Inferred Mineral Resources could be upgraded to Indicated Mineral Resources with continued exploration.
The database comprises a total of 822 drill holes for 302,931 m of drilling completed by Vizsla between November 2019 and September 2023.
The mineral resource estimate is based on 28 three-dimensional ("3D") resource models, constructed in Leapfrog, representing the Napoleon area (15 wireframes), the Copala area (7 wireframes), Tajitos (1 wireframe), Animas (5 wireframes) and San Antonio (1 wireframe).
Silver, gold, lead, and zinc were estimated for each mineralization domain in the Panuco Project. Blocks within each mineralized domain were interpolated using 1.5 m capped composites assigned to that domain. To generate grade within the blocks, the inverse distance squared (ID2) interpolation method was used for all domains. All estimates are based on variable block dimensions (by deposit area) and estimation search parameters (by domain).
Average density values were assigned per zone based on 1,919 samples analysed by ALS in Zacatecas, Mexico or inhouse with 5% checks by ALS.
|
|
It is envisioned that the Panuco Project deposits may be mined using underground mining methods. Mineral resources are reported at a base case cut-off grade of 150 g/t AgEq. The mineral resource grade blocks were quantified above the base case cut-off grade, below surface and within the constraining mineralized wireframes.
The base-case AgEq Cut-off grade considers metal prices of $24.00/oz Ag, $1800/oz Au, $1.10/lb Pb and $1.35/lb Zn and considers metal recoveries of 93% for silver, 90% for gold, 94% for Pb and 94% for Zn.
The base case cut-off grade of 150 g/t AgEq considers a mining cost of US$45.00/t rock and processing, treatment and refining, transportation, and G&A cost of US$50.00/t of mineralized material.
The Updated Mineral Resource Estimate may be materially affected by environmental, permitting, legal, title, taxation, socio-political, marketing, or other relevant issues.
25.7 Mining Methods
In the opinion of the QP, the mining methods planned for the Panuco Project are appropriate for underground mining of vein-type deposits found in the silver-belt of the Sierra Madre region of northwestern Mexico. Mining at the Panuco project is proposed to use predominantly longhole stoping over 20 m sublevels in predicted ground conditions that are mostly fair to good. Mining at the Copala North deposit is proposed to use drift-and-fill to reduce the impacts of blasting and excavations to the overlaying town.
The mine plan targets the higher-margin material in the Copala Main and Cristiano deposits in the early stages of the project while development advances to the north and south of Copala, and the Napoleon mine is prepared.
Implementing an Elevated Cut-off Value approach for the first five years of mining activity facilitates the delivery of higher-grade mineralized material to the mill, improving the return on the initial investment.
The mine plan assumes the implementation of paste-backfilling, which reduces the footprint of the tailings storage on surface, reduces stope cycle times in veins with widths greater than 4 m and allows for top-down extraction where considered.
Contract mining was selected due to the benefit of deferring initial capital. A contractor can also supply existing mining systems, equipment, and access to experienced mining personnel to support a shorter development and production ramp-up.
A two-year preproduction has been assumed which is considered adequate to reach the planned mine throughput of 1.2 Mtpa for the first three years of processing, followed by a further expansion to 1.5 Mtpa starting in year 4.
25.8 Recovery Methods
The selected flowsheet aligns with conventional practices in the industry. Comminution, flotation, precious metal extraction, recovery of payable metals, destruction of free cyanide and handling of tailings are achieved through conventional processes that are commonly used in the industry for similar projects with no significant elements of technological innovation. Previous studies, coupled with available test work results and financial evaluations, were used to develop the resulting flowsheet.
|
|
The employment of a staged expansion approach allows for management of varying recoveries of precious metals throughout the life of mine without incurring unnecessary capital costs early in the project.
25.9 Infrastructure
25.9.1 Site Infrastructure
The Panuco Project includes on-site infrastructure such as civil, structural and earthworks development, site facilities and buildings, on-site roads, water management facilities and site electrical power facilities. Off-site infrastructure includes access roads, fresh water supply and power supply. The site infrastructure will include:
Mine facilities include the paste plant, truck shop, explosives storage, and other miscellaneous facilities,
Process facilities including the process plant, crusher facilities, assay lab, plant workshop and warehouse,
Tailings storage facility,
Administration offices and
Mine, process administration facilities will be serviced with potable water, fire water, compressed air, power, diesel, communication and sanitary systems.
The property site can be accessed by travelling 25 km east along Highway 15, then travelling 43 km northeast along Highway 40. This leads to an entrance to a gravel access road system that can be used to navigate across the property. The existing access road and on-site road system will be upgraded to provide access to the project site.
Power will be provided from a connection to Comisión Federal de Electricidad (CFE) electrical grid via a 69 kV transmission line. The transmission line will be stepped down to the 13.8 kV at the substation for distribution to different power requirements across the project site.
Fresh water will be sourced from the Panuco River. The water will be transported through pumps. Approximately 2.6 km of overland pipeline will be installed from Panuco River to the process plant where freshwater tanks will be located. This water will be the source of potable and fire water on site, used for administration buildings and process plant.
25.9.2 Tailings Storage Facility
The tailings storage for the project includes an above ground tailings storage facility with containment embankment ranging from 28 to 64m high crest and a LoM storage capacity of the 8.8 Mt. The facility has been designed in accordance with GISTM guidelines. Tailings will be slurried from the process plant to the TSF by way of a pipeline, which would extend 2/3rd around each facility to evenly deposit tailings over each site. A water reclaim system has been designed to reclaim excess slurry water and rainfall runoff.
25.9.3 Water Management
The proposed water management strategy includes the following key elements and associated considerations:
|
|
The proposed water management structure includes developing diversion channels and a collection dam to capture, and store diverted water for reuse in process operations, with the water balance calculations indicating that this system will be a deficit and will require make-up water to meet process demands.
An initial high-level estimate of excavation volumes has been carried out, considering the proposed dimensions of the structure and the site's topography. This estimate provides a preliminary understanding of the required earthworks.
The proposed locations and sizes of the diversion channels and collection dam are subject to change as the project progresses and as additional information becomes available.
25.10 Markets and Contracts
Market price assumption were based on review of public information, industry consensus, standard practices and specific information from comparable operations in the region, however no specific market studies or product valuations were completed as part of this PEA.
The Ag + Au doré bars will be trucked from the project site to Mazatlán, where it will be subsequently transported by air to clients. Ag + Au doré will be sold into the general market to North American smelters and refineries.
For this technical report, the metal prices presented below in Table 25-3 were used for financial modelling. The metal prices are estimated based on historic market prices. These prices are also consistent with the range of prices used for recent, comparable studies.
Table 25-3: Metal Price Projections
Metal | Commodity Unit | Study Unit Price ($US) |
Silver | Troy ounce (oz.) | 26.00 |
Gold | Troy ounce (oz.) | 1,975 |
There are currently no sales contracts or refining agreements in place for the project.
For the PEA, payability and refining costs have been assumed for the Panuco project based on terms recently published for comparable projects. Payabilities within the doré product are assumed to be 98% for silver and 99.5% for gold. Treatment and refining costs are assumed to be US$0.50/oz Ag and US$5.00/oz Au.
25.11 Environmental, Permitting and Community
The baseline environmental information provided in this report have been largely gathered by reports commissioned to support the exploration phases of the Project. Baseline data is available on meteorology and climate, surface water, air quality, noise, and flora and fauna. A preliminary desktop study was completed on the social aspects of the Project and on regional hydrogeological aspects. At the time of this report data was not available from public or other sources for the subject areas of geochemistry and archaeology for the Project site. To support the next stage of the Project design work and to support future environmental assessment and permitting activities, additional targeted site-based environmental and local socioeconomic studies will need to be initiated. Studies will need to be initiated and/or further advanced to support the next phase of the project design in the areas of groundwater modelingx, geochemistry studies, and further refinement of the mine water balance (incorporationg mine water dewatering predictions). The purpose of these studies would be to more accurately quantify water supply and use available on a day to day basis to support Project requirements, identify potential impacts to the local groundwater resource, and to identify the need for any water treatment requirements.
|
|
Currently, the only known environmental liabilities are associated with the exploration site activities and access roads. and existing underground workings from former operations Remediation of surface disturbances and removal of wastes will be mitigated by compliance with applicable Mexican regulatory requirements.
As the Project progresses though future and EIS/permitting stages, environmental management and monitoring plans will be required to guide the development and operation of the Project to mitigate and limit environmental impacts. These plans will be complementary to the engineered designs that will be required for the storage of tailings, waste rock, mineralized material, and conveyance/storage and processing of these materials.
Mining in Mexico is subject to a well-developed system of environmental regulation that applies from the exploration stage to mine development, operation, and ultimately through mine closure. There are several environmental permits required for the construction and operation of the Project. Most of the mining regulations are at a federal level, but there are also a number of permits regulated and approved at state and local level. Detailed presentation of permitting requirements for the Project are presented in Section 20, Table 20-4. No permits are currently held for construction or operations activities.
Over the years, the company has reported that it has actively engaged with local communities as part of its social commitment and has recently entered into discussions with local communities regarding its proposed Project. Socio-economic studies and continued community engagement efforts will help to identify community needs and provide a basis for targeted community investment in local development projects, training, education, health, and employment. These activities will continue to enhance community support that will be required to progress the Project on a timely basis through the regulatory process.
Implementation of the recommendations provided in Section 26 will help to address and mitigate permitting and community risks.
25.12 Capital Cost Estimate
The capital cost estimates presented in this PEA provide substantiated costs that can be used to access the preliminary economics of the Panuco Project. These estimates are primarily based on a underground mine operation, process plant construction and operation, tailings storage facility construction and operation and owner's cost and provisions.
The capital cost estimate conforms to Class 5 guidelines of the Associatio for the Advancement of Cost Engineering Internation (AACE International) with an estimated accuracy of +50%/-30%. The capital cost estimate was developed in Q3 2024 United States dollars. The process plant, infrastructure costs, tailings storage facility and water management costs were estimated by Ausenco, and mining costs were estimated by Entech.
|
|
The total initial capital cost for the Panuco Project is US$223.5M, expansion capital cost is US$11.1M and LOM sustaining cost including financing and closure cost of US$31.8M is is US$262.0M. The capital costs are summarized in Section 21.
25.13 Operating Cost Estimate
The operating cost estimate was developed in Q3 2024 using data from projects, studies and previous operations from internal databases. The operating cost estimate is approximately +50%/-30% accurate, matching that of the capital cost estimate. The estimate covers the mining, processing, tailings handling, maintenance, power and general and administrative activities. Section 21 includes a summary of the operating expenses.
The unit operating cost is US$76.40/t processed, including an annual G&A cost of US$9.9M.
25.14 Economic Analysis
An economic model was developed to estimate the Project's annual pre-tax and post-tax cash flows, sensitivities and net present value results using a 5% discount rate.
The pre-tax NPV (net present value) discounted at 5% is US$1,778M; the IRR (internal rate of return) is 124.1%, and payback period is 0.6 years. On a post-tax basis, the NPV discounted at 5% is US$1,137M, the IRR is 85.7%, and the payback period is 0.8 years.
A sensitivity analysis was conducted on the base case NPV and IRR of the project using the following variables: discount rate, head grade, recovery, total operating cost, initial capital cost, as well as silver and gold prices, which were encompassed in a single variable, metal price. The sensitivity analysis revealed that the project is most sensitive to changes in head grade and metal price.
The preliminary economic assessment is preliminary in nature, that it includes inferred mineral resources that are considered too speculative geologically to have the economic considerations applied to them that would enable them to be categorized as mineral reserves, and there is no certainty that the preliminary economic assessment will be realized.
25.15 Risks and Opportunities
25.15.1 Risks
25.15.1.1 Mineral Resource Estimate
A portion of the contained metal of the Deposit, at the reported cut-off grades for the updated MRE, is in the Inferred Mineral Resource classification. It is reasonably expected that the majority of Inferred Mineral resources could be upgraded to Indicated Minerals Resources with continued exploration.
|
|
The mineralized structures (mineralized domains) in all zones are relatively well understood. However, due to the limited drilling in some areas, all mineralization zones might be of slightly variable shapes from what have been modeled. A different interpretation from the current mineralization models may adversely affect the current MRE. Continued drilling may help define with more precision the shapes of the zones and confirm the geological and grade continuities of the mineralized zones.
25.15.1.2 Metallurgical Test Work
The Napoleon and Tajitos composites were not tested using the proposed process of flotation and fine concentrate regrinding followed by leaching of the concentrate and rougher tails streams as extensively as the Copala composites. Their metallurgical performance under the designed process conditions may vary from the estimated response.
25.15.1.3 Mining
The Copala North is a shallow dipping deposit which is located close to the surface and under the town of Copala. In the opinion of the QP, controlled blasting techniques, vibrations analysis, limiting the size of the excavations and a baseline of the current conditions will be required to avoid impact to surface infrastructure and to maintain social license to operate in this area.
Further investigation and analysis are required to improve the understanding of the geotechnical and geohydrological conditions of the mineralized zones and the surrounding rockmass.
A detailed assessment of the paste-backfill specifications is needed to define the binder content required to reach the necessary strength to support stoping adjacent to previously mined excavations.
Higher mining costs can arise from changes or updates to the mineral resource models and are not limited to the following:
Higher dilution and lower mining recovery factors than estimated,
Higher contractor pricing and higher consumable pricing (including power, diesel and explosives),
Mining productivities are not achieved, causing a longer mine life, increase in fixed costs and lower annual metal production,
Ground conditions are worse than assumed,
Ground water is higher than assumed,
Hotter environmental conditions are found requiring air cooling (refrigeration),
Geology is less continuous than the current model, and,
Lack of suitably skilled technical staff to manage contractor and compliance to plan.
|
|
25.15.1.4 Recovery Methods
The flowsheet was designed with limited metallurgical testing available, potentially resulting in the following:
Crushing and grinding equipment was selected based on the available comminution test data and may be undersized if actual values are higher than design,
The precious metals recovery flowsheet was selected based on the available test data and may not be optimized,
Solid liquid separation data was not available at the time of the study. Thickeners and filters may be undersized if actual settling and filtration rates are lower than design, and
Cyanide detoxification data was not available at the time of the study. Reagent addition systems and consumption rates may be undersized if actual rates are higher than design.
25.15.1.5 Tailings Storage Facility
The ground conditions and stability of the proposed process plant area, TSF, WRSF (if required), and other infrastructure areas are unknown as a geotechnical program has not been completed. The slopes and heights of the stockpiles, WRSF (if required), and TSF may change as future site geotechnical programs are completed.
A dam break analysis has not been completed for the PEA. The TSF has been classified with a high dam failure consequence classification. Depending on a formal dam break analysis, the classifcation could be higher.
There is a possibility for cost increase if the geotechnical, hydrogeological or tailings depostion considerations for the TSF are different than the criteria considered in this study impacting the capital, sustaining capital and operating costs of the Project along with a high dam break classification.
25.15.1.6 Water Management/Hydrology
The locations and geometry of the diversion channels and collection dam could be further optimized based on the integration of additional geotechnical and topographical information.
- Providing the required water for process purposes from available surface water from the site footprint only is not deemed feasible at this stage. With additional hydrogeology investigations, there may be potential to source water from make-up wells or underground dewatering and it may be possible to achieve net-zero makeup water requirements, optimizing water use and minimizing additional water intake.
25.15.1.7 Environmental, Permitting and Social Community
The main risks associated with the environmental, permitting, and social aspects of the Project include:
Maintaining support for the Project from local communities, rightsholders and stakeholders,
Maintaining regulatory compliance and ongoing implementation of social commitments during the exploration phase of the project, and future start-up construction and operational phases,
|
|
Potential for site baseline data gaps for environmental and social aspects of the Project including areas of geochemistry, archaeology, air quality, noise, and socioeconomic studies. Additional studies may also be required in other bio-physical areas, based on future design and permitting requirements,
Risk related to mine siting, especially in regard to how site infrastructure and processes may potentially impact listed/threatened species and their habitat (as specified in applicable legislation) and how to mitigate and /or compensate against such interactions,
Potential for gaps in the areas of hydrogeological/geochemistry modelling and mine water balance determinations that may impact critical path design components for the Project and required regulatory approvals including water management infrastructure sizing and requirements for water treatment, and
Potential delays in obtaining approvals for the purpose of construction and operation of key infrastructure.
The timely implementation of the recommendations presented in Section 26 will help to quantify, qualify, and mitigate these risks to the feasibility design stage and to support permitting, construction and operations schedules.
25.15.1.8 Market Studies and Contracts
The doré transportation cost in the PEA is based on projects in the nearby region which may vary and impact the project economics.
There are no contracts established with any equipment suppliers, power or fuel suppliers and marketing companies. Equipment quotes were received for the major process equipment; however, the prices are subject to vary at the time of project construction and execution.
The marketing terms considered in this PEA are based on projects with similar commodities. No marketing study was completed, or any discussions were held with the marketing companies in determining the marketing terms.
25.15.1.9 Cost Estimates
Estimates were based on recent quotes that may not reflect actual prices at the time of project execution. These costs should be updated as market conditions change.
Reagent and consumable consumption rates were estimated based on preliminary testwork.
25.15.2 Opportunities
25.15.2.1 Mineral Resource Estimate
There is an opportunity in all deposit areas to extend known mineralization at depth, on strike and elsewhere on the Property and to potentially convert Inferred Mineral Resources to Indicated Mineral Resources. Vizsla's intentions are to direct their exploration efforts towards resource growth in 2024 with a focus on extending the limits of known mineralization and testing other targets on the greater Panuco Property.
|
|
25.15.2.2 Metallurgical Test Work
There may be opportunities to optimize the process through further metallurgical testing. Additional testing may identify leach conditions that provide faster silver leach kinetics, higher precious metal extractions and lower sodium cyanide consumptions.
25.15.2.3 Mining
There may be opportunities to improve the economics of the project once detailed engineering is completed. The following opportunities specific to mining have been identified during the PEA and should be confirmed with trade-off studies:
- Lower Mining Costs
An owner-operator model could demonstrate lower mining costs, albeit at higher upfront capital;
Power availability at site supports a transition to battery equipment, which will improve working conditions and may reduce ventilation demand and mining costs. Battery equipment is increasing in availability and should be considered in future studies to investigate higher productivity and lower operating cost.
- Additional mineralized material suitable for underground mining
Lower mining costs could reduce the cutoff and lead to more material being selected for mining hence potentially improving economics; and,
Additional resources found through expansionary drilling that is closer to the surface will defer capital required to access material lower in the mine.
25.15.2.4 Recovery Methods
There may be opportunities to optimize the flowsheet once additional metallurgical testing is completed. Future studies should include the following engineering trade-off studies to confirm the following:
Optimum primary grind size and comminution circuit selection,
Consideration of a live stockpile instead of the surge bin, emergency stockpile arrangement,
Revalidation of financial benefit to inclusion of the pre-leach thickener and/or tailings thickener,
Revalidation of expansion approach and requirement of flotation circuit,
Optimal regrind size and regrind mill technology selection, and
Optimization of leaching retention time.
|
|
25.15.2.5 Water Management/Hydrology
There may be opportunities to optimize the surface water management infrastructure and refine or validate the current understanding of surface water conditions. Future studies should include the following:
Integrating geotechnical conditions (i.e. depth to groundwater, soil type, etc.), as it becomes available, to further optimize the location and layout of water management infrastructure.
Carryout additional investigations (desktop and field programs) to identify potential groundwater sources for make-up water.
Continue to collect the site weather station to augment and supplement the existing understanding of site meteorological conditions.
Establish site surface water monitoring program to validate the inputs and assumptions used in the water balance. This will also aid in estimating the amount and timing of surface water available from the site.
The Project has the potential to achieve net-zero makeup water usage by utilizing underground water resource. The abundance and availability of groundwater needs to be verified in future studies.
25.15.2.6 Environmental, Permitting and Social Considerations
Opportunities, as listed below, should be considered as the project continues along the development and permitting path:
The timely and sustained efforts in the area of community and regulatory engagement regarding proposed project, anticipated impacts (both positive and adverse) and proposed impact mitigation, including discussions with communities on potential benefits of the project,
The timely baseline gap filling for any subject areas that require additional environmental and socio-economic baseline information that will inform impact mitigation and risk reduction measures associated with infrastructure footprint, and adoption of appropriate low impact and sustainable technologies, and
Regarding hydrological, hydrogeological, and geochemical studies, there are opportunities to work closely and collaborate with the exploration, geotechnical, water resources, and mineralized material processing engineering teams and hence, reduce effort and costs.
25.15.2.7 Cost Estimates
Reagent and consumption rates can be further optimized with more testwork on the mineralized material.
|
|
26 RECOMMENDATIONS
26.1 Overall Recommendations
The Panuco Project demonstrates positive economics, as shown by the results presented in this technical report.
It is recommended to continue developing the Project through FS. The recommended work program to advance through FS includes additional drilling to convert inferred resources to indicated resources, metallurgical work and trade-off studies to further improve the process plant design, additional geotechnical drilling to improve the mine plan, further work to characterise the water management and tailings storage facility and expansion and ongoing data collection of environmental data for future permitting. Table 26-1 summarized the estimated cost for the recommended future work on the Panuco Project.
Table 26-1: Cost Summary for the Recommended Future Work
Program Component | Estimated Total Cost (US$M) |
Exploration and Drilling | 8.40 |
Metallurgical Test work | 0.60 |
Geotechnical and Geohydrological Drilling (supplemental holes) | 0.40 |
Mining & Geotechnical Studies, including backfilling | 2.00 |
Process and Infrastructure Engineering | 1.50 |
Geotechnical Field Work | 0.56 |
Tailings Storage Facility | 0.35 |
Environmental Studies | 0.87 |
Market Studies | 0.06 |
Total | 14.74 |
Note: Total may not add up due to rounding
26.2 Exploration & Drilling
The Deposits of the Panuco Project contain underground Indicated and Inferred Mineral Resources that are associated with well-defined mineralized trends and models. All deposits are open along strike and at depth.
The QP considers that the Project has potential for delineation of additional Mineral Resources and that further exploration is warranted. Given the prospective nature of the Panuco Property, it is the opinion of QP that the Property merits further exploration and that a proposed plan for further work by Vizsla is justified.
QP is recommending Vizsla conduct further exploration, subject to funding and any other matters which may cause the proposed exploration program to be altered in the normal course of its business activities or alterations which may affect the program as a result of exploration activities themselves.
For 2024, the company plans to drill ~45,000 m on current resource areas, priority targets proximal to current resources in the west, as well as on other high-priority targets in the eastern portion of the district (Figure 26-1).
|
|
26.2.1 Resource Extension Targets
The Copala structure remains open along strike to the north and down dip to the south. In 2024, Vizsla plans to continue 1) upgrading inferred resources in south Copala and 2) continue expanding Copala and its footwall splays down dip.
At Napoleon, Vizsla plans to upgrade inferred resources and to conduct resource expansion drilling along the hanging wall-4 vein (HW4) to the east, as well as to explore three potential vein feeders along the main Napoleon structure at depth.
26.2.2 Proximal Targets
At La Luisa, the team plans to continue expanding the footprint of the high-grade shoot on the south and infill drilling the recently defined 400 m gap between the northern most drill-hole intercepts and the high-grade shoot on the south.
The EL Molino Vein reported significant silver and gold grades close to surface, and Vizsla plans to explore the vein along strike and at depth to add additional high-grade resources close to planned infrastructure in 2024.
Vizsla plans to drill-test a conceptual target at the projected northern intersection of the Copala fault with the Napoleon vein system near La Estrella area.
26.2.3 District Targets
New mapping efforts completed in 2023 have highlighted an abundance of historic workings in the northeastern portion of the district. This new area named "Camelia" is marked by serval high-grade surface samples grading up to 400 g/t Ag and 5.0 g/t Au. Given, the overall density of veins mapped on surface and the abundance of surface samples related to historic workings this has become a high priority district target in the east.
26.2.4 Bulk Sample / Test Mine
Vizsla has received permits to develop and operate a test mine program at its Panuco project to extract a combined 25,000 tonne bulk sample from the Copala and Napoleon structures. Initial engineering for the bulk sample test mine has already begun with plans to begin underground development in 2024.
26.2.5 Key Objectives for 2024
Deliver an updated MRE for the project in YE 2024
Start Bulk Sample / Test Mine program
Complete +45,000 m of drilling
Complete a ~950 line-kilometre VTEM survey and acquire high-resolution multispectral satellite imagery for Panuco district.
The total cost of the planned work program by Vizsla is estimated at ~US$8.4M and includes:
|
|
- Drilling:
35,000 m all in US$5.0M (drilling only US$3.7M) infill mostly and resource expansion
10,000 m exploration all in US$3.6M (drilling only US$1.8M)
All in costs include geos and workers salaries, equipment, fuel, accommodation expenses, truck rentals, and sample shipment, assaying, QA/QC, standards, density checks.
Figure 26-1: Plan Map of the Panuco District Highlighting Primary 2024 Exploration Targets Relative to Mapped and Sampled Mineralized Veins.
![]()
Source: Vizsla, 2024.
Note: Purple ellipse represents Resource Extension targets, the yellow ellipse represents Proximal targets, and the blue arrows represent distal District targets
26.3 Metallurgical Test Work
Additional metallurgical testing should be conducted to advance the project to a Feasibility level of understanding, which should include the following:
|
|
Testing of master composites from the main vein system deposits, assembled from drill core intervals that represent greater spatial coverage of the potential mill feed material.
A greater number of variability samples should be tested across each deposit, with a focus on the first 5 years of production to confirm material hardness properties and metallurgical response. A minimum of 25 variability samples is recommended.
A batch scale regrinding energy test on a representative rougher concentrate, suitable for vendor sizing,
Dynamic thickener settling tests on rougher tailings, reground rougher concentrate, and CCD circuit feed for confirmation of thickener sizing,
Cyanide detox testing on material representative of the final CCD underflow,
Paste tailings testing,
Environmental characterization of tailings, and
Flow property testing of crushed mill feed material for surge bin design.
- The cost of this work is estimated to be US$0.60M.
26.4 Mining Methods
Although a conservative approach has been taken, there are inherent risks with Preliminary Economic Assessments, and further analyses and data collection is recommended to advance the project to a Pre-Feasibility level of understanding:
Preliminary investigations for geotechnical modelling have been carried out, but not to the extent to support Mineral Reserves. To declare Mineral Reserves, Entech recommends creating a detailed model of the geotechnical regime reflecting collected data (oriented core-drilling, hydrogeology modelling, mapping, rock strength testing, in-situ stress assessment, paste strength testing and design, etc.) to more accurately estimate ground support requirements, mining costs, and further support the mining approach, and,
Additional geotechnical data may revise dilution assumptions, sublevel stope height and spans, ground support assumptions, paste fill assumptions, advance rates, support costs, of which may increase mining costs, dilution or loss of mineralisation.
Additional mining studies / analyses to complete are as follows:
Ad-hoc mining contractor pricing for the selected mine plan,
Complete an owner-operator model to assess if a transition to owner-operator would be beneficial or a combination of owner-operator and mining contractor,
Update base case plan with additional information provided by geotechnical and hydrological studies,
Assess electric/battery equipment in lieu of relatively low power costs of approximately $0.12/kWh, and,
|
|
- Complete Prefeasibility Study components.
The cost of this work is estimated to be US$2.0M which includes US$0.5M for diamond drilling to support geotechnical assessments.
26.5 Process and Infrastructure Engineering
The estimated cost for process and infrastructure engineering for the FS is US$1.5M engineering deliverables would include:
Process trade-off studies (comminution, grinding, flotation, leaching and Merrill Crowe),
Flow diagrams
Detailed equipment list
Power listing and consumption estimate,
Architectural (building sizes) to estimate steel and concrete quantities,
Detailed material and water balance,
Detailed process design criteria,
General arrangements (GA) and elevation drawings,
Electrical single line drawing,
Equipment and supply quotations updated and sources determined,
Estimate of equipment and materials freight quantities,
Capital cost estimate,
Operating cost estimate,
Major equipment spares and warehouse inventory cost estimate,
Construction workhours estimate, and
Construction schedule.
26.6 Site Geotechnical Field and Laboratory Program
The site is located in an area of rugged mountainous terrain, which means that the design of all mining infrastructure must account just for the stability and deformation of earth masses.
|
|
A comprehensive geotechnical site investigation program should be performed in the next phase of the project. The program should include a site field geotechnical investigation and laboratory testing program that includes the following facilities:
Tailings storage facility
Waste rock storage facility, if required
Primary crusher
Process plant
Mine infrastructure
Mine roads
The main purposes of the recommended field investigation and laboratory program is:
Provide detailed characterizations of the sites of tailings storage facility, waste rock storage facility (if required), primary crusher, process plant and supporting infrastructure, and
Establish detailed foundation and groundwater conditions underneath the existing TSF and the proposed TSF that would bring it in line with current GISTM guidelines.
For the tailings storage facility, the site investigation include total of 6 boreholes to a depth of 40m or 10 m into bedrock and 10 test pits to a depth of 4m or refusal. The boreholes should be drilled within the footprint of the impoundment, proposed embankments, and any potential faults (if present).
For the process plant and primary crusher, a total of 4 boreholes to a depth of 30m or 10m into bedrock and 6 test pits to 4m or refusal shall be performed. Plus, an additional 10 test pits to a depth of 4m or refusal for other site infrastructure.
In addtion, several geophysics lines shall be perfromed to aid in the definition of subgrade consditions for a total length of 1,200 m.
Based on the above the site investigation program for mine Infrastructure the total program shall include a total of sixteen (16) boreholes, twenty-six (26) test pits, and 1,200 m of geophysics lines. The boreholes shall be drill using a geotechnical rig capable of performing Standard Penetration Test (SPT), packer testing (rock), and constant head test (Soil) along with taking samples. The test pits shall be performed using an CAT 320 excavator, or equivalant.
In addition, the field program shall include a total of six (6) vibrating wire piezometers in selected boreholes to measure fluctuations in groundwater levels.
A budget estimate for this work, assuming an all-in drilling cost of US$115,200 for geotechnical drilling, excavator and operator US$98,000, a field engineer to oversee drilling, logging and test pitting, field testing, conduct sampling from boreholes and test pits, perform surface mapping, oversee the installation of the piezometer is US$116,000, lab testing is US$65,000, vibrating wire piezometer and logger is US$15,600, US$60,000 for geophysics, and both factual and interpretative reports is US$90,000. The total cost of the field and laboratory program is approximately US$0.56M.
|
|
26.7 Tailings Storage and Waste Rock Storage Design
A design will be developed for the tailings storage that includes a traditional TSF. For the waste rock storage facility, if require, a the mine planner with the geotechnical design criteria will be developed. The following task will be performed:
Acquire lidar imagery for the site to improve topography for the project.
Develop seepage predictions and seepage control measures for the TSF.
Perform stability analysis for TSF embankments.
Perform a liquefaction assessment with consideration of material properties for both the TSF embankments and WRSF foundations.
Optimize the tailings deposition strategy.
Develop FS level design of TSF tailings disposal (including surface water management, tailings water balance, seepage and sediment ponds).
Solicit additional budgetary quotes for earthworks and geosynthetics (i.e., geomembrane, geotextile, and piping) to get more accurate pricing for the next cost estimates.
Develop cost estimates (i.e, capital, sustaining capital, and operating costs) for TSF tailings storage.
The estimated cost for the recommended work is approximately US$0.35M.
26.8 Environmental Studies, Permitting, Social or Community Recommendations
The following recommendations are made regarding reducing risk and uncertainty in the areas of environmental studies, permitting schedule, and community. Qualified professionals should be retained to design and oversee the implementation of each of these studies. These studies and activities will be necessary to support the Project to the future feasibility stages and provide a strong basis for future environmental impact assessment preparation and permitting. Some of these studies may overlap with other recommendations outlined in Section 26, and cost savings can be realized by integrating this work with those studies.
26.8.1 Water Resources
- Building upon the results of existing desktop hydrographic studies, develop and implement a multi-year seasonal hydrological and meteorological monitoring plan for the study area to further characterize the hydrological conditions and to develop a more detailed water balance model. The water balance model will be used as a predictive tool regarding the quantity and quality of water available to support mineral processing as well as prediction of effluent quality and quantity.
|
|
Building on the results of existing baseline studies, develop and implement a multiyear seasonal groundwater monitoring, sampling, and testing plan focusing on areas that will be potentially affected by mine infrastructure based on current infrastructure and processing plans. Coordinating with planned exploration and geotechnical drilling programs may help to reduce effort and cost of the hydrogeological program.
A conceptual hydrogeological model should be developed for the site and study area, based on groundwater monitoring and testing results and should provide the basis for the future development of a three-dimensional numerical groundwater model that will support feasibility level design and environmental impact assessment / permitting requirements. The model should assess impacts to the aquifers within and near the project area and the potential drawdown of aquifers and potential changes to water quality for current groundwater users.
Estimated cost for the above recommendations is US$0.5M. Cost savings may be realized for hydrogeological characterization work by coordinating closely with geotechnical and exploration teams and their drilling programs.
26.8.2 Geochemistry
A geochemical assessment of the ARD/ML risk for the project should be implemented utilizing the existing geological model for the site and sampling of fresh drill core sampled intervals, if available. Generally, the program should consist of the collection adequate waste rock, overburden, and tailings samples to be considered representative of the mine rock and tailings to be stored on site and used as fill. The identification of quantity and location of the samples should be based on the site geological and structural model, and mineralogical considerations.
Range of analytical tests should include elemental analysis, acid-base accounting, shake flask extraction (short term leach), NAG pH, minerology, and humidity cell testing (minimum 52 weeks).
Development of preliminary source terms for the weathering of waste rock, mineralized material, tailings, and pit walls for use in water balance modelling.
Preliminary interpretation of results and assessment of requirement for site-specific mine rock tailings management practices and water treatment.
The estimated costs for the above are US$0.2M.
26.8.3 Other Environmental Baseline Studies
Conduct a data gap assessment for baseline studies and where gaps are indicated, develop and implement a seasonal multi-year baseline vegetation/ecosystem and wildlife/wildlife habitat survey plan for areas of disturbance within the Project area with special emphasis on listed and threatened species under Mexican legislation. The plan should build upon baseline work completed to date.
Similarly, the requirement for additional baseline data collection in the areas of air quality and noise should be reviewed and based on planned infrastructure, additional data collected if needed for near field and further afield operations.
Additional data related to near surface soil textures and chemistry should be collected based on planned infrastructure.
|
|
- Archaeological baseline study will be required to identify archaeological resources, within and near the proposed disturbance footprint.
The estimated costs for the above is US$0.05M.
26.8.4 Socio-Economic, Cultural Baseline Studies and Community Engagement
- Socio-economic studies should be undertaken, and community engagement efforts should continue, building on previous work, to help identify community needs and provide a basis for targeted community investment in local development projects, training, education, and employment.
The estimated cost for this program is US$0.1M.
26.8.5 Environmental Constraints Mapping
- To assist in the development of the project at the feasibility design phase, environmental constraints mapping should be initiated and periodically updated, based on the results of historical and future baseline environmental and land use studies. This mapping should be utilized to limit risks at the design stages of the project.
The estimated cost for this program is US$0.02M.
26.9 Market Studies
A doré marketing study should be completed to confirm the payable metal values and penalties (if any) associated with the sale of both silver and gold doré.
The estimated cost for the above task is US$0.06M.
|
|
27 REFERENCES
Abzalov, M. (2008): Quality control of assay data: a review of procedures for measuring and monitoring precision and accuracy. Exploration and Mining Geology, Vol.17, No 3-4, p.131-144, ISSN 0964-1823
Albinson, T., Norman, D.I., Cole, D., and Chomiak, B., 2001, Controls on Formation of Low-Sulfidation Epithermal Deposits in Mexico: Constraints from Fluid Inclusion and Stable Isotope Data: ECONOMIC GEOLOGY, Special Publication 8, p. 1 - 32.
Anonymous (2016). Estudio Geofisico en el Proyecto Copala-Panuco; Geophysical Surveys S.A. de C.V., 49-page report prepared for Minera Rio Panuco S.A. de C.V.
Aranda-Gomez, J., Henry, C.D., Juhr, J., McDowell, F. (2003). Cenozoic volcanic-tectonic development of northwestern Mexico-a transect across the Sierra Madre Occidental volcanic field and observations of extension-related magmatism in the southern basin and range and Gulf of California tectonic sub provinces; UNAM, Geologic Transects across Cordilleran Mexico, p. 71-121.
Armitage, A., Eggers, B. and Camus, Y. (2023). National Instrument 43-101 Technical Report titled Mineral Resource Estimate Update for the Panuco Ag-Au-Pb-Zn Project, Sinaloa State, Mexico, for Vizsla, dated March 10, 2023,186 p.
Armitage, A., Eggers, B., Mehrfert, P. 2024. Technical Report on the Updated Mineral Resource Estimate for the Panuco Ag-Au-Pb-Zn Project, Sinaloa State, Mexico. Compiled for Vizsla Silver Corp. by SGS Canada Inc. Geological Services, issued February 12, 2024.
Avila-Ramirez, P. (1999). Informe de la cartografía geológico-minera y geoquímica hoja Copala clave F13A37 escala 1:50,000 estados de Sinaloa y Durango, 75 p.
Barton, N. 1976. Recent experience with the Q-system of tunnel support design. Proceedings of the Symposium on Exploration for Rock Engineering. November 1976:107-117.
Benton, L.D., 1991, Composition and source of the hydrothermal fluids of the San Mateo vein, Fresnillo, Mexico as determined from 87Sr/ 86Sr, stable isotope and gas analyses:Unpublished Master's Thesis, New Mexico Institute of Mining and Technology, 55 p.
Campa, M.F., and Coney, P.J., 1983, Tectono- stratigraphic terranes and mineral resource distributions in Mexico: Canadian Journal of Earth Sciences, vol. 20, p. 1040-1051.
Camprubí A. and Albinson T., 2006, Depósitos epitermales en México: actualización de su conocimiento y reclasificación empírica, Sociedad Geológica Mexicana, Tomo LVIII, Num. 1, P. 27-81
Camprubí, A., and Albinson, T., 2007, Epithermal deposits in Mexico: Update of current knowledge, and an empirical reclassification: Geological Society of America, Special Paper 422, p. 377-415.
|
|
Centeno-García, E. (2017). Mesozoic tectono-magmatic evolution of Mexico: An overview; Ore Geology Reviews, v. 81 p. 1035-1052.
Centeno-García, E., Guerrero-Suastegui, M., Talavera-Mendoza, O. (2008). The Guerrero Composite Terrane of western Mexico: collision and subsequent rifting in a supra-subduction zone: Geological Society of America Special Paper 436, p. 279-308.
Christopher, P. and Sim, R. (2008). Technical Report on the Copala Project, Sinaloa State, Mexico; Silverstone Resources Corp., 100 p.
Consultores Interdisciplinarios En Medio Ambiente S.C. (CIMA) (Octubre 2020). Manifestación de Impacto Ambiental Modalidad Particular Proyecto "Exploración Panuco-Copala". Prepared for Vizsla Silver Corp.
Coote, A., 2021a, Petrologic Studies of Drill Core From AM21-31, CO21-50, CS20-01, 11 & 23, NP20-02 & 07 and NP21-102, 150 & 170, Panuco Silver Gold District, Mexico, pp.65.
Coote, A., 2021b, Fluid Inclusion Microthermometric Studies From Drill Core:AM21-31, CO21-50, CS20-01& 11, NP20-02 & 07 and NP21-102&150, Panuco Silver Gold District, Mexico, pp. 33.
Data Mexico. (2024). Sinaloa: Economy, employment, equity, quality of life, education, health and public safety. Available: https://www.economia.gob.mx/datamexico/en/profile/geo/sinaloa (Accessed July 2024).
Duque-Trujillo, J., Ferrari, L., López Martínez, M., Orozco-Esquivel, T., and Lonsdale, P. (2013). Early to Middle Miocene syn-extensional magmatism in the southern Gulf of California: Geological Society of America Abstracts with Programs, v. 45, no. 6, p. 15.
Duque-Trujillo, J., Ferrari, L., Norini, G., López-Martínez, M. (2014). Miocene faulting in the southwestern Sierra Madre Occidental, Nayarit, Mexico: kinematics and segmentation during the initial rifting of the southern Gulf of California; Revista Mexicana de Ciencias Geológicas, v. 31, núm. 3, p. 283-302
Escamilla-Torres, T. (2001). Informe de la cartografía geológico-minera y geoquímica hoja Cosala clave G13C74 escala 1:50,000 estado de Sinaloa, 66 p.
Ferrari, L., López-Martínez, M. Orozco-Esquivel, T., Bryan, S.E., Duque-Trujillo, J., Lonsdale, P., Solari, L. (2013). Late Oligocene to Middle Miocene rifting and synextensional magmatism in the southwestern Sierra Madre Occidental, Mexico: The beginning of the Gulf of California rift; Geosphere v. 9; no. 5; p. 1161-1200; doi:10.1130/GES00925.1; 15 figures; 2 tables; 1 supplemental file.
Ferrari, L., López-Martínez, M., Rosas-Elguera, J. (2002). Ignimbrite flare-up and deformation in the southern Sierra Madre Occidental, western Mexico: Implications for the late subduction history of the Farallon plate; Tectonics v. 21 No. 4 10.1029/2001TC001302, p. 17-1 to 17-24
Ferrari, L., Valencia Moreno. M., Bryan, S. (2005). Magmatismo y tectónica en la Sierra Madre Occidental y su relación con la evolución de la margen occidental de Norteamérica, Boletín de la Sociedad Geológica Mexicana Volumen Conmemorativo del Centenario Temas Selectos de La Geología Mexicana Tomo LVII, N. 3, 343-378.
|
|
Flores Doncel Consultores, SC (Abril 2022). Estudio De Línea Báse. Prepared for Vizsla Silver Corp.
Flores Doncel Y Muniz Consultores, SC (Diciembre 2022). Evaluación De Impacto Social, Proyecto De Exploración Minera Pánuco, Concordia. Prepared for Vizsla Silver Corp.
Geoinformation Portal 2024. Geoportal of the National Biodiversity Information System [16,861]. Available: http://www.conabio.gob.mx/informacion/gis/ (Accessed July 2024).
González-León, C. M., Solari, L. Solé, J. Ducea, M.N., Lawton, T.F., Bernal, J.P., González-Becuar, E., Gray, F., López Martínez, M., Santacruz, R.L. (2011). Stratigraphy, geochronology, and geochemistry of the Laramide magmatic arc in north-central Sonora, Mexico; Geosphere; December 2011; v. 7; no. 6; p. 1392-1418
Hedenquist, J.W., Arribas, A., Jr., and Reynolds, J.T., (1998). Evolution of an Intrusion-Centered Hydrothermal System: Far Southeast-Lepanto Porphyry and Epithermal Cu-Au Deposits, Philippines: ECONOMIC GEOLOGY, vol. 93, p. 373-404.
Hedenquist, J.W., Arribas, A.R., Gonzalez-Urien, E. (2000). Exploration for epithermal gold-silver deposits, in Hagemann, S.G., and Brown, P.E., eds., Gold in 2000: Society of Economic Geologists, Reviews in Economic Geology, v. 13, p. 245-277.
Hedenquist, J.W., White, N.C. (2005). Epithermal gold-silver deposits: characteristics, interpretation, and exploration; Prospectors and Developers of Canada and Society of Economic Geologists Short Course Notes.
Heidbach, O., M. Rajabi., K. Reiter, M. Ziegler, WSM Team. 2016: World Stress Map Database Release 2016. V. 1.1. GFZ Data Services. https://doi.org/10.5880/WSM.2016.001.
Henry, C.D., McDowell, F.W., Silver, L.T. (2003). Geology and Geochronology of granitic batholithic complex, Sinaloa, Mexico: Implications for Cordilleras magmatism and tectonics; Geological Society of America Special Paper 374, p. 237-273.
Horner, J., Enriquez, E., 1999. Epithermal precious metal mineralization in a strike-slip corridor: the San Dimas District, Durango, Mexico. Econ. Geol. 94 (8), 1375-1380.
INEGI (2020). Instituto Nacional de Estadística y Geografía. Available: https://www.inegi.org.mx/ (Accessed July 2024).
Maunula, T. and Murray, K. (2022). National Instrument 43-101 Technical Report for the Panuco Project Mineral Resource Estimate, Concordia, Sinaloa, Mexico for Vizsla Dated: April 7, 2022, and with an Effective Date: March 1, 2022, 176 p. (Posted on SEDAR+ under Vizsla's profile).
Mawdesley, C., Trueman R. & W. J. Whiten, 2003. Extending the Mathews stability graph for open-stope design.
|
|
McDowell, F.W., and Keizer, R.P., 1977, Timing of mid-Tertiary volcanism in the Sierra Madre Occidental between Durango City and Mazatlan, Mexico: Geological Society of America Bulletin, vol. 88, pp. 1479 - 1487.
Montoya-Lopera, P., Ferrari, L., Levressea, G., Abdullinb, F., Mata L. (2019). New insights into the geology and tectonics of the San Dimas mining district, Sierra Madre Occidental, Mexico; Ore Geology Reviews 105: 273-294.
NGI (Norwegian Geotechnical Institute), 2022. Using the Q-system - Rock mass classification and support design. Oslo, Norway.
Norman, D.I., Moore, J.N. and Musgrave J., 1997, More on the use of fluid inclusion gaseous species as tracers in geothermal systems, Twenty-second workshop on geothermal reservoir engineering, Stanford University, Stanford, California, pp. 27 - 29
Polanco-Salas, A., Valdez-Monsiváis, A., Saldaña-Saucedo, G. (2003). Informe de la cartografía geológico-minera y geoquímica hoja Concordia clave F13A36 escala 1:50,000 estado de Sinaloa, 77 p.
Potvin, Y. & Hadjigeorgiou, J., 2016. Selection of Ground Support for Mining Drives Based on the Q-System. Proceeding from the Eight International Symposium on Ground Support in Mining and Underground Construction.
PueblosAmerica.com. (2024). Pánuco (Sinaloa) Concordia. Available: https://en.mexico.pueblosamerica.com/i/panuco-2/ (Accessed July 2024).
Robinson, M. (2019). Technical ReporrRosendo-Brito, M., Guerrero-Salazar, C., Bustos-Moreno, M., Escamilla de la Rosa, J. (2019). Informe de la cartografía geológico-minera y geoquímica hoja Villa Unión clave F13A46 escala 1:50,000 estado de Sinaloa, 77 p.
Sedlock R. L., Ortega-Gutiérrez F., Speed R. C., 1993, Tectonostratigraphic Terranes and Tectonic Evolution of Mexico, Geological Society of America, Special Papers, vol. 278, p. 74-80.
Servicio Geológico Mexicano (2017). Panorama Minero del Estado de Sinaloa, 50 pages.
Shimizu, T. (2014). Reinterpretation of Quartz Textures in Terms of Hydrothermal Fluid Evolution at the Koryu Au-Ag Deposit, Japan; Economic Geology, v. 109, p. 2051-2065.
Simmons, S.F., 1991, Hydrologic Implications of Alteration and Fluid Inclusion Studies in the Fresnillo District, Mexico: Evidence for a Brine Reservoir and a Descending Water Table During the Formation of Hydrothermal Ag-Pb-Zn Orebodies: ECONOMIC GEOLOGY, vol. 91, pp. 204 - 212.
Simmons, S.F., Gemmell, J.B., and Sawkins, F.J., 1988, The Santo Niño Silver-Lead-Zinc Vein, Fresnillo District, Zacatecas, Mexico: Part II. Physical and Chemical Nature of Ore-Forming Solutions: ECONOMIC GEOLOGY, vol. 83, p. 1619-1641.
|
|
SRK 2023a. Panuco Project - Recommendations from PEA to FS. Draft prepared for Vizsla Silver Corp. by SRK Consulting (Canada) Inc., issued August 17, 2023.
SRK 2023b. 2023 Geotech PEA Level Update. Draft prepared for Vizsla Silver Corp. by SRK Consulting (Canada) Inc., issued April 25, 2023.
SRK 2023c. Geotech PEA Level Update. Mining Method Selection for the Copala Veins. Draft prepared for Vizsla Silver Corp. by SRK Consulting (Canada) Inc., issued August 24, 2023.
SRK 2023d. Mine Design and Parameters - PEA Level Study. Napoleon, Tajitos and Copala. Draft prepared for Vizsla Silver Corp. by SRK Consulting (Canada) Inc., issued September 27, 2023.
SRK 2023e. 2023 Test Mine Study. Draft prepared for Vizsla Silver Corp. by SRK Consulting (Canada) Inc., issued October 23, 2023.
SRK 2024. Vizsla Panuco 2023-2024 Hydrogeological Investigation - Factual Data Report, prepared for Vizsla Silver Corp. by SRK Consulting (Canada) Inc., issued February 2024.
SRK, 2022. 2022 Geotech PEA Level Update. Prepared for Vizsla Silver Corp. by SRK Consulting (Canada) Inc., issued May 22, 2022.
Stanley, C., and Lawie, D. (2007): Average Relative Error in Geochemical Determinations: Clarification, Calculation, and a Plea for Consistency; Exploration and Mining Geology, Vol. 16, Nos. 3-4, p. 265-274
Starling, T. (2019). Structural Review of the Panuco District, Private Report prepared for Vizsla Resources Corp., 54 p.
Stewart, S.B. V. & Forsyth, W. W., 1995. The Mathew's method for open stope design. CIM bulletin, 88(992), 45-53.
Tasse, E., 2024. Geotechnical Review - Panuco Project. Unpublished technical memorandum prepared by Equilibrium Mining for Entech Mining Ltd., issued June 27, 2024.
Vizsla Silver Corp. (2024) Maps & Figures. Available: https://vizslasilvercorp.com/projects/panuco-project/maps-figures/ (Accessed July 2024).
WSP Golder, (Mayo 2022). Resultados de la Primera Campana de Muestreos de Línea Base Ambiental, Proyecto Panuco. Prepared for Minera CANAM, S.A. de C.V.
WSP Golder, (Septiembre 2022). Resultados de la Segunda Campana de Muestreos de Línea Base Ambiental, Proyecto Panuco. Prepared for Minera CANAM, S.A. de C.V.
WSP Golder, (Febrero 2023). Proyecto Panuco - Tercer Campana De Muestreo. Prepared for Vizsla Silver Corp. through Minera CANAM, S.A. de C.V.
WSP Golder, (Febrero 2023). Proyecto Panuco - Cuarta Campana De Muestreo. Prepared for Vizsla Silver Corp. through Minera CANAM, S.A. de C.V.
|
|
WSP Golder, (Junio 2023). Memorando Técnico 5TA Ronda De Muestreos De Estudios De Linea Basea Ambiental Proyecto Panuco. Prepared for Vizsla Silver Corp. through Minera CANAM, S.A. de C.V.
WSP Golder, (Marzo 2024). Memorando Técnico 6° Ronda de Muestreos De Estudios De Linea Basea Ambiental Proyecto Panuco, Prepared for Vizsla Silver Corp. through Minera CANAM, S.A. de C.V.
WSP Golder, (Marzo 2024). Memorando Técnico 6° Ronda de Mestrões De Flora Y Fauna, Estúdios De Linea Basea Ambiental Proyecto Panuco, Prepared for Vizsla Silver Corp. through Minera CANAM, S.A. de C.V.