QMIS SECURITIES CAPITAL (M) SDN. BHD.
CONSOLIDATED STATEMENTS OF CASH FLOWS
| | For the Year Ended | | | For the Nine Months Ended |
| | December 31, | | | December 31, | | | September 30, | | | September 30, |
| | 2021 | | | 2020 | | | 2022 | | | 2021 |
| | | | | | | | (Unaudited) | | | (Unaudited) |
Cash Flows from Operating Activities | | | | | | | | | | | |
| | | | | | | | | | | |
Net loss | $ | 266,554 | | $ | (467,139) | | $ | (1,912,610) | | $ | (356,618) |
Adjustments to reconcile net loss | | | | | | | | | | | |
Depreciation | | 5,388 | | | 14,012 | | | 3,497 | | | 4,193 |
Amortization of operating lease right-of-use assets | | 22,683 | | | 18,669 | | | 17,361 | | | 16,899 |
Impairment of fixed assets | | - | | | 2,071 | | | - | | | - |
Changes in assets and liabilities | | | | | | | | | | | |
Accounts receivable | | (241,983) | | | - | | | 182,189 | | | - |
Prepaid expenses | | (54,513) | | | - | | | 48,230 | | | - |
Contract security deposit | | (656) | | | 950 | | | 1,074 | | | (661) |
Accounts payable | | 25,978 | | | - | | | 10,903 | | | 7,262 |
Accrued expenses | | 6,306 | | | 3,818 | | | 2,744 | | | 34,573 |
Taxes payable | | 177,428 | | | 277,125 | | | 194,689 | | | 142,729 |
Deferred revenue | | 25,318 | | | - | | | (24,156) | | | 20,483 |
Operating lease liabilities | | (22,597) | | | (18,584) | | | (17,154) | | | (16,943) |
| | - | | | - | | | - | | | - |
Net cash used by operating activities | | 209,906 | | | (169,078) | | | (1,493,233) | | | (148,083) |
| | | | | | | | | | | |
Cash Flows from Investing Activities | | | | | | | | | | | |
Purchase of property and equipment | | (242) | | | - | | | (356) | | | - |
Advances and loans made to related parties | | (1,152,550) | | | (814,859) | | | - | | | - |
Repayment of advances and loans made to related parties | | 1,591,442 | | | - | | | - | | | 1,445,043 |
Net cash provided (used) by investing activities | | 438,650 | | | (814,859) | | | (356) | | | 1,445,043 |
| | | | | | | | | | | |
Cash Flows from Financing Activities | | | | | | | | | | | |
Shareholder capital contribution | | 296 | | | - | | | 999,975 | | | 296 |
Proceeds from related parties | | 744,530 | | | 46,467 | | | - | | | 242,988 |
Repayment to related parties | | - | | | - | | | (760,879) | | | - |
Net cash provided (used) by financing activities | | 744,826 | | | 46,467 | | | 239,096 | | | 243,284 |
| | | | | | | | | | | |
Effect on changes in foreign exchange rate | | (10,425) | | | 6,412 | | | 41,155 | | | (9,404) |
Increase (decrease) in cash | | 1,382,957 | | | (931,058) | | | (1,213,338) | | | 1,530,840 |
Cash at beginning of period | | 26,837 | | | 957,895 | | | 1,409,794 | | | 26,837 |
Cash at end of period | $ | 1,409,794 | | $ | 26,837 | | $ | 196,456 | | $ | 1,557,677 |
| | | | | | | | | | | |
Supplemental Disclosures of Cash Flow Information: | | | | | | | | | | | |
Cash paid during the year for: | | | | | | | | | | | |
Interest | $ | - | | $ | - | | $ | - | | $ | - |
Income tax | $ | - | | $ | - | | $ | 41,115 | | $ | - |
The accompanying notes are an integral part of these consolidated financial statements.
7
QMIS SECURITIES CAPITAL (M) SDN. BHD.
NOTES TO CONSOLIDATED FINANCIAL STATEMENTS
Note 1-ORGANIZATION
QMIS Securities Capital SDN BHD (the “Company” or “QSC”) was incorporated by the Companies Commission of Malaysia on January 13, 2015 under the Companies Act 1965 as a private limited company with the name Multi Securities Capital (M) SDN BHD. Subsequently, the name was changed to QMIS Securities Capital (M) SDN BHD on March 19, 2015.
On November 16, 2015, QSC acquired 99.9% equity ownership interest of QMIS Capital Venture SDN BHD (“QCV”), which was incorporated by the Companies Commission of Malaysia on January 14, 2015 under the private limited company act with the name Diversified Multi Capital Venture (M) SDN BHD. Subsequently, the name was changed to QMIS Capital Venture SDN BHD on March 19, 2015.
On October 15, 2015, QSC acquired 69.99% equity ownership interest of QMIS World Trade International SDN BHD (“QWT”), and subsequently on November 27, 2015, QSC acquired anther 0.01% equity ownership interest in QWT, which was incorporated by the Companies Commission of Malaysia on 15 October 2014 under the private limited company act with the name of Santubong Business Trading SDN BHD. Subsequently, the name was changed to QMIS World Trade International SDN BHD on August 7, 2015.
On December 31, 2021, QSC acquired 100% equity ownership interest of QMIS TBS Capital Group Corporation Limited (“QTBS”), which was incorporated in Hong Kong on September 9, 2013 under the Companies Ordinance as a limited liability company under the name QMIS Huayin Finance Credit Limited. Subsequently, the name was changed to QMIS Ample Luck Financial Group Limited on July 19, 2018 and finally QMIS TBS Capital Group Corporation Limited on June 16, 2020.
On December 31, 2021, QSC acquired 100% equity ownership interest of QMIS Finance Limited (“QFL”), which was incorporated in Hong Kong on July 20, 2007 under the Companies Ordinance as a limited liability company with the name of Hua Xia Syndicate Financial Credit Limit. Subsequently, the name is changed to QMIS Syndicate Financial Credit Limited on February 21, 2014 and finally to QMIS Finance Limited on March 31, 2016.
On May 27, 2020, QFL, QSC, and QWT acquired 60%, 20%, and 20%, respectively, equity ownership interest in QMIS Green Energy Berhad (“QGE”), which was incorporated by the Companies Commission of Malaysia on May 27, 2020 under the private limited company act with the name of QMIS Waste Management Group Berhad. Subsequently, the name was changed QMIS Green Energy Berhad on September 13, 2022.
On May 8, 2020, QFL, QSC, and QWT acquired 60%, 20%, and 20%, respectively, equity ownership interest in QMIS Biotech Group Berhad (“QBT”), which was incorporated by the Companies Commission of Malaysia on 8 May 2020 under the private limited company act with the name of QMIS Biotech Group Berhad. Subsequently, the name was changed to QMIS Biotech Group Berhad on May 29, 2020.
8
QMIS SECURITIES CAPITAL (M) SDN. BHD.
NOTES TO CONSOLIDATED FINANCIAL STATEMENTS
Note 1 - ORGANIZATION (continued)
On June 22, 2020, QFL incorporated QMIS Investment Bank Limed (“QIB”) by the Labuan Financial Services Authority (LFSA) in Malaysia under the company limited by shares act with the name of QMIS Finance (L) Limited. Subsequently, the name was changed to QMIS Labuan Investment Bank Limited on March 24, 2021 and finally to QMIS Investment Bank Limited on 28 July 2022. QFL owns 100% equity ownership interest in QIB.
On June 21, 2021, QFL and four other shareholders incorporated QMIS Richwood Blacktech Sdn. Bhd. (“QR”) by the Companies Commission of Malaysia under the private limited company act. QFL owns 51% equity ownership interest in QR.
The Company’s structure follows,
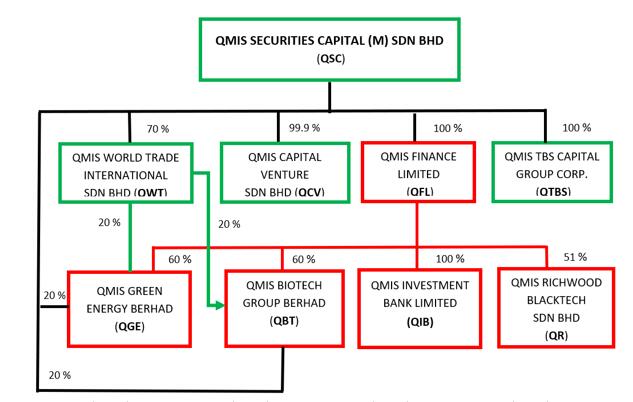
Currently, QSC, QFL, and QTBS work together to provide consultant services. QR is engaged in the business of software development. The other companies are not currently engaged in business.
The Reorganization of the Company has been accounted for as a recapitalization among entities under common control since the same controlling shareholders controlled all these entities before and after the Reorganization. The consolidation of the Company and its subsidiaries has been accounted for at historical cost and prepared on the basis as if the aforementioned transactions had become effective as of the beginning of the first period presented in the accompanying consolidated financial statements. Results of operations for the periods presented comprise those of the previously separate entities combined from the beginning of the period to the end of the period, eliminating the effects of intra-entity transactions.
9
QMIS SECURITIES CAPITAL (M) SDN. BHD.
NOTES TO CONSOLIDATED FINANCIAL STATEMENTS
Note 2-SUMMARY OF SIGNIFICANT ACCOUNTING POLICIES
Basis of Presentation and Principles of Consolidation
The accompanying consolidated financial statements have been prepared in accordance with accounting principles generally accepted in the United States of America (“U.S. GAAP”) and pursuant to the rules and regulations of the Securities and Exchange Commission (“SEC”). The consolidated financial statements include the accounts of the Company and its subsidiaries. All significant intercompany accounts and transactions have been eliminated.
Interim Financial Statements
The interim financial statements have been prepared in accordance with accounting principles generally accepted in the United States of America (“GAAP”) for interim financial information and with the rules and regulations of the U.S. Securities and Exchange Commission (“SEC”). Accordingly, these condensed consolidated financial statements do not include all of the information and footnotes required for audited annual financial statements. In the opinion of management, all adjustments (consisting of normal recurring accruals) considered necessary to make the condensed consolidated financial statements not misleading have been included.
The interim financial statements should be read in conjunction with the audited consolidated financial statements and the notes for the year ended December 31, 2021 and 2020. The results of operations for the nine and three months ended September 30, 2022, are not necessarily indicative of the results to be expected for the full year.
Foreign Currency Translation
The accompanying consolidated financial statements are presented in United States dollar (“USD”), which is the reporting currency of the Company. The functional currency of QSC, QWT, QCV, QGE, QBT, and QRB are Malaysian Ringgit (“MYR”). The functional currency of QFL and QTCG are Hong Kong dollar ("HKD"). The functional currency of QIB is USD.
The Company maintains its books and record in its functional currency. Transactions denominated in currencies other than the functional currency are translated into the functional currency at the exchange rates prevailing at the dates of the transaction. The resulting exchange differences are recorded in the statements of operations.
10
QMIS SECURITIES CAPITAL (M) SDN. BHD.
NOTES TO CONSOLIDATED FINANCIAL STATEMENTS
Note 2 - SUMMARY OF SIGNIFICANT ACCOUNTING POLICIES (continued)
Foreign Currency Translation (continued)
The reporting currency of the Company is the United States Dollars (“US$”), and the accompanying consolidated financial statements have been expressed in US$. In accordance with ASC Topic 830-30, “Translation of Financial Statements”, assets and liabilities of the Company whose functional currency is not US$ are translated into US$, using the exchange rate on the balance sheet date. Revenues and expenses are translated at average rates prevailing during the period. The gains and losses resulting from the translation of financial statements are recorded as a separate component of accumulated other comprehensive gain (loss) within the statements of changes in shareholders’ deficit.
The exchange rates used for foreign currency translation were as follows:
(1) | USD$1 = HKD | | | |
| Period Covered | Balance Sheet Date Rates | | Average Rates |
| | | | |
| Year ended December 31, 2021 | 7.7996 | | 7.7727 |
| Year ended December 31, 2020 | 7.7534 | | 7.7559 |
| Nine Months ended September 30, 2022 | 7.8498 | | 7.8335 |
| Nine Months ended September 30, 2021 | 7.7850 | | 7.7673 |
| Six Months ended June 30, 2022 | 7.8472 | | 7.8260 |
| Six Months ended June 30, 2021 | 7.7658 | | 7.7617 |
(2) | USD$1 = MYR | | | |
| Period Covered | Balance Sheet Date Rates | | Average Rates |
| | | | |
| Year ended December 31, 2021 | 4.1750 | | 4.1439 |
| Year ended December 31, 2020 | 4.0178 | | 4.2029 |
| Nine Months ended September 30, 2022 | 4.6359 | | 4.3431 |
| Nine Months ended September 30, 2021 | 4.1870 | | 4.1311 |
| Six Months ended June 30, 2022 | 4.4075 | | 4.2710 |
| Six Months ended June 30, 2021 | 4.1479 | | 4.0976 |
Statements of Cash Flows
In accordance with FASB ASC 830-230, “Statement of Cash Flows”, cash flows from the Company’s operations is calculated based upon the functional currency. As a result, amounts related to assets and liabilities reported on the statement of cash flows may not necessarily agree with changes in the corresponding balances on the balance sheet.
11
QMIS SECURITIES CAPITAL (M) SDN. BHD.
NOTES TO CONSOLIDATED FINANCIAL STATEMENTS
Note 2 - SUMMARY OF SIGNIFICANT ACCOUNTING POLICIES (continued)
Use of Estimates
The preparation of financial statements in conformity with U.S. GAAP requires management to make estimates and judgments that affect the reported amounts of assets and liabilities, disclosure of contingent assets and liabilities on the date of the financial statements and the reported amounts of revenues and expenses during the reporting period. The Company bases its estimates and judgments on historical experience and on various other assumptions and information that are believed to be reasonable under the circumstances. Estimates and assumptions of future events and their effects cannot be perceived with certainty and, accordingly, these estimates may change as new events occur, as more experience is acquired, as additional information is obtained and as operating environment changes. Significant estimates and assumptions by management include, among others, estimated life and impairment of long-lived assets, allowance for doubtful accounts, contingencies and litigation, total costs in connection with service revenues, and income taxes including the valuation allowance for deferred tax assets.
While the Company believes that the estimates and assumptions used in the preparation of the financial statements are appropriate, actual results could differ from those estimates. Estimates and assumptions are periodically reviewed and the effects of revisions are reflected in the financial statements in the period they are determined to be necessary.
Fair Value of Financial Instruments
The Company adopted ASC 820 “Fair Value Measurements,” which defines fair value, establishes a three-level valuation hierarchy for disclosures of fair value measurement and enhances disclosures requirements for fair value measures. Current assets and current liabilities qualified as financial instruments and management believes their carrying amounts are a reasonable estimate of fair value because of the short period of time between the origination of such instruments and their expected realization and if applicable, their current interest rate is equivalent to interest rates currently available. The three levels are defined as follow:
Level 1:Inputs to the valuation methodology are quoted prices (unadjusted) for identical assets or liabilities in active markets.
Level 2:Inputs to the valuation methodology include quoted prices for similar assets and liabilities in active markets, and inputs that are observable for the assets or liability, either directly or indirectly, for substantially the full term of the financial instruments.
Level 3:Inputs to the valuation methodology are unobservable and significant to the fair value.
12
QMIS SECURITIES CAPITAL (M) SDN. BHD.
NOTES TO CONSOLIDATED FINANCIAL STATEMENTS
Note 2 - SUMMARY OF SIGNIFICANT ACCOUNTING POLICIES (continued)
Fair Value of Financial Instruments (continued)
As of the balance sheet date, the estimated fair values of the financial instruments approximated their fair values due to the short-term nature of these instruments. Determining which category an asset or liability falls within the hierarchy requires significant judgment. The Company evaluates the hierarchy disclosures each year.
Cash and Cash Equivalents
Cash and cash equivalents include cash on hand and cash in time deposits, certificates of deposit and all other highly liquid instruments with original maturities of three months or less.
Accounts Receivable
Accounts receivable, net represent the amounts that the Company has an unconditional right to consideration, which are stated at the original amount less an allowance for doubtful receivables. The Company reviews the accounts receivable on a periodic basis and makes general and specific allowances when there is doubt as to the collectability of individual balances. The Company usually determines the adequacy of reserves for doubtful accounts based on individual account analysis and historical collection trends. The Company establishes a provision for doubtful receivables when there is objective evidence that the Company may not be able to collect amounts due. The allowance is based on management’s best estimates of specific losses on individual exposures, as well as a provision on historical trends of collections. The provision is recorded against accounts receivables balances, with a corresponding charge recorded in the consolidated statements of operations and comprehensive income (loss). Delinquent account balances are written off against the allowance for doubtful accounts after management has determined that the likelihood of collection is remote. In circumstances in which the Company receives payment for accounts receivable that have previously been written off, the Company reverses the allowance and bad debt.
Property, plant and equipment
Property and equipment primarily consist of office equipment, furniture, and leasehold improvement, which are stated at cost less accumulated depreciation less any provision required for impairment in value. Depreciation is computed using the straight-line method based on the estimated useful lives as follows:
Office equipment and furniture | 10 years |
Computers and printers | 2.5 years |
Leasehold improvements | 5 years (lease term) |
Costs of repairs and maintenance are expensed as incurred and asset improvements are capitalized. The cost and related accumulated depreciation of assets disposed of or retired are removed from the accounts, and any resulting gain or loss is reflected in the consolidated statement of income.
13
QMIS SECURITIES CAPITAL (M) SDN. BHD.
NOTES TO CONSOLIDATED FINANCIAL STATEMENTS
Note 2 - SUMMARY OF SIGNIFICANT ACCOUNTING POLICIES (continued)
Impairment of long-lived assets
The Company reviews long-lived assets for impairment whenever events or changes in circumstances indicate that the carrying amount of an asset may not be recoverable. Recoverability of assets to be held and used is measured by a comparison of the carrying amount of an asset to the future undiscounted cash flows expected to be generated by the asset. If such assets are considered to be impaired, the impairment recognized is measured by the amount by which the carrying amount of the assets exceeds the fair value of the assets. No impairment of long-lived assets was recognized for the years ended December 31, 2021 and 2020; and the nine months ended September 31, 2022 and 2021.
Operating lease
The Company leases are classified as operating leases in accordance with Topic 842. Under Topic 842, lessees are required to recognize the following for all leases (with the exception of short-term leases) on the commencement date: (i) lease liability, which is a lessee’s obligation to make lease payments arising from a lease, measured on a discounted basis; and (ii) right-of-use asset, which is an asset that represents the lessee’s right to use, or control the use of, a specified asset for the lease term.
At the commencement date, the Company recognizes the lease liability at the present value of the lease payments not yet paid, discounted using the interest rate implicit in the lease or, if that rate cannot be readily determined, the Company’s incremental borrowing rate for the same term as the underlying lease. The right-of-use asset is recognized initially at cost, which primarily comprises the initial amount of the lease liability, plus any initial direct costs incurred, consisting mainly of brokerage commissions, less any lease incentives received. All right-of-use assets are reviewed for impairment. No impairment for right-of-use lease assets incurred in the years ended December 31, 2021 and 2020; and the nine months ended September 31, 2022 and 2021.
Concentration of Credit Risk
Financial instruments the Company holds that are subject to concentrations of credit risk are cash and accounts receivable arising from its normal business activities. The Company places its cash and restricted cash in what it believes to be credit-worthy financial institutions. The Company conducts periodic reviews of the financial condition and payment practices of its customers to minimize collection risk on accounts receivable.
For the year ended December 31, 2021, customer A represents 90.1% of the Company’s total revenues. For the year ended December 31, 2020, customer A and customer B account for 45.2% and 52.5% of the Company’s total revenues, respectively.
For the nine months ended September 30, 2022, customer A represents 89.2% of the Company’s total revenues. For the nine months ended September 30, 2021, customer A account for 89.8% of the Company’s total revenues.
14
QMIS SECURITIES CAPITAL (M) SDN. BHD.
NOTES TO CONSOLIDATED FINANCIAL STATEMENTS
Note 2 - SUMMARY OF SIGNIFICANT ACCOUNTING POLICIES (continued)
Revenue Recognition
The Company adopted ASC 606 upon inception. Under ASC 606, revenue is recognized when a customer obtains control of promised goods or services, in an amount that reflects the consideration which the entity expects to receive in exchange for those goods or services. To determine revenue recognition for arrangements that an entity determines are within the scope of ASC 606, the Company performs the following five steps: (i) identify the contract(s) with a customer; (ii) identify the performance obligations in the contract; (iii) determine the transaction price; (iv) allocate the transaction price to the performance obligations in the contract; and (v) recognize revenue when (or as) the entity satisfies a performance obligation.
The Company currently generates its revenue from the following main sources:
Revenue from consultant services
QSC, QFL, and QTBS work together to provide business consultant services to customers. The revenue is recognized at the point in time when the consultant services promised are performed and accepted by the customers, which is generally when the consultant project is delivered and accepted by the customer.
Revenue from Software Development
QR provides customers with software development and support service pursuant to their specific requirements, which primarily compose of custom application development, supporting, and training. The Company generally recognized revenue at a point in time when control is transferred to the customers and the Company is entitled to the payment, or when the promised services are delivered and accepted by the customers.
Payments for services received in advance in accordance to the contract is recognized as deferred revenues when received.
Cost of Revenues
Cost of revenues primarily consists of salaries and related expenses (e.g. bonuses, employee benefits, statutory pension contribution, and payroll taxes) for personnel, and consultant and professional expenses directly involved in the delivery of services and products directly to customers.
Comprehensive Income (Loss)
ASC 220 “Comprehensive Income” established standards for reporting and display of comprehensive income/loss, its components and accumulated balances. Components of comprehensive income/loss include net income/loss and foreign currency translation adjustments. The component of accumulated other comprehensive income (loss) consisted of foreign currency translation adjustments.
15
QMIS SECURITIES CAPITAL (M) SDN. BHD.
NOTES TO CONSOLIDATED FINANCIAL STATEMENTS
Note 2 - SUMMARY OF SIGNIFICANT ACCOUNTING POLICIES (continued)
Income Taxes
The Company accounts for current income taxes in accordance with the laws of the relevant tax authorities. Deferred income taxes are recognized when temporary differences exist between the tax bases of assets and liabilities and their reported amounts in the consolidated financial statements. Deferred tax assets and liabilities are measured using enacted tax rates expected to apply to taxable income in the years in which those temporary differences are expected to be recovered or settled. The effect on deferred tax assets and liabilities of a change in tax rates is recognized in income in the period including the enactment date. Valuation allowances are established, when necessary, to reduce deferred tax assets to the amount expected to be realized.
An uncertain tax position is recognized only if it is “more likely than not” that the tax position would be sustained in a tax examination. The amount recognized is the largest amount of tax benefit that is greater than 50% likely of being realized on examination. For tax positions not meeting the “more likely than not” test, no tax benefit is recorded. Penalties and interest incurred related to underpayment of income tax are classified as income tax expense in the period incurred. No significant penalties or interest relating to income taxes were incurred during the fiscal years ended December 31, 2021 and 2020. In the nine months ended September 30, 2022, the Company recorded a tax penalty of MYR 260,530 (approximately $59,988). The Company does not believe there was any uncertain tax provision as of September 30, 2022.
QSC, QWT, QCV, QGE, QBT, QIB, and QR operate in Malaysia and are subject to the income tax laws of Malaysia. QFL and QTBS operate in Hong Kong and are subject to the income tax law of Hong Kong. As of December 31, 2021 and 2020, and September 30, 2022, all of the Company’s tax returns remain open for statutory examination by relevant tax authorities.
Service taxes
Service tax is a consumption tax levied by Malaysian tax authorities and is charged on any taxable service income (including digital services) provided in Malaysia by a registered company in carrying on their business. The rate of service tax is 6% ad valorem for all taxable services. A taxable entity is a company that is registered or liable to be registered for service taxes. A company is liable to be registered if the total value of its taxable services for a 12-month period exceeds or is expected to exceed the prescribed registration threshold of MYR500,000 as consultancy, training or coaching services providers and digital and information technology services providers . Service taxes were recorded as a deduction against the Company’s gross revenue. Service taxes were nominal for the years ended December 31, 2021 and 2020. In the nine months ended September 30, 2022, the Company recorded a penalty of MYR 333,908 (approximately $76,883).
16
QMIS SECURITIES CAPITAL (M) SDN. BHD.
NOTES TO CONSOLIDATED FINANCIAL STATEMENTS
Note 2 - SUMMARY OF SIGNIFICANT ACCOUNTING POLICIES (continued)
Earnings per share
Basic earnings per ordinary share is computed by dividing net earnings attributable to ordinary shareholders by the weighted-average number of ordinary shares outstanding during the period. Diluted earnings per share is computed by dividing net income attributable to ordinary shareholders by the sum of the weighted average number of ordinary share outstanding and of potential ordinary share (e.g., convertible securities, options and warrants) as if they had been converted at the beginning of the periods presented, or issuance date, if later. Potential ordinary shares that have an anti-dilutive effect (i.e., those that increase income per share or decrease loss per share) are excluded from the calculation of diluted earnings per share. For the years ended December 31, 2021 and 2020, and the nine months ended September 30, 2022 and 2021, the Company had no dilutive stocks.
Related Parties Transactions
The Company identifies related parties, and accounts for, discloses related party transactions in accordance with ASC 850, “Related Party Disclosures” and other relevant ASC standards.
A related party is generally defined as (i) any person that holds 10% or more of the Company’s securities and their immediate families, (ii) the Company’s management, (iii) someone that directly or indirectly controls, is controlled by or is under common control with the Company, or (iv) anyone who can significantly influence the financial and operating decisions of the Company. A transaction is considered as a related party transaction when there is a transfer of resources or obligations between related parties. Related parties may be individuals or corporate entities.
Transactions involving related parties cannot be presumed to be carried out on an arm’s-length basis, as the requisite conditions of competitive, free market dealings may not exist. Representations about transactions with related parties, if made, shall not imply that the related party transactions were consummated on terms equivalent to those that prevail in arm’s-length transactions unless such representations can be substantiated. It is not, however, practical to determine the fair value of amounts of related party transactions due to their related party nature.
Segment Reporting
ASC 280, “Segment Reporting,” requires use of the “management approach” model for segment reporting. The management approach model is based on the way a company’s chief operating decision maker organizes segments within the Company for making operating decisions assessing performance and allocating resources. Reportable segments are based on products and services, geography, legal structure, management structure, or any other manner in which management disaggregates a company.
Management determined the Company’s operations constitute two reportable segments in accordance with ASC 280, business consultant services and software development.
17
QMIS SECURITIES CAPITAL (M) SDN. BHD.
NOTES TO CONSOLIDATED FINANCIAL STATEMENTS
Note 2 - SUMMARY OF SIGNIFICANT ACCOUNTING POLICIES (continued)
Recently Issued Accounting Pronouncements
The Company considers the applicability and impact of all ASUs. Management periodically reviews new accounting standards that are issued.
In December 2019, the FASB issued ASU 2019-12 - Income Taxes (Topic 740): Simplifying the Accounting for Income Taxes. This ASU provides an exception to the general methodology for calculating income taxes in an interim period when a year-to-date loss exceeds the anticipated loss for the year. This update also (1) requires an entity to recognize a franchise tax (or similar tax) that is partially based on income as an income-based tax and account for any incremental amount incurred as a non-income-based tax, (2) requires an entity to evaluate when a step-up in the tax basis of goodwill should be considered part of the business combination in which goodwill was originally recognized for accounting purposes and when it should be considered a separate transaction, and (3) requires that an entity reflect the effect of an enacted change in tax laws or rates in the annual effective tax rate computation in the interim period that includes the enactment date. The standard is effective for the Company for fiscal years beginning after December 15, 2020, with early adoption permitted. The adoption of this guidance did not have a material impact on the Company’s consolidated financial statements.
In June 2016, the Financial Accounting Standards Board (the “FASB”) issued ASU 2016-13, Financial Instruments – Credit Losses (Topic 326) (“ASU 2016-13”), which requires entities to measure all expected credit losses for financial assets held at the reporting date based on historical experience, current conditions, and reasonable and supportable forecasts. This replaces the existing incurred loss model and is applicable to the measurement of credit losses on financial assets measured at amortized cost. ASU 2016-13 was subsequently amended by ASU 2018-19, Codification Improvements to Topic 326, Financial Instruments – Credit Losses, ASU 2019-04, Codification Improvements to Topic 326, Financial Instruments – Credit Losses, Topic 815, Derivatives and Hedging, and Topic 825, Financial Instruments, and ASU 2019-05, Targeted Transition Relief. In November 2019, the FASB issued ASU 2019-10, which extends the effective date for adoption of ASU 2016-13. In November 2019, the FASB issued ASU 2019-11 to clarify its new credit impairment guidance in ASU 326. Accordingly, for public entities that are not smaller reporting entities, ASU 2016-13 and its amendments are effective for fiscal years, and interim periods within those fiscal years, beginning after December 15, 2019. For all other entities, this guidance and its amendments will be effective for fiscal years beginning after December 15, 2022, including interim periods within those fiscal years. The Company is currently evaluating the impact of its pending adoption of ASU 2016-13 on its consolidated financial statements.
Except as mentioned above, the Company does not believe other recently issued but not yet effective accounting standards, if currently adopted, would have a material effect on the Company’s condensed consolidated balance sheets, statements of operations and comprehensive income (loss), and statements of cash flows.
18
QMIS SECURITIES CAPITAL (M) SDN. BHD.
NOTES TO CONSOLIDATED FINANCIAL STATEMENTS
Note 3 - GOING CONCERN
The financial statements have been prepared “assuming that we will continue as a going concern,” which contemplates that we will realize our assets and satisfy our liabilities and commitments in the ordinary course of business.
The Company incurred loss of $1,919,086 in the nine months ended September 30, 2022. As of September 30, 2022, the Company had an accumulated deficit of $2,264,013 and working capital deficit of $850,826. These factors among others raise substantial doubt about the ability to continue as a going concern for a reasonable period of time.
In order to continue as a going concern, The Company will need, among other things, additional capital resources. Management’s plan is to obtain such resources by obtaining capital from directors/shareholders sufficient to meet its minimal operating expenses and seeking third party equity and/or debt financing. However, management cannot provide any assurances that the Company will be successful in accomplishing any of its plans. These financial statements do not include any adjustments related to the recoverability and classification of assets or the amounts and classification of liabilities that might be necessary should the Company be unable to continue as a going concern.
Note 4 - ACCOUNTS RECEIVABLE
Accounts receivable consists of the following:
| | September 30, | | December 31, | | December 31, |
| | 2022 | | 2021 | | 2020 |
| | (Unaudited) | | | | |
Accounts receivable | $ | - | $ | 240,178 | $ | - |
Accounts receivable-related parties | | 45,619 | | - | | - |
Less: Allowance for doubtful accounts | | - | | - | | - |
Accounts receivable, net | $ | 45,619 | $ | 240,178 | $ | - |
Bad debt expense charged to operations was $0 for the years ended December 31, 2021 and 2020; and the nine months ended September 30, 2022 and 2021.
* Refer to Note 9 (1) - accounts payable to related parties.
Note 5 - PROPERTY, PLANT AND EQUIPMENT
The following is a summary of property, plant and equipment:
| | September 30, | | December 31, | | December 31, |
| | 2022 | | 2021 | | 2020 |
| | (Unaudited) | | | | |
Office equipment and furniture | $ | 4,762 | | 4,917 | | 4,860 |
Computers and printers | | 11,408 | | 12,667 | | 13,163 |
Leasehold improvements | | 19,405 | | 21,547 | | 22,389 |
Total | | 35,575 | | 39,131 | | 40,412 |
Less: Accumulated depreciation | | (30,156) | | (29,846) | | (25,457) |
Total property, plant and equipment, net | $ | 5,419 | $ | 9,285 | $ | 14,955 |
Depreciation expense charged to operations was $5,388 and $14,012 for the year ended December 31, 2021 and 2022, respectively; and $3,497 and $4,193 for the nine months ended September 30, 2022 and 2021, respectively.
19
QMIS SECURITIES CAPITAL (M) SDN. BHD.
NOTES TO CONSOLIDATED FINANCIAL STATEMENTS
Note 6 - ACCOUNTS PAYABLE
Accounts payable consist of the following:
| | September 30, | | December 31, | | December 31, |
| | 2022 | | 2021 | | 2020 |
| | (Unaudited) | | | | |
Accounts payable | $ | - | $ | 11,413 | $ | - |
Accounts payable-related parties* | | 33,435 | | 14,371 | | - |
Total | $ | 33,435 | $ | 25,784 | $ | - |
* Refer to Note 9 (4) - Related party transaction.
Note 7- ACCRUED EXPENSES
Accrued expenses consist of the following:
| | September 30, | | December 31, | | December 31, |
| | 2022 | | 2021 | | 2020 |
| | (Unaudited) | | | | |
| | | | | | |
Accrued pension and employee benefit | $ | 16,847 | $ | 8,884 | $ | 1,696 |
Accrued professional fees | | - | | 8,590 | | 12,447 |
Accrued office expenses | | 5,493 | | 4,170 | | 1,450 |
Total | $ | 22,340 | $ | 21,644 | $ | 15,593 |
Note 8 - TAXES PAYABLE
Taxes payable consist of the following:
| | September 30, | | December 31, | | December 31, |
| | 2022 | | 2021 | | 2020 |
| | (Unaudited) | | | | |
| | | | | | |
Malaysia income taxes payable | $ | 126,561 | $ | 120,899 | $ | 125,628 |
Malaysia services taxes payable | | 162,062 | | 99,972 | | 103,883 |
Hong Kong income taxes payable | | 634,756 | | 539,482 | | 364,840 |
Total | $ | 923,379 | $ | 760,353 | $ | 594,351 |
20
QMIS SECURITIES CAPITAL (M) SDN. BHD.
NOTES TO CONSOLIDATED FINANCIAL STATEMENTS
Note 9 - RELATED PARTY TRANSACTIONS
The Company had transactions with the following related parties:
Name of Related Party | Nature of Relationship |
| |
Mr. Yung Kong Chin | A director of QMIS Securities Capital (M) SDN. BHD. ("QSC") |
Mr. Hua Fung Chin | A director of QMIS Securities Capital (M) SDN. BHD. ("QSC"), |
son of Mr. Yung Kong Chin | |
Mr. Ting Teck Sheng | A director of QMIS Richwood Blacktech SDN BHD ("QR") |
Richwood Ventures Berhad | A Malaysia company, Mr. Ting Teck Sheng is a director. |
Panpay Holdings SDN BHD | A Malaysia company Mr. Ting Teck Sheng is a director. |
Pantop Venture Capital SDN BHD | A Malaysia company owns 40% of QMIS Richwood Blacktech SDN BHD |
Pantop Millennium SDN BHD | A Malaysia company owns 3% of QMIS Richwood Blacktech SDN BHD |
QMIS Financial Group Limited | A Hong Kong company, Mr. Yung Kong Chin is a director. |
(1)Software development services provided to Richwood Ventures Berhad and Panpay Holdings SDN BHD
QMIS Richwood Blacktech SDN BHD ("QR") provides software development servicers to Richwood Ventures Berhad and Panpay Holdings SDN BHD. QR did not generate any revenue from software development services in the year ended December 2021 and 2020. As of December 31, 2021, QR received advanced payment of $25,129 from Richwood Ventures Berhad, and recorded the payment as deferred revenue. In the nine months ended September 30, 2022, QR generated revenue of $30,393 and $70,917 from Richwood Ventures Berhad and Panpay Holdings SDN BHD, respectively. As of September 30, 2022, accounts receivable from Richwood Ventures Berhad and Panpay Holdings SDN BHD amounted to $2,043 and $43,576 , respectively.
(2)QSC, QTCG, and QFL worked together to provide business consultant service to Mr. Ting Teck Sheng
QSC, QTCG, and QFL worked together to provide business consultant service to Mr. Ting Teck Sheng in the year ended December 31, 2020, and the revenue amounted to $45,352. There was no outstanding account receivable from Mr. Ting Teck Sheng as of September 30, 2022, December 31, 2021 and 2020.
(3)Management fees paid to QMIS Financial Group Limited
QMIS Finance Limited ("QFL") and QMIS TBS Capital Group Corp. ("QTBS") paid management fees to QMIS Financial Group Limited for general and administrative services, such as office space and bookkeeping. The management fees amounted to $910,392 and 927,329 in the years ended December 31, 2021 and 2020, respectively; and $939,903 and $911,029 in the nine months ended September 30, 2022 and 2021, respectively. There was no outstanding balance for account payable to QMIS Finance Limited as of September 30, 2022, December 31, 2021 and 2020.
21
QMIS SECURITIES CAPITAL (M) SDN. BHD.
NOTES TO CONSOLIDATED FINANCIAL STATEMENTS
Note 9 - RELATED PARTY TRANSACTIONS (continued)
(4)Accounts payable to Pantop Milliennium SND BHD
Pantop Milliennium SND BHD has provided general and administrative services, such as office space and administrative stuff, to QMIS Richwood Blacktech SND BHD ("QR") since its inception in June 2021. The amount was $14,371 for the year ended December 30, 2021; and $19,064 and $7,165 for the nine months ended September 30, 2022 and 2021, respectively. The account payable to Pantop Milliennium SND BHD amounted to $33,435 and $14,371 as of September 30, 2022, December 31, 2021, respectively.
(5)Due to relate parties
Since QMIS Richwood Blacktech SND BHD ("QR") did not have a bank account, Pantop Venture Capital SDN BHD has paid QR's expenses for its operation. These advanced payments are unsecured, non-interest bearing and payable on demand. There are no written agreements for these advances.
In 2021 and 2020, the Company made advances and loans to Mr. Yung Kong Chin. These advances and loans are unsecured, non-interest bearing and payable on demand. There are no written agreements for these advances. Mr. Chin paid back these loans and advances as of December 31, 2021.
Due to lack of cash resource, Mr. Yung Kong Chin has financed the Company's operation. Whenever the Company needs cash resource, he loans money to the Company to support its operation. These loans are unsecured, non-interest bearing and payable on demand. There are no written agreements for these advances.
Due to related parties consists of the following:
| | September 30, | | December 31, | | December 31, |
| | 2022 | | 2021 | | 2020 |
| | (Unaudited) | | | | |
| | | | | | |
Mr. Yung Kong Chin | $ | 33,055 | $ | 828,988 | $ | (296,236) |
Pantop Venture Capital SDN BHD | | 74,658 | | 55,844 | | - |
Total | $ | 107,713 | $ | 884,832 | $ | (296,236) |
(6)Compensation paid to directors
Mr. Yung Kong Chin and Mr. Huan Fund Chin lead the consultant service group which provides consultant services to customers. Their compensation were recorded in the costs of consultant services.
Compensation paid to directors consists of the following:
| | For the Nine Months Ended | | For the Year Ended |
| | September 30, | | September 30, | | December 31, | | December 31, |
| | 2022 | | 2022 | | 2021 | | 2020 |
| | (Unaudited) | | (Unaudited) | | | | |
| | | | | | | | |
Mr. Yung Kong Chin | $ | 615,902 | $ | 893,034 | $ | 1,397,502 | $ | 164,096 |
Mr. Huan Fund Chin | | 49,196 | | 52,368 | | 65,242 | | 141,082 |
Total | $ | 665,098 | $ | 945,402 | $ | 1,462,744 | $ | 305,178 |
22
QMIS SECURITIES CAPITAL (M) SDN. BHD.
NOTES TO CONSOLIDATED FINANCIAL STATEMENTS
Note10 - LEASES
The Company has operating leases for corporate offices, employees’ accommodation, and office equipment. These leases have initial lease terms of 12 months to 5 years. The Company has elected not to recognize lease assets and liabilities for leases with an initial term of 12 months or less.
The Operating lease right-of-use assets and liabilities are recognized at commencement date based on the present value of lease payments over the lease term. The discount rate used to calculate present value is incremental borrowing rate or, if available, the rate implicit in the lease. The Company determines the incremental borrowing rates for these leases based primarily on lease terms were 8% in Malaysia.
The components of lease costs, lease term and discount rate with respect of operating leases with an initial term of more than 12 months are as follows:
| For the Nine Months Ended September 30, | | For the Year Ended December 31, |
| | 2022 | | 2021 | | 2021 | | 2020 |
| | (Unaudited) | | (Unaudited) | | | | |
| | | | | | | | |
Operating lease cost | $ | 17,822 | $ | 19,733 | $ | 26,386 | $ | 27,149 |
| | September 30, | | December 31, |
| | 2022 | | 2021 |
| | (unaudited) | | |
| | | | |
Weighted Average Remaining Lease Term - Operating leases | | 0.81 years | | 1.54 years |
| | | | |
Weighted Average Discount Rate - Operating leases | | 8.00% | | 8.00% |
The following is a schedule, by years, of maturities of operating lease liabilities:
| | September 30, | | December 31, |
| | 2022 | | 2021 |
| | (unaudited) | | |
| | | | |
2022 | $ | | $ | 26,386 |
2023 | | 18,287 | | 13,623 |
2024 | | 466 | | 388 |
Total undiscounted cash flows | | 18,753 | | 40,397 |
Less: imputed interest | | (620) | | (2,418) |
Present value of lease liabilities | $ | 18,133 | $ | 37,979 |
23
QMIS SECURITIES CAPITAL (M) SDN. BHD.
NOTES TO CONSOLIDATED FINANCIAL STATEMENTS
Note 11 - INCOME TAXES
Malaysia
QMIS Securitas Capital (M) SDN BHD, QMIS World Trade International SDN BHD, QMIS Capital Venture SDN BHD, QMIS Green Energy Berhad, QMIS Biotech Group Berhad, QMIS Investment Bank Limited, and QMIS Richwood Blacktech SDN BHD were incorporated in Malaysia, and accordingly are governed by the income tax laws of Malaysia. The income tax provision in respect of operations in Malaysia is calculated at the applicable tax rates on the taxable income for the periods based on existing legislation, interpretations, and practices. Under the Income Tax Act of Malaysia, enterprises incorporated in Malaysia are usually subject to a unified 24% enterprise income tax rate while prefe, tax holidays, and tax exemptions may be granted on a case-by-case basis. The tax rate for small and medium sized companies (generally companies incorporated in Malaysia with paid-in capital of MYR2,500,000 or less, and gross income of not more than MYR50 million) is 17% for the first MYR600,000 (or approximately $150,000) taxable income, with the remaining balance being taxed at the 24% rate.
Hong Kong
QMIS Financial Limited and QMIS TBS Capital Group Corp. were incorporated in Hong Kong, and accordingly are subject to income tax at 8.25% on the first HKD 2,000,000 profit and 16.5% on the remaining profits arising in or derived from Hong Kong.
The components of the income tax provision were as follows:
| | For the Nine months ended | | For the Year ended |
| | September 30, | | September 30, | | December 31, | | December 31, |
| | 2022 | | 2021 | | 2021 | | 2020 |
| | (Unaudited) | | (Unaudited) | | | | |
Current tax provision: | | | | | | | | |
Malaysia | $ | 59,987 | $ | - | $ | - | $ | - |
Hong Kong | | 98,933 | | 142,728 | | 177,427 | | 277,409 |
| | 158,920 | | 142,728 | | 177,427 | | 277,409 |
Deferred tax provision: | | | | | | | | |
Malaysia | | - | | - | | - | | - |
Hong Kong | | - | | - | | - | | - |
| | - | | - | | - | | - |
| $ | 158,920 | $ | 142,728 | $ | 177,427 | $ | 277,409 |
Accounting for Uncertainty in Income Taxes
The local tax authority conducts periodic and ad hoc tax filing reviews on business enterprises after those enterprises complete their relevant tax filings. Therefore, the Company’s tax filings are subject to examination. It is therefore uncertain as to whether the local tax authority may take different views about the Company’s tax filings, which may lead to additional tax liabilities.
24
QMIS SECURITIES CAPITAL (M) SDN. BHD.
NOTES TO CONSOLIDATED FINANCIAL STATEMENTS
Note 12 - SEGMENT REPORTING
Revenue by service categories
| For the Nine Months Ended
September 30, | | For the Year Ended
December 31, |
| | 2022 | | 2021 | | 2021 | | 2020 |
| | (Unaudited) | | (Unaudited) | | | | |
| | | | | | | | |
Revenue | | | | | | | | |
Consultant services | $ | 839,374 | $ | 3,127,570 | $ | 4,386,915 | $ | 1,916,487 |
Software development | | 101,310 | | - | | - | | - |
| | 940,684 | | 3,127,570 | | 4,386,915 | | 1,916,487 |
Operating costs | | | | | | | | |
Consultant services | | 2,588,934 | | 3,304,728 | | 3,881,905 | | 2,099,454 |
Software development | | 112,957 | | 28,157 | | 53,518 | | - |
| | 2,701,891 | | 3,332,885 | | 3,935,423 | | 2,099,454 |
Income (loss) from operations | | | | | | | | |
Consultant services | | (1,749,560) | | (177,158) | | 505,010 | | (182,967) |
Software development | | (11,647) | | (28,157) | | (53,518) | | - |
| | (1,761,207) | | (205,315) | | 451,492 | | (182,967) |
Other income (expenses) | | | | | | | | |
Consultant services | | 7,517 | | (8,575) | | (7,511) | | (6,763) |
Software development | | - | | - | | - | | - |
| | 7,517 | | (8,575) | | (7,511) | | (6,763) |
Income (loss) before income tax expense | | | | | | | |
Consultant services | | (1,742,043) | | (185,733) | | 497,499 | | (189,730) |
Software development | | (11,647) | | (28,157) | | (53,518) | | - |
| | (1,753,690) | | (213,890) | | 443,981 | | (189,730) |
Income tax expense | | | | | | | | |
Consultant services | | 158,920 | | 142,728 | | 177,427 | | 277,409 |
Software development | | - | | - | | - | | - |
| | 158,920 | | 142,728 | | 177,427 | | 277,409 |
Net income (loss) | | | | | | | | |
Consultant services | | (1,900,963) | | (328,461) | | 320,072 | | (467,139) |
Software development | | (11,647) | | (28,157) | | (53,518) | | - |
| $ | (1,912,610) | $ | (356,618) | $ | 266,554 | $ | (467,139) |
| | | | | | | | |
Capital expenditure | | | | | | | | |
Consultant services | $ | - | $ | - | $ | - | $ | - |
Software development | | - | | - | | - | | - |
| $ | - | $ | - | $ | - | $ | - |
| | | | | | | | |
Total assets | | | | | | | | |
Consultant services | $ | 69,334 | $ | 1,434,034 | $ | 1,537,083 | $ | 235,335 |
Software development | | 49,342 | | - | | 54,342 | | - |
Other | | 158,254 | | 187,426 | | 169,866 | | 175,214 |
| $ | 276,930 | $ | 1,621,460 | $ | 1,761,291 | $ | 410,549 |
25
QMIS SECURITIES CAPITAL (M) SDN. BHD.
NOTES TO CONSOLIDATED FINANCIAL STATEMENTS
Note 13 - EQUITY CAPITAL
QMIS Securities Capital SDN BHD (the “Company” or “QSC”) was incorporated by the Companies Commission of Malaysia on January 13, 2015 under the Companies Act 1965 as a private limited company with the name Multi Securities Capital (M) SDN BHD. Subsequently, the name was changed to QMIS Securities Capital (M) SDN BHD on March 19, 2015. There were 1,000,100 shares of ordinary share issued and outstanding as of September 30, 2022, December 31, 2021 and 2020.
In January 2022, a major shareholder made capital contribution of $999,975 to QMIS Finance Limited for the purpose to increase its investment in QMIS Investment Bank Limited.
Note 14 - CONCENTRATIONS, RISKS AND UNCERTAINTIES
Foreign operation
The Company’s operations are carried out in Malaysia and Hong Kong. Accordingly, the Company’s business, financial condition and results of operations may be influenced by the political, economic and legal environments therein. In addition, the Company’s business may be influenced by changes in governmental policies with respect to laws and regulations, anti-inflationary measures, currency conversion and remittance abroad, rates and methods of taxation among other factors.
Liquidity risk
The Company is exposed to liquidity risk which is risk that it is unable to provide sufficient capital resources and liquidity to meet its commitments and business needs. Liquidity risk is controlled by the application of financial position analysis and monitoring procedures. When necessary, the Company will turn to other financial institutions and the shareholders to obtain short-term funding to meet the liquidity shortage.
Other risk
The Company’s business, financial condition and results of operations may also be negatively impacted by risks related to natural disasters, extreme weather conditions, health epidemics and other catastrophic incidents, such as the COVID-19 outbreak and spread, which could significantly disrupt the Company’s operations.
26
QMIS TBS CAPITAL GROUP CORP. AND SUBSIDIARIES |
|
UNAUDITED PRO FORMA CONDENSED CONSOLIDATED BALANCE SHEET |
| | | | | | | | | | | | | | | | | |
September 30, 2022 |
| | | | | | | | | | | | | | | | Pro Forma | |
| | | | | | | | | | QMIS TBS CAPITAL | | QMIS SECURITIES | | Pro Forma | | Consolidated | |
| | | | | | | | | | GROUP CORP. | | CAPITAL (M) SDN. BHD. | | Adjustments | | Balance Sheet | |
| ASSETS | | | | | | | | | |
| Current Assets: | | | | | | | | | | | | | |
| | Cash and cash equivalents | | | | $ | - | $ | 196,456 | | | $ | 196,456 | |
| | Accounts receivable, net | | | | | | | 45,619 | | | | 45,619 | |
| | Prepaid expenses | | | | | - | | 3,543 | | | | 3,543 | |
| | Contract security deposit | | | | | - | | 8,109 | | | | 8,109 | |
| | Initial deposit for acquisition agreement (Note 3) | | 25,000 | | - | | | | 25,000 | |
| | | Total Current Assets | | | | | 25,000 | | 253,727 | | | | 278,727 | |
| | | | | | | | | | | | | | | | | |
| Noncurrent Assets | | | | | | | | | | | | | |
| | Property, plant and equipment, net | | | | - | | 5,419 | | | | 5,419 | |
| | Operating lease right of use asset, net | | | - | | 17,784 | | | | 17,784 | |
| | | Total Noncurrent Assets | | | | | - | | 23,203 | | | | 23,203 | |
| | | | | | | | | | | | | | | | | |
| Total Assets | | | | | $ | 25,000 | $ | 276,930 | | | $ | 301,930 | |
| | | | | | | | | | | | | | | | | |
| LIABILITIES AND SHAREHOLDERS' EQUITY | | | | | | | | | |
| Current Liabilities: | | | | | | | | | | | | | |
| | Accounts payable-related parties | | | $ | - | $ | 33,435 | | | $ | 33,435 | |
| | Accrued expenses | | | | | 126,694 | | 22,340 | | | | 149,034 | |
| | Taxes payable | | | | | - | | 923,379 | | | | 923,379 | |
| | Due to related parties | | | | | 562,573 | | 107,713 | | | | 670,286 | |
| | Operating lease liabilities | | | | | - | | 17,686 | | | | 17,686 | |
| | | Total Current Liabilities | | | | | 689,267 | | 1,104,553 | | | | 1,793,820 | |
| | | | | | | | | | | | | | | | | |
| Noncurrent Liabilities | | | | | | | | | | | | |
| | Operating lease liabilities | | | | | - | | 447 | | | | 447 | |
| | | Total Noncurrent Liabilities | | | | - | | 447 | | | | 447 | |
| | | | | | | | | | | | | | | | | |
| Total Liabilities | | | | | | 689,267 | | 1,105,000 | | | | 1,794,267 | |
| | | | | | | | | | | | | | | | | |
| Commitments and Contingencies (Note 8) | | | - | | - | | | | - | |
| | | | | | | | | | | | | | | | | |
| Shareholders' Equity: | | | | | | | | | | | | |
| | | Common stock, par value $0.0001, 750,000,000 shares authorized; | | | | | | | | |
| | | | 300,000,000 shares issued and outstanding | | | 30,000 | | | | | | 30,000 | |
| | | Ordinary stock, par value RM1 (approximately $0.24) per share | | | | | | | | | |
| | | | 1,000,100 shares issued and outstanding | | | - | | 244,414 | (a) | (244,414) | | - | |
| | | Additional paid-in capital | | | | | - | | 1,007,036 | (a) | 244,414 | | 1,251,450 | |
| | | Accumulated deficit | | | | | (694,267) | | (2,264,013) | | | | (2,958,280) | |
| | | Accumulated other comprehensive income | | | - | | 62,839 | | | | 62,839 | |
| | | Total parent company shareholders' equity | | | (664,267) | | (949,724) | | | | (1,613,991) | |
| | | | Non-controlling interest | | | | - | | 121,654 | | | | 121,654 | |
| | | Total Shareholders' Equity (Deficit) | | | (664,267) | | (828,070) | | | | (1,492,337) | |
| | | Total Liabilities and Shareholders' Equity (Deficit) | | | $ | 25,000 | $ | 276,930 | | | $ | 301,930 | |
27
QMIS TBS CAPITAL GROUP CORP. AND SUBSIDIARIES |
| | | | | | | | | | | | | | | | | |
UNAUDITED PRO FORMA CONDENSED CONSOLIDATED BALANCE SHEET |
| | | | | | | | | | | | | | | | | |
December 31, 2021 |
| | | | | | | | | | | | | | | | Pro Forma | |
| | | | | | | | | | QMIS TBS CAPITAL | | QMIS SECURITIES | | Pro Forma | | Consolidated | |
| | | | | | | | | | GROUP CORP. | | CAPITAL (M) SDN. BHD. | | Adjustments | | Balance Sheet | |
| ASSETS | | | | | | | | | |
| Current Assets: | | | | | | | | | | | | | |
| | Cash and cash equivalents | | | | $ | - | $ | 1,409,794 | | | $ | 1,409,794 | |
| | Accounts receivable, net | | | | | - | | 240,178 | | | | 240,178 | |
| | Prepaid expenses | | | | | - | | 54,106 | | | | 54,106 | |
| | Contract security deposit | | | | | - | | 10,121 | | | | 10,121 | |
| | Initial deposit for acquisition agreement (Note 3) | | | 25,000 | | - | | | | 25,000 | |
| | | Total Current Assets | | | | | 25,000 | | 1,714,199 | | | | 1,739,199 | |
| | | | | | | | | | | | | | | | | |
| Noncurrent Assets | | | | | | | | | | | | |
| | Property, plant and equipment, net | | | | - | | 9,285 | | | | 9,285 | |
| | Operating lease right of use asset, net | | | - | | 37,807 | | | | 37,807 | |
| | | Total Noncurrent Assets | | | | | - | | 47,092 | | | | 47,092 | |
| | | | | | | | | | | | | | | | | |
| Total Assets | | | | | $ | 25,000 | $ | 1,761,291 | | | $ | 1,786,291 | |
| | | | | | | | | | | | | | | | | |
| LIABILITIES AND SHAREHOLDERS' EQUITY | | | | | | | | | |
| Current Liabilities: | | | | | | | | | | | | | |
| | Accounts payable-related parties | | | $ | - | $ | 25,784 | | | $ | 25,784 | |
| | Accrued expenses | | | | | 183,458 | | 21,644 | | | | 205,102 | |
| | Deferred revenue-related parties | | | | - | | 25,129 | | | | 25,129 | |
| | Taxes payable | | | | | - | | 760,353 | | | | 760,353 | |
| | Due to related parties | | | | | 353,082 | | 884,832 | | | | 1,237,914 | |
| | Operating lease liabilities | | | | | - | | 24,487 | | | | 24,487 | |
| | | Total Current Liabilities | | | | | 536,540 | | 1,742,229 | | | | 2,278,769 | |
| | | | | | | | | | | | | | | | | |
| Noncurrent Liabilities | | | | | | | | | | | | |
| | Operating lease liabilities | | | | | - | | 13,492 | | | | 13,492 | |
| | | Total Noncurrent Liabilities | | | | - | | 13,492 | | | | 13,492 | |
| | | | | | | | | | | | | | | | | |
| Total Liabilities | | | | | | 536,540 | | 1,755,721 | | | | 2,292,261 | |
| | | | | | | | | | | | | | | | | |
| Commitments and Contingencies (Note 8) | | | - | | - | | | | - | |
| | | | | | | | | | | | | | | | | |
| Shareholders' Equity: | | | | | | | | | | | | |
| | | Common stock, par value $0.0001, 750,000,000 shares authorized; | | | | | | | | |
| | | | 300,000,000 shares issued and outstanding | | | 30,000 | | - | | | | 30,000 | |
| | | Ordinary stock, par value RM1 (approximately $0.24) per share | | | | | | | | | |
| | | | 1,000,100 shares issued and outstanding | | | - | | 244,414 | (a) | (244,414) | | - | |
| | | Additional paid-in capital | | | | | - | | 7,061 | (a) | 244,414 | | 251,475 | |
| | | Accumulated deficit | | | | | (541,540) | | (344,927) | | | | (886,467) | |
| | | Accumulated other comprehensive income | | | - | | (17,445) | | | | (17,445) | |
| | | Total parent company shareholders' equity | | | (511,540) | | (110,897) | | | | (622,437) | |
| | | | Non-controlling interest | | | | - | | 116,467 | | | | 116,467 | |
| | | Total Shareholders' Equity (Deficit) | | | (511,540) | | 5,570 | | | | (505,970) | |
| | | Total Liabilities and Shareholders' Equity (Deficit) | | $ | 25,000 | $ | 1,761,291 | | | $ | 1,786,291 | |
28
QMIS TBS CAPITAL GROUP CORP. AND SUBSIDIARIES |
| | | | | | | | | | | | | | | | | |
UNAUDITED PRO FORMA CONDENSED CONSOLIDATED BALANCE SHEET |
| | | | | | | | | | | | | | | | | |
December 31, 2020 |
| | | | | | | | | | | | | | | | Pro Forma | |
| | | | | | | | | | QMIS TBS CAPITAL | | QMIS SECURITIES | | Pro Forma | | Consolidated | |
| | | | | | | | | | GROUP CORP. | | CAPITAL (M) SDN. BHD. | | Adjustments | | Balance Sheet | |
| ASSETS | | | | | | | | | |
| Current Assets: | | | | | | | | | | | | | |
| | Cash and cash equivalents | | | | $ | - | $ | 26,837 | | | $ | 26,837 | |
| | Contract security deposit | | | | | - | | 9,840 | | | | 9,840 | |
| | Initial deposit for acquisition agreement (Note 3) | | | 25,000 | | - | | | | 25,000 | |
| | Due from related parties | | | | | - | | 296,236 | | - | | 296,236 | |
| | | Total Current Assets | | | | | 25,000 | | 332,913 | | | | 357,913 | |
| | | | | | | | | | | | | | | | | |
| Noncurrent Assets | | | | | | | | | | | | | |
| | Property, plant and equipment, net | | | | - | | 14,955 | | | | 14,955 | |
| | Operating lease right of use asset, net | | | - | | 62,681 | | | | 62,681 | |
| | | Total Noncurrent Assets | | | | | - | | 77,636 | | | | 77,636 | |
| | | | | | | | | | | | | | | | | |
| Total Assets | | | | | $ | 25,000 | $ | 410,549 | | | $ | 435,549 | |
| | | | | | | | | | | | | | | | | |
| LIABILITIES AND SHAREHOLDERS' EQUITY | | | | | | | | | |
| Current Liabilities: | | | | | | | | | | | | | |
| | Accrued expenses | | | | $ | 135,023 | $ | 15,593 | | | | 150,616 | |
| | Taxes payable | | | | | - | | 594,351 | | | | 594,351 | |
| | Due to related parties | | | | | 66,382 | | - | | | | 66,382 | |
| | Operating lease liabilities | | | | | - | | 23,484 | | | | 23,484 | |
| | | Total Current Liabilities | | | | | 201,405 | | 633,428 | | | | 834,833 | |
| | | | | | | | | | | | | | | | | |
| Noncurrent Liabilities | | | | | | | | | | | | |
| | Operating lease liabilities | | | | | - | | 39,286 | | | | 39,286 | |
| | | Total Noncurrent Liabilities | | | | - | | 39,286 | | | | 39,286 | |
| | | | | | | | | | | | | | | | | |
| Total Liabilities | | | | | | 201,405 | | 672,714 | | | | 874,119 | |
| | | | | | | | | | | | | | | | | |
| Commitments and Contingencies | | | | | - | | - | | | | - | |
| | | | | | | | | | | | | | | | | |
| Shareholders' Equity: | | | | | | | | | | | | |
| | Common stock, par value $0.0001, 750,000,000 shares authorized; | | | | | | | | | |
| | | 300,000,000 shares issued and outstanding | | | 30,000 | | - | | | | 30,000 | |
| | Ordinary stock, par value RM1 (approximately $0.24) per share | | | | | | | | | | |
| | | 1,000,100 shares issued and outstanding | | | - | | 244,414 | (a) | (244,414) | | - | |
| | Additional paid-in capital | | | | | - | | 7,061 | (a) | 244,414 | | 251,475 | |
| | Accumulated deficit | | | | | (206,405) | | (583,865) | | | | (790,270) | |
| | Accumulated other comprehensive income | | | - | | (19,851) | | | | (19,851) | |
| | Total parent company shareholders' equity | | | (176,405) | | (352,241) | | | | (528,646) | |
| | | Non-controlling interest | | | | | - | | 90,076 | | | | 90,076 | |
| | Total Shareholders' Equity (Deficit) | | | | (176,405) | | (262,165) | | | | (438,570) | |
| | Total Liabilities and Shareholders' Equity (Deficit) | | $ | 25,000 | $ | 410,549 | | | $ | 435,549 | |
29
QMIS TBS CAPITAL GROUP CORP. AND SUBSIDIARIES |
| | | | | | | | | | | | | | |
UNAUDITED PRO FORMA CONDENSED CONSOLIDATED STATEMENTS OF OPERATIONS |
|
For the Nine Months Ended September 30, 2022 |
| | | | | | | | | | | | | Pro Forma | |
| | | | | | | QMIS TBS CAPITAL | | QMIS SECURITIES | | Pro Forma | | Consolidated | |
| | | | | | | GROUP CORP. | | CAPITAL (M) SDN. BHD. | | Adjustments | | Statements of Operation | |
| | | | | | | | | | | | | | |
| Revenue | | | | | | | | | | |
| | Consultant services | | $ | - | $ | 839,374 | | | $ | 839,374 | |
| | Software development-related parties | | | - | | 101,310 | | | | 101,310 | |
| | | Total revenue | | | - | | 940,684 | | | | 940,684 | |
| | | | | | | | | | | | | | |
| Costs of Revenue | | | | | | | | | | |
| | Costs of consultant services | | | - | | 1,330,218 | | | | 1,330,218 | |
| | Costs of software development | | | - | | 64,281 | | | | 64,281 | |
| | | Total of costs of revenue | | | - | | 1,394,499 | | | | 1,394,499 | |
| | | | | | | | | | | | | | |
| Gross profit | | | - | | (453,815) | | | | (453,815) | |
| | | | | | | | | | | | | | |
| Operating Expenses | | | | | | | | | | |
| | Payroll and employee benefit | | | - | | 21,949 | | | | 21,949 | |
| | Depreciation expenses | | | - | | 3,497 | | | | 3,497 | |
| | Office expenses | | | 9,027 | | 126,354 | | | | 135,381 | |
| | Rental expenses | | | - | | 29,224 | | | | 29,224 | |
| | Due and subscription | | | - | | 33,435 | | | | 33,435 | |
| | Consultant fees | | | - | | 137,000 | | | | 137,000 | |
| | Professional fees | | | 98,700 | | 16,030 | | | | 114,730 | |
| | Management fees | | | 45,000 | | - | | | | 45,000 | |
| | Management fees-related parties | | | - | | 939,903 | | | | 939,903 | |
| | | Total Operating Expenses | | | 152,727 | | 1,307,392 | | | | 1,460,119 | |
| | | | | | | | | | | | | | |
| Net Income (Loss) from Operations | | | (152,727) | | (1,761,207) | | | | (1,913,934) | |
| | | | | | | | | | | | | | |
| Other Income (Expenses) | | | | | | | | | | |
| | Other income (expenses) | | | - | | 7,517 | | | | 7,517 | |
| | | Total Other Income (Expenses) | | | - | | 7,517 | | | | 7,517 | |
| | | | | | | | | | | | | | |
| Net Income (Loss) before Provision for Income Tax | | | (152,727) | | (1,753,690) | | | | (1,906,417) | |
| | | | | | | | | | | | | | |
| Provision for Income Tax | | | - | | 158,920 | | | | 158,920 | |
| | | | | | | | | | | | | | |
| Net Income (Loss) | | $ | (152,727) | $ | (1,912,610) | | | $ | (2,065,337) | |
| | | | | | | | | | | | | | |
| | Less: net income attributable to non-controlling interest | | | - | | 6,476 | | | | 6,476 | |
| | | | | | | | | | | | | | |
| | Net income (loss) attributable to | | | | | | | | | | |
| | | parent company | | $ | (152,727) | $ | (1,919,086) | | | $ | (2,071,813) | |
| | | | | | | | | | | | | | |
| Other comprehensive income (loss) | | | | | | | | | | |
| | Effects of foreign currency conversion | | | - | | 78,995 | | | | 78,995 | |
| Total comprehensive income (loss) | | | (152,727) | | (1,840,091) | | | | (1,992,818) | |
| | Less: comprehensive income attributable to non-controlling interest | | | - | | (1,289) | | | | (1,289) | |
| Comprehensive income (loss) attributable to | | | | | | | | | | |
| | parent company | | $ | (152,727) | $ | (1,838,802) | | | $ | (1,991,529) | |
| | | | | | | | | | | | | | |
| Basic and Fully Diluted Loss per Share | | | | | | | | $ | (0.01) | |
| | | | | | | | | | | | | | |
| Weighted average shares outstanding | | | | | | | | | 300,000,000 | |
| | | | | | | | | | | | | | |
| | | | | | | | | | | | | | |
| | | | | | | | | | | | | | |
The accompanying notes are an integral part of these financial statements. |
30
QMIS TBS CAPITAL GROUP CORP. AND SUBSIDIARIES |
| | | | | | | | | | | | | | |
UNAUDITED PRO FORMA CONDENSED CONSOLIDATED STATEMENTS OF OPERATIONS |
|
For the Year Ended December 31, 2021 |
| | | | | | | | | | | | | Pro Forma | |
| | | | | | | QMIS TBS CAPITAL | | QMIS SECURITIES | | Pro Forma | | Consolidated | |
| | | | | | | GROUP CORP. | | CAPITAL (M) SDN. BHD. | | Adjustments | | Statements of Operation | |
| | | | | | | | | | | | | | |
| Revenue | | | | | | | | | | |
| | Consultant services | | $ | - | $ | 4,386,915 | | | | 4,386,915 | |
| | Software development-related parties | | | - | | - | | | | - | |
| | | Total revenue | | | - | | 4,386,915 | | | | 4,386,915 | |
| | | | | | | | | | | | | | |
| Costs of Revenue | | | | | | | | | | |
| | Costs of consultant services | | | - | | 2,748,036 | | | | 2,748,036 | |
| | Costs of software development | | | - | | - | | | | - | |
| | | Total of costs of revenue | | | - | | 2,748,036 | | | | 2,748,036 | |
| | | | | | | | | | | | | | |
| Gross profit | | | - | | 1,638,879 | | | | 1,638,879 | |
| | | | | | | | | | | | | | |
| Operating Expenses | | | | | | | | | | |
| | Payroll and employee benefit | | | - | | 61,988 | | | | 61,988 | |
| | Depreciation expenses | | | - | | 5,388 | | | | 5,388 | |
| | Office expenses | | | 16,609 | | 21,855 | | | | 38,464 | |
| | Rental expenses | | | - | | 39,709 | | | | 39,709 | |
| | Due and subscription | | | - | | 34,548 | | | | 34,548 | |
| | Research and development expenses | | | - | | 37,091 | | | | 37,091 | |
| | Professional fees | | | 253,526 | | 76,416 | | | | 329,942 | |
| | Management fees | | | 65,000 | | - | | | | 65,000 | |
| | Management fees-related parties | | | - | | 910,392 | | | | 910,392 | |
| | | Total Operating Expenses | | | 335,135 | | 1,187,387 | | | | 1,522,522 | |
| | | | | | | | | | | | | | |
| Net Income (Loss) from Operations | | | (335,135) | | 451,492 | | | | 116,357 | |
| | | | | | | | | | | | | | |
| Other Income (Expenses) | | | | | | | | | | |
| | Other income (expenses) | | | - | | (7,511) | | | | (7,511) | |
| | | Total Other Income (Expenses) | | | - | | (7,511) | | | | (7,511) | |
| | | | | | | | | | | | | | |
| Net Income (Loss) before Provision for Income Tax | | | (335,135) | | 443,981 | | | | 108,846 | |
| | | | | | | | | | | | | | |
| Provision for Income Tax | | | - | | 177,427 | | | | 177,427 | |
| | | | | | | | | | | | | | |
| Net Income (Loss) | | $ | (335,135) | $ | 266,554 | | | | (68,581) | |
| | | | | | | | | | | | | | |
| | Less: net income attributable to non-controlling interest | | | - | | 27,616 | | | | 27,616 | |
| | | | | | | | | | | | | | |
| | Net income (loss) attributable to | | | | | | | | | | |
| | | parent company | | $ | (335,135) | $ | 238,938 | | | | (96,197) | |
| | | | | | | | | | | | | | |
| Other comprehensive income (loss) | | | | | | | | | | |
| | Effects of foreign currency conversion | | | - | | 885 | | | | 885 | |
| Total comprehensive income (loss) | | | (335,135) | | 239,823 | | | | (95,312) | |
| | Less: comprehensive income attributable to non-controlling interest | | | - | | (1,521) | | | | (1,521) | |
| Comprehensive income (loss) attributable to | | | | | | | | | | |
| | parent company | | $ | (335,135) | $ | 241,344 | | | | (93,791) | |
| | | | | | | | | | | | | | |
| Basic and Fully Diluted Loss per Share | | | | | | | | | (0.00) | |
| | | | | | | | | | | | | | |
| Weighted average shares outstanding | | | | | | | | | 300,000,000 | |
| | | | | | | | | | | | | | |
| | | | | | | | | | | | | | |
| | | | | | | | | | | | | | |
The accompanying notes are an integral part of these financial statements. |
31
QMIS TBS CAPITAL GROUP CORP. AND SUBSIDIARIES |
|
| | | | | | | | | | | | | | |
UNAUDITED PRO FORMA CONDENSED CONSOLIDATED STATEMENTS OF OPERATIONS |
|
For the Year Ended December 31, 2020 |
| | | | | | | | | | | | | | |
| | | | | | | | | | | | | Pro Forma | |
| | | | | | | QMIS TBS CAPITAL | | QMIS SECURITIES | | Pro Forma | | Consolidated | |
| | | | | | | GROUP CORP. | | CAPITAL (M) SDN. BHD. | | Adjustments | | Statements of Operation | |
| | | | | | | | | | | | | | |
| Revenue | | | | | | | | | | |
| | Consultant services | | $ | - | $ | 1,916,487 | | | $ | 1,916,487 | |
| | Software development-related parties | | | - | | - | | | | - | |
| | | Total revenue | | | - | | 1,916,487 | | | | 1,916,487 | |
| | | | | | | | | | | | | | |
| Costs of Revenue | | | | | | | | | | |
| | Costs of consultant services | | | - | | 1,015,068 | | | | 1,015,068 | |
| | Costs of software development | | | - | | - | | | | - | |
| | | Total of costs of revenue | | | - | | 1,015,068 | | | | 1,015,068 | |
| | | | | | | | | | | | | | |
| Gross profit | | | - | | 901,419 | | | | 901,419 | |
| | | | | | | | | | | | | | |
| Operating Expenses | | | | | | | | | | |
| | Directors' fees | | | 30,000 | | - | | | | 30,000 | |
| | Payroll and employee benefit | | | - | | 7,751 | | | | 7,751 | |
| | Depreciation expenses | | | - | | 14,012 | | | | 14,012 | |
| | Office expenses | | | 90 | | 30,544 | | | | 30,634 | |
| | Rental expenses | | | - | | 40,562 | | | | 40,562 | |
| | Due and subscription | | | - | | 186 | | | | 186 | |
| | Research and development expenses | | | - | | - | | | | - | |
| | Professional fees | | | 175,891 | | 11,681 | | | | 187,572 | |
| | Consultant fees | | | - | | 52,321 | | | | 52,321 | |
| | Management fees-related parties | | | - | | 927,329 | | | | 927,329 | |
| | | Total Operating Expenses | | | 205,981 | | 1,084,386 | | | | 1,290,367 | |
| | | | | | | | | | | | | | |
| Net Income (Loss) from Operations | | | (205,981) | | (182,967) | | | | (388,948) | |
| | | | | | | | | | | | | | |
| Other Income (Expenses) | | | | | | | | | | |
| | Other income (expenses) | | | - | | (6,763) | | | | (6,763) | |
| | | Total Other Income (Expenses) | | | - | | (6,763) | | | | (6,763) | |
| | | | | | | | | | | | | | |
| Net Income (Loss) before Provision for Income Tax | | | (205,981) | | (189,730) | | | | (395,711) | |
| | | | | | | | | | | | | | |
| Provision for Income Tax | | | - | | 277,409 | | | | 277,409 | |
| | | | | | | | | | | | | | |
| Net Income (Loss) | | $ | (205,981) | $ | (467,139) | | | $ | (673,120) | |
| | | | | | | | | | | | | | |
| | Less: net income attributable to non-controlling interest | | | - | | 1,106 | | | | 1,106 | |
| | | | | | | | | | | | | | |
| | Net income (loss) attributable to | �� | | | | | | | | | |
| | | parent company | | $ | (205,981) | $ | (468,245) | | | $ | (674,226) | |
| | | | | | | | | | | | | | |
| Other comprehensive income (loss) | | | | | | | | | | |
| | Effects of foreign currency conversion | | | - | | (17,567) | | | | (17,567) | |
| Total comprehensive income (loss) | | | (205,981) | | (485,812) | | | | (691,793) | |
| | Less: comprehensive income attributable to non-controlling interest | | | - | | 799 | | | | 799 | |
| Comprehensive income (loss) attributable to | | | | | | | | | | |
| | parent company | | $ | (205,981) | $ | (486,611) | | | $ | (692,592) | |
| | | | | | | | | | | | | | |
| Basic and Fully Diluted Loss per Share | | | | | | | | $ | (0.00) | |
| | | | | | | | | | | | | | |
| Weighted average shares outstanding | | | | | | | | | 300,000,000 | |
| | | | | | | | | | | | | | |
| | | | | | | | | | | | | | |
| | | | | | | | | | | | | | |
The accompanying notes are an integral part of these financial statements. |
32
QMIS TBS CAPITAL GROUP CORP. AND SUBSIDIARIES
NOTES TO THE UNAUDITED PRO FORMA CONSOLIDATED FINANCIAL STATEMENTS
Note 1 - BASIS OF PRESENTATION
On February 13, 2023, QMIS TBS Capital Group Corp. (the "Company") closed a share exchange (the “Share Exchange”) with QMIS Securities Capital (M) Sdn. Bhd. ("QSC"), pursuant to which the shareholders of QSC sold all of their capital stock in QSC to the Company in exchange for an aggregate of 1,000,100 shares of the Company’s common stock. QSC was incorporated in Malaysia on July 20, 2014, under the Company Act Of Malaysia as a private limited company. In connection with the Share Exchange, the Company became the 100% owner of QSC.
The acquisition of QSC has been accounted for as a recapitalization among entities under common control since the same controlling shareholders controlled the Company and QSC before and after the acquisition.
The accompanying unaudited pro forma condensed consolidated balance sheets and the unaudited pro forma condensed consolidated statements of operations have been prepared assuming the acquisition had occurred at the beginning of the period presented.
The unaudited pro forma condensed consolidated financial statements do not necessarily represent the actual results that would have been achieved had the acquisition taken place at the beginning of the period presented, nor may they be indicative of future operations. These unaudited pro forma condensed financial statements should be read in conjunction with the companies’ respective historical financial statements and notes included thereto.
Note 2 - PRO FORMA ASSUMPTIONS AND ADJUSTMENTS
(a)The adjustments were made to reflect the capital structure of the parent company.
Note 3 - INITIAL DEPOSIT FOR ACQUISITION OF RICHFIELD ORION INTERNATIONL, INC.
On April 30, 2020, the Company entered into a Broker/Dealer Purchase Agreement (the “Agreement”) with Richfield Orion International, LLC (the “Seller”), a Colorado Limited liability company, the sole owner of Richfield Orion International, Inc. (“Richfield”), a Colorado corporation. Pursuant to the Agreement, the Company acquired 100% equity ownership of Richfield for $75,000. Richfield is engaged in business as a broker-dealer registered with the U.S. Securities and Exchange Commission (“SEC”) and with the Financial Industry Regulatory Authority (“FINRA”) The Company has paid $25,000 as an initial deposit per the Agreement. The balance of the purchase price will be due on the final closing upon the receipt of the acceptance by FINRA of the Amended Member Agreement wherein the Company is acknowledged by FINRA as the sole owner of Richfield. In the event that FINRA should deny the acceptance of the Company as sole owner of Richfield, the Agreement shall immediately lapse. If the Agreement is null and void, funds that may have been previously paid to Seller in payment any interest or work on this Agreement shall default to Seller.
On November 4, 2022, the Company's Board of directors (the "Board") decided to terminate the Agreement, and accordingly the acquisition of Richfield.
33

